Embed Size (px)
Citation preview

THESEDEDOCTORAT
Pourl’obtentiondugradede
DOCTEURDEL’UNIVERSITÉDEPAUETDESPAYSDEL’ADOUR
Spécialité:Chimiedespolymères
par
CéliaBADJI
Vieillissementdematériauxcompositesrenforcésdefibres
naturelles:étudedel’impactsurlespropriétésd’aspectetsurles
émissionsdansl’airintérieur
Soutenue le 06 Décembre 2017 devant la comission d'examen
Jean-Charles BÉNÉZET, Maître de recherche HDR, IMT Mines Alès Co-directeur
Anne BERGERET, Professeur, IMT Mines Alès Examinateur
Patrice BLONDEAU, Maître de conférences HDR, Université de La Rochelle Rapporteur
Valérie DESAUZIERS, Professeur, IMT Mines Alès Co-Directeur
Hélène GARAY, Enseignant-Chercheur, IMT Mines Alès Examinateur
Jean-Luc GARDETTE, Professeur des universités, Université Clermont Auvergne Rapporteur
Valérie NASSIET, Professeur des universités, Ecole Nationale d'Ingénieurs de Tarbes Examinateur

1

REMERCIEMENTS
Cettethèses’estdérouléeauseindespôlesMatériauxPolymèresAvancés(MPA)etRéactivité
etInteractionsentrelesMatériauxetl’Environnement(RIME)duCentredesMatériauxdes
minesd’Alès(C2MA).JesouhaiteraispremièrementremercierValérieNASSIETdem’avoirfait
l’honneurdeprésidermonjurydethèse.JeremercieégalementPatriceBLONDEAUetJean-
LucGARDETTEd’avoiracceptédejugermontravaildethèseetd’enêtrelesrapporteurs.
Je tiens à remercier toutparticulièrementmesdirecteursde thèseValérieDESAUZIERSet
Jean-CharlesBÉNÉZETpourm’avoirfaitconfiancetoutaulongdecestroisannées.Ilsm’ont
beaucoupapprisetnoséchangesont toujoursété fructueux. Je souhaite fairepartdema
reconnaissanceenversAnneBERGERETetHélèneGARAYpouravoirencadréceprojetdansla
bonne humeur mais aussi pour leur grande disponibilité lorsque j’en avais besoin. Mes
remerciementsvontaussiàJoanaBEIGBEDERdontlacontributionaétéindispensablemais
aussipoursagrandegentillesseetsapatience.
J’exprimemaprofondegratitudeàJean-Serge(autrementnomméMacGyverdulabo)quia
toujourssutrouverlessolutionsauxproblèmesainsiqueSylviemaisaussiHervéetOlivier
pour leur aide et leurs histoires plus qu’intéressantes aux pauses café. Un remerciement
particulieràtoutelafamilleSPICERIME,premièrementDrJane(aliasBritney)etDrMylène
quim’ont accueillie les bras ouverts et sans qui l’aventure n’aurait pas été aussi joyeuse
qu’elle ne l’a été, PhD Alexandre qui a toujours su se rendre disponible pour les soucis
informatiquesettoujourspartantpourlesEscapeGame.
JeremercieégalementLatad’avoirpartagésonexpérienceavecmoientoutdébutdethèse,
Vanessaquej’airetrouvéavecgrandejoieàAlès(etquej’espèreretrouverencore!),Tamara
poursagentillesseinégalable,savolontédetoujoursvenirenaideauxgensetpoursesplats
libanais,Soniapoursajoiedevivreetsonécoute(surtoutnechangepas!)maisaussiAnne-
LaurepournosjoursdeplainteetnosmidisDell’Arte.

JetiensàremercierNicoleetGérard,mesanges-gardiensdepuis10ansetquionttoujours
essayédefacilitermesdémarches.
Jem’adresseenfinàmapetitefamilleenparticuliermestroissœurs,cellesquiontlepluscru
enmoi et quim’ont donné la force et le courage lorsque j’en avais besoin ainsi quemes
parentsquim’ontsoutenujusqu’audernierjour.Enfin,underniermotpourBilhelquiavécu
patiemmentcetteaventureàmescôtés,quim’apaiseetmesoulageetmerendheureusede
jourenjour.J’espèrequ’ilsaitquejesuisaussifièredelui.

2
Tabledesabréviations
ACEA:EuropeanAutomobileManufacturersAssociation
ACP:AnalyseenComposantesPrincipales
ADEME:Agencedel’EnvironnementetdelaMaîtrisedel’Energie
AIAM:AssociationofInternationalAutomobileManufacturers
ASEF:AssociationSantéEnvironnementdeFrance
BMW:BavarianMotorsWorks
BRDF:BidirectionalReflectanceDistributionFunction
CAFE:CorporateAverageFuelEconomy
CAGR:Tauxdecroissanceannuelcomposé
CAR:Carboxen
CIE:CommissionInternationaledel’Eclairage
CIRC:CentreInternationaldeRecherchesurleCancer
CMR:Cancérogène,Mutagène,toxiquepourlaReproduction
COSV:ComposésOrganiquesSemi-Volatils
COV:ComposésOrganiquesVolatils
COVT:ComposésOrganiquesVolatilsTotaux
DOSEC:DeviceforOnSiteEmissionControl`
DSC:DifferentialScanningCalorimetry
DVB:Divinylbenzène

3
FRD:FibreRechercheetDéveloppement
FTIR:FourierTransformInfraredspectroscopy
FID:DétectionparIonisationdeFlamme
GC:Chromatographieenphasegazeuse
HS:Headspace
ISO:InternationalOrganizationforStandardization
JAMA:JapanAutomobileManufacturersAssociation
MA:Anhydridemaléique
MS:Spectrométriedemasse
OEM:OriginalautomotiveEquipmentManufacturers
OMS:OrganisationMondialedelaSanté
PBS:Polybutylènesuccinate
PCA:PrincipalComponentAnalysis
PDMS:Polydiméthylsiloxane
PEBD:Polyéthylènebassedensité
PEHD:Polyéthylènehautedensité
PLA:Polyacidelactique
PP:Polypropylène
PSA:PeugeotSociétéAnonyme
PVC:Polychloruredevinyle
RTM:ResinTransferMolding
SCS:SickCarSyndrome

4
SPME:Micro-ExtractionsurPhaseSolide
TVOCs:TotalVolatileOrganicCompounds
UV:Ultraviolet
VIAQ:VehicleIndoorAirQuality
VOCs:VolatileOrganicCompounds
WPC:WoodPlasticComposites

5
Tabledessymboles
a*:Coordonnéechromatiquesurl’axevert-rouge
b*:Coordonnéechromatiquesurl’axebleu-jaune
C:Concentrationducomposédansl’air(µg.cm-3)
Ca:Concentrationducomposéàlasurfacedesorption(µg.cm-3)
Cs:Concentrationenphasegazeuseàlasurfacedumatériau(µg.m-3)
D:Coefficientdediffusion(m2.s-
1)
E:Moduled’élasticité(MPa)
Ea:Energied’activation(J.mol-1)
EF:Tauxd’émission(µg.m-2.h
-1)
G2:Brillantdecontraste
G1:Brillantdehaze
I:Intensité(W.m-2)
k:constantedevitesseréactionnelle
L*:Coordonnéedeclartésurl’axefoncé-clair
Q:EnergieUVcumulée(J.m-2)
R:Constanteuniverselledesgazparfaits(8,314J.mol-1.K
-1)
RH:Humiditérelative(%)
Sa:Paramètrederugosité(µm)
t:Temps(s)

6
T:température
DHm:Enthalpiedefusion(J.g-1)
q:Anglededétection(°)
l:Longueurd’onde(nm)
n:Nombred’onde(cm-1)
ρ :massevolumique(g.cm-3)
s:Contrainteàlaflècheconventionnelle(MPa)
Xc:Tauxdecristallinité(%)

7
SOMMAIRE
Tabledesabréviations........................................................................................................2
Tabledessymboles............................................................................................................5
INTRODUCTIONGÉNÉRALE...............................................................................................14
CHAPITREI:SYNTHÈSEBIBLIOGRAPHIQUE
I. Lessecteursd’applicationdesbiocomposites...........................................................21
Evolutiondumarchémondial.......................................................................................21
Secteurdelaconstruction.............................................................................................22
Secteurdel’automobile................................................................................................24
II. Lesmatrices..............................................................................................................28
Généralités...................................................................................................................28
Lepolypropylène(PP)etsoncomportementthermomécanique...................................30
III. Lesfibresnaturelles..............................................................................................32
Productionetdéveloppementdesfibresnaturelles......................................................32
Propriétés.....................................................................................................................34
Compositionchimique..................................................................................................35
Cellulose......................................................................................................................36
Hémicelluloses............................................................................................................37
Lignine.........................................................................................................................38
Pectines.......................................................................................................................39
Minéraux.....................................................................................................................39
Structureetmorphologie..............................................................................................39
IV. Lesbiocomposites.................................................................................................40
Propriétésmécaniques.................................................................................................40
Procédésdemiseenœuvreetmiseenforme...............................................................43

8
V. Lesdifférentstypesdevieillissement:impactsurlespropriétésmécaniqueset
microstructuraledesbiocomposites.................................................................................45
Vieillissementphotochimique.......................................................................................45
Vieillissementthermique..............................................................................................48
Vieillissementhydrolytique...........................................................................................50
Vieillissementdesbiocompositespareffetsynergique.................................................52
Vieillissementartificiel.....................................................................................................52
Vieillissementnaturel......................................................................................................55
VI. L’aspectvisuel.......................................................................................................60
L’interactionlumière-matière.......................................................................................60
Lacouleur.....................................................................................................................61
Colorimétrieetcalculdesvaleurstristimulaires.........................................................61
Labrillance...................................................................................................................63
Définitionetrelationavecl’aspectdesurface............................................................63
Impactduvieillissementsurl’apparencevisuelledesbiocomposites............................63
VII. EmissiondeComposésOrganiquesVolatils(COV)etqualitédel’airdeshabitacles
automobiles.....................................................................................................................67
Règlementationsetguides............................................................................................68
Normalisationdesméthodesdeprélèvementetd’analyse...........................................70
Emissionsdanslesvéhicules.........................................................................................70
EmissiondeCOVparlespolymères...............................................................................75
EmissiondeCOVparlesbiocomposites........................................................................75
AnalysedesCOVémisparlesmatériaux.......................................................................77
LaMicroExtractionsurPhaseSolide(SPME)...............................................................78
Couplagecellulesd’émission-Echantillonnagepassif................................................79
VIII. Relationspouvantexisterentreindicateursdevieillissementobtenusàpartir
d’essaisnondestructifsetdestructifs...............................................................................80
Lespolymères...........................................................................................................80
Lesbiocompositesetmatériauxlignocellulosiques...................................................85
IX. Synthèsebibliographiqueetproblématique..........................................................87
Références.......................................................................................................................88
9
CHAPITREII:VIEILLISSEMENTSNATURELSEXTÉRIEURETSOUSVITREPARE-BRISEDE
BIOCOMPOSITESPP/CHANVRE:IMPACTSURLESPROPRIÉTÉSPHYSICO-CHIMIQUESETLES
RELATIONSENTRELESPROPRIÉTÉS
I. Exteriorandunderglassnaturalweatheringofhempfibersreinforcedpolypropylene
biocomposites:impactonmechanical,chemical,microstructuralandvisualaspect
properties......................................................................................................................113
Abstract.........................................................................................................................113
Introduction................................................................................................................114
MaterialsandMethods...............................................................................................117
Materials........................................................................................................................117
Materialprocessing.......................................................................................................117
Weatheringconditions..................................................................................................118
Mechanicalcharacterization.........................................................................................120
Visualaspectcharacterization.......................................................................................120
Microstructurecharacterization....................................................................................122
Chemicalcompositioncharacterization........................................................................122
Surfacecharacterization................................................................................................123
ResultsandDiscussion................................................................................................123
Mechanicalperformance...............................................................................................123
Microstructure...............................................................................................................126
Chemicalstructure.........................................................................................................127
Visualaspect..................................................................................................................130
Topography....................................................................................................................135
Conclusion..................................................................................................................137
Acknowledgements.....................................................................................................139
References..................................................................................................................139
II. Naturalweatheringofhempfibersreinforcedpolypropylenebiocomposites:
Relationshipsbetweenvisualandsurfaceaspects,mechanicalpropertiesand
microstructurebasedonPCAstatisticalapproach..........................................................144
Abstract.........................................................................................................................144
Introduction................................................................................................................145
Materialsandmethods...............................................................................................148

10
Rawmaterials................................................................................................................148
Processconditions.........................................................................................................148
Weathering....................................................................................................................149
Flexuraltests..................................................................................................................151
DifferentialScanningCalorimetry(DSC)........................................................................151
Infraredspectroscopy....................................................................................................152
Spectrocolorimetry........................................................................................................152
Spectrophotogoniometry..............................................................................................152
Rugosimetry...................................................................................................................153
Statisticalanalysis......................................................................................................153
Resultsanddiscussion................................................................................................154
Globaldatatreatment...................................................................................................154
Datatreatmentbytypeofweathering..........................................................................158
Treatmentbyfiberloading............................................................................................160
Treatmentbytimeofweathering.................................................................................164
Conclusion..................................................................................................................168
References..................................................................................................................169
CHAPITREIII:VIEILLISSEMENTSOUSVITREPARE-BRISEDEBIOCOMPOSITESPP/CHANVRE:
ÉTUDEDEL'ÉMISSIONDECOMPOSÉSORGANIQUESVOLATILS
I. Underglassweatheringofhempfibersreinforcedpolypropylenebiocomposites:
ImpactofVolatileOrganicCompoundsemissionsonindoorairquality..........................180
Abstract.........................................................................................................................180
Introduction................................................................................................................181
MaterialsandMethods...............................................................................................184
Materials........................................................................................................................184
Processconditions.........................................................................................................185
Weathering....................................................................................................................185
Samplingandanalyticalmethodology...........................................................................186
Quantitativeanalysis.....................................................................................................187
ResultsandDiscussion................................................................................................188
Chemicalfamiliesevolution...........................................................................................188
..............................................................................................................................................192

11
..............................................................................................................................................192
IndividualVOCsevolution..............................................................................................192
Impactonindoorairquality(IAQ).................................................................................201
Conclusion..................................................................................................................204
Acknowledgements.....................................................................................................205
References..................................................................................................................205
II. Underwindshieldglassweatheringofhempfibersreinforcedpolypropylene
biocomposites:ReactionsbetweenVolatileOrganicCompounds...................................211
Abstract.........................................................................................................................211
Introduction................................................................................................................211
Materialandmethods.................................................................................................214
Materials........................................................................................................................214
Processconditions.........................................................................................................214
Weatheringconditions..................................................................................................214
Samplingandanalyticalmethodology...........................................................................215
Quantitativeanalysis.....................................................................................................216
Resultsanddiscussion................................................................................................216
Polypropyleneoxidation................................................................................................216
Celluloseandhemicellulosesdegradation....................................................................217
Lignindegradation.........................................................................................................225
Conclusion..................................................................................................................227
Acknowledgements.....................................................................................................228
References..................................................................................................................228
III. Underglassexposuretestofhempfibersreinforcedpolypropylenebiocomposites
tosimulateinteriorcarageing:RelationshipsbetweenVOCsemissions,visualaspect,
mechanicalproperties,andmicrostructure....................................................................233
Abstract.........................................................................................................................233
Introduction................................................................................................................234
Materialsandmethods...............................................................................................237
Rawmaterials............................................................................................................237
Processconditions.....................................................................................................237
Weathering................................................................................................................238
Flexuraltests.............................................................................................................238

12
DifferentialScanningCalorimetry(DSC)....................................................................239
FourierTransformInfraredspectroscopy(FTIR).......................................................239
Spectrocolorimetry....................................................................................................239
Spectrogoniometry....................................................................................................240
Rugosimetry..............................................................................................................240
VOCsemission...........................................................................................................241
Statisticalanalysis......................................................................................................241
Resultsanddiscussion................................................................................................242
Globaltreatment.......................................................................................................242
Treatmentbyfiberloading........................................................................................244
Treatmentbyweatheringtime.................................................................................248
Conclusion..................................................................................................................253
References..................................................................................................................254
CHAPITREIV:VIEILLISSEMENTNATURELENEXTÉRIEURETVIEILLISSEMENTARTIFICIELEN
ENCEINTEDESBIOCOMPOSITESPP/CHANVRE:UNEÉTUDECOMPARATIVE
I. Correlationbetweenartificialandnaturalweatheringofhempfibersreinforced
polypropylenebiocomposites........................................................................................264
Abstract.........................................................................................................................264
Introduction................................................................................................................264
MaterialsandMethods...............................................................................................268
Materials........................................................................................................................268
Materialprocessing.......................................................................................................269
Weatheringconditions..................................................................................................269
Mechanicalcharacterization.........................................................................................270
Visualaspectcharacterization.......................................................................................270
Microstructurecharacterization....................................................................................271
Chemicalcompositioncharacterization........................................................................272
Surfacecharacterization................................................................................................272
PrincipalComponentAnalysis(PCA).............................................................................273
Resultsanddiscussion................................................................................................273
Mechanicalperformance...............................................................................................273
Microstructure...............................................................................................................275

13
Chemicalstructure.........................................................................................................276
Visualappearance.........................................................................................................281
Surfaceaspect...............................................................................................................285
Statisticalanalysis..........................................................................................................287
Conclusion..................................................................................................................293
References..................................................................................................................294
ANNEXEI:L’aspectvisuel...............................................................................................304
Lacouleur...................................................................................................................304
Labrillance.................................................................................................................305
Références..................................................................................................................306
ANNEXEII:L’analyseencomposantesprincipales(ACP)................................................307
II.1.Projectiondesindividus....................................................................................................307
II.2.Projectiondesvariables....................................................................................................309
II.3.Contributiondesvariablesetdesindividusauxcomposantesprincipales.........................310
II.4.Conclusion........................................................................................................................311
II.5.Références.......................................................................................................................311
14
INTRODUCTIONGÉNÉRALE
Depuis le protocole de Kyoto acté en 1997, la France, pays signataire de l’accord
internationalsur lapréservationdel’environnement,apourobjectifderéduirede75%les
émissionsenCO2entre1990et2050pourlimiterl’effetdeserre[1,2].Deplus,uneprisede
consciencenonnégligeablesurl’impactenvironnementaldesactivitéshumaines,conduisant
à l'épuisement de nos ressources, a fortement incité les chercheurs et industriels au
développement de matériaux respectueux de l’environnement. Ainsi, afin de limiter le
recoursauxressourcesfossiles, l’utilisationdematériauxissusderessourcesrenouvelables
émergedepuisquelquesannées.Aussi, lacontributionà latransitionécologiquesereflète
deplusenplusdanslessecteurstelsquel’automobileoulaconstructionoùlaperformance
mécanique des matériaux nécessite d’être améliorée par des renforts. En effet, les
composites à fibresnaturelles semblent êtreunealternativeprometteuseaux composites
traditionnels renforcés de fibres synthétiques. En plus de présenter des avantages
environnementaux, les propriétés mécaniques spécifiques des fibres végétales (rapport
entrelapropriétémécaniqueconsidéréeetladensité)sontcomparablesàcellesdesfibres
deverrecourammentutiliséespour lerenfortdesmatériaux.Cescompositesrenforcésde
fibres naturelles, que l’on appelle plus souvent biocomposites, sont par ailleurs très
intéressants sur leplanéconomiquepuisque leur légèreté favorisenotammentunebaisse
de la consommationencarburantetuneémission réduitedegazàeffetde serrepour le
secteurautomobile.Cependant,lafaiblerésistancethermiquedesfibresnaturelleslimitele
choix desmatrices dans lesquelles elles peuvent être incorporées et seules celles dont la
températuredemiseenformeestinférieureà200°Ctelleslespolyoléfines(polyéthylènePE,
polypropylènePP,polychloruredevinylePVC)sontenvisageables.
Cependant, l’un des verrous souvent mis aussi en exergue demeure la sensibilité des
biocomposites aux variations climatiques suite à leur exposition face aux agressions
extérieures telles que les rayons ultraviolets (UV) provenant du soleil, la chaleur ou
l’humiditéélevée.Cettesensibilitépeutsemanifesterparunepertedelatenuemécanique.
Deplus,lesmodificationsdestructuredesbiocompositespeuventinduiredeschangements
d’aspectvisuel.Ainsi,uneétudequantitativedesrelationsexistantentrelastructureetles
propriétés macroscopiques des biocomposites permettrait d’apporter des éléments de

15
compréhension sur leurs mécanismes de dégradation et expliquer l’endommagement
provoquéparlesfacteursextérieurs.
Parailleurs, lesbiocomposites sont reconnuscommeresponsablesd’odeurs [3,4].Puisque
cesderniers sontactuellement intégrésdans leséquipements intérieursd’automobile tels
que les tableauxdebordou lespanneauxdeporte [5],cesodeurspeuventdoncnuireau
bien-êtredespassagersduvéhiculeetpotentiellementcontribuerau«newcarsmell». Ils
sont donc des sources potentielles de polluants pouvant compromettre la qualité de l’air
intérieur d’automobile. Des règlementations mises en place ces dernières années
notammentenAsievisentàlimiterladégradationdelaqualitédel’airintérieurd’habitacle.
Ces dernières proposent des valeurs limites de concentration de certains composés
retrouvés dans les véhicules dont l’impact sur notre santé est reconnu. Par ailleurs, des
normessontproposéesauxconstructeursautomobilesafindemesurerlesémissionsdeCOV
des véhicules et des pièces intérieures avant mise sur le marché du véhicule. Toutefois,
l’impactdesémissionsdeComposésOrganiquesVolatils(COV)pardesbiocompositessurla
qualité sanitaire de l’air intérieur de véhicule reste encore peu documenté. Ainsi, il est
proposédanscetteétudededéterminerlacontributiondesfibresnaturellesetl’impactdes
conditions d’usage sur le profil d’émission de COV des biocomposites. Pour cela, une
méthodologieprécédemmentdéveloppéeaulaboratoirepermettantunemesuresimpleet
non destructive des émissions de surface des matériaux a été appliquée En effet, les
indicateurs de dégradation habituellement suivis au cours du vieillissement consistent
notammentenl’évaluationdelaperformancemécaniqueàtraversdestestsdestructifs.Un
suivi de traceurs tels que les émissions de COV et/ou l’aspect visuel permettrait donc de
s’affranchirdecettedémarcheclassiquedestructive.
Le vieillissement naturel reste le moyen le plus fiable pour évaluer la durabilité des
matériaux.Cependant, ilnécessitesouventuneexpositionde longueduréepour identifier
une dégradation effective du matériau. Ainsi, des essais de vieillissement artificiel en
enceinte dédiée permettent d’accélérer les processus de dégradation des matériaux.
Toutefois, il apparaît primordial de vérifier la fiabilité de ce type d’approches quant à la
représentativitédes conditionsextérieuresen laboratoire.Aussi, un facteurd’accélération
de la dégradation des matériaux entre l’exposition artificielle et l’exposition naturelle
permet d’estimer le temps nécessaire de test en enceinte pour représenter une certaine

16
durée d’exposit ion du matériau en condit ions réelles. Cependant , il n’existe pas de facteur
d’accélérat ion universel pouvant êt re appliqué à toute étude de cas puisque le degré de
dégradat ion dépend fortement du matériau et des condit ions de vieillissement De plus, lorsque
le nombre de propriétés étudiées est conséquent , il semble nécessaire de proposer une analyse
synthét ique et fiable permet tant d’est imer un facteur d’accélérat ion par matériau et par
propriété considérée. Au vu des applicat ions en environnements extérieurs et intérieurs des
biocomposites, l’intérêt sera d’étudier l’évolut ion de leur comportement en condit ions réelles et
art ificielles et déterminer l’influence des condit ions d’usage
(extérieure et intérieure) sur leurs caractérist iques init iales telles que la tenue mécanique, la
microst ructure, l’apparence visuelle et les émissions de COV pour l’applicat ion intérieure. Dans
ce contexte, ce t ravail de thèse a été entrepris et le manuscrit qui en découle s’art icule en 5
chapit res : L’état de l’art sur l’ut ilisat ion de biocomposites en industrie ainsi que les principaux
verrous scient ifiques limitant leur développement const ituera le Chapit re I. Il en sera déduit la
nature du biocomposite qui sera étudié (matrice polymère et renfort de fibres végétales). Ce
chapit re présentera aussi les différents paramètres responsables de la dégradat ion des
biocomposites et l’influence de chaque facteur sur l’évolut ion des propriétés physico-
chimiques, mécaniques et d’aspect visuel dans leurs condit ions d’usage. Aussi, les études
quant itat ives des polluants fréquemment ident ifiés dans les habitacles de véhicule seront
présentées et les émissions de COV seront mises en relat ions avec les autres propriétés d’usage.
La part ie 1 du Chapit re II présentera l’impact de vieillissements naturels extérieur et sous vit re
pare-brise des biocomposites étudiés sur leur durabilité au cours d’une année. Le vit rage
pare-brise est choisi afin de simuler un environnement intérieur d’automobile. L’influence des
condit ions d’usage sera évaluée à t ravers le suivi des propriétés mécaniques, physiques et
chimiques. La nature des relat ions existant entre les différentes propriétés suivies au cours des
vieillissements sera établie dans une seconde part ie à t ravers une approche stat ist ique
permet tant de met t re en évidence l’évolut ion des corrélat ions au cours de l’exposit ion. Le
Chapit re III sera consacré à l’étude de l’impact de l’exposit ion sous vit rage sur les émissions de
COV des biocomposites. Premièrement , l’impact du vieillissement et de l’incorporat ion de fibres
végétales dans le matériau sur les émissions sera évalué. Ensuite,
16
17
desmécanismes réactionnels de dégradation desmatériaux seront proposés à partir des
COV analysés. Enfin, une analyse statistique sera effectuée afin d’évaluer la possibilité
d’utiliserlesémissionsdeCOVcommeindicateurdevieillissement.
Enfin,leChapitreIVtraiteradelacomparaisonentreunvieillissementaccéléréeffectuéen
enceintede laboratoireet le vieillissementextérieurnaturel desmatériauxbiocomposites
afind’évaluerlasimulationdesconditionsextérieuresenenceinte.
Références
[1] Feature, construction, solutions, medical, biocomposites, n°111, JEC Compos. Mag.
(2017)1–122.
[2] COP21:lesengagementsnationauxdelaFrance,(2015).gouvernement.fr.
[3] O. Faruk, A.K. Bledzki, H.-P. Fink, M. Sain, Biocomposites reinforced with natural
fibers: 2000–2010, Prog. Polym. Sci. 37 (2012) 1552–1596.
doi:10.1016/j.progpolymsci.2012.04.003.
[4] H.-S. Kim, B.-H. Lee, H.-J. Kim, H.-S. Yang,Mechanical–thermal properties and VOC
emissions of natural-flour-filled biodegradable polymer hybrid bio-composites, J.
Polym.Environ.19(2011)628–636.doi:10.1007/s10924-011-0313-5.
[5] Z.L. Yan, H.Wang, K.T. Lau, S. Pather, J.C. Zhang, G. Lin, Y. Ding, Reinforcement of
polypropylene with hemp fibres, Compos. Part B Eng. 46 (2013) 221–226.
doi:10.1016/j.compositesb.2012.09.027.

18

19
CHAPITREI
SYNTHESEBIBLIOGRAPHIQUE

20

21
L’étude bibliographique présente tout d’abord les secteurs d’application principaux des
biocompositesainsiqueleurscaractéristiquesgénérales.Ensuite,lesprincipalescausesdes
variationsdespropriétésdesbiocompositesainsiqueleur impactsur leurspropriétéssont
décrites. Puis, l’état de l’art sur l’impact des émissions de Composés Organiques Volatils
(COV) sur la qualité de l’air intérieur de véhicule (une des principales utilisations des
biocomposites) est présenté. Enfin, les relations entre les propriétés des polymères
dégagéesdanslalittératuresontdétaillées.
Evolutiondumarchémondial
Ledéveloppementdematériauxbiocomposites,définiscommepartiellementoutotalement
constitués de matériaux issus de la biomasse, résulte d’une prise de conscience des
problèmesenvironnementauxetdesrèglementationsdeplusenpluscontraignantessurles
émissionsenCO2.
Leurdéveloppements’étendsur tous lescontinents. L’AmériqueduNordprésente leplus
grand marché de composites renforcés de fibres naturelles, notamment dû à leur
prédominance dans les activités liées au bâtiment et la construction, dont les composites
renforcés de fibres de bois sont les plus représentatifs. En Europe, la production en
compositesrenforcésde fibresnaturelleset farinedeboisconstitue15%de laproduction
totale en composites [1]. En 2012, l’Union européenne a produit 397 000 tonnes de
biocompositesetceladevraitaugmenterde1,2%voire3%en2020selonlesincitationspour
le développement des produits biosourcés et les scénarios de politique gouvernementale
[2].Cependant,unedemandecroissanteémergeaussidel’Asie.Eneffet,ilestenvisagéque,
durantladécennieprochaine,l’Asie-PacifiqueincluantleJapon,laChineetlaCoréeduSud
devrait témoignerde laplus forte croissanceglobaleenbiocompositespuisque l’industrie
automobile y est de plus en plus développée [3]. De plus, celle-ci dispose d’abondantes
matièrespremièresissuesdelabiomassenécessairespourproduiredesbiocomposites[4].
Le graphe suivant (Figure 1) représente la répartition en volume du marché global des
biocomposites en fonction de leur secteur d’application [5]. Cette figure démontre
clairementquelaconstructionprésentelaplusgrandepartdemarchésuivieparl’industrie

22
automobile.Cesdeuxsecteursd’applicationsserontdoncdétaillésdanslasuitedecetétat
del’art.
Secteurdelaconstruction
Lesecteurdelaconstructiondominelemarchéglobaldesbiocompositesavecuneparten
volumedeplusde50%en2015[6].Celas’expliquenotammentparunevolontécroissante
de réduire l’empreinte environnementale des constructions mais aussi par le
développement accru d’infrastructures. Les principaux produits commercialisés constitués
dematériauxbiocompositessontleslamesdeterrasse(decking),parementsetclôtures[7].
Par ailleurs, les composites à renforts de fibres ou de farines de bois (Wood Plastic
Composites, autrement désignés WPC) sont les plus répandus, particulièrement dans le
marché résidentiel en raison de leur légèreté, de leurs caractéristiques esthétiques et de
leurspropriétésmécaniques. Ilsreprésentent60%dumarchédelaconstruction[6,8]mais
aussiunealternativeavantageuse,entermesdecoûtdemaintenanceetdepoids,auxlames
deterrasseclassiquesexclusivementconstituéesdebois[9].LesEtats-UnisetlaChinesont
lespayslesplusgrandsproducteursdeWPC.EnEurope,ils’avèrequelemarchédesWPC
pourunusageen lamesdeterrasseestresté longtempsaustadededéveloppementpour
atteindreactuellementunstadedematurité[8].
Les WPC sont principalement extrudés sous forme de planches de terrasse creuses ou
Automobile
Construction
Electroniques
Autres
Articlesdesport
Figure 1 - Répart it ion des biocomposites par applicat ion

23
pleines (Figure 2). Même si les profils creux restent moins coûteux, plus légers et
représentent56%enmassedelatotalitédesproduitsenWPCen2015[10],lesprofilspleins
enWPCtendentàêtreplusdéveloppés[8]notammentpourraisonsesthétiquesetpourleur
résistanceauxintempériesplusélevée[11,12].
Figure2-LamesdeterrasseenWPCpleines(gauche)etcreuses(droite)Ecodeck®[12]
LafibredeboisjoueunrôlemajeurdanslesperformancesdesWPCaucoursdeleurcycle
de vie. Elle est utilisée comme renfort pour réduire les coûtsdeproductiondematériaux
destinés à la construction [13]. Dans ce secteur, les bois de résineux (épicéa, pin) sont
principalement utilisés [8]. Cela peut s’expliquer par leur coûtmoins élevé que celui des
bois de feuillus (érable, chêne)bienqu’ils sedégradentplus rapidementque cesderniers
[14].
Lepolyéthylène(PE)estlamatricelaplusutiliséepourlesWPC.Cependant,lastructureetla
résistance aux agents chimiques du polypropylène (PP) sont appréciées, notamment en
Europe[8].Parailleurs,lefaibledegréd’expansion/contractionthermique(CTE)duPPetdu
PE est un point fort vis-à-vis des variations de température extérieures [15]. De plus, ces
polymèresprésententunCTEencoreplus faibleune fois renforcésde farinesou fibresde
bois[16].Cependant,latempératuredefusionduPPnécessitantdesconditionsthermiques
demiseenœuvreplusélevées,saplusgrandefragilitéetsonprixsupérieuràceluiduPE
représententunfreinàsondéveloppement,notammentenAmériqueduNord[17].
Le ratio fibresdebois/matrice thermoplastiqueconditionne fortement les caractéristiques
desWPC.Lechoixseportegénéralementversunratio50/50enmasse[18].Cependant,de
parleurinstabilitéetleursensibilitéenenvironnementextérieur,desadjuvantstelsquedes
colorants,agentsdecouplage,stabilisantsUVetthermiquesoulubrifiantssontajoutésaux
WPCafind’améliorerlescaractéristiquesetladurabilitédesproduitsfinis.

24
Aujourd’hui, suite aux politiques de gouvernement tendant à préserver les forêts, les
fabricants de WPC favorisent le renforcement partiel des plastiques par des composés
biosourcés alternatifs aux fibres de bois permettant des performances dematériaux plus
ciblées [18,19]. En effet, des renforts alternatifs tels que les fibres techniques et sous-
produitsvégétaux(bambou,lin,chanvreetballescéréalièrescommelerizetleblé)sontde
plusenplusvalorisés[17,18].Lafibredechanvreconstituel’unedesfibresalternativesles
plus intéressantes [19]. Le chanvre est une plante qui permettrait de produire plus de
matièrepremièredestinéeà la constructionpourunemêmesuperficieque laplupartdes
arbres [20]. En ce qui concerne les balles céréalières comme le riz, leur composition
chimique présentant une forte teneur en silicates, composés hydrophobes, limite
l’absorption d’eau et donc l’instabilité dimensionnelle [17]. Cependant, certains aspects
contraignants,telsquelamauvaisecoulabilitédesfibresdanslesdoseursd’alimentationdes
appareillageslorsdelamiseenœuvre [21], justifientlefaitquecetypedebiocomposites
restentprincipalementdans les centresde rechercheetdéveloppementnotammentpour
mieuxmaîtrisercesaspects.
Les biocomposites restent cependant moins développés pour des usages en intérieur de
bâtiments. Ce type d’application intérieure est pour l’instant surtout réservé au domaine
automobiledécritci-après.
Secteurdel’automobile
Laconceptiondepiècesdevéhiculepartiellementobtenuesàpartirdematériauxbiosourcés
a été initiée par le fondateur de la compagnie FordMotors dans les années 1930s [22].
Depuis, des recherches ont été entreprises conduisant à l’utilisation étendue de
biocompositesdurantle20ème
siècledontlafinestcaractériséeparunediminutionévidente
desressourcesfossilesselonlepicdeHubbert(peakoil)[23,24].Lesbiocompositespeuvent
être retrouvés dans les pièces intérieures de véhicule sous forme de composants non
structurelstelsquelesintérieursdeportes,dossiersoutableauxdebord.Cependant,ceux-
ci tendentàêtredeplusenplusutiliséspourdescomposantsplusstructurelstelsque les
planchers,motopropulseursousystèmesdedirection[25–27].LePPchargédefibresdelin
ou de chanvre est la matrice la plus développée dans ce secteur. Cette volonté de
développer l’utilisation de biocomposites peut être attribuée à un besoin croissant en

25
véhicules plus sûrs, plus légers et donc moins consommateurs en carburant puisque
l’intégrationdecompositesrenforcésdefibresnaturellesdanslesvéhiculespeutpermettre
ungaindemasseglobalde10%pourdesperformancesmécaniqueséquivalentesà celles
descompositestraditionnels[28].Parailleurs,uneréductiond’environ57kgrésulteraiten
ungainéconomiquede0,09à0,21kmpar litredecarburant [29].Deplus, l’énergiepour
fabriquer des composites renforcés de fibres naturelles nécessite seulement 60%de celle
requisepourlescompositesàfibressynthétiques[30].Ainsi,lesémissionsdegazàeffetde
serre sont limitées du fait d’une consommation en énergie moindre au cours de la
production [31]. En effet, il a été démontré qu’en convertissant l’énergie en émission de
CO2,celle-cipouvaitêtreréduitede3tonnesCO2partonnedecompositeensubstituantles
fibresdeverrepardesfibresdechanvre.
Lesconstructeursallemandssontparticulièrementactifsencequiconcernel’intégrationde
biocomposites dans leurs véhicules. Les premiers efforts commercialisés réalisés par
Mercedes-Benz [8] sont des composites à base de polymères renforcés de fibres de jute,
banane,lin,chanvre,sisal,laine,etcotonpourlesintérieursdeporte,housses,panneauxet
dossierdesiègedesmodèlesclasseE(1994),classeA(2004)etclasseS(2006)[25,26,32,33].
Ainsi,uneréductiondemassede20%et jusqu’à45%despanneauxdeportedesmodèles
classeEet classe S [25] respectivementaétéobservée. La Figure3 représente lemodèle
classeEplusrécentdontl’intérieurestcomposéde50piècesdifférentesincluantdesfibres
naturelles [33]. Les compagnies Volkswagen et BavarianMotorWorks (BMW) s’engagent
aussi dans cette démarche d’utilisation de matériaux verts [33–36]. Par exemple,
Volkswagenutilisedesbiocompositespourlescomposantsstructurelstelquelecomposite
PP/fibresnaturelles[35].

26
Figure3–Piècesintérieuresdevéhiculesdeconstructeursallemands(MercedesE-class(a)[37],
BMW(b)[38])[40])etdeconstructeursfrançais(Peugeot308(c)[39],LotusEcoElise(d)[40])
constituéesdebiocompositesconstituéesdebiocomposites
Les constructeurs français PSA et Renault sont aussi concernés par le développement de
matériaux respectueux de l’environnement, notamment à travers des «bioconcept-cars»
[41,42]. Cependant, certains véhicules sont aussi retrouvés sur le marché [43]. Aussi,
l'approcheholistiqueadoptéeestillustréepourlevéhiculeLotusEcoEliseparl’utilisationde
fibres végétales locales (chanvre) (Figure 4) [40,44]. Par ailleurs, comme observé dans le
Tableau 1, les constructeurs automobiles japonais Mitsubishi Motors (MMC) et Toyota
adoptentaussiunetechnologievertepourleursvéhicules[25,32].
Lesfabricantsetfournisseursd’équipementsdontleséquipementiersfrançaisFaureciaSAet
ValéoSAclassésaux9ème
et10ème
rangsparmi leséquipementiersmondiauxselon l’indice
RolandBergeren2016[45],tendentàdévelopperdesmatériauxàpartirdefibresvégétales
etparticipentdoncaudéveloppementd'uneéconomie«sobre»encarbone[46].Deplus,
Faurecia favorise particulièrement le développement dematériaux destinés aux intérieurs
d’automobileàbasedechanvre[46].
Destechnologiescommunesauxfabricantsetconstructeursautomobilesprennentdeplus
en plus d’essor. Le procédé de moulage par injection NAFIlean®, dont le projet réunit
PeugeotSA(PSA)et l’équipementierFaureciaen2013,enestunexempleconcret[46].Ce
a)
c)
b)
d)

27
procédé consiste à formuler des composites PP renforcé de 20% en masse de fibres de
chanvrepourles4panneauxdeportedelaPeugeot308.Cebiocompositecorrespondàla
première pièce structurelle bio-sourcéemoulée par injection sur lemarché des intérieurs
d’automobilespermettantdecréerdesformesetarchitecturescomplexestoutenapportant
ungaindepoids[47].Parailleurs,en2016,cematériauaétéutilisépour lapremièrefois
pourletableaudebordcompletdelaGiulia(AlfaRoméo)[48,47,49].
PSA Peugeot-Citroën, Faurecia et Lineo ont aussi développé FlaxpregTM, un composite
sandwich léger àmatrice époxy renforcé de fibres de lin longues dont l’originalité réside
dans la suppression des étapes de filature et de tissage, induisant des fibres planes non
torsadées, pour réduire le coût de production du FlaxTapeTM non-tissé. Aussi, le chimiste
japonais Mitsubishi Chemicals et Faurecia se sont associés afin de développer un
bioplastique polybutylène succinate (PBS), entièrement fabriqué à partir de matières
premières renouvelables, biodégradable et renforcé de fibres de chanvre à la résistance
mécaniqueetàlatenueaufeuélevées.Cematériaupourraitêtre100%recyclableen2018
[47,50]. Ainsi, parmi les biocomposites les plus développés par les constructeurs et
fabricants de véhicule cités précédemment, le renfort des matériaux par des fibres de
chanvresembleêtremaîtrisé.
Des avancées communes aux secteurs académique et industriel ont permis de progresser
rapidementdanscettedémarche[51,52].Parexemple,desétudesenuniversitésetinstituts
de recherche en partenariat avec la compagnie brésilienne Ancel-Reinforced Plastics ont
démontréparanalysedecycledevie(ACV),qu’ilétaitpossibledefabriqueruncapotfrontal
structurel d’un véhicule à base de fibres de jute en substitution aux fibres de verre
présentant demeilleures caractéristiques et performances environnementales grâce à un
poidsplusfaible[52].
L’utilisation sous forme de composants extérieurs d’automobile connaît aussi un intérêt
croissant [32,33,53]. La première version des biocomposites est apparue en 2000 sur le
modèleMercedes-BenzTravegoéquipéd’unmoteurrenforcédepolyester/linetd'enceintes
pourisolationacoustique.Grâceàtouscesdéveloppements,lesecteurautomobilepourrait
êtrelesegmentleplusprometteurdansl’adoptiondebiocompositesauseindesonmarché
entre2016et2021[54].

28
Tableau1-Piècesintérieuresenbiocompositesdedifférentsmodèlesdevéhicule
Constructeurs Modèles Pièces Matrices Fibres Source
Daimler/Mercedes-Benz
ClassesA,C,E,
S
Housses, revêtements,
dossiers, tableaux de
bord, panneaux de
porte, panneaux de
recouvrement
Epoxy,
polyesters,
PP,PE
jute,
banane,lin,
chanvre,
sisal,laine,
coton
[25,26,32,33,37]
VolkswagenGolfA4,Passat,
AudiA2
Dossiers de siège,
revêtementdebavette
arrière, panneaux de
porte
PP,PU lin,sisal [25,33]
BMW Séries3,5,7
Revêtements,
panneaux de porte,
panneaux isolants
acoustiques
PU,
copolymère
acrylique
chanvre,lin,
sisal[37,55]
FordFordMondeo,
FordFlex2010
SUV
Panneauxdeporte PPkénaf,paille
deblé[34][56]
GeneralMotorsChevrolet
ImpalaPlagearrière PP lin [33]
Toyota ES3Garniture et autres
piècesintérieuresPLA kénaf [37]
MitsubishiMotors
Panneaux de porte,
plancherdecoffrePBS bambou [34,37]
Renault Clio Plagearrière PP lin [37,56]
PeugeotPeugeot308,
Peugeot406
Panneaux de porte,
plage arrière, faux-
plancherdecoffrePP chanvre [46]
Citroën C3,C5
Plage arrière,
revêtement de coffre,
intérieursdeporte bois [43][33]
Lotus EcoElise Tapisintérieurs,sièges polyesterchanvre,
sisal,laine[40,44,56]
AlfaRomeo Giulia Tableaudebord PP chanvre [49]
Cette partie décrit les différents types de matrice développés en industrie ainsi que les
caractéristiques thermo-mécaniques de l’une des polyoléfines les plus produites dans le
monde.
Généralités
Lamatrice joue lerôlede liantentre lesrenfortset lesprotège.Lesbiocompositesutilisés
dans le secteurde la construction sontprincipalement constituésd’unematricepolymère
thermoplastique (polyoléfines), alorsque le secteurde l’automobile favoriseégalement le
développementdepolymèresthermodurcissables(époxy,polyesters)pourcertainespièces

29
[25]. La différence entre ces deux matières plastiques réside en la structure des chaînes
macromoléculaires, réticuléesdans lecasdespolymèresthermodurcissableset librespour
les polymères thermoplastiques. Les composites à matrice thermoplastique tendent à
remplacerdeplusenplus les thermodurcissablespour lesavantagesqu’ilsprésentent tels
que le recyclage et les possibilités plus diverses de design [31,30,34]. Leur tonnage
évolueraitplusrapidementqueceluidesthermodurcissables.Parailleurs,lagrandeductilité
de la matrice thermoplastique confère aux biocomposites une meilleure résistance aux
chocs et unemeilleure résistance à l’impact en comparaison à ceux à base de polymères
thermodurcissables [57]. Leur structure peut être de nature amorphe ou semi-cristalline
[58–61].Cettespécificités’avèreimportantecarelleconditionneessentiellementlaréponse
mécaniquedubiocompositeauquellepolymèreestintégré.
Le polymère peut provenir de ressources renouvelables (biosourcé) ou non renouvelables
(pétrosourcé) et peut être biodégradable ounonbiodégradable (Figure 4). Lesmatrices à
polymère synthétique généralement utilisées dans les biocomposites retrouvés dans les
véhiculesoudanslesmatériauxdeconstructionsontlePP,lePEetlePVC[15,62,63].Ceux-
cisontsuivisparlespolymèresbiosourcéstelsquelePBSetlePLA[64,65].
Figure4-Lesdifférentescombinaisonsentrematriceetrenfort[66]
Résin
e p
étr
o-s
ourc
ée
(t
herm
opla
stiqu
e, th
erm
odu
re) Ma
tric
e
Résin
e b
iosourc
ée
(th
erm
opla
stiqu
e, th
erm
odu
re)
Renfort
Fibre synthétique (verre, carbone, aramid, etc.)
Fibres naturelles (lin, chanvre, etc.)
Composites biosourcés
Composites conventionnels
Composites biosourcés
Composites biosourcés
1
5

30
Aussi, le choix de la matrice est limité par la température de dégradation des fibres
végétales,environ200°C,quiestlatempératuredemiseenœuvredesbiocomposites[27].
Deplus,lescontraintestechniquesetéconomiquesdesindustrielsliésauxmatériaux100%
issus de la biomasse affectent la production en série. Demanière ponctuelle, lorsque ces
matériaux sontutilisésdansdes véhiculesde série, ils se limitent àdes applicationsoù le
produit sera soumis à des contraintes thermiques et mécaniques restreintes [67]. Par
ailleurs, les biocomposites dérivés de matrices synthétiques présentent une balance
intéressante entre les intérêts environnementaux et économiques pour plusieurs
applications[68].LespolymèrestelsquelePEoulePPserontprivilégiésaudétrimentdes
PBSetPLA.Deplus,leurmoindrecoûtleurvautleursuccèsdanslesbiocompositesutilisés
dans les deux secteurs cités précédemment. Au vu des avantages liés à l’utilisation de
thermoplastiques, le PP est donc sélectionné pour notre étude comme matrice des
biocomposites.
Lepolypropylène(PP)etsoncomportementthermomécanique
Le polypropylène, dont la formule chimique est CnH2n (Figure 5), est la deuxièmematière
plastiquelapluslargementproduiteaprèslePE[69]. Iltrouvedenombreusesapplications
tellesquelesemballagesalimentairesoulespiècesextérieuresetintérieuresd’automobile.
Eneffet,ilestretrouvénonrenforcédanslespiècesmouléesd’automobiletelsquelespare-
chocs[70],etrenforcésousformedecompositesdanslespanneauxdeporteoutableauxde
bord[37].
LePPestunepolyoléfinesaturée.Ilestparailleurstrèsrésistantàlafatigue,laflexionetla
déformationthermique.IlrestecependanttrèsfragileetsensibleaurayonnementUVetla
température en raison de structure branchée [15]. C’est pourquoi des antioxydants sont
souventajoutéspourunemeilleurestabilitéthermiquedupolymère[15,71,72].
Figure5–StructureduPP

31
LePPprésenteuncomportementviscoélastiquenonlinéaire.Plusieursparamètrestelsque
laformulation, leprocédédemiseenœuvre(organisationdeschaînesmacromoléculaires,
consommation d’additifs), l’environnement d’utilisation ou la sollicitation influent sur la
réponsemécaniquedupolymère[73,74].Parexemple,lesdifférentsmodesdedéformation
uniaxiaux tels que la traction, la flexion ou la compression peuvent influencer
considérablementlavaleurdumoduletraduisantlarigiditédumatériaulorsquelematériau
est inhomogène et anisotrope dans le cas de polymères chargés [75]. Par ailleurs, la
répartitiondescontrainteslelongdumatériauaucoursdelasollicitationdiffèreenfonction
dumodededéformation.
LetypedePP(homopolymère,copolymèreséquencé,statistique)estchoisienfonctiondela
spécificité requise et du coût associé. Les homopolymères et copolymères sont les plus
communémentutilisés bienque la première famille soit plus rigide et plus résistante à la
traction[76,77].Parailleurs,leprofilmécaniqueseraaussidifférentenfonctiondutypede
PP.LeTableau2répertorielespropriétésthermomécaniquesd’unPPhomopolymère[77].
Le comportement mécanique de ce polymère dépend aussi de sa morphologie
microstructurale.Eneffet,lespolymèressemi-cristallinstelsquelePPontlaparticularitéde
pouvoircristalliserentre leurtempératuredetransitionvitreuseTget leurtempératurede
fusionTf.Or,untauxdecristallinitéélevé induitunerigiditérelativement importante[78].
Parailleurs,unecristallisationduPP isotactiqueaétémiseenévidencedans la littérature
une fois en contact avec des charges lors de son refroidissement au cours de lamise en
œuvre[79].Celainduitl’apparitiond’autresstructurescristallinesetpeutaffecterletauxde
cristallinité.Aussi,ilaétédémontréquelePPcristallisaitsouslesphasesaetbenprésence
decelluloseagissantentantqu’agentsdenucléationalorsque lePPnonchargécristallise
seulement sous laphasea [80].Donc, pouruneanalyse correctede lamicrostructuredu
polymère,lacontributiondeschargesourenfortsdoitêtremaîtrisée.
Tableau2-Propriétésthermomécaniquesd'unPPhomopolymère[15][77]
Indicedefluidité
(g/10min)
Cristallinité
(%)
Résistanceà
l’impact
(Kj.m-2)
r
(g.cm-3)
Tg
(°C)
Tf
(°C)
Résistanceàla
traction
(N.mm-2)
Module
(GPa)
2à5 30à50 3-300,9à
0.91
-20à-
18
160à
16533 1,4
32
Productionetdéveloppementdesfibresnaturelles
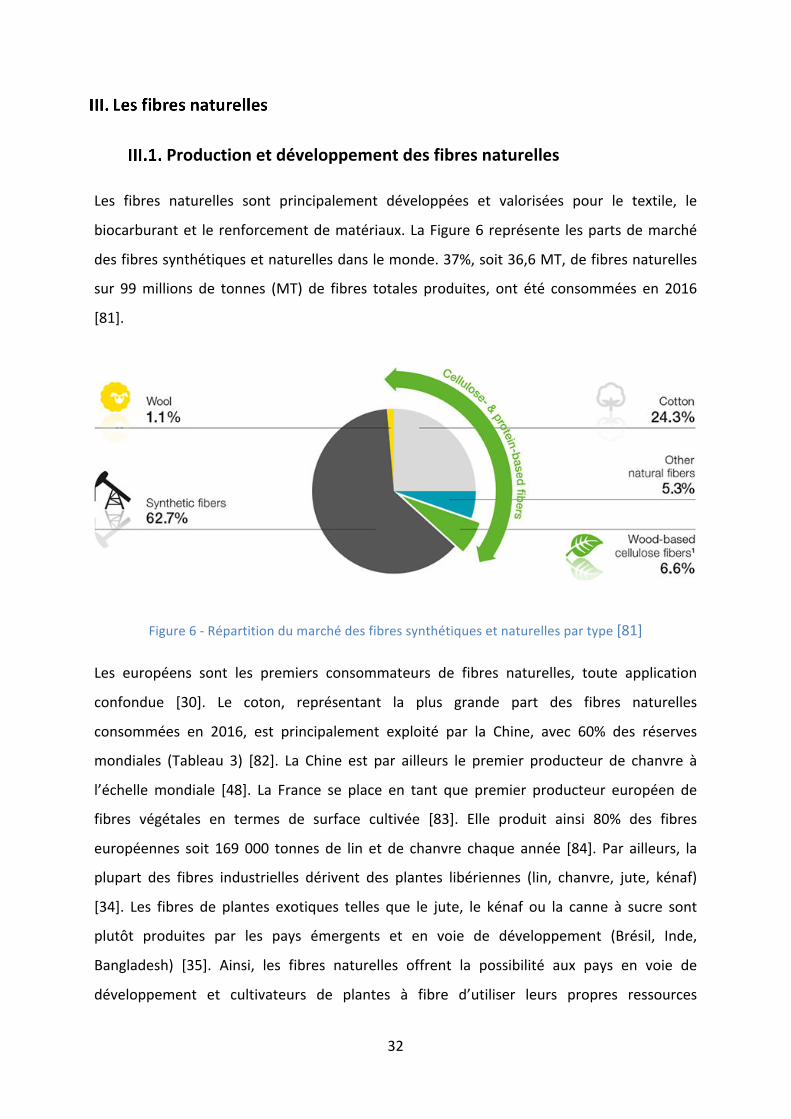
Les fibres naturelles sont principalement développées et valorisées pour le textile, le
biocarburantet le renforcementdematériaux.LaFigure6représente lespartsdemarché
desfibressynthétiquesetnaturellesdanslemonde.37%,soit36,6MT,defibresnaturelles
sur 99millions de tonnes (MT) de fibres totales produites, ont été consommées en 2016
[81].
Figure6-Répartitiondumarchédesfibressynthétiquesetnaturellespartype[81]
Les européens sont les premiers consommateurs de fibres naturelles, toute application
confondue [30]. Le coton, représentant la plus grande part des fibres naturelles
consommées en 2016, est principalement exploité par la Chine, avec 60% des réserves
mondiales (Tableau 3) [82]. La Chine est par ailleurs le premier producteur de chanvre à
l’échellemondiale [48]. La France se place en tant que premier producteur européen de
fibres végétales en termes de surface cultivée [83]. Elle produit ainsi 80% des fibres
européennes soit 169 000 tonnes de lin et de chanvre chaque année [84]. Par ailleurs, la
plupart des fibres industrielles dérivent des plantes libériennes (lin, chanvre, jute, kénaf)
[34]. Les fibres de plantes exotiques telles que le jute, le kénaf ou la canne à sucre sont
plutôt produites par les pays émergents et en voie de développement (Brésil, Inde,
Bangladesh) [35]. Ainsi, les fibres naturelles offrent la possibilité aux pays en voie de
développement et cultivateurs de plantes à fibre d’utiliser leurs propres ressources

33
naturellesdansl’industriedescomposites.
Tableau3–Productionannuellemondialeetpaysproducteursprincipauxdefibresnaturelles
[17,30,85,86]
Fibresnaturelles Productionmondiale
(103tonnes)1erpaysproducteurmondial
Canneàsucre 75000 Brésil
Bambou 30000 Chine
Lin 830 France,Belgique
Chanvre 214 Chine
Coton 26000 Chine
Soie 202000 Chine
Sisal 378 Mexique
Kénaf 970 Bangladesh,Inde
Jute 2300 Inde,Bangladesh
Selon une étude menée en 2016 par l’Agence De l’Environnement et de la Maîtrise de
l’Energie(ADEME)etlasociétéFibreRechercheetDéveloppement(FRD),lesfibrespeuvent
êtrerépartiesselonleurdegréd’utilisationetdeconnaissance[49].SelonlaFigure7,trois
groupes de plantes à fibres se distinguent (disponibles, en développement, potentielles)
selon leur taux de production, le développement des implantations et leur validation à
l’échelleindustrielle.

34
Figure7-Degrédematuritédel'utilisationdesfibresvégétalesdanslesmatériauxenFrance
[49]
Al’issuedeleurpremièretransformation,lesfibresinclusesdanslesbiocompositespeuvent
êtredetaillecentimétrique,millimétriqueoumicrométriqueselonl’applicationrecherchée
etselonlamatrice[49].
Propriétés
Les avantages des fibres naturelles par rapport aux fibres inorganiques synthétiques sont
multiples.Eneffet,ellesprésententunedensitéplusfaibleetpermettentdoncd’obtenirdes
composites plus légers [87]. Par ailleurs, celles-ci présentent une résistance spécifique
élevée et comparable à celle des fibres de verre (Tableau 4). Parmi les fibres naturelles
présentées dans le Tableau 4, les fibres de chanvre présentent, avec celles de lin, les
propriétés mécaniques les plus favorables avec une résistance spécifique et un module
d’Youngparticulièrementélevés.

35
Tableau4-Propriétésdesfibresvégétales(NS:Nonspécifié)[30,88]
Fibres Origine
Longueur(mm)
Diamètre(µm)
Résistancespécifique(MPa)
Résistanceàlatraction(MPa)
Moduled’Young(GPa)
Densité(g.cm
-3)
Verre Synthétique - <17 800-1400 2000-3500 70-76 2,5-2,59
Chanvre Plante(Tige) 5-55 10-51 370-510 550-900 30-60 1,35
Lin Plante(Tige) 10-65 5-38 345-620 580-1100 50-70 1,38
Sisal Plante(Feuille) 0,8-8 7-47 55-580 507-855 9,22 1,20
Jute Plante(Tige) 0,8-6 5-25 140-320 187-773 20-55 1,23
Coco Fruit 0,3-3 7-30 92-152 175 6 1,2
Ramie Plante(Tige) 900-1200 20-80 590 400-1000 60 1,0-1,55
Boisrésineux Tronc 1,0 30 NS 45,5-11,7 3,6-14,3 0,30-0,59
Abaca Plante(Feuille) 4,6-5,2 10-30 NS 430-813 31,1-33,6 1,5
Enfin,unefibreestcaractériséeparsa longueurL,sondiamètreDetsonrapportd’aspect
L/D [89,90]. Ce dernier paramètre a une forte influence sur la capacité de transfert de
chargesentrefibresetmatrice.
Compositionchimique
Les fibres végétales contiennentdespolymèresnaturels qui leur confèrent despropriétés
mécaniques intéressantes. Ces polymères naturels sont la cellulose (α-cellulose), les
hémicelluloses, la lignineet lescomposésextractibles (cires,pectines)auxquels s’ajoute la
matière inorganique en très faible quantité [34,88,91,92]. Les structures chimiques des
composés principaux confèrent un caractère hydrophile et une résistance thermo-
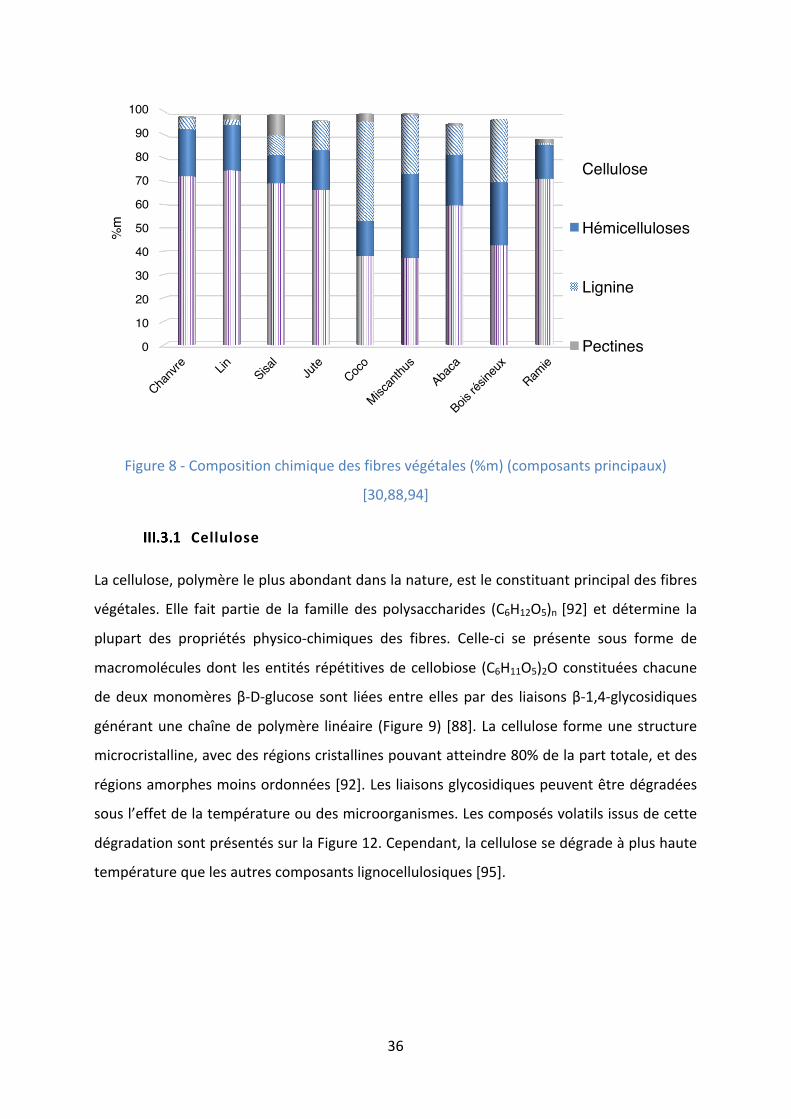
mécanique plus ou moins importants aux fibres. La Figure 8 représente la composition
chimique de certaines fibres lignocellulosiques. Les valeurs correspondent aux moyennes
desvaleursextrêmesminimalesetmaximalesreportéesdansla littérature[30,88].Enplus
desdifférents constituants, il est nécessairedeprendreen compte la teneur eneau ainsi
quelesproduitssolubleset/oulamatièreinorganique.Eneffet,l’humiditéabsorbéeparles
fibresderamieparexemplepeutatteindre12voire17%delamassetotale.Cependant,la
composition des fibres peut varier fortement en fonction du climat [93], du champ de
récolteetdesprocédésdetransformationqu’ellessubissentaprèsrécolte[92].
36
Figure8-Compositionchimiquedesfibresvégétales(%m)(composantsprincipaux)
[30,88,94]
Cellulose
Lacellulose,polymèreleplusabondantdanslanature,estleconstituantprincipaldesfibres
végétales. Elle fait partie de la famille des polysaccharides (C6H12O5)n [92] et détermine la
plupart des propriétés physico-chimiques des fibres. Celle-ci se présente sous forme de
macromoléculesdont lesentités répétitivesdecellobiose (C6H11O5)2Oconstituéeschacune
dedeuxmonomèresβ-D-glucose sont liéesentreellespardes liaisonsβ-1,4-glycosidiques
générantunechaînedepolymère linéaire (Figure9) [88].Lacellulose formeunestructure
microcristalline,avecdesrégionscristallinespouvantatteindre80%delaparttotale,etdes
régionsamorphesmoinsordonnées[92].Lesliaisonsglycosidiquespeuventêtredégradées
sousl’effetdelatempératureoudesmicroorganismes.Lescomposésvolatilsissusdecette
dégradationsontprésentéssurlaFigure12.Cependant,lacellulosesedégradeàplushaute
températurequelesautrescomposantslignocellulosiques[95].
0
10
20
30
40
50
60
70
80
90
100%
m
Cellulose
Hémicelluloses
Lignine
Pectines

37
Figure9-Structuredelacellulose
Hémicelluloses
Leshémicellulosessontlespolysaccharideslesplusprésentsdanslemondevégétalaprèsla
celluloseetfontpartie,enplusdelacellulose,delafractioncarbohydratéedesfibres.Les
hémicelluloses sont constituées de polymères ramifiés contenant des groupes latéraux à
l'originedesastructurechimiqueamorpheetvariée[96].Ellescontiennentdessucresà5-6
atomesde carbone [53]. Eneffet, contrairement à la cellulose, leshémicellulosesne sont
pas seulement constituées de glucose. Les monomères sont principalement des xyloses,
mannosesetgalactosesselonlaplanted’origineetleurconditiondesynthèsedanslanature
(Figure 10) [97]. Se situant à l’interface entre les microfibrilles de cellulose et la lignine,
celles-ci jouent le rôle de liant entre ces composants. Par ailleurs, les hémicelluloses sont
facilementhydrolysablesconduisantàlaformationdesous-produitstelsquelesfuraneset
cyclopentanones[98].
Figure10-Structureschimiquedel’hémicellulosexylane

38
Lignine
La lignine, troisième constituant, est un polymère amorphe de structure complexe
tridimensionnelle le plus abondant sur terre après les polysaccharides [99]. Elle est
constituéed’unités aromatiquesphénylpropane [100]. Contrairement à la celluloseet aux
hémicelluloses,lalignineesthydrophobeetcontribueàlarigiditédesfibres[53].Lesunités
primairesconstituant la lignine,autrementappelésmonolignols, sont l'alcoolconiférylique
(G), l'alcool sinapylique (S) et l’alcoolp-coumarylique (H) (Figure11) [92]. La ligninene se
structure pas de lamême façon selon les différents types de fibres. Les propriétés d’une
ligninesontalorssouventcaractériséesparlerapportdestauxS/Gnotammentpourdéfinir
la dégradabilité de la lignine. Cependant, les monomères représentés sur la figure sont
communsàtoutesleslignines[101].Dessous-produitsissusdeladécompositionthermique
de la lignine tels que les acides sinapylique, p-coumarylique et vanillique peuvent être
formés[102].
Figure11–Structuregénéraledelalignine[103]

39
Figure12-Substancesissuesdelalignocellulose[7,98,104,105]
Pectines
Les pectines appartenant aussi à la famille des polysaccharides sont généralement
retrouvéesàfaibleteneurdanslesfibresvégétales[97].Lesfibressontliéesàlatigeparles
pectines.Cesdernièressontessentiellementéliminéesaucoursdurouissageconsistanten
unpré-traitementdedéfibragepourfavoriserlaséparationdesfibresdelatige[97].
Minéraux
Les minéraux constituent la part inorganique des fibres regroupant la silice et les sels
métalliques [92]. Pour les fibres présentées sur le diagramme de la Figure 8, le taux est
généralementinférieurouégalà1%.Parailleurs,lesselsdepotassiumpeuventaccélérerla
réaction de décomposition de la lignocellulose. En effet, leur activité catalytique a été
démontréeaucoursd’unepyrolysedesfibres,pendant laquelle laformationdecokeétait
favoriséeenprésenced’acétatedepotassium[106].
Structureetmorphologie
Lesfibresnaturellespeuventêtredéfiniescommedesmatériauxcompositespluristratifiés.
Leurs différents composants décrits précédemment s’organisent selon un schéma bien
défini.Lesfibressontcomposéesd’uneparoicellulaireprimairehydrophilesouple(P)etde
trois parois cellulaires secondaires plus hydrophobes et rigides (S1, S2, S3) (Figure 13)
[62,97]. Ces parois cellulaires incluent des microfibrilles cristallines (chaînes de cellulose
assemblées) orientées de manière hélicoïdale et reliées entre elles par la lignine et les
Holocellulose
Cellulose Hémicelluloses Lignine
Furane
s
Cyclopentanones
Guaïacol Dérivés benzéniques
Phénol
s
Lévoglucosanes

40
hémicelluloses. La paroi secondaire, assimilée à un composite organisé constitué de
plusieurs polymères tels que les microfibrilles de cellulose et une matrice amorphe
lignine/hémicellulose [7], joue un rôle majeur dans les propriétés physico-chimiques et
mécaniques des fibres puisqu’elle présente le plus faible anglemicrofibrillaire. Ce dernier
définitl’anglequeformentlesmicrofibrillesavecl’axeprincipaldelafibreetconditionneles
caractéristiquesdesfibresderenfortspuisquedepetitsanglesfavoriserontuneforceetune
rigiditéélevéesdesfibresalorsquedelargesanglesinduirontuneductilité[107].Lesfibres
dechanvreprésententunanglemicrofibrillaireparticulièrementétroit(2-6,2°)comparéaux
autres fibres naturelles telles que le lin (5-10°), la banane (30-49°) ou le sisal (10-22°)
justifiantcertainementleurrésistancespécifiqueélevée(Tableau4).
Figure13-Organisationstructurelled’unefibreélémentaire[97]
Ainsi,danscegroupedeplantesàfibres,lechanvreaétéretenupournotreétudedufaitde
sespropriétésspécifiquesintéressantes,desondegrédeconnaissanceimportantetdeson
utilisationdanslesdeuxsecteursdelaconstructionetdel’automobileétudiés.
Propriétésmécaniques
Lapossibilitéd’utiliserdesbiocompositesenremplacementdescompositesconventionnels
pour des pièces de panneaux intérieurs de composants automobiles a été évaluée par
Ahmadetal [34]. Lesmatériaux furentcomparésselon leur indicedeperformanceévalué
selonlerapportentrelemoduled’YoungE1/3
oularésistanceàlatractionS1/2
etleurdensité
41
r.Ainsi,unmatériaurigideourésistantetpeudensepossèdeunindiceélevé.Lecomposite
époxy/fibres de carbone fut le matériau satisfaisant au mieux les exigences requises
évaluéesselonlesindicesE1/3/retS
1/2/r.Cependant,lePPrenforcédefibresdechanvrese
manifestacommeuncandidatplusadaptéquelePPrenforcédefibresdeverrepuisqueson
indiceplusélevédémontrauneforceetunerigiditéélevéestoutenétantplusléger.Donc
lesbiocompositesprésententunfortpotentielderemplacementdescompositesàfibresde
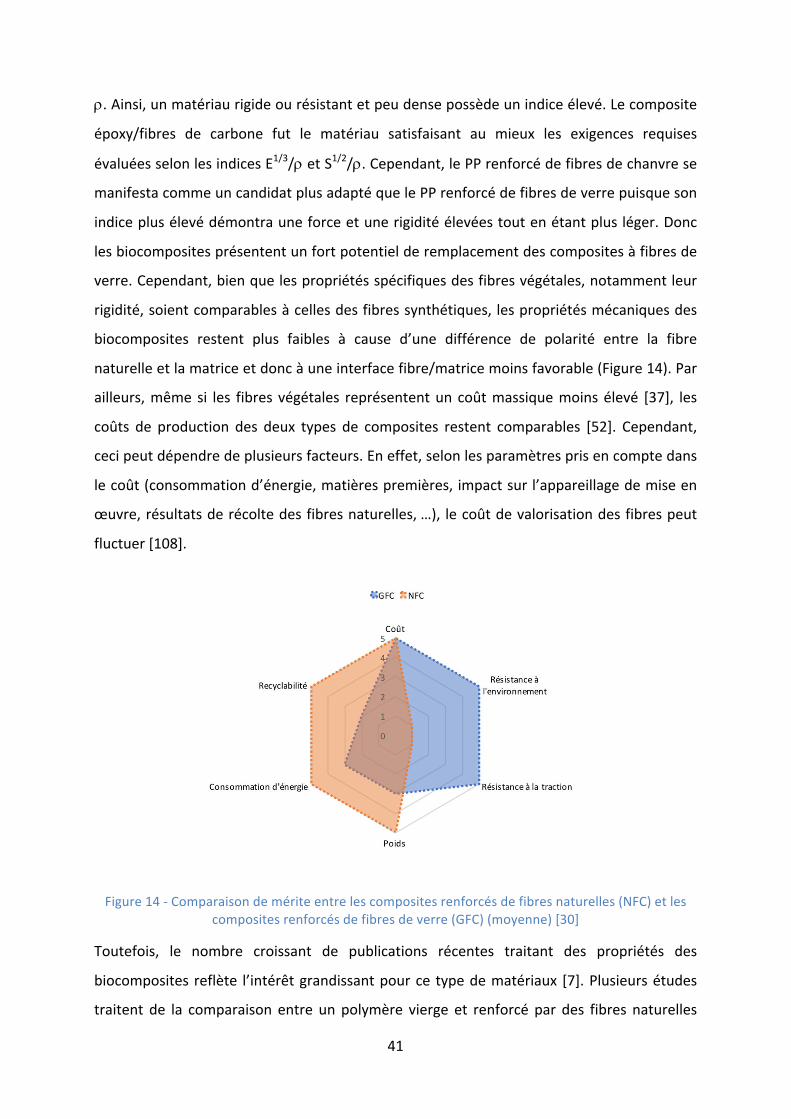
verre.Cependant,bienquelespropriétésspécifiquesdesfibresvégétales,notammentleur
rigidité,soientcomparablesàcellesdesfibressynthétiques, lespropriétésmécaniquesdes
biocomposites restent plus faibles à cause d’une différence de polarité entre la fibre
naturelleetlamatriceetdoncàuneinterfacefibre/matricemoinsfavorable(Figure14).Par
ailleurs,mêmesi les fibres végétales représententun coûtmassiquemoinsélevé [37], les
coûts de production des deux types de composites restent comparables [52]. Cependant,
cecipeutdépendredeplusieursfacteurs.Eneffet,selonlesparamètresprisencomptedans
lecoût(consommationd’énergie,matièrespremières,impactsurl’appareillagedemiseen
œuvre,résultatsderécoltedesfibresnaturelles,…), lecoûtdevalorisationdesfibrespeut
fluctuer[108].
Figure14-Comparaisondemériteentrelescompositesrenforcésdefibresnaturelles(NFC)etles
compositesrenforcésdefibresdeverre(GFC)(moyenne)[30]
Toutefois, le nombre croissant de publications récentes traitant des propriétés des
biocompositesreflète l’intérêtgrandissantpourcetypedematériaux [7].Plusieursétudes
traitent de la comparaison entre un polymère vierge et renforcé par des fibres naturelles

42
tellesquelesfibresdechanvrechoisiespourcetteétude.LaFigure15résumel’influencede
différentes fibresvégétalesetdeverre incluesdansdifférentes résinespétrosourcées (PP,
PE) et biosourcées (PLA, PBS) sur lemodule et la résistance à la flexion (test de flexion 3
points)mesurésavantetaprèsincorporationdefibresvégétalesdanslamatricepolymèreà
unmêmetaux(30%m).Anoterquelacomparaisonaveclescompositesrenforcésdefibre
deverreestàanalyseravecprécautionétantdonnélesdifférencesdedensité.Demême,les
mêmes fibres de renforts ont été sélectionnées dans la littérature afin de comparer
l’influence de la matrice. En général, plus le taux de fibres augmente, meilleure est la
performancemécanique des composites. Par ailleurs, la composition chimique des fibres
naturelles (proportion en cellulose, hémicellulose, lignine, et cires et pectines) a un effet
conséquent sur la rigidification et le renforcement du composite. On peut noter que la
résistance à la flexion augmente avec le taux de cellulose. En effet, au sein d’unemême
résine(icilePP),lacellulosepurerenforcedavantagelematériauprésentantunerésistance
plusélevéequelescompositesrenforcésdefibreslignocellulosiques.Unemêmetendancea
étéreportéeparBledzkietalaprèsuntestentraction[96].Toutefois,cecin’estpasvalable
pour le composite PLA/cellulose recyclée. En effet, l’étape de recyclage de la cellulose a
sûrement fortement affecté la structure cristalline du composé carbohydraté et donc
dégradésespropriétés.Laligninerigidifielesparoiscellulairesdesfibresetagitcommeune
barrièreprotectricepour lacellulose[65,109].Cecipourraitnotammentjustifier lemodule
plusélevédescompositesPPetPLArenforcéspardesfibresd’abacaparrapportauxautres
fibres.Eneffet,l’abacacontientplusdeligninequelechanvreetlelin(Figure8).Parailleurs,
lespropriétésdesbiocompositesrestentcomparablesauxcompositesàfibredeverre[110].

43
Figure15–Pourcentaged’augmentationdespropriétésmécaniquesenflexiondebiocomposites
pourunmêmetauxmassiquedefibrede30%[55,87,110–121]
Procédésdemiseenœuvreetmiseenforme
Généralement,desproduitssemi-finissontutiliséspourmettreenformelesbiocomposites
[31]. Cesproduitspeuventêtresousplusieursformes:
• lesfibresseulesnonmélangéesàlarésinesousformedematsobtenusparlaméthode
decardagepourdémêlerlesfibresousousformedetissés.
• lesmélangesfibres/matricesobtenusparextrusionenvoiefondue.
Différentestechnologiesdemiseenformedesproduitssemi-finisexistentviadesprocédés
couramment utilisés pour des composites plus conventionnels. Les moulages par
compression et par injection utilisés sont ceux principalement développés pour les
composites àmatrice thermoplastique [31,90]. Lemoulagepar injection est le procédé le
plus largement utilisé en raison notamment de ses temps de cycle courts et sa
reproductibilité. Ce procédé permet de fabriquer des formes complexes en injectant une
matièrefonduedansunmoule[31]. D’autresprocédéstelsquelemoulagepartransfertde
résine(RTM)etl’infusion[3]sontréservésàlamiseenœuvredebiocompositesàmatrice
thermodurcissable.
PP PE PLA PBS

44
Plusieurs travaux ont été reportés dans la littérature sur les biocomposites à matrice PP
obtenusparmoulageparcompression[90,111,112,122,123]etmoulageparinjection[124–
127] généralement précédés d’une étape d’extrusion dont les propriétés mécaniques,
thermiques,microstructuralesoudedurabilitéontétémesurées.Desétudescomparatives
entrelesdifférentsprocédésdemiseenœuvredesbiocomposites,toustypesdematrices
confondus,ontaussiétémenées.Parexemple,Liuetalontformulédesbiocompositesdont
lamatricebiosourcéeestàbasedeprotéinesdesoja renforcéede fibresdekénaf. Ilsont
relevéunetempératuredefléchissementsouscharge(HDT)etunerésistanceauchocIzod
entaillé des biocompositesmis en forme par compression plus élevées que ceux injectés.
Cela signifie que le moulage par compression permet de mieux préserver les propriétés
thermiquesetmécaniquesdesbiocompositescarleseffortsdecisaillementsontplusfaibles
qu’en injection.LespropriétésmécaniquesdePVCrenforcédefibresdeverreet fibresde
boisobtenusaprèsprocédéd’extrusionbi-visontétécomparéesàcellesdePVCobtenupar
unprocédédecompression[128].Lecompositeétaitplusdenseaprèscompressionévitant
les propagations de défauts liés aux espaces vides éventuellement formés à l’interface
fibre/matrice.Bledzkietalontaussiexaminél’impactduchoixdelatechniquedemiseen
formeparmi lesmélangeur-moulagepar injection,mélangeur-moulageparcompressionet
moulage par compression directe sur les propriétés mécaniques (résistance à l’essai de
résilienceCharpy, traction, flexion) dePP renforcéde fibres d’abaca [129]. Le procédéde
mélangeur-moulage par injection a garanti un composite de meilleure résistance à la
traction (environ 90%) que les autres procédés. Cependant, le moulage par compression
directe (sansmélangepréalable)a induitunemeilleure résistanceà l’essaiCharpyque les
deuxautresprocédésdemiseenœuvre.Tousces faitsdémontrent l’importanceduchoix
rigoureux des techniques et paramètres de formulation appropriés afin d’obtenir un
compositeauxperformancesoptimales.
Deplus,iln’estpossibledeprofiterdespropriétésmécaniquesdurenfortquesiletransfert
de contraintes entre la matrice et le renfort est efficace. Une bonne cohésion est alors
indispensable. Cependant, la différence de polarité entre la fibre naturelle polaire et la
matricedepolymèregénéralementnonpolaireinduituneliaisoninterfacialefaible[130]et
donc une limitation des propriétés finales du biocomposite. Des solutions permettent de
pallier ce problème, telles que le traitement chimique en surface des fibres avant

45
incorporationdans lamatrice [131,132]pour favoriser les liaisonschimiques.Aussi, l’ajout
d’un agent de compatibilisation évite d’avoir recours à un pré-traitement chimique des
fibresvégétales[67,112,133].Lesagentsàbased’anhydridemaléiques’avèrentnotamment
êtreefficacespourlesbiocompositesàmatricepolyoléfinecommelePP[130].
Cependant,des limitesnonnégligeablesentravent l’utilisationde fibresnaturellesetdonc
leur émergence dans les domaines d’application cités précédemment. En effet, les fibres
végétalessonttrèshydrophilesdeparleurcompositionchimiqueetsontdoncsensiblesaux
conditions environnantes (lorsque le taux d’humidité est élevé, par exemple). Aussi, la
structure des composés lignocellulosiques rend les fibres très sensibles aux conditions
extérieurestellesquel’expositionauxrayonnementsUVprovenantdusoleil,àlachaleurou
un fort taux d’humidité. Ainsi, il est crucial de déterminer les causes de l’altération de la
performancedesbiocompositesetleurconséquencesurlesvariationsdeleurspropriétés.
Le vieillissement peut être défini selon son mécanisme, physique ou chimique, ou selon son
mode d’action qui peut être principalement de nature hydrolytique, thermique ou
photochimique. Les vieillissements présentés par la suite sont des causes de
dégradation dues aux contraintes extérieures et conduisent donc à des modifications ou
des ruptures de chaînes de polymère.
Vieillissementphotochimique
Lorsqu’unmatériaupolymèreest exposéau soleil, celui-ci absorbe l’énergiede la lumière
solaireetpassedesonétat fondamentalàunétatexcité.Cepassageàunnouvelétat lui
confère une réactivité qu’il n’avait pas auparavant. Ceci se traduit par la formation de
radicauxlibresquisontdescomposésinstablesetpropagentlephénomènededégradation
dumatériau. Ces radicauxpeuventnotamment réagir avec l’oxygèneprésentdans l’air et
former des composés radicaux peroxydes POO° et hydroperoxydes POOH (Figure 16).
L’abstractiond’hydrogèneparlesespècesradicalairesPOO°ouOH°pourgénérerleradical
P°durantlapropagationseferapréférentiellementsurlecarbonetertiaire[134,135].Cette

46
générationderadicauxsupplémentairesconsistedoncenunprocessusd’auto-dégradation
photochimique.
Figure16-Mécanismedephotodégradationdespolymères[135]
De même, la faible énergie de dissociation de PO-OH (42 kJ.mol-1) justifie sa très forte
réactivité[135].Deparlaprésenced’électronsnonappariés,ditsélectronscélibataires,dans
lacoucheexternedesradicauxoxyPO°formés,cesderniersprésententeuxaussiunetrès
forte instabilité qui provoque leur décomposition en composés carbonylés accompagnée
d’unclivagedechaînesmacromoléculaires[136].Eneffet,lesespècesPO°peuventsubirune
b-scissionouformerungroupementcarbonyle intra-chaîne[135].Cescarbonyles instables
se décomposent par photolyse via les mécanismes de type Norrish. La réaction de type
NorrishIimpliqueuneb-scissiondescomposéscarbonylésformésavecdégagementdeCO
etformationdedeuxalkylesradicaux[136].LaréactiondetypeNorrishIIestunprocessus
intramoléculaire via l’abstraction d’un g-hydrogène générant des espèces carbonyles et
vinyles[137,138].
Lespolymèresthermoplastiquessontsoumisàcetypedevieillissementdurantleurcyclede
vie. Leur exposition à la lumière solaire résulte endes scissionsde chaîne et réticulations

47
pourlePEouscissionsdechaîneseulementpourlePP[136].Celainduitunediminutionde
la masse moléculaire et donc des chaînes plus courtes et plus mobiles cristallisant plus
facilement[7].Cependant,auseind’unbiocompositeàmatricepolyoléfine,ladégradation
photochimiqueaffecteparticulièrementlesfibresnaturelles.Eneffet,àl’étatnondégradé,
les composés lignocellulosiques contiennent des molécules avec des groupements
fonctionnelscétonescapablesd’absorberdesphotons,autrementqualifiéeschromophores.
CesespècespeuventabsorberlalumièreUVinitiantdesréactionsdephoto-oxydation[119].
Le schéma simplifié suivant proposé par Azwa et al résume le cheminmécanistique dans
lequel sont impliquées la photodégradation du polymère et des fibres et l’activité
catalytiquedesgroupementschromophoresetdeshydropéroxydesPOOH[7].
Figure17-Photodégradationdesbiocompositesetleurscomposants
Sachantque le rayonnementUVproche (l =315-400nm)estprincipalement responsable
desmodificationsdestructurechimique,denombreuxchercheursontprocédéàcetypede
dégradationenenceinteenimposantuneradianceUVfixeàl’aidedelampesàfluorescence
ouxénon.Lesvariationsdespropriétésmécaniquesetmicrostructuralesdebiocomposites
ont été ainsi mesurées après vieillissement accéléré en fonction du type de fibres et de
farinesnaturelles.Lorsd’uneexpositionUV,lespropriétésmécaniquestellesquelemodule

48
d’Youngetlarésistanceàlatractionouàlaflexionsontgénéralementaffectées.Eneffet,le
moduleaaugmentéd’environ4%,25%et7%pourlescompositesPLA/25%mdeballesderiz
en 1000h, PE/50%m de farine de bois en 3000h et PP/30%m de lignine en 960h
respectivement après leur exposition sous rayons UV [100,139–141]. Ceci résulte d’une
rigidification desmatériaux liée à la cristallisation des chaînes plus courtes formées après
scissionsdechaînesdupolymère.Cettehypothèseestconfirméeparlesmesuresdudegré
decristallinitédesmatricesayantaugmentéde3,71%à26,02%en1000hetde13,62%à
20,85%en600hpour lecompositeàmatricePLA renforcédeballesde rizetde fibresde
celluloserespectivement[139,142].
Les loisde réciprocitésontcommunémentutiliséespourdécrire l’effetde l’intensitéde la
lumière sur les polymères à partir de paramètres empiriques [143,144]. Bien qu’elles
conviennent pour décrire des phénomènes dont les intensités ne varient pas
significativement entre les conditions expérimentales de vieillissement et les conditions
réelles d’usage, ces lois ne peuvent être appliquées lorsque le coefficient de
proportionnalitévarieavecl’intensitédelalumière.Eneffet,l’intensitédelalumièresolaire
filtréeparl’atmosphèreneserapasfiltréeenmêmequantitéenenceinte.Schwarzschilda
modifiélaloideréciprocitéclassiqueenconsidérantl’indicep(coefficientdeSchwarzschild),
paramètre supplémentaire permettant de considérer l’influence du matériau et des
conditionsexpérimentalesmaisindépendantdelalongueurd’ondedelalumière[143–145]:
! = #$×& Eq.1
avec Q l’énergie de rayonnement cumulatif (J.m-2) (constant), t le temps (h), I l’intensité
(W.m-2) et p le paramètre de Schwarzschild. Ainsi, des sources de lumière d'intensité
différenteprovoquent lemêmedegrédedégradation sousdifférentesexpositions si leurs
produitsIp´tsontéquivalents.
Ceci permet d’établir une corrélation entre les sources lumineuses de vieillissements
artificieletnaturel.
Vieillissementthermique
Lesfibresnaturellesetlesmatricesdepolymèresontsoumisesàunedégradationthermique
lors de l’étape demise enœuvre des biocomposites durant laquelle la température peut

49
s’éleverà220°C.Cependant, levieillissement thermiquepeutêtreégalementobservé lors
ducycledeviedubiocomposite.Ceprocessuss’enclencheparlagénérationd’unradicalsoit
par la présence de défauts de structure (irrégularités structurales) soit par rupture de
liaisonsdeschaînesmacromoléculaires,soitparlaprésenced’impuretés(amorceurs,résidus
de catalyseurs de polymère,…). Lesmécanismes de dégradation sont similaires à ceux se
déroulant au cours d’une dégradation photochimique. Ainsi, la composition chimique des
biocompositesestaffectéeetdescomposésoxygénéstelsquedesalcools,cétones,acides,
péroxydesetaldéhydessontformésetpeuventêtredétectésparanalyseinfrarouge.
Josephet al ont étudié le vieillissement thermiqueeffectuéà 80°Cdepolyéthylènebasse
densité (PEBD) renforcé de fibres de sisal d’une part, et de fibres de verre d’autre part,
pendant 7 jours [146]. Le dernier composite a présenté une meilleure stabilité
dimensionnelle que le biocomposite grâce à une meilleure interface fibres
synthétiques/matrice.
Laprédictiondeladuréedevied’unmatériauaétélargementétudiéenotammentselonle
modèle type Arrhénius. Dans un cas simple de vieillissement thermique accéléré,
l’extrapolation de la performance du matériau sous conditions ambiantes la plus
communément appliquée implique que le taux de dégradation soit contrôlé par un taux
réactionnelkexprimécommesuit[48,144,147]:
' = ()*$(−-.
/0)
Eq.2
avec k la constante de vitesse réactionnelle, A le coefficient pré-exponentiel, Ea l’énergie
d’activation (J.mol-1), R constante universelle des gaz parfaits (8,314 J.mol
-1.K
-1), T la
température absolue (K). Cependant, l’extrapolation d’Arrhénius linéaire est controversée
[144,147].Eneffet,unerelationtypeArrhéniusnon-linéaireseraitplusadaptéenotamment
à cause de la diffusion d’oxygène. En effet, des changements mécanistiques avec deux
régimesdifférentsàtempératurefaibleetàtempératureélevéeinduisentdesvariationsde
l’énergied’activationdevantêtreprisesencomptedanslarelationprécédente:
'1 + '2 = (1)*$ −-56
/0+ (2)*$ −
-58
/0
Eq.3

50
aveck1etk2lestauxréactionnelsdesdeuxrégimes.Parailleurs,latempératureaccentuele
phénomène de photo-oxydation des polymères présenté précédemment. Dans un cas
simple de photo-vieillissement, le modèle cinétique peut être décrit d’après la loi
d’additivité, inspiré de la loi d’Arrhénius cité précédemment en incluant l’intensité de la
lumière I[148].Cependant,mêmesi letempsd’inductionde laphoto-oxydationestréduit
quand la température augmente [148], le taux de photo-oxydation évalué à partir de
mesuresspectroscopiquesmontreunedépendancen’obéissantpasàlarelationd’Arrhénius
[143,148].
Vieillissementhydrolytique
Enconditionsnaturelles,ladégradationparrupturehydrolytiqueestcauséeparlapluieou
un fort taux d’humidité. La présence d’eau peut ainsi induire des scissions de chaîne du
polymèreetungainenmasse lorsque l’eause fixedemanière irréversibleauxchaînesde
polymèrecompromettantlastabilitédimensionnelledumatériau[149].L’absorptiond’eau
par les biocomposites est gouvernée par les groupements hydroxyles présents dans les
fibres.Decefait,untauxélevéenhémicellulosesdanslesfibresfavoriseral’absorptiondu
fluide.Lemécanismed’absorptiond’eauparlesbiocompositespeutêtredécritparlaloide
diffusiondeFickpuisquel’eaudiffuseselonungradientdeconcentration.L’équationdela
loideFickaétésimplifiéeparShenetSpringerpourdémontrerquel’absorptioninitialeest
expriméeselonlaformulesuivante[150]:
9&
9∞=4
ℎ×=×&
>
1/2
Eq.4
avecMt le taux de gainmassique à l’instant t (%),M∞ le tauxmaximal d’eau absorbée à
saturation (%), D le coefficient de diffusion dans le composite (cm2.s-1), h l’épaisseur de
l’échantillon(cm)ettletempsd’immersion(s).Ainsi,selonlaFigure18représentantletaux
d’humidité dumatériau en fonction de t1/2, l’absorption d’eau augmente linéairement au
débutpuisatteintunplateaudesaturation[151].

51
Figure18-Alluredelacourbed’absorptiond'eauparlesbiocomposites[7]
Lamigrationde l’eauauseindupolymèreest favoriséedans leszonesamorphesquisont
perméablesauxmoléculesd’eau.Parailleurs,lespolyesters(PLA,PBS)sontparticulièrement
sensiblesàl’hydrolyse[152].Eneffet,leclivagedesgroupementsestersestfavoriséparles
moléculesd’eau.Ce caractèrepeutd’autantplus fragiliser lesbiocomposites. L’immersion
dans l’eauchaufféeà60°CdePLA renforcéde fibresde ramieàun faible taux (10%m)a
induitunediminutiondrastiquedesrésistancesà la tractionetà la flexionde87%et77%
respectivementenmoinsde3semaines[149].Parcontre, lePPchargéà40%mdefibres
Kraft, fibres plus sensibles à l’absorption d’eau que les fibres de ramie puisque
principalementcarbohydratées,présentepourtantuntauxdediminutiondelarésistanceà
latractiondeseulement30%aprèsimmersionàtempératureplusélevée(70°C)[153].Ceci
suggèrequelePLAaétéfortementaffectéparlevieillissementhydrolytique.
Aussi,lacapacitéd’absorptiond’eaudépenddel’affinitéqu’alepolymèrevis-à-visdel’eau
et cette affinité peut être déterminée à partir de son paramètre de solubilité: plus ce
paramètreestprochedeceluide l’eau,plus lepolymèreauneaffinitéaveccesolvant.La
températuredetransitionvitreuseTgdupolymèredéterminéeparanalysethermiqueDSC
peut aussi être modifiée: le matériau présente alors un aspect caoutchouteux à une
température plus faible que sa Tg initiale, on parle de plastification du polymère. Cela
engendre un matériau plus ductile, d’où une diminution du module d’élasticité et une
augmentationdel’allongementàlarupture[152].
Lavulnérabilitéd’unbiocompositefaceàunvieillissementhydrolytiqueestprincipalement
liée à l’interface fibre/matrice qui est une zone très fragile (Figure 19). En effet, un

52
vieillissementparimmersiondansl’eaudecompositesPP/linaétéeffectuéparArbelaizetal
afind’étudierlescinétiquesdegainenmasseparcesderniers[125].Cetteimmersionaalors
provoqué un gonflement de la cellulose. Ceci a généré des contraintes de cisaillement à
l’interface matrice/fibre, et donc leur décohésion affectant les propriétés mécaniques
(moduleetrésistanceàlatraction)desbiocompositesaprèsimmersion[7].
Figure19-Mécanismed'absorptiond'eauparlesbiocomposites[7]
Deplus,latempératurepeutfaciliterladiffusiondesmoléculesd’eauauseindumatériau.
Parexemple,JosephetalontobservéunepriseeneaudecompositesPP/sisalplusrapide
une fois l’eau chauffée à 70°C [154].Afinde limiter l’absorptiond’eauen environnement
humide par les composites renforcés de fibres naturelles, la méthode communément
utiliséeconsisteàaugmenterl’hydrophobicitédesfibresetaméliorerl’adhésioninterfaciale
par traitement des fibres. Par exemple, l’ajout d’agent de couplage a permis de limiter la
priseeneaudesbiocomposites[37,111,155].
Vieillissementdesbiocompositespareffetsynergique
Vieillissementartificiel
Des vieillissements accélérés incluant les paramètres rayonnement UV, température,
humiditéet/oupulvérisationd’eausontgénéralementréalisésenenceintedevieillissement

53
spécifiquepourrefléterlesconditionsextérieuresauxquellesserontpotentiellementsoumis
lesbiocomposites.Descyclesdevieillissementsontrépétésplusieursfoispourcorrespondre
à une durée totale de vieillissement souhaitée. Puisque les lampes intégrées dans ces
enceintes doivent refléter la lumière solaire, le spectre des lumières artificielles doit
correspondreàceluidelalumièresolaireetêtredonccontinudanslagamme300à400nm.
Trois typesde sourcesUV sontparticulièrementutilisés. Eneffet, les chambresdephoto-
vieillissementARTACCetSEPAPsontéquipéesd’unelampeàvapeurdemercurealorsque
leslampesfluorescentessontfavoriséesdansl’enceinteQUVetleslampesàarc-xénondans
l’enceinteXenostest.Leslampeslespluscourantesontdesirradiancesà340nmde0,35à
0,55 W.m-2. Les conditions hygrothermiques peuvent aussi être contrôlées. Les résultats
peuventdépendredutypedelampeutilisé.
Plusieurs travaux extraits de la littérature sont présentés dans le Tableau 5 résumant la
perte(en%)despropriétésmécaniques(modulesetcontrainteàlaruptureentractioneten
flexion) et les variations des propriétés microstructurales (taux de cristallinité) de
biocompositesaprèsvieillissementartificiel.
LesrésultatsduTableau5montrentque,selonlesconditionsdevieillissement,lesvariations
depropriétésmécaniquesetdemicrostructuresontplusoumoinssignificatives.Onobserve
que, lorsque tous lesparamètres (rayonsUV, chaleur, pulvérisationet condensation) sont
considérés,l’impactsurlespropriétéspeutêtretrèsimportant.Parexemple,l’expositionà
touscesfacteursd’uncompositePLArenforcéà30%mdefibresdechanvreaprovoquéune
réduction drastique de 83% de la contrainte à la rupture en flexion et en traction et du
module en traction et flexion de 74-84% en 1000h [115]. Cependant, des conditions
d’expositionsimilaires ontbeaucoupmoinsendommagé lecompositePPchargéà40%m
defibresdepinKraftavecunechutedemodulesentractionouflexionde11-13%[156].Ce
résultat suggère que dans des mêmes conditions de vieillissement les biocomposites à
matricePPdisposeraientd’unemeilleuredurabilitéqueceuxàmatricepolyester.
Parailleurs,lesdonnéesdecetableaudesynthèsemontrentque,pourunmêmematériau,
chaque paramètre de vieillissement aurait plus ou moins d’impact sur les propriétés
mécaniquesdubiocomposite.Parexemple,StarketMatuanaontdémontréparunsimple
essai UV et un essai UV + pulvérisation que l’étape de pulvérisation d’eau contribuait

54
fortementàlacinétiquededégradationdePEHDrenforcédefarinedebois(50m%)[140].
Eneffet, l’expositionauxrayonsUVainduitunerigidificationdubiocompositevérifiéepar
une augmentation du module de +25% alors que le module chute de 33% après un
vieillissementcombinantUVetpulvérisation.Celapeutêtredûàlaprésenced’eaufacilitant
la pénétration de la lumière dans le bois et donc accélérant la photo-oxydation du
composite.Uneautreétudeamontréquel’humiditérelativeaffectedavantagelacontrainte
àlaruptureenflexionetlemoduled’élasticitéquelatempératureetlesrayonsUVdansle
casde compositesPEHD/farinedebois(60%m)[157].Cesauteursproposent l’hypothèse
qu’unehumiditépresquesaturanteamplifieladégradationphotochimiquedescomposites.
CerésultatcorroboreceluiobservéparBergeretetalquiontmisenévidenceuneplusforte
sensibilitédubiocompositePLA/ballesderizsouscyclede24hpendant3jours(16hà85°C
sous une humidité de 45% puis 8h à 40°C sous une humidité de 95%) que sous simple
rayonnementUVde1000h[139].Josephetal[154],danslecasd’unmatériauPP/sisal(30
%m) immergé dans l’eau à 70 °C pendant seulement 7h, ont mis en évidence t une
fragilisation, quantifiée après essai à la traction, à peu près comparable à celle observée
après 2016hd’irradiationUV à 30°C.Onpeut noter qued’autres auteurs ontmontré des
résultatscohérentsàcesderniersavecuneimmersionde2hà70°C[154,155].
Parallèlement, Lopez et al se sont intéressés au vieillissement hygrothermique sans
irradiation(40°Cà93%d’humidité)dePEHD/farinedebois(60%m)[157].Ilenarésultéune
réductiondelacontrainteàlaruptureenflexionde25%alorsqu’unvieillissementdansles
mêmesconditionshygrothermiquesmaisavecrayonnementUVrésulteenunevariationde-
32%de lamêmecontrainte.Ainsi, lespropriétésmécaniquessontmoinsaffectées lorsque
les composites sont seulement exposés à un taux d’humidité élevé. Donc une action
synergiquedesparamètrespeutconsidérablementamplifierleseffets.
Les composants lignocellulosiques jouent un rôle prépondérant dans l’évolution des
propriétés mécaniques et microstructurale des biocomposites au cours du vieillissement.
D’après l’étude de Peng et al, le composite PP/lignine (30 %m) présente une meilleure
conservation de la résistance à la rupture et du module à la flexion que les composites
PP/farinedebois (40%m)etsurtoutPP/cellulose(40%m)[141].Eneffet, ilaétésuggéré
que les régions cristallines de la cellulose pouvaient être significativement affectées par
l’expositionauxrayonsUVetà l’absorptiond’eau.Aucontraire, lescomposésphénoliques

55
structurantlalignineetleureffetantioxydantpourraientprévenirladégradationoxydative
du matériau. Ainsi, même si des modifications de structure ont été confirmées par des
variationsdecouleur,laligninepeutpermettredeconserverlespropriétésmécaniquesdu
composite [141]. De plus, l’augmentation du taux de cristallinité est significativement
atténuée en présence de lignine suggérant que les scissions de chaîne ont été retardées.
Plusieurschercheursontconfirmécetteactivitéstabilisantedelalignine[65].Cependant,la
proportionen ligninedoitêtreassez importantepourque lescaractéristiquesmécaniques
ducompositesoientoptimisées.Eneffet,Spiridonetalonttestéaucoursdedeuxtravaux
distincts la réponsemécaniqueà la tractiondePLA renforcéde30%mdecellulosed’une
partetde7%mdelignineextraiteduboisd’autrepart[65,142].Lesdeuxcompositesfurent
exposés à un même vieillissement soit à 30°C sous 60% d’humidité et sous UV. Il a été
constaté que la dégradation des propriétés mécaniques en traction est légèrement plus
marquéepourlePLA/lignine.
Pour conclure, des fibres contenant des taux de cellulose et lignine différents se
comporterontdifféremmentdansdesconditionsd’usagesimilaires.
Vieillissementnaturel
Les vieillissements effectués en laboratoire ne permettent pas de simuler tous les
paramètres extérieurs susceptibles d’altérer les propriétés des biocomposites au cours de
leurcycledevie.Eneffet,lespluiesacides,lapollutionextérieureouledéveloppementde
bactéries peuvent catalyser la cinétique de dégradation. De ce fait, les vieillissements
naturels sont plus fiables quant à la représentation des conditions réelles. Cependant, ce
typedevieillissementestmoinsreportédans la littérature(Tableau6).Eneffet,untemps
d’exposition très long est souvent nécessaire pour détecter une dégradation effective du
matériau.Parailleurs,onpeutremarquerque lestravauxsur lesvieillissementsextérieurs
de biocomposites incluent principalement des propriétés de surface telles que la
composition chimique et l’aspect visuel (couleur, brillance). Parmi ces études, beaucoup
concernent le comportement de WPCs en environnement extérieur, ce qui peut être
expliquéparleurprincipaleapplicationextérieure(decking).
Lesmatrices de composites PP deWPC (60%m) placés dans un environnement tempéré
froid durant 4mois ont subi une augmentation du taux de cristallinité de 10% alors que

56
l’expositionsouslemêmeclimatpendant12moisd’uncompositeéquivalentmaisavecun
tauxdechargede70%mainduitunediminutiondutauxdecristallinitéde17%[158,159].
En effet, les temps de vieillissement courts provoquent généralement une chimi-
cristallisationduPPdueauxscissionsdechaîne.Alongterme,laphotodégradationatteint
leszonescristallinesréduisantledegrédecristallinité[140,160].
Des différences principalement en flexion de biocomposites PP/bambou (environ 35%m)
exposés à Xi’an en Chine (climat subtropical) pendant des durées comparables (10 à 12
mois)mais des années différentes ont étémesurées [161,162]. Ceci a été attribué à des
conditionsmétéorologiquesdifférentesrégnantaumomentdutestdevieillissement.
Les composites PEHD renforcés de 60%m de fibres de bamboumoulés par compression
présententuntauxdecristallinitéplusélevéqu’à l’étatnonvieillimêmeauboutde3ans
d’expositionàTaichung(Taïwan)[163].Ceciestdûàunestabilisationdutauxdecristallinité
après4moisd’augmentation,périodeaprèslaquellelaproportiondelaphasecristallinen’a
sûrement pas été affectée. La dégradation s’est certainement manifestée par des
réticulationsdeschaînesmacromoléculairesduPE.
Par ailleurs, les vieillissements artificiels effectués en enceinte peuvent être corrélés aux
vieillissementsnaturels.Lesvariationsd’aspectvisueltelquelacouleurpeuventnotamment
êtresuiviespourcomparerlesmécanismesdedégradationmisesenjeuaucoursdesdeux
types de vieillissement afin d’évaluer la représentativité des conditions de vieillissement
naturellesenenceinte[145].

57
Tableau5-Variationsdespropriétésmécaniquesetmicrostructuraledebiocompositesaprèsunvieillissementaccéléré(NS:nonspécifié,Tamb:
températureambiante)–Xc1etXc2tauxdecristallinitémesurésparDSCàpartirdel’enthalpiedefusiondéterminéeselonla1èreet2
èmerampede
températurerespectivement
Renforts Matrice
Taux
de
renfort
(%m)
Durée
totale
(h)
Irradiation
UV(W.m-2
@340nm)
Humiditérelative
(%)
Température
(°C)
Pulvérisation(P)/
Condensation(C)/
Immersion(I)
Traction(%) Flexion(%) Xc(%)
Sourcecontrainte
àla
rupture
module
contrainte
àla
rupture
module Xc1 Xc2
fibrede
chanvre
PP 40 3624 - - Tamb I -35 -56 - - - - [172]
PLA 30 10000,68
(1h)- 50
P(1min)
C(2h)-83 -84 -83 -74
- -[121]
fibrede
sisal
PP 30
2 - - 70 I -4 -16 - - - - [163]
7 - - 70 I -11 -21 - - - -[162]
2016 NS - 30 -24 -35 - - - -
PEBD 20 168 - - 80 - -20 -45 - - - - [154]
balles
derizPLA 25
1000 NS - 65 - - -47 +4 +600 -
[147]72 -
-45%(16h,85°C)
-95%(8h,40°C)
- - - -90 -34 - -
fibrede
pin
Kraft
PP 401000
0,68
(1h,- 50
P(1min)
C(2h)-13 -11 - - -7 - [164]
5712 - - 70 I -30 -69 - - - - [161]
farine
debois
PP
40 9600,89
(8h)- 60 C(4h) - - -10 -30 +167 - [106,149]
30 120NS
(8h,55°C)-
C(4h,35°C) -30 -10 - - [17]
PEHD
60 2000
8,5 93%(avecUV) 40 - - - -32 -20 - -
[165]- 93% 40 - - - -25 -15 - -
- 34% 40 - - - -17 -11 - -
8,5 - 40 - - - -4 -7 - -
8,5 34% NS - - - -3 -3 - -
50 3000 NS(1,8h) - P(12min,avecUV) - - -27 -33 - -
[148] - - - -2 +25 - -
50 2000 NS(1,8h) - P(12min,avecUV) - - -22 -26 - - [173]

58
Tableau5-Variationsdespropriétésmécaniquesetmicrostructuraledebiocompositesaprèsunvieillissementaccéléré(NS:nonspécifié,Tamb:
températureambiante)–Xc1etXc2tauxdecristallinitémesurésparDSCàpartirdel’enthalpiedefusiondéterminéeselonla1èreet2
èmerampede
températurerespectivement
Renforts Matrice
Taux
de
renfort
(%m)
Durée
totale
(h)
Irradiation
UV(W.m-2
@340nm)
Humiditérelative
(%)
Température
(°C)
Pulvérisation(P)/
Condensation(C)/
Immersion(I)
Traction(%) Flexion(%) Xc(%)
Sourcecontrainte
àla
rupture
module
contrainte
àla
rupture
module Xc1 Xc2
ramie PLA 10 504 - - 60 I -87 - -77 +25 +18 - [157]
fibrede
kénafPEHD
50 40000,35
(1,7h)NS(1,8h)
62P(18min,avecUV) - - -37 -62 - - [174]
40 10000,55
(0,66h)
65
(40min,avecUV)62 P(60min) -29 -36 - - - - [175]
ligninePP 30 960
0,89
(8h,60°C)-
C(4h,50°C) - - +19 +7 +13 - [106,149]
PLA 7 600 NS 60 30 - -15 +4 - - - +17 [69]
fibresde
cellulose
PP 40 9600,89
(8h,60°C)
C(4h,50°C) - - -60 -78
+30 -[106,149]
PP 30 500 NS(22h) 50 C(2h) -14 -10 - - [132]
PLA 30 600 NS 60 30 - -11 +1 - - +53 - [150]
fibrede
bambouPP 20 2016 - -
75I -12 -38 - -
- -[176]
fibrede
lin
PLA 30 2160 - - 40 I -30 -55 - - -15 [63]
PP 30 5040 - - Tamb I -7 -30 - - - - [131]

59
Tableau6-Variationsdespropriétésmécaniquesetmicrostructuraledebiocompositesaprèsunvieillissementnaturel–Xc1etXc2tauxdecristallinité
mesurésparDSCàpartirdel’enthalpiedefusiondéterminéeselonla1èreet2
èmerampedetempératurerespectivement
Renforts MatriceTauxderenfort
(%)
Durée
(mois)Climat
Traction(%) Flexion(%) Xc(%) Source
contrainteà
larupturemodule
contrainteà
larupturemodule Xc1 Xc2
farinedepaille
decolzaPEHD 50 4 subtropicalhumide -
-- - +1 [169]
farinedebois
PEHD40 3 continentalhumide - - - - [136]
60 18 tempéréfroid -9 -18 [157]
PP
70 12 tempéréfroid - - - - -17 -35 [159]
30 12 Méditerranéen -14 - - - -11 -7 [170]
35,3 12 tropical - - -4 -11 - - [160]
60 4 tempéréfroid --
- - +10 - [158]
fibredekénaf PBS 30 6 équatorialtempéré - - -46 -37 - - [87]
fibredebambouPP
33 12 subtropical -10 - -3 -11 - - [161]
35 10 subtropicalhumide -18 - -26 -7 - - [162]
PEHD 60 36 subtropicalhumide - - -17 -34 +42 - [163]

60
L’aspect visueld’unmatériauestuncritèreesthétique importantquipeut conditionner le
choix d’unobjet. Lamaîtrise de la perceptiondes produits est donc aujourd’hui un enjeu
industrielmajeur, qui nécessite de connaître les propriétés de surface des produits et les
interactionsavecleurenvironnementlumineux.
Parailleurs,desvariationsd’aspectdesmatériauxpeuventsemanifesteraucoursdutemps.
Bienqu’ellessoientgénéralementnonsouhaitéesparl’utilisateur,celles-cipeuventfournir
desinformationsquantauxéventuellesmodificationsdespropriétésphysico-chimiquesd’un
matériau mais aussi indiquer quels composants entrent en jeu dans un processus de
vieillissementd’unbiocompositeparexemple.
L’interactionlumière-matière
L’aspect visuel d’un objet est une propriété multi-critères. Il est le résultat perçu de
l’interaction entre un rayon lumineux incident et la surface d’un objet. Plusieurs
phénomènes de surface et de volumepeuvent êtremis en jeu lors de l’interaction d’une
ondelumineuseaveclamatière.Cesprocessusoptiquessontprésentéssur laFigure20et
détaillésdansl’AnnexeIdecemanuscrit.
Lorsque le rayon lumineux rencontre la surface d’un matériau polymère ou d’un
biocomposite, une partie du rayonnement est réfléchie sans pénétrer dans le matériau:
c’est la réflexion spéculaire, qui est quasi unidirectionnelle si la surface est très lisse (de
dimensionde rugosité très inférieure à la longueur de la lumière). Si lematériau est plus
rugueux, la lumière est réfléchie selon toutes les directions de l’espace, onparle alors de
réflexion diffuse. L’autre part du rayonnement lumineux pénètre dans le matériau et se
propage. La présence d’éléments comme les fibres, d’indice de réfraction différent de la
matricedePP,provoqueladiffusionde la lumière.Laprésencedechromophoresdans les
fibres végétales, capables d’absorber certaines longueurs d’onde du rayonnement visible,
peutpriver le rayonnementdiffusédeces longueursd’ondeetdoncgénérerunecouleur.
C’est pour cette raison que la couleur peut consister en un témoin de l’évolution du
matériauaucoursduvieillissement,puisquelesstructureschimiquesetdonclespropriétés

61
d’absorptionvarient.PourlePP,cesontlesphasescristalliséesquivontgénérerladiffusion
carellesaussiontunindicederéfractiondifférentdeszonesamorphes.
Figure20-Interactionlumière-matière
Lacouleur
Colorimétrieetcalculdesvaleurstristimulaires
La colorimétrie permet de quantifier la couleur, en essayant autant que possible de tenir
comptedelamanièredontonperçoitlescouleurs.Cependant,ilfautêtrevigilantsurlefait
que la couleur n’est pas une propriété propre de l’objet. En effet, la couleur d’un objet
dépenddel’objet,delasourcelumineuseetdel’observateur.Demême,lacontributionde
cestroiscritèresdanslaperceptiondelacouleurestabordéedansl’AnnexeI.Ellepeutêtre
caractérisée et quantifiée par spectrocolorimétrie et son résultat sera exprimé dans un
système de référence faisant appel à un espace de couleurs dont deux coordonnées
représentent la chromaticité et une coordonnée représente la clarté [171]. Plusieurs
systèmesexistent,maisnousnous limiteronsaudétaild’unseul systèmeretrouvédans la
littératureettraitantdesvariationsdecouleurdesbiocompositesaucoursduvieillissement,
soit l’espace tridimensionnel L*a*b*. Celui-ci est défini selon le modèle proposé par la
Commission Internationale de l’Eclairage (CIE) adopté en 1976 [172]. Une couleur,
m0
Réfraction
b
m1
Absorption
Transmission
Rayonincident a
Réflexionspéculaire
a
Diffusiondesurface
Diffusiondevolume

62
représentéeparunpointdansl’espacetridimensionnel(Figure21),estdoncdéfinieparles
troiscoordonnéessuivantes:
• L*laclartéquipeutêtrecompriseentre0pouret100,
• a*quiestlapositionchromatiquesurunaxeallantduvertaurouge(entre-300pourle
vertet300pourlerouge),
• b*quireprésentelapositionchromatiquesurunaxebleu-jaune(entre-300pourlebleu
et300pourlejaune).
Figure21-EspacetridimensionnelcolorimétriqueL*a*b*
Ces coordonnées sont obtenues à partir des courbes de réflectance étant définies par la
quantitéd'énergieréémiseparrapportàlaquantitéd'énergiereçueàtoutesleslongueurs
d'onde (200-700nm). Par ailleurs, l’écart total basé sur la distance euclidienne des
coordonnéesest souventcalculéen industriepourcomparerdifférentespièces fabriquées
afindevérifierlareproductibilitédescouleursparexemple.Ilpeutêtredéterminéselonla
formulesuivante:
∆" = ∆% ∗'+∆) ∗ ² +∆+ ∗ ² Eq.5

63
Labrillance
Définitionetrelationavecl’aspectdesurface
LebrillantestdéfiniparlaCIEcomme«l’aspectdanslequelonperçoitdesrefletslumineux
d’objets commesuperposésà la surfacepar suitedespropriétésdirectionnelles sélectives
decettesurface»[173].Labrillanced’unmatériauestd’autantplusmarquéequelalumière
estréfléchiedemanièredirigée.Ainsi,lorsquelalumièreilluminelasurfaced’unobjet,elle
peut êtrecomplètement réfléchie (réflexion spéculaire) ou réfléchie dans toutes les
directions (réflexion diffuse) [174]. Lorsqu’un matériau est rugueux, sa surface n’est pas
complètementplaneetprésentedeszonesd’inclinaisondifférente.Cesinclinaisonsd’angles
différentsquipeuventêtrecauséesparlaprésencedefibresnaturellesensurfacepourles
biocomposites, induisentuneréflexiondesrayons lumineuxdanstoutes lesdirections.Les
directions des ondes réfléchies dépendent ainsi des irrégularités de surface. Deux
paramètresreprésentantlebrillantserontsuivisaucoursdecetteétude:
• lebrillantdecontraste.Celui-cicorrespondaurapportentrelaluminositéapparentede
la surface à un angle spéculaire et celle mesurées à un angle éloigné de la zone
spéculaire.
• lehazedéterminéauvoisinagedeladirectionspéculaire.L’aspectflouetbrumeuxpeu
contrasté qualifié par ce paramètre peut être problématique car il peut affecter la
qualitéd’apparence.
Impactduvieillissementsurl’apparencevisuelledesbiocomposites
Plusieurstravauxonttraitédel’évolutiondelacouleurdebiocompositessousvieillissement
naturelouaccéléréenenceinte.Lesbiocompositeslesplusétudiéssontàbasedefarinede
boisetlesuividesparamètresL*,a*etb*decesWPC(WoodPlasticComposites)apermis
d’en déduire l’influence majeure de l’exposition extérieure sur la couleur du composite
[100,141,175].Eneffet,PengetalontpudémontrerquelescompositesPP/farinedebois,
présentant une couleur brune avant exposition, blanchissaient au fur et à mesure du
vieillissement[100].Cettevariationdecouleurestduenotammentàunedécompositiondes
constituantslignocellulosiquessensiblesauxrayonnementssolairesetàlapluie.Parailleurs,
laligninesembleêtretrèsréactivefaceauxrayonsUVetsedégradeplusfacilementqueles

64
polysaccharides. En effet, celle-ci présente des groupes chromophoriques, structures très
sensiblesàlalumière[176].Ladécompositionphotochimiquesedérouleendeuxétapes:
• Formationdecomposésparaquinoniquessuiteàuneoxydationdeschaînesdepolymère
de la ligninequisemanifesteparunjaunissementdumatériau.Lesréactionsmisesen
jeu sontune scissionde chaînede la lignineet/ouunedéméthoxylation [176,177]. Ce
dernierprocessusdedécompositionestmisenévidenceparunediminutiondutauxde
groupements méthoxy -OCH3 après exposition à la lumière ultraviolette [176]. Par
ailleurs, ces composés peuvent être présents dans la lignine avant son exposition aux
conditions climatiques. En effet, les composés paraquinones et/ou orthoquinones
peuvent aussi être retrouvés dans les biocomposites non exposés aux conditions
climatiques. La décomposition de ces produits en d’autres molécules peut justifier
l’absencedejaunissementdesbiocompositesaprèsvieillissement[136].
• Réduction des paraquinones en hydroquinones causant un blanchiment en surface
[61,100].
Ladégradationreposedoncsurunprocessusd’oxydo-réductionpourlequelMuasheretSain
proposentleschémaréactionnelprésentésurlaFigure22[136].
Figure22-Processusd'oxydo-réductiondescomposésphénoliquesissusdelalignine[136]
Afin de comprendre l’influence de la lignine sur la dégradation de composites formulés à
base de PP et de bois, Peng et al ont comparé l’évolution de la couleur de différents
composites formulés à partir de différents taux de farine de bois, cellulose et lignine
incorporésdansunemêmematricePPdurantun vieillissementartificiel enenceinteQUV
selonlanormeASTMG154(Figure23)[100].Ilsontconstatéunblanchiment(augmentation

65
de ΔL) durant les 250 premières heures de vieillissement pour tous les composites,
phénomèneobservépard’autreschercheurstelsqueMuasheretSain[136],Butylinaetal
[159]ouencoreFabiyietMcDonald[178]aprèsvieillissementdeWPC.Aussi,lescinétiques
deblanchimentétaientplusrapidespourlescompositesL1etL2pourlesquelslerenforta
étéeffectuéparajoutdelignine(Figure23).SeullematériauformuléàpartirdePPrenforcé
du plus fort taux de charge en lignine pure (30 %m) se décolore plus lentement. Cette
observation se justifie par un effet antioxydant des groupements phénols de la lignine
s’activantlorsqu’elleestprésenteengrandeproportiondanslecomposite.Cettepropriétéa
aussiétémiseenavantsurdesbiocompositesPLA/lignineformulésparSpiridonetal[65].
Figure23-Evolutiondelacouleurdecompositesaucoursd'unvieillissementaccéléré[100]
Parallèlement,lesvaleursdeΔbrelevéesaucoursduvieillissementontdiminué,indiquant
une perte de la couleur jaune et donc une réduction des composés paraquinoniques en
composés hydroquinoniques correspondant à la deuxième phase de la dégradation
photochimique.Demême,lematériauL3évoluedifféremmentdesautresbiocompositesau
coursduvieillissementpuisque lavariationdeΔbest trèspeuprononcée.Cecipeutaussi
être lié à la propriété de barrière attribuée à la lignine face à la dégradation oxydative.
Toutefois, d’autres ont observé un jaunissement. Fabiyi a démontré que les variations de
couleur et clarté évaluées par le calcul de ΔE étaient liées à la formation d’espèces
PP/30%mfarinedebois
PPvierge
PP/40%mcellulose
PP/10%mlignine
PP/20%mlignine

66
carbonyles et à la dégradation de la lignine [179]. La fraction carbohydratée des fibres
végétales est aussi responsable du jaunissement des biocomposites [180]. En effet, des
composés carbonyles chromophores peuvent être issus de l’oxydation des chaînes de
polymèredecelluloseethémicelluloses.Aussi, laprésencedestructureschromophoriques
decouleurrougeaétéexpliquéeparlaformationdesstructuresquinoïdesdueàlaphoto-
dégradation de la lignine [180]. Cependant, le paramètre chromatique a* n’est
généralementpassignificativementmodifiéaucoursdesvieillissements[87,100].
Par ailleurs, l’eau accentue la décoloration des biocomposites. En effet, les WPCs
blanchissentplusrapidementlorsqu’ilssontexposésàlaradiationetàlapulvérisationd’eau
quesousradiationseulement[181].
Outre lesanalysescolorimétriques,Pengetalontprocédéàdesmesuresdebrillancedes
biocompositespardéterminationdelaréflectivité.Pourcela,unbrillancemètreaétéutilisé
dont l’échelledemesure s’étendde0à100,100étant leniveaudebrillant spéculairede
l’étalonderéférence.Lesunitésdebrillance(GU:GlossUnits)sontreprésentéesenfonction
del’échantillon.IlaétéconstatéquetouslesmatériauxC,CL,PP,L1,L2etL3(Figure23)ont
perdudeleurbrillanceinitialeaprèsseulement240hdevieillissementartificiel.Lesimages
obtenues par microscopie électronique à balayage (MEB) ont confirmé l’apparition de
microfissuresensurfaceainsiquedescreuxinduisantuneréflexionplusdiffuseetdoncune
surface matte. En plus des brillancemètres qui mesurent en général la brillance selon 3
angles, lesspectrogoniomètrespeuventaussiêtreutilisésafindequantifier labrillancede
plastiques[63].Eneffet, l’énergieradiométriquede la lumièredétectéeétantcollectéeen
fonction de l‘angle de détection (détecteur mobile), ceci permet d’évaluer la répartition
angulairedel’intensitédelalumièreréfléchieetd’ainsidéterminerletypederéflexiondu
matériau.
Ainsi,lescomposéschromophoriquesetsensiblesàl’humiditédenaturelignocellulosiqueet
présentsdans les fibresnaturelles induisentdesmodificationsde couleuretde clartédes
biocomposites et WPCs de par des changements structuraux et peuvent affecter leur
brillancedurantleurcycledevie.

67
Les biocomposites sont de plus en plus utilisés comme pièces intérieures de véhicules et
peuventdoncavoirunimpact,commelesautresmatériauxdel’habitacle,surlaqualitéde
l’air intérieur, devenue depuis une trentaine d’années, un enjeu important de santé
publique.Eneffet,danslespaysindustrialiséstelsquelesÉtats-Unisoul’UnionEuropéenne,
nouspassonsenviron80%denotretempsdanslesenvironnementsclos[182]et,aprèsles
lieux d’habitation et les lieux de travail, les moyens de transport sont le troisième
environnement auquel nous sommes le plus longtemps exposés : plus d’1h chaque jour
[183]. Ainsi, depuis 1970, des recherches ont été entreprises sur la qualité de l’air en
intérieur de véhicule (VIAQ) notamment en Allemagne [184]. Aujourd’hui, la pollution
retrouvéedansnoshabitaclesdevoitureestconsidéréepar l’OrganisationMondialede la
Santé (OMS) comme une menace potentielle pour la santé humaine [185,186]. En effet,
selon l’enquête menée par l’Association Santé Environnement de France (ASEF), l'air
intérieur de l'habitacle d'un véhicule présenterait un degré de pollution plus élevé qu'à
l'extérieur[187].Lestauxdeparticulesfines,dedioxyded'azoteetdebenzènerelevésont
montré un phénomène d'accumulation dans cet espace clos impliquant des taux
d’exposition élevés [187,188].Mais récemment, l’identification de polluants toxiques émis
parlescomposantsintérieursd’habitacletelsquelestableauxdebords,panneauxdeporte,
revêtement des sièges et matériaux de planchers suggère que les sources intérieures
contribuentaussiàladégradationdelaqualitédel’air[189,190].Decefait,l’impactsurla
santé des pièces intérieures d’automobile devient un intérêt sociétal majeur [183]. Les
polluants émis par ces matériaux sont principalement des Composés Organiques Volatils
(COV)quel’OMSaclasséen4catégorieslistéesdansleTableau7ci-après:

68
Tableau7-Classificationdescomposésorganiquesselonl’OMS[191]
Composés Abréviations Gammedetempératuresd’ébullition
Composésorganiquestrèsvolatils COTV <0°Cà50-100°C
Composésorganiquesvolatils COV 50-100°Cà240-260°C
Composésorganiquessemivolatils COSV 240-260°Cà380-400°C
Composésorganiquesassociésauxparticules POM >380°C
Ces composés peuvent causer des irritations des yeux du nez et des voies respiratoires
(asthme,notamment)ainsiquedesréactionsallergiques[190].Desexpositionstrèslongues
etrégulièresàdestauxsignificativementélevésdecertainspolluantsclasséscancérigène,
mutagène ou toxiques pour la reproduction (CMR) pourraient causer des problèmes plus
graves à long terme tels que le développement de cancer, la baisse de fertilité ou des
problèmes thyroïdiens [186,192,193]. A l’instar du «Sick Building Syndrome» mis en
évidence dans des immeubles de bureaux aux USA dans les années 1980s, le «Sick Car
Syndrome» a également été largement reconnu: il désigne un ensemble de symptômes
diffus (fatigue, maux de tête, irritations, asthme…), dus aux polluants présents dans les
habitacles [186][194]. D’ailleurs, suite à la reconnaissance étendue de ce syndrome,
plusieurs constructeurs automobiles ont dû racheter ou rembourser l’achat de véhicules
[195].
Outreleurseffetspotentielssurlasanté,lesCOVpeuventégalementêtreresponsablesde
nuisancesolfactives[196,197].L’odeurdevoitureneuve(«newcarsmell»enanglais)peut
eneffetdevenirdésagréableetentêtanteà long terme [189,198].Desétudesportant sur
l’évaluationsensoriellecoupléeàl’analysephysico-chimiquedel’airontrévéléquel’odeur
dans un véhicule neuf résulte de l’émission de plus de 200 substances provenant de
différentespartiesdel’habitacle[186,197].Lestravauxsurlesodeurssontnombreuxmaisla
relationchimie-odeurrestetrèsdifficileàétablir,surtoutdanslecasdesourcesmultipleset
complexescommelescomposantsd’unhabitacleautomobile.
Règlementationsetguides
Enraisonde l’impactdesCOVsur laqualitéde l’airdeshabitacles,desréglementationset
desnormessontinstaurées.Dansl’ordrechronologique,laCoréesuiviedelaChinepuisdu

69
Japonsesontengagésàmettreenœuvredesvaleurslimitesdeconcentrationsenpolluants
afin d’améliorer la VIAQ. Ainsi, la Corée a établi en 2007 la notification No. 2007-539
spécifiant les concentrations limites de 6 substances dont les valeursmaximales permises
listées dans le Tableau 8 doivent être respectées par les constructeurs et équipementiers
automobiles [199]. Les concentrations se situententre30µg.m-3pour lebenzèneet1600
µg.m-3 pour l’éthylbenzène [194,200]. Suite à cette initiative, les résultats ont été positifs
puisque laconcentrationmesuréedans lesvéhiculesneufsadiminuéen7années jusqu’à
87% pour l’éthylbenzène [201]. En Chine, la normeGB/T 27630 a été introduite en 2012
[202,203]. Elle propose des valeurs limites de concentration pour l’acétaldéhyde et
l’acroléineenplusdes6polluantslistésdanslaNo.2007-539.Récemment,lesassociations
de fabricantsautomobilesdu Japon (JAMA),d’Europe (ACEA)etdumonde (AIAM)sesont
également engagées dans la démarched’améliorationde laVIAQ [204–206]. Toutefois, la
concentrationmaximale autoriséepour unemême substancediffère entre chaquenorme
issuedechaquepays(Tableau9).Deplus,onnoteque,quellequesoitlaréglementationou
recommandation, les composés cancérogènes tel que le benzène font l’objet demesures
plusrestrictives.
Tableau8-ConcentrationslimitesdesCOVdanslesrecommandationsetrèglementationsetleurclassementparleCentreInternationaldeRecherchesurleCancer(CIRC)((1:cancérogènepourl’Homme,2B:probablementcancérogènepourl’Homme,3:inclassable)[194,200,203,204]
Concentrationslimites(µg.m-3)
CatégorieCIRCJAMA
(Japon)
GB/T27630
(Chine)
No2007-539
(Corée)
Formaldéhyde 100 100 250 1
Acétaldéhyde 48 50 - 2B
Benzène - 110 30 1
Toluène 260 1100 1000 3
Styrène 220 260 300 2B
Xylène 870 1500 870 3
Acroléine - 50 - 3
Éthylbenzène 3800 1500 1600 2B

70
Des travaux sont aussimenés en Europe pour une législation de la VIAQ. La commission
européennes’engageà impliquerdesexpertscompétentsenmatièrede législationsur les
polluantschimiques[201].Cependant, toutesces instructionsneconcernentpour l’instant
quel'évaluationglobaledel’airduvéhicule.Desvaleursseuilsouvaleursguidesàl'échelle
desmatériauxd’intérieurd’automobilenesontpasdisponibles.
Normalisationdesméthodesdeprélèvementetd’analyse
AfindeproposerdesvéhiculesconformesauxvaleurslimitesVIAQ,desnormesdécrivantles
méthodes d'essai pour la détermination des émissions de COV par les composants
automobiles sontmises à disposition des industriels. Au cours des années, desméthodes
spécifiques aux fabricants pour lesmesures de COVet COSV en air intérieur de véhicules
tellesquelanormeaméricaineGeneralMotorsGMW1564,lanormeallemandeVolkswagen
PB VWL 709 ou la norme française Renault D42 3109 ont été adoptées, employant de
nombreuses techniques analytiques [206,207]. Par ailleurs, les normes ISO 12219 dont la
plus ancienne est publiée en 2012 ont harmonisé les normes européennes et décrivent
différentsprotocolesdemesuredesCOVàdifférenteséchelles, depuis le tauxd’émission
des matériaux jusqu’à la concentration dans l'air intérieur des véhicules [208–211].
L’industrieautomobileeuropéenneaaussiadoptédesméthodes tellesquecellesdécrites
danslaVDA278pourmesurerlesémissionsdespiècesintérieures.
Emissionsdanslesvéhicules
Quelques travaux traitent des émissions de COV dans les véhicules et de l’influence de
différents facteurs sur leurs taux d’émission. Certaines études décrivent une analyse
exhaustivedesCOV[212]alorsqued’autresportentsurlamesuredeCOVspécifiques[189]
correspondantauxpolluantspotentiellementdangereuxet listésdans lesrèglementations.
OutrelaconcentrationdesCOVindividuels,laconcentrationenCOVtotaux(COVT)estaussi
déterminéepourévaluer laVIAQ[189,194,212–215]. LesCOVTsontdéfinisdans lanorme
ISO16000-6commelasommedesCOVdont letempsderétentionsesitueentreceuxde
l’hexane et l’hexadécane dans des conditions d’analyse par chromatographie en phase
gazeusebiendéfinies[216,217].

71
Lesrésultatsd’unedizained’étudessontrésumésdansleTableau9oùchaquevéhiculeou
lotde véhicules est arbitrairementdésignépar les appellationsVE1àVE19.On remarque
que le toluèneet l’éthylbenzènesontsystématiquementdétectés. Ilaétémontréqueces
émissions de COV dépendent fortement de la température [189,218]. En effet, une
diminution de 4°C par l’activation du conditionnement d’air (AC) dans le véhicule peut
réduire de 4 à 6 fois les concentrations mesurées en toluène et éthylbenzène
respectivement [189]. Par ailleurs, il a été montré que les concentrations étaient plus
élevéesdanslesvéhiculesplacésenconditionsstatiques(garés,non-ventilés)quedansceux
enconditionsdeconduiteetdeventilation(Figure24) [215].L’introductiond’airextérieur
dansl’habitaclefaitgénéralementbaisserletauxdeCOVpareffetdedilution.Eneffet,ila
étédémontréquedansdesconditionsdeventilation(fan)offetrecirculationd’air(RC)off
(Cf.VE10dans leTableau9)oufanonetRCon(Cf.VE11), laVIAQétaitplusaffectéeque
sous condition de ventilation fan on RC off (Cf. VE12). Cependant, bien que le taux de
renouvellement d’air réduise les niveaux de COV intérieurs, d’autres COV peuvent être
apportés via l’air extérieur en fonction de la densité du trafic routier. Ceci est
particulièrementvérifiépourletoluène[215].
Figure24-ConcentrationsenCOVTde3modèlesdevoitureenconditionstatiqueetdeconduitependant90minutes[215]
Parailleurs,uneétudecomparativemenéesur12COVamontréquelesconcentrationsdans
les habitacles de véhicules neufs de différentesmarques et différents lieux de fabrication
pouvaient,pourunmêmecomposé,varierd’unfacteur1000voireplus(dequelquesµg.m-3
0
200
400
600
800
1000
1200
1400
1600
1800
2000
Chevrolet 1997 neuve
Ford 1997 neuve Toyota 1993 usagée
75 100 150
760
1980
450
Concentr
ation e
n C
OV
T (μ
g.m
-3)
conduite statique
72
àenviron8000µg.m-3pourlesm,p-xylènes)[189].UneétudeaétémenéeparYoshidaetal
sur 50 véhicules de 6 marques différentes pour évaluer l’influence du constructeur, des
spécifications (matériaux utilisés, prix catalogue) ainsi que l’état d’utilisation des voitures
(distanceparcourue, ventilation) sur lapollutionde l’air intérieurpar ces composés [219].
Ce travailmontreque l’hétérogénéitédes concentrationsmesurées avant (VE18) et après
livraisonetutilisationdesvéhicules(VE19)étaitprincipalementdueauxdifférentsmatériaux
intérieursutilisésoulaqualité(luxeoubonmarché)plusquedépendanteduconstructeur.
Eneffet,lacompositiondespiècesintérieuresinfluenceleprofild’émission,notammentle
type de revêtement couvrant les sièges. Les pièces en cuir émettent des quantités plus
élevéesquedespiècesentissuavecunfortimpactsurlaconcentrationdetoluènequipeut
augmenter de 39% [189,214]. Mais d’autres produits (peintures, revêtement de surface)
peuventaussicontribuerauxémissionsdepolluantsetimpacterlaVIAQ[220].
Encomplémentdel’analysedel’airdeshabitacles,desétudessurlamesuredesémissions
desmatériauxconstitutifsdes intérieursautomobilessontdoncnécessairespour identifier
et caractériser les sources de polluants. La technique de l’espace de tête (Head-Space)
coupléàlaMicro-ExtractionsurPhaseSolide(SPME)reposantsurunprélèvementpassifdes
COV, a été employée pour évaluer les sources potentielles de COV en analysant
individuellement (et hors véhicule) des échantillonsde chaque composant intérieur [189].
L’antioxydant2,6-di-tert-butyl-4-methylphénol(BHT)aétédétectécommecomposémajeur
émisparlesproduitspétrosourcés.Ilaétémontréquedeshydrocarburesaliphatiquestels
que l’heptadécane ou le tétradécane proviennent principalement des graisses (lubrifiants
parexemple)alorsquelespluslongueschaînestellesquel’éicosaneouledocosaneétaient
émis par des matériaux plastiques. Cette famille chimique (hydrocarbures aliphatiques)
représente52%desCOVT.Des composésaromatiques, telsque le toluèneet les xylènes
issusdesadhésifs,ontaussiétéidentifiésetreprésentent42%delaconcentrationenCOVT.
D’autres familles chimiques comme des composés halogénés, des espèces carbonylées et
desestersontaussiétédétectéesenplusfaibleproportion.LePVCpeutnotammentêtreà
l’originedelapollutiondel’airpardescomposéschlorés[189].Dansuneétudedifférente,
275 COV ont été détectés avec une grande proportion d’hydrocarbures aliphatiques et
aromatiques[221],cequicorroborelesrésultatsdel’étudeprésentéeprécédemment[189].

73
Pourdesvéhiculesusagés,lesconcentrationspeuventêtrebeaucoupplusfaiblesqu’àl’état
neuf[189].Celaestprobablementdûàladiminutiondutauxd’émissiondesmatériauxde
l’habitacle au cours du temps. Par exemple, Yoshida et Matsunga ont montré une
décroissance exponentielle de la concentration en COVT au cours du temps avec une
diminutionde1/10èmeaprèsuneannée(Cf.VE1dansleTableau9)[212].Après5années,les
concentrationssontsignificativementréduites(VE8etVE9)[214].
Lesdifférentesétudesprésentéesci-dessusmontrentque laqualitéde l’airdeshabitacles
automobilesdoitêtreamélioréeetqu’unesélectiondematériauxpeuémetteursenamont
de la construction pourrait fortement y contribuer, de même que la mise en place de
réglementations.Eneffet,on remarqueque lesvéhiculesexaminés lorsd’études récentes
effectuées en Chine satisfont les limites imposées par la norme chinoise GB/T 27630
[214,222].

74
Tableau9-ConcentrationdeCOVdansplusieurshabitaclesdevéhiculesneufsetusagésenconditionsstatiquesetdeconduite(TMB:triméthylbenzène,
NM:nonmesuré)
Désignation Etatvéhicule ConditionsprélèvementConcentration(µg.m
-3)
Sourcetoluène benzène éthylbenzène 1,2,4-TMB m&p-xylène o-xylène ∑xylènes styrène COVT
VE1 neufventilationoff,
statique 226 6 361 212 3104 899 4003 74 14000 [212]
VE2 neuf conduite(90min) 12 2 2 NM 4 1 5 NM NM [215]
VE3 neuf conduite(26min) 5 2 1 3 4 2 6 NM NM [223]
VE4 neufventilationoff,
statique 34 NM 66 73 140 53 193 130 NM [189]
VE5 neufventilationoff,
statique2000 NM 35 41 2500 1400 3900 1500 NM [189]
VE6 neufventilationoff,
statique 210 NM 42 30 78 39 117 54 NM [189]
VE7 neufventilationoff,
statique 2700 NM 170 500 230 140 370 140 NM [189]
VE8 neufventilationoff,
statique 105 20 23 NM NM NM NM 13 NM [214]
VE9 usagé(5ans)ventilationoff,
statique 49 14 10 NM NM NM NM 10 NM [214]
VE10 neufventilationoff,
statique66 17 14 NM NM NM 28 7 612 [214]
VE11 neuf
ventilationon,
recirculationon
statique85 18 16 NM NM NM 30 4 NM [214]
VE12 neuf
ventilationon,
recirculationoff,
statique47 14 10 NM NM NM 17 5 NM [214]
VE13 neufventilationoff,
statique 82 48 85 NM 346 95 441 155 4940 [222]
VE14 usagé(1an)ventilationoff,
statique 50 10 10 NM 20 10 30 10 1240 [222]
VE15 neuf ventilationoff,
statique
72 5 9 NM - - 100 4 NM[202]
VE16 neuf 68 8 11 NM - - 134 4 NM
VE17 usagé(2,6ans)ventilationoff,
statique 151 60 54 NM NM NM 133 NM NM [220]
VE18 neufsventilationon/off,
statique 12-368 1-53 3-62 6-186 5-163 2-83 NM 1-675556-
11398[219]
VE19 usagés(<3ans)ventilationon/off,
statique12-356 1-33 2-59 2-98 3-65 1-25 NM 0-79
136-
3968[221]

75
EmissiondeCOVparlespolymères
Parmi les matériaux émetteurs mis en évidence dans les paragraphes précédents, les
polymères peuvent contribuer de façon importante à la pollution de l’air intérieur des
véhicules[191].CesmatériauxémettentgénéralementdesCOVàdestauxélevésaudébut
deleurcycledevie,puisl’émissionsestabiliseauboutdequelquesjours(10à30jours)à
températureethumiditéambiantes[191].Cependant, lorsquelesmatièresplastiquessont
utilisées dansdesmilieuxdont les conditions peuvent endégrader lamatrice primaire, la
structure de ces dernières et donc la nature des composés émis peuvent être altérées et
conduireà la libérationdepolluantsvolatils.Ainsi,dansplusieursétudes, lePP,trèsutilisé
dans des pièces d’habitacle, a été soumis à des dégradations artificielles (photo-chimique
[224], thermique [225], radiative [134] ou photo-thermique [143]) afin d’apporter des
informationsmécanistiquesdedégradation.Descomposésvolatilsissusdeladécomposition
du polymère tels que les alcanes, alcènes, alcools, aldéhydes sont formés. Les COV
appartenant aux deux dernières familles chimiques sont générés suite à l’oxydation des
chaînesdepolymère.Desschémasréactionnelsontétéproposésimpliquantprincipalement
lesréactionsradicalairesprécédemmentexposées(partieV.1)[134,225].
EmissiondeCOVparlesbiocomposites
CommedétaillédanslapartieV,lesfibresvégétalesretrouvéesdanslesbiocompositessont
sensiblesauxconditionsclimatiquestellesquelerayonnementUV,l’humiditéoulachaleur.
Leur dégradation peut induire l’émission de sous-produits issus de la décomposition des
composés lignocellulosiques [226]. Quelques articles scientifiques reportent des résultats
relatifs auxémissionsdeCOVet audégagementd’odeurspardesbiocomposites.Comme
observésurlaFigure25,lecompositecomportantdesfibresd’abacaémetdesodeursàplus
forteconcentrationqueceuxrenforcéspardesfibresdelinoudejute.

76
Figure25-Concentrationsd'odeurdebiocompositesàmatricePPrenforcéepardifférentstypesdefibresvégétales(abaca,lin,jute)[31]
Afindelimiterl’impactdesbiocompositessurlaqualitédel’air,K.W.Kimetalontétudiéla
réductiondel’émissiondeCOVpardesbiocompositesàmatricebiodégradablePLAetPBS
renforcéesdefibresd’ananasetdefibresdemaniocpar leprocédéde«bake-out»[213].
Celaconsisteàchaufferlesmatériauxsousunfluxd’airavantleurutilisationafinderéduire
lesCOV(sortede«dégazage»)[213].Au-delàde70°C,lescompositesPLA/fibresd’ananas
etPLA/fibresdemaniocprésententdesfacteursd'émissiondeCOVTplusélevésquelePLA
puren raisonde l'émissionplus importantedeCOVdégagéspar les renfortsnaturels tels
quele2-furancarboxaldéhyde(furfural)provenantdesfibres,etle1,4-dioxaneissuduPLA,
cesdeuxcomposésétantclassésCMR[193].EnCorée,latempératuremaximaleintérieure
d’uneautomobiledurant lesdeuxsaisonsdeprintempsetautomneestd'environ50°Cet
peutatteindre90 °Cenété [213].Celamontredonc l’importancede la températuredans
l’évaluationdel’impactdesbiocompositessurlaVIAQ.
Dansunmêmeobjectif,H.S.Kimetalontquantifiélaréductiond’odeuretlesémissionsde
COVdebiocomposites,dont lesmatricesPLAetPBS renforcéesde farinevégétaleétaient
similaires,enincorporantdeschargesinorganiquesporeusespouvantpiégerlessubstances
gazeuses [227]. Les émissions de COV tels que le tridécane provenant de lamatrice et le
furfural émis par la farine de bambou ont été réduites. Des analyses olfactométriques
coupléesàdesanalyseschimiquesontpermisdeconstaterque l’odeurétaitdueauxCOV
oxygénésémisparlamatricethermoplastiqueetlesfarines[196].
0
500
1000
1500
2000
2500
PP-abaca PP-lin PP-Jute
2140
840 890
Co
ncen
trati
on
d'o
deu
r
(un
ité d
'od
eu
r.m
-3)

77
Un article concerne les émissions de COV dérivant de la dégradation thermique de
compositesPP/fibresdecelluloseetfibresdechanvreetayantétéanalysésparespacede
tête(Headspace)-SPME(HS-SPME)[226].PlusieursCOVontétéidentifiésàl’étatinitialetà
l’étatvieilli(hydrocarburesaliphatiques,acidescarboxyliques,alcools).DesCOVspécifiques
aux fibresvégétales commedescomposéscarbohydratéset le2-furanmethanol issude la
déshydratationetladécarboxylationduglucopyranoseetxylopyranose,structuresprimaires
de la cellulose et des hémicelluloses [228,229] ont été détectés. Ce dérivé furanique est
suspecté être cancérogène selon la classification CMR [193]. Il a été constaté une
augmentation du nombre et de la concentration des COV après le traitement thermique
[226].Donc,unprocessusthermo-oxydatifayantdégradélastructureprimairedupolymère
etdelacelluloseacertainementfavoriséledégagementdesous-produitsdedécomposition.
AnalysedesCOVémisparlesmatériaux
Dans la plupart des études décrites précédemment concernant les atmosphères de
véhicules,lesCOVontétéanalysésdirectementdansl’airdeshabitaclespardestechniques
deprélèvementsactifsdécritesdansdesnormestellesquel’ISO12219-1[208].Lestravaux
traitantdelacaractérisationdesémissionsdematériauxsontmoinsfréquemmentreportés
dans la littérature.Latechniqueclassiquementutiliséepourprélever lesCOVémispardes
matériaux est l’espace de tête couplé à la SPME (HS-SPME) [196,226,230–232]. Cette
techniqued’extractionconsisteàpréleverlespolluantsdanslapartiesupérieured’unflacon
hermétiquement scellé contenant le matériau à caractériser. Cette mesure est simple et
rapideavecdestempsd'extractioncourts.Maisl’HS-SPMEimpliquesouventunedestruction
du matériau puisqu’une découpe en morceaux de petite dimension est nécessaire pour
introduire l’échantillon dans le flacon d’espace de tête. Par conséquent, cette procédure
d'échantillonnage ne convient pas pour fournir des données quantitatives liées aux
émissionsdesurface(tauxd’émission,parexemple).Pourladéterminationdecesderniers,
destestsenchambred’émissionsonteffectués.Selonletyped’usagedumatériau(tableau
debord,garnissagedeportière…),deschambresdevolumessupérieursà4m3peuventêtre
utiliséesetlesessaispeuventdurerplusieursjoursselonletempsdestabilisationrequispar
lesnormes[209–211].Cesprotocolessontdonccomplexesetlongsàmettreenœuvre.Ils
sontpar conséquentpeuadaptésàun suivi fréquentduvieillissementd’unmatériau,par

78
exemple.
En alternative à ces mesures en chambre d’émission, notre laboratoire a développé une
méthoded’échantillonnagepassifparcouplaged’unecelluled’émissionàlatechniqueSPME
[233,234].
LaMicroExtractionsurPhaseSolide(SPME)
La technique deMicroExtraction sur Phase Solide (SPME) développée par Pawliszyn et al
reposesurunprélèvementpassifdespolluants[233].Ledispositifdepiégeageimpliquéest
basésurl’ad-(oul’ab-)sorptiondesCOVàlasurfaced’unefibreconstituéed’unbarreaude
silice fondue recouvert d’une phase stationnaire. Cette phase peut être constituée de
polydiméthylsiloxane (PDMS), de divinylbenzène (DVB) et/ou de Carboxen (CAR) selon les
propriétésphysico-chimiquesdespolluantsàanalyser.Durantlaphasedeprélèvement,les
COV diffusent de l’air vers la fibre: la première loi de Fick s’applique et la quantité de
matièreextraitepeutêtredéterminéeselonl’équation6[235]:
!"=$%×'()*
(,%−,./01)3
0)3
Eq.6
avec nf la quantité de matière extraite sur l’adsorbant (μg), Di le coefficient de diffusion
moléculaireducomposéidansl’air(m2.s-1),Sadlasectiondel’adsorbant(m2),zlalongueur
dediffusion(m),Cilaconcentrationducomposédansl’air(μg.m-3),Csorblaconcentrationdu
composéàlasurfacedel’adsorbant(μg.m-3)ettladuréed’échantillonnage(s).
Audébutdel’échantillonnage,Csorbpeutêtrenégligé.L’intégrationdel’équationprécédente
conduitdoncà:
!"=k×,%×3 Eq. 7
kkk
Avec k = $5× 6
978 , nf est donc proportionnel au produit produit Ci´t, autrement désigné dose
d’exposition et exprimé en μg.m-3.s [236]. nf étant déterminé par chromatographie en phase
gazeuse après désorption thermique de la fibre SPME dans l’injecteur, il est alors possible de
déterminer Ci, connaissant t, le temps d’extraction sur fibre.

79
Couplagecellulesd’émission-Echantillonnagepassif
DeviceforOnSiteEmissionControl(DOSEC)coupléeàlaSPME
Unpremierdispositifaétéréaliséaulaboratoirepourmesurerdefaçonsimplelesémissions
surfaciques de matériaux: il consistait à coupler une cellule d’émission FLEC (Field and
Laboratory Emission Cell) recommandée par la norme ISO 16000-10 à la SPME [237]. Ce
couplageaensuiteétéoptimiséparBourdinetalafind’enaméliorerlesperformances[234].
Unenouvellecelluleenverre(DOSEC)aainsiétédéveloppée(Figure26).
Figure26-CelluleDOSECcoupléeàlaSPME
Cetteméthoded'échantillonnagepassifpermetdedéterminer laconcentrationdesCOVà
l'interfacematériau/air (Cis) liéeautauxd'émission(EF)par lapremière loidediffusionde
Fickdansdesconditionsderégimestationnaire[238] selonl’équation8[239]:
:; = −$5),
)<= −$5
,5 − ,5=>
Eq.8
avecEF le tauxd’émission (µg.m-3.s-1),Di lecoefficientdediffusiondupolluant idans l’air
(m2.s-1), Ci la concentration du composé dans l’air (µg.m-3), Cis la concentration en phase
gazeuseà la surfacedumatériau (µg.m-3) et L l’épaisseurde la couche limitedediffusion
(m).
Lamesuredel’émissiond’unmatériausedérouleendeuxétapes.Premièrement,lacellule
est placée sur le matériau afin d’isoler la surface à analyser. Les COV diffusent alors du
matériau vers l’air enfermé dans la cellule jusqu’à l’établissement de l’équilibre des
Fibre SPME
CelluleDOSEC

80
concentrationsdesCOVàl’interfacematériau/air.Unefoisl’équilibrematériau/airétabli,la
fibre SPMEest exposéeauxCOVémiset la concentrationà la surfacedumatériauCis est
déterminéeaprèsextractionsurfibreSPMEenmodestatique(Cf.paragrapheVII.6.1).
CedispositifadéjàétéappliquépourlamesuredesémissionsdeCOVpardesmatériauxde
constructiondansunesalledeclassed’uncollège[235,238]etpourl’étudedelaqualitéde
l’airintérieurdemaisons[240]afind’envérifierlafaisabilité.Cedispositifseratransposéà
notreétudepour leprélèvementdeCOVémispardesbiocompositespouvantêtreutilisés
enéquipements intérieursdevéhiculeetdont l’impactsur laqualitéde l’air intérieurdoit
êtrecaractérisé.
L’évaluationdes relationsentre lesgrandeurs intensivespropresauxmatériauxpeutavoir
plusieurs intérêts. Premièrement, puisque lamesure des propriétésmécaniques implique
souvent un endommagement, voire une destruction du matériau, des indicateurs de
dégradationàpartird’essaisnondestructifspourraientpermettred’estimer lapertede la
stabilité et de la performance de plastiques. Aussi, cela permet d’apporter une
compréhension auxmécanismes de vieillissement. Cette partie abordera tout d’abord un
étatdel’artsurlespolymèrespuissurlesbiocomposites.
Lespolymères
Lepremierintérêts’estmanifestéàtraversladéterminationderelationsexistantentredes
paramètresquantitatifsnonmécaniquesetlespropriétésmécaniques,parexempleentrela
formation de produits de photo-oxydation comme les espèces carbonylés (mesurées par
spectroscopie infrarouge) et l’élongation et la force à la rupture obtenues par test en
traction[241].LesmatériauxPEBDnonréticuléetréticulésoumisàuneexpositionUVont
présentéunmêmeprofilbienque la relationétaitnon linéaire suggérantque le suivides
variationsdu tauxd’espècescarbonylepeut serviràprédire la tenuemécaniquedePEde
différentes structures. Cependant, d’autres études ont montré qu’aucune relation simple
n’existait entre lesmodifications de la composition chimiqueet de structureduPE et ses

81
propriétés mécaniques. En effet, lors d’une autre étude sur le vieillissement de PEBD,
l’élongation à la rupture apparait comme stable au début du vieillissement accéléré puis
diminuedefaçonimportantealorsquel’intensitédelabandeinfrarougeliéeauxcarbonyle
(1715cm-1)augmentecontinuellement[242].Cettestabilisationdurantlestempscourtsde
vieillissementseraitdueauxréactionsderéticulationentreleschaînesdePE.Parallèlement,
lorsduvieillissementnatureldecesmêmesmatériaux,unediminutiondel’élongationà la
ruptureestobservéedès les tempscourtsd’exposition suggérantque lesphénomènesde
scissiondechaîneontprédominé.Donc,selonlesconditionsd’exposition,lesrelationsentre
l’élongationetletauxdecarbonyleseraitdifférent.Aussi,aprèsavoirrépertoriélesdonnées
de déformation en fonction de l’augmentation relative des groupements carbonyles au
coursduvieillissementnaturelduPEBD,Akayetalremarquentaussiquelacorrélationn’est
pasévidente[243].Ladiminutiondeladéformationàlaruptureestplusprononcéelorsque
letauxdeformationdecomposésoxygénésestfaible,c’est-à-direlorsquelog(I+ΔI1725)≤0,1
généralement(Figure27).Ensuite,l’évolutionestpluscomplexe.Donc,leschangementsde
structurechimiquedupolymèren’influencentpassignificativementlespropriétésgénérales.
Deplus,pendantlasaisonhivernale,aucunevariationsignificativedutauxdecarbonylen’a
été détectée par spectroscopie infrarouge alors que la contrainte et la déformation à la
ruptureavaientaugmentéetlemoduled’élasticitédiminué.Cestendancessuggèrentquela
réticulationavaitprédominéaudétrimentdesscissionsdechaîne.

82
Figure27–Variationdulogarithmedel'élongationàlarupturedePEBD?
?@enfonctiondulogarithme
dutauxdecarbonylesB + ∆BEFGH(leséchantillonsP1àP9représententdifférentstauxdestabilisantsUV)[243]
Beaucoup moins d’études concernent l’approche corrélative des propriétés physico-
chimiques aux propriétés mécaniques du PP. L’évolution de la force résiduelle a été
comparéeàcelledelaviscositéintrinsèquedurant3vieillissementsartificiels(expositionà
différentsrayonnementsUV)etunvieillissementnaturel[244](Figure28).Quelquesoitle
modededégradation,laviscositéaévoluélinéairementaveclarésistance.Cecisuggèreque
les modifications à l’échelle moléculaire telles que le poids moléculaire gouvernent les
propriétésmécaniques.

83
Figure28-Relationentrel’augmentationdelaviscositéintrinsèqueetdelaforcerésiduelleentractionduPPaucoursdedifférentsphoto-vieillissements[244]
Quelques études existent sur les relations entre propriétésmicrostructurales au cours du
vieillissementduPE.L’interdépendanceentrelesparamètresaétéquantifiéepourproposer
des hypothèses sur les mécanismes de dégradation ou apporter des informations de
compréhension. Comme démontré sur la Figure 30, une relation linéaire entre le taux de
cristallinitéχcetl’inversedelaracinecarréedelamassemoléculaireenpoidsE
√JKdePEHDa
été établie dans la revue de Fayolle et al qui ont tenté de valider cette relation dans
plusieurs travaux menés par d’autres chercheurs [245]. Ceci permettait de vérifier si les
variationsdelongueurdechaînedupolymèrepouvaientêtreexclusivementexpliquéespar
le phénomène de chimi-cristallisation estimé par le taux de cristallinité. La pente et
l’ordonnéeàl’originedépendentdelastructurechimiquedupolymèreetdesconditionsde
cristallisation. Cependant, même si une dépendance linéaire peut être supposée dans
certains cas, les résultats sont relativement dispersés pour d’autres et la dépendance ne
peutêtretoutletempsreprésentéeouvérifiéeparunelinéaritéentrelesgrandeurs.
50 60 70 80 90 10040
50
60
70
80
90
100
Resi
du
al
Str
en
gth
(%
)
Residual Intrinsic Viscosity (%)
8-lamp-test
4-lamp-test
2-lamp-test
outdoor test

84
Figure30-VariationdeXcenfonctiondeMw-1/2dePEHD(lesdifférentescourbescorrespondantaux
différentstravauxréaliséspardifférentschercheurs)symbolesremplis:cristallisationpartrempe,symbolesvides:cristallisationisotherme[245]
Le tauxdecristallinitépeutêtreaussidéterminépar spectroscopie infrarougeàpartirdes
bandes d’absorption attribuées aux phases amorphe et cristalline [246]. Au cours d’un
vieillissement hivernal de PEHD de 3mois, ces bandes se sont révélées être linéairement
corrélées(r²=0,98)àl'enthalpiedefusionΔHm[246].Cecitémoignedeladépendancedela
microstructureà la composition chimique.Akayetalont constatéque l'indicevinyle (910
cm-1)et l'indicedecarbonyle(1725cm-1)variaientdefaçonproportionnelleaucoursde la
dégradation naturelle du PE [243]. Cependant, cette étude de cas ne vérifie pas le
mécanisme de conversion de groupements vinyle en groupements carbonyle (Norrish II)
[247,248] qui, généralement, induit la stabilisationde la teneur en groupements vinyles à
partird’uncertaintempsdevieillissementpuisquecesespècespeuventseréarrangerpour
former des espèces carbonyles. Ceci suggère que, soit unmode de dégradation différent
s’estdérouléaucoursduvieillissement,soitletempsdevieillissementétaittropcourtdans
cesconditionsd’expositionpourapercevoirunestagnationdel’indicevinyle.
L’évolution des émissions de COV a été comparée à d’autres propriétés au cours du
vieillissementdepolymères,tellequelesvariationsdecouleur/clarté,demicrostructureou
depropriétésmécaniques,ceciafindedéterminersilesdommagesphysiquesdesmatériaux
polymères peuvent être associés aux modifications des profils d’émission de COV. Par
exemple, l’étude de Carlsson et al sur le vieillissement photochimique de PVC a mis en
évidenceunliendirectentreleblanchimentdeséchantillonsetlalibérationdeCOVchlorés
0
0.1
0.2
0.3
0.4
0.5
0.6
0.7
0.8
0.9
1
0 0.002 0.004 0.006 0.008 0.01 0.012
MW
-1/2
XC

85
tels que le 1-chlorobutane et la 1,1-dichloroacétone [249–251]. Par ailleurs, il a été
démontréqueledegrédedégradationestiméàpartirdutauxdescissionsdechaîneetdela
chutede lamassemoléculaireaprès thermo-oxydationdematériauxpolymèresétait relié
au taux de COV oxygénés tels que les acides carboxyliques et lactones [252]. Plus
précisément, l’acidebutanedioïquepouvaitservird’indicateurdevieillissementpermettant
d’éviter le suivi d’une famille chimique complète de composés volatils. De même, une
corrélation a été établie entre l’émission du produit de dégradation 1-pentyl-2,5-
pyrrolidinedione dérivant du polyamide PA 6,6 recyclé et les propriétés mécaniques du
matériauaprèsvieillissementthermique[253].Eneffet,ladiminutionrapidedelarésistance
àlatractionaprèsunepérioded'inductioncoïncidaitaveclaquantitéélevéedeproduitsde
dégradationformés.
Lesbiocompositesetmatériauxlignocellulosiques
Peu de travaux sont reportés sur les relations entre les propriétés de biocomposites
déterminées au cours du vieillissement. Fabiyi et al ont dégagé des corrélations linéaires
entre le blanchiment exprimé par ΔL et la concentration en acides carboxyliques et la
concentrationenestersàlasurfacedeWPC(R2de0,93et0,87respectivement)[138].Donc,
unesimpleévaluationdelaclartédumatériaudanscesconditionsspécifiquesd’exposition
pourraitindiquerdesmodificationsàl’échellemoléculairepuisqu’unliendecausalitéentre
laformationdecomposésoxygénésetladécolorationestétabli.Aucoursd’unautretravail
réalisé sur lemême typedematériaux, une relation linéaire est établie entre ledegréde
cristallinitéet lamassemoléculaireenpoidsde lamatricePPdeWPCvalidéeaucoursde
vieillissements artificiel sous arc xenon (R2 = 0,90) et en extérieur (R2 = 0,99) [158]. Ceci
suggèreque ladiminutiondupoidsmoléculaireétait responsablede l’augmentationde la
cristallinité.Des tendancescorrélativespourunemêmepropriétéévaluée selondifférents
paramètres peuvent aussi être vérifiées. En effet, un degré de dépendance élevé a été
déterminéentrelesdeuxparamètresliésàlacouleura*etb*aucoursd’unvieillissement
accéléré de WPC indépendamment du temps de vieillissement [254]. Cela pourrait être
certainement dû à la formation de paraquinones de couleur jaune et de composés de
couleurrougetelsquelesorthoquinonessuiteàladécompositiondelalignine.

86
Ladégradationde la lignocelluloseseulepermetdecomprendre la contributiondes fibres
auxvariationsdespropriétésphysico-chimiquesdesbiocompositesmaisaussidedéterminer
le rôle de chaque composant sur les évolutions des propriétés. De même que pour les
polymères, l’éventuelle existence de relations entre différentes propriétés, comme la
couleuretlamicrostructure,aétéétudiée.Eneffet,ilaétémontréquelesvariationsdela
valeurΔEd’échantillonsdeboissontbiencorréléesaveclerapportdesabsorbancesà1509
et897cm-1deliaisonsC=C.Celles-cicorrespondentauxcomposésphénoliquesdelalignine
quiapparaîtensurfaceaucoursd’unvieillissementartificielàrayonnementUV[255]. Cette
relationsuggèrequelesvariationsdecouleursontprincipalementattribuéesàlaformation
de chromophores résultant de la dégradation photochimique de la lignine. De même,
Bonifazi a établi une corrélation, validée par analyse statistique, des changements de
couleur telque leblanchiment (augmentationdeL*)et la coloration rouge(augmentation
de a*) dus à la photo-dégradation des composants en bois, notamment la lignine, et les
changements observés par analyse spectrale [256]. Une autre étude portait sur la
dégradation de la cellulose. Son degré de polymérisation a été déterminé à partir de la
viscositéintrinsèquereprésentéenfonctiondelarésistanceàlatractionenmodezero-span,
essai mécanique donnant des indications sur la résistance des fibres de papier, sous
différentesconditionsdevieillissementaccéléré.Celaimpliquequelalongueurdechaînede
lacelluloseaffecteconsidérablementlarésistancemécanique[257].
Les émissions de COV par des matériaux lignocellulosiques et leur rapport aux autres
propriétés ont notamment été évalués pour vérifier si des mesures effectuées selon des
méthodes de caractérisation non invasives telles que l’échantillonnage de COV sur des
objets de valeur par exemple (pièces de musée) peuvent indiquer l’état de dégradation
avancé. Ladégradationdepapiershistoriques contenantprincipalementde la celluloseet
une très faible proportion en lignine a été étudiée [258]. Une relation quantitative s’est
dégagéeentrelesproduitsvolatilspouvantservirdemarqueursdedégradationetlateneur
enlignine.Enoutre,lateneurengroupementscarbonylesétaitcorréléepositivementavec
lateneurenligninefournissantdesinformationssurlacomposition.Touscesderniersfaits
témoignent de la contribution de la lignine, même à faible taux, dans l’évolution des
propriétésdepolymèresàbasedelignocellulose.

87
La société actuelle connaît une expansion croissante du développement de matériaux
biosourcés sur le marché. Suite à une volonté de préservation de l’environnement, des
intérêts sont portés par les industriels aux biocomposites en alternative aux composites
traditionnels,notammentdans lessecteursde laconstructionetde l’automobile.Eneffet,
les fibres naturelles sont biodégradables, issus de ressources renouvelables et requièrent
peu d’énergie pour être produites. De plus, la structure organisée des composantes des
fibresconfèreauxfibresdespropriétésspécifiquescomparablesàcellesdesfibresdeverre.
Cependant, ce développement se heurte à une forte dépendance des propriétés des
biocompositesauxconditionsd’usageetdoncàunevariabiliténonnégligeable.Mêmeside
nombreux moyens sont déployés et largement utilisés pour s’affranchir de ces limites
(stabilisants, protection, revêtements, …), comprendre les mécanismes de dégradation et
s’intéresser aux phénomènes impliqués dans la dégradation reste le meilleur moyen de
maîtriserleurcomportementfaceauxconditionsd’usage.
Danslesdeuxtypesd’applicationsprécités(bâtimentetautomobile),lespolymèresdetype
PPrenforcésdefibresdechanvresonttrèsutilisésetserontdoncétudiésiciavecdifférents
taux de charge. Leur durabilité sera évaluée au travers de deux types de vieillissements
naturels adaptés aux applications visées: une exposition directe aux intempéries et une
exposition sous vitre pare-brise. Les propriétés mécaniques, de microstructure, d’aspect
visuel seront suivies tout au long du processus. Au vu du nombre restreint d’études
reportées dans la littérature sur les émissions de COV par les biocomposites, des
prélèvements des substances émises par les matériaux seront effectués tout au long du
vieillissement sous vitrage. Cela permettra de contribuer à l’évaluation du risque
d’expositiondansleshabitacles.Deplus,cesnouvellesdonnéespourrontaussicontribuerà
expliquer,voireàproposercertainsmécanismesdedégradation.
Des corrélations interprétées par certains auteurs entre les propriétés de matériaux
thermoplastiques au cours de leur vieillissement ont permis d’évaluer la possibilité de
s’affranchirdemesuresinvasivesauprofitdetechniquesnondestructives(mesured’aspect
visuel et d’émission de COV, par exemple) pour déterminer l’état de dégradation.

88
Cependant, des études similaires extrapolées au comportement des biocomposites et
incluant plusieurs types de propriétés n’ont pas encore été abordées. C’est pourquoi la
naturedescorrélationsentre lespropriétésphysico-chimiquesdesbiocompositesaucours
de leurs conditions d’usage sera interprétée afin de rendre compte des relations existant
entre tous les paramètres étudiés. Une partie développée en Annexes détaille l’outil
statistiqueutiliséafindetrouverlesliensentrecesderniers.
Enfin, l’objectif seradecomparer les résultats issusd’unvieillissementenenceinteàceux
obtenusaprèsvieillissementnaturelextérieurafindevérifier si l’expositionen laboratoire
reflèteréellement lesconditionsnaturellesd’expositionets’ilestdoncpossibledemettre
enévidenceuneéquivalencetemporelle.
Références
[1] J. Aspling, H.Oxfall, S. Danielsson, A. Segerborg, K. Segerholm, S.Wännström, RISEreportonroadmap2015to2025:Bio-basedcomposites,(2017)1–11.
[2] NovaInstitut,FeatureWindEnergy,n°99,JECCompos.Mag.(2015)18–19.
[3] DenzilWalton,Markets: thebio-based composites inAsia JECAsiabusiness review,JECCompos.Mag.(2017).
[4] MarketsandMarkets, Report on natural fiber composites market: Global trends &forecaststo2019,Mark.Res.(2014).
[5] Grand View Research Inc, Natural fiber composites market analysis and segmentforecaststo2024report,2015.
[6] GrandViewResearchInc,Researchreportonnaturalfibercompositesmarketanalysisby rawmaterial, bymatrix, by technology, by application and segment forecasts to2024,2016.
[7] Z.N.Azwa,B.F.Yousif,A.C.Manalo,W.Karunasena,Areviewonthedegradabilityofpolymeric composites based on natural fibres, Mater. Des. 47 (2013) 424–442.doi:10.1016/j.matdes.2012.11.025.
[8] A.Eder,M.Carus,GlobalTrendsinComposites(WPC),Build.Constr.8(2013)16–17.
[9] Kebony, Choosing the best low maintenance decking option, (2017).http://kebony.com/fr/blog/best-low-maintenance-decking/ (accessed August 3,2017).
[10] B.J.Davis,GlobaloverviewWPCdeckingmarket,Eko-TekConsult.(2015).
[11] BuildDirect,Differenttypesofcompositedecking:hollowvssolidcoreboards,(n.d.).https://www.builddirect.com/(accessedJune1,2017).

89
[12] Ecodeck, Hollow vs solid composites decking, (2013).http://ecodek.co.uk/blog/hollow-solid-composite-decking/(accessedAugust3,2017).
[13] Nathan Johnson, Composite and plastic decking: product in review, ArchitectureDesign,(2014).
[14] F.P. La Mantia, M. Morreale, Accelerated weathering of polypropylene/wood flourcomposites, Polym. Degrad. Stab. 93 (2008) 1252–1258.doi:10.1016/j.polymdegradstab.2008.04.006.
[15] A.A.Klyosov,CompositionofWoodPlasticCompositesdeckboards: thermoplastics,in: Wood Plast. Compos., John Wiley & Sons, 2007: pp. 50–58.doi:10.1002/9780470165935.ch2.
[16] A.A.Klyosov,Foreword-overview :woodplasticcomposites,in:WoodPlast.Compos.,JohnWiley&Sons,2007.doi:10.1002/9780470165935.ch1.
[17] K.Wood,Wood-filledcompositesjumpoffthedeck,CompositesWorld.(2007).
[18] J.H.Schut,Beyonddecking:woodcompositesbranchout,PlacticsTechnol.(2004).
[19] A. Kerr, Potential of industrial hemp to displace fiber from forests, (1998).http://www.andykerr.net/hemp-replacing-wood/.
[20] S.Grahams,10materialsthatcouldreplacewoodoneday,Mercur.News.(2011).
[21] A. El-Sabbagh, A. Ramzy, L. Steuernagel, D. Meiners, Flowability and fiber contenthomogeneity of natural fiber polypropylene composites in injection molding, AIPConf.Proc.1779(2016).doi:10.1063/1.4965531.
[22] F. Sarasini, Biocomposites for high-performance applications - current barriers andfutureneedstowardsindustrialdevelopment,Woodheadpublishing,2017.
[23] Y. Regnier, Le pic de Hubbert: Mieux comprendre le débat actuel sur la « fin » dupétrole,Attac.(2005)1–8.
[24] K. Aleklett, C. Campbell, J. Lahèrrere, Peak Oil, Assoc. Study Peak Oil. (n.d.).https://www.peakoil.net.
[25] O.Akampumuza,P.M.Wambua,A.Ahmed,W.Li,X.Qin,Reviewoftheapplicationsofbiocomposites in the automotive industry, Polym. Compos. 16 (2016) 101–113.doi:10.1002/pc.23847.
[26] G. Marsh, Next step for automotive materials, Mater. Today. 6 (2003) 36–43.doi:10.1016/S1369-7021(03)00429-2.
[27] D.H.Mueller,Improvingtheimpactstrengthofnaturalfiberreinforcedcompositesbyspecifically designedmaterial and process parameters, Int. Nonwovens J. 13 (2004)31–38.
[28] M.Saxena,A.Pappu,A.Sharma,R.Haque,S.Wankhede,Compositematerials fromnatural resources: Recent trends and future potentials, in: P. Tesinova (Ed.), Adv.

90
Compos.Mater.-Anal.Nat.Man-MadeMater.,InTech,2011.doi:10.5772/50570.
[29] W.C.Inc.,Ward’sMotorVehicleFactsandFigures,StandfordLibraries,2008.
[30] S.Shibata,NaturalFiberComposites,in:R.D.S.G.Campilho(Ed.),Nat.FiberCompos.,2016:pp.157–173.
[31] O. Faruk, A.K. Bledzki, H.-P. Fink, M. Sain, Biocomposites reinforced with naturalfibers: 2000–2010, Prog. Polym. Sci. 37 (2012) 1552–1596.doi:10.1016/j.progpolymsci.2012.04.003.
[32] G.Koronis,A.Silva,M.Fontul,Greencomposites:Areviewofadequatematerialsforautomotive applications, Compos. Part B Eng. 44 (2013) 120–127.doi:10.1016/j.compositesb.2012.07.004.
[33] K.Hill,B.Swiecki, J.Cregger,Thebio-basedmaterialsautomotivevaluechain,Cent.Automot.Res.(2012)1–92.
[34] F.Ahmad,H.S.Choi,M.K.Park,AReview :NaturalFiberCompositesSelectioninViewof Mechanical , Light Weight , and Economic Properties, (2015) 10–24.doi:10.1002/mame.201400089.
[35] D.Brosius,Naturalfibercompositesslowlytakeroot,Compos.Technol.12(2006)32–37.
[36] U. Vaidya, Biocomposites, recycling and environmental aspects, in: Compos.Automotive,TruckMassTransit,2011:pp.373–400.
[37] L.Mohammed,M.N.M.Ansari, G. Pua,M. Jawaid,M.S. Islam, A ReviewonNaturalFiber Reinforced Polymer Composite and Its Applications, Int. J. Polym. Sci. 2015(2015).doi:10.1155/2015/243947.
[38] P. Malnati, Interior innovation: The value proposition, CompositesWorld. (2010).http://www.compositesworld.com/articles/interior-innovation-the-value-proposition(accessedJune20,2017).
[39] N.Mavi,R.Döflemeler,Peugeot308,FrankfurtMot.Show.(2013)5–6.
[40] Lotus Eco Elise, (n.d.). http://www.lotuscars.com/engineering/eco-elise (accessedAugust10,2017).
[41] AmandaJacob,BioConceptcarwinsCompositesEuropeaward,Reinf.Plast.(2009).
[42] ProShift Inc.,RenaultMeganebio-conceptcarhasfirstracingsuccesswithnewPS3,(2010).http://www.proshift.com.
[43] Citroën Jordan Inc., Sustainability, (n.d.). http://www.citroen-jo.com/citroen-universe/environnement/durable-developement/(accessedJune15,2017).
[44] Industrialapplicationsfornaturalfibrereinforcedcomposites,JECMag.(2011).
[45] J. Thoin-Bousquié, Les 100 équipementiers automobiles mondiaux les plus

91
performantsen2016,L’UsineNouvelle.(2017).
[46] AmandaJacob,Faureciadevelopshemp-basedmaterialsforautomotiveapplications,Reinf.Plast.(2014).
[47] Faurecia, Faurecia’s living garden at Frankfurt Motor Show demonstrates rapidlygrowingchoicesinbio-materials,Bio-BasedNews.(2015).
[48] Feature, construction, solutions, medical, biocomposites, n°111, JEC Compos. Mag.(2017)1–122.
[49] FibresRecherche etDéveloppement (FRD),Mémento 2016: Panoramadesmarchés« fibresvégétalestechniquesmatériaux(horsbois) »,(2016).
[50] FaureciaCorporate,(n.d.).http://www.faurecia.com/fr.
[51] O. Le Friec, Communiqué de presse: Faurecia FlaxpregTM remporte le prix del’innovation JEC Europe 2015 dans la catégorie produits semi-finis, Faurecia News.(2015).
[52] C. Alves, P.M.C. Ferrão, A.J. Silva, L.G. Reis, M. Freitas, L.B. Rodrigues, D.E. Alves,Ecodesignofautomotivecomponentsmakinguseofnaturaljutefibercomposites,J.Clean.Prod.18(2010)313–327.doi:10.1016/j.jclepro.2009.10.022.
[53] M.John,S.Thomas,Biofibresandbiocomposites,Carbohydr.Polym.71(2008)343–364.doi:10.1016/j.carbpol.2007.05.040.
[54] MarketsandMarkets Inc, Natural fiber composites market by type, manufacturingprocess,application,andregion-Globalforecaststo2021,(2016).
[55] A. Shahzad,Hemp fiber and its composites - a review, J. Compos.Mater. 46 (2012)973–986.doi:10.1177/0021998311413623.
[56] A.N.Netravali,C.M.Pastore,Sustainablecomposites,DEStech,2015.
[57] Osborne Industries Inc, The difference between thermoplastic and thermosettingplastic,(2017).
[58] E.Adamopoulou,Poly(butylenesuccinate):apromisingpolymer,PhDthesis,Schoolofchemicalengineering,2012.
[59] A. Le Duigou, P. Davies, C. Baley, Seawater ageing of flax/poly(lactic acid)biocomposites, Polym. Degrad. Stab. 94 (2009) 1151–1162.doi:10.1016/j.polymdegradstab.2009.03.025.
[60] D. Rusu, S.A.E. Boyer, M.F. Lacrampe, P. Krawczak, Bioplastics and Vegetal FiberReinforcedBioplasticsforAutomotiveApplications,Handb.BioplasticsBiocompositesEng.Appl.(2011)397–449.doi:10.1002/9781118203699.ch15.
[61] L.Soccalingame,D.Perrin,J.-C.Bénézet,S.Mani,F.Coiffier,E.Richaud,A.Bergeret,Reprocessing of artificial UV-weathered wood flour reinforced polypropylenecomposites, Polym. Degrad. Stab. 120 (2015) 313–327.

92
doi:10.1016/j.polymdegradstab.2015.07.013.
[62] F. Ilczyszyn, Caractérisation expérimentale et numérique du comportementmécanique des agro-composites renforcés par des fibres de chanvre, Thèse dedoctorat,UniversitédetechnologiedeTroyes,2013.
[63] C.Badji,L.Soccalingame,H.Garay,A.Bergeret,J.C.Bénézet,Influenceofweatheringonvisualand surfaceaspectofwoodplastic composites:Correlationapproachwithmechanicalpropertiesandmicrostructure,Polym.Degrad.Stab.137(2017)162–172.doi:10.1016/j.polymdegradstab.2017.01.010.
[64] Y.Feng,H.Shen,J.Qu,B.Liu,H.He,L.Han,PreparationandpropertiesofPBS/sisal-fibercomposites,Polym.Eng.Sci.51(2011)474–481.doi:10.1002/pen.21852.
[65] I. Spiridon,K. Leluk,A.M.Resmerita,R.N.Darie, EvaluationofPLA–ligninbioplasticsproperties before and after acceleratedweathering, Compos. Part B Eng. 69 (2015)342–349.doi:10.1016/j.compositesb.2014.10.006.
[66] J.Bausset,M.Loyaux,Intégrezdesproduitsbiosourcésdansvoscomposites,JECEur.(2014)1–36.
[67] L. Soccalingame, Etude des scénarios de fin de vie de biocomposites, Thèse dedoctorat,UniversitédeMontpellierII,2014.
[68] S. Lee, D. Cho, W. Park, S. Han, L. Drzal, Novel silk/poly(butylene succinate)biocomposites: the effect of short fibre content on their mechanical and thermalproperties, Compos. Sci. Technol. 65 (2005) 647–657.doi:10.1016/j.compscitech.2004.09.023.
[69] Worldplasticsmaterialsdemand2015bytypes,Plast.Mark.Res.Gr.(2015)3.
[70] Service Public de Wallonie (SPW), Fiche technique n°1.09: Le Polypropylène (PP),(2010)1–2.
[71] J.A.Garde,R.Catala,R.Gavara,Analysisofantioxidantsextractedfrompolypropyleneby supercritical fluid extraction, Food Addit. Contam. 15 (1998) 701–708.doi:10.1080/02652039809374700.
[72] V. Ambrogi, P. Cerruti, C. Carfagna, M. Malinconico, V. Marturano, M. Perrotti, P.Persico,Naturalantioxidantsforpolypropylenestabilization,Polym.Degrad.Stab.96(2011)2152–2158.doi:10.1016/j.polymdegradstab.2011.09.015.
[73] N. Billon, Cours sur le comportement mécanique des polymères (chapitre XVII),MatériauxPourL’ingénieurl’EcoleDesMinesParis.(2006).
[74] M. Denac, V.Musil, I. Šmit, F. Ranogajec, Effects of talc and gamma irradiation onmechanical properties and morphology of isotactic polypropylene/talc composites,Polym.Degrad.Stab.82(2003)263–270.doi:10.1016/S0141-3910(03)00220-9.
[75] P. Wambua, J. Ivens, I. Verpoest, Natural fibres: Can they replace glass in fibrereinforcedplastics?,Compos.Sci.Technol.63(2003)1259–1264.doi:10.1016/S0266-

93
3538(03)00096-4.
[76] J.Maida,Growth inhousingand construction industrieswill drive theWoodPlasticCompositesmarket,Bus.Wire.(n.d.).https://www.technavio.com/(accessedMay13,2017).
[77] C. Hindle, Polypropylene, Br. Plast. Fed. (n.d.).http://www.bpf.co.uk/plastipedia/polymers/PP.aspx.
[78] L. Garnier, Relations entre élaboration, structure et propriétés de mélanges depolypropylènesisotactiqueetsyndiotactique:Applicationauxprocédésd’élaborationdefilsélastiques,Thèsededoctorat,UniversitéLille1:Sciencesettechnologie,2009.
[79] M. Vite, Relations entre microstructure , propriétés mécaniques et résistance à larayuredupolypropylèneinjecté,Thèsededoctorat,UniversitédeSavoie,2009.
[80] N. Ljungberg, J.Y. Cavaillé, L. Heux, Nanocomposites of isotactic polypropylenereinforced with rod-like cellulose whiskers, Polymer (Guildf). 47 (2006) 6285–6292.doi:10.1016/j.polymer.2006.07.013.
[81] Lenzing Corporation, The global fiber market in 2016, (2015) 6–7.http://www.lenzing.com/en/investors/equity-story/global-fiber-market.html.
[82] M. Jaque, Coton : la Chine liquide une partie de ses immenses stocks, LesEchos.fr.(2016).
[83] C. Meirhaeghe, H. Bewa, F.R. et D. (FRD), Etude du gisement accessible de fibresvégétalesàusagesmatériauxenFrance,2011.
[84] A. Dureuil, Agrocomposites - Une structuration nécessaire de la filière en France,Agrobiobase.(2012).
[85] InitiativeDiscoverNatural Fibres (DNFI) organization,Natural fibers are sustainable,(n.d.).dnfi.org(accessedMay3,2017).
[86] Consoglobe Planétoscope, (2015). https://www.planetoscope.com/agriculture-alimentation/1178-production-mondiale-de-coton.html(accessedAugust11,2017).
[87] M.Z. Ahmad Thirmizir, Z.A. Mohd Ishak, R. Mat Taib, S. Rahim, S. Mohamad Jani,Natural Weathering of kenaf bast fibre-filled poly(butylene succinate) composites:Effectoffibre loadingandcompatibiliseraddition,J.Polym.Environ.19(2010)263–273.doi:10.1007/s10924-010-0272-2.
[88] T.Gurunathan, S.Mohanty, S.K.Nayak, Composites : Part AA reviewof the recentdevelopments in biocomposites based on natural fibres and their applicationperspectives, Compos. PART A. 77 (2015) 1–25.doi:10.1016/j.compositesa.2015.06.007.
[89] L. Soccalingame,A.Bourmaud,D.Perrin, J.-C.Bénézet,A.Bergeret,Reprocessingofwoodflourreinforcedpolypropylenecomposites:Impactofparticlesizeandcouplingagentoncompositeandparticleproperties,Polym.Degrad.Stab.113(2015)72–85.

94
doi:10.1016/j.polymdegradstab.2015.01.020.
[90] P. Joseph, Effect of processing variableson themechanical propertiesof sisal-fiber-reinforced polypropylene composites, Compos. Sci. Technol. 59 (1999) 1625–1640.doi:10.1016/S0266-3538(99)00024-X.
[91] A. Shahzad,Hemp fiber and its composites - a review, J. Compos.Mater. 46 (2011)973–986.doi:10.1177/0021998311413623.
[92] J.S.Han,J.S.Rowell,ChemicalCompositionofFibers,in:R.M.Rowell,R.A.Young,J.K.Rowell. (Eds.), Pap. Compos. fromAgro-Based Resour., CRC/Lewis Publishers, 1996:pp.84–134.
[93] M.S.Huda,D. Ray, A.K.Mohanty,M.Misra, Properties and performance of naturalfibre composites, Woodhead Publishing, 2008. doi:10.1016/B978-0-323-05712-7.00031-3.
[94] J.M. Yatim, N. Hafizah, B. Abd, R. Mahjoub, Biocomposites for the constructionmaterialsandstructures,in:CIDBSemin.Sarawak,2011:pp.1–29.
[95] C. Courgneau, D. Rusu, C. Henneuse, V. Ducruet, M.F. Lacrampe, P. Krawczak,Characterisationof low-odour emissivepolylactide/cellulose fibre biocomposites forcar interior, Express Polym. Lett. 7 (2013) 787–804.doi:10.3144/expresspolymlett.2013.76.
[96] A.K. Bledzki, J. Gassan, Composites reinforced with cellulose based fibres, Prog.Polym.Sci.24(1999)221–274.doi:10.1016/S0079-6700(98)00018-5.
[97] C. Baley, Fibres naturelles de renfort pourmatériaux composites, Tech. l’Ingénieur.(2013)1–17.
[98] C.He,C.L.Chen,A.Giannis,Y.Yang,J.Y.Wang,Hydrothermalgasificationofsewagesludgeandmodelcompoundsforrenewablehydrogenproduction:Areview,Renew.Sustain.EnergyRev.39(2014)1127–1142.doi:10.1016/j.rser.2014.07.141.
[99] N. Sallem-Idrissi, C. Vanderghem, T. Pacary, A. Richel, D.P. Debecker, J. Devaux,M.Sclavons, Lignin degradation and stability: Volatile Organic Compounds (VOCs)analysis throughout processing, Polym. Degrad. Stab. 130 (2016) 30–37.doi:10.1016/j.polymdegradstab.2016.05.028.
[100] Y. Peng, R. Liu, J. Cao, Y. Chen, Effects of UV weathering on surface properties ofpolypropylenecompositesreinforcedwithwoodflour,lignin,andcellulose,Appl.Surf.Sci.317(2014)385–392.doi:10.1016/j.apsusc.2014.08.140.
[101] J.S.Lupoi,S.Singh,R.Parthasarathi,B.a.Simmons,R.J.Henry,Recentinnovationsinanalyticalmethods for thequalitativeandquantitativeassessmentof lignin,Renew.Sustain.EnergyRev.49(2015)871–906.doi:10.1016/j.rser.2015.04.091.
[102] G. Dorez, L. Ferry, R. Sonnier, A. Taguet, J.-M. Lopez-Cuesta, Effect of cellulose,hemicellulose and lignin contents on pyrolysis and combustion of natural fibers, J.Anal.Appl.Pyrolysis.107(2014)323–331.doi:10.1016/j.jaap.2014.03.017.

95
[103] C.B. Clifford, Alternative fuels from biomass sources, (n.d.). https://www.e-education.psu.edu/egee439/node/670(accessedAugust31,2017).
[104] L.Pollegioni,F.Tonin,E.Rosini,Lignin-degradingenzymes,FEBSJ.282(2015)1190–1213.doi:10.1111/febs.13224.
[105] K. Katō, H. Komorita, Pyrolysis of Cellulose, Agric. Biol. Chem. 32 (1968) 21–26.doi:10.1080/00021369.1968.10859016.
[106] D.J. Nowakowski, J.M. Jones, Uncatalysed and potassium-catalysed pyrolysis of thecell-wallconstituentsofbiomassandtheirmodelcompounds,J.Anal.Appl.Pyrolysis.83(2008)12–25.doi:10.1016/j.jaap.2008.05.007.
[107] J.R.Barnett,V.aBonham,Cellulosemicrofibrilangle inthecellwallofwoodfibres.,Biol. Rev. Camb. Philos. Soc. 79 (2004) 461–472. doi:Doi10.1017/S1464793103006377.
[108] W.D. Brouwer, Natural fibre composites: Saving weight and cost with renewablematerials,in:Thirteen.Int.Conf.Compos.Mater.Beijing,2001.
[109] M. Ho, H. Wang, J.-H. Lee, C.-K. Ho, K.-T. Lau, J. Leng, D. Hui, Critical factors onmanufacturingprocessesofnaturalfibrecomposites,Compos.PartB.8(2012)3549–3562.doi:10.1016/j.compositesb.2011.10.001.
[110] M.S.Huda,L.T.Drzal,A.K.Mohanty,M.Misra,Choppedglassandrecyclednewspaperas reinforcement fibers in injection molded poly(lactic acid) (PLA) composites: Acomparative study, Compos. Sci. Technol. 66 (2006) 1813–1824.doi:10.1016/j.compscitech.2005.10.015.
[111] T.T.Law,Z.A.M.Ishak,AbsorptionandDimensionalStabilityofShortKenafFiber-FilledPolypropylene Composites Treated with Maleated Polypropylene, Polym. Polym.Compos.21(2013)449–456.doi:10.1002/app.
[112] G. Cantero, A. Arbelaiz, F.Mugika, A. Valea, I.Mondragon,Mechanical Behavior ofWood/PolypropyleneComposites:EffectsofFibreTreatmentsandAgeingProcesses,J.Reinf.Plast.Compos.22(2003)37–50.doi:10.1106/073168403021495.
[113] K.B.Adhikary,S.Pang,M.P.Staiger,Dimensional stabilityandmechanicalbehaviourof wood-plastic composites based on recycled and virgin high-density polyethylene(HDPE), Compos. Part B Eng. 39 (2008) 807–815.doi:10.1016/j.compositesb.2007.10.005.
[114] A.K. Bledzki, A. Jaszkiewicz, D. Scherzer, Mechanical properties of PLA compositeswithman-madecelluloseandabacafibres,Compos.PartAAppl.Sci.Manuf.40(2009)404–412.doi:10.1016/j.compositesa.2009.01.002.
[115] M.S. Islam, K.L. Pickering, N.J. Foreman, Influence of accelerated ageing on thephysico-mechanical properties of alkali-treated industrial hemp fibre reinforcedpoly(lactic acid) (PLA) composites, Polym. Degrad. Stab. 95 (2010) 59–65.doi:10.1016/j.polymdegradstab.2009.10.010.

96
[116] S. Ochi, Mechanical properties of kenaf fibers and kenaf/PLA composites, Mech.Mater.40(2008)446–452.doi:10.1016/j.mechmat.2007.10.006.
[117] L. Sisti,G.Totaro,M.Vannini,P.Fabbri, S.Kalia,A.Zatta,A.Celli,Evaluationof theretting process as a pre-treatment of vegetable fibers for the preparation of high-performance polymer biocomposites, Ind. Crops Prod. 81 (2016) 56–65.doi:10.1016/j.indcrop.2015.11.045.
[118] C.-F. Kuan, C.-C.M. Ma, H.-C. Kuan, H.-L. Wu, Y.-M. Liao, Preparation andcharacterization of the novel water-crosslinked cellulose reinforced poly(butylenesuccinate) composites, Compos. Sci. Technol. 66 (2006) 2231–2241.doi:10.1016/j.compscitech.2005.12.011.
[119] N. Lu,S.Oza,Acomparative studyof themechanicalpropertiesofhemp fiberwithvirginandrecycledhighdensitypolyethylenematrix,Compos.PartBEng.45 (2013)1651–1656.doi:10.1016/j.compositesb.2012.09.076.
[120] L.Liu,J.Yu,L.Cheng,W.Qu,Mechanicalpropertiesofpoly(butylenesuccinate)(PBS)biocompositesreinforcedwithsurfacemodified jutefibre,Compos.PartAAppl.Sci.Manuf.40(2009)669–674.doi:10.1016/j.compositesa.2009.03.002.
[121] B.L.Shah,S.E.Selke,M.B.Walters,P.A.Heiden,Effectsofwoodflourandchitosanonmechanical, chemical, and thermal properties of polylactide, Polym. Compos. 16(2008)101–113.doi:10.1002/pc.
[122] K.B.Adhikary, S. Pang,M.P. Staiger,AcceleratedUltravioletWeatheringofRecycledPolypropylene--SawdustComposites,J.Thermoplast.Compos.Mater.22(2009)661–679.doi:10.1177/0892705709096550.
[123] S.Mukhopadhyay,R.Srikanta,Effectofageingofsisal fibresonpropertiesofsisal–Polypropylene composites, Polym. Degrad. Stab. 93 (2008) 2048–2051.doi:10.1016/j.polymdegradstab.2008.02.018.
[124] A. Bourmaud, C. Baley, Rigidity analysis of polypropylene/vegetal fibre compositesafter recycling, Polym. Degrad. Stab. 94 (2009) 297–305.doi:10.1016/j.polymdegradstab.2008.12.010.
[125] A. Arbelaiz, B. Fernández, J.A. Ramos, A. Retegi, R. Llano-Ponte, I. Mondragon,Mechanicalpropertiesofshortflaxfibrebundle/polypropylenecomposites:Influenceofmatrix/fibremodification, fibrecontent,wateruptakeandrecycling,Compos.Sci.Technol.65(2005)1582–1592.doi:10.1016/j.compscitech.2005.01.008.
[126] R. Gadioli, J.A. Morais, W.R. Waldman, M.-A. De Paoli, The role of lignin inpolypropylenecompositeswithsemi-bleachedcellulosefibers:Mechanicalpropertiesand its activity as antioxidant, Polym. Degrad. Stab. 108 (2014) 23–34.doi:10.1016/j.polymdegradstab.2014.06.005.
[127] N.S.Egute,P.L.Forster,F.D.Parra,D.M.Fermino,S.Santana,A.B.Lugão,Mechanicalandthermalpropertiesofpolypropylenecompositeswithcuraua fibre, in: Int.Nucl.Atl.Conf.,2009.

97
[128] S. Tungjitpornkull, N. Sombatsompop, Processing technique and fiber orientationangle affecting the mechanical properties of E-glass fiber reinforced wood/PVCcomposites, J. Mater. Process. Technol. 209 (2009) 3079–3088.doi:10.1016/j.jmatprotec.2008.07.021.
[129] A.K. Bledzki, O. Faruk, A.A.Mamun, Influence of compounding processes and fibrelength on the mechanical properties of abaca fibre-polypropylene composites,Polimery/Polymers.53(2008)120–125.
[130] K.L.Fung,X.S.Xing,R.K.Y.Li,S.C.Tjong,Y.-W.Mai,Aninvestigationontheprocessingof sisal fibre reinforced polypropylene composites, Compos. Sci. Technol. 63 (2003)1255–1258.doi:10.1016/S0266-3538(03)00095-2.
[131] N.LeMoigne,M.Longerey,J.-M.Taulemesse,J.-C.Bénézet,A.Bergeret,Studyoftheinterface in natural fibres reinforced poly(lactic acid) biocomposites modified byoptimized organosilane treatments, Ind. Crops Prod. 52 (2014) 481–494.doi:10.1016/j.indcrop.2013.11.022.
[132] D. Chen, J. Li, J. Ren, Influenceof fiber surface-treatmenton interfacial property ofpoly(l-lactic acid)/ramie fabric biocomposites under UV-irradiation hydrothermalaging, Mater. Chem. Phys. 126 (2011) 524–531.doi:10.1016/j.matchemphys.2011.01.035.
[133] N. Petchwattana, S. Covavisaruch, S. Chanakul, Mechanical properties, thermaldegradationandnaturalweatheringofhighdensitypolyethylene/ricehullcompositescompatibilizedwithmaleicanhydridegraftedpolyethylene, J. Polym.Res.19 (2012)9921.doi:10.1007/s10965-012-9921-6.
[134] R.Bernstein,S.M.Thornberg,A.N.Irwin,J.M.Hochrein,D.K.Derzon,S.B.Klamo,R.L.Clough,Radiation-oxidationmechanisms:VolatileorganicdegradationproductsfrompolypropylenehavingselectiveC-13labelingstudiedbyGC/MS,Polym.Degrad.Stab.93(2008)854–870.doi:10.1016/j.polymdegradstab.2008.01.020.
[135] J.F.Rabek,PhotostabilizationofPolymers:Principlesandapplications,ElsevierAppliedScience,1990.doi:10.1007/978-94-009-07-47-8.
[136] M.Muasher,M. Sain, The efficacy of photostabilizers on the color changeofwoodfilled plastic composites, Polym. Degrad. Stab. 91 (2006) 1156–1165.doi:10.1016/j.polymdegradstab.2005.06.024.
[137] T.Salthammer,EmissionsofVolatileOrganicCompoundsfromProducts,4(2004)37–71.doi:10.1007/b94830.
[138] J.S. Fabiyi, A.G. McDonald, M.P. Wolcott, P.R. Griffiths, Wood plastic compositesweathering:Visualappearanceandchemicalchanges,Polym.Degrad.Stab.93(2008)1405–1414.doi:10.1016/j.polymdegradstab.2008.05.024.
[139] A. Bergeret, J. Benezet, T.P.T. Tran, G.C. Papanicolaou, A. Koutsomitopoulou,Valorizationofagriculturalby-productsinpoly(lacticacid)todevelopbiocomposites,in:V.K.Thakur (Ed.),GreenCompos. fromNat.Resour.,CRCPress,Taylor&Francis

98
LLC,2013.doi:10.13140/2.1.1271.2969.
[140] N.M. Stark, L.M. Matuana, Influence of photostabilizers on wood flour-HDPEcomposites exposed to xenon-arc radiation with and without water spray, Polym.Degrad.Stab.91(2006)3048–3056.doi:10.1016/j.polymdegradstab.2006.08.003.
[141] Y. Peng, R. Liu, J. Cao, Characterization of surface chemistry and crystallizationbehaviour of polypropylene composites reinforced with wood flour, cellulose, andlignin during accelerated weathering, Appl. Surf. Sci. (2015).doi:10.1016/j.apsusc.2015.01.147.
[142] I. Spiridon, R.N. Darie, H. Kangas, Influence of fiber modifications on PLA/fibercomposites.Behaviortoacceleratedweathering,Compos.PartBEng.92(2016)19–27.doi:10.1016/j.compositesb.2016.02.032.
[143] A.François-Heude,E.Richaud,E.Desnoux,X.Colin,Influenceoftemperature,UV-lightwavelengthand intensityonpolypropylenephotothermaloxidation,Polym.Degrad.Stab.100(2014)10–20.doi:10.1016/j.polymdegradstab.2013.12.038.
[144] J.W. Martin, R.A. Ryntz, J. Chin, R.A. Dickie, Service life prediction of polymericmaterials: Global perspectives, in: R.A. Ryntz, J. Chin, R.A. Dickie (Eds.), SpringerScience&BusinessMedia,2008:p.537.doi:10.1007/978-0-387-84876-1.
[145] X.Yang,X.Jiang,J.Hu,F.Wang,C.Hu,Relationshipbetweenphysicalandmechanicalproperties of accelerated weathering and outdoor weathering of PVC-coatedmembrane material under tensile stress, J. Ind. Text. (2016).doi:10.1177/1528083716639062.
[146] K. Joseph, S. Thomas, C. Pavithran, Effect of ageingon thephysical andmechanicalpropertiesofsisalfiberreinforcedpolyethylenecomposites,Compos.Sci.Technol.53(1995)99–110.doi:10.1016/0266-3538(94)00074-3.
[147] M.Celina,K.T.Gillen,R.A.Assink,Acceleratedagingandlifetimeprediction:Reviewofnon-Arrhenius behaviour due to two competing processes, Polym.Degrad. Stab. 90(2005)395–404.doi:10.1016/j.polymdegradstab.2005.05.004.
[148] L. Audouin, S. Girois, L. Achimsky, J. Verdu, Effect of temperature on thephotooxidation of polypropylene films, Polym. Degrad. Stab. 60 (1998) 137–143.doi:10.1016/S0141-3910(97)00042-6.
[149] T.Yu,F.Sun,M.Lu,Y.Li,Waterabsorptionandhygrothermalagingbehaviorofshortramie fiber reinforced poly(lactic acid) composites, Polym. Compos. (2016) 1–7.doi:10.1002/pc.24038.
[150] C.-H.Shen,G.S.Springer,Moistureabsorptionanddesorptionofcompositematerials,J.Compos.Mater.10(1976)2–20.doi:10.1177/002199837601000101.
[151] H. Han, Study of agro-composite hemp/Polypropylene : Treatment of fibers ,morphologicalandmechanicalcharacterization,PhDthesis,UniversitédetechnologiedeTroyes,2015.

99
[152] Y.J. Phua, W.S. Chow, Z. a. Mohd Ishak, The hydrolytic effect of moisture andhygrothermal aging on poly(butylene succinate)/organo-montmorillonitenanocomposites, Polym. Degrad. Stab. 96 (2011) 1194–1203.doi:10.1016/j.polymdegradstab.2011.04.017.
[153] M.D.H. Beg, K.L. Pickering, Mechanical performance of Kraft fibre reinforcedpolypropylenecomposites: Influenceof fibre length, fibrebeatingandhygrothermalageing, Compos. Part A Appl. Sci. Manuf. 39 (2008) 1748–1755.doi:10.1016/j.compositesa.2008.08.003.
[154] P. V. Joseph, M.S. Rabello, L.H.C. Mattoso, K. Joseph, S. Thomas, Environmentaleffects on the degradation behaviour of sisal fibre reinforced polypropylenecomposites, Compos. Sci. Technol. 62 (2002) 1357–1372. doi:10.1016/S0266-3538(02)00080-5.
[155] D.F.Caulfield,D.Feng,S.Prabawa,R.A.Young,A.R.Sanadi,Interphaseeffectsonthemechanicalandphysicalaspectsofnatural fibercomposites,DieAngew.Makromol.Chemie. 272 (1999) 57–64. doi:10.1002/(SICI)1522-9505(19991201)272:1<57::AID-APMC57>3.0.CO;2-W.
[156] M.D.H.Beg,K.L.Pickering,AcceleratedweatheringofunbleachedandbleachedKraftwood fibre reinforced polypropylene composites, Polym. Degrad. Stab. 93 (2008)1939–1946.doi:10.1016/j.polymdegradstab.2008.06.012.
[157] J.L.Lopez,M.Sain,P.Cooper,Performanceofnatural-fiber-plasticcompositesunderstressforoutdoorapplications:Effectofmoisture,temperature,andultraviolet lightexposure,J.Appl.Polym.Sci.99(2006)2570–2577.doi:10.1002/app.22884.
[158] J.S. Fabiyi,A.G.McDonald,Degradationofpolypropylene innaturally andartificiallyweathered plastic matrix composites, Maderas. Cienc. Y Tecnol. 16 (2014) 0–0.doi:10.4067/S0718-221X2014005000021.
[159] S.Butylina,M.Hyvärinen,T.Kärki,Astudyofsurfacechangesofwood-polypropylenecompositesastheresultofexteriorweathering,Polym.Degrad.Stab.97(2012)337–345.doi:10.1016/j.polymdegradstab.2011.12.014.
[160] C. Homkhiew, T. Ratanawilai,W. Thongruang, Effects of natural weathering on theproperties of recycled polypropylene composites reinforcedwith rubberwood flour,Ind.CropsProd.56(2014)52–59.doi:10.1016/j.indcrop.2014.02.034.
[161] X. Zhou, S. Huang, L. Chen, Effect of antiaging agents on the outdoor naturalweathering of bamboo powder/polypropylene foamed composites, J. Vinyl Addit.Technol.22(2014)311–319.doi:10.1002/vnl.21433.
[162] X. Zhou, S. Huang, Y. Yu, J. Li, L. Chen, Outdoor natural weathering of bambooflour/polypropylene foamed composites, J. Reinf. Plast. Compos. 33 (2014) 1835–1846.doi:10.1177/0731684414548611.
[163] K.C.Hung, Y.L. Chen, J.H.Wu,Naturalweathering properties of acetylated bambooplastic composites, Polym. Degrad. Stab. 97 (2012) 1680–1685.

100
doi:10.1016/j.polymdegradstab.2012.06.016.
[164] S.Panthapulakkal,M. Sain, Injection-molded shorthemp fiber/glass fiber-reinforcedpolypropylene hybrid composites—Mechanical, water absorption and thermalproperties,J.Appl.Polym.Sci.103(2006)2432–2441.doi:10.1002/app.
[165] N.M.Stark,L.M.Matuana,Ultravioletweatheringofphotostabilizedwood-flour-filledhigh-density polyethylene composites, J. Appl. Polym. Sci. 90 (2003) 2609–2617.doi:10.1002/app.12886.
[166] T.Lundin,S.M.Cramer,R.H.Falk,C.Felton,Acceleratedweatheringofnaturalfiber-filled polyethylene composites, J. Mater. Civ. Eng. 16 (2004) 547–555.doi:10.1061/(ASCE)0899-1561(2004)16.
[167] A.H. Umar, E.S. Zainudin, S.M. Sapuan, Effect of accelerated weathering on tensileproperties of kenaf reinforced high-density polyethylene composites, J.Mech. Eng.Sci.2(2012)198–205.doi:http://dx.doi.org/10.15282/jmes.2.2012.7.0018.
[168] M.M.Thwe,K.Liao,Durabilityofbamboo-glassfiberreinforcedpolymermatrixhybridcomposites, Compos. Sci. Technol. 63 (2003) 375–387. doi:10.1016/S0266-3538(02)00225-7.
[169] P. Zou, H. Xiong, S. Tang, Natural weathering of rape straw flour (RSF)/HDPE andnano-SiO2/RSF/HDPE composites, Carbohydr. Polym. 73 (2008) 378–383.doi:10.1016/j.carbpol.2007.12.002.
[170] L.Soccalingame,D.Perrin,J.-C.Bénézet,A.Bergeret,ReprocessingofUV-weatheredwood flour reinforced polypropylene composites: Study of a natural outdoorexposure, Polym. Degrad. Stab. 133 (2016) 389–398.doi:10.1016/j.polymdegradstab.2016.09.011.
[171] M.Sablier,M.Perraudeau,Lumièreetcouleur,Tech.l’Ingénieur.(2004).
[172] P.Callet,Couleuretapparencevisuelle-Letransparentetl’opaque,Tech.L’ingénieur.(2004).
[173] Commission Internationale de l’Eclairage, Vocabulaire international de l’Eclairage,Rapporttechnique17.4,CIEPubl.(1987).
[174] V. Domurado, Étude et modélisation de la réflectance de la surface d’objets réels,Mémoiredefind’études,2001.
[175] M.Kiguchi,Y.Kataoka,H.Matsunaga,K.Yamamoto,P.D.Evans,Surfacedeteriorationofwood-flourpolypropylenecompositesbyweatheringtrials,J.WoodSci.53(2006)234–238.doi:10.1007/s10086-006-0838-8.
[176] D.N.-S.Hon, S.-T. Chang, Surfacedegradationofwoodbyultraviolet light, J. Polym.Sci.Polym.Chem.Ed.22(1984)2227–2241.doi:10.1002/pol.1984.170220923.
[177] K.Srinivas,K.K.Pandey,Photodegradationofthermallymodifiedwood,J.Photochem.Photobiol.BBiol.117(2012)140–145.doi:10.1016/j.jphotobiol.2012.09.013.

101
[178] J.S.Fabiyi,A.G.McDonald,Physicalmorphologyandquantitativecharacterizationofchemical changes of weathered PVC/Pine composites, J. Polym. Environ. 18 (2009)57–64.doi:10.1007/s10924-009-0152-9.
[179] J.S. Fabiyi, D.McIlroy, A.G.McDonald,Woodmodification effects onweathering ofHDPE-based Wood Plastic Composites, J. Polym Env. 17 (2009) 34–48.doi:10.1007/s10924-009-0118-y.
[180] D.Rosu,R.Bodîrləu,C.A.Teacə,L.Rosu,C.D.Varganici,EpoxyandsuccinicanhydridefunctionalizedsoybeanoilforwoodprotectionagainstUVlightaction,J.Clean.Prod.112(2016)1175–1183.doi:10.1016/j.jclepro.2015.07.092.
[181] N.M.Stark,Effectofweatheringcycleandmanufacturingmethodonperformanceofwoodflourandhigh-densitypolyethylenecomposites,J.Appl.Polym.Sci.100(2006)3131–3140.doi:10.1002/app.23035.
[182] N.E.Klepeis,W.C.Nelson,W.R.Ott,J.P.Robinson,aM.Tsang,P.Switzer,J.VBehar,S.C.Hern,W.H.Engelmann,TheNationalHumanActivityPatternSurvey (NHAPS):aresourceforassessingexposuretoenvironmentalpollutants., J.Expo.Anal.Environ.Epidemiol.11(2001)231–252.doi:10.1038/sj.jea.7500165.
[183] D.Müller,D.Klingelhöfer,S.Uibel,D.aGroneberg,Carindoorairpollution-analysisofpotential sources., J.Occup.Med.Toxicol.6 (2011)33.doi:10.1186/1745-6673-6-33.
[184] KoreanAutomobileTesting&ResearchInstitute,MinistryofLandInfrastructureandTransport,ProposalforaNewGTRonVehicleIndoorAirQuality(VIAQ),(n.d.)25–28.
[185] X.Chen,G.Zhang,H.Chen,Controllingstrategiesandtechnologiesofvolatileorganiccompounds pollution in interior air of cars, Proc. - 2010 Int. Conf. Digit. Manuf.Autom.ICDMA2010.1(2010)450–453.doi:10.1109/ICDMA.2010.375.
[186] MCS-Aware, Sick Car Syndrome, (2015). http://www.mcs-aware.org/general-articles/189-sick-car-syndrome(accessedJanuary5,2017).
[187] Automobile :unconcentrédepollutionàl’intérieurdesvoitures,LeParisien.(2015).
[188] B.Xu,X.Chen,J.Xiong,Airqualityinsidemotorvehicles’cabins:Areview,IndoorBuiltEnviron.(2016)1–14.doi:10.1177/1420326X16679217.
[189] Y.C.Chien,Variations inamountsandpotentialsourcesofvolatileorganicchemicalsin new cars, Sci. Total Environ. 382 (2007) 228–239.doi:10.1016/j.scitotenv.2007.04.022.
[190] AirqualitysciencesInc.,IndoorAirQualityhazardsofnewcars,(2006)47–51.
[191] C.Yu,D.Crump,AreviewoftheemissionofVOCsfrompolymericmaterialsusedinbuildings,Build.Environ.33(1998)357–374.doi:10.1016/S0360-1323(97)00055-3.
[192] C. Weathers, Is that New Car Smell killing you ?, AlterNet. (2014).http://www.alternet.org/new-car-smell-killing-you(accessedSeptember4,2017).

102
[193] Chemical Risk Prevention Unit, CNRS, European harmonised classification andlabelling of carcinogenic, mutagenic and toxic for reproduction (CMR) substancesaccordingtothecriteriaoftheCLPRegulation,(2015).
[194] H. Kim, B. Lee, S. Choi, Sustainable biocomposites for automotive interior parts, in:18THInt.Conf.Compos.Mater.,2011:pp.1–4.
[195] R.Grisanti,Isyourcarmakingyousick?,Funct.Med.Univ.(2012).
[196] J.S. Félix, C. Domeño, C. Nerín, Characterization of wood plastic composites madefrom landfill-derived plastic and sawdust: volatile compounds and olfactometricanalysis,WasteManag.33(2013)645–55.doi:10.1016/j.wasman.2012.11.005.
[197] K.Sakakibara,K.Kaitani,C.Hamada,S.Sato,M.Matsuo,Analysisofodorincarcabin,JSAERev.20(1999)237–241.doi:10.1016/S0389-4304(98)00073-3.
[198] C.Weathers,IsthatNewCarSmellkillingyou ?,AlterNet.(2014).
[199] Infrastructure and Transportation Ministry of Labor, MLIT 2007–539: Newlymanufacturedvehicleindoorairqualitymanagementstandard,SouthKorea,(2007).
[200] Underwriters Laboratories UL LLC, Vehicle Interior Air Quality: Addressing chemicalexposureinautomobiles,(2015).
[201] Korean Automobile Testing & Research Institute, Proposal for Vehicle Indoor AirQuality(VIAQ),GRPE-69-28,(2014)5–6.
[202] J.Xiong,T.Yang,J.Tan,L.Li,Y.Ge,CharacterizationofVOCemissionfrommaterialsinvehicular environment at varied temperatures: Correlation development andvalidation,PLoSOne.10(2015)1–21.doi:10.1371/journal.pone.0140081.
[203] Ministry of environmental protection, GB/T 27630-2011 Chinese national standard:Guidelineforairqualityassesmentofpassengercar,(2011).
[204] JAMA, Announces Voluntary Guidelines for Reducing Vehicle Cabin VOCConcentrationLevels,2005.http://www.jama-english.jp/.
[205] EuropeanAutomobileManufacturersAssociation,(n.d.).http://www.acea.be/.
[206] C.S. Widdowson, Vehicle interior air quality - (S)VOC emission from materials:regulation, standardmethods and analytical implementation, Top. C7 Transp. CabinEnviron.(2017).
[207] BureauVeritasServices,Vérificationdesémissionsdesmatériauxetproduits,(2009).www.bureauveritas.fr.
[208] ISO 12219-1: Whole vehicle test chamber — Specification and method for thedeterminationofvolatileorganiccompoundsincabininteriors,(2012).
[209] ISO 12219-2: Screening method for the determination of the emissions of volatileorganiccompoundsfromvehicleinteriorpartsandmaterials—Bagmethod,(2012).

103
[210] ISO 12219-3: Screening method for the determination of the emissions of volatileorganiccompoundsfromvehicleinteriorpartsandmaterials—Micro-scalechambermethod,(2012).
[211] ISO 12219-4: Interior air of road vehicles – Method for the determination of theemissionsof volatileorganic compounds fromvehicle interiorparts andmaterials –Smallchambermethod.,(2013).
[212] T. Yoshida, I. Matsunaga, A case study on identification of airborne organiccompounds and time courses of their concentrations in the cabin of a new car forprivateuse,Environ.Int.32(2006)58–79.doi:10.1016/j.envint.2005.04.009.
[213] K.-W.Kim,B.-H.Lee,S.Kim,H.-J.Kim,J.-H.Yun,S.-E.Yoo,J.R.Sohn,ReductionofVOCemission from natural flours filled biodegradable bio-composites for automobileinterior,J.Hazard.Mater.187(2011)37–43.doi:10.1016/j.jhazmat.2010.07.075.
[214] B. Xu, Y.Wu, Y.Gong, S.Wu, X.Wu, S. Zhu, T. Liu, Investigationof volatile organiccompoundsexposureinsidevehiclecabinsinChina,Atmos.Pollut.Res.7(2015)215–220.doi:10.1016/j.apr.2015.09.005.
[215] M.J. Fedoruk, B.D. Kerger, Measurement of volatile organic compounds insideautomobiles, J. Expo. Anal. Environ. Epidemiol. 13 (2003) 31–41.doi:10.1038/sj.jea.7500250.
[216] S. Kim, J.-A. Kim, H.-J. Kim, S. Do Kim, Determination of formaldehyde and TVOCemissionfactorfromwood-basedcompositesbysmallchambermethod,Polym.Test.25(2006)605–614.doi:10.1016/j.polymertesting.2006.04.008.
[217] ISO 16000-6: Indoor air -- Part 6: Determination of volatile organic compounds inindoor and test chamber air by active sampling on Tenax TA sorbent, thermaldesorptionandgaschromatographyusingMSorMS-FID,(2011).
[218] S. Overton, J. Manura, Identification of volatile organic compounds in a newautomobile,Sci.Instrum.Serv.Inc.(1999)1–6.
[219] T.Yoshida,I.Matsunaga,K.Tomioka,S.Kumagai,InteriorairpollutioninautomotivecabinsbyVolatileOrganicCompoundsdiffusingfrominteriormaterials:II.influenceofmanufacturer, specificationsandusagestatusonairpollution,andestimationofairpollution levels in initial phases of deliv, Indoor Built Environ. 15 (2006) 425–444.doi:10.1177/1420326X06069395.
[220] X. Chen, G. Zhang, Q. Zhang, H. Chen, Mass concentrations of BTEX inside airenvironment of buses in Changsha, China, Build. Environ. 46 (2011) 421–427.doi:10.1016/j.buildenv.2010.08.005.
[221] T.Yoshida,I.Matsunaga,K.Tomioka,S.Kumagai,InteriorairpollutioninautomotivecabinsbyVolatileOrganicCompoundsdiffusing from interiormaterials: I. Surveyof101 Types of Japanese domestically produced cars for private use, Indoor BuiltEnviron.15(2006)425–444.doi:10.1177/1420326X06069395.
[222] K. You, Y. Ge, B. Hu, Z. Ning, S. Zhao, Y. Zhang, P. Xie,Measurement of in-vehicle

104
volatileorganic compoundsunder static conditions, J. Environ. Sci. 19 (2007)1208–1213.doi:10.1016/S1001-0742(07)60197-1.
[223] C.C.Chan,H.Özkaynak,J.D.Spengler,L.Sheldon,DriverexposuretoVolatileOrganicCompounds, CO, Ozone, and NO2 under different driving conditions, Environ. Sci.Technol.25(1991)964–972.doi:10.1021/es00017a021.
[224] C.Rouillon,P.-O.Bussiere, E.Desnoux, S.Collin,C.Vial, S. Therias, J.-L.Gardette, IsCarbonyl Index a quantitative probe to monitor polypropylene photodegradation?,Polym. Degrad. Stab. 128 (2016) 200–208.doi:10.1016/j.polymdegradstab.2015.12.011.
[225] A.François-Heude,E.Richaud,J.Leprovost,M.Heninger,H.Mestdagh,E.Desnoux,X.Colin,Real-timequantitativeanalysisofvolatileproductsgeneratedduringsolid-statepolypropylene thermal oxidation, Polym. Test. 32 (2013) 907–917.doi:10.1016/j.polymertesting.2013.04.008.
[226] A.Espert,L.A.delasHeras,S.Karlsson,Emissionofpossibleodourouslowmolecularweight compounds in recycled biofibre/polypropylene composites monitored byhead-space SPME-GC–MS, Polym. Degrad. Stab. 90 (2005) 555–562.doi:10.1016/j.polymdegradstab.2005.03.009.
[227] H.-S. Kim, B.-H. Lee, H.-J. Kim, H.-S. Yang,Mechanical–thermal properties and VOCemissions of natural-flour-filled biodegradable polymer hybrid bio-composites, J.Polym.Environ.19(2011)628–636.doi:10.1007/s10924-011-0313-5.
[228] M.G. Al-Shaal, W. Ciptonugroho, F.J. Holzhäuser, J.B. Mensah, P.J.C. Hausoul, R.Palkovits,Catalyticupgradingofα-angelicalactonetolevulinicacidestersundermildconditions over heterogeneous catalysts, Catal. Sci. Technol. 5 (2015) 5168–5173.doi:10.1039/C5CY00446B.
[229] R.F. Perez, M.A. Fraga, Hemicellulose-derived chemicals: one-step production offurfurylalcoholfromxylose,GreenChem.16(2014)3942.doi:10.1039/C4GC00398E.
[230] Ó. Ezquerro, B. Pons, M.T. Tena, Development of a headspace solid-phasemicroextraction–gas chromatography–mass spectrometry method for theidentification of odour-causing volatile compounds in packaging materials, J.Chromatogr.A.963(2002)381–392.doi:10.1016/S0021-9673(02)00211-X.
[231] J.Salafranca,I.Clemente,F. Isella,C.Nerín,O.Bosetti, Influenceofoxygenandlongtermstorageontheprofileofvolatilecompoundsreleasedfrompolymericmultilayerfoodcontactmaterialssterilizedbygamma irradiation,Anal.Chim.Acta.878 (2015)118–130.doi:10.1016/j.aca.2015.03.055.
[232] P. Kusch, G. Knupp, Headspace-SPME-GC-MS Identification of Volatile OrganicCompoundsreleasedfromexpandedpolystyrene,12(2004)83–87.
[233] C.L.Arthur, J. Pawliszyn, Solid PhaseMicroextractionwith thermal desorptionusingfusedsilicaopticalfibers,Anal.Chem.62(1990)2145–2148.
[234] D.Bourdin,P.Mocho,V.Desauziers,H.Plaisance,Formaldehydeemissionbehaviorof

105
buildingmaterials: on-sitemeasurements andmodeling approach to predict indoorair pollution., J. Hazard. Mater. 280 (2014) 164–73.doi:10.1016/j.jhazmat.2014.07.065.
[235] D. Bourdin, Composés Organiques Volatils émis par lesmatériaux de construction :impact sur la qualité de l’air intérieur, Thèse de doctorat,Université de Pau et despaysdel’Adour,2013.
[236] V.Desauziers,AnalysedesCOVentracesdansl’air,Tech.l’Ingénieur.33(2009).
[237] J.Nicolle,V.Desauziers,P.Mocho,Solidphasemicroextractionsampling fora rapidand simple on-site evaluation of volatile organic compounds emitted from buildingmaterials,J.Chromatogr.A.1208(2008)10–15.doi:10.1016/j.chroma.2008.08.061.
[238] V. Desauziers, D. Bourdin, P. Mocho, H. Plaisance, Innovative tools and modelingmethodology for impactpredictionandassessmentof the contributionofmaterialsonindoorairquality,Herit.Sci.3(2015)1.doi:10.1186/s40494-015-0057-y.
[239] N. Shinohara, M. Fujii, A. Yamasaki, Y. Yanagisawa, Passive flux sampler formeasurementofformaldehydeemissionrates,Atmos.Environ.41(2007)4018–4028.doi:10.1016/j.atmosenv.2007.01.028.
[240] APR ADEME CORTEA 2013, Projet COVBAT-BOIS - Nature et déterminants de lacontamination aux composés organiques volatils et prédiction de la qualité de l’airintérieurdansleslogementsàossaturebois,2016.
[241] A.Torikai,A.Takeuchi,S.Nagaya,K.Fueki,Photodegradationofpolyethylene :effectof crosslinking on the oxygenated products and mechanical properties, Polym.Photochem.7(1986)199–211.
[242] A. Tidjani, R. Arnaud, A. Dasilva, Natural and accelerated photoaging of linear lowdensity polyethylene: Changes of the elongation at break, J. Appl. Polym. Sci. 47(1993)211–216.doi:10.1002/app.1993.070470203.
[243] G. Akay, T. Tinçer, H.E. Ergöz, A study of degradation of low density polyethyleneunder natural weathering conditions, Eur. Polym. J. 16 (1980) 601–605.doi:10.1016/0014-3057(80)90095-6.
[244] X. Yang, X. Ding, Prediction of outdoor weathering performance of polypropylenefilamentsbyacceleratedweatheringtests,Geotext.Geomembranes.24(2006)103–109.doi:10.1016/j.geotexmem.2005.11.002.
[245] B.Fayolle,E.Richaud,X.Colin,J.Verdu,Review :degradation-inducedembrittlementin semi-crystalline polymers having their amorphous phase in rubbery state, (2008)6999–7012.doi:10.1007/s10853-008-3005-3.
[246] P.Pagès,F.C.J.Saurina,X.Colom,FTIRandDSCstudyofHDPEstructuralchangesandmechanicalpropertiesvariationwhenexposedtoweatheringagingduringCanadianwinter,J.Appl.Polym.Sci.60(1996)153–159.
[247] N.M.Stark,L.M.Matuana,SurfacechemistrychangesofweatheredHDPE/wood-flour

106
compositesstudiedbyXPSandFTIRspectroscopy,Polym.Degrad.Stab.86(2004)1–9.doi:10.1016/j.polymdegradstab.2003.11.002.
[248] S.A.Jabarin,E.A.Lofgren,Photooxidativeeffectsonpropertiesandstructureofhigh-density polyethylene, J. Appl. Polym. Sci. 53 (1994) 411–423.doi:10.1002/app.1994.070530404.
[249] D.J. Carlsson,M. Krzymien, J.Worsfold, Volatiles releasedduring theweathering ofPVC,J.VinylAddit.Technol.3(1997)100–106.
[250] K.Curran,M.Strlic,Polymersandvolatiles :UsingVOCanalysisfortheconservationofplastic and rubber objects, Stud. Conserv. 0 (2014) 1–14.doi:10.1179/2047058413Y.0000000125.
[251] D.J. Carlsson, M.E. Krzymien, D.J. Pleizier, G., Worsfold, M. Day, Volatiles releasedfrom PVC during photochemical degradation. The fate of chlorine., in: Society ofPlasticsEngineers(Ed.),Conf.Soc.Plast.Eng.,1999.
[252] M. Hakkarainen, A.-C. Albertsson, Indicator products: A new tool for lifetimeprediction of polymeric materials, Biomacromolecules. 6 (2005) 775–779.doi:10.1021/bm049483f.
[253] M. Groning, M. Hakkarainen, Headspace solid-phase microextraction with gaschromatography/mass spectrometry reveals a correlation between the degradationproduct pattern and changes in the mechanical properties during thethermooxidation of in-plant recycled polyamide 6,6, J. Appl. Polym. Sci. 86 (2002)3396–3407.doi:10.1002/app.11345.
[254] J.S. Fabiyi, A.G. McDonald, Effect of wood species on property and weatheringperformanceofwoodplasticcomposites,Compos.PartAAppl.Sci.Manuf.41(2010)1434–1440.doi:10.1016/j.compositesa.2010.06.004.
[255] D.Rosu,C.A.Teaca,R.Bodirlau,L.Rosu,FTIRandcolorchangeofthemodifiedwoodasaresultofartificiallightirradiation,J.Photochem.Photobiol.BBiol.99(2010)144–149.doi:10.1016/j.jphotobiol.2010.03.010.
[256] G. Bonifazi, L. Calienno, G. Capobianco, A. Lo, C. Pelosi, R. Picchio, S. Serranti,Modelingcolorandchemicalchangesonnormalandredheartbeechwoodbyre flectance spectrophotometry, Fourier Transform Infrared spectroscopy andhyperspectral imaging, Polym. Degrad. Stab. 113 (2015) 10–21.doi:10.1016/j.polymdegradstab.2015.01.001.
[257] X. Zou, N. Gurnagul, T. Uesaka, J. Bouchard, Accelerated aging of papers of purecellulose: mechanism of cellulose degradation and paper embrittlement, Polym.Degrad.Stab.43(1994)393–402.doi:10.1016/0141-3910(94)90011-6.
[258] M.Strlič,J.Thomas,T.Trafela,L.Cséfalvayová,I.K.Cigić,J.Kolar,M.Cassar,Materialdegradomics: On the smell of old books, Anal. Chem. 81 (2009) 8617–8622.doi:10.1021/ac9016049.

107

108
CHAPITREII
VIEILLISSEMENTSNATURELSENEXTÉRIEURETSOUSVITRE
PARE-BRISEDEBIOCOMPOSITESPP/CHANVRE:
IMPACTSURLESPROPRIETESPHYSICO-CHIMIQUESETLES
RELATIONSENTRELESPROPRIÉTÉS

109

110
ChapitreII
Vieillissementsnaturelsenextérieuretsousvitrepare-brise
debiocompositesPP/chanvre:Impactsurlespropriétés
physico-chimiquesetlesrelationsentrelespropriétés
Cechapitrecomprenddeuxparties.
Lapremièreparties’intéresseàl’impactdedeuxconditionsd’usagedupolypropylènevierge
(PP)etdesbiocompositesPPrenforcédefibresdechanvre(10et30%enmasse)simulant
pendant une année un vieillissement en habitacle automobile (vieillissement naturel sous
vitre pare-brise) et de lames de terrasse (vieillissement naturel en extérieur). Différentes
propriétésontété suiviesaucoursduvieillissementcomme lespropriétésmécaniquesen
flexion, la structure chimique par spectroscopie infrarouge, l’apparence visuelle (couleur,
rugosité), la microstructure (taux de cristallinité). Les résultats ont montré que les
biocompositesPP/chanvresontd’unemanièregénéraleplussensiblesauxvieillissementsque
lamatricePPseule,etcelaquelquesoitletypedevieillissementnaturel.Toutefois,chacun
des vieillissements a permis de comprendre la contribution de différents facteurs de
dégradation dans les mécanismes observés. Ainsi, la pluie et les rayonnements UV
conduisent pour tous les matériaux à un accroissement en composés vinyliques et à la
formationdemicro-fissuresdesurface.Laconcentrationencomposéscarbonylésn’estpar
contre pas affectée. Des températures élevées comme celles rencontrées lors du
vieillissement sous vitrage favorisent la chimi-cristallisation du PP et un fort jaunissement
desbiocomposites,alorsquelevieillissementenextérieurconduitàunepertedesnuances
deteinterougedesbiocomposites.
Dans la seconde partie de ce chapitre, les corrélations entre les différentes propriétés
mesurées au cours des vieillissements sont étudiées à travers une analyse statistique en
composantes principales (ACP) dont le principe est détaillé dans l’Annexe II. Ainsi, les
résultatsontmontréunedépendanceentrelachutedespropriétésmécaniques(moduleen
flexion,contrainteàlaflècheconventionnelle)etl’évolutiondutauxdecomposésoxygénés

111
(acides carboxyliques, cétones, lactones)évaluépar spectroscopie infrarouge.Deplus, il a
été démontré que le blanchiment des biocomposites (paramètre L*) évalué par
spectrocolorimétrie est fortement relié au taux de liaisons vinyliques C=C mesuré par
spectroscopieinfrarouge.Outrelesscissionsdechainesresponsablesdelaformationdece
typede liaison, lescomposésaromatiquesde la ligninecontribuentaussià l’augmentation
du taux de liaisons C=C. Donc cette analyse a aussi permis de confirmer de façon
quantitativequelalignineétaitenpartieresponsabledesvariationsdeclartédesurfacedes
biocomposites.
Cechapitrefait l’objetdedeuxpublications, lapremièreétantsoumiseaujournalPolymer
DegradationandStabilityetladeuxièmeàsoumettreàCompositeScienceandTechnology.

112

113
CéliaBadji,JoanaBeigbeder,HélèneGaray,AnneBergeret,Jean-CharlesBénézetandValérie
Desauziers
EcoledesMinesd’Alès,C2MA,6AvenuedeClavières,30319Alès,CedexFrance
Abstract
This work aims to investigate two types of natural weathering, exterior and under glass
weathering, representing respectively decking and car interior end uses of hemp fibers
reinforced polypropylene (PP) biocomposites. Mechanical flexural tests were firstly
performed. Then, the evolution of the PPmatrixmicrostructurewas determined through
DifferentialScanningCalorimetry(DSC).Thechemicalcompositionwasfollowedbyinfrared
spectroscopy tounderstand thephoto- and thermo-chemicalmechanisms.CIELab system-
based colorimetric measurements were carried out to determine the evolution of the
chromaticityandlightness.Throughanewapproach,glosswasobtainedbydeterminingthe
type of reflection of materials either specular or diffuse. Also, the surface aspect was
characterizedbyrugosimetry.Theinfluenceofthehempfibersrate(from0to30wt%)was
studied. Results showed that biocomposites were generally more sensitive than neat PP
whatevertheweatheringconditions.However,eachtypeofweatheringassessmentallowed
understanding the contribution of each degradation factor. Indeed, rainfall or UV-A rays
inducedanincreaseofvinylconcentrationandtheformationofcracksonsurfacewhatever
thematerialwhereasthecarbonylfunctionalgroupsratewasnotinfluencedbythetypeof
weathering. The high temperatures found under windshield glass favored a
chemicrystallization at the first period of exposition and a stronger color instability
(yellowing)whereasoutdoorexposureinducedredcolorloss.
Keywords:hempfibers,degradation,gloss,roughness,oxidation,rain,temperature

114
Introduction
Duetoenvironmentandsustainabilityissues,biocompositeshaveencounteredremarkable
interest in the last decades. They are developed in numerous industrial sectors such as
construction (decking), automobile (door panels, dashboards) and sport (surfboard) in
replacement of glass or carbon fibers reinforced compositesmaterials [1]. Although they
present lowermechanical performances than glass fibers reinforced polymer composites,
theirspecificmechanicalpropertiesareexcellent.Compositesbasedonthermoplasticssuch
aspolypropylene(PP),polyethylene(PE),polyvinylchloride(PVC)orpolylacticacid(PLA)are
widelyused inmodernsociety [2–4].PP isbesides.TheglobalproductionofPP isnear60
millionMTperyearandcouldreach75millionMTin2022[5].
Thehighsensitivityfacetoclimaticconditionsofvegetalfibersusedforthebiocomposites
reinforcementconstitutesadragfortheiruse.Lotsofrecentstudiesdealwiththenatural
fibers composites exterior weathering in different countries and environments such as
Mediterranean[3], tropical [6,7]andcontinental [8,9]climatestotest theirdurability.The
expositioninducedtheirdegradationandhypotheseswerebroughttoexplaintheextrinsic
variations.Indeed,radical-basedoxidativeprocessesduetohightemperatureorultraviolet
(UV) rays are responsible to the physico-chemical properties alteration. During the
weathering,thepolymermatrixdegrades into lowermolecularweightproductsbyNorrish
typeIandIIreactionschainscissions[9,10].Asregardsvegetalfibers,formationofquinoid
structures, UV radiation absorption by lignin, Norrish reactions and photo-yellowing
reactions occur and lead to the formation of chromophoric groups. Also, the thermal
degradation could particularly affect the hemicelluloses stability [11]. These chemical
mechanisms resulted in amechanical performance loss, visual aspect andmicrostructural
changes [7,12,13]. The degradation can be reduced by stabilizers incorporated during
processingandslowingdownthephoto-oxidationrate[14].
The influence of each exterior degradation factorwas assessed byweathering realized in
laboratories allowing to uncouple these parameters in order to understand their
contribution on biocomposites properties evolution. Depending on the studied property,
eitherUVrays,temperatureorwaterhadamoresevereimpact.Indeed,UVexposureofrice
husks reinforced PLA biocomposites was studied in accordance with potential final
115
applications [15]. It was compared to immersion and hygrothermal conditions. UV and
hygrothermalageingcarriedoutat65°Cand85°Crespectivelypresentedamoresignificant
effectonthepolymercrystallinityratethanimmersionway.Theobservedincreasewasdue
to a chemicrystallization mechanism of PLA macromolecular chains favored at high
temperature[16].Otherwise,molecularweightsandbendingstrengthexhibitedastronger
decrease under hygrothermal ageing conditions than under otherweathering ones. Thwe
and Liao [17] also worked on the hygrothermal ageing of bamboo fibers reinforced PP
composites. Samples were immersed in water at 25 °C for 6 months and at 75 °C for 3
months.Tensilestrengthandmodulusshowedaslightdecreaseafterageingat25°Cafter6
months. However, they were highly reduced after immersion at 75 °C. The interfacial
adhesion was also impacted due to debonding caused by the incompatibility between
thermal and moisture expansion coefficients. The temperature promoted the water
saturation phenomenon [18,19]. The immersion representing extreme water absorption
conditionswasalsostudiedbyArbelaizetal[20].Thewateruptakeinducedafibersswelling
until reaching saturation that affected the interfacial adhesion and the mechanical
properties. This also led to microcracking of the composite and dimensional instability.
Otherwise, Bauer suggested that the rate of photo-oxidation due to UV rays exposition
increased with the temperature with an Arrenhius rate dependence [21]. The photo-
oxidationrateofnaturalfibersreinforcedcompositesalsoincreasedwiththehumidity[11],
thewaterfacilitatingthelightpenetrationintothevegetalmatter.Thus,asynergisticeffect
couldalsoenlargethedegradationphenomenonduringtheweathering.
The contribution of each vegetal fibers component (lignin, hemicellulose, non-cellulosic
componets for example) on variations of biocomposites properties during theweathering
hasbeeninvestigated.Begetal.evaluatedtheeffectsofligninandhemicellulosespresence
on composite properties. A better interfacial bonding and higher tensile strength were
observedwhenbleachedKraftwoodfibersareincorporatedinPPallalongtheageingthanks
totheremovalofnon-cellulosiccompounds[11].Also,Pengetal.showedthatthecellulose
favored the formation of microcracks on the surface of cellulose fibers reinforced PP
composites but any significant discoloration was observed [22]. Indeed, the high
hygroscopicity of cellulose may induce a composite swelling and thus a higher surface
roughness compared to neat PP. The discoloration of compositeswas accelerated by the

116
presenceof lignin,especiallyathighcontent. Indeed, it iswidelyacceptedthataphenoxy
quinoneredoxmechanismis implied in lignindecomposition[14]. Infact,theparaquinone
structureswith a characteristic yellow color formed after ageing are further decomposed
into hydroquinone molecules responsible for the composites bleaching. However, it was
recently demonstrated that the carbohydrate part of lignocellulosic materials could also
undergone yellowing due to chromophoric carbonyl formation after photo-oxidation [23].
Otherwise, Penget al. alsonoted that thepresenceof lignin induceda lowerdecrease in
flexuralstrengthandmodulusofPPcomposites,aswellasalownumberofmicrocracksat
the composite surface and a better surface hydrophobicity towards weathering than in
presenceofcelluloseorwoodflour[22].Thesameimprovementofmechanicalpropertiesin
presenceof lignin in cellulose fibers reinforcedPP compositeswasnotedbyGadioli et al.
[24].Thisanti-oxidantroleof lignincanbeexplainedbythepresenceofhinderedphenols
that prevent free radical-based reactions during the polymer stabilization process [22,24].
Otherwise, infrared spectroscopy revealed that an oxidative degradation of materials
occurredwhateverthelignocellulosiccomponentchosenforthecompositereinforcement.
Nevertheless,hemicellulosesreinforcedthermoplasticcompositeswerenotstudiedbecause
oftheirverylowthermalstabilitylimitingtheirprocess.
Severalstudieswereinvestigatedaboutnaturalandartificialweatheringofcarexteriorand
interior pieces made of paints and coatings [21,25–27]. The main works reported in the
literature dealing with the car interior pieces behaviour examine their Volatile Organic
Compounds (VOCs) emissions and their impact on indoor air quality [28–30]. To our
knowledge, any exterior ageingof natural fibers reinforced composites representing a car
interiorenvironmentwasreportedintheliterature.
Theobjectiveofthisworkistoassesstheinfluenceofthetypeofweathering,eitherexterior
orunderwindshieldglass,on theevolutionofphysico-chemicalpropertiesofhemp fibers
reinforced PP biocomposites. Flexural properties as well as microstructure and chemical
compositionwerefollowedovertheweathering.Visualandsurfaceaspectswereanalyzed
thankstoopticalmeasurements.Acomparisonbetweenthetwoweatheringwasdonefor
eachmaterialandeachcharacterizationtounderstandtheeffectsoftheweatheringexterior
parameters.

117
MaterialsandMethods
Materials
Polypropylene grade H733-07 with a melt flow rate of 7.5 g/10 min (230 °C, 2.16 kg)
purchased from Braskem Co. (Sao Paulo, Brazil) was used as thermoplasticmatrix. Hemp
fibers(2-6mm)wereprovidedbyAgroChanvre(Barenton,France).Aftertherettingprocess
(38 days), their cellulose, hemicelluloses and lignin rates displayed in Table 1 were
determinedbysuccessivechemicalextractionsbasedonTAPPIT264,ASTMD1104standards
[31,32].Twohempfibersloading10wt%(PP10)and30wt%(PP30)werechosen(Table2).
Maleic anhydride grafted polypropylene (MA-g-PP) with a 1 wt% grafting rate (Orevac
CA100)andsuppliedbyArkema(France),wasaddedat3.1wt%ofPPascouplingagent.
Table1-Hempfiberschemicalcomposition
Cellulose Hemicelluloses Lignin Liphophilic
extractives
Ash
(wt%) 82.1 8.5 4.5 2.7 2.1
Table2-Designationofmaterials
Composition(wt%)
PP Hempfibers MA-g-PP
PP 100 - -
PP10 87.3 10 2.7
PP30 67.9 30 2.1
Materialprocessing
HempfibersandMA-g-PPhavebeendriedbeforeprocessingfor15hat60°Cinanovento
removeresidualwater.GranulesofPPandMA-g-PPweremixedwithhempfibersinaBC21
Clextralco-rotatingtwin-screwextruder(L/D=36withthediameterD=25mm)(Clextral,
France)withthetemperatureprofile190-190-190-180-175-175-175°Cfromfeedtodieand
ascrewspeedof220rpm.Oncedried for3daysat60°C,extrudedpelletswere injection
molded in a Krauss Maffei KM50-T180CX at 210 °C (Krauss Maffei, Germany) with an
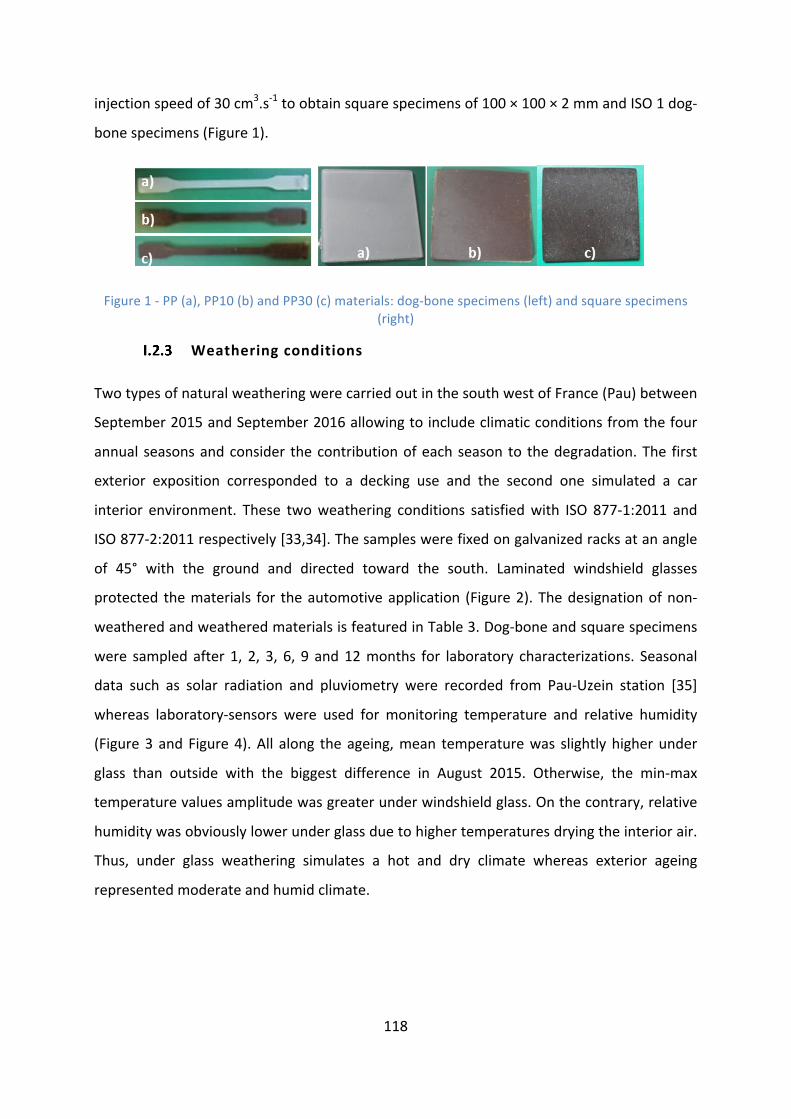
118
injectionspeedof30cm3.s-1toobtainsquarespecimensof100×100×2mmandISO1dog-
bonespecimens(Figure1).
Figure1-PP(a),PP10(b)andPP30(c)materials:dog-bonespecimens(left)andsquarespecimens(right)
Weatheringconditions
TwotypesofnaturalweatheringwerecarriedoutinthesouthwestofFrance(Pau)between
September2015andSeptember2016allowingtoincludeclimaticconditionsfromthefour
annual seasonsandconsider thecontributionofeachseason to thedegradation.The first
exterior exposition corresponded to a decking use and the second one simulated a car
interior environment. These twoweathering conditions satisfiedwith ISO 877-1:2011 and
ISO877-2:2011respectively[33,34].Thesampleswerefixedongalvanizedracksatanangle
of 45° with the ground and directed toward the south. Laminated windshield glasses
protected thematerials for theautomotiveapplication (Figure2).Thedesignationofnon-
weatheredandweatheredmaterialsisfeaturedinTable3.Dog-boneandsquarespecimens
were sampledafter 1, 2, 3, 6, 9 and12months for laboratory characterizations. Seasonal
data such as solar radiation and pluviometry were recorded from Pau-Uzein station [35]
whereas laboratory-sensors were used for monitoring temperature and relative humidity
(Figure3andFigure4).All along theageing,mean temperaturewas slightlyhigherunder
glass than outside with the biggest difference in August 2015. Otherwise, the min-max
temperaturevaluesamplitudewasgreaterunderwindshieldglass.Onthecontrary,relative
humiditywasobviouslylowerunderglassduetohighertemperaturesdryingtheinteriorair.
Thus, under glass weathering simulates a hot and dry climate whereas exterior ageing
representedmoderateandhumidclimate.

119
Figure2-Exposureracks
Table3-Designationofnon-weatheredandPP,PP10andPP30weatheredmaterials
Non-weathered
materials
Exteriorweathered
materials
Underglassweathered
materials
DesignationPP-UW,PP10-UW,
PP30-UW
PP-EW,PP10-EW,
PP30-EW
PP-GW,PP10-GW,
PP30-GW
AB
Figure3–Mean(rounds),minimum(triangles)andmaximum(squares)temperature(A)andrelativehumidity(B)(red:underglassweathering,dark:exteriorweathering)

120
AB
Figure4–Totalamountofrainfall(A)andmean(round),minimum(triangles)andinstantaneousglobalsolarradiationSRvaluesmaximum(squares)(B)
Mechanicalcharacterization
Beforemechanicaltest,sampleswereconditionedfor3daysat23±2°Cand50±10%RH.
Then,flexuralpropertiescharacterizationwasperformedbythreepointbendingtestcarried
outinthesamehygrothermalconditionsonISO1Adog-bonesamplesinaccordancetothe
ISO178:2010 standard [36].AZwickTH010pressapparatuswasusedwitha2.5kN load
cell.ElasticmodulusEf calculatedbetween0.05and0.25%of strainand thestressat the
conventional deflectionσfc corresponding to the stress at a strain of 3.5%werededuced
from stress-strain curves. The cross-head speedswere set at 2 and 100mm.min-1 for the
modulusandflexuralstressattheconventionaldeflectionmeasurementsrespectively.Eight
samplesofeachmaterialweretestedtoevaluatethereproducibility.
Visualaspectcharacterization
Spectrocolorimetry
The surface color analysis was performed with a Chroma Sensor 3 spectrocolorimeter
(Datacolor,UnitedStates).Theconfiguration illuminant/observerchosenwasD65/10°.The
CIE 1976 L*, a*, b* uniform system was used. L*, a* and b* were deduced from the
reflectancecurves.TheL*coordinaterepresentsthelightnesswhereasa*andb*represent
thechromaticity.AnincreaseofL*(from0to100)witnessesamateriallightening.a*andb*

121
arethechromaticitypositionsonaxesfrom-300to+300whicharegreen(-a*)tored(+a*)
andblue(-b*)toyellow(+b*)axesrespectively.Valueswereobtainedfromtheanalysisof
fourareasofthreesamples.
Spectrophotogoniometry
The distribution of the intensity of light reflected by amaterial according to the angle of
detection can be related to the surface aspect of a material [37]. Indeed the gloss of a
materialismorepronouncedasthelightisreflecteddirectionally.Onthecontrary,arough
surfaceinducesadiffusereflectionsincethereflectedlightisnotconcentratedinanarrow
bundle(Figure5).AGON360goniometer(InstrumentSystemsGmbH)coupledtoaMAS40
spectrometer with a halogen lamp and a power supply of 12V was used to collect the
radiometricpower.Thesourceanglewasfixedat20°accordingtoISO2813standard[38].
Detectoranglesvariedfrom5°to-60°withanangularstepsmaller inthespecularzonein
order todetect thehighvariationsof intensity in this zone.The spectral rangeofanalysis
was380-780nmandfromeveryspectrumI=f(λ(nm))obtainedforeverydetectorangle,the
totalintensitycanberepresentedversusthedetectorangle:I(u.a.)=f(!(°)).
Figure5-Diffuse(a)andspecular(b)reflections(fromISO2813)
G1 corresponding to haze gloss was detemined from the ratio of themaximum intensity
obtainedfortheangleofdetectionof-20°I(Θ=-20°)totheintensityobtainedfortheangle
of-22°I(Θ=-20+-2°)bothsituatedinthespecularzonewascalculatedforallsamples(Eq.
1).TheratioG2ofI(Θ=-20°)totheintensitycollectedfortheangleof-35°I(Θ=-20+-15°)
ofadiffuselyreflectedlightfarawayfromthespecularzonesowasalsocalculated(Eq.2)
andcorresponds tocontrastgloss.Thehigher thevalueofG1andG2are, theglossierand
smootherthesurfaceseems.Theglosswascomputedforthreereplicatesatfourlocations
oneachmaterial.

122
LE =B(M = −20°)
B(M = −22°) Eq.1
LG =B(M = −20°)
B(M = −35°)
Eq.2
Microstructurecharacterization
Differentialscanningcalorimetry(DSC)
A PYRIS Diamond calorimeter (Perkin Elmer, United States) was employed for the
determination of the polymer crystallinity behavior during the weathering. The
measurements were carried out under nitrogen atmosphere at a 20 mL.min-1 flow. The
temperaturerangedfrom30to210°Cwithaheatingrampat10°C.min-1.Twoheatingsteps
withan intermediatecoolingstepat -10°C.min-1wereperformed.Fragmentsofalmost10
mg sampled at the materials surface were placed into standard aluminium pans. Two
replicate samples per material were analyzed. The crystallinity ratio was calculated
accordingtothefollowingequationtakingintoaccountthemeltingenthalpy:
RSE % =UVWE
X×UVW100
×100 Eq.3
RSG % =UVWG
X×UVW100
×100 Eq.4
whereWisthePPmassfraction,ΔHm1andΔHm2(J.g-1)arethemeltingenthalpydetermined
from the 1st and 2nd heating steps respectively and ΔHm100 corresponds to the estimated
meltingenthalpyofafullycrystallinePP(209J.g-1)[39,40].
Chemicalcompositioncharacterization
FourierTransformInfraRedspectroscopy(FTIR)
AIFS66spectrometer(Bruker,UnitedStates)operatingintheAttenuatedTotalReflectance
(ATR) mode was used to follow the functional groups specific to the polymer and
biocomposites degradation. The device was equipped with a single reflection diamond
crystal accessory. Thin slices of exposed surfaces were analyzed and the spectra were

123
recordedasaresultoftheaverageof32scansinthe400to4000cm-1spectralrangewitha
resolution of 1 cm-1. Infrared spectra were normalized according to the Min-Max
normalizationmethodwith the 2925 cm-1 reference band assigned to the CH2methylene
groups.
Surfacecharacterization
Confocalrugosimetricmeasurement
AMICROMESURESTILsystemequippedwithaSTILCHR150opticalsensor(STIL,France)was
used to evaluate the roughness by altitude measurement of each surface point on the
samplewithoutcontactwiththesampleaccordingtotheISO25178internationalstandard.
Moredetailsaregiven inapreviouspaper[12].Abidimensionalscanningallowsobtaining
theimageofthesamplesurfacelocatedataprecisedistancefromtheSTILopticalsensor.
AcquisitionsoftwareSurfaceMap®allowedthecontrolofthestationandthepost-treatment
MountainsMap® software was used to analyze the surface geometry and to calculate
roughnessparameters.Themicrometricrangeoftheopticalpenwas285µm. Itpermitsa
tridimensionalanalysisandtheanalyzedareaX*Ywas5mm*5mmwithananalysisstepof
10µminXandYdirections.ThetridimensionalroughnessparameterSafollowedduringthe
weatheringcorrespondstothearithmeticmeanoftheabsoluteoftheheightvalues(Eq.4):
Sa = 1
\]*(<, _)
J`E
abc
d`E
ebc
Eq.5
withMthenumberofpointsalongtheXaxis,NthenumberofpointsalongtheYaxis,and
zx,ythealtitudeinµm.Meanvaluesandstandarddeviationswereobtainedfromtheanalysis
offourareasofthreesamples.
ResultsandDiscussion
Mechanicalperformance
Stress-straincurvesofPP,PP10andPP30areplotted inFigure6beforeandafterexterior
andunderglassone-yearweathering.Atnon-weatheredstate,thestressincreasedwiththe
fiberloadingforasamestrainvalue.However,PPandPP10presentedacontinuousincrease
of stress until 5% of deformation whereas the flexural strain at break of PP30 almost

124
equalledto3.5%.Thisearlybreakisexplainedbythestiffnessprovidedbythevegetalfibers.
A similarbehaviorwasobservedafterweatheringexcept for virginPP thatbrokeafter12
monthsofexteriorweatheringat lowerstress (46MPa)thanexteriorweatheredPP30(71
MPa).ThisrupturesuggeststhatthestrengthofneatPPwasmostlyaffectedbytheexterior
weathering than by under glass exposition. However, although the one-year exposition
overthrew the flexural properties of biocomposites, the type of weathering had no
significantinfluenceontheirmechanicalbehavior.
Figure6-Stress-straincurvesofPP(a),PP10(b)andPP30(c)before(fullline)andafterone-yearexterior(dashedline)andone-yearunderwindshieldglass(dottedline)weathering
The elastic modulus Ef and the stress at the conventional deflection σfc have also been
recordedduringtheageingandtheirevolutionisrepresentedinFigure7.

125
Atnon-weatheredstate,Ef increasedfrom19±0.15to47±0.5GPawiththefiber loading.
Moreover, the modulus value of biocomposites was higher than virgin PP whatever the
weatheringstate.Thus,thematerialstiffeningeffectofthefiberswasmaintainedoverthe
exposition. However, higher significant variations all along the ageingwere noted for the
highest loadingwitha firstmoderate increaseduring the first2monthsof1%and5% for
PP30-EW and PP30-GW respectively. Therefore, this trend was more pronounced under
windshieldglass.Thisincreasewasfollowedbyadecreaseuntil12monthswhichwasbarely
moresignificantafterexteriorexpositionofPP30,andseemsthustobemoreharmfulthan
underglassweathering.
Theconventionaldeflectionflexuralstressσfc showedanequivalent increasingtrendwith
thefiberrate,meaningthatthefibershaveareinforcementeffect.However,σfcdecreased
withthetimeofexpositionwhateverthematerialduetothedegradationofbothpolymer
andhemp fibers.Aswell as for Ef, σfc of PP30underwentahigherdropduring the first 9
months than PP and PP10 confirming that the presence of vegetal fibers weakened the
mechanical stability. However, PP showed a drastic decrease of σfc after 12 months of
exteriorweathering.Indeed,itdecreasedby18%whereasitcamedownby4%forPP30in
the last 3 months of exterior exposition. This was certainly due to the rainfall or the
exposition to long and short waves UV-A, B or C rays that were filtered by laminated
windshieldglassesatabout98%[41].Nevertheless,inviewofclimaticconditionsobserved
betweenJuneandAugust2016correspondingtothe10thand12thmonthsofageing,itcan
be assumed that the photo-oxidation of the polymer couldmainly be responsible to this
embrittlementattheendoftheyear(Figure4).Indeed,thisthree-monthperiodparticularly
sufferedfromthesolarradiationreachinganaveragesolarradiationofalmost760W.m-2for
the last month. Finally, PP10-EW and PP10-GW evolutions presented less significant
differenceandvariationsthanPPandPP30.

126
Figure1–EvolutionoftheelasticmodulusEf(a)andthestressattheconventionaldeflectionsfc(b)duringone-yearexposition(blue:PP,red:PP10,PP30:green,fullline:exteriorweathering,dashed
line:underglassweathering)
Microstructure
Since the elasticmodulus evolution can be related to the crystallization behaviour of the
polymer, the crystallinity degree was determined from the first and the second heating
ramps(Figure8).
Globally,crystallinitypercentagesofmaterialsare lowerforthefirstheatingstepthanthe
secondone.Moreover,atnon-weatheredstate,PP30exhibited2%and4%higherχc1andχc2
crystallinityratesrespectivelythanvirginPP.Asameincreasewiththefibercontentofthe
crystallinitypercentageofpolymermatricesdeduced from the first [3,42] and the second
heating ramp [43,44] was observed at initial state. This implies that lignocellulosic
compoundsplayedtheroleofnucleatingagentsfavouringthecrystallizationofthepolymer
[44,45].
Otherwise,theevolutionofthecrystallinityrateovertheweatheringfirstlyshowsthatthe
expositiondidnothaveconsiderableinfluenceonPPandPP10.However,PP30underwent
higher variationswith a slight increase until 2months and a decrease during 10months.
Indeed, this first increase is more important for the highest fiber reinforced composite
suggesting that the nucleation effect of the fibers improved the crystallinty rate [24].

127
Moreover,theincreasewasmorepronouncedunderwindshieldglasswheretemperatures
almostreached90°C.AsregardsunderglassweatheredPP30,thevaluesincreasedby11%
forχc1against9%forχc2.SoasametrendasYoung’smodulusevolutionwasregisteredand
isascribedtothepolymerchemicrystallizationintheamorphousphasefavoredunderhigh
temperatures due to the reduction of the macromolecular chains length inducing their
highermobility[46].However,theexteriorexpositiongenerallyinducedahigherdropofχc
thanunderglassone,especiallyforχc2duringthe10lastmonthsofageing.Indeed,χc1and
χc2ofPP30-EWdecreasedby20%and23%whereas itdeclinedby3and6%forPP30-GW.
Otherwise,nosignificantdifferencewasnotedbetweenχc1andχc2evolutiontendencies.
Figure8-Evolutionofthecrystalinityrate(χc1fromthefirstheatingrunandχc2fromthesecondone)duringone-yearexposition(blue:PP,red:PP10,PP30:green,fullline:exteriorweathering,dashed
line:underglassweathering)
Chemicalstructure
Theevolutionoftheinfraredpeaksofcarbonylgroupssuchasγ-lactones(1780cm-1),esters
and aliphatic aldehydes (1740 cm-1), carboxylic acids and ketones (1711 cm-1) specific to
oxidative degradation and ethenyl functional groups (1650 cm-1) for polymer and fibers
chainscissionsaredepictedinFigure9beforeandafterone-yearexposition[9,40,47].The
spectra were zoomed in the wavenumber range of interest 1490-1820 cm-1. Before
weathering, the increase of the intensity of absorption bands assigned to C=O and C=C
bonds vibration with the fiber loading was due to the presence of carbonyl and carbon
doublebondsnaturallypresentinholocelluloseandlignin[48,49].

128
Duringtheweathering,thecontinuouslinearincreaseoftheintensityofcarboxylicacidsand
estersabsorbanceon thePP spectrumwith theweathering timemainly indicatesaphoto
and thermo-oxidative degradation of the polymer under UV rays and high temperatures
(Figure10)involvingreactionwithoxygenfromtheatmosphere.Asregardsγ-lactones,the
absorbancedidnotvaryalotduringthefirst6months.Thenitsuddenlyrosefrom0.02to
0.16 in 6months. The carbonyls absorbance increasewasmoredrastic for biocomposites
which suggests that hemp fibers also underwent photo and thermo-oxidation. The
proportionofvegetalfibersatthesurfaceexceedingthePPproportionovertheageingdue
toapolymerdecompositioncouldalsocontributetothis increase.Amongall thecarbonyl
containingderivatives, ketonesandcarboxylicacidswerepreferentially formedduring the
weathering contrary to non-weathered state. It is supposed that the hydrolysis of esters
products occurred leading to the formation of carboxylic acids. Moreover, this
characterizationallowed tohighlight that, contrary tocarbonyl concentrationpresentinga
similarevolutionunderthetwotypesofweathering,theexteriorageingpromotedagreater
generationofcarbondoublebondsthanunderglassone.Thistrendwasmorepronounced
forweatheredPP10andPP30implyingthatthevegetalfiberscontributedtotheC=Cbonds
formation. The rising protrusion of fibers on surface, including lignin containing aromatic
ring-based structure, may involve the C=C stretching detection [3]. Also, their increasing
formationduringthe first6monthsmightbe favoredbyhydrolyticeffectofheavyrainfall
increasingduringthisperiod(Figure4)leadingtochainscissionsalongtheearlyexposition.
Otherwise, the evolution of vinyl tended to stabilize after 6 months whatever the
weatheringconditions,especiallyforbiocomposites.Also,aconversionofC=CtowardsC=O
groups via Norrish type II reaction may explain this formed plateau [10]. Moreover, the
increasingtemperatureandsolarradiationobservedduringthisstagecouldencouragetheir
conversion.

129
Figure9-Infraredspectraofunweatheredandone-yearweatheredPP,PP10andPP30in1490-1820cm-1region

130
Figure10-AbsorbancevaluesofC=O(at1711cm-1(a),1740cm-1(b),1780cm-1(c))andC=C(1650cm-1(d))versustheweatheringtime(blue:PP,red:PP10,PP30:green,fullline:exteriorweathering,
dashedline:underglassweathering)
Visualaspect
Color
Contrary to virgin PP, the weathering had a great impact on biocomposites lightness
evolution(Figure11).Indeed,thelightnessofPP30variedinawiderangeofL*valuesinthe
firstmonths,especiallybyexteriorweatheringsinceitsbleachingkineticwashigherthanby
underwindshieldglassone.Thedegradationofligninisresponsibletothisbleachingandis
explainedby the reductionmechanismofparaquinone tohydroquinonemoleculesdue to
UV radiation [3]. Then, L* remained constantuntil 12months. Indeed,PP30 reacheda L*

131
coordinate maximum at approximately 75 after 3 months of exterior weathering and 6
monthsofunderglassweathering.This lightness saturation is inagreementwithprevious
colorstudiesofnaturalfibersreinforcedplasticcomposites[8,22,50,51].Here,itisassumed
to be due to the increasing proportion of holocellulose at the analyzed surface which is
completelyuncoveredafterthesecondhalfoftheyear.
Figure11-L*coordinateevolutionovertheweathering(blue:PP,red:PP10,PP30:green,fullline:exteriorweathering,dashedline:underglassweathering)
Thecolorwasmonitoredduringthetwotypesofweatheringandthecoordinatesa*andb*
arerepresentedinthechromaticplaneintheFigure12foreachmaterialateachweathering
state.Firstly,thisgraphclearlyshowsthatthreemaingroupscanbeformedaccordingtothe
fiberloading.
Secondly, biocomposites experienced higher variations in color than PP, in particular by
yellowing.Moreover,underglassweatheringimpliedahigheryellowingkineticthanexterior
exposition.Forinstance,b*ofPP30-GWincreasedby10unitswhereasitonlyincreasedby1
unitafterone-yearofexposition.Thiswascertainlyduetothehighertemperatures.Aswell
as for the bleaching, this yellowingwas due to the decomposition of the lignin structure
present in hemp fibers into paraquinones whose characteristic color is yellow. Thus, the
temperaturemayfavortheformationofparaquinones,whichwillbeconsequentlyfavored
during under glass ageing and the redox cycle previously mentioned might be shifted
towards the oxidation of hydroquinones to paraquinones. However, asmentioned in the

132
introductory part, holocellulose at high content in long-time retted hemp fibers, could
undergo yellowing due to its oxidation. Indeed, hemicelluloses, well-known as thermally
sensitive substances, may preferentially oxidize and thus yellow faster under high
temperaturethanUVradiation.Asregardsa*evolution,itsdecreasewitnessedalossofred
color of biocomposites due to orthoquinones or phenolic extractives degradation [52].
Otherwise,PP10wasparticularly subjected to the redcolor lossafter9and12monthsof
exteriorageing,stageduringwhichtemperaturesandUVradiationwerethehighest.Soan
exteriorweatheringpromoteda*decreasewhereasunderglassexposurepromotedtheb*
increase. This observation leads to presume that chromophoric yellowing structures are
sensitivetohightemperatureswhereasUVraysandwaterabsorptioncouldinducereddish
quinonesandextractivesdecomposition.
Figure12-a*andb*chromaticcoordinatesevolutionovertheweatheringofPP(diamonds),PP10(spheres)andPP30(squares)(thenumberscorrespondingtothetimeofexposition(months))
Gloss
0
1
2
3
6
9
12
1
2
3
69
12
0
12
3
6
9
12
12
3
6
9
12
0
123
6
912
0
2
4
6
8
10
12
14
-1 0 1 2 3 4 5
b*
a*
PP-GW PP-EW PP10-GW
PP10-EW PP30-GW PP30-EW

133
The intensityofthe lightreflectedbynon-weatheredandone-yearweatheredmaterials is
represented as a function of the angle of detection in Figure 13. Focusing on the non-
weathering state, themaximum intensity of the specular peak decreased with the hemp
fibersrate.Thismeansthatglossdiminishedwiththefiberloadingbecauseofthepresence
of hemp fibers at the surface leading to a less smooth surface [12]. Otherwise, the peak
decreasedby5timesbetweenPP10andPP30.Moreover,thespecularpeakofthehighest
fiberloadedcompositeisextendedonawiderrangeofdetectionanglesthanPPandPP30
and demonstrates a more diffuse reflection of the light induced by the presence of the
fibers.
As regards PP, PP10 andPP30weathered samples, the specular peak becomeswider and
extendedonseveralangles.PPunderwentagreat relativedecreaseofglossafterexterior
weathering, the maximum intensity decreasing by almost 5 times. The specular peak of
exterior and under glass weathered PP30 was hardly visible. It firstly suggests that the
expositioninducedalossofmatteratthesurfaceimpactingonthebrightness.Thenextpart
will permit to analyze the surface aspect. Also, it can be assumed that hemp fiberswere
partly responsibleof the surfaceaspectalteration.Theasymmetric repartitionof the light
intensityaccordingto-20°canbeexplainedbythenon-flatsurfaceofbiocomposites.

134
Figure13–Angularrepartitionofthelightreflectedbynon-weathered(a),one-yearunderglassweathered(b)andone-yearexteriorweathered(c)PP(blue),PP10(red)andPP30(green)
ThevariationsofG1andG2valuesaredisplayedinFigure14forallmaterials.Theinfluence
ofthetypeofweatheringwasmainlyobservedforneatPPallalongtheageingwhosethe
glossmostlysufferedfromtheexteriorparameterssuchasUVraysorrainfallthanextreme
temperatures. The loss of gloss of neat PP-EW could originate from the dust and other
impurities deposits and the formation ofmicrocracks issued from the degradation of the
polymer.As regardsbiocomposites, thedegradationofbothhemp fibersand thepolymer
matrixatthesurfaceinducedadropofbothG1andG2.GlossvaluesofPP30-EWandPP30-
GW tended towards aG1 andG2minimum ratio of 1 at an early stage of theweathering
demonstrating the severe impact on the biocomposite gloss. Otherwise, G1 of non-
weatheredPP10equivalentto44wasclosetoPP30oneequaling12unliketheG2ratiovalue
decreasing from2418 forPP10 to30 forPP30.Thismeans that its specularpeak shape is
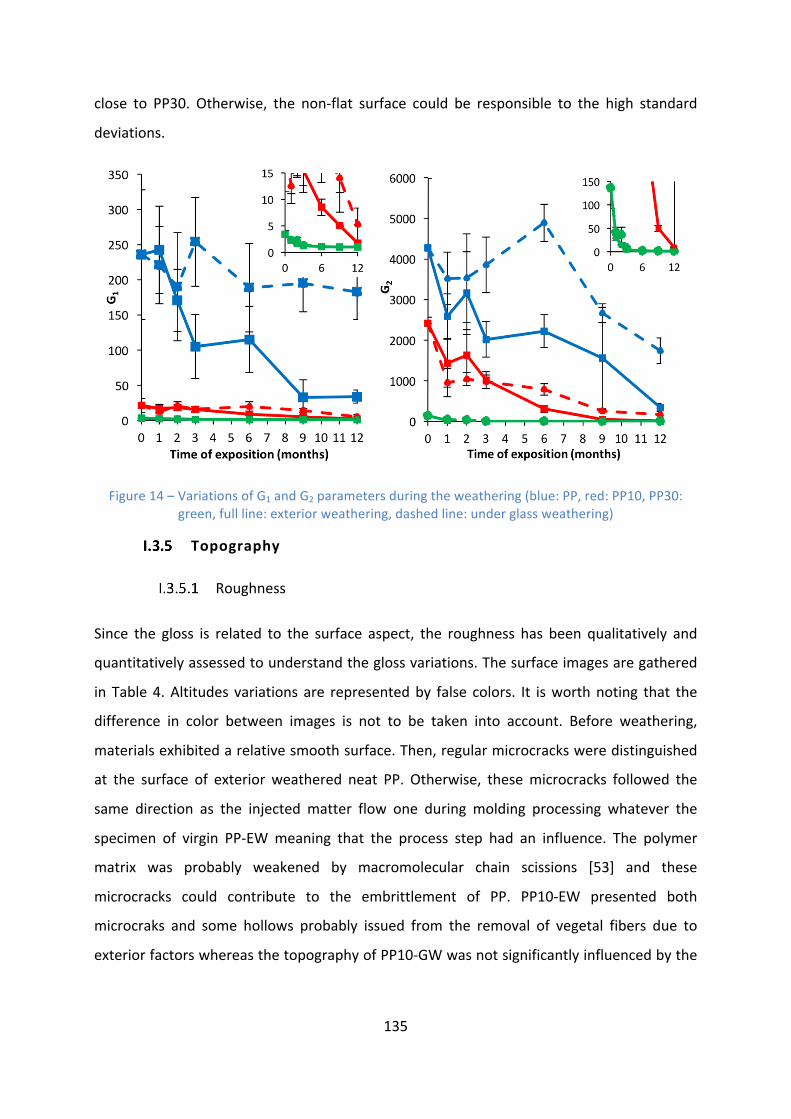
135
close to PP30. Otherwise, the non-flat surface could be responsible to the high standard
deviations.
Figure14–VariationsofG1andG2parametersduringtheweathering(blue:PP,red:PP10,PP30:green,fullline:exteriorweathering,dashedline:underglassweathering)
Topography
Roughness
Since the gloss is related to the surface aspect, the roughness has been qualitatively and
quantitativelyassessedtounderstandtheglossvariations.Thesurfaceimagesaregathered
in Table4.Altitudes variations are representedby false colors. It isworthnoting that the
difference in color between images is not to be taken into account. Before weathering,
materialsexhibitedarelativesmoothsurface.Then,regularmicrocracksweredistinguished
at the surface of exterior weathered neat PP. Otherwise, thesemicrocracks followed the
same direction as the injected matter flow one during molding processing whatever the
specimen of virgin PP-EWmeaning that the process step had an influence. The polymer
matrix was probably weakened by macromolecular chain scissions [53] and these
microcracks could contribute to the embrittlement of PP. PP10-EW presented both
microcraks and some hollows probably issued from the removal of vegetal fibers due to
exteriorfactorswhereasthetopographyofPP10-GWwasnotsignificantlyinfluencedbythe
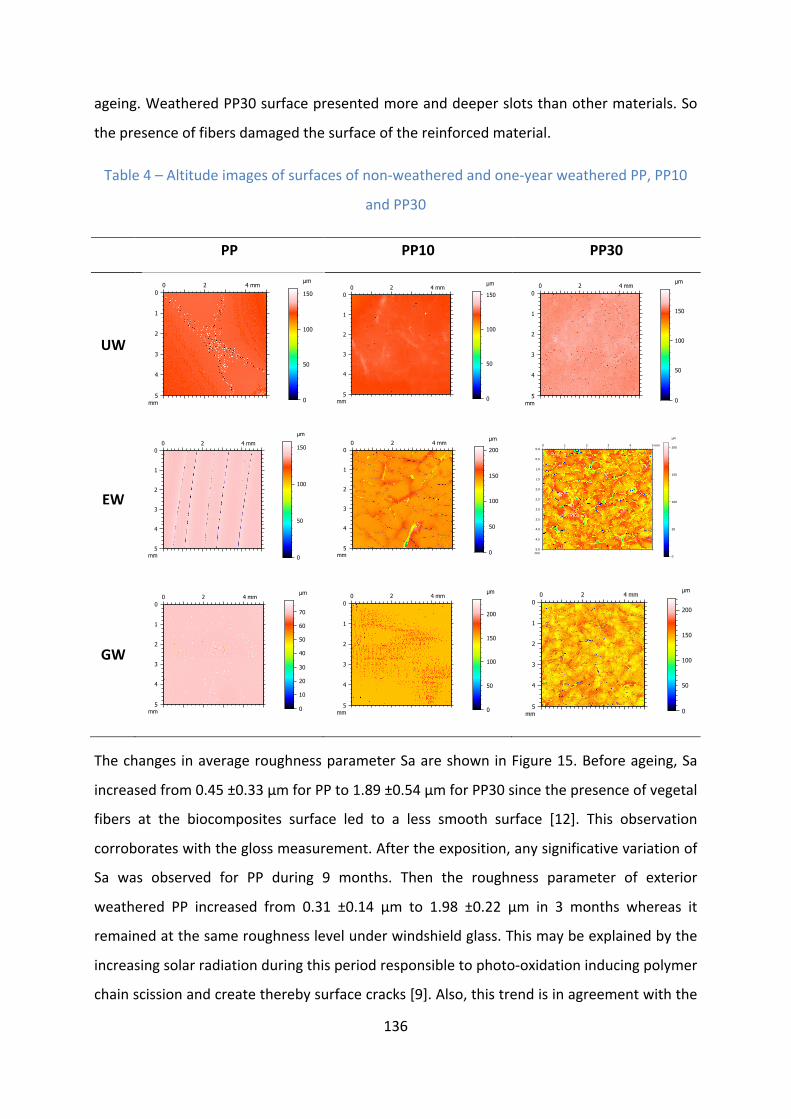
136
ageing.WeatheredPP30surfacepresentedmoreanddeeperslotsthanothermaterials.So
thepresenceoffibersdamagedthesurfaceofthereinforcedmaterial.
Table4–Altitudeimagesofsurfacesofnon-weatheredandone-yearweatheredPP,PP10
andPP30
PP PP10 PP30
UW
EW
GW
Thechanges inaverageroughnessparameterSaareshowninFigure15.Beforeageing,Sa
increasedfrom0.45±0.33µmforPPto1.89±0.54µmforPP30sincethepresenceofvegetal
fibers at the biocomposites surface led to a less smooth surface [12]. This observation
corroborateswiththeglossmeasurement.Aftertheexposition,anysignificativevariationof
Sa was observed for PP during 9 months. Then the roughness parameter of exterior
weathered PP increased from 0.31 ±0.14 µm to 1.98 ±0.22 µm in 3 months whereas it
remainedatthesameroughnesslevelunderwindshieldglass.Thismaybeexplainedbythe
increasingsolarradiationduringthisperiodresponsibletophoto-oxidationinducingpolymer
chainscissionandcreatetherebysurfacecracks[9].Also,thistrendisinagreementwiththe
0 2 4 mm
mm
0
1
2
3
4
5
µm
0
50
100
1500 2 4 mm
mm
0
1
2
3
4
5
µm
0
50
100
150
0 2 4 mm
mm
0
1
2
3
4
5
µm
0
50
100
150
0 2 4 mm
mm
0
1
2
3
4
5
µm
0
50
100
1500 2 4 mm
mm
0
1
2
3
4
5
µm
0
50
100
150
2000 1 2 3 4 5 mm
mm
0.0
0.5
1.0
1.5
2.0
2.5
3.0
3.5
4.0
4.5
5.0
µm
0
50
100
150
200
0 2 4 mm
mm
0
1
2
3
4
5
µm
0
10
20
30
40
50
60
70
0 2 4 mm
mm
0
1
2
3
4
5
µm
0
50
100
150
200
0 2 4 mm
mm
0
1
2
3
4
5
µm
0
50
100
150
200

137
evolutionofthestressattheconventionaldeflectionandtheappearanceofthiscrackson
surface may brittle the mechanical resistance. Nevertheless, the formation of these
microcracks was expected to occur on surfaces of under glasses weathered samples for
which the crystallinity rate mostly increased at the beginning of exposition due to chain
scission.Butthesemicrocrackswereonlydistinguishedforexteriorweatheredsamples.This
couldbelinkedtorainfallandUVrayssynergeticeffectacceleratingthedegradationofthe
polymer after the first two-month short period favoringmicrocracks for outdoor exposed
materials.Savaluesofbiocompositesexhibitedacubiccontinuousgrowth.Thisincreasewas
duetothedegradationofthepolymermatrixandfibersinducinganappearanceoffiberson
the surface. Also, a water uptake could provoke fiber-matrix debonding despite of the
presence of coupling agent. Contrary to other studied properties, PP10-EWand PP10-GW
didnotexhibitsimilarevolutions. IndeedSaoftheintermediateloadingbiocompositethat
wasexteriorlyweatheredincreasedfasterfromFebruraytoAugust2016.
Figure15-Saroughnessparameterevolutionovertheexposition(blue:PP,red:PP10,PP30:green,fullline:exteriorweathering,dashedline:underglassweathering)
Conclusion
The objective of this work was to understand the influence of the type of weathering
(exteriorversusunderglassweathering)onPPandPP/hempfibersbiocomposites (10and
138
30wt%) properties such as mechanical, chemical, microstructural and visual aspect
properties.
Even if flexuralmechanical properties (modulus and stress at the conventional deflection)
are improved thanks to vegetal fiber reinforcement as already shown in literature, the
biocompositesmodulusseems tobe less stableover theweatheringwhatever thekindof
exposition. Similarly, under glass ageing (GW) induced stronger changes of conventional
deflection stress of PP30 than PP one. Also, the exterior ageing (EW) more affected the
strength of biocomposites during the first 9months. Then, the stress at the conventional
deflectionofexterioragedPPdrasticallydecreasedby18%whereasitslightlydecreasedfor
exterioragedPP30after12months.Hence,PPwascertainlyhighlysensitivetohighUVlight
intensityatthisstageofexpositionhighlydeterioratingthesyntheticpolymer.
Physical properties were mostly affected for biocomposites than PP because of their
sensitivity face to climatic conditions. However, even if they bleached at the same level
under the two expositions, some differences in color instability, especially by yellowing
duringGWandredcolor lossduringEW,wasobservedforweatheredbiocomposites.This
wasexplainedby thepossibledifferentsensitivitiesof thehempfiberscomponentsunder
thedifferentfactors.
As regards chemical and microstructural properties, even if all materials underwent
oxidation, a higher kinetic of chemical structure degradation was recorded for PP30
suggesting that either carbonyl-containing lignocellulosic compounds appeared at the
surfaceorhempfibersoxidizedfaster.Otherwise,theexteriorweatheringmorefavoredthe
formationofcarbondoublebondsandthedecreaseofthecrystallinityrateeithercausedby
solarradiation,rainfallortheirsynergeticeffect.
Also,ithighlyalteredthesurfaceaspect(gloss,roughness)atdifferentdegradationkinetics
according to the fiber content. The assessment of G1 and G2 parameters allowed to
understandthecontributionofthepresenceofhempfiberstothereflectioninthespecular
ordiffusezones.Thecarbonylabsorbance increasingduringtheageingwasnot influenced
by the type of weathering conditions. Otherwise, analyses showed that either under
windshieldglassorexteriorweatheringhadthehighestimpactaccordingtotheproperty.All
thesepropertieswillbefacedtogethertobringoutrelationships.

139
In summary, according to the property, either under glass or outdoor ageing induced the
highest variations. Also, visual appearance and chemical stability of biocomposites were
moreaffected.Thus,UVstabilizersorpigmentsshouldbe incorporatedduringtheprocess
tolimitthevariationsandallowtheiruseindeckingorautomobilestructures.Nonetheless,
in view of the properties changes over the exposition, PP10 material raised as a good
compromise between mechanical performance and visuals aspect changes. Indeed, its
mechanical performance was enhanced compared to neat PP. Moreover, this material
underwent lower drastic variations (in particular by bleaching and yellowing) than those
observedforPP30.
Acknowledgements
This research did not receive any specific grant from funding agencies in the public,
commercial,ornot-for-profitsectors.
References
[1] G. Marsh, Next step for automotive materials, Mater. Today. 6 (2003) 36–43.doi:10.1016/S1369-7021(03)00429-2.
[2] X. Zhou, S. Huang, L. Chen, Effect of antiaging agents on the outdoor naturalweathering of bamboo powder/polypropylene foamed composites, J. Vinyl Addit.Technol.22(2014)311–319.doi:10.1002/vnl.21433.
[3] L.Soccalingame,D.Perrin,J.-C.Bénézet,A.Bergeret,ReprocessingofUV-weatheredwood flour reinforced polypropylene composites: Study of a natural outdoorexposure, Polym. Degrad. Stab. 133 (2016) 389–398.doi:10.1016/j.polymdegradstab.2016.09.011.
[4] N.LeMoigne,M.Longerey,J.-M.Taulemesse,J.-C.Bénézet,A.Bergeret,Studyoftheinterface in natural fibres reinforced poly(lactic acid) biocomposites modified byoptimized organosilane treatments, Ind. Crops Prod. 52 (2014) 481–494.doi:10.1016/j.indcrop.2013.11.022.
[5] PlattspetrochemicalAnalytics,Report:Globalpolyolefinsoutlook:2014-2025,2016.www.platts.com/ppa(accessedJune16,2017).
[6] L.Belec,T.H.Nguyen,D.L.Nguyen,J.F.Chailan,Comparativeeffectsofhumidtropicalweathering and artificial ageing on a model composite properties from nano- tomacro-scale, Compos. Part A Appl. Sci. Manuf. 68 (2015) 235–241.doi:10.1016/j.compositesa.2014.09.028.
[7] M.Z. Ahmad Thirmizir, Z.A. Mohd Ishak, R. Mat Taib, S. Rahim, S. Mohamad Jani,

140
NaturalWeathering of Kenaf Bast Fibre-Filled Poly(Butylene Succinate) Composites:EffectofFibreLoadingandCompatibiliserAddition,J.Polym.Environ.19(2010)263–273.doi:10.1007/s10924-010-0272-2.
[8] S.Butylina,M.Hyvärinen,T.Kärki,Astudyofsurfacechangesofwood-polypropylenecompositesastheresultofexteriorweathering,Polym.Degrad.Stab.97(2012)337–345.doi:10.1016/j.polymdegradstab.2011.12.014.
[9] J.S. Fabiyi, A.G. McDonald, M.P. Wolcott, P.R. Griffiths, Wood plastic compositesweathering:Visualappearanceandchemicalchanges,Polym.Degrad.Stab.93(2008)1405–1414.doi:10.1016/j.polymdegradstab.2008.05.024.
[10] N.M.Stark,L.M.Matuana,SurfacechemistrychangesofweatheredHDPE/wood-flourcompositesstudiedbyXPSandFTIRspectroscopy,Polym.Degrad.Stab.86(2004)1–9.doi:10.1016/j.polymdegradstab.2003.11.002.
[11] M.D.H.Beg,K.L.Pickering,AcceleratedweatheringofunbleachedandbleachedKraftwood fibre reinforced polypropylene composites, Polym. Degrad. Stab. 93 (2008)1939–1946.doi:10.1016/j.polymdegradstab.2008.06.012.
[12] C.Badji,L.Soccalingame,H.Garay,A.Bergeret,J.-C.Bénézet,Influenceofweatheringonvisualand surfaceaspectofwoodplastic composites:Correlationapproachwithmechanicalpropertiesandmicrostructure,Polym.Degrad.Stab.137(2017)162–172.doi:10.1016/j.polymdegradstab.2017.01.010.
[13] M.I.Popa,S.Pernevan,C.Sirghie, I.Spiridon,D.Chambre,D.M.Copolovici,N.Popa,Mechanical Properties and Weathering Behavior of Polypropylene-Hemp ShivesComposites,J.Chem.2013(2013)1–8.doi:10.1155/2013/343068.
[14] M.Muasher,M. Sain, The efficacy of photostabilizers on the color changeofwoodfilled plastic composites, Polym. Degrad. Stab. 91 (2006) 1156–1165.doi:10.1016/j.polymdegradstab.2005.06.024.
[15] A. Bergeret, J. Benezet, T.P.T. Tran, G.C. Papanicolaou, A. Koutsomitopoulou,Valorizationofagriculturalby-productsinpoly(lacticacid)todevelopbiocomposites,in:V.K.Thakur (Ed.),GreenCompos. fromNat.Resour.,CRCPress,Taylor&FrancisLLC,2013.doi:10.13140/2.1.1271.2969.
[16] M.S. Islam, K.L. Pickering, N.J. Foreman, Influence of accelerated ageing on thephysico-mechanical properties of alkali-treated industrial hemp fibre reinforcedpoly(lactic acid) (PLA) composites, Polym. Degrad. Stab. 95 (2010) 59–65.doi:10.1016/j.polymdegradstab.2009.10.010.
[17] M.M.Thwe,K.Liao,Durabilityofbamboo-glassfiberreinforcedpolymermatrixhybridcomposites, Compos. Sci. Technol. 63 (2003) 375–387. doi:10.1016/S0266-3538(02)00225-7.
[18] O. Gil-Castell, J.D. Badia, T. Kittikorn, E. Strömberg, A. Martínez-Felipe, M. Ek, S.Karlsson, A. Ribes-Greus, Hydrothermal ageing of polylactide/sisal biocomposites.Studies of water absorption behaviour and Physico-Chemical performance, Polym.

141
Degrad.Stab.108(2014)212–222.doi:10.1016/j.polymdegradstab.2014.06.010.
[19] A. Le Duigou, P. Davies, C. Baley, Seawater ageing of flax/poly(lactic acid)biocomposites, Polym. Degrad. Stab. 94 (2009) 1151–1162.doi:10.1016/j.polymdegradstab.2009.03.025.
[20] A. Arbelaiz, B. Fernández, J.A. Ramos, A. Retegi, R. Llano-Ponte, I. Mondragon,Mechanicalpropertiesofshortflaxfibrebundle/polypropylenecomposites:Influenceofmatrix/fibremodification, fibrecontent,wateruptakeandrecycling,Compos.Sci.Technol.65(2005)1582–1592.doi:10.1016/j.compscitech.2005.01.008.
[21] D.R.Bauer,Interpretingweatheringaccelerationfactorsforautomotivecoatingsusingexposure models, Polym. Degrad. Stab. 69 (2000) 307–316. doi:10.1016/S0141-3910(00)00074-4.
[22] Y. Peng, R. Liu, J. Cao, Y. Chen, Effects of UV weathering on surface properties ofpolypropylenecompositesreinforcedwithwoodflour,lignin,andcellulose,Appl.Surf.Sci.317(2014)385–392.doi:10.1016/j.apsusc.2014.08.140.
[23] D.Rosu,R.Bodîrləu,C.A.Teacə,L.Rosu,C.D.Varganici,EpoxyandsuccinicanhydridefunctionalizedsoybeanoilforwoodprotectionagainstUVlightaction,J.Clean.Prod.112(2016)1175–1183.doi:10.1016/j.jclepro.2015.07.092.
[24] R. Gadioli, J.A. Morais, W.R. Waldman, M.-A. De Paoli, The role of lignin inpolypropylenecompositeswithsemi-bleachedcellulosefibers:Mechanicalpropertiesand its activity as antioxidant, Polym. Degrad. Stab. 108 (2014) 23–34.doi:10.1016/j.polymdegradstab.2014.06.005.
[25] U. Schulz, V.Wachtendorf, T. Klimmasch, P. Alers, The influence of weathering onscratches and on scratch and mar resistance of automotive coatings, Prog. Org.Coatings.42(2001)38–48.doi:10.1016/S0300-9440(01)00148-5.
[26] N. Tahmassebi, S. Moradian, S.M. Mirabedini, Evaluation of the weatheringperformance of basecoat/clearcoat automotive paint systems by electrochemicalproperties measurements, Prog. Org. Coatings. 54 (2005) 384–389.doi:10.1016/j.porgcoat.2005.08.004.
[27] P.Šimon,M.Fratričová,P.Schwarzer,H.W.Wilde,Evaluationoftheresidualstabilityof polyurethane automotive coatings by DSC: Equivalence of Xenotest and desertweatheringtestsandthesynergismofstabilizers, J.Therm.Anal.Calorim.84(2006)679–692.doi:10.1007/s10973-005-7549-z.
[28] S. Overton, J. Manura, Identification of volatile organic compounds in a newautomobile,1999.
[29] B. Xu, Y.Wu, Y.Gong, S.Wu, X.Wu, S. Zhu, T. Liu, Investigationof volatile organiccompoundsexposureinsidevehiclecabinsinChina,Atmos.Pollut.Res.7(2015)215–220.doi:10.1016/j.apr.2015.09.005.
[30] M.J. Fedoruk, B.D. Kerger, Measurement of volatile organic compounds insideautomobiles, J. Expo. Anal. Environ. Epidemiol. 13 (2003) 31–41.

142
doi:10.1038/sj.jea.7500250.
[31] J.S.Han,J.S.Rowell,ChemicalCompositionofFibers,in:R.M.Rowell,R.A.Young,J.K.Rowell. (Eds.), Pap. Compos. fromAgro-Based Resour., CRC/Lewis Publishers, 1996:pp.84–134.
[32] J. Acera Fernández, N. Le Moigne, A.S. Caro-Bretelle, R. El Hage, A. Le Duc, M.Lozachmeur, P. Bono, A. Bergeret, Role of flax cell wall components on themicrostructureandtransversemechanicalbehaviourof flax fabricsreinforcedepoxybiocomposites, Ind. Crops Prod. 85 (2016) 93–108.doi:10.1016/j.indcrop.2016.02.047.
[33] ISO 877-1: Plastics -- Methods of exposure to solar radiation -- Part 1: Generalguidance,(2011).
[34] ISO 877-2: Plastics -- Methods of exposure to solar radiation -- Part 2: Directweatheringandexposurebehindwindowglass,(2011).
[35] Pau-Uzein meteorological station, Real-time weather reports, (2016).http://www.infoclimat.fr/observations-meteo/temps-reel/pau-uzein/07610.html(accessedJune16,2017).
[36] ISO178:2010,Plastics–Determinationofflexuralproperties,(2010).
[37] R.Alexander-Katz,R.G.Barrera,Surfacecorrelationeffectsongloss,J.Polym.Sci.36(1997)1321–1334.
[38] ISO2813:Coatings:Determinationofglossvalueat20°,60°and85°,(2014)1–31.
[39] Sperling L.H., Introduction to physical polymer science, 4th ed., JohnWiley& Sons,2006.doi:10.1002/0471757128.ch9.
[40] C. Rouillon, P.O. Bussiere, E. Desnoux, S. Collin, C. Vial, S. Therias, J.L. Gardette, Iscarbonyl index a quantitative probe to monitor polypropylene photodegradation?,Polym. Degrad. Stab. 128 (2016) 200–208.doi:10.1016/j.polymdegradstab.2015.12.011.
[41] Joanne Will, Does my windshield protect me from the sun ?, Globe Mail. (2013).https://www.theglobeandmail.com/globe-drive/culture/commuting/does-my-windshield-protect-me-from-the-sun/article12495123(accessedAugust16,2017).
[42] L. Běhálek, M. Maršálková, P. Lenfeld, J. Habr, J. Bobek, M. Seidl, Study ofcrystallizationofpolylactic acid composites andnanocompositeswithnatural FibresbyDSCmethod,in:NANOCONConf.,2013:pp.1–6.
[43] L. Soccalingame,A.Bourmaud,D.Perrin, J.-C.Bénézet,A.Bergeret,Reprocessingofwoodflourreinforcedpolypropylenecomposites:Impactofparticlesizeandcouplingagentoncompositeandparticleproperties,Polym.Degrad.Stab.113(2015)72–85.doi:10.1016/j.polymdegradstab.2015.01.020.
[44] N.S.Egute,P.L.Forster,F.D.Parra,D.M.Fermino,S.Santana,A.B.Lugão,Mechanical

143
andthermalpropertiesofpolypropylenecompositeswithcuraua fibre, in: Int.Nucl.Atl.Conf.,2009.
[45] M.John,S.Thomas,Biofibresandbiocomposites,Carbohydr.Polym.71(2008)343–364.doi:10.1016/j.carbpol.2007.05.040.
[46] B.Fayolle,E.Richaud,J.Verdu,F.Farcas,Embrittlementofpolypropylenefibreduringthermaloxidation,J.Mater.Sci.43(2007)1026–1032.doi:10.1007/s10853-007-2242-1.
[47] L.Wei,A.G.McDonald,C.Freitag,J.J.Morrell,Effectsofwoodfiberesterificationonproperties, weatherability and biodurability of wood plastic composites, Polym.Degrad.Stab.98(2013)1348–1361.doi:10.1016/j.polymdegradstab.2013.03.027.
[48] J.S. Félix, C. Domeño, C. Nerín, Characterization of wood plastic composites madefrom landfill-derived plastic and sawdust: volatile compounds and olfactometricanalysis,WasteManag.33(2013)645–55.doi:10.1016/j.wasman.2012.11.005.
[49] J.Li,H.-C.Hu,X.-S.Chai,Rapidmethodfordeterminationofcarbonylgroupsinlignincompoundsbyheadspacegaschromatography.,J.Chromatogr.A.1404(2015)39–43.doi:10.1016/j.chroma.2015.05.055.
[50] K.Srinivas,K.K.Pandey,Photodegradationofthermallymodifiedwood,J.Photochem.Photobiol.BBiol.117(2012)140–145.doi:10.1016/j.jphotobiol.2012.09.013.
[51] H. Du, W. Wang, Q. Wang, S. Sui, Y. Song, Effects of ultraviolet absorbers on theultraviolet degradation of rice-hull/high-density polyethylene composites, J. Appl.Polym.Sci.126(2012)906–915.doi:10.1002/app.36558.
[52] A.J. Vinha, A.G. Carvalho, M. Teixeira de Souza, C. Marangon Jardim, A. de CassiaOliveiraCarneiro,J.LuizColodette,EffectofextractivesonwoodcolorofheattreatedPinus radiata and Eucalyptus pellita,Maderas. Cienc. Y Tecnol. 17 (2015) 857–864.doi:10.4067/S0718-221X2015005000074.
[53] J.S. Fabiyi, D.McIlroy, A.G.McDonald,Woodmodification effects onweathering ofHDPE-based Wood Plastic Composites, J. Polym Env. 17 (2009) 34–48.doi:10.1007/s10924-009-0118-y.

144
CéliaBadji,JoanaBeigbeder,HélèneGaray,AnneBergeret,Jean-CharlesBénézetandValérie
Desauziers
C2MA,Ecoledesminesd’Alès,6avenuedeClavières,30319CedexFrance
Keywords:ageing,statisticalmethod,hempfibers,relationships,similarities
Abstract
Exterior and under windshield glass natural weathering of neat polypropylene (PP) and
hempfibersreinforcedPPbiocompositeswereinvestigated.Theobjectivewastoemphasize
therelationshipsbetweenthepropertiesofmaterialsaccordingtotheweatheringtype,the
fiber loading and the weathering time in order to bring new insights of degradation
mechanisms understanding. For this purpose, a Principal Component Analysis (PCA)
statisticalmethodwasapplied to thewholedata.Hence, thecontributionof thedifferent
properties to the principal components drawing was determined. Properties that
discriminated the most the samples and the relationships between them were deduced.
Otherwise, specific groups of individuals to which samples were assigned as well as
similitudes between them characterized by variables were highlighted. As regards global
calculation, properties linked to chemical composition, surface aspect and mechanical
performance merged as significant variables. The treatment carried out by isolating
materials loaded by the three different hemp fiber rates particularly outstand the link
betweenmechanical properties andproducts issued fromoxidation. The close correlation
between whitening parameter and C=C bond level also confirmed the lignin degradation
way.Finally,dependingontheweatheringduration,thepropertiescharacterizedeitherfiber
loadingorweatheringstate(unweatheredorweathered)whereasmechanicalperformance
differentiated the different fiber rate containing non-weathered samples whatever the
exposuretime.

145
Introduction
Theuseofnaturalfibersforthermoplasticsreinforcementresultsfromthewillofdeveloping
materials based on renewable resources as alternatives for fossil ones. In 2015, the
construction industry dominated the worldwide market of natural fibers reinforced
compositesintermsofapplicationfollowedbytheautomotiveindustry[1].Theregulations
and standards implemented by the Corporate Average Fuel Economy (CAFE) to reduce
vehicle weight are likely to prompt a positive impact on demand of biocomposites by
automotiveindustriesoverthenextyears[2].
Biocomposites combine advantages such as stiffness and recyclability. However, the high
sensitivityofvegetalfibersimpedestheirextensiveapplication.Indeed,UVrayssensitivity,
thermal instabilityandmoistureabsorptionarethemaincharacteristicsresponsibletothe
broadvariabilityoftheirproperties.Sinceseveraldecades,theirdurabilityhasbeenstudied
and several works investigated the influence of biocomposites ageing onmechanical and
visual aspect properties. Results obviously showed that the degradation of the materials
affected their mechanical behavior. Biocomposites strongly lost strength and stiffness
depending on the degradation conditions [3–7]. The presence of natural fibers were
evidencedtogiverisetomaterialssurfacedefects,particularlyduetofibersswellingfaceto
rainfallprovokingrougheningandcracking.Thegloss, importantappearanceparameter, is
besidesmainlycompromisedbythesesurfaceaspectchanges[3,8,9].Moreover,thenatural
reinforcingpartalsoinstigatedthebiocompositesdiscolorationbyphoto-inducedoxidation
via yellowing and bleaching [3,9,10]. Some solutions can be brought to avert these
variations, for example by adding chemical stabilizers that can prolong their lifetime [11].
However, inorder toeffectively intervene, thedegradationmechanismsmustbehandled.
Theelucidationofrelationshipsbetweenthedifferentpropertiesgoverningthevariationsin
biocompositesduringweatheringisrequiredtoassessdurability.
Well-knownrelationshipsexistbetweenstructureandpropertiesofthermoplasticpolymers
[12–15].Relationshipsbetweenpropertiesevolutionsofthermoplasticsdeterminedallalong
theirweatheringhavebeeninvestigated.Aninterestingcorrelationbetweenmodificationof
crystalline fraction and detection of micro-cracks after polypropylene (PP) accelerated
ageing was deduced from microscopy and calorimetry analyses [8]. But this observation
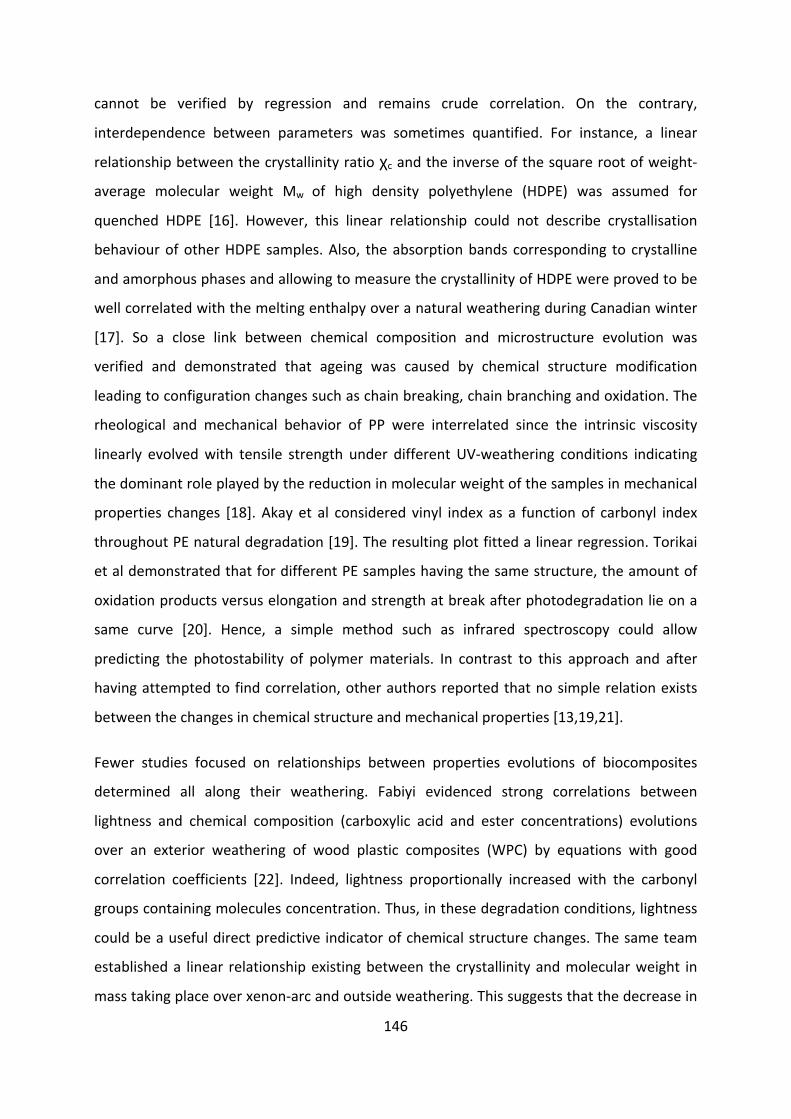
146
cannot be verified by regression and remains crude correlation. On the contrary,
interdependence between parameters was sometimes quantified. For instance, a linear
relationshipbetweenthecrystallinityratioχcandtheinverseofthesquarerootofweight-
average molecular weight Mw of high density polyethylene (HDPE) was assumed for
quenched HDPE [16]. However, this linear relationship could not describe crystallisation
behaviourofotherHDPE samples.Also, theabsorptionbands corresponding to crystalline
andamorphousphasesandallowingtomeasurethecrystallinityofHDPEwereprovedtobe
wellcorrelatedwiththemeltingenthalpyoveranaturalweatheringduringCanadianwinter
[17]. So a close link between chemical composition and microstructure evolution was
verified and demonstrated that ageing was caused by chemical structure modification
leadingtoconfigurationchangessuchaschainbreaking,chainbranchingandoxidation.The
rheological and mechanical behavior of PP were interrelated since the intrinsic viscosity
linearly evolvedwith tensile strength under different UV-weathering conditions indicating
thedominantroleplayedbythereductioninmolecularweightofthesamplesinmechanical
properties changes [18]. Akay et al considered vinyl index as a functionof carbonyl index
throughoutPEnaturaldegradation[19].Theresultingplotfittedalinearregression.Torikai
etaldemonstratedthatfordifferentPEsampleshavingthesamestructure,theamountof
oxidationproductsversuselongationandstrengthatbreakafterphotodegradationlieona
same curve [20]. Hence, a simple method such as infrared spectroscopy could allow
predicting the photostability of polymermaterials. In contrast to this approach and after
havingattemptedtofindcorrelation,otherauthorsreportedthatnosimplerelationexists
betweenthechangesinchemicalstructureandmechanicalproperties[13,19,21].
Fewer studies focused on relationships between properties evolutions of biocomposites
determined all along their weathering. Fabiyi evidenced strong correlations between
lightness and chemical composition (carboxylic acid and ester concentrations) evolutions
over an exterior weathering of wood plastic composites (WPC) by equations with good
correlation coefficients [22]. Indeed, lightness proportionally increased with the carbonyl
groupscontainingmoleculesconcentration.Thus,inthesedegradationconditions,lightness
couldbeausefuldirectpredictiveindicatorofchemicalstructurechanges.Thesameteam
establisheda linear relationshipexistingbetween thecrystallinityandmolecularweight in
masstakingplaceoverxenon-arcandoutsideweathering.Thissuggeststhatthedecreasein

147
chainlengthduetochainscissioninducedasimultaneousincreaseofthecrystallinityratio
[23]. A linear regression between a* and b* chromatic coordinates was observed after
accelerated ageing of thermoplastic/white oak composites irrespectively to the exposure
time[24].Indeed,asyellownessincreased,sodidtheredness.Somestudiesoncorrelations
after lignocellulosic materials degradation were also assessed. For example, overall color
changes (ΔE)occurredasabsorbanceofC=Cbonds inaromatic structure containing lignin
increasedduringUVlightirradiationofwood[25].Thisrelationshipsuggeststhatthecolor
variations during irradiationweremainly due to the formation of chromophores resulting
fromphotochemicaldegradationof lignin.Moreprecisely,anotherpaper reporting results
dealingwithregressionanalysesduringartificialphoto-irradiationofindicatedthatinfrared
peak intensity related to lignin containing bonds vibrations has a significant statistical
relation with the chromatic and lightness coordinates, in particular with L* and a* [26].
Anotherstudydealtwithcellulosedegradation.Thegraphingofitsdegreeofpolymerization
determinedfromthe intrinsicviscosityasafunctionofzero-spantensilestrengthfeltona
commonlineoverdifferentacceleratedageingconditions.Thisimpliesthatchainlengthof
celluloseimpactsthestrength[27].
Most of the time, statistical analyses reported in works regarding weathering of natural
fillersandfibersreinforcedmaterialswereusedtoevaluatethesignificanceofvariationsof
physico-chemical properties before and after materials degradation. This allowed
emphasizing through statistical means the properties that significantly evolved. Besides,
Student’st-testwasconductedasrecurrentrelevantmethod[10,28–30].Also,acomparison
between the influence of two artificial ageings on wood loss from WPC surface was
statisticallycomputedbyFabiyiandhisco-workers[22].
Principal Component Analysis (PCA) is also a useful statistical technique that has found
application in fieldssuchasbiology,healthandagriculture,etc.Thiscommontechnique is
requiredforfindingpatternsinhigh-dimensionaldataset.AsregardsapplicationofPCAfor
lignocellulosicmaterialsageingstudies,Bonifazietal.employedthismethodtodistinguish
themaingroupsofsamplesofdifferentwoodspeciesthatwereformedovertheageingand
presentingsamefeatures[26].Thedegradationofbothcelluloseandligninwassuspectedto
be mainly responsible to chemical evolution. Indeed, principal components explained
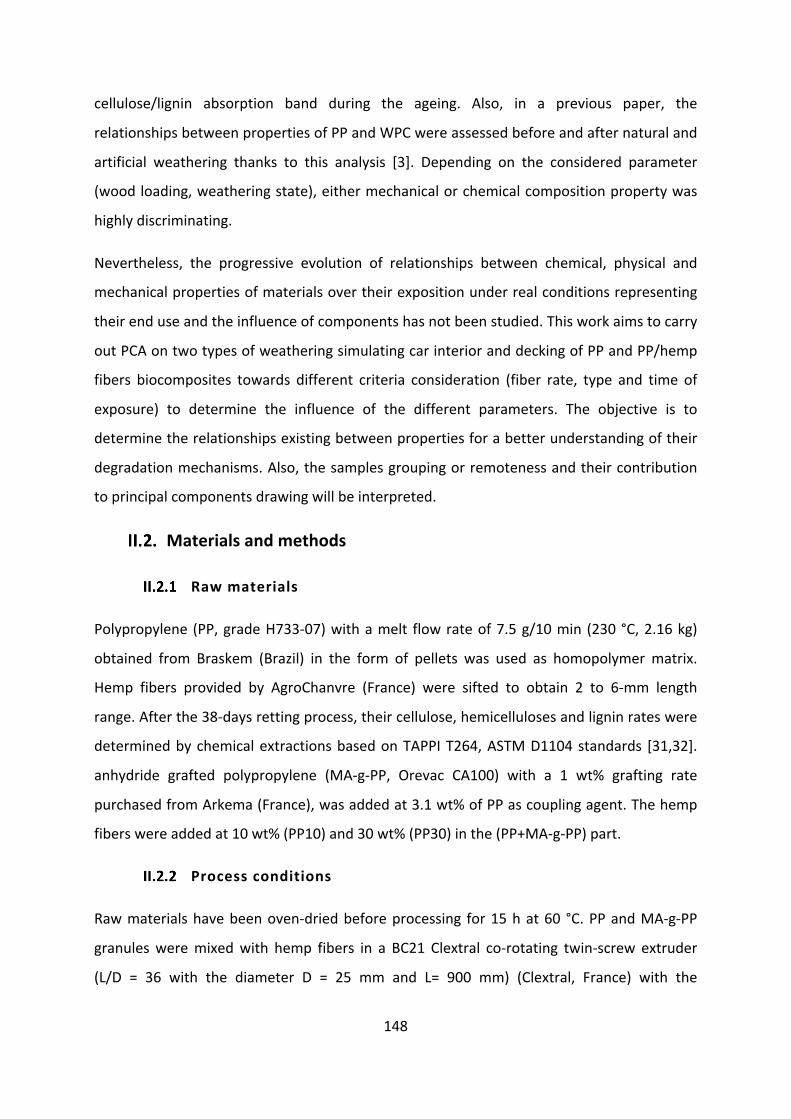
148
cellulose/lignin absorption band during the ageing. Also, in a previous paper, the
relationshipsbetweenpropertiesofPPandWPCwereassessedbeforeandafternaturaland
artificial weathering thanks to this analysis [3]. Depending on the considered parameter
(woodloading,weatheringstate),eithermechanicalorchemicalcompositionpropertywas
highlydiscriminating.
Nevertheless, the progressive evolution of relationships between chemical, physical and
mechanicalpropertiesofmaterialsovertheirexpositionunderrealconditionsrepresenting
theirenduseandtheinfluenceofcomponentshasnotbeenstudied.Thisworkaimstocarry
outPCAontwotypesofweatheringsimulatingcarinterioranddeckingofPPandPP/hemp
fibers biocomposites towards different criteria consideration (fiber rate, type and time of
exposure) to determine the influence of the different parameters. The objective is to
determinetherelationshipsexistingbetweenpropertiesforabetterunderstandingoftheir
degradationmechanisms.Also,thesamplesgroupingorremotenessandtheircontribution
toprincipalcomponentsdrawingwillbeinterpreted.
Materialsandmethods
Rawmaterials
Polypropylene (PP,gradeH733-07)withamelt flowrateof7.5g/10min (230°C,2.16kg)
obtained from Braskem (Brazil) in the form of pellets was used as homopolymer matrix.
Hemp fibers provided by AgroChanvre (France) were sifted to obtain 2 to 6-mm length
range.Afterthe38-daysrettingprocess,theircellulose,hemicellulosesandligninrateswere
determinedbychemicalextractionsbasedonTAPPIT264,ASTMD1104standards [31,32].
anhydride grafted polypropylene (MA-g-PP, Orevac CA100) with a 1 wt% grafting rate
purchasedfromArkema(France),wasaddedat3.1wt%ofPPascouplingagent.Thehemp
fiberswereaddedat10wt%(PP10)and30wt%(PP30)inthe(PP+MA-g-PP)part.
Processconditions
Rawmaterialshavebeenoven-driedbeforeprocessing for15hat60 °C.PPandMA-g-PP
granulesweremixedwith hemp fibers in a BC21 Clextral co-rotating twin-screw extruder
(L/D = 36 with the diameter D = 25 mm and L= 900 mm) (Clextral, France) with the

149
temperature ranging from190 to175 °C from feed todieanda screwspeedof220 rpm.
Once dried for 3 days at 60 °C in an air-circulating oven, extruded pellets were injection
molded in a Krauss Maffei KM50-T180CX at 210 °C (Krauss Maffei, Germany) with an
injectionspeedof30cm3.s-1andamoldkeptat40°C.ISO1dog-bonespecimensandsquare
specimensof100×100×2mm3andwereobtainedforbothmechanicalperformanceand
visualappearancecharacterizationsrespectively(Figure1).
Figure1-(a)PP,(b)PP10and(c)PP30materials:dog-bonespecimens(left)andsquarespecimens(right)
Weathering
Weathering tests were operated in Pau in the south west of France. Exterior and under
windshield glass one-year expositions were chosen to represent exterior and interior
applications of materials. Samples were exposed according to ISO 877-2011 standard
[33,34].Thesampleswerefixedongalvanizedracksatanangleof45°withthegroundand
directedtowardthesouthdirection.Laminatedwindshieldglassescoveredthematerialsfor
the automotive application (Figure 2). Meteorological data from September 2015 to
September 2016 were provided from Pau-Uzein station for outdoor parameters [35]
whereas laboratory-sensors were used for under windshields glasses monitoring. Data
evolutionsmonitoredall along theexpositionare shown in Figure3.Changes inmaterials
propertiesweremeasuredafter1,2,3,6,9and12months.
a)
b)
c)a) b) c)

150
Figure2-Exteriorandunderglassexposureracks
Table1-Designationofnon-weatheredandweatheredPP,PP10andPP30materials
Ageing
time
(Months)
Non-weatheredmaterials Exteriorweatheredmaterials Underglassweatheredmaterials
0 PP-UW,PP10-UW,PP30-UW - -
1 - PP-EW1,PP10-EW1,PP30-EW1 PP-GW1,PP10-GW1,PP30-GW1
2 - PP-EW2,PP10-EW2,PP30-EW2 PP-GW2,PP10-GW2,PP30-GW2
3 - PP-EW3,PP10-EW3,PP30-EW3 PP-GW3,PP10-GW3,PP30-GW3
6 - PP-EW6,PP10-EW6,PP30-EW6 PP-GW6,PP10-GW6,PP30-GW6
9 - PP-EW9,PP10-EW9,PP30-EW9 PP-GW9,PP10-GW9,PP30-GW9
12 - PP-EW12,PP10-EW12,PP30-EW12 PP-GW12,PP10-GW12,PP30-GW12
Figure3–MeantemperatureandmeansolarradiationSR(bluecurve)(a)andmeanrelativehumidityandrainfall(b)
0
100
200
300
400
500
600
700
800
0
5
10
15
20
25
30
35
40
45
50
SR(W.m
-2)
T(°C)
Date(months)
T(EW)
T(GW)
SR
0
50
100
150
200
250
0
10
20
30
40
50
60
70
80
90
100Rainfall(m
m)
RH(%)
Date(months)
RH(EW)
RH(GW) Rainfall
a) b)

151
Flexuraltests
Mechanicalpropertiesweremeasuredbythree-pointbendingtestat23±2°Cand50±10%
RHonISO1Adog-bonesamplesinaccordancetotheISO178:2010standard.AZwickTH010
pressapparatusanda2.5kNloadcellwereusedtocharacterizeflexuralproperties.Values
ofelasticmodulusEfandthestressattheconventionaldeflectionσfccorrespondingtothe
stressatastrainof3.5%werecalculatedfromstress-straincurves.Thecross-headspeeds
were set at 2 and 100mm.min-1 for themodulus and flexural stress at the conventional
deflectionmeasurementsrespectively.Eightsamplesofeachmaterialweretested.
DifferentialScanningCalorimetry(DSC)
CalorimetricdatawereobtainedthroughDifferentialScanningCalorimetry(DSC)bymeans
ofaPYRISDiamondcalorimeter (PerkinElmer,UnitedStates).Theanalysiswasconducted
undernitrogenatmosphereata20mL.min-1constantflow.Surfacefragmentsofalmost10
mgwereanalysed.Sampleswereheatedfrom30to210°Cwithaheatingrampat10°C.min-
1.Twoheatingstepswithanintermediatecoolingstepat-10°C.min-1wereperformed.Two
replicatesamplespermaterialwereanalysed.Thecrystallinityratewascalculatedaccording
tothefollowingequationfromthemeltingenthalpy:
RS % =UVW
X×UVW100
×100
Eq.1
withW the PP mass fraction, ΔHm (J.g-1) the melting enthalpy determined from the 2nd
heatingstepandΔHm100 thestandardmeltingenthalpyofa100%crystallinePP(209J.g-1)
[36,37].The2ndheatingcyclewaschosen inorder toovercomethecrystallinity related to
the thermal background of the polymer (processing). Otherwise, the second run provides
information about the ability of degraded chains of the polymer to crystallize [10,37–40].
Moreover, sameevolution tendencies ofχc deduced from1st and 2nd heating cycleswere
observedduringtheweathering.

152
Infraredspectroscopy
AIFS66spectrometer(Bruker,UnitesStates)operatingintheAttenuatedTotalReflectance
(ATR) mode was used to follow vinyl and carbonyl bonds formation witnessing outdoor
degradation. The devicewas equippedwith a single reflection diamond crystal accessory.
Thinslicesofexposedsurfaceswereanalyzedandthespectrawererecordedasaresultof
theaverageof32scans inthe400to4000cm-1spectralrangewitharesolutionof1cm-1.
InfraredspectrawerenormalizedaccordingtotheMin-Maxnormalizationmethodwiththe
2925cm-1referencebandassignedtothemethylenegroups.Absorbancevaluesforspecific
peaks (1711 cm-1 for C=O of carboxylic acids/ketones; 1740 cm-1 for C=O of
esters/aldehydes; 1780 cm-1 for C=O of g-lactones; 1650 cm-1 for C=C of vinyls) were
recorded.
Spectrocolorimetry
The surface color analysiswas performed by spectrocolorimetry on a Chroma Sensor CS3
(DataColor,UnitedStates).Theilluminant/observerconfigurationwasD65/10°.TheCIE1976
L*,a*,b*uniformsystemwasusedtodeterminethelightnessandthecolor.L*,a*andb*
were obtained from the reflectance curves. The L* coordinate represents the lightness
whereas a* and b* represent the chromaticity. An increase of L* (from 0 to 100)
demonstratesamateriallightening.a*andb*arethechromaticitypositionsonaxesfrom-
300to+300axesfromgreen(-a*)tored(+a*)andfromblue(-b*)toyellow(+b*).Values
wereobtainedfromtheanalysisoffourareasofthreesamples.
Spectrophotogoniometry
AGON360goniometer (InstrumentService,Germany)coupledtoaMAS40spectrometer
equippedwithahalogenlampwasusedtocollecttheradiometricpower.Thesourceangle
wasfixedat20°accordingtoISO2813standard[41].Detectoranglesvariedfrom5°to-60°
withanangularstepsmallerinthespecularzonetodetectthehighvariationsofintensityin
thiszone.Thedistributionof the intensityof lightreflectedbyamaterialaccordingtothe
angle of detection allowed to characterize the gloss aspect [42]. G1 corresponding to the
hazeglosswasdeterminedfromtheratiobetweenthemaximumintensityobtainedforthe
angleofdetectionof-20°I(Θ=-20°)andtheintensityobtainedfortheangleof-22°I(Θ=-20

153
+ -2°) both situated in the specular zone (Eq. 2). The ratio between I(Θ = -20°) and the
intensitycollectedfortheangleof-35°I(Θ=-20+-15°)ofadiffuselyreflectedlightfaraway
fromthespecular zonewasalsocalculatedandcorrespond thecontrastgloss (Eq.3).The
higherthevalueofG1andG2are, theglossierandsmootherthesurfaceseems.Thegloss
wascomputedforthreereplicatesatfourlocationsoneachmaterial.
L1 =B(M = −20°)
B(M = −22°) Eq.2
L2 =B(M = −20°)
B(M = −35°)
Eq.3
Rugosimetry
A MICROMESURE STIL system equipped with a STIL CHR150 optical sensor was used to
evaluate the roughness by altitude measurement of each surface point on the sample
withoutcontactwith thesampleaccording to the ISO25178 international standard.More
details are given in a previous paper [3]. A bidimensional scanning allows obtaining the
image of the sample surface located at a precise distance from the STIL optical sensor.
AcquisitionsoftwareSurfaceMap®allowedthecontrolofthestationandthepost-treatment
MountainsMap® software was used to analyze the surface geometry and to calculate
roughnessparameters.Themicrometricrangeoftheopticalpenwas285µm. Itpermitsa
tridimensionalanalysisandtheanalyzedareaX*Ywas5mm*5mmwithananalysisstepof
10µminXandYdirections.ThetridimensionalroughnessparameterSafollowedduringthe
weatheringcorrespondstothearithmeticmeanoftheabsoluteoftheheightvalues(Eq.4):
Sa = 1
\]*(<, _)
J`E
abc
d`E
ebc
Eq.4
withMthenumberofpointsalongtheXaxis,NthenumberofpointsalongtheYaxis,and
zx,ythealtitudeinµm.Meanvaluesandstandarddeviationswereobtainedfromtheanalysis
offourareasofthreesamples.
Statisticalanalysis
PrincipalComponentAnalysis(PCA)wascarriedoutonStatistica13software(Dell,France).
This multivariate statistical technique is used to make the cloud of the whole data

154
(propertiesofallsamples)easytoexploreandvisualize it inareduceddimension.Forthis
purpose, a set of orthogonal non-correlated principal components (axes) is built.More
detailsofthecalculationmethodprinciplearegivenelsewhere[3,43].Inordertoovercome
thedifferenceofunitsbetweenalltheproperties(variables)forcorrectinterpretation,the
standardization of the dataset by centering-reduction was used for the correlation circle
representation:
f5′ = f5 − f
he Eq.5
whereXi’isthecentered-reducedvariable,XiisthevariableandX¶andσxarethemeanand
standarddeviationofthevariableXrespectively.Thedesignationsofvariables(properties)
aregatheredinTable2.
Table2-Designationofparameters
Designation Parameter
E Modulusofelasticity(MPa)
s Stressattheconventionaldeflection(MPa)
Xc Crystallinityrate(%)
A1 AbsorbanceC=Oat1711cm-1(carboxylicacids/ketones)
A2 AbsorbanceC=Oat1740cm-1(esters/aldehydes)
A3 AbsorbanceC=Oat1780cm-1(γ-lactones)
A4 AbsorbanceC=Cat1650cm-1(vinyls)
Sa Roughness(µm)
G1 Hazegloss
G2 Contrastgloss
L* Lightness(light-dark)
a* Chromaticcoordinate(red-green)
b* Chromaticcoordinate(yellow-blue)
Resultsanddiscussion
Globaldatatreatment
The correlation circle allows explaining the contribution of variables (properties) to the
provided informationratebytheirprojection intoatwo-dimensionsubspaceandverifying
the correlations betweenproperties. The correlation circle taking into account theoverall
dataset is represented in Figure 4. The first two principal components (axes) account for
almost70%ofthetotalinertia.Thismeansthataremainingpartof30%iscarriedbyother

155
components that are not represented here. Otherwise, the horizontal first principal
component PC1 accounts for almost 47% of the information and represents the highest
inertiarate(twotimeshigherthanthesecondaxisPC2).
Vector ends of chemical bonds absorbance values, followed over the weathering to
understandtheoxidativedegradationandcarbon-carbondoublebondformationarenearto
the circle. Thismeans that theyarewell representedby the correlation circle.Also, these
variablesareclosetoPC1correspondingtothemainprincipalaxismeaningthattheymostly
contributed to thedrawingof this factor. Thus, PC1explains thedifferences linked to the
chemical composition and surface aspect evolution. A further study of the individuals
(materials)willshowhowtheanalysedsamplesinfluencedthevariablesrepresentation.
Carbonylabsorptionbandsarestronglycorrelatedwitheachothersincetheyexhibitclose
correlationcoefficientswithbothPC1andPC2.ThissuggeststhatA1,A2andA3evolvedina
same way throughout the weathering. Mechanical properties vectors (E and s), for their
part,mostlyheadinthesamedirectionasPC2.Also,thecrystallinityrateXccontributedto
the drawing of PC2. So, flexural and microstructure properties bring a different or
complementary information to the chemical composition. However, parameters linked to
stiffness and stress are non-correlatedwith C=Omaximal absorbance variables since they
exhibit an angle of 90°. Thus, any relationship between chemical bonds evolution and
mechanicalperformancecanbeconcluded.
All the other parameters including the color and the lightness coordinates displayed low
correlationcoefficientabsolutevaluesaccordingtoPC1andPC2andarethusfarawayfrom
thecircle.Thissuggeststhattheywerenotwellprojectedintotheplanafterthedimensions
reducing calculation. This might be due to strong differences in color changes between
materialsexplainedbydifferentloadingofvegetalfibersinPPmatrix.

156
Figure4–Globaldatatreatment:Correlationcircletakingintoaccountoveralldataset
Theprojectionoftheindividuals(samples)isshowninFigure5.Theirrelativepositionsand
theirdistancewiththetwoPCaxesallowidentifyingthegroupsofindividualshavingtaken
close values on variables. Also, the observed tendencies of variableswill be used for the
individuals graph interpretation. Firstly, threemain groups according to the fiber loading
represented by three different colors are easily distinguished. The group of the PP30
weatheredduring1,2,3monthsgloballyscoresrelativelyhighvaluesaccordingtothefirst
and second axes by comparisonwith PP10 and PPweathered during the same time. This
meansthatPP30samplestakehighervaluesofmechanicalpropertiesandcarbonylandvinyl
absorbance. However, whatever the type of weathering and the fiber rate, thematerials
take on increasingly low values according to PC1 and PC2 all along the ageing. Thus, by
simultaneous analysis with the correlation circle, long-time exposedmaterials particularly
exhibithighabsorbancevaluesandlowmechanicalperformance.
Also,after6,9and12monthsofweathering,thediscriminationofthefiberloadingismainly
madebyPC1,sohere,bythechemicalcompositionparametersandtheroughnessproperty
and no more by the mechanical performance. Indeed, the discrimination between the
different fiber ratesmaterials is mainly well represented by the second axis (E, s) at the

157
beginning of the exposition. Then, from 6 months of weathering, PC1 becomes the axis
explicatingthehempfiberrate.So,dependingontheweatheringtime,chemicalstructure
and surface aspect or mechanical performance play a major role in discernment of neat
thermoplastic andbiocomposites. Thenext treatmentbyweathering time (paragraph3.2)
willallowunderstandingtheevolutionofpropertiesdiscriminatingpower.
Also, materials weathered under windshield glass and outside during a same time of
weathering loadequallyaccording toPC2 fora same fiber loading (Figure5).This trend is
observedforthethreematerialsandsuggeststhatmechanicalpropertiesarenotinfluenced
by the typeofweathering.However,exteriorweatheredmaterials take lowervalues than
underglassweatheredonesaccordingtoPC1whatevertheweatheringtime,meaningthat
theyunderwentfasteroxidationandglossloss.Otherwise,thedifferencebetweenthetypes
ofweatheringEWandGWofeachindividualincreaseswiththeweatheringtime.
TheindividualscontributingthemosttoPC1arePP-UWandPP30-EW12whereasPP30-GW2
andPP-GW12representtheendpointsofPC2.Therefore,followedabsorptionbandspeaks
andSamostlyopposenon-weatheredneatPPandone-yearoutdoorweatheredPP30that
certainlypresent themoredisparatebehaviorsof oxidationand surfacedeterioration.On
thecontrary,mechanicalperformanceandcrystallinityopposePP-GW12andlowweathered
PP30. Indeed, the last one particularly took high values in E and Xc due to
chemicrystallizationofPPoccurringduringshort-timesexposure[9,16].

158
Figure5–Globaldatatreatment:Projectionofallindividuals(PP30materials:green,PP10materials:red,PPmaterials:blue)
Datatreatmentbytypeofweathering
The correlation circles of exterior (EW) and under windshield glass (GW) weathering are
represented inFigure6. Firstly, roughly similar factorial coordinatesofabsorbancevalues,
roughness parameter, contrast gloss and mechanical parameters are raised for the two
typesofweathering.Moreover,thecorrelationsprofileofvariablesissuedfromEWdataset
does not significantly differentiate with the previous global treatment one. The main
difference between global data and exterior exposure data analysis is the higher rate of
variationsbroughtbyPC1whenonlyEWdataisconsidered.Indeed,somevariablessuchas
b*, that is besides better represented than previously, bring more information in the
degradationmechanismssincetheygetclosetoPC1andtheirnumbervaluesarehigh(close
to the circle) in the case of EW. Otherwise, this colorimetric parameter seems to highly
contributetothedrawingofPC2forGW.Indeed,theinertiarateofPC2increasedfromEW
toGWexplainedbythemoveofb*parametertowardsPC2.

159
Figure6–Influenceofthetypeofweathering:CorrelationcirclesofEW(a)andGW(b)
ThesamethreemainclustersPP,PP10andPP30areemphasizedwhatevertheconditionsof
exposition(Figure7).Also,theindividualsgetincreaseinroughnessandcarbonylandvinyl
bonds formationaswellas loss in stiffness, stressatdeflectionandcrystallinity ratioover
the exposure. However, some differences are noted between the two individuals’
projections of EW samples in one hand and GW samples in another hand. For the three
samplesbatches, the gapsbetweenEW samplesweathered at different times are equally
importantaccordingtoPC2andPC1.However, theyaredifferentlyorganizedwithamore
verticalevolutionovertheunderglassweatheringthanoverexteriorone.Indeed,thegaps
between GW samples weathered at different times of weathering are less important
accordingtoPC1thanforEWsamples.Thismightbeduetothefactthatmaterialssurface
oxidationandalteration(roughnessincreaseandglossdecrease)duringGWoccurredslower
thanduringEW.However,b*andXctendto1and-1valuesrespectivelyaccordingtoPC2
for GW. This observation suggests that they also highly contribute to themain variations
overGWsince samplesmainly arrangedvertically.As regardsnon-weathered samples, b*
decreases with the fiber loading. Otherwise, it is interesting to note that b* mainly
differentiatesthethreefiberloadingsafterone-yearexteriorageing(Figure7a)accordingto
PC1,whereasitratherrepresentsthedegradationevolution(fromUWtoGW12)overunder
glass exposition according to PC2 (Figure 7b). Indeed, concerning EW, b* value of
biocomposites remained lower thanPPoneafterone-yearanddidnotsignificantlyevolve
b)a)

160
with theweathering.Thisobservationcan justify themaindifferentiationaccordingto the
fiber rate.However,a fastyellowingkineticofbiocompositeswasobserveddue tohigher
temperaturesunderwindshieldglass(Figure3A).Sincetemperaturewasthemaindegrading
factor under glass, yellowing was certainly linked to hemp fibers thermal instability,
especially hemicelluloses [44]. Thus, the exposition conditions influence correlations and
visualaspectexplainseitherhempfiberrateorweatheringtimedependingonthevariation
degree. Furthermore, as concluded previously, mainly oxygenated bonds concentration,
surfaceroughnessandgloss(PC1)opposePP,PP10andPP30afterlong-durationofEWand
GWsincePC2nolongerdifferentiatesthethreematerials.
Also, the gaps in PP30 samples (weathered at different times) between them are more
importantthanbetweenPPandPP10ones.Thisisattributedtogreaterchangesinphysico-
chemicalproperties.Hence,afurtherdataanalysisbyfiberloadingisrequiredtoverifymore
specificallythecontributionofeachvariabletothisvariationsenlargement.
Figure7-Influenceofthetypeofweathering:EW(a)andGW(b)individualsprojection
Treatmentbyfiberloading
The correlation circles of PP, PP10 and PP30 gathering non-weathered and weathered
samples are illustrated in Figure 8. It is interesting to note that a maximum variance is
extractedfromthebidimensionalprojectionwhosevariablescorrelationsareinterpretedby
fiberloading.Thisatteststheimportanceofthematerialssplit-upparticularlydependingon
thefiberrateforthepropertieslinking.Aswellasforglobalandweatheringtypeanalyses,
the maximum absorbance of infrared bands characteristic to oxidative degradation and
PP30-GW2
PP30-GW3
PP30-GW6
PP30-GW9
PP30-GW12
PP10-UW
PP10-GW3
PP10-GW6
PP10-GW9
PP10-GW12
PP-GW1
PP-GW9
PP-GW12
-10 -8 -6 -4 -2 0 2 4 6 8
Fact. 1: 51.91%
-6
-5
-4
-3
-2
-1
0
1
2
3
4
5
6
Fa
ct.
2
: 2
8.3
3%
PP30-UW
PP30-GW1
PP10-GW1
PP10-NGW2
PP-UW
PP-GW2
PP-GW3
PP-GW6
Fiberloading(afterlong-timeexposition)
PP-UW
PP10-UW
PP30-EW3
PP30-EW6
PP30-EW9
PP30-EW12
PP10-EW6
PP10-EW9
PP10-EW12
PP-EW2
PP-EW12
-10 -8 -6 -4 -2 0 2 4 6 8
Fact. 1: 51.09%
-6
-5
-4
-3
-2
-1
0
1
2
3
4
5
6
Fact. 2: 24.2
1%
PP30-UW
PP-EW1
PP10-EW1
PP30-EW1
PP30-EW2
PP10-EW2
PP10-EW3
PP-EW3
PP-EW6
PP-EW9
Fiberloading(afterlong-timeexposition)
b)a)

161
chain scissionand the surfaceaspect remainonesof themainparameters contributing to
PC1.Moreover, the treatmentby fiber loading induced an alignmentofmost of variables
according toPC1, translatingahighervariance rateofPC1. Indeed,Xc,Eands, thatwere
previously linked to PC2 and mostly discriminated the differences between the different
fiberrates,herecontributetothedrawingofthemostimportantcomponent.Thus,plotting
variableson thesedimensionswill allowdiscussingonly the influenceof timeand typeof
weatheringbythesamplesrepresentation.
Thegreaterthefiberloading,thehighertheinformationshareisretainedbyPC1.Thus,the
highervegetal fiberbiocomposite, thebetter thedata isgraphically summarised.Forboth
neat PP and biocomposites, an anti-correlation between mechanical properties and
carboxylic acids, ketones and γ-lactones concentration is observed. Therefore, when
materialsareconsideredbytheirhempfiberrate,themechanicalperformanceloss(elastic
modulusandstressat conventionaldeflectiondecrease)couldbe linked to theiroxidative
degradation.Thisanti-correlationwasnotverifiedthankstothepreviousrepresentations.It
canbe supposed thatmechanicalproperties thatmostlybrought informationon the fiber
loading role cannot explain this factor in this analysis since PP, PP10 and PP30 are
dissociated.Also,asmallanglebetweenlightness(L*)andC=Cvibrationband(A4)vectorsis
raised on biocomposites correlation circles. This could witness the contribution of lignin
degradation or surface emergence by the increase of C=C bonds in phenolic structures
responsibletofurtherbleachingduetochromophoresmoleculesgeneration[4,10].
Unlike biocomposites, even if the elasticmodulus of neat PP iswell represented since its
vectortipisclosetothecircle,itdoesnotstronglycontributetoPC1inertiarate.Otherwise,
the higher the fiber rate, the closer to PC2 b* chromatic coordinate is. Hence, b* brings
informationdistincttotheothervariables.

162
Figure8–Influenceofthefiberloading:CorrelationcirclesofPP(a),PP10(b)andPP30(c)
Factorial plans containing individuals are plotted in Figure 9. The oxidation process and
mechanicalperformancelossqualifytheevolutionovertheexposition(PC1)ratherthanthe
type of degradation. This observation reinforces our earlier interpretation. Otherwise,
individualsbelongingtoPP30-GWgroupscorehighonthesecondcomponentwhilePP30-
EW2,PP30-EW3andPP30-EW6scorelow.Thus,thetypeofweatheringismainlyclassified
byb*parameterduetothedifferentratesofyellowingofthebiocompositesoutdoorand
under glass. Indeed, yellowing was assigned to chromophore structures containing
paraquinoneswhoseformationseemstobefavouredunderthehightemperaturesrecorded
under windshield glass. Also, the weathering time factor is better represented since this
evolves from1 to 12months according to the component carrying themost information.
Xc
L*
a*b*
G2
G1
A4
-1.0 -0.5 0.0 0.5 1.0
Fact. 1 : 70.73%
-1.0
-0.5
0.0
0.5
1.0
Fa
ct.
2
: 1
1.7
6% E
s
Sa
A1
A2
A3
s
XcL*
a*
G2
G1
-1.0 -0.5 0.0 0.5 1.0
Fact. 1 : 73.29%
-1.0
-0.5
0.0
0.5
1.0
Fac
t.
2 :
13.6
4%
E
b*
Sa
A1A2
A3
A4
E
s
Xc
L*
a*b*
G2
G1
SaA1
A2
A3
-1.0 -0.5 0.0 0.5 1.0
Fact. 1 : 66.00%
-1.0
-0.5
0.0
0.5
1.0
Fa
ct.
2
: 1
4.0
2%
A4
c)
b)a)
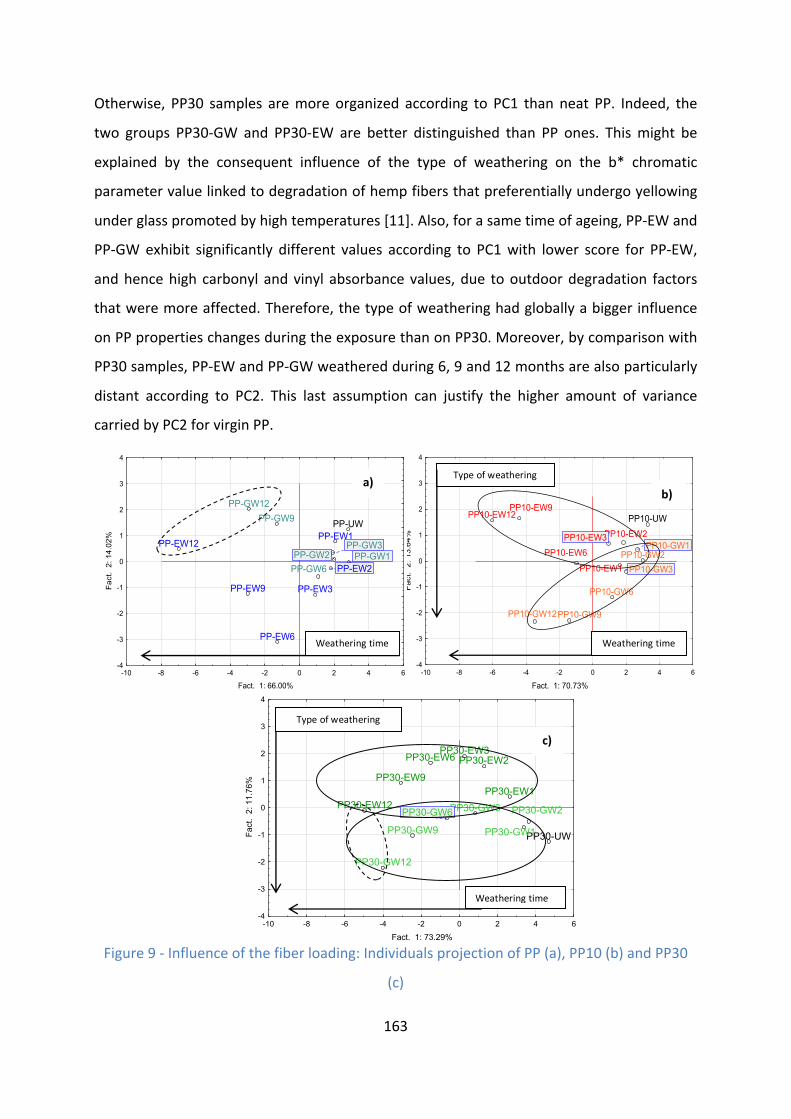
163
Otherwise, PP30 samples aremore organized according to PC1 than neat PP. Indeed, the
two groups PP30-GW and PP30-EW are better distinguished than PP ones. Thismight be
explained by the consequent influence of the type of weathering on the b* chromatic
parametervaluelinkedtodegradationofhempfibersthatpreferentiallyundergoyellowing
underglasspromotedbyhightemperatures[11].Also,forasametimeofageing,PP-EWand
PP-GWexhibit significantly different values according to PC1with lower score for PP-EW,
andhencehighcarbonylandvinyl absorbancevalues,due tooutdoordegradation factors
thatweremoreaffected.Therefore,thetypeofweatheringhadgloballyabiggerinfluence
onPPpropertieschangesduringtheexposurethanonPP30.Moreover,bycomparisonwith
PP30samples,PP-EWandPP-GWweatheredduring6,9and12monthsarealsoparticularly
distant according to PC2. This last assumption can justify the higher amount of variance
carriedbyPC2forvirginPP.
Figure9-Influenceofthefiberloading:IndividualsprojectionofPP(a),PP10(b)andPP30
(c)
PP30-UW
PP30-EW1
PP30-EW2
PP30-EW3PP30-EW6
PP30-EW9
PP30-EW12 PP30-GW3
PP30-GW9
PP30-GW12
-10 -8 -6 -4 -2 0 2 4 6
Fact. 1: 73.29%
-4
-3
-2
-1
0
1
2
3
4
Fact. 2: 11.7
6%
PP30-GW1
PP30-GW2PP30-GW6
Typeofweathering
Weatheringtime
PP10-UWPP10-EW12
PP10-GW2
PP10-GW6
-10 -8 -6 -4 -2 0 2 4 6
Fact. 1: 70.73%
-4
-3
-2
-1
0
1
2
3
4
Fa
ct.
2
: 1
3.6
4%
PP10-EW1
PP10-EW2PP10-EW3
PP10-EW6
PP10-EW9
PP10-GW1
PP10-GW3
PP10-GW9PP10-GW12
PP-UW
PP-EW1
PP-EW3
PP-EW6
PP-EW9
PP-EW12
PP-GW9
PP-GW12
-10 -8 -6 -4 -2 0 2 4 6
Fact. 1: 66.00%
-4
-3
-2
-1
0
1
2
3
4
Fa
ct.
2
: 14
.02
%
PP-EW2
PP-GW1PP-GW2
PP-GW3
PP-GW6
c)
b)a)
Weatheringtime
Typeofweathering
Weatheringtime

164
Treatmentbytimeofweathering
The evolution over the weathering of the relationships between properties and their
contribution to principal components are depicted in Figure 10. The inertia rate of PC1
globallydecreasedthroughouttheweatheringtothebenefitofPC2one.Thus,information
ofdifferentnature isprovided.Atearlystageofexpositiontoclimaticconditions,E,s,A1,
A4,Saontheonehand,andL*,G1,G2ontheotherhand,arerespectivelypositivelyand
negatively correlated with PC1 whereas A3 (γ-lactones) and a* color coordinate are
describedbyPC2.Indeed,at1monthofweathering,A2andA3absorbancevaluesarenotas
much asmeaningful than for previous analyses since the farther to PC1 the variable, the
lowertheinformationratecapturedbythisvariable.However,theyrapidlyjoinPC1.From6
months of exposition, variables linked to the mechanical parameters come off PC1 and
provideinformationthroughPC2.Individualsscoreplotwillbringcomplementaryinsightto
understandthisevolution.
The average roughness is more and more anti-correlated with gloss parameters as the
ageingtimegoeson.Moreover,itisanacknowledgedfactthatthesurfacetopographyhasa
direct impact on brightness [3,42], but Sa preferentially anti-correlates with G2
corresponding to contrast gloss. Thismay be justified through changes in gloss values all
alongtheexposition.Indeed,glossofPP-EWexhibiteddrasticdecreaseinG2between9and
12months whereas G1 remained almost constant. G2 decrease could justify the sudden
increase of roughness parameter at the same period.Moreover, literature data revealed
thatcontrastglosswasintimatelyrelatedtoaverageroughnessandconfirmsourhypothesis
[45]. Similarly, crystallinity degreeXc and carbonyl functional groups absorbance are anti-
correlated after 9 and 12 months whereas Xc headed in the same way as A1 at the
beginning. Indeed, thedecompositionofpolymer chains firstly inducedan increaseof the
degreeofcrystallinityduetochainscissionintheamorphousphasepromotingformationof
short chains which rearrange into a crystalline phase [9,16]. Nevertheless, when chain
scission continues further, the crystalline regions are affected and the crystallinity ratio
decreases due to oxidative degradation whatever the material [30,46]. The unstable and
reactive molecules formed through polymer decomposition oxidized and thus carbonyl
absorptionbandscouldincreasetothedetrimentofthewell-organizedcrystallinephase.

165
Figure10–Influenceoftheweatheringduration:Correlationcirclesafter1(a),2(b),3(c),6(d),9(e)and12(f)monthsofweathering
E s
Xc
L*
a*
b*
G2G1
Sa
A4
-1.0 -0.5 0.0 0.5 1.0
Fact. 1 : 53.38%
-1.0
-0.5
0.0
0.5
1.0
Fa
ct.
2
: 2
2.9
2%
A1
A2
A3
L*
a*
b*G2
G1
-1.0 -0.5 0.0 0.5 1.0
Fact. 1 : 61.95%
-1.0
-0.5
0.0
0.5
1.0
Fact. 2 : 1
7.4
7%
E
s
Xc
Sa
A1
A2 A3
A4
Es
Xc
L*
a*
b*
G2
G1
Sa
A1A2
A3
A4
-1.0 -0.5 0.0 0.5 1.0
Fact. 1 : 51.92%
-1.0
-0.5
0.0
0.5
1.0
Fact. 2 : 2
3.2
5%
Xc
L*
a*
b*
G2
G1
A3
-1.0 -0.5 0.0 0.5 1.0
Fact. 1 : 67.84%
-1.0
-0.5
0.0
0.5
1.0
Fact. 2 : 1
6.5
5%
Es
Sa
A1
A2
A4
Xc
L*
a*
b*
Sa
A2
A3
-1.0 -0.5 0.0 0.5 1.0
Fact. 1 : 64.80%
-1.0
-0.5
0.0
0.5
1.0F
act. 2 : 1
9.1
2%
Es
G2
G1
A1
A4
a) b)
c)
e) f)
Xc
L*
a*
G2
G1
Sa
-1.0 -0.5 0.0 0.5 1.0
Fact. 1 : 52.78%
-1.0
-0.5
0.0
0.5
1.0F
act. 2 : 2
0.0
9%
Es
b*
A1A2
A3A4
d)

166
Scatterplots of individuals byweathering time are reported in Figure 11. After 1, 2 and 3
monthsofexposition,PP30samplespresentlowervaluesonPC1thanPPandPP10onesi.e.
highvaluesinmechanical,C=OandC=Cbonds,roughnessproperties.Thus,theseproperties
demonstrateoxidation and surface aspect alterationdue topresenceof hemp fibers. The
difference between the fiber loadings is better interpreted thanweathering states at the
beginningofexposition. Indeed,atearly stage (1,2,3months),allmaterials spreadalong
PC1whereasPC2differences thestatesofweathering (UW,EW,GW)explainedbya*,A2
and A3. This observation leads us to presume that aldehydes, esters and g-lactones are
particularlyduetoweatheringratherthantheirnaturallyoccurringpresenceinhempfibers
asketonesandcarboxylicacids(PC1).IndeedEWmaterialstakelowscoresonPC2andthus
highvaluesofA2andA3.
However, thedifferentstatesofweatheringtendtoorganizethemselvesaccordingtoPC1
throughout the ageing. So this reversal suggests that the variables linked to PC1
(absorbance, surface aspect including roughness, contrast gloss and crystallinity) further
differentiate the states of thematerials, either non-weathered orweathered, at a higher
degreethanatthebeginning.So,long-termexposureobviouslycausedhigherchangesthat
arebettercharacterizedbyPC1whateverthematerialandtheweatheringtype.AsregardsE
ands,astheyprogresstowardsPC2,non-agedmaterialsalsoprogressivelyspreadoutalong
PC2 whereas EW and GW samples more and more align themselves on PC1. Therefore,
mechanical performancedefines the fiber loadingmainly atnon-weathered state. Indeed,
difference of bulk properties (elastic modulus and conventional deflection stress values),
betweennon-weatheredPP,PP10andPP30isnotable.Onthecontrary,theircarbonyland
vinylbondspeaksandcrystallinityratio,thatarepropertiesmeasuredatthesurface,arenot
sodifferent.This canbeexplainedbyamajorpresenceofpolymermatrixat thematerial
non-aged surface covering vegetal fibers and hence, leading to main analysis of PP
properties. On the contrary, the exposition led to microstructure and absorbance
differentiationbetweenPPandbiocompositesbecauseofemergenceofhempfibersatthe
surface, to thedetrimentofdistinctionbybulkproperties (mechanicalperformance) since
theirvalueswerenotasdifferentasnon-weatheredstatevalues.

167
Nevertheless, the gap between non-weathered andweathered states according to PC1 is
higher than according to PC2 after 9 and 12-month exposition whereas the contrary is
observedafter3and6months.ThiscanbeduetodegreeofcrystallinityandC=Oabsorption
bands relating to PC1, parameters witnessing degradation rather than describing vegetal
fibersrate.
Figure11–Influenceoftheweatheringduration:Individualsprojectionsafter1(a),2(b),3(c),6(d),9(e)and12(f)monthsofweathering
PP10-NEW1
PP10-NGW1
-7 -6 -5 -4 -3 -2 -1 0 1 2 3 4 5 6
Fact. 1: 64.80%
-4
-3
-2
-1
0
1
2
3
4
5
Fact. 2: 19.1
2% PP-UW
PP10-UW
PP30-UW
PP-NEW1
PP30-NEW1PP-NGW1
PP30-NGW1
-7 -6 -5 -4 -3 -2 -1 0 1 2 3 4 5 6
Fact. 1: 67.84%
-4
-3
-2
-1
0
1
2
3
4
5
Fact. 2: 16.5
5%
PP-UW
PP10-UW
PP30-UW PP-NEW2
PP10-NEW2
PP30-NEW2PP-NGW2
PP10-NGW2
PP30-NGW2
PP-UW
PP10-UW
PP-EW12
PP-GW12
PP10-GW12
PP30-GW12
-7 -6 -5 -4 -3 -2 -1 0 1 2 3 4 5 6
Fact. 1: 53.38%
-4
-3
-2
-1
0
1
2
3
4
5
Fact. 2: 22.9
2%
PP30-UW
PP10-EW12
PP30-EW12
PP-UW
PP30-NEW9
-7 -6 -5 -4 -3 -2 -1 0 1 2 3 4 5 6
Fact. 1: 51.92%
-4
-3
-2
-1
0
1
2
3
4
5
Fact. 2: 23.2
5%
PP10-UW
PP30-UW
PP-NEW9
PP10-NEW9
PP-NGW9
PP10-NGW9
PP30-NGW9
PP10-UW
-7 -6 -5 -4 -3 -2 -1 0 1 2 3 4 5 6
Fact. 1: 52.78%
-4
-3
-2
-1
0
1
2
3
4
5
Fact. 2: 20.0
9%
PP-UW
PP30-UW
PP-EW6
PP10-EW6
PP30-EW6
PP-GW6
PP10-GW6
PP30-GW6PP-UW
PP30-UW
PP30-EW3 PP-EW3
PP-GW3PP30-GW3
-7 -6 -5 -4 -3 -2 -1 0 1 2 3 4 5 6
Fact. 1: 61.95%
-4
-3
-2
-1
0
1
2
3
4
5
Fact. 2: 17.4
7%
PP10-UW
PP10-EW3
PP10-GW3
a) b)
c) d)
e) f)

168
Conclusion
Principal Component Analysis (PCA) is a statistical method used to derive underlying
variablesandreducethenumberofdimensionsinordertoconsidermoreeasilyadataset.In
this work, the relationships between properties of neat PP and natural fibers reinforced
compositesweredeterminedand the interpretationof samples groupingwas carriedout.
According to the considered individuals, the measurements brought complementary
information.
The global analysis allowed to give off the main parameters (C=O and C=C maximum
absorbance measured through infrared spectrometry, roughness, bending mechanical
performance) distinguishing the main aggregates corresponding to neat PP and PP
reinforcedby10wt%(PP10)and30wt%(PP30)ofhempfibers.
Thetreatmentaccordingtothetypeofweathering(exteriorEWorunderwindshieldglass
GW) exhibited some differences between correlation profiles meaning that exterior or
indoorconditionsinfluencedlinksexistingbetweentheproperties.Indeed,thisshowedthat
parameters sensitive to high temperature such as b* (blue-yellow chromatic coordinate
measuredthroughspectrocolorimetry)differentiatedageingtimesafterunderglassageing
thanfiberrateswhereasthecontrarywasobservedforexteriorageing.Indeed,b*valueof
EW biocomposites remaining lower than PP one did not significantly change with the
weathering timewhereasa fastyellowingkineticofbiocompositeswasobservedwith the
ageing time. This yellowing can be explained by some by-products formation sensitive to
temperature.
Statisticalcalculationbyseparationofmaterialsbyfiber loadingsshoweddifferentprofiles
ofindividuals. PP30-EW and PP30-GW clusters were well distinguished according to b*
coordinatemeaningthatthemajorparameterdifferentiatingthebiocompositesweathering
conditionsisthevisualaspect(yellowing).However,PP-EWandPP-GWweredifferentiated
bymostofthevariablessuggestingthatthetypeofweatheringhadahigherimpactonthe
globalchangeskineticinpropertiesofPPthanthoseofbiocomposites.Also,asregardslinks
between measured parameters, this representation could allow prediction of mechanical
performancelossthankstocarbonylbandsmonitoring.Also,theintimaterelationshipfound

169
between L* and C-C double bond absorption band including C=C of lignin structure for
biocomposites,confirmedthecontributionoflignindegradationreportedinliterature.
Finally,anevolutionofpropertiesinthecorrelationcirclesandtheircontributiontoprincipal
componentswasobservedovertheweathering.Firstly,thefiberloadingwasdiscriminated
bychemicalbonds,surfaceaspect(roughnessandcontrastgloss)andcrystallinitywhereas
stateofweatheringwas characterizedby these samevariables after long-timeexposition.
Also, itwasnotedthat,contrarytoketonesandcarboxylicacids,aldehydesandg-lactones
species were generated by weathering after short period rather than their naturally
occurring presence in vegetal fibers. After one year, non-weathered PP, PP10 and PP30
samples considered as referencematerialsweremainly distinguished by flexuralmodulus
and conventional deflection stress whereas weathered PP, PP10 and PP30 were
distinguished by surface properties. This was certainly due to bulk properties distinction
favoured at non-weathered state contrary to surface characteristics of materials
differentiatedafterlong-timeexpositionduetomatrixdecomposition.Thus,alongexposure
time accentuated the difference between surface aspects of the threematerials. An anti-
correlationbetweenC=Oabsorptionbandsandcrystallinity ratioobservedafter long-time
weathering was explained by the crystalline phase deterioration under oxidative
degradation. After long-time exposition (9 to 12months), degree of crystallinity and C=O
absorptionbandsalsowitnesseddegradationratherthandistinguishvegetalfibersrate.
Therefore, the use of this statistical tool allowed taking into account 13 quantitative
variablessimultaneouslyanddrawrelationshipsbetweenthematasametime.
References
[1] Grand View Research Inc, Natural fiber composites market analysis and segmentforecaststo2024report,2015.
[2] Flexform,VehicleweightreductionandsafetyconcernsformeetingCAFEstandards,(2012).http://www.naturalfibersforautomotive.com/?p=84(accessedJune1,2017).
[3] C.Badji,L.Soccalingame,H.Garay,A.Bergeret,J.-C.Bénézet,Influenceofweatheringonvisualand surfaceaspectofwoodplastic composites:Correlationapproachwithmechanicalpropertiesandmicrostructure,Polym.Degrad.Stab.137(2017)162–172.doi:10.1016/j.polymdegradstab.2017.01.010.
[4] L.Soccalingame,D.Perrin,J.-C.Bénézet,S.Mani,F.Coiffier,E.Richaud,A.Bergeret,

170
Reprocessing of artificial UV-weathered wood flour reinforced polypropylenecomposites, Polym. Degrad. Stab. 120 (2015) 313–327.doi:10.1016/j.polymdegradstab.2015.07.013.
[5] L.Soccalingame,D.Perrin,J.-C.Bénézet,A.Bergeret,ReprocessingofUV-weatheredwood flour reinforced polypropylene composites: Study of a natural outdoorexposure, Polym. Degrad. Stab. 133 (2016) 389–398.doi:10.1016/j.polymdegradstab.2016.09.011.
[6] A. Le Duigou, P. Davies, C. Baley, Seawater ageing of flax/poly(lactic acid)biocomposites, Polym. Degrad. Stab. 94 (2009) 1151–1162.doi:10.1016/j.polymdegradstab.2009.03.025.
[7] A. Arbelaiz, B. Fernández, J.A. Ramos, A. Retegi, R. Llano-Ponte, I. Mondragon,Mechanicalpropertiesofshortflaxfibrebundle/polypropylenecomposites:Influenceofmatrix/fibremodification, fibrecontent,wateruptakeandrecycling,Compos.Sci.Technol.65(2005)1582–1592.doi:10.1016/j.compscitech.2005.01.008.
[8] C.Rouillon,P.-O.Bussiere, E.Desnoux, S.Collin,C.Vial, S. Therias, J.-L.Gardette, IsCarbonyl Index a quantitative probe to monitor polypropylene photodegradation?,Polym. Degrad. Stab. 128 (2016) 200–208.doi:10.1016/j.polymdegradstab.2015.12.011.
[9] Y. Peng, R. Liu, J. Cao, Y. Chen, Effects of UV weathering on surface properties ofpolypropylenecompositesreinforcedwithwoodflour,lignin,andcellulose,Appl.Surf.Sci.317(2014)385–392.doi:10.1016/j.apsusc.2014.08.140.
[10] S.Butylina,M.Hyvärinen,T.Kärki,Astudyofsurfacechangesofwood-polypropylenecompositesastheresultofexteriorweathering,Polym.Degrad.Stab.97(2012)337–345.doi:10.1016/j.polymdegradstab.2011.12.014.
[11] M.Muasher,M. Sain, The efficacy of photostabilizers on the color changeofwoodfilled plastic composites, Polym. Degrad. Stab. 91 (2006) 1156–1165.doi:10.1016/j.polymdegradstab.2005.06.024.
[12] M.R. Kantz, H.D. Newman, F.H. Stigale, The skin-core morphology and structure-property relationships in injection-molded polypropylene, J. Appl. Polym. Sci. 16(1972)1249–1260.doi:10.1002/app.1972.070160516.
[13] N.M. Stark, L.M. Matuana, Surface chemistry and mechanical property changes ofwood-flour/high-density-polyethylene composites after accelerated weathering, J.Appl.Polym.Sci.94(2004)2263–2273.doi:10.1002/app.20996.
[14] D.Feng,D.F.Caulfield,A.R.Sanadi,Effectofcompatibilizeronthestructure-propertyrelationships of kenaf-fiber/polypropylene composites, Polym. Compos. 22 (2001)506–517.doi:10.1002/pc.10555.
[15] W.Y. Chiang, W.D. Yang, B. Pukánszky, Polypropylene composites. II: Structure-property relationships in two-and three-component polypropylene composites,Polym.Eng.Sci.32(1992)641–648.

171
[16] B.Fayolle,E.Richaud,X.Colin,J.Verdu,Review :degradation-inducedembrittlementin semi-crystalline polymers having their amorphous phase in rubbery state, (2008)6999–7012.doi:10.1007/s10853-008-3005-3.
[17] P.Pagès,F.C.J.Saurina,X.Colom,FTIRandDSCstudyofHDPEstructuralchangesandmechanicalpropertiesvariationwhenexposedtoweatheringagingduringCanadianwinter,J.Appl.Polym.Sci.60(1996)153–159.
[18] X. Yang, X. Ding, Prediction of outdoor weathering performance of polypropylenefilamentsbyacceleratedweatheringtests,Geotext.Geomembranes.24(2006)103–109.doi:10.1016/j.geotexmem.2005.11.002.
[19] G. Akay, T. Tinçer, H.E. Ergöz, A study of degradation of low density polyethyleneunder natural weathering conditions, Eur. Polym. J. 16 (1980) 601–605.doi:10.1016/0014-3057(80)90095-6.
[20] A.Torikai,A.Takeuchi,S.Nagaya,K.Fueki,Photodegradationofpolyethylene :effectof crosslinking on the oxygenated products and mechanical properties, Polym.Photochem.7(1986)199–211.
[21] A. Tidjani, R. Arnaud, A. Dasilva, Natural and accelerated photoaging of linear low-density polyethylene: Changes of the elongation at break, J. Appl. Polym. Sci. 47(1993)211–216.doi:10.1002/app.1993.070470203.
[22] J.S. Fabiyi, A.G. McDonald, M.P. Wolcott, P.R. Griffiths, Wood plastic compositesweathering:Visualappearanceandchemicalchanges,Polym.Degrad.Stab.93(2008)1405–1414.doi:10.1016/j.polymdegradstab.2008.05.024.
[23] J.S. Fabiyi,A.G.McDonald,Degradationofpolypropylene innaturally andartificiallyweathered plastic matrix composites, Maderas. Cienc. Y Tecnol. 16 (2014) 0–0.doi:10.4067/S0718-221X2014005000021.
[24] J.S. Fabiyi, A.G. McDonald, Effect of wood species on property and weatheringperformanceofwoodplasticcomposites,Compos.PartAAppl.Sci.Manuf.41(2010)1434–1440.doi:10.1016/j.compositesa.2010.06.004.
[25] D.Rosu,C.A.Teaca,R.Bodirlau,L.Rosu,FTIRandcolorchangeofthemodifiedwoodasaresultofartificiallightirradiation,J.Photochem.Photobiol.BBiol.99(2010)144–149.doi:10.1016/j.jphotobiol.2010.03.010.
[26] G. Bonifazi, L. Calienno, G. Capobianco, A. Lo, C. Pelosi, R. Picchio, S. Serranti,Modelingcolorandchemicalchangesonnormalandredheartbeechwoodbyre flectance spectrophotometry, Fourier Transform Infrared spectroscopy andhyperspectral imaging, Polym. Degrad. Stab. 113 (2015) 10–21.doi:10.1016/j.polymdegradstab.2015.01.001.
[27] X. Zou, N. Gurnagul, T. Uesaka, J. Bouchard, Accelerated aging of papers of purecellulose: mechanism of cellulose degradation and paper embrittlement, Polym.Degrad.Stab.43(1994)393–402.doi:10.1016/0141-3910(94)90011-6.
[28] N.M.Stark,L.M.Matuana,Ultravioletweatheringofphotostabilizedwood-flour-filled

172
high-density polyethylene composites, J. Appl. Polym. Sci. 90 (2003) 2609–2617.doi:10.1002/app.12886.
[29] N.M.Stark,L.M.Matuana,SurfacechemistrychangesofweatheredHDPE/wood-flourcompositesstudiedbyXPSandFTIRspectroscopy,Polym.Degrad.Stab.86(2004)1–9.doi:10.1016/j.polymdegradstab.2003.11.002.
[30] C. Homkhiew, T. Ratanawilai,W. Thongruang, Effects of natural weathering on theproperties of recycled polypropylene composites reinforcedwith rubberwood flour,Ind.CropsProd.56(2014)52–59.doi:10.1016/j.indcrop.2014.02.034.
[31] J.S.Han,J.S.Rowell,ChemicalCompositionofFibers,in:R.M.Rowell,R.A.Young,J.K.Rowell. (Eds.), Pap. Compos. fromAgro-Based Resour., CRC/Lewis Publishers, 1996:pp.84–134.
[32] J. Acera Fernández, N. Le Moigne, A.S. Caro-Bretelle, R. El Hage, A. Le Duc, M.Lozachmeur, P. Bono, A. Bergeret, Role of flax cell wall components on themicrostructureandtransversemechanicalbehaviourof flax fabricsreinforcedepoxybiocomposites, Ind. Crops Prod. 85 (2016) 93–108.doi:10.1016/j.indcrop.2016.02.047.
[33] ISO 877-1: Plastics -- Methods of exposure to solar radiation -- Part 1: Generalguidance,(2011).
[34] ISO 877-2: Plastics -- Methods of exposure to solar radiation -- Part 2: Directweatheringandexposurebehindwindowglass,(2011).
[35] Pau-Uzein meteorological station, Real-time weather reports, (2016).http://www.infoclimat.fr/observations-meteo/temps-reel/pau-uzein/07610.html(accessedJune16,2017).
[36] Sperling L.H., Introduction to physical polymer science, 4th ed., JohnWiley& Sons,2006.doi:10.1002/0471757128.ch9.
[37] C. Rouillon, P.O. Bussiere, E. Desnoux, S. Collin, C. Vial, S. Therias, J.L. Gardette, Iscarbonyl index a quantitative probe to monitor polypropylene photodegradation?,Polym. Degrad. Stab. 128 (2016) 200–208.doi:10.1016/j.polymdegradstab.2015.12.011.
[38] L. Sisti,G.Totaro,M.Vannini,P.Fabbri, S.Kalia,A.Zatta,A.Celli,Evaluationof theretting process as a pre-treatment of vegetable fibers for the preparation of high-performance polymer biocomposites, Ind. Crops Prod. 81 (2016) 56–65.doi:10.1016/j.indcrop.2015.11.045.
[39] M. Groning, M. Hakkarainen, Headspace solid-phase microextraction with gaschromatography/mass spectrometry reveals a correlation between the degradationproduct pattern and changes in the mechanical properties during thethermooxidation of in-plant recycled polyamide 6,6, J. Appl. Polym. Sci. 86 (2002)3396–3407.doi:10.1002/app.11345.
[40] K.B.Adhikary, S. Pang,M.P. Staiger,AcceleratedUltravioletWeatheringofRecycled

173
Polypropylene--SawdustComposites,J.Thermoplast.Compos.Mater.22(2009)661–679.doi:10.1177/0892705709096550.
[41] ISO2813:Coatings:Determinationofglossvalueat20°,60°and85°,(2014)1–31.
[42] R.Alexander-Katz,R.G.Barrera,Surfacecorrelationeffectsongloss,J.Polym.Sci.36(1997)1321–1334.
[43] L.J.Williams,H.Abdi,PrincipalComponentAnalysis,Wiley Interdiscip.Rev.Comput.Stat.2(2010)433–459.doi:10.1002/wics.101.
[44] J.Gassan,A.K.Bledzki,Thermaldegradationofflaxandjutefibers,J.Appl.Polym.Sci.82(2001)1417–1422.doi:10.1002/app.1979.
[45] W.J.O’Brien,W.M.Johnston,F.Fanian,S.Lambert,Thesurfaceroughnessandglossof composites., J. Dent. Res. 63 (1984) 685–688.doi:10.1177/00220345840630051601.
[46] N.M. Stark, L.M. Matuana, Influence of photostabilizers on wood flour-HDPEcomposites exposed to xenon-arc radiation with and without water spray, Polym.Degrad.Stab.91(2006)3048–3056.doi:10.1016/j.polymdegradstab.2006.08.003.

174

175
CHAPITREIII
VIEILLISSEMENTSOUSVITREPARE-BRISEDE
BIOCOMPOSITESPP/CHANVRE:
ETUDEDEL’ÉMISSIONDECOMPOSÉSORGANIQUES
VOLATILS

176

177
ChapitreIII
Vieillissementsousvitrepare-brisedebiocomposites
PP/chanvre:Etudedel’émissiondeComposésOrganiques
Volatils
Actuellement, un intérêt croissant pour l’impact des émissions de Composés Organiques
Volatils(COV)surlaqualitédel’airintérieurémerge,enparticulierdanslecasdesvéhicules.
Les biocomposites étant de plus en plus intégrés dans les pièces d’habitacles, une étude
quantitativedeleursémissionsdeCOVenconditionsd’usageprésentetoutsonintérêt.En
effet, à notre connaissance, aucune étude de ce type n’est à ce jourété reportée
dans la littérature.
Cechapitrecomprendtroisparties.
La première partie est consacrée à lamesure des émissions de COVpar le polypropylène
(PP)etlesbiocompositesàmatricePPrenforcéedefibresdechanvreaucoursd’uneannée
d’expositionsousvitrepare-brise.L’objectifestd’évaluerl’influencedesfibresvégétalessur
laqualitédel’airintérieuretdedéterminerl’impactdesfacteursenvironnementauxsurles
variations d’émission. Pour cela, un protocole d’échantillonnage des COV émis par les
matériauxprécédemmentdéveloppé au laboratoire a été appliqué. Cette étude amontré
que la présence de renforts végétaux contribue fortement aux émissions de composés
volatils. Après exposition, la présence de fibres végétales a principalement induit des
émissionsdecomposésoxygénéstelsquedesphénols,acidescarboxyliquesetfuranesissus
de la décomposition oxydative de la lignine et de l’holocellulose, en plus des alcanes
provenantdupolypropylène.
Danslalittérature,lesmécanismesdedécompositiondelabiomassesontétudiésàpartirde
l’identificationde sous-produits volatils telsque les furanes issusde ladécompositiondes
carbohydratesstructurant les fibreset identifiésdansce travail. LagénérationdecesCOV
est généralement provoquée par pyrolyse ou par réaction catalytique. Toutefois ces
procédés impliquent des conditions énergétiques favorables à la formation de tels

178
composés,cequin’estpaslecasdanscetteétude.Ainsi,lasecondepartieduchapitreviseà
démontrer que les réactions de Maillard peuvent être extrapolées à des conditions de
vieillissementnaturel.Eneffet, lesprotéineset lessucresnaturellementprésentsdans les
fibreset identifiésen tantqueCOVsontpotentiellement responsablesde la formationde
certains furanes issus de la dégradation thermique. Par ailleurs, des réactions entre les
substancesoxygénées linéaires identifiées au cours de l’expositionont étéproposées afin
d’expliquerlaformationd’autrescomposésfuraniquesidentifiésaucoursduvieillissement.
Ces réactionssontbaséessurdes interactionsmoléculairesentre lescétoneset lesacides
carboxyliquesetfontintervenirdescyclisationsetladéshydratationdesmolécules.
Finalement, latroisièmepartieviseàcorrélerlesprofilsd’émissionsdeCOVdesmatériaux
auxpropriétésdontlesévolutionsaucoursduvieillissementontétéprécédemmentdécrites
(chapitre II).Ainsi, les tauxd’émissionsont inclusdans lecalcul statistiquede l’analyseen
composantesprincipales (ACP) (Cf.Annexe II)et sontmisen relationavec laperformance
mécanique (module, contrainte en flexion), la microstructure (taux de cristallinité) et
l’aspect de surface (couleur, rugosité, brillant). Les liens établis entre la variable
représentant les émissions et celles correspondant aux autres propriétés au cours du
vieillissementsontobtenusàtraversl’interprétationdesprofilsdecorrélationobtenuespar
analysestatistique.L’étudestatistiqueesteffectuéeendistinguantlesdifférentsmatériaux
selonleurtauxdefibres(0,10,30%m)d’unepart,etlesdifférentstempsdevieillissement
d’autre part. Lorsque l’étude statistique est effectuée parmatériau, une relation émerge
entrelesémissionsdeCOVetlaperformancemécanique(moduleetcontrainteàlaflèche
conventionnelle). Ces résultats sont une ouverture au recours de techniques non
destructivespourprédireladuréedeviedesbiocomposites.
Lapremièrepartiedecechapitresousformedepublicationaétésoumisepourpublicationà
Polymer Degradation and Stability. La publication incluse dans la deuxième partie a été
soumise au Journal of Polymers and the Environment. Enfin, la troisième partie est à
soumettreàMacromolecularMaterialsandEngineering.

179

180
CéliaBadji,JoanaBeigbeder,HélèneGaray,AnneBergeret,Jean-CharlesBénézetandValérie
Desauziers
C2MA,EcoledesMinesd’Alès,6AvenuedeClavières,30319,AlèsCedex,France
Abstract
Nowadays, natural fibers reinforced composite materials can be used in closed
environmentssuchascarcabins.Ithashencebecomeanecessitytostudytheiremissionsof
VolatileOrganicCompounds(VOCs)tochecktheirimpactonindoorairquality.Thepurpose
of this work was first to study the emissions of VOCs from hemp fibers reinforced
polypropylene (PP) biocomposites in comparison with neat PP. The influence of under
windshieldglassweatheringonVOCs releasewas then investigated. Theexposition lasted
oneyearandthefiberloadinginfluenceonemissionswasstudiedallalongtheweathering.
The VOCs concentration at the material/air interface was determined using a passive
sampling method involving an emission cell coupled with Solid Phase MicroExtraction
(SPME). VOCs analysis was then carried out by gas chromatography coupled to mass
spectrometry and flame ionization detections. One of the most significant results is the
drastic increase of oxygenated compounds concentration during the exposition, especially
for biocomposites. Among these oxidation by-products, formaldehyde, acetaldehyde,
furfural and 2-furanmethanol, recognized as Cancerogen, Mutagen and toxic for
Reproduction (CMR), were detected. A broad range of alkanes, specific of PP matrix
degradationwasalsoidentified.Finally,measuredconcentrationsofsubstancesfoundinthis
work and listed in Vehicle Indoor Air Quality (VIAQ) standardswere gathered in order to
discussthebiocompositesemissionsimpactonindoorairquality.
Keywords:vegetalfibers,polypropylene,automobile,VolatileOrganicCompoundsemission,
weathering

181
Introduction
Thedevelopmentofnaturalfibersusedasanalternativetoglassfibersinthereinforcement
of thermoplastic polymers has grown as the result of environmental concerns and the
depletion of fossil resources. Indeed, their low density, good specific properties and low
environmental impact make them attractive in fields like automobile and construction
(decking).Moreover,theproductionofnaturalfiberscompositescouldincreasefrom92,000
metrictons(MT)in2012to370,000MTin2020accordingtotheincentives[1].
Concerningautomotivesector,theuseofbiocompositematerialsinvehicleinteriorpartsis
increasinglyseeninreplacementofglassfibersreinforcedcomposites.Theyaremainlyused
incarbinnacleslikedoorpanelsanddashboards.Thermoplasticssuchaspolypropylene(PP)
andbiopolyestersincludingmainlypolylacticacid(PLA)andpolybutylenesuccinate(PBS)are
mainly used as polymermatrices. However, the highlighting of the time spent in vehicles
induces more investigations on the health impact of car interior pieces [2]. Indeed,
transportation is thethirdenvironmentthathumansattendafterhousesandworkplaces,
wheretheyaresubjectedtoindoorairpollution.Moreover,theWorldHealthOrganization
(WHO)hasrecognisedinteriorairpollutionofvehiclesasamajorthreattohumanhealth[3].
Several sources like traffic emissions, tobacco smoke or interiormaterials can result in a
poorbinnacleairquality.Recently,the“SickCarSyndrome”hasbeenhighlightedasaresult
ofthe identificationoftoxicproductsemittedbybinnaclepieces[4].Theyare issuedfrom
thedashboard,doorpanels,seatcoveringsandflooringmaterials.Theycancauseeye,nose
andthroatirritations,allergicskinreactions,headachesandfatigue.EmittedVOCscanalso
beresponsibleforolfactoryannoyanceandcouldlimitenduseapplication[5,6].
Currently, some national regulations and standardizations have been implemented to
improve vehicle interior air quality (VIAQ). Korea government has been one of the first
countriesto manageVIAQguideline.TheyhaveestablishedthenotificationNo.2007-539in
2007 specifying limit concentration levels for 6 substances which are benzene, toluene,
formaldehyde,xylene,ethylbenzeneandstyrenewithlimitlevelsrangingfrom30µg.m-3for
benzene to 1600 µg.m-3 for ethylbenzene [7,8]. After that, a study made by Korea
Automobile Testing&Research Institute showeda significant concentrationdecrease in5
years[9].CarinteriorVOCsemissionsarealsocomingundermorescrutinyinChina.Indeed,

182
the standard GB/T 27630 implemented on 2012 is inspired from the recommendatory
standard guideline for air quality assessment of passenger car issued on 2011 [10]. This
applies the evaluation on binnacle air quality by proposing limit values for the previously
mentioned 6 substances plus acetaldehyde and acrolein. Associations such as Japan
Automobile Manufacturers Association (JAMA) and European Automobile Manufacturers
Association(ACEA)recentlymadeheadwaytoimproveVIAQ[11,12].Forinstance,JAMAhas
drawn up the guideline “vehicle cabin VOC testing methods for passenger cars” for
conducting thenecessaryVOCmeasurements.Nevertheless, the limit concentration levels
are different between each country standard. Indeed, formaldehyde concentration limit
ranges from 100 µg.m-3 in Chinese and Japanese standards to 250 µg.m-3 in Korean
guideline. They only concern whole vehicle assessment whereas threshold values at the
material scale are mostly imposed by automotive industries. In order to propose new
vehiclescomplyingwiththeVIAQlimitvalues,worldwidestandardsdescribingtestmethods
for the determination of VOCs emissions from car trim components are already
implemented.InEurope,ISO12219standardsdescribedifferentprotocolsandscalesforthe
determination of either VOCs concentrations in car indoor air or VOCs emission rate for
materials[13–15].
Lots of studies dealt with pollutants emission in vehicles and the influence of different
parametersontheirconcentrations.Mostofthetime,totalVOCs(TVOCs)concentrationis
alsomeasured, besides individual VOC levels, to evaluate indoor air quality [8,16–20]. In
automotive and building industry, all VOCs whose retention times are between those of
hexane and hexadecane under specific gas chromatographic conditions represent TVOCs
[21]. It was shown that static conditions (parked, unventilated) favored higher TVOCs
concentrationincarcabinsthanspecifieddrivingconditionsandventilation.TVOCslevelwas
decreased from1980µg.m-3 inmoderate-heat (almost40 °C) and static conditions to100
µg.m-3 under 90-minutes driving conditions in a 1997 Ford vehicle [20]. Vehicle age also
playsarole.Indeed,Chiencomparedmeasuredlevelsinnewcarsforspecifiedproductswith
levelsfoundinliterature[18].Itwasobservedthattheycouldbethreeordersofmagnitude
higherthanthoseofoldercars,buttheydecreaseovertime[22].VOCsemissionisstrongly
temperaturedependent [22]butotherparameters like relativehumidity and interior trim
compositions have also an influence. Indeed, leather pieces emit higher quantities than

183
fabricpieceswithabiginfluenceontolueneVIAQconcentrationwhichcanincreaseby39%
[17,18]. The contribution of materials to the VIAQ is therefore very important. That is
highlighted by a study only focused on VOCs emissions from materials [19]. Long-chain
aliphatic hydrocarbons and aromatic compounds, like toluene and xylenes, were mostly
identified and counted for 52 % and 42 % of TVOCs concentration respectively. Other
chemical families like halocarbons, carbonyls and esters were also detected. This kind of
study is not very widespread and to our knowledge, no work is published regarding
emissionsofVOCsemittedbycarinteriorfinishedpartsmadeofbiocomposites.
Vegetal fibersused inbiocompositesareknowntobesensitive face toclimaticconditions
suchasultraviolet (UV)rays,hightemperaturesandhumidity.Physico-chemicalproperties
of natural fillers composites are thereby affected by water absorption and oxidation
reactions leading to mechanical performance loss and chemical composition and visual
aspectchanges[23–30].Someworksdescribedqualitativeandsemi-quantitativeanalysisof
VOCsevolvedfrombiocomposites.AstudyhasbeendoneonemissionsofVOCssampledby
headspace solidphasemicro-extraction (HS-SPME)after a thermal ageingof celluloseand
hempfibersreinforcedpolypropylene(PP)composites[31].DifferentVOCschemicalfamilies
were identified such as aliphatic hydrocarbons, carboxylic acids and alcohols but also
compounds specific to natural fibers like 2-furanmethanol. K.W. Kimet al.workedon the
reduction of TVOCs emission from pineapple and destarched cassava flour reinforced
polylactic acid (PLA) and polybutylene succinate (PBS) biocomposites by the bake-out
process[16].ThestudyinvestigatedtheinfluenceoftemperatureandbakingtimeonTVOCs
emissionfactor.Theynotedafactorincreasewithtemperatureandadecreasewithbaking
time.Otherwise,neatPLAandPBSpresentedloweremissionfactorthanloadedones.Inthe
same line,H.S. Kimet al.workedon the reduction of odor andVOCemissions of vegetal
flourfilledreinforcedPLAandPBScompositesbyincorporatingporousinorganicfillers[32].
Volatileproductsemissionscausedbyhightemperaturemanufacturing liketridecanefrom
thematrixandfurfural frombambooflourweredecreased.Olfactometricanalysescarried
out on natural fillers composites allowed to understand the high responsibility of
oxygenatedcompoundsissuedfromboththepolymerandnaturalfillerstounpleasantodor
[5]. However, no study deals with the VOCs emissions of biocomposites under real
conditionsofusesince the impactofnatural fibercompositesageingonVOCsemission is

184
poorly documented. Indeed, standard measurement methods (e.g. emission chamber
methods)arecomplextoimplementandtimeconsumingforthemonitoringofthetemporal
evolution of VOCs emissions [33,34]. As an alternative, HS-SPME is themostwidely used
technique for sampling VOCs emitted by polymericmaterials [5,31,35–37]. Its advantages
aresimplicityandtimesavingaccordingtoshortextractiontimes.Butthismethodinvolves
material destruction by cutting it in small pieces for introduction in the headspace vial.
Hence, this sampling procedure is not relevant to provide quantitative data related to
surfaceemission.Thesamplingmethodologyusedforthisworkandpreviouslydeveloped,is
based on a home-made emission cell coupled with SPME [38,39]. This simple and non-
destructive passive sampling method allows determining the VOCs concentration at the
material/airinterfacewhichisrelatedtotheemissionratebythefirstFick’slawofdiffusion
understeadystateconditions[39].
This studyaims toassess the impactofVOCsemittedbyhempfibers reinforcedPPonair
qualityandtheinfluenceofmaterialageingonthesesemissionsregardinghempfibersrate
and sampling temperature. A car interior environment was simulated by exposing
laboratory-made materials under windshield glass for one year. Emitted VOCs were
identifiedover theweatheringand their concentrationsat thematerial/air interfacewere
determined.Resultsarediscussednotably intermsofhealth impact.Forthispurpose, the
Europeanregulationclassesofcriticalproductsaccordingtotheir impactonhumanhealth
andtheirconcentrationsweregatheredaswellas limitvaluesalreadyimposed,orat least
advised,byVIAQguidelinesandnationalstandards.
MaterialsandMethods
Materials
PolypropylenegradeH733-07withamelt flow rateof7.5g/10min (230 °C,2.16kg)was
purchasedfromBraskem(SaoPaulo,Brazil)andusedaspolymermatrix.Hempfiberswith
sizeincludedinthe2-6mmrangewereprovidedbyAgroChanvre(Barenton,France).Their
retting lasted 38 days and their cellulose, hemicelluloses, lignin and lipophilic extractives
ratesof82,8,5and3wt%respectivelyweredeterminedbysuccessivechemicalextractions
basedonTAPPIT264,ASTMD1104standards.Twohempfibersloading10wt%(PP10)and

185
30 wt% (PP30) were tested (Table 1).Maleic anhydride grafted polypropylene (MA-g-PP)
with a 1 wt% grafting rate, under the trademark Orevac CA100 and supplied by Arkema
(France),wasaddedat3.1wt%ofPPascouplingagent.
Table1-Designationofmaterials
Composition(wt%)
PP Hempfibers MA-g-PP
PP 100 - -
PP10 87.3 10 2.7
PP30 67.9 30 2.1
Processconditions
Prior toextrusion,hemp fibersandMA-g-PPhavebeendried for15hat60 °C to remove
residualwater.GranulesofPPandMA-g-PPweremixedwithhempfibersinaBC21Clextral
co-rotatingtwin-screwextruder(L/D=36withD=25mm)withthefollowingtemperature
profile 190-190-190-180-175-175-175 °C from feed to die and a screw speed of 220 rpm.
Then, pellets were dried in an air-circulating oven for 3 days at 60 °C. Finally, extruded
pelletswereinjectionmoldedintospecimensinaKraussMaffeiKM50-T180CXat210°Cwith
aninjectionspeedof30cm3.s-1.Squaresamplesof100×100×2mm3wereobtained.
Weathering
SquaresampleswereexposedintheSouthWestofFrance(Pau)underflatwindshieldglass
to simulatecar interiorenvironmentaccording to ISO877-2:2011standard (Figure1).The
expositionpanelswereorientedtowardsSouthat45°withtheground.Interiorenvironment
wasnaturallyventilatedthankstoholeslocatedatthetopandbottomofthestainlesssteel
boxes2hoursperday.TheexposurestartedinSeptember2015andfinishedinSeptember
2016inordertostudylong-termageingeffects.TemperatureT(°C)andrelativehumidityRH
(%) were monitored (Figure 2). The maximum temperature and relative humidity values
reachedovertheweatheringwererespectively89°Cand95%whereastheminimumvalues
were-5°Cand3%.ThreesamplesofeachmaterialPP,PP10andPP30takenafter1,2,3,6,
9and12monthsofexpositionwereanalyzedatthelaboratory.
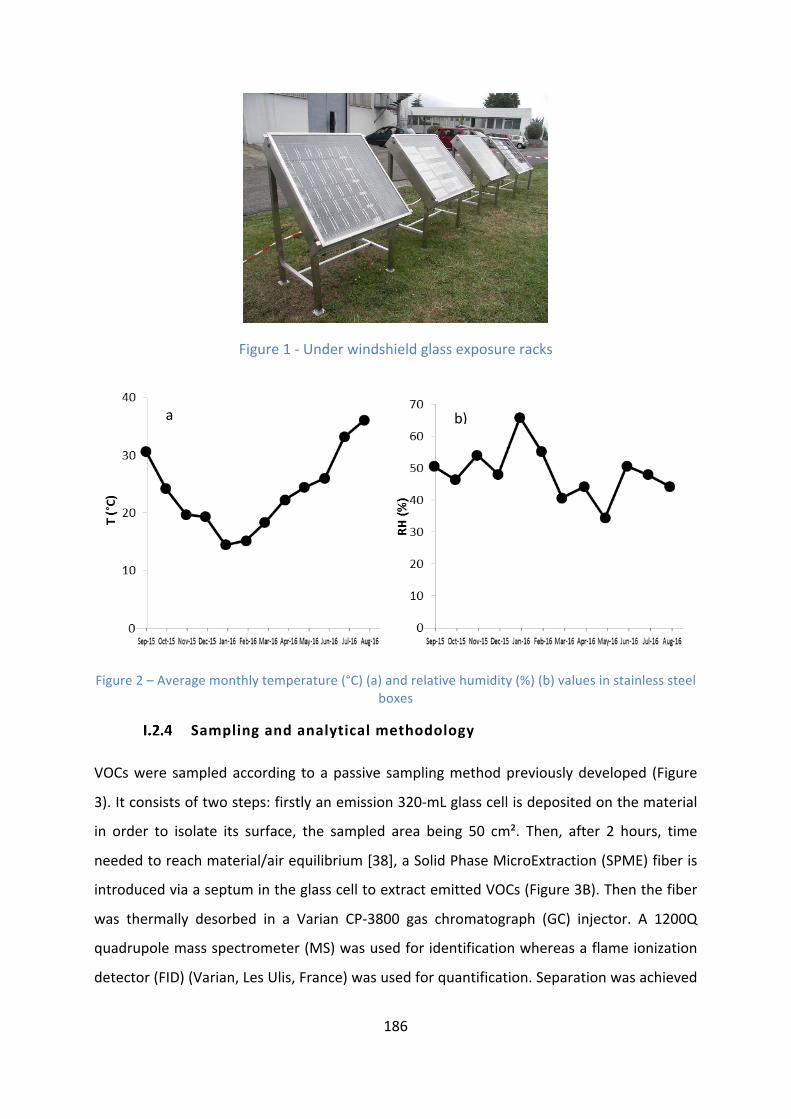
186
Figure1-Underwindshieldglassexposureracks
Figure2–Averagemonthlytemperature(°C)(a)andrelativehumidity(%)(b)valuesinstainlesssteelboxes
Samplingandanalyticalmethodology
VOCswere sampledaccording toapassive samplingmethodpreviouslydeveloped (Figure
3).Itconsistsoftwosteps:firstlyanemission320-mLglasscellisdepositedonthematerial
in order to isolate its surface, the sampled area being 50 cm². Then, after 2 hours, time
neededtoreachmaterial/airequilibrium[38],aSolidPhaseMicroExtraction(SPME)fiberis
introducedviaaseptumintheglasscelltoextractemittedVOCs(Figure3B).Thenthefiber
was thermally desorbed in a Varian CP-3800 gas chromatograph (GC) injector. A 1200Q
quadrupolemassspectrometer(MS)wasusedforidentificationwhereasaflameionization
detector(FID)(Varian,LesUlis,France)wasusedforquantification.Separationwasachieved
a b)

187
usingapolydimethylsiloxane(PDMS)5%phenylcapillarycolumnof60m×0.25mmi.d.x1
µmfilmthickness.Thecompleteanalyticalprocedureisdetailedelsewhere[40].
Twodifferent analyseswere performedonnon-weathered andweathered samples: VOCs
screening to identify and quantify the widest range of emitted compounds, and specific
analysis of formaldehyde and acetaldehyde which are classified as CMR [41]. For VOCs
screening, a polydimethylsiloxane-divinylbenzene-carboxen fiber (PDMS/DVB/CAR, 50/30
µm) was selected. For formaldehyde and acetaldehyde, a polydimethylsiloxane-
divinylbenzene (PDMS/DVB, 65 µm) fiber impregnated with O-(2,3,4,5,6-
pentafluorobenzyl)hydroxylamine hydrochloride (PFBHA) (Fluka, Brucks, Switzerland) was
used [40,42]. The two SPME fibers were purchased by Supelco (Bellefonte, USA). Two
samplingtemperatures,23°Cand80°C,weretestedtosimulateambientandextremecar
interiorconditions.For the two fibers,at23 °C,anextraction time of20minwaschosen
frompreviouswork [43]. At 80°C, an extraction timeof 5minwas determined as a good
compromisebetweensensitivityandshort-timesampling.Allsamplingswereconductedin
triplicatestoevaluatethemeasurementrepeatability.
Figure -Schematicrepresentationoftheemissioncell-SPMEsystem(A:establishmentofthematerial/airequilibrium,B:SPMEsamplingofVOCs)
Quantitativeanalysis
For the screening analysis using PDMS-DVB-CAR fiber, VOCs were quantified as toluene
equivalentusingFIDresponsesinceitis proportionaltotheeffectivecarbonatomsnumber
in the molecule [20]. Standard gas of toluene was generated by a continuous syringe
3

188
injectionsystemsuppliedbyCalibrage(SaintChamas,France)equippedwithasyringepump
(PHD 2000, Harvard Apparatus, Les Ulis, France) [43]. Covered toluene concentrations
rangedfrom17to388µg.m-3forthe20min-samplingand67to1553µg.m-3forthe5min-
sampling. Furfural and 2-furanmethanol, compounds specific to hemp fibers and listed as
CMRsubstances[41]werespecificallyquantified.Standardgaseswerealsogeneratedbya
continuoussyringeinjection,asdescribedabove.
ForthespecificanalysisofformaldehydeandacetaldehydebyPDMS/DVBfiberimpregnated
withPFBHA,standardgasesweregeneratedaccordingtothepermeationmethod[44].The
deviceusedwassuppliedbyCalibrage(SaintChamas,France).
ForthetwoSPMEmethods,theLimitsofDetection(LOD)are intheµg.m-3order level for
the20min-samplingandarearound10µg.m-3for5min-sampling.
ResultsandDiscussion
Chemicalfamiliesevolution
Non-weatheredstate
TheconcentrationofVOCsemittedbynon-weatheredPP,PP10andPP30andsampledby
PDMS/DVB/CAR fiber was measured at two temperatures (23 and 80 °C). The last
temperature was chosen to simulate thermal conditions that could be found in vehicles
facingSouthinsummer.NoVOCwasdetectedbeforeweatheringatambienttemperature.
As expected, a higher temperature promoted the emission of volatile products.However,
some VOCs were detected for all materials at 80 °C. Their levels are shown by chemical
familyinFigure4.AllVOCssurfaceconcentration,whichrepresentstheconcentrationofall
detectedVOCs(PDMS-DVB-CARfiber),increasedwiththehempfibersloadingfrom7±0.6
mg.m-3 forvirginPP to10±1mg.m-3 forPP30atnon-weatheredstate.Thus,hemp fibers
ratehadan influenceonVOCsconcentration.Theseproductswereprobablygeneratedby
the thermo-oxidative degradation during the extreme sampling temperature conditions
during the extrusion and injection molding process. PP mainly emitted aliphatic
hydrocarbons either caused by polymerization defects or thermal degradation of polymer
chainsduringprocessingorsampling.Afewoxygenatedcompoundswerealsoidentifieddue
tothehighprocesstemperatureswhichinducedoxidationofpolymerchains.However,the

189
concentrationofoxygenatedproductslikealcohols,carboxylicacids,ketonesandaldehydes
increased with the fiber loading to the detriment of alkanes. Indeed, some oxygenated
compounds specific to vegetal fiberswere emitted at themg.m-3 level, but also phenolic
compoundsandnitrogencontainingproducts(azines)atabout400µg.m-3and60µg.m-3in
additiontoaliphatichydrocarbonsandoxygenatedVOCsemittedbythematrix.
Figure4-VOCschemicalfamiliesatnonweatheredstate(PDMS/DVB/CARSPMEfiber–samplingat80°C)
Weatheredstates
I.3.1.2.1 Samplingatambienttemperature(23°C)
The material/air interface concentration evolution of VOCs emitted by all materials over
underglassexpositionandanalysedbyPDMS/DVB/CARfiberat23°CisplottedinFigure5.
ThisconcentrationincreasedduringtheweatheringsuggestingthatVOCswereissuedfrom
materialsdegradationduringtheweatheringandcausedbyseveralparameterssuchasUV
raysexposition,temperatureandhighhumidity(Figure2).Onlyketonesandcarboxylicacids
weredetected.Theseoxygenatedfamiliescomefromthepolymerchainsandhempfibers
oxidation under high temperatures and UV rays, key factors favoring free-radical
mechanismsinvolvingreactionswithoxygenfromtheatmosphere[45].

190
For these compounds, the surface concentration increase was more significant for the
highest fiber loading whereas PP exhibited less significant variation. Indeed, oxygenated
compoundslevelincreasedby45timesforPP30whereasit increasedby15timesforneat
PP in11months. ThismeansthatweatheringaffectedmorehempfibersstabilitythanPP
one,demonstratingthattheunderglassweatheringhadabiggerinfluenceondegradation
productsemission frombiocomposites.AsconcernsPP10, itsemission levelwassimilar to
PP one during the first 9months. For instance, the surface concentrations of oxygenated
productsemittedafter6monthsofageingwere22±3µg.m-3and29±14µg.m-3forPPand
PP10respectively.Then, theconcentrationdrastically rose from65to638µg.m-3 forPP10
from9to12months.Otherwise,standarddeviationswerehighafterweathering(until168
µg.m-3forone-yearweatheredPP30)becauseofatemperature inhomogeneity instainless
steelsupportsraisedduringtheexposition.
Figure5-EvolutionofchemicalVOCsovertheweathering(PDMS/DVB/CARSPMEfiber–samplingat23°C)
I.3.1.2.2 Samplingatextremetemperature(80°C)
The total concentration (sumof all chemical families concentrations) evolutionduring the
weatheringofVOCsemittedbyPP,PP10andPP30andsampledat80°C isrepresented in
Figure 6. During the first three-month stage of exposition, global concentrations largely
exceeded values found under ambient conditions whatever theweathering time. Indeed,

191
after3monthsofexposition,allVOCslevelincreasedfrom94±22µg.m-3at23°Cto22196
± 2648µg.m-3 at 80 °C for the highest fiber loading. TheVOCs concentrations for PP and
PP10werequitesimilaranddidnotsignificantlyvarywhereasPP30emittedVOCsathigher
concentrations.Afterthisshortperiod,theconcentrationofVOCsemittedbybiocomposites
drasticallyincreasedby10and5timesforPP10andPP30in10monthswhereasPPemitted
VOCsat thesame level.Thisglobalobservationconfirmsthatnaturalweatheringofhemp
fibersisresponsibletotheVOCsconcentrationvariationdemonstratingthatbiocomposites
aremoresubjectedtoweatherconditions.
TheevolutionofVOCs surfaceconcentrationsmeasuredateach timeofexposition isalso
illustrated by main chemical family. As regards PP, C9-C15 alkanes were among the
predominantVOCspecies sampledall along theweathering.However, ketones,aldehydes
and carboxylic acids proportion increased and represented 28% of VOCs surface
concentration after 1 year. In addition, the substituted phenols detected in virgin PP
identifiedas2,6-bis(1,1-dimethylethyl)phenoland2,6-di-butyl-2,5-cyclohexadiene-1,4-dione
werederivedfromtheIrganoxL140®andIrganox1010®antioxidantsrespectivelyprobably
incorporatedduringmanufacturingprocesstostabilizethepolymerandpreventitsthermo-
oxidation[31].
Higher concentration variations were observed for biocomposites. Indeed, the overall
surfaceconcentrationofoxygenatedcompoundsemittedbyPP30rosefrom10±1mg.m-3at
non-weathered state to 53 ±9mg.m-3 at the finalweathering stage.Moreover, carboxylic
acids and ketones concentrations mostly contributed to the final level. As previously
observed, this drastic increase with weathering time was due to the oxidation of both
polymer and vegetal fibers caused by high temperatures and UV rays effects during the
exposition.Asalreadyseenforambienttemperaturesampling,PP10presentedasameVOCs
emission profile as PP30 after 1 year. This suggests that hemp fibers proportion on PP10
surface could increase with the weathering time to the detriment of polymer matrix.
Moreover, studies reporting the surface topography evolution during an ageing showed a
roughnessincreaseonnaturalfillerscompositessurfacecausedbyfillersproportionincrease
[23,30].
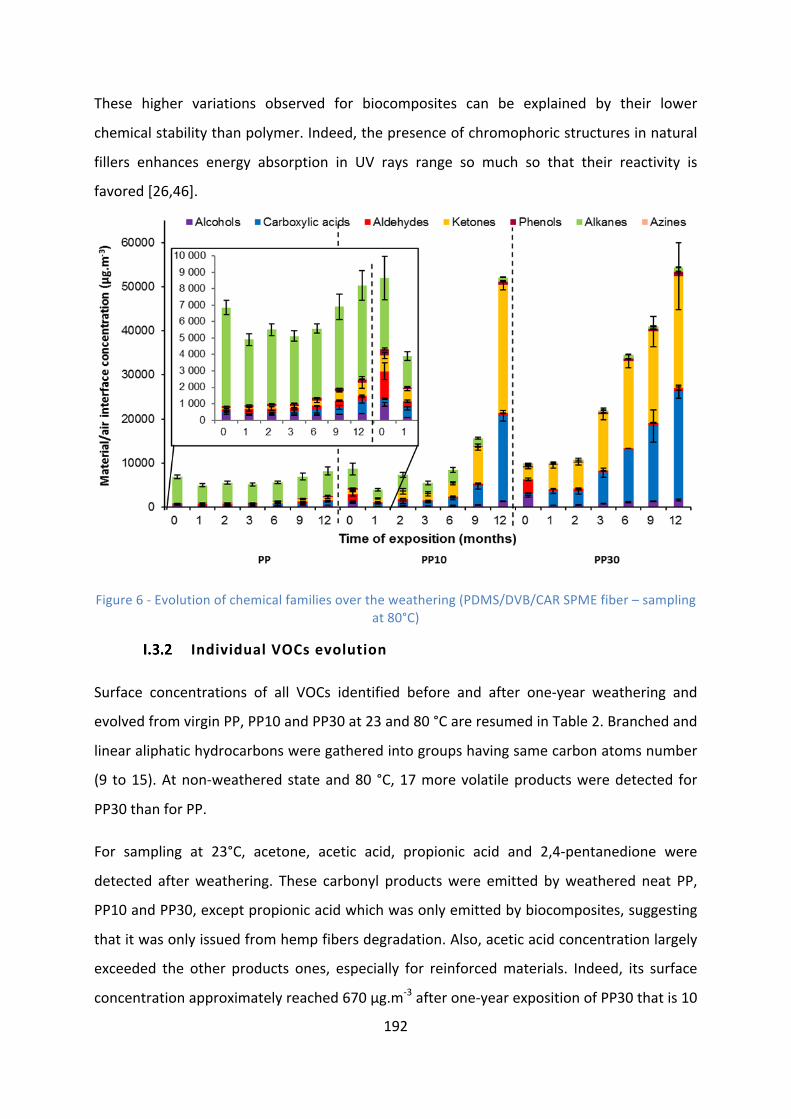
192
These higher variations observed for biocomposites can be explained by their lower
chemicalstabilitythanpolymer.Indeed,thepresenceofchromophoricstructuresinnatural
fillers enhances energy absorption in UV rays range so much so that their reactivity is
favored[26,46].
Figure6-Evolutionofchemicalfamiliesovertheweathering(PDMS/DVB/CARSPMEfiber–samplingat80°C)
IndividualVOCsevolution
Surface concentrations of all VOCs identified before and after one-year weathering and
evolvedfromvirginPP,PP10andPP30at23and80°CareresumedinTable2.Branchedand
linearaliphatichydrocarbonsweregatheredintogroupshavingsamecarbonatomsnumber
(9 to15).Atnon-weatheredstateand80 °C,17morevolatileproductsweredetected for
PP30thanforPP.
For sampling at 23°C, acetone, acetic acid, propionic acid and 2,4-pentanedione were
detected afterweathering. These carbonyl productswere emitted byweathered neat PP,
PP10andPP30,exceptpropionicacidwhichwasonlyemittedbybiocomposites,suggesting
thatitwasonlyissuedfromhempfibersdegradation.Also,aceticacidconcentrationlargely
exceeded the other products ones, especially for reinforcedmaterials. Indeed, its surface
concentrationapproximatelyreached670µg.m-3afterone-yearexpositionofPP30thatis10

193
timeshigherthanacetone.Thisresultcanbeexplainedbyanacidiccatalysisfavoredbythe
presenceof lignin inhempfibersandresulting inareleaseofaceticacidasmajorproduct
[47,48].
For sampling at 80°C, although the compounds nature differed, the number of detected
VOCsdidnot significantly change forPPandPP30beforeandafterweathering. Themost
drastic change was observed for the group of ketones emitted by the biocomposites for
whichlinearandcyclicmoleculesconfigurationswerenotsimilarbetweenunweatheredand
weatheredsamples.Carboxylicacids,whichalso representedaconsiderableproportionof
the overall concentration (37 % and 45% of total concentration for one-year weathered
PP10 and PP30 respectively), were mainly issued from main natural components
decompositionbutprobablyalsofromfattyacidsconstitutingvegetalfillerstoo.
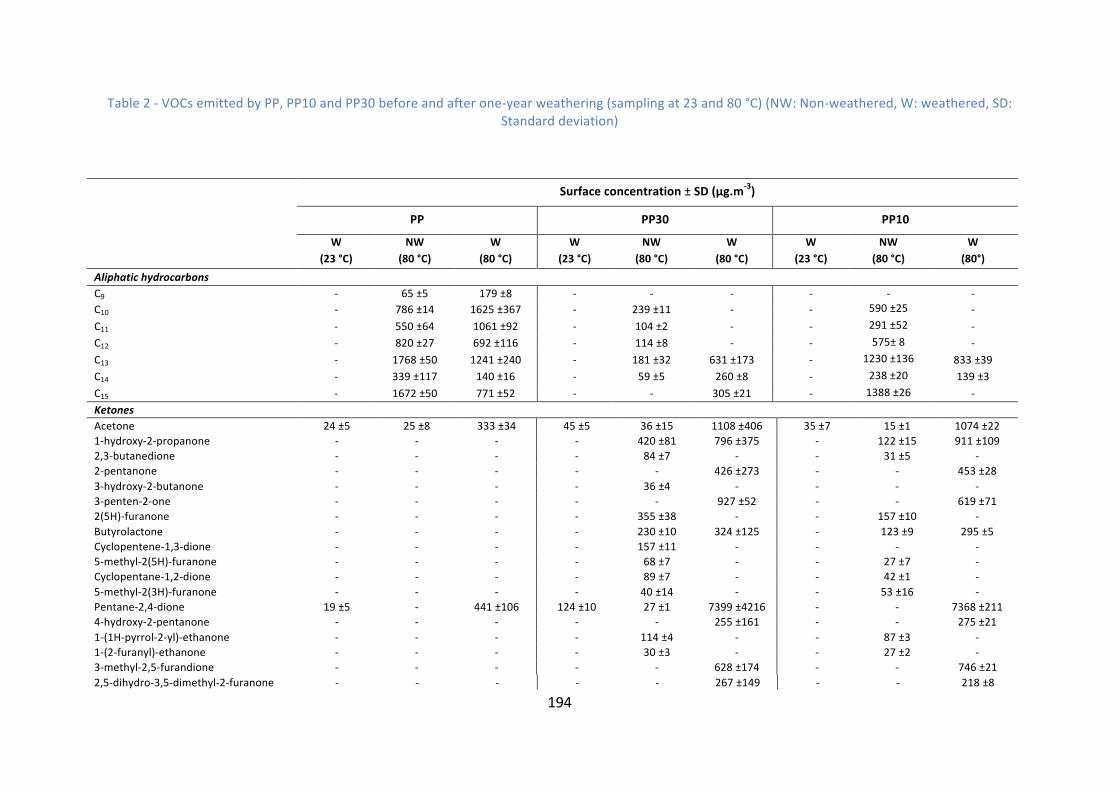
194
Table2-VOCsemittedbyPP,PP10andPP30beforeandafterone-yearweathering(samplingat23and80°C)(NW:Non-weathered,W:weathered,SD:
Standarddeviation)
Surfaceconcentration±SD(µg.m-3)
PP PP30 PP10
W
(23°C)
NW
(80°C)
W
(80°C)
W
(23°C)
NW
(80°C)
W
(80°C)
W
(23°C)
NW
(80°C)
W
(80°)
Aliphatichydrocarbons
C9 - 65±5 179±8 - - - - - -
C10 - 786±14 1625±367 - 239±11 - - 590±25 -
C11 - 550±64 1061±92 - 104±2 - - 291±52 -
C12 - 820±27 692±116 - 114±8 - - 575±8 -
C13 - 1768±50 1241±240 - 181±32 631±173 - 1230±136 833±39
C14 - 339±117 140±16 - 59±5 260±8 - 238±20 139±3
C15 - 1672±50 771±52 - - 305±21 - 1388±26 -
Ketones
Acetone 24±5 25±8 333±34 45±5 36±15 1108±406 35±7 15±1 1074±22
1-hydroxy-2-propanone - - - - 420±81 796±375 - 122±15 911±109
2,3-butanedione - - - - 84±7 - - 31±5 -
2-pentanone - - - - - 426±273 - - 453±28
3-hydroxy-2-butanone - - - - 36±4 - - - -
3-penten-2-one - - - - - 927±52 - - 619±71
2(5H)-furanone - - - - 355±38 - - 157±10 -
Butyrolactone - - - - 230±10 324±125 - 123±9 295±5
Cyclopentene-1,3-dione - - - - 157±11 - - - -
5-methyl-2(5H)-furanone - - - - 68±7 - - 27±7 -
Cyclopentane-1,2-dione - - - - 89±7 - - 42±1 -
5-methyl-2(3H)-furanone - - - - 40±14 - - 53±16 -
Pentane-2,4-dione 19±5 - 441±106 124±10 27±1 7399±4216 - - 7368±211
4-hydroxy-2-pentanone - - - - - 255±161 - - 275±21
1-(1H-pyrrol-2-yl)-ethanone - - - - 114±4 - - 87±3 -
1-(2-furanyl)-ethanone - - - - 30±3 - - 27±2 -
3-methyl-2,5-furandione - - - - - 628±174 - - 746±21
2,5-dihydro-3,5-dimethyl-2-furanone - - - - - 267±149 - - 218±8

195
3-methyl-1,2-cyclopentanedione - - - - 101±17 - - 42±6 -
3-methyl-3-hexen-2-one - - - - - 168±83 - - 127±2
(1-(3,3-dimethyloxiranyl)-ethanone - - - - - 663±27 - - 872±5
3,4-epoxy-3-ethyl-2,3-butanone - - - - - 361±53 - - 313±6
2,5-hexanedione - - - - - 868±107 - - 521±40
1-acetyloxy-2-propanone - - - - 366±11 377±153 - 147±17 451±10
2-pentanone,4-hydroxy-4-methyl - 65±13 82±25 - 87±10 3125±137 - 79±15 3592±82
6-methyl-5-hepten-2-one - - 49±1 - - - - - -
4-methoxy-2-heptanone - - - - - 162±64 - - 189±6
Maltol - - - - 145±19 - - 43±2 -
Levoglucosenone - - - - 97±4 - - 68±9 -
3,4-dimethyl-2,5-furanedione - - - - - 118±32 - - -
2,4,4-trimethylbut-2-enolide - - - - - 1314±20 - - 1990±146
3-ethyl-2-hydroxy-2-cyclopenten-1-one - - - - 72±9 - - - -
5-hydroxy-4,5-dimethyl-2,5-(2H)-
furanone- - - - - 754±118 - - 968±44
3,3-dimethyl-2,4-pentanedione - - - - - 157±55 - - 135±1
1-(2,4-dimethyl-furan-3-yl)-ethanone - - - - - 1063±243 - - 1807±149
3-acetonyl
cyclopentanone- - - - - 1899±70 - - 2324±120
2,4-dihydro-5-hydroxy-3,3,5-trimethyl-
2-furanone- - - - - 303±48 - - 330±18
4-acetonylcyclohexanone - - - - - 277±63 - - 333±5
4,6-dimethyl-2-heptanone - - - - - 361±81 - - 278±2
2-methyl-3-nonanone - - - - - 110±9 - - 85±11
3,6-dimethyloctan-2-one - - - - - 265±56 - - 344±4
6,10-dimethyl-5,9-undecadien-2-one - - - - 48±0 - - - -
4,4,5,5-tetramethyl-2,7-octanedione - - - - - 172±48 - - 212±26
Carboxylicacids
Aceticacid 30±4 26±1 542±61 667±152 397±62 18304±620 452±200 179±74 13008±874
Propionicacid - - - 56±16 - 1403±3 39±4 - 839±75
Crotonicacid - - - - - 3332±612 - - 3682±175
Methacrylicacid - - 120±70 - - - - - -
Hexanoicacid - 24±8 81±25 - 130±8 213±48 - 69±15 199±17
Benzoicacid - - - - 45±6 - - 44±13 -
Heptanoicacid - - - - - 115±15 - - 87±9
Octanoicacid - 25±7 62±4 - 70±10 201±14 43±22 238±1
7-oxooctanoicacid - - - - - 271±26 - - 389±2
Nonanoicacid - - - - - 266±27 - - 304±2

196
Dehydroaceticacid - - - - - 473±55 - - 618±41
Aldehydes
Methacrolein - - - - - 291±44 - - 107±76
Furfural - - - - 1611±20 - - 703±15 -
Furfurylformate - - - - 38±4 - - - -
Furfurylacetate - - - - 43±4 - - - -
5-methylfurfural - - - - 660±30 - - 245±14 -
Benzaldehyde - - - 93±0 77±10 - 28±11
Octanal - 26±6 51±1 - 29±7 54±15 - 27±5 41±3
Nonanal - - - - 160±28 94±14 259±27 149±2
2,4-dimethyl-pentanal - - - - - 64±1 - - 89±9
2-nonenal - - 65±7 - - 27±10 -
Decanal - 89±28 135±1 - 119±30 121±16 - 128±12 146±1
1-(1,1-dimethylethyl)methyl-2-propenal - - - - - 741±71 - - 882±42
Dodecanal - 40±9 57±30 - 63±3 - - 53±8 -
1H-pyrrole-2-carboxaldehyde - - - - 121±22 - - 79±6 -
Vanillin - - - - 159±27 - - - -
Alcohols
2-methyl-2-propen-1-ol - - - - 602±110 - - 293±41
2-furanmethanol - - - - 2319±176 - - 641±89 -
2-ethyl-1-hexanol - 52±11 52±4 - 79±9 176±17 - 101±7 148±1
2-isopropyl-5-methyl-1-heptanol - 206±9 214±1 - 44±1 - - 166±15 -
4-methyl-1,6-heptadien-4-ol - - - - - 832±46 - - 889±23
2-ethyldecanol - - 62±1 - - - - - -
Tridecanol - 63±6 50±4 - - - - - -
2-methyltridecanol - 89±50 26±1 - - - - 59±9 -
Phenols
3,5-dimethylphenol - - - - - 471±75 - - 642±2
2-methoxy-4vinylphenol - - - - 195±28 - - - -
2,6-bis(1,1-dimethylethyl)phenol - 124±7 195±22 - 163±16 120±11 - 392±60 158±7
Furans
2,4-dimethylfuran/2,5-dimethylfuran - - 82±14 - - 2462±143 - - 990±82
Azines
Methylpyrazine - - - - 25±2 - - - -
N-acetyl-4(H)-pyridine - - - - 38±4 - - - -
Non-quantified(N.Q.) -
C15(1VOC) - N.Q. N.Q. - N.Q. N.Q. - N.Q. N.Q.
2,6-di-butyl-2,5-cyclohexadiene-1,4-
dione- N.Q. N.Q. - N.Q. N.Q. - N.Q. N.Q.

197
Polymerby-products
Theevolutionofpolymerderivativesduringtheweathering isdisplayedonFigure7forPP
and PP30. Concerning neat PP, long polymer chains between C9 and C15 were detected.
However,C9,C10andC11alkaneconcentrationsincreasedduringtheageingtothedetriment
ofC14andC15longeralkanes.Thus,thisresultsuggeststhattheweatheringinducedpolymer
chain scissions which favored shorter chains formation. As regards C12 and C13, their
concentration decreased at the first stage of exposition then remained constant for 11
months.
Asobservedpreviously,PP30emittedalkanesatlowerconcentrations.However,C13,C14and
C15 levels increased during the expositionwhereas C9,C10 andC12 alkaneswere no longer
detected. This may be due to polymer derivatives emission hindrance at non-weathered
state caused by the presence of physical entanglement of hemp fibers. Then, the
degradation of vegetal fibers leads to fibers network overthrow inducing increase of long
alkanesemissionwithweatheringtime.
Figure7–VariationsofalkanesemissionsforPP(a)andPP30(b)overtheweathering(PDMS/DVB/CARSPMEfiber–samplingat80°C)
Celluloseandhemicellulosesby-products

198
TheevolutionofVOCsissuedfromcelluloseandhemicellulosesdegradationwasindividually
followed. Their surface concentrations variations measured for the highest fiber loading
biocompositearerepresentedinFigure8forfuranandcycloketoneproducts.
Some products like furfural (1.6 ±0.0 mg.m-3) and 2-furanmethanol (2.3 ±0.2 mg.m-3),
present for unaged samples, were no longer detected after the weathering of
biocomposites. Other furans were emitted and, contrary to non-weathered state, mainly
methylsubstitutedfuranonesappeared.After6monthsofweathering,theirconcentrations
stagnated except for dimethylfuran, the lightest furan molecule, increasing all along the
ageing. This last trend can be explained by a reaction equilibrium favored towards short
carbonyl fragments formation, continually increasing, rather than furanone derivatives
formation.Also, thehigher temperaturesobservedduring the secondhalf-yearexposition
(Figure2)couldfavorshorterproductsemissionsduetolong-termdegradationfavoringlow
molecularweight products emission. However, the rising release of dimethylfuran can be
dueto,contrarytootherfuranmolecules,thecontributionofpolymermatrixtothisproduct
emissioninadditiontohempfibers[49].
As regards cyclic alkaneproducts, twoacetonyl substituted cyclic ketone substanceswere
formedduringtheageing.Otherwise,3-acetonylcyclopentanonewasthemainVOCreleased
amongallsubstancesbelongingtothisgroupofcompounds.Thismoleculepresentingreat
quantity(almost2mg.m-3after1year)issupposedtomainlyoriginatefromcellulosesource
ratherthanhemicelluloses[47,50].Moreover,thelowerthermalstabilityofhemicelluloses
maymainlyimplyvolatileproductsformationatthefirststageofexposition.
Ligninby-products
Phenolicmonomeric products emitted by PP30were linked to the thermal breakdown of
lignin, amorphous cross-linked phenolic polymer contained in vegetal fibers (Figure 8).
Whatever the weathering duration, phenolic molecules concentrations are lower than
carbohydratesderivedVOCs.Itmaybeexplainedbythelowerproportionofligninpresentin
hempfibers,whichapproximatelyaccountsforlessthan10wt%whereastheholocellulose
part almost represents 85 wt% [51,52]. Moreover, hemp fibers having undergone a long
rettingtimetofacilitateseparationofthefiberfromthestem,itcouldleadtoalowerlignin
199
proportionsincechromophorespresentinligninaresensitivetorettingparameterssuchas
solarradiation[53–55].
Methoxysubstitutedphenolgroupslike4-hydroxy-3-methoxybenzaldehyde(vanillin)and2-
methoxy-4-vinylphenol (4-vinylguaiacol) disappeared after weathering. These compounds
wereoriginatedfroma ligninprimarydecomposition[56].3,5-dimethylphenol,which isan
alkyl substituted aromatic ring, replaced them after ageing as secondary decomposition
product.Thelastoneinvolvesreactionsinvaporphaseorheterogeneousgas/solidreactions
whereas primary reactions occur in solid phase. Indeed, bonds cleavage of preformed
guaiacolstructurescaninducealkylsubstitutedphenolsformation.

200
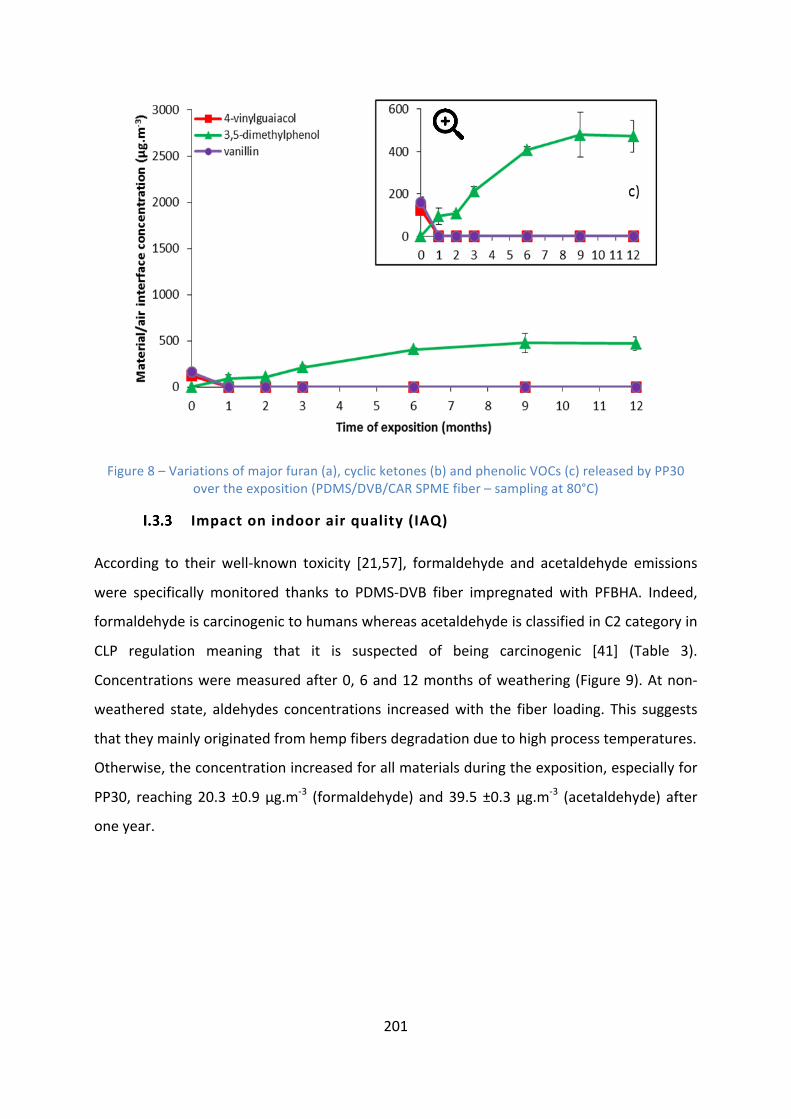
201
Figure8–Variationsofmajorfuran(a),cyclicketones(b)andphenolicVOCs(c)releasedbyPP30overtheexposition(PDMS/DVB/CARSPMEfiber–samplingat80°C)
Impactonindoorairquality(IAQ)
According to their well-known toxicity [21,57], formaldehyde and acetaldehyde emissions
were specifically monitored thanks to PDMS-DVB fiber impregnated with PFBHA. Indeed,
formaldehydeiscarcinogenictohumanswhereasacetaldehydeisclassifiedinC2categoryin
CLP regulation meaning that it is suspected of being carcinogenic [41] (Table 3).
Concentrationsweremeasuredafter0,6and12monthsofweathering(Figure9).Atnon-
weathered state, aldehydes concentrations increasedwith the fiber loading. This suggests
thattheymainlyoriginatedfromhempfibersdegradationduetohighprocesstemperatures.
Otherwise,theconcentrationincreasedforallmaterialsduringtheexposition,especiallyfor
PP30, reaching20.3±0.9µg.m-3 (formaldehyde) and39.5±0.3µg.m-3 (acetaldehyde) after
oneyear.

202
Figure9–Formaldehyde(spheres)andacetaldehyde(squares)surfaceconcentrationsovertheweathering(blue:PP,red:PP10,green:PP30)(PDMS/DVBSPMEfiberimpregnatedwithPFBHA–
samplingat23°C)
Recently, the vehicle indoor air quality (VIAQ) has been getting extensive attention as a
resultof varioushazardous substancesdetection.Hence, thispart focuseson thepossible
toxicityornoxiousnessofsomeidentifiedproducts.
Furfural (2-furaldehyde) and2-furanmethanol (furfuryl alcohol), emittedby biocomposites
at high surface concentration in high-heat conditions (1.6 ±0.0 and 2.3 ±0.2 mg.m-3
respectively for PP30), are classified in C2 category (Table 3). Nevertheless, the
biocomposites weathering induced their disappearance and would thus no longer have
negative effects. Other substituted furan compounds appeared and could be of concern
since furanmolecule ispresentedasaC1BM2.Also,alkanesreleasedathigh levelbythe
polymerheatedat80°CarealsoclassifiedinC1Bcategory.Otherwise,phenolscomingfrom
lignin component are notified as impacting organic pollutants and are classified as of
concern.

203
Table3-CLPregulationofharmfulsubstances(C1B:carcinogenic,M2:suspectedtobemutagenic,C2:suspectedtobecarcinogenic,M3:substanceofconcerninreasonofpossiblemutageniceffects)
Substances CMRclassification
Formaldehyde C1BM2
Acetaldehyde C2
Furan C1BM2
2-furaldehyde C2
Furfurylalcohol C2
C12-C26branchedandlinearalkanes C1B
Phenols M3
Table4resumesformaldehyde,acetaldehydeandTVOCssurfaceconcentrationsdetermined
in this study. Limit values of indoor concentrations given by existing VIAQ guidelines and
standardsweregatheredinTable5.Onlyformaldehydeandacetaldehydeareconcerned.It
shouldbenoticedthatthedata fromtables4and5cannotbedirectlycompared. Indeed,
therelationshipbetweenindoorairconcentrationandsurfaceconcentrationofapollutantis
deducedfromthefirstFick’slawofdiffusionandisgivenbyequation1,consideringthatthe
studied indoor environment (e.g. the car cabin) behaves as a continuous stirred reactor
operatinginsteadystateconditions[38].
!"# = ℎ"#&#
'()*"# − )")
Eq.1
withhij the convectivemass transfer coefficientof pollutant i through theboundary layer
over thematerial j (m.s-1),Aj the surface areaof thematerial j (m²),V the volumeof the
studied indoor environment (m3), Csij the concentration of the pollutant i at thematerial
surfaceandCitheaverageindoorairconcentrationofthepollutanti(µg.m-3).
Table 4 shows that surface concentrations of aldehydes slightly increased over the
weathering but they are always lower than their respective indoor concentration limits.
Hence, thematerials studiedherecanbeconsideredasvery lowemissive regarding these
compoundsandtheywouldcomplywiththecurrentVIAQregulations.
Currently, no VIAQ standard or guideline has been found preconizing TVOCs limit
concentration.However,asreportedintheintroductorypart,TVOCsindoorconcentrationis
an indicator of health effects. Relationship between TVOCs levels found in indoor air and

204
discomfort felt by individuals has been investigated through epidemiological studies [58].
Four exposure ranges were proposed that are a comfort (< 20 µg.m-3), a multifactorial
exposure (20-300µg.m-3), a discomfort (300-25,000µg.m-3), and a toxic (> 25,000µg.m-3)
ranges. Weathered PP10 and PP30 can imply possible irritation and discomfort if other
exposures interact according to this dose-response model. However, all materials may
potentiallycausemoresevereeffectswhentheyareheatedat80°C.Thisassumptionshould
be moderated by the fact that biocomposites are generally implemented with other
materials (for example, door panels). Thus, linings and coatings may act as barrier and
reduce biocomposite emission in indoor air, as observed for other material assemblies
[59,60].
Table4-Formaldehyde,acetaldehydeandTVOCslevels(ST:samplingtemperature)
Table5-Guidelineandrecommendedstandardlimitvalues
Conclusion
The weathering had a higher impact on the evolution of VOCs types and emitted
concentrationsofbiocompositesthanofneatPP.VOCsemissionlevelwasinfluencedbythe
samplingtemperatureforallmaterials.Thisdemonstratesthe importanceofventilation in
ST(°C)
Surfaceconcentration(µg.m-3)
Beforeweathering Afterweathering
PP PP10 PP30 PP PP10 PP30
Formaldehyde 23 2.8 2.24 6.9 16.2 14.7 20.3
Acetaldehyde 23 - 5.1 14.1 4.6 9.1 39.5
TVOCs23 - - - 19 112 124
80 6342 8322 9267 7676 35284 30849
VIAQlimitvalues(µg.m
-3)
JAMA(Japan)
GB/T27630(China)
No2007-539(Korea)
Formaldehyde 100 100 250
Acetaldehyde 48 50 -
TVOCs - - -

205
case of car interior end-use under hot climatic conditions. At non-weathered state, the
greaterthefiberloadingwas,thehighertheVOCssurfaceconcentrationwas.Moreover,the
VOCs emission drastically increased for the highest loading (PP30) after 12 months of
weathering. Oxygenated products mostly contributed to the weathered biocomposites
emission concentration, demonstrating an oxidative degradation due to UV radiation and
hightemperatures.
AllproductstoxicitywascheckedandapotentialimpactonVIAQwasnotedbecauseofthe
release of some products issued from both PP and vegetal fibers. Even if their
concentrations satisfywith current VIAQ regulation, this emphasizes a drawback of these
fibersreinforcedpolymersregardingtheiruseinindoorenvironmentsbecauseofthehigher
concentrationofhazardousVOCsemittedbybiocompositesthanvirginPP.TheTVOCslevel,
which considerably increasedwithweathering time, the temperature and the hemp fiber
rate,indicatedthathealtheffectsbyexpositiontoheatedagedbiocompositescouldbecome
of greater concern. Nevertheless, biocomposites in vehicles are generally implemented in
materialsassembliesandpossiblebarriereffectscouldreducetheimpactonVIAQ.
Otherwise, VOCs emissions characterization can be a useful way for understanding
degradationmechanismsexplainingtheformationoftheidentifiedproductsissuedfromthe
polymer matrix and the carbohydrates and lignin decomposition. This last topic will be
treatedinanotherpaper.
Acknowledgements
This research did not receive any specific grant from funding agencies in the public,
commercial,ornot-for-profitsectors.
References
[1] NovaInstitut,FeatureWindEnergy,JECCompos.Mag.(2015)18–19.
[2] D.Müller,D.Klingelhöfer,S.Uibel,D.aGroneberg,Carindoorairpollution-analysisofpotential sources., J.Occup.Med.Toxicol.6 (2011)33.doi:10.1186/1745-6673-6-33.
[3] X.Chen,G.Zhang,H.Chen,Controllingstrategiesandtechnologiesofvolatileorganiccompounds pollution in interior air of cars, Proc. - 2010 Int. Conf. Digit. Manuf.Autom.ICDMA2010.1(2010)450–453.doi:10.1109/ICDMA.2010.375.
[4] MCS-Aware, Sick Car Syndrome, (2015). http://www.mcs-aware.org/general-

206
articles/189-sick-car-syndrome.
[5] J.S. Félix, C. Domeño, C. Nerín, Characterization of wood plastic composites madefrom landfill-derived plastic and sawdust: volatile compounds and olfactometricanalysis,WasteManag.33(2013)645–55.doi:10.1016/j.wasman.2012.11.005.
[6] K.Sakakibara,K.Kaitani,C.Hamada,S.Sato,M.Matsuo,Analysisofodorincarcabin,JSAERev.20(1999)237–241.doi:10.1016/S0389-4304(98)00073-3.
[7] Underwriters Laboratories UL LLC, Vehicle Interior Air Quality: Addressing ChemicalExposureinAutomobiles,(2015).
[8] H. Kim, B. Lee, S. Choi, Sustainable biocomposites for automotive interior parts, in:18THInt.Conf.Compos.Mater.,n.d.
[9] Korean Automobile Testing & Research Institute, Proposal for Vehicle Indoor AirQuality(VIAQ),GRPE-69-28,n.d.
[10] Ministry of environmental protection, GB/T 27630-2011 Chinese national standard:Guidelineforairqualityassesmentofpassengercar,(2011).
[11] JAMA, Announces Voluntary Guidelines for Reducing Vehicle Cabin VOCConcentrationLevels,2005.http://www.jama-english.jp/.
[12] EuropeanAutomobileManufacturersAssociation,(n.d.).http://www.acea.be/.
[13] ISO 12219-1: Whole vehicle test chamber — Specification and method for thedeterminationofvolatileorganiccompoundsincabininteriors,(2012).
[14] ISO 12219-2: Screening method for the determination of the emissions of volatileorganiccompoundsfromvehicleinteriorpartsandmaterials—Bagmethod,(2012).
[15] ISO 12219-3: Screening method for the determination of the emissions of volatileorganiccompoundsfromvehicleinteriorpartsandmaterials—Micro-scalechambermethod,(2012).
[16] K.-W.Kim,B.-H.Lee,S.Kim,H.-J.Kim,J.-H.Yun,S.-E.Yoo,J.R.Sohn,ReductionofVOCemission from natural flours filled biodegradable bio-composites for automobileinterior,J.Hazard.Mater.187(2011)37–43.doi:10.1016/j.jhazmat.2010.07.075.
[17] B. Xu, Y.Wu, Y.Gong, S.Wu, X.Wu, S. Zhu, T. Liu, Investigationof volatile organiccompoundsexposureinsidevehiclecabinsinChina,Atmos.Pollut.Res.7(2015)215–220.doi:10.1016/j.apr.2015.09.005.
[18] Y.C.Chien,Variationsinamountsandpotentialsourcesofvolatileorganicchemicalsinnew cars, Sci. Total Environ. 382 (2007) 228–239.doi:10.1016/j.scitotenv.2007.04.022.
[19] T. Yoshida, I. Matsunaga, A case study on identification of airborne organiccompounds and time courses of their concentrations in the cabin of a new car forprivateuse,Environ.Int.32(2006)58–79.doi:10.1016/j.envint.2005.04.009.

207
[20] M.J. Fedoruk, B.D. Kerger, Measurement of volatile organic compounds insideautomobiles, J. Expo. Anal. Environ. Epidemiol. 13 (2003) 31–41.doi:10.1038/sj.jea.7500250.
[21] S. Kim, J.-A. Kim, H.-J. Kim, S. Do Kim, Determination of formaldehyde and TVOCemissionfactorfromwood-basedcompositesbysmallchambermethod,Polym.Test.25(2006)605–614.doi:10.1016/j.polymertesting.2006.04.008.
[22] S. Overton, J. Manura, Identification of volatile organic compounds in a newautomobile,Sci.Instrum.Serv.(1999)1–6.
[23] Y. Peng, R. Liu, J. Cao, Characterization of surface chemistry and crystallizationbehaviour of polypropylene composites reinforced with wood flour, cellulose, andlignin during accelerated weathering, Appl. Surf. Sci. (2015).doi:10.1016/j.apsusc.2015.01.147.
[24] J.S. Fabiyi, A.G. McDonald, M.P. Wolcott, P.R. Griffiths, Wood plastic compositesweathering:Visualappearanceandchemicalchanges,Polym.Degrad.Stab.93(2008)1405–1414.doi:10.1016/j.polymdegradstab.2008.05.024.
[25] O. Gil-Castell, J.D. Badia, T. Kittikorn, E. Strömberg, A. Martínez-Felipe, M. Ek, S.Karlsson, A. Ribes-Greus, Hydrothermal ageing of polylactide/sisal biocomposites.Studies of water absorption behaviour and Physico-Chemical performance, Polym.Degrad.Stab.108(2014)212–222.doi:10.1016/j.polymdegradstab.2014.06.010.
[26] M.Z. Ahmad Thirmizir, Z. a. Mohd Ishak, R. Mat Taib, S. Rahim, S. Mohamad Jani,NaturalWeathering of Kenaf Bast Fibre-Filled Poly(Butylene Succinate) Composites:EffectofFibreLoadingandCompatibiliserAddition,J.Polym.Environ.19(2010)263–273.doi:10.1007/s10924-010-0272-2.
[27] D. Chen, J. Li, J. Ren, Influenceof fiber surface-treatmenton interfacial property ofpoly(l-lactic acid)/ramie fabric biocomposites under UV-irradiation hydrothermalaging, Mater. Chem. Phys. 126 (2011) 524–531.doi:10.1016/j.matchemphys.2011.01.035.
[28] L.Soccalingame,D.Perrin,J.-C.Bénézet,S.Mani,F.Coiffier,E.Richaud,A.Bergeret,Reprocessing of artificial UV-weathered wood flour reinforced polypropylenecomposites, Polym. Degrad. Stab. 120 (2015) 313–327.doi:10.1016/j.polymdegradstab.2015.07.013.
[29] L.Soccalingame,D.Perrin,J.-C.Bénézet,A.Bergeret,ReprocessingofUV-weatheredwood flour reinforced polypropylene composites: Study of a natural outdoorexposure, Polym. Degrad. Stab. 133 (2016) 389–398.doi:10.1016/j.polymdegradstab.2016.09.011.
[30] C.Badji,L.Soccalingame,H.Garay,A.Bergeret,J.-C.Bénézet,Influenceofweatheringonvisual and surfaceaspectofwoodplastic composites:Correlationapproachwithmechanical properties and microstructure, Polym. Degrad. Stab. (2017).doi:10.1016/j.polymdegradstab.2017.01.010.

208
[31] A.Espert,L.a.delasHeras,S.Karlsson,Emissionofpossibleodourouslowmolecularweight compounds in recycled biofibre/polypropylene composites monitored byhead-space SPME-GC–MS, Polym. Degrad. Stab. 90 (2005) 555–562.doi:10.1016/j.polymdegradstab.2005.03.009.
[32] H.-S. Kim, B.-H. Lee, H.-J. Kim, H.-S. Yang,Mechanical–Thermal Properties and VOCEmissions of Natural-Flour-Filled Biodegradable Polymer Hybrid Bio-Composites, J.Polym.Environ.19(2011)628–636.doi:10.1007/s10924-011-0313-5.
[33] ISO 16000-9: Indoor air -- Part 9: Determination of the emission of volatile organiccompoundsfrombuildingproductsandfurnishing--Emissiontestchambermethod,(2006).
[34] ISO 16000-6: Indoor air -- Part 6: Determination of volatile organic compounds inindoor and test chamber air by active sampling on Tenax TA sorbent, thermaldesorptionandgaschromatographyusingMSorMS-FID,(2011).
[35] Ó. Ezquerro, B. Pons, M.T. Tena, Development of a headspace solid-phasemicroextraction–gas chromatography–mass spectrometry method for theidentification of odour-causing volatile compounds in packaging materials, J.Chromatogr.A.963(2002)381–392.doi:10.1016/S0021-9673(02)00211-X.
[36] J.Salafranca,I.Clemente,F. Isella,C.Nerín,O.Bosetti, Influenceofoxygenandlongtermstorageontheprofileofvolatilecompoundsreleasedfrompolymericmultilayerfoodcontactmaterialssterilizedbygamma irradiation,Anal.Chim.Acta.878 (2015)118–130.doi:10.1016/j.aca.2015.03.055.
[37] P. Kusch, G. Knupp, Headspace-SPME-GC-MS Identification of Volatile OrganicCompoundsReleasedfromExpandedPolystyrene,12(2004)83–87.
[38] D.Bourdin,P.Mocho,V.Desauziers,H.Plaisance,Formaldehydeemissionbehaviorofbuildingmaterials:on-sitemeasurementsandmodelingapproachtopredictindoorairpollution.,J.Hazard.Mater.280(2014)164–73.doi:10.1016/j.jhazmat.2014.07.065.
[39] V. Desauziers, D. Bourdin, P. Mocho, H. Plaisance, Innovative tools and modelingmethodology for impactpredictionandassessmentof the contributionofmaterialsonindoorairquality,Herit.Sci.3(2015)1.doi:10.1186/s40494-015-0057-y.
[40] D. Bourdin, V. Desauziers, Development of SPME on-fiber derivatization for thesamplingofformaldehydeandothercarbonylcompoundsinindoorair,Anal.Bioanal.Chem.406(2014)317–328.doi:10.1007/s00216-013-7460-6.
[41] Chemical Risk Prevention Unit, CNRS, European harmonised classification andlabelling of carcinogenic, mutagenic and toxic for reproduction (CMR) substancesaccordingtothecriteriaoftheCLPRegulation,(2015).
[42] J.A.Koziel,J.Noah,J.Pawliszyn,Fieldsamplinganddeterminationofformaldehydeinindoor airwith solid-phasemicroextraction andon-fiberderivatization, Environ. Sci.Technol.35(2001)1481–1486.doi:10.1021/es001653i.
[43] J.Nicolle,V.Desauziers,P.Mocho,Solidphasemicroextractionsampling fora rapid

209
and simple on-site evaluation of volatile organic compounds emitted from buildingmaterials,J.Chromatogr.A.1208(2008)10–15.doi:10.1016/j.chroma.2008.08.061.
[44] V. Desauziers, Traceability of pollutant measurements for ambient air monitoring,TrendsAnal.Chem.23(2004)252–260.doi:10.1016/S0165-9936(04)00310-3.
[45] Y. Peng, R. Liu, J. Cao, Y. Chen, Effects of UV weathering on surface properties ofpolypropylenecompositesreinforcedwithwoodflour,lignin,andcellulose,Appl.Surf.Sci.317(2014)385–392.doi:10.1016/j.apsusc.2014.08.140.
[46] G. Bonifazi, L. Calienno, G. Capobianco, A. Lo, C. Pelosi, R. Picchio, S. Serranti,Modelingcolorandchemicalchangesonnormalandredheartbeechwoodbyre flectance spectrophotometry, Fourier Transform Infrared spectroscopy andhyperspectral imaging, Polym. Degrad. Stab. 113 (2015) 10–21.doi:10.1016/j.polymdegradstab.2015.01.001.
[47] Y.Peng,S.Wu,Fastpyrolysischaracteriscticsofsugarcanebagassehemicellulose,45(2011)605–612.
[48] G. Dorez, L. Ferry, R. Sonnier, A. Taguet, J.-M. Lopez-Cuesta, Effect of cellulose,hemicellulose and lignin contents on pyrolysis and combustion of natural fibers, J.Anal.Appl.Pyrolysis.107(2014)323–331.doi:10.1016/j.jaap.2014.03.017.
[49] R.Bernstein,S.M.Thornberg,A.N.Irwin,J.M.Hochrein,D.K.Derzon,S.B.Klamo,R.L.Clough,Radiation-oxidationmechanisms:VolatileorganicdegradationproductsfrompolypropylenehavingselectiveC-13labelingstudiedbyGC/MS,Polym.Degrad.Stab.93(2008)854–870.doi:10.1016/j.polymdegradstab.2008.01.020.
[50] M. Carrier, A. Loppinet-Serani, C. Absalon, C. Aymonier, M. Mench, Degradationpathwaysofholocellulose,ligninandalpha-cellulosefromPterisvittatafrondsinsub-and super critical conditions, Biomass and Bioenergy. 43 (2012) 65–71.doi:10.1016/j.biombioe.2012.03.035.
[51] O. Faruk, A.K. Bledzki, H.-P. Fink, M. Sain, Biocomposites reinforced with naturalfibers: 2000–2010, Prog. Polym. Sci. 37 (2012) 1552–1596.doi:10.1016/j.progpolymsci.2012.04.003.
[52] Z.L. Yan, H.Wang, K.T. Lau, S. Pather, J.C. Zhang, G. Lin, Y. Ding, Reinforcement ofpolypropylene with hemp fibres, Compos. Part B Eng. 46 (2013) 221–226.doi:10.1016/j.compositesb.2012.09.027.
[53] L. Sisti,G.Totaro,M.Vannini,P.Fabbri, S.Kalia,A.Zatta,A.Celli, Evaluationof theretting process as a pre-treatment of vegetable fibers for the preparation of high-performance polymer biocomposites, Ind. Crops Prod. 81 (2016) 56–65.doi:10.1016/j.indcrop.2015.11.045.
[54] P.Md.Tahir,A.B.Ahmed,S.O.A.SaifulAzry,Z.Ahmed,Rettingprocessofsomebastplant fibres and its effect on fibre quality: A review, BioResources. 6 (2011) 5260–5281.doi:10.15376/biores.6.4.5260-5281.
[55] O.F.Unit,C.Scouring, Influenceofwetprocessingonphysico-chemicalpropertiesof

210
okrabastfibre,29(2016)412–414.
[56] R.Wittkowski, J. Ruther, H. Drinda, F. Rafiei-Taghanaki, Formation of smoke flavorcompoundsbythermallignindegradation,ACSSymp.Ser.490(1992)232–243.
[57] M. Baharoğlu, G. Nemli, B. Sarı, S. Bardak, N. Ayrılmış, The influence of moisturecontentofrawmaterialonthephysicalandmechanicalproperties,surfaceroughness,wettability, and formaldehydeemissionofparticleboard composite,Compos.PartBEng.43(2012)2448–2451.doi:10.1016/j.compositesb.2011.10.020.
[58] L.Molhave,Volatileorganiccompounds, indoorairqualityandhealth, IndoorAir.1(1991)357–376.doi:10.1111/j.1600-0668.1991.00001.x.
[59] K.W. Kim, S. Kim, H.J. Kim, J.C. Park, Formaldehyde and TVOC emission behaviorsaccordingtofinishingtreatmentwithsurfacematerialsusing20LchamberandFLEC,J.Hazard.Mater.177(2010)90–94.doi:10.1016/j.jhazmat.2009.09.060.
[60] G. Nemli, G. Çolakoǧlu, The influence of lamination technique on the properties ofparticleboard,Build.Environ.40(2005)83–87.doi:10.1016/j.buildenv.2004.05.007.

211
Célia Badjia, Jean-Marc Sotiropoulosb, Joana Beigbedera, Hélène Garaya, Anne Bergereta,
Jean-CharlesBénézetaandValérieDesauziersa*
aC2MA,EcoledesMinesd’Alès,6AvenuedeClavières,30319AlèsCedex,France
bIPREM, Université de Pau et des Pays de l’Adour, 2 Avenue du Président Pierre Angot,
64000Pau,France
Abstract
Thedurabilityofhempfibersreinforcedpolypropylenebiocompositeswasinvestigatedafter
one-yearunderglassexposure.VolatileOrganicCompounds(VOCs)emissionswereassessed
using a new passive samplingmethod. Degradation pathwayswere examined in order to
understand the weathering mechanisms. The polymer matrix was decomposed into
oxygenated products due to UV rays and high temperatures. As regards hemp fibers,
differentdegradationstepsofthecarbohydrateswerehighlightedaccordingtothenatureof
the detected furans. At non-weathered state, dehydrations preceded ring-opening
mechanism, often catalysed by Maillard reactions. The further cyclisation induced the
formation of 2- or 5-substituted furans emitted by non-weathered materials. Reactions
between identified products afterweatheringwere proposed. They often implied a keto-
enoltautomerismbutalsodehydrationsthatinducedtheformationof3-and4-substituted
furanones.Thesedifferencescanbeexplainedbyaprimarydecompositionofcarbohydrates
favouredatnon-weatheredstateandasecondaryoneoccurringatweatheredstate.
Keywords:hempfiber;polypropylene;oxidation;dehydration;VOCs
Introduction
Recently, bio-fillers have emerged as an attractive alternative to inorganic fillers in the
reinforcement of thermoplastics in response to the environmental consciousness and
increasing global waste problems. The main application areas of vegetal filler reinforced
composites are automotive and building industries [1,2]. Otherwise, with the increasing

212
concernsaboutindoorairquality,VolatileOrganicCompounds(VOCs)emissionsbehaviour
of the interior materials used as automotive parts has become widely recognized as an
importanttopicforindoorenvironmentquality[3,4].
During themeltmixingprocessofbiocomposites throughextrusionand injectionmolding,
thehighmanufacturingtemperaturesexceedthebio-fillersdegradationtemperature[5,6].
Also, during their use, climatic conditionsweaken their chemical stabilitybecauseof their
high sensitivity [7,8]. Temperature variations induce a carbonization andodors emanating
fromtheheatedmatter.Also,apressmoldingtemperatureincreaseinducesbiocomposites
colorturningfrombrowntoclosetoblack[9].Thiswasthoughttobetheresultofvegetal
fibers caramelization. Some solutions for reducing the odors and the amount of VOCs
produced by biocomposites have been studied [10,11]. Butmolecules responsible for the
worseningairquality,colorchangesandodorsmustbeassessed.
VOCsemittedbyplasticsaregenerallyduetothepolymerdegradation.Studiesonthermal
and photochemical oxidation of polypropylene (PP) showed that radical processes are
responsibleforchainscissionleadingtolowmolecularweightproductsmigrationfromthe
polymericmatrixtotheatmosphere[12,13].ThisiswidelyacceptedthatNorrishtypeIandII
photochemical reactions occur involving C-C cleavage, leading to oxygenated compounds
formation[14,15].Thosegenerallyresultfromtheoxidationoftertiarycarbonatomsofthe
polymerchains leadingtomethylketones,alongwithalcoholsandaldehydesformation in
additiontoaliphatichydrocarbons.
The pyrolysis of lignocellulosic biomass was widely studied and further identification of
volatile compounds issued from the natural fibers thermal degradation was sometimes
performed. Some products, originating from pyrolysis of cellulose (molecular formula:
(C6H10O5)n), are identified as lowmolecular weight compounds. They are formed by ring-
openingreactions,whilepyransandfuransareobtainedfromdehydrationreactions[16,17].
Thesemoleculesaregenerallystablearomaticcompoundsandhardlydecomposeintolower
molecular weight compounds [18]. Their decomposition accounts for themajor reactions
occurringinthesecondaryreactionstageofcellulose.Hemicellulosesconsistofsaccharides
suchasglucose,mannose,xyloseandarabinose[16,19].Oncepyrolyzed,thederivativesof
these pentose sugars such as cyclopentanes and cyclopentenones are detected in large

213
quantity in addition to furan molecules [20,21]. Lignin component, a highly complex
aromaticstructure,breaksdownintophenolicstructures[22,23].Itmainlyconsistsofthree
basic buildingblocks that are guaiacyl, syringyl andp-hydroxyphenyl units.However, non-
cellulosicpolysaccharidessuchasproteinsarealsofoundinlowerproportionunderamino
acids forms [24]. Each component proportion present in the vegetal fibers depends on
severalparameterssuchastheirnature,rettingtimeandgeographicorigin.
Maillardreactionsaremainlyresponsiblefortheformationofflavorcompoundslikethe2-
furanones with similar structures than those of volatile substances issued from biofillers
degradation.Besidestheflavoringoffood,theinterestinMaillardmechanismhasgrownin
fieldslikephysico-chemicalpropertiesofproteinsandpolysaccharides[25,26].Thisreaction
impliestheinteractionbetweentheaminogroupfromanaminoacid,aproteinoranamine
and the carbonyl functional group from the carbohydrate part (glucose, fructose) under
heatingconditions [27]. ItgivesunstableN-substitutedglycosylaminocompound.This first
stepisreversiblebutthegeneratedglycosylamineisimmediatelyconvertedintoanAmadori
compound [28]. Amadori intermediates compounds belonging to the 1-amino-1-deoxy-2-
ketosesfamilyareimportantprecursorsintheformationofflavorcompoundsfromMaillard
reactions [27,29]. Caramelized sugar aromas furanones, such as furfural and 5-
methylfurfural, or pyranones such as maltol, evolving from holocellulose are generated
through sugar-amine condensation. Then, the formedAmadori compound can react along
multiple pathways to form Maillard reaction products at lower temperature than those
found in pyrolysis studies of natural fibers since the presence of nitrogen containing
compounds catalyses the reaction [28]. For instance, maltol, a well-known carbohydrate
derivative, and 4-hydroxy-2,5-dimethyl-3(2H)-furanone, derives from a common
intermediate arising by sugar-amine condensation and Amadori rearrangement. 2,3-
enolization of the 1-amino-1-deoxy-2-ketose and elimination of the 1-amino group finally
occuratthefinalstep[29].Then,dehydrationsandcyclisationleadtofuransgeneration[30]
andene-diolscissionsandretroaldolisationtoshortproducts[31].
However, formationsof the substances found in literaturedealingwithbiomass and their
controlleddecomposition(pyrolysis)werenotexplainedthankstothismechanism.Indeed,
the reactions involved require the presence of artificial catalysts (chromium, copper)
facilitating the conversion [19,32].Otherwise,whendecomposition products are obtained

214
from pyrolysis process, this includes energetic conditions so favourable (temperature
reaching 800 °C) that ring-opening, dehydrogenation and cracking can occur [17,20].
Moreover, formation of othermethylfurans that could issue from thermal decomposition
andreactionsbetweenvolatilechemicalsemittedbynaturalfiberswerenotreported.
Aone-yearnaturalunderglassweatheringofhempfibersreinforcedPPbiocompositeswas
investigated to simulate car interiorenvironment.VOCsemissionswereassessedall along
the ageing. The objective is to understand the components degradation way by firstly
examining the well-known Maillard mechanism for the holocellulose part decomposition
thanks to VOCs identification. Secondly, reactions between identified VOCs and their
concentrationevolutionwereproposed.Finally,thelignindegradationwasalsoinvestigated.
Materialandmethods
Materials
Polypropylene (PP)gradeH733-07withamelt flow rateof7.5g/10min (230 °C,2.16kg)
(Braskem,Brazil)wasusedaspolymermatrix.HempfiberswereprovidedbyAgroChanvre
(France).Twohempfibers loading,10wt%(PP10)and30wt%(PP30)were tested.Maleic
anhydride grafted polypropylene (MA-g-PP) under the trademark Orevac CA100 (Arkema,
France),wasaddedat3.1wt%ofPPascouplingagent.
Processconditions
HempfibersandMA-g-PPweredriedfor15hat60°C.Then,granulesofPPandMA-g-PP
weremixedwithhempfibers inaBC21Clextraltwin-screwextruder(L/D=36withD=25
mm)(Clextral,France)withthetemperatureprofile190-190-190-180-175-175-175°Canda
screw speed of 220 rpm. Once dried for 3 days at 60 °C, extruded pelletswere injection
moldedintospecimensinaKraussMaffeimachine(KraussMaffei,Germany)at210°Cwith
aninjectionspeedof30cm3.s-1.Squaresamplesof100×100×2mm3wereobtained.
Weatheringconditions
Samples were exposed from September 2015 to September 2016 in the South West of
France underwindshield glass to simulate car interior environment according to ISO 877-
2:2011 (Figure 1). The exposition panels were oriented towards South at 45° with the

215
ground. Interiorenvironmentwasnaturally ventilated thanks toholes locatedon stainless
steelboxes2hoursperday.TemperatureT(°C)andrelativehumidityRH(%)weremonitored
and PP, PP10 and PP30 materials were sampled after 1, 2, 3, 6, 9 and 12 months.
Temperature ranged from -5°C in February to 91°C in August and relative humidity
fluctuatedbetween3%inSeptemberand95%inNovember.
Figure1-Underwindshieldglassexposureracks
Samplingandanalyticalmethodology
At eachweathering step, 3 samples of eachmaterialwere brought from the racks to the
laboratory where VOCs emission analysis was carried out through a passive sampling
methoddevelopedatthelaboratory[33].Itconsistsoftwosteps:firstly,aglasscellisplaced
onthematerialinordertoisolateapartofitssurface,andtheVOCswerelettodiffusefrom
thematerial to the air enclosed in the cell.When the VOCs concentration stabilized, i.e.
whenmaterial/air equilibrium is reached [33], a Solid PhaseMicroExtraction (SPME) fiber
wasintroducedintheglasscellthroughaseptumtosampleemittedVOCs.Then,theSPME
fiber was desorbed in the injector of a gas chromatograph (GC) coupled with mass
spectrometer(MS)andflameionizationdetector(FID)(Varian,France)foridentificationand
quantification of VOCs. The analytical procedure is detailed elsewhere [34]. Both VOCs
screening and specific analysis of formaldehyde and acetaldehyde,which are classified as
Carcinogen Mutagenic and Reprotoxic (CMR) substances, were performed [35]. A
polydimethylsiloxane-divinylbenzene-Carboxen fiber (PDMS/DVB/CAR, 50/30 µm) was
selectedforVOCsscreeningwhereasapolydimethylsiloxane-divinylbenzene(PDMS/DVB,65

216
µm) fiber impregnated with O-(2,3,4,5,6-pentafluorobenzyl)hydroxylamine hydrochloride
(PFBHA) (Fluka, Switzerland) was used for formaldehyde and acetaldehyde [34,36]. The
SPME fiberswerepurchased fromSupelco (UnitedStates).Sampling temperatureof80 °C
was tested to simulateextremecar interior conditions.Theextraction timewas fixedat5
min.
Quantitativeanalysis
Themethodologydescribedaboveallowsdeterminingtheconcentration(inµg.m-3)ofVOCs
at the material/air interface. That concentration is related to the emission rate of the
consideredsubstancebythefirstFicklawofdiffusionundersteadystateconditions[26].For
the screening analysis using PDMS-DVB-CAR fiber, VOCs were quantified as toluene
equivalentusingFIDresponsesinceitis proportionaltotheeffectivecarbonatomsnumber
inthemolecule[37].Furfuraland2-furanmethanol,compoundsspecifictohempfibersand
listedasCMRsubstances[35],aswellasformaldehydeandacetaldehyde,werespecifically
quantified. Standard gases of formaldehyde and acetaldehyde were generated by a
permeation device [27]. For the other standard VOCs (toluene, furfural and 2-
furanmethanol), a continuous syringe injectionmethodwas used, as described elsewhere
[38,39]. The detection limit and quantification limit are around 8 µg.m-3 and 23 µg.m-3
respectively for all compounds and the repeatability (relative standarddeviation) is about
3%for3replicates.
Resultsanddiscussion
Polypropyleneoxidation
Some emitted VOCs were issued from the polymer degradation: long-chain aliphatic
hydrocarbons and oxygenated products (linear ketones, aldehydes and carboxylic acids).
Aceticacid,acetoneand2,4-pentanedionewerethemaincompoundsemittedbyweathered
PP. Some pathways are proposed in the literature to explain the formation ofmolecules
containing carbonyl functional group. The schemegivenby François-Heudeet al. resumes
their mechanistic formation [40]. Mainly radical reactions lead to intermediate tertiary
alkoxyradicalsandtheirβ-scissioninducesthepreviousidentifiedcarbonylproducts(Figure
2). 2,4-pentanedione can result from the oxidation ofmethylketone issued from polymer

217
chain reaction with unstable hydroperoxide. Moreover, 4-hydroxy-4-methyl-2-pentanone
wasalsodetectedashigh-levelketone(65±13and82±25µg.m-3fornon-weatheredand
forone-yearweatheredPPrespectively). It isproposedtooriginatefromthesamemethyl
ketoneprecursor.Indeed,thehydroxylformationresultingfromalkoxyradicalreactionwith
hydrogenfollowedbyscissioncouldform4-hydroxy-4-methyl-2-pentanone.
Formaldehyde and acetaldehyde were also released by the polymer and biocomposites.
Their levels increased with the time of exposure. A polymer degradation way, similar to
previous oxygenated chemicals pathway, could explain acetaldehyde generation with
secondary alkoxy radical initiator responsible for this lowmolecular compound formation.
Moreover, formaldehyde generation is reported according to themechanism of Hoff and
Jacobsson,whichconsistsoftheoxidationofprimaryalkylradicals[41].
Alcohols,resultingfrompolymerdegradation,couldarisefromintermediatealkoxyradicals.
However,abstractofahydrogenfromanothermoleculeyieldsanhydroxylgroupintertiary
carbonratherthanacarbonylgroup[42].
Figure2-PPdegradationglobalscheme(from[42])
Celluloseandhemicellulosesdegradation
Primarydecomposition

218
Twospecificallyquantifiedfuranderivatives,furfuraland2-furanmethanolwereemittedat
1611±20and2319±176µg.m-3respectivelybynon-weatheredPP30.Also,5-methylfurfural
(660±30µg.m-3),5-methyl-2(3H)-furanone(40±14µg.m-3), furfuryl formate(38±4µg.m-3)
and furfuryl acetate (43 ±4 µg.m-3) evolved from biocomposites at the initial state. Apart
fromthetwo lastcompounds, these lowmolecularweightproductswereevidencedtobe
generatedbyholocellulosesequentialdegradation[19,43–45].Figure3showstheformation
pathwaysofdegradationproductsidentifiedinthisstudyandissuedfromthecarbohydrate
part of hemp fibers. The nominated products were those identified as VOCs issued from
biocomposites. The carbohydrates degradation under high temperature involves the
depolymerization of polysaccharides by the glycosidic bonds cleavage between D-glucose
units [30]. This process is followed by dehydrations, leading to D-glucopyranose and D-
xylofuranoseformation.Theformationof2-or5-substitutedfuransisgenerallyexplainedto
occur via glucopyranose ring-opening pathway with acyclic forms such as hexoses and
pentoses intermediates [17,19]. The further cyclisation of these oses leads to the furans
formation. Primary subsequent dehydration steps produced specifically followed furfural
and 2-furanmethanol emitted at high concentration by non-weathered biocomposites. In
thismechanistic scheme, other cyclicmoleculeswere derived fromhydroxymethylfurfural
which was not detected in the conditions of this study. Otherwise, the generation of
levoglucosenone(97±4µg.m-3)derivativedoesnotneedthesugarring-opening.

219
Figure3-Primaryholocellulosedecompositionproductsandtheirdehydratedderivativesthroughfunnelingpathways[19,43–45]
Theproductsissuedfromthecarbohydrateprimarydecompositionweremainlyemittedby
biocompositesatnon-weatheredstate.Ithasbeensupposedthatgenerationcouldalsobe
favored by Maillard reactions for which non-elevated temperatures (almost 100°C) are
required [28] (chosen sampling temperature and those found in exposure racks do not
exceed91°C) contrary to thepyrolysismethod. Indeed,untilnow,Maillard reactionshave

220
not supported degradation pathways of vegetal fibers. However, either 1,2- or 2,3-
enolizationoftheAmadoricompound,previouslymentionedintheintroductorypart,rising
fromaldoses such as glucose could effectively lead to furfural andhydroxymethylfurfural.
Indeed, thesecompoundswerealreadyexplainedtooriginate fromsugar-containing food,
suchas lactose,throughMaillardreactions[28].Butthesamemechanismcouldjustifythe
formation of products detected here. Also, further intermediate dicarbonyls (reductones)
formed after intra-rearrangement (enolization) are responsible for the autocatalytic
characterofMaillardreaction(Figure4).Moreover,asmentionedintheintroductorypart,
proteins present in fibers could allow the glycosylamine precursor formation required for
obtainingadvancedMaillardreactionproducts.Otherwise, theirpresence isdemonstrated
bythedetectionofpyrazinesemittedbybiocomposites(methylpyrazineandN-acetyl-4(H)-
pyridine at 25 ±2 and 38 ±4 µg.m-3 respectively for PP30). These secondary products of
Streckerdegradationareduetoaminoketonescondensation.
Figure4-Glucoseandaminoacidinteraction(R=aminoacidsidegroup)(from[46])
CH2OH
H2C-NH-RHC=O
CH2OH
HC=O
CH2OH
H2C-NH-R
CH2OHCH2OH
HC-NH-RHC=N-R
CH2OH
OHH
OHH
OH
OH
H H
OHH
OHH
O
H OH
H OH
OH H
H OH
OHH
OHH
HOH
O
OHH
OHH
HOH
OH
OHH
OHH
HOH
OHHRNH2
H2O
RNH2H2O
Amadoricompound

221
Contrarytoothercompounds,theformationoffurfurylformateandfurfurylacetate(total
concentrationof81±8µg.m-3)arousedfromnon-weatheredPP30compositeisnotreported
in the literature. Here, it is suggested that they result from the interaction between the
hydroxy functional groups of 2-furanmethanol and formaldehyde and acetaldehyde
respectively(Figure3).FormaldehydeandacetaldehydecouldalsoevolvefromtheStrecker
degradation [28,29]byβ-scission. Indeed, forbiocomposites, lotsof aliphatic ketones and
aldehydes such as 1-hydroxy-2-propanone, 1-acetyloxy-2-propanone and nonanal are
emittedatthehighestlevelsoftheirchemicalfamily:420±81,366±11and160±28µg.m-3
respectively for unaged PP30. They were identified as hemp fibers by-products at non-
weathered state. Theseby-products couldbe linked to reactionbetweenaminoacidsand
two-carbonylcompounds.
Secondarydecomposition
Afterweathering,mainlymethyl substituted furanones deriving from carbohydrateswere
formed.They represented13%of the levelof ketones releasedbyPP30afteroneyearof
weatheringwhereas they only accounted for 8% of ketones by-products emitted by non-
weathered PP30. Moreover, contrary to non-weathered state, only furans compounds
containingatleastonesubstitutionin3and4positionswereidentifiedafterweathering.In
addition,contraryto2-and5-substitutedfuranonespresentedinFigure3,theexplanation
of3-or4-substitutedfuranonesissuedfromvegetalfibersdecompositionisnotyetreported
in the literature. The proposed reactions featured in Figure 5 involve the interaction
betweenfunctionalgroupsof identifiedvolatileproducts.Substancesthataredesignedby
theirnamesinFigure5correspondtosubstancesdetectedinthiswork.Thefirstreaction1)
impliesaradicalattack inαpositionoftwosamepropionicacidby-products,whose levels
increased from39±4 to839±75µg.m-3 and56±16 to1403±3µg.m-3 forPP10andPP30
respectively, via photo-chemicalway caused by ultraviolet (UV) rays. It is followedby the
dehydration of the generated intermediate symmetrical molecule leading to an
intramolecular cyclisation giving 3,4-dimethyl-2,5-furanedione (118 ±32 µg.m-3 for
weatheredPP30).
The reaction 2) occurs through the establishment of a keto-enolization equilibrium
thermodynamically driven between the keto and enol forms of 4-hydroxy-4-methyl-2-
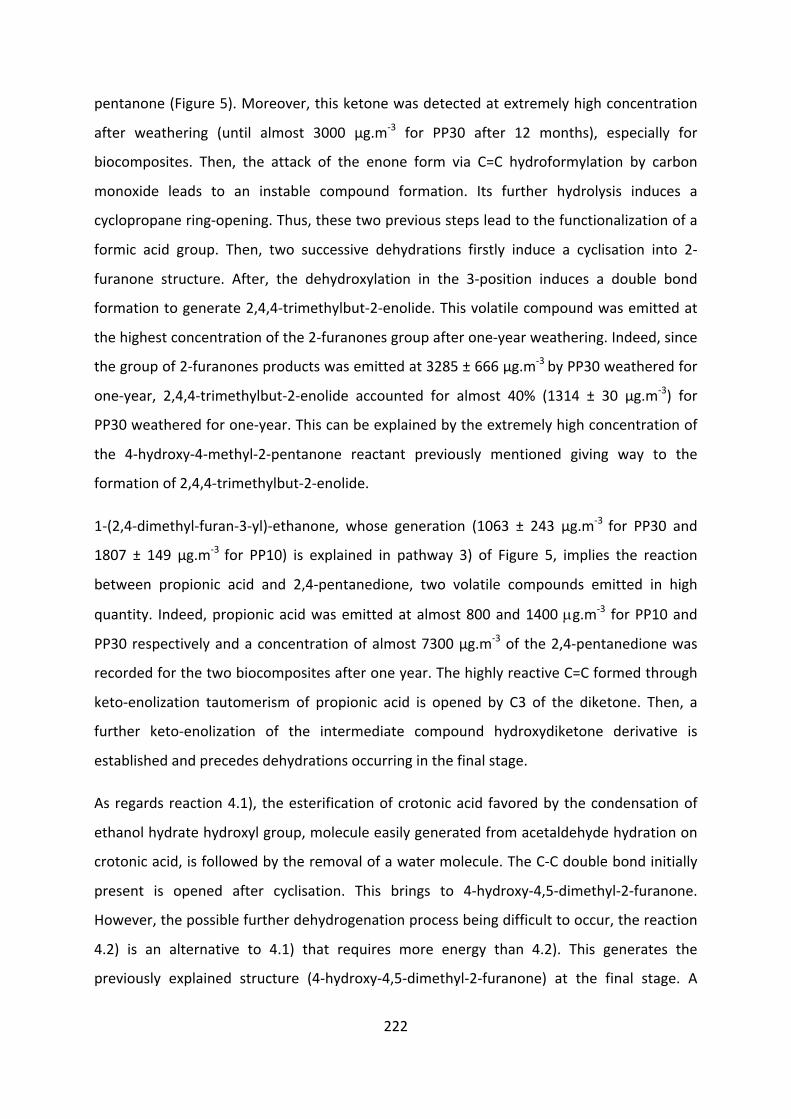
222
pentanone(Figure5).Moreover,thisketonewasdetectedatextremelyhighconcentration
after weathering (until almost 3000 µg.m-3 for PP30 after 12 months), especially for
biocomposites. Then, the attack of the enone form via C=C hydroformylation by carbon
monoxide leads to an instable compound formation. Its further hydrolysis induces a
cyclopropanering-opening.Thus,thesetwopreviousstepsleadtothefunctionalizationofa
formic acid group. Then, two successive dehydrations firstly induce a cyclisation into 2-
furanone structure. After, the dehydroxylation in the 3-position induces a double bond
formationtogenerate2,4,4-trimethylbut-2-enolide.Thisvolatilecompoundwasemittedat
thehighestconcentrationofthe2-furanonesgroupafterone-yearweathering.Indeed,since
thegroupof2-furanonesproductswasemittedat3285±666µg.m-3byPP30weatheredfor
one-year, 2,4,4-trimethylbut-2-enolide accounted for almost 40% (1314 ± 30 µg.m-3) for
PP30weatheredforone-year.Thiscanbeexplainedbytheextremelyhighconcentrationof
the 4-hydroxy-4-methyl-2-pentanone reactant previously mentioned giving way to the
formationof2,4,4-trimethylbut-2-enolide.
1-(2,4-dimethyl-furan-3-yl)-ethanone, whose generation (1063 ± 243 µg.m-3 for PP30 and
1807 ± 149 µg.m-3 for PP10) is explained in pathway 3) of Figure 5, implies the reaction
between propionic acid and 2,4-pentanedione, two volatile compounds emitted in high
quantity. Indeed,propionicacidwasemittedatalmost800and1400µg.m-3 forPP10and
PP30respectivelyandaconcentrationofalmost7300µg.m-3of the2,4-pentanedionewas
recordedforthetwobiocompositesafteroneyear.ThehighlyreactiveC=Cformedthrough
keto-enolization tautomerism of propionic acid is opened by C3 of the diketone. Then, a
further keto-enolization of the intermediate compound hydroxydiketone derivative is
establishedandprecedesdehydrationsoccurringinthefinalstage.
Asregardsreaction4.1), theesterificationofcrotonicacid favoredbythecondensationof
ethanolhydratehydroxylgroup,moleculeeasilygeneratedfromacetaldehydehydrationon
crotonicacid,isfollowedbytheremovalofawatermolecule.TheC-Cdoublebondinitially
present is opened after cyclisation. This brings to 4-hydroxy-4,5-dimethyl-2-furanone.
However,thepossiblefurtherdehydrogenationprocessbeingdifficulttooccur,thereaction
4.2) is an alternative to 4.1) that requires more energy than 4.2). This generates the
previously explained structure (4-hydroxy-4,5-dimethyl-2-furanone) at the final stage. A

223
similaresterificationwayofthediketoneintermediateproductfollowedbyacyclisationand
dehydrationcouldexplainitsformation.
The same precursors as found in reaction 2) may be responsible to 5-hydroxy-3,3,5-
trimethyl-2-furanoneformation(pathway5)).Indeed,thedehydrationandhydroformylation
of the methylpentanone due to its reactions with CO and O2 lead to methyl substituted
levulinic acid generation,well-known biomass derivative [44], that finally cyclizes after its
keto-enolization.
Someofthesereactionsmayrequirehighenergyconditionstooccur.However,thebiomass
inorganicpartcontainsmetalswhichcouldcatalyzethesereactions[16].
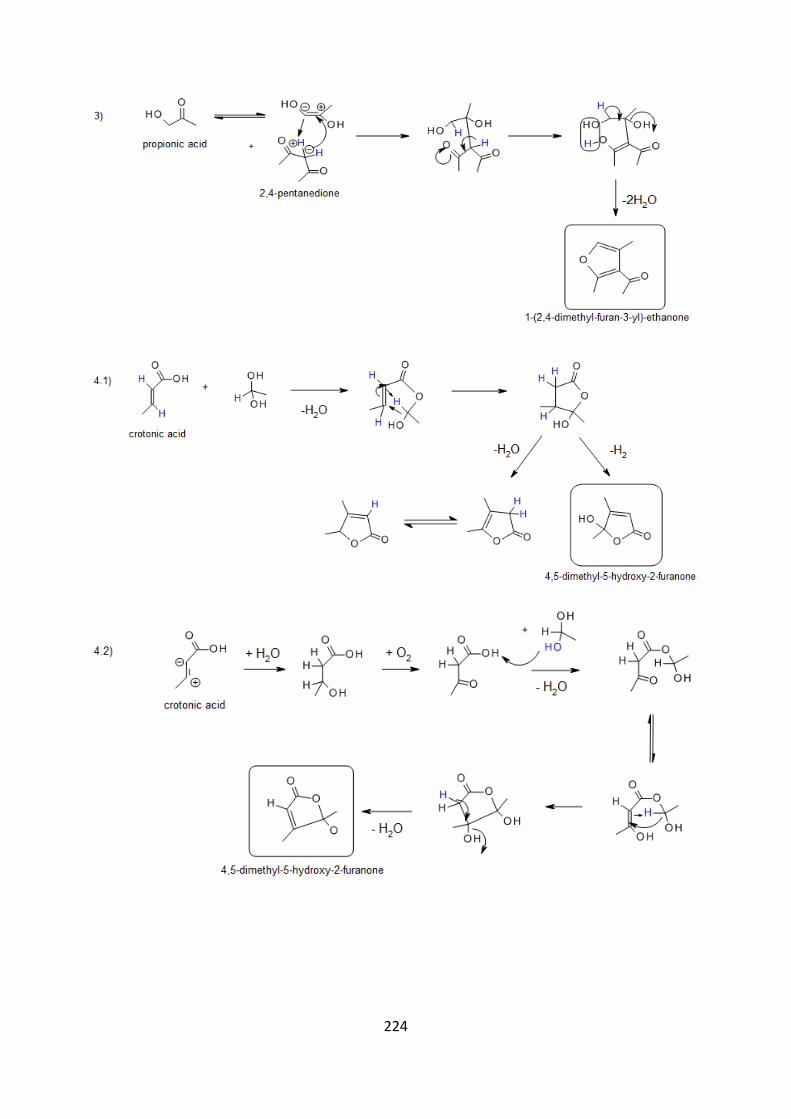
224

225
Figure5-Proposedreactionpathwaysoffuranderivatives(VOCsidentifiedinthisworkaredesignedbytheirnamesinthisscheme)
Lignindegradation
Primarydecomposition
Two methoxy-substituted phenols, vanillin and 4-vinylguaiacol, were emitted by non-
weatheredbiocomposites.These twocompoundsare thought tooriginate fromaprimary
decomposition of lignin favored in heating conditions of ferulic acid, a well-known by-
productevolvingfromlignindegradation,butnotidentifiedinthisstudy[47,48].
Firstly,decarboxylationofferulicacidmaycausetheformationofvinylguaiacolthrough1.1)
pathway(Figure6)[47].Indeed,itisreportedthattemperaturesrangingfrom100to250°C
(including the process temperature) cause severe damage on natural fibers chemical
structure through depolymerization, dehydration or decarboxylation [49]. Vanillin is
explained to originate from the oxidation of 4-vinylguaiacol issued from lignin (1.2)). The
literaturealsoproposedvanillinarisingthroughthehydrolysisoftheferulicacidby-product
(2.1))[48].Afurtherdeacetylationcouldinducetheformationofvanillin(2.2)).Thispathway
could occur more easily than the vinylguaiacol or eugenol oxidation. Indeed, even if the
decarboxylationconsistsinanaturallyoccurringstep,theoxidationofcarbon-carbondouble
bondmustbecatalyzed.Moreover,ithasbeenshownthat2)pathwayspreferentiallyoccur
forobtainingvanillin than1)ones [48].Otherwise,presenceofmetalloproteinscontaining
iron,cupperandmanganesemightcatalyzeby-productsformation[50].
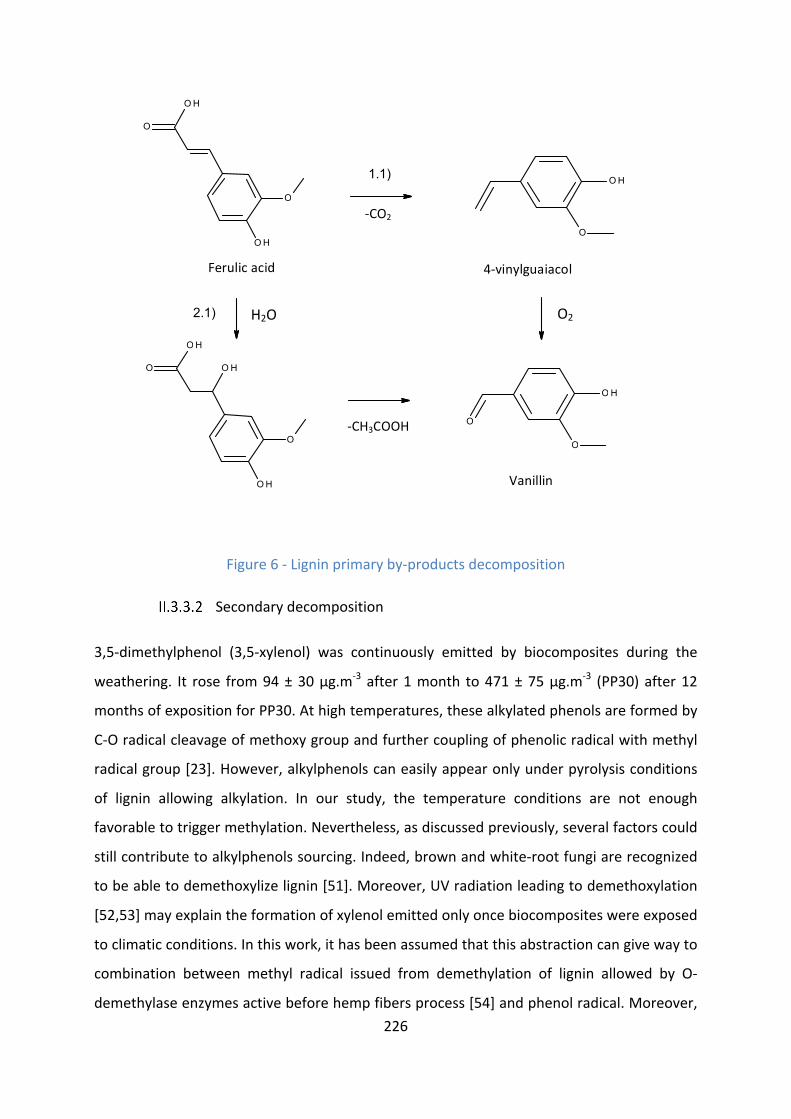
226
Figure6-Ligninprimaryby-productsdecomposition
Secondarydecomposition
3,5-dimethylphenol (3,5-xylenol) was continuously emitted by biocomposites during the
weathering. It rose from94±30µg.m-3 after1month to471±75µg.m-3 (PP30)after12
monthsofexpositionforPP30.Athightemperatures,thesealkylatedphenolsareformedby
C-Oradicalcleavageofmethoxygroupandfurthercouplingofphenolicradicalwithmethyl
radicalgroup[23].However,alkylphenolscaneasilyappearonlyunderpyrolysisconditions
of lignin allowing alkylation. In our study, the temperature conditions are not enough
favorabletotriggermethylation.Nevertheless,asdiscussedpreviously,severalfactorscould
stillcontributetoalkylphenolssourcing.Indeed,brownandwhite-rootfungiarerecognized
tobeabletodemethoxylizelignin[51].Moreover,UVradiationleadingtodemethoxylation
[52,53]mayexplaintheformationofxylenolemittedonlyoncebiocompositeswereexposed
toclimaticconditions.Inthiswork,ithasbeenassumedthatthisabstractioncangivewayto
combination between methyl radical issued from demethylation of lignin allowed by O-
demethylaseenzymesactivebeforehempfibersprocess[54]andphenolradical.Moreover,
OH
O
OH
O
OH
OH
O
O
OH
O
O
OH
O
OH1.1)
2.1)
Ferulicacid 4-vinylguaiacol
Vanillin
-CO2
-CH3COOH
O2H2O

227
enzymespresentinligninandincludedinproteinscouldplaytheroleofnaturalbiocatalysts
of these reactions before process of biocomposites [50]. In addition, the retting process
couldfavormicroorganismsformationacceleratingby-productsgeneration.
Conclusion
Sincebiocompositesaremoreandmoreintegratedinvehicles,carindoorenvironmentcan
be polluted by volatile substances released by cellulose-based materials. Moreover, the
originsof thebiocompositesodors causedbyhighmanufacturing temperaturehave tobe
determined. The aim of this work was to understand the formation of VOCs and their
structures issued from non-weathered and under glass weathered PP and hemp fibers
reinforcedbiocomposites.Reactionsschemeswereproposedaccordingtovolatileproducts
thatwereidentifiedinthisstudy.
Firstly,itwasassumedthatprimarydecompositionofholocelluloseandlignininhempfibers
occurred at non-weathered state whereas secondary decomposition was favored at
weathered state. Mainly 2- and 5-substituted furans were emitted by non-weathered
biocomposites.Sincesameprecursorsandsamenitrogen-containingchemicalsevolvedfrom
non-weathered vegetal fibers decomposition as food thermal degradation, Maillard
mechanism could be extrapolated to this study. 3-, 4- and 5-substituted furanones were
preferentially emitted after weathering. Some reactions between volatile products were
proposed: theymainly involvedketo-enolization,dehydrationand cyclisationmechanisms.
As regards lignindecomposition,methoxyphenols,detectedatnon-weathered state,were
explained by hydration and oxidation whereas dimethylphenol, evolved from weathered
biocomposites,couldoriginatefromradicalreactions.
However, the reactions implying dehydrogenation to give 4,5-dimethyl-5-hydroxy-2-
furanone (cellulose) and oxidation of vinyl specie to give vanillin (lignin) need highly
favorableconditionstooccur.Thus,activationenergycalculationoftheproposedreactions
could be further modeled to check their occurrence feasibility. Also, the precise role of
proteinsandenzymesincarbohydratesandlignindegradationmustbedeeperinvestigated.
Additivessuchaslightstabilizersorantioxidantsincorporatedinthematerialscanbeused

228
to limitdehydrations inducingsugarsring-openingandtheimpactofexpositiontoUVrays
andhightemperature.
Acknowledgements
This research did not receive any specific grant from funding agencies in the public,
commercial,ornot-for-profitsectors.
References
[1] Z.N.Azwa,B.F.Yousif,A.C.Manalo,W.Karunasena,Areviewonthedegradabilityofpolymeric composites based on natural fibres, Mater. Des. 47 (2013) 424–442.doi:10.1016/j.matdes.2012.11.025.
[2] M.John,S.Thomas,Biofibresandbiocomposites,Carbohydr.Polym.71(2008)343–364.doi:10.1016/j.carbpol.2007.05.040.
[3] AirqualitysciencesInc.,IndoorAirQualityhazardsofnewcars,(2006)47–51.
[4] C.Yu,D.Crump,AreviewoftheemissionofVOCsfrompolymericmaterialsusedinbuildings,Build.Environ.33(1998)357–374.doi:10.1016/S0360-1323(97)00055-3.
[5] A.Khazaeian,A.Ashori,M.Y.Dizaj,Suitabilityofsorghumstalkfibersforproductionofparticleboard, Carbohydr. Polym. 120 (2015) 15–21.doi:10.1016/j.carbpol.2014.12.001.
[6] G.Dorez,A.Taguet,L.Ferry,J.M.Lopez-Cuesta,Thermalandfirebehaviorofnaturalfibers/PBS biocomposites, Polym. Degrad. Stab. 98 (2013) 87–95.doi:10.1016/j.polymdegradstab.2012.10.026.
[7] P. Zou, H. Xiong, S. Tang, Natural weathering of rape straw flour (RSF)/HDPE andnano-SiO2/RSF/HDPE composites, Carbohydr. Polym. 73 (2008) 378–383.doi:10.1016/j.carbpol.2007.12.002.
[8] C.Badji,L.Soccalingame,H.Garay,A.Bergeret,J.-C.Bénézet,Influenceofweatheringonvisual and surfaceaspectofwoodplastic composites:Correlationapproachwithmechanicalpropertiesandmicrostructure,Polym.Degrad.Stab.137(2017)162–172.doi:10.1016/j.polymdegradstab.2017.01.010.
[9] S.Shibata,NaturalFiberComposites,in:R.D.S.G.Campilho(Ed.),Nat.FiberCompos.,2016:pp.157–173.
[10] H.-S.Kim,S.Kim,H.-J.Kim,H.-G.Kim,Physico-mechanicalproperties,odorandVOCemission of bio-flour-filled poly(propylene) bio-composites with different volcanicpozzolan contents, Macromol. Mater. Eng. 291 (2006) 1255–1264.doi:10.1002/mame.200600212.
[11] H.-S. Kim, B.-H. Lee, H.-J. Kim, H.-S. Yang,Mechanical–thermal properties and VOC

229
emissions of natural-flour-filled biodegradable polymer hybrid bio-composites, J.Polym.Environ.19(2011)628–636.doi:10.1007/s10924-011-0313-5.
[12] C. Rouillon, P.O. Bussiere, E. Desnoux, S. Collin, C. Vial, S. Therias, J.L. Gardette, Iscarbonyl index a quantitative probe to monitor polypropylene photodegradation?,Polym. Degrad. Stab. 128 (2016) 200–208.doi:10.1016/j.polymdegradstab.2015.12.011.
[13] A.François-Heude,E.Richaud,E.Desnoux,X.Colin,Influenceoftemperature,UV-lightwavelengthand intensityonpolypropylenephotothermaloxidation,Polym.Degrad.Stab.100(2014)10–20.doi:10.1016/j.polymdegradstab.2013.12.038.
[14] J.F.Rabek,PhotostabilizationofPolymers:Principlesandapplications,ElsevierAppliedScience,1990.doi:10.1007/978-94-009-07-47-8.
[15] M.Muasher,M. Sain, The efficacy of photostabilizers on the color changeofwoodfilled plastic composites, Polym. Degrad. Stab. 91 (2006) 1156–1165.doi:10.1016/j.polymdegradstab.2005.06.024.
[16] D.J. Nowakowski, J.M. Jones, Uncatalysed and potassium-catalysed pyrolysis of thecell-wallconstituentsofbiomassandtheirmodelcompounds,J.Anal.Appl.Pyrolysis.83(2008)12–25.doi:10.1016/j.jaap.2008.05.007.
[17] E.B.Sanders,A.I.Goldsmith,J.I.Seeman,Amodelthatdistinguishesthepyrolysisofd-glucose, d-fructose, and sucrose from that of cellulose. Application to theunderstandingofcigarettesmokeformation,J.Anal.Appl.Pyrolysis.66(2003)29–50.doi:10.1016/S0165-2370(02)00104-3.
[18] K. Katō, H. Komorita, Pyrolysis of Cellulose, Agric. Biol. Chem. 32 (1968) 21–26.doi:10.1080/00021369.1968.10859016.
[19] J.B.Binder, J.J. Blank,A.V.Cefali, R.T.Raines, Synthesisof furfural fromxyloseandxylan,ChemSusChem.3(2010)1268–1272.doi:10.1002/cssc.201000181.
[20] Y. Peng, S. Wu, Fast pyrolysis characterisctics of sugarcane bagasse hemicellulose,Cellul.Chem.Technol.45(2011)605–612.
[21] M. Carrier, A. Loppinet-Serani, C. Absalon, C. Aymonier, M. Mench, Degradationpathwaysofholocellulose,ligninandalpha-cellulosefromPterisvittatafrondsinsub-and super critical conditions, Biomass and Bioenergy. 43 (2012) 65–71.doi:10.1016/j.biombioe.2012.03.035.
[22] I. Brzonova, E. Kozliak,A. Kubátová,M.Chebeir,W.Qin, L. Christopher, Y. Ji, Kenafbiomass biodecomposition by basidiomycetes and actinobacteria in submergedfermentation for production of carbohydrates and phenolic compounds., Bioresour.Technol.173(2014)352–60.doi:10.1016/j.biortech.2014.09.057.
[23] R.Wittkowski, J. Ruther, H. Drinda, F. Rafiei-Taghanaki, Formation of smoke flavorcompoundsbythermallignindegradation,ACSSymp.Ser.490(1992)232–243.
[24] Y.W.Sari,Biomassanditspotentialforproteinandaminoacids;valorizingagricultural

230
by-products,PhDthesis,WageningenUniversity,2015.
[25] Mitsuo Namiki, Chemistry of Maillard reactions: Recent studies on the browningreaction mechanism and the development of antioxydants and mutagens, in: C.O.Chichester,B.S.Schweigert(Eds.),Adv.FoodRes.,ElsevierInc,1988:pp.116–143.
[26] C.He,C.L.Chen,A.Giannis,Y.Yang,J.Y.Wang,Hydrothermalgasificationofsewagesludgeandmodelcompoundsforrenewablehydrogenproduction:Areview,Renew.Sustain.EnergyRev.39(2014)1127–1142.doi:10.1016/j.rser.2014.07.141.
[27] Q. Zhang, J.M. Ames, R.D. Smith, J.W. Baynes, T.O. Metz, A perspective on theMaillardreactionandtheanalysisofproteinglycationbymassspectrometry:probingthe pathogenesis of chronic disease, J. Proteome Res. 8 (2008) 754–769.doi:10.1021/pr800858h.
[28] A.E. Newton, A.J. Fairbanks,M. Golding, P. Andrewes, J.A. Gerrard, The role of theMaillardreactionintheformationofflavourcompoundsindairyproducts-Notonlyadeleteriousreactionbutalsoarichsourceofflavourcompounds,FoodFunct.3(2012)1231–1241.doi:10.1039/c2fo30089c.
[29] J.E.Hodge,F.D.Mills,B.E.Fisher,Compoundsofbrownedflavorderivedfromsugar-aminereactions,Am.Assoc.CerealChem.17(1972)34–40.
[30] S.Wang,X.Guo,T.Liang,Y.Zhou,Z.Luo,Mechanismresearchoncellulosepyrolysisby Py-GC/MSand subsequent density functional theory studies, Bioresour. Technol.104(2012)722–728.doi:10.1016/j.biortech.2011.10.078.
[31] H.-D.Belitz,W.Grosch, P. Schieberle,Aroma compounds, in:M.Dekker (Ed.), FoodChem.,CRCPress,2004:pp.340–402.doi:10.1007/978-3-662-07279-0.
[32] R.F. Perez, M.A. Fraga, Hemicellulose-derived chemicals: one-step production offurfurylalcoholfromxylose,GreenChem.16(2014)3942.doi:10.1039/C4GC00398E.
[33] D.Bourdin,P.Mocho,V.Desauziers,H.Plaisance,Formaldehydeemissionbehaviorofbuildingmaterials:on-sitemeasurementsandmodelingapproachtopredictindoorairpollution.,J.Hazard.Mater.280(2014)164–73.doi:10.1016/j.jhazmat.2014.07.065.
[34] D. Bourdin, V. Desauziers, Development of SPME on-fiber derivatization for thesamplingofformaldehydeandothercarbonylcompoundsinindoorair,Anal.Bioanal.Chem.406(2014)317–328.doi:10.1007/s00216-013-7460-6.
[35] Chemical Risk Prevention Unit, CNRS, European harmonised classification andlabelling of carcinogenic, mutagenic and toxic for reproduction (CMR) substancesaccordingtothecriteriaoftheCLPRegulation,(2015).
[36] J.A.Koziel,J.Noah,J.Pawliszyn,Fieldsamplinganddeterminationofformaldehydeinindoor airwith solid-phasemicroextraction andon-fiberderivatization, Environ. Sci.Technol.35(2001)1481–1486.doi:10.1021/es001653i.
[37] M.J. Fedoruk, B.D. Kerger, Measurement of volatile organic compounds insideautomobiles, J. Expo. Anal. Environ. Epidemiol. 13 (2003) 31–41.

231
doi:10.1038/sj.jea.7500250.
[38] J.Nicolle,V.Desauziers,P.Mocho,Solidphasemicroextractionsampling fora rapidand simple on-site evaluation of volatile organic compounds emitted from buildingmaterials,J.Chromatogr.A.1208(2008)10–15.doi:10.1016/j.chroma.2008.08.061.
[39] V. Desauziers, Traceability of pollutant measurements for ambient air monitoring,TrendsAnal.Chem.23(2004)252–260.doi:10.1016/S0165-9936(04)00310-3.
[40] A.François-Heude,E.Richaud,J.Leprovost,M.Heninger,H.Mestdagh,E.Desnoux,X.Colin,Real-timequantitativeanalysisofvolatileproductsgeneratedduringsolid-statepolypropylene thermal oxidation, Polym. Test. 32 (2013) 907–917.doi:10.1016/j.polymertesting.2013.04.008.
[41] A. Hoff, S. Jacobsson, Thermal oxidation of polypropylene close to industrialprocessing conditions, J. Appl. Polym. Sci. 27 (1982) 2539–2551.doi:10.1002/app.1982.070270723.
[42] R.Bernstein,S.M.Thornberg,A.N.Irwin,J.M.Hochrein,D.K.Derzon,S.B.Klamo,R.L.Clough,Radiation-oxidationmechanisms:VolatileorganicdegradationproductsfrompolypropylenehavingselectiveC-13labelingstudiedbyGC/MS,Polym.Degrad.Stab.93(2008)854–870.doi:10.1016/j.polymdegradstab.2008.01.020.
[43] D.K.Shen,S.Gu,Themechanismforthermaldecompositionofcelluloseanditsmainproducts, Bioresour. Technol. 100 (2009) 6496–6504.doi:10.1016/j.biortech.2009.06.095.
[44] M.G. Al-Shaal, W. Ciptonugroho, F.J. Holzhäuser, J.B. Mensah, P.J.C. Hausoul, R.Palkovits,Catalyticupgradingofα-angelicalactonetolevulinicacidestersundermildconditions over heterogeneous catalysts, Catal. Sci. Technol. 5 (2015) 5168–5173.doi:10.1039/C5CY00446B.
[45] P. Mäki-Arvela, E. Salminen, T. Riittonen, P. Virtanen, N. Kumar, J.P. Mikkola, Thechallenge of efficient synthesis of biofuels from lignocellulose for future renewabletransportationfuels,Int.J.Chem.Eng.2012(2012).doi:10.1155/2012/674761.
[46] O.R.Fennema,FoodChemistry,3rded.,CRCPress,1996.
[47] S. Coghe,K.Benoot, F.Delvaux,B.Vanderhaegen, F.R.Delvaux, Ferulic acid releaseand 4-vinylguaiacol formation during brewing and fermentation: indications forferuloylesteraseactivityinSaccharomycescerevisiae.,J.Agric.FoodChem.52(2004)602–608.doi:10.1021/jf0346556.
[48] H. Peleg, M. Naim, U. Zehavi, R.L. Rouseff, S. Nagy, Pathways of 4-vinylguaiacolformationfromferulicacidinmodelsolutionsoforangejuice,J.Agric.FoodChem.40(1992)764–767.doi:10.1021/jf00017a011.
[49] J.Gassan,A.K.Bledzki,Thermaldegradationofflaxandjutefibers,J.Appl.Polym.Sci.82(2001)1417–1422.doi:10.1002/app.1979.
[50] L.Pollegioni,F.Tonin,E.Rosini,Lignin-degradingenzymes,FEBSJ.282(2015)1190–

232
1213.doi:10.1111/febs.13224.
[51] M. Lopretti, D. Cabella, J. Morais, A. Rodrigues, Demethoxylation of lignin-modelcompoundswith enzyme extracts fromGloeophilum trabeum, Process Biochem. 33(1998)657–661.doi:10.1016/S0032-9592(98)00028-4.
[52] K.Srinivas,K.K.Pandey,Photodegradationofthermallymodifiedwood,J.Photochem.Photobiol.BBiol.117(2012)140–145.doi:10.1016/j.jphotobiol.2012.09.013.
[53] D.N.-S.Hon, S.-T. Chang, Surfacedegradationofwoodbyultraviolet light, J. Polym.Sci.Polym.Chem.Ed.22(1984)2227–2241.doi:10.1002/pol.1984.170220923.
[54] X.Peng,E.Masai,H.Kitayama,K.Harada,Y.Katayama,M.Fukuda,Characterizationofthe 5-Carboxyvanillate Decarboxylase gene and its role in lignin-related biphenylcatabolism in Sphingomonas paucimobilis SYK-6, 68 (2002) 4407–4415.doi:10.1128/AEM.68.9.4407.

233
CéliaBadji,JoanaBeigbeder,HélèneGaray,AnneBergeret,Jean-CharlesBénézetandValérie
Desauziers
C2MA,Ecoledesminesd’Alès,6avenuedeClavières,30319CedexFrance
Keywords: VOCs emission, correlation, hemp fibers, oxidation, yellowness, mechanical
properties
Abstract
Natural one-year under windshield degrading test was designed in order tomeasure the
synergiceffectofvehicle interior conditionsonhemp fibers reinforcedpolypropylene (PP)
biocomposites properties. For this purpose, physical, mechanical and chemical properties
were correlatedwith VolatileOrganic Compounds (VOCs) emissions. Considering the high
numberofsamplesandproperties,aPrincipalComponentAnalysis (PCA)wasproposedto
easily identify the more important properties that describe the dataset. Also, the
correlationsbetweenpropertieswereassessedthroughthisanalysis.Statisticalclusteringof
sampleshighlightedthesimilarities/differencesbetweenthem.Preliminarycalculationwas
performed and provided overview on global variables causal relationships. This allowed
classifying through an unsupervised method the quantitative variables (properties) by
determining the contribution of each variable to the axes drawing. Chemical composition
andVOCsemissioncontributedtothemoreinformativecomponentdrawingandthusbest
discriminatedtheindividuals.Separatingmaterialsaccordingtotheirhempfibersloading(0,
10, 30 wt%) permitted only discussing the influence of the weathering time on variables
relationships. Results revealed that VOCs emission could indicate the mechanical
performanceloss.Finally,correlations,eitherpositiveornegative,weredeterminedateach
timeofweathering.Thisshowedthatcorrelationbetweenroughnessandglossaspectwas
verified whatever the time of weathering. Nonetheless, mechanical properties and VOCs
emissionsremainednon-correlatedwhatevertheexpositiontime,certainlybecauseneatPP
andbiocompositeswereallincludedinthestatisticalcalculation.

234
Introduction
With the depletion of fossil resources and environmental issues come requirements for
deployment of renewable resources. That is why attention has turned to biocomposites
developmentasnaturalfibersareeco-friendlyandlowenergymanufactureconsumingand
present specific mechanical properties close to traditional glass ones. They are generally
associatedtopetroleum-basedsuchaspolypropylene(PP),polyethylene(PE)andpolyvinyl
chloride(PVC))ortobio-basedpolymerssuchaspolyhydroxyalcanoate(PHA)andpolylactic
acid(PLA).Otherwise,OriginalautomotiveEquipmentManufacturers (OEMs)tendtosupply
differentcarpartsmadeofnaturalfiberscomposites[1,2].Thedashboardsarebesidesmore
andmoremadeof biocomposites in vehicles fromautomakers such asMercedes-Benz or
Alfa Romeo [3,4]. These pieces are hence directly exposed to UV radiation and the low
stabilityofnaturalfiberstowardstemperature,UVraysandmoistureleadtocolorchanges,
strengthlossanddegradationproductsemission[5].Assignedtolignocellulosiccomponents
decomposition, this last consequence can induce unpleasant odor, important factor for
confined-space uses such as car interiors [6,7]. Indeed, furfural and 5-methylfurfural as
holocelluloseby-products,aremainlyresponsiblefortheodoremittedbybiocomposites[8].
Lignin is also implied in odorous substances release since this amorphous aromatic cross-
linked polymer decomposes into vanillin. So all these products can accentuate “new car
smell” [9] towards use of biocomposites destined to vehicles interior parts. However, the
scent of new vehicle can transform into more problematic Sick Car Syndrome (SCS)
depending on the indoor conditions (temperature, ventilation, …) and Volatile Organic
Compounds(VOCs)levelsandtoxicity[10].Hence,inadditiontoregulationsestablishedby
number of countries regarding limiting chemicals levels in vehicles [11–13], OEMs and
automotive manufacturers have implemented VOCs targets in passenger cars based on
standardsmethodsandanalyticalimplementation[14,15].
SomereportsareavailableonthemeasurementandreductionofVOCsemissionandodorof
biocomposites [5–7,9]. But fewer studies relate the impact of biocomposites ageing on
indoor air quality allowing to understand the polymer and natural fibers degradation
mechanisms.Among theexisting studies,Espertetal conducteda thermaldegradationof
pulp and hemp fibers reinforced PP biocomposites. They assessed its influence on the

235
materials VOCs emission. The type of identified volatile products emitted by thermally
degraded materials differed from unaged ones [16]. Mainly alcohols and carboxylic
derivativesincreasedintermsofdetectedcompoundsnumber.
Headspace-solidphasemicroextraction (HS-SPME) coupledwithgas chromatography-mass
spectrometry (GC-MS) has been recognized as a suitable characterizing tool in rapid
diagnosticanalysisofchemicalsevolving frompolymericmaterials [17–19].Moreover, this
method is sensitive and easy to implement thanks to possible automation of the overall
analytical procedure. These qualities have prompted some researchers for favoring this
analyticalmethodto followdegradationstateofpolymers [16,20,21].Naturalcomponents
weatheringwasalso investigatedbymeansof this technique. For instance, carbohydrates
andligninrelevantdegradationcompounds(furfural,5-methylfurfural,vanillinandguaiacol)
havingevolvedfrompaperageingwereverifiedasageingmarkers[22].However,HS-SPME
techniquesometimesrequiressamplescuttingtointroducesamplesinthevials.Thepassive
samplingmethodusedinthisworkallowstomeasureVOCsemissionwithoutdamagingthe
analyzedmaterial.TheemissionratebeingdescribedbythefirstFick’slawofdiffusionunder
steady-state conditions, the VOCs concentration at the surface of the material can be
determined[23].
VOCsemissionsweresometimesrelatedtootherproperties.Forinstance,polymericpartsof
museum pieces including cellulose acetate, cellulose nitrate, PVC and polyurethane (PU)
were naturally and artificially weathered [24]. It was demonstrated that aldehydes and
ketonesemissionswere related tovisualappearanceevolution (discoloration)ofpolymers
and infrared spectra bands evolution. Carlsson et al. investigated the influence of
weathering on PVC discoloration and VOCs release behavior in Ottawa [25–27]. Plastic
underwent chalking directly linked to chlorinated VOCs. PE films exhibited lowmolecular
weightcompoundsemissionfittingpolymerchainscissionphenomenon[28].Otherwise,the
relative amount of VOCs belonging to the dicarboxylic acids family correlated well with
molecular weight decrease. VOCs emission from virgin and recycled polyamide-6,6 were
measuredbyHS-SPME/GC-MSduringtheirageing[29].Acorrelationbetweendegradation
product pattern, in particular 1-pentyl-2,5-pyrrolidinedione, and mechanical properties
deteriorationhasbeenissued.Indeed,whateverthepolymerstate(virginorrecycled),the

236
decrease ofmechanical performance inversely coincidedwith the increase of the relative
abundance of the heaviest emitted degradation product. A quantitative correlation of
volatile products derived from degrading cellulose (paper) and lignin with acidity and
different components content (lignin, ash, protein, rosin) has been also evaluated [30]. A
particular interestwas focused on the effects of different compounds on cellulosic paper
stability.Also,carbonylgroupcontentwaspositivelycorrelatedwith ligninwhilerosinwas
negatively correlated with protein rate. These two observations gave information on
composition. It was observed that not only cellulosic compounds were responsible for
carbonyl rate increase but also rosin thanks to volatile chemicals analyses. As regards
biocomposites, Courgneau et al.measured several properties includingmolecular weight,
thermal stability and odor emission behavior of cellulose fibers reinforced PLA
biocompositesforcarinterior[9].Therelationbetweenodorgeneratedbychemicalsrelease
and degradation after their compounding was also investigated by these authors. They
showed that the effect of the process-induced degradation was a decrease in molecular
weightofPLAandtheformationofodorantVOCs.
Principal Component Analysis (PCA) allows simplifying interpretation ofmultidimensional-
space data by projecting properties and samples on a plan. It has besides found some
applicationforestimatingmajorsourcecontributionstoambientVOCsconcentrations[31–
34]. Also, PCA was sometimes conducted in works bringing polymers under degradation
conditions and assessing volatile products emission. As an example, the influence of γ-
irradiation on volatile products release by polymericmultilayermaterialswas determined
[35]. Considering the high number of samples, PCAwas performedon the overall data in
order to put forward the main chemical families differencing samples that were non-
irradiatedandirradiatedatdifferentrates.Themorediscriminatingchemicalfamilieswere
aromaticsandcycliccompoundscloselyrelatedtotheprincipalcomponentsexplainingthe
mostofvariance.Otheroxygenatedproductsfamiliessuchasketones,andotheroxidation
productswereopposedtoantioxidantsandalkenesrespectively,suggestingthatoxygenated
VOCswereformedattheexpenseofthelatter.Also,thesamemethodwasusedtoclassify
historicalpapersthroughchemicalsissuedfromlignocellulosicstructures[30].Thisshowed
howwell-knowncarbohydratesandligninvolatilederivativesdominatedthemainprincipal
components and distinguished papers of different nature (rag, bleached-pulp and

237
groundwood-containingpapers).Also,differentclassificationsofthesampleswereachieved
by considering either VOCs or compounds content. However, to our best knowledge,
statisticalanalysisincludingVOCsemissionofpolymersandothercommonpropertiesfora
betterunderstandingofmaterialdegradationwasnotcarriedout.
Theaimofthisstudy istodetermine ifthevolatiledegradationproductpatternofPPand
hemp fibers reinforced biocomposites can bring some elements on mechanisms of
degradationbymeansofstatisticalway.Forthispurpose,VOCsemissionwillberelatedto
macroscopic signs of degradation and to the simultaneous changes in mechanical, visual
appearance andmicrostructure properties during under glassweathering. Otherwise, this
calculationmethodwillpermittoverifyifVOCsemissioncanbeconsideredasausefuland
reliant indicatorofbiocompositesdegradation.Finally,themost importantfeatureswillbe
extractedbyplottingthedata.
Materialsandmethods
Rawmaterials
Polypropylene (PP,gradeH733-07)withamelt flowrateof7.5g/10min (230°C,2.16kg)
(Braskem, Brazil) in the form of pellets was used as homopolymer matrix. Hemp fibers
providedbyAgroChanvre(Barenton,France)weresiftedtoselectfiberslengthrangeof2to
6-mm.Maleicanhydridegraftedpolypropylene(MA-g-PP,OrevacCA100)(Arkema,France)
was added at 3.1 wt% of PP as coupling agent. The hemp fibers were added at 10 wt%
(PP10)and30wt%(PP30)inthe(PP+PP-g-MA)part.
Processconditions
Oven-dried PP andMA-g-PP granulesweremixedwith hemp fibers in a BC21Clextral co-
rotating twin-screw extruder (L/D = 36 with the diameter D = 25 mm and L= 900 mm)
(Clextral,France)withthetemperaturerangingfrom190to175°Cfromhoppertodieend
and a screw speed of 220 rpm.Once dried for 3 days at 60 °C in an air-circulating oven,
extruded pellets were injection molded in a Krauss Maffei KM50-T180CX (Krauss Maffei,
Germany) at 210 °Cwith an injection speedof 30 cm3.s-1. ISO1 dog-bone specimens and
squarespecimensof100×100×2mmandwereobtainedforbothmechanicalperformance
andvisualappearancecharacterizationsrespectively.

238
Weathering
One-yearexposition inthesouthwestofFrancewascarriedoutfromSeptember,2015to
September,2016torepresentapplicationofbiocompositesincarinteriors,accordingtoISO
877:2-2011standard [36].Thesampleswere fixedongalvanizedracksatanangle fixedat
45°withtheground,directedtowardtheSouthandcoveredbylaminatedwindshieldglasses
(Figure1).Hygrothermicdataweremonitored.Monthlyaveragetemperaturerangedfrom
15 °C in January to 37 °C in August and monthly average relative humidity took values
between33%inMayto69%inJanuary.Materialspropertiesweremeasuredafter1,2,3,6,
9and12months.Non-weatheredmaterialsweredesignedasPP-UW,PP10-UWandPP30-
UW. PP-GWn, PP10-GWn and PP30-GWnwere affected toweathered sampleswith n the
numberofmonthsofexposition.
Figure1-Underglassexposureracks
Flexuraltests
To characterize the samples strength, flexural testwas operated at room temperature on
dog-bonesamplesinaccordancetotheISO178:2010standard.Themechanicalbehaviours
weretestedbyZwickTH010pressmachinewitha2.5kNloadcell.Thethreepointbending
system was used with crosshead speeds of 2 and 100 mm.min-1 for the modulus E and
flexuralstressattheconventionaldeflectionσfcmeasurementsrespectively.

239
DifferentialScanningCalorimetry(DSC)
ThermogramswereobtainedfromPYRISDiamondcalorimeter(PerkinElmer,UnitedStates).
Samplesofapproximately10mgwererampedfrom30°Cto210°Cat10°C.min-1thencooled
downto30°Cwithacoolingrateof10°C.min-1.Thefirstheatwasfinallyrepeatedoncetime.
AllmesaurementswereperformedunderN2atmosphere.ThedegreeofcrystallinityofPP
wascalculatedfromtheratioofthemeltingenthalpyΔHm(J.g-1)ofthesampletothethe
meltingenthalpyof100%crystallinePP(209J.g-1)andthePPmassfraction:
-. % =123
4×123100×100
Eq.1
Thecrystallinityrateχcwasdeterminedfrom2ndheatingcyclesincethesecondrunprovides
information on the ability of degraded chains of the polymer to crystallize [29,37–40].
Moreover,sameevolutiontendencieswereobservedduringthe1stand2ndheatingcycles.
Theanalysisofeachmaterialwasrepeated2timesinordertoensurethereproducibility.
FourierTransformInfraredspectroscopy(FTIR)
FourierTransformInfraredspectrawererecordedwithaIFS66spectrometer(Bruker,United
States) inAttenuated Total Reflectance (ATR)mode. This technique allowed to determine
thevariationsofratesofvinylbondsandcarbonylbondsinlactones,aldehydesandesters,
carboxylicacidsandketonesmolecules.FT-IRspectraofthesamplesrecordedintherange
4000–400cm−1witharesolutionof1cm−1and32scans.Theywerenormalizedaccordingto
the band at 2925 cm−1 assigned to CH2methylene stretching, which is usually used as a
referencebandforcelluloseandPPsincethisbondisnonaffectedbyweatheringconditions
[41,42].
Spectrocolorimetry
The surface color analysiswas performed by spectrocolorimetry on a Chroma Sensor CS3
(DataColor,UnitedStates).TheCIE1976L*,a*,b*uniformsystemwasused to represent
the color and the lightness. An increase of L* (from 0 to 100) demonstrates a material
lighteningwhereasa*andb*arethechromaticitypositionsonaxesfrom-300to+300axes

240
from green (-a*) to red (+a*) and from blue (-b*) to yellow (+b*). A total of 12 areas by
materialwerecharacterized.
Spectrogoniometry
Gloss measurements were carried out using a GON 360 goniometer (Intrument Service,
Germany) associated with a MAS 40 spectrometer equipped with a halogen lamp. The
principlofthisisdevelopedelsewhere[43].Thegoniometerlightsourcewassetat20°and
reflectedlightwascollectedinthedetectoranglesrange5°-(-60°)withastepsmallerinthe
specular zone todetect thehighvariationsof intensity in this zone.The representationof
the intensity versus the detector angle allowed to characterize the gloss aspect [44]. The
haze gloss G1 was determined from the ratio of themaximum intensity obtained for the
angleofdetectionof-20°I(Θ=-20°)totheintensityobtainedfortheangleof-22°I(Θ=-22°)
bothsituatedinthespecularzone.ThecontrastglossG2wasobtainedfromtheratioofI(Θ=
-20°) to the intensitycollected for theangleof -35° I(Θ=35°)ofadiffusely reflected light
wasalsocalculated.Meanvaluesandstandarddeviationswereobtainedfromtheanalysis
offourareasofthreesamples.ThehigherGvalueis,theglossierandsmootherthesurface
seems.
Rugosimetry
The microtopography consisted on measuring the altitude of each surface point on the
sampleaccordingtotheISO25178standard.Forthispurpose,aMICROMESURESTILsystem
equipped with a STIL CHR150 optical sensor (STIL, France) was used to determine the
roughnessparameterSa(μm)(Eq.2).Moredetailsaregiveninapreviouspaper[43,45].The
micrometric rangeof theopticalpenwas285µm. Itpermitsa tridimensionalanalysisand
theanalyzedareaX*Ywas5mm*5mmwithananalysisstepof10µminXandYdirections.
Sa = 1
:;<(=, ?)
@AB
CDE
FAB
GDE
Eq.2
withMthenumberofpointsalongtheXaxis,NthenumberofpointsalongtheYaxis,and
zx,ythealtitudeinµm.Fourlocationsofthreesampleswereexamined.

241
VOCsemission
Samplingandanalyticalmethodology
Unlike the differentworks presented in introduction andbasedonHS-SPMEanalysis, this
study involved a specific passive sampling method to only measure materials surface
emission[23].Itconsistsintwosteps:acylindricalglasscell(50mL)equipedwithaseptum
incentralpositionisfirstlydepositedonthematerialinordertoisolateapartofitssurface.
Duringthisstep,emittedVOCsdiffusefromthematerialtotheairinthecelluntilreaching
stable concentrations meaning that material/air equilibrium is achieved [23]. A
polydimethylsiloxane-divinylbenzene-carboxen SPME fiber (PDMS/DVB/CAR, 50/30 µm)
(Supelco,UnitedStates) isthenintroducedintheglasscellthroughtheseptumtoextract
emitted VOCs. Then, the SPME fiber is thermally desorbed in the injection port of a gas
chromatograph (GC) coupledwithmass spectrometer (MS) and flame ionization detector
(FID) (Varian, France) forVOCs identification andquantification.Moredetails of analytical
procedurearegivenelsewhere[46].Samplingtemperatureof23°Cwastestedtosimulate
ambient interior conditions. Three samples of each material PP, PP10 and PP30 were
analysedateachtimeofweathering.
Quantitativeanalysis
The sampling method described above allows determining material/air interface
concentration(inµg.m-3)ofVOCs[23].VOCswerequantifiedastolueneequivalentusingFID
response [47]. For calibration, toluene standard atmospheres were generated by a
continuoussyringeinjectionmethod[48,49].Thequantificationlimitisabout3µg.m-3.
Statisticalanalysis
ThePCA is carriedout on Statistica 13 software (Dell, France). Thismultivariate statistical
method is a multivariate technique that analyzes a data table in which observations are
described by several inter-correlated quantitative variables. For this purpose, a set of
orthogonal linear combinations called principal components is built.More details on the
calculation method principle are given elsewhere [43,50]. In order to overcome the
difference of units between all the properties (variables) for accurate interpretation, the

242
standardization of the dataset by centering-reduction was conducted for the correlation
circlerepresentation:
H"′ = H" − H
JG Eq.3
whereXi’isthecentered-reducedvariable,XiisthevariableandXïandσxarethemeanand
standarddeviationofthevariableXrespectively.
Table1-Designationofparameters
Designation Parameter
E Modulusofelasticity(MPa)
s Stressattheconventionaldeflection(MPa)
Xc Crystallinityrate(%)
A1 AbsorbanceC=Oat1711cm-1(carboxylicacidsandketones)
A2 AbsorbanceC=Oat1740cm-1(estersandaldehydes)
A3 AbsorbanceC=Oat1780cm-1(γ-lactones)
A4 AbsorbanceC=Cat1650cm-1(vinyls)
Sa Roughness(µm)
G1 Hazegloss
G2 Contrastgloss
L* Lightness(light-dark)
a* Chromaticcoordinate(red-green)
b* Chromaticcoordinate(yellow-blue)
Cvoc AllVOCsconcentration(µg.m-3)
Cca Carboxylicacidsconcentration(µg.m-3)
Ck Ketonesconcentration(µg.m-3)
Resultsanddiscussion
Globaltreatment
The relationships between mechanical, physical and chemical properties including VOCs
emissions were assessed over under windshield glass weathering. For this aim, the
correlation loadingsareplotted inFigure2.Firstly, thetwofirstprincipalcomponentsPC1
and PC2 summarize almost 80% of the total information of inertia. Therefore, this is a
reliable representation of projected variables. Otherwise, variables are generally well
representedsincetheyexhibithighradius.Onlyvariablesrelatedtocolorandlightnessare
farawayfromthecircle,especiallya*,meaningthattheywerenotwellprojected.
Asforcarbonylabsorbancevalues,VOCsconcentrationsvariablesCvoc,CcaandCkexhibit
the highest coefficients of correlation among all the studied variableswith the firstmain

243
component PC1 bringing more than 50% of inertia. Cvoc corresponds to the sum of the
concentrationofCcaandCksinceonlyketonesandcarboxylicacidsweredetectedallalong
the ageing. Otherwise, variables increasewith decreasing PC1. This implies their negative
correlationwith PC1. In addition to previous ones, the roughness variable also dominates
the first principal component. Thus, this principal component can be perceived as an axis
describingchemicalpropertiesandtopography.Also,thecarboxylicacids(Cca),ketones(Ck)
and all VOCs (Cvoc) concentrations are strongly correlatedwithA1, A2 andA3 since they
overlap.Thissuggeststhatthese6criteriavarytogether:ifoneincreases,theotherstendto
doaswell.ThisappearsobvioussinceA1andA2representintensityofvibrationofcarbonyl
bondsinacidsandketonesforA1andestersandaldehydesforA2.Thehigherproportionof
carboxylic acids than ketones accounted in all VOCs level (Cvoc)might explain the higher
angle formed between Cvoc and Ck vectors. Otherwise, C=C absorption band (A4) and
roughnessparameter(Sa)varytogether.
TheelasticmodulusE,thestressattheconventionaldeflectionsandthecrystallinityratio
XcpositivelyhighlycontributetoPC2.Nevertheless,variables-PC2correlationismuchmore
importantforEands.Thus,primarilymechanicalperformancemakessensetoPC2.
Scatter plot of individuals (samples) is also displayed in Figure 2. Each dot represents PP,
PP10 and PP30 samples exposed during differentweathering time. PCA clearly led to the
differentiationbetweenPP,PP10andPP30 individuals.AllweatheredneatPParecloseto
eachothersuggestingthattheyarealikeandtakesimilarvaluesespeciallyonPC2whereas
weatheredbiocompositesareverticallyandhorizontallydistant.ThismeansthatPP10and
PP30wereparticularlyaffectedbytheexposure.
GapsbetweenPP,PP10andPP30accordingtoPC2aremuchhigherafter1,2and3months
ofweatheringthanthoseaccordingtoPC1.Thus,themechanicalpropertiesandcrystallinity
ratearethevariablesthatmostlycharacterizedifferencesbetweenmaterialswithdifferent
hempfiberloadingsattheearlystageofageing.Otherwise,thecoordinateaccordingtoPC2
axis increaseswith fiber loading. Indeed, thehighest fiber rate reinforcedbiocomposite is
stiffer and stronger. Then, VOCs release, absorbance attributing to C=O and C=C bonds
(chemical composition) and roughness (surface aspect) mostly discriminate the three
materials from 6 to 12months with the highest absolute scores attributed to PP30. This

244
confirms the high sensitivity of fiber face to oxidative degradation leading to by-products
releasefrombiocomposite.
Figure2-Correlationcircleandallindividualsprojection
Treatmentbyfiberloading
Correlation circle plots of PP, PP10 and PP30 separately are schematized in Figure 3. As
regards neat PP, variables vectors are particularly exploded. Indeed, any particular
correlation between variables is noted. On the contrary, a lot of information is captured
fromthedatasetofPP30thankstothefirsttwoprincipalcomponentssincetheyconserve
almost96%oftheinertia.Moreover,morevariables,withradiusclosetox2+y2=1withx
and y the variable coordinates on PC1 and PC2 respectively, are calculated for
biocomposites.Thisindicatesthehighlysatisfactoryqualityofrepresentation.
Inaddition,thenumberofvariablesinfluencingthedefinitionofPC1increaseswiththefiber
loading.For instance,bycomparison toglobalanalysis,Eands rotateso that theymostly
devote toPC1.Otherwise,whereasmechanicalpropertieswerenon-correlatedwithVOCs
emissions for global treatment presented above, they are here anti-correlatedwith VOCs
emissionwhateverthenaturalfiberrate. Indeed,the increasingemissionof lowmolecular
weightcompoundsfrommaterialsduringitsusemightbethesignofdegradation[16]and,
inthiscase,ofperformanceloss.Thisnegativecorrelationwasnotpreviouslyverifiedmaybe
due to the fact thatmechanicalpropertiesmoreexplain fiber rate factor thanweathering
Es
Xc
L*
a*
b*
G2G1
Sa
A4
-1.0 -0.5 0.0 0.5 1.0
Fact. 1 : 54.81%
-1.0
-0.5
0.0
0.5
1.0
Fact. 2 : 2
4.7
4%
A1
A2
A3
Cca
CkCvoc
PP30-GW3
PP30-GW6
PP30-GW9
PP30-GW12
PP10-GW3
PP10-GW6PP10-GW9
PP10-GW12
-12 -10 -8 -6 -4 -2 0 2 4 6 8
Fact. 1: 54.81%
-5
-4
-3
-2
-1
0
1
2
3
4
5
6
Fact. 2: 24.7
4%
PP30-UWPP30-GW1
PP30-GW2
PP10-UW
PP10-GW1PP10-GW2
PP-UW
PP-GW1
PP-GW2PP-GW3
PP-GW6
PP-GW9
PP-GW12

245
time one. Similarly, Sa, Cvoc and Cca variables are opposed to Xcone according to the
gravity center especially for biocomposites. It can be assumed that the polymer chain
scissionsmightinduceroughness[51]andfavorreleaseofvolatilecompounds.Moreover,as
regards reinforced materials, degradation of polymer chains promoted emissions of
chemicals linkedtofibersdecompositionduetomatrixentanglementdestruction.This last
pointcouldjustifythespruceanti-correlationbetweenXcandCvocforPP10andPP30rather
than for PP. Otherwise, Sa varies increasingly with the fiber loading in a same way as
variablesrelatingallchemicalsemissions.Indeed,thecorrelationcoefficientbetweenthese
two parameters (Sa and Cvoc) reaches 0.98 for PP30. This can be interpreted by the
increasing appearance of fibers at the surface inducing a rougher surface and release of
aliphatic ketones, aldehydes and acids specifically evolving from natural fibers. All these
causal relationships between hemp fibers degradation and mechanical and surface
properties loss could translate the more informative components of biocomposites
correlationcircles.
Contrary to global treatment, color coordinates have been well projected. a* is well
representedandclosetoPC2forPPandPP10.Butasalreadymentionedinapreviouspaper
[43],anyinterpretationcanbedoneforPPandPP10sincea*isassignedtotheevolutionof
colorofhempfibersduetolignindegradation[52].AsregardsPP30,b*ishighlycorrelated
with A2 and A3 suggesting that they increase in line. Actually, correlation coefficients
equaling0.99and0.98respectivelywerenoted.Thus,theyellowingobservedallalongthe
underglassexpositionisassumedtooriginatefromaldehydesandlactonesformationissued
from holocellulose and lignin depolymerisation. This is the reasonwhy the relationship is
only observed for biocomposites analyses. The small angle formed between A4 and L*
vectors for biocomposites suggests a connection existing between C=C bonds level and
lightness. Indeed, the evolution of the properties as a function of the timeofweathering
evidencedaplateauformedafter6months(Figure4).ThestagnationofC=Clevelobserved
after longweathering timewas assumed to originate from a conversion of C=C into C=O
species. However, lignin highly contributes to C=C surface rate via carbon-carbon double
bondinaromaticmolecules[40,42].Onthebasisofthesefacts,thegrowingappearanceof
lignin quinonic structures including C=C aromatic bonds at the surface might induce the
bleachingofcomposites.Thus,inthisstudy,ligninisalsoassumedtopartiallycontributeand

246
be commonly responsible tobleaching and vinyl band increaseand justify the close angle
betweenA4andL*.
Figure3-CorrelationcirclesofPP(a),PP10(b)andPP30(c)
s
Xc
L*
a*
b*
G2
G1
Sa
A2
A4
-1.0 -0.5 0.0 0.5 1.0
Fact. 1 : 66.28%
-1.0
-0.5
0.0
0.5
1.0
Fa
ct.
2
: 1
5.6
4%
E
A1
A3
Cca
Ck
Cvoc
E
s
Xc
a*
G2
G1
-1.0 -0.5 0.0 0.5 1.0
Fact. 1 : 74.89%
-1.0
-0.5
0.0
0.5
1.0
Fa
ct.
2
: 1
4.1
2% b*
L*
Sa
A1
A2
A3
A4
Cca
Ck
Cvoc
a*
G2
G1
-1.0 -0.5 0.0 0.5 1.0
Fact. 1 : 86.27%
-1.0
-0.5
0.0
0.5
1.0
Fact. 2 : 9.4
5%
E
sXc
L*
b*
Sa
A1
A2
A3
A4
Cca
Ck
Cvoc
c)
b)a)

247
Figure4–EvolutionofL*(a)andabsorbanceat1650cm-1(b)overunderglassweathering
IndividualsexposedduringdifferenttimesofweatheringaremainlyspreadaccordingtoPC1
(Figure 5). Indeed, they continuously take higher and higher values on variables
demonstrating oxidation (VOCs emissions and C=O bonds from FTIR) and roughness. The
differencesaccordingtoPC2areextremelylow.Moreover,asmentionedbefore,a*cannot
reallyexplainverticaldistancesbetweensamplesforPPandPP10.However,itturnsoutthat
the coordinate on PC2 continuously increases from UW to GW6 for PP and PP10, then
decreases.Therefore,themaximumonPC2isattributedforPP-GW6,PP10-GW6andPP30-
GW6.Thisperiodeffectivelycorrespondstothemomentduringwhicha*slightlydecreased
forPPandPP10after its increase from1 to6months.However, thedecreasevalued less
than1,andwashenceconsiderednon-significant[43].
AsregardsPP30biocomposite,positionsofindividualsaccordingtoPC2presentedthesame
overall elbow-shaped profile that cannot be explained by redness coordinate since a* is
mostly linked to PC1. However, chemicrystallization phenomenon due to chain scission
induced increase of the crystallinity ratio and modulus during the first two months of
weathering. This justifies the increase from UW to GW2 state according to PC2 that are
partially characterized by E and Xc. Gloss partially negatively represented by PC2 is also
responsible to this increaseaccording toPC2.Otherwise,A4andL*partiallycontribute to
PC2forbiocomposites.Therefore, itcanbeassumedthattheA4andL*valuesincreaseof
biocomposites until 6months preceding their stabilitymight be also related to the score
increase of PP10 and PP30 on PC2 from UW to GW6. However, six-months weathering
20
30
40
50
60
70
80
90
0 1 2 3 4 5 6 7 8 9 10 11 12
L*
Timeofexposition(months)
PP-GW
PP10-GW
PP30-GW 0
0,05
0,1
0,15
0,2
0,25
0,3
0 1 2 3 4 5 6 7 8 9 10 11 12
Absorban
ceat1650cm
-1
Timeofexposition(months)
PP-GW
PP10-GW
PP30-GW
a) b)

248
corresponds to the stage when Xc of PP30 dropped below PP one justifying the further
decrease on PC2. Thus, this stage corresponded to a critical period with variations trend
changes.
Figure5-IndividualsprojectionofPP(a),PP10(b)andPP30(c)
Treatmentbyweatheringtime
Theinfluenceofthetimeofageingoncorrelationsbetweenvariablesisdeterminedafter1,
2, 3, 6, 9 and 12months of under glass exposition (Figure 6). After 1month, threemain
groupsofvariables(Sa,E,s,A4),(G1,G2,L*,b*)and(Cvoc,Cca,Ck)aredistinguished.We
notice that the two last ones describe visual appearance andVOCs emission respectively.
This result indicates that the observed variables are grouped into the wide physical and
emissionpropertiescategories.Also,mostofthevariablesaremainly linkedtoPC1except
Cvoc, Cca and L* that equally contribute to PC1 and PC2. Otherwise, A2 attributed to
PP10-UW
PP10-GW1
PP10-GW6
PP10-GW9
PP10-GW12
-10 -8 -6 -4 -2 0 2 4 6
Fact. 1: 74.89%
-3
-2
-1
0
1
2
3
Fact. 2: 14.1
2%
PP10-GW2
PP10-GW3
PP-UW
PP-GW6
PP-GW9
PP-GW12
-10 -8 -6 -4 -2 0 2 4 6
Fact. 1: 66.28%
-3
-2
-1
0
1
2
3
Fact. 2: 15.6
4%
PP-GW1
PP-GW2
PP-GW3
b)a)
PP30-UW
PP30-GW1
PP30-GW2
PP30-GW9
PP30-GW12
-10 -8 -6 -4 -2 0 2 4 6
Fact. 1: 86.27%
-3
-2
-1
0
1
2
3
Fact. 2: 9
.45%
PP30-GW3PP30-GW6
c)

249
aliphaticaldehydesandestersabsorptionbandisparticularlyclosetoPC1sinceitsvectoris
confusedwithPC1axis.
During the exposition, the concentration of VOCs, ketones and carboxylic acids aswell as
their absorption bands maximum values A1 and A2 progressively tend to negatively
correlatewithPC1.However,evenifPC1alwaysrepresentsthehighestvariance,itisworthy
tonote thatPC1canbedifferentsince theyare issued fromdifferenteigenvaluesateach
time. After one year, these parameters have given a great weight on PC1. Therefore,
oxygenatedproductsreleasemoreandmoredefinesPC1comparedtootherpropertiesuntil
CvocoutrightreachesPC1axis.Also,Saanti-correlateswithG1andG2sincetheyforman
angleofalmost180°.Indeed,aroughersurfaceinducesalterationofglossaspect[53,44].
On another hand, E and s primarily strongly define PC1 and then characterize PC2. This
justifiesthe increasing inertiaratecarriedbyPC2.However,thecrystallinityvariable isnot
well projected at intermediateweathering time (6months)whereas theother correlation
circlesexhibitedhighradiusforthisvariable.Byverifyingrawdata,thisperiodcorresponds
tothecriticalstagewhencrystallinityratioofPP30getsdefinitivelylowervaluethanPPone
whereas the contrarywas observedbefore. Therefore, thenucleating agent role of hemp
fibersthatledtohighercrystallizationrateofpolymermatrixinbiocompositesthanneatPP
onewasnolongerkept.However,afterthisstage,itopposedcarbonylabsorbancevariables
suggesting that the degradation led to polymer deterioration and crystalline phase
oxidation.Otherwise,it is interestingtonotethatEandsarenon-correlatedwithCvocfor
eachweatheringtimewhereasananti-correlationwasnotedinanalysisbyfiberloading.As
explained in the previous part (paragraph III.3.2), this can be due to the fact that, in this
case,allmaterials(PP,PP10,PP30)areincludedinthestatisticaltreatmentleadingtobetter
differentiationoffiberratebythemodulusandstress.Finally,a*isclosetothecirclecenter
whatevertheweatheringtime.Thus,thiscolorcoordinateisnotinterpretable.

250
Figure6-Correlationscirclesafter1(a),2(b),3(c),6(d),9(e)and12(f)monthsofweathering
L*
a*
G2A1
A2
-1.0 -0.5 0.0 0.5 1.0
Fact. 1 : 66.48%
-1.0
-0.5
0.0
0.5
1.0F
act. 2 : 2
0.1
7%
E
s
Xcb*
G1
Sa
A3
A4
Cca
CkCvoc
L*
a*
b*
G2
G1
Ck
-1.0 -0.5 0.0 0.5 1.0
Fact. 1 : 67.10%
-1.0
-0.5
0.0
0.5
1.0
Fa
ct.
2
: 1
8.4
5%
E
s
Xc
Sa
A1
A2
A3
A4
Cca
Cvoc
L*
a*
G1
-1.0 -0.5 0.0 0.5 1.0
Fact. 1 : 64.99%
-1.0
-0.5
0.0
0.5
1.0
Fa
ct.
2
: 2
2.0
3% E
s
Xc
b*
G2
Sa
A1
A2
A3
A4
Cca
Ck
Cvoc
Es
Xc
L*
a*
b*
G2G1
Sa
-1.0 -0.5 0.0 0.5 1.0
Fact. 1 : 58.02%
-1.0
-0.5
0.0
0.5
1.0
Fa
ct.
2
: 2
1.9
6%
A1
A2A3
A4
CcaCk
Cvoc
Es
Xc
L*
a*
b*G2
G1
-1.0 -0.5 0.0 0.5 1.0
Fact. 1 : 55.55%
-1.0
-0.5
0.0
0.5
1.0
Fa
ct.
2
: 2
6.3
5%
Sa
A1A2
A3
A4
Cca
Ck
Cvoc
L* G2
G1
Sa
A4
-1.0 -0.5 0.0 0.5 1.0
Fact. 1 : 57.36%
-1.0
-0.5
0.0
0.5
1.0
Fact. 2 : 2
6.5
0%
E s
Xc
a*
b*
A1A2
A3
Cca
Ck
Cvoc
a) b)
c) d)
e) f)
251
ThefactorialplancanbedividedinthreepartscorrespondingtoPP,PP10andPP30groups
(Figure 7). For short-time weathering, most of the variables mainly differentiate the
materials fiber rate since these three groups arediscriminated throughPC1 (Figure 6 and
Figure7).Theoneand two-monthexpositioncertainly induced too lowdegradation tobe
consequently discriminated between their UW and GW state by the variables. However,
VOCs emission also describes state of weathering (PC2) demonstrating emission profiles
difference between UW and GW samples already at early exposition. Indeed, non-
weatheredsampleswerenotemissive(concentration<quantification limit)whereassome
carbonyls were detected once weathered. The score plots of individuals also considering
non-weatheredmaterialsallowstohighlightthatmechanicalparameters,herelinkedtoPC2,
moreconsiderablyexplainthefiber loadingatthenon-weatheredstatethanatweathered
state.
After one year of exposition (Figure 7f)), PC1mainly explainsweathering state and hemp
fiber loading throughVOCs releaseandchemical structurewhereasPP-UW,PP10-UWand
PP30-UWaredescribedbymechanicalpropertiessincetheyarrangeaccordingtoPC2.The
major difference of stiffness and strength between PP and biocomposites at UW state
certainly cause these differences. Then, the degradation induced PP, PP10 and PP30
distinction throughchemical compositioncausedbyhemp fibersprotrusionat the surface
leadingtotheirdetectionandVOCsemissionspecificallyissuedfromvegetalfibers.Finally,
whatever the time of exposition, volatile compounds emissions relate the state of
weatheringwhereasmechanicalpropertiestranslatethehempfiberrate.
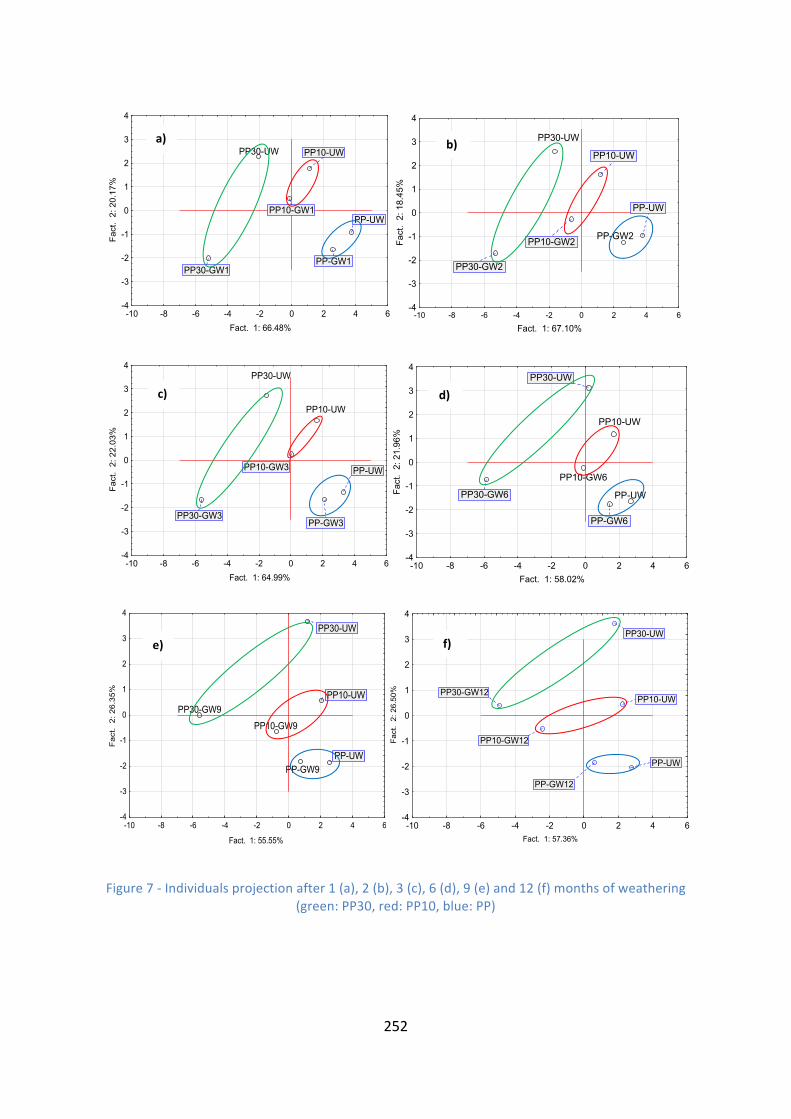
252
Figure7-Individualsprojectionafter1(a),2(b),3(c),6(d),9(e)and12(f)monthsofweathering(green:PP30,red:PP10,blue:PP)
PP30-UW
-10 -8 -6 -4 -2 0 2 4 6
Fact. 1: 66.48%
-4
-3
-2
-1
0
1
2
3
4F
act. 2: 20.1
7%
PP-UW
PP10-UW
PP-GW1
PP10-GW1
PP30-GW1
-10 -8 -6 -4 -2 0 2 4 6
Fact. 1: 67.10%
-4
-3
-2
-1
0
1
2
3
4
Fact. 2: 18.4
5%
PP-UW
PP10-UW
PP30-UW
PP-GW2PP10-GW2
PP30-GW2
a) b)
PP-UW
-10 -8 -6 -4 -2 0 2 4 6
Fact. 1: 58.02%
-4
-3
-2
-1
0
1
2
3
4
Fa
ct.
2
: 2
1.9
6%
PP10-UW
PP30-UW
PP-GW6
PP10-GW6
PP30-GW6
PP10-GW9
PP30-GW9
-10 -8 -6 -4 -2 0 2 4 6
Fact. 1: 55.55%
-4
-3
-2
-1
0
1
2
3
4
Fa
ct.
2
: 2
6.3
5%
PP-UW
PP10-UW
PP30-UW
PP-GW9
-10 -8 -6 -4 -2 0 2 4 6
Fact. 1: 64.99%
-4
-3
-2
-1
0
1
2
3
4
Fact. 2: 22.0
3%
PP-UW
PP10-UW
PP30-UW
PP-GW3
PP10-GW3
PP30-GW3
-10 -8 -6 -4 -2 0 2 4 6
Fact. 1: 57.36%
-4
-3
-2
-1
0
1
2
3
4
Fa
ct.
2
: 26
.50
%
PP-UW
PP10-UW
PP30-UW
PP-GW12
PP10-GW12
PP30-GW12
d)
f)
c)
e)

253
Conclusion
Theaimof thisworkwastoassessrelationshipsbetweenphysico-chemicalpropertiesand
similarities between PP and biocomposites samples over weathering representing a car
interiorenvironment.
Global treatment implying statistical calculation on all variables and individuals gave
overviewaboutinformationlinkedtocorrelationsbetweenvariablesincludingVOCsrelease.
The variables discriminated either fiber rate orweathering time depending on exposition
duration. Variables relating oxidative degradation mechanisms were non-correlated with
mechanical properties variables. As regards individuals clusters size, weathered PP30
samples (30%hempfiber loading)weremoredispatchedwhereasneatPPexhibitedsmall
group. This indicates the high degradation kinetic and the impact of weathering time on
biocompositesstability.
Theanalysiscarriedoutby isolatingthematerialsaccordingtotheirdifferentfiber loading
level was more informative. Firstly, the highest fiber composite entailed the better
projection of the dataset with the highest variance rate. This was assumed to be due to
direct causal links existing between properties of hemp fibers. Also, this analysis showed
thatVOCemissionsmeasurement canprovidevaluable information regardingdegradation
processessinceitwasanti-correlatedwithmechanicalperformance.Moreover,concerning
biocomposites, roughness increasedue to fibers lossandpolymermatrixdegradationwas
alsolinkedtodegradationproductpattern.Thecrystallinityratedecreasewasevidencedto
be certainlydue to crystallinephaseoxidation.Also, thanks to this statisticalmethod, the
color changes (b* increase over the weathering) was linked to ketones and lactones
formationwhereasbleachingwasexplainedbyligninchromophoricstructurescontribution.
Finally, thetreatmentbyweatheringtimeemphasizedthe impactofexposuredurationon
properties an their explanation of fiber rate and weathering state. After short-term
exposure,volatiledegradationproductsdescribedweatheringstateandhempfiberloading.
Moreover,mechanicalparametersalwaysbetterdifferentiatedfiberrateatnon-weathered
state rather than at weathering state. Indeed, bulk properties more differentiated non-
weathered state PP and biocomposites samples than weathered ones. Thus, degradation

254
inducednolongersignificantstiffeningandmechanicalperformanceenhancementthanksto
vegetal fibers after weathering. On the contrary, oxigenated bonds and volatile products
opposed weathered PP and biocomposites due to the emergence of vegetal fibers at
biocomposites surface and their higher sensitivity face to photothermal oxidative
degradationofnaturalfiberscomponentsthanPPone.
Accordingtothesestatisticalcalculations,VOCs issuedfrommatterdegradationare linked
to visual appearance evolution. Therefore, a sample visual aspect assessment could be
monitored to foretell chemical structure degradation. Moreover, the degradation
responsibleforchemicalsreleasemustbe limitedandmaterialsmustbeprotectedagainst
oxidation to conserve their aesthetic appeal. Also, all along biocomposites uses, VOCs
emissionmeasuredthankstonon-destructivemethodcanbeusedasindicatorforpredicting
mechanicalpropertieschangeswithoutdamagingthematerials.
References
[1] D. Rusu, S.A.E. Boyer, M.F. Lacrampe, P. Krawczak, Bioplastics and Vegetal FiberReinforcedBioplasticsforAutomotiveApplications,Handb.BioplasticsBiocompositesEng.Appl.(2011)397–449.doi:10.1002/9781118203699.ch15.
[2] O.Akampumuza,P.M.Wambua,A.Ahmed,W.Li,X.Qin,Reviewoftheapplicationsofbiocomposites in the automotive industry, Polym. Compos. 16 (2016) 101–113.doi:10.1002/pc.23847.
[3] L.Mohammed,M.N.M.Ansari, G. Pua,M. Jawaid,M.S. Islam, A ReviewonNaturalFiber Reinforced Polymer Composite and Its Applications, Int. J. Polym. Sci. 2015(2015).doi:10.1155/2015/243947.
[4] Feature, construction, solutions, medical, biocomposites, n°111, JEC Compos. Mag.(2017)1–122.
[5] K.-W.Kim,B.-H.Lee,S.Kim,H.-J.Kim,J.-H.Yun,S.-E.Yoo,J.R.Sohn,ReductionofVOCemission from natural flours filled biodegradable bio-composites for automobileinterior,J.Hazard.Mater.187(2011)37–43.doi:10.1016/j.jhazmat.2010.07.075.
[6] H.-S.Kim,S.Kim,H.-J.Kim,H.-G.Kim,Physico-mechanicalproperties,odorandVOCemission of bio-flour-filled poly(propylene) bio-composites with different volcanicpozzolan contents, Macromol. Mater. Eng. 291 (2006) 1255–1264.doi:10.1002/mame.200600212.
[7] H.-S. Kim, B.-H. Lee, H.-J. Kim, H.-S. Yang,Mechanical–thermal properties and VOCemissions of natural-flour-filled biodegradable polymer hybrid bio-composites, J.Polym.Environ.19(2011)628–636.doi:10.1007/s10924-011-0313-5.
255
[8] H.-S. Kim, B.-H. Lee, H.-J. Kim, H.-S. Yang,Mechanical–thermal properties and VOCemissions of natural-flour-filled biodegradable polymer hybrid bio-composites, J.Polym.Environ.19(2011)628–636.doi:10.1007/s10924-011-0313-5.
[9] C. Courgneau, D. Rusu, C. Henneuse, V. Ducruet, M.F. Lacrampe, P. Krawczak,Characterisationof low-odour emissive polylactide/cellulose fibre biocomposites forcar interior, Express Polym. Lett. 7 (2013) 787–804.doi:10.3144/expresspolymlett.2013.76.
[10] MCS-Aware, Sick Car Syndrome, (2015). http://www.mcs-aware.org/general-articles/189-sick-car-syndrome(accessedJanuary5,2017).
[11] Ministry of environmental protection, GB/T 27630-2011 Chinese national standard:Guidelineforairqualityassesmentofpassengercar,(2011).
[12] JAMA, Announces Voluntary Guidelines for Reducing Vehicle Cabin VOCConcentrationLevels,2005.http://www.jama-english.jp/.
[13] KoreanAutomobileTesting&ResearchInstitute,MinistryofLandInfrastructureandTransport,ProposalforaNewGTRonVehicleIndoorAirQuality(VIAQ),(n.d.)25–28.
[14] Underwriters Laboratories UL LLC, Vehicle Interior Air Quality: Addressing chemicalexposureinautomobiles,(2015).
[15] C.S. Widdowson, Vehicle interior air quality - (S)VOC emission from materials:regulation, standardmethods and analytical implementation, Top. C7 Transp. CabinEnviron.(2017).
[16] A.Espert,L.A.delasHeras,S.Karlsson,Emissionofpossibleodourouslowmolecularweight compounds in recycled biofibre/polypropylene composites monitored byhead-space SPME-GC–MS, Polym. Degrad. Stab. 90 (2005) 555–562.doi:10.1016/j.polymdegradstab.2005.03.009.
[17] Ó.Ezquerro,B.Pons,M.T.Tena,Directquantitationofvolatileorganiccompoundsinpackagingmaterials by headspace solid-phasemicroextraction-gas chromatography-mass spectrometry, J. Chromatogr. A. 985 (2003) 247–257. doi:10.1016/S0021-9673(02)01829-0.
[18] Ó. Ezquerro, B. Pons, M.T. Tena, Development of a headspace solid-phasemicroextraction–gas chromatography–mass spectrometry method for theidentification of odour-causing volatile compounds in packaging materials, J.Chromatogr.A.963(2002)381–392.doi:10.1016/S0021-9673(02)00211-X.
[19] M.Ghislain, J. Beigbeder, L. Dumazert, J.M. Lopez-Cuesta,M. Lounis, S. Leconte, V.Desauziers,Determinationof thevolatile fractionofphosphorus flameretardants incushioningfoamofupholsteredfurniture:towardsrespiratoryexposureassessment,Environ.Monit.Assess.188(2016).doi:10.1007/s10661-016-5566-y.
[20] R.Bernstein,S.M.Thornberg,A.N.Irwin,J.M.Hochrein,D.K.Derzon,S.B.Klamo,R.L.Clough,Radiation-oxidationmechanisms:VolatileorganicdegradationproductsfrompolypropylenehavingselectiveC-13labelingstudiedbyGC/MS,Polym.Degrad.Stab.

256
93(2008)854–870.doi:10.1016/j.polymdegradstab.2008.01.020.
[21] C.Rouillon,P.-O.Bussiere, E.Desnoux, S.Collin,C.Vial, S. Therias, J.-L.Gardette, Iscarbonyl index a quantitative probe to monitor polypropylene photodegradation?,Polym. Degrad. Stab. 128 (2016) 200–208.doi:10.1016/j.polymdegradstab.2015.12.011.
[22] A. Lattuati-Derieux, S. Bonnassies-Termes, B. Lavédrine, Characterisationofcompounds emitted during natural andartificial ageing ofabook. Useofheadspace-solid-phasemicroextraction/gaschromatography/massspectrometry,J.Cult.Herit.7(2006)123–133.doi:10.1016/j.culher.2006.02.004.
[23] D.Bourdin,P.Mocho,V.Desauziers,H.Plaisance,Formaldehydeemissionbehaviorofbuildingmaterials:on-sitemeasurementsandmodelingapproachtopredictindoorairpollution.,J.Hazard.Mater.280(2014)164–73.doi:10.1016/j.jhazmat.2014.07.065.
[24] K. Curran, M. Underhill, L. Gibson, A. Moore, M. Strlic, VOC analysis of degradingmodernpolymericmaterials inmuseumcollections, in:9thInt.Conf.Modif.Degrad.Stab.Polym.,2016.Poland.
[25] D.J. Carlsson,M. Krzymien, J.Worsfold, Volatiles releasedduring theweathering ofPVC,J.VinylAddit.Technol.3(1997)100–106.
[26] K.Curran,M.Strlic,Polymersandvolatiles :UsingVOCanalysisfortheconservationofplastic and rubber objects, Stud. Conserv. 0 (2014) 1–14.doi:10.1179/2047058413Y.0000000125.
[27] D.J. Carlsson, M.E. Krzymien, D.J. Pleizier, G., Worsfold, M. Day, Volatiles releasedfrom PVC during photochemical degradation. The fate of chlorine., in: Society ofPlasticsEngineers(Ed.),Conf.Soc.Plast.Eng.,1999.
[28] M. Hakkarainen, A.-C. Albertsson, Indicator products: A new tool for lifetimeprediction of polymeric materials, Biomacromolecules. 6 (2005) 775–779.doi:10.1021/bm049483f.
[29] M. Groning, M. Hakkarainen, Headspace solid-phase microextraction with gaschromatography/mass spectrometry reveals a correlation between the degradationproduct pattern and changes in the mechanical properties during thethermooxidation of in-plant recycled polyamide 6,6, J. Appl. Polym. Sci. 86 (2002)3396–3407.doi:10.1002/app.11345.
[30] M.Strlič,J.Thomas,T.Trafela,L.Cséfalvayová,I.K.Cigić,J.Kolar,M.Cassar,Materialdegradomics: On the smell of old books, Anal. Chem. 81 (2009) 8617–8622.doi:10.1021/ac9016049.
[31] M.A. Bari, W.B. Kindzierski, A.J. Wheeler, M.-È. Héroux, L.A. Wallace, Sourceapportionment of indoor and outdoor volatile organic compounds at homes inEdmonton, Canada, Build. Environ. 90 (2015) 114–124.doi:10.1016/j.buildenv.2015.03.023.
[32] J.G. Watson, J.C. Chow, E.M. Fujita, Review of volatile organic compound source

257
apportionment by chemical mass balance, Atmos. Environ. 35 (2001) 1567–1584.doi:10.1016/S1352-2310(00)00461-1.
[33] M.C.McCarthy,Y.-A.Aklilu,S.G.Brown,D.A.Lyder,SourceapportionmentofvolatileorganiccompoundsmeasuredinEdmonton,Alberta,Atmos.Environ.81(2013)504–516.doi:10.1016/j.atmosenv.2013.09.016.
[34] H. Guo, T. Wang, P.K.K. Louie, Source apportionment of ambient non-methanehydrocarbons inHongKong:Applicationof aprincipal component analysis/absoluteprincipal component scores (PCA/APCS) receptormodel, Environ. Pollut. 129 (2004)489–498.doi:10.1016/j.envpol.2003.11.006.
[35] J.Salafranca,I.Clemente,F. Isella,C.Nerín,O.Bosetti, Influenceofoxygenandlongtermstorageontheprofileofvolatilecompoundsreleasedfrompolymericmultilayerfoodcontactmaterialssterilizedbygamma irradiation,Anal.Chim.Acta.878 (2015)118–130.doi:10.1016/j.aca.2015.03.055.
[36] ISO 877-2: Plastics -- Methods of exposure to solar radiation -- Part 2: Directweatheringandexposurebehindwindowglass,(2011).
[37] L. Sisti,G.Totaro,M.Vannini,P.Fabbri, S.Kalia,A.Zatta,A.Celli, Evaluationof theretting process as a pre-treatment of vegetable fibers for the preparation of high-performance polymer biocomposites, Ind. Crops Prod. 81 (2016) 56–65.doi:10.1016/j.indcrop.2015.11.045.
[38] K.B.Adhikary, S. Pang,M.P. Staiger,AcceleratedUltravioletWeatheringofRecycledPolypropylene--SawdustComposites,J.Thermoplast.Compos.Mater.22(2009)661–679.doi:10.1177/0892705709096550.
[39] C. Rouillon, P.O. Bussiere, E. Desnoux, S. Collin, C. Vial, S. Therias, J.L. Gardette, Iscarbonyl index a quantitative probe to monitor polypropylene photodegradation?,Polym. Degrad. Stab. 128 (2016) 200–208.doi:10.1016/j.polymdegradstab.2015.12.011.
[40] S.Butylina,M.Hyvärinen,T.Kärki,Astudyofsurfacechangesofwood-polypropylenecompositesastheresultofexteriorweathering,Polym.Degrad.Stab.97(2012)337–345.doi:10.1016/j.polymdegradstab.2011.12.014.
[41] N.LeMoigne,M.Longerey,J.-M.Taulemesse,J.-C.Bénézet,A.Bergeret,Studyoftheinterface in natural fibres reinforced poly(lactic acid) biocomposites modified byoptimized organosilane treatments, Ind. Crops Prod. 52 (2014) 481–494.doi:10.1016/j.indcrop.2013.11.022.
[42] L.Soccalingame,D.Perrin,J.-C.Bénézet,S.Mani,F.Coiffier,E.Richaud,A.Bergeret,Reprocessing of artificial UV-weathered wood flour reinforced polypropylenecomposites, Polym. Degrad. Stab. 120 (2015) 313–327.doi:10.1016/j.polymdegradstab.2015.07.013.
[43] C.Badji,L.Soccalingame,H.Garay,A.Bergeret,J.-C.Bénézet,Influenceofweatheringonvisual and surfaceaspectofwoodplastic composites:Correlationapproachwith

258
mechanicalpropertiesandmicrostructure,Polym.Degrad.Stab.137(2017)162–172.doi:10.1016/j.polymdegradstab.2017.01.010.
[44] R.Alexander-Katz,R.G.Barrera,Surfacecorrelationeffectsongloss,J.Polym.Sci.36(1997)1321–1334.
[45] STIL,Presentationofopticalprinciples1:Confocalchromatic,(2016)38–40.
[46] D. Bourdin, V. Desauziers, Development of SPME on-fiber derivatization for thesamplingofformaldehydeandothercarbonylcompoundsinindoorair,Anal.Bioanal.Chem.406(2014)317–328.doi:10.1007/s00216-013-7460-6.
[47] M.J. Fedoruk, B.D. Kerger, Measurement of volatile organic compounds insideautomobiles, J. Expo. Anal. Environ. Epidemiol. 13 (2003) 31–41.doi:10.1038/sj.jea.7500250.
[48] J.Nicolle,V.Desauziers,P.Mocho,Solidphasemicroextractionsampling fora rapidand simple on-site evaluation of volatile organic compounds emitted from buildingmaterials,J.Chromatogr.A.1208(2008)10–15.doi:10.1016/j.chroma.2008.08.061.
[49] V. Desauziers, Traceability of pollutant measurements for ambient air monitoring,TrendsAnal.Chem.23(2004)252–260.doi:10.1016/S0165-9936(04)00310-3.
[50] L.J.Williams,H.Abdi,PrincipalComponentAnalysis,Wiley Interdiscip.Rev.Comput.Stat.2(2010)433–459.doi:10.1002/wics.101.
[51] J.S. Fabiyi, A.G. McDonald, M.P. Wolcott, P.R. Griffiths, Wood plastic compositesweathering:Visualappearanceandchemicalchanges,Polym.Degrad.Stab.93(2008)1405–1414.doi:10.1016/j.polymdegradstab.2008.05.024.
[52] P.Filson,B.E.Dawson-Andoh,L.Matuana,Colorimetricandvibrationalspectroscopiccharacterization of weathered surfaces of wood and rigid polyvinyl chloride–woodflourcompositelumber,WoodSci.Technol.43(2009)669–678.doi:10.1007/s00226-009-0254-5.
[53] W.J.O’Brien,W.M.Johnston,F.Fanian,S.Lambert,Thesurfaceroughnessandglossof composites., J. Dent. Res. 63 (1984) 685–688.doi:10.1177/00220345840630051601.

259

260
CHAPITREIV
VIEILLISSEMENTNATURELEXTÉRIEURETVIEILLISSEMENT
ACCÉLERÉENENCEINTEDESBIOCOMPOSITESPP/CHANVRE:
UNEÉTUDECOMPARATIVE

261

262
ChapitreIV
Vieillissementnaturelenextérieuretvieillissementartificiel
enenceintedesbiocompositesPP/chanvre:uneétude
comparative
L’évaluationdeladurabilitédesmatériauximpliqueunemesuredeleurcomportementface
aux conditions climatiques dans lesquelles ils seront potentiellement utilisés durant leur
cycle de vie. Les vieillissements artificiels en enceinte offrent la possibilité de réduire le
temps de vieillissement naturel pour dégrader significativement les matériaux et estimer
leur tempsdevie.Enquelques joursou semaines, lesenceintesdevieillissementartificiel
reproduisent les dégradations observées après plusieurs mois ou plusieurs années de
vieillissementnaturelenl'extérieur.
Unvieillissementnaturelextérieuretunvieillissementartificielenenceinteclimatiquedes
biocomposites étudiés font donc l’objet de ce chapitre. Plusieurs prélèvements sont
effectuésaucoursd’uneannéedevieillissementnaturelenextérieuretaucoursde42jours
de vieillissement artificiel. Une analyse des propriétés mécaniques, de microstructure et
d’aspectdesurfacedescompositesayantsubilesdeuxvieillissementsesteffectuéeafinde
comparer les deux types de vieillissement. Les résultats montrent une accélération de la
dégradation des biocomposites et du PP en enceinte de vieillissement artificiel. En effet,
pourunemêmeduréed’exposition,un tauxdedégradationplusélevéest constatéaprès
vieillissementartificiel.L’étudecomparatives’estbaséesurleprofildescorrélations(obtenu
par analyse statistique en composantes principales ACP dont le principe est détaillé dans
l’AnneII)entrelesdifférentsparamètressuivis.Lareprésentativité,enenceinteclimatique,
desmécanismesdedégradationmisenjeusousvieillissementnaturelaétévalidéeparACP.
De ce fait, il a été possible d’estimer des équivalences temporelles par type dematériau
prenantencompte l’ensembledespropriétésmesurées.Cesrésultatssuggèrentque l’ACP
peutêtreemployéepourcorrélerlesdeuxtypesd’expositionetprédireladuréedeviedes
biocomposites.
Cechapitre fait l’objetd’unepublicationà soumettreau journalPolymerDegradationand
Stability.

263

264
Célia Badji, Joana Beigbeder, Hélène Garay, Anne Bergeret, Jean-Charles Bénézet and Valérie
Desauziers
C2MA,Ecoledesminesd’Alès,6avenuedeClavières,30319CedexFrance
Abstract
The degradation behavior of hemp fibers reinforced PP biocomposites under one-year
outdoor and 1000-hour artificial laboratory weathering conditions were compared to
establishacorrelation.Forthispurpose,severalmeasurementswereperformedthroughout
the expositions. Mechanical performance was tested by three-point bending test.
Microstructure and chemical composition changes were also assessed. Otherwise, visual
aspect (color, gloss) and topography which could be linked to chemical composition
variations were determined. The artificial weathering effectively accelerated the
degradation mechanisms. Oxidation pathways and thus surface aspect alteration of both
polymerandbiocompositesoccurredfaster.However,whereasbiocompositesweremainly
subjectedtooutdoorconditionsduetohighsensitivityofhempfibers,virginPPwasglobally
mostly affected by laboratory chamber conditions. Its oxidation rate via lactones and
aldehydes formation largely outstripped reinforced materials ones. Principal Component
Analysis was used for verifying the differences of profiles of normalized variables
correlationsbetweenartificialandexteriorageingdataset inorder tocompare theoverall
degradationmechanisms.Throughthestatisticalanalysis,someattemptsweremadetofind
equivalence between artificial and outdoor weathering times thanks to properties
degradationratesimilarities.
Keywords: accelerated ageing, natural ageing, statistical method, hemp fibers, temporal
equivalence
Introduction
Environmental and production aspect benefits of natural fibers encourage research and
industriestodevelopbio-basedmaterials.Amongthem,hempfibershavelongbeenvalued

265
fortheirhighstrength,andwerebesidesextensivelyemployed inthefabricationofropes,
sails and textiles [1]. Nowadays they are also used as a substitute for glass, carbon or
metallic fibers for the reinforcement of thermoplastic matrix. Automotive, building and
furnitureindustriesconstitutethemainapplicationofbiocomposites.
Solarradiation,air,oxygen,rain,temperatureandbioticfactorsconstitutethemainweather
features of materials degradation. Some works reported results regarding biocomposites
durability. Few trialsperformingnaturalweatheringofnatural fibersand flours reinforced
biocomposites are reported in literature [2–4]. Synergic effect combining temperature,
humidityand,ultraviolet(UV)radiationcausesmaterialsdegradation.Evenifexpositionto
realconditionsisreliabletointerprettheperformanceloss, it isdifficulttounderstandthe
contribution of each factor to properties variations. Moreover, outdoor durability test is
oftenlaboriousandincludesirregularchangesandslowdegradationrateinducinglong-term
exposures needed to observe noticeable changes. Therefore, artificial weathering carried
out in laboratory chambers can substitute them in order to accelerate the degradation
phenomenon and predict outdoor weathering [5–7]. They intended to simulate exposure
conditions that would potentially be experienced by materials employed in real world
applications.
Most of estimations of correlations between artificial and exterior exposition assumed an
intimatelinkofdecompositionratewithonlyUVlightsinceitiswidelyacceptedthatphoto-
chemicalreactionsaremainlyresponsibleforpropertiesvariationsofpolymers.SoUVlamps
aresupposedtocloselysimulatespectralpowerdistributionofsunlight[8].Thereciprocity
law is classically used to correlate two ageing [9–11]. This law implies that for a same
cumulativeUVenergyundertwotypesofageing,thedegradationdegreesaresimilarevenif
lightintensitiesdiffer.Laboratoryageingofpolypropylene(PP)wascomparedtowholeyear
outdoorweatheringoccurringinShanghaireasoningonlythroughUVradiation[12].Intrinsic
viscosity and tensile strength values obtained under outdoor exposurewere compared to
those measured under several lamps UV intensities. It was noticed that, at the same
cumulativeUVirradiation,theresultsoftestcarriedoutwithlampswhoseintensitiesare82
and163W.m-2weremorecompatiblewiththeoutdoorweatheringtest,whiletestachieved
under 325 W.m-2 lamp induced higher loss of tensile strength. Moreover, it was
266
demonstratedbyinfraredspectroscopythatadifferentoxidativemechanismoccurredunder
325W.m-2 lamp.Thus, the reciprocity law isnot verified in this case. Similarly, inanother
study,theincrementofcarbonylabsorbance(measuredthroughinfraredexperiments)ofPP
against cumulativeexposureenergyhighlightedoutdoorexposureasmore impactful than
acceleratedoneforasameamountofUVexposure[13].Yangetalattemptedtocorrelate
outdoorandartificialweathering(UVradiationfollowedbyspray)ofpolyvinylchloride(PVC)
intermsofcumulativeUVradiationenergyQ[14].Whensamplesweresubjectedtoasame
Qvalue,desaturationandultimatestrengthdecreasewerefasterunderacceleratedageing
thanunderoutdoorone.Therefore,as forpreviousworks,bothweatheringconditionsdid
not correlate according to the classic reciprocity law. However, results obtained from
acceleratedandnaturalweatheringfittedbyapplicationofapowerlawgeneralizationofthe
reciprocity law. Indeed, the power index added to the reciprocity formula and related to
materials made consistent the aging levels of samples obtained at different radiation
intensitieswhenQ is constant.Nevertheless, even if samples behaviour is highly UV light
dependent, it was shown that different weathering performances can occur even if the
cumulative energyofUV irradiation is identical [15]. Indeed, dependingon light intensity,
different compounds having evolved from aged PP were detected. It was noted that
differenthydroperoxidesdecompositionpathwayscouldoccurgeneratingeithercarboxylic
acids and ketonesor esters by varyingUV intensity.Also, the lackof agreementbetween
spectralradiationandsolarspectrumononesideandtheweathervariabilityontheother
sidemay jeopardize a good simulation.Moreover, other exterior factors suchashumidity
cancatalysephoto-degradation[16–18].
Fabiyi et al conducted simultaneous natural and accelerated weathering of wood plastic
composites(WPC).TheycomparedPPmatrixdegradationofWPCafteroutdoorandxenon-
arcageingbyconsideringallexteriorfactors[19].Similarly,othercomparisonswerecarried
out without any calculation of degradation acceleration factor which corresponds to the
ratio between time of natural weathering and time of acceleratedweathering needed to
obtain a same degradation degree [20,21]. However, quantitative correlation between
artificial and exterior ageing was also performed to find a temporal equivalence by
comparingthealterationdegreeoftheanalysedmaterials.HowardandGilroystudiedlow-
densitypolyethylene(LDPE)degradationafterverylong-termnaturalandWeather-Ometer

267
ageing[22].Onthebasisofexperimentaldata,theyestablishedanexpressionverifyingthe
relationship between the two kinds of exposure. This equation indicated that during the
earlystageofexposure,changeswerefasterintheWeather-Ometerchamberthanoutdoor.
Nevertheless,whenexpositioncontinuedfurther,theefficacyoftheaccelerateddevicefalls
offataneverincreasingrate.Otherwise,thedecisiveelementforuseofwoodintheharsh
outsideenvironmentisitsdurability.Becauseofslownessofthenaturalweatheringprocess
ofwood,thecompressivestrengthvaluesofwoodsamplesrecordedallalongtheartificial
weathering were compared to the value obtained after one-year and two-year exterior
weatheringinPolishtemperateclimate[23].Theacceleratedageingincludedsoaking(16h),
high-temperaturestepat70°C(8h),andirradiationat30°C(6h).Equivalencewasdeduced
from comparison between these artificial conditions and an exterior weathering by
recordingintersectionofthetwosetsofdatacorrespondingtoasamerateofdegradation.
It revealed that the number of artificial cycles representing one-year ageing differed
accordingthewoodspecie.Itwasfoundthatshortcyclicalchangeshighlyputsamplesunder
stress. Indeed, cyclic exposures tend tobemore severe than steady-state exposures [24].
Otherwise, no particular factor was considered as major influential parameter. They
suggested that interaction ofmany exterior factors induce their degradation. In addition,
onesingleacceleration factordoesnotexist. Indeed,geographicalandclimaticconditions,
materialscomposition,stronglycontributetotheacceleration.
But correlations between natural and artificial ageing were also deduced from different
kinds of properties. For instance, Lv et al determinedmicrostructure, surfacemorphology
and mechanical properties of isotactic polypropylene under several outdoor weathering
stations situated in China. They were compared to properties measured under artificial
weathering [25]. A modified Arrhenius equation extended to three parameters that are
temperature, UV radiation and oxygen pressure, was proposed to correlate properties of
outdoorweatheredPPwiththosemeasuredunderacceleratedageing.Itwasdemonstrated
that a single acceleration factor based on the improved Arrhenius equation and
meteorologicaldatacouldsatisfactorilypredictoutdoordurability.Tidjanietalestimatedan
acceleration factor from the carbonyl absorbancewhose valuewas arbitrarily fixed at 0.1
[26]. The acceleration factor (ratio between artificial and natural ageing times needed to
obtain absorbance of 0.1) equalled 29.Most of the time, this ratio was often punctually

268
calculated at just one precise time of weathering and fewer verified the ratio over
continuousperiods.
Artificial weathering should obviously duplicate changes resulting from exterior exposure.
However, artificial ageing does not sometimes exactly correlate with natural exposure
[27,28]. Indeed, Martin et al conducted artificial and outdoor weathering on polyvinyl
chloride(PVC)[29].Short-periodexposureinchamberreproducedsamecolorvariationsas
outdoor whereas longer duration caused darkening that was not observed under natural
ageing.Nevertheless,Yangetalshowedthatwhenexpositioncontinuesfurther,thesurface
color of PVC could gradually change from chalky (1000h) to dark (2000h) [14]. Thus, this
darkeningcanalsoresultfromtoolongartificialexposition.
ThemaintargetofthisworkistostudyoutdoorandacceleratedweatheringofPPandhemp
fibers reinforced polypropylene biocomposites. The investigation focuses on physical,
chemical and mechanical properties changes all along the exposure. Then, in view of
literaturereportsconclusions,onemustverifywhetherdegradationmechanismsaresimilar
ornot throughPrincipalComponentAnalysis (PCA).Finally, relationshipsbetweenthetwo
typesofageingbyfindingtemporalequivalencewillbeattempted.
MaterialsandMethods
Materials
Polypropylene grade H733-07 with a melt flow rate of 7.5 g/10 min (230 °C, 2.16 kg)
purchasedfromBraskemCo.(Brazil)wasusedasthermoplasticmatrix.Hempfibers(2-6mm)
were provided by AgroChanvre (France). After the retting process, their cellulose,
hemicellulosesandligninratesdisplayedinTable1weredeterminedbysuccessivechemical
extractionsbasedonTAPPIT264,ASTMD1104standards[30,31].Twohempfibersloading
10wt% (PP10) and 30wt% (PP30)were chosen.Maleic anhydride grafted polypropylene
(MA-g-PP)couplingagentwitha1wt%graftingrate(OrevacCA100)andsuppliedbyArkema
(France),wasaddedat3.1wt%ofPPinthebiocomposites.
Table1-Hempfiberschemicalcomposition
Cellulose Hemicelluloses Lignin Liphophilicextractives Ash
(wt%) 82.1 8.5 4.5 2.7 2.1

269
Materialprocessing
HempfibersandMA-g-PPhavebeendriedbeforeprocess for15hat60 °C inanoven to
removeresidualwater.GranulesofPPandMA-g-PPweremixedwithhempfibersinaBC21
Clextralco-rotating twin-screwextruder (L/D=36with thediameterD=25mm)with the
temperature ranging from190 to175 °C from feed todieanda screwspeedof220 rpm.
Oncedried for3daysat60 °C,extrudedpelletswere injectionmolded inaKraussMaffei
KM50-T180CXat210°Cwithaninjectionspeedof30cm3.s-1toobtainsquarespecimensof
100×100×2mmandISO1dog-bonespecimens.
Weatheringconditions
Naturalweathering
Naturalweatheringwas carriedout in theSouthWestof France fromSeptember2015 to
September 2016. The exterior exposition corresponded to a decking use. Theweathering
conditionswereinadequacywithISO877-1:2011standard[32].Thesampleswerefixedon
galvanizedracksatanangleof45°withthegroundandlookedSouth.Dog-boneandsquare
specimensweresampledafter1,2,3,6,9and12monthsforlaboratorycharacterizations.
Average seasonal datawere recorded fromPau-Uzeinmeteorological station [33] andare
illustratedinFigure1.
Figure1–MeanrelativehumidityRH(%)andrainfall(mm)(a)andmeantemperatureT(°C)andinstantaneoussolarradiationmaximumSR(W.m-2)(b)
0
50
100
150
200
250
0
10
20
30
40
50
60
70
80
90
100
Sep-15
Oct-15
Nov-15
Dec-15
Jan-16
Feb-16
Mar-16
Apr-16
May-16
Jun-16
Jul-16
Aug-16
Rainfall(m
m)
RH(%)
Date(months)
RH(EW)
Rainfall
0
100
200
300
400
500
600
700
800
0
5
10
15
20
25
30
Sep-15
Oct-15
Nov-15
Dec-15
Jan-16
Feb-16
Mar-16
Apr-16
May-16
Jun-16
Jul-16
Aug-16
SR(W.m
-2)
T(°C)
Date(months)
T(EW) SR
a) b)

270
Artificialweathering
Artificialweatheringaimedtoemulateexteriorexposure.QUV-SprayapparatusfromQ-Lab
(Labomat Essor, France) using fluorescentUVA-340 lamps providing 365-295 nmUV solar
spectrumpartwasused.Theconditions followedthe ISO4892-3:2013standard [34].Each
12-hourweatheringcycleconsistedof8hofdryUVexposurewithanirradiancelevelof0.76
W.m-2atl=340nmat50°C,followedby3.75hofcondensationexposureat50°Cwithout
irradiationand0.25hspraystep.Specimenswerecollectedforanalysisafter100,150,250,
500,750and1000hofexposure.
Thedesignationofnon-weatheredandweatheredmaterialsisfeaturedinTable2.
Table2-Designationofnon-weatheredandweatheredmaterials(n:monthsnumber,m:hoursnumber)
Non-weathered
materialsExteriorweathered
materialsArtificialweathered
materials
DesignationPP-UW,PP10-UW,
PP30-UWPP-EWn,PP10-EWn,
PP30-EWnPP-AWm,PP10-AWm,
PP30-AWm
Mechanicalcharacterization
FlexuralpropertiescharacterizationwasconductedusingZwickTH010pressapparatuswith
a2.5kN loadcell.Testwascarriedoutat23±2°Cand50±10%RHonISO1Adog-bone
samples (ISO 178:2010) [35]. A three point bending system was utilized with cross-head
speeds of 2 and 100 mm.min-1 for the modulus and flexural stress at the conventional
deflection measurements respectively. Flexural stress-strain behaviors of samples were
analyzed in order to determine elasticmodulus Ef calculated between 0.05 and 0.25% of
strainandthestressattheconventionaldeflectionσfccorrespondingtothestressatastrain
of3.5%.Eightreplicatesspecimensofeachmaterialweretested.
Visualaspectcharacterization
Spectrocolorimetry
AChromaSensor3spectrocolorimeter(Datacolor,UnitedStates)wasusedtomeasurethe
surface color according to the CIE 1976 L*, a*, b* uniform system. The configuration
illuminant/observer was set at D65/10°. An increase of L* (from 0 to 100) witnesses a

271
material lightening whereas a* and b* are defined as the chromaticity positions on axes
from -300 to +300which are green (-a*) to red (+a*) and blue (-b*) to yellow (+b*) axes
respectively.Colorwasmeasuredonfourareasofthreespecimens.
Spectrophotogoniometry
AGON360goniometer(InstrumentSystems,Germany)coupledtoaMAS40spectrometer
withahalogenlampwasusedtomeasuretheglossbycollectingtheradiometricpowerat
differentanglesofdetection.Forthispurpose,thesourceanglewasfixedat20°accordingto
ISO2813standard[36]anddetectoranglesvariedfrom5°to-60°.Moredetailsaregivenin
a previous paper [20]. The haze gloss G1 was determined from the ratio of the intensity
obtained for the angle of detection to the intensity obtained for the angle of -22° both
situated in thespecular zone (Eq.1).ThecontrastglossG2wasdetermined fromthe ratio
betweentheintensityat-20°Candtheintensitycollectedfortheangleof-35°ofadiffusely
reflectedlight(Eq.2).ThehigherthevalueofG1andG2are,theglossierthesurfaceseems.
Theglosswascalculatedforthreereplicatesatfourlocationsoneachmaterial.
KB =L(M = −20°)
L(M = −22°) Eq.1
KP =L(M = −20°)
L(M = −35°) Eq.2
Microstructurecharacterization
Differentialscanningcalorimetry(DSC)
The thermal propertiesweremeasured using a PYRISDiamond calorimeter (Perkin Elmer,
UnitedStates).Thesamples(10mg)wereheatedfrom30to210°Cwithaheatingrampat
10 °C.min-1 under nitrogen atmosphere at a 20mL.min-1 flow. Two heating stepswith an
intermediate cooling step were performed. Two replicate samples per material were
analysed.ThecrystallinitywasdeterminedusingEquations(3)and(4).
-SB % =12TB
4×123100×100
Eq.3
-SP % =12TP
4×123100×100 Eq.4

272
whereW is the PPmass fraction, ΔHm (J.g-1) is the first or second heating rampmelting
enthalpyandΔHm100correspondstothetheoreticalmeltingenthalpyofafullycrystallinePP
(ΔHm100=209J.g-1[37]).
Chemicalcompositioncharacterization
FourierTransformInfraRedspectroscopy(FTIR)
AIFS66spectrometer(Bruker,UnitedStates)wasusedinAttenuatedTotalReflectance(ATR)
mode to follow the functional groups assigned to the samples degradation. The exposed
surfaceswereanalysedandthespectraofmaterialswererecordedbetween400and4000
cm-1 with a resolution of 1 cm-1. In order to normalize the spectra, the Min-Max
normalizationmethodofthespectrawiththe2925cm-1referencebandassignedtotheCH2
methylenegroupswasperformed.
Surfacecharacterization
Confocalrugosimetricmeasurement
AMICROMESURESTILsystemequippedwithaSTILCHR150opticalsensor(STIL,France)was
used to evaluate the roughness by altitude measurement of each surface point on the
samplewithoutcontactwiththesampleaccordingtotheISO25178internationalstandard.
Theanalysisprinciple isdetailedelsewhere [20].Themicrometric rangeof theopticalpen
was285µm.TheanalyzedareaX*Ywas5mm*5mmwithananalysisstepof10µminX
andYdirections.TheroughnessparameterSafollowedduringtheweatheringcorresponds
tothearithmeticmeanoftheabsoluteoftheheightvalues(Eq.5).
Sa = 1
:;<(=, ?)
@AB
CDE
FAB
GDE
Eq.5
withMthenumberofpointsalongtheXaxis,NthenumberofpointsalongtheYaxis,and
zx,y the altitude in µm. Mean values and standard deviations were obtained from the
analysisoffourareasofthreesamples.

273
PrincipalComponentAnalysis(PCA)
Principal Component Analysis (PCA) gives a simple graphical overview on large set of
observations of variables (properties) by data reduction. It also estimates the correlation
structureofthevariablesandrelatednessbetweenpopulations.Statistica13(Dell,France)
software was employed for the statistical calculation. Statistical analysis was used to
compare dataset of exterior and accelerated ageing. This aimed to first verify if the
relationshipsestablishedbetweenpropertiesaresimilarforthetwoweathering.Then,the
method was used to attempt correlating the two weathering by individuals (samples)
analysis.Variablesvalueswerecentered-reducedtoscalethemforovercomingdomination
ofvariableswiththehighestvariance.TheTable3resumesdenominationsofvariables.
Table3-Designationofvariables
Designation Parameter
E Modulusofelasticity(MPa)
s Stressattheconventionaldeflection(MPa)
χc1,χc2 Crystallinityratefrom1stand2ndheatingsteps(%)
A1 AbsorbanceC=Oat1711cm-1(carboxylicacidsandketones)
A2 AbsorbanceC=Oat1740cm-1(estersandaldehydes)
A3 AbsorbanceC=Oat1780cm-1(γ-lactones)
A4 AbsorbanceC=Cat1650cm-1(vinyls)
Sa Roughness(µm)
G1 Hazegloss
G2 Contrastgloss
L* Lightness(light-dark)
a* Chromaticcoordinate(red-green)
b* Chromaticcoordinate(yellow-blue)
Resultsanddiscussion
Mechanicalperformance
Flexural properties of PP and biocompositeswere determined all along one-year outdoor
(EW)and1000-hourartificial(AW)weathering.TheirchangesareillustratedinFigure2.The
highervaluesofbiocompositesmechanicalpropertiesrecordedwhateverthetimeandtype
of exposure are associatedwith the reinforcement and stiffening effect of vegetal fibers.
However, elastic modulus (Ef) and conventional deflection stress (σfc) of all materials
declinedduringthetwoweatheringsduetopolymerandhempfibersdegradation.

274
Otherwise, the longest-timeacceleratedageingmoreaffectedmoreelasticmodulusofPP
andPP/hempfiberscompositesthanoutdooroneduetohighnumberofcyclicalchangesin
moisture,temperatureandUVradiationinshorttimes[23].Also,theperformancelossrate
over ageing increased from PP to PP30 after exterior ageing whereas it decreased after
artificialone.Indeed,elasticmodulusdecreasedby20%and8%forPP30-EWandneatPP-
EWrespectivelyafter12months.Onthecontrary,itdiminishedby30%and41%forPP30-
AW and PP-AW respectively after 1000 hours. This can be explained by either different
degradationmechanismsduringEWandAWleadingtodifferentperformancelossspeedsor
too-longexpositioncorrespondingtomorethan1yearofnaturalexposurecoveredbythe
acceleratedageing.Thepropertiespresentedlaterwillallowfurtherunderstandingofthese
variationsandtargetthepossiblereasonsofdifferences.
Asregardstrendofσfcchanges,neatPPstresswasmoreinfluencedthanPP30whateverthe
typeofweatheringafterthetotalduration.Also,inthelastsixmonths,σfcofPP-EWfellby
21%whereasitremainedalmostconstantbefore.Aftera250-hourstableperiod,itlinearly
droppedby36%forPP-AW.Thus,artificialageingamplifiedthestrengthloss.

275
Figure2-ElasticmodulusandconventionaldeflectionstressofPP(blue),PP10(red)andPP30(green)overEW(fullline)andAW(dashedline)
Microstructure
The crystallinity degree of polymer was influenced by the weathering (Figure 3). Indeed,
evenifthephotodegradationisprevalentintheamorphousphasewhosemolecularchains
canfurthercrystallize,theglobaldecreaseofcrystallinityratesuggeststhatcrystallinephase
wasmostly affected [3,38]. Firstly,χc1was slightly less impacted byweatherings thanχc2.
Indeed,themaindifferenceisnotedforPP-AWdecreasingfrom46.1±0.2%to33.3±1.6%
and from 51.0 ±0.3 % to 25.0 ±2.8 % for χc1 and χc2 respectively at the end of the AW.
Moreover, somedifferenceswere noted betweenAWand EW. Indeed, the high absolute
curve slope of χc2 evolution of artificially aged materials indicates a higher kinetic of
crystallinityratedecreaseunderartificialweatheringconditions.Forinstance,χc2ofPP-AW
1000
1500
2000
2500
3000
3500
4000
4500
5000
5500
0 1 2 3 4 5 6 7 8 9 10 11 12
Ef(MPa)
TimeofexpositionEW(months)
1000
1500
2000
2500
3000
3500
4000
4500
5000
5500
0 1002003004005006007008009001000
Ef(MPa)
TimeofexpositionAW(hours)
30
40
50
60
70
80
90
100
0 1 2 3 4 5 6 7 8 9 10 11 12
σfc(MPa)
TimeofexpositionEW(months)
30
40
50
60
70
80
90
100
0 1002003004005006007008009001000
σfc(MPa)
TimeofexpositionAW(hours)

276
exhibitedadrasticdecreaseof50% in1000hourswhereasPP-EWone lostonly7%of its
crystallinity degreeoriginal value after 12months.Otherwise, unlike for EW,neat PPwas
moresubjectedtoQUVchamberconditionsthanPP10andPP30.Theseobservationsmatch
withresultsobtainedfrommodulusmeasurements.Itisnotedthatonlyχc1correspondsto
materialsmicrostructurewhenmechanicallytested.
Figure3-CristallinityrateofPP(blue),PP10(red)andPP30(green)overEW(fullline)andAW(dashedline)
Chemicalstructure
It is common to monitor photooxidation products in the 1700-1800 cm-1 region of FTIR
spectra of polymers throughout their ageing. Thus, carbonyls compounds including
carboxylicacidsinthedimerformandketones,estersandaldehydes,andlactonespeaking
20
25
30
35
40
45
50
55
60
0 1 2 3 4 5 6 7 8 9 10 11 12
Xc 1(%
)
TimeofexpositionEW(months)
20
25
30
35
40
45
50
55
60
0 100 200 300 400 500 600 700 800 9001000
Xc 1
(%)
TimeofexpositionAW(hours)
20
25
30
35
40
45
50
55
60
0 1 2 3 4 5 6 7 8 9 10 11 12
Xc 2(%
)
TimeofexpositionEW(months)
20
25
30
35
40
45
50
55
60
0 100 200 300 400 500 600 700 800 9001000
Xc 2
(%)
TimeofexpositionAW(hours)

277
at 1711, 1740and1780 cm-1 respectivelywereanalysed [15]. Thermoplastic polymers can
alsoundergochainscissioninducingvinylspeciesformationwhose1650cm-1infraredband
attests itspresence.Theanalysis ishencefocusedonabsorptionbandsbetween1490and
1830cm-1.The infraredspectraofmaterials thatwereunweathered,artificiallyweathered
for1000handexteriorweatheredforoneyeararefeaturedinFigure4.
Firstly, increaseofallcarbonylandvinylbandswiththefiber loadingcomesfromC=Oand
C=Cbondsnaturallypresentincellulose,hemicellulosesandlignin.Also,theirincreaseafter
expositionofallmaterialscorroboratesoxidativemechanismandscissionofpolymerchains.
It can be noticed that lactones level of each material was not influenced by the kind of
ageingafter1000hoursandoneyearofacceleratedandexteriorweatheringrespectivelyat
theoppositeofothercarbonylderivedsubstanceswhateverthematerial.Indeed,oxidative
degradationraterecordedafter1000hoursofAWcorrespondingto41daysishigherthan
those after 1 year of EW. So artificial ageingwasmore impactful than exterior ageing for
durationsthatwerechoseninthiswork.
Similarly,C=Cbondpeakheightwashigher forPP-AW1000 than forPP-EW12whereasno
difference was observed for biocomposites. PP was, once again, mainly sensitive to
laboratorychamberconditionsthatacceleratedpolymerchainscissions.

278
Figure4-InfraredspectraofUW,EW(1year)andAW(1000h)materials:PP(bluebased),PP10(redbased),PP30(greenbased)
ThemaximumabsorbanceevolutionsofC=Ocarboxylicacidandketonebonds(1711cm-1),
C=Oesterandaldehydebonds (1740cm-1),C=Og-lactonebond (1780cm-1)andC=Cvinyl
bond (1650 cm-1) with the ageing time and type (EW, AW) are showed on Figure 5.
Oxygenatedproductsarousedfromhydroperoxidespecies formedunderUVraysandhigh
temperatureofthetwotypesofweatheringthatcandecomposeintoalkoxyradicalswhich
dissociate into lower molecular weight products [25,39]. However, the increase rate of
oxygenatedproductswaslowerafternaturalageingthanafterartificialageingwhateverthe
material. Otherwise, this trendwas evenmore valid for virgin PP. So, artificially aged PP
underwentstrongeroxidativedegradation.
As regardscarbonylbondsevolutionprofile, results showthatestersandaldehydes (1740
cm-1)ononehandandlactones(1780cm-1)onanotherhandevolvingfromPPdegradation
reached a constant absorbance value after 250h of 0.3 and 0.15 respectively whereas
ketones and carboxylic acids (1711 cm-1) were progressively detected for artificial
weathering.Thissuggeststhat,atthisweatheringstage,ketonesandacidswereformedto
thedetrimentofthepreviousones.Sameevolutionwasobservedforbiocompositeswitha
slightlyslowerincreaseofesters,aldehydesandlactonesgenerationafter250hratherthan
a plateau. Therefore, ketones and acids groups could be favored in these conditions of
0
0,1
0,2
0,3
0,4
0,5
0,6
0,7
149015101530155015701590161016301650167016901710173017501770179018101830
Absorban
ce
Wavenumber(cm-1)
PP-UW
PP-EW
PP-AW
PP10-UW
PP10-EW
PP10-AW
PP30-UW
PP30-EW
PP30-AW
γ-lactones
(1780cm-1)
Esters/aldehyde
(1740cm-1)
Carboxylic
acids/ketones
(1711cm-1)
Vinyls
(1650cm-1)

279
humidity, UV radiation and temperature. Concerning exterior weathering, continuous
increase of these oxygenated compounds was recorded. However, the maximum shifted
from 1740 to 1711 cm-1 from non-weathered to weathered state whatever the type of
weathering.Thehydrolysisofesterspeciesleadingtocarboxylicacidscouldberesponsible
tothe1711cm-1bandlevelincrease.
g-lactonesgenerallyoriginatingfromintramolecularreactionscouldevolvefromback-bitting
mechanism [25]. Otherwise, the evolution of lactones absorbance peak reveals an auto-
acceleratedshapemeaningfirstinductionstagefollowedbyrapidincreaseandsteadystate
period [40]. A short inductionperiod, of about 100h, is observed for PP-AWwhereas this
stagelasted6monthsforPP-EW.
As regards vinyl bonds evolution profiles, biocomposites level stabilized after almost 6
monthsand250hofnaturalandacceleratedweatheringrespectively.Indeed,enolicgroups
can further rearrange into carbonyl species [41]. Also, even if they exhibit the same
evolutionprofile,vinylgroupslevellessincreasedforAWbiocompositesthanforEWones.It
canbeduetocontinuoushightemperatureinchamber(50°C)inducingthehigherdecrease
ofvinylstotheprofitofcarbonyls[25].However,adifferenttendencyisobservedforneat
PPsince,asforketonesevolution,itprogressivelyincreased.Moreover,theamountofC=C
species after one year corresponds to 250h of accelerated ageing. Thus, this mechanism
seems to correlate with an acceleration of degradation rate of PP under conditions of
artificialexposurethatwereappliedinthisstudy.

280
Figure5–Maximumabsorbancevaluesat1711,1740,1780and1650cm-1ofPP(blue),PP10(red)andPP30(green)infraredspectraoverAWandEW
0
0,1
0,2
0,3
0,4
0,5
0,6
0 1 2 3 4 5 6 7 8 9 10 11 12
Absorban
ceat1740cm
-1
TimeofexpositionEW(months)
0
0,1
0,2
0,3
0,4
0,5
0,6
0 100 200 300 400 500 600 700 800 9001000
Absorban
ceat1740cm
-1
TimeofexpositionAW(hours)
0
0,05
0,1
0,15
0,2
0,25
0,3
0 1 2 3 4 5 6 7 8 9 10 11 12
Absorban
ceat1780cm
-1
TimeofexpositionEW(months)
0
0,05
0,1
0,15
0,2
0,25
0,3
0 100 200 300 400 500 600 700 800 9001000
Absorban
ceat1780cm
-1
TimeofexpositionAW(hours)
0
0,1
0,2
0,3
0,4
0,5
0,6
0 1 2 3 4 5 6 7 8 9 10 11 12
Absorban
ceat1711cm
-1
TimeofexpositionEW(months)
0
0,1
0,2
0,3
0,4
0,5
0,6
0 100 200 300 400 500 600 700 800 9001000
Absorban
ceat1711cm
-1
TimeofexpositionAW(hours)
0
0,05
0,1
0,15
0,2
0,25
0,3
0 1 2 3 4 5 6 7 8 9 10 11 12
Absorban
ceat1650cm
-1
TimeofexpositionEW(months)
0
0,05
0,1
0,15
0,2
0,25
0,3
0 100 200 300 400 500 600 700 800 9001000
Absorban
ceat1650cm
-1
TimeofexpositionAW(hours)

281
Visualappearance
Color
Figure6depictslightnessevolutionversusexposuretime.PPwasnotsignificantlyinfluenced
by the ageing. Nevertheless, results showed that lightness increased for biocomposites
becauseoffibersphotodegradationandstructuralchanges.Asreportedinliterature,oxido-
reduction process of lignin leading to formation of hydroquinones due to chromophore
structuresformationinligninmayinducewhitening[4].ThebleachingkineticsofPP10-AW
and PP30-AW were more important than those of PP10-EW and PP30-EW respectively.
Otherwise,PP30bleachingsaturatedatalmost75after3monthsofEWand250hofAW.
Thiscanbeexplainedbytheincreasingrateofholocelluloseatthesurfacebeinguncovered
after biocomposites exposition. Otherwise, they degraded in a similar manner. Thus, the
typeofweatheringdidnotmodifytheevolutionprofile.
Figure6-LightnessevolutionofPP(blue),PP10(red),andPP30(green)materialsunderEWandAW
Figure7showsa*andb*colorimetriccoordinatesinatwo-dimensionspace.
ResultsshowthatPPcolorimetriccoordinateswasnothighlyinfluencedbythetwotypesof
ageing.
20
30
40
50
60
70
80
90
100
0 1 2 3 4 5 6 7 8 9 10 11 12
L*
TimeofexpositionEW(months)
PP-EW
PP10-EW
PP30-EW
20
30
40
50
60
70
80
90
100
0 100 200 300 400 500 600 700 800 9001000
L*
TimeofexpositionAW(hours)
PP-AW
PP10-AW
PP30-AW

282
As concerns a* coordinate values, results showed that non-weathered PP10 presented
highera*coordinatevalue(about3)thannon-weatheredPPandPP30(bothabout1).This
canbeattributedtoagreaterextractives(whosecolor isreddish)migrationatthesurface
duringmouldingprocess for low fiber rate than forhigher fiber contentbecauseof steric
hindranceduetoholocelluloseandlignin[42][43].Thehigherextractivesproportionatthe
surfaceofthe lowestfiberratebiocompositedemonstratedbyhighera*parametervalue,
was certainly due to extractives whereas steric hindrance due to holocellulose and lignin
limitstheirmigrationatPP30surface.Otherwise,thepresenceofvegetalfibersinducedhigh
chromatic variations of reinforced materials over the expositions. Indeed, a* value of
biocompositesdiminishedwhateverthetypeofweatheringdemonstratingaredcolorloss.
Thiscanbeattributedtoextractivesandredchromophoresdegradationorremovaldueto
radiationandrainforEWandsprayforAW.
Asregardsb*coordinatechanges,PP30underwentyellowingduringthe firststageuntil6
months(EW)and500h(AW),thenb*decreased.Thisevolutionhasalreadybeenobserved
by Peng et al demonstrating that yellow paraquinones and photooxidative products
formation due to presence of chromophore comprised of carbonyl groups was firstly
favoured. This preceded the further reduction of paraquinones part into hydroquinones.
However, the quinones formation mechanism occurred slower during exterior ageing.
Indeed, PP30-AW rose from 1.91 for non-aged sample to 2.45 after 500h then drastically
dropped to 0.20 after 1000hwhereas PP30-EW increased to 3.11 then decreased to 2.32
after12months.Similarly,b*valueofPP10-AWdecreaserateexceededPP10-EWone.So,
in our experimental conditions, chamber testingmight be favourable for accelerating the
degradationphenomenon.

283
Figure7-ColorimetriccoordinatesofPP(triangles),PP10(spheres)andPP30(squares)overAW(lightercolors)andEW(darkercolors)(h:hours,m:months)
Gloss
The light angular repartition profile of non-weathered and longest-weathered materials
(1000hforAWand1yearforEW)isshowninFigure8.
For non-weathered sample, maximum intensity of the specular peak dropped with the
vegetal fibers ratemeaning that brightness decreased. Some irregularities brought by the
presence of short hemp fibers at the sample surface were responsible for less smooth
surfaces.
Afterageing,glosswasreducedforallmaterials.Indeed,thepeakwasnolongerprominent
afterweathering and specular zoneswere no longerwell defined, especially for PP30 for
which peak almost disappeared due to diffuse reflection enhancement. No significant
differencebetweenPP30-AWandPP30-EWcurveswasobserved.Nevertheless,agedvirgin
100h
150h
250h
500h
750h1000h
1m
2m0
3m
6m
9m12m
1m
2m
3m
6m
9m
12m
1m2m
12m
6m
9m
3m
0
100h
150h
250h
500h
750h
1000h
0100h
150h
250h
500h
750h
1000h
0
1
2
3
4
5
6
7
8
-1 0 1 2 3 4 5
b*
a*
PP-AW
PP-EW
PP10-EW
PP30-EW
PP30-AW
PP10-AW

284
PPexhibitedshortandbroadsymmetricpeakthatwasextremely less intensethanPP-UW
one, signifying that polymer was particularly affected. Indeed, the maximum radiometric
powervaluewentfrom17,094u.a.to2,676u.a.and264u.a.afterEWandAWrespectively.
Thus,glossandsmoothnessdecreasedfasterin1000hofartificialageingthaninoneyearof
outdoornaturalone.PP10wentthroughthesametendency.
Figure8-AngularrepartitionofintensityoflightreflectedbyPP(blue),PP10(red)andPP30(green)before(fullline)andafter1000-hourartificial(dottedline)andone-yearnatural(dashedline)ageing
EvolutionsofglossparametersthroughoutweatheringarepresentedinFigure9.
G1andG2ofPP-AWsignificantlydecreasedfrom235and4275to1and5respectively for
the first 250h whereas G1 and G2 of PP-EW took one year to go down to 34 and 12
respectively.PP10-AWreachedapproximately1whatever thegloss ratioafter longer time
(500h) whereas PP10-EW reached 9 (G1) and 1 (G2) value ratio after 9 and 12 months
respectively. BothPP30-AWandPP30-EWparameters rapidly tended to 1 suggesting that
intensity level reached a same levelwhatever thedetection angle. As previously seen, PP
wasmostlydegraded.Asregardsglossvariations,thistrendwasconfirmedforartificialand
outdoorageing.Moreover,theratiocannotdropbelow1,sothecomparisonbetweenPP30
and PP decrease rates cannot directly be compared since non-weathered PP30 already
exhibitedlowglossparameterscloseto1andthusswiftlyreachedthelowestparameter.
0
2000
4000
6000
8000
10000
12000
14000
16000
18000
-60 -55 -50 -45 -40 -35 -30 -25 -20 -15 -10 -5 0 5
Intensity(u.a.)
Angleofdetection (°)
0
50
100
150
200
250
300
-60 -50 -40 -30 -20 -10 0

285
Figure9-GlossparametersoverEW(fullline)andAW(dashedline)ofPP(blue),PP10(red),andPP30(green)
Surfaceaspect
Roughness
Average roughness was estimated by altitude variations measurement at the samples
surface.Figure10gathersnon-agedand1000-hourartificiallyandone-yearnaturallyaged
materials. Before ageing, materials surface was relatively smooth. Some surface crackles
progressivelyappearedafterwards,deepenedandpropagatedgraduallywithageingtime.It
isobserved that thesurfacepicturesdifferedaccording to thekindofweatheringand the
0
1000
2000
3000
4000
5000
6000
0 1 2 3 4 5 6 7 8 9 10 11 12
G2
TimeofexpositionEW(months)
0
1000
2000
3000
4000
5000
6000
0 100 200 300 400 500 600 700 800 9001000
G2
TimeofexpositionAW(hours)
-50
50
150
0 500 1000
0
50
100
150
200
250
300
350
0 1 2 3 4 5 6 7 8 9 10 11 12
G1
TimeofexpositionEW(months)
0
10
0 6 12
0
50
100
150
200
250
300
350
0 100 200 300 400 500 600 700 800 9001000
G1
TimeofexpositionAW(hours)
0
10
0 500 1000

286
material andartificialweathering inducedmore surfacesdeterioration. Finally, differences
arenotedaccordingtothematerialasneatPPpresentedregularmicrocrackswhosedepthis
higher after accelerated ageing. On the contrary, PP30 exhibited some dispersed hollows
duetohempfibersremovalorprotrusioncausedbyexteriorparameters[8].
PP PP10 PP30
UW
EW
AW
Figure10-SurfaceimagesofPP,PP10andPP30before(UW)andafterartificial(AW)andexterior(EW)weathering
Figure 11 clearly emphasizes the roughness continuous increase of all materials. By
comparingEWandAWgraphs, thehighestdegradationkineticmeasuredthroughaverage
roughnessparameterduringexteriorweatheringwasattributedtobiocompositeswhereas
neatPProughnessoutstrippedduringartificialweathering.
0 2 4 mm
mm
0
1
2
3
4
5
µm
0
50
100
1500 2 4 mm
mm
0
1
2
3
4
5
µm
0
50
100
150
0 2 4 mm
mm
0
1
2
3
4
5
µm
0
50
100
150
0 2 4 mm
mm
0
1
2
3
4
5
µm
0
50
100
1500 2 4 mm
mm
0
1
2
3
4
5
µm
0
50
100
150
200
0 2 4 mm
mm
0
1
2
3
4
5
µm
0
50
100
150
200
0 2 4 mm
mm
0
1
2
3
4
5
µm
0
50
100
150
200
0 2 4 mm
mm
0
1
2
3
4
5
µm
0
50
100
150
200
0 2 4 mm
mm
0
1
2
3
4
5
µm
0
50
100
150
200
250
300

287
Figure11-RoughnessparameterevolutionofPP(blue),PP10(red)andPP30(green)overAWandEW
Statisticalanalysis
The previous observations do not corroborate the well-known higher sensitivity of
biocompositesthanconventionalglassfiberscompositesfacetoUVradiation,temperature
and humidity [1,45,46]. In view of properties changes, neat PP was globally particularly
degraded due to artificial degradation. Therefore, parameters implemented in the
laboratory chamber that strongly affected neat polymer stability may have been over-
represented.PCAanalysiswillpermittounderstandandclarifythesedifferences.
Globaldegradationmechanisms
All along the exposition, neat PP andbiocomposites properties evolved at different rates.
Moreover,dependingon theproperty, thehigherdegradationkineticwas recordedeither
for PP or PP30 after artificial weathering whereas the contrary was noted after outdoor
ageing.Thus, inorder toverify themechanismsandunderstand theobserveddifferences,
PCAisusedtoconsiderallstudiedproperties.
Thecorrelationcirclesallowrepresentingtheprofileofcorrelationsbetweenvariablesand
canbring elements on causal relationships (Figure 12). If theproximity between variables
measured after EW differs from that measured after AW, we can assume that different
mechanisms of degradation occurred. For this purpose, values were normalized to non-
0
10
20
30
40
50
60
0 1 2 3 4 5 6 7 8 9 10 11 12
Rough
nessparam
eterSa(µm)
TimeofexpositionEW(months)
0
10
20
30
40
50
60
0 1002003004005006007008009001000
Rough
nessparam
eterSa(µm)
TimeofexpositionAW(hours)

288
weathered state values in order to only consider the influence of time of weathering on
propertieschangesforaccurateinterpretationofglobaldegradationmechanismsinducedby
exposure.Itcanbenoticedthatpositionsofvariablesprojectedonthetwocirclesglobally
do not differ. Gloss parameters,microstructure andmechanical properties are effectively
well defined and positively correlated with the first principal component PC1 (horizontal
axis). On the contrary, lightness is positively represented by PC2 for both ageing. Since
weatheringtimesaremainlyorganizedaccordingtoPC1andfiberloadingaccordingtoPC2
(Figure 13), normalized stiffness, conventional deflection stress and crystallinity ratio
variablesdiscriminatesamplesweatheredatdifferentageing times.Finally,A1,A2andA4
assignedtoketonesandacids,toaldehydesandestersandtovinylsnormalizedabsorption
bands respectively equally contribute to PC1 and PC2. Otherwise, b* coordinate was far
away from the two circles meaning that it was not well projected. Thus b* colorimetric
parametercannotbeinterpreted.
Variables representing roughness parameter Sa and lactone maximum absorbance A3
contributeatdifferentratestoPC1andPC2principalcomponentsaxesdrawing.Indeed,A3
andSaareclosetoPC1carryingthehighestrateofinformationofthecloudofdata(almost
56%) for EW. But these variables getmore contribution to PC2 for AW. By simultaneous
interpretation of individuals scatterplots and correlation circles, it is deduced that these
parameters mostly discriminate the weathering time according to PC1 than fiber rate
according to PC2 for EW (Figure 12 and Figure 13). On the contrary, for AW, Sa and A3
mainlydistinguishfiberloadingsthroughPC2.Indeed,strongdifferencesofevolutiontrend
ofroughnessandlactonemaximumabsorbancebetweenPP,PP10andPP30wereobserved
(Figure5andFigure11).Short-term inductiontimesof150hand100hrespectivelybefore
theincreaseofparameterswereverifiedforPP-AWwhereastheyincreasedafter6months
and 1month respectively for PP-EW. This factmaybe induced themain discrimination of
fiberloadingsforAW(Figure13b).Thus,thedifferenceofA3andSapositionsbetweenAW
andEW is explainedby thedecomposition acceleration generatedby the artificial ageing.
Otherwise,theyremainopposedaccordingtoPC1axiswhateverthekindofweathering.
Formation of cracks (Sa variations) were favored by UV rays and rain rather than high
temperature[47].Indeed,itwasshownthattemperaturehasnotalteredthecrackgrowth

289
mechanism[48].Moreover,ithasbeendeducedfrominfraredspectroscopythathydrolysis
could be responsible for carboxylic acid and ketone functional groups continuously fast
increaseforAW.Therefore,spraysteprepresentingrainfallmightacceleratepolymerchains
scissions.Moreover, watermight enhance the diffusion of oxygen in thematter favoring
chainsoxidation.So,sprayandUVradiationstepsespeciallyinducingsurfaceaspectchanges
could be over-represented. Also, in this case, lignin component found in vegetal fibers
certainly acted as antioxidant after extended-timeartificial exposure since the increaseof
theroughnessandoxygenatedproductsofartificiallyagedPP30kineticwaslower[5,49].
Figure12-CorrelationcirclesofnormalizedvariablesunderEW(a)andAW(b)
Figure13–ScatterplotsofEW(a)andAWsamples(b)
E
a*
b*
Sa
A3
-1.0 -0.5 0.0 0.5 1.0
Fact. 1 : 56.27%
-1.0
-0.5
0.0
0.5
1.0
Fact.
2 :
21.4
6%
s
Xc2
Xc1
L*
G2
G1
A1
A2A4
s
a*
b*A1
-1.0 -0.5 0.0 0.5 1.0
Fact. 1 : 54.89%
-1.0
-0.5
0.0
0.5
1.0
Fact.
2 :
26.1
2%
E
Xc2
Xc1
L*
G2
G1
Sa
A2
A3
A4
PP30-AW250
PP30-AW500
PP30-AW750
PP30-AW1000
PP10-AW250
PP-AW750
-6 -5 -4 -3 -2 -1 0 1 2 3 4 5 6
Fact. 1: 54.89%
-6
-5
-4
-3
-2
-1
0
1
2
3
4
Fa
ct.
2
: 2
6.1
2% PP30-AW100
PP30-AW150
PP10-AW100PP10-AW150
PP10-AW500
PP10-AW750
PP10-AW1000
PP-AW100PP-AW150
PP-AW250
PP-AW500
PP-AW1000
PP10-EW1
PP30-EW12
PP10-EW6PP10-EW9PP10-EW12
PP-EW3
PP-EW6
PP-EW9
PP-EW12
-6 -5 -4 -3 -2 -1 0 1 2 3 4 5 6
Fact. 1: 56.27%
-6
-5
-4
-3
-2
-1
0
1
2
3
4
Fact. 2: 21.4
6%
PP30-EW1
PP30-EW2
PP30-EW3
PP30-EW6PP30-EW9
PP10-EW2
PP10-EW3 PP-EW1
PP-EW2
WeatheringtimeWeatheringtime

290
Temporalequivalence
Theobjective is to find similarbehaviourbetweennaturallyexteriorly (EW)andartificially
(AW)weatheredsamples.Hence,toassesseventualtemporalequivalence,individualsliving
in a multidimensional space whose dimensions number corresponds to the number of
variables, were projected on a plan to easily perceive the proximities (Figure 14). As
previously, normalized variables were considered for only considering influence of
exposition.
PP-AW100andPP-EW3presentalmostsamecoordinatesaccordingtoPC1axistowhichall
properties are mostly linked. Therefore, these materials are supposed to present same
degradationrateaccordingtothestudiedproperties.Otherwise,theyarealsoclosetoeach
other according to PC1 corresponding to the most important linear combination
characterized by the most of variables and capturing the largest information (75%). PP-
AW250 and PP-EW12 present almost same coordinates according to PC1 and PC2. Thus,
acceleration factorswere calculatedby the ratiobetween timeofnaturalweatheringand
that of artificial weathering. Theywere estimated at 22 and 35 at these precise periods.
Indeed, it is evident that non-linear evolution induces different acceleration factors
according to the weathering stage. However, ketone and acid groups absorbance
represented by A1 only verified the first equivalence whereas most of other properties
mainlyconfirmedthesecondone.
Asregardsbiocompositeloadedat10wt%ofhempfibers,PP10-AW100isrelatedtoPP10-
EW2.Otherwise, 250h and6months also generated sameamounts of damage. Thus, the
accelerationfactorsequalalmost14and17.5.Inaddition,bycomparisonwithneatPP,PP10
requiredtwotimeshigherofnaturalexposuredurationthanPPtoreflect250hofageingin
theQUVchamber.
Finally,asforpreviousmaterials,twotemporalcorrespondencesaregivenforPP30.Indeed,
the two last natural weathering times 9 and 12 months coincide with 500 and 750h
respectively.Soaccelerationfactorsare13and12.Thetwoaccelerationfactorsarealmost
equivalent.Thiscanbejustifiedbythefactthatthetwosamplingwereverycloseintimeas
muchoutside(9and12months)asinthechamber(500hand750h).Also,plotsofproperties

291
such as carbonyl groupsmaximum absorbance, conventional deflection stress and elastic
modulusasafunctionofweatheringtimepresentlinearcorrelationcoefficientssuperiorto
0.90. This can justify the low difference between acceleration factors since for linear
evolution,theratiobetweentheslopeofEWandAWcorrespondstoaccelerationfactor.

292
L*
a*
b*
G2
G1
Sa
A1
A2
A3
A4
-1.0 -0.5 0.0 0.5 1.0
Fact. 1 : 77.43%
-1.0
-0.5
0.0
0.5
1.0
Fact.
2 :
11.9
7%
Es
Xc2
Xc1
L*
b*
G2
A4
-1.0 -0.5 0.0 0.5 1.0
Fact. 1 : 78.40%
-1.0
-0.5
0.0
0.5
1.0
Fact.
2 :
12.9
6%
Es
Xc2
Xc1
a*
G1Sa
A1
A2
A3
Figure14-CorrelationcirclesandscatterplotsofPP(a),PP10(b)andPP30(c)
E
s
L*
a*b*
G2
G1
Sa
A1A2A3
A4
-1.0 -0.5 0.0 0.5 1.0
Fact. 1 : 74.41%
-1.0
-0.5
0.0
0.5
1.0
Fact.
2 :
12.3
1%
Xc2
Xc1
PP-EW1
PP-EW6
PP-EW9
PP-AW250
PP-AW500
PP-AW750
PP-AW1000
-10 -8 -6 -4 -2 0 2 4 6 8
Fact. 1: 74.41%
-4
-3
-2
-1
0
1
2
3
4
Fa
ct. 2
: 1
2.3
1%
PP-EW2
PP-EW3
PP-EW12
PP-AW100
PP-AW150
PP10-EW3
PP10-EW6
PP10-EW12
PP10-AW250
PP10-AW750
PP10-AW1000
-10 -8 -6 -4 -2 0 2 4 6 8
Fact. 1: 77.43%
-4
-3
-2
-1
0
1
2
3
4
Fa
ct.
2:
11
.97%
PP10-EW2
PP10-EW1
PP10-EW9
PP10-AW100
PP10-AW150PP10-AW500
PP30-EW1
PP30-AW100
PP30-AW150
PP30-AW1000
-10 -8 -6 -4 -2 0 2 4 6 8
Fact. 1: 78.40%
-4
-3
-2
-1
0
1
2
3
4
Fact.
2: 12.9
6%
PP30-EW2
PP30-EW3PP30-EW6
PP30-EW9
PP30-EW12 PP30-AW250
PP30-AW500PP30-AW750
293
Conclusion
ThisworkaimedtoperformnaturalandartificialageingofneatPPandbiocompositesand
correlate the two weathering conditions. Results showed that conditions of irradiation,
humidity,temperatureandwatersprayingchoseninthisworkacceleratedoxidationkinetics
and enhancedmechanical performance decrease under artificial weathering compared to
outdoor conditions. Thenatural fibers photo-oxidationmechanisms inducing surface color
variationsofbiocompositeswereaccentuatedintheQUVchamber.a*andb*colorimetric
parameters decrease due to carbohydrates and lignin components decomposition was
mostly intensified through artificial ageing. Smooth surface aspect of samples was also
altered. Otherwise, the type of roughness differed according to thematerialwith regular
cracksforneatPPandsomeholesforthebiocompositewiththehighestfiberratelimiting
thesurfacegloss.
Otherwise,resultsshowedthatmodulusdecreaseofneatPPismoreimportantthanthose
of biocomposites after artificial ageing. Elsewhere it was observed that the degradation
generallyincreasedwiththefiberrateafteroutdoorweatheringwhereasitdecreasedafter
artificial one. It also dug the cracks and holes formed after decomposition causingmore
deepcracksatvirginPPsurface.
PCA allowed comparing artificial and exterior weathering. It was found that correlation
circleswerequitesimilarapartfromvariableswhoseprofileexhibitedinductionstage.Thus,
this statistical method has disclosed a relationship between outside and chamber
weathering. It permitted to conclude that artificial ageing more accelerated neat PP
degradationmaybeduetooverrepresentationof factors incycles thanthose foundoutof
doorsandsensitivityofPPfacetoshortcyclicalchanges.
Dependingonthematerial,differentaccelerationfactorswereestimatedfromPCA.Indeed,
one-yearnaturalexposureofneatpolymerwasrepresentedby250hofacceleratedageing
whereas 750hwere required for the highest fiber loading composite. Contrary to studies
found in literature that classically face together values of a sameproperty obtained after
acceleratedandnaturalageing,thisstatisticalmethodusedtoestimateaccelerationfactors
allowed to take into account all parameters at the same time. It could be interesting to
294
generalize this approach to other materials and other quantitative parameters
representativeofweathering.
References
[1] A.Shahzad,Hempfiberanditscomposites-areview,J.Compos.Mater.46(2012)973–986.doi:10.1177/0021998311413623.
[2] M.Z. Ahmad Thirmizir, Z.A. Mohd Ishak, R. Mat Taib, S. Rahim, S. Mohamad Jani, NaturalWeathering of kenaf bast fibre-filled poly(butylene succinate) composites: Effect of fibreloading and compatibiliser addition, J. Polym. Environ. 19 (2010) 263–273.doi:10.1007/s10924-010-0272-2.
[3] C.Homkhiew,T.Ratanawilai,W.Thongruang,Effectsofnaturalweatheringonthepropertiesofrecycledpolypropylenecompositesreinforcedwithrubberwoodflour,Ind.CropsProd.56(2014)52–59.doi:10.1016/j.indcrop.2014.02.034.
[4] S. Butylina, M. Hyvärinen, T. Kärki, A study of surface changes of wood-polypropylenecomposites as the result of exterior weathering, Polym. Degrad. Stab. 97 (2012) 337–345.doi:10.1016/j.polymdegradstab.2011.12.014.
[5] I.Spiridon,K.Leluk,A.M.Resmerita,R.N.Darie,EvaluationofPLA–ligninbioplasticspropertiesbefore and after accelerated weathering, Compos. Part B Eng. 69 (2015) 342–349.doi:10.1016/j.compositesb.2014.10.006.
[6] K.C.C.C. Benini, H.J.C. Voorwald, M.O.H. Cioffi, Mechanical properties of HIPS/sugarcanebagasse fibercompositesafteracceleratedweathering,ProcediaEng.10 (2011)3246–3251.doi:10.1016/j.proeng.2011.04.536.
[7] N.M. Stark, L.M.Matuana, Ultravioletweathering of photostabilizedwood-flour-filled high-density polyethylene composites, J. Appl. Polym. Sci. 90 (2003) 2609–2617.doi:10.1002/app.12886.
[8] L. Soccalingame, D. Perrin, J.-C. Bénézet, S. Mani, F. Coiffier, E. Richaud, A. Bergeret,Reprocessing of artificial UV-weathered wood flour reinforced polypropylene composites,Polym.Degrad.Stab.120(2015)313–327.doi:10.1016/j.polymdegradstab.2015.07.013.
[9] A. François-Heude, E. Richaud, E. Desnoux, X. Colin, Influence of temperature, UV-lightwavelengthandintensityonpolypropylenephotothermaloxidation,Polym.Degrad.Stab.100(2014)10–20.doi:10.1016/j.polymdegradstab.2013.12.038.
[10] J.W. Martin, R.A. Ryntz, J. Chin, R.A. Dickie, Service life prediction of polymeric materials:Global perspectives, in: R.A. Ryntz, J. Chin, R.A. Dickie (Eds.), Springer Science & BusinessMedia,2008:p.537.doi:10.1007/978-0-387-84876-1.
[11] X. Yang, X. Jiang, J. Hu, F. Wang, C. Hu, Relationship between physical and mechanicalproperties of accelerated weathering and outdoor weathering of PVC-coated membranematerialundertensilestress,J.Ind.Text.(2016).doi:10.1177/1528083716639062.
[12] X.Yang,X.Ding,Predictionofoutdoorweatheringperformanceofpolypropylenefilamentsbyaccelerated weathering tests, Geotext. Geomembranes. 24 (2006) 103–109.doi:10.1016/j.geotexmem.2005.11.002.

295
[13] Y.Azuma,H.Takeda,S.Watanabe,H.Nakatani,Outdoorandacceleratedweatheringtestsforpolypropyleneandpolypropylene/talc composites:A comparative studyof theirweatheringbehavior, Polym. Degrad. Stab. 94 (2009) 2267–2274.doi:10.1016/j.polymdegradstab.2009.08.008.
[14] X. Yang, X. Jiang, J. Hu, F. Wang, C. Hu, Relationship between physical and mechanicalproperties of accelerated weathering and outdoor weathering of PVC-coated membranematerialundertensilestress,J.Ind.Text.(2016).doi:10.1177/1528083716639062.
[15] J.L.Philippart,C.Sinturel,R.Arnaud,J.L.Gardette, Influenceoftheexposureparametersonthemechanismofphotooxidationofpolypropylene,Polym.Degrad.Stab.64(1999)213–225.doi:10.1016/S0141-3910(98)00191-8.
[16] M.D.H.Beg, K.L. Pickering,AcceleratedweatheringofunbleachedandbleachedKraftwoodfibre reinforced polypropylene composites, Polym. Degrad. Stab. 93 (2008) 1939–1946.doi:10.1016/j.polymdegradstab.2008.06.012.
[17] D.R. Bauer, Interpreting weathering acceleration factors for automotive coatings usingexposure models, Polym. Degrad. Stab. 69 (2000) 307–316. doi:10.1016/S0141-3910(00)00074-4.
[18] G.R.Fedor,P.J.Brennan,Technicalbulletin(Q-LAB):ComparisonbetweennaturalweatheringandfluorescentUVexposures :UVA-340lamptestsresults,2011.
[19] J.S. Fabiyi, A.G. McDonald, Degradation of polypropylene in naturally and artificiallyweathered plastic matrix composites, Maderas. Cienc. Y Tecnol. 16 (2014) 0–0.doi:10.4067/S0718-221X2014005000021.
[20] C. Badji, L. Soccalingame, H. Garay, A. Bergeret, J.-C. Bénézet, Influence of weathering onvisualandsurfaceaspectofwoodplasticcomposites:Correlationapproachwithmechanicalproperties and microstructure, Polym. Degrad. Stab. 137 (2017) 162–172.doi:10.1016/j.polymdegradstab.2017.01.010.
[21] L. Belec, T.H. Nguyen, D.L. Nguyen, J.F. Chailan, Comparative effects of humid tropicalweatheringandartificialageingonamodelcompositepropertiesfromnano-tomacro-scale,Compos.PartAAppl.Sci.Manuf.68(2015)235–241.doi:10.1016/j.compositesa.2014.09.028.
[22] J.B. Howard, H.M. Gilroy, Natural and artificial weathering of polyethylene plastics, Polym.Eng.Sci.9(1969)286–294.doi:10.1002/pen.760090409.
[23] A. Jankowska, P. Kozakiewicz, Comparison of Outdoor and Artificial weathering usingcompressiveproperties,WoodRes.59(2014)245–252.
[24] M. Crewdson,OutdoorWeatheringMustVerifyAccelerated Testing, Antec 2011. 91 (2010)260–266.
[25] Y.Lv,Y.Huang,J.Yang,M.Kong,H.Yang,J.Zhao,G.Li,Outdoorandacceleratedlaboratoryweatheringofpolypropylene:Acomparisonandcorrelationstudy,Polym.Degrad.Stab.112(2015)145–159.doi:10.1016/j.polymdegradstab.2014.12.023.
[26] A. Tidjani, R. Arnaud, A. Dasilva, Natural and accelerated photoaging of linear low-densitypolyethylene: Changes of the elongation at break, J. Appl. Polym. Sci. 47 (1993) 211–216.doi:10.1002/app.1993.070470203.
[27] Z.N. Azwa, B.F. Yousif, a. C. Manalo, W. Karunasena, A review on the degradability of

296
polymeric composites based on natural fibres, Mater. Des. 47 (2013) 424–442.doi:10.1016/j.matdes.2012.11.025.
[28] C.A. Taylor, A. Amiri, D.C. Webster, C.A. Ulven, Long-term behavior of bio-composites forstructural applications, CAMX 2016 - Compos. Adv. Mater. Expo. (2016).doi:10.13140/RG.2.2.33964.87682.
[29] K.G.Martin,R.I.Tilley,DivisionofBuildingResearchreport04-2-6,CSIROAust.(1970).
[30] J.S.Han,J.S.Rowell,ChemicalCompositionofFibers,in:R.M.Rowell,R.A.Young,J.K.Rowell.(Eds.),Pap.Compos.fromAgro-BasedResour.,CRC/LewisPublishers,1996:pp.84–134.
[31] J.AceraFernández,N.LeMoigne,A.S.Caro-Bretelle,R.ElHage,A.LeDuc,M.Lozachmeur,P.Bono, A. Bergeret, Role of flax cell wall components on themicrostructure and transversemechanical behaviour of flax fabrics reinforced epoxy biocomposites, Ind. Crops Prod. 85(2016)93–108.doi:10.1016/j.indcrop.2016.02.047.
[32] ISO 877-1: Plastics -- Methods of exposure to solar radiation -- Part 1: General guidance,(2011).
[33] Pau-Uzein meteorological station, Real-time weather reports, (2016).http://www.infoclimat.fr/observations-meteo/temps-reel/pau-uzein/07610.html (accessedJune16,2017).
[34] ENISO4892-3:Plastics-Methodsofexposuretolaboratorylightsources-Part3:Fluorescentlamps,(2013)2–14.
[35] ISO178:2010,Plastics–Determinationofflexuralproperties,(2010).
[36] ISO2813:Coatings:Determinationofglossvalueat20°,60°and85°,(2014)1–31.
[37] Sperling L.H., Introduction to physical polymer science, 4th ed., JohnWiley & Sons, 2006.doi:10.1002/0471757128.ch9.
[38] N.M. Stark, L.M. Matuana, Influence of photostabilizers on wood flour-HDPE compositesexposedtoxenon-arcradiationwithandwithoutwaterspray,Polym.Degrad.Stab.91(2006)3048–3056.doi:10.1016/j.polymdegradstab.2006.08.003.
[39] J.F. Rabek, Photostabilization of Polymers: Principles and applications, Elsevier AppliedScience,1990.doi:10.1007/978-94-009-07-47-8.
[40] S. Morlat, B. Mailhot, D. Gonzalez, J.L. Gardette, Photo-oxidation ofPolypropylene/Montmorillonite Nanocomposites. 1. Influence of Nanoclay andCompatibilizingAgent,Chem.Mater.16(2004)377–383.doi:10.1021/cm031079k.
[41] S.A. Jabarin,E.A.Lofgren,Photooxidativeeffectsonpropertiesandstructureofhigh-densitypolyethylene,J.Appl.Polym.Sci.53(1994)411–423.doi:10.1002/app.1994.070530404.
[42] D. Rosu, R. Bodîrləu, C.A. Teacə, L. Rosu, C.D. Varganici, Epoxy and succinic anhydridefunctionalized soybean oil for wood protection against UV light action, J. Clean. Prod. 112(2016)1175–1183.doi:10.1016/j.jclepro.2015.07.092.
[43] A.J. Vinha, A.G. Carvalho,M. Teixeira de Souza, C.Marangon Jardim, A. de Cassia OliveiraCarneiro, J.LuizColodette,EffectofextractivesonwoodcolorofheattreatedPinusradiataand Eucalyptus pellita, Maderas. Cienc. Y Tecnol. 17 (2015) 857–864. doi:10.4067/S0718-

297
221X2015005000074.
[44] L. Soccalingame, D. Perrin, J.-C. Bénézet, S. Mani, F. Coiffier, E. Richaud, A. Bergeret,Reprocessing of artificial UV-weathered wood flour reinforced polypropylene composites,Polym.Degrad.Stab.120(2015)313–327.doi:10.1016/j.polymdegradstab.2015.07.013.
[45] G.Dorez,L.Ferry,R.Sonnier,A.Taguet,J.-M.Lopez-Cuesta,Effectofcellulose,hemicelluloseandlignincontentsonpyrolysisandcombustionofnaturalfibers,J.Anal.Appl.Pyrolysis.107(2014)323–331.doi:10.1016/j.jaap.2014.03.017.
[46] P.Wambua, J. Ivens, I. Verpoest, Natural fibres: Can they replace glass in fibre reinforcedplastics?,Compos.Sci.Technol.63(2003)1259–1264.doi:10.1016/S0266-3538(03)00096-4.
[47] H.Du,W.Wang,Q.Wang,S.Sui,Y.Song,Effectsofultravioletabsorberson theultravioletdegradationofrice-hull/high-densitypolyethylenecomposites,J.Appl.Polym.Sci.126(2012)906–915.doi:10.1002/app.36558.
[48] M.M. Thwe, K. Liao, Durability of bamboo-glass fiber reinforced polymer matrix hybridcomposites,Compos.Sci.Technol.63(2003)375–387.doi:10.1016/S0266-3538(02)00225-7.
[49] Y. Peng, R. Liu, J. Cao, Y. Chen, Effects of UV weathering on surface properties ofpolypropylene composites reinforcedwith wood flour, lignin, and cellulose, Appl. Surf. Sci.317(2014)385–392.doi:10.1016/j.apsusc.2014.08.140.

298

299
CONCLUSIONGÉNÉRALE
Aujourd’hui, l’industrie est confrontée à deux enjeux environnementaux importants. Le
premier enjeu vise à limiter les émissions de gaz à effet de serre grâce à l’efficacité
énergétique et à réduire la contribution des activités humaines aux changements
climatiques. Le deuxième enjeu concerne la réduction de la dépendance aux énergies
fossiles qui tendent à s’épuiser. Le développement de matériaux issus de ressources
renouvelables semble être une réponse prometteuse à ces enjeux. Par ailleurs, les
laboratoires et centres de recherche et de développement réalisent des travaux visant à
incorporerdesmatériauxde renforcementd’origine végétaleauxplastiquesdont l’origine
est généralement fossile. Aujourd’hui, ces composites à base de fibres végétales sont
retrouvésdansleslamesdeterrasse(«decking»),lesmeublesdejardin,lesbardagesetles
pièces intérieuresd’automobile(panneauxdeporteettableauxdebord).Cependant,bien
que les propriétés mécaniques spécifiques (caractéristiques mécaniques ramenées à la
densité)desfibresvégétalesconfèrentauxbiocompositesunetenuemécaniquecompétitive
vis-à-visdescomposites renforcésde fibresdeverre, leurdéveloppementest limitépar la
fortedépendancedeleurspropriétésauxconditionsd’usageetd’environnement.L’objectif
principaldecettethèseaétéd’évaluer l’impactdedeuxtypesdevieillissementnaturelet
d’un vieillissement artificiel sur plusieurs caractéristiques des biocomposites à matrice
polypropylène(PP)renforcéedefibresdechanvre(àdestauxmassiquesde10et30%).Ce
travail a ainsi permis de mieux appréhender les mécanismes physico-chimiques de
dégradationimpliquéslorsd’uneexpositioncompromettantladurabilitédesbiocomposites.
Lapremièrepartiedupremierchapitreaconcernél’étudedesmécanismesdedégradations
desbiocomposites lorsd’unvieillissementenconditionsd’usageaucoursd’uneannée.Le
premiertypedevieillissementaconsistéenuneexpositiondirecteauxintempéries(enlien
avec l’exposition réelle de lames de terrasse) alors que le deuxième a reflété un
environnement intérieur de véhicule (exposition sous vitre pare-brise). Les résultats ont
montré que les propriétés des biocomposites et du PP ont été dégradées par les trois
facteursprépondérantsquisontlapluie,lerayonnementUVetlatempératureainsiquepar
leureffetsynergique.Globalement, laprésencedefibresvégétalesaccentuelemécanisme
descissionsdechaîneetd’oxydationdeschaînesmacromoléculaires.Bienqueladifférence

300
entre les deux conditions d’exposition ait peu influé sur la réponse mécanique des
biocomposites,lamicrostructureetl’aspectdesurfacedesbiocompositeetduPPviergeont
étéplusimpactéslorsdel’expositionextérieuresansvitrage.Eneffet,l’expositionextérieure
afavorisélaformationd’irrégularitésdesurfacesuggérantquelapluieetlesrayonsUVsont
principalementresponsablesdecetterugosité.
Afindecomprendrelesdifférencesobservéesentrelesmatériauxchargésetnonchargéet
lesévolutionsdespropriétésdifférantselonletyped’exposition,lesrelationsexistantentre
tous les paramètres suivis ont été déterminées. Pour cela, une Analyse en Composantes
Principales (ACP) a été effectuée. Les différents traitements statistiques ont apporté
plusieurs informations complémentaires. La distinction des données par type de
vieillissement (extérieur et sous vitrage) a indiqué que les liens entre les différents
paramètresn’ontpasétésignificativementaffectésalorsqueladistinctiondesdonnéespar
taux de fibres a permis de dégager un lien de causalité entre la formation de composés
oxygénés (mesurés par spectroscopie infrarouge) et la réduction des performances
mécaniquestellesquelemoduled’élasticitéetlacontrainteàlaflècheconventionnelle.De
plus,l’évolutiondescorrélationsémergeantaucoursduvieillissementadémontréqu’après
9moisd’exposition,laréductiondutauxdecristallinitéétaitnotammentdueàl’oxydation
delastructurecristalline.
Les biocomposites de l’étude étant notamment destinés à être utilisés en environnement
clos (véhicules), il est important de connaitre leur potentiel d’émission de Composés
Organiques Volatils (COV). La méthode DOSEC-SPME précédemment développée au
laboratoire a donc été appliquée à la mesure des émissions de COV par les matériaux
biocomposites exposés sous vitre pare-brise. Il a été constaté que la présence de fibres
végétales augmente la concentration et la quantité en COV émis. De plus, l’exposition
favoriselesémissionssuggérantquelessubstancesidentifiéesproviennentessentiellement
de la décomposition des fibres. La formation des composés volatils émis par les
biocompositesnonvieillisaétéexpliquéeparlesréactionsdeMaillarddontlesinteractions
mettentenjeulesprotéinesàfaibleteneurdanslesfibresetlespolysaccharides.Apartirde
l’étude qualitative et quantitative des COV détectés tout au long du vieillissement, de
nouveaux chemins réactionnels ont été proposés. Ainsi, à l’état vieilli, une décomposition

301
secondaire de la matière végétale fait intervenir des réactions intermoléculaires dans la
phasegazeuse.
Aussi,lesconcentrationsdeCOVémisparlesmatériauxontétéétudiéesconjointementaux
autres caractéristiques tout au long de l’exposition pour évaluer les dépendances par
l’approchestatistiqued’ACP.Latendancemajeuredégagéeestquelamesuredesémissions
de COV peut fournir des informations sur les processus de dégradation puisque la
concentration globale en COV est anti-corrélée au module et à la résistance à la flèche
conventionnelledechaquetypedematériau.
Danscetteétude,ilnousaparuprimordialdemenerenparallèleunessaidevieillissement
accéléré,quiestprivilégiéauniveauindustrielpourungaindetempsdedéveloppement,et
denousassurerdelareprésentativitédesconditionssimuléesenenceintedetypeQUVen
lescomparantauvieillissementextérieur.LevieillissementenenceinteQUVainclusuncycle
d’expositionauxrayonnementsUV,àunepulvérisationd’eauetàunetempératureélevée.
Une accentuation du phénomène de dégradation a été observée dans le cas du
vieillissement QUV à travers les propriétés mécaniques et l’aspect de surface a été
significativementaffecté.Contrairementauvieillissementnaturel,letauxdedégradationen
enceinteQUVdu PP a été globalement plus élevé que celui des biocomposites suggérant
que le PP est plus sensible aux cycles courts de rayonnement et pulvérisation que les
biocomposites ou plus vulnérable à la surreprésentation des paramètres rayons
UVs/pulvérisation.
Le même outil statistique d’ACP a été utilisé pour évaluer la corrélation entre les deux
vieillissements. En se basant sur la proximité des matériaux à différents temps de
vieillissement sur un même graphe de projection, il a été conclu qu’une année de
vieillissementnaturelduPPetdubiocompositePP/30%enmassedefibrescorrespondaità
250het750hdevieillissementaccélérérespectivement.
Plusieurs perspectives issues de ce travail sont proposées. Il a été démontré dans la
littératurequedeschargesporeuses(zéolithes,pouzzolane,argile,…) incorporéesdansles
plastiquespouvaientpiégerlesCOVémis.Ainsi,cemêmeprincipedepiégeagepourraitêtre
extrapoléàuneétudesurlesémissionsdeCOVparlesbiocompositesetdoncpourraitêtre
unevoieintéressanteàdévelopperpourréduireleurimpactsurlaqualitédel’airintérieur.

302
Aussi,lesdifférentesréactionsproposéesdanscetravaildethèsepourraientêtrevalidéesà
traversunemodélisationde l’énergied’activationdes réactionsdans laphasegazeusequi
nécessitentdesconditionsfavorables.
Ilseraitintéressantdecontinuerlevieillissementnaturelaprès12moisd’expositionafinde
tester la durabilité desbiocomposites à plus long termemais aussi vérifier si les résultats
corroborent ceux observés après vieillissement artificiel, ce dernier ayant potentiellement
représenté un état de vieillissement naturel plus avancé. Par ailleurs, une étude plus
poussée visant à découpler les différents facteurs (rayonnement, pulvérisation,
température) en enceinte apporterait des éléments de compréhension sur leurs
contributionsrespectivesàl’évolutiondespropriétésdesmatériaux.Ainsiledécouplagedes
paramètreseffectuéaucoursde la thèsedeVincentBerthé (C2MA, IMTMinesAlès)pour
des matériaux à base de PLA pourrait être extrapolé à notre étude. Il serait d’ailleurs
judicieux de procéder à un vieillissement artificiel thermique du PP pour notamment
conforter nos hypothèses émises sur la surreprésentation des paramètres
rayonnement/pluie en enceinte par rapport aux conditions naturelles. Aussi, le
renforcement de thermoplastiques par les carbohydrates et la lignine séparément
constituerait des résultats complémentaires à la compréhension de la contribution des
composants lignocellulosiquesà l’évolutionde tous lesaspects,notammentdesémissions
deCOVparlesbiocomposites,abordésdurantcetravaildethèse.

303
ANNEXES

304
Lacouleur
Laperceptiond’unecouleurdépenddetroiscritèresquidoiventêtreprisencomptepoursa
caractérisation.Cestroiscritèressont:
• L’objet qui réémet, absorbe ou transmet les longueurs d’ondes du rayon lumineux
incident[1]selonlastructuremoléculairedesesconstituants.Parexemple,unobjetsera
rouge s’il absorbe les radiations vertes et bleues ou jaune s’il absorbe les radiations
rougesetbleues[1].
• Lasourcelumineuse(ouilluminant)définieparsonspectred’émissionquireprésentela
distributiondesintensitésd’émission,enfonctiondelalongueurd’onde.Pouréviterdes
variations non maîtrisées des sources lumineuses, la Commission Internationale de
l’Eclairage (CIE) a défini plusieurs illuminants standards qui permettent de simuler des
éclairages réels.Onpeutciter l’éclairementnaturel solaire (D65)ou l’éclairement sous
lampe à tungstène (A) ou fluorescente (F2) [2]. La Figure 1 montre la distribution
spectraledeceséclairages.
Figure1-Spectresd'émissiondedifférentsilluminantsstandards[193][190](éclairementsnaturelsolaire(D65),(C),souslampeàtungstène(A)fluorescente(F2),(F7),(F11))
• L’observateur/détecteurcaptelapartdusignalrenvoyéparl’objetetarrivantdansson
champdevision.LaCIEproposeégalementl’utilisationd’unobservateurstandard,dont
lasensibilitévisuellecorrespondàlasensibilitémoyenneobservéesurunecentainede

305
personnes au cours d’expériences menées en 1931 [2]. Puisque la perception des
couleursvarieenfonctiondupointdevuedel’observateur,l’observateurstandarddéfini
en1931aété fondédont l’angled’ouvertureduchampvisuelest fixéà2° (zonede la
rétineoulavisionatteintsaplusgrandenetteté).LaCIEadéfiniunobservateurstandard
supplémentairebasésurunchampde10°en1964.
Selon le principe de la trivariance visuelle issu des travaux de Grassman (1853) et Abney
(1913), la couleur d’un objet est déterminée suivant trois attributs que sont la teinte, la
clartéouluminositéetlasaturation[1].Comptetenudelatrivariancedelavisionhumaine,
des systèmes de synthèse des couleurs tridimensionnels sont proposés en colorimétrie.
Cependant,plusieursespacestridimensionnelsexistent.OnpeutciterlessystèmesLuv,xyz
ouLab.
Labrillance
Lebrillantestunegrandeurvisuellequidérivedel’analysedeladistributiongéométriquede
la lumière réémise par la surface d’un matériau. En effet, la brillance d’un matériau est
d’autant plus marquée que la lumière est réfléchie de manière dirigée. Ainsi, lorsque la
lumièreilluminelasurfaced’unobjet,ellepeutêtre:
• complètementréfléchiedansuneseuledirection.Onparlealorsderéflexionspéculaire
suivant la loi de Snell-Descartes pour une surface parfaitement lisse (Figure 2). On
entend par «lisse» une surface dont la rugosité est de dimension très inférieure à la
longueurd’ondedelalumière.
• réfléchie dans toutes les directions, définie par une réflexion diffuse. Ce phénomène
caractériséparlemodèledeLambertpourundiffuseurparfaitsemanifestenotamment
pour des surfaces rugueuses [3] et est dû à la multiple orientation des facettes
constituantlasurfacedumatériauetéclairéesparlespotlumineux.
• réfléchie dans une direction donnée où le comportement mixte inclut la réflexion
spéculaireetlaréflexiondiffuse.

306
Figure2–Différentesmodélisationsdelaréflexiond’unfaisceausurunesurface(diffusiondanstouteslesdirections(a),diffusiondansunerégiondonnée(b),réflexionspéculaire(c))
Lagrandeurpertinentedanslacaractérisationdelabrillancedelasurfaced’unobjetestla
fonctiondedistributionbidirectionnellederéflectance(BRDF)définiepar lequotientde la
luminance de l’élément de surfacemesurée dans une direction, par l’éclairement produit
parunrayonnementayantuneincidencedéfinie[3].Ceconceptphysiquemetenœuvredes
quantités infinitésimalespuisque laBRDF correspondàdes faisceaux lumineux incidentet
réfléchi compris dans des angles solides infinitésimaux [4]. La BRDF est une grandeur
multidimensionnelle complexe souvent modélisée. En effet, l’acquisition de la BRDF de
matériauxestunprocessuslongquiproduitunequantitédedonnéesconsidérabledifficileà
manipuler. Cependant, des paramètres alternatifs tels que le brillant de contraste et le
brillantdehaze,déterminésàpartirdelarépartitionangulairedelalumièreréfléchieparle
matériau,permettentd’évaluerletypederéflexionmisenjeu.
Références
[1] M.Sablier,M.Perraudeau,Lumièreetcouleur,Tech.l’Ingénieur.(2004).
[2] P.Callet,Couleuretapparencevisuelle-Letransparentetl’opaque,Tech.L’ingénieur.
(2004).
[3] V. Domurado, Étude et modélisation de la réflectance de la surface d’objets réels,
Mémoiredefind’études,2001.
[4] L. Bousquet, Mesure et modélisation des propriétés optiques spectrales et
directionnelles des feuilles, Thèse de doctorat, Université Paris 7 - Denis Diderot,
2007.
b)a) c)

307
L’analyse en composantes principales (ACP) est une méthode statistique multivariée qui
s’avèreutile lorsqu’unnombreimportantdevariablesquantitativesestétudié.Ellepermet
d’appréhender la structure d’un nuage de données et de déterminer les liaisons sur
l’ensembledesvariablesconsidérées.Cetteméthodedecalculreposesurlaprojectiond’un
ensemble de données quantitatives appartenant à un espace multidimensionnel sur un
espacebidimensionnel.Ainsi,desrelationsnonvisualisablesdansunespacedontlenombre
dedimensionsestsupérieurà2sontmisesenlumièresurleplandeprojection.Demême,
ellepermetdemieuxdistinguerlesressemblancesentrelesindividusdecetespace.
Pourunensemblededonnéesquantitatives,sinvariablessontobservéessurNindividus,le
tableausuivantpeutêtrereprésenté(Figure1):
Figure1-TableaudesindividusNdansl’espaceRn(lignes)auxvariablesndansl’espaceRN(colonnes)
Xij correspond à la valeur de la ième observation pour la jième variable. Ce tableau des
donnéesbrutesdéfinitdoncdeuxnuagesdepoints[1]:
- Le nuage des variables (colonnes): coordonnées des vecteurs variables tracés dans le
repèredontlesaxesreprésententlesindividus(espacededimensionN)
- Lenuagedesindividus(lignes):coordonnéesdesvecteursvariablestracésdanslerepère
dontlesaxesreprésententlesindividus(espacededimensionn).
II.1.Projectiondesindividus
Afindevisualiser l’ensembledesdonnéesdu tableauexposéprécédemmentetmettreen
évidence les relationsparune représentationgraphique synthétique,un sous-espaceFde
Xij
1
1 jVariables
Individus

308
dimension jdeRN avec j=2doitêtredéterminé [1].Pource faire, j(=2)nouvellesvariables
correspondant aux combinaisons linéaires des n variables initiales déformant le moins
possiblelenuageinitialsontdéfinies.Celaéquivautàtrouverlameilleureimageprojetéedu
nuagedepointsdedimensionsnde sorteque ladistanceentre l’individu i appartenantà
l’espace initial et sa projection Hi soit minimisée (Figure 2). D’après le théorème de
Pythagore, si la distance entre l’individu et le centre de gravité dunuagedepoints initial
(Oi)2estconstante,(OHi)2doitêtremaximiséepourque(iHi)
2soitlapluspetitepossible.
Figure2-ProjectionHidel’individui
Donc, si tous les individus sont pris en compte, la somme des distancesSOHi2 doit être
maximiséepourrefléteraumieuxladispersiondunuaged’individusinitial.Ainsi,unpremier
axe Composant Principal 1 (CP1) correspondant à la première combinaison linéaire des
variables initiales est tracé. Un second axe CP2 orthogonal à CP1 est généré pour
représenter leplandeprojection.AprèsCP1,cetaxereprésente lecomposantprincipal le
plusprochedunuagebrutsynthétisantaumieux ladispersiondesdonnéesappartenantà
l’espaceinitial[2].
Sil’onconsidèreAetBdesindividusappartenantàl’espacededimensionsnsurlaFigure3,
A’etB’sontdesimagesprojetéssurl’axeCP1etA’’etB’’sontlesimagesprojetéessurCP2.

309
Figure3–PlanprincipaldeprojectiondesindividusAetB(PC1etPC2représentésenrouge)[3]
Cettedispersionesttraduiteparlepourcentaged’inertiedunuagedesindividus,mesurant
laqualitédelaprojection,expliquéparchaqueaxedeprojectionquiestdéterminécomme
suit[4]:
L =1
:UP
F
B
(V, 2") Eq.1
avecdladistanceentrelecentredegravitéOetlaprojectionHidel’individuisurl’axeCP1.
L’inertiedusous-espacefactorielestégaleàlasommedespourcentagesd’inertieportéspar
CP1etCP2.
II.2.Projectiondesvariables
Demêmequepour les individus, lenuagedesvariablesàdimensionsNestajustéafinde
projeter ces variables sur un plan en minimisant la perte d’information, c’est-à-dire en
conservantladispersiondesvariables.Ainsi,lessommesdescorrélationsentrelevecteurF1
et chacune des variables k Sr(F1,k)2 et entre le vecteur F2 orthogonal à F1 et chacune
variableskSr(F2,k)sontmaximisées.Cesdeuxfacteurspermettantlavisualisationdunuage
desvariables,sontdenouvellesvariablesquisynthétisentleplusfidèlementpossiblel’angle
formé entre les vecteurs des variables et permettent donc l’interprétation correcte des
corrélations entre les variables dégagées sur le plan. Ces corrélations peuvent être
interprétéessurlesgraphiquesdesvariables,nomméscerclesdescorrélations,obtenusen

310
calculantlacorrélationentrelesvariablesdel’espacenonprojetéetlesaxesprincipauxde
vecteurdirecteurF(Figure4).
Figure4–EspacededimensionNcontenantlenuagedesvariablesU,V,W(a)etcercledescorrélations(U’,V’,W’:variablesprojetées)(b)
Deplus,lorsquelesunitésdesvariablessontdifférentes,lesdonnéessontnormaliséespar
centrage-réduction.Une fois centrées-réduites, les angles entre les vecteurs des variables
sur lecercledescorrélationspeuventêtre interprétéspuisque lecoefficientdecorrélation
entre la variable k et la variable l r(k,l) correspond au cosinus de l’angleformé entre les
mêmesvariablesunefoisprojetéesHketHl:
W X, Y = cos ]k,l ≈ cos(]Hk,Hl) Eq.2
Ainsi,d’aprèscetterelation,plusl’angleforméentredeuxvariablesserafaible,pluscesdeux
variablesserontliées.
II.3. Contribution des variables et des individus aux composantes
principales
Unevariablekcontribuerad’autantplusàlaconfectiond’unaxe,quesaprojectionsurcet
axe sera éloignée du centre de gravité du nuage. La contribution Ctr de la variable k à la
construction de l’axe étant un des composantes principales P exprimée en % peut être
déterminéeàpartirducoefficientdecorrélationentrelavariableketlevecteurdel’axep
FP:
)bW X % =W cP, X P
W cP, X PeB
Eq.3
kl
θ
m
O
r(Hk,F2)
r(Hk,F1)
-1
-1
1
1
Hl
Hm
Hk
b)a)

311
Demême, lacontributiond’un individu ipeutêtredéterminéeselonsacoordonnéeFi sur
l’axeP[2]:
)bW f % = Hi(P)P
Hi(P)PFB
Eq.4
avec XiP la coordonnée de l’individu i sur l’axe P. Cela permet demettre en évidence les
individusparticulierscontribuantprincipalementàlaconstructiond’unaxeCP.
II.4.Conclusion
Finalement,cetoutilstatistiquepermet,parunchangementderéférentiel,desimplifier la
description d’un ensemble de données afin d’en extraire les informations les plus
pertinentes.Parlecalculdecombinaisonslinéairesdesanciennesvariables,lastructureest
visualisée et analysée et les relations entre variables et similitudes entre individus sont
déterminées. L’ACP a été utilisée dans le cadre de cette étude pour l’étude des relations
entrelesparamètresmesurés.
II.5.Références
[1] “Introductionàl’AnalyseenComposantesPrincipales(ACP),”WikiStat,pp.1–5.
[2] L. J. Williams and H. Abdi, “Principal Component Analysis,”Wiley Interdiscip. Rev.
Comput.Stat.,vol.2,no.4,pp.433–459,2010.
[3] T.Foucart,“Courssurl’AnalyseenComposantesPrincipales,Chap.9.”2013.
[4] C.DubyandS.Robin,“AnalyseenComposantesPrincipales,”CoursAgroParisTech,pp.
1–54,2009.


