Embed Size (px)
Citation preview

Control of Thick Airfoil, Deep Dynamic Stall UsingSteady Blowing
Hanns F. Müller-Vahl∗
Technion–Israel Institute of Technology, 32000 Haifa, Israel
Christoph Strangfeld,† Christian N. Nayeri,‡ and Christian O. Paschereit§
Technische Universität Berlin, 10623 Berlin, Germany
andDavid Greenblatt¶
Technion–Israel Institute of Technology, 32000 Haifa, Israel
DOI: 10.2514/1.J053090
The utility of constant blowing as an aerodynamic load control concept for wind turbine blades was explored
experimentally. A NACA 0018 airfoil model equipped with control slots near the leading edge and at mid-chord was
investigated initially underquasi-static conditions atReynolds numbers ranging from 1.25 · 105 to 3.75 · 105. Blowingfrom the leading-edge slot showed a significant potential for load control applications. Leading-edge stall was either
promoted or inhibited depending on the momentum coefficient, and a corresponding reduction or increase in lift on
the order of Δcl ≈ 0.5 was obtained. Control from the mid-chord slot counteracted trailing-edge stall but was
ineffective at preventing leading-edge separation. The impact of blowing from the leading-edge slot on dynamic stall
was explored by means of unsteady surface pressure measurements and simultaneous particle image velocimetry
above the suction surface. At a sufficiently high momentum coefficient, the formation and shedding of the dynamic
stall vortex were fully suppressed. This led to a significant reduction in lift hysteresis and form drag while
simultaneously mitigating moment coefficient excursions.
Nomenclature
c = airfoil chord length (348 mm)cd = form drag coefficientcl = lift coefficientcm = moment coefficientcp = pressure coefficientCμ = momentum coefficient; hU2
j∕ 12cU2
∞f = airfoil pitching frequency, Hzh = control slot height (1.2 mm)k = reduced pitching frequency; πfc∕U∞M = Mach numberN = number of samplesRe = Reynolds number; U∞c∕νs = airfoil span (610 mm)u = streamwise velocity component (wind-tunnel frame of
reference), m∕sUe = local boundary-layer edge velocity, m∕sUj = blowing jet velocity, m∕sU∞ = wind-tunnel speed, m∕s_V = volumetric blowing flow rate, m3∕sx, y = chordwise and chord-normal positions (airfoil frame of
reference), m
x 0,y 0
= streamwise and normal positions (wind-tunnel frame ofreference), m
ym = distance of the point of maximum jet velocity from thewall, m
α = angle of attack, degαs = static stall angle, degΔcl = relative change in lift coefficient produced by controlη = angle of the control slots relative to the airfoil
surface (20 deg)ν = kinematic viscosity, m2∕sσcl = standard deviation of the lift coefficientσcm = standard deviation of the moment coefficientϕ = phase angle of the sinusoidal pitching motion, degω = airfoil pitching angular frequency; 2πfωz = nondimensional vorticity; �∂v∕∂x − ∂u∕∂y� · c∕U∞
I. Introduction
OVER the years, economic considerations have led to asignificant increase in the rotor diameter of wind turbines. This
trend still continues today with the development of even largerturbines, especially for offshore applications. The increase in size hashelped reduce the cost of energy but, at the same time, structuralproblems arise, especially in the root section of the blades and thehub. As the ever increasing length of the blades necessitates a lightconstruction, it becomes crucial to limit the aerodynamic loads actingupon them by means of active control. Contemporary wind turbinescommonly employ pitch control to regulate power and limit the bladeloads. However, pitch control is less suitable for the rotors of modernmulti-megawatt turbines. As the rotor diameter increases, the inflowconditions vary significantly across the blade span, making itimpossible to maintain an optimal angle of attack along the entireblade by adjusting the pitch angle alone [1–3]. Moreover, the largemoment of inertia of the blades limits the speed of deflection, and thewear of the related bearings and actuators poses an additionalchallenge [4]. Consequently, a significant further increase in turbinesize will presumably require new load control approaches.Recently, much research activity has been focused on applying
active flow control on turbine blades for load alleviation [4–6]. Incontrast to traditional pitch control, the concept of so-called smart
Presented as Paper 2013-0854 at the 51st AIAA Aerospace SciencesMeeting Including the New Horizons Forum and Aerospace Exposition,Grapevine (Dallas/Ft. Worth Region), TX, 7–10 January 2013; received 18September 2013; revision received 6 April 2014; accepted for publication 12June 2014; published online 24 September 2014. Copyright © 2014 by DavidGreenblatt and Hanns Müller-Vahl. Published by the American Institute ofAeronautics andAstronautics, Inc., with permission. Copies of this papermaybe made for personal or internal use, on condition that the copier pay the$10.00 per-copy fee to the Copyright Clearance Center, Inc., 222 RosewoodDrive, Danvers, MA 01923; include the code 1533-385X/14 and $10.00 incorrespondence with the CCC.
*Ph.D. Student, Faculty of Mechanical Engineering; [email protected].
†Ph.D. Student, Chair of Fluid Dynamics, Müller-Breslau-Str. 8.‡Research Assistant, Chair of Fluid Dynamics, Müller-Breslau-Str. 8.§Professor, Chair of Fluid Dynamics, Müller-Breslau-Str. 8.¶Associate Professor, Faculty of Mechanical Engineering, Technion City;
[email protected]. Senior Member AIAA.
AIAA Early Edition / 1
AIAA JOURNAL
Dow
nloa
ded
by T
EC
HN
ION
(E
lyac
har
Cen
tral
Lib
rary
) on
Sep
tem
ber
28, 2
014
| http
://ar
c.ai
aa.o
rg |
DO
I: 1
0.25
14/1
.J05
3090

structures is envisioned to allow for localized, rapid changes of theaerodynamic properties of the blades. Actuators distributed along thespan are combined with sensors and controllers to provide feedbackcontrol. For a load control technique to be effective, it should becapable of producing sufficient changes in the blade section liftcoefficient under the various inflow conditions experienced byturbine blades. By far, the most common approach to the problem isto employ some type of trailing-edge device or modification, such asflaps [7,8], adaptive trailing-edge geometries [9,10], or activeGurneyflaps or microtabs [11–14]. The success of trailing-edge flaps in theaircraft industry makes them an especially promising candidate forload control on wind turbines. They offer a comparatively largecontrol authority using small surface deflections and require far lessenergy input for actuation than pitch control [15]. On the downside,trailing-edge flaps add a considerable amount of weight to the bladesand require complex linkage systems [16]. In addition, flow separationabove the low-pressure surface occurring at high deflection anglesleads to additional drag [17]. Flaps are also required to operate at highblade angles of attack, where trailing-edge separation is present, andthismay impair their effectiveness. Someof these disadvantages can bereduced with flexible trailing-edge geometries; hence, this concept iscurrently receiving increased attention [17,18].The present investigation motivates for the use of slot blowing as a
means of power regulation and load control. Historically, theformulation of boundary-layer theory by Prandtl in 1904 marked thebeginning of research on boundary-layer control (BLC) [19]. Alongwith constant suction, slot blowing was one of the first controlconcepts to be investigated. Steady blowing from control slotslocated on the suction surface of airfoils has been studied since theearly 1920s and was found to produce significant lift enhancement[20–22]. When the jet momentum exceeds a critical value, theboundary layer becomes more resistant to separation. This is theclassical application of constant blowing where the excess mo-mentumnear thewall offsets the adverse pressure gradient that wouldotherwise promote separation (e.g., Poisson-Quinton and LePage[23]). The introduction of gas turbine engines on fighter aircraft in the1950s provided an easily accessible supply of compressed air thatgave new impetus to the practical application of constant blowing[24]. The application at the shoulder of deflected flaps for the purposeof increasing lift, typically for landing, has been investigatedextensively and reached the stage of serial production on severalaircraft [25,26].High-momentum slot blowing can potentially be employed on
wind turbines to effectively mitigate or fully suppress dynamic stall.This is a common problem on vertical axis wind turbine (VAWT)blades where it occurs periodically throughout the rotation of theblades at low tip-speed ratios [27].Dynamic stall is characterized by astrong vortex, the dynamic stall vortex (DSV), which forms near theleading edge. When the DSV is convected downstream, a brief liftovershoot and a subsequent sharp drop in lift as well as severepitching moment fluctuations result [28]. This leads to a numberof undesired effects: On the one hand, the drop in lift and thesimultaneous increase in pressure drag caused by the full separationabove the suction surface reduce the rotor torque, and thus the turbineperformance [29]. On the other hand, the unsteady aerodynamicloads cause fatigue stresses acting not only on the rotor blades butalso on the generator and drive train [30]. To withstand these loads,more robust designs are required for the affected components leadingto increased manufacturing costs. Thus, a flow control methodcapable of mitigating or fully preventing dynamic stall on VAWTblades would have a beneficial effect on the cost of energy.Awide range of control approaches has been investigated to reduce
the detrimental effects of dynamic stall. Most of these efforts weretargeted primarily at the application on helicopter blades where thevibrations resulting from dynamic stall limit the flight speed andmaneuverability. Commonly, the main goal of control is to reduceunsteady fluctuations of the aerodynamic loads (particularly pitchingmoment and lift) while avoiding loss of time-mean lift; this isgenerally true not only for rotorcraft applications but also for windturbines where the fatigue loads and turbine performance are ofparticular importance. One possible approach to tackle the problem is
to use active control devices such as trailing-edge flaps [31,32] toalleviate the vibratory loads. In contrast, methods aimed directly atmanipulating or eliminating the dynamic stall vortex, which are thefocus of this work, are applied almost exclusively in the leading-edgeregion where the DSV is formed in order to maximize controleffectiveness [33,34].Geometric modifications in the leading-edge region including
droop nosemechanisms [35,36], deforming airfoils [37] and leading-edge slats [38,39] have been considered. Recently, vortex generators(VGs), which are commonly applied on wind turbine blades forperformance enhancement [40,41], have been investigated as apotential dynamic stall control solution.Martin et al. [42] found that acombination of counter-rotating vane-typeVGs and amodification ofthe leading-edge geometry (both passive) was effective at controllinglight stall at Mach numbers up to M � 0.3. Circular and wedge-shaped leading-edge vortex generators, also termed “disturbancegenerators,” have been shown to significantly reduce the drop inpitching moment and the loss in lift associated with dynamic stall[34,43]. Deployable vortex generators protruding from the leadingedge that can be retracted into the blade to reduce drag penalties haverecently been proposed [44]. By adjusting the time during which theVGs were employed, various compromises between limiting themaximum negative pitching moment and avoiding loss in lift werereached.Avariety of active control approaches based on the (continuous or
periodic) removal or addition of momentum to the boundary layerclose to the location where the dynamic stall vortex is formed hasbeen investigated. Leading-edge suction has been tested on a NACA0012 airfoil at comparatively low Reynolds numbers at the IllinoisInstitute of Technology [45,46]. The removal of near-wall reverseflowing fluid was aimed at preventing the shear layer liftup thatwould otherwise lead to the formation of the DSV. Within a limitedrange of pitch rates and Reynolds numbers, a complete suppressionof dynamic stall was achieved. Zero mass-flux excitation, whichrelies on the Kelvin–Helmholtz instability to amplify periodicperturbations introduced into the boundary layer, has been shown toeffectively suppress the dynamic stall vortex formation [47,48].Plasma actuators have been demonstrated to have a positive effectunder dynamic stall conditions, improving the lift hysteresis andreducing the negative pitching moment [49,50]. Experiments con-ducted on a VAWT turbine model have shown that control withplasma actuators located at the leading edges of the turbine bladescan produce a net turbine performance increase. Particle imagevelocimetry (PIV) measurements revealed that control reduced thestrength of the dynamic stall vortex and delayed its shedding [51,52].Previous research aimed at controlling dynamic stall by means ofconstant blowing has also produced some positive results. McCloudet al. found that blowing from a slot near the leading edge(x∕c � 8.5%) was capable of delaying retreating-blade stall [53].More recently,Weaver et al. reported a reduction in lift hysteresis anda decrease in unsteady load fluctuations produced by constantblowing on a VR-7 airfoil [54,55]. Somewhat similar observationswere made by Singh et al. [56], who used air-jet vortex generators tocontrol dynamic stall on an RAE 9645 airfoil.When a low-momentum wall jet is introduced into an attached
boundary layer subjected to an adverse pressure gradient, separationcan be precipitated. This destabilizing effect of blowing is expectedwhen the jet velocity is below the local stream velocity [57]. Whenthe slot is located at or near the leading-edge, a low-momentum walljet can significantly decrease lift [58,59]. The slot location andstalling nature of the blade (leading edge versus trailing edge) have aprofound impact on the blowing slot’s effectiveness in promoting orovercoming separation. The precise mechanism has never beenstudied in detail to the authors’ knowledge, presumably because theresulting loss of lift is not desired inmost practical applications. It canbe surmised that the lowering of the momentum in the boundarylayer, combinedwith the adverse pressure gradient, brings about flowreversal near thewall immediately downstream of the slot. This effectcould be exploited when the goal is to temporarily reduce the lift ofwind turbine blades to reduce unsteady load fluctuations.
2 AIAA Early Edition / MÜLLER-VAHL ETAL.
Dow
nloa
ded
by T
EC
HN
ION
(E
lyac
har
Cen
tral
Lib
rary
) on
Sep
tem
ber
28, 2
014
| http
://ar
c.ai
aa.o
rg |
DO
I: 1
0.25
14/1
.J05
3090

In addition to load control applications, low-momentum blowingcould be employed on wind turbines as an aerodynamic brakingsystem, especially on VAWTs. In contrast to horizontal axis windturbines (HAWTs), it is difficult to implement aerodynamic brakes onVAWTs; neither tip-mounted “paddles” nor blade pitching appearto be feasible. Effective braking must be employed to prevent a“runaway” turbine that self-destructs [60]. On even larger machines,mechanical brakes are not viable. This need led to the development ofpassive low-momentum fluid ejection (air bleed) that enforcesseparation and produces aerodynamic braking [61]. With the jetmomentum controllable, low-momentum slot blowing emerges as apotentially useful solution. Continuously ejecting low-momentumfluid from a control slot located on the suction surface near theleading edge could be used to induce separation, causing a loss in liftand a simultaneous increase in drag.On vertical axis wind turbines, the blades are alternately operating
at both positive and negative angles of attack; the suction surface islocated on the inboard side of the blade throughout the upstreamhalf of the azimuth and on the outboard side over the downstreamhalf. To maximize the effectiveness of control, blowing slots couldbe installed on both sides of the blades. This would permit theapplication of constant blowing on the suction surface at any givenazimuth angle to mitigate fatigue loads, tackle dynamic stall, orinduce separation for the purpose of aerodynamic braking.The dual effect of slot blowing makes this control method
remarkably versatile. The wide range of applications renders it apromising candidate for active aerodynamic control on wind turbineblades; this was the main motivation for this study. The primaryobjective was to investigate experimentally the utility of a leading-edge blowing slot for the purpose of controlling the loads on a thickairfoil that exhibits trailing-edge separation. Both quasi-steady anddynamic pitching cases were considered. Specifically, this in-vestigation examines the aerodynamic effect of constant blowing on aNACA 0018 profile, which is a symmetric thick airfoil typical ofVAWTs. Horizontal axis wind turbines employ cambered airfoils forwhich the thickness-to-chord ratio depends on the spanwise positionon the blades. The general trends observed here can be expected to besomewhat representative of midspan HAWT airfoils as well, sincetheir thickness ratio is comparable to the NACA 0018 airfoil studiedhere. The results presented in this work are intended to outline thepotential merits and limitations of using constant blowing on windturbine blades.
II. Experimental Setup
Experimentswere conducted in a blowdownwind tunnel driven bya 75 kW backward-bladed radial blower. Wind-tunnel turbulenceand velocity profile nonuniformity in the test section were less than0.3 and 1%, respectively. A schematic of the test section (innerdimensions: 610 × 1004 mm) that produces the rotation of the wingis presented in Fig. 1. The airfoil model is firmly mounted to thecircular Plexiglas windows with the axis of rotation located at thequarter-chord position. The windows are rotated by means of a servomotor that is connected to the aluminum rings holding the windowsvia a pair of belt drives. Tests showed that the deviations in angle ofattack resulting from the dynamically varying mechanical loadsacting on the belt drive system do not exceed Δα � 0.2 deg. Thefloor and ceiling of the test section were made of Plexiglas to provideaccess for optical measurement techniques.The constant chord NACA 0018 airfoil model with a chord length
of c � 347 mm and a span of s � 610 mm was machined fromObumodulan®, a synthetic material developed for model building. Aschematic of the wing showing the two control slots at 5 and 50%chord is presented in Fig. 2. The slots have a height of h � 1.2 mmand are located on the suction surface at positive angles of attack. Theangle of the slots relative to the airfoil surface is 20 deg. It is desirabletominimize this angle to obtain a jet of air parallel to thewall (see, forexample, Reid and Bamber [21]). In the present case, a smaller anglecould not be obtained due to structural limitations. Nevertheless,measurements of the velocity field clearly indicate that the jet is infact parallel to the surface as desired. Pressurized air was supplied to
the plenumchambers fromboth spanwise sides throughmetal flangesconnected to thewindows. The airfoil was equipped with 40 pressureports (ϕ 0.8mm) symmetrically distributed along the upper and lowersurfaces. The pressure portswere located nearmidspan and staggeredat an angle of 10 deg relative to the x axis to avoid interference. TwoPressure Systems ESP-32HD piezoresistive pressure scanners weremounted inside the airfoil close to the quarter-chord position. Thevinyl tubes used to connect the pressure ports to the pressure trans-ducers each had an inner diameter of 0.8mm and a length of 440mm.The lag and attenuation of the pressure signal were found to beinsignificant for the dynamic experiments [62].The pressurized air used for steady blowing was taken from a wall
tap connected to a pressure reservoir. Themass flow ratewas adjustedby means of an SMC Pneumatics AW40-F04 pressure regulator andmeasured with a Dwyer Instruments VFC-122-EC rotameter. Theoutlet of the rotameter was connected to the airfoil plenum chamberby means of vinyl tubing. Whenever no control was applied, theflanges were sealed to prevent a net mass flux through the slots.The control authority of steady blowing scaleswith themomentum
rather than the mass flow of the fluid that is added [23] and themomentum coefficient Cμ is commonly used as a measure of controlinput. Assuming constant air density gives
Cμ �hU2
j
�1∕2�cU2∞
(1)
where Uj is the jet speed, and h refers to the slot height. Uj wasestimated from the volumetric flow rate assuming a top-hat velocityprofile of the control jet:Uj � _V∕shj. The accuracy of the rotameteris specified as 2% of full scale. The spanwise variation of themomentum coefficient was ΔCμ < 7% across the central 67% of theairfoil span. The overall uncertainty of the momentum coefficientwas estimated as ΔCμ 10%.
Fig. 1 View of the test section showing the approximate location of theairfoil.
Fig. 2 Schematic of the NACA 0018 airfoil model.
AIAA Early Edition / MÜLLER-VAHL ETAL. 3
Dow
nloa
ded
by T
EC
HN
ION
(E
lyac
har
Cen
tral
Lib
rary
) on
Sep
tem
ber
28, 2
014
| http
://ar
c.ai
aa.o
rg |
DO
I: 1
0.25
14/1
.J05
3090

III. Experimental Procedure
Measurements were carried out at wind-tunnel speeds of U∞ �5.6, 11.1, and 16.7 m∕s corresponding to Reynolds numbers ofRe � 1.25 · 105, 2.5, and 3.75 · 105 respectively. During the quasi-steady tests, the airfoil was pitched at a rate of 0.45 deg ∕s in therange of−2.5 deg < α < 32.5 deg. The surface pressure distributionwas continuously measured at 490 Hz, and each test was repeatedthree times. The mean pressure distributions were obtained byaveraging the data in angle of attack windows with a width of 0.6 degand then ensemble averaging the results obtained during the threeruns. Additional quasi-static baseline tests were carried out in therange of −32.5 deg < α < 32.5 deg to quantify the effect of thepresence of the passive control slots on the stalling behavior ofthe airfoil model.For the dynamic stall test cases, the airfoil was pitched sinusoidally
[α � 15 deg�10 deg · sin�ωt�] at f � 0.75 Hz, which corre-sponds to a reduced frequency of k � πfc∕U∞ � 0.074. The errorsresulting from the orientation and acceleration of the pressurescanners caused by the pitching motion were determined to benegligible (Δcp < 0.02). Pressure data were acquired throughout 60cycles of the pitching motion at a sample rate of 499 Hz. Once again,each measurement was repeated three times to record a sufficientnumber of pitching cycles and ensure small statistical uncertainties.The instantaneous wind-tunnel speed was monitored with twohotwire probes located at centerspan approximately 380 mmupstream of the leading edge at distances of 100 mm from the floorand ceiling, respectively.U∞ was taken as themeanvalue of thewindspeed recorded at the two locations. This was necessary because ofthe variation in blockage resulting from the presence of the airfoil.The results presented here were not corrected for wind-tunnelblockage.The instantaneous lift coefficient cl;i�ϕ� was obtained by
integrating the instantaneous pressure coefficient distributionscp;i�x;ϕ� and normalizing with the instantaneous wind-tunnel speedU∞;i�ϕ�. The subscript i is the measurement index in each phaseanglewindow,where i � 1; 2; : : : ; N andN ≈ 1000 is the number ofsamples in a given window. The phase-averaged lift coefficient cl�ϕ�was then calculated by averaging over windows with a width ofΔϕ � 3 deg in the following way:
cl�ϕ� �1
N
XNi�1
cl;i�ϕ� (2)
For instance, cl (ϕ � 3 deg) was obtained from cl;i(1.5 deg < ϕ < 4.5 deg). The phase-averaged form drag coefficientand moment coefficient were determined in an analogous way. Forsimplicity, the phase-averaged results are denoted as cl, cd, and cm inthe following unless otherwise stated.At selected phase angles, PIV measurements were carried out
using a 200 mJ double-pulsed Nd-YAG laser in conjunction with a 4megapixel charge-coupled device camera. The PIVand pressure dataacquisition were synchronized and, for each phase angle, data from200 pitching cycles were recorded and subsequently phase averaged.A commercial seeding generator produced diethylhexylsebacatsynthetic oil particles of 1 μm diameter (according to manufacturerspecifications) within the tunnel plenum. The laser head wasmounted underneath the test section introducing the light sheetthrough the transparent floor. The light sheet was oriented per-pendicular to the airfoil surface, parallel to the x and y axes. A 12-mm-wide strip of red adhesive film (3MScotchcal, 75 μm thickness)was attached to the airfoil surface at the spanwise location of the lightsheet. It was oriented parallel to the x axis and spanned the entirecircumference of the airfoil. In conjunction with an optical filter thatonly permits light at thewavelength of the laser (532 nm) a significantreduction of the reflections from the airfoil surface was achieved,improving the data quality near the wall. For the adhesive tape not tointerfere with the pressure measurements, the spanwise location ofthe PIV interrogation region was chosen as z � 60 mm. Thespanwise spacing between the adhesive tape and the pressure portswas no less than 24 mm. A pulse separation of 40 μs was selected,
and a decreasing size multipass correlation approach was adoptedusing the software DaVis by LaVision. The final results werecalculated from 12 × 12 pixel interrogation windows with nooverlap, yielding a velocity field with a spacing of 3.1 mm betweenadjacent vectors. The normalized vorticity fields were computedaccording to ωz � �∂v∕∂x − ∂u∕∂y� · c∕U∞.
IV. Results
A. Passive Effect of the Control Slots
Before the discussion of the results obtained with control, thepassive effect of the control slots should be appreciated. The slot atx∕c � 5% is of particular significance because of its proximity to theleading edge. Passive tripping devices in the leading-edge region canhave a significant impact on the stalling behavior of airfoils,the discontinuity of the airfoil surface commonly triggers earlyboundary-layer transition. At low Reynolds numbers, this shift oftransition to a location further upstream can be exploited to avoidlaminar separation [63]. Since a turbulent boundary layer canwithstand a stronger adverse pressure gradient, trippingmay increasethe static stall angle. A detailed overview of boundary-layer trippingdevices has been provided by Carmichael [64].To illustrate the passive effect of the control slots, the lift
coefficient obtained during a quasi-static pitch-up motion ispresented in Fig. 3 for various Reynolds numbers. The solid lineslabeled “slot” correspond to the cases where the control slots arelocated on the suction surface, whereas “smooth” indicates that theslots are on the pressure surface. Both slots were left open for the testsshown here. The presence of the slots on the suction surface delaysthe onset of stall by approximately Δαs ≈ 2 deg and producesslightly elevated values of cl before stall at Re � 2.5 · 105 and3.75 · 105. Similar observations have been made by Seele et al. [65].who reported an increase in the static stall angle of Δαs � 6 degcaused by the presence of an open forcing slot near the leading edgeof an elliptical airfoil operating at Re � 2.5 · 105. In addition to thesurface discontinuity, they suspected resonance with variousinstability modes inside the cavity to induce a tripping of the laminarboundary layer. In the present case, the presence of the leading-edgecontrol slot on the suction surface had a notable impact on the laminarseparation bubble, which is examined in the following. The mid-chord slot only had a marginal effect on the quasi-static aerodynamiccoefficients; sealing it with a thin adhesive tape had virtually no effect(not shown).Laminar separation bubbles play a crucial role in determining the
stalling characteristics of airfoils over a wide range of Reynoldsnumbers. Since the first detailed description provided by vonDoenhoff in 1938 [66,67], numerous detailed investigations havebeen carried out, but the models proposed to date are largelyempirical [68,69]. When the adverse pressure gradient downstream
14 16 18 20 22 24
0.6
0.8
1
1.2
1.4
α angle of attack,
c l lif
t coe
ffic
ient
Re = 1.25 ⋅ 105, slot
Re = 1.25 ⋅ 105, smooth
Re = 2.5 ⋅ 105, slot
Re = 2.5 ⋅ 105, smooth
Re = 3.75 ⋅ 105, slot
Re = 3.75 ⋅ 105, smooth
Fig. 3 Effect of the passive control slots (Cμ � 0) on the onset of stallduring quasi-static pitch-up.
4 AIAA Early Edition / MÜLLER-VAHL ETAL.
Dow
nloa
ded
by T
EC
HN
ION
(E
lyac
har
Cen
tral
Lib
rary
) on
Sep
tem
ber
28, 2
014
| http
://ar
c.ai
aa.o
rg |
DO
I: 1
0.25
14/1
.J05
3090

of the suction peak is sufficiently large, the laminar boundary layerfails to follow the curved airfoil surface and separates. An instabilityin the separated shear layer leads to transition to turbulence, whichmay cause reattachment via enhanced entrainment. A short bubblecan be formedwhen theReynolds number is in the range between twocritical values: If it is sufficiently low, the separated shear layer doesnot reattach [70]. On the other hand, laminar separation does notoccur when the Reynolds number is high enough for transitionto move ahead of the theoretical laminar separation point [71].Generally, laminar separation bubbles occur in the range ofapproximately 5 · 104 < Re < 5 · 106 [63,70]. However, the valuesvary significantly, since the state of the boundary layer depends onseveral other parameters including inflow turbulence, surfaceroughness, angle of attack, and airfoil shape [72].The effect of the control slot on the laminar separation bubble that
is formed on the suction surface is illustrated in Fig. 4 with surfacepressure distributions recorded during a quasi-static pitch-up motionat various Reynolds numbers. The regions of almost constant
pressures (singular) that are characteristic of the laminar portion ofseparation bubbles (see, for example, [69,70]) indicate thatseparation occurs at approximately x∕c � 5%. The only exception isthe case of α � 6 deg at Re � 3.75 · 105, where no laminarseparation bubble is apparent. In the other cases, the transition point(which is marked by the beginning of the steep pressure recoverydownstream of the low-pressure plateau) appears to be close to ordownstream of the pressure port at x∕c � 8.5%. The change in slopeof the cp curve at x∕c � 13.5% suggests that reattachment occursnear this location in most cases. A precise evaluation of the bubblelocations is hindered by the limited resolution of pressure ports.Depending on the chordwise position, the uncertainty can be as highas Δx∕c ≈ 5%.Despite this uncertainty, the pressure distributions reveal
significant qualitative differences associated with the presence ofthe control slot on the suction surface. A comparison of the presentfindings with experimental results reported for NACA 0018 airfoilswith no surface discontinuities is shown in Fig. 5. Gerakopulos et al.[69] investigated the location of the laminar separation bubble atReynolds numbers ranging from 8 · 104 to 2 · 105 and found that,at α � 6 deg andRe � 2 · 105, laminar separation occurs at approx-imately x∕c � 20%. At angles of attack of α � 8 and 10 deg, theseparation location was found to be at x∕c ≈ 10% and x∕c ≈ 8%,respectively. Similar results were reported by Nakano et al. [73] forRe � 1.6 · 105. The locations of laminar separation (S), transition(T) and reattachment (R) measured in the present case with a smoothsuction surface (control slots located on the pressure surface) areindicated with markers in Fig. 5. In this case, the bubble locationsagree reasonably well with the published findings. On the basis ofsurface pressure measurements, Gerakopulos et al. [69] identifiedtwo regions of different rates at which the laminar separation bubbleadvanced toward the leading edgewith increasing angle of attack. Atlower angles of attack, the bubble advanced at a comparatively highrate that was correlated with a larger lift slope throughout this region.A reduced rate of advancement of the separation bubblewas observedat angles of attack above α ≈ 7 deg (Re � 1.4 · 105) and α ≈ 9 deg(Re � 2 · 105). Within the limits of the spatial resolution of pressureports, the present results recorded with a smooth suction surfaceindicate a similar qualitative behavior. In contrast, when the controlslots are on the suction surface, the pressure distributions reveal ashift of the bubble location toward the leading edge. As shown inFig. 4, the points of separation, transition and reattachment do notvary appreciably as a function of Reynolds number or α in this rangeof angles of attack. The approximate locations are indicated byshaded regions in Fig. 5.These findings suggest that the control slot at x∕c � 5% has a
significant effect on the laminar separation bubble, in that the locationof laminar separation is fixed at the lip of the slot. The region of
0 0.05 0.1 0.15 0.2 0.25 0.3
−4
−3
−2
−1
0
1
x/c chordwise position
c p pr
essu
re c
oeff
icie
ntRe = 1.25 ⋅ 105, α = 6°Re = 1.25 ⋅ 105, α = 8°Re = 1.25 ⋅ 105, α = 10°Re = 2.5 ⋅ 105, α = 6°Re = 2.5 ⋅ 105, α = 8°Re = 2.5 ⋅ 105, α = 10°Re = 3.75 ⋅ 105, α = 6°Re = 3.75 ⋅ 105, α = 8°Re = 3.75 ⋅ 105, α = 10°
Fig. 4 Chordwise pressure distributions recorded during a quasi-static
pitch-up motion.
6 8 10 12 140
0.1
0.2
0.3
0.4
0.5
slotlocation S
T
R
α angle of attack, º
x/c
chor
dwis
e po
sitio
n
S, Re = 1.2⋅105, Gerakopulos et al. [69]
T, Re = 1.2⋅105, Gerakopulos et al. [69]
R, Re = 1.2⋅105, Gerakopulos et al. [69]
S, Re = 1.25⋅105, present study
T, Re = 1.25⋅105, present study
R, Re = 1.25⋅105, present study
S, Re = 1.6⋅105, Nakano et al. [73]
R, Re = 1.6⋅105, Nakano et al. [73]
6 8 10 12 140
0.1
0.2
0.3
0.4
0.5
slotlocation S
T
R
α angle of attack, º
x/c
chor
dwis
e po
sitio
n
S, Re = 1.9⋅105, present study
T, Re = 1.9⋅105, present study
R, Re = 1.9⋅105, present study
S, Re = 2⋅105, Gerakopulos et al. [69]
T, Re = 2⋅105, Gerakopulos et al. [69]
R, Re = 2⋅105, Gerakopulos et al. [69]
S, Re = 2.5⋅105, present study
T, Re = 2.5⋅105, present study
R, Re = 2.5⋅105, present study
Fig. 5 Chordwise positions of laminar separation (S), transition (T), and reattachment (R).
AIAA Early Edition / MÜLLER-VAHL ETAL. 5
Dow
nloa
ded
by T
EC
HN
ION
(E
lyac
har
Cen
tral
Lib
rary
) on
Sep
tem
ber
28, 2
014
| http
://ar
c.ai
aa.o
rg |
DO
I: 1
0.25
14/1
.J05
3090

almost constant pressure between x∕c � 5% and x∕c � 8.5%indicates that the shear layer initially remains separated above thesurface downstream of the slot before turbulent reattachment. Atangles of attack exceeding a value of roughly α ≈ 14 deg, theseparation point moves upstream of the slot. At this stage, the bubblelength may still be reduced by a shorter transition length resultingfrom the presence of the cavity.
B. Effect of Constant Blowing
The stalling behavior of theNACA0018model investigatedhere istypical of thick airfoils that generally stall from the trailing edge aslong as the leading-edge radius is sufficiently large [59]. The liftcharacteristics and chordwise pressure distributions are in goodagreement with established definitions of trailing-edge stall [72,74].With increasing angle of attack, the boundary layer thickens acrossthe rear of the blade. At a Reynolds number of 2.5 · 105, turbulentboundary-layer separation begins at the trailing edge at α ≈ 8 degand gradually propagates upstream as the angle of attack is increased.The strength of the leading-edge suction peak continues to increasewith increasing angle of attack after the commencement of trailing-edge separation. At α ≈ 16 deg, the boundary layer is separatedacross the rear half of the blade and the maximum lift coefficient isobtained. The leading-edge separation bubble bursts at α ≈ 19 deg,causing a collapse of the suction peak and an abrupt loss in lift that isaccompanied by a sudden increase in drag. From this point, thepressure coefficient is virtually constant across the entire suctionsurface, indicating boundary-layer separation at the leading edge.The effect of steady blowing from the leading-edge slot is
illustrated with flowfield data recorded at a fixed angle of attack ofα � 15 deg in Fig. 6. The normalized chordwise and chord-normalcoordinates are x 0∕c and y 0∕c, respectively, in the coordinate systemrelative to thewind tunnel. The baseline case is shown in Fig. 6a; thissituation roughly corresponds to the flowfield atmaximum lift.Whensteady blowing is applied from the leading-edge control slot,boundary-layer separation can either be induced or suppressed
depending on the momentum coefficient. Control with Cμ � 0.6%promotes leading-edge separation; see Fig. 6b. This observation canbe explained with a thickening of the boundary layer. The strongadverse pressure gradient across this region decelerates the near-wallfluid, which can lead to flow reversal. Ejecting low-momentum fluidfrom the control slot exacerbates this situation and destabilizesthe boundary layer promoting separation. Alternatively, ejectinglow-momentum fluid into the laminar separation bubble locateddownstream of the leading-edge control slot may cause it to burstprematurely. Both mechanisms are discussed in Sec. IV.D.Figure 6c illustrates the capability of steady blowing at a com-
paratively high momentum coefficient to prevent boundary-layerseparation. The PIV data clearly show the jet of high-momentumfluid tangential to the suction surface that energizes the boundarylayer and effectively suppresses the flow reversal across the rear halfof the blade. Correspondingly, circulation is enhanced and thestrength of the suction peak is increased (a comparison of chordwisepressure distributions is presented in Sec. IV.C). As a result, lift isenhanced by Δcl ≈ 0.65 relative to the baseline.The flowfield data presented here are intended to illustrate the dual
effect of steady blowing. However, the effectiveness of control fromthe leading-edge slot is not limited to the suppression of trailing-edgestall shown in Fig. 6. With a sufficiently high jet velocity, leading-edge separation can be effectively controlled as well yieldingattached flow across the entire suction surface at incidence angles farbeyond the baseline static stall angle. This capability of suppressingleading-edge stall contributes significantly to the potential of steadyblowing for load control applications.The control input of constant blowing is usually quantified based
on the momentum coefficient Cμ. However, in cases where low-momentum blowing is employed to induce stall and temporarilyreduce lift, Uj is typically below the local boundary-layer edgevelocity Ue. In this situation, Cμ may not be an appropriate scalingparameter formeasurements taken at different ratios of the slot heightand chord length. For instance, increasing the slot height and
a) Baseline
b) C = 0.6%μ c) C = 5%μ
Fig. 6 Mean velocity fields recorded with blowing from the leading-edge slot at α � 15 deg, Re � 2.5 · 105.
6 AIAA Early Edition / MÜLLER-VAHL ETAL.
Dow
nloa
ded
by T
EC
HN
ION
(E
lyac
har
Cen
tral
Lib
rary
) on
Sep
tem
ber
28, 2
014
| http
://ar
c.ai
aa.o
rg |
DO
I: 1
0.25
14/1
.J05
3090

maintaining a givenvalue ofCμ would yield a lower jet velocity and alarger mass flux from the slot, both of which appear likely todestabilize the boundary layer to a larger extent. Kelly [57] inves-tigated the limitations of using the momentum coefficient and foundthat it is dependable for high duct pressures. When the jet velocity isin the order of Ue, the boundary-layer control parameter
CBLC � Cμ
�1 −
UeUj
�(3)
which takes into account the mass flux from the slot and the localboundary-layer edge velocity, gave a better agreement between data
recordedwith different slot dimensions.Nevertheless, sinceCμ ismorecommonly used, it is retained throughout this work for consistency.
C. Comparison of Control Slot Locations
The choice of the chordwise location where constant blowing isapplied has a profound impact on the effect of control, the qualitativedifferences are explored in this section. Quasi-static aero-dynamic coefficients obtained with various momentum coefficientsare presented in Fig. 7 for control from the leading-edge slot and inFig. 8 for themid-chord slot.The pitch-upmotion is indicatedwith solidlines, and the pitch-down motion is indicated with dashed lines. Inaddition, chordwise pressure coefficient distributions obtained from thesame quasi-static measurements are shown in Fig. 9 for selected angles
0 5 10 15 20 25 30
0
0.5
1
1.5
2
α angle of attack, º
c l lif
t coe
ffic
ient
baselineCμ=0.3%
Cμ=0.6%
Cμ=1.2%
Cμ=2.5%
Cμ=5%
a)
b)
c)
0 5 10 15 20 25 30
0
0.2
0.4
0.6
0.8
α angle of attack, º
c d fo
rm d
rag
coef
fici
ent
baselineCμ=0.3%
Cμ=0.6%
Cμ=1.2%
Cμ=2.5%
Cμ=5%
0 5 10 15 20 25 30
−0.2
−0.15
−0.1
−0.05
0
0.05
α angle of attack, º
c m m
omen
t coe
ffic
ient
baselineCμ=0.3%
Cμ=0.6%
Cμ=1.2%
Cμ=2.5%
Cμ=5%
Fig. 7 Control from the leading-edge slot (x∕c � 5%), Re � 2.5 · 105.
0 5 10 15 20 25 30
0
0.5
1
1.5
2
α angle of attack, º
c l lif
t coe
ffic
ient
baselineCμ=0.3%
Cμ=0.6%
Cμ=1.2%
Cμ=2.5%
Cμ=5%
0 5 10 15 20 25 30
0
0.2
0.4
0.6
0.8
α angle of attack, º
c d fo
rm d
rag
coef
fici
ent
baselineCμ=0.3%
Cμ=0.6%
Cμ=1.2%
Cμ=2.5%
Cμ=5%
0 5 10 15 20 25 30
−0.2
−0.15
−0.1
−0.05
0
0.05
α angle of attack, º
c m m
omen
t coe
ffic
ient
baselineCμ=0.3%
Cμ=0.6%
Cμ=1.2%
Cμ=2.5%
Cμ=5%
a)
b)
c)Fig. 8 Control from the mid-chord slot (x∕c � 50%), Re � 2.5 · 105.
AIAA Early Edition / MÜLLER-VAHL ETAL. 7
Dow
nloa
ded
by T
EC
HN
ION
(E
lyac
har
Cen
tral
Lib
rary
) on
Sep
tem
ber
28, 2
014
| http
://ar
c.ai
aa.o
rg |
DO
I: 1
0.25
14/1
.J05
3090

of attack. The pressure port locations are indicated with circles inFig. 9d. The suction surface is denotedwith a solid line, and the pressuresurface is denoted with a dashed line. During all test presented here,including the baseline, both control slots were left open. The flangeswere sealed when no blowing was applied to prevent a net mass fluxthrough the passive slots. The pre-stall baseline lift curve (see Fig. 7a)can be roughly divided into twomain regions: a region of high lift sloperanging up to α ≈ 7 deg, and a region of reduced lift slope (caused bythe onset of trailing-edge stall) at higher angles of attack. This is in goodagreement with measurements carried out by Timmer [75] andGerakopulos et al. [69] onNACA0018 airfoils at comparableReynoldsnumbers.
1. Control from the Leading-Edge Slot
The quasi-static results presented in Figs. 7 and 9 demonstrate thatconstant blowing from the leading-edge slot is capable of eitherpromoting or delaying boundary-layer separation depending on themomentum coefficient. At pre-stall angles of attack, blowing withsufficiently high Cμ suppresses trailing-edge separation, yielding liftcoefficients far exceeding baseline values. For instance, blowingwithCμ � 5% produces an increase in lift coefficient of Δcl > 0.5 in therange of 9 deg < α < 19 deg. The corresponding change inthe flowfield is exemplified for α � 15 deg in Figs. 6a and 6c.With the same momentum coefficient, the static stall angle isincreasedby Δαs � 8 deg, from αs � 16 deg in the baseline case, to αs �24 deg. At this point, the pressure coefficient at the suction peakreaches its minimum value. When α is further increased, the pressure
in the fore region increases, whereas the region of constant pressureacross the rear half of the suction surface propagates towards theleading edge, indicating a smooth onset of trailing-edge stall. Atangles of attack above α ≈ 26 deg, blowing at the largestmomentumcoefficient considered in thisworkwas unable to overcome the severeadverse pressure gradient; the cp distribution and the resultingaerodynamic loads gradually approach baseline values as the angle ofattack exceeds α � 30 deg.The effect of control with Cμ � 2.5% is qualitatively similar; the
relative increase in the static stall angle is virtually the same as forCμ � 5%. In both cases, the lift slope is small over a wide range ofangles of attack (approximately 13 deg < α < 26 deg). This isadvantageous for wind turbine applications because a fluctuation in αwould result in a smaller load variation, reducing the fatigue loadscaused by the unsteady inflow. Steady blowing with highmomentumcoefficients eliminates the hysteresis behavior, as can be seen from acomparison of the pitch-up and pitch-down data in Figs. 7a–7c. Theslight deviations are presumably caused by random variations in Cμ.In contrast to the stall delay produced by control at high
momentum coefficients, steady blowing precipitates an early onset ofleading-edge separationwhen the jet speed is below the local velocityat the edge of the boundary layer.WithCμ � 0.3 and 0.6%, the staticstall angle is reduced to αs ≈ 10 and 9 deg, respectively, and asignificant reduction in cl relative to the baseline is observed at highervalues of α. At α � 7 deg, the cp distribution obtained with Cμ �0.6% is still almost identical to the baseline; see Fig. 9a. As the angleof attack is increased, the suction peak falls off dramatically and theregion of almost constant pressure across a large part of the suction
0 0.1 0.2 0.3 0.4 0.5 0.6 0.7 0.8 0.9 1
−8
−7
−6
−5
−4
−3
−2
−1
0
1
x/c chordwise position
c p pr
essu
re c
oeff
icie
nt
baselineleading-edge slot, Cμ = 0.6%
leading-edge slot, Cμ = 5%
mid-chord slot, Cμ = 0.6%
mid-chord slot, C μ = 5%
0 0.1 0.2 0.3 0.4 0.5 0.6 0.7 0.8 0.9 1
−8
−7
−6
−5
−4
−3
−2
−1
0
1
x/c chordwise position
c p pr
essu
re c
oeff
icie
nt
baselineleading-edge slot, Cμ = 0.6%
leading-edge slot, Cμ = 5%
mid-chord slot, Cμ = 0.6%
mid-chord slot, Cμ = 5%
0 0.1 0.2 0.3 0.4 0.5 0.6 0.7 0.8 0.9 1
−8
−7
−6
−5
−4
−3
−2
−1
0
1
x/c chordwise position
c p pr
essu
re c
oeff
icie
nt
baselineleading-edge slot, Cμ = 0.6%
leading-edge slot, Cμ = 5%
mid-chord slot, Cμ = 0.6%
mid-chord slot, Cμ = 5%
0 0.1 0.2 0.3 0.4 0.5 0.6 0.7 0.8 0.9 1
−8
−7
−6
−5
−4
−3
−2
−1
0
1
x/c chordwise position
c p pr
essu
re c
oeff
icie
nt
baselineleading-edge slot, Cμ = 0.6%
leading-edge slot, Cμ = 5%
mid-chord slot, Cμ = 0.6%
mid-chord slot, Cμ = 5%
a) = 7ºα
b) = 12ºα d) = 25ºα
c) = 18ºα
Fig. 9 Pressure coefficient distributions obtained with constant blowing during quasi-static pitch-up, Re � 2.5 · 105.
8 AIAA Early Edition / MÜLLER-VAHL ETAL.
Dow
nloa
ded
by T
EC
HN
ION
(E
lyac
har
Cen
tral
Lib
rary
) on
Sep
tem
ber
28, 2
014
| http
://ar
c.ai
aa.o
rg |
DO
I: 1
0.25
14/1
.J05
3090

surface indicates boundary-layer separation (Fig. 9b). This leads to asignificant increase in form drag, as can be seen in Fig. 7b. Thecombination of lift reduction and drag increase emphasizes thepotential of low-momentum blowing for aerodynamic braking.
2. Control from the Mid-Chord Slot
Constant blowing from the mid-chord slot effectively counteractstrailing-edge separation.WithCμ � 5%, the lift coefficient increasesalmost linearly up to αs � 16.5 deg. In contrast to control from theleading-edge slot, a positive effect on cl is also observed withCμ � 1.2%, suggesting that the proximity of the control slot to theseparation location improves the control authority. This finding ishardly surprising, since thewall jet entrains fluid, decreasing its peakvelocity and reducing its effectiveness at energizing the boundarylayer further downstream. According to Carriere and Eichelbrenner,the maximum jet velocity diminishes more rapidly than 1∕
���xp
because of the adverse pressure gradient [76]. Simultaneously, thedistance of the point of maximum jet velocity from the wall ymincreases approximately linearly with the distance from the controllocation [76]. The value for a flat plate suggested by Carriere andEichelbrenner is dym∕dx � 0.01, whereas the flowfield datapresented in Fig. 6c indicate that the spreading angle is approximatelytwice as large in the present case. Furthermore, the boundary-layeredge velocity is lower above the mid-chord slot, which also suggeststhat a lower-momentum coefficient is sufficient to counteractseparation.However, in terms of practical application, the most important
difference in the control authority (singular) obtained at therespective slot locations lies in the effectiveness at counteractingleading-edge separation. Although steady blowing from the mid-chord slot is capable of producing notable lift enhancement in the pre-stall range, it has no significant effect on the static stall angle.Irrespective of the momentum coefficient, a sharp drop in lift causedby leading-edge stall occurs at αs ≈ 19 deg. The pressuredistributions recorded with Cμ � 5% substantiate this finding: Atα � 21 deg, the cp distribution is virtually identical to thatmeasuredat α � 25 deg, shown in Fig. 9d, where the constant pressure abovethe suction surface indicates separation at x∕c ≈ 1.5%. Once theboundary layer separates from the leading edge, blowing even at highCμ is ineffective at counteracting separation because the slot islocated too far downstreamof the separation location. The jet of high-momentum fluid is injected deepwithin the “dead-air region”with nomeasurable effect on separation at the leading edge. The hysteresisbehavior is also barely affected.Similarly, the large distance from the leading edge also hinders
steady blowing from the mid-chord slot from producing significantlift reductions in the pre-stall range. The effect measured at the lower-momentum coefficients investigated here is comparatively small. Inthe range of 7 deg < α < 15 deg, control with Cμ � 0.3 and 0.6%yields a slight lift reduction. At higher angles of attack, the pressuredistributions are hardly affected (see Fig. 9c). Figure 6 shows thatthe considerable reductions in lift observed with low-momentumblowing from the leading-edge slot are the result of enforced leading-edge separation. Irrespective of the exact control mechanism, theproximity of the control location to the laminar separation bubble andthe strong adverse pressure gradient downstream of the suctionpeak is expected to be vital for inducing separation. Consequently,blowing from the mid-chord slot is not capable of producingcomparable lift reductions.The post-stall lift coefficient is only mildly affected by blowing
from the mid-chord slot. The slight increase in lift seen at highmomentum coefficients may to some extent be the result ofmeasurement inaccuracy rather than a real change in the flowfield.The increased lift is in part caused by the low-pressure “spike”directly downstream of the control slot; see Fig. 9. A similar butshorter spike is also observed downstream of the leading-edge slotwhen control is applied there. The proximity of the pressure port atx∕c � 51.4% to the high-speed jet is surmised to be the reason for thelow pressure measured here. It is unclear from the available data howfar this region of low cp actually extends across the airfoil surface.The pressure port at x∕c � 62.6% shows no such effect, which
suggests that the impact of the low-pressure region on the aero-dynamic coefficients may be overestimated. A higher spatial densityof pressure ports in this region would be desirable. In any case, theimpact of the spike on the overall results is limited, it only accountsfor a small fraction of the lift increase caused by steady blowingwhena fundamental change in the flowfield (i.e., enforced attachment) isproduced.The qualitative differences linked to the chordwise location of the
control slots are explored further in Fig. 10. The change in liftcoefficient Δcl produced by control from the leading-edge (LE) andmid-chord (MC) slots is plotted as a function of the momentumcoefficient. Positive values of Δcl indicate an increase in lift relativeto the baseline. The approximate values of the correspondingnormalized control jet velocity Uj∕U∞ are indicated above thefigure. A comparison of the results for different Reynolds numbersshows that the effect of control is qualitatively similar. The onlysignificant deviations are observed at 18 deg < α < 21 deg (notshown) and are caused by the Reynolds number dependence of thestatic stall angle.At pre-stall angles of attack, the momentum coefficients at which
the effect of blowing from the leading-edge slot changes from liftreduction to lift enhancement are approximately on the orderof 1.7% < Cμ < 2.5%, roughly corresponding to jet velocities of1.6 < Uj∕U∞ < 1.9. These values are based on the linear inter-polation between data points, shown in Fig. 10, and are ratherimprecise because of the low resolution of themomentumcoefficient.Nevertheless, they are in good agreement with the observation ofKelly that constant blowing reduces the stability of the boundarylayer when the jet velocity is below the local boundary-layer edgevelocity [57]. Based on PIV data recorded at Re � 2.5 · 105, thevelocity above the control slot is approximately Ue∕U∞ ≈ 1.5 atα � 10 deg and Ue∕U∞ ≈ 1.7 at α � 16 deg. Comparing thesevalues to the points where the interpolated curves intersect theline of Δcl � 0 confirms that the boundary layer is destabilizedwhen Uj < Ue.
D. Stall-Inducing Effect of Low-Momentum Blowing
To date, the exact mechanism by which steady blowing at low jetspeeds induces the separation of an otherwise attached boundary layerhas not been investigated in detail to the authors’ knowledge. It isgenerally interpreted as the “inverse effect” of blowing at high jetvelocities: The addition of low-momentum fluid near the walldecreases the boundary-layer momentum, making it more susceptibleto separation (see, for example, Attinello [77]). This explanationappearswell suited to explain the loss in lift observed in previouswork,such as that by Reid and Bamber [21], where the control slot waslocated at chordwise positions where the boundary layer waspresumably turbulent. In such a scenario, the loss in lift is likely toresult from a destabilization of the turbulent boundary layer in thepresence of an adverse pressure gradient. In the present case, however,the situation is more complex because control is applied just upstreamof or within the laminar separation bubble. Hence, the possibilitythat low-momentum blowing produces leading-edge separation bydestabilizing the bubble and causing it to burst should also beconsidered.A comparison of baseline pressure distributions to those obtained
with control at a low jet velocity is presented in Fig. 11. In the baselinecase, the laminar separation bubble is clearly detectable fromthe characteristic region of almost constant pressure throughout thelaminar portion and the steep pressure recovery downstream of thetransition point. As discussed in Sec. IV.A, the location of laminarseparation appears to be fixed at the lip of the control slot at x∕c �5% over the range of approximately 6 deg < α < 14 deg. When theangle of attack is increased to α � 18 deg, the separation pointmoves upstream.Constant blowing at x∕c � 5% with Cμ � 0.6% significantly
alters the cp distributions. This value of the momentum coefficientcorresponds to Uj∕U∞ ≈ 0.9, which is approximately half of thelocal boundary-layer edgevelocity (Uj∕Ue ≈ 0.6 at α � 10 deg andUj∕Ue ≈ 0.5 at α � 18 deg). The pressure distributions can be
AIAA Early Edition / MÜLLER-VAHL ETAL. 9
Dow
nloa
ded
by T
EC
HN
ION
(E
lyac
har
Cen
tral
Lib
rary
) on
Sep
tem
ber
28, 2
014
| http
://ar
c.ai
aa.o
rg |
DO
I: 1
0.25
14/1
.J05
3090

divided in twomain categories: the pre-stall range up to α � 10 deg,and the post-stall range at higher angles of attack. Leading-edgeboundary-layer separation manifests in a loss in suction across theupper surface and a decrease in lift (see Fig. 7a). The almost constantlevel of cp downstream of x∕c � 15% observed at α � 12 deg isindicative of separation.At angles of attack up to α � 10 deg, a second low-pressure peak
is observeddownstreamof the suction peak,which is likely caused bythe jet emanating from the control slot. This effect of blowing on thepressure measurements further adds to the difficulty of using thepressure distributions as an analytical tool. Although the cpdistribution atα � 12 degmay indicate a separation bubble, it is alsopossible that it is in fact caused by the control jet. At α � 15 deg, thepressure distribution does not indicate the presence of a bubble.Overall, these findings suggest that blowing with Cμ � 0.6%eliminates the laminar separation bubble at angles of attack below thebaseline static stall angle.The mechanism by which the ejection of low-momentum fluid
from the slot promotes the bursting of the naturally occurringseparation bubble can be illustrated based on amomentumbalance.Aschematic of the separation bubble downstream of the leading-edgeslot is shown in Fig. 12. The bubble height is exaggerated for clarity.The control volume is bounded by the points S, T, R, and W(previously defined). The ~x axis is parallel to the airfoil surface,which is assumed to be straight throughout this region for simplicity.Since the dividing streamline is chosen as the boundary, there is no
momentum flux across this boundary by definition. Furthermore, thewall shear forces can be neglected because the boundary layers areeither separating or reattaching. Based on these assumptions, thebubble is essentially held in place by a balance of pressure and shearforces acting on the control volume:
ZSTR
τ� ~x� cos�β� ds � −ZSTR
p� ~x� sin�β� ds (4)
When constant blowing is applied, this balance may be disturbedby the momentum flux Js emanating from the slot, which passesthrough the boundary between the points S andW:
Js � ρju2jhj cos�η� (5)
where η � 20 deg is the angle of the control slot relative to thesurface. It can be argued that the bursting of the laminar separationbubble caused by steady blowing results from the destabilizing effectof the injection of momentum into the bubble. Another possibleexplanation for the bursting of the bubble is that the shear in theseparated laminar flow downstream of the lip of the slot is reduced bythe low-momentum jet. This might delay transition and prevent theturbulent reattachment that would otherwise occur. Furthermore, it isalso possible that a separation bubble would hypothetically beformed, but separation occurs just downstream of it. Wallis observed
0 0.5 1 1.5 2 2.5 3 3.5 4 4.5 5
−0.5
0
0.5
1
1.5
Cμ momentum coefficient, %
Δ c l
U /U∞ control jet velocityj
0 0.8 1.2 1.5 1.7 1.9 2.1 2.2 2.4 2.6 2.7
LE slot, Re = 1.25 ⋅ 105
LE slot, Re = 2.5 ⋅ 105
LE slot, Re = 3.75 ⋅ 105
MC slot, Re = 1.25 ⋅ 105
MC slot, Re = 2.5 ⋅ 105
MC slot, Re = 3.75 ⋅ 105
0 0.5 1 1.5 2 2.5 3 3.5 4 4.5 5
−0.5
0
0.5
1
1.5
Cμ momentum coefficient, %
Δ c l
U /U∞ control jet velocityj
0 0.8 1.2 1.5 1.7 1.9 2.1 2.2 2.4 2.6 2.7
LE slot, Re = 1.25 ⋅ 105
LE slot, Re = 2.5 ⋅ 105
LE slot, Re = 3.75 ⋅ 105
MC slot, Re = 1.25 ⋅ 105
MC slot, Re = 2.5 ⋅ 105
MC slot, Re = 3.75 ⋅ 105
0 0.5 1 1.5 2 2.5 3 3.5 4 4.5 5
−0.5
0
0.5
1
1.5
Cμ momentum coefficient, %
Δ c l
U /U∞ control jet velocityj
0 0.8 1.2 1.5 1.7 1.9 2.1 2.2 2.4 2.6 2.7
LE slot, Re = 1.25 ⋅ 105
LE slot, Re = 2.5 ⋅ 105
LE slot, Re = 3.75 ⋅ 105
MC slot, Re = 1.25 ⋅ 105
MC slot, Re = 2.5 ⋅ 105
MC slot, Re = 3.75 ⋅ 105
0 0.5 1 1.5 2 2.5 3 3.5 4 4.5 5
−0.5
0
0.5
1
1.5
Cμ momentum coefficient, %
Δ c l
U /U∞ control jet velocityj
0 0.8 1.2 1.5 1.7 1.9 2.1 2.2 2.4 2.6 2.7
LE slot, Re = 1.25 ⋅ 105
LE slot, Re = 2.5 ⋅ 105
LE slot, Re = 3.75 ⋅ 105
MC slot, Re = 1.25 ⋅ 105
MC slot, Re = 2.5 ⋅ 105
MC slot, Re = 3.75 ⋅ 105
a) = 10ºα
b) = 16ºα d) = 29ºα
c) = 22ºα
Fig. 10 Change in lift coefficient Δcl produced with control during quasi-static pitch-up.
10 AIAA Early Edition / MÜLLER-VAHL ETAL.
Dow
nloa
ded
by T
EC
HN
ION
(E
lyac
har
Cen
tral
Lib
rary
) on
Sep
tem
ber
28, 2
014
| http
://ar
c.ai
aa.o
rg |
DO
I: 1
0.25
14/1
.J05
3090

that the boundary-layer shape parameter H, which is defined as theratio of displacement thickness and momentum thickness, canapproach values that are associated with turbulent separation justdownstream of a short laminar bubble [78,79]. He suggested thatthis pattern of a short bubble, a short extent of attached turbulentboundary layer, and subsequent turbulent separation is unstable [80].In the present case, the ejection of low-momentum fluid from thecontrol slot may lead to a similar situation: If the bubble bursting wastriggered by the reseparation of the turbulent boundary layer justdownstream of the bubble, the boundary layer would effectivelyremain separated downstream of the laminar separation point.In light of the limitations of the available experimental data, it is not
possible to clearly identify the mechanism by which the low-momentum jet from the leading-edge control slot promotes earlyseparation. The results suggest that a laminar separation bubble formsdownstream of the lip of the slot and that the low-momentum jetcauses this bubble to burst. It is also possible that the bubble plays asubordinate role and the early stall is essentially caused by thedestabilizing effect of low-momentum blowing on the boundarylayer. In any case, the question arises whether this control methodcould be exploited to produce temporary lift reductions on windturbine blades. The blades of large-scale commercial wind turbinesoperate at Reynolds numbers that are approximately one order of
magnitude larger than those considered in the present case. They areexposed to adverse environmental influences such as insects, sand,and hail, which dramatically increase the surface roughness,especially in the leading-edge region [81]. In addition, the inflowturbulence levels are significantly higher. Laminar separationbubbles are therefore far less likely to form on an actual wind turbineblade. This may suggest that a control concept relying on bubblebursting might not be applicable on wind turbines. However, even ifno separation bubble exists, ejecting low-momentum fluid into theturbulent boundary layer would have a significant destabilizingeffect. In view of the strong adverse pressure gradient downstream ofthe suction peak, it appears likely that this would promote leading-edge separation. In future work, this assumption will be tested withmeasurements at higher Reynolds numbers.
E. Dynamic Stall Control
The impact of steady blowing from the leading-edge slot on thedynamic stall mechanism was investigated for a sinusoidal pitchingmotion of α � 15 deg�10 deg · sin�ωt� at a reduced frequency ofk � 0.074 and a Reynolds number of Re � 2.5 · 105. Phase-averaged pressure coefficient distributions for the baseline aswell as two control cases (namely, blowing with Cμ � 0.6% andCμ � 7.2%) are shown in Fig. 13. Phase-averaged velocity andvorticity fields obtained with PIV and simultaneously recordedphase-averaged pressure distributions are presented in Figs. 14 and15. Every third velocity vector is plotted in both directions for clarity.The flowfields are shown in the coordinate system relative to theairfoil. The instantaneous direction of the free stream is indicated byan arrow located at the axis of rotation. The pressure coefficient on theupper surface is indicated by a dashed line, and the one on the lowersurface is indicated by a dotted line. In addition, phase-averagedaerodynamic loads are presented as a function of both ϕ and α inFigs. 16 and 17 for various momentum coefficients. In Fig. 17, thepitch-up motion is denoted with solid lines, and the pitch-down isdenoted with dashed lines.In the baseline case, at a phase angle of ϕ � 0 deg, the surface
pressure distribution indicates the presence of a separation bubble atapproximately 5% ≤ x∕c ≤ 15%; see Fig. 13a. At this stage, a largeregion of vortical flow forms below the thick boundary layer in thetrailing-edge region (Figs. 14a and 14d). Simultaneously, theleading-edge separation bubble shortens (ϕ � 21 deg) and bursts,which marks the point where the dynamic stall vortex is shed. Itssubsequent convection downstream manifests in the motion of thecorresponding low-pressure region (see ϕ � 45 deg and ϕ �51 deg in Fig. 13a as well as Fig. 15a). After the shedding of theDSV, the boundary layer is fully separated from the suction surface,resulting in a virtually constant value of cp along the chord. It can beseen from Fig. 16 that the shedding of the dynamic stall vortexproduces a sharp drop in cm that is accompanied by a momentaryincrease and subsequent drop in lift. This is in good agreement withestablished findings on deep dynamic stall; see, for example, [28].Starting at approximately ϕ � 195 deg, the boundary layerreattaches from the leading edge.Constant blowing at a low Cμ has a significant impact on the
unsteady aerodynamic loads. With Cμ � 0.6%, the shedding of theDSVoccurs at an earlier stage and the magnitude of the associatedphase-averaged load fluctuations is reduced. This observation bearssome similarities to the quasi-static results discussed previously,where blowing at the same momentum coefficient induced leading-edge separation. The shedding of the DSVoccurs at approximatelyϕ ≈ 3 deg as opposed to ϕ ≈ 39 deg in the baseline case. A similarstall inducing effect of low-momentum steady blowing has beenobserved by Greenblatt and Wygnanski [58]. They found thatconstant blowingwithCμ � 0.1% from a control slot located directlyat the leading edge of a NACA 0015 airfoil induced separation abovethe suction surface, leading to a dramatic loss in lift. In the presentcase, the lowermagnitude of the load fluctuations ismainly a result ofthe weaker dynamic stall vortex compared to the baseline, which isapparent both from the lower magnitude of the associated low-pressure region (Fig. 13b) and from a comparison of the velocity
0 0.05 0.1 0.15 0.2 0.25 0.3
−5
−4
−3
−2
−1
0
x/c chordwise position
c p pr
essu
re c
oeff
icie
ntbaseline, α = 6°baseline, α = 10°baseline, α = 12°baseline, α = 15°baseline, α = 18°Cμ = 0.6, α = 6°
Cμ = 0.6, α = 10°
Cμ = 0.6, α = 12°
Cμ = 0.6, α = 15°
Cμ = 0.6, α = 18°
Fig. 11 Pressure distributions above the suction surface during quasi-static pitch-up, Re � 2.5 · 105.
Fig. 12 Schematic of the separation bubble located downstream of theleading-edge control slot.
AIAA Early Edition / MÜLLER-VAHL ETAL. 11
Dow
nloa
ded
by T
EC
HN
ION
(E
lyac
har
Cen
tral
Lib
rary
) on
Sep
tem
ber
28, 2
014
| http
://ar
c.ai
aa.o
rg |
DO
I: 1
0.25
14/1
.J05
3090

fields in Figs. 14b and 15a. The DSVoriginates from a region of highvorticity that accumulates near the airfoil surface [82]. When itsshedding is promoted by the low-momentum jet, the process ofvorticity accumulation is interrupted at an earlier stage, whichaccounts for the lower strength of the DSV. Constant blowingwith Cμ � 0.6% reduces the lift coefficient throughout most of thepitching cycle (see Fig. 16a), substantiating the potential foraerodynamic braking.When a high-velocity jet is ejected from the leading-edge slot
during the dynamic pitching motion, the shedding of the dynamicstall vortex is fully suppressed. Figure 13c illustrates that the strengthof the suction peak is increased dramaticallywithCμ � 7.2%. A dropin cl and a simultaneous momentary reduction in cm, which appear tobe similar to the load fluctuations resulting from dynamic stall, areobserved near the maximum angle of attack. However, neither theunsteady cp distributions nor the velocity fields show any signs ofthe shedding of a dynamic stall vortex. Instead, a gradual reduction ofthe strength of the suction peak occurs between ϕ � 69 deg andϕ � 99 deg, followed by a recovery until ϕ ≈ 132 deg (seeFig. 13c). The velocity field presented in Fig. 15f reveals that themomentary loss in lift is caused by a thickening of the boundary layeracross the rear half of the blade, which signifies trailing-edge stall. Acomparison of the surface pressures at phase angles of ϕ � 48 degand ϕ � 132 deg, which correspond to α � 22.4 deg during pitch-up and pitch-down, respectively, shows only minor differences,indicating that, throughout the lower angle of attack range of thepitching cycle, the degree of hysteresis is small.Constant blowing at high momentum coefficients produces a
number of desirable effects with regard to the application onwind turbine blades. Lift is enhanced substantially throughout theentire pitching cycle. This would not translate to a corresponding
increase in turbine power since the net energy that can be extractedfrom the wind is limited by the Betz limit (see, for example, [83]).Nevertheless this provides a large control authority for adjusting cl byadapting the momentum coefficient. As in the quasi-static cases, clincrease monotonically with increasing Cμ above a certain thresholdvalue which is an important prerequisite for control. The increase incl obtainedwith high-momentum blowing could also be exploited bymanufacturing turbine blades with a shorter chord length that wouldprovide the same lift as larger blades operating without control. Thiswould reduce theweight of the blades and the associated loads on thebearings, potentially decreasing the cost of investment. Constantblowing at high momentum coefficients significantly reduces theform drag (Fig. 16b), which translates to improved turbine efficiency.Furthermore, the phase-averaged moment coefficient variations arereduced significantly compared to the baseline. This is a direct resultof the suppression of the dynamic stall vortex: The large negativepitching moment observed at a phase angle of ϕ ≈ 60 deg in thebaseline case (Fig. 16c) is caused by the convection of theDSVacrossthe suction surface. The peak negative value of cm occurs when theresulting low-pressure region is located above the rear half of theairfoil. In comparison, the moment variations caused by the briefoccurrence of trailing-edge stall near the maximum angle of attackobserved with high-momentum blowing are significantly smaller.The peak negative pitching moment is reduced from cm � −0.33(ϕ � 63 deg) in the baseline case to cm � −0.06 (Cμ � 5%,ϕ � 72 deg) and cm � −0.09 (Cμ � 7.2%, ϕ � 90 deg), respec-tively. The amplitude of the phase-averaged moment coefficientfluctuations, calculated as the difference between the maximum andminimum values of cm occurring throughout the entire pitchingcycle, is reduced by approximately 66% relative to the baselinewith Cμ � 7.2%.
0 0.2 0.4 0.6 0.8 1
−12
−10
−8
−6
−4
−2
0
x/c chordwise position
c p pr
essu
re c
oeff
icie
nt
φ = 0°, α = 15°φ = 21°, α = 18.6°φ = 45°, α = 22.1°φ = 51°, α = 22.8°φ = 105°, α = 24.7°
a) Baseline
0 0.2 0.4 0.6 0.8 1
−12
−10
−8
−6
−4
−2
0
x/c chordwise position
c p pr
essu
re c
oeff
icie
nt
φ = 0°, α = 15°φ = 9°, α = 16.6°φ = 105°, α = 24.7°φ = 270°, α = 5°φ = 348°, α = 12.9°
0 0.2 0.4 0.6 0.8 1
−12
−10
−8
−6
−4
−2
0
x/c chordwise position
c p pr
essu
re c
oeff
icie
nt
φ = 48°, α = 22.4°φ = 69°, α = 24.3°φ = 99°, α = 24.9°φ = 132°, α = 22.4°φ = 348°, α = 12.9°
b) C = 0.6%μ c) C = 7.2%μ
Fig. 13 Pressure coefficient distributions at selected phase angles of the pitching motion. α � 15 deg�10 deg · sin�ωt�, k � 0.074, Re � 2.5 · 105.
12 AIAA Early Edition / MÜLLER-VAHL ETAL.
Dow
nloa
ded
by T
EC
HN
ION
(E
lyac
har
Cen
tral
Lib
rary
) on
Sep
tem
ber
28, 2
014
| http
://ar
c.ai
aa.o
rg |
DO
I: 1
0.25
14/1
.J05
3090

The performance of a dynamic stall control method can becharacterized based on the aerodynamic damping; see, for example,[43,44]. In the case of negative damping, the airfoil system extractsenergy from the freestream; this is the condition for aerodynamicflutter. Negative damping is potentially harmful for the bladesbecause it can increase the amplitude of the pitch oscillations. Theaverage cycle damping is defined as
Icm dα
and the damping is positive for a counter-rotating circuit [84]. It isclear from the experimental data that the aerodynamic damping is
positive in all control cases considered: The circuits of cm over α arecounter-rotating irrespective of the momentum coefficient; seeFig. 17c.It is interesting to note that the main effects of high-momentum
steady blowing observed in the present case have been well predictednumerically for a comparable test casebyYuet al. [85].Using theZETAcode, which uses the vorticity vector as the primary variable, theysimulated constant blowing on a NACA 0012 airfoil by prescribingnonzero tangential velocity on part of the upper surface. For an angle-of-attack variation of α � 15 deg�10 deg · sin�ωt� and Re �2 · 105, they predicted that blowing with twice the freestream velocityprevents the formation of the dynamic stall vortex. As a result, momentstall and the temporary increase in drag are eliminated and the lift
U∞
a) = 10º, = 16.7º, baselineφ α
b) = 10º, = 16.7º, C = 0.6%φ α
d) = 30º, = 20º, baselineφ α
U∞
U∞
U∞
U∞
U∞
μ
c) = 10º, = 16.7º, C = 7.2%φ α μ f) = 30º, = 20º, C = 7.2%φ α μ
e) = 30º, = 20º, C = 0.6%φ α μ
Fig. 14 Phase-averaged normalized vorticity fields and surface pressure coefficients. α � 15 deg�10 deg · sin�ωt�, k � 0.074, Re � 2.5 · 105.
AIAA Early Edition / MÜLLER-VAHL ETAL. 13
Dow
nloa
ded
by T
EC
HN
ION
(E
lyac
har
Cen
tral
Lib
rary
) on
Sep
tem
ber
28, 2
014
| http
://ar
c.ai
aa.o
rg |
DO
I: 1
0.25
14/1
.J05
3090

coefficient remains almost constant at high angles of attack. The drop inlift caused by trailing-edge separation at high angles of attack that wasobserved here was not predicted by the simulations.It appears that positioning the control slot at 5% chord rather than
further downstream increases the effectiveness of constant blowing.In contrast to the tests by Weaver et al. [54,55], where constantblowingwas applied at quarter chord andCμ > 16%was required foreffective control, blowing fully suppressed the formation of the DSVat a comparatively low-momentum input in the present case.However, the validity of this comparison is limited because of thedifferent airfoil geometries, Reynolds numbers, and angle-of-attackranges.The experimental data indicate that, even though blowing at a high
momentumcoefficient is capable of fully suppressing the shedding ofthe DSV, unsteady lift fluctuations occur near the maximum angle of
attack, which are comparable in strength to those resulting fromdynamic stall. There are several control approaches that could beapplied to counteract these fluctuations and reduce the fatigue loads.The quasi-static baseline data show that blowing from the mid-chordslot is more effective at suppressing trailing-edge separation. Sincethe temporal drop in lift is associated with the thickening of theboundary layer in the trailing-edge region and a correspondingreduction in circulation, applying control from the mid-chord slotthroughout this small range of phase angles may reduce the drop inlift. However, this was not attempted here. From a practicalperspective, implementing an additional mid-chord control slot onwind turbine blades would further increase the manufacturing costsand might lead to problems regarding the structural integrity of theblades. Incorporating a single control slot near the leading edgeappears more feasible and cost effective. Therefore, it might be
a) φ = 50º, α = 22.7º, baseline d) φ = 80º, α = 24.8º, baseline
b) = 50º, = 22.7º, C = 0.6%φ α μ e) = 80º, = 24.8º, C = 0.6%φ α μ
c) = 50º, = 22.7º, C = 7.2%φ α μ f) = 80º, = 24.8º, C = 7.2%φ α μ
Fig. 15 Phase-averaged normalized vorticity fields and surface pressure coefficients. α � 15 deg�10 deg · sin�ωt�, k � 0.074, Re � 2.5 · 105.
14 AIAA Early Edition / MÜLLER-VAHL ETAL.
Dow
nloa
ded
by T
EC
HN
ION
(E
lyac
har
Cen
tral
Lib
rary
) on
Sep
tem
ber
28, 2
014
| http
://ar
c.ai
aa.o
rg |
DO
I: 1
0.25
14/1
.J05
3090

preferable to counteract the drop in lift with a temporal increase of themomentum coefficient of the jet from the leading-edge control slot.Provisions are currently made to implement a mass flow controllerthat will allow for variations of the control jet velocity at timescalessignificantly shorter than the period of the pitching motion. One ofthe next steps of this research project will be to dynamically adapt themomentum coefficient to minimize the lift fluctuations and theassociated fatigue loads.
To explore the impact of control on the cycle-to-cycle loadfluctuations, the standard deviation of the lift coefficient σcl wascalculated according to
σcl�ϕ� �
�����������������������������������������������1
N
XNi�1�cl;i�ϕ� − cl�ϕ��2
vuut (6)
0 45 90 135 180 225 270 315 3600
0.5
1
1.5
2
2.5
3
3.5
φ phase angle, º
c l lif
t coe
ffic
ient
baselineCμ = 0.6%
Cμ = 2.5%
Cμ = 5%
Cμ = 7.2%
a)
b)
c)
0 45 90 135 180 225 270 315 360
0
0.2
0.4
0.6
0.8
φ phase angle, º
c d fo
rm d
rag
coef
fici
ent
baselineCμ = 0.6%
Cμ = 2.5%
Cμ = 5%
Cμ = 7.2%
0 45 90 135 180 225 270 315 360
−0.3
−0.2
−0.1
0
0.1
φ phase angle, º
c m m
omen
t coe
ffic
ient
baselineCμ = 0.6%
Cμ = 2.5%
Cμ = 5%
Cμ = 7.2%
Fig. 16 Aerodynamic coefficients as a function of the phase angle ϕ.α � 15 deg�10 deg · sin�ωt�, k � 0.074, Re � 2.5 · 105.
5 10 15 20 250
0.5
1
1.5
2
2.5
3
α angle of attack, º
c l lif
t coe
ffic
ient
baselineCμ = 0.6%
Cμ = 2.5%
Cμ = 5%
Cμ = 7.2%
a)
b)
c)
5 10 15 20 25
0
0.2
0.4
0.6
0.8
α angle of attack, º
c d fo
rm d
rag
coef
fici
ent
baselineCμ = 0.6%
Cμ = 2.5%
Cμ = 5%
Cμ = 7.2%
5 10 15 20 25
−0.3
−0.2
−0.1
0
0.1
α angle of attack, º
c m m
omen
t coe
ffic
ient
baselineCμ = 0.6%
Cμ = 2.5%
Cμ = 5%
Cμ = 7.2%
Fig. 17 Aerodynamic coefficients as a function of the angle of attack α.α � 15 deg�10 deg · sin�ωt�, k � 0.074, Re � 2.5 · 105.
AIAA Early Edition / MÜLLER-VAHL ETAL. 15
Dow
nloa
ded
by T
EC
HN
ION
(E
lyac
har
Cen
tral
Lib
rary
) on
Sep
tem
ber
28, 2
014
| http
://ar
c.ai
aa.o
rg |
DO
I: 1
0.25
14/1
.J05
3090
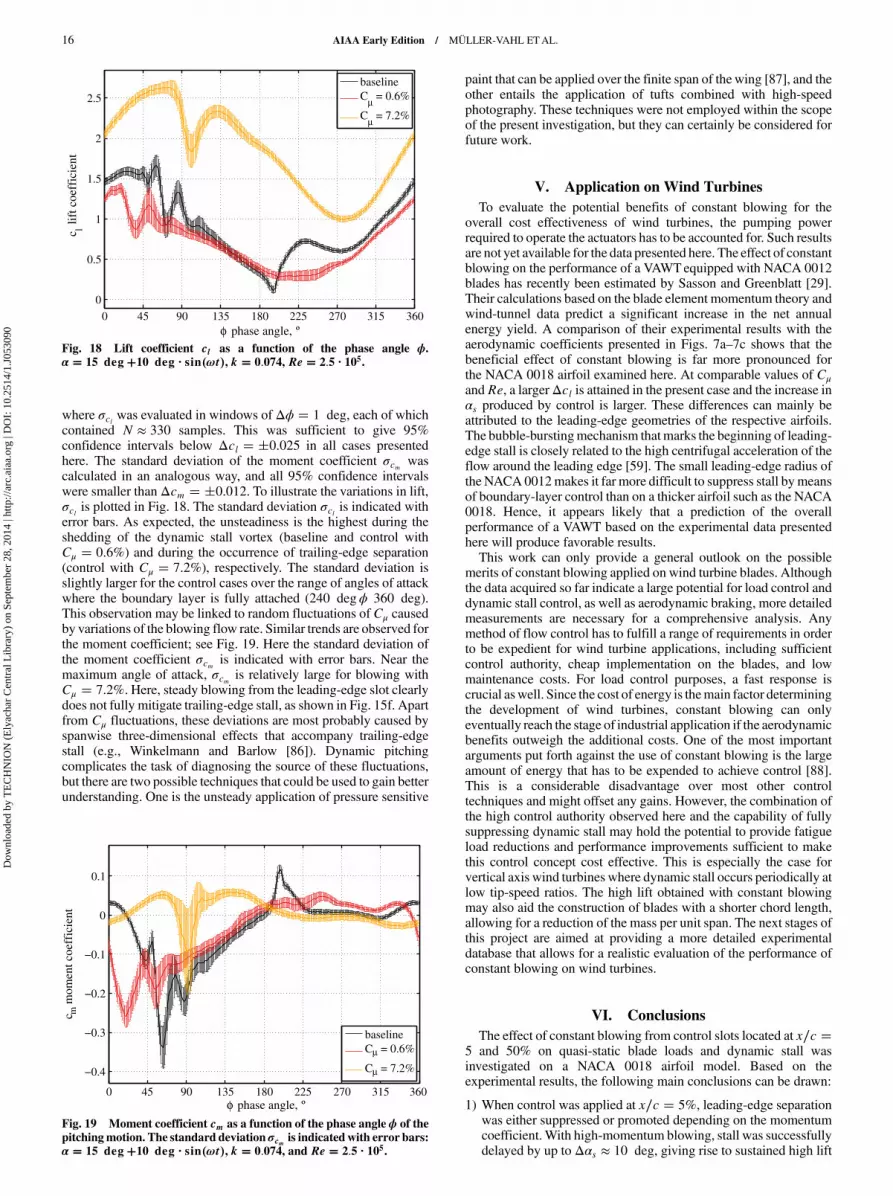
where σcl was evaluated in windows of Δϕ � 1 deg, each of whichcontained N ≈ 330 samples. This was sufficient to give 95%confidence intervals below Δcl � �0.025 in all cases presentedhere. The standard deviation of the moment coefficient σcm wascalculated in an analogous way, and all 95% confidence intervalswere smaller than Δcm � �0.012. To illustrate the variations in lift,σcl is plotted in Fig. 18. The standard deviation σcl is indicated witherror bars. As expected, the unsteadiness is the highest during theshedding of the dynamic stall vortex (baseline and control withCμ � 0.6%) and during the occurrence of trailing-edge separation(control with Cμ � 7.2%), respectively. The standard deviation isslightly larger for the control cases over the range of angles of attackwhere the boundary layer is fully attached (240 degϕ 360 deg).This observation may be linked to random fluctuations of Cμ causedby variations of the blowing flow rate. Similar trends are observed forthe moment coefficient; see Fig. 19. Here the standard deviation ofthe moment coefficient σcm is indicated with error bars. Near themaximum angle of attack, σcm is relatively large for blowing withCμ � 7.2%. Here, steady blowing from the leading-edge slot clearlydoes not fully mitigate trailing-edge stall, as shown in Fig. 15f. Apartfrom Cμ fluctuations, these deviations are most probably caused byspanwise three-dimensional effects that accompany trailing-edgestall (e.g., Winkelmann and Barlow [86]). Dynamic pitchingcomplicates the task of diagnosing the source of these fluctuations,but there are two possible techniques that could be used to gain betterunderstanding. One is the unsteady application of pressure sensitive
paint that can be applied over the finite span of the wing [87], and theother entails the application of tufts combined with high-speedphotography. These techniques were not employed within the scopeof the present investigation, but they can certainly be considered forfuture work.
V. Application on Wind Turbines
To evaluate the potential benefits of constant blowing for theoverall cost effectiveness of wind turbines, the pumping powerrequired to operate the actuators has to be accounted for. Such resultsare not yet available for the data presented here. The effect of constantblowing on the performance of a VAWTequipped with NACA 0012blades has recently been estimated by Sasson and Greenblatt [29].Their calculations based on the blade element momentum theory andwind-tunnel data predict a significant increase in the net annualenergy yield. A comparison of their experimental results with theaerodynamic coefficients presented in Figs. 7a–7c shows that thebeneficial effect of constant blowing is far more pronounced forthe NACA 0018 airfoil examined here. At comparable values of Cμand Re, a largerΔcl is attained in the present case and the increase inαs produced by control is larger. These differences can mainly beattributed to the leading-edge geometries of the respective airfoils.The bubble-burstingmechanism thatmarks the beginning of leading-edge stall is closely related to the high centrifugal acceleration of theflow around the leading edge [59]. The small leading-edge radius ofthe NACA0012makes it far more difficult to suppress stall bymeansof boundary-layer control than on a thicker airfoil such as the NACA0018. Hence, it appears likely that a prediction of the overallperformance of a VAWT based on the experimental data presentedhere will produce favorable results.This work can only provide a general outlook on the possible
merits of constant blowing applied on wind turbine blades. Althoughthe data acquired so far indicate a large potential for load control anddynamic stall control, as well as aerodynamic braking, more detailedmeasurements are necessary for a comprehensive analysis. Anymethod of flow control has to fulfill a range of requirements in orderto be expedient for wind turbine applications, including sufficientcontrol authority, cheap implementation on the blades, and lowmaintenance costs. For load control purposes, a fast response iscrucial aswell. Since the cost of energy is themain factor determiningthe development of wind turbines, constant blowing can onlyeventually reach the stage of industrial application if the aerodynamicbenefits outweigh the additional costs. One of the most importantarguments put forth against the use of constant blowing is the largeamount of energy that has to be expended to achieve control [88].This is a considerable disadvantage over most other controltechniques and might offset any gains. However, the combination ofthe high control authority observed here and the capability of fullysuppressing dynamic stall may hold the potential to provide fatigueload reductions and performance improvements sufficient to makethis control concept cost effective. This is especially the case forvertical axis wind turbines where dynamic stall occurs periodically atlow tip-speed ratios. The high lift obtained with constant blowingmay also aid the construction of blades with a shorter chord length,allowing for a reduction of the mass per unit span. The next stages ofthis project are aimed at providing a more detailed experimentaldatabase that allows for a realistic evaluation of the performance ofconstant blowing on wind turbines.
VI. Conclusions
The effect of constant blowing from control slots located at x∕c �5 and 50% on quasi-static blade loads and dynamic stall wasinvestigated on a NACA 0018 airfoil model. Based on theexperimental results, the following main conclusions can be drawn:
1) When control was applied at x∕c � 5%, leading-edge separationwas either suppressed or promoted depending on the momentumcoefficient.With high-momentum blowing, stall was successfullydelayed by up to Δαs ≈ 10 deg, giving rise to sustained high lift
0 45 90 135 180 225 270 315 360
0
0.5
1
1.5
2
2.5
φ phase angle, º
c l lif
t coe
ffic
ient
baselineCμ = 0.6%
Cμ = 7.2%
Fig. 18 Lift coefficient cl as a function of the phase angle ϕ.α � 15 deg�10 deg · sin�ωt�, k � 0.074, Re � 2.5 · 105.
0 45 90 135 180 225 270 315 360
−0.4
−0.3
−0.2
−0.1
0
0.1
φ phase angle, º
c m m
omen
t coe
ffic
ient
baselineCμ = 0.6%
Cμ = 7.2%
Fig. 19 Moment coefficient cm as a function of the phase angle ϕ of thepitchingmotion. The standard deviation σcm is indicatedwith error bars:α � 15 deg�10 deg · sin�ωt�, k � 0.074, and Re � 2.5 · 105.
16 AIAA Early Edition / MÜLLER-VAHL ETAL.
Dow
nloa
ded
by T
EC
HN
ION
(E
lyac
har
Cen
tral
Lib
rary
) on
Sep
tem
ber
28, 2
014
| http
://ar
c.ai
aa.o
rg |
DO
I: 1
0.25
14/1
.J05
3090

over a wide range of angles of attack. The lift coefficient wasincreased by up to Δcl ≈ 0.6 relative to pre-stall baseline values.
2) When the control jet velocity was below the local boundary-layeredge velocity, blowing from the leading-edge slot precipitatedboundary-layer separation. As a result, a significant loss in lift anda dramatic increase in drag were observed at angles of attackbelow the baseline static stall angle.
3) Control from the mid-chord slot significantly enhanced lift at pre-stall angles of attack by suppressing trailing-edge separation.However, it was ineffective at controlling leading-edge stall.
4) Overall, constant blowing at x∕c � 5% was found to be moreeffective and versatile than blowing at the mid-chord.
5) Steady blowing from the leading-edge slot at Cμ � 0.6%promoted the early shedding of the dynamic stall vortex, yieldingsmaller unsteady load fluctuations. The lift coefficient wasdecreased over most of the pitching cycle, which attests to thepotential of low-momentum blowing for aerodynamic braking.
6) Blowing at a momentum coefficient of Cμ � 7.2% fullysuppressed the formation of the dynamic stall vortex andsignificantly enhanced lift throughout the entire pitching cycle.The phase-averaged momentum coefficient fluctuations werereduced to approximately one-third of the baseline value.
7) Even when the DSV was eliminated with high-momentumblowing, a short-term loss in lift resulting from trailing-edgeseparation was observed near the maximum angle of attack.Such adverse load fluctuations could potentially be mitigatedby varying the momentum coefficient as a function of thephase angle.
These results indicate a large potential for the application of slotblowing as a tool for load control on wind turbine blades. Asignificant control authority regarding the achievable change in liftwas observed over a wide range of angles of attack. The absence ofmoving parts on the blades poses an additional advantage. Blowingcould also be employed to suppress dynamic stall, yielding bothperformance increases and fatigue load reductions. Finally, thecapability of low-momentum blowing to induce leading-edge stallwould provide an effective aerodynamic braking system.For a more comprehensive evaluation of the potential of this
control technique, the energy required for actuation has to beaccounted for. The benefits of slot blowing could presumably beenhanced by varying the momentum coefficient as a function of theturbine blades’ azimuth angle to reduce the overall energy input or tominimize the load fluctuations throughout the rotation. In futurework, a high priority will be placed on improving the precision of themomentum coefficient obtained in the experiments. The rotameterused in this work has since been replaced with an Alicat ScientificMCR-3000 mass flow controller. The suitability of constant blowingas a load control method will soon be tested by dynamically adaptingthe momentum coefficient to the unsteady inflow conditions.
Acknowledgments
This research was supported by the Israel Science Foundation(grant no. 840/11). The authors gratefully acknowledge the supportfrom Bastian Blümel, Thorsten Dessin, Georgios Pechlivanoglou,Wilfried Postel, and Heiko Stolpe.
References
[1] Johnson, K. E., and Fingersh, L. J., “Adaptive Pitch Control of Variable-Speed Wind Turbines,” 45th AIAA Aerospace Sciences Meeting and
Exhibit, AIAA Paper 2007-1023, 2007.[2] Bossanyi, E. A., “Individual Blade Pitch Control for Load Reduction,”
Wind Energy, Vol. 6, No. 2, 2003, pp. 119–128.doi:10.1002/we.76
[3] Van Wingerden, J. W., Hulskamp, A. W., Barlas, T., Marrant, B., vanKuik, G. A. M., Molenaar, D. P., and Verhaegen, M., “On the Proof ofConcept of a Smart Wind Turbine Rotor Blade for Load Alleviation,”Wind Energy, Vol. 11, No. 3, 2008, pp. 265–280.doi:10.1002/we.264
[4] Nakafuji, D. T. Y., van Dam, C. P., Smith, R. L., and Collins, S. D.,“Active Load Control for Airfoils Using Microtabs,” Journal of Solar
Energy Engineering, Vol. 123, No. 4, 2001, pp. 282–289.doi:10.1115/1.1410110
[5] Lackner, M., and van Kuik, G. A. M., “The Performance of WindTurbine Smart Rotor Control Approaches During Extreme Loads,”Journal of Solar Energy Engineering, Vol. 132, No. 1, 2010,pp. 011008-1–011008-8.doi:10.1115/1.4000352
[6] Berg, D., Wilson, D., Resor, B., Berg, J., Barlas, J., Crowther, A., andHalse, C., “System ID Modern Control Algorithms for ActiveAerodynamic Load Control and Impact on Gearbox Loading,” 3rd
EWEA Conference — Torque 2010, European Wind EnergyAssociation, Heraklion, Greece, 2010.
[7] Troldborg, N., “Computational Study of the Ris-B1-18 Airfoil with aHinged Flap Providing Variable Trailing Edge Geometry,” Wind
Engineering, Vol. 29, No. 2, 2005, pp. 89–113.doi:10.1260/0309524054797159
[8] Wilson, D., Resor, B., Berg, D., Barlas, T., and van Kuik, G., “ActiveAerodynamic Blade Distributed Flap Control Design Procedure forLoad Reduction on the UpWind 5MW Wind Turbine,” 48th AIAA
Aerospace Sciences Meeting, AIAA Paper 2010-0254, 2010.[9] Barlas, T., van Wingerden, J. W., Hulskamp, A., and van Kuik, G.,
“Closed-LoopControlWind Tunnel Tests on anAdaptiveWind TurbineBlade for LoadReduction,” 46th AIAAAerospace SciencesMeeting and
Exhibit, AIAA Paper 2008-1318, 2008.[10] Andersen, P. B., Henriksen, L., Gaunaa, M., Bak, C., and Buhl, T.,
“Deformable Trailing Edge Flaps for Modern Megawatt Wind TurbineControllers UsingStrainGauge Sensors,”WindEnergy, Vol. 13,Nos. 2–3, 2010, pp. 193–206.doi:10.1002/we.371
[11] Mayda, E. A., van Dam, C., and Yen Nakafuji, D., “ComputationalInvestigation of Finite Width Microtabs for Aerodynamic LoadControl,” 43rd AIAA Aerospace Sciences Meeting and Exhibit, AIAAPaper 2005-1185, 2005.
[12] Chow, R., and van Dam, C., “Computational Investigations ofDeploying Load Control Microtabs on a Wind Turbine Airfoil,” 45th
AIAA Aerospace Sciences Meeting 2007, AIAA Paper 2007-1018,2007.
[13] Bach, A. B., Holst, D., Nayeri, C. N., and Paschereit, C. O.,“Transitional Effects of Active Micro-Tabs for Wind Turbine LoadControl,” ASME Turbo Expo, American Soc. of Mechanical EngineersPaper GT2013-94369, Fairfield, NJ, 2013.
[14] Cooperman, A.M., Chow, R., and vanDam,C. P., “Active LoadControlof a Wind Turbine Airfoil Using Microtabs,” Journal of Aircraft,Vol. 50, No. 4, 2013, pp. 1150–1159.doi:10.2514/1.C032083
[15] Barlas, T. K., and van Kuik, G. A. M., “Review of State of the Art inSmart Rotor Control Research for Wind Turbines,” Progress in
Aerospace Sciences, Vol. 46, No. 1, 2010, pp. 1–27.doi:10.1016/j.paerosci.2009.08.002
[16] Berg, D., Johnson, S. J., and van Dam, C. P., “Active Load ControlTechniques forWind Turbines,” SandiaNational Labs TR-SAND2008-4809, Albuquerque, NM, July 2008.
[17] Pechlivanoglou, G. K., Wagner, J., Nayeri, C. N., and Paschereit, C. O.,“Active Aerodynamic Control of Wind Turbine Blades with HighDeflection Flexible Flaps,” 48th AIAA Aerospace Sciences Meeting,AIAA Paper 2010-0644, 2010.
[18] Barlas, T. K., and van Kuik, G., “State of the Art and Prospectives ofSmart Rotor Control for Wind Turbines,” Journal of Physics:
Conference Series, Vol. 75, No. 1, 2007, pp. 1–20.doi:10.1088/1742-6596/75/1/012080
[19] Prandtl, L., “Über Flüssigkeitsbewegung bei sehr Kleiner Reibung,”Proceedings of 3rd International Mathematics Congress, Teubner,Leipzig, Germany, 1904, pp 484–491.
[20] Baumann, A., “Tragflügel für Flugzeugemit Luftaustrittsöffnung in derAussenhaut,” Deutsches Reichs Patent No. 400806, Germany, 1921.
[21] Reid, E. G., and Bamber,M. J., “Preliminary Investigation on BoundaryLayer Control by Means of Suction and Pressure with the U.S.A. 27Airfoil,”National Advisory Committee for Aeronautics TR-286, 1928.
[22] Knight,M., andBamber,M. J., “WindTunnel Tests onAirfoil BoundaryLayer Control Using a Backward Opening Slot,” National AdvisoryCommittee for Aeronautics TR-323, 1929.
[23] Poisson-Quinton, P., and Lepage, L., “Boundary Layer and FlowControl: Its Principles and Application,” Survey of French Research onthe Control of Boundary Layer and Circulation, edited by Lachmann,G. V., Vol. 1, Pergamon, New York, 1961, pp. 21–73.
[24] Williams, J., “Boundary Layer and Flow Control: Its Principles andApplication,” A Brief History of British Research on Boundary Layer
Control for High Lift, edited by Lachmann, G. V., Vol. 1, Pergamon,New York, 1961, pp. 74–103.
AIAA Early Edition / MÜLLER-VAHL ETAL. 17
Dow
nloa
ded
by T
EC
HN
ION
(E
lyac
har
Cen
tral
Lib
rary
) on
Sep
tem
ber
28, 2
014
| http
://ar
c.ai
aa.o
rg |
DO
I: 1
0.25
14/1
.J05
3090

[25] Belyakov, R. A., and Marmain, J., MiG: Fifty Years of Secret Aircraft
Design, Naval Institute Press, Annapolis, MD, 1994, p. 315.[26] Bowman, M., Lockheed F-104 Starfighter, Crowood Press, Marl-
borough, England, U.K., March 2001, p. 76.[27] Ferreira, C. S.,Kuik,G.V., Bussel,G.V., andScarano, F., “Visualization
by PIVof Dynamic Stall on a Vertical AxisWind Turbine,” Experimentsin Fluids, Vol. 46, No. 1, 2009, pp. 97–108.doi:10.1007/s00348-008-0543-z
[28] Carr, L. W., “Progress in Analysis and Prediction of Dynamic Stall,”Journal of Aircraft, Vol. 25, No. 1, 1988, pp. 6–17.doi:10.2514/3.45534
[29] Sasson, B., and Greenblatt, D., “Effect of Leading-Edge Slot Blowingon a Vertical Axis Wind Turbine,” AIAA Journal, Vol. 49, No. 9, 2011,pp. 1932–1942.doi:10.2514/1.J050851
[30] Paraschivoiu, I., “Double-Multiple Streamtube Model for DarrieusWind Turbines,” Second DOE/NASA Wind Turbines Dynamics
Workshop, NASA CP-2186, 1981, pp. 19–25.[31] Depailler, G., and Friedmann, P., “Alleviation of Dynamic Stall Induced
Vibrations Using Actively Controlled Flaps,” Annual Forum
Proceedings–American Helicopter Society, Vol. 58, No. 1, AmericanHelicopter Soc., 2002.
[32] Gerontakos, P., and Lee, T., “Dynamic Stall FlowControl via a Trailing-Edge Flap,” AIAA Journal, Vol. 44, No. 3, 2006, pp. 469–480.doi:10.2514/1.17263
[33] Greenblatt, D., and Wygnanski, I., “Dynamic Stall Control by PeriodicExcitation, Part 1: NACA 0015 Parametric Study,” Journal of Aircraft,Vol. 38, No. 3, 2001, pp. 430–438.doi:10.2514/2.2810
[34] Mai, H., Dietz, G., Geissler, W., Richter, K., Bosbach, J., Richard, H.,and de Groot, K., “Dynamic Stall Control by Leading Edge VortexGenerators,” Journal of the AmericanHelicopter Society, Vol. 53, No. 1,2008, pp. 26–36.doi:10.4050/JAHS.53.26
[35] Geissler, W., and Raffel, M., “Dynamic Stall Control by AirfoilDeformation,” 19the European Rotorcraft Forum, Paper C1, Vol. 1,Como, Italy, Sept. 1993.
[36] Chandrasekhara, M. S., Martin, P. B., and Tung, C., “CompressibleDynamic Stall Control Using a Variable Droop Leading Edge Airfoil,”Journal of Aircraft, Vol. 41, No. 4, 2004, pp. 862–869.doi:10.2514/1.472
[37] Chandrasekhara, M. S., Wilder, M. C., and Carr, L. W., “Unsteady StallControl Using Dynamically Deforming Airfoils,” AIAA Journal,Vol. 36, No. 10, 1998, pp. 1792–1800.doi:10.2514/2.294
[38] Carr, L., and McAlister, K., “The Effect of a Leading-Edge Slat on theDynamic Stall of an Oscillating Airfoil,” AlAA Aircraft Design, Systems
and Technology Meeting, AIAA Paper 1983-2533, 1983.[39] DeHugues, P.,McAlister, K.W., and Tung, C., “Effect of an Extendable
Slat on the Stall Behavior of a VR-12 Airfoil,” NASA TR-3407,Sept. 1993.
[40] Velte, C. M., Hansen, M. O. L., Meyer, K. E., and Fuglsang, P.,“Evaluation of the Performance of Vortex Generators on the DU91-W2-250 Profile Using Stereoscopic PIV,” Journal of Systemics, Cyberneticsand Informatics, Vol. 7, No. 3, 2009, pp. 92–96.
[41] Müller-Vahl, H., Pechlivanoglou, G., Nayeri, C. N., and Paschereit, C.O., “Vortex Generators for Wind Turbine Blades: A Combined WindTunnel and Wind Turbine Parametric Study,” ASME Turbo Expo 2012,American Society of Mechanical Engineers Paper GT2012-69197,Fairfield, NJ, 2012.
[42] Martin, P. B., Wilson, J. S., Berry, J. D., Wong, T.-C., Moulton, M., andMcVeigh, M. A., “Passive Control of Compressible Dynamic Stall,”26th AIAA Applied Aerodynamics Conference, AIAA Paper 2008-7506, 2008.
[43] Heine, B., Mulleners, K., Joubert, G., and Raffel, M., “Dynamic StallControl by Passive Disturbance Generators,” AIAA Journal, Vol. 51,No. 9, 2013, pp. 2086–2097.doi:10.2514/1.J051525
[44] Pape, A. L., Costes, M., Richez, F., Joubert, G., David, F., and Deluc, J.M., “Dynamic Stall Control Using Deployable Leading-Edge VortexGenerators,” AIAA Journal, Vol. 50, No. 10, 2012, pp. 2135–2145.doi:10.2514/1.J051452
[45] Karim, M. A., and Acharya, M., “Suppression of Dynamic-StallVortices over Pitching Airfoils by Leading-Edge Suction,” AIAA
Journal, Vol. 32, No. 8, 1994, pp. 1647–1655.doi:10.2514/3.12155
[46] Alrefai, M., and Acharya, M., “Controlled Leading-Edge Suction forManagement of Unsteady Separation over PitchingAirfoils,” 26th AIAAFluid Dynamics Conference, AIAA Paper 1995-2188, 1995.
[47] Greenblatt, D., Nishri, B., Darabi, A., and Wygnanski, I., “DynamicStall Control by Periodic Excitation, Part 2: Mechanisms,” Journal ofAircraft, Vol. 38, No. 3, 2001, pp. 439–447.doi:10.2514/2.2811
[48] Greenblatt, D., “Active Control of Leading-Edge Dynamic Stall,”International Journal of Flow Control, Vol. 2, No. 1, 2010, pp. 21–38.doi:10.1260/1756-8250.2.1.21
[49] Post, M. L., and Corke, T. C., “Separation Control Using PlasmaActuators: Dynamic Stall Vortex Control on Oscillating Airfoil,” AIAAJournal, Vol. 44, No. 12, 2006, pp. 3125–3135.doi:10.2514/1.22716
[50] Lombardi, A. J., Bowles, P. O., and Corke, T. C., “Closed-LoopDynamic Stall Control Using a Plasma Actuator,” AIAA Journal,Vol. 51, No. 5, 2013, pp. 1130–1141.doi:10.2514/1.J051988
[51] Greenblatt, D., Schulman, M., and Ben-Harav, A., “Vertical Axis WindTurbine Performance Enhancement Using Plasma Actuators,” Renew-able Energy, Vol. 37, No. 1, 2012, pp. 345–354.doi:10.1016/j.renene.2011.06.040
[52] Greenblatt, D., Ben-Harav, A., and Müller-Vahl, H., “Dynamic StallControl on a Vertical-Axis Wind Turbine Using Plasma Actuators,”AIAA Journal, Vol. 52, No. 2, 2014, pp. 456–462.doi:10.2514/1.J052776
[53] McCloud, J., Hall, L., and Brady, J., “Full-Scale Wind-Tunnel Tests ofBlowing Boundary-Layer Control Applied to a Helicopter Rotor,”NASA TR-TN-D-335, 1960.
[54] Weaver, D., McAlister, K. W., and Tso, J., “Suppression of DynamicStall by Steady and PulsedUpper-SurfaceBlowing,” 16th AIAAApplied
Aerodynamics Conference, AIAA Paper 1998-2413, 1998.[55] Weaver, D., McAlister, K. W., and Tso, J., “Control of VR-7 Dynamic
Stall by Strong Steady Blowing,” Journal of Aircraft, Vol. 41, No. 6,2004, pp. 1404–1413.doi:10.2514/1.4413
[56] Singh, C., Peake, D. J., Kokkalis, A., Khodagolian, V., Coton, F. N., andGalbraith, R. A.M., “Control of Rotorcraft RetreatingBlade Stall UsingAir-Jet Vortex Generators,” Journal of Aircraft, Vol. 43, No. 4, 2006,pp. 1169–1176.doi:10.2514/1.18333
[57] Kelly, M. W., “Analysis of Some Parameters Used in CorrelatingBlowing-Type Boundary-Layer Control Data,” NACA TR-RM-A56F12, 1956.
[58] Greenblatt, D., and Wygnanski, I., “Dynamic Stall Control byOscillatory Forcing,” 36th AIAA Aerospace Sciences Meeting and
Exhibit, AIAA Paper 1998-0676, 1998.[59] Greenblatt, D., and Wygnanski, I., “Effect of Leading-Edge Curvature
onAirfoil SeparationControl,” Journal of Aircraft, Vol. 40, No. 3, 2003,pp. 473–481.doi:10.2514/2.3142
[60] Sutherland, H., Berg, D., and Ashwill, T., “A Retrospective of VAWTTechnology,” Sandia National Laboratories TR-SAND2012-0304,Albuquerque, NM, 2012.
[61] Cyrus, J., Kadlec, E., andKlimas, P., “Jet Spoiler Arrangement forWindTurbine,” U.S. Patent No. 4, 504, 192, March 1985.
[62] Greenblatt, D., Kiedaisch, J., and Nagib, H., “Unsteady-PressureCorrections in Highly Attenuated Measurements at Moderate MachNumbers,” 15th AIAA Computational Fluid Dynamics Conference
2001, AIAA Paper 2001-2983, 2001.[63] Lissaman, P. B. S., “Low-Reynolds-Number Airfoils,” Annual Review
of Fluid Mechanics, Vol. 15, Jan. 1983, pp. 223–239.doi:10.1146/annurev.fl.15.010183.001255
[64] Carmichael, B. H., “Low Reynolds Number Airfoil Survey, Volume 1,”NASA CR-165803, NASA Langley Research Center, Hampton, VA,Nov. 1981.
[65] Seele, R., Chen, C., Bhamburkar, C., andWygnanski, I., “Some Effectsof Blowing, Suction and Trailing Edge Bluntness on Flow Separationfrom Thick Airfoils; Computations & Measurements,” 29th AIAA
Applied Aerodynamics Conference, AIAA Paper 2011-3357, 2011.[66] Doenhoff, A. E. V., “A Preliminary Investigation of Boundary Layer
Transition Along a Flat Plate with Adverse Pressure Gradient,” NACATR-TN-639, 1938.
[67] Jacobs, E. N., and von Doenhoff, A. E., “Transition As It OccursAssociated with and Following Laminar Separation,” Proceedings of
Fifth International Congress for Applied Mechanics, edited by DenHartog, J. P., and Peters, H., John Wiley & Sons, 1938, pp. 311–314.
[68] Weibust, E., Bertelrud, A., and Ridder, S. O., “ExperimentalInvestigation of Laminar Separation Bubbles and Comparison withTheory,” Journal of Aircraft, Vol. 24, No. 5, 1987, pp. 291–297.doi:10.2514/3.45443
18 AIAA Early Edition / MÜLLER-VAHL ETAL.
Dow
nloa
ded
by T
EC
HN
ION
(E
lyac
har
Cen
tral
Lib
rary
) on
Sep
tem
ber
28, 2
014
| http
://ar
c.ai
aa.o
rg |
DO
I: 1
0.25
14/1
.J05
3090

[69] Gerakopulos, R., Boutilier,M. S.H., andYarusevych, S., “AerodynamicCharacterization of a NACA 0018 Airfoil at Low Reynolds Numbers,”40th AIAAFluidDynamics Conference, AIAAPaper 2010-4629, 2010.
[70] Tani, I., “Low-Speed Flows Involving Bubble Separations,” Progress inAeronautical Sciences, Vol. 5, 1964, pp. 70–103.doi:10.1016/0376-0421(64)90004-1
[71] Millikan, C. B., and Klein, A. L., “The Effect of Turbulence,” AircraftEngineering, Vol. 5, No. 8, 1933, pp. 169–174.doi:10.1108/eb029703
[72] McCullough, G., and Gault, D., “Examples of Three RepresentativeTypes of Airfoil-Section Stall at Low Speed,” NACA TN-250, 1951.
[73] Nakano, T., Fujisawa, N., Oguma, Y., Takagi, Y., and Lee, S.,“Experimental Study on Flow and Noise Characteristics of NACA0018Airfoil,” Journal of Wind Engineering and Industrial Aerodynamics,Vol. 95, No. 7, 2007, pp. 511–531.doi:10.1016/j.jweia.2006.11.002
[74] Jones, B. M., “Stalling,” Journal of the Royal Aeronautical Society,Vol. 38, No. 285, 1934, pp. 753–770.
[75] Timmer, W. A., “Two-Dimensional Low-Reynolds Number WindTunnel Results for Airfoil NACA 0018,” Wind Engineering, Vol. 32,No. 6, 2008, pp. 525–537.doi:10.1260/030952408787548848
[76] Carriere, P., and Eichelbrenner, E., “Boundary Layer and Flow Control:Its Principles and Application,” Theory of Flow Reattachment by a
Tangential Jet Discharging Against a Strong Adverse Pressure
Gradient, edited by Lachmann, G. V., Vol. 1, Pergamon, New York,1961, pp. 209–231.
[77] Attinello, J. S., “Boundary Layer and Flow Control: Its Principles andApplication,” Design and Engineering Features of Flap Blowing
Installations, edited by Lachmann, G. V., Vol. 1, Pergamon, New York,1961, pp. 463–515.
[78] Wallis, R. A., “Experiments with Air Jets to Control the Nose Stall on a3 ft. Chord NACA 64A006 Aerofoil,” Aeronautical ResearchLaboratory Aeronautical Note 139, Melbourne, Australia, 1954.
[79] Wallis, R. A., “Advances in Aeronautical Sciences 3,” Boundary LayerTransition at the Leading Edge of Thin Wings and Its Effect on General
Nose Separation, Pergamon, New York, 1962, pp. 161–184.
[80] Tani, I., “Critical Survey of Published Theories on the Mechanism ofLeading-Edge Stall,” Aeronautical Research Institute, Univ. of Tokyo,Rept. 367, Vol. 367, Tokyo, 1961.
[81] Pechlivanoglou,G., Fuehr, S., Nayeri, C. N., and Paschereit, C. O., “TheEffect of Distributed Roughness on the Power Performance of WindTurbines,” ASME IGTI Turbo Expo, American Society of MechanicalEngineers Paper GT2010-23258, Fairfield, NJ, 2010.
[82] Shih, C., and Ho, C.-M., “Vorticity Balance and Time Scales of a Two-Dimensional Airfoil in an Unsteady Free Stream,” Physics of Fluids,Vol. 6, No. 2, 1994, pp. 710–723.doi:10.1063/1.868310
[83] Burton, T., Jenkins, N., Sharpe, D., and Bossanyi, E., Wind Energy
Handbook, 2nd ed., Wiley Interscience, New York, 2011, p. 43.[84] Liiva, J., “Unsteady Aerodynamic and Stall Effects on Helicopter Rotor
Blade Airfoil Sections,” Journal of Aircraft, Vol. 6, No. 1, 1969,pp. 46–51.doi:10.2514/3.44000
[85] Yu, Y. H., Lee, S., McAlister, K. W., Tung, C., and Wang, C. M.,“Dynamic Stall Control for Advanced Rotorcraft Application,” AIAA
Journal, Vol. 33, No. 2, 1995, pp. 289–295.doi:10.2514/3.12496
[86] Winkelmann, A. E., and Barlow, J. B., “Flowfield Model for aRectangular Planform Wing Beyond Stall,” AIAA Journal, Vol. 18,No. 8, 1980, pp. 1006–1007.doi:10.2514/3.50846
[87] Gregory, J. W., Sakaue, H., Liu, T., and Sullivan, J. P., “Fast Pressure-Sensitive Paint for Flow and Acoustic Diagnostics,” Annual Review of
Fluid Mechanics, Vol. 46, Sept. 2014, pp. 303–330.doi:10.1146/annurev-fluid-010313-141304
[88] Pechlivanoglou, G., Nayeri, C., and Paschereit, C., “PerformanceOptimization ofWindTurbineRotorswithActiveFlowControl,”ASME
IGTI Turbo Expo, American Society of Mechanical Engineers PaperGT2011-45493, Fairfield, NJ, 2011.
M. VisbalAssociate Editor
AIAA Early Edition / MÜLLER-VAHL ETAL. 19
Dow
nloa
ded
by T
EC
HN
ION
(E
lyac
har
Cen
tral
Lib
rary
) on
Sep
tem
ber
28, 2
014
| http
://ar
c.ai
aa.o
rg |
DO
I: 1
0.25
14/1
.J05
3090


