Embed Size (px)
Citation preview

Thinking Outside the Box
2020 Thought Pieces
The Institute of Transport and Logistics Studies (ITLS) at the University of Sydney Business School in 2015 started a commentary series, adding it to its portfolio of engagement with the broader community of interests in the space of Infrastructure, Transport, Logistics and Supply Chain Management.
While academic publications and reports are a very important outlet for high quality research including debates on themes with a rich policy and strategic value beyond theory, methods and evidence, there is room for a series of short pungent commentaries on themes that are of broad community interest. These are short pieces so they can be digested through the many social media platforms and focus on topics of currency that are also likely to be challenging and controversial – hence the titling of the series ‘Thinking Outside the Box’. It has all the elements of critical thinking and the ‘challenge of change’.
Each piece is published monthly since April 2015, but we thought it would be useful to bring all of the 2020 contributions together into a monograph that is freely available. We hope it will useful to researchers, consultants, government and industry agencies and associations as well as in the classroom for debate and discussion.
David A. Hensher Founding Director, ITLS
Thinking outside the Box Series
Read the latest from our world-leading academics and researches. Opinion pieces are available monthly at https://sydney.edu.au/business/news-and-events/news/institute-of-transport-and-logistics-studies/thinking-outside-the-box.html
COVID-19 research
ITLS is undertaking essential research into the unprecedented impacts that the COVID-19 crisis is having on transport and logistics, both here in Australia and overseas. Our experts are creating thought pieces on a range of pertinent issues including the impact on public transport and traffic congestion as well as lessons to be learnt from overseas. We are also regularly being called upon for media comments. You can view all our COVID related work at https://www.sydney.edu.au/business/our-research/institute-of-transport-and-logistics-studies/research-activity/projects.html

2
Contents
1. Intelligent Mobility in the Suite of Future Transport Options .............................................. 3
7 January 2020
2. A Supply Chain Perspective on the Novel Coronavirus ...................................................... 5
3 February 2020
3. More on Electric Cars – Life Cycle Emission Concerns ........................................................ 6
2 March 2020
4. COVID-19 risk on public transport: What we can learn from overseas............................... 7
20 March 2020
5. Public mass emergency planning and the overlooked role of “behavioural intervention”..10
6 April 2020
6. Unintended consequence of COVID-19: working from home (WFH) a good and achievable idea after all …………………………………………………………………………………….. 15
4 May 2020
7. Practice social distancing on trains: a pious hope for Sydneysiders? ............................... 16
18 May 2020
8. What might COVID-19 mean for Mobility as a Service (MaaS)? ....................................... 21
25 May 2020
9. Will Mobility as a Service make Travel Demand Management strategies redundant? ..... 26
1 June 2020
10. It’s cycling, but not as we know it ................................................................................ 28
9 June 2020
11. COVID-19 pandemic and the unprecedented mobilisation of scholarly efforts to fight a global health crisis ................................................................................................................... 30
15 June 2020
12. Public Transport post-COVID-19 – A quick scan of some of the immediate challenges and those in the longer term............................................................................................................ 33
6 July 2020
13. Pooled testing to help Australia tackle the second wave of COVID-19 ........................ 35
3 August 2020
14. Opening-up Melbourne again? .................................................................................... 37
24 August 2020
15. WFH(ome)? How WFC(afe) may be a part of the post corona workplace change ........ 42
7 September 2020
16. Business location decisions before and after COVID 19 ............................................... 43
28 September 2020
17. “Personalised Analytics” to battle coronavirus outbreak and beyond ......................... 45
2 November 2020
18. What might the changing incidence of Working from Home (WFH) tell us about Future Transport and Land Use Agendas ............................................................................................ 47
7 December 2020

3
1. Intelligent Mobility in the Suite of Future Transport Options
7 January 2020
Chinh Ho explores options for emerging products in the sphere of Mobility as a Service (MaaS), and discusses the considerations that need to be taken into account when designing such products.
We are witnessing the beginning of the next transport ‘revolution’ with the introduction of new mobility services such as Uber, OLA, MaaS (Mobility as a Service), and AV (autonomous vehicles). This digitally supported transport revolution will undoubtedly impact many aspects of our lives, directly and indirectly. In the last few years, we have seen Uber disrupting the market and revolutionising the taxi industry. Travellers welcome the new ride-sharing services but cities around the world react to this differently, with some welcoming and others banning. NSW for instance, has changed the regulations to create a level playing field for both taxi and Uber, while Transport for London is set to strip Uber of its licence. This is a sign that Uber takes many by surprise. And we need to be more prepared for the arrival of MaaS and AVs. The question is why should we?
If we look at the taxi market, Uber and taxi together account for only 1% of total travel demand in Sydney. The market that MaaS aims to disrupt the personal car. The car market is much larger, and hence the impact of MaaS is expected to be much larger than the Uber effects we’ve seen on the taxi industry. Whether MaaS has the potential to promote sustainability by reducing the private car use will heavily depend on the market demand for various MaaS products. So what are emerging MaaS products?
On the low end of the spectrum, MaaS can be as basic as providing a digital platform that helps travellers plan, book and use different transport modes to move from A to B. Example products are TripGo and Moovit apps. In this most basic form, MaaS can be seen as a journey planner with some extra features that facilitate multimodal journeys. However, MaaS can be fully integrated services with many built-in features, including customised plans and financial incentives to alter behaviour. To understand how mobility plans works, thinking about a mobile phone plan that gives you unlimited talk and text to domestic numbers but limits the minutes you can call internationally. In a similar way, MaaS can offer unlimited PT and some Uber or taxi kms to promote PT use, and to address the first and last mile issue.
What do we know about the market demand for various MaaS products? The answer is not much, mainly because the number of studies on intelligent mobility is still limited, although fast-growing.
To date, we know that travellers are demanding a platform that can facilitate information requests, better match demand to supply, and finalise the booking and payment across transport services. What we don’t know yet is how much they would be willing to pay for such the app? A couple of studies looked at this and we are far from a consensus.
The travelling public also want to have a choice of payment method. That is, some want a pay-per-ride and some want to a prepay option that comes with some discounts.
How about the mix of transport services? Of course, the more the better; but if we have to choose, PT is a must have, followed by car-sharing. Other modes such as taxis and Uber are welcome but by only a segment of population, with the effect of car-rental and bike-share on bundle uptake still debatable.

4
Who are likely to be early adopters of MaaS? A few studies point to the same early adopters. These are people who exhibit multi-modal behaviour, they are concerned with the environment and a healthy lifestyle, they don’t see car ownership important and they don’t use car often.
These early findings help us better place intelligent mobility in the suite of transport options available to future travel markets. However, there are many more questions that we don’t have an answer yet such as how intelligent mobility will change the way people live, work and travel and its values to sustainability. I may be a bit sceptic but with the early evidence we have, I think uniting the existing transport services to make it MaaS will not be a game changer. We need much more than just a smart-phone app. We need to bring to the scheme more innovations that are sustainable, environmentally (alternative fuels) and politically (alternative to the current fuel excise) appealing.

5
2. A Supply Chain Perspective on the Novel Coronavirus
3 February 2020
Understanding the development of the Novel Coronavirus from a supply chain perspective is essential if we are to prevent similar public health crises in the future, writes Dr Geoffrey Clifton.
The Novel Coronavirus outbreak is a medical crisis with responses focusing on how to prevent new infections and treat those who are already infected. It is a testament to the agility of China's Supply Chains that new hospitals are being built and commissioned within a week. However, the Coronavirus is also a Supply Chain emergency and preventing the next outbreak will require fundamental changes to supply chains that date back thousands of years.
Scientists are still debating the specific cause of the current outbreak but we know that sometime in the recent past a sick animal, possibly not even showing signs of infection, was sold in a traditional wet market in Wuhan. There is much confusion and anxiety about what a wet market is and whether they should be shut down permanently. So it is important to understand why wet markets exist and what the alternatives are.
Wet markets exist because trapping and raising animals has traditionally been a very small-scale industry. Lots of individual sellers need to come together with lots of individual buyers and the best place to do that is in a wet market. Here stall holders rent space to sell fruits, vegetable, meat, live animals and traditional medicines. The slaughtering and butchering of animals also takes place in wet markets because without refrigeration the best way to transport meat to market is whilst the animal is still alive.
Wet markets are one of the oldest forms of commerce with Trajan's market in Rome and Athens’ Agora remaining tourist attractions to this day. Before the advent of rail and modern road transport networks, every city was home to such markets but modern cold chain logistics lets us safely slaughter and butcher animals in large, hygienic and carefully regulated abattoirs far from the supermarkets that sell the finished products. Indeed, several of the graduates of our Master of Logistics and Supply Chain Management helped pioneer the cold chain logistics industry in China.
So given the alternatives, why do wet markets still exist? It is a matter of cultural preferences and tastes. The range of animals on sale in wet markets might be shocking to people accustomed to buying their meat in a supermarket but customers of wet markets like the variety of animals and like the way that animals are freshly slaughtered on site. Your local supermarket is unlikely to start butchering exotic wildlife to order so until demand disappears there will still be wet markets. The Chinese government has shut down wet markets until the Coronavirus crisis is over but permanently banning wet markets won’t eliminate the demand and may just drive buyers to the black market where hygiene standard will be impossible to enforce. Understanding the role of preferences and tastes in supply chain management is one of the key areas of research at the Institute of Transport and Logistics Studies and will be increasingly important as more attention is placed on issues managing sustainability, resource security and equity of Supply Chains.
6
3. More on Electric Cars – Life Cycle Emission Concerns
2 March 2020
The environmental and ethical ramifications of electric cars and battery technologies need to be taken into consideration before being hailed as a panacea for the global mobility crisis, writes Professor David Hensher.
Most of the world’s electricity comes from carbon and is likely to be the case for decades. Exceptions include the power generated by nuclear plants as in France for example, which emits zero carbon. Energy stored in batteries looks like being the most common way to fuel electric cars in the future, although other technologies may evolve (hydrogen, solar, wind). A big concern with battery technology is that key chemical components are sourced from extractive industries which in the main are lithium and cobalt, rare earth materials often mined in countries in Central Africa in particular where low cost child labourers working very long hours provide the manpower to extract these minerals from the ground. In addition, in China, the country with the greatest anticipated take up of electric cars designed to reduce end use emission, the likelihood of the generation source for electric cars will be fuel-burning utilities operating with coal. This seems like a continuing toxic combination and raises the more challenging question of why we seem so committed to protecting the future of the car when all so called environmentally aligned plans appear to be besmirched no matter what direction they take.
The ‘solution’ to mobility, the ultimate reason for car use (hence the original name ‘automobile’), has to be found from somewhere else. While we would prefer to seek a more global dominating solution through shared mobility typified by high capacity public transport, we are seeing an almost revolutionary focus on car based sharing through ride share (e.g., Uber, Ola) and car sharing (e.g., Go get, car next door), and one wonders whether this is really a panacea for what is fairly described as a crisis of mobility aligned with ever increasing congestion on the roads and environmental pollution!
At the centre of the concern is a solution, but a complex one, shrouded in societal self-interest. It is known as sharing, and the growth in mobility sharing if achievable may be the way to tackle this dilemma. While more people in cars will certainly improve the performance of the transport network, it may have limited long term impacts on the environment as populations grow (especially in cities), and the amount of car based kilometres increases even with greater occupancy. We will inevitably have to do something about repricing the use of the car regardless of whether it is private or shared in a corporate offering, and the great appeal of the latter is that the user charge can hide the emotionally charged desire to tame traffic through congestion charging. It becomes a fee for service like any fee and can have a peak and off peak charging regime similar to electricity.
But again, this may not be enough if the energy sources (let along the abuse of child labour) are themselves inappropriate. Mobility clearly is the great challenge of the 21st century, redefining the meaning of space and time, and I believe that the ongoing challenge is to find better ways to move people and goods that give us more confidence in achieving appropriate congestion reduction and life cycle environmental improvement outcomes. It is not obvious that car-based initiatives will be adequate or appropriate.

7
4. COVID-19 risk on public transport: What we can learn from overseas1
20 March 2020
What are the best ways to reduce infection risk? Australia can learn from how other countries are reducing the spread of the virus on public transport, writes Dr Yale Zhuxiao Wong
Public transport in our cities is highly vulnerable to disease outbreaks such as the global coronavirus (COVID-19) pandemic. However, public transport is the lifeblood of our cities, so it’s desirable to keep services running as long as possible. Australia can learn from what has been done overseas, especially in China, where concrete strategies to reduce the spread of the virus on public transport helped eventually to contain the disease.
The confined spaces and limited ventilation of public transport vehicles could lead to infections among passengers, while frontline transport workers are particularly exposed. An outbreak among these workers could bring entire fleets to a standstill. It would also disrupt the travel of health workers who need to be mobilised during the pandemic.
Unions representing transport workers have rightly voiced their concerns and imposed actions including a unilateral ban on cash handling. The Australian government has offered guidelines for drivers and passengers. Transport authorities have engaged expert taskforces and begun the process of sourcing products like hand sanitisers.
While these steps are important, surely we need advice beyond general instructions to “practise good hygiene” and “use disinfectant wipes”?
China is using QR codes to help trace sources of viral contact and contraction. Joe Ma, Author provided (No reuse)
1 This article was first published on The Conversation

8
What are other countries doing?
In China, despite most of the country being in lockdown, public transport was entirely suspended only in Wuhan and its commuter belt. Buses were then used to move medical staff and deliver goods.
Most other Chinese cities ran reduced public transport services, with a heavy focus on hygiene and sanitation.
In most cities, the temperatures of transport staff are checked daily. They are equipped with adequate protection gear like face masks and gloves. Masks are compulsory for all staff and passengers, as is common practice across Asia.
In a typical city like Shenzhen, the bus fleet is sanitised after each trip. Particular attention is paid to seats, armrests and handles. At depots and interchanges, this is done as often as every two hours.
Buses are filled to no more than 50% capacity (one person per seat). On-board cameras are used to enforce this rule. Floor markings (also adopted in Europe) provide a guide to minimum distances between passengers and encourage social distancing.
Across China, health control checkpoints are being used at train and metro stations (as well as in many public and private buildings). This enables temperature checks and the tracing of the movement of people, in case of contact with a suspected COVID-19 carrier. In many taxis, buses and metro carriages, passengers are encouraged to scan a QR code to register their name and contact number, to help with contact tracing.
Constant public education reminders are broadcast to passengers.
Cities across Asia are providing hand sanitiser gel in public transport vehicles and interchanges. Cleaning of air-conditioning filters has been enhanced. To increase natural ventilation and reduce the risk of infection, some operators have retrofitted window vents to air-conditioned fleets.
Hong Kong rail operator MTR is even using a fleet of cleaning robots to disinfect trains and stations. In Shanghai, ultraviolet light is being used to disinfect buses.
In Europe, many public transport agencies have closed off use of the front door to reduce infection risk for drivers. Passengers now use the rear door (all-door boarding has been common practice).
Some bus operators have retrofitted opening windows to help increase air circulation. Kowloon Motor Bus, Author provided.

9
What’s happening in Australia?
One of the best ways to reduce infection risk is to step up cleaning efforts. Public transport operators are already doing this, but not to the extent required during the course of the day.
Most private bus operators (contracted to government) are simply not equipped to take on the massive task if required to disinfect their vehicles, say, three times a day. For many operators, drivers are required to “sweep” their bus at the end of their shift. Buses undergo a full interior clean overnight.
There is no capability to clean buses en route during shifts. Extreme cases like biohazard incidents (blood and vomit) require vehicles to be taken out of service.
To increase the frequency of cleaning, perhaps a government authority could organise “rapid response” cleaners stationed at terminals. While this might cause delays between trips, it would reduce the pressure on individual operators. Having a cleaning crew work across multiple operators would also be more efficient.
The government could provide free health services via video consultation for frontline transport workers. The critical role of the transport sector also warrants their protection through government-issued face masks, especially given how hard it is now to source these in the community.
These proactive measures based on disease prevention should always be preferred to any reactive approach after a major outbreak hits our transport system. Industry associations like the American Public Transportation Association (APTA) and International Association of Public Transport (UITP) have developed a suite of responses that can be adopted.
Our transport authorities and operators must step up in this critical time of need.

10
5. Public mass emergency planning and the overlooked role of “behavioural intervention”
6 April 2020
Planning for public disaster mitigation and emergencies like COVID-19 should include behavioural intervention, treating people as an ally rather than a problem to control, writes Dr Milad Haghani.
For the safety and security of our communities, it is paramount that both people and authorities be prepared for public emergencies and mass evacuations of crowds. Planning practices, however, need not be confined to mathematical models and architectural design of the infrastructure. Rather, we should recognise that the preparedness of individuals, their knowledge and the effectiveness of their responses could make a significant difference in increasing their chance of survival. Modern evacuation planning practices should move on from viewing people as the problem to control and should rather seek to harness the potential and critical role of the public in disaster mitigation. Put differently, the public should be regarded as an ally and become part of the disaster management solutions. This can be achieved through education and peace-time training, and it could save lives in times of crises. Pursuing this approach, however, requires that (i) researchers enhance their knowledge of optimum individual evacuation strategies and actions and (ii) the public be educated and equipped with evidence-based and scientifically-proven knowledge and training to deploy during crises. The notion of behavioural intervention and public education/training could also be potentially extended and adopted as a pragmatic method of enhancing community preparedness and response to crises other than
mass crowd evacuations. This could include health emergencies and also wildfire evacuations.
Mass emergencies are realities of urban living
Mass emergencies have become part and parcel of living in dense urban communities. They are rare incidents but could have catastrophic consequences if not dealt with and planned for competently. None of us is a stranger anymore with the news of terror attacks, mass shootings or building fires that occupy the social media feed every now and then plus the more recent bushfires in Australia and the ongoing coronavirus hysteria. Such incidents of mass emergency have become so ubiquitous that singling out one incident in this note might be unnecessary as it may downplay other similar tragedies that have taken lives and caused physical and mental trauma to people around the world.
Dense urban areas are hot spots for mass emergencies
Perpetrators of evil acts who mean to harm the public, such as terrorists or mass shooters, often target high-density spaces. Crowded places such as airports, theatres, sport stadiums, nightclubs, festivals, places of worship, high-rise buildings or shopping centres, are soft targets. In general, any public space where there is a high concentration of people could be vulnerable as it allows those with nefarious intentions to maximise the catastrophic impact of their actions. But our problem at hand is not confined to the cases of intentional man-made disasters. Public spaces and buildings are also often vulnerable to cases of fire or earthquake emergencies. Regardless of the nature of these emergencies, an important issue here is that our urban communities need to be prepared for incidents which require a high concentration of people, a mass crowd, be

11
swiftly evacuated. In such instances of acute emergencies, every second counts as it can spell the difference between death and survival. Therefore, planning for mass evacuations of crowds is an essential and paramount component of disaster preparedness for our growing urban societies.
How has research been helping our mass evacuation preparedness?
Given the significance of the problem that was described and its implications for saving lives in times of emergency, an ample amount of research has been conducted, mostly within the last twenty years or so. The aim has been to better understand evacuation processes and to ultimately equip authorities and practitioners with tools and solutions that can be used for evacuation preparedness. A major cornerstone of the research in this area has been the development of numerical prediction models for evacuations. Such computational tools have advanced substantially and have become increasingly sophisticated, from models that drew analogies between the movement of crowds and that of fluids and replicated crowd flows based on the principles of fluid mechanics—the so-called macroscopic models—to the modern agent-based models that recognise the composition of crowds from individual entities. Such microscopic models are, in fact, often reminiscent of the traffic simulation models that we use for transport planning. In fact, a common principle applies here: one can run these computational tools, simulate the movement process (of pedestrians or vehicles), test various likely scenarios, and obtain estimates of the system performance, in this case an estimate of the evacuation time. This is, in and of itself, immensely useful. But does having an estimate of the likely evacuation time per se translate to shorter evacuation times and saving lives? The answer is likely negative as this would be just the first step.
Accelerating mass evacuations, how can that be achieved?
To answer this question, researchers have predominantly resorted to numerical computational
models. The problem is often referred to, in the scholarly literature, as evacuation optimisation. An inspection of the literature shows two main streams of optimisation approaches in this domain. One stream treats the problem as mathematical optimisation programming. In formulating such mathematical models, by using the numerical simulation tools, researchers aim to identify evacuation plans that maximise system performance. The solution to such optimisation problems often determine a path and/or departure-schedule plan for the entire crowd that minimises the total time to evacuate compared to all other path and/or departure-schedule schemes. The other stream of optimisation research also often resorts to numerical simulation models but views the problem from the perspective of infrastructure design. Researchers in that domain have investigated architectural designs that best support evacuation processes and have identified a range of solutions that are assumed to facilitate the movements of crowds.
What are the practical challenges of the existing evacuation planning approaches?
The scientific value of these mathematical and architectural methods in evacuation planning cannot be ruled out. However, there are reasons why neither of these two approaches have not made their way effectively to the practical domain. When it comes to mathematical models, one major issue is that the optimised solutions often do not come with clear methods of implementation. In fact, enforcement of optimised path and/or departure-schedule planning solutions often requires that an entire crowd of occupants be guided by a central body. Such central authority, however, does not often exist during evacuations. Moreover, these mathematical models only address two specific aspects of evacuation response: path choice and/or departure schedule. Whereas, evacuation response is comprised of a multitude of

12
dimensions. Local microscopic aspects of individual evacuation behaviour are often not addressed within this approach. In regard to the design of the infrastructure and its relation to evacuation planning, two major issues need to be considered. First, most of our existing facilities and buildings have not been designed optimally to support mass evacuations and making them suitable for evacuations, even if we assume that we have the perfect scientifically proven design solutions at hand, may require major alterations to the design of current buildings. This is not in many cases practical. On the other hand, the effectiveness of many of the design solutions are currently in dispute in the scholarly literature. We should note that the majority of the design solutions have been obtained from computational models, and these models, like any other prediction tool, are never perfect. They often suffer from issues of modelling artefacts. Recent developments in the experimental domain of crowd research has succeeded in testing some of these design hypotheses and, in many cases, the experimental observations have failed to validate recommendations of the numerical models. There is a perfect example to be made here, a well-known design solution that is perhaps no longer confined to the research domain and is even ubiquitously believed by lay persons as a potential effective way for crowd management. For a long time, there has been this counterintuitive assumption that by partially obstructing the area in front of an exit one could facilitate the flow of people. As a researcher who has been active in this domain for several year now, it has been a repeated personal experience to receive this comment after presenting research outcomes to an audience who may not even have expertise in this field: “it is common knowledge how you can accelerate crowd flows, by placing blocks in front of exits, maybe in an optimal way though”. To many transport scholars, this may be reminiscent of the so-called Braess Paradox in road network design. But the analogy may not hold below the surface. Regardless of the fact that in many existing buildings, from an architectural and aesthetic perspective, it is rather unimaginable to place permanent blocks in front of exits, recent experimental testings have shown that this solution is not even effective and may actually have consequences contrary to what we believed. Evidence is gradually emerging to suggest that such drastic solutions that may seem counterintuitive at first glance, may in fact be counterproductive [1].
Public education and preparedness, a dimension overlooked in emergency planning
Given the challenges of conventional evacuation optimisation approaches that were laid out in the previous lines, the question is whether there are more practical ways for evacuation management, potential solutions that are overlooked. The answer is affirmative. The contemporary research in the field of crowd dynamics is producing evidence that suggest there is considerable benefit to be gained through modifying or influencing the behaviour of individual
evacuees during mass emergencies. This approach that I refer to as behavioural
optimisation, or better said, behavioural intervention, is in recognition of the fact that the efficiency of an evacuation process is the collective outcome of the strategies that individuals choose. Hence, improving individual strategies could majorly benefit a system of evacuees. This, however, is itself a highly nuanced and multi-dimensional problem as evacuation response is comprised of several behavioural layers and types of decision-making. It would be the researchers’ task to identify behavioural layers that could be improved and to discover how they should be improved in order to increase collective efficiency. In tackling this question, parametric numerical models could be handy here too as they can provide an inexpensive behavioural laboratory to test various behavioural strategies and discover the optimum behaviour [2]. Re-emphasising on our previous caveat about the possible artefacts of the numerical models, once informed hypotheses were made, one would need to put them under experimental scrutiny to ascertain their effectiveness before educating the public. This approach of behavioural intervention and enhancing individual preparedness is assumed to offer solutions to the practical challenges of the more conventional methods in mass evacuation planning, and deserves to be explored more closely.
13
Why behavioural intervention has not received the attention that it deserves?
Traditional approaches in crowd evacuation management have not typically viewed the public
as a potential ally. Rather, the conventional view of panicking irrational crowds that depicts people involved in crises as non-thinking individuals has hindered such potential efforts. While a detailed discussion on the suitability of the panic theory and its contribution to crowd management practices is beyond the scope of this note [3], it may suffice to say that recent developments in social psychology have challenged this perspective [4]. It has been shown that even under acute stress, people are capable of making decisions and recalling their training to varying degrees [5, 6]. We do recognise the importance of training and preparedness for first responders, but why not think the same way for the zero responders, i.e., the public [7]. Such public training programs could embody a wide range of individual actions from rendering first-aid medical assistance to those injured—that could immensely contribute to the mitigation of fatalities— to choosing efficient self-evacuation strategies that could help the person herself as well as others in the scene. In theory, the potential benefits of the behavioural intervention method could also be utilised in planning for public crises of various natures – other than mass crowd evacuations – including public health emergencies and bushfire evacuations. For example, a study has shown that non-pharmaceutical interventions intended to reduce infectious contacts between persons during the 1918 Influenza pandemic – or, what we now call social distancing in the face of the recent global pandemic – could potentially reduce death rates to nearly 50%, according to the historical data from the United States [8]. This could be only one proven example and recognised dimension of how behavioural intervention could be used as an effective and pragmatic tool in managing public emergencies.
We should harness the role of the people in public disaster mitigation
One should note that when a crisis strikes, there is always a time window when individuals on the ground are on their own, and when no central authority has taken control to guide and assist
them. Within that period of time, i.e. the silent gap, it is the action and preparedness of the individuals embroiled in the emergency that has the most significant impact on their survival. Therefore, modern emergency planning practices should recognise the role of the public and their awareness and preparedness in disaster mitigation. Rather than placing blocks in their way which may even hinder their survival, we should consider educating the public and equipping them with the knowledge of the best evacuation strategies under various kinds of mass emergencies. How these education or training programs should be delivered, however, is another matter to be addressed by the researchers.
References
[1] Á. Garcimartín, D. Maza, J.M. Pastor, D.R. Parisi, C. Martín-Gómez, I. Zuriguel, Redefining the role of obstacles in pedestrian evacuation, New Journal of Physics, 20 (2018) 123025.
[2] S.M.V. Gwynne, A.L.E. Hunt, Why model evacuee decision-making?, Safety Science, 110 (2018) 457-466.
[3] M. Haghani, E. Cristiani, N.W.F. Bode, M. Boltes, A. Corbetta, Panic, Irrationality, and Herding: Three Ambiguous Terms in Crowd Dynamics Research, Journal of Advanced Transportation, 2019 (2019) 58.
[4] J. Drury, The role of social identity processes in mass emergency behaviour: An integrative review, European Review of Social Psychology, 29 (2018) 38-81.

14
[5] R. Lovreglio, V. Gonzalez, Z. Feng, R. Amor, M. Spearpoint, J. Thomas, M. Trotter, R. Sacks, Prototyping virtual reality serious games for building earthquake preparedness: The Auckland City Hospital case study, Advanced Engineering Informatics, 38 (2018) 670-682.
[6] M. Kinateder, P. Pauli, M. Müller, J. Krieger, F. Heimbecher, I. Rönnau, U. Bergerhausen, G. Vollmann, P. Vogt, A. Mühlberger, Human behaviour in severe tunnel accidents: Effects of information and behavioural training, Transportation Research Part F: Traffic Psychology and Behaviour, 17 (2013) 20-32.
[7] I. Ashkenazi, R.C. Hunt, You’re It—You’ve Got to Save Someone: Immediate Responders, Not Bystanders, Frontiers in Public Health, 7 (2019).
[8] R.J. Hatchett, C.E. Mecher, M. Lipsitch, Public health interventions and epidemic intensity during the 1918 influenza pandemic, Proceedings of the National Academy of Sciences, 104 (2007) 7582.

15
6. Unintended consequence of COVID-19: working from home (WFH) a good and achievable idea after all
4 May 2020
Professor David Hensher suggests that post-COVID-19, employers could be more amenable to staff working from home, resulting in significant improvements to traffic congestion and the lowering of greenhouse gas emissions.
COVID-19 may have broken the resistance of many employers to working from home. The idea that working from home through telecommuting or a nine day fortnight, referred to as distributed work practices, has been suggested for many years. Indeed earlier research on finding ways to reduce enhanced greenhouse emissions, essentially CO2 in the transport sector, suggested that the two main ways of achieving this, in the absence of road pricing reform, was to improve the fuel efficiency of cars (reduced emission per kilometre) and to introduce distributed work practices.
Efforts to improve public transport within the financial constraints of government have not proven to be a panacea in making a significant difference to traffic congestion. We now have first-hand evidence - a real market test, admittedly under severe restrictions - that working from home works much more than many employers, and indeed many employees, had thought. So the evidence is in, and although we do not expect such a high incidence of working from home when restrictions are lifted, we now have a real opportunity to promote an increased amount of working from home to achieve a number of other societal challenges.
One of the greatest impacts has been on traffic congestion, although we recognise that it has resulted in a significant drop in public transport use and some trips normally by public transport are undertaken by car given the growing importance of bio security on one’s health risk. When the restrictions are fully relaxed, if we could obtain at least one day a week working from home, spread equally over the five working days (or reasonably equally to avoid a dominance of Friday or Monday to give long weekends), then we can improve the travel times on the roads significantly, and this will have a greater impact on traffic congestion, especially in the peak periods, than simply construction of new roads or changing the physical capacity of existing roads through transport management interventions.
I suggest that this may be politically more palatable than road pricing reform, which remains a challenge. There is no reason now to not take advantage of this ‘new normal’ to contain congestion growth, and indeed, if we can reduce car traffic each day by about 10 percent, we should eliminate the worst of congestion, returning all times of the years to levels of traffic experienced in school holidays which is usually very acceptable to the travelling public. We could even do better than 10 percent.
This is an opportunity not to be foregone by industry and government, offering a real opportunity for employers to show a commitment to sustainable goals, something many aspire to and very few ever get close to achieving. With the field test complete, let us use this to benefit climate change, wellbeing and infrastructure priority funding, enabling a greater amount of funding directed to essential services such as health services and care support.

16
7. Practice social distancing on trains: a pious hope for Sydneysiders?
18 May 2020
Although coronavirus restrictions are starting to ease in NSW, the difficulties associated with practising social distancing on public transport need to be addressed sooner rather than later, writes Dr Chinh Ho.
Weeks before NSW officially went to lockdown and workers were recommended to work at home, many workers with flexible working arrangements had already done so to reduce the risk of contracting the coronavirus or spreading it unwittingly. Although workplaces were considered safe, and keeping a physical distance from colleagues and clients at work was not too difficult, practicing social distancing on the way to and from work was impossible for many public transport commuters, especially for those who work in the Central Business District (CBD) where trains and platforms are usually packed during the morning and afternoon commute time (7– 9 AM and 4–6 PM). As Australia has now flattened the curve, and NSW has started to relax restrictions, the roads are noticeably busier at present (i.e., May 2020), this will be the case for
buses and trains in due course. With social distancing expected in public places, how feasible is it for Sydney Train commuters to practice social distancing, both inside the train and on the platform?
If avoiding touching surfaces when you are on a train or a bus sounds difficult to you, then keeping the recommended distance of 1.5 metres from your fellow travellers is nearly impossible. Pre-COVID, regular train commuters experienced “sardine trains” on the way to and from work, with standing room only (Humphries, 2017). Many train services during the morning and afternoon peak commute had passenger numbers exceeding 135% of seating capacity – a load that the transport authority considers as a crush load (red line in Figure 1). The example train service on the T4 line below shows this. Despite being quite ‘early’ (arriving at Bondi Junction at 8:15 AM), passengers travelling between Penhurst and Town Hall stations had no choice but to stand for this 28-minutes journey. This was hardly the busiest train on the Sydney Trains network, with many services on the T1 line carrying many more passengers, sometimes up to 1,700 per train.
With only 25% of the normal passenger volume (it is expected that one in four train users will travel by train post-COVID), practicing social distancing while inside the train will still be impossible. With the current configuration of train seats, one train car can only carry up to 38 passengers for social distancing to be observed (see illustration below: 13 passengers in the lower deck + 13 in the upper deck + 12 in the boarding/alighting areas). Most Sydney trains
have 8 cars, totalling a social-distancing capacity of 304 passengers per train. For the example train on the T4 line above, this reduced capacity represents about 20% to 23% of the normal volume at the busiest stations (Wolli Creek to Redfern Station). Thus, only a quarter of the normal train volume would put many commuters in a close contact with their fellow travellers (i.e., travelling together in a closed space for more than 15 minutes).

17
Figure 1: Crowding profile of a Waterfall – Bondi Junction service on T4 line in the morning peak, pre-COVID.
Figure 2: Illustration of social distancing on one train-car
If practicing social distancing while on the train is somehow possible, CBD commuters will have another hurdle to jump over once arriving at their stations. Again, let’s start with some numbers. Pre-COVID, busy train stations in Sydney such as Central and Town Hall typically welcomed 4,000 to 5,000 travellers every 5 minutes during the peak hours (see Figure 3).

18
Figure 3: Top 10 busiest stations in Sydney pre-COVID
As train passengers are not spread evenly across the station platforms, some platforms at these stations are much busier than others. For example, Platforms 16 and 17 at Central station are busiest in the morning, with more than 1,500 train users constantly present on these platforms between 8:30 am and 8:40 am of a working day pre- COVID (see Figure 4). Passengers on these platforms fluctuated between 500 and 1,200 per minute between 8 am and 8:30 am and between 8:40 am and 9:10 am.
Figure 4: Passenger numbers on Central and Town Hall platforms pre- COVID
19
Now, let’s assume the staggered start and finish times flagged by the Australia’s Chief Medical Officer, Prof. Murphy (McElroy, 2020) will be fully adopted by both employers and employees. This means that workers can start working in the office any time in between 7 and 11 AM. This assumption is based on an observation that many businesses, including government offices, have core time, requiring staff to be in office between 10 AM and 3 PM (plus/minus 30 minutes). Assume further that businesses, schools, childcares and fellow travellers coordinate their business/school/work times perfectly so that the total number of passengers are spread evenly across trains that arrive at these stations in the 7–11am time window (i.e., the peak hours simply disappear). With these perfect conditions, the average number of passengers present on the platform when a train arrives will be around 300 for Platforms 16 and 17 at Central Station, but this will be close to 500 on Platforms 5 & 6, and 1,130 on Platform 3 at Town Hall Station. While co-ordinating train movements to make better use of platform space within these busy stations is an option to reduce passenger crowds, there is very little room for significant reduction since currently trains already arrive at these busy platforms every two minutes. Using just one platform as an example, the Town Hall Station Platform 3 has a total area of 1,100 m2 so these volumes translate to about one square metre per person, which is far lower than the density that the social distancing rule expects (4m2 per person).
Let us next consider that not everyone will need to go back to work in the office 5 days per week post-COVID. After all, the lockdown has forced non-essential workers to work at home, and as a result of adapting well to work at home, more employers may be more open to working at home arrangements (Hern, 2020). Assume that for any given working day post-COVID, only 3 in 5 CBD workers will go back to work in the office, this could mean that workers take turns to work in the office 3 days per week (and the rest working at home), or that out of 5 CBD workers, two will continue working from home five days per week while three workers will go back to the office every workday. Assume the same patterns for non-work travellers (i.e., only 3 out of 5 non-work trips to/from the CBD will be observed post-COVID). This lower need for travel would see passenger flows on the network reduced by 40%. For the busy platforms at a central station, passenger numbers could be reduced to 700–900 people per minute between 8 and 9:10 am. As Platforms 16&17 at Central Station have a combined area of 1400 m2, this reduced passenger flow translates to an area of 1.5 to 2 m2 per person, which still results in passengers standing closer than the recommended physical distance of 1.5 metres.
Let’s drive then! Surely one can afford to buy a car if working in the CBD? Yes, this may be true for many commuters, but having a car is different from being able to drive to work in the CBD every day or a few days a week. Parking costs are expensive in the City with the most affordable parking charging an early bird rate of around $20 to $40 per day, while it is not uncommon to see a parking cost as high as $120 per day in the Sydney CBD (Ison, Mulley, Mifsud, & Ho, 2014). As many people will choose to go by car to minimise social contact, parking demand will increase, and thus time taken to find parking locations will be longer, not to mention increased parking cost due to the laws of supply and demand. Traffic congestion in the City will be worse post-COVID. Expensive parking cost, longer time to park cars, and worsened traffic congestion would see many CBD workers giving up their intention to drive to the CBD. They will either continue to work at home or get on a train or bus to go to work, because driving is not affordable, both in time and cost.
It appears that train commuters working in the CBD do not have much room, both inside the trains and on the platforms, to practice social distancing. Limiting passengers on each train is an easier possibility that the transport authority should consider for long distance inter-regional travel where passengers can make advanced bookings and authorities can control how many tickets to sell each service. However, limiting passengers per train is extremely difficult for urban train lines. This is particularly true for the Sydney Trains Network which was designed as a commuting network with long train lines and many stops on each line to facilitate one-seat journeys. Also, at busy interchanges such as Redfern and Town Hall, transfer passengers contribute as much as 20% of the passenger flow (Ho, 2020 Forthcoming). This declines the possibility of limiting the number of passengers on the platform for stations with a small concourse area like Redfern since passengers does not have enough room to practice social distancing while queuing. In the end, it is possible that public transport will follow schools where social distancing is not applied. Students know that it will not work, teachers know that it does not work, and the government/society cannot afford a year of children missing school. The result? A compromise!

20
In the same vein, many train commuters know that they do not have a choice (if they do, they will not commute by public transport and risk their health). The fear factor associated with use of public transport will remain for some time post-lockdown. Emerging evidence indicates the fear factor is real with a quarter of Toronto public users saying they will not return until there is a vaccine (Wilson, 2020). Transport authorities and operators know that platforms are not wide enough to practice social distancing, and adding more services to reduce ‘crowding’ is out of the question due to network constraints and driver shortage (O'Sullivan, 2019). Bus can be the saver of public transport capacity shortage for CBD commuters to practice social distancing; however, traffic in the CBD will be in chaos with extra buses required to transport a large number of commuters left behind by train. Many businesses cannot wait to have their employees back to the office (Olle, 2020; Wilkie & Hanrahan, 2020; Sherman, Repko, Wayland et al, 2020). Result? A compromise, you may guess.
Acknowledgements: The author thanks Professors David Hensher, Corinne Mulley, and John Nelson for insightful comments on earlier drafts. Statistics on train and platform crowding were extracted from the author’s previous work to which Transport for NSW and Sydney Trains provide necessary input.
References
Hern, A. (2020). COVID-19 could cause permanent shift towards home working. The Guardian. https://www.theguardian.com/technology/2020/mar/13/COVID-19-could-cause-permanent-shift-towards-home-working
Ho, C. (2020 Forthcoming). Crowding on trains and stations in complex networks with multiple services sharing the same track Transport Research Part A: Policies and Practices.
Humphries, G. (2017). Train was standing room only all the way to Sydney. Mercury. https://www.illawarramercury.com.au/story/4807767/train-was-standing-room-only-all-the-way-to-sydney/
Ison, S., Mulley, C., Mifsud, A., & Ho, C. (2014). A Parking Space Levy: a case study of Sydney, Australia In S. Ison & C. Mulley (Eds.), Parking issues and policies (Vol. 5, pp. 317-334): Emerald.
McElroy, N. (2020, 5 May 2020). The main points from Scott Morrison's latest coronavirus update. ABC News. https://www.abc.net.au/news/2020-05-05/morrison-key-points-on-coronavirus-economic-response/12217026
Olle, E. (2020). Myer to trial reopening of NSW, WA and SA stores as COVID-19 restrictions ease. 7News. https://7news.com.au/business/myer-to-trial-reopening-of-nsw-wa-and-sa-stores-as-COVID-19-restrictions-ease-c-1035137
O'Sullivan, M. (2019, 09/09/20219). Driver and guard shortage force cancellation of intercity trains. The Sydney Morning Herald. https://www.smh.com.au/national/nsw/driver-guard-shortage-forces-cancellation-of-intercity-trains-20190909-p52pcx.html
Sherman, A., Repko, M., Wayland, M., Son, H., Josephs, L., & Thomas, L. (2020, 09/04/2020). How the biggest companies in the world are preparing to bring back their workforce. CNBC. https://www.cnbc.com/2020/04/09/how-businesses-are-planning-to-bring-workers-back-after-coronavirus.html
Wilkie, K., & Hanrahan, J. (2020, 15/052020). Australia gets back to business: Cafes and restaurants open their doors to their first customers under strict 10-person rule as people queue up for entry and flock to beaches for some exercise. Daily Mail Australia. https://www.dailymail.co.uk/news/article-8321163/Australias-restaurants-cafes-open-doors-coronavirus-lockdown-restrictions-eased.html
Wilson, C. (2020, 12/05/2020). A quarter of ex-TTC riders will not take transit again until there is a COVID-19 vaccine, survey finds. CTV News. https://toronto.ctvnews.ca/a-quarter-of-ex-ttc-riders-will-not-take-transit-again-until-there-is-a-COVID-19-vaccine-survey-finds-1.4935329

21
8. What might COVID-19 mean for Mobility as a Service (MaaS)?
25 May 2020
Professor David Hensher suggests that the 'new normal' introduced as a result of coronavirus restrictions offers a golden opportunity to reform the Mobility as a Service (MaaS) sector.
This short paper speculates on what role MaaS may have post COVID-19. Two scenarios are proposed with one being business as usual, and the other being a significant change in the mobility framework as shared modes are less attractive and working from home takes on an increasingly popular status by both employees and employers. We argue that the ‘new normal’ offers opportunities never before achievable in terms of taming congestion on the roads and crowding on public transport, and that this opportunity should not be frittered away.
Mobility as a Service (MaaS) has, as its centrepiece in most countries, the shared modes of public transport and rideshare (Uber, Ola, Didi, taxis), bikeshare and carshare[1]. With the COVID-19 pandemic, we observed a wholesale reduction in the use of such modes (Beck and Hensher 2020), in part due to restrictions that required large numbers of people to stay at home, and only workers on essential work that could not be undertaken at home to be out and about, many of which were tradies and retail workers with adequate free parking when they drove their car. While use of all modes of transport declined, there remained a higher percentage of travel by the private car (Beck and Hensher 2020, Figure 21) given that fears of exposure to the virus were high in shared modes, whereas biosecurity risk was low, if non-existent, in the private car. So, what does this mean for MaaS in the immediate period, the medium term and the long term?
In setting a context within which to comment on possible MaaS futures, we list and discuss two main scenarios which are likely to represent alternative futures on the spectrum within which MaaS can reboot as a multimodal and multiservice offering.
Scenario 1: Travel will return to the pre-COVID-19 normal within a few months, with public transport, ride share and private car use showing very similar levels of use, crowding and congestion as before. Working from home (WFH) will have a limited impact. The rationale is that, although the situation is somewhat fluid and the likely response is very uncertain, with Australia’s success compared to other countries in minimising exposure and transmission (‘flattening the curve’), there is a real possibility that normality might return quicker, with perceptions of risk dissipating at a fast rate. Habit persistence is also a significant trait of human beings. Crowds, described as heaving, at shopping precincts on Mother’s day (10 May 2020) in Melbourne and Sydney, despite social distancing requirements in place, highlights this outcome.
Scenario 2: One of the most important policy levers now available[2], in contrast to pre-COVID 19, is the effectiveness and growing acceptance of WFH. We have never had a real experiment of what might happen to the transport network in the presence of a growing interest in WFH. One of Australia’s leading banks, the National Australia Bank (NAB), for example, is reporting a 15% increase in productivity (associated with WFH) since travel restrictions. This evidence, and growing anecdotal evidence together with the Beck and Hensher (2020) findings from a National Survey, suggest the possibility of a noticeable shift to WFH and consequent changes in commuting (and non-commuting) travel demand. WFH will be encouraged all the while offices are required to practice social distancing and hence have to stagger working hours for staff, including the possibility of less days in the main office and the balance as WFH. Firms will be interested, as they can save on office space in the longer term (although NAB have just invested in a huge building or buildings at Redfern near the City).
22
Scenario 2 is the one that we would like to see play out over the next 18 months, with employers supporting staggered working hours (even when there is no imposed external constraint to do so) for employees whose work aligns with this strategy, and also with the number of days working from home varying by negotiation, especially where there is substantive evidence of no productivity loss and desirably productivity gain. This is an opportunity for the sustainability charter of supporting mandating increased flexibility of office hours as a consequence of social distancing, which will oblige a number of businesses to introduce staggered working hours, and only requiring attendance at the main office on an agreed number of days per week[3].
Many sectors already support WFH pre-COVID-19 such as the technology sector. Importantly more generally and widespread now, WFH is a new[4] policy lever to use to benefit the transport network[5]. In particular, we want to never return to the peak phenomenon where we have excessive road congestion and public transport crowding[6]. Governments need to not lose this opportunity, especially while social distancing is in place, assuming the anxiety around using public transport can be overcome fairly quickly,[7] to support a re-aligned network that also works for employers and employees and the wider community more broadly. Flattening the peaks has huge productivity benefits beyond passenger movements, with the freight distribution sector in particular gaining significant travel time savings and reduced costs of doing business. Some light goods movement can be picked up by underemployed Uber drivers and also by Community Transport.
While this new normal is ambitious, it may just be achievable for the first time in our history since the advent of the internal combustion engine, but it will also require a rethink of road user charges to ensure that the road network in particular does not deliver growing congestion through not only private car use but also increased road freight vehicle activity. The position of the private car is dependent on the extent of WFH, the staggered daily commute times and an in-place road user charge scheme. This is a very important point, and the latter will be necessary to at least provide funding (in contrast to an efficient pricing model) to support the revenue loss from public transport[8] (which typically only recovers 24% from the fare box) and other sources of mobility revenue loss, as well as supporting new initiatives in mobility investments (such as improved walking and cycling infrastructure). If governments desire to flatten the peaks, they may be prepared to offer tax relief to employers who arrange employer work hours in order to achieve this[9], especially after social distancing is relaxed. This can be seen as a very relevant transport demand management (TDM) initiative. The benefits may well outweigh the additional costs to society of a return to congestion[10] and crowding. However, counteracting this may well be a longer term saving in office space rental[11] as less employees need to be in the one location at any point in time[12].
The MaaS Reboot
Although operational changes will be required to support a more hygienic shared mode environment[13], they are a necessary but not sufficient condition for a significant return to public transport and ridesharing. The challenge is to get people back to public transport and ride share (at least until a vaccine is widely available, which may be up to two years), or more generally away from the private car. If WFH and parking charges, in the absence of road pricing reform, do not contribute to taming road congestion, we risk growing the modal share in favour of the private car and a significant setback for MaaS, not only as a niche offering but as a scalable prospect.
The starting position has to be the MaaS elements that can ensure biosecurity safety, and the obvious candidates are micro-mobility modes such as e-scooters[14] and bicycles, which are however mainly limited to short trips (possibly up to 5 kilometres)[15], and car sharing from the rental market (for medium to longer trip lengths) that complies with stringent health assurances. One idea is to support carpooling through MaaS with a pre-approved group of individuals that are known and trusted by each sharing passenger. This is the familiar and very old idea of carpooling[16], but with a difference – no one passenger owns the car per se but arranges to share what might be best described as collaborative ownership and consumption of the modal

23
service where there is trust in the provider[17]. For this to happen, employers can play an important role, actively promoting sustainable mobility practices. This interpretation of the initial phasing back of MaaS aligns well with views of Sampo Hietanen, MaaS Global, who suggests that ‘The profitable part [of MaaS] is having access to a car on weekends[18] otherwise MaaS is just a utility service’. This may have to be reviewed as a seven days a week offer, under the ‘familiarity of sharing’[19] adage, which might be attractive where individuals can see the appeal of also being able to select a class of vehicle that best fits their activity needs, as linked to the particular subscription fee of a bundle plan (Reck et al. 2020).
We also believe that MaaS needs to be seen as more than a multimodal offering, but as a multiservice offering. What we mean by this is that some of the services are not only the passenger mode discount, but discounts on non-transport services, for example, retail purchases, as well as having goods delivered to the subscriber, and especially where WFH becomes more popular, or MaaS points that can be redeemed for goods or gift cards. We finally can see the word ‘service’ being given a much broader and meaningful multi-sectoral definition, which may be the basis of a business case that can morph into a commercial proposition.
Under scenario 1, we might expect MaaS in Australia, and more generally any COVID-19 affected economy, to reboot pretty much along the same lines as pre-COVID-19. It is under scenario 2 that MaaS may have the greatest challenges but also opportunities, at least in the foreseeable future. MaaS may be a way of arresting a decline in public transport use by offering a first and last mile rideshare[20] discount where the convenience of public transport is in place, although how we resolve the matter of hygiene in Uber and taxi remains a concern[21]. What is encouraging in Australia during the COVID-19 pandemic is that, with the exception of Western Australia that reverted all services to a weekend timetable, the service levels of urban public transport remained in place[22].However, the resurrection of public transport as the centrepiece of MaaS may have to take a back role for a little while, as indeed will rideshare.
The design of MaaS bundles (Reck et al. 2020, Hensher et al. 2020) is likely to be affected by the preferred (and most likely) Scenario 2 from a societal perspective, with concerns about having to subscribe for a month when some days are WFH[23]. This is almost certain to influence responses to offered monthly subscription fees, and risks staying with pay as you go (PAYG), even outside of a digital platform that promotes modal integration in trip planning and selection.
Recommendation: Under Scenario 2, a bundle consisting of flexibility in choosing the subscription period, a micro-mobility mode for short local trips, a shared car for familiar sharers that is coordinated through the broker, and a rental car for individual use, may be a good first start as a reset offer after rebooting MaaS. Importantly, there may still be a need for the private car outside of the MaaS offer, but the offer may result in a reduction of the number of private cars in a household. Under Scenario 1, MaaS can resume as before but we might want to take advantage of prospective opportunities under Scenario 2, where possible.
Acknowledgments. I thank Corinne Mulley, John Nelson, Glenn Lyons, Daniel Reck and Chinh Ho for insightful comments on earlier drafts.
References
Beck, M. and Hensher, D.A. (2020) Insights into the impact of COVID-19 on household travel, work, activities and shopping in Australia – the early days under restrictions, ITLS working paper 20-09.
Brewer, A. and Hensher, D.A. (1998) Flexible Work and Travel Behaviour: A Research Framework, in International Perspectives on Telework: From Telecommuting to the Virtual
Organisation, edited by P. Jackson and Jos M. van der Wielen, Routledge, London, 215-232.
Bureau of Infrastructure, Transport and Regional Economics (BITRE) (2015) Information Sheet 74, Department of Infrastructure and Regional Development, Canberra.

24
Hensher, D.A., Mulley, C., Ho, C., Nelson, J., Smith, G. and Wong, Y. (2020) Understanding
Mobility as a Service (MaaS) - Past, Present and Future. Elsevier, published May 18 2020, 204 pp.
Hensher, D.A., Ho, C. and Reck, D. (2020) Mobility as a Service and private car use: evidence from the Sydney MaaS trial, submitted to Transportation Research Part A, 11 May.
Reck, D.J., Guidon, S., Haitao, H. and Axhausen, K.W. (2020) Shared micromobility in Zurich, Switzerland: Analysing usage, competition and mode choice. Paper presented at the 20th Swiss Transport Research Conference, Ascona, May.
Reck, D.J., Hensher, D.A. and Ho, C MaaS Bundle Designs (2020) submitted to Transportation
Research Part A, 10 February 2020, referees reports 24 April 2020, revised 12 May.
Footnotes
[1] While most e-scooter providers halted their operations in Switzerland (and only just restarted on May 6), bikeshare providers have continued to operate and partially seen large increases in usage as well (also in NYC). Maybe this is a consequence of a balance between users having fewer travel options now and weighing risk to (literally) touch shared mobility. In Switzerland, the huge increase in bicycle use might be due to the excellent infrastructure and also the warm spring weather. Will it last? Time will tell.
[2] Milan has a very interesting approach where the city is attempting a more sustainable restart with regards to transport, reimagining the city by reallocating street space from cars to cycling and walking, in response to the coronavirus crisis. https://www.theguardian.com/world/2020/apr/21/milan-seeks-to-prevent-post-crisis-return-of-traffic-pollution
[3] Tangential to this initiative is a view that some public servants have a flexi day and want to ensure this is maintained when they work, to some extent, from home.
[4] ‘New’ in the sense that there is a much broader interest in WFH given the forced circumstance. Telecommuting, for example, is not new (see Brewer and Hensher 1998) but has always struggled to get support from either employees or employers, and especially where the matching of employees and employers is required for it to be implemented. See also https://www.linkedin.com/pulse/why-do-we-meet-anyway-chance-relieve-burden-meetings-glenn-lyons/
[5] The internet seems to be able to handle mass WFH.
[6] Flattening of the curve is now replaced with the challenge to find ways to maintain flattening of the peak now that COVID-19 has done the hard work for us. ‘The camel has died’ and now we want to preserve ‘the horse’.
[7] See https://www.smh.com.au/national/nsw/anxious-parents-and-students-face-school-commute-amid-lockdown-20200509-p54req.html
[8] Some redistribution of tax money will have to happen – providing a good opportunity to highlight road pricing (once again), given also that fuel tax income will decrease with increasing electrification.
[9] Which has associated emission reduction benefits.
[10] In Australia, it is suggested that the annual cost of congestion in terms of lost productive and leisure time is $30billion (BITRE 2015).
[11] However, with social distancing, office spaces will need to be rearranged and the ‘floor area to worker ratio’ will increase, possibly resulting in no gain.
[12] However, there will be the issue of the costs of running an office from home and who might fund that.
[13] Examples for public transport including automatic doors to avoid touching entry and exit points both on trains and buses and also platforms, cleaning wash rooms more often (or even

25
closing them) given they are a major source of disease transmission, separating bus drivers by a plastic separator (the two-thirds design used by many bus operators to enable some safe communication with passengers), no cash payments, the wearing of masks, and temperature check on entry to and exit from public transport. Also Apps are being developed such as SkedGo’s occupancy feature and COVID-19 alerts for public transport confidence: https://skedgo.com/skedgo-launches-occupancy-feature-and-COVID-19-alerts-for-
public-transport-confidence/.
This feature allows passengers to choose quieter routes and carriages, or switch to alternative forms of transport to maintain social distancing, such as cycling or e-scooters. The occupancy feature has been trialled using open source data from Transport for New South Wales in Sydney and can be rolled out worldwide, depending on data availability. For rideshare, the big challenge is how we might ensure that drivers clean the passenger areas every time someone alights and before someone gets on board. Rideshare may be more challenging than public transport in managing the biosecurity risk. It will also be interesting to see how micro-mobility providers ensure disinfection of vehicles. It has also been suggested that buses might be preferred over trains where the latter travel long distances underground in situations perceived as contained. With a bus, one can open the windows which is seen as an advantage regardless of whether it makes a difference to the health risk. Importantly, it will be easier to increase passenger capacity under social distancing through adding more buses into the network than increasing train capacity which is often at its limits given track constraints.
[14] Although they are currently not legal in New South Wales.
[15] In Zurich, for example, shared dockless e-scooters are used only for very short trips (median: 721m) while shared docked bikes (median: 1’312m) and shared docked/dockless e-bikes (median: 1’574m) are used for substantially longer trips. Of course, this is very context-dependent, but a first indication. See Reck, Guidon et al. (2020).
[16] Carpooling historically has faced many difficulties in finding a match (i.e., fellow travellers). With the extra layer of trust required, it may be challenging to achieve this.
[17] But we do not want to discourage informal lift-sharing between trusted groups using someone’s car – which is how carpooling started in the first place.
[18] This has general appeal; despite it being a rather Finnish viewpoint since regular trips to the “summer cottage” (= shack!) is how Finns spend their free time.
[19] I thank Glenn Lyons for his liking of this interpretation, which in his words ‘merits further attention’.
[20] Some commentators have suggested that rideshare is part of the hyped 'shared mobility' concept rather than a reality arriving soon.
[21] Will taxi drivers, for example, clean the seats and surrounding space every time a passenger gets out? There have been a lot of licences returned recently. https://www.theaustralian.com.au/nation/coronavirus-no-idle-threat-as-cabbies-in-decimated-taxi-industry-return-plates/news-story/5e359d5e047674789d09de2b4bc507c5
[22] Continuing normal service levels has allowed customers to physically distance on trains and platforms.
[23] Daniel Reck (Personal communication) in commenting on this says: ‘Interesting idea, one way this could work out is by taking up UbiGo’s idea of selling a number of PT daily passes instead of a monthly ticket to accommodate irregular / part time commutes.’

26
9. Will Mobility as a Service make Travel Demand Management strategies redundant?
1 June 2020
Travel Demand Management (TDM) initiatives involve influencing people's travel behaviour in order to favour alternative mobility options. Professor Emerita Corinne Mulley and Professor John Nelson discuss how these strategies may be useful in the wake of COVID-19.
The recent past has witnessed considerable interest in the emergence of Mobility as a Service (MaaS). Although there is no single accepted definition of MaaS, the concept has evolved to have a number of agreed components. It is a one stop service integrating all forms -both public and private transport services – and will provide customised access through a common interface, such as a smart app, so that information, booking (if necessary) and payment are facilitated in real-time for multimodal options to travel from origin to destination. A successful vision for MaaS also sees better options for those not owning a car for whom transport options might have been more limited, so making these citizens more socially included. The popular view of MaaS sees it as the centre of future collaborative and connected mobility.
Early concepts of MaaS envisaged travellers purchasing a “mobility package” in much the same way as individuals purchase a mobile phone package. The traveller would be able to select the bundle that suits them best, using different forms of transport. The many pilot schemes of MaaS have taken this approach and the most long-standing MaaS in Helsinki, Finland, also takes this approach. In almost all cases, access to public transport is implemented as the core of the mobility package.
On the policy side, MaaS is being seen as a way for users to satisfy their mobility needs without having to own their own car (whether this is a private car at present or an autonomous car in the future). In this way MaaS is seen as having the ability to reduce car traffic and in particular to reduce traffic congestion. As the MaaS culture matures, it might be expected that there will be huge variations in offerings, if the current pilot schemes in operation around the world are anything to go by.
The question motivating this ‘out of the box’ is whether, as MaaS matures, can it be a conduit for travel behaviour change? Can a MaaS package, for example, provide selective discounts to ‘nudge’ travelling in a manner to be supportive of transport policy goals? Could gamification be used to encourage the gaming of travel in the way policy wants (see Yen et al 2019)?
Travel Demand Management (TDM) initiatives are applied by transport planners to establish and enable appropriate use of critical transport infrastructure. Meyer (1999) defined TDM initiatives as an ‘action or set of actions aimed at influencing people's travel behaviour in such a way that alternative mobility options are presented and/or congestion is reduced’. TDM strategies are normally applied as a package including measures which directly affect private car use (e.g. parking restrictions or regulations) as well as ‘carrots’ to encourage public transport use. A common example of a TDM measure to encourage public transport use is a travel plan that can be tailored to enable travellers to maintain their desired lifestyle whilst encouraging the adoption of low carbon mobility solutions, which in some senses is similar to the intentions of a MaaS delivery. The introduction of TDM initiatives in travel plans via the workplace can give employers the unique ability to influence travel behaviour of large numbers of commuters. Indeed, it need not be just employers – Transport for NSW undertook a huge business employee consultation as part of a TDM project called “Travel Choices” (beginning in 2015) to reduce AM peak hour vehicle traffic entering, leaving and circulating within the Sydney CBD area impacted

27
by the preparation for the light rail works, which included the reorganisation of CBD bus services. Furthermore, both the journey to work, and travel within the course of work, can be addressed. Employees are also the target group of the current IMOVE-funded MaaS trial in Sydney in which ITLS are participating along with project partners IAG and Skedgo.
There are some obvious synergies between MaaS and TDM designed to encourage public transport use – both (broadly speaking) have the intention of encouraging the optimization of transportation systems for commuters (and other travellers) through facilitating enhanced accessibility, information, and traveller choice.
This raises the question as to whether MaaS has the potential to replace public transport strategies within a TDM package? The MaaS app could certainly replace public transport initiatives which might be promoted by TDM, such as personalised travel planning, green travel plans (such as that introduced at Rouse Hill, NSW), and travel plans introduced in response to infrastructure building disruption, and other softer measures to influence travel behaviour (like carbon footprint data). How does this leave the policy maker trying to build an overall TDM package? They would be left with the ‘sticks’ (e.g. road closures or parking management) with the ‘carrots’ of public transport initiatives being actioned by the MaaS application. Ultimately, TDM as we now know it (a package of ‘sticks’ and ‘carrots’) would become redundant and we should question whether policy makers can lose one of their tools and still move towards a more sustainable transport future.
As an addendum to this piece written before the COVID pandemic, we now ask the extra question as to the role of TDM and MaaS in the post-pandemic ‘new normal’ world. We see people being nervous about public transport yet businesses needing to grapple with finding ways to operate, potentially with staggered start and finish times. A transfer to car travel will compromise not only sustainable transport goals but also climate change aspirations. This surely suggests a greater role for TDM in the short run by recognising its ability to package ‘sticks’ and ‘carrots’ and a lesser role for MaaS whilst public transport travel re-establishes itself to become the core of MaaS activity.
Further information
Meyer, M.D. (1999). Demand management as an element of transportation policy: using carrots and sticks to influence travel behavior. Transp. Res. Part A. 33, 575–599.
Yen, B. T. H., et al. (2019). "Gamification in transport interventions: Another way to improve travel behavioural change." Cities 85: 140-149.
28
10. It’s cycling, but not as we know it 9 June 2020
Cycling has played a significant role during the COVID-19 lockdown. Professor Stephen Greaves and PhD candidate Tony Arnold discuss how we can capitalise on this to get more people cycling for transport in the future.
With the phased lifting of restrictions under the COVID-19 pandemic in Australia, it is timely to reflect on what we have learned about ourselves when it comes to getting around. Fundamentally, we’ve recognised that many day-to-day activities can be done at home, ranging from work, study, exercising, or socialising over Zoom with family and friends, obviating the need for around 50% of pre-COVID travel. Those of us still having to travel for work or dash down to the store to grab the last pack of toilet paper, have welcomed empty roads, cheaper petrol and fewer parking restrictions, while those sticking with public transport have faced 80% fewer passengers, guaranteeing not just a seat, but often a whole carriage to themselves.
Amid all this change, and fuelled by the glorious autumnal weather, many have (re)discovered that the bicycle gathering dust in the garage provides an enjoyable and legal way to get some exercise as well as a chance to connect with families in a quiet neighbourhood street or on a well-worn cycleway. Others, more attune to enjoying early morning Sunday group rides have turned to cycling alone or using stationary bike technology coupled with apps such as Zwift or Peloton to try to recreate some of the thrill. The bicycle has played a vital role in keeping the night-time economy afloat with backpackers, students and other willing workers coming laden-up on e-bikes with food from our favourite restaurants, forced to close to eat-in diners. These front-line workers receive fewer accolades than the nurses and doctors keeping the health system functioning, but they too have risked their lives, often for sub-award remuneration and conditions. Underpinning all this, the bicycle economy has seen a renaissance, with bicycle shops reportedly overwhelmed with demand for new bicycles, repairs, and stationary bicycles.
With public transport capacity a fraction of pre-COVID levels (In NSW trains are set to run at 24% capacity, buses 14%), people are predicted to return en masse to their cars - in Wuhan for instance, usage of private cars nearly doubled when their lockdown ended. True, more flexible work practices may offset some of this growth, with fewer days spent at the office, or travel conducted outside of peak hours. However, with children returning to school on a full-time basis and less use of school buses, the routines of parents may be dictated by the school timetable, forcing travel to be made during traditional peak periods. If this is the case, and we also see a strong shift away from public transport, then we may see a sort of “carmageddon” that makes driving even more unbearable than usual.
Given that cycling has played such an important role during the lockdown, we may ask whether we can build on the current momentum and get more people cycling for transport, instead of getting back in their cars. Many nations are thinking along these lines – for instance, on May 9th the UK announced a £2 Billion Post-Pandemic Plan, that provided a significant boost for cycling and walking. Germany and New Zealand have instituted fast-tracked projects to increase footpath widening and install ‘pop-up’ bicycle lanes. Encouragingly, the NSW government has provided a $15 million fund in which councils can apply for grants up to $100,000 for immediate pilot projects and up to $1 million for longer term projects. Transport for NSW and the City of Sydney have also announced a series of popup cycleways.
Of course, there will be challenges to overcome before the bicycle tyre can hit the road on these investments. The checks and balances that are set up to ensure that our road network adequately serves our community become (somewhat necessary) barriers when rapid change is desired. Before any change is made, we must ask whether the changes will affect emergency services vehicle access, whether bus routes are affected, whether property access is maintained, and whether rapidly-deployed pilot treatments are safe for all road users. We must also

29
consider and engage with a range of stakeholders such as residents and local councils. Then designs need to be generated and audited, before the actual work begins. Even if no concrete is poured, traffic signals may need to be reprogrammed and regulatory signs installed. With the complexity involved in even minor changes, the challenge will be to look for ‘quick wins’, otherwise this could be a lost opportunity.
Even with these infrastructure changes, a strong uptake in transport cycling is not guaranteed. On the positive side, those who dusted off their bicycles during lockdown have already overcome rudimentary barriers such as owning a working bicycle and building confidence in low-risk settings. Admittedly, there are still several barriers to overcome before many will be ready to ride in traffic or adjust lifestyles to accommodate bicycle commuting. However, with transport systems in a state of flux, this may present an opportunity to shape future mobility behaviour that might build on some of the healthier lifestyle components coming out of the crisis, instead of contributing to our sedentary lifestyle. The humble bicycle has proven time and again it is resilient to major crises, congestion, transport strikes, power outages and social distancing impacts and it may be accessible to people who cannot afford to own and run a car.
With car traffic already building, it is critical that we take this opportunity to strike now while the bicycle is hot.

30
11. COVID-19 pandemic and the unprecedented mobilisation of scholarly efforts to fight a global health crisis
15 June 2020
The COVID-19 pandemic has generated a huge scholarly output across academia. However, Dr Milad Haghani believes that there is still more to be done in the area of safety research, especially where it can assist policy makers.
During the current century, each major corona virus outbreak has triggered a quick surge of academic publications on this topic. The spike in research publications following the COVID-19 outbreak, however, has been like no other. The global crisis resulted from COVID-19 has mobilised scientific efforts in an unprecedented way. With the crisis affecting all aspects of life, research on COVID-19 seems to have become a focal point of interest across nearly all academic disciplines. However, there are still relevant domains where scholarly outputs on COVID-19 are urgently needed to inform policymaking but underrepresented, though they may be underway.
The term coronavirus may have become the part and parcel of life across the globe since the beginning of 2020. While for many of us, who are not medical experts or virologists, the term might have been a stranger prior to 2020, in the medical field research on the family of coronaviruses has been around for many years. Academic research on this topic dates back to nearly 50 years ago when the first published study appeared in Nature (Almeida et al. 1968). Since then, the world has experienced a few major outbreaks of Corona viruses, with the SARS (Sever Acute Respiratory Syndrome) outbreak in 20022 and the MERS (Middle East Respiratory Syndrome) outbreak in 20123 being the most prominent outbreaks of this family of viruses, until COVID-19 came along in 20194.
Since 1968, more than 23,000 published studies related to Corona viruses have emerged and been indexed by major academic databases. A closer look at these records (See Figure 1(a)) shows that the scientific research attention to this topic has not been so steady. Rather, each major outbreak of the corona viruses has immediately promoted a quick surge in the number of studies. This has been the case with the SARS outbreak which triggered the first major increase in the number of studies on corona viruses, then ten years later with the MERS outbreak and most notably and recently with the COVID-19 outbreak. The record also shows that each of these spikes in scholarly outputs have lasted for about 2-3 years and has been subsequently followed by a gradual decline in the amount of academic attention to this topic reflecting in the number of published studies.
The spike of scholarly efforts in response to the COVID-19 pandemic, however, has been like no other. As of May 13, 2020; i.e. only 134 days since the official reporting of the first case, more than 7,700 published studies related to this topic have been indexed by Scopus, while the number is increasing noticeably each day. This has indeed been unprecedented in the history of research on Corona viruses and, perhaps arguably, in the general field of viral diseases. Authors from 130 countries have contributed their knowledge, ideas and research outcomes on this topic within this short period of time. A closer inspection into the bibliometric details of these studies
2 The first case reported on November 16, 2002 in the Guangdong province in southern China 3 The first case reported on June 13, 2012 in Jeddah, Saudi Arabia 4 The first case reported on December 31, 2019 in Wuhan, China

31
reveals that, while British Medical Journal, Journal of Medical Virology and Lancet have been the most prominent outlets for studies on COVID-19, research on COVID-19 has now gone far beyond the medial field. With the pandemic affecting all aspects of life at a global scale, researchers across the board have contributed their insight and expertise and the scholarly efforts have now reached academic journals in Social Sciences, Psychology, Veterinary, Environmental Sciences, Engineering, Mathematics, Economics, Chemistry, Economics and Business, only to mention the disciplines with at least 50 publications in this domain so far (See Figure 1(C), or Haghani et al. (2020) for further details).
An analysis of the keywords that have appeared in the title and abstract of these studies also reveal interesting patterns. Based on such key term analyses, three major clusters of studies (See Figure 1(b)) are identifiable: (i) a cluster of studies with a main focus on signs and symptoms of the disease (the green cluster), (ii) a cluster of studies with a main focus on treatments, drugs and vaccines (the blue cluster), and (iii) a cluster of studies pertinent to public health emergency
management and policy making. The term Safety is a prominent term that appears to have been
cited frequently in studies on COVID-19. A recent scoping review by Haghani et al. (2020) has shown that at least ten major aspects of safety research has attracted the attention of researchers in relation to the COVID-19 crisis. Still, with the crisis affecting almost all aspects of human life, there appear to be areas where more research particularly in the domain of safety could help policy makers. Observations of consumer panic shopping at early stages of the outbreak, for instance, brought the importance of the safety and robustness of supply chains back to the attentions. Also, with many countries initiating transitions to normal socio-economic activities, the importance of crowd control, or public transport management (De Vos 2020) seem to be more prominent than ever, while unprecedented challenges require swift mobilisation of research efforts in those areas. An invigoration of COVID-19 research in these underrepresented areas would be essential and instrumental to provide evidence-based solutions and policy recommendations during various phases of recovery, in addition to making us better prepared for future health crises.

32
Figure 1. Bibliometric aspects of the scholarly publications on COVID-19
References
Almeida, J., Berry, D., Cunningham, C., Hamre, D., Hofstad, M., Mallucci, L., Mcintosh, K., Tyrrell, D. (1968). Coronaviruses. Nature 220 (650), 2.
De Vos, J. (2020). The effect of covid-19 and subsequent social distancing on travel behavior. Transportation Research Interdisciplinary Perspectives 5, 100121.
Haghani, M., Bliemer, M.C.J., Goerlandt, F., Li, J. (2020). The scientific literature on coronaviruses, covid-19 and its associated safety-related research dimensions: A scientometric analysis and scoping review. Safety Science, 104806.

33
12. Public Transport post-COVID-19 – A quick scan of some of the immediate challenges and those in the longer term
6 July 2020
The COVID-19 pandemic has exposed some critical issues inherent in the current public transport system. However, according to Professor David Hensher and Yale Wong, this is an opportune time to address these problems in order to create a more resilient and adaptable transport sector.
A significant global challenge which has emerged in early 2020 is the COVID-19 pandemic, with major ramifications for the transport sector, its funding and governance. To consider the range of implications, it is necessary to distinguish between the immediate short term operational impacts from longer term strategic consequences.
In the short term, there is a huge focus on increased sanitation and distancing measure, especially during the return-to-work phase when ‘second wave’ infections might be expected. Enhanced sanitation initiatives will need to be continued, with the possible opportunity to explore how the use of technologies like ultraviolet, ozone, ioniser, nano-product and bleach robotic cleaning can make sanitation less reliant on manual labour. One of the major weaknesses is that present cleaning staff are depot-based, meaning that buses cannot be cleaned en-route. One possibility is that cleaning crew can be arranged by the authority and stationed at major interchanges, who sanitise buses from any contracted operator during extended dwells and layover time. A major question is how the financial cost of these enhanced sanitation measures will be borne, including how the additional cost burden is being shared between the authority and contracted operators.
Whilst sanitation helps to avoid the spreading of the virus via hard surfaces, better adherence to social distancing guidelines and the protection of frontline employees ensures that the virus is less likely to be spread via airborne particles. Distancing measures may be voluntary as well as physical. In the return-to-work phase, vehicles may need to be limited to 50% maximum passenger loading, with particular seats cordoned from use and standing banned. Sneeze guards can be installed to protect drivers. Active network monitoring will need to ensure the ability to ‘insert’ additional services as required to maintain these loads. One of the key issues is the impact on contracted operators where patronage incentives are a part of their revenue stream. Whilst this is minor in most urban settings (although for light and heavy rail, patronage plays a greater role), there are instances in the regions (e.g. Queensland) where operators have had to receive government support. Operators in the charter and long-distance markets who operate on a commercial basis have also struggled in the face of a severe reduction in their patronage. These realities call for urgent reform to ensure these operators survive and that their essential services (a lifeline for regional communities) can continue to be provided.
One of the major unknowns is how COVID-19 will change the nature of travel under a ‘new normal’. Remote working may continue to be prevalent amongst white collar workers, who
typically exhibit nine-to-five working patterns. Employers may be asked to continue supporting risk management initiatives initially, and if there is no evidence of voluntary commitment then they may be mandated by government (e.g., to work in alternating A and B teams). Any remote work will mean a likely flattening of commuting peaks, reducing crowding and capacity pressures on the public transport system. This is very positive for maintaining physical distancing, and will also have operational impacts on future transport planning and policy. Rather than
catering for the peaks exclusively, public transport systems can be better tailored to service all-

34
day demand. This will have impacts on reducing vehicle requirements as well as the number of frontline staff required. Less travel demand will also have traffic ramifications on the road network, on which buses and coaches run.
However, the extent to which traffic congestion will ease is dependent on any possible modal shifts in travel behaviour. A likely outcome is that biosecurity becomes a new attribute in mode choice, and with private car travel perceived to be safer, it may lead to pressure on the road network and travel speeds. Governments will need to manage this through the taxation system and user-pays schemes (e.g., on CBD access and parking). Shorter trips might see a shift towards active mode like cycling and e-scooters (as has been exhibited during the lock down period). These travel behaviour shifts will place pressure on public transport authorities and operators as they seek to attract users back on to the system.
In the longer term, key questions need to be asked around how well the public transport industry is prepared to weather these ‘black swan’ events, and how the network may be called upon to perform crucial functions during periods of emergency. The COVID-19 pandemic has exposed some critical realities in the bus and coach industry. The continual focus on cost efficiency has meant that there is now less capability to ‘scale up’ in times of crisis—such as to implement rigorous sanitation regimes or to run an emergency network at short notice. Authorities worldwide and the Thredbo ‘narrative’ have encouraged the build-up of very successful and ‘lean’ operators, which are a point of credit but also a source of potential policy conflict and tension going forward.
As an example, most Australian capital cities (Perth being the main exception) have maintained a full public transport service and the same schedules and rosters throughout the lockdown period. The result is far too much dwell time for trains and running time for buses, which is operationally inefficient and frustrating for customers. Operators need to be more resilient and agile in responding to these changes in demand and traffic. Future tender requirements might call for the development of pandemic management plans and reduced service offerings based on the weekend timetable with Friday/Saturday night supplements, a curtailing of all peak express routes but with the addition of route augments to service medical facilities. Driver shifts might be shortened (to better distribute work amongst the full workforce), thereby reducing the need for breaks which put drivers at risk by being out and about in the community.
COVID-19 has also brought lessons in terms of multi-agency coordination and pandemic preparedness. What is evident is that there continues to be poor operational integration between operators and modes. Individual operators have contributed buses and drivers to be used in higher risk operations, such as for quarantining international arrivals and to assist hospitals and the aged-care community. However, there is no infrastructure in place to enable efficient communication during these pooled operations (the same may be said for rail replacement services). There is a need to develop centralised control capabilities shared between operators in a city (e.g., as occurs through CentreComm in London), complete with pooled spare drivers and the capacity for immediate service insertion to aid in ensuring agile and resilient operations. There needs to be plans in place for the urgent procurement of personal protective equipment for all frontline staff, as well as education on their safe and proper use. The Six Sigma doctrine should be incorporated as part of standard operating procedures for risk management and quality control purposes.
The COVID-19 experience will also bring questions in terms of asset and infrastructure spend. In the bus and coach sector, the pandemic experience will likely affect fleet/asset procurement in the future in terms of the Australian Design Rules (ADRs) which specify vehicle design, the use of materials and requirements for driver protection. Large-scale infrastructure needs may need to be reviewed and put on hold, in light of budgetary pressures, the changing nature of work, a decline in tourism and possible reduced population growth. There may be a reprioritisation of projects towards a focus on packages of smaller investments. The next edition of Thredbo will make for interesting case studies on the issue and bring clarity as to what is required to ensure that the land passenger transport sector can be more resilient and adaptable in times of crises.

35
13. Pooled testing to help Australia tackle the second wave of COVID-19
3 August 2020
Pooled testing is a cost-effective method of testing in which a single test is run on a group of samples. Dr Saman Eskandarzadeh and Professor Ben Fahimnia explain how it could help Australia tackle a second wave of COVID-19 whilst reducing the need for tough restrictions.
The threat of a second wave of COVID-19 looms on the horizon, with case numbers jumping in Victoria since the Australian Government’s easing of restrictions. Prime Minister Scott Morrison says outbreaks should be anticipated and that the government plans for localised restrictions to contain the spread of the virus. “Pooled testing” is a cost-effective method for keeping track of the virus by screening targeted/local populations for the virus – shows research at Sydney University.
Prompt detection of the Sars-COV-2 virus is vital to the government’s approach to track and contain the COVID-19 outbreak. Currently, testing occurs only in symptomatic individuals or close contacts of those with confirmed disease. But an infected individual can be shedding virus for days prior the development of any symptoms[1], and some may not get any symptoms at all[2].
Extensive testing of the local population within a “hotspot” can ensure that infected people are identified and quarantined before they infect others. However, it is also beyond Australia’s budget and testing capacity to perform so many tests. A solution to this problem is pooled testing.
Pooled testing, as the name suggests, is the pooling together of a group of samples to run only one test[3]. For example, every week all households in one street could collect their own samples of saliva[4], mail those samples to a testing centre or deposit them in a testing bin (methods already in use for screening programs such as Bowel Cancer screening). The lab then combines together all the saliva samples from one household, or one street, or even one suburb, into a single sample for testing. In this way the number of tests required can be reduced by a factor of 10 or more.
Pooled testing makes sense where the disease prevalence (number of cases in a population at a given time) is low. If the disease prevalence is high, then most of the grouped samples will be positive, which then requires individual testing of all the individuals in that group – rendering pooled testing a useless exercise to reduce test numbers.
Since January 22 this year, Australia has performed over two million tests, with an average of 0. 4% tests returning positive[5]. The incidence (number of new cases in a population) of COVID-19 in Australia since May is 0.04-0.58 cases per 100000, and the prevalence is less than 0.1%. This makes pooled testing perfect for the Australian scenario.
There are three common pooled testing methods: Simple grouping (S method), Square Array grouping (SA method), and Household-based Square Array (HSA method).
In the S method[6], individual samples are combined together and a single test is run on the grouped sample. If the grouped sample tests positive, then each sample is individually tested. For our population of 25 million, if the group size is 10, and the prevalence of infected cases in the population is one percent, then 2,750,000 tests per week are needed. Though this number is a great deal less than 25 million, it is still beyond Australia’s testing capacity.

36
In the SA method, a grouped sample (with 10 individuals) is further combined with other groups, making the group size 100. Individual samples are arranged in a square array of 10 by 10. A test is run on combined samples of each column group and each row group. As there are 10 columns and 10 rows, 20 tests are run. An individual sample is considered positive if its column group test or its row group test is positive. For the Australian population, again, we need 5,000,000 tests per week. The difference with the SA method is that each sample is tested twice, and this decreases the probability of a false negative.
The HSA method[7] is similar to the SA method, except that each sample is a pooled sample of an entire household. A household sample is considered positive if both its column group and its row group test is positive. In this case, if a sample is tested positive then a whole household needs to be quarantined as the test does not differentiate between members of a household. However, as it is quite likely that all members of the household are infected, under current guidelines the entire household would most likely be quarantined regardless. This method reduces the required number of tests to 2,000,000 per week, assuming a household size of 2.5 people.
With each of these three testing methods, the group sizes can be increased to any number to accommodate any population size and any budget. One criticism is that the number of false negatives may be too high, but given that the tests are repeated every week, even if some infected individuals are not detected in one week, they will most likely be detected in the following week. Thus, pooled testing makes testing of a whole population a feasible goal.
Pooled testing is a method that could enable Australia to test its entire population for COVID-19 every week, eliminating the threat of asymptomatic spread and super-spreaders, and allowing “targeted” quarantine. With the adoption of testing methods like saliva testing (currently not available in Australia), pooled testing allows the rapid lifting of restrictions while avoiding a second wave of infection.
References
[1] https://www.cdc.gov/mmwr/volumes/69/wr/mm6914e1.htm
[2] https://www.acpjournals.org/doi/10.7326/M20-3012
[3] https://healthpolicy.usc.edu/research/getting-americans-back-to-work-and-school-with-pooled-testing/
[4] https://www.abc.net.au/news/health/2020-07-01/new-saliva-test-for-COVID-19-how-accurate-is-it/12406912
[5] https://www.health.gov.au/news/health-alerts/novel-coronavirus-2019-ncov-
health-alert/coronavirus-COVID-19-current-situation-and-case-numbers
[6] https://healthpolicy.usc.edu/wp-
content/uploads/2020/05/USC_Schaeffer_PooledTesting_WhitePaper_FINAL-1.pdf
[7] https://docs.google.com/document/d/1joxMjHdWWo9XLFqfTdNXPQRAfeMjHYEyvVljqNCaKyE/edit

37
14. Opening-up Melbourne again? 24 August 2020
The incidence of COVID-19 across Melbourne marks a stark divide, with case numbers much more heavily concentrated in the north and west than in the south or east. What are the factors contributing to this spatial pattern? How can Melbourne ‘re-open’ in a way that tackles entrenched disadvantage? Adjunct Professor John Stanley and Associate Professor Janet Stanley discuss these questions and more, below.
Taking advantage of Cold Spots
The compounding disasters of bushfires, COVID-19 shutdown and economic depression are leading to a further disaster in the mental health of Victorians. There is increasing evidence of the growth in mental illness and reduced wellbeing in the State. This can be found in increased generalised anxiety and depression, and suicidal thoughts and behaviours, particularly in young people and other vulnerable populations. On-going social disconnection and prolonged social isolation, as well as greater levels of uncertainty about employment prospects, can exacerbate prior mental health issues as well as lead to the development of new conditions.
By the end of Stage 4 in Melbourne, people will be expecting the opportunity to live a close to normal life again and this will also be important for easing the growing levels of mental illness and reduced wellbeing, and for the turning the rising tide of unemployment. The longer Stage 4 continues, the more likely it seems that there will be a diminishing propensity to maintain lockdown, given growing weariness with isolation and restrictions, so easing as soon as practicable has much to commend it.
Re-opening businesses is central to Melbourne returning to ‘normal’. Hot spots have been used in trying to gain greater control over COVID spread and there is merit in thinking about a similar approach to unlocking: cold spots if you like. Such an approach has the benefit of enabling people in areas that, for whatever reason, have achieved lower numbers of COVID cases, to get earlier access to (near) normality, be they residents, workers, business owners and/or customers.
At Local Government Area (LGA) level, potential cold spots might be identified by comparing active case numbers to resident population. Active case numbers change daily, so numbers as published on 31/7, 7/8 and 14/8 were averaged to obtain ‘representative’ figures in the second wave, per LGA, as shown in Figure 1.

38
Source: Active case numbers https://COVIDlive.com.au/report/active-cases-by-lga; Population as at 30 June 2019 from ABS (2020).
The range in the data is large, underlining the point about hot spots and, equally, the opportunity to think about cold spots. Brimbank, Wyndham, Melton, Maribyrnong, Hume, Whittlesea and Moreland all had more than 2 active cases per 1000 resident population. These seven LGAs are all in the north or west of Melbourne.
Conversely, 17 LGAs averaged fewer than 1.0 active case/1000 population, with the lowest 16 all being in the south or east, joined then by Nillumbik in the north-east (and Banyule at just over 1 case/1000 population - also in the NE). This underlines how COVID is really a tale of two cities in Melbourne. The average number of active cases per LGA in the 12 NW LGAs was 370 across the three days, four times the average number per LGA in the SE (where there are 18 LGAs, City of Melbourne not being included as NW or SE in this regional comparison).
Influences on active case numbers
Prima facie, LGAs with the lowest case numbers would be candidates for early re-opening, provided Stage 4 substantially reduces overall numbers and these LGAs keep their numbers low. Looking to assess possible re-opening, however, should also include considerations other than just active case numbers relative to population size, considering (for example) factors that might be associated with higher/lower numbers. Thirty factors (for which census, population health, unemployment or other public data is readily available) were considered at LGA level, encompassing variables such as population, various age groups, job numbers, productivity, part-time employment rates, unemployment, area, density, (broad) land uses, social-economic disadvantage, trust, whether the main language spoken at home is English, education level, proportion of occupied dwellings that are separate houses, persons per dwelling, asthma, smoking and reported health. Eleven variables were significantly correlated with active case numbers at a 1% significance level: population (+ correlation), population growth rate 2011 to 2016 (+), English-only spoken at home (- correlation), population aged 80 or over (-), population aged 75 or more (-), population aged 65-79 (-), persons per dwelling (+), unemployment rate (+), SEIFA Index (-), smokers (+) and fair or poor health (+).

39
Multiple regression analysis suggested a model that retained only four significant explanatory variables (10% significance level), explaining 63.8% of the variance in numbers of active cases by LGA. Variables such as the unemployment rate and persons per dwelling dropped out, being significantly correlated with other retained variables. The four variables, with their estimated contributions are:
• Resident population - the number of active cases in an LGA was predicted to increase by 0.9 for each additional 1000 population
• Percentage of the population speaking English-only at home - a percentage point increase here is predicted to reduce the number of active cases by 5.3, highlighting the importance of language appropriate COVID messaging
• Percentage of the population aged 80 and over - a percentage point increase in the population in this age group is predicted to reduce the number of active cases by 52.7. There are not many percentage points in this age group (which accounts for 3.9% of Greater Melbourne’s population), so a one percentage point difference is substantial. This finding suggests good risk awareness in this vulnerable age group, notwithstanding the terrible impacts that have emerged in many care settings
• Percentage of the adult population who are smokers - a percentage point increase here is predicted to increase the number of active cases by 13.3, perhaps suggesting lower health risk awareness among adult smokers.
The model was used to identify relative performance by LGA, the LGAs with the most favourable difference between actual active case numbers and predicted numbers, given their characteristics in terms of the four explanatory variables, being Greater Dandenong (275 fewer than predicted), Casey (170 fewer), Monash (153 fewer), Frankston (106 fewer) and Knox (103 fewer). The least favourable LGAs were Wyndham (288 more), Brimbank (279 more), Moreland (125 more) and Moonee Valley (113 more). It would appear that residents in these LGAs are adopting good protective practices. These results again reflect the S/E and N/W divide.
The proportion of population speaking English-only at home, proportion of population aged 80 and over and proportion of the population who are smokers explain most of the difference in predicted case numbers between the NW and SE in the model. Model co-efficients were used to predict actual case numbers for a ‘typical’ NW and SE LGA, using weighted average values for each of the co-efficients across the NW and SE to derive these ‘typical’ LGAs. The model underestimated actual case numbers in the NW LGAs overall by about ten per cent and substantially overestimated numbers in the SE, such that the actual difference between the NW and SE that is ‘explained’ by the model is only a little over half. A little under half the actual difference in active case numbers between a typical NW LGA and one from the SE thus remains unexplained by the model, indicating a need to search more broadly for suitable (spatial) explanatory variables. Data on casual employment would be interesting but does not appear to be available.
Greater Dandenong is an interesting case. In the model (with the four explanatory variables) it is rated the best performing LGA but is only mid-range in Figure 1. This implies good performance in terms of numbers of active COVID cases, given the LGA’s characteristics. For example, Greater Dandenong has the lowest proportion of households where English-only is spoken at home, which predicts relatively high numbers. The relatively low numbers of active cases reflect well on the community. There should be lessons here.
Re-opening
Looking to a brighter future post Stage 4, the sooner that Victoria can re-open the better. This will improve economic health and promote individual and community wellbeing. Ideally the entire State of Victoria will be able to re-open for business at the same time. While this article has concentrated on Melbourne, similar issues arise in regional Victoria, where there is high youth

40
unemployment and high levels of social disconnectedness. Levels of suicide deaths, self-harm (resulting in hospitalisation) and presentation at emergency departments are at risk of dramatically increasing in some areas, such that there may be increases in suicides in regions of Australia up to 10 percentage points higher than the national average over the next 5 years.
If substantial spatial disparities in incidence persist, then there is a case to look at a possible staged re-opening, supporting better outcomes at an earlier time in the lower risk parts of the metropolitan area (and regional Victoria). This would be likely to require a means of limiting activity catchments for the re-opened areas to residents of those areas.
Based on Figure 1 and the modelling undertaken for this article, the most likely current candidate LGAs for early re-opening in Melbourne would be Local Government Areas in the east, south and north-east (Nillumbik and Banyule). This could change in coming weeks, depending on trends in incidence.
Tackling spatial disadvantage
The analysis demonstrates the inequities in COVID incidence across Greater Melbourne, with the north and west bearing the brunt of the disease. This again confirms our knowledge that economic downturns, and now pandemics, do not affect all groups equally, especially hard hit being those employed in casual work, those without accumulated assets and those who have not established independent social networks. These groups are often younger people. There is a high risk that, without special attention to this group, there will be growth in inter-generational inequality. Spatial inequity has been highlighted in this paper.
Staged re-opening, if required, poses risks of continuing, and even accentuating for a short time, the spatial disadvantage that has long been experienced by LGAs in the north and west of Melbourne, relative to the east and south. This spatial disadvantage should be tackled head-on, with resources channelled in coming weeks into the north and west, to accelerate return to normal from COVID, including a focus on messaging in languages other than English (among other things) and on people who are less health conscious. An approach along these lines will, ideally, remove any need for staged re-opening but will also minimise risks of adding to disadvantage, should staging be considered.
Longer term, increased resources should be devoted to ensuring that entrenched disadvantage in the north and west of Melbourne is removed. Regional development bodies, such as Northlink, have assembled comprehensive priority lists that will assist here. For example, rather than starting to build a Suburban Rail Loop in Melbourne’s south-east, which will further disadvantage the north (e.g. La Trobe University), the State Government should immediately improve Medium Capacity Transit in the north, connecting to the east, south and west (e.g. SmartBus, Bus Rapid Transit, light rail). This will boost regional accessibility, productivity and all that flows therefrom.
One very important lesson from this pandemic is that, as a society, we need to move away from blaming individuals as being solely responsible for their disadvantaged conditions, in terms of (for example) unemployment, early school leaving, and low wellbeing. The pandemic reveals that it is often the lack of opportunities that perpetuates disadvantage, where resources are not evenly distributed between people and places. In this sense, COVID compounds existing disadvantage, including in many fast-growing outer suburbs, where population growth has run ahead of provision of the requisite infrastructure and services.
A comprehensive strategy to tackle entrenched disadvantage should be one legacy from COVID in Melbourne. To improve long term social resilience and wellbeing, COVID has reminded us that there is a social gradient of impact/harm, with the poorer suburbs hurt more. Addressing disadvantage is a matter of social justice, but is also, as Stiglitz (2012) reminds us, a strategy of enlightened self-interest for the rest of the community.

41
References
ABS (2020). Regional Population Growth Australia2018-19, Cat. 3218.0, https://www.abs.gov.au/ausstats/[email protected]/mf/3218.0.
Atkinson, J., Skinner, A., Lawson, K., Song, Y. & Hickie, I. (2020). Road to Recovery: Restoring Australia’s Mental Wealth: Uncovering the Road to Recovery of Our Mental Health and Wellbeing Using Systems Modelling and Simulation, Brain and Mind Centre, The University of Sydney.
Brain, P., Stanley, J. and Stanley, J. (2019). Melbourne: How big, how fast and at what cost? MSSI Research Paper, Melbourne Sustainable Society Institute, The University of Melbourne.
Hickie, I. (2020). As ‘lockdown fatigue’ sets in, the toll on mental health will require an urgent response, The Conversation, August 4, https://theconversation.com/as-lockdown-fatigue-sets-in-the-toll-on-mental-health-will-require-an-urgent-response-143817
Brain and Mind Centre (2020). Sounding the Alarm: A Post-COVID-19 Curve for Suicide. Preliminary Results From Systems Modelling: North Coast Primary Health Network, https://www.sydney.edu.au/content/dam/corporate/documents/brain-and-mind-centre/mental-wealth/sounding_the_alarm_usyd_ncphn.pdf
Meyrick, J., Schulz, J. & O’Connor, J. (2020). At moment like these, we need a cultural policy, The Conversation, August 7, https://theconversation.com/at-moments-like-these-we-need-a-cultural-policy-141974
Schneiders, B. and Millar, R. (2020). A city divided: COVID-19 finds a weakness in Melbourne’s social fault lines, The Age 9th August, https://www.theage.com.au/national/victoria/a-city-divided-COVID-19-finds-a-weakness-in-melbourne-s-social-fault-lines-20200807-p55ji2.html

42
15. WFH(ome)? How WFC(afe) may be a part of the post corona workplace change
7 September 2020
PhD student James Bushell explores the Work From Cafe (WFC) phenomenon, which may well be part of the 'new normal' alongside working from home and working from the office.
As reported in another Thinking outside the box series article penned by Professor David Hensher, WFH is likely to become more of a feature of the future of work than less of one. The working from home (WFH) revolution has been pushed into its final stages over the last two months, out of public health necessity instead of anything else, and surprisingly has been made to work. Perhaps not as well as going to a workplace itself, but it hasn’t resulted in a complete stop to our economy and is allowing us to continue.
In a follow up to this piece, a lesser known phenomenon, working from cafes (WFC) is probably also set to become a more prominent part of what we do. Subject to future potential regulations around social distancing, or the fact that we may personally prefer some social distance post corona, WFC may become a feature of the modern way of working as an extension of WFH, or some part way hybrid between WFO and WFH. Being separate to your home removes the distractions of that load of washing or cleaning task to be done, that pet that is hassling for attention, or the ‘lets just put an episode of the latest show on for noise’ in the background. And the process of going somewhere for a short period of time helps focus attention on specific tasks.
WFC is popular in places that have agile workforces and for freelance workers without a permanent office. But any officeworkers with a laptop have found it useful too. The flexibility of working unmonitored in a pleasant space often gives people the sense of freedom from standard workplace norms, and a connection to the world in which we live. And the beauty of it is that you can work in different parts of your city and have little mini workday excursions.
There are rules though, an unspoken and unwritten etiquette. You don’t take up more space than you need, and you need to ‘buy’ your space with the coffee (or food) you purchase – the longer you spend the more you should buy. You can’t establish there for hours and days on end and make it an actual office – that is taking it too far, and you must watch the other tables to make sure if there is a lineup, you should make space if you’ve been there too long. Though if there is plenty of space (that is, too much free space) the café might want you to stay there to give it the impression of being a place to be! And respect the Wi-Fi (though I prefer not to use the Wi-Fi and be disconnected so I can work on a discrete task for a period of time with focus)
What does this mean for transport? Well, not a lot in itself, WFC isn’t going to lead to major changes in transport patterns, but if the WFH trend continues and other forms of WFx arise (including what I think I saw on a recent Zoom seminar, WFB (working from a boat!)) less time will be spent in the office and less transport time devoted to reaching it. Cafes close to home or on the way to the office are likely to be candidates for more WFC use given they can be linked with existing travel plans (and people can drop in on their way or augment their WFH routines with some variation), though interesting cafes might prove to be destinations in themselves depending on what the individual wants to achieve or if they’re in the area for another reason (e.g., a client meeting or private appointment).
And with the café sector taking a large hit, WFC is likely going to be a welcome boost to the economy of this sector.

43
16. Business location decisions before and after COVID 19
28 September 2020
Dr Camila Balbontin examines the ramifications of COVID-19 for local businesses in regards to their location planning and decisions.
The impact of COVID 19 in transport and urban planning will likely affect short- and long-term decisions worldwide. Most businesses have been required to shift towards working from home (WFH) which will likely have an important effect after this crisis is over. Early 2019 we conducted a survey where we asked businesses around the Greater Sydney Metropolitan Area for their location decisions (Balbontin & Hensher, 2019ab). When trying to understand possible reasons to move in the future (see Figure 1), our study found that 48% of businesses said they would probably move because their current space was too small. The figure below shows other interesting findings in terms of reasons for possible relocation, such as 2% of respondents said they might need to downsize.
Figure 1: Key reasons for moving in the future
When looking at these responses through the new COVID-19 lens, we might wonder how they will be affected, particularly by the new WFH business policies. For roles that have proven to be equally (or sometimes more) productive when working from home, it is likely that businesses might incorporate WFH practices on a regular basis – some might even provide “hot desks” to their employees (although there are concerns about biosecurity when desks are shared), expecting them to work from home for an important part of their week. If this is the case, the reasons to relocate might change entirely where some businesses will seek to reduce their office space; or it might reduce the importance of office space where businesses will be more likely to adapt to their current space rather than finding a new space. Our study also evaluated the importance of several physical infrastructure factors when businesses are deciding where to locate, the most relevant for the current situation are presented in Figure 2 on a scale from not at all important (1) to very important (2).
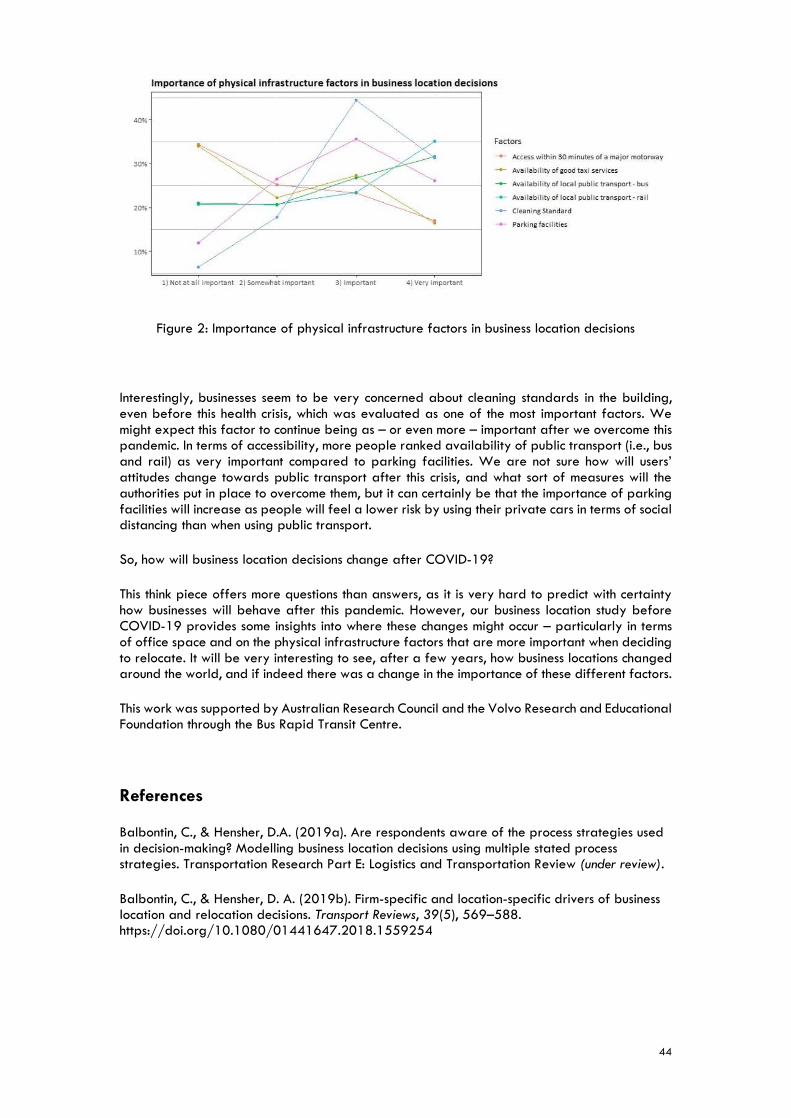
44
Figure 2: Importance of physical infrastructure factors in business location decisions
Interestingly, businesses seem to be very concerned about cleaning standards in the building, even before this health crisis, which was evaluated as one of the most important factors. We might expect this factor to continue being as – or even more – important after we overcome this pandemic. In terms of accessibility, more people ranked availability of public transport (i.e., bus and rail) as very important compared to parking facilities. We are not sure how will users’ attitudes change towards public transport after this crisis, and what sort of measures will the authorities put in place to overcome them, but it can certainly be that the importance of parking facilities will increase as people will feel a lower risk by using their private cars in terms of social distancing than when using public transport.
So, how will business location decisions change after COVID-19?
This think piece offers more questions than answers, as it is very hard to predict with certainty how businesses will behave after this pandemic. However, our business location study before COVID-19 provides some insights into where these changes might occur – particularly in terms of office space and on the physical infrastructure factors that are more important when deciding to relocate. It will be very interesting to see, after a few years, how business locations changed around the world, and if indeed there was a change in the importance of these different factors.
This work was supported by Australian Research Council and the Volvo Research and Educational Foundation through the Bus Rapid Transit Centre.
References
Balbontin, C., & Hensher, D.A. (2019a). Are respondents aware of the process strategies used in decision-making? Modelling business location decisions using multiple stated process strategies. Transportation Research Part E: Logistics and Transportation Review (under review).
Balbontin, C., & Hensher, D. A. (2019b). Firm-specific and location-specific drivers of business location and relocation decisions. Transport Reviews, 39(5), 569–588. https://doi.org/10.1080/01441647.2018.1559254

45
17. “Personalised Analytics” to battle coronavirus outbreak and beyond
2 November 2020
Personalised analytics involves using the data gathered and analysed by artificial intelligence with personal, human judgement. Professor Behnam Fahimnia looks at how this could be implemented to handle logistics disruptions caused by events such as the coronavirus.
Social media and news outlets have been headlining global mask shortages, toilet paper shortages, mixed messages about the virus spread, and photos of supermarkets with empty shelves one day, and overflowing with an oversupply of rice another day. These examples clearly indicate how unprepared our governments and industries are in tackling disruptions caused by serious disasters.
It is true that Artificial intelligence (AI) and data science tools can track and analyse data/information faster than a virus can travel. Machine-learning techniques and natural-language processing are now being used to review and analyse numerous news reports, patient records, social media, public health data, and related scientific articles to map the coronavirus outbreak and thereby understand its movement patterns and spreading behaviour (the age, gender, and location of those most at risk).
What makes AI and data science not very effective is the fact that the accuracy of these analytics and the actions to take based on the findings are reliant on the judgment of individual decision makers – be they policymakers or industry executives. How an individual interprets and applies the results produced by the analytics is influenced by their background, experience, personality traits, and cognitive biases.
Analytical models such as AI-powered optimisation models are often used to generate a set of “feasible solutions” to problems with multiple objective. Each of these feasible solutions may partially satisfy some of the objectives. A decision maker can then choose the most preferred solution from those feasible solutions.
Choosing a solution from a set of feasible solutions is reliant on the judgement of a decision maker. However, humans are prone to cognitive limitations which often causes information to be misused and decisions to deviate from that of a ‘rational’ decision maker. Understanding how human behaviour and cognition influence and interact with the design and implementation of analytics and AI-powered tools is rapidly-evolving area of academic research[1].
‘Personalised analytics’ brings together the best of two worlds – data science and human judgement – to empower policymakers and executives with information on how to better predict and tackle disruptions. Personalised Analytics are analytical models that can be customised to an individual’s background and personal characteristics. Individuals have ‘customised’ access to relevant data and information that can help them make more informed decisions.
Australia relies on AI and data analytics to tackle the productivity slowdown facing our industry. Approximately 78 percent of organisations who responded to a recent executive survey stated that analytical models and AI-based tools have empowered their managers in making some of the executive decisions[2]. The food industry, for example, identifies analytics as the key to advancement in productivity with a potential boost of A$20.3 billion in the value of food production[3].

46
There is no doubt that the increasing amount of data and continuing maturation of AI and data analytics can help our executives and policymakers make more informed decisions. But the shift toward the development and adoption of personal analytics is essential to help integrate “analytics” and “intuition” to achieve what neither individuals nor machines could reach on their own.
References
[1]Fahimnia, B., Pournader, M., Siemsen, E., Bendoly, E., 2019. Behavioral Operations and Supply Chain Management . Decision Sciences, Volume 50, Issue 6, Pages 1127-1183
[2] Loucks, J., Davenport, T., Schatsky, D., 2018. State of AI in the Enterprise (2nd Edition). Deloitte Insights October 2018.
[3] Perrett, E., Heath, R., Laurie, A., Darragh, L., 2017. Accelerating precision agriculture to decision agriculture – analysis of the economic benefit and strategies for delivery of digital agriculture in Australia. Australian Farm Institute.

47
18. What might the changing incidence of Working from Home (WFH) tell us about Future Transport and Land Use Agendas
7 December 2020
Professor David Hensher and Associate Professor Matthew Beck look at some of the ways the COVID-19 pandemic has significantly changed the way we travel and work, and how these changes might be taken advantage of for economic, social and environmental benefit.
“Governments and employers working with employees can, and should, take advantage of the unintended positive consequences of COVID-19.”
“Finally, we are truly in Liminal (“Threshold”) Time – the gateway between two stages in life!”
This is a short think piece[1] that recognises that while the pandemic forced change without choice for almost all individuals and households, it has resulted in unintended consequences[2]. We are in the midst of a real-world experiment that has created positive outcomes in that it has been suggested that the pandemic has made us less selfish and more societal focused and caring for others through being, in general, better responsible members of the community. There are, however, negative outcomes associated with the challenging, if not traumatic, experience for some individuals and households associated with job loss, social isolation, and inter-personal pressures within the household. However, a notable and potentially lasting consequence with positive impact, is working from home (WFH) and how that might translate into many impacts through the supply chain of businesses, particularly those that depend heavily on workers at the office, or who work outside of the home.
Before discussing WFH and the impact it may have on future transport and land use agendas, it is worth highlighting the seismic impact of COVID-19 and associated policies on broad mobility patterns. Using Google Mobility Data (Google 2020) we can see that, in a small sample of 16 countries from different parts of the globe, the time spent in transit (Figure 1), at workplaces (Figure 2) and in the home ((Figure 3) has changed dramatically almost everywhere. In particular, people have spent significantly less time in transit and workplaces, and more time inside the home which has in turn become the place of work (or study) for many. It stands to reason that the time spent at transit stations, workplaces and residences are intimately linked. Figure 4 highlights the degree to which these activities are related, with very strong positive correlations between the time spent at transit stations and work, and strong negative correlations between time spent at transit stations and home, and between time spent at work versus at home. It is interesting to note the differences in behaviour represented by South Korea and in particular Taiwan, suggesting that there are some differences in how these two countries are broadly responding to COVID-19.

48
Figure 1: Google Mobility Data – Transit Stations
Figure 2: Google Mobility Data – Transit Stations
Figure 3: Google Mobility Data – Residential

49
Figure 4: Correlations between Time Spent in Transit, Workplaces, and Homes[3]
A useful tool to measure the relative stringency of government policy across time is the Oxford COVID-19 Government Response Tracker (OxGRT 2020). OxGRT collect data on fourteen measures collected which are grouped into three over-arching dimensions, of which nine are used in the calculation of the Stringency Index:
where k is the number of component indicators in an index and Ij is the sub-index score for an individual indicator (see Hale et al. 2020 for further information). The indicators used in the stringency index are as follows:
(i) Containment and Closure:
· School closing · Workplace closing · Cancel public events · Restrictions on gathering size · Close public transport · Stay at home requirements · Restrictions on internal movement · Restrictions on international travel
(ii) Economic Response:
· Nil used in Stringency Index
(iii) Health Systems:
· Public information campaign

50
As can be seen, the biggest components in determining how stringent governments have been in responding to COVID-19 has been the limitations placed on the movement of people, which largely explains the shifting patterns in mobility that are observed in Figures 1-3. Generally speaking, it is unsurprising that countries that have been more stringent in their response have been so because of higher rates of infection. This is highlighted by way of a simple comparison. Figure 5 shows the average rate of positive tests within each of the 16 countries sampled, plotted against the average stringency index within each country for the time periods in which OxGRT has collected data on each measure. The darker dashed lines represent the average positive test rate over the 16 samples countries (0.036) and the average of the stringency index over the sampled countries (47.0). While outliers exist, generally countries with higher levels of stringency are grappling with higher positive test rates for COVID-19.
Figure 5: Positive COVID-19 Test Rates vs Stringency Index
To gain insight into the way in which the stringency of government policy impacts on travel behaviour, we employ cross-correlation analysis to help identify lags of the x-variable (Stringency Index) that might be useful predictors of the y-variable (time spent at transit stations). The cross-correlation is given by equation (2) where we are estimating the correlation between
a variable y and a different time-shifted variable xt+k, and σx and σy are the sample standard
deviations of xt and yt respectively. Note that since time spent at transit stations is very strongly correlated with time spent either at work (positive correlation) or at home (negative correlation), analysing this one variable as a proxy for “movement” is sufficient.
Figure 6 provides the cross-correlation coefficients for lag periods +/- 20 days either side of when government policy was made more, or less stringent. The negative correlations indicate that an above average value of “stringency” is likely to lead to a below average value of “transit”. In the majority of the sampled countries, the peak correlations (indicated by darker red) occur at a time lag around 0, indicating the changes in time spent in transit locations occur mainly on the day in which policy interventions are made. Some outliers exist, in particular Hong Kong and Germany seem to have changes in mobility that occur before government policy is enacted (positive lag), and Japan has a negative lag of about 4 days which indicates that

51
citizens respond more slowly to changes in stringency. Once again, Taiwan and South Korea also represent unusual cases.
It is clear that to restrict the spread of COVID-19, governments have deployed policies designed to curb the movement of people, which has in turn changed the nature of where time is spent and where work is done. It is undeniable that the change in work location is of considerable interest in many countries[4] and with people spending more time at home globally, many are now also having to work from this location (admittedly to varying degrees of success). This is resulting in work-related laws being revised. For example, Germany is drafting a new law to make working from home a legal right (Elliot 2020), large corporations in the technology sector were among to shift employees to WFH and have limited plans for them to return to the office (Lerman and Greene 2020), and the Office of National Statistics in the UK (ONS 2020) has noted a rise in the number of employees working exclusively from home (almost a quarter of those surveyed).
It is our belief that, a notable and potentially lasting consequence with positive impact, is working from home (WFH) and how that might translate into many impacts through the supply chain of businesses, particularly those that depend heavily on workers at the office, or who work outside of the home. In focussing on WFH[5], we emphasise that while the pandemic forced a cataclysmic change on our lives without much time to prepare, it has happened, and as we continue to respond to the pandemic by keeping our distance, evidence is building on the pros and cons of WFH and the extent to which WFH will continue at a level that is greater than pre-COVID-19.
There is plenty of evidence that this is a global trend. The software company Slack (channel-based messaging platform for fostering teamwork and collaboration within organisations) commissioned a survey of workers who identify as ‘skilled office workers’ in the US, the UK, France, Germany, Japan and Australia, fielded between June 30 and August 11, 2020. A key finding of this survey was the extent to which employees would prefer to work in the future in a hybrid way, mixing time working both from home and from the office, with only 11.6% wanting to return to the office full-time (Elliot 2020). Figure 7 shows the proportion of respondents in each country who would prefer a hybrid work model.
Figure 6: Cross-Correlations of Stringency Index and Google Mobility Data (Transit Stations)

52
Figure 7: Workers Who Would Prefer Mix of Work from Home and Office
In focussing on WFH, we emphasise that while the pandemic forced a cataclysmic change on our
lives without much time to prepare, it has happened, and as we continue to respond to the pandemic by keeping our distance, evidence is building on the pros and cons of WFH and the extent to which WFH will continue at a level that is greater than pre-COVID-19. At a high level, preliminary indications as of early September 2020, in Australia, are that we can expect to see a growing number of workers in some occupation classes (notably white collar but not exclusively) working from home for one to two days a week, and that this comes with the blessing of employers in particular, who believe there is generally no difference, on average, in productivity for employees who are currently working from home compared to before COVID-19 (Beck and Hensher 2020, 2020a). Studying from home (SFH) has also occurred, and while this has subsided in Australia for primary and secondary education, it largely remains in place for tertiary education, and in many instances international students are now studying from their home country (though in considerably less numbers than before across the sector). The physical absence of tertiary students has had a significantly large and negative impact on local suppliers of student accommodation, and other support industries and services.
While we have had disruption in the past, a key difference with COVID-19 compared to those such as SARS, MERS, the Global Financial Crisis and natural disasters, has been the duration, coverage and the extent to which disruption has occurred and continues to occur. Our evidence suggests that COVID-19 has also broken the back of significant business resistance to WFH, and at a time where many businesses are looking to reduce costs, many see WFH as an appealing and viable option to reduce the cost of office space provision where lease costs in the CBD in particular, are often sizeable. Ongoing levels of WFH would also be a prudent risk management strategy should the COVID-19 pandemic re-emerge or another replace it in the future. Significantly lowering the environmental impact of staff travelling every day can also allow big corporates to deliver on their sustainability charter which has generally alluded them to date.
Again, we acknowledge that not all can WFH as well as others and that occupation and the nature of work is a key determinant. For example, those with a face-to-face role in a service economy are facing unique difficulties in the face of a pandemic (in 2018 Deloitte produced a report about the rising importance of the service economy estimating that 70% of employment in the OECD is driven by this type of activity). Also, many workers face work/life balance concerns along with unequal distribution of non-paid labour in the home, and constraints on available space suitable for ongoing WFH. Technology access also plays a role, for example the availability, reliability and speed of an internet connection is pivotal. While these caveats remain, there are other considerable benefits that accrue to the employee who is able to WFH successfully such as being able to allocate their work hours in a more flexible way, or most importantly recovering time that is often lost to commuting. Employees (and/or their employers) have also likely made investments in the last six months to enable WFH (e.g., improved home office capability) and given the duration of the pandemic, new strategies and habits are likely being developed to make WFH work for them. While there does remain some hurdles to the ongoing levels of WFH such as social connectedness, team work, collaboration and creativity,

53
the human desire for face-to-face interactions with others (many authors have explored the role of social capital in the workplace and how friendship and connection can improve productivity), many of these barriers can be addressed with innovation and a work environment where there is a mix of WFH and working in “the office”.
The growth in WFH translates into some important positive changes in the performance of the transport network, particularly in the larger cities. Our research in Australia suggests that we might anticipate at least a 10 to 15 percent improvement in the metropolitan transport networks due to reduced traffic congestion on the roads and crowding on public transport. We suggest that WFH promises to be the greatest ‘transport’ lever for policy makers to reduce congestion and crowding that the sector has ever had. What we are seeing in our tracking surveys to date since March 2020 (Beck and Hensher 2020, 2020a) is that the increase in WFH in Australia is spread evenly throughout the five weekdays. This is important, since infrastructure and service capacity is typically determined by peak demand, and if this can be flattened as it suggests it might, then the implications for prioritising and deferring funds and planning in transport are potentially significant, even going forward over many years.
There are a growing number of structural responses that should be given serious consideration, and we now set out a number of likely futures post-COVID19.It will be useful to list a number of potential changes to the fabric of society that could occur due to increased WFH brought on by the pandemic and likely to continue well after the pandemic has subsided. These should, at a minimum, be part of any discussions by government in particular, but more generally, on future transport and land use agendas in all countries.
1. While we are likely to see a recovery of office workers back to the Central Business District (CBD) of the cities on any given day, it could be at a reduced level, around 80%, which will not only support reduced road traffic congestion but also manageable crowding on public transport compared to pre-COVID-19. Central areas of major metropolitan cities will continue to have a role, but as we discuss below, the idea of reinvigoration in suburbia should not be dismissed lightly in any attempt to protect and preserve the CBD as a matter of faith. Although this CBD impact is still a dent in the revenue sources for many businesses in the central city precincts that depend to a large extent on office trade, it is still enough activity to revitalise much of the business in the supply chain that is currently suffering. We must recognise that much of the loss in the supply chain is due to restrictions that are separate to restrictions on office workers and which are slowly being lifted. Furthermore, an increasing number of businesses have been moving to online trading and consequentially, one can expect a decline in traditional bricks and mortar trade. Restaurants and other food outlets will be the biggest winners as activity returns to some degree of normality in the CBD; however some structural change is likely, with new opportunities opening up in suburbia, and especially the locations that have already started to take on the appearance of a CBD or a small but growing business precinct.
2. Local suburbanisation can take on a new and appealing meaning which opens up opportunities for revitalisation of suburbia. These locational adjustments of WFH align well with promoting the 20 or 30 minute city, which remains a challenge given a strong radial and CBS focussed strategy in many cities throughout the world. We need to promote ‘be local and buy local’ to help capture the redistributive effect of increased WFH where small business in suburban areas can benefit from increased economic activity that they would otherwise not participate in.
3. All of these locational responses will present challenges for property developers and property agents who manage office space. Rents, relative to the average trend, may decline in the CBD as large enterprises rethink their priorities (especially the reduced number of workers in the office at any one time), and while lower rents may attract a new class of small to medium sized businesses into (or back into) the CBD, we would suggest that this will be balanced against the benefits of a more local office plan, where rents will also be competitive and office space more convenient to where people live, again reducing the pressures of the commute and supporting more flexible working hours.

54
4. Although there is much talk in many countries about getting back to the pre-COVID-19 office versus continuing to WFH, there is another way to reduce the burden on WFH while avoiding the need for the stressful commutes and loss of flexibility in working hours, namely the local shared or satellite office, often referred to as the ‘third office’ or neighbourhood business hub. This has the advantage of supporting ‘working close to home’ (WCTH) (reduced time spent in travel), but not at home with all of its accompanying limitations such as lack of social interaction, and poor space to work effectively without interruptions from, or interrupting, other family members. It also significantly reduces the lease cost of office space and its associated overheads as well as creating connections locally, be they work or social, effectively reducing excess office capacity in this new world of connectivity through digital capability. What we have here is similar to efforts to reduce the fixed costs of private car ownership through mobility services such as Mobility as a Service (MaaS), with the prospect of growing demand for the lower cost ‘Office Location as a Service (OLaaS)’.
5. With fewer days commuting, we can expect to see a greater use of the private car in general, but specifically for commuting, since commuters who were previously public transport users might be more prepared to put up with traffic congestion and parking costs for two to three days a week, but not necessarily for five days. This has important implications for public transport patronage, and indeed may require a rethink of the structure of fares (beyond a peak and off-peak differentiation) and local on-demand services. As Mobility as a Service (MaaS) reboots after the pandemic (Hensher et al. 2020 Hensher 2020), there is a need to rethink monthly subscription plans to allow for subscriptions that have value when used for lesser number of days compared to the typical monthly pay plan. These might be repackaged for specific combinations of numbers of days per month. A greater focus on local shared mobility offerings, especially bicycles and e-scooters, should increasingly be built into the offered subscription bundles.
6. We should also reflect on long distance domestic travel as restrictions are lifted. Specifically, we are likely to see a significant reduction in domestic business air travel in many jurisdictions, replacing for example, the Sydney to Melbourne or the New York to Chicago and return flights (typically 4 hours out of the day) to attend a one hour meeting with an online meeting. This may translate into a growth in local non-commuting activity with time freed up.
7. With a greater focus on local activity, there will be a need to reprioritise improvements in local public transport, safer pedestrian walkways and precincts, and bicycle lanes, serving short distant trips throughout the day, with the added benefit of improving first and last mile connectivity to PT and (hopefully) contributing to improved health outcomes. Local road amenity and safety may also need to be revisited, with a greater focus on localised maintenance and traffic control measures to cope with a potential change to localised traffic flow. Generally, we need a rethink where infrastructure funding should go, including deferring major infrastructure spend. We might even find that active travel strategies can become embedded within investment in key public infrastructure
8. The freight distribution sector, which has already shown significant growth with a noticeable increase in distribution to homes for online orders due to COVID-19, will continue to grow and investment to support freight networks with less “friction” will be crucial to the economy, even more so in the future.
9. Governments can lead the way in supporting WFH as a way of reducing pressure on the transport network, especially in metropolitan settings, but where this pressure is not of great consequence (e.g., many regional and rural contexts), they should encourage and support reduced travel and improvements in wellbeing associated with greater flexibility in work hours and days of the week working at home. Evidence through doing (leading by example) can flow through to the private sector to use WFH and WCTH to deliver on their sustainability charter.
10. Governments will also need to think creatively if they wish to reap the potential environmental benefits of increased work from home. Preliminary research has indicated that for people who commute by car, working from home is likely to reduce their carbon dioxide
(CO2) footprint if their journey to work is greater than about 6 kilometres[6]. However, for short

55
car commutes or those done by public transport, working from home could increase CO2 emissions due to extra residential energy consumption. Encouraging more thermally efficient buildings and sustainable energy sources such as solar could be considered.
In summary, the liminal threshold imposed on society by the COVID-19 pandemic provides an opportunity to allow decision-makers to take a hard look at the assumptions being used pre-COVID-19 that underlie many of the decisions made on transport and land use futures. Doing this may offer a real opportunity for sustained change that many have been seeking. COVID-19 has brought us all together and the future must be seen as an all of society commitment.
Acknowledgements
These papers relate to the ITLS research program on WFH. Post-Wave 2, the project has received funding from the iMove CRC with industry partners TMR Qld, TfNSW and WA DoT. Wave 1 = late March 2020; Wave 2 = late May 2020.
Recent Talks:
Presentation: https://www.youtube.com/watch?v=qDNDox3oPhU
Extended Q&A Session: https://youtu.be/aUr3Y5E0x4w
Footnotes
[1] We thank our colleague, Professor John Nelson, and Sherri Fields of TfNSW for their comments.
[2] The opinions in this thought piece are those of the authors alone. The paper was prepared outside of two research projects which we are now engaged in, and we acknowledge the support from the iMOVE CRC (https://imoveaustralia.com/) and our industry partners (Transport and Main Roads (TMR) MR Queensland, Transport for NSW (TfNSW) and the Western Australia Department of Transport (WA DoT) in moving the WFH agenda forward in the next 18 months.
[3] All correlation coefficients are statistically significant at the 1% level. Spearman’s correlations were used for the Australian, German, New Zealand, Hong Kong, Japan and Taiwan, and within South Korea for correlations with “work” only, due to the data being non-normal.
[4] Simple searches “work from home COVID” produces 789,816 results in ProQuest, 36,000 results in Google Scholar.
[5] Studying from home (SFH) has also occurred, and while this has subsided in Australia for primary and secondary education, it largely remains in place for tertiary education, and in many instances international students are now studying from their home country (though in considerably less numbers than before across the sector). The physical absence of tertiary students has had a significantly large and negative impact on local suppliers of student accommodation, and other support industries and services.
[6] https://www.iea.org/commentaries/working-from-home-can-save-energy-and-reduce-emissions-but-how-much

56
References
Beck, M. and Hensher, D.A. (2020). Insights into the Impact of COVID-19 on Household Travel, Work, Activities and Shopping in Australia – the early days under restrictions, Transport Policy, 96, 76-93. https://doi.org/10.1016/j.tranpol.2020.07.00 (Wave 1)
Beck, M. and Hensher, D.A. (2020a). Insights into the impact of COVID-19 on household travel and activities in Australia – the early days of easing restrictions, Transport Policy, 99,95-119. (Waves 1 and 2), https://doi.org/10.1016/j.tranpol.2020.08.004
Beck, M., Hensher, D.A. and Wei, E. (2020). Slowly coming out of COVID-19 restrictions in Australia: implications for working from home and commuting trips by car and public transport, Journal of Transport Geography, 88. (Waves 1 and 2), doi.org/10.1016/j.jtrangeo.2020.102846
Elliot, B. (2020). Rewiring how we work: building a new employee experience for a digital-first world, https://slack.com/intl/en-au/blog/transformation/remote-employee-experience-index-launch, accessed 24/10/20.
Elliot, D. (2020.) Germany drafting law to give people the legal right to work from home, World Economic Forum, https://www.weforum.org/agenda/2020/10/germany-is-set-to-make-home-working-a-legal-right/, accessed 23/10/20.
Google (2020). "Google COVID-19 Community Mobility Reports.” https://www.google.com/COVID19/mobility, accessed 23/10/20.
Hale, T., N. Angrist, E. Cameron-Blake, L. Hallas, B. Kira, S. Majumdar, A. Petherick, T. Phillips, H. Tatlow, and S. Webster (2020). Variation in government responses to COVID-19, BSG Working Paper Series, BSG-WP-2020/032 Version 8.0, https://www.bsg.ox.ac.uk/sites/default/files/2020-10/BSG-WP-2020-032-v8.pdf, accessed 23/10/20.
Hensher, D.A. (2020). What might COVID-19 mean for mobility as a service (MaaS)? Transport Reviews, 40 (5), 551-556.
Hensher, D.A., Beck, M. and Wei, E. (2020). Working from home and its implications for strategic transport modelling given the changing quantum of commuting trips by car and public transport in the early days of the COVID-19 pandemic, submitted to Transportation Research Part A, 1 June, revised 14 September (Wave 1)
Hensher, D.A., Wei, E., Beck, M.J. and Balbontin, C. (2020a). The impact of COVID-19 on the time and monetary cost outlays for commuting - the case of the Greater Sydney Metropolitan Area after three months of restrictions (Wave 2), submitted to Transport Policy, 14 September.
Hensher, D.A., Mulley, C., Ho, C., Nelson, J., Smith, G. and Wong, Y. (2020b). Understanding Mobility as a Service (MaaS) - Past, Present and Future. Elsevier, UK, 204 pp. ISBN 9780128200445.
Lerman, R. and J. Green (2020). Big Tech was first to send workers home. Now it’s in no rush to bring them back. The Washington Post, https://www.washingtonpost.com/technology/2020/05/18/facebook-google-work-from-home/, accessed 23/10/20.
ONS (2020). Coronavirus and the latest indicators for the UK economy and society Coronavirus and the latest indicators for the UK economy and society: 1 October 2020, Office of National Statistics, https://www.ons.gov.uk/peoplepopulationandcommunity/healthandsocialcare/conditionsanddiseases/bulletins/coronavirustheukeconomyandsocietyfasterindicators/1october2020, accessed 23/10/20.
OxGRT (2020). Coronavirus Government Response tracker, https://www.bsg.ox.ac.uk/research/research-projects/coronavirus-government-response-tracker, accessed 23/10/2020.


