Embed Size (px)
Citation preview
www.elsevier.com/locate/brainres
Brain Research 997 (2004) 40–51
Research report
Time course of efferent fiber and spiral ganglion cell degeneration
following complete hair cell loss in the chinchilla
Sandra L. McFadden*, Dalian Ding, Haiyan Jiang, Richard J. Salvi
Center for Hearing and Deafness, University at Buffalo, 215 Parker Hall, Buffalo, NY 14214, USA
Accepted 20 October 2003
Abstract
Ethacrynic acid (EA) is known to interact with aminoglycoside antibiotics such as gentamicin (GM). In the chinchilla, co-administration
of GM and EA can produce hair cell lesions ranging from a small loss of outer hair cells (OHCs) in the base of the cochlea to complete
destruction of all hair cells, depending on dosing parameters. Although hair cell loss has been characterized, little is known about the fate of
efferent fibers or spiral ganglion neurons (SGNs) in this model. To study the time course of efferent fiber and SGN loss, chinchillas were
injected with GM (125 mg/kg IM) followed immediately by EA (40 mg/kg IV). Estimates of efferent fiber loss and density changes were
made after 3 days or 1, 2, 3, or 4 weeks of survival. Estimates of SGN loss and density changes were made after 15 days or 1, 2, 4, or 6
months of survival. Cochlear function was rapidly abolished and all cochlear hair cells were missing within 24 h after treatment. Inner hair
cells (IHCs) in the middle turn of the cochlea died earlier than cells in the apex or base, and OHCs in Rows 1 and 2 died earlier than OHCs in
Row 3. Degeneration of efferent nerve fibers began 3–7 days post-injection, versus 15–30 days for SGNs, and the loss of efferent fibers was
essentially complete within 1 month, versus 2–4 months for SGNs. The rapid time course of efferent fiber and SGN loss in the chinchilla
may make it a practical model for studying mechanisms of neural loss and survival in the mammalian inner ear.
D 2003 Elsevier B.V. All rights reserved.
Theme: Development and regeneration
Topic: Neuronal death/sensory systems
Keywords: Aminoglycoside antibiotic; Loop diuretic; Ototoxicity; Inner ear pathology; Ganglion neuron; Nerve fiber; Cochlea
1. Introduction
Research on topics related to the protection, rescue and
repair of neurons and their processes is aided by the use of
animal models in which neural degeneration occurs in a
predictable manner over a well-defined time course. One
method for producing an animal model of spiral ganglion
neuron (SGN) and nerve fiber degeneration in the cochlea
is to destroy cochlear hair cells by administering a large
dose of an aminoglycoside antibiotic (AAB) and ethacrynic
acid (EA) [14–16,21,24–26]. SGNs degenerate following
IHC destruction, with a time course that depends on factors
such as species and magnitude of IHC loss. The AAB/EA
deafening procedures that have been used with cats,
0006-8993/$ - see front matter D 2003 Elsevier B.V. All rights reserved.
doi:10.1016/j.brainres.2003.10.031
* Corresponding author. Tel.: +1-716-829-2001x13; fax: +1-716-829-
2980.
E-mail address: [email protected] (S.L. McFadden).
monkeys and guinea pigs typically result in variable and
incomplete hair cell loss, thereby confounding studies of
SGN degeneration and treatments aimed at preserving
them. Furthermore, SGN degeneration is a slow process
that can take more than a year to complete in cats and
guinea pigs [15,21,25]. The slow time course and variable
magnitude of SGN degeneration can be a major drawback
for studies of neural death and survival mechanisms. We
recently described a GM/EA deafening procedure that
reliably destroys all cochlear hair cells in chinchillas [17].
In these animals, we also observed rapid degeneration of
SGNs and nerve fibers in the cochlea, suggesting that the
chinchilla may be a practical model for studies of neural
protection, rescue and repair. The current study describes
the time course of SGN and nerve fiber degeneration in the
chinchilla cochlea following a single injection of GM (125
mg/kg IP) and EA (40 mg/kg IV) that rapidly destroyed
hair cells and abolished cochlear function. We were par-
ticularly interested in comparing the time course of efferent
S.L. McFadden et al. / Brain Research 997 (2004) 40–51 41
fiber degeneration and afferent fiber/SGN degeneration
caused by the GM/EA combination, given speculation
about a trophic role of lateral olivocochlear (LOC) efferent
fibers in the cochlea [18].
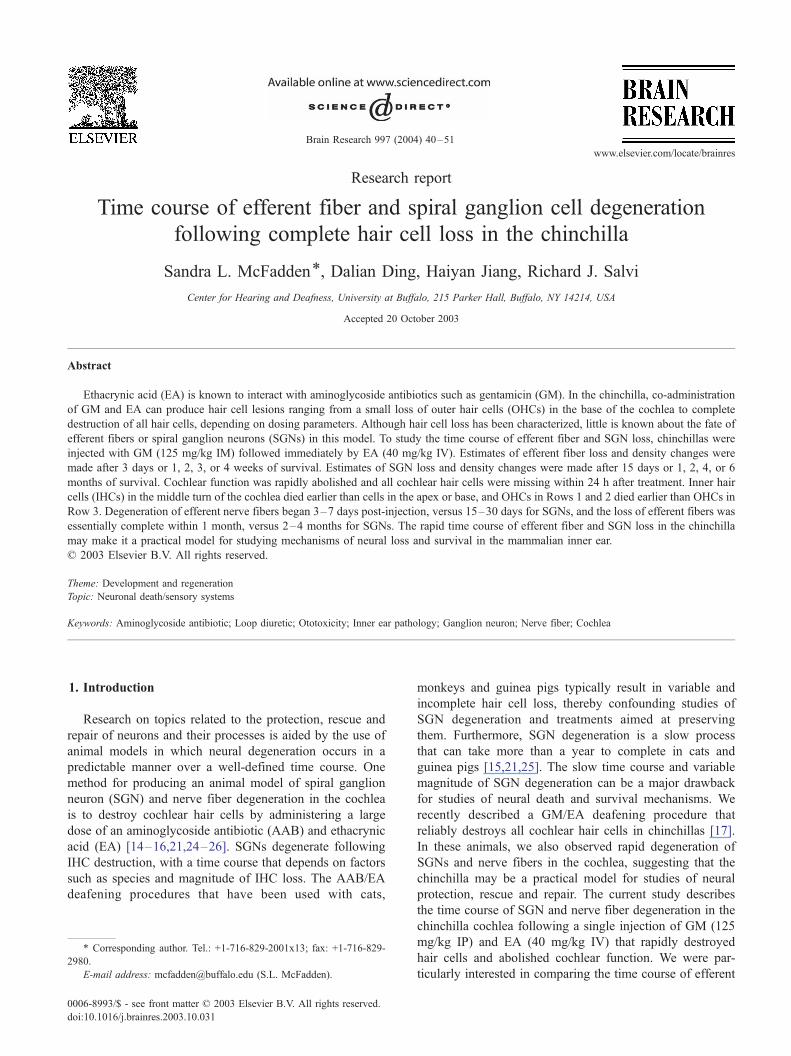
Fig. 1. Surface preparation from the middle turn of a normal cochlea,
‘‘stained’’ with silver nitrate for hair cell counting. Note the presence of
three rows of OHCs (OHC1, OHC2, OHC3) and one row of IHC, separated
by pillar cells (PC). The arrow shows where one OHC is missing from the
third row. OHC were replaced by a phalangeal scar (arrow) formed by
supporting cells. Scale bar = 20 Am.
2. Materials and methods
2.1. Subjects
Subjects were 41 healthy adult chinchillas obtained from
a commercial breeder. Four chinchillas were prepared for
electrophysiological recording by implanting chronic re-
cording electrodes at the round window niche (see below).
Thirty-six chinchillas, including the four animals with round
window electrodes, were anesthetized with ketamine (55
mg/kg IM) and acepromazine (0.5 mg/kg IM), then injected
with GM (gentamicin sulfate, Sigma Chemicals; 125 mg/kg
IM), followed immediately by EA (Sodium EdecrinR,Merck & Co., Inc., West Point, PA; 40 mg/kg into the right
jugular vein). For counts of efferent nerve fibers, animals
were sacrificed after survival times of 3 days or 1, 2, 3, or 4
weeks (N = 15, three animals at each time point). For counts
of SGNs and examination of nerve fibers in the habenula
perforata of the osseous spiral lamina (OSL), animals were
sacrificed after survival times of 15 days or 1, 2, 4, or 6
months (N = 15, three animals at each time point). Six
chinchillas were sacrificed at 6, 12 or 24 h post-injection
for verification of rapid hair cell loss [17]. Five untreated
chinchillas served as normal controls for SGN counts.
2.2. Electrophysiology
Compound action potentials (CAP), cochlear microphon-
ics (CM) and summating potentials (SP) were monitored in
four chinchillas to observe the time course of decline of
cochlear function following GM/EA injection. The chin-
chillas were prepared for electrophysiological recording by
implanting a Teflon-coated silver wire ball electrode at the
round window niche of the right ear under surgical anes-
thesia (ketamine, 55 mg/kg IM; acepromazine, 0.5 mg/kg
IM). Animals were allowed to recover for at least 1 week
prior to GM/EA injection. Stimuli were digitally generated
tones at 1, 2, 4 and 8 kHz, presented at a rate of 19 per s
from a loudspeaker located 25 cm directly in front of the
animal in a double-walled sound attenuating booth. For
CAP, tones were 7 ms duration, 1 ms rise/fall; for CM and
SP, tones were 17 ms duration, 1 ms rise/fall. Electrical
activity recorded from the round window electrode was
amplified (20,000� for CAP and CM, 5000� for SP),
filtered (100–3000 Hz for CAP; 10–10,000 for CM; 1–300
Hz for SP), digitized by an A/D converter on a signal
processing board in a computer, and averaged for 100
presentations at each stimulus level. Stimulus level was
incremented in 10 dB steps, from 0 to 70 dB SPL for CAP,
from 50 to 90 dB SPL for CM, and from 40 to 90 dB SPL
for SP. Responses were recorded prior to GM/EA injection,
and at 0.5, 1.0, 1.5, 2.0, 24, and 72 h following injection.
2.3. Morphological assessment
Animals were sacrificed with CO2 and decapitated, and
the bullae were quickly removed. As described in detail by
Azeredo et al. [1], two distinct populations of olivocochlear
efferent fibers, referred to as LOC and medial olivocochlear
(MOC) efferents, innervate the chinchilla cochlea. The vast
majority of olivocochlear efferent fibers are small, unmy-
elinated fibers that arise from neurons located within the
lateral superior olivary nucleus; these LOC efferent fibers
project almost exclusively to the ipsilateral cochlea, where
they form synapses with the afferent fibers beneath the IHCs.
A smaller number of olivocochlear efferent fibers are large,
myelinated fibers that arise from neurons located in the
medial region of the superior olive, particularly the dorso-
medial peri-olivary nucleus; theseMOC fibers project to both
cochleas (in a 1:4 ipsilateral to contralateral ratio in chinchil-
la), lose their myelin at the habenula perforata, and cross the
tunnel of Corti to form synapses directly with the OHCs.
For determination of LOC and MOC efferent fiber loss,
cochleas were prepared using acetylcholine esterase (AChE)
histochemistry as described previously [2,30]. In AChE
stained cochleas, MOC fibers can be seen crossing the
tunnel of Corti en route to the OHCs, whereas LOC fibers
travel in the inner spiral bundle (ISB) in the IHC region (see
Fig. 5A). Cochleas were first perfused with 4% paraformal-
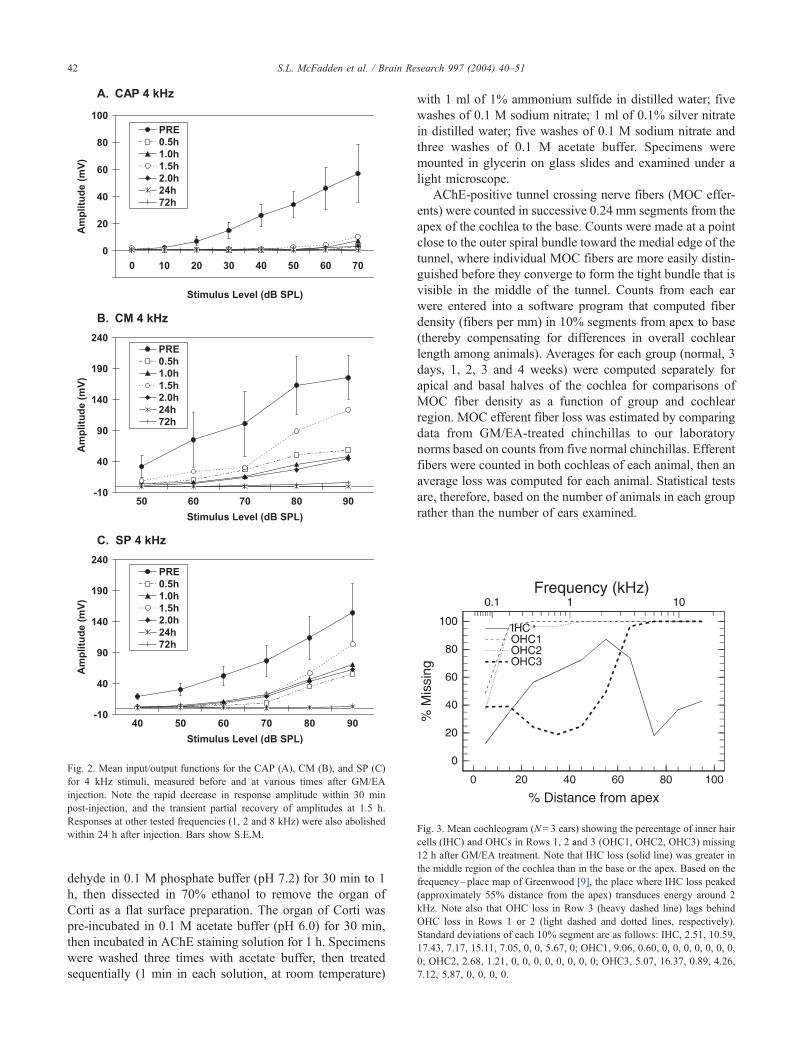
Fig. 3. Mean cochleogram (N= 3 ears) showing the percentage of inner hair
cells (IHC) and OHCs in Rows 1, 2 and 3 (OHC1, OHC2, OHC3) missing
12 h after GM/EA treatment. Note that IHC loss (solid line) was greater in
the middle region of the cochlea than in the base or the apex. Based on the
frequency–place map of Greenwood [9], the place where IHC loss peaked
(approximately 55% distance from the apex) transduces energy around 2
kHz. Note also that OHC loss in Row 3 (heavy dashed line) lags behind
OHC loss in Rows 1 or 2 (light dashed and dotted lines, respectively).
Standard deviations of each 10% segment are as follows: IHC, 2.51, 10.59,
17.43, 7.17, 15.11, 7.05, 0, 0, 5.67, 0; OHC1, 9.06, 0.60, 0, 0, 0, 0, 0, 0, 0,
0; OHC2, 2.68, 1.21, 0, 0, 0, 0, 0, 0, 0, 0; OHC3, 5.07, 16.37, 0.89, 4.26,
7.12, 5.87, 0, 0, 0, 0.
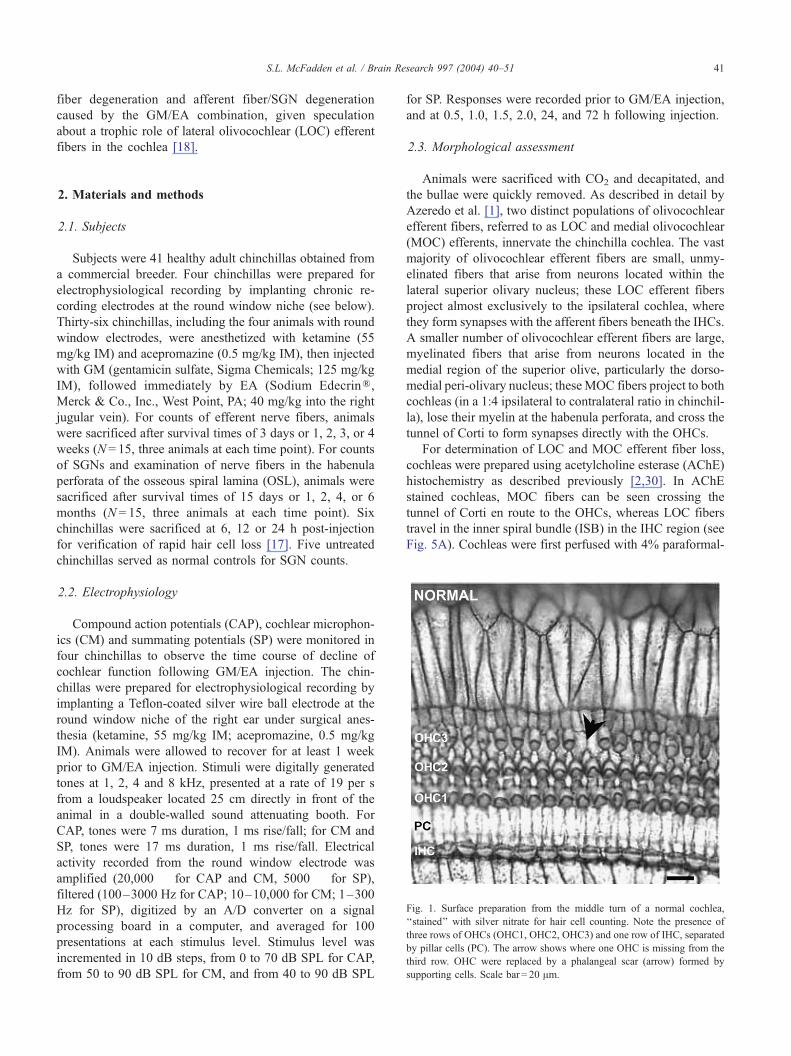
Fig. 2. Mean input/output functions for the CAP (A), CM (B), and SP (C)
for 4 kHz stimuli, measured before and at various times after GM/EA
injection. Note the rapid decrease in response amplitude within 30 min
post-injection, and the transient partial recovery of amplitudes at 1.5 h.
Responses at other tested frequencies (1, 2 and 8 kHz) were also abolished
within 24 h after injection. Bars show S.E.M.
S.L. McFadden et al. / Brain Research 997 (2004) 40–5142
dehyde in 0.1 M phosphate buffer (pH 7.2) for 30 min to 1
h, then dissected in 70% ethanol to remove the organ of
Corti as a flat surface preparation. The organ of Corti was
pre-incubated in 0.1 M acetate buffer (pH 6.0) for 30 min,
then incubated in AChE staining solution for 1 h. Specimens
were washed three times with acetate buffer, then treated
sequentially (1 min in each solution, at room temperature)
with 1 ml of 1% ammonium sulfide in distilled water; five
washes of 0.1 M sodium nitrate; 1 ml of 0.1% silver nitrate
in distilled water; five washes of 0.1 M sodium nitrate and
three washes of 0.1 M acetate buffer. Specimens were
mounted in glycerin on glass slides and examined under a
light microscope.
AChE-positive tunnel crossing nerve fibers (MOC effer-
ents) were counted in successive 0.24 mm segments from the
apex of the cochlea to the base. Counts were made at a point
close to the outer spiral bundle toward the medial edge of the
tunnel, where individual MOC fibers are more easily distin-
guished before they converge to form the tight bundle that is
visible in the middle of the tunnel. Counts from each ear
were entered into a software program that computed fiber
density (fibers per mm) in 10% segments from apex to base
(thereby compensating for differences in overall cochlear
length among animals). Averages for each group (normal, 3
days, 1, 2, 3 and 4 weeks) were computed separately for
apical and basal halves of the cochlea for comparisons of
MOC fiber density as a function of group and cochlear
region. MOC efferent fiber loss was estimated by comparing
data from GM/EA-treated chinchillas to our laboratory
norms based on counts from five normal chinchillas. Efferent
fibers were counted in both cochleas of each animal, then an
average loss was computed for each animal. Statistical tests
are, therefore, based on the number of animals in each group
rather than the number of ears examined.
S.L. McFadden et al. / Brain Research 997 (2004) 40–51 43
It is not possible to count individual AChE-labeled fibers
in the ISB, and both cochlear afferents and medial efferent
tunnel crossing fibers (TFC) can be interspersed among ISB
fibers [12]; therefore, LOC efferent loss could only be
roughly estimated from our material, based on changes in
the width of the ISB over time. The ISB was examined in
10-Am long samples (one from the apical turn and one from
the basal turn of the cochlea), and measurements were taken
at the narrowest and widest points along this segment.
Average ISB widths were computed for each group based
on 5–10 samples per group.
For counts of SGNs in Rosenthal’s canal and examina-
tion of nerve fibers in the OSL, the cochleas were perfused
through the round window with approximately 1 ml of 4%
paraformaldehyde in 0.1 M phosphate buffered saline (pH
Fig. 4. Structure of the organ of Corti at various times after the loss of all cochlear h
the normal organ of Corti shows OHCs from rows 1, 2 and 3 (OHC1, OHC2, OH
(HC), and outer pillar cells (OPC) bordering the tunnel of Corti (asterisk)), and an in
hair cells. B–F. Cross sections at various times after GM/EA injection: (B) 2 days;
7.4), then immersed in fixative for approximately 24 h. The
fixed cochleas were decalcified by immersion in Decal
(Baxter Scientific Products) for 2 days, dehydrated, and
embedded in Epon 812 resin. Serial sections were cut in a
plane parallel to the modiolus at a thickness of 3 Am(Reichert Super Nova microtome), mounted on slides and
stained with toluidine blue [2]. For estimates of SGN
numbers, every neuron with a nucleus was counted in every
fifth section through the modiolus [26]. To sample the entire
area of Rosenthal’s canal, approximately 40–50 sections per
modiolus were examined. Counts were obtained from five
normal animals, and from 15 animals treated with GM and
EA. To estimate the density of SGNs, modiolar sections
from the apical and basal turns of the cochlea were exam-
ined. The number of SGNs in a 0.2-mm diameter visual
air cells (all sections from the lower middle turn). (A) Cross section through
C3), supporting cells (Dieter’s cells (DC) beneath the OHCs, Hensen’s cells
ner hair cell (IHC). The tectorial membrane (TM) extends over the top of the
(C) 15 days; (D) 1 month; (E) 2 months and (F) 4 months. Scale bar = 10 Am.
S.L. McFadden et al. / Brain Research 997 (2004) 40–5144
field was counted for five samples from the apical turn, and
five samples from the basal turn of each cochlea. Group
averages for the number of SGNs per square millimeter,
based on two to five animals per group, were computed
separately for the apical and basal turns. In addition, every
fifth section containing habenula perforatae was examined
to determine the condition of nerve fibers in the OSL in the
middle turn. Because most nerve fibers were absent even at
2 weeks post-injection, counts of habenular nerve fibers of
GM/EA-treated animals were not made. The nerve fiber
counts from normal control animals that are presented in this
paper were obtained from six normal chinchillas as part of a
separate study [4]. Nerve fibers passing through 10 basal, 10
middle turn, and 10 apical openings in the OSL of each
cochlea were counted and averaged for the group.
The opposite cochlea of each animal was used to confirm
hair cell loss, using succinate dehydrogenase (SDH) histo-
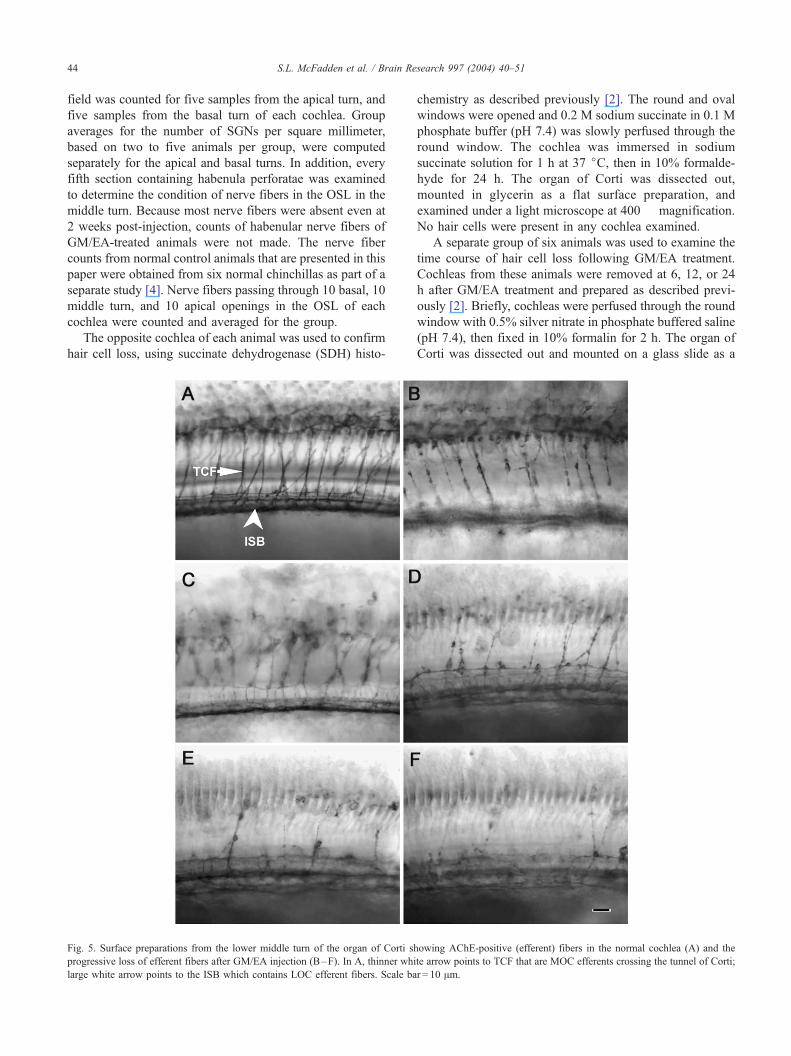
Fig. 5. Surface preparations from the lower middle turn of the organ of Corti sh
progressive loss of efferent fibers after GM/EA injection (B–F). In A, thinner whi
large white arrow points to the ISB which contains LOC efferent fibers. Scale ba
chemistry as described previously [2]. The round and oval
windows were opened and 0.2 M sodium succinate in 0.1 M
phosphate buffer (pH 7.4) was slowly perfused through the
round window. The cochlea was immersed in sodium
succinate solution for 1 h at 37 jC, then in 10% formalde-
hyde for 24 h. The organ of Corti was dissected out,
mounted in glycerin as a flat surface preparation, and
examined under a light microscope at 400� magnification.
No hair cells were present in any cochlea examined.
A separate group of six animals was used to examine the
time course of hair cell loss following GM/EA treatment.
Cochleas from these animals were removed at 6, 12, or 24
h after GM/EA treatment and prepared as described previ-
ously [2]. Briefly, cochleas were perfused through the round
window with 0.5% silver nitrate in phosphate buffered saline
(pH 7.4), then fixed in 10% formalin for 2 h. The organ of
Corti was dissected out and mounted on a glass slide as a
owing AChE-positive (efferent) fibers in the normal cochlea (A) and the
te arrow points to TCF that are MOC efferents crossing the tunnel of Corti;
r = 10 Am.
S.L. McFadden et al. / Brain Research 997 (2004) 40–51 45
surface preparation, then exposed to indirect sunlight for
approximately 1 h to enhance staining contrast. Specimens
were examined under a light microscope at 400� magnifi-
cation, and hair cell loss was determined in successive 0.24-
mm segments, beginning at the apex. Fig. 1 shows a
representative surface preparation from the middle turn of
a normal cochlea. Hair cells were counted as present if their
stereocilia or cell bodies were visible, or as missing if a
phalangeal scar was visible (Fig. 1, arrow). Cochleograms
showing the percent of missing hair cells as a function of
basilar membrane position, normalized to percent distance
from the apex, were prepared for animals in the 12 h group.
Counts from each ear were entered into a software program
that computed hair cell density (cells per mm) in 10%
segments of the cochlea from apex to base, and compared
these values to lab standards based on hair cell counts from
nine normal, young adult chinchillas. Estimates of frequency
corresponding to percent distance from the apex were made
using the frequency–place map of Greenwood [9].
All procedures regarding the use and care of animals in
this study were reviewed and approved by the Institutional
Animal Care and Use Committee at University at Buffalo.
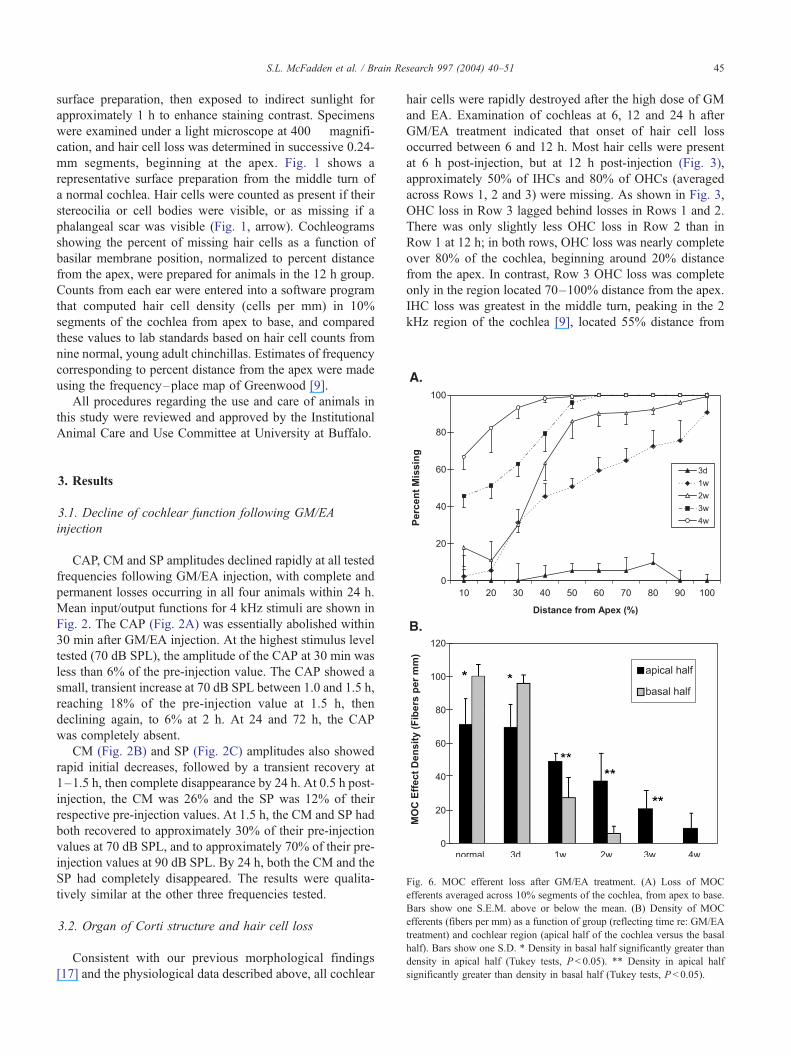
Fig. 6. MOC efferent loss after GM/EA treatment. (A) Loss of MOC
efferents averaged across 10% segments of the cochlea, from apex to base.
Bars show one S.E.M. above or below the mean. (B) Density of MOC
efferents (fibers per mm) as a function of group (reflecting time re: GM/EA
treatment) and cochlear region (apical half of the cochlea versus the basal
half). Bars show one S.D. * Density in basal half significantly greater than
density in apical half (Tukey tests, P< 0.05). ** Density in apical half
significantly greater than density in basal half (Tukey tests, P< 0.05).
3. Results
3.1. Decline of cochlear function following GM/EA
injection
CAP, CM and SP amplitudes declined rapidly at all tested
frequencies following GM/EA injection, with complete and
permanent losses occurring in all four animals within 24 h.
Mean input/output functions for 4 kHz stimuli are shown in
Fig. 2. The CAP (Fig. 2A) was essentially abolished within
30 min after GM/EA injection. At the highest stimulus level
tested (70 dB SPL), the amplitude of the CAP at 30 min was
less than 6% of the pre-injection value. The CAP showed a
small, transient increase at 70 dB SPL between 1.0 and 1.5 h,
reaching 18% of the pre-injection value at 1.5 h, then
declining again, to 6% at 2 h. At 24 and 72 h, the CAP
was completely absent.
CM (Fig. 2B) and SP (Fig. 2C) amplitudes also showed
rapid initial decreases, followed by a transient recovery at
1–1.5 h, then complete disappearance by 24 h. At 0.5 h post-
injection, the CM was 26% and the SP was 12% of their
respective pre-injection values. At 1.5 h, the CM and SP had
both recovered to approximately 30% of their pre-injection
values at 70 dB SPL, and to approximately 70% of their pre-
injection values at 90 dB SPL. By 24 h, both the CM and the
SP had completely disappeared. The results were qualita-
tively similar at the other three frequencies tested.
3.2. Organ of Corti structure and hair cell loss
Consistent with our previous morphological findings
[17] and the physiological data described above, all cochlear
hair cells were rapidly destroyed after the high dose of GM
and EA. Examination of cochleas at 6, 12 and 24 h after
GM/EA treatment indicated that onset of hair cell loss
occurred between 6 and 12 h. Most hair cells were present
at 6 h post-injection, but at 12 h post-injection (Fig. 3),
approximately 50% of IHCs and 80% of OHCs (averaged
across Rows 1, 2 and 3) were missing. As shown in Fig. 3,
OHC loss in Row 3 lagged behind losses in Rows 1 and 2.
There was only slightly less OHC loss in Row 2 than in
Row 1 at 12 h; in both rows, OHC loss was nearly complete
over 80% of the cochlea, beginning around 20% distance
from the apex. In contrast, Row 3 OHC loss was complete
only in the region located 70–100% distance from the apex.
IHC loss was greatest in the middle turn, peaking in the 2
kHz region of the cochlea [9], located 55% distance from
S.L. McFadden et al. / Brain Research 997 (2004) 40–5146
the apex (Fig. 3, solid line). At 24 h (not shown), cochleas
were devoid of all hair cells.
Despite the loss of all hair cells within 24 h, supporting
cells (Deiters’ cells and pillar cells (PC)) were present for
several months after treatment (Fig. 4). By 4 months after
treatment (Fig. 4F), the organ of Corti had collapsed onto
the basilar membrane. The collapse of the supporting cells
followed a base to apex gradient in all cochleas (data not
shown).
3.3. Efferent fiber degeneration
Fig. 5 shows the pattern of efferent innervation as it
appears in AChE-stained surface preparations of the organ
of Corti. In the normal organ of Corti (Fig. 5A), fibers
passing through the upper portion of the tunnel of Corti and
fibers within the spiral bundles are clearly identified by their
Fig. 7. Appearance of SGNs in Rosenthal’s canal (all sections from the middle tu
surrounded by a myelin sheath (arrowhead) and have a prominent nucleolus (sma
irregularly shaped and surrounded by fluid filled vacuoles. (C) 1 month, (D) 2 m
dark brown label. The TCF are axons from MOC neurons
that terminate at the base of the OHCs, while most efferent
fibers within the ISB are axons from LOC efferent neurons
that terminate on afferent dendrites beneath the IHCs. Panels
B–F in Fig. 5 show the progressive loss of TCF and ISB
fibers between 3 days and 4 weeks after GM/EA treatment.
MOC efferent fiber loss is quantified in Fig. 6. Fig. 6A
shows the percentage of TCF missing as a function of
cochlear location and time after GM/EA injection. There
was a clear base-to-apex progression of loss. By 3 weeks,
efferent fibers were completely gone in the basal half of the
cochlea. Fiber loss in the apical half of the cochlea was 67%
at 3 weeks, and increased to 88% at 4 weeks. The base-to-
apex gradient in efferent fiber degeneration is illustrated
more clearly in Fig. 6B, which shows the density of MOC
efferent fibers in the apical and basal halves of the cochlea
as a function of Group (corresponding to time relative to
rn). (A) Normal SGNs before GM/EA treatment; note that type I SGNs are
ller arrow). (B) 15 days after GM/EA; although SGNs are present, most are
onths, (E) 4 months, and (F) 6 months. Scale bar=10 Am.
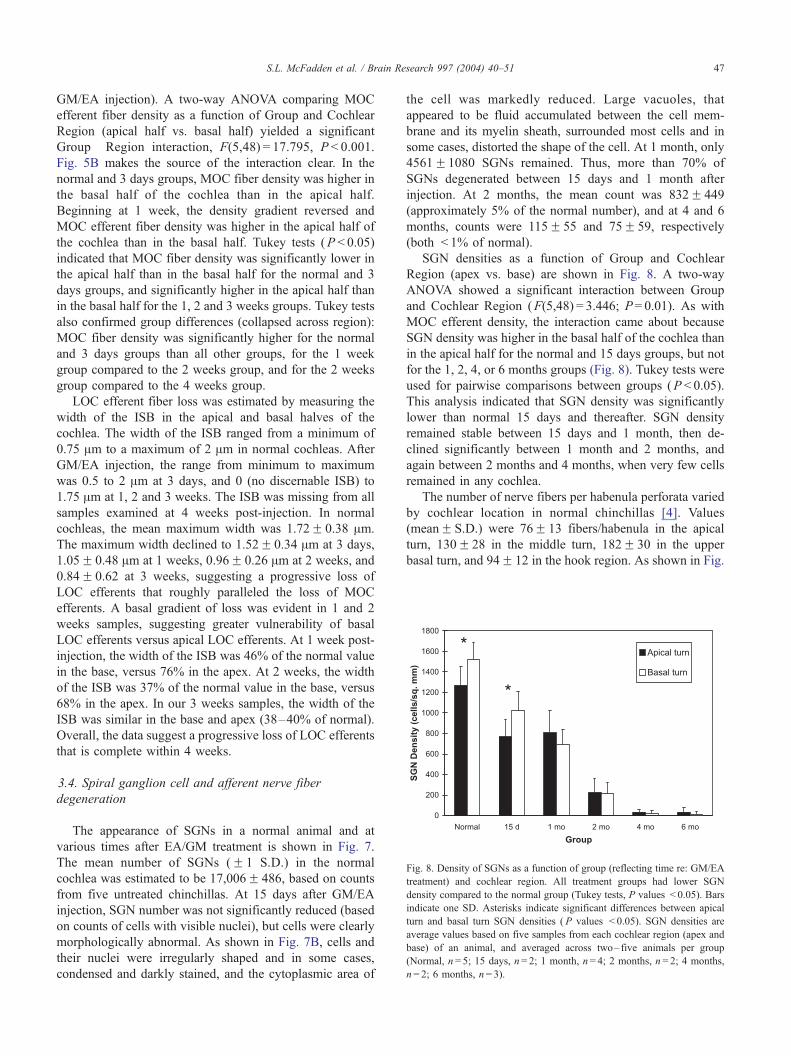
Fig. 8. Density of SGNs as a function of group (reflecting time re: GM/EA
treatment) and cochlear region. All treatment groups had lower SGN
density compared to the normal group (Tukey tests, P values < 0.05). Bars
indicate one SD. Asterisks indicate significant differences between apical
turn and basal turn SGN densities ( P values < 0.05). SGN densities are
average values based on five samples from each cochlear region (apex and
base) of an animal, and averaged across two– five animals per group
(Normal, n= 5; 15 days, n= 2; 1 month, n= 4; 2 months, n= 2; 4 months,
n= 2; 6 months, n= 3).
S.L. McFadden et al. / Brain Research 997 (2004) 40–51 47
GM/EA injection). A two-way ANOVA comparing MOC
efferent fiber density as a function of Group and Cochlear
Region (apical half vs. basal half) yielded a significant
Group�Region interaction, F(5,48) = 17.795, P < 0.001.
Fig. 5B makes the source of the interaction clear. In the
normal and 3 days groups, MOC fiber density was higher in
the basal half of the cochlea than in the apical half.
Beginning at 1 week, the density gradient reversed and
MOC efferent fiber density was higher in the apical half of
the cochlea than in the basal half. Tukey tests (P < 0.05)
indicated that MOC fiber density was significantly lower in
the apical half than in the basal half for the normal and 3
days groups, and significantly higher in the apical half than
in the basal half for the 1, 2 and 3 weeks groups. Tukey tests
also confirmed group differences (collapsed across region):
MOC fiber density was significantly higher for the normal
and 3 days groups than all other groups, for the 1 week
group compared to the 2 weeks group, and for the 2 weeks
group compared to the 4 weeks group.
LOC efferent fiber loss was estimated by measuring the
width of the ISB in the apical and basal halves of the
cochlea. The width of the ISB ranged from a minimum of
0.75 Am to a maximum of 2 Am in normal cochleas. After
GM/EA injection, the range from minimum to maximum
was 0.5 to 2 Am at 3 days, and 0 (no discernable ISB) to
1.75 Am at 1, 2 and 3 weeks. The ISB was missing from all
samples examined at 4 weeks post-injection. In normal
cochleas, the mean maximum width was 1.72F 0.38 Am.
The maximum width declined to 1.52F 0.34 Am at 3 days,
1.05F 0.48 Am at 1 weeks, 0.96F 0.26 Am at 2 weeks, and
0.84F 0.62 at 3 weeks, suggesting a progressive loss of
LOC efferents that roughly paralleled the loss of MOC
efferents. A basal gradient of loss was evident in 1 and 2
weeks samples, suggesting greater vulnerability of basal
LOC efferents versus apical LOC efferents. At 1 week post-
injection, the width of the ISB was 46% of the normal value
in the base, versus 76% in the apex. At 2 weeks, the width
of the ISB was 37% of the normal value in the base, versus
68% in the apex. In our 3 weeks samples, the width of the
ISB was similar in the base and apex (38–40% of normal).
Overall, the data suggest a progressive loss of LOC efferents
that is complete within 4 weeks.
3.4. Spiral ganglion cell and afferent nerve fiber
degeneration
The appearance of SGNs in a normal animal and at
various times after EA/GM treatment is shown in Fig. 7.
The mean number of SGNs (F 1 S.D.) in the normal
cochlea was estimated to be 17,006F 486, based on counts
from five untreated chinchillas. At 15 days after GM/EA
injection, SGN number was not significantly reduced (based
on counts of cells with visible nuclei), but cells were clearly
morphologically abnormal. As shown in Fig. 7B, cells and
their nuclei were irregularly shaped and in some cases,
condensed and darkly stained, and the cytoplasmic area of
the cell was markedly reduced. Large vacuoles, that
appeared to be fluid accumulated between the cell mem-
brane and its myelin sheath, surrounded most cells and in
some cases, distorted the shape of the cell. At 1 month, only
4561F1080 SGNs remained. Thus, more than 70% of
SGNs degenerated between 15 days and 1 month after
injection. At 2 months, the mean count was 832F 449
(approximately 5% of the normal number), and at 4 and 6
months, counts were 115F 55 and 75F 59, respectively
(both < 1% of normal).
SGN densities as a function of Group and Cochlear
Region (apex vs. base) are shown in Fig. 8. A two-way
ANOVA showed a significant interaction between Group
and Cochlear Region (F(5,48) = 3.446; P= 0.01). As with
MOC efferent density, the interaction came about because
SGN density was higher in the basal half of the cochlea than
in the apical half for the normal and 15 days groups, but not
for the 1, 2, 4, or 6 months groups (Fig. 8). Tukey tests were
used for pairwise comparisons between groups (P < 0.05).
This analysis indicated that SGN density was significantly
lower than normal 15 days and thereafter. SGN density
remained stable between 15 days and 1 month, then de-
clined significantly between 1 month and 2 months, and
again between 2 months and 4 months, when very few cells
remained in any cochlea.
The number of nerve fibers per habenula perforata varied
by cochlear location in normal chinchillas [4]. Values
(meanF S.D.) were 76F 13 fibers/habenula in the apical
turn, 130F 28 in the middle turn, 182F 30 in the upper
basal turn, and 94F 12 in the hook region. As shown in Fig.
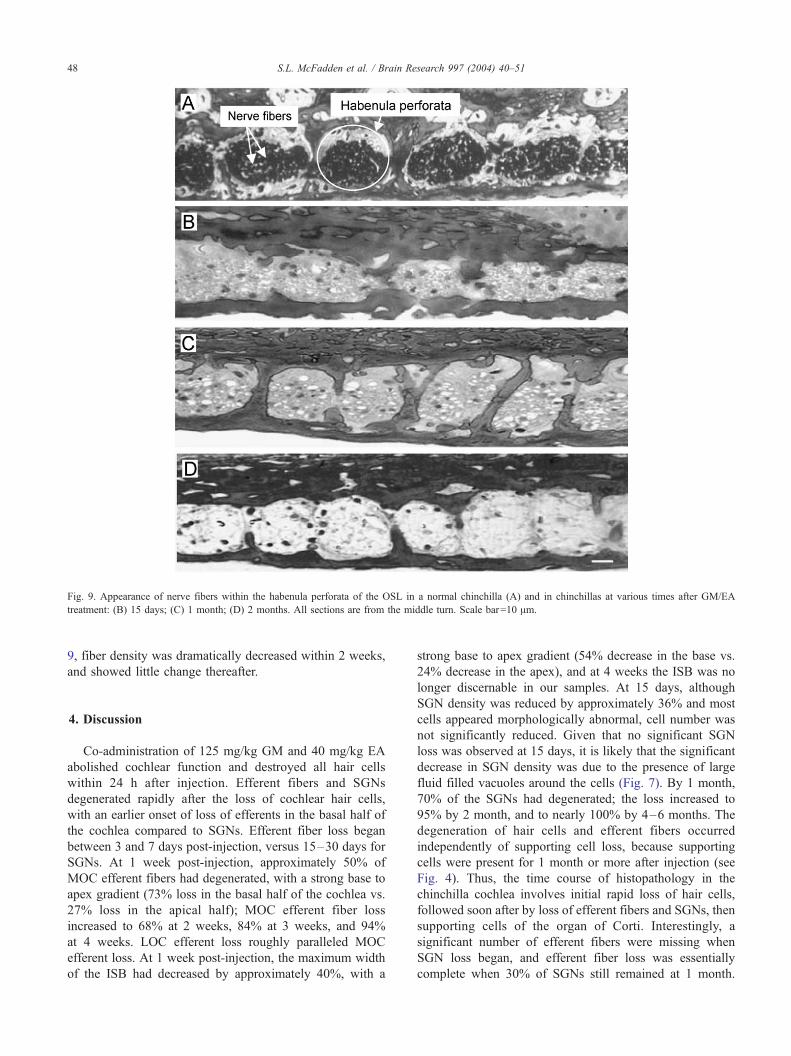
Fig. 9. Appearance of nerve fibers within the habenula perforata of the OSL in a normal chinchilla (A) and in chinchillas at various times after GM/EA
treatment: (B) 15 days; (C) 1 month; (D) 2 months. All sections are from the middle turn. Scale bar=10 Am.
S.L. McFadden et al. / Brain Research 997 (2004) 40–5148
9, fiber density was dramatically decreased within 2 weeks,
and showed little change thereafter.
4. Discussion
Co-administration of 125 mg/kg GM and 40 mg/kg EA
abolished cochlear function and destroyed all hair cells
within 24 h after injection. Efferent fibers and SGNs
degenerated rapidly after the loss of cochlear hair cells,
with an earlier onset of loss of efferents in the basal half of
the cochlea compared to SGNs. Efferent fiber loss began
between 3 and 7 days post-injection, versus 15–30 days for
SGNs. At 1 week post-injection, approximately 50% of
MOC efferent fibers had degenerated, with a strong base to
apex gradient (73% loss in the basal half of the cochlea vs.
27% loss in the apical half); MOC efferent fiber loss
increased to 68% at 2 weeks, 84% at 3 weeks, and 94%
at 4 weeks. LOC efferent loss roughly paralleled MOC
efferent loss. At 1 week post-injection, the maximum width
of the ISB had decreased by approximately 40%, with a
strong base to apex gradient (54% decrease in the base vs.
24% decrease in the apex), and at 4 weeks the ISB was no
longer discernable in our samples. At 15 days, although
SGN density was reduced by approximately 36% and most
cells appeared morphologically abnormal, cell number was
not significantly reduced. Given that no significant SGN
loss was observed at 15 days, it is likely that the significant
decrease in SGN density was due to the presence of large
fluid filled vacuoles around the cells (Fig. 7). By 1 month,
70% of the SGNs had degenerated; the loss increased to
95% by 2 month, and to nearly 100% by 4–6 months. The
degeneration of hair cells and efferent fibers occurred
independently of supporting cell loss, because supporting
cells were present for 1 month or more after injection (see
Fig. 4). Thus, the time course of histopathology in the
chinchilla cochlea involves initial rapid loss of hair cells,
followed soon after by loss of efferent fibers and SGNs, then
supporting cells of the organ of Corti. Interestingly, a
significant number of efferent fibers were missing when
SGN loss began, and efferent fiber loss was essentially
complete when 30% of SGNs still remained at 1 month.
S.L. McFadden et al. / Brain Research 997 (2004) 40–51 49
Within 4–6 months after a single injection of GM and EA,
the chinchilla cochlea was devoid of all hair cells and
supporting cells, and nearly all nerve fibers and SGNs.
4.1. Hair cell dysfunction and loss
The onset of hair cell loss occurred between 6 h, when
most cells were present, and 12 h, when approximately 50%
of IHCs and 80% of OHCs were missing. Although hair
cells were physically intact at 6 h, it is likely that they were
functionally impaired within hours after GM/EA injection.
The physiological data suggest an initial depression of CAP,
SP and CM due to loss of the positive endocochlear
potential (EP), followed by cochlear dysfunction attributable
to permanent changes in the hair cells themselves. We
previously showed that a single dose of EA (40 mg/kg
IV) results in reversal of the EP, from approximately + 80
to � 10 mV, within 10 min after injection, followed by slow
recovery beginning 25 min post-injection [3]. CAP and SP
amplitudes declined rapidly as well, reaching their lowest
levels (close to zero) at 30 min, then beginning a slow,
progressive recovery 60 min after EA injection. The CM
showed the same pattern of decline and recovery, but with a
delay of approximately 30 min relative to the CAP and SP.
In the current study, CAP, CM and SP were depressed
across all frequencies and stimulus levels at the first
measurement time of 30 min, consistent with a loss of EP.
The CAP and SP showed some recovery at the 1 and 1.5
h measurement times, while the CM showed recovery at 1.5
h (Fig. 2). These physiological changes parallel those seen
with EA alone [3], and are likely to represent reversible
effects of EA on the cochlear EP. The subsequent depression
of CAP, SP and CM at 2 h may reflect a delayed action of
GM on cochlear hair cell function. Alternatively, the tran-
sient recovery and subsequent loss of the cochlear potentials
might reflect delayed permanent damage to the stria vascu-
laris. Regardless of the mechanisms, the results suggest a 2
h delay in the effects of GM on cochlear function versus an
almost immediate effect of EA. Preliminary data from our
lab [5] suggest that mitochondrial dysfunction contributes to
transduction failure and activation of apoptotic cell death
pathways within hours after GM/EA injection, prior to
visible morphological damage to the hair cells.
At 12 h post-injection, OHC loss in Row 3 showed a
typical base-to-apex gradient, whereas most OHCs in Rows
1 and 2 had already died (see Fig. 3). The reason for the
slower rate of death for OHCs in Row 3 versus Rows 1 and
2 is unclear at this time, but it is interesting that differences
in OHC susceptibility to AABs by rows has previously been
attributed to differential distribution of MOC efferents [13].
In contrast to Row 3 OHCs, IHCs in the middle turn of the
cochlea succumbed to GM/EA sooner than IHCs in the base
or apex. This peculiar pattern of IHC loss was observed in
an earlier study [17], when chinchillas received a lower dose
of GM (10 and 20 mg/kg IP) combined with EA (40 mg/kg
IV). Together, the data indicate that IHCs in the middle turn
of the chinchilla cochlea are more vulnerable to damage
from GM and EA than IHCs in the apex or the base. The
reasons underlying the higher vulnerability of middle turn
IHCs, and whether this enhanced vulnerability is specific to
chinchillas and to GM, remain to be determined. Interest-
ingly, complete section of the auditory nerve in chinchillas
results in the loss of approximately 50% of IHCs in the basal
turn of the cochlea, accompanied by loss of type I, but not
type II ganglion cells in the base [29]. This indicates that the
vulnerability of IHCs in the chinchilla cochlea varies
according to the damaging agent, and is not a characteristic
that is specific or unique to middle turn IHCs.
4.2. Implications of the time course of SGN and efferent
fiber degeneration
It is not possible to determine from this study whether the
loss of efferent fibers and SGNs was a primary effect of
GM/EA treatment, or a secondary effect of cell loss in the
organ of Corti. Previously, Webster and Webster [24] argued
that SGN degeneration in AAB/EA-treated animals was at
least partially due to direct neurotoxic effects of the drugs,
based on the observation that SGN degeneration occurred
much earlier in cochleas damaged by AAB/EA treatment
than in cochleas injured by noise. However, at least some
SGN degeneration may be secondary to IHC loss. Imamura
and Adams [10,11] used immunocytochemistry to investi-
gate the uptake and retention of GM in the guinea pig inner
ear. After a single injection of GM, SGNs showed only
modest uptake and short retention of GM, and there was a
long delay in cytochemical changes and cell death. Based on
these observations as well as the fact that SGN loss only
occurred in regions of the cochlea where there was complete
destruction of the organ of Corti, Imamura and Adams
suggested that SGN death was secondary to loss of trophic
and sensory input from cells of the organ of Corti. Studies
showing that SGN survival can be enhanced by neuro-
trophic factors [6,22,26,27] can be taken as support for
the hypothesis that IHC loss deprives SGNs of trophic
factors that normally promote their survival. The current
data do not rule out a trophic role of IHCs on SGN survival;
however, it is interesting that some SGNs die within weeks,
whereas others are able to survive for extended periods of
time following IHC loss. The characteristics of SGNs that
make them susceptible or resistant to degeneration, either
from neurotoxicity or from trophic deprivation, should be
investigated in future studies.
In view of the earlier loss of efferent fibers versus SGNs
and the trophic role ascribed to efferent fibers in the
cochlea [18], it is interesting to speculate that SGN survival
is influenced by the presence and condition of the efferent
nerve fibers. A large number of neuroactive substances
have been identified in efferent fibers, including enkepha-
lins and dopamine in the vesiculated endings of LOC
efferent fibers in the inner spiral sulcus below IHCs
[7,8]. Pujol [18] and others have suggested that LOC
S.L. McFadden et al. / Brain Research 997 (2004) 40–5150
efferent fibers play a role in protecting the auditory
dendrites and their synapses with IHCs and assisting in
their repair after excitotoxic injury. It is possible that lateral
efferent fibers also influence the survival and recovery of
SGNs and their peripheral processes following aminoglyco-
side toxicity. The current data provide no direct support for
this hypothesis; however, the time course of degeneration,
with the demise of efferent fibers occurring earlier than that
of SGNs, does not rule out the possibility of a trophic
interaction between lateral efferent fibers and the afferent
fibers they normally contact.
4.3. Comparisons with previous studies
Li et al. [16] studied the effects of electrical stimulation
on survival of SGNs in guinea pigs deafened with kanamy-
cin (400 mg/kg SC) and EA (40 mg/kg IV). In normal
guinea pigs, SGN numbers declined from base to apex. This
is consistent with the current data showing higher SGN
density in the basal turn versus the apical turn in normal
chinchillas. In cochleas of kanamycin/EA treated guinea
pigs, approximately 40–50% of SGNs remained 8 weeks
after treatment, versus only 5% in the present study. One
factor that may account for the apparent discrepancy in the
magnitude of SGN loss in the two studies is the number of
hair cells surviving the deafening procedure. Whereas all
hair cells were destroyed in the present study, approximately
23% of IHCs and OHCs survived the kanamycin/EA
treatment in the Li et al. study. If IHC survival promotes
SGN survival, then residual hair cell survival rather than
species differences may account for the higher percentage of
SGNs surviving at 2 months in drug-deafened guinea pigs
versus chinchillas.
Guinea pigs that were deafened by a single injection of
neomycin into the middle ear cavity showed no significant
loss of SGNs until 6 weeks, when a pronounced toxicity in
the apical turn was observed; at 10 weeks, significant SGN
loss was observed in all turns of the cochlea, but variability
among animals was large [28]. SGN loss was greatest in the
apex (82% at 10 weeks) and least in the lower middle turn
(47%), with intermediate loss in the basal turn (70%).
Again, however, hair cell loss was incomplete and variable.
The authors suggested that a longer survival time might
have led to more severe hair cell pathology and possibly
more uniform SGN loss as well.
The studies cited above highlight an important issue
regarding animal models of SGN loss. Deafening proce-
dures used in previous studies with guinea pigs [14,16,23]
and cats [20,25,28] have produced variable amounts of
IHC and OHC loss across animals and treatment groups,
thereby confounding the interpretation of SGN degenera-
tion and treatments aimed at promoting SGN survival. In
one study, GM injected into the middle ear cavity of
anesthetized guinea pigs produced near-total OHC loss,
but variable IHC loss across animals and cochlear location
[23]. Similarly, injection of a neomycin solution into the
middle ear cavity destroyed most OHCs, but spared large,
and variable, numbers of IHCs [28]. A cochleogram from
one of the most severely affected guinea pigs showed
nearly complete sparing of IHCs in the region from
approximately 45–80% distance from the apex but nearly
complete loss in all other cochlear regions. Even when a
large systemic dose of kanamycin is combined with EA,
hair cell losses appear to be variable, producing complete
or nearly complete loss of cochlear hair cells in some cases,
but sparing a significant number of hair cells in others
[14,16,20]. Clearly, if SGN survival is linked to hair cell
survival, as proposed by Zappia and Altschuler [28] and
others, variability in hair cell loss is an undesirable con-
founding factor in experimental models. The deafening
protocol used in the current study wiped out all hair cells
in the chinchilla cochlea without exception, allowing us to
document the time course of SGN degeneration without the
confounding influence of remaining hair cells. The reliable
absence of cochlear hair cells in the chinchilla model may
help reduce variability in future studies using various
protection and rescue strategies.
4.4. Implications for future studies
The interdependence between IHCs and SGNs presents a
challenge for the management of profound hearing loss.
Currently, cochlear implants can be used to bypass a
dysfunctional cochlea, providing that SGNs and their axons
projecting to the cochlear nucleus remain intact. In the
future, hair cell regeneration will be useful only if SGNs
are intact and their neuronal processes are able to establish
synaptic contact with the repopulated sensory epithelium.
Thus, there is a strong clinical need for establishing ways of
promoting SGN survival following hair cell death. The rapid
time course of cochlear degeneration in the GM/EA treated
chinchilla may make it a particularly useful model for future
studies of cell death mechanisms and strategies for promot-
ing cell survival.
Several additional issues would be interesting to pursue
in future studies. First, what makes some cells susceptible to
rapid loss, while others resist loss for months after an
ototoxic insult? Second, is the base-to-apex gradient in
efferent fiber loss related to differential production and/or
distribution of cochlear antioxidants, as has been suggested
for cochlear hair cells [19]? Third, is there a direct link
between the loss of efferent fibers and SGN loss? Fourth, is
the loss of efferent fibers is the cochlea associated with
degeneration of medial and/or LOC neurons in the brain-
stem? The present study lays the groundwork for answering
these and other questions.
Acknowledgements
Supported by grants from NIH/NIDCD (P01 DC03600)
to R.J.S. and S.L.M.
S.L. McFadden et al. / Brain Research 997 (2004) 40–51 51
References
[1] W.J. Azeredo, M.L. Kliment, B.J. Morley, E. Relkin, N.B. Slepecky,
A. Sterns, W.B. Warr, J.M. Weekly, C.I. Woods, Olivocochlear neu-
rons in the chinchilla: a retrograde fluorescent labelling study, Hear.
Res. 134 (1999) 57–70.
[2] D. Ding, X. Zheng, J. Wang, Quantitation of nerve fibers in habenula
perforata in chinchilla, Zhonghua Er Bi Yan Hou Ke Za Zhi 33 (1998)
30–31.
[3] D. Ding, S.L. McFadden, R.J. Salvi, Cochlear hair cell densities and
inner-ear staining techniques, in: J.F.Willott (Ed.), Handbook ofMouse
Auditory Research, CRC Press, Boca Raton, 2001, pp. 189–204.
[4] D. Ding, S.L. McFadden, J.M. Woo, R.J. Salvi, Ethacrynic acid rap-
idly and selectively abolishes blood flow in vessels supplying the
lateral wall of the cochlea, Hear. Res. 173 (2002) 1–9.
[5] D.L. Ding, H. Jiang, S.L. McFadden, R.J. Salvi, Hair cell loss from
the combination of gentamicin and ethacrynic acid is initiated by
caspase 9 and cytochrome c release, Assoc. Res. Otolaryngol. Abstr.
(2004) (submitted).
[6] P. Ernfors, M.L. Duan, W.M. ElShamy, B. Canlon, Protection of
auditory neurons from aminoglycoside toxicity by neurotrophin-3,
Nat. Med. 2 (1996) 463–467.
[7] M. Eybalin, Neurotransmitters and neuromodulators of the mamma-
lian cochlea, Physiol. Rev. 73 (1993) 309–373.
[8] M. Eybalin, G. Charachon, N. Renard, Dopaminergic lateral efferent
innervation of the guinea-pig cochlea: immunoelectron microscopy of
catecholamine-synthesizing enzymes and effect of 6-hydroxydop-
amine, Neuroscience 54 (1993) 133–142.
[9] D.D. Greenwood, A cochlear frequency-position function for several
species—29 years later, J. Acoust. Soc. Am. 87 (1990) 2592–2605.
[10] S.I. Imamura, J.C. Adams, Changes in cytochemistry of sensory and
nonsensory cells in gentamicin-treated cochleas, J. Assoc. Res. Oto-
laryngol. 4 (2003) 196–218.
[11] S.I. Imamura, J.C. Adams, Distribution of gentamicin in the guinea
pig inner ear after local or systemic application, J. Assoc. Res. Oto-
laryngol. 4 (2003) 176–195.
[12] S. Iurato, C.A. Smith, D.H. Eldredge, D. Henderson, C. Carr, Y.
Ueno, S. Cameron, R. Richter, Distribution of the crossed olivo-
cochlear bundle in the chinchilla’s cochlea, J. Comp. Neurol. 182
(1978) 57–76.
[13] A. Kohonen, Effect of some ototoxic drugs upon the pattern and
innervation of cochlear sensory cells in the guinea pig, Acta Otolar-
yngol. (Suppl. 208) (1965) 1–70.
[14] M. Komeda, B.J. Roessler, Y. Raphael, The influence of interleukin-1
receptor antagonist transgene on spiral ganglion neurons, Hear. Res.
131 (1999) 1–10.
[15] P.A. Leake, G.T. Hradek, Cochlear pathology of long term neomycin
induced deafness in cats, Hear. Res. 33 (1988) 11–33.
[16] L. Li, C.W. Parkins, D.B. Webster, Does electrical stimulation of deaf
cochleae prevent spiral ganglion degeneration? Hear. Res. 133
(1999) 27–39.
[17] S.L. McFadden, D. Ding, H. Jiang, J.M. Woo, R.J. Salvi, Chinchilla
models of selective cochlear hair cell loss, Hear. Res. 174 (2002)
230–238.
[18] R. Pujol, Lateral and medial efferents: a double neurochemical mech-
anism to protect and regulate inner and outer hair cell function in the
cochlea, Br. J. Audiol. 28 (1994) 185–191.
[19] S.H. Sha, R. Taylor, A. Forge, J. Schacht, Differential vulnerability of
basal and apical hair cells is based on intrinsic susceptibility to free
radicals, Hear. Res. 155 (2001) 1–8.
[20] R.K. Shepherd, E. Javel, Electrical stimulation of the auditory nerve.
I. Correlation of physiological responses with cochlear status, Hear.
Res. 108 (1997) 112–144.
[21] R.K. Shepherd, J. Matsushima, R.L. Martin, G.M. Clark, Cochlear
pathology following chronic electrical stimulation of the auditory
nerve: II. Deafened kittens, Hear. Res. 81 (1994) 150–166.
[22] H. Staecker, R. Gabaizadeh, H. Federoff, T.R. Van De Water, Brain-
derived neurotrophic factor gene therapy prevents spiral ganglion
degeneration after hair cell loss, Otolaryngol. Head Neck Surg. 119
(1998) 7–13.
[23] M. Suzuki, M. Yagi, J.N. Brown, A.L. Miller, J.M. Miller, Y. Raphael,
Effect of transgenic GDNF expression on gentamicin-induced coch-
lear and vestibular toxicity, Gene Ther. 7 (2000) 1046–1054.
[24] M. Webster, D.B. Webster, Spiral ganglion neuron loss following
organ of corti loss: a quantitative study, Brain Res. 212 (1981)
17–30.
[25] S.A. Xu, R.K. Shepherd, Y. Chen, G.M. Clark, Profound hearing loss
in the cat following the single co-administration of kanamycin and
ethacrynic acid, Hear. Res. 70 (1993) 205–215.
[26] M. Yagi, S. Kanzaki, K. Kawamoto, B. Shin, P.P. Shah, E. Magal, J.
Sheng, Y. Raphael, Spiral ganglion neurons are protected from degen-
eration by GDNF gene therapy, J. Assoc. Res. Otolaryngol. 1 (2000)
315–325.
[27] J. Ylikoski, U. Pirvola, J. Virkkala, P. Suvanto, X.Q. Liang, E. Magal,
R. Altschuler, J.M. Miller, M. Saarma, Guinea pig auditory neurons
are protected by glial cell line-derived growth factor from degener-
ation after noise trauma, Hear. Res. 124 (1998) 17–26.
[28] J.J. Zappia, R.A. Altschuler, Evaluation of the effect of ototopical
neomycin on spiral ganglion cell density in the guinea pig, Hear.
Res. 40 (1989) 29–37.
[29] X.Y. Zheng, D.L. Ding, S.L. McFadden, D. Henderson, Evidence that
inner hair cells are the major source of cochlear summating potentials,
Hear. Res. 113 (1997) 76–88.
[30] X.Y. Zheng, D. Henderson, B.H. Hu, D.L. Ding, S.L. McFadden, The
influence of the cochlear efferent system on chronic acoustic trauma,
Hear. Res. 107 (1997) 147–159.


