Embed Size (px)
Citation preview
Ž .Journal of Immunological Methods 208 1997 169–179
Time-resolved fluorescence imaging in islet cell autoantibodyquantitation
Maris Rulli a,b,), Ari Kuusisto c, Juha Salo c, Hannu Kojola c, Olli Simell a,b
a Department of Pediatrics, UniÕersity of Turku, Kiinamyllynkatu 4-8, FIN-20520 Turku 52, Finlandb MediCity Research Laboratory, UniÕersity of Turku, Tykistokatu 6 A, FIN-20520 Turku 52, Finland¨
c Wallac Oy, Turku, Finland
Received 24 March 1997; revised 16 July 1997; accepted 21 August 1997
Abstract
Ž .The prodromal period of insulin-dependent diabetes mellitus IDDM is characterized by circulating islet cell autoanti-Ž .bodies ICA and other beta cell specific autoantibodies. Despite biochemical characterization of the major beta cell
autoantigens insulin, glutamic acid decarboxylase and protein tyrosine phosphatase and development of the respectiveantibody assays, ICA has remained the standard in IDDM prediction. Conventional ICA quantitation using classicfluorochromes is prone to errors since fluorescence intensity is estimated subjectively using the human eye, which is alsounable to differentiate specific signals from non-specific signals and autofluorescence. Using Eu3q-chelate labelled
Ž . Ž .anti-human polyclonal IgG decay time 1000 ms as the secondary antibody in time-resolved fluorescence imaging TRFI ,Ž .the chelate and autofluorescence signals typical decay time-100 ns are fully separated. The image is recorded using an
optically gated cooled digital CCD camera. The specificity of the ICA signal is further improved by interactive analysis ofthe image. Signal detection is objective, the signal-to-background ratio improves, and ICA quantitation is possible using
Ž .undiluted serum. Of 57 consecutive new-onset IDDM patients, 55 96.5% were ICA positive in the new assay while 51Ž .89.5% were positive in the conventional assay suggesting that the sensitivity of TRFI exceeds that of the IAA, GAD and65
IA-2 autoantibody assays combined. For later comparisons, the stained slides may be stored in the light for years withoutany decrease in specific fluorescence. q 1997 Elsevier Science B.V.
Keywords: Insulin-dependent diabetes; Islet cell autoantibodies; Lanthanides; Europium chelate; Time-resolved fluorescence imaging
Abbreviations: CCD, Charge coupled camera; CF-ICA, Complement-fixing islet cell autoantibodies; Cpp, Counts per pixel, mean lightŽintensity per pixel; DELFIA, Dissociation-enhanced lanthanide fluoroimmunoassay; Eu-DTA-terpy, Eu- 4,6-dichloro-1,3,5-triazin-2-
. X X Yyl amino-2,2 :6 ,2 -terpyridine; FITC, Fluoresceinisothiocyanate; GAD , Glutamic acid decarboxylase, 65 kDa isoform; IAA, Insulin65Ž .autoantibody; IA-2, Autoantibody against protein tyrosine phosphatase; ICA, Islet cell autoantibodies; IDDM, Insulin-dependent type 1
diabetes mellitus; JDFU, Juvenile Diabetes Foundation Unit; PBS, Phosphate buffered saline; Pixel, Picture element, representing 19=19mm true area on the microscope slide; Rh, Rhesus blood group; TRFI, Time-resolved fluorescence imaging; TRFU, Time-resolvedfluorescence intensity unit; these units are used when TRFI-specific fluorescence intensities of undiluted serum samples are compared with
Ž . ŽTRFI-specific fluorescence intensities of the international standard serum 80 JDFU and its dilutions international standard reference.curve
) Corresponding author. Tel.: q358-2-3337040; fax: q358-2-3337000; e-mail: [email protected]
0022-1759r97r$17.00 q 1997 Elsevier Science B.V. All rights reserved.Ž .PII S0022-1759 97 00145-2
( )M. Rulli et al.rJournal of Immunological Methods 208 1997 169–179170
1. Introduction
The description of cytoplasmic islet cell autoanti-Ž . Ž .bodies ICA by Bottazzo et al. 1974 made possible
for the first time a rough prediction of the develop-Ž .ment of insulin-dependent diabetes IDDM . In con-
ventional ICA analysis, the specific signal is subjec-tively distinguished from non-specific signals andautofluorescence by the human eye. Further disad-vantages of the conventional technique are the rapidfading of the fluorescent signal if the samples arestored and the need for serum dilutions in ICAquantitation. Since the eye differentiates fluorescenceintensities only poorly at low signal levels, Srikanta
Ž . Ž .et al. 1985 and Bright 1987 suggested objectivequantitation of the fluorescence intensities of theislets. However, as they were unable to eliminate themarked autofluorescence caused by the acinar andislet tissues, their ICA quantitation attempts re-mained unsuccessful.
The three lanthanide ions, europium, samariumand terbium, are excellent immunolabels since theyform highly fluorescent chelates with long decaytimes, large Stokes’ shifts and sharp emission peaksŽ .Hemmila et al., 1984; Seveus et al., 1992 . These¨labels have been extensively utilized in DELFIA and
ŽDNA hybridization assays Dahlen et al., 1989;Hemmila, 1991; Ogata et al., 1992; Seveus et al.,¨
.1992; Sjoroos et al., 1995 . In addition, new chelate¨labels have been developed for immunohistochemi-
Žcal and in situ hybridization assays Mukkala et al.,.1993 . The use of these new fluorochromes with
decay times around 1000 ms for labelling of thesecondary antibody in the ICA assay combined with
Ž .time-resolved fluorescence imaging TRFI excludesautofluorescence, which decays in less than 100 nsŽ .Beverloo et al., 1990; Seveus et al., 1992 . Comput-erized image handling further increases the objectiv-ity of the assay.
In recent years, immunological IDDM predictionhas improved as combinations of assays of autoanti-bodies directed against beta cell associated antigens
Ž . Žinsulin IAA , glutamic acid decarboxylase GAD -65. Ž .A and protein tyrosine phosphatase IA-2 have
been used, but even combined tests fail to detect allŽnew-onset IDDM subjects Zimmet et al., 1994;
.Bonifacio et al., 1995; Myers et al., 1995 . The ICAquantitation method described here circumvents the
most important pitfalls in the conventional ICA as-say, is more objective and appears to be suitable forIDDM prediction.
2. Materials and methods
2.1. Pancreatic samples
ŽFour human pancreases from organ donors bloodgroups O Rh negative, O Rh positive, A Rh positive
.and B Rh positive were used. These were cut into 1cm3 pieces, which were snap-frozen using isopen-
Ž .tane Fluka, Buchs, Switzerland in an acetone-dryice bath. The freezing procedure was finished within1 h following removal of the pancreases from thedonors. The samples were stored at y708C. 8 mm
Žsections were cut on a cryotome HM 500 OM,.Walldorf, Germany at y238C, placed on poly-L-
Ž .lysine Sigma, St. Louis, MO coated microscopeslides and stored at y708C until used. Each piece ofpancreas was allowed to thaw to y238C for cuttingonly twice.
2.2. Serum samples
The sample of the international standard serumwith 80 JDF units of ICA was kindly donated by Dr.Noel K. Maclaren, University of Florida, Gainesville,FL. Serum samples from 57 consecutive newly diag-nosed children with diabetes at the Department of
ŽPediatrics, University of Turku, Turku, Finland age.range 1.5–16.7 years were used. In addition, sera of
29 adult students and 192 healthy 1 to 14-year-oldsiblings of healthy newborns who carried HLA-DQB1 allele combinations ) 0302r ) 0201 or)
) Ž)0302r x xsnone of the protective alleles) ) ) .0602, 0603 or 0301 were available for study.
For the construction of ICA dilution curves, serawere diluted with ICA negative serum or, where
Ž .indicated, with PBS pH 7.4 .
2.3. Antibodies and labelling
Anti-human polyclonal IgG from Sigma was la-Žbelled with the recently synthesized Eu- 4,6-di-
. X X Ychloro-1,3,5-triazin-2-yl amino-2,2 :6 ,2 -terpyridineŽ . ŽEu-DTA-terpy at 48C as described Mukkala et al.,
( )M. Rulli et al.rJournal of Immunological Methods 208 1997 169–179 171
1993; Eur. Patent No. 139,675; US Patent No..4,808,541 at the Labelling Service of Wallac Oy
Ž .Turku, Finland . Briefly, IgG was incubated withŽ .Eu-DTA-terpy in carbonate buffer pH 9 overnight
and purified on a combined column of SephadexŽ . Ž .G50 10 cm and Sepharose 6B 30 cm by eluting
with 50 mM Tris–HCl buffer containing 0.15 MNaCl and 0.05% NaN solution.3
Ž .Fluoresceinisothiocyanate FITC conjugatedŽ .anti-human polyclonal IgG Sigma was used for the
conventional ICA assay.
2.4. Immunohistochemistry
Unfixed pancreas sections were dried on thecoated microscope slides at room temperature for 1 h
Žand circled with an Orlow-Techno marker pen Lyra,.Nurnberg, Germany . 20 ml of serum were incubated¨
with the section in a humidified chamber at roomtemperature for 30 min. After three 5 min washes inPBS the slides were incubated with Eu3q-chelate orFITC labelled anti-human polyclonal IgG for 30 minin the chamber and washed three times in PBS. Thesections incubated with Eu3q-chelate labelled anti-body were fixed for 5 min in 0.5% glutaraldehydeŽ .Sigma made ex tempore, dehydrated using increas-ing alcohol concentrations, mounted using Mercko-
Ž .glas medium Merck, Darmstadt, Germany and cov-ered with cover slips. The slides incubated with theFITC labelled antibody were dried after the washes,
Žmounted using Gurr fluoromount BDH, Poole, Eng-.land and covered with cover slips.
Complement-fixing ICA were detected using athree-layer immunofluorescence test as previously
Ž .described Bottazzo et al., 1980 . Conventional ICAand CF-ICA were measured at the Finnish ICAreference laboratory, University of Oulu, which per-formed well in the latest international ICA exchangeworkshop.
2.5. Microscopy and time-resolÕed fluorometry
A Nikon Optiphot conventional microscopeŽ .Nikon, Tokyo, Japan was equipped for time-re-
Žsolved fluorescence imaging as described Seveus et.al., 1992 , except that an OMA4 model 1530-Ž .ArAUV EG and G PARC, Princeton, NJ was used
as a cooled charge coupled photo-optical device. The
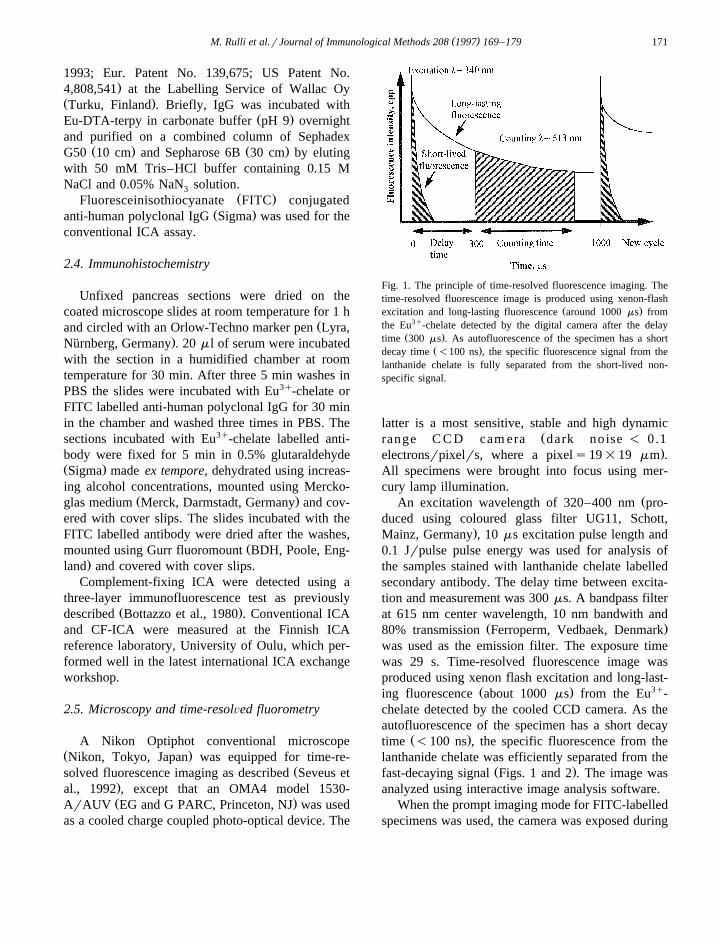
Fig. 1. The principle of time-resolved fluorescence imaging. Thetime-resolved fluorescence image is produced using xenon-flash
Ž .excitation and long-lasting fluorescence around 1000 ms fromthe Eu3q-chelate detected by the digital camera after the delay
Ž .time 300 ms . As autofluorescence of the specimen has a shortŽ .decay time -100 ns , the specific fluorescence signal from the
lanthanide chelate is fully separated from the short-lived non-specific signal.
latter is a most sensitive, stable and high dynamicŽrange C C D cam era dark noise - 0.1
.electronsrpixelrs, where a pixels19=19 mm .All specimens were brought into focus using mer-cury lamp illumination.
ŽAn excitation wavelength of 320–400 nm pro-duced using coloured glass filter UG11, Schott,
.Mainz, Germany , 10 ms excitation pulse length and0.1 Jrpulse pulse energy was used for analysis ofthe samples stained with lanthanide chelate labelledsecondary antibody. The delay time between excita-tion and measurement was 300 ms. A bandpass filterat 615 nm center wavelength, 10 nm bandwith and
Ž .80% transmission Ferroperm, Vedbaek, Denmarkwas used as the emission filter. The exposure timewas 29 s. Time-resolved fluorescence image wasproduced using xenon flash excitation and long-last-
Ž . 3qing fluorescence about 1000 ms from the Eu -chelate detected by the cooled CCD camera. As theautofluorescence of the specimen has a short decay
Ž .time -100 ns , the specific fluorescence from thelanthanide chelate was efficiently separated from the
Ž .fast-decaying signal Figs. 1 and 2 . The image wasanalyzed using interactive image analysis software.
When the prompt imaging mode for FITC-labelledspecimens was used, the camera was exposed during
( )M. Rulli et al.rJournal of Immunological Methods 208 1997 169–179172
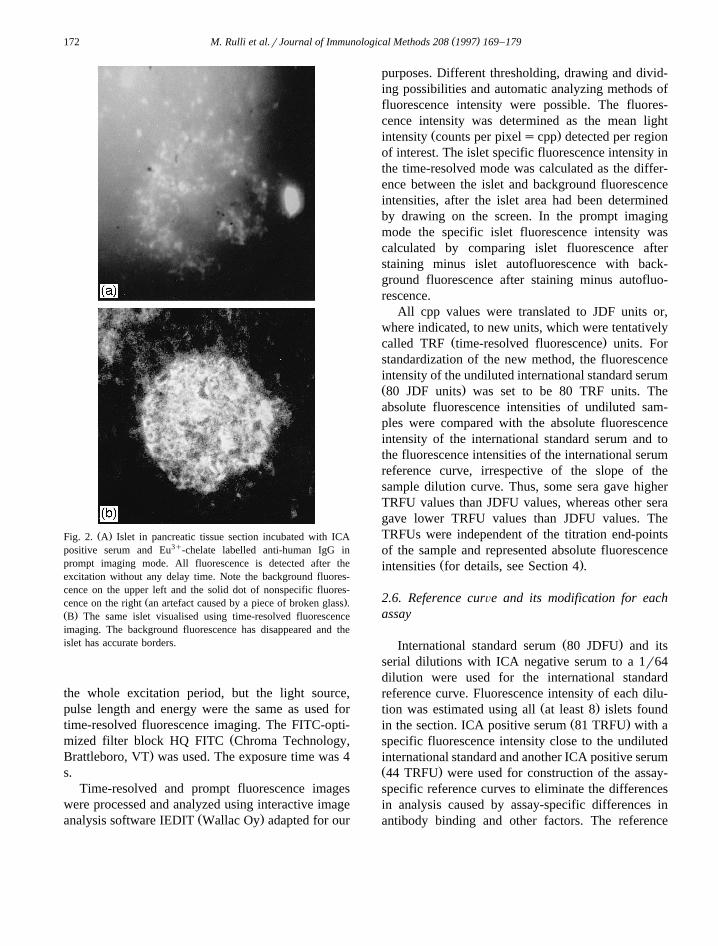
Ž .Fig. 2. A Islet in pancreatic tissue section incubated with ICApositive serum and Eu3q-chelate labelled anti-human IgG inprompt imaging mode. All fluorescence is detected after theexcitation without any delay time. Note the background fluores-cence on the upper left and the solid dot of nonspecific fluores-
Ž .cence on the right an artefact caused by a piece of broken glass .Ž .B The same islet visualised using time-resolved fluorescenceimaging. The background fluorescence has disappeared and theislet has accurate borders.
the whole excitation period, but the light source,pulse length and energy were the same as used fortime-resolved fluorescence imaging. The FITC-opti-
Žmized filter block HQ FITC Chroma Technology,.Brattleboro, VT was used. The exposure time was 4
s.Time-resolved and prompt fluorescence images
were processed and analyzed using interactive imageŽ .analysis software IEDIT Wallac Oy adapted for our
purposes. Different thresholding, drawing and divid-ing possibilities and automatic analyzing methods offluorescence intensity were possible. The fluores-cence intensity was determined as the mean light
Ž .intensity counts per pixelscpp detected per regionof interest. The islet specific fluorescence intensity inthe time-resolved mode was calculated as the differ-ence between the islet and background fluorescenceintensities, after the islet area had been determinedby drawing on the screen. In the prompt imagingmode the specific islet fluorescence intensity wascalculated by comparing islet fluorescence afterstaining minus islet autofluorescence with back-ground fluorescence after staining minus autofluo-rescence.
All cpp values were translated to JDF units or,where indicated, to new units, which were tentatively
Ž .called TRF time-resolved fluorescence units. Forstandardization of the new method, the fluorescenceintensity of the undiluted international standard serumŽ .80 JDF units was set to be 80 TRF units. Theabsolute fluorescence intensities of undiluted sam-ples were compared with the absolute fluorescenceintensity of the international standard serum and tothe fluorescence intensities of the international serumreference curve, irrespective of the slope of thesample dilution curve. Thus, some sera gave higherTRFU values than JDFU values, whereas other seragave lower TRFU values than JDFU values. TheTRFUs were independent of the titration end-pointsof the sample and represented absolute fluorescence
Ž .intensities for details, see Section 4 .
2.6. Reference curÕe and its modification for eachassay
Ž .International standard serum 80 JDFU and itsserial dilutions with ICA negative serum to a 1r64dilution were used for the international standardreference curve. Fluorescence intensity of each dilu-
Ž .tion was estimated using all at least 8 islets foundŽ .in the section. ICA positive serum 81 TRFU with a
specific fluorescence intensity close to the undilutedinternational standard and another ICA positive serumŽ .44 TRFU were used for construction of the assay-specific reference curves to eliminate the differencesin analysis caused by assay-specific differences inantibody binding and other factors. The reference
( )M. Rulli et al.rJournal of Immunological Methods 208 1997 169–179 173
curve was modified by computer for each new analy-sis session to form an assay-specific reference curve.The assay-specific reference curve was the statisti-cally best-matching curve when the dilution data ofour own standard sera and the international standardserum were compared. Using this assay-specific ref-erence curve the ICA titer of each sample wascalculated using the mean fluorescence intensity ofat least 5 islets.
An ICA negative serum was always used in theassays as a negative control.
3. Ethics
The study has been approved by the Joint Com-mittee on Ethics of the Turku University and theTurku University Central Hospital.
4. Results
Use of Eu3q-chelate labelled antibody and TRFIin ICA quantitation leads to the measurement of onlythe specific signal derived from the label as short-lived fluorescent artefacts and autofluorescence de-cay before the counting begins 300 ms after the
Ž .excitation pulse Figs. 1 and 2 .The four pancreases used in this study represented
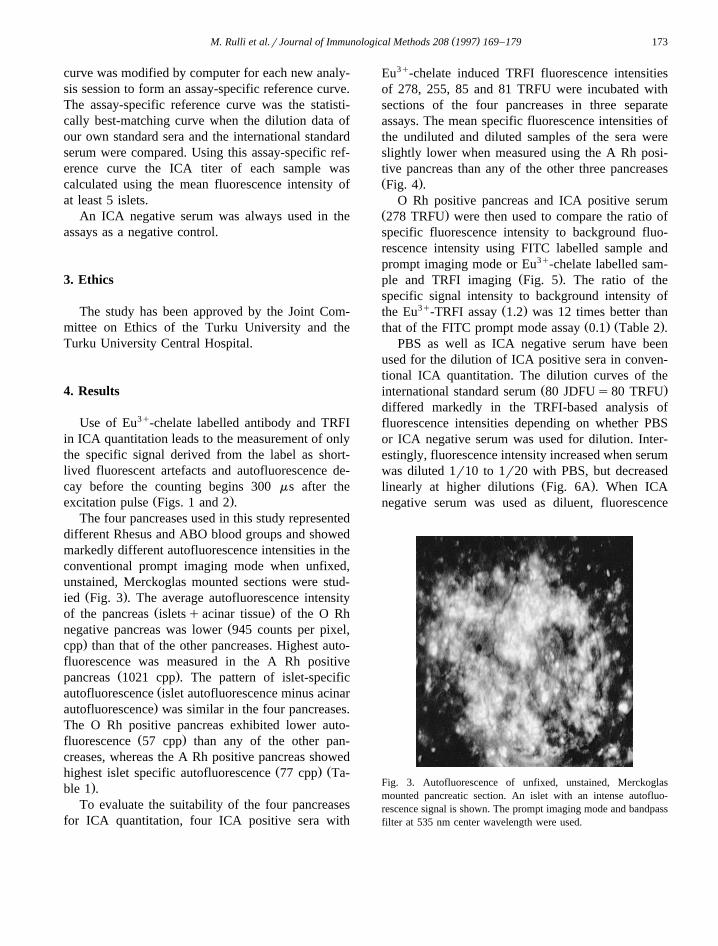
different Rhesus and ABO blood groups and showedmarkedly different autofluorescence intensities in theconventional prompt imaging mode when unfixed,unstained, Merckoglas mounted sections were stud-
Ž .ied Fig. 3 . The average autofluorescence intensityŽ .of the pancreas isletsqacinar tissue of the O Rh
Žnegative pancreas was lower 945 counts per pixel,.cpp than that of the other pancreases. Highest auto-
fluorescence was measured in the A Rh positiveŽ .pancreas 1021 cpp . The pattern of islet-specific
Žautofluorescence islet autofluorescence minus acinar.autofluorescence was similar in the four pancreases.
The O Rh positive pancreas exhibited lower auto-Ž .fluorescence 57 cpp than any of the other pan-
creases, whereas the A Rh positive pancreas showedŽ . Žhighest islet specific autofluorescence 77 cpp Ta-
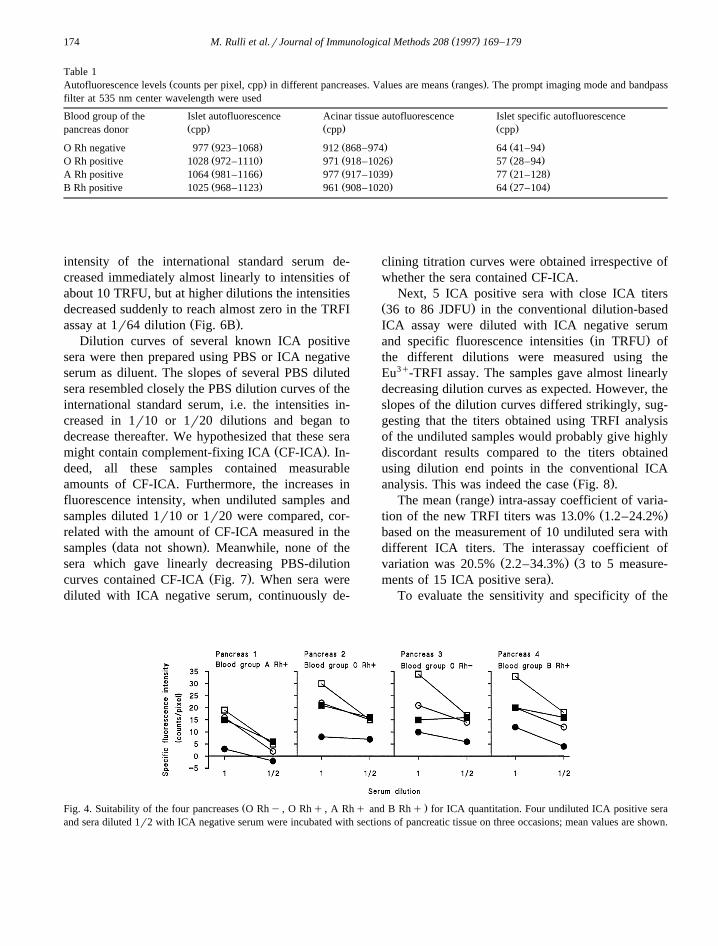
.ble 1 .To evaluate the suitability of the four pancreases
for ICA quantitation, four ICA positive sera with
Eu3q-chelate induced TRFI fluorescence intensitiesof 278, 255, 85 and 81 TRFU were incubated withsections of the four pancreases in three separateassays. The mean specific fluorescence intensities ofthe undiluted and diluted samples of the sera wereslightly lower when measured using the A Rh posi-tive pancreas than any of the other three pancreasesŽ .Fig. 4 .
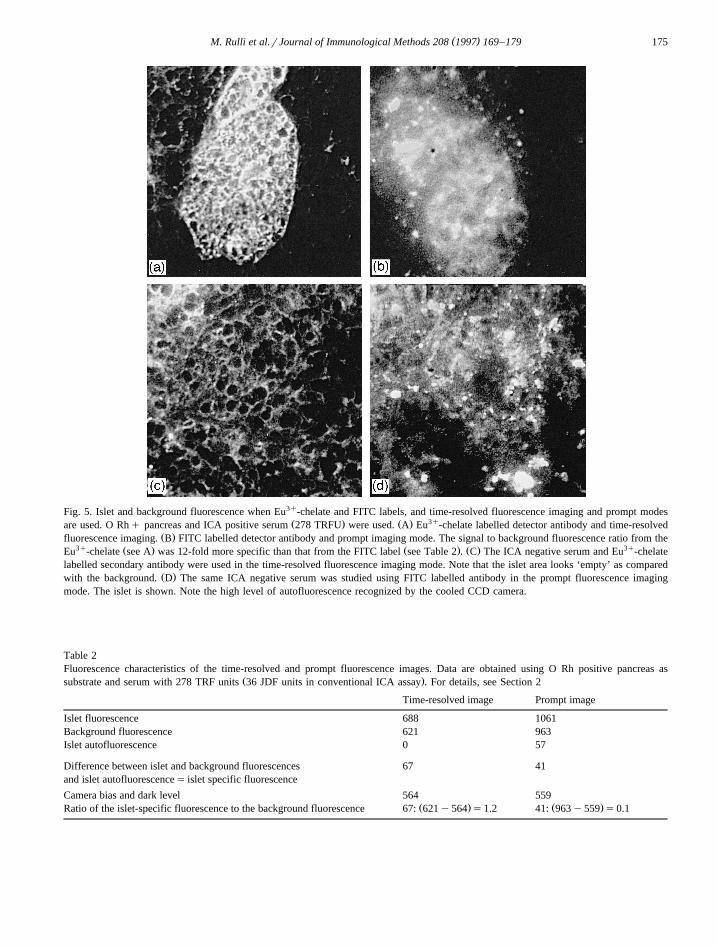
O Rh positive pancreas and ICA positive serumŽ .278 TRFU were then used to compare the ratio ofspecific fluorescence intensity to background fluo-rescence intensity using FITC labelled sample andprompt imaging mode or Eu3q-chelate labelled sam-
Ž .ple and TRFI imaging Fig. 5 . The ratio of thespecific signal intensity to background intensity of
3q Ž .the Eu -TRFI assay 1.2 was 12 times better thanŽ . Ž .that of the FITC prompt mode assay 0.1 Table 2 .
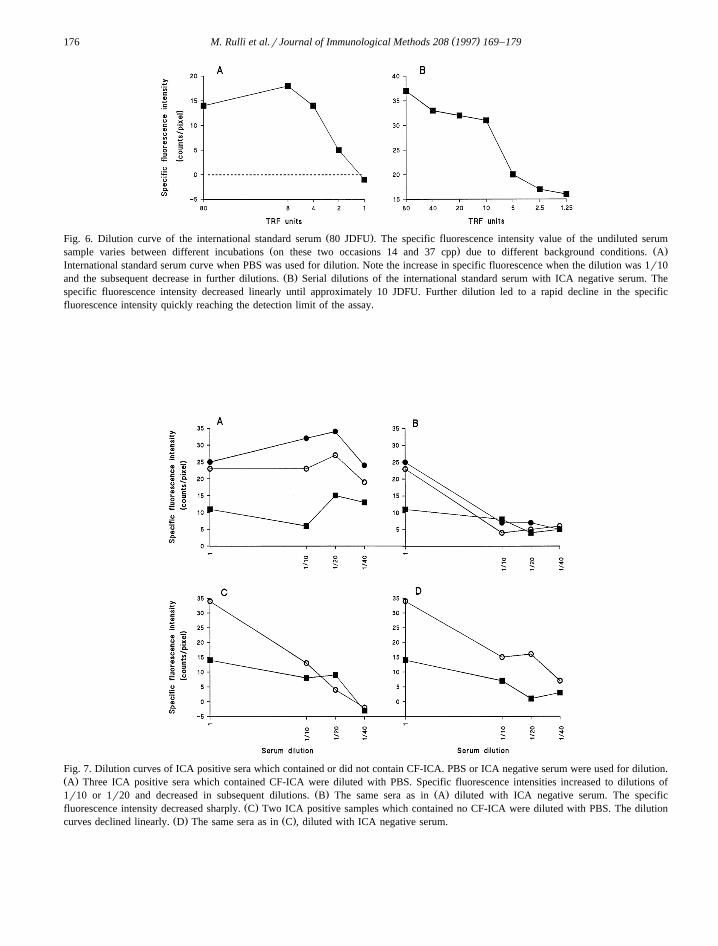
PBS as well as ICA negative serum have beenused for the dilution of ICA positive sera in conven-tional ICA quantitation. The dilution curves of the
Ž .international standard serum 80 JDFUs80 TRFUdiffered markedly in the TRFI-based analysis offluorescence intensities depending on whether PBSor ICA negative serum was used for dilution. Inter-estingly, fluorescence intensity increased when serumwas diluted 1r10 to 1r20 with PBS, but decreased
Ž .linearly at higher dilutions Fig. 6A . When ICAnegative serum was used as diluent, fluorescence
Fig. 3. Autofluorescence of unfixed, unstained, Merckoglasmounted pancreatic section. An islet with an intense autofluo-rescence signal is shown. The prompt imaging mode and bandpassfilter at 535 nm center wavelength were used.
( )M. Rulli et al.rJournal of Immunological Methods 208 1997 169–179174
Table 1Ž . Ž .Autofluorescence levels counts per pixel, cpp in different pancreases. Values are means ranges . The prompt imaging mode and bandpass
filter at 535 nm center wavelength were used
Blood group of the Islet autofluorescence Acinar tissue autofluorescence Islet specific autofluorescenceŽ . Ž . Ž .pancreas donor cpp cpp cpp
Ž . Ž . Ž .O Rh negative 977 923–1068 912 868–974 64 41–94Ž . Ž . Ž .O Rh positive 1028 972–1110 971 918–1026 57 28–94Ž . Ž . Ž .A Rh positive 1064 981–1166 977 917–1039 77 21–128Ž . Ž . Ž .B Rh positive 1025 968–1123 961 908–1020 64 27–104
intensity of the international standard serum de-creased immediately almost linearly to intensities ofabout 10 TRFU, but at higher dilutions the intensitiesdecreased suddenly to reach almost zero in the TRFI
Ž .assay at 1r64 dilution Fig. 6B .Dilution curves of several known ICA positive
sera were then prepared using PBS or ICA negativeserum as diluent. The slopes of several PBS dilutedsera resembled closely the PBS dilution curves of theinternational standard serum, i.e. the intensities in-creased in 1r10 or 1r20 dilutions and began todecrease thereafter. We hypothesized that these sera
Ž .might contain complement-fixing ICA CF-ICA . In-deed, all these samples contained measurableamounts of CF-ICA. Furthermore, the increases influorescence intensity, when undiluted samples andsamples diluted 1r10 or 1r20 were compared, cor-related with the amount of CF-ICA measured in the
Ž .samples data not shown . Meanwhile, none of thesera which gave linearly decreasing PBS-dilution
Ž .curves contained CF-ICA Fig. 7 . When sera werediluted with ICA negative serum, continuously de-
clining titration curves were obtained irrespective ofwhether the sera contained CF-ICA.
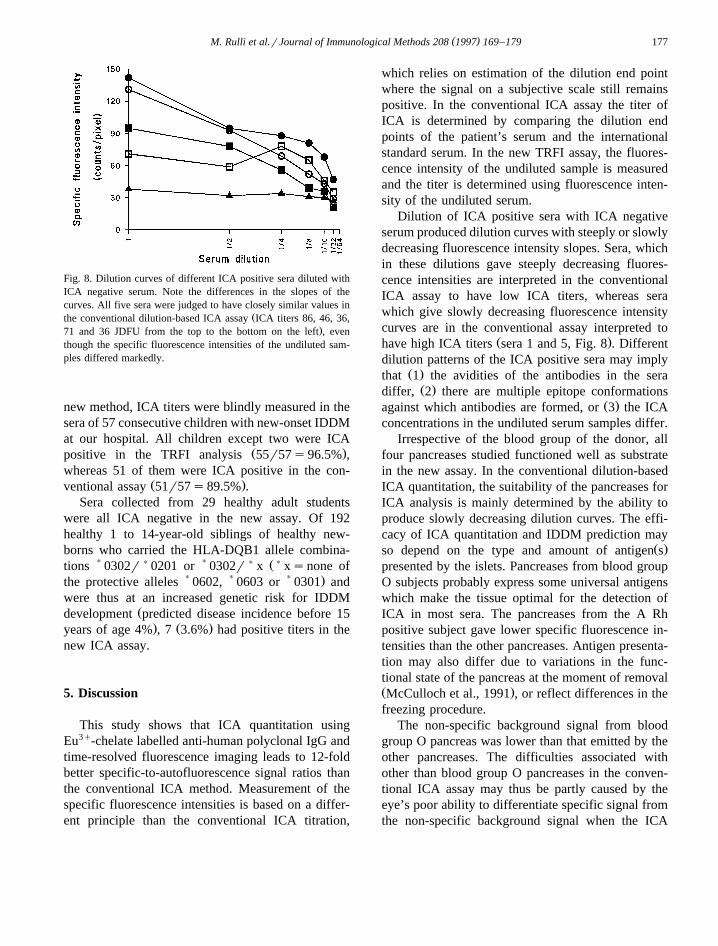
Next, 5 ICA positive sera with close ICA titersŽ .36 to 86 JDFU in the conventional dilution-basedICA assay were diluted with ICA negative serum
Ž .and specific fluorescence intensities in TRFU ofthe different dilutions were measured using theEu3q-TRFI assay. The samples gave almost linearlydecreasing dilution curves as expected. However, theslopes of the dilution curves differed strikingly, sug-gesting that the titers obtained using TRFI analysisof the undiluted samples would probably give highlydiscordant results compared to the titers obtainedusing dilution end points in the conventional ICA
Ž .analysis. This was indeed the case Fig. 8 .Ž .The mean range intra-assay coefficient of varia-
Ž .tion of the new TRFI titers was 13.0% 1.2–24.2%based on the measurement of 10 undiluted sera withdifferent ICA titers. The interassay coefficient of
Ž . Žvariation was 20.5% 2.2–34.3% 3 to 5 measure-.ments of 15 ICA positive sera .
To evaluate the sensitivity and specificity of the
Ž .Fig. 4. Suitability of the four pancreases O Rhy , O Rhq , A Rhq and B Rhq for ICA quantitation. Four undiluted ICA positive seraand sera diluted 1r2 with ICA negative serum were incubated with sections of pancreatic tissue on three occasions; mean values are shown.
( )M. Rulli et al.rJournal of Immunological Methods 208 1997 169–179 175
Fig. 5. Islet and background fluorescence when Eu3q-chelate and FITC labels, and time-resolved fluorescence imaging and prompt modesŽ . Ž . 3qare used. O Rhq pancreas and ICA positive serum 278 TRFU were used. A Eu -chelate labelled detector antibody and time-resolved
Ž .fluorescence imaging. B FITC labelled detector antibody and prompt imaging mode. The signal to background fluorescence ratio from the3q Ž . Ž . Ž . 3qEu -chelate see A was 12-fold more specific than that from the FITC label see Table 2 . C The ICA negative serum and Eu -chelate
labelled secondary antibody were used in the time-resolved fluorescence imaging mode. Note that the islet area looks ‘empty’ as comparedŽ .with the background. D The same ICA negative serum was studied using FITC labelled antibody in the prompt fluorescence imaging
mode. The islet is shown. Note the high level of autofluorescence recognized by the cooled CCD camera.
Table 2Fluorescence characteristics of the time-resolved and prompt fluorescence images. Data are obtained using O Rh positive pancreas as
Ž .substrate and serum with 278 TRF units 36 JDF units in conventional ICA assay . For details, see Section 2
Time-resolved image Prompt image
Islet fluorescence 688 1061Background fluorescence 621 963Islet autofluorescence 0 57
Difference between islet and background fluorescences 67 41and islet autofluorescences islet specific fluorescence
Camera bias and dark level 564 559Ž . Ž .Ratio of the islet-specific fluorescence to the background fluorescence 67: 621y564 s1.2 41: 963y559 s0.1
( )M. Rulli et al.rJournal of Immunological Methods 208 1997 169–179176
Ž .Fig. 6. Dilution curve of the international standard serum 80 JDFU . The specific fluorescence intensity value of the undiluted serumŽ . Ž .sample varies between different incubations on these two occasions 14 and 37 cpp due to different background conditions. A
International standard serum curve when PBS was used for dilution. Note the increase in specific fluorescence when the dilution was 1r10Ž .and the subsequent decrease in further dilutions. B Serial dilutions of the international standard serum with ICA negative serum. The
specific fluorescence intensity decreased linearly until approximately 10 JDFU. Further dilution led to a rapid decline in the specificfluorescence intensity quickly reaching the detection limit of the assay.
Fig. 7. Dilution curves of ICA positive sera which contained or did not contain CF-ICA. PBS or ICA negative serum were used for dilution.Ž .A Three ICA positive sera which contained CF-ICA were diluted with PBS. Specific fluorescence intensities increased to dilutions of
Ž . Ž .1r10 or 1r20 and decreased in subsequent dilutions. B The same sera as in A diluted with ICA negative serum. The specificŽ .fluorescence intensity decreased sharply. C Two ICA positive samples which contained no CF-ICA were diluted with PBS. The dilution
Ž . Ž .curves declined linearly. D The same sera as in C , diluted with ICA negative serum.
( )M. Rulli et al.rJournal of Immunological Methods 208 1997 169–179 177
Fig. 8. Dilution curves of different ICA positive sera diluted withICA negative serum. Note the differences in the slopes of thecurves. All five sera were judged to have closely similar values in
Žthe conventional dilution-based ICA assay ICA titers 86, 46, 36,.71 and 36 JDFU from the top to the bottom on the left , even
though the specific fluorescence intensities of the undiluted sam-ples differed markedly.
new method, ICA titers were blindly measured in thesera of 57 consecutive children with new-onset IDDMat our hospital. All children except two were ICA
Ž .positive in the TRFI analysis 55r57s96.5% ,whereas 51 of them were ICA positive in the con-
Ž .ventional assay 51r57s89.5% .Sera collected from 29 healthy adult students
were all ICA negative in the new assay. Of 192healthy 1 to 14-year-old siblings of healthy new-borns who carried the HLA-DQB1 allele combina-
))
)) Ž)tions 0302r 0201 or 0302r x xsnone of
) ) ) .the protective alleles 0602, 0603 or 0301 andwere thus at an increased genetic risk for IDDM
Ždevelopment predicted disease incidence before 15. Ž .years of age 4% , 7 3.6% had positive titers in the
new ICA assay.
5. Discussion
This study shows that ICA quantitation usingEu3q-chelate labelled anti-human polyclonal IgG andtime-resolved fluorescence imaging leads to 12-foldbetter specific-to-autofluorescence signal ratios thanthe conventional ICA method. Measurement of thespecific fluorescence intensities is based on a differ-ent principle than the conventional ICA titration,
which relies on estimation of the dilution end pointwhere the signal on a subjective scale still remainspositive. In the conventional ICA assay the titer ofICA is determined by comparing the dilution endpoints of the patient’s serum and the internationalstandard serum. In the new TRFI assay, the fluores-cence intensity of the undiluted sample is measuredand the titer is determined using fluorescence inten-sity of the undiluted serum.
Dilution of ICA positive sera with ICA negativeserum produced dilution curves with steeply or slowlydecreasing fluorescence intensity slopes. Sera, whichin these dilutions gave steeply decreasing fluores-cence intensities are interpreted in the conventionalICA assay to have low ICA titers, whereas serawhich give slowly decreasing fluorescence intensitycurves are in the conventional assay interpreted to
Ž .have high ICA titers sera 1 and 5, Fig. 8 . Differentdilution patterns of the ICA positive sera may imply
Ž .that 1 the avidities of the antibodies in the seraŽ .differ, 2 there are multiple epitope conformations
Ž .against which antibodies are formed, or 3 the ICAconcentrations in the undiluted serum samples differ.
Irrespective of the blood group of the donor, allfour pancreases studied functioned well as substratein the new assay. In the conventional dilution-basedICA quantitation, the suitability of the pancreases forICA analysis is mainly determined by the ability toproduce slowly decreasing dilution curves. The effi-cacy of ICA quantitation and IDDM prediction may
Ž .so depend on the type and amount of antigen spresented by the islets. Pancreases from blood groupO subjects probably express some universal antigenswhich make the tissue optimal for the detection ofICA in most sera. The pancreases from the A Rhpositive subject gave lower specific fluorescence in-tensities than the other pancreases. Antigen presenta-tion may also differ due to variations in the func-tional state of the pancreas at the moment of removalŽ .McCulloch et al., 1991 , or reflect differences in thefreezing procedure.
The non-specific background signal from bloodgroup O pancreas was lower than that emitted by theother pancreases. The difficulties associated withother than blood group O pancreases in the conven-tional ICA assay may thus be partly caused by theeye’s poor ability to differentiate specific signal fromthe non-specific background signal when the ICA
( )M. Rulli et al.rJournal of Immunological Methods 208 1997 169–179178
titers are low. The TRFI method also totally excludesthe effect of the short-lasting autofluorescence fromthe long-lived signal of the label and thus furtherincreases the specificity of the findings.
The specific fluorescence intensity of CF-ICAcontaining sera increased when the samples werediluted 1r10 or 1r20 with PBS. This effect of PBShas been recognized also in the conventional ICA
Ž .assay Betterle et al., 1980; Bottazzo et al., 1980 .The specific fluorescence intensities never increasedwhen ICA negative serum was used for dilution. Thevalue of this finding for IDDM prediction remainsunclear, even though CF-ICA have been proposed toassociate with acute islet damage and onset of clini-
Ž .cal IDDM Bottazzo et al., 1980 .The TRFI-based quantitation of ICA is useful
since subjective judgement becomes unnecessary,serum dilutions are not needed and the titers aredirectly expressed as numerical values when digitaldata handling and analysis are used. Two minor extrasteps, fixation and dehydration, are needed in thepreparation of the samples. A major disadvantage ofthe method is the high investment cost of the TRFIinstruments, mainly for the optically gated digitalCCD camera. However, the equipment is also wellsuited for objective quantitation of several othertissue-specific antibodies. Additional advantages ofthe TRFI method are the stability of the fluorescentsignal, which together with the digital data handlingsystem offer possibilities for full automation of theICA measurements.
Finally, the differences in the titers measuredusing the conventional ICA assay or TRFI-basedICA measurements suggest that the abilities of thetwo methods to predict IDDM may differ. Since theTRFI-quantitation of ICA was more objective thanthe conventional ICA assay, clearly showed positivetiters in all but two new-onset IDDM cases and theexpected small numbers of ICA positives in an unse-lected population, we hypothesize that the TRFI-based, automated ICA quantitation may improve thepossibilities of population-based IDDM prediction.
Acknowledgements
This study has been supported by grants from theTurku University Foundation, the Instrumentarium
Science Foundation, the Novo-Nordisk Foundationand the Diabetes Research Foundation, Finland.
References
Betterle, C., Caretto, A., Tiengo, A., Trevisan, A., 1980. Comple-ment-fixing islet-cell antibodies in type I diabetes and insusceptible patients with autoimmune diseases. Lancet i, 1418.
Beverloo, H.B., van Schadewijk, A., van Gelderen-Boele, S.,Tanke, H.J., 1990. Inorganic phosphors as new luminescentlabels for immunocytochemistry and time-resolved mi-croscopy. Cytometry 11, 784.
Bonifacio, E., Genovese, S., Braghi, S., Bazzigaluppi, E., Lampa-sona, V., Bingley, P.J., Rogge, L., Pastore, M.R., Bognetti, E.,Bottazzo, G.F., 1995. Islet autoantibody markers in IDDM:Risk assessment strategies yielding high sensitivity. Diabetolo-gia 38, 816.
Bottazzo, G.F., Florin-Christensen, A., Doniach, D., 1974. Isletcell antibodies in diabetes mellitus with autoimmune polyen-docrine deficiencies. Lancet i, 1279.
Bottazzo, G.F., Gorsuch, A.N., Dean, B.M., Cudworth, A.G.,Doniach, D., 1980. Complement-fixing islet-cell antibodies intype I diabetes: Possible monitors of active beta-cell damage.Lancet i, 668.
Bright, G.M., 1987. Quantitative assay for human cytoplasmicislet cell antibodies. Diabetes 36, 1183.
Dahlen, P., Hurskainen, P., Lovgren, T., 1989. Alternative labels¨in DNA hybridization. In: Balows, A., Tilton, R.C., Turano,
Ž .A. Eds. , Rapid Methods and Automation in Microbiologyand Immunology. Brixia Academic Press, Brescia, Italy, p.214.
Hemmila, I., Dakubu, S., Mukkala, V.M., Siitari, H., Lovgren, T.,¨ ¨1984. Europium as a label in time-resolved immunofluoromet-ric assays. Anal. Biochem. 137, 335.
Hemmila, I., 1991. Applications of Fluorescence in Immunoas-¨says. Wiley-Interscience, New York.
McCulloch, D.K., Barmeier, H., Neifing, J.L., Palmer, J.P., 1991.Metabolic state of the pancreas affects end-point titre in theislet cell antibody assay. Diabetologia 34, 622.
Mukkala, V.-M., Helenius, M., Hemmila, I., Kankare, J., Takalo,¨Ž .H., 1993. Development of luminescent europium III and ter-
Ž . X X Ybium III chelates of 2,2 :6 ,2 -terpyridine derivatives for pro-tein labelling. Helv. Chim. Acta 76, 1361.
Myers, M.A., Rabin, D.U., Rowley, M.J., 1995. Pancreatic isletsell cytoplasmic antibody in diabetes is represented by anti-bodies to islet cell antigen 512 and glutamic acid decarboxyl-ase. Diabetes 44, 1290.
Ogata, A., Tagoh, H., Lee, T., Kuritani, T., Takahara, Y., Shima-mura, T., Ikegami, H., Kurimoto, M., Yoshizaki, K., Kishi-moto, T., 1992. A new highly sensitive immunoassay forcytokines by dissociation-enhanced lanthanide fluoroim-
Ž .munoassay DELFIA . J. Immunol. Methods 148, 15.Seveus, L., Vaisala, M., Syrjanen, S., Sandberg, M., Kuusisto, A.,¨ ¨ ¨ ¨

( )M. Rulli et al.rJournal of Immunological Methods 208 1997 169–179 179
Harju, R., Salo, J., Hemmila, I., Kojola, H., Soini, E., 1992.¨Time-resolved fluorescence imaging of europium chelate labelin immunohistochemistry and in situ hybridization. Cytometry13, 329.
Sjoroos, M., Iitia, A., Ilonen, J., Reijonen, H., Lovgren, T., 1995.¨ ¨ ¨Triple-label hybridization assay for type-1 diabetes-relatedHLA alleles. BioTechniques 18, 870.
Srikanta, S., Rabizadeh, A., Omar, M.A.K., Eisenbarth, G.S.,
1985. Assay for islet cell antibodies. Protein A-monoclonalantibody method. Diabetes 34, 300.
Zimmet, P.Z., Elliott, R.B., Mackay, I.R., Tuomi, T., Rowley,M.J., Pilcher, C.C., Knowles, W.J., 1994. Autoantibodies toglutamic acid decarboxylase and insulin in islet cell antibodypositive presymptomatic type 1 diabetes mellitus: Frequencyand segregation by age and gender. Diabetic Med. 11, 866.


