Embed Size (px)
Citation preview

RESEARCH ARTICLE
E. J. Foeth Æ C. W. H. van Doorne Æ T. van Terwisga
B. Wieneke
Time resolved PIV and flow visualization of 3D sheet cavitation
Received: 20 April 2005 / Revised: 22 July 2005 / Accepted: 24 October 2005� Springer-Verlag 2006
Abstract Time-resolved PIV was applied to study fullydeveloped sheet cavitation on a hydrofoil with a spanwisevarying angle of attack. The hydrofoil was designed tohave a three-dimensional cavitation pattern closelyrelated to propeller cavitation, studied for its adverseeffects as vibration, noise, and erosion production. Forthe PIV measurements, fluorescent tracer particles wereapplied in combination with an optical filter, in order toremove the reflections of the laser lightsheet by the cavi-tation. An adaptive mask was developed to find theinterface between the vapor and liquid phase. The velocityat the interface of the cavity was found to be very close tothe velocity predicted by a simple streamline model. For avisualization of the global flow dynamics, the laser beamwas expanded and used to illuminate the entire hydrofoiland cavitation structure. The time-resolved record-ings reveal the growth of the attached cavity and thecloud shedding. Our investigation proves the viability ofaccurate PIV measurements around developed sheetcavitation. The presented results will further be madeavailable as a benchmark for the validation of numericalsimulations of this complicated flow.
1 Introduction
Cavitation is the evaporation of liquid when the pressurefalls below the vapor pressure. When such a low pressureregion is formed near the leading edge of a hydrofoil, theflow detaches and a pocket of vapor is formed, namedattached or sheet cavitation. Downstream of this sheet
cavity, the flow re-attaches to the hydrofoil and a stag-nation point is formed. The positive pressure gradient inthis region forces a thin stream of liquid upstream intothe cavity, termed the re-entrant jet. When the re-entrantjet impinges farther upstream on the fluid–vapor inter-face, part of the sheet cavity is pinched off and will beadvected downstream. The advected cloud is often bothhighly turbulent and bubbly in nature and may collapseviolently depending on the pressure condition. After theshedding of a cloud, the attached cavity starts to growagain and the process is repeated. For an overview ofcavitation, see Rood (1991, inception), Brennen (1995,bubble cavitation), Arndt (2002, vortical cavitation) andFranc (2001, sheet cavitation).
Sheet cavitation is a major cause of noise, vibration,and erosion on ship propellers. As it is usually notpossible to avoid, it has to be controlled. Although thefinal evaluation of a propeller design is based on modelexperiments, numerical tools for cavitation simulationare becoming increasingly more important. Potentialflow solvers are currently the industrial standard (Youngand Kinnas 2001), and both Euler (Choi and Kinnas1998; Sauer and Schnerr 2000) and RANS (Kunz et al.1999; Senocak and Shyy 2001) codes are frequentlyapplied. More recently, LES is used to predict cavitationbehavior (Wikstrom et al. 2003; Qin et al. 2003). How-ever, up to now simulations are not able to capture thepressure radiated by cavitation or to predict erosionlocation and severity on propellers (ITTC 2002). Insupport of this rapidly expanding field of numericalsimulation, this experimental research was started with athreefold goal; firstly, analyzing the physical mecha-nisms of the instability of the flow; secondly, building adata set of simple cavitating flows to be used as bench-mark material and thirdly, extending the insights gainedto guidelines for propeller design. Validation material inthe form of cavity volume, shedding frequency, velocityfields, and pressure measurement is essential.
Since cavitation forms one of the most importantdesign criteria for ship propellers, there have beennumerous experimental studies in the past. Research
E. J. Foeth (&) Æ C. W. H. van Doorne Æ T. van TerwisgaLaboratory of Ship Hydromechanics,Delft University of Technology, Mekelweg 2,2628 CD Delft, The NetherlandsE-mail: [email protected]
B. WienekeLaVision GmbH, Anna-Vandenhoek-Ring 19,37081 Goettingen, GermanyE-mail: [email protected]
Experiments in Fluids (2006)DOI 10.1007/s00348-005-0082-9

interests have varied from the influence of the boundarylayer on the cavitation on axis-symmetric headforms(Arakeri and Acosta 1973), to the cavitation patternsobserved on two-dimensional (2D) hydrofoils (Astolfiet al. 2000). Callenaere et al. (2001) used a 2D backwardfacing step to create a sheet cavity behind the step.Despite the 2D geometry of the setup, the cavity wasoften found to shed vapor clouds intermittently and atrandom locations, leading to a completely 3D andcomplex flow field. Laberteaux and Ceccio (2001)showed that the sweep (or skew) of the applied hydrofoilhad a significant effect on the topology of the cavity andon the direction of the re-entrant jet. For this 3Dgeometry, the cavity was found to be far more stable.The importance of the re-entrant jet was furtherdemonstrated by Kawanami (1997), who blocked there-entrant jet and subsequently altered the cavitationbehavior. From these and other experiments, it hasbecome clear that the form and stability of the cavitationis very sensitive to the 3D geometry of the hydrofoil.
Cavitation on ship propellers is distinctly 3D due tothe 3D geometry of the propeller, the radially increasingvelocity, the finite span of the blade and the periodicchange of inflow conditions due to the wake behind aship. As studying cavitation on a rotating object isinherently more difficult, it is common practice to studythe flow on a steady (3D) hydrofoil with a cavitationtopology and inflow condition closely related to pro-pellers. A 3D hydrofoil with its shedding mechanismdepending on its spanwise loading and reduced wallinfluence has a more structured and repeatable sheetthan a 2D hydrofoil at a constant angle of attack. Thisallows for observations of the influence of controlled 3Deffects. Ultimately, we hope to be able to adjust thepropeller design in such a way that the cavitation patternis stabilized and the vapor shedding will be minimized.
The main purpose of this paper is to show the via-bility of time resolved PIV measurements (Raffel et al.1998) for the study of sheet cavitation. In Sect. 2, we firstpresent the experimental setup and the applied methodsincluding a description of the cavitation, the applied 3Dhydrofoil and the PIV setup. A common problem in theapplication of optical techniques to two-phase flows isthe risk of strong reflections in the direction of thecamera and the obstruction of the optical path (Tassin1995). The first problem was avoided by the use offluorescent tracer particles in combination with anoptical filter in front of the camera lens blocking all laserlight (Gopalan and Katz 2000; Bachert 2003). Particleimages of good quality were obtained in the liquidphase, whereas the regions occupied by the vapor in thecavity appeared as blurred region in the PIV images. Tosolve the latter problem, an adaptive mask was devel-oped to find the interface between the vapor and theliquid phase, as is discussed in Sect. 2.4. In Sect. 3 theresults are presented. When the vapor regions wereexcluded from the PIV analysis, the velocity of the liquidphase could be evaluated within about 1 mm from thecavity interface. Visualization is another indispensable
tool for the study of the global dynamics of the cavita-tion. When the laser beam was expanded to illuminatethe entire hydrofoil and cavitation structure, it waspossible to obtain clear movies of the sheet cavity andvapor shedding. Finally, we summarize the work anddraw some conclusions in Sect. 4.
2 Experimental setup and methods
2.1 Cavitation tunnel
The experiments were performed in the University ofDelft Cavitation Tunnel shown in Fig. 1. The measure-ment channel is 0.60 m long, the cross section is0.297 m·0.297 m, with optical access from all sides.Velocities up to 10 m/s per second can be attained andthe local pressure can be reduced to 5,000 Pa. The non-dimensional cavitation number, defined as
r ¼ P0 � PV
12qV 2
0
; ð1Þ
and expresses the ratio of the pressure head to thevaporization pressure (PV) and the dynamic pressure(0.5 q V0
2) at the entrance of the test section.The pressure was measured with ten Keller PAA-15
pressure transducers at each wall of both the inlet andthe outlet of the test section, and on two locations beforethe contraction upstream of the test section (Fig. 2).These sensors were calibrated in situ to within 1% errorwith a Keller PAA-33 pressure transmitter located in thetest section. The velocity at the entrance of the testsection (V0) was estimated from the pressure drop overthe contraction and the known contraction ratio.Uncertainty analysis and error propagation indicated anuncertainty in r of nearly 7.5% within a 95% confidenceinterval for the presented measurements.
Fig. 1 Sketch of the cavitation tunnel. The upper and left leg arerectangular, the lower and right leg are cylindrical. The flow iscounter clockwise and the air is evacuated at the dome on top ofthe tunnel

For the measurements, a stationary and spatiallyuniform inflow was applied. The unsteady behavior ofthe cavity will, therefore, not be driven by an externalpressure field but by its intrinsic dynamics. In the future,we also plan to apply periodic inflow conditions bymeans of an upstream mounted flow oscillator.
2.2 Three-dimensional hydrofoil
The applied 3D hydrofoil was used before in a study byDang (2000), see Fig. 3. It spans the entire test section of294 mm, and it has a chord length of 150 mm. The crosssection of the hydrofoil is defined by the NACA0009thickness distribution (Abbott and von Doenhoff 1959).In order to avoid damage during the manufacturing ofthe hydrofoil, the profile’s trailing edge was thickened toa minimum of 0.4 mm. For this, the NACA polynomialt(x)N for the dimensionless thickness was complementedfrom xP=0.35 until the trailing edge, where x=[0...1]stands for the dimensionless chordwise coordinate, bythe following polynomial:
tðxÞ ¼ tðxÞN þtmin
max tðxÞN� �
C� tð1ÞN
!
� x� xp
1� xp
� �2
H xp� �
;
C is the chord length, t the non-dimensional thickness,tmin the non-dimensional minimum trailing edge thick-ness, and H the heaviside function.
The hydrofoil is given a 3D shape by a variation inthe angle of attack (a) along the spanwise direction (y):
aðyÞ ¼ aT 16 y � 1
2
����
����
3
�12 y � 1
2
����
����
2
þ1 !
þ b:
The hydrofoil was manufactured with a span of 300 mmtrimmed to size to fit the test section. The center ofrotation of the hydrofoil is located halfway down thechord. The angle of attack increases smoothly towardthe center of the hydrofoil by aT=8� (Fig. 4). The angleb is the rotation angle of the entire hydrofoil and is equalto the angle of attack at the wall, which was zero for ourPIV experiment. This geometry results in a low-pressureregion in the center of the hydrofoil, and the cavitationwill develop here first. This immediately results in a 3Dshape of the sheet cavity without interference from thewalls.
In laminar flow, at low Reynolds number for smoothobjects, cavitation forms in the regions of laminar flowseparation. Therefore, a natural transition to turbulencecan temporarily suppress the leading edge detachmentand the cavitation inception (Franc and Michel 1985).
Fig. 2 A close-up of the test section showing the hydrofoil, thelocation for the camera for PIV measurements (C) and the lightsheet (L)
Fig. 3 Top, side and front view of the hydrofoil. The black outlinein the top view indicates the viewing area of Fig. 6 (6.1–6.20)
Geometric angle of attack
0
1
2
3
4
5
6
7
8
0 50 100 150 200 250 300Span [mm]
Ang
le [d
eg]
Fig. 4 Chordwise distribution of the angle of attack

This was avoided by the application of roughness ele-ments of 120 lm at the leading edge (4% of the chordlength) as a turbulence tripping mechanism. Prior to theexperiments, the tunnel was left to run for a few daysunder minimum pressure conditions to ensure a minimalgas content. The gas content was not measured, but theroughness will supply the degassed flow with amplenuclei for sheet cavitation to develop (Kuiper 1982).Incipient cavitation on roughness elements is typicallyobserved when r equals the minimum pressure coeffi-cient (Caron et al. 2000) and the nuclei content of theflow is no longer critical.
2.3 PIV setup
The PIV experiment was performed with a New WavePegasus dual-head, diode pumped Nd:YLF laser, with a180 ns pulse duration and an energy of 10 mJ/pulse at arepetition rate of 1,000 Hz. The light sheet was formedwith a compact system of cylindrical lenses, and thelightsheet thickness was estimated at 2 mm. The energydensity in the lightsheet was sufficiently low to avoiddamage to the perspex windows of the test section.
An optical filter and fluorescent tracer particles wereapplied to block reflections of the lightsheet from thecavity interface. This principle was successfully appliedin cavitating flows by e.g. Bachert (2003). The PMMA-Rhodamine B fluorescent particles’ diameters are typi-cally 20–50 lm and emit light in the orange band(around 590 nm). Fourteen grams of tracer particleswere used on the tunnel volume estimated at 7.5 m3.Although the particles are not neutrally buoyant(q=1.19·103 kg/m3) and will settle between experiments(estimated settling velocity is less than 0.3 mm/s for thelargest particles), they were quickly dispersed at start-up.No appreciable decrease in the particle density wasnoticed after 1 month of continuous running.
The camera used is a LaVision Flow-master High-SpeedStar 4 (Photron Ultima APX) with a 10 bit dy-namic range, 1 Megapixel resolution at a repetition rateof 2 kHz, and with 2.6 GB memory. A Nikon AFNikkor 50 mm lens was used, with an f-stop of 2.8. Thefield of view was 18·18 cm2, centered around thehydrofoil in the lower part of the image. Small detailssuch as the exact location of the flow detachment at theleading edge of the foil shown by Farhat and Avellan(2001) to occur within a region as small as 0.3% of thechord length for Re=3·106, corresponding to less than2.5 pixels for the current magnification) are invariablylost. However, the main focus of this research is to studythe large scale phenomena as the shedding sequence ofthe attached cavity and the flow around the cavitationstructures, and these were well resolved with the currentsetup.
Cavitation clouds that occur between the camera andthe lightsheet can block the view of the camera on thelightsheet. In order to (partly) avoid this problem, thecamera was tilted (8.2�) to view the cavitation structure
from above (Fig. 2). This inclined viewing induces asmall error in the vertical velocity component of about1.4%. Viewing under large angles results in opticalaberrations and necessitates a larger depth of view butfor the applied angle neither effect was noticed.
2.4 PIV analysis
The evaluation of the vector fields from the PIV-imagesis performed with the commercial PIV-software DaVis7.0 from LaVision, and an overview of the parameters ispresented in Table 1. The effective measurement fre-quency (1 KHz) is half the camera frequency, as singleexposure double frame PIV images were recorded. Witha laser pulse delay of 250 ms a typical particledisplacement of 8 pixels at a flow rate of 7 m/s wasobtained. The interrogation areas of 32·32 pixels large,with 75% overlap were used, resulting in a vector-to-vector spacing of 1.46 mm. Vectors with a deviationlarger than 1.5 times the RMS of the neighboringvectors were considered spurious and were removed.The final results are smoothed once with a 3·3 Gaussiankernel.
The refraction at the cavitation interface makes itimpossible to have a clear view of the interior of theattached cavity, and therefore no tracer particles can bedistinguished inside the sheet (Fig. 5.1), but particles canbe seen in the cloud. Although the optical filter in frontof the camera filters out the strong reflections of the laserlightsheet, the cavity appears clearly in the PIV images,as the entire test section is illuminated by the emittedlight from the fluorescent tracer particles. For interro-gation areas that partly overlap the cloud, the blurredand relatively high intensity level in this region can leadto large errors in the estimated velocities of the fluidmotion at the cavity interface. To improve the accuracyof the velocity near the cavitation interface, an adaptivemask was applied to the PIV images to exclude theregions occupied by the cavitation, the hydrofoil andthe entire region below the hydrofoil, from the vectorevaluation.
2.5 Adaptive mask
In order to exclude the regions occupied by vapor fromthe PIV analysis, an adaptive mask was developed tofind the interface between the liquid and gaseous flowregions. The region within the mask was set to zeroduring PIV interrogation. The mask identified the vaporregion as the region where the minimal intensity (thebackground) level surpassed a certain threshold, due tothe bright reflections on the cavity interface, combinedwith the regions where the intensity of gradients wassmall, indicating the absence of tracer particles. It isstressed that the parameters of the mask, such asthreshold levels and filter lengths, were determinedempirically in order to match the calculated cavitation

interface with the interface observed by eye in the PIVimages. The image was mirrored at its sides to avoiderrors when a filter window exceeded the borders of theimage.
In Fig. 5 (5.1–5.12) we show the intermediate steps ofthe adaptive mask in more detail. Figure 5.1 shows anunprocessed PIV image. The upper part of the image isdark as the frame of the test section blocked the view onthis region of the flow. In the first step, a sliding medianfilter was applied to remove the particles from the image,where the fifth minimal intensity level in a window of5·5 pixels provided a convenient measure for thebackground level, displayed in Fig. 5.2. A threshold wasapplied to convert the background intensity into a bin-ary image (Fig. 5.3), and pixels within a radial distanceof 6 pixels of the active regions were added to the filterto consolidate groups of neighboring pixels into con-tiguous regions (Fig. 5.4). As the intensity of the light-sheet was not constant, the threshold was varied acrossthe image.
Tracer particles, typically a few pixels large, weredetected in the original image by application of a gra-dient filter using the following convolution kernels:
Kver ¼�1 0 þ1�2 0 þ2�1 0 þ1
2
4
3
5; Khor ¼þ1 þ2 þ10 0 0�1 �2 �1
2
4
3
5:
The gradient was calculated asffiffiffiffiffiffiffiffiffiffiffiffiffiffiffiffiffiffiffiffiffiffiffiK2hor þ K2
ver
q: A thresh-
old was applied to the gradient level to obtain the binaryimage shown in Fig. 5.5. Groups of isolated pixels wereidentified and removed. The regions where no particlesoccured within a radial distance of 7 pixels wereassigned to the masked region, as shown in Fig. 5.6.
For the detection of the cavity interface, the regionoccupied by the hydrofoil and the flow region below thehydrofoil were subtracted from the vapor region and thevapor region was grown by another 6 pixels to smooththe surface (Fig. 5.7). The interface was still very irreg-ular due to either reflections of bright tracer particles onthe interface or the absence of tracer particles.
In Fig. 5.9 the regions detected by the large back-ground intensity and the absence of tracer particles werecombined to find the total region occupied by vapor.Small and isolated regions corresponding to the wettedflow region were removed from the filter. For the finalsmoothing of the cavitation interface, the temporalsequence of 2D masks was stagged into a 3D array andsmoothed three times by a 3D Gaussian kernel. The finalresult is shown in Fig. 5.10, and the cavitation interfaceis shown together with the original PIV image inFig. 5.11.
The interface of the cavitation as determined by theadaptive mask corresponds reasonably well to theinterface observed by eye in the PIV images. However,the absence of particle images in several regions of theflow, particularly near the leading edge where theintensity of the lightsheet was weak, resulted inmasking errors. For future measurements, the lightsheet will be made more homogenous for an easieridentification of the sheet interface. The light sheet wasaimed at the closure of the attached cavity, and,therefore, this region was well illuminated. This isillustrated by the magnified view of the cavitationinterface in the neighborhood of the closure region ofthe attached cavity in Fig. 5.1, and around the sepa-rated cavitation cloud in Fig. 5.2. From the latterimage, it can further be seen that the cavitation
Table 1 Overview of theexperimental parameters Tunnel Fluid Water
Max velocity 10 m/sMin pressure 5,000 PaMin r 0.5
Test section Height 0.297 mWidth 0.297 mLength 0.6 mMaterial PerspexWall thickness 40 mm
Seeding Type SphericalDiameter 20–50 lm
Light sheet Laser type Nd:YLFMaximum energy 10 mJ/pulseWave length 527 nmPulse duration 180 nsThickness 1.5 mm
Camera Type Photron Ultima APX Photron Ultima APXResolution 1,024·1,024 PixelsDiscretization 10 bitRepetition rate 2,000 Hz
Imaging Lens focal length 50 mmf-number 2.8Viewing area 180·180 mm2
Exposure delay time 1.0 lsMaximum particle displacement 8 Pixels
PIV analysis Interrogation area 32·32 PixelsOverlap IA 75%

interface around the vapor cloud is not well-defined, asboth particles and large reflections from the vaporcloud are observed in this region, but an exact inter-face is unclear by any standard in this transitionalregion. The cavity cloud was seen to strongly reflectthe light sheet thereby illuminating particles outside
the measurement plane. Furthermore, liquid and par-ticles are ingested into the cloud during its collapse.The mask is used to identify the entire region wherePIV interrogation will lead to unpredictable results butmakes no further attempt at differentiating betweensheet and encompassed cloud structures.
Fig. 5 Steps in the adaptivemask to locating the cavityinterface.
Another problem is that vapor structures in front ofthe light sheet will block the view of the camera. It is,therefore, uncertain to what extent the cavitation inter-face detected by the mask corresponds to the actualinterface in the cross section of the light sheet. However,since we performed our measurements in the symmetryplane of the 3D hydrofoil where the cavitation structuresare the largest, as follows from the results of the flowvisualization, we assume that the mask provides a fairlyaccurate estimation of the cavitation interface in theplane of the light sheet.
3 Results
3.1 Flow visualization
For the flow visualization shown in Fig. 6 (6.1–6.20) thelaser beam was expanded to illuminate the entire cavi-tation structure. The images were recorded with the PIVcamera, repositioned to view the suction side of thehydrofoil at a straight angle.
In Fig. 6.1 the attached cavity has reached its maxi-mum length and is crescent shaped due to the spanwisevariation of the loading of the hydrofoil. The strongadverse pressure gradient in the stagnation region at thedownstream end of the cavity forces a re-entrant jet intothe vapor structure. The velocity is known to reflect on theenvelope of the cavitation interface (de Lange 1998), andfor a cavity with a 3D shape the reentrant jet will thushave different directions. The re-entrant flow will collidein the center of the foil and at this point the cavity willquickly change from a smooth pocket of attached vaporinto a highly turbulent region and detach from the leadingedge [Fig. 6 (6.2–6.8)]. The vapor cloud becomes turbu-lent and is advected downstream by themain flow, as seenin Fig. 6 (6.16, 6.17). In the final images of the collapse ofthe vapor cloud, a clear vortex structure is observed[Fig. 6 (6.17–6.20)]. In Fig. 6 (6.13–6.18; indicated by theletter A in Fig. 6.17) also two smaller vortices are seento form at the downstream end of the attached cavity,considered a small secondary shedding.
The entire shedding cycle was very periodic and a fullperiod took approximately 47.5 ms, corresponding to aStrouhal number of St=0.19, based on cavity chordlength and mean stream velocity V0. This is significantlylower than the the Strouhal number observed for 2Dflows fL=V0 ¼ 0:25
ffiffiffiffiffiffiffiffiffiffiffi1þ rp
¼ 0:33� �
by Arndt (1995).From this, we conclude that the behavior of the 3Dcavity is significantly different from that in a 2D cavity,and a more detailed study on the 3D effect of the cavityon the re-entrant jet and global dynamics will be pre-sented in later work.
3.2 Cavitation interface
The temporal development of the cavitation interface isshown in Fig. 7 for a period of 100 ms, corresponding
to a sequence of 100 PIV images. The shedding of theattached cavity is well visible. The vapor cloud is fur-ther seen to increase quickly in height as it is advecteddownstream. This sudden expansion of the cavitationcloud above the hydrofoil has not been captured by 2Dcalculation with Euler codes (Sauer 2000). This evolu-tion of the cavitation cloud is more likely to be thecaptured by Large Eddy Simulations (Qin 2003) Thevariation in location of the flow separation atthe leading edge of the hydrofoil is not physical. Itshows that the mask was less accurate near the leadingedge, due to the poor illumination of this region. Infuture, a more homogenous light sheet will applied toimprove the identification of the cavitation interfaceclose to the leading edge.
3.3 PIV results
Figures 8.1, 8.2 and 9 show different examples of theevaluated vector fields and the contours of the cavityinterface. The velocity appears to be parallel to theinterface when the cavity is attached (Figs. 8.1, 9).Assuming the flow along the cavity to be (1) approxi-mately stationary, (2) two-dimensional and (3) at apressure equal to the vapor pressure, a simple streamlinemodel can be used to estimate the velocity at the cavi-tation interface, refered to as the vapor pressure (VV).From Bernoulli’s equation (P0+0.5q V0
2=PV+0.5q VV2 )
in conjunction with Eq. 1 we obtain:
VV ¼ffiffiffiffiffiffiffiffiffiffiffiffiffiffiffiffiffiffiffið1þ rÞV0
p: ð2Þ
Based on pressure measurements on both sides of thecontraction upstream of the measurement section, P0
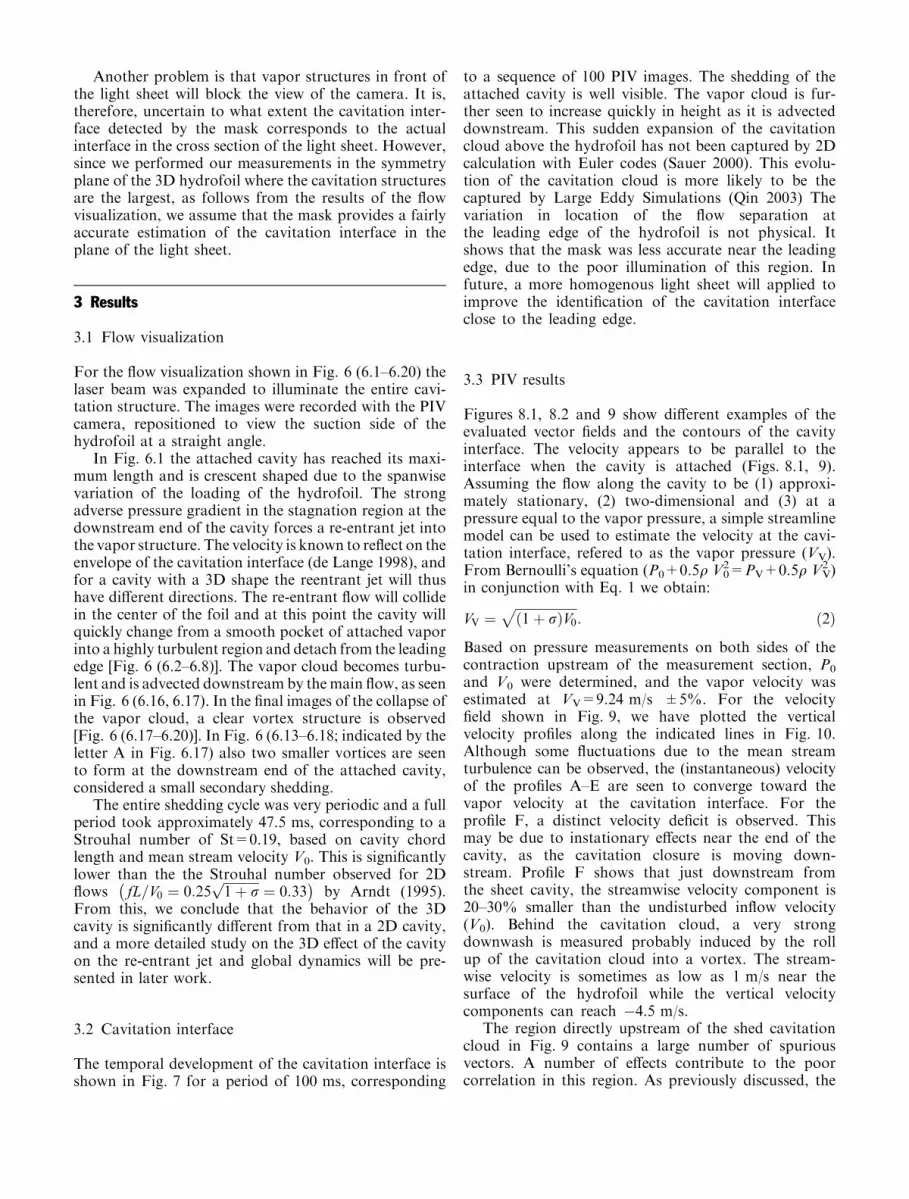
and V0 were determined, and the vapor velocity wasestimated at VV=9.24 m/s ±5%. For the velocityfield shown in Fig. 9, we have plotted the verticalvelocity profiles along the indicated lines in Fig. 10.Although some fluctuations due to the mean streamturbulence can be observed, the (instantaneous) velocityof the profiles A–E are seen to converge toward thevapor velocity at the cavitation interface. For theprofile F, a distinct velocity deficit is observed. Thismay be due to instationary effects near the end of thecavity, as the cavitation closure is moving down-stream. Profile F shows that just downstream fromthe sheet cavity, the streamwise velocity component is20–30% smaller than the undisturbed inflow velocity(V0). Behind the cavitation cloud, a very strongdownwash is measured probably induced by the rollup of the cavitation cloud into a vortex. The stream-wise velocity is sometimes as low as 1 m/s near thesurface of the hydrofoil while the vertical velocitycomponents can reach �4.5 m/s.
The region directly upstream of the shed cavitationcloud in Fig. 9 contains a large number of spuriousvectors. A number of effects contribute to the poorcorrelation in this region. As previously discussed, the

cavitation interface around the vapor cloud is not welldefined, as both particles and large reflections from thevapor cloud are observed in this region. The largebackground noise in the PIV images increases the PIVcorrelation noise significantly. Second, from the high-speed flow visualizations, it is seen that the cavitationcloud is highly turbulent. Gopalan and Katz measured aReynolds shear stress 25–40% of normal stress in theclosure region. The loss of particle pairs due to strongout-of-plane motions is therefore high, increasing thecorrelation noise further.
4 Conclusion and discussion
Time-resolved PIV was applied to study sheet cavitationon a hydrofoil with a spanwise varying angle of attack.In order to block strong reflections of the laser lightsheetby the cavitation, fluorescent tracer particles wereapplied in combination with an optical filter. Neverthe-less, the cavitation structures were clearly visible in thePIV images, due to the reflection of light emitted by thefluorescent tracer particles. Refraction at the cavitation
Fig. 6 Flow visualization atV0=7.04 m/s ±1.16%, b=1�,r=0.77±7.4%, recorded atf=2.000 Hz showing every fifthframe. Viewing area as outlinedin Fig. 3, flow from top tobottom, white lines indicateleading and trailing edgelocation

interface makes it impossible to see into the cavity toperform PIV in the vapor region and the re-entrant jetcould not be observed from the PIV images. In order toimprove the velocity estimation close to the cavitationinterface, an adaptive mask was developed to excludethe vapor region from the PIV analysis. The velocity atthe interface of the attached cavity was found to beparallel to the interface and very close to the vaporvelocity estimated with Bernoulli’s equation. The inter-face of the shed cavitation cloud that appeared was notwell defined as both particles and vapor could often beobserved simultaneously, leading to reduced perfor-mance of the mask and PIV analysis close to the cloud.Due to strong turbulence levels around the collapsingcloud, there was a considerable loss of particle pairs inthe PIV images, leading to an increased noise level in thisregion.
Fig. 7 Development of thecavity interface at the centerplane of the foil as determinedby the adaptive mask for aperiod of 100 ms
Fig. 8 Details of a PIV frame a at the closure region of theattached cavity; b upstream of a collapsing vapor cloud. For theattached cavity, the velocity vectors are parallel to the interface.The obstruction of the view on the light sheet close to thestagnation point at the downstream end of the cavity (indicated bythe letter A) makes it impossible to observe the re-entrant jet withthe current setup
Fig. 9 A vector field near theend of growth cycle before postprocessing. Only 50% of thevectors are shown in thehorizontal direction for clarity.The velocity profiles along theindicated lines are shown inFig. 10

For a visualization of the global flow dynamics, thelaser beam was expanded and used to illuminatethe entire hydrofoil and cavitation structure. The timeresolved visualizations reveal the growth of the attachedcavity and the cloud shedding that follows it in everydetail. The vapor cloud is seen to increase remarkably inheight as it is advected downstream. The vapor sheddingcycle on the applied 3D hydrofoil was further found tobe highly periodic with a Strouhal number 30% smallerthan observed for 2D sheet cavitation. This confirms theimportant influence of the 3D geometry of the hydrofoilon the flow dynamics and stability of the cavitationpattern.
In the near future, the current work will be extendedto the study of the cavitation and flow dynamics underinstationary inflow conditions, and a more profoundinvestigation of the effect of the 3D geometry of thehydrofoil on the cavitation patterns will be performed.
Acknowledgements This research is funded by the Dutch Technol-ogy Foundation STW project TSF.6170 and Royal NetherlandsNavy. See http://www.stw.nl for more details.
References
Abbott IH, von Doenhoff AE (1959) Theory of wing sections.Dover Publications Inc, NY, ISBN 486-60586-8
Arakeri VH, Acosta AJ (1973) Viscous effects in the inception ofcavitation on axisymmetric bodies. J Fluids Eng 95(4):519–527
Arndt REA (2002) Cavitation in vortical flows. Annu Rev FluidMech 34:143–175
Arndt REA, Ellis C, Paul S (1995) Preliminary investigation of theuse of air injection to mitigate cavitation erosion. J Fluids Eng117:498–592
Astolfi JA, Dorange P, Leroux JB, Billard JY (2000) An experimentalinvestigation of cavitation inception and development of partial
sheet cavities on two-dimensional hydrofoils. In: 23rd ONRsymposium on naval hydrodynamics, Val de Reuil, France
Bachert R, Stoffel B (2003) Messung instationarer, dreidimensio-naler Effekte kavitierender Stromungen an einem Einzelprofilmit Hilfe der PIV/LIF Messtechnik, GALA-Fachtagung‘‘Lasermethoden in der Stromungsmesstechnik’’, Braunschw-eich, Germany
Brennen CE (1995) Cavitation and bubble dynamics, OxfordEngineering Science Series 44
Callenaere M, Franc JP, Michel JM (2001) The cavitation insta-bility induced by the development of a re-entrant jet. J FluidMech 444:223–265
Caron JF, Farhat M, Avellan F (2000) Physical investigation of thecavitation phenomenon. In: Sixth international symposium onfluid control, measurement and visualization (Flucome 2000),August 13–17, 2000, Sherbrooke, Canada
Choi JK, Kinnas S (1998) A 3-D Euler solver and its application onthe analysis of cavitating propellers. In: Twenty fifth Americantowing tank conference, Iowa City, IA, USA
Dang J (2000) Numerical simulation of unsteady partial cavityflows. PhD Thesis, Technical University of Delft, Delft
Farhat M, Avellan F (2001) On the detachment of a leading edgecavitation. In: Fourth international symposium on cavitation,Pasadena, CA, USA
Franc JP (2001) Partial cavity instabilities and re-entrant jet. In:Fourth international symposium on cavitation, Pasadena, CA,USA
Franc JP, Michel JM (1985) Attached cavitation and the boundarynumerical treatment. J Fluid Mech 154:63–90
Gopalan S, Katz J (2000) Flow structure and modeling issues in theclosure region of attached cavitation. Phys Fluids 12(4):895–911
ITTC (2002) Final report and recommendations to the 23rd ITTCby The Specialist Committee on cavitation induced pressures.In: Proceedings of 23rd international towing tank conference,Venice, Italy, vol 2, pp 417–458
Kawanami Y, Kato H, Yamaguchi H, Tagaya Y, Tanimura M(1997) Mechanism and control of cloud cavitation. J Fluids Eng119(4):788–795
Kuiper G (1982) Some experiments with specific types of cavitationon ship propellers. J Fluid Eng 1:105–114
Kunz RF, Boger DA, Stinebring DR, Chyczewski TS, Gibeling HJ(1999) A preconditioned Navier–Stokes method for two-phase
7.0
7.5
8.0
8.5
9.0
9.5
-50-45-40-35-30-25-20-15-10-505101520253035
Position [mm]
Vel
ocit
y [m
/s]
A
B
C
D
E
F
G
Fig. 10 Velocity profiles along the lines drawn in Fig. 9. The velocity profiles A– E all converge toward the estimated vapor velocity of9.24 m/s

flows with application to cavitation prediction. American Insti-tute of Aeronautics and Astronautics, Baltimore, pp 99–3329
Laberteaux KR, Ceccio SL (2001) Partial cavity flows Pt 2. Cavitiesforming on test objects with spanwise variation. J Fluid Mech431:43–63
de Lange DF, de Bruin GJ (1998) Sheet cavitation and cloudcavitation, re-entrant jet and three-dimensionality. Appl Sci Res58:91–114
Qin Q, Song CCS, Arndt REA (2003) Numerical study of unsteadyturbulent wake behind a cavitating hydrofoil. In: Fifth inter-national symposium on cavitation, Osaka, Japan
Raffel M, Willer C, Kompenhans J (1998) Particle imaging veloc-imetry; a practical guide, ISBN 3-540-63683-8. Springer, BerlinHeidelberg New York
Rood EP (1991) Review—mechanisms of cavitation inception.J Fluids Eng 113:163–175
Sauer J, Schnerr GH (2000) Unsteady cavitating flow—a newcavitation model based on a modified front capturing methodand bubble dynamics. ASME Fluids Eng. Summer Conference,FEDSM2000/11095-2000, June 11–15, 2000, Boston, USA
Senocak I, Shyy W (2001) Numerical simulation of turbulent flowswith sheet cavitation. In: Fourth international symposium oncavitation, Pasadena, CA, USA
Tassin AL, Li CY, Ceccio SL, Bernal LP (1995) Velocity fieldmeasurements of cavitating flows. Exp Fluids 20:125–130
Wikstrom N, Bark G, Fureby C (2003) Large Eddy Simulation ofcavitation submerged objects. In: Eighth international confer-ence on numerical ship hydrodynamics, Busan, Korea
Young YL, Kinnas SA (2001) A BEM for the prediction ofunsteady midchord Face, and/or back propeller cavitation.J Fluids Eng 123(2):311–319


