Embed Size (px)
Citation preview

Journal of Molecular Catalysis, 74 (1992) 233-246M2914
Titanium sites in titanium silicalites: an XPS, XANES andEXAFS study
233
D. Trong On, L. BonneviotDepartment of Chemistry and CERPIC, Uniuersite Laval, Ste-Foy, Que., GIK 7P4(Canada)
A. Bittar, A. Sayari and S. KaliaguineDepartment of Chemical Engineering and CERPIC, Unioersite Laval, Ste-Fou, Que.,GIK 7P4 (Canada)
Abstract
Three titanium silicalite samples with MEL structure and different Ti loadings have beenexamined by Near-Edge and Extended X-ray Absorption Fine Structure techniques. Titaniumspecies are present in these zeolites as monomeric and dimeric species and have threetypes of coordination: tetrahedral, square pyramidal, and octahedral. The relative contentof these species depends on the overall Ti loading. The most striking finding of thisinvestigation is that the TiOx units and Si04 tetrahedra are linked through an edge ratherthan via the usual corner-sharing mode. Framework Ti species are thus better describedas structural defects rather than T atoms isomorphously substituted for Si in the zeolitelattice.
Introduction
Because of their remarkable catalytic properties in various reactionsinvolving partial oxidation of organic compounds by dilute solutions of H202,titanium silicalites have been the focus of much attention. The catalyticproperties of these zeolites in the ammoximation of cyclohexanone [1), theepoxidation of olefins [2), the hydroxylation of phenol and benzene [3), thepartial oxidation of alkanes [4), and other reactions [5] have been reported.A number of studies have also been devoted to the characterization of suchmaterials using a variety of techniques including XRD, IT-IR, UV-Vis, 29SiMAS NMR, sorption capacity, etc. [6). While there is no doubt that thecatalytic properties of titanium silicalite are due to the titanium speciesengaged into the zeolite structure, the immediate environment of these speciesand the way titanium is actually bonded to the zeolite framework are stilla matter of debate. According to the widely shared belief that Ti is isomorphously substituted for Si, it is presumed that Ti, like Si, is sited in atetrahedrally symmetric position. However, since Ti strongly prefers octahedralsites, such a hypothesis cannot be adopted lightly; thus the immediateenvironment in Ti silicalites has to be carefully examined. Moreover, several
0304-5102/92/$5.00 © 1992 - Elsevier Sequoia. All rights reserved

234
authors who proposed reaction mechanisms for the partial oxidation oforganic molecules by H202 in the presence of these catalysts assumed thepresence of titanyl groups mainly because of the appearance of an IR bandat 960 cm- 1 [6e]. However, the assignment of the characteristic 960 crn "!
IR band is not unanimous, as some authors assigned this band to the stretchingmode of Si04 units bonded to a titanium ion [6d].
X-ray absorption techniques (XANES and EXAFS) have the potential toprovide a detailed picture of the immediate environment of a given scatteringatom [7]. Therefore, the aforementioned conflicting views about the localsymmetry of Ti atoms in titanium silicalites and the possible presence oftitanyl groups may be resolved usingXAFStechniques. Indeed, these techniqueshave been successfully applied to a variety of catalytic systems [7]. As faras Ti silicalite and related systems are concerned, only a limited number ofstudies have been reported.
Based mostly on Ti K-edge XANES data, Behrens et al. [8] found thatTi in a TS-1 sample (i.e., with ZSM-5 structure) was mainly octahedrallycoordinated, even though small but measurable amounts of tetrahedral andsquare-pyramidal Ti were detected. No further information regarding thenature and exact location of neighboring atoms could be extracted fromEXAFS oscillations. These oscillations were too weak, probably because theamount of framework Ti, at least the amount indicated by the unit celldimensions, was too low. Moreover, Behrens et al. [8] also found that theTi distribution among the three symmetries was weakly dependent on dehydration. Conversely, Lopez et al. [9] reported that in TS-1 zeolites, Ti isessentially either octahedral or tetrahedral, depending on the hydration stateof the sample.
Several other XAFS studies have dealt with Ti-containing materials otherthan zeolites [10-12]. Lytle's group [12a, 12b] found that Ti atoms in titaniumsilicate glasses with a Ti02 content in the range of 1-7 wt.% were mostlyin fourfold coordination, while octahedral Ti became the dominant speciesbelow 1 wt.% as well as above 7 wt.% Ti02 • These sites have Ti-O distancesof 1.80±0.02 A and 1.92±0.02 A, respectively [12b]. In vitreousK20-Ti02-2Si02 , titanium was found to be exclusively in square-pyramidalcoordination with four neighboring oxygens at 1.93 ± 0.02 A and a fifthoxygen at 1.65 ± 0.02 A. Other natural and synthetic titanium silicates havebeen studied in detail by XRD [13]. In all cases Si04 octahedra were foundto be connected to TiOx (4.,;;x.,;;6) polyhedra via a corner-sharing mode.For example, in Ti02-Si02 glasses a Ti-Si distance of 3.38±0.03 A wasattributed to a corner-sharing type of bonding with a Ti-O-Si angle of 1590
[12b]. Only in very exceptional instances would Si04 tetrahedra share anedge with other polyhedra instead of a corner. Wiess and Wiess [14] reportedon a fibrous polymorph of silica that exhibits edge-sharing Si04 units. Oneobjective of this paper is to demonstrate, mainly on the basis of XAFS data,that in titanium silicalites, most of the Ti polyhedra are joined to Si04 unitsvia an edge. Limited XPS data will also be used to reinforce this conclusion.Two preliminary reports [6a, 15] dealing with this issue have been published.

235
Detailed characterization of Ti silicalites using a number of other techniqueswill be reported elsewhere [16].
Experimental
MaterialsA series of titanium silicalite samples with MEL structure (TS-2) containing
various amounts of titanium were synthesized according to literature procedures [6c]. Gels with different compositions were prepared by mixingcalculated amounts of tetraethyl orthosilicate, 2-propanol, tetrabutylammonium hydroxide (40% in water), and water. The gels were transferred toTeflon® coated stainless-steel autoclaves and heated under autogeneouspressure at 443 K for 7 days. The solids were then filtered, washed withdeionized water, and dried at 373 K. The organic template was decomposedby calcination at 773 K. Samples will be referred to as x-TS-2, where xdesignates the Ti/(Ti + Si) ratio, given as a percentage.
CharacterizationChemical analysis of all samples was carried out by atomic absorption
using a Perkin-Elmer 1100 B spectrometer. X-ray diffraction (Rigaku, CuKa),IR spectroscopy of framework and OH vibrations (Digilab FTS 60), BETsurface area and pore-size distribution (Omnisorp 100) were performed onall samples.
XPS spectra were recorded using a V.G. Scientific Escalab Mark IIspectrometer with a hemispherical analyzer operated in the constant passenergy mode. A Mg Ka X-ray source was used. A binding energy of 103.3eV for Si(2p) was chosen as an internal reference. Additional informationconcerning data handling may be found elsewhere [17].
Three samples corresponding to x values of 1.6, 4.2, and 6.4% wereexamined using XAFS techniques. Data were secured while performingexperiments in the transmission mode at the LURE synchrotron facility(France). Sample preparation and data collection, analysis, and reductionwere carried out in accordance with the recommendations of the InternationalWorkshop on Standards and Criteria in XAFS [18]. The X-ray beam wasemitted in a single bending magnet mode by the DCI storage ring runningat 1.85 GeV with a maximum intensity of about 250 rnA. The white radiationwas monochromatized by a SiCIll) two-crystal monochromator allowingrejection of the harmonics. An optimum value for tiM(E) of about 0.1 with1. 7 for M(E) was reached for the 1.6-TS-2 sample in homogeneously filled0.3-mm-thick cell equipped with Kapton windows. The 4.2- and 6.4-TS-2samples had tiM(E) of 0.3 and 0.4, respectively. The zero of the energyscale was taken at the maximum of the first peak of a titanium foil K-edge,i.e. 4964.2 eV.

236
Analysis of XANES and XAFS spectra was performed using softwaredeveloped by Michalowicz [191. Background treatment of the pre- and postedge regions and for the normalization of EXAFS signals was achieved usingstandard procedures. The energy threshold, Eo was taken at the maximumof the edge. The k 3 weighted Fourier transform of the EXAFS was filteredwith a Kaiser (7"=3.7) window in the region of k I=2.1O A.-I to k 2=12.71
A.-1before the radial distribution functions were derived. The single-electronsingle-scattering EXAFS theory [201 was applied by using eqn. (1):
(1)
where the reduction factor So2(k) associated with the absorber was keptequal to unity, N, and R, are the number and distance, k; the wave vectorcorresponding to the shift (t:.Eo) of the energy threshold, and Ui the Debye-Waller factor of the ith neighbor. McKale theoretical phase and amplitudeback-scattering functions, h(-1T,ki) and <Poi(ki) , respectively, were used [21].The electron inelastic mean free path, Ai (A.), was estimated by the empiricalequation Ai = (vri) / [(g/k i)4+kil. where k; is the photon wave vector in A-Iand T; and g are empirical parameters. For the simulation, gwas kept constantat 3.1 and r i , usually close to 0.95, was optimized during the simulation ofreference compounds. The best fits were obtained by the combination of ashell-by-shell and a global analysis in order to overcome the difficulty ofstrong interferences between the various FT peaks. Such a multi-shell simulation was applied to anatase and nickel silicate reference compounds togenerate a correct set of parameters (T, a, and .1Eo) for the back-scatterers,while their numbers and distances were kept at the crystallographic positions.Among various fitted shells, both titanium shells at 3.035 and 3.785 A. werefitted with u=0.087 and 0.12, r= 1.00 and 0.95, and finally t:.Eo= -6 and-1 eV. The oxygen atoms at 3.865 A. were fitted with u=0.045, r= 1.1and 0.95, and finally t:.Eo= - 7 eV. The Eo was found to systematically shifttoward lower energies for farther shells (t:.Eo < 0). For silicon, both silicateswere fitted with r= 0.6 ± 0.2 and u= 0.07 ± 0.02. The simulations of thetitanium silicalites were then performed with r= 1.1 for 0 and Ti and 0.6for Si.
The simulation of Ti(1V) EXAFS oscillations are particularly difficult,since the first coordination shell of this ion usually contains 2 oxygen distancesand eventually more. Moreover, in this study, the situation is aggravated bythe presence of a very close silicon shell that contributes significantly tothe first FT peak. The use of theoretical phase and amplitude functionscombined with a multishell analysis [221 was completed by a fit of thebaseline residue as a fake EXAFS. This additional fit rather than a filtrationoperation had the advantage of taking into account the low-frequency residuecontribution of the background treatment.

237
Results and discussion
Nine samples, with x values ranging from 0.86 to 9.1 %, were synthesized.All samples had an XRD pattern characteristic of the tetragonal MEL phase.The BET surface area and pore volume of samples with 0 ~x ~ 5.5 werepractically independent of x; their values were about 360 m Zg- 1 and 0.12crn 3 g-l. In agreement with these findings, all the samples with x ~ 5.5%[1'i-1 a crystallinity of greater than 85%. As x increased further, the crystallinity,BET surface area, and pore volume decreased steadily with x, indicating theformation of extra lattice amorphous materials. The presence of increasingamounts of Ti in the zeolite framework up to a Ti/(Ti +Si) ratio of ca. 5%is evidenced by the progressive development of the IR peak at 960 cm -1 .
This is illustrated in Fig. 1 as a plot of the intensity ratio of the 960 to the555 cm-1 bands against Ti loading; the 555 ern -1 band is characteristic ofthe MEL structure.
Figure 2 shows the Ti(2p) photoelectron transition for four differentsamples. It is seen that as the titanium content increases, the dominantspecies changes from a species with a Ti(2p3/z) binding energy of 459.8 eVto a species with a Ti(2p3/z) binding energy of 458.3 eV. The binding energiesof the Ti(2p) electron in the most loaded sample, i.e., 9.1-TS-2, are identicalto those accepted for TiOz. Therefore, the Ti(2p) line observed in this samplewill be attributed to Ti(lV) in octahedral coordination. The small shift observedon this peak for samples containing 4.2 and 6.4% Ti is believed to beassociated with differential charging on extraframework oxidic titanium phase.The Ti(2p) photoelectron transition with high binding energy observed inthe 1.6- and 4.2-TS-2 samples is reminiscent of the recently reported datafor the binding energy of the 2p electron of tetrahedral Ti in TiOz-SiOzglasses [23]. Therefore, we concur that the Ti(2p3/z) photoelectron transitionobserved at 459.8 eV is due to a tetrahedral Ti species.
Figure 3 depicts the normalized pre-edge peaks of tetrahedral Ti in aTiOz-SiOz glass (Fig. 3a), octahedral Ti in 'no, rutile (Fig. 3f), and Ti in
0.6 ....---r----r---.--r---r----,
LJ")LJ")
,;;) 0.4-o\<l(1)
......0.2 •
o "--_...L-_-'-_--'-__L.-_...L-_--'
2 4 6
100 Ti/Ti+SiFig. 1. Intensity ratio of the IR bands at 960 and 555 em -1 for TS-2 samples. ce designatessamples analyzed by EXAFS.)

238
10.2
11 14459.8 469.1450.5
-4 -1 2 5 8
Binding energy (eV) Enerqy leV)
Fig. 2. Ti(2p) XPS photolines for selected TS-2 samples.
Fig. 3. XANES spectra, pre-edge features at Ti K-edge: (a) tetrahedral Ti in a Ti02-Si02 glass;(b) 1.6-T8-2; (c) 4.2-TS-2; (d) 6.4-TS-2; (e) 9.1-TS-2; (D octahedral Ti in rutile.
four Ti silicalite samples (Fig. 3b-3e). It is seen that the silicalites exhibita significantly higher pre-edge peak than Ti02 rutile but a smaller one thanthe Ti02-Si02 glass. Table 1 summarizes the characteristics of these peaksas well as data for tetrahedral, square-pyramidal, and octahedral symmetries.From the data for reference compounds, it is obvious that the pre-edge peakintensity decreases from tetrahedral to square pyramidal and finally tooctahedral sites. At the same time, the peak maximum is shifted from 2.5to 4.7 eV. Moving from rutile to anatase and kaersutite, the octahedral sitedistortion increases and the pre-edge height increases as well, from 0.18 to0.30.
The single pre-edge peak (and the central peak for octahedral symmetry)is related to the electronic transition from the 1s orbital to the lowestunoccupied molecular orbital (LUMO). Only Is to p transitions are Laporteallowed. Thus the pre-edge intensity reflects the titanium 4p and oxygen 2pcontributions in the LUMO of the Ti atom. Because, unlike s or d orbitals,p orbitals have no inversion center, any symmetry or distortion that suppressesthe inversion center leads to an increase in the p contribution in the LUMOand, consequently, to a higher transition probability, i.e., a higher pre-edgeintensity. Figures 3b-3e and the data for TS-2 samples in Table 1 areconsistent with an intermediate situation between tetrahedral and octahedralsites. This could be regarded either as a mixture of sites or as a single site

239
TABLE 1
Pre-edge characteristics for titanium silicalites and various reference compounds
Compound Symmetry" Position" Height Linewidth Ref.(eV) (eV)
B~Ti04 T 2.5 0.S4 1.5 [12c]Ti phthalocyanine SP 3.5 0.79 1.9 [12c]kaersutite distorted a 3.5 0.30 2.7 [9]anatase a 2.3/4.7/7.S 0.13/0.22/0.21 t.w.", [11]rutile a 2.0/4.717.S 0.04/0.1S/0.16 2.2 t.w., [9]
1.9-TS-1 distorted a 3.5 0.27 2.3 [9]1.9-TS-1 dehydr. distorted T 2.S 0.50 1.5 [9]x-TS-1 d T+SP+O 3.6e 0.2Se 2.ge [Sa]1.6-TS-2 T+SP 2.9 0.49 2.0 t.w.4.2-TS-2 T+SP 3.0 0.40 2.3 t.W.6.4-TS-2 T+SP+O -/3.3/- sh/0.33/- 2.9 t.w.9.1-TS-2 T+SP+O 1.9/3.5/- sh/0.2S/vw 3.4 t.w.
"T = tetrahedral, SP = square pyramidal, and a = octahedral.~he zero of energy was recalculated for the literature data when the reference point wasdifferent; all values are ± 0.2 eV."t.w. = this work.dThe Ti/(Ti+Si) ratio, x, is not provided in ref. [Sa]."Estimated from a figure in ref. [Sa].
of an intermediate symmetry such as a square pyramid or a trigonal bipyramid.Considering the progressive evolution of the peak position from 2.9 to 3.5eV, of the linewidth from 2.0 to 3.4 eV, and of the height from 0.49 to 0.28when the Ti/(Ti + Si) ratio increases from 1.6 to 9.1 (Table 1), it is suggestedthat our data are the result of a mixture of sites, in agreement with previousfindings for a TS-1 sample [8a]. Furthermore, the pre-edge intensities in our1.6- and 4.2-TS-2 samples are much higher than those reported earlier forhydrated TS-1 samples [8a, 9], indicating a higher concentration of lowcoordination sites in the low-loading samples. The 1.6-TS-2 sample is comparable to a dehydrated TS-1 sample [9] containing mainly tetrahedral sites,while the 9.1-TS-2 sample is comparable to another TS-1 sample [8a] containingmostly octahedral sites. Thus the various Ti sites in our samples encompassall the types of Ti sites encountered in previous XAFS studies.
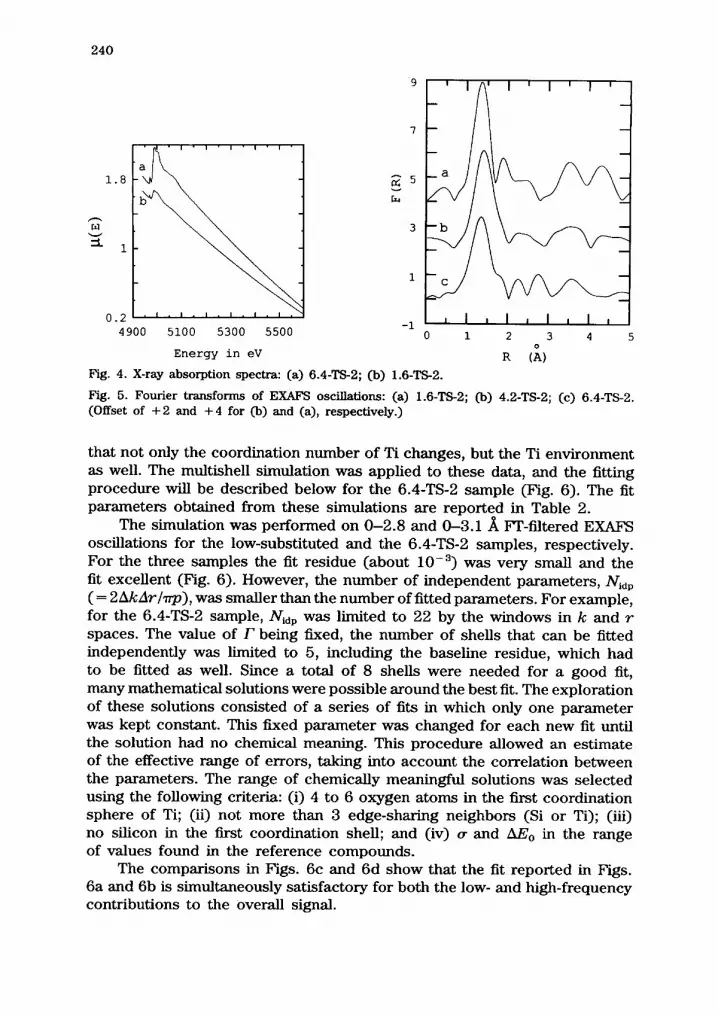
The EXAFS oscillations for 1.6-, 4.2-, and 6.4-TS-2 samples were investigated; for the sake of clarity, only two of these spectra are shown inFig. 4. The IT of the three spectra are shown in Fig. 5. The first intensepeak corresponds to back-scatterers in the first coordination sphere and liesat about 1.4 A (the difference between this value and the ca. 1.9 A valueexpected for Ti-O distances is normal and associated with the phase-shifteffect depicted by the cPoi(ki) term in eqn. (1)). Contrary to what would beexpected from the pre-edge study, the peak decreases in intensity as the Tiloading increases. As discussed below, this is associated with interferenceeffects. Finally, the changing features between 2 and 3 A strongly suggest
240
9
7
;;: 5
[J.,
3
1
-10 1 2 3 4 5
0
R (A)
o.2 L.....o.....1-.......L~..........--'-........Jc............J..--......
4900 5100 5300 5500
Energy in eV
Fig. 4. X-ray absorption spectra: (a) 6.4-TS-2j (b) 1.6-TS-2.
Fig. 5. Fourier transforms of EXAFS oscillations: (a) 1.6-TS-2j (b) 4.2-TS-2j (c) 6.4-TS-2.(Offset of + 2 and + 4 for (b) and (a), respectively.)
1.8
1
that not only the coordination number of Ti changes, but the Ti environmentas well. The multishell simulation was applied to these data, and the fittingprocedure will be described below for the 6.4-TS-2 sample (Fig. 6). The fitparameters obtained from these simulations are reported in Table 2.
The simulation was performed on 0-2.8 and 0-3.1 A IT-filtered EXAFSoscillations for the low-substituted and the 6.4-TS-2 samples, respectively.For the three samples the fit residue (about 10- 3
) was very small and thefit excellent (Fig. 6). However, the number of independent parameters, N id p
( = 2~k.::1rhrp), was smaller than the number of fitted parameters. For example,for the 6.4-TS-2 sample, N id p was limited to 22 by the windows in k and rspaces. The value of T being fixed, the number of shells that can be fittedindependently was limited to 5, including the baseline residue, which hadto be fitted as well. Since a total of 8 shells were needed for a good fit,many mathematical solutions were possible around the best fit. The explorationof these solutions consisted of a series of fits in which only one parameterwas kept constant. This fixed parameter was changed for each new fit untilthe solution had no chemical meaning. This procedure allowed an estimateof the effective range of errors, taking into account the correlation betweenthe parameters. The range of chemically meaningful solutions was selectedusing the following criteria: (i) 4 to 6 oxygen atoms in the first coordinationsphere of Ti; (ii) not more than 3 edge-sharing neighbors (Si or Ti); (iii)no silicon in the first coordination shell; and (iv) (T and !!.Eo in the rangeof values found in the reference compounds.
The comparisons in Figs. 6c and 6d show that the fit reported in Figs.6a and 6b is simultaneously satisfactory for both the low- and high-frequencycontributions to the overall signal.

241
I
I I I I I If i Lt.e r ed
(\ ~~~t"'l-~dI \ r.ora I
0.3 1-\ / \. -~ !!':\~
\Vj \~.:J '
-0.3 I I I I I I I I
10 12
(a) k in A-I (b) R (A)
I
-- fit
expo
I I I
ITI I , \0.05 I I If
;\ (\j \ ! \
~ \. {' I\ I: '"V'V ~
·-0 _Ii'; I I I I
I I I I \ I I I I I
(c) k in A-I10 ]}
(d)
B 10
k in A-I12
Fig, 6, EXAFS data treatment for sample 6.4-TS-2: (a) EXAFS oscillations (bottom: completeand filtered (0,3-3,1 A) signal; top: filtered signal and fit); (b) Fourier transforms of lines inFig. 6(a); (c) low-frequency contribution to lines in Fig. 6(a) [0(1), 0(2), Si(1), Ti(1); seeTable 2]; (d) high-frequency contribution to lines in Fig. 6(a) [Ti(l), Si(2), 0(3), Si(3); seeTable 2].
It is also worth mentioning that despite the numerous procedures testedfor treating the baseline in the analysis of the low-frequency contributions,no short Ti-O distances in the range 1.55-1.75 A, which would have beenconsistent with the Ti=O titanyl group, were found to be compatible withour data. Finally, the evolution of the FT data reported in fig. 5 was foundto arise from interferences between oxygen shells (0(1) «.rd 0(2)) and thesilicon shell Si(1) at about 2.2 A. Figure 7 shows that ~\l first oxygen shell,0(1), with only 3.4 atoms would alone lead to a much more intense FTpeak than the superposition of the actual shells contributions. The consequenceof this negative interference is the decrease in FT peak intensity with increasingTi substitution level, as seen in Fig. 5.
As shown in Table 2, for all three samples the EXAFS oscillations arefitted by introducing two kinds of oxygen atoms, 0(1) located at a distanceshorter than 1.9 A and 0(2) at about 2.05 A, and a silicon shell at 2.2 A,Si(1). The three samples also show a titanium, Ti(1), and a silicon neighbor,Si(2), at about the same distances, 2.6 A and 3.0 A, respectively. Only for

TA
BL
E2
EX
AFS
sim
ulat
ion
par
amet
ers
for
the
tita
nium
sili
cali
tes
Ti/
(Ti+
Si)
Sim
ulat
ion
Nei
ghbo
rs"
(%)
para
met
ers"
0(1
)0
(2)
Si(
l)T
i(l)
Si(
2)0(
3)C
Si(3
)C
1.6
N3
.9±
0.4
1.0
±0
.71
.6±
0.5
0.7
±0
.40
.3±
0.2
5u
X10
2(A
)4
.04.
04
.04.
28.
1R
(A)
1.8
7±
0.0
52
.02
±0
.12
.19
±0
.O6
2.6
±0
.13
.0±
0.1
8A
Bo
(eV
)7.
8-1
4.0
-12
.1-2
0.5
-22
.0
4.2
N3
.6±
0.5
1.4
±0
.81
.2±
0.5
0.9
±0
.40
.5±
0.2
5u
X1
02
(A)
5.2
4.1
4.8
5.5
5.8
R(A
)1
.89
±0
.05
2.0
6±
0.1
2.1
9±
0.0
62
.6±
0.1
2.9
±0
.18
AB
o(e
V)
7.4
-10
.8-9
.3-1
5.4
-20
.6
6.4
N3
.4±
0.6
2.5
±O
.90
.8±
0.6
0.7
±0
.50
.5±
0.3
2.5
0.6
uX
102
(A)
7.7
7.7
4.8
5.7
6.7
6.2
6.7
R(A
)1
.87
±0
.06
2.0
9±
0.1
2.2
2±
0.0
72
.6±
0.1
3.0
±0
.23
.43
.5A
Bo
(eV
)2
.7-4
.60
-9.2
-9.6
-17
.9-3
.4
"Nan
dR
are
the
nu
mb
ers
and
dist
ance
so
fne
ighb
orin
gat
oms.
bEst
imat
eder
ror
ofN
and
Rde
fine
sth
era
nge
of
acce
ptab
leso
luti
ons;
see
text
."T
hela
sttw
osh
ells
wer
ete
ntat
ivel
yp
rop
ose
das
the
mo
stpr
obab
leco
mbi
nati
on.
Intr
oduc
ing
aT
i-T
idi
stan
ceo
fab
ou
t3
Ais
poss
ible
bu
tin
crea
ses
the
nu
mb
erof
sili
con
ato
ms
at3
.0A
asw
ell.
I:\:) *"I:\:)

243
("
f '\I I, •••••••• 0(2)
/ \ -- --- 0 (1)
i.... \ . expo!' ,\!, , \
I, .~'"\
r, /, / "'~: .]: i \\',. :~./. \\~...~~..
•.A \ ...~.
2 3o
R (A)
Fig. 7. Comparison of the Fourier transform of the low-frequency part of EXAFS oscillationsin Fig. 6(c), with the IT contributions of 0(1) and 0(2); see Table 2.
sample 6.4-TS-2 were two additional shells necessary for the simulation ofEXAFS data, namely 0(3) located at 3.4 A and Si(3) at 3.5 A.
As the Ti/(Ti +Si) ratio increases from 1.6 to 6.4%, the number of 0(2)oxygen atoms increases while the number of 0(1) neighbors decreases. Atthe same time, the number of Si(1) silicons decreases from 1.6 to 0.8 whilethe number of Ti(1) neighbors first increases from 0.7 to 0.9 and thendecreases to 0.7. These values are consistent with the presence of mixturesof at least three oxygen coordination sites. In sample 1.6-TS-2, the oxygencoordination between 4 and 5 would correspond to a mixture of tetrahedralTi and pentacoordinated sites. The presence of octahedral species in thissample can be excluded on the basis of XPS data. The tetrahedral sites withfour 0(1) oxygens would be comparable to the tetrahedral sites with Ti-Odistances of 1.85 A found in TiOz-SiOz glasses [12b].
The pentacoordinated site would be dominant in sample 4.2-TS-2, asthe presence of a major proportion of octahedral sites in this sample canbe excluded on the basis of the pre-edge peak (Fig. 3). This site is probablyin the distorted square-pyramidal symmetry proposed by Behrens et al. [8].
The third site in octahedral symmetry is found to be predominant insample 6.4-TS-2. This is confirmed both by the XPS data (Fig. 2) and bythe presence of shoulders at 1.9 and 8.0 eV in the pre-edge spectrum ofFig. 3. During the fit of the EXAFS of this sample, deliberate attempts weremade to test the possible presence of an extraframework oxidic phase oftitanium by imposing a 3.0 ATi-Ti distance. Our data would not be compatiblewith an average number of such titanium neighbors higher than one pertitanium scatterer. Thus extraframework TiOz is not a major component ofthis sample, and the octahedral titanium found is more likely a frameworkspecies.
The Si(1) species with a Ti-Si distance of 2.19 A in 1.6- and 4.2-TS-2samples is of special interest. This Ti - Si distance is far too short to beconsistent with any classical bonding to Si04 units. Such a distance is indeedcompatible only with an edge-sharing structure, as represented by compound

244
1 in Scheme 1. The edge-sharing binding mode usually occurs betweenoctahedral units, as in anatase, rutile, or silicates, but as a general rule theSi04 units bind to each other or to octahedral units centered on other metalsin a comer-sharing mode [23]. The edge-sharing linkage between Si04 andTiOx units is very unexpected. This type of linkage is definitely not compatiblewith the generally accepted isomorphous substitutional site of titanium inthe titanium silicalite lattice. In such a case the Tt-Si distance would be onthe order of 3.5 A, and it is especially surprising that such a distance isfound only in the 6.4-TS-2 sample (Si(3)), for which most of the titaniumis in octahedral coordination.
The Ti(l) back-scatterer is located at a remarkably short Ti-Ti distanceof 2.60 A. This value must be compared with the 2.95 and 3.05 Ti-Ti distancein rutile and anatase, respectively, and also with the 2.8 A distance foundin a sterically hindered dimeric titanium compound [24, 25]. As the averagenumber of Ti(l) atoms in smaller than one and the average number of Si(l)atoms is between 1 and 2, it is proposed that the low-coordination sites insamples 1.6- and 4.2-TS-2 are mixtures of monomeric (I in Scheme 1) anddimeric (II in Scheme 1) Ti species.
As the EXAFS measurements were conducted on air-exposed samples,it is believed that the fivefold coordinated Ti species observed in samples1.6- and 4.2-TS-2 are generated by water adsorption on the tetracoordinatedspecies described in Scheme 1. The simulation of EXAFS oscillations forsample 6.4-TS-2 indicates that the dominant octahedral titanium is linkedto the silicalite framework by three types of attachments, as shown inScheme 2.
I
Scheme 1.
II
III
Scheme 2.
o
~Ti 3.0 A
/10: 0
1/ IO?i......... O .......Si~~
IV
oT?' 2.25 Ao/t
.......... t
II~t
V

245
As mentioned for the other two samples, the Si(1) neighboring atomhas a Ti-Si distance compatible only with the edge-sharing linkage depictedas V in Scheme 2. The Si(2) species with a Ti-Si distance of about 3.0 Ais associated with a corner-sharing type of linkage on two vicinal Si04 units,as illustrated by IV in Scheme 2. Finally, the Si(3) back-scatterer is at adistance compatible with a corner-sharing attachment involving the 1.65 ASi-O distance usually found in zeolite lattices and the 1.9 A distance of0(1) species.
Conclusion
The multishell analysis of EXAFS oscillations for TS-2 samples revealsthe variety of Ti environments in titanium silicalites, and the changes in sitedistribution with titanium content.
It is especially noteworthy that the expected symmetry for a Ti atomsitting in a T position, i.e., isomorphously substituted for a Si atom in thesilicalite network, was not observed. The tetrahedrally coordinated Ti atomsare linked to the framework by an edge-sharing type of linkage. These Tiatoms are present as both monomeric (I) and dimeric (II) species. Theparticularly short Ti-Ti distance in the dimers indicates a very strong stressin these framework pairs. It is believed that the pentacoordinated titaniumdetected by EXAFS is derived from the tetrahedral sites by adsorption of awater molecule. Octahedral framework titanium species have also beenobserved. They are linked to the silicalite lattice by at least three types ofattachment.
Framework Ti in the three coordination symmetries are thus best describedas structure defects rather than T atoms isomorphously substituted for Siin the silicalite lattice.
References
(a) P. Raffia, G. Leofanti, A. Cesana, M. Mantegazza, M. Padovan, G. Petrini, S. Tonti andP. Gervasutti, Stud. Surf. Sci. Catal., 55 (1990) 43; (b) A. Thangara], S. Sivasanker andP. Ratnasamy, J. Catal., 131 (1991) 394.
2 M. G. Clerici, G. Bellussi and U. Romano, J. Catal., 129 (1991) 159.3 (a) A. Thangaraj, R. Kumar and P. Ratnasamy, Appl. Catal., 57 (1990) L1; (b) A. Thangaraj,
R. Kumar and P. Ratnasamy, J. Catal., 131 (1991) 294.4 (a) M. G. Clerici, Appl. Catal., 68 (1991) 249; D.R.C. Huybrechts, L. De Bruycker and
P. Jacobs, Nature (London), 345 (1990) 240; (c) T. Tatsurni, M. Nakamura, S. Negishiand H. Tominaga, J. Chern. Soc., Chern. Cornrnun., (1990) 476.
5 (a) G. Perego, G. Bellussi, C. Como, M. Taramasso, F. Buonomo and A. Esposito, Stud.Surf Sci. Catal., 28 (1986) 129; (b) B. Notari, Stud. Surf. Sci. Catal., 37 (1988) 413;(c) U. Romano, A. Esposito, F. Maspero, C. Neri and M. G. Clerici, Stud. Surf Sci. Catal.,55 (1990) 33; (d) U. Romano, A. Esposito, F. Maspero, C. Neri and M. G. Clerici, Chim.Ind. (Milan), 72 (1990) 610; (e) P. R. Hari Prasad Rao, A. Thangaraj and A. V. Ramaswamy,J. Chern. Soc., Chern. Commun., (1991) 1139.

246
6 (a) A. Bittar, A. Sayari, D. Trong On, L. Bonneviot and S. Kaliaguine, Proc. 6th BrazilianSemin. CataL, Salvador, Brazil, Sept. 1991, p. 657; (b) A. Thangaraj, R. Kumar, S. P.Mirajkar and P. Ratnasamy, J. Catal., 130 (1991) 1; (c) J. S. Reddy and R. Kumar, J.CataL, 130 (1991) 440; (d) M. R. Boccuti, K. M. Rao, A. Zecchina, G. Leofanti and G.Petrini, Stud. Sur;[. Sci. CataL, 48 (1989) 133; (e) D.R.C. Huybrechts, I. Vaesen, H. X.Li and P. A. Jacobs, CataL Lett., 8 (1991) 237.
7 (a) O. Clause, L. Bonneviot, M. Che and H. Dexpert, J. CataL, 130 (1991) 21; (b) J.C.C.Bart, Adv. CataL, 34 (1986) 203; (c) J.C.C. Bart and G. Vlaic, Adv. CataL, 35 (1987)1.
8 (a) P. Behrens, J. Felsche, F. Vetter, G. Schulz-Elkoff, N. I. Jaeger and W. Niemann, J.Chem. Soc., Chem. Commun., (1991) 678; (b) P. Behrens, S. ABmann, J. Felsche, F.Vetter, G. Schulz-Elkoff and N. I. Jaeger, in Proc. 6th Int. Conf. X-ray Absorption FineStructure, York, U.K., 1990, Elsevier, Amsterdam, 1990, p. 552.
9 A. Lopez, H. Kessler, J. L. Guth, M. H. Tullier and J. M. Popa, in Proc. 6th Int. Conf. Xray Absorption Fine Structure, York, U.K, 1990, Elsevier, Amsterdam, 1990, p. 548.
10 G. A. Waychunas, Am. Mineral., 72 (1987) 89.11 F. Babonneau, S. Doeuff, A. Leaustic, C. Sanchez, C. Cartier and M. Verdaguer, Inorg.
Chem., 27 (1988) 3166.12 (a) D. R. Sandstrom, F. W. Lytle, P. Wei, R. B. Greegor, J. Wong and P. Schultz, J. Non
Cryst. Solids, 41 (1980) 201; (b) R. B. Greegor, F. W. Lytle, D. R. Sandstrom, J. Wongand P. Schultz, J. Non-Crust. Solids, 55 (1983) 27; (c) C. A. Yarker, P.A.V. Johnson, A.C. Wright, J. Wong, R. B. Greegor, F. W. Lytle and R. N. Sinclair, J. Non-Crust. Solids,79 (1986) 117.
13 D. M. Chapman and A. L. Roe, Zeolites, 10 (1990) 730.14 A. Wiess and A. Wiess, Z. Anorg. AUg. Chem., 276 (1954) 95.15 D. Trong On, A. Bittar, A. Sayari, S. Kaliaguine and L. Bonneviot, CataL Lett., submitted.16 A. Bittar, A. Sayari, D. Trong On, L. Bonneviot and S: Kaliaguine, 9th Int. Zeolite Conf.,
Montreal, May 1992, accepted.17 (a) R. Borade, A. Sayari, A. Adnot and S. Kaliaguine, J. Phys. Chem., 94 (1990) 5989;
(b) A. Sayari, A. Adnot, S. Kaliaguine and J. R. Brown, J. Electron Spectrosc. Relat.Phenom., in press.
18 Reports on the International Workshop on Standards and Criteria in XAFS, in Proc. 6thInt. Conf. X-ray Absorption Fine Structure, York, U.K., 1990, Elsevier, Amsterdam, 1990,p. 751.
19 A. Michalowicz, in H. Dexpert, A. Michalowicz and M. Verdaguer (eds.), Structures Finesd'absorption X en Chimie, CNRS, Orsay, 1990, vol. 3.
20 B. K. Teo, EXAFS: Basic Principles and Data Analysis, Springer, Berlin, 1988.21 A. G. Mckale, B. W. Veal, A. P. Paulikas, S. K. Chan and G. S. Knapp, J. Am. Chem. Soc.,
110 (1988) 3763.22 M. Choi, J. I. Budnick, D. M. Please, G. H. Hayes and J. Wong, Phys. Rev. B, 41 (1990)
9654.23 S. M. Mukhopadhyay and S. H. Garofalini, J. Non-Crust. Solids, 126 (1990) 202.24 F. Liebau, Structural Chemistry of Silicates, Springer, Berlin, 1985.25 I. D. William, S. F. Pedersen, K. B. Sharpless and S. J. Lippard, J. Am. Chem. Soc., 106
(1984) 6430.


