Embed Size (px)
Citation preview
Design and Layout: Erin Sharkey, Massachusetts Avenue ProjectProject Coordinator: Jessie Hersher Gouck, Buffalo Niagara Medical Campus, Inc.
Healthy Kids, Healthy Communities-Buffalo partnership
Buffalo’sFood System
Strengthening
To Promote Healthy Eating Among ChildrenKailee Neuner and Samina Raja
Food Systems Planning and Healthy Communities LabUniversity at Buffalo, The State University of New York
Food sustains us and gives us joy. The food children eat in Buffalo comes from
a complex food system. The food system includes the farmers who grow our food
as well as the businesses that process, transport, market, and sell food. In addition
to the entrepreneurial private sector, the government too plays a role in our food
system through policies, laws, incentives, and regulations at local, state, and federallocal, state, and federal levels. Our food system depends on the availability
of natural and human-made resources – such as soil, water, land, and labor - and
infrastructure to grow, process, and distribute food. In summary, our food system includes our food system includes
a diverse set of processes, stakeholders, a diverse set of processes, stakeholders, regulations, and resources that enable regulations, and resources that enable
the production, processing, distribution, the production, processing, distribution, consumption, and disposal of food.consumption, and disposal of food.
2
3
Buffalo’s Food SystemBuffalo’s Food SystemBuffalo’s food system presents signifi cant barriers that limit children from eating well. Healthy Kids, Healthy Communities-Buffalo (HKHC-Buffalo) aspires to improve Buffalo’s food system to enable all children to have access to nutritious, affordable, and culturally appropriate food. This policy brief documents the current state of the food system within the city of Buffalo. Within Buffalo’s food system, particular components are worthy of immediate attention by policy makers and the community at large. Children live, study, and play in food environments that limit healthy eating. Many residential neighborhoods, especially those with a high density of children and low income households, are underserved by food retail establishments that sell healthful foods. Similarly, the food environment in the vicinity of schools is dominated by convenience stores that mostly advertise and sell high calorie, low nutrition foods. Innovative policy and planning is essential for improving the food environment for children in Buffalo.
Food Production Food Production Buffalo is fortunate to have a signifi cant amount of land available for growing food within and surrounding its perimeter. There are about 60 community gardens located on 106 land lots in Buffalo. Of these 106 lots, 16 are privately owned, and 90 are on land leased from the city government. [2] Demand for community gardens is growing. Grassroots Gardens of Buffalo, a non-profi t group that provides insurance to community gardens, is currently seeking lease approval for 50 additional lots from the city government. Buffalo also has a few urban farms including Wilson Street farm on the East Side, and the Massachusetts Avenue Project and Curbside Crofts farms on the West Side. Community gardens and urban agriculture are a smart use for many of the 15,330 vacant lots in Buffalo. Surrounding Buffalo, within Erie County, are a number of farms that grow crops and raise livestock. Erie County is home to 1,215 farms; the average size of a farm in Erie County is 123 acres. [3] Erie County farms are an important part of the local economy. The total market value of products sold from Erie County farms in 2007 was over 117 million dollars, a 27% increase since 2002. Of the total products sold, livestock sales constitute a majority (64%) of the sales (over 75 million dollars) while crop sales make up for the rest (over 41 million dollars). The average sales per farm in 2007 were 96,322 dollars, an increase of 34% from 2002. [4]
Our local farms face considerable challenges. The number of farms and farmland is declining over time. Farming continues to be an economically challenging profession. For a sizeable proportion (48%) of Erie County farmers, farming is not their primary profession; for many farmers second jobs are a means to sustain their families economically. Partly due to economic challenges, few younger individuals are entering the profession of farming. The average age of farmers in Erie County is 57 years old. Local farmers also report the limited availability of seasonal labor to be a signifi cant challenge. [5]
Annual (2009) Monthly Average
Agencies Served Pounds
Meals Served
Households Served
People Served
% of Buffalo Population Served*
Meals / People Served
149 4,954,478 417,133 14,220 34,762 13.4% 12
Table 1: Distribution of Food in the City of Buffalo by the Food Bank of Western New York
Source: Food Bank of WNY, Cumula ve Category Totals
* Based on total city popula on es mates from the 2006-2008 American Community Survey [8]
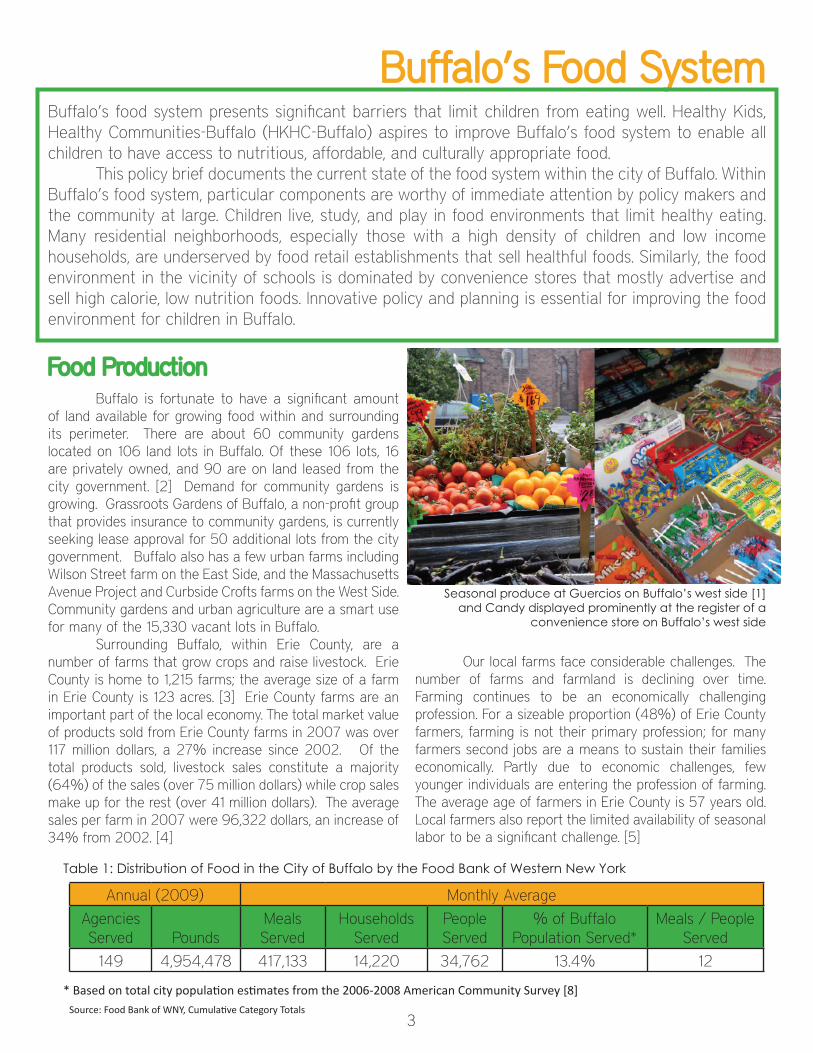
Seasonal produce at Guercios on Buffalo’s west side [1] and Candy displayed prominently at the register of a
convenience store on Buffalo’s west side
4
Food ProcessingFood Processing
The city of Buffalo has a rich legacy of food processing dating back to its days as a key player in the grain industry in the United States. Buffalo is home to 41 food manufacturing establishments, about 11% of all manufacturing establishments in the city. These establishments employ 2,192 individuals with an annual payroll of 93.8 million dollars. [6] Local and regional food producers frequently report the limited availability of small-scale food processing services in the city of Buffalo. There is a signifi cant opportunity to promote food-based economic development in the city by promoting additional food processing businesses in the city - especially small scale food processing - and link it to local and regional food producers. Buffalonians can purchase food from 750 food businesses. A majority of these are restaurants (69%) and convenience stores (11%).
Food Distribution Food Distribution
Food grown and processed reaches consumers through the private sector as well as the non-profi t sector. The private sector includes wholesalers and retailers, while the non-profi t sector includes emergency food services such as food banks and food pantries. Food wholesalers operating within the city of Buffalo is limited to 33 establishments. The sector is important to the local economy with annual sales of over 33.7 million dollars, about 17% of all sales within the wholesale sector
Food Destination % of Total
Restaurant 69.6%
Convenience 11.1%
Bakery 5.9%
Grocery 5.9%
Meat and Fish 2.8%
Candy and Nut 1.6%
Supermarket 1.2%
Fruit and Veg. 0.7%
Natural 0.7%
Specialty 0.5%
Dairy 0.0%
Table 2: Buffalo’s Food Destinations
Data Source: Reference USA and phone/site visit verifi ca on
of Buffalo’s economy. Food wholesalers in Buffalo employ 919 individuals and have an annual payroll of 29.3 million dollars. [7] Strengthening the distribution sector such that it reconnects local and regional farmers and local processors with local retailers (and consumers) has the potential to further promote economic development, as well as increase availability of healthful produce within the city of Buffalo.
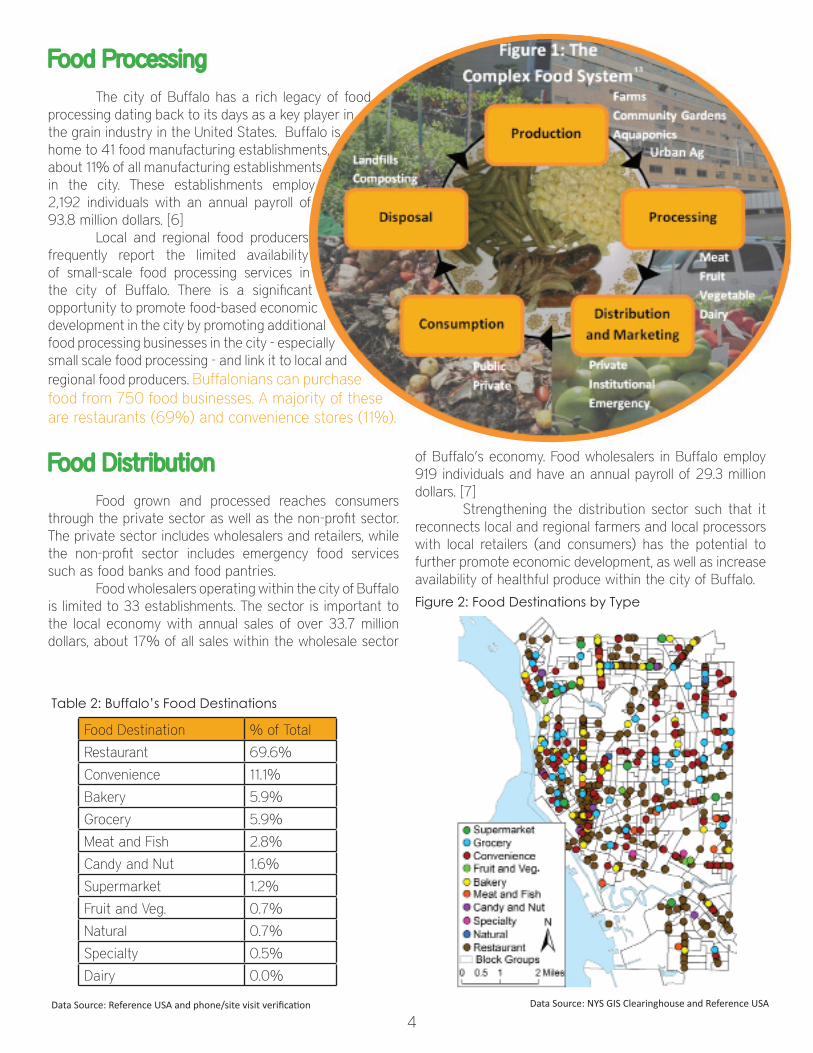
Figure 2: Food Destinations by Type
Data Source: NYS GIS Clearinghouse and Reference USA
5
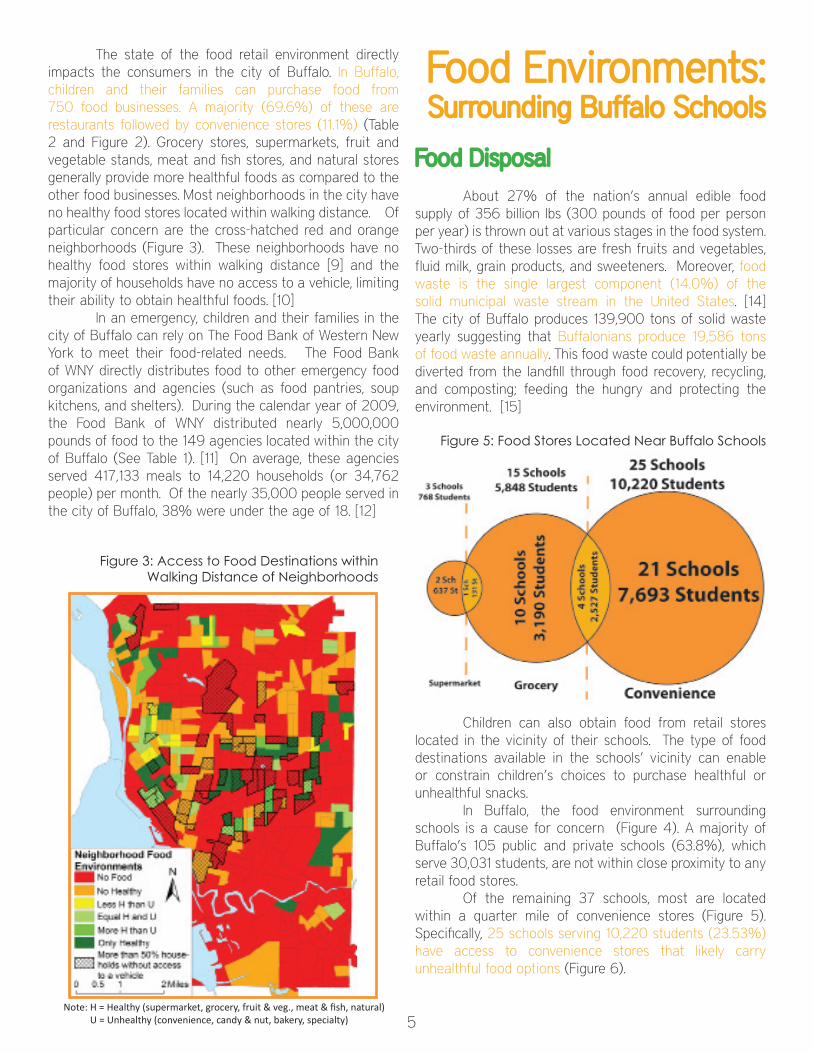
Figure 3: Access to Food Destinations within Walking Distance of Neighborhoods
Note: H = Healthy (supermarket, grocery, fruit & veg., meat & fi sh, natural) U = Unhealthy (convenience, candy & nut, bakery, specialty)
The state of the food retail environment directly impacts the consumers in the city of Buffalo. In Buffalo, children and their families can purchase food from 750 food businesses. A majority (69.6%) of these are restaurants followed by convenience stores (11.1%) (Table 2 and Figure 2). Grocery stores, supermarkets, fruit and vegetable stands, meat and fi sh stores, and natural stores generally provide more healthful foods as compared to the other food businesses. Most neighborhoods in the city have no healthy food stores located within walking distance. Of particular concern are the cross-hatched red and orange neighborhoods (Figure 3). These neighborhoods have no healthy food stores within walking distance [9] and the majority of households have no access to a vehicle, limiting their ability to obtain healthful foods. [10] In an emergency, children and their families in the city of Buffalo can rely on The Food Bank of Western New York to meet their food-related needs. The Food Bank of WNY directly distributes food to other emergency food organizations and agencies (such as food pantries, soup kitchens, and shelters). During the calendar year of 2009, the Food Bank of WNY distributed nearly 5,000,000 pounds of food to the 149 agencies located within the city of Buffalo (See Table 1). [11] On average, these agencies served 417,133 meals to 14,220 households (or 34,762 people) per month. Of the nearly 35,000 people served in the city of Buffalo, 38% were under the age of 18. [12]
Food Environments: Food Environments: Surrounding Buffalo SchoolsSurrounding Buffalo Schools
Food DisposalFood Disposal
About 27% of the nation’s annual edible food supply of 356 billion lbs (300 pounds of food per person per year) is thrown out at various stages in the food system. Two-thirds of these losses are fresh fruits and vegetables, fl uid milk, grain products, and sweeteners. Moreover, food waste is the single largest component (14.0%) of the solid municipal waste stream in the United States. [14] The city of Buffalo produces 139,900 tons of solid waste yearly suggesting that Buffalonians produce 19,586 tons of food waste annually. This food waste could potentially be diverted from the landfi ll through food recovery, recycling, and composting; feeding the hungry and protecting the environment. [15]
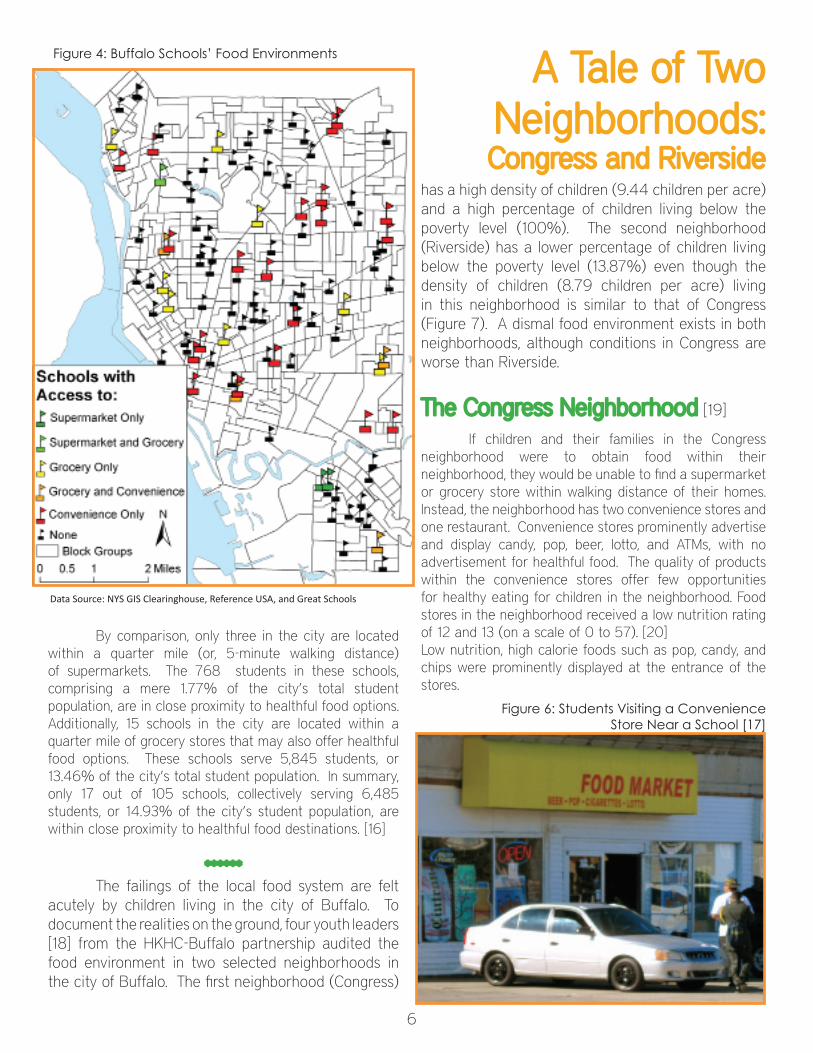
Children can also obtain food from retail stores located in the vicinity of their schools. The type of food destinations available in the schools’ vicinity can enable or constrain children’s choices to purchase healthful or unhealthful snacks. In Buffalo, the food environment surrounding schools is a cause for concern (Figure 4). A majority of Buffalo’s 105 public and private schools (63.8%), which serve 30,031 students, are not within close proximity to any retail food stores. Of the remaining 37 schools, most are located within a quarter mile of convenience stores (Figure 5). Specifi cally, 25 schools serving 10,220 students (23.53%) have access to convenience stores that likely carry unhealthful food options (Figure 6).
Figure 5: Food Stores Located Near Buffalo Schools
6
Figure 4: Buffalo Schools’ Food Environments
Data Source: NYS GIS Clearinghouse, Reference USA, and Great Schools
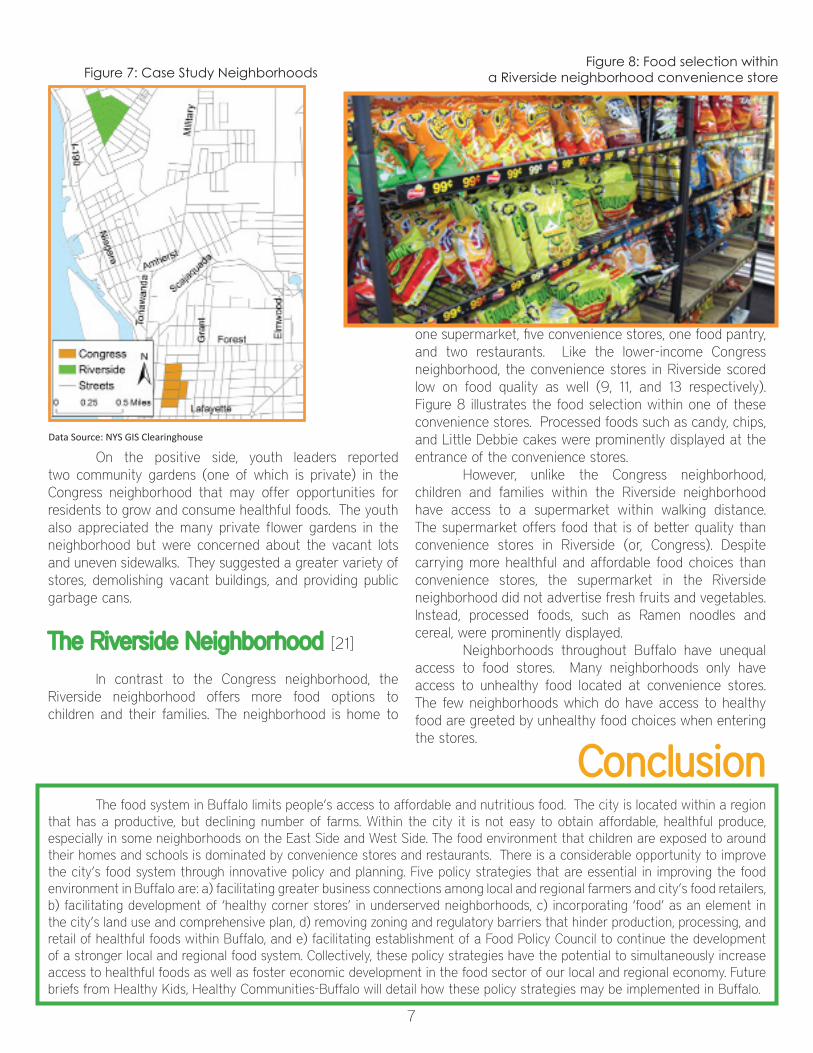
Figure 6: Students Visiting a Convenience Store Near a School [17]
A Tale of Two A Tale of Two Neighborhoods:Neighborhoods:Congress and RiversideCongress and Riverside
By comparison, only three in the city are located within a quarter mile (or, 5-minute walking distance) of supermarkets. The 768 students in these schools, comprising a mere 1.77% of the city’s total student population, are in close proximity to healthful food options. Additionally, 15 schools in the city are located within a quarter mile of grocery stores that may also offer healthful food options. These schools serve 5,845 students, or 13.46% of the city’s total student population. In summary, only 17 out of 105 schools, collectively serving 6,485 students, or 14.93% of the city’s student population, are within close proximity to healthful food destinations. [16]
************ The failings of the local food system are felt acutely by children living in the city of Buffalo. To document the realities on the ground, four youth leaders [18] from the HKHC-Buffalo partnership audited the food environment in two selected neighborhoods in the city of Buffalo. The fi rst neighborhood (Congress)
has a high density of children (9.44 children per acre) and a high percentage of children living below the poverty level (100%). The second neighborhood (Riverside) has a lower percentage of children living below the poverty level (13.87%) even though the density of children (8.79 children per acre) living in this neighborhood is similar to that of Congress (Figure 7). A dismal food environment exists in both neighborhoods, although conditions in Congress are worse than Riverside.
The Congress NeighborhoodThe Congress Neighborhood [19]
If children and their families in the Congress neighborhood were to obtain food within their neighborhood, they would be unable to fi nd a supermarket or grocery store within walking distance of their homes. Instead, the neighborhood has two convenience stores and one restaurant. Convenience stores prominently advertise and display candy, pop, beer, lotto, and ATMs, with no advertisement for healthful food. The quality of products within the convenience stores offer few opportunities for healthy eating for children in the neighborhood. Food stores in the neighborhood received a low nutrition rating of 12 and 13 (on a scale of 0 to 57). [20] Low nutrition, high calorie foods such as pop, candy, and chips were prominently displayed at the entrance of the stores.
7
Figure 7: Case Study Neighborhoods
Data Source: NYS GIS Clearinghouse
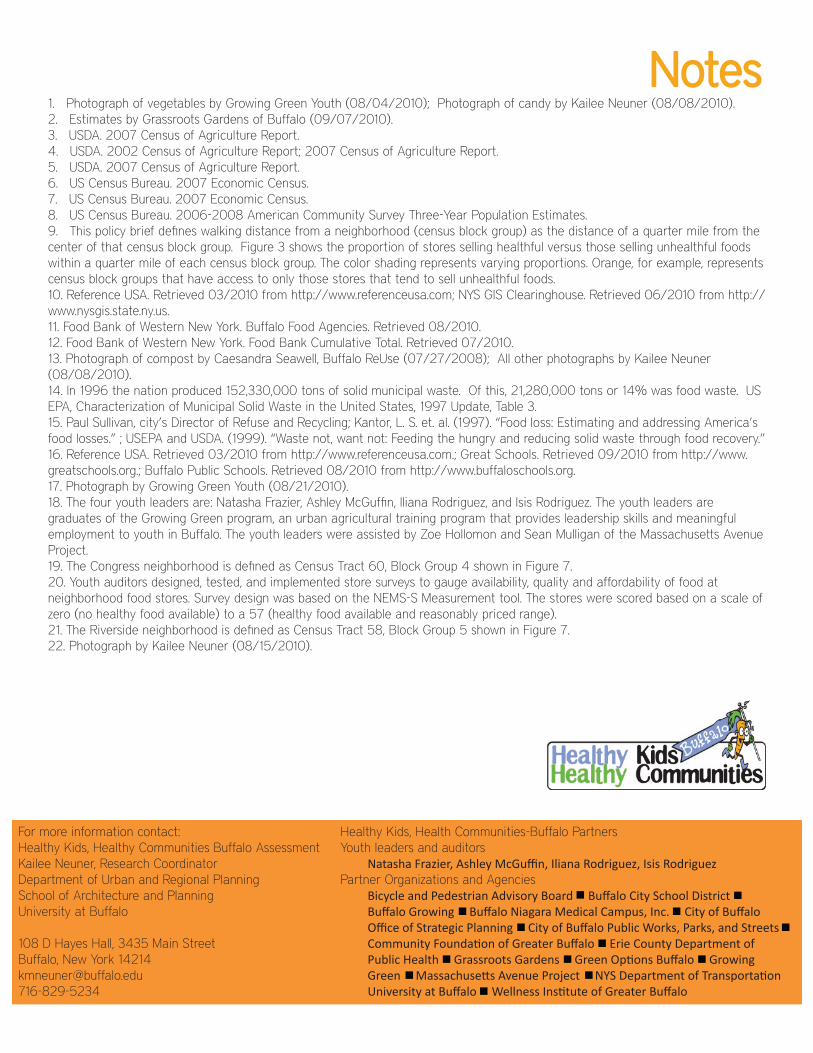
Figure 8: Food selection within a Riverside neighborhood convenience store
The food system in Buffalo limits people’s access to affordable and nutritious food. The city is located within a region that has a productive, but declining number of farms. Within the city it is not easy to obtain affordable, healthful produce, especially in some neighborhoods on the East Side and West Side. The food environment that children are exposed to around their homes and schools is dominated by convenience stores and restaurants. There is a considerable opportunity to improve the city’s food system through innovative policy and planning. Five policy strategies that are essential in improving the food environment in Buffalo are: a) facilitating greater business connections among local and regional farmers and city’s food retailers, b) facilitating development of ‘healthy corner stores’ in underserved neighborhoods, c) incorporating ‘food’ as an element in the city’s land use and comprehensive plan, d) removing zoning and regulatory barriers that hinder production, processing, and retail of healthful foods within Buffalo, and e) facilitating establishment of a Food Policy Council to continue the development of a stronger local and regional food system. Collectively, these policy strategies have the potential to simultaneously increase access to healthful foods as well as foster economic development in the food sector of our local and regional economy. Future briefs from Healthy Kids, Healthy Communities-Buffalo will detail how these policy strategies may be implemented in Buffalo.
ConclusionConclusion
On the positive side, youth leaders reported two community gardens (one of which is private) in the Congress neighborhood that may offer opportunities for residents to grow and consume healthful foods. The youth also appreciated the many private fl ower gardens in the neighborhood but were concerned about the vacant lots and uneven sidewalks. They suggested a greater variety of stores, demolishing vacant buildings, and providing public garbage cans.
The Riverside Neighborhood The Riverside Neighborhood [21] In contrast to the Congress neighborhood, the Riverside neighborhood offers more food options to children and their families. The neighborhood is home to
one supermarket, fi ve convenience stores, one food pantry, and two restaurants. Like the lower-income Congress neighborhood, the convenience stores in Riverside scored low on food quality as well (9, 11, and 13 respectively). Figure 8 illustrates the food selection within one of these convenience stores. Processed foods such as candy, chips, and Little Debbie cakes were prominently displayed at the entrance of the convenience stores. However, unlike the Congress neighborhood, children and families within the Riverside neighborhood have access to a supermarket within walking distance. The supermarket offers food that is of better quality than convenience stores in Riverside (or, Congress). Despite carrying more healthful and affordable food choices than convenience stores, the supermarket in the Riverside neighborhood did not advertise fresh fruits and vegetables. Instead, processed foods, such as Ramen noodles and cereal, were prominently displayed. Neighborhoods throughout Buffalo have unequal access to food stores. Many neighborhoods only have access to unhealthy food located at convenience stores. The few neighborhoods which do have access to healthy food are greeted by unhealthy food choices when entering the stores.
NotesNotes1. Photograph of vegetables by Growing Green Youth (08/04/2010); Photograph of candy by Kailee Neuner (08/08/2010).2. Estimates by Grassroots Gardens of Buffalo (09/07/2010).3. USDA. 2007 Census of Agriculture Report.4. USDA. 2002 Census of Agriculture Report; 2007 Census of Agriculture Report.5. USDA. 2007 Census of Agriculture Report.6. US Census Bureau. 2007 Economic Census.7. US Census Bureau. 2007 Economic Census.8. US Census Bureau. 2006-2008 American Community Survey Three-Year Population Estimates. 9. This policy brief defi nes walking distance from a neighborhood (census block group) as the distance of a quarter mile from the center of that census block group. Figure 3 shows the proportion of stores selling healthful versus those selling unhealthful foods within a quarter mile of each census block group. The color shading represents varying proportions. Orange, for example, represents census block groups that have access to only those stores that tend to sell unhealthful foods. 10. Reference USA. Retrieved 03/2010 from http://www.referenceusa.com; NYS GIS Clearinghouse. Retrieved 06/2010 from http://www.nysgis.state.ny.us. 11. Food Bank of Western New York. Buffalo Food Agencies. Retrieved 08/2010.12. Food Bank of Western New York. Food Bank Cumulative Total. Retrieved 07/2010.13. Photograph of compost by Caesandra Seawell, Buffalo ReUse (07/27/2008); All other photographs by Kailee Neuner (08/08/2010). 14. In 1996 the nation produced 152,330,000 tons of solid municipal waste. Of this, 21,280,000 tons or 14% was food waste. US EPA, Characterization of Municipal Solid Waste in the United States, 1997 Update, Table 3. 15. Paul Sullivan, city’s Director of Refuse and Recycling; Kantor, L. S. et. al. (1997). “Food loss: Estimating and addressing America’s food losses.” ; USEPA and USDA. (1999). “Waste not, want not: Feeding the hungry and reducing solid waste through food recovery.”16. Reference USA. Retrieved 03/2010 from http://www.referenceusa.com.; Great Schools. Retrieved 09/2010 from http://www.greatschools.org.; Buffalo Public Schools. Retrieved 08/2010 from http://www.buffaloschools.org.17. Photograph by Growing Green Youth (08/21/2010).18. The four youth leaders are: Natasha Frazier, Ashley McGuffi n, Iliana Rodriguez, and Isis Rodriguez. The youth leaders are graduates of the Growing Green program, an urban agricultural training program that provides leadership skills and meaningful employment to youth in Buffalo. The youth leaders were assisted by Zoe Hollomon and Sean Mulligan of the Massachusetts Avenue Project.19. The Congress neighborhood is defi ned as Census Tract 60, Block Group 4 shown in Figure 7.20. Youth auditors designed, tested, and implemented store surveys to gauge availability, quality and affordability of food at neighborhood food stores. Survey design was based on the NEMS-S Measurement tool. The stores were scored based on a scale of zero (no healthy food available) to a 57 (healthy food available and reasonably priced range).21. The Riverside neighborhood is defi ned as Census Tract 58, Block Group 5 shown in Figure 7.22. Photograph by Kailee Neuner (08/15/2010).
For more information contact: Healthy Kids, Healthy Communities Buffalo AssessmentKailee Neuner, Research Coordinator Department of Urban and Regional Planning School of Architecture and Planning University at Buffalo
108 D Hayes Hall, 3435 Main Street Buffalo, New York 14214 [email protected] 716-829-5234
Healthy Kids, Health Communities-Buffalo PartnersYouth leaders and auditors Natasha Frazier, Ashley McGuffi n, Iliana Rodriguez, Isis Rodriguez Partner Organizations and Agencies Bicycle and Pedestrian Advisory Board Buff alo City School District Buff alo Growing Buff alo Niagara Medical Campus, Inc. City of Buff alo Offi ce of Strategic Planning City of Buff alo Public Works, Parks, and Streets Community Founda on of Greater Buff alo Erie County Department of Public Health Grassroots Gardens Green Op ons Buff alo Growing Green Massachuse s Avenue Project NYS Department of Transporta on University at Buff alo Wellness Ins tute of Greater Buff alo