Embed Size (px)
Citation preview
Investors are advised to refer through important disclosures made at the last page of the Research Report. Motilal Oswal research is available on www.motilaloswal.com/Institutional-Equities, Bloomberg, Thomson Reuters, Factset and S&P Capital.
14 November 2017
Research Team ([email protected])
Equities - India Close Chg .% YTD.% Sensex 33,034 -0.8 24.1 Nifty-50 10,225 -0.9 24.9 Nifty-M 100 19,483 -0.5 35.8 Equities-Global Close Chg .% YTD.% S&P 500 2,585 0.1 15.5 Nasdaq 6,758 0.1 25.5 FTSE 100 7,415 -0.2 3.8 DAX 13,074 -0.4 13.9 Hang Seng 11,685 -0.5 24.4 Nikkei 225 22,381 -1.3 17.1 Commodities Close Chg .% YTD.% Brent (US$/Bbl) 63 -1.0 13.4 Gold ($/OZ) 1,279 -0.5 10.3 Cu (US$/MT) 6,861 1.6 24.2 Almn (US$/MT) 2,089 0.2 22.6 Currency Close Chg .% YTD.% USD/INR 65.4 0.4 -3.6USD/EUR 1.2 0.0 10.4USD/JPY 113.4 -0.1 -3.1YIELD (%) Close 1MChg YTDchg 10 Yrs G-Sec 7.0 0.0 0.5 10 Yrs AAA Corp 7.8 0.0 0.2 Flows (USD b) 13-Nov MTD YTD FIIs 0.0 1.5 7.0 DIIs 0.0 0.2 11.5 Volumes (INRb) 13-Nov MTD* YTD* Cash 348 427 304 F&O 4,007 6,847 5,587 Note: YTD is calendar year, *Avg
Today’s top research idea Market snapshot
Cos/Sector Key Highlights Reliance Inds Latin touch; Higher refining margins to sustain Axis Bank Strong capitalization to fast-track recovery; Upgrading to Buy Ecoscope CPI inflation hits seven-month high in October Telecom Vodafone, Idea announce tower biz sale NTPC Strong perf. on RAB growth, efficiencies and incentives Coal India Employee provisioning, other income impact results HPCL EBITDA significantly below estimate; Core GRM at USD5.6/bbl NMDC Strong operating performance Idea Cellular EBITDA misses estimate; net loss widens P & G Hygiene Healthy operating performance, fair valuations Guj. St. Petronet EBITDA below estimate; in-line transmission volumes Jagran Prakashan Print ad market yet to recover Sadbhav Engg Revenue miss but PAT exceeds estimates JK Lakshmi Cement EBITDA beat led by higher-than-estimated realization Other Results SLPA | ASBL | SHKL | REPCO
Results Expectation BOB | BATA | CDH | CEAT | EIM | FORH | GAIL | GRASIM | ICNT | IPCA | MRPL | MANB | SUNP IN
Axis Bank: Strong capitalization to fast-track recovery Upgrading to Buy v Axis Bank’s board has approved a capital raising plan amounting to USD1.79b
(INR116.26b) to provide the necessary growth capital to the bank and support asset quality clean-up.
v We estimate AXSB’s FY18E/19E book value to increase by 9%/10% and Tier-I ratioby 170bp to 13.8% by FY18E. The entire capital raising will eventually result indilution of 9.1% on the existing capital base (8.3% on post-issue basis).
v We revise our estimates and project ~42% earnings CAGR over FY17-20, even aswe factor in credit cost of 2.7%/1.8%/1.5% over FY18-20E. We turn positive onAXSB from a medium-term perspective, and revise our PT to INR680, based on2.3x Mar-20E ABV. We thus upgrade our rating to Buy.
Retail inflation rises to 3.6% in October 2017 Inflation in ‘core services’ eased further
Research covered
Chart of the Day: EcoScope (CPI inflation hits seven-month high in October)
14 November 2017 2
Govt to launch Bharat 22 ETF today, seeks to raise Rs8,000 crore The government will launch the ‘Bharat 22’ exchange traded fund (ETF) managed by ICICI Prudential Mutual Fund, on Tuesday, targeting an initial amount of about Rs8,000 crore. The new fund offer will be open for subscription till 17 November…
Retail inflation in October jumps to 3.58%, RBI rate cut in December now unlikely India’s retail inflation quickened to 3.58% in October, the fastest pace in seven months, spurred by rising food and fuel prices, virtually ruling out the possibility of an interest rate cut by the Reserve Bank of India (RBI) in its 6 December monetary policy review. The consumer price index (CPI), a measure of retail inflation, had come in at 3.28% in September. Data released by Central Statistics Office (CSO) showed that CPI in urban India, at 3.81, was higher than that in rural India, at 3.36%…
Jaitley signals further GST rate cuts, hits out against politicizing tax reform Finance minister Arun Jaitley on Monday signalled more GST rate cuts and appealed to businesses to pass on the benefit of the recent reductions to consumers. “The tax rate rationalisation process will always continue…
Centre raises more than half its divestment target for FY18 The Centre appears well-positioned to meet its disinvestment target for 2017-18, going by the data put out by the Department of Investment and Public Asset Management. Of the target of raising ₹72,500 crore this fiscal, the Centre had, as of November 1, garnered ₹30,185 crore via disinvestment…
Centre may look at PSU stake sale option to set fiscal math right Faced with rising global crude oil prices and uncertainty in its tax revenue, the government is looking at stake sale proceeds and other options to keep the fiscal deficit in check. “Disinvestment in public sector units (PSUs) is on track this fiscal. One of the ways in which the fisc can be managed is by higher revenue from disinvestment in PSUs, but it has to be seen how far that can be managed,” said a person familiar with the development. The Centre plans to raise ₹72,500 crore from stake sales in PSUs this fiscal,…
Hero Future Energies, Greenko in race to acquire Orange Renewable Greenko Group and Hero Future Energies Pvt. Ltd are in separate talks with Singapore-based AT Capital Group to acquire Orange Renewable’s portfolio of 758 megawatt (MW) capacity, several people aware of the development said. New Delhi-based Orange Renewable, a unit of AT Holdings Pte. Ltd,…
Airtel plans to raise $400 mn from Bharti Infratel stake sale via block deals Bharti AirtelBSE -0.75 % plans to raise $400 million (Rs 2,617.2 crore) by selling 3.5% in listed tower unit Bharti Infratel through block deals in the open market on Tuesday, said people familiar with the move, which seeks to pare debt, free up cash for expansion projects, and help offset the pressure on revenue…
Kindly click on textbox for the detailed news link
In the news today
2
5
6 7
4
1
3
14 November 2017 3
BSE SENSEX S&P CNX CMP: INR875 TP: INR1,077 (+23%) Buy33,315 10,322
Stock Info Bloomberg RIL IN Equity Shares (m) 6502.0 52-Week Range (INR) 958/466 1, 6, 12 Rel. Per (%) 2/21/57 M.Cap. (INR b) 5775.4 M.Cap. (USD b) 86.6 Avg Val, INRm 12,330 Free float (%) 53.8
Financials Snapshot (INR b) Y/E March 2018E 2019E 2020E Net Sales 4,119 5,017 5,202 EBITDA 622 761 821 Net Profit 345 394 455 Adj. EPS (INR) 58.3 66.5 77.0 EPS Gr. (%) 15.3 14.2 15.7 BV/Sh. (INR) 492 542 601 RoE (%) 12.4 12.9 13.5 RoCE (%) 7.8 8.2 8.9 P/E (x) 15.2 13.3 11.5 P/BV (x) 1.8 1.6 1.5 EV/EBITDA (x) 12.0 9.2 7.9
Shareholding pattern (%) As On Sep-17 Jun-17 Sep-16 Promoter 46.2 45.0 45.1 DII 11.4 11.1 12.5 FII 26.0 25.6 23.7 Others 16.5 18.3 18.7
FII Includes depository receipts
Stock Performance (1-year)
Latin touch Higher refining margins to sustain
n We had talked about the worsening refining glut in our thematic report, The ThreeMusketeers, January 2017. While we continue to believe capacity addition wouldremain strong, especially in low cost condensate splitters, utilization of the LatinAmerican refineries does not appear to be improving any time soon. This wouldenable RIL to continue clocking GRM of ~USD11.5/bbl during FY19-20.
n Additionally, delays in upcoming ethylene crackers in the US are also likely to resultin higher petchem deltas. We expect EBITDA/mt of USD300 for RIL during FY19-20.
n RJio’s revised plans are priced ~15% higher, with an average ARPU of INR150 for itspopular unlimited price plans. We expect actions towards ARPU accretion to driveARPU of INR156 in FY18 and INR172 in FY19.
Latin touch to refining – margins to remain strong at USD11.5/bbl n Argentina, Mexico, Brazil and Venezuela have all been facing severe under-
utilization of their refining assets. There is a mismatch between domestic crudeavailability, refining configurations, and domestic-market productrequirements. Additionally, the refineries have not been upgraded for long,which results in frequent maintenance requirements and shutdowns.
n Utilization in Mexico and Venezuela has been at 40% in the recent months.Utilization in Argentina at 76% is the lowest since 1996. Utilization in Brazil at74.3% is also the lowest in six years.
n Such lower utilization in these four countries alone, home to 6% of globalcapacity, would boost refining margins. Additionally, Africa with another 6% ofglobal refining capacity, has also been witnessing utilization of below 70% since 2011. Expect USD11.5/bbl of GRM for RIL in FY18-20.
Further delays in US expansions could support petchem margins n A total of 9.7mmtpa of greenfield ethylene expansions in addition to 1.2mmtpa
of brownfield expansions were to come up in the US by 2020. While 3.5mmtpaof capacity has already come up, few others appear to be delayed.
n Only in 2017 and 2018, incremental supply was expected to outgrowincremental demand globally. Such delays in capacity addition could help inhealthy demand and supply, preventing margins from falling sharply.
Gaining confidence in RJio’s profitability n RJio’s revised plans are priced about 15% higher, with an average ARPU of
INR150 for its popular unlimited price plans. Interestingly, this is above Bharti’sARPU of INR145 for 2QFY18.400
550
700
850
1,000
Nov
-16
Feb-
17
May
-17
Aug-
17
Nov
-17
Reliance Inds.Sensex - Rebased
14 November 2017 Update | Sector: Oil & Gas
Reliance Industries
14 November 2017 4
n We estimate 181m subscribers in FY18 and 205m subscribers in FY19. Thisimplies addition of 42m subscribers in 2HFY18 and 24m subscribers in FY19. Weexpect actions towards ARPU accretion to drive ARPU of INR156 in FY18 andINR172 in FY19.
n Our DCF-based value for RJio is INR245/share (EV of 10x FY21E EBITDA ofINR278b). The management’s indication of reduced freebies should drivesubsequent ARPU accretion.
Reiterate Buy with a revised target of INR1,077 n Global refining peers are trading at 7x FY19E EV/EBITDA and 10-11x FY19E P/E.
We value RIL at a higher multiple of 7.5x (7x earlier) average FY19-20EEV/EBITDA to factor in higher capacity utilization, better yield management,crude optimization, and sound risk management.
n Global petchem companies are trading at 7x FY19E EV/EBITDA and 10x FY19EP/E. We value RIL at 7.5x (7x earlier) average FY19-20E EV/EBITDA. The highermultiple takes into account RIL’s higher level of integration, flexibility infeedstock, as well as strong growth in the domestic petchem market.
n We value RIL using SOTP. We use 7.5x EV/EBITDA for refining and petchem, DCFfor E&P, 1x EV/Sales for Reliance Retail and DCF for RJio. Our target price isrevised from INR1,005 to INR1,077, implying an upside of 21%. We reiterate ourBuy recommendation.
14 November 2017 5
BSE SENSEX S&P CNX CMP: INR545 TP: INR680 (+25%) Upgrading to Buy 33,315 10,322
Stock Info Bloomberg AXSB IN
Equity Shares (m) 2,395.0
M.Cap.(INR b)/(USD b) 1,303 / 20.2
52-Week Range (INR) 556/425 1, 6, 12 Rel. Per (%) 2/-2/-14 12M Avg Val (INR M) 4273
Free float (%) 71.4
Financials & Valuation (INR b) Y/E March 2018E 2019E 2020E
NII 190.1 219.1 256.6
OP 179.9 206.9 244.2
NP 45.6 79.8 105.1
NIM (%) 3.2 3.2 3.2
EPS (INR) 18.4 30.8 40.2
BV/Sh. (INR) 268.3 299.1 334.7
RoE (%) 7.3 10.8 12.7
RoA (%) 0.7 1.1 1.2
P/E(X) 29.6 17.7 13.5
P/BV (X) 2.0 1.8 1.6
Shareholding pattern (%) As On Sep-17 Jun-17 Sep-16
Promoter 28.6 28.7 28.9
DII 9.1 8.7 9.5
FII 52.1 52.4 52.9
Others 10.3 10.2 8.8
FII Includes depository receipts Stock Performance (1-year)
Strong capitalization to fast-track recovery; Upgrading to Buy n Event: Axis Bank’s (AXSB) board has approved a capital raising plan amounting
to USD1.79b (INR116.26b) to provide the necessary growth capital to the bank and support asset quality clean-up. Of the approved amount, USD1.4b (INR90.63b) is proposed to be raised via preferential issue of equity shares at INR525/share, while the remaining USD396.1m (INR25.63b) would be raised via warrants, which can be converted into equity shares at INR565/share.
n Investing entities: Bain Capital will invest USD1.06b (INR68.54b) – USD710m (INR45.94b) would be in the form of equity and the balance USD349.3m (INR22.6b) via warrants. LIC will invest USD244.7m (INR15.83b) directly via the equity route. The balance USD446.1m (INR28.86b) via equity and USD46.8m (INR3.03b) via warrants would be invested by several other institutional funds.
n Impact: FY19E BV (increase by 10%), Tier-1 (increase by 170bp) and dilution of 9.1% on existing equity base: We expect warrant conversion to take place in FY19, and thus, estimate AXSB’s FY18E/19E book value to increase by 9%/10%. This will also help improve the bank’s Tier-I ratio by 170bp to 13.8% by FY18E, providing it with the necessary growth capital to pursue business opportunities. The entire capital raising will eventually result in dilution of 9.1% on the existing capital base (8.3% on post-issue basis).
n Corporate slippages account for >80% of total slippages; expect normalcy to return from 2HFY19: We expect continued pressure on asset quality in the near term, as AXSB further purges its books. However, we note that the corporate slippages over the past six quarters have been accounting for >80% of the total slippages, with a majority of it originating from the watch-list assets. AXSB has INR158.1b of BB & below-rated assets, of which ~64% are lying under the watch-list plus other dispensations. We estimate slippages to remain high over the near term – as AXSB aggressively cleanses its books – and then moderate sharply from 2HFY19E, driving a sharp decline in the net NPL ratio. AXSB has exposure of INR70.41b toward IBC accounts under both the RBI lists, on which it already carries a provision of INR38.86b (~55% coverage).
n 12.6% RoE by FY20E v/s ~7% in FY18E; see scope of positive surprise: We revise our numbers, as we build in the proposed capital raising, and fine-tune our slippage/credit cost estimates. We thus project ~42% earnings CAGR over FY17-20, even as we factor in credit cost of 2.7%/1.8%/1.5% over FY18-20E. This compares conservatively to AXSB’s average credit cost of 0.7% over FY11-15, leaving scope of a positive surprise on earnings/multiple expansion. We thus expect RoA/RoE of 1.2%/12.6% in FY20E v/s 0.7%/7.3% in FY18E.
n Valuation view: We believe that the capital raising will be an important step in taking AXSB closer to its historical level of return ratios, albeit the journey will take a few years to complete. We believe that the growing proportion of retail franchise, de-risking of loan book and pursuing growth opportunities in the corporate working capital loan segment (+36% YoY in 2QFY18) will enable steady re-rating of the stock. We turn positive on AXSB from a medium-term perspective, and revise our PT to INR680, based on 2.3x Mar-20E ABV. We thus upgrade our rating to Buy.
400
460
520
580
640
Nov
-16
Feb-
17
May
-17
Aug-
17
Nov
-17
Axis BankSensex - Rebased
14 November 2017
Update | Sector: Financials - Banks
Axis Bank
14 November 2017 6
13 November 2017
ECOSCOPE The Economy Observer
CPI inflation hits seven-month high in October Vegetable, housing inflation surges; core inflation unchanged
n CPI inflation inched up to 3.6% YoY in October 2017, higher than consensus of 3.4%, but lower than our estimate of
3.8%. This was the highest level of inflation in seven months. n The rise was largely driven by a surge in vegetable inflation to a 15-month high of 7.5% in October 2017. Food inflation
increased to 1.9% from 1.3% in September 2017. n Core inflation remained unchanged versus the preceding month at 4.6% in October. Although housing inflation surged
to 6.7%, it was offset by a decline in inflation in the transport & communication group. Inflation in core services declined to a record low of 3.4% in October 2017.
n We expect headline CPI inflation to rise toward 4.5% and core inflation to touch 5% by Jan-Feb 2018. Accordingly, we do not expect any rate cut in the remaining part of FY18.
n CPI inflation at seven-month high…: CPI-based inflation increased to 3.6% YoY
in October 2017, from 3.3% in the preceding month (Exhibit 1). This is the highest level of inflation in seven months. The number was higher than consensus of 3.4%, but lower than our expectation of 3.8%. A surge in food inflation led to higher inflation in the month.
n …led by a surge in vegetable prices…: Inflation in vegetables surged to a 15-month high of 7.5% YoY in October 2017, from 3.9% in the preceding month. This contributed 21bp to the rise in headline inflation in October compared to the preceding month (Exhibit 2). Excluding vegetables, CPI inflation rose marginally to 3.3% from 3.2% in September 2017. Owing to the surge in vegetables, food inflation rose to a seven-month high of 1.9% in October 2017 from 1.3% in the preceding month. Inflation in the fuel & light group rose to a 46-month high of 6.4% (Sep’17: 5.6%).
n …while core inflation remains unchanged: Further, core inflation (all items excluding ‘food & beverages’ and ‘fuel & light’) remained unchanged at 4.6% YoY in October, compared to the preceding month. Within core inflation, housing inflation increased to 6.7% (40-month high) from 6.1% in September 2017. This was offset by a fall in inflation in the transport & communication group to 2.3% from 3.5% in the preceding month. Core-core inflation (excluding petrol/diesel from core inflation) edged up marginally to 4.5% from 4.4%.
n Inflation in ‘core services’ falls to a new low: Further refinement of CPI items shows that inflation in ‘core services’ eased to a record low of 3.4% in October 2017, while inflation in ‘goods’ increased to a seven-month high of 3.2% (Exhibit 4). Inflation in core services has declined continuously over the last two years.
n We expect headline CPI inflation to rise toward 4.5% and core inflation to touch 5% by Jan-Feb 2018. Accordingly, we do not expect any rate cut in the remaining part of FY18.
14 November 2017 7
Vodafone, Idea announce tower biz sale
In a latest industry development, Idea Cellular (IDEA) and Vodafone India announced that the two companies have separately agreed to sell their telecom towers to ATC Telcom at a combined enterprise value (EV) of INR78.5b.
EV/tenancy of INR2.9m once the merger goes through IDEA and Vodafone have a combined portfolio of ~20,000 towers, with a 1.65x tenancy ratio (i.e. 33,000 tenancies). Post the Vodafone-Idea merger, ~6,300 duplicate tenancies will be terminated over two years without any exit penalties. This implies EV/tower of INR3.9m and EV/tenancy (adjusting for tenancy cut) of INR2.9.
Deal valued at ~6% discount to Bharti Infratel Bharti Infratel is valued at EV/tower of INR8.1m and EV/tenancy of INR3.1m, with a 2.4x tenancy ratio. Thus, the deal is valued at ~6% discount to Bharti Infratel.
Idea valued at EV/EBITDA of 11.6x/9.2x on FY18/19E The tower business sale will help reduce the combined entity’s net debt of ~INR1,100b by ~7%, in line with our estimate. Also, the sale of Idea’s 11% stake in Indus should generate INR100b (benchmarking to ATC sale value). Vodafone-Idea is valued at EV/EBITDA of 11.6x/9.2x, factoring in the sale value. We believe that the EBITDA synergies in FY20E could make the stock compelling at 7.3x EV/EBITDA.
Combined Vodafone Idea Total Towers 78,500 38,500 40000 tenancy (x) 20000 8886 10926 Total Tenancies 1.65 1.79 1.56 Cut in tenancies 33000 15918 17049 tenancy factor (x) 6300 3150 3150 Net Tenancies 0.32 0.35 0.29 tenancy factor (x) 26700 12768 13899
1.34 1.44 1.27 EV/tower (INRm) EV/ tenancy (INRm) 3.9 4.3 3.7 EV/ tenancy (adjusting for cut) (x) 2.4 2.4 2.3 Total Towers 2.9 3.0 2.9
Update | 13 November 2017
Telecom
14 November 2017 8
BSE SENSEX S&P CNX CMP: INR177 TP: INR211 (+19%) Buy 33,034 10,225 Bloomberg NTPC IN Equity Shares (m) 8,245 M.Cap.(INRb)/(USDb) 1,459.0 / 22.3
52-Week Range (INR) 188/149 1, 6, 12 Rel. Per (%) -1/3/-7 Avg Val, INRm/ Vol m 944.0 Free float (%) 37.0
Financials & Valuations (INR b) Y/E Mar 2017 2018E 2019E Net Sales 813.8 849.3 966.4 EBITDA 215.0 241.0 309.9 PAT 98.6 110.9 129.3 EPS (INR) 12.0 13.4 15.7 Gr. (%) 1.8 12.4 16.6 BV/Sh (INR) 118.7 126.7 136.4 RoE (%) 10.5 11.0 11.9 RoCE (%) 6.4 6.6 7.7 P/E (x) 14.8 13.2 11.3 P/BV (x) 1.5 1.4 1.3
Estimate change TP change Rating change
Strong perf. on RAB growth, efficiencies and incentives EPS CAGR of ~14% over FY17-20E; valuations attractive; Buy NTPC’s 2QFY18 PAT adjusting for prior periods and reversals (net of tax) increased 21% YoY to INR28.4b, well ahead of our estimate of INR24.4b, driven by regulated equity growth, efficiency gains and higher PLF incentive. Reported PAT was down 2% YoY at INR24.4b. n 2.6GW capacity was capitalized in S/A, driving a 15% YoY increase in regulated
equity (RAB) to INR488b in 2Q. Including 445MW capitalized in JVs, the group’sdeclared capacity is 50.6GW and installed capacity is 51.6GW.
n Unit fuel cost was down 9% YoY at 1.93/kWh, led by GST savings, lower specificconsumption and grade adjustment by Coal India.
n Efficiency gains were driven by lower auxiliary consumption/SHR and somebenefit from changes in grid norms for compensation for part load operation of plants. PLF incentive increased from INR30m in 2QFY17 to INR660m in 2QFY18.
n The hearing on GCV measurement based on report submitted by CEA isscheduled on 21st November 2017. Any relaxation would drive some earningsupside.
Earnings growth to accelerate; valuations attractive; Buy NTPC has already capitalized 3.3GW in 1HFY18, and with expected 800MW in 2H, it is on track to meet its target of ~4GW for FY18. Capitalization is expected to accelerate further in FY19 and FY20. We expect regulated equity CAGR of ~20% over FY17-20E. PAT is estimated to grow at ~14% CAGR over FY17-20E. Capitalization would start to outpace capex, boosting RoEs and driving re-rating of the stock. Our estimates are unchanged for the efficiency gains in 2Q, as we would wait for their sustainability. The stock trades attractive at 1.3x FY19E P/BV, while earnings growth is strong. We value the stock at INR211/share, even after factoring in 150bp risk to regulated RoE w.e.f. FY20E in our DCF model. Maintain Buy.
Quarterly Performance (Standalone) – INR m Y/E March FY17 FY18 FY17 FY18E FY18 Var.
1Q 2Q 3Q 4Q 1Q 2Q 3QE 4QE 2QE (%) Sales 188,585 193,979 193,959 204,167 201,076 198,518 199,602 211,704 782,734 810,900 202,242 -2EBITDA 52,139 53,914 52,260 58,248 52,684 55,933 60,516 70,610 216,200 239,743 57,397 -3
Other income 1,579 1,906 2,502 4,702 6,626 2,616 3,823 2,792 10,689 15,857 2,544 PBT 30,761 32,580 30,819 30,080 34,654 32,228 35,608 38,905 123,879 141,394 32,048 1
Tax 7,066 7,621 6,131 9,286 8,472 7,842 8,546 9,075 30,026 33,935 7,692 PAT 23,695 24,960 24,687 20,794 26,182 24,386 27,062 29,830 93,853 107,460 24,356 0
Change (%) 4.1 -17.9 -7.5 -25.5 10.5 -2.3 9.6 43.5 -12.9 14.5 -2.4 Adj. PAT 24,047 23,410 22,448 26,606 25,742 28,387 27,062 26,269 96,227 107,460 24,356 17
Change (%) 5.7 -0.7 0.0 0.5 7.0 21.3 20.6 -1.3 1.0 11.7 4.0 A. Core PAT 22,827 22,138 20,536 23,121 20,757 26,337 24,156 24,159 88,298 95,408 22,423 17
Core RoE (%) 21.9 21.0 19.4 21.4 18.9 22.7 19.4 18.8 20.7 19.9 19 a. Base RoE - 15.5% 15,582 16,337 16,428 16,765 17,058 17,972 19,322 19,933 65,113 74,286 18,040 0 b. PLF incentive 1,530 30 0 1,470 549 660 726 484 3,030 2,419 604 c. Others 5,715 5,771 4,108 4,885 3,150 7,705 4,108 3,742 20,155 18,704 3,780 104
B. Other income 1,220 1,272 1,912 3,485 4,985 2,050 2,906 2,111 7,930 12,051 1,933 6 Key metrics
Regulated Equity 420,146 423,072 424,822 440,489 439,927 487,680 509,595 519,196 440,489 519,196 491,157 -1Commercial cap.(MW) 39,552 39,602 39,602 40,522 40,522 43,392 44,442 44,442 40,522 44,442 43,392 0
13 November 2017 2QFY18 Results Update | Sector: Utilities
NTPC
14 November 2017 9
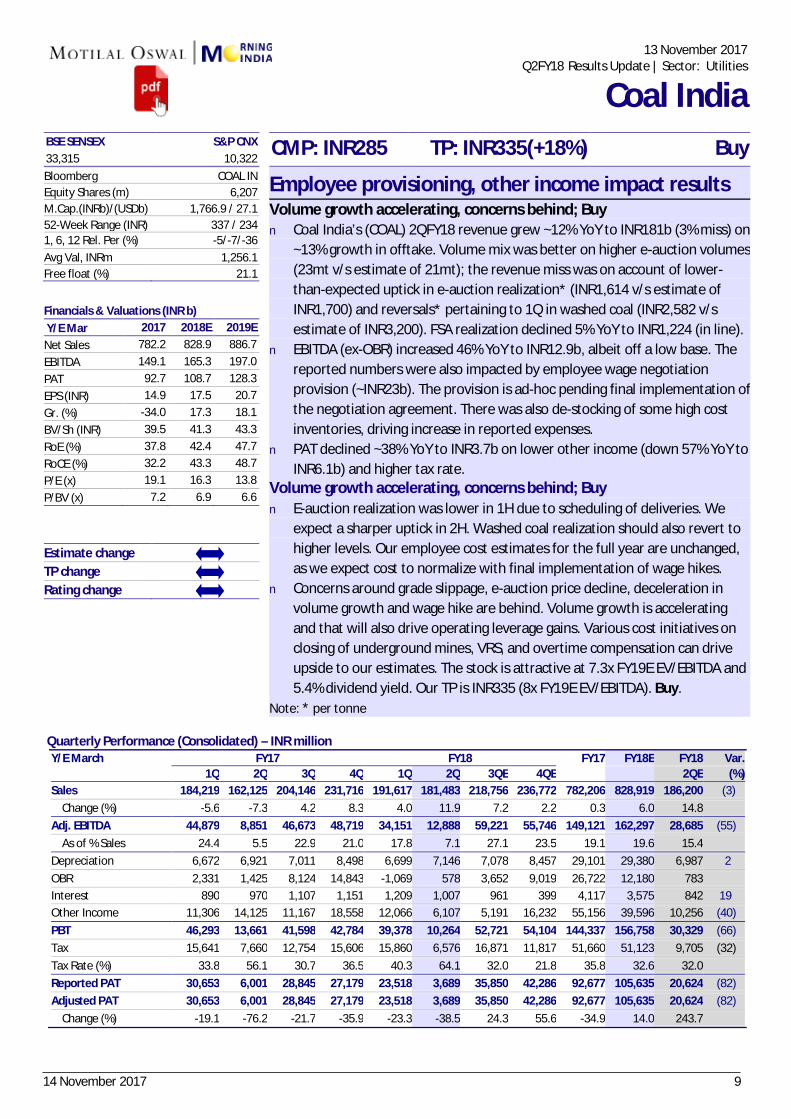
BSE SENSEX S&P CNX CMP: INR285 TP: INR335(+18%) Buy 33,315 10,322 Bloomberg COAL IN Equity Shares (m) 6,207 M.Cap.(INRb)/(USDb) 1,766.9 / 27.1
52-Week Range (INR) 337 / 234 1, 6, 12 Rel. Per (%) -5/-7/-36 Avg Val, INRm 1,256.1 Free float (%) 21.1 Financials & Valuations (INR b) Y/E Mar 2017 2018E 2019E Net Sales 782.2 828.9 886.7 EBITDA 149.1 165.3 197.0 PAT 92.7 108.7 128.3 EPS (INR) 14.9 17.5 20.7 Gr. (%) -34.0 17.3 18.1 BV/Sh (INR) 39.5 41.3 43.3 RoE (%) 37.8 42.4 47.7 RoCE (%) 32.2 43.3 48.7 P/E (x) 19.1 16.3 13.8 P/BV (x) 7.2 6.9 6.6
Estimate change TP change Rating change
Employee provisioning, other income impact results Volume growth accelerating, concerns behind; Buy n Coal India’s (COAL) 2QFY18 revenue grew ~12% YoY to INR181b (3% miss) on
~13% growth in offtake. Volume mix was better on higher e-auction volumes (23mt v/s estimate of 21mt); the revenue miss was on account of lower-than-expected uptick in e-auction realization* (INR1,614 v/s estimate of INR1,700) and reversals* pertaining to 1Q in washed coal (INR2,582 v/s estimate of INR3,200). FSA realization declined 5% YoY to INR1,224 (in line).
n EBITDA (ex-OBR) increased 46% YoY to INR12.9b, albeit off a low base. The reported numbers were also impacted by employee wage negotiation provision (~INR23b). The provision is ad-hoc pending final implementation of the negotiation agreement. There was also de-stocking of some high cost inventories, driving increase in reported expenses.
n PAT declined ~38% YoY to INR3.7b on lower other income (down 57% YoY to INR6.1b) and higher tax rate.
Volume growth accelerating, concerns behind; Buy n E-auction realization was lower in 1H due to scheduling of deliveries. We
expect a sharper uptick in 2H. Washed coal realization should also revert to higher levels. Our employee cost estimates for the full year are unchanged, as we expect cost to normalize with final implementation of wage hikes.
n Concerns around grade slippage, e-auction price decline, deceleration in volume growth and wage hike are behind. Volume growth is accelerating and that will also drive operating leverage gains. Various cost initiatives on closing of underground mines, VRS, and overtime compensation can drive upside to our estimates. The stock is attractive at 7.3x FY19E EV/EBITDA and 5.4% dividend yield. Our TP is INR335 (8x FY19E EV/EBITDA). Buy.
Note: * per tonne
Quarterly Performance (Consolidated) – INR million Y/E March FY17 FY18 FY17 FY18E FY18 Var. 1Q 2Q 3Q 4Q 1Q 2Q 3QE 4QE 2QE (%) Sales 184,219 162,125 204,146 231,716 191,617 181,483 218,756 236,772 782,206 828,919 186,200 (3) Change (%) -5.6 -7.3 4.2 8.3 4.0 11.9 7.2 2.2 0.3 6.0 14.8 Adj. EBITDA 44,879 8,851 46,673 48,719 34,151 12,888 59,221 55,746 149,121 162,297 28,685 (55) As of % Sales 24.4 5.5 22.9 21.0 17.8 7.1 27.1 23.5 19.1 19.6 15.4 Depreciation 6,672 6,921 7,011 8,498 6,699 7,146 7,078 8,457 29,101 29,380 6,987 2 OBR 2,331 1,425 8,124 14,843 -1,069 578 3,652 9,019 26,722 12,180 783 Interest 890 970 1,107 1,151 1,209 1,007 961 399 4,117 3,575 842 19 Other Income 11,306 14,125 11,167 18,558 12,066 6,107 5,191 16,232 55,156 39,596 10,256 (40) PBT 46,293 13,661 41,598 42,784 39,378 10,264 52,721 54,104 144,337 156,758 30,329 (66) Tax 15,641 7,660 12,754 15,606 15,860 6,576 16,871 11,817 51,660 51,123 9,705 (32) Tax Rate (%) 33.8 56.1 30.7 36.5 40.3 64.1 32.0 21.8 35.8 32.6 32.0 Reported PAT 30,653 6,001 28,845 27,179 23,518 3,689 35,850 42,286 92,677 105,635 20,624 (82) Adjusted PAT 30,653 6,001 28,845 27,179 23,518 3,689 35,850 42,286 92,677 105,635 20,624 (82) Change (%) -19.1 -76.2 -21.7 -35.9 -23.3 -38.5 24.3 55.6 -34.9 14.0 243.7
13 November 2017
Q2FY18 Results Update | Sector: Utilities
Coal India
14 November 2017 10
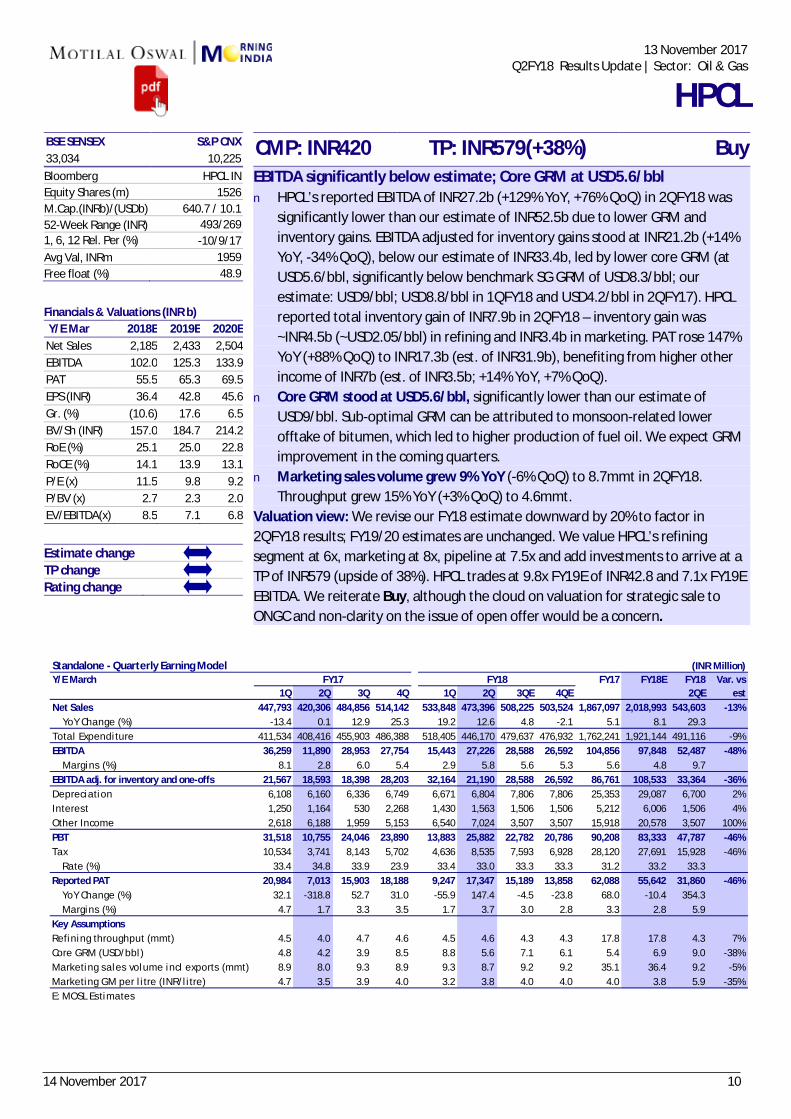
BSE SENSEX S&P CNX CMP: INR420 TP: INR579(+38%) Buy 33,034 10,225 Bloomberg HPCL IN Equity Shares (m) 1526 M.Cap.(INRb)/(USDb) 640.7 / 10.1
52-Week Range (INR) 493/269 1, 6, 12 Rel. Per (%) -10/9/17 Avg Val, INRm 1959 Free float (%) 48.9
Financials & Valuations (INR b) Y/E Mar 2018E 2019E 2020E Net Sales 2,185 2,433 2,504 EBITDA 102.0 125.3 133.9 PAT 55.5 65.3 69.5 EPS (INR) 36.4 42.8 45.6 Gr. (%) (10.6) 17.6 6.5 BV/Sh (INR) 157.0 184.7 214.2 RoE (%) 25.1 25.0 22.8 RoCE (%) 14.1 13.9 13.1 P/E (x) 11.5 9.8 9.2 P/BV (x) 2.7 2.3 2.0 EV/EBITDA(x) 8.5 7.1 6.8
Estimate change TP change Rating change
EBITDA significantly below estimate; Core GRM at USD5.6/bbl n HPCL’s reported EBITDA of INR27.2b (+129% YoY, +76% QoQ) in 2QFY18 was
significantly lower than our estimate of INR52.5b due to lower GRM and inventory gains. EBITDA adjusted for inventory gains stood at INR21.2b (+14% YoY, -34% QoQ), below our estimate of INR33.4b, led by lower core GRM (at USD5.6/bbl, significantly below benchmark SG GRM of USD8.3/bbl; our estimate: USD9/bbl; USD8.8/bbl in 1QFY18 and USD4.2/bbl in 2QFY17). HPCL reported total inventory gain of INR7.9b in 2QFY18 – inventory gain was ~INR4.5b (~USD2.05/bbl) in refining and INR3.4b in marketing. PAT rose 147% YoY (+88% QoQ) to INR17.3b (est. of INR31.9b), benefiting from higher other income of INR7b (est. of INR3.5b; +14% YoY, +7% QoQ).
n Core GRM stood at USD5.6/bbl, significantly lower than our estimate of USD9/bbl. Sub-optimal GRM can be attributed to monsoon-related lower offtake of bitumen, which led to higher production of fuel oil. We expect GRM improvement in the coming quarters.
n Marketing sales volume grew 9% YoY (-6% QoQ) to 8.7mmt in 2QFY18. Throughput grew 15% YoY (+3% QoQ) to 4.6mmt.
Valuation view: We revise our FY18 estimate downward by 20% to factor in 2QFY18 results; FY19/20 estimates are unchanged. We value HPCL’s refining segment at 6x, marketing at 8x, pipeline at 7.5x and add investments to arrive at a TP of INR579 (upside of 38%). HPCL trades at 9.8x FY19E of INR42.8 and 7.1x FY19E EBITDA. We reiterate Buy, although the cloud on valuation for strategic sale to ONGC and non-clarity on the issue of open offer would be a concern.
Standalone - Quarterly Earning Model (INR Million)Y/E March FY17 FY18E FY18 Var. vs
1Q 2Q 3Q 4Q 1Q 2Q 3QE 4QE 2QE estNet Sales 447,793 420,306 484,856 514,142 533,848 473,396 508,225 503,524 1,867,097 2,018,993 543,603 -13% YoY Change (%) -13.4 0.1 12.9 25.3 19.2 12.6 4.8 -2.1 5.1 8.1 29.3Tota l Expenditure 411,534 408,416 455,903 486,388 518,405 446,170 479,637 476,932 1,762,241 1,921,144 491,116 -9%EBITDA 36,259 11,890 28,953 27,754 15,443 27,226 28,588 26,592 104,856 97,848 52,487 -48% Margins (%) 8.1 2.8 6.0 5.4 2.9 5.8 5.6 5.3 5.6 4.8 9.7EBITDA adj. for inventory and one-offs 21,567 18,593 18,398 28,203 32,164 21,190 28,588 26,592 86,761 108,533 33,364 -36%Depreciation 6,108 6,160 6,336 6,749 6,671 6,804 7,806 7,806 25,353 29,087 6,700 2%Interest 1,250 1,164 530 2,268 1,430 1,563 1,506 1,506 5,212 6,006 1,506 4%Other Income 2,618 6,188 1,959 5,153 6,540 7,024 3,507 3,507 15,918 20,578 3,507 100%PBT 31,518 10,755 24,046 23,890 13,883 25,882 22,782 20,786 90,208 83,333 47,787 -46%Tax 10,534 3,741 8,143 5,702 4,636 8,535 7,593 6,928 28,120 27,691 15,928 -46% Rate (%) 33.4 34.8 33.9 23.9 33.4 33.0 33.3 33.3 31.2 33.2 33.3Reported PAT 20,984 7,013 15,903 18,188 9,247 17,347 15,189 13,858 62,088 55,642 31,860 -46% YoY Change (%) 32.1 -318.8 52.7 31.0 -55.9 147.4 -4.5 -23.8 68.0 -10.4 354.3 Margins (%) 4.7 1.7 3.3 3.5 1.7 3.7 3.0 2.8 3.3 2.8 5.9Key AssumptionsRefining throughput (mmt) 4.5 4.0 4.7 4.6 4.5 4.6 4.3 4.3 17.8 17.8 4.3 7%Core GRM (USD/bbl ) 4.8 4.2 3.9 8.5 8.8 5.6 7.1 6.1 5.4 6.9 9.0 -38%Marketing sa les volume incl exports (mmt) 8.9 8.0 9.3 8.9 9.3 8.7 9.2 9.2 35.1 36.4 9.2 -5%Marketing GM per l i tre (INR/l i tre) 4.7 3.5 3.9 4.0 3.2 3.8 4.0 4.0 4.0 3.8 5.9 -35%E: MOSL Estimates
FY17 FY18
13 November 2017 Q2FY18 Results Update | Sector: Oil & Gas
HPCL
14 November 2017 11
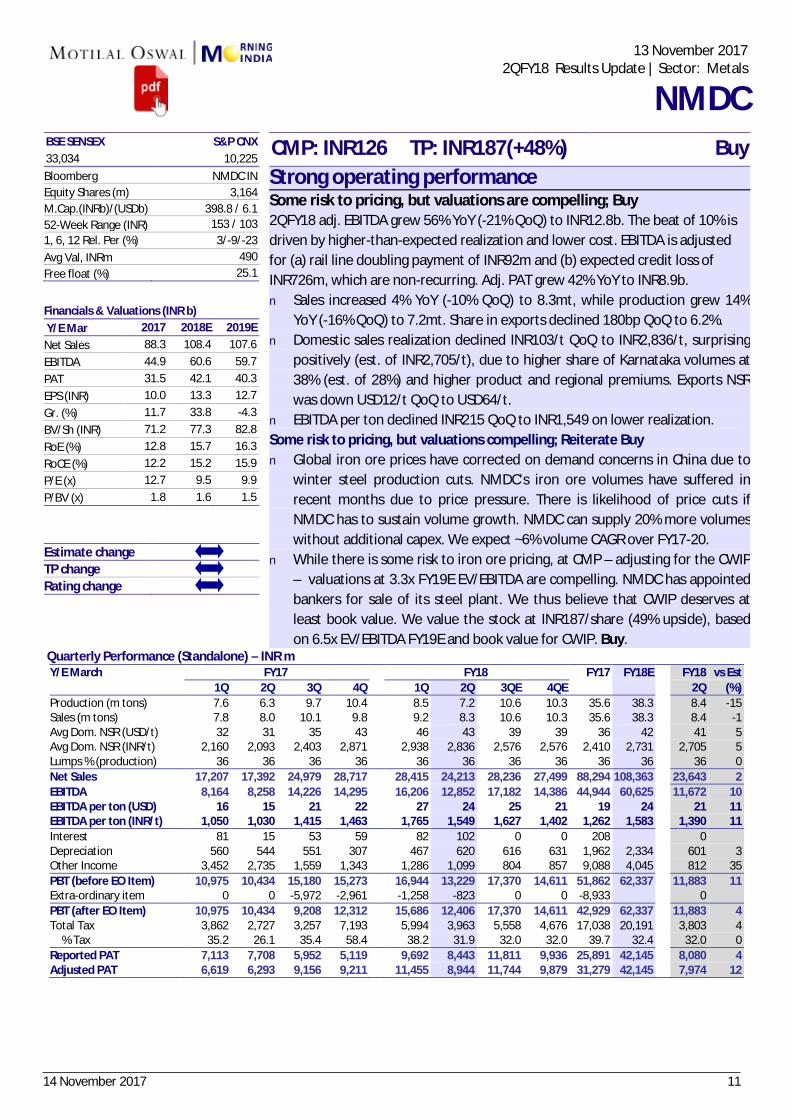
BSE SENSEX S&P CNX CMP: INR126 TP: INR187(+48%) Buy 33,034 10,225 Bloomberg NMDC IN Equity Shares (m) 3,164 M.Cap.(INRb)/(USDb) 398.8 / 6.1
52-Week Range (INR) 153 / 103 1, 6, 12 Rel. Per (%) 3/-9/-23 Avg Val, INRm 490 Free float (%) 25.1
Financials & Valuations (INR b) Y/E Mar 2017 2018E 2019E Net Sales 88.3 108.4 107.6 EBITDA 44.9 60.6 59.7 PAT 31.5 42.1 40.3 EPS (INR) 10.0 13.3 12.7 Gr. (%) 11.7 33.8 -4.3BV/Sh (INR) 71.2 77.3 82.8 RoE (%) 12.8 15.7 16.3 RoCE (%) 12.2 15.2 15.9 P/E (x) 12.7 9.5 9.9 P/BV (x) 1.8 1.6 1.5
Estimate change TP change Rating change
Strong operating performance Some risk to pricing, but valuations are compelling; Buy 2QFY18 adj. EBITDA grew 56% YoY (-21% QoQ) to INR12.8b. The beat of 10% is driven by higher-than-expected realization and lower cost. EBITDA is adjusted for (a) rail line doubling payment of INR92m and (b) expected credit loss of INR726m, which are non-recurring. Adj. PAT grew 42% YoY to INR8.9b. n Sales increased 4% YoY (-10% QoQ) to 8.3mt, while production grew 14%
YoY (-16% QoQ) to 7.2mt. Share in exports declined 180bp QoQ to 6.2%.n Domestic sales realization declined INR103/t QoQ to INR2,836/t, surprising
positively (est. of INR2,705/t), due to higher share of Karnataka volumes at 38% (est. of 28%) and higher product and regional premiums. Exports NSR was down USD12/t QoQ to USD64/t.
n EBITDA per ton declined INR215 QoQ to INR1,549 on lower realization.Some risk to pricing, but valuations compelling; Reiterate Buyn Global iron ore prices have corrected on demand concerns in China due to
winter steel production cuts. NMDC’s iron ore volumes have suffered in recent months due to price pressure. There is likelihood of price cuts if NMDC has to sustain volume growth. NMDC can supply 20% more volumes without additional capex. We expect ~6% volume CAGR over FY17-20.
n While there is some risk to iron ore pricing, at CMP – adjusting for the CWIP – valuations at 3.3x FY19E EV/EBITDA are compelling. NMDC has appointed bankers for sale of its steel plant. We thus believe that CWIP deserves at least book value. We value the stock at INR187/share (49% upside), based on 6.5x EV/EBITDA FY19E and book value for CWIP. Buy.
Quarterly Performance (Standalone) – INR m Y/E March FY17 FY18 FY17 FY18E FY18 vs Est
1Q 2Q 3Q 4Q 1Q 2Q 3QE 4QE 2Q (%) Production (m tons) 7.6 6.3 9.7 10.4 8.5 7.2 10.6 10.3 35.6 38.3 8.4 -15Sales (m tons) 7.8 8.0 10.1 9.8 9.2 8.3 10.6 10.3 35.6 38.3 8.4 -1Avg Dom. NSR (USD/t) 32 31 35 43 46 43 39 39 36 42 41 5Avg Dom. NSR (INR/t) 2,160 2,093 2,403 2,871 2,938 2,836 2,576 2,576 2,410 2,731 2,705 5Lumps % (production) 36 36 36 36 36 36 36 36 36 36 36 0Net Sales 17,207 17,392 24,979 28,717 28,415 24,213 28,236 27,499 88,294 108,363 23,643 2 EBITDA 8,164 8,258 14,226 14,295 16,206 12,852 17,182 14,386 44,944 60,625 11,672 10 EBITDA per ton (USD) 16 15 21 22 27 24 25 21 19 24 21 11 EBITDA per ton (INR/t) 1,050 1,030 1,415 1,463 1,765 1,549 1,627 1,402 1,262 1,583 1,390 11 Interest 81 15 53 59 82 102 0 0 208 0 Depreciation 560 544 551 307 467 620 616 631 1,962 2,334 601 3 Other Income 3,452 2,735 1,559 1,343 1,286 1,099 804 857 9,088 4,045 812 35 PBT (before EO Item) 10,975 10,434 15,180 15,273 16,944 13,229 17,370 14,611 51,862 62,337 11,883 11 Extra-ordinary item 0 0 -5,972 -2,961 -1,258 -823 0 0 -8,933 0 PBT (after EO Item) 10,975 10,434 9,208 12,312 15,686 12,406 17,370 14,611 42,929 62,337 11,883 4 Total Tax 3,862 2,727 3,257 7,193 5,994 3,963 5,558 4,676 17,038 20,191 3,803 4
% Tax 35.2 26.1 35.4 58.4 38.2 31.9 32.0 32.0 39.7 32.4 32.0 0 Reported PAT 7,113 7,708 5,952 5,119 9,692 8,443 11,811 9,936 25,891 42,145 8,080 4 Adjusted PAT 6,619 6,293 9,156 9,211 11,455 8,944 11,744 9,879 31,279 42,145 7,974 12
13 November 2017 2QFY18 Results Update | Sector: Metals
NMDC
14 November 2017 12
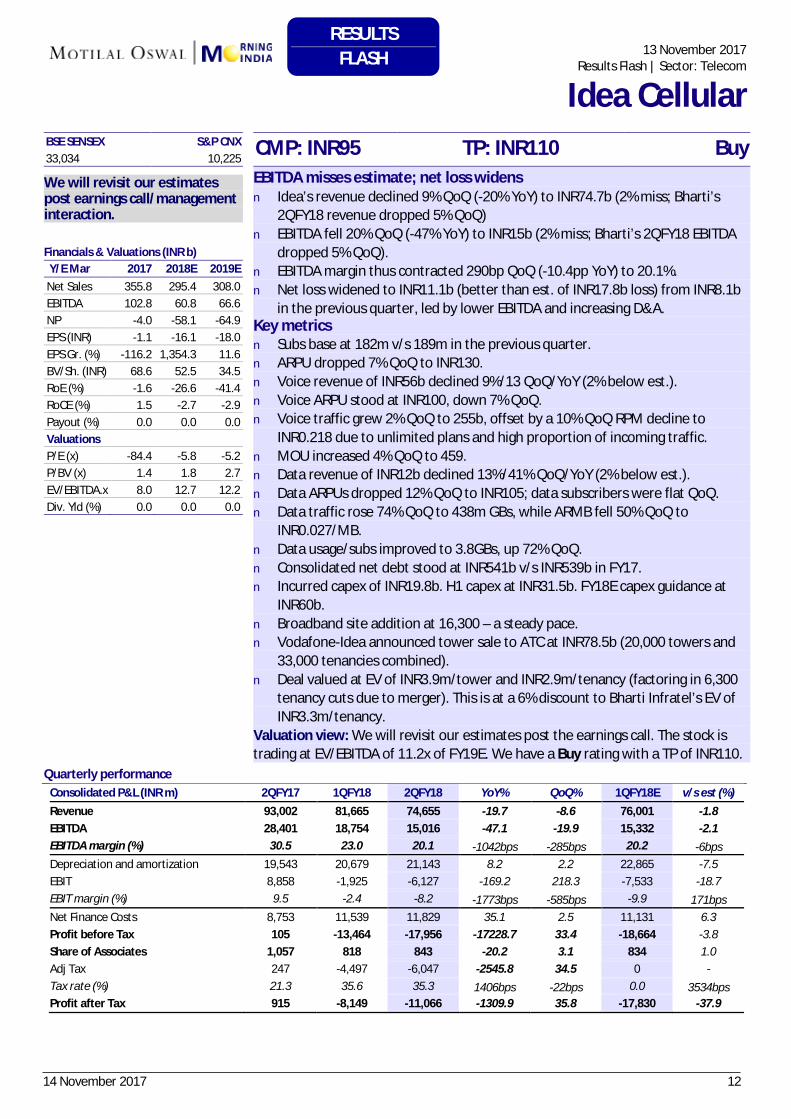
13 November 2017Results Flash | Sector: Telecom
Idea Cellular BSE SENSEX S&P CNX CMP: INR95 TP: INR110 Buy 33,034 10,225
We will revisit our estimates post earnings call/management interaction.
Financials & Valuations (INR b) Y/E Mar 2017 2018E 2019E Net Sales 355.8 295.4 308.0 EBITDA 102.8 60.8 66.6 NP -4.0 -58.1 -64.9EPS (INR) -1.1 -16.1 -18.0EPS Gr. (%) -116.2 1,354.3 11.6 BV/Sh. (INR) 68.6 52.5 34.5 RoE (%) -1.6 -26.6 -41.4RoCE (%) 1.5 -2.7 -2.9Payout (%) 0.0 0.0 0.0 Valuations P/E (x) -84.4 -5.8 -5.2P/BV (x) 1.4 1.8 2.7 EV/EBITDA.x 8.0 12.7 12.2 Div. Yld (%) 0.0 0.0 0.0
EBITDA misses estimate; net loss widens n Idea’s revenue declined 9% QoQ (-20% YoY) to INR74.7b (2% miss; Bharti’s
2QFY18 revenue dropped 5% QoQ)n EBITDA fell 20% QoQ (-47% YoY) to INR15b (2% miss; Bharti’s 2QFY18 EBITDA
dropped 5% QoQ). n EBITDA margin thus contracted 290bp QoQ (-10.4pp YoY) to 20.1%.n Net loss widened to INR11.1b (better than est. of INR17.8b loss) from INR8.1b
in the previous quarter, led by lower EBITDA and increasing D&A. Key metrics n Subs base at 182m v/s 189m in the previous quarter.n ARPU dropped 7% QoQ to INR130.n Voice revenue of INR56b declined 9%/13 QoQ/YoY (2% below est.).n Voice ARPU stood at INR100, down 7% QoQ.n Voice traffic grew 2% QoQ to 255b, offset by a 10% QoQ RPM decline to
INR0.218 due to unlimited plans and high proportion of incoming traffic.n MOU increased 4% QoQ to 459.n Data revenue of INR12b declined 13%/41% QoQ/YoY (2% below est.).n Data ARPUs dropped 12% QoQ to INR105; data subscribers were flat QoQ.n Data traffic rose 74% QoQ to 438m GBs, while ARMB fell 50% QoQ to
INR0.027/MB.n Data usage/subs improved to 3.8GBs, up 72% QoQ.n Consolidated net debt stood at INR541b v/s INR539b in FY17.n Incurred capex of INR19.8b. H1 capex at INR31.5b. FY18E capex guidance at
INR60b.n Broadband site addition at 16,300 – a steady pace.n Vodafone-Idea announced tower sale to ATC at INR78.5b (20,000 towers and
33,000 tenancies combined).n Deal valued at EV of INR3.9m/tower and INR2.9m/tenancy (factoring in 6,300
tenancy cuts due to merger). This is at a 6% discount to Bharti Infratel’s EV ofINR3.3m/tenancy.
Valuation view: We will revisit our estimates post the earnings call. The stock is trading at EV/EBITDA of 11.2x of FY19E. We have a Buy rating with a TP of INR110.
Quarterly performance Consolidated P&L (INR m) 2QFY17 1QFY18 2QFY18 YoY% QoQ% 1QFY18E v/s est (%) Revenue 93,002 81,665 74,655 -19.7 -8.6 76,001 -1.8EBITDA 28,401 18,754 15,016 -47.1 -19.9 15,332 -2.1EBITDA margin (%) 30.5 23.0 20.1 -1042bps -285bps 20.2 -6bps Depreciation and amortization 19,543 20,679 21,143 8.2 2.2 22,865 -7.5EBIT 8,858 -1,925 -6,127 -169.2 218.3 -7,533 -18.7EBIT margin (%) 9.5 -2.4 -8.2 -1773bps -585bps -9.9 171bps Net Finance Costs 8,753 11,539 11,829 35.1 2.5 11,131 6.3 Profit before Tax 105 -13,464 -17,956 -17228.7 33.4 -18,664 -3.8Share of Associates 1,057 818 843 -20.2 3.1 834 1.0 Adj Tax 247 -4,497 -6,047 -2545.8 34.5 0 - Tax rate (%) 21.3 35.6 35.3 1406bps -22bps 0.0 3534bps Profit after Tax 915 -8,149 -11,066 -1309.9 35.8 -17,830 -37.9
RESULTS FLASH
14 November 2017 13
BSE SENSEX S&P CNX CMP: INR8,729 TP: INR9,267 (+6%) Neutral 33,034 10,225 Bloomberg PG IN Equity Shares (m) 32.5 M.Cap.(INRb)/(USDb) 286 /4.4
52-Week Range (INR) 8925 / 6139 1, 6, 12 Rel. Per (%) -1/0/3 Avg Val, INRm/ Vol m 47 Free float (%) 29.4
Financials & Valuations (INR b) Y/E March FY17 FY18E FY19E Net Sales 23.2 26.8 31.3 EBITDA 6.6 7.9 9.0 NP 4.3 4.9 5.7 EPS (INR) 132.9 151.5 176.7 EPS Gr. (%) 2.3 14.0 16.6 BV/Sh. (INR) 212.2 255.8 306.4 RoE (%) 39.3 64.8 62.9 RoCE (%) 40.2 66.1 63.9 P/E (x) 65.7 57.6 49.4 P/BV (x) 41.1 34.1 28.5 Estimate change TP change Rating change
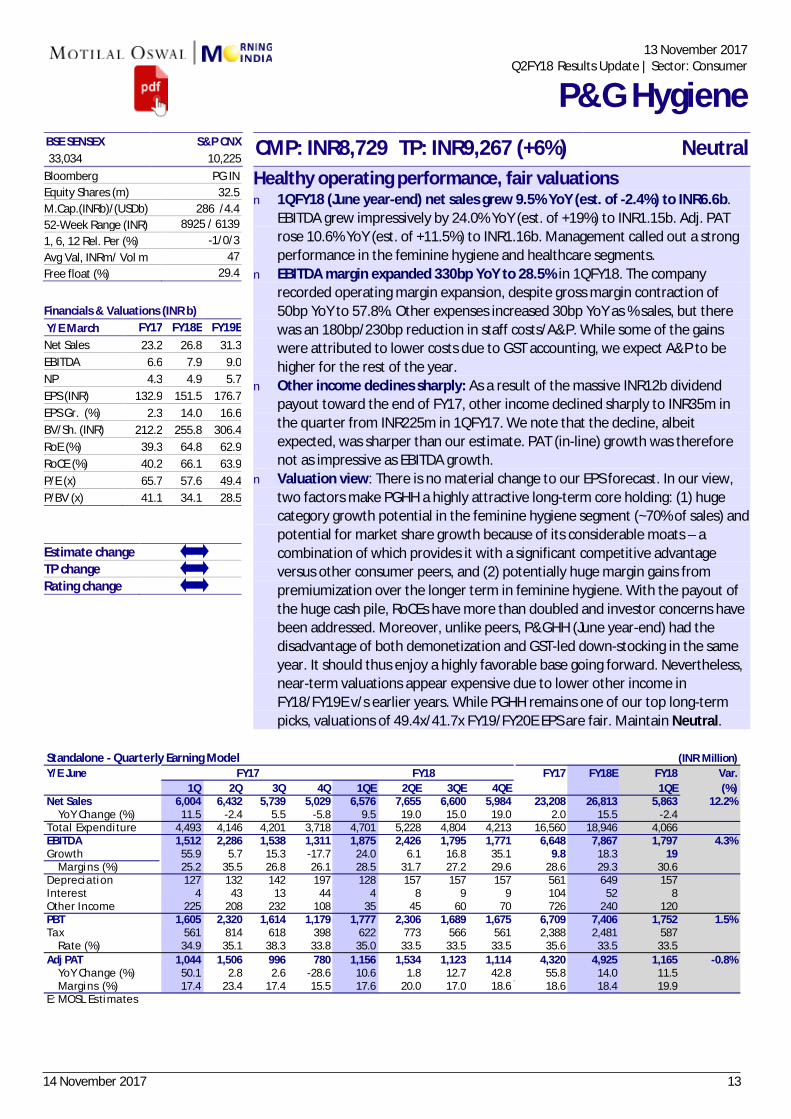
Healthy operating performance, fair valuations n 1QFY18 (June year-end) net sales grew 9.5% YoY (est. of -2.4%) to INR6.6b.
EBITDA grew impressively by 24.0% YoY (est. of +19%) to INR1.15b. Adj. PAT rose 10.6% YoY (est. of +11.5%) to INR1.16b. Management called out a strong performance in the feminine hygiene and healthcare segments.
n EBITDA margin expanded 330bp YoY to 28.5% in 1QFY18. The company recorded operating margin expansion, despite gross margin contraction of 50bp YoY to 57.8%. Other expenses increased 30bp YoY as % sales, but there was an 180bp/230bp reduction in staff costs/A&P. While some of the gains were attributed to lower costs due to GST accounting, we expect A&P to be higher for the rest of the year.
n Other income declines sharply: As a result of the massive INR12b dividend payout toward the end of FY17, other income declined sharply to INR35m in the quarter from INR225m in 1QFY17. We note that the decline, albeit expected, was sharper than our estimate. PAT (in-line) growth was therefore not as impressive as EBITDA growth.
n Valuation view: There is no material change to our EPS forecast. In our view, two factors make PGHH a highly attractive long-term core holding: (1) huge category growth potential in the feminine hygiene segment (~70% of sales) and potential for market share growth because of its considerable moats – a combination of which provides it with a significant competitive advantage versus other consumer peers, and (2) potentially huge margin gains from premiumization over the longer term in feminine hygiene. With the payout of the huge cash pile, RoCEs have more than doubled and investor concerns have been addressed. Moreover, unlike peers, P&GHH (June year-end) had the disadvantage of both demonetization and GST-led down-stocking in the same year. It should thus enjoy a highly favorable base going forward. Nevertheless, near-term valuations appear expensive due to lower other income in FY18/FY19E v/s earlier years. While PGHH remains one of our top long-term picks, valuations of 49.4x/41.7x FY19/FY20E EPS are fair. Maintain Neutral.
Standalone - Quarterly Earning Model (INR Million)Y/E June FY17 FY18E FY18 Var.
1Q 2Q 3Q 4Q 1QE 2QE 3QE 4QE 1QE (%)Net Sales 6,004 6,432 5,739 5,029 6,576 7,655 6,600 5,984 23,208 26,813 5,863 12.2% YoY Change (%) 11.5 -2.4 5.5 -5.8 9.5 19.0 15.0 19.0 2.0 15.5 -2.4Tota l Expenditure 4,493 4,146 4,201 3,718 4,701 5,228 4,804 4,213 16,560 18,946 4,066EBITDA 1,512 2,286 1,538 1,311 1,875 2,426 1,795 1,771 6,648 7,867 1,797 4.3%Growth 55.9 5.7 15.3 -17.7 24.0 6.1 16.8 35.1 9.8 18.3 19 Margins (%) 25.2 35.5 26.8 26.1 28.5 31.7 27.2 29.6 28.6 29.3 30.6Depreciation 127 132 142 197 128 157 157 157 561 649 157Interest 4 43 13 44 4 8 9 9 104 52 8Other Income 225 208 232 108 35 45 60 70 726 240 120PBT 1,605 2,320 1,614 1,179 1,777 2,306 1,689 1,675 6,709 7,406 1,752 1.5%Tax 561 814 618 398 622 773 566 561 2,388 2,481 587 Rate (%) 34.9 35.1 38.3 33.8 35.0 33.5 33.5 33.5 35.6 33.5 33.5 Adj PAT 1,044 1,506 996 780 1,156 1,534 1,123 1,114 4,320 4,925 1,165 -0.8% YoY Change (%) 50.1 2.8 2.6 -28.6 10.6 1.8 12.7 42.8 55.8 14.0 11.5 Margins (%) 17.4 23.4 17.4 15.5 17.6 20.0 17.0 18.6 18.6 18.4 19.9E: MOSL Estimates
FY18FY17
13 November 2017
Q2FY18 Results Update | Sector: Consumer
P&G Hygiene
14 November 2017 14
BSE SENSEX S&P CNX CMP: INR215 TP: INR184 (-14%) Neutral 33,315 10,332 Bloomberg GUJS IN Equity Shares (m) 563.0 M.Cap.(INR b)/(USD b) 101.5/ 1.6
52-Week Range (INR) 223 / 119 1, 6, 12 Rel. Per (%) 7/14/17 12M Avg Val (INR M) 134 Free float (%) 62.3
Financials & Valuations (INR b) Y/E Mar 2018E 2019E 2020E Sales 13.5 14.4 15.7 EBITDA 11.9 12.7 13.9 Adj. PAT 6.8 7.4 8.5 Adj. EPS (INR) 12.1 13.2 15.2 EPS Gr. (%) 37.9 8.7 14.8 BV/Sh.(INR) 89.2 99.5 111.3 RoE (%) 14.4 14.0 14.4 RoCE (%) 12.2 11.9 12.3 P/E (x) 17.7 16.3 14.2 P/BV (x) 2.4 2.2 1.9
Estimate change TP change Rating change
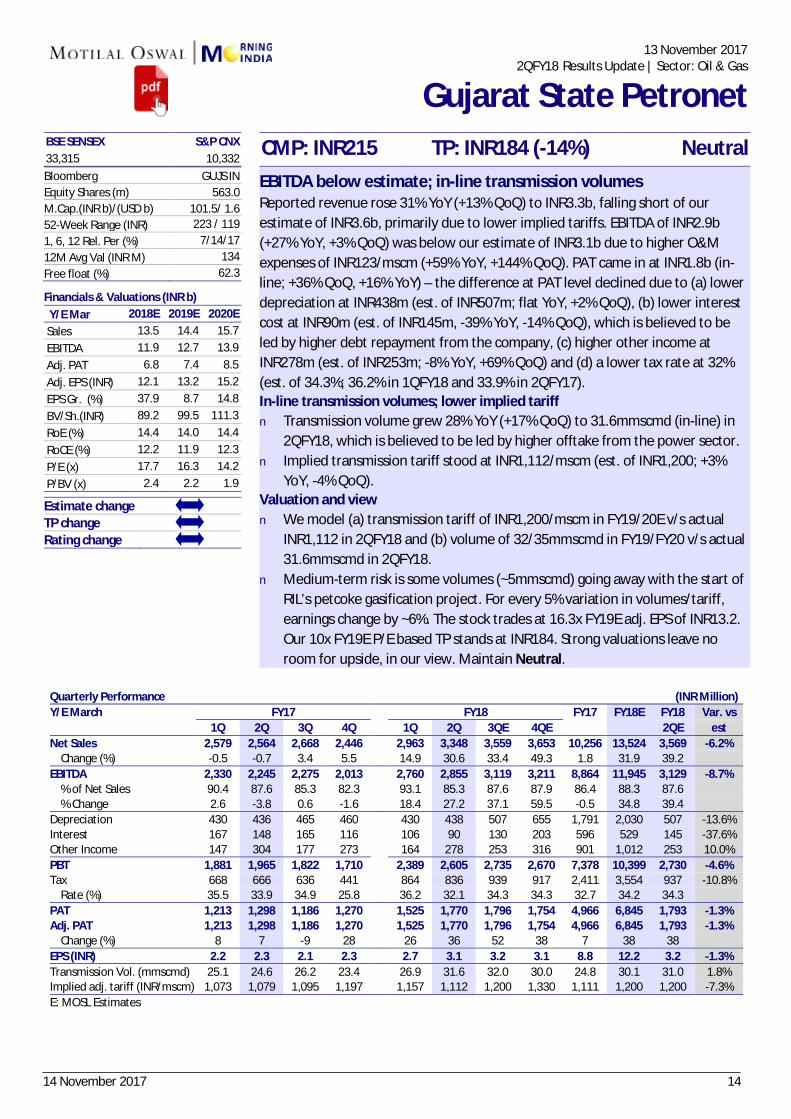
EBITDA below estimate; in-line transmission volumes Reported revenue rose 31% YoY (+13% QoQ) to INR3.3b, falling short of our estimate of INR3.6b, primarily due to lower implied tariffs. EBITDA of INR2.9b (+27% YoY, +3% QoQ) was below our estimate of INR3.1b due to higher O&M expenses of INR123/mscm (+59% YoY, +144% QoQ). PAT came in at INR1.8b (in-line; +36% QoQ, +16% YoY) – the difference at PAT level declined due to (a) lower depreciation at INR438m (est. of INR507m; flat YoY, +2% QoQ), (b) lower interest cost at INR90m (est. of INR145m, -39% YoY, -14% QoQ), which is believed to be led by higher debt repayment from the company, (c) higher other income at INR278m (est. of INR253m; -8% YoY, +69% QoQ) and (d) a lower tax rate at 32% (est. of 34.3%; 36.2% in 1QFY18 and 33.9% in 2QFY17). In-line transmission volumes; lower implied tariff n Transmission volume grew 28% YoY (+17% QoQ) to 31.6mmscmd (in-line) in
2QFY18, which is believed to be led by higher offtake from the power sector.n Implied transmission tariff stood at INR1,112/mscm (est. of INR1,200; +3%
YoY, -4% QoQ).Valuation and view n We model (a) transmission tariff of INR1,200/mscm in FY19/20E v/s actual
INR1,112 in 2QFY18 and (b) volume of 32/35mmscmd in FY19/FY20 v/s actual31.6mmscmd in 2QFY18.
n Medium-term risk is some volumes (~5mmscmd) going away with the start ofRIL’s petcoke gasification project. For every 5% variation in volumes/tariff,earnings change by ~6%. The stock trades at 16.3x FY19E adj. EPS of INR13.2.Our 10x FY19E P/E based TP stands at INR184. Strong valuations leave noroom for upside, in our view. Maintain Neutral.
Quarterly Performance (INR Million) Y/E March FY17 FY18 FY17 FY18E FY18 Var. vs
1Q 2Q 3Q 4Q 1Q 2Q 3QE 4QE 2QE est Net Sales 2,579 2,564 2,668 2,446 2,963 3,348 3,559 3,653 10,256 13,524 3,569 -6.2% Change (%) -0.5 -0.7 3.4 5.5 14.9 30.6 33.4 49.3 1.8 31.9 39.2 EBITDA 2,330 2,245 2,275 2,013 2,760 2,855 3,119 3,211 8,864 11,945 3,129 -8.7% % of Net Sales 90.4 87.6 85.3 82.3 93.1 85.3 87.6 87.9 86.4 88.3 87.6 % Change 2.6 -3.8 0.6 -1.6 18.4 27.2 37.1 59.5 -0.5 34.8 39.4 Depreciation 430 436 465 460 430 438 507 655 1,791 2,030 507 -13.6%Interest 167 148 165 116 106 90 130 203 596 529 145 -37.6%Other Income 147 304 177 273 164 278 253 316 901 1,012 253 10.0% PBT 1,881 1,965 1,822 1,710 2,389 2,605 2,735 2,670 7,378 10,399 2,730 -4.6%Tax 668 666 636 441 864 836 939 917 2,411 3,554 937 -10.8% Rate (%) 35.5 33.9 34.9 25.8 36.2 32.1 34.3 34.3 32.7 34.2 34.3 PAT 1,213 1,298 1,186 1,270 1,525 1,770 1,796 1,754 4,966 6,845 1,793 -1.3%Adj. PAT 1,213 1,298 1,186 1,270 1,525 1,770 1,796 1,754 4,966 6,845 1,793 -1.3% Change (%) 8 7 -9 28 26 36 52 38 7 38 38 EPS (INR) 2.2 2.3 2.1 2.3 2.7 3.1 3.2 3.1 8.8 12.2 3.2 -1.3%Transmission Vol. (mmscmd) 25.1 24.6 26.2 23.4 26.9 31.6 32.0 30.0 24.8 30.1 31.0 1.8% Implied adj. tariff (INR/mscm) 1,073 1,079 1,095 1,197 1,157 1,112 1,200 1,330 1,111 1,200 1,200 -7.3%E: MOSL Estimates
13 November 2017 2QFY18 Results Update | Sector: Oil & Gas
Gujarat State Petronet
14 November 2017 15
BSE SENSEX S&P CNX CMP: INR173 TP: INR225(+30%) Buy 33,034 10,225 Bloomberg JAGP IN Equity Shares (m) 327 M.Cap.(INRb)/(USDb) 56.0/ 0.9
52-Week Range (INR) 210 / 163 1, 6, 12 Rel. Per (%) -5/-20/-30 Avg Val, INRm 44 Free float (%) 39.2
Financials & Valuations (INR b) Y/E Mar 2017 2018E 2019E
Net Sales 22.8 25.0 27.5 EBITDA 6.4 7.1 7.9 PAT 3.5 3.9 4.4 EPS (INR) 10.8 12.2 14.0 Gr. (%) 2.7 13.0 15.1 BV/Sh (INR) 73.7 74.3 86.3 RoE (%) 17.6 16.3 17.3 RoCE (%) 15.2 14.6 15.6 P/E (x) 16.3 14.5 12.6 P/BV (x) 2.4 2.4 2.0
Estimate change TP change Rating change
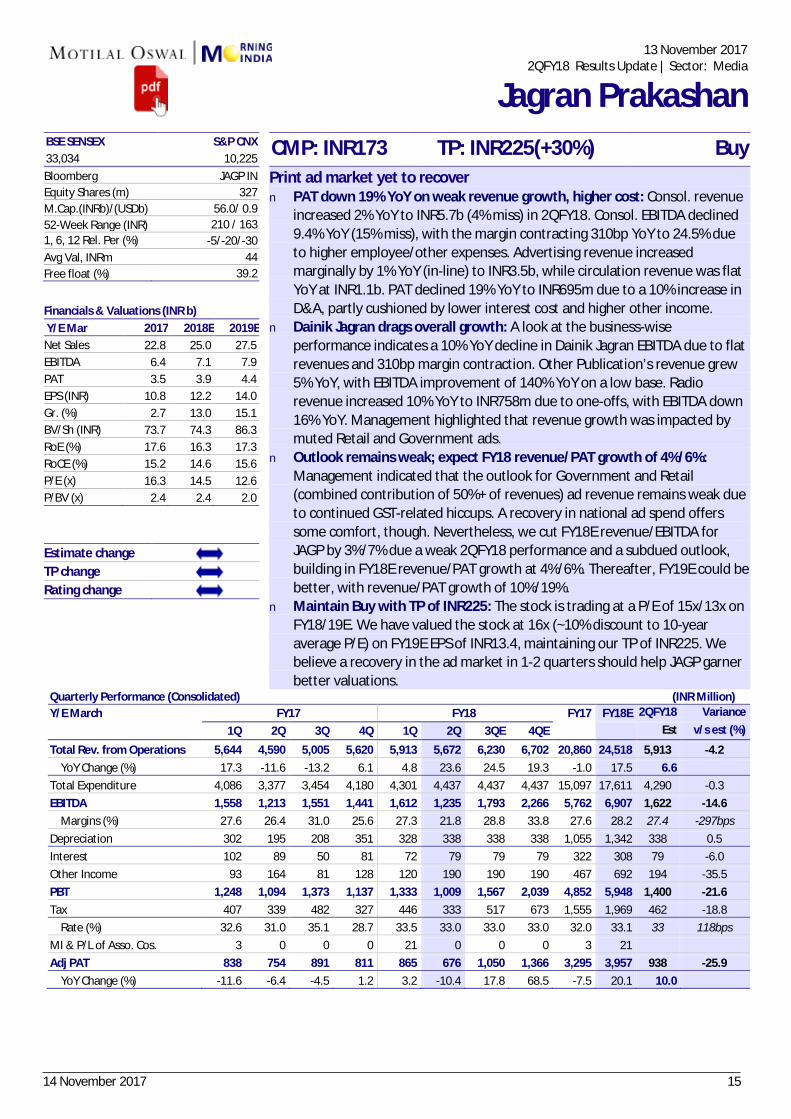
Print ad market yet to recover n PAT down 19% YoY on weak revenue growth, higher cost: Consol. revenue
increased 2% YoY to INR5.7b (4% miss) in 2QFY18. Consol. EBITDA declined9.4% YoY (15% miss), with the margin contracting 310bp YoY to 24.5% dueto higher employee/other expenses. Advertising revenue increasedmarginally by 1% YoY (in-line) to INR3.5b, while circulation revenue was flatYoY at INR1.1b. PAT declined 19% YoY to INR695m due to a 10% increase inD&A, partly cushioned by lower interest cost and higher other income.
n Dainik Jagran drags overall growth: A look at the business-wiseperformance indicates a 10% YoY decline in Dainik Jagran EBITDA due to flatrevenues and 310bp margin contraction. Other Publication’s revenue grew5% YoY, with EBITDA improvement of 140% YoY on a low base. Radiorevenue increased 10% YoY to INR758m due to one-offs, with EBITDA down16% YoY. Management highlighted that revenue growth was impacted bymuted Retail and Government ads.
n Outlook remains weak; expect FY18 revenue/PAT growth of 4%/6%:Management indicated that the outlook for Government and Retail(combined contribution of 50%+ of revenues) ad revenue remains weak dueto continued GST-related hiccups. A recovery in national ad spend offerssome comfort, though. Nevertheless, we cut FY18E revenue/EBITDA forJAGP by 3%/7% due a weak 2QFY18 performance and a subdued outlook,building in FY18E revenue/PAT growth at 4%/6%. Thereafter, FY19E could be better, with revenue/PAT growth of 10%/19%.
n Maintain Buy with TP of INR225: The stock is trading at a P/E of 15x/13x onFY18/19E. We have valued the stock at 16x (~10% discount to 10-yearaverage P/E) on FY19E EPS of INR13.4, maintaining our TP of INR225. Webelieve a recovery in the ad market in 1-2 quarters should help JAGP garnerbetter valuations.
Quarterly Performance (Consolidated) (INR Million) Y/E March FY17 FY18 FY17 FY18E 2QFY18 Variance
1Q 2Q 3Q 4Q 1Q 2Q 3QE 4QE Est v/s est (%)
Total Rev. from Operations 5,644 4,590 5,005 5,620 5,913 5,672 6,230 6,702 20,860 24,518 5,913 -4.2 YoY Change (%) 17.3 -11.6 -13.2 6.1 4.8 23.6 24.5 19.3 -1.0 17.5 6.6 Total Expenditure 4,086 3,377 3,454 4,180 4,301 4,437 4,437 4,437 15,097 17,611 4,290 -0.3EBITDA 1,558 1,213 1,551 1,441 1,612 1,235 1,793 2,266 5,762 6,907 1,622 -14.6 Margins (%) 27.6 26.4 31.0 25.6 27.3 21.8 28.8 33.8 27.6 28.2 27.4 -297bps Depreciation 302 195 208 351 328 338 338 338 1,055 1,342 338 0.5 Interest 102 89 50 81 72 79 79 79 322 308 79 -6.0Other Income 93 164 81 128 120 190 190 190 467 692 194 -35.5PBT 1,248 1,094 1,373 1,137 1,333 1,009 1,567 2,039 4,852 5,948 1,400 -21.6Tax 407 339 482 327 446 333 517 673 1,555 1,969 462 -18.8 Rate (%) 32.6 31.0 35.1 28.7 33.5 33.0 33.0 33.0 32.0 33.1 33 118bps MI & P/L of Asso. Cos. 3 0 0 0 21 0 0 0 3 21 Adj PAT 838 754 891 811 865 676 1,050 1,366 3,295 3,957 938 -25.9 YoY Change (%) -11.6 -6.4 -4.5 1.2 3.2 -10.4 17.8 68.5 -7.5 20.1 10.0
13 November 2017 2QFY18 Results Update | Sector: Media
Jagran Prakashan
14 November 2017 16
11 November 2017Results Flash | Sector: Infrastructure
Sadbhav Engineering BSE SENSEX S&P CNX CMP: INR316 TP: INR385 Buy 33,034 10,225
We will revisit our estimates post earnings call/management interaction.
Conference Call Details Date: 14th Nov 2017 Time: 4:30pm IST Dial-in details: +91-22-3960 0637
Financials & Valuations (INR b) Y/E Mar 2018E 2019E 2020E Net Sales 38.4 45.0 53.6 EBITDA 4.3 5.1 6.1 NP 2.4 2.5 2.9 EPS (INR) 14.3 14.5 17.0 EPS Gr. (%) 30.4 1.8 17.1 BV/Sh. (INR) 109.7 122.8 138.4 RoE (%) 13.8 12.5 13.0 RoCE (%) 9.0 10.2 10.8 P/E (x) 22.2 21.8 18.6 P/BV (x) 2.9 2.6 2.3
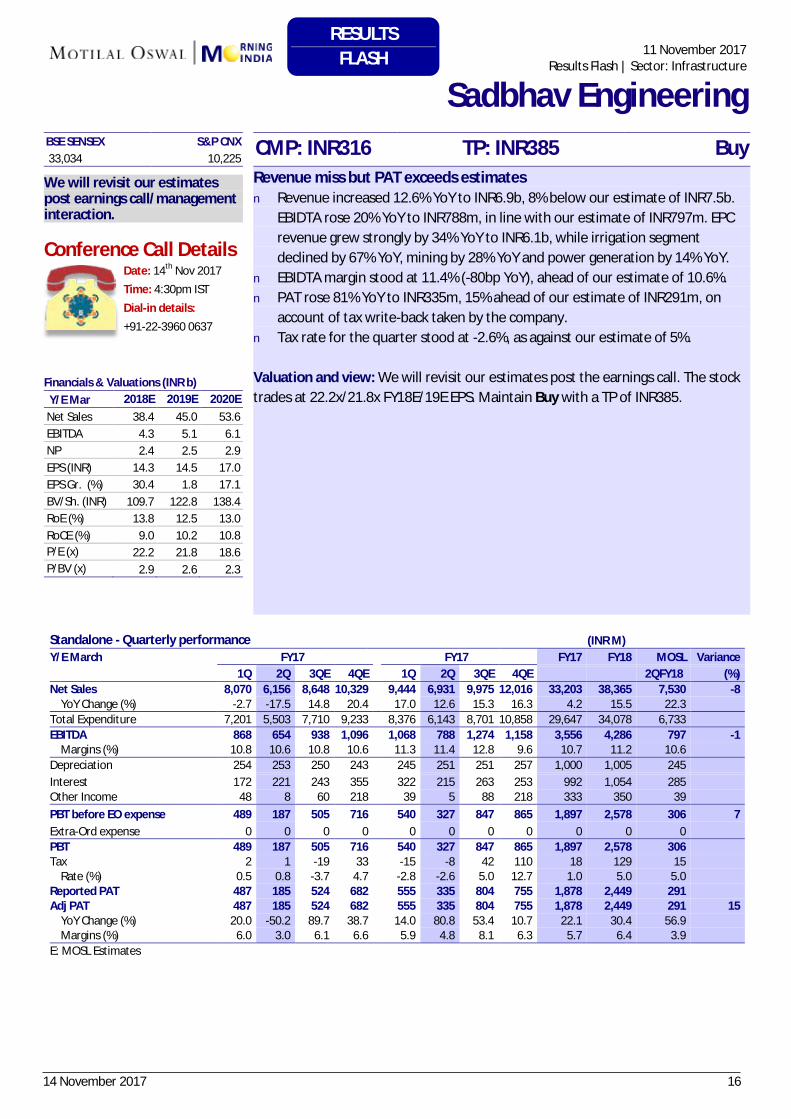
Revenue miss but PAT exceeds estimates n Revenue increased 12.6% YoY to INR6.9b, 8% below our estimate of INR7.5b.
EBIDTA rose 20% YoY to INR788m, in line with our estimate of INR797m. EPCrevenue grew strongly by 34% YoY to INR6.1b, while irrigation segmentdeclined by 67% YoY, mining by 28% YoY and power generation by 14% YoY.
n EBIDTA margin stood at 11.4% (-80bp YoY), ahead of our estimate of 10.6%.n PAT rose 81% YoY to INR335m, 15% ahead of our estimate of INR291m, on
account of tax write-back taken by the company.n Tax rate for the quarter stood at -2.6%, as against our estimate of 5%.
Valuation and view: We will revisit our estimates post the earnings call. The stock trades at 22.2x/21.8x FY18E/19E EPS. Maintain Buy with a TP of INR385.
Standalone - Quarterly performance (INR M) Y/E March FY17 FY17 FY17 FY18 MOSL Variance
1Q 2Q 3QE 4QE 1Q 2Q 3QE 4QE 2QFY18 (%) Net Sales 8,070 6,156 8,648 10,329 9,444 6,931 9,975 12,016 33,203 38,365 7,530 -8 YoY Change (%) -2.7 -17.5 14.8 20.4 17.0 12.6 15.3 16.3 4.2 15.5 22.3 Total Expenditure 7,201 5,503 7,710 9,233 8,376 6,143 8,701 10,858 29,647 34,078 6,733 EBITDA 868 654 938 1,096 1,068 788 1,274 1,158 3,556 4,286 797 -1 Margins (%) 10.8 10.6 10.8 10.6 11.3 11.4 12.8 9.6 10.7 11.2 10.6 Depreciation 254 253 250 243 245 251 251 257 1,000 1,005 245 Interest 172 221 243 355 322 215 263 253 992 1,054 285 Other Income 48 8 60 218 39 5 88 218 333 350 39 PBT before EO expense 489 187 505 716 540 327 847 865 1,897 2,578 306 7 Extra-Ord expense 0 0 0 0 0 0 0 0 0 0 0 PBT 489 187 505 716 540 327 847 865 1,897 2,578 306 Tax 2 1 -19 33 -15 -8 42 110 18 129 15 Rate (%) 0.5 0.8 -3.7 4.7 -2.8 -2.6 5.0 12.7 1.0 5.0 5.0 Reported PAT 487 185 524 682 555 335 804 755 1,878 2,449 291 Adj PAT 487 185 524 682 555 335 804 755 1,878 2,449 291 15 YoY Change (%) 20.0 -50.2 89.7 38.7 14.0 80.8 53.4 10.7 22.1 30.4 56.9 Margins (%) 6.0 3.0 6.1 6.6 5.9 4.8 8.1 6.3 5.7 6.4 3.9 E: MOSL Estimates
RESULTS FLASH
14 November 2017 17
BSE SENSEX S&P CNX CMP: INR439 TP: INR512 (+16%) Buy 33,034 10,225 Bloomberg JKLC IN Equity Shares (m) 117.7 M.Cap.(INRb)/(USDb) 52.1 / 0.8
52-Week Range (INR) 514 / 253 1, 6, 12 Rel. Per (%) 12/-25/-17 Avg Val, INRm 60.0 Free float (%) 54.1
Financials & Valuations (INR b) Y/E Mar 2018E 2019E 2020E Net Sales 36.0 40.5 45.8 EBITDA 5.0 6.4 7.4 PAT 1.4 2.2 3.0 EPS (INR) 12.1 19.1 25.2 Gr. (%) 74.3 57.2 32.3 BV/Sh (INR) 128.4 146.2 170.3 RoE (%) 9.9 13.9 15.9 RoCE (%) 8.1 9.5 11.5 P/E (x) 36.0 40.5 45.8 P/BV (x) 5.0 6.4 7.4
Estimate change TP change Rating change
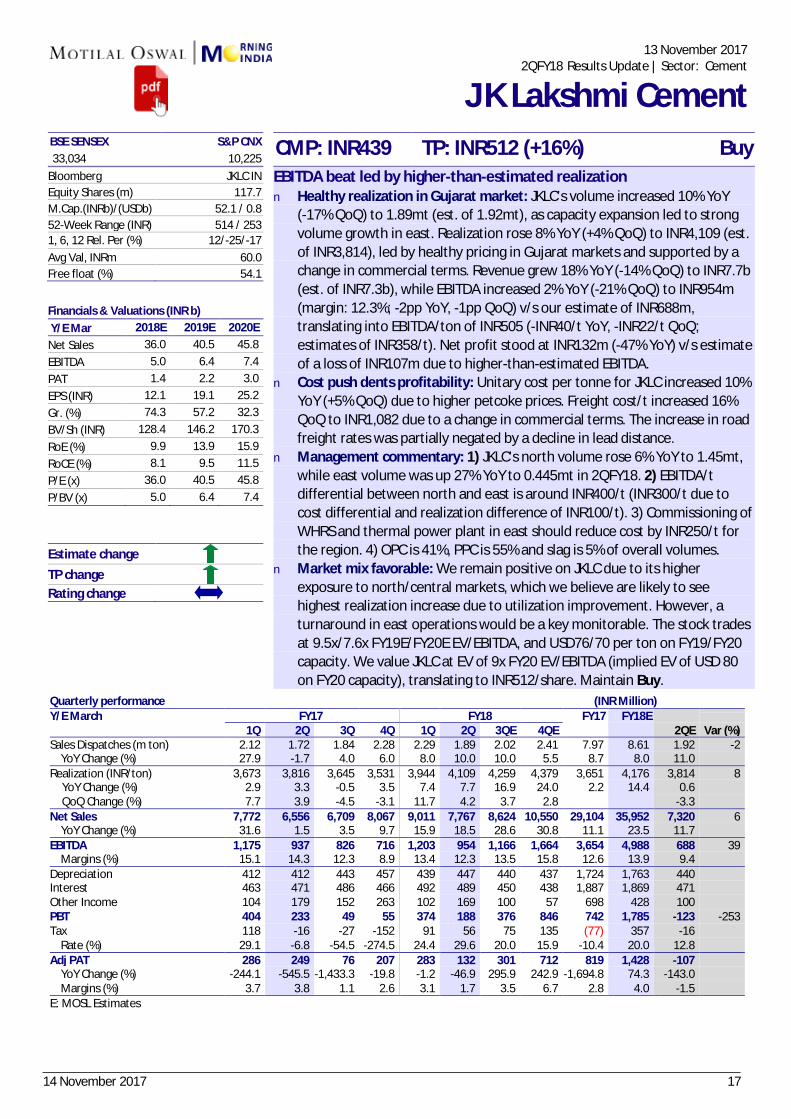
EBITDA beat led by higher-than-estimated realization n Healthy realization in Gujarat market: JKLC’s volume increased 10% YoY
(-17% QoQ) to 1.89mt (est. of 1.92mt), as capacity expansion led to strongvolume growth in east. Realization rose 8% YoY (+4% QoQ) to INR4,109 (est.of INR3,814), led by healthy pricing in Gujarat markets and supported by achange in commercial terms. Revenue grew 18% YoY (-14% QoQ) to INR7.7b(est. of INR7.3b), while EBITDA increased 2% YoY (-21% QoQ) to INR954m(margin: 12.3%; -2pp YoY, -1pp QoQ) v/s our estimate of INR688m,translating into EBITDA/ton of INR505 (-INR40/t YoY, -INR22/t QoQ;estimates of INR358/t). Net profit stood at INR132m (-47% YoY) v/s estimateof a loss of INR107m due to higher-than-estimated EBITDA.
n Cost push dents profitability: Unitary cost per tonne for JKLC increased 10%YoY (+5% QoQ) due to higher petcoke prices. Freight cost/t increased 16%QoQ to INR1,082 due to a change in commercial terms. The increase in roadfreight rates was partially negated by a decline in lead distance.
n Management commentary: 1) JKLC’s north volume rose 6% YoY to 1.45mt,while east volume was up 27% YoY to 0.445mt in 2QFY18. 2) EBITDA/tdifferential between north and east is around INR400/t (INR300/t due tocost differential and realization difference of INR100/t). 3) Commissioning ofWHRS and thermal power plant in east should reduce cost by INR250/t forthe region. 4) OPC is 41%, PPC is 55% and slag is 5% of overall volumes.
n Market mix favorable: We remain positive on JKLC due to its higherexposure to north/central markets, which we believe are likely to seehighest realization increase due to utilization improvement. However, aturnaround in east operations would be a key monitorable. The stock tradesat 9.5x/7.6x FY19E/FY20E EV/EBITDA, and USD76/70 per ton on FY19/FY20capacity. We value JKLC at EV of 9x FY20 EV/EBITDA (implied EV of USD 80on FY20 capacity), translating to INR512/share. Maintain Buy.
Quarterly performance (INR Million) Y/E March FY17 FY18 FY17 FY18E
1Q 2Q 3Q 4Q 1Q 2Q 3QE 4QE 2QE Var (%) Sales Dispatches (m ton) 2.12 1.72 1.84 2.28 2.29 1.89 2.02 2.41 7.97 8.61 1.92 -2 YoY Change (%) 27.9 -1.7 4.0 6.0 8.0 10.0 10.0 5.5 8.7 8.0 11.0 Realization (INR/ton) 3,673 3,816 3,645 3,531 3,944 4,109 4,259 4,379 3,651 4,176 3,814 8
YoY Change (%) 2.9 3.3 -0.5 3.5 7.4 7.7 16.9 24.0 2.2 14.4 0.6 QoQ Change (%) 7.7 3.9 -4.5 -3.1 11.7 4.2 3.7 2.8 -3.3
Net Sales 7,772 6,556 6,709 8,067 9,011 7,767 8,624 10,550 29,104 35,952 7,320 6 YoY Change (%) 31.6 1.5 3.5 9.7 15.9 18.5 28.6 30.8 11.1 23.5 11.7 EBITDA 1,175 937 826 716 1,203 954 1,166 1,664 3,654 4,988 688 39 Margins (%) 15.1 14.3 12.3 8.9 13.4 12.3 13.5 15.8 12.6 13.9 9.4 Depreciation 412 412 443 457 439 447 440 437 1,724 1,763 440 Interest 463 471 486 466 492 489 450 438 1,887 1,869 471 Other Income 104 179 152 263 102 169 100 57 698 428 100 PBT 404 233 49 55 374 188 376 846 742 1,785 -123 -253Tax 118 -16 -27 -152 91 56 75 135 (77) 357 -16 Rate (%) 29.1 -6.8 -54.5 -274.5 24.4 29.6 20.0 15.9 -10.4 20.0 12.8Adj PAT 286 249 76 207 283 132 301 712 819 1,428 -107 YoY Change (%) -244.1 -545.5 -1,433.3 -19.8 -1.2 -46.9 295.9 242.9 -1,694.8 74.3 -143.0 Margins (%) 3.7 3.8 1.1 2.6 3.1 1.7 3.5 6.7 2.8 4.0 -1.5E: MOSL Estimates
13 November 2017 2QFY18 Results Update | Sector: Cement
J K Lakshmi Cement
14 November 2017 18
BSE SENSEX S&P CNX CMP: INR658 TP: INR797 (+21% ) Buy 33,034 10,225 Bloomberg SLPA IN Equity Shares (m) 80 M.Cap.(INRb)/(USDb) 52.7 / 0.8
52-Week Range (INR) 787 / 528 1, 6, 12 Rel. Per (%) -6/-14/-8
Avg Val, INRm 41 Free float (%) 45.3 Financials & Valuations (INR b) Y/E Mar 2017 2018E 2019E Net Sales 7.8 8.7 10.9 EBITDA 1.8 2.0 2.7 PAT 1.1 1.5 2.4 EPS (INR) 14.0 18.1 29.9 Gr. (%) 6.2 29.3 65.1 BV/Sh (INR) 114.4 131.5 159.8 P/E(x) 47.0 36.3 22.0 P/B (x) 5.8 5.0 4.1 ROE (%) 14.4 14.7 20.5 RoCE (%) 11.5 11.2 16.2
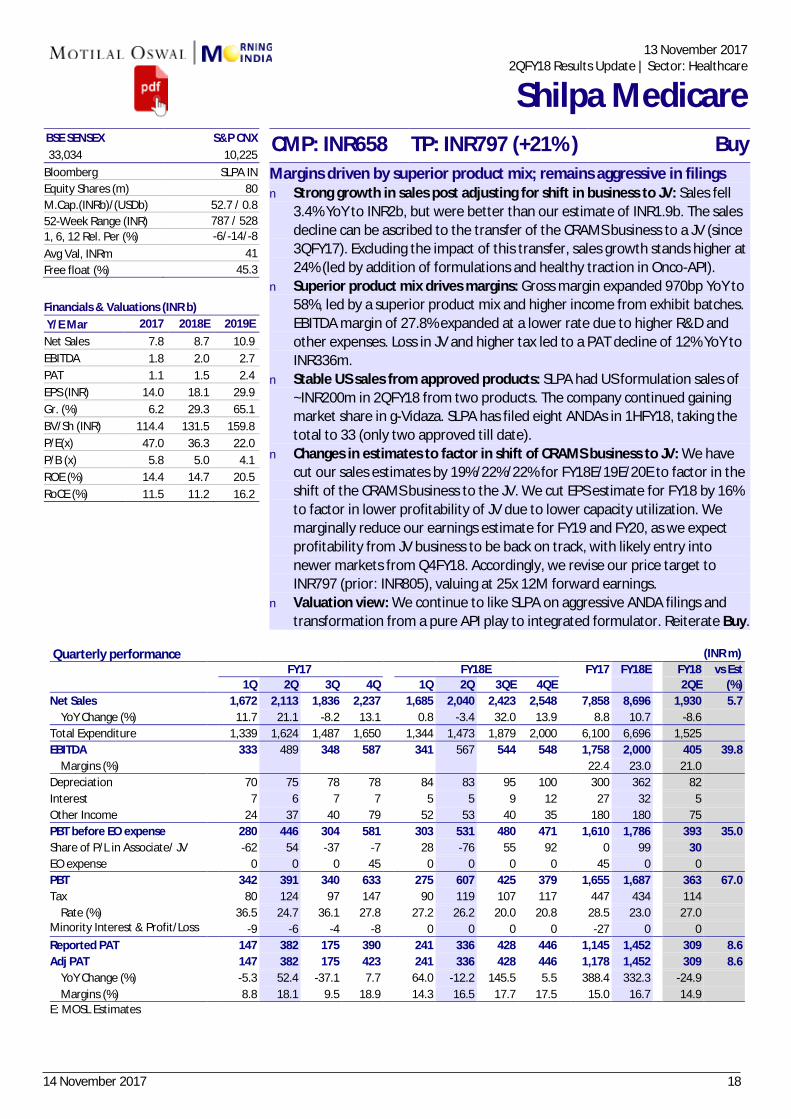
Margins driven by superior product mix; remains aggressive in filings n Strong growth in sales post adjusting for shift in business to JV: Sales fell
3.4% YoY to INR2b, but were better than our estimate of INR1.9b. The sales decline can be ascribed to the transfer of the CRAMS business to a JV (since 3QFY17). Excluding the impact of this transfer, sales growth stands higher at 24% (led by addition of formulations and healthy traction in Onco-API).
n Superior product mix drives margins: Gross margin expanded 970bp YoY to 58%, led by a superior product mix and higher income from exhibit batches. EBITDA margin of 27.8% expanded at a lower rate due to higher R&D and other expenses. Loss in JV and higher tax led to a PAT decline of 12% YoY to INR336m.
n Stable US sales from approved products: SLPA had US formulation sales of ~INR200m in 2QFY18 from two products. The company continued gaining market share in g-Vidaza. SLPA has filed eight ANDAs in 1HFY18, taking the total to 33 (only two approved till date).
n Changes in estimates to factor in shift of CRAMS business to JV: We have cut our sales estimates by 19%/22%/22% for FY18E/19E/20E to factor in the shift of the CRAMS business to the JV. We cut EPS estimate for FY18 by 16% to factor in lower profitability of JV due to lower capacity utilization. We marginally reduce our earnings estimate for FY19 and FY20, as we expect profitability from JV business to be back on track, with likely entry into newer markets from Q4FY18. Accordingly, we revise our price target to INR797 (prior: INR805), valuing at 25x 12M forward earnings.
n Valuation view: We continue to like SLPA on aggressive ANDA filings and transformation from a pure API play to integrated formulator. Reiterate Buy.
Quarterly performance
(INR m)
FY17 FY18E FY17 FY18E
FY18 vs Est 1Q 2Q 3Q 4Q 1Q 2Q 3QE 4QE
2QE (%)
Net Sales 1,672 2,113 1,836 2,237 1,685 2,040 2,423 2,548 7,858 8,696
1,930 5.7 YoY Change (%) 11.7 21.1 -8.2 13.1 0.8 -3.4 32.0 13.9 8.8 10.7
-8.6
Total Expenditure 1,339 1,624 1,487 1,650 1,344 1,473 1,879 2,000 6,100 6,696
1,525 EBITDA 333 489 348 587 341 567 544 548 1,758 2,000
405 39.8
Margins (%)
22.4 23.0
21.0 Depreciation 70 75 78 78 84 83 95 100 300 362
82
Interest 7 6 7 7 5 5 9 12 27 32
5 Other Income 24 37 40 79 52 53 40 35 180 180
75
PBT before EO expense 280 446 304 581
303 531 480 471 1,610 1,786
393 35.0 Share of P/L in Associate/ JV -62 54 -37 -7
28 -76 55 92 0 99
30
EO expense 0 0 0 45 0 0 0 0 45 0
0 PBT 342 391 340 633
275 607 425 379 1,655 1,687
363 67.0
Tax 80 124 97 147
90 119 107 117 447 434
114 Rate (%) 36.5 24.7 36.1 27.8
27.2 26.2 20.0 20.8 28.5 23.0
27.0
Minority Interest & Profit/Loss
-9 -6 -4 -8 0 0 0 0 -27 0
0 Reported PAT 147 382 175 390
241 336 428 446 1,145 1,452
309 8.6
Adj PAT 147 382 175 423
241 336 428 446 1,178 1,452
309 8.6 YoY Change (%)
-5.3 52.4 -37.1 7.7
64.0 -12.2 145.5 5.5
388.4 332.3
-24.9
Margins (%) 8.8 18.1 9.5 18.9 14.3 16.5 17.7 17.5 15.0 16.7
14.9 E: MOSL Estimates
13 November 2017
2QFY18 Results Update | Sector: Healthcare
Shilpa Medicare
14 November 2017 19
BSE SENSEX S&P CNX CMP: INR208 TP: INR260(+25%) Buy 33,315 10,322 Bloomberg ASBL IN Equity Shares (m) 187.1 M.Cap.(INRb)/(USDb) 40.2 / 0.6
52-Week Range (INR) 243 / 137 1, 6, 12 Rel. Per (%) 8/-11/7 Avg Val, INRm 69 Free float (%) 43.4
Financials & Valuations (INR b) Y/E Mar 2017 2018E 2019E Net Sales 29.8 33.7 38.7 EBITDA 8.9 9.7 10.8 PAT -0.1 0.3 1.3 EPS (INR) -0.5 1.8 7.1 Gr. (%) -41.0 -442.5 289.9 BV/Sh (INR) 89.3 96.5 101.2 RoE (%) -0.6 1.9 7.1 RoCE (%) 9.5 9.8 10.2 P/E (x) NM 118.7 30.5 P/BV (x) 2.4 2.2 2.1 Estimate change TP change Rating change
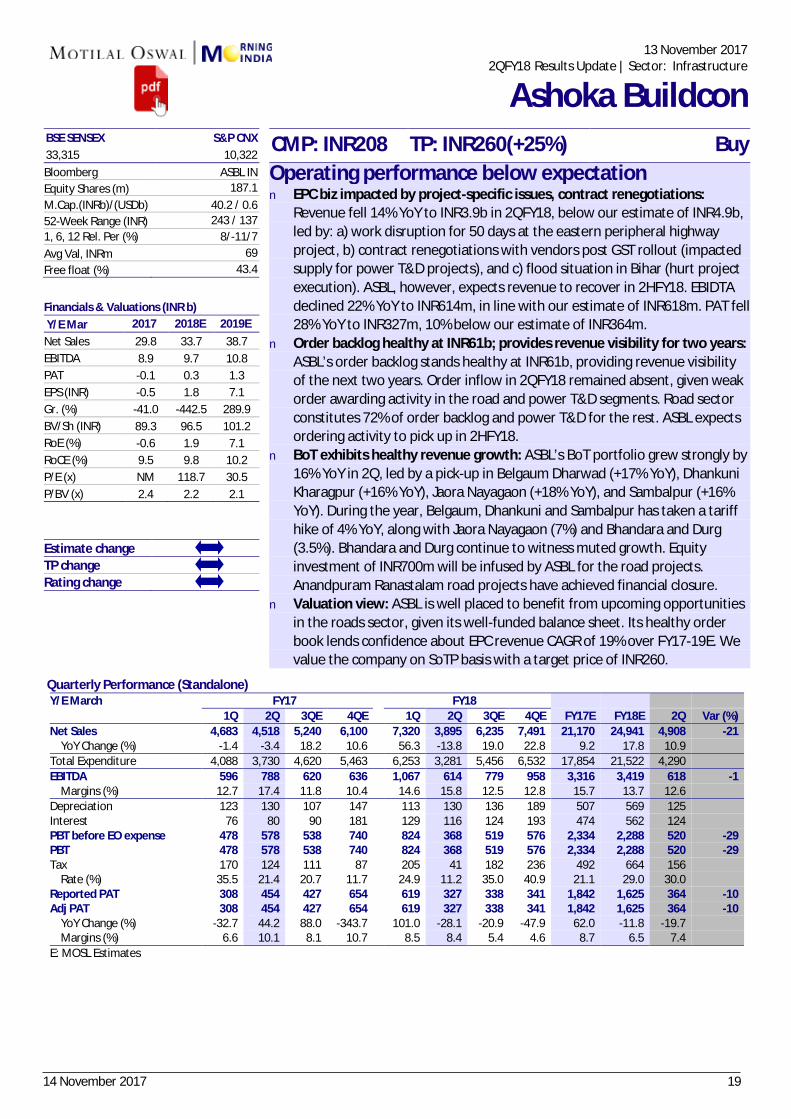
Operating performance below expectation n EPC biz impacted by project-specific issues, contract renegotiations:
Revenue fell 14% YoY to INR3.9b in 2QFY18, below our estimate of INR4.9b, led by: a) work disruption for 50 days at the eastern peripheral highway project, b) contract renegotiations with vendors post GST rollout (impacted supply for power T&D projects), and c) flood situation in Bihar (hurt project execution). ASBL, however, expects revenue to recover in 2HFY18. EBIDTA declined 22% YoY to INR614m, in line with our estimate of INR618m. PAT fell 28% YoY to INR327m, 10% below our estimate of INR364m.
n Order backlog healthy at INR61b; provides revenue visibility for two years: ASBL’s order backlog stands healthy at INR61b, providing revenue visibility of the next two years. Order inflow in 2QFY18 remained absent, given weak order awarding activity in the road and power T&D segments. Road sector constitutes 72% of order backlog and power T&D for the rest. ASBL expects ordering activity to pick up in 2HFY18.
n BoT exhibits healthy revenue growth: ASBL’s BoT portfolio grew strongly by 16% YoY in 2Q, led by a pick-up in Belgaum Dharwad (+17% YoY), Dhankuni Kharagpur (+16% YoY), Jaora Nayagaon (+18% YoY), and Sambalpur (+16% YoY). During the year, Belgaum, Dhankuni and Sambalpur has taken a tariff hike of 4% YoY, along with Jaora Nayagaon (7%) and Bhandara and Durg (3.5%). Bhandara and Durg continue to witness muted growth. Equity investment of INR700m will be infused by ASBL for the road projects. Anandpuram Ranastalam road projects have achieved financial closure.
n Valuation view: ASBL is well placed to benefit from upcoming opportunities in the roads sector, given its well-funded balance sheet. Its healthy order book lends confidence about EPC revenue CAGR of 19% over FY17-19E. We value the company on SoTP basis with a target price of INR260.
Quarterly Performance (Standalone) Y/E March FY17 FY18 1Q 2Q 3QE 4QE 1Q 2Q 3QE 4QE FY17E FY18E 2Q Var (%) Net Sales 4,683 4,518 5,240 6,100
7,320 3,895 6,235 7,491 21,170 24,941 4,908 -21
YoY Change (%) -1.4 -3.4 18.2 10.6 56.3 -13.8 19.0 22.8 9.2 17.8 10.9 Total Expenditure 4,088 3,730 4,620 5,463 6,253 3,281 5,456 6,532 17,854 21,522 4,290 EBITDA 596 788 620 636
1,067 614 779 958 3,316 3,419 618 -1
Margins (%) 12.7 17.4 11.8 10.4 14.6 15.8 12.5 12.8 15.7 13.7 12.6 Depreciation 123 130 107 147
113 130 136 189 507 569 125
Interest 76 80 90 181
129 116 124 193 474 562 124 PBT before EO expense 478 578 538 740
824 368 519 576 2,334 2,288 520 -29
PBT 478 578 538 740
824 368 519 576 2,334 2,288 520 -29 Tax 170 124 111 87
205 41 182 236 492 664 156
Rate (%) 35.5 21.4 20.7 11.7
24.9 11.2 35.0 40.9 21.1 29.0 30.0 Reported PAT 308 454 427 654
619 327 338 341 1,842 1,625 364 -10
Adj PAT 308 454 427 654
619 327 338 341 1,842 1,625 364 -10 YoY Change (%) -32.7 44.2 88.0 -343.7
101.0 -28.1 -20.9 -47.9 62.0 -11.8 -19.7
Margins (%) 6.6 10.1 8.1 10.7 8.5 8.4 5.4 4.6 8.7 6.5 7.4 E: MOSL Estimates
13 November 2017
2QFY18 Results Update | Sector: Infrastructure
Ashoka Buildcon
14 November 2017 20
13 November 2017Results Flash | Sector: Consumer
SH Kelkar BSE SENSEX S&P CNX CMP: INR263 TP: INR298 (13%) Buy 33,315 10,322
We will revisit our estimates post earnings call/management interaction.
Conference Call Details Date: 14th Nov 2017 Time: 12.00pm IST Dial-in details: +91-22-3938 1071
Financials & Valuations (INR b) Y/E Mar 2017 2018E 2019E Sales 10.6 11.2 13.2 EBITDA 1.7 1.7 2.2 NP 1.0 1.1 1.4 Adj EPS (INR) 7.2 7.6 9.9 EPS Gr. (%) 43.5 4.9 30.5 BV/Sh (INR) 56.1 61.5 68.6 RoE (%) 13.7 12.9 15.2 RoCE (%) 19.0 18.9 22.8 Valuations P/E (x) 36.3 34.6 26.5 P/BV (x) 4.7 4.3 3.8 EV/EBITDA (x) 23.0 21.7 17.1
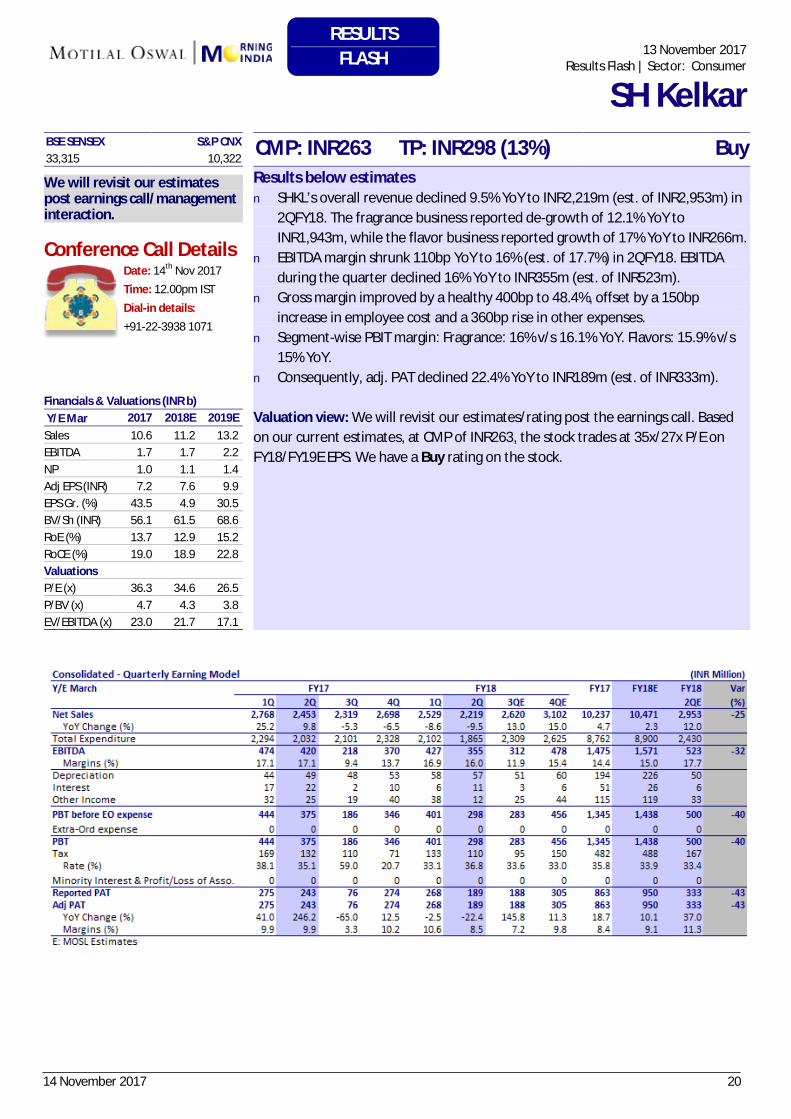
Results below estimates n SHKL’s overall revenue declined 9.5% YoY to INR2,219m (est. of INR2,953m) in
2QFY18. The fragrance business reported de-growth of 12.1% YoY toINR1,943m, while the flavor business reported growth of 17% YoY to INR266m.
n EBITDA margin shrunk 110bp YoY to 16% (est. of 17.7%) in 2QFY18. EBITDAduring the quarter declined 16% YoY to INR355m (est. of INR523m).
n Gross margin improved by a healthy 400bp to 48.4%, offset by a 150bpincrease in employee cost and a 360bp rise in other expenses.
n Segment-wise PBIT margin: Fragrance: 16% v/s 16.1% YoY. Flavors: 15.9% v/s15% YoY.
n Consequently, adj. PAT declined 22.4% YoY to INR189m (est. of INR333m).
Valuation view: We will revisit our estimates/rating post the earnings call. Based on our current estimates, at CMP of INR263, the stock trades at 35x/27x P/E on FY18/FY19E EPS. We have a Buy rating on the stock.
RESULTS FLASH
14 November 2017 21
13 November 2017Results Flash | Sector: Financials - NBFC
Repco Home Finance BSE SENSEX S&P CNX CMP: INR590 33,315 10,322
We will revisit our estimates post earnings call/management interaction.
Financials & Valuations (INR b) Y/E March 2018E 2019E 2020E NII 4.5 5.1 6.0 PPP 4.1 4.6 5.4 PAT 2.2 2.6 3.0 EPS (INR) 35.6 41.8 48.7 BV/Sh. (INR) 214.1 252.3 296.8 RoAA (%) 2.3 2.3 2.3 RoE (%) 18.0 17.9 17.7 Payout (%) 8.7 8.7 8.7 Valuation P/E (x) 16.6 14.1 12.1 P/BV (x) 2.8 2.3 2.0 Div. Yld (%) 0.5 0.5 0.6
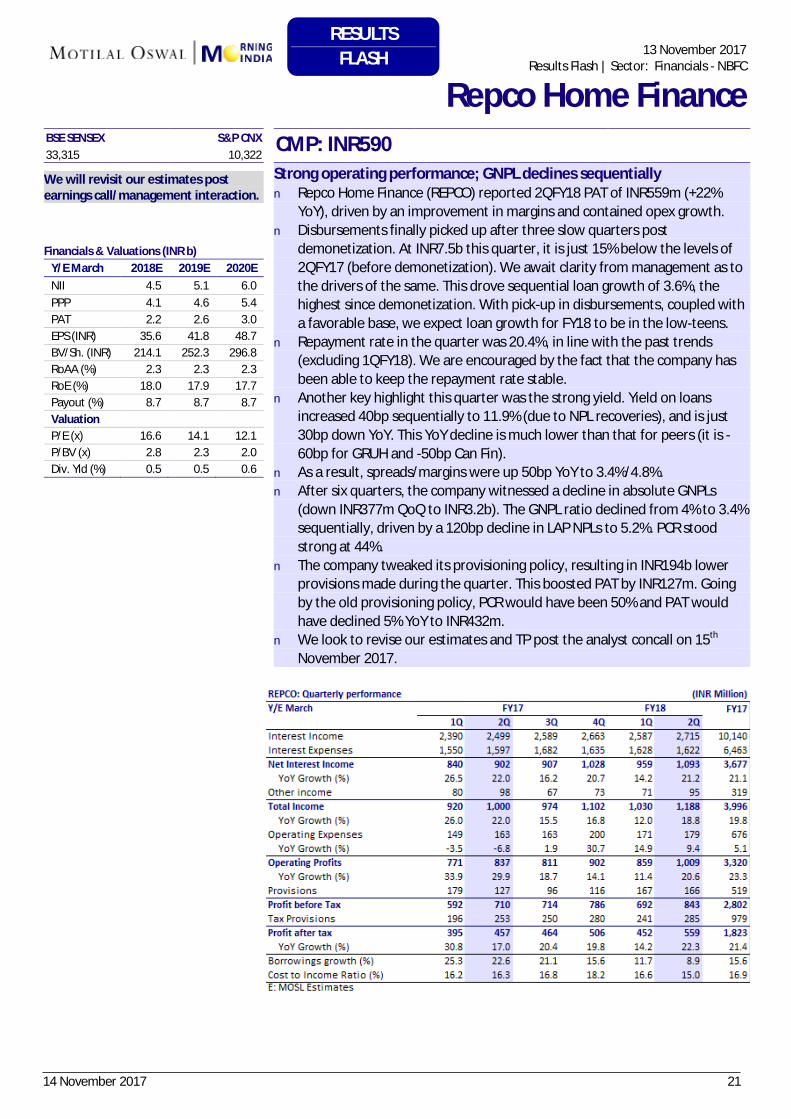
Strong operating performance; GNPL declines sequentially n Repco Home Finance (REPCO) reported 2QFY18 PAT of INR559m (+22%
YoY), driven by an improvement in margins and contained opex growth.n Disbursements finally picked up after three slow quarters post
demonetization. At INR7.5b this quarter, it is just 15% below the levels of2QFY17 (before demonetization). We await clarity from management as tothe drivers of the same. This drove sequential loan growth of 3.6%, thehighest since demonetization. With pick-up in disbursements, coupled witha favorable base, we expect loan growth for FY18 to be in the low-teens.
n Repayment rate in the quarter was 20.4%, in line with the past trends(excluding 1QFY18). We are encouraged by the fact that the company hasbeen able to keep the repayment rate stable.
n Another key highlight this quarter was the strong yield. Yield on loansincreased 40bp sequentially to 11.9% (due to NPL recoveries), and is just30bp down YoY. This YoY decline is much lower than that for peers (it is -60bp for GRUH and -50bp Can Fin).
n As a result, spreads/margins were up 50bp YoY to 3.4%/4.8%.n After six quarters, the company witnessed a decline in absolute GNPLs
(down INR377m QoQ to INR3.2b). The GNPL ratio declined from 4% to 3.4%sequentially, driven by a 120bp decline in LAP NPLs to 5.2%. PCR stoodstrong at 44%.
n The company tweaked its provisioning policy, resulting in INR194b lowerprovisions made during the quarter. This boosted PAT by INR127m. Goingby the old provisioning policy, PCR would have been 50% and PAT wouldhave declined 5% YoY to INR432m.
n We look to revise our estimates and TP post the analyst concall on 15th
November 2017.
RESULTS FLASH
14 November 2017 22
Quarterly Performance (INR m) FY17 FY18 FY17 FY18E
1Q 2Q 3Q 4Q 1Q 2QE 3QE 4QE Interest Income 1,04,335 1,04,852 1,04,061 1,06,216 1,05,527 1,07,948 1,10,854 1,16,428 4,21,999 4,40,756 Interest Expense 70,624 70,591 72,717 72,933 71,478 72,907 74,001 77,075 2,86,865 2,95,461 Net Interest Income 33,711 34,261 31,344 33,283 34,050 35,041 36,853 39,352 1,35,134 1,45,295 % Change (YoY) -2.6 5.6 15.9 -0.1 1.0 2.3 17.6 18.2 6.1 7.5 Other Income 14,444 15,614 17,750 19,773 15,512 17,014 16,425 20,061 67,581 69,012 Net Income 48,155 49,875 49,093 53,056 49,561 52,054 53,278 59,413 2,02,715 2,14,307 Operating Expenses 21,460 22,973 23,141 25,390 23,080 24,515 26,022 28,528 92,964 1,02,145 Operating Profit 26,695 26,902 25,952 27,666 26,481 27,539 27,256 30,885 1,09,751 1,12,162 % Change (YoY) 21.2 15.1 52.3 7.5 -0.8 2.4 5.0 11.6 24.5 2.2 Other Provisions 20,041 17,958 20,795 26,230 23,681 20,064 18,752 19,063 85,024 81,559 Profit before Tax 6,654 8,944 5,157 1,436 2,801 7,476 8,504 11,822 24,727 30,602 Tax Provisions 2,418 3,422 2,630 2,425 767 2,093 2,381 3,328 10,896 8,569 Net Profit 4,236 5,521 2,527 -989 2,034 5,383 6,123 8,494 13,831 22,034 % Change (YoY) -59.7 343.5 NA NA -52.0 -2.5 142.3 NA NA 59.3 Operating Parameters NIM (Calculated, %) 2.2 2.2 2.0 2.1 2.2 2.3 2.3 2.4 1.9 2.3 Deposit Growth (%) -5.2 -7.3 0.0 4.8 1.5 3.6 3.6 7.0 4.8 7.0 Loan Growth (%) -11.2 -14.6 -8.9 -0.1 4.1 9.8 15.6 10.0 -0.1 10.0 CD Ratio (%) 64.5 62.4 59.3 63.7 66.2 0.0 0.0 0.0 63.7 0.0 Asset Quality OSRL (INR B) 142 139 141 108 118 0 0 0 108 0 OSRL (%) 3.9 3.9 4.0 2.8 3.1 0.0 0.0 0.0 2.8 0.0 Gross NPA (INR B) 430 429 426 427 462 457 451 435 427 435 Gross NPA (%) 11.2 11.4 11.4 10.5 11.4 11.7 11.2 10.3 10.5 10.3 E: MOSL Estimates
September 2017 Results Preview | Sector: Financials
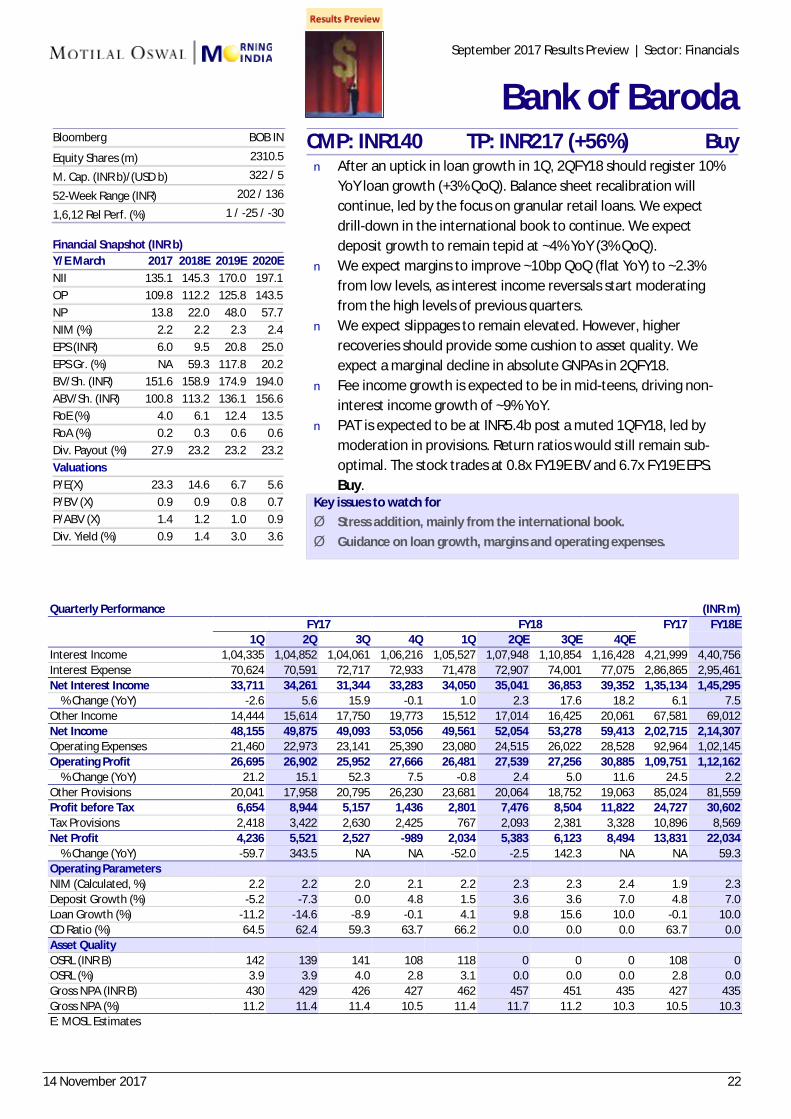
Bank of BarodaCMP: INR140 TP: INR217 (+56%) Buy n After an uptick in loan growth in 1Q, 2QFY18 should register 10%
YoY loan growth (+3% QoQ). Balance sheet recalibration willcontinue, led by the focus on granular retail loans. We expectdrill-down in the international book to continue. We expectdeposit growth to remain tepid at ~4% YoY (3% QoQ).
n We expect margins to improve ~10bp QoQ (flat YoY) to ~2.3%from low levels, as interest income reversals start moderatingfrom the high levels of previous quarters.
n We expect slippages to remain elevated. However, higherrecoveries should provide some cushion to asset quality. Weexpect a marginal decline in absolute GNPAs in 2QFY18.
n Fee income growth is expected to be in mid-teens, driving non-interest income growth of ~9% YoY.
n PAT is expected to be at INR5.4b post a muted 1QFY18, led bymoderation in provisions. Return ratios would still remain sub-optimal. The stock trades at 0.8x FY19E BV and 6.7x FY19E EPS.Buy.
Key issues to watch for Ø Stress addition, mainly from the international book.Ø Guidance on loan growth, margins and operating expenses.
Bloomberg BOB IN
Equity Shares (m) 2310.5
M. Cap. (INR b)/(USD b) 322 / 5
52-Week Range (INR) 202 / 136
1,6,12 Rel Perf. (%) 1 / -25 / -30
Financial Snapshot (INR b) Y/E March 2017 2018E 2019E 2020E NII 135.1 145.3 170.0 197.1 OP 109.8 112.2 125.8 143.5 NP 13.8 22.0 48.0 57.7 NIM (%) 2.2 2.2 2.3 2.4 EPS (INR) 6.0 9.5 20.8 25.0 EPS Gr. (%) NA 59.3 117.8 20.2 BV/Sh. (INR) 151.6 158.9 174.9 194.0 ABV/Sh. (INR) 100.8 113.2 136.1 156.6 RoE (%) 4.0 6.1 12.4 13.5 RoA (%) 0.2 0.3 0.6 0.6 Div. Payout (%) 27.9 23.2 23.2 23.2 Valuations P/E(X) 23.3 14.6 6.7 5.6 P/BV (X) 0.9 0.9 0.8 0.7 P/ABV (X) 1.4 1.2 1.0 0.9 Div. Yield (%) 0.9 1.4 3.0 3.6
14 November 2017 23
Quarterly Performance
(INR m) Y/E March FY17 FY18 FY17 FY18E Consolidated 1Q 2Q 3Q 4Q 1Q 2QE 3QE 4QE Net Sales 6,747 5,837 6,408 5,980 7,431 6,421 7,177 6,578 24,743 27,604 YoY Change (%) -1.5 1.6 2.5 6.1 10.1 10.0 12.0 10.0 1.0 11.6 Total Expenditure 5,895 5,302 5,651 5,413 6,476 5,792 6,266 5,894 21,957 24,429 EBITDA 851 535 757 567 955 629 911 684 2,786 3,174 Margins (%) 12.6 9.2 11.8 9.5 12.9 9.8 12.7 10.4 11.3 11.5 Depreciation 162 160 162 166 137 188 168 169 650 717 Interest 7 13 5 16 9 5 4 5 40 22 Other Income 80 141 190 122 116 159 144 151 460 622 PBT before EO expense 762 504 780 507 925 595 883 661 2,555 3,058 Extra-Ord expense 0 0 217 0 0 0 0 0 217 0 PBT 762 504 563 507 925 595 883 661 2,339 3,058 Tax 257 158 186 147 321 192 295 212 749 1,040 Rate (%) 33.8 31.3 23.8 29.1 34.7 32.2 33.4 32.1 32.0 34.0 Reported PAT 505 346 377 359 604 404 588 449 1,590 2,018 Adj PAT 505 346 594 359 604 404 588 449 1,737 2,018 YoY Change (%) 6.8 53.2 32.5 27.3 19.7 16.7 -0.9 24.9 7 16 Margins (%) 7.5 5.9 9.3 6.0 8.1 6.3 8.2 6.8 7.0 7.3 E: MOSL Estimates
September 2017 Results Preview | Sector: Consumer
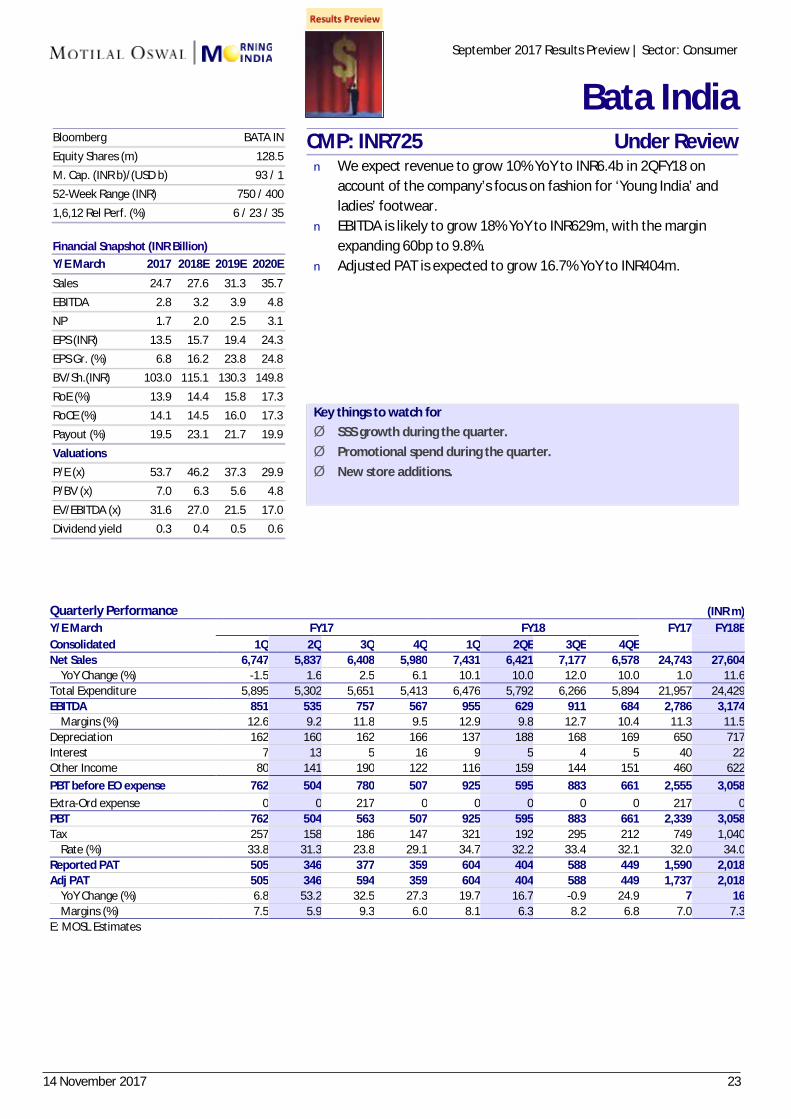
Bata India CMP: INR725 Under Review n We expect revenue to grow 10% YoY to INR6.4b in 2QFY18 on
account of the company’s focus on fashion for ‘Young India’ and ladies’ footwear.
n EBITDA is likely to grow 18% YoY to INR629m, with the margin expanding 60bp to 9.8%.
n Adjusted PAT is expected to grow 16.7% YoY to INR404m.
Key things to watch for Ø SSS growth during the quarter. Ø Promotional spend during the quarter. Ø New store additions.
Bloomberg BATA IN
Equity Shares (m) 128.5 M. Cap. (INR b)/(USD b) 93 / 1 52-Week Range (INR) 750 / 400
1,6,12 Rel Perf. (%) 6 / 23 / 35 Financial Snapshot (INR Billion) Y/E March 2017 2018E 2019E 2020E
Sales 24.7 27.6 31.3 35.7 EBITDA 2.8 3.2 3.9 4.8 NP 1.7 2.0 2.5 3.1
EPS (INR) 13.5 15.7 19.4 24.3 EPS Gr. (%) 6.8 16.2 23.8 24.8 BV/Sh.(INR) 103.0 115.1 130.3 149.8
RoE (%) 13.9 14.4 15.8 17.3 RoCE (%) 14.1 14.5 16.0 17.3 Payout (%) 19.5 23.1 21.7 19.9
Valuations P/E (x) 53.7 46.2 37.3 29.9 P/BV (x) 7.0 6.3 5.6 4.8
EV/EBITDA (x) 31.6 27.0 21.5 17.0 Dividend yield 0.3 0.4 0.5 0.6
14 November 2017 24
Quarterly Performance (INR Million) Y/E March FY17E FY18E FY17 FY18E 1Q 2Q 3Q 4Q 1Q 2QE 3QE 4QE Net Revenues 22,871 23,531 23,111 24,782 21,973 29,552 29,819 33,346 94,295 114,689 YoY Change (%) -1.2 1.0 -4.8 1.2 -3.9 25.6 29.0 34.6 -1.0 21.6 EBITDA 5,239 5,160 4,043 4,636 2,773 7,240 7,604 9,335 19,036 26,952 Margins (%) 22.9 21.9 17.5 18.7 12.6 24.5 25.5 28.0 20.2 23.5 Depreciation 843 864 898 1,145 1,220 1,000 1,000 921 3,750 4,141 Interest 140 187 66 99 219 405 405 -15 450 1,014 Other Income 153 236 166 731 210 257 257 305 1,286 1,029 PBQ before EO Income 4,409 4,345 3,245 4,123 1,544 6,093 6,456 8,733 16,122 22,826 EO Exp/(Inc) 2 0 0 0 0 0 0 0 0 0 PBQ after EO Income 4,407 4,345 3,245 4,123 1,544 6,093 6,456 8,733 16,122 22,826 Tax 966 1,068 504 19 293 1,219 1,291 1,762 1,289 4,565 Rate (%) 21.9 24.6 15.5 0.5 19.0 20.0 20.0 20.2 8.0 20.0 Min. Int/Adj on Consol -121 -99 -76 249 133 -84 -84 -300 47 -335 Adj PAT 3,564 3,376 2,817 3,855 1,384 4,791 5,081 6,670 14,880 17,926 YoY Change (%) -13.0 -26.5 -27.8 -0.7 -61.2 41.9 80.4 73.0 3.7 20.5 Margins (%) 15.6 14.3 12.2 15.6 6.3 16.2 17.0 20.0 15.8 15.6
September 2017 Results Preview | Sector: Healthcare
Cadila Healthcare
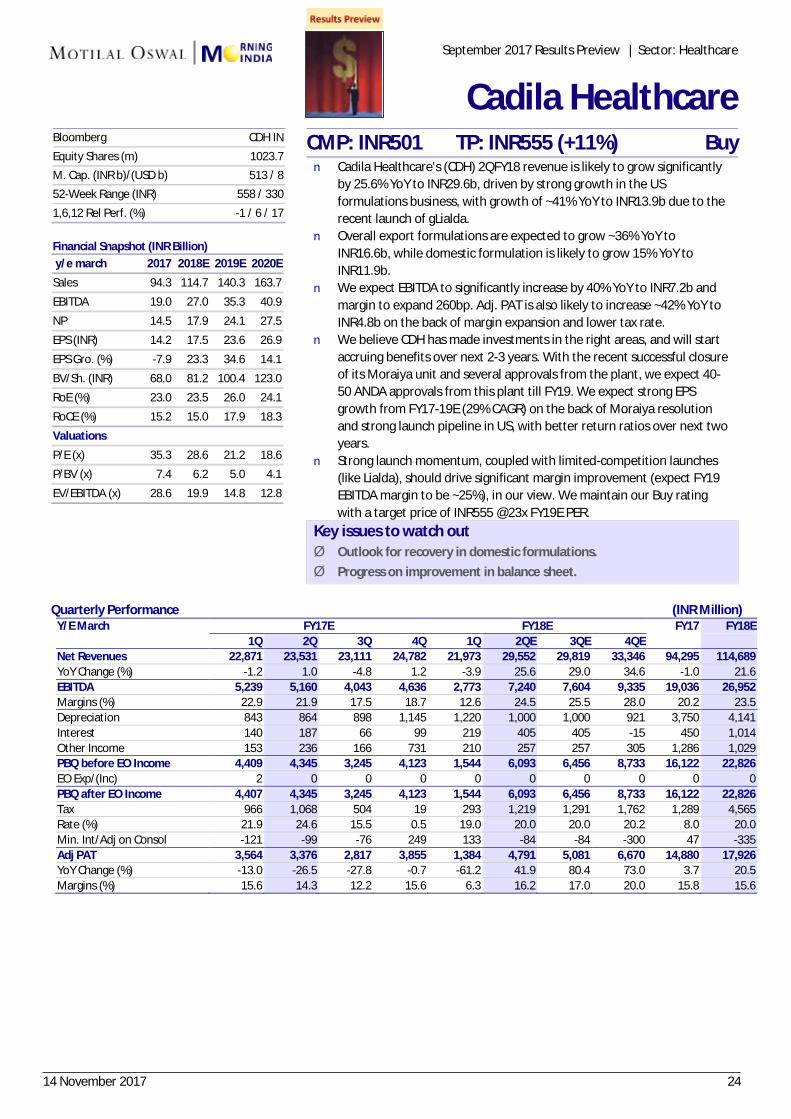
CMP: INR501 TP: INR555 (+11%) Buy n Cadila Healthcare's (CDH) 2QFY18 revenue is likely to grow significantly
by 25.6% YoY to INR29.6b, driven by strong growth in the US formulations business, with growth of ~41% YoY to INR13.9b due to the recent launch of gLialda.
n Overall export formulations are expected to grow ~36% YoY to INR16.6b, while domestic formulation is likely to grow 15% YoY to INR11.9b.
n We expect EBITDA to significantly increase by 40% YoY to INR7.2b and margin to expand 260bp. Adj. PAT is also likely to increase ~42% YoY to INR4.8b on the back of margin expansion and lower tax rate.
n We believe CDH has made investments in the right areas, and will start accruing benefits over next 2-3 years. With the recent successful closure of its Moraiya unit and several approvals from the plant, we expect 40-50 ANDA approvals from this plant till FY19. We expect strong EPS growth from FY17-19E (29% CAGR) on the back of Moraiya resolution and strong launch pipeline in US, with better return ratios over next two years.
n Strong launch momentum, coupled with limited-competition launches (like Lialda), should drive significant margin improvement (expect FY19 EBITDA margin to be ~25%), in our view. We maintain our Buy rating with a target price of INR555 @23x FY19E PER.
Key issues to watch out Ø Outlook for recovery in domestic formulations. Ø Progress on improvement in balance sheet.
Bloomberg CDH IN
Equity Shares (m) 1023.7 M. Cap. (INR b)/(USD b) 513 / 8 52-Week Range (INR) 558 / 330
1,6,12 Rel Perf. (%) -1 / 6 / 17 Financial Snapshot (INR Billion) y/e march 2017 2018E 2019E 2020E
Sales 94.3 114.7 140.3 163.7
EBITDA 19.0 27.0 35.3 40.9
NP 14.5 17.9 24.1 27.5
EPS (INR) 14.2 17.5 23.6 26.9
EPS Gro. (%) -7.9 23.3 34.6 14.1
BV/Sh. (INR) 68.0 81.2 100.4 123.0
RoE (%) 23.0 23.5 26.0 24.1
RoCE (%) 15.2 15.0 17.9 18.3
Valuations
P/E (x) 35.3 28.6 21.2 18.6
P/BV (x) 7.4 6.2 5.0 4.1
EV/EBITDA (x) 28.6 19.9 14.8 12.8
14 November 2017 25
Consolidated - Quarterly Earning Model Y/E March FY17 FY18 FY17 FY18E 1Q 2Q 3Q 4Q 1Q 2QE 3QE 4QE Net Sales 16,462 15,966 15,572 16,413 16,286 17,515 17,596 18,547 64,413 69,944 YoY Change (%) 4.2 5.1 1.1 5.0 -1.1 9.7 13.0 13.0 3.9 8.6 Total Expenditure 14,608 14,113 14,037 15,088 15,740 15,676 15,467 16,154 57,845 63,037 EBITDA 1,854 1,854 1,535 1,325 547 1,839 2,129 2,393 6,568 6,907 Margins (%) 11.3 11.6 9.9 8.1 3.4 10.5 12.1 12.9 10.2 9.9 Depreciation 302 317 351 460 396 377 368 371 1,431 1,512 Interest 252 162 191 212 226 252 233 210 817 921 Other Income 57 37 57 36 103 52 58 61 186 274 PBT before EO expense 1,356 1,411 1,050 689 28 1,262 1,586 1,873 4,506 4,749 Extra-Ord expense 9 0 0 125 4 0 0 0 133 4 PBT 1,347 1,411 1,050 564 25 1,262 1,586 1,873 4,373 4,745 Tax 417 430 262 -45 48 419 508 487 1,064 1,461 Rate (%) 30.9 30.5 25.0 -7.9 192.3 33.2 32.0 26.0 24.3 30.8 Minority Interest & P/L of Asso.Cos. -102 -88 -50 -55 -37 -78 -80 -90 -295 -285 Reported PAT 1,033 1,069 838 663 14 921 1,159 1,476 3,603 3,569 Adj PAT 1,039 1,069 838 798 11 921 1,159 1,476 3,704 3,572 YoY Change (%) -14.7 0.9 -26.1 -24.8 -99.0 -13.9 38.2 85.0 -17.0 -3.6 Margins (%) 6.3 6.7 5.4 4.9 0.1 5.3 6.6 8.0 5.8 5.1 E: MOSL Estimates
September 2017 Results Preview | Sector: Automobiles
CEAT Ltd
CMP: INR1,718 TP: INR2,029 (18%) Buy n We expect revenue to increase 9.7% YoY to INR17.5b in 2QFY18.
n The larger effect of softening of raw material basket is expected to be witnessed in 2HFY18.
n We estimate 110bp YoY contraction in EBITDA margin to 10.5%. EBITDA is likely to remain flat at INR1,839m.
n We expect adjusted PAT to decline 14% YoY to INR921m. Buy.
Key things to watch for Ø Change in raw materials prices. Ø Performance of replacement market.
Bloomberg CEAT IN
Equity Shares (m) 40.5 M. Cap. (INR b)/(USD b) 69 / 1 52-Week Range (INR) 1948 / 1060
1,6,12 Rel Perf. (%) 0 / 23 / 11 Financial Snapshot (INR Billion) Y/E March 2017 2018E 2019E 2020E
Sales 64.4 69.9 75.3 81.7 EBITDA 6.6 7.3 9.0 10.4 NP 3.8 3.8 5.1 5.9
EPS (Rs) 93.3 94.2 126.8 145.4 EPS Gr. (%) -16.9 1.0 34.5 14.7 BV/Share 597.0 678.8 788.8 914.9
RoE (%) 16.9 14.8 17.3 17.1 RoCE (%) 13.5 12.2 14.7 16.1 Valuations
P/E (x) 18.4 18.2 13.5 11.8 P/BV (x) 2.9 2.5 2.2 1.9 EV/EBITDA (x) 11.9 10.5 8.3 7.0
EV/Sales (x) 1.2 1.1 1.0 0.9
14 November 2017 26
Quarterly performance (Consolidated) (INR m) Y/E March FY17 FY18 FY17 FY18E
1Q 2Q 3Q 4Q 1Q 2QE 3QE 4QE Net Operating income 15,557 17,549 18,348 18,881 20,006 22,080 23,645 24,842 70,334 90,574
Growth (%) 42.0 35.0 42.9 23.2 28.6 25.8 28.9 31.6 42.4 61.0 EBITDA 4,700 5,422 5,770 5,848 6,207 7,000 7,611 8,019 21,740 28,838 Recurring PAT 30.2 30.9 31.4 31.0 31.0 31.7 32.2 32.3 60.9 31.8
Growth (%) 3,763 4,132 4,182 4,594 4,596 5,509 5,829 6,560 16,671 22,494 Standalone (RE) 58.6 45.2 50.0 33.9 22.1 33.3 39.4 42.8 55.7 68.7 Royal Enfield (units)
Growth (%) 147,483 166,941 173,838 178,228 183,998 202,867 216,250 225,615 666,490 828,730 Net Realn (INR/unit) 38.3 30.8 38.2 20.3 24.8 21.5 24.4 26.6 38.8 55.4
Change - YoY (%) 105,603 105,576 105,477 105,731 108,691 108,841 109,341 110,141 105,598 109,292 EBITDA Margins (%) 2.7 3.7 3.3 1.5 2.9 3.1 3.7 4.2 2.4 3.5 Recurring PAT 4,796 5,524 5,828 5,910 6,278 7,000 7,611 7,949 22,058 28,838
Growth (%) 30.8 31.3 31.8 31.4 31.4 31.7 32.2 32.0 31.3 31.8 VECV 3,371 3,962 4,152 4,116 4,943 5,043 5,391 5,573 15,600 20,950 Total CV Volumes 69.6 54.2 64.5 8.5 46.6 27.3 29.9 35.4 48.9 67.9
Growth (%) Net Realn (INR '000/unit) 16,071 13,408 11,784 17,230 11,583 15,013 15,065 19,001 58,493 60,662
Change - YoY (%) 32.5 15.0 -7.1 10.8 -27.9 12.0 27.8 10.3 16.0 29.6 EBITDA Margins (%) 1,331.3 1,470.5 1,599.6 1,482.3 1,556.6 1,587.7 1,619.5 1,628.7 1,461.5 1,602.5 Recurring PAT -9.6 -3.8 1.9 11.2 16.9 8.0 1.2 9.9 -4.3 9.6
Growth (%) 9.1 7.2 6.9 8.2 8.3 8.5 8.1 9.1 7.9 8.6 E: MOSL Estimates
September 2017 Results Preview | Sector: Automobiles
Eicher Motors
CMP: INR30,788 TP: INR36,487 (+19%) Buy n Royal Enfield’s volumes grew 21.5% YoY (+10.3% QoQ) to 202,867
units, led by additional capacity amid continued healthy demand. Net realization should improve by 3.1% YoY (flat QoQ), helped by price hikes. We expect EBITDA to expand ~40bp YoY to 31.7% (+30bp QoQ).
n VECV’s volume increased by ~12.3% YoY (+28% QoQ). We expect net realization to increase by 8% YoY (+2% QoQ), led by price hikes post BSIV implementation. Margin is expected to be at 8.5%, up by ~130bp YoY (20bp QoQ).
n Consolidated revenue would increase ~25.7% YoY (+10.4% QoQ) to INR22b. Consolidated margin is likely to be 31.7%. Consolidated PAT is estimated to rise ~33.3% YoY (+19.9% QoQ) to INR5.5b.
n We have cut our VECV volume estimates by ~3% in both FY18 and FY19, while increasing our FY19E RE volume by ~2%. Consequently, we have cut our FY18E consol. EPS by 3% and increased our FY19E consol. EPS by 2.4%.
n The stock trades at 37.2x FY18E and 27.5x FY19E EPS. Maintain Buy. Key issues to watch Ø Demand for RE at the retail level and order book position. Ø Update on new product launches in RE. Ø Update on current demand trends for commercial vehicles, discount
levels and inventory post BS-IV and GST. Ø Impact of competition on ICV segment.
Bloomberg EIM IN
Equity Shares (m) 27.2 M. Cap. (INR b)/(USD b) 838 / 13 52-Week Range (INR) 33484 / 19571
1,6,12 Rel Perf. (%) -3 / 15 / 5
Financial Snapshot (INR b) Y/E Dec FY17 FY18E FY19E FY20E
Net Income 70.3 90.6 111.4 132.6 EBITDA 21.7 28.8 37.4 45.9 Net Profit 16.7 22.5 30.5 38.0 Adj. EPS (INR) 613.8 826.7 1119.2 1395.8 EPS Gr. (%) 55.7 34.9 35.4 24.7 BV/Sh. (INR) 1,769 2,614 3,531 4,696 RoE (%) 40.3 36.1 36.4 33.9 RoCE (%) 27.1 32.6 33.5 31.9 Payout (%) 0.4 0.5 0.6 0.6 Valuations P/E (x) 45.4 37.7 27.8 22.3 P/BV (x) 15.7 11.9 8.8 6.6 EV/EBITDA (x) 28.0 23.9 17.9 14.2 Div. Yield (%) 0.4 0.5 0.6 0.6
14 November 2017 27
Quarterly performance (INR million) Y/E March FY17E FY18E FY17 FY18E 1Q 2Q 3Q 4Q 1Q 2QE 3QE 4QE Net Sales 11,212 11,957 11,334 11,234 11,566 13,392 13,034 13,241 45,737 51,234 YoY Change (%) 8.4 10.9 8.9 3.2 3.2 12.0 15.0 17.9 7.8 12.0 Total Expenditure 10,585 10,968 10,211 10,444 10,705 12,107 11,587 11,239 42,208 45,638 EBITDA 626 990 1,123 790 861 1,286 1,447 2,002 3,529 5,596 Margins (%) 5.6 8.3 9.9 7.0 7.4 9.6 11.1 15.1 7.7 10.9 Depreciation 476 517 599 630 590 750 780 230 2,222 2,350 Interest 420 461 748 666 644 500 500 756 2,294 2,400 Other Income 330 380 589 361 576 75 75 -426 1,660 300 PBT before EO expense 61 393 365 -146 203 111 242 590 673 1,146 Extra-Ord expense 0 -9 -4,194 8 6 0 0 0 16 0 PBT 61 402 4,559 -153 197 111 242 590 657 1,146 Tax 29 242 190 263 123 37 80 139 724 378 Rate (%) 47.3 60.2 4.2 -171.7 62.1 33.0 33.0 23.6 110.3 33.0 Minority Interest & P/L of Asso. Cos. -130 -154 -165 -41 -151 -61 -61 30 -4,861 -243 Reported PAT 162 314 4,533 -375 226 135 223 421 4,793 1,011 Adj PAT 162 310 514 -354 228 135 223 421 4,791 1,011 YoY Change (%) -82.6 -62.6 -193.1 -61.0 41.1 -56.5 -56.7 -218.9 460.3 -78.9 Margins (%) 1.4 2.6 4.5 -3.2 2.0 1.0 1.7 3.2 10.5 2.0
September 2017 Results Preview | Sector: Healthcare
Fortis Healthcare
CMP: INR150 TP:INR220 (+47%) Buy n We expect Fortis to deliver low-double-digit revenue growth of
12% to INR13.4b on the back of steady growth in the core businesses (Hospitals & Diagnostics), partially impacted by demonetization.
n EBITDA margin will continue to expand sequentially, despite seasonality impact, on the back of better efficiency and fading impact of demonetization.
n We expect hospital EBITDA to grow more than 4x by FY19E (from FY16 base) on the back of lower base, coupled with strong high-teen growth in EBITDAC, relatively flattish BT cost (at normalized level) and FHTL transaction.
n We expect EBITDA margin for the diagnostics business to improve by ~200bp by FY19E on the back of deeper penetration in existing markets, rationalization of low-margin centers, growth in samples tested and higher share from the O&M model.
n We argue for multiple re-rating, led by a multifold increase in Hospital EBITDA, SRL demerger, asset light expansion strategy and FHTL transaction. We value Hospital and Diagnostic based on 20x FY19E EV/EBITDA. FORH is our top pick in the healthcare delivery space with a TP of INR220.
Key issues to watch out Ø SRL demerger. Ø Possibility of capital infusion and usage of capital. Ø PAT breakeven of hospitals business.
Bloomberg FORH IN
Equity Shares (m) 518.0 M. Cap. (INR b)/(USD b) 78 / 1 52-Week Range (INR) 231 / 126
1,6,12 Rel Perf. (%) -1 / -27 / -26 Financial Snapshot (INR Billion) y/e march 2017 2018E 2019E 2020E
Sales 45.7 51.2 58.2 67.0
EBITDA 3.5 5.6 7.6 9.7
NP 4.8 1.0 2.6 4.0
EPS (INR) 10.3 2.2 5.6 8.6
EPS Gro. (%) -638.2 -78.9 155.6 54.8
BV/Sh. (INR) 96.8 111.0 116.5 125.1
RoE (%) 11.3 2.1 4.9 7.1
RoCE (%) 3.5 3.4 4.9 6.1
Valuations
P/E (x) 14.5 68.7 26.9 17.4
P/BV (x) 1.6 1.4 1.3 1.2
EV/EBITDA (x) 24.5 13.8 9.9 7.3
EV/Sales (x) 1.9 1.5 1.3 1.1
14 November 2017 28
Quarterly Performance
(INR Million) Y/E March FY17 FY18 FY17 FY18E 1Q 2Q 3Q 4Q 1Q 2QE 3QE 4QE Net Sales 106,866 118,582 121,079 134,217 114,065 131,905 131,196 146,789 480,743 523,955 Change (%) -14.6 -15.8 -9.5 15.4 6.7 11.2 8.4 9.4 -6.9 9.0 EBITDA 15,732 15,155 17,015 15,250 18,994 20,585 19,545 20,436 63,152 79,560 % of Net Sales 14.7 12.8 14.1 11.4 16.7 15.6 14.9 13.9 13.1 15.2 Depreciation 3,354 3,563 3,579 3,471 3,451 3,580 3,580 3,656 13,968 14,267 Interest 1,774 1,198 1,601 220 1,014 860 860 703 4,794 3,437 Other Income 1,362 3,361 3,002 4,981 1,158 2,350 2,350 2,961 12,705 8,819 Extraordinary item* 4,893 0 0 -7,880 0 0 0 0 -2,987 0 PBT 16,858 13,755 14,836 8,659 15,687 18,495 17,455 19,038 54,108 70,676 Tax 3,506 4,508 5,007 6,058 5,431 6,288 5,935 6,473 19,079 24,127 Rate (%) 20.8 32.8 33.7 70.0 34.6 34.0 34.0 34.0 35.3 34.1 PAT 13,352 9,247 9,829 2,602 10,256 12,207 11,521 12,565 35,029 46,549 Adj PAT 8,459 9,247 9,829 10,482 10,256 12,207 11,521 12,565 38,016 46,549 Change (%) 99.4 109.9 48.0 36.1 21.3 32.0 17.2 19.9 65.4 22.4 EPS (INR) 5.0 5.5 5.8 6.2 6.1 7.2 6.8 7.4 22.5 27.5 Key Assumptions
Gas Trans. volume (mmsmd) 96 101 103 102 100 109 108 108 100 106 Petchem sales ('000MT) 110 136 146 186 131 180 180 184 578 675 E: MOSL Estimates
September 2017 Results Preview | Sector: Oil & Gas
GAIL
CMP: INR431 TP: INR334 (-22%) Sell n We expect GAIL to report PAT of INR12.2b (+32% YoY and +19%
QoQ). We model nil subsidy sharing for GAIL in 2QFY18 (v/s nil in 2QFY17 and 1QFY18).
n We estimate EBITDA at INR20.6b in 2QFY18 v/s INR15.2b in 2QFY17 and INR18.9b in 1QFY18.
n We model Brent crude price of USD53/bbl for FY18 and USD55/bbl for FY19/20.
n Segmental EBIT (pre-subsidy) is expected to be INR17b (+47% YoY), led by a turnaround in petchem division profitability and likely higher gas transmission profitability.
n GAIL trades at 11.8x FY19E EPS of INR29.8. Maintain Sell.
Key issues to watch for Ø (a) Petchem profitability, (b) profitability in the gas trading business, (c)
progress of pipeline projects, (d) pending tariff revisions for key pipelines, and (e) visibility on placement of US contracts.
Ø
Bloomberg GAIL IN Equity Shares (m) 1691.3 M. Cap. (INR b)/(USD b) 729 / 11 52-Week Range (INR) 440 / 289 1,6,12 Rel Perf. (%) 14 / 7 / 31 Financial snapshot (INR b) Y/E March 2017 2018E 2019E 2020E Sales 480.7 524.5 604.1 650.1
EBITDA 63.2 76.8 84.7 89.8
Adj. PAT 38.2 44.8 50.7 54.1
Adj. EPS (INR) 22.6 26.5 30.0 32.0
EPS Gr. (%) 71.4 17.5 13.2 6.7
BV/Sh.(INR) 225.6 242.1 260.8 280.7
RoE (%) 9.6 11.3 11.9 11.8
RoCE (%) 8.7 9.7 10.2 10.1
Payout (%) 41.1 37.7 37.7 37.7
Valuations
P/E (x) 19.1 16.3 14.4 13.5
P/BV (x) 1.9 1.8 1.7 1.5
EV/EBITDA (x) 10.5 9.1 8.3 7.8
Div. Yield (%) 1.6 1.9 2.2 2.3
14 November 2017 29
Quarterly Performance* (INR Million) Y/E March FY17 FY18 FY17 FY18E (Standalone) 1Q 2Q 3Q 4Q 1Q 2QE 3QE 4QE VSF Volume (ton) 121,000 123,994 122,000 133,000 121,000 145,200 134,200 104,594 499,994 504,994 YoY Change (%) 17.8 9.00 1.1 2.31 0.00 17.10 10.00 -21.36 6.8 1.0 VSF Realization (INR/ton) 128,039 130,713 137,438 139,960 142,124 141,124 139,124 133,909 135,837 139,337 YoY Change (%) 13.0 12.0 9.0 11.0 11.0 8.0 1.2 -4.3 11.6 2.6 QoQ Change (%) 1.5 2.1 5.1 1.8 1.5 -0.7 -1.4 -3.7 Net Sales 23,959 24,887 25,260 28,761 27,403 29,929 27,698 19,528 103,457 104,558 YoY Change (%) 23.8 17.4 9.7 13.1 14.4 20.3 9.7 -32.1 15.3 1.1 EBITDA 5,078 5,301 5,428 5,254 5,553 5,514 5,365 8,719 21,548 25,152 Margins (%) 21.2 21.3 21.5 18.3 20.3 18.4 19.4 44.7 20.8 24.1 Depreciation 1,104 1,119 1,106 1,133 1,103 1,160 1,160 1,289 4,461 4,711 Interest 231 156 107 83 73 45 45 16 576 179 Other Income 781 3,587 553 304 658 2,800 450 1,092 4,739 5,000 PBT before EO Items 4,525 7,612 4,769 4,343 5,036 7,109 4,610 8,507 21,249 25,261 Extraordinary Inc/(Exp) 0 0 0 0 0 0 0 0 0 0 PBT after EO Items 4,525 7,612 4,769 4,343 5,036 7,109 4,610 8,507 21,249 25,261 Tax 1,317 1,690 1,455 1,188 1,564 2,133 1,383 2,499 5,649 7,578 Rate (%) 29.1 22.2 30.5 27.4 31.1 30.0 30.0 29.4 26.6 30.0 Reported PAT 3,209 5,923 3,314 3,155 3,472 4,976 3,227 6,008 15,600 17,683 Adj. PAT 3,209 5,923 3,314 3,155 3,472 4,976 3,227 6,008 15,600 17,683 Margins (%) 13.4 23.8 13.1 11.0 12.7 16.6 11.7 30.8 15.1 16.9 YoY Change (%) 251.6 55.2 21.9 72.7 8.2 -16.0 -2.6 90.4 57.0 13.4 E: MOSL Estimates;*Grasim: Financials are only for VSF and chemical business and does not include impact of ABNL merger
September 2017 Results Preview | Sector: Cement
Grasim Industries
CMP: INR1,160 TP: INR1,276 (+10%) Neutral n We expect VSF volumes to increase 5% YoY to 130,193 tons in
2QFY18, while realizations are expected to rise 8% YoY to INR141,124/ton. Standalone revenues are likely to increase 20.3% YoY to INR26.9b.
n Standalone EBITDA margin is estimated at 18.4% (-2.8pp YoY, -1.84pp QoQ).
n EBITDA is estimated to increase 4% YoY to INR5.5b, translating into PAT of INR4.9b (-16% YoY). Neutral.
Key issues to watch out for: Ø Pick-up in cement demand and pricing thereon. Ø Outlook on VSF business, and strategy to utilize upcoming
capacities globally. Ø Impact of demonetization on caustic soda demand.
Bloomberg GRASIM IN
Equity Shares (m) 466.8 M. Cap. (INR b)/(USD b) 541 / 8 52-Week Range (INR) 1274 / 640
1,6,12 Rel Perf. (%) -1 / 28 / 32 Financial Snapshot (INR Billion) Y/E March 2017 2018E 2019E 2020E
Sales 360.7 444.9 538.9 610.4
EBITDA 73.9 89.7 115.7 136.7
Adj. PAT 31.7 33.0 47.3 54.8
Adj. EPS (INR) 67.8 70.6 101.2 117.3
EPS Gr. (%) 28.3 4.1 43.4 15.8
BV/Sh. (INR) 672.3 737.9 834.2 946.4
RoE (%) 10.8 10.0 12.9 13.2
RoCE (%) 12.2 10.8 12.1 13.0
Payout (%) 7.8 7.1 5.0 4.3
14 November 2017 30
Standalone - Quarterly Earning Model Y/E March FY17 FY18 FY17 FY18E
1Q 2Q 3Q 4Q 1Q 2QE 3QE 4QE Net Sales 4,926 5,763 5,029 5,129 4,318 5,763 5,331 5,642 22,578 21,020 YoY Change (%) 7.6 0.0 0.4 -0.1 -12.4 0.0 6.0 10.0 7.0 -6.9 Total Expenditure 3,824 4,599 4,009 4,228 3,665 4,778 4,430 4,756 18,294 17,615 EBITDA 1,103 1,164 1,020 901 653 986 901 886 4,285 3,405 Margins (%) 22.4 20.2 20.3 17.6 15.1 17.1 16.9 15.7 19.0 16.2 Depreciation 80 73 79 79 75 105 110 105 331 395 Interest 98 116 91 89 82 80 90 90 421 342 Other Income 0 0 0 0 0 0 0 0 0 0 PBT 924 975 849 733 496 801 701 691 3,532 2,668 Tax 321 348 287 245 177 283 235 229 965 915 Rate (%) 34.8 35.7 33.8 33.4 35.6 35.4 33.6 33.1 27.3 34.3 Reported PAT 603 627 562 488 320 517 465 462 2,567 1,753 Adj PAT 603 627 562 488 320 517 465 462 2,567 1,753 YoY Change (%) 15.6 21.5 -27.3 -28.1 -47.0 -17.5 -17.2 -5.3 -10.7 -31.7 Margins (%) 12.2 10.9 11.2 9.5 7.4 9.0 8.7 8.2 11.4 8.3 E: MOSL Estimates
September 2017 Results Preview | Sector: Textiles
Indo Count Industries
CMP: INR108 TP: INR118 (+10%) Neutral n We expect revenue to remain flat YoY (+33% QoQ) at INR5,763m
in 2QFY18 due to the after-effects of destocking on account of GST.
n EBITDA margin is likely to contract 310bp YoY to 17.1%, and EBITDA is likely to decline 15% YoY to INR986m.
n PAT is expected to de-grow 17.5% YoY to INR517m in 2QFY18.
Key things to watch for Ø Impact on raw material prices on account of increased cotton acreage. Ø Impact on margin going forward due to a reduction in duty drawback.
Bloomberg ICNT IN
Equity Shares (m) 197.4 M. Cap. (INR b)/(USD b) 21 / 0 52-Week Range (INR) 210 / 95
1,6,12 Rel Perf. (%) -6 / -51 / -39 Financial Snapshot (INR Billion) Y/E March 2017 2018E 2019E 2020E
Sales 22.6 21.0 23.0 25.0 EBITDA 4.3 3.4 3.9 4.4 NP 2.6 1.8 2.1 2.5
EPS (INR) 13.0 8.9 10.8 12.5 EPS Gr. (%) -10.7 -31.7 21.2 16.4 BV/Sh. (INR) 42.9 52.7 64.8 76.1
RoE (%) 34.8 18.6 18.3 17.8 RoCE (%) 26.5 16.5 17.3 26.7 Valuations
P/E (x) 8.3 12.2 10.0 8.6 P/BV (x) 2.5 2.0 1.7 1.4 EV/EBITDA (x) 5.6 6.7 5.7 4.8
EV/Sales (x) 1.1 1.1 1.0 0.8
14 November 2017 31
Quarterly Performance (INR Million) Y/E March FY17 FY18E FY17 FY18E 1Q 2Q 3Q 4Q 1Q 2QE 3QE 4QE Net Revenues (Core) 8,422 8,720 7,398 6,658 7,130 8,891 8,381 9,329 32,106 33,731 YoY Change (%) 11.1 16.8 8.1 6.6 -15.3 2.0 13.3 40.1 11.3 5.1 EBITDA 1,285 1,280 1,104 677 215 1,423 1,299 1,441 4,448 4,378 Margins (%) 15.3 14.7 14.9 10.2 3.0 16.0 15.5 15.4 13.9 13.0 Depreciation 422 429 432 428 433 459 459 446 1,730 1,797 Interest 65 68 57 44 56 71 71 46 241 244 Other Income 49 62 59 52 62 100 100 138 226 400 PBT before EO Expense 847 845 675 257 -212 992 869 1,087 2,703 2,736 Extra-Ord Expense 81 -78 39 0 0 0 0 0 0 0 PBT after EO Expense 766 923 636 257 -212 992 869 1,087 2,703 2,736 Tax 290 374 222 -187 -10 233 204 215 675 643 Rate (%) 34.2 44.2 32.9 -72.7 4.6 23.5 23.5 19.8 25.0 23.5 Reported PAT 476 549 414 444 -202 759 665 872 2,028 2,093 Adj PAT 557 471 453 444 -202 759 665 872 2,028 2,093 YoY Change (%) 82.5 31.1 88.4 9.6 -136.4 61.0 46.6 96.5 62.8 3.2 Margins (%) 5.6 6.3 5.6 6.7 -2.8 8.5 7.9 9.3 6.3 6.2
September 2017 Results Preview | Sector: Healthcare
Ipca Laboratories
Bloomberg IPCA IN
Equity Shares (m) 126.2 M. Cap. (INR b)/(USD b) 67 / 1 52-Week Range (INR) 656 / 400
1,6,12 Rel Perf. (%) 26 / -24 / -27 Financial Snapshot (INR Billion) Y/E MARCH 2017 2018E 2019E 2020E
Sales 32.1 33.7 39.5 45.1
EBITDA 4.4 4.4 6.1 7.7
NP 2.0 2.1 3.4 4.5
EPS (INR) 16.1 16.6 26.8 35.7
EPS Gro. (%) 52.8 3.2 61.9 33.0
BV/Sh. (INR) 194.6 208.7 231.5 261.8
RoE (%) 8.6 8.2 12.2 14.5
RoCE (%) 7.5 7.4 10.7 12.7
Valuations
P/E (x) 32.8 31.8 19.7 14.8
P/BV (x) 2.7 2.5 2.3 2.0
EV/EBITDA (x) 11.9 11.9 0.0 0.0
D. Yield (%) 0.4 0.5 0.8 1.0
CMP: INR528 TP:INR430 (-19%) Neutral n We expect Ipca Laboratories (IPCA) revenues to post muted
growth of 2% YoY to INR8.9b, mainly due to a decline in International business by ~12% to INR2.3b, while domestic revenues are expected to grow 17% YoY to INR4.7b.
n International generic business is expected to decline ~20% YoY. API business is expected to decline marginally by 1%YoY to INR1.8b.
n EBITDA is likely to increase 11% YoY to INR1.4b, with increase of 130bp in EBITDA margin to 16%.
n PAT is expected to increase significantly by 61% YoY to INR759m, primarily due to deferred tax of INR160m in 2QFY17.
n We do not expect revival in the US business before 2HFY19E. Despite the stock’s attractive valuation, we believe regulatory overhang will keep multiples under check in the near term. Reiterate Neutral with a TP of INR430 @ 16x FY19E, a discount of ~15-20% to peers.
Key issues to watch out Ø Update on resolution of USFDA regulatory issues. Ø Outlook for institutional tender business. Ø Impact of emerging market currency weakness.
14 November 2017 32
Standalone - Quarterly Earning Model (INR Million) Y/E March FY17 FY18 FY17 FY18E 1Q 2Q 3Q 4Q 1Q 2QE 3QE 4QE Net Sales 84,288 99,690 114,753 133,349 102,624 113,907 107,815 108,648 432,079 432,995 YoY Change (%) -25.5 -2.5 30.1 43.5 21.8 14.3 -6.0 -18.5 9.0 0.2 EBITDA 12,206 7,855 11,476 15,540 5,827 13,578 9,476 9,547 47,076 38,428 Margins (%) 14.5 7.9 10.0 11.7 5.7 11.9 8.8 8.8 10.9 8.9 Depreciation 1,703 1,681 1,702 1,703 1,637 1,896 1,896 1,896 6,788 7,325 Interest 1,459 1,115 1,395 1,219 1,074 1,263 1,263 1,263 5,188 4,864 Other Income 2,295 926 636 375 204 588 588 588 4,232 1,969 PBT before EO expense 11,340 5,984 9,015 12,993 3,320 11,007 6,905 6,976 39,332 28,207 Extra-Ord expense 0 0 0 -15,973 0 0 0 0 -15,973 0 PBT 11,340 5,984 9,015 28,966 3,320 11,007 6,905 6,976 55,305 28,207 Tax 4,155 1,826 3,355 9,542 980 3,669 2,301 2,325 18,877 9,275 Rate (%) 37 31 37 33 30 33 33 33 34 33 Reported PAT 7,185 4,159 5,660 19,424 2,340 7,338 4,604 4,651 36,428 18,933 Adj PAT 7,185 4,159 5,660 8,713 2,340 7,338 4,604 4,651 25,907 18,933 YoY Change (%) 36.0 -146.5 91.8 -35.5 -67.4 76.5 -18.7 -46.6 98.3 -26.9 Margins (%) 8.5 4.2 4.9 6.5 2.3 6.4 4.3 4.3 6.0 4.4 Key Assumptions
Refining throughput (mmt) 3.7 4.0 4.4 4.2 4.0 4.0 4.0 4.0 16.3 16.0 Core GRM (USD/bbl) 5.3 5.5 5.1 8.1 7.1 6.5 6.3 6.3 6.0 6.6 E: MOSL Estimates
CMP: INR127 TP: INR112 (-11%) Sell n We expect MRPL to report EBITDA of INR13.6b (v/s INR5.8b in
1QFY18). We estimate adjusted PAT at INR7.3b (v/s INR2.3b in 1QFY18).
n Reuters Singapore’s GRM is up +62% YoY and +29% QoQ at USD8.3/bbl. We model MRPL’s GRM at USD6.5/bbl (v/s USD7.1/bbl in 1QFY18 and USD5.5/bbl in 2QFY17) due to shutdown of polypropylene unit and few other secondary units at its plant.
n We expect refinery throughput at 4mmt v/s 4mmt in 1QFY18 and 2QFY17.
n For MRPL, we model GRM of ~USD6.6/bbl in FY18 and ~USD6.5/bbl in FY19/20. The stock trades at 10.9x FY19E EPS of INR11.6 and EV of 5.9x FY19E EBITDA. Maintain Sell.
Key issues to watch for Ø GRM. Ø Forex fluctuations. Ø Inventory changes.
September 2017 Results Preview | Sector: Oil & Gas
MRPL
Bloomberg MRPL IN
Equity Shares (m) 1752.7 M. Cap. (INR b)/(USD b) 222 / 3 52-Week Range (INR) 144 / 78
1,6,12 Rel Perf. (%) -8 / 10 / 30 Financial snapshot (INR b) y/e march 2017 2018E 2019E 2020E
Sales 432.1 433.0 481.7 488.2
EBITDA 47.1 38.4 39.8 40.3
Adj. PAT 25.9 18.7 20.3 21.6
Adj. EPS (INR) 14.8 10.7 11.6 12.3
EPS Gr. (%) 95.1 (28) 8.5 6.7
BV/Sh.(INR) 57.5 65.6 74.5 83.9
RoE (%) 31.4 17.3 16.5 15.6
RoCE (%) 19.6 12.8 13.3 13.3
Payout (%) 23.4 23.4 23.4 23.4
Valuation
P/E (x) 8.6 11.9 10.9 10.3
P/BV (x) 2.2 1.9 1.7 1.5
EV/EBITDA (x) 5.7 6.1 5.9 4.9
Div. Yield (%) 3.3 1.7 1.8 2.0
14 November 2017 33
Standalone - Quarterly Earning Model Y/E March FY17 FY18 FY17 FY18E 1Q 2Q 3Q 4Q 1Q 2QE 3QE 4QE Net Sales 2,369 1,025 1,025 2,734 3,015 1,281 1,639 4,320 7,171 10,235 YoY Change (%) 63.1 34.6 11.6 28.6 27.2 25.0 60.0 58.0 34.8 42.7 Total Expenditure 1,917 803 844 2,217 2,451 1,013 1,329 3,443 5,773 8,219 EBITDA 453 222 181 518 563 268 310 877 1,398 2,016 Margins (%) 19.1 21.7 17.6 18.9 18.7 20.9 18.9 20.3 19.5 19.7 Depreciation 149 171 177 241 237 216 230 260 738 965 Interest 1 8 2 1 4 2 1 1 12 0 Other Income 17 17 60 85 98 21 46 50 179 215 PBT 320 61 61 361 421 71 125 666 827 1,266 Tax 33 7 13 48 62 8 20 79 101 152 Rate (%) 10.4 10.8 21.9 13.2 14.7 11.8 16.2 11.8 12.2 12.0 Minority Interest & Profit/Loss of Asso. Cos. 0 0 0 0 0 0 0 0 0 0 Reported PAT 286 54 48 313 359 62 105 587 726 1,114 Adj PAT 286 54 48 313 359 62 105 587 726 1,114 YoY Change (%) 82.5 24.5 -1.4 22.5 25.3 15.3 118.2 87.4 43.8 53.4 Margins (%) 12.1 5.3 4.7 11.5 11.9 4.9 6.4 13.6 10.1 10.9 E: MOSL Estimates
September 2017 Results Preview | Sector: Consumer
Manpasand Beverages
CMP: INR477 TP: INR534 (12%) Buy n We expect revenue to grow 25% YoY to INR1,281m in 2QFY18,
with healthy growth in Mango Sip and Fruits Up, and increased traction in the recently launched Jeera Sip.
n EBITDA margin is likely to contract 80bp to 20.9%, and EBITDA is expected to grow 20% YoY to INR268m.
n The pilot for tie-up with Parle Products has been initiated in West Bengal, and should boost its distribution network.
n We estimate PAT at INR62m, as against INR54m in 2QFY17,growth of 15.3% YoY. Buy.
Key issues to watch for Ø Update on expected tie-ups for products other than Mango Sip. Ø Update on advertisement campaigns and plans ahead. Ø Update on commissioning of new plants.
Equity Shares (m) MANB IN
M. Cap. (INR b)/(USD b) 114.4 52-Week Range (INR) 55 / 1 1,6,12 Rel Perf. (%) 512 / 253
Equity Shares (m) 18 / 28 / 13 Financial Snapshot (INR Billion) Y/E March 2017 2018E 2019E 2020E
Sales 7.2 10.2 15.2 19.9 EBITDA 1.4 2.0 3.0 3.9 NP 0.7 1.1 1.7 2.3 Adj EPS (INR) 6.3 9.7 15.3 20.4 EPS Gr. (%) 43.8 53.4 56.7 33.6 BV/Sh. (INR) 100.8 108.1 119.6 135.0 RoE (%) 7.3 8.2 13.4 16.0 RoCE (%) 8.4 9.3 15.2 18.2 Valuations
P/E (x) 75.1 49.0 31.3 23.4 P/BV (x) 4.7 4.4 4.0 3.5 EV/EBITDA (x) 37.4 26.3 17.6 13.2 EV/Sales (x) 7.3 5.2 3.5 2.6
14 November 2017 34
Quarterly Performance (INR Million) Y/E March FY17 FY18E FY17 FY18E 1Q 2Q 3Q 4Q 1Q 2QE 3QE 4QE Net Revenues 80,067 77,640 76,832 68,252 61,667 67,603 76,830 73,570 302,642 279,670 YoY Change (%) 18.4 13.0 8.5 -10.6 -23.0 -12.9 0.0 7.8 7.1 -7.6 Total Expenditure 53,220 50,974 54,595 55,895 51,131 55,097 60,696 57,396 214,892 224,320 EBITDA 26,847 26,666 22,237 12,357 10,535 12,507 16,134 16,174 87,751 55,350 Margins (%) 33.5 34.3 28.9 18.1 17.1 18.5 21.0 22.0 29.0 19.8 Depreciation 3,160 3,038 3,068 3,382 3,466 3,350 3,400 3,584 12,648 13,800 Net Other Income 2,588 5,668 1,851 4,913 847 2,250 2,250 1,653 15,376 7,000 PBT before EO Exp 26,275 29,295 21,020 13,888 7,916 11,407 14,984 14,243 90,479 48,550 EO Exp/(Inc) 0 0 0 0 9,505 0 0 0 0 0 PBT 26,275 29,295 21,020 13,888 -1,589 11,407 14,984 14,243 90,479 48,550 Tax 3,527 4,417 3,729 443 1,618 1,711 2,248 1,706 12,116 7,283 Rate (%) 13.4 15.1 17.7 3.2 20.4 15.0 15.0 12.0 13.4 15.0 PAT (pre Minority Interest) 22,748 24,879 17,291 13,445 -3,207 9,696 12,737 12,537 78,363 41,268 Minority Interest 2,411 2,528 2,573 1,208 1,042 1,400 1,400 1,158 8,719 5,000 Reported PAT 20,337 22,351 14,718 12,237 -4,249 8,296 11,337 11,379 69,644 36,268 YoY Change (%) 265.8 117.3 3.9 -28.6 -120.9 -62.9 -23.0 -7.0 28.9 -47.9
CMP: INR514 TP:INR515 (+0%) Buy n Sun Pharmaceuticals (SUNP) is likely to register decline in
revenues by 12.9% YoY to INR67.6b, primarily on the back of a decrease in US business by 35% to INR24b.
n India business is expected to grow 9.4% YoY, while the Row and API business are expected to grow 2.5% YoY and 11.6% YoY, respectively.
n SUNP’s EBITDA is expected to decline ~53% YoY to INR12.5b, with margin contraction of ~1,580bp to 18.5% due to pricing pressure and increased competition. Also, during 2QFY17, the company’s operating income was higher due to the acquisition of Novartis (Japan) brands, one-time revenue of USD25m and lower other operating expense attributed to RBXY integration.
n PAT is expected to decline 62.9% YoY to INR8.3b due to the decline in EBITDA margin.
n We expect the stock to remain under pressure in near term due to challenges related to growth and margins. Maintain Buy with a reduced TP of INR515, based on 22x FY19E. We expect recovery from 2HFY18E/FY19E as earnings bounce back, Halol resolution happens and visibility of specialty business monetization improves.
Key issues to watch out Ø Update on resolution of USFDA warning letter and 483 observations on
Halol. Ø Turnaround of Ranbaxy’s business. Ø Outlook on competitive landscape for Taro’s products.
Bloomberg SUNP IN
Equity Shares (m) 2399.3 M. Cap. (INR b)/(USD b) 1233 / 19 52-Week Range (INR) 772 / 433
1,6,12 Rel Perf. (%) 5 / -31 / -44
Financial Snapshot (INR Billion) Y/E MARCH 2017 2018E 2019E 2020E
Sales 302.6 279.7 321.7 366.3
EBITDA 87.8 55.4 78.7 96.8
NP 69.6 36.3 55.9 65.4
EPS (INR) 28.9 15.1 23.3 27.2
EPS Gro. (%) 48.0 -47.9 54.3 17.0
BV/Sh. (INR) 152.3 160.4 176.6 196.8
RoE (%) 18.1 9.6 13.8 14.6
RoCE (%) 19.0 10.0 14.2 15.7
Valuations
P/E (x) 19.7 34.1 22.1 18.9
P/BV (x) 3.4 3.2 2.9 2.6
EV/EBITDA (x) 13.2 20.3 13.7 10.7
D.Yield (%) 0.7 1.2 1.2 1.2
September 2017 Results Preview | Sector: Healthcare
Sun Pharma
14 November 2017 35
1. AXIS BANK : To focus on growth opportunities; Shikha Sharma, MD & CEO n Have raised capital in the past with a three-year cycle with an intent not to
come to the market too often. The current capital raising is also with that cycle in mind and assuming growth would come back, this raise would suffice.
n Plan for capital raising was done with three things in mind – Indian accounting standards (IndAS) provisioning, growth and subsidiary capitalization.
n Largest portion of the raised capital plus the one that is internally generated over three-years would be utilised for growth.
n Bain Capital will be short of 5 percent equity in the bank even on fully diluted basis and will have the right to ask for a seat on the board.
n Bank has always strived to be a good bank, be a bank that services customers, to be a bank that has strong capabilities. Being a no. 1 bank or no.2 bank is not the big driver – the big driver is – to see that bank has a great franchise, has enough growth opportunities and is creating value for shareholders.
2. M&M : Passenger vehicle segment will see double-digit growth for FY18; VS Parthasarathy, CFO n Passenger vehicle segment will see double-digit growth for FY18, there is a
bounce back in the rural demand on a back of a good monsoons and pick-up in rural demand.
n In automotive business with more new products on the anvil, looking towards the second half of the year with a lot of positivity.
n Margins were higher due to good performance of both tractor and auto divisions. Also saw margin improvement due to higher realizations.
n There was no one-off in Q2 margin, likely to sustain going forward.
3. JAIN IRRIGATION : Expect to list agro biz in FY19; aim to achieve guided rev growth; Anil Jain, MD n Reduction in net profit was due to higher depreciation and some tax issues but
overall in the year that issue will get compensated. However, the second half is expected to be strong on good orderbook.
n Company is on track to achieve the guided revenue growth of 20 percent in FY18.
n To achieve the guided EBITDA growth of 20-25 percent, Q3 and Q4 needs to grow 25-30 percent more in terms of revenues. Orders in hand will allow company to achieve the guided EBITDA growth as well.
n At India level the order book is around Rs 2200 crore and consolidated order book is at Rs 3900 crore.
n The second quarter saw some disruptions due to goods and service tax (GST). n With regards to food processing business, overall outlook was quite strong. n Company plans to list agro business in FY19. n Company's MIS division has bagged an order for prestigious Waghur canal
integrated irrigation project through e-tendering process.
In conversation
14 November 2017 36
4. ASHOKA BUILDCON : AIM to achieve 20% growth in fy18; bid scenario robust; Paresh Mehta, CFO n There was slowdown on the EPC front due to stoppage in an important project
of Eastern Peripheral road in Delhi. However, was a one-off impact and project is now back on track. Will be completed before January.
n The other setback was the GST impact on power sector in recognition of prices with the vendors. This too has been brought back into flow and the performance will continue to grow.
n Despite these setbacks the company has achieved their targeted first half growth and will achieve the targeted 20 percent growth in FY18.
n Second half continues to be promising from whatever bids are expected to come out. There are bids of Rs 62000 crore from NHAI and others, where will be participating in more than 60 percent of the bids. By March end, would likely wrap up Rs 3000-3500 crore.
5. EVEREADY INDIA : Lighting & appliances to drive growth; CFL to phase out post Q3; Amritanshu Khaitan, MD n Most of the growth came because of volumes on back of recovery seen in the
battery segment, in the flashlights and the biggest in LED lightings. n Of the overall revenues of Rs 740 crore, batteries constitute about 55 percent,
lighting & appliance is close to 30 percent and the rest is flash lights. n CFL is virtually being phased out and Q3 will be the last quarter where company
will be selling it. n The profitability in the LED lighting segment has been the strongest. n Second half will continue to see strong growth in terms of revenues. So, lighting
and appliance are slated to take the company forward on a strong path in terms of revenue growth, while battery and flashlights are likely to be stable.
14 November 2017 37
1. GST Clears a hurdle, but tougher challenges await n Last Friday, the verbal slugfest between the Bharatiya Janata Party (BJP) and the
Congress, both in the run-up to and after the meeting of the goods and services tax (GST) Council in Guwahati, all but hijacked the narrative. For any lay person, listening in on this political grandstanding, it would seem as though the entire meeting was about the slashing of GST rates for over 200 commodities and as to which of the two parties deserve the credit—understandable since the Congress has made GST, especially the glitches in its implementation, a central issue in the ongoing electoral campaign for the Gujarat assembly. Indeed the facts of the matter, as always, are otherwise. More importantly, the political differences didn’t derail the day-long deliberations. Actually it almost did, when tempers frayed over some of the social media messages put out by some Congress politicians.
2. Taking bank recapitalisation to its logical conclusion n India’s decisive public sector bank (PSB) recapitalisation plan has been met with
a big thumbs-up by markets. The PSU Bank equity index jumped 30% on the news and, almost three weeks later, has held on to all those gains. And why not? In one fell swoop, the government committed more capital than it has cumulatively done over the past decade. Furthermore, this front-loaded commitment brings a much-needed coherence to the resolution process, with banks hopefully becoming more willing to take the large haircuts that are needed to effectively resolve impaired assets. Both for the decisive recapitalisation and the growing invocation of the bankruptcy law, policymakers need to be strongly commended. But to appreciate the broader macroeconomic implications, one has to dig deeper. Has enough “resolution capital” been provided to adequately solve the problem? Has enough “growth capital” been provided to boost PSB lending—which is the whole point of the exercise?
3. India needs a federal green agency n The thick smog that has enveloped north India over the past few days is a public
health emergency. The callous response by various government agencies to what has become an annual affair is nothing short of scandalous. There is a deeper problem here. As every state blames the other, the weak policy response is also an indication of an institutional vacuum to deal with public goods issues in a federal political system. The story so far is well known. Citizens living in the National Capital Region are among the millions who have been left gasping as farmers in neighbouring states burn stubble on their farms, before preparing them for the winter sowing cycle. The immediate responses include calls for a ban on such biomass burning. However, as Mridula Ramesh of the Sundaram Climate Institute has written in Firstpost, a far better alternative to a unilateral ban is to examine solutions based on an understanding of why farmers burn stubble in the first place. Any viable policy response should take into account the needs of the farmers as well as city dwellers.
From the think tank
14 November 2017 38
4. GOLD DEMAND IN INDIA: Here is what killed the craze for the yellow metal
n Given how global growth prospects are looking a lot firmer than in the past, and even Europe looks more stable now, it is not surprising that demand for gold has been trending downwards for some time and is now at an eight-year low, according to data from the World Gold Council. Down to just 915 tonnes in the quarter ending September 2017, this level was last seen in the September quarter of 2009—in even the June quarter of 2016, demand was a robust 1,270 tonnes. While global growth steadying has been one reason for gold demand falling, another big reason is the collapse in demand from India that accounts for a fifth to a fourth of global demand—in the March quarter of 2012, for instance, India’s imports were 23% of global demand whereas in the September quarter of 2017, this fell to 19%.
International 5. The real risk to the global economy n One of the great mysteries of today’s global markets is their irrepressible
enthusiasm, even as the world around them appears on the verge of chaos or collapse. And yet, investors may be more rational than they appear when it comes to pricing in political risks. If investing is foremost about discounting future cash flows, it’s important to focus precisely on what will and will not affect those calculations. The potential crises that may be most dramatic or violent are, ironically, the ones that the market has the easiest time looking through. Far more dangerous are gradual shifts in international global institutions that upend expectations about how key players will behave. Such shifts may emerge only slowly, but they can fundamentally change the calculus for pricing in risks and potential returns.
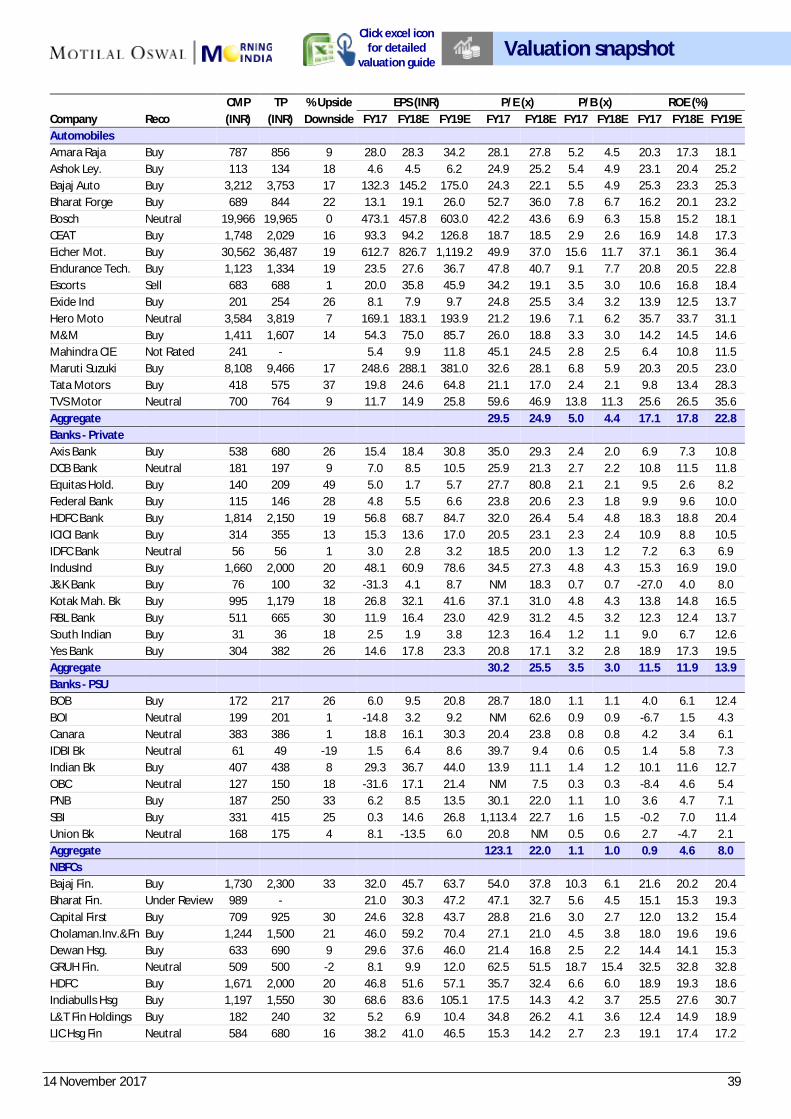
14 November 2017 39
CMP TP % Upside EPS (INR) P/E (x) P/B (x) ROE (%) Company Reco (INR) (INR) Downside FY17 FY18E FY19E FY17 FY18E FY17 FY18E FY17 FY18E FY19E Automobiles Amara Raja Buy 787 856 9 28.0 28.3 34.2 28.1 27.8 5.2 4.5 20.3 17.3 18.1 Ashok Ley. Buy 113 134 18 4.6 4.5 6.2 24.9 25.2 5.4 4.9 23.1 20.4 25.2 Bajaj Auto Buy 3,212 3,753 17 132.3 145.2 175.0 24.3 22.1 5.5 4.9 25.3 23.3 25.3 Bharat Forge Buy 689 844 22 13.1 19.1 26.0 52.7 36.0 7.8 6.7 16.2 20.1 23.2 Bosch Neutral 19,966 19,965 0 473.1 457.8 603.0 42.2 43.6 6.9 6.3 15.8 15.2 18.1 CEAT Buy 1,748 2,029 16 93.3 94.2 126.8 18.7 18.5 2.9 2.6 16.9 14.8 17.3 Eicher Mot. Buy 30,562 36,487 19 612.7 826.7 1,119.2 49.9 37.0 15.6 11.7 37.1 36.1 36.4 Endurance Tech. Buy 1,123 1,334 19 23.5 27.6 36.7 47.8 40.7 9.1 7.7 20.8 20.5 22.8 Escorts Sell 683 688 1 20.0 35.8 45.9 34.2 19.1 3.5 3.0 10.6 16.8 18.4 Exide Ind Buy 201 254 26 8.1 7.9 9.7 24.8 25.5 3.4 3.2 13.9 12.5 13.7 Hero Moto Neutral 3,584 3,819 7 169.1 183.1 193.9 21.2 19.6 7.1 6.2 35.7 33.7 31.1 M&M Buy 1,411 1,607 14 54.3 75.0 85.7 26.0 18.8 3.3 3.0 14.2 14.5 14.6 Mahindra CIE Not Rated 241 - 5.4 9.9 11.8 45.1 24.5 2.8 2.5 6.4 10.8 11.5 Maruti Suzuki Buy 8,108 9,466 17 248.6 288.1 381.0 32.6 28.1 6.8 5.9 20.3 20.5 23.0 Tata Motors Buy 418 575 37 19.8 24.6 64.8 21.1 17.0 2.4 2.1 9.8 13.4 28.3 TVS Motor Neutral 700 764 9 11.7 14.9 25.8 59.6 46.9 13.8 11.3 25.6 26.5 35.6 Aggregate 29.5 24.9 5.0 4.4 17.1 17.8 22.8 Banks - Private Axis Bank Buy 538 680 26 15.4 18.4 30.8 35.0 29.3 2.4 2.0 6.9 7.3 10.8 DCB Bank Neutral 181 197 9 7.0 8.5 10.5 25.9 21.3 2.7 2.2 10.8 11.5 11.8 Equitas Hold. Buy 140 209 49 5.0 1.7 5.7 27.7 80.8 2.1 2.1 9.5 2.6 8.2 Federal Bank Buy 115 146 28 4.8 5.5 6.6 23.8 20.6 2.3 1.8 9.9 9.6 10.0 HDFC Bank Buy 1,814 2,150 19 56.8 68.7 84.7 32.0 26.4 5.4 4.8 18.3 18.8 20.4 ICICI Bank Buy 314 355 13 15.3 13.6 17.0 20.5 23.1 2.3 2.4 10.9 8.8 10.5 IDFC Bank Neutral 56 56 1 3.0 2.8 3.2 18.5 20.0 1.3 1.2 7.2 6.3 6.9 IndusInd Buy 1,660 2,000 20 48.1 60.9 78.6 34.5 27.3 4.8 4.3 15.3 16.9 19.0 J&K Bank Buy 76 100 32 -31.3 4.1 8.7 NM 18.3 0.7 0.7 -27.0 4.0 8.0 Kotak Mah. Bk Buy 995 1,179 18 26.8 32.1 41.6 37.1 31.0 4.8 4.3 13.8 14.8 16.5 RBL Bank Buy 511 665 30 11.9 16.4 23.0 42.9 31.2 4.5 3.2 12.3 12.4 13.7 South Indian Buy 31 36 18 2.5 1.9 3.8 12.3 16.4 1.2 1.1 9.0 6.7 12.6 Yes Bank Buy 304 382 26 14.6 17.8 23.3 20.8 17.1 3.2 2.8 18.9 17.3 19.5 Aggregate 30.2 25.5 3.5 3.0 11.5 11.9 13.9 Banks - PSU BOB Buy 172 217 26 6.0 9.5 20.8 28.7 18.0 1.1 1.1 4.0 6.1 12.4 BOI Neutral 199 201 1 -14.8 3.2 9.2 NM 62.6 0.9 0.9 -6.7 1.5 4.3 Canara Neutral 383 386 1 18.8 16.1 30.3 20.4 23.8 0.8 0.8 4.2 3.4 6.1 IDBI Bk Neutral 61 49 -19 1.5 6.4 8.6 39.7 9.4 0.6 0.5 1.4 5.8 7.3 Indian Bk Buy 407 438 8 29.3 36.7 44.0 13.9 11.1 1.4 1.2 10.1 11.6 12.7 OBC Neutral 127 150 18 -31.6 17.1 21.4 NM 7.5 0.3 0.3 -8.4 4.6 5.4 PNB Buy 187 250 33 6.2 8.5 13.5 30.1 22.0 1.1 1.0 3.6 4.7 7.1 SBI Buy 331 415 25 0.3 14.6 26.8 1,113.4 22.7 1.6 1.5 -0.2 7.0 11.4 Union Bk Neutral 168 175 4 8.1 -13.5 6.0 20.8 NM 0.5 0.6 2.7 -4.7 2.1 Aggregate 123.1 22.0 1.1 1.0 0.9 4.6 8.0 NBFCs Bajaj Fin. Buy 1,730 2,300 33 32.0 45.7 63.7 54.0 37.8 10.3 6.1 21.6 20.2 20.4 Bharat Fin. Under Review 989 - 21.0 30.3 47.2 47.1 32.7 5.6 4.5 15.1 15.3 19.3 Capital First Buy 709 925 30 24.6 32.8 43.7 28.8 21.6 3.0 2.7 12.0 13.2 15.4 Cholaman.Inv.&Fn Buy 1,244 1,500 21 46.0 59.2 70.4 27.1 21.0 4.5 3.8 18.0 19.6 19.6 Dewan Hsg. Buy 633 690 9 29.6 37.6 46.0 21.4 16.8 2.5 2.2 14.4 14.1 15.3 GRUH Fin. Neutral 509 500 -2 8.1 9.9 12.0 62.5 51.5 18.7 15.4 32.5 32.8 32.8 HDFC Buy 1,671 2,000 20 46.8 51.6 57.1 35.7 32.4 6.6 6.0 18.9 19.3 18.6 Indiabulls Hsg Buy 1,197 1,550 30 68.6 83.6 105.1 17.5 14.3 4.2 3.7 25.5 27.6 30.7 L&T Fin Holdings Buy 182 240 32 5.2 6.9 10.4 34.8 26.2 4.1 3.6 12.4 14.9 18.9 LIC Hsg Fin Neutral 584 680 16 38.2 41.0 46.5 15.3 14.2 2.7 2.3 19.1 17.4 17.2
Valuation snapshot Click excel icon
for detailed valuation guide
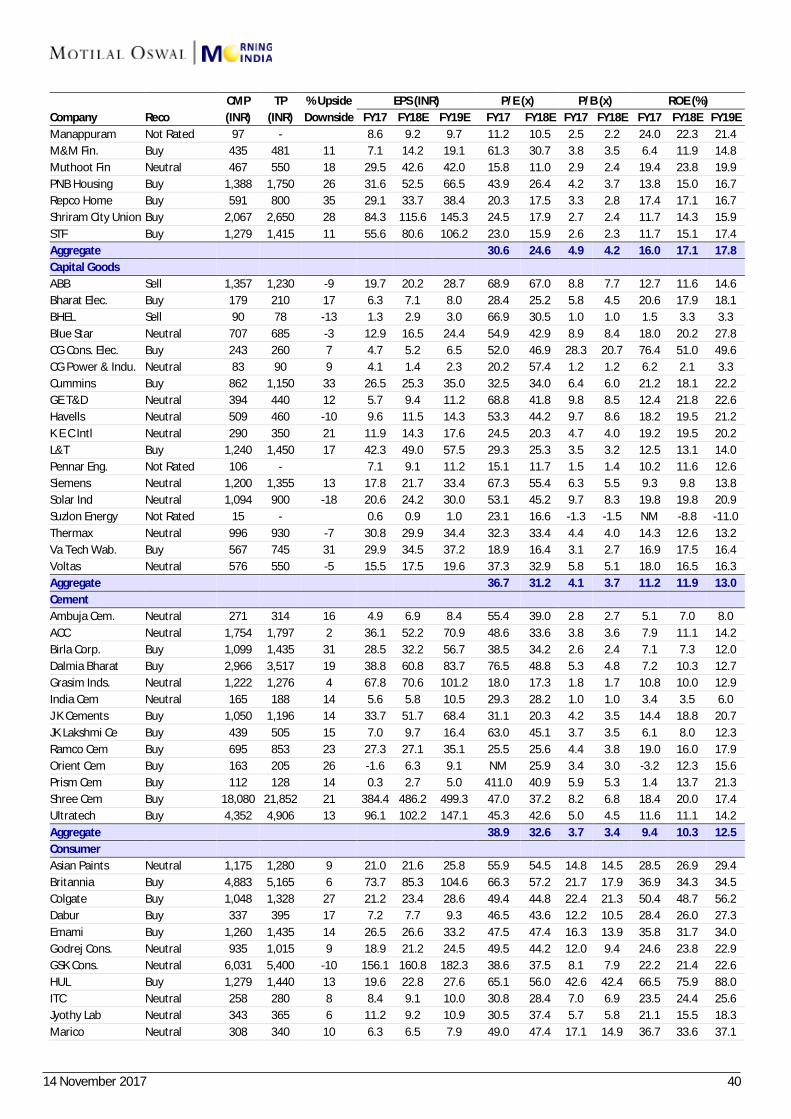
14 November 2017 40
CMP TP % Upside EPS (INR) P/E (x) P/B (x) ROE (%) Company Reco (INR) (INR) Downside FY17 FY18E FY19E FY17 FY18E FY17 FY18E FY17 FY18E FY19E Manappuram Not Rated 97 - 8.6 9.2 9.7 11.2 10.5 2.5 2.2 24.0 22.3 21.4 M&M Fin. Buy 435 481 11 7.1 14.2 19.1 61.3 30.7 3.8 3.5 6.4 11.9 14.8 Muthoot Fin Neutral 467 550 18 29.5 42.6 42.0 15.8 11.0 2.9 2.4 19.4 23.8 19.9 PNB Housing Buy 1,388 1,750 26 31.6 52.5 66.5 43.9 26.4 4.2 3.7 13.8 15.0 16.7 Repco Home Buy 591 800 35 29.1 33.7 38.4 20.3 17.5 3.3 2.8 17.4 17.1 16.7 Shriram City Union Buy 2,067 2,650 28 84.3 115.6 145.3 24.5 17.9 2.7 2.4 11.7 14.3 15.9 STF Buy 1,279 1,415 11 55.6 80.6 106.2 23.0 15.9 2.6 2.3 11.7 15.1 17.4 Aggregate 30.6 24.6 4.9 4.2 16.0 17.1 17.8 Capital Goods ABB Sell 1,357 1,230 -9 19.7 20.2 28.7 68.9 67.0 8.8 7.7 12.7 11.6 14.6 Bharat Elec. Buy 179 210 17 6.3 7.1 8.0 28.4 25.2 5.8 4.5 20.6 17.9 18.1 BHEL Sell 90 78 -13 1.3 2.9 3.0 66.9 30.5 1.0 1.0 1.5 3.3 3.3 Blue Star Neutral 707 685 -3 12.9 16.5 24.4 54.9 42.9 8.9 8.4 18.0 20.2 27.8 CG Cons. Elec. Buy 243 260 7 4.7 5.2 6.5 52.0 46.9 28.3 20.7 76.4 51.0 49.6 CG Power & Indu. Neutral 83 90 9 4.1 1.4 2.3 20.2 57.4 1.2 1.2 6.2 2.1 3.3 Cummins Buy 862 1,150 33 26.5 25.3 35.0 32.5 34.0 6.4 6.0 21.2 18.1 22.2 GE T&D Neutral 394 440 12 5.7 9.4 11.2 68.8 41.8 9.8 8.5 12.4 21.8 22.6 Havells Neutral 509 460 -10 9.6 11.5 14.3 53.3 44.2 9.7 8.6 18.2 19.5 21.2 K E C Intl Neutral 290 350 21 11.9 14.3 17.6 24.5 20.3 4.7 4.0 19.2 19.5 20.2 L&T Buy 1,240 1,450 17 42.3 49.0 57.5 29.3 25.3 3.5 3.2 12.5 13.1 14.0 Pennar Eng. Not Rated 106 - 7.1 9.1 11.2 15.1 11.7 1.5 1.4 10.2 11.6 12.6 Siemens Neutral 1,200 1,355 13 17.8 21.7 33.4 67.3 55.4 6.3 5.5 9.3 9.8 13.8 Solar Ind Neutral 1,094 900 -18 20.6 24.2 30.0 53.1 45.2 9.7 8.3 19.8 19.8 20.9 Suzlon Energy Not Rated 15 - 0.6 0.9 1.0 23.1 16.6 -1.3 -1.5 NM -8.8 -11.0 Thermax Neutral 996 930 -7 30.8 29.9 34.4 32.3 33.4 4.4 4.0 14.3 12.6 13.2 Va Tech Wab. Buy 567 745 31 29.9 34.5 37.2 18.9 16.4 3.1 2.7 16.9 17.5 16.4 Voltas Neutral 576 550 -5 15.5 17.5 19.6 37.3 32.9 5.8 5.1 18.0 16.5 16.3 Aggregate 36.7 31.2 4.1 3.7 11.2 11.9 13.0 Cement Ambuja Cem. Neutral 271 314 16 4.9 6.9 8.4 55.4 39.0 2.8 2.7 5.1 7.0 8.0 ACC Neutral 1,754 1,797 2 36.1 52.2 70.9 48.6 33.6 3.8 3.6 7.9 11.1 14.2 Birla Corp. Buy 1,099 1,435 31 28.5 32.2 56.7 38.5 34.2 2.6 2.4 7.1 7.3 12.0 Dalmia Bharat Buy 2,966 3,517 19 38.8 60.8 83.7 76.5 48.8 5.3 4.8 7.2 10.3 12.7 Grasim Inds. Neutral 1,222 1,276 4 67.8 70.6 101.2 18.0 17.3 1.8 1.7 10.8 10.0 12.9 India Cem Neutral 165 188 14 5.6 5.8 10.5 29.3 28.2 1.0 1.0 3.4 3.5 6.0 J K Cements Buy 1,050 1,196 14 33.7 51.7 68.4 31.1 20.3 4.2 3.5 14.4 18.8 20.7 JK Lakshmi Ce Buy 439 505 15 7.0 9.7 16.4 63.0 45.1 3.7 3.5 6.1 8.0 12.3 Ramco Cem Buy 695 853 23 27.3 27.1 35.1 25.5 25.6 4.4 3.8 19.0 16.0 17.9 Orient Cem Buy 163 205 26 -1.6 6.3 9.1 NM 25.9 3.4 3.0 -3.2 12.3 15.6 Prism Cem Buy 112 128 14 0.3 2.7 5.0 411.0 40.9 5.9 5.3 1.4 13.7 21.3 Shree Cem Buy 18,080 21,852 21 384.4 486.2 499.3 47.0 37.2 8.2 6.8 18.4 20.0 17.4 Ultratech Buy 4,352 4,906 13 96.1 102.2 147.1 45.3 42.6 5.0 4.5 11.6 11.1 14.2 Aggregate 38.9 32.6 3.7 3.4 9.4 10.3 12.5 Consumer Asian Paints Neutral 1,175 1,280 9 21.0 21.6 25.8 55.9 54.5 14.8 14.5 28.5 26.9 29.4 Britannia Buy 4,883 5,165 6 73.7 85.3 104.6 66.3 57.2 21.7 17.9 36.9 34.3 34.5 Colgate Buy 1,048 1,328 27 21.2 23.4 28.6 49.4 44.8 22.4 21.3 50.4 48.7 56.2 Dabur Buy 337 395 17 7.2 7.7 9.3 46.5 43.6 12.2 10.5 28.4 26.0 27.3 Emami Buy 1,260 1,435 14 26.5 26.6 33.2 47.5 47.4 16.3 13.9 35.8 31.7 34.0 Godrej Cons. Neutral 935 1,015 9 18.9 21.2 24.5 49.5 44.2 12.0 9.4 24.6 23.8 22.9 GSK Cons. Neutral 6,031 5,400 -10 156.1 160.8 182.3 38.6 37.5 8.1 7.9 22.2 21.4 22.6 HUL Buy 1,279 1,440 13 19.6 22.8 27.6 65.1 56.0 42.6 42.4 66.5 75.9 88.0 ITC Neutral 258 280 8 8.4 9.1 10.0 30.8 28.4 7.0 6.9 23.5 24.4 25.6 Jyothy Lab Neutral 343 365 6 11.2 9.2 10.9 30.5 37.4 5.7 5.8 21.1 15.5 18.3 Marico Neutral 308 340 10 6.3 6.5 7.9 49.0 47.4 17.1 14.9 36.7 33.6 37.1
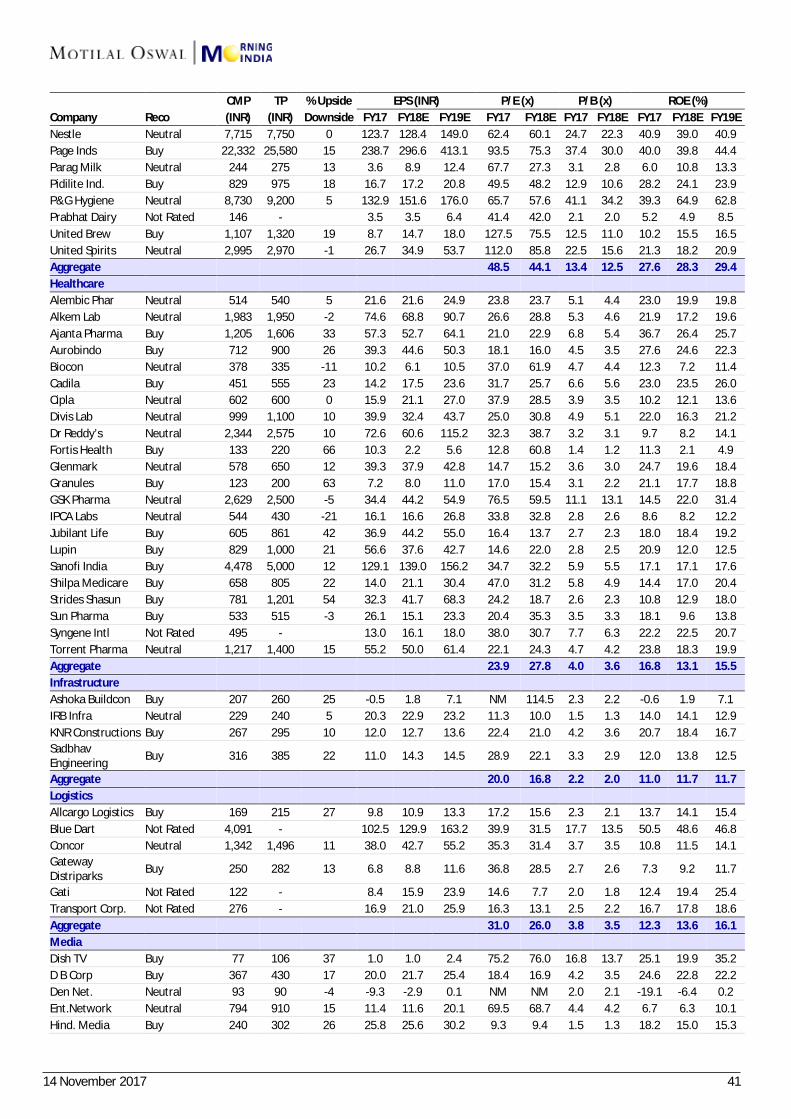
14 November 2017 41
CMP TP % Upside EPS (INR) P/E (x) P/B (x) ROE (%) Company Reco (INR) (INR) Downside FY17 FY18E FY19E FY17 FY18E FY17 FY18E FY17 FY18E FY19E Nestle Neutral 7,715 7,750 0 123.7 128.4 149.0 62.4 60.1 24.7 22.3 40.9 39.0 40.9 Page Inds Buy 22,332 25,580 15 238.7 296.6 413.1 93.5 75.3 37.4 30.0 40.0 39.8 44.4 Parag Milk Neutral 244 275 13 3.6 8.9 12.4 67.7 27.3 3.1 2.8 6.0 10.8 13.3 Pidilite Ind. Buy 829 975 18 16.7 17.2 20.8 49.5 48.2 12.9 10.6 28.2 24.1 23.9 P&G Hygiene Neutral 8,730 9,200 5 132.9 151.6 176.0 65.7 57.6 41.1 34.2 39.3 64.9 62.8 Prabhat Dairy Not Rated 146 - 3.5 3.5 6.4 41.4 42.0 2.1 2.0 5.2 4.9 8.5 United Brew Buy 1,107 1,320 19 8.7 14.7 18.0 127.5 75.5 12.5 11.0 10.2 15.5 16.5 United Spirits Neutral 2,995 2,970 -1 26.7 34.9 53.7 112.0 85.8 22.5 15.6 21.3 18.2 20.9 Aggregate 48.5 44.1 13.4 12.5 27.6 28.3 29.4 Healthcare Alembic Phar Neutral 514 540 5 21.6 21.6 24.9 23.8 23.7 5.1 4.4 23.0 19.9 19.8 Alkem Lab Neutral 1,983 1,950 -2 74.6 68.8 90.7 26.6 28.8 5.3 4.6 21.9 17.2 19.6 Ajanta Pharma Buy 1,205 1,606 33 57.3 52.7 64.1 21.0 22.9 6.8 5.4 36.7 26.4 25.7 Aurobindo Buy 712 900 26 39.3 44.6 50.3 18.1 16.0 4.5 3.5 27.6 24.6 22.3 Biocon Neutral 378 335 -11 10.2 6.1 10.5 37.0 61.9 4.7 4.4 12.3 7.2 11.4 Cadila Buy 451 555 23 14.2 17.5 23.6 31.7 25.7 6.6 5.6 23.0 23.5 26.0 Cipla Neutral 602 600 0 15.9 21.1 27.0 37.9 28.5 3.9 3.5 10.2 12.1 13.6 Divis Lab Neutral 999 1,100 10 39.9 32.4 43.7 25.0 30.8 4.9 5.1 22.0 16.3 21.2 Dr Reddy’s Neutral 2,344 2,575 10 72.6 60.6 115.2 32.3 38.7 3.2 3.1 9.7 8.2 14.1 Fortis Health Buy 133 220 66 10.3 2.2 5.6 12.8 60.8 1.4 1.2 11.3 2.1 4.9 Glenmark Neutral 578 650 12 39.3 37.9 42.8 14.7 15.2 3.6 3.0 24.7 19.6 18.4 Granules Buy 123 200 63 7.2 8.0 11.0 17.0 15.4 3.1 2.2 21.1 17.7 18.8 GSK Pharma Neutral 2,629 2,500 -5 34.4 44.2 54.9 76.5 59.5 11.1 13.1 14.5 22.0 31.4 IPCA Labs Neutral 544 430 -21 16.1 16.6 26.8 33.8 32.8 2.8 2.6 8.6 8.2 12.2 Jubilant Life Buy 605 861 42 36.9 44.2 55.0 16.4 13.7 2.7 2.3 18.0 18.4 19.2 Lupin Buy 829 1,000 21 56.6 37.6 42.7 14.6 22.0 2.8 2.5 20.9 12.0 12.5 Sanofi India Buy 4,478 5,000 12 129.1 139.0 156.2 34.7 32.2 5.9 5.5 17.1 17.1 17.6 Shilpa Medicare Buy 658 805 22 14.0 21.1 30.4 47.0 31.2 5.8 4.9 14.4 17.0 20.4 Strides Shasun Buy 781 1,201 54 32.3 41.7 68.3 24.2 18.7 2.6 2.3 10.8 12.9 18.0 Sun Pharma Buy 533 515 -3 26.1 15.1 23.3 20.4 35.3 3.5 3.3 18.1 9.6 13.8 Syngene Intl Not Rated 495 - 13.0 16.1 18.0 38.0 30.7 7.7 6.3 22.2 22.5 20.7 Torrent Pharma Neutral 1,217 1,400 15 55.2 50.0 61.4 22.1 24.3 4.7 4.2 23.8 18.3 19.9 Aggregate 23.9 27.8 4.0 3.6 16.8 13.1 15.5 Infrastructure Ashoka Buildcon Buy 207 260 25 -0.5 1.8 7.1 NM 114.5 2.3 2.2 -0.6 1.9 7.1 IRB Infra Neutral 229 240 5 20.3 22.9 23.2 11.3 10.0 1.5 1.3 14.0 14.1 12.9 KNR Constructions Buy 267 295 10 12.0 12.7 13.6 22.4 21.0 4.2 3.6 20.7 18.4 16.7 Sadbhav Engineering Buy 316 385 22 11.0 14.3 14.5 28.9 22.1 3.3 2.9 12.0 13.8 12.5
Aggregate 20.0 16.8 2.2 2.0 11.0 11.7 11.7 Logistics Allcargo Logistics Buy 169 215 27 9.8 10.9 13.3 17.2 15.6 2.3 2.1 13.7 14.1 15.4 Blue Dart Not Rated 4,091 - 102.5 129.9 163.2 39.9 31.5 17.7 13.5 50.5 48.6 46.8 Concor Neutral 1,342 1,496 11 38.0 42.7 55.2 35.3 31.4 3.7 3.5 10.8 11.5 14.1 Gateway Distriparks Buy 250 282 13 6.8 8.8 11.6 36.8 28.5 2.7 2.6 7.3 9.2 11.7
Gati Not Rated 122 - 8.4 15.9 23.9 14.6 7.7 2.0 1.8 12.4 19.4 25.4 Transport Corp. Not Rated 276 - 16.9 21.0 25.9 16.3 13.1 2.5 2.2 16.7 17.8 18.6 Aggregate 31.0 26.0 3.8 3.5 12.3 13.6 16.1 Media Dish TV Buy 77 106 37 1.0 1.0 2.4 75.2 76.0 16.8 13.7 25.1 19.9 35.2 D B Corp Buy 367 430 17 20.0 21.7 25.4 18.4 16.9 4.2 3.5 24.6 22.8 22.2 Den Net. Neutral 93 90 -4 -9.3 -2.9 0.1 NM NM 2.0 2.1 -19.1 -6.4 0.2 Ent.Network Neutral 794 910 15 11.4 11.6 20.1 69.5 68.7 4.4 4.2 6.7 6.3 10.1 Hind. Media Buy 240 302 26 25.8 25.6 30.2 9.3 9.4 1.5 1.3 18.2 15.0 15.3
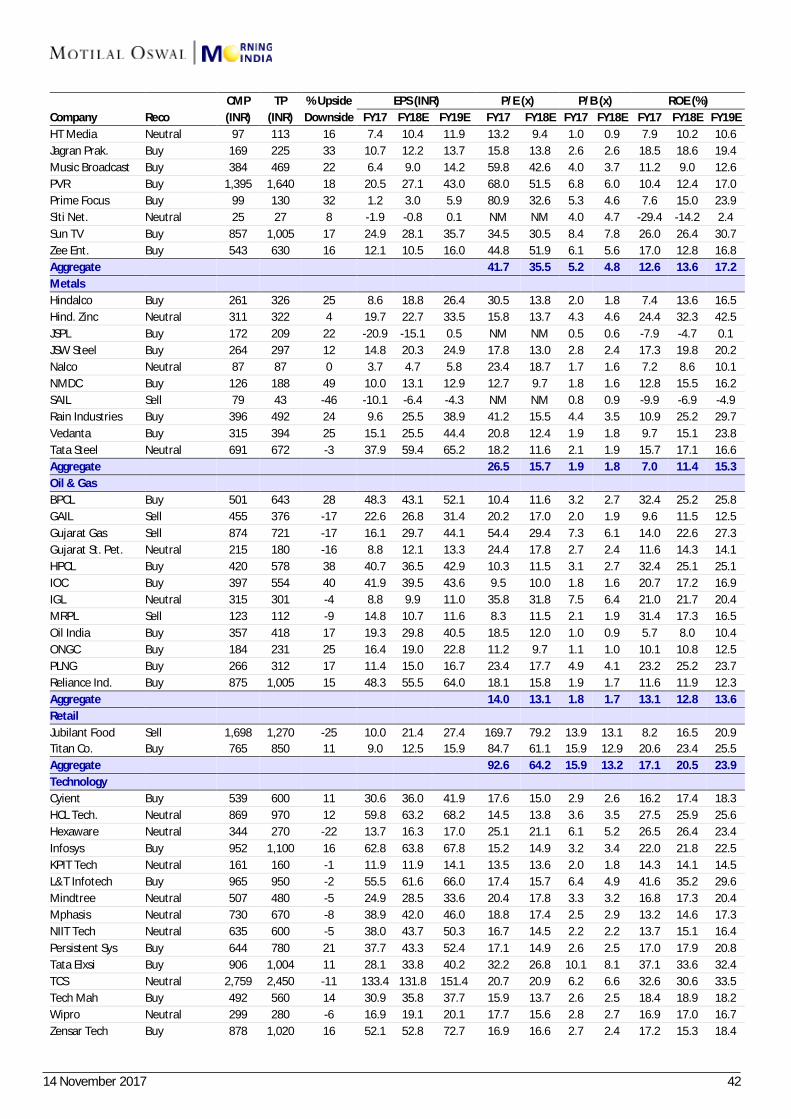
14 November 2017 42
CMP TP % Upside EPS (INR) P/E (x) P/B (x) ROE (%) Company Reco (INR) (INR) Downside FY17 FY18E FY19E FY17 FY18E FY17 FY18E FY17 FY18E FY19E HT Media Neutral 97 113 16 7.4 10.4 11.9 13.2 9.4 1.0 0.9 7.9 10.2 10.6 Jagran Prak. Buy 169 225 33 10.7 12.2 13.7 15.8 13.8 2.6 2.6 18.5 18.6 19.4 Music Broadcast Buy 384 469 22 6.4 9.0 14.2 59.8 42.6 4.0 3.7 11.2 9.0 12.6 PVR Buy 1,395 1,640 18 20.5 27.1 43.0 68.0 51.5 6.8 6.0 10.4 12.4 17.0 Prime Focus Buy 99 130 32 1.2 3.0 5.9 80.9 32.6 5.3 4.6 7.6 15.0 23.9 Siti Net. Neutral 25 27 8 -1.9 -0.8 0.1 NM NM 4.0 4.7 -29.4 -14.2 2.4 Sun TV Buy 857 1,005 17 24.9 28.1 35.7 34.5 30.5 8.4 7.8 26.0 26.4 30.7 Zee Ent. Buy 543 630 16 12.1 10.5 16.0 44.8 51.9 6.1 5.6 17.0 12.8 16.8 Aggregate 41.7 35.5 5.2 4.8 12.6 13.6 17.2 Metals Hindalco Buy 261 326 25 8.6 18.8 26.4 30.5 13.8 2.0 1.8 7.4 13.6 16.5 Hind. Zinc Neutral 311 322 4 19.7 22.7 33.5 15.8 13.7 4.3 4.6 24.4 32.3 42.5 JSPL Buy 172 209 22 -20.9 -15.1 0.5 NM NM 0.5 0.6 -7.9 -4.7 0.1 JSW Steel Buy 264 297 12 14.8 20.3 24.9 17.8 13.0 2.8 2.4 17.3 19.8 20.2 Nalco Neutral 87 87 0 3.7 4.7 5.8 23.4 18.7 1.7 1.6 7.2 8.6 10.1 NMDC Buy 126 188 49 10.0 13.1 12.9 12.7 9.7 1.8 1.6 12.8 15.5 16.2 SAIL Sell 79 43 -46 -10.1 -6.4 -4.3 NM NM 0.8 0.9 -9.9 -6.9 -4.9 Rain Industries Buy 396 492 24 9.6 25.5 38.9 41.2 15.5 4.4 3.5 10.9 25.2 29.7 Vedanta Buy 315 394 25 15.1 25.5 44.4 20.8 12.4 1.9 1.8 9.7 15.1 23.8 Tata Steel Neutral 691 672 -3 37.9 59.4 65.2 18.2 11.6 2.1 1.9 15.7 17.1 16.6 Aggregate 26.5 15.7 1.9 1.8 7.0 11.4 15.3 Oil & Gas BPCL Buy 501 643 28 48.3 43.1 52.1 10.4 11.6 3.2 2.7 32.4 25.2 25.8 GAIL Sell 455 376 -17 22.6 26.8 31.4 20.2 17.0 2.0 1.9 9.6 11.5 12.5 Gujarat Gas Sell 874 721 -17 16.1 29.7 44.1 54.4 29.4 7.3 6.1 14.0 22.6 27.3 Gujarat St. Pet. Neutral 215 180 -16 8.8 12.1 13.3 24.4 17.8 2.7 2.4 11.6 14.3 14.1 HPCL Buy 420 578 38 40.7 36.5 42.9 10.3 11.5 3.1 2.7 32.4 25.1 25.1 IOC Buy 397 554 40 41.9 39.5 43.6 9.5 10.0 1.8 1.6 20.7 17.2 16.9 IGL Neutral 315 301 -4 8.8 9.9 11.0 35.8 31.8 7.5 6.4 21.0 21.7 20.4 MRPL Sell 123 112 -9 14.8 10.7 11.6 8.3 11.5 2.1 1.9 31.4 17.3 16.5 Oil India Buy 357 418 17 19.3 29.8 40.5 18.5 12.0 1.0 0.9 5.7 8.0 10.4 ONGC Buy 184 231 25 16.4 19.0 22.8 11.2 9.7 1.1 1.0 10.1 10.8 12.5 PLNG Buy 266 312 17 11.4 15.0 16.7 23.4 17.7 4.9 4.1 23.2 25.2 23.7 Reliance Ind. Buy 875 1,005 15 48.3 55.5 64.0 18.1 15.8 1.9 1.7 11.6 11.9 12.3 Aggregate 14.0 13.1 1.8 1.7 13.1 12.8 13.6 Retail Jubilant Food Sell 1,698 1,270 -25 10.0 21.4 27.4 169.7 79.2 13.9 13.1 8.2 16.5 20.9 Titan Co. Buy 765 850 11 9.0 12.5 15.9 84.7 61.1 15.9 12.9 20.6 23.4 25.5 Aggregate 92.6 64.2 15.9 13.2 17.1 20.5 23.9 Technology Cyient Buy 539 600 11 30.6 36.0 41.9 17.6 15.0 2.9 2.6 16.2 17.4 18.3 HCL Tech. Neutral 869 970 12 59.8 63.2 68.2 14.5 13.8 3.6 3.5 27.5 25.9 25.6 Hexaware Neutral 344 270 -22 13.7 16.3 17.0 25.1 21.1 6.1 5.2 26.5 26.4 23.4 Infosys Buy 952 1,100 16 62.8 63.8 67.8 15.2 14.9 3.2 3.4 22.0 21.8 22.5 KPIT Tech Neutral 161 160 -1 11.9 11.9 14.1 13.5 13.6 2.0 1.8 14.3 14.1 14.5 L&T Infotech Buy 965 950 -2 55.5 61.6 66.0 17.4 15.7 6.4 4.9 41.6 35.2 29.6 Mindtree Neutral 507 480 -5 24.9 28.5 33.6 20.4 17.8 3.3 3.2 16.8 17.3 20.4 Mphasis Neutral 730 670 -8 38.9 42.0 46.0 18.8 17.4 2.5 2.9 13.2 14.6 17.3 NIIT Tech Neutral 635 600 -5 38.0 43.7 50.3 16.7 14.5 2.2 2.2 13.7 15.1 16.4 Persistent Sys Buy 644 780 21 37.7 43.3 52.4 17.1 14.9 2.6 2.5 17.0 17.9 20.8 Tata Elxsi Buy 906 1,004 11 28.1 33.8 40.2 32.2 26.8 10.1 8.1 37.1 33.6 32.4 TCS Neutral 2,759 2,450 -11 133.4 131.8 151.4 20.7 20.9 6.2 6.6 32.6 30.6 33.5 Tech Mah Buy 492 560 14 30.9 35.8 37.7 15.9 13.7 2.6 2.5 18.4 18.9 18.2 Wipro Neutral 299 280 -6 16.9 19.1 20.1 17.7 15.6 2.8 2.7 16.9 17.0 16.7 Zensar Tech Buy 878 1,020 16 52.1 52.8 72.7 16.9 16.6 2.7 2.4 17.2 15.3 18.4
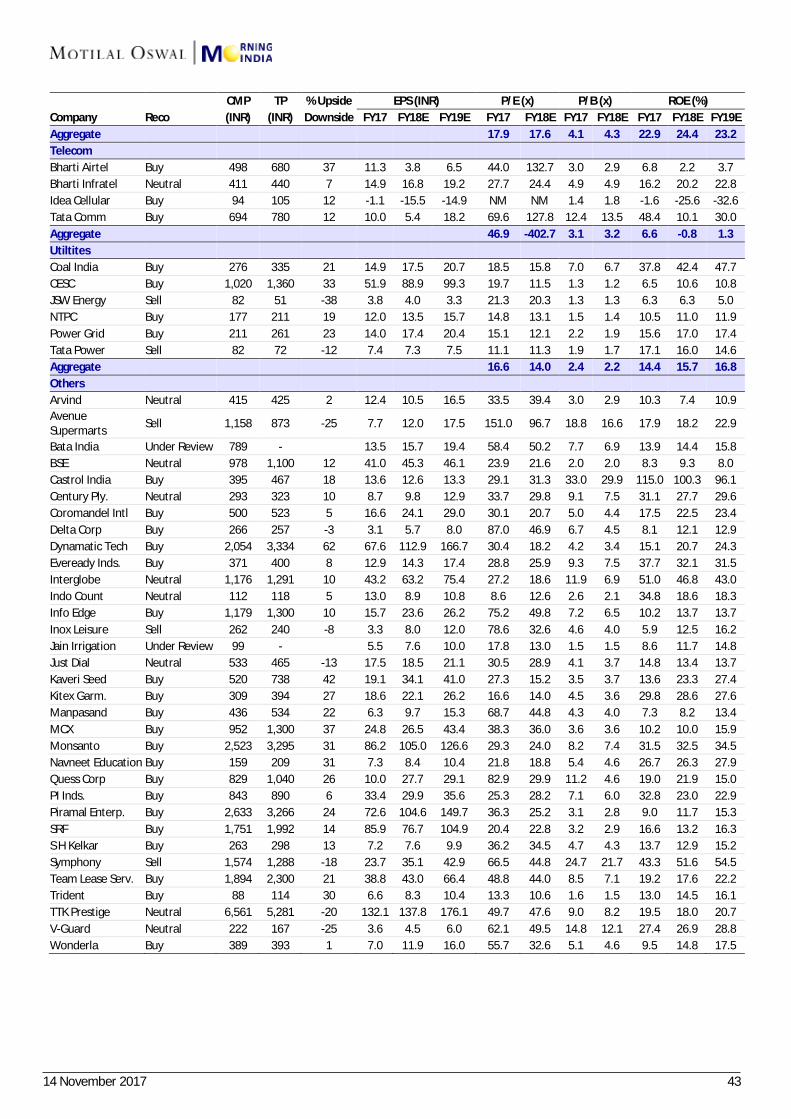
14 November 2017 43
CMP TP % Upside EPS (INR) P/E (x) P/B (x) ROE (%) Company Reco (INR) (INR) Downside FY17 FY18E FY19E FY17 FY18E FY17 FY18E FY17 FY18E FY19E Aggregate 17.9 17.6 4.1 4.3 22.9 24.4 23.2 Telecom Bharti Airtel Buy 498 680 37 11.3 3.8 6.5 44.0 132.7 3.0 2.9 6.8 2.2 3.7 Bharti Infratel Neutral 411 440 7 14.9 16.8 19.2 27.7 24.4 4.9 4.9 16.2 20.2 22.8 Idea Cellular Buy 94 105 12 -1.1 -15.5 -14.9 NM NM 1.4 1.8 -1.6 -25.6 -32.6 Tata Comm Buy 694 780 12 10.0 5.4 18.2 69.6 127.8 12.4 13.5 48.4 10.1 30.0 Aggregate 46.9 -402.7 3.1 3.2 6.6 -0.8 1.3 Utiltites Coal India Buy 276 335 21 14.9 17.5 20.7 18.5 15.8 7.0 6.7 37.8 42.4 47.7 CESC Buy 1,020 1,360 33 51.9 88.9 99.3 19.7 11.5 1.3 1.2 6.5 10.6 10.8 JSW Energy Sell 82 51 -38 3.8 4.0 3.3 21.3 20.3 1.3 1.3 6.3 6.3 5.0 NTPC Buy 177 211 19 12.0 13.5 15.7 14.8 13.1 1.5 1.4 10.5 11.0 11.9 Power Grid Buy 211 261 23 14.0 17.4 20.4 15.1 12.1 2.2 1.9 15.6 17.0 17.4 Tata Power Sell 82 72 -12 7.4 7.3 7.5 11.1 11.3 1.9 1.7 17.1 16.0 14.6 Aggregate 16.6 14.0 2.4 2.2 14.4 15.7 16.8 Others Arvind Neutral 415 425 2 12.4 10.5 16.5 33.5 39.4 3.0 2.9 10.3 7.4 10.9 Avenue Supermarts Sell 1,158 873 -25 7.7 12.0 17.5 151.0 96.7 18.8 16.6 17.9 18.2 22.9
Bata India Under Review 789 - 13.5 15.7 19.4 58.4 50.2 7.7 6.9 13.9 14.4 15.8 BSE Neutral 978 1,100 12 41.0 45.3 46.1 23.9 21.6 2.0 2.0 8.3 9.3 8.0 Castrol India Buy 395 467 18 13.6 12.6 13.3 29.1 31.3 33.0 29.9 115.0 100.3 96.1 Century Ply. Neutral 293 323 10 8.7 9.8 12.9 33.7 29.8 9.1 7.5 31.1 27.7 29.6 Coromandel Intl Buy 500 523 5 16.6 24.1 29.0 30.1 20.7 5.0 4.4 17.5 22.5 23.4 Delta Corp Buy 266 257 -3 3.1 5.7 8.0 87.0 46.9 6.7 4.5 8.1 12.1 12.9 Dynamatic Tech Buy 2,054 3,334 62 67.6 112.9 166.7 30.4 18.2 4.2 3.4 15.1 20.7 24.3 Eveready Inds. Buy 371 400 8 12.9 14.3 17.4 28.8 25.9 9.3 7.5 37.7 32.1 31.5 Interglobe Neutral 1,176 1,291 10 43.2 63.2 75.4 27.2 18.6 11.9 6.9 51.0 46.8 43.0 Indo Count Neutral 112 118 5 13.0 8.9 10.8 8.6 12.6 2.6 2.1 34.8 18.6 18.3 Info Edge Buy 1,179 1,300 10 15.7 23.6 26.2 75.2 49.8 7.2 6.5 10.2 13.7 13.7 Inox Leisure Sell 262 240 -8 3.3 8.0 12.0 78.6 32.6 4.6 4.0 5.9 12.5 16.2 Jain Irrigation Under Review 99 - 5.5 7.6 10.0 17.8 13.0 1.5 1.5 8.6 11.7 14.8 Just Dial Neutral 533 465 -13 17.5 18.5 21.1 30.5 28.9 4.1 3.7 14.8 13.4 13.7 Kaveri Seed Buy 520 738 42 19.1 34.1 41.0 27.3 15.2 3.5 3.7 13.6 23.3 27.4 Kitex Garm. Buy 309 394 27 18.6 22.1 26.2 16.6 14.0 4.5 3.6 29.8 28.6 27.6 Manpasand Buy 436 534 22 6.3 9.7 15.3 68.7 44.8 4.3 4.0 7.3 8.2 13.4 MCX Buy 952 1,300 37 24.8 26.5 43.4 38.3 36.0 3.6 3.6 10.2 10.0 15.9 Monsanto Buy 2,523 3,295 31 86.2 105.0 126.6 29.3 24.0 8.2 7.4 31.5 32.5 34.5 Navneet Education Buy 159 209 31 7.3 8.4 10.4 21.8 18.8 5.4 4.6 26.7 26.3 27.9 Quess Corp Buy 829 1,040 26 10.0 27.7 29.1 82.9 29.9 11.2 4.6 19.0 21.9 15.0 PI Inds. Buy 843 890 6 33.4 29.9 35.6 25.3 28.2 7.1 6.0 32.8 23.0 22.9 Piramal Enterp. Buy 2,633 3,266 24 72.6 104.6 149.7 36.3 25.2 3.1 2.8 9.0 11.7 15.3 SRF Buy 1,751 1,992 14 85.9 76.7 104.9 20.4 22.8 3.2 2.9 16.6 13.2 16.3 S H Kelkar Buy 263 298 13 7.2 7.6 9.9 36.2 34.5 4.7 4.3 13.7 12.9 15.2 Symphony Sell 1,574 1,288 -18 23.7 35.1 42.9 66.5 44.8 24.7 21.7 43.3 51.6 54.5 Team Lease Serv. Buy 1,894 2,300 21 38.8 43.0 66.4 48.8 44.0 8.5 7.1 19.2 17.6 22.2 Trident Buy 88 114 30 6.6 8.3 10.4 13.3 10.6 1.6 1.5 13.0 14.5 16.1 TTK Prestige Neutral 6,561 5,281 -20 132.1 137.8 176.1 49.7 47.6 9.0 8.2 19.5 18.0 20.7 V-Guard Neutral 222 167 -25 3.6 4.5 6.0 62.1 49.5 14.8 12.1 27.4 26.9 28.8 Wonderla Buy 389 393 1 7.0 11.9 16.0 55.7 32.6 5.1 4.6 9.5 14.8 17.5
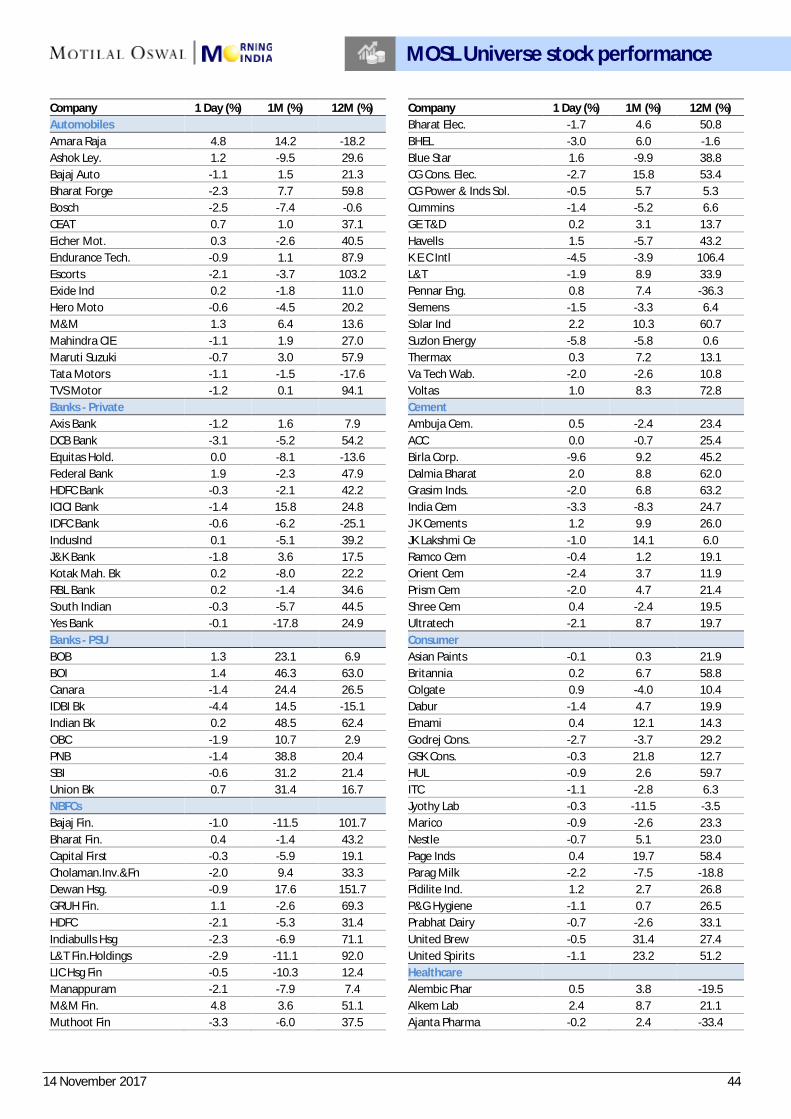
14 November 2017 44
Company 1 Day (%) 1M (%) 12M (%) Company 1 Day (%) 1M (%) 12M (%) Automobiles Bharat Elec. -1.7 4.6 50.8 Amara Raja 4.8 14.2 -18.2 BHEL -3.0 6.0 -1.6Ashok Ley. 1.2 -9.5 29.6 Blue Star 1.6 -9.9 38.8 Bajaj Auto -1.1 1.5 21.3 CG Cons. Elec. -2.7 15.8 53.4 Bharat Forge -2.3 7.7 59.8 CG Power & Inds Sol. -0.5 5.7 5.3 Bosch -2.5 -7.4 -0.6 Cummins -1.4 -5.2 6.6 CEAT 0.7 1.0 37.1 GE T&D 0.2 3.1 13.7 Eicher Mot. 0.3 -2.6 40.5 Havells 1.5 -5.7 43.2 Endurance Tech. -0.9 1.1 87.9 K E C Intl -4.5 -3.9 106.4 Escorts -2.1 -3.7 103.2 L&T -1.9 8.9 33.9 Exide Ind 0.2 -1.8 11.0 Pennar Eng. 0.8 7.4 -36.3Hero Moto -0.6 -4.5 20.2 Siemens -1.5 -3.3 6.4 M&M 1.3 6.4 13.6 Solar Ind 2.2 10.3 60.7 Mahindra CIE -1.1 1.9 27.0 Suzlon Energy -5.8 -5.8 0.6 Maruti Suzuki -0.7 3.0 57.9 Thermax 0.3 7.2 13.1 Tata Motors -1.1 -1.5 -17.6 Va Tech Wab. -2.0 -2.6 10.8 TVS Motor -1.2 0.1 94.1 Voltas 1.0 8.3 72.8 Banks - Private Cement Axis Bank -1.2 1.6 7.9 Ambuja Cem. 0.5 -2.4 23.4 DCB Bank -3.1 -5.2 54.2 ACC 0.0 -0.7 25.4 Equitas Hold. 0.0 -8.1 -13.6 Birla Corp. -9.6 9.2 45.2 Federal Bank 1.9 -2.3 47.9 Dalmia Bharat 2.0 8.8 62.0 HDFC Bank -0.3 -2.1 42.2 Grasim Inds. -2.0 6.8 63.2 ICICI Bank -1.4 15.8 24.8 India Cem -3.3 -8.3 24.7 IDFC Bank -0.6 -6.2 -25.1 J K Cements 1.2 9.9 26.0 IndusInd 0.1 -5.1 39.2 JK Lakshmi Ce -1.0 14.1 6.0 J&K Bank -1.8 3.6 17.5 Ramco Cem -0.4 1.2 19.1 Kotak Mah. Bk 0.2 -8.0 22.2 Orient Cem -2.4 3.7 11.9 RBL Bank 0.2 -1.4 34.6 Prism Cem -2.0 4.7 21.4 South Indian -0.3 -5.7 44.5 Shree Cem 0.4 -2.4 19.5 Yes Bank -0.1 -17.8 24.9 Ultratech -2.1 8.7 19.7 Banks - PSU Consumer BOB 1.3 23.1 6.9 Asian Paints -0.1 0.3 21.9 BOI 1.4 46.3 63.0 Britannia 0.2 6.7 58.8 Canara -1.4 24.4 26.5 Colgate 0.9 -4.0 10.4 IDBI Bk -4.4 14.5 -15.1 Dabur -1.4 4.7 19.9 Indian Bk 0.2 48.5 62.4 Emami 0.4 12.1 14.3 OBC -1.9 10.7 2.9 Godrej Cons. -2.7 -3.7 29.2 PNB -1.4 38.8 20.4 GSK Cons. -0.3 21.8 12.7 SBI -0.6 31.2 21.4 HUL -0.9 2.6 59.7 Union Bk 0.7 31.4 16.7 ITC -1.1 -2.8 6.3 NBFCs Jyothy Lab -0.3 -11.5 -3.5Bajaj Fin. -1.0 -11.5 101.7 Marico -0.9 -2.6 23.3 Bharat Fin. 0.4 -1.4 43.2 Nestle -0.7 5.1 23.0 Capital First -0.3 -5.9 19.1 Page Inds 0.4 19.7 58.4 Cholaman.Inv.&Fn -2.0 9.4 33.3 Parag Milk -2.2 -7.5 -18.8Dewan Hsg. -0.9 17.6 151.7 Pidilite Ind. 1.2 2.7 26.8 GRUH Fin. 1.1 -2.6 69.3 P&G Hygiene -1.1 0.7 26.5 HDFC -2.1 -5.3 31.4 Prabhat Dairy -0.7 -2.6 33.1 Indiabulls Hsg -2.3 -6.9 71.1 United Brew -0.5 31.4 27.4 L&T Fin.Holdings -2.9 -11.1 92.0 United Spirits -1.1 23.2 51.2 LIC Hsg Fin -0.5 -10.3 12.4 Healthcare Manappuram -2.1 -7.9 7.4 Alembic Phar 0.5 3.8 -19.5M&M Fin. 4.8 3.6 51.1 Alkem Lab 2.4 8.7 21.1 Muthoot Fin -3.3 -6.0 37.5 Ajanta Pharma -0.2 2.4 -33.4
MOSL Universe stock performance
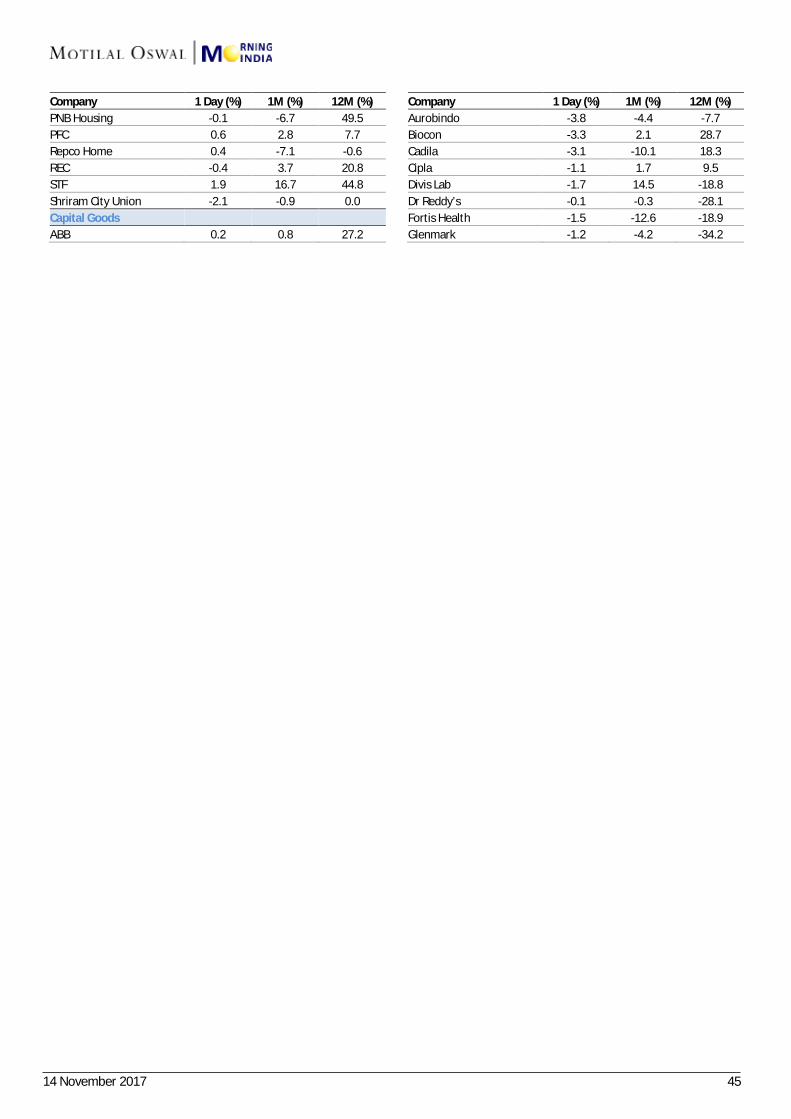
14 November 2017 45
Company 1 Day (%) 1M (%) 12M (%) Company 1 Day (%) 1M (%) 12M (%) PNB Housing -0.1 -6.7 49.5 Aurobindo -3.8 -4.4 -7.7 PFC 0.6 2.8 7.7 Biocon -3.3 2.1 28.7 Repco Home 0.4 -7.1 -0.6 Cadila -3.1 -10.1 18.3 REC -0.4 3.7 20.8 Cipla -1.1 1.7 9.5 STF 1.9 16.7 44.8 Divis Lab -1.7 14.5 -18.8 Shriram City Union -2.1 -0.9 0.0 Dr Reddy’s -0.1 -0.3 -28.1 Capital Goods Fortis Health -1.5 -12.6 -18.9 ABB 0.2 0.8 27.2 Glenmark -1.2 -4.2 -34.2
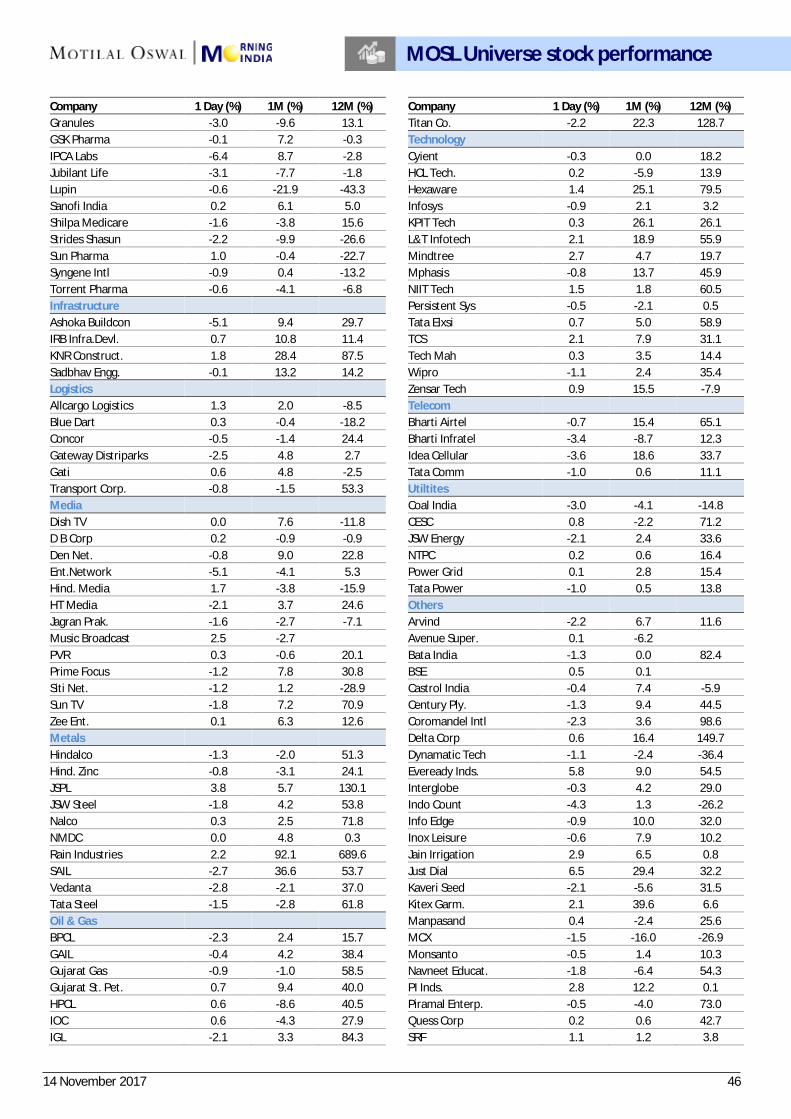
14 November 2017 46
Company 1 Day (%) 1M (%) 12M (%) Company 1 Day (%) 1M (%) 12M (%) Granules -3.0 -9.6 13.1 Titan Co. -2.2 22.3 128.7 GSK Pharma -0.1 7.2 -0.3 Technology IPCA Labs -6.4 8.7 -2.8 Cyient -0.3 0.0 18.2 Jubilant Life -3.1 -7.7 -1.8 HCL Tech. 0.2 -5.9 13.9 Lupin -0.6 -21.9 -43.3 Hexaware 1.4 25.1 79.5 Sanofi India 0.2 6.1 5.0 Infosys -0.9 2.1 3.2 Shilpa Medicare -1.6 -3.8 15.6 KPIT Tech 0.3 26.1 26.1 Strides Shasun -2.2 -9.9 -26.6 L&T Infotech 2.1 18.9 55.9 Sun Pharma 1.0 -0.4 -22.7 Mindtree 2.7 4.7 19.7 Syngene Intl -0.9 0.4 -13.2 Mphasis -0.8 13.7 45.9 Torrent Pharma -0.6 -4.1 -6.8 NIIT Tech 1.5 1.8 60.5 Infrastructure Persistent Sys -0.5 -2.1 0.5 Ashoka Buildcon -5.1 9.4 29.7 Tata Elxsi 0.7 5.0 58.9 IRB Infra.Devl. 0.7 10.8 11.4 TCS 2.1 7.9 31.1 KNR Construct. 1.8 28.4 87.5 Tech Mah 0.3 3.5 14.4 Sadbhav Engg. -0.1 13.2 14.2 Wipro -1.1 2.4 35.4 Logistics Zensar Tech 0.9 15.5 -7.9Allcargo Logistics 1.3 2.0 -8.5 Telecom Blue Dart 0.3 -0.4 -18.2 Bharti Airtel -0.7 15.4 65.1 Concor -0.5 -1.4 24.4 Bharti Infratel -3.4 -8.7 12.3 Gateway Distriparks -2.5 4.8 2.7 Idea Cellular -3.6 18.6 33.7 Gati 0.6 4.8 -2.5 Tata Comm -1.0 0.6 11.1 Transport Corp. -0.8 -1.5 53.3 Utiltites Media Coal India -3.0 -4.1 -14.8Dish TV 0.0 7.6 -11.8 CESC 0.8 -2.2 71.2 D B Corp 0.2 -0.9 -0.9 JSW Energy -2.1 2.4 33.6 Den Net. -0.8 9.0 22.8 NTPC 0.2 0.6 16.4 Ent.Network -5.1 -4.1 5.3 Power Grid 0.1 2.8 15.4 Hind. Media 1.7 -3.8 -15.9 Tata Power -1.0 0.5 13.8 HT Media -2.1 3.7 24.6 Others Jagran Prak. -1.6 -2.7 -7.1 Arvind -2.2 6.7 11.6 Music Broadcast 2.5 -2.7 Avenue Super. 0.1 -6.2PVR 0.3 -0.6 20.1 Bata India -1.3 0.0 82.4 Prime Focus -1.2 7.8 30.8 BSE 0.5 0.1 Siti Net. -1.2 1.2 -28.9 Castrol India -0.4 7.4 -5.9Sun TV -1.8 7.2 70.9 Century Ply. -1.3 9.4 44.5 Zee Ent. 0.1 6.3 12.6 Coromandel Intl -2.3 3.6 98.6 Metals Delta Corp 0.6 16.4 149.7 Hindalco -1.3 -2.0 51.3 Dynamatic Tech -1.1 -2.4 -36.4Hind. Zinc -0.8 -3.1 24.1 Eveready Inds. 5.8 9.0 54.5 JSPL 3.8 5.7 130.1 Interglobe -0.3 4.2 29.0 JSW Steel -1.8 4.2 53.8 Indo Count -4.3 1.3 -26.2Nalco 0.3 2.5 71.8 Info Edge -0.9 10.0 32.0 NMDC 0.0 4.8 0.3 Inox Leisure -0.6 7.9 10.2 Rain Industries 2.2 92.1 689.6 Jain Irrigation 2.9 6.5 0.8 SAIL -2.7 36.6 53.7 Just Dial 6.5 29.4 32.2 Vedanta -2.8 -2.1 37.0 Kaveri Seed -2.1 -5.6 31.5 Tata Steel -1.5 -2.8 61.8 Kitex Garm. 2.1 39.6 6.6 Oil & Gas Manpasand 0.4 -2.4 25.6 BPCL -2.3 2.4 15.7 MCX -1.5 -16.0 -26.9GAIL -0.4 4.2 38.4 Monsanto -0.5 1.4 10.3 Gujarat Gas -0.9 -1.0 58.5 Navneet Educat. -1.8 -6.4 54.3 Gujarat St. Pet. 0.7 9.4 40.0 PI Inds. 2.8 12.2 0.1 HPCL 0.6 -8.6 40.5 Piramal Enterp. -0.5 -4.0 73.0 IOC 0.6 -4.3 27.9 Quess Corp 0.2 0.6 42.7 IGL -2.1 3.3 84.3 SRF 1.1 1.2 3.8
MOSL Universe stock performance
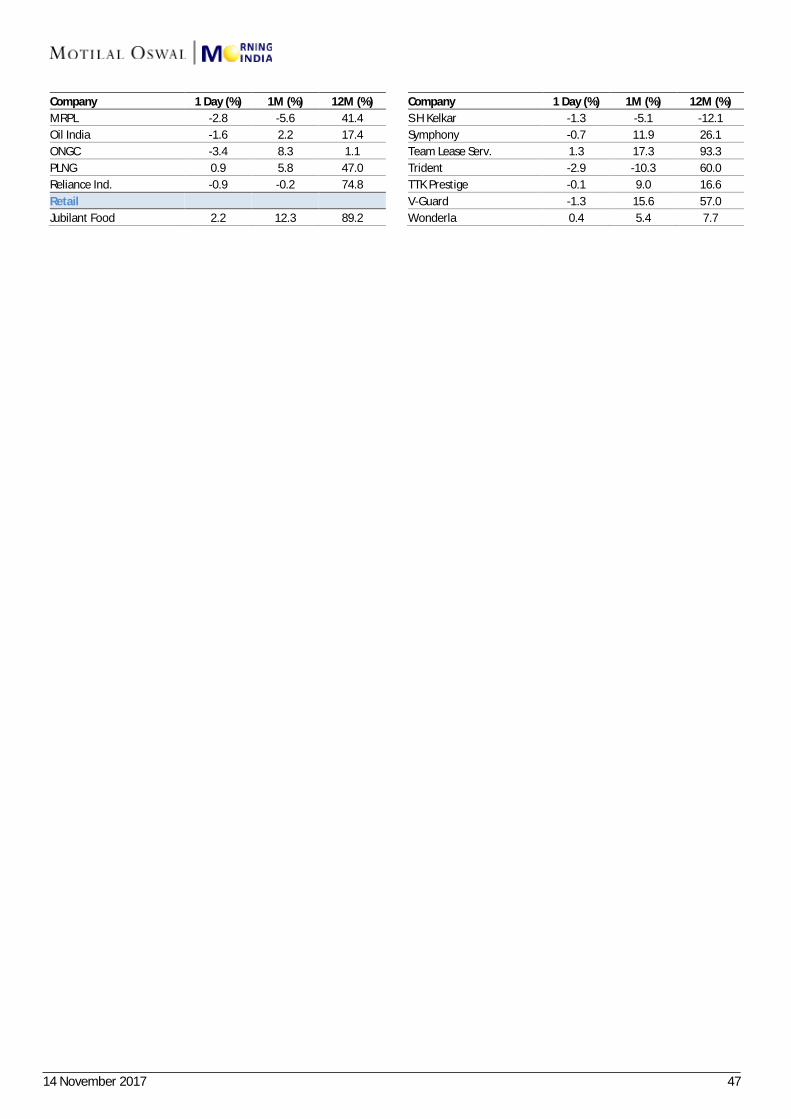
14 November 2017 47
Company 1 Day (%) 1M (%) 12M (%) Company 1 Day (%) 1M (%) 12M (%) MRPL -2.8 -5.6 41.4 S H Kelkar -1.3 -5.1 -12.1 Oil India -1.6 2.2 17.4 Symphony -0.7 11.9 26.1 ONGC -3.4 8.3 1.1 Team Lease Serv. 1.3 17.3 93.3 PLNG 0.9 5.8 47.0 Trident -2.9 -10.3 60.0 Reliance Ind. -0.9 -0.2 74.8 TTK Prestige -0.1 9.0 16.6 Retail V-Guard -1.3 15.6 57.0 Jubilant Food 2.2 12.3 89.2 Wonderla 0.4 5.4 7.7

14 November 2017 48
N O T E S

THEMATIC/STRATEGY RESEARCH GALLERY

RECENT INITIATING COVERAGE REPORTS
REPORT GALLERY
DIFFERENTIATED PRODUCT GALLERY
13 December 2016 49
Disclosures: The following Disclosures are being made in compliance with the SEBI Research Analyst Regulations 2014 (herein after referred to as the Regulations).
Motilal Oswal Securities Ltd. (MOSL) is a SEBI Registered Research Analyst having registration no. INH000000412. MOSL, the Research Entity (RE) as defined in the Regulations, is engaged in the business of providing Stock broking services, Investment Advisory Services, Depository participant services & distribution of various financial products. MOSL is a subsidiary company of Motilal Oswal Financial Service Ltd. (MOFSL). MOFSL is a listed public company, the details in respect of which are available on www.motilaloswal.com. MOSL is registered with the Securities & Exchange Board of India (SEBI) and is a registered Trading Member with National Stock Exchange of India Ltd. (NSE) and Bombay Stock Exchange Limited (BSE), Metropolitan Stock Exchange Of India Ltd. (MSE) for its stock broking activities & is Depository participant with Central Depository Services Limited (CDSL) & National Securities Depository Limited (NSDL) and is member of Association of Mutual Funds of India (AMFI) for distribution of financial products. Details of associate entities of Motilal Oswal Securities Limited are available on the website at http://onlinereports.motilaloswal.com/Dormant/documents/Associate%20Details.pdf
Pending Regulatory Enquiries against Motilal Oswal Securities Limited by SEBI: SEBI pursuant to a complaint from client Shri C.R. Mohanraj alleging unauthorized trading, issued a letter dated 29th April 2014 to MOSL notifying appointment of an Adjudicating Officer as per SEBI regulations to hold inquiry and adjudge violation of SEBI Regulations; MOSL requested SEBI to provide all documents, records, investigation report relied upon by SEBI which were referred in Show Cause Notice and also sought personal hearing. The matter is currently pending. MOSL, it’s associates, Research Analyst or their relative may have any financial interest in the subject company. MOSL and/or its associates and/or Research Analyst may have beneficial ownership of 1% or more securities in the subject company at the end of the month immediately preceding the date of publication of the Research Report. MOSL and its associate company(ies), their directors and Research Analyst and their relatives may; (a) from time to time, have a long or short position in, act as principal in, and buy or sell the securities or derivatives thereof of companies mentioned herein. (b) be engaged in any other transaction involving such securities and earn brokerage or other compensation or act as a market maker in the financial instruments of the company(ies) discussed herein or act as an advisor or lender/borrower to such company(ies) or may have any other potential conflict of interests with respect to any recommendation and other related information and opinions.; however the same shall have no bearing whatsoever on the specific recommendations made by the analyst(s), as the recommendations made by the analyst(s) are completely independent of the views of the associates of MOSL even though there might exist an inherent conflict of interest in some of the stocks mentioned in the research report. Research Analyst may have served as director/officer, etc. in the subject company in the last 12 month period. MOSL and/or its associates may have received any compensation from the subject company in the past 12 months.
In the last 12 months period ending on the last day of the month immediately preceding the date of publication of this research report, MOSL or any of its associates may have:
n managed or co-managed public offering of securities from subject company of this research report,
n received compensation for investment banking or merchant banking or brokerage services from subject company of this research report,
n received compensation for products or services other than investment banking or merchant banking or brokerage services from the subject company of this research report.
n Subject Company may have been a client of MOSL or its associates during twelve months preceding the date of distribution of the research report.
MOSL and it’s associates have not received any compensation or other benefits from the subject company or third party in connection with the research report. To enhance transparency, MOSL has incorporated a Disclosure of Interest Statement in this document. This should, however, not be treated as endorsement of the views expressed in the report. MOSL and / or its affiliates do and seek to do business including investment banking with companies covered in its research reports. As a result, the recipients of this report should be aware that MOSL may have a potential conflict of interest that may affect the objectivity of this report. Compensation of Research Analysts is not based on any specific merchant banking, investment banking or brokerage service transactions.
Terms & Conditions: This report has been prepared by MOSL and is meant for sole use by the recipient and not for circulation. The report and information contained herein is strictly confidential and may not be altered in any way, transmitted to, copied or distributed, in part or in whole, to any other person or to the media or reproduced in any form, without prior written consent of MOSL. The report is based on the facts, figures and information that are considered true, correct, reliable and accurate. The intent of this report is not recommendatory in nature. The information is obtained from publicly available media or other sources believed to be reliable. Such information has not been independently verified and no guaranty, representation of warranty, express or implied, is made as to its accuracy, completeness or correctness. All such information and opinions are subject to change without notice. The report is prepared solely for informational purpose and does not constitute an offer document or solicitation of offer to buy or sell or subscribe for securities or other financial instruments for the clients. Though disseminated to all the customers simultaneously, not all customers may receive this report at the same time. MOSL will not treat recipients as customers by virtue of their receiving this report. Analyst Certification The views expressed in this research report accurately reflect the personal views of the analyst(s) about the subject securities or issues, and no part of the compensation of the research analyst(s) was, is, or will be directly or indirectly related to the specific recommendations and views expressed by research analyst(s) in this report.
Disclosure of Interest Statement Companies where there is interest § Analyst ownership of the stock No A graph of daily closing prices of securities is available at www.nseindia.com, www.bseindia.com. Research Analyst views on Subject Company may vary based on Fundamental research and Technical Research. Proprietary trading desk of MOSL or its associates maintains arm’s length distance with Research Team as all the activities are segregated from MOSL research activity and therefore it can have an independent view with regards to subject company for which Research Team have expressed their views.
Regional Disclosures (outside India) This report is not directed or intended for distribution to or use by any person or entity resident in a state, country or any jurisdiction, where such distribution, publication, availability or use would be contrary to law, regulation or which would subject MOSL & its group companies to registration or licensing requirements within such jurisdictions.
For Hong Kong: This report is distributed in Hong Kong by Motilal Oswal capital Markets (Hong Kong) Private Limited, a licensed corporation (CE AYY-301) licensed and regulated by the Hong Kong Securities and Futures Commission (SFC) pursuant to the Securities and Futures Ordinance (Chapter 571 of the Laws of Hong Kong) “SFO”. As per SEBI (Research Analyst Regulations) 2014 Motilal Oswal Securities (SEBI Reg No. INH000000412) has an agreement with Motilal Oswal capital Markets (Hong Kong) Private Limited for distribution of research report in Hong Kong. This report is intended for distribution only to “Professional Investors” as defined in Part I of Schedule 1 to SFO. Any investment or investment activity to which this document relates is only available to professional investor and will be engaged only with professional investors.” Nothing here is an offer or solicitation of these securities, products and services in any jurisdiction where their offer or sale is not qualified or exempt from registration. The Indian Analyst(s) who compile this report is/are not located in Hong Kong & are not conducting Research Analysis in Hong Kong.
For U.S. Motilal Oswal Securities Limited (MOSL) is not a registered broker - dealer under the U.S. Securities Exchange Act of 1934, as amended (the"1934 act") and under applicable state laws in the United States. In addition MOSL is not a registered investment adviser under the U.S. Investment Advisers Act of 1940, as amended (the "Advisers Act" and together with the 1934 Act, the "Acts), and under applicable state laws in the United States. Accordingly, in the absence of specific exemption under the Acts, any brokerage and investment services provided by MOSL, including the products and services described herein are not available to or intended for U.S. persons. This report is intended for distribution only to "Major Institutional Investors" as defined by Rule 15a-6(b)(4) of the Exchange Act and interpretations thereof by SEC (henceforth referred to as "major institutional investors"). This document must not be acted on or relied on by persons who are not major institutional investors. Any investment or investment activity to which this document relates is only available to major institutional investors and will be engaged in only with major institutional investors. In reliance on the exemption from registration provided by Rule 15a-6 of the U.S. Securities Exchange Act of 1934, as amended (the "Exchange Act") and interpretations thereof by the U.S. Securities and Exchange Commission ("SEC") in order to conduct business with Institutional Investors based in the U.S., MOSL has entered into a chaperoning agreement with a U.S. registered broker-dealer, Motilal Oswal Securities International Private Limited. ("MOSIPL"). Any business interaction pursuant to this report will have to be executed within the provisions of this chaperoning agreement.
The Research Analysts contributing to the report may not be registered /qualified as research analyst with FINRA. Such research analyst may not be associated persons of the U.S. registered broker-dealer, MOSIPL, and therefore, may not be subject to NASD rule 2711 and NYSE Rule 472 restrictions on communication with a subject company, public appearances and trading securities held by a research analyst account.
For Singapore Motilal Oswal Capital Markets Singapore Pte Limited is acting as an exempt financial advisor under section 23(1)(f) of the Financial Advisers Act(FAA) read with regulation 17(1)(d) of the Financial Advisors Regulations and is a subsidiary of Motilal Oswal Securities Limited in India. This research is distributed in Singapore by Motilal Oswal Capital Markets Singapore Pte Limited and it is only directed in Singapore to accredited investors, as defined in the Financial Advisers Regulations and the Securities and Futures Act (Chapter 289), as amended from time to time. In respect of any matter arising from or in connection with the research you could contact the following representatives of Motilal Oswal Capital Markets Singapore Pte Limited:
Disclaimer: The report and information contained herein is strictly confidential and meant solely for the selected recipient and may not be altered in any way, transmitted to, copied or distributed, in part or in whole, to any other person or to the media or reproduced in any form, without prior written consent. This report and information herein is solely for informational purpose and may not be used or considered as an offer document or solicitation of offer to buy or sell or subscribe for securities or other financial instruments. Nothing in this report constitutes investment, legal, accounting and tax advice or a representation that any investment or strategy is suitable or appropriate to your specific circumstances. The securities discussed and opinions expressed in this report may not be suitable for all investors, who must make their own investment decisions, based on their own investment objectives, financial positions and needs of specific recipient. This may not be taken in substitution for the exercise of independent judgment by any recipient. Each recipient of this document should make such investigations as it deems necessary to arrive at an independent evaluation of an investment in the securities of companies referred to in this document (including the merits and risks involved), and should consult its own advisors to determine the merits and risks of such an investment. The investment discussed or views expressed may not be suitable for all investors. Certain transactions -including those involving futures, options, another derivative products as well as non-investment grade securities - involve substantial risk and are not suitable for all investors. No representation or warranty, express or implied, is made as to the accuracy, completeness or fairness of the information and opinions contained in this document. The Disclosures of Interest Statement incorporated in this document is provided solely to enhance the transparency and should not be treated as endorsement of the views expressed in the report. This information is subject to change without any prior notice. The Company reserves the right to make modifications and alternations to this statement as may be required from time to time without any prior approval. MOSL, its associates, their directors and the employees may from time to time, effect or have effected an own account transaction in, or deal as principal or agent in or for the securities mentioned in this document. They may perform or seek to perform investment banking or other services for, or solicit investment banking or other business from, any company referred to in this report. Each of these entities functions as a separate, distinct and independent of each other. The recipient should take this into account before interpreting the document. This report has been prepared on the basis of information that is already available in publicly accessible media or developed through analysis of MOSL. The views expressed are those of the analyst, and the Company may or may not subscribe to all the views expressed therein. This document is being supplied to you solely for your information and may not be reproduced, redistributed or passed on, directly or indirectly, to any other person or published, copied, in whole or in part, for any purpose. This report is not directed or intended for distribution to, or use by, any person or entity who is a citizen or resident of or located in any locality, state, country or other jurisdiction, where such distribution, publication, availability or use would be contrary to law, regulation or which would subject MOSL to any registration or licensing requirement within such jurisdiction. The securities described herein may or may not be eligible for sale in all jurisdictions or to certain category of investors. Persons in whose possession this document may come are required to inform themselves of and to observe such restriction. Neither the Firm, not its directors, employees, agents or representatives shall be liable for any damages whether direct or indirect, incidental, special or consequential including lost revenue or lost profits that may arise from or in connection with the use of the information. The person accessing this information specifically agrees to exempt MOSL or any of its affiliates or employees from, any and all responsibility/liability arising from such misuse and agrees not to hold MOSL or any of its affiliates or employees responsible for any such misuse and further agrees to hold MOSL or any of its affiliates or employees free and harmless from all losses, costs, damages, expenses that may be suffered by the person accessing this information due to any errors and delays.
Registered Office Address: Motilal Oswal Tower, Rahimtullah Sayani Road, Opposite Parel ST Depot, Prabhadevi, Mumbai-400025; Tel No.: 022-3980 4263; www.motilaloswal.com. Correspondence Address: Palm Spring Centre, 2nd Floor, Palm Court Complex, New Link Road, Malad (West), Mumbai- 400 064. Tel No: 022 3080 1000. Compliance Officer: Neeraj Agarwal, Email Id: [email protected], Contact No.:022-30801085.
Registration details of group entities.: MOSL: NSE (Cash): INB231041238; NSE (F&O): INF231041238; NSE (CD): INE231041238; BSE (Cash): INB011041257; BSE(F&O): INF011041257; BSE(CD); MSE(Cash): INB261041231; MSE(F&O): INF261041231; MSE(CD): INE261041231; CDSL: IN-DP-16-2015; NSDL: IN-DP-NSDL-152-2000; Research Analyst: INH000000412. AMFI: ARN 17397. Investment Adviser: INA000007100. Motilal Oswal Asset Management Company Ltd. (MOAMC): PMS (Registration No.: INP000000670) offers PMS and Mutual Funds products. Motilal Oswal Wealth Management Ltd. (MOWML): PMS (Registration No.: INP000004409) offers wealth management solutions. *Motilal Oswal Securities Ltd. is a distributor of Mutual Funds, PMS, Fixed Deposit, Bond, NCDs, Insurance and IPO products. * Motilal Oswal Commodities Broker Pvt. Ltd. offers Commodities Products. * Motilal Oswal Real Estate Investment Advisors II Pvt. Ltd. offers Real Estate products. * Motilal Oswal Private Equity Investment Advisors Pvt. Ltd. offers Private Equity products


