Embed Size (px)
Citation preview
T O R O M O N T I N D U S T R I E S L T D . 1 9 9 9 A N N U A L R E P O R T
Together We Are...
Brought to you by Global Reports

A Powerful
Brought to you by Global Reports
Toromont 1
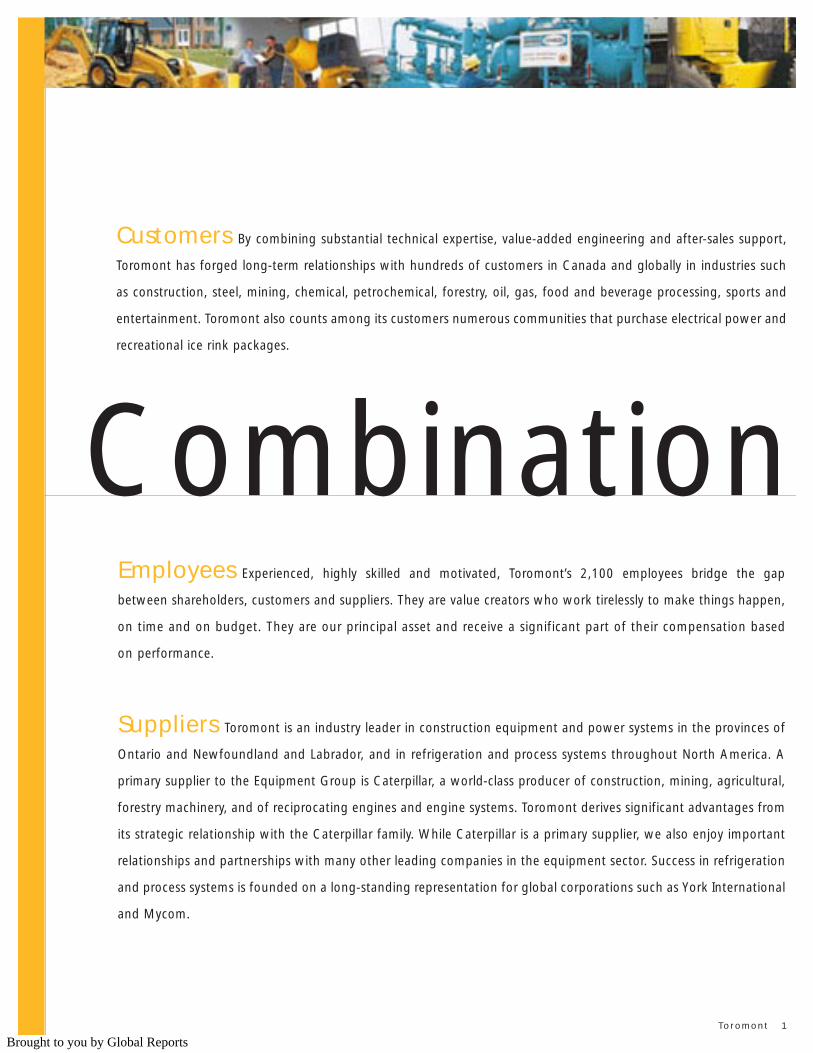
Combination
Customers By combining substantial technical expertise, value-added engineering and after-sales support,
Toromont has forged long-term relationships with hundreds of customers in Canada and globally in industries such
as construction, steel, mining, chemical, petrochemical, forestry, oil, gas, food and beverage processing, sports and
entertainment. Toromont also counts among its customers numerous communities that purchase electrical power and
recreational ice rink packages.
Employees Experienced, highly skilled and motivated, Toromont’s 2,100 employees bridge the gap
between shareholders, customers and suppliers. They are value creators who work tirelessly to make things happen,
on time and on budget. They are our principal asset and receive a significant part of their compensation based
on performance.
Suppliers Toromont is an industry leader in construction equipment and power systems in the provinces of
Ontario and Newfoundland and Labrador, and in refrigeration and process systems throughout North America. A
primary supplier to the Equipment Group is Caterpillar, a world-class producer of construction, mining, agricultural,
forestry machinery, and of reciprocating engines and engine systems. Toromont derives significant advantages from
its strategic relationship with the Caterpillar family. While Caterpillar is a primary supplier, we also enjoy important
relationships and partnerships with many other leading companies in the equipment sector. Success in refrigeration
and process systems is founded on a long-standing representation for global corporations such as York International
and Mycom.
Brought to you by Global Reports
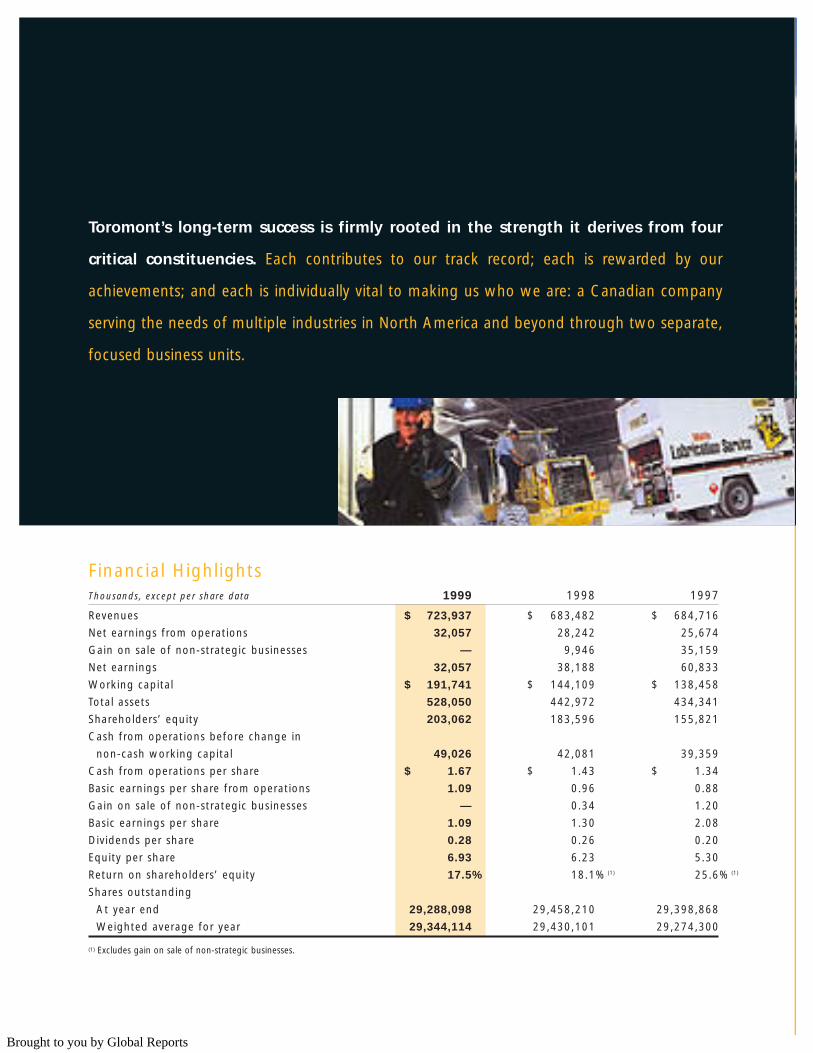
Financial HighlightsThousands, except per share data 1999 1998 1997
Revenues $ 723,937 $ 683,482 $ 684,716
Net earnings from operations 32,057 28,242 25,674
Gain on sale of non-strategic businesses — 9,946 35,159
Net earnings 32,057 38,188 60,833
Working capital $ 191,741 $ 144,109 $ 138,458
Total assets 528,050 442,972 434,341
Shareholders’ equity 203,062 183,596 155,821
Cash from operations before change in
non-cash working capital 49,026 42,081 39,359
Cash from operations per share $ 1.67 $ 1.43 $ 1.34
Basic earnings per share from operations 1.09 0.96 0.88
Gain on sale of non-strategic businesses — 0.34 1.20
Basic earnings per share 1.09 1.30 2.08
Dividends per share 0.28 0.26 0.20
Equity per share 6.93 6.23 5.30
Return on shareholders’ equity 17.5% 18.1%(1) 25.6%(1)
Shares outstanding
At year end 29,288,098 29,458,210 29,398,868
Weighted average for year 29,344,114 29,430,101 29,274,300
(1) Excludes gain on sale of non-strategic businesses.
Toromont’s long-term success is firmly rooted in the strength it derives from four
critical constituencies. Each contributes to our track record; each is rewarded by our
achievements; and each is individually vital to making us who we are: a Canadian company
serving the needs of multiple industries in North America and beyond through two separate,
focused business units.
Brought to you by Global Reports
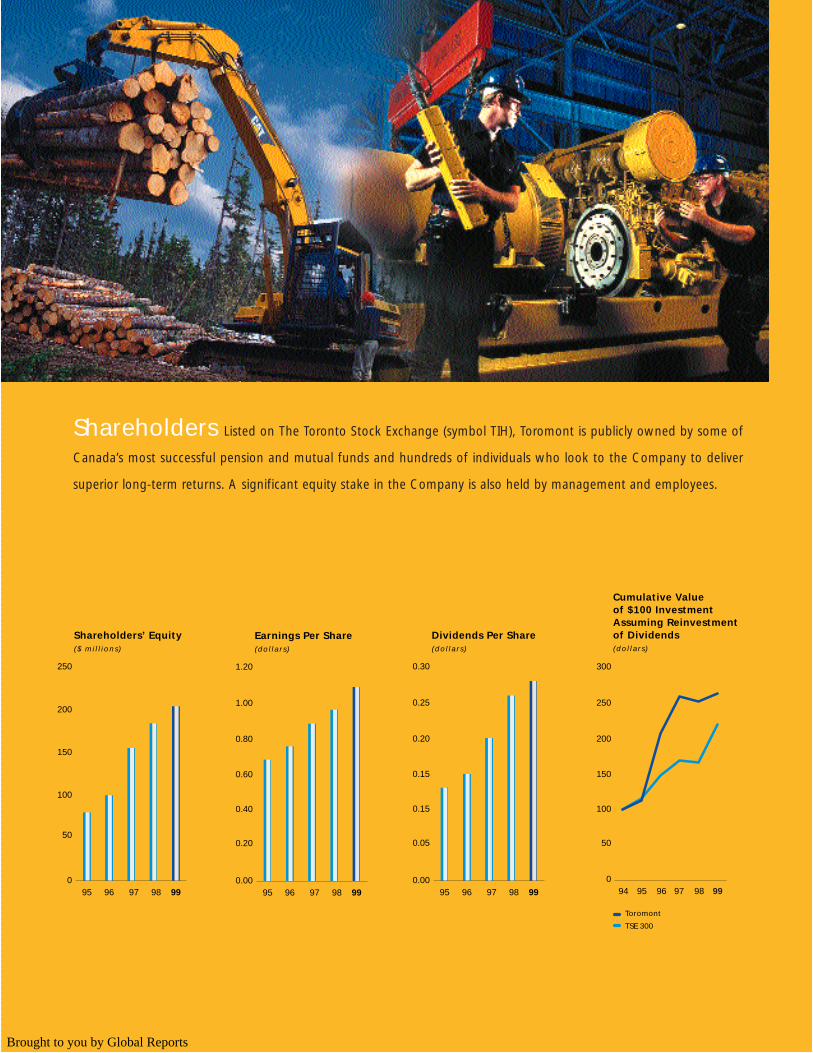
Shareholders Listed on The Toronto Stock Exchange (symbol TIH), Toromont is publicly owned by some of
Canada’s most successful pension and mutual funds and hundreds of individuals who look to the Company to deliver
superior long-term returns. A significant equity stake in the Company is also held by management and employees.
9998979695
Earnings Per Share(dollars)
0.00
0.20
1.00
0.80
0.60
0.40
1.20
9998979695
Dividends Per Share(dollars)
0.00
0.05
0.25
0.20
0.15
0.15
0.30
99989794 9695
Cumulative Value of $100 Investment Assuming Reinvestment of Dividends (dollars)
0
50
250
200
150
100
300
Toromont
TSE 300
9998979695
Shareholders’ Equity($ mil l ions)
0
50
200
150
100
250
Brought to you by Global Reports
2 Toromont
1990 1993• Consolidated revenue $192 million• Process Systems purchased
• Ontario Caterpillar dealership acquired• Public share issue• $17 million proceeds from Enerflex IPO; Enerflex ownership stake
diluted to 30%
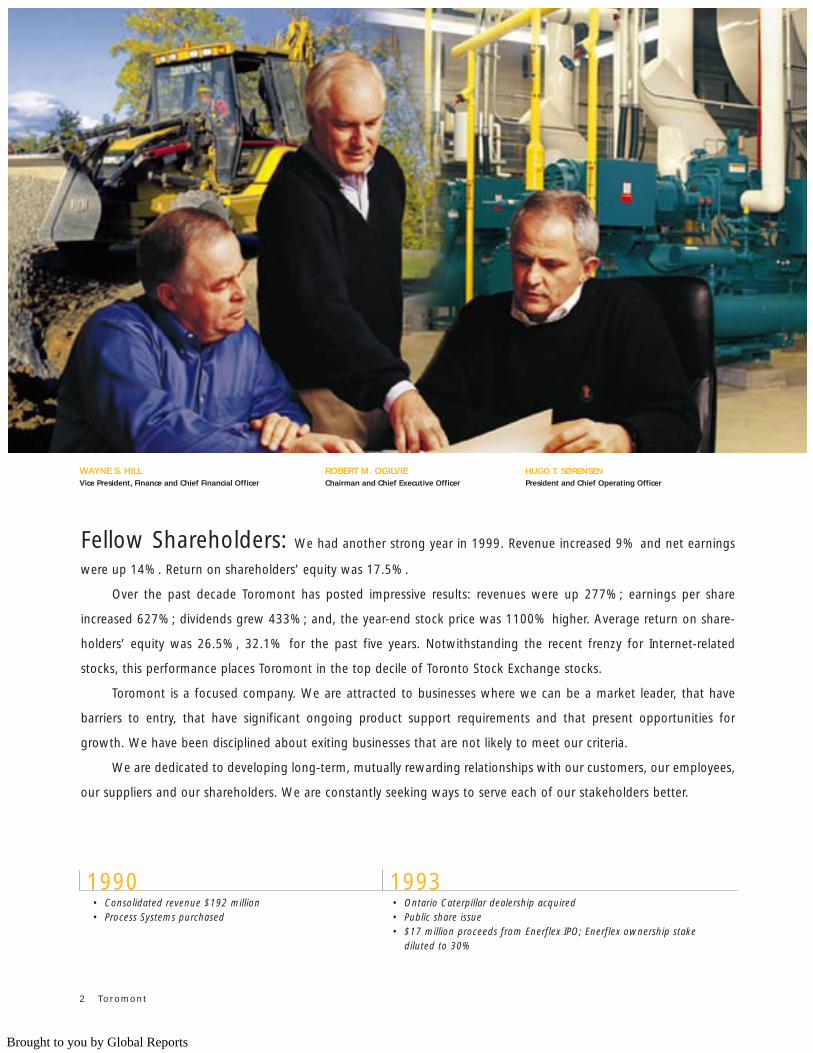
Fellow Shareholders: We had another strong year in 1999. Revenue increased 9% and net earnings
were up 14%. Return on shareholders’ equity was 17.5%.
Over the past decade Toromont has posted impressive results: revenues were up 277%; earnings per share
increased 627%; dividends grew 433%; and, the year-end stock price was 1100% higher. Average return on share-
holders’ equity was 26.5%, 32.1% for the past five years. Notwithstanding the recent frenzy for Internet-related
stocks, this performance places Toromont in the top decile of Toronto Stock Exchange stocks.
Toromont is a focused company. We are attracted to businesses where we can be a market leader, that have
barriers to entry, that have significant ongoing product support requirements and that present opportunities for
growth. We have been disciplined about exiting businesses that are not likely to meet our criteria.
We are dedicated to developing long-term, mutually rewarding relationships with our customers, our employees,
our suppliers and our shareholders. We are constantly seeking ways to serve each of our stakeholders better.
WAYNE S. HILL ROBERT M. OGILVIE HUGO T. SØRENSENVice President, Finance and Chief Financial Officer Chairman and Chief Executive Officer President and Chief Operating Officer
Brought to you by Global Reports
Our balance sheet has always been strong relative to our competition and is particularly so now. At year-end, debt
net of cash and short-term investments was only 20% of equity. There are no intangible assets such as goodwill on our
balance sheet.
Our employees deliver our performance. They are empowered and appropriately rewarded for results. As they own
close to 20% of the shares of the Company, they are also dedicated to long-term share performance.
We invest heavily in leading-edge information systems so that our employees at all levels have access to up-to-
date information, allowing them to monitor results and assets to achieve optimum performance. Likewise, we are
steadily adding information modules to our customer interfaces, so that they have access to us and to their information
24 hours a day. Customers of the Caterpillar dealership are able to review oil test results, order parts, search for new
and used equipment, and look at their outstanding invoices—just some of the ways in which we make it easier for our
customers to work with us.
Battlefield Equipment has grown dramatically from one store and two satellite trailers when we purchased the
company in 1996 to 24 branches through acquisitions and greenfield start-ups. Two additional locations were added
in 1999, and Battlefield is off to a good start in 2000 with the previously announced acquisition of Craig Equipment,
opening up the Ottawa Valley market. Simultaneously, Battlefield has continued to expand its scope of supply to
customers. In 1999, Battlefield began to distribute the new Caterpillar Compact Construction line of equipment, which
includes skid-steer loaders, mini-wheel loaders and mini-excavators.
Toromont Process achieved several important breakthroughs in 1999, including new customers in the United States
and United Kingdom, additional market penetration in western Canada and the first ever sales of gas compression
equipment to Australia and Russia. Another accomplishment was a strategic partnership with a compressor manufacturer
that extends Process Systems’ product range and market reach. These initiatives position Toromont Process for accelerated
growth in markets that are recovering from low oil prices and the Asian economic slowdown.
CIMCO will build ice rink surfaces for the NHL’s newest entrants in Ohio and Minnesota, bringing its installed base
of NHL facilities to 21. High profile installations, such as these and others for NBA multi-purpose arenas, also assist in
CIMCO sales of community ice rink packages in North America, the United Kingdom, Europe and the Middle East. In
the industrial refrigeration market, CIMCO will benefit from a recently signed strategic supply agreement with a major
Toromont 3
1994 1996• Two-for-one stock split • New Process Refrigeration facility opens in Calgary
• Revenue surpasses $500 million• Battlefield Equipment Rentals acquired• Newfoundland/Labrador Caterpillar dealership purchased• Process Systems doubles capacity with new Houston facility & Calgary expansion• Two-for-one stock split• $30 million private debt placement
Letter to Shareholders
Brought to you by Global Reports
Canadian food products company as well as ongoing demand from cold storage, food processing and related
companies for technologically-advanced equipment, fully supported by customer service agreements.
Toromont Cat signed the largest contract in its history for equipment and long-term product support. This
contract was indicative of the tremendous progress made throughout Toromont in developing long-term service and
supply arrangements that dramatically reduce customers’ capital employed and operating and maintenance costs, while
improving machine availability and production flexibility.
In every corner of Toromont, the focus is on profitably extending our track record of growth. We believe our
businesses are well positioned to achieve this objective on a long-term basis. Meanwhile, your executives are focusing
their efforts on new initiatives that will accelerate our growth. One such opportunity is in power generation.
Along with many other jurisdictions in North America, Ontario is in the process of deregulating its power generation
and distribution monopoly. In addition to creating opportunities for independent power generation, it raises issues such
as reliability of supply and market pricing exposure for power consumers. Caterpillar and its dealers, including
Toromont, are the worldwide leaders in power generation involving diesel and natural gas-fuelled reciprocating
engines, turbines and co-generation. Toromont Energy was formed as a stand-alone business unit in 1998 to focus on
the opportunities expected to arise from impending deregulation of the power generation and distribution industry
in Ontario.
Our preference is to sell or lease power generation equipment to our customers and thereafter to enter into long-
term support agreements. However, it is evident that many would prefer to outsource this equipment to a reliable
supplier, while receiving benefits such as assured supply of power and steam at lower costs. Accordingly, we have
begun to build a portfolio of owned and operated power generation and co-generation assets. In 1999, we invested
$20 million, up from $2 million in our first year. We are on target to invest over $30 million in 2000. At this pace, power
generation will soon become a major investment for your Company and, we expect, a significant future contributor to
Toromont’s bottom line. As these power plants have expected useful lives exceeding 20 years, we are developing an
annuity that will provide stable income and cash flow over the business cycle. Our strong balance sheet enables us to
build a significant portfolio without having to source additional equity.
4 Toromont
Letter to Shareholders
1997 1998• 30% Enerflex Systems stake sold for $90 million• Process Systems doubles revenues and earnings
• Commercial refrigeration divested ($26 million proceeds)• CIMCO named NHL‘s “Preferred Ice Rink Equipment Supplier”• Two-for-one stock split• Battlefield’s network expands to 22 locations• Caterpillar Compact Construction Equipment line launched
Brought to you by Global Reports
To ensure your Company maintains its “best-in-class” results in the future, we will continue to invest in areas
offering the best long-term returns. In 1999, we committed $30 million to new and upgraded facilities, rental fleet
additions and information technology. We are also investing heavily in employee training, education and succession
planning programs with a view to developing Toromont’s leaders of tomorrow.
Outlook
Year-end backlogs were higher than a year ago, indicating continued momentum in 2000. The areas of strength that
delivered the strong performance of 1999 continue unabated in 2000. All markets in Canada continue to perform well
below their potential and historical peaks, indicating some upside. Construction markets in Ontario remain bullish. The
growing political will to invest in highway and other infrastructure projects should continue to stimulate construction
and demand for our equipment and services. With recovery of cash flows in the energy industry and some improvement
evident in forestry and mining, we expect these sectors to provide some growth in the coming year.
We are actively seeking acquisition opportunities to complement our existing businesses.
We are pleased to report that your Board has approved a four cent increase in the annual dividend to 32 cents, or
8 cents per quarter, effective with the April 3, 2000 payment. This dividend is the eleventh consecutive annual increase.
We are delighted that Mr. Ronald G. Gage has joined our Board of Directors. Ron recently retired as Chairman
and Chief Executive Officer of Ernst & Young LLP, Chartered Accountants. He brings many years of financial and
management experience to Toromont.
We thank those who have contributed to our success, particularly our customers, our 2,100 employees and our
suppliers. We gratefully acknowledge the valuable advice provided by our dedicated Board of Directors. Finally and
sincerely, we thank our shareholders for their continued interest and support.
Toromont 5
1999• Revenue exceeds $700 million• Return on shareholders’ equity averages 26.5% over the decade• Dividend increased 10th consecutive year (31st consecutive year of dividend payment)• Toromont CAT signs largest Customer Support Agreement; CIMCO completes largest project in 86-year history• $60 million debt offering completed• Finishes century with record profitability
Robert M. Ogilvie (Signed)
Chairman and Chief Executive Officer
February 2000
Brought to you by Global Reports
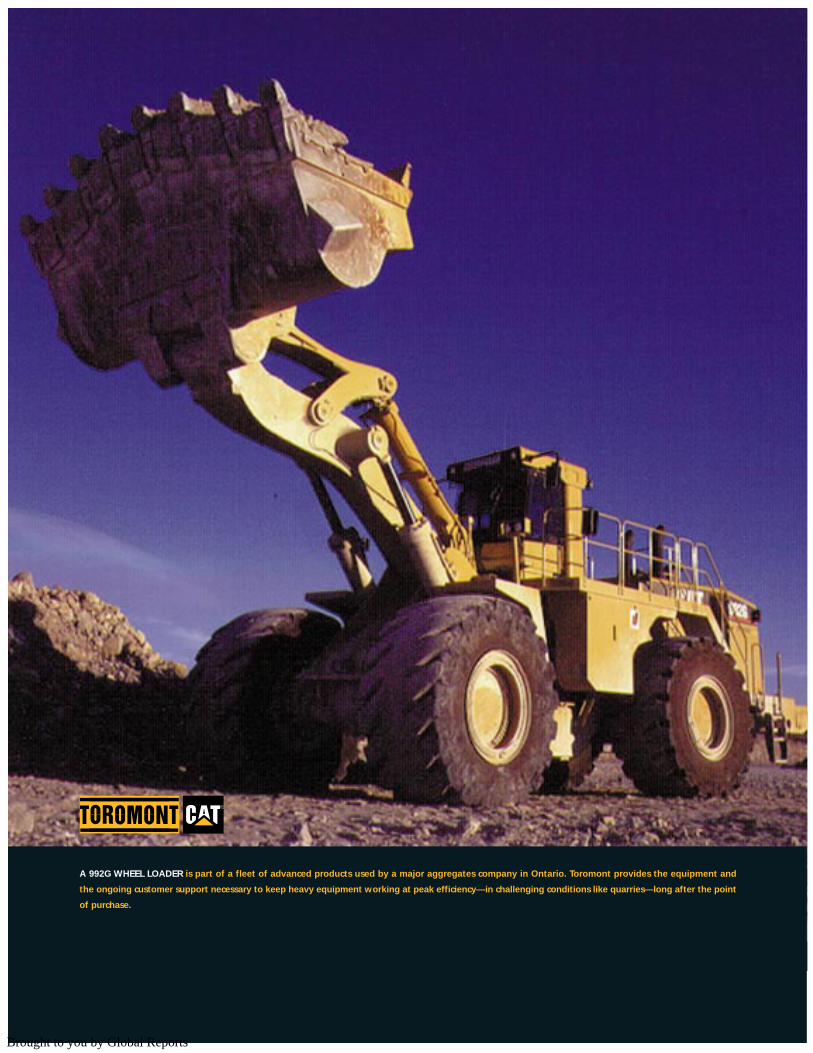
A 992G WHEEL LOADER is part of a fleet of advanced products used by a major aggregates company in Ontario. Toromont provides the equipment and
the ongoing customer support necessary to keep heavy equipment working at peak efficiency—in challenging conditions like quarries—long after the point
of purchase.
Brought to you by Global Reports
EQ
UIP
ME
NT
GR
OU
PS
AL
ES
AN
D M
AR
KE
TIN
G
Toromont 7
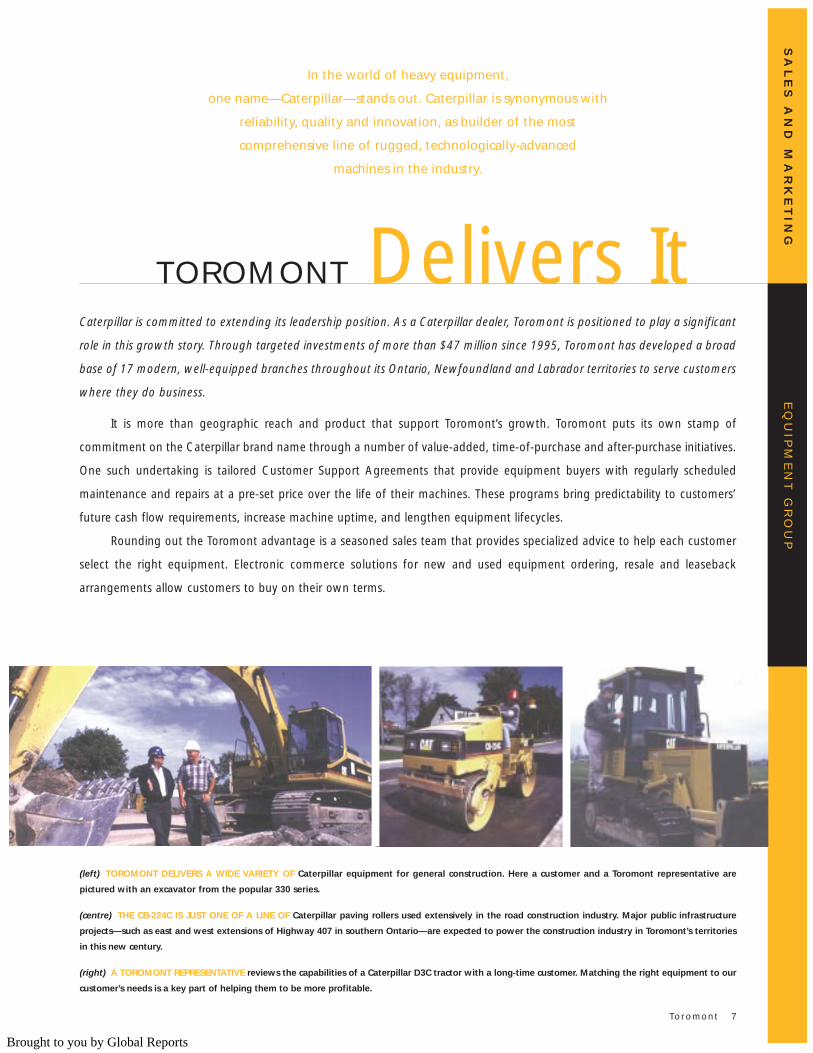
TOROMONT Delivers ItCaterpillar is committed to extending its leadership position. As a Caterpillar dealer, Toromont is positioned to play a significant
role in this growth story. Through targeted investments of more than $47 million since 1995, Toromont has developed a broad
base of 17 modern, well-equipped branches throughout its Ontario, Newfoundland and Labrador territories to serve customers
where they do business.
It is more than geographic reach and product that support Toromont’s growth. Toromont puts its own stamp of
commitment on the Caterpillar brand name through a number of value-added, time-of-purchase and after-purchase initiatives.
One such undertaking is tailored Customer Support Agreements that provide equipment buyers with regularly scheduled
maintenance and repairs at a pre-set price over the life of their machines. These programs bring predictability to customers’
future cash flow requirements, increase machine uptime, and lengthen equipment lifecycles.
Rounding out the Toromont advantage is a seasoned sales team that provides specialized advice to help each customer
select the right equipment. Electronic commerce solutions for new and used equipment ordering, resale and leaseback
arrangements allow customers to buy on their own terms.
In the world of heavy equipment,
one name—Caterpillar—stands out. Caterpillar is synonymous with
reliability, quality and innovation, as builder of the most
comprehensive line of rugged, technologically-advanced
machines in the industry.
(left) TOROMONT DELIVERS A WIDE VARIETY OF Caterpillar equipment for general construction. Here a customer and a Toromont representative are
pictured with an excavator from the popular 330 series.
(centre) THE CB-224C IS JUST ONE OF A LINE OF Caterpillar paving rollers used extensively in the road construction industry. Major public infrastructure
projects—such as east and west extensions of Highway 407 in southern Ontario—are expected to power the construction industry in Toromont’s territories
in this new century.
(right) A TOROMONT REPRESENTATIVE reviews the capabilities of a Caterpillar D3C tractor with a long-time customer. Matching the right equipment to our
customer’s needs is a key part of helping them to be more profitable.
Brought to you by Global Reports
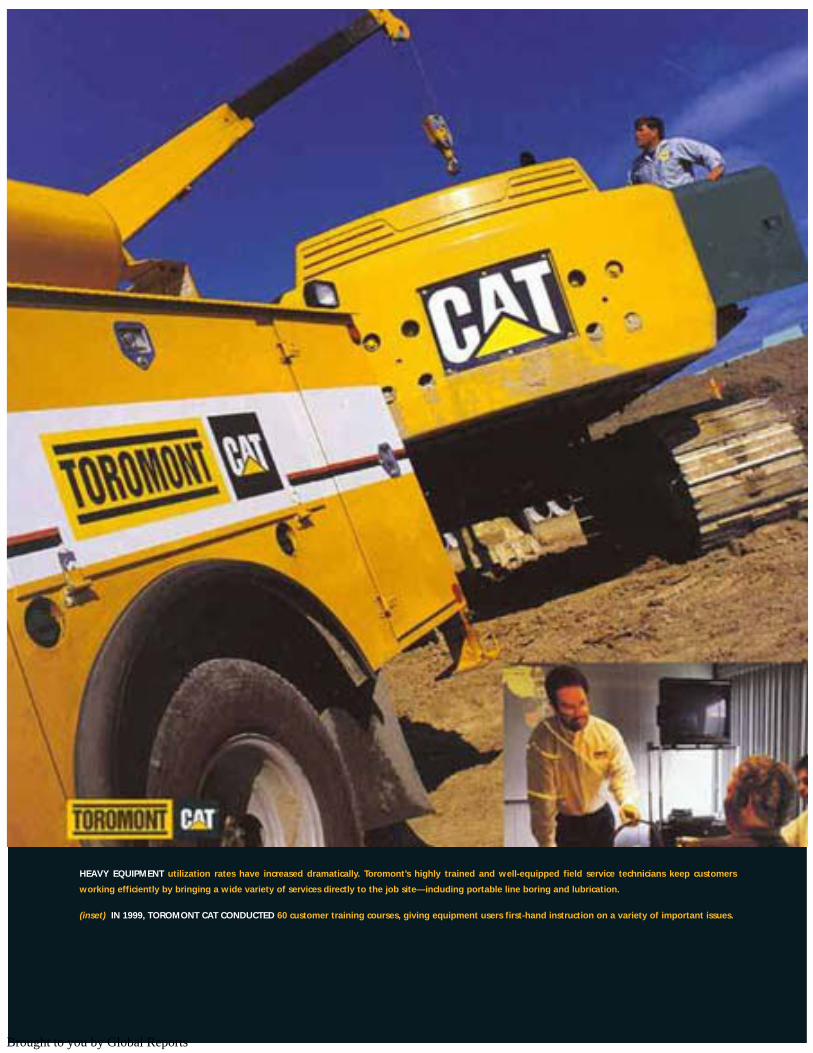
HEAVY EQUIPMENT utilization rates have increased dramatically. Toromont’s highly trained and well-equipped field service technicians keep customers
working efficiently by bringing a wide variety of services directly to the job site—including portable line boring and lubrication.
(inset) IN 1999, TOROMONT CAT CONDUCTED 60 customer training courses, giving equipment users first-hand instruction on a variety of important issues.
Brought to you by Global Reports
EQ
UIP
ME
NT
GR
OU
PP
RO
DU
CT
SU
PP
OR
T
Toromont 9
Toromont CAT is the only heavy equipment dealer in its territories to offer comprehensive remanufacturing capabilities, job-site
line boring and lubrication, fluid analysis with expert results interpretation and repair financing.
Comprehensive repair facilities are found in all Toromont CAT branches, complemented by more than 90 field service
technicians who troubleshoot with sophisticated portable computer diagnostic equipment and order parts on-line from the nearest
branch stocking point. This mobile maintenance capability is backed by advanced oil analysis and fuel injection rebuild laboratories.
Inside the 80,000-square-foot Croman remanufacturing centre, technicians thoroughly analyze the content and
condition of oil samples, informing customers of results on-line—through a secure Internet connection or by phone—to identify
potential engine, transmission or hydraulic wear problems before they result in costly failure. The fuel injection lab rebuilds,
tests and calibrates these components, using the most sophisticated equipment available.
In other specialized facilities, Toromont rebuilds Caterpillar and OEM engines, transmissions, hydraulic pumps, cylinders
and components to original specifications, offering industry-leading warranties on all work.
To service heavy equipment on a cost effective basis, particularly sophisticated electronics, an extensive support network is
vital. Toromont has the critical mass and the knowledge that comes from maintaining fleets for some of Canada’s largest heavy
equipment users. In 1999 alone, Toromont tested more than 50,000 oil samples and rebuilt more than 5,500 components.
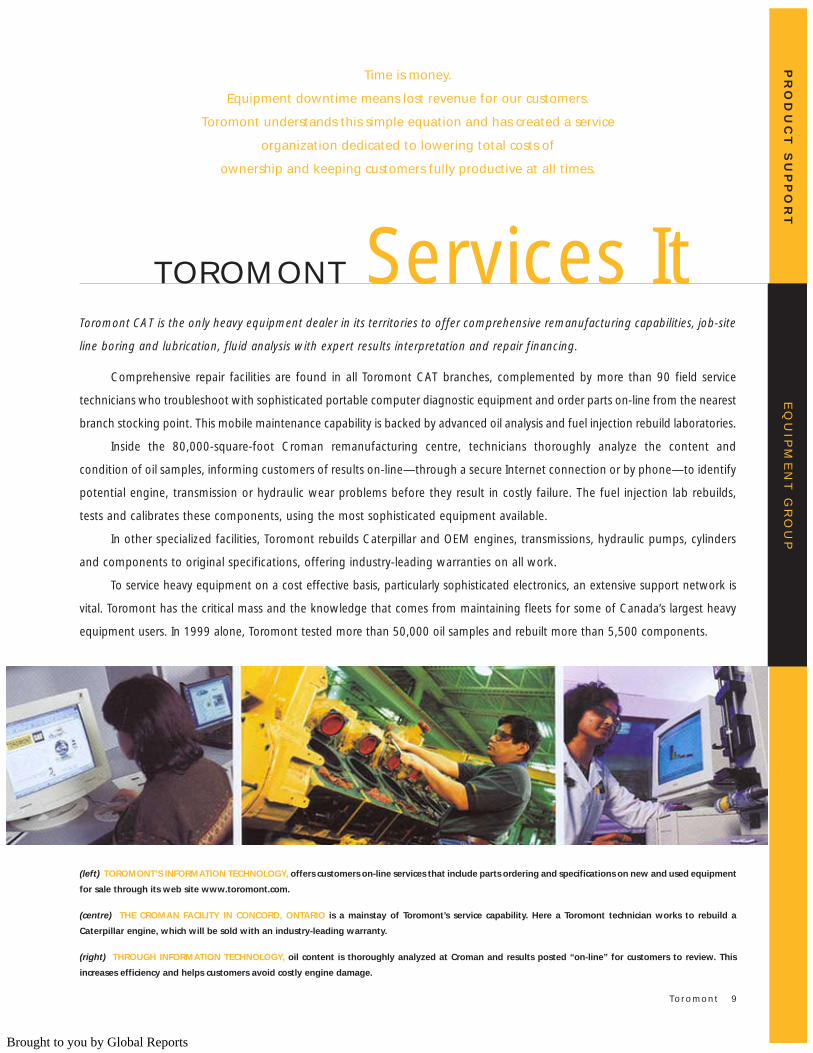
TOROMONT Services It
Time is money.
Equipment downtime means lost revenue for our customers.
Toromont understands this simple equation and has created a service
organization dedicated to lowering total costs of
ownership and keeping customers fully productive at all times.
(left) TOROMONT’S INFORMATION TECHNOLOGY, offers customers on-line services that include parts ordering and specifications on new and used equipment
for sale through its web site www.toromont.com.
(centre) THE CROMAN FACILITY IN CONCORD, ONTARIO is a mainstay of Toromont’s service capability. Here a Toromont technician works to rebuild a
Caterpillar engine, which will be sold with an industry-leading warranty.
(right) THROUGH INFORMATION TECHNOLOGY, oil content is thoroughly analyzed at Croman and results posted “on-line” for customers to review. This
increases efficiency and helps customers avoid costly engine damage.
Brought to you by Global Reports
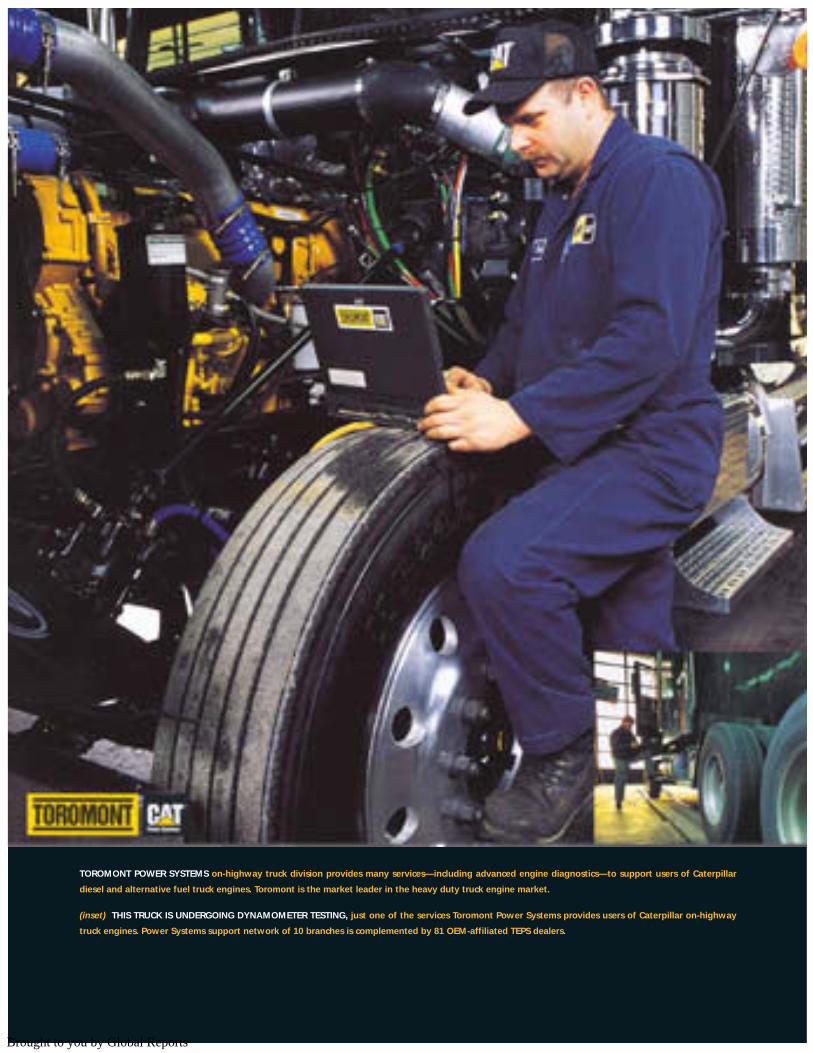
TOROMONT POWER SYSTEMS on-highway truck division provides many services—including advanced engine diagnostics—to support users of Caterpillar
diesel and alternative fuel truck engines. Toromont is the market leader in the heavy duty truck engine market.
(inset) THIS TRUCK IS UNDERGOING DYNAMOMETER TESTING, just one of the services Toromont Power Systems provides users of Caterpillar on-highway
truck engines. Power Systems support network of 10 branches is complemented by 81 OEM-affiliated TEPS dealers.
Brought to you by Global Reports
EQ
UIP
ME
NT
GR
OU
PO
N-H
IGH
WA
Y T
RU
CK
S
Toromont 11
This group of professionals is dedicated to providing marketing, service and technical support to thousands of truck engine users
and Original Equipment Manufacturer (OEM) dealers. The on-highway truck team assists dealers and their customers to efficiently
integrate the latest Caterpillar truck engine advancements into leading OEM trucks and buses.
The extensive range of Caterpillar diesel and alternative fuel truck engines requires Toromont Power Systems to balance
intimate product knowledge with an appreciation of OEM dealer and fleet requirements.
By understanding these needs and capitalizing on one of the world’s most recognizable names in truck engines,
Toromont Power Systems has achieved leadership in the heavy duty truck engine market and also made significant market share
gains in the mid-range market.
In addition to great products—readily available from Caterpillar’s state-of-the-art manufacturing plants—Toromont Power
Systems also derives an advantage by offering an extensive after-sales support network. In Toromont’s region alone, this
network includes 10 Toromont CAT branches incorporating 75 dedicated truck bays as well as 81 Caterpillar-authorized, OEM-
affiliated, Truck Engine Product Support (TEPS) dealers.
Linked to Toromont through Caterpillar PC software, the TEPS network performs a vital role as they order engine parts
on-line, electronically gather the latest information on new products and provide the same high level of customer support as
OEM dealers in every corner of Toromont’s region.
Together, TEPS dealers and Toromont Power Systems go that extra mile to move their customers.
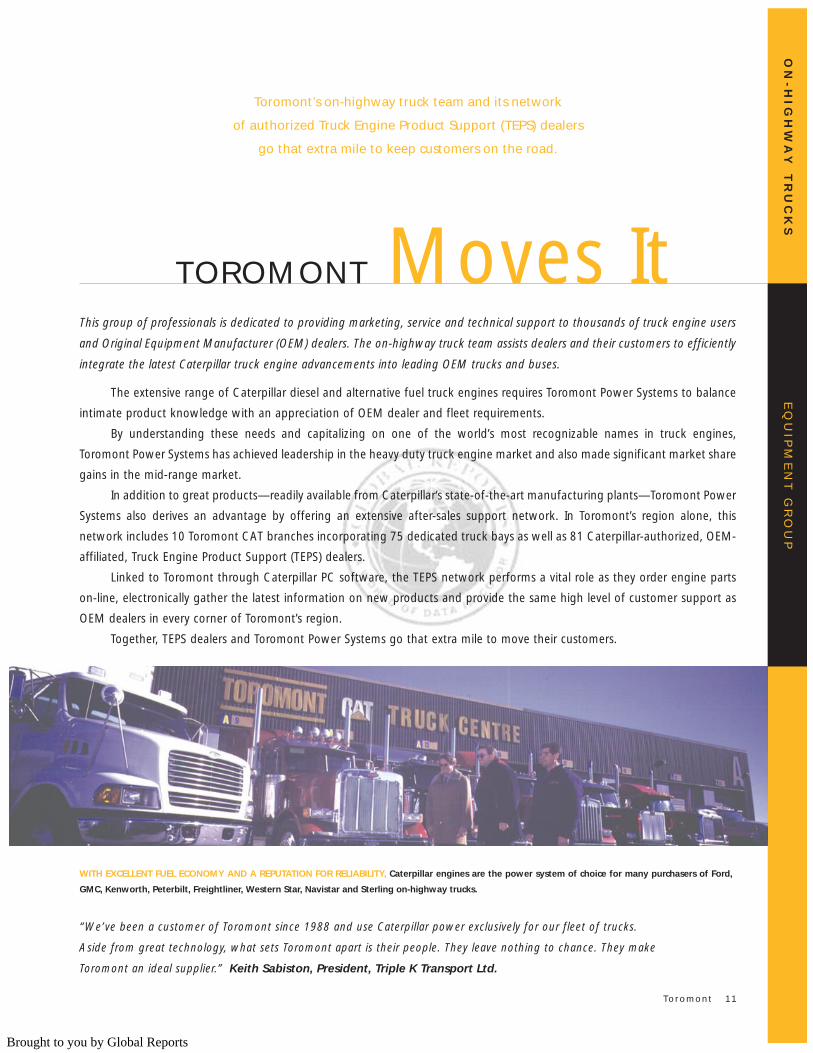
WITH EXCELLENT FUEL ECONOMY AND A REPUTATION FOR RELIABILITY, Caterpillar engines are the power system of choice for many purchasers of Ford,
GMC, Kenworth, Peterbilt, Freightliner, Western Star, Navistar and Sterling on-highway trucks.
TOROMONT Moves It
Toromont’s on-highway truck team and its network
of authorized Truck Engine Product Support (TEPS) dealers
go that extra mile to keep customers on the road.
“We’ve been a customer of Toromont since 1988 and use Caterpillar power exclusively for our fleet of trucks.
Aside from great technology, what sets Toromont apart is their people. They leave nothing to chance. They make
Toromont an ideal supplier.” Keith Sabiston, President, Triple K Transport Ltd.
Brought to you by Global Reports
12 Toromont
TOROMONT Powers ItWhether it’s Caterpillar and Olympian generator sets for prime power and emergency standby applications, Caterpillar marine
propulsion engines and auxiliary generator sets for pleasure craft and commercial applications, or industrial engines for OEM
and other customer applications, Toromont Power Systems sells it, packages it and services it.
Toromont Power Systems is a single-source, turn-key equipment provider—the only one in its territories. It is also a highly
diversified, customer-focused business.
Through its technical sales and engineering groups, Power Systems designs power packages to meet the exacting require-
ments of each customer. Starting with off-the-shelf products, such as marine propulsion and auxiliary systems from 81 to
15,000 horsepower, Toromont custom engineers the system to optimize performance and fuel economy. For standby and prime
power generation, Power Systems customizes diesel and spark-ignited reciprocating engines capable of producing between
eight and 12,000 kilowatts of power.
Toromont Power Systems also provides value-added extras such as operator training and 24-hours-a-day customer
support. A single call to the 24-hour Toromont Rental Power hotline (416.667.5544) brings electrical power generation,
transformers, distribution equipment and temperature control equipment (including chillers, air handlers, air conditioners and
heaters) to the customer’s jobsite quickly and cost effectively.
Through these customer-focused activities, Toromont makes the most of the world’s best line-up of power
systems equipment.
Toromont Power Systems is where
Ontario and Newfoundland turn for power.
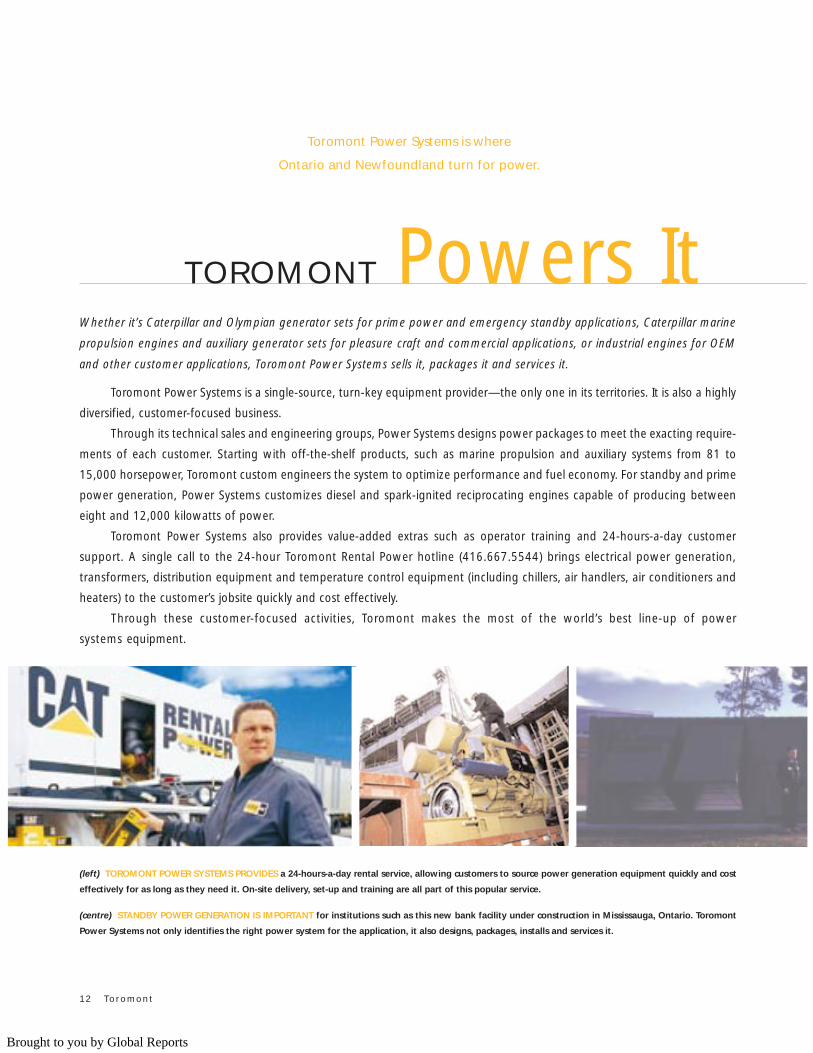
(left) TOROMONT POWER SYSTEMS PROVIDES a 24-hours-a-day rental service, allowing customers to source power generation equipment quickly and cost
effectively for as long as they need it. On-site delivery, set-up and training are all part of this popular service.
(centre) STANDBY POWER GENERATION IS IMPORTANT for institutions such as this new bank facility under construction in Mississauga, Ontario. Toromont
Power Systems not only identifies the right power system for the application, it also designs, packages, installs and services it.
Brought to you by Global Reports
EQ
UIP
ME
NT
GR
OU
PP
OW
ER
SY
ST
EM
S
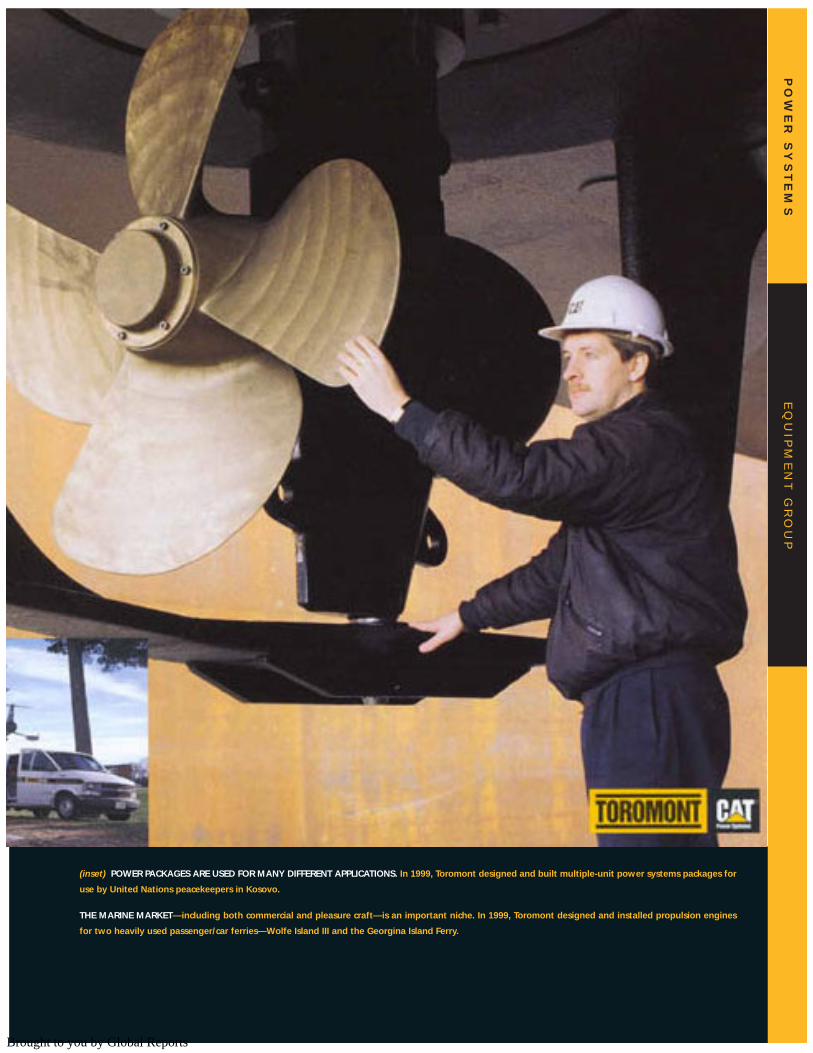
(inset) POWER PACKAGES ARE USED FOR MANY DIFFERENT APPLICATIONS. In 1999, Toromont designed and built multiple-unit power systems packages for
use by United Nations peacekeepers in Kosovo.
THE MARINE MARKET—including both commercial and pleasure craft—is an important niche. In 1999, Toromont designed and installed propulsion engines
for two heavily used passenger/car ferries—Wolfe Island III and the Georgina Island Ferry.
Brought to you by Global Reports
14 Toromont
As a leading developer of off-grid, district energy and co-generation projects, Toromont Energy has built its franchise on four
pillars: technology, knowledge, service and capital.
Toromont Energy builds all of its projects using Caterpillar’s broad base of power generation technology with world
class efficiency.
Using the knowledge gained from developing more than 50 high efficiency power plants over the past 15 years, and
extensive in-house engineering and construction management resources, Toromont Energy skillfully applies this proven
technology. Its turn-key design-build services provide substantial value-added for today’s demanding marketplace.
Whether it’s a sophisticated power generation system or energy delivered from one of our plants, our success is a result
of the reliability and worry-free operation of Caterpillar technology and our value-added service. 24-hour parts support, and
continual remote monitoring by operations staff, delivers an essential level of service customers requiring reliable power.
Toromont Energy is positioned to go a step further. When economics warrant, Toromont has the capital to invest in power
generation assets. As a partial or full owner, Toromont can become the energy provider, allowing energy users to remain
focused on their core businesses.
In these ways, Toromont Energy is focused on bringing the benefits of deregulation to energy users everywhere.
TOROMONT Energizes It
The electrical energy industry is changing.
With deregulation resulting in greater choice for industrial and
community energy users, the demand for new power generation options,
including those presented by Toromont Energy, has grown.
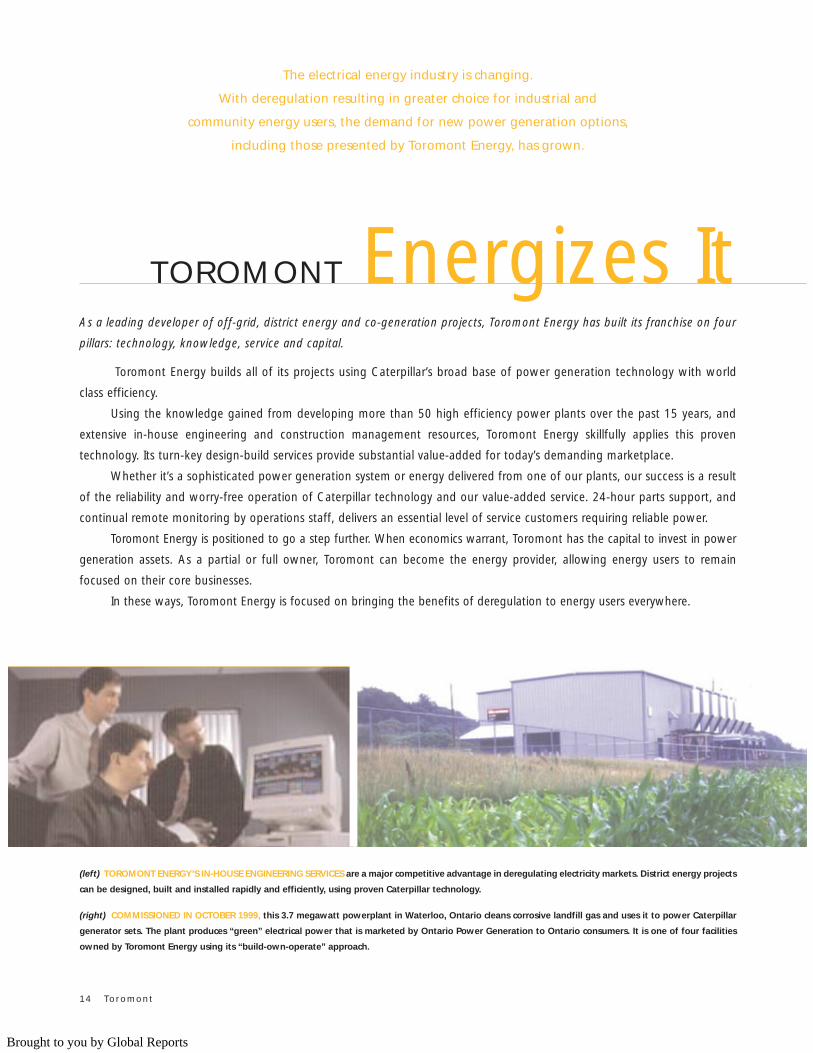
(left) TOROMONT ENERGY’S IN-HOUSE ENGINEERING SERVICES are a major competitive advantage in deregulating electricity markets. District energy projects
can be designed, built and installed rapidly and efficiently, using proven Caterpillar technology.
(right) COMMISSIONED IN OCTOBER 1999, this 3.7 megawatt powerplant in Waterloo, Ontario cleans corrosive landfill gas and uses it to power Caterpillar
generator sets. The plant produces “green” electrical power that is marketed by Ontario Power Generation to Ontario consumers. It is one of four facilities
owned by Toromont Energy using its “build-own-operate” approach.
Brought to you by Global Reports
EQ
UIP
ME
NT
GR
OU
PT
OR
OM
ON
T E
NE
RG
Y
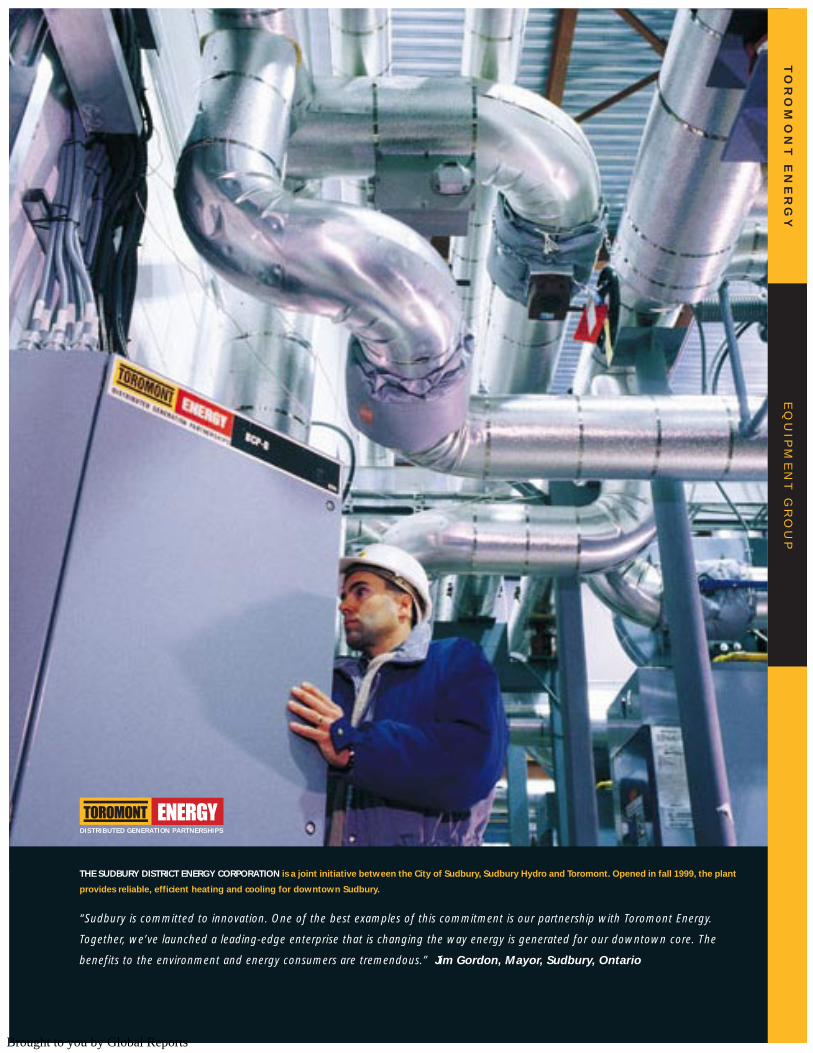
THE SUDBURY DISTRICT ENERGY CORPORATION is a joint initiative between the City of Sudbury, Sudbury Hydro and Toromont. Opened in fall 1999, the plant
provides reliable, efficient heating and cooling for downtown Sudbury.
“Sudbury is committed to innovation. One of the best examples of this commitment is our partnership with Toromont Energy.
Together, we’ve launched a leading-edge enterprise that is changing the way energy is generated for our downtown core. The
benefits to the environment and energy consumers are tremendous.” Jim Gordon, Mayor, Sudbury, Ontario
��������DISTRIBUTED GENERATION PARTNERSHIPS
Brought to you by Global Reports
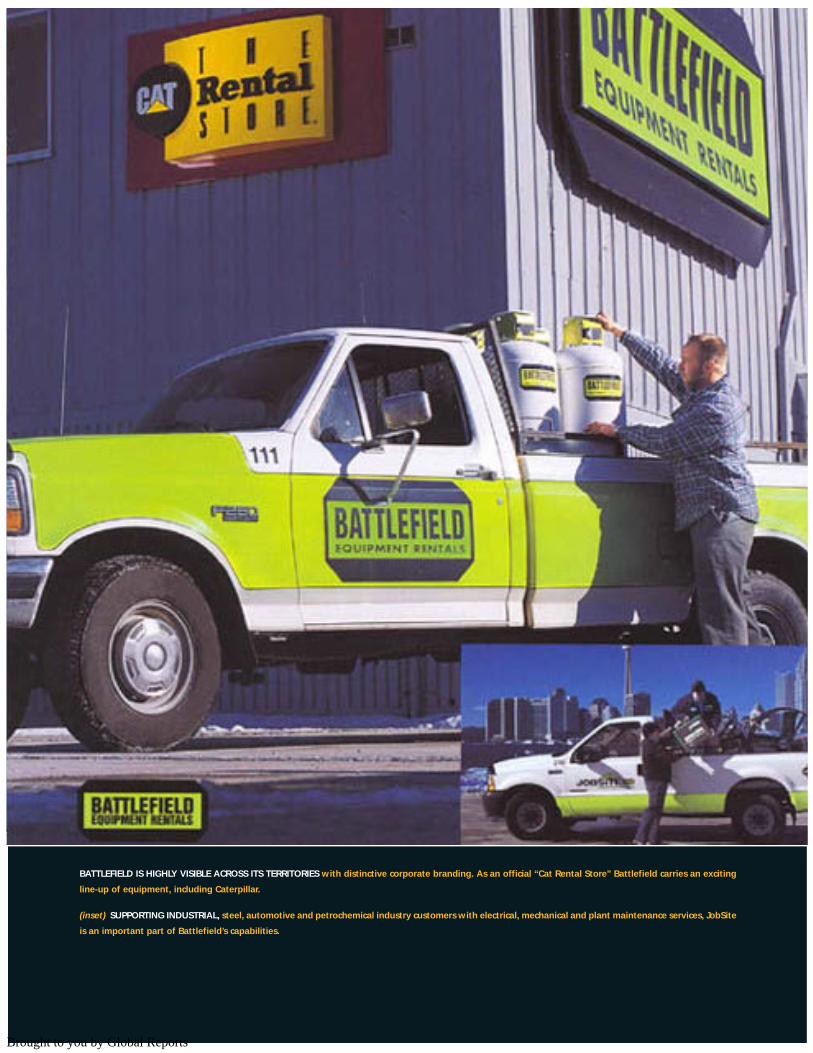
BATTLEFIELD IS HIGHLY VISIBLE ACROSS ITS TERRITORIES with distinctive corporate branding. As an official “Cat Rental Store” Battlefield carries an exciting
line-up of equipment, including Caterpillar.
(inset) SUPPORTING INDUSTRIAL, steel, automotive and petrochemical industry customers with electrical, mechanical and plant maintenance services, JobSite
is an important part of Battlefield’s capabilities.
Brought to you by Global Reports
EQ
UIP
ME
NT
GR
OU
PB
AT
TL
EF
IEL
D
Toromont 17
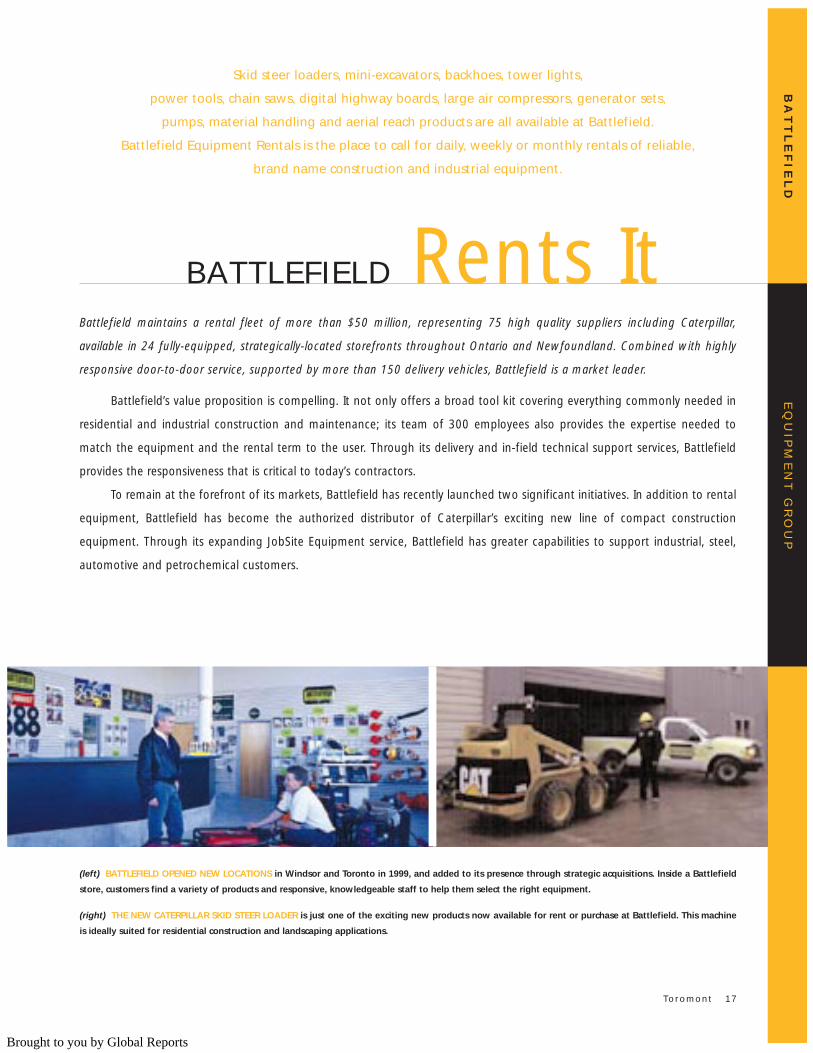
BATTLEFIELD Rents ItBattlefield maintains a rental fleet of more than $50 million, representing 75 high quality suppliers including Caterpillar,
available in 24 fully-equipped, strategically-located storefronts throughout Ontario and Newfoundland. Combined with highly
responsive door-to-door service, supported by more than 150 delivery vehicles, Battlefield is a market leader.
Battlefield’s value proposition is compelling. It not only offers a broad tool kit covering everything commonly needed in
residential and industrial construction and maintenance; its team of 300 employees also provides the expertise needed to
match the equipment and the rental term to the user. Through its delivery and in-field technical support services, Battlefield
provides the responsiveness that is critical to today’s contractors.
To remain at the forefront of its markets, Battlefield has recently launched two significant initiatives. In addition to rental
equipment, Battlefield has become the authorized distributor of Caterpillar’s exciting new line of compact construction
equipment. Through its expanding JobSite Equipment service, Battlefield has greater capabilities to support industrial, steel,
automotive and petrochemical customers.
Skid steer loaders, mini-excavators, backhoes, tower lights,
power tools, chain saws, digital highway boards, large air compressors, generator sets,
pumps, material handling and aerial reach products are all available at Battlefield.
Battlefield Equipment Rentals is the place to call for daily, weekly or monthly rentals of reliable,
brand name construction and industrial equipment.
(left) BATTLEFIELD OPENED NEW LOCATIONS in Windsor and Toronto in 1999, and added to its presence through strategic acquisitions. Inside a Battlefield
store, customers find a variety of products and responsive, knowledgeable staff to help them select the right equipment.
(right) THE NEW CATERPILLAR SKID STEER LOADER is just one of the exciting new products now available for rent or purchase at Battlefield. This machine
is ideally suited for residential construction and landscaping applications.
Brought to you by Global Reports
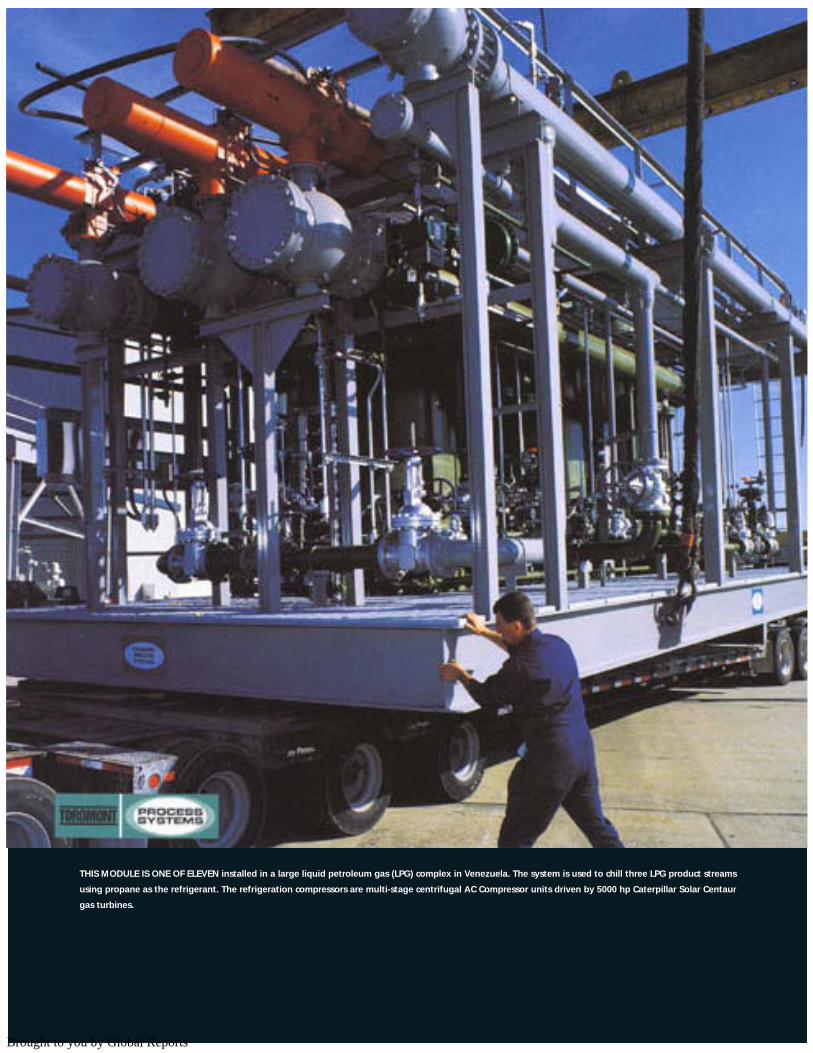
THIS MODULE IS ONE OF ELEVEN installed in a large liquid petroleum gas (LPG) complex in Venezuela. The system is used to chill three LPG product streams
using propane as the refrigerant. The refrigeration compressors are multi-stage centrifugal AC Compressor units driven by 5000 hp Caterpillar Solar Centaur
gas turbines.
Brought to you by Global Reports
RE
FR
IGE
RA
TIO
N G
RO
UP
PR
OC
ES
S S
YS
TE
MS
Toromont 19
The diverse and cyclical industries served by Toromont Process Systems have a common need to rapidly and cost-effectively
deploy specialized modular process class refrigeration and gas compression equipment. This equipment must conform to
the latest environmental standards. Often required on short notice, these complex systems play a vital role in natural gas
production, industrial gas purification, petroleum refining, carbon dioxide recovery and chemical processing.
Toromont Process Systems responds to customer needs in many ways. First, it has internationally recognized engineering
capabilities—augmented by advanced computer-aided design techniques—that allow each system to be developed quickly to
complex and unique specifications.
Second, Process Systems’ equipment is designed and manufactured in modular form so that standardized systems can
be purchased or rented for quick and cost effective deployment. With modular production, new customer plants are designed,
existing plants are expanded and repair work is completed with economies of time, space and expense. Process Systems ensures
quality with total unit responsibility from concept and sub-component manufacturing through to installation, warranty and
custom tailored technical support programs.
Third, Toromont is a leader in using environmentally friendly refrigerants, including CFC alternatives such as ammonia,
propane and propylene.
This dedication to meeting individual needs has earned Process Systems a stellar reputation with customers around
the globe.
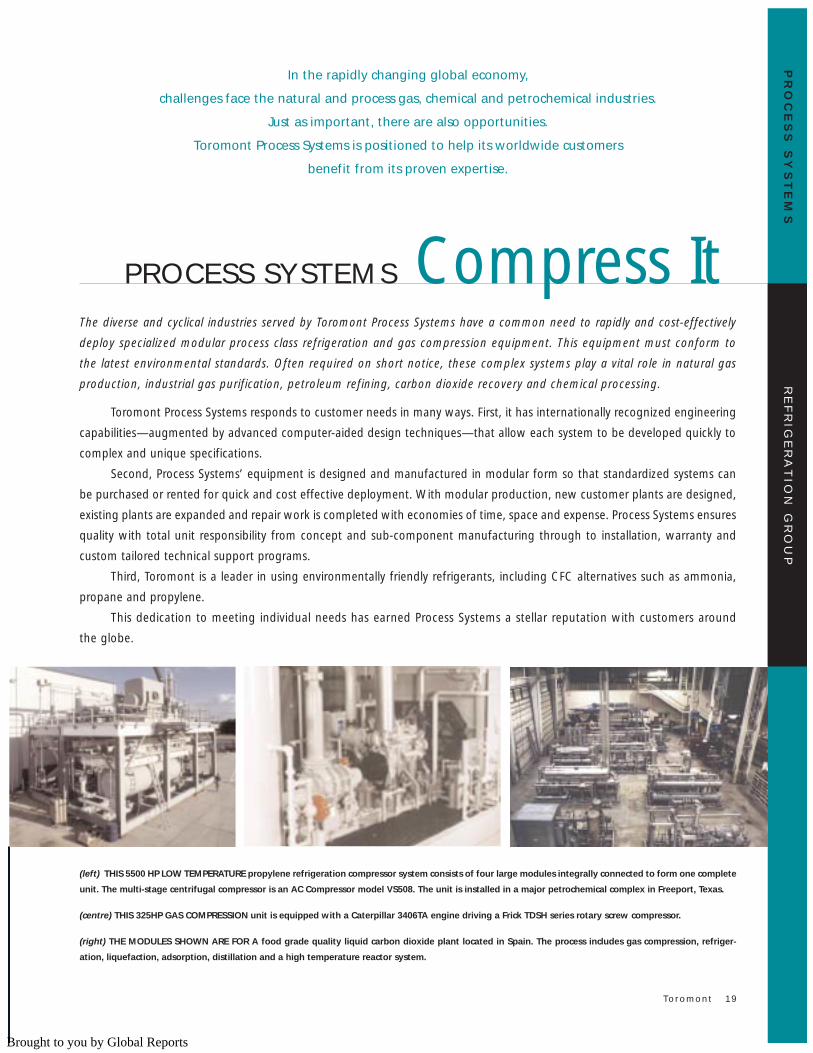
PROCESS SYSTEMS Compress It
In the rapidly changing global economy,
challenges face the natural and process gas, chemical and petrochemical industries.
Just as important, there are also opportunities.
Toromont Process Systems is positioned to help its worldwide customers
benefit from its proven expertise.
(left) THIS 5500 HP LOW TEMPERATURE propylene refrigeration compressor system consists of four large modules integrally connected to form one complete
unit. The multi-stage centrifugal compressor is an AC Compressor model VS508. The unit is installed in a major petrochemical complex in Freeport, Texas.
(centre) THIS 325HP GAS COMPRESSION unit is equipped with a Caterpillar 3406TA engine driving a Frick TDSH series rotary screw compressor.
(right) THE MODULES SHOWN ARE FOR A food grade quality liquid carbon dioxide plant located in Spain. The process includes gas compression, refriger-
ation, liquefaction, adsorption, distillation and a high temperature reactor system.
Brought to you by Global Reports
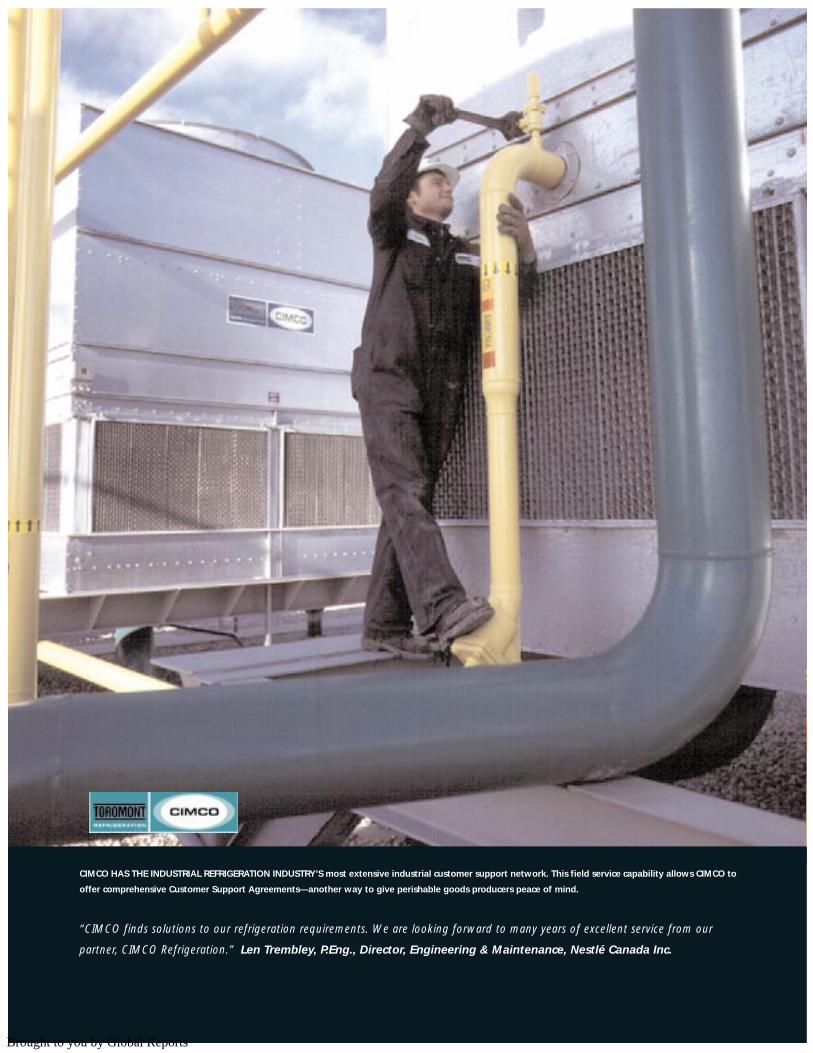
CIMCO HAS THE INDUSTRIAL REFRIGERATION INDUSTRY’S most extensive industrial customer support network. This field service capability allows CIMCO to
offer comprehensive Customer Support Agreements—another way to give perishable goods producers peace of mind.
“CIMCO finds solutions to our refrigeration requirements. We are looking forward to many years of excellent service from our
partner, CIMCO Refrigeration.” Len Trembley, P.Eng., Director, Engineering & Maintenance, Nestlé Canada Inc.
Brought to you by Global Reports
RE
FR
IGE
RA
TIO
N G
RO
UP
CIM
CO
IND
US
TR
IAL
Toromont 21
As Canada’s largest industrial refrigeration supplier, Toromont’s CIMCO Refrigeration plays a critical role in keeping food
processors, distribution centres, breweries and beverage producers operating at peak efficiency and productivity.
With a highly skilled workforce, CIMCO designs and integrates the technologies required to meet any industrial refriger-
ation need, including total immersion and individually quick freeze systems. From its 60,000-square-foot manufacturing facility,
CIMCO designs and builds refrigeration packages along with component heat exchangers, pressure vessels, electrical control
panels, sophisticated hardware and control software. Internally developed by CIMCO’s Micro-Monitoring group, the control
software continuously checks, operates and regulates the various components integrated in today’s complex refrigeration systems.
The demand for advanced industrial refrigeration equipment continues to grow for a number of reasons, including:
population growth, industry consolidation, modernization and the increasing value of perishable goods inventories.
CIMCO is ready to meet this demand with full, single-source capabilities for design, production, installation and ongoing
maintenance. On an as-needed, 24-hours-a-day basis, CIMCO stands behind its technology with a North American customer
support capability. “All inclusive” Customer Support Agreements not only offer customers peace of mind, but also guaranteed
maintenance costs. With an enviable 86-year reputation for quality and innovation, CIMCO has earned long-term relationships
and preferred supplier status with leading food and beverage companies throughout Canada and the United States.
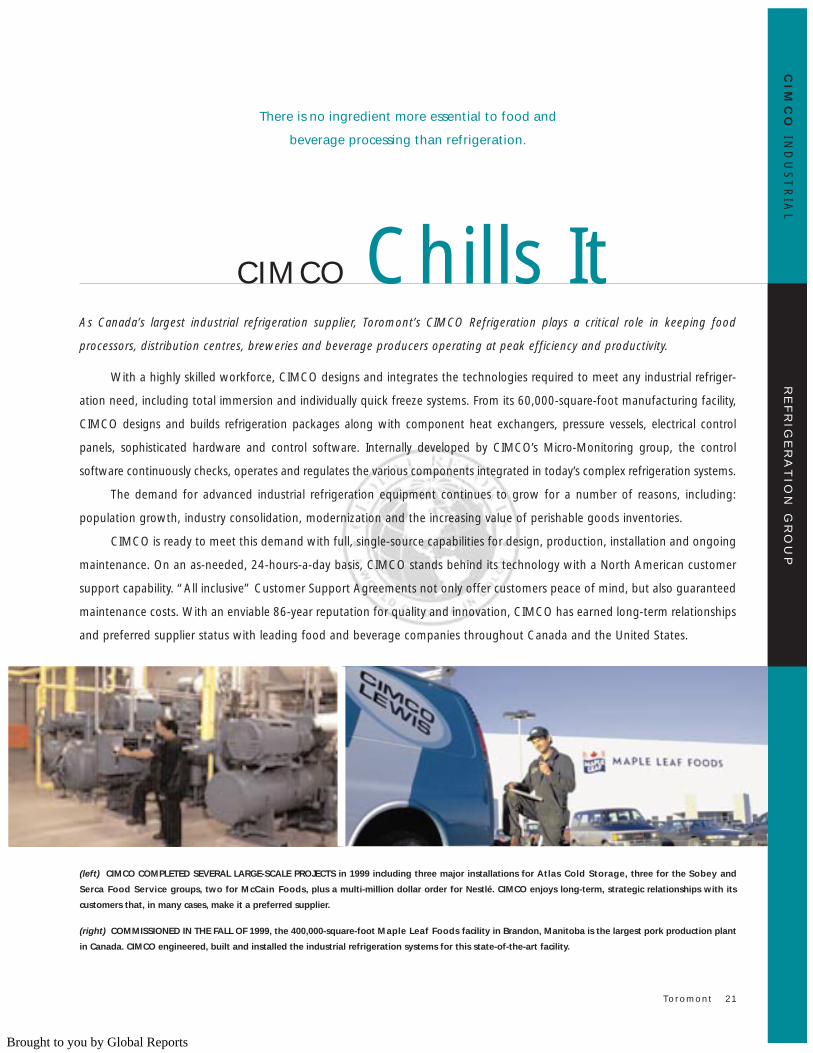
CIMCO Chills It
There is no ingredient more essential to food and
beverage processing than refrigeration.
(left) CIMCO COMPLETED SEVERAL LARGE-SCALE PROJECTS in 1999 including three major installations for Atlas Cold Storage, three for the Sobey and
Serca Food Service groups, two for McCain Foods, plus a multi-million dollar order for Nestlé. CIMCO enjoys long-term, strategic relationships with its
customers that, in many cases, make it a preferred supplier.
(right) COMMISSIONED IN THE FALL OF 1999, the 400,000-square-foot Maple Leaf Foods facility in Brandon, Manitoba is the largest pork production plant
in Canada. CIMCO engineered, built and installed the industrial refrigeration systems for this state-of-the-art facility.
Brought to you by Global Reports
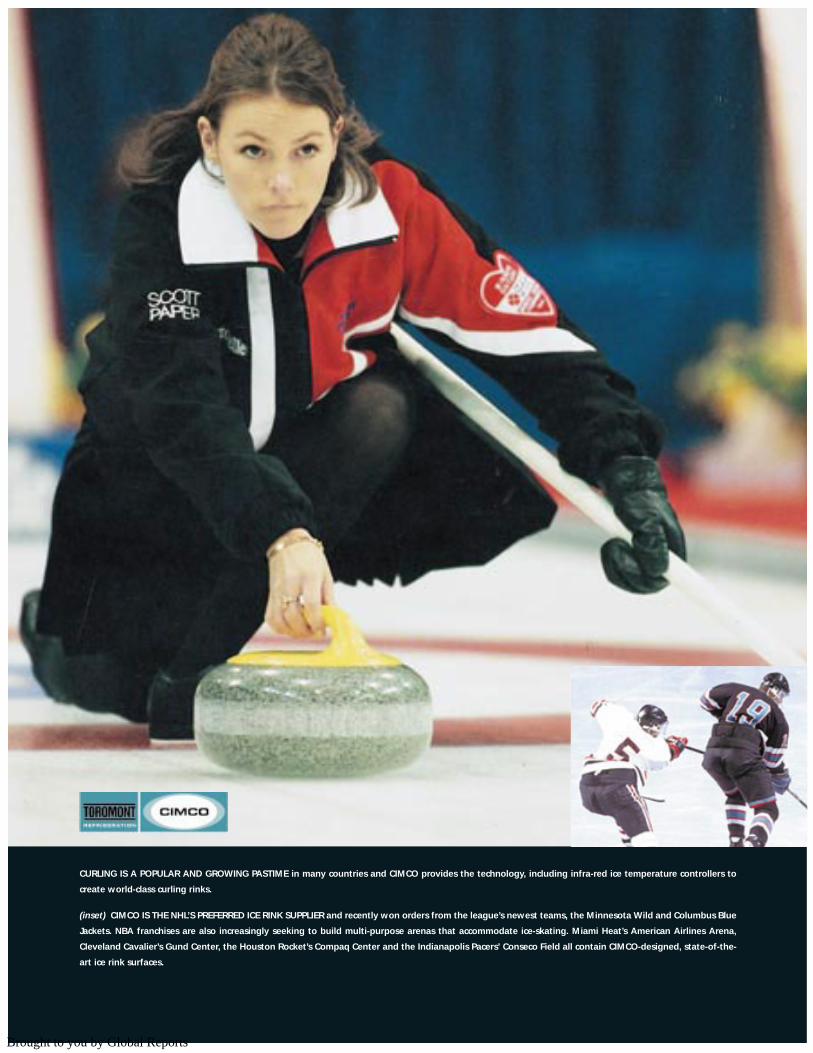
CURLING IS A POPULAR AND GROWING PASTIME in many countries and CIMCO provides the technology, including infra-red ice temperature controllers to
create world-class curling rinks.
(inset) CIMCO IS THE NHL’S PREFERRED ICE RINK SUPPLIER and recently won orders from the league’s newest teams, the Minnesota Wild and Columbus Blue
Jackets. NBA franchises are also increasingly seeking to build multi-purpose arenas that accommodate ice-skating. Miami Heat’s American Airlines Arena,
Cleveland Cavalier’s Gund Center, the Houston Rocket’s Compaq Center and the Indianapolis Pacers’ Conseco Field all contain CIMCO-designed, state-of-the-
art ice rink surfaces.
Brought to you by Global Reports
RE
FR
IGE
RA
TIO
N G
RO
UP
CIM
CO
RE
CR
EA
TIO
N
Toromont 23
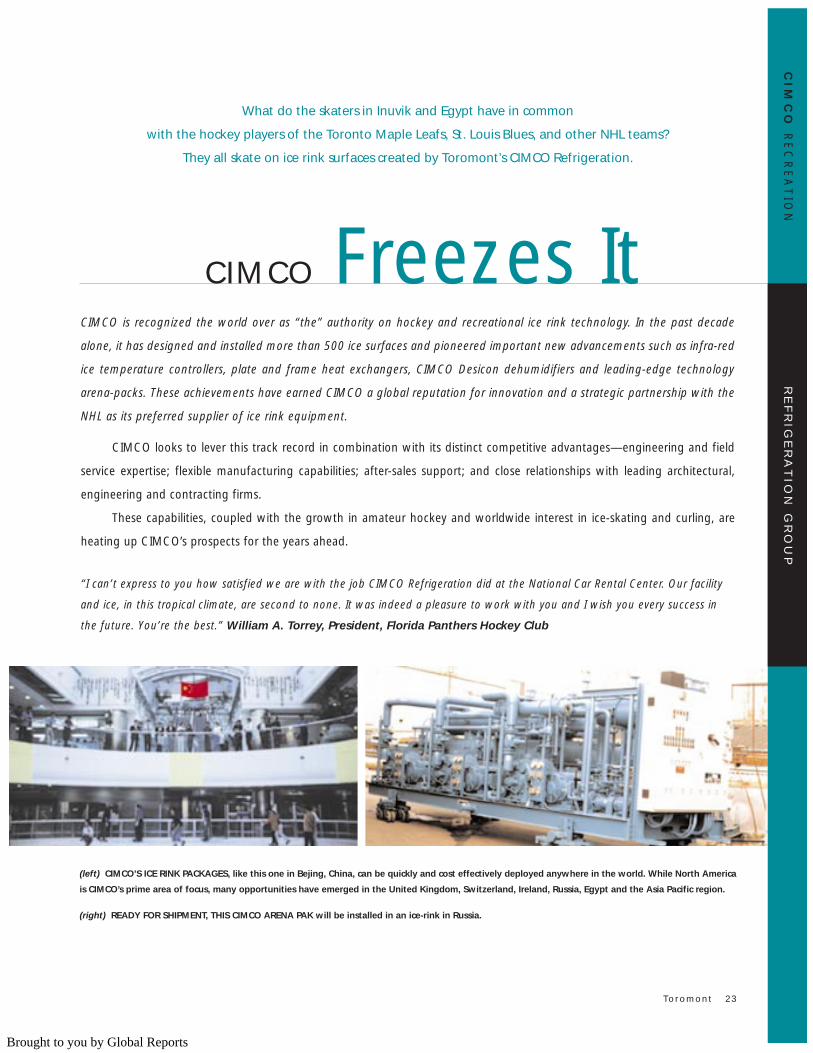
CIMCO is recognized the world over as “the” authority on hockey and recreational ice rink technology. In the past decade
alone, it has designed and installed more than 500 ice surfaces and pioneered important new advancements such as infra-red
ice temperature controllers, plate and frame heat exchangers, CIMCO Desicon dehumidifiers and leading-edge technology
arena-packs. These achievements have earned CIMCO a global reputation for innovation and a strategic partnership with the
NHL as its preferred supplier of ice rink equipment.
CIMCO looks to lever this track record in combination with its distinct competitive advantages—engineering and field
service expertise; flexible manufacturing capabilities; after-sales support; and close relationships with leading architectural,
engineering and contracting firms.
These capabilities, coupled with the growth in amateur hockey and worldwide interest in ice-skating and curling, are
heating up CIMCO’s prospects for the years ahead.
“I can’t express to you how satisfied we are with the job CIMCO Refrigeration did at the National Car Rental Center. Our facility
and ice, in this tropical climate, are second to none. It was indeed a pleasure to work with you and I wish you every success in
the future. You’re the best.” William A. Torrey, President, Florida Panthers Hockey Club
CIMCO Freezes It
What do the skaters in Inuvik and Egypt have in common
with the hockey players of the Toronto Maple Leafs, St. Louis Blues, and other NHL teams?
They all skate on ice rink surfaces created by Toromont’s CIMCO Refrigeration.
(left) CIMCO’S ICE RINK PACKAGES, like this one in Bejing, China, can be quickly and cost effectively deployed anywhere in the world. While North America
is CIMCO’s prime area of focus, many opportunities have emerged in the United Kingdom, Switzerland, Ireland, Russia, Egypt and the Asia Pacific region.
(right) READY FOR SHIPMENT, THIS CIMCO ARENA PAK will be installed in an ice-rink in Russia.
Brought to you by Global Reports
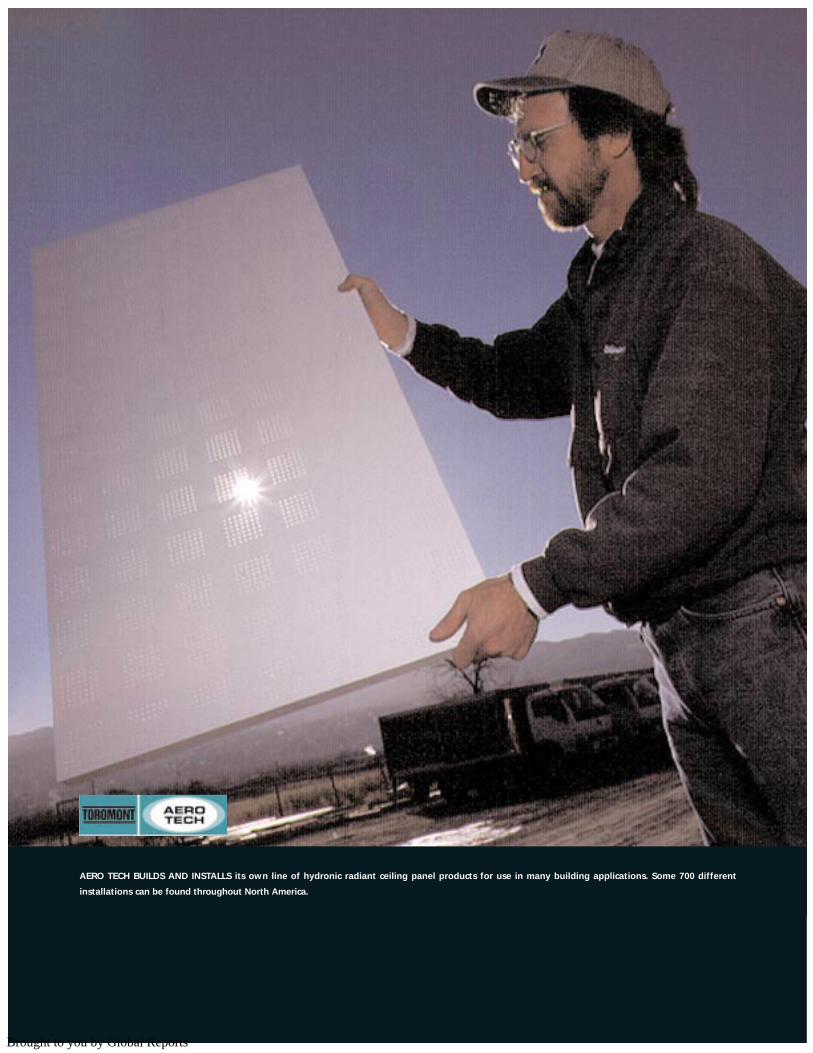
AERO TECH BUILDS AND INSTALLS its own line of hydronic radiant ceiling panel products for use in many building applications. Some 700 different
installations can be found throughout North America.
Brought to you by Global Reports
RE
FR
IGE
RA
TIO
N G
RO
UP
AE
RO
TE
CH
Toromont 25
This custom precision sheet metal fabricator, based in North Salt Lake, Utah, is a value-added, just-in-time supplier to a variety
of North American industries including medical, gaming, electrical and printing. Like the customers it serves, Aero Tech is a
dynamic, profitable and entrepreneurial organization.
Aero Tech often plays a big role for its customers by bringing their prototypes to full production through its engineering
design and manufacturing capabilities.
These capabilities start with the resident knowledge of Aero Tech’s engineering personnel who provide customer support
through all phases of product design and development.
Once project specifications are set, Aero Tech employs its experience to manufacture the components and/or sub-assemblies
to exacting standards. The products are then finished in-house with a liquid or powder coating application. Throughout the
manufacturing process, statistical process control methods are used to ensure defect-free, high-precision fabrication.
The result is rapid, high-spec production, satisfied customers and ongoing opportunities for revenue growth.
AERO TECH Fabricates It
Electrical enclosures, computer and medical chassis, printing plate
processing equipment and municipal / industrial waste water filtration assemblies
are just some of the products and components that pass through
Toromont’s Aero Tech Manufacturing facility.
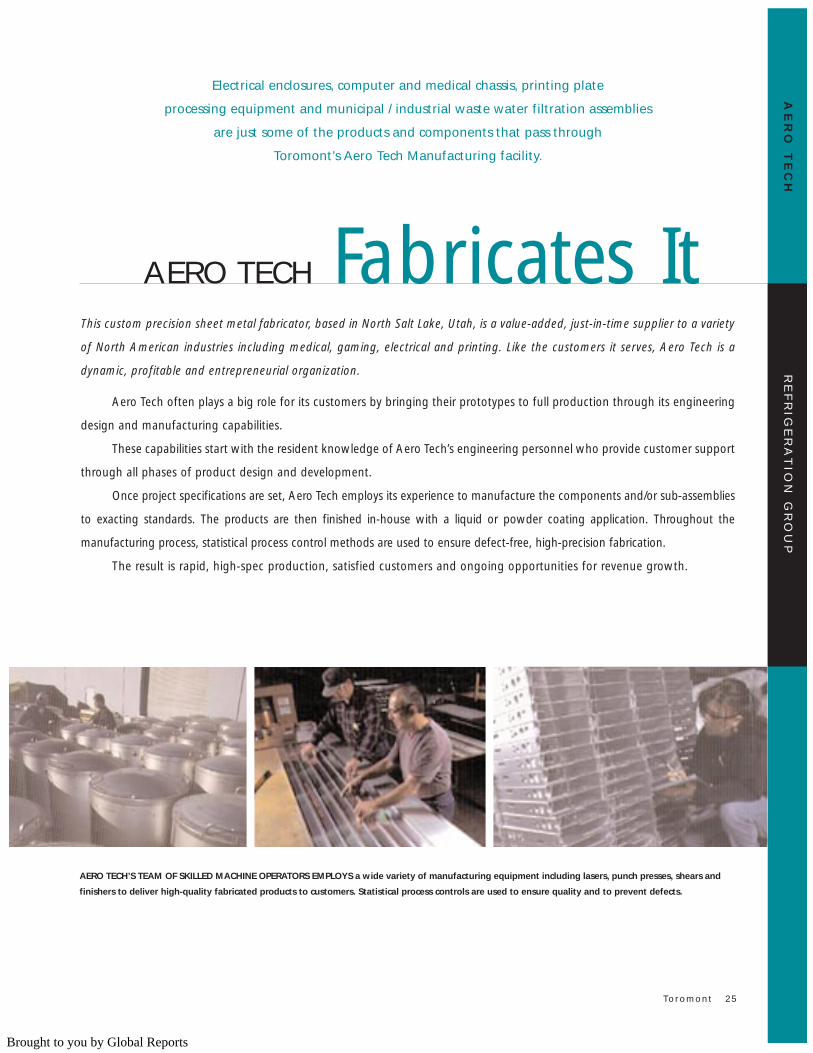
AERO TECH’S TEAM OF SKILLED MACHINE OPERATORS EMPLOYS a wide variety of manufacturing equipment including lasers, punch presses, shears and
finishers to deliver high-quality fabricated products to customers. Statistical process controls are used to ensure quality and to prevent defects.
Brought to you by Global Reports
26 Toromont
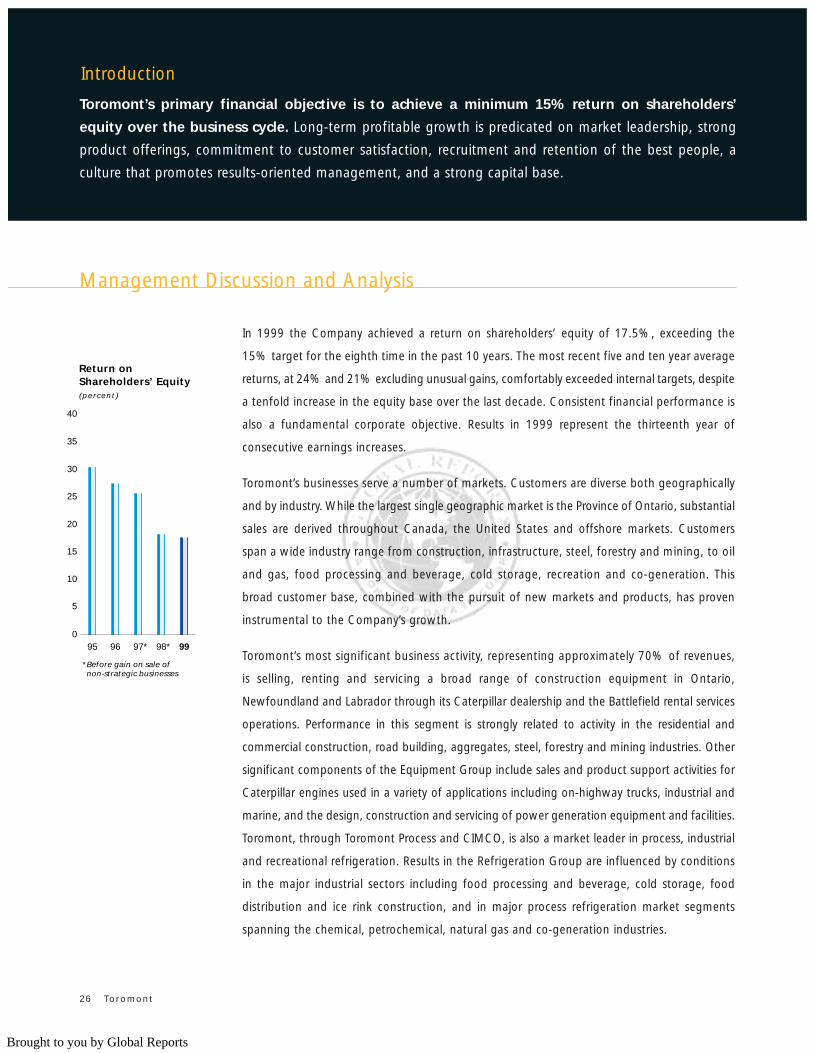
In 1999 the Company achieved a return on shareholders’ equity of 17.5%, exceeding the
15% target for the eighth time in the past 10 years. The most recent five and ten year average
returns, at 24% and 21% excluding unusual gains, comfortably exceeded internal targets, despite
a tenfold increase in the equity base over the last decade. Consistent financial performance is
also a fundamental corporate objective. Results in 1999 represent the thirteenth year of
consecutive earnings increases.
Toromont’s businesses serve a number of markets. Customers are diverse both geographically
and by industry. While the largest single geographic market is the Province of Ontario, substantial
sales are derived throughout Canada, the United States and offshore markets. Customers
span a wide industry range from construction, infrastructure, steel, forestry and mining, to oil
and gas, food processing and beverage, cold storage, recreation and co-generation. This
broad customer base, combined with the pursuit of new markets and products, has proven
instrumental to the Company’s growth.
Toromont’s most significant business activity, representing approximately 70% of revenues,
is selling, renting and servicing a broad range of construction equipment in Ontario,
Newfoundland and Labrador through its Caterpillar dealership and the Battlefield rental services
operations. Performance in this segment is strongly related to activity in the residential and
commercial construction, road building, aggregates, steel, forestry and mining industries. Other
significant components of the Equipment Group include sales and product support activities for
Caterpillar engines used in a variety of applications including on-highway trucks, industrial and
marine, and the design, construction and servicing of power generation equipment and facilities.
Toromont, through Toromont Process and CIMCO, is also a market leader in process, industrial
and recreational refrigeration. Results in the Refrigeration Group are influenced by conditions
in the major industrial sectors including food processing and beverage, cold storage, food
distribution and ice rink construction, and in major process refrigeration market segments
spanning the chemical, petrochemical, natural gas and co-generation industries.
Toromont’s primary financial objective is to achieve a minimum 15% return on shareholders’
equity over the business cycle. Long-term profitable growth is predicated on market leadership, strong
product offerings, commitment to customer satisfaction, recruitment and retention of the best people, a
culture that promotes results-oriented management, and a strong capital base.
Introduction
Management Discussion and Analysis
9998*97*9695
Return on Shareholders’ Equity(percent)
*Before gain on sale of non-strategic businesses
0
5
20
15
10
30
35
25
40
Brought to you by Global Reports
Operating Results
The decade ended with excellent momentum moving into the year 2000. Fourth quarter 1999
earnings represented a new quarterly high.
1999 produced record revenues and earnings from operations. Market activity remained brisk
with increased sales of primary equipment adding to Toromont’s installed base and feeding
higher product support sales.
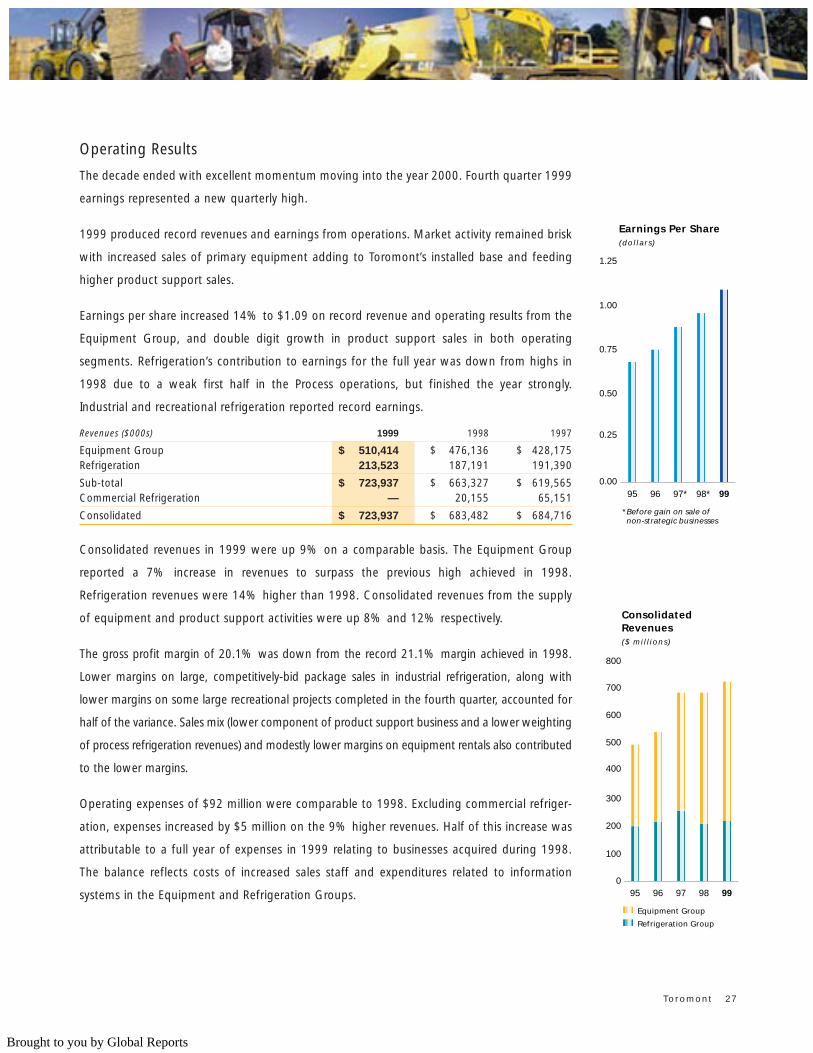
Earnings per share increased 14% to $1.09 on record revenue and operating results from the
Equipment Group, and double digit growth in product support sales in both operating
segments. Refrigeration’s contribution to earnings for the full year was down from highs in
1998 due to a weak first half in the Process operations, but finished the year strongly.
Industrial and recreational refrigeration reported record earnings.
Revenues ($000s) 1999 1998 1997
Equipment Group $ 510,414 $ 476,136 $ 428,175Refrigeration 213,523 187,191 191,390
Sub-total $ 723,937 $ 663,327 $ 619,565Commercial Refrigeration — 20,155 65,151
Consolidated $ 723,937 $ 683,482 $ 684,716
Consolidated revenues in 1999 were up 9% on a comparable basis. The Equipment Group
reported a 7% increase in revenues to surpass the previous high achieved in 1998.
Refrigeration revenues were 14% higher than 1998. Consolidated revenues from the supply
of equipment and product support activities were up 8% and 12% respectively.
The gross profit margin of 20.1% was down from the record 21.1% margin achieved in 1998.
Lower margins on large, competitively-bid package sales in industrial refrigeration, along with
lower margins on some large recreational projects completed in the fourth quarter, accounted for
half of the variance. Sales mix (lower component of product support business and a lower weighting
of process refrigeration revenues) and modestly lower margins on equipment rentals also contributed
to the lower margins.
Operating expenses of $92 million were comparable to 1998. Excluding commercial refriger-
ation, expenses increased by $5 million on the 9% higher revenues. Half of this increase was
attributable to a full year of expenses in 1999 relating to businesses acquired during 1998.
The balance reflects costs of increased sales staff and expenditures related to information
systems in the Equipment and Refrigeration Groups.
Toromont 27
9998*97*9695
Earnings Per Share(dollars)
*Before gain on sale of non-strategic businesses
0.00
0.25
1.00
0.75
0.50
1.25
9998979695
ConsolidatedRevenues($ mil l ions)
Equipment Group
Refrigeration Group
0
100
200
300
400
500
600
800
700
Brought to you by Global Reports
Management Discussion and Analysis
1999 1998 1997
% to % to % toOperating Income ($000s) Revenues ($000s) Revenues ($000s) Revenues
Equipment Group $ 38,276 7.5 $ 34,466 7.2 $ 30,224 7.1Refrigeration 15,494 7.3 17,738 8.6 15,881 6.2
Consolidated $ 53,770 7.4 $ 52,204 7.6 $ 46,105 6.7
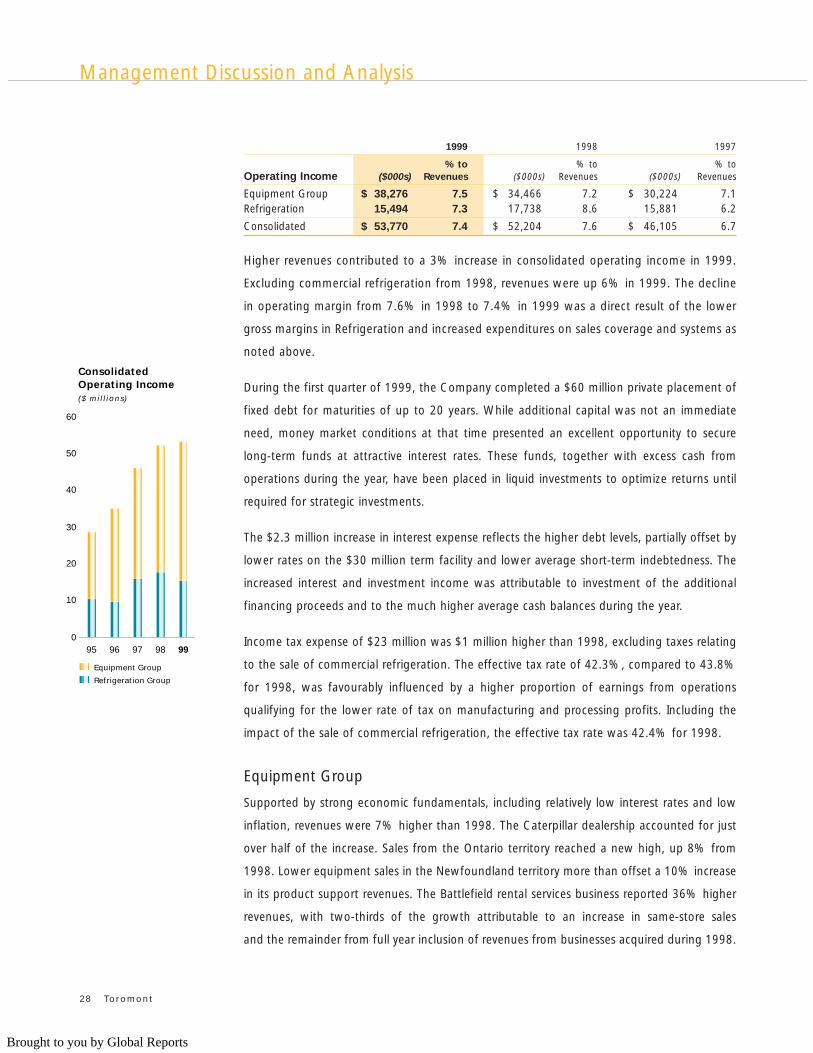
Higher revenues contributed to a 3% increase in consolidated operating income in 1999.
Excluding commercial refrigeration from 1998, revenues were up 6% in 1999. The decline
in operating margin from 7.6% in 1998 to 7.4% in 1999 was a direct result of the lower
gross margins in Refrigeration and increased expenditures on sales coverage and systems as
noted above.
During the first quarter of 1999, the Company completed a $60 million private placement of
fixed debt for maturities of up to 20 years. While additional capital was not an immediate
need, money market conditions at that time presented an excellent opportunity to secure
long-term funds at attractive interest rates. These funds, together with excess cash from
operations during the year, have been placed in liquid investments to optimize returns until
required for strategic investments.
The $2.3 million increase in interest expense reflects the higher debt levels, partially offset by
lower rates on the $30 million term facility and lower average short-term indebtedness. The
increased interest and investment income was attributable to investment of the additional
financing proceeds and to the much higher average cash balances during the year.
Income tax expense of $23 million was $1 million higher than 1998, excluding taxes relating
to the sale of commercial refrigeration. The effective tax rate of 42.3%, compared to 43.8%
for 1998, was favourably influenced by a higher proportion of earnings from operations
qualifying for the lower rate of tax on manufacturing and processing profits. Including the
impact of the sale of commercial refrigeration, the effective tax rate was 42.4% for 1998.
Equipment Group
Supported by strong economic fundamentals, including relatively low interest rates and low
inflation, revenues were 7% higher than 1998. The Caterpillar dealership accounted for just
over half of the increase. Sales from the Ontario territory reached a new high, up 8% from
1998. Lower equipment sales in the Newfoundland territory more than offset a 10% increase
in its product support revenues. The Battlefield rental services business reported 36% higher
revenues, with two-thirds of the growth attributable to an increase in same-store sales
and the remainder from full year inclusion of revenues from businesses acquired during 1998.
28 Toromont
9998979695
ConsolidatedOperating Income ($ mil l ions)
Equipment Group
Refrigeration Group
0
10
20
30
40
50
60
Brought to you by Global Reports
Two new rental services branches were opened during 1999, one in downtown Toronto and
one in Windsor.
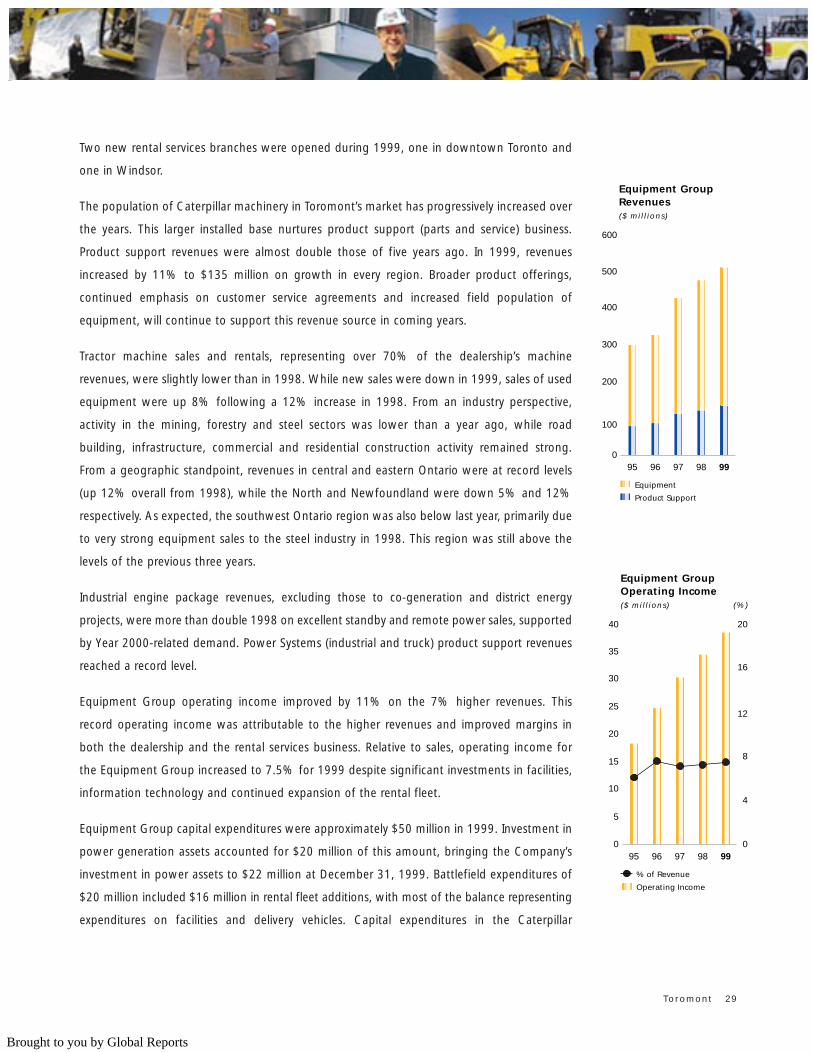
The population of Caterpillar machinery in Toromont’s market has progressively increased over
the years. This larger installed base nurtures product support (parts and service) business.
Product support revenues were almost double those of five years ago. In 1999, revenues
increased by 11% to $135 million on growth in every region. Broader product offerings,
continued emphasis on customer service agreements and increased field population of
equipment, will continue to support this revenue source in coming years.
Tractor machine sales and rentals, representing over 70% of the dealership’s machine
revenues, were slightly lower than in 1998. While new sales were down in 1999, sales of used
equipment were up 8% following a 12% increase in 1998. From an industry perspective,
activity in the mining, forestry and steel sectors was lower than a year ago, while road
building, infrastructure, commercial and residential construction activity remained strong.
From a geographic standpoint, revenues in central and eastern Ontario were at record levels
(up 12% overall from 1998), while the North and Newfoundland were down 5% and 12%
respectively. As expected, the southwest Ontario region was also below last year, primarily due
to very strong equipment sales to the steel industry in 1998. This region was still above the
levels of the previous three years.
Industrial engine package revenues, excluding those to co-generation and district energy
projects, were more than double 1998 on excellent standby and remote power sales, supported
by Year 2000-related demand. Power Systems (industrial and truck) product support revenues
reached a record level.
Equipment Group operating income improved by 11% on the 7% higher revenues. This
record operating income was attributable to the higher revenues and improved margins in
both the dealership and the rental services business. Relative to sales, operating income for
the Equipment Group increased to 7.5% for 1999 despite significant investments in facilities,
information technology and continued expansion of the rental fleet.
Equipment Group capital expenditures were approximately $50 million in 1999. Investment in
power generation assets accounted for $20 million of this amount, bringing the Company’s
investment in power assets to $22 million at December 31, 1999. Battlefield expenditures of
$20 million included $16 million in rental fleet additions, with most of the balance representing
expenditures on facilities and delivery vehicles. Capital expenditures in the Caterpillar
Toromont 29
9998979695
Equipment GroupRevenues($ mil l ions)
Equipment
Product Support
0
100
200
300
400
500
600
9998979695
Equipment GroupOperating Income ($ mil l ions)
% of Revenue
Operating Income
0
10
15
5
20
25
30
35
40
0
4
8
12
16
20
(%)
Brought to you by Global Reports
Management Discussion and Analysis
dealership included $6 million on new and existing facilities and $4 million on information
technology, machinery and equipment, and vehicle purchases.
Refrigeration Group
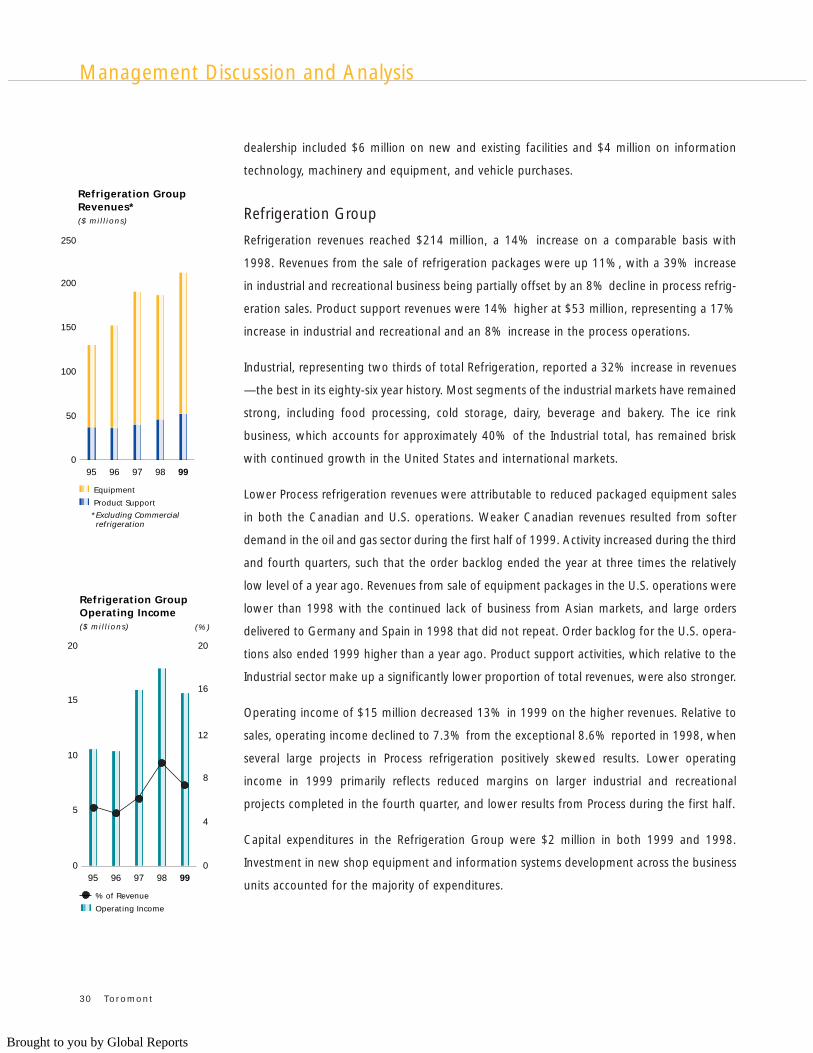
Refrigeration revenues reached $214 million, a 14% increase on a comparable basis with
1998. Revenues from the sale of refrigeration packages were up 11%, with a 39% increase
in industrial and recreational business being partially offset by an 8% decline in process refrig-
eration sales. Product support revenues were 14% higher at $53 million, representing a 17%
increase in industrial and recreational and an 8% increase in the process operations.
Industrial, representing two thirds of total Refrigeration, reported a 32% increase in revenues
—the best in its eighty-six year history. Most segments of the industrial markets have remained
strong, including food processing, cold storage, dairy, beverage and bakery. The ice rink
business, which accounts for approximately 40% of the Industrial total, has remained brisk
with continued growth in the United States and international markets.
Lower Process refrigeration revenues were attributable to reduced packaged equipment sales
in both the Canadian and U.S. operations. Weaker Canadian revenues resulted from softer
demand in the oil and gas sector during the first half of 1999. Activity increased during the third
and fourth quarters, such that the order backlog ended the year at three times the relatively
low level of a year ago. Revenues from sale of equipment packages in the U.S. operations were
lower than 1998 with the continued lack of business from Asian markets, and large orders
delivered to Germany and Spain in 1998 that did not repeat. Order backlog for the U.S. opera-
tions also ended 1999 higher than a year ago. Product support activities, which relative to the
Industrial sector make up a significantly lower proportion of total revenues, were also stronger.
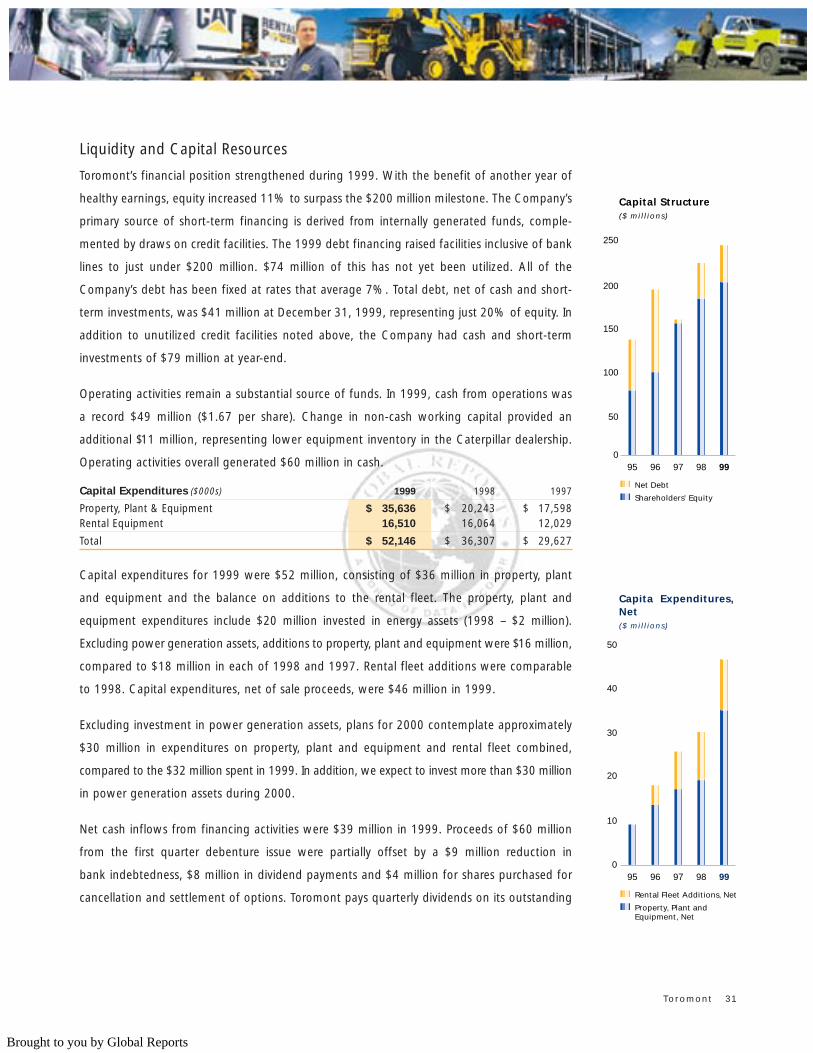
Operating income of $15 million decreased 13% in 1999 on the higher revenues. Relative to
sales, operating income declined to 7.3% from the exceptional 8.6% reported in 1998, when
several large projects in Process refrigeration positively skewed results. Lower operating
income in 1999 primarily reflects reduced margins on larger industrial and recreational
projects completed in the fourth quarter, and lower results from Process during the first half.
Capital expenditures in the Refrigeration Group were $2 million in both 1999 and 1998.
Investment in new shop equipment and information systems development across the business
units accounted for the majority of expenditures.
30 Toromont
9998979695
Refrigeration GroupOperating Income($ mil l ions)
% of Revenue
Operating Income
0
5
10
15
20
0
4
8
12
16
20
(%)
9998979695
Refrigeration GroupRevenues*($ mil l ions)
2
2
Equipment
Product Support
*Excluding Commercial refrigeration
0
50
100
150
200
250
Brought to you by Global Reports
Liquidity and Capital Resources
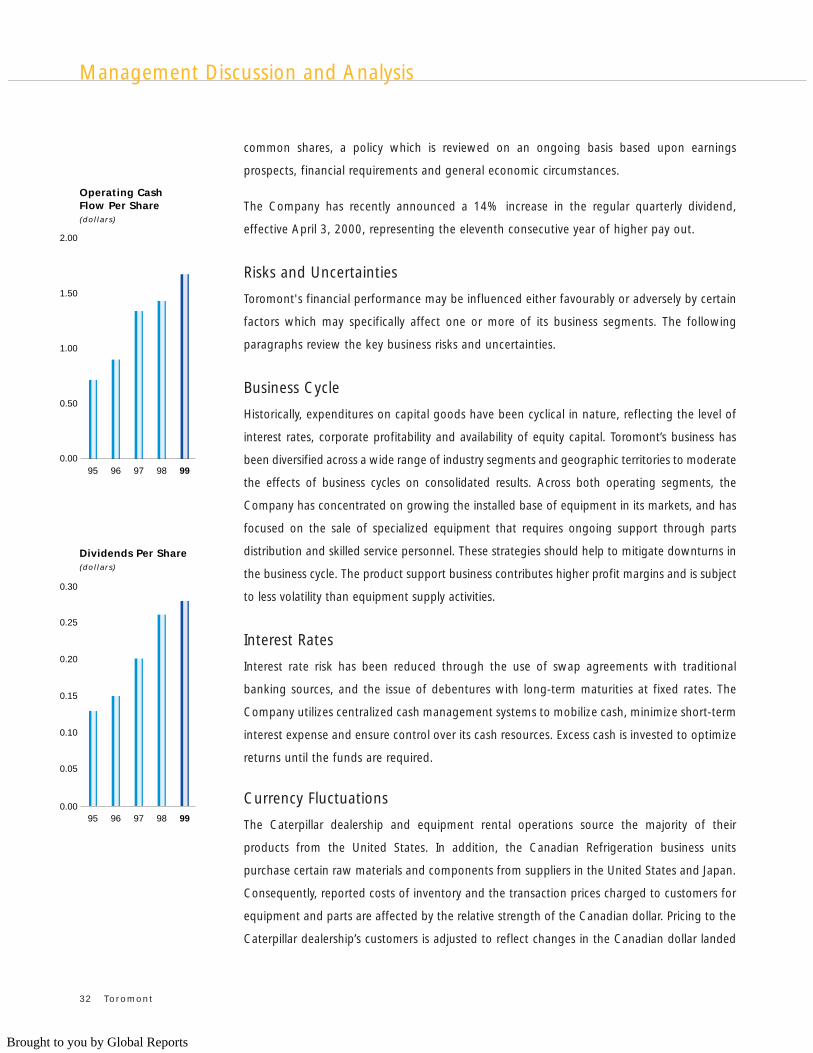
Toromont’s financial position strengthened during 1999. With the benefit of another year of
healthy earnings, equity increased 11% to surpass the $200 million milestone. The Company’s
primary source of short-term financing is derived from internally generated funds, comple-
mented by draws on credit facilities. The 1999 debt financing raised facilities inclusive of bank
lines to just under $200 million. $74 million of this has not yet been utilized. All of the
Company’s debt has been fixed at rates that average 7%. Total debt, net of cash and short-
term investments, was $41 million at December 31, 1999, representing just 20% of equity. In
addition to unutilized credit facilities noted above, the Company had cash and short-term
investments of $79 million at year-end.
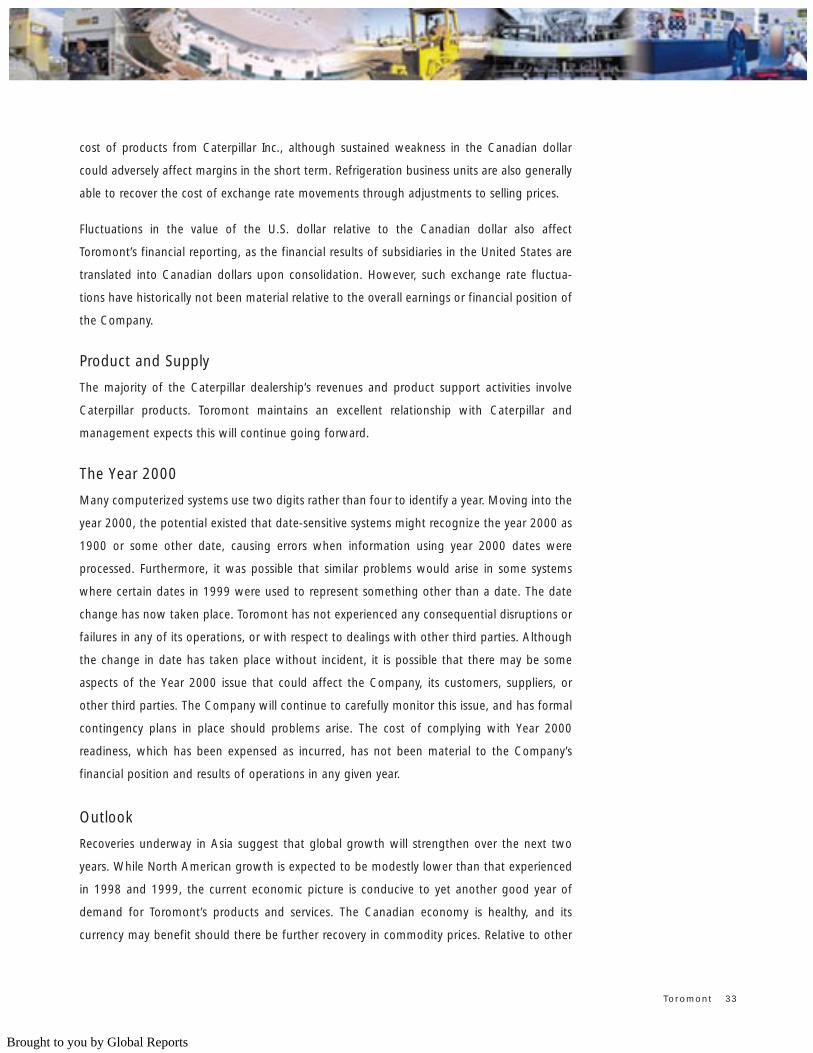
Operating activities remain a substantial source of funds. In 1999, cash from operations was
a record $49 million ($1.67 per share). Change in non-cash working capital provided an
additional $11 million, representing lower equipment inventory in the Caterpillar dealership.
Operating activities overall generated $60 million in cash.
Capital Expenditures ($000s) 1999 1998 1997
Property, Plant & Equipment $ 35,636 $ 20,243 $ 17,598Rental Equipment 16,510 16,064 12,029
Total $ 52,146 $ 36,307 $ 29,627
Capital expenditures for 1999 were $52 million, consisting of $36 million in property, plant
and equipment and the balance on additions to the rental fleet. The property, plant and
equipment expenditures include $20 million invested in energy assets (1998 – $2 million).
Excluding power generation assets, additions to property, plant and equipment were $16 million,
compared to $18 million in each of 1998 and 1997. Rental fleet additions were comparable
to 1998. Capital expenditures, net of sale proceeds, were $46 million in 1999.
Excluding investment in power generation assets, plans for 2000 contemplate approximately
$30 million in expenditures on property, plant and equipment and rental fleet combined,
compared to the $32 million spent in 1999. In addition, we expect to invest more than $30 million
in power generation assets during 2000.
Net cash inflows from financing activities were $39 million in 1999. Proceeds of $60 million
from the first quarter debenture issue were partially offset by a $9 million reduction in
bank indebtedness, $8 million in dividend payments and $4 million for shares purchased for
cancellation and settlement of options. Toromont pays quarterly dividends on its outstanding
Toromont 31
9998979695
Capital Structure($ mil l ions)
Net Debt
Shareholders’ Equity
0
50
100
150
200
250
9998979695
Capita Expenditures,Net($ mil l ions)
Rental Fleet Additions, Net
Property, Plant and Equipment, Net
0
10
20
30
40
50
Brought to you by Global Reports
common shares, a policy which is reviewed on an ongoing basis based upon earnings
prospects, financial requirements and general economic circumstances.
The Company has recently announced a 14% increase in the regular quarterly dividend,
effective April 3, 2000, representing the eleventh consecutive year of higher pay out.
Risks and Uncertainties
Toromont's financial performance may be influenced either favourably or adversely by certain
factors which may specifically affect one or more of its business segments. The following
paragraphs review the key business risks and uncertainties.
Business Cycle
Historically, expenditures on capital goods have been cyclical in nature, reflecting the level of
interest rates, corporate profitability and availability of equity capital. Toromont’s business has
been diversified across a wide range of industry segments and geographic territories to moderate
the effects of business cycles on consolidated results. Across both operating segments, the
Company has concentrated on growing the installed base of equipment in its markets, and has
focused on the sale of specialized equipment that requires ongoing support through parts
distribution and skilled service personnel. These strategies should help to mitigate downturns in
the business cycle. The product support business contributes higher profit margins and is subject
to less volatility than equipment supply activities.
Interest Rates
Interest rate risk has been reduced through the use of swap agreements with traditional
banking sources, and the issue of debentures with long-term maturities at fixed rates. The
Company utilizes centralized cash management systems to mobilize cash, minimize short-term
interest expense and ensure control over its cash resources. Excess cash is invested to optimize
returns until the funds are required.
Currency Fluctuations
The Caterpillar dealership and equipment rental operations source the majority of their
products from the United States. In addition, the Canadian Refrigeration business units
purchase certain raw materials and components from suppliers in the United States and Japan.
Consequently, reported costs of inventory and the transaction prices charged to customers for
equipment and parts are affected by the relative strength of the Canadian dollar. Pricing to the
Caterpillar dealership’s customers is adjusted to reflect changes in the Canadian dollar landed
32 Toromont
Management Discussion and Analysis
9998979695
Dividends Per Share(dollars)
0.00
0.05
0.10
0.15
0.20
0.25
0.30
9998979695
Operating Cash Flow Per Share(dollars)
0.00
0.50
1.00
1.50
2.00
Brought to you by Global Reports
cost of products from Caterpillar Inc., although sustained weakness in the Canadian dollar
could adversely affect margins in the short term. Refrigeration business units are also generally
able to recover the cost of exchange rate movements through adjustments to selling prices.
Fluctuations in the value of the U.S. dollar relative to the Canadian dollar also affect
Toromont’s financial reporting, as the financial results of subsidiaries in the United States are
translated into Canadian dollars upon consolidation. However, such exchange rate fluctua-
tions have historically not been material relative to the overall earnings or financial position of
the Company.
Product and Supply
The majority of the Caterpillar dealership’s revenues and product support activities involve
Caterpillar products. Toromont maintains an excellent relationship with Caterpillar and
management expects this will continue going forward.
The Year 2000
Many computerized systems use two digits rather than four to identify a year. Moving into the
year 2000, the potential existed that date-sensitive systems might recognize the year 2000 as
1900 or some other date, causing errors when information using year 2000 dates were
processed. Furthermore, it was possible that similar problems would arise in some systems
where certain dates in 1999 were used to represent something other than a date. The date
change has now taken place. Toromont has not experienced any consequential disruptions or
failures in any of its operations, or with respect to dealings with other third parties. Although
the change in date has taken place without incident, it is possible that there may be some
aspects of the Year 2000 issue that could affect the Company, its customers, suppliers, or
other third parties. The Company will continue to carefully monitor this issue, and has formal
contingency plans in place should problems arise. The cost of complying with Year 2000
readiness, which has been expensed as incurred, has not been material to the Company’s
financial position and results of operations in any given year.
Outlook
Recoveries underway in Asia suggest that global growth will strengthen over the next two
years. While North American growth is expected to be modestly lower than that experienced
in 1998 and 1999, the current economic picture is conducive to yet another good year of
demand for Toromont’s products and services. The Canadian economy is healthy, and its
currency may benefit should there be further recovery in commodity prices. Relative to other
Toromont 33
Brought to you by Global Reports
economies, Ontario should remain an above-average performer, assuming a continued
favourable performance for the U.S. economy. The primary threat to this positive outlook is
the potential for higher interest rates that would dampen economic activity.
Management believes there remains significant potential for internal growth based on a
number of factors. Economic forecasts are positive in our key territories. Construction, partic-
ularly in Ontario, is expected to continue to be strong, with major road building and new
housing and commercial construction stimulating heavy equipment usage. Conditions are
improving for the oil and natural gas industries which should benefit Toromont Process as the
year progresses. In addition, we continue to find opportunities for new business in industrial
and recreational refrigeration throughout North America, fuelled by modernization and
consolidation trends in the industry.
With its strong financial and operating platform, the Company is in an excellent position
to pursue both internal growth initiatives and acquisitions. It also intends to capitalize on
opportunities that arise in the next phase of the business cycle.
Toromont will remain focused on maintaining a strong balance sheet and achieving its long-
term objective of a minimum 15% return on shareholders’ equity through the business cycle.
The Company will continue to aggressively deploy capital to build shareholder value.
34 Toromont
Management Discussion and Analysis
Brought to you by Global Reports
Toromont 35
The accompanying consolidated financial statements and all information in the Annual Report have beenprepared by management and approved by the Board of Directors of the Company. The consolidatedfinancial statements were prepared in accordance with generally accepted accounting principles and,where appropriate, reflect management’s best estimates and judgments. Management is responsible forthe accuracy, integrity and objectivity of the consolidated financial statements within reasonable limits ofmateriality and for the consistency of financial data included in the text of the Annual Report with thatcontained in the consolidated financial statements.
To assist management in the discharge of these responsibilities, the Company maintains a system ofinternal controls designed to provide reasonable assurance that accounting records are reliable and itsassets are safeguarded.
The Audit Committee, which is comprised exclusively of outside directors, is appointed annually by theBoard of Directors. The Audit Committee meets with management as well as with external auditors tosatisfy itself that management is properly discharging its financial reporting responsibilities and to reviewthe consolidated financial statements and the independent auditors’ report. The Audit Committee reportsits findings to the Board of Directors for consideration in approving the consolidated financial statementsfor presentation to the shareholders. The external auditors have direct access to the Audit Committee ofthe Board of Directors.
The consolidated financial statements have been independently audited by Ernst & Young LLP on behalfof the shareholders, in accordance with generally accepted auditing standards. Their report outlines thenature of their audit and expresses their opinion on the consolidated financial statements of the Company.
WAYNE S. HILL, Vice President, Finance and Chief Financial OfficerJanuary 24, 2000
Management‘s Responsibility for Financial Information
Auditors’ Report
To the Shareholders of Toromont Industries Ltd.
We have audited the consolidated balance sheets of Toromont Industries Ltd. as at December 31, 1999and 1998 and the consolidated statements of earnings, retained earnings and cash flows for the yearsthen ended. These financial statements are the responsibility of the Company’s management. Ourresponsibility is to express an opinion on these financial statements based on our audits.
We conducted our audits in accordance with generally accepted auditing standards. Those standardsrequire that we plan and perform an audit to obtain reasonable assurance whether the financial statements are free of material misstatement. An audit includes examining, on a test basis, evidencesupporting the amounts and disclosures in the financial statements. An audit also includes assessing theaccounting principles used and significant estimates made by management, as well as evaluating theoverall financial statement presentation.
In our opinion, these consolidated financial statements present fairly, in all material respects, the financialposition of the Company as at December 31, 1999 and 1998 and the results of its operations and its cashflows for the years then ended in accordance with generally accepted accounting principles.
TORONTO, CANADA ERNST & YOUNG LLPJanuary 24, 2000 Chartered Accountants
Brought to you by Global Reports
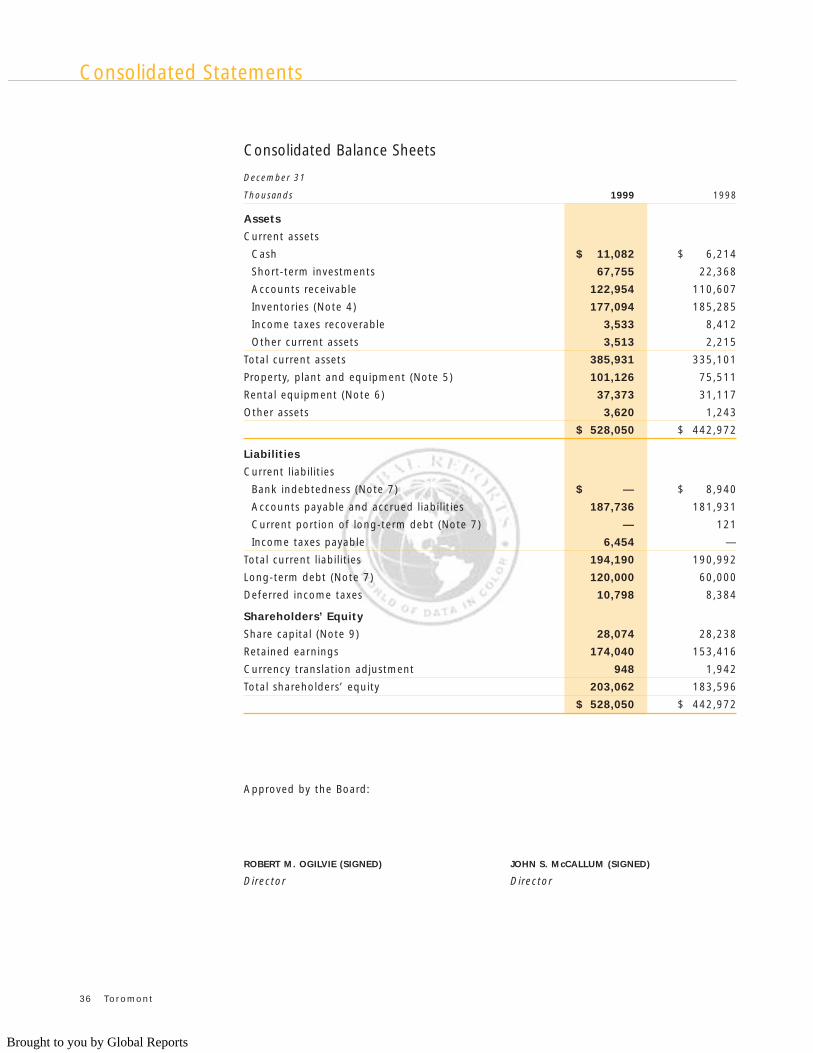
Consolidated Balance Sheets
December 31
Thousands 1999 1998
Assets
Current assets
Cash $ 11,082 $ 6,214
Short-term investments 67,755 22,368
Accounts receivable 122,954 110,607
Inventories (Note 4) 177,094 185,285
Income taxes recoverable 3,533 8,412
Other current assets 3,513 2,215
Total current assets 385,931 335,101
Property, plant and equipment (Note 5) 101,126 75,511
Rental equipment (Note 6) 37,373 31,117
Other assets 3,620 1,243
$ 528,050 $ 442,972
Liabilities
Current liabilities
Bank indebtedness (Note 7) $ — $ 8,940
Accounts payable and accrued liabilities 187,736 181,931
Current portion of long-term debt (Note 7) — 121
Income taxes payable 6,454 —
Total current liabilities 194,190 190,992
Long-term debt (Note 7) 120,000 60,000
Deferred income taxes 10,798 8,384
Shareholders’ Equity
Share capital (Note 9) 28,074 28,238
Retained earnings 174,040 153,416
Currency translation adjustment 948 1,942
Total shareholders’ equity 203,062 183,596
$ 528,050 $ 442,972
Approved by the Board:
ROBERT M. OGILVIE (SIGNED) JOHN S. McCALLUM (SIGNED)
Director Director
36 Toromont
Consolidated Statements
Brought to you by Global Reports
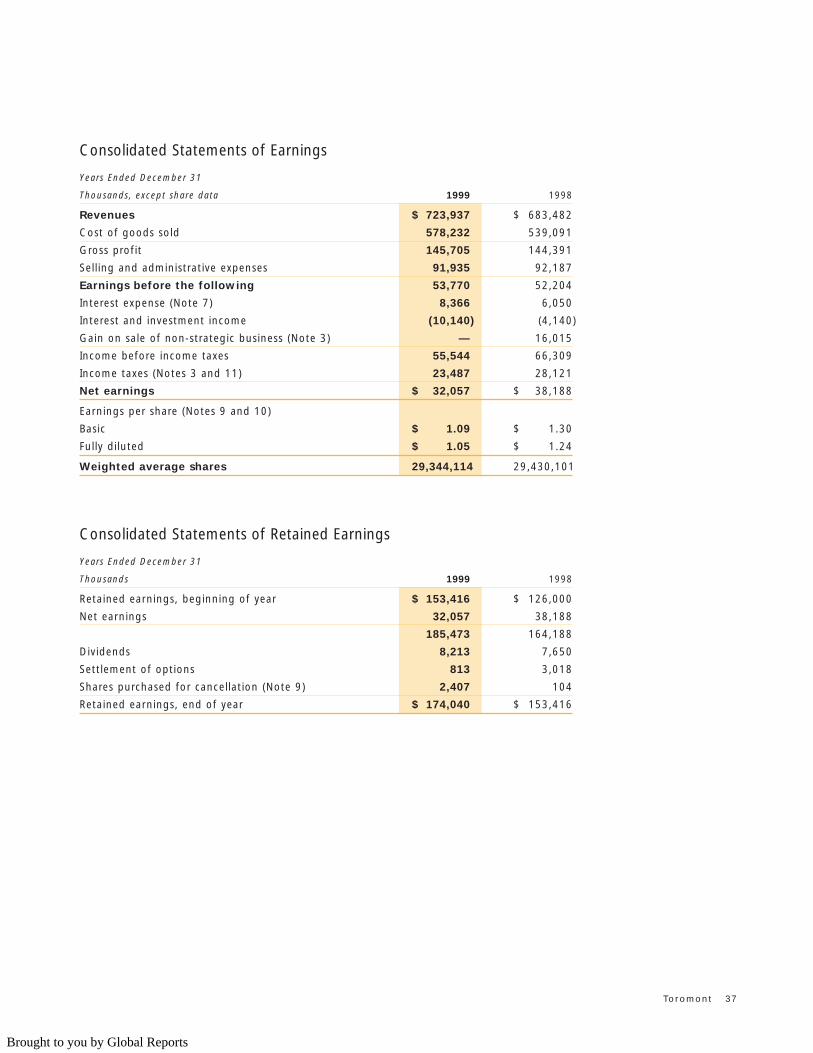
Consolidated Statements of Earnings
Years Ended December 31
Thousands, except share data 1999 1998
Revenues $ 723,937 $ 683,482
Cost of goods sold 578,232 539,091
Gross profit 145,705 144,391
Selling and administrative expenses 91,935 92,187
Earnings before the following 53,770 52,204
Interest expense (Note 7) 8,366 6,050
Interest and investment income (10,140) (4,140)
Gain on sale of non-strategic business (Note 3) — 16,015
Income before income taxes 55,544 66,309
Income taxes (Notes 3 and 11) 23,487 28,121
Net earnings $ 32,057 $ 38,188
Earnings per share (Notes 9 and 10)
Basic $ 1.09 $ 1.30
Fully diluted $ 1.05 $ 1.24
Weighted average shares 29,344,114 29,430,101
Consolidated Statements of Retained Earnings
Years Ended December 31
Thousands 1999 1998
Retained earnings, beginning of year $ 153,416 $ 126,000
Net earnings 32,057 38,188
185,473 164,188
Dividends 8,213 7,650
Settlement of options 813 3,018
Shares purchased for cancellation (Note 9) 2,407 104
Retained earnings, end of year $ 174,040 $ 153,416
Toromont 37
Brought to you by Global Reports
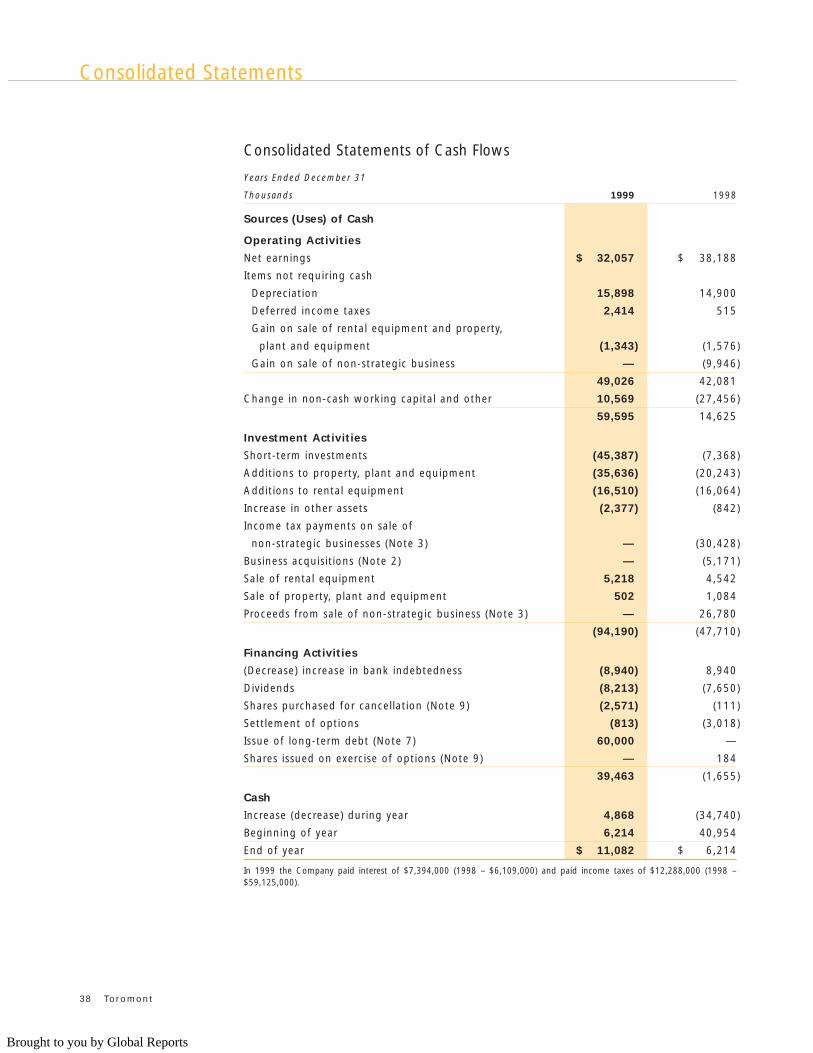
Consolidated Statements of Cash Flows
Years Ended December 31
Thousands 1999 1998
Sources (Uses) of Cash
Operating Activities
Net earnings $ 32,057 $ 38,188
Items not requiring cash
Depreciation 15,898 14,900
Deferred income taxes 2,414 515
Gain on sale of rental equipment and property,
plant and equipment (1,343) (1,576)
Gain on sale of non-strategic business — (9,946)
49,026 42,081
Change in non-cash working capital and other 10,569 (27,456)
59,595 14,625
Investment Activities
Short-term investments (45,387) (7,368)
Additions to property, plant and equipment (35,636) (20,243)
Additions to rental equipment (16,510) (16,064)
Increase in other assets (2,377) (842)
Income tax payments on sale of
non-strategic businesses (Note 3) — (30,428)
Business acquisitions (Note 2) — (5,171)
Sale of rental equipment 5,218 4,542
Sale of property, plant and equipment 502 1,084
Proceeds from sale of non-strategic business (Note 3) — 26,780
(94,190) (47,710)
Financing Activities
(Decrease) increase in bank indebtedness (8,940) 8,940
Dividends (8,213) (7,650)
Shares purchased for cancellation (Note 9) (2,571) (111)
Settlement of options (813) (3,018)
Issue of long-term debt (Note 7) 60,000 —
Shares issued on exercise of options (Note 9) — 184
39,463 (1,655)
Cash
Increase (decrease) during year 4,868 (34,740)
Beginning of year 6,214 40,954
End of year $ 11,082 $ 6,214
In 1999 the Company paid interest of $7,394,000 (1998 – $6,109,000) and paid income taxes of $12,288,000 (1998 –$59,125,000).
38 Toromont
Consolidated Statements
Brought to you by Global Reports
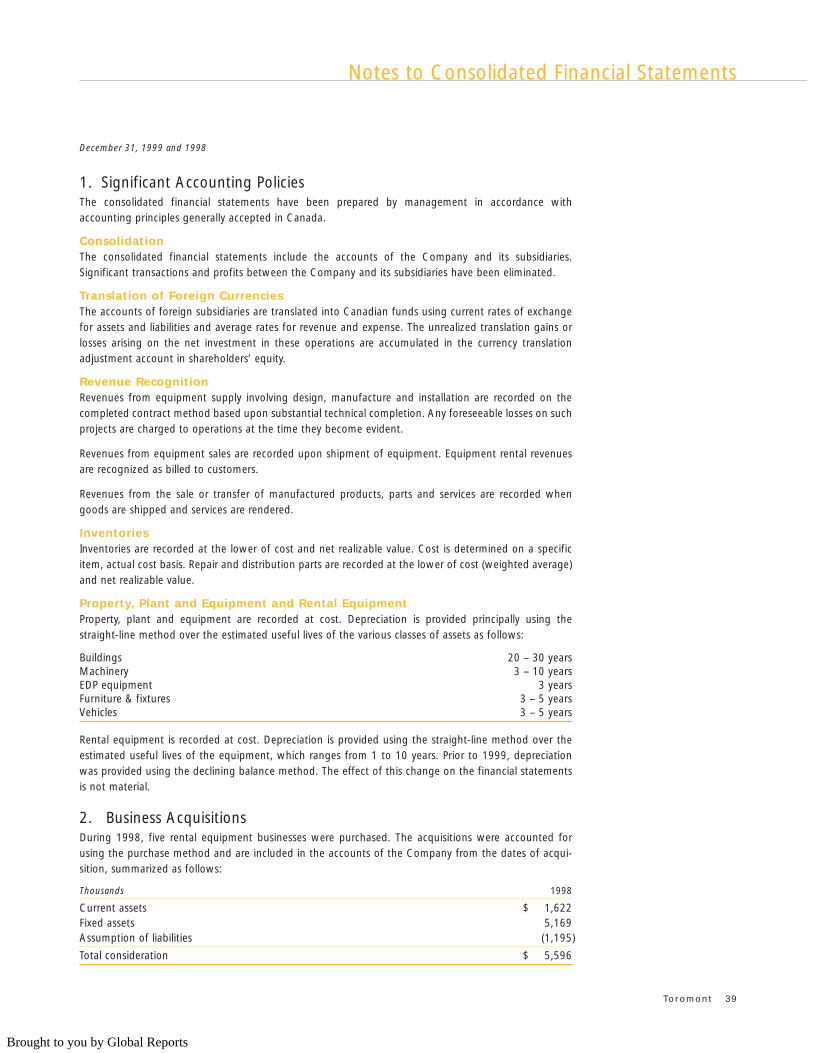
December 31, 1999 and 1998
1. Significant Accounting PoliciesThe consolidated financial statements have been prepared by management in accordance withaccounting principles generally accepted in Canada.
ConsolidationThe consolidated financial statements include the accounts of the Company and its subsidiaries.Significant transactions and profits between the Company and its subsidiaries have been eliminated.
Translation of Foreign CurrenciesThe accounts of foreign subsidiaries are translated into Canadian funds using current rates of exchangefor assets and liabilities and average rates for revenue and expense. The unrealized translation gains orlosses arising on the net investment in these operations are accumulated in the currency translationadjustment account in shareholders’ equity.
Revenue RecognitionRevenues from equipment supply involving design, manufacture and installation are recorded on thecompleted contract method based upon substantial technical completion. Any foreseeable losses on suchprojects are charged to operations at the time they become evident.
Revenues from equipment sales are recorded upon shipment of equipment. Equipment rental revenuesare recognized as billed to customers.
Revenues from the sale or transfer of manufactured products, parts and services are recorded whengoods are shipped and services are rendered.
InventoriesInventories are recorded at the lower of cost and net realizable value. Cost is determined on a specificitem, actual cost basis. Repair and distribution parts are recorded at the lower of cost (weighted average)and net realizable value.
Property, Plant and Equipment and Rental EquipmentProperty, plant and equipment are recorded at cost. Depreciation is provided principally using thestraight-line method over the estimated useful lives of the various classes of assets as follows:
Buildings 20 – 30 yearsMachinery 3 – 10 yearsEDP equipment 3 yearsFurniture & fixtures 3 – 5 yearsVehicles 3 – 5 years
Rental equipment is recorded at cost. Depreciation is provided using the straight-line method over theestimated useful lives of the equipment, which ranges from 1 to 10 years. Prior to 1999, depreciationwas provided using the declining balance method. The effect of this change on the financial statementsis not material.
2. Business AcquisitionsDuring 1998, five rental equipment businesses were purchased. The acquisitions were accounted forusing the purchase method and are included in the accounts of the Company from the dates of acqui-sition, summarized as follows:
Thousands 1998
Current assets $ 1,622Fixed assets 5,169Assumption of liabilities (1,195)
Total consideration $ 5,596
Toromont 39
Notes to Consolidated Financial Statements
Brought to you by Global Reports
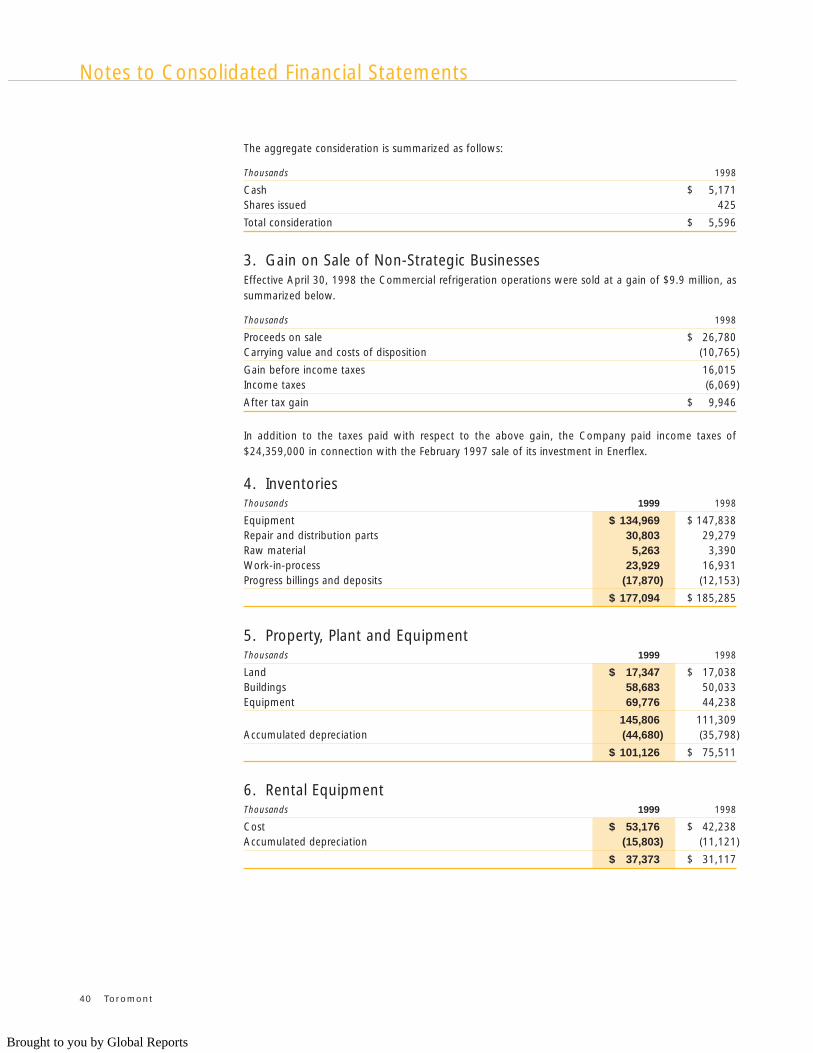
The aggregate consideration is summarized as follows:
Thousands 1998
Cash $ 5,171Shares issued 425
Total consideration $ 5,596
3. Gain on Sale of Non-Strategic BusinessesEffective April 30, 1998 the Commercial refrigeration operations were sold at a gain of $9.9 million, assummarized below.
Thousands 1998
Proceeds on sale $ 26,780Carrying value and costs of disposition (10,765)
Gain before income taxes 16,015Income taxes (6,069)
After tax gain $ 9,946
In addition to the taxes paid with respect to the above gain, the Company paid income taxes of$24,359,000 in connection with the February 1997 sale of its investment in Enerflex.
4. InventoriesThousands 1999 1998
Equipment $ 134,969 $ 147,838Repair and distribution parts 30,803 29,279Raw material 5,263 3,390Work-in-process 23,929 16,931Progress billings and deposits (17,870) (12,153)
$ 177,094 $ 185,285
5. Property, Plant and EquipmentThousands 1999 1998
Land $ 17,347 $ 17,038Buildings 58,683 50,033Equipment 69,776 44,238
145,806 111,309Accumulated depreciation (44,680) (35,798)
$ 101,126 $ 75,511
6. Rental EquipmentThousands 1999 1998
Cost $ 53,176 $ 42,238Accumulated depreciation (15,803) (11,121)
$ 37,373 $ 31,117
40 Toromont
Notes to Consolidated Financial Statements
Brought to you by Global Reports
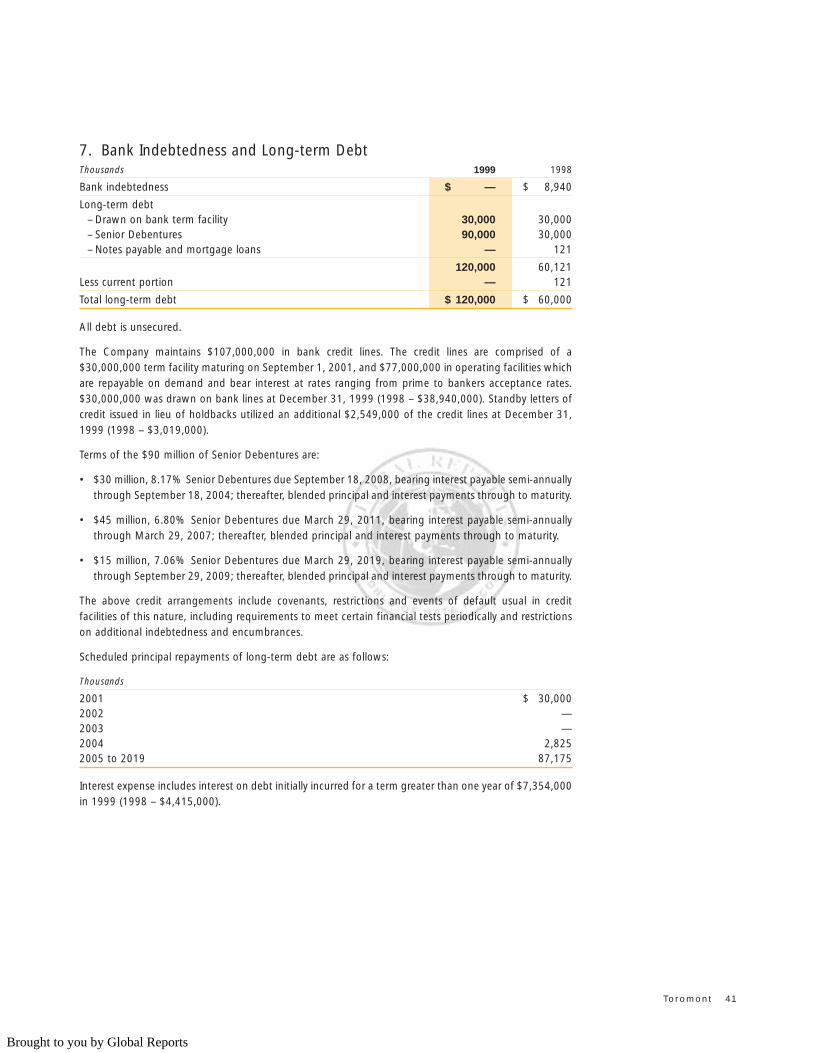
7. Bank Indebtedness and Long-term DebtThousands 1999 1998
Bank indebtedness $ — $ 8,940
Long-term debt– Drawn on bank term facility 30,000 30,000– Senior Debentures 90,000 30,000– Notes payable and mortgage loans — 121
120,000 60,121Less current portion — 121
Total long-term debt $ 120,000 $ 60,000
All debt is unsecured.
The Company maintains $107,000,000 in bank credit lines. The credit lines are comprised of a$30,000,000 term facility maturing on September 1, 2001, and $77,000,000 in operating facilities whichare repayable on demand and bear interest at rates ranging from prime to bankers acceptance rates.$30,000,000 was drawn on bank lines at December 31, 1999 (1998 – $38,940,000). Standby letters ofcredit issued in lieu of holdbacks utilized an additional $2,549,000 of the credit lines at December 31,1999 (1998 – $3,019,000).
Terms of the $90 million of Senior Debentures are:
• $30 million, 8.17% Senior Debentures due September 18, 2008, bearing interest payable semi-annuallythrough September 18, 2004; thereafter, blended principal and interest payments through to maturity.
• $45 million, 6.80% Senior Debentures due March 29, 2011, bearing interest payable semi-annuallythrough March 29, 2007; thereafter, blended principal and interest payments through to maturity.
• $15 million, 7.06% Senior Debentures due March 29, 2019, bearing interest payable semi-annuallythrough September 29, 2009; thereafter, blended principal and interest payments through to maturity.
The above credit arrangements include covenants, restrictions and events of default usual in creditfacilities of this nature, including requirements to meet certain financial tests periodically and restrictionson additional indebtedness and encumbrances.
Scheduled principal repayments of long-term debt are as follows:
Thousands
2001 $ 30,0002002 —2003 —2004 2,8252005 to 2019 87,175
Interest expense includes interest on debt initially incurred for a term greater than one year of $7,354,000in 1999 (1998 – $4,415,000).
Toromont 41
Brought to you by Global Reports
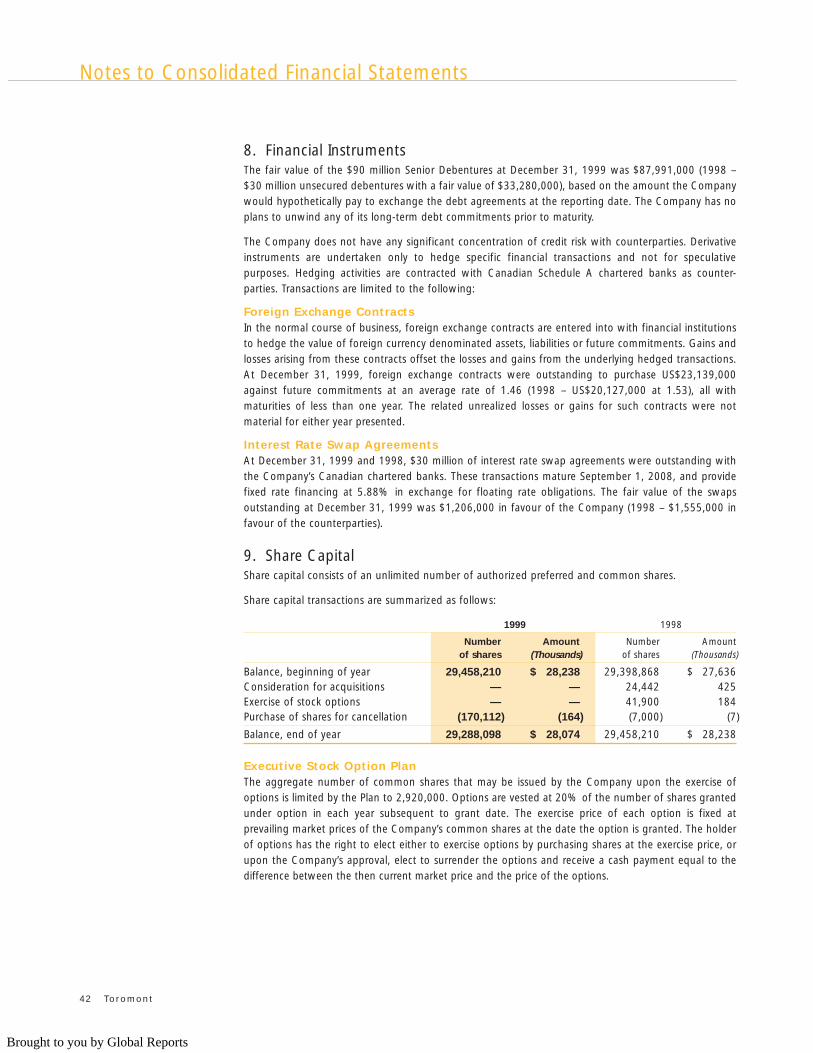
8. Financial InstrumentsThe fair value of the $90 million Senior Debentures at December 31, 1999 was $87,991,000 (1998 – $30 million unsecured debentures with a fair value of $33,280,000), based on the amount the Companywould hypothetically pay to exchange the debt agreements at the reporting date. The Company has noplans to unwind any of its long-term debt commitments prior to maturity.
The Company does not have any significant concentration of credit risk with counterparties. Derivativeinstruments are undertaken only to hedge specific financial transactions and not for speculativepurposes. Hedging activities are contracted with Canadian Schedule A chartered banks as counter-parties. Transactions are limited to the following:
Foreign Exchange Contracts In the normal course of business, foreign exchange contracts are entered into with financial institutionsto hedge the value of foreign currency denominated assets, liabilities or future commitments. Gains andlosses arising from these contracts offset the losses and gains from the underlying hedged transactions.At December 31, 1999, foreign exchange contracts were outstanding to purchase US$23,139,000against future commitments at an average rate of 1.46 (1998 – US$20,127,000 at 1.53), all withmaturities of less than one year. The related unrealized losses or gains for such contracts were notmaterial for either year presented.
Interest Rate Swap AgreementsAt December 31, 1999 and 1998, $30 million of interest rate swap agreements were outstanding withthe Company’s Canadian chartered banks. These transactions mature September 1, 2008, and providefixed rate financing at 5.88% in exchange for floating rate obligations. The fair value of the swapsoutstanding at December 31, 1999 was $1,206,000 in favour of the Company (1998 – $1,555,000 infavour of the counterparties).
9. Share CapitalShare capital consists of an unlimited number of authorized preferred and common shares.
Share capital transactions are summarized as follows:
1999 1998
Number Amount Number Amountof shares (Thousands) of shares (Thousands)
Balance, beginning of year 29,458,210 $ 28,238 29,398,868 $ 27,636Consideration for acquisitions — — 24,442 425Exercise of stock options — — 41,900 184Purchase of shares for cancellation (170,112) (164) (7,000) (7)
Balance, end of year 29,288,098 $ 28,074 29,458,210 $ 28,238
Executive Stock Option PlanThe aggregate number of common shares that may be issued by the Company upon the exercise ofoptions is limited by the Plan to 2,920,000. Options are vested at 20% of the number of shares grantedunder option in each year subsequent to grant date. The exercise price of each option is fixed atprevailing market prices of the Company’s common shares at the date the option is granted. The holderof options has the right to elect either to exercise options by purchasing shares at the exercise price, orupon the Company’s approval, elect to surrender the options and receive a cash payment equal to thedifference between the then current market price and the price of the options.
42 Toromont
Notes to Consolidated Financial Statements
Brought to you by Global Reports
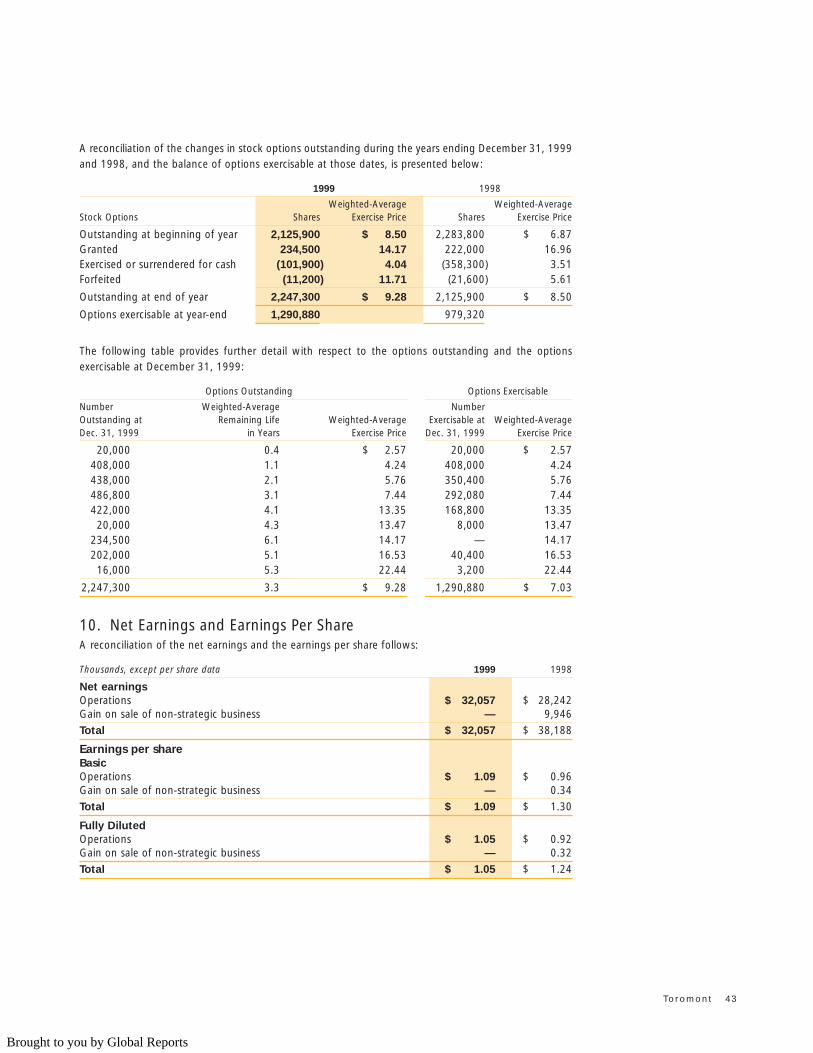
A reconciliation of the changes in stock options outstanding during the years ending December 31, 1999and 1998, and the balance of options exercisable at those dates, is presented below:
1999 1998
Weighted-Average Weighted-AverageStock Options Shares Exercise Price Shares Exercise Price
Outstanding at beginning of year 2,125,900 $ 8.50 2,283,800 $ 6.87Granted 234,500 14.17 222,000 16.96Exercised or surrendered for cash (101,900) 4.04 (358,300) 3.51Forfeited (11,200) 11.71 (21,600) 5.61
Outstanding at end of year 2,247,300 $ 9.28 2,125,900 $ 8.50
Options exercisable at year-end 1,290,880 979,320
The following table provides further detail with respect to the options outstanding and the optionsexercisable at December 31, 1999:
Options Outstanding Options Exercisable
Number Weighted-Average NumberOutstanding at Remaining Life Weighted-Average Exercisable at Weighted-AverageDec. 31, 1999 in Years Exercise Price Dec. 31, 1999 Exercise Price
20,000 0.4 $ 2.57 20,000 $ 2.57408,000 1.1 4.24 408,000 4.24438,000 2.1 5.76 350,400 5.76486,800 3.1 7.44 292,080 7.44422,000 4.1 13.35 168,800 13.35
20,000 4.3 13.47 8,000 13.47234,500 6.1 14.17 — 14.17202,000 5.1 16.53 40,400 16.53
16,000 5.3 22.44 3,200 22.44
2,247,300 3.3 $ 9.28 1,290,880 $ 7.03
10. Net Earnings and Earnings Per ShareA reconciliation of the net earnings and the earnings per share follows:
Thousands, except per share data 1999 1998
Net earningsOperations $ 32,057 $ 28,242Gain on sale of non-strategic business — 9,946
Total $ 32,057 $ 38,188
Earnings per shareBasicOperations $ 1.09 $ 0.96Gain on sale of non-strategic business — 0.34
Total $ 1.09 $ 1.30
Fully Diluted Operations $ 1.05 $ 0.92Gain on sale of non-strategic business — 0.32
Total $ 1.05 $ 1.24
Toromont 43
Brought to you by Global Reports
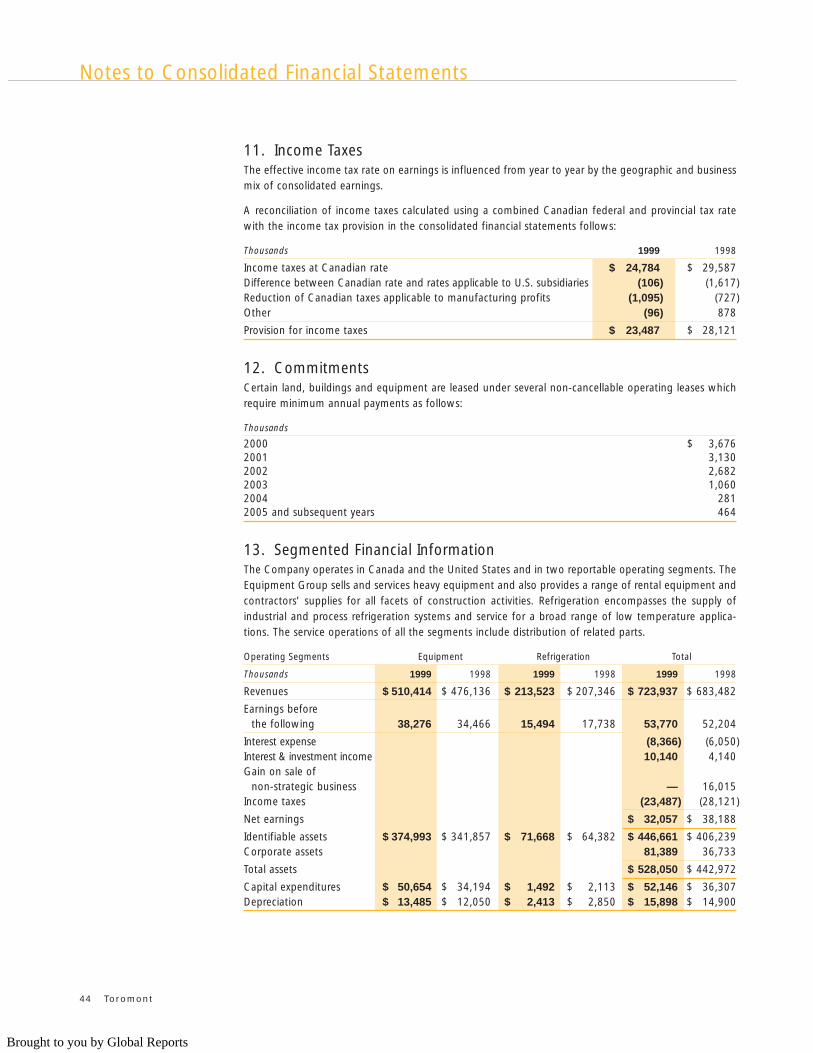
11. Income TaxesThe effective income tax rate on earnings is influenced from year to year by the geographic and businessmix of consolidated earnings.
A reconciliation of income taxes calculated using a combined Canadian federal and provincial tax ratewith the income tax provision in the consolidated financial statements follows:
Thousands 1999 1998
Income taxes at Canadian rate $ 24,784 $ 29,587Difference between Canadian rate and rates applicable to U.S. subsidiaries (106) (1,617)Reduction of Canadian taxes applicable to manufacturing profits (1,095) (727)Other (96) 878
Provision for income taxes $ 23,487 $ 28,121
12. CommitmentsCertain land, buildings and equipment are leased under several non-cancellable operating leases whichrequire minimum annual payments as follows:
Thousands
2000 $ 3,6762001 3,1302002 2,6822003 1,0602004 2812005 and subsequent years 464
13. Segmented Financial InformationThe Company operates in Canada and the United States and in two reportable operating segments. TheEquipment Group sells and services heavy equipment and also provides a range of rental equipment andcontractors’ supplies for all facets of construction activities. Refrigeration encompasses the supply ofindustrial and process refrigeration systems and service for a broad range of low temperature applica-tions. The service operations of all the segments include distribution of related parts.
Operating Segments Equipment Refrigeration Total
Thousands 1999 1998 1999 1998 1999 1998
Revenues $ 510,414 $ 476,136 $ 213,523 $ 207,346 $ 723,937 $ 683,482
Earnings beforethe following 38,276 34,466 15,494 17,738 53,770 52,204
Interest expense (8,366) (6,050)Interest & investment income 10,140 4,140Gain on sale of
non-strategic business — 16,015Income taxes (23,487) (28,121)
Net earnings $ 32,057 $ 38,188
Identifiable assets $ 374,993 $ 341,857 $ 71,668 $ 64,382 $ 446,661 $ 406,239Corporate assets 81,389 36,733
Total assets $ 528,050 $ 442,972
Capital expenditures $ 50,654 $ 34,194 $ 1,492 $ 2,113 $ 52,146 $ 36,307Depreciation $ 13,485 $ 12,050 $ 2,413 $ 2,850 $ 15,898 $ 14,900
44 Toromont
Notes to Consolidated Financial Statements
Brought to you by Global Reports
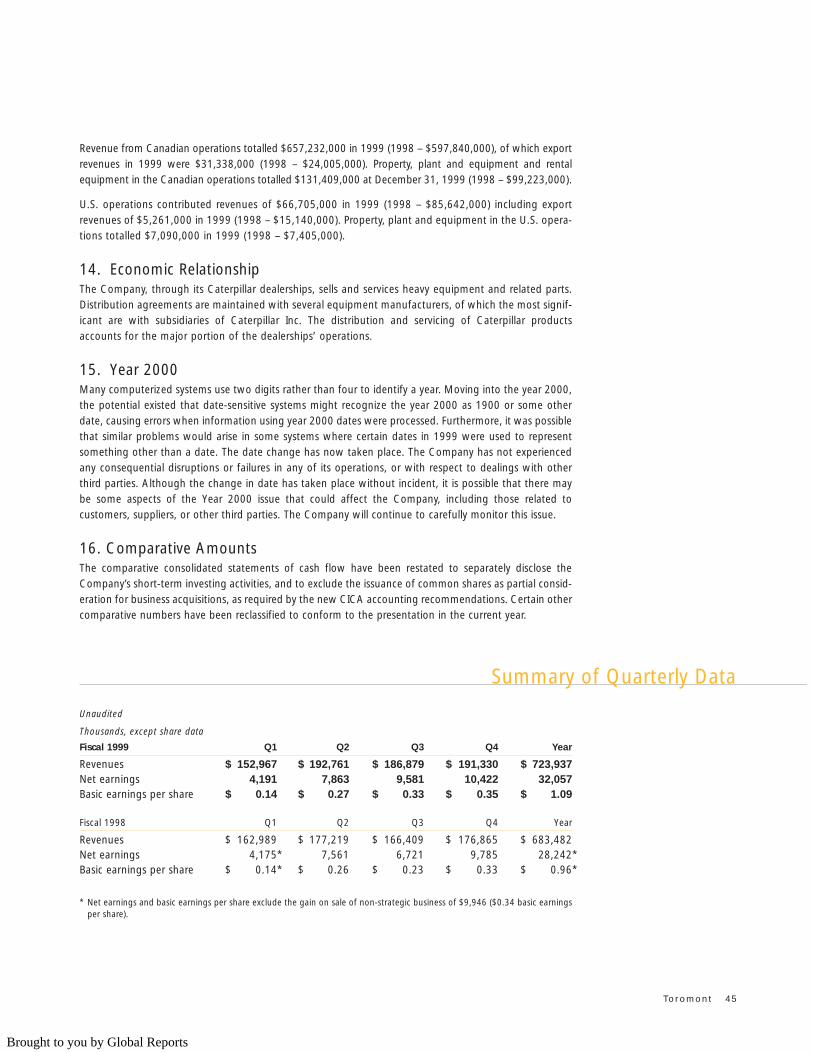
Revenue from Canadian operations totalled $657,232,000 in 1999 (1998 – $597,840,000), of which exportrevenues in 1999 were $31,338,000 (1998 – $24,005,000). Property, plant and equipment and rentalequipment in the Canadian operations totalled $131,409,000 at December 31, 1999 (1998 – $99,223,000).
U.S. operations contributed revenues of $66,705,000 in 1999 (1998 – $85,642,000) including exportrevenues of $5,261,000 in 1999 (1998 – $15,140,000). Property, plant and equipment in the U.S. opera-tions totalled $7,090,000 in 1999 (1998 – $7,405,000).
14. Economic RelationshipThe Company, through its Caterpillar dealerships, sells and services heavy equipment and related parts.Distribution agreements are maintained with several equipment manufacturers, of which the most signif-icant are with subsidiaries of Caterpillar Inc. The distribution and servicing of Caterpillar productsaccounts for the major portion of the dealerships’ operations.
15. Year 2000Many computerized systems use two digits rather than four to identify a year. Moving into the year 2000,the potential existed that date-sensitive systems might recognize the year 2000 as 1900 or some otherdate, causing errors when information using year 2000 dates were processed. Furthermore, it was possiblethat similar problems would arise in some systems where certain dates in 1999 were used to representsomething other than a date. The date change has now taken place. The Company has not experiencedany consequential disruptions or failures in any of its operations, or with respect to dealings with otherthird parties. Although the change in date has taken place without incident, it is possible that there maybe some aspects of the Year 2000 issue that could affect the Company, including those related tocustomers, suppliers, or other third parties. The Company will continue to carefully monitor this issue.
16. Comparative AmountsThe comparative consolidated statements of cash flow have been restated to separately disclose theCompany’s short-term investing activities, and to exclude the issuance of common shares as partial consid-eration for business acquisitions, as required by the new CICA accounting recommendations. Certain othercomparative numbers have been reclassified to conform to the presentation in the current year.
Unaudited
Thousands, except share data
Fiscal 1999 Q1 Q2 Q3 Q4 Year
Revenues $ 152,967 $ 192,761 $ 186,879 $ 191,330 $ 723,937Net earnings 4,191 7,863 9,581 10,422 32,057Basic earnings per share $ 0.14 $ 0.27 $ 0.33 $ 0.35 $ 1.09
Fiscal 1998 Q1 Q2 Q3 Q4 Year
Revenues $ 162,989 $ 177,219 $ 166,409 $ 176,865 $ 683,482Net earnings 4,175* 7,561 6,721 9,785 28,242*Basic earnings per share $ 0.14* $ 0.26 $ 0.23 $ 0.33 $ 0.96*
* Net earnings and basic earnings per share exclude the gain on sale of non-strategic business of $9,946 ($0.34 basic earningsper share).
Toromont 45
Summary of Quarterly Data
Brought to you by Global Reports
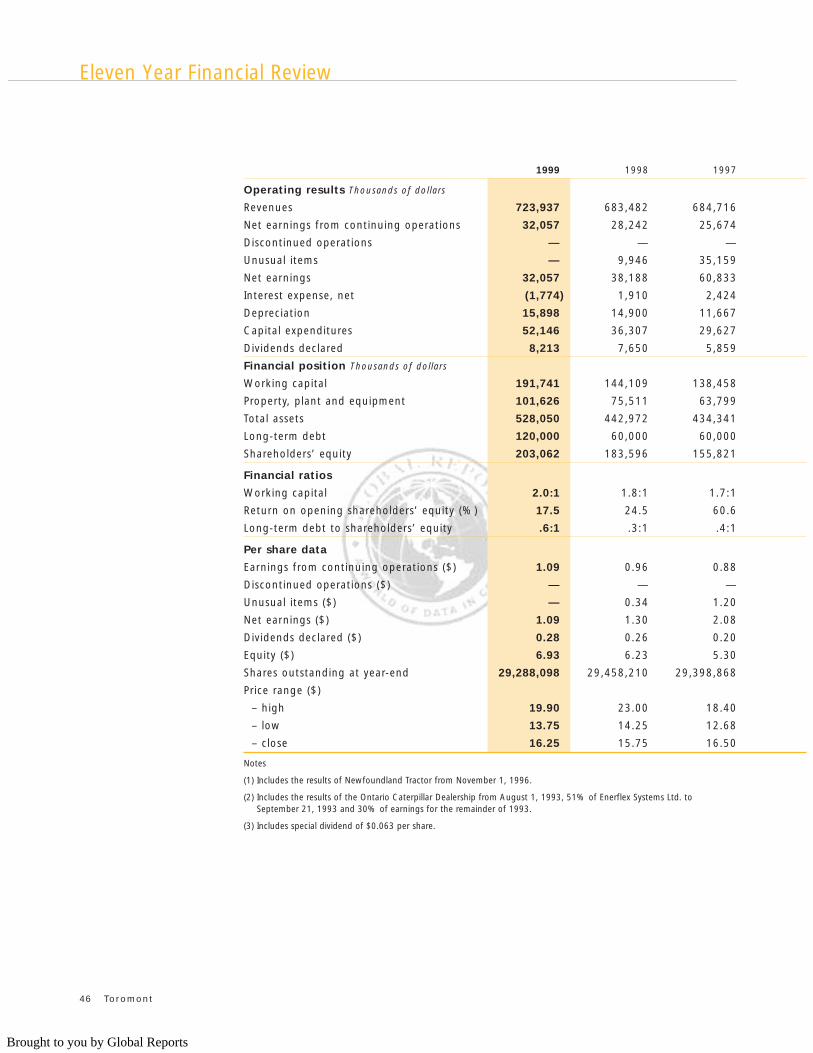
1999 1998 1997
Operating results Thousands of dollars
Revenues 723,937 683,482 684,716
Net earnings from continuing operations 32,057 28,242 25,674
Discontinued operations — — —
Unusual items — 9,946 35,159
Net earnings 32,057 38,188 60,833
Interest expense, net (1,774) 1,910 2,424
Depreciation 15,898 14,900 11,667
Capital expenditures 52,146 36,307 29,627
Dividends declared 8,213 7,650 5,859
Financial position Thousands of dollars
Working capital 191,741 144,109 138,458
Property, plant and equipment 101,626 75,511 63,799
Total assets 528,050 442,972 434,341
Long-term debt 120,000 60,000 60,000
Shareholders’ equity 203,062 183,596 155,821
Financial ratios
Working capital 2.0:1 1.8:1 1.7:1
Return on opening shareholders’ equity (%) 17.5 24.5 60.6
Long-term debt to shareholders’ equity .6:1 .3:1 .4:1
Per share data
Earnings from continuing operations ($) 1.09 0.96 0.88
Discontinued operations ($) — — —
Unusual items ($) — 0.34 1.20
Net earnings ($) 1.09 1.30 2.08
Dividends declared ($) 0.28 0.26 0.20
Equity ($) 6.93 6.23 5.30
Shares outstanding at year-end 29,288,098 29,458,210 29,398,868
Price range ($)
– high 19.90 23.00 18.40
– low 13.75 14.25 12.68
– close 16.25 15.75 16.50
Notes
(1) Includes the results of Newfoundland Tractor from November 1, 1996.
(2) Includes the results of the Ontario Caterpillar Dealership from August 1, 1993, 51% of Enerflex Systems Ltd. to September 21, 1993 and 30% of earnings for the remainder of 1993.
(3) Includes special dividend of $0.063 per share.
46 Toromont
Eleven Year Financial Review
Brought to you by Global Reports
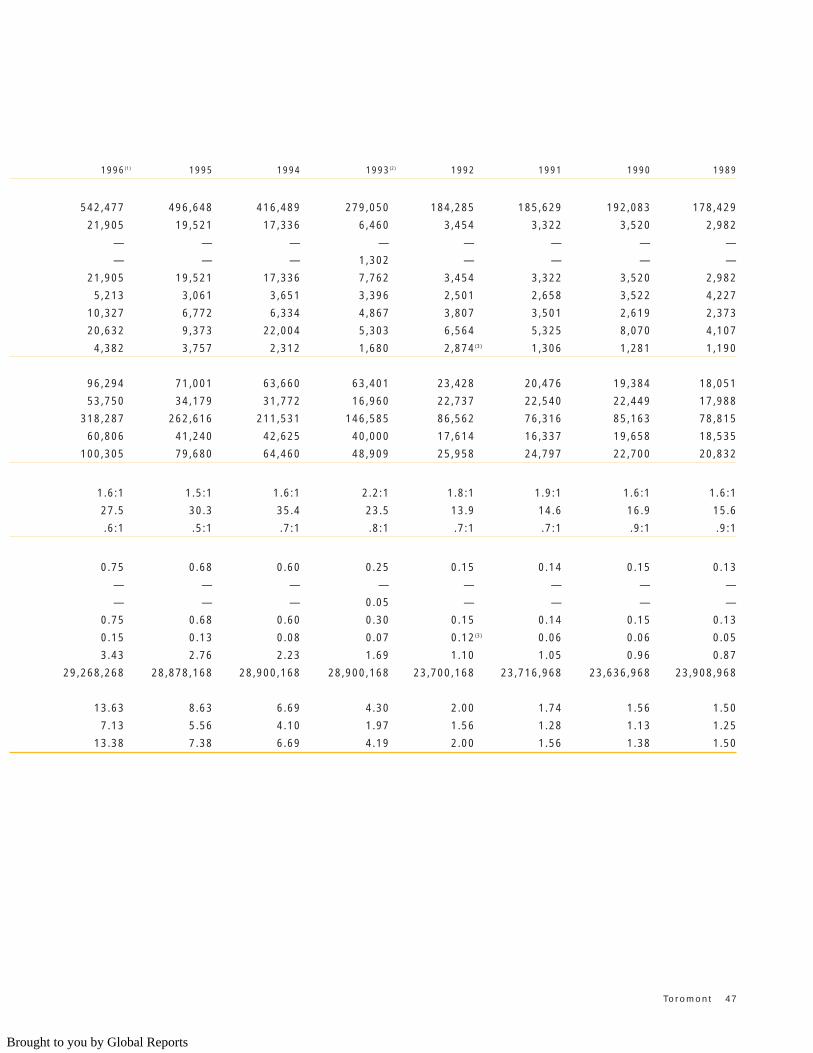
1996(1) 1995 1994 1993(2) 1992 1991 1990 1989
542,477 496,648 416,489 279,050 184,285 185,629 192,083 178,429
21,905 19,521 17,336 6,460 3,454 3,322 3,520 2,982
— — — — — — — —
— — — 1,302 — — — —
21,905 19,521 17,336 7,762 3,454 3,322 3,520 2,982
5,213 3,061 3,651 3,396 2,501 2,658 3,522 4,227
10,327 6,772 6,334 4,867 3,807 3,501 2,619 2,373
20,632 9,373 22,004 5,303 6,564 5,325 8,070 4,107
4,382 3,757 2,312 1,680 2,874(3) 1,306 1,281 1,190
96,294 71,001 63,660 63,401 23,428 20,476 19,384 18,051
53,750 34,179 31,772 16,960 22,737 22,540 22,449 17,988
318,287 262,616 211,531 146,585 86,562 76,316 85,163 78,815
60,806 41,240 42,625 40,000 17,614 16,337 19,658 18,535
100,305 79,680 64,460 48,909 25,958 24,797 22,700 20,832
1.6:1 1.5:1 1.6:1 2.2:1 1.8:1 1.9:1 1.6:1 1.6:1
27.5 30.3 35.4 23.5 13.9 14.6 16.9 15.6
.6:1 .5:1 .7:1 .8:1 .7:1 .7:1 .9:1 .9:1
0.75 0.68 0.60 0.25 0.15 0.14 0.15 0.13
— — — — — — — —
— — — 0.05 — — — —
0.75 0.68 0.60 0.30 0.15 0.14 0.15 0.13
0.15 0.13 0.08 0.07 0.12(3) 0.06 0.06 0.05
3.43 2.76 2.23 1.69 1.10 1.05 0.96 0.87
29,268,268 28,878,168 28,900,168 28,900,168 23,700,168 23,716,968 23,636,968 23,908,968
13.63 8.63 6.69 4.30 2.00 1.74 1.56 1.50
7.13 5.56 4.10 1.97 1.56 1.28 1.13 1.25
13.38 7.38 6.69 4.19 2.00 1.56 1.38 1.50
Toromont 47
Brought to you by Global Reports
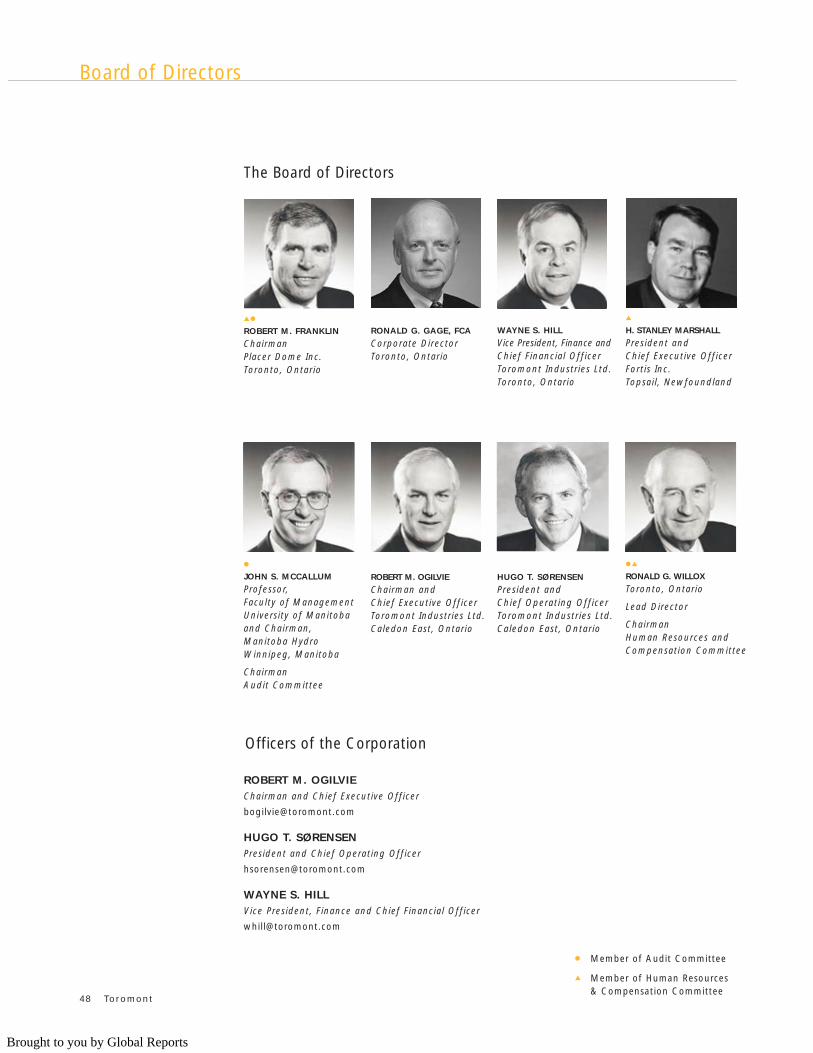
48 Toromont
Board of Directors
The Board of Directors
Officers of the Corporation
ROBERT M. OGILVIEChairman and Chief Executive Officer
HUGO T. SØRENSENPresident and Chief Operating Officer
WAYNE S. HILLVice President, Finance and Chief Financial Officer
▲●
ROBERT M. FRANKLIN
ChairmanPlacer Dome Inc.Toronto, Ontario
WAYNE S. HILL
Vice President, Finance andChief Financial OfficerToromont Industries Ltd.Toronto, Ontario
▲
H. STANLEY MARSHALL
President and Chief Executive OfficerFortis Inc.Topsail, Newfoundland
●
JOHN S. MCCALLUM
Professor,Faculty of ManagementUniversity of Manitoba and Chairman,Manitoba HydroWinnipeg, Manitoba
ChairmanAudit Committee
RONALD G. GAGE, FCA
Corporate DirectorToronto, Ontario
ROBERT M. OGILVIE
Chairman andChief Executive OfficerToromont Industries Ltd.Caledon East, Ontario
HUGO T. SØRENSEN
President and Chief Operating OfficerToromont Industries Ltd.Caledon East, Ontario
● Member of Audit Committee
▲ Member of Human Resources& Compensation Committee
●▲
RONALD G. WILLOX
Toronto, Ontario
Lead Director
ChairmanHuman Resources andCompensation Committee
Brought to you by Global Reports
Equipment Group
Toromont CAT
3131 Highway 7 WestP.O. Box 5511Concord, OntarioL4K 1B7Tel: (416) 667-5511Fax: (416) 667-5555H.T. SØRENSEN
President
Toromont Energy
151 Corstate AvenueConcord, OntarioL4K 4Y2Tel: (416) 667-5600Fax: (416) 667-5694S.M. CHEBIB
Vice President & General Manager
Battlefield Equipment Rentals
880 South Service RoadStoney Creek, OntarioL8H 7S8Tel: (905) 577-7777Fax: (905) 643-6008W.R. ATTWELL
President
Refrigeration Group
Aero Tech Mfg. Inc.
395 West 1100 NorthNorth Salt Lake, Utah 84054Tel: (801) 292-0493Fax: (801) 292-9908T.J. RILEY
President
CIMCO Refrigeration
65 Villiers StreetToronto, Ontario M5A 3S1Tel: (416) 465-7581Fax: (416) 465-8815S.D. MCLEOD
President
Lewis Refrigeration Co.
200 Maplewood StreetMalden, Massachusetts 02148Tel: (781) 322-7460Fax: (781) 324-9637S.D. MCLEOD
President
Toromont Process Systems
3615 - 34th Street N.E.Calgary, Alberta T1Y 6Z8Tel: (403) 291-3438Fax: (403) 291-3443D.F. DUNCAN
President
Toromont Process Systems Inc.
10815 Telge RoadHouston, Texas 77095Tel: (281) 345-9300Fax: (281) 345-7434D.F. DUNCAN
President
Corporate Information
Annual Meeting
The Annual Meeting of Shareholders of Toromont Industries Ltd. will be held in the Auditorium, Toronto Stock Exchange Conference Centre,
The Exchange Tower130 King Street WestToronto, Ontario M5X 1J2at 10:00 a.m. on Thursday, April 13, 2000.
Brought to you by Global Reports
How to get in touch with Toromont
BY TELEPHONE: (416) 667-5511
BY FAX: (416) 667-5555
BY E-MAIL: [email protected]
THE INTERNET: www.toromont.com
TRANSFER AGENT AND REGISTRAR:Investors are encouraged to contact CIBC Mellon Trustfor information regarding their security holdings. They can be reached at:
CIBC Mellon Trust320 Bay StreetToronto, Ontario M5H 4A6
ANSWER LINE: (416) 643-5500 or toll-free throughoutNorth America at 1-800-387-0825
INTERNET ADDRESS: www.cibcmellon.com (web site) [email protected] (e-mail)
COMMON SHARES: Listed on The Toronto StockExchange Stock Symbol–TIH
Toromont Industries Ltd.Corporate Office3131 Highway 7 WestP.O. Box 5511Concord, Ontario L4K 1B7
Brought to you by Global Reports