Embed Size (px)
Citation preview

RESEARCH ARTICLE
Topographic and stochastic influences on pāhoehoe lava lobeemplacement
Christopher W. Hamilton & Lori S. Glaze &
Mike R. James & Stephen M. Baloga
Received: 19 November 2012 /Accepted: 1 September 2013# Springer-Verlag Berlin Heidelberg 2013
Abstract A detailed understanding of pāhoehoe emplace-ment is necessary for developing accurate models of flowfield development, assessing hazards, and interpreting thesignificance of lava morphology on Earth and other planetarysurfaces. Active pāhoehoe lobes on Kīlauea Volcano, Hawai'i,were examined on 21–26 February 2006 using oblique timeseries stereo-photogrammetry and differential global position-ing system measurements. During this time, the local dis-charge rate for peripheral lava lobes was generally constantat 0.0061±0.0019 m3/s, but the areal coverage rate of thelobes exhibited a periodic increase every 4.13±0.64 min. Thisperiodicity is attributed to the time required for the pressurewithin the liquid lava core to exceed the cooling-inducedstrength of its margins. The pāhoehoe flow advanced througha series of down-slope and cross-slope breakouts, which be-gan as ∼0.2-m-thick units (i.e., toes) that coalesced and inflat-ed to become approximately meter-thick lobes. The lobeswere thickest above the lowest points of the initial topographyand above shallow to reverse-facing slopes, defined relative tothe local flow direction. The flow path was typically con-trolled by high-standing topography, with the zone directlyadjacent to the final lobe margin having an average relief that
was a few centimeters higher than the lava-inundated region.This suggests that toe-scale topography can, at least tempo-rarily, exert strong controls on pāhoehoe flow paths by im-peding the lateral spreading of the lobe. Observed cycles ofenhanced areal spreading and inflated lobe morphology arealso explored using a model that considers the statisticallikelihood of sequential breakouts from active flow marginsand the effects of topographic barriers.
Keywords Topographic influences . Stochastic processes .
Pāhoehoe lava . Lobe emplacement
Introduction
Basalt is the most common rock type on the surface ofterrestrial bodies throughout the solar system and—by totalvolume and areal coverage—pāhoehoe flows are the mostabundant form of basaltic lava in subaerial and submarineenvironments on Earth (Self et al. 1996, 1997, 1998).Pāhoehoe flow fields are composed of flows, lobes, and toes,which represent a continuum of lava emplacement scales, withtoes being the smallest elements. Pāhoehoe flows commonlyadvance as toes break out along lobemargins (Hon et al. 1994;Crown and Baloga 1999; Hoblitt et al. 2012). These new toesquickly cool and develop a rheological gradient that includesan inferred three-part structure composed of a brittle outercrust, underlying viscoelastic layer, and inner molten core(Hon et al. 1994). As toes develop sufficient strength to retainincoming lava, they can pressurize, coalesce, and inflate toform lobes that are interconnected with other portions of theflow through internal fluid pathways (Walker 1991, 2009).The evolution of these pathways can vary considerably(Kauahikaua et al. 1998), but the initial emplacement ofpāhoehoe flow fronts can influence the subsequent develop-ment of the flow. Consequently, a detailed understanding of
Editorial responsibility: S. Calvari
C. W. Hamilton : L. S. GlazePlanetary Geodynamics Laboratory, NASA Goddard Space FlightCenter, Greenbelt, MD 20771, USA
C. W. Hamilton (*)Department of Astronomy, University of Maryland, College Park,MD, USAe-mail: [email protected]
M. R. JamesLancaster Environment Centre, Lancaster University, Lancaster, UK
S. M. BalogaProxemy Research, Laytonsville, MD, USA
Bull Volcanol (2013) 75:756DOI 10.1007/s00445-013-0756-8

processes operating on the scale of toes and lobes can provideimportant information for modeling aspects of flow fielddevelopment, assessing hazards, and interpreting the signifi-cance of lava flow morphology on Earth and other planetarybodies (Peitersen and Crown 2000; Byrnes and Crown 2001).
Hon et al. (1994) suggest that “microtopography” (i.e., tensof centimeters relief), herein termed “toe-scale topography,”can strongly affect the emplacement of pāhoehoe lava flowsthat reach a final inflated thickness of several meters. Previousstudies have attempted to determine the relationship betweentopography and pāhoehoe emplacement (Crown and Balgoa1999; Peitersen and Crown 2000; Byrnes and Crown 2001),but these studies have been unable to quantify the effects oftoe-scale topography at the flow front due to data resolutionlimitations. Here, oblique digital photogrammetry and differ-ential global positioning system (DGPS) measurements arecombined to quantify key physical parameters involved inpāhoehoe flow growth through the development of toes andlobes, which constitute the fundamental building blocks of allpāhoehoe flows (Walker 1991; Self et al. 1996, 1998;Thordarson and Self 1998). These field observations are alsoused to inform and constrain a new stochastic model thatdescribes pāhoehoe lobe emplacement in terms of a balancebetween random and nonrandom processes.
Background
Pāhoehoe flow fields exhibit a multitude of branching eventsat several scales (Crown and Baloga 1999) and include self-similar morphologies (Bruno et al. 1994) that enable localobservations to be used to understand larger aspects of flowfields and their emplacement. However, these patterns arecomplicated and irregular because of the influence of stochas-tic processes operating on multiple scales (Kilburn 1996).This makes it important to identify the scales over whichrecurring processes and structures combine to form the overallpattern of a pāhoehoe flow field. Understanding how eruptionparameters, deterministic factors, and random influences af-fect the emplacement of pāhoehoe flows also makes it possi-ble to develop improved probabilistic models to describelikely patterns of flow growth (Glaze and Baloga 2013). Thisstudy examines active pāhoehoe lava lobes on Kīlauea Volca-no, Hawai'i, to characterize the effects of toe-scale topographyon flow emplacement and identify key parameters needed tomodel statistical aspects of the process.
Pāhoehoe flows grow through a combination of arealspreading and inflation, with new toes breaking out alonglobe margins and quickly cooling by radiation (Hon et al.1994; Keszthelyi and Denlinger 1996; Harris et al. 2007a,Harris 2013). However, as time progresses and a thermallyinsulating skin develops on the surface of the new toes, thetransfer of heat from the flow's interior becomes increasingly
dominated by conduction (Keszthelyi and Denlinger 1996;Castruccio et al. 2013). The crust also helps to retain incominglava, which slows the advance of the new toes as their internalpressure decreases relative to the increasing confining strengthof the growing crust (Hon et al. 1994). Given a constant influxof lava, this leads to a reduction in the areal coverage rate ofthe toes and an increase in the rate of inflation. Inflation willthen tend to dominate the emplacement process until theinternal pressurization of the lobe reaches a threshold requiredto rupture the flow margins and initiate a new cycle of en-hanced areal spreading (Hoblitt et al. 2012).
Within an active pāhoehoe flow, internal connections be-tween numerous lobes can form extensive lava pathways(Kauahikaua et al. 1998). Preferred pathways within theselava networks will generally concentrate in existing topo-graphic lows and may develop into a tube system as thesurrounding flow cools and stagnates. This allows pāhoehoeflows to advance great distances by transporting lava to theflow front through thermally insulated pathways that canreduce cooling rates to only 0.5–1.0 °C/km (Harris andRowland 2009). As lava is distributed from a master pathwayinto peripheral lobes and toes, the local discharge rates willprogressively decrease with each branch in the system. Localdischarge rates may therefore be constant over short periods oftime (Hon et al. 1994), but are expected to evolve as the lobesat the former flow front are incorporated into the growingbody of the lava transport system. In this study, lobes along theperiphery of a low-discharge pāhoehoe flow are examined toexplore flow front emplacement processes and inflation.
Study area
The Prince KūhiōKalaniana'ole (PKK) flowwas erupted fromPu'u 'Ō'ō on Kīlauea Volcano, Hawai'i, from March 2004 toJune 2007 (Fig. 1). Active margins along the flow wereexamined in the field between 21 and 26 February 2006.During this time, lava from Pu'u 'Ō'ōwas primarily transferredthough an established tube system that reached the ocean(Koeppen et al. 2013). However, during February 2006, themaster tube system also fed a series of small surface flowslocated ∼7 km south of Pu'u 'Ō'ō. Harris et al. (2007a) referredto this portion of the PKK flow as the “Hook flow.” Fieldobservations and thermal imagery were used to establish thatthe Hook flow exhibited breakouts of S-type pāhoehoe(Wilmoth and Walker 1993) from three small flows on 21February. However, by 23 February, the activity had dwindledto the distal margin of just one flow. Waning activity was alsoevidenced by a decrease in maximum core temperature from1,141 °C on 21 February to 1,131 °C on 23 February and adecrease in areal coverage rate from ∼0.22 m2/s on 22 Febru-ary to ∼0.03 m2/s on 23 February (Harris et al. 2007a).Additionally, there was a corresponding decrease in discharge
756, Page 2 of 16 Bull Volcanol (2013) 75:756

rate feeding small surface flows, from ∼0.14 m3/s on 22February to ∼0.03 m3/s on 23 February (Harris et al. 2007a).These surface flows stagnated on 24 February. Measurementsreported in this study were made contemporaneously with theobservations of Harris et al. (2007a), who used thermal imagechronometry to establish broad relations among cooling, dis-charge rate, and areal coverage rates for the whole flow.
To place the local lava discharge rates into a broadercontext, the Pu'u 'Ō'ō-Kupaianaha eruption began eruptingin Kīlauea Volcano's East Rift Zone (ERZ) on 3 January1983, and between 1983 and 2002, its time-averaged dis-charge rate (Harris et al. 2007b) was ∼3.81 m3/s dense-rock-equivalent lava (Heliker andMattox 2003). However, the Pu'u'Ō'ō-Kupaianaha eruption has undergone numerous changesthroughout its history (Heliker and Mattox 2003), and in2003–2007, the magma supply rate to the ERZ increasedsignificantly during a mantle-derived surge to Kīlauea Volca-no (Poland et al. 2012). During this time, the magma supply toKīlauea Volcano increased by a factor of 2 (Poland et al.2012). By 2005, the supply rate to the ERZ increased to∼5.11 m3/s (Poland et al. 2012), and so at the time of the fieldcampaign in February 2006, effusion rates from Pu'u 'Ō'ōwere probably higher than the long-term average. Tilt meterrecords from the Hawaiian Volcano Observatory's Pu'u 'Ō'ōcone station also show that there was an oscillatory pattern ofinflation and deflation between 21 and 26 February 2006 (Orr2011). This pattern began with an inflation event on 21February, which was followed by gradual deflation over the
next 5 days through a series of smaller tilt cycles (Tim Orr,personal communication, 2013). Orr (2011) showed that thesetilt cycles were associated with fluctuations in lava dischargethrough the tube system and may have contributed to theobserved breakouts from the master tube. Discharge ratesassociated with the small surface flows examined within thisstudy were therefore much lower than for the concurrentlyactive PKK tube and for the Pu'u 'Ō'ō-Kupaianaha eruption asa whole.
Methods of digital terrain modeling
To quantify the aspects of the pāhoehoe emplacement pro-cesses, two complementary methods were employed. First,time series oblique stereo-imaging and photogrammetry(Robson and James 2007) were used to determine the chang-ing geometric properties of an active lava lobe, herein referredto as Lobe A. Second, DGPS measurements of topographybefore and after the emplacement of a second pāhoehoe lobe(Lobe B) were used to assess the relationship between initialtopography and final lobe morphology. Lobes A and B werelocated along the same lava pathway system, with Lobe Blocated ∼10 m directly down-flow of Lobe A (Fig. 1).
Time series stereo-image pairs of Lobe Awere acquired on23 February using two synchronized tripod-mounted digitalsingle-lens reflex cameras (6 megapixel Canon EOS 300D),which collected image pairs every minute over a duration of
1986-1992
1983-1986
1992-2002
2002-2004
2003-20042004-2005
1997HVNP Boundary
Kalapana
PacificOcean
East Lae`apuki
Plama Pali
4200 m
0 m
N
Ele
vatio
n
30 km
Pu`u `K paianahau
Chainof Craters
Rd
Hawai`i VolcanoesNational Park (HVNP)
LavaTube
2004-2007
200 m
100 m
300 m
400
m
500
m
100 m
600m
700
m
800
m
900
m
200 m
800 m
600 m
500 m
0 1 2 3 4
Kilometers
50 m contour interval
N
700 m
Study AreaFebruary 21-26, 2006
March 20, 2004 - April 12, 2006Prince Kuhio Kalaniana`ole (PKK) flows
RoyalGardenssubdivision
Fig. 1 Lava flow map showingthe study area location(19.336430° N, 155.055235° W)within the Prince KūhiōKalaniana'ole flow (shown inyellow) on Kīlauea Volcano,Hawai'i. Pāhoehoe lava lobes atthis locality were fed lava fromPu'u 'Ō'ō. Field measurementswere acquired on 21–26 February2006 for two lobes (A and B)located along the same lavapathway system. Lobe B waslocated directly down-slope ofLobe A, with a separationdistance of ∼10 m. The dashedlines approximately bound theedifices of Pu'u 'Ō'ō andKupaianaha. Lava flow dataprovided by Tim Orr, UnitedStates Geologic Survey
Bull Volcanol (2013) 75:756 Page 3 of 16, 756

35min (Robson and James 2007). The cameras were mountedapproximately 1 m apart and had pre-calibrated, fixed-focus28-mm lenses. Photogrammetric control was provided usingspherical targets (25 mm in diameter) with positions deter-mined by the DGPS measurements. The analysis was carriedout using Vision Measurement System (Robson and Shortis,http://www.geomsoft.com) with image matching by theGOTCHA dense matching algorithm (Gruen 1985; Day andMuller 1989; Otto and Chau 1989). A typical stereopairprovided topographic point cloud data with positional preci-sions of 25, 65, and 20 mm in easting (x ), northing (y ), andelevation (z ), respectively. To quantify surface changes, thesepoint cloud data were gridded in Surfer using a kriging algo-rithm over a 0.1-m/pixel x–y grid. The data were thenimported into ArcGIS.
For Lobe B, x , y, and z coordinates for topographic sur-faces were acquired before (23 February) and after lava em-placement. Post-emplacement surveys were performed on 24–26 February. However, no changes were observed after 24February and so data from these three surveys were combinedtogether. Data were collected at a sampling rate of 0.5 s usingtwo Ashtech Z-Xtreme DGPS receivers—one operating inkinematic mode and the other as a static base station. Thesedata were post-processed using Ashtech Solutions 2.60 withdifferential, L1/L2 (1,575.42/1,227.60 MHz) frequency cor-rection for ionospheric delay error, and International GlobalNavigation Satellite System Service Standard Product 3 pre-cise orbit file corrections. Resulting data points were filteredto remove measurements with more than 0.05 m residualaccuracy error. On volcanic terrains, Hamilton et al. (2010)estimate the vertical precision of single traverse kinematicDGPS surveys to be ±0.08 m, and double traverses being±0.06 m, with horizontal precision being better than the ver-tical measurements. Most gridded cells in this dataset containmultiple DGPS observations and should have a vertical pre-cision of ±0.06 m. The resulting datasets for the initial andfinal topography include 14,618 and 20,585 records, respec-tively. To avoid spatial aliasing and to eliminate redundantdata, the BLOCKMODE function in Generic Mapping Tools(GMT; Wessel and Smith 1991) was used to average z withineach pixel. Filtered x , y, and z , data were then interpolatedusing NEARNEIGHBOR in GMT to form a 0.1-m/pixel x–ygrid.
Time series observations of pāhoehoe lobe emplacement
Stereogrammetric point clouds and interpolated digital terrainmodels (DTMs) were used to identify and digitize the activemargins of Lobe A at 1-min intervals (Fig. 2). These arealspreading maps show that the lava lobe grew by a series ofbreakouts that broadly fit into two categories: narrow (0.2–0.6-m-wide) toes that grew preferentially down-slope and
broad (1.4–3.5-m-wide) breakouts that formed along the sidesof the lobe, nearly perpendicular to the down-flow axis (Figs. 3and 4). Initial toe thicknesses were typically ∼0.2 m and,during the 35-min period of observation, they inflated to amaximum thickness of ∼1.1 m, with most toes inflating to halftheir final observed thickness within 10 min. Within the firstminute of emplacement, toes generally extended ∼0.2 m, witha range of 0.05 to 0.55m. After 28min, the active flowmarginbegan to exit the field of view of the stereo-cameras, and toelengths could not be accurately constrained.
The mean local discharge rate measured at Lobe A over thefirst 19 min was 0.0061±0.0019 m3/s (N =19, Fig. 5a). Notethat all uncertainties in this study are reported at 1 standarddeviation, σ , unless otherwise noted. Standard deviation de-scribes how much variation there is from the mean, whereasstandard error on the mean, σμ, provides a measure of howwell the mean itself is known based on the number of datapoints, N , used in the calculation. We therefore provide N aswell as σ to enable the calculation of σμ ¼ σ=
ffiffiffiffiN
p. After
35 min, the lobe covered a new area of 11.7 m2 and achieved acumulative volume of 10.4 m3.
This local discharge rate was remarkably constant duringthe observation period, except for the interval between 19 and24 min, when it decreased by nearly a factor of 4. During thisinterval, the lobe experienced little inflation and had generallylower than average areal spreading rates (Fig. 5a). However,this may have been due to breakouts occurring outside thefield of view. At 24min, the local discharge rate of 0.0061 m3/s resumed, but after 28 min, the measured rate of volumechange gradually decreased as the active flow front began toexit the field of view of the stereo-cameras. The mean arealcoverage rate was 0.0055±0.0038m2/s (N =35), but exhibiteda cyclicity with peaks ∼3 times greater than the mean(Fig. 5b), with a period of 4.13±0.64min (N =8). During eachcycle of areal enhanced growth (measured from trough totrough in areal coverage rates shown in Fig. 5b), the lobecovers a new area of 1.59±0.28 m2 (N =7).
In this study, excess lobe volume is defined as the volumechange in the field of view per minute minus the change inarea during that minute, multiplied by the typical initial thick-ness of the new breakouts. Excess lobe volume is significantbecause it accounts for the change in lobe volume that is notdirectly attributable to its areal expansion. The typical thick-ness of new breakouts from Lobe Awas ∼0.2 m, but may varyfor other flows—generally scaling with local discharge rate(Self et al. 1998). Excess volume changes for Lobe A appearto be weakly anti-correlated with its areal spreading rate.However, to quantify the degree of anti-correlation, the Pear-son cross-correlation coefficient (Sheskin 2011) was calculat-ed between areal growth and excess volume. The correlationanalysis was restricted to the first 19 min of observation whenthe volume flow rate feeding the lobe was relatively constant.The areal growth rate during this 19-min period exhibits a
756, Page 4 of 16 Bull Volcanol (2013) 75:756

slight overall increase over time (slope=0.013 m2/min2 andintercept=0.206 m2/min), and therefore, the trend was re-moved prior to analysis. After trend removal, the Pearsoncross-correlation coefficient, at lag=0 (i.e., the measure ofdirect anti-correlation), is −0.22. The negative sign of thisstatistic indicates anti-correlation; however, the magnitude iswell within the 90 % confidence interval (±0.34) indicatingthat the anti-correlation is very weak and not statisticallysignificant at this level. This suggests that there may be atrade-off between areal spreading and inflation given an ap-proximately constant lava supply, but that the relationshipmay be complicated by other factors. See “Model simulationsof areal growth” section for further discussion.
Lava thickness, inflation, and the effects of topographicrelief on pāhoehoe lobe emplacement
Topographic maps of the terrain before and after the emplace-ment of Lobe B are shown in Fig. 6. Lava covered 111.83 m2
within the DGPS survey region, with a total lobe volume of59.45 m3. Forward looking infrared radiometer (FLIR) mea-surements of the flow at 06:00 on 24 February 2006 revealedno anomalously hot pixels within the study region, whichindicates that the flow terminated at least 5 h before (Harris
A
A’
B
B’
2 mN
Stereo-derived elevationpoint cloud ( = 35 minutes)t
Region of interest usedfor volume flux calculations
Active flow margin(5 minute interval)
Active flow margin(1 minute interval)
A
A’
B
B’
Down-slope profile(7 m-length)
Cross-slope profile(4 m-length)
Fig. 2 Orthorectified view ofphotogrammetric point cloud attime t=35 min for Lobe A, withoverlaid lava flow boundariesshown at 1-min intervals and thelocations of the down-slope
AA0� �
and cross-slope BB0� �
profiles shown in Fig. 4
0 min.5 min.
15 min.
10 min.
20 min.
25 min.
25min.
35 min.
1 m
15 min.
20 min.
30 min.
25 min.
30 min.35min.
N
Fig. 3 Time series evolution of Lobe A. Dark lines show the extent ofthe flow at 5-min intervals with gray lines showing the flowmargins at 1-min intervals. The flow begins to move outside the field of view at 28 min
Bull Volcanol (2013) 75:756 Page 5 of 16, 756

et al. 2007a). Based on the time of the last field observationson 23 February, this constrains the emplacement duration to<8 h. If the mean areal coverage and discharge rates weresimilar for Lobes A and B, then the emplacement duration ofLobe B was likely between 2.6 and 5.2 h.
Using the before and after DTMs (Fig. 6a, b), topographicprofiles have been extracted down-slope (Fig. 7a) and cross-slope (Fig. 7b). The lava entered the study region from thenorth, and the lobe grew to a length of ∼18 m and a maximumwidth of 9.1 m. However, the distal part of the flow focusedinto a 4.3-m-wide topographic constriction before being bi-furcated by a 1.0-m-high topographic obstacle into two small-er lobes that were 2.4- and 4.0-m-wide. The profiles show thatinflation of the lava tended to topographically invert thelandscape, with the thickest portions of the lobe developingabove topographic depressions and shallow to reverse-facingslopes, defined relative to the local flow direction. Thus,apparent barriers to the spreading of the flow are typicallymuch smaller than the maximum height of the lobe, and thethicker portions of the lobe appear confined by the thinnerperipheral parts of the flow.
The thickness of Lobe B above the existing surface(Fig. 6c) was calculated by taking the simple differencebetween the final and initial topography. This yields a meanlobe thickness of 0.57±0.24 m, with a maximum of 1.21 m.However, this simple topographic difference overestimatesinflation because lobes are initially emplaced as toes with aninitial thickness. Additionally, lava had to fill small closed
depressions before thickening above the surroundingtopography.
To account for the infilling of small topographic depres-sions, a new initial surface was created by smoothing theinitial topography in a process that is analogous to tightlystretching a rubber sheet through the data. The smoothedsurface was created using the GMT function SURFACE,which interpolates a grid using continuous curvature splinesin tension (Smith and Wessel 1990). Specifically, the SUR-FACE applies the Laplace transform (L ) to the initial topog-raphy (z ):
1–Tð ÞL� L zð Þð Þ þ T � L zð Þ ¼ 0: ð1Þ
Varying the tension factor T between 1 (i.e., the harmonicsurface solution) and 0 (i.e., the minimum curvature solution)enables this data interpolation method to smooth the initialsurface to different degrees. For instance, a grid producedwithhigh tension (T→1) will suppress local maxima and minimaby fitting an increasingly taut surface between the data con-straints, whereas applying a looser tension factor (T→0) willproduce a smooth polynomial function analogous to a flexedelastic plate that is anchored by the data (Smith and Wessel1990).
To constrain the inflated thickness of Lobe B, a smoothedlocal datum was fit to the initial topography using a T valueof 1. This removes high-frequency oscillations in the topog-raphy, while preserving the overall shape of the terrain.
0.0 1.0 2.0 3.0 4.0 5.0 6.0 7.0115.5
115.7
115.9
Distance Along Profile (m)
Ele
vatio
n (m
) W
GS
84 D
atum
0.0 1.0 2.0 3.0 4.0 5.0 6.0 7.0115.5
115.7
115.9
116.1
116.3
116.5
116.7
116.9
117.1
Distance Along Profile (m)
Ele
vatio
n (m
) W
GS
84 D
atum
b
10 min.
5 min.
0 min.
30 min.
25 min.
35 min.
10 min.
20 min.
15 min.
5 min.
0 min. Projected Initial Surface
A A’
B
B’
Cross-Slope Profile
116.1
116.3
116.5
116.7
116.9
117.1a
30 min.
25 min.
20 min.
15 min.
35 min.
Down-Slope ProfileFig. 4 a Down-slope AA0
� �
and b cross-slope BB0� �
profiles
for Lobe A showing the changingtopography of the lava lobeshown in Figs. 1 and 2
756, Page 6 of 16 Bull Volcanol (2013) 75:756

Subtracting this surface from the final topography isolates thethickness of lava above the local datum and provides a betterproxy for inflation than the simple difference map because itreduces the thickness contributions due to small basin infilling.Using this method, the mean thickness due to inflation was 0.34±0.21 m (N=9614), with a maximum of 1.00 m (Fig. 6d).
To isolate local relief within the initial topography, a secondinterpolated surface was created using Eq. (1) with T =0.25. Aloose tension factor of T =0.25 is recommended for low-tension interpolations to suppress extraneous oscillations(i.e., minima and maxima) that can otherwise be generatedwhen using the end-member minimum curvature solution(i.e., T =0; Wessel and Smith, http://gmt.soest.hawaii.edu/).The new surface preserves more variations in the initialtopography than the harmonic surface solution (T =1) andwas subtracted from the original initial topography to isolatehigh-frequency changes in elevation (i.e., relief) above andbelow a new local datum centered on 0 m.
In the lava-inundated region, the distribution of initial relief isunimodal with a mean of −0.02±0.07 m (N =9,614 pixels;Fig. 8). For comparison, a 1-pixel buffer region was also definedaround the outer extent of the lobe and, in this buffer region, thefrequency distribution of relief had a mean of 0.00±0.07 m (N=499 pixels). However, relative to the lava-inundated region,there are more pixels with a relief of 0.03 to 0.09 m and fewerpixels with a relief of −0.09 to −0.03 m (Fig. 8). This means thatthere are systematically more high relief pixels bounding thepāhoehoe lava lobe than in the region that was inundated.Consequently, positive relief on the order of only a few centi-meters may exert an important influence on bounding the extentof low effusion-rate pāhoehoe flows.
Toe-scale topography (i.e., on the order of centimeters inthis case) appears to influence the areal spreading of pāhoehoelobes by blocking peripheral toes, which may then stagnateand help to confine the interior portions of the flow. If theinterior of the flow continues to be supplied by lava, it may
5 10 15 20 25 30 35Time (minutes)
10
12Change in Local Discharge Rate
Lava Begins to Leave the Field of View
0.0061 m/s3
0
2
4
6
8
Cum
ulat
ive
Vol
ume
(m)3
0.0016 m /s3
0.0061 m/s3
Lava Advanceand Inflation
Little LavaInflation
0 5 10 15 20 25 30 350.0
0.2
0.4
0.6
0.8
1.0
Are
al C
over
age
Rat
e (m
/min
ute)
2
Time (minutes)
-0.05
0.05
0.15
0.25
0.35
0.45
Exc
ess
Vol
ume
Cha
nge
(m/m
inut
e)3
a
b
Area Spreading is Accommodatedby Depletion of Stored Lava
Lava Advanceand Inflation
Fig. 5 a Cumulative volume in the region of interest identified in Fig. 2for Lobe A. The mean local discharge rate (0.0061±0.0019 m3/s, calcu-lated for the first 19 min) is generally constant during the observationperiod, except for the interval between 19 and 24 min where the meanlocal discharge rate decreases by nearly a factor of 4 and the lobeexperiences little inflation and generally lower than average areal spread-ing rates. At 28 min, the rate of volume change gradually decreases as theactive flow front begins to exit the field of view of the stereo-cameras. b
Areal coverage rate (mean 0.33±0.23 m2/min, filled black circles withsolid black line) and mean excess volume change (0.23±0.12 m3/min,open circles with broken line), where excess volume change is defined inthe text. Excess volume change less than 0, between 20 and 23 min,implies that areal growth was accommodated by depletion of stored lavaduring this time interval. The areal coverage rate shows a periodicity withpeaks at intervals of 4.13±0.64 min. All uncertainties are reported at 1σ
Bull Volcanol (2013) 75:756 Page 7 of 16, 756

then inflate above the height of surrounding barriers, therebytopographically inverting the landscape. Barriers to flow maytherefore be much less than the final inflated thickness of alobe. Based on observations of Lobe B, relief that is at least15 % of a toe's initial thickness may be significant in terms ofaffecting the path of low-discharge pāhoehoe lava lobes, butgiven sample size-dependent restrictions on the optimum binsize for the data (Sturges 1926; Doane 1976), influences ofeven smaller variations in topography cannot be precluded.Obstacle heights affecting the path of higher local dischargerate flows may also scale with initial toe height.
Stochastic modeling of pāhoehoe lobe emplacement
Overview of the model
Random effects strongly influence the processes ofpāhoehoe flow growth and pose a fundamental difficulty in
developing models for their emplacement (Hon et al. 1994;Thordarson and Self 1998; Keszthelyi et al. 1999; Crownand Baloga 1999). Glaze and Baloga (2013) have recentlydeveloped a new simulation approach for modelingpāhoehoe emplacement that builds on the ideas presentedin Baloga and Glaze (2003). This model is based on (1)conservation of lava volume and (2) prescribed stochasticrules for lava movements within a pāhoehoe lobe. Thisapproach differs significantly from other models that treatlava emplacement as a gravity-driven viscous fluid flow onan inclined plane (e.g., Danes 1972; Hulme 1974; Balogaand Pieri 1986; Baloga 1987; Crisp and Baloga 1990; Harrisand Rowland 2001; Rowland et al. 2004; Baloga and Glaze2008). The Glaze and Baloga (2013) model simulates thethree-dimensional shape for pāhoehoe lobes as they evolvein time, subject to a wide variety of ambient and internalconditions and processes. Here, the new model is used toexplore the effects of inflation on pāhoehoe lobes analogousto Lobes A and B.
b
25 m
Elev
atio
n (m
)
142.4
Elev
atio
n (m
)
144.5
142.4
1.1– 1.21.0– 1.10.9– 1.00.8– 0.90.7– 0.80.6– 0.70.5– 0.60.4– 0.50.3– 0.40.2– 0.30.1– 0.20.0– 0.1
Thi
ckne
ss (
m)
cc cd
N
DD’
C’
C
C’
5 m5 m
a 144.5C
DD’
Fig. 6 a Initial and b post-lavalobe emplacement DTMsgenerated from DGPSmeasurements for Lobe B, withcool colors showing lowelevation and warm colorsshowing relatively higherelevation. c Simple differencebetween the final and initialtopography. d Differencebetween the final topography anda Laplacian harmonic surfacesolution, which removes theeffects of closed basin filling.
Profiles CC0� �
and DD0� �
are
shown in panels a and b of Fig. 7,respectively. Elevations in (a) and(b) are reported relative to theWGS84 datum, and lavathicknesses in (c) and (d) areshown to the same scale
756, Page 8 of 16 Bull Volcanol (2013) 75:756

The fundamental building block of the Glaze and Baloga(2013) model is the lava “parcel.” A parcel of lava is definedhere as a volumetric unit sampled from a probability distributionof lava volumes that typically construct a pāhoehoe lobe. Thus,the smallest toe observed on the surface or along themargins of apāhoehoe lobe may represent a lava parcel volume from the
small end of the distribution. However, larger toes may eitherrepresent a larger parcel volume ormay be comprised ofmultipleparcels.
A parcel is observable as a “toe” when it is permanentlyaffixed at the surface or margin of a lobe. In the Glaze andBaloga (2013) model, lava parcels originate from a source
142.8
143.0
143.2
143.4
143.6
143.8
144.0
144.2
144.4
144.6
144.8
Ele
vatio
n (m
) W
GS
84 D
atum
Distance Along Profile (m)0 2 4 6 8 10 12 14 16 18 20
142.4
142.6
142.8
143.0
143.2
143.4
143.6
143.8
144.0
144.2
144.4
Ele
vatio
n (m
) W
GS
84 D
atum
Distance Along Profile (m)0 2 4 6 8 10 12 14 16 18 20
a
bC C’
D
D’
Confining Topography
Paleo-topographic Low
Topographic Inversion
Minimal Lava Inflation
Inflated Lava Lobe
Inflated Lava Lobe
(Upper)
(Lower)Forward Slope
Reverse Slope
Reverse Slope
Down-Slope Profile
Confining Flow Margin
Topographic Inversion
Inflated Lava Lobe
Confining Topography
Paleo-topographic Low
Confining Topography
(Upper)
Cross-Slope Profile
Fig. 7 a Down-slope and b cross-slope profiles showing the initialand final topography for Lobe B(see CC0� �
and DD0� �in Fig. 6).
The flow has topographicallyinverted the landscape, withinflation being greatest abovepaleo-topographic lows and anti-facing slopes, and least aboveforward-facing slopes. Note thepre-eruption topography and thinconfining flow margins that mayhelp to confine the thicker interiorportions of the lobe
0
5
10
15
20
25
30
35
40
Relief of the Pre-Emplacement Surface (m)
% o
fTot
alA
rea
Lava Inundated Region
1 Pixel Exterior Buffer Region
-0.3
3to
-0.2
7
-0.2
7to
-0.2
1
-0.2
1to
-0.1
5
-0.1
5to
-0.0
9
-0.0
9to
-0.0
3
-0.0
3to 0.03
0.03 to 0.09
0.09 to 0.15
0.15 to 0.21
0.21 to 0.27
0.27 to 0.33
Fig. 8 Frequency distribution of relief on initial surface within the lava-inundated region (dark gray) and within a 1-pixel buffer region aroundLobe B (light gray). Themean relief within both regions is close to 0 (i.e.,0.02±0.07 m in the inundated region and 0.00±0.07 m in the buffer
region), but the buffer region exhibits more +0.03 to +0.09 m reliefsurfaces and −0.09 to −0.03 m relief surface, which implies that positiverelief on the order of only a few centimeters may act to confine the arealspreading of the flow. All uncertainties are reported at 1σ
Bull Volcanol (2013) 75:756 Page 9 of 16, 756
region and are transported through fluid internal pathways. Forthe purposes of discussion here, the model assumes a constantparcel size for all parcels. Crown and Baloga (1999) measureddimensions of hundreds of toes, and their mean thickness is verywell constrained at ∼0.20 cm (0.19±0.08 m,N =448). Based onthe geometric mean toe sizes measured by Crown and Baloga(1999), the parcel volume is assumed to be 0.09 m3 (Glaze andBaloga 2013). Assuming a square x–y grid and a typical parcelthickness of 0.2m—comparable to the observed initial thicknessof toes in our study area—the corresponding cell spacing is0.67 m, with a parcel area of 0.45 m2.
The Glaze and Baloga (2013) random simulation modelbegins with an initial source region (a single point, linearsource, etc.), a constant supply of lava (i.e., one parcel per timestep), and probabilistic rules governing where each parcel willbe transferred and allocated. For example, in the most basicscenario of complete randomness, two random choices aremade for each breakout. First, a parcel is randomly selectedto be the source for the next parcel transfer. Second, a random
selection is made to determine the orientation of the new parceltransfer relative to its source (i.e., north, south, east, or west). Inthe purely random case, every face of every parcel has an equalprobability of being the source for the next parcel transfer. Asvarious factors that influence emplacement are examined (e.g.,barriers, slope, etc.), different probabilistic rules are applied thatdetermine where and when each parcel will be transferred.
Model simulations of areal growth
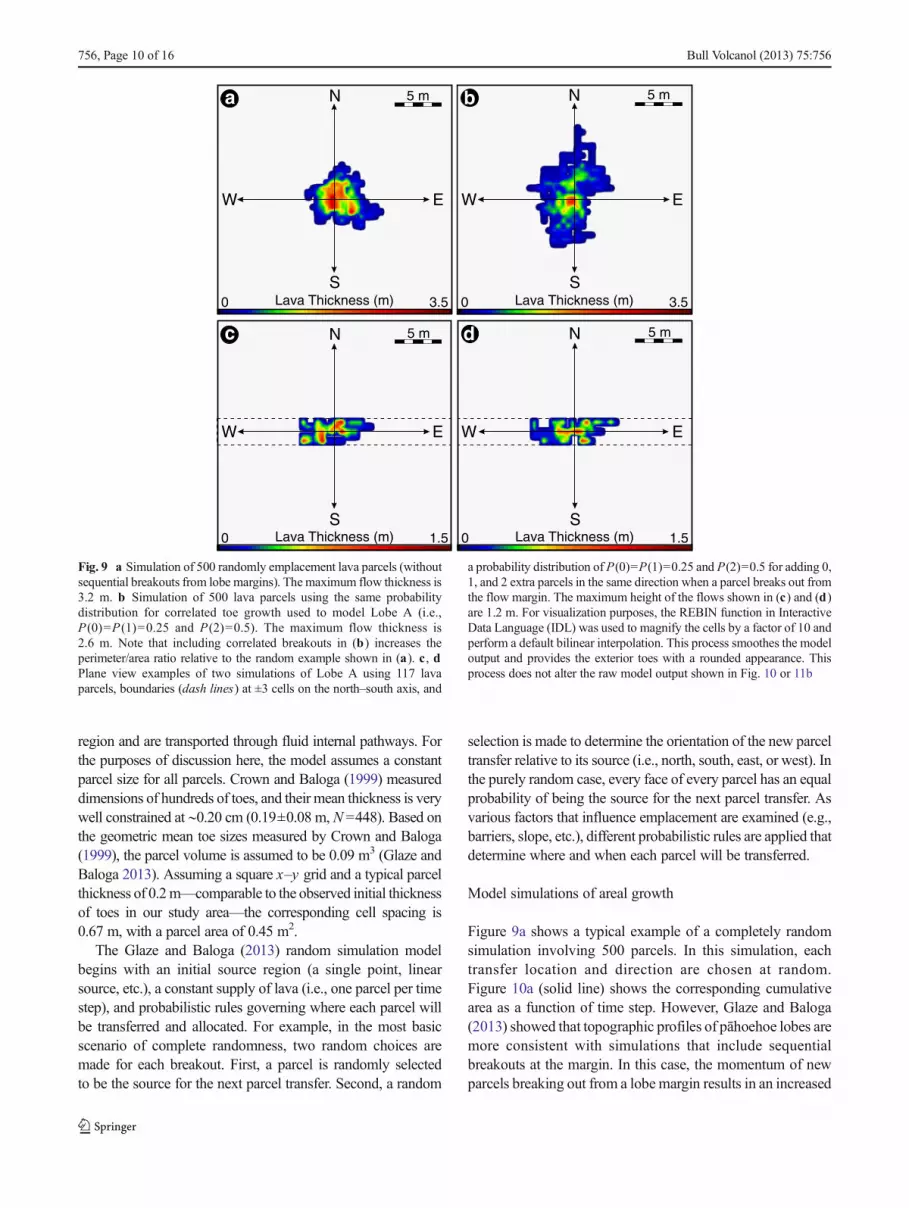
Figure 9a shows a typical example of a completely randomsimulation involving 500 parcels. In this simulation, eachtransfer location and direction are chosen at random.Figure 10a (solid line) shows the corresponding cumulativearea as a function of time step. However, Glaze and Baloga(2013) showed that topographic profiles of pāhoehoe lobes aremore consistent with simulations that include sequentialbreakouts at the margin. In this case, the momentum of newparcels breaking out from a lobe margin results in an increased
a b
0 3.5Lava Thickness (m) 0 3.5Lava Thickness (m)
N
S
N
S
5 m 5 m
N
S
EW
EW
N
S
EW
EW
c d
0 1.5Lava Thickness (m) 0 1.5Lava Thickness (m)
5 m 5 m
Fig. 9 a Simulation of 500 randomly emplacement lava parcels (withoutsequential breakouts from lobe margins). The maximum flow thickness is3.2 m. b Simulation of 500 lava parcels using the same probabilitydistribution for correlated toe growth used to model Lobe A (i.e.,P (0)=P (1)=0.25 and P (2)=0.5). The maximum flow thickness is2.6 m. Note that including correlated breakouts in (b) increases theperimeter/area ratio relative to the random example shown in (a). c , dPlane view examples of two simulations of Lobe A using 117 lavaparcels, boundaries (dash lines) at ±3 cells on the north–south axis, and
a probability distribution of P(0)=P(1)=0.25 and P(2)=0.5 for adding 0,1, and 2 extra parcels in the same direction when a parcel breaks out fromthe flow margin. The maximum height of the flows shown in (c) and (d)are 1.2 m. For visualization purposes, the REBIN function in InteractiveData Language (IDL) was used to magnify the cells by a factor of 10 andperform a default bilinear interpolation. This process smoothes the modeloutput and provides the exterior toes with a rounded appearance. Thisprocess does not alter the raw model output shown in Fig. 10 or 11b
756, Page 10 of 16 Bull Volcanol (2013) 75:756

probability that the next parcel will be transferred from themost recent parcel in the same direction. Figure 9b shows theinfluence of allowing sequential breakouts at the lobe marginon lobe morphology. Specifically, every time a new parcel istransferred to the margin (increasing the lobe area), probabi-listic rules are used to determine whether 0, 1, or 2 extraparcels will be added at that location. For the simulationshown in Fig. 9b, the probability of 0 additional parcels isP(0)=0.25, of 1 additional parcel being added is P (1)=0.25,and of 2 additional parcels is P (2)=0.5. As expected, thecumulative area of the simulation that includes sequentialbreakouts at the margin rapidly diverges from the purelyrandom simulation (Fig. 10a), exhibiting a steeper gradientand overall greater cumulative area. Although a general trendin the areal growth (cubic meter per time step) is evident inboth simulations (Fig. 10a), the curves are irregular withperiods where the area increases rapidly and periods wherethe area does not change at all. Also as expected, the rate ofoverall areal growth tapers off over time as the number ofavailable lava transfer locations along the margins decreasesrelative to the total area of the lobe.
The Glaze and Baloga (2013) simulation approach explic-itly requires that lava parcels will either expand the area of theflow or contribute to inflation if they are allocated to the flowinterior. This naturally results in a trade-off between arealgrowth and interior lobe inflation similar to the pattern ob-served during the emplacement of Lobe A. The natural peri-odicity of the areal growth rate in the simulated lobes isillustrated by the solid line in Fig. 10b. Also shown inFig. 10b is the excess volume, which was defined in “Timeseries observations of pāhoehoe lobe emplacement” section asthe volume above what is directly associated with the changein lobe area. This distinction is required because all breakoutswill be emplaced with some initial thickness. For the simulat-ed data, the definition of excess volume results in a periodicbehavior that exactly mirrors the areal growth (i.e., perfectanti-correlation). This suggests that the weak anti-correlation
shown in Fig. 5b may be relevant, but that other processes arepresent in the field that have not yet been accounted for by themodel. Also in the field example, there was a period ofanomalously low average lava flux between 20 and 23 min,which coincided with a period of negative excess volumechange. This indicates that areal spreading can also be accom-modated by the depletion of lava stored within the parent lobe,rather than always being related to a simple balance betweenpressurization and confining strength under conditions of con-stant lava supply. Future studies would therefore benefit fromlonger time series observations of multiple active lava lobes tofurther explore the statistical significance of the relationshipbetween areal spreading and inflation.
Comparisons between model simulations and observations
Given the measured volume of Lobe A and typical parcelvolume of 0.09 m3, Lobe Awould include ∼117 parcels. Thesimulation of a lobe composed of 117 parcels begins with a1×7 cell linear source region trending east–west (depicted asthe gray-shaded region in Fig. 11a crossing through the mid-point of the array). This source region, with one parcel in eachof the seven cells, is approximately equivalent to the initiallength of Lobe A (i.e., ∼4.69 m; see Fig. 4a). The model alsoincludes two parallel barriers located at ±3 cells along thenorth–south axis. The barriers are considered transitionalzones in which the advancing lava enters, but becomesblocked, thereby reflecting the lava parcel back toward theinterior of the flow. The distance between these barriers is4.69m (including the barrier cells as well), which correspondsto the topographically bounded maximum width of Lobe A.The probabilities of sequentially adding 0, 1, or 2 extra parcelsfrom an existing flowmargin are P (0)=P(1)=0.25 and P(2)=0.5.
One cannot expect any specific realization of the stochasticmodel to exactly reproduce the morphology of an observedlava lobe, but characteristics of the simulated lobes are broadly
0
1
2
0
2
4
6
0 100 200 300 400 500
Inat
ion
(m3 /
inte
rva
l)
Are
al G
row
th (
m2 /
inte
rval
)
Time Step
Areal Growth
In ation0
50
100
0 100 200 300 400 500
Cum
ulat
iveL
obeA
rea
(m2 )
Time Step
correlateduncorrelated
a b
Fig. 10 a Cumulative lobe area versus time for two stochastic simulationrealizations of pāhoehoe lobe emplacement. The uncorrelated realization(lower solid line) was generated by considering purely random selectionof both the location and direction of each parcel transfer. The correlatedscenario (upper dashed line) modifies this model by introducing anincreased probability of sequential parcel emplacement when new parcels
break out at the periphery of the flow. In this case, the probabilities ofadding 0, 1, and 2, correlated parcels are P(0)=0.25, P(1)=0.25, andP (2)=0.5, respectively. b Periodicities and anti-correlation in arealspreading and excess volume change for a typical purely random simu-lation and an interval of 20 time steps
Bull Volcanol (2013) 75:756 Page 11 of 16, 756

consistent with the morphology of Lobe A. Figure 11b showsexamples of topographic profiles taken perpendicular to the
flow direction through the simulated lobes averaged over 10,20, 30, and 60 realizations. These examples demonstrate thatthere are stochastic variations between simulations, but alsopersistent morphological characteristics. For example, thesimulated lobes are thickest in the middle (i.e., along the axisof the linear source region) with maximum heights that areconsistent with those observed for Lobe A. The models alsoexhibit the effects of lava confinement along lobe margins dueto lava parcels being reflected back toward the interior of theflow. Plan views of the simulated lobes (e.g., Fig. 9) also showirregular margins and thickness variations that are typical ofinflated pāhoehoe lobes.
Discussion
Relationships between pāhoehoe breakouts and inflation
Pāhoehoe breakouts will be emplaced with some initial thick-ness and then grow through a process of inflation. This infla-tion process includes two dominant components: thickeningof the molten core and thickening of the crust (Hon et al.1994), with the crust consisting of both a brittle outer layer andunderlying viscoelastic layer. After an initial chilled marginforms around a new toe, it will retain incoming lava and inflateas its molten core thickens to equalize the pressure with otherconnected portions of the fluid lava pathway. During the earlystages of emplacement, the rate of core thickening will greatlyexceed the rate of crustal thickening (Hon et al. 1994), but asthe fluid interior achieves its equilibrium thickness, inflationwill be increasingly dominated by the process of crustalgrowth (Cashman and Kauahikaua 1997).
Two conditions must be met for the upper crust to continueto accrete a new material and contribute to inflation. First,there must be a continuous influx of new lava through themolten core and, second, there must be physical coupling ofthe molten core to the upper crust (Kauahikaua et al. 1998). Ifthe flow of lava through the core stagnates, then the lava willcool in situ and will not increase the flow's total thickness.Additionally, if the molten core partially drains and decouplesfrom the upper crust, then the new material will not be addedto the base of the surface layer and the crust may even subsideand “deflate” (Kauahikaua et al. 1998). Cooling historiesinferred from the thicknesses of the upper brittle and visco-elastic layers (Hon et al. 1994) therefore provide an estimateof the time that a lava pathway flowed at full capacity, but notnecessarily the total duration of emplacement if the core of theflow and the upper crust were decoupled. In some cases, themolten core of a flow can also undergo cycles of pressuriza-tion related to changes in the local discharge rate (Orr 2011).This can lead to variations in molten core pressure that inducecycles of surface disruption and subsidence, thereby produc-ing a range of surface textures, including slabbly pāhoehoe,
2-1 0 1-2Distance from mid-point along North-South axis (m)-3 3
0.0
Thi
ckne
ss (
m)
0.1
0.2
0.4
0.3
0.6
0.5
0.8
0.7
0.9N = 60N = 30N = 20N = 10Lobe A
i
iiiii
iv
i
ii
0
+1
+2
+3
-1
-2
-3
0 +1 +2 +3 +4 +5-1-2-3-4-5-6-7 +6 +7
1 2
3
4
East-West axis (1 cell = 0.67 m)
Nor
th-S
outh
axi
s(1
cel
l = 0
.67
m)
Barrier
Barriera
b
iii
Fig. 11 a A schematic example showing how the stochastic modelworks. A linear source region (shown in gray) passes through the mid-point of the array and trends east–west. Two parallel barriers are shown±3 cells from the linear source along the north–south axis. In the simu-lation, a cell is first chosen at random fromwithin the confines of the flow(initially corresponding to the extent of the linear source region), andthen, a random cardinal direction is chosen. A lava parcel is then trans-ferred to the specified cell (marked with a filled black circle , e.g., “1”) andto adjacent cell (identified by the associated arrow). If the parcel wouldbe allocated beyond the confines of the flow, there is a 0.25, 0.25, and0.50 probability that 0, 1, or 2 extra parcels, respectively, will be allocatedto sequential cells in the same direction (e.g., “2” shows 1 extra, 2 total,cells being added). As the areal extent of the flow increases, new parceltransfer locations become available (e.g., “3”). If a cell allocation wouldresult in a parcel being extended beyond the barrier, then the parcel isreflected back towards the cell interior (e.g., “4”). Each parcel allocated to agiven cell increases its thickness by 0.2 m. This process is repeated until alllava parcels are allocated, which in the case of Lobe A includes a total of117 parcels. b Simulated north–south profiles for Lobe A, averaged over10, 20, 30, and 60 realizations of the model. The results show that despitethe stochastic nature of the model, the average simulations converge to astable equilibrium shape over a few tens of realizations though thereremains persistent topographic variations. Also shown is the flow-perpen-dicular cross-section though Lobe A (Fig. 4b) with the underlying topo-graphic trend removed. i Themaximumwidth-simulated lobes and Lobe Aare determined by the influences of topographic barriers. ii Reflecting oflava parcels by the barriers produces an excess thickening in the adjacentinterior cells. iii High-standing topography and stagnated peripheral toeshelp to confine the interior of the lobe and promote inflation. iv The thickestportion of the simulated lobe is located along the medial axis and isgenerally consistent with the thickness of Lobe A along the flow axis
756, Page 12 of 16 Bull Volcanol (2013) 75:756

rubbly pāhoehoe, and shatter rings (Keszthelyi et al. 2000,2006; Guilbaud et al. 2005; Orr 2011).
Initial cooling can strengthen the margins of a lava flow(Castruccio et al. 2013), but the process is complicated by thedevelopment of numerous cooling fractures. These fractureswill mechanically weaken the outer brittle crust and make theunderlying viscoelastic layer more important in terms ofgoverning the overall confining strength of the flow. Thefrequency of breakouts will therefore depend on the balancebetween the combined strength of the brittle and viscoelasticlayers relative to the pressure within the molten core (Hoblittet al. 2012). If the internal pressure exceeds the confiningstrength of the flow's outer layers, then the periphery of theflow will rupture and generate new breakouts that promoteincreased areal growth. In contrast, if the exterior of the flowdoes not rupture, it will pressurize and inflate through gradualdeformation of the viscoelastic layer and opening of fracturesin the overlying brittle crust.
In this study, peripheral lobes along the margins of the PKKflow on the flanks of Kīleaua Volcano exhibited a generallyconstant local discharge rate (0.0061±0.0019m2/s). However,approximately every 4 min, there was a significant increase inthe areal spreading rate. The observed periodicity in arealcoverage may relate to the changing balance between theconfining strength of the lava as it cools and strengthens andthe internal pressure within the core of the flow. This balancewould give rise to an increased frequency of new breakoutswhen the core pressure exceeds the confining strength of theexterior. Enhanced areal spreading rates would then persistuntil the core pressure decreases below a critical thresholdrequired to continuously rupture the active flow margin. Asthe rate of areal spreading deceases, continued influx of lavainto the lobe would begin to re-pressurize its fluid core andperpetuate a new cycle. This process, operating on the scale ofan individual lobe, is similar to what Hoblitt et al. (2012) haveobserved on the scale of an entire pāhoehoe flow, whichdemonstrates the self-similarity of the inflation mechanismover a range of scales.
Static and dynamic pressure considerations
During early stages of pāhoehoe emplacement, the inflationprocess will be dominated by molten core thickening as theliquid interior of the flow moves toward an equilibrium thick-ness. However, there are multiple factors that can contribute tothis equilibrium. Calculations generally assume a Binghamliquid rheology, with lava descending a slope as an unconfinedlaminar flow under the influence of gravity (Hulme 1974;Dragoni et al. 1986; Castruccio et al. 2013). Within thisscenario, the critical depth h s required to induce down-slopeflow will be
hs ¼ σ0=ρgsin βð Þ ð2Þ
where σ0 is the flow's yield stress, ρ is the flow's density, g isthe gravitational acceleration, and β is the underlying slope (seeEq. (14) in Hulme 1974). However, calculations of a lava flow'sequilibrium thickness will be complicated by cooling-inducedchanges in rheology and other factors that influence its internalpressure. Several studies (e.g., Rossi and Gudmundsson 1996;Anderson et al. 1999, 2012) have considered the “magmastatic”pressure (herein referred to as “hydrostatic” pressure) generatedby fluid elevation changes along hydrostatically connected path-ways, as well as the pressure required to drive lava through pipe-like pathways and lift the crust. These models generally assumethat the pathways (i.e., lava tubes) are cylindrical pipes withconstant cross-sectional area, but the geometry of lava pathwayscan vary widely within a pāhoehoe flow (e.g., Guest et al. 1984;Kauahikaua et al. 1998; Self et al. 1998; Calvari and Pinkerton1999). This raises the possibility that changes in pathway ge-ometry can introduce additional changes in lava core pressuredue to dynamic processes.
These dynamic effects may be understood within the con-text of Bernoulli's principle, which describes the inverse rela-tionship between fluid flow velocity and fluid pressure withinincompressible laminar flows through a pipe (Resnick andHalliday 1977; Batchelor 1980). Within a lava flow, changesin fluid core pressure could affect inflation rates by changingthe magnitude of the stresses applied to the overlying crust.This may lead to increased inflation rates where the flowvelocity decreases and the core pressure increases. Converse-ly, inflation rates would be lower where the flow velocityincreases and the core pressure decreases. For otherwiseequivalent lava flows through a pipe-like pathway, the mostimportant controls on fluid velocity will be the pipe's cross-sectional area and underlying slope. In general, lava velocitieswill be relatively low where the flow pathway is broad and itscross-sectional area is large and/or where it descends a shal-low slope or encounters a reverse-facing slope. Alternatively,flow velocities will be higher when lava enters a narrowtopographic constriction and/or descends a steeper slope. The-se scenarios are broadly consistent with the observed relation-ship between the initial topography and final morphology forLobe B. In this case, maximum inflation was observed wherethe flow was the broadest and above shallow to reverse-facingslopes, whereas the least inflation was observed where theflow passed through narrow constrictions and descended steepslopes (Figs. 6 and 7). These observations support the viabilityof a conservation of energy approach to modeling the spatialvariability of inflation and its relationship to emplacementprocesses. Early stage inflation processes related to core pres-surization and thickening may also help to establish preferredpathways through the thickest parts of the flow, which wouldcontinue to preferentially inflate through crustal accretion ifthe pathways remain full. Continued crustal accretion anduplift must also be coupled with overpressurization of themolten core, which Cashman and Kauahikaua (1997) inferred
Bull Volcanol (2013) 75:756 Page 13 of 16, 756

from their observations of pāhoehoe crustal vesicularity pro-files that exhibit decreased vesicle number density with depth.These examples highlight the importance of considering bothfluid static and dynamic components in models of pāhoehoeinflation.
Conclusions
The confining strength of a lava lobe depends strongly on theage distribution of its surfaces, with the youngest surfaces (i.e.,sites of the most recent breakouts) being the weakest. There-fore, when new breakouts occur, growth tends to concentrate atthese localities. Otherwise, the next most likely location for abreakout to occur is from an older fractured surface overlying astill molten core. This process is treated with a stochastic modelby introducing correlation with a probability distribution de-scribing the preferential growth of the flow in the direction ofnew breakouts through sequential emplacement of lava parcels(i.e., toes) from that locality. Including correlated growth intothe model also recreates observed periods of enhanced arealspreading and lobe morphologies.
Time series data for Lobe A shows that periods of en-hanced areal spreading roughly alternate with periods of in-creased excess volume change. For an approximately constantlocal discharge rate, this suggests that the volume of lava notutilized during the process of areal spreading can contribute tothickening through inflation. Trade-offs between areal spread-ing and inflation should be detectable in thermal infrared (e.g.,FLIR) imagery, provided that a single lobe is isolated in thefield of view. For instance, when the flow enters a period ofabove average areal spreading, newly exposed lava surfaceswill radiate more thermal energy and will contribute to anincreased frequency distribution of high temperature pixelswithin the field of view. As the flow shifts toward an inflation-dominated mode, older lava surfaces will cool dominantly byconduction rather than radiation (Hon et al. 1994), and thiswould shift the frequency distribution of temperatures towardlower values. Temperature distributions in FLIR data maytherefore be used to identify the patterns of pāhoehoe flowemplacement, such as periodicities in areal spreading rate andthe trade-off with inflation. Statistical models of flow em-placement may be improved by coupling them with a coolingmodel to estimate the temperature distribution of the lavabased on its emplacement age.
New toes are highly sensitive to subtle topographic irreg-ularities, and for low-discharge rate, flows may be deflected orstopped by obstacles measuring only a few centimeters inheight. This process was observed during the emplacementof Lobe B and demonstrates that the final morphology of alobe may inherit boundaries influenced by variations in theinitial toe-scale topography that are orders of magnitudesmaller than the flow's final thickness. Even though toes
may be locally deflected or impeded by toe-scale topography,inflating pāhoehoe lobes may overcome local barriers througha combination of stochastic breakouts in down-flow andcross-flow directions that allow them to find and follow themaximum regional slope. These behaviors are described in themodel by considering the sequential emplacement of new lavaparcels (i.e., toes) from existing flow margins, with bound-aries that reflect parcels back towards the interior of the flow.
Combining measurements of initial topography with timeseries observations of active pāhoehoe lobes provides newinsights into the growth of pāhoehoe flows. These observa-tional constraints also help to improve statistical models oflava emplacement processes and better understand the rela-tionship between areal expansion and inflation. This informa-tion is important for understanding how subtle topographicinfluences can be inherited by inflated lobes to develop pre-ferred lava pathways that influence the overall development ofpāhoehoe lava flows on Earth and other planetary surfaces.
Acknowledgments We thank Benjamin Brooks and the Pacific GPSfacility for providing access to DGPS survey equipment and post-processing resources, Samuel Hulme for his assistance with GMT, Rich-ard Herd for kindly providing DGPS data for photogrammetry control,Andrew Harris for his assistance in the field making contemporaneousFLIR observations, TimOrr for providing historical lava flow data shownin Fig. 1, as well as Sarah Fagents, Thorvaldur Thordarson, and JacobBleacher for many insightful discussions relating to lava flow emplace-ment. Prof. S. Robson and Prof. J. P. Muller are thanked for their ongoingsupport through the provision of VMS and GOTCHA, respectively.Christopher Kilburn and Jim Kauahikaua are sincerely thanked for theirthorough and constructive reviews. Field work was conducted in HawaiiVolcanoes National Park under Scientific Research and Collecting Permit# HAVO-2006-SCI-0003. CWHwas supported by an appointment to theNASA Postdoctoral Program at the Goddard Space Flight Center, admin-istered by Oak Ridge Associated Universities through a contract withNASA. LSG and SMB research was supported by the NASA PlanetaryGeology and Geophysics and Mars Data Analysis programs (LSG,811073.02.01.04.44 and 203959.02.03.17.56; SMB, NNX08AF16Gand NNX10AP63G).
References
Anderson SW, Stofan ER, Smrekar SE, Guest JE, Wood B (1999) Pulsedinflation of pahoehoe lava flows: implications for flood basalt em-placement. Earth Planet Sci Lett 168:7–18
Anderson SW, Smrekar SE, Stofan ER (2012) Tumulus development onlava flows: insights from observations of active tumuli and analysisof formation models. Bull Volcanol 74:931–946. doi:10.1007/s00445-012-0576-2
Baloga S (1987) Lava flows as kinematic waves. J Geophys Res 92(B9):9271–9279
Baloga S, Glaze LS (2003) Pahoehoe transport as a correlated randomwalk. J Geophys Res 108:2031. doi:10.1029/2001JB001739
Baloga S, Glaze LS (2008) Self-replication model for long channelizedlava flows on the Mars plains. J Geophys Res 113, E05003. doi:10.1029/2007JE002954
Baloga S, Pieri DC (1986) Time-dependent profiles of lava flows. JGeophys Res 91:9543–9552
756, Page 14 of 16 Bull Volcanol (2013) 75:756

Batchelor GK (1980)An introduction to fluid dynamics. CambridgeUnivPress, New York, 615 p
Bruno BC, Taylor GJ, Rowland SW, Baloga SM (1994) Quantifying theeffect of rheology of lava-flow margins using fractal geometry. BullVolcanol 56:193–206
Byrnes JM, Crown DA (2001) Relationships between pahoehoe surfaceunits, topography, and lava tubes at Mauna Ulu, Kilauea Volcano,Hawaii. J Geophys Res 106(B2):2139–2151
Calvari S, Pinkerton H (1999) Lava tube morphology on Etna andevidence for lava flow emplacement mechanisms. J VolcanolGeotherm Res 90:263–280
Cashman KV, Kauahikaua JP (1997) Reevaluation of vesicle distributionsin basaltic lava flows. Geology 25:419–422. doi:10.1130/0091-7613
Castruccio A, Rust AC, Sparks RJS (2013) Evolution of crust- and core-dominated lava flows using scaling analysis. Bull Volcanol 75:681.doi:10.1007/s004455-012-0681-2
Crisp JA, Baloga SM (1990) A model for lava flows with two thermalcomponents. J Geophys Res 95:1255–1270
Crown DA, Baloga SM (1999) Pahoehoe toe dimensions morphology,and branching relationships at Mauna Ulu, Kilauea Volcano, Ha-wai'i. Bull Volcanol 61:288–305
Danes ZF (1972) Dynamics of lava flows. J Geophys Res 77:1430–1432Day T, Muller JP (1989) Digital elevation model production by stereo-
matching SPOT image-pairs: a comparison of algorithms. Image Vi-sion Comput 7:95–101
DoaneDP (1976) Aesthetic frequency classifications. Am Stat 30:181–1905Dragoni M, Bonafede M, Boschi E (1986) Downslope models of a
Bingham liquid: implications for lava flow. J Volcanol GeothermRes 30:305–325
Glaze LS, Baloga SM (2013) Simulation of inflated pahoehoe lava flows.J Volcanol Geotherm Res 255:108–123. doi:10.1016/j.jvolgeores.2013.01.018
Gruen AW (1985) Adaptive least squares correlation: a powerful imagematching technique. S Afr J Photogramm Remote Sens Cartogr 14:175–187
Guest JE, Wood C, Greeley R (1984) Lava tubes, terraces andmegatumuli on the 1614–24 pahoehoe lava flow field, Mount Etna,Sicily. Bull Volcanol 47(3):635–648
Guilbaud M-N, Self S, Thordarson T, Blake, S (2005) Morphology,surface structures and emplacement of lavas produced by Laki,AD 1783–1874. In: Manga M, Ventura G (eds) Kinematics anddynamics of lava flows (Special Papers No. 396). GeologicalSociety of America, pp 81–102
Hamilton CW, Thordarson T, Fagents SA (2010) Explosive lava–waterinteractions I: architecture and emplacement chronology of volcanicrootless cone groups in the 1783–1784 Laki lava flow, Iceland. BullVolcanol 72(4):449–467. doi:10.1007/s00445-009-0330-6
Harris AJL (2013) Lava flows. In: Fagents SA, Gregg TKP, Lopes RMC(eds) Modeling volcanic processes: the physics and mathematics ofvolcanism. Cambridge University Press, New York, pp 85–106
Harris AJL, Rowland SK (2001) FLOWGO: a kinematic thermo-rheologicalmodel for lava flowing in a channel. Bull Volcanol 63:20–44
Harris AJL, Rowland SK (2009) Effusion rate controls on lava flowlength and the role of heat loss: a review. In: Thordarson T, Self S,Larsen G, Rowland SK, Hoskuldsson A (eds) Studies in volcanol-ogy: the legacy of George Walker (Special Publication of IAVCEINo. 2). Geological Society, London, pp 33–51
Harris AL, Dehn J, James MR, Hamilton C, Herd R, Lodato L, Steffke A(2007a) Pahoehoe flow cooling, discharge, and coverage rates fromthermal image chronometry. Geophys Res Lett 34, L19303. doi:10.1029/2007GL030791
Harris AJL, Dehn J, Calvari S (2007b) Lava effusion rate definition andmeasurement: a review. Bull Volcanol 70:1–22
Heliker C, Mattox TN (2003) The first two decades of the Pu‘u ‘Ō‘ō–Kūpaianaha eruption: chronology and selected bibliography.In: Heliker C, Swanson DA, Takahashi TJ (eds) The Pu‘u
‘Ō‘ō–Kūpaianaha eruption of Kīlauea volcano, Hawai‘i the first20 years. USGS Professional Paper 1676, pp 1–28
Hoblitt RP, Orr TR, Heliker C, Denlinger RP, Hon K, Cervelli PF (2012)Inflation rates, rifts, and bands in a pāhoehoe sheet flow. Geosphere8(5):179–195. doi:10.1130/GES00656.1
Hon K, Kauahikaua J, Denlinger R, MacKay R (1994) Emplacement andinflation of pahehoe sheet flows: observations and measurements ofactive lava flows on Kilauea Volcano, Hawaii. Geol Soc Am Bull106:351–370
Hulme G (1974) The interpretation of lava flow morphology. Geophys JR astr Soc 39:361–383
Kauahikaua J, Cashman KV, Mattox TN, Heliker CC, Hon LA, ManganMT, Thornber CR (1998) Observations on basaltic lava streams intubes from Kilauea Volcano, island of Hawai'i. J Geophys Res103(B11):27,303–27,323
Keszthelyi L, Denlinger R (1996) The initial cooling of pahoehoe flowlobes. Bull Volcanol 58:5–18
Keszthelyi L, Self S, Thordarson T (1999) Application of recent studieson the emplacement of basaltic lava flows to the Deccan Traps.Mem Geolog Soc India 43:485–520
Keszthelyi L, McEwen AS, Thordarson T (2000) Terrestrial analogs andthermal models for Martian flood lavas. J Geophys Res 105(E6):15,027–15,049
Keszthelyi L, Self S, Thordarson T (2006) Flood lavas on Earth, Io andMars. J Geol Soc 163(2):253–264
Kilburn CRJ (1996) Patterns and predictability in the emplacement ofsubaerial lava flows and flow fields. In: Scarpa R, Tilling RI (eds)Monitoring andmitigation of volcanic hazards. Springer, NewYork,pp 491–537
Koeppen WC, Patrick M, Orr T, Sutton AJ, Dow D, Wright R (2013)Constraints on the portioning of Kīlauea's lavas between surface andtube flows, estimated from infrared satellite data, sulfur dioxideemission rates, and field observations. Bull Volcanol 75:716. doi:10.1007/s00445-013-0716-3
Orr TR (2011) Lava tube shatter rings and their correlation with lava fluxincreases at Kīlauea Volcano, Hawai'i. Bull Volcanol 73:355–346.doi:10.1007/s00445-010-0414-3
Otto GP, Chau TKW (1989) Region-growing algorithm for matching ofterrain images. Image Vision Comput 7:83–94
Peitersen MN, Crown DA (2000) Correlations between topography andintraflow width behavior in Martian and terrestrial lava flows. JGeophys Res 105(E2):4123–4123
Poland MP, Miklius A, Jeff Sutton A, Thornber CR (2012) A mantle-driven surge in magma supply to Kilauea Volcano during 2003–2007. Nat Geosci 5(4):295–300
Resnick R, Halliday D (1977) Physics: part one, 3rd ed. Wiley, NewYork, 608 p
Robson S, James MR (2007) Photogrammetric image sequenceprocessing to determine change in active lava flows. ProcRemote Sensing and Photogrammetry Society Ann Conf,2007 (RSPSoc 2007), 11–14th September, Newcastle uponTyne, U.K.
Rossi MJ, Gudmundsson A (1996) The morphology and formation offlow-lobe tumuli and Icelandic shield volcanoes. J VolcanolGeotherm Res 72:291–308
Rowland SK, Harris AJL, Garbeil H (2004) Effects of Martianconditions on numerically modeled, cooling-limited channel-ized lava flows. J Geophys Res 109(E10010). doi:10.1029/2004JE002288
Self S, Thordarson T, Keszthelyi L, Walker GPL, Hon K, Murphy MT,Long P, Finnemore D (1996) A new model for the emplacement ofColumbia River basalts as large, inflated pahoehoe lava flow fields.Geophys Res Lett 23:2689–2692
Self S, Thordarson T, Keszthelyi L (1997) Emplacement of continentalflood basalt lava flows. Am Geophys Union Monograph 100:381–410
Bull Volcanol (2013) 75:756 Page 15 of 16, 756

Self S, Keszthelyi L, Thordarson T (1998) The importance of pāhoehoe.Ann Rev Earth Planet Sci 26(1):81–110
Sheskin DJ (2011) Handbook of parametric and nonparametric statisticalprocedures, 5th edn. Chapman and Hall/CRC, New York, p 1926
SmithWHF,Wessel P (1990) Gridding with continuous curvature splinesin tension. Geophysics 55(3):293–305
Sturges H (1926) The choice of a class-interval. J Am Stat Assoc 21:65–66
Thordarson T, Self S (1998) The Roza Member, Columbia River BasaltGroup: a gigantic pahoehoe lava flow field formed by endogenousprocesses? J Geophys Res 103(B11):27411–27445
Walker GPL (1991) Structure, and origin by injection of lava undersurface crust, of tumuli, ‘lava rises’, ‘lava-rise pits’, and ‘lava-inflation clefts’ in Hawaii. Bull Volcanol 53:546–558
Walker GPL (2009) The endogenous growth of pahoehoe lava lobes andmorphology of lava-rise edges. In: Thordarson T, Self S, Larsen G,Rowland SK, Hoskuldsson A (eds) Studies in volcanology—thelegacy of George Walker (Special Publications of IAVCEI No. 2).The Geol Soc: pp 17–32
Wilmoth RA,Walker GPL (1993) P-type and S-type pahoehoe: a study ofvesicle distribution and patterns in Hawaiian lava flows. J VolcanolGeotherm Res 55:129–142
756, Page 16 of 16 Bull Volcanol (2013) 75:756


