Embed Size (px)
Citation preview

Topography of Purkinje Cells and Other Calbindin-ImmunoreactiveCells Within Adult and Hatchling Turtle Cerebellum
Michael Ariel & Kyle C. Ward & Daniel L. Tolbert
Published online: 23 June 2009# Springer Science + Business Media, LLC 2009
Abstract The turtle's cerebellum (Cb) is an unfoliatedsheet, so the topography of its entire cortex can be easilystudied physiologically by optical recordings. However,unlike the mammalian Cb, little is known about thetopography of turtle Purkinje cells (PCs). Here, topographywas examined using calbindin-D28K immunohistochemistryof adult and hatchling turtles (Trachemys scripta elegans,2.5–15 cm carapace length). Each Cb was flattenedbetween two Sylgard sheets and fixed in paraformaldehyde.Sections (52 µm thick) were cut parallel to the flattenedcortex (tangential), resulting in calbindin-immunolabeledPCs being localized to three to six sections for each turtle.PC position and size were quantified using NeurolucidaImage Analysis system. Although hatchling Cb weremedial-laterally narrower (3.0 vs. 6.5 mm) and rostral-caudally shorter (2.5 vs. 5.5 mm) than adult Cb, bothaveraged near 15,000 PCs distributed uniformly. HatchlingPCs were smaller than adult PCs (178 vs. 551 µm2) andmore densely packed (2,180 vs. 625 cells/mm2). Calbindinimmunoreactivity also labeled non-PCs along the Cb'smarginal rim and its caudal pole. Many of these were verysmall (22.9 µm2) ovoid-shaped cells clustered together,possibly proliferating external granule layer cells. Otherlabeled cells were larger and fusiform-shaped (12.6×33.4 µm) adjacent to inner granule cells along the marginal
rim, suggestive of migrating cells. It is not known whetherthese are new neurons being generated within the adult andhatchling Cb and if they connect to efferent and afferentpaths. Based on these anatomical findings, we suggest thatunique physiological features may exist along the rim of theturtle Cb.
Keywords Purkinje cells . Calbindin-immunoreactive cells .
Turtle cerebellum
Introduction
The pond turtle has been used as a common model systemfor neurophysiological experiments because of its brain’shigh resistance to the anoxic conditions in an in vitrochamber [1–4]. Its cerebellum (Cb) is uniquely suited for atopographic analysis because it is an unfoliated sheet ofcortex covering the fourth ventricle, unlike most vertebrateswhose cerebella is highly foliated. In spite of thissimplification, the turtle Cb retains the same cellularorganization of cerebella of higher vertebrates [5], consist-ing of a molecular layer, a Purkinje cell (PC) layer, and aninternal granule cell layer. It is connected to each side of thebrainstem by a broad attachment to the optic tectum and thedorsolateral part of the rostral medulla. The PC axons,mossy fibers, and climbing fibers travel through the lateralportion of this attachment, the cerebellar peduncle.
While the intact turtle Cb has been used extensively forin vitro physiology investigations [6–9], little is knownabout the distribution of its cortical neurons. Here, the PCtopography of adult and hatchling turtle Cb was examinedby calbindin-D28K (calbindin) immunohistochemistry. Theentire cerebellar cortex was reconstructed from tangentialsections to provide quantitative data about the size and
Cerebellum (2009) 8:463–476DOI 10.1007/s12311-009-0123-7
M. ArielDepartment of Pharmacological & Physiological Science,Saint Louis University, School of Medicine,Saint Louis, MO 63104, USA
M. Ariel (*) :K. C. Ward :D. L. TolbertCenter for Anatomical Sciences and Education,Department of Surgery, Saint Louis University,School of Medicine,Saint Louis, MO 63104, USAe-mail: [email protected]

shape of calbindin-immunoreactive (calcium-binding pro-tein immunoreactive; CaBP-IR) cells and their distributionacross the cerebellum. These experiments complementoptical recordings of voltage-sensitive activity that demon-strate regionally specific responses within the turtle Cb[10].
We find that labeled PCs were distributed uniformlyacross the flat turtle Cb cortex. The uniformity is a usefulfinding since it simplifies interpretation of optical record-ings of the turtle Cb [10]. The number of PCs fromhatchling to adult turtle Cb increased slightly. In addition,small CaBP-IR cells exist in the extreme lateral and caudalaspects of the turtle Cb that may represent a proliferativezone reminiscent of the external granule cell layer. Anotherconspicuous group of CaBP-IR cells was located along thelateral marginal Cb edge, which show characteristics ofmigrating cells. The purpose of CaBP-IR cells other thanPurkinje cells requires further investigation.
Methods
Twelve red-eared pond turtles (Trachemys scripta elegans;adults: carapace length, 10–18 cm; weight, 0.2–1 kg; andhatchlings: carapace length, 2–5 cm; weight, 8–10 g) werekept at 25–30°C in an aquarium with swimming andbasking facilities and a 16-h/8-h light–dark cycle. Theterms “adult” and “hatchling” only refer to these animalsbased on their size. The actual age and maturity of theseturtles caught in the wild are unknown. Protocols for animalcare and surgical procedures were approved by the SaintLouis University Animal Care Committee, in accordancewith the Principles of Laboratory Animal Care of the NIH.
Experimental Procedures
The surgical details have been described previously [11,12]. Briefly, adult turtles were exposed to a 1-h period ofcryanesthesia in ice water accompanied by injection with1 ml of 1.25% (w/v) sodium thiopental (intramuscular). Theturtles were then decapitated and perfused bilaterallythrough the neck vasculature with approximately 10 ml ofturtle Ringer’s solution. Perfusion with approximately10 ml of 4% (w/v) paraformaldehyde in 0.1 M phosphatebuffer (PB, pH 7.4) immediately followed the exsanguination.
Hatchling turtles were exposed to a 30-min period ofcryanesthesia in ice water accompanied by an injection with0.03 ml of 1.25% (w/v) sodium thiopental (intramuscular).Then, the plastron of the turtle was removed with smallscissors. Once the plastron was detached, the pericardiumwas opened to allow access to the heart. A tiny cut wasmade at the apex of the ventricle to allow cannulation of theaorta. The hatchlings were perfused with approximately
2 ml of turtle Ringer’s solution followed by approximately2 ml of 4% paraformaldehyde in 0.1 M PB.
After perfusion, the brains of the adult and hatchlingturtles were removed from the cranium. Half of thecerebella were immersion fixed overnight in their naturalshape in 4% paraformaldehyde in 0.1 M PB and then cutinto transverse sections. The remaining cerebella to besectioned tangentially were separated from the brainstemand placed between two pieces of Sylgard for flattening in achamber of the fixative for 8–16 h at 4°C. Afterpostfixation, the brains were cyroprotected in 30% sucrosein 0.1 M PB at 4°C overnight. The tissues were frozen(−35°C) and sectioned (52 µm thick) in the tangential ortransverse plane with a sliding microtome. Serial sectionswere mounted on gelatin-subbed slides and processed forcalbindin immunohistochemistry.
Calbindin Immunohistochemistry and Analysis
To localize calbindin, normal horse serum (Sigma H-1270)was used to block non-specific binding of immunoglobulin.Monoclonal anti-calbindin-D28K (mouse IgG1 1:3750, SigmaC-9848) was used as the primary antibody, followed bybiotinylated anti-mouse IgG (H+L) as a secondary (1:200,Vector Laboratories BA-2000). This marker was amplifiedwith avidin/biotinylated enzyme complex (ABC 1:500,Vector Laboratories PK-6100) and visualized with the 3,3′-diaminobenzidine technique [13]. In some cases, the sectionswere counterstained with cresyl violet. After immunohisto-chemistry, the slides were dehydrated in alcohols, cleared inxylenes and coverslipped with Permount.
Using brightfield illumination and a ×40 objective, allCaBP-IR-labeled neurons (diameter >10 µm) were countedin six Cbs using Neurolucida Image Analysis (Micro-BrightField, Inc.). Although cerebella were flattened andthen sectioned tangentially to reduce the total area ofadjacent sections that might have overlapping labeled cells,a maximum number of potential double-counted cells wasestimated and corrected as follows. In regions of overlap,cells in each section were counted to determine whichsection had the lower number of cells. That lower numberwas summed with the lower number of each of the otheroverlapping regions of the same reconstructed cerebellum.That sum constituted of the maximum number of poten-tially double-counted cells, which was then corrected usingthe Abercrombie equation [14]: P=AM/(L+M); P=corrected cell count, A=raw cell count, M=section thick-ness, L=cell height [14]. The average mean diameter wasused as the cell height. The validity of the Abercrombiemethod depends on several assumptions: (a) The cell size isuniform across the region of interest, (b) the mean height isknowable, and (c) every fractionated cell can be counted. Inthis Cb material, the cell size appears to be substantially
464 Cerebellum (2009) 8:463–476

uniform, except for the Cb rim (see Fig. 5e). The meanheight was adjusted according to the assumption that thePCs were spherical (see Fig. 5f), yet their large primarydendrite creates a slightly ellipsoid shape. The correctedcell count was similar to the raw cell count (see Table 1)because the use of tangential sections minimized the extentof areas with overlapping labeled cells in adjacent sectionsto a small fraction.
It is important to note that the measured nearest neighbordistance was recorded in only the x–y plane, neglecting thez-axis. These data were not recorded because of thedifficulty in determining the center of the cell in the z-axis.PCs in the turtle do not appear to be organized in a thinmonolayer but rather overlapping slightly at various heights(see Fig. 3). As a result, the measured nearest neighbordistance is slightly underestimated.
Measuring soma diameters for five of the six Cb was notaffected by the fractionation of the cell body into differentsections because the regions selected for tracing had labeledcells well within a single tangential section. All the cells ofthe sixth Cb were traced (A24, see Fig. 2a), so their meansoma diameter may be slightly underestimated due to thefractionation of the cell bodies across adjacent sections.Although such smaller fractions might have been measuredwith diameters less than their true diameter, that underes-timate could only occur in 10% of the cells of that Cbbecause less than one tenth of the Cb area of that specimenhad overlapping labeled regions in adjacent sections.
The x–y coordinates of each cell were also recorded bythe Neurolucida software. These values, along with acomputed nearest neighbor distance (the shortest distancefrom the center of one cell to the center of its nearestneighboring cell), were exported into Microsoft Excel.Labeled cell density was calculated by dividing the cellcounts by the total area of the Cb. The Cb surface wasmapped onto a 60×60 grid to create average values of the
measured anatomical parameters for display as pseudocolorimages (Matlab 6.1, The MathWorks Inc.).
For each turtle, a representative region close to the middleof each Cb was selected that was not within an area of overlapof labeled cells between two sections and yet contained at least5% of the corrected cell count. Within those regions, allCaBP-IR cells were traced using Neurolucida software, whichcomputed each soma’s mean diameter and aspect ratio (theratio of its longer dimension to its shorter dimension). In oneadult turtle, all the CaBP-IR cell bodies of its entire Cb weretraced for further quantification of topographic features ofthe labeled cells. The diameter and aspect ratio of each cell inthis Cb were graphed as a function of medial-lateral androstral-caudal position using Microsoft Excel.
The Pearson product-moment correlation coefficient (ρ)was used to express the magnitude and direction of therelationship between two variables. Linear regression lineswere drawn by Microsoft Excel and an analysis of variance(Microsoft Excel) determined whether these relationshipswere significant. Anatomical terminology for cerebellarstructures came from Larsell [15] unless noted otherwise.
Results
Similar to other species [16–19], calbindin-D28K immuno-histochemistry can be used to identify all PCs in the turtlecerebellar cortex [20]. By flattening the unfoliated turtleCb, a small number of tangential sections will include mostof the Purkinje cell layer.
Cell Density and Cortical Area The size and spatialdistribution of CaBP-IR cells are clearly different whenviewing the cerebella of adult and hatchling turtles (Fig. 1aand c, respectively). Nearly all the large cell bodies labeledfor calbindin-D28K in the PC layer were ovoid to spherical-
Table 1 Measurements of calbindin-labeled cells of three adult and hatchling turtles
Turtle no. Cb area(mm2)
CaBP-IR cells CaBP-IR soma
Cellscounted
Countscorrected
Density(cells/mm2)
Near neighbor(μm)
Mean diam.(μm)
Mean area(μm2)
Adult A45 21.99 14,669 14,361 653.1 21.50 24.13 464
A24 26.98 16,412 15,888 588.9 24.40 26.23 551
A22 27.49 20,294 19,057 693.3 22.20 23.33 432
Hatchling H47 4.44 15,293 14,692 3,308.6 10.40 13.60 147
H48 6.25 14,003 13,525 2,162.9 12.90 16.90 226
H37 7.07 15,759 15,474 2,187.4 13.00 14.99 179
Adult Mean 25.49 17,125 16,435 645.1 22.70 24.56 482
Hatchling Mean 5.92 15,018 14,564 2,552.9 12.10 15.16 184
Ratio a/h 4.30 1.14 1.13 0.25 1.88 1.62 2.62
Cerebellum (2009) 8:463–476 465

shaped (see tracings, Fig. 1b, d). The differences of theirdiameters and spacing between adult and hatchling Cbsuggest that as the turtle grows, its PC somata size increasesin diameter and spread further apart.
In order to analyze the complete spatial topographyof the labeled cells, data from color-coded seriallyadjacent tangential sections were combined, as shownfor an adult and hatchling turtle in Fig. 2a and c,respectively. From these montages, cell density (somata/unit area) was computed and converted to a pseudocolorscale as displayed in Fig. 2b and d. Two key observationsare made from these analyses: First, cell density is greaterin the hatchling Cb than the adult Cb, and (2) cell densityin both hatchling and adult Cb is roughly uniform acrosstheir cerebellar surfaces.
However, careful inspection of Fig. 2 reveals twoareas where density was relatively decreased. First, thereare several parasagittal zones of low cell density. Whitearrows point to these zones in the hatchling example(Fig. 2d). Similar zones are present in the adult (Fig. 2aand arrows in transverse sections of Fig. 3). These zonesare not as apparent in Fig. 2b because the range of thispseudocolor plot was identical to that of the hatchling plot(Fig. 2d), which had a much higher overall density thanthe adult (2,187.4 and 588.9 cells/mm2, respectively).These zones correspond to grooves that can be observedon the ventricular surface of fresh tissue (not shown).
Larsell [15] identified five sagittally oriented sulci in theturtle Cb, one midline sulcus (also referred to as themidline raphe; see arrowhead in central inset of Fig. 3),two intermediate sulci, and two lateral sulci [15].Similarly, based on Nissl-stained Cb, there are zones thatlack large somata in the PC layer, which are associatedwith parasagittal sulci on the ventricular surface [21, 22].These low PC density zones are seen in Fig. 2 based onCaBP-IR labeling.
The second area of decreased cell density extendsfrom each cerebellar peduncle, which is not readilyapparent from the pseudocolor density plots (Fig. 2b, d).In the flattened Cb preparation, each peduncle extendsrostro-laterally, as sketched in Fig. 2a (dashed line), and ischiefly composed of white matter. They remained attachedto the Cb when flattened and fixed (see “Methods”) butshowed no CaBP-IR staining after immunohistochemicalprocessing. However, just caudal to each peduncle is anarrow area along the lateral cerebellar edge with lowercell density (Fig. 2a, c; black arrows and Fig. 2d; whitedashed ellipses).
While acknowledging these topographical differencesin cell density, we conclude that the density of CaBP-IRimmunoreactive cells was nearly uniform across theentire cortical surface of the turtle Cb. Cerebella fromthree adults and three hatchling turtles were quantita-tively analyzed (Table 1). The mean area was 25.49 mm2
Fig. 1. Size and spatial distri-bution of turtle Purkinje cells.Photomicrographs (a, c) anddrawings (b, d) of flattened52-µm-thick sections processedfor calbindin immunohisto-chemistry from adult (a, b) andhatchling (c, d) cerebella (turtlesA24 and H37, respectively).The images were photographedand enlarged using identicalmagnifications. Adult cellswere large and more spatiallyseparated than in hatchlingturtles. Data from Neurolucidatracings (b, d) were used insubsequent figures to quantifythe spatial relationships ofthese cells
466 Cerebellum (2009) 8:463–476

in the adult cerebella and 5.92 mm2 in the hatchlingcerebella. However, the relationship between the totalnumber of CaBP-IR cells in each Cb and its Cb area(Fig. 4a, diamonds, R2=0.405) had no significant trend(p=0.174). This finding suggests that Cb maturation doesnot involve the addition of new CaBP-IR cells but itcorrelates with an increase in the size of the cell bodies.This is supported by data illustrated in Fig. 4c, whichshows that a positive correlation (p<0.005) exists between
the Cb area and the means of both the soma area(triangles, R2=0.995) and soma diameter (squares, R2=0.923). Furthermore, as cell size increases, the distancesbetween the centers of the cells increase. A strongpositive relationship (p<0.005) also exists between theCb area and the average nearest neighbor distance(Fig. 4c, circles, R2=0.972). As noted earlier, this densitychange between the adult and hatchling Cb is noticeablebetween Fig. 2b and d. Finally, along with the large
Fig. 2. Quantification of the density distribution in the cortex.Individual calbindin-immunoreactive cells are represented by dots inreconstructed adult (a, A24) and hatchling (c, H37) cerebellar cortex.Different dot colors represent the nine and five sections used toreconstruct the flattened adult and hatchling cortices, respectively.These plots illustrate how all cells of a cerebellum are quantified in arelatively few serial sections. Note the greater density of Purkinje cellsthroughout the hatchling cerebellum. b Pseudocolor representation of
cell density in the same adult (a) using the same scaling. dPseudocolor representation of the same hatchling (b). The arrowsindicate narrow parasagittal regions of low Purkinje cell density thatoverly the grooves on the ventricular surface (see arrows in Fig. 3).White dashed ellipses surround the lateral regions of low cell density.The boxed areas in a, c identify the location of the photomicrographsused Fig. 1a and b, respectively
Cerebellum (2009) 8:463–476 467

increase in Cb size, there is an increase from hatchling toadult in the variability of their nearest neighbor distances(Fig. 4b, d).
Table 1 summarizes the adult and hatchling CB celldensity data. The labeled cell density of adult turtles was onefourth that of the hatchlings, which corresponds to the 4.3-fold increase in Cb size from hatchling to adult. However,there is only a 60% increase in the mean cell diameter and an88% increase in the mean distance between the centers ofcells. Therefore, the growth of the Cb must also involveother factors that also account for the large increase in Cbsize, such as the increase in the spacing variability of labeledcells in the adult Cb (compare Fig. 4b and d).
Cell Size and Shape Topography The topographic organi-zation of PC somata based on differences in their size orshape was analyzed in a single adult turtle by tracing every
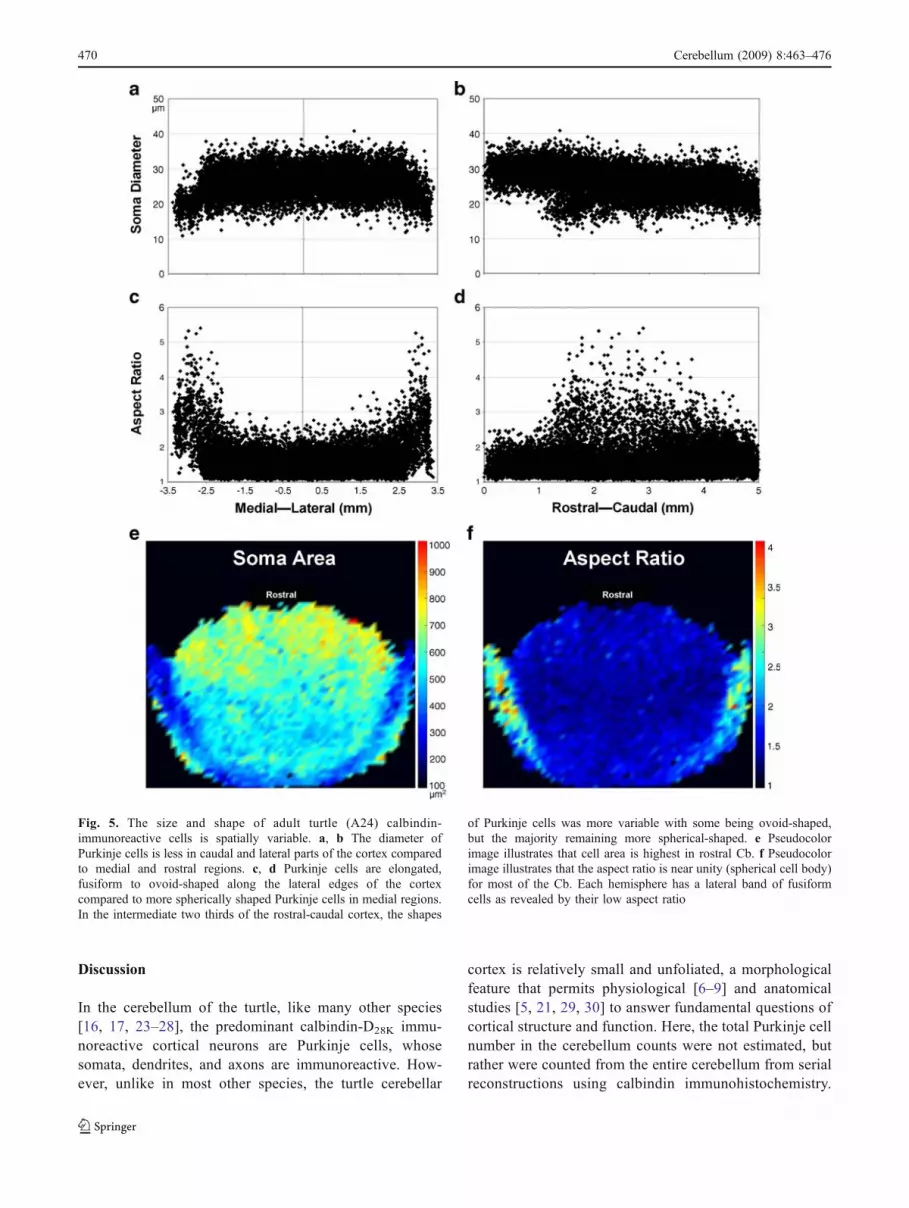
CaBP-IR soma in the Cb. A total of 16,412 cells with somaareas between 100 and 1,200 µm2 (average 550 µm2) weretraced, and then their shape parameters were plotted alongboth the medial-lateral axis and rostral-caudal axis (Fig. 5).Larger cell bodies are present predominately in the rostral-most 1 mm of the Cb in an area where there is lessvariability in cell size (Fig. 5b). That same rostral regionhad cells with smaller and less variable aspect ratios(Fig. 5d). This homogeneous population of large sphericalCaBP-IR cells (see Fig. 1a) is medial to the peduncles (seeFig. 2a).
The mean somatic area slowly decreases along thecaudal 4 mm of the Cb coincident with more non-spherical-shaped cell bodies with aspect ratios greater than2 (Fig. 5b, d). Based on an analysis of medial-lateralmorphologies, the more heterogeneous sample of CaBP-IRcells observed in the caudal 4 mm of the Cb is due to thecontribution of cells along the lateral edge of the Cb.Within 1 mm of the lateral edges, cells are smaller (Fig. 5a)and less spherical (Fig. 5c) than in the rest of the Cb.Within 1 mm of the midline, cells have a uniform diameternear 28 µm and an aspect ratio close to unity.
These topographical differences are displayed as apseudocolor images in Fig. 5e, f. Note that the lateral Cbrim contains distinctive CaBP-IR cell shapes. Apart from atrend for decreasing area from rostral to caudal cells alongthe midline (Fig. 5e; yellow to light blue), there is also aclear subset of smaller CaBP-IR cells along the lateral edgeof the Cb, beginning near each peduncle (Fig. 5e; darkblue) and extending along the caudal rim. Figure 5findicates that most of the CaBP-IR cells are spherical (darkblue = an aspect ratio near unity), except for elongated cellsextending from the attachment of the peduncles, a regionthat coincides with the presence of small diameter cells(Fig. 5e; dark blue).
CaBP-IR Somata May Not All Be Purkinje Cells
The topographic differences of soma size and aspect ratioalong the lateral rim of the Cb led to a re-examination of thestained tissue to identify how this subpopulation of CaBP-IR cells differed morphologically from the large sphericalcells seen in most other areas of the Cb (Fig. 1). Lateral rimCaBP-IR cells were different in their size and shape: (a)large fusiform cells in the lateral Cb, (b) small sphericalcells in the PC layer that were counted near the Cb rim, (c)very small cells (diameters «10 µm) in a high-density zonealong the entire rim of the Cb that were never counted, and(d) occasional very small cells scattered in the granule celllayer and along the midline.
Large Fusiform and Small Spherical Cells in the LateralCb Guided by the quantitative analysis (Fig. 5), the
Fig. 3. Organization of the adult turtle cerebellar cortex. Low-powerphotomicrograph of a transverse section of turtle brainstem andcerebellum at the level of the cerebellar peduncles, stained forcalbindin-D28K immunohistochemistry. Arrows point to regions thatlack labeled cells in the Purkinje cell layer, which correspond tosagittally oriented indentations in the ventricular surface separating thedifferent parts of the cortex (see arrows in Fig. 2d). The inset shows a50% magnification of the midline of the adjacent section. Just abovethe midline raphe, note the lack of immunoreactive Purkinje cells yetthe continuous dense staining up in the molecular layer
468 Cerebellum (2009) 8:463–476

stained tissue from that same adult Cb (A24) wasreexamined. Figure 6a is a low-power photomicrographthat corresponds to the tangential section scored as darkblue dots in Fig. 2a. Along the lateral Cb edge, close to thepeduncle, small clusters of fusiform CaBP-IR cells werevisible. These elongated cells had their long axes orientedin a rostrocaudal direction with processes that oftenextended caudally tens of microns. These cells clearlydiffer in shape from the spherical PC somata (Fig. 6c,magnified from the white boxed region in Fig. 6a). Ingeneral, the spherical PCs diameters vary from 20 to 33 µmwith aspect ratios less than 2. The smaller cells in that rangeare found in the lateral Cb. The elongated fusiform cells, onthe other hand, had very different minimum and maximumdiameters ranging from 5.7×30.7 µm to 12.3×58.2 µm andaspect ratios from 3 to 5. Figure 6b shows a low-powerphotomicrograph from that hatchling Cb, in which elongatedCaBP-IR cell processes were also observed extendingcaudally along its lateral edge (see magnified view inFig. 6d).
Very Small Cells Near the Lateral Cb Rim As notedabove, the topography of cell size and shape revealedthat smaller cells were located near the lateral Cb rim(Fig. 5e; dark blue), where its thickness decreases (Fig. 7).The analysis above quantified CaBP-IR cells whose somas
were greater than 100 µm2. The cellular makeup of the rimareas was best studied in transverse sections where thetissue always showed strong label. These very compactand very small cells were too numerous for counting, notto mention tracing. Zones of high-density, CaBP-IR cellbodies were observed in the molecular layer and at thevery edge of the cerebellum (Fig. 7). Although they werestrongly CaBP-immunoreactive, their size suggests thatmay not be typical neurons (maybe neuroblasts or gliacells).
Very Small Spherical Cells in the Granule Cell Layer andAlong the Midline at the Caudal Cb In addition to verycompact clusters of labeled cells, other more scatteredand very small CaBP-IR cells and fibers were alsoobserved among non-labeled cells within the granulecell layer as seen in Fig. 8. In tangential sections of adultCb, these labeled cells are observed in regions of Cbbetween the PC layer and the ventricle, presumably thegranule cell layer (Fig. 8a). These cells are denser near themidline. Similar labeled cells are very prominent inhatchlings, clearly scattered within the granule cell layercounterstained with cresyl violet (Fig. 8b). Their presenceat the caudal rim and near the midline suggests thatcalbindin may label migrating granule cells, glia, orneuroblasts.
Fig. 4. Quantitative data on thenumber, size, and spatial densityof Purkinje cells. Data from thecerebella of three adult and threehatchling turtles are plotted.a The total number of cellsplotted relative to cerebellar areaindicates a small difference incell number in spite of a largedifference in cortical area.Hatchling data on the left; adultdata on the right. c Plots somaarea (triangles, left ordinate),cell diameter (squares, rightordinate), and nearest neighbordistance (circles, right ordinate);each relative to cerebellar area.Distributions of nearest neigh-bor distance of adults (b) andhatchlings (d) are shown, eachline corresponding to an indi-vidual cerebellum. Note thatdistances between labeled cellsin adults are more variable thanhatchlings
Cerebellum (2009) 8:463–476 469
Discussion
In the cerebellum of the turtle, like many other species[16, 17, 23–28], the predominant calbindin-D28K immu-noreactive cortical neurons are Purkinje cells, whosesomata, dendrites, and axons are immunoreactive. How-ever, unlike in most other species, the turtle cerebellar
cortex is relatively small and unfoliated, a morphologicalfeature that permits physiological [6–9] and anatomicalstudies [5, 21, 29, 30] to answer fundamental questions ofcortical structure and function. Here, the total Purkinje cellnumber in the cerebellum counts were not estimated, butrather were counted from the entire cerebellum from serialreconstructions using calbindin immunohistochemistry.
Fig. 5. The size and shape of adult turtle (A24) calbindin-immunoreactive cells is spatially variable. a, b The diameter ofPurkinje cells is less in caudal and lateral parts of the cortex comparedto medial and rostral regions. c, d Purkinje cells are elongated,fusiform to ovoid-shaped along the lateral edges of the cortexcompared to more spherically shaped Purkinje cells in medial regions.In the intermediate two thirds of the rostral-caudal cortex, the shapes
of Purkinje cells was more variable with some being ovoid-shaped,but the majority remaining more spherical-shaped. e Pseudocolorimage illustrates that cell area is highest in rostral Cb. f Pseudocolorimage illustrates that the aspect ratio is near unity (spherical cell body)for most of the Cb. Each hemisphere has a lateral band of fusiformcells as revealed by their low aspect ratio
470 Cerebellum (2009) 8:463–476

Then, spatial distribution and morphological analyses ofevery PC somata in the cerebellar cortex were performed.Also, some calbindin immunoreactivity was observed inother small populations of cells within the Cb. These non-PC cells that express calbindin suggest that intracellular
calcium regulation may play an important role in cells thatmay be proliferating and migrating within the cerebellum,even in the adult.
We found that PCs are uniformly distributed across thecortical sheet (also see Fig. 3 in Ref. [21]). While the Cb
Fig. 6. Differences in the size and shapes of other calbindin-immunoreactive cells in the cerebellum. a Low-power photomicro-graph from an adult turtle (A24) illustrating part of its flattenedcerebellar cortex. The Purkinje (PCL), molecular (ML), and granulecell layers (GCL) are identified. c Higher magnification of the boxedarea in a. Here, calbindin-immunoreactive elongated cells on the left
can be compared to mature Purkinje cells on the right. b Photomicro-graph from a hatchling turtle (H37) that illustrates an area along thelateral cortical edge with small, spherical-shaped calbindin-immunoreactive cells. d Higher magnification shows how numerouscalbindin-immunoreactive reactive processes
Cerebellum (2009) 8:463–476 471

area increased more than 4-fold from hatchlings and adultturtles, the number of PCs increased only 13% fromhatchling to adult. Moreover, that percentage may be biasedsomewhat by data from a single adult turtle (see A22 inTable 1). When those data are not included when averagingthe adult PC counts, there is only 561 more Purkinje cells inadult Cb or a 4% increase over hatchlings.
To account for this, many morphometric parameterswere measured yet they are not independent of oneanother. Obviously, the cell density dropped by a fourth,but the PC some size did not quadruple, nor did thedistance between the labeled cells. The postnatal Cbgrowth from the hatchling to the adult turtle may alsoresult from increases in dendritic size, complexity andthe number of neuronal connections, or a widerdistribution of PC nearest neighbor distances. However,it is difficult to separate the primary causes of growth
from the secondary changes in cerebellar anatomybecause these features may be interdependent.
Cerebellar Organization in the Turtle
In many species, functional Cb divisions have beendescribed based on the gross morphology, cerebellarconnections, and expression patterns of various molec-ular markers (e.g., zebrin I/II and acetylcholinesterase,AChE; reviewed by [31]). While Cb circuitry of anycerebellar region may be the same, molecular expressionpatterns have been proposed to represent specific func-tional modules [32]. In turtle, however, molecular markers(e.g., zebrin) have not revealed any parasagittal subdivi-sions (Hawkes, unpublished data). Only AChE has beenlocalized topographically in the turtle Cb, limited to acaudal subdivision [33].
Fig. 7. Presence of very small turtle calbindin-immunoreactive cellsat the adult lateral cerebellar rim. Low-power photomicrograph of atransverse section approximately 1 mm caudal to the peduncle, withthe cerebellar rim at each edge magnified in the insets below. At theedges of the cortex, two clusters of very small spherical cells are
labeled, one at the very tip and one in the molecular layer. For sizecomparison, note the larger labeled cells (arrowheads) in the Purkinjecell layer that were counted and the occasional red blood cell (arrows)in the granule cell layer (counterstained with cresyl violet)
472 Cerebellum (2009) 8:463–476

The gross anatomy of the turtle Cb has provided a simpleorganizational pattern into three distinct anatomical subdivi-sions, as described by Larsell, from medial to lateral: parsinterposita, pars lateralis, and flocculus [15]. These subdivi-sions are demarcated by parasagittal oriented grooves on theventricular surface of the cerebellum (Fig. 2), a midlinesulcus medianus [34]; paired intermediate grooves serve as aboundary line between the pars interposita and pars lateralis,and lateral grooves delineates the pars lateralis from theflocculus (dorsal internal floccular sulcus; [15]). Whilefundamental Cb features remain similar across the reptileclass, the relative thickness of the par interposita and the parslateralis varies. This may reflect functional differences. Forexample, snakes have a distinctive par interposita and usetrunk musculature for locomotion. Conversely, turtles have amore distinct pars lateralis and use limb musculature forlocomotion. For these reasons, the pars interposita wassuggested to influence trunk musculature, while the parslateralis may influence limb musculature [35].
In mammals, histological observations of cerebellarcorticonuclear projections provide support for multiplelongitudinal cerebellar zones. In general, zones of thevermis (A, X, and B) project to the fastigial and vestibularnuclei, intermediate zones (C1–3) project to the interposednuclei, and lateral zones (D1,2) project to the dentatenucleus (reviewed by [36]). Prior evidence from behavioralstudies has shown the functional implications of the basiclongitudinal zones. The medial zones influence posturethrough trunk and proximal limb musculature; the interme-diate and lateral zones influence coordinated movementsthrough the distal limb musculature [37].
A synthesis of this information provides support forstructural homology in the turtle and mammalian Cb. Thepars interposita can be compared to the vermis ofmammals, the rostrolateral portions of the pars lateraliscan be compared to the intermediate zones of mammals,and the flocculus can be compared to its mammaliancounterpart. The diversity of CaBP-IR cells in this floccular
Fig. 8. Presence of very small calbindin-immunoreactive cells ingranule cell layer at the caudal cerebellar rim. The boxed areas in thelow-power photomicrographs on the right are enlarged in a and b. a Ahigh-power view from a midline tangential section of the flattenedcerebellar cortex, caudal end down, of the adult tissue shown inFig. 6a (A24). Note that very small cells are frequently labeled in both
the molecular (lower, darker) and granule cell layers, obscuring manyof the labeled PCs. The layering is more apparent with sectionscounterstained with cresyl violet as in b, a hatchling caudal cerebellarrim also oriented with molecular layer down. Very small cells arelabeled in the granule cell layer (arrowhead), many along the midline
Cerebellum (2009) 8:463–476 473

region and along the Cb rim suggests that it plays a uniquerole in Cb processing.
Calbindin Labeling Suggests Adult Neurogenesisand Calcium Regulation in Non-Purkinje Cells
In addition to clear CaBP-IR PCs in the corpus of the Cb,several distinct cell types were labeled for calbindin, allnear the Cb rim. One type was a relatively large, fusiform-shaped cell observed in the lateral Cb near the peduncle inboth hatchling and adult turtles (Fig. 6). The size of thistype was sufficiently large to suggest that they may beimmature PCs, and long apical processes may be theextending processes of migrating PCs. If indeed these weremigrating new PCs, this would explain the modest increasein PC numbers between hatchling and adult turtles. Anothertype of CaBP-IR cells were smaller spherical-shaped cellsthat were relatively too large to be considered granule cells(Fig. 8). Because the location of these cells was in the PClayer and extended almost a millimeter from the Cb rim,these cells may also be PCs, but at a later stage of maturity.This suggestion is supported by their soma size, interme-diate between that of the hatchling PCs and the adultmidline PCs.
A third set of labeled cells was difficult to characterizebecause these cells were heavily labeled for calbindin yetvery small (diameters «10 µm) and packed densely alongthe entire rim of the Cb. Their location coincides with a cellproliferative zone found in the developing Cb of manyspecies, from which cells migrate first to form an externalgranule layer that was not observed in the hatchlings andthen to populate the granule cell layer internally as weobserved [38, 39]. However, here in the turtle Cb, cells ofthis last type were readily observed in the adult as are cellswhich incorporate BrdU [40]. Therefore, it is unclear ifsome of these CaBP-IR small cells truly represent futureneurons (see below) or if some may be pyknotic figures,indicating local Cb cell death.
A final cell type observed was most prominent inhatchlings: scattered small cells in the granule cell layerand along the midline (Fig. 8). The diameter of these cellswere similar to that of granule cells and may representimmature granule cells that still express calbindin prior toreaching their mature state. Alternatively, these may behomologous to calbindin-immunoreactive granule cellsreported in the auricular lobe of frogs [25]. The midlinelocation of these cells in turtles, frogs, and fish arecongruous [41].
In humans, adult neurogenesis has been observed in twodiscrete areas: the subventricular zone located within thelateral wall of the lateral ventricle, which gives rise toolfactory bulb neurons, and the subgranule layer of thehippocampal dentate gyrus, which gives rise to hippocam-
pal granule cells [42, 43]. However, lower vertebrates (e.g.,birds, reptiles, amphibians and fish) exhibit an ability toproduce an array of new neurons in various parts of thebrain [41, 44–47]. Although adult neurogenesis commonlyoccurs within various subventricular zones of lowervertebrates, it also persists within non-ventricular zones offish [48, 49]. Evidence for adult neurogenesis within theturtle brain has been reported for the telencephalon (i.e.,olfactory bulb, cerebral cortex, septum, anterior dorsalventricular ridge, striatum) and spinal cord [50–52].Regardless of location, the adult proliferation zones appearto be remnants of embryonically active proliferation zones.
According to mammalian cerebellar embryology, theexternal granule cell layer (EGL) is derived from the upperrhombic lip of the alar plate. During development, cellsdestined for the EGL surround the peripheral Cb surface bytangential migration. These cells differentiate into granulecells by budding parallel fibers in opposite directions in thetransverse plane. Once the parallel fibers are established,the granule cells descend radially along Bergmann glia, pastthe immature PCs, into the internal granule cell layer,leaving a vertical axon connected to the parallel fibers inthe future molecular layer.
In humans, the EGL can continue to proliferate throughthe second year after birth (reviewed by [53]). However,granule cell genesis continues even longer in lowervertebrates. Certain fish retain a neurogenically activeportion of the EGL through at least 15% of their lifespan[41, 49]. Late granule cell genesis has also been demon-strated in birds [38]. It has also been suggested that theAChE-positive zone within the caudal tip of the adult turtleCb may be unrelated to cholinergic transmission but relatesto cell migration and neural growth [33]. This AChE-positive zone may therefore correspond to a persistent EGLwithin the adult turtle Cb.
Purkinje neurons and cortical interneurons originatefrom the ventricular zone of the metencephalic alar plateand migrate along radial glial cells into their respectivelayers [54]. Adult neurogenesis of these cell types has notbeen reported in any vertebrate species. However, becauseproliferation zones in adulthood tend to correspond with anembryological derivative, adult neurogenesis should occurin a subventricular zone of the fourth ventricle adjacent tothe caudal rim of the adult turtle Cb. Even as an adult, agross examination of its Cb in situ reveals that this caudalrim is in direct contact with both the brainstem below andthe vast capillary bed that lies within the fourth ventricle. Itis therefore possible that the caudal rim of the adult Cb stillserves as a source for new cells. These new cells mayreplace dying cells or along the Cb to continue to enlargeeven during its mature state.
Studying small cells along the CB rim electrophysiolog-ically at a single cell level is difficult. However, optical
474 Cerebellum (2009) 8:463–476
recordings of intact turtle Cb, stained with voltage-sensitivedyes, have revealed unique topographic responses that arerestricted to the lateral Cb rim [55]. Understanding both theanatomical and physiological data of the topography of thisunfoliated structure may lead to a better understanding ofcerebellar function.
Acknowledgments We thank Dr. John Martin for his help with theNeurolucida system and for comments on the manuscript. This workwas supported by grant NS-46499 from the National Institute ofNeurological Disorders and Stroke.
References
1. Anderson CW, Keifer J (1997) The cerebellum and red nucleusare not required for in vitro classical conditioning of the turtleabducens nerve response. J Neurosci 17:9736–9745
2. Keifer J, Armstrong KE, Houk JC (1995) In vitro classicalconditioning of abducens nerve discharge in turtles. J Neurosci15:5036–5048
3. Reali C, Russo RE (2005) An integrated spinal cord-hindlimbspreparation for studying the role of intrinsic properties insomatosensory information processing. J Neurosci Methods142:317–326
4. Senseman DM (1996) Correspondence between visually evokedvoltage-sensitive dye signals and synaptic activity recorded incortical pyramidal cells with intracellular microelectrodes. VisNeurosci 13:963–977
5. Tolbert DL, Conoyer B, Ariel M (2004) Quantitative analysis ofgranule cell axons and climbing fiber afferents in the turtlecerebellar cortex. Anat Embryol 209:49–58
6. Chesler M, Chan CY (1988) Stimulus-induced extracellular pHtransients in the in vitro turtle cerebellum. Neuroscience 27:941–948
7. Krizaj D, Rice ME, Wardle RA, Nicholson C (1996) Watercompartmentalization and extracellular tortuosity after osmoticchanges in cerebellum of Trachemys scripta. J Physiol 492:887–896
8. Okada YC, Huang JC, Rice ME, Tranchina D, Nicholson C(1994) Origin of the apparent tissue conductivity in the molecularand granular layers of the in vitro turtle cerebellum and theinterpretation of current source-density analysis. J Neurophysiol72:742–753
9. Perez-Pinzon MA, Rosenthal M, Lutz PL, Sick TJ (1992) Anoxicsurvival of the isolated cerebellum of the turtle Pseudemis scriptaelegans. J. Comp Physiol, B. Biochem Syst Environ Physiol162:68–73
10. Brown ME, Ariel M (2009) Topography and response timing ofintact cerebellum stained with absorbance voltage-sensitive dye. JNeurophysiol 101:474–490
11. Martin J, Ariel M (2005) Localization of GABA ([gamma]-aminobutyric acid) markers in the turtle's basal optic nucleus.Brain Res 1066:109–119
12. Rosenberg AF, Ariel M (1990) Visual-response properties ofneurons in turtle basal optic nucleus in vitro. J Neurophysiol63:1033–1045
13. Graham RC Jr, Karnovsky MJ (1966) The early stages ofabsorption of injected horseradish peroxidase in the proximaltubules of mouse kidney: ultrastructural cytochemistry by a newtechnique. J Histochem Cytochem 14:291–302
14. Abercrombie M (1946) Estimation of nuclear population frommicrotome sections. Anat Rec 94:239–247
15. Larsell O (1932) The cerebellum of reptiles: chelonians andalligator. J Comp Neurol 41:59–94
16. Yan XX, Garey LJ (1998) Complementary distributions ofcalbindin, parvalbumin and calretinin in the cerebellar vermis ofthe adult cat. J Hirnforsch 39:9–14
17. Fortin M, Marchand R, Parent A (1998) Calcium-binding proteinsin primate cerebellum. Neurosci Res 30:155–168
18. Scotti AL, Nitsch C (1992) Differential Ca2+ binding propertiesin the human cerebellar cortex: distribution of parvalbumin andcalbindin D-28 k immunoreactivity. Anat Embryol 185:163–167
19. Sequier JM, Hunziker W, Richards G (1988) Localization ofcalbindin D28 mRNA in rat tissues by in situ hybridization.Neurosci Lett 86:155–160
20. Mutema GK, Rhoten WB (1994) Occurrence and localization ofcalbindin-D28K in kidney and cerebellum of the slider turtle,Trachemys scripta. Anat Rec 239:185–190
21. Bangma GC, ten Donkelaar HJ, Pellegrino A (1983) Cerebellarcorticonuclear projections in the red-eared turtle Pseudemysscripta elegans. J Comp Neurol 215:258–274
22. Gerrits NM, Voogd J (1973) The distribution of the Purkinje cellsin the cerebellum of testudo hermanni (turtle). Acta MorpholNeerl Scand 11:357–358
23. Whitney ER, Kempera TL, Rosenea DL, Baumana ML, Blatta GJ(2007) Calbindin-D28k is a more reliable marker of humanPurkinje cells than standard Nissl stains: a stereological experi-ment. J Neurosci Methods 168:42–47
24. Bell CC, Meek J, Yang JY (2005) Immunocytochemical identi-fication of cell types in the mormyrid electrosensory lobe. J CompNeurol 483:124–142
25. Uray NJ, Gona AG (1999) Calbindin immunoreactivity in theauricular lobe and interauricular granular band of the cerebellumin bullfrogs. Brain Behav Evol 53:10–19
26. Kevetter GA, Leonard RB (1997) Use of calcium-binding proteinsto map inputs in vestibular nuclei of the gerbil. J Comp Neurol386:317–327
27. Rodriguez-Moldes I, Timmermans JP, Adriaensen D, De Groodt-Lasseel MH, Scheuermann DW, Anadon R (1990) Immunohisto-chemical localization of calbindin-D28K in the brain of acartilaginous fish, the dogfish (Scyliorhinus canicula L.). ActaAnat 137:293–302
28. Fujii JT, Lucaj Z (1993) Calcium-binding proteins in the chickEdinger Westphal nucleus. Brain Res 605:200–206
29. Mugnaini E, Atluri RL, Houk JC (1974) Fine structure of granularlayer in turtle cerebellum with emphasis on large glomeruli. JNeurophysiol 37:1–29
30. Kunzle H (1983) Spinocerebellar projections in the turtle.Observations on their origin and terminal organization. Exp BrainRes 53:129–141
31. Armstrong CL, Hawkes R (2000) Pattern formation in thecerebellar cortex. Biochem Cell Biol 78:551–562
32. Hawkes R (1997) An anatomical model of cerebellar modules.Prog Brain Res 114:39–52
33. Brand S, Mugnaini E (1980) Pattern of distribution of acetylcho-linesterase in the cerebellar cortex of the pond turtle, withemphasis on parallel fibers. A histochemical and biochemicalstudy. Anat Embryol 158:271–287
34. Cruce WL, Nieuwenhuys R (1974) The cell masses in the brainstem of the turtle Testudo hermanni; a topographical andtopological analysis. J Comp Neurol 156:277–306
35. Larsell O (1967) The comparative anatomy and histology of thecerebellum from myxinoids through birds. University of Minne-sota Press, Minneapolis
36. Voogd J (2003) The human cerebellum. J Chem Neuroanat26:243–252
37. Chambers WW, Sprague JM (1955) Functional localization in thecerebellum. I. Organization in longitudinal cortico-nuclear zones
Cerebellum (2009) 8:463–476 475

and their contribution to posture, both extrapyramidal andpyramidal. J Comp Neurol 103:105–130
38. Stamatakis A, Barbas H, Dermon CR (2004) Late granule cellgenesis in quail cerebellum. J Comp Neurol 474:173–189
39. Uray NJ (1985) Early stages in the formation of the cerebellum inthe frog. J Comp Neurol 232:129–142
40. Martin J, Chanasue L, Ariel M (2008) Neurogenesis in the turtlecerebellum. Soc Neurosci Abstr 32
41. Zupanc GK, Horschke I (1995) Proliferation zones in the brain ofadult gymnotiform fish: a quantitative mapping study. J CompNeurol 353:213–233
42. Eriksson PS, Perfilieva E, Bjork-Eriksson T, Alborn AM,Nordborg C, Peterson DA et al (1998) Neurogenesis in the adulthuman hippocampus. Nat Med 4:1313–1317
43. Bedard A, Parent A (2004) Evidence of newly generated neurons inthe human olfactory bulb. Brain Res Dev Brain Res 151:159–168
44. Goldman SA, Nottebohm F (1983) Neuronal production, migra-tion, and differentiation in a vocal control nucleus of the adultfemale canary brain. Proc Natl Acad Sci U S A 80:2390–2394
45. Chetverukhin VK, Polenov AL (1993) Ultrastructural radioauto-graphic analysis of neurogenesis in the hypothalamus of the adultfrog, Rana temporaria, with special reference to physiologicalregeneration of the preoptic nucleus. I. Ventricular zone cellproliferation. Cell Tissue Res 271:341–350
46. Polenov AL, Chetverukhin VK (1993) Ultrastructural radioauto-graphic analysis of neurogenesis in the hypothalamus of the adultfrog, Rana temporaria, with special reference to physiologicalregeneration of the preoptic nucleus. II. Types of neuronal cellsproduced. Cell Tissue Res 271:351–362
47. Perez-Canellas MM, Garcia-Verdugo JM (1996) Adult neuro-genesis in the telencephalon of a lizard: a [3H] thymidineautoradiographic and bromodeoxyuridine immunocytochemicalstudy. Brain Res Dev Brain Res 93:49–61
48. Zupanc GK, Horschke I, Ott R, Rascher GB (1996) Postembry-onic development of the cerebellum in gymnotiform fish. J CompNeurol 370:443–464
49. Maeyama K, Nakayasu H (2000) Postembryonic neurogenesis inzebrafish (Danio rerio) brain: presence of two different systems.Zoolog Sci 17:959–966
50. Perez-Canellas MM, Font E, Garcia-Verdugo JM (1997) Postnatalneurogenesis in the telencephalon of turtles: evidence for non-radial migration of new neurons from distant proliferativeventricular zones to the olfactory bulbs. Brain Res Dev BrainRes 101:125–137
51. Fernandez A, Radmilovich M, Trujillo-Cenoz O (2002) Neuro-genesis and gliogenesis in the spinal cord of turtles. J CompNeurol 453:131–144
52. Radmilovich M, Fernandez A, Trujillo-Cenoz O (2003) Environ-ment temperature affects cell proliferation in the spinal cord andbrain of juvenile turtles. J Exp Biol 206:3085–3093
53. ten Donkelaar HJ, Lammens M, Wesseling P, Thijssen HO, RenierWO (2003) Development and developmental disorders of thehuman cerebellum. J Neurol 250:1025–1036
54. Hatten ME (1999) Central nervous system neuronal migration.Annu Rev Neurosci 22:511–539
55. Brown ME, Ariel M (2008) Stimulation of an eighth cranial nerveactivates discrete bilateral regions of the lateral edge of the turtlecerebellum. Soc Neurosci Abstr 32
476 Cerebellum (2009) 8:463–476


