Embed Size (px)
Citation preview
Towards magnetic engineering at
metal surfaces
A dissertation submitted to the
SWISS FEDERAL INSTITUTE OF TECHNOLOGY
LAUSANNE
for the degree of
Docteur es Sciences
presented by
Paolo Messina
Laureato in Fisica, Universita di Pavia
examining board:
Prof. K. Kern, directeur de these
Dr. C. Carbone, rapporteur
Prof. W.Dieter Schneider, rapporteur
Prof. H. Vogel, rapporteur
March 2003

2
Version abregee
Cette these s’articule autour de deux axes principaux : d’une part la miseau point une nouvelle methode d’elaboration de nanostructures magnetiquessupportees en surface et d’autre part la construction d’un nouveau micro-scope effet tunnel fonctionnant en ultra haut vide et basse temperature(1K), destine coupler la resolution spatiale du STM avec la capacite dedetecter le magnetisme.Le premier chapitre porte sur la construction du systeme complet comprenantle microscope STM. Un accent particulier est mis sur le design et les fonc-tionnalites. Le systeme est un STM UHV LT de type Eigler. Cette classe deSTM basse temperature est basee sur un mecanisme pendulaire qui decouplemecaniquement le STM du reste du systeme UHV. La stabilite mecaniqueest grandement amelioree grce ce dispositif. En outre, ce design permettrade developper un systeme permettant de contrler precisement la temperatureentre 1 et 80 K.A la difference des STM de type Eigler de premiere generation, la temperaturepeut tre abaissee en dessous de 4,2 K par l’utilisation d’un cycle de detenteferme de type Joule-Thomson. De l’helium 3 se detend dans la cavite autourdu pendule. La temperature du microscope peut descendre jusqu’ 0,5 K grcela circulation du gaz autour du pendule.Le design du STM est adapte d’une configuration originale proposee par Panet developpee par Pietzch. Ce design est compact, stable et procure unebonne stabilite thermique, il permet aussi la rotation de l’echantillon in situsur 180◦.Differentes propositions pour la detection du magnetisme par STM sontpresentees la fin de ce chapitre.Le deuxieme chapitre est centre sur l’elaboration de nanostructures de sur-face en conditions UHV.Le STM-VT est utilise pour caracteriser des structures organometalliquesformees sur Cu(100). Un atome magnetique, le fer, et une molecule or-ganique, le TMA, sont deposes sur la surface. Une reaction chimique a lieuentre ces deux adsorbas.
3
Les molecules de TMA presentent trois groupes carboxyliques susceptiblesde former une liaison laterale avec les atomes de fer. Ainsi, l’interactioncoordinante entre les groupes carboxyles et les atomes de Fe peut tre as-tucieusement utilisee pour construire toute une gamme de nanostructuresen contrlant la stchiometrie, la sequence de deposition des adsorbas et latemperature du substrat.Les complexes Fe[TMA]4 se developpent pour de faibles valeurs de [M ]
[L]
mononucleaire. Ces complexes sont chiraux. Des liaisons multiples desmolecules de TMA sont observees quand le rapport [M ]
[L]augmente. On
observe des complexes polynucleaires sur des terrasses planes en inversantl’ordre de deposition des adsorbas.Suite un recuit le nombre de structures 1D et 2D formees augmente. Lesassemblages 2D sont constitues d’arrangements chiraux de structures 1D.Les assemblages 2D pourraient provenir d’un effet hierarchique d’interactionschimiques l’interieur et entre les structures 1D, c’est--dire de liaisons coordi-nantes et de liaisons hydrogene. Ici, contrairement l’ingenierie des cristauxl’interaction adsorba-substrat a un rle non negligeable.Une discussion approfondie des applications possibles de cette technique pourreproduire des resultats de magneto-chimie est aussi aborde.
4
Abstract
The aim of this thesis is twofold: on the one hand to demonstrate a newmethod of building magnetic nanostructures at surfaces and on the otherhand to present the construction of a new 1K UHV Low Temperature STMaimed at coupling the spatial resolution of the STM microscope with thecapability to detect magnetism.The focus of the first chapter is the construction of the entire system incorpo-rating the STM microscope. Design and the functionalities of the instrumentare emphasized. The system is an Eigler type UHV LT STM. This class oflow T STM relies on a pendulum mechanism which mechanically decouplesthe STM from the entire UHV system. As a result the mechanical stabilityof the microscope is particularly improved. Besides, this design will alloweventually to develop a temperature control allowing the instrument to workbetween 1 and 80 K.Unlike the first generation of Eigler type STM, the temperature can be low-ered below 4.2 K by the use of a Joule-Thompson expansion closed cycle.He3 is let to expand into the cavity allocating the pendulum. Upon circu-lation of the gas around the pendulum the microscope is cooled down to atemperature as low as 0.5 K.The STM microscope itself is adapted from a design originally proposed byPan and then developed by Pietzch. This design is compact, stable, providesa good thermal stability and allows for in situ 1800 sample rotation.Different proposals for the detection of magnetism with the STM are de-scribed at the end of the chapter.The second chapter is inherently focused on the construction of magneticnanostructures at surfaces under UHV conditions.A VT-STM is used to characterize organo-metallic assemblies formed onCu(100). A magnetic atom, Fe, and an organic molecule, TMA, are de-posited on the surface. A chemical reaction between the two adsorbatestakes place.The TMA molecules offers three carboxyle moieties for lateral linkage to theFe atoms. In this respect the coordinative interaction between the carboxyle
5
moiety and the Fe atom can be suitably used to build a range of differentnano structures. By tuning the reciprocal amount of ligand [L] and metal
[M ] i.e. [M ][L]
, the sequence of adsorbates deposition, the substrate tempera-ture, a number of different structures can be synthesized.At low values of [M ]
[L]mononuclear Fe[TMA]4 complexes evolve. These com-
plexes are chiral. For increasing values [M ][L]
multiple linkage of TMA moleculesis observed. By inverting the order of adsorbates deposition polynuclear com-plexes are observed at flat terraces.Upon annealing the formation of 1D and 2D structures arises. The 2D as-semblies comprise chiral arrangements of 1D structures.The 2D assemblies may result from an hierarchical effect of chemical in-teractions within and among 1D structures, i.e. coordinative bonding andhydrogen bonding. Unlike crystal engineering the adsorbate-substrate inter-action still plays a relevant role in this scenario.A thorough discussion of the possible applications of this technique to repro-duce results of magneto chemistry is also presented.
6

7

Abbreviations and CommonSymbols
LITD Laser Induced Thermal DesorptionRAIRS Reflection Adsorption Infrared SpectroscopyHREELS High Resolution Electron Energy Loss(L)DOS (Local) Density Of StatesPES PhotoEmission SpectroscopySTM Scanning Tunneling MicroscopySTS Scanning Tunneling Spectroscopy2D Two-Dimensional2DEG Two-Dimensional Electron GasUHV Ultra-High VacuumSMM Single Molecular MagnetsVT-STM Variable Temperature STMLT-STM Low Temperature STMCVD Chemical Vapor DepositionTMA 1,3,5 Tricarboxylic Benzoic AcidHtBDC 3,5-di-ter-butyl-phenyl-porphyrinTTBPP Tetrakis porphyrinTCNE TetracyanoethyleneJ-T Joule Thompson expantionPI Proportional Integrative controllerP Proportional controllerD Derivative controller: Dipolar Field splitting operatorδ delta functiondI/dV differential conductance∆V sinusoidal peak-to-peak bias modulationE energy with respect to the Fermi energy (if not otherwise
stated)e protonic charge, e = 1.6 · 10−19 CEF equilibrium Fermi energyf(E, T ) equilibrium Fermi functionG Free energy
8
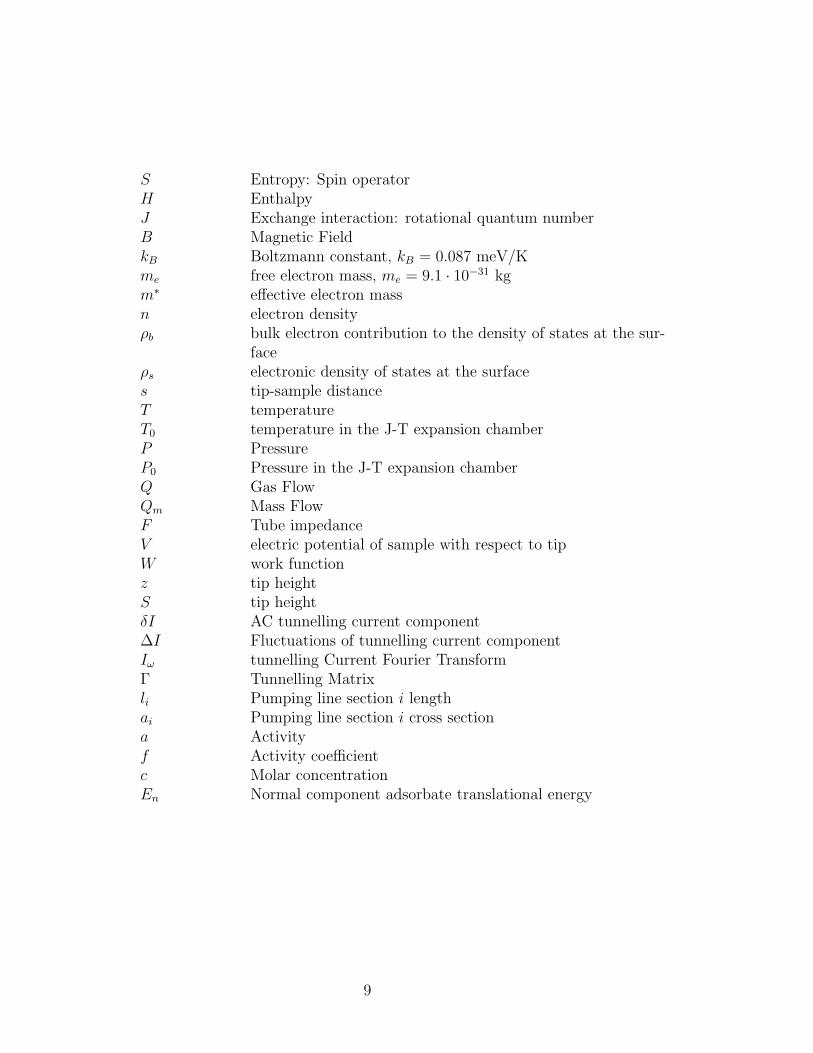
S Entropy: Spin operatorH EnthalpyJ Exchange interaction: rotational quantum numberB Magnetic FieldkB Boltzmann constant, kB = 0.087 meV/Kme free electron mass, me = 9.1 · 10−31 kgm∗ effective electron massn electron densityρb bulk electron contribution to the density of states at the sur-
faceρs electronic density of states at the surfaces tip-sample distanceT temperatureT0 temperature in the J-T expansion chamberP PressureP0 Pressure in the J-T expansion chamberQ Gas FlowQm Mass FlowF Tube impedanceV electric potential of sample with respect to tipW work functionz tip heightS tip heightδI AC tunnelling current component∆I Fluctuations of tunnelling current componentIω tunnelling Current Fourier TransformΓ Tunnelling Matrixli Pumping line section i lengthai Pumping line section i cross sectiona Activityf Activity coefficientc Molar concentrationEn Normal component adsorbate translational energy
9

10
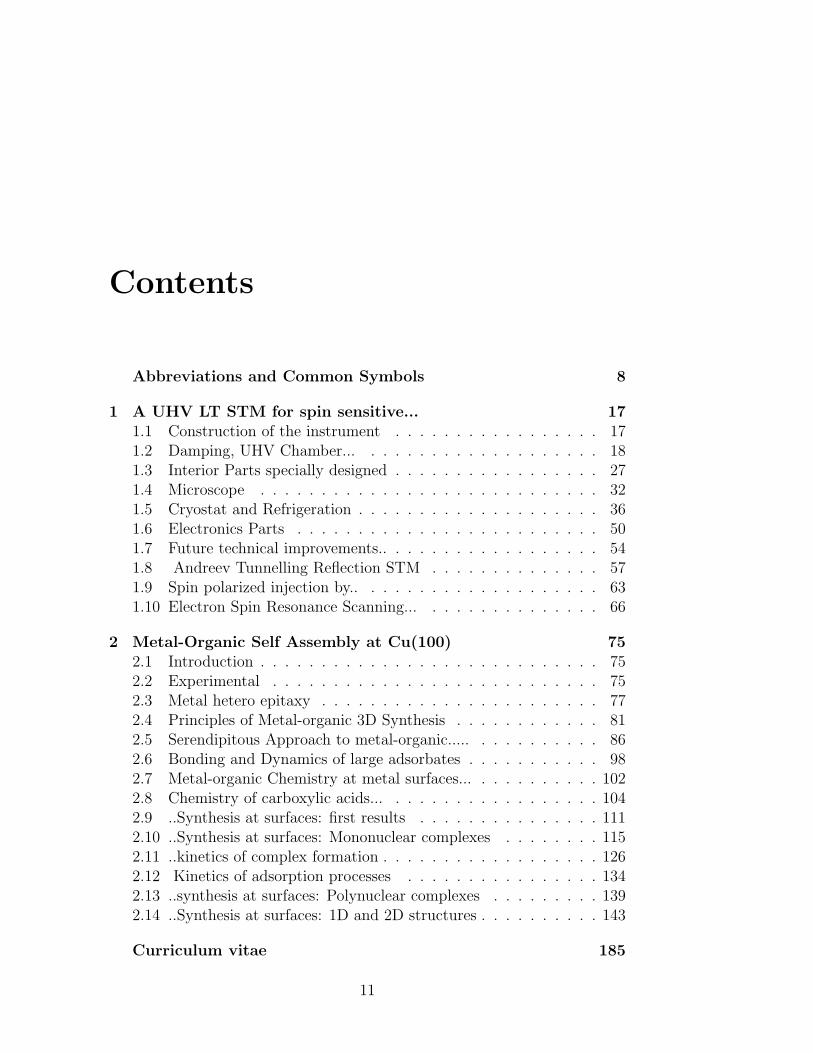
Contents
Abbreviations and Common Symbols 8
1 A UHV LT STM for spin sensitive... 171.1 Construction of the instrument . . . . . . . . . . . . . . . . . 171.2 Damping, UHV Chamber... . . . . . . . . . . . . . . . . . . . 181.3 Interior Parts specially designed . . . . . . . . . . . . . . . . . 271.4 Microscope . . . . . . . . . . . . . . . . . . . . . . . . . . . . 321.5 Cryostat and Refrigeration . . . . . . . . . . . . . . . . . . . . 361.6 Electronics Parts . . . . . . . . . . . . . . . . . . . . . . . . . 501.7 Future technical improvements.. . . . . . . . . . . . . . . . . . 541.8 Andreev Tunnelling Reflection STM . . . . . . . . . . . . . . 571.9 Spin polarized injection by.. . . . . . . . . . . . . . . . . . . . 631.10 Electron Spin Resonance Scanning... . . . . . . . . . . . . . . 66
2 Metal-Organic Self Assembly at Cu(100) 752.1 Introduction . . . . . . . . . . . . . . . . . . . . . . . . . . . . 752.2 Experimental . . . . . . . . . . . . . . . . . . . . . . . . . . . 752.3 Metal hetero epitaxy . . . . . . . . . . . . . . . . . . . . . . . 772.4 Principles of Metal-organic 3D Synthesis . . . . . . . . . . . . 812.5 Serendipitous Approach to metal-organic..... . . . . . . . . . . 862.6 Bonding and Dynamics of large adsorbates . . . . . . . . . . . 982.7 Metal-organic Chemistry at metal surfaces... . . . . . . . . . . 1022.8 Chemistry of carboxylic acids... . . . . . . . . . . . . . . . . . 1042.9 ..Synthesis at surfaces: first results . . . . . . . . . . . . . . . 1112.10 ..Synthesis at surfaces: Mononuclear complexes . . . . . . . . 1152.11 ..kinetics of complex formation . . . . . . . . . . . . . . . . . . 1262.12 Kinetics of adsorption processes . . . . . . . . . . . . . . . . 1342.13 ..synthesis at surfaces: Polynuclear complexes . . . . . . . . . 1392.14 ..Synthesis at surfaces: 1D and 2D structures . . . . . . . . . . 143
Curriculum vitae 185
11

acknowledgements 187
12
Introduction
Magnetism has fascinated scientists for a long time. In the 19th century thedebate on the nature of electrical and magnetic phenomena culminated withthe establishment of the electromagnetic theory. The Maxwells equationsrepresent the summary of studies in this field in that century. The symmetryof those equations describing Electric and Magnetic Field is broken at thelevel of the origin of the two fields. The divergence of the vector E(Electricfield) is connected to the electric charge, however the divergence of the vectorB is equal to zero. As a result, no source of the magnetic field really exists.The reason has been explained in the theory of relativity.Basically the search for magnetic monopole has been a long aimed goal ofphysics. Today physics rather than searching for magnetic monopole aimsat measuring the smallest magnetic dipole of the smallest stable aggregateof matter known, i.e. the magnetic moment of a single atom, absorbed on asurface or embedded among electric leads.The magnetic moment of a single atom and inherently of single moleculeshas a spin contribution and an orbital contribution. The measure of themagnetization on a smallest possible scale would give information on thesetwo quantities and those ones related. The further possibility of direct accessto the spin of single atoms (molecules) would give the possibility to distin-guish between the intrinsic magnetic properties of a microscopic system andthe effect due to the surroundings manifesting itself through effects on theangular moment.Surface science offers an invaluable opportunity to provide atomically flatand clean surfaces on which studies of single magnetic adsorbates becomefeasible. The development of nano-probes also offers a number of techniquesthat can couple spatial resolution with physical sensitivity to different phe-nomena. However, the outermost spatial resolution is achieved routinelyonly from the Scanning Tunnelling Microscope (STM). Accordingly, the cou-pling of the spatial lateral resolution offered by the STM and the capabil-ity of detecting Magnetism is of paramount fundamental and technologicalimportance[1, 2, 3].
13
The first part of this thesis focuses on the construction of a UHV LT-STMaimed at detecting magnetism on a nano-scale. Only two groups in the worldare known to have achieved sub nanometric magnetic resolution by using fer-romagnetic tips[4, 5, 6]. This technique enables to measure the magnetizationof the nanostructure placed underneath the STM tip. Nevertheless, the strayfield generated from the ferromagnetic tip can severely affect the orientationof the magnetic moments of atomic or molecular adsorbates. The former isa major drawback of this technique that limits its range of applications.Different proposals for circumventing this limitation have appeared in thespecialized literature including the use of Mott insulating tips [7] and ferromagnetic-superconductor tips [8].However, large echo in the nano probes scientific community has been grantedto the use of superconducting tips [9, 10, 11, 12] and the detection of highfrequency components of the tunnelling current[1].Recent experiments have proven that Andreev reflection on the interface be-tween a ferromagnetic single point contact and a superconductor can be usedto assess quantitatively the degree of spin polarization of the ferromagnet[13].As matter of a fact there are no constraints that would prevent to apply thismethod to the STM microscope. In this way the magnetism of a nanos-tructure on surfaces would be proven by measuring the suppression of thetunnelling current flowing across the sample and the superconducting tip.Moreover it has been recently proved that a magnetic impurity suppresseslocally superconductivity [14]. This effect can be exploited to produce a spinpolarized current[15]. The stray field generated from the magnetic impurityon the very apex of the STM tip is expected to be much lower than the oneused for ferromagnetic tips.The possibility of coupling magnetic resonances and nanoprobes has beenvalidated in the case of Atomic Force Microscope (AFM) about one decadeago [16]. Also, the very first experiment coupling STM and a magnetic reso-nance technique was accomplished by Manassen and coworkers at IBM morethan one decade ago[17]. The experimental set up (ESR-STM) was able todetect the giromagnetic ratio g through a mechanism that is still matterof debate[18]. In spite of several critics, some new experimental evidenceshave been brought about over the last years[19, 20]. In particular the lastexperiment has been performed using ESR standard radicals in air. The lat-ter opens up the possibility of studying magnetic molecular adsorbates onsurfaces[21, 22, 23].Particularly intriguing would be the study of systems which exibit the lowrate relaxation of the magnetization such as Single Molecular Magnets (SMM)[24,25] or 1D spin chains[26]. Besides, a number of intriguing quantum phenom-ena such as the Tunnelling of the Magnetization (MQT) and quantum phases
[27] could be studied at single molecular level.Another class of magnetic molecular systems that may be studied at the sin-gle molecular are endohedral fullerenes [28]. As the magnetic atom comprisedin the carbon cage is insulated from the surface, these systems may be partic-ularly interesting to probe the effect of dipolar interactions on different typeof surfaces. Among endohedral fullerenes a new class of N,P magnetic dopedfullerenes have been recently reported [29]. This class is interesting in termof applications to quantum computing[30] as the magnetic atom included inthe carbon cage does not interact with the cage in itself. A current challengeis bringing these molecule on to surfaces as their degradation temperatureexceeds the sublimation point [31].The possibility of studying the magnetism of molecular adsorbates may turnto be of fundamental importance to understand the physical properties ofmolecular-solid state systems as well as for implementing solid state electronspin single molecular quantum computing [32, 33, 34, 35].There is a different approach to study molecular magnetic adsorbates on sur-faces instead of building them for i.e. directly on the surface. This is theapproach explained in the second part of the thesis.Supramolecular chemistry has revealed to be an invaluable tool to build com-plex structures [36]. It is also expected to provide major solutions to shrinkthe sizes of basic computer components [37] [38] [36].Particularly, coordinative interaction offers many advantages in the designof complex structures over other noncovalent interactions[39].Noncovalent interactions, such as hydrogen bonding, have been already usedto build nano structures on metal surfaces[40, 41]. By contrast, the use of co-ordinative interaction has occured only very recently [42]. Lin and coworkershave reported the observation of complex formation at Cu(100) [42] althoughthe weak stability of the formed complexes indicates that the strength of theinteraction is not as high as in normal coordination compounds.Basically coordinative complexes of Fe and 1,3,5 tricarboxylic benzoic acid(TMA)have been obtained in this work [43]. Very recently the cast for shrinking thesize of transistor[44] has lead to build devices comprising a single dinuclearcomplex [45] or even a single atom comprised in organometallic complex [46].In these works the coupling between the leads and the magnetic molecularadsorbate is enhanced in order to let evolve a Kondo effect.Building organometallic complexes on surfaces in a similar way opens up thepossibility of studying a range of different couplings between the electron gason the surface and the magnetic atom within the complex. However, coor-dinative interaction can be used also for building polynuclear clusters andchains. In this respect a major challenge is to tailor directly the magneticproperties of 0D and 1D assemblies pretty much like the case of SMM[24]and

magnetic Co chains [26].In coordinative crystal engineering coordinative bonding is used alongsidewith noncovalent interactions to try the production of certain structures. Onthe surface the presence of adsorbate-substrate interaction and noncovalentinteractions among adsorbates such as hydrogen bonding may result in in-triguing 2D arrangements.Within the framework of this thesis the former concepts are explored and re-veal to be applicable to the direct construction of nanostructures on surfacesunder UHV conditions.
Chapter 1
A UHV LT STM for spinsensitive tunnellingspectroscopy
1.1 Construction of the instrument
The scanning tunnelling microscope [47] is an instrument which allows toimage the morphology of a surface. It also allows to do local electron spec-troscopy at low energy (| E−EF |≤ 2 eV) [48]. The STM has also been usedto manipulate atoms [49]and molecules [50]. It is inherently a multifunc-tional tool for surface investigation. Usually a metallic tip is brought closeto the surface by means of an electro-mechanic mechanism. This mechanismis called STM microscope. If the tip is brought close enough to the surfaceso that the empty states on the tip can overlap the occupied states on thesurface, a tunnelling current can flow from the surface towards the tip [51].The amount of the current which flows from the surface to the tip is expo-nentially proportional to the surface tip separation ( typically of the order5-10 A). In UHV conditions the surface can be prepared in order to becomeatomically flat and clean. If the microscope operates in ultra high vacuumconditions atomically flat and clean surfaces can be routinely imaged. Low-ering the temperature allows also a further stability, as the thermal drift ofthe instrument is reduced. Besides, low temperature operation results in abetter energy resolution during the scanning tunnelling spectroscopy STS.The combination of UHV with cryogenic technology and the constructionof the microscope are the object of the following pages. There are a num-ber of different examples of instruments which combine the afore mentionedcapabilities. For instance the system constructed by Pietzsch et. al. [52]
17
18 CHAPTER 1. A UHV LT STM FOR SPIN SENSITIVE...
is designed for sample and tip exchange. However, this system is only ableto reach temperatures as low as 11 K. The former is due to the limitationintroduced by the presence of a view port in the sample area which allowsradiation to warm up the sample even though shields are present. Other de-signs emphasize the low temperature performance reducing then the amountof irradiation at the sample. In this configuration the sample region is notobservable during standard load operations. As a result the degree of preci-sion requested in all the mechanical movements during the sample exchangetransfer is increased. This suggests that the STM microscope, to be incor-porated in the system, should be simple and easily operated. A simple 3Hedesign is provided by Hudson et al. [53]. Nevertheless the latter design doesnot provide a UHV environment for sample preparation limiting the rangeof application of the microscope. Another design of a UHV STM (reaching300 mK) has been published recently by Kugler at al.[54]. In this design theauthors use a 3He sorption pump refrigerator. The STM microscope shuttlesfrom the sample preparation area to the experimental location. The formerrequirement implies a certain degree of risk that one of the connections tothe STM can break from time to time reducing therefore the maintenancetime interval. We opted for a top loaded design based on Joule-Thompsonrefrigeration cycle following the construction outlined by Heinrich and Eiglerat IBM Almaden research Center [55].
1.2 Damping, UHV Chamber and other Vac-
uum parts
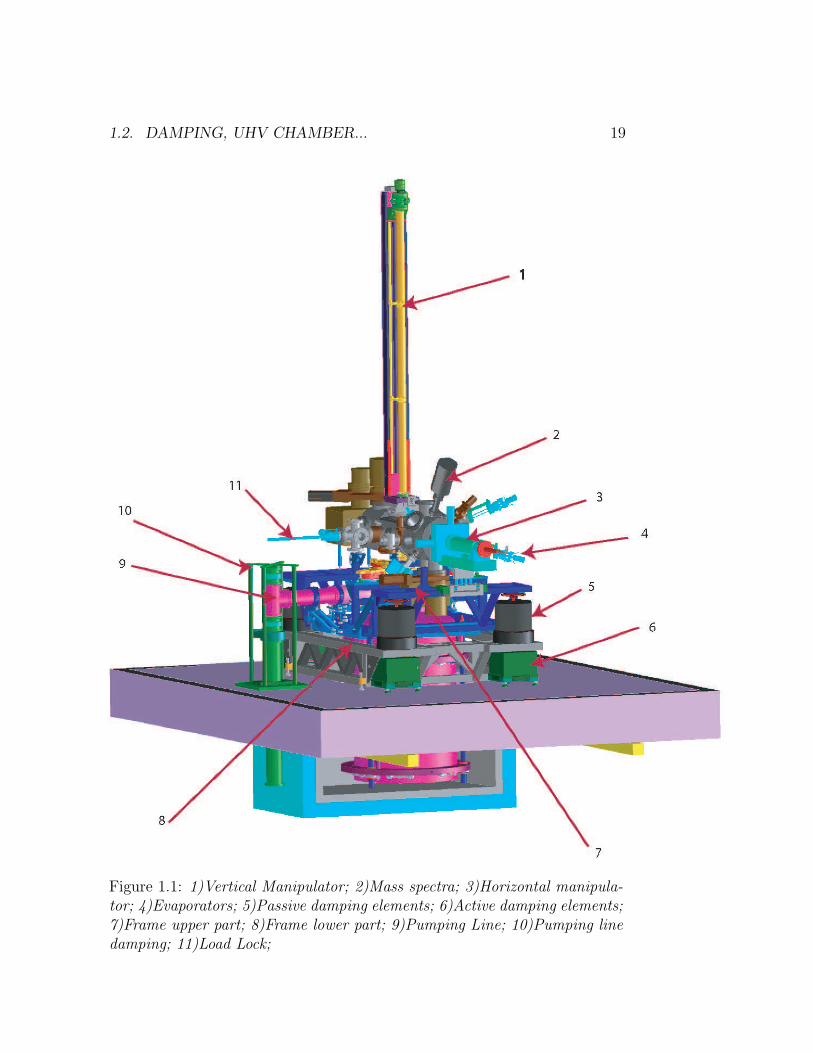
In Fig. 1.1 the general construction of the entire instrument is shown. Thesystem consists of a cryostat, the UHV chamber and accessories, the micro-scope, the damping system and the control electronics and related instrumen-tation. There are two UHV chambers mounted on a rigid frame. The twochambers are divided by a gate valve. The horizontal manipulator is mountedon the sample preparation chamber allowing the sample to be transferredfrom the preparation area to the second chamber named STM chamber .In the former chamber the sample can be transferred to the vertical manipu-lator and then loaded in the STM. The STM chamber is connected to theSTM microscope through a UHV Tube which goes all the way through thecryostat and is mechanically decoupled from both the chamber and the cryo-stat. There are two different strategies of providing an appropriate dampinginsulation of the STM microscope. The first one is to make the microscopeas rigid as possible. The second one is to provide a number of mechanical
1.2. DAMPING, UHV CHAMBER... 19
Figure 1.1: 1)Vertical Manipulator; 2)Mass spectra; 3)Horizontal manipula-tor; 4)Evaporators; 5)Passive damping elements; 6)Active damping elements;7)Frame upper part; 8)Frame lower part; 9)Pumping Line; 10)Pumping linedamping; 11)Load Lock;
20 CHAPTER 1. A UHV LT STM FOR SPIN SENSITIVE...
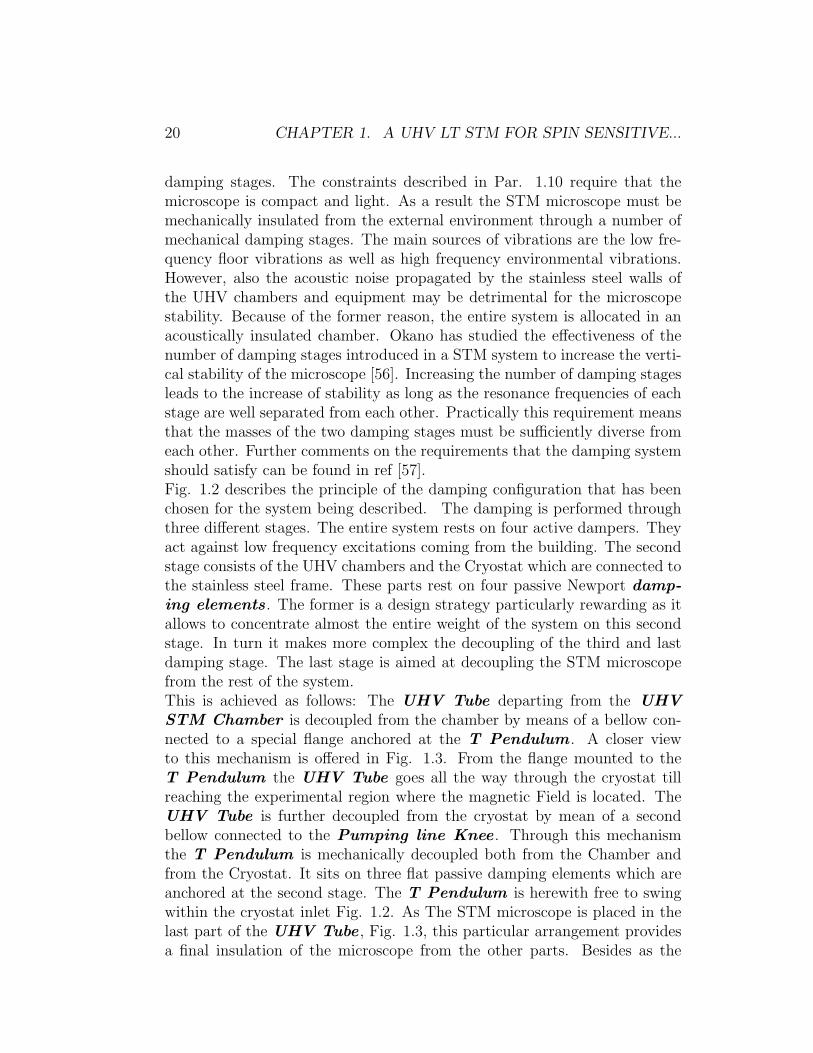
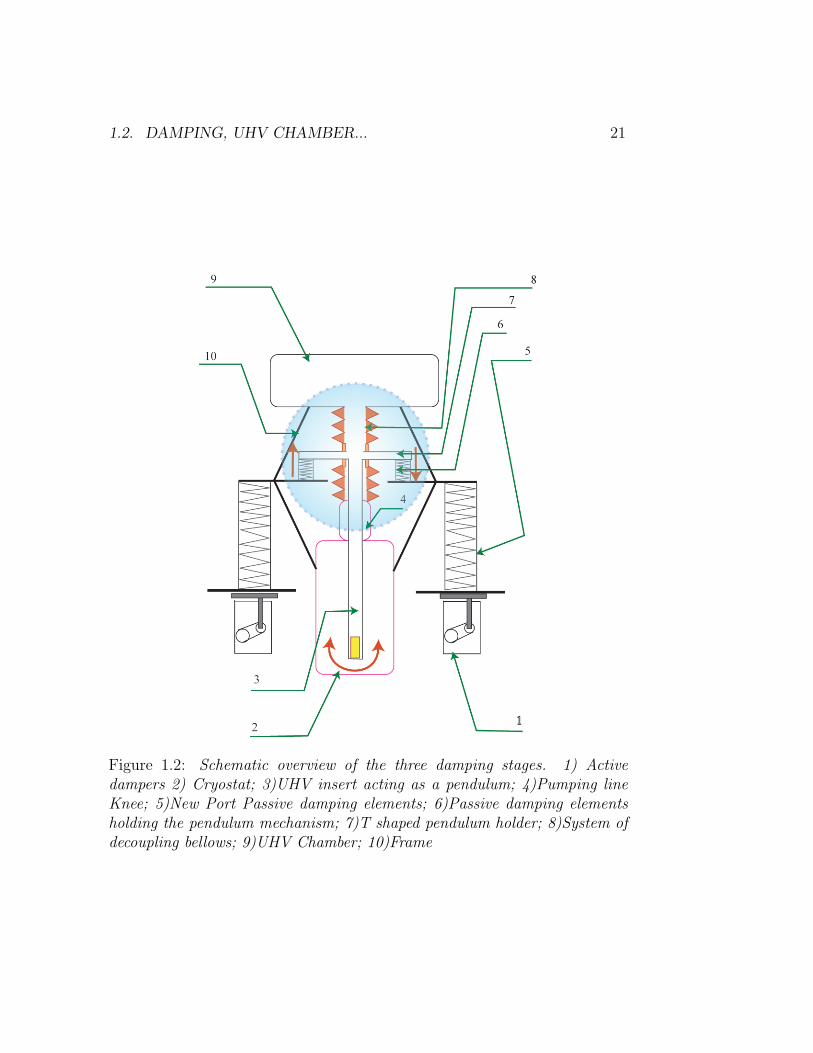
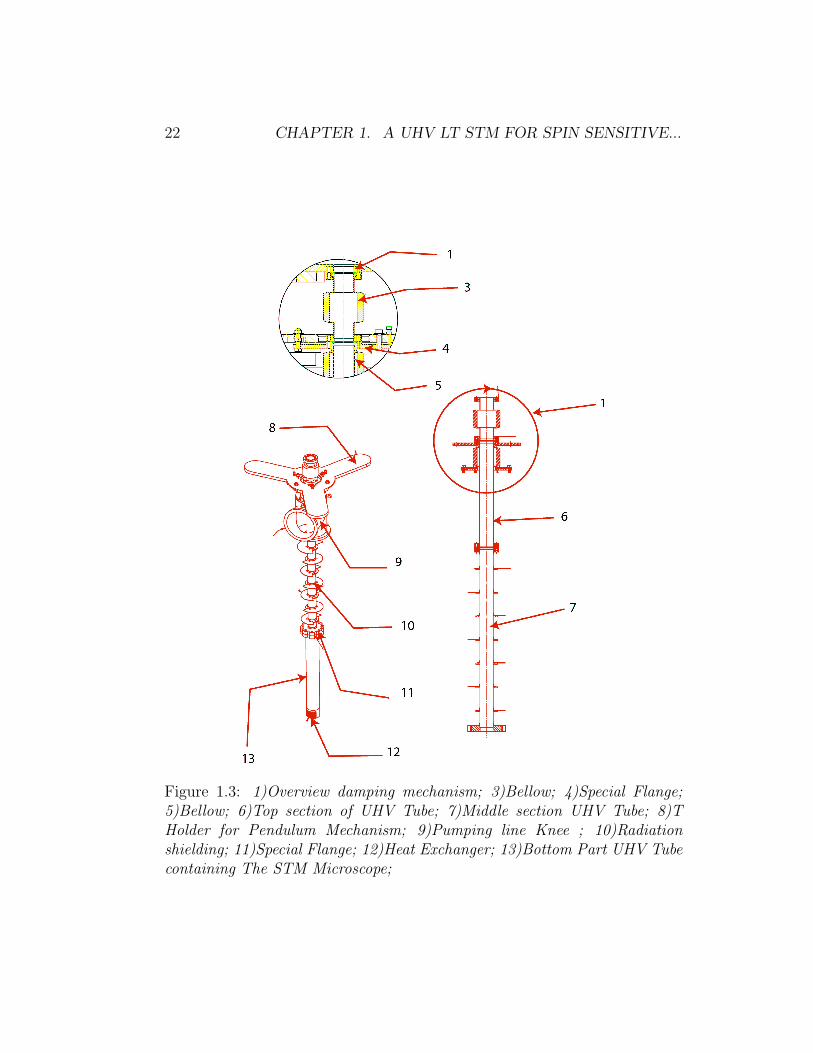
damping stages. The constraints described in Par. 1.10 require that themicroscope is compact and light. As a result the STM microscope must bemechanically insulated from the external environment through a number ofmechanical damping stages. The main sources of vibrations are the low fre-quency floor vibrations as well as high frequency environmental vibrations.However, also the acoustic noise propagated by the stainless steel walls ofthe UHV chambers and equipment may be detrimental for the microscopestability. Because of the former reason, the entire system is allocated in anacoustically insulated chamber. Okano has studied the effectiveness of thenumber of damping stages introduced in a STM system to increase the verti-cal stability of the microscope [56]. Increasing the number of damping stagesleads to the increase of stability as long as the resonance frequencies of eachstage are well separated from each other. Practically this requirement meansthat the masses of the two damping stages must be sufficiently diverse fromeach other. Further comments on the requirements that the damping systemshould satisfy can be found in ref [57].Fig. 1.2 describes the principle of the damping configuration that has beenchosen for the system being described. The damping is performed throughthree different stages. The entire system rests on four active dampers. Theyact against low frequency excitations coming from the building. The secondstage consists of the UHV chambers and the Cryostat which are connected tothe stainless steel frame. These parts rest on four passive Newport damp-ing elements . The former is a design strategy particularly rewarding as itallows to concentrate almost the entire weight of the system on this secondstage. In turn it makes more complex the decoupling of the third and lastdamping stage. The last stage is aimed at decoupling the STM microscopefrom the rest of the system.This is achieved as follows: The UHV Tube departing from the UHVSTM Chamber is decoupled from the chamber by means of a bellow con-nected to a special flange anchored at the T Pendulum . A closer viewto this mechanism is offered in Fig. 1.3. From the flange mounted to theT Pendulum the UHV Tube goes all the way through the cryostat tillreaching the experimental region where the magnetic Field is located. TheUHV Tube is further decoupled from the cryostat by mean of a secondbellow connected to the Pumping line Knee . Through this mechanismthe T Pendulum is mechanically decoupled both from the Chamber andfrom the Cryostat. It sits on three flat passive damping elements which areanchored at the second stage. The T Pendulum is herewith free to swingwithin the cryostat inlet Fig. 1.2. As The STM microscope is placed in thelast part of the UHV Tube , Fig. 1.3, this particular arrangement providesa final insulation of the microscope from the other parts. Besides as the
1.2. DAMPING, UHV CHAMBER... 21
Figure 1.2: Schematic overview of the three damping stages. 1) Activedampers 2) Cryostat; 3)UHV insert acting as a pendulum; 4)Pumping lineKnee; 5)New Port Passive damping elements; 6)Passive damping elementsholding the pendulum mechanism; 7)T shaped pendulum holder; 8)System ofdecoupling bellows; 9)UHV Chamber; 10)Frame
22 CHAPTER 1. A UHV LT STM FOR SPIN SENSITIVE...
Figure 1.3: 1)Overview damping mechanism; 3)Bellow; 4)Special Flange;5)Bellow; 6)Top section of UHV Tube; 7)Middle section UHV Tube; 8)THolder for Pendulum Mechanism; 9)Pumping line Knee ; 10)Radiationshielding; 11)Special Flange; 12)Heat Exchanger; 13)Bottom Part UHV Tubecontaining The STM Microscope;
1.2. DAMPING, UHV CHAMBER... 23
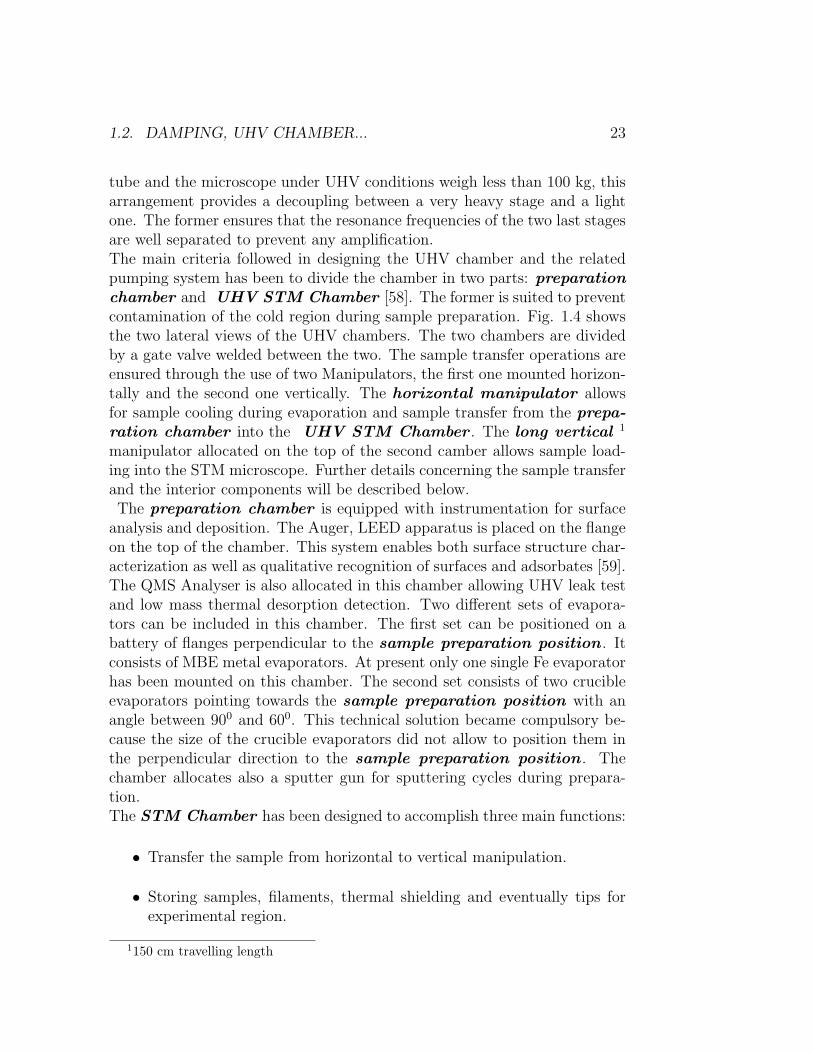
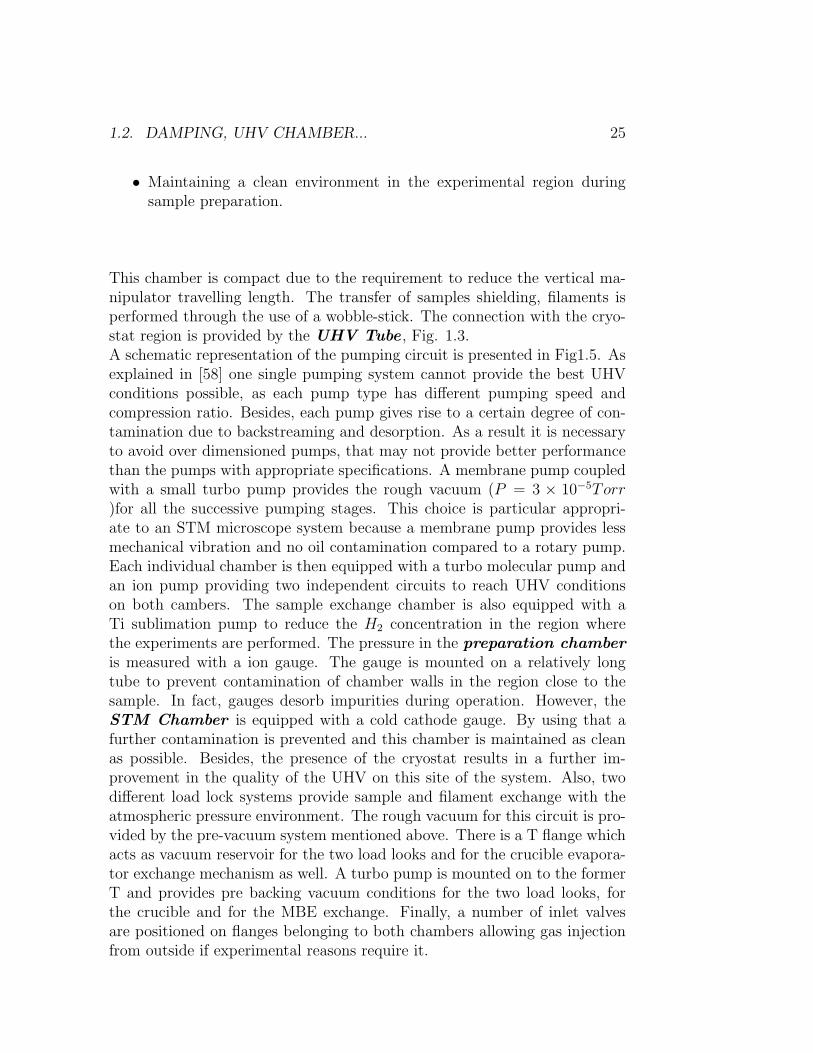
tube and the microscope under UHV conditions weigh less than 100 kg, thisarrangement provides a decoupling between a very heavy stage and a lightone. The former ensures that the resonance frequencies of the two last stagesare well separated to prevent any amplification.The main criteria followed in designing the UHV chamber and the relatedpumping system has been to divide the chamber in two parts: preparationchamber and UHV STM Chamber [58]. The former is suited to preventcontamination of the cold region during sample preparation. Fig. 1.4 showsthe two lateral views of the UHV chambers. The two chambers are dividedby a gate valve welded between the two. The sample transfer operations areensured through the use of two Manipulators, the first one mounted horizon-tally and the second one vertically. The horizontal manipulator allowsfor sample cooling during evaporation and sample transfer from the prepa-ration chamber into the UHV STM Chamber . The long vertical 1
manipulator allocated on the top of the second camber allows sample load-ing into the STM microscope. Further details concerning the sample transferand the interior components will be described below.The preparation chamber is equipped with instrumentation for surface
analysis and deposition. The Auger, LEED apparatus is placed on the flangeon the top of the chamber. This system enables both surface structure char-acterization as well as qualitative recognition of surfaces and adsorbates [59].The QMS Analyser is also allocated in this chamber allowing UHV leak testand low mass thermal desorption detection. Two different sets of evapora-tors can be included in this chamber. The first set can be positioned on abattery of flanges perpendicular to the sample preparation position . Itconsists of MBE metal evaporators. At present only one single Fe evaporatorhas been mounted on this chamber. The second set consists of two crucibleevaporators pointing towards the sample preparation position with anangle between 900 and 600. This technical solution became compulsory be-cause the size of the crucible evaporators did not allow to position them inthe perpendicular direction to the sample preparation position . Thechamber allocates also a sputter gun for sputtering cycles during prepara-tion.The STM Chamber has been designed to accomplish three main functions:
• Transfer the sample from horizontal to vertical manipulation.
• Storing samples, filaments, thermal shielding and eventually tips forexperimental region.
1150 cm travelling length
24 CHAPTER 1. A UHV LT STM FOR SPIN SENSITIVE...
Figure 1.4: Entire microscope 3D drawing. 1)View port; 2)Turbo molecu-lar pump; 3) Vertical manipulator; 4)wobble stick; 5)UHV Tube; 6)Rotat-able carrousel; 7)MBE Evaporator; 8)MBE Evaporator; 9)Crucible Evapora-tor; 10)Crucible Evaporator; 11)Horizontal manipulator; 12)Turbo MolecularPump; 13)Mass Spectra; 14)Sputter Gun; 15)Ion pump; 16)Gas Inlet Valve;17)View Port; 18)Ion Pump and Titanium sublimation pump; 19)Load lock;20)Ion Pump; 21)View port; 22)Ion gauge;
1.2. DAMPING, UHV CHAMBER... 25
• Maintaining a clean environment in the experimental region duringsample preparation.
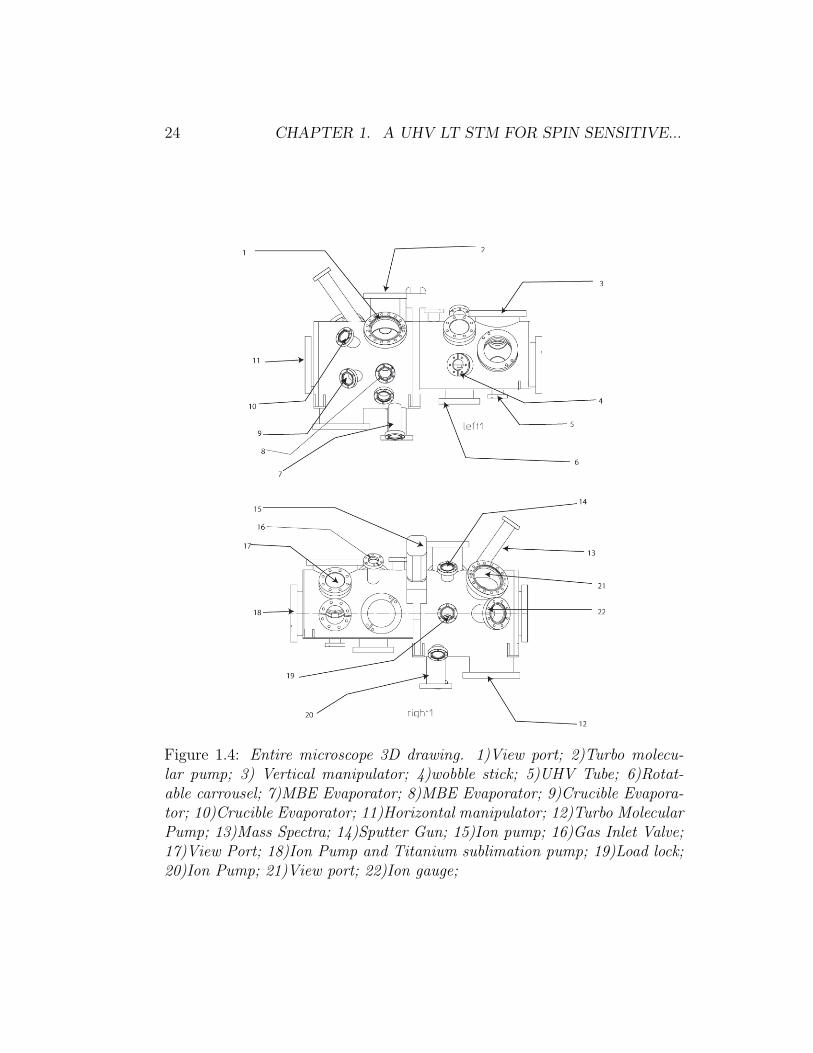
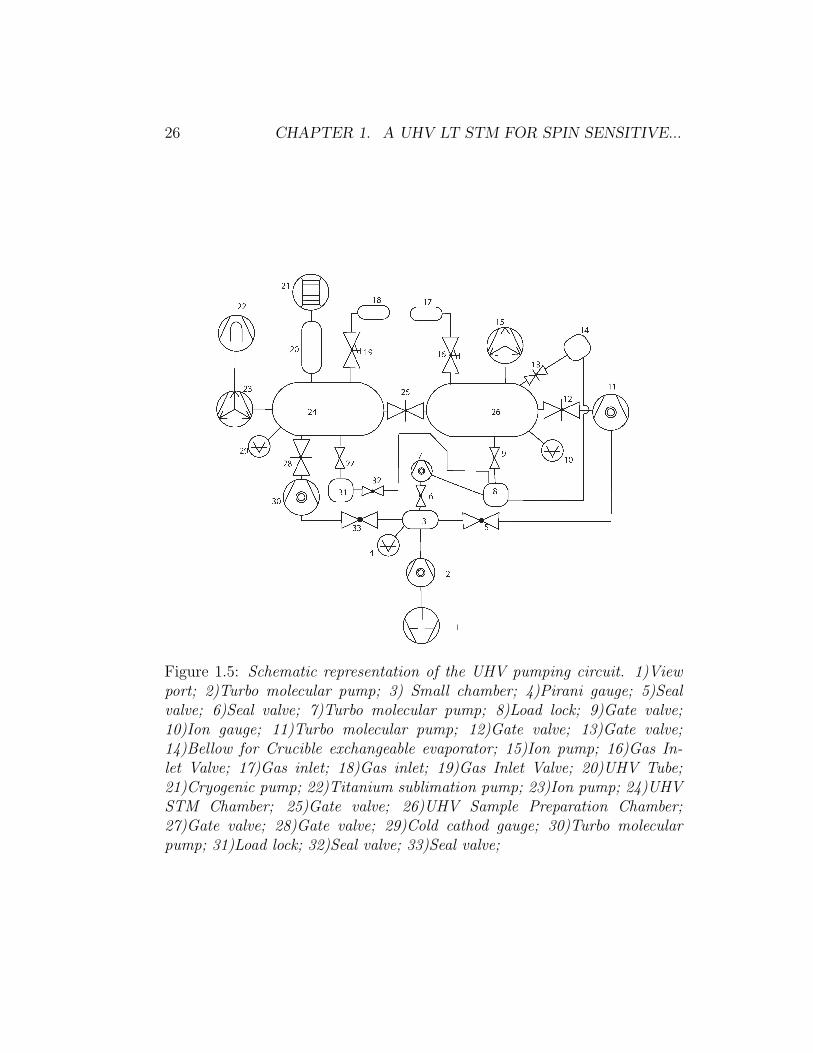
This chamber is compact due to the requirement to reduce the vertical ma-nipulator travelling length. The transfer of samples shielding, filaments isperformed through the use of a wobble-stick. The connection with the cryo-stat region is provided by the UHV Tube , Fig. 1.3.A schematic representation of the pumping circuit is presented in Fig1.5. Asexplained in [58] one single pumping system cannot provide the best UHVconditions possible, as each pump type has different pumping speed andcompression ratio. Besides, each pump gives rise to a certain degree of con-tamination due to backstreaming and desorption. As a result it is necessaryto avoid over dimensioned pumps, that may not provide better performancethan the pumps with appropriate specifications. A membrane pump coupledwith a small turbo pump provides the rough vacuum (P = 3 × 10⁻⁵Torr)for all the successive pumping stages. This choice is particular appropri-ate to an STM microscope system because a membrane pump provides lessmechanical vibration and no oil contamination compared to a rotary pump.Each individual chamber is then equipped with a turbo molecular pump andan ion pump providing two independent circuits to reach UHV conditionson both cambers. The sample exchange chamber is also equipped with aTi sublimation pump to reduce the H2 concentration in the region wherethe experiments are performed. The pressure in the preparation chamberis measured with a ion gauge. The gauge is mounted on a relatively longtube to prevent contamination of chamber walls in the region close to thesample. In fact, gauges desorb impurities during operation. However, theSTM Chamber is equipped with a cold cathode gauge. By using that afurther contamination is prevented and this chamber is maintained as cleanas possible. Besides, the presence of the cryostat results in a further im-provement in the quality of the UHV on this site of the system. Also, twodifferent load lock systems provide sample and filament exchange with theatmospheric pressure environment. The rough vacuum for this circuit is pro-vided by the pre-vacuum system mentioned above. There is a T flange whichacts as vacuum reservoir for the two load looks and for the crucible evapora-tor exchange mechanism as well. A turbo pump is mounted on to the formerT and provides pre backing vacuum conditions for the two load looks, forthe crucible and for the MBE exchange. Finally, a number of inlet valvesare positioned on flanges belonging to both chambers allowing gas injectionfrom outside if experimental reasons require it.
26 CHAPTER 1. A UHV LT STM FOR SPIN SENSITIVE...
Figure 1.5: Schematic representation of the UHV pumping circuit. 1)Viewport; 2)Turbo molecular pump; 3) Small chamber; 4)Pirani gauge; 5)Sealvalve; 6)Seal valve; 7)Turbo molecular pump; 8)Load lock; 9)Gate valve;10)Ion gauge; 11)Turbo molecular pump; 12)Gate valve; 13)Gate valve;14)Bellow for Crucible exchangeable evaporator; 15)Ion pump; 16)Gas In-let Valve; 17)Gas inlet; 18)Gas inlet; 19)Gas Inlet Valve; 20)UHV Tube;21)Cryogenic pump; 22)Titanium sublimation pump; 23)Ion pump; 24)UHVSTM Chamber; 25)Gate valve; 26)UHV Sample Preparation Chamber;27)Gate valve; 28)Gate valve; 29)Cold cathod gauge; 30)Turbo molecularpump; 31)Load lock; 32)Seal valve; 33)Seal valve;
1.3. INTERIOR PARTS SPECIALLY DESIGNED 27
1.3 Interior Parts specially designed
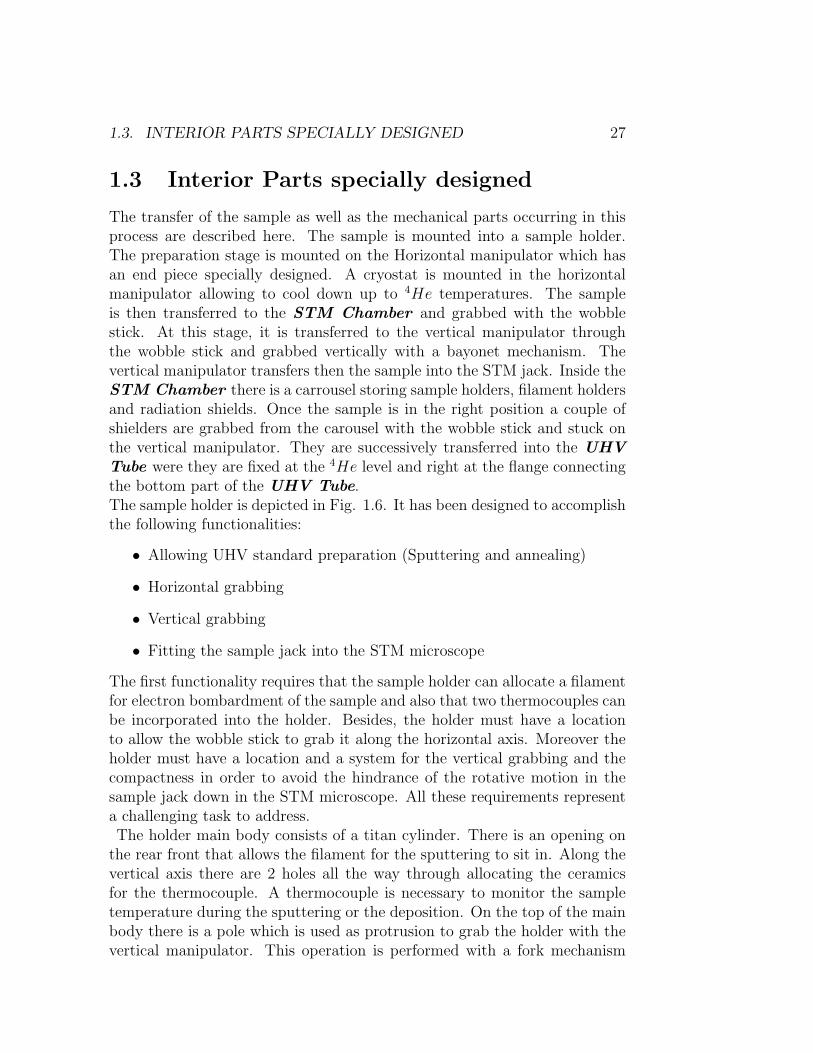
The transfer of the sample as well as the mechanical parts occurring in thisprocess are described here. The sample is mounted into a sample holder.The preparation stage is mounted on the Horizontal manipulator which hasan end piece specially designed. A cryostat is mounted in the horizontalmanipulator allowing to cool down up to 4He temperatures. The sampleis then transferred to the STM Chamber and grabbed with the wobblestick. At this stage, it is transferred to the vertical manipulator throughthe wobble stick and grabbed vertically with a bayonet mechanism. Thevertical manipulator transfers then the sample into the STM jack. Inside theSTM Chamber there is a carrousel storing sample holders, filament holdersand radiation shields. Once the sample is in the right position a couple ofshielders are grabbed from the carousel with the wobble stick and stuck onthe vertical manipulator. They are successively transferred into the UHVTube were they are fixed at the 4He level and right at the flange connectingthe bottom part of the UHV Tube.The sample holder is depicted in Fig. 1.6. It has been designed to accomplishthe following functionalities:
• Allowing UHV standard preparation (Sputtering and annealing)
• Horizontal grabbing
• Vertical grabbing
• Fitting the sample jack into the STM microscope
The first functionality requires that the sample holder can allocate a filamentfor electron bombardment of the sample and also that two thermocouples canbe incorporated into the holder. Besides, the holder must have a locationto allow the wobble stick to grab it along the horizontal axis. Moreover theholder must have a location and a system for the vertical grabbing and thecompactness in order to avoid the hindrance of the rotative motion in thesample jack down in the STM microscope. All these requirements representa challenging task to address.The holder main body consists of a titan cylinder. There is an opening on
the rear front that allows the filament for the sputtering to sit in. Along thevertical axis there are 2 holes all the way through allocating the ceramicsfor the thermocouple. A thermocouple is necessary to monitor the sampletemperature during the sputtering or the deposition. On the top of the mainbody there is a pole which is used as protrusion to grab the holder with thevertical manipulator. This operation is performed with a fork mechanism
28 CHAPTER 1. A UHV LT STM FOR SPIN SENSITIVE...
Figure 1.6: Schematic representation of the sample holder. 1)Bottom holder;2)Sapphire ring (electrical insulation); 3)Sample; 4)Sample holder mainbody; 5)Cleavage for fork mechanism; 6) Guide holes for wobble stick grab-bing; 7)Thermocouple insulation ceramic; 8)Pole for clamping mechanism;9)Screw; 10)Screw ceramic insulation; 11)Opening for filament; 12)Sapphirewash insulating thermocouple; 13)thermocouple;
1.3. INTERIOR PARTS SPECIALLY DESIGNED 29
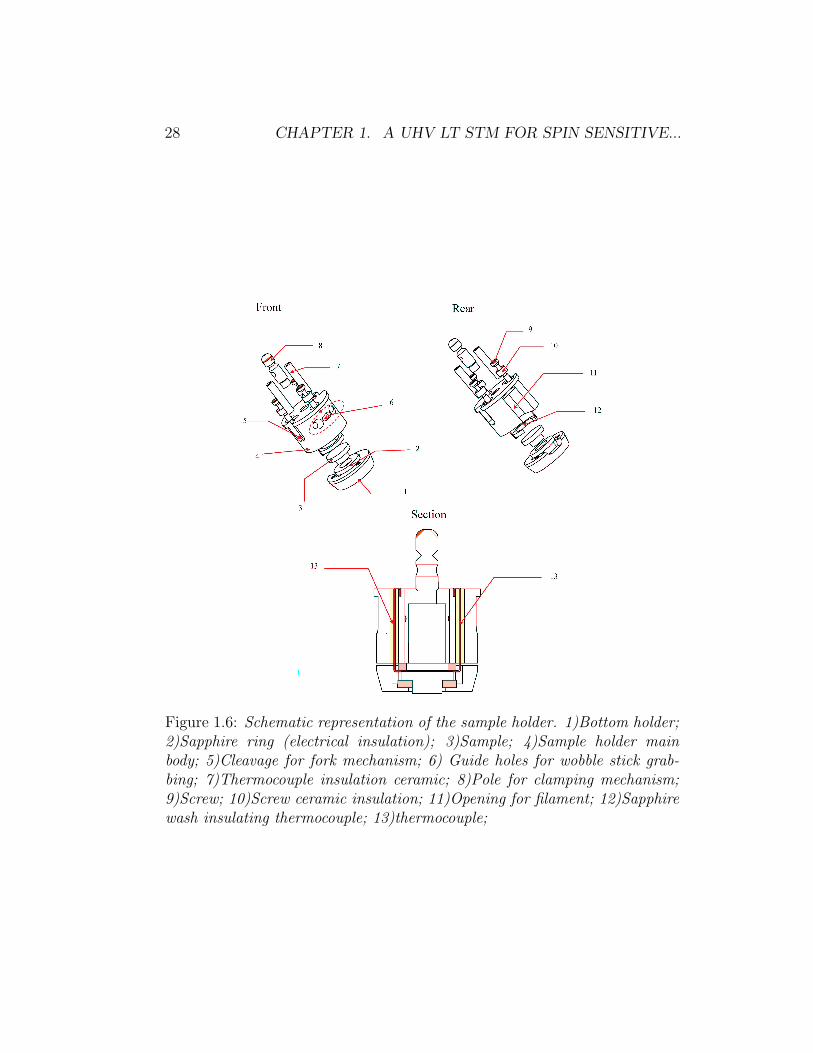
Figure 1.7: 1)Main body; 2)Sample holder; 3)Thermocouple connections area;
described below. The two legs of the fork fit in two cleavages positionedat the main body sides. The bottom part of the holder consists of a conewith an inner slot, designed to allocate the sample. The conic shape is dueto the fact that the entire sample holder must enter the jack into the STMmicroscope being driven by a long manipulator. This operation is performedwithout visual control from the operator and therefore it is requested a selfcentering mechanism which is provided by the conical shape of the bottompart of the sample holder alongside the bottom part of the jack hole. Thesample has the shape of a hat stuck one to one another.
The sample preparation stage is illustrated in Fig. 1.7. It has been de-signed for allowing annealing, sputtering and cooling operations. The designstrongly depends on the sample holder shape which is imposed by the con-straints enumerated above. The main body is built in copper and mounted
30 CHAPTER 1. A UHV LT STM FOR SPIN SENSITIVE...
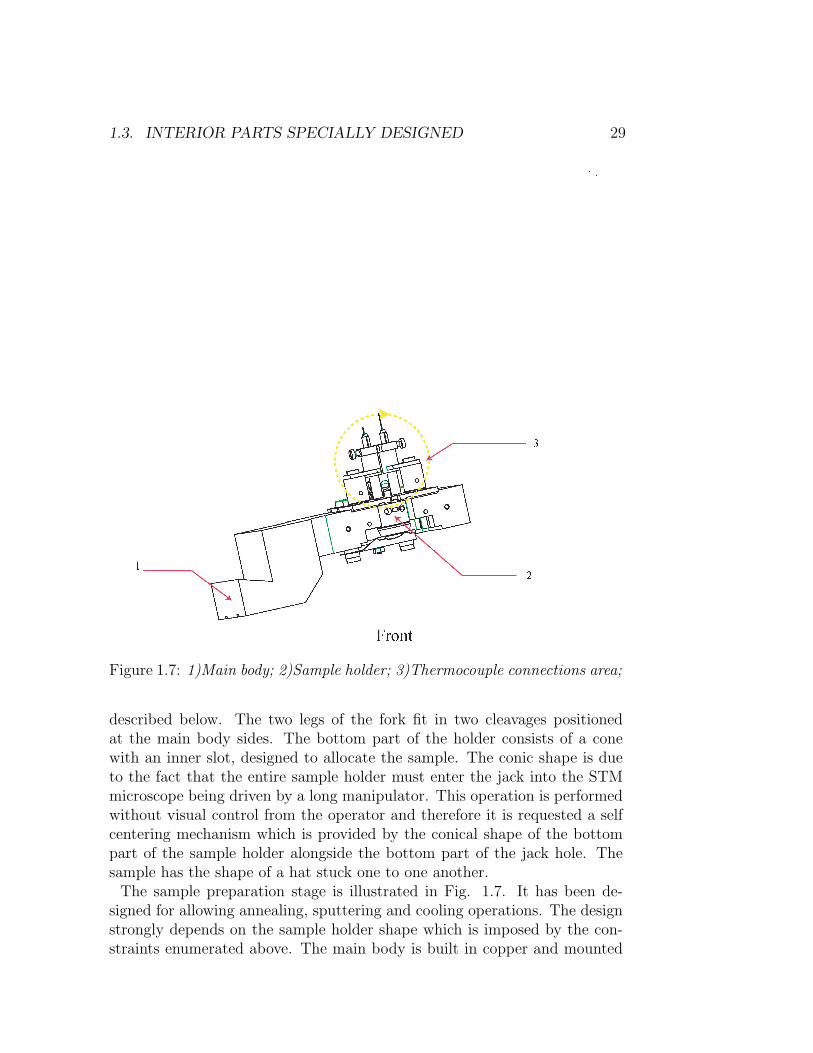
Figure 1.8: Vertical manipulator final part. 1)Connection to the verticalmanipulator; 2)System for sample holder fine positioning; 3)Damper Mecha-nism frame; 4)Damper mechanism slide; 5)bayonet system; 6)Fork; 7)Sampleholder;
on the horizontal bar. The sample holder is fit into a special overture. Onthe rear front there is a system, which holds the filament, and a stop. Thestop prevents the filament from being damaged during the sample load op-eration. The high voltage is applied through a plate mounted underneaththe main body. The temperature is measured through a contact to the twothermocouple on the top of the sample holder.The transfer along the vertical direction is performed by the vertical manip-
ulator whose last part is illustrated in Fig. 1.8. The part is insulated by themain bar by a piece of teflon. Following the latter there is a system whichallows the final part to slide backwards and damp pushes against the STMmicroscope. The damper consists of three poles on which three springs are
1.3. INTERIOR PARTS SPECIALLY DESIGNED 31
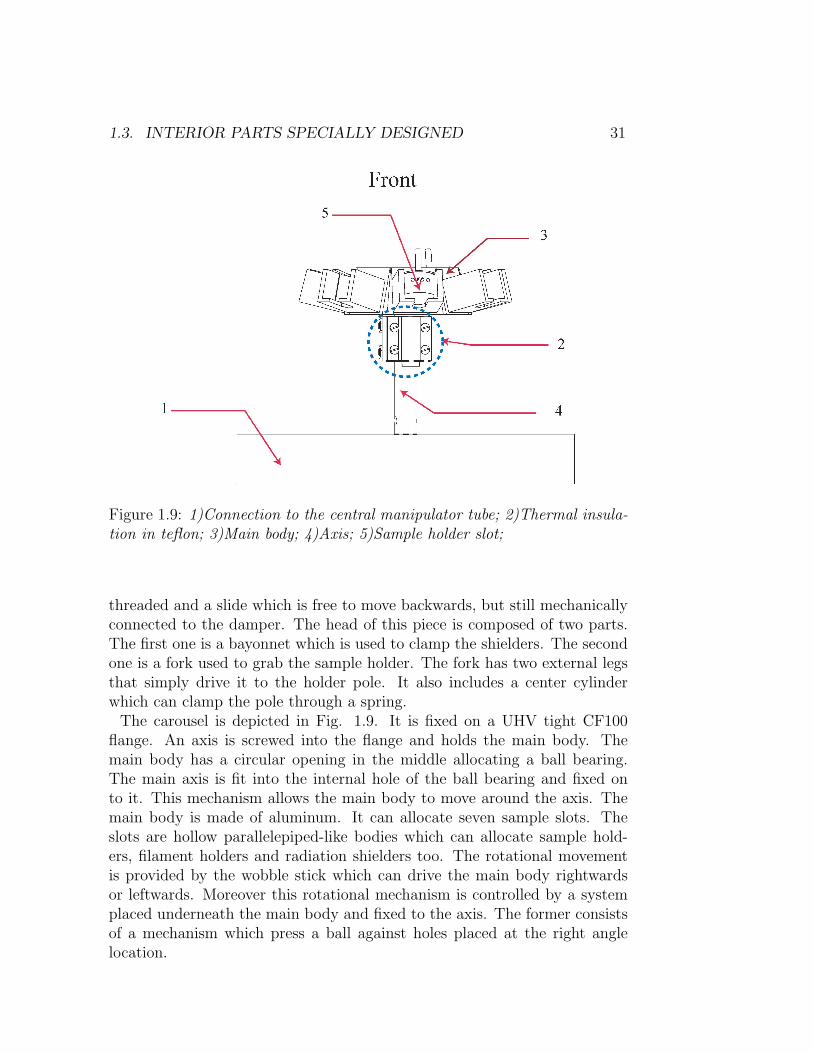
Figure 1.9: 1)Connection to the central manipulator tube; 2)Thermal insula-tion in teflon; 3)Main body; 4)Axis; 5)Sample holder slot;
threaded and a slide which is free to move backwards, but still mechanicallyconnected to the damper. The head of this piece is composed of two parts.The first one is a bayonnet which is used to clamp the shielders. The secondone is a fork used to grab the sample holder. The fork has two external legsthat simply drive it to the holder pole. It also includes a center cylinderwhich can clamp the pole through a spring.
The carousel is depicted in Fig. 1.9. It is fixed on a UHV tight CF100flange. An axis is screwed into the flange and holds the main body. Themain body has a circular opening in the middle allocating a ball bearing.The main axis is fit into the internal hole of the ball bearing and fixed onto it. This mechanism allows the main body to move around the axis. Themain body is made of aluminum. It can allocate seven sample slots. Theslots are hollow parallelepiped-like bodies which can allocate sample hold-ers, filament holders and radiation shielders too. The rotational movementis provided by the wobble stick which can drive the main body rightwardsor leftwards. Moreover this rotational mechanism is controlled by a systemplaced underneath the main body and fixed to the axis. The former consistsof a mechanism which press a ball against holes placed at the right anglelocation.
32 CHAPTER 1. A UHV LT STM FOR SPIN SENSITIVE...
1.4 Microscope
The design of the STM Microscope must match a number of requirementswhich are listed below.
1. Mechanical stability
2. Thermal stability and homogeneity
3. Space availability
4. UHV compatibility
The perfect microscope is as mechanically rigid as possible. This means thatthe best design would be a single piece STM as heavy as possible [48]. Thisis obviously not feasible under the constrain of UHV and low temperaturecompatibility. A realistic microscope will be composed of many parts includ-ing a number of vibrational modes which must be damped.The thermal stability of the microscope is crucial to the quality of the scannedimages. Besides, the lower the temperature the lower the thermal broadeningof the tip and sample electronic levels. This improves the energy resolutionin STS measurements. Also if tip and sample are at the same temperaturethe effect of thermal voltage across the tunnelling junction is minimized. Forthe former two reasons it is important to ensure that tip and sample have thesame temperature. This is a challenging requirement as the tip is mountedon a electromechanical mechanism which ensures mechanical motion and thesample is mounted on an holder which must satisfy different constraints 1.3.The two parts have different functionalities requiring different mechanicaldesign and materials. The former reveals to be a major problem in ensuringthe same heat transfer to the sample and the tip. In fact the limiting param-eters which affect the transfer of heat through different pieces are the typeof interface and the number of interfaces [60, 61, 62, 63]. The mechanicaland electrical functionalities of the sample and the tip are different implyinga different number of interfaces in the two cases as well as the demand fordifferent materials. The difference in the materials used turns in to differentthermal interfaces.The compatibility with the Cryogenic environment requires a compact de-sign as the amount of space available for the microscope and the electricalconnections connected to it is limited.A further constrain to the choice of materials to be adopted is representedby the UHV conditions under which the microscope is supposed to operate.All materials used must stand baking temperatures and they must have alow vapor pressure [58].
1.4. MICROSCOPE 33
Besides, the overall design of the microscope including mechanical function-alities and electrical connections should be reliable in order to allow a longoperational time before maintenance.Moreover, some special requirements have to be satisfied in order to matchthe initial goals of this system.
1. Scanning area
2. Atomic deposition at low temperature
3. Magnetic compatibility
4. Easy sample loading
The design of the STM depends on the scanning area required. In thiscase as the system was mostly thought for atomic manipulation and localspectroscopy on single adsorbates a large scanning area is not a stringentrequirement though still a good asset.A special requirement of this system is the possibility to deposit atoms atlow temperature while the sample is in the experimental area on the bottomof the UHV Tube . This requirement has a deep impact on the microscopedesign.The presence of the 14 T magnetic field is necessary to avoid ferromagneticmaterials in all the experimental area and superconductors right close to thesample position. If a ferromagnet was magnetized in the experimental region,the remanence field would be enough to affect the magnetization of singleadsorbates in the experimental area. The use of superconductors may leadto unexpected movements during scanning in presence of a magnetic field.As last requirement, one needs an easy sample loading. This point is quiteimportant as the microscope is located in a region which is not accessibleto any view port. Moreover the long manipulator does not offer the samemechanical sensitivity that a shorter one can do. This means that the controlof the sample positioning is problematic and therefore the loading systemshould be as effective and simple as possible. However, this requirementmust fit the other requirements listed above, particularly the availabilityof a sample position for atomic deposition at low T. As we opted for arotary sample holder, the allocation of the sample into the holder becomesproblematic, because a rough movement could severely damage the rotarymechanism (described below).
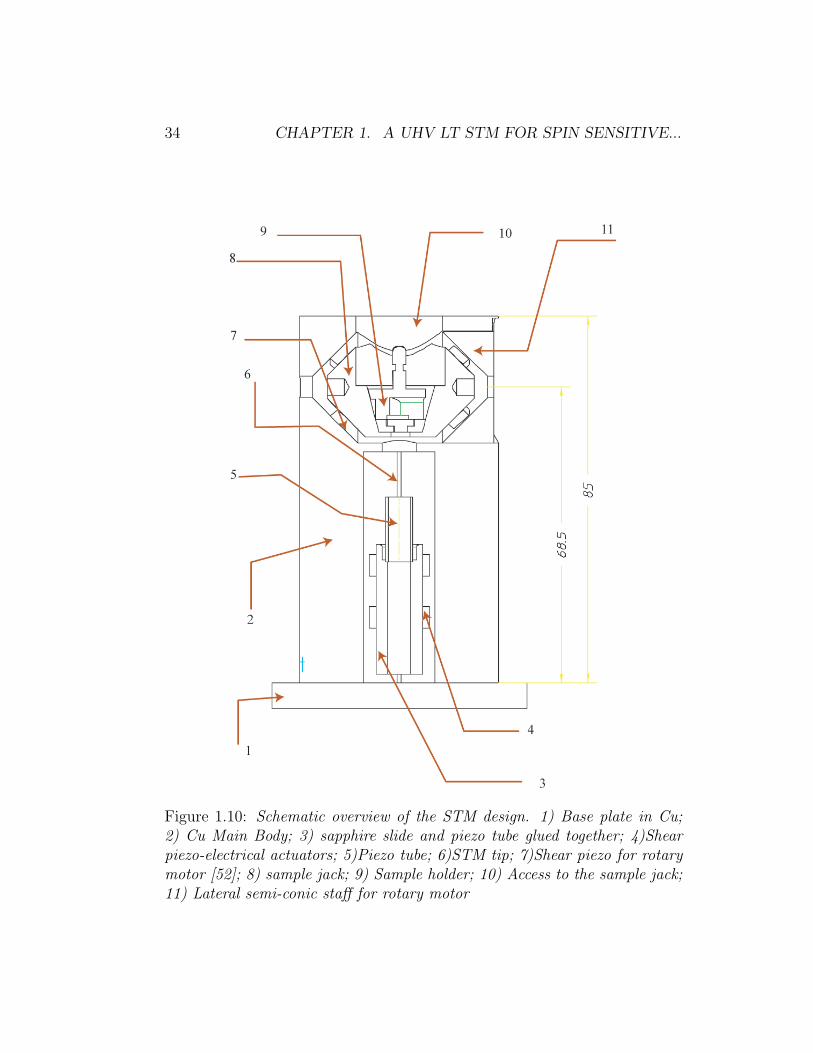
Considering all these requirements we opted for a vertical STM with arotative mechanism for the sample holder. The basic idea worked out for themicroscope is related to the design mentioned in [52]. Fig. 1.10 illustrates a
34 CHAPTER 1. A UHV LT STM FOR SPIN SENSITIVE...
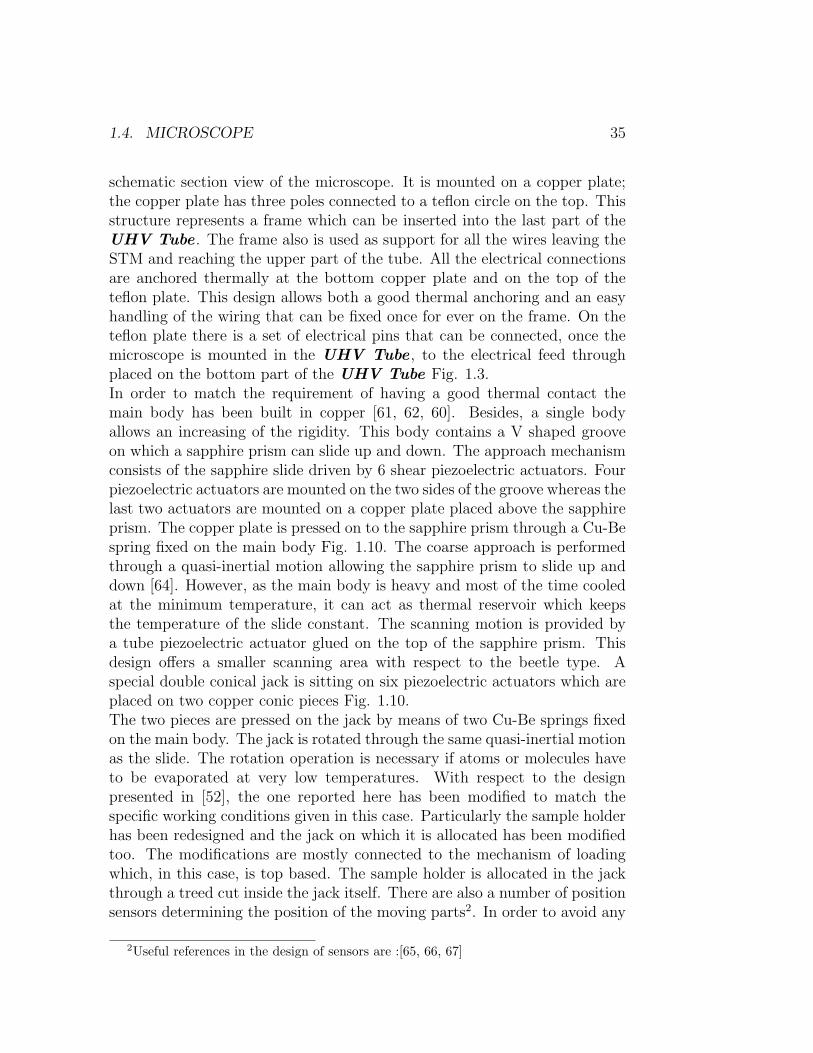
Figure 1.10: Schematic overview of the STM design. 1) Base plate in Cu;2) Cu Main Body; 3) sapphire slide and piezo tube glued together; 4)Shearpiezo-electrical actuators; 5)Piezo tube; 6)STM tip; 7)Shear piezo for rotarymotor [52]; 8) sample jack; 9) Sample holder; 10) Access to the sample jack;11) Lateral semi-conic staff for rotary motor
1.4. MICROSCOPE 35
schematic section view of the microscope. It is mounted on a copper plate;the copper plate has three poles connected to a teflon circle on the top. Thisstructure represents a frame which can be inserted into the last part of theUHV Tube . The frame also is used as support for all the wires leaving theSTM and reaching the upper part of the tube. All the electrical connectionsare anchored thermally at the bottom copper plate and on the top of theteflon plate. This design allows both a good thermal anchoring and an easyhandling of the wiring that can be fixed once for ever on the frame. On theteflon plate there is a set of electrical pins that can be connected, once themicroscope is mounted in the UHV Tube , to the electrical feed throughplaced on the bottom part of the UHV Tube Fig. 1.3.In order to match the requirement of having a good thermal contact themain body has been built in copper [61, 62, 60]. Besides, a single bodyallows an increasing of the rigidity. This body contains a V shaped grooveon which a sapphire prism can slide up and down. The approach mechanismconsists of the sapphire slide driven by 6 shear piezoelectric actuators. Fourpiezoelectric actuators are mounted on the two sides of the groove whereas thelast two actuators are mounted on a copper plate placed above the sapphireprism. The copper plate is pressed on to the sapphire prism through a Cu-Bespring fixed on the main body Fig. 1.10. The coarse approach is performedthrough a quasi-inertial motion allowing the sapphire prism to slide up anddown [64]. However, as the main body is heavy and most of the time cooledat the minimum temperature, it can act as thermal reservoir which keepsthe temperature of the slide constant. The scanning motion is provided bya tube piezoelectric actuator glued on the top of the sapphire prism. Thisdesign offers a smaller scanning area with respect to the beetle type. Aspecial double conical jack is sitting on six piezoelectric actuators which areplaced on two copper conic pieces Fig. 1.10.The two pieces are pressed on the jack by means of two Cu-Be springs fixedon the main body. The jack is rotated through the same quasi-inertial motionas the slide. The rotation operation is necessary if atoms or molecules haveto be evaporated at very low temperatures. With respect to the designpresented in [52], the one reported here has been modified to match thespecific working conditions given in this case. Particularly the sample holderhas been redesigned and the jack on which it is allocated has been modifiedtoo. The modifications are mostly connected to the mechanism of loadingwhich, in this case, is top based. The sample holder is allocated in the jackthrough a treed cut inside the jack itself. There are also a number of positionsensors determining the position of the moving parts2. In order to avoid any
2Useful references in the design of sensors are :[65, 66, 67]
36 CHAPTER 1. A UHV LT STM FOR SPIN SENSITIVE...
unexpected magnetization effects sample holder and sample jack have beenbuilt in Ti.
1.5 Cryostat and Refrigeration
The choice of the refrigeration system [68, 69] for the instrument affects theentire design. There are a number of parameters [70]that have to be takeninto account including:
• Cooling time
• Cooling power
• Temperature range
• Temperature stability
• Total power input
• Vibration
The low temperature UHV STM microscope available are mostly workingdown to temperature as low as 4 K [57, 52, 71, 72, 73]. However, the aimof this project is to reach temperature below 1 K. The STM microscope isan instrument which must be connected to the external world. The numberof electrical connections it has, represents a source of heat leaks. Thereforethe cryogenic cycle cooling power should take into account the relative highamount of cooling power required below 1 K. The requirement of workingunder UHV conditions implies that the standard baking procedure could beaccomplished. The vibration of the cryostat are crucial to other parts of thedesign as the STM microscope should be mechanically insulated from theexternal environment. Finally, also the cost of the cryostat itself is relevant.There are two main different types of refrigeration cycles: open cycle andclosed cycle [70]. In the open cycles the refrigerant is used to run a par-ticular thermodynamic transformation after which it is lost in the open air.Open cycles are cryogenic refrigerant consuming i.e. He4 bath. Closed cycleschemes use the same amount of refrigerant which undergoes a particularthermodynamic cycle. Closed cycle may imply complex construction thatalong with other requirements of the system construction may make theoverall design quite complex. As far as open cycle cryostats are concernedone possibility to reach temperatures below 4K is a pumped 4He cryostat.This type of cryostat is He consuming and the cooling power drops below 1.2
1.5. CRYOSTAT AND REFRIGERATION 37
K as surperfluidity sets in. N2 vessel may be required to reduce the radiationheat reaching the 4He bath. Such vessel would subsequently increase vibra-tions noise related to the N2 boil off. There are examples of STM constructedusing this type of cryostat [57], though from time to time operation must beinterrupted in order to enable the pumping of N2.3He sorption cryostat are also capable to reach the range of interesting tem-peratures. Such type of cryostat are commercially available. Neverthelessthey require 3 vessels N2/He4/He3. The former makes the design expensiveand complex to be combined with UHV requirements and particularly withthe possibility to back up the system at temperatures as high as 150 0C orhigher. The Cooling power of this refrigerator would be few mW (2-5) at 0.5K.Another cryogenic cooling scheme able to reach temperature below 1K is di-lution refrigeration. The dilution refrigerator uses a mixture of 3He −4 Heand the internal constructive details are complex [70]. They provide up to2 mW cooling power at 100 mK. Their price is high. It also increases ifthe construction of the cryostat has to be modified to include a 4He bathspecially designed to host a superconductive magnet. The number of opera-tion to perform before operating the microscope would lead to a substantialrise in temperature because of irradiation and thermal contact with partscoming from the UHV area. Particularly, inserting the sample into the STMand depositing atoms would require the radiation shields to be removed andthe cold area to warm up. As the thermal mass of the STM is bigger thannormal sample mass in very low temperature experiments, warming up thecold region may lead to long cooling times before the experimental regionrecovers the lowest operational temperature. In order to understand this,the following simplified formula can be considered3:
∆t =mCp
∆W·∆T (1.1)
• Cp = sample specific heat
• m = sample mass
• ∆W = Wrefrigeration-Wheatleak
In order to improve speed in operating the microscope a high cooling poweris consequently required. There are a number of static closed cycles that
3The problem is actually more complex. The conductivity of the sample and thedifferent thermal resistances should be considered. The interested reader is referred to[74]
38 CHAPTER 1. A UHV LT STM FOR SPIN SENSITIVE...
may be used to achieve temperature in the range of interest such as adia-batic demagnetization, and thermoelectric refrigeration which require a cer-tain experience in the design and handling of the system [63, 70]. A simpleway of reaching temperatures below 4K is to perform a Joule-Thompsonexpansion[75, 76] using either 3He or 4He. If 4He it is possible to reachtemperatures around 2.2 K with a relative little effort. However, for reachinglower temperatures it is advisable to use 3He to prevent the superfluid tran-sition in 4He and related problems. The former refrigerant is expensive andtherefore the refrigeration cycle must be non regenerative to avoid loss ofrefrigerant.3He Joule-Thompson has been proven to provide cooling power as high as200 mW at 1.5 K using a flow of 7lmin−1[77, 78]. In this case the authorsprovide a design which is based on a N2-
4He pre-cooling stage of 3He. Thedesign relies on a Joule-Thompson expansion needle which lets the refriger-ant into the expansion chamber. The cryostat is proven to work well alsowithout N2 pre-cooling stage, simplifying then drastically the design.For these reasons we opted for a Joule-Thompson expansion performed ina normal super insulated 4He cryostat equipped with a 14T magnet. Themicroscope is allocated into a UHV tube which goes through the Cryostatopening. The STM microscope is top loaded. The expansion is performed inthe interspace between the tube and the Cryostat walls fig 1.17.This technicalchoice allows high cooling power around 1K and therefore a better perfor-mances in the cooling time. For the temperature range between 0.5 K and1.5 the cooling power provided from this cooling method is among the bestperformance possible. The vibration insulation is necessary as the refriger-ant must be compressed before expansion but, a number of different solutionsmay be adopted and this will be described in the 1.2. The temperature sta-bility of this method is good and furthermore if 3He is liquefied, the cyclecan be switched off for some hours. The maintenance is relativity easy as thecomplexity of the entire refrigeration apparatus is reduced. Standard UHVbaking procedures are also simplified as described in paragraph 1.2. Finally,the cost of such a system is kept relativity low as only the super insulated4He Cryostat must be purchased from sailer.In order to understand how the refrigeration is performed it is necessary to
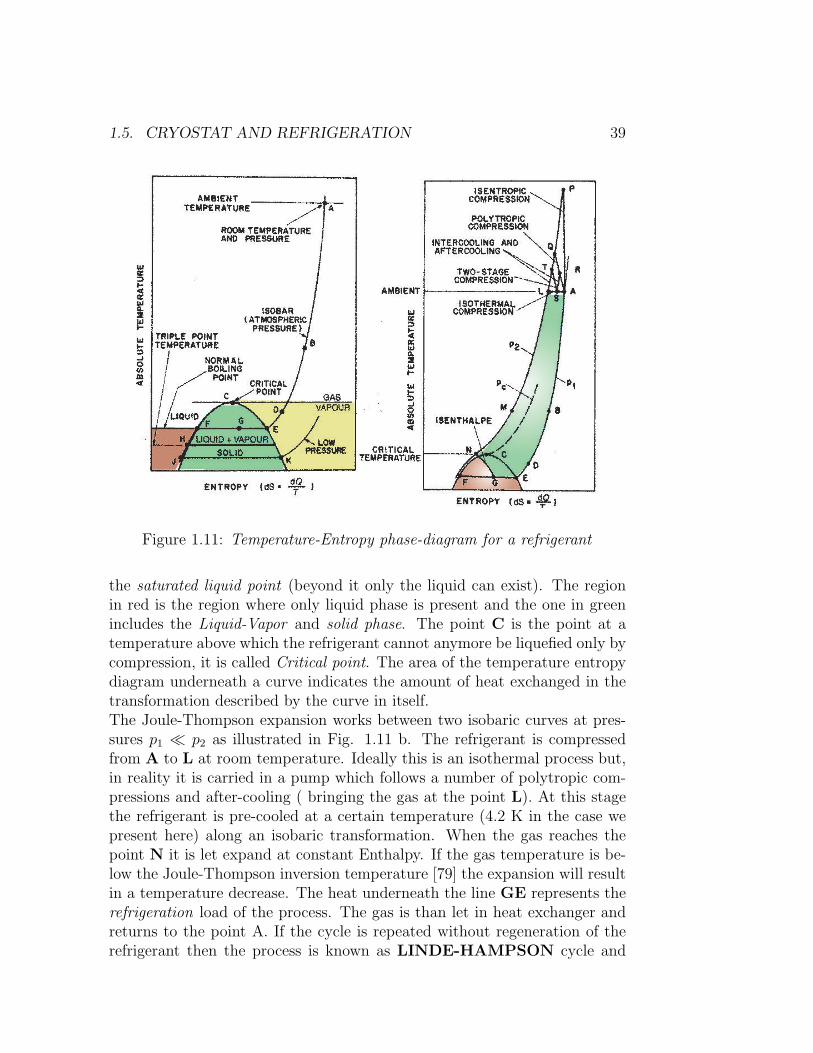
recall briefly few concepts of thermodynamics. In Fig 1.11 the temperatureentropy phase diagram for a typical refrigerant such as 4He, 3He, N2, O2
is illustrated. The point A represents the room temperature conditions forthe refrigerant. The curve AE represents an isobaric transformation fromroom temperature to the liquefaction temperature at atmospheric pressure.When the refrigerant reaches D it becomes vapor. Along the line EF liquidand vapor coexist and E represents the saturated vapor point whereas F is
1.5. CRYOSTAT AND REFRIGERATION 39
Figure 1.11: Temperature-Entropy phase-diagram for a refrigerant
the saturated liquid point (beyond it only the liquid can exist). The regionin red is the region where only liquid phase is present and the one in greenincludes the Liquid-Vapor and solid phase. The point C is the point at atemperature above which the refrigerant cannot anymore be liquefied only bycompression, it is called Critical point. The area of the temperature entropydiagram underneath a curve indicates the amount of heat exchanged in thetransformation described by the curve in itself.The Joule-Thompson expansion works between two isobaric curves at pres-sures p1 ¿ p2 as illustrated in Fig. 1.11 b. The refrigerant is compressedfrom A to L at room temperature. Ideally this is an isothermal process but,in reality it is carried in a pump which follows a number of polytropic com-pressions and after-cooling ( bringing the gas at the point L). At this stagethe refrigerant is pre-cooled at a certain temperature (4.2 K in the case wepresent here) along an isobaric transformation. When the gas reaches thepoint N it is let expand at constant Enthalpy. If the gas temperature is be-low the Joule-Thompson inversion temperature [79] the expansion will resultin a temperature decrease. The heat underneath the line GE represents therefrigeration load of the process. The gas is than let in heat exchanger andreturns to the point A. If the cycle is repeated without regeneration of therefrigerant then the process is known as LINDE-HAMPSON cycle and
40 CHAPTER 1. A UHV LT STM FOR SPIN SENSITIVE...
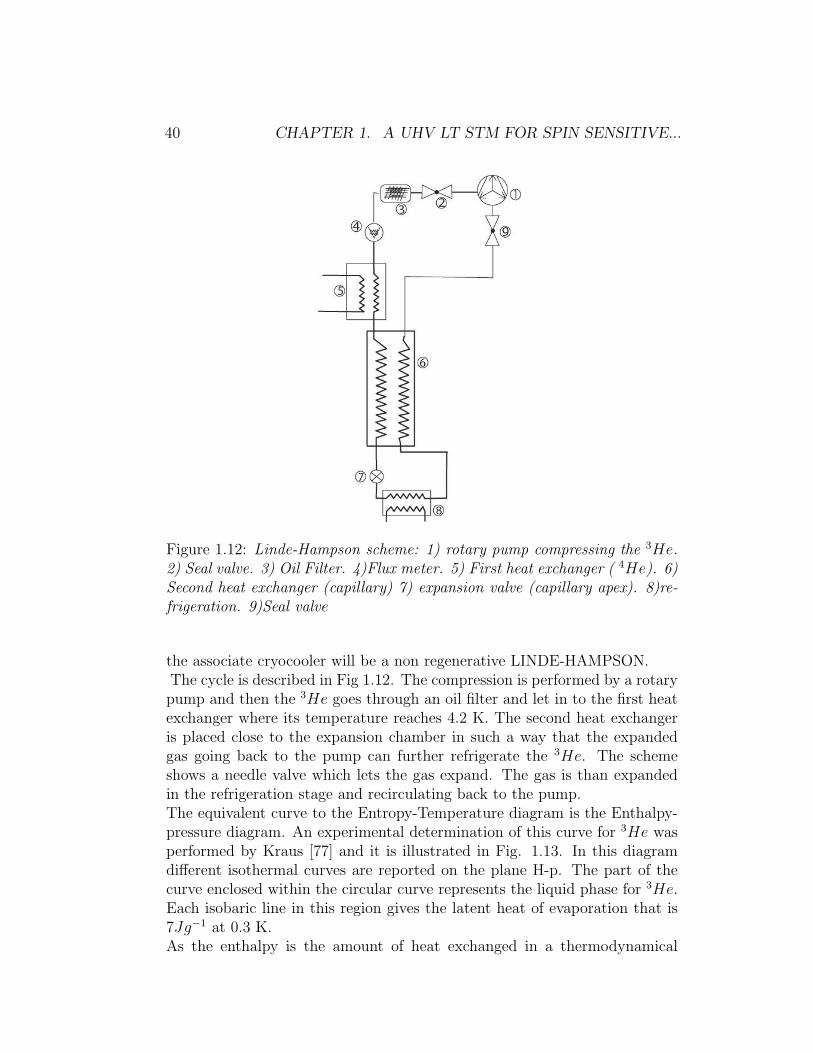
Figure 1.12: Linde-Hampson scheme: 1) rotary pump compressing the 3He.2) Seal valve. 3) Oil Filter. 4)Flux meter. 5) First heat exchanger ( 4He). 6)Second heat exchanger (capillary) 7) expansion valve (capillary apex). 8)re-frigeration. 9)Seal valve
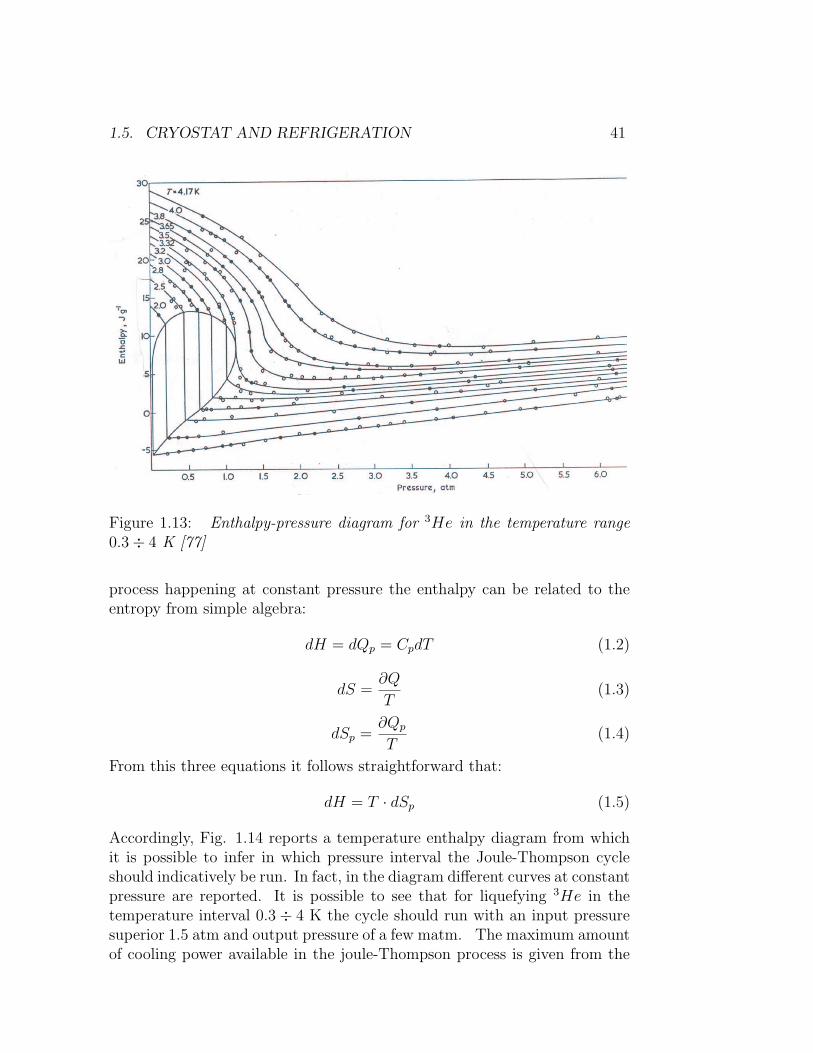
the associate cryocooler will be a non regenerative LINDE-HAMPSON.The cycle is described in Fig 1.12. The compression is performed by a rotarypump and then the 3He goes through an oil filter and let in to the first heatexchanger where its temperature reaches 4.2 K. The second heat exchangeris placed close to the expansion chamber in such a way that the expandedgas going back to the pump can further refrigerate the 3He. The schemeshows a needle valve which lets the gas expand. The gas is than expandedin the refrigeration stage and recirculating back to the pump.The equivalent curve to the Entropy-Temperature diagram is the Enthalpy-pressure diagram. An experimental determination of this curve for 3He wasperformed by Kraus [77] and it is illustrated in Fig. 1.13. In this diagramdifferent isothermal curves are reported on the plane H-p. The part of thecurve enclosed within the circular curve represents the liquid phase for 3He.Each isobaric line in this region gives the latent heat of evaporation that is7Jg−1 at 0.3 K.As the enthalpy is the amount of heat exchanged in a thermodynamical
1.5. CRYOSTAT AND REFRIGERATION 41
Figure 1.13: Enthalpy-pressure diagram for 3He in the temperature range0.3÷ 4 K [77]
process happening at constant pressure the enthalpy can be related to theentropy from simple algebra:
dH = dQp = CpdT (1.2)
dS =∂Q
T(1.3)
dSp =∂Qp
T(1.4)
From this three equations it follows straightforward that:
dH = T · dSp (1.5)
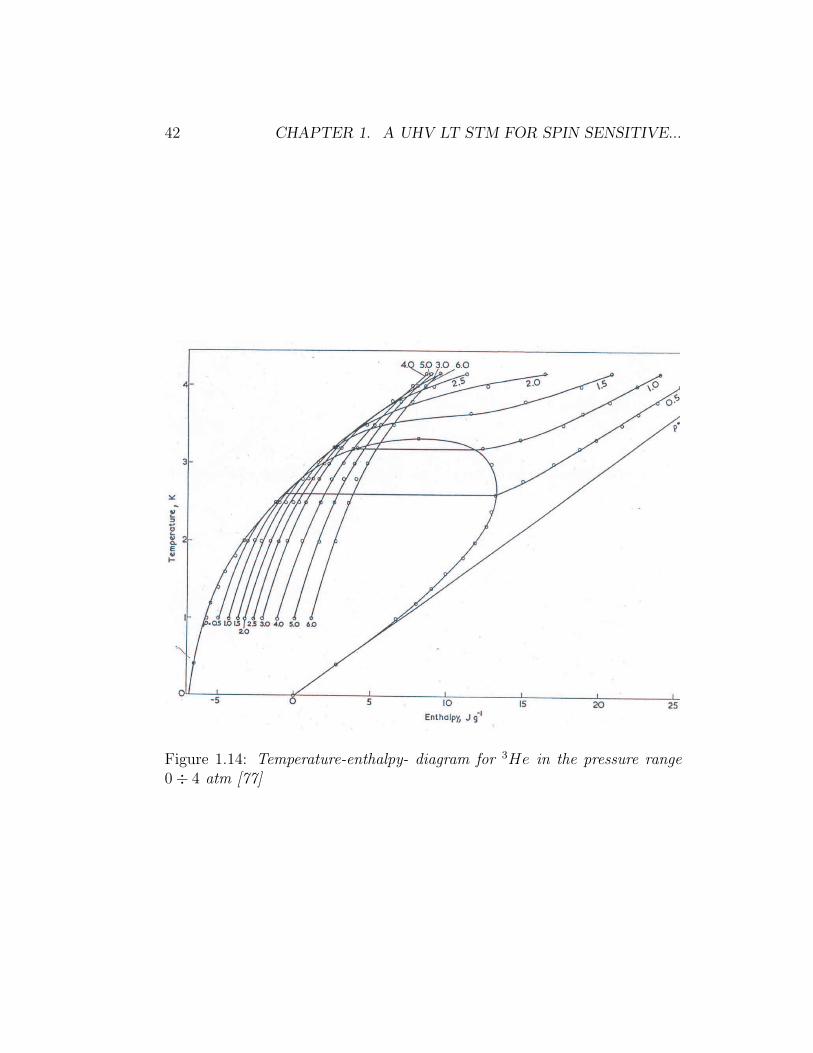
Accordingly, Fig. 1.14 reports a temperature enthalpy diagram from whichit is possible to infer in which pressure interval the Joule-Thompson cycleshould indicatively be run. In fact, in the diagram different curves at constantpressure are reported. It is possible to see that for liquefying 3He in thetemperature interval 0.3 ÷ 4 K the cycle should run with an input pressuresuperior 1.5 atm and output pressure of a few matm. The maximum amountof cooling power available in the joule-Thompson process is given from the
42 CHAPTER 1. A UHV LT STM FOR SPIN SENSITIVE...
Figure 1.14: Temperature-enthalpy- diagram for 3He in the pressure range0÷ 4 atm [77]
1.5. CRYOSTAT AND REFRIGERATION 43
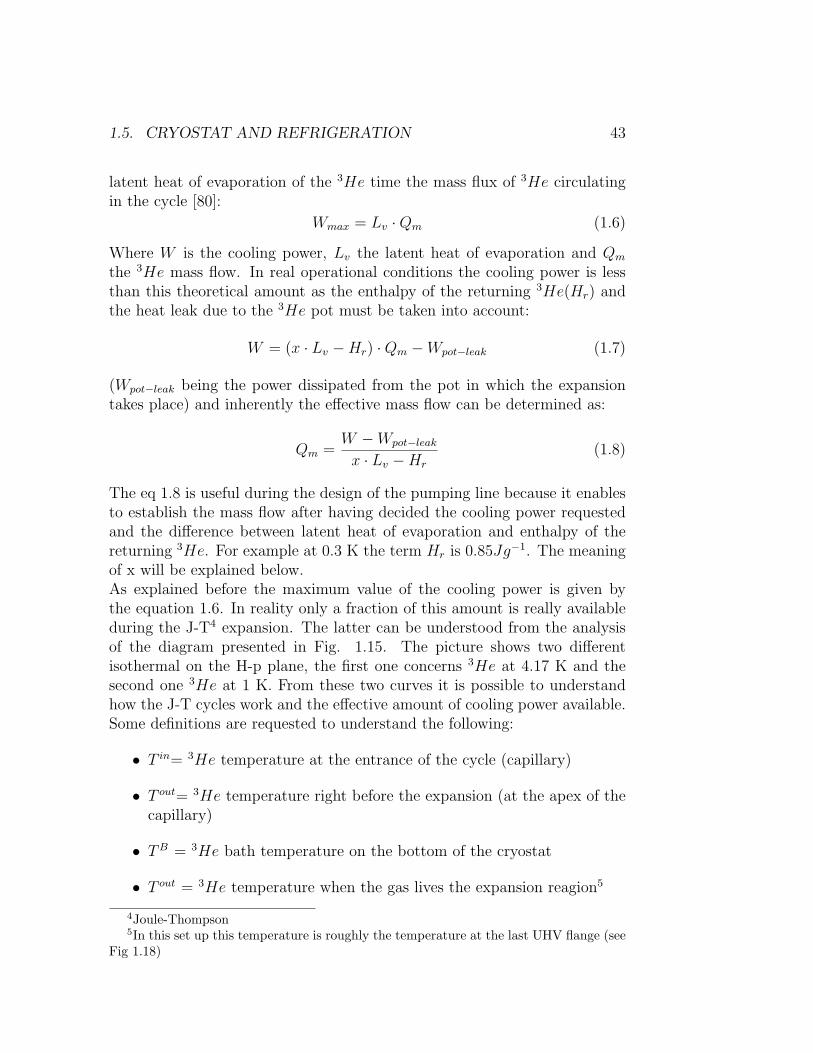
latent heat of evaporation of the 3He time the mass flux of 3He circulatingin the cycle [80]:
Wmax = Lv ·Qm (1.6)
Where W is the cooling power, Lv the latent heat of evaporation and Qm
the 3He mass flow. In real operational conditions the cooling power is lessthan this theoretical amount as the enthalpy of the returning 3He(Hr) andthe heat leak due to the 3He pot must be taken into account:
W = (x · Lv −Hr) ·Qm −Wpot−leak (1.7)
(Wpot−leak being the power dissipated from the pot in which the expansiontakes place) and inherently the effective mass flow can be determined as:
Qm =W −Wpot−leak
x · Lv −Hr
(1.8)
The eq 1.8 is useful during the design of the pumping line because it enablesto establish the mass flow after having decided the cooling power requestedand the difference between latent heat of evaporation and enthalpy of thereturning 3He. For example at 0.3 K the term Hr is 0.85Jg−1. The meaningof x will be explained below.As explained before the maximum value of the cooling power is given bythe equation 1.6. In reality only a fraction of this amount is really availableduring the J-T4 expansion. The latter can be understood from the analysisof the diagram presented in Fig. 1.15. The picture shows two differentisothermal on the H-p plane, the first one concerns 3He at 4.17 K and thesecond one 3He at 1 K. From these two curves it is possible to understandhow the J-T cycles work and the effective amount of cooling power available.Some definitions are requested to understand the following:
• T in= 3He temperature at the entrance of the cycle (capillary)
• T out= 3He temperature right before the expansion (at the apex of thecapillary)
• TB = 3He bath temperature on the bottom of the cryostat
• T out = 3He temperature when the gas lives the expansion reagion5
4Joule-Thompson5In this set up this temperature is roughly the temperature at the last UHV flange (see
Fig 1.18)
44 CHAPTER 1. A UHV LT STM FOR SPIN SENSITIVE...
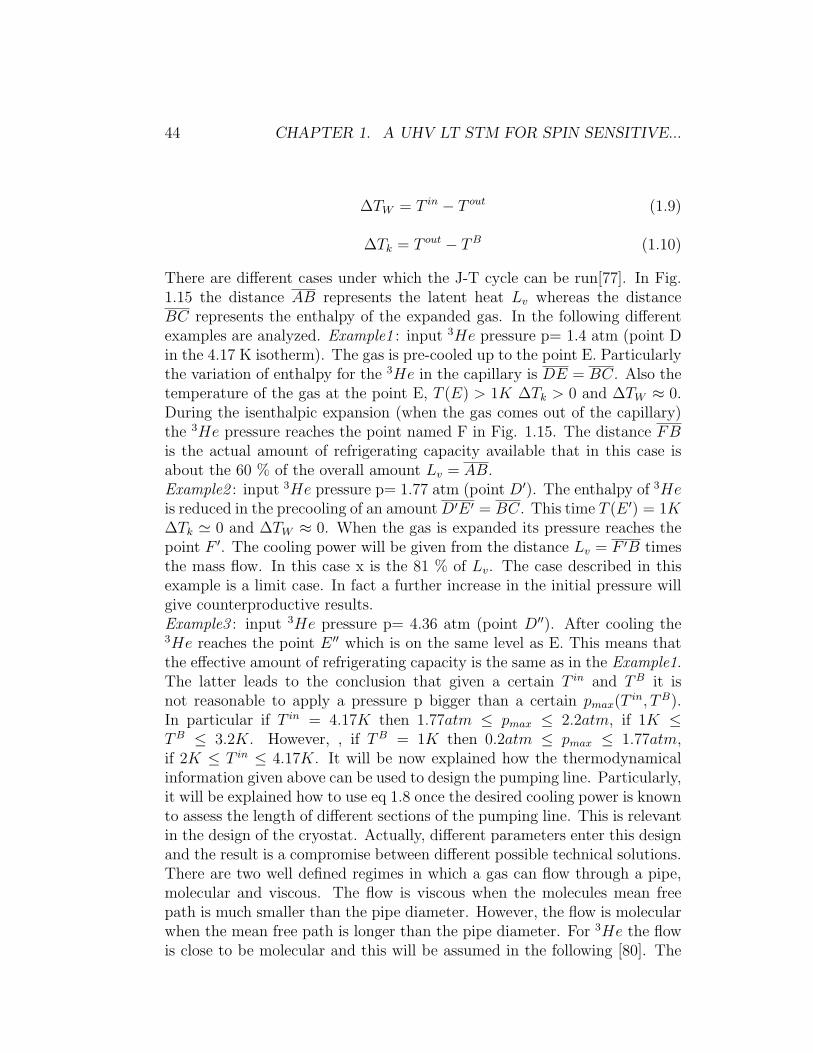
∆TW = T in − T out (1.9)
∆Tk = T out − TB (1.10)
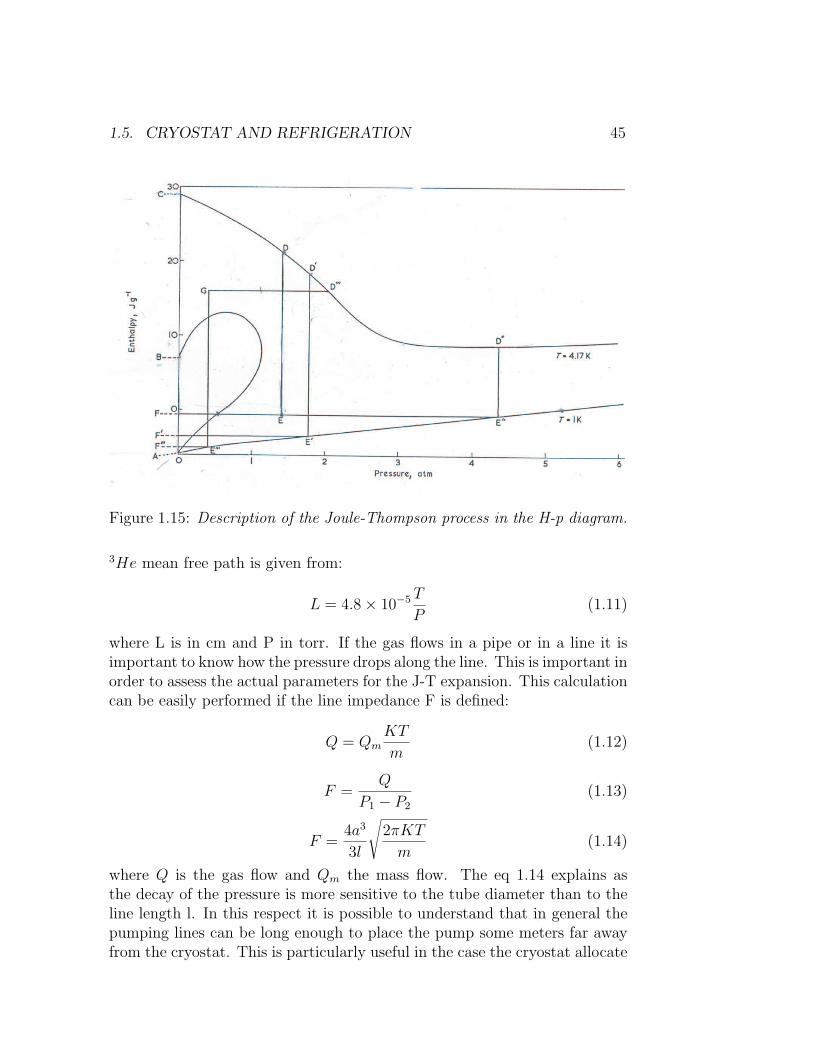
There are different cases under which the J-T cycle can be run[77]. In Fig.1.15 the distance AB represents the latent heat Lv whereas the distanceBC represents the enthalpy of the expanded gas. In the following differentexamples are analyzed. Example1 : input 3He pressure p= 1.4 atm (point Din the 4.17 K isotherm). The gas is pre-cooled up to the point E. Particularlythe variation of enthalpy for the 3He in the capillary is DE = BC. Also thetemperature of the gas at the point E, T (E) > 1K ∆Tk > 0 and ∆TW ≈ 0.During the isenthalpic expansion (when the gas comes out of the capillary)the 3He pressure reaches the point named F in Fig. 1.15. The distance FBis the actual amount of refrigerating capacity available that in this case isabout the 60 % of the overall amount Lv = AB.Example2 : input 3He pressure p= 1.77 atm (point D′). The enthalpy of 3Heis reduced in the precooling of an amount D′E ′ = BC. This time T (E ′) = 1K∆Tk ' 0 and ∆TW ≈ 0. When the gas is expanded its pressure reaches thepoint F ′. The cooling power will be given from the distance Lv = F ′B timesthe mass flow. In this case x is the 81 % of Lv. The case described in thisexample is a limit case. In fact a further increase in the initial pressure willgive counterproductive results.Example3 : input 3He pressure p= 4.36 atm (point D′′). After cooling the3He reaches the point E ′′ which is on the same level as E. This means thatthe effective amount of refrigerating capacity is the same as in the Example1.The latter leads to the conclusion that given a certain T in and TB it isnot reasonable to apply a pressure p bigger than a certain pmax(T
in, TB).In particular if T in = 4.17K then 1.77atm ≤ pmax ≤ 2.2atm, if 1K ≤TB ≤ 3.2K. However, , if TB = 1K then 0.2atm ≤ pmax ≤ 1.77atm,if 2K ≤ T in ≤ 4.17K. It will be now explained how the thermodynamicalinformation given above can be used to design the pumping line. Particularly,it will be explained how to use eq 1.8 once the desired cooling power is knownto assess the length of different sections of the pumping line. This is relevantin the design of the cryostat. Actually, different parameters enter this designand the result is a compromise between different possible technical solutions.There are two well defined regimes in which a gas can flow through a pipe,molecular and viscous. The flow is viscous when the molecules mean freepath is much smaller than the pipe diameter. However, the flow is molecularwhen the mean free path is longer than the pipe diameter. For 3He the flowis close to be molecular and this will be assumed in the following [80]. The
1.5. CRYOSTAT AND REFRIGERATION 45
Figure 1.15: Description of the Joule-Thompson process in the H-p diagram.
3He mean free path is given from:
L = 4.8× 10⁻⁵ T
P(1.11)
where L is in cm and P in torr. If the gas flows in a pipe or in a line it isimportant to know how the pressure drops along the line. This is important inorder to assess the actual parameters for the J-T expansion. This calculationcan be easily performed if the line impedance F is defined:
Q = QmKT
m(1.12)
F =Q
P1 − P2
(1.13)
F =4a3
3l
√2πKT
m(1.14)
where Q is the gas flow and Qm the mass flow. The eq 1.14 explains asthe decay of the pressure is more sensitive to the tube diameter than to theline length l. In this respect it is possible to understand that in general thepumping lines can be long enough to place the pump some meters far awayfrom the cryostat. This is particularly useful in the case the cryostat allocate
46 CHAPTER 1. A UHV LT STM FOR SPIN SENSITIVE...
an STM as the acoustic and mechanical vibration, due to the pump, can bedamped along the line.Combining together the three former equations it is obtained:
Qm =4a3
3l
√2πm
K(
P1√T1
− P2√T2
) (1.15)
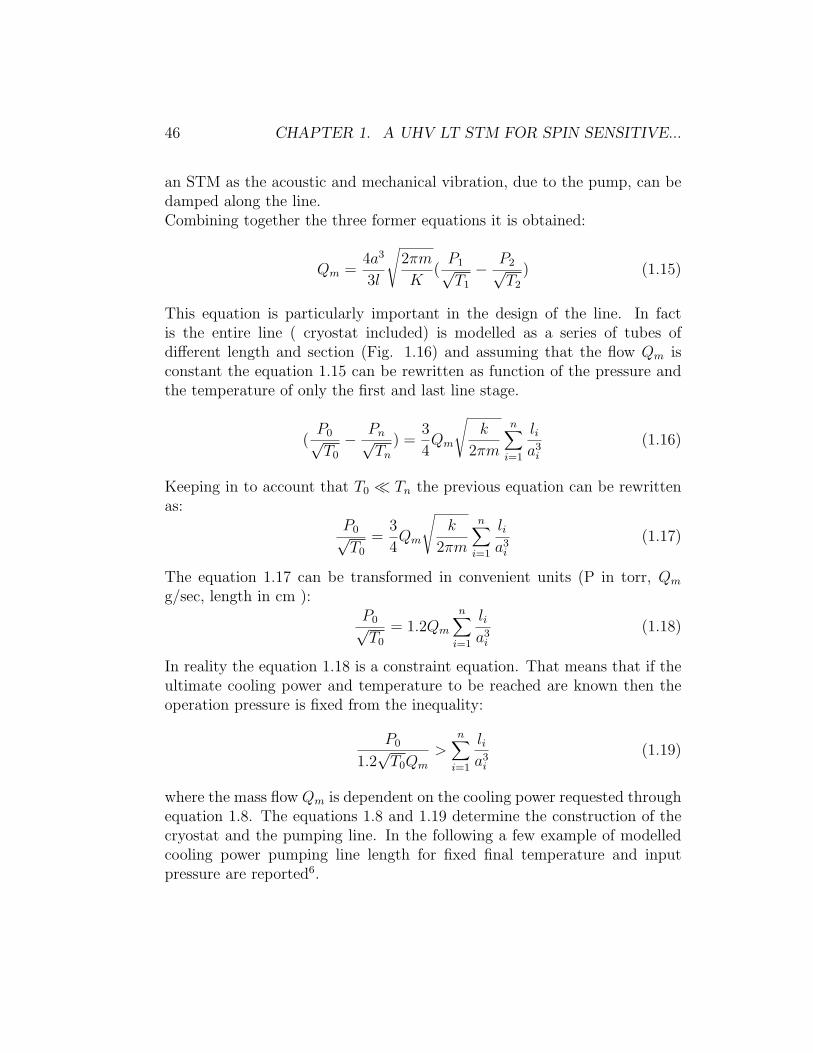
This equation is particularly important in the design of the line. In factis the entire line ( cryostat included) is modelled as a series of tubes ofdifferent length and section (Fig. 1.16) and assuming that the flow Qm isconstant the equation 1.15 can be rewritten as function of the pressure andthe temperature of only the first and last line stage.
(P0√T0
− Pn√Tn
) =3
4Qm
√k
2πm
n∑
i=1
lia3
i
(1.16)
Keeping in to account that T0 ¿ Tn the previous equation can be rewrittenas:
P0√T0
=3
4Qm
√k
2πm
n∑
i=1
lia3
i
(1.17)
The equation 1.17 can be transformed in convenient units (P in torr, Qm
g/sec, length in cm ):P0√T0
= 1.2Qm
n∑
i=1
lia3
i
(1.18)
In reality the equation 1.18 is a constraint equation. That means that if theultimate cooling power and temperature to be reached are known then theoperation pressure is fixed from the inequality:
P0
1.2√
T0Qm
>n∑
i=1
lia3
i
(1.19)
where the mass flow Qm is dependent on the cooling power requested throughequation 1.8. The equations 1.8 and 1.19 determine the construction of thecryostat and the pumping line. In the following a few example of modelledcooling power pumping line length for fixed final temperature and inputpressure are reported6.
1.5. CRYOSTAT AND REFRIGERATION 47
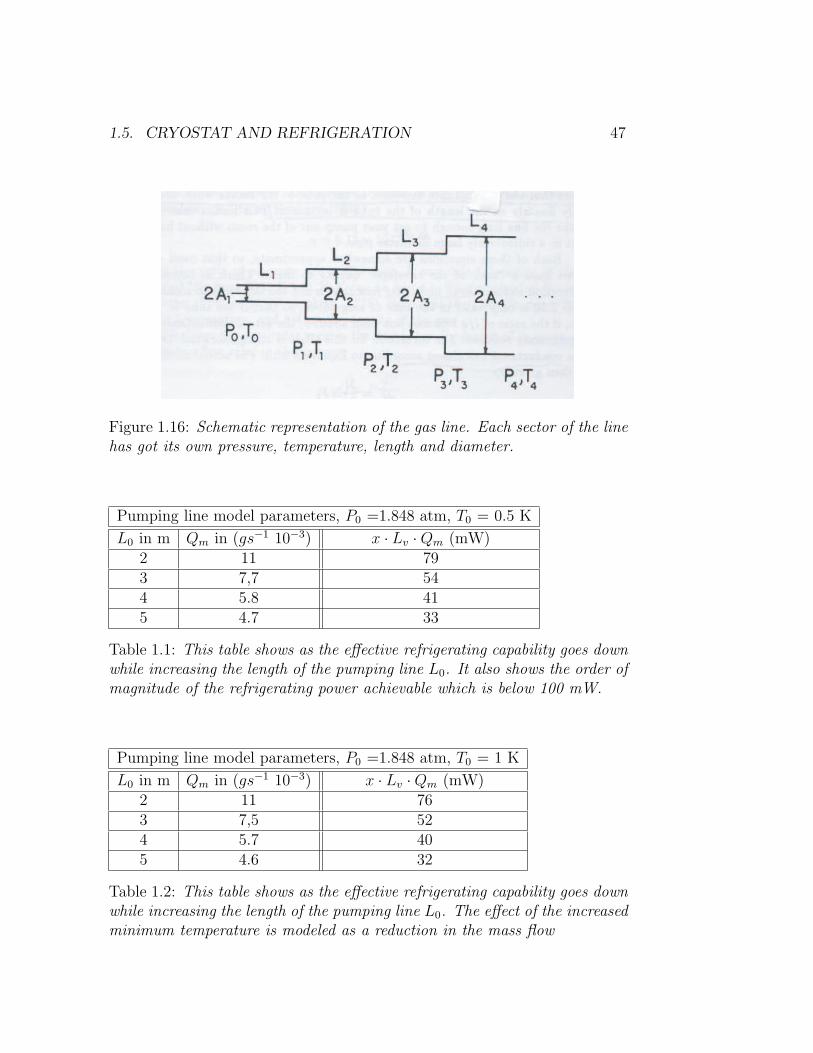
Figure 1.16: Schematic representation of the gas line. Each sector of the linehas got its own pressure, temperature, length and diameter.
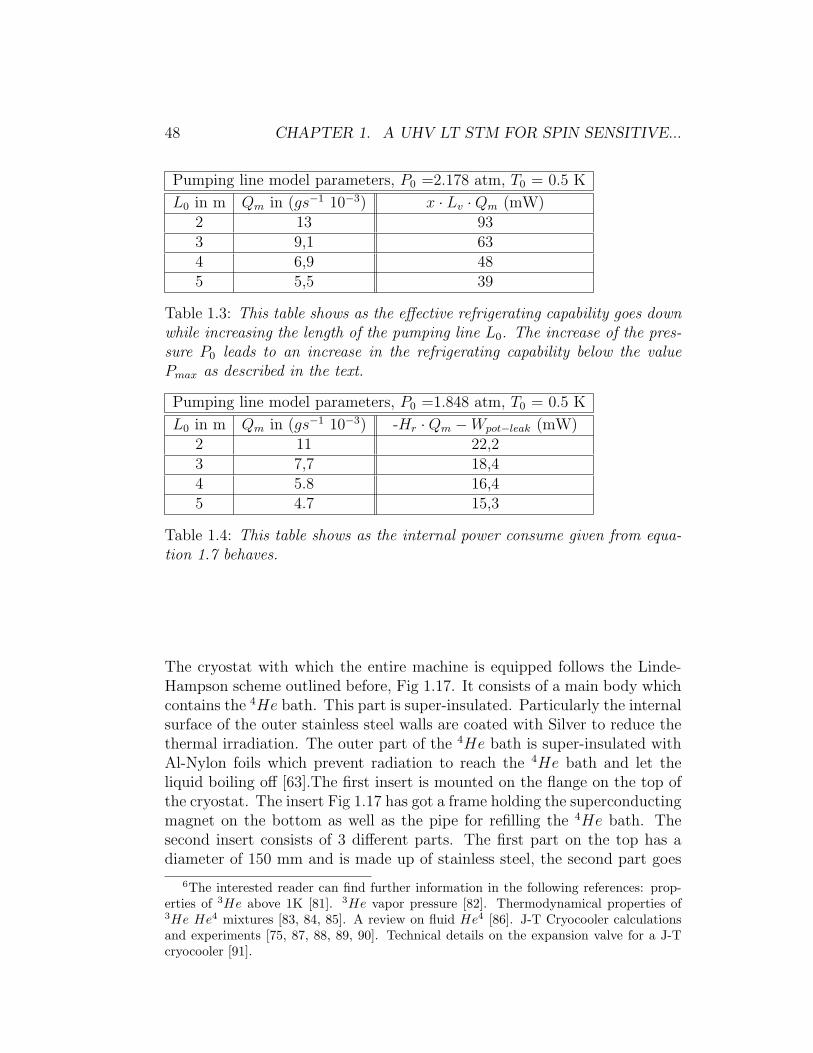
Pumping line model parameters, P0 =1.848 atm, T0 = 0.5 K
L0 in m Qm in (gs−1 10−3) x · Lv ·Qm (mW)2 11 793 7,7 544 5.8 415 4.7 33
Table 1.1: This table shows as the effective refrigerating capability goes downwhile increasing the length of the pumping line L0. It also shows the order ofmagnitude of the refrigerating power achievable which is below 100 mW.
Pumping line model parameters, P0 =1.848 atm, T0 = 1 K
L0 in m Qm in (gs−1 10−3) x · Lv ·Qm (mW)2 11 763 7,5 524 5.7 405 4.6 32
Table 1.2: This table shows as the effective refrigerating capability goes downwhile increasing the length of the pumping line L0. The effect of the increasedminimum temperature is modeled as a reduction in the mass flow
48 CHAPTER 1. A UHV LT STM FOR SPIN SENSITIVE...
Pumping line model parameters, P0 =2.178 atm, T0 = 0.5 K
L0 in m Qm in (gs−1 10−3) x · Lv ·Qm (mW)2 13 933 9,1 634 6,9 485 5,5 39
Table 1.3: This table shows as the effective refrigerating capability goes downwhile increasing the length of the pumping line L0. The increase of the pres-sure P0 leads to an increase in the refrigerating capability below the valuePmax as described in the text.
Pumping line model parameters, P0 =1.848 atm, T0 = 0.5 K
L0 in m Qm in (gs−1 10−3) -Hr ·Qm −Wpot−leak (mW)2 11 22,23 7,7 18,44 5.8 16,45 4.7 15,3
Table 1.4: This table shows as the internal power consume given from equa-tion 1.7 behaves.
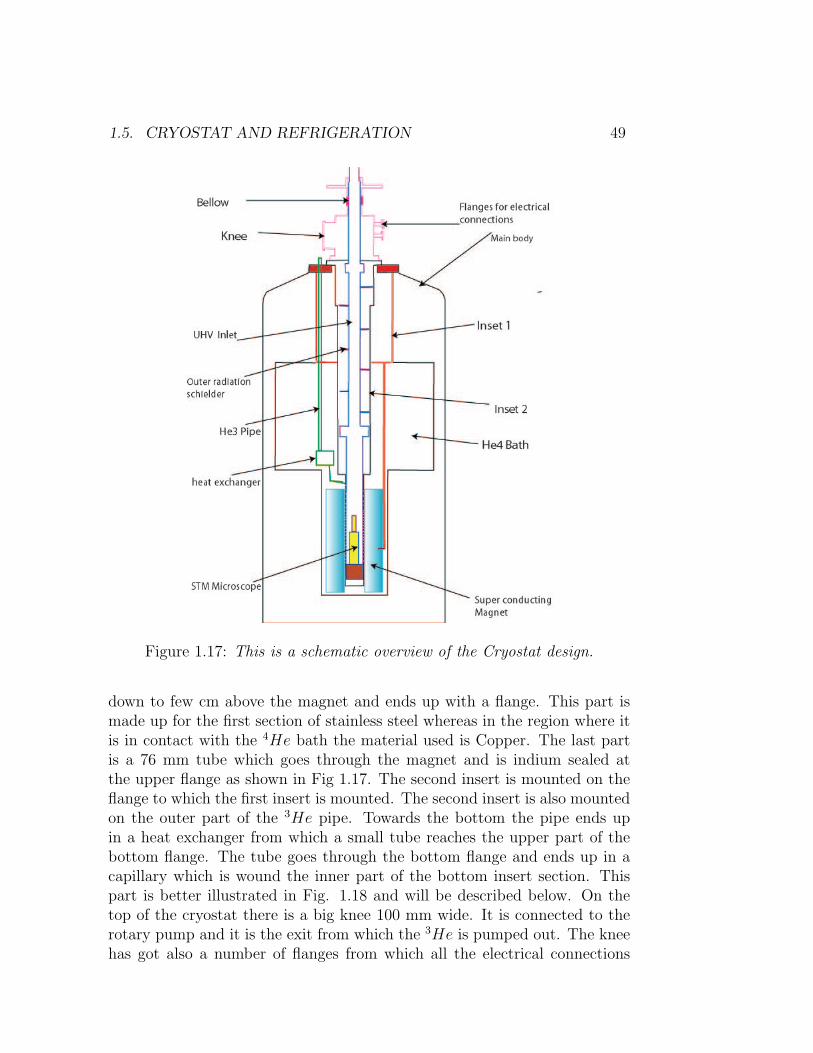
The cryostat with which the entire machine is equipped follows the Linde-Hampson scheme outlined before, Fig 1.17. It consists of a main body whichcontains the 4He bath. This part is super-insulated. Particularly the internalsurface of the outer stainless steel walls are coated with Silver to reduce thethermal irradiation. The outer part of the 4He bath is super-insulated withAl-Nylon foils which prevent radiation to reach the 4He bath and let theliquid boiling off [63].The first insert is mounted on the flange on the top ofthe cryostat. The insert Fig 1.17 has got a frame holding the superconductingmagnet on the bottom as well as the pipe for refilling the 4He bath. Thesecond insert consists of 3 different parts. The first part on the top has adiameter of 150 mm and is made up of stainless steel, the second part goes
6The interested reader can find further information in the following references: prop-erties of 3He above 1K [81]. 3He vapor pressure [82]. Thermodynamical properties of3He He4 mixtures [83, 84, 85]. A review on fluid He4 [86]. J-T Cryocooler calculationsand experiments [75, 87, 88, 89, 90]. Technical details on the expansion valve for a J-Tcryocooler [91].
1.5. CRYOSTAT AND REFRIGERATION 49
Figure 1.17: This is a schematic overview of the Cryostat design.
down to few cm above the magnet and ends up with a flange. This part ismade up for the first section of stainless steel whereas in the region where itis in contact with the 4He bath the material used is Copper. The last partis a 76 mm tube which goes through the magnet and is indium sealed atthe upper flange as shown in Fig 1.17. The second insert is mounted on theflange to which the first insert is mounted. The second insert is also mountedon the outer part of the 3He pipe. Towards the bottom the pipe ends upin a heat exchanger from which a small tube reaches the upper part of thebottom flange. The tube goes through the bottom flange and ends up in acapillary which is wound the inner part of the bottom insert section. Thispart is better illustrated in Fig. 1.18 and will be described below. On thetop of the cryostat there is a big knee 100 mm wide. It is connected to therotary pump and it is the exit from which the 3He is pumped out. The kneehas got also a number of flanges from which all the electrical connections
50 CHAPTER 1. A UHV LT STM FOR SPIN SENSITIVE...
go into the cryostat. On the top of the knee there is a special flange whichis described in the UHV section. It allows the UHV insert to go throughthe cryostat. The insert is 38 mm wide and it is divided in three partsconnected to each other through standard CF40 UHV flanges. Along withthe second part, there is a set of radiation shielding which prevent radiationto reach the coldest part of the second insert. The last part of the UHV tubecontains the STM microscope and two sets of electrical UHV feed-through.The latter allows the electrical connections to go from the microscope in UHVconditions to the outer region which has a few mbar pressure. The regionwhere the Joule-Thompson expansion is performed is illustrated in Fig 1.18.The capillary is wounded around the UHV tube at a distance of about 1mmfrom the tube. It ends with a small apex from which the 3He is let expandinto the expansion chamber as shown in Fig 1.18. The bottom part of theUHV tube consists of a copper heat exchanger designed to transfer the heatfrom the STM microscope (mounted inside the UHV tube) to the saturated3He gas flowing from the expansion chamber to the top of the cryostat. Themagnet [63, 92] with which the cryostat is equipped is a single coil SolenoidAmerican Magnetics model A9030-3 capable to reach 9.34 T7 at 4.2 K undera current of about 80 A.
1.6 Electronics Parts
The system electronics relies partially on home built components and is PCcontrolled. It differs therefore from our previous low temperature microscopedescribed in [57]. Fig. 1.19 offers a schematic outline of the electronic de-sign used. The control is provided by a PC which has been equipped with2 National Instruments boards designed for instrumentation computer com-munication. The first one is basically an Analogical Digital (A/D) converter[93, 65, 94]which provides 16 single ended channels or 8 double ended chan-nels. The second one is an Input-output (I/O) board.The central part of the control electronics of any STM microscope is theFeedback loop [48]. The tunnelling current is compared with a referencevalue (Set Point ) the resulting signal is processed and used as control signalfor the Z movement of the scanning piezoelectric actuator. In this way anyvariation in the tunnelling current results in variation in the applied highvoltage to the Z piezoelectric actuator. In general the feedback loop couldbe integrative or derivative [95]. However, derivative controller (D) is rarelyused because of its noisy character whereas integrative controller (I) is oftencombined with a proportional controller (P). The basic reason for this is, that
7The magnet will be eventually substituted with a new one reaching 14 T.
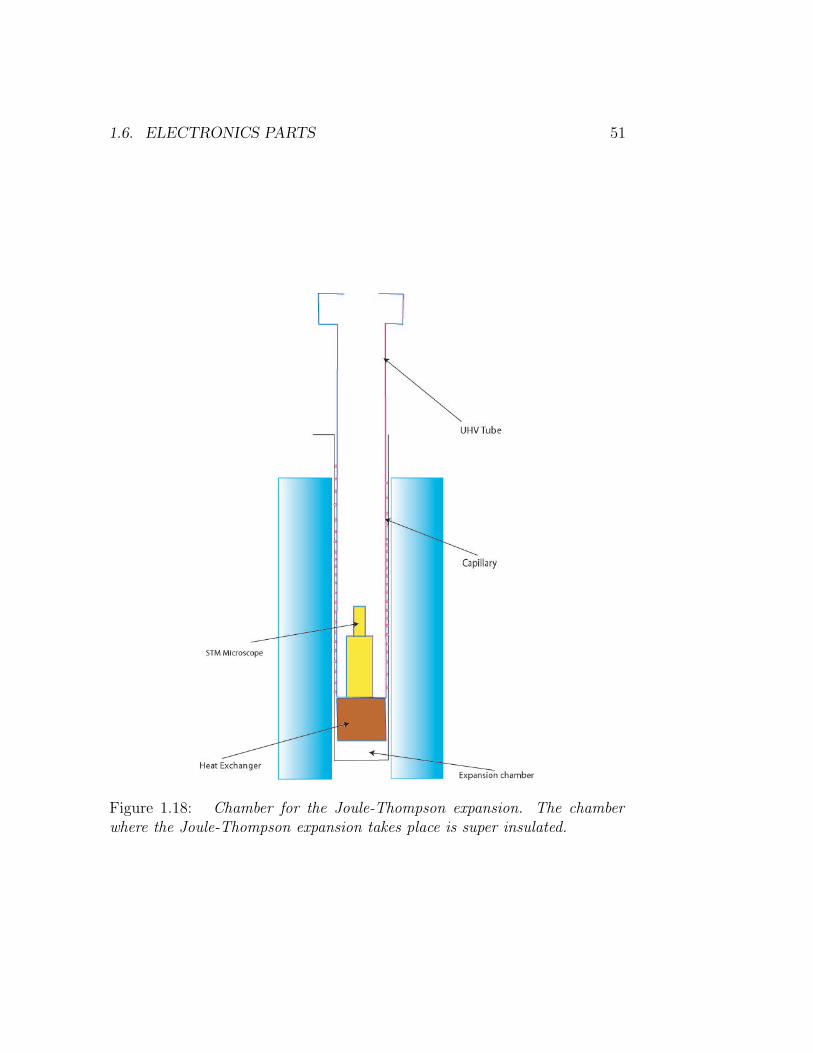
1.6. ELECTRONICS PARTS 51
Figure 1.18: Chamber for the Joule-Thompson expansion. The chamberwhere the Joule-Thompson expansion takes place is super insulated.
52 CHAPTER 1. A UHV LT STM FOR SPIN SENSITIVE...
an integrative-proportional (PI) controller has zero steady state error and afaster response time than I the controller alone. In the set up described herewe also use a PI controller. This type of controllers relies on two parameterswhich are the total loop gain and the relative gain between P and I. Thetwo must be appropriately set by the operator to achieve suitable workingconditions.The analogical feedback is in principle the fastest controller possible but, thetype of feedback function is fixed and cannot be modified through a computerprogram. A different approach that will be eventually developed is a digitalfeedback. In general Digital Signal Processing (DSP) offers a number ofadvantages over analogical counterpart [96, 97]:
• The feedback loop parameters are easily controllable by the host com-puter
• Feedback functions implemented in software are inherently more flexi-ble than hardware circuitry.
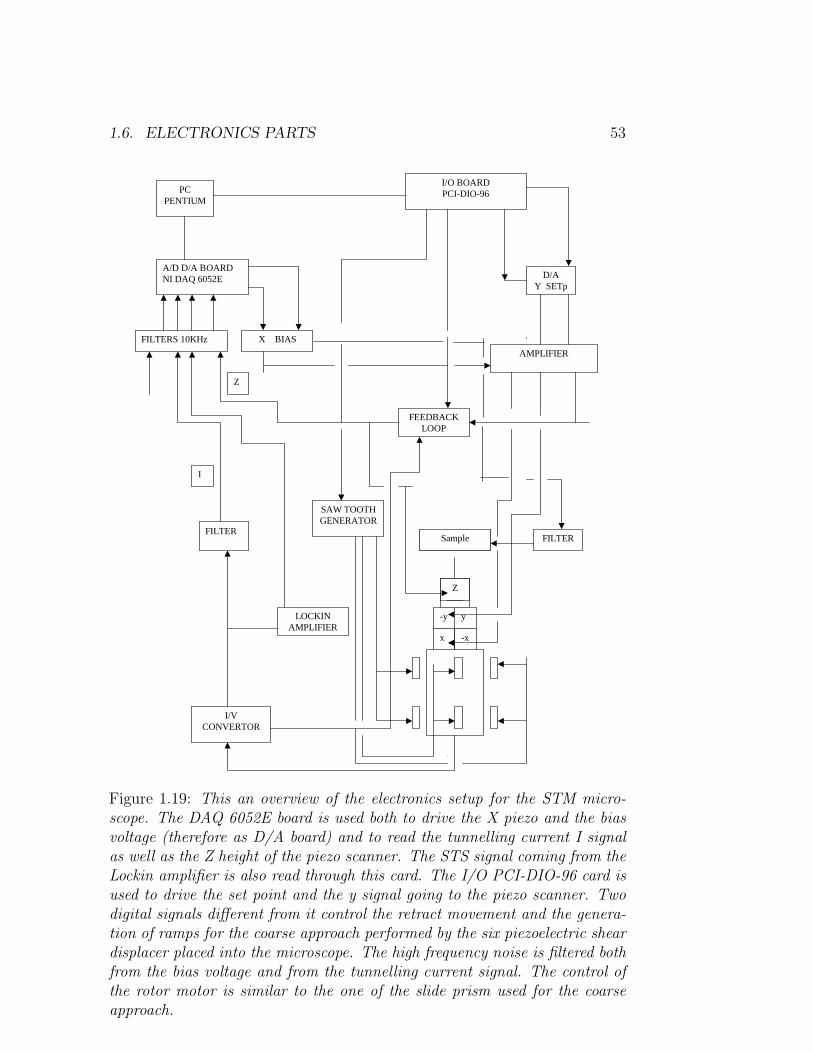
This implementation will allow the possibility of introducing special feed-back algorithms for atomic and molecular manipulation as well as for specialspectroscopies purposes.Referring to Fig. 1.19 it is possible to outline the main functions of theelectronic design. The microscope requires 6 outputs for the scanning tubepiezoelectric actuator, particularly (X,-X,Y,-Y,Z,-Z). Besides, it requires onechannel for applying the bias voltage between sample and tip. Also two dif-ferent control channels are requested to drive the coarse approach and therotative motion of the jack on the top of the STM microscope. The Y and Zsignal are feed from the I/O board in to a battery of home built D/A convert-ers. Those converters produce an output of ±10V . These output signals arefeed into an instrumental amplifier. The basic circuitry of these amplifiersconsists of two operational amplifiers whose inverting terminals are feed intoa variable resistor. The output terminals are feed in the two input terminalsof a third operational amplifier. The final gain is proportional to the inputsignal and depends upon the variable resistance.However, the X and the bias signal go through the data acquisition card
DAQ according to the specifications of the control software. The signals arethen sent to the instrumental amplifier described above.The bias voltage is sent to a home built active filter. This type of filter isknown as Multiple Feedback arrangement (MFB) [66]. This filter sharplycuts components above 10 KHz accounting for an accurate answer at fre-quencies below that threshold. Besides, the filter stabilizes the tunnellingcurrent avoiding high frequency components to affect it. As result also the
1.6. ELECTRONICS PARTS 53
x -x
Sample
y -y
Z
PC PENTIUM
A/D D/A BOARD NI DAQ 6052E
I/O BOARD PCI-DIO-96
X BIAS FILTERS 10KHz
D/A Y SETp
AMPLIFIER
FILTER
I/V CONVERTOR
LOCKIN AMPLIFIER
FILTER
SAW TOOTH GENERATOR
FEEDBACK LOOP
I
Z
Figure 1.19: This an overview of the electronics setup for the STM micro-scope. The DAQ 6052E board is used both to drive the X piezo and the biasvoltage (therefore as D/A board) and to read the tunnelling current I signalas well as the Z height of the piezo scanner. The STS signal coming from theLockin amplifier is also read through this card. The I/O PCI-DIO-96 card isused to drive the set point and the y signal going to the piezo scanner. Twodigital signals different from it control the retract movement and the genera-tion of ramps for the coarse approach performed by the six piezoelectric sheardisplacer placed into the microscope. The high frequency noise is filtered bothfrom the bias voltage and from the tunnelling current signal. The control ofthe rotor motor is similar to the one of the slide prism used for the coarseapproach.
54 CHAPTER 1. A UHV LT STM FOR SPIN SENSITIVE...
feedback control turns to be stabilized.The I/O board provides also digital control output for the coarse approachand rotor. These digital signals are feed into some FET based cards whichprovide a correct signal amplitude and shape for the shear piezoelectric ac-tuators in the STM microscope.The tunnelling current is feed into the current voltage convertor I/V. Thereason is that the current is small ( from pA to nA) and it needs to be am-plified as soon as it comes out from the cryostat. The I/V converter is a3 stages amplifier based on a simple OP27E configuration which provides a108 amplification. It is connected to a small post amplifier which providesanother order of magnitude in amplification. One of the terminals of the I/Vconvertor is feed into the feedback circuit. Another one goes into the lockinamplifier for STS. Finally, one terminal is feed into a multistage filter withcut off frequency above 10 KHz.The tunnelling current, Z level and Lockin amplifier signals 8 are read fromthe DAQ card. Previously all the 3 signals are feed in to a signal condition-ing stage consisting of RC 10 KHz filters. The conditioning stage is usefulto avoid any undesired signal or high voltage to enter the computer boards.
1.7 Future technical improvements and de-
velopments
In this section it is briefly shown what can be the future developments of thissystem. There are three goals that seem to be achievable without changingdrastically the design that has been described so far:
• Introducing an in-situ STM Tip exchange
• Widening the range of operational temperature
• Optical pumping of magnetic adsorbates into excited states
As it will be explained in the following paragraphs a number of proposalsfor the detection of the single adsorbates magnetization rely on certain prop-erties of the tip. Inherently the possibility to have access to tips made upof different materials, namely different superconductors, is of fundamentalimportance.Besides, the possibility of fastening the operations required for exchangingthe STM tip may facilitate the access to semiconducting samples. As the
8reference notes on our Lockin can be found in [98]
1.7. FUTURE TECHNICAL IMPROVEMENTS.. 55
system is equipped with a relatively9 high magnetic field (14 T), the studyof certain semiconducting surfaces may be interesting to shed light on differ-ent intriguing effects,10 characterizing these materials with a spatial lateralresolution better than 1 nm.The design described here could be implemented to allocate a tip exchangefollowing Pietsch [4] with a more sophisticated electronic positioning whichconsiders the fact that in our setup there is no possibility of looking at theSTM. Nevertheless, the difficulty of this implementation may reveal the goalnot reachable. It is possible to follow an intermediate solution instead. Itcould be possible to insert a gate valve between the STM UHV chamber andthe cryostat. The valve can be positioned somewhere along the UHV Tubebefore the 100 KF knee. In this way it could be possible to close the pathbetween the UHV chamber and the UHV tube. If a small CF 16 lateralflange is adjoint to the UHV tube below the gate valve, the part of the UHVtube inside the cryostat could be vented. The UHV tube may be removedand the STM brought to air. Once the STM and its frame are on air, theexchange of the tip may be performed manually looking directly at the mi-croscope. Once mounted back, the STM on the UHV tube, the tube maybe pumped to UHV conditions from a turbo molecular pump connected tothe CF 16 flange. After cooling the system to 4 ÷ 0.5K UHV conditionsare easily achieved without baking the tube as described in [53]. As UHVconditions set in the gate valve between the knee and the chamber can beopened reestablishing standard operational conditions. This solution wouldreduce the time requested for tip exchange. However, exchange of specialtips prepared in UHV would still not be possible.Many important results have been achieved lowering11 the operation temper-ature of STM[102, 103, 104, 105, 106, 49, 107, 14]. However, there are a lot
9In the study of high Tc Superconductors magnetic fields of 40÷ 50 T or even higherare requested to reach the critical field.
10The reduced mass of a surface state on a metal surface is about 13 of the electron mass.
However, in semiconducting surfaces as InAs(110) the reduced mass is some 0.002 timesthe electron mass. The electrons are less delocalized than in metals, they feel a weakerelectron repulsion and inherently the external magnetic field modifies their properties moreincisively than it can on metal surfaces.
11The aim of lowering the operational temperature of the STM has recently led to buildinstruments capable of reaching 20 mK in magnetic fields as high as 6 T [99]. This fieldof very low nano probes has been reviewed from Nunes [100]. If the UHV ULT STMconstructed has to be used in studying, the quantum tunnelling of the magnetization insingle molecular magnets or the local magnetic order specially in metal organic structuresself assembled on surfaces, temperatures lower than 0.3 K may be required. Such a re-quirement in the system may be carried out through the magnetic cooling [101]. However,the complexity of such a development may result difficult to implement in the microscope.
56 CHAPTER 1. A UHV LT STM FOR SPIN SENSITIVE...
of interesting phenomenon such as phase transitions and migrations of singleadsorbates that manifest themselves in the temperature interval 1 ÷ 80 K.This phenomenon are interesting to be studied with the spatial resolution of-fered by this type of microscope ( known as Eigler type [108]) which is amongthe most stable through the low T STM microscopes. A way for achieving atemperature control over the range 4÷80K has been presented recently[109].In this work a particular property of the gas (He4) is exploited. Below acertain critical pressure pc = 1.5× 10⁻³mbar, the mean free path of the gaslm is longer than the space between the pendulum and the cryostat walls. Inthese conditions the thermal conductivity is proportional to the gas densityand inherently to the pressure Λ ∼ nHe ∼ pHe. Accordingly the thermalconductivity varies linearly with the pressure. If the flux of gas flowing be-tween the UHV tube and the He4 cryostat is arrested12 a gradient of pressurefrom the top to the bottom of the cryostat arises. The He4 is more concen-trated close to the bottom of the cryostat and less on top of the pendulummechanism. In this respect if a small resistor is positioned close to the STMflange the pressure gradient along the cryostat can be varied. Accordinglythe temperature can be modified. Rust and coworkers use a PI controller tostabilize the temperature. The feedback reacts within 2 min and stabilizesin about 10 minutes. Actually this type of control can be implemented alsoon a system using 3He. The mean free path of the gas depends upon themolecule diameter and this does not change from 3He to He4. Therefore,once arrested the J-T expansion, the temperature could be controlled up to80 K or may be to higher temperatures.Finally, I remark that studying non linear phenomenon on molecules andatomic structure as well as the coupling between optical and resonance tech-niques are also within the range of possibilities for further developments ofthis instrument. One thing that may be achieved reasonably quickly is theoptical pumping of adsorbates at surfaces. Large organo-metallic clusterssuch as SMM [110] or even magnetic radicals [111] may have high value ofzero field splitting. Promoting the system into interesting excited levels mayturn to be difficult with the STM. Alternatively shading UV light through awave guide on the sample can match the goal mentioned above. In principleit could be possible to connect optical fibers to the last stage of the UHVtube where the microscope is mounted. A laser can be connected to the setup to provide both high speed pulses or simply to shed light on the scanningarea. There are enough feedthroughs and space to reach the experimental
12In the design used from Rust and coworkers[109] during operation the flux is arrestedand the turbo molecular pump pumping the He4 is switched off. In this design there isnot J-T expansion the He4 is used only as thermal conducting mean.
1.8. ANDREEV TUNNELLING REFLECTION STM 57
area. Technology and electronics necessary are described in [112].
1.8 Andreev Tunnelling Reflection STM
Over the last years it has become possible to use STM tips made of super-conducting materials [11]. The former opens up the possibility to extend anumber of effects related to superconductor mesoscopic physics13 to a smallerscale; i.e. sub-nanometric scale. In this chapter it is briefly described therange of possible application for Andreevs reflection.The main scientific focus of the instrument built is the detection of mag-netism on the atomic scale. In particular the focus of this paragraph is thedetection of the magnetization of magnetic nanostructures deposited on tosurfaces. The detection of the magnetization gives crucial information aboutthe magnetic anisotropy [128] providing therefore valuable indication on theelectronic structure of the system studied and its coupling with the surround-ings. One physical effect that may reveal sensitive to the magnetization of a
13One effect of mesoscopic superconductivity that is interesting to reproduce with theSTM is the Josephsons effect. In superconductor tunnelling junctions a zero voltage cur-rent appears due to quantum mechanical effects [113]. The current depends on the SCorder parameter and on the magnitude of the tunnelling resistance. This current is knownas Josephsons current. Sc Tips have already proven to work with reproducible results inthe S/I/N and S/I/S configuration [11, 10, 51]. Developing a Josephsons STM (JSTM)would be of interest because it may provide direct access to SC order parameter, infor-mation about its behaviors under application of high magnetic field, nature of the gap inHigh Tc SC. In order to access the Josephsons regime some physical conditions have tobe matched
1. Josephson energy must be bigger then thermal fluctuations[113]
2. The tunnelling resistance must be as low as possible[114]
3. Coulomb energy must be smaller than the SC OP [115, 116]
4. Coulomb energy must be smaller than Josephson energy[117]
The former conditions are difficult to meet in an STM environment. First evidencesof JSTM have been reported [9, 118, 119][120]. In particular as far as the experimentreported in [9] is concerned, the temperature was as high as 2K and the Josephsons regimewas not reached. The authors study a transition region and give indirect confirmationof the detection of a Josephsons current by applying a 15 GHz microwave field. If amaterial showing an high Tc is used, the Josephson regime is achieved also at temperaturehigher than 1÷ 2 K. Recent experiments done on the new superconductor MgB2 accountfor Josephsons Nb/MgB2 points contact [121] and for the production of small MgB2
wires[122]. Accordingly MgB2 may be a good candidate for JSTM. As the junction isformed by the tip and the surface appropriate surface as counterpart of the tunnellingjunction must be chosen [123, 124, 125]. Recent studies of MgB2 surfaces have appearedin literature making this material available for this type of experiments too [126, 127].
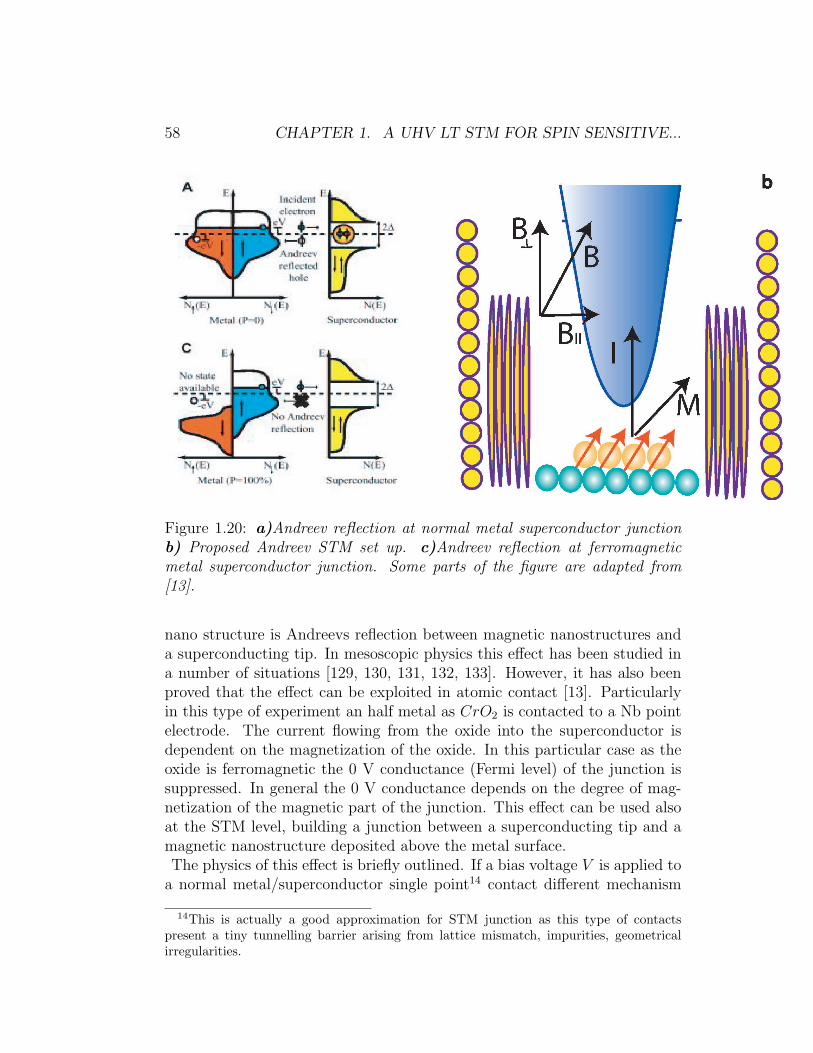
58 CHAPTER 1. A UHV LT STM FOR SPIN SENSITIVE...
Figure 1.20: a)Andreev reflection at normal metal superconductor junctionb) Proposed Andreev STM set up. c)Andreev reflection at ferromagneticmetal superconductor junction. Some parts of the figure are adapted from[13].
nano structure is Andreevs reflection between magnetic nanostructures anda superconducting tip. In mesoscopic physics this effect has been studied ina number of situations [129, 130, 131, 132, 133]. However, it has also beenproved that the effect can be exploited in atomic contact [13]. Particularlyin this type of experiment an half metal as CrO2 is contacted to a Nb pointelectrode. The current flowing from the oxide into the superconductor isdependent on the magnetization of the oxide. In this particular case as theoxide is ferromagnetic the 0 V conductance (Fermi level) of the junction issuppressed. In general the 0 V conductance depends on the degree of mag-netization of the magnetic part of the junction. This effect can be used alsoat the STM level, building a junction between a superconducting tip and amagnetic nanostructure deposited above the metal surface.The physics of this effect is briefly outlined. If a bias voltage V is applied to
a normal metal/superconductor single point14 contact different mechanism
14This is actually a good approximation for STM junction as this type of contactspresent a tiny tunnelling barrier arising from lattice mismatch, impurities, geometricalirregularities.
1.8. ANDREEV TUNNELLING REFLECTION STM 59
lead the current I to enter the superconductor [134, 135]. Quasi particlestunnelling predominates at V À ∆. The quasi particles travelling into thesuperconductor relax eventually in the Cooper condensate. By contrast, ifthe applied voltage is such that V ¿ ∆ there are no available quasi particlestates in which the metal quasi particles can tunnel, Fig.1.20 a. The quasiparticles, in order to enter the superconductor, must be directly convertedinto Cooper pairs [134]. Accordingly, a charge 2e is transferred across theinterface and a hole is reflected back. This process is known as Andreevsreflection. The zero bias conductance G(0) results then enhanced to a valueG(0)/Gn = 2. Gn being the normal conductance for V À ∆.In case the metal is a ferromagnet Fig.1.20 b the situation is different. Asthe d bands of the metal are split in spin up and spin down parts, the amountof quasi particles available for conversion into Cooper pairs will be depen-dent on the degree of polarization P of the ferromagnet. In general for apolarization P G(= 0) is given from:
G(0)/Gn = 2(1− P ) (1.20)
The former equation indicates a clear reduction of G(= 0) down to the lim-iting value 0 for P = 1 (perfect ferromagnet).The dependence of the tunnelling current on microscopic parameters wasstudied by Blonder and coworkers [134]. In this study the different irreg-ular contribution to the tunnelling barrier were simulated introducing a δfunction interface potential. Its strength is given from a dimensionless pa-rameter Z. The tunnelling current I expression depends upon four coef-ficients A,B,C,D. A is the Andreev reflection probability, B the normaltransmission probability and C, D the related transmission probabilities foran impinging electron with energy E. As A + B + C + D = 1 a convenientexpression for the current I results to be:
I(V, ∆, Z) = 2eSNvF
∫ +∞
−∞[f(E − V, T )− f(E, T )][1 + A−B]dE (1.21)
In Eq.1.21 the dependence upon Z and ∆ is included in the coefficientsA = A(E, ∆, Z) and B = B(E, ∆, Z). The conductance is easily calculatedas G(v) = dI(V )/dV .This model becomes a bit more complex if one part of the junction is com-posed of a ferromagnetic metal. In fact, in this case two contribution tothe current are present, the unpolarized Iu and the polarized Ip [135]. Thecurrent I will be function of the polarization P :
I(V, ∆, Z, P ) = (1− P )Iu + PIp (1.22)
60 CHAPTER 1. A UHV LT STM FOR SPIN SENSITIVE...
Where Iu and Ip are calculated by choosing the appropriate probabilities,namely Au, Bu, Ap = 0, Bp. This model correctly foresees the 0 bias enhance-ment of the tunnelling current as well as the suppression of the Andreevs re-flection effect(Ip −→ 0) for Z ∼ 1. Z is the parameter that takes into account,among the other things, the width of the tunnelling barrier. It is then evidentthat if this Andreevs reflection is to be used to determine the polarizationof the tunnelling current P in a STM-Tip/magnetic-nanostructure/surfacejunction (Fig. 1.20 b) care must be taken in positioning the tip close enoughto the structure.An important point is whether the configuration shown in Fig. 1.20 b can de-tect more than the simple polarization of the current P , namely the directionand the magnitude of the magnetization M. In the absence of any symmetrybreaking agent there is no reason for Eq.1.21 to depend on M. However, if amagnetic field B is present then the magnetization of the nanostructure willbe a function of B. Accordingly the spin part of the wave function describingan impinging electron into the barrier will be function of B. Presumably thereflection and transmission probabilities may become function of M such thatA = A(E, ∆, Z,M) and B = B(E, ∆, Z,M). In this respect ∆ is function ofB ∆ = ∆(B)15. The tunnelling current would then depend on B and M:
I(V, ∆, Z, P,M,B) = (1− P )Iu(B) + PIp(M,B) (1.23)
. If this was the case the former equation could be inverted numerically toachieve M). In this respect mapping the tunnelling current as function ofthe applied magnetic field may lead to the detection of the magnetization ofmagnetic adsorbates at surfaces. A deep theoretical and experimental studyis on demand.From the discussion above it is evident that it is essential to choose theright material for the tip. Nb and Ta would restrict the experimental con-ditions to low magnetic Field. Besides, they do not have a large gap, 2meV[13, 123, 124]. There are different alternative possibilities coming from Highmagnetic field magnet technology. Particularly if atomic resolution is notstrictly required16different materials may be considered. As example NbTiwires or Chevrel phases wires like PbMo6S8 may be used. The recent discov-ery of MgB2 high SC Tc [121, 122, 136] makes this material a good candidate
15Proximity effect may prevent the suppression of the superconductivity to field as highas 1,5 T.
16This is the case for a system as large as several nanometers like endohedral fullerenes[28] or even single molecular magnets [25]. Nevertheless in the study of large molecularadsorbates it may be possible that the tunnelling current I has to be set at high values(e.g.1 eV). In this case is not possible to choice different materials satisfying the conditionV ≤ ∆.
1.8. ANDREEV TUNNELLING REFLECTION STM 61
for Sc tips too.There are 2 different approaches that can be considered in order to make asuperconducting tip. The first one is sticking a SC fiber or single crystal ona metal wire such as W. The second one is using a wire entirely made up ofa superconductor material. A good superconducting tip for the experimentsdescribed here should have the following characteristics:
• High critical magnetic field Bc2
• High transition temperature and therefore a large SC gap∆(0)
• being not oxidative at the surface
• Good mechanical properties
• Highly oriented chemical bonds
As far as the first approach is concerned there are two materials that maybe used, MgB2 and V3Si. A comprensive review on the properties of MgB2
can be found in [136]. The Tc temperature of this material is around 39 Kwhereas its critical field Bc2 can vary up to 40 T17. STM studies of MgB2
surfaces have already appeared in literature [126] as well as studies of smallgrains junctions [127]. Particularly in [126] a gap of 5 meV was measured18.As for V3Si recent studies show that it has a gap of about 2.6 meV [137, 138].Its critical temperature is 19 K, though surface effects may reduce it and thecritical field is 20 T. It has already been used by making superconductorwires with a Cu clad [139]19
Very recently MgB2 superconductive STM tips have revealed to be usable[12]. In this experiment a piece of MgB2 single crystal is cleaved and gluedonto the tip holder. The holder is inserted into the UHV apparatus andcleaned by Ar sputtering cycles. Scanning imaging of Au(111) is demon-strated up to temperatures as high as 30 K. This experiment actually opensup the way of using special materials for the fabrication of superconductivetips.
17There are different methods to produce MgB2. Recently single fibers [121] have beenproduced. Their diameter was 160µm and they were produced by exposing B fibers to Mgvapors at 950 C.
18. Josephsons current in single point contacts MgB2 / Nb has been detected too [120]envisaging the possibility to extend this effect to junctions made of superconductive STMtip and MgB2
19For studies on tunnelling junctions V3Si/SiO/Pb the reader is referred to [140, 141].For an extensive review of the physical properties of the A15 alloys one may refer to [142].These materials have been known longer than MgB2 and it is expected to have bettermechanical properties and less attitude to oxidation.
62 CHAPTER 1. A UHV LT STM FOR SPIN SENSITIVE...
A different approach consists of etching superconducting wires, by use ofacids that have a protecting clad on the superconducting material. NbTiwires with a Cu clad are available on the market and they can be largelyused for this approach. Their Tc is about 9 K and Bc2 about 14 T. Anotherpossibility is represented by Pb0.2SnMo6S8 wires whose Tc is about 17 kand Bc2 as high as 50 T20. Finally, Nb3Sn wires with Tc 18 K and Bc2 24T may be supplied too and become available for Tip construction. Some ofthese materials have been tested and analyzed with transmission electron mi-croscopy (TEM). The hard materials gave fragile tips and the images showedthat the apex of the tips was not sharp. The Tips fabricated were not testedon the STM. However, NbTi wires showed the best mechanical properties.Pure wires were easily prepared and TEM images showed a sharp tip apex.The discussion above shows that in principle there is a possibility to usespecial materials whose critical magnetic field and temperature can be ashigh as 20 T and 40 K. Under these conditions we can envisage more effec-tive methods to detect the actual direction of the magnetization occurring innanostructures underneath the tip. The proximity effect will enhance even 20times the critical field. The latter has been recently experimentally provenin a special tunnel configuration made up Pb [144]. Under high magneticfields it is possible to split the spin up and spin down channel in a supercon-ductor without breaking the superconducivity[145, 146]. In this way a spinpolarized current can be produced through which it is possible to determinethe magnetization of the underneath magnetic structure.In general the application of an external magnetic field could be limiting. Ifthe coercively field of the structure put under the tip, were lower than thefield applied, the structure magnetization would follow the field direction. Inthis respect only a theoretical description of the nano structure magnetiza-tion dynamics may elucidate the ground state magnetization. As a result,alongside the experimental development of superconductor tip based probes,the development of an appropriate theory is requested.As described before the application of 3D magnetic field it may be possibleto measure the tunnelling current at constant hight mode while varying thedirection of the applied magnetic field. The Andreevs reflection would de-pend on the direction of the magnetic field as the magnetic anisotropy of thestudied structure varies with the direction of the applied field. This conceptmay lose significance at the limit of single atomic adsorbate but, if the proba-bilities A = A(E, ∆, Z,M) and B = B(E, ∆, Z,M) could be calculated thenan answer on this point would be available. Accordingly one may decidewhether to modify the experimental set up in a way which is able to apply a
20For a review on Chevrel superconductors the reader is referred to [143]
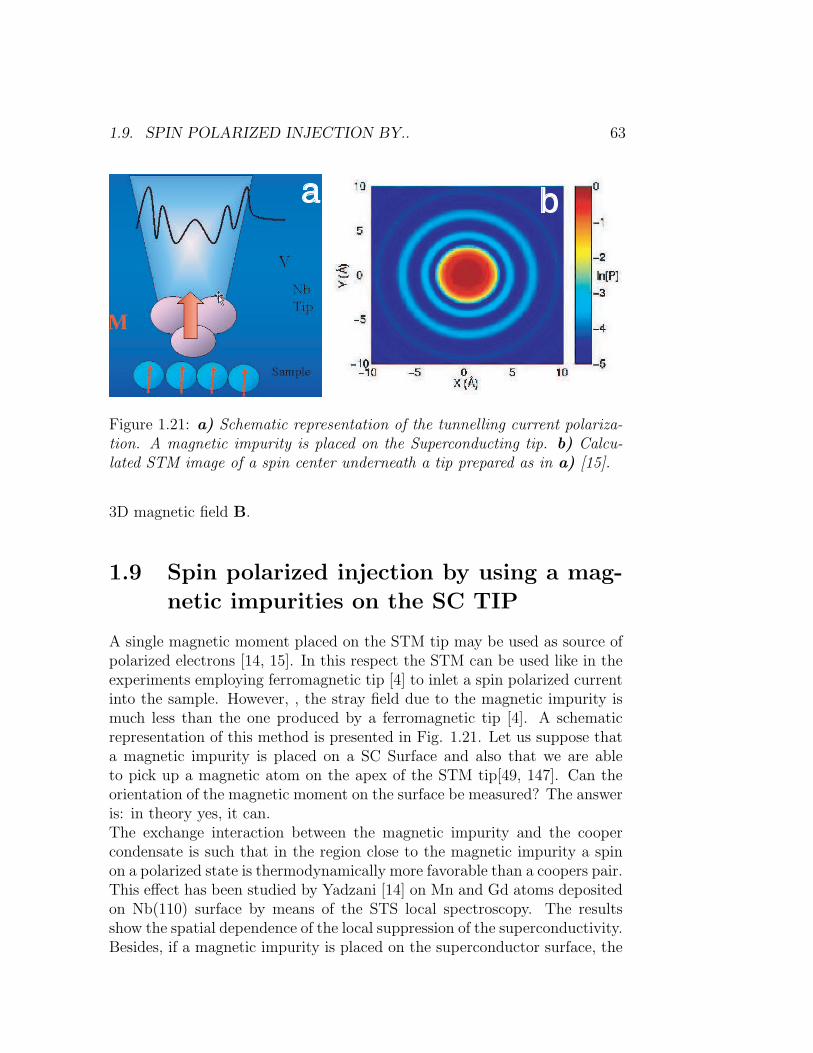
1.9. SPIN POLARIZED INJECTION BY.. 63
a b
Figure 1.21: a) Schematic representation of the tunnelling current polariza-tion. A magnetic impurity is placed on the Superconducting tip. b) Calcu-lated STM image of a spin center underneath a tip prepared as in a) [15].
3D magnetic field B.
1.9 Spin polarized injection by using a mag-
netic impurities on the SC TIP
A single magnetic moment placed on the STM tip may be used as source ofpolarized electrons [14, 15]. In this respect the STM can be used like in theexperiments employing ferromagnetic tip [4] to inlet a spin polarized currentinto the sample. However, , the stray field due to the magnetic impurity ismuch less than the one produced by a ferromagnetic tip [4]. A schematicrepresentation of this method is presented in Fig. 1.21. Let us suppose thata magnetic impurity is placed on a SC Surface and also that we are ableto pick up a magnetic atom on the apex of the STM tip[49, 147]. Can theorientation of the magnetic moment on the surface be measured? The answeris: in theory yes, it can.The exchange interaction between the magnetic impurity and the coopercondensate is such that in the region close to the magnetic impurity a spinon a polarized state is thermodynamically more favorable than a coopers pair.This effect has been studied by Yadzani [14] on Mn and Gd atoms depositedon Nb(110) surface by means of the STS local spectroscopy. The resultsshow the spatial dependence of the local suppression of the superconductivity.Besides, if a magnetic impurity is placed on the superconductor surface, the
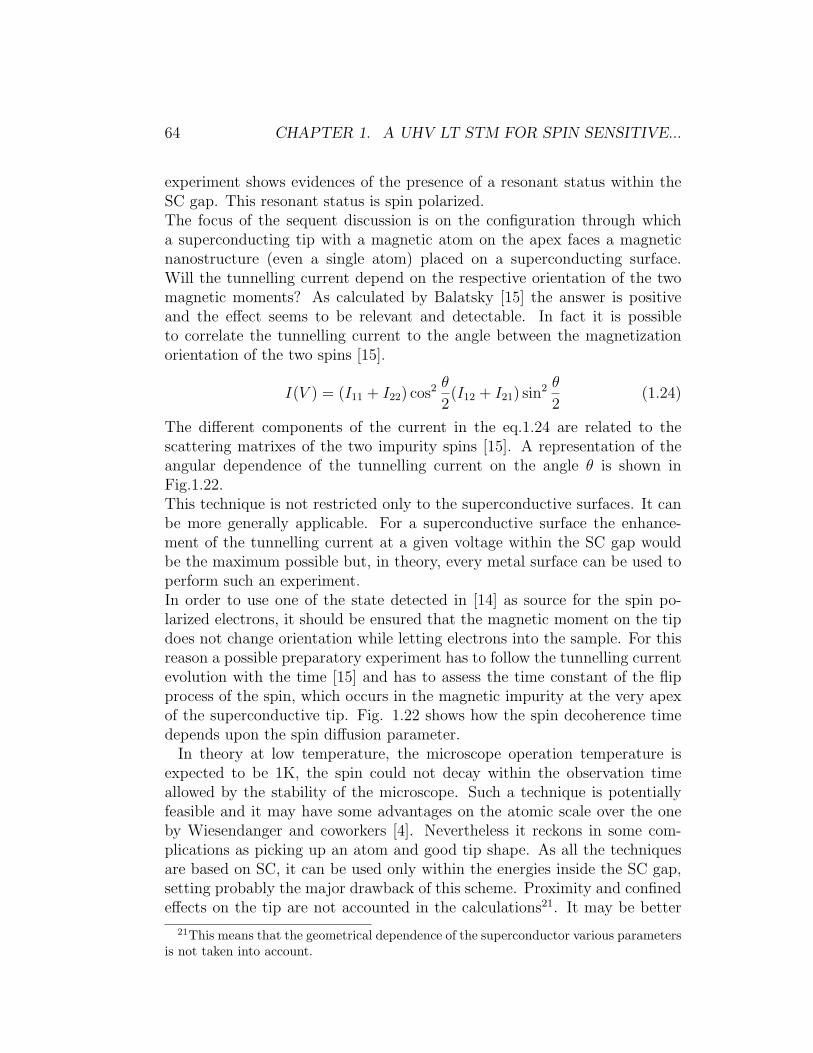
64 CHAPTER 1. A UHV LT STM FOR SPIN SENSITIVE...
experiment shows evidences of the presence of a resonant status within theSC gap. This resonant status is spin polarized.The focus of the sequent discussion is on the configuration through whicha superconducting tip with a magnetic atom on the apex faces a magneticnanostructure (even a single atom) placed on a superconducting surface.Will the tunnelling current depend on the respective orientation of the twomagnetic moments? As calculated by Balatsky [15] the answer is positiveand the effect seems to be relevant and detectable. In fact it is possibleto correlate the tunnelling current to the angle between the magnetizationorientation of the two spins [15].
I(V ) = (I11 + I22) cos2 θ
2(I12 + I21) sin2 θ
2(1.24)
The different components of the current in the eq.1.24 are related to thescattering matrixes of the two impurity spins [15]. A representation of theangular dependence of the tunnelling current on the angle θ is shown inFig.1.22.This technique is not restricted only to the superconductive surfaces. It canbe more generally applicable. For a superconductive surface the enhance-ment of the tunnelling current at a given voltage within the SC gap wouldbe the maximum possible but, in theory, every metal surface can be used toperform such an experiment.In order to use one of the state detected in [14] as source for the spin po-larized electrons, it should be ensured that the magnetic moment on the tipdoes not change orientation while letting electrons into the sample. For thisreason a possible preparatory experiment has to follow the tunnelling currentevolution with the time [15] and has to assess the time constant of the flipprocess of the spin, which occurs in the magnetic impurity at the very apexof the superconductive tip. Fig. 1.22 shows how the spin decoherence timedepends upon the spin diffusion parameter.
In theory at low temperature, the microscope operation temperature isexpected to be 1K, the spin could not decay within the observation timeallowed by the stability of the microscope. Such a technique is potentiallyfeasible and it may have some advantages on the atomic scale over the oneby Wiesendanger and coworkers [4]. Nevertheless it reckons in some com-plications as picking up an atom and good tip shape. As all the techniquesare based on SC, it can be used only within the energies inside the SC gap,setting probably the major drawback of this scheme. Proximity and confinedeffects on the tip are not accounted in the calculations21. It may be better
21This means that the geometrical dependence of the superconductor various parametersis not taken into account.
1.9. SPIN POLARIZED INJECTION BY.. 65
Figure 1.22: Calculated dependence of the tunnelling current I0 on the angleθ between the direction of the impurity magnetization and the magnetizationof the magnetic adsorbate. The calculation is performed for a Nb surfaceand Mn atoms as magnetic impurity and adsorbate. The graph on the rightrefers to the spin correlation function decay. it shows how the spin decoher-ence time depends upon a spin diffusion parameter Λ that can be measuredexperimentally. Figure adapted from [15].
to start with the study of the confinement effects of the impurity intra-gapstates on a SC island and eventually the dynamics of magnetic moments onmetal surfaces. A typical STM image of a single spin has been calculated in[15] and it is shown in Fig 1.21. It refers to the degree of polarization of thetunnelling current P flowing across the junction:
P =I↑↑ − I↑↓I↑↑ + I↑↓
(1.25)
where I↑↑ is the spin polarized part of the tunnelling current I0 and I↑↓ is theunpolarized part.Even though this technique presents some major drawbacks connected to theactual possibility to pick up the right adsorbate at the surface, it is promis-ing in terms of possible spin-electronics experiment at molecular scale. Thepossibility of probing the magnetism or input polarized tunnelling current insingle molecules on surfaces is particularly promising for possible applicationsto single molecular computers [35].
66 CHAPTER 1. A UHV LT STM FOR SPIN SENSITIVE...
1.10 Electron Spin Resonance Scanning Tun-
nelling Microscope ESR-STM
One of the most established techniques for the investigation of magnetismin molecular systems and solid state[111] is Electron Spin Resonance (ESR).It is particularly used for the study of metal organic systems as complexesof transition metal ions [148, 149] and therefore particularly relevant for thetheory argued in the following chapter.A magnetic atom or molecule in a magnetic field is described by a simplehamiltonian, relating the angular momentum and the spin momentum asfollows[111]:
H = H0 + gβJ ·B (1.26)
In the former equation J = L + S commutes with the hamiltonian andinherently its eigenvalue J and Mj are good quantum numbers for the system.In the equation 1.26 g is given from:
g = 1 +J(J + 1) + S(S + 1)− L(L + 1)
2J(J + 1)(1.27)
In presence of a crystal field the mathematical treatment must change inorder to make evident the presence of the crystal field itself. This is a typicalsituation in complexes. As described in the next chapter it occurs also incrystalline solids or magnetic adsorbates on surfaces. If a crystal field ispresent the energy levels will be split accordingly. There are two extremesituations[111, 150]: the spin orbit interaction within the magnetic centeris weaker than the crystal field or the other way around. The first case istypical for the d transition metals where the spin orbit interaction amountsto 10 ÷ 100 meV and the crystal field amounts to several eV. However, , incase of f transition metals the spin orbit interaction can amount up to 1 eVand the quenching of the angular moment results in small Mj. In this casethe spin orbit splitting is predominant with respect to the Zeeman splitting.In presence of a crystalline field the magnetic center can be convenientlydescribed from the spin hamiltonian. It accounts for three terms:
• The Zeeman splitting
• Dipolar splitting
• Hyperfine splitting
H = βB · g · S + S ·D · S + S ·A · I (1.28)
1.10. ELECTRON SPIN RESONANCE SCANNING... 67
g = ge1 + 2λΛ (1.29)
D = λ2Λ (1.30)
A = hyperfine− tensor (1.31)
each of these interactions is associated to a tensor whose component canbe determined through ESR spectroscopy. In the former equations λ repre-sents the magnitude of the spin orbit coupling. However, , Λ is a complextensor that considers the effect of the crystal field. The hyperfine interac-tion is about 3 orders of magnitude smaller then the Zeeman splitting (MHzregime).A standard ESR Spectrometer is composed of a Klystron generating a mi-crowave field, a resonant cavity, a magnet and detection electronics. Eachresonant cavity has a fixed frequency. The operation mode is at constantfrequency. A magnetic field placed around the cavity is switched in order tofind the peak of the absorption. From the peak position, height and widththe hamiltonian parameters of the spin can be inferred.The technique is improved a lot if the resonant frequency is high, as the finestructures in the absorption peaks can be better inferred [110] determiningtheir different components of the tensor mentioned before. This leads toelucidate the contribution of high order terms in the different magnetic in-teractions characterizing a particular sample. The technique has proven togive particular insights in the magnetic behavior of SMM [151].In general sensitivity is proportional to the square of the operational fre-quency. Increasing the operation frequency is not simple, as the size of thesample must be reduced, the homogeneity of the magnetic field increased anddielectric adsorption from the sample limited.The focus of this paragraph is to describe a possible coupling between thistechnique and the spatial resolution offered by the STM. Besides, a standardESR technique has usually a sensitivity 22 limit of 1011 ÷ 1010 paramagnetic
22The formula giving the minimum number of spin centers detectable is:
Nmin =3VckbTsΓ
2πg2β2S(S + 1)BrQu(FkbTdb
P0)
12 (1.32)
where
• Vc= cavity volume
• k= Boltzman constant
• Ts= sample temperature
• Γ= half half-width of the adsorption line
• Br= magnetic field at the center of the adsorption line
68 CHAPTER 1. A UHV LT STM FOR SPIN SENSITIVE...
centers [111] whereas there are some experimental evidences that may getthis number down to one single spin as described here.The possibility to detect the ESR signal from a smaller magnetic assemblyand even to the level of a single atom placed on a surface is not forbidden byany physical constraint. The reason why the limit in the detection is high isdue to the inefficiency of the detection system. However, the STM offers theopportunity to investigate carefully single adsorbates on the surface. Theformer implies that if a mechanism of magnetic coupling between the tip andthe adsorbate is established, it is possible to detect magnetic information atsingle atomic or molecular level.Coupling between a single ion in a magnetic field and the tunnelling currenthave been demonstrated [17, 20, 1]. The authors called this effect ESR-STM.The first experiment was conducted in UHV condition at room temperatureon Si(111)(7 × 7). A schematic representation of the setup is illustrated inFig. 1.23. This surface present dangling p orbitals which act as paramagneticcenters. In presence of a perpendicular magnetic field the spins in this dan-gling orbitals precess around the direction of the field (in a classical picture),bringing the tip of the STM close to one Si atom results in the presence of anhigh frequency signal in the tunnelling current. The position of this signal isproportional to the magnitude of the applied field (few hundreds Gauss) indi-cating a correct value of the magnetic ratio g. The experiment was repeatedunder the presence of perpendicular AC field in such a way to modulate thefrequency of the precessing spins. Also the experiment was made by detect-ing induced modulated components of the tunnelling current through a phasesensitive detection scheme [152]. The effect was early explained in terms ofoscillating electric dipole induced on the spin center through the precessionof the spin [153, 154]. There is also a more complex mathematical analysis ofthe coupling between the tip and the precessing spin which will not actuallybe discussed in this chapter [155]. The effect of the oscillating charge on themagnetic center is turned into a modulation of the tunnelling barrier at theprecessing frequency inducing a high frequency component in the tunnellingfrequency as reported in [157]. Recently the same group reported a new ex-periment on ESR-STM [17] .The surface chosen was Si(111)(7×7). Fe atoms
• Qu= the effective unloaded Q factor of the cavity
• Td detector temperature
• b= band width of the detecting and amplifying synstem
• P0= microwave power incident on the cavity
• F = noise figure attributable to sources other than thermal detector noise
as reported by Wertz [111].
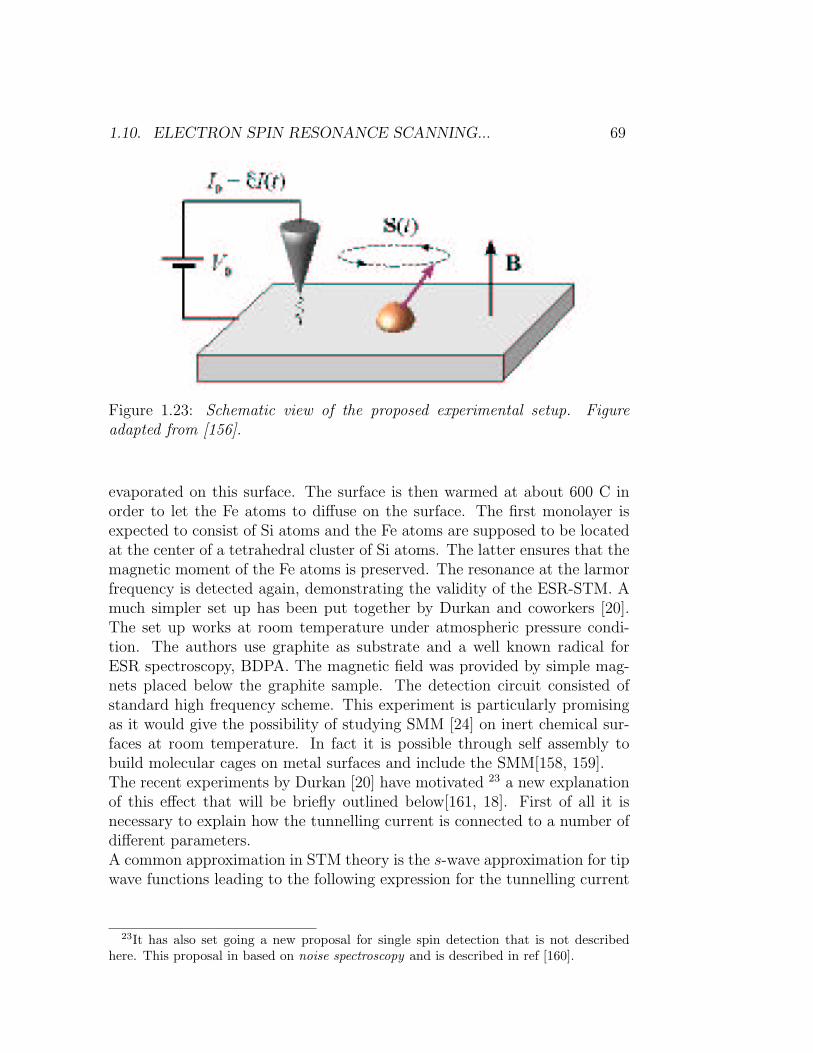
1.10. ELECTRON SPIN RESONANCE SCANNING... 69
Figure 1.23: Schematic view of the proposed experimental setup. Figureadapted from [156].
evaporated on this surface. The surface is then warmed at about 600 C inorder to let the Fe atoms to diffuse on the surface. The first monolayer isexpected to consist of Si atoms and the Fe atoms are supposed to be locatedat the center of a tetrahedral cluster of Si atoms. The latter ensures that themagnetic moment of the Fe atoms is preserved. The resonance at the larmorfrequency is detected again, demonstrating the validity of the ESR-STM. Amuch simpler set up has been put together by Durkan and coworkers [20].The set up works at room temperature under atmospheric pressure condi-tion. The authors use graphite as substrate and a well known radical forESR spectroscopy, BDPA. The magnetic field was provided by simple mag-nets placed below the graphite sample. The detection circuit consisted ofstandard high frequency scheme. This experiment is particularly promisingas it would give the possibility of studying SMM [24] on inert chemical sur-faces at room temperature. In fact it is possible through self assembly tobuild molecular cages on metal surfaces and include the SMM[158, 159].The recent experiments by Durkan [20] have motivated 23 a new explanationof this effect that will be briefly outlined below[161, 18]. First of all it isnecessary to explain how the tunnelling current is connected to a number ofdifferent parameters.A common approximation in STM theory is the s-wave approximation for tipwave functions leading to the following expression for the tunnelling current
23It has also set going a new proposal for single spin detection that is not describedhere. This proposal in based on noise spectroscopy and is described in ref [160].
70 CHAPTER 1. A UHV LT STM FOR SPIN SENSITIVE...
([51] and references therein):
I(V, T, x, y, d) ∝∫ ∞
−∞dE ρs(E, x, y) ρt(E − eV )×
T (E, V, s) [f(E − eV, T )− f(E, T )] , (1.33)
where ρt is the DOS of the tip, x and y characterize the lateral position on thesample and d the distance between tip and sample measured from a virtualplane passing through the uppermost atoms. ρs is the LDOS of the samplein this virtual plane. An often used expression for the tunneling transmissionfactor T (E, V, s) disregards the p|| dependence of Tµ,ν and reads [51]:
T0 = T (E, V, s) = exp
(−2s
√me
h2
√Ws + Wt − 2E + eV
). (1.34)
For24 low bias voltages the bias and energy dependence of the transmissionfactor in Eq. (1.34) can be disregarded, leading to the following simplifiedexpression for the current:
I(V, T, x, y, s) ∝ e−2s√
meh2
√2 W
∫ ∞
−∞dE ρs(E, x, y) ρt(E − eV ) g(E, V, T ) ,
(1.35)where 2 W = Ws + Wt and g(E, V, T ) = f(E − eV, T ) − f(E, T ). The Eq.1.35 shows how the density of state of tip and sample are convoluted in thetunnelling current expression. It also exemplifies the role of the tunnellingmatrix in the determination of the tunnelling current.During the time of precession 1
ωL∼ 2ns there are about 20 electrons crossing
the tunnelling barrier if it is assumed that the DC tunnelling current25 I0 =e/τe = 1 nA and the tunnelling rate of a single electron 1/τe ∼ 1010 Hz.This is an amount small enough for a fluctuation of the tunnelling currentspin polarization to take place [161, 18]. If this happen then it is possible toimagine that the local spin polarized current can be coupled to the precessingspin on the surface, Fig. 1.21, through exchange interaction. The former willaffect the tunnelling matrix from Eq. 1.34 in the following way:
Γ = T0 exp[−√
Φ− JS(t)σ
Φ0
] (1.36)
Where S(t) is the precessing spin operator and σ is the spin operator of thetunnelling electrons. J is the exchange coupling and Φ the tunnelling energy
24Ws surface work function, Wt tip work function25The notation will be simplified from now on. The DC tunnelling current will be
referred as I0
1.10. ELECTRON SPIN RESONANCE SCANNING... 71
barrier and Φ0 is a parameter depending on tip sample separation. Under thereasonable hypothesis that the tunnelling barrier is bigger than the exchangecoupling the( Eq. 1.36) can be expanded in JS as follows:
Γ = T0 exp[−(Φ
Φ0
)12 ][cosh(
JS
2Φ(
Φ
Φ0
)12 ) + σn(t) sinh(
JS
2Φ(
Φ
Φ0
)12 )] (1.37)
where the dependence of S with respect t has been discharged on n(t) definedfrom S(t) = n(t)S. From Eq.1.37 it is possible to infer that the AC compo-nent of the tunnelling current will be proportional to the product σ(t)n(t).In the precession period associated to ωL, T there will be N = I0T electronstunnelling. Besides, the time average current ∆I will be dependent on δI(t).The time fluctuation of ∆I give an estimation of the magnitude of the ACcomponent. It is found [161, 18]that (< ∆I2 >)1/2 ∼ (I0B)1/2 indicating thatthe magnitude of the AC component is slightly dependent on the magnitudeof the applied magnetic field and DC current. A numerical estimation of thetunnelling current fluctuation leads to asses them to be in the order of 10 pAwhen I0 = 1 nA and the exchange coupling J = 0.1 eV [161, 18]. The formeris according to experimental results. It is also possible to estimate the effectof the exchange interaction on the precessing spin S(t). This effect leads to adecoherence of the precessing spin. The time scale associated to this processis named 1/τs and it is estimated to be about 4 × 10⁶Hz which is sensiblyless than ωL/2π = 5× 10⁸ Hz if the applied field is about 200 Gauss. In thisrespect it is possible to see that before getting affected from the tunnellingcurrent the precessing spin can encode an AC signal in the current. Finally,in order to estimate the signal to noise ratio the authors calculate the Fouriertransform of the tunnelling current and estimate it at ωL [161, 18]:
< Iω2 >
< IShot−noise(ω)2 >= [sinh(
JS
2Φ(
Φ
Φ0
)12 )]2
1
τeγ= 2÷ 4 (1.38)
This amount corresponds to the experimental magnitude reported in[17,20]26. It seems that this theory could explain the experiments. It also showshow the DC current, the magnetic field applied, the magnitude of the ex-change coupling and Finally, the size of the spin center are all parametersthat can be tuned to magnify this effect.There are two possible experimental setups that can be implemented onthe system described. One relying on low temperature high frequency elec-tronics and the other one much simpler relying on standard high frequencyelectronics. In [19] the experimental setup used was adapted to a room tem-perature. A splitter was placed close to the tunnel junction and two filters
26γ is a width entering the fourier transform Loretzian.
72 CHAPTER 1. A UHV LT STM FOR SPIN SENSITIVE...
were allocated in vacuum. One was a low pass filter for normal STM oper-ation and the other one consists of a high pass filter to be connected to anRF circuit. As the tunnelling junction is normally of the order of MOhm animpedance matching circuit is also required. As explained in [93] up to 1GHzthe transmission line for circuit connections can be a coaxial cable thoughmore complex coaxial wires can be used for high frequency low temperatureapplications [69]. Nevertheless in order to avoid undesirable reflection theimpedance of the line, the source and the load must be equal. Furthermorein order to transfer the maximum power from the source to the spectrumanalyzer the input impedance of the instrument must be equal to the outimpedance of the RF amplifier. As discussed in [162] if a line between asource and a measurement apparatus has to be placed in the circuit somedrawbacks may appear:
• Reduction of source quality factor Q
• Degradation of high frequency performance due to the phase shift in-duced by the line length
• Interference and noise increase.
For these reasons in a cryogenic environment, as in our set up, it may mebetter to use a configuration which incorporates some parts of the electron-ics in the low temperature stage. Particularly a high frequency filter and apreamplifier with appropriate matching impedance should be incorporated.Previous to those two components an AC-DC splitter has to be connectedto the tunnelling junction to allow the detection of the DC channel. Thepresence of these components may introduce a heat leak. Kirshman [163]provides some insights about the former issue. The best device to buildan high frequency cryogenic amplifier is a GaAs MOSFET whose power con-sumption can be reduced to 10 µW. Thermal conductance of the componentsused to build the high frequency detection circuit is a relevant parameter,as it can affect the cooling time of the experimental region. UnfortunatelyGaAs thermal conductance decreases below 77 K. A typical example of highfrequency pre amplifier is described in [164]. In the set up described in thischapter a further power consumption of 10 µW should not be a problem aswe expect a cooling power at 0.5 K of 3 mW. The circuit is small and thereis enough space to place it close to the STM or on the STM frame.However, a much simpler approach is also possible relying on standard highfrequency components connected outside the UHV environment. The for-mer makes the detection problem much easier to handle. A simple circuitconsisting of an AC-DC splitter plugged directly on the tunnelling current
1.10. ELECTRON SPIN RESONANCE SCANNING... 73
line just before the I/V convertor has been assembled and tested. Followingthe splitter a band pass filter (200-400 MHz) is connected to two amplifiers.The amplifiers have 20 dBm. All the components have an input -outputimpedance of 50 Ohm that incorporates an easy plugging in the spectrumanalyzer. Impedance matching at the tip level is simply ensured by the coax-ial cable connected to the tip itself.The technique described in this section is particularly promising as it can beimplemented in simple set up at air pressure, like in [20] and in complex setup as the system described here. Besides, the possibility of studying intrigu-ing magnetic systems as molecular magnets [24, 165] can be also envisaged.Nevertheless clusters of high nuclearity as SMM have usually high zero fieldsplitting D [110], this means that the minimum magnetic field, that has tobe applied in order to excite the precession of the spin, is much higher thanin the experiments reported so far [20](D can be as high as 30 ÷ 40 GHz).This requirement shows how the technique must be necessarily developed athigher frequencies than those used so far in the detection of the ESR-STMeffect.Also, the magnetism and the coordinative bonding nature of metal-organicself assembled structures at surfaces [43, 166], can be elucidated using a spinsensitive local probe as the one being described. Finally, the use of ESR STMand magnetic molecules for alternative approaches to quantum computation[34, 35, 133] is certainly one of the most intriguing technological applicationsof the ESR STM. Particularly very recently Harneit and Coworkers have pro-posed a quantum computing approach based on endohedral fullerenes [30]and ESR detection. This approach can be extended to single molecular levelif a resource for local read out was available [167]. In view of this ESR-STMis proposed as the tool for locally addressing the single magnetic adsorbates.Although all the former applications are certainly intriguing, the most straight-forward application of this technique may be the study of simple moleculeswith a relatively low zero field splitting. In this respect radicals are certainlypotentially the best candidates. Different types of employable radicals maybe inferred from the well established work in this field [168, 169].

74 CHAPTER 1. A UHV LT STM FOR SPIN SENSITIVE...

Chapter 2
Metal-Organic Self Assembly atCu(100)
2.1 Introduction
In this chapter is described a new method to produce nanostructures onsurfaces. The first paragraphs elucidate the difference between metal heteroepitaxy on metals and metal-organic self assembly at metal surfaces. A quickreview of programmed self assembly is presented. Also, in the fourth para-graph concepts of magnetochemical synthesis, such as synthesis of polynu-clear magnetic clusters and magnetic chains, are presented and discussed inview of applications on the direct metalorganic synthesis on surfaces. Thenext sections describe the adsorption and the surface dynamics of large adsor-bates. A survey of metalorganic chemistry on surfaces including the behaviorof TMA at Cu(100), is presented in paragraph 6. Following results on mononuclear complex and analysis (including chemical kinetic ) are reported. Re-sults and discussion on polynuclear clusters are reported. Besides a foregoingon the kinetics of adsorbate adsorption follows. The last part of the chapterdescribes the formation of 1D and 2D metalorganic structures. Results areinterpreted in view of concepts of metalorganic chemical engineering. Par-ticular relevance is given to the hydrogen bond as tool to tune the shape oflongrange ordered metalorganic structures.
2.2 Experimental
Iron and 1,3,5 tricarboxylic benzoic acid (TMA) Fig.2.1 have been coevapo-rated on a Cu(100) surface in ultra high vacuum of 5 × 10⁻¹⁰ mbar. Underthese conditions the surfaces can be prepared such to become clean and atom-
75
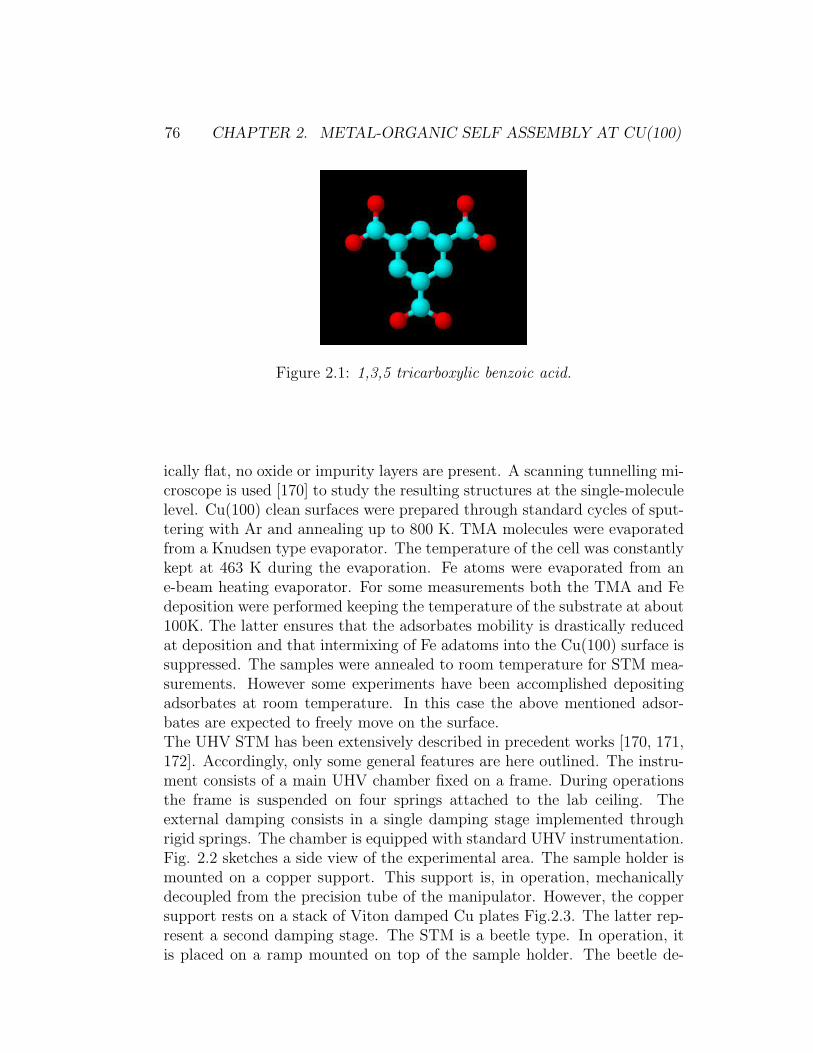
76 CHAPTER 2. METAL-ORGANIC SELF ASSEMBLY AT CU(100)
Figure 2.1: 1,3,5 tricarboxylic benzoic acid.
ically flat, no oxide or impurity layers are present. A scanning tunnelling mi-croscope is used [170] to study the resulting structures at the single-moleculelevel. Cu(100) clean surfaces were prepared through standard cycles of sput-tering with Ar and annealing up to 800 K. TMA molecules were evaporatedfrom a Knudsen type evaporator. The temperature of the cell was constantlykept at 463 K during the evaporation. Fe atoms were evaporated from ane-beam heating evaporator. For some measurements both the TMA and Fedeposition were performed keeping the temperature of the substrate at about100K. The latter ensures that the adsorbates mobility is drastically reducedat deposition and that intermixing of Fe adatoms into the Cu(100) surface issuppressed. The samples were annealed to room temperature for STM mea-surements. However some experiments have been accomplished depositingadsorbates at room temperature. In this case the above mentioned adsor-bates are expected to freely move on the surface.The UHV STM has been extensively described in precedent works [170, 171,172]. Accordingly, only some general features are here outlined. The instru-ment consists of a main UHV chamber fixed on a frame. During operationsthe frame is suspended on four springs attached to the lab ceiling. Theexternal damping consists in a single damping stage implemented throughrigid springs. The chamber is equipped with standard UHV instrumentation.Fig. 2.2 sketches a side view of the experimental area. The sample holder ismounted on a copper support. This support is, in operation, mechanicallydecoupled from the precision tube of the manipulator. However, the coppersupport rests on a stack of Viton damped Cu plates Fig.2.3. The latter rep-resent a second damping stage. The STM is a beetle type. In operation, itis placed on a ramp mounted on top of the sample holder. The beetle de-
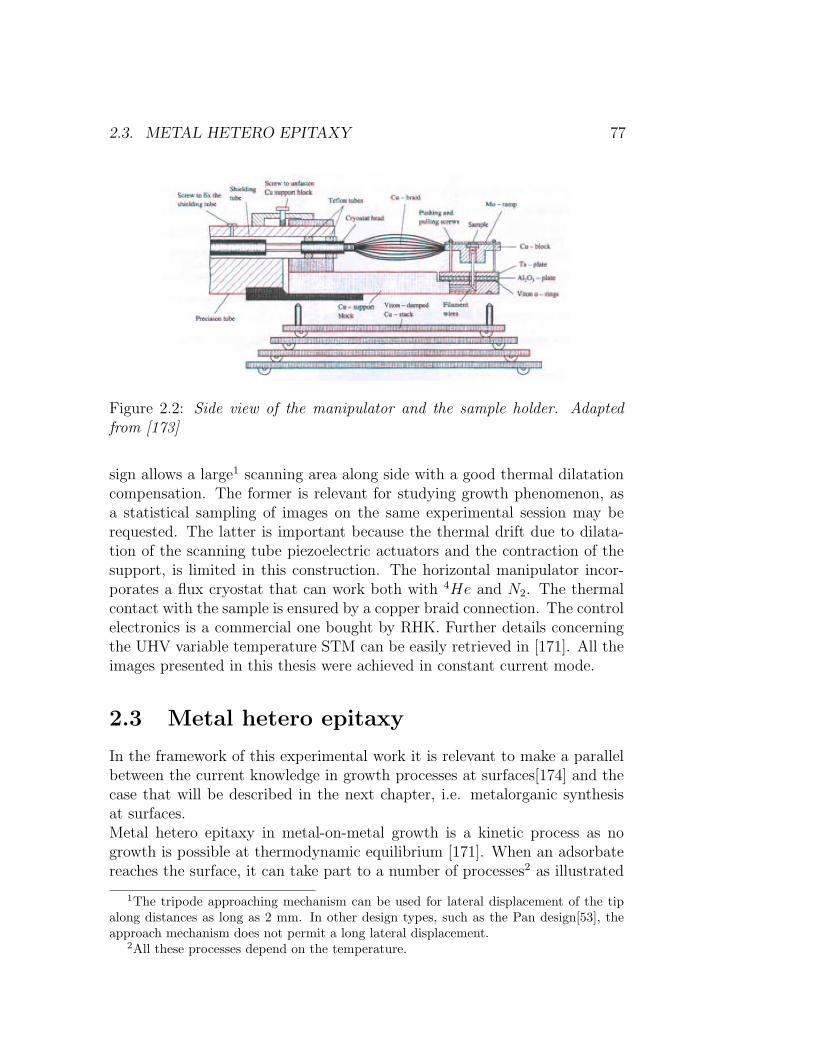
2.3. METAL HETERO EPITAXY 77
Figure 2.2: Side view of the manipulator and the sample holder. Adaptedfrom [173]
sign allows a large1 scanning area along side with a good thermal dilatationcompensation. The former is relevant for studying growth phenomenon, asa statistical sampling of images on the same experimental session may berequested. The latter is important because the thermal drift due to dilata-tion of the scanning tube piezoelectric actuators and the contraction of thesupport, is limited in this construction. The horizontal manipulator incor-porates a flux cryostat that can work both with 4He and N2. The thermalcontact with the sample is ensured by a copper braid connection. The controlelectronics is a commercial one bought by RHK. Further details concerningthe UHV variable temperature STM can be easily retrieved in [171]. All theimages presented in this thesis were achieved in constant current mode.
2.3 Metal hetero epitaxy
In the framework of this experimental work it is relevant to make a parallelbetween the current knowledge in growth processes at surfaces[174] and thecase that will be described in the next chapter, i.e. metalorganic synthesisat surfaces.Metal hetero epitaxy in metal-on-metal growth is a kinetic process as nogrowth is possible at thermodynamic equilibrium [171]. When an adsorbatereaches the surface, it can take part to a number of processes2 as illustrated
1The tripode approaching mechanism can be used for lateral displacement of the tipalong distances as long as 2 mm. In other design types, such as the Pan design[53], theapproach mechanism does not permit a long lateral displacement.
2All these processes depend on the temperature.
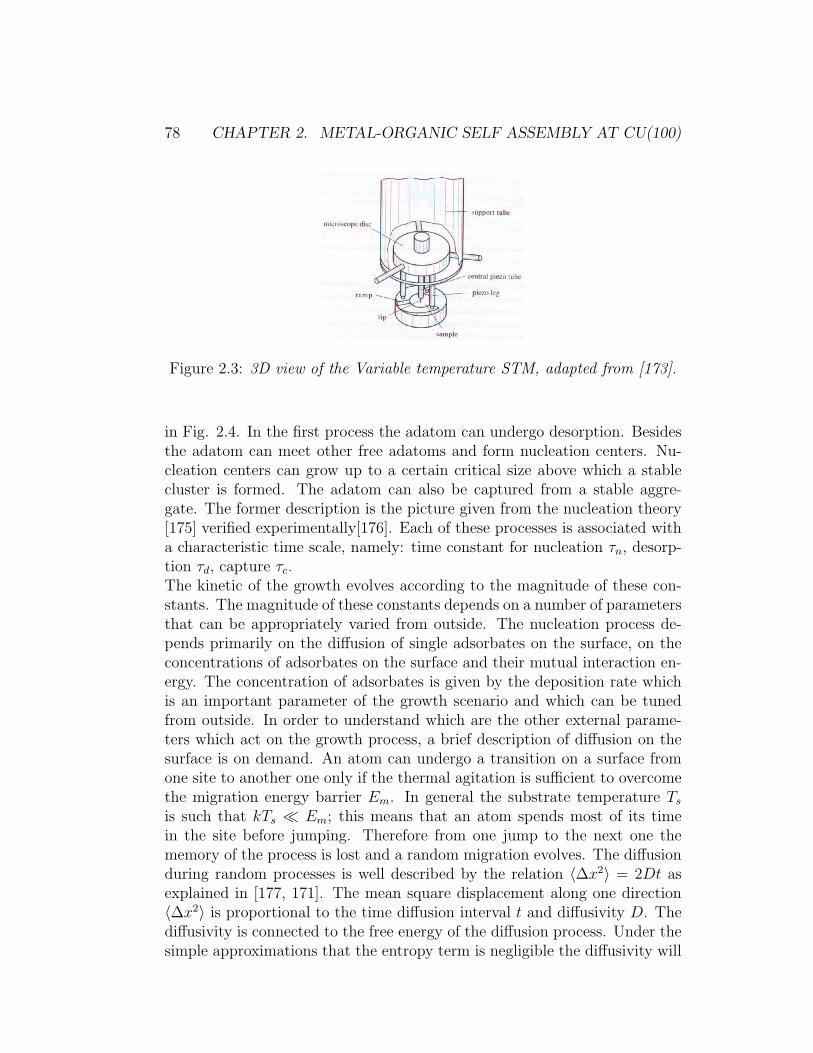
78 CHAPTER 2. METAL-ORGANIC SELF ASSEMBLY AT CU(100)
Figure 2.3: 3D view of the Variable temperature STM, adapted from [173].
in Fig. 2.4. In the first process the adatom can undergo desorption. Besidesthe adatom can meet other free adatoms and form nucleation centers. Nu-cleation centers can grow up to a certain critical size above which a stablecluster is formed. The adatom can also be captured from a stable aggre-gate. The former description is the picture given from the nucleation theory[175] verified experimentally[176]. Each of these processes is associated witha characteristic time scale, namely: time constant for nucleation τn, desorp-tion τd, capture τc.The kinetic of the growth evolves according to the magnitude of these con-stants. The magnitude of these constants depends on a number of parametersthat can be appropriately varied from outside. The nucleation process de-pends primarily on the diffusion of single adsorbates on the surface, on theconcentrations of adsorbates on the surface and their mutual interaction en-ergy. The concentration of adsorbates is given by the deposition rate whichis an important parameter of the growth scenario and which can be tunedfrom outside. In order to understand which are the other external parame-ters which act on the growth process, a brief description of diffusion on thesurface is on demand. An atom can undergo a transition on a surface fromone site to another one only if the thermal agitation is sufficient to overcomethe migration energy barrier Em. In general the substrate temperature Ts
is such that kTs ¿ Em; this means that an atom spends most of its timein the site before jumping. Therefore from one jump to the next one thememory of the process is lost and a random migration evolves. The diffusionduring random processes is well described by the relation 〈∆x2〉 = 2Dt asexplained in [177, 171]. The mean square displacement along one direction〈∆x2〉 is proportional to the time diffusion interval t and diffusivity D. Thediffusivity is connected to the free energy of the diffusion process. Under thesimple approximations that the entropy term is negligible the diffusivity will
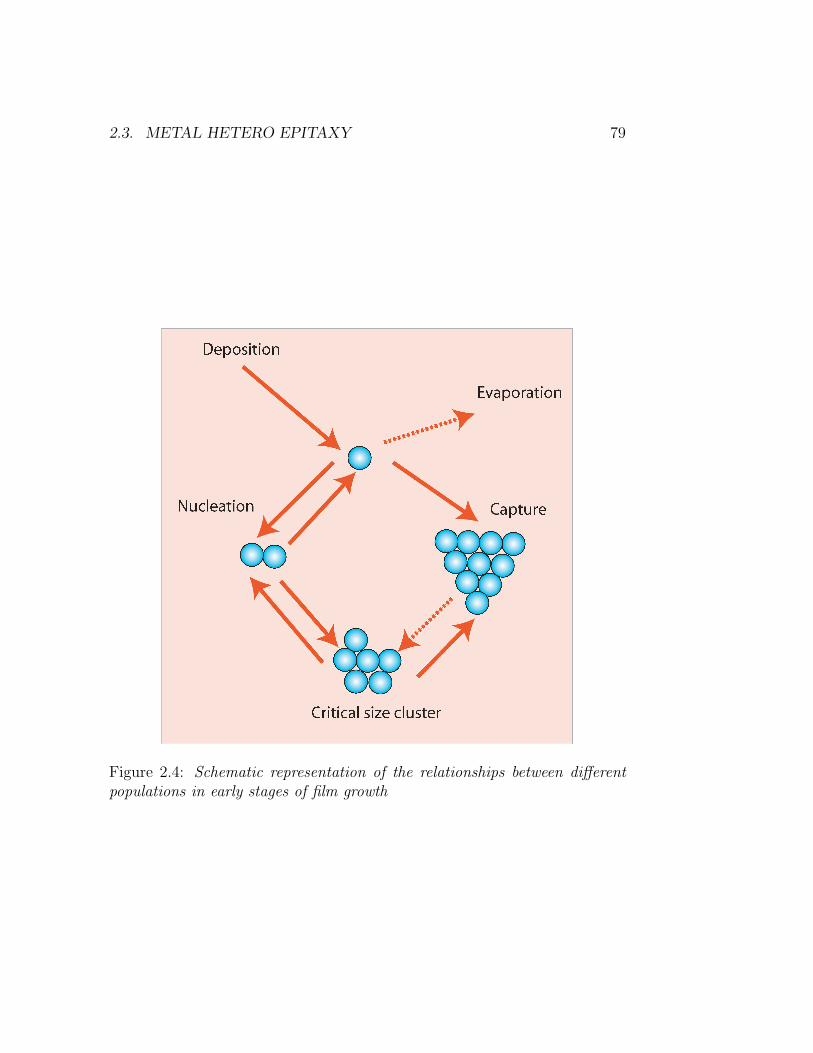
2.3. METAL HETERO EPITAXY 79
Figure 2.4: Schematic representation of the relationships between differentpopulations in early stages of film growth
80 CHAPTER 2. METAL-ORGANIC SELF ASSEMBLY AT CU(100)
depend exponentially on the ratio between the migration energy Em and thesubstrate temperature Ts
3. The connection with the migration Em energyclarifies how the chemical nature of adsorbates and substrate may affect thegrowth scenario. However, the geometrical structure of the surface will alsoaffect the diffusion accounting for a variation of the pre-factor constant. Fi-nally the adsorbate-adsorbate interaction will determine the critical size ofstable clusters, for a given temperature. Summarizing a number of externalparameters can be appropriately tuned to control the growth scenario [172].As shown in Fig. 2.5 the control on these parameters lets form nanostructureswhose study enables to elucidate the dependence of growth on microscopicalparameters. The former lead to a better choice of the external parametersin order to shape the desired nanostructure.The external parameters tunable from the operator are:
• Deposition rate
• Substrate temperature
• Substrate, adsorbate material and symmetry
These parameters are extremely relevant to the discussion in this thesis asthey are not the only ones relevant when two different adsorbates are de-posited on the surface. Particularly if the second adsorbate is an organicmolecule other degrees of freedom come into play. Besides if a chemicalreaction between the two adsorbates takes place the nanostructure growthprocess is intimately modified.As matter of fact in normal metal epitaxy growth adsorbate-substrate in-teraction is the most relevant interaction, however in the case discussed inthe following adsorbate-adsorbate interaction is sensibly enhanced. In somecases, as for instance at Cu(100), self diffusing process[178] can affect thegrowth scenario leading to surfaces alloys. Migration of Cu adatoms fromthe step edges to the terraces at Copper surfaces is a well established phe-nomenon and has been the object of different theoretical and experimentalstudies [178, 179, 180, 181, 182, 183, 184]. This is a process which certainlytakes place in the experiments performed in this thesis when the substratetemperature approaches room temperature.Other relevant surface processes which are of importance to the experimentsperformed here are the migration of Fe adatoms to the step edges [185, 186]and the exchange of Cu surface atoms with Fe adatoms [185]. Fe adatomsare also known to dig into the first layer of Cu(100) [187]. Such phenomenon
3in this picture the diffusivity will depend linearly on a specific constant
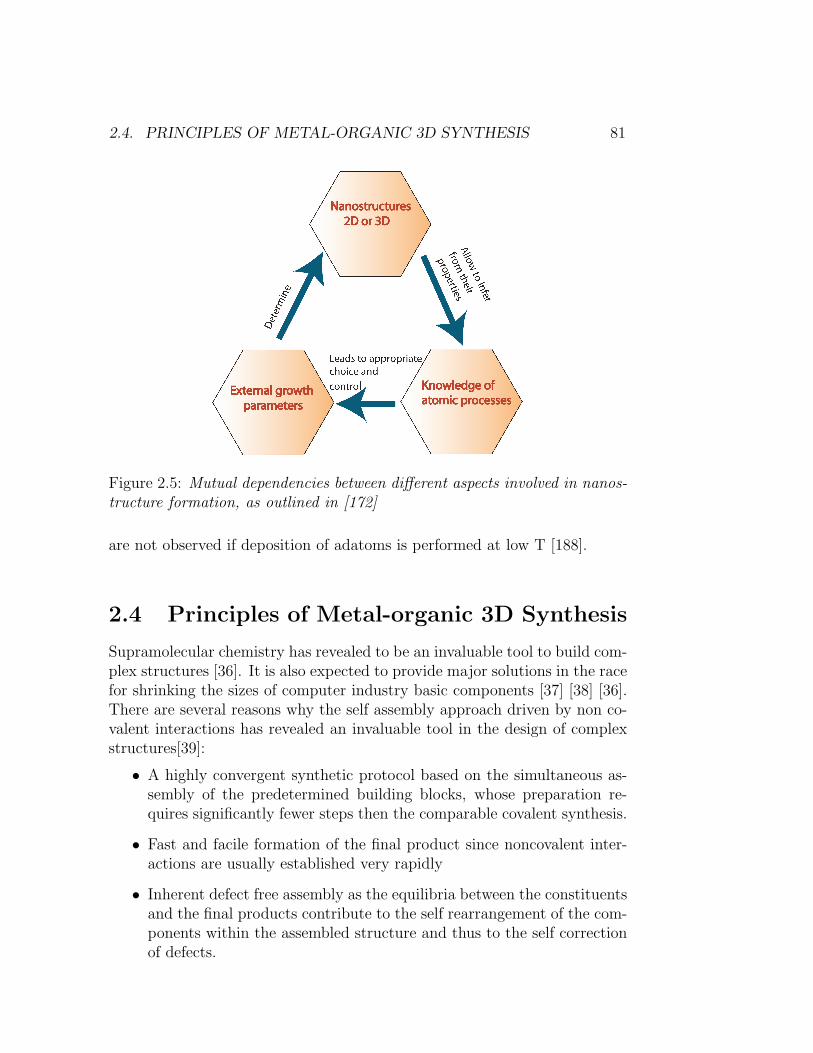
2.4. PRINCIPLES OF METAL-ORGANIC 3D SYNTHESIS 81
Figure 2.5: Mutual dependencies between different aspects involved in nanos-tructure formation, as outlined in [172]
are not observed if deposition of adatoms is performed at low T [188].
2.4 Principles of Metal-organic 3D Synthesis
Supramolecular chemistry has revealed to be an invaluable tool to build com-plex structures [36]. It is also expected to provide major solutions in the racefor shrinking the sizes of computer industry basic components [37] [38] [36].There are several reasons why the self assembly approach driven by non co-valent interactions has revealed an invaluable tool in the design of complexstructures[39]:
• A highly convergent synthetic protocol based on the simultaneous as-sembly of the predetermined building blocks, whose preparation re-quires significantly fewer steps then the comparable covalent synthesis.
• Fast and facile formation of the final product since noncovalent inter-actions are usually established very rapidly
• Inherent defect free assembly as the equilibria between the constituentsand the final products contribute to the self rearrangement of the com-ponents within the assembled structure and thus to the self correctionof defects.
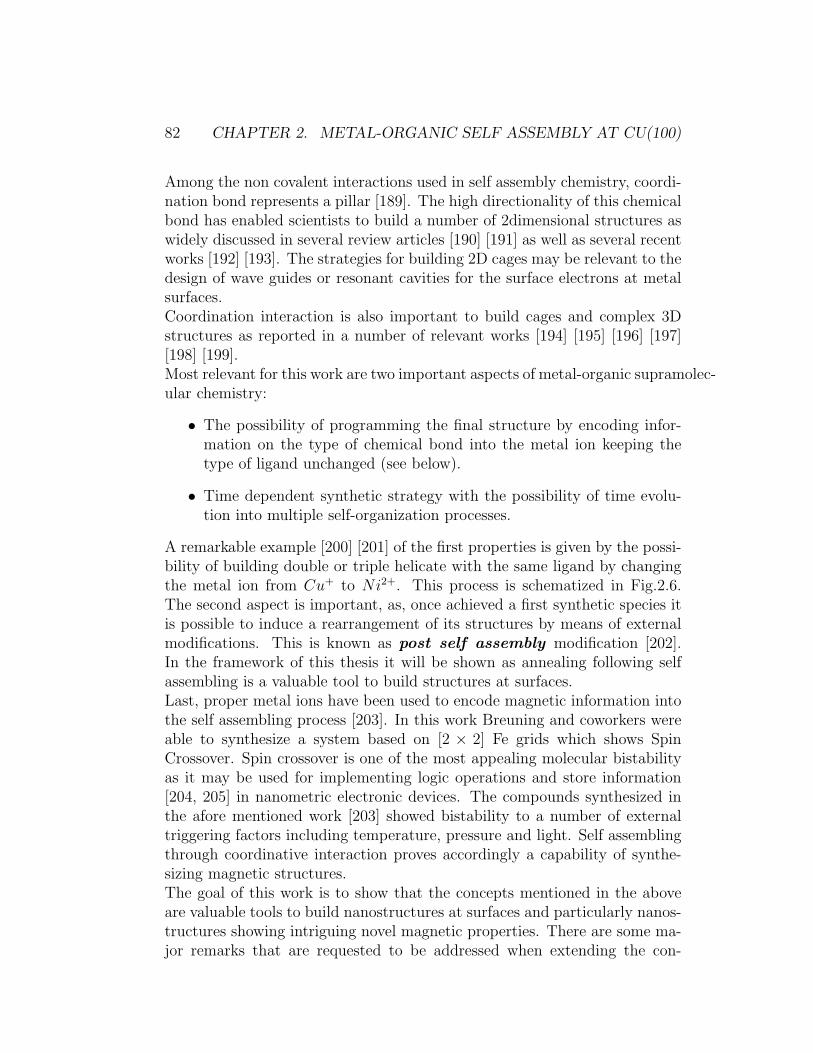
82 CHAPTER 2. METAL-ORGANIC SELF ASSEMBLY AT CU(100)
Among the non covalent interactions used in self assembly chemistry, coordi-nation bond represents a pillar [189]. The high directionality of this chemicalbond has enabled scientists to build a number of 2dimensional structures aswidely discussed in several review articles [190] [191] as well as several recentworks [192] [193]. The strategies for building 2D cages may be relevant to thedesign of wave guides or resonant cavities for the surface electrons at metalsurfaces.Coordination interaction is also important to build cages and complex 3Dstructures as reported in a number of relevant works [194] [195] [196] [197][198] [199].Most relevant for this work are two important aspects of metal-organic supramolec-ular chemistry:
• The possibility of programming the final structure by encoding infor-mation on the type of chemical bond into the metal ion keeping thetype of ligand unchanged (see below).
• Time dependent synthetic strategy with the possibility of time evolu-tion into multiple self-organization processes.
A remarkable example [200] [201] of the first properties is given by the possi-bility of building double or triple helicate with the same ligand by changingthe metal ion from Cu+ to Ni2+. This process is schematized in Fig.2.6.The second aspect is important, as, once achieved a first synthetic species itis possible to induce a rearrangement of its structures by means of externalmodifications. This is known as post self assembly modification [202].In the framework of this thesis it will be shown as annealing following selfassembling is a valuable tool to build structures at surfaces.Last, proper metal ions have been used to encode magnetic information intothe self assembling process [203]. In this work Breuning and coworkers wereable to synthesize a system based on [2 × 2] Fe grids which shows SpinCrossover. Spin crossover is one of the most appealing molecular bistabilityas it may be used for implementing logic operations and store information[204, 205] in nanometric electronic devices. The compounds synthesized inthe afore mentioned work [203] showed bistability to a number of externaltriggering factors including temperature, pressure and light. Self assemblingthrough coordinative interaction proves accordingly a capability of synthe-sizing magnetic structures.The goal of this work is to show that the concepts mentioned in the aboveare valuable tools to build nanostructures at surfaces and particularly nanos-tructures showing intriguing novel magnetic properties. There are some ma-jor remarks that are requested to be addressed when extending the con-
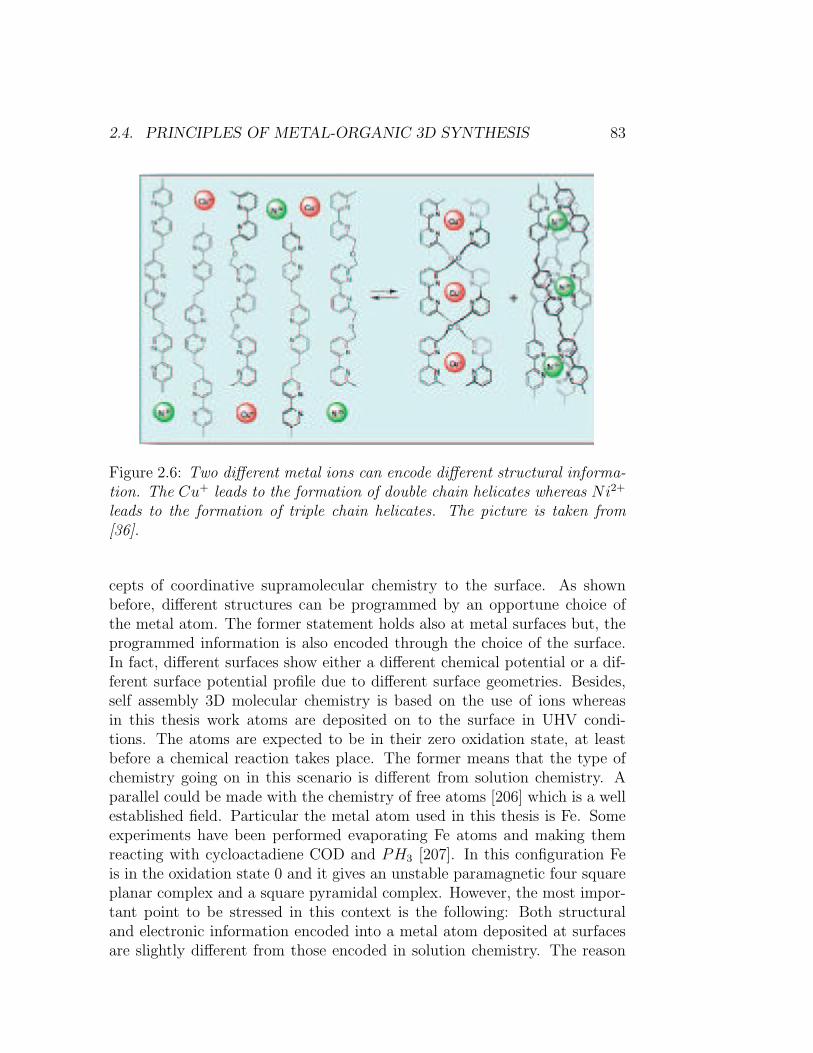
2.4. PRINCIPLES OF METAL-ORGANIC 3D SYNTHESIS 83
Figure 2.6: Two different metal ions can encode different structural informa-tion. The Cu+ leads to the formation of double chain helicates whereas Ni2+
leads to the formation of triple chain helicates. The picture is taken from[36].
cepts of coordinative supramolecular chemistry to the surface. As shownbefore, different structures can be programmed by an opportune choice ofthe metal atom. The former statement holds also at metal surfaces but, theprogrammed information is also encoded through the choice of the surface.In fact, different surfaces show either a different chemical potential or a dif-ferent surface potential profile due to different surface geometries. Besides,self assembly 3D molecular chemistry is based on the use of ions whereasin this thesis work atoms are deposited on to the surface in UHV condi-tions. The atoms are expected to be in their zero oxidation state, at leastbefore a chemical reaction takes place. The former means that the type ofchemistry going on in this scenario is different from solution chemistry. Aparallel could be made with the chemistry of free atoms [206] which is a wellestablished field. Particular the metal atom used in this thesis is Fe. Someexperiments have been performed evaporating Fe atoms and making themreacting with cycloactadiene COD and PH3 [207]. In this configuration Feis in the oxidation state 0 and it gives an unstable paramagnetic four squareplanar complex and a square pyramidal complex. However, the most impor-tant point to be stressed in this context is the following: Both structuraland electronic information encoded into a metal atom deposited at surfacesare slightly different from those encoded in solution chemistry. The reason
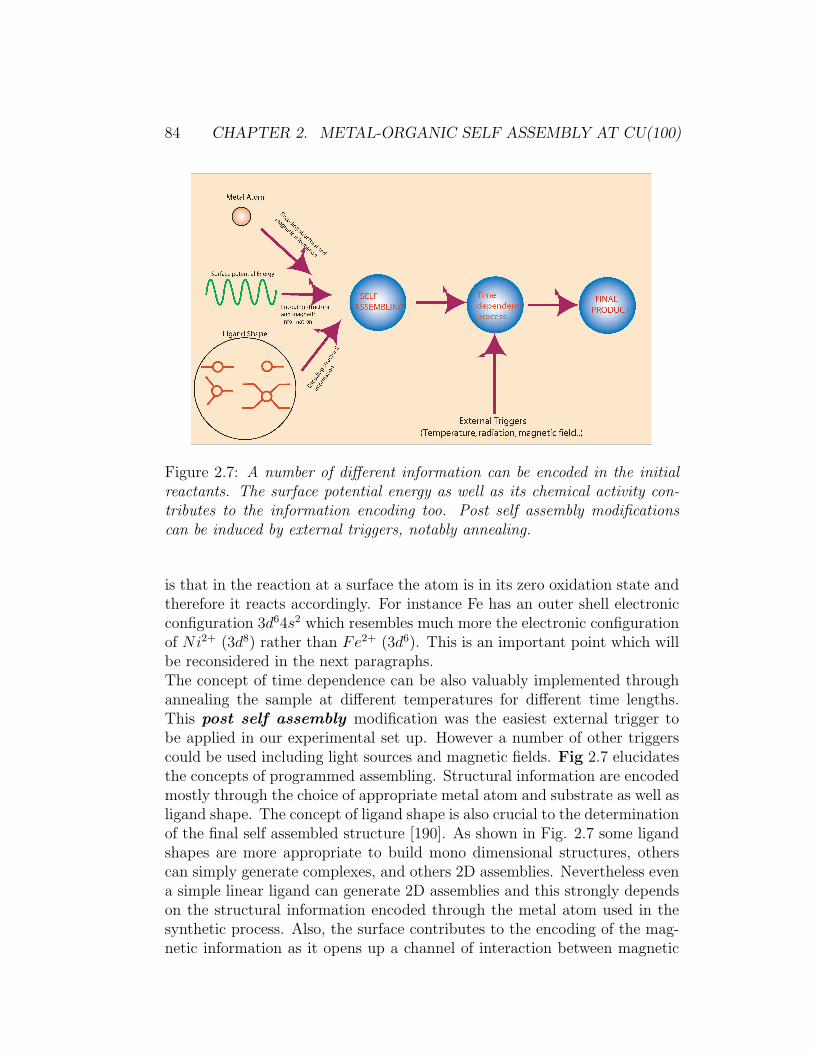
84 CHAPTER 2. METAL-ORGANIC SELF ASSEMBLY AT CU(100)
Figure 2.7: A number of different information can be encoded in the initialreactants. The surface potential energy as well as its chemical activity con-tributes to the information encoding too. Post self assembly modificationscan be induced by external triggers, notably annealing.
is that in the reaction at a surface the atom is in its zero oxidation state andtherefore it reacts accordingly. For instance Fe has an outer shell electronicconfiguration 3d64s2 which resembles much more the electronic configurationof Ni2+ (3d8) rather than Fe2+ (3d6). This is an important point which willbe reconsidered in the next paragraphs.The concept of time dependence can be also valuably implemented throughannealing the sample at different temperatures for different time lengths.This post self assembly modification was the easiest external trigger tobe applied in our experimental set up. However a number of other triggerscould be used including light sources and magnetic fields. Fig 2.7 elucidatesthe concepts of programmed assembling. Structural information are encodedmostly through the choice of appropriate metal atom and substrate as well asligand shape. The concept of ligand shape is also crucial to the determinationof the final self assembled structure [190]. As shown in Fig. 2.7 some ligandshapes are more appropriate to build mono dimensional structures, otherscan simply generate complexes, and others 2D assemblies. Nevertheless evena simple linear ligand can generate 2D assemblies and this strongly dependson the structural information encoded through the metal atom used in thesynthetic process. Also, the surface contributes to the encoding of the mag-netic information as it opens up a channel of interaction between magnetic

2.4. PRINCIPLES OF METAL-ORGANIC 3D SYNTHESIS 85
center. This will be described in the next section.
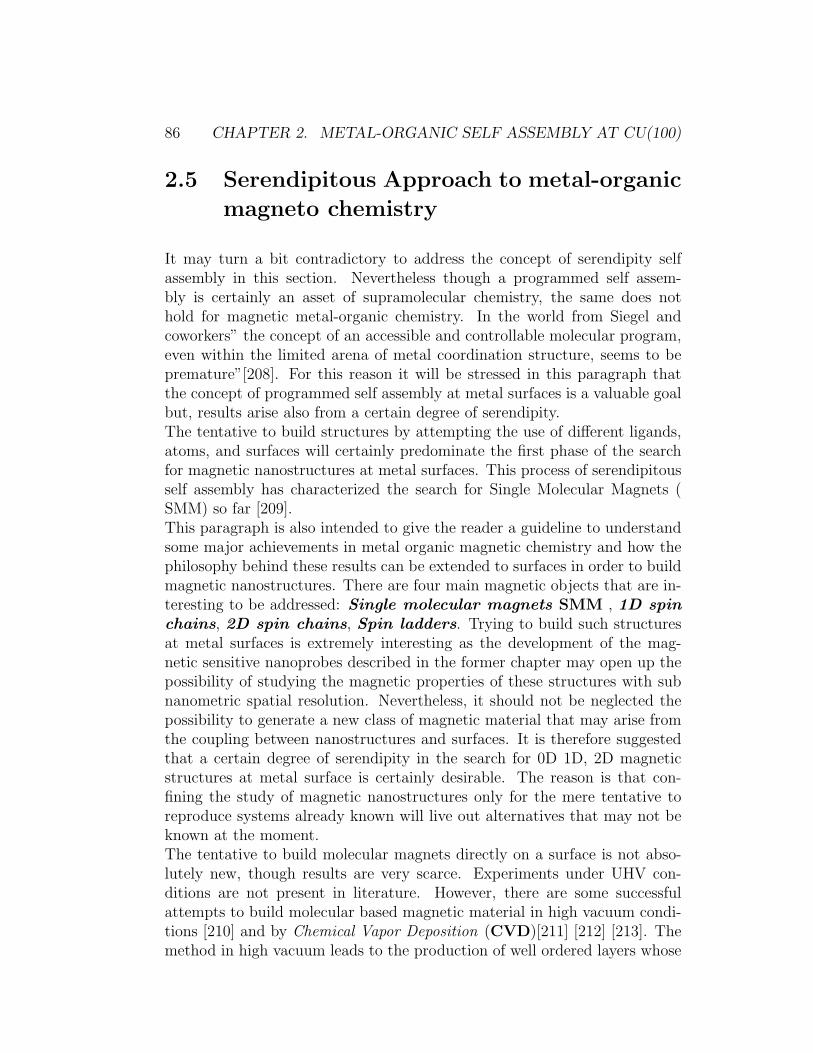
86 CHAPTER 2. METAL-ORGANIC SELF ASSEMBLY AT CU(100)
2.5 Serendipitous Approach to metal-organic
magneto chemistry
It may turn a bit contradictory to address the concept of serendipity selfassembly in this section. Nevertheless though a programmed self assem-bly is certainly an asset of supramolecular chemistry, the same does nothold for magnetic metal-organic chemistry. In the world from Siegel andcoworkers” the concept of an accessible and controllable molecular program,even within the limited arena of metal coordination structure, seems to bepremature”[208]. For this reason it will be stressed in this paragraph thatthe concept of programmed self assembly at metal surfaces is a valuable goalbut, results arise also from a certain degree of serendipity.The tentative to build structures by attempting the use of different ligands,atoms, and surfaces will certainly predominate the first phase of the searchfor magnetic nanostructures at metal surfaces. This process of serendipitousself assembly has characterized the search for Single Molecular Magnets (SMM) so far [209].This paragraph is also intended to give the reader a guideline to understandsome major achievements in metal organic magnetic chemistry and how thephilosophy behind these results can be extended to surfaces in order to buildmagnetic nanostructures. There are four main magnetic objects that are in-teresting to be addressed: Single molecular magnets SMM , 1D spinchains, 2D spin chains, Spin ladders. Trying to build such structuresat metal surfaces is extremely interesting as the development of the mag-netic sensitive nanoprobes described in the former chapter may open up thepossibility of studying the magnetic properties of these structures with subnanometric spatial resolution. Nevertheless, it should not be neglected thepossibility to generate a new class of magnetic material that may arise fromthe coupling between nanostructures and surfaces. It is therefore suggestedthat a certain degree of serendipity in the search for 0D 1D, 2D magneticstructures at metal surface is certainly desirable. The reason is that con-fining the study of magnetic nanostructures only for the mere tentative toreproduce systems already known will live out alternatives that may not beknown at the moment.The tentative to build molecular magnets directly on a surface is not abso-lutely new, though results are very scarce. Experiments under UHV con-ditions are not present in literature. However, there are some successfulattempts to build molecular based magnetic material in high vacuum condi-tions [210] and by Chemical Vapor Deposition (CVD)[211] [212] [213]. Themethod in high vacuum leads to the production of well ordered layers whose
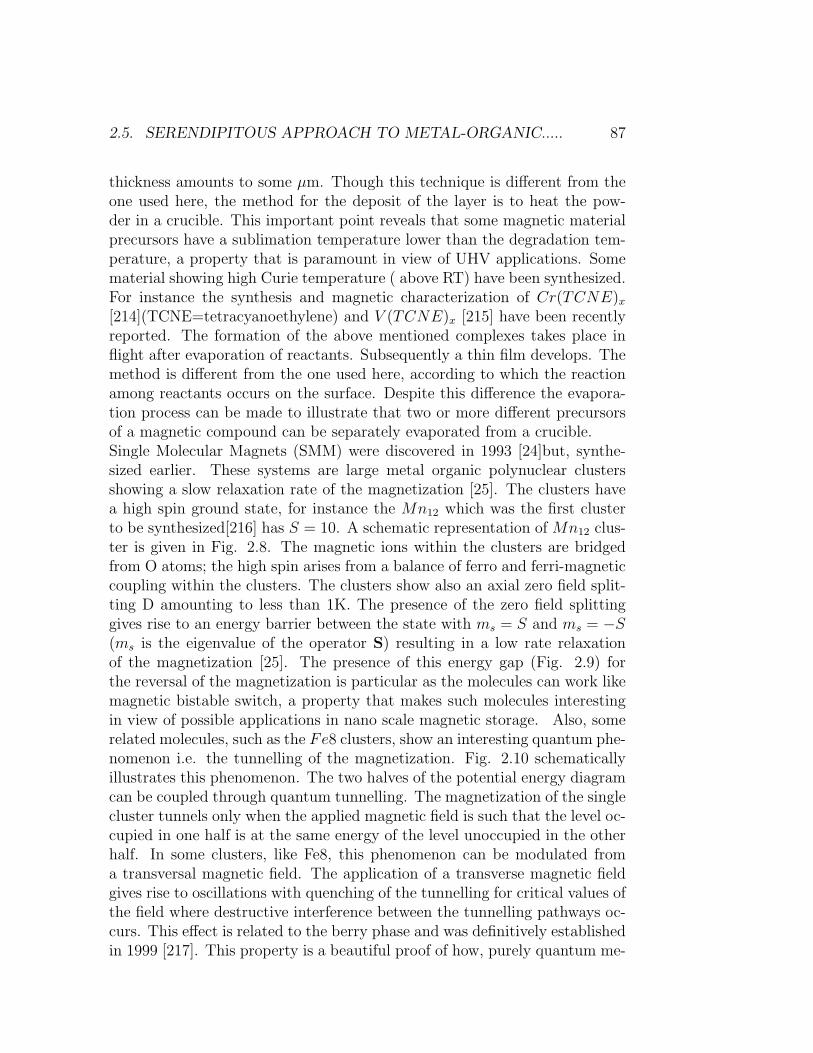
2.5. SERENDIPITOUS APPROACH TO METAL-ORGANIC..... 87
thickness amounts to some µm. Though this technique is different from theone used here, the method for the deposit of the layer is to heat the pow-der in a crucible. This important point reveals that some magnetic materialprecursors have a sublimation temperature lower than the degradation tem-perature, a property that is paramount in view of UHV applications. Somematerial showing high Curie temperature ( above RT) have been synthesized.For instance the synthesis and magnetic characterization of Cr(TCNE)x
[214](TCNE=tetracyanoethylene) and V (TCNE)x [215] have been recentlyreported. The formation of the above mentioned complexes takes place inflight after evaporation of reactants. Subsequently a thin film develops. Themethod is different from the one used here, according to which the reactionamong reactants occurs on the surface. Despite this difference the evapora-tion process can be made to illustrate that two or more different precursorsof a magnetic compound can be separately evaporated from a crucible.Single Molecular Magnets (SMM) were discovered in 1993 [24]but, synthe-sized earlier. These systems are large metal organic polynuclear clustersshowing a slow relaxation rate of the magnetization [25]. The clusters havea high spin ground state, for instance the Mn12 which was the first clusterto be synthesized[216] has S = 10. A schematic representation of Mn12 clus-ter is given in Fig. 2.8. The magnetic ions within the clusters are bridgedfrom O atoms; the high spin arises from a balance of ferro and ferri-magneticcoupling within the clusters. The clusters show also an axial zero field split-ting D amounting to less than 1K. The presence of the zero field splittinggives rise to an energy barrier between the state with ms = S and ms = −S(ms is the eigenvalue of the operator S) resulting in a low rate relaxationof the magnetization [25]. The presence of this energy gap (Fig. 2.9) forthe reversal of the magnetization is particular as the molecules can work likemagnetic bistable switch, a property that makes such molecules interestingin view of possible applications in nano scale magnetic storage. Also, somerelated molecules, such as the Fe8 clusters, show an interesting quantum phe-nomenon i.e. the tunnelling of the magnetization. Fig. 2.10 schematicallyillustrates this phenomenon. The two halves of the potential energy diagramcan be coupled through quantum tunnelling. The magnetization of the singlecluster tunnels only when the applied magnetic field is such that the level oc-cupied in one half is at the same energy of the level unoccupied in the otherhalf. In some clusters, like Fe8, this phenomenon can be modulated froma transversal magnetic field. The application of a transverse magnetic fieldgives rise to oscillations with quenching of the tunnelling for critical values ofthe field where destructive interference between the tunnelling pathways oc-curs. This effect is related to the berry phase and was definitively establishedin 1999 [217]. This property is a beautiful proof of how, purely quantum me-
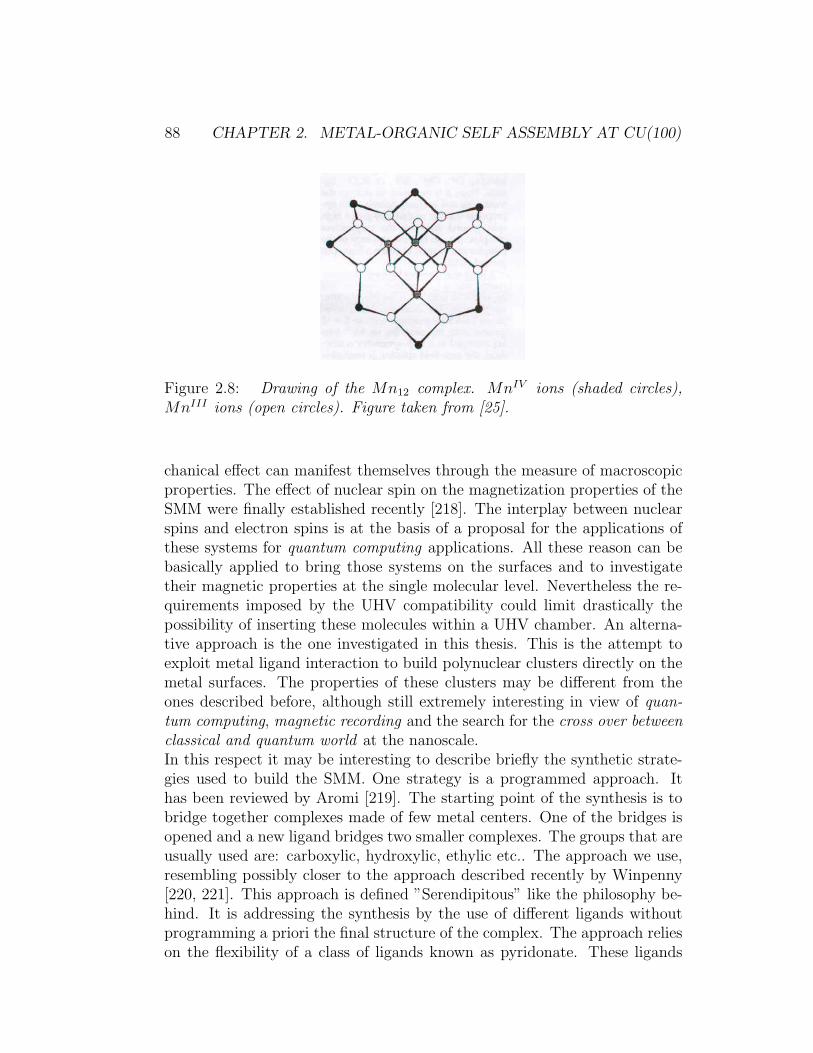
88 CHAPTER 2. METAL-ORGANIC SELF ASSEMBLY AT CU(100)
Figure 2.8: Drawing of the Mn12 complex. MnIV ions (shaded circles),MnIII ions (open circles). Figure taken from [25].
chanical effect can manifest themselves through the measure of macroscopicproperties. The effect of nuclear spin on the magnetization properties of theSMM were finally established recently [218]. The interplay between nuclearspins and electron spins is at the basis of a proposal for the applications ofthese systems for quantum computing applications. All these reason can bebasically applied to bring those systems on the surfaces and to investigatetheir magnetic properties at the single molecular level. Nevertheless the re-quirements imposed by the UHV compatibility could limit drastically thepossibility of inserting these molecules within a UHV chamber. An alterna-tive approach is the one investigated in this thesis. This is the attempt toexploit metal ligand interaction to build polynuclear clusters directly on themetal surfaces. The properties of these clusters may be different from theones described before, although still extremely interesting in view of quan-tum computing, magnetic recording and the search for the cross over betweenclassical and quantum world at the nanoscale.In this respect it may be interesting to describe briefly the synthetic strate-gies used to build the SMM. One strategy is a programmed approach. Ithas been reviewed by Aromi [219]. The starting point of the synthesis is tobridge together complexes made of few metal centers. One of the bridges isopened and a new ligand bridges two smaller complexes. The groups that areusually used are: carboxylic, hydroxylic, ethylic etc.. The approach we use,resembling possibly closer to the approach described recently by Winpenny[220, 221]. This approach is defined ”Serendipitous” like the philosophy be-hind. It is addressing the synthesis by the use of different ligands withoutprogramming a priori the final structure of the complex. The approach relieson the flexibility of a class of ligands known as pyridonate. These ligands
2.5. SERENDIPITOUS APPROACH TO METAL-ORGANIC..... 89
Figure 2.9: Plot of the potential energy versus the Magnetization directiondirection for a single-molecule-magnet with an S=10 ground state. Figuretaken from [25].
Figure 2.10: Schematic representation of how the potential energy of an SMMchanges when the magnetic field is swept of an amount H = nD
gµb. The tun-
nelling of the magnetization can occur only when the energy levels in the twohalves of the diagram are aligned. Figure taken from [25].
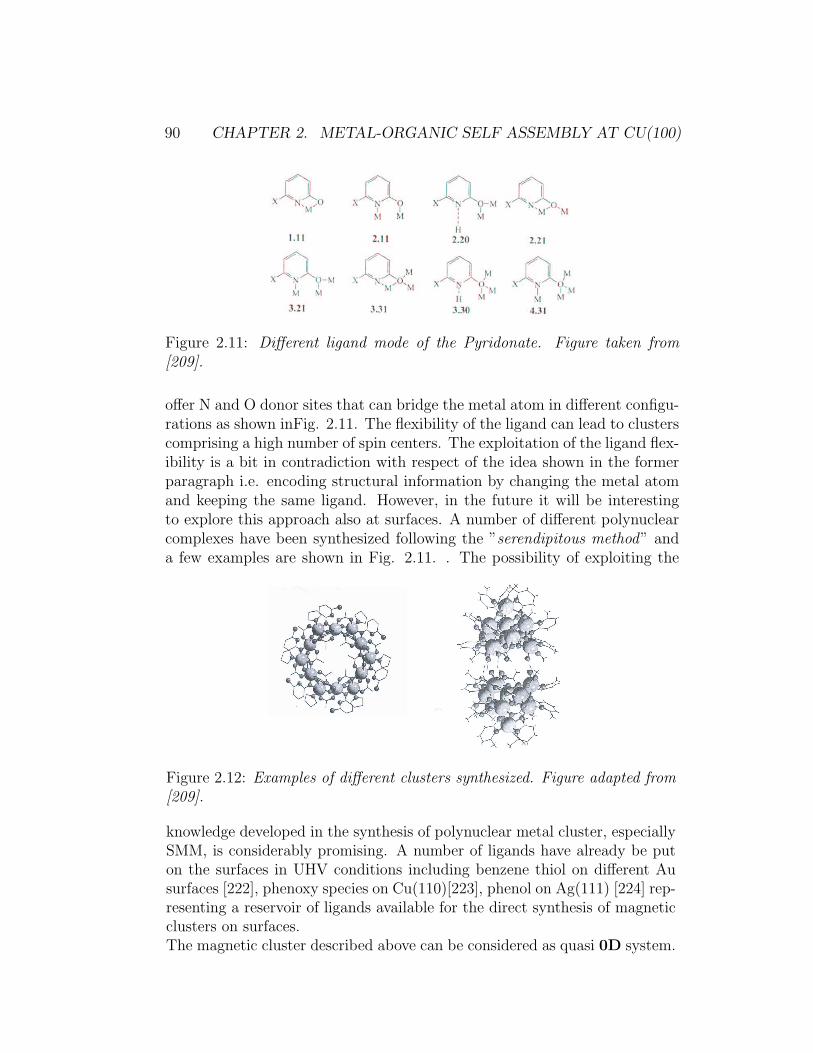
90 CHAPTER 2. METAL-ORGANIC SELF ASSEMBLY AT CU(100)
Figure 2.11: Different ligand mode of the Pyridonate. Figure taken from[209].
offer N and O donor sites that can bridge the metal atom in different configu-rations as shown inFig. 2.11. The flexibility of the ligand can lead to clusterscomprising a high number of spin centers. The exploitation of the ligand flex-ibility is a bit in contradiction with respect of the idea shown in the formerparagraph i.e. encoding structural information by changing the metal atomand keeping the same ligand. However, in the future it will be interestingto explore this approach also at surfaces. A number of different polynuclearcomplexes have been synthesized following the ”serendipitous method” anda few examples are shown in Fig. 2.11. . The possibility of exploiting the
Figure 2.12: Examples of different clusters synthesized. Figure adapted from[209].
knowledge developed in the synthesis of polynuclear metal cluster, especiallySMM, is considerably promising. A number of ligands have already be puton the surfaces in UHV conditions including benzene thiol on different Ausurfaces [222], phenoxy species on Cu(110)[223], phenol on Ag(111) [224] rep-resenting a reservoir of ligands available for the direct synthesis of magneticclusters on surfaces.The magnetic cluster described above can be considered as quasi 0D system.
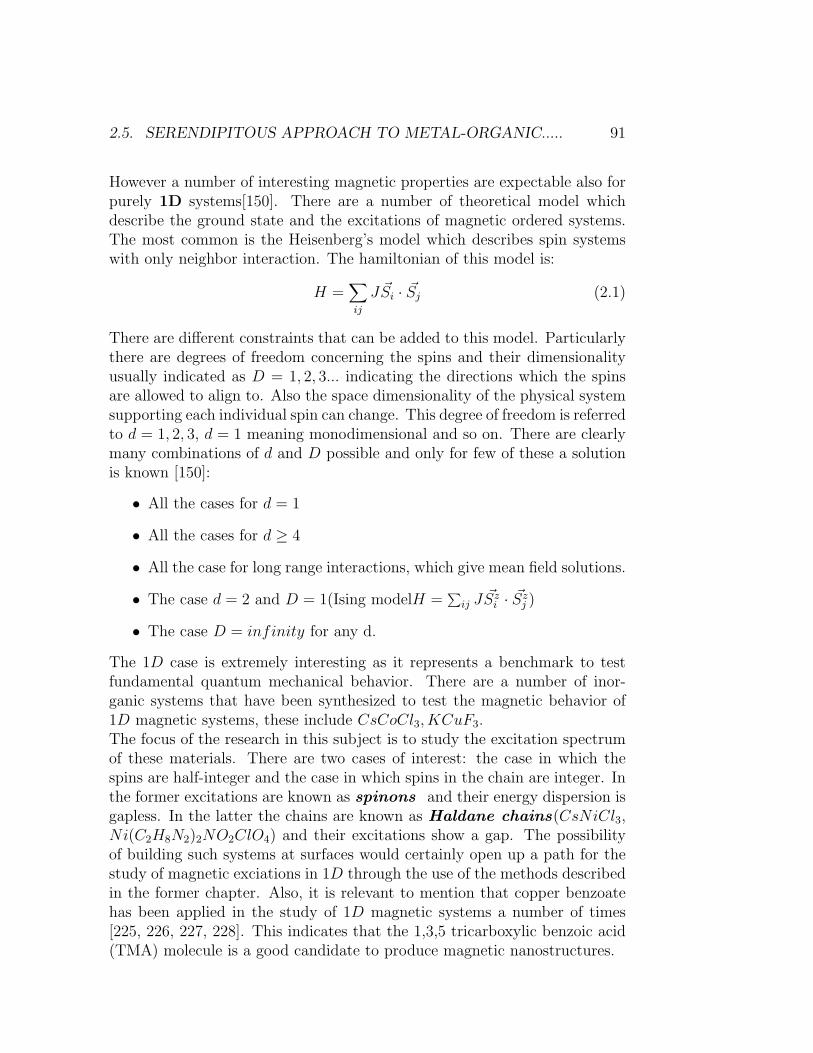
2.5. SERENDIPITOUS APPROACH TO METAL-ORGANIC..... 91
However a number of interesting magnetic properties are expectable also forpurely 1D systems[150]. There are a number of theoretical model whichdescribe the ground state and the excitations of magnetic ordered systems.The most common is the Heisenberg’s model which describes spin systemswith only neighbor interaction. The hamiltonian of this model is:
H =∑
ij
J ~Si · ~Sj (2.1)
There are different constraints that can be added to this model. Particularlythere are degrees of freedom concerning the spins and their dimensionalityusually indicated as D = 1, 2, 3... indicating the directions which the spinsare allowed to align to. Also the space dimensionality of the physical systemsupporting each individual spin can change. This degree of freedom is referredto d = 1, 2, 3, d = 1 meaning monodimensional and so on. There are clearlymany combinations of d and D possible and only for few of these a solutionis known [150]:
• All the cases for d = 1
• All the cases for d ≥ 4
• All the case for long range interactions, which give mean field solutions.
• The case d = 2 and D = 1(Ising modelH =∑
ij J ~Szi · ~Sz
j )
• The case D = infinity for any d.
The 1D case is extremely interesting as it represents a benchmark to testfundamental quantum mechanical behavior. There are a number of inor-ganic systems that have been synthesized to test the magnetic behavior of1D magnetic systems, these include CsCoCl3, KCuF3.The focus of the research in this subject is to study the excitation spectrumof these materials. There are two cases of interest: the case in which thespins are half-integer and the case in which spins in the chain are integer. Inthe former excitations are known as spinons and their energy dispersion isgapless. In the latter the chains are known as Haldane chains(CsNiCl3,Ni(C2H8N2)2NO2ClO4) and their excitations show a gap. The possibilityof building such systems at surfaces would certainly open up a path for thestudy of magnetic exciations in 1D through the use of the methods describedin the former chapter. Also, it is relevant to mention that copper benzoatehas been applied in the study of 1D magnetic systems a number of times[225, 226, 227, 228]. This indicates that the 1,3,5 tricarboxylic benzoic acid(TMA) molecule is a good candidate to produce magnetic nanostructures.
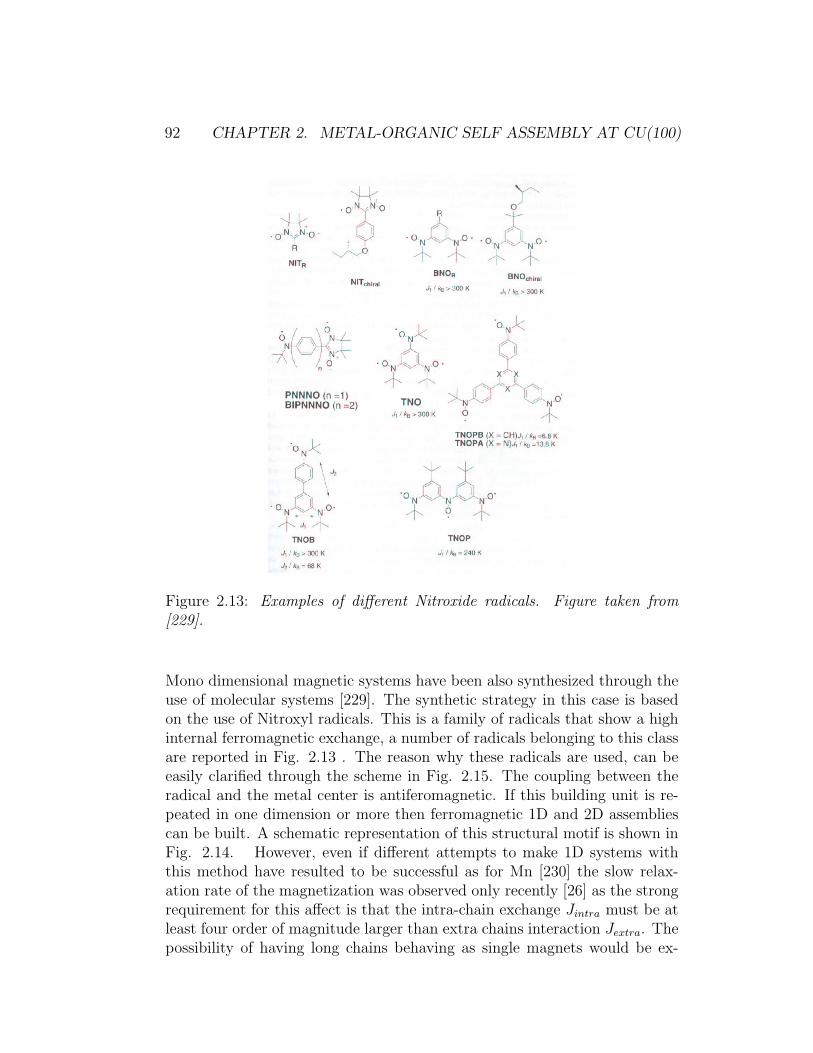
92 CHAPTER 2. METAL-ORGANIC SELF ASSEMBLY AT CU(100)
Figure 2.13: Examples of different Nitroxide radicals. Figure taken from[229].
Mono dimensional magnetic systems have been also synthesized through theuse of molecular systems [229]. The synthetic strategy in this case is basedon the use of Nitroxyl radicals. This is a family of radicals that show a highinternal ferromagnetic exchange, a number of radicals belonging to this classare reported in Fig. 2.13 . The reason why these radicals are used, can beeasily clarified through the scheme in Fig. 2.15. The coupling between theradical and the metal center is antiferomagnetic. If this building unit is re-peated in one dimension or more then ferromagnetic 1D and 2D assembliescan be built. A schematic representation of this structural motif is shown inFig. 2.14. However, even if different attempts to make 1D systems withthis method have resulted to be successful as for Mn [230] the slow relax-ation rate of the magnetization was observed only recently [26] as the strongrequirement for this affect is that the intra-chain exchange Jintra must be atleast four order of magnitude larger than extra chains interaction Jextra. Thepossibility of having long chains behaving as single magnets would be ex-
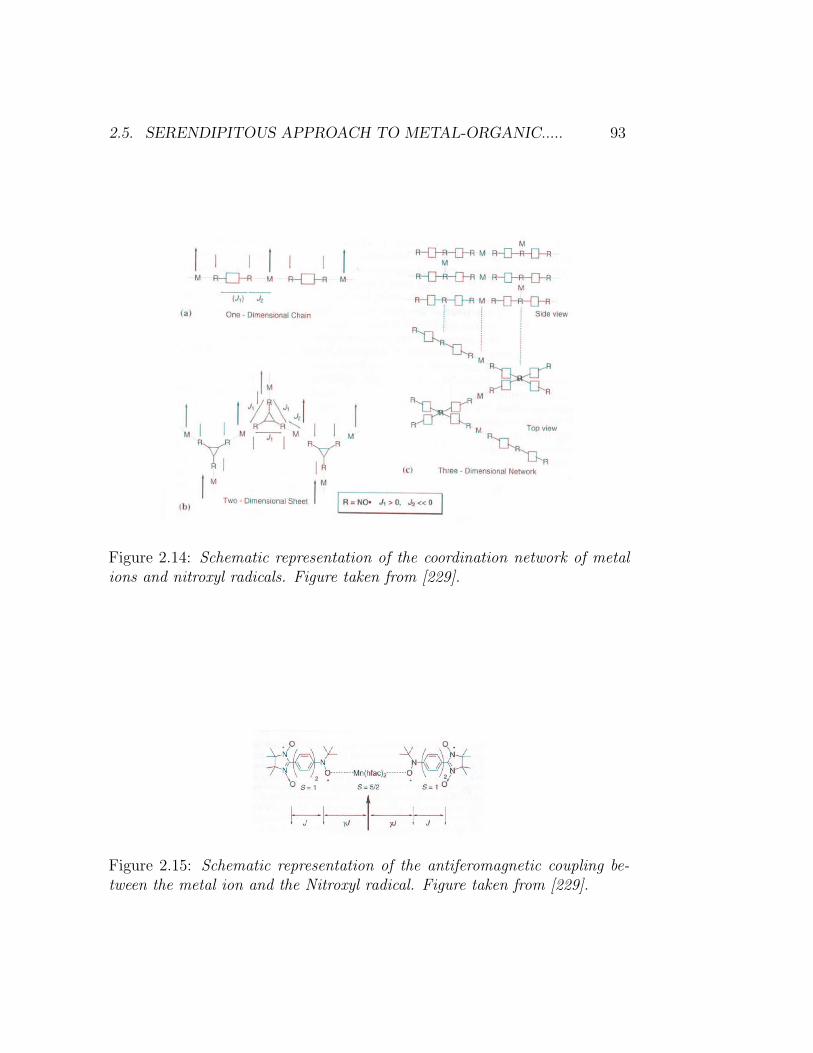
2.5. SERENDIPITOUS APPROACH TO METAL-ORGANIC..... 93
Figure 2.14: Schematic representation of the coordination network of metalions and nitroxyl radicals. Figure taken from [229].
Figure 2.15: Schematic representation of the antiferomagnetic coupling be-tween the metal ion and the Nitroxyl radical. Figure taken from [229].
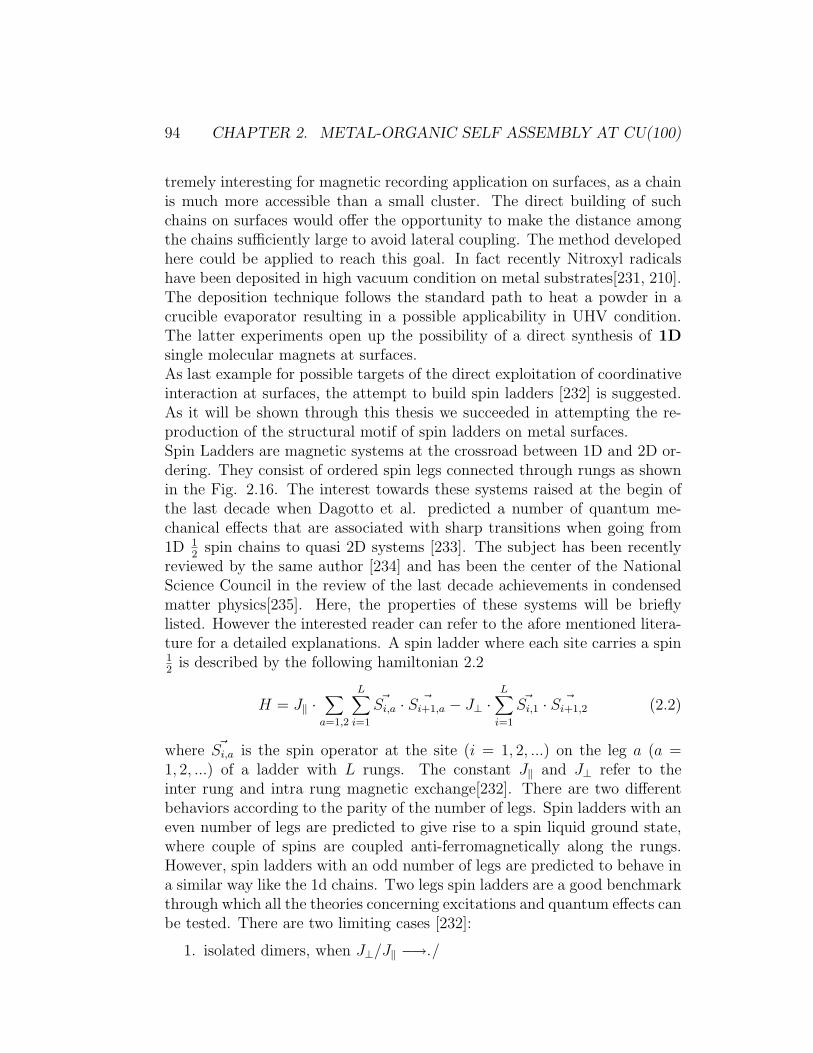
94 CHAPTER 2. METAL-ORGANIC SELF ASSEMBLY AT CU(100)
tremely interesting for magnetic recording application on surfaces, as a chainis much more accessible than a small cluster. The direct building of suchchains on surfaces would offer the opportunity to make the distance amongthe chains sufficiently large to avoid lateral coupling. The method developedhere could be applied to reach this goal. In fact recently Nitroxyl radicalshave been deposited in high vacuum condition on metal substrates[231, 210].The deposition technique follows the standard path to heat a powder in acrucible evaporator resulting in a possible applicability in UHV condition.The latter experiments open up the possibility of a direct synthesis of 1Dsingle molecular magnets at surfaces.As last example for possible targets of the direct exploitation of coordinativeinteraction at surfaces, the attempt to build spin ladders [232] is suggested.As it will be shown through this thesis we succeeded in attempting the re-production of the structural motif of spin ladders on metal surfaces.Spin Ladders are magnetic systems at the crossroad between 1D and 2D or-dering. They consist of ordered spin legs connected through rungs as shownin the Fig. 2.16. The interest towards these systems raised at the begin ofthe last decade when Dagotto et al. predicted a number of quantum me-chanical effects that are associated with sharp transitions when going from1D 1
2spin chains to quasi 2D systems [233]. The subject has been recently
reviewed by the same author [234] and has been the center of the NationalScience Council in the review of the last decade achievements in condensedmatter physics[235]. Here, the properties of these systems will be brieflylisted. However the interested reader can refer to the afore mentioned litera-ture for a detailed explanations. A spin ladder where each site carries a spin12
is described by the following hamiltonian 2.2
H = J‖ ·∑
a=1,2
L∑
i=1
~Si,a · ~Si+1,a − J⊥ ·L∑
i=1
~Si,1 · ~Si+1,2 (2.2)
where ~Si,a is the spin operator at the site (i = 1, 2, ...) on the leg a (a =1, 2, ...) of a ladder with L rungs. The constant J‖ and J⊥ refer to theinter rung and intra rung magnetic exchange[232]. There are two differentbehaviors according to the parity of the number of legs. Spin ladders with aneven number of legs are predicted to give rise to a spin liquid ground state,where couple of spins are coupled anti-ferromagnetically along the rungs.However, spin ladders with an odd number of legs are predicted to behave ina similar way like the 1d chains. Two legs spin ladders are a good benchmarkthrough which all the theories concerning excitations and quantum effects canbe tested. There are two limiting cases [232]:
1. isolated dimers, when J⊥/J‖ −→./
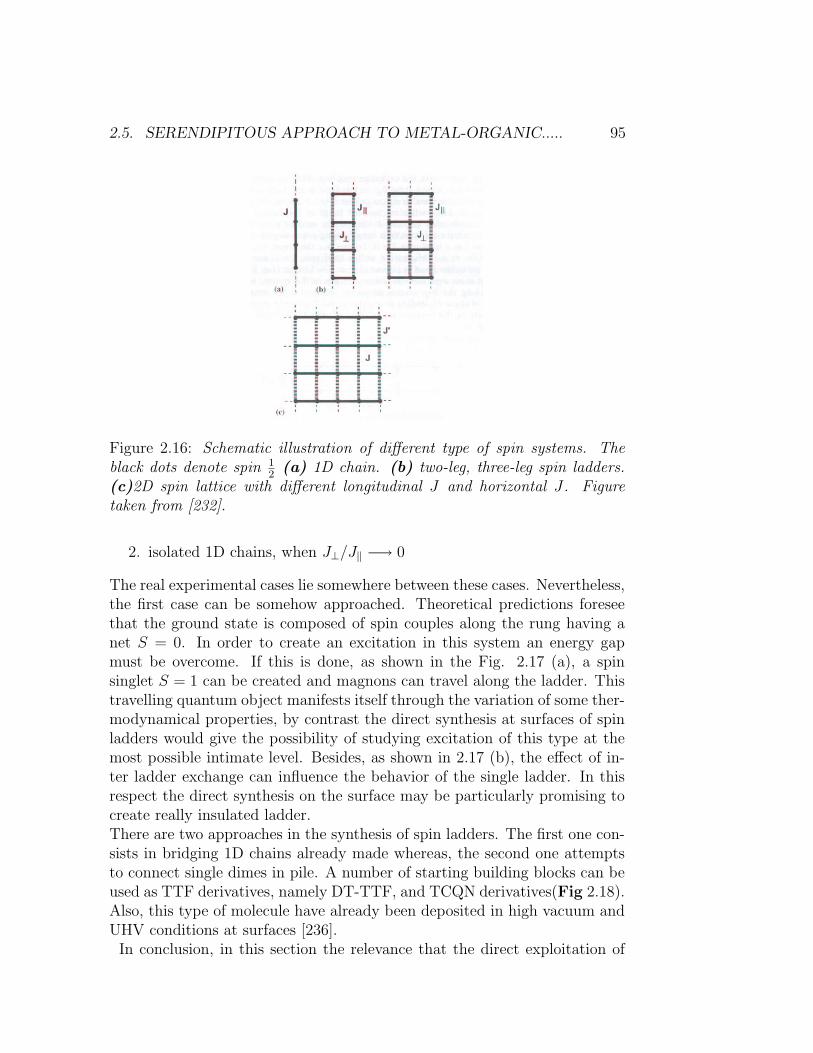
2.5. SERENDIPITOUS APPROACH TO METAL-ORGANIC..... 95
Figure 2.16: Schematic illustration of different type of spin systems. Theblack dots denote spin 1
2(a) 1D chain. (b) two-leg, three-leg spin ladders.
(c)2D spin lattice with different longitudinal J and horizontal J . Figuretaken from [232].
2. isolated 1D chains, when J⊥/J‖ −→ 0
The real experimental cases lie somewhere between these cases. Nevertheless,the first case can be somehow approached. Theoretical predictions foreseethat the ground state is composed of spin couples along the rung having anet S = 0. In order to create an excitation in this system an energy gapmust be overcome. If this is done, as shown in the Fig. 2.17 (a), a spinsinglet S = 1 can be created and magnons can travel along the ladder. Thistravelling quantum object manifests itself through the variation of some ther-modynamical properties, by contrast the direct synthesis at surfaces of spinladders would give the possibility of studying excitation of this type at themost possible intimate level. Besides, as shown in 2.17 (b), the effect of in-ter ladder exchange can influence the behavior of the single ladder. In thisrespect the direct synthesis on the surface may be particularly promising tocreate really insulated ladder.There are two approaches in the synthesis of spin ladders. The first one con-sists in bridging 1D chains already made whereas, the second one attemptsto connect single dimes in pile. A number of starting building blocks can beused as TTF derivatives, namely DT-TTF, and TCQN derivatives(Fig 2.18).Also, this type of molecule have already been deposited in high vacuum andUHV conditions at surfaces [236].In conclusion, in this section the relevance that the direct exploitation of
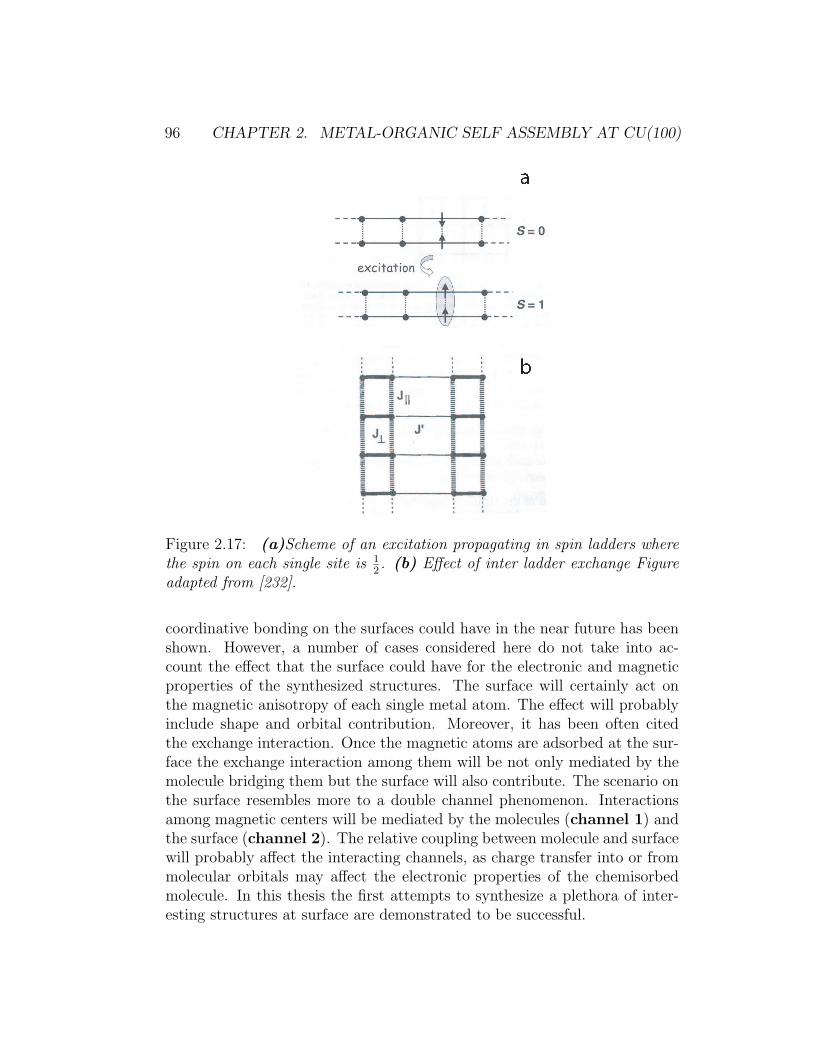
96 CHAPTER 2. METAL-ORGANIC SELF ASSEMBLY AT CU(100)
Figure 2.17: (a)Scheme of an excitation propagating in spin ladders wherethe spin on each single site is 1
2. (b) Effect of inter ladder exchange Figure
adapted from [232].
coordinative bonding on the surfaces could have in the near future has beenshown. However, a number of cases considered here do not take into ac-count the effect that the surface could have for the electronic and magneticproperties of the synthesized structures. The surface will certainly act onthe magnetic anisotropy of each single metal atom. The effect will probablyinclude shape and orbital contribution. Moreover, it has been often citedthe exchange interaction. Once the magnetic atoms are adsorbed at the sur-face the exchange interaction among them will be not only mediated by themolecule bridging them but the surface will also contribute. The scenario onthe surface resembles more to a double channel phenomenon. Interactionsamong magnetic centers will be mediated by the molecules (channel 1) andthe surface (channel 2). The relative coupling between molecule and surfacewill probably affect the interacting channels, as charge transfer into or frommolecular orbitals may affect the electronic properties of the chemisorbedmolecule. In this thesis the first attempts to synthesize a plethora of inter-esting structures at surface are demonstrated to be successful.
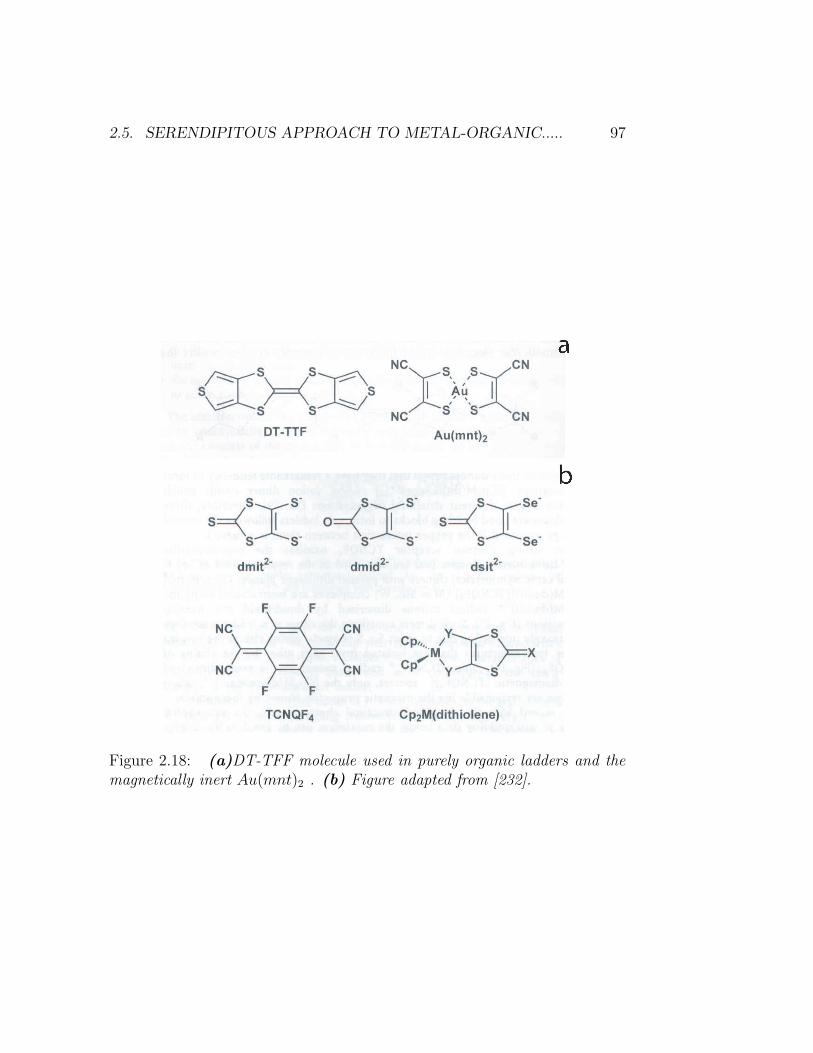
2.5. SERENDIPITOUS APPROACH TO METAL-ORGANIC..... 97
Figure 2.18: (a)DT-TFF molecule used in purely organic ladders and themagnetically inert Au(mnt)2 . (b) Figure adapted from [232].
98 CHAPTER 2. METAL-ORGANIC SELF ASSEMBLY AT CU(100)
2.6 Bonding and Dynamics of large adsor-
bates
One of the major goals of this thesis is to individuate the control param-eters for the self assembling process at metal surfaces involving the directexploitation of the coordinative bonding between two chemical species. Forthis reason it is important to understand to what extent the processes, whichtake place at surface, affect the synthesis of metal organic nanostructures.In the first part of this chapter dynamical effects during deposition will beignored, though they may be extremely relevant in determining the kineticsof the reaction between TMA molecules and Fe atoms.The strength of the molecule-substrate interaction is one of the relevantparameters though, as it will be stressed in the foregoing, molecule-metaladatom coordinative interaction seems to be decisive for 2-dimensional or-dering. Particularly molecule-substrate interaction is expected to play a rolein the ability of the molecule to be effectively integrated in supramolecularassemblies. This is important for the kinetics of complexes formation andalso when a post modification is induced by an external trigger as for in-stance annealing. Besides molecule-substrate interactions may be relevantto determine the kinetic of the reaction with the metal adsorbates throughthe control of the adsorbate diffusivity. Diffusivity is important because itdetermines both the preferential direction on which the molecules diffuse andthe type of diffusion mechanism they undergo. The two former features mayconsiderably affect the reaction kinetics. Unfortunately the instrument usedin these studies does not allow an easy sample exchange and therefore onlythe Cu(100) surface has been employed. Also, measurements of the diffusiv-ity of TMA molecules on Cu(100) were not systematically performed 4.In view of these reasons a brief account of physisorption and chemisorption[237,238, 59], with a particular emphasis to large organic molecules, will be pro-vided.Physisorption is a process according to which the long range dipolar interac-tions between the adsorbate and the surface take place[59]. The interactionis of the order of few tents of meV and is typical for passivated surfacesas hydrogenated Si or highly oriented pyrolytic graphite (HOPG). At metalsurfaces the phenomenon can occur if the outer shell atomic or molecular or-bitals of the adsorbate are substantial higher in energy (several eV) than themetal surface Fermi energy. It can also occur if the surface is somehow pas-sivated, for instance with an oxide. As in this study surfaces are atomicallyclean and flat, transition metals, molecules are expected to be chemisorbed.
4Molecules can be imaged on the Cu(100) surface at 100 K.
2.6. BONDING AND DYNAMICS OF LARGE ADSORBATES 99
Chemisorption is a much more predominant physical phenomenon than ph-ysisorption. It involves energies of some eV. A simple description of thisphenomenon can be done in terms of frontier orbitals [239]. Some of themolecular orbitals of the adsorbate species lie slightly above the Fermi level.In a simple picture the chemisorption process can be imaged as a two stageprocess[59]. The afore mentioned molecular orbital interacts with the spbands of the surface and give rise to a slightly broadened new orbital whichlies slightly below the Fermi energy. This process is common to all the metalsurfaces and results in a attractive interaction between the adsorbate andthe surface. In the case of transition metal surfaces also the d bands playa role. The state formed between adsorbate orbitals and sp band interactswith the d bands( these are much less broadened than the sp bands) form-ing a two level state (slightly broadened) as illustrated in Fig. 2.19. Theresulting interaction between the adsorbate will be attractive or repulsiveaccording to the degree of filling of the antibonding orbital generated. Thereare three main factors characterizing the strength of the chemisorption in-teraction [238, 240]:
• Filling of the d bands
• Strength of the adsorbate d-bands coupling
• Position of the d band, εd, with respect the Fermi energy, εF
The position of the d band,εd, is very important to determine the level of theantibonding state with respect to the Fermi level. If the antibonding statelies above the Fermi level, it turns to be empty and the adsorbate-surfaceinteraction is inherently strong ( several eV). Conversely, if the antibondinglevels lies below the Fermi level, Fig. 2.19 (b), the level will be filled up andthe resulting adsorbate-surface interaction will be weak. For most transi-tion metal surfaces the antibonding level lies just across(accounting for itsbroadening) the Fermi level. The filling of the d bands determines how manyelectrons will occupy the antibonding orbital. The higher is this numberthe less stable is the resulting chemical bond. Finally, the strength of theadsorbate d bands coupling is also relevant to the stability of the adsorbate-surface interaction. For instance Cu is more reactive ( respect to adsorbates) then Au as the 3d bands are stronger coupled to the adsorbates molecu-lar orbitals than in Au. The chemisorption of small molecules on differentsubstrates is a well established domain of surface science[59],e.g. the behav-ior of CO on Cu(100) [241], O2 on Pd(111)[242] are well known. Howevera few studies are present in the literature concerning large molecules. It isknown benzene sticks flat [243]. Some calculations [244] shows that TMA
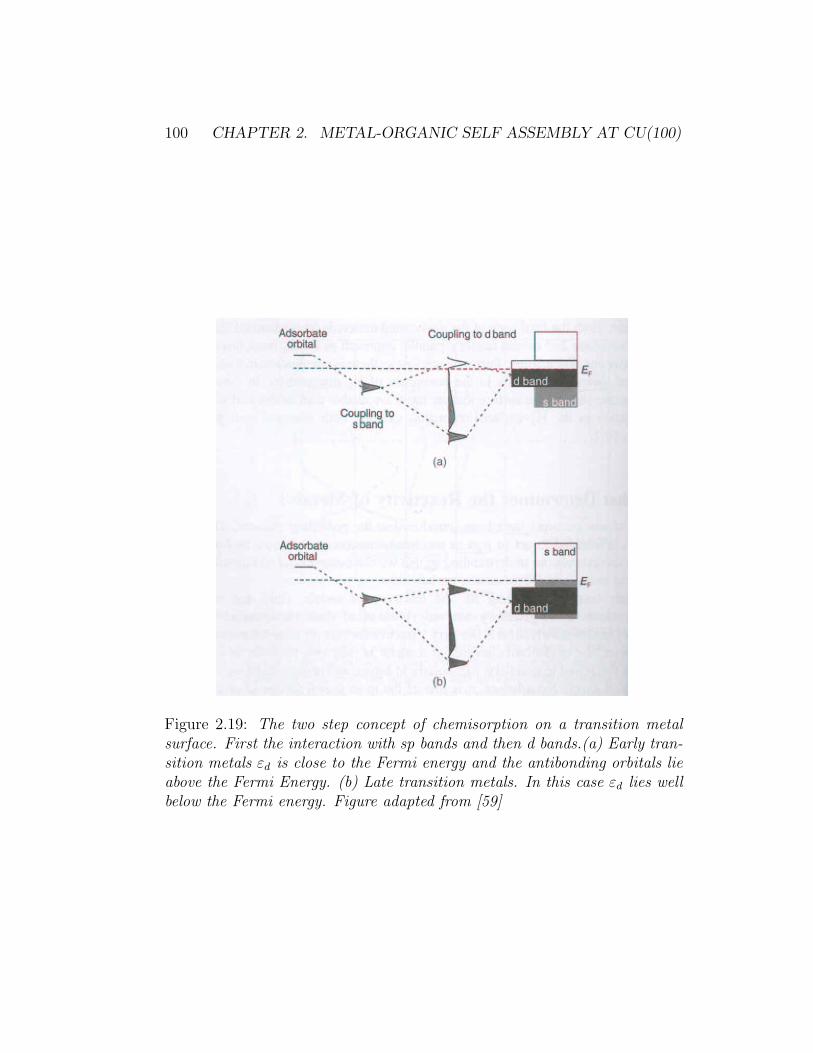
100 CHAPTER 2. METAL-ORGANIC SELF ASSEMBLY AT CU(100)
Figure 2.19: The two step concept of chemisorption on a transition metalsurface. First the interaction with sp bands and then d bands.(a) Early tran-sition metals εd is close to the Fermi energy and the antibonding orbitals lieabove the Fermi Energy. (b) Late transition metals. In this case εd lies wellbelow the Fermi energy. Figure adapted from [59]
2.6. BONDING AND DYNAMICS OF LARGE ADSORBATES 101
most favorable adsorption orientation on Cu(100) is lying flat. A possibleexplanation is that the π orbitals of the phenyl ring can overlap easily withthe d bands of the underlying Cu surface. Molecules containing two phenylrings such as PVBA and PEBA show as well a preferential flat lying ad-sorption at surfaces like Pd(110) and Ag(111) [245, 246]. Nevertheless theargument that the π orbitals overlap with the surface bands is not alwaystrue. If, for instance, a N atom is included in the phenyl ring the situation.For e. g. for pyridine the most stable configuration on Au(111) is expectedto stand upright [247]. Besides, some of big molecules including a big aro-matic unit connected to different legs type molecules have been studied byusing STM. For instance hexa-tert-butyl-decacyclene molecules (HtBDC)adsorbs with the main aromatic (π system) group parallel to the surface ofCu(110)[248] as well as Lander molecules do [249]. Also, the same moleculecan have different restructuring adapting itself to different surface substratesas for tetra-3,5-di-ter-butyl-phenyl-porphyrin (TBPP) at Cu(100), Cu(111)and Cu(211) surfaces [250]. The former example clarifies how the presenceof an aromatic (or more then one) ring is not a sufficient condition for flatadsorption.Another well known process is chemisorbed induced dissociation. Hydro-gen molecules are an example of well studied system which dissociate forthe effect of the surface [251]. In fact, the presence of the surface not onlycauses a chemisorption process but, it also induce an electron transfer intothe antibonding empty orbitals. The latter process results in a weakening ofthe interatomic bond strength which, in certain cases, breaks. Here belowit would be important to know whether Cu(100) can break, at proper tem-perature, the OCO-H bond. This point will be addressed briefly in the nextparagraph. However, it would be relevant to have access to calculations thataddressed this point. Particularly, in this case, the dissociation process couldbe of dynamic nature.Last, the diffusion of large molecule is scarcely studied in literature [252].A number of studies using Laser Induced Thermal Desorption(LITD) havebeen carried on n alkane on Ru(0001) [252] demonstrating that the bindingenergy (0.48-0.65 eV) (of the adsorbed molecule) growths with the lengthof the molecule. Besides, it was proposed that the mechanism of diffu-sion of such molecules could follow a long jumps (40-50 A) diffusion [253].Very recently Schunack and collaborators [254] have analyzed the diffusionmechanism of two big molecules on Cu(110), decacyclene (DC) and hexa-tert-butyldecacyclene (HtBDC). They found in both case a long jumpsmechanism for the diffusion though for DC (where π stacking still prevails[255, 256], the jumps amount to about 4 neighbor sites whereas for HtBDCthey amount to 7 neighbor sites. Also the diffusion attempt frequency showed
102 CHAPTER 2. METAL-ORGANIC SELF ASSEMBLY AT CU(100)
a difference of four orders of magnitude between the two molecules. As stud-ies of diffusivity were not accomplished for TMA on Cu(100), it is interestingto attempt a parallel with the former study. The DC is the molecule that iscloser in shape to TMA, as it presents a flat aromatic multi ring adsorbingon the surface. However, DC does have some 7 phenyl rings. It is signifi-cantly larger than TMA and it is in theory not possible to draw any directassociation between the diffusion of DC and TMA. Besides, studies of thediffusion of PVBA and C60 on Pd(110) [252, 173, 257] demonstrate that theprevailing mechanism for diffusion (for this molecule) is based on short jumps.Weckesser [173] determines the migration energy of PVBA on Cu(110) to be0.83 eV and estimates the binding energy in about 2.8 eV. TMA is closer tothe PVBA molecule in Shape. Accordingly (in a very first rough approxima-tion) its dynamics on the surface is expected to resemble closer to the one ofPVBA rather than DC.
2.7 Metal-organic Chemistry at metal sur-
faces under UHV conditions
Noncovalent interactions have been exploited to form self assembled nanos-tructures at different metal surfaces [40, 258, 259, 260]. Interactions such asdipole-dipole, Van der Waals, Hydrogen bonding have been proven to havemagnitude comparable to chemisorption interactions[252]. The final stageof self assembling processes is the result of the competition between theafore mentioned surface adsorbate interactions and the adsorbate-adsorbateinteraction[40, 261]. This type of interactions give assemblies that are weaklylinked and inherently not very stable.Metal-ligand interaction is one of the pillar of supramolecular chemistry[189].Attempts to use this interaction for self-assembly at surfaces are restrictedto a number of approaches at atmospheric pressure and few in Ultra highvacuum (UHV).Metalorganic complexes have been deposited on metal surfaces through evap-oration. A remarkable example of STM studied metal-organic molecules isthe class of porphyrins [262]. Porphyrins are interesting to be studied asthey are very well spread in biology and can act as catalysts. Particularlyphtalocyanines have been used to identify different metals included in theirhollow cavity [263]. Also, through the study of the tunnelling current at themetal site it was possible to distinguish between Cu(II) and Co(II) phtalo-cyanin deposited on Au(111) in UHV. There have been also several attemptsto decouple the central metal atom of the phtalocyanine (described in [263])
2.7. METAL-ORGANIC CHEMISTRY AT METAL SURFACES... 103
from the surface. These attempts consisted in inserting appropriate legs intothe macrocycle[264, 265]. The former studies were extended to STM inves-tigation of Ni(II) /Co(II) tetrakis-porphyrin TTBPP [266, 267]. In thesestudies the two different chemical species Ni-TTBPP and Co-TTBPP weredeposited on Au(111) at sub-monolayer coverage. The two macrocycles couldbe identified through difference in their respective tunnelling currents. Thedifference in the tunnelling current through the central metal atoms wasobserved, even though the metal atom in the center of the complex were de-coupled from the surface. Very recently, complexes of Xe and Cu(II) Etiol-porphyrin were formed directly in a UHV environment [268]. The authorsuse atomic manipulation to detach Xe atoms from the macrocycle after Xedeposition. The experiments were carried on Cu(100) and formation of Cu-Xe as well as Cu-Xe2 were observed5.The class of diketonate compounds are very common in the research areaof electro luminescent solar cells thanks to their optical properties [271]. Thestructure of these complexes is such that the two oxygen atoms of the diketonmolecule are bounded to a metal atom. The metal Oxygen bond is coordi-native. In some cases the complexation cage of the metal is completed withfurther covalent bonding to multi ring pyridine compounds [272, 273]. Themolecules are such that they provide a closed sheath for the ion inside. Noparticular functional groups can be attached to the outer part of the diket-onate. The former implies that this class of molecules are not expected toform any supra molecular structure as the interacting chemical groups lieinside the compound. Octahedral coordination compounds with diketonateligands have also been deposited on metal surfaces. As result of the adsorp-tion process the ligand out of the surface plane is dissociated. Moreover thecomplexes on the surface do not tend to form any ordered supramolecularassemblies [274]. Besides, some studies have been preformed on HOPG inair by depositing Cu(II) diketonate [275]. The study was aimed at comparingtopography and theoretical calculations.The rare tentative to assemble supramolecular structures comprising metalorganic complexes involves mostly the use of hydrogen bonding through dif-ferent complexes [261]. Supramolecular aggregates of transition metal com-plexes on metal surface in UHV conditions have been achieved by depositionof Bis terpyridine derivative octahedral complexes of Co and Zn on HOPG[276, 277, 278]. However this case accounts also for lateral hydrogen bondinglinkage among Bis terpyridine derivative ligands. The lateral linkage resultsin supramolecular aggregates linking single complexes. The cases listed above
5Some other exotic studies on the formation of water and other monolayer have beenreported too [269, 270].
104 CHAPTER 2. METAL-ORGANIC SELF ASSEMBLY AT CU(100)
reckons in a quite restrict scenario in the use of coordinative interaction tobuild nanostructures at surfaces. The case of Chemical Vapor Deposition(CVD) in UHV conditions, considering a huge number of applications inmicroelectronics is not included here. In the cases above mentioned, the oxi-dation state of the central metal atom is known, as the metal atom is part ofa complex prepared outside the UHV environment. By contrast, in the casedescribed in the next paragraphs, the metal atom within the complexes inter-acts with the surface. As result the oxidation state cannot be unambiguouslydetermined.
2.8 Chemistry of carboxylic acids at metal
surfaces
The chemistry of carboxylic acids on Copper, Palladium and Nickel has beenthe object of some experimental studies due to the interest towards the cat-alytic properties of these metal surfaces [279, 182, 183]. Also, early studiesof carboxylate formation on copper were motivated by the intent of under-standing the bonding structure of polymide precursors [280, 281]. The goalof these studies was to grow ordered monolayers through CVD. Only recentlycarboxylic bonding has been used to build nanostructures at surfaces exploit-ing directly their ability to form coordinative bonds [42, 166].Previous studies of benzoate at Cu(110) and Cu(111) [184, 282, 183], acetateon Cu(110) [283, 284], formate on Cu(100) and Cu(110)[285], have elucidatedthat the carboxylic group of the carboxylate species tends to interact eitherwith the surface or with the self diffusing Cu adatoms.Particularly relevant to this work are the previous studies on the behavior ofbenzoate at Cu(111) and Cu(100) investigated by STM imaging, HREELS(High Resolution Electron Energy Loss Spectroscopy ) and RAIRS(Reflectionadsorption infrared spectroscopy) [184]. These studies have established a re-lationship between the surface and the type of adsorption. The benzoatespecies adsorbs always in the upright standing configuration at Cu(111)6.However, at Cu(110) the benzoate species is flat lying even at temperatureabove 300 K. As benzene is known to desorb on this surface at below roomtemperature [286] the π orbitals surface interaction alone cannot account forthe stability of the flat lying benzoate. However two different explanationshave been provided for the benzoate adsorbed on Cu(111) and on Cu(110).It is suggested that on Cu(111) the benzoate is upright standing (Fig. 2.20)with the two oxygen of the carboxyle group linking to two adjacent Cu
6At least in the temperature interval addressed in the study
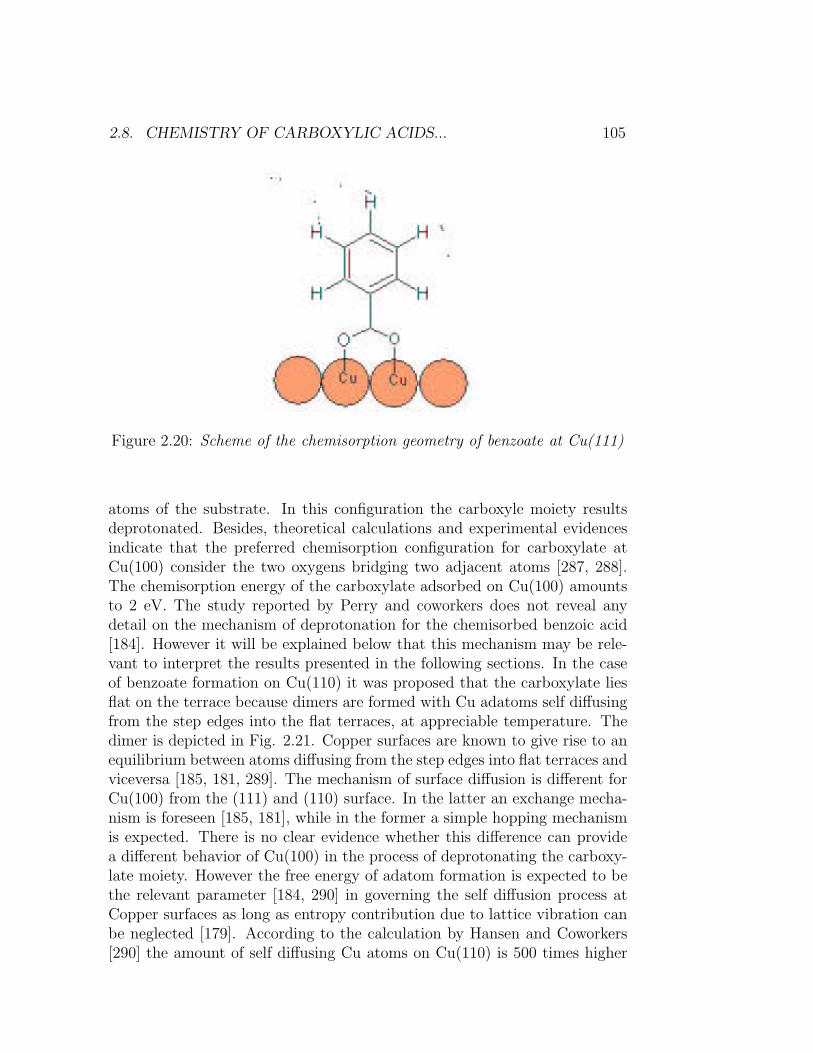
2.8. CHEMISTRY OF CARBOXYLIC ACIDS... 105
Figure 2.20: Scheme of the chemisorption geometry of benzoate at Cu(111)
atoms of the substrate. In this configuration the carboxyle moiety resultsdeprotonated. Besides, theoretical calculations and experimental evidencesindicate that the preferred chemisorption configuration for carboxylate atCu(100) consider the two oxygens bridging two adjacent atoms [287, 288].The chemisorption energy of the carboxylate adsorbed on Cu(100) amountsto 2 eV. The study reported by Perry and coworkers does not reveal anydetail on the mechanism of deprotonation for the chemisorbed benzoic acid[184]. However it will be explained below that this mechanism may be rele-vant to interpret the results presented in the following sections. In the caseof benzoate formation on Cu(110) it was proposed that the carboxylate liesflat on the terrace because dimers are formed with Cu adatoms self diffusingfrom the step edges into the flat terraces, at appreciable temperature. Thedimer is depicted in Fig. 2.21. Copper surfaces are known to give rise to anequilibrium between atoms diffusing from the step edges into flat terraces andviceversa [185, 181, 289]. The mechanism of surface diffusion is different forCu(100) from the (111) and (110) surface. In the latter an exchange mecha-nism is foreseen [185, 181], while in the former a simple hopping mechanismis expected. There is no clear evidence whether this difference can providea different behavior of Cu(100) in the process of deprotonating the carboxy-late moiety. However the free energy of adatom formation is expected to bethe relevant parameter [184, 290] in governing the self diffusion process atCopper surfaces as long as entropy contribution due to lattice vibration canbe neglected [179]. According to the calculation by Hansen and Coworkers[290] the amount of self diffusing Cu atoms on Cu(110) is 500 times higher
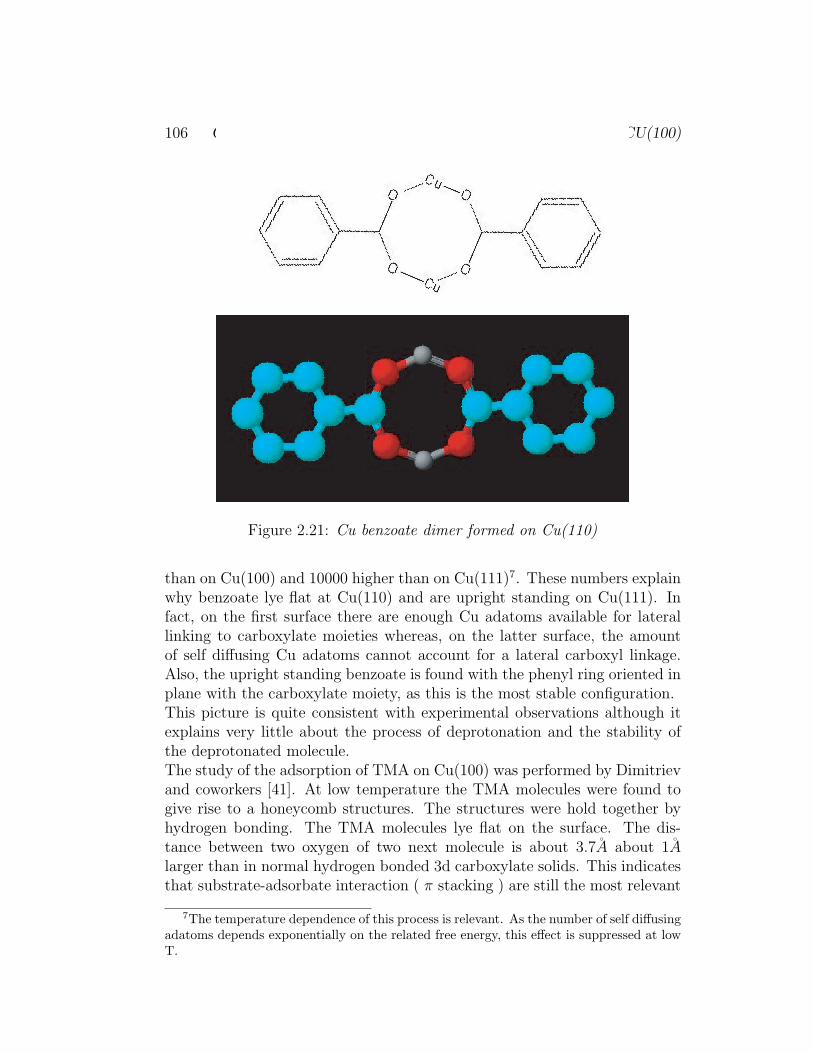
106 CHAPTER 2. METAL-ORGANIC SELF ASSEMBLY AT CU(100)
Figure 2.21: Cu benzoate dimer formed on Cu(110)
than on Cu(100) and 10000 higher than on Cu(111)7. These numbers explainwhy benzoate lye flat at Cu(110) and are upright standing on Cu(111). Infact, on the first surface there are enough Cu adatoms available for laterallinking to carboxylate moieties whereas, on the latter surface, the amountof self diffusing Cu adatoms cannot account for a lateral carboxyl linkage.Also, the upright standing benzoate is found with the phenyl ring oriented inplane with the carboxylate moiety, as this is the most stable configuration.This picture is quite consistent with experimental observations although itexplains very little about the process of deprotonation and the stability ofthe deprotonated molecule.The study of the adsorption of TMA on Cu(100) was performed by Dimitrievand coworkers [41]. At low temperature the TMA molecules were found togive rise to a honeycomb structures. The structures were hold together byhydrogen bonding. The TMA molecules lye flat on the surface. The dis-tance between two oxygen of two next molecule is about 3.7A about 1Alarger than in normal hydrogen bonded 3d carboxylate solids. This indicatesthat substrate-adsorbate interaction ( π stacking ) are still the most relevant
7The temperature dependence of this process is relevant. As the number of self diffusingadatoms depends exponentially on the related free energy, this effect is suppressed at lowT.
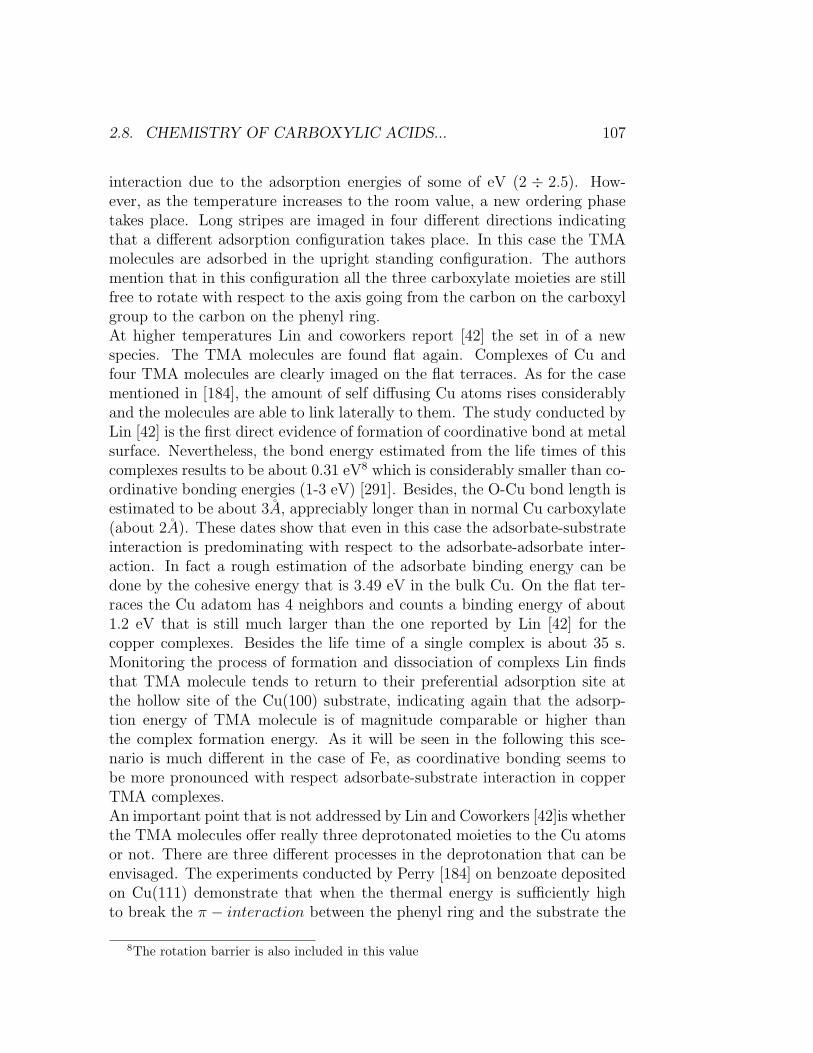
2.8. CHEMISTRY OF CARBOXYLIC ACIDS... 107
interaction due to the adsorption energies of some of eV (2 ÷ 2.5). How-ever, as the temperature increases to the room value, a new ordering phasetakes place. Long stripes are imaged in four different directions indicatingthat a different adsorption configuration takes place. In this case the TMAmolecules are adsorbed in the upright standing configuration. The authorsmention that in this configuration all the three carboxylate moieties are stillfree to rotate with respect to the axis going from the carbon on the carboxylgroup to the carbon on the phenyl ring.At higher temperatures Lin and coworkers report [42] the set in of a newspecies. The TMA molecules are found flat again. Complexes of Cu andfour TMA molecules are clearly imaged on the flat terraces. As for the casementioned in [184], the amount of self diffusing Cu atoms rises considerablyand the molecules are able to link laterally to them. The study conducted byLin [42] is the first direct evidence of formation of coordinative bond at metalsurface. Nevertheless, the bond energy estimated from the life times of thiscomplexes results to be about 0.31 eV8 which is considerably smaller than co-ordinative bonding energies (1-3 eV) [291]. Besides, the O-Cu bond length isestimated to be about 3A, appreciably longer than in normal Cu carboxylate(about 2A). These dates show that even in this case the adsorbate-substrateinteraction is predominating with respect to the adsorbate-adsorbate inter-action. In fact a rough estimation of the adsorbate binding energy can bedone by the cohesive energy that is 3.49 eV in the bulk Cu. On the flat ter-races the Cu adatom has 4 neighbors and counts a binding energy of about1.2 eV that is still much larger than the one reported by Lin [42] for thecopper complexes. Besides the life time of a single complex is about 35 s.Monitoring the process of formation and dissociation of complexs Lin findsthat TMA molecule tends to return to their preferential adsorption site atthe hollow site of the Cu(100) substrate, indicating again that the adsorp-tion energy of TMA molecule is of magnitude comparable or higher thanthe complex formation energy. As it will be seen in the following this sce-nario is much different in the case of Fe, as coordinative bonding seems tobe more pronounced with respect adsorbate-substrate interaction in copperTMA complexes.An important point that is not addressed by Lin and Coworkers [42]is whetherthe TMA molecules offer really three deprotonated moieties to the Cu atomsor not. There are three different processes in the deprotonation that can beenvisaged. The experiments conducted by Perry [184] on benzoate depositedon Cu(111) demonstrate that when the thermal energy is sufficiently highto break the π − interaction between the phenyl ring and the substrate the
8The rotation barrier is also included in this value
108 CHAPTER 2. METAL-ORGANIC SELF ASSEMBLY AT CU(100)
molecule is free to rotate out of the surface plane. In this process the porbitals on the O linking the H atoms overlap more consistently with thed electrons of the Cu surface atoms. The surface atoms have 9 neighborsagainst the 12 in the bulk. This means that they are less coordinated andoffer still some sharp localized d orbitals along the z axis. Because of thespherical symmetry of the s orbitals, the hydrogen atom can still bond tothe oxygen atom even though the molecule is tilt towards the upright stand-ing position. Accordingly, while the molecule reaches the upright standingposition the overlap between the p orbitals on the O atom and d bands ofthe surface increases. The overlap between the s orbitals of H and the d Cusurface atoms orbitals increases as well. This possible mechanism accountsfor a charge transfer in the O-H bond which ultimately results in the breakof the O-H bond with the formation of O-Cu and H-Cu bonds. In this way,a thermal activated surface dissociative chemisorption is suggested. In fact,the thermal energy at room temperature amounts to 25 meV, a value whichcould not support a direct thermal dissociation of the O-H bond, which isweak but still considerably stronger than 25 meV. However, 25 meV is theorder of magnitude of rotation excitation at low J. The mechanism proposedcould also explain the results achieved by Dimitriev on TMA [41] at roomtemperature. The Cu(100) surface atoms have 8 neighbors and the com-ments outlined before are still valid. The TMA molecule are found to stickin the upright position at room temperature and no conclusion can be drawnon the other two carboxylic groups. However, in the study by Lin [42] it issuggested that all the three carboxylic groups of the TMA molecule are de-protonated. In solution the process of successive deprotonation accounts foran increase of the electrostatic energy on the molecule. On the surface theatoms underneath the molecule can stabilize the electrostatic charge thoughthe deprotonation of three carboxylic groups requires a mechanism that can-not be simply thermal vibration. Remarkably, vibrations are excited at hightemperature.A second possibility to explain the process of deprotonation could consist in athermal induced chemical bond distortion. In this view the C-C-O-H bridgecan bend towards the surface in way such that the overlap between the O porbitals and the d surface orbital increases. In this fashion the sp electronscould provide enough charge to break the O-H bond. As result the O atomwill bridge to the surface and the H will be diffusing on the surface. It willeventually recombine with another H and desorb as H2. The two processescan be schematized in the following equations:
R−COOH −→ R−CO−O−−−H −→ R−CO−O∗surface+H∗
surface (2.3)
H∗surface− + H∗
surface −→ HSurface2 −→ Hgas
2 (2.4)
2.8. CHEMISTRY OF CARBOXYLIC ACIDS... 109
This process implies that the thermal energy should compensate the dis-tortion energy associated with the bending of the C-C-O-H bridge and theenergy spent in loosening the phenyl ring surface bond. Also, the process out-lined here does not account for an ionization of the H atom but, rather for adissociation. Dissociation seems to be a much likelier process than ionization.Besides, if the process outlined above was true the actual mobility of TMAmolecules after deprotonation should be sensibly reduced as the amount ofchemisorption energy per chemical bound is roughly 2 eV resulting in a 6 eVtotal chemisorption energy. Weckesser [173] reports the migration energy forPVBA molecule. He estimates this value to be about the 30 % of the bind-ing energy. If the same criteria is applied to TMA, a quite high migrationenergy for TMA molecules at room temperature would result. However, theexperimental evidence at low coverage demonstrates that molecules are stillquite mobile on the surface.Alternatively a third possible mechanism, attempting to explain the processof deprotonation at Cu(100) can be based on a simple picture of adsorbateinduced dissociative chemisorption. Because of its reduced coordination theCu adatom on the surface has a lower binding energy (roughly 1.15 eV)and a sharper d band localization. The former makes the Cu suitable forchemisorbing adsorbates. Particularly the in plane d orbitals are readilyavailable for superposition with the p orbitals of the O atom without thatany structural reordering takes place inside the TMA molecule. Further-more, as the H atom has s spherical symmetric orbitals it can easily bond toa Cu surface atom. In this picture a Cu adatom meeting a TMA moleculeon the surface, tends to interact with the O atoms weakening the O-H bond.sp electrons can provide enough charge to break the O-H bond whereas theH atom can easily attach to a Cu surface atom and eventually recombinesomewhere else, on the surface, with another H atom. This picture clearlyaccounts for a dynamical vision of the deprotonation process. The presenceof a Cu adatom becomes compulsory for the deprotonation process to takeplace. In this respect the hypothesis of Lin and Coworkers [42], three depro-tonated carboxylic moieties, may not correspond to the reality. In fact if aCu atom is indispensable for the deprotonation process and as the Cu com-plexes do not evolve in supramolocular structures, then the carboxylic groupsnot involved on the Cu-O bond are not deprotonated. Fig. 2.22 shows thecomplexes reported by Lin [42] alongside a model. It is remarkable that nolonger ordering is observed even upon annealing for Cu complexes as shownin Fig. 2.22 c). This fact is different with respect to the Fe case that will bedescribed in the next chapters. The process of deprotonation is extremelyrelevant for interpreting the findings in the case in which Cu is substitutedwith Fe. It is likely that the Fe adatom induces the O-H dissociation pro-
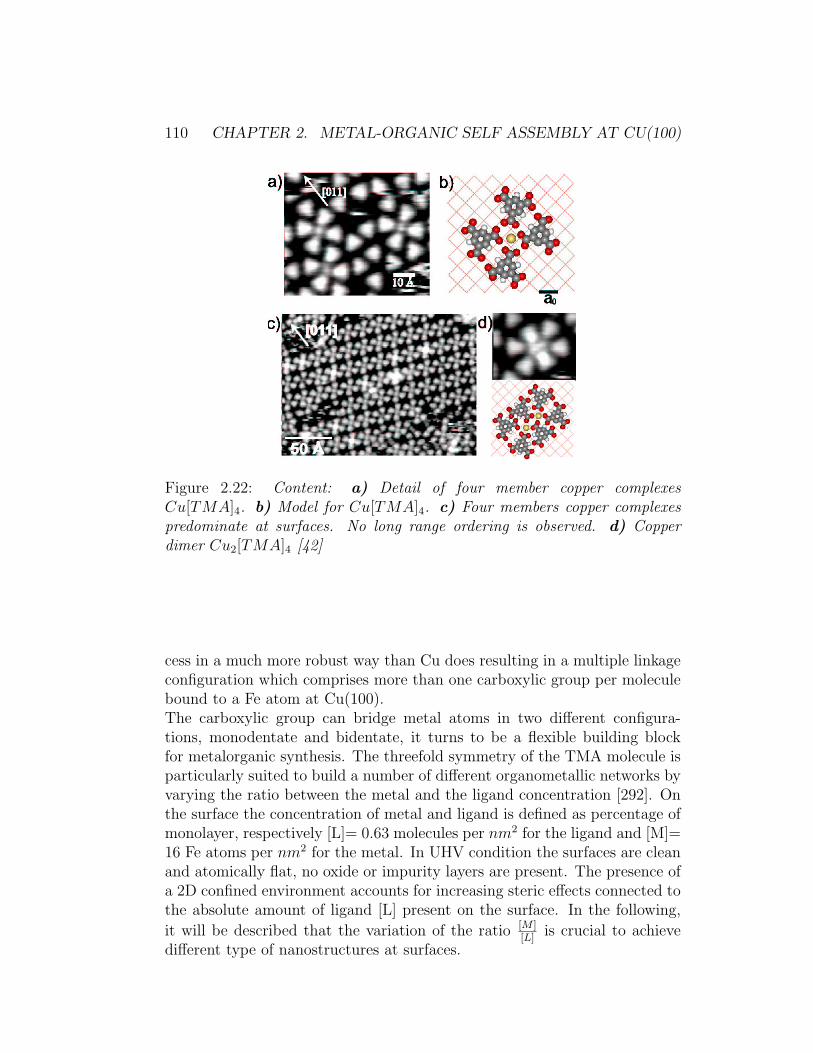
110 CHAPTER 2. METAL-ORGANIC SELF ASSEMBLY AT CU(100)
Figure 2.22: Content: a) Detail of four member copper complexesCu[TMA]4. b) Model for Cu[TMA]4. c) Four members copper complexespredominate at surfaces. No long range ordering is observed. d) Copperdimer Cu2[TMA]4 [42]
cess in a much more robust way than Cu does resulting in a multiple linkageconfiguration which comprises more than one carboxylic group per moleculebound to a Fe atom at Cu(100).The carboxylic group can bridge metal atoms in two different configura-tions, monodentate and bidentate, it turns to be a flexible building blockfor metalorganic synthesis. The threefold symmetry of the TMA molecule isparticularly suited to build a number of different organometallic networks byvarying the ratio between the metal and the ligand concentration [292]. Onthe surface the concentration of metal and ligand is defined as percentage ofmonolayer, respectively [L]= 0.63 molecules per nm2 for the ligand and [M]=16 Fe atoms per nm2 for the metal. In UHV condition the surfaces are cleanand atomically flat, no oxide or impurity layers are present. The presence ofa 2D confined environment accounts for increasing steric effects connected tothe absolute amount of ligand [L] present on the surface. In the following,
it will be described that the variation of the ratio [M ][L]
is crucial to achievedifferent type of nanostructures at surfaces.
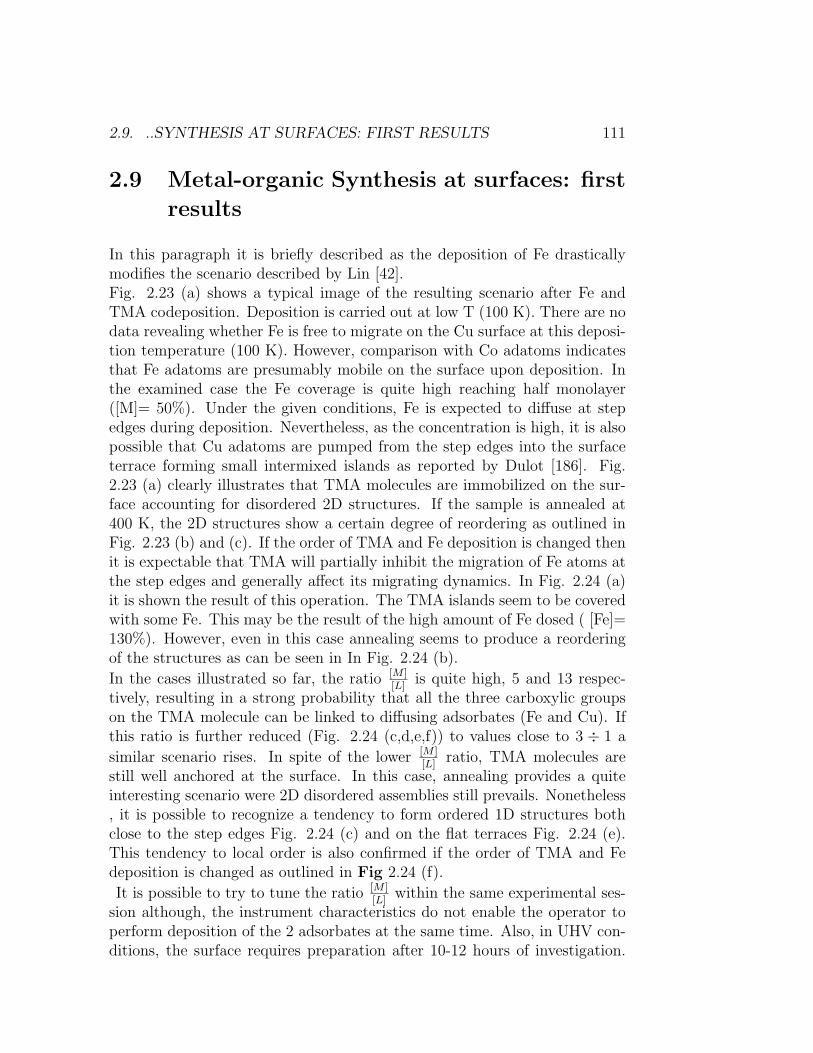
2.9. ..SYNTHESIS AT SURFACES: FIRST RESULTS 111
2.9 Metal-organic Synthesis at surfaces: first
results
In this paragraph it is briefly described as the deposition of Fe drasticallymodifies the scenario described by Lin [42].Fig. 2.23 (a) shows a typical image of the resulting scenario after Fe andTMA codeposition. Deposition is carried out at low T (100 K). There are nodata revealing whether Fe is free to migrate on the Cu surface at this deposi-tion temperature (100 K). However, comparison with Co adatoms indicatesthat Fe adatoms are presumably mobile on the surface upon deposition. Inthe examined case the Fe coverage is quite high reaching half monolayer([M]= 50%). Under the given conditions, Fe is expected to diffuse at stepedges during deposition. Nevertheless, as the concentration is high, it is alsopossible that Cu adatoms are pumped from the step edges into the surfaceterrace forming small intermixed islands as reported by Dulot [186]. Fig.2.23 (a) clearly illustrates that TMA molecules are immobilized on the sur-face accounting for disordered 2D structures. If the sample is annealed at400 K, the 2D structures show a certain degree of reordering as outlined inFig. 2.23 (b) and (c). If the order of TMA and Fe deposition is changed thenit is expectable that TMA will partially inhibit the migration of Fe atoms atthe step edges and generally affect its migrating dynamics. In Fig. 2.24 (a)it is shown the result of this operation. The TMA islands seem to be coveredwith some Fe. This may be the result of the high amount of Fe dosed ( [Fe]=130%). However, even in this case annealing seems to produce a reorderingof the structures as can be seen in In Fig. 2.24 (b).
In the cases illustrated so far, the ratio [M ][L]
is quite high, 5 and 13 respec-tively, resulting in a strong probability that all the three carboxylic groupson the TMA molecule can be linked to diffusing adsorbates (Fe and Cu). Ifthis ratio is further reduced (Fig. 2.24 (c,d,e,f)) to values close to 3 ÷ 1 a
similar scenario rises. In spite of the lower [M ][L]
ratio, TMA molecules arestill well anchored at the surface. In this case, annealing provides a quiteinteresting scenario were 2D disordered assemblies still prevails. Nonetheless, it is possible to recognize a tendency to form ordered 1D structures bothclose to the step edges Fig. 2.24 (c) and on the flat terraces Fig. 2.24 (e).This tendency to local order is also confirmed if the order of TMA and Fedeposition is changed as outlined in Fig 2.24 (f).
It is possible to try to tune the ratio [M ][L]
within the same experimental ses-sion although, the instrument characteristics do not enable the operator toperform deposition of the 2 adsorbates at the same time. Also, in UHV con-ditions, the surface requires preparation after 10-12 hours of investigation.
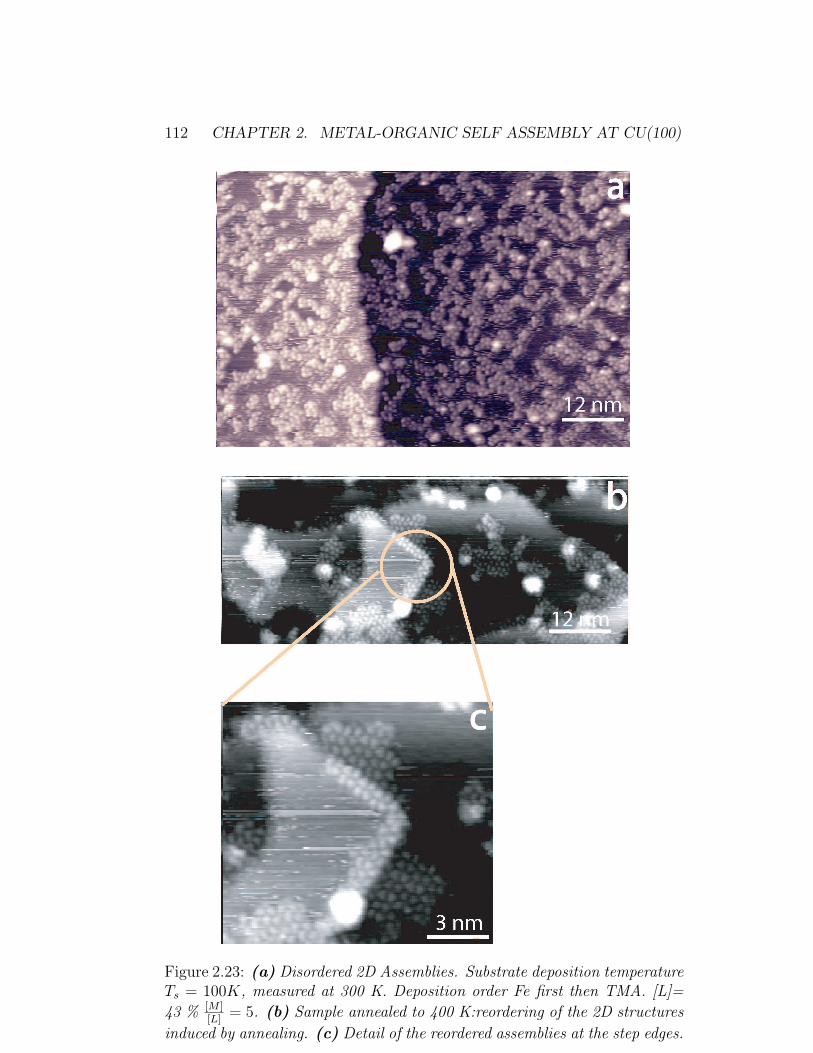
112 CHAPTER 2. METAL-ORGANIC SELF ASSEMBLY AT CU(100)
Figure 2.23: (a) Disordered 2D Assemblies. Substrate deposition temperatureTs = 100K, measured at 300 K. Deposition order Fe first then TMA. [L]=
43 % [M ][L]
= 5. (b) Sample annealed to 400 K:reordering of the 2D structures
induced by annealing. (c) Detail of the reordered assemblies at the step edges.
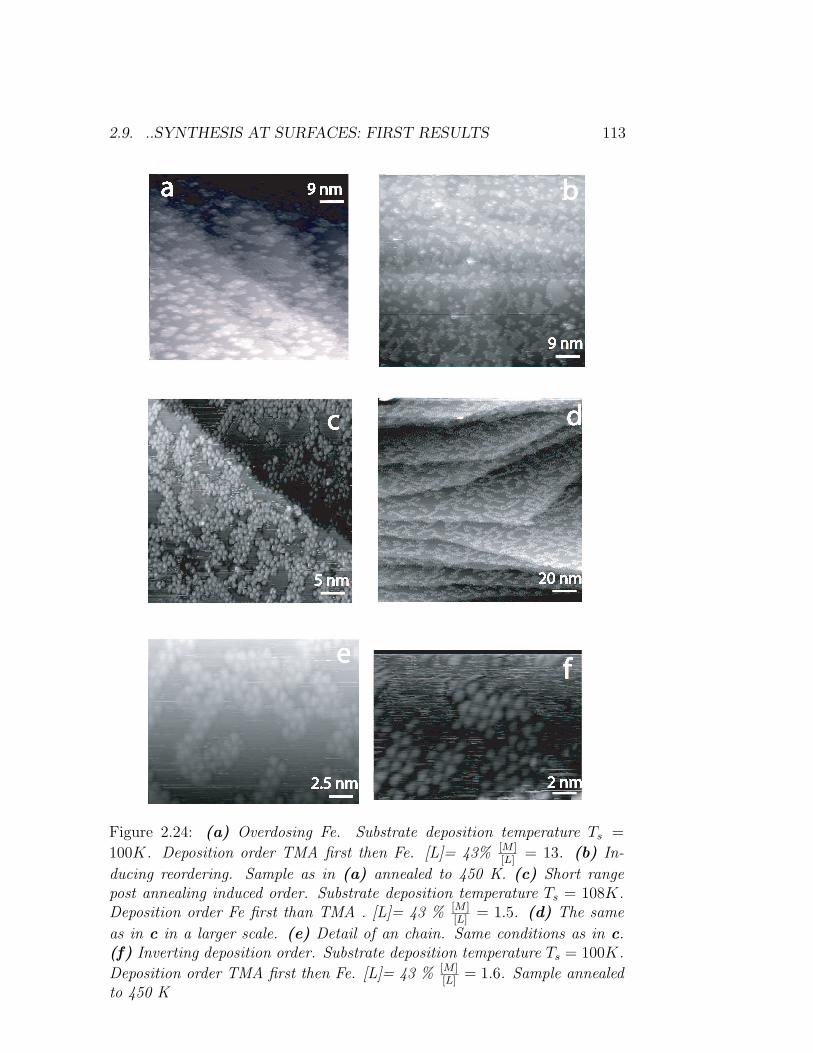
2.9. ..SYNTHESIS AT SURFACES: FIRST RESULTS 113
Figure 2.24: (a) Overdosing Fe. Substrate deposition temperature Ts =
100K. Deposition order TMA first then Fe. [L]= 43% [M ][L]
= 13. (b) In-
ducing reordering. Sample as in (a) annealed to 450 K. (c) Short rangepost annealing induced order. Substrate deposition temperature Ts = 108K.Deposition order Fe first than TMA . [L]= 43 % [M ]
[L]= 1.5. (d) The same
as in c in a larger scale. (e) Detail of an chain. Same conditions as in c.(f) Inverting deposition order. Substrate deposition temperature Ts = 100K.
Deposition order TMA first then Fe. [L]= 43 % [M ][L]
= 1.6. Sample annealedto 450 K
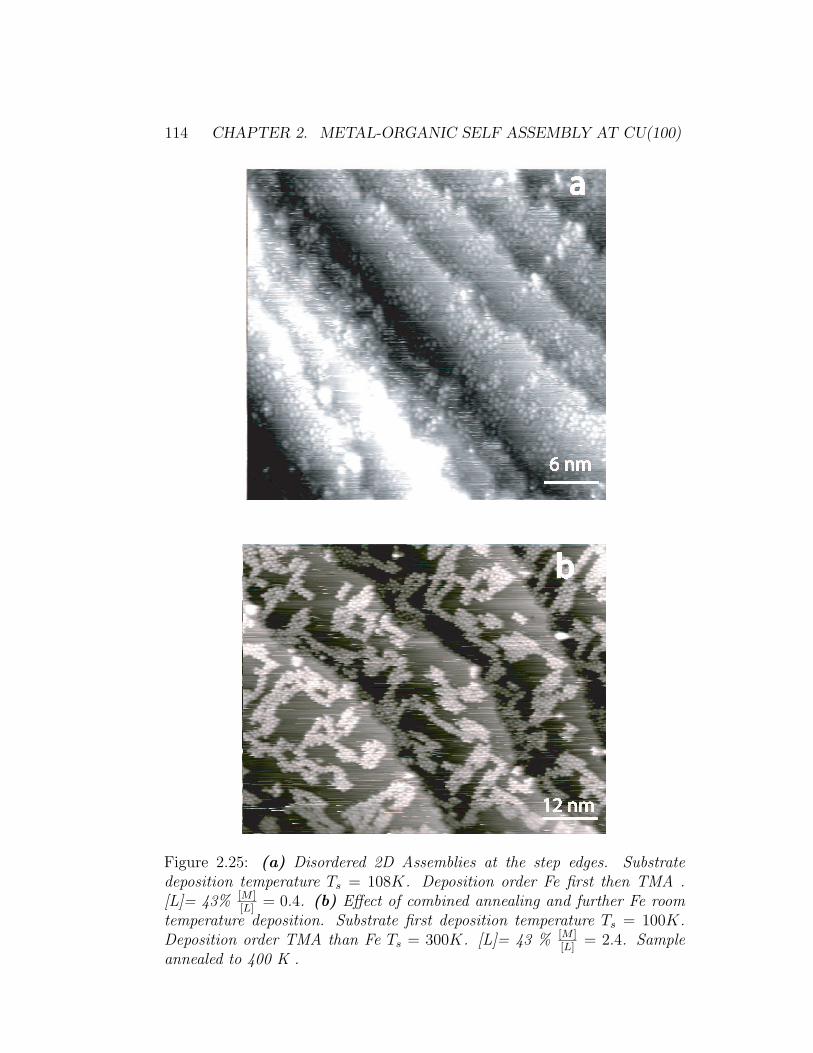
114 CHAPTER 2. METAL-ORGANIC SELF ASSEMBLY AT CU(100)
Figure 2.25: (a) Disordered 2D Assemblies at the step edges. Substratedeposition temperature Ts = 108K. Deposition order Fe first then TMA .[L]= 43% [M ]
[L]= 0.4. (b) Effect of combined annealing and further Fe room
temperature deposition. Substrate first deposition temperature Ts = 100K.Deposition order TMA than Fe Ts = 300K. [L]= 43 % [M ]
[L]= 2.4. Sample
annealed to 400 K .
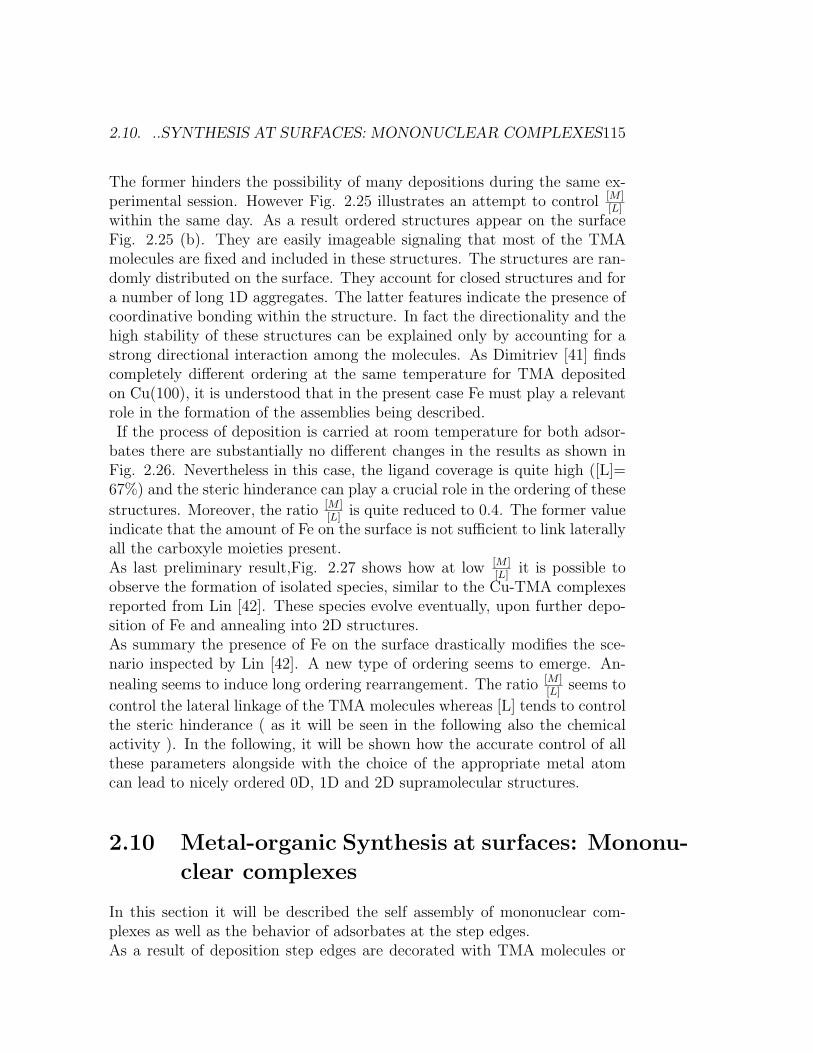
2.10. ..SYNTHESIS AT SURFACES: MONONUCLEAR COMPLEXES115
The former hinders the possibility of many depositions during the same ex-perimental session. However Fig. 2.25 illustrates an attempt to control [M ]
[L]
within the same day. As a result ordered structures appear on the surfaceFig. 2.25 (b). They are easily imageable signaling that most of the TMAmolecules are fixed and included in these structures. The structures are ran-domly distributed on the surface. They account for closed structures and fora number of long 1D aggregates. The latter features indicate the presence ofcoordinative bonding within the structure. In fact the directionality and thehigh stability of these structures can be explained only by accounting for astrong directional interaction among the molecules. As Dimitriev [41] findscompletely different ordering at the same temperature for TMA depositedon Cu(100), it is understood that in the present case Fe must play a relevantrole in the formation of the assemblies being described.If the process of deposition is carried at room temperature for both adsor-
bates there are substantially no different changes in the results as shown inFig. 2.26. Nevertheless in this case, the ligand coverage is quite high ([L]=67%) and the steric hinderance can play a crucial role in the ordering of these
structures. Moreover, the ratio [M ][L]
is quite reduced to 0.4. The former valueindicate that the amount of Fe on the surface is not sufficient to link laterallyall the carboxyle moieties present.As last preliminary result,Fig. 2.27 shows how at low [M ]
[L]it is possible to
observe the formation of isolated species, similar to the Cu-TMA complexesreported from Lin [42]. These species evolve eventually, upon further depo-sition of Fe and annealing into 2D structures.As summary the presence of Fe on the surface drastically modifies the sce-nario inspected by Lin [42]. A new type of ordering seems to emerge. An-
nealing seems to induce long ordering rearrangement. The ratio [M ][L]
seems to
control the lateral linkage of the TMA molecules whereas [L] tends to controlthe steric hinderance ( as it will be seen in the following also the chemicalactivity ). In the following, it will be shown how the accurate control of allthese parameters alongside with the choice of the appropriate metal atomcan lead to nicely ordered 0D, 1D and 2D supramolecular structures.
2.10 Metal-organic Synthesis at surfaces: Mononu-
clear complexes
In this section it will be described the self assembly of mononuclear com-plexes as well as the behavior of adsorbates at the step edges.As a result of deposition step edges are decorated with TMA molecules or
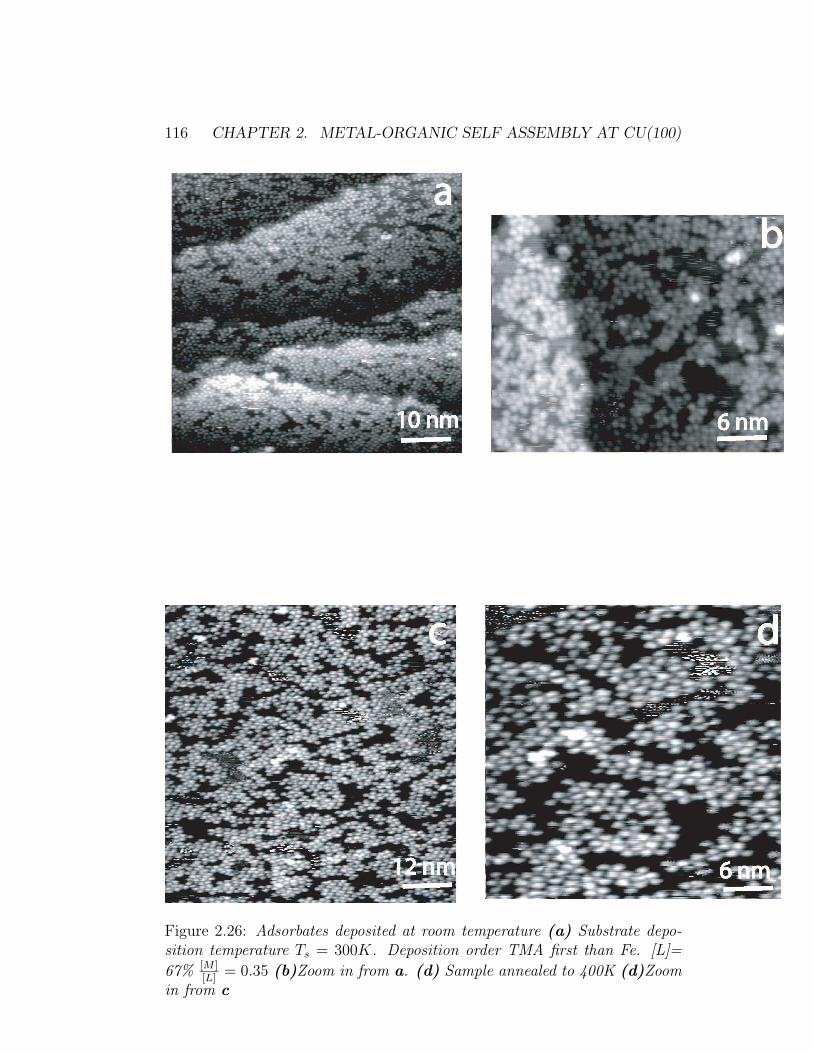
116 CHAPTER 2. METAL-ORGANIC SELF ASSEMBLY AT CU(100)
Figure 2.26: Adsorbates deposited at room temperature (a) Substrate depo-sition temperature Ts = 300K. Deposition order TMA first than Fe. [L]=
67% [M ][L]
= 0.35 (b)Zoom in from a. (d) Sample annealed to 400K (d)Zoomin from c
2.10. ..SYNTHESIS AT SURFACES: MONONUCLEAR COMPLEXES117
Figure 2.27: (a) Mononuclear complexes. Substrate deposition temperature
Ts = 100K. Deposition order Fe first then TMA . [L]= 57 % [M ][L]
= 0.19. (b)
Further Fe Deposition Ts = 300K. [L]= 57 % [M ][L]
= 0.5. Sample annealedto 400 K
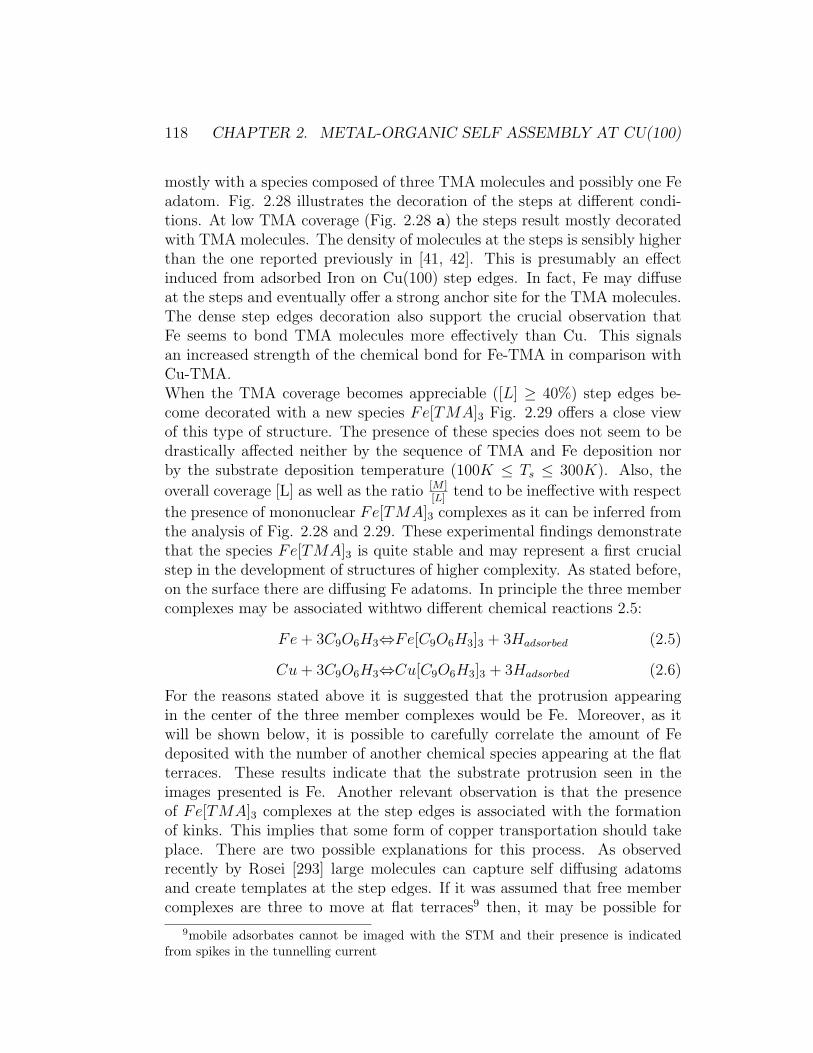
118 CHAPTER 2. METAL-ORGANIC SELF ASSEMBLY AT CU(100)
mostly with a species composed of three TMA molecules and possibly one Feadatom. Fig. 2.28 illustrates the decoration of the steps at different condi-tions. At low TMA coverage (Fig. 2.28 a) the steps result mostly decoratedwith TMA molecules. The density of molecules at the steps is sensibly higherthan the one reported previously in [41, 42]. This is presumably an effectinduced from adsorbed Iron on Cu(100) step edges. In fact, Fe may diffuseat the steps and eventually offer a strong anchor site for the TMA molecules.The dense step edges decoration also support the crucial observation thatFe seems to bond TMA molecules more effectively than Cu. This signalsan increased strength of the chemical bond for Fe-TMA in comparison withCu-TMA.When the TMA coverage becomes appreciable ([L] ≥ 40%) step edges be-come decorated with a new species Fe[TMA]3 Fig. 2.29 offers a close viewof this type of structure. The presence of these species does not seem to bedrastically affected neither by the sequence of TMA and Fe deposition norby the substrate deposition temperature (100K ≤ Ts ≤ 300K). Also, the
overall coverage [L] as well as the ratio [M ][L]
tend to be ineffective with respect
the presence of mononuclear Fe[TMA]3 complexes as it can be inferred fromthe analysis of Fig. 2.28 and 2.29. These experimental findings demonstratethat the species Fe[TMA]3 is quite stable and may represent a first crucialstep in the development of structures of higher complexity. As stated before,on the surface there are diffusing Fe adatoms. In principle the three membercomplexes may be associated withtwo different chemical reactions 2.5:
Fe + 3C9O6H3⇔Fe[C9O6H3]3 + 3Hadsorbed (2.5)
Cu + 3C9O6H3⇔Cu[C9O6H3]3 + 3Hadsorbed (2.6)
For the reasons stated above it is suggested that the protrusion appearingin the center of the three member complexes would be Fe. Moreover, as itwill be shown below, it is possible to carefully correlate the amount of Fedeposited with the number of another chemical species appearing at the flatterraces. These results indicate that the substrate protrusion seen in theimages presented is Fe. Another relevant observation is that the presenceof Fe[TMA]3 complexes at the step edges is associated with the formationof kinks. This implies that some form of copper transportation should takeplace. There are two possible explanations for this process. As observedrecently by Rosei [293] large molecules can capture self diffusing adatomsand create templates at the step edges. If it was assumed that free membercomplexes are three to move at flat terraces9 then, it may be possible for
9mobile adsorbates cannot be imaged with the STM and their presence is indicatedfrom spikes in the tunnelling current
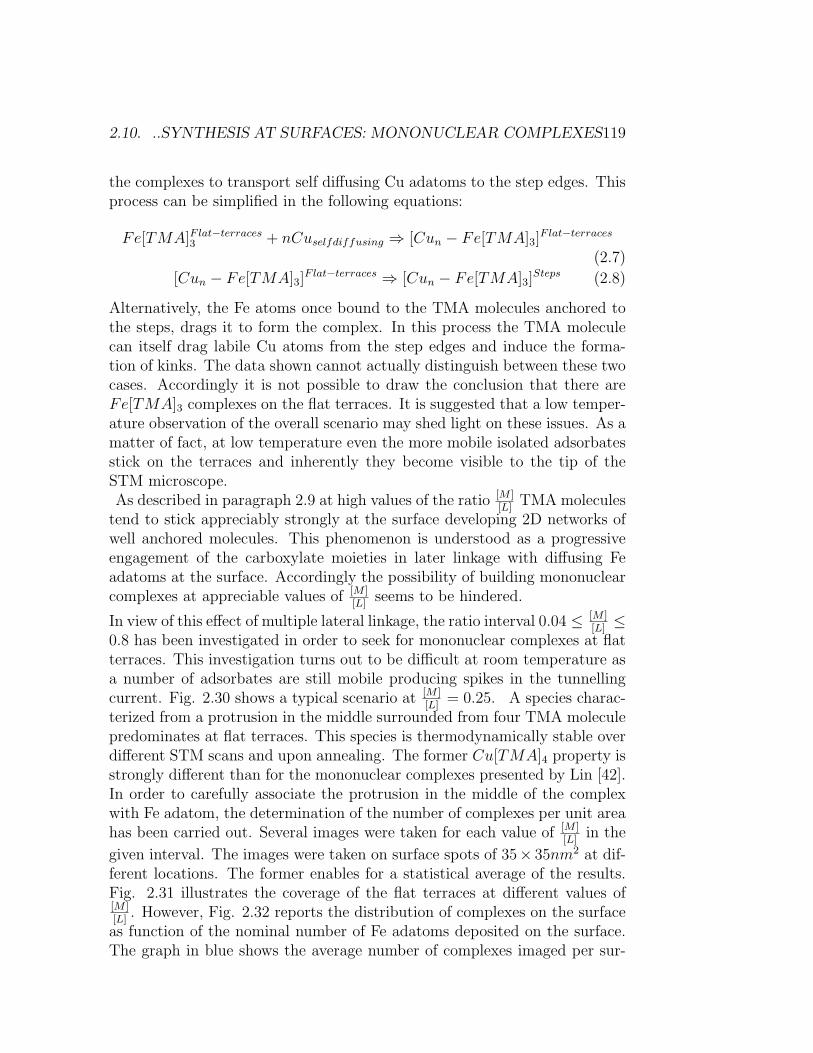
2.10. ..SYNTHESIS AT SURFACES: MONONUCLEAR COMPLEXES119
the complexes to transport self diffusing Cu adatoms to the step edges. Thisprocess can be simplified in the following equations:
Fe[TMA]Flat−terraces3 + nCuselfdiffusing ⇒ [Cun − Fe[TMA]3]
Flat−terraces
(2.7)
[Cun − Fe[TMA]3]Flat−terraces ⇒ [Cun − Fe[TMA]3]
Steps (2.8)
Alternatively, the Fe atoms once bound to the TMA molecules anchored tothe steps, drags it to form the complex. In this process the TMA moleculecan itself drag labile Cu atoms from the step edges and induce the forma-tion of kinks. The data shown cannot actually distinguish between these twocases. Accordingly it is not possible to draw the conclusion that there areFe[TMA]3 complexes on the flat terraces. It is suggested that a low temper-ature observation of the overall scenario may shed light on these issues. As amatter of fact, at low temperature even the more mobile isolated adsorbatesstick on the terraces and inherently they become visible to the tip of theSTM microscope.As described in paragraph 2.9 at high values of the ratio [M ]
[L]TMA molecules
tend to stick appreciably strongly at the surface developing 2D networks ofwell anchored molecules. This phenomenon is understood as a progressiveengagement of the carboxylate moieties in later linkage with diffusing Feadatoms at the surface. Accordingly the possibility of building mononuclearcomplexes at appreciable values of [M ]
[L]seems to be hindered.
In view of this effect of multiple lateral linkage, the ratio interval 0.04 ≤ [M ][L]≤
0.8 has been investigated in order to seek for mononuclear complexes at flatterraces. This investigation turns out to be difficult at room temperature asa number of adsorbates are still mobile producing spikes in the tunnellingcurrent. Fig. 2.30 shows a typical scenario at [M ]
[L]= 0.25. A species charac-
terized from a protrusion in the middle surrounded from four TMA moleculepredominates at flat terraces. This species is thermodynamically stable overdifferent STM scans and upon annealing. The former Cu[TMA]4 property isstrongly different than for the mononuclear complexes presented by Lin [42].In order to carefully associate the protrusion in the middle of the complexwith Fe adatom, the determination of the number of complexes per unit areahas been carried out. Several images were taken for each value of [M ]
[L]in the
given interval. The images were taken on surface spots of 35× 35nm2 at dif-ferent locations. The former enables for a statistical average of the results.Fig. 2.31 illustrates the coverage of the flat terraces at different values of[M ][L]
. However, Fig. 2.32 reports the distribution of complexes on the surfaceas function of the nominal number of Fe adatoms deposited on the surface.The graph in blue shows the average number of complexes imaged per sur-
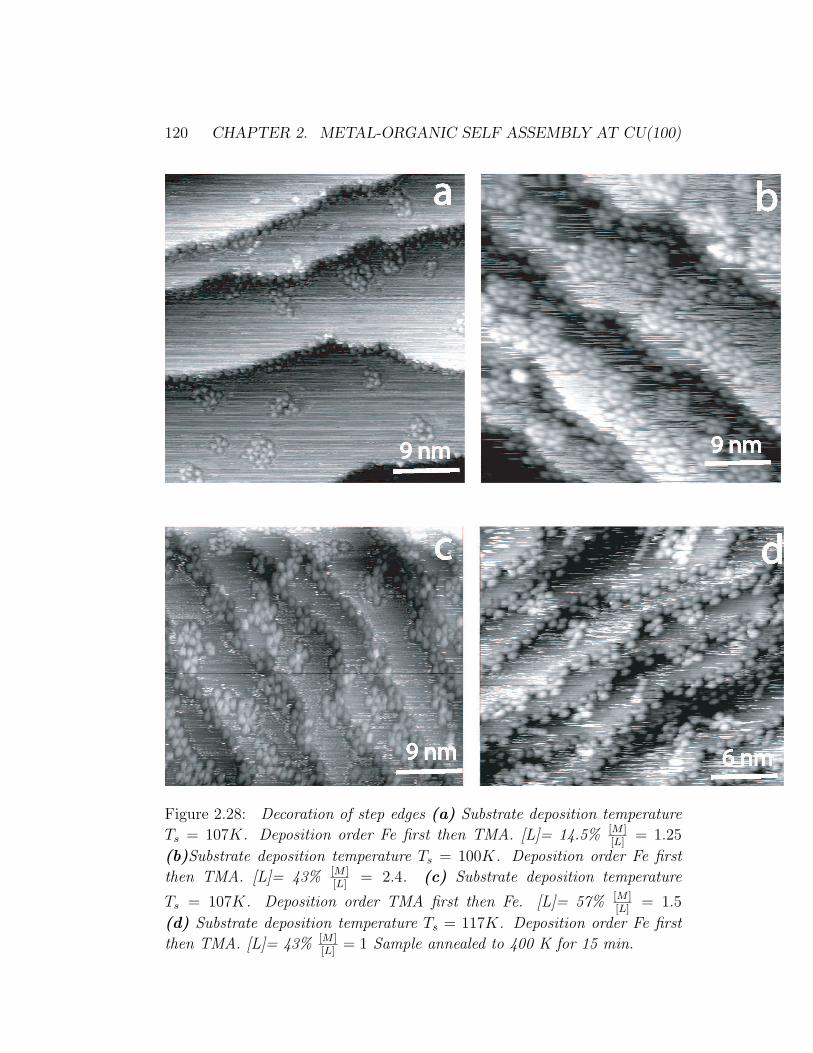
120 CHAPTER 2. METAL-ORGANIC SELF ASSEMBLY AT CU(100)
Figure 2.28: Decoration of step edges (a) Substrate deposition temperature
Ts = 107K. Deposition order Fe first then TMA. [L]= 14.5% [M ][L]
= 1.25
(b)Substrate deposition temperature Ts = 100K. Deposition order Fe first
then TMA. [L]= 43% [M ][L]
= 2.4. (c) Substrate deposition temperature
Ts = 107K. Deposition order TMA first then Fe. [L]= 57% [M ][L]
= 1.5
(d) Substrate deposition temperature Ts = 117K. Deposition order Fe first
then TMA. [L]= 43% [M ][L]
= 1 Sample annealed to 400 K for 15 min.
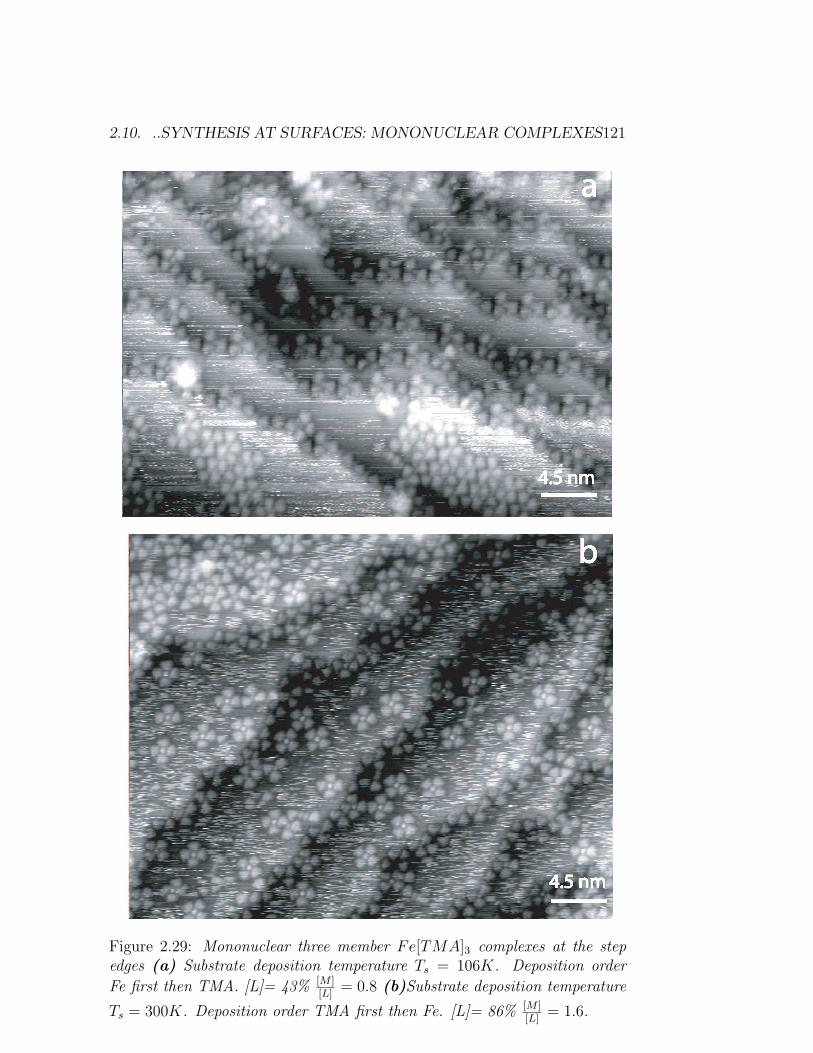
2.10. ..SYNTHESIS AT SURFACES: MONONUCLEAR COMPLEXES121
Figure 2.29: Mononuclear three member Fe[TMA]3 complexes at the stepedges (a) Substrate deposition temperature Ts = 106K. Deposition order
Fe first then TMA. [L]= 43% [M ][L]
= 0.8 (b)Substrate deposition temperature
Ts = 300K. Deposition order TMA first then Fe. [L]= 86% [M ][L]
= 1.6.
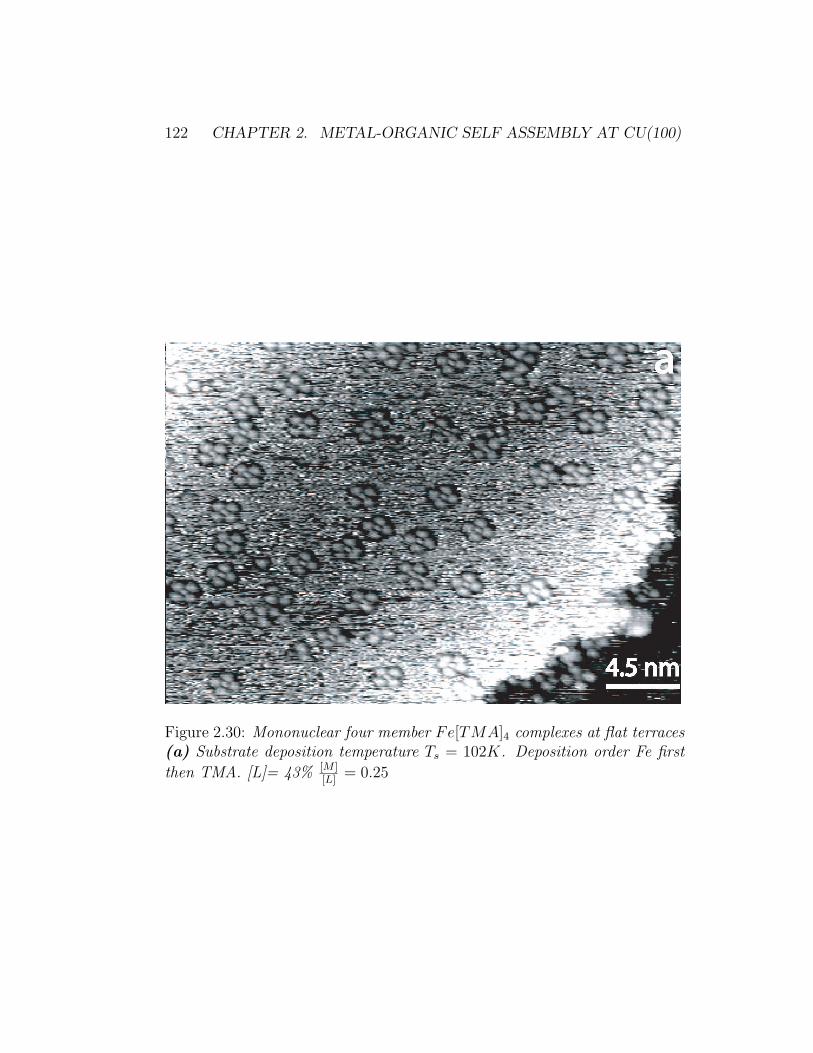
122 CHAPTER 2. METAL-ORGANIC SELF ASSEMBLY AT CU(100)
Figure 2.30: Mononuclear four member Fe[TMA]4 complexes at flat terraces(a) Substrate deposition temperature Ts = 102K. Deposition order Fe first
then TMA. [L]= 43% [M ][L]
= 0.25
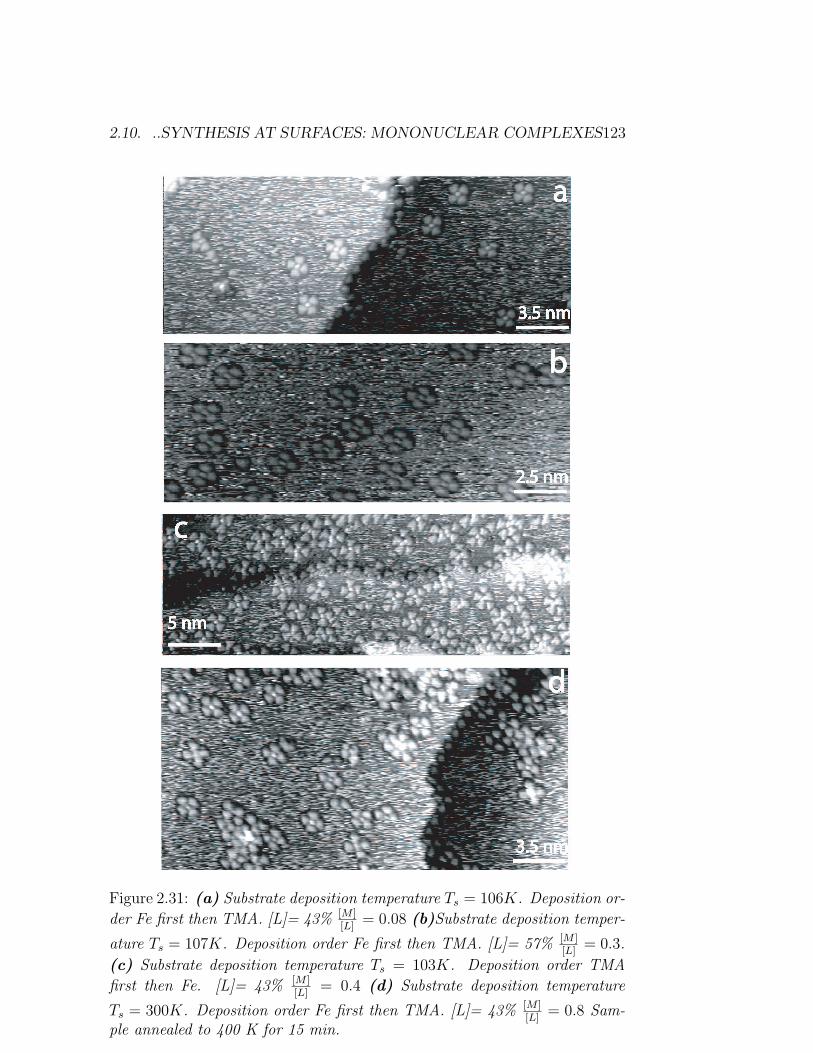
2.10. ..SYNTHESIS AT SURFACES: MONONUCLEAR COMPLEXES123
Figure 2.31: (a) Substrate deposition temperature Ts = 106K. Deposition or-
der Fe first then TMA. [L]= 43% [M ][L]
= 0.08 (b)Substrate deposition temper-
ature Ts = 107K. Deposition order Fe first then TMA. [L]= 57% [M ][L]
= 0.3.
(c) Substrate deposition temperature Ts = 103K. Deposition order TMA
first then Fe. [L]= 43% [M ][L]
= 0.4 (d) Substrate deposition temperature
Ts = 300K. Deposition order Fe first then TMA. [L]= 43% [M ][L]
= 0.8 Sam-ple annealed to 400 K for 15 min.
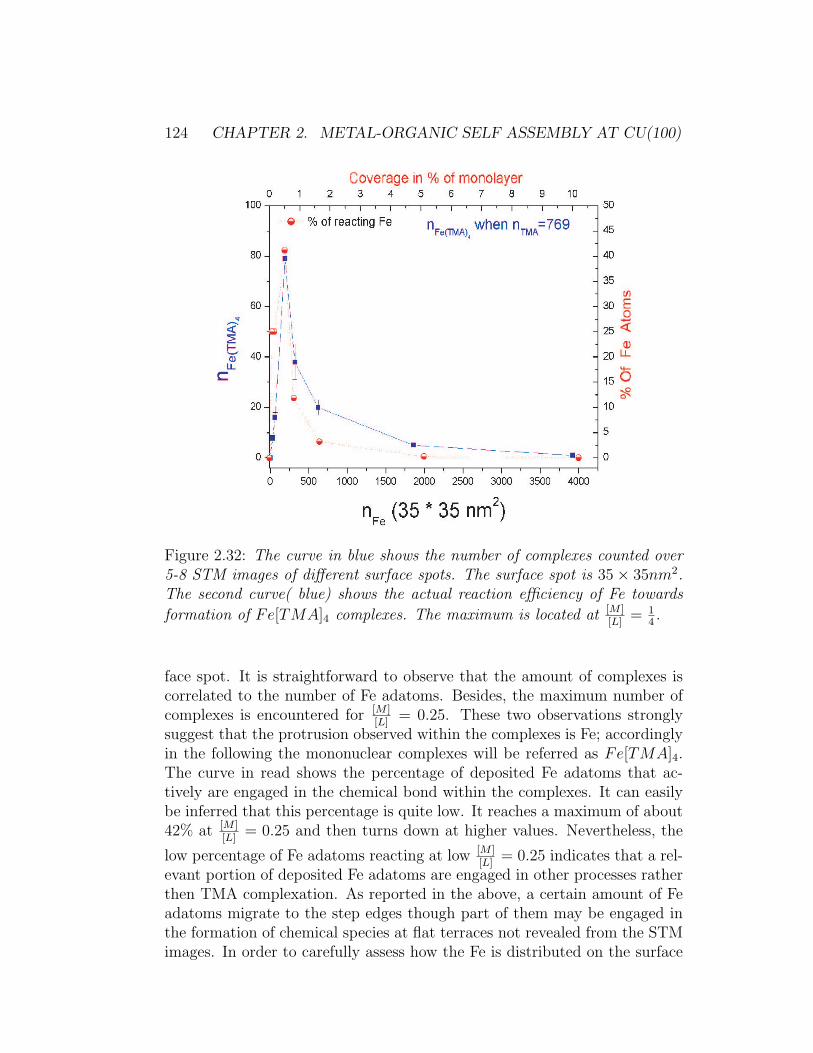
124 CHAPTER 2. METAL-ORGANIC SELF ASSEMBLY AT CU(100)
Figure 2.32: The curve in blue shows the number of complexes counted over5-8 STM images of different surface spots. The surface spot is 35× 35nm2.The second curve( blue) shows the actual reaction efficiency of Fe towards
formation of Fe[TMA]4 complexes. The maximum is located at [M ][L]
= 14.
face spot. It is straightforward to observe that the amount of complexes iscorrelated to the number of Fe adatoms. Besides, the maximum number ofcomplexes is encountered for [M ]
[L]= 0.25. These two observations strongly
suggest that the protrusion observed within the complexes is Fe; accordinglyin the following the mononuclear complexes will be referred as Fe[TMA]4.The curve in read shows the percentage of deposited Fe adatoms that ac-tively are engaged in the chemical bond within the complexes. It can easilybe inferred that this percentage is quite low. It reaches a maximum of about42% at [M ]
[L]= 0.25 and then turns down at higher values. Nevertheless, the
low percentage of Fe adatoms reacting at low [M ][L]
= 0.25 indicates that a rel-evant portion of deposited Fe adatoms are engaged in other processes ratherthen TMA complexation. As reported in the above, a certain amount of Feadatoms migrate to the step edges though part of them may be engaged inthe formation of chemical species at flat terraces not revealed from the STMimages. In order to carefully assess how the Fe is distributed on the surface
2.10. ..SYNTHESIS AT SURFACES: MONONUCLEAR COMPLEXES125
it is suggested to repeat these measurements at low temperature.On the basis of the analysis of the STM images a purely geometrical modelcan be built to illustrate the structure of a single Fe[TMA]4 complex, Fig.2.33 a. The Fe atom is placed at the Cu(100) hollow site for symmetric rea-son. From an inspection of the Fig. 2.33 a it can be inferred that each TMAmolecule apex is not pointing directly towards the center of the protrusion.However, the axis of the triangle (TMA molecule) is rotated 220 respect tothe direction connecting the center of the triangle (TMA molecule) with thecenter of the protrusion. This observation account for a monodentate Fe-Olinkage as for the case studied from Lin [42]. Besides, from simple geometricalconsideration the Fe-O bond length is estimated to be about 2A appreciablysmaller than the one reported by Lin [42] and in line with typical Fe carboxy-late bond length [294]. Inherently, the TMA molecules result placed close tothe Fe adatom and their phenyl ring is placed out of the closest hollow site10.This aspect is also different from the case reported by Lin [42] were TMAmolecules tend to return to the next hollow site.In conclusion, the complexes synthesized in this section are thermodynami-cally stable, they show lateral bond of typical coordination compounds, thesurface geometry seems not affecting the final equilibrium stage. These obser-vations confirm the hypothesis traced in the former paragraphs. Particularlyupon replacing the Cu adatom with Fe, the type of product of the chemicalreaction is different. The latter is probably due to the electronic propertiesof Fe: it does have still 2 d empty orbitals that can accommodate electronscoming from the carboxylic group. Also , the presence of a more reactiveadatom enhances the deprotonation process indicating a lateral dissociativechemisorption process for the deprotonation of the TMA carboxylic groups.Fig. 2.33 shows also that two different Fe[TMA]4 complexes are presentat the surface. A closer inspection shows that the two species are one themirrored image of the other one. The complexes are inherently chiral [43].The chirality is understood in the model shown in Fig. 2.33 as a result ofthe monodentate carboxylic bonding and the TMA-TMA correlation. Inparticular, on each complex only the right(left for S) hand side oxygen inthe carboxyle group is linking the central Fe atom. The former results in todifferent chiral arrangements Fig. 2.33 b. The presence of chirality confirmsthat the bonding configuration is monodentate. Besides, TMA-TMA corre-lation may be due to hydrogen bonding. Possible hydrogen bonding betweenthe free oxygen on the carboxyle moiety and the phenyl ring are representedwith a dash line 2.33 b. Accordingly, chirality may be an indirect proof ofthe effectiveness of the hydrogen bonding between the H on the phenyl ring
10Assuming Fe placed at the center of the hollow site
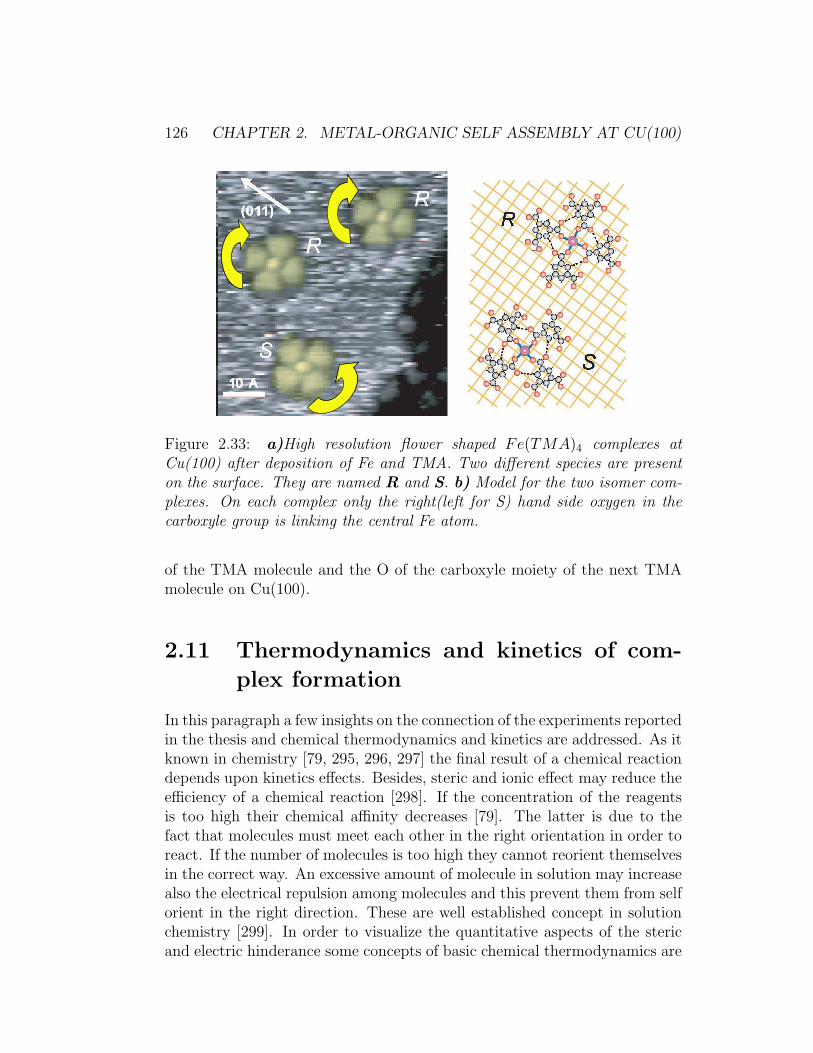
126 CHAPTER 2. METAL-ORGANIC SELF ASSEMBLY AT CU(100)
Figure 2.33: a)High resolution flower shaped Fe(TMA)4 complexes atCu(100) after deposition of Fe and TMA. Two different species are presenton the surface. They are named R and S. b) Model for the two isomer com-plexes. On each complex only the right(left for S) hand side oxygen in thecarboxyle group is linking the central Fe atom.
of the TMA molecule and the O of the carboxyle moiety of the next TMAmolecule on Cu(100).
2.11 Thermodynamics and kinetics of com-
plex formation
In this paragraph a few insights on the connection of the experiments reportedin the thesis and chemical thermodynamics and kinetics are addressed. As itknown in chemistry [79, 295, 296, 297] the final result of a chemical reactiondepends upon kinetics effects. Besides, steric and ionic effect may reduce theefficiency of a chemical reaction [298]. If the concentration of the reagentsis too high their chemical affinity decreases [79]. The latter is due to thefact that molecules must meet each other in the right orientation in order toreact. If the number of molecules is too high they cannot reorient themselvesin the correct way. An excessive amount of molecule in solution may increasealso the electrical repulsion among molecules and this prevent them from selforient in the right direction. These are well established concept in solutionchemistry [299]. In order to visualize the quantitative aspects of the stericand electric hinderance some concepts of basic chemical thermodynamics are
2.11. ..KINETICS OF COMPLEX FORMATION 127
recalled. The difference in free energy associated witha chemical reaction isequivalent to the maximum amount of effective work that can be exploitedfrom the reaction in reversible conditions as reported in eq. 2.9:
∆G = −Leffective (2.9)
This connection permits to measure ∆G from a number of electrochemicalreactions. Also, the free energy is an extensive variable, meaning that itdepends on the amount of reactants. At room temperature and atmosphericpressure G is equal to the standard free energy (G0). For each componenttaking part to any chemical process it is possible to define a relation betweenthe the free energy and the activity 2.10:
nG = nG0 + nRT ln(a) (2.10)
were a is defined as:a = f × c (2.11)
In the former equation a is defined as the activity of the chemical speciesand f is the activity coefficient, n the number of moles and c the concen-tration. The activity coefficient accounts for the thermodynamic connectionof the microscopic effects cited above. The free energy can be related to theequilibrium constant of the reaction through the eq 2.12:
∆G0 = −RT ln(Keq) (2.12)
However, if the reaction is drawn out of the standard conditions the variationof free energy is given by eq 2.14:
aA + bB ⇀↽ cC + dD (2.13)
∆G = −RT ln(Keq) + RT lnfa
A[A]× f bB[B]
f cC [C]× fd
D[D](2.14)
In the equation 2.14 the information concerning the variation of the chemicalactivity is contained in the second term. If the chemical activity of the re-actants varies the free energy will vary accordingly to 2.14. This means thatreducing the chemical activity of the reactants will result in an increase ofthe reaction free energy. In turn the degree of advancement of the chemicalreaction will reduce. As a net result the amount of products decreases.In order to check this concept in the formation of mononuclear complexesFe[TMA]4 we have investigated what happens when the Fe coverage is keptconstant ([M]=1.65% ) and the TMA coverage([L]) is variable. The TMAmolecule is by far the most cumbersome object on the surface as it occupies
128 CHAPTER 2. METAL-ORGANIC SELF ASSEMBLY AT CU(100)
an area equivalent to 28 Fe atoms [41]. Therefore it is better to vary [L] inorder to check the steric hindrance and all the combined effects leading toa variation of the activity a. Fig. 2.34 a,b,c shows a typical STM imageat high [L]. Also,Fig. 2.36 a,b illustrates a close view of the scenario when[M ][L]
= 0.25 but, [L] = 71.6%. It is possible to recognize two major differenceswith respect the case reported in the previous chapter. First the numberof complexes Fe[TMA]4 seems smaller, second molecules are clearly imagedsignaling that steric hinderance blocks them into place. The results of thecounting of Fe[TMA]4 measurements are reported in Fig 2.35. The numberof four member complexes formed increases with the TMA coverage up to amaximum. This maximum is reached at [M ]
[L]= 0.3. This result is different
with respect to what shown in Fig. 2.32. This is an indication that thereaction is affected by steric effects. In fact the chemical activity of TMA islower and inherently the ratio [M ]
[L]where the maximum amount of complexes
is achieved is enhanced. The red curve in the same graph refers to the re-action efficiencyFig. 2.35. On the top x axis we report the average distanceamong molecules calculated simply by dividing the free space expected onthe surface by the number of molecules. All the data are referred to a surfacearea of 35× 35 nm2. The reaction efficiency can be found at values between18% and 28% within a range of intermolecular distance between 0.5 nm and1.3 nm. The results are only indicative as the counting at low coverage isdifficult due to spikes in the tunnelling current. However, these experimentsoffer the opportunity to show that the STM can have the capability to de-termine the order of magnitude of thermodynamic parameters as: ∆G ∆H∆S, associated to a chemical reaction taking place at surfaces.
The complex we observe ( Fe[TMA]4)could be either square planar orsquare pyramidal where the last ligand is one Cu atom on the surface. Theformer depends on the effective electron transfer from the surface. It has al-ready been argued that the lateral coordinative linkage experienced from theFe atom should be more pronounced in parallel to Cu with respect to the mag-nitude of the perpendicular linkage with the surface atoms. Accordingly, it ispossible to refer to the Fe[TMA]4 as square planar complexes, chemisorbedat Cu(100). It is know that in aqueously solution only Ni(II) Pd(II) Pt(II)Au(III), Rd(I) and Ir(I) give square planar Complexes [300, 301]. All thisions are characterized of an outer shell electronic configuration d8 and theoverall number of electrons taking part to the coordination bond is 16. Thisis a favorable situation for square planar complexes according to standardmolecular orbital theory (MO) [302, 296]. The square pyramidal electronicstructure follows from the former one simply allocating two more electronsin the MO. Fe is not known to give square planar complexes in any of the
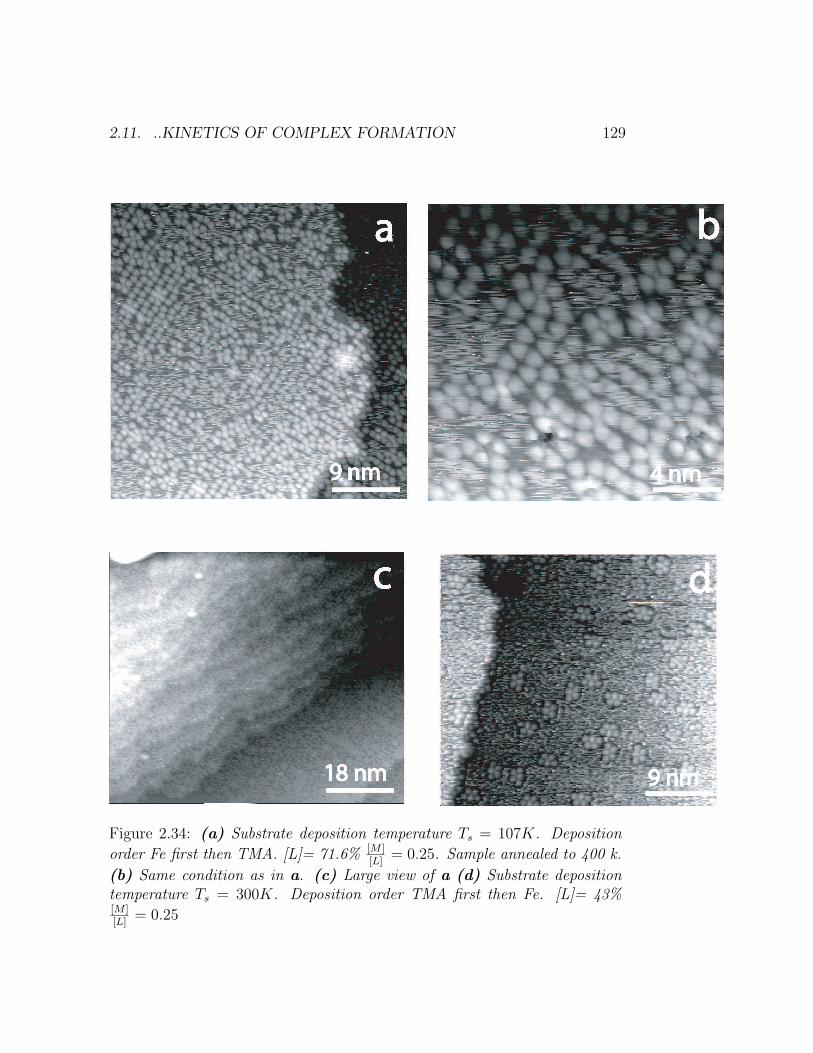
2.11. ..KINETICS OF COMPLEX FORMATION 129
Figure 2.34: (a) Substrate deposition temperature Ts = 107K. Deposition
order Fe first then TMA. [L]= 71.6% [M ][L]
= 0.25. Sample annealed to 400 k.
(b) Same condition as in a. (c) Large view of a (d) Substrate depositiontemperature Ts = 300K. Deposition order TMA first then Fe. [L]= 43%[M ][L]
= 0.25
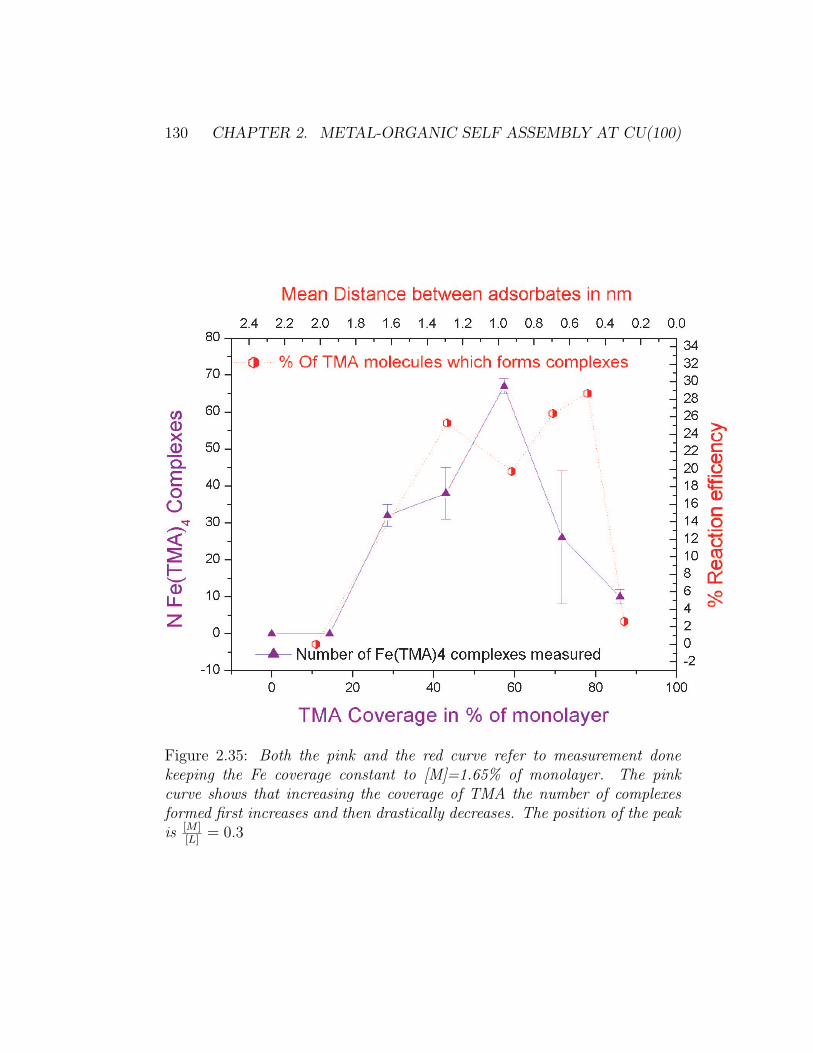
130 CHAPTER 2. METAL-ORGANIC SELF ASSEMBLY AT CU(100)
Figure 2.35: Both the pink and the red curve refer to measurement donekeeping the Fe coverage constant to [M]=1.65% of monolayer. The pinkcurve shows that increasing the coverage of TMA the number of complexesformed first increases and then drastically decreases. The position of the peakis [M ]
[L]= 0.3
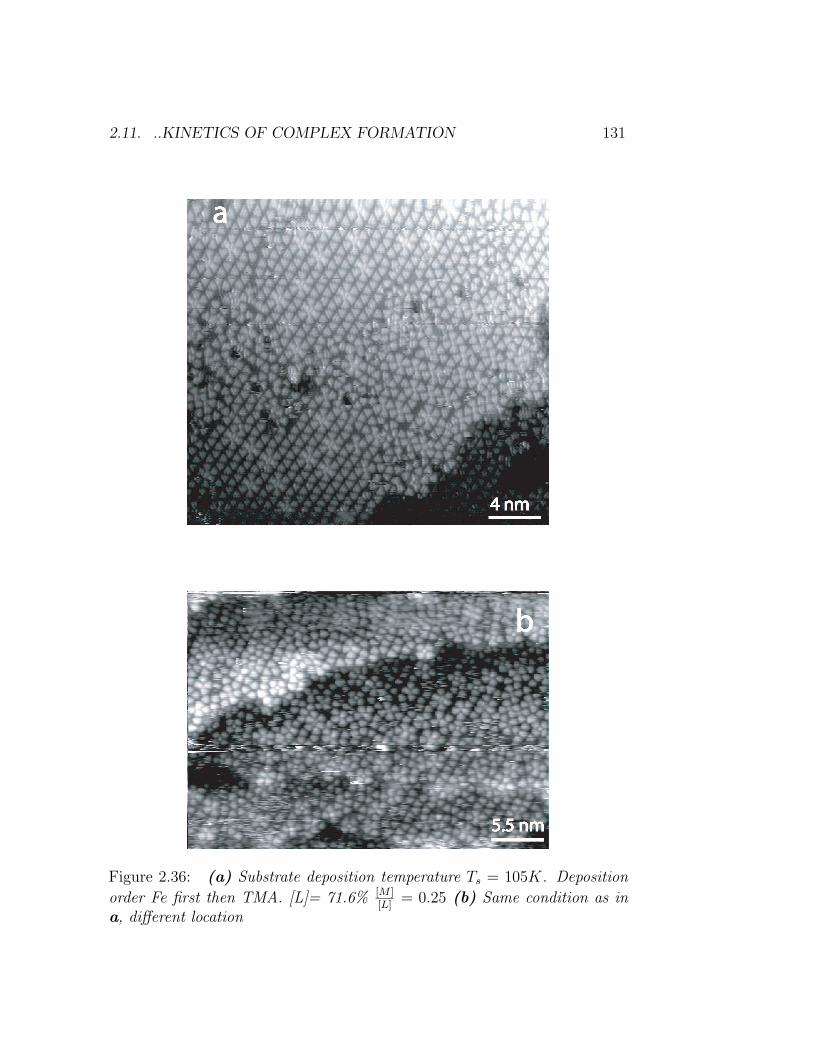
2.11. ..KINETICS OF COMPLEX FORMATION 131
Figure 2.36: (a) Substrate deposition temperature Ts = 105K. Deposition
order Fe first then TMA. [L]= 71.6% [M ][L]
= 0.25 (b) Same condition as ina, different location
132 CHAPTER 2. METAL-ORGANIC SELF ASSEMBLY AT CU(100)
oxidation numbers known (from -II to VI) whereas in the oxidation numberI and III, d7, it is known to give square pyramidal complexes [294]. As men-tioned in the previous paragraph, if it was assumed that Fe is in the oxidationstate zero ( reasonable hypothesis under the experimental conditions) thenthe electronic structure of Fe would resemble to the one of Ni(II) in solutionsignaling the possibility to form stable square planar complexes.Different theories describe the kinetics of reactions in solution. Among thesethe theory of the transition state is among the most recognized[303]. Accord-ing to this theory reactants spontaneously form an intermediate state whichis in equilibrium with both the reactants and the products:
A + B ⇀↽ [AB]∗ ⇀↽ products (2.15)
The speed of the chemical reaction is defined as the speed of products for-mations11:
d[products]
dt= k∗[AB]∗ = k2 · [A][B] (2.16)
also, as the equilibrium constant for eq. 2.15 is K∗ = [AB∗][A][B]
it is possible torewrite 2.16 as follows:
d[products]
dt= k∗K∗ · [A][B] (2.17)
Recalling the eq 2.12 the speed constant k2 will be connected to the standardfree energy of formation of the transition state ∆G0
∗ through the followingrelationship:
k2 = k∗ exp(−∆G0
∗RT
) (2.18)
The eq 2.18 is important as it defines a clear relationship with the transitionstate enthalpy of formation and entropy of formation. Clearly any increaseof the ordering associated to the transition state or the esothermicity of thesame will foster a quicker reaction. A bit of more algebra [303]leads to aexplicit form of eq 2.18:
k2 = κKbT
hexp(
−∆G0∗
RT) (2.19)
where κ is a constant between 0 and 1 and h is the Planck constant and Kb isthe Boltzman constant. It is not possible to answer here to the spontaneousquestion on whether this theoretical implant holds for the case examined
11k∗ is the speed constant for the formation of the transition state. k2 is the speedconstant for the formation of the products.
2.11. ..KINETICS OF COMPLEX FORMATION 133
here. Another theoretical description of kinetics refers to diffusion controlledkinetics. This scenario is possible only if the probability of products forma-tion is much higher than the probability of collision. The resulting speed ofreaction in this case depends on the diffusion of reactants. This case is nottreated here.Though the approach refers to a 3D scenario it is possible to consider theconstraint effect of the surface as a pressure applied to the molecule to stickon to the surface. In this case the variation of the reaction rate with respectto the pressure is related to the transition state volume variation through eq2.16
(∂k2
∂P)T =
−∆V∗RT
(2.20)
Roughly speaking the eq 2.20 states that for a negative variation of thetransition state volume the reaction speed is increased. This is what couldhappen at the surface, although the entropy contribution must also be takeninto account.Besides, as eq 2.16 relates the reaction rate to the equilibrium constant ofthe transition state it follows straightforward that the reaction rate itself isaffected by the activity of the reactants:
k2 =KbT
h·K∗ · fafb
f∗(2.21)
As it can be easily seen a variation in the activity coefficient of the reactantsgives rise to a linear variation in the reaction rate. Particularly, the ideacasted here is that when the activity of one of the reactants approaches zeroalso the reaction rate does. It is possible to artificially slow down a reactionby acting on the amount of reactants. The kinetics can inherently be followedby using the STM even if a fast scanning mode is not available. This may bethe case for reaction whose speed is higher than the case shown by Lin [42].It is known in chemistry that a chemical reaction follows different stages[296].In particular in the case of metal organic complexes the stages usu-ally followed by the reaction are: Reactants/ Precursor complex /Transitionstate/ Successor complex/ Products. Any steric or electrical effect on thechemical affinity acts at one of the central stages.In the high coverage region the formation of three member complexes Yshaped is imaged clearly as depicted in Fig. 2.39. These complexes are im-aged with two molecules attempting to enter the complex on the side. Theshape of the Fe[TMA]3 seems to indicate that the two molecule on the armsare bonding to the metal atom with the left oxygen and the right hand sideoxygen of the carboxylic group. This is in strong contrast with the fourmember case where all the molecules bond with the right or left Oxygen of
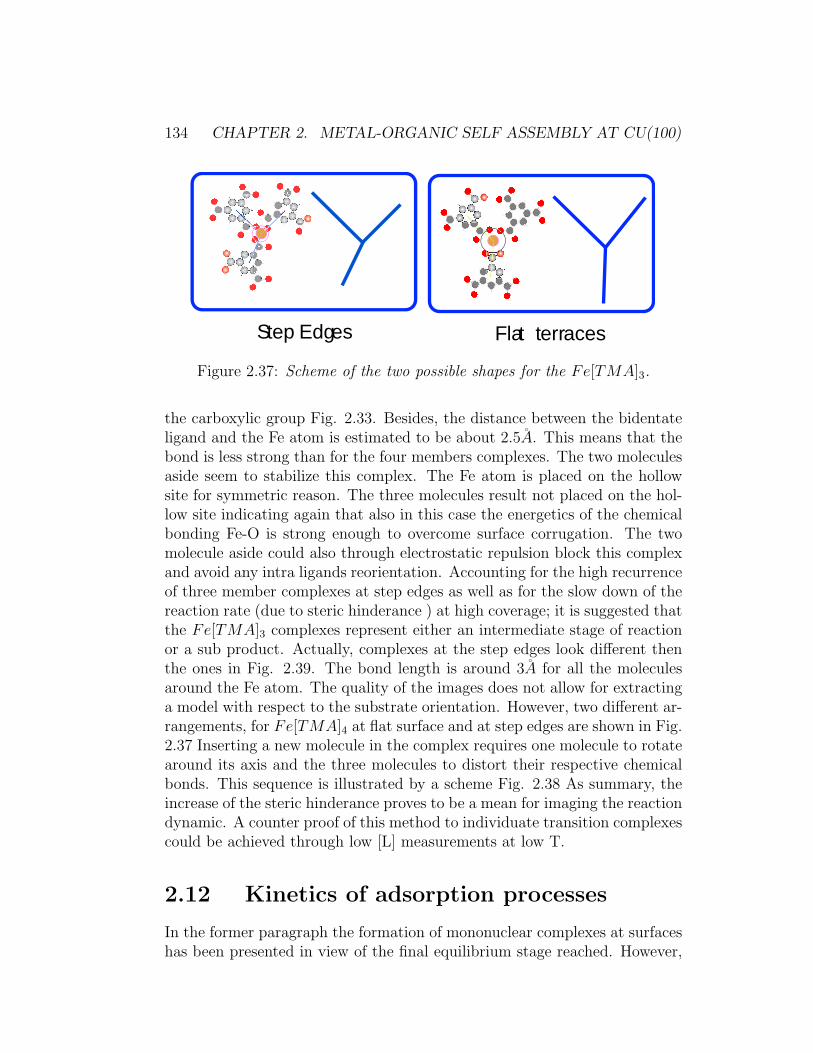
134 CHAPTER 2. METAL-ORGANIC SELF ASSEMBLY AT CU(100)
Flat terraces Step Edges
Figure 2.37: Scheme of the two possible shapes for the Fe[TMA]3.
the carboxylic group Fig. 2.33. Besides, the distance between the bidentateligand and the Fe atom is estimated to be about 2.5A. This means that thebond is less strong than for the four members complexes. The two moleculesaside seem to stabilize this complex. The Fe atom is placed on the hollowsite for symmetric reason. The three molecules result not placed on the hol-low site indicating again that also in this case the energetics of the chemicalbonding Fe-O is strong enough to overcome surface corrugation. The twomolecule aside could also through electrostatic repulsion block this complexand avoid any intra ligands reorientation. Accounting for the high recurrenceof three member complexes at step edges as well as for the slow down of thereaction rate (due to steric hinderance ) at high coverage; it is suggested thatthe Fe[TMA]3 complexes represent either an intermediate stage of reactionor a sub product. Actually, complexes at the step edges look different thenthe ones in Fig. 2.39. The bond length is around 3A for all the moleculesaround the Fe atom. The quality of the images does not allow for extractinga model with respect to the substrate orientation. However, two different ar-rangements, for Fe[TMA]4 at flat surface and at step edges are shown in Fig.2.37 Inserting a new molecule in the complex requires one molecule to rotatearound its axis and the three molecules to distort their respective chemicalbonds. This sequence is illustrated by a scheme Fig. 2.38 As summary, theincrease of the steric hinderance proves to be a mean for imaging the reactiondynamic. A counter proof of this method to individuate transition complexescould be achieved through low [L] measurements at low T.
2.12 Kinetics of adsorption processes
In the former paragraph the formation of mononuclear complexes at surfaceshas been presented in view of the final equilibrium stage reached. However,
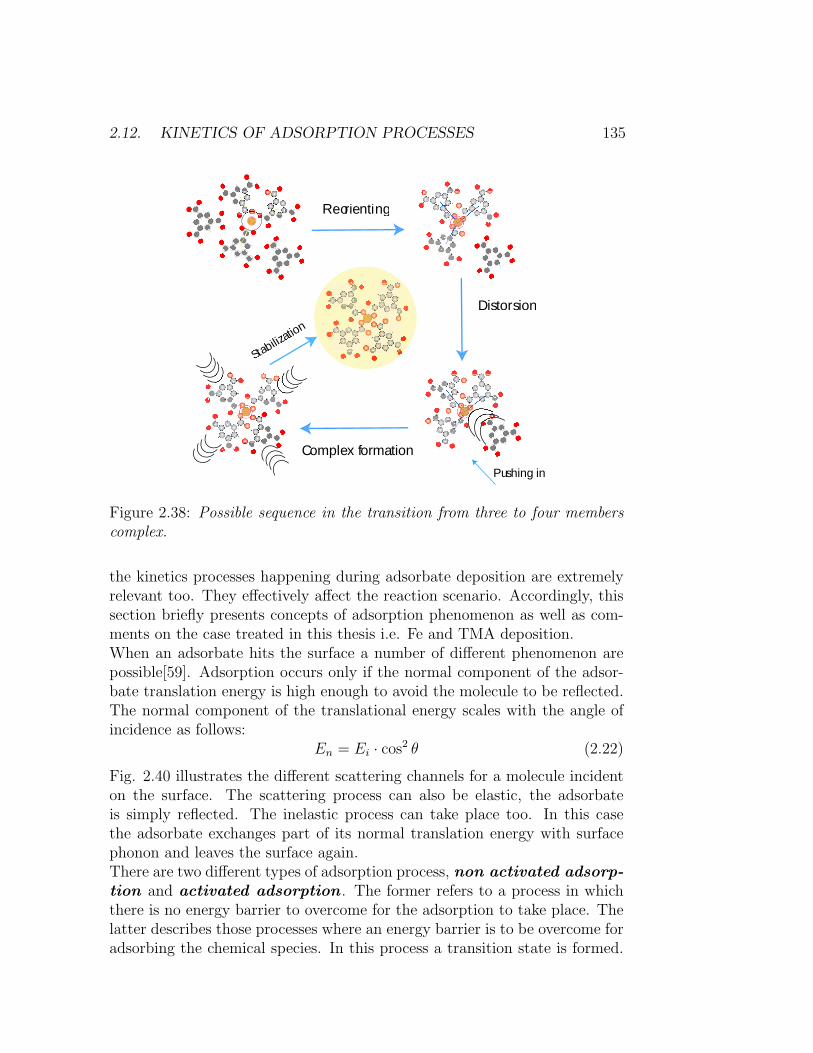
2.12. KINETICS OF ADSORPTION PROCESSES 135
Reorienting
Distorsion
Complex formation
Pushing in
Stabiliz
ation
Figure 2.38: Possible sequence in the transition from three to four memberscomplex.
the kinetics processes happening during adsorbate deposition are extremelyrelevant too. They effectively affect the reaction scenario. Accordingly, thissection briefly presents concepts of adsorption phenomenon as well as com-ments on the case treated in this thesis i.e. Fe and TMA deposition.When an adsorbate hits the surface a number of different phenomenon arepossible[59]. Adsorption occurs only if the normal component of the adsor-bate translation energy is high enough to avoid the molecule to be reflected.The normal component of the translational energy scales with the angle ofincidence as follows:
En = Ei · cos2 θ (2.22)
Fig. 2.40 illustrates the different scattering channels for a molecule incidenton the surface. The scattering process can also be elastic, the adsorbateis simply reflected. The inelastic process can take place too. In this casethe adsorbate exchanges part of its normal translation energy with surfacephonon and leaves the surface again.There are two different types of adsorption process, non activated adsorp-tion and activated adsorption . The former refers to a process in whichthere is no energy barrier to overcome for the adsorption to take place. Thelatter describes those processes where an energy barrier is to be overcome foradsorbing the chemical species. In this process a transition state is formed.
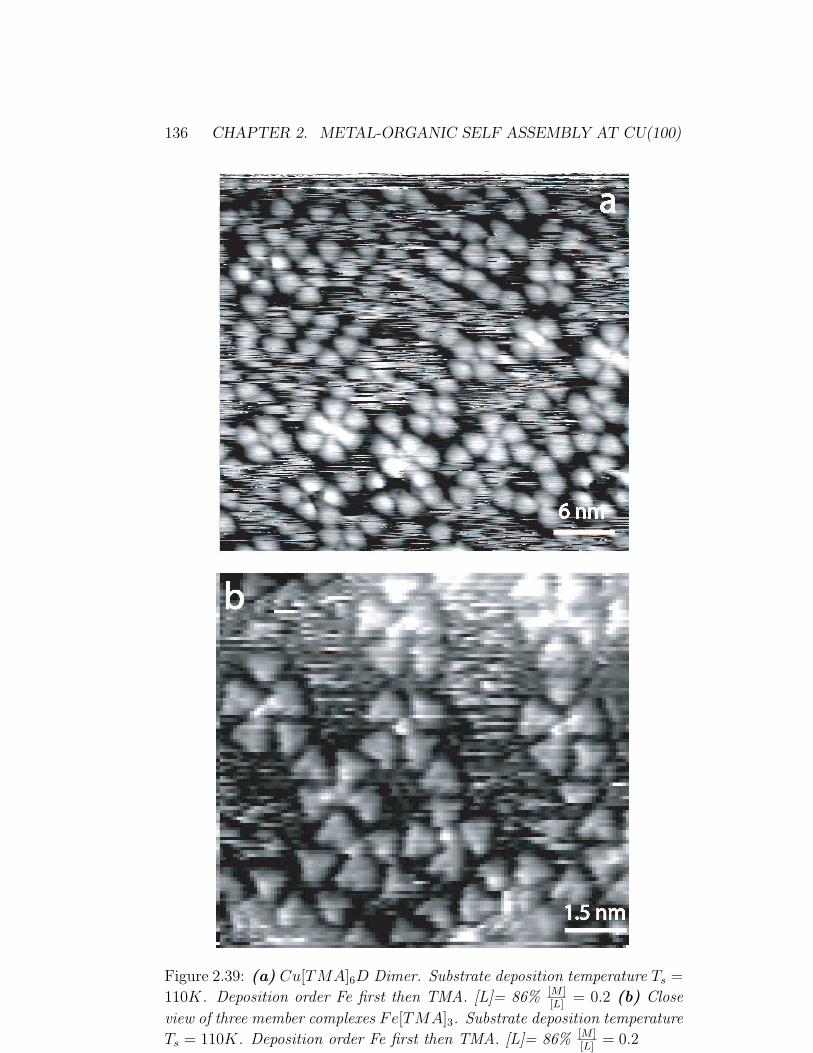
136 CHAPTER 2. METAL-ORGANIC SELF ASSEMBLY AT CU(100)
Figure 2.39: (a) Cu[TMA]6D Dimer. Substrate deposition temperature Ts =
110K. Deposition order Fe first then TMA. [L]= 86% [M ][L]
= 0.2 (b) Close
view of three member complexes Fe[TMA]3. Substrate deposition temperature
Ts = 110K. Deposition order Fe first then TMA. [L]= 86% [M ][L]
= 0.2
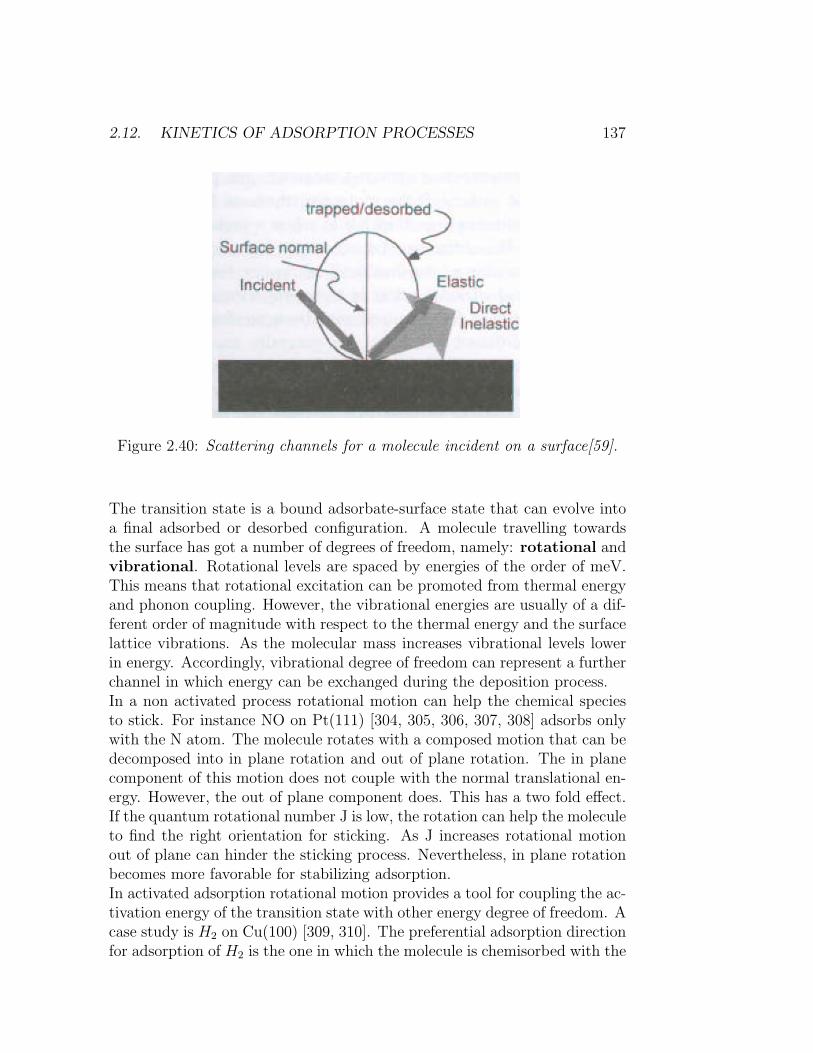
2.12. KINETICS OF ADSORPTION PROCESSES 137
Figure 2.40: Scattering channels for a molecule incident on a surface[59].
The transition state is a bound adsorbate-surface state that can evolve intoa final adsorbed or desorbed configuration. A molecule travelling towardsthe surface has got a number of degrees of freedom, namely: rotational andvibrational. Rotational levels are spaced by energies of the order of meV.This means that rotational excitation can be promoted from thermal energyand phonon coupling. However, the vibrational energies are usually of a dif-ferent order of magnitude with respect to the thermal energy and the surfacelattice vibrations. As the molecular mass increases vibrational levels lowerin energy. Accordingly, vibrational degree of freedom can represent a furtherchannel in which energy can be exchanged during the deposition process.In a non activated process rotational motion can help the chemical speciesto stick. For instance NO on Pt(111) [304, 305, 306, 307, 308] adsorbs onlywith the N atom. The molecule rotates with a composed motion that can bedecomposed into in plane rotation and out of plane rotation. The in planecomponent of this motion does not couple with the normal translational en-ergy. However, the out of plane component does. This has a two fold effect.If the quantum rotational number J is low, the rotation can help the moleculeto find the right orientation for sticking. As J increases rotational motionout of plane can hinder the sticking process. Nevertheless, in plane rotationbecomes more favorable for stabilizing adsorption.In activated adsorption rotational motion provides a tool for coupling the ac-tivation energy of the transition state with other energy degree of freedom. Acase study is H2 on Cu(100) [309, 310]. The preferential adsorption directionfor adsorption of H2 is the one in which the molecule is chemisorbed with the
138 CHAPTER 2. METAL-ORGANIC SELF ASSEMBLY AT CU(100)
main axis aligned along the surface. The reason is that this orientation pro-vides the best charge transfer from the surface into the 2σ∗ molecular orbitals.Accordingly, for J=0 rotation provides a tool for orienting the molecule inthe right position. However, low values of J result in an hinderance of thetransition state formation.For appreciably heavy molecules a number of low energy vibrational statesare available. These states can be populated during adsorption [59] resultingthen in a channel in which translational energy can be diverted to.Another import aspect of the adsorption dynamics is the sequence of depo-sition. When two adsorbates are to be deposited on the surface the finalresult of the adsorption process can vary drastically as result of the differentorder of adsorbate deposition. A case study is represented from CO, O2 onPd(111) [311, 312]. In fact, CO has an higher affinity to adsorb at Pd(111)asit can soak more electron density from the surface. If CO is deposited first,then a further deposition of O2 will not displace CO. Conversely if O2 isdeposited first three different species appears. They are related to differentadsorption configurations at different binding energies. As CO is depositedthe O2 species more strongly bound to the Pd(111) surface are displaced.The reason is that those species adsorb at the sites where CO is willing toadsorb. besides, these species can be converted to the species which bind toone single site. As the CO coverage increases the adsorption barrier increasesas there are less electrons on the Pd surface to be pulled out. In this respectit becomes thermodynamically more favorable that a certain portion of sitesremains covered with the upright standing chemisorbed O2. As it can beseen, the order of adsorbate deposition is a relevant parameter.On the basis of the previous discussion a change in the Fe,TMA depositionorder may lead to different findings, at least prior that post annealing washesout the effect. If TMA is deposited first at low T, its preferential adsorptionconfiguration will be flat lying standing. In fact, the aromatic ring tends toestablish a π bond with the surface atoms. Probably, the molecules oncearrive at the surface tend to lose parallel translational energy through longjumps and activating vibrational and rotational degree of freedom. However,the presence of other molecules on the surface slightly changes the PES andnew coming molecules tend to stick in the proximity of other molecules. Priorto Fe deposition it is likely that a local order is established. The adsorbate-substrate interaction will tend to order the TMA molecule with the phenylring at the substrate hollow sites, whereas weak lateral interaction will ro-tate the molecule to align one side of the triangle along the main substratedirections. When Fe is deposited the adatoms will probably undergo differ-ent processes. On the one hand they could be captured from the carboxylicgroup of one molecule just at the moment they arrive at the surface or they
2.13. ..SYNTHESIS AT SURFACES: POLYNUCLEAR COMPLEXES 139
can reach free surface sites and than migrate to meet the TMA island alreadyformed at the surface. Such a mechanism may lead to the formation of clus-ters as the starting point of the synthesis are TMA islands at flat surfaces.By contrast, if Fe is deposited first the surfaces rugosity increases. In thisconditions TMA molecule can bind on four sites , the phenyl ring and thethree carboxylic12. The bonding process using the carboxylic groups is likelyto be an activated adsorption. However, statistically a certain fraction ofimpinging TMA molecule will directly capture an Fe adatom. The resultingdimer may still be able to migrate and capture another impinging molecule.This process is probably reversible, though it may happen on time scale smallenough that a new molecule is captured before the first TMA molecule re-leases the translational energy and leans on the surface. This process if truewould unavoidably lead to a higher number of Fe[TMA]3 complexes formedduring deposition with respect the former case. As a result, statistically thenumber of Fe[TMA]3 evolving into Fe[TMA]4 would be higher than in thecase in which TMA is deposited first.In the next paragraph it will be seen that actually when TMA is depositedfirst the synthesis leads to the formation of polynuclear clusters rather thanFe[TMA]4. The previous arguments, even though speculative, can help tofigure out a possible reason.
2.13 Metal-organic synthesis at surfaces: Polynu-
clear complexes
In this section the synthesis of polynuclear clusters at Cu(100) is described.There are two major changes that need to be undertaken in order to produceisolated clusters. First the order of adsorbates deposition must be changed:TMA is deposited first followed by Fe. Second the ratio [M ]
[L]is increased with
respect to the value used for producing mononuclear complexes. The secondchange is easily understood. As matter of fact, in order to produce clustersthe lateral linkage of TMA molecules must be increased. However, as theaim of the synthesis is to produce clusters and not long 2D arrays, not allthe carboxylic groups are to be engaged in lateral linkage. Accordingly the[M ][L]
ratio is chosen to be around one.
The first example of a polynuclear cluster is depicted in Fig. 2.41 (a). Adsor-bates deposition is carried out at low T. The flat terraces appear populatedwith a number of TMA aggregates as large as few nm (5 ÷ 10). In orderto achieve a better resolution the sample was annealed to 400 K. Anneal-
12Only upon deprotonation.
140 CHAPTER 2. METAL-ORGANIC SELF ASSEMBLY AT CU(100)
ing improves the measuring conditions, in fact as explained before at roomtemperature it is extremely difficult to resolve the structures present on thesurface when the overall coverage [L] is low ([L] ≤ 50%). For these reasonsresolving the inner structure of the clusters was a difficult task. The reso-lution achieved was insufficient to derive a geometrical model. However,Fig.2.41 (b) shows a detail of one of the clusters. A quite relevant feature isthat at the middle of the cluster there is a four member complex Fe[TMA]4surrounded by a complex structure where three member complexes seem topredominate. It is not possible from the analysis of the image to establishwhether the three member complexes are bond to the central core Fe[TMA]4with bidentate carboxylate bonding or through hydrogen bonding13. Slightlyincreasing [M ]
[L]to one permits to image the polynuclear complexes without
annealing the sample. This is shown if Fig. 2.42 (b). The clusters aremostly composed by a core made up of a Fe[TMA]4 on whose corners athree member complex Fe[TMA]3 sticks. The structure of these polynuclearclusters is actually different from the single molecular magnets discussed inPar.2.5. In SMM single magnetic atoms are bridged together through oxygenor N atoms. On the contrary, here different magnetic atoms (Fe) are bridgedthrough molecules. Nevertheless, it is still possible that a magnetic super-exchange interaction takes place among the two atoms bridged[313, 314]. Infact the π electrons over the phenyl ring can constitute a communicationchannel through atoms. Upon annealing the clusters tend to size up andnew molecules attach to them. In order to resolve the interior structure ofthese polynuclear clusters it is suggested to perform low temperature highresolved scanning imaging.
13H-bonding are unlikely due to their low thermal stability.
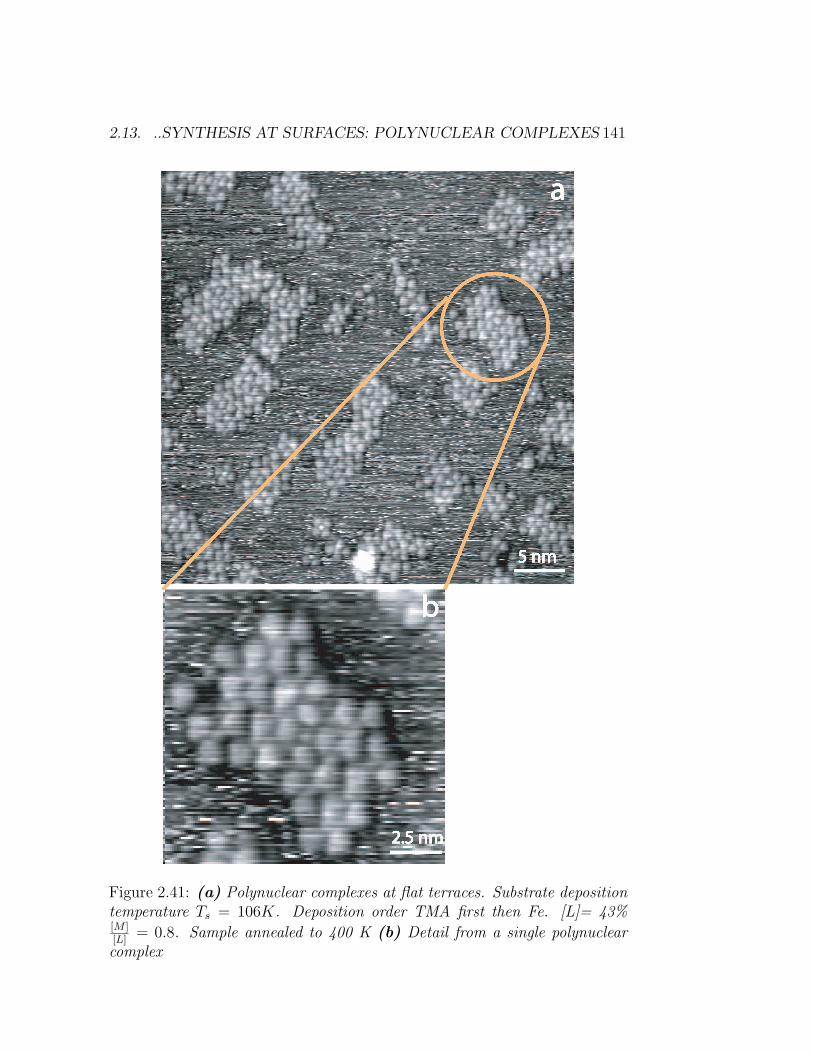
2.13. ..SYNTHESIS AT SURFACES: POLYNUCLEAR COMPLEXES 141
Figure 2.41: (a) Polynuclear complexes at flat terraces. Substrate depositiontemperature Ts = 106K. Deposition order TMA first then Fe. [L]= 43%[M ][L]
= 0.8. Sample annealed to 400 K (b) Detail from a single polynuclearcomplex
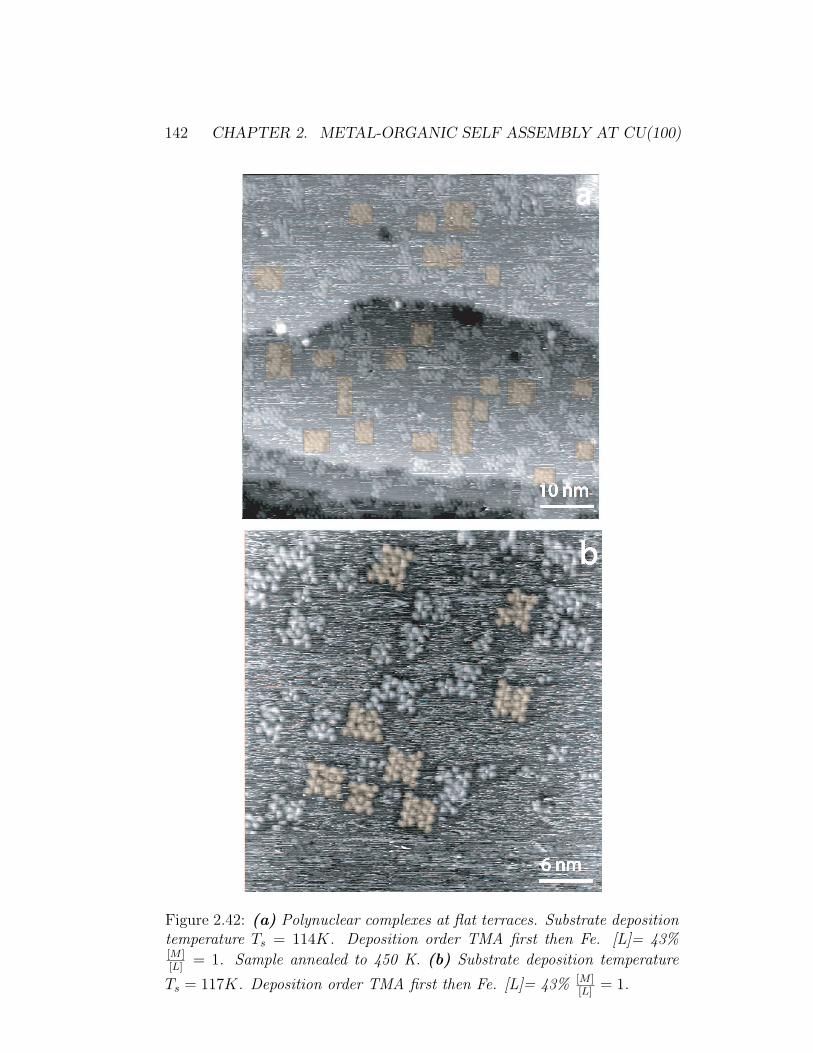
142 CHAPTER 2. METAL-ORGANIC SELF ASSEMBLY AT CU(100)
Figure 2.42: (a) Polynuclear complexes at flat terraces. Substrate depositiontemperature Ts = 114K. Deposition order TMA first then Fe. [L]= 43%[M ][L]
= 1. Sample annealed to 450 K. (b) Substrate deposition temperature
Ts = 117K. Deposition order TMA first then Fe. [L]= 43% [M ][L]
= 1.
2.14. ..SYNTHESIS AT SURFACES: 1D AND 2D STRUCTURES 143
2.14 Metal-organic Synthesis at surfaces: 1D
and 2D structures
In this paragraph it is shown how an important external trigger, anneal-ing , can act on the surface scenario after that a first chemical assembly hastaken place.If an external trigger acts on the assembling process after that it has reachedthe thermodynamic equilibrium the overall procedure is known as self as-sembly followed by post modification [202]. Fig.2.45 a, offers an overview of
the scenario followed after deposition of TMA and Fe for appreciable [M ][L]
i.e.[M ][L]
> 1. It can be observed that a number of aggregates are present at thesurface. Their structure is not ordered. Nonetheless, it may be inferred thatthe structures account for multiple lateral linkage of TMA molecules.In such a scenario the effect of annealing can be extremely relevant. Table 2.1illustrates how the thermal energy increases while increasing the substratetemperature. Besides, the increase in the exponential part of the moleculardiffusion coefficient is also reported. If the exponential part of the diffusioncoefficient is considered as the number of attempts that the adsorbates doesto leave its site, than it is possible to infer the following: Even if a strongchemical coordinative bond between Fe and carboxylic groups is formed (energies up to some eV) the TMA molecules and the Fe atoms within theassemblies have still some degrees14 of freedom. In fact with higher to highertemperature the probability that the molecule can slightly shift towards abetter place at the surface increases. Also, the Fe atoms can repositionthemselves upon annealing. The process of reordering does not involve nec-essarily the breaking up of the Fe-O bond. In fact this bond can stretchand distort itself upon annealing. Presumably, a fraction of Fe-O bonds arestatistically broken in favor of O-H recombination15.The mobility of high diffusing species, including the fantom Fe[TMA]3, isalso increased upon annealing. inherently the probability that two or morefantom species meet or fuse themselves into one object increases.Last the evaporation of Fe atoms captured at the step edges into flat ter-races is increased upon annealing. The reason is that most of the adatom atflat terraces are linked within the assemblies. Accordingly the equilibriumsketched in the reaction 2.23 is moved towards the right, and more Fe atomsreach the terraces.
14translation, partial bonding distortion and stretching, partial rotation, rotation ofmononuclear complexes...
15This is a purely thermodynamical consideration.
144 CHAPTER 2. METAL-ORGANIC SELF ASSEMBLY AT CU(100)
Magnitude of thermal energy and diffusion factors
T (K) KT (meV) Em
KTlog(
exp(− EmKTRT
)
exp(− EmKTannealing
))
300 26 31.92 0350 31 26.77 2.38400 35 23.71 3.5450 39.4 21.06 4.7500 43.7 18.99 5.6
Table 2.1: The different values are calculated accounting for Em = 0.8 eV .It is an indicative value.
Festeps ⇀↽ Feterrace (2.23)
In the previous paragraph it has been seen that when [M ][L]
= 0.8÷ 1 polynu-clear clusters evolve. However, if the sample is annealed for a sufficientlylong time(t ≥ 15min) one dimensional structures develop[166] at flat ter-races. These structures are distributed at the surface as shown in Fig. 2.43.The structures seem to depart mostly from step edges though the quality ofthe images in Fig.2.43 is low. In fact the amount of mobile species on thesurface under the measuring conditions is still appreciable. As a result thetip picks noise up, reducing the quality of the image. As stated in section 2.5,the initial aim of the experiment described here was to achieve 1D isolatedmagnetic structures available for investigation with magnetic local probes.In view of this requirement, it has been attempted to reduce drastically [L]
while keeping [M ][L]
constant and equal to 1. Nice isolated chains can be image
at the step edges as shown in Fig. 2.44 a. Further increasing [M ][L]
to 1.5, givesrise to intermixed 1D structures and polynuclear clusters upon annealing.The latter indicates that [M ]
[L]must be kept below 1.5 if 1D structures are to
be observed. Surprisingly it is also possible to achieve 1D structures uponannealing if [M ]
[L]= 0.5 as shown in Fig. 2.44 c. This is an important point.
In fact this value of [M ][L]
represents an intermediate region between the inter-
val in which Fe[TMA]4 complexes predominate and the polynuclear clustersset in. Inherently the number of fantom species Fe[TMA]3 at flat terracesshould be still considerable. The fact that 1D species evolve upon annealingsignals that the three member complexes could be the precursor of these 1Dassemblies. Besides, this is also an indication that annealing may provokea rearrangement of the chemical bonds between Fe and O. In fact, if twocomplexes Fe[TMA]3 meet at surfaces they need to distort themselves dras-
2.14. ..SYNTHESIS AT SURFACES: 1D AND 2D STRUCTURES 145
tically to develop a 1D structure. Moreover, if annealing is performed at 440K degree for a longer time wider 1D structures emerge. This is illustrated inFig. 2.44 d. The former indicates that the threefold symmetry of the TMAmolecules can be exploited to provoke 2D well ordered arrangement.2D ordering sets in at appreciable TMA coverage ([L] ≥ 43%). When the
ratio [M ][L]
is kept below 1.5 the nominal amount of Fe16 at the surface is lessthan necessary for engaging all the carboxylic groups present at the surfacewithin Fe-O coordinative bonds. Accordingly, Fig. 2.45 (b) shows how an-nealing produces an intermixed scenario of 1D and 2D structures alignedalong the substrate main directions. However, if [L] is reduced to 43% while[M ][L]
increased to 2.4 the amount of Fe at surface is enough to complex allthe TMA molecules at surfaces. As a result islands 20÷ 30nm long developat flat terraces, as shown in Fig. 2.46. Unfortunately, the STM was unableto resolve the inner structure of these assemblies. Low temperature STMobservations are suggested in order to clarify this issue. However, it was pos-sible to isolate a number of phases at high [L][166, 315]. In the framework ofthis thesis the focus will be on the assemblies reported in Fig. 2.48. Theseassemblies predominates when the deposition temperature of the adsorbatesis below room temperature. This fact signals that the annealing is sensitiveto a sort of memory effect. Only an accurate low temperature investigationcould offer an effective overall vision of the chemical species present at sur-faces.These structures develop at Cu(100) and are composed of the 1D assembliesaligned one after the other along the substrate main directions [011] and[01-1]. The higher is the annealing temperature the more ordered structuresappear on the surface.The example of 2D assembly reported in Fig. 2.48 is paramount evidence of
the application of concepts of coordinative crystal engineering[316]. In fact,as it will be seen below, coordinative interaction is responsible for the intrachain ordering though the long range inter-chain order is mostly imputableto the weaker hydrogen bond interaction. In crystal engineering hydrogenbonding is responsible for the bending, bridging, and ordering of structures[316]. Hydrogen bonding is classified into three categories [317]:
• strong hydrogen bonding up to 1.7 eV
• moderate hydrogen bonding up to 0.63 eV
• weak hydrogen bonding up to 0.2 eV
16It is not possible to evaluate the amount of Fe adatoms stuck at the step edges
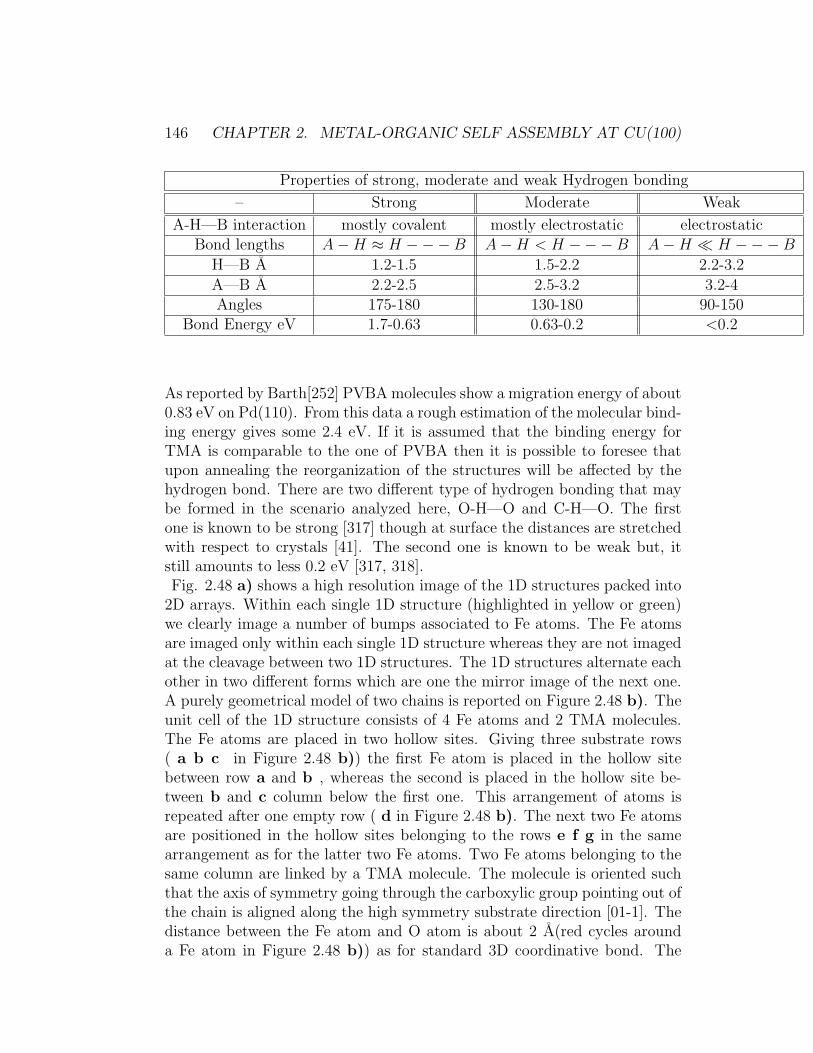
146 CHAPTER 2. METAL-ORGANIC SELF ASSEMBLY AT CU(100)
Properties of strong, moderate and weak Hydrogen bonding
– Strong Moderate Weak
A-H—B interaction mostly covalent mostly electrostatic electrostaticBond lengths A−H ≈ H −−−B A−H < H −−−B A−H ¿ H −−−B
H—B A 1.2-1.5 1.5-2.2 2.2-3.2
A—B A 2.2-2.5 2.5-3.2 3.2-4Angles 175-180 130-180 90-150
Bond Energy eV 1.7-0.63 0.63-0.2 <0.2
As reported by Barth[252] PVBA molecules show a migration energy of about0.83 eV on Pd(110). From this data a rough estimation of the molecular bind-ing energy gives some 2.4 eV. If it is assumed that the binding energy forTMA is comparable to the one of PVBA then it is possible to foresee thatupon annealing the reorganization of the structures will be affected by thehydrogen bond. There are two different type of hydrogen bonding that maybe formed in the scenario analyzed here, O-H—O and C-H—O. The firstone is known to be strong [317] though at surface the distances are stretchedwith respect to crystals [41]. The second one is known to be weak but, itstill amounts to less 0.2 eV [317, 318].Fig. 2.48 a) shows a high resolution image of the 1D structures packed into
2D arrays. Within each single 1D structure (highlighted in yellow or green)we clearly image a number of bumps associated to Fe atoms. The Fe atomsare imaged only within each single 1D structure whereas they are not imagedat the cleavage between two 1D structures. The 1D structures alternate eachother in two different forms which are one the mirror image of the next one.A purely geometrical model of two chains is reported on Figure 2.48 b). Theunit cell of the 1D structure consists of 4 Fe atoms and 2 TMA molecules.The Fe atoms are placed in two hollow sites. Giving three substrate rows( a b c in Figure 2.48 b)) the first Fe atom is placed in the hollow sitebetween row a and b , whereas the second is placed in the hollow site be-tween b and c column below the first one. This arrangement of atoms isrepeated after one empty row ( d in Figure 2.48 b). The next two Fe atomsare positioned in the hollow sites belonging to the rows e f g in the samearrangement as for the latter two Fe atoms. Two Fe atoms belonging to thesame column are linked by a TMA molecule. The molecule is oriented suchthat the axis of symmetry going through the carboxylic group pointing out ofthe chain is aligned along the high symmetry substrate direction [01-1]. Thedistance between the Fe atom and O atom is about 2 A(red cycles arounda Fe atom in Figure 2.48 b)) as for standard 3D coordinative bond. The
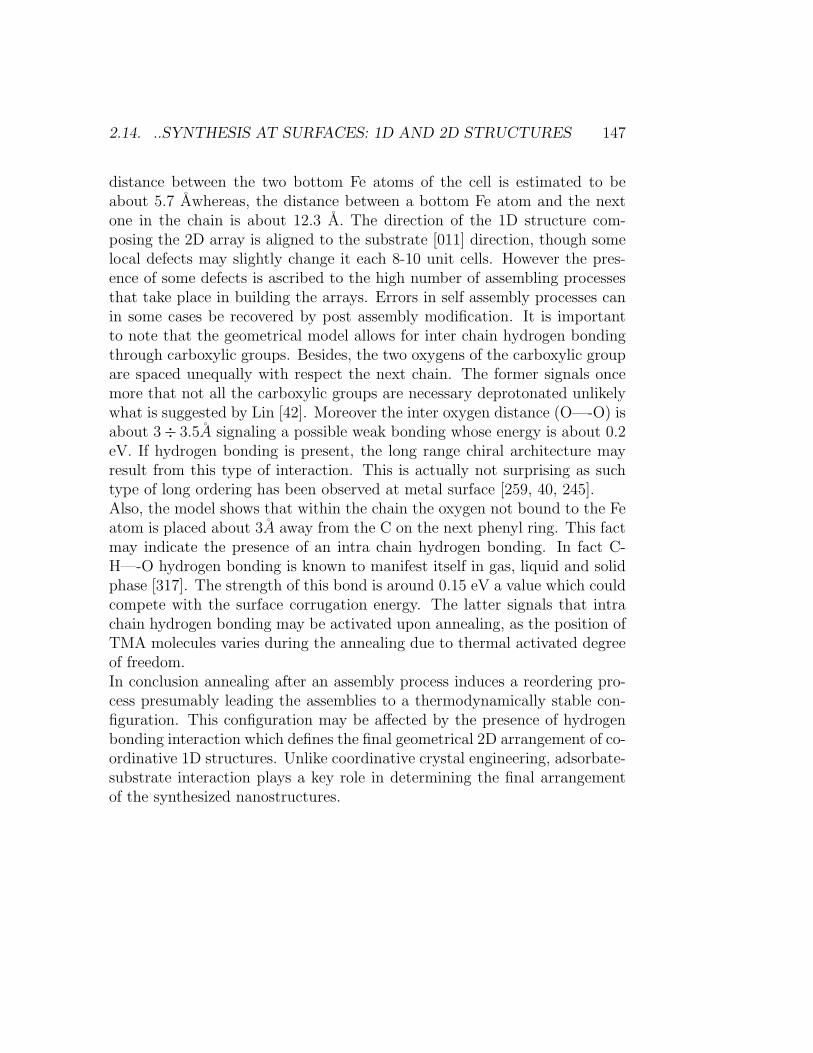
2.14. ..SYNTHESIS AT SURFACES: 1D AND 2D STRUCTURES 147
distance between the two bottom Fe atoms of the cell is estimated to beabout 5.7 Awhereas, the distance between a bottom Fe atom and the nextone in the chain is about 12.3 A. The direction of the 1D structure com-posing the 2D array is aligned to the substrate [011] direction, though somelocal defects may slightly change it each 8-10 unit cells. However the pres-ence of some defects is ascribed to the high number of assembling processesthat take place in building the arrays. Errors in self assembly processes canin some cases be recovered by post assembly modification. It is importantto note that the geometrical model allows for inter chain hydrogen bondingthrough carboxylic groups. Besides, the two oxygens of the carboxylic groupare spaced unequally with respect the next chain. The former signals oncemore that not all the carboxylic groups are necessary deprotonated unlikelywhat is suggested by Lin [42]. Moreover the inter oxygen distance (O—-O) isabout 3÷ 3.5A signaling a possible weak bonding whose energy is about 0.2eV. If hydrogen bonding is present, the long range chiral architecture mayresult from this type of interaction. This is actually not surprising as suchtype of long ordering has been observed at metal surface [259, 40, 245].Also, the model shows that within the chain the oxygen not bound to the Featom is placed about 3A away from the C on the next phenyl ring. This factmay indicate the presence of an intra chain hydrogen bonding. In fact C-H—-O hydrogen bonding is known to manifest itself in gas, liquid and solidphase [317]. The strength of this bond is around 0.15 eV a value which couldcompete with the surface corrugation energy. The latter signals that intrachain hydrogen bonding may be activated upon annealing, as the position ofTMA molecules varies during the annealing due to thermal activated degreeof freedom.In conclusion annealing after an assembly process induces a reordering pro-cess presumably leading the assemblies to a thermodynamically stable con-figuration. This configuration may be affected by the presence of hydrogenbonding interaction which defines the final geometrical 2D arrangement of co-ordinative 1D structures. Unlike coordinative crystal engineering, adsorbate-substrate interaction plays a key role in determining the final arrangementof the synthesized nanostructures.
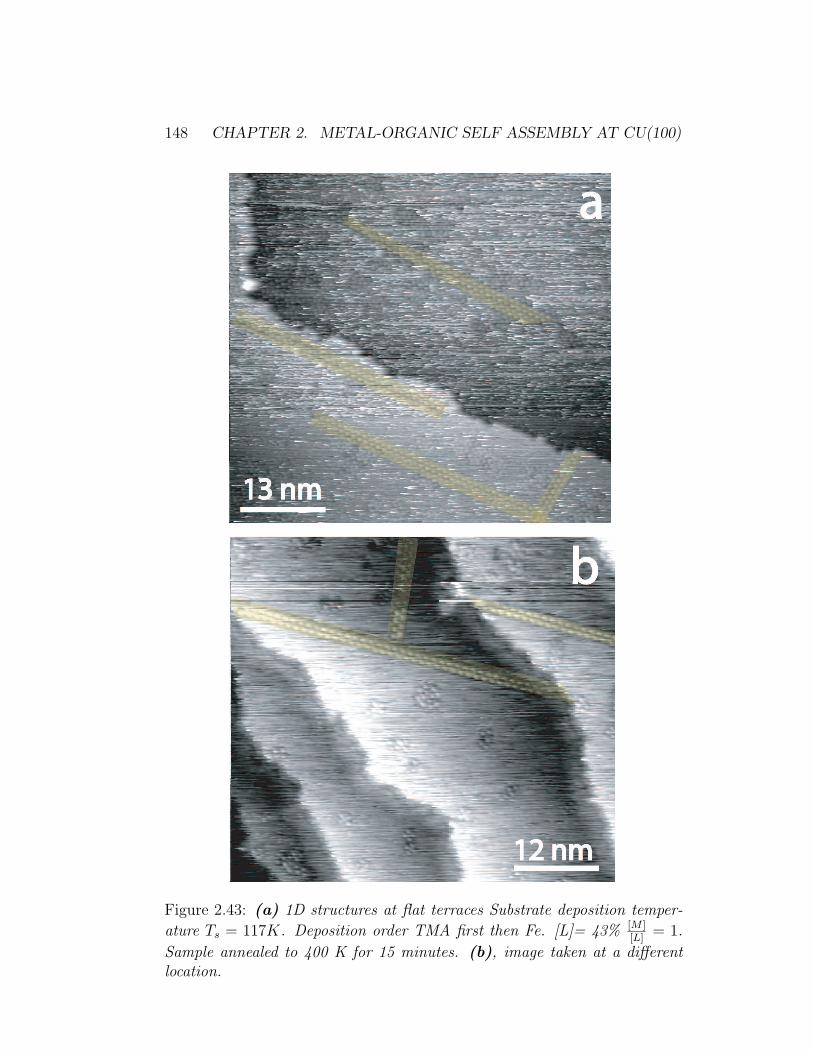
148 CHAPTER 2. METAL-ORGANIC SELF ASSEMBLY AT CU(100)
Figure 2.43: (a) 1D structures at flat terraces Substrate deposition temper-
ature Ts = 117K. Deposition order TMA first then Fe. [L]= 43% [M ][L]
= 1.
Sample annealed to 400 K for 15 minutes. (b), image taken at a differentlocation.
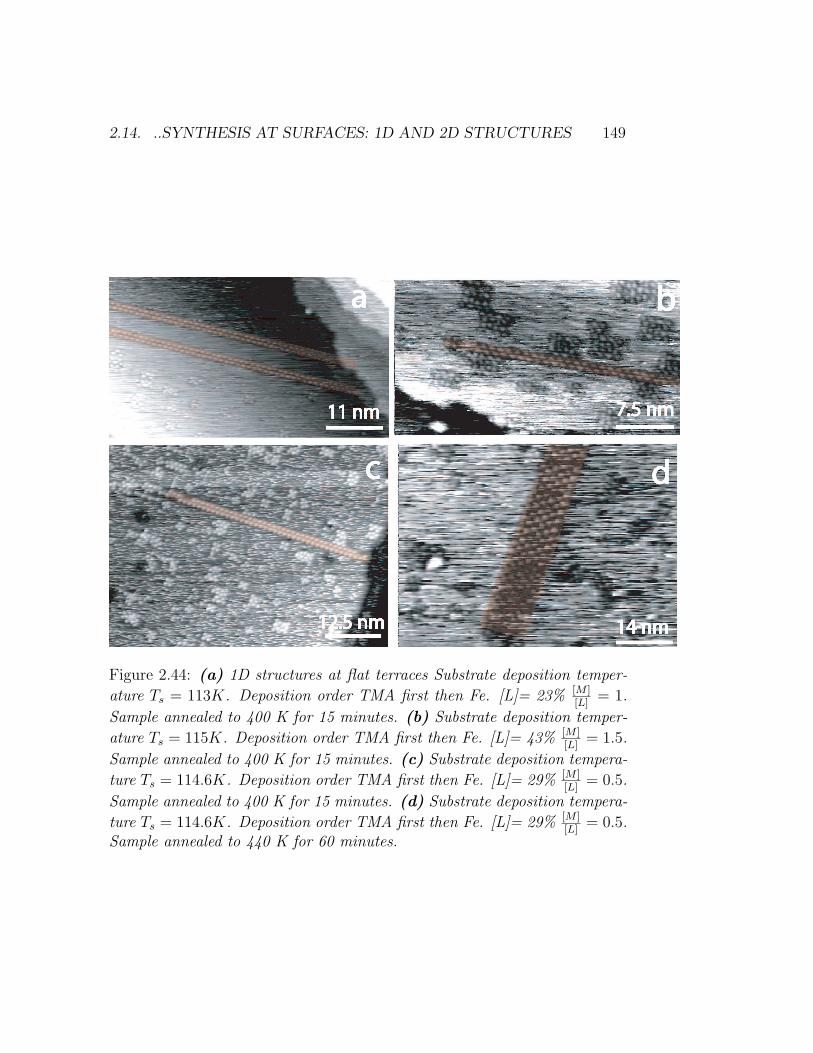
2.14. ..SYNTHESIS AT SURFACES: 1D AND 2D STRUCTURES 149
Figure 2.44: (a) 1D structures at flat terraces Substrate deposition temper-
ature Ts = 113K. Deposition order TMA first then Fe. [L]= 23% [M ][L]
= 1.
Sample annealed to 400 K for 15 minutes. (b) Substrate deposition temper-
ature Ts = 115K. Deposition order TMA first then Fe. [L]= 43% [M ][L]
= 1.5.
Sample annealed to 400 K for 15 minutes. (c) Substrate deposition tempera-
ture Ts = 114.6K. Deposition order TMA first then Fe. [L]= 29% [M ][L]
= 0.5.
Sample annealed to 400 K for 15 minutes. (d) Substrate deposition tempera-
ture Ts = 114.6K. Deposition order TMA first then Fe. [L]= 29% [M ][L]
= 0.5.Sample annealed to 440 K for 60 minutes.
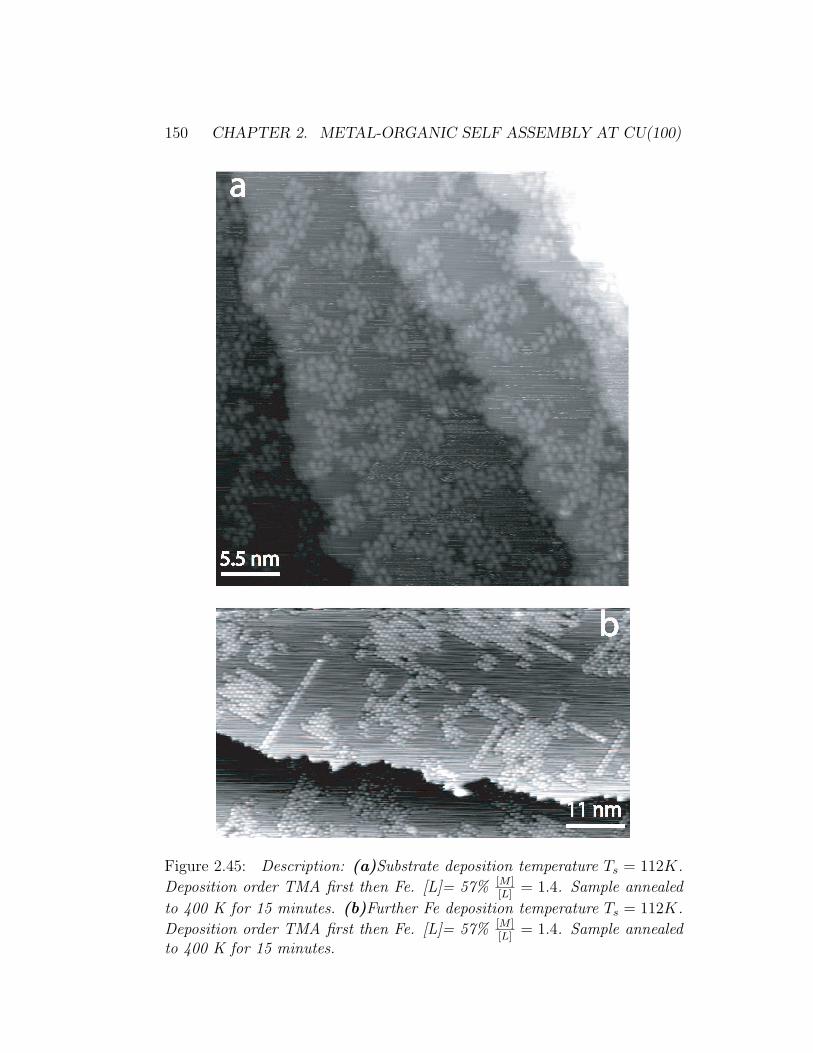
150 CHAPTER 2. METAL-ORGANIC SELF ASSEMBLY AT CU(100)
Figure 2.45: Description: (a)Substrate deposition temperature Ts = 112K.
Deposition order TMA first then Fe. [L]= 57% [M ][L]
= 1.4. Sample annealed
to 400 K for 15 minutes. (b)Further Fe deposition temperature Ts = 112K.
Deposition order TMA first then Fe. [L]= 57% [M ][L]
= 1.4. Sample annealedto 400 K for 15 minutes.
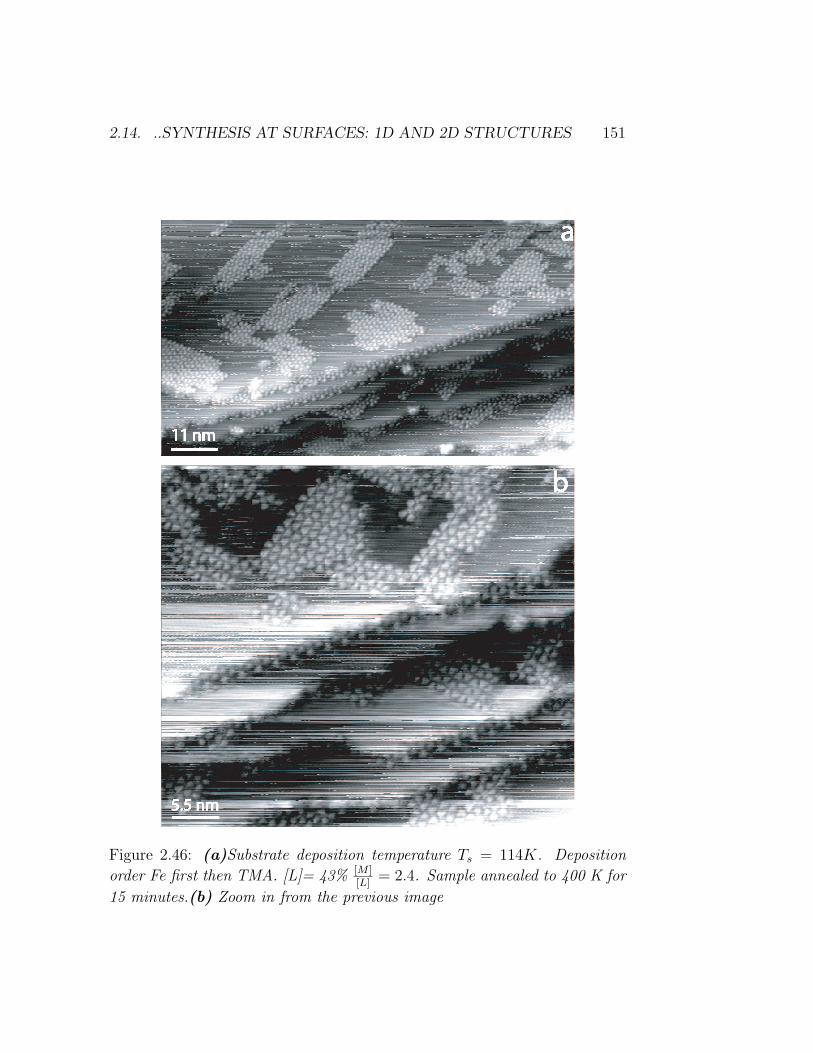
2.14. ..SYNTHESIS AT SURFACES: 1D AND 2D STRUCTURES 151
Figure 2.46: (a)Substrate deposition temperature Ts = 114K. Deposition
order Fe first then TMA. [L]= 43% [M ][L]
= 2.4. Sample annealed to 400 K for
15 minutes.(b) Zoom in from the previous image
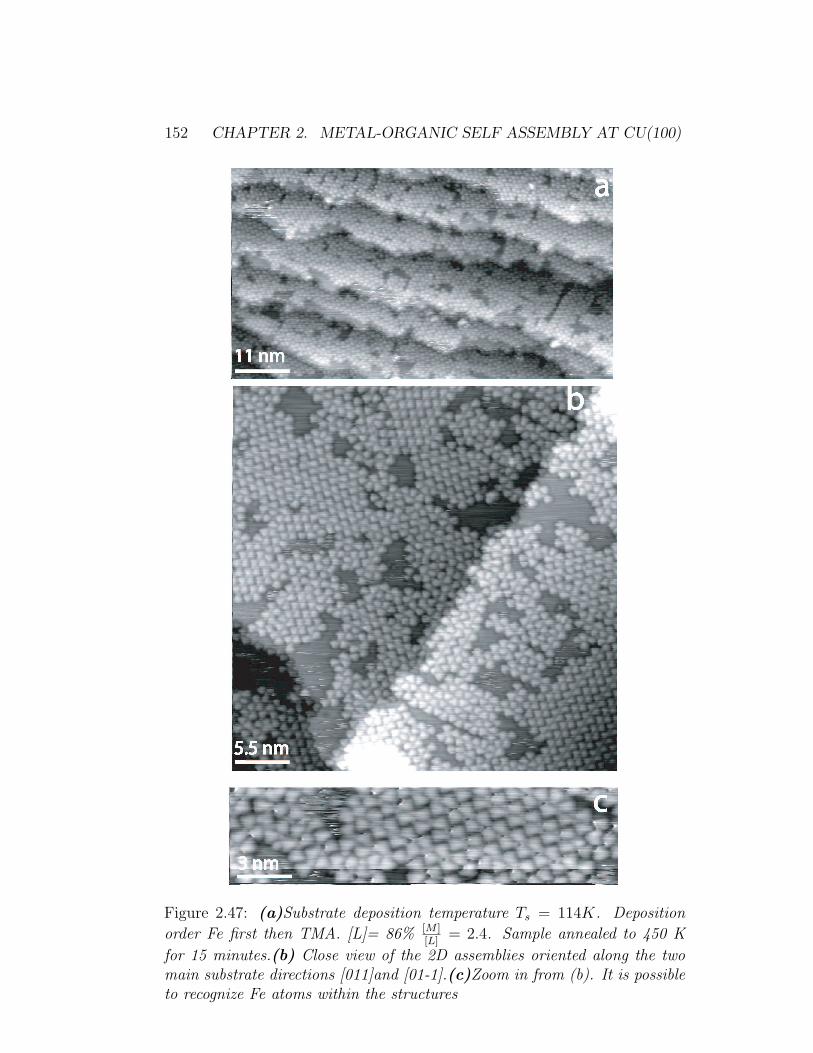
152 CHAPTER 2. METAL-ORGANIC SELF ASSEMBLY AT CU(100)
Figure 2.47: (a)Substrate deposition temperature Ts = 114K. Deposition
order Fe first then TMA. [L]= 86% [M ][L]
= 2.4. Sample annealed to 450 K
for 15 minutes.(b) Close view of the 2D assemblies oriented along the twomain substrate directions [011]and [01-1].(c)Zoom in from (b). It is possibleto recognize Fe atoms within the structures
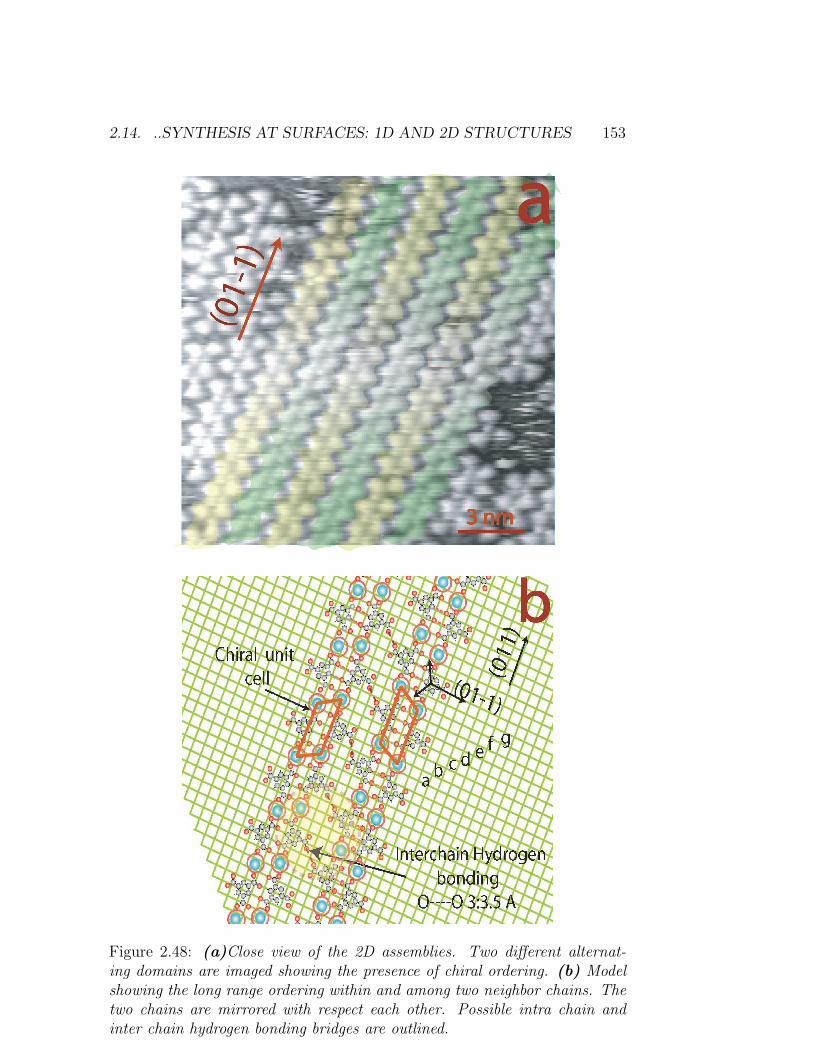
2.14. ..SYNTHESIS AT SURFACES: 1D AND 2D STRUCTURES 153
Figure 2.48: (a)Close view of the 2D assemblies. Two different alternat-ing domains are imaged showing the presence of chiral ordering. (b) Modelshowing the long range ordering within and among two neighbor chains. Thetwo chains are mirrored with respect each other. Possible intra chain andinter chain hydrogen bonding bridges are outlined.

Conclusions and Perspectives
It has been proved in this thesis that the coordinative interaction can beexploited directly on surfaces footnoteEven though the measurements havebeen carried out on Cu(100)only, this does not affect the generality of thestatement. In fact, Cu(100) has an appreciable corrugation. As weaker in-teractions have proven to be effective to build nanostructures on differentmetal surfaces, coordinative interaction can inherently be expected to dothe same.. Mononuclear complexes including one Fe atom and three or fourTMA molecules have been synthesized. These results are easily reproducible.Besides, polynuclear complexes including about 9 Fe atoms have been achievedtoo. In comparison with SMM this complexes account for Fe-Fe atomsbridged from the entire TMA molecules.1D and 2D organometallic structures have been reliably and reproduciblysynthesized too. In case of 1D assemblies, the internal structure accounts fora cell comprising 4 Fe atoms and 2 TMA molecule. 1D and 2D structuresare achieved only upon annealing. With higher and higher annealing tem-peratures more ordered structures evolve on the surface.I suggest to investigate further the structure of 1D chains by the use of LT-STM. Moreover, studies at low temperature can easily elucidate whether the”phantom” Fe[TMA]3 complexes are an intermediate stage of reaction onthe road towards Fe[TMA]4 formation.Even though the structural arrangement of the 2D assemblies differs frommetal monolayers, where atomic magnetic orbitals overlap, it is suggestedto check the magnetism of the assemblies built. In fact, as in the case ofCo 1D chains studied by Gambardella [128], the local anisotropy, due to thepresence of the surface atoms and the ligands, may lead to some form ofmagnetic ordering. Besides, the combined presence of a molecule and thesurface linking two Fe atoms may result in a form of magnetic coupling. Forthese reasons I envisage XMCD measurements to elucidate the points out-lined before.As far as the understanding of the chemistry underneath the synthesis oforganometallic species on surfaces is concerned, I suggest to study different
155
coordinative groups such as −SH, −OH or −CN . Possibly electron attrac-tor ligands are better suited than electron donor ligands to link a metal atomdeposited on a surface. In fact, prior to interaction with the surface the atomis in its 0 oxidation state, therefore it does not have a strong attitude to ac-cept a retrodonation from the ligand.It is also important to check the effect of the metal electronic structure onthe number of ligands that attach to it. In this case I suggest to use atomslike Ni or Pd that fall in between Fe and Cu in the periodic table, withoutchanging the ligand.The real magnitude of the adsorbate-adsorbate interaction can be inferredonly if different surfaces are reliably tested. I envisage therefore the study ofthe reaction between Fe and TMA on different surfaces.As for the tuning of the magnetic interaction among metal atoms within thesynthesized structure, I would also try to use a ligand which is known to giverise to magnetic coupling between the metals it bridges.Finally it has to be stated that, in order to further pursue a research projecton surface magneto chemistry a different type of instrumentation is stronglyon demand. I inherently sketch the major features that the appropriateinstrumentation should have. Deposition of several types of atoms andmolecules should be accomplished at the same time possibly in scanningconditions. UV radiation should be available at the reaction site, such totrigger the reaction itself. Also a magnetic field of appreciable magnitude (1T) should be available at the reaction site17. The possibility to perform IRspectroscopy on the reaction site, is absolutely necessary in order to assess in-disputably the nature of the different chemical bonds within the assemblies.ESR spectroscopy may be arranged in a position other than the scanningposition. STM tip fast scanning is highly requested in order to follow thedeposition process. The construction of a VT STM allowing all these opera-tions is certainly a difficult task, though not prohibitive.It is anyway a challenge that must be accepted if a real systematic study of”spatial constraint magneto chemistry ” has to be carried out.
17This is possibly most difficult piece of equipment to incorporate in the set up described
Outlook
Chemical Atomic Manipulation
Two methods have been used so far to position atoms on surfaces[147]. Thefirst one is lateral manipulation of atoms. In this method the tip of an STMmicroscope is positioned close to the adsorbate. Increasing the tunnellingcurrent and opening the feedback loop enables the tip to come to a smalldistance from the adsorbates. Wander Walls interactions between the tipand the adsorbate become comparable to the migration energy of adsorbateson metal surface. The latter enables the adsorbate to follow the tip Movingon the surface. The second Method is vertical manipulation. In this methoda voltage pulse is applied to the adsorbate keeping the feedback loop open.The resulting polarization of the adsorbate leads it to jump. This is possiblebecause the attraction between Tip and adsorbate has a size comparable withthe desorption energy. Here we introduce the concept of chemical manipula-tion e.g. we use chemical interaction to position atoms at metal surfaces andbuild nanostructures of nanometer size. This concept is known in 3D chem-istry [316] and consists of different organic ligands and different coordinativemodes used to position metal atoms on a three dimensional lattice. Chem-ical atomic manipulation can tune the electronic state of the metal atomas well as the interaction between two or more atoms. On metal surfacesthere are three major parameters18 controlling the final result of chemicalatomic manipulation: 1) The ratio between the concentration of the metalatom concentration [M] and ligand concentration [L]. 2) The strength of theinteraction between metal and surface M-S compared with the strength ofthe interaction between metal and ligand M-L. 3) The shape of the organicmolecule and the number of ligands that it can allocate. In this work we fixthe last two parameters and we explore the range of nanostructures formedon the surface by varying the ratio [M]/[L]. On a different value scale of thisratio we find that some species are predominate compared with others. It has
18The relative deposition time between metal and ligands may also reveal to be a relevantparameter
157
to be mentioned that this form of manipulation takes place at room temper-ature, even though for this experiment deposition of adsorbates was carriedat 100 K. So far there is only one mechanism which has been shown to beable of atomic manipulation at room temperature. The inelastic scatteringof the tunnelling current can result in a vibrational excitation of adsorbatesinducing a lateral motion [319]. This mechanism has been successful in mov-ing Br atoms on Cu(100) surfaces for a few A. However the concept we showhere is that Chemical atomic manipulation is able to achieve the formationof nanostructures at room temperature even though the motion of a singleatom is not directly under control.
Manipulation of the spin of the central atom
We find complexes of Fe and 4 molecules of TMA[43]. These complexes areimaged as stars with a bump in the middle. We have developed a modelfor the structure of the observed complexes. The model consists of a lig-and metal atom distance of about 2A which is typical for iron carboxylate.Carboxylate group is known to link metal atoms in two different configura-tions: monodentate, e.g., one single oxygen bounding; bidentate, e.g., twooxygens bonding the metal atom. In the 4 member complexes all the fourcarboxylate group bind the metal atom in a monodentate configuration. Themaximum concentration of four member complexes is found at [M]/[L] = 1
4.
We find 3 member complexes at step edges. They are bound to kinks. Thedifferent number of ligands attached to the metal atom offers the possibilityto tune the spin state of the central atom. Due to the planar ligands the dorbital energy levels within the metal atoms may be modified. The changesmanifest themselves, regardless of the effect of the surfaces on the absoluteactual electronic configuration of the metal atom[239]. In a four ligand con-figuration, the central atom will experience a crystal field which will pushthe dx2−y2 orbital up. In a three member complex with bidentate bond theangle between two ligands is reduced and the distance is increased to 3A.The former will result in a low energy of dx2−y2 and in a enhanced energy ofthe dxy orbitals. Therefore moving from monodentate 4 member complexesto 3 member complexes the relative energy difference of atomic levels change.This will affect the spin state of the central atom and different configurationwill be possible: S = 0, 1
2, 1. The coupling between a magnetic atom and
conduction electrons is known to generate a many body state. This statemanifests itself in an increase of the resistance at low temperature and in apeak of the conductance at zero bias. This effect has been recently observedon a single metal complex linked to two leads through thiol bonding [320].
This experiment has shown that a single organometallic complex is suited tostudy the interaction through spin impurity and conduction electrons. Theinteraction between a magnetic impurity and the bulk electron at the surfaceis a phenomenon that has been elucidated in the last years.We have evidences that the strength of the Fe TMA bond is with respect toadsorbate-substrate interaction in parallel to other cases studied [166]. Thislets envisage the possibility to form complexes like this at different surfacesi.e nobel metal close packed surfaces showing surface states. We have alsoindirect evidences that the metal surface separation is enhanced at least forthe three member complexes [166]. We could therefore use the range of dif-ferent complexes to probe the spin dependence of the Kondo effect. Furtherby tuning the crystal field splitting through ligand interaction we may probethe dependence of the Kondo feature in degenerate spin state under appli-cation of magnetic field [321]. Finally, the presence of the ligands offers thepossibility to tune the portion of surface angle that the metal atom offersto surface electrons for the scattering. The presence of four or three ligandswould give rise to different impinging angle for the surface electrons. Thepresence of three member complexes of different Y shape give a further degreeof freedom in tuning the angle offered by the metal for the scattering process.The application of this concept to Kondo effect may lead to a new scatteringscenario that may not be ascribable to an s wave scattering phenomenon.

160 CHAPTER 2. METAL-ORGANIC SELF ASSEMBLY AT CU(100)
Bibliography
[1] H.C.Manoharan. Spin spotting. Nature, 416:24, 2002.
[2] S.A Wolf and D.D. Awschalom et Al. Spintronics: A spin-based elec-tronics vision for the future. Science, 294:1488, 2001.
[3] D.Orgassa, G.J.Mankey, and H.Fujiwara. Spin inhection into carbonnanotubes and posossible application in spin-resolved scanning tun-nelling microscopy. Nanotechnology, 12:281, 2001.
[4] S.Heinze M.Bode et al. Science, 288:1805.
[5] R. Wiesendanger and M. Bode. Nano- and atomic-scale magnetismstudied by spin-polarized scanning tunneling microscopy and spec-troscopy. Sol.Stat.Com., 119:341, 2001.
[6] Haiqiang, Et., and Al. Atomic-scale spin-polarized scanning tunnelingmicroscopy applied to Mn3N2 010. Phy.Rev.Lett., 89:226101–2, 2002.
[7] TP. Pareek and P. Bruno. Magnetic scanning tunneling mi-croscopy with a two-terminal nonmagnetic tip: Quantitative results.Phy.Rev.B., 63:165424, 2001.
[8] D. Feinberg and G. Deutscher. Using a hybrid superconducting-ferromagnetic tip as a magnetic scanning tunneling microscope. Phys-ica E, 15:88, 2002.
[9] O.Naaman, W Teizer, and R.C.Dynes. Fluctuation dominated joseph-son tunnelling with a scanning tunnelling microscope. Phy.rev.Lett,87:2001.
[10] O.Naaman, W.Teizer, and R.C. Dynes. The fabrication of reproduciblesuperconducting scanning tunnelling microscope tips. Rev.Sci.Inst.,72:1688, 2001.
161
162 BIBLIOGRAPHY
[11] S.H.Pan, E.W.Hudson, , and J .C.Davis. Vacuum tunnelling of super-conducting quasi particles from atomically sharp scanning tunnellingmicroscope tips. App.Phy.Lett, 73:2992, 1998.
[12] M.Xu, Y.Takano, T.Hatano, M.Kitahara, and D.Fujita. MgB2 super-conducting tips for scanning tunnelling microscopy study. J.Supercond.,15:303, 2002.
[13] R.J.Soulen and et al. Science, 282:85, 1998.
[14] Ali Yazdani, * B. A. Jones, C. P. Lutz, M. F. Crommie, and D. M.Eigler. Probing the local effects of magnetic impurities on supercon-ductivity. Science, 275:1767, 1997.
[15] J.Smakov, I.Martin, and V.Balatsky. Scanning tunnelling microscopymeasuraments of single spin relaxation time in superconductors.ArXiv:cond-mat, April, 2001.
[16] D.Rugar, C.S.Yannoni, and J.A.Sidles. Nature. Nature, 360:563, 1992.
[17] Y.Manassen and R.J. Hamers et al. Direct observation of the pre-cession of individual paramagnetic soins on oxidazed silicon surfaces.Phy.Rev.lett, 62:2531, 1989.
[18] A.V.Balatsky, Y.Manassen, and R.Salem. Phy.Rev.B., 66:195416–1,2002.
[19] Y.Manassen, I.Mukhopadhyay, , and Ramesh Rao. Esr stm on ironatoms in silicon. Phy.Rev.B, 61:16223, 2000.
[20] C.Durkan and M.E.Welland. Electronic spin detection in moleculesusing scanning-tunneling-microscopy-assisted electron-spin resonance.Appl.Phys.Lett. Vol 80 and 2002.
[21] P.M.Lahti. Magnetic Properties of Organic Materials. Dekker, 1999.
[22] J.Veciana. Pi Greca Electron Magnetism from Molecules to MagneticMaterials. Springer, Berlin, 2001.
[23] J.Veciana H Iwamura. Organic magnets. MRS Bulletin, November2000.
[24] R.Sessoli, D.Gatteschi, A.Caneschi, and M.A. Novack. Nature, 365:141,1993.
BIBLIOGRAPHY 163
[25] G.Christou D. Gatteschi et al. Single molecule magnets. MRS Bulletin,November:66, 2000.
[26] A.Caneschi, D.Gatteschi, N. Lalioti, and et Al. Cobalt(II)-nitronylnitroxide chains as molecular magnetic nanowires. Ang.Chem.Int. Ed,40:1760, 2001.
[27] W.Wernsdorfer and R.Sessoli. Quantum phase interference and parityeffects in magnetic molecular clusters. Science, 284:5411, 1997.
[28] H.Schinohara. Endohedral metallofullerenes. Rep.Prog.Phys., 63:843,2000.
[29] E.Dietel, A.Hirsch, B.Pietzak, M.Waiblinger, K.Lips, et, and Al. J.Am. Chem. Soc., 121:2432, 1999.
[30] Wolfgang Harneit. A fullerene based electron spin quantum computer.Phy.Rev.A, 65:032322, 2002.
[31] M.Waiblinger, K.Lips, W.Harneit, and A Weidinger. Thermal sta-bility of the endohedral fullerenes N@C60 , N@C70 , and [email protected]., 64:159901, 2001.
[32] B.E. Kane. A silicon based nuclear spin quantum computer. Nature,393:133, 1998.
[33] D. Loss and D.P.Devincenzo. Quantum computation with quantumdots. Phy.Rev.A, 57:120, 1998.
[34] G.P.Berman, G.W.Brown, M.E.Hawley, and V.ITsifrinivich. Solid-state quantum computer based on scanning tunnelling microscopy.Phy.Rev.Lett., 87:097902–1, 2001.
[35] C.Joachim. Bonding more atoms together for a single molecule com-puter. Nanotechnology, 13:R1, 2002.
[36] J.M.Lehn. Towards self-organization and complex matter. Science,295:2400, 2002.
[37] R.F.Service. Molecules get wired. Science, 294:2442, 2001.
[38] R.F.Service. Assembling nanocircuits from the bottom up. Science,293:782, 2002.
[39] P.J.Stang and B.Olenyuk. Self-assembly and symmetry and and molec-ular architecture. Acc.Chem.Res., 30:502, 1997.
164 BIBLIOGRAPHY
[40] J. Weckesser, A. De Vita, J.V. Barth, C. Cai, and K. Kern. Mesoscopiccorrelation of supramolecular chirality in one-dimensional hydrogen-bonded assemblies. Phy.Rev.Lett., 87:096101–1, 2001.
[41] A.Dimitriev, N.Lin, J.Weckesser, J.V.Barth, and K.Kern. Supramolec-ular assemblies of trimesic acid on a cu(100) surface. J.Phy.Chem.B106, 6907, 2002.
[42] N.Lin, A.Dimitriev, J.Weckesser, J.V.Barth, and K.Kern. Real-timesingle-molecule imaging of the formation and dynamics of coordinationcompounds. Ang.Chem.Int.Ed., 2002.
[43] P.Messina, A.Dimitriev, N.Lin, H.Spillmann, M.Abel, J.V.Barth,and K.Kern. Single-molecule level observation of chirality gener-ation of metal-organic complexes by achiral molecules on surfaces.J.Am.Chem.Soc. 124 (47): 14000 2002.
[44] S.De.Franceschi and L.Kouwenhoven. Electronics and the single atom.Nature, 417:701, 2002.
[45] W.Liang, et, and Al. Kondo resonance in a single molecule transistor.Nature, 417:725, 2002.
[46] Jiwoong Park, 1, 2, 3 Abhay N. Pasupathy, 1, and 3 Jonas I. Goldsmith.Coulomb blockade and the kondo effect in single-atom transistors. Na-ture, 417:722, 2002.
[47] G.Binnig, H.Rohrer, C.Gerber, and E.Weibel. Phy.Rev.Lett., 49:57,1982.
[48] C.Bai. Scanning Tunnelling Microscopy and its Applications. Springer,2001.
[49] E.K.Schweizer and D.M.Eigler. Nature, 344:524, 1990.
[50] B.Neu, G.Meyer, and K.Rieder. Appl.Phys.A., 60:343, 1995.
[51] Lukas Burgi. Scanning Tunnelling Microscopy as Local Probe of Elec-tron Density, Dynamics, and Transport at Metal Surfaces. PhD thesis,EPFL LAUSANNE, 1999.
[52] O.Pietzsch, A.Kubetzaka, and D.Haude et al. A low temperaturevac-uum scanning tunnelling microscope with a split coil magnet and arotary motion step.. Rev.Sci.Inst., 71:434, 2000.
BIBLIOGRAPHY 165
[53] S.H.Pan, E.W.Hudson, and J.C.Davis. He3 refrigerator based verylow temperature scanning tunneling microscope. Rev.Sci.Ins., 70:1459,1999.
[54] M.Kugler, Ch.Renner, and O.Fischer. A he3 refrigerated scanningtunneling microscope in high magnetic fields and ultrahigh vacuum.Rev.Sci.Ins., 71:1474, 2000.
[55] A.J.Heinrich, C.P.Lutz, J.A.Gupta, and D.M.Eigler. Molecule cas-cades. Science, 298:1381, 2002.
[56] M.Okano, K.Kajimura, S.Wakiyama, Fsakai, W.Mizutani, and M.Ono.J.Vac.Sci.Technol.A, 5:3313, 1987.
[57] Andreas Hirstain. Low Temperature Scanning Tunnelling Microscopyand Spectroscopy in Ultra UHV and High Magnetic Fields. 1998.
[58] J.F.OHanlon. A Users Guide to Vacuum Technology Second Edition.Wiley, 1989.
[59] Kurt.W.Kolasinski. Surface Science : Foundation of Catalysis andNanoscience. Wiley, 2002.
[60] E Gemilin et al. Thermal boundary resistance of mechanical contacts....J.Phy.D, 32:19, 1999.
[61] R.C. Richardson E.N. Smith. Experimental Techniques in CondensedMatter Physics at Low Temperatures. 1988.
[62] F.Barron. Cryogenic Heat Transfer. Taylor francis, US, 1999.
[63] P.J. Meeson G.K.White. Experimental Techniques in Low TemperaturePhysics. Oxford, 2002.
[64] G.Mariotto, M.DAngelo, , and I.V. Shvets. Dynamic behaviour ofa piezowolker and inertial and frictional configuration. Rev.Sci.Inst.,70:3651, 1999.
[65] E.O.Doebelin. Measurement Systems. McGraw Hill, US, 1990.
[66] J.A.Blakburn. Modern Instrumentation for Scientists and Engineers.Springer, 2001.
[67] J.Fraden. Handbook of Modern Sensors. AIP Press, 1997.
[68] Bend Seeber. Handbook of applied superconductivity. 1, 1998.
166 BIBLIOGRAPHY
[69] Nicholas Howard Balshaw. Practical Cryogenics - An Introduction toLaboratory Cryogenics.
[70] G.Walker E.R.Bingham. Low Capacity Cryogenic Refrigeration. Ox-ford, 1994.
[71] M.J.Yang J.B.Dottellis T.H.Chang, C.H.Yang. Cryogenic scanningtunnelling microscope for quantum dot spectroscopy. Rew.Sci.Ins.,72:2989, 2001.
[72] J.W.Lyding E.T.Foley, A.F.Kam. Cryogenic variable temperature ul-trahigh vacuum scanning tunnelling microscope. Rew.Sci.Ins., 71:3428,2000.
[73] T.Amakusa N.Shibata S.Chiba M.Iawatsuki H.Tokumoto Y.Kondo,E.T.Foley. Development of an ultrahigh vacuum scanning tunnellingmicroscope cooled by superfluid he4. Rew.Sci.Ins., 72:2977, 2001.
[74] H.S.Carslaw and J.C.Jeager. Conduction of Heat in Solids. Oxford,1959.
[75] B.Z.Maytal. Performance of ideal flow regulated regulated cryocooler.Cryogenics, 34:723, 1994.
[76] R.Barron. Cryogenic Systems. McGraw Hill, 1972.
[77] Kraus et al. Enthalpy-pressure diagram of he3 in the range... Cryo-genics, page 29, 1974.
[78] W.R.Wilkes. A 200 mW recirculating he3 refrigerator. Cryogenics,page 180, 1972.
[79] P.W.Aktins. Chemical Physics. Oxford University Press, 1989.
[80] E.N.Smith R.C.Richardson, editor. Experimental techniques in Con-densed Matter Physics at Low Temperatures. Addison Wesley, 1988.
[81] R.M.Gibbons and C.Mckidney. Preliminary Thermodynamic Proper-ties of Helium-3 Between 1 and 100. 1974.
[82] G.S.Sydoriak and T.R.Roberts. Thermodynamic properties of liquidhelium three: Vapor pressure below 1k. Phy.Rev., 106:175, 1957.
[83] H.W.Jackson. Phy.Rev.B., 26:66, 1982.
[84] H.W.Jackson. Phy.Rev.B., 28:1286, 1983.
BIBLIOGRAPHY 167
[85] J.G.M.Kuerten, C.A.M.Canstelijns, A.T.AA.M.Waele, andH.M.Gijsman. Cryogenics, 25:419, 1985.
[86] D.S.Betts. Cryogenics, Junuary:3, 1976.
[87] F.C.Chou, C.F.Pai, S.B.Chien, and J.S.Chen. Cryogenics, 35:311,1995.
[88] B.Z.Maytal. Cryogenics, 35:69, 1995.
[89] B.Z.Maytal and A.Shavit. Cryogenics, 37:33, 1997.
[90] B.Z.Maytal. Cryogenics, 36:271, 1996.
[91] S.B.Chien, L.T.Chen, and F.C.Chou. A study on the trensient char-acteristics of a self-regulating joule-thompson cryocooler. Cryogenics,36:979, 1996.
[92] F.M. Asner. High Field Superconducting Magnets. Oxford, 1999.
[93] Horowitz&Hill. The Art of Electronics. Canbridge, 1999.
[94] National instruments white papers on GPIB systems. 2001.
[95] R.F.Willis D.Jeon. Feedback system response in a scanning tunnellingmicroscope. Rev.Sci.Instr., 62:1650, 1991.
[96] G.W.Stupian B.A.Morgan. Digital feedback control loops for scanningtunnelling microscopes. Rev.Sci.Inst., 62:3112, 1991.
[97] O.V.Obyedkov V.Rostislav, L.Obyedkov. Fast acting piezoactua-tor and digital feedback loop for scanning tunnelling microscopes.Rev.Sci.Instr., 64:2883, 1993.
[98] Perkinelmer white papers on lockin amplifiers. 2001.
[99] T.Matsui, H.Kambara, and H.Fukuyama. Development of a new ULTscanning tunnelling microscope. J.Low.Temp.Phy., 121:803, 2000.
[100] G.Nunes. Scanned probe microscopy at millikelvin temperatures. Phys-ica B, 280:546, 2000.
[101] O.Tegus, E.Bruck, K.H.J.Buschow, F.R., de, and Boer. Transition-metal-based magnetic refrigerants for room-temperature applications.Nature. 415 and 150 2002.
168 BIBLIOGRAPHY
[102] EW. Hudson, SH. Pan, AK. Gupta, and JC. Davis. Atomic-scale quasi-particle scattering resonances in Bi2Sr2CaCu2O8+delta. Science, 285(5424): 88 1999.
[103] SH. Pan, EW. Hudson, KM. Lang, H. Eisaki, S. Uchida, and JC. Davis.Imaging the effects of individual zinc impurity atoms on superconduc-tivity in Bi2Sr2CaCu2O8+delta. Nature, 403 (6771): 746 2000.
[104] E.W. Hudson, K.M. Lang, V. Madhavan, S.H. Pan, H. Eisaki,S. Uchida, and J.C. Davis. Interplay of magnetism andhigh-tc superconductivity at individual ni impurity atoms inBi2Sr2CaCu2O8+delta. Nature, 411 (6840): 920; 2001.
[105] J.E.Hoffman, E.W.Hudson, K.M.Lang, V.Madhavan, S.UchidaH.Eisaki, , and J.C.Davis. A four unit cell periodic pattern of quasi-particle states surrounding vortex cores in Bi2Sr2CaCu2O8+. Science,2002 295: 466.
[106] K.M.Lang, V.Madhavan, J.E.Hoffman, E.W.Hudson, S.UchidaH.Eisaki, and J.C.Davis. Imaging the granular structure of high-tcsuperconductivity in underdoped Bi2Sr2CaCu2O8+. Nature, 415 and412 2002).
[107] H. C. Manoharan, C. P. Lutz, and D. M. Eigler. Quantum miragesformed by coherent projection of electronic structure. Nature, 403:512,2000.
[108] P.S.Weiss and D.M.Eigler. Nanosoruces and manipulation of atoms .....In V.T.Binh, N.Garcia, and K.Dransfeld, editors, NATO ASI Series,page 213. Plenum, 1993.
[109] H.P.Rust, M.Doering, and J.I.Pascual et Al. Temperature controlof a liquid helium cooled eigler-style scanning tunneling microscope.Rev.Sci.Inst., 72:4393, 2001.
[110] D.Gatteschi and L.Pardi. High Frequency EPR Spectroscopy. Springer,2002.
[111] J.E.Wertz and J.R.Bolton. Electron Spin Resonance: Elementary The-ory and Practical Applications. Mc graw Hill, 1972.
[112] Stefan Grafstrom. Photoassisted scanning tunneling microscopy.J.Appl.Phy.Lett. 91 2002 , Ipp. 1717-1753.
BIBLIOGRAPHY 169
[113] M.Cyrot and D.Pavuna. Introduction to Suerconductivity and High TcMaterials. World Scientific, 1992.
[114] J.Smakov, I.Martin, and V.Balatsky. Josephson scanning tunnellingmicroscopy. Phy.Rev.B, 21:6421, 2001.
[115] K.Mullen et Al. I-v characteristics of coupled ultrasmall capacitancenormal tunnel juctions. Phy.Rev.B, 37:98, 1988.
[116] K.Mullen et al. Charging effects in coupled sc tunnel junctions andtheir implications for tunnelling measuraments... Phy.Rev.B, 38:5150,1988.
[117] K.Mullen et Al. Combined effect of zener and quasiparticle transi-tions on the dynamics of mesoscopic josephson juctions. Phy.rev.Lett.,60:1097, 1988.
[118] A.Steinbach and P.Yoyez et al. Direct measurament of the josephsonsuper current in ultra small josephson junction. Phy.rev.Lett, 87, 2001.
[119] R.S.Gonnelli, A.Calzolari, D.Daghero, G.A.Ummarino, V.A.Stepanov,G.Giunchi, S.Ceresara, and G.Ripamonti. Josephson effect in MgB2break junctions. Phy.Rev.Lett., page 8709 (9): 2001.
[120] ZZ.Li, Y.Xuan, H.J.Tao, Z.A.Ren, G.C.Che, B.R.Zhao, and Z.X.Zhao.Josephson effects in MgB2/Nb point-contacts. Superc.Sci.Tech., 14(11): 944 2001.
[121] P. C. Canfield, D. K. Finnemore, S. L. Bud’ko, J. E. Ostenson,G. Lapertot, C. E. Cunningham, , and C. Petrovic. Superconduc-tivity in dense MgB2 wires. Physical Review Letters, Physical ReviewLetters, March 12 and 2001.
[122] Y.Y.Wu, B.Messer, and P.D.Yang. Superconducting MgB2 nanowires.Adv.Mater., 13 (19):1487, 2001.
[123] A.Darlinsky and J.Halbritter. On angle resolved x-ray photoelectronspectroscopy of oxides and serrations and and protrusion at interfaces.J.Vac.Sci., 5 (4): 1235 1987.
[124] A.Darlinski and J.Halbritter. Angle resolved xps studies of oxides atnbn and nbc and nb surfaces. Sur.Interf.Analys., 10:223, 1987.
170 BIBLIOGRAPHY
[125] L.I.Johansson and H.I.P.Johansson. Core level study of NbC(100) andNbN(100) and. Core level study of NbC(100) and NbN(100) and, 801996, 237.
[126] G.Karapetrov, M.Iavarone, W.K.Kwok, G.W.Crabtree, andD.G.Hinks. Scanning tunneling spectroscopy in MgB2. Phy.Rev.Lett.,2001, 86, pp. 4374.
[127] B.G.Rubio, H.Suderow, and S.Vieira. Tunneling spectroscopy in smallgrains of superconducting MgB2. Phy.Rev.Lett., 86 (24): 5582 2001.
[128] P.Gambardella, A.Dallmeyer, K.Maiti, M.C.Malagoli, W.Eberhardt,K.Kern, and C.Carbone. Ferromagnetism in one-dimensionalmonatomic metal chains. Nature 416, 301 (2002).
[129] K. Kikuchi, 1 H. Imamura, 2 S. Takahashi, 1, and S. Maekawa1.Conductance quantization and andreev reflection in narrow ferromag-net/superconductor point contacts. Phys. Rev. B 65 and 020508(R)(2002).
[130] Yu Zhu, Qing-Feng Sun, , and Tsung-Han Lin. Andreev reflectionthrough a quantum dot coupled with two ferromagnets and a super-conductor. Phys. Rev. B 65 and 024516 (2002).
[131] V. V. Ryazanov, V. A. Oboznov, A. V. Veretennikov, , andA. Yu. Rusanov. Intrinsically frustrated superconducting array ofsuperconductor-ferromagnet-superconductor junctions. Physical Re-view B, 65 and 020501 (2002).
[132] R. E. S. Otadoy and A. Lodder. Andreev bound states and self-consistent gap functions in clean layered superconductor/normal metalsystems with finite transverse width. Physical Review B, 65 and 024521(2002).
[133]
[134] G.E.Blonder. Transition from metallic to tunnelling regimes in super-conducting microconstrictions:. Phy.Rev.B, 25:4515, 7.
[135] G.J.Strijkers, Y.Ji, F.Y.Yang, C.L.Chien, and J.M.Byers. Andreevreflections at metalTsuperconductor point contacts: Measurement andanalysis. Phy.Rev.B., 63:104510, 2001.
[136] C. Buzea and T. Yamashita. Review of the superconducting propertiesof MgB2. Super.Sci.Tech., 14 (11): R115 2001.
BIBLIOGRAPHY 171
[137] Reinert E, Nicolay G, Eltner B, Ehm D, Schmidt S, Hufner S, Probst U,and Bucher E. Observation of a BCS spectral function in a conventionalsuperconductor by photoelectron spectroscopy. Phy.rev.Lett., 85 : 39302000.
[138] Reinert F, Nicolay G, Hufner S, Probst U, and Bucher E. Investiga-tion of the BCS density of states on a conventional superconductor byhigh-resolution photoelectron spectroscopy. J.Elec.Spectr., 114: 615-622 2001.
[139] T. Takeuki and K. Inoue. V3SI multifilamentary superconductor pro-duced by a modified bronze process. J.Appl.Phys., 74 (10): 6454 1993.
[140] K. E. Kihlstrom. Tunneling alpha 2f( omega ) as a function of compo-sition in a15 v-si. Phys. Rev. B, 32 and 28912894 (1985).
[141] J. Kwo and T. H. Geballe*. Superconducting tunneling into the a15Nb3Al thin films. Phys. Rev. B, 23 and 32303239 (1981).
[142] J Muller. A15-type superconductors. Rep.Prog.Phys., 43 (May 1980)641-687.
[143] Corrignan A, Hamard C, and Pena O. Superconducting properties ofsolid solutions (Mo6Se8)Pb-x and PbxMo6Se8 in the ternary systempb-mo-se. J.Alloy.Comp., 289 (1-2): 260 1999.
[144] H. Suderow, E. Bascones, A. Izquierdo, F. Guinea, , and S. Vieira.Proximity effect and strong-coupling superconductivity in nanostruc-tures built with an STM. Physical Review B 65, 100519 (2002) (4pages).
[145] P.G. de Gennes. Superconductivity of Metals and Alloys.W.A.Benjamin, New York, 1966.
[146] M.Tinkham. Introduction to Superconductivity. R.E. Krieger Publish-ing Company, Malabar, 1980.
[147] S.Gauthier. Atomic and molecular manipulation of individual adsor-bates by STM. App.Surf.Sci., 164:84, 2000.
[148] A.Bencini and D.Gatteschi. EPR of Exchange Coupled Systems.Springer, 1990.
[149] A.Abragam B.Bleaney. Electron Paramagnetic Resonance of TransitionIons. Orford, 1970.
172 BIBLIOGRAPHY
[150] Srephen Blundell. Magnetism in Condensed Matter. Oxford, 2002.
[151] A.Caneschi et Al. J.Mag.Magn.Mat., 200:182, 1999.
[152] Y Manassen. Real time response and phase sensitive detection.....J.Mag.Res, 126:133, 1997.
[153] D.Sachal and Y.Manassen. Spin-orbit coupling mechanism for scanningtunneling microscopy observation of individual paramagnetic spins.Phy.Rev.B.comm, 44:11528, 1991.
[154] D.Shachal and Y.Manessen. Mechana2ism of electron-spin resonancestudied with use of scanning tunneling microscopy. Phy.Rev.B, 46:4795,1992.
[155] S.N.Molotkov. On the theory of the tunneling current modulation atthe larmor frequency due at the larmor frequency due to precession ofan individual spin on a paramagnetic center. Surf.Sci., 264:235, 1991.
[156] A.V.Balatsky and I.Martin. Single spin detection with stm.ArXiv:cond-mat, Dicember 9, 2001.
[157] Y.Manassen and E Ovanesyan et al. Esr stm experiments on thermallyoxidized si(1 and 1 and 1). Phy.Rev.B, 48:4887, 1993.
[158] E.Dalcanale P.Jacopozzi. Angew.Chem.Int.Ed., 36:613, 1997.
[159] E.Wegelius K.Rissanen P.Cozzini E.Marastani E.Fisicaro P.ManiniR.Fokkens E.Dalcanale F.Fochi, P.Jacopozzi. J.Am.Chem.Soc.,123:7539, 2001.
[160] Z.Nussinov, M.F.Crommie, and V.Balatsky. ArXiv:cond-mat/0301032,v1, 2003.
[161] A.V.Balatsky, Y.Manassen, and R.Salem. Phi.Mag.B., 82:1291, 2002.
[162] M.G. Richards et Al. Cryogenic GaAS FET amplifiers and their use inNMR detection. Rev.Sci.Ins., 57:404, 1986.
[163] RK. Kirschman. Cold electronics an overview. Cryogenics 25 (3):115-122 1985.
[164] R.J.Prance et Al. UHF ultra low noise cryogenic FET preamplifier.J.Phy.E, 15:101, 1982.
BIBLIOGRAPHY 173
[165] Claudio Sangregorio. Magnetic Nanoparticles : The Sol-Gel and theMolecular Approaches. PhD thesis, Department Of Chemistry Univer-sity Of Florence Italy, 1998.
[166] P.Messina, A.Dimitriev, N.Lin, H.Spillmann, J.V.Barth, and K.Kern.A new route to synthesize metal-organic supramolecular assemblies atmetal surfaces. In submission.
[167] W.Harneit, C.Meyer, A.Weidinger, D.Suter, and J.Twamley.Phy.Stat.Sol.(b), 233:453, 2002.
[168] D.Gatteschi and P.Rey. Design and synthesis and and properties of ni-troxide networked materials. In P.M.Lathi, editor, Magnetic Propertiesof Organic Materials, page 601. Marcel Dekker, 1999.
[169] D.Gatteschi. Coupled transition metal ions-organic radicals. InA.Bencini and D.Gatteschi, editors, EPR Of Exchange Coupled Sys-tems, page 193. Springer Verlag, 1990.
[170] H.Brune, H.Roder, K.Bromann, and K.Kern. Thin Solid Films,264:230, 1995.
[171] Bjorn Fischer. Nucleation and Growth in Metal-on-Metal Epitaxy: TheInfluence of Strain and Surface Reconstruction. PhD thesis, EPFLLausanne, 1998.
[172] Karsten Bromann. Controlling Epitaxial Morphologies On the Micro-scopic Scale. PhD thesis, EPFL Lausanne, 1998.
[173] J. Weckesser. Atomic Scale Observation Of Large Organic Moleculesat Metal ..... PhD thesis, EPFL Lausanne, 2000.
[174] H.Brune. Microscopic view of epitaxial metal growth nucleation andaggregation. Sur.Sci.Rep, 31, 1998.
[175] J.A.Venables, G.D.T.Spiller, and M.Hanbucken. Rep.Prog.Phys.,47:399, 1984.
[176] H.Brune, H.Roder, C.Boragno, and K.Kern. Phy.Rev.Lett., 73:1955,1994.
[177] G.Ehrlich. Surf.Sci., 246:1, 1991.
[178] L.Hansen and P.Stolze et Al. Self-diffusion on copper surfaces.Phy.Rev.B, 44:6523, 1991.
174 BIBLIOGRAPHY
[179] U.Kurpick. Self-diffusion on (100) and (110) and and (111) surfacesof ni and cu: A detailed study of prefactors and activation energies.PHy.Rev.B 64 (7): 075418 2001.
[180] G.Boisvert and L.J.Lewis. Self-diffusion of adatoms and dimers andand vacancies on cu(100). Phy.Rev.B 56 (12): 7643 1997.
[181] L.B.Hansen, Pstoltze, K.W. Jacobsen, and J.K NORSKOV. ACTI-VATION FREE ENERGY AND ENTROPY FOR THE NORMALEXCHANGE SELFDIFFUSION PROCESS ON cu(100). Surf.Sci.,289:68–74, 1993.
[182] B.G.Federick, M.R.Ashton, and N.V.Richardson. Surf.Sci., 292:33,1993.
[183] B.G.Fredericka, Q.Chena, F.M.Leibsle, M.B.Lee, and N.V.RichardsonK.J.Kitchinga. Long-range periodicity in c(8 2) benzoate/Cu(110): Acombined STM and LEED and HREELS study. Surf.Sci., 394 (1-3):1–25, 1997.
[184] C. C. Perry, S. Haq, B. G. Frederick, and N. V. Richardson. Facespecificity and the role of metal adatoms in molecular reorientation atsurfaces. Surface science, Volume 409, Issue 3, 10 July 1998 Pages512-520.
[185] H Mehl, O Biham, I Furman, and et Al. Models for adatom diffusionon fcc (001) metal surfaces. Phys.Rev.B 60 (3): 2106-2116 JUL 151999.
[186] F Dulot, B Kierren, and D Malterre. Influence of the initial step densityon the growth mechanisms of the Fe/Cu(100) interface. Surf.Sci. 494(3): 229-237 DEC 1 2001.
[187] J.V.Barth and D.E.Fulwer. Low-coverage nonpseudomorphic andmetastable of magnetic fe on cu(001). Phy.Rev.B 52 11432 (1985).
[188] K.E.Johnson, D.D.Chambliss, R.J.Wilson, and S.Chiang. A structuralmodel and mechanism for fe epitaxy on cu(100). Surf.Sci., 313:L811,1994.
[189] M.W. Hosseini J-P.Sauvage. Templating, Self Assembly, and Self -Organization, Comprehensive Supramolecular Chemistry. Pergamon,1996.
BIBLIOGRAPHY 175
[190] B.J.Holliday and C.A.Mirkin. Strategies for the construc-tion of supramolecular conpounds through coordination chemistry.Angew.Chem.Int.Ed., 40:2022, 2001.
[191] S.R.Batten and R.Robson. Interpenetrating nets.Angew.Chem.Int.Ed., 37:1460, 1998.
[192] K.Campbell, C.J.Kuehl, M.J.Fergusom, P.J.Stang, andR.R.Tykwinski. Coordination-driven self assembly: Solids withbidirectional porosity. J.Am.Chem.Soc, 124:7266, 2002.
[193] A.Jeffery, C.V.Lu, and P.J.Stang. Molecular architecture via coordi-nation. J.Am.Chem.Soc, 119:2524, 1997.
[194] F.M.Tabellion, S.R.Seidal, A.M.Arif, and P.J.Stang. Discretesupramolecular architectures vs crystal engineering.... J.Am.Chem.Soc,123:7740, 2001.
[195] C.J.Kuehl, T.Yamamoto, S.R, Seidel, and P.J.Stang. Self-assembly ofmolecular prisms via organometallic ”clip”. Org.Lett., 4:913, 2002.
[196] M.D.Levin and P.J.Stang. Insights into the mechanism of coordination-directed self assembly. J.Am.Chem.Soc, 122:7428, 2000.
[197] S.R.Seidel and P.J.Stang. High symmetry coordination cages via self-assembly. Acc.Chem.Res., 35:972, 2002.
[198] M.Fujita, J.Yazaki, and K.Ogura. Preparation of a macrocyclic polynu-clear complex. J.Am.Chem.Soc., 112:5645, 1990.
[199] G.F.Swiegers and T.J.Malafetse. New self-assembled structural motifin coordination chemistry. Chem.Rev., 100:3483, 2000.
[200] R.Kramer, J.M.Lehn, and A.M.Rigault. Proc.Natl.Ac.Sci., 90:5394,1993.
[201] J. Siegel J.Harrowfield B.Chevrier J.M.Lehn, A.M.Rigault. Proc. Natl.Acad. Sci. USA, 84:2565, 1987.
[202] J.S.Lindsey. Self assembly in synthetic routes to molecular devices. bi-ological principles and chemical perspectives : A review. New.J.Chem.,15:153–180, 1991.
176 BIBLIOGRAPHY
[203] E.Breuning, M.Ruben, J.M.Lehn, F.Renz, Y.Garcia, V.Ksenofontov,P.Gutlich, E.Wegelius, and K.Rissanen. Spin crossover in a supramolec-ular fe-4(II) [2 x 2] grid triggered by temperature and pressure and andlight. Ang.Chem.Int.Ed., 39:2504, 2000.
[204] O.Kahn and C.J.Martinez. Science, 279:44, 1998.
[205] W.Fujita and K.Awaga. Science, 286:261, 1999.
[206] K.J. Klabunde. Chemistry of Free Atoms and Particles. AcademicPress, 1980.
[207] R.Mackinzie and P.L.Timms. and J.Chem.Commun., page 650, 1974.
[208] S.Toyota, C.R.Woods, M.Benaglia, and et Al. Angew.Chem.Int.Ed.,40:751, 2001.
[209] R.E.P.Winpenny. J.Chem.Soc.Dalton.Trans., 1:1, 2002.
[210] J.Caro, J.Fraxedas, O.Jurgens, and J.Santiso. The first oriented thinfilms based on nitronyl nitroxide radical. Adv.Mater., 10:608, 1998.
[211] K.I.Pokhodnya, A.J.Epstein, and J.S.Miller and. Adv.Mater., 12:410,2000.
[212] D.de Caro, M.Basso, and J.Sakah et Al. CVD-grown thin films ofmolecule based materials. Chem.Mater., 12:587, 2000.
[213] H.Casellas, D. de Caro, and L.Valade et Al. Molecular magnets andconductors on surfaces. J.Phys IV, 11:271, 2001.
[214] H.Casellas, D.Caro, L.Valade, and P.Cassoux. A new chromium-basedmolecular magnet grown as a thin film by CVD. Chem.Vap.Dep., 8:145,2002.
[215] K.I.Pokhodnya, D.Pejakovic, A.J.Epstein, and J.S.Miller. Effect ofsolvent on the magnetic properties of the high-temperature V(TCNE)molecule-based magnet. Phy.Rev.B., 63:174408–1, 2001.
[216] R.Sessoli, H.L.Tsai, A.R.Schake, and et Al. J.Am.Chem.Soc., 115:1804,1993.
[217] W.Wernsdorfer and R.Sessoli. Science, 284:133, 1999.
[218] Wernsdorfer, A.Caneschi, R.Sessoli, and D.Gatteschi et al.Phy.Rev.Lett., 84:2965, 2000.
BIBLIOGRAPHY 177
[219] G.Aromi, S.M.J.Aubin, and M.A. Bolcar et al. Polyhedron, 17:3005,1998.
[220] R.E.P.Winnpenny. Serependitous assembly of polynuclear cage com-pounds. J.Chem.Soc.Dalton.Trans., 1:1, 2002.
[221] R.E.P.Winnpenny. Chem.Soc.Rev., 27:447, 1998.
[222] C. M. Whelan, C. J. Barnes, C. Gregoire, and J. J. Pireaux. Theinfluence of step sites on the bonding of benzenethiol on au surfaces.Surface Science, Volumes 454-456 and 20 May 2000, Pages 67-72.
[223] X.C.Guo and R.J.Madix. Monolayer structure of phenoxy species oncu(110). Surf.Sci., 341:L1065, 1995.
[224] Junseok Lee, Sunmin Ryu, and Seong Keun Kim. The adsorption andphotochemistry of phenol on ag(1 1 1). Surface Science Volume 481,Issues 1-3 10 June 2001 Pages 163-171.
[225] D. C. Dender, D. Davidovic, Daniel H. Reich, , and Collin Broholm.Magnetic properties of a quasi-one-dimensional s=1/2 antiferromagnet:Copper benzoate. Phys. Rev. B 53 and 25832589 (1996).
[226] D.C.Dender, P.R.Hammar, D.H.Reich, C.Broholm, and G.Aeppli. Di-rect observation of field-induced incommensurate fluctuations in a one-dimensional s = 1/2 antiferromagnet. Phys. Rev. Lett. 79 and 17501753(1997).
[227] T.Asano, H.Nojiri, Y.Inagaki, J.P.Boucher, T.Sakon, Y. Ajiro, andM. Motokawa. ESR investigation on the breather mode and the spinon-breather dynamical crossover in cu benzoate. Phy. Rev. Lett. 2000 84,Issue 25, pp. 5880.
[228] B.Pilawa, E.Herrling, and I. Odenwald. G-factor and linewidth of thequasi-one-dimensional heisenberg antiferromagnet copper benzoate.J.Mag.Mag.Mater., 226-230:417, 2001.
[229] K.Inoue. Metal-aminoxyl-based molecular magnets. In Electron Mag-netism From Molecules to Magnetic Materials, page 62, 2001.
[230] A.Caneschi, D.Gatteschi, P.Rey, and R.Sessoli. Inorg.Chem., 30:3936,1991.
178 BIBLIOGRAPHY
[231] J.Caro, J.Fraxedas, J.Santiso, A.Figureas, J.N.B.Smith J.M.Rawson,G.Antorrena, and F.Palacio. Preparation and characterization of ori-ented thin films of a sulfur-nitrogen radical. Thin.Sol.Fil., 352:102,1999.
[232] C.Rovira. Molecular compounds showing a spin ladder behaviour. Elec-tron Magnetism : from molecules to magnetic materials, Structure andBonding 100:163, 2001.
[233] E.Dagotto, J.Riera, and D.J.Scalpino. Phy.Rev.B., 45:5744, 1992.
[234] Elbio Dagotto. Experiments on ladders reveal a complex inter-play between a spin-gapped normal state and superconductivity.Rep.Prog.Phy., 62:1525, 1999.
[235] National Research Council. Condensed Matter and Materials Physics: Basic Research for Tomorrows Technology. National Academy Press,1999.
[236] J.Fraxedas, J.Caro, A.Figureas, and P.Gorostiza et al.J.Vac.Sci.Technol.A., 16:2517, 1998.
[237] J.Norskov. Rep.Prog.Phys., 53:1253, 1990.
[238] B.Hammer and J.Norskov. Chemisorption and Reactivity on SupportedMetal Clusters and Thin Films. Kluwer, 1997.
[239] R.Hoffmann. Solids And Surfaces: AChemists View of Bonding inExtended Structures. VCH, 1988.
[240] Pietro Gambardella. Growth and Electronic Structure and Magnetismof Supported Metal Nanowires. PhD thesis, EPFL Lausanne (CH),2000.
[241] A.Fohlisch et al. J.Chem.Phys., 112:1946, 2000.
[242] K.W.Kolasinski, F.Cemic, and E.Hasselbrink. Chem.Phys.Lett,219:113, 1994.
[243] J.I.Pascual, J.J.Jackiw, K.F.Kelly, H.Conrad, H-P.Rust, andP.S.Weiss. Local electronic structural effects and measurements onthe adsorption of benzene on ag(110). Phy.Rev.B., 62:12632, 2000.
[244] G.Trimarchi. Private communication, 2002.
BIBLIOGRAPHY 179
[245] J.Weckesser, J.V.Barth, and K.Kern. J.Chem.Phys., 110:5351, 1999.
[246] J.Weckesser, J.V.Barth, and K.Kern. Phy.Rev.B., 64:161403, 2001.
[247] Ante Bili, Jeffrey R. Reimers, , and Noel S. Hush. Adsorption ofpyridine on the gold(111) surface: Implications for ”alligator clips”for molecular wires. J. Phys. Chem. B, 106(26):6740, 2002.
[248] M.Schunack, L.Petersen, A.Kuhnle, E.Legsgaard, I.JohannsenI.Stensgaard, and F.Besenbacher. Anchoring of organic molecules tometal surfaces: HtBDC on cu(110). Phy.Rev.Lett., 86:456, 2001.
[249] M.Schunack, F.Rosei, Y.Naitoh, P.Jiang, A.Gourdon, I.StensgaardE.Laegsgaard, and C.Joachim. Adsorption behavior of lander moleculeson cu(110) studied by scanning tunneling microscopy. J.Chem.Phy.,117:6259, 2002.
[250] F.Moresco, G.Meyer, K.H.Rieder, J.Ping, H.Tang, and C.Joachim.TBPP molecules on copper surfaces: A low temperatue scanning tun-neling microscope investigation. Surf.Sci., 499:94, 2002.
[251] G.R.Darling and S.Hollaway. Rep.Prog.phys., 58:1595, 1995.
[252] J.V. Barth. Transport of adsorbates at metal surfaces: From thermalmigration to hot precursors. Surf.Sci.Rep., 40 (3-5):75–149, 2000.
[253] J.L.Brand, M.V.Arena, A.A.Deckert, and S.M.George. J.Chem.Phys.,92:5136, 1990.
[254] M.Schunack, T.R.Linderoth, F.Rosei, E.Legsgaard, and F.BesenbacherI.Stensgaard. Long jumps in the surface diffusion of large molecules.Phy.Rev.Lett., 88:15602–1, 2002.
[255] F.P.Netzer, G.Ranglov, and G.Rosina and. J.Chem.Phys., 89:3331,1988.
[256] J.Stohr. NEXAFS Spectroscopy and Vol.25 Springer Series in SurfaceSciences. Springer, 1991.
[257] J. Weckesser, JV. Barth, and K. Kern. Mobility and bonding transitionof c-60 on pd(110). Phy.Rev.B., 64:161403, 2001.
[258] D.G.Yablon, L.C.Giancarlo, and G.W.Flynn. Manipulating self-assembly with achiral molecules: An STM study of chiral segregationby achiral adsorbates. J. Phys. Chem. B, 104(32);:7627–7635, 2000.
180 BIBLIOGRAPHY
[259] J.V.Barth, J.Wesscker, and G.Trimarchi. J.Am.Chem.Soc., 2002.
[260] T Kamikado, Y Okuno, S Mashiko, and A Yokoyama. Nature, 413:619,2001.
[261] K.W.Hipps, L.Scudiero, D.E. Barlow, and M.P. Cooke and. A self-organized 2-dimensional bifuctional structure formed by supramolecu-lar design. J.Am.Chem.Soc., 124:2126, 2001.
[262] Shirley Chiang. Scanning tunneling microscopy imaging of small ad-sorbed molecules on metal surfaces in an ultrahigh vacuum environ-ment. Chemical Reviews, 1997; 97(4); 1083-1096.
[263] X.Lu, K.W.Hipps, and X.D.Wang U. Mazur. Scanning tunneling mi-croscopy of metal phthalocyanines: d7 and d9 cases. J. Am. Chem.Soc. 1996 and 118 and 7197-7202.
[264] T. A. Jung, R. R. Schlittler, J. K. Gimzewski, H. Tang, , andC. Joachim. Controlled room-temperature positioning of individualmolecules: Molecular flexure and motion. Science 1996 ; 271: 181.
[265] J.K.Gimzewiski, T.A.Jung, M.T.Cuberes, and R.R.Schliter. Surf.Sci.,386:101, 1997.
[266] L. Scudiero, Dan E. Barlow, and U.Mazur K. W. Hipps. Scanningtunneling microscopy and orbital-mediated tunneling spectroscopy andand ultraviolet photoelectron spectroscopy of Metal(II) tetraphenylpor-phyrins deposited from vapor. J. Am. Chem. Soc. 2001 and 123 and4073-4080.
[267] L.Scudiero, D.E.Barlow, U. Mazur, and K.W. Hipps and. Scanningtunneling microscopy and orbital-mediated tunneling spectroscopy andand ultraviolet photoelectron spectroscopy of Nickel(II) octaethylpor-phyrin deposited from. J. Phys. Chem. B. ; 2002; 106(5); 996.
[268] X.Qiu, G.V.Nazin, A.Hotzel, and W.Ho. Manipulation and character-ization of xenon-metalloporphyrin complexation with a scanning tun-nelling microscope. J.Am.Chem.Soc., 124:14804, 2002.
[269] K.Morgenstern and K.H.Rieder. Formation of the cyclic ice hexamervia excitation of vibrational molecular modes by the scanning tunnelingmicroscope. J.Chem.Phy., 116:5746, 2002.
BIBLIOGRAPHY 181
[270] E.V.Tsipera, Z.G.Soos, W.Gaob, and A.Kahnb. Electronic polariza-tion at surfacesand thin films of organic molecularcrystals: PTCDA.Chem.Phy.Lett., 360:47–52, 2002.
[271] F. et al. Gilberto. A novel fluorinated Eu(III) beta-diketone complexas thin film for optical device application. Optical Materials, 11, 231998.
[272] S.Bruck. Synthesis and structure and optical characteristics of pyridilsubstituted diketonates of lanthanoids. Inorg.Chem.Comm., 3:666–670,2000.
[273] J.Batista et Al. Synthesis and x ray structure.................. Inorg.Chem,37:3542, 1998.
[274] S.E.Grillo, H.Tang, C.Coudret, and S.Gauthier. STM observation ofthe dissociation of a chromium tris-diketonato complex on cu(1 0 0)and. Chem.Phys.Lett., 355:289, 2002.
[275] D. W. Wang, F. Tian, , and J. G. Lu. Characterization of self-assembledalkanethiol monolayers using a low-current scanning tunneling micro-scope. J.Vac.Sci.Tech.B, 20:60–64, January 2002.
[276] U.Ziener, J.M.Lehn, A.Mourran, and M.Moller. Supramolecular assem-blies of a bis(terpyridine) ligand and of its [2 x 2] grid-type zn-II andco-II complexes on highly ordered pyrolytic graphite. Chem.A.Eur.J.,8:951–957, 2002.
[277] Breuning E, Ziener U, Lehn JM, Wegelius E, and Rissanen K. Two-levelself-organisation of arrays of [2x2] grid-type tetranuclear metal com-plexes by hydrogen bonding. Eur. J.Inorg.Chem, 6:1515–1521, 2001.
[278] D.G.Kurth, K.M.Fromm, and J.M.Lehn. Hydrogen-bonding andmetal-ion-mediated self-assembly of a nanoporous crystal lattice.Eur.J.Inorg.Chem., 6:1523, 2001.
[279] T.E.Jones and C.J.Baddeley. A RAIRS and STM and TPD study oftheni1 1 1/r and r-tartaric acidsystem: Modelling the chiral modificationof ni nanoparticles. Surf.Sci., 513:463, 2001.
[280] B.G.Frederick, T.S.Jones, P.Pudney, and N.V.Richardson.J.Electron.Spectrosc., 64/65:115, 199.
[281] B.G.Frederick, , M.R.Aschton, N.V.Richardson, and T.S.Jones.Surf.Sci., 292:33, 1993.
182 BIBLIOGRAPHY
[282] Q.Chen, C.C.Perry, and B.G.Frederik et al. Surf.Sci., 446:63, 2000.
[283] K.U. Weiss, R. Dippel, K.M. Schindler, P. Gardner, V. Fritzsche, andA. M. Bradshaw. Chemical shift photoelectron diffraction from molec-ular adsorbates. Phys. Rev. Lett., 69 and 31963199 (1992).
[284] S.M.York, S.Haq, K.V.Kilway, J.M.Phillips, and F.M. Leibsle. STMand FTIR andquantum chemical calculation studies of acetate struc-tures on cu(110) surfaces. Surf.Sci, 522:34, 2003.
[285] M.Bowker and R.J.Madix. Surf.Sci., 102:542, 1981.
[286] S.Haq and D.A.King. J.Phy.Chem., 100:16957, 1996.
[287] M Casarin et al. A lcao-ldf study of formate chemisorption on cu(100).Sur.Sci., 307-309, 95 1994.
[288] M.Sambi, G.Granozzo, M.Casarin, G.A.Rizzi, L.S.Caputi A.Vittadini,and G.Chiarello. Surface carboxylate species on cu(100) studied byangle-scanned photoelectron diffraction and LCAO-LDF calculations.Surf.sci., 315:309, 1994.
[289] G.Boisvert and L.J.Lewis. Self-diffusion of adatoms and dimers andand vacancies on cu(100). Phy.Rev.B, 56:7643, 1997.
[290] L.HansenL, P.Stolze, K.W.Jacobsen, and J.K.Norskov. Activation freeenergy and entropy for the normal and excange self diffusion processeson cu(100). Surf.Sci. 289 (1-2): 68-74 1993.
[291] S.F.A.Kettle. Physical Inorganic Chemistry. Spektrum, 1996.
[292] O.M.Yaghi, H.Li, C.Davis, D.Richardson, and T.L.Groy. Syntheticstrategies and structure patterns and and emerging properties in thechemistry of modular porous solids. Acc.Chem.Res., 31(8):474–484,1998.
[293] F.Rosei, M.Schunack, P.Jiang, A.Gourdon, E.Lægsgaard, I.Stensgaard,C.Joachim, and F.Besenbacher. Organic molecules acting as templateson metal surfaces. Science. 296,328; 2002.
[294] R.K.Bruce. Encyclopedia of Inorganic Chemistry.
[295] A.W.Adamson. A Text Book Of Physical Chemistry. Academic Press,1973.
BIBLIOGRAPHY 183
[296] SF.A:Kettle. Physical Inorganic Chemistry. Spectrum, 1996.
[297] Douglas McDaniel. Concepts and Models of Inorganic Chemistry. JhonWiley, 1983.
[298] R.N.Boyd R.T.Morrison. Organic Chemistry. Allyn and Bacon, 1987.
[299] S.Pascquetto and L.Patrone. Chimica Fisica : Volume Terzo. Masson,Milano, 1990.
[300] L.Cattalini. Prog.Inorg.Chem., 13:263, 1970.
[301] R.J.Cross. An appraisal of square planar substitution reaction. Ad-vances in Inorganic Chemistry, 34:219, 1989.
[302] M.H. Whangbo T.A: Albright, J.K. Burdett. Orbital Interaction inChemistry. John Wiley, 1984.
[303] S.R.Logan. Fundamentals of Chemical Kinetics. Longman, 1995.
[304] M.J.Cardillo. Annu.Rev.Phy.Chem., 32:331, 1981.
[305] E.W.Kuipers, M.G.Tenner, A.W.Kleyn, and S.Stolte. Phy.Rev.Lett.,62:2152, 1989.
[306] E.W.Kuipers, M.G.Tenner, A.W.Kleyn, and S.Stolte. Nature, 334:420,1988.
[307] C.Haug, W.Brenig, and T.Brunner. Surf.Sci., 265:56, 1992.
[308] A.W.Kleyn, A.C.Luntz, and D.J.Aurbach. Surf.Sci., 152:99, 1985.
[309] P.J.Feibelman. Phy.Rev.Lett., 67:461, 1991.
[310] D.Wetzig, R.Dopheide, M.Rutkoski, R.David, and H.Zacharias.Phy.Rev.Lett., 76:463, 1996.
[311] K.W.Kolasinski, F.Cemic, and E.Hesselbrink. Chem.Phys.Lett,219:113, 1994.
[312] K.W.Kolasinski, F.Cemic, A.Meijere, and E.Hasselbrink. Surf.Sci.,334:19, 1995.
[313] Oliver kahn, editor. Molecular Magnetism. Wiley, VCH, 1992.
[314] Richard L. Carlin. Magnetochemistry: A research proposal.Coo.Chem.Rev., 79:215, 1987.
184 BIBLIOGRAPHY
[315] H.Spillmann, P.Messina, A.Dimitriev, N.Lin, J.V.Barth, and K.Kern.In Preparation.
[316] D.Braga, F.Grepioni, and G.R.Desiraju. Crystal engineering andorganometallic architecture. Chem.Rev., 98(4):1375, 1998.
[317] G.A.Jeffrey. An Introduction to Hydrogen Bonding. Oxfor UniversityPress, 1997.
[318] T.Steiner. The hydrogen bond in the solid state. Angw.Chem.Int.Ed.,41:48–76, 2002.
[319] T. W. Fishlock, A. Oral, R. G. Egdell, and J. B. Pethica. Manipulationof atoms across a surface at room temperature. Nature, 404:743, 2000.
[320] W.Liang, P.Matthew, M.Bockrath, and J.R.Long. Kondo resonance ina single-molecule transistor. Nature, 417:725, 2002.
[321] W. G. Van der Wiel, S.De Franceschi, J.M.Elzerman, S.Tarucha, andL.P.Kouwenhoven. Two-stage kondo effect in a quantum dot at a highmagnetic field. Phys. Rev. Lett., 88:126803, 2002.
Curriculum vitae
Name: Paolo MessinaDate of Birth: August 20, 1974Nationality Italian
1988–1993 High School at the ”Enrico Fermi” institute. Major, Chem-istry and biology, Italy
1993–1998 Selected student at ”Collegio Borromeo” Pavia, Italy1993–1998 Undergraduate studies in physics at the University of Pavia,
ItalyJunua 1998–Oct 1998 Diploma thesis in the group of Prof Dr A.Stella at the Lab-
oratory for Solid State Physics of the University of Pavia:“Optical properties of metal nano particles emebedded in di-electric matrix”
Oct 1998–Oct 1999 Research assistant in the group of Dr.S.Thomson, Spintronicsat high frequencies. University of York, UK.
Oct 1999–Mar 2000 Research assistant in the group of Prof Dr K. Kern at the In-stitute for Experimental Physics of the Swiss Federal Instituteof Technology in Lausanne.
Mar 2000–Mar 2003 Research assistant in the group of Prof Dr K. Kern at the MaxPlanck Institute for solid state research, Stuttgart, Germany
2003 PhD thesis: “Towards magnetic engineering at metal sur-faces”
185

Acknowledgements
I would like to thank Prof.Kern for the support and the opportunity to ac-complish this work. I also thank all the members of the examining commis-sion,Dr.Carbone, Prof.Schneider, Prof.Vogel and the President Prof.Meister.A special thank to Johannes Barth for the useful scientific discussions andfor having corrected part of this manuscript.I’ am grateful to Wolfgang Stiepany that has helped me in the design of the1K microscope. To my mind he represents and example of capability anddedication at the work place.I thank Nian Lin for having thought me STM alongside with Sasha, Ma-teu and Hanness for having welcome me in their group. I also thank AlexSchneider for the correction of part of the manuscript.I’ m grateful to Ralf Vogelgesang for all the scientific and not scientific dis-cussions and for having helped me so many times with latex and relatedproblems!I thank Sabine, our group secretary, for all the assistance she gave me....a lotof work!Thanks also to the people in the cryogenic group at the MPI.I’ m especially grateful to D.M.Eigler for his useful advice.It is time for the friends now! Let’ s start with Stuttgart . I want to men-tion first Ashant (the only Indian at this world capable to flatter girls inslovakian!). I thank him for the support and the friendship he granted tome.MAXXXXXXXX ! It is you turn now! MAX in arte ”Lo zozzone”. I willnever forgive him for not having brought me in Poland with him.”How muchI will miss our....art oriented..trips..to Prague and Bratislava!”. Max and Ishare one of the fundamental properties of nature: being Terroni19! I alsothank my private thermometer Marco from Florence for all the time he men-tioned the temperature in Florence!A special thank to Ketty, Simona, Alessandra and Silvia for having listenedto all my complains...... A thank to all the guys in Stuttgart Marcello,
19Southern Italians
187
Marco Ge, Chiara, Sabrina, Prisca Bellissima, Sandra Furilli, Mike, Angela,Kristo.., and why not ”Trombone detto Trombosterone” Tobias !Let’ go to Lausanne now. I want to tank Daniel for reminding me I’ amnot the only crazy guy at this world: I miss you and your 7 languages! Ithank Tim for all the time we spent together in Lausanne and the times helet me sleep in his living room! Pietro do not worry , I have not forgottenyou! I thank him for all the discussions and support during these years: Iwill always make political public statements, it is unusefull to try to changethis!Thanks also to Elisa for being the prettiest physicist I have worked with!Alessandro, the philosopher from Rome transplanted in the Yorkshire, myspiritual guide during my adventure abroad. Dear Alessandro I have not lostthe Italian attitude to try finding a way to get around rules !Back to Italy, I want to sincerely thank my friend Amos for all the supporthe gave me during this years. Actually he should also thank me for havingintroduced him ..to Prague.. and its works of art !I thank Kirstin , the German blond giournalist, for the discussions and thevisit to Colonia! Kirstin: unfortunately I have not found my sweet lovelyblond journalist. Well , who else? I would like to thank the hundreds ofpeople that I have met during these years and that have given me the op-portunity to look at the world from different prospectives!


