Embed Size (px)
Citation preview

Martin HoltIryna Zablotska
Evelyn LeeDermot Ryan
Ian DownTodd HeardKaren Nairn
Garrett PrestageJohn de Wit
National Centre in HIV Social ResearchNational Centre in HIV Epidemiology and Clinical ResearchACONHunter New England Area Health Service
Town and country: gay community surveySYDNEY and REGIONAL NEW SOUTH WALES, August–November 2009


Town and country: gay community surveySYDNEY and REGIONAL NEW SOUTH WALES, August–November 2009
Martin Holt1
Iryna Zablotska2
Evelyn Lee1
Dermot Ryan3
Ian Down2,3
Todd Heard4
Karen Nairn4
Garrett Prestage2
John de Wit1
1 National Centre in HIV Social Research2 National Centre in HIV Epidemiology and Clinical Research
3 ACON4 Hunter New England Area Health Service
National Centre in HIV Social ResearchFaculty of Arts and Social SciencesThe University of New South Wales

National Centre in HIV Social ResearchLevel 2, Robert Webster BuildingUniversity of New South WalesSydney NSW 2052 Australia
Telephone: +61 2 9385 6776Fax: +61 2 9385 6455Email: [email protected]: http://nchsr.arts.unsw.edu.au
© National Centre in HIV Social Research 2010ISBN 978-1-921493-24-9
Cover photograph © Stockbyte, reproduced under licence
Design and layout by Judi Rainbow
The National Centre in HIV Social Research is partially funded by the Australian Department of Health and Ageing and is affiliated with the Faculty of Arts and Social Sciences at the University of New South Wales.
Suggested citation:Holt., M., Zablotska, I., Lee, E., Ryan, D., Down, I., Heard, T., Nairn, K., Prestage, G., & de Wit, J. (2010). Town and country: gay community survey—Sydney and Regional New South Wales, August–November 2009. Sydney: National Centre in HIV Social Research, The University of New South Wales. Available at http://nchsr.arts.unsw.edu.au/publications_gay.html

Town and country: gay community survey—Sydney and Regional New South Wales, August–November 2009Holt, Zablotska, Lee, Ryan, Down, Heard, Naim, Prestage and de Wit
i
Contents
Acknowledgments ii
List of figures iii
List of tables iv
Glossary v
Executive summary 1
Background 2
Demographic profile 3
Involvement in gay community 3
HIV testing and status 3
Sexual relationships with men 3
Findings 3
Meeting casual partners 6
Perceptions of HIV risk 7
Sexual health 7
Reporting 8
Tables 8
Appendix A1

ii Town and country: gay community survey—Sydney and Regional New South Wales, August–November 2009Holt, Zablotska, Lee, Ryan, Down, Heard, Naim, Prestage and de Wit
We acknowledge the following individuals and organisations for contributing to the success of this project:
NSW Health
who funded the project
ACON
for ongoing support of the study and assistance in data collection
Survey coordinators
Ian Down (Sydney) and Dermot Ryan (Regional NSW)
Recruiters
who gave of their time to administer the survey
Survey participants
The 2,346 men who contributed their time to ensure that the study was fully inclusive of their particular circumstances
Venues
The management and staff of the various gay community venues and clinics who gave generous permission for the survey to be administered on their premises and assisted in the administration of the survey.
National Centre in HIV Social Research
Judi Rainbow
Acknowledgments

Town and country: gay community survey—Sydney and Regional New South Wales, August–November 2009Holt, Zablotska, Lee, Ryan, Down, Heard, Naim, Prestage and de Wit
iii
List of figures
Figure 1: Match of HIV status between regular partners 4
Figure 2: Anal intercourse and condom use with casual partners 5
Figure 3: Disclosure of HIV status to sex partners (by respondents in their home town), among men who had sex partners 5
Figure 4: Number of male sex partners in the last six months 6
Figure 5: Where and how men met their male sex partners 6
Figure 6: Where HIV-positive men underwent STI testing 7
Figure 7: Where HIV-negative and untested men underwent STI testing 8

iv Town and country: gay community survey—Sydney and Regional New South Wales, August–November 2009Holt, Zablotska, Lee, Ryan, Down, Heard, Naim, Prestage and de Wit
Table 1: Recruitment venue 8
Table 2: Residential location 8
Table 3: Age 9
Table 4: Ethnicity 9
Table 5: Employment 9
Table 6: Involvement in broad gay community 9
Table 7: Involvement in local gay community 9
Table 8: Most recent HIV test results (excluding men recruited from sexual health clinics) 10
Table 9: Most recent HIV test among non-HIV-positive men (excluding men recruited from sexual health clinics) 10
Table 10: Agreements with regular male partners about sex within the relationship 10
Table 11: Agreements with regular male partners about sex outside the relationship 10
Table 12: Match of HIV status between regular partners 11
Table 13: Anal intercourse and condom use with regular partners 11
Table 14: Anal intercourse and condom use with casual partners 11
Table 15: Number of male sex partners in the six months prior to the survey 11
Table 16: Where men met their male sex partners, by geographical area 11
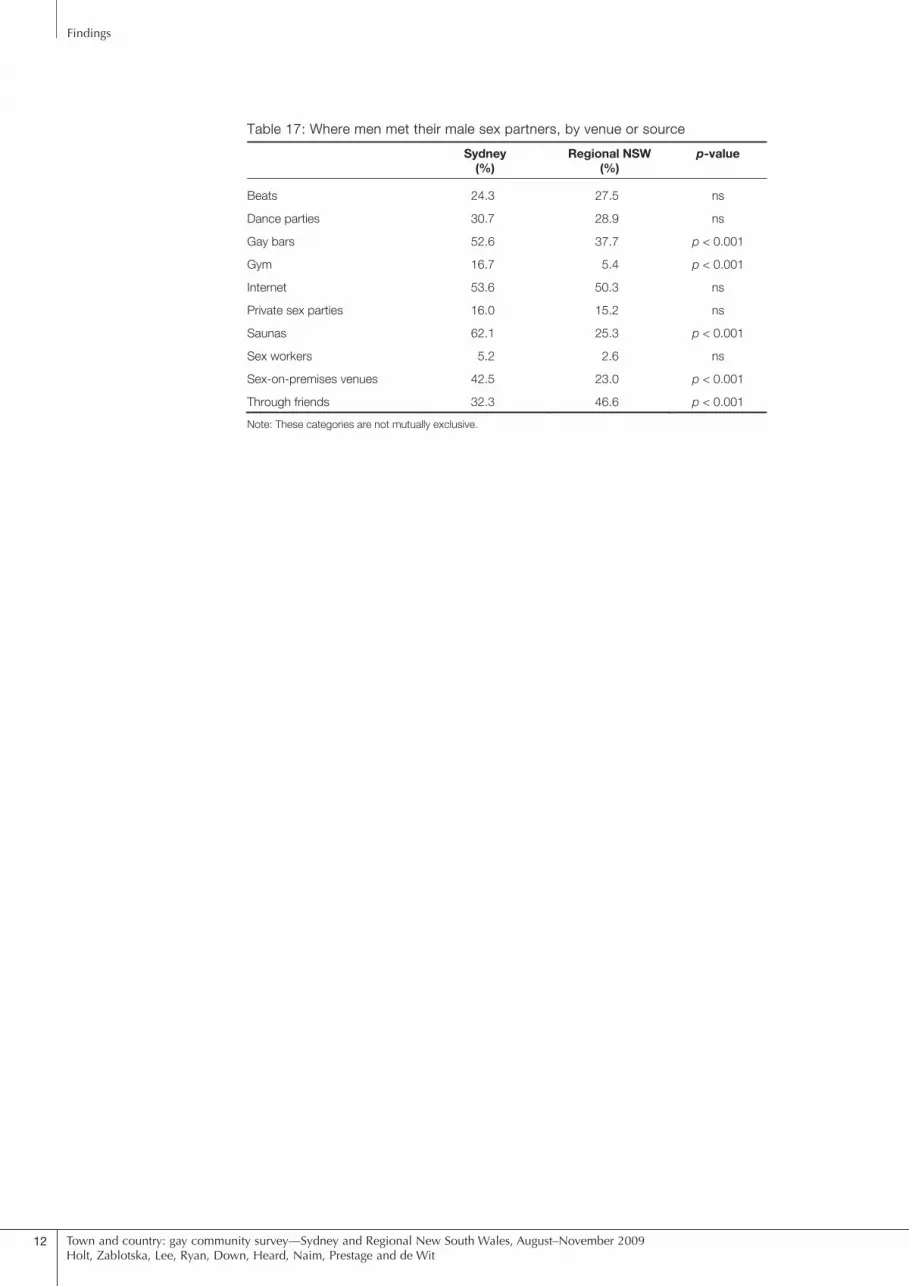
Table 17: Where men met male sex partners, by venue or source 12
List of tables

Town and country: gay community survey—Sydney and Regional New South Wales, August–November 2009Holt, Zablotska, Lee, Ryan, Down, Heard, Naim, Prestage and de Wit
v
ACON AIDS Council of New South Wales
AIDS acquired immune deficiency syndrome
HIV human immunodeficiency virus
HIV-seroconcordant relationship a relationship in which both partners are of the same HIV serostatus, either HIV-positive or HIV-negative
HIV-serodiscordant relationship a relationship in which both partners are known (as a result of testing) to be of different HIV serostatus, e.g. HIV-positive and HIV-negative
HIV-serononconcordant relationship a relationship in which the HIV serostatus of at least one partner in the relationship is not known, e.g. HIV-positive and untested, HIV-negative and untested or both untested
HIV serostatus a person’s antibody status established by HIV testing, e.g. HIV-negative, HIV-positive, or unknown (untested)
STI sexually transmissible infection
UAI unprotected anal intercourse
UAIC unprotected anal intercourse with casual partners
UAIR unprotected anal intercourse with regular partners
Glossary


Town and country: gay community survey—Sydney and Regional New South Wales, August–November 2009Holt, Zablotska, Lee, Ryan, Down, Heard, Naim, Prestage and de Wit
1
Executive summary
Men from Sydney and regional NSW were different in the following ways:
AgeYounger (<25) and older (>50) men were more likely to live in regional NSW than in Sydney.
Gay communityMen from regional NSW were more likely than men from Sydney to say that they were ‘very involved’ in gay community.
HIV and STI testingSydney men were more likely to have been tested for HIV and STIs than men from regional areas. Sydney men were also more likely to have been recently tested for HIV.
Agreements with regular partnersMen from regional NSW who had regular male partners were more likely than men in Sydney to say they had an agreement about sex outside the relationship.
HIV status of regular partnersSerodiscordant relationships were more common in Sydney. Serononconcordant relationships were more common in regional NSW.
Casual sex partnersMen from Sydney were more likely to report having casual male sex partners, and were more likely to report anal
intercourse (and condom use) with those partners (rates of unprotected anal intercourse with casual partners were similar in both samples).
Meeting sex partnersSydney men were more likely to meet men in gay bars, gyms, saunas, sex-on-premises venues and when travelling overseas. Men from regional NSW were more likely to meet sex partners through friends.
Men from Sydney and regional NSW were similar in the following ways:
Regular sex partnersSimilar proportions of men in Sydney and regional NSW reported a current regular male partner or partners.
Condom use with regular partnersRates of condom use and unprotected anal intercourse between regular partners were similar in Sydney and regional NSW.
HIV disclosureRates of HIV disclosure to sex partners were similar among men in Sydney and regional NSW.
Meeting sex partnersMen from Sydney and regional NSW were equally likely to report using beats, dance parties, the internet, private sex parties or sex workers to meet other men.
In August 2009, 1371 men were recruited for the Sydney Gay Community Periodic Survey. 469 men were recruited between August and November 2009 for a survey of gay men in regional New South Wales. The following report compares these two groups of men (from the city and regional areas) on a range of indicators.
Overall, it would appear that gay men in Sydney and regional NSW are generally similar in their sexual practices. Men from regional areas do not appear to engage in particularly high risk practices with their regular or casual male sex partners (and do not report more risk-taking than their Sydney counterparts). Particular opportunities for education and prevention in regional NSW appear to be related to HIV and STI testing, given the lower overall rates of testing and the increased likelihood of nonconcordant relationships (where at least one partner does not know his HIV status). We therefore recommend that HIV and STI testing uptake and reinforcement activities are strengthened in regional NSW.

2 Town and country: gay community survey—Sydney and Regional New South Wales, August–November 2009Holt, Zablotska, Lee, Ryan, Down, Heard, Naim, Prestage and de Wit
This report describes the similarities and differences between gay men in Sydney and regional areas of New South Wales, focusing in particular on sexual practices, HIV status and testing and perceptions of risk. The aim was to consider the views and experiences of men in a variety of locations across NSW to assist the development and targeting of local and state-wide responses to HIV and sexual health. The idea of assessing the health promotion and HIV prevention needs of men in regional NSW came about after the Health in Sex project, conducted by the (then) Hunter Area Health Service and ACON Hunter. During the project it was recognised that the routine Sydney Gay Community Periodic Survey only reached a small number of men from rural and regional areas, and a targeted survey of men in regional areas would therefore be useful and timely. A proposal was put to NSW Health, who agreed to fund a regional survey. Undertaking the regional survey was a resource intensive but thoroughly worthwhile exercise.
In August 2009, 1371 men were recruited from 17 gay social and sexual venues and clinics in Sydney for the Sydney Gay Community Periodic Survey (see Table 1). The Sydney Gay Community Periodic Survey is conducted in February and August every year. Recruitment is coordinated by ACON, overseen by the National Centre in HIV Social Research and National Centre in HIV Epidemiology and Clinical Research and is funded by NSW Health. The response rate in August 2009 was 56.5%.
The regional NSW survey was a one-off survey conducted between August and November 2009. During this period, 469 men were recruited from 29 gay community events, social and sexual venues and clinics in regional New South Wales (in the Greater Southern, Illawarra, Hunter/New England, North Coast and Northern Rivers areas) (see Table 1). Recruitment was led by ACON, overseen by the National Centre in HIV Social Research and National Centre in HIV Epidemiology and Clinical Research and supported by Area Health Services. The regional survey was funded by NSW Health. The response rate for the regional survey was 78.3%.
The following report compares men in Sydney and regional NSW on a range of indicators. These indicators give us an insight into the sexual practices, perceptions of HIV, connections to local communities and gay social networks of men in Sydney and regional NSW.
Background

Town and country: gay community survey—Sydney and Regional New South Wales, August–November 2009Holt, Zablotska, Lee, Ryan, Down, Heard, Naim, Prestage and de Wit
3
Demographic profileJust over a tenth of men who participated in the Sydney survey and a fifth of the men in the regional New South Wales survey were classed as visitors (based on their postcodes) and were excluded from subsequent analyses (see Table 2).
The age profiles of the two samples were significantly different (see Table 3). The regional NSW sample had higher proportions of younger and older men (men under 25 and men over 50) and the Sydney sample had higher proportions of men in their thirties and forties.
The ethnic profiles of the two samples were significantly different (see Table 4). Men from regional NSW were more likely to be Anglo-Australian and less likely to have an overseas ethnic background than men from Sydney. Both samples had similar proportions of men (around one in twenty) who were Aboriginal or Torres Strait Islanders.
The Sydney sample had a much higher proportion of men in full-time employment than the regional sample (see Table 5). Men from regional NSW were more likely to be employed part-time, unemployed or in other forms of employment.
Involvement in gay communityBoth samples were highly socially involved with gay men. 80.3% of men in Sydney and 76.9% of men in regional NSW said at least some of their friends were gay men. Men in Sydney were more likely than men in regional NSW to say they spent at least some of their time with gay men (81.2% vs. 70.2%).
Men from regional NSW were significantly more likely than men from Sydney to say that they were ‘very involved’ in the gay community in general or their local gay community (see Tables 6 and 7).
HIV testing and statusMen from Sydney were significantly more likely to have been ever tested for HIV than men from regional NSW (92.6% vs. 88.9%). In regional NSW there was a lower proportion of HIV-positive men and a higher proportion of untested/unknown status men than in Sydney (see Table 8).
Sydney men tended to have been tested for HIV more recently than men in regional areas (see Table 9). Sydney-based men were more likely to have been tested for HIV in the last 6 months than men from regional NSW (62.5% vs. 56.3%). However, the likelihood of having been tested for HIV in the last 12 months was very similar in both samples (71.1% vs. 70.1%). There was a higher proportion of men who had tested for HIV over 2 years ago in regional NSW, compared with Sydney (16.5% vs. 11.9%).
Sexual relationships with menSimilar proportions of men in Sydney and regional NSW reported a current regular male partner or partners (48.2% and 53.3% respectively). Men in Sydney were more likely to report sex with casual male partners than men in regional NSW (66.4% vs. 56.2%).
Findings

4 Town and country: gay community survey—Sydney and Regional New South Wales, August–November 2009Holt, Zablotska, Lee, Ryan, Down, Heard, Naim, Prestage and de Wit
Findings
Men in Sydney and regional NSW who had regular male partners reported similar rates of agreements about sex within the relationship (see Table 10). The majority of men (around 80% of men with a regular partner) had an agreement about sex within the relationship. The most commonly reported agreement allowed anal intercourse without a condom within the relationship.
Men with regular male partners in regional NSW were more likely than their counterparts in Sydney to have an agreement about sex outside the relationship (see Table 11). For men in regional NSW, the most common reported agreement about sex outside the relationship was that sex was not permitted with casual partners i.e. the partners had agreed to be monogamous. In Sydney, the most common agreement about sex outside the relationship was that anal intercourse with casual partners was permitted, but only with a condom.
Nearly half the men in regular relationships in both samples reported that they were in a seroconcordant relationship where both they and their partner were HIV-negative (see Table 12). Serodiscordant relationships, in which one partner is HIV-positive and the other is HIV-negative, were twice as likely to be reported in Sydney as in regional NSW. Serononconcordant relationships, where at least one partner does not know his HIV status, were more common in regional NSW (see Figure 1).
Rates of condom use and unprotected anal intercourse between regular partners were similar in Sydney and regional NSW (see Table 13). 46.7% of men with regular partners in Sydney and 49.5% of men in regional NSW reported any unprotected anal intercourse with their regular partner.
40%
50%
60%
70%
80%
90%
100%
Serononconcordant
Serodiscordant
Seroconcordant, HIV-negative
0%
10%
20%
30%
40%
50%
60%
70%
80%
90%
100%
Sydney Regional NSW
Serononconcordant
Serodiscordant
Seroconcordant, HIV-negative
Seroconcordant, HIV-positive
Figure 1: Match of HIV status between regular partners
Rates of anal intercourse and condom use with casual partners did, however, differ between the two samples (see Table 14 and Figure 2). Men in regional NSW who had casual partners were less likely to report anal intercourse with those partners, compared with Sydney men. Sydney men were more likely to report condom use for anal intercourse with casual partners than men in regional NSW (40.0% vs. 29.6%). Rates of unprotected anal intercourse with casual partners (UAIC) were similar in both samples (around one third of men with casual partners reported this practice).
The likelihood of UAIC varied according to the HIV status of casual partner(s) involved. UAIC was least likely with HIV-positive partners, more likely with men of untested or unknown status and most likely with HIV-negative men. This pattern was similar for both Sydney men and men from regional NSW. The surveys also assessed whether the likelihood of UAIC with men of different HIV statuses varied according to the geographical location in which sex occurred (Sydney, suburban NSW, somewhere else in NSW, interstate or overseas). Geographical location did not,

Town and country: gay community survey—Sydney and Regional New South Wales, August–November 2009Holt, Zablotska, Lee, Ryan, Down, Heard, Naim, Prestage and de Wit
5
Findings
however, appear to affect rates of UAIC with partners of different HIV statuses for either Sydney men or men from regional NSW.
40%
50%
60%
70%
80%
90%
100%
Sometimes does not use a condom
Always uses a condom
No anal intercourse
0%
10%
20%
30%
40%
50%
60%
70%
80%
90%
100%
Sydney Regional NSW
Sometimes does not use a condom
Always uses a condom
No anal intercourse
Figure 2: Anal intercourse and condom use with casual partners
Rates of HIV disclosure to sex partners were similar among men in Sydney and regional NSW (see Figure 3). In both samples, HIV-positive men were more likely than HIV-negative men to disclose to some or all of their sex partners e.g. 71.9% of HIV-positive men in Sydney and 80.0% of HIV-positive men in regional NSW reported disclosing to some or all of their sex partners. In contrast, 40.2% of HIV-negative men in Sydney and 50.8% of HIV-negative men in regional NSW reported disclosing to some or all of their sex partners.
40%
50%
60%
70%
80%
90%
100%
None
Some
All
0%
10%
20%
30%
40%
50%
60%
70%
80%
90%
100%
Sydney Regional NSW Sydney Regional NSW
None
Some
All
HIV-positive HIV-negative
Figure 3: Disclosure of HIV status to sex partners (by respondents in their home town), among respondents who had sex partners
In general, men in Sydney had more male sex partners in the last six months than men in regional NSW (see Table 15 and Figure 4), although it should be noted that over 40% of both samples reported between two and ten male sex partners in the last six months. Men in regional NSW were more likely than men in Sydney to report that they had had no male sex partners (18.3% vs. 10.2%) or only one male sex partner (20.8% vs. 14.9%). Nearly one in five Sydney men (18.1%) had had more than 20 male sex partners in the last six months, compared with only 6.6% of men from regional NSW.

6 Town and country: gay community survey—Sydney and Regional New South Wales, August–November 2009Holt, Zablotska, Lee, Ryan, Down, Heard, Naim, Prestage and de Wit
Findings
40%
50%
60%
70%
80%
90%
100%
Over 50
21 to 50
11 to 20
2 to 10
0%
10%
20%
30%
40%
50%
60%
70%
80%
90%
100%
Sydney Regional NSW
Over 50
21 to 50
11 to 20
2 to 10
One
None
Figure 4: Number of male sex partners in the last six months
Meeting casual partnersUnsurprisingly, men were most likely to meet casual male sex partners in their local area (see Table 16). Three-quarters of men in Sydney but only a quarter of men in regional NSW said they had met casual partners in Sydney. Men from regional NSW were more likely than Sydney men to say they had met casual male sex partners in suburban areas or elsewhere in NSW. Sydney men were more likely to have met partners overseas.
In terms of venues or other ways to meet male sex partners, men from Sydney and regional NSW were equally likely to report using beats, dance parties, the internet, private sex parties or sex workers to meet other men (see Table 17 and Figure 5).
Reflecting access to venues, men from Sydney were more likely to meet men in gay bars (52.6% vs. 37.7%), gyms (16.7% vs. 5.4%), saunas (62.1% vs. 25.3%) and sex-on-premises venues (42.5% vs. 23.0%). Men from regional NSW were more likely than Sydney men to meet male sex partners through friends (46.6% vs. 32.3%).
Saunas
Private sex parties
Internet
Gyms
Gay bars
Dance parties
Beats
Regional NSW
Sydney
0% 20% 40% 60% 80% 100%
Through friends
Sex-on-premises venues
Sex workers
Saunas
Private sex parties
Internet
Gyms
Gay bars
Dance parties
Beats
Regional NSW
Sydney
Figure 5: Where and how men met their male sex partners

Town and country: gay community survey—Sydney and Regional New South Wales, August–November 2009Holt, Zablotska, Lee, Ryan, Down, Heard, Naim, Prestage and de Wit
7
Findings
Perceptions of HIV riskTo assess perceptions of HIV risk, participants in both surveys were asked how likely they thought it was that someone could get HIV if they had unprotected anal intercourse with a man in NSW, in another state/territory or overseas (compared with having UAI in Sydney). Interestingly, around half the men in both samples thought that the risk of UAI was similar in Sydney, NSW, in other states/territories and overseas. The perception of HIV risk overseas appeared slightly elevated, with 18.6% of men in Sydney and 18.3% of men in regional NSW indicating that they thought it was more likely to get HIV from UAIC when you were overseas compared with Sydney. However, it was of course not clear which overseas locations men were thinking of when they answered the question.
Sexual healthMen in Sydney were more likely than men in regional NSW to have ever been tested for sexually transmissible infections (95.0% vs. 90.1%). In both samples, HIV-positive men were more likely to have been recently tested for STIs (in the last six months) than HIV-negative men and men of unknown HIV status. HIV-positive men living in Sydney were more likely to have been tested for STIs in the last six months than HIV-positive men living in regional NSW (90.1% vs. 83.3%). HIV-negative men living in Sydney were just as likely as HIV-negative men in regional NSW to have been tested for STIs in the last six months (60.1% vs. 60.6%).
Men in Sydney and regional NSW differed in where they reported going for STI testing. Among HIV-positive men, the most common locations for STI testing were a ‘regular doctor’ in Sydney (72.4%) and a ‘sexual health clinic’ in regional NSW (74.5%), presumably reflecting the greater availability of high-caseload GPs (s100 prescribers) in Sydney (see Figure 6). Among HIV-negative/untested men, the most common STI testing locations were regular doctors (54.1%) and sexual health clinics (34.3%) in Sydney and regular doctors (44.2%) and sexual health clinics (42.7%) in regional NSW (see Figure 7).
40%
50%
60%
70%
80%
90%
100%
Somewhere else
Hospital
Sexual health clinic
0%
10%
20%
30%
40%
50%
60%
70%
80%
90%
100%
Sydney Regional NSW
Somewhere else
Hospital
Sexual health clinic
Another doctor
Regular doctor
Figure 6: Where HIV-positive men underwent STI testing

8 Town and country: gay community survey—Sydney and Regional New South Wales, August–November 2009Holt, Zablotska, Lee, Ryan, Down, Heard, Naim, Prestage and de Wit
Findings
40%
50%
60%
70%
80%
90%
100%
Somewhere else
Hospital
Sexual health clinic
0%
10%
20%
30%
40%
50%
60%
70%
80%
90%
100%
Sydney Regional NSW
Somewhere else
Hospital
Sexual health clinic
Another doctor
Regular doctor
Figure 7: Where HIV-negative and untested men underwent STI testing
The vast majority of Sydney men (90.9%) went for STI testing at a doctor’s surgery or clinic within the Sydney metropolitan area. The majority of men in regional NSW generally reported attending local doctors or clinics (73.1%), although noticeable proportions of men reported travelling to sexual health services in Sydney (7.5%) or somewhere else in NSW (13.0%).
ReportingWhere p-values are provided, the difference is statistically significant. Where there is no significant change, this is indicated by ns (non-significant).
TablesThe findings of the survey are presented in tables 1 to 17 below.
Table 1: Recruitment venue
Sydney n (%)
Regional NSW n (%)
Gay community events1 0 269 (57.4)
Gay social venues2 696 (50.8) 170 (36.2)
Sex-on-premises venues 457 (33.3) 0
Sexual health clinics/GP surgeries 218 (15.9) 30 (6.4)
Total 1,371 (100) 469 (100)
1 Includes dance parties, festivals, trivia and film nights and youth events
2 Includes bars, gyms, night clubs and community organisations
Table 2: Residential location
Sydney n (%)
Regional NSW n (%)
Total n (%)
Lived in local area 1,217 (88.8) 374 (79.9) 1,591 (86.5)
Visiting 154 (11.2) 94 (20.1) 248 (13.5)
Total 1,371 (100) 468 (100) 1,839 (100)
Note: 2 = 23.44, p < 0.001

Town and country: gay community survey—Sydney and Regional New South Wales, August–November 2009Holt, Zablotska, Lee, Ryan, Down, Heard, Naim, Prestage and de Wit
9
Findings
Table 3: Age
Sydney n (%)
Regional NSW n (%)
Total n (%)
Under 25 111 (9.2) 118 (31.9) 229 (14.6)
25–29 163 (13.6) 42 (11.4) 205 (13.0)
30–39 415 (34.5) 58 (15.7) 473 (30.1)
40–49 325 (27.0) 76 (20.5) 401 (25.5)
50 and over 188 (15.6) 76 (20.5) 264 (16.8)
Total 1,202 (100) 370 (100) 1,572 (100)
Note: 2 = 142.89, p < 0.001
Table 4: Ethnicity
Sydney n (%)
Regional NSW n (%)
Total n (%)
Anglo-Australian 797 (65.5) 323 (86.4) 1,120 (70.4)
European 160 (13.2) 26 (7.0) 186 (11.7)
Non-European 202 (16.6) 8 (2.1) 210 (13.2)
Aboriginal or Torres Strait Islander
58 (4.8) 17 (4.6) 75 (4.7)
Total 1,217 (100) 374 (100) 1,591 (100)
Note: 2 = 72.44, p < 0.001
Table 5: Employment
Sydney n (%)
Regional NSW n (%)
Total n (%)
Full-time 849 (71.1) 168 (46.4) 1,017 (65.3)
Part-time 126 (10.5) 67 (18.5) 193 (12.4)
Unemployed/other 220 (18.4) 127 (35.1) 347 (22.3)
Total 1,195 (100) 362 (100) 1,557 (100)
Note: 2 = 74.69, p < 0.001
Table 6: Involvement in broad gay community
Sydney n (%)
Regional NSW n (%)
Total n (%)
Not at all involved 348 (29.0) 86 (23.4) 434 (27.7)
Somewhat involved 724 (60.4) 229 (62.4) 952 (60.9)
Very involved 127 (10.6) 52 (14.2) 179 (11.4)
Total 1,199 (100) 367 (100) 1,566 (100)
Note: 2 = 6.50, p < 0.05
Table 7: Involvement in local gay community
Sydney n (%)
Regional NSW n (%)
Total n (%)
Not at all involved 442 (42.4) 77 (24.3) 519 (38.2)
Somewhat involved 497 (47.6) 181 (57.1) 678 (49.9)
Very involved 104 (10.0) 59 (18.6) 163 (12.0)
Total 1,043 (100) 317 (100) 1,360 (100)
Note: 2 = 40.34, p < 0.001

10 Town and country: gay community survey—Sydney and Regional New South Wales, August–November 2009Holt, Zablotska, Lee, Ryan, Down, Heard, Naim, Prestage and de Wit
Findings
Table 8: Most recent HIV test results (excluding men recruited from sexual health clinics)
Sydney n (%)
Regional NSW n (%)
Total n (%)
HIV-positive 201 (19.6) 50 (16.8) 251 (19.0)
HIV-negative 704 (68.9) 194 (65.3) 898 (68.0)
No tested/no results 119 (11.6) 53 (17.9) 172 (13.0)
Total 1,024 (100) 297 (100) 1,321 (100)
Note: 2 = 8.19, p < 0.05
Table 9: Most recent HIV test among non-HIV-positive men (excluding men recruited from sexual health clinics)
Sydney n (%)
Regional NSW n (%)
Total n (%)
Less than 6 months ago 513 (62.5) 143 (56.3) 656 (61.0)
7–12 months ago 71 (8.7) 35 (13.8) 106 (9.9)
1–2 years ago 139 (16.9) 34 (13.4) 173 (16.1)
More than 2 years ago 98 (11.9) 42 (16.5) 140 (13.0)
Total 821 (100) 254 (100) 1,075 (100)
Note: 2 = 11.06, p < 0.05
Table 10: Agreements with regular male partners about sex within the relationship
Sydney n (%)
Regional NSW n (%)
Total n (%)
No spoken agreement about anal intercourse 108 (20.3) 28 (15.9) 136 (19.2)
No anal intercourse permitted 31 (5.8) 14 (8.0) 45 (6.4)
Anal intercourse permitted only with a condom 187 (35.1) 52 (29.6) 239 (33.7)
Anal intercourse permitted without a condom 207 (38.8) 82 (46.6) 289 (40.8)
Total 533 (100) 176 (100) 709 (100)
Table 11: Agreements with regular male partners about sex outside the relationship
Sydney n (%)
Regional NSW n (%)
Total n (%)
No spoken agreement about casual sex 149 (28.1) 28 (16.0) 177 (25.1)
Sexual contact with casual partners not permitted 151 (28.5) 75 (42.8) 226 (32.1)
Anal intercourse with casual partners not permitted 25 (4.7) 12 (6.9) 37 (5.3)
Anal intercourse with casual partners permitted only with a condom 173 (32.6) 45 (25.7) 218 (30.9)
Anal intercourse with casual partners permitted without a condom 32 (6.0) 15 (8.6) 47 (6.7)
Total 530 (100) 175 (100) 705 (100)
Note: 2 = 20.62, p < 0.001

Town and country: gay community survey—Sydney and Regional New South Wales, August–November 2009Holt, Zablotska, Lee, Ryan, Down, Heard, Naim, Prestage and de Wit
11
Findings
Table 12: Match of HIV status between regular partners
Sydney n (%)
Regional NSW n (%)
Total n (%)
Seroconcordant, HIV-positive 34 (6.0) 7 (3.5) 41 (5.4)
Seroconcordant, HIV-negative 261 (46.0) 85 (42.9) 346 (45.2)
Serodiscordant 67 (11.8) 12 (6.1) 79 (10.3)
Serononconcordant 206 (36.3) 94 (47.5) 300 (39.2)
Total 568 (100) 198 (100) 766 (100)
Note: 2 = 11.34, p < 0.05
Table 13: Anal intercourse and condom use with regular partners
Sydney n (%)
Regional NSW n (%)
Total n (%)
No anal intercourse 186 (32.8) 68 (34.3) 254 (33.2)
Always uses a condom 117 (20.6) 32 (16.2) 149 (19.5)
Sometimes does not use a condom 265 (46.7) 98 (49.5) 363 (47.4)
Total 568 (100) 363 (47.4) 766 (100)
Table 14: Anal intercourse and condom use with casual partners
Sydney n (%)
Regional NSW n (%)
Total n (%)
No anal intercourse 313 (26.8) 136 (38.0) 449 (29.4)
Always uses a condom 468 (40.0) 106 (29.6) 574 (37.6)
Sometimes does not use a condom 389 (33.3) 116 (32.4) 505 (33.1)
Total 1,170 (100) 358 (100) 1,528 (100)
Note: 2 = 19.72, p < 0.001
Table 15: Number of male sex partners in the six months prior to the survey
Sydney n (%)
Regional NSW n (%)
Total n (%)
None 121 (10.2) 67 (18.3) 188 (12.1)
One 177 (14.9) 76 (20.8) 253 (16.3)
2–10 498 (41.8) 171 (46.7) 669 (42.9)
11–20 180 (15.1) 28 (7.7) 208 (13.4)
21–50 148 (12.4) 18 (4.9) 166 (10.7)
Over 50 68 (5.7) 6 (1.6) 74 (4.8)
Total 1,192 (100) 366 (100) 1,558 (100)
Note: 2 = 59.22, p < 0.001
Table 16: Where men met their male sex partners, by geographical area
Sydney (%)
Regional NSW (%)
p-value
Sydney 77.7 25.1 p < 0.001
Town/suburb in NSW 39.9 57.0 p < 0.001
Elsewhere in NSW 16.8 29.4 p < 0.001
In other states/territories 20.1 17.7 ns
Overseas 21.5 6.4 p < 0.001
Note: These categories are not mutually exclusive.
12 Town and country: gay community survey—Sydney and Regional New South Wales, August–November 2009Holt, Zablotska, Lee, Ryan, Down, Heard, Naim, Prestage and de Wit
Findings
Table 17: Where men met their male sex partners, by venue or source
Sydney (%)
Regional NSW (%)
p-value
Beats 24.3 27.5 ns
Dance parties 30.7 28.9 ns
Gay bars 52.6 37.7 p < 0.001
Gym 16.7 5.4 p < 0.001
Internet 53.6 50.3 ns
Private sex parties 16.0 15.2 ns
Saunas 62.1 25.3 p < 0.001
Sex workers 5.2 2.6 ns
Sex-on-premises venues 42.5 23.0 p < 0.001
Through friends 32.3 46.6 p < 0.001
Note: These categories are not mutually exclusive.

Town and country: gay community survey—Sydney and Regional New South Wales, August–November 2009Holt, Zablotska, Lee, Ryan, Down, Heard, Naim, Prestage and de Wit
A1
Appendix
National Centre in HIV Social Research & National Centre in HIV Epidemiology & Clinical Research THE UNIVERSITY OF NEW SOUTH WALES ACON PLWHA (NSW)
Sydney Gay Community Periodic SurveyThis survey is for men who have had sex with another man in the past five years.
PLEASE DO NOT COMPLETE IF YOU HAVE ALREADY DONE SO THIS WEEK.For each question, please TICK one box only if not otherwise specified
1. How many of your friends are gay or homosexual men? None 1 A few 2 Some 3 Most 4 All 52. How much of your free time is spent with gay or homosexual men? None 1 A little 2 Some 3 A lot 43. How old are you? _______ years 4. Are you of Aboriginal or Torres Strait Islander origin? No 1 Yes 2 5. What is your ethnic background? (eg Dutch, Greek, Indian) Anglo-Australian only 01 Other
6. Are you: (tick one only) Employed full-time 1 Employed part-time 2 On pension / social security 3 A student 4 Unemployed 5 Other 6
7. Where do you live?? Postcode: OR Suburb/Town: __________________________________ 8. Are you … Gay/Homosexual 1 Bisexual 2 Other 3 Unsure 49. How involved do you see yourself in the gay community?The gay community in general Not at all involved 1 Somewhat involved 2 Very involved 3Your local gay community Not at all involved 1 Somewhat involved 2 Very involved 3
In this survey we distinguish between REGULAR (boyfriend/lover) and CASUAL partners… 10. Do you currently have sex with A. CASUAL male partners? No 1 Yes 2 B. REGULAR male partner? No 1 Yes 2
About your regular partner…11. If you are in a regular relationship with a man, for how long has it been?
Less than 6 months 1 6–11 months 2 1–2 years 3 More than 2 years 4 Not in a regular relationship with a man 5
12. Where does your regular partner live? (skip to Q.22) With me 1 Nearby, 2 In another town in NSW 3 In another state/territory 4 Overseas 5
13. If you and your regular partner do not live in the same city, how often have you met in the past six months? Every week 1 once or twice a month 2 once every few months 3 only once 4 we did not meet in past six months 5
14. Do you have a clear (spoken) agreement with your regular partner about anal sex (fucking) within your relationship? No agreement 1 Agreement: All anal sex is with a condom 3 Agreement: No anal sex at all 2 Agreement: Anal sex can be without a condom 4
15. Do you have a clear (spoken) agreement with your regular partner about sex with other male partners? No agreement 1 Agreement: No sex at all 2 Agreement: All anal sex is with a condom 4 Agreement: No anal sex at all 3 Agreement: Anal sex can be without a condom 5
16. When was your regular partner’s last tested for HIV? In the last 6 months 1 More than 6 months ago 2 Never 3 I don’t know 4
17. What is your regular partner’s HIV status? No test / Don’t know 1 Negative 2 Positive 3
If your regular partner is HIV positive: 18. Is your regular partner on combination antiretroviral therapy? No 1 Yes 2 19. Is his viral load…? Undetectable 1 Detectable 2 Don’t know / unsure 3
20. In the last 6 months, have you had sex with a regular partner: Yes 1 No 2 (Skip to Q.22)21. In the last 6 months, which of the following have you done with your regular partner?
Never Occasionally Often Never Occasionally Often Oral Sex : I sucked his cock 1 2 3 He sucked my cock 1 2 3
Anal Sex: I fucked him with a condom 1 2 3 He fucked me with a condom 1 2 3
I fucked him without a condom, but pulled out before I came 1 2 3 He fucked me without a condom,
but pulled out before he came 1 2 3
I fucked him without a condom and came inside 1 2 3 He fucked me without a condom
and came inside 1 2 3
22. Have you ever had an HIV test? Yes 2 No 1 Skip to Q.29 over the page23. When were you last tested for HIV? Less than a week ago 1 1–6 months ago 3 1–2 years ago 5
1–4 weeks ago 2 7–12 months ago 4 Over 2 years ago 6 Never 7
24. Based on the results of your HIV tests, what is your HIV status? No test/Don’t know 1 Negative 2 Positive 3
If you are HIV positive: 25. When were you first diagnosed as HIV-positive? Year 26. Where were you first diagnosed as HIV-positive? Sydney 1 Town/suburb where I live 2 Somewhere else in NSW 3 Other state/territories 4 Overseas 5
27. Are you on combination antiretroviral therapy? No 1 Yes 228. Is your viral load? Undetectable 1 Detectable 2 Don’t know / unsure 3

A2 Town and country: gay community survey—Sydney and Regional New South Wales, August–November 2009Holt, Zablotska, Lee, Ryan, Down, Heard, Naim, Prestage and de Wit
29. In the last 6 months, how many different men in total have you had sex with? None 1 One 2 2–5 men 3 6–10 men 4 11–20 men 5 21–50 men 6 More than 50 men 7
30. In the last 6 months, which of the following have you done with other male partners?Never Occasionally Often Never Occasionally Often
Oral Sex : I sucked his cock 1 2 3 He sucked my cock 1 2 3
Anal Sex: I fucked him with a condom 1 2 3 He fucked me with a condom 1 2 3I fucked him without a condom, but
pulled out before I came 1 2 3 He fucked me without a condom,but pulled out before he came 1 2 3
I fucked him without a condom andcame inside 1 2 3 He fucked me without a condom
and came inside 1 2 3
31. In the last 6 months, how often did you have sex with other male partners in any of the following places?Sydney Never 1 Occasionally 2 Often 3
Town/suburb where I live Never 1 Occasionally 2 Often 3Somewhere else in NSW Never 1 Occasionally 2 Often 3
Interstate Never 1 Occasionally 2 Often 3Was it in Victoria 1 Queensland 1 other state/territory 1 ? (tick all that apply)
Overseas Never 1 Occasionally 2 Often 3 Please list countries where this happened: __________________________________________________________________32. In the last 6 months, did you fuck or were you fucked WITHOUT a condom by any man you knew to be (Please tick all that apply) HIV-positive HIV-negative or Whose HIV status you did not know
…in Sydney No 1 Yes 2 No 1 Yes 2 No 1 Yes 2Town/suburb where I live No 1 Yes 2 No 1 Yes 2 No 1 Yes 2
Somewhere else in NSW No 1 Yes 2 No 1 Yes 2 No 1 Yes 2Interstate No 1 Yes 2 No 1 Yes 2 No 1 Yes 2Overseas No 1 Yes 2 No 1 Yes 2 No 1 Yes 2
33. In the last 6 months, did you ……. A. Have group sex with at least two men? B. Use party drugs for sex?
…in Sydney No 1 Yes 2 …in Sydney No 1 Yes 2Town/suburb where I live No 1 Yes 2 Town/suburb where I live No 1 Yes 2
Somewhere else in NSW No 1 Yes 2 Somewhere else in NSW No 1 Yes 2Interstate No 1 Yes 2 Interstate No 1 Yes 2Overseas No 1 Yes 2 Overseas No 1 Yes 2
34. In the last 6 months, when you had sex with other male partners in your home town, to how many of them did you tell your HIV status before sex? None 1 Some 2 All 3 No sex there with other male partners 4
35. In the last 6 months, if visiting the following places, how many of your other male partners told you his HIV status before sex?Sydney None 1 Some 2 All 3 No sex there with other male partners 4
Town/suburb where I live None 1 Some 2 All 3 No sex there with other male partners 4Somewhere else in NSW None 1 Some 2 All 3 No sex there with other male partners 4
Interstate None 1 Some 2 All 3 No sex there with other male partners 4Overseas None 1 Some 2 All 3 No sex there with other male partners 4
36. In the last 6 months, how often did you meet men for sex in the following ways?Internet Never 1 Occasionally 2 Often 3 Gay sauna Never 1 Occasionally 2 Often 3Gay bar Never 1 Occasionally 2 Often 3 Other sex club/venue Never 1 Occasionally 2 Often 3Dance party Never 1 Occasionally 2 Often 3 Private sex party Never 1 Occasionally 2 Often 3Gym Never 1 Occasionally 2 Often 3 Through friends Never 1 Occasionally 2 Often 3Beat Never 1 Occasionally 2 Often 3 Sex workers Never 1 Occasionally 2 Often 3
37.Compared with Sydney, how likely do you think it is to get HIV when having sex without a condom with men in …..? Other parts of NSW less likely than in Sydney 1 same as in Sydney 2 more likely than in Sydney 3 I don’t know 4 Other states: less likely than in Sydney 1 same as in Sydney 2 more likely than in Sydney 3 I don’t know 4 Overseas : less likely than in Sydney 1 same as in Sydney 2 more likely than in Sydney 3 I don’t know 4
38. When did you last have a check for any sexually transmitted infection (STI or STD) other than HIV?Less than a week ago 1 1–6 months ago 3 1–2 years ago 5
1–4 weeks ago 2 7–12 months ago 4 Over 2 years ago 6 Never 7
39. Where did you go the last time you had a test for any sexually transmitted infection (STI or STD) other than HIV?My regular doctor 1 Another doctor 2 A sexual health clinic 3 Hospital 4 Somewhere else 5
40. Where was this service located? Sydney 1 Town/suburb where I live 2 Somewhere else in NSW 3 Other state/territories 4 Overseas 5
41 Please look at the resource materials on the reverse side of the Information Sheet. Which ones have you seen before? A: Yes 1 No 2 B: Yes 1 No 2 C: Yes 1 No 2 D: Yes 1 No 2
--------------------------------------------------------------------------------------------------------------------------------------------------------------------------------------------------------------------------------------------------------------------------------- T H A N K Y O U F O R Y O U R T I M E 2 - 2009/