Embed Size (px)
Citation preview

Economic Histoy Rm’ew, XLVIII, 4(1995), pp. 643664
Tracing the beginning of the Kuznets curve: western EuroDe during the early modern period
By 3. L. VAN ZANDEN
n some respects comparative research into the inequality of income and I wealth in western Europe during the early modern period is virgin territory. There are a large number of studies on the assessment lists of several kinds of taxes on (components of) wealth, such as land, merchant capital, and houses, that give an impression of the degree of inequality in this period.’ But the analysis is virtually always confined to the construction of a benchmark estimate of the inequality of wealth or of the social structure in a specific region or city. Only a few studies attempt to present a long- term view on the development of inequality based upon a comparison of data from a number of towns and villages. Nevertheless, they have not ventured beyond the observation that the late medieval sources show a large measure of inequality and that this pattern persisted in the cities of the early modem period.2
Research into the inequality in early modern western Europe is in need of a theoretical framework that allows for a consistent interpretation of the results of the various case studies. The historiography of the development of income inequality in the nineteenth and twentieth centuries has gained a measure of conceptual unity by means of the Kuznets curve, a hypothesis dating from 1955.3 During the first phase of ‘modern economic growth’ Kuznets found an increase in income inequality. After 19 or 1920 this trend ended and a process of continuous levelling of incomes began, which persevered until the 1970s as can presently be established. On the strength of these findings Kuznets argued that the relation between modern economic growth and the inequality of income displayed an inverse U-shaped curve. During the 1970s this hypothesis was revived by the work of Lindert and Williamson on inequality in the United States and Great Britain.4 Despite their research, the ‘upswing’ of inequality in Great Britain in the first half of the nineteenth century remains controversial. In a scathing review Feinstein has sharply criticized Williamson’s conclusions.5 In a recent survey
A review of these studies is presented in section 11, below. Drafts of this article were presented at the workshop on economic history at the Free University of Brussels, and at the Congress of the American Economic History Association. I wish to thank the participants in these sessions and Edwin Horlings, Maarten Prak, Jan de Vries, and the anonymous referees of this journal for their comments. *See for instance Van Uytven and Blockmans, ‘Noodzaak’; Fischer and Szarda, ‘Die sociale
Verteilung’; Fiigedi, ‘Steuerliste’; Slack, Povery, pp. 40-3. Kuznets, ‘Economic growth’. Lindert and Williamson, ‘Three centuries’; Williamson and Lindert, Ameriun inequality; Williamson,
Feinstein, ‘Rise and fall’. British capitolism.
0 E c d H i m y S&.y 1995. Published by B h c h U Publ i sh , 108 CmLy Road, Oxford OX4 rJF, UK ad 238 Main Suert, Com6ndgr, MA 02142, USA.

644 J . L . VAN ZANDEN
of research into income inequality in the nineteenth and twentieth centuries Kaelble and Thomas observed that the ‘downswing’ of the U-curve-the decline in inequality during the twentieth century-has been demonstrated conclusively by empirical examination, but that the ‘upswing’ is still under discussion. The increase in income inequality during the nineteenth century has been shown adequately only for (parts of) Germany and Sweden. On the other hand, Scandinavian countries such as Denmark and Norway do not provide any indication of an increase in inequality.6
It is striking that historians of the Kuznets curve have made various subtle distinctions in the analysis of the actual development of inequality, while the concept of ‘modern economic growth’, the other ‘variable’ in Kuznets’s hypothesis, has been left aside. Yet, research into the origins and development of the industrial revolution has made important contributions to the reassessment of this concept. Intriguing publications by Crafts, Cameron, and others emphasize the gradual nature of industrialization,’ while a separate theory was formulated that stresses the early modern roots of ‘modern industry’-the theory of ‘proto-industry’. * This has put into perspective the classic image of an agrarian economy that stagnated until about 1780 or 1820 and that underwent a process of dynamic economic growth only after a phase of ‘take-off. The great importance of developments in international trade, of urbanization, and of the increase in agricultural productivity before 1750 are now generally recognized.
This ‘new’ approach to economic development in the period before 1800 raises the question whether the history of the Kuznets curve can be extended into the early modern period. In other words, was there a connection between ‘premodern economic g r ~ w t h ’ ~ and the development of the inequality of income and wealth? This question is at the centre of this article. In short, the proposition is that premodern economic growth was coupled with an upswing in inequality. First, the patterns of inequality in Europe during the early modern period will be examined by way of introduction. Next, a case study will be presented concerning income inequality in Holland in the period 1561-1808. The final sections deal with the theoretical approach to historical changes in the inequality of income and wealth. In this context various interpretations of the Kuznets curve will be discussed.
I
Numerous monographs of towns and regions in western Europe during the early modern period make use of data regarding the distribution of wealth, or its components, among the population, for example to give an impression of the social stratification. If the results of these studies are systematically compared, a number of patterns can be discerned which have
Kaelble and Thomas, ‘Introduction’, pp. 43-5.
Mendels, ‘Proto-industrialization’. I prefer the phrase ‘premodern economic growth‘ to the term coined by Persson in his title, Pre-
industrial econornic growth because Persson’s term again seems to stress the role of industry in economic development before the ‘industrial revolution’.
0 Economic H u m Sm-iety IM
’ Crafts, British economic growth; Cameron, Concise economic histmy, pp. 221-72.

THE BEGINNING OF THE KUZNETS CURVE 645 not been the subject of examination as yet. This section will provide a short description of these patterns on the basis of data from several countries.
One of the most famous sources for the study of inequality in the late middle ages is the Florentine catasto of 1427, which is a highly detailed register of the wealth of the inhabitants of Tuscany. Thanks to the work of Herlihy, Klapisch-Zuber, Brown, and others it is possible to estimate the measure of inequality in the distribution of wealth in the cities (and in a part of the countryside). An important drawback of the source is the absence of the poor. Using the catasto of 1457 De Roover has constructed a wealth pyramid including and excluding the propertyless.10 It can be calculated from his data that the Gini-coefficient including the poor is roughly 8 per cent higher than the coefficient excluding this group (0.847 and 0.787 respectively). Thus, the estimates presented in table I slightly underestimate the measure of inequality.
Table I . Inequality in the distribution of wealth according to the Florentine catasto of 1427
Florence Six smaller cities
Pistoia countryside of Pistoia
Plain Middle hills Mountains
PeSCia
Number of inhabitants 40,000
3,@33-7,000
4,412
5,700 3 Po9 2,928 I ,800
Gini-coeflicient Top I% Top f‘h Poorest 50%
3
59 4
47 7 0.634 37 I3 0.533 36 15 0.515
0.605 - 44 I 0
- 0.788 27 67 - - 0.747
0.713 -
- - -
~~ ~ ~
Nore: Ad data exclude ‘paupers’ with the excepnon of Pescia where a number of such households was included. The six smaller ciues are: Rsa, Pistoia, Arezzo, Prato, Volterra, and &ITOM.
Sources: Herlihy, M e d m 1 and Renurrsunce Prtm, pp. 70, 188; Idem, Crms and socw~y, x111.8; Herlhy and Klapixh- Zuber, Les Toscam, p. 250; Brown, In the shodow.
This objection does not detract from the pattern that is shown by these data: in the large city of Florence inequality is considerably greater than in the smaller towns, while wealth is even more equally distributed in tiny Pescia. Finally, from Herlihy’s data for the countryside of Pistoia it can be deduced that the inequality of wealth was even less than in the small towns. In addition, inequality in the poorer mountain areas was lower than in the relatively affluent plains.
These and other comparable studies generally show that the inequality of wealth was large in the cities of late medieval and early modern Europe. Gini-coefficients of at least 0.75 were normal in cities such as Lyons (1545),” Dresden (1488 and 1502), Freiburg ( I M ~ ) , Konstanz (1450),’~ Norwich (I525),I3 Leiden (1498), Haarlem (1483), and Alkmaar (1534).14 Much lower values were found in smaller towns such as Edam (in Holland) in 1462
lo De Roover, Rise and decline, pp. 21-31. Calculated from Gascon, Grand commerce, pp. 369-72, 892-5. Fiigedi, ‘Steuerliste’, pp. 67, 74.
I3 Calculated from Pound, ‘Social and trade structure’, p. 131. l4 Van den Berg and Van Zanden, ‘Vier eeuwen’, p. 203.
0 E c m i c €fumy Soctry 1995

646 J . L . VAN ZANDEN
(G = 0.50),15 Zutphen in 1498 (G = o.59),16 or Hildesheim in I450 (G = 0.52).17
The records of the revenue of the wealth tax in Augsburg between 1498 and 1702-a source similar to the catasto-can give an impression of the development of the inequality of wealth in the sixteenth and seventeenth centuries. This source was already used for this purpose by historians at the end of the nineteenth century.” Because all households are included in the tax registers, it provides a fairly accurate picture of the distribution of wealth in this town, which was one of the centres of the (south) German economy in the sixteenth century. The prosperity of the urban economy resulted in a growth of the population from c. 20,000 in 1500 to 48,000 in 1600, which made Augsburg the largest German city (jointly with Danzig).” After 1618 the town was severely struck by the Thirty Years War, which ended the period of economic prosperity and caused a decline in population (to 21,000 in 1650).~O
The wealth tax data allow an examination of the relation between economic prosperity and capital accumulation on the one hand, and the development of the inequality of wealth on the other. For that purpose figure I displays: (I) the estimated Gini-coefficient of the inequality of wealth in Augsburg; (2) the total number of ‘Steuerzuhler’ including the poor, who merely paid the ‘stuira minor’; and (3) the average sum paid by the ‘Steuerzuhler’, which may serve as an indication of per caput wealth since tariffs remained unchanged. This figure demonstrates that during the sixteenth century the economic flourishing of the city resulted in a growth of population, of capital holdings, and of inequality. On balance the Gini coefficient increased by 35 per cent from 0.657 in 1498 to 0.890 in 1604. However, the Thirty Years War brought about a sharp decline in population, capital holdings, and inequality. It can be concluded that in Augsburg, a city which was in many respects typical of the economic expansion of the sixteenth century, capital accumulation was accompanied by an increase in inequality, and that the decline after 1618 had a reverse effect.
The primary objection that can be raised against this example is that the data concerning the distribution of wealth provide an overly pessimistic image of the measure of inequality. Nearly all these sources show that 30 to 60 per cent of the urban inhabitants were (all but) unpropertied, and that a very small elite--2 to 5 per cent of the population-wned almost the entire wealth.21 The degree of polarization in the social structure appears to be enormous, but is probably overestimated by the data. Research into labour relations, guilds, and poor relief in the early modern town shows that a large proportion of the working population was self-employed (as artisans) and could count on a relatively stable income, for example through
l5 Ibid. l6 Calculated from Van Schaik, Belasting, p. 219.
l 8 Hartung, ‘Die direkten Steuern’; for this source see also Streider, Zur Genesis, and Roeck, Eine
l9 Figures of urban population from De Vries, European urbanization, pp. 272-3. 2o See Roeck, Eine Studt.
Slack, Poverty, p. 40.
Fugedi, ‘Steuerliste’, p. 74.
Studi, pp. 46-62.
0 Ecaomic Hislory Socicry 1995

THE BEGINNING OF THE KUZNETS CURVE
guild membership. In fact, there probably did exist a kind of ‘middle class’ between the large group of have-nots and the small elite, which was not registered adequately in the wealth taxes.22
647
Figure I . Wealth inequality in Augsburg according to the tax on wealth: number of taxpayers, average awwunt per taxpayer, and Gini coefficient, 1498-1702
A much better impression of social differences can presumably be gained by using data relating to the inequality of the income distribution. But these data are even scarcer; one source is provided by experiments with a tax on income at the end of the seventeenth century and during the eighteenth century in Holland. Soltow analysed the most useful of the remaining tax registers, that of 1742, and arrived at the following estimates of G: Amsterdam 0.69, all cities in Holland south of the IJ 0.70, and the countryside in this region 0.60.~~ In eighteenth-century Holland inequality was also lower in the countryside than in the cities.
Recent research into income inequality in Overijssel in 1750 reveals a similar pattern, although this province, which was much less ‘developed’ than Holland and had a lower per caput income, had a lower aggregate level of inequality (table 2) . The following picture emerges: inequality was most pronounced in the three largest cities, where average income was also relatively high. The estimated Gini-coefficients are similar to those of the cities of Holland. The differences among the three cities are fairly
22 This point was made by Rappaport, Worlds. 23 Soltow, ‘Income and wealth inequality’, p. 77.

648 J. L. VAN Z A N D E N
Table 2. Income inequality in Overijssel according to the assignment of quotas in 1750
Deventer Kampen Zwolle Total (three cities)
Twente Towns Countryside
Total
Sdand Towns Countryside
Total
V o 11 e nh o v e Towns Countryside
Total
Total for province
Number of houses Average income per house
I ,636 385 1,252 265 2,438 285 5,326 310
943 176 2,860 I 4 4 3,803 152
24&93 I 80
Gini-coeffinent 0.62 0.54 0.67 0.64
0.45 0.32 0.36
0.39 0.39 0.39
0.44 0.32 0.36
0.49
Sources: F’rovincial Archives Overijssel (Zwolle), Collectie G.K van den Santheuvel, no. 55; Oude Statenarchief, no. 699; Collectie Placcaaten; population size and the number of households from Slicher van Bath, Samenkuing.
insignificant: the economically stagnant Kampen had a slightly lower measure of inequality than its more dynamic neighbour Zwolle.
There is a wide gap between the three cities and the countryside, where income per house is less than half the urban level and the degree of inequality is almost as large. The average Gini-coefficient of 0.36 for the countryside can be compared with the degree of inequality in the Netherlands in the 1970s and 1980s. Generally speaking inequality is somewhat larger in the towns of Twente and the Land van Vollenhove than in the surrounding countryside. This does not apply to Salland, where the ‘towns’ were poorer than the countryside.
This pattern is confirmed by data on the rental value of houses. It is assumed that these came quite close to the distribution of incomes. To an important degree a house reflects the social status of the occupant. Therefore, information on rents gives an indication of both permanent income and ~ e l l - b e i n g . ~ ~
As a rule information on the rental value of houses shows a much lower degree of inequality than the records of wealth taxes. For two German towns, Weimar and Eisenach, both types of source are available for the year 1542. These demonstrate the following. The inequality of wealth was, compared with that of other German towns, not very high: G is 0.64 for Weimar (426 households) and 0.65 for Eisenach (632 households). The Gini-
24 Williamson, British capitalism, p. 59; Van den Berg and Van Zanden, ‘Vier eeuwen’, p. 196. 0 ECOIU~IU HUWIY SociOry I995

THE BEGINNING OF THE KUZNETS CURVE 649 coefficient of the rental value of houses is the same for both towns: 0.46 or almost 30 per cent lower than the unevenness of the distribution of wealth.25
Data relating to the distribution of wealth in the (large) cities thus generally suggest a very high degree of inequality in western Europe during the modern period. Gini-coefficients could rise to as much as 0.8 or even 0.9. By and large the measure of inequality in the income distribution was much lower. Gini-coefficients of the order of 0.5 to 0.65 were presumably ‘normal’ for the (large) towns, even though for Amsterdam the data clearly rise above this level.
In the main centres of merchant capitalism-Florence, Augsburg, Amster- dam-the extent of inequality was larger than in smaller towns, while the countryside was characterized by a reasonably low degree of inequality. Inequality appears to increase systematically along with the level of income and also with the size of the village or town. This stratification was linked to the concentration of capital in the cities and especially in the centres of merchant capitalism, where international trade and banking were concen- trated. The Medici, the Fuggers, and the Trippen had enormous fortunes that dominated the pyramids of income and wealth in these cities. This was also the explanation Herlihy and Klapisch-Zuber gave for this pattern. In Tuscany wealth was to a large extent concentrated in the capital, Florence. Per caput wealth was much lower in the smaller cities-and all the more so in the countryside-than in the capital, where the wealthiest citizens lived. 26
In the countryside the differences in income between farmers, cottagers, and farm labourers were small, even though this may reflect a ‘perspectival diminution’: from the viewpoint of the elite, those who compiled the tax registers, the differences between farmers and cottagers may have seemed insignificant. The income of small groups of merchants and ‘petty bourgeois’ (shopkeepers, teachers, clergymen, craftsmen) in the small towns and parishes was considerably higher than that of most farmers and smallholders. But since they were relatively small in number the top of the income pyramid was fairly small (and flat) in the countryside. Moreover, a fair proportion of the large landowners in Tuscany and Overijssel lived in the towns. This transfer of income from the countryside to the towns contributed significantly to the high level and concentration of income in the urban sector. In the early modern period income from land was a highly dynamic part of the total income of cities, which increased as a result of the growth of agricultural productivity and the long-term rise of the relative price of agricultural product^.^' Due to this mechanism the ‘agricultural revolution’ of this period also added to the increase in inequality in town and countryside.
There are therefore reasons to assume that economic development, urbanization, and capital accumulation in the early modern period went
25 Calculated from Eberhardt, ‘Die Land- und Tiirkensteuerregister’, pp. 17, 41; it can be added that according to this study inequality of wealth in the countryside was less extreme than in the two towns.
26 Herlihy and Klapisch-Zuber, Les Toscans, p. 250. 27 Studies which show the long term rise in rents are Hoffman, ‘Land rents’; Daelemans, ‘Pachten’;
VandenBroeke, Vlaamse koopkracht. @ ECOWIIZU HUW SOcirrJl I993

650 J. L. VAN ZANDEN
hand in hand with an increase in inequality. This could mean that the origins of the Kuznets curve must be located in the early modern period. In this context a ‘super Kuznets curve’ might be suggested with an upward phase from the sixteenth century to the nineteenth and a downward phase in the twentieth century. The following section will test this hypothesis for the province of Holland.
I1
Testing the hypothesis of an increase in income inequality during the phase of premodern economic expansion is made possible by the availability of a number of unique sources regarding the tax on the rental value of dwellings (and other buildings). For the years 1561 and 1732 the records of the tax of the tenth penny and of the property tax (verponding) respectively have been preserved for nearly every town and village in Holland. These records give detailed information on the average annual rent of dwellings. For the year 1808 detailed stratifications of the rental value of houses are available which make possible an accurate analysis of income inequality.
The unique advantage of these sources is that they cover the total distribution of income including the poor. For 1561 this is sometimes supplemented by information on the occupation of the heads of households, on whether the house was owned by its occupant or rented out, and so on. On the basis of this source De Vries has made a detailed analysis of the social structure of the countryside of Holland in the sixteenth century.28
The sources of 1561 and 1732 have two main shortcoming^.^^ In 1561 many returns of villages make no separate note of the rental value of the dwelling house, but merely state the total rent of the entire farm. Only a limited number of records provide full information; in 1732 the returns of most towns have a similar problem: only the total rent of the entire building is stated, whereas most buildings were occupied by several households. For this reason research was limited to those towns for which complete information of rental value per household is a~ailable.~’
Since this examination had to be restricted to those towns and villages for which suitable data were available in both benchmark years, taking a random sample was out of the question. Instead, I opted for a segmented ‘sample’: Holland is divided into five demographic units: the city of Amsterdam; the large industrial towns (Leiden, Delft, Haarlem, Gouda); the (usually smaller) commercial towns (Rotterdam, Dordrecht, Allunaar, Hoorn, and so on); the vlekkm-relatively large villages in the countryside that depended mainly on non-agricultural activities such as shipping, fisheries, peat digging, or textilesand finally the predominantly agricultural villages.31 An estimate was made of the size of the population in each of
28 De Vries, Dutch rural economy, pp. 35-67. 29 For a more detailed discussion of these sources see Van den Berg and Van Zanden, ‘Vier eeuwen’,
30 For Amsterdam in I732 complete information was available for 43 of 60 wards. 31 A detailed analysis of (rural) Holland in the sixteenth and seventeenth centuries is given by
0 Economic Hasmy Sociery 1995
pp. 203-8, and Van Zanden, ‘Income and wealth inequality’.
De Vries, Dutch rural economy.

THE BEGINNING OF THE KUZNETS CURVE 65 1
these segments and the tax returns of a number of towns and villages were processed in each unit in 1561 and 1732. As a rule we took a sample of one in ten in the cities, while the data on the rental value of houses in the villages were copied in their entirety. Population data were then used to weight the results for the towns and villages. On this basis a pyramid of the rental value of dwellings in the whole of Holland could be constructed for the years 1561 and 1732.
Table 3. The inequality of the rent of houses in the cities and the countryside of Holland, 1561
Amsterdam Industrial cities Delft Leiden Commercial cities Dordrecht Rotterdam Alkmaar Hoorn Ail cities 3 vlekken 12 villages
Number of houses Gini-coefficient Average rent per house (fl.) 6,130 0.57 31.99
2,950 0.46 2,860 0.45
2,465 044 I ,670 0.33 1,770 0.34 I ,622 0.37
0.52
556 0.30 1,317 0.36
20.31 9.43 7.62 11.97 ‘7.53 3.82 4.45
Countryside 0.35 4.29 Holland 0.56 9.38
The v k b are: Vlaardingen, Hilversum, and Wormer/Jisp. The villages are: Overschie, Twisk, Katwijk aan Zee, Callantsoog, Bleiswijk, Engelen, Zwijndrecht, Nwrd-Scharwoude, Bodegraven, Ransdorp, Hendrik Ido Ambacht, and Kethel. Sources: National Archives The Hague, Staten van Holland vwr 1572, no. no6 (Amsterdam), 1231, 1234, 1240 (Delft), I243 (Dordrecht), 1251, 1288, 1308, 1312, 1330 (Leiden), 1333, 1371, 1398, 1406, 1429, 1490. For full details: Van Zanden, ‘Income and wealth inequality’.
A number of things stand out in an analysis of the outcome of this examination (table 3). Already in 1561 Amsterdam is not only the largest city by far, it also has the most pronounced inequality and the highest level of average rents. The very expensive houses with a rental value of over 200 guilders are found only in Amsterdam. At the other end of the range the vlekken are characterized by a very low degree of inequality, even lower than in the various agricultural villages. Between these extremes are the remaining towns: the three large cities (Delft, Dordrecht, and Leiden) with a Gini-coefficient of about 20 per cent below the level of Amsterdam, and the smaller towns (Rotterdam, Alkmaar, and Hoorn) with coefficients of inequality resembling those of the countryside. In Holland in 1561 the same pattern can be found as in Tuscany in 1427 and Overijssel in 1750.
The most striking result is that the aggregate Gini-coefficient for Holland is much higher than was expected on the basis of the coefficients of the individual towns and villages. The explanation for this is that differences in income between urban and rural areas and between poor and rich cities were included in the coefficient for Holland. The importance of this factor
652 J . L . VAN ZANDEN
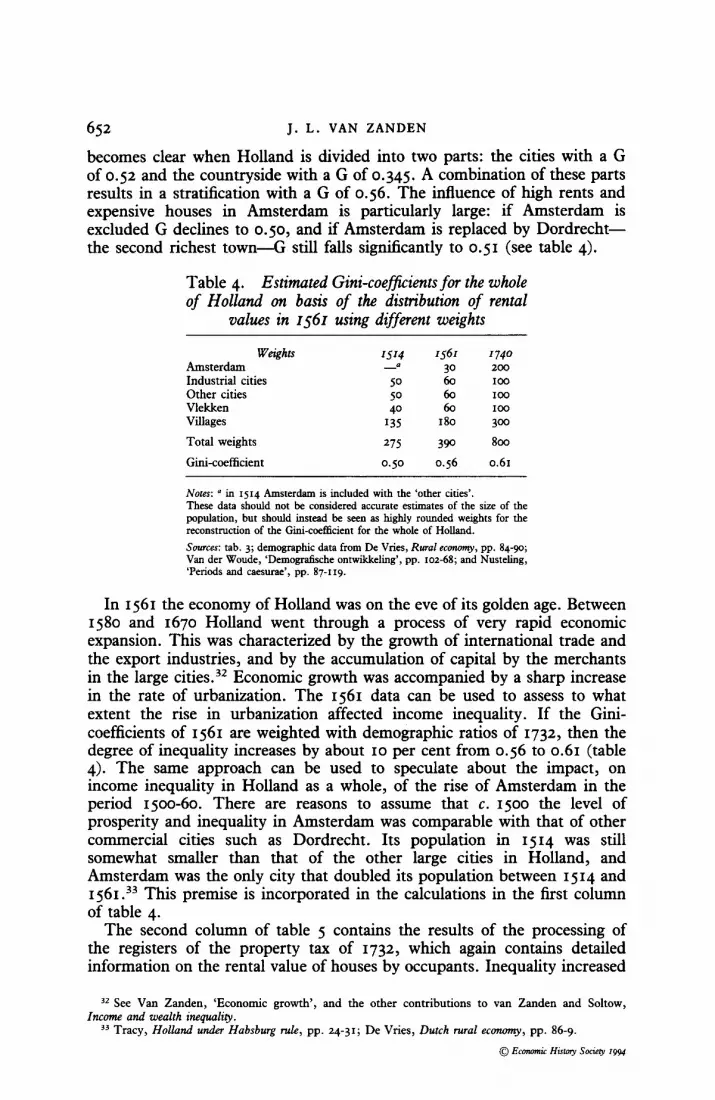
becomes clear when Holland is divided into two parts: the cities with a G of 0.52 and the countryside with a G of 0.345. A combination of these parts results in a stratification with a G of 0.56. The influence of high rents and expensive houses in Amsterdam is particularly large: if Amsterdam is excluded G declines to 0.50, and if Amsterdam is replaced by Dordrecht- the second richest town-G still falls significantly to 0.51 (see table 4).
Table 4. Estimated Gini-coefiients for the whole of Holland on basis of the distribution of rental
values in 1561 using different weights
Weights I 5 I 4 1561 I 7 4 0 Amsterdam - 30 200 Industrial cities 50 60 I 0 0 Other cities 50 60 I 0 0 Vlekken 40 60 I 0 0
Total weights 275 390 800
Villages 135 180 300
Gini-coefficient 0.50 0.56 0.61
Notes: These data should not be considered accurate estimates of the size of the population, but should instead be seen as highly rounded weights for the reconstruction of the Gini-coefficient for the whole of Holland. Sources: tab. 3; demographic data from Jk Vries, Rural economy, pp. 84-90; Van der Woude, ‘Demogralische onnvikkeling’, pp. 102-68; and Nusteling, ‘Periods and caesurae’, pp. 87-119.
in 1514 Amsterdam is included with the ‘other cities’.
In 1561 the economy of Holland was on the eve of its golden age. Between 1580 and 1670 Holland went through a process of very rapid economic expansion. This was characterized by the growth of international trade and the export industries, and by the accumulation of capital by the merchants in the large cities.32 Economic growth was accompanied by a sharp increase in the rate of urbanization. The 1561 data can be used to assess to what extent the rise in urbanization affected income inequality. If the Gini- coefficients of 1561 are weighted with demographic ratios of 1732, then the degree of inequality increases by about 10 per cent from 0.56 to 0.61 (table 4). The same approach can be used to speculate about the impact, on income inequality in Holland as a whole, of the rise of Amsterdam in the period 1500-60. There are reasons to assume that c. 1500 the level of prosperity and inequality in Amsterdam was comparable with that of other commercial cities such as Dordrecht. Its population in 1514 was still somewhat smaller than that of the other large cities in Holland, and Amsterdam was the only city that doubled its population between 1514 and 1 5 6 1 . ~ ~ This premise is incorporated in the calculations in the first column of table 4.
The second column of table 5 contains the results of the processing of the registers of the property tax of 1732, which again contains detailed information on the rental value of houses by occupants. Inequality increased
32 See Van Zanden, ‘Economic growth’, and the other contributions to van Zanden and Soltow,
33 Tracy, Holland under Habsburg rule, pp. 24-31; De Vries, Dutch rural economy, pp. 86-9. Income and wealth ineqwliry.
0 EcmK History Sockty 1994

THE BEGINNING OF THE KUZNETS CURVE
by at least 10 per cent in all the cities and in the three vlekken. It is only in Amsterdam that the Gini-coefficient may have remained stable (but the Amsterdam estimate for 1732 rests on poor data). On balance, according to these calculations inequality increased by 12.5 per cent in the province of Holland between 1561 and 1732. This increase may be understated since the Amsterdam data are incomplete. However, the 1732 estimate for the entire province is in keeping with a similar estimate for 1808, which also arrives at a Gini-coefficient of about 0.63.
653
Table 5 . Gini-coefficients of the inequality of the distribution of incomes and rents, 1561-1808
Amsterdam Leiden Delft Dordrecht Rotterdam Allunaar 3 v l e k h 12 villages Cities Countryside Holland
1561 1732 1808 0.57 0.57” 0.59-0.61 0 4 5 0.49’ 0.46 0.51 0.44 - 0.33 0.34 0.44 0.30 0.39
0.52 0.59
0.56 0.63 0.63
-
0.36 0.37
0.35 0.38
Notes: ’ I749 All data relate to the rental value by occupant. Sources: 1561: tab. 3. 1732: National Archives The Hague, Financie van Holland, no. 488-521;Tjalsma, ‘Een karakterisering’, p. 25 (Leiden 1749). 1808: Soltow, ‘Inequality’; Van Leeuwen, Bijstund, pp. 338-40 (Amsterdam 1808).
Estimate relates to only 43 out of 60 wards.
It should be noted that these calculations of the inequality in house rents in 1732 are lower than Soltow’s estimates of income inequality in 1742, presented in the previous section. This may point towards a systematic underestimation of income inequality by the data on the rental value of houses. Those with higher incomes will spend a progressively smaller part of their income on rent (see the next section). It is also quite possible that Soltow has overestimated the inequality of the income distribution. He used data on incomes only above 600 guilders, and he had to approximate the income of the remaining households (75 to 86 per cent of the total number) by means of log-linear p r~ jec t ion ;~~ this method is, of course, subject to certain margins of error.
By following the share of the various income brackets, movements in the distribution of incomes can be followed more precisely (table 6). The share of the richest I per cent remained virtually unchanged between 1561 and 1808, although a slight increase did take place in the first half of the sixteenth century. This seemingly constant proportion of the richest inhabitants may also be a consequence of problems concerning the use of rental values as an indication of income. During the seventeenth century
34 Soltow, ‘Income and wealth inequality’, p. 74.
0 ECOIWPIU HUW SO&& 29%

654 J . L . VAN ZANDEN
the very affluent not only moved into more expensive houses, they also occupied more than one house-a country house in the summer, a canalside house in the winter. As a result the top of the pyramid of rents became flatter than the top of the income distribution. In a sample of 451 inhabitants of Amsterdam mentioned in the wealth tax of 1742 Soltow found that the inequality of the rental value of their house was much less than that of their income (G is 0.34 and 0.48 re~pectively).~’ In view of the strong growth of the very high incomes in Holland between 1561 and 1732 these data probably underestimate the growth of inequality.
Table 6. The distribution of the rental value of houses and of incomes over deciles and percentiles (%)
Highest 1% 5% 10%
I S W 1561 I732 1808
I 0 14 15 I4 27 34 40 37 40 46 54 52
Deciles 10% to 50% 41 38 34 36 Lowest 50% 19 16 I2 I1
Note: a guesstimates Sources: see tabs. 3 and 5.
Table 6 shows clearly that the share in the rental value of those below the upper I per cent did increase considerably. The upper 5 per cent in particular substantially improved its position. This was done mostly at the expense of the poorer 50 per cent who went through a continuous decline in their share in the total rental value. These figures also confirm the relative stability of the distribution of incomes in the second half of the eighteenth century. This issue deserves some attention: a number of authors have identified the growing gap between rich and poor, which manifested itself in the course of the eighteenth century, with the economic decline of Holland during this period (though without demonstrating this relationship). 36
This examination comes to a different conclusion: the economic prosperity of the long seventeenth century, between 1590 and 1740, was indeed accompanied by an increase in inequality, while the economic stagnation during the rest of the eighteenth century was coupled with a stabilization of the income distribution. Between 1732 and 1808 the share of both extreme groups, the poorer 50 per cent and the richest 5 per cent, decreased slightly. The further decline of the share of the poor may be related to the impoverishment that contemporary authors witnessed during the second half of the eighteenth century. 37 The hypothesis that premodern economic growth-an increase in real income per caput before the onset of Kuznets’s ‘modern economic growth’ in the nineteenth ~entury~~-went hand in hand with an important increase in income inequality is confirmed by this examination.
35 Ibid., p. 76. 36 See Riley, ‘Dutch economy after 1650’, pp. 552-60. 37 See for instance Jansen, ‘Poverty’. 38 Estimates of the growth of GDP per head are in Van Zanden, ‘Economic growth‘.

THE BEGINNING OF THE KUZNETS CURVE 655 Apart from Holland, in the early modern period Great Britain was
probably the best example of a dynamic economy that was able to increase its per caput income. It is tempting to make a comparison between the countries on both sides of the North Sea. For Great Britain the data on the inequality of income distribution start in 1688 with the estimates of Gregory King. Soltow shows that these data can be used to argue for an almost constant level of income inequality between 1688 (G = 0.55) and 1801-3 (G = 0.56).~~ A revision of these data by Lindert and Williamson resulted in somewhat lower estimates; according to their work G fell from 0.54 in 1688 to 0.51 in 1759 and started to increase rapidly during the classic period of the industrial revolution (G = 0.58 in 1801-3).~’ In view of Feinstein’s criticism of the way in which these estimates were constructed, the debate on the development of inequality in Great Britain is still in progress. In comparison with the level of inequality in Holland, with coefficients of 0.70 (income distribution according to Soltow) or 0.63 (rental values according to this study), it seems that the degree of inequality of the income distribution in Britain was significantly lower. A different outcome might have been expected in view of the large differences in the structure of landownership in the two countries. Large landholders dominated the British countryside, whereas they were virtually non-existent in Holland. The much higher level of urbanization and the importance of a very wealthy bourgeoisie in Holland were probably behind the relatively high level of inequality there.
I11
We will consider various interpretations of the Kuznets curve in an analysis of these results. Roughly speaking, the literature provides three explanations relating to the development of inequality in early modern Europe.
Kuznets himself gave the following straightforward explanation. Modern economic growth is related to a shift of labour from a sector with low income and productivity-agriculture-to high-income sectors--industry (and services). If we assume that the income gap between traditional and modern sectors remains the same during this transition, then for mathematical reasons income inequality will increase during the first phase of growth. If 100 per cent of the working population is employed in agriculture, income inequality will be minimal. But if this percentage declines and the proportion of the population that earns a higher income in industry grows, inequality increases. This development proceeds until about 50 per cent of the labour force is agricultural. Beyond this point inequality will diminish, because a growing part of the population earns the higher industrial income. In short, the inverted U-curve is a consequence of the transition from a traditional agrarian economy with a low income level to a ‘modern’ industrial society with a high income level.41
If we replace industry and agriculture with urban and rural-an option
39 Soltow, ‘Long-run changes’.
41 Kuznets, ‘Economic growth‘; see also Kaelble and Thomas, ‘Introduction’, pp. 9-14. Linden and Williamson, ‘Reinterpreting’, p. 102.
0 E c m u H i m y Socierr 1994

656 J . L . VAN ZANDEN
also suggested by Kuznets-then this interpretation fits well with the results presented above. In early modern Europe urban incomes were without doubt higher than those in the countryside. The gradual urbanization that typified this period probably contributed to a rise in income inequality through the mechanism described by Kuznets. Nevertheless, this ‘model’ fails to provide a conclusive interpretation of the upswing of the super Kuznets curve. After all, Kuznets’s model does not allow for the striking differences in the degree of inequality in town and countryside that run parallel to differences in the level of income. Perhaps the ‘upswing’ of the U-curve should not be explained by the higher level of urban incomes, but by the larger degree of inequality in the cities, especially in the large centres of merchant capitalism. In order to account decisively for this phenomenon, we have to investigate the differences in the social and economic structure of the towns and the countryside as well as processes of proletarianization and capital accumulation that underlay this structure. Thus we arrive at the second, ‘classical’ explanation of the Kuznets curve and of changes in income inequality in general.
IV This approach has its origins in the works of the classical economists
(Smith and Ricardo) and Mam4* It explains variations in the inequality of income from changes in the functional distribution of incomes. In this view the quantitative relations between income from wages, capital, and land are decisive, and these relations are ultimately determined by the relative position and power of the various social groups-nobility , entrepreneurs, and the working class. In Mam’s view the early modern period witnessed the division between workers and the means of production. This was the phase of the original accumulation of capital. As a result capital (and perhaps income) was increasingly concentrated in the hands of a small group of ‘capitalists’. This involves a number of interrelated and fairly well-documented processes.43 First, the proletarianization of labour in the course of which the share of the self-employed in the labour force declined and the share of wage-earning workers increased. Secondly, a decline in real wages in the long run, in particular during periods of inflation (1500-1650 and after 1750). Thirdly, the accumulation of capital, especially at the urban junctions in the network of international trade: Antwerp, southern Germany, and northern Italy in the sixteenth century (and earlier); Holland in the seventeenth century; and England in the eighteenth. Fourthly, the concen- tration of capital holdings in the hands of the urban citizenry, which can be considered the reverse of the proletarianization of labour during this period.
To a varying degree these processes have all been the subject of intensive
42 A recent review of the debate on this issue by the members of the German Historical School is
43 A general survey of these processes m Lis and Soly, Poverfy. 44 Evidence of the concentration of capital in Holland is supplied by Klein, ‘De heffig’, pp. 31, 41-
given by Dumke, ‘Income inequality’, pp: 118-25.
63; a detailed discussion of this process is given in Van Zanden, ‘Income and wealth inequality’. 0 Ecaanu Humy Sofrery 1995

THE BEGINNING OF THE KUZNETS CURVE 657 study. A summary of the most important results will therefore suffice. Since the work of Hamilton on the price revolution of the sixteenth century and its consequences for the functional distribution of incomes, numerous studies have appeared regarding the development of real wages in western Europe. Virtually all of these show a long-term decline in real In this respect the publications of Phelps Brown and Hopkins (especially) on the price revolution of the sixteenth century are as pessimistic as the recent research of Soderberg on the development of real wages in a large number of European cities in the period 1730-1850.~~ With a few exceptions (such as Copenhagen) the latter examination found a downward trend in real wages in the second half of the eighteenth century. Apart from the few cases where the development of wages managed to keep up with the movement of prices as, for example, in Florence in the sixteenth ~entury,~’ or Holland after 1580:~ it seems reasonable to conclude that real wages declined in western Europe between 1500 and 1800. It is conceivable that the fall in wages was compensated by working longer or harder, by mobilizing more members of the household into the production process, or by introducing cheap substitutes-potatoes or maize-that lessened the decrease in purchasing power.49 The standard of living probably declined less than real wages suggest, even though this does not alter the fact that the wage level fell.
The proletarianization of labour has been documented less extensively. Important information on this process can be derived from numerous studies of the long-term development of rural regions, which have been published in the past 40 years, inspired by the paradigm of Annales. The outlines of two patterns can be distinguished. In large parts of western Europe-from the countryside of Osnabriick to Tuscany-the number of (large) farms increased little, if at all. Due to population growth a group of ‘cottars’, ‘Heuerlinge’ or ‘luvorutom’ came into existence. These usually had a small farm, but to make ends meet they had to work as wage labourers for large commercial farmers, in proto-industry, or as migrant workers in the urban sector.50 In some highly urbanized regions, such as southern England, the western Netherlands, the Paris Basin, and the Po valley, the commercialization and intensification of agriculture was accompanied by the consolidation of large capital-intensive farms and the development of a large group of agricultural labourers entirely dependent on wage labour.51 In both patterns labour was modestly or even to a very high degree pr~letarianized.’~
45 See for instance Abel, Agrarkrisen, pp. 235-366 (with data from Germany, France, Austria, and England).
Phelps Brown and Hopkins, Perspective; Sijderberg, ‘Real wage trends’.
Noordegraaf, Hollandr welvaren?
Fischer, ‘Rural industrialization’; Lucassen, ‘Beschouwingen’, pp. 338-40; Slicher van Bath, Samenleving; Kriedte, Medick, and Schlumbohm, ~ndurfrialisierung, pp. 171-5; Ladurie, Peasants; Macardle, Altopas&, pp. 116-8.
5’ See De Vries, Dutch rural economy; Van Zanden, Transfmtion, pp. 7-10; Jacquart, La h e ; for a new, critical view of the connection between the growth of agricultural productivity and the rise of the large farm, see Allen, ‘Two English agricultural revolutions’. ” Estimates of the development of proletarianization are made by Tilly, ‘Demographic origins’, p. 36.
47 Parenti, Prime ricerche.
49 De Vries, ‘Purchasing power’.
0 ECOW~U Hirtay S~ney 1995

658 J . L. VAN ZANDEN
A detailed ‘classical’ analysis of the relationship between economic growth and the distribution of income in the early modern period is given by Allen. In his study of the agricultural revolution in the south midlands of England he shows that landlords profited most from the increase in productivity; consumers, farmers, and labourers hardly gained at all. In short, real rents increased sevenfold, whereas the standard of living of labourers probably declined as a result of falling real wages and the increase in surplus labour in the country~ide.~~ Allen’s study suggests that even in a region that was characterized by high inequality in landownership at the onset of the process of premodern economic growth, the agrarian revolution of the early modern period must have resulted in an increase in inequality.
V During the last 30 years the ‘classical’ approach has become discredited
with economists who study the causes of income inequality. Research has moved away from changes in the functional distribution of incomes and has increasingly concentrated on the analysis of differences in payment.54 It is assumed that these are connected with differences in productivity and with the scarcity of specific skills. This approach is quite understandable in the light of the relative decline of income from capital in the course of the twentieth century.55 This has (presumably) helped to increase the impact of wage disparities on income inequality. These new theories in the field of income inequality emphasize the relative scarcity of various groups of skilled and unskilled labour rather than the distribution of power among social groups. Williamson has used this approach in his analysis of British inequality in the nineteenth century. His explanation of the upswing in the Kuznets curve is that demand for certain kinds of skilled labour grew rapidly during the first phase of the process of modern economic growth. As a result the difference in pay between unskilled and skilled labour-the skill premium- increased. This rise in the skill premium explains the increase in inequality during the first half of the nineteenth century. The expansion of education and changes in the production process resulted in an increase in the supply of skills and a relative decline in demand for skilled labour. As a result the skill premium began to fall during the second half of the nineteenth century and income inequality diminished in the long run.56
This third approach cannot be tested easily for the early modern period. Research into real wages has focused almost exclusively on the wages of construction workers. These studies generally show a (nearly) stable relation between the wages of skilled workers (carpenters, bricklayers) and unskilled labourers (assistants, hodmen). According to Phelps Brown and Hopkins this ratio remained constant for as long as five centuries and, even though some fluctuations can be found elsewhere, other data do not reveal a clear long- term trend.57
53 Allen, Enclosure, pp. 283-302. 54 See for instance Williamson, ‘Structure of pay’, pp. 1-2. 55 Kaelble and Thomas, ‘Introduction’, p. 8. 56 Williamson, Brinih capitalism. 57 Phelps Brown and Hopkins, Perspective, pp. 9-10; De Vries, ‘Labour market’, pp. 62, 73.

THE BEGINNING OF THE KUZNETS CURVE 659 Williamson, however, also used data on the income of ‘intellectual’
professions (especially) in the service sector (clerks, teachers, clergymen, solicitors) in his study of pay ratios in Great Britain.58 Up to now such information has almost never been collected for the early modern period. At the very most the available studies of wages and prices during this period contain some tables with the salaries of civil servants employed by cities or hospitals, but in the main the number and timespan of these series is insufficient to draw conclusions. One of the exceptions is Pribram’s study of prices, wages, and salaries in Vienna.59 This yields a fairly extensive body of information on salaries of officials employed by the Biirgerhospital, as Schulmeister, Organist, (Wund)artz, Pfarrer, Schaffer, Kellner, Schreiber, and Koch-a wide range of professions that have one thing in common: their payment rises considerably faster than that of construction workers employed by the same organization (table 7). In order to demonstrate this, wage indices of the various occupations were calculated using 1590/1600 as the base period. There are data covering the entire period 1520-1780 for only seven professions. The unweighted average of these seven series is displayed in column 3 of table 7. For an additional 11 professions partial series are available. This information was used to construct the first series of table 7 (which therefore shows a changing number of occupations).
The salaries of these officials increased about twelvefold (measured in grammes of silver), while the daily wage of the Maurergesell rose by no more than 15 per cent (also in grammes of silver). After 1700 especially, salaries increased much faster than the daily wage of construction workers, but this trend can also be observed in the sixteenth and seventeenth centuries, This strong rise occurred in the salary of all the Angestellten of the Biirgerhospital, although there were of course differences between the various occupations. This material shows that in all likelihood an increase in the skill premium took place in Vienna.
Table 7 . The development of wages of salaried employees and of construction workers of the Burgerhospital in Vienna, I S Z O / ~ O - I 770180 (indices
15901160o = 100)
10 to 18 dififerent professions (n) 7 professions Consnuction worker I 520130 I~gOlI600 1640150 I6golI700 1740150 I77011800
70.5 (16) 53.7 102.8 100 (18) I00 1 0 0
194.4 (18) 178.8 143.5 219.9 (15) 180.3 114.1 833.0 (12) 523.2 125.1 821.8 (10) 666.6 117.6
Nofes: The indices refer to wage series converted into grammes of silver. 7 professions: M a m k h t (servant), Mutter uuf der Fmuensruben (‘mother of the women’s room’), Pfmer (preacher), Caplm (chaplain), Wudzrzt (physician), Schfler (manager), and Kellner (waiter). 10 to 18 professions: also include: Schulmeism (teacher), Orgunisr, Koch (cook), A m (physician), Pfim (baker), Superinbdenf, Gtundschreiber (clerk), Zehenrner (tithe collector), Remcmeneer [unidentified], Schreiber (clerk), and Zucchrom (butcher). Construction worker: Mawergere11 (literally, ‘mason’s helper’). Source: Pribram, Materialien.
s8 Williamson, ‘Structure of pay’. 59 Pribram, Materialien.

660 J . L . VAN ZANDEN
The same process was documented by Jansson and Soderberg for Stockholm in the seventeenth century. They found that ‘the wage scale is widening: the qualified gain more than the lower administrative personnel, who in turn gain more than the building labourers’. In their view this must be explained by a process of professionalization and the transfer to full-time jobs. 6o
Some additional research has been done on the development of salaries of employees of the city of Amsterdam. One complication of this type of research is that the salary paid by authorities and agencies was only a part of the total income of a civil servant. A schoolmaster also received tuition fees; a surgeon was also paid for every operation; and a clerk was paid a certain sum for every page he transcribed. Furthermore, it was not unusual for one person to hold several offices. Lucrative positions were sometimes put out to substitutes who carried out the work for much lower payment. In short, we tread on dangerous ground because the salary recorded in the book-keeping of the city or agency does not necessarily correspond to the actual income of the official.
Table 8. The annual salay of groups of officials in Amsterdam, 1580-1789, compared with the daily wage of a carpenter (guilders)
Schoolmaster Barber-surgeon Clerk PenrioMrif Carpenter [daily wage) 1580 125 25 21 5 400 0.75 I595 275 - 330 650-1,200 1.10 1620 405 75 380 1,600 I .20 1664 540-600 150-264 1,000 2,~x)-4,000 I .SO 1712 c. 700 150-264 1,030 3@’3-4G’J 1.50 1789 750-1,OSO 150-264 1,200 3,0@3-4,000 1.50
Note: a Secretary of the city government Sources: Municipal Archives Amsterdam, Thesaurieren Ordinaris, Weddeboeken (5039) no. 725-728 and Ambten en Officien (5031), no. 37; Van Ravesteyn, Onderzoektngen, pp. 254-7.
Nevertheless, the data on the payment of officials can give an impression of the development of the relative income of this group. At the very least this will provide an insight into the amounts the authorities were prepared to pay in order to be sure of the services of ministers, doctors, and schoolmasters. Table 8 contains the results of this examination.
The general picture ,&at emerges from these data is entirely unambiguous. The salary of an official rose much faster than the wage of a construction worker, which is probably an accurate reflection of the general development of wages. While nominal wages merely doubled in Amsterdam between 1580 and 1789, the pay of a schoolmaster, clerk, pensionark, and barber- surgeon increased by a factor of 5 to 10. It is notable that in Amsterdam salaries continued to increase even after a long period of wage rigidity had commenced in Holland after 1640. To the extent that these data allow, it can be inferred that during the first half of the eighteenth century, when
Jansson et al., Dagligr, p. 194.
THE BEGINNING OF THE KUZNETS CURVE 661
the cost of living declined, the upward movement of salaries came to a halt. After I770 prices again increased rapidly, and this led to new pay agreements, whereas construction workers were bypassed once more.
There is reason to believe that these developments were not unique to Vienna or to Amsterdam. The marked increase in the income of schoolmasters, physicians, and clerks is almost certainly related to the upward social mobility which these occupational groups experienced during the early modern period. This can in turn be connected to the increasing importance attached to their activities. In other words, the relative scarcity of their skills increased. This process appears to have occurred throughout Europe. However, to a certain degree the rise in the income of civil servants and of the professions was a derivative of a broad process of polarization. The more social differentiation and income inequality increased, the more these members of the ‘middle class’ will have tried to achieve an increase in income comparable to the growth of income at the top of the pyramid. This resulted in a widening gap with the payment of (building) labourers. Therefore, it does not seem too bold to suggest that the development of pay ratios in Vienna, Stockholm, and Amsterdam was typical of the European pattern.
VI
In this article an exploratory examination has been made of the relation between economic development and the inequality of income and wealth in western Europe during the early modern period. This has been done mainly by means of Dutch, Italian, British, and German data. It has been demonstrated that certain patterns existed in the inequality of income and wealth. On the whole inequality increased in proportion to the prosperity and size of towns and villages. The results suggest that there was a highly uneven distribution of the benefits of economic development. The case study of Holland also showed that economic growth during the golden age led to a more unequal distribution of income. Each of the three explanations for an increase in inequality during the early modern period that have been considered contributed to our understanding of this phenomenon. In a sense the increase in inequality in Holland between 1561 and 1732 is over- explained: urbanization, an increase in the skill premium, and changes in the functional distribution of income all seem to have played a role. However, the effect of the rise in the skill premium on total inequality was probably rather small, since the size of the group of ‘professions’ and civil servants was highly Therefore, the best explanation of changes in inequality within cities and within the countryside is offered by the classical approach.
Thus, there are strong indications that prior to 1800 economic expansion, where it occurred, was coupled with a considerable increase in inequality as was shown in the examples of Augsburg and Holland. At some time in the course of the nineteenth century (and in some countries only after 19)
This point is discussed at length in Van Zanden, ‘Income and wealth inequality’ @ Ec& History SOcLIy 1995

662 J. L. VAN ZANDEN
this relationship must have changed. In the past hundred years throughout Europe the inequality in the distribution of income and wealth has decreased noticeably, a process that did not come to a halt until after 1975. Between c. 1870/1900 and c. 1975 economic growth was usually accompanied by a decrease in inequality. Consequently, it can be argued that there was a super Kuznets curve spanning many centuries that was characterized by rising inequality until some time in the nineteenth century and a decline in inequality during the twentieth century. Aside from reconstructing this super curve, it is perhaps more interesting to ask why the nature of the process of economic growth changed so that it was no longer associated with growing inequality of the income distribution but instead with growing equality. Presumably this change was linked to the transition from ‘premodern growth’ to ‘modern economic growth’ and to the disappearance of the ‘labour surplus economy’, but that is a story I hope to discuss in another context.
University of Utrecht
Footnote references Abel, W., Agrarkrisen und Agrarkonjunkzur (Hamburg/Berlin, 1966). Allen, R. C., ‘The two English agricultural revolutions’, in B. M. S. Campbell and M. Overton, eds.,
Allen, R. C., Enclosure and the yeoman (Oxford, 1992). van den Berg, W. J. and van Zanden, J. L., ‘Vier eeuwen welstandsongelijkheid in Allunaar, ca 1530- 1930’, Ttjdschriji voor Sociale Geschiedenis, 19 (1988), pp. 193-215.
Brown, J. C., Zn the shadow of Florence: provincial society in Renaissance Pescia (New York, 1982). Cameron, R., A concise economic hismy of the world (New York, 1989). Crafts, N. F. R., British economic growth during the indusnial revolution (Oxford, 1985). Daelemans, F., ‘Pachten en welvaart op het platteland van Belgisch Brabant (15de-18de eeuw)’, AAG
Bijdragen, 28 (1986), pp. 165-84. Dumke, R., ‘Income inequality and industrialization in Germany, 1850-1913: the Kuznets hypothesis
reexamined‘, in Y. S. Brenner, et al., eds., Income distribution in historical perspective (Cambridge, WI), PP. 117-48.
Eberhardt, H., ‘Die Land- und Tiirkensteuerregister des 16. Jahrhunderts und die Moglichkeiten ihrer Auswertung’, in E. Schwarze, ed., Soziale Smcktur und Ben’merhdmisse des hindlichen Bevolkmng Oosnhihingm itn 16. Jahrhundert (Weimar, I975), pp. 13-52.
Feinstein, C. H., ‘The rise and fall of the Williamson curve’, J . Econ. Hisr., XLVIII (1988), pp. 699-
Fisher, W. and Szarda, P., ‘Die soziale Verteilung vom mobilen Vermogen in Deutschland seit dem Spatmittelalter’, in Troisihe ConfZrence Zntentatiaole d’HistOire Economique (Par iahe Hague, 1968),
Fisher, W., ‘Rural industrialization and population change’, Comp. Stud. SOL. t3’ Hist., 15 (1973),
Fugedi, E., ‘Steuerliste, Vermogen und soziale Gruppen in mittelalterlichen Stadten’, in I. Batori, ed., Sfiidtische Gesellschafi und Refonnation (Stuttgart, 1980), pp. 58-97.
Gascon, R., Grand commerce et vie wbaine au XVZe &cle (Paris, 1971). Harmng, J., ‘Die direkten Steuern und die Vermogensentwicklung in Augsburg von der Mitte des 16.
bis nun 18. Jahrhunderts’, Schmollers Jahrbuch fir Gesetegebung, Venualtung und Volkm’rtschaji, 22
Land, labour and livestock (Manchester, I ~ I ) , pp. 236-54.
729,
PP, 253-76.
pp. 158-70.
(1898), PP. 171-209. Herlihy, D., Medieval and Renaissance Pistoia (New HavedLondon, 1967). Herlihy, D., Cities and society in medieval Italy (1980). Herlihy, D. and Klapisch-Zuber, C., Les Toscans et Ieurs famdles (Paris, 1978). Hoffman, P. T., ‘Land rents and agricultural productivity: the Paris Basin, 1450-1789’, 7. Econ. Hist.,
Jacquart, J., La h e rural en Zle-de-France, ISSO-1670 (Paris, 1967). Jansen, P. C., ‘Poverty in Amsterdam at the close of the eighteenth century’, Acta Historiae Neerhndicae,
Jansson, A., Andersson Palm, L., and Siiderberg, J., Dagligt briid i onda rider (Gotene, 1991).
LI (1991)~ PP. 771-805.
x (1978), pp. 98-116.
0 ECOMWIIC HUWY SOnery 1995

THE BEGINNING OF T H E KUZNETS CURVE
Kaelble, H. and Thomas, M., ‘Introduction’, in Y. S. Brenner et al., eds., Income dism’bution in historical
Klein, P. W., ‘De heffing van de 100e en z00e penning van het vermogen te Gouda’, Economisch- en
Kriedte, P., Medick, H., and Schlumbohm, J., Indusrrialisierung vor der Industrialisimng (Gottingen,
Kuznets, S., ‘Economic growth and income inequality’, Amer. Econ. Rev., 45 (1955), pp. 1-28. van Leeuwen, M. H. D., Bijstand in Ammdam, ca 1800-1850 (Utrecht, 19). Ladurie, E. le R., The peasants of Languedoc (Urbana, 1974). Linden, P. H. and Williamson, J. G., ‘Three centuries of American inequality’, Res. Econ. Hist., I
Linden, P. H. and Williamson, J. G., ‘Reinterpreting Britain’s social tables, 1688-1913’, Exp. Econ.
Lis, C. and Soly, H., Povetry and capitalism in pre-indusrrial Europe (Hassocks, 1979). Lucassen, J., ‘Beschouwingen over seizoengebonden trekarbeid’, Tijdschrift voor Sociale Geschiedenis, 8
Macardle, F., A~topascio (Cambridge, 1978). Mendels, F., ‘Proto-industrialization: the first phase of the industrialization process’, 3. Econ. Hist.,
Noordegraaf, L., Hol&nds welvaren? (Bergen, 1985). Nusteling, H. P. H., ‘Periods and caesurae in the demographic history of the Netherlands, ~ h - r g o o ’ ,
Parenti, G., Prime ricerche d& rivoluZiae dei prem in Firenze (Florence, 1939). Persson, K. G., Pre-indusrrial economic growth (Oxford, 1988). Phelps Brown, H. and Hopkins, S. V., A perspective of wages and prices (1981). Pound, J . F., ‘The social and trade structure of Norwich, 1525-1575’, in P. Clark, ed., The early modern
Pribram, A. F., Materiolim zur Geschichre der Preise und Lohne in Osterreich (Vienna, 1938). Rappaport, S., Worlds within worlds: structures of life in sixteenth centuty London (Cambridge, 1989). van Ravesteyn, W., Onderwekingen over de economische en sociale onm‘kkeling van Amsterdum gedurende
Riley, J. C., ‘The Dutch economy after 1650: decline or growth?’, J . Eur. Econ. Hist., 8 (1984,
Roeck, B., Eine Stadt in Krieg und Frieden (Gijttingen, 1989). de Roover, R., The rise and decline of the Medici bank, 1397-1494 (Cambridge, Mass.), 1963. van Schaik, R., Belosting, bevolking en bezit in Gelre en Zutphm, I350-I550 (Hilversum, 1987). Slack, P., Poverry and policy in Tudor and Stuun England (London, 1988). Slicher van Bath, B. H., Een samenleving onder spanning (Assen, 1957). Sderberg, J., ‘Real wage trends in urban Europe, 1730-1850: Stockholm in a European perspective’,
SM. Hist., 12 (1987)~ pp. 155-76. Soltow, L., ‘Long-run changes in British income inequality’, Econ. Hist. Rev., 2nd ser., XXI (1968),
PP. 17-29. Soltow, L., ‘Income and wealth inequality in Amsterdam, 1585-1805’, Economisch- en Sociaal-historisch
Jaarboek, 52 (1989)~ PP. 72-95. Soltow, L., ‘Inequality of wealth and income in the Netherlands at the beginning of the nineteenth
century’, in J. L. van Zanden and L. Soltow, Income and wealth inequality in the Netherlands, 16th- 20th centuries, forthcoming.
663
perspective (Cambridge, I ~ I ) , pp. 1-57.
Socioal-historisch Jaorboek, 31 (1967), pp. 41-63.
1978).
(1976), PP. 69-123.
Hist., 20 (1983)~ pp. 94-109.
(I982), PP. 327-59.
xxx11 (1972), pp. 241-61.
Econ. & Soc. Hist. Nether&nds, I (1989), pp. 87-11?.
town (1976), PP. 129-48.
de 16de en her eerste kwan der r7de eeuw (Amsterdam, I#).
PP. 521%.
Streider, J., Zur Genesis des modemen Kapitu1ismUS (Munich, 1935). Tilly, C., ‘The demographic origins of the European proletariat’, in D. Levine, ed., Proletarianization
Tjalsma, H. D., ‘Een karakterisering van Leiden in 1749’, in H. A. Diederiks et al., eds., Armoede en
Tracy, J . D., Holkand under Habsburg d, 1506-1566 (Berkeley, 19). van Uytven, R. and Blockmans, W., ‘De noodzaak van een ge‘ihtegreerde sociale geschiedenis’, Tijdschrift
VandenBroeke, C., V h m e koopkracht, gismen, vandaag en nwrgen (Leuven, 1984). de Vries, J., The Dutch rural economy in the golden age (New Haven/London, 1974). de Vries, J., European urbanization, z~oo-z8oo (1984). de Vries, J., ‘Between purchasing power and the world of goods’, in J. Brewer and R. Porter, eds.,
de Vries, J., ‘The labour market’, Econ. & Soc. Hist. Nether&nds, 4 ( I ~ Z ) , pp. 55-79. Williamson, J. G., ‘The structure of pay in Britain, 1 7 1 0 - I ~ I I ’ , Res. Econ. Hist., 7 (1982), pp. 1-54. Williamson, J. G., Did British capituh?n breed inequality? (Boston, 1985). Williamson, J. G. and Lindert, P. H., American inequality: 4 mom-economic hisfop (New York, 1980).
and famib histay (Orlando, 1984), pp. 1-86.
sociale spanning (Hilversum, 1989, pp. 17-44.
voor Geschiedenis, 84 (1971), pp. 276-90.
Consumption and the world of goods (1993), pp. 85-133.
0 ECOWIIW HIS~WY S a w I995

664 J . L . VAN ZANDEN
van der Woude, A. M., ‘Demografische ontwikkeling van de Noordelijke Nederlanden, 1500-1800’,
van Zanden, J. L., ‘Economic growth during the golden age: the development of the economy of
van Zanden, J. L., The transfmtion of European agriculture in the nineteenth centuy: the case of the
van Zanden, J. L., ‘Income and wealth inequality in Holland, 1500-1800’, in J. L. van Zanden and L.
Algemene Geschiedenis der Nederlanden, 5 (Bussum, 1980), pp. 102-68.
Holland, 1500-1650’, Econ. &Soc. Hist. Netherlands, 4 ( ~ y p ) , pp. 5-26.
Netherlands (Amsterdam, 1994).
Soltow, Income and wealth inequality in the Netherlands, 16th-2oth centuries, forthcoming.


