Embed Size (px)
Citation preview

Trade Liberalization and Rural Poverty in Vietnam
David Vanzetti and Pham Lan Huong
Australian National University and independent consultant1
Contributed paper at the
18th Annual Conference on Global Economic Analysis
Melbourne, Australia, June 17-19th 2015
Abstract
Vietnam is about to sign a path-breaking free trade agreement with the European Union. When fully
implemented, this will lead to a significant increase in exports from Vietnam to the European Union.
The major sectors to benefit include textiles, apparel, footwear and fish. However, tariff reductions
will expose Vietnam’s less competitive agricultural sectors, such as beef, dairy, pork and sugar. This
has implications for rural poverty, given that many poor people reside in rural areas.
The likely effects are quantified using GTAP, a well-known general equilibrium model. The standard
model is modified to account for an expanding economy since the base year (2007) and for expected
growth to 2025, the period in which tariff reform is expected to be completed. To project the baseline
to 2025, we first use forecasts of capital, labour, land and natural resources to 2025. Next, we use the
model to find productivity growth that will generate each year’s GDP target, given the growth in
factors of production. We then feed the resulting productivity changes back into the model and solve
as normal to reproduce the target growth in output. The baseline takes account of known reductions in
tariffs from FTAs negotiated but not fully implemented. This includes Vietnam’s FTAs with ASEAN
(AFTA), China (ACFTA), Korea (AKFTA), Japan (AJCEP), India (AIFTA), and Australia and New
Zealand (AANZFTA). However, it does not include agreements which have not been negotiated, such
as the TPP. The EU-VNM free trade agreement is still under negotiation, but the expected tariff cuts
and exemptions can be estimated by looking at the EU agreements with Korea, the Caribbean and
several Latin American countries, and the Vietnamese agreements with Japan, Korea and China.
These agreements specify a sensitive list, a highly sensitive list and an exclusion list, and this gives an
indication of the sectors that Vietnam would like to protect and is perhaps prepared to phase out
protection over a short or extended period of time.
The impact of the proposed FTA on rural poverty is assessed using a combination of the GTAP model
and a micro-simulation (MS) module. The module includes detailed income and expenditure
information for each of the 9000 plus households included in both the income and expenditure survey
modules of the Vietnam Household Living Standard Survey (VHLSS) conducted in 2010.
The MS module uses an income equation that takes account of detailed income sources (land, capital,
labour and transfers) of each household in the survey. This income equation is then updated using
changes in factor prices and quantities from GTAP simulation results. Hence, after a policy change, it
1 The authors thank UNCTAD for funding this project, and Do Lien Huong, Pham Thi Hong Van and Tran Cong
Thang from IPSARD in Hanoi for help with the data and analysis. The views expressed are those of the authors, and do not necessarily represent the views of the affiliated institutions. Contact: [email protected].

2
is possible to compare the level of each household’s income and the contribution of each income
source to total household income before and after the shocks. By accounting for differences in income
sources for each household, the MS module allows for the possibility of analysing the impacts of
policies on incomes/poverty both between groups (inter-group distribution) and within a group (intra-
group).
The CGE simulation results indicate that Vietnam stands to experience significant gains in national
income (GDP) over the implementation period to 2025. An FTA with the European Union would
increase overall growth by around 7-8 per cent over and above the growth that would occur in the
absence of any FTA.
The greatest gains to Vietnam will most likely occur in the textiles and fisheries sectors. The effects
on agriculture are limited because both parties seem likely to maintain protection on some sensitive
agricultural products. One example is rice. In previous FTAs the European Union has not removed its
significant tariff on this product, a major Vietnamese export. Vietnam is likely to expose some of its
markets to competition, because it has agreed to phase out high tariffs on meat and dairy products in
its FTAs with Australia and New Zealand, for example.
Micro-simulation results suggest that rural labour is expected to benefit from the FTA, not so much
from any increase in agricultural output, but from increased wages driven by the enhanced demand for
labour from non-agricultural industries. Rural poverty will lessen slightly as a result. However, the
positive effects of the FTA on poverty reduction are slight compared with the improvement expected
over time as national income improves. This is driven by the inflow of capital. To continue to reduce
poverty, Vietnam needs to attract capital and ensure that it is used productively.
Keywords; Vietnam, agriculture, trade, FTA.
3
1. What’s at stake? Vietnam is about to sign a far reaching free trade agreement with the European Union (EU), a major
trading partner of Vietnam. Both parties are sensitive about their agricultural sectors and have tended
to shield them from competition. Vietnam is a competitive producer of a number of agricultural
products, such as rice, coffee, cashews and some fruit and vegetable products, while the European
Union is competitive in bacon, dairy products, wine and various processed agricultural products.
Removing these barriers would bring benefits to both countries, but so far each country has shown
reluctance to fully liberalise their agricultural sectors. Both parties engage in applying peak levels of
protection and both parties engage in a range of instruments to either directly subsidize or maintain
income support for the sector. Employment, poverty alleviation and rural development will be
affected by any policy reforms made in the sector. Hence, the negotiations on agriculture are being
observed with interest.
Vietnam’s major imports from the European Union are aircraft, cruise ships, motor vehicles and other
manufactured goods. In the other direction Vietnam’s exports to the European Union are mainly
textiles, apparel, fish and coffee.
Vietnam has an open economy with significant integration in the world economy. Trade flows
(imports and exports) amounts to around 180 percent of GDP. This means that changes in trade flows
can have a large impact on GDP and per capita incomes. Since the European Union is a major trading
partner, with significant but not prohibitive barriers on some major exports, comprehensive tariff
liberalisation has the potential to results in exceptionally large benefits for Vietnam.
Vietnam joined the WTO in 2007 and as a result reduced its tariffs from 18 per cent in 2007 to 10 per
cent in 2013. Most of the applied tariffs are between zero and 40 per cent. There are 1011 domestic
tariff peaks. Many (471) of the peak tariffs are on processed agricultural goods, including alcohol and
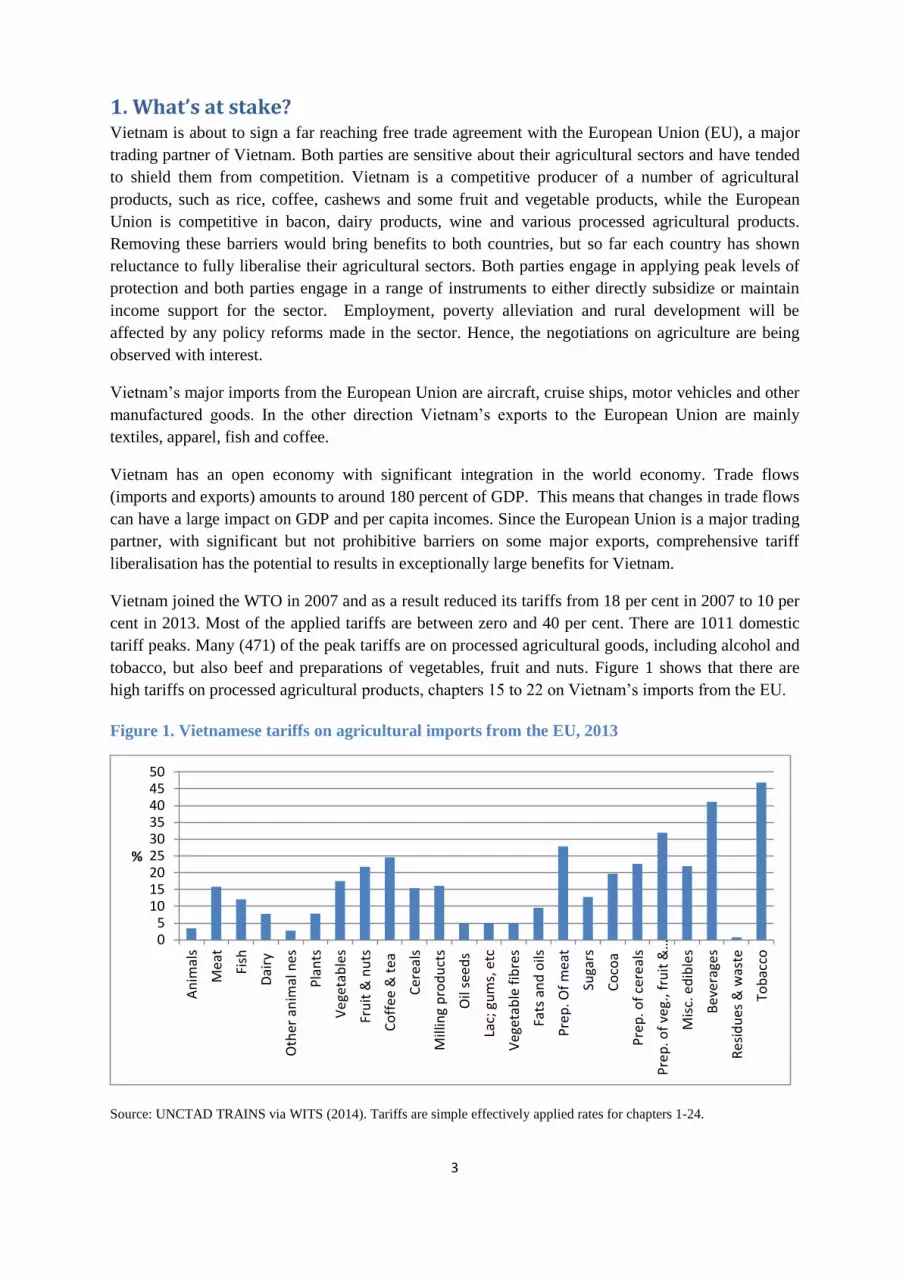
tobacco, but also beef and preparations of vegetables, fruit and nuts. Figure 1 shows that there are
high tariffs on processed agricultural products, chapters 15 to 22 on Vietnam’s imports from the EU.
Figure 1. Vietnamese tariffs on agricultural imports from the EU, 2013
Source: UNCTAD TRAINS via WITS (2014). Tariffs are simple effectively applied rates for chapters 1-24.
05
101520253035404550
An
imal
s
Me
at
Fish
Dai
ry
Oth
er a
nim
al n
es
Pla
nts
Ve
geta
ble
s
Fru
it &
nu
ts
Co
ffe
e &
tea
Ce
real
s
Mill
ing
pro
du
cts
Oil
see
ds
Lac;
gu
ms,
etc
Ve
geta
ble
fib
res
Fats
an
d o
ils
Pre
p. O
f m
eat
Suga
rs
Co
coa
Pre
p. o
f ce
real
s
Pre
p. o
f ve
g., f
ruit
&…
Mis
c. e
dib
les
Be
vera
ges
Re
sid
ues
& w
aste
Tob
acco
%
4
A few agricultural products have tariff rate quotas, such as those relating to eggs, sugar,
unmanufactured tobacco and tobacco refuse, and salt.
Vietnam’s merchandise exports to the European Union face the GSP rate. The trade weighted average
tariff is 3.9 per cent, but this hides some 225 domestic tariff peaks. Taking into account trade flows,
the most significant tariffs for Vietnam are outside of agriculture, on textiles, clothing and footwear
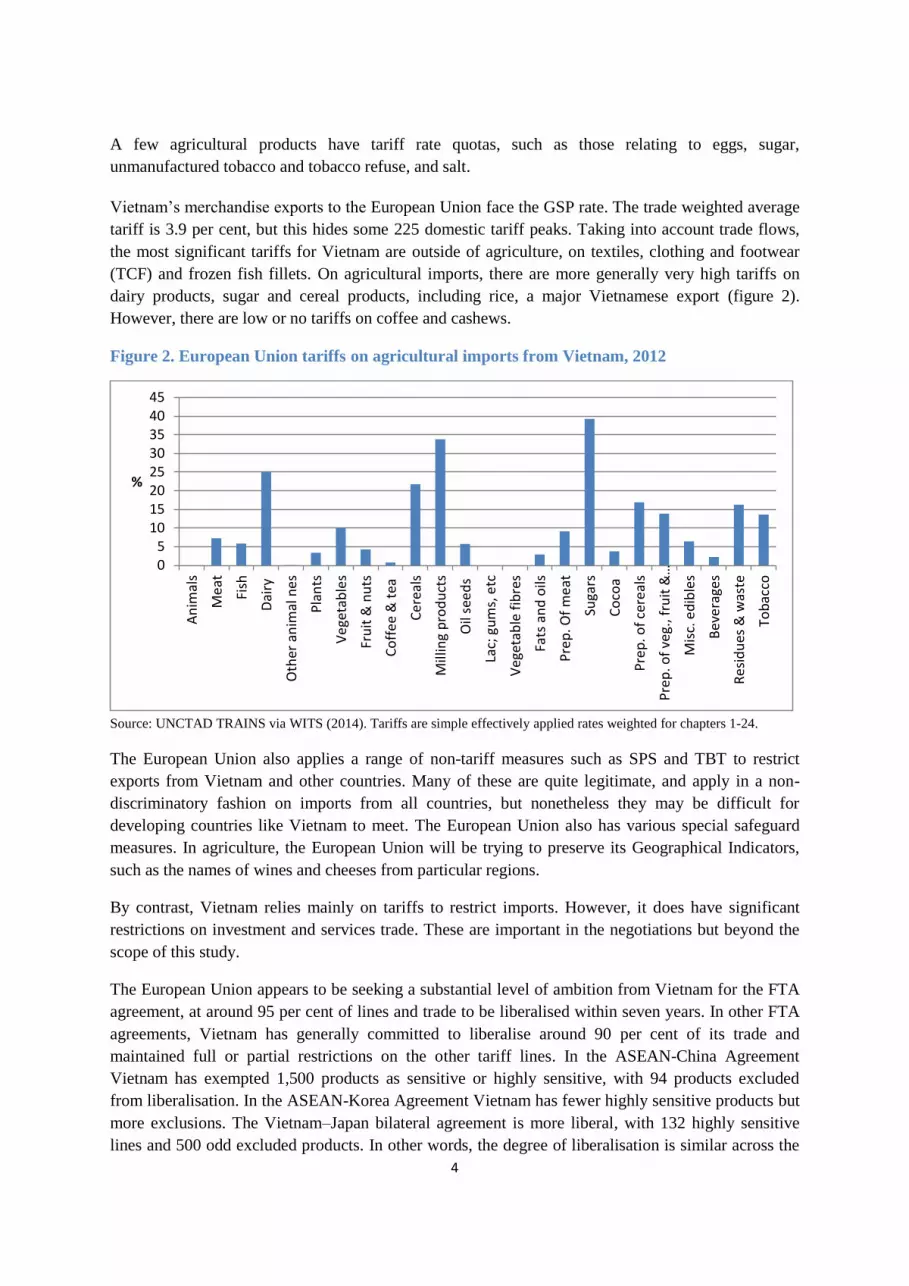
(TCF) and frozen fish fillets. On agricultural imports, there are more generally very high tariffs on
dairy products, sugar and cereal products, including rice, a major Vietnamese export (figure 2).
However, there are low or no tariffs on coffee and cashews.
Figure 2. European Union tariffs on agricultural imports from Vietnam, 2012
Source: UNCTAD TRAINS via WITS (2014). Tariffs are simple effectively applied rates weighted for chapters 1-24.
The European Union also applies a range of non-tariff measures such as SPS and TBT to restrict
exports from Vietnam and other countries. Many of these are quite legitimate, and apply in a non-
discriminatory fashion on imports from all countries, but nonetheless they may be difficult for
developing countries like Vietnam to meet. The European Union also has various special safeguard
measures. In agriculture, the European Union will be trying to preserve its Geographical Indicators,
such as the names of wines and cheeses from particular regions.
By contrast, Vietnam relies mainly on tariffs to restrict imports. However, it does have significant
restrictions on investment and services trade. These are important in the negotiations but beyond the
scope of this study.
The European Union appears to be seeking a substantial level of ambition from Vietnam for the FTA
agreement, at around 95 per cent of lines and trade to be liberalised within seven years. In other FTA
agreements, Vietnam has generally committed to liberalise around 90 per cent of its trade and
maintained full or partial restrictions on the other tariff lines. In the ASEAN-China Agreement
Vietnam has exempted 1,500 products as sensitive or highly sensitive, with 94 products excluded
from liberalisation. In the ASEAN-Korea Agreement Vietnam has fewer highly sensitive products but
more exclusions. The Vietnam–Japan bilateral agreement is more liberal, with 132 highly sensitive
lines and 500 odd excluded products. In other words, the degree of liberalisation is similar across the
05
1015202530354045
An
imal
s
Me
at
Fish
Dai
ry
Oth
er a
nim
al n
es
Pla
nts
Ve
geta
ble
s
Fru
it &
nu
ts
Co
ffe
e &
tea
Ce
real
s
Mill
ing
pro
du
cts
Oil
see
ds
Lac;
gu
ms,
etc
Ve
geta
ble
fib
res
Fats
an
d o
ils
Pre
p. O
f m
eat
Suga
rs
Co
coa
Pre
p. o
f ce
real
s
Pre
p. o
f ve
g., f
ruit
&…
Mis
c. e
dib
les
Be
vera
ges
Re
sid
ues
& w
aste
Tob
acco
%
5
various agreements, with the same sectors protected in each case. This provides some guidance as to
what Vietnam would be hoping to exempt in an agreement with the EU.
Other Related Areas Beyond tariff liberalisation and commitments made in services, the European Union has become
increasingly ambitious on the scope of its agreements, to include government procurement,
intellectual property rights, competition policy, trade facilitation and customs measures, cooperation
on non-tariff measures (including SPS and TBT issues), mode 4 issues relating to recognition of
qualifications, dispute settlement provisions, and labour and environmental standards.
Labour standards are a concern for Vietnam in the negotiations. Vietnam has not yet accepted the ILO
Declaration of Fundamental Principles and Rights at Work (1998). The core principles relate freedom
of association, collective bargaining, forced labour, child labour and discrimination in employment.
Vietnam does not allow organised (union) labour apart from State run unions. Many concerns have
been raised about Vietnam’s labour standards and the rights of workers. The concerns include forced
labour, child labour, discrimination, and the absence of freedom of association, which implies the
inability to form a union. In 2013, the Vietnamese Government revised many of its labour codes,
relating for example to grassroots democracy, labour disputes, licensing of labour lease, wages,
working time, rest time and occupational safety and hygiene, labour contracts and units in which
strikes are prohibited (ILO 2013).
2. Modelling the potential impacts of an FTA To examine the potential impact of reducing or eliminating tariffs on trade between Vietnam and the
EU, a well-known general equilibrium model, Global Trade Analysis Project (GTAP), is used. The
standard GTAP model is a multiregional, multisector, computable general equilibrium (CGE) model
that assumes perfect competition and constant returns to scale.2 Bilateral trade is handled via the so-
called Armington assumption that differentiates imports by source. Input-output tables reflect the
links between sectors. GTAP is ideally suited for analysis of free trade agreements, involving the
preferential liberalisation of bilateral tariffs, which are likely to have international and intersectoral
effects. The input-output tables capture the indirect intersectoral effects, while the bilateral trade flows
capture the linkages between countries. A shock or policy change in any sector has effects throughout
the whole economy. Tariff support for one sector, such as cattle, tends to have negative effects on
downstream sectors (beef) by raising prices and costs. Changes in policies in sectors such as
agriculture tend to have relatively important economy-wide effects because many workers provide
inputs into production and many consumers purchase the product. Support in one market often has a
negative effect on others because each sector competes with the others for factor inputs, capital,
labour and land. CGE models attempt to capture these effects. In this application, it appears that these
general equilibrium effects dominate in the agricultural sector, rather than the direct effects of tariff
reductions.
The GTAP 8 database The GTAP 8 database is used here (Narayanan et al. 2012). The value (of output and trade flows) data
relate to 2007 and the behavioural parameters, such as elasticities, are taken from the literature rather
2 The GTAP model is documented in Hertel (1997). See Chapter 2 in particular for a description of the structure of the
model. A useful introduction to the use of GTAP can be found in Burfisher (2011).

6
than econometrically estimated specifically for use within the model. Input-output data are taken from
national accounts and vary from year to year, depending on their availability in particular countries.
The Vietnamese input-output tables are from 2005. The base tariff data, including preferential tariffs,
are included in the database. For this application the negotiated bilateral tariff data are taken from the
text of the FTA agreements. This information is available online in pdf form from for example the
ASEAN Secretariat (2014) and the European Commission (2014). The specified tariff line cuts for
each country are fed into a software package, Tariff Analytical and Simulation Tool for Economists
(TASTE).3 This program has bilateral trade and tariff data for 227 countries and 5,113 products at the
HS6 level. TASTE is used to calculate the shocks that are in turn fed into GTAP. For this aggregation
there are 30 sectors and 20 regions.
Aggregation In a CGE framework it is not possible to analyse 5,113 individual products. The GTAP model has 57
sectors, and these must be aggregated in turn to 20 or 30 sectors so that the model can solve. In each
country or region, the economy is divided into 30 sectors, including 11 agricultural sectors, 13
industrial sectors and five service sectors (Appendix table A1).
The GTAP model has 134 regions but once again these need to be aggregated for the model to solve.
The 20 regions for this application are shown in Appendix table A2. The selection reflects Vietnam’s
main trading partners and competitors. The members of the European Union are treated as one region.
Labour market assumptions In GTAP the standard labour market assumption specifies that the amount of skilled and unskilled
labour in each country is fixed, although workers can move readily between sectors within the
country. Wage rates are assumed flexible. This assumption is somewhat at odds with reality, given
that unemployment varies with the business cycle. In addition, in developing countries in particular,
there appears to be a pool of unemployed or members of the labour force that are underemployed or
work with low intensity. Changes in the amount of labour employed have a far greater effect on
output and welfare than merely reallocating resources in response to changes in relative prices. The
assumption that labour can move freely between sectors to take advantage of new opportunities is
only realistic over the long run.
An alternative to the standard treatment used in this application is to assume labour market adjustment
occurs in both price and quantity. It is assumed, somewhat arbitrarily, that the response is equal, so
that an increase, or decrease, in the demand for labour leads to a similar increase in both real wages
and employment. This applies only to unskilled labour in developing countries. Skilled labour remains
fixed. This is based on the intuition that the informal sector in developing countries is characterized
by significant unemployment and underemployment. Because the demand for labour is indirectly
derived from the demand for labour-intensive goods, liberalisation tends to increase employment in
developing countries and reduce it in developed countries. Thus, with this assumption, developing
countries appear to gain more from liberalisation than do developed countries.
3 See Horridge and Laborde (2008) for documentation.

7
The baseline The standard model is modified to account for an expanding economy since the base year (2007) and
for expected growth to 2025, the period in which tariff reform is expected to be completed. For
example, since 2007 the Vietnamese economy has expanded 40 per cent, and is expected to expand by
165 per cent by 2025 (IMF 2013). Driving the change in output are changes in factors of production
— capital, labour, land and natural resources — and productivity. Capital is projected to grow much
in line with GDP, and in fact is the main driver. The population of 85 million in 2007 is expected to
reach 100 million in 2025. The labour force, reflecting the share of the population of working age, is
projected to grow from 49 million in 2007 to 60 million in 2025 (ILO 2013). The amount of land
available in Vietnam is expected to decrease by around 0.6 per cent a year to reflect urban
encroachment, roads and other infrastructure (NIAPP 2010). The remaining factor is productivity.
This is difficult to measure and reflects a number of unobserved variables. To project the baseline to
2025, we first use forecasts of capital, labour, land and natural resources to 2025.4 Next, we use the
model to find productivity growth that will generate each year’s GDP target, given the growth in
factors of production. We then feed the resulting productivity changes back into the model and solve
as normal to reproduce the target growth in output. This is done for all countries, because growth in
all countries is necessary to generate demand for Vietnamese exports. The baseline not only projects
GDP, but also provides estimates of growth in sectoral output and trade.
Table 1 Baseline assumptions for Vietnam
Variable 2007 2015 2020 2025
GDP 100 155 203 265
Land 100 96 93 90
Capital 100 144 201 282
Unskilled labour 100 115 119 124
Skilled labour 100 115 119 124
Natural resources 100 132 152 172
Source: IMF (2013), NIAPP (2010), ILO (2013). 2007=100.
The baseline takes account of known reductions in tariffs from FTAs negotiated but not fully
implemented. This includes Vietnam’s FTAs with ASEAN (AFTA), China (ACFTA), Korea
(AKFTA), Japan (AJCEP), India (AIFTA), and Australia and New Zealand (AANZFTA). However, it
does not include agreements which have not been negotiated. The most important of these is the Trans
Pacific Partnership (TPP). This includes Vietnam, the United States and ten other countries, with the
notable exception of China.
This approach highlights the importance of capital and productivity growth in boosting incomes.
Furthermore, while some sectors will face competitive pressures arising from the tariff reductions,
against the background of an expanding economy, the output of individual sectors may merely grow
at a slower rate in absolute terms. This eases the burden of adjustment.
4 We set productivity endogenous and solve the model by varying it to hit each year’s GDP target. We then swap the
closure and feed back in the productivity changes as exogenous variables.

8
After the tariff shocks are specified at a six-digit level and aggregated to 30 sectors, the simulated
outcome is compared with the baseline data. Impacts of the removal of trade barriers on output, trade
flows, wages and welfare within Vietnam can then be ascertained.
Scenarios
The EU-VNM free trade agreement is still under negotiation, but the expected tariff cuts and
exemptions can be estimated by looking at the European Union agreements with Korea, the Caribbean
and several Latin American countries, and the Vietnamese agreement with Japan and Korea and
China. These agreements specify a sensitive list, a highly sensitive list and an exclusion list, and this
gives an indication of the sectors that Vietnam would like to protect and is perhaps prepared to phase
out protection over a short or extended period of time.
In this analysis we propose a relatively modest but most likely scenario, labelled ‘FTA’. Following
previous negotiated outcomes, Vietnam’s tariffs are divided into four groups — normal, sensitive,
highly sensitive and exempted. At present, it is not known what tariff lines may or may not be in any
particular list, so selection is based on past agreements plus some judgment. For Vietnam the
ASEAN-Korea FTA and the ASEAN-China FTA provide a guide as to what Vietnam may wish to
include in its sensitive, highly sensitive and exemption lists. Where an eight-digit (or higher) tariff
line is selected, the whole of the six-digit category is included in the list. A spread of the tariffs across
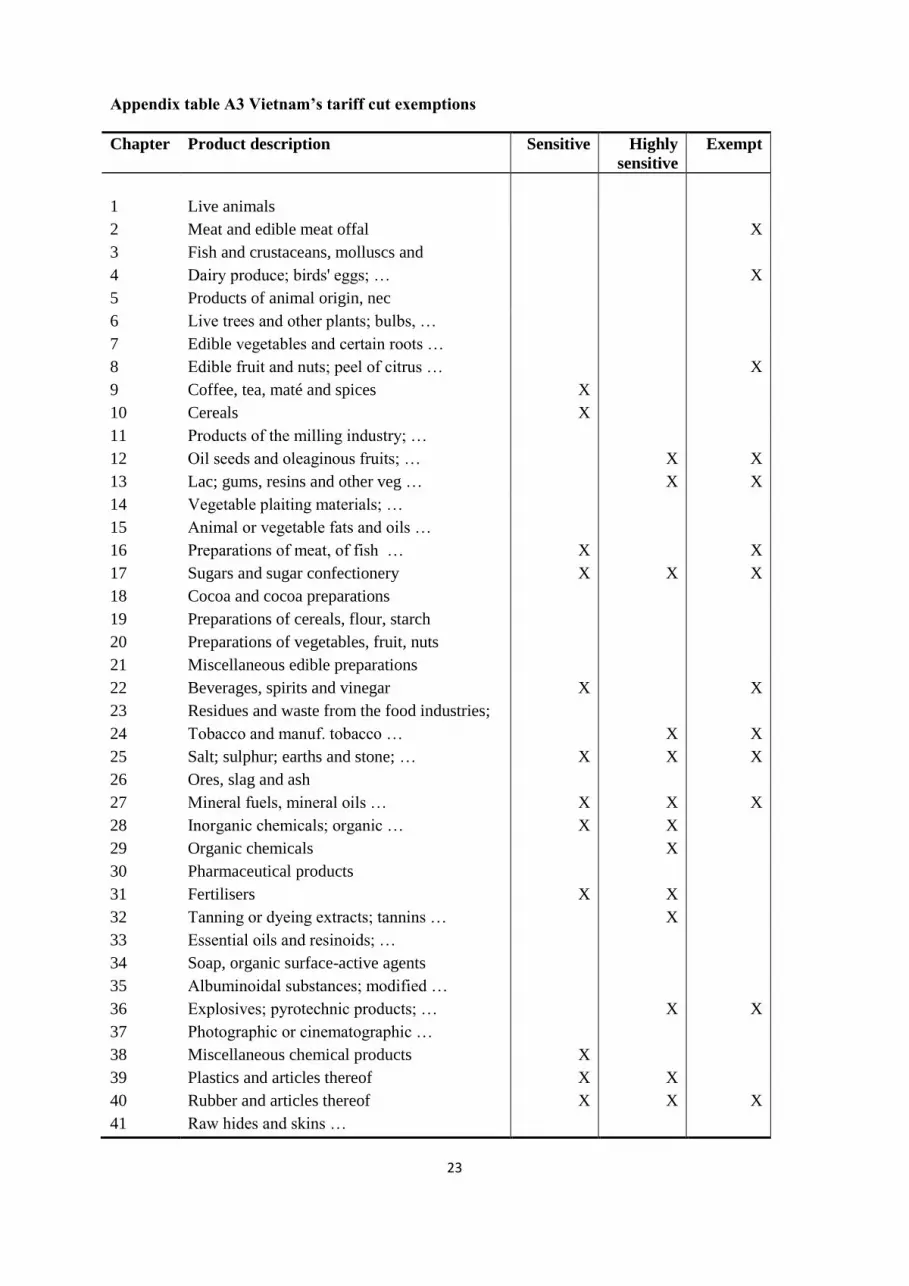
chapters in the various lists is shown in Appendix table A3.5
The sensitive list includes 270 tariffs at the six digit level spread across 36 chapters including meat,
dairy products, citrus, sugar, tobacco products, iron and steel, steel products and motor vehicles.
Vietnam’s highly sensitive list has 396 tariffs from 34 chapters. This includes many of the chapters in
the sensitive list, but more tariffs are selected.
Finally, exempted product cover 267 tariffs in 29 chapters, including meat, dairy products, citrus,
sugar, tobacco products, iron and steel, steel products and motor vehicles, similar to the sensitive list.
The treatment of these lists is as follows. For Vietnam the normal tariffs are removed immediately the
agreement comes into force, assumed to be 2015 in this analysis. The sensitive group is capped at 20
per cent immediately and phased out by 2020. The highly sensitive group is capped at 50 per cent
immediately, 20 per cent by 2020 and phased out by 2025. The exempt group is not subject to tariff
cuts. The bilateral tariff cuts are calculated at the six-digit level using TASTE, and aggregated to the
25 GTAP merchandise sectors.
The baseline tariffs and their likely levels when finally implemented are shown for Vietnam in figure
3. Tariffs on meat and dairy products are maintained, as are the high tariffs on alcohol and tobacco.
5 There are 99 chapters, as listed in appendix table A3.

9
Figure 3. Vietnamese tariffs on agricultural imports from the EU
Source: TASTE and authors’ calculations.
For the EU, the selection and treatment of tariffs largely follows the EU-Korea FTA. This involves
most tariffs being phased out over ten years. However, there is an exclusion list. We base the
European Union exclusion list on the EU-Colombia FTA, which covers 489 tariffs in 18 chapters,
including meat, dairy products, edible vegetables, oils, sugar, various processed foods, and isolated
industrial products.
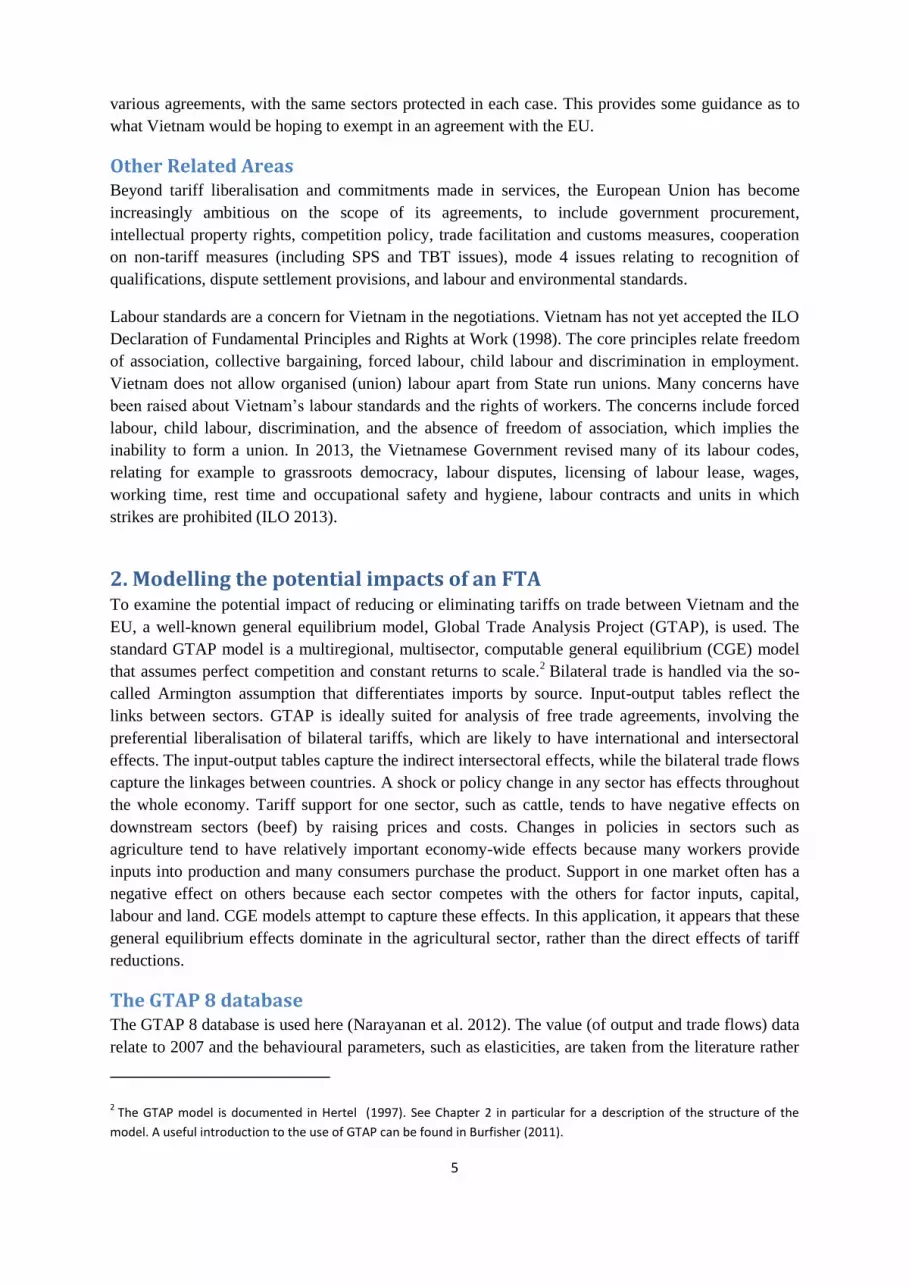
The European Union is assumed to maintain its rice tariff but to remove the tariffs on dairy products
but not on sugar and beef and veal (figure 4). Since Vietnam exports few if any of these products the
impact is not significant. The main point of interest is the removal of tariffs on fish products and TCF.
On these products the tariffs are relatively low but the volumes are high.
0
10
20
30
40
50
60
%
Base
FTA
10
Figure 4. EU tariffs on agricultural imports from Vietnam
Source: TASTE and authors’ calculations.
3. Results The major interest here is the effects on the agricultural sector but it is instructive to examine the
macroeconomic effects because changes in the non-agriculture sector are significant and impinge on
agriculture. We look at national income, imports and exports first before turning our attention to
agriculture specifically.
Macroeconomic effects
Income
The simulation results indicate that Vietnam stands to gain significant in national income (GDP) over
the implementation period to 2025. An FTA with the European Union would increase overall growth
by around 7-8 per cent over and above the growth that would occur in the absence of any FTA.
Recall from the baseline that national income is projected to grow from 2007 by 73 per cent to
2020 and 108 per cent by 2025. An FTA, if implemented as modelled, is estimated to
increase national income to 78 per cent and 116 per cent respectively, an additional 5 and 8
percentage points. The estimated gains in welfare gains relative to the base are around $2.2 billion in
2020 and $3.9 billion in 2025. These are very significant gains from an FTA, but relatively
insignificant in comparison with the growth that is expected to occur over the implementation period
in the absence of an agreement.
Real wages for unskilled labour are estimated to improve by around 3 per cent because workers
respond to higher wages by supplying more labour. However, household income increases faster than
0
20
40
60
80
100
120
140
%
Base
FTA

11
wages because the additional labour boosts earnings. Real wages for skilled labour would grow at a
faster rate because there is limited scope for additional supply of skilled labour.6
Exports
Vietnam’s exports to the European Union are estimated to increase by around 50 per cent by 2020,
well above the growth in the base. There is also a further boost in 2025, as the agreement gets fully
implemented (figure 5).
However, there is a substantial amount of trade which will be diverted from other countries towards
the EU market. This can be seen in Vietnam’s national exports. These increase from 89 per cent in the
base to around 93 to 94 per cent in 2020. By 2025, the additional exports amount to 10 per cent. As to
be expected, the FTA is beneficial for national exports but the growth in exports is nowhere near as
large as the increase in bilateral exports.
Figure 5. Vietnam's exports to the EU (percentage change over 2007 base)
Source: GTAP simulations. Estimates are relative to 2007 base.
Imports
Vietnam’s imports from the European Union are also estimated to increase significantly over the
2015-2025 horizon. This is shown in figure 6. The underlying growth is substantial, although it slows
in 2020 as Vietnam’s agreements with other countries (Japan, Korea, China, India, Australia and New
Zealand) start to take effect. The FTA has a significant impact in 2020 and 2025. Imports from the
European Union increase by 32 percentage points above the baseline in 2020 and 45 percentage points
in 2025, reflecting the greater reduction in tariffs. However, total Vietnamese imports (from all
sources) increase by only 5 to 6 per cent above the baseline.
6 We assume there is ideal unskilled labour that can respond to higher wages, but the national supply of skilled
workers is fixed. We also assume no change in international migration of labour.
0
50
100
150
200
250
300
2015 2020 2025
%
Vietnam: Exports to EU
Base
FTA

12
Figure 6. Vietnam's imports from the EU (percentage change over 2007 base)
Source: GTAP simulations. Estimates are relative to 2007 base.
Sectoral effects
Output
The estimated effects of a likely FTA with the European Union on the Vietnamese agricultural sector
are marginally negative, but this reflects the demand for capital and labour to expand production in
non-agricultural sectors rather than competition from imports. The estimated output effects for
Vietnam for the 11 GTAP agricultural sectors are shown in Figure 7.7 The most obvious feature of the
chart is the growth over time of almost all sectors. The economy expands by two and a half times
between 2007 and 2025, but the growth in primary commodities does not keep up with the expansion
of the economy. This is because land is in limited supply, and is in fact shrinking due to urban
encroachment, roads and other factors. There is no such limit on production of industrial goods and
services.
Although the general picture is one of rapid growth over the implementation period, 2015 to 2025, the
FTA seems likely to have a marginally negative impact on agricultural output by 2020 and also in
2025. However, the deviations are small, less than one per cent of projected agricultural output in
each case. The fall in output is driven by the demand for resources from other sectors rather than
import competition from imports.
7 This includes fisheries and forestry.
0
10
20
30
40
50
60
70
80
2015 2020 2025
% Base
FTA

13
Figure 7. Estimated agricultural output in 2025 relative to base in 2007
Source: GTAP simulation.
Outside of agriculture, the sector to benefit the most is TCF. This comprises 50 per cent of exports to
the EU. Average tariffs are fairly low at around 7-9 per cent, but their removal results in a significant
benefit to Vietnam. However, in order to increase output in the TCF sectors, it is necessary that labour
and capital migrate from other sectors, and as a result output in these sectors grows less strongly than
if the TCF and fisheries did not expand. For example, under an FTA, output of the rice sector grows
by 93 per cent instead of 94 per cent in the baseline, as shown in figure 7.
The deviations from the baseline are better illustrated in figure 8, which shows the deviation in 2025
from the base in that year. This chart is similar to figure 7 except that the base has been deducted from
the changes. Here we see that most sectors shrink in relative terms to provide labour and capital for
the rapidly expanding TCF sectors. Thus, some structural adjustment will be required but this is likely
to be easily managed because output is merely growing at a slower rate rather than contracting. This
will make the adjustment process easier because it is less likely the workers become unemployed or
that capital is written off.
This conclusion may not apply at a more disaggregated level. There may be industries that need to
contract in absolute terms. One example might be fresh cut flowers (HS 060310) which currently has
a tariff of 40 per cent. If the 100 per cent tariff on ‘wine of fresh grapes including fortified wines’ (HS
220421) is removed, the domestic wine industry may find it difficult to compete.
In terms of output at least, the major agricultural industry to benefit from an FTA with the European
Union is fish. The major fish exports to the European Union are shrimp (HS 030616) and catfish (HS
030462). The tariffs are rather low, 7 and 5 per cent respectively, but the volumes are high. Vietnam
has a virtual monopoly on exports of catfish, accounting for 99 per cent of world trade.
0
50
100
150
200
250
%
Base
FTA

14
Figure 9. Agricultural output. Deviation from base in 2025
Source: GTAP simulation. Excludes dairy products.
Trade
The changes in national exports as a result of the FTA follow a pattern similar to output. There is
generally positive growth over the base period in most sectors, and the FTA has a relatively small
impact. There is an increase in TCF and food products (fish fillets), as previously noted, and a
marginal decrease in exports in other sectors relative to the baseline. This is shown in figure 9 and for
all sectors, including non-agriculture, in Appendix table A5.
The sector Food products is large, in fact the largest of our agricultural sectors. Thus a relatively small
percentage change (2.6 percentage points) in exports can amount to a large absolute value, $117
million.
Vietnam’s major agricultural exports to the European Union include fish and shrimp. Primary
agricultural products such as coffee, cashews and pepper are significant but face no tariffs. Vietnam is
a major rice exporter but very little goes to the EU. While the European Union imports substantial
quantities of rice, these supplies are sourced from India and Thailand. Agriculture is a sensitive area
for the EU, and as a result our simulations show no increase in bilateral agricultural exports to the
European Union with the exception of fish products.
-100
-50
0
50
100
150
200
% Base
FTA

15
Figure 9. Agricultural exports in 2025 relative to base in 2007
Source: GTAP simulations. Estimates are relative to 2007 base.
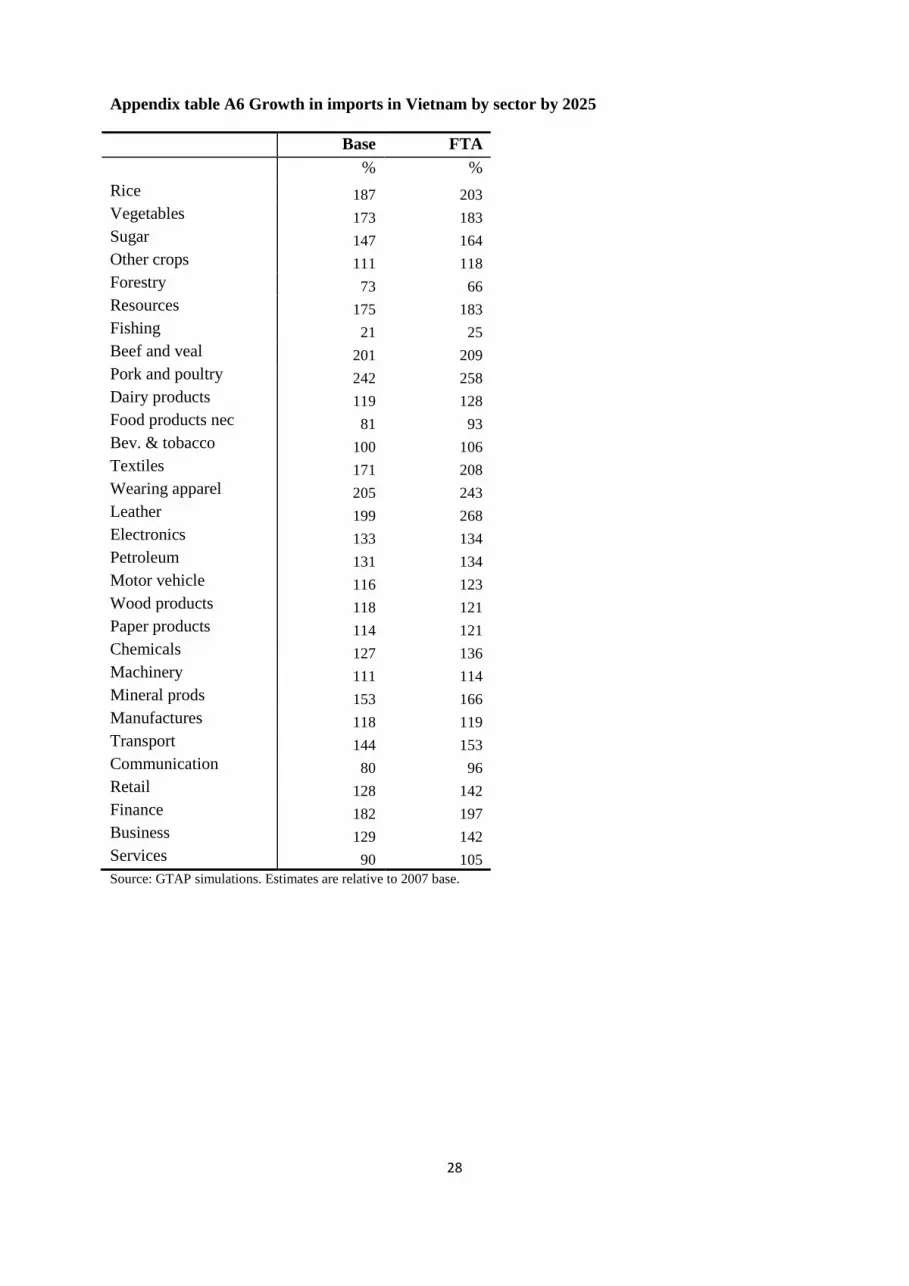
The pattern for Vietnamese agricultural imports by sector is a little different. Once again there is
growth in imports across all agricultural sectors in the baseline as shown in figure 10 and in Appendix
table A6. The tariff cuts in Vietnam lead to an increase in imports across the board with the exception
of forestry. Notably, the largest relative increases are in sugar and pork and poultry, but in absolute
terms “other crops” and “food products” show the largest increases.
Figure 10. Agricultural imports in 2025 relative to base in 2007
Source: GTAP simulations. Estimates are relative to 2007 base.
-100
-50
0
50
100
150
200
% Base
FTA
0
50
100
150
200
250
300
%
Base
FTA

16
In terms of bilateral imports from the EU, the agricultural commodities most affected are “Other
crops”, pork and dairy, processed foods and beverages and tobacco. However, a certain amount of
trade diversion occurs, with Vietnam switching its source of supply from India, the USA, Australia
and New Zealand to the EU. This explains why the changes in national imports are much less than the
changes in bilateral imports.
Note that in our scenario, considered most likely, there is little change in tariffs on many livestock
product categories, such as beef, pork and dairy products. Over time there is an increase in imports of
these products, but the FTA as envisaged has relatively little impact. This is because negotiators have
been concerned about the employment effects of potential changes. Next we examine the effects of
the FTA on the labour market and poverty.
Impact on rural labour and poverty The impact of an FTA on rural poverty is conducted using a combination of the GTAP model and a
micro-simulation (MS) module. The module includes detailed income and expenditure information
for each of the 9000 plus households included in both the income and expenditure survey modules of
the Vietnam Household Living Standard Survey (VHLSS) conducted in 2010.
The MS module uses an income equation that takes account of detailed income sources (land, capital,
labour and transfers) of each household in the survey. This income equation is then updated using
changes in factor prices and quantities from GTAP simulation results. Hence, after a policy change, it
is possible to compare the level of each household’s income and the contribution of each income
source to total household income before and after the shocks. By accounting for differences in income
sources for each household, the MS module allows for the possibility of analysing the impacts of
policies on incomes/poverty both between groups (inter-group distribution) and within a group (intra-
group).
Table 2 shows the potential impacts of the EU-Vietnam FTA on rural poverty in Vietnam. The
impacts are favourable, but not large. Without the EU-Vietnam FTA implementation, the country will
continue to make progress on poverty reduction anyhow, but the FTA will accelerate progress. The
largest positive impacts occur by 2015, where the poverty rate for the whole country is reduced by
0.054 per cent compared with no FTA. This means some 33,000 rural people escape poverty when the
FTA is first implemented, another 18,000 by 2020 and a further 6,000 when fully implemented
(2025). The impacts lessen toward the end of the FTA implementation period, when poverty is much
reduced as a result of ongoing growth in incomes unrelated to the FTA.
Table 2 Poverty rate in rural areas
Year Base FTA Change
(1) (2) (3) (4)
2010 17.45
2015 9.62 9.57 -0.054
2020 6.57 6.53 -0.040
2025 4.33 4.32 -0.010
Source: Micro simulations.

17
The rural poor own very little land and capital and make most of their income from selling their
labour. As a result the main factors contributing to the positive impacts on poverty reduction do not
come from the expansion of exports, as the poor make negligible income from such activities.
Taken together, income of the poor from labour, capital and land in the three most rapidly expanding
sectors (leather, wearing apparel and textiles) accounts for just 0.6 per cent of their total income in
2010. Detailed examination (Table 3) reveals that although the poor do not benefit directly from the
expansion of output in selected sectors, they could improve their income in the first place by an
increase in their real wage (unskilled labour), and secondly by increasing the supply of labour in
response to a higher demand for labour in the expanding sectors. Both result in the largest increase in
the real income for unskilled labour earned by the poor.
Table 3. Contribution to income growth of the rural poor by factor (%)
Base2015 FTA2015 Base2020 FTA2020 Base2025 FTA2025
Land 0.04 0.04 0.09 0.09 0.17 0.17
Unskilled
labour
28.18 28.43 60.77 61.47 103.25 104.51
Skilled labour 0.10 0.10 0.21 0.22 0.35 0.37
Capital 0.28 0.28 0.49 0.51 0.80 0.84
Total growth 28.60 28.86 61.56 62.29 104.57 105.88
Source: Micro simulations.
Disaggregated income data suggest that while the urban poor benefit from higher income growth in
non-farm sectors, farm income received by the rural poor grows at a higher rate than that of the urban
poor. As the farm sectors by and large grow at lower rates than the non-farm ones, favourable impacts
of the FTA on the urban poor are larger.
By region, the Central Highlands and Mekong River Delta are the regions benefiting most from the
FTA, followed by the North Central Coasts. No changes are observed in the two most developed
regions (the Red River Delta and the South East region).
Table 4. Poverty rates by region (per cent)
Red
River
Delta
North
Mountain
North
Central
Coast
South
Central
Coast
Central
Highlands
South
East
Mekong
Delta
Base
2010 6.67 30.03 27.42 13.21 20.52 2.02 11.41
2015 2.09 18.29 14.64 6.11 12.49 0.75 6.07
2020 1.18 13.15 9.99 3.77 8.00 0.64 4.14
2025 0.83 8.40 6.38 2.72 5.16 0.60 2.75

18
FTA
2010 6.67 30.03 27.42 13.21 20.52 2.02 11.41
2015 2.09 18.24 14.54 6.11 12.05 0.75 6.07
2020 1.18 13.04 9.93 3.74 7.89 0.64 4.02
2025 0.83 8.51 6.30 2.72 5.33 0.60 2.54
Source: Micro simulations
4. Policy implications and Conclusions The simulation results suggest that Vietnam will gain significantly from improved market access by
signing a free trade agreement with the European Union and rural labour will benefit as well. The
greatest gains to Vietnam will most likely occur in the TCF and fisheries sectors. The effects on
agriculture are limited because both countries seem likely to maintain protection on some sensitive
agricultural products. One example is rice. In previous FTAs the European Union has not removed its
significant tariff on this product, a major Vietnamese export. Vietnam is likely to expose some of its
markets to competition, because it has agreed to phase out high tariffs on meat and dairy products in
its FTAs with Australia and New Zealand, for example.
The analysis indicates that the agricultural sector in Vietnam will experience a net improved
performance as a result of an FTA. These benefits have three sources. The first is improved market
access through the reduction in tariffs in a trading partner. The major agricultural product to benefit is
fish.8 The second is improved efficiency due to reallocating resources from unproductive industries
such as beef and dairy products. The third source is improved wages through competition from other
sectors that raise the prices of labour and capital. The major factor here is TCF. Increased exports of
TCF products draw labour and capital out of agriculture. Rural workers gains from these effects.
However, the quantity of agricultural output may fall. We can see this in the simulation results for
most agricultural sectors. Output falls not because of increased competition from imports, but from
increased competition for factors of production. 9.
Will this happen? The negotiations are undertaken in secret and the outcome is not known, but the
simulated tariff reductions are rather conservative, and would be considered modest rather than
ambitious. A further consideration is even if tariffs are reduced, non-tariff measures remain, and in the
area of agriculture these can be significant barriers to trade. SPS restrictions are quite high in the EU.
Before drawing conclusions from the analysis, limitations of the modelling should be noted. As with
all modelling, poor quality data is a concern. In particular, the input-output tables, showing the
relationship between sectors, are from 2007 and are likely to have changed since then, especially in a
fast growing economy such as Vietnam’s. .
Endogenous changes in investment that might occur with a more liberal trade regime were not taken
into account by the model. Indeed, the technological improvements that come from inward flows of
foreign investment may be the major driver of economic growth. In this respect our results are biased
downwards.
8 The WTO does not treat fish as an agricultural product, but its inclusion is more appropriate when discussing
farmed fish, as is the case here.
9 This is a general equilibrium result, which may not be evident in a partial equilibrium model.
19
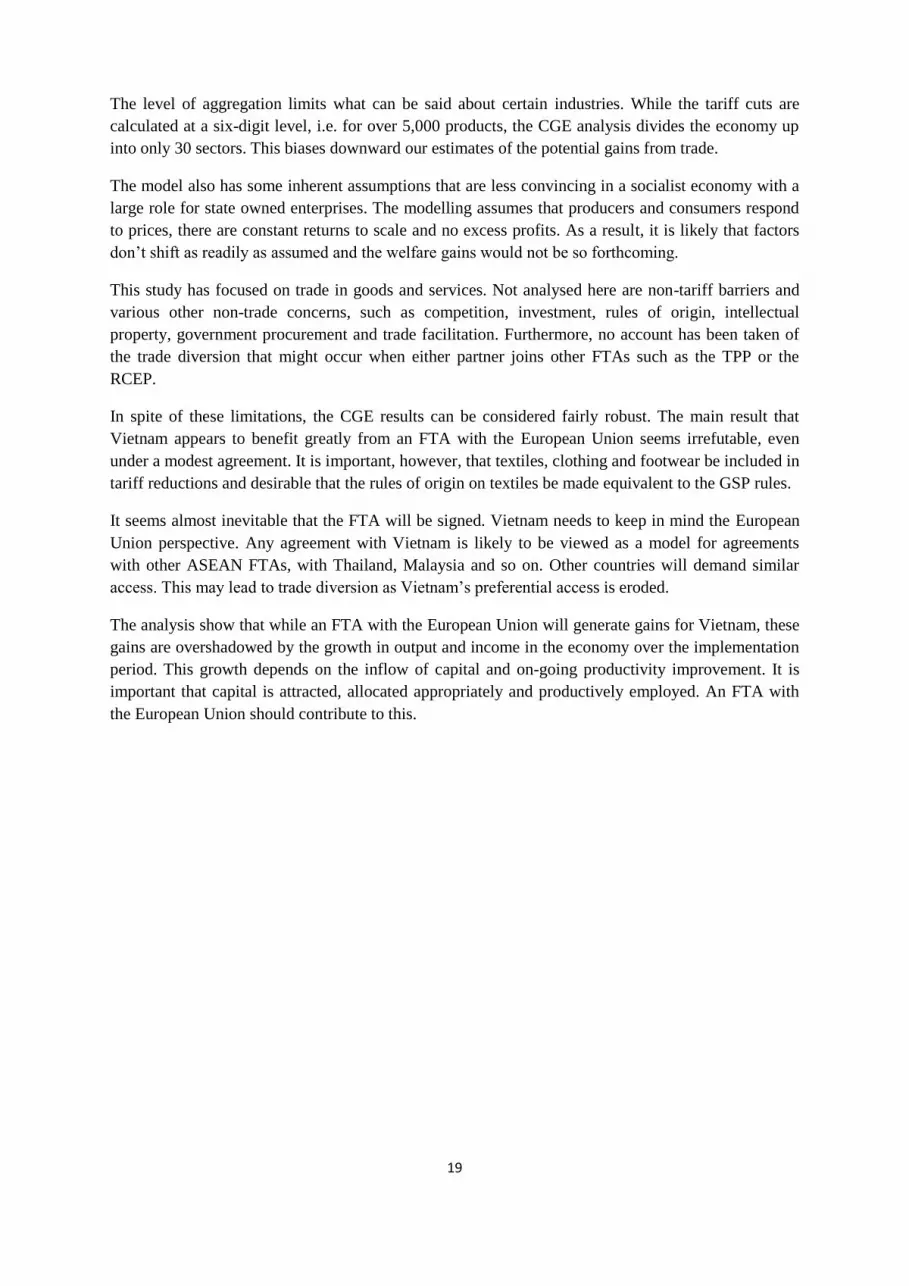
The level of aggregation limits what can be said about certain industries. While the tariff cuts are
calculated at a six-digit level, i.e. for over 5,000 products, the CGE analysis divides the economy up
into only 30 sectors. This biases downward our estimates of the potential gains from trade.
The model also has some inherent assumptions that are less convincing in a socialist economy with a
large role for state owned enterprises. The modelling assumes that producers and consumers respond
to prices, there are constant returns to scale and no excess profits. As a result, it is likely that factors
don’t shift as readily as assumed and the welfare gains would not be so forthcoming.
This study has focused on trade in goods and services. Not analysed here are non-tariff barriers and
various other non-trade concerns, such as competition, investment, rules of origin, intellectual
property, government procurement and trade facilitation. Furthermore, no account has been taken of
the trade diversion that might occur when either partner joins other FTAs such as the TPP or the
RCEP.
In spite of these limitations, the CGE results can be considered fairly robust. The main result that
Vietnam appears to benefit greatly from an FTA with the European Union seems irrefutable, even
under a modest agreement. It is important, however, that textiles, clothing and footwear be included in
tariff reductions and desirable that the rules of origin on textiles be made equivalent to the GSP rules.
It seems almost inevitable that the FTA will be signed. Vietnam needs to keep in mind the European
Union perspective. Any agreement with Vietnam is likely to be viewed as a model for agreements
with other ASEAN FTAs, with Thailand, Malaysia and so on. Other countries will demand similar
access. This may lead to trade diversion as Vietnam’s preferential access is eroded.
The analysis show that while an FTA with the European Union will generate gains for Vietnam, these
gains are overshadowed by the growth in output and income in the economy over the implementation
period. This growth depends on the inflow of capital and on-going productivity improvement. It is
important that capital is attracted, allocated appropriately and productively employed. An FTA with
the European Union should contribute to this.

20
References
ASEAN Secretariat www.asean.org.
Burfisher, M. E. (2011) Introduction to General Equilibrium Models, Cambridge University Press.
European Commission (2014) http://ec.europa.eu/trade/policy/countries-and-regions/agreements/
ILO (International Labour Organisation) (2013) ILO “Economically active population estimates and
projections” http://laborsta.ilo.org/applv8/data/EAPEP/v6/EAPEP-1990-2020.xlsx
IMF (International Monetary Fund) (2013), World Economic Outlook Database, April 2013.
Hertel, T.W. (1997) (Ed.), Global Trade Analysis: Modeling and Applications, Cambridge University
Press.
Horridge, M. and Laborde, D. (2008) TASTE: A program to adapt detailed trade and tariff data to
GTAP-related purposes’, unpublished conference paper,
https://www.gtap.agecon.purdue.edu/resources/download/4938.pdf.
Narayanan, B., Aguiar, A. and McDougall, R. (Eds.) (2012) Global Trade, Assistance, and
Production: The GTAP 8 Data Base, Center for Global Trade Analysis, Purdue University.
NIAPP (National Institute of Agricultural Planning and Projection) (2010) Policy research on
Vietnam’s food security and rice value chain dynamics: Theme 1 – Food security research,
Draft report, Hanoi, November.
WCO (2014) HS Nomenclature 2012 Edition
http://www.wcoomd.org/en/topics/nomenclature/instrument-and-
tools/hs_nomenclature_2012/hs_nomenclature_table_2012.aspx.
WITS (2014) World Integrated Trade Solution, World Bank.
http://wits.worldbank.org/product_concordance.html

21
Appendices
Table A1 Sectoral aggregation
No. Label Description
1 RCE Rice
2 VFN Vegetables, fruit, nuts
3 SUG Sugar
4 CRPS Other crops
5 FRS Forestry
6 RES Resources
7 FSH Fishing
8 BV Beef and veal
9 PP Pork and poultry
10 DRY Dairy products
11 OFD Food products nec
12 B_T Beverages & tobacco
13 TXT Textiles
14 WAP Wearing apparel
15 LEA Leather
16 ELE Electronics
17 P_C Petroleum and coal products
18 MVT Motor vehicle & transport equipment
19 LUM Wood products
20 PPP Paper products, publishing
21 CRP Chemical, rubber & plastics
22 OME Machinery and equipment nec
23 NMM Mineral products nec
24 MAN Manufactures
25 TSP Transport
26 CMN Communication
27 TRD Retail & wholesale trade
28 FI Finance & insurance
29 BSV Business services
30 SVC Other services

22
Table A2 Regional aggregation
No Label Description
1 AUS Australia
2 NZL New Zealand
3 JPN Japan
4 MYS Malaysia
5 SGP Singapore
6 VNM Viet Nam
7 CAN Canada
8 USA United States of America
9 MEX Mexico
10 CHL Chile
11 PER Peru
12 CHINA China
13 KOR Korea
14 IND India
15 XAS Rest of ASEAN
16 LAM Latin America
17 EU28 European Union
18 ODV Other developed
19 AFR Africa
20 ROW Rest of the World
23
Appendix table A3 Vietnam’s tariff cut exemptions
Chapter Product description Sensitive Highly
sensitive
Exempt
1 Live animals
2 Meat and edible meat offal X
3 Fish and crustaceans, molluscs and
4 Dairy produce; birds' eggs; … X
5 Products of animal origin, nec
6 Live trees and other plants; bulbs, …
7 Edible vegetables and certain roots …
8 Edible fruit and nuts; peel of citrus … X
9 Coffee, tea, maté and spices X
10 Cereals X
11 Products of the milling industry; …
12 Oil seeds and oleaginous fruits; … X X
13 Lac; gums, resins and other veg … X X
14 Vegetable plaiting materials; …
15 Animal or vegetable fats and oils …
16 Preparations of meat, of fish … X X
17 Sugars and sugar confectionery X X X
18 Cocoa and cocoa preparations
19 Preparations of cereals, flour, starch
20 Preparations of vegetables, fruit, nuts
21 Miscellaneous edible preparations
22 Beverages, spirits and vinegar X X
23 Residues and waste from the food industries;
24 Tobacco and manuf. tobacco … X X
25 Salt; sulphur; earths and stone; … X X X
26 Ores, slag and ash
27 Mineral fuels, mineral oils … X X X
28 Inorganic chemicals; organic … X X
29 Organic chemicals X
30 Pharmaceutical products
31 Fertilisers X X
32 Tanning or dyeing extracts; tannins … X
33 Essential oils and resinoids; …
34 Soap, organic surface-active agents
35 Albuminoidal substances; modified …
36 Explosives; pyrotechnic products; … X X
37 Photographic or cinematographic …
38 Miscellaneous chemical products X
39 Plastics and articles thereof X X
40 Rubber and articles thereof X X X
41 Raw hides and skins …

24
42 Articles of leather; saddlery and … X
43 Furskins and artificial fur; … X
44 Wood and articles of wood; …
45 Cork and articles of cork
46 Manufactures of straw, of esparto …
47 Pulp of wood or of other fibrous …
48 Paper and paperboard; articles of … X X
49 Printed books, newspapers, pictures
50 Silk
51 Wool, fine or coarse animal hair; … X
52 Cotton X X X
53 Other vegetable textile fibres; …
54 Man-made filaments; strip … X X X
55 Man-made staple fibres X X X
56 Wadding, felt and nonwovens; … X X
57 Carpets and other textile floor … X
58 Special woven fabrics; tufted textile X X
59 Impregnated, coated, covered … X X X
60 Knitted or crocheted fabrics X X
61 Articles of apparel and clothing … X
62 Articles of apparel and clothing … X
63 Other made-up textile articles; sets; … X
64 Footwear, gaiters and the like; … X
65 Headgear and parts thereof
66 Umbrellas, sun umbrellas, walking …
67 Prepared feathers and down and …
68 Articles of stone, plaster, cement, …
69 Ceramic products X
70 Glass and glassware X X X
71 Natural or cultured pearls, precious … X
72 Iron and steel X X X
73 Articles of iron or steel X X
74 Copper and articles thereof X
75 Nickel and articles thereof
76 Aluminium and articles thereof X
78 Lead and articles thereof
79 Zinc and articles thereof
80 Tin and articles thereof
81 Other base metals; cermets; …
82 Tools, implements, cutlery, spoons … X X
83 Miscellaneous articles of base metal X X
84 Nuclear reactors, boilers, machinery… X X X
85 Electrical machinery and equipment X X
86 Railway or tramway locomotives, …
87 Vehicles other than railway … X X X
88 Aircraft, spacecraft, and parts thereof

25
89 Ships, boats and floating structures X X
90 Optical, photographic, …
91 Clocks and watches and parts thereof
92 Musical instruments; …
93 Arms and ammunition; … X X
94 Furniture; bedding, mattresses, … X X
95 Toys, games and sports requisites; … X
96 Miscellaneous manufactured articles X X
97 Works of art, collectors' pieces …
Tariffs are selected at the 6 or 8 digit levels. This table indicates the chapters that contain some
exemptions at the 6 digit level. Note “…” denotes the product description is incomplete. A full
description can be found at WCO (2014).

26
Appendix table A4 Growth in output in Vietnam by sector by 2025
Base FTA
% %
Rice 94 93
Vegetables 70 69
Sugar 97 97
Other crops 22 20
Forestry 212 202
Resources 198 196
Fishing 130 132
Beef and veal 97 100
Pork and poultry 90 92
Dairy products 150 146
Food products nec 92 91
Bev. & tobacco 93 95
Textiles 194 214
Wearing apparel 202 249
Leather 330 417
Electronics 300 276
Petroleum 256 253
Motor vehicle 177 171
Wood products 118 105
Paper products 174 169
Chemicals 210 203
Machinery 154 136
Mineral prods 174 174
Manufactures 199 185
Transport 120 124
Communication 197 198
Retail 201 206
Finance 230 222
Business 200 194
Services 193 198 Source: GTAP simulations. Estimates are relative to 2007 base.

27
Appendix table A5 Growth in exports in Vietnam by sector by 2025
Base FTA
% %
Rice 166 158
Vegetables 115 111
Sugar 126 108
Other crops 17 14
Forestry 778 775
Resources 184 182
Fishing 124 120
Beef and veal -64 -68
Pork and poultry -16 -21
Dairy products 217 192
Food products nec 58 61
Bev. & tobacco 50 48
Textiles 139 156
Wearing apparel 116 153
Leather 211 281
Electronics 236 217
Petroleum 546 519
Motor vehicle 90 84
Wood products 65 57
Paper products 132 118
Chemicals 180 164
Machinery 85 73
Mineral prods 83 76
Manufactures 120 106
Transport 38 42
Communication 87 94
Retail 57 55
Finance 82 77
Business 77 70
Services 110 101 Source: GTAP simulations. Estimates are relative to 2007 base.
28
Appendix table A6 Growth in imports in Vietnam by sector by 2025
Base FTA
% %
Rice 187 203
Vegetables 173 183
Sugar 147 164
Other crops 111 118
Forestry 73 66
Resources 175 183
Fishing 21 25
Beef and veal 201 209
Pork and poultry 242 258
Dairy products 119 128
Food products nec 81 93
Bev. & tobacco 100 106
Textiles 171 208
Wearing apparel 205 243
Leather 199 268
Electronics 133 134
Petroleum 131 134
Motor vehicle 116 123
Wood products 118 121
Paper products 114 121
Chemicals 127 136
Machinery 111 114
Mineral prods 153 166
Manufactures 118 119
Transport 144 153
Communication 80 96
Retail 128 142
Finance 182 197
Business 129 142
Services 90 105
Source: GTAP simulations. Estimates are relative to 2007 base.


![HERITAGE ROAD & PARADISE OF CENTRAL VIETNAM Vietnam Tourism VITOURS JSC., VIETNAM DISCOVER [2014-2015 EDITION] Vietnam Tourism VITOURS Top Ten Travel Agents in Vietnam Page 2 INTINERARY](https://img.pdfslide.net/doc/110x75/631aea28d43f4e176304a8e9/heritage-road-paradise-of-central-vietnam-vietnam-tourism-vitours-jsc-vietnam.jpg)


