Embed Size (px)
Citation preview

ORNL/TM-2006/140
Trade Studies for the Liquid-Salt-Cooled Very High-Temperature Reactor: Fiscal Year 2006 Progress Report
February 2007 Prepared by D. T. Ingersoll C. W. Forsberg P. E. MacDonald Contributors: K. T. Clarno, C. W. Forsberg, J. C. Gehin, C. O. Slater, J. J. Carbajo, D. F. Williams Oak Ridge National Laboratory T. A. Taiwo, J. E. Cahalan, T. K. Kim, J. Sienicki, F. Szakaly, A. Moisseytsev, M. Farmer, F. Dunn Argonne National Laboratory P. F. Peterson, E. Greenspan, H. Zhao University of California Berkeley J. Ambrosek University of Wisconsin

DOCUMENT AVAILABILITY
Reports produced after January 1, 1996, are generally available free via the U.S. Department of Energy (DOE) Information Bridge:
Web site: http://www.osti.gov/bridge Reports produced before January 1, 1996, may be purchased by members of the public from the following source:
National Technical Information Service 5285 Port Royal Road Springfield, VA 22161 Telephone: 703-605-6000 (1-800-553-6847) TDD: 703-487-4639 Fax: 703-605-6900 E-mail: [email protected] Web site: http://www.ntis.gov/support/ordernowabout.htm
Reports are available to DOE employees, DOE contractors, Energy Technology Data Exchange (ETDE) representatives, and International Nuclear Information System (INIS) representatives from the following source:
Office of Scientific and Technical Information P.O. Box 62 Oak Ridge, TN 37831 Telephone: 865-576-8401 Fax: 865-576-5728 E-mail: [email protected] Web site: http://www.osti.gov/contact.html
This report was prepared as an account of work sponsored by an agency of the United States Government. Neither the United States government nor any agency thereof, nor any of their employees, makes any warranty, express or implied, or assumes any legal liability or responsibility for the accuracy, completeness, or usefulness of any information, apparatus, product, or process disclosed, or represents that its use would not infringe privately owned rights. Reference herein to any specific commercial product, process, or service by trade name, trademark, manufacturer, or otherwise, does not necessarily constitute or imply its endorsement, recommendation, or favoring by the United States Government or any agency thereof. The views and opinions of authors expressed herein do not necessarily state or reflect those of the United States Government or any agency thereof.

ORNL/TM-2006/140
TRADE STUDIES ON THE LIQUID-SALT-COOLED VERY HIGH-TEMPERATURE
REACTOR: FISCAL YEAR 2006 PROGRESS REPORT
D. T. Ingersoll C. W. Forsberg
P. E. MacDonald
Contributors:
K. T. Clarno, C. W. Forsberg, J. C. Gehin, C. O. Slater, J. J. Carbajo, and D. F. Williams Oak Ridge National Laboratory
T. A. Taiwo, J. E. Cahalan, T. K. Kim, J. Sienicki, F. Szakaly, A. Moisseytsev,
M. Farmer, and F. Dunn Argonne National Laboratory
P. F. Peterson, E. Greenspan, and H. Zhao
University of California Berkeley
J. Ambrosek University of Wisconsin
Date Published: February 2007
Prepared by OAK RIDGE NATIONAL LABORATORY
P.O. Box 2008 Oak Ridge, Tennessee 37831-6283
managed by UT-Battelle, LLC
for the U.S. DEPARTMENT OF ENERGY
under contract DE-AC05-00OR22725


iii
CONTENTS
Page
LIST OF FIGURES ..................................................................................................................................vii LIST OF TABLES ...................................................................................................................................xiii LIST OF ACRONYMNS .......................................................................................................................xvii EXECUTIVE SUMMARY .....................................................................................................................xix ABSTRACT............................................................................................................................................. xxv 1. INTRODUCTION............................................................................................................................. 1
1.1 Initial Baseline Design .............................................................................................................. 2 1.2 FY-06 Work Scope.................................................................................................................... 7 1.3 Overview of Report ................................................................................................................... 9
2. GOALS AND REQUIREMENTS ................................................................................................. 11 2.1 Economic Goals ...................................................................................................................... 11 2.2 Sustainability Goals................................................................................................................. 14 2.3 Safety and Reliability Goals.................................................................................................... 15 2.4 Proliferation Resistance and Physical Protection Goals.......................................................... 16 2.5 Functional Safety Requirements.............................................................................................. 16
3. SALT STUDIES .............................................................................................................................. 17 3.1 Assessment of Candidate Salt Coolants for the Primary Coolant System............................... 17
3.1.1 Melting Point...........................................................................................................17 3.1.2 Vapor Pressure and Vapor Species ......................................................................... 21 3.1.3 Density .................................................................................................................... 23 3.1.4 Heat Capacity..........................................................................................................24 3.1.5 Viscosity ................................................................................................................. 25 3.1.6 Thermal Conductivity ............................................................................................. 27 3.1.7 Heat-Transfer Comparisons .................................................................................... 29 3.1.8 Parasitic Neutron Capture and Moderation............................................................. 31 3.1.9 Reactivity Coefficients............................................................................................32 3.1.10 Short-Term Activation ............................................................................................ 35 3.1.11 Long-Term Activation ............................................................................................ 36 3.1.12 Cost of the Salt ........................................................................................................ 38 3.1.13 Chemical Considerations ........................................................................................ 40 3.1.14 Reactor Coolant Conclusions and Recommendations ............................................ 45
3.2 Assessment of Candidate Salts for the Secondary Heat-Transfer Loop.................................. 46 3.2.1 Melting Point and Vapor Pressure .......................................................................... 47 3.2.2 Density .................................................................................................................... 51 3.1.3 Heat Capacity..........................................................................................................52 3.1.4 Viscosity ................................................................................................................. 52 3.2.5 Thermal Conductivity ............................................................................................. 53 3.2.6 Heat-Transfer Comparisons .................................................................................... 54 3.2.7 Cost of Salts ............................................................................................................ 55 3.2.8 Chemical Considerations ........................................................................................ 58 3.2.9 Heat-Transfer Loop Summary and Recommendations ........................................... 62

iv
3.3 Preliminary Molten Salt Property Tests .................................................................................. 63 3.3.1 Salt Preparation ....................................................................................................... 63 3.3.2 Density Measurements ............................................................................................ 64 3.3.3 Melting Point and Heat of Fusion Measurements................................................... 65
4. NEW BASELINE DESIGN............................................................................................................ 71 4.1 Design Features ....................................................................................................................... 75 4.2 Core, Primary Vessel, and Buffer Salt Tank ........................................................................... 76 4.3 Primary Loop Components ..................................................................................................... 79
5. LS-VHTR DECAY HEAT REMOVAL STUDIES...................................................................... 81 5.1 Assessment of Decay Heat Removal Options ......................................................................... 81
5.1.1 Reactor Vessel Auxiliary Cooling System (RVACS)............................................. 82 5.1.2 Direct Reactor Auxiliary Cooling System (DRACS) ............................................. 83 5.1.3 Pool Reactor Auxiliary Cooling System (PRACS)................................................. 84 5.1.4 Decay-Heat Removal System Ranking Criteria...................................................... 86
5.2 Performance of RVACS and DRACS Decay Heat Removal Systems.................................... 87 5.2.1 RVACS Steady State Performance Analysis .......................................................... 87 5.2.2 RVACS Transient Systems Analysis ...................................................................... 93 5.2.3 DRACS Systems Analysis ...................................................................................... 96 5.2.4 RVACS and DRACS Summary............................................................................ 100
5.3 Performance of PRACS Decay Heat Removal System......................................................... 101 5.3.1 Decay Heat System Assessment ........................................................................... 101 5.3.2 RELAP-5 Loss of Forced Cooling (LOFC) Transient Response Modeling
for the PB-AHTR .................................................................................................. 104 5.4 Basis for Selection of the Decay Heat Removal System....................................................... 110
6. LS-VHTR CORE DESIGN STUDIES ........................................................................................ 113 6.1 ORNL Neutronics Studies..................................................................................................... 113
6.1.1 Analysis Methods and Data .................................................................................. 113 6.1.2 Parametric Study of a Clustered-Fuel Rod Assembly for the LS-VHTR ............. 114 6.1.3 Two-Dimensional R–Z Analysis of Radiation Levels for the 2400 MW(t)
LS-VHTR.............................................................................................................. 123 6.2 ORNL Thermal/Hydraulic Analyses..................................................................................... 131
6.2.1 Steady State Flow and Temperature Results......................................................... 132 6.2.2 Transient State Flow and Temperature ................................................................. 134
6.3 ANL Neutronic Assessment of Stringer Fuel Assembly Design .......................................... 138 6.3.1 LS-VHTR Core Using Stringer Fuel Assembly.................................................... 139 6.3.2 Computational Methods and Model Verification.................................................. 140 6.3.3 Performance of LS-VHTR Stringer Fuel Assembly ............................................. 144 6.3.4 Annular Pin Assembly Conclusions...................................................................... 149
7. REFUELING OPTIONS AND CONSIDERATIONS FOR LIQUID-SALT-COOLED VERY HIGH-TEMPERATURE REACTORS.......................................................................... 151 7.1 Issues Associated with Refueling.......................................................................................... 151
7.1.1 Coolant Salt Options and Implications for Refueling ........................................... 151 7.1.2 Fuel Designs and Implications for Refueling........................................................ 152 7.1.3 Decay Heat and Implications on Refueling .......................................................... 152
7.2 Mechanical Operations in Liquid Salt: Experience from Molten Salt Reactors ................... 153

v
7.3 High-Temperature Reactor Refueling Experience ................................................................ 155 7.3.1 Prismatic-Graphite-Fuel High-Temperature Reactors .......................................... 156 7.3.2 Pebble-Bed Reactor...............................................................................................163 7.3.3 Stringer or Assembly High-Temperature Reactors ............................................... 170
7.4 Fast Reactor Experience........................................................................................................ 173 7.4.1 Common Sodium and Salt Refueling Characteristics ........................................... 173 7.4.2 Fast Reactor Refueling Experience....................................................................... 174 7.4.3 Liquid-Salt-Cooled Refueling............................................................................... 182
7.5 Conclusions ........................................................................................................................... 185 8. INSTRUMENTATION FOR REFUELING, INSPECTION, AND MAINTENANCE.......... 187
8.1 Instrumentation Requirements .............................................................................................. 187 8.2 Optical Access to the Reactor ............................................................................................... 187 8.3 Precision Metrology .............................................................................................................. 188 8.4 Spectroscopy ......................................................................................................................... 190 8.5 Television .............................................................................................................................. 191 8.6 Conclusions ........................................................................................................................... 191
9. LS-VHTR SPENT-FUEL CHARACTERISTICS AND REPOSITORY IMPACTS ............. 193 9.1 Plant Efficiency vs Repository Size ...................................................................................... 193 9.2 Fuel Cycle Characteristics vs Repository Size ...................................................................... 193 9.3 SNF Volume.......................................................................................................................... 195 9.4 Repository Performance ........................................................................................................197 9.5 Graphite-Matrix SNF Repository .......................................................................................... 197 9.6 Conclusions ........................................................................................................................... 197
10. LS-VHTR SAFETY AND LICENSING ANALYSES AND TESTING PROGRAM............. 199 10.1 Safety and Licensing Analyses and Testing Program ........................................................... 199 10.2 Design of Scaled Integral Experiments for High Temperature Liquid Salt Mechanics and
Heat Transfer......................................................................................................................... 201 10.2.1 Nomenclature ........................................................................................................ 202 10.2.2 Scaling Laws ......................................................................................................... 203 10.2.3 Potential Simulant-Fluid Candidates..................................................................... 205 10.2.4 Scaling................................................................................................................... 207 10.2.5 Integral Experiment Designs................................................................................. 210 10.2.6 Conclusions........................................................................................................... 211
11. REFERENCES.............................................................................................................................. 213 APPENDIX A—ORGANIZATIONS AND DEVELOPMENT ACTIVITIES ASSOCIATED
WITH THE LIQUID-SALT-COOLED VERY-HIGH-TEMPERATURE REACTOR AND RELATED CONCEPTS..................................................................................................... 227
APPENDIX B—BIBLIOGRAPHY....................................................................................................... 229

vi

vii
LIST OF FIGURES
Figure Page
1.1 Functional layout of the LS-VHTR for hydrogen production or electricity production...... 2
1.2 Elevation view of baseline LS-VHTR reactor........................................................................... 3
1.3 LS-VHTR reference core design, 265 fuel columns and 10.0 MW/m3 power density.................... 3
1.4 Elevation view of the revised baseline LS-VHTR for normal operation and refueling modes................................................................................................................................ 5
1.5 Plan view of the revised baseline LS-VHTR at core midplane elevation........................................ 5
1.6 Scaled comparison of the 600 MW(t) GT-MHR reactor and the 2400 MW(t) LS-VHTR......................................................................................................................................... 6
1.7 Diffusion bonded formed plate heat exchanger fabricated by Heatric............................................. 6
2.1 Relative quantities of materials per unit power output required to construct various types of reactors ............................................................................................................................. 12
2.2 LS-VHTR functional safety requirements ..................................................................................... 16
3.1 Ternary phase diagram for LiF-NaF-ZaF4 ............................................................................... 19
3.2 Ternary phase diagram for RbF-NaF-ZrF4 .............................................................................. 20
3.3 Liquidus temperatures for RbF-NaF-ZrF4 system with Na:Rb = 1.44................................. 20
3.4 Vapor pressure trends in alkali fluoride–BeF2 systems at 900ºC................................................... 22
3.5 Vapor pressure trends in alkali fluoride-ZrF4 systems at 900ºC.................................................... 22
3.6 Range of viscosities for various salt systems................................................................................. 26
3.7 Effect of BeF2 composition on the viscosity of LiF-BeF2 mixtures at 600°C ............................... 27
3.8. Effect of alkali composition on the viscosity in BeF2 salts............................................................ 27
3.9 Composition effects on viscosity in ZrF4 mixtures........................................................................ 28
3.10 Activity levels for candidate coolants and comparison materials......................................... 35
3.11 Activity levels for components of various salt options .......................................................... 36
3.12 Effect of redox potential on tellurium cracking of Hastelloy-N .................................................... 41
3.13 Vapor pressure of selected candidate coolant salts ........................................................................ 49
3.14 Salt viscosity based upon experimental measurements ................................................................. 52
3.15. Thermal conductivity correlation in one-component nitrate and halide salts ................................ 53
3.16 FLiNaK volumetric expansion...........................................................................................65
3.17 The initial melt of the sample for the 35% ZrF4 shows a phase transition at 250°C and a devitrification at 310°C.................................................................................................... 66
3.18 The sample capsule for the 45% ZrF4 salt was covered with ZrF4 that had recrystallized onto the surface of the capsule.......................................................................... 67

viii
3.19 A rough boundary for the ternary phase diagram LiF-KF-ZrF4 ........................................... 68
4.1 Schematic view of the flow distribution in the AHTR-MI ............................................................ 71
4.2 Sealed comparison of the 600 MW(t) GT-MHR reactor and the 2400 MW(t) AHTR-MI ...................................................................................................................................... 72
4.3 Elevation view of the AHTR-MI for normal operation and refueling modes................................ 73
4.4 Plan view of the AHTR-MI operating deck................................................................................... 74
4.5 Lumped-mass transient temperature response of the 2400 MW(t) AHTR-MI to LOFC ......................................................................................................................................... 75
4.6 AHTR-MI core design has 325 fuel columns with eight layers (10.2 MW/m3) ............................ 76
4.7 Elevation view of the MSBR reactor vessel and reflector and moderator elements...................... 77
4.8 Diffusion bonded formed plate heat exchanger (FPHE) fabricated by Heatric ............................. 79
4.9 Vendor's brochure figure for the EPR primary pump showing the suction, discharge, a mixed flow impellor, and two water-lubricated bearings............................................................ 79
5.1 Reactor vessel auxiliary cooling system ........................................................................................ 82
5.2 Direct reactor auxiliary cooling system ......................................................................................... 83
5.3 Pool reactor auxiliary cooling system............................................................................................ 84
5.4 VHTR configuration modeled in steady state RVACS decay heat removal code ......................... 88
5.5 Steady state maximum reactor vessel inner surface temperature vs core inlet temperature for RVACS heat removal........................................................................................... 89
5.6 Steady state percentage of full power removed by RVACS vs core inlet temperature for RVACS heat removal........................................................................................... 90
5.7 Steady state coolant temperature rise through core (outlet–inlet temperatures) vs core inlet temperature for RVACS heat removal........................................................................... 90
5.8 Steady state coolant mean-velocity through core vs core inlet temperature for RVACS heat removal .................................................................................................................... 91
5.9 Steady state liquid salt primary coolant temperatures with RVACS heat removal.......... 922
5.10 Steady state system temperatures with RVACS heat removal............................................ 922
5.11 Steady state radial temperature distributions with RVACS heat removal......................... 933
5.12 Steady state radial temperature distributions in vessel region with RVACS heat removal................................................................................................................................. 93
5.13 Coolant systems model of the LS-VHTR ...................................................................................... 94
5.14 Transient reactor power and RVACS heat removal....................................................................... 95
5.15 Transient coolant and reactor vessel temperatures ........................................................................ 95
5.16 Schematic illustration of a direct reactor auxiliary cooling system (DRACS) for the LS-VHTR ........................................................................................................................... 96
5.17 Tube sheet planar area vs number of tubes for a 3 MW(t) DRHX ................................................ 98
5.18 Tube length vs number of tubes for a 3 MW(t) DRHX ................................................................. 98

ix
5.19 Primary (shell) and secondary (tube) side ΔP vs number of tubes for a 3 MW(t) DRHX ............................................................................................................................. 98
5.20 Core and cold plenum temperature vs number of available DRHXs............................................. 99
5.21 DRACS heat removal rate and decay heat vs number of available DRHXs.................................. 99
5.22 Calculated temperatures of the core/vessel and the buffer tank after reactor shutdown .................................................................................................................................... 102
5.23 Decay heat and power removed by the PRACS and the DRACS after reactor shutdown [as fractions of the reactor nominal power, 2400 MW(t)] ................................. 102
5.24 Coolant exit and average core temperature in K after reactor shutdown........................... 103
5.25 Decay heat as a function of time after shutdown .................................................................. 103
5.26 Elevation view of the PB-AHTR showing the elevation and height of the current reference PHX design ............................................................................................................... 105
5.27 Plan view of the PB-AHTR showing the locations of the four defueling machines........ 106
5.28 RELAP-5 nodalization for LOFC transient analysis of the PB-AHTR ....................................... 107
5.29 Initial steady state temperature distribution, in Kelvin, along the centerline of the PB-AHTR core, for the coolant, pebble surface, and pebble centers................................. 108
5.30 Transient response of the reference PB-AHTR core inlet, average, and outlet temperatures, in Kelvin, during a LOFC transient with scram ........................................... 108
5.31 Transient response of the reference PB-AHTR buffer salt temperature, in Kelvin, at various elevations.................................................................................................................. 109
6.1 FY-05 baseline LS-VHTR fuel block .......................................................................................... 115
6.2 Assembly baseline design for LS-VHTR............................................................................... 116
6.3 Reactivity (k) vs C/235U ratio for 3- and 2-cm-diam fuel pins with 15 and 20% coolant fractions........................................................................................................................... 117
6.4 Reactivity (k) vs block pitch/coolant channel diameter for 3-cm-diam fuel rods with a fuel pitch of 3.6 cm (fuel pitch/rod diam = 1.2)........................................................................ 118
6.5 Reactivity (k) vs block pitch/coolant channel diameter for 2-cm-diam fuel rods with a fuel pitch of 2.2 cm (fuel pitch/rod diam = 1.1)........................................................................ 118
6.6 Reactivity (k) vs block pitch/coolant channel diameter for 1.5-cm-diam fuel rods with a fuel pitch of 1.65 cm (fuel pitch/rod diam = 1.1.) ..................................................................... 119
6.7 Reactivity vs cladding thickness for various fuel pitches using 2.2-cm-diam fuel compacts ...................................................................................................................................... 120
6.8 Power peaking in baseline clustered-rod fuel assembly .............................................................. 121
6.9 Reactivity vs full power days for a one-batch core loading......................................................... 122
6.10 Clustered-rod baseline fuel element design ........................................................................... 122
6.11 Core layout using clustered-rod baseline fuel blocks and solid graphite reflector blocks ........... 122
6.12 Two-dimensional R-Z geometry model for the LS-VHTR ................................................. 124

x
6.13 Contours of the total neutron flux (cm−2 s−1) for a 2-D R–Z model of the LS-VHTR............................................................................................................................. 127
6.14 Contours of the heating rates (W/cm3) for a 2-D R-Z model of the LS-VHTR ............... 128
6.15 Contours of the total dose rate (mrem/h) for a 2-D R-Z model of the LS-VHTR............ 129
6.16 Neutron flux spectra at key locations for the Portland concrete shielded LS-VHTR ...... 130
6.17 Neutron flux spectra at key locations for the Portland concrete shielded LS-VHTR ...... 130 6.18 Calculated coolant and fuel centerline temperatures along the core height at 100% power
under steady state conditions ....................................................................................................... 132
6.19 Calculated radial temperature profile in the fuel pin with the largest fuel centerline temperature (at 4.5 m elevation) .................................................................................................. 133
6.20 Schematic view of the RELAP5–3D model of the AHTR .......................................................... 135
6.21 Isometric view of the RELAP5–3D model of the AHTR.................................................... 136
6.22 Axial temperatures calculated by RELAP5–3D for an average assembly ........................ 137
6.23 Natural convection mass flow rate through a PRACS module ........................................... 137
6.24 System temperature in Kelvin vs time calculated by RELAP5–3D ............................................ 138
6.25 LS-VHTR core layout.................................................................................................................. 139
6.26 Radial layouts of new 18-pin and 36-pin stringer assemblies............................................. 139
6.27 Schematic of CACTUS geometry model............................................................................... 143
6.28 Enlarged view of annular fuel compacts ................................................................................ 143
6.29 Representation of TRISO particles in fuel............................................................................. 143
6.30 Comparison of k-infinity vs burnup for 25% packing fraction.................................................... 145
6.31 Comparison of k-infinity vs cycle length for 25% packing fraction............................................ 145
6.32 Trend of beginning-of-life k-infinity vs fuel-to-moderator ratio ................................................. 146
6.33 Cycle length vs fuel-to-moderator ratio ................................................................................. 147
6.34 Variation of neutron spectrum with assembly design.................................................................. 147
7.1 Temperature rise per unit time as a function of cooling time ...................................................... 153
7.2 High-temperature reactor fuel types and core configurations ............................................. 156
7.3 Prismatic high-temperature fuel.......................................................................................157
7.4 Schematic of Fort St. Vrain refueling machine ...............................................................158
7.5 Photograph of Fort St. Vrain refueling machine..............................................................159
7.6 Example of a top-locking mechanism for a prismatic-fuel reactor .................................... 161
7.7 German THTR core .........................................................................................................164
7.8 Pebble-bed fuel ................................................................................................................164
7.9 Refueling of a helium-cooled pebble-bed reactor................................................................. 165

xi
7.10 Refueling of a salt-cooled pebble-bed reactor ............................................................................. 166
7.11 Schematic of pebble recirculation system being studied at UCB showing pebble insertion into the coolant cold legs for injection at 32 locations around the bottom inlet plenum of the reactor ................................................................................................................................ 167
7.12 The 7.25-m diameter upper reflector of the PB-AHTR showing the four 40-cm diameter defueling chutes and two of the four 82-cm diameter hot leg ports............................................. 167
7.13 PREX-0 experiments have provided proof-of-principle for the extraction of floating pebbles in a liquid-cooled core under scaled experimental conditions that match Re, Fr, and pebble/salt density ratio .................................................................... 168
7.14 Examples of PREX-0 pebble pathways after video capture analysis using particle tracking for three of the geometries studied .......................................................................... 169
7.15 Schematic illustration of the PREX-1 experiment, and figure showing final design....... 169
7.16 Advanced gas-cooled reactor stringer and fuel element .............................................................. 170
7.17 Dungeness B advanced gas-cooled reactor.................................................................................. 171
7.18 Stringer for an LS-VHTR ............................................................................................................ 171
7.19 Stringer fuel assembly for an LS-VHTR ..................................................................................... 172
7.20 Japanese High-Temperature Test Reactor fuel assembly with fuel rod....................................... 172
7.21 Moderator block with stringer fuel assembly .............................................................................. 173
7.22 EBR-II fuel-handling system................................................................................................... 175
7.23 General arrangement of FFTF reactor refueling facilities ........................................................... 177
7.24 FFTF closed loop ex-vessel machine (red machine on rail tracks).............................................. 178
7.25 FFTF driver fuel-handling sequence ...................................................................................... 179
7.26 FFTF driver fuel-handling sequence between interim decay storage and reactor vessel.............................................................................................................................. 179
7.27 CRBRP reactor refueling system ............................................................................................ 181
7.28 CRBRP reactor vessel head rotating plugs ............................................................................ 183
7.29 Thermal profile for FFTF fuel and test assembly handling ......................................................... 184
8.1 Liquid flibe (Li2BeF4) in air flowing into a fused silica test tube ................................................ 187
8.2 Mirror system for transmitting signals into and out of the reactor vessel.................................... 188
8.3 Image of a dime obtained by laser scanning of the surface from a distance of 4.2 m ................. 189
8.4 Precision metrology surface inspection of the first-wall component of a fusion reactor: photograph and metrology scan of the surface ............................................................................ 190
9.1 Differences in liquid-salt-cooled LS-VHTR and helium-cooled MHTG reactor cores............... 194
10.1 RELAP5–3D annular model of a unit cell in a fuel block also used as the geometry for the LS-VHTR integral effects experiment ............................................................................. 200
10.2 One-fourth-scale LS-VHTR pilot plant core arrangement........................................................... 200

xii
xiii
LIST OF TABLES
Table Page
1.1 Key parameters and targets for FY-06 baseline LS-VHTR design.................................................. 4
1.2 Organizations and responsibilities participating in FY-2006 LS-VHTR studies ............... 9
2.1 DOE Generation IV reactor goals..................................................................................... 11
3.1 Useful salt compositions for LS-VHTR coolants .......................................................................... 18
3.2 Boiling and freezing points of salt compounds and key mixtures .................................... 21
3.3 Salt density equations developed from experimental studies ........................................................ 23
3.4 Standard molar volumes for use in estimation of mixture density ................................... 24
3.5 Salt density by method of additive molar volumes for candidate coolants not previously measured ........................................................................................................................................ 24
3.6 Experimental and estimated values of heat capacity for key salts.................................... 25
3.7 Comparison of measured and predicted thermal conductivities ....................................... 29
3.8 Properties of comparison coolants and candidate coolants at 700°C ............................... 30
3.9 Heat transfer figures of merit ............................................................................................ 31 3.10 Neutronic efficiency for comparison materials and candidate coolants ........................................ 31
3.11 Reactivity coefficients for coolant loss.......................................................................................... 32
3.12 Reactivity coefficients for LS-VHTR with 900°C inlet temperature ............................... 33
3.13 Effect of key core design parameters on LS-VHTR reactivity coefficients ..................... 34
3.14 Nominal activity level of coolant constituents after 1 year of decay................................ 37
3.15 Nominal activity level of coolant constituents after 10 years of decay ............................ 38
3.16 Price estimate of salt coolants in 1971 (U.S. dollars) ....................................................... 39
3.17 Commodity prices for selected materials.......................................................................... 39
3.18 Predominant oxidation states of dissolved alloy constituents in various molten salts ................................................................................................................................... 44
3.19 Equilibrium level of dissolved metals for pure elements in contact with various fuel salts ............................................................................................................................ 44
3.20 Useful salt compositions (mole %) and eutectic temperatures for the NGNP/NHI heat-transfer loop .............................................................................................................. 48
3.21 Selected phase transition properties of salt compounds and key mixtures....................... 50
3.22 Salt density equations developed from experimental studies or the method of additive molar volumes..................................................................................................... 51
3.23 Salt heat capacity from experiments and prediction ...................................................................... 52
3.24 Comparison of measured and predicted thermal conductivities ....................................... 54

xiv
3.25 Estimates of properties for additional secondary coolant candidates ............................... 55
3.26 Heat-transfer ranking of secondary coolant candidates at 700ºC ..................................... 55
3.27 Price estimate of salt coolants (1971 U.S. dollars) ........................................................... 56
3.28 Commodity prices for selected materials.......................................................................... 57
3.29 Estimated raw material costs for various salt mixtures .................................................... 58
3.30 Comparison of free energies of constituents in chloride and fluoride systems.............................. 59
3.31 Relevant free energies of constituents in the NaF-NaBF4 system ................................................. 60
3.32 Summary of Brookhaven loop corrosion tests for chloride salts...................................... 61
3.33 Summary of Hastelloy-N corrosion loops with NaF-NaBF4 eutectic salt ........................ 62
3.34 Masses of the constituents and the resulting composition of the mixed salt .................... 63
3.35 The solid density of the different salt mixtures increases as the mol % of ZrF4 increases except at 45 mol % ZrF4 ........................................................................... 64
3.36 The melting and peak temperatures for the salt samples show an initial increase in melting temperature ...................................................................................................... 67
3.37 The latent heat of fusion for the two eutectic mixtures, FLiNaK and LiF-KF, show a slight decrease over published values ............................................................................ 68
3.38 The change in mass in successive runs for copper and carbon......................................... 69
4.1 Mass and thermal capacity (at 655°C) of AHTR-MI materials ..................................................... 71
5.1 Characteristics of reactor coolants .................................................................................... 81
5.2 Features of alternative decay heat removal systems ......................................................... 87
5.3 Mass and thermal capacity of the LS-VHTR components ............................................. 101
5.4 Reference design parameters used in the RELAP-5 model ............................................ 107
6.1 Power peaking values for possible fuel designs ............................................................. 121 6.2 One- and two-batch cycle lengths for various core heights ......................................................... 121
6.3 Comparison of geometry and parameters for assembly design and FY-05 baseline design ................................................................................................................ 123
6.4 Radial dimensions for the 2-D R-Z model of the LS-VHTR.......................................... 125
6.5 Elevations for various components in the 2-D R-Z model of the LS-VHTR ................. 126 6.6 LS-VHTR steady state calculations ............................................................................................. 133
6.7 Comparison of design data for LS-VHTR cores using block and stringer fuel assemblies ................................................................................................................ 141
6.8 Comparison of k-infinity values for fuel element at cold state....................................... 144
6.9 Cycle length and discharge burnup (linear reactivity model with 1.5% leakage approximation)................................................................................................................ 149
7.1 Candidate liquid salts...................................................................................................... 152

xv
7.2 Characteristics and operation time for ORNL salt and liquid metal pumps ................... 154
7.3 Comparison of FSV, commercial HTGR, and LS-VHTR reactor cores ........................ 160
7.4 Reactivity effect of ballast materials when lumped or distributed homogeneously with fresh fuel that contains no poison ........................................................................... 162
7.5 Reactivity effect of ballast materials when lumped or distributed homogeneously with fresh fuel that contains erbium-oxide poison.......................................................... 163
7.6 Pebble-bed reactors...................................................................................................................... 165
9.1 Relative core and fuel cycle parameters for the MHTGR and LS-VHTR with two batch refueling ................................................................................................................ 194
9.2 SNF characteristics ......................................................................................................... 196
10.1 Approximated liquid salt thermophysical properties, after D. Williams (2006) ............ 206
10.2 Liquid salt potential simulants ........................................................................................ 206
10.3 Thermal properties of candidate materials of construction for the prototype and for the model ................................................................................................................... 207
10.4 Liquid salts simulated by Drakesol® 260....................................................................... 209
10.5 Liquid salts simulated by Therminol® 72 ...................................................................... 210
A.1 Organizations conducting research on the liquid-salt-cooled very-high-temperature reactor ............................................................................................................................. 227

xvi

xvii
LIST OF ACRONYMNS
ABWR advanced boiling water reactor
AGR advanced gas-cooled reactor
AHTR advanced high-temperature reactor
AHTR-MI advanced high-temperature reactor-metallic internals
ALWR advanced light-water reactor
ANL Argonne National Laboratory
ASME American Society of Mechanical Engineers
AVR Arbeitsgemeinshaft Versuchsreaktor
CANDU Canadian deterium natural uranium (reactor)
CCP core component pot
CLEM closed loop ex-vessel machine
CRBRP Clinch River Breeder Reactor Plant
CSAM code scaling and applicability methodology
CVR coolant void reactivity
DHS DRACS heat exchanger
DRACS direct reactor auxiliary cooling system
DRHX direct reactor heat exchanger
DSC differential scanning calorimeter
EBR-II Experimental Breeder Reactor–II
EPR European pressurized-water reactor
ESBWR economic simplified boiling-water reactor
FOM figure of merit
GT-MHR gas-turbine modular helium reactor
HTGR high-temperature gas-cooled reactor
IET integral effects test
IVHM in-vessel handling machine
HTL heat transfer loop
HTTR High-Temperature Test Reactor (Japan)
IHX intermediate heat exchanger
INL Idaho National Laboratory
LOFC loss of forced circulation

xviii
LS-VHTR liquid-salt-cooled very high-temperature reactor
LWR light-water reactor
MHR modular helium reactor
MHTGR modular high-temperature gas-cooled reactor
MSR molten salt reactor
NDHX natural draft heat exchanger
NGNP Next Generation Nuclear Plant
NHI Nuclear Hydrogen Initiative
ORNL Oak Ridge National Laboratory
PIRT phenomina identification and ranking table
PIV particle imaging velocimeter
PBMR pebble bed modular reactor
PBR pebble bed reactor
PHX PRACS heat exchanger
PREX Pebble Refueling Experiment (UCB)
PRACS pool reactor auxiliary cooling system
PWR pressurized-water reactor
RIM refueling inspection and maintenance
RVACS reactor vessel auxiliary cooling system
SFR sodium fast reactor
SNF spent nuclear fuel
S-PRISM Super Power Reactor Inherently Safe Module
UCB University of California at Berkeley
UW University of Wisconsin at Madison
VHTR very high-temperature reactor

xix
EXECUTIVE SUMMARY
The Next Generation Nuclear Plant (NGNP) Project being conducted by the U.S. Department of Energy’s (DOE) Office of Nuclear Energy (NE) seeks to develop and demonstrate advanced nuclear reactor technology to produce electricity and hydrogen in a highly efficient, passively safe, and economical manner. The NGNP functional requirements will necessitate very-high-temperature operation (>900°C) compared with conventional systems. The traditional choice of coolant for a very-high-temperature reactor has been helium, and several helium-cooled designs have been built or are being developed world-wide. The leading reactor concept for the NGNP is also a helium-cooled concept designated the Very High-Temperature Reactor (VHTR). However, an alternative option for future high-temperature reactors is a liquid-salt very high-temperature reactor (LS-VHTR) that uses a liquid salt as the primary coolant with the same coated-particle fuel; this offers several advantages over gas coolants owing to the superior thermodynamic properties of liquids.
For electricity production, there are strong incentives to consider an advanced high-temperature reactor (AHTR) that operates near 750°C. There are available code-qualified materials of construction. Consequently, vendor studies have focused on reactors near these operating temperatures. The DOE program has emphasized higher operating temperatures (900–950°C) for the LS-VHTR because the primary goal is hydrogen production. In practice, most of the development work (excluding materials) is independent of the peak operating temperatures. However, there are very strong incentives to develop designs that minimize the number of reactor components that operate at high temperatures and minimize the requirements on those components. Many of the design choices, such as the decay heat cooling systems, are driven by this need.
The LS-VHTR programmatic goal is to provide an advanced design capable of satisfying the top-level functional requirements of the NGNP and provide a technology base that is sufficiently robust to allow a growth path to higher power output and higher temperatures, and also offer the potential for significant reduction in plant costs.
The technical viability and economic potential of the LS-VHTR have been established in previous studies. The focus of the project in FY-2006 was two fold: (1) expand our understanding of liquid salt coolant technology and (2) investigate key design options that are impacted by the choice of liquid salt coolant. This report summarizes the various technology and design studies conducted through the year by the several contributing organizations, which include Oak Ridge National Laboratory (ORNL), Argonne National Laboratory (ANL), University of California at Berkeley (UCB), and the University of Wisconsin (UW). Areva-NP also participated in the AHTR studies, but their work will be reported elsewhere.
The initial baseline concept carried forward from FY-2005 consisted of a pool-type design with external intermediate heat exchangers and a cylindrical prismatic core and reflector. The revised FY-2006 baseline concept differs significantly from the previous reference LS-VHTR design and uses a closed primary loop immersed in a tank containing a separate buffer salt. Separation of the primary coolant salt from the buffer salt allows different and optimal salt compositions to be used for the primary, buffer, and intermediate salt applications. The loop configuration also helps minimize the amount of primary coolant and thereby facilitates the use of more expensive salt options for the primary system, particularly enriched lithium salts. The AHTR has very slow and relatively benign temperature transients during design basis accidents because of the large thermal inertia of the prismatic core and primary coolant and the additional thermal inertia of the buffer salt. Also, most of the primary system is at or below the inlet temperature of the reactor core; only the outlet piping, the intermediate heat exchanger (IHX), and possibly the pump impeller need to be at the outlet temperature. This helps minimize the primary loop material challenges.
As with the previous baseline design, the revised LS-VHTR core has a cylindrical shape rather than the annular shape used for the prismatic helium-cooled VHTR design. The improved neutron economy of

xx
the cylindrical core geometry, along with the better heat transfer and transport of the liquid coolant, results in a very large increase in total power output. The LS-VHTR produces about 4 times as much power as a helium-cooled reactor with similar size, passive safety, and outlet temperatures. The new LS-VHTR baseline design adopts the same fuel, control rod, and safety rod designs used in the Fort St. Vrain reactor; however, alternative fuel forms are being considered to replace the Fort St. Vrain prismatic block type fuel in the baseline loop design.
Because the LS-VHTR concept has evolved considerably since its inception six years ago, it was prudent to revisit the guiding goals of the Generation IV program to understand how well the LS-VHTR measures against those goals of economics, sustainability, safety, and proliferation resistance. Regarding economics, the LS-VHTR has the potential for low capital cost per unit electrical and thermal output because of several factors. The LS-VHTR can be a high-power reactor with the associated economics of scale. The high operating temperatures result in higher plant efficiency. This implies less thermal energy is required per unit of electricity that is produced and thus the size and cost of the decay heat removal systems, cooling towers, and other components are reduced per unit of electricity. The closed Brayton power cycles have lower capital costs compared with traditional steam cycles and the high volumetric heat capacity of liquid salts reduces the size (and hence the costs) of pumps, valves, and heat exchangers. As with all new reactor concepts, there are significant uncertainties; however, initial estimates support a plant capital cost goal per kilowatt (electric) that is one-third to one-half less than that for advanced helium-cooled and light-water-cooled reactors.
Regarding sustainability goals, the LS-VHTR uranium consumption will be about the same as LWRs resulting from an offsetting of factors such as an improvement in uranium utilization that is due to the higher thermal-to-electricity efficiency of the LS-VHTR and the higher enrichment requirements for the LS-VHTR. Relative to the VHTR, the LS-VHTR will have lower uranium consumption and higher spent nuclear fuel burnup due to the improved neutron economy of the cylindrical core design enabled by liquid coolant. The repository disposal costs for LS-VHTR spent nuclear fuel (SNF) will be less than the VHTR due to higher fuel burnup that reduces waste volumes. The repository performance is expected to be better than that of light-water reactors (LWRs) due to the improved corrosion resistance of graphite-coated particle fuel. The passive safety features of the VHTR and LS-VHTR ranks them both above LWRs with respect to safety. The LS-VHTR further surpasses the VHTR in safety considerations because the low pressure primary system and the additional barrier provided by the salt coolant reduce the likelihood of radionuclide releases to the environment during a core damage accident. Finally, the LS-VHTR matches the VHTR in proliferation resistance due to the unattractive fuel form provided by the graphite-coated particle fuel.
A significant fraction of the year’s effort was to evaluate salt candidates for both the primary and secondary systems of the LS-VHTR and to reestablish an experimental capability to measure salt properties. Considerable experience exists with molten salts; however, previous nuclear experience with molten salts was for reactor systems that contained fissile and fertile material in the primary fluid (which served as both fuel and primary coolant). The LS-VHTR uses solid fuel and “clean” coolant salt and is expected to operate at higher temperatures than previous applications. Hence, the property and composition requirements may be different than those for previous applications.
The salt property and chemistry assessment for the primary coolant focused on alkali fluoride containing salts, zirconium fluoride containing salts, and beryllium fluoride containing salts. Physical properties such as melting point, vapor pressure, density heat capacity, viscosity, and thermal conductivity were evaluated and compared as well as nuclear properties such as absorption, moderation, and activation. Additionally bulk material cost considerations were explored and chemical compatibility with materials of construction were investigated.

xxi
Based on this assessment, the following conclusions were reached regarding the primary coolant options:
• Salts composed of low-atomic-weight constituents (“light” salts) possess superior heat- transfer metrics for use as the LS-VHTR coolant, although heavier salts are also relatively good coolants and would likely prove acceptable for design purposes.
• Analysis indicates that the key reactivity coefficients (and their net effect) that control response to transients are more strongly affected by parameters associated with the fuel-block design (coolant volume fraction, poison level, and distribution) than by the identity of the particular salts.
• Activation levels in LS-VHTR candidate coolants appear to be acceptable from both an operational and long-term disposal standpoint with the light salts being preferred.
• No differentiator exists to select a particular salt based on its corrosion behavior with high-temperature alloys.
• A number of the ZrF4-containing salts appear to offer the best potential for achieving a low-cost coolant.
It is recommended that two types of salts should be considered in the future for the primary coolant: (1) salts containing BeF2 or ZrF4 in the concentration range 25–40 mol %, which have been shown in the past to support the least corrosion, and (2) alkali-fluoride salts and BeF2-containing salts that provide the opportunity for controlling corrosion by establishing a very reducing salt environment. The four leading candidate salts and their mole compositions are 7LiBe (67-33), NaBe (57-43), 7LiNaZr (26-37-37), and NaZr (59.5-40.5). The 7LiBe salt is the baseline salt composition. All of these salts appear to be viable.
A similar assessment for the intermediate heat transport loop (HTL) between the reactor and the hydrogen production plant for either a VHTR or LS-VHTR resulted in the following recommendations:
• The HTL design study should exclude the previous choice of NaF-NaBF4 as a coolant option (high vapor pressure at 900°C) and replace this choice with (a) a chloride salt or (b) KF-KBF4.
• Because FLiNaK is clearly superior in heat transfer to all other salts considered, there is little reason to consider other moderately expensive fluoride salts (e.g., KF-ZrF4), unless a lower melting point is required or a more economical option is identified.
• The best compromise between raw material cost, performance, and melting point appears to be the ternary eutectic LiCl-KCl-MgCl2 (melting point of 402ºC , 9-63-28 mol %).
• High-temperature corrosion tests with properly purified chloride salts should be conducted to confirm the possibility of using chloride salts in the secondary heat transport system. These tests should include both batch exposures and loop tests and will probably also require the innovative use of redox buffers to minimize corrosion.
The new baseline concept introduces several new design features that differentiate it from earlier AHTR designs. Key design distinctions include:
• Separates the primary loop salt from a larger mass of buffer salt in a buffer salt tank, allowing different, optimal salt compositions to be used for the primary, buffer, and intermediate salt applications. Under this revised design, forced and natural circulation operation more closely matches that in pressurized-water reactors (PWRs) than pool-type sodium fast reactors (SFR) such as S-PRISM.
• Uses metallic construction for the primary loop boundary, pumps, intermediate heat exchanger (IHX), and buffer salt tank. All metallic components, except the primary pumps and IHX, operate at or below the reactor core inlet temperature under normal operation. Under a loss of forced circulation accident, only the primary pumps, IHX, PRACS heat exchangers (PHXs), and

xxii
reactor cover operate at the core outlet temperature, while the other primary loop structures remain close to the buffer salt temperature.
• Uses a seismically base-isolated reactor building and a water-cooled, refractory lined reinforced concrete reactor cavity with a flat-bottomed, uninsulated tank to contain the buffer salt. The water-cooled reactor cavity liner eliminates the requirement for a guard vessel while minimizing the free volume between the tank and cavity walls. Under a beyond-design-basis accident with rupture of the buffer salt tank, the cavity cooling system provides ultimate heat removal.
• Has the capability to operate at conservatively low temperatures for electricity production that allows the use of existing ASME-code qualified materials for all components. An upgrade path then exists to increase the core outlet temperature for hydrogen production using advanced IHX, primary pump, and PHX materials while continuing to use conventional materials for other components.
• Uses compact, metallic Heatric®-type IHX modules located in the buffer tank to reduce the primary salt volume, hot and cold leg lengths, and radiation shielding requirements.
• Uses a combination of PHX and DRACS heat exchangers (DHXs) to provide modularity for decay heat removal following loss of forced cooling. This allows the modular decay heat removal systems to be scaled independently from the reactor size and greatly simplifies the design of integral effects test facilities.
Three classes of decay heat removal systems were investigated and their performance for the LS-VHTR was analyzed and compared. The three classes include: reactor vessel auxiliary cooling system (RVACS), direct reactor auxiliary cooling system (DRACS), and pool reactor auxiliary cooling system (PRACS). All three systems are based on technologies originally developed for sodium-cooled reactors. The analysis of these options for various accident transients concluded that any of the alternative decay heat removal systems could be made to work. However, it was concluded that the DRACS approach is preferred over an RVACS because it is less constraining on reactor vessel size and power output. RVACS removes decay heat through the primary reactor vessel; thus, the decay heat removal capacity and ultimately the reactor power output is tied to the maximum size vessel that can be fabricated. DRACS uses modular heat exchangers where the system decay heat removal capacity is determined by the number of such units. Also, the use of a PRACS in addition to the DRACS appears to offer sufficient benefit to offset the added complexity.
The primary focus of the reactor physics and thermal-hydraulics analysis effort this year was to evaluate the impacts and benefits of alternative fuel forms (i.e., fuel geometries other than the traditional Fort St. Vrain prismatic block design). Several concepts were studied by both ORNL and ANL for “clustered rod” concepts that begin to resemble LWR fuel pin bundles except for retaining the graphite-coated particle fuel and graphite moderator. The motivations for these alternative geometries are to simplify core refueling operations, simplify fuel fabrication, and potentially reduce the volume of waste to be sent to the repository. The clustered rod design can also enable the possibility of online refueling, which would be impractical with the traditional prismatic design.
Parameters that were varied in the trade-off studies included: fuel-to-moderator ratio, pin diameter and pitch, moderator pitch, and graphite cladding thickness. The ORNL fuel form study resulted in a clustered rod design that includes 72 pins per block using 2.2-cm-diam fuel compacts clad with 0.3 cm of graphite and spaced on a 3.08-cm pitch. The block size was increased from 36 cm to 45 cm (across flats), which reduced the number of fuel columns from 265 to 211 to achieve the same 2400 MW(t) total power. The ANL study considered the use of annular fuel compacts and varied the number of pins per cluster. It was concluded that an 18-pin cluster could not meet the fuel cycle constraints, but that a 36-pin arrangement could achieve an 18-month fuel cycle with a 235U enrichment of 15% and a particle packing fraction of 30%.

xxiii
Thermal-hydraulic analyses were performed for steady-state and transient conditions for the case of the clustered rod fuel arrangement. Several variations were considered, including both circular and hexagonal channels in the moderator blocks to accommodate the hexagonal fuel bundles. Peak fuel temperatures ranged from 1184 to 1214°C. The coolant velocities ranged from 0.77 to 1.4 m/s for steady-state operation at full power, which is well below the coolant velocities of traditional LWRs. The new fuel geometry had very little impact on the results of the transient analysis, which were similar to previous safety analyses performed for earlier AHTR designs. In all cases, the temperature transients are slow and benign owing to the formation of natural circulation loops and effective decay heat removal by the DRACS. A preliminary thermal-hydraulic analysis was also performed for the UCB pebble-bed variant of the AHTR, which showed that this variant also demonstrates a relatively slow and benign response to loss of forced circulation transients.
An analysis was performed to predict the neutron and gamma-ray flux levels throughout the primary system. This was done to provide exposure and response data needed for the evaluation and selection of various materials of construction, including reactor internals and the reactor and guard vessels. Several parameters were calculated, including flux, dose, nuclear heating, and gas production. The analysis was performed for the original FY-2005 baseline design, but it retains some relevancy for the revised design.
A critical economic issue for any reactor is efficient refueling for high plant availability. Because of the perceived challenges of refueling the LS-VHTR, which will need to be conducted in a pool of liquid salt at temperatures potentially greater than 500°C, a significant effort was focused on understanding the refueling challenges and options. The study included a comprehensive review of refueling approaches and experience in past and existing reactor systems and a review of refueling schemes planned for the next generation reactors. All types of reactors were considered, including gas-cooled (helium and CO2), sodium-cooled, and light- and heavy-water-cooled reactors. Also, systems with batch and online refueling approaches were evaluated.
In addition to studying refueling approaches and experience in other reactors, refueling implications unique to the LS-VHTR were evaluated. Several factors were identified that will impact refueling considerations, including both positive and negative impacts. Some of these considerations include: high coolant temperature, coolant transparency, coolant density and viscosity, fuel form (prismatic, pebble, or stringer types), and decay heat characteristics.
The review of historical experience with other types of reactors indicates that the LS-VHTR does not present an unusually harsh environment beyond previous experience. In general, refueling systems for previous reactors with similar challenges have performed very reliably. This provides confidence that refueling of a LS-VHTR is practical and can be accomplished in an acceptable period of time. Three principal options for refueling three basic types of reactor cores (prismatic, pebble, and stringer [rod bundle] fuel geometries) have been identified. Still, the development of the refueling machinery for this reactor, with its relatively high refueling temperatures, will require a major engineering effort. Trade studies necessary for the selection of the fuel geometry will require consideration of reactor core behavior, fuel fabrication, and online vs batch refueling.
The transparency of the salt may allow advanced instrumentation methods that will greatly simplify refueling, inspection, and maintenance (RIM) operations relative to those for sodium-cooled and other high-temperature reactors. A brief study was performed that identified advanced high-precision metrology and spectroscopy technologies that could be adapted to LS-VHTR RIM operations.
An initial examination of LS-VHTR spent nuclear fuel (SNF) characteristics and the potential repository impacts was completed during the year. The characteristics and repository impacts of direct disposal of the LS-VHTR SNF with a burnup of 150,000 MWd/t were compared with those of light-water reactor (LWR) SNF with a burnup of 50,000 MWd/t and modular high-temperature gas-cooled reactor (MHTGR) SNF with a burnup of 100,000 MWd/t. Compared to LWR SNF, the LS-VHTR SNF will

xxiv
require less repository area per unit of electricity produced because of the higher efficiency in converting heat to electricity, which implies that fewer radionuclides and less decay heat are produced per unit of electricity. The LS-VHTR will also have lower SNF volumes and a lower SNF fissile content than the MHTGR because of the higher SNF burnup for the same initial uranium enrichment levels, but it will require larger equivalent volumes per unit of electricity than those of high-burnup LWR SNF.
Finally, a study at UCB was initiated relative to safety and licensing requirements for the LS-VHTR. Issues and methodologies were identified related to identifying key safety phenomena and performing scaled separate effects test and full integrated system tests. This included initial assessments of the requirements and design characteristics for a test reactor
In summary, several technology and design trade-off studies were performed for the LS-VHTR in order to mature the concept and resolve concerns and uncertainties unique to this very promising concept. Major design options such as fuel form (prismatic, pebble, or stringer fuel geometry) and decay heat removal options (RVACS, DRACS, and PRACS) were studied. Also, operational considerations such as refueling, inspection, and maintenance were addressed. A substantial evaluation was made of salt properties and chemistry considerations for both primary and secondary coolant applications resulting in recommendations of a narrow range of salts for further study. The collective outcome of the various studies is the confirmation that the LS-VHTR does indeed offer significant potential as a technically viable and cost competitive option for the next generation of nuclear power plants.

xxv
ABSTRACT
The Liquid-Salt Very High-Temperature Reactor (LS-VHTR) is a new reactor concept that combines four existing technologies: (1) liquid-salt cooling, (2) coated-particle fuel, (3) Brayton power cycles, and (4) passive safety systems from liquid-metal-cooled reactors. It is the high-temperature variant of the Advanced High-Temperature Reactor. The LS-VHTR goals include peak operating temperatures approaching 950°C, plant sizes in excess of 2400 MW(t), and superior economics relative to light-water reactors and modular gas-cooled reactors. It is a salt-cooled variant of a helium-cooled VHTR. The modular helium-cooled VHTR is the primary focus of the U.S. Department of Energy Next Generation Nuclear Plant (NGNP) Project. Within that program, the LS-VHTR is a longer-term option that shares 80% of the technology of the helium-cooled VHTR but has potentially superior economics.
A series of trade studies for the LS-VHTR were conducted in FY-2006, and a refined set of goals was developed. Three alternative decay heat removal systems were compared and evaluated with the selection of a new base-line decay heat removal system: the Pool Reactor Auxiliary Cooling System (PRACS). Also, a new primary system configuration was selected that is a hybrid pool/loop design. The baseline fuel design is a coated-particle prismatic fuel, the same fuel used in gas-cooled high-temperature reactors. Evaluations were begun on two alternative fuel assembly geometries—pebble bed and stringer (fuel rod bundle) fuel. Both show promise as alternative fuel geometries. A series of salt coolant studies were completed that have down selected the salt options to a short list based on performance requirements. Refueling studies provided reasonable confidence in the feasibility and viability of high-temperature refueling based on experience with other reactors. Fuel cycle evaluations show the fuel cycle is similar to other high-temperature reactors except there is the potential for higher burnup relative to modular gas-cooled reactors for the same fuel enrichment levels because of better neutron economy. A strategy for licensing and testing has been developed. This has been aided by the discovery of low-temperature oils with physical properties very similar to the liquid salts at operating temperatures. Such simulants enable low-cost experimental simulation of many aspects of system performance. A preconceptual design of the reactor core for a small LS-VHTR test reactor was developed.

xxvi

1
1. INTRODUCTION
The Liquid-Salt-Cooled Very High-Temperature Reactor (LS-VHTR) is a new reactor concept that combines four established technologies in a new way: (1) coated-particle graphite-matrix nuclear fuels successfully used in helium-cooled reactors, (2) Brayton power cycles, (3) passive safety systems and plant designs previously developed for liquid-metal-cooled fast reactors, and (4) low-pressure liquid-salt coolants. The new combination of technologies enables the design of a high-power [2400 to 4000 MW(t)], high-temperature (750 to 950ºC outlet coolant temperatures) reactor with fully passive safety systems and economic production of electricity or hydrogen. The LS-VHTR capital costs have been estimated to be about one-half that of a modular gas-cooled or liquid-metal-cooled reactor for equivalent electrical output (Forsberg 2005).
The LS-VHTR uses coated-particle graphite-matrix fuels and a liquid-fluoride-salt coolant. The fuel is the same type that has been successfully used in high-temperature gas-cooled reactors such as Peach Bottom, Fort St. Vrain, Arbeitsgemeinshaft Versuchsreaktor, and the Thorium High-Temperature Reactor. The optically transparent liquid salt coolant is a mixture of fluoride salts with freezing points near 400°C and atmospheric boiling points of ~1400°C. Several different salts can be used as the primary coolant, including lithium-beryllium and sodium-zirconium fluoride salts. Clean liquid fluoride salts have a number of highly positive attributes for high-temperature heat transfer: high volumetric heat capacity compared to gases and sodium, high Prandtl numbers that mitigate thermal shock phenomena, transparency similar to water and gases that enables optical in-service inspection, very low vapor pressures, and very low corrosion rates with graphite and high-nickel alloys using appropriate chemistry control.
The major disadvantages of liquid salts have been (1) their high freezing temperatures (~350 to 450°C) that result in complex steam-generator designs and (2) their potential corrosiveness when used as solvents for molten salt fuels. The LS-VHTR resolves the freezing issue by using a high-temperature, closed Brayton cycle for production of electricity or by producing high temperature process heat for hydrogen production or other uses. Also, the reactor uses a solid fuel and clean salt coolant. This avoids the corrosion challenges of the molten salt reactor where the fuel was dissolved in the coolant.
The reactor operates at near-atmospheric pressure, and at these operating conditions, the liquid-salt heat-transfer properties are similar to those of water. Heat is transferred from the reactor core by the primary liquid-salt coolant to an intermediate heat-transfer loop. The intermediate heat-transfer loop uses a secondary liquid-salt coolant to move the heat to a thermo-chemical hydrogen production facility or to a turbine hall to produce electricity. If electricity is produced, a multi-reheat nitrogen or helium Brayton power cycle (with or without a bottoming steam cycle) is used. Because of the much smaller temperature rise across the reactor core compared to a gas-cooled reactor, a liquid-salt-cooled reactor can deliver heat to the hydrogen production or power conversion units at average temperatures very near the outlet coolant temperature, thus significantly improving production efficiency relative to a gas-cooled reactor with the same outlet temperature. A functional diagram of the LS-VHTR is shown in Fig. 1.1.

2
ReactorPassive DecayHeat Removal
Hydrogen/Brayton ElectricityProductionReactor
Passive DecayHeat Removal
Hydrogen/Brayton ElectricityProduction
Fig. 1.1. Functional layout of the LS-VHTR for hydrogen production (top) or electricity production (bottom).
1.1 INITIAL BASELINE DESIGN
The FY-2005 baseline design concept for a 2400 MW(t) LS-VHTR (Ingersoll et al. 2005) was carried over as the initial baseline design for FY-2006 and was the basis for some of the trade studies performed early in the year. Near midyear, a significantly different baseline design was selected, as described below.
An elevation view of the FY-2005 reactor concept is shown in Fig. 1.2. The 9.2-m-diam reactor vessel and auxiliary decay-heat-cooling system are located in a below-grade silo, similar to the S-PRISM sodium-cooled reactor concept developed by General Electric Company. The reactor decay heat is (1) transferred from the reactor core to the reactor vessel graphite reflector by natural circulation of the liquid salts, (2) conducted through the graphite reflector and reactor vessel wall, (3) transferred across an argon gap by radiation to a guard vessel, (4) conducted through the guard vessel, and then (5) removed from outside of the guard vessel by natural circulation of ambient air. There are no pumps, valves, or other active systems necessary for successful decay heat removal. Note also that the low pressure reactor vessel is enclosed by a guard vessel so that any coolant leaks from the reactor vessel will be contained by the guard vessel, making a loss-of-coolant accident impossible.

3
Elev. 0.0 m
Elev. -2.2 m
Elev. -8.7 m
Elev. -18.2 m
Elev. -20.9 mElev. -21.1 m
Reactor Head
Cavity Cooling Channels
Floor Slab
Cavity Cooling Baffle
Cavity Liner
Guard Vessel
Graphite Liner
Outer Reflector
Reactor Core
Coolant Pump
Control Rod Drives
Siphon Breaker
Coolant Pump Motor
Fig. 1.2. Elevation view of baseline LS-VHTR reactor.
The reactor core design is shown in Fig. 1.3. The core is cylindrical rather than the annular shape used
for gas-cooled VHTR designs. The annular shape is present in a gas-cooled reactor to improve heat transfer from the core during a loss of forced circulation (LOFC) accident. However, simulations for the LS-VHTR have shown that significant natural circulation of the liquid salt coolant occurs during the transient and provides effective heat transfer to the vessel. Thus, the inner reflector is not required, and removing it improves the overall neutron economy of the LS-VHTR by reducing the neutron leakage from the core and also eliminates the problem of power peaking near the inner reflector-core interface observed in the gas-cooled VHTR.
Reflector Blocks
Fuel Blocks
Fig. 1.3. LS-VHTR reference core design, 265 fuel
columns and 10.0 MW/m3 power density.

4
Table 1.1 tabulates the primary design features and baseline assumptions for the FY-2005 concept.
Table 1.1. Key parameters and targets for FY-06 baseline LS-VHTR design
Parameter Value Coolant salt 2LiF-BeF2 7Li isotopic concentration 99.995% Outlet coolant temperature 950°C Inlet coolant temperature 850°C Total thermal power 2400 MW(t) Reactor vessel diameter 9.2 m Fuel kernel composition U1.0C0.5O1.5 Fuel kernel diameter 425 μm Particle diameter 845 μm 235U enrichment 15% Particle packing fraction 25% Fuel cycle length 18 months Discharge burnup 156 GWd/t Fuel element: Graphite density 1.74 g/cm3 Diameter (across flats) 36.0 cm Height 79.3 cm Fuel channel diameter 1.27 cm Number of fuel channels 216 Coolant channel diameter 1.4 cm Number of coolant channels 108 Pitch between channels 1.88 cm Power density 10.0 MW/m3 Number of fuel columns 265 Number of fuel blocks per column 10
The revised FY-2006 baseline concept for a 2400 MW(t) LS-VHTR is based substantially on the
work at the University of California Berkley (UCB) and is shown in Fig. 1.4 (elevation view), and Fig. 1.5 (plan view). This design differs significantly from the previous reference LS-VHTR design because it uses a closed primary loop immersed in a tank containing a separate buffer salt. Separation of the primary coolant loop salt from the buffer salt allows different and optimal salt compositions to be used for the primary, buffer, and intermediate salt applications. The loop configuration also helps minimize the amount of primary coolant and thereby facilitates the use of more expensive salt options for the primary system, particularly isotopically enriched Li salts. As with gas-cooled reactors, the coated-particle fuel in the LS-VHTR has a large thermal inertia, but this design also derives large, additional thermal inertia due to the buffer salt. The large amount of buffer salt in the outer tank results in little temperature rise during any design basis accident. Also, most of the primary system is at or below the inlet temperature of the reactor, only the outlet piping, the intermediate heat exchanger (IHX), and possibly the pump impeller need to be at the outlet temperature. This helps minimize the primary loop material issues.

5
Fig. 1.4. Elevation view of the revised baseline LS-VHTR for normal operation (left) and refueling (right) modes.
Fig. 1.5. Plan view of the revised baseline LS-VHTR at core midplane elevation.

6
The new LS-VHTR baseline design adopts the fuel, control, and safety rod designs used in the Fort St. Vrain reactor. However, alternative fuel forms are being considered to replace the Fort St. Vrain prismatic block type fuel in the baseline loop design (discussed in Chapter 6).
As with the previous baseline design, the revised LS-VHTR core has a cylindrical shape rather than the annular shape used for gas-cooled VHTR designs. The improved neutron economy of the cylindrical core geometry, along with the better heat transfer and transport of the liquid coolant, results in a very large increase in total power output, as shown by the scaled comparison in Fig. 1.6 contrasting the 600-MW(t) gas turbine modular helium reactor (GT-MHR) vessel and the 2400-MW(t) LS-VHTR. The LS-VHTR produces about 4 times as much power as a gas-cooled reactor with similar size, passive safety and outlet temperatures.
The LS-VHTR primary loop operates in forced circulation during normal operation, transferring heat to four intermediate liquid salt loops using modular, compact intermediate heat exchangers (IHXs) located in the buffer salt tank. The high volumetric heat capacity of the liquid salt relative to sodium provides a much larger thermal inertia in the same vessel volume, which will allow higher power output than an equivalently sized sodium-cooled reactor. The physical properties of the salt coolant and the high power density compact heat exchangers allow the IHX modules to be located in the buffer salt pool. Figure 1.7 shows a diffusion-bonded, offset strip fin Heatric heat exchanger that provides the baseline for the LS-VHTR IHXs.
Upstream of the IHX modules are four primary pumps, which take suction from the core outlet plenum at near atmospheric pressure. The LS-VHTR primary pumps have similar requirements to the vertical shaft, single-stage centrifugal pump designs that were developed in the early 1970s for the Molten Salt Breeder Reactor (MSBR).
Continued heat removal by the IHX modules after a loss of forced primary loop circulation creates buoyancy forces that drive a natural circulation flow of 1 to 2% of normal primary-loop flow. Reduced heat transfer in the reactor core due to flow laminarization causes the core temperatures to rise, stopping fission due to temperature feedback effects even if reactor scram does not
Inner reflector (GT-MHR only)
AHTR-MI2400 MW(t)
GT-MHR600 MW(t)
31.0 m
Outer reflector
Fuel
19.5 m
Fig. 1.6. Scaled comparison of the 600 MW(t)
GT-MHR reactor and the 2400 MW(t) LS-VHTR.
Fig. 1.7. Diffusion bonded formed plate heat exchanger fabricated by Heatric.

7
occur. If intermediate loop heat removal is continued, natural circulation continues to occur in the primary system through the IHX modules. When forced circulation in the secondary coolant system stops, heat rejection from the primary system also occurs to the buffer salt, through the Pool Reactor Auxiliary Cooling System (PRACS) heat exchangers. These PRACS loops (Fig. 1.1) include a fluidic diode, which reduces leakage flows under normal conditions of primary loop forced circulation. Fluidic diodes are simple, passive devices that provide a large flow resistance in one direction but offer little resistance to fluid flow in the other direction. They have been used in nuclear applications in the British Advanced Gas-Cooled Reactors (AGRs) and in German sodium-cooled fast reactors. The simplest fluidic diode devices generate an irreversible loss of kinetic energy by creating a strong vortex flow in one direction, while flow in the opposite direction does not have this effect.
The PRACS heat exchanger (PHX) area can be sized to match decay heat generation approximately 1 to 2 h after loss of primary system forced cooling and circulation occurs. Heat removal from the buffer salt to the environment occurs dominantly through Direct Reactor Auxiliary Cooling System (DRACS) heat exchangers (DHX), with some heat removal also occurring through the reactor cavity cooling system. The DRACS heat removal systems are sized to match decay heat generation approximately 12 to 48 h after loss of forced cooling and forced circulation occurs.
Design experience with DRACS heat removal systems exists for both the Experimental Breeder Reactor (EBR-II) and the European Fast Reactor (EFR). Conversely, the S-PRISM sodium fast reactor uses a Reactor Vessel Auxiliary Cooling System (RVACS) for decay heat removal, which was the approach chosen in the previous LS-VHTR baseline design. RVACS removes decay heat through the reactor vessel. The ultimate RVACS decay heat removal capability depends upon the size of reactor vessel and thus the ultimate power output of the reactor is limited by the size of the reactor vessel. The modular PRACS/DRACS decay heat removal system was selected over an integrated RVACS because it (1) allows the decay heat removal capacity to be scaled independent of the reactor vessel size, thus simplifying power up-rates, (2) allows the design of reactors with larger power outputs, and (3) reduces the high-temperature materials challenges. This approach also reduces the distortion in the design of reduced area Integral Effects Test experiments for the LS-VHTR, which will be required for reactor licensing.
1.2 FY-06 WORK SCOPE
The FY-06 work initially focused on two primary areas: (1) progress on the preconceptual design of the LS-VHTR and (2) the study of salt coolant science and technology issues. An overall plant design was further developed that took maximum advantage of the attractive features of liquid salt as a coolant for a nuclear hydrogen generation or electric power producing plant while addressing its inherent challenges: high freeze temperature, structural material compatibility, potential chemical or occupational hazards, and reactivity feedback effects. The work scope included:
• Neutronics, thermal-hydraulics, and system dynamics analyses to determine key core design parameters such as fuel pin and coolant channel diameters, pin/channel pitch, fuel enrichment, fuel packing fraction, etc., as well as overall core volume, shape, and power density.
• Extending the chemistry and property knowledge base for liquid fluoride salts. This work included defining operational requirements of the primary coolant salt specific to VHTR applications, establishing a lab-scale capability to prepare clean salts and perform property and analytic chemistry measurements on high-temperature salts, and conducting initial measurements to extend the salt properties knowledge base.
The ultimate goal for this activity was to develop a reactor concept with the following attributes:
• Attractive economic potential for hydrogen generation through simplicity, compactness, maintainability, and reliability.

8
• High degree of passive safety, particularly passive decay heat removal. • Minimal use of materials that create chemical, occupational, or radiological hazards. • Highly reliable operation, attractive cycle length, and low exposure to plant personnel. • Favorable core reactivity response consistent with passive safety and economic goals. A revised program plan was developed in January to also address refueling and maintenance
concerns; a four-phase approach was prepared:
1. Requirements, Issues, and Experience: Technical and operational requirements for refueling a salt-cooled reactor at elevated temperatures (400–500°C) were developed, such as: fuel handling and transport, salt freezing, buoyancy effects, off gassing, instrumentation, etc. Also, the experience base for existing and designed reactors such as liquid-sodium reactors, helium and carbon dioxide-cooled reactors (Ft. St. Vrain, GT-MHR, HTTR, AGR, etc.), and reactors with online refueling (AVR, CANDU, RBMK, etc.) were assessed.
2. Concept Development: Based on outcomes from Task 1, multiple LS-VHTR concepts that offer promising refueling features were developed.
3. Concept Evaluation: Dynamic system models and neutronics and thermal-hydraulic methods were used to evaluate the viability of the alternative concepts.
4. Concept Review and Selection: Three LS-VHTR core design options were selected in April for further development. The prismatic fuel LS-VHTR remains the baseline concept but a final selection has not been made.
With respect to the salt science portion of the project, the revised scope included the evaluation of property and chemical compatibility data and the selection of leading salt candidates for the intermediate heat transport loop as well as the primary coolant system.
Several organizations were involved in the present LS-VHTR studies. These include: Oak Ridge National Laboratory (ORNL), Argonne National Laboratory (ANL), the University of California Berkley, and the University of Wisconsin. Areva-NP also participated with the laboratory and university team and studied several aspects of the LS-VHTR, especially regarding balance-of-plant and economics. Principle responsibilities for each of the organizations participating in the LS-VHTR studies during FY-2006 are listed in Table 1.2. Note that although most of the work scope presented in Table 1.2 is included in this report, the Areva-NP tasks are reported elsewhere.

9
Table 1.2. Organizations and responsibilities participating in FY-2006 LS-VHTR studies
ORNL • Coordinate and manage activities for all organizations. Prepare monthly reports, administer program execution data, and prepare and manage subcontracts with industry, laboratory, and university experts. Develop top level design goals and requirements for the primary missions including electricity generation and hydrogen production
• Evaluate technical requirements and experience base for refueling and maintenance operations of past and current reactor systems including high-temperature systems (liquid-metal cooled and gas cooled) and light-water reactors. Conduct meeting with industry, laboratory, and university experts to assess refueling/maintenance options and issues
• Conduct assessment and analysis of alternative primary system concepts using system dynamic model and more rigorous methods as appropriate
• Use industry, laboratory, and university experts to perform a critical review of alternative reactor concepts regarding commercial viability of refueling and maintenance operations. Down-select to most promising concept(s)
• Review, analysis, and recommendation of preferred salts for both core and intermediate heat transport loop applications
• Conduct metrological screening measurements on preferred salt compositions (melting point, vapor pressure, heat capacity, and viscosity if needed)
ANL • Evaluate technical requirements and experience base for refueling and maintenance operations of past and current systems including high-temperature systems (liquid-metal and gas-cooled) and light-water-cooled reactors
• Conduct assessment and analysis of selected alternative concepts using dynamic system models and more rigorous methods as required. Evaluate commercial viability of concepts as well as general physics viability
UCB • Develop alternative baseline design with all metallic internal components and enhanced safety and operation features
• Investigate scaling requirements for reduced size integral test of key LS-VHTR phenomena, including identification of potential surrogate salts
• Assess benefits and issues associated with pebble-bed version of LS-VHTR UW • Assist ORNL in the experimental study of liquid salt properties Areva • Evaluate experience base for refueling and maintenance operations of previous
reactor systems, specifically EBR-II, and assist ORNL and ANL in assessing alternative concepts for a liquid-salt-cooled very high-temperature reactor
• Develop refueling, maintenance, and inspection requirements and guidelines based on previous operating experience with LWR and SFR plants. Also, provide fuel handling process information for prismatic gas-cooled reactor designs
• Develop balance-of-plant concept and perform economic assessment of LS-VHTR construction and operating costs
1.3 OVERVIEW OF REPORT
This report represents a compendium of trade-off studies performed during FY-2006 for the LS-VHTR. For many of the studies, separate topical reports were produced that cover the sections in greater detail. These topical reports are appropriately cited and should be consulted in order to fully understand the bases for the results and conclusions highlighted in this report.

10
Top level design goals and requirements originally developed for the Generation IV Roadmap process are presented in Chapter 2 as they apply to the LS-VHTR. The results of extensive salt studies, first for the primary coolant system and then for the secondary coolant system, are presented in Chapter 3. Also included in Chapter 3 are results of the preliminary salt property measurements and a discussion of the fluids that can be used for simulation studies.
The new baseline design developed during FY-06 is presented in Chapter 4, followed by an assessment of decay heat removal options presented in Chapter 5. The results of LS-VHTR alternative core design studies are presented in Chapter 6. Chapter 7 presents the technical and operational requirements for refueling a salt-cooled reactor at elevated temperatures and a discussion of the experience base for existing and designed reactors. Instrumentation and waste management considerations are presented in Chapters 8 and 9. Finally, test reactor scaling studies are discussed in Chapter 10.
In addition to the trade-off studies described in Chapters 2–10, the report includes two appendices: Appendix A provides a list of organizations that are currently conducting some degree of work related to the use of liquid salt in nuclear systems and the various types of applications of liquid salt, and Appendix B provides a complete bibliography of reports and papers that reference liquid-salt related activities. These appendices are provided for general reference.

11
2. GOALS AND REQUIREMENTS
Because the LS-VHTR is a new concept and its development is modestly funded, the top-level requirements had not been systematically assembled, assessed, and reviewed. To start this effort, an initial set of goals and functional safety requirements was developed (Forsberg 2006a). In cooperation with other countries, the U. S. Department of Energy (DOE) had previously developed the Generation IV goals, criteria, and metrics for future reactors (DOE 2002). This structure was used as a basis for the LS-VHTR goals and criteria. Table 2.1 lists the DOE Generation IV goals, criteria, and metrics. The goals are broken into four categories: economics; sustainability; safety and reliability; and proliferation resistance and physical protection.
Table 2.1. DOE Generation IV reactor goals
2.1 ECONOMIC GOALS
The economics should be defined relative to competing methods to produce electricity or hydrogen in 2025—the approximate time frame for initial deployment of an LS-VHTR. Because technologies advance, it is not sufficient to match the economics of today’s nuclear reactors. A new reactor concept must have significantly superior economics to ensure a competitive machine in 2025. Two methods have been used to develop initial rough cost estimates, based on a 2400-MW(t) LS-VHTR reactor.
Goal Areas Goals Criteria MetricsOvernight construction costs •Overnight construction costs EC1-1
Life Cycle CostEC1Economics
Production costs •Production costs EC1-2Construction duration •Construction durationEC1-3Overnight construction costs •Overnight construction costs EC2-1Risk to CapitalEC2 Construction duration •Construction durationEC2-2
Safety and Reliability
Reliability •Forced outage rate SR1-1Operational Safety and Reliability
SR1Worker/public – routine exposure •Routine exposuresSR1-2Worker/public – accident exposure •Accident exposuresSR1-3
Robust safety features •Reliable reactivity control•Reliable decay heat removalSR2-1
Core DamageSR2Well-characterized models
•Dominant phenomena – low uncertainty•Long fuel thermal response time•Integral experiments scalability
SR2-2
Proliferation Resistance and Physical Protection
Susceptibility to diversion or undeclared production
•Separated materials•Spent fuel characteristics
PR1-1Proliferation Resistance and Physical Protection
PR1
Vulnerability of installationsPR1-2 •Passive safety features
Well-characterized source term/energySR3-1Offsite Emergency Response
SR3
Robust mitigation featuresSR3-2
•Source term•Mechanisms for energy release•Long system time constants•Long and effective holdup
Fuel utilization •Use of fuel resources
Waste minimization
Environmental impact of waste management and disposal
SU1-1
SU2-1
SU2-2
Resource Utilization
Waste Minimization and Management
SU1
SU2
Sustainability •Waste mass•Volume•Heat load•Radiotoxicity•Environmental impact

12
• Sodium and gas-cooled high temperature reactor comparisons. Costs have been derived relative to the S-PRISM and the gas turbine modular high-temperature helium reactor (GT-MHR) designs, based on scaling factors on a system-by-system basis (Ingersoll et al. 2004). The capital costs of the LS-VHTR were estimated to be between 50 and 60% of those for the previous two reactors per kilowatt (electric). Both the S-PRISM and the GT-MHR are modular reactors; thus, the 2400-MW(t) LS-VHTR has the benefits of large economics of scale. Figure 1.6 in Chapter 1 above shows a scale drawing of the nuclear systems for a 600 MW(t) GT-MHR vs a 2400 MW(t) LS-VHTR to provide a perspective on the scale of the different reactors (Peterson and Zhao 2006).
• Light Water Reactor (LWR) comparisons. Figure 2.1 provides an economic comparison of various current and future LWRs based on the quantities of materials required for their construction (Peterson and Zhao 2004). All quantities are relative to that required to build a standard pressurized-water reactor in 1970. The oldest reactors are on the left, and the most advanced concepts are on the right. The first-generation reactors used relatively small quantities of materials. Following the Three Mile Island accident and the added safety requirements that resulted, a significant increase in the quantities of material per unit power output occurred, as is seen in the GE Advanced Boiling Water Reactor (ABWR) and the Areva NP Economic Pressurized-Water Reactor (EPR). However, as technology progressed, the quantities of materials lessened as seen in the projected quantities of materials for the GE Economic Simplified Boiling-Water Reactor (ESBWR) that is now being licensed in the United States. The comparison of quantities of materials in Fig. 2.1 indicates potentially highly competitive economics for the LS-VHTR.
The potential for a low LS-VHTR plant capital cost is due to several factors: the LS-VHTR can be a large reactor with the associated economics of scale; the high temperature and resulting high efficiency reduces capital costs (relatively smaller decay-heat-removal systems, power system heat rejection system,
0.00
0.50
1.00
1.50
2.00
2.50
1970sPWR
1970sBWR
EPR ABWR ESBWR GT-MHR AHTR-IT
Building volume (relative to 336 m3/MWe)Concrete volume (relative to 75 m3/MWe)Steel (relative to 36 MT/MWe)
Non-nuclear inputNuclear input
1000 MWe 1000 MWe 1600MWe 1350 MWe 1550 MWe 286 MWe 1235 MWe
0.00
0.50
1.00
1.50
2.00
2.50
1970sPWR
1970sBWR
EPR ABWR ESBWR GT-MHR AHTR-IT
Building volume (relative to 336 m3/MWe)Concrete volume (relative to 75 m3/MWe)Steel (relative to 36 MT/MWe)
Non-nuclear inputNuclear input
1000 MWe 1000 MWe 1600MWe 1350 MWe 1550 MWe 286 MWe 1235 MWe
Fig. 2.1. Relative quantities of materials per unit power output required to construct various types of reactors.
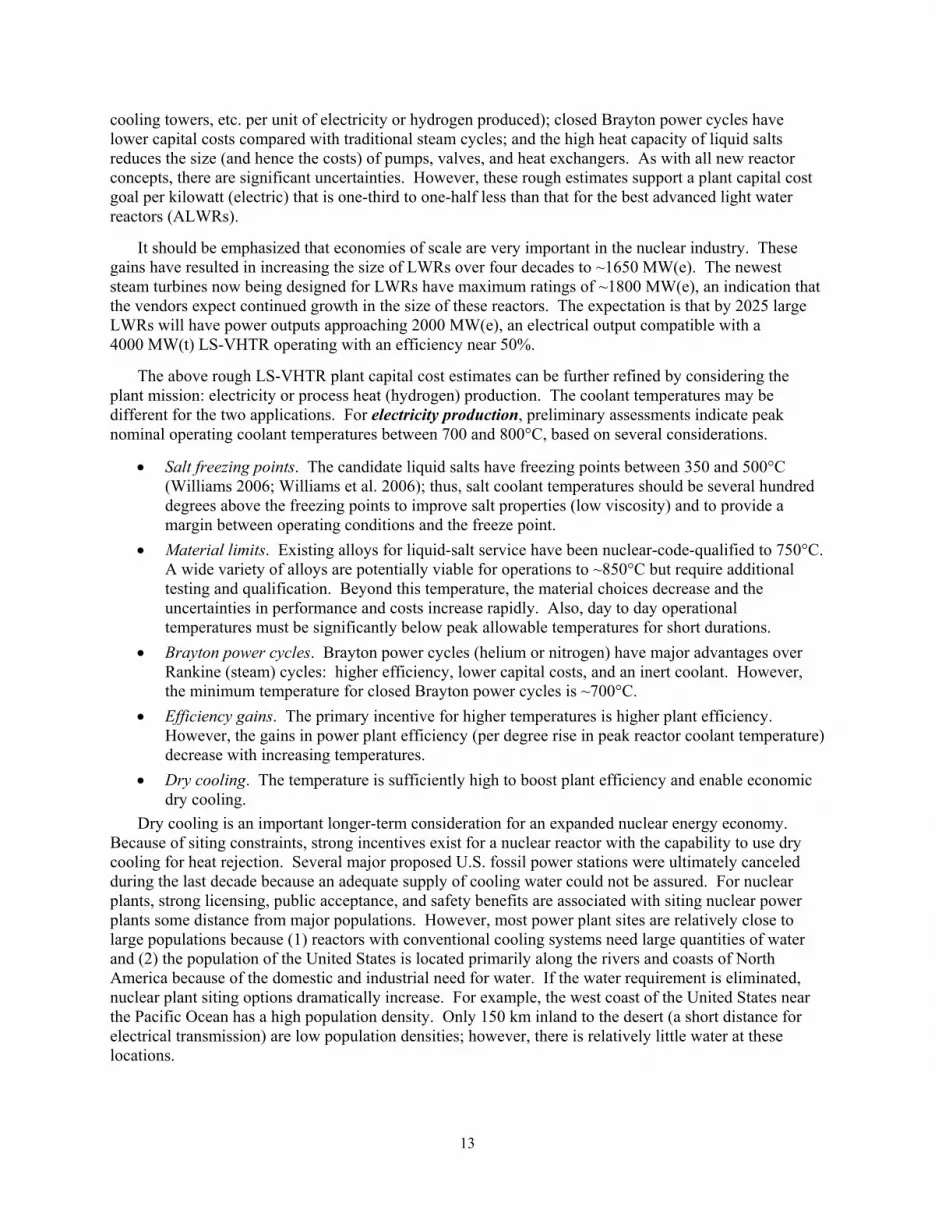
13
cooling towers, etc. per unit of electricity or hydrogen produced); closed Brayton power cycles have lower capital costs compared with traditional steam cycles; and the high heat capacity of liquid salts reduces the size (and hence the costs) of pumps, valves, and heat exchangers. As with all new reactor concepts, there are significant uncertainties. However, these rough estimates support a plant capital cost goal per kilowatt (electric) that is one-third to one-half less than that for the best advanced light water reactors (ALWRs).
It should be emphasized that economies of scale are very important in the nuclear industry. These gains have resulted in increasing the size of LWRs over four decades to ~1650 MW(e). The newest steam turbines now being designed for LWRs have maximum ratings of ~1800 MW(e), an indication that the vendors expect continued growth in the size of these reactors. The expectation is that by 2025 large LWRs will have power outputs approaching 2000 MW(e), an electrical output compatible with a 4000 MW(t) LS-VHTR operating with an efficiency near 50%.
The above rough LS-VHTR plant capital cost estimates can be further refined by considering the plant mission: electricity or process heat (hydrogen) production. The coolant temperatures may be different for the two applications. For electricity production, preliminary assessments indicate peak nominal operating coolant temperatures between 700 and 800°C, based on several considerations.
• Salt freezing points. The candidate liquid salts have freezing points between 350 and 500°C (Williams 2006; Williams et al. 2006); thus, salt coolant temperatures should be several hundred degrees above the freezing points to improve salt properties (low viscosity) and to provide a margin between operating conditions and the freeze point.
• Material limits. Existing alloys for liquid-salt service have been nuclear-code-qualified to 750°C. A wide variety of alloys are potentially viable for operations to ~850°C but require additional testing and qualification. Beyond this temperature, the material choices decrease and the uncertainties in performance and costs increase rapidly. Also, day to day operational temperatures must be significantly below peak allowable temperatures for short durations.
• Brayton power cycles. Brayton power cycles (helium or nitrogen) have major advantages over Rankine (steam) cycles: higher efficiency, lower capital costs, and an inert coolant. However, the minimum temperature for closed Brayton power cycles is ~700°C.
• Efficiency gains. The primary incentive for higher temperatures is higher plant efficiency. However, the gains in power plant efficiency (per degree rise in peak reactor coolant temperature) decrease with increasing temperatures.
• Dry cooling. The temperature is sufficiently high to boost plant efficiency and enable economic dry cooling.
Dry cooling is an important longer-term consideration for an expanded nuclear energy economy. Because of siting constraints, strong incentives exist for a nuclear reactor with the capability to use dry cooling for heat rejection. Several major proposed U.S. fossil power stations were ultimately canceled during the last decade because an adequate supply of cooling water could not be assured. For nuclear plants, strong licensing, public acceptance, and safety benefits are associated with siting nuclear power plants some distance from major populations. However, most power plant sites are relatively close to large populations because (1) reactors with conventional cooling systems need large quantities of water and (2) the population of the United States is located primarily along the rivers and coasts of North America because of the domestic and industrial need for water. If the water requirement is eliminated, nuclear plant siting options dramatically increase. For example, the west coast of the United States near the Pacific Ocean has a high population density. Only 150 km inland to the desert (a short distance for electrical transmission) are low population densities; however, there is relatively little water at these locations.

14
Although dry cooling is expensive, about 30,000 MW(e) of fossil plants worldwide have such systems. Dry cooling systems have not been used with nuclear power plants because the lower efficiency of LWRs (~33%) relative to fossil plants (~40%) requires much larger cooling systems. Increasing the efficiency of the nuclear power plant from ~33% (LWR) to ~50% (LS-VHTR) reduces the heat rejection per kilowatt of electricity by a factor of 2. This reduction is sufficient to make dry cooling a potentially viable cooling option under a wide variety of circumstances. To obtain efficiencies of ~50%, the peak reactor coolant temperatures must be above 700°C.
Hydrogen production, potentially the second largest market for nuclear energy, has the long-term potential to approach the size of the electricity market, regardless of whether hydrogen-fueled cars are ever deployed (National Research Council 2004). Hydrogen demand is growing rapidly today because of the need to upgrade heavy crude oil to liquid fuels (gasoline, diesel, and jet fuel) and to improve liquid fuel quality by removal of sulfur compounds. Almost all hydrogen today is made by steam reforming of natural gas. Currently greater than 5% of the natural gas in the United States is used to produce hydrogen by steam reforming.
However, the energy from nuclear reactors can convert water to hydrogen and oxygen. The existing technology is electrolysis, the room-temperature process that breaks water into hydrogen and oxygen with an electric current. Three other classes of technologies, which use much less electricity and more heat to convert water to hydrogen and oxygen, are being developed (Nuclear Energy Agency 2003): high-temperature electrolysis, hybrid electrolysis and thermo-chemical cycles, and pure thermo-chemical cycles. Various studies have projected the cost of hydrogen production via the thermo-chemical processes to be as low as 60% of those for conventional electrolysis, with long-term potential heat-to-hydrogen efficiencies in excess of 60%.
However, the thermochemical processes require relatively high temperatures. This may increase the capital costs of the nuclear plant. For the hybrid and thermochemical processes, the required peak chemical-process temperatures are near 850°C (ongoing research may potentially lower these temperatures by 100 to 150°C). Because of temperature loses across heat exchangers and safety requirements that an intermediate heat transport loop be used to separate the nuclear reactor from the hydrogen production plant, the peak reactor coolant temperatures will be higher than the hydrogen process plant temperatures. The peak reactor coolant temperature for a thermo-chemical plant may be as high as 950°C. However, the high-temperature electrolysis process may be viable with a somewhat lower reactor outlet temperature of 850°C. LS-VHTR plants with higher coolant outlet temperatures will require more costly materials and have somewhat higher capital costs.
To provide perspective on the current scale of industrial hydrogen operations, the largest hydrogen production complex now under construction to support oil refinery operations will have four parallel trains producing hydrogen from natural gas (Haldor Topsoe A/S 2005). Each train will produce 3.9 × 10⁶ m3/d of hydrogen, with a total hydrogen facility output of 15.6 × 10⁶ m3/d. The power equivalent of that rate of hydrogen production is about 2300 MW. Thus, if electrolysis were used with typical efficiencies, approximately three 1000-MW(e) nuclear plants would be required to provide the electricity to produce the hydrogen. If a single LS-VHTR with 50% efficiency produced that quantity of hydrogen, the reactor output would be 4600 MW(t).
2.2 SUSTAINABILITY GOALS
The Generation IV sustainability goals address the availability of uranium resources and the impacts of the technology on the waste repositories. The LS-VHTR uranium consumption will be about the same as LWRs (Forsberg 2006b). Improvements in the uranium utilization are due to the higher thermal-to-electricity efficiency of the LS- VHTR (50%) relative to that for LWRs (33%) and the higher conversion ratio and burnup. However, these improvements are off-set by higher enrichment requirements for the

15
LS-VHTR. The LS-VHTR does have lower uranium consumption and higher spent nuclear fuel burnup than the GT-MHR. Although the two reactor types have similar core materials, this difference occurs because the LS-VHTR is a large reactor with a cylindrical core and low neutron leakage, whereas, the GT-MHR, with its annular core, has relatively high neutron leakage. This allows the LS-VHTR to have significantly higher spent nuclear fuel burnup relative to the GT-MHR for the same initial fresh-fuel enrichment.
With respect to repository impacts, the LS-VHTR spent nuclear fuel toxicity and spent nuclear fuel decay-heat load in the repository are less per kilowatt electricity than for LWRs (Forsberg 2006b). This is primarily because of the higher thermal-to-electricity efficiency of the LS-VHTR (50%) relative to that for LWRs (33%) which results in fewer fissions per unit of electricity produced. The reduced decay heat per unit of electricity produced implies greater repository capacity per unit of electricity. The corrosion resistance of the TRISO coated fuel is several orders of magnitude better than that of the metal clad LWR spent nuclear fuel (Forsberg 2006b). Therefore, the overall sustainability goal for the LS-VHTR is approximately a 50% improvement compared to LWRs.
There is also the long-term option of recycling the spent nuclear fuel. Recent research has identified new methods for front-end processing technologies that are potentially major improvements over the historical technologies for processing carbon-matrix spent nuclear fuels (Del Cul et al. 2002). The technologies integrate front-end spent nuclear fuel processing and the waste treatment operations to use the carbon in the spent nuclear fuel to produce a very high-performance high-level-waste form. The one restriction is that the equipment and technologies may require facilities with large throughputs.
2.3 SAFETY AND RELIABILITY GOALS
The safety and reliability goals for the LS-VHTR are to match or exceed those of the GT-MHR and other fully passive reactor designs. This goal substantially exceeds the safety goals of ALWRs and assures that there will be no major radionuclide releases from the fuel during beyond-design-basis accidents. While current LWR and ALWR designs meet all safety requirements, there are potentially large economic and institutional advantages if these more aggressive goals can be achieved.
Earlier assessments by the U.S. Nuclear Regulatory Commission indicated that high temperature gas-cooled reactors will have the capability to withstand accidents involving non-mechanistic failures of all the decay-heat-removal systems (Williams et al. 1989). Under such conditions, the plant is disabled (in terms of its capability to produce electricity), but no major releases of radioactivity occur. These safety capabilities are a consequence of the very high temperature capabilities of the graphite-matrix, coated-particle fuel and a plant system design that allows sufficient decay heat flow to ground during severe accidents. The LS-VHTR will retain these same goals and capabilities (Forsberg and Peterson 2003).
Achieving these safety goals requires the use of inherent and passive safety systems. As defined by the International Atomic Energy Agency, inherent safety is “safety achieved by the elimination of a specified hazard by means of the choice of material and design concept” (IAEA 1991, IAEA 2006). Passive safety is “either a system which is composed entirely of passive components and structures or a system which uses active components in a very limited way to initiate subsequent passive operation.” Two examples of inherent safety that are unique to the LS-VHTR as a high-temperature reactor are: (1) a low-pressure coolant that eliminates pressure as a driving force to move radionuclides to the environment and (2) a coolant that dissolves and holds most fission products (including iodine and cesium) and actinides if these materials escape from the fuel.
The safety capabilities of the LS-VHTR may eliminate the need for off-site emergency responses (Forsberg and Peterson 2003). This will have economic benefits in terms of reduced emergency off-site preparation, increased public acceptance, and less-stringent security requirements.

16
2.4 PROLIFERATION RESISTANCE AND PHYSICAL PROTECTION GOALS
In terms of meeting the Generation IV goals in this area, the LS-VHTR characteristics will be approximately equal to those of the GT-MHR because the two reactors use similar fuels. The GT-MHR spent nuclear fuel has the highest resistance to proliferation (Criteria PR1-1) of all reactor fuels because (1) the fissile material is diluted compared with other types of reactor fuels and (2) the fuel is in a relatively inert matrix. These characteristics complicate recovery of fissile materials on a small scale, as might be attempted by a proliferator. Equally important, the safety strategy for these plants protects the public against radionuclide release in the event of an assault (Criteria PR1-2) on the plant. Thus, the safety strategy has the potential to reduce the physical protection requirements.
2.5 FUNCTIONAL SAFETY REQUIREMENTS
Based on earlier work (Forsberg et al. 1989), functional safety requirements for the LS-VHTR have been developed (see Fig. 2.2). The functional requirements start with the top-level requirement to maintain control of the radionuclides. These functional requirements define what the safety systems must accomplish. The combination of functional requirements, regulatory requirements, and safety goals is used as a basis for choice of safety systems.
MAINTAIN CONTROL OF RADIONUCLIDESMAINTAIN CONTROL OF RADIONUCLIDES
Control Radiation from
Processes
Control Radiation from
Processes
Control Radiation from SNF/Equipment
in Storage
Control Radiation from SNF/Equipment
in Storage
ControlRadiation from
Core
ControlRadiation from
Core
ControlDirect
Radiation
ControlDirect
Radiation
Control Radionuclide
Transport
Control Radionuclide
Transport
Maintain Core Integrity
Maintain Core Integrity
Control Transport from Primary Circuit Control Transport
from Primary Circuit Control Transport from ContainmentControl Transport from Containment
Affect Transport from Site
Affect Transport from Site
Control Reactivity with Inherent
Feedback
Control Reactivity with Inherent
Feedback
Limit Excess
Reactivity
Limit Excess
Reactivity
Provide Process Shutdown
Mechanism
Provide Process Shutdown
Mechanism
Transport Heat to Ultimate Heat Sink
Transport Heat to Ultimate Heat Sink
Maintain Core Coolant Makeup
Maintain Core Coolant Makeup
Maintain Core Coolant Boundary
Integrity
Maintain Core Coolant Boundary
Integrity
Control Energy in
Containment
Control Energy in
Containment
Effect Containment
Isolation
Effect Containment
Isolation
Control RadiationControl Radiation Control AccessControl Access
Trap Radionuclides
Trap Radionuclides
Maintain Containment
Boundary Integrity
Maintain Containment
Boundary Integrity
Isolate Primary Circuit from
Balance of Process
Isolate Primary Circuit from
Balance of Process
Control Primary Circuit
Pressure
Control Primary Circuit
Pressure
Maintain Coolant Boundary Integrity
Maintain Coolant Boundary Integrity
Remove CoreHeat
Remove CoreHeat
Control Core Heat Generation Rate
(Reactivity Control)
Control Core Heat Generation Rate
(Reactivity Control)
Control Chemical
Attack of Clad
Control Chemical
Attack of Clad
MAINTAIN CONTROL OF RADIONUCLIDESMAINTAIN CONTROL OF RADIONUCLIDES
Control Radiation from
Processes
Control Radiation from
Processes
Control Radiation from SNF/Equipment
in Storage
Control Radiation from SNF/Equipment
in Storage
ControlRadiation from
Core
ControlRadiation from
Core
Control Radiation from
Processes
Control Radiation from
Processes
Control Radiation from SNF/Equipment
in Storage
Control Radiation from SNF/Equipment
in Storage
ControlRadiation from
Core
ControlRadiation from
Core
ControlDirect
Radiation
ControlDirect
Radiation
Control Radionuclide
Transport
Control Radionuclide
Transport
ControlDirect
Radiation
ControlDirect
Radiation
Control Radionuclide
Transport
Control Radionuclide
Transport
Maintain Core Integrity
Maintain Core Integrity
Control Transport from Primary Circuit Control Transport
from Primary Circuit Control Transport from ContainmentControl Transport from Containment
Affect Transport from Site
Affect Transport from Site
Control Reactivity with Inherent
Feedback
Control Reactivity with Inherent
Feedback
Limit Excess
Reactivity
Limit Excess
Reactivity
Provide Process Shutdown
Mechanism
Provide Process Shutdown
Mechanism
Transport Heat to Ultimate Heat Sink
Transport Heat to Ultimate Heat Sink
Maintain Core Coolant Makeup
Maintain Core Coolant Makeup
Maintain Core Coolant Boundary
Integrity
Maintain Core Coolant Boundary
Integrity
Control Energy in
Containment
Control Energy in
Containment
Effect Containment
Isolation
Effect Containment
Isolation
Control Reactivity with Inherent
Feedback
Control Reactivity with Inherent
Feedback
Limit Excess
Reactivity
Limit Excess
Reactivity
Provide Process Shutdown
Mechanism
Provide Process Shutdown
Mechanism
Transport Heat to Ultimate Heat Sink
Transport Heat to Ultimate Heat Sink
Maintain Core Coolant Makeup
Maintain Core Coolant Makeup
Maintain Core Coolant Boundary
Integrity
Maintain Core Coolant Boundary
Integrity
Control Energy in
Containment
Control Energy in
Containment
Effect Containment
Isolation
Effect Containment
Isolation
Control RadiationControl Radiation Control AccessControl AccessControl RadiationControl Radiation Control AccessControl Access
Trap Radionuclides
Trap Radionuclides
Maintain Containment
Boundary Integrity
Maintain Containment
Boundary Integrity
Isolate Primary Circuit from
Balance of Process
Isolate Primary Circuit from
Balance of Process
Control Primary Circuit
Pressure
Control Primary Circuit
Pressure
Maintain Coolant Boundary Integrity
Maintain Coolant Boundary Integrity
Remove CoreHeat
Remove CoreHeat
Control Core Heat Generation Rate
(Reactivity Control)
Control Core Heat Generation Rate
(Reactivity Control)
Control Chemical
Attack of Clad
Control Chemical
Attack of CladTrap
RadionuclidesTrap
RadionuclidesMaintain
Containment Boundary Integrity
Maintain Containment
Boundary Integrity
Isolate Primary Circuit from
Balance of Process
Isolate Primary Circuit from
Balance of Process
Control Primary Circuit
Pressure
Control Primary Circuit
Pressure
Maintain Coolant Boundary Integrity
Maintain Coolant Boundary Integrity
Remove CoreHeat
Remove CoreHeat
Control Core Heat Generation Rate
(Reactivity Control)
Control Core Heat Generation Rate
(Reactivity Control)
Control Chemical
Attack of Clad
Control Chemical
Attack of Clad
05-078
Fig. 2.2. LS-VHTR functional safety requirements.

17
3. SALT STUDIES
3.1 ASSESSMENT OF CANDIDATE SALT COOLANTS FOR THE PRIMARY COOLANT SYSTEM
The purpose of this work (Williams 2006) was to provide a critical review of relevant properties of candidate salts for use in the evaluation and ranking of coolants for the LS-VHTR. Considerable experience exists with molten salts; however, previous nuclear experience with molten salts was for reactor systems that contained fissile and fertile material in the primary fluid (which served as both fuel and primary coolant). The LS-VHTR uses solid fuel and “clean” coolant salt. Also, the LS-VHTR is expected to operate at higher temperatures than previous applications. Hence, the property and composition requirements may be different than those for previous applications, and a new assessment of options was required.
The screening logic for selecting primary and secondary salt coolants established by Grimes (1967, 1970) many years ago still applies to the selection of the LS-VHTR coolant. Grimes first considered all the elements that could possibly be used in a molten salt coolant based on thermal neutron-capture cross-sections (values <1 barn). He then applied a number of additional screening criteria to candidate compounds. Grimes required that elements must form compounds that:
• exhibit chemical stability at T > 800ºC, • are stable under intense radiation, • melt at useful temperatures (<525ºC) and are not volatile, • are compatible with high-temperature alloys and graphite, and • dissolve useful quantities of fertile and fissile material.
Only the last item does not apply to the LS-VHTR primary coolant.
Three basic salt systems exhibit usefully low melting points and also have the potential for neutronic viability and materials compatibility with alloys: (1) alkali fluoride salts, (2) ZrF4-containing salts, and (3) BeF2-containing salts. These three families of salts were the focus of this study. Other coolants (water, liquid metals, and additional salts) are included as a basis for heat-transfer comparisons, even though they are not suitable candidates for the LS-VHTR coolant.
3.1.1 Melting Point
Without question, the melting (or freezing) point is an important physical property for a candidate coolant. Because salt coolants possess high heat capacity, the temperature drop in the primary loop of a salt cooled reactor is typically small—between 50 and 100ºC. For the design and operation of salt-fueled reactors, such as the Aircraft Reactor Experiment (ARE), the Molten Salt Reactor Experiment (MSRE), and the Molten Salt Breeder Reactor (MSBR), a requirement was established that the nominal-salt temperature should be high enough to provide a temperature margin >100ºC to freezing throughout the plant. Thus, fuel-containing salts were required to have freezing points below 525ºC to be considered useful (Grimes 1967). The 525ºC limit was also dictated by the need for the primary coolant to exchange heat in a practical manner with the secondary coolant. The previous generation of secondary coolant salts were expected to operate in a steam generator, so a secondary-salt freezing point less than 400ºC was required (Sanders 1971).
While the requirement for a low freezing point is not as fundamental a constraint for the LS-VHTR system as for previous salt-fueled systems, it will still be highly desirable to have as low a value as possible for the purposes of having cheaper materials and simpler systems everywhere in the plant.

18
Therefore, the requirements for the freezing point for the LS-VHTR coolant will probably exist somewhere between the limits established previously for the MSBR fuel salt (525ºC) and secondary salt (400ºC). Salts that freeze below 400ºC should be given priority, all other factors being equal.
Because no single-component salt freezes at a sufficiently low temperature, multi-component mixtures of salts are required. Nearly all of the binary phase diagrams of interest have been measured, and many of the ternary systems have also been investigated (McMurdie et al. 2006; Thoma 1975). In general, the primary lowering of the freezing point (as much as 500ºC) occurs with the addition of the first salt to a pure component. Additional lowering of the freezing point can be achieved by adding a third component, but these freezing-point depressions are of a lower order (~50ºC). Additional components are typically important for reasons other than lowering of the freezing point (e.g., cost, neutronics, or some other physical property). Table 3.1 lists the primary eutectic compositions in each of the useful families in order of freezing point.
Table 3.1. Useful salt compositions for LS-VHTR coolants
Alkali Fluorides ZrF4 Salts BeF2 Salts LiF-ZrF4 (51-49) 509ºC
NaF-ZrF4 (59.5-40.5) 500ºC
LiF-KF (50-50) 492ºC LiF-RbF (44-56) 470ºC
LiF-NaF-KF (“FLiNaK”) (46.5-11.5-42) 454ºC
LiF-NaF-ZrF4 (42-29-29) 460ºC LiF-BeF2 (“FLiBe”) (67-33) 460ºC
LiF-NaF-RbF (42-6-52) 435ºC LiF-NaF-ZrF4 (26-37-37) 436ºC LiF-BeF2-ZrF4 (64.5-30.5-5) 428ºC NaF-RbF-ZrF4 (33-24-43) 420ºC RbF-ZrF4 (58-42) 410ºC
KF-ZrF4 (58-42) 390ºC NaF-BeF2 (57-43) 340ºC
LiF-NaF-BeF2 (31-31-38) 315ºC Note: Primary binary compositions are shown in bold.
In creating the list in Table 3.1, we excluded certain compositions for reasons that may not be readily apparent. For example, in the phase diagram of the BeF2 systems, there exist very low freezing-temperature compositions in the BeF2-rich region, and it would be natural to include these in a list of low-freezing candidates. However, experience has demonstrated that these BeF2-rich systems are not good candidates because they are very viscous due to the associative behavior of BeF2 in these mixtures. Table 3.1 also includes some systems normally excluded from consideration as primary coolants. Potassium-containing salts are usually excluded from consideration as a primary coolant because of the relatively large parasitic capture cross-section of potassium. However, potassium-containing salts are commonly used in non-nuclear applications and serve as a useful frame of reference (e.g., FLiNaK). As can be seen in Table 3.1, in all cases, there are rubidium analogs to the potassium systems that have freezing points close to that of corresponding potassium systems. Rubidium has a parasitic thermal neutron-capture cross-section much lower than potassium; however, it also possesses epithermal resonance absorption bands. The desirability of considering ternary salt systems is discussed below for each family of salts.
The alkali fluorides possess the simple ternary low-melting eutectic compositions listed in Table 3.1. These ternary systems possess only modest melting point depressions (~40ºC) compared to the binary

19
eutectics. However, the ternary eutectic compositions are favored in preference to the binary eutectics because they substitute inexpensive NaF for expensive 7LiF and neutron-absorbing KF. The ternary eutectic in the LiF-NaF-BeF2 system possesses a 25ºC melting-point depression compared to the NaF-BeF2 eutectic, but this mixture does not seem useful as a coolant because it does not offer a significant advantage over the NaF-BeF2 eutectic, and yet it requires the addition of an expensive component: 7LiF.
The ternary systems containing ZrF4 offer more promising possibilities. The ternary eutectic in the LiF-NaF-ZrF4 system possesses a large phase field (Fig. 3.1) with melting points below 500ºC and distinct eutectic compositions at a Na:Zr ratio of 1. These ternary eutectics (42-29-29 and 26-37-37 mol %) are the most promising candidate coolants because (a) they maintain ZrF4 <40 mol % (necessary for low vapor pressure) and (b) they provide a significant melting point depression (40–64ºC) compared to the NaF-ZrF4 binary system. The eutectic composition of 30-24-46 is not favored because it offers little melting point advantage and yet still imposes high ZrF4 vapor pressures and significant 7Li content.
The NaF-RbF-ZrF4 ternary system, (shown in Fig. 3.2) also possesses some attractive compositions with low melting points. The advantage of replacing RbF with NaF is that NaF is relatively inexpensive, it has a lower effective neutron cross-section than RbF, and compositions with lower ZrF4 content (and thus lower vapor pressure) can be considered. The very lowest melting point regions (T <400ºC) shown in Fig. 3.2 are not significantly different than the RbF-ZrF4 eutectic compositions. The eutectic regions in the neighborhood of Na:Rb = 1.44 have a number of interesting properties. Quite a few eutectic mixtures exist with melting points in the neighborhood of 420–430ºC. Figure 3.3 displays the liquidus temperatures along the line Na:Rb =1.44, and indicates a minimum melting point region in the neighborhood of ZrF4 = 39–43 mol %. A composition of 33-23.5-43.5 melting at 420ºC was selected as a candidate coolant because it is likely to have the best neutronic behavior among these particular compositions.
Fig. 3.1. Ternary phase diagram for LiF-NaF-ZaF4.
500°C envelope
500°C envelope
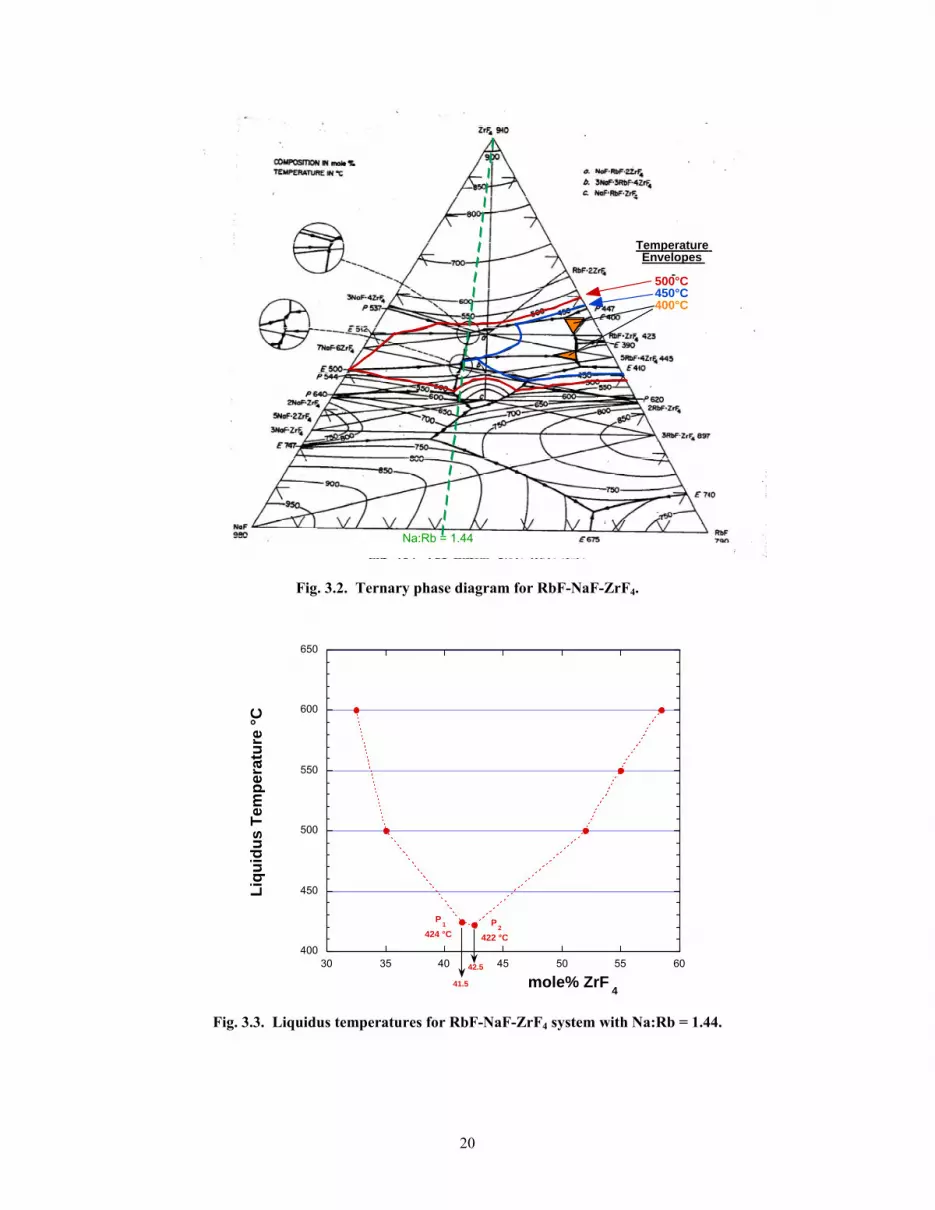
20
Temperature Envelopes
500°C 450°C 400°C
Na:Rb = 1.44
Fig. 3.2. Ternary phase diagram for RbF-NaF-ZrF4.
Fig. 3.3. Liquidus temperatures for RbF-NaF-ZrF4 system with Na:Rb = 1.44.
400
450
500
550
600
650
30 35 40 45 50 55 60
Liqu
idus
Tem
pera
ture
°C
mole% ZrF 4
P1
424 °CP
2 422 °C
41.5
42.5

21
3.1.2 Vapor Pressure and Vapor Species
Most fluoride salts exhibit very low vapor pressures. Only compounds with higher oxidation state cations (such as BF3, UF6, and MoF6) exhibit high vapor pressures. A few of the elements useful for coolants (BeF2, ZrF4) exhibit appreciable vapor pressures (>1 mm mercury) at 800ºC. Table 3.2 catalogs the normal boiling and freezing points of single-component salts and of a few key multicomponent mixtures (Janz 1967). As is evident in Table 3.2, mixtures of these pure components will always exhibit lower vapor pressures (higher boiling points) than the most volatile constituent. Therefore, these salts do not exert significant vapor pressures (> 1 bar) except at very extreme temperatures.
Table 3.2. Boiling and freezing points of salt compounds and key mixtures
Salt constituent(s) Freezing point (ºC)
Normal boiling point (ºC)
LiF 845 1681 NaF 995 1704 KF 856 1502 RbF 775 1408 BeF2 555 1327a ZrF4 903 600 (Sublimes) LiF-NaF-KF (46.5-11.5-42) 454 1570 LiF-BeF2 (67-33) 458 ~1400a NaF-BeF2 (57-43) 340 ~1400a NaF-ZrF4 (59.5-40.5) 500 ~1350a RbF-ZrF4 (58-42) 410 ~1450a aEstimated by extrapolation of lower-temperature data (~1100ºC).
However, other factors are important. In any high-temperature salt system, a purged cover gas will be necessary. The transport of significant amounts of salt vapor in this cover gas system can cause problems. In the operation of the ARE, it was found that the vapor over the ARE salt (53%NaF-41% ZrF4 -6%UF4) was nearly pure ZrF4. Because ZrF4 sublimes rather than boils, ZrF4 “snow” was found in the exhaust piping. Therefore, the ZrF4 was not returned to the salt reservoir by condensing as a liquid and draining back to the salt reservoir. Elaborate “snow traps” were designed to mitigate this problem (AEC 1964), but it appears that a wise choice of salt composition can eliminate it completely.
The experience with the MSRE was quite different. The MSRE salts (65%LiF-29%BeF2-5% ZrF4-1% UF4) exhibited very low vapor pressure; more than 100 times lower than the ARE salt. The vapor over the MSRE salt was also of a different character. This vapor contained both LiF and BeF2 in a proportion that melted at a low temperature, such that the condensate would drain back to the reservoir as a liquid.
Vapor pressure is the physical property that is most sensitive to salt composition (Sense et al. 1957, 1958). The effect of salt composition on vapor pressure can be explained with the Lewis acid-base theory (Williams et al. 2001). The native volatility of compounds containing the “acidic” constituent (Zr4+, Be2+) can be suppressed by donation of fluoride anions from the “basic” alkali fluoride constituent. The product of this donation is a low-volatility coordination-complex that is an integral part of the molten salt solution. Not all the alkali fluorides are equal in their ability to donate fluoride anions for coordination compounds. The affinity of alkali cations for their own fluoride anion decreases with increasing atomic number; thus, the heavier alkali elements will more readily donate their fluoride anions. Therefore, heavier alkali fluorides are more effective in reducing the native volatility of the compounds containing the acidic species (Zr4+, Be2+).

22
The effect of salt composition on vapor pressure is readily apparent in the BeF2 and ZrF4 systems. Figures 3.4 and 3.5 display the suppression of volatility as the ratio of alkali fluoride content increases so that it satisfies the coordination-bonding demands of the polyvalent cation. These figures also show the heavier alkali fluorides are more effective in suppressing the native volatility of the compound containing the polyvalent element (e.g., beryllium or zirconium).
The decrease of vapor pressure due to coordination bonding is also accompanied by a change in vapor composition. For a system rich in alkali fluoride, the vapor consists primarily of the alkali fluoride. For salt compositions that exist at the optimum ratio that just satisfies the coordination demands of the system, the vapor species is an association complex of the alkali fluoride and the polyvalent cation. For systems deficient in alkali fluoride, the volatile species is the parent compound containing the polyvalent cation. These trends are also indicated in Figs. 3.4 and 3.5.
From a practical standpoint, we should favor salt compositions with very low vapor pressures (<1 mm mercury at 900ºC) that generate vapor species that readily melt after condensing. This corresponds to salt compositions with a ZrF4 mole fraction in the range of ~20–45%, and with a mole fraction of BeF2 less than ~35–45%, depending on the alkali cations present and the temperature under consideration.
0.1
1
10
0
10
20
30
40
50
20 30 40 50 60 70 80 90 100
NaF-BeF2
LiF-BeF2
Be:Na ratioin vapor
Der
ived
Vap
or P
ress
ure
(mm
Hg)
Be:Na ratio
in vapor
mole % BeF2
Primarily BeF
2 vapor
Vapor Association of NaF and BeF
2
NaF rich vapor
vapor pressure
vaporcomposition
Fig. 3.4. Vapor pressure trends in alkali fluoride–BeF2
systems at 900ºC.
0.01
0.1
1
10
100
1000
0 20 40 60 80 100
NaF-ZrF4 RbF-ZrF4 LiF-ZrF4
Vap
or P
ress
ure (
mm
Hg)
mol% ZrF4
Fig. 3.5. Vapor pressure trends in alkali fluoride-ZrF4 systems at 900ºC.

23
3.1.3 Density
Fluid density is important for the purpose of gauging the heat transport capability of a coolant in both forced convection and (especially) natural convection. Density is among the most straightforward of properties to measure and is one of the most readily estimated for new compositions. Liquid salt density decreases linearly with increasing temperature. As expected, low atomic number salts tend to be light (sp.g. ~2) and high atomic number salts tend to be heavy (sp.g. > 4). Table 3.3 contains salt density equations developed from experimental measurements for some of the candidate LS-VHTR salts (Janz 1967).
It was discovered that there is a simple and accurate method for predicting salt density based on additive molar volumes (Grimes 1966). ORNL researchers compiled a list of single-compound molar volumes, given in Table 3.4, that allows estimation of mixture densities to an accuracy better than 5% and permits useful density estimates for all of the LS-VHTR candidate mixtures. The following relationship is recommended for prediction of molar volume and density for salt mixtures:
ρmix(T) = Σ Xi Mi / Σ Xi Vi (T) , (3.1)
where: Xi = mole fraction of component I, Mi = formula weight of component i (g/mole), and Vi (T) = molar volume of component i at temperature T. The values in Table 3.4 at two different temperatures allow interpolation or extrapolation to other temperatures.
Table 3.3. Salt density equations developed from experimental studies
Salt constituents Molar composition
Density equation (g/cm3)
LiF-BeF2 (66-34) 2.280–0.000488•T(ºC)
NaF-BeF2 (57-43) 2.270–0.00037•T(ºC)
LiF-BeF2-ZrF4 (64.7-30.1-5.2) 2.539–0.00057•T(ºC)
LiF-KF (50-50) 2.460–0.00068•T(ºC)
LiF-RbF (43-57) 3.300–0.00096•T(ºC)
LiF-NaF-KF (46.5-11.5-42) 2.530–0.00073•T(ºC)
NaF-ZrF4 (57-43) 3.650–0.00088•T(ºC)

24
Table 3.4. Standard molar volumes for use in estimation of mixture density
Molar volume (cm3/mole)
Component fluoride
Formula weight (g/mole) 600ºC 800ºC
7LiF 26.0 13.46 14.19 NaF 42.0 19.08 20.20 KF 58.1 28.1 30.0 RbF 104.5 33.9 36.1 CsF 151.9 40.2 43.1 BeF2 47.0 23.6 24.4 MgF2 62.3 22.4 23.3 CaF2 78.1 27.5 28.3 AlF3 86.7 26.9 30.7 ZrF4 167.2 47.0 50.0
There is no a priori reason to select a salt based on density alone, except that salts that have a large
density change with temperature may remove heat by natural convection better, resulting in better cooling. Very dense salts may develop undesirable hydrostatic heads and may make extra demands on pumping equipment, or may require consideration of buoyant graphite. Density will be factored into heat transfer metrics along with other fluid properties in Chapter 3. Density equations for candidate coolants not measured are listed in Table 3.5 according to the method of additive molar volumes.
3.1.4 Heat Capacity
Fluoride salts have relatively large heat capacities, in fact, they rival water in their ability to carry heat. There is no fundamental theory that allows one to predict the heat capacity of various salt compositions, but the empirical method of Dulong and Petit, which assumes a contribution of 8 cal/ºC per mole of each atom in the mixture, has been the most successful estimation method (Grimes 1966). The Dulong and Petit estimation equation takes the form
Cp = 8 • Σ Xi Ni / Σ Xi Mi , (3.2)
where: Xi = mole fraction of component I, Ni = atoms per salt constituent i (g/mole) [ = 2 for alkali halides, = 3 for BeF2, = 5 for ZrF4], and Mi = formula weight of component i (g/mole). This method is accurate to only ±20%. Results for salts containing BeF2 and ZrF4 were more accurate (±10%) than those for the alkali fluorides. Experimentally determined and estimated values of heat capacity are shown in Table 3.6. It should be noted that most of these experimental values were determined with relatively crude calorimeters as judged by today’s standards. The experimental accuracy for these older measurements is no better than ±10%.
Table 3.5. Salt density by method of additive molar volumes for candidate coolants not previously measured
Salt constituents
Molar composition
Density equation (g/cm3)
LiF-NaF-RbF 42-6-52 3.261–0.000811•T(ºC)
LiF-NaF-BeF2 31-31-38 2.313–0.000450•T(ºC)
LiF-ZrF4 51-49 3.739–0.000924•T(ºC)
RbF-ZrF4 58-42 3.923–0.00100•T(ºC)
LiF-NaF-ZrF4 26-37-37 3.533–0.000870•T(ºC)

25
Table 3.6. Experimental and estimated values of heat capacity for key salts
Salt components Composition (mol %)
Heat capacity measured at 700ºC
(cal/g-ºC)
Dulong-Petit prediction (cal/g-ºC)
LiF-NaF-KF 46.5-11.5-42 0.45 0.387 LiF-KF 50-50 0.44 0.381 LiF-NaF-Rb 42-6-52 — 0.236 LiF-RbF 43-57 0.284 0.226 LiF-BeF2 66.7-33.3 0.577 0.566 NaF-BeF2 57-43 0.52 0.440 LiF-NaF-BeF2 31-31-38 — 0.489 LiF-ZrF4 51-49 — 0.292 Li-Na-ZrF4 26-37-37 — 0.296 NaF-ZrF4 57-43 0.28 0.275 KF-NaF-ZrF4 52-5-43 0.26 0.252 KF-ZrF4 58-42 — 0.251 RbF-ZrF4 58-42 — 0.200
The measurement of the MSRE coolant salt (67%LiF-33%BeF2) was refined and is more accurate (better than ±2%) than the other values (Rosenthal et al. 1969). The variation of heat capacity with temperature is small and is typically neglected during preliminary calculations. The temperature variation was not resolved within the accuracy of most previous measurements.
3.1.5 Viscosity
Molten salts exhibit normal fluid behavior. They are Newtonian fluids and exhibit the typical exponential decrease in viscosity, µ, with reciprocal temperature:
µ (cP) = A exp (-B/T(K)) . (3.3)
Viscosity varies more with temperature than with any other fluid property. There are no truly predictive models for molten salt viscosity; therefore, viscosity has been measured for many systems by complementary methods. Even though there is a significant database, there are a number of important mixtures for which no information exists; therefore, it is necessary to examine the variation of viscosity with composition and to identify trends and bounds.
The information for binary mixtures is fairly complete and is displayed in Fig. 3.6 (Janz 1967). All of the three families of low-melting salts have mixtures that exhibit reasonably low viscosities (<10 cP) that make their use as industrial coolants possible. In contrast to other properties, compositional changes can have significant effects on fluid viscosity. These changes are evident in the variation of viscosity for different compositions within a binary or ternary system.

26
Viscosity, like vapor pressure and melting point, is strongly influenced by associative phenomena in the fluid phase. The influence of salt composition is most dramatic in the BeF2 systems. The Be2+ cation has a special tendency to self-associate in fluoride melts that do not possess the requisite number of fluoride anions (1:4 Be:F) to satisfy the coordination demand of Be2+. The association of Be2+ cations leads to an extended network that acts to increase the viscosity of the molten salt. The thickening of the melt as the BeF2 content increases (and the Be:F ratio in the entire melt decreases) is shown in Fig. 3.7 for LiF-BeF2 (Cantor et al. 1969) and in Fig. 3.8 for NaF-BeF2 (Cohen et al. 1957). This thickening restricts the useful range of composition to less than 45% BeF2.
Figure 3.8 also reveals that the identity of the alkali cation in these systems has an effect. The more basic rubidium and sodium cations more readily donate the fluoride anion to Be2+ than does the lithium cation, resulting in a decreased amount of Be2+ self-association. Substitution of sodium for lithium, and rubidium for sodium or lithium, will lower the viscosity in these BeF2 systems. The effect of potassium is expected to be intermediate between that of sodium and rubidium. Highly viscous pure BeF2 was investigated to see whether it displayed non-Newtonian behavior. No deviation from Newtonian behavior was found (Moynihan and Cantor 1968).
It is more difficult to assess ZrF4-salts in the same manner as BeF2 salts (Cohen et al. 1957). The ZrF4 phase diagrams have narrow low-melting regions; therefore, it is not possible to investigate large composition changes without also changing the alkali cation identity. Figure 3.9 displays the broadest low-melting phase field of NaF-ZrF4 with a solid line. Within this range of ZrF4 content (42 to 52%), the change in viscosity is not large, but it does increase slightly with increasing ZrF4 content. The effect of adding or replacing the alkali cation is the same in the BeF2 system: lighter alkalis increase the viscosity, and heavier alkalis reduce the viscosity.
1
10
600 650 700 750 800
LIF-NaF-KF: μ= (0.04)exp[4170/T(K)]LiF-RbF: μ= (0.0212)exp(4678/T(K)]KF-ZrF
4: μ= (0.0159)exp[3179/T(K)]
NaF-ZrF4(57-43) μ= (0.0767)exp[3977/T(K)]
NaF-BeF2: μ= (0.0346)exp[5165/T(K)]
LiF-BeF2: μ= (0.0116)exp[3755/T(K)]
Visc
osity
(cP)
Temperature (degrees C)
Alkali-fluorides
BeF2 salts
ZrF4 salts
Fig. 3.6. Range of viscosities for various salt systems.

27
Fig. 3.7. Effect of BeF2 composition on the
viscosity of LiF-BeF2 mixtures at 600ºC.
1
10
100
1000
20 30 40 50 60 70 80
600°C
700°C
800°C
600°C
700°C
800°C
600°C
700°C
800°C
Visc
osot
y (c
P)
mole %BeF2
RbF lowering of viscosity compared to NaF
LiF elevation of viscosity compared to NaF
NaF-BeF2 RbF-BeF2 LiF-BeF2
Fig. 3.8. Effect of alkali composition on the
viscosity in BeF2 salts.
The variation in viscosity of various alkali fluoride mixtures is not large (Fig. 3.6) and follows the same basic trend found for the BeF2 and ZrF4 systems. Heavier alkali mixtures are less viscous than lighter alkali systems.
It should also be noted that the three families of salts represent three distinct classes of liquid behavior. The alkali fluorides are ideal mixtures of very similar chemical constituents with very little associative behavior, whereas both ZrF4 and BeF2 mixtures are potential glass-formers (Grande et al. 1995). BeF2–rich mixtures are “strong” glass formers characterized by extended association of cations into networks of large extent, thus giving rise to high viscosity “glassy” mixtures. BeF2 is the fluoride analog to the SiO2 glasses. Mixtures of ZrF4 and alkali halides represent a different class of “fragile” glass mixtures that form due to a particular type of mixture thermodynamics that inhibits crystallization and preserves an amorphous structure during the liquid/solid phase transition. The ZBLA (ZrF4-BaF2-LaF3) and ZBLAN (ZrF4-BaF2-LaF3-NaF) glasses used for infrared optics are examples of this type of fragile glass (Lucas 1989).
3.1.6 Thermal Conductivity
The thermal conductivity of molten salt is the most difficult fluid property to measure, and it has led to the greatest amount of confusion and error in heat-transfer calculations. All of the previous systematic errors in measurement led to higher apparent values for thermal conductivity (AEC 1964). When heat-transfer studies were conducted using the “high” value for thermal conductivity, it was found that the heat flow was lower than expected. Because of the unexpected “low” heat flux, it was postulated that a significant film resistance must exist, and it was assumed that some type of insulating film impeded heat flow between the salt and the metal. A film coefficient was assumed in order to correct for this apparent discrepancy. However, numerous corrosion studies on alloys exposed to salt for many years show that there is no such film on the surface of metals and that there is no heat-transfer impediment due to
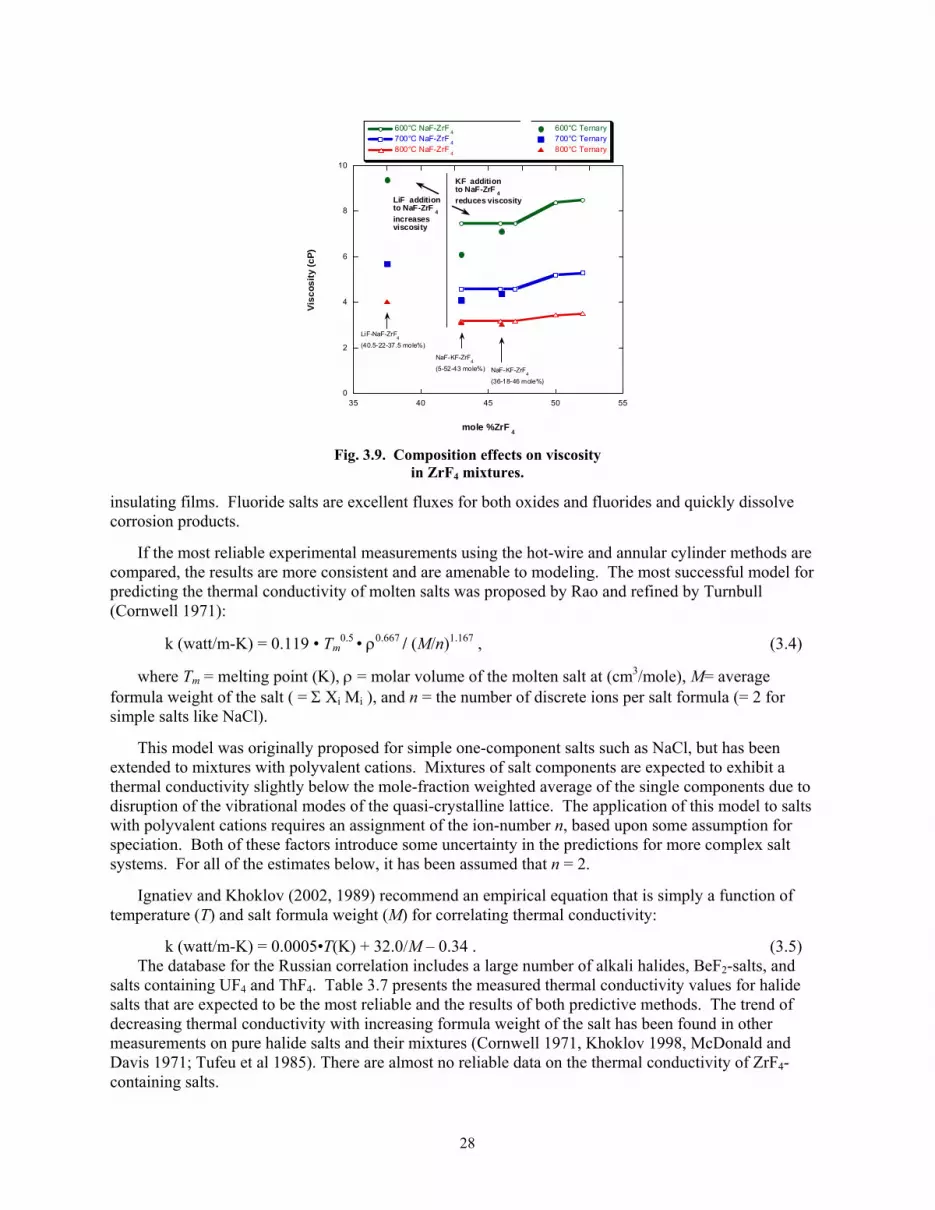
28
insulating films. Fluoride salts are excellent fluxes for both oxides and fluorides and quickly dissolve corrosion products.
If the most reliable experimental measurements using the hot-wire and annular cylinder methods are compared, the results are more consistent and are amenable to modeling. The most successful model for predicting the thermal conductivity of molten salts was proposed by Rao and refined by Turnbull (Cornwell 1971):
k (watt/m-K) = 0.119 • Tm0.5 • ρ0.667 / (M/n)1.167 , (3.4)
where Tm = melting point (K), ρ = molar volume of the molten salt at (cm3/mole), M= average formula weight of the salt ( = Σ Xi Mi ), and n = the number of discrete ions per salt formula (= 2 for simple salts like NaCl).
This model was originally proposed for simple one-component salts such as NaCl, but has been extended to mixtures with polyvalent cations. Mixtures of salt components are expected to exhibit a thermal conductivity slightly below the mole-fraction weighted average of the single components due to disruption of the vibrational modes of the quasi-crystalline lattice. The application of this model to salts with polyvalent cations requires an assignment of the ion-number n, based upon some assumption for speciation. Both of these factors introduce some uncertainty in the predictions for more complex salt systems. For all of the estimates below, it has been assumed that n = 2.
Ignatiev and Khoklov (2002, 1989) recommend an empirical equation that is simply a function of temperature (T) and salt formula weight (M) for correlating thermal conductivity:
k (watt/m-K) = 0.0005•T(K) + 32.0/M – 0.34 . (3.5) The database for the Russian correlation includes a large number of alkali halides, BeF2-salts, and
salts containing UF4 and ThF4. Table 3.7 presents the measured thermal conductivity values for halide salts that are expected to be the most reliable and the results of both predictive methods. The trend of decreasing thermal conductivity with increasing formula weight of the salt has been found in other measurements on pure halide salts and their mixtures (Cornwell 1971, Khoklov 1998, McDonald and Davis 1971; Tufeu et al 1985). There are almost no reliable data on the thermal conductivity of ZrF4-containing salts.
0
2
4
6
8
10
35 40 45 50 55
600°C NaF-ZrF 4 700°C NaF-ZrF 4 800°C NaF-ZrF 4
600°C Ternary700°C Ternary800°C Ternary
Visc
osity
(cP)
mole %ZrF 4
LiF-NaF-ZrF4
(40.5-22-37.5 mole%)
LiF additionto NaF-ZrF 4increasesviscosity
KF additionto NaF-ZrF 4reduces viscosity
NaF-KF-ZrF4
(5-52-43 mole%) NaF-KF-ZrF4
(36-18-46 mole%)
Fig. 3.9. Composition effects on viscosity in ZrF4 mixtures.

29
Table 3.7. Comparison of measured and predicted thermal conductivities
Salt composition (mol %)
Formula weight
(g/mole)
Melting point (°C)
Temperature(°C)
Measureda conductivity (watt/m-K)
Rao-Turnbull
prediction (watt/m-K)
Kokhlov correlation (watt/m-K)
LiCl-KCl (56-41) 55.6 355 355 0. 69 0.65 — LiF-NaF-KF (46.5-11.5-42) 41.3 454 500, 700 0.60 0.68 0.82, 0.92 LiF-NaF-RbF (42-6-52) 67.8 435 700 — 0.42 0.62 LiF-BeF2 (66.7-33.3) 33.0 460 600 1.0 0.79 1.1 NaF-BeF2 (57-43) 44.1 340 700 — 0.58 0.87 LiF-NaF-BeF2 (26-37-37) 38.9 315 700 — 0.62 0.97 LiF-ZrF4 (51-49) 95.2 509 700 — 0.35 0.48 NaF-ZrF4 (59.5-40.5) 92.7 500 700 — 0.36 0.49 KF-ZrF4 (58-42) 103.9 390 700 — 0.32 0.45 RbF-ZrF4 (58-42) 130.8 410 700 — 0.26 0.39 LiF-NaF-ZrF4 (26-37-37) 84.16 436 700 — 0.36 0.53 NaF-AlF3 (75-25) 52.5 1000 1000 0.80 0.79 0.91
aMeasured values are drawn from Williams et al. 2001, Rosenthal et al. 1969, Lucas 1989, and Grande et al. 1993.
3.1.7 Heat-Transfer Comparisons
It is useful to compare the heat-transfer performance of the LS-VHTR candidate coolants to other coolants with which we have experience, or would like to consider for related applications (secondary heat transfer fluids). With the exception of water, the temperature of 700ºC was selected for comparison because this permits properties to be evaluated more readily. A temperature of 300ºC was selected for water, because this is a typical coolant temperature used in the primary circuit of existing nuclear power plants.
Table 3.8 lists the properties of the coolants to be used in the heat-transfer comparisons, as well as the properties of ten candidate LS-VHTR salts.
Generalized heat-transfer metrics are a useful tool for grouping coolant performance in the absence of more detailed system designs. Bonilla (1958) has provided general figures of merit (FOM) based on minimal pumping power for a given coolant temperature rise as the objective function for forced convection:
FOM (forced convection, turbulent) = μ0.2 / (ρ2 Cp2.8) , (3.6)
where μ = viscosity,
ρ= fluid density, and Cp = heat capacity.

30
Table 3.8. Properties of comparison coolants and candidate coolants at 700°C
Coolants Heat capacity, Cp (cal/g-ºC)
Density, ρ (g/cc)
Viscosity, μ (cP)
Volume expansivity, β
(1/ºC)
Thermal conductivity, k
(W/m-K)
Prandtl # Cp•μ/k
Comparison coolants Water(300ºC) 1.370 0.72 0.09 3.30E-03 0.54 0.967 Na (550ºC) 0.303 0.82 0.23 8.60E-04 62 0.004 NaF-NaBF4 (700ºC)
0.360 1.75 0.88 4.25E-04 0.5 2.640
Candidate salt coolants at 700ºC FLiNaK 0.450 2.02 2.9 3.61E-04 0.92 5.938 LiF-NaF-RbF 0.236 2.69 2.6 3.01E-04 0.62 4.143 2LiF-BeF2 0.577 1.94 5.6 2.52E-04 1 13.525 NaF-BeF2 0.520 2.01 7 1.84E-04 0.87 17.513 LiF-NaF-BeF2 0.489 2.00 5 2.25E-04 0.97 10.551 LiF-ZrF4 0.292 3.09 > 5.2 2.99E-04 0.48 > 13.241 NaF-ZrF4 0.280 3.14 5.1 2.96E-04 0.49 12.199 KF-ZrF4 0.251 2.80 < 5.1 3.17E-04 0.45 < 11.907 RbF-ZrF4 0.200 3.22 5.1 3.11E-04 0.39 10.948 LiF-NaF-ZrF4
a 0.300 2.79 6.9 3.12E-04 0.53 19.073 a For 26-37-37 mol %.
For natural convection cooling, Bonilla also provide the following groups for passive cooling:
FOM (natural convection, turbulent) = [ μ0.2 / β ρ2 Cp1.8] 0.36 , (3.7)
FOM (natural convection, laminar) = [ μ / β ρ2 Cp] 0.5 , (3.8) where β = volume expansivity = 1/ρ • dρ/dT [1/ºC] .
During evaluation of secondary coolants for the MSBR, Sanders (1971) proposed a FOM related to the area required for the primary heat exchanger: FOM (heat exchanger area) = μ0.2 / [Cp
0.6 k0.6 ρ0.3] . (3.9)
Sanders recommends that this FOM be used only for comparison within a coolant group type (salts, metals, or other). All of these FOMs are “golf-scores”—i.e., lower numbers correlate with better performance.
Table 3.9 lists the various FOMs for the comparison of candidate coolants. In general, we can conclude that the lighter molten salts (those not containing large quantities of higher-atomic-number elements (e.g., rubidium and zirconium) have somewhat better heat transfer performance than the heavy salts. The one exception is the laminar regime of natural convection. In most passive cooling situations, the turbulent natural convection component is of primary importance.

31
Table 3.9. Heat transfer figures of merita
Coolant Turbulent
Forced Convect.
Coolant Heat
Exchanger Area
Coolant Turbulent
Natural Convect.
Coolant Laminar Natural Convect.
Water (300ºC) 0.20 Na 1.6 Water (300°C) 4.8 Water (300°C) 0.63 LiF-BeF2 0.70 Water(300ºC) 13.0 FLiNaK 13.3 Na 3.60 NaF-BeF2 0.91 LiF-BeF2 21.5 LiF-BeF2 13.9 NaF-NaBF4 4.31 LiF-NaF-BeF2 1.02 FLiNaK 21.6 LiF-NaF-ZrF4
b 13.9 FLiNaK 6.61 FLiNaK 1.13 LiF-NaF-BeF2 22.6 LiF-ZrF4 14.5 LiF-NaF-RbF 7.11 LiF-NaF-ZrF4
b 1.42 NaF-BeF2 25.2 NaF-NaBF4 14.7 LiF-ZrF4 7.90 LiF-ZrF4 1.82 NaF-NaBF4 28.0 NaF-ZrF4 14.7 NaF-ZrF4 7.90 NaF-ZrF4 1.98 LiF-NaF-RbF 31.8 LiF-NaF-BeF2 15.6 RbF-ZrF4 8.89 NaF-NaBF4 2.20 LiF-NaF-ZrF4 35.9 NaF-BeF2 16.5 LiF-NaF-ZrF4
b 9.01 KF-ZrF4 3.39 NaF-ZrF4 37.4 KF-ZrF4 16.7 KF-ZrF4 9.05 LiF-NaF-RbF 3.79 LiF-ZrF4 37.5 LiF-NaF-RbF 17.4 2LiF-BeF2 10.12 RbF-ZrF4 4.82 KF-ZrF4 42.5 RbF-ZrF4 17.6 LiF-NaF-BeF2 10.66 Na 13.15 RbF-ZrF4 48.7 Na 20.0 NaF-BeF2 13.45
aSuperior ranking is indicated by lower values. bFor 26-37-37 mol %.
3.1.8 Parasitic Neutron Capture and Moderation
Table 3.10 displays the parasitic-neutron-capture rates (relative to pure graphite on a per-unit-volume basis) for the candidate salts from Table 3.1. The table also displays the moderating ratio, a figure of merit that relates the effectiveness of moderation vs the parasitic neutron capture for a given energy range:
( )( )
s
c
EModerating Ratio
Eξ φ
φΣ Δ
=Σ Δ
, (3.10)
where ( )s Eξ φΣ Δ = rate of energy loss (lethargy gain) due to neutron scattering for a given energy range, ( )c EφΣ Δ = rate of parasitic neutron capture for the same energy range, and
EΔ = 0.1 to 10 eV for this analysis.
As indicated in Table 3.10, the total neutron capture of light water is very large, much larger than that of the other traditional coolants, such as heavy water or graphite, and also larger than that of most of the salts. However, the excellent moderating power of light water leads to a much larger moderating ratio than that of any salt coolant. The neutron-capture rates of the salts are much larger than those of (pure) graphite; therefore, minimizing the coolant in the core will improve the fuel efficiency substantially from a neutronics perspective.
Table 3.10. Neutronic efficiency for comparison materials and candidate coolantsa
Material
Total neutron capture per unit volume relative
to graphite
Moderating ratio (avg. over 0.1–10 eV)
Heavy water 0.2 11449 Light water 75 246 Graphite 1 863 Sodium 47 2 UCO 285 2 UO2 3583 0.1 LiF-BeF2 8 60 LiF-BeF2-ZrF4 8 54 NaF-BeF2 28 15 LiF-BeF2-NaF 20 22 LiF-ZrF4 9 29 NaF-ZrF4 24 10 LiF-NaF-ZrF4
b 20 13 KF-ZrF4 67 3 RbF-ZrF4 14 13 LiF-KF 97 2 LiF-RbF 19 9 LiF-NaF-KF 90 2 LiF-NaF-RbF 20 8
aComputations conducted with 99.995 7Li bFor 42-29-29 mol %.
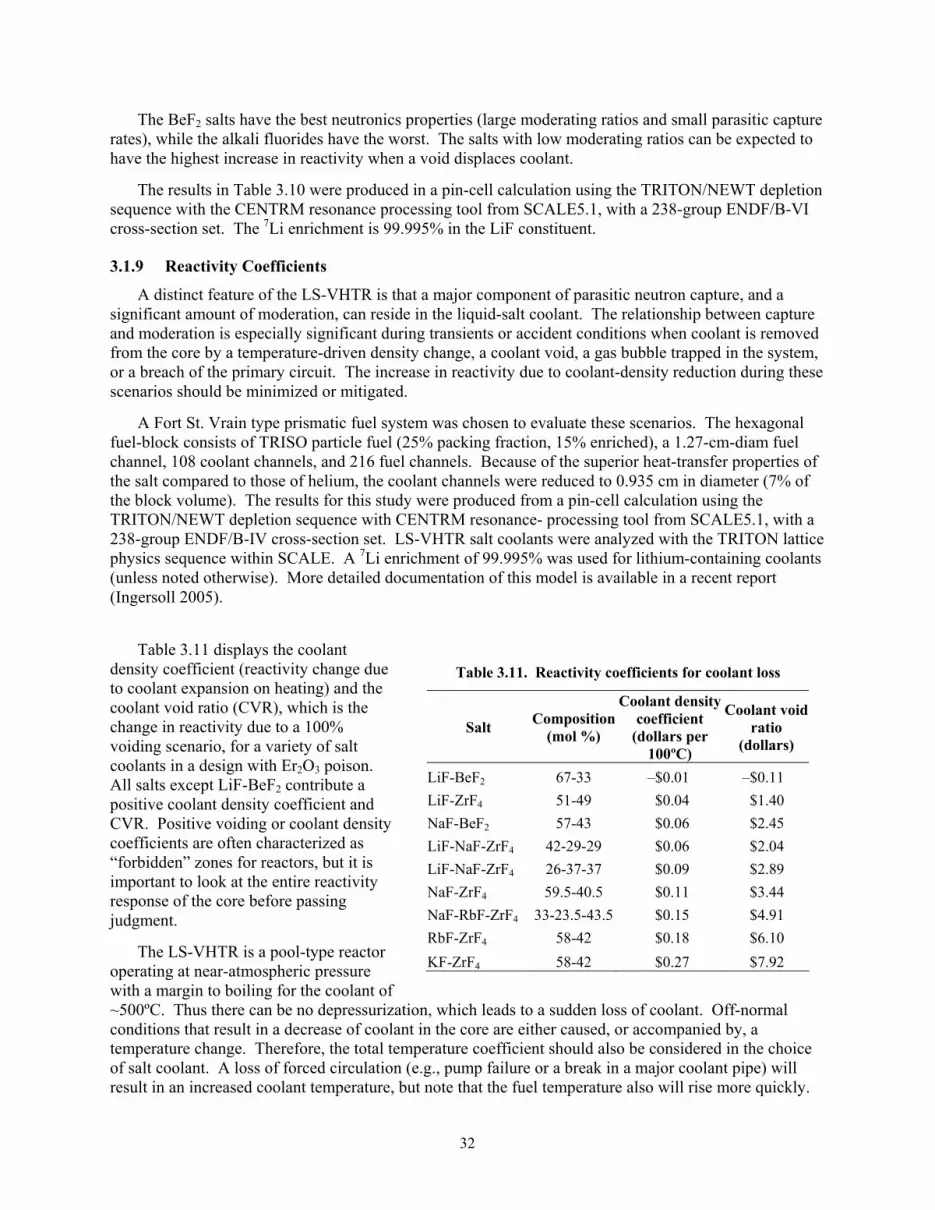
32
The BeF2 salts have the best neutronics properties (large moderating ratios and small parasitic capture rates), while the alkali fluorides have the worst. The salts with low moderating ratios can be expected to have the highest increase in reactivity when a void displaces coolant.
The results in Table 3.10 were produced in a pin-cell calculation using the TRITON/NEWT depletion sequence with the CENTRM resonance processing tool from SCALE5.1, with a 238-group ENDF/B-VI cross-section set. The 7Li enrichment is 99.995% in the LiF constituent.
3.1.9 Reactivity Coefficients
A distinct feature of the LS-VHTR is that a major component of parasitic neutron capture, and a significant amount of moderation, can reside in the liquid-salt coolant. The relationship between capture and moderation is especially significant during transients or accident conditions when coolant is removed from the core by a temperature-driven density change, a coolant void, a gas bubble trapped in the system, or a breach of the primary circuit. The increase in reactivity due to coolant-density reduction during these scenarios should be minimized or mitigated.
A Fort St. Vrain type prismatic fuel system was chosen to evaluate these scenarios. The hexagonal fuel-block consists of TRISO particle fuel (25% packing fraction, 15% enriched), a 1.27-cm-diam fuel channel, 108 coolant channels, and 216 fuel channels. Because of the superior heat-transfer properties of the salt compared to those of helium, the coolant channels were reduced to 0.935 cm in diameter (7% of the block volume). The results for this study were produced from a pin-cell calculation using the TRITON/NEWT depletion sequence with CENTRM resonance- processing tool from SCALE5.1, with a 238-group ENDF/B-IV cross-section set. LS-VHTR salt coolants were analyzed with the TRITON lattice physics sequence within SCALE. A 7Li enrichment of 99.995% was used for lithium-containing coolants (unless noted otherwise). More detailed documentation of this model is available in a recent report (Ingersoll 2005).
Table 3.11 displays the coolant
density coefficient (reactivity change due to coolant expansion on heating) and the coolant void ratio (CVR), which is the change in reactivity due to a 100% voiding scenario, for a variety of salt coolants in a design with Er2O3 poison. All salts except LiF-BeF2 contribute a positive coolant density coefficient and CVR. Positive voiding or coolant density coefficients are often characterized as “forbidden” zones for reactors, but it is important to look at the entire reactivity response of the core before passing judgment.
The LS-VHTR is a pool-type reactor operating at near-atmospheric pressure with a margin to boiling for the coolant of ~500ºC. Thus there can be no depressurization, which leads to a sudden loss of coolant. Off-normal conditions that result in a decrease of coolant in the core are either caused, or accompanied by, a temperature change. Therefore, the total temperature coefficient should also be considered in the choice of salt coolant. A loss of forced circulation (e.g., pump failure or a break in a major coolant pipe) will result in an increased coolant temperature, but note that the fuel temperature also will rise more quickly.
Table 3.11. Reactivity coefficients for coolant loss
Salt Composition(mol %)
Coolant density coefficient
(dollars per 100ºC)
Coolant voidratio
(dollars)
LiF-BeF2 67-33 –$0.01 –$0.11 LiF-ZrF4 51-49 $0.04 $1.40 NaF-BeF2 57-43 $0.06 $2.45 LiF-NaF-ZrF4 42-29-29 $0.06 $2.04 LiF-NaF-ZrF4 26-37-37 $0.09 $2.89 NaF-ZrF4 59.5-40.5 $0.11 $3.44 NaF-RbF-ZrF4 33-23.5-43.5 $0.15 $4.91 RbF-ZrF4 58-42 $0.18 $6.10 KF-ZrF4 58-42 $0.27 $7.92

33
A sudden reactivity insertion will also cause a rise in coolant temperature, but this rise will lag behind the rapid rise in fuel temperature. In this regard, it is useful to define a new parameter, the coolant safety ratio, which is the ratio of the magnitude of a positive (total) coolant temperature coefficient and the total non-coolant temperature coefficient. For instance, a coolant safety ratio of 1.9% implies that the fuel and graphite must increase only 1.9ºC to offset a 100ºC increase in coolant temperature.
Table 3.12 shows a group of temperature coefficients for an LS-VHTR fuel block for conditions with and without Er2O3 poison. The total coolant temperature coefficient is far smaller than the non-coolant negative temperature coefficient. This effect is more pronounced when erbium poison is added to the core because a small change in temperature substantially increases the fraction of neutrons in the 0.3 eV resonance of 167Er.
Table 3.12. Reactivity coefficients for LS-VHTR with 900°C inlet temperature
Coefficients of reactivity
(dollars per 100ºC) Composition Coolant Noncoolant
Salt mol % Temp Density Total Fuel Graphite Total
Coefficients without Er2O3 poison present
LiF-BeF2 67-33 –$0.01 $0.01 $0.00 –$0.46 –$0.12 –$0.58 LiF-ZrF4 51-49 –$0.01 $0.04 $0.03 –$0.64 $0.03 –$0.61 NaF-BeF2 57-43 $0.00 $0.06 $0.07 –$0.41 $0.02 –$0.39 LiF-NaF-ZrF4 42-29-29 –$0.01 $0.06 $0.05 –$0.47 –$0.03 –$0.50 LiF-NaF-ZrF4 26-37-37 $0.00 $0.09 $0.09 –$0.41 $0.00 –$0.41 NaF-ZrF4 59.5-40.5 $0.00 $0.11 $0.11 –$0.39 $0.05 –$0.35 NaF-RbF-ZrF4 33-23.5-43.5 $0.00 $0.14 $0.13 –$0.37 $0.12 –$0.25 RbF-ZrF4 58-42 –$0.02 $0.17 $0.15 –$0.50 $0.07 –$0.43 KF-ZrF4 58-42 –$0.01 $0.27 $0.26 –$0.57 $0.05 –$0.52
Coefficients with Er2O3 poison present
LiF-BeF2 67-33 –$0.09 $0.00 –$0.09 –$0.92 –$1.54 –$2.45 LiF-ZrF4 51-49 –$0.03 $0.04 $0.01 –$0.64 –$1.42 –$2.08 NaF-BeF2 57-43 –$0.08 $0.06 –$0.01 –$0.86 –$1.40 –$2.25 LiF-NaF-ZrF4 42-29-29 –$0.03 $0.06 $0.03 –$0.47 –$1.38 –$1.85 LiF-NaF-ZrF4 26-37-37 –$0.05 $0.09 $0.04 –$0.87 –$1.41 –$2.27 NaF-ZrF4 59.5-40.5 –$0.05 $0.11 $0.06 –$0.85 –$1.37 –$2.21 NaF-RbF-ZrF4 33-23.5-43.5 –$0.05 $0.15 $0.11 –$0.82 –$1.29 –$2.10 RbF-ZrF4 58-42 –$0.04 $0.19 $0.15 –$0.50 –$1.31 –$1.81 KF-ZrF4 58-42 –$0.02 $0.27 $0.25 –$0.57 –$1.33 –$1.90
aComputations conducted with 99.995 7Li
The coolant safety ratio parameters for the leading coolant candidates are shown in Table 3.13. The design basis for the LS-VHTR includes a two-batch core with a 1.5-year cycle and a burnup of 150 MWd/kgU. Therefore, because of differences in parasitic capture of the salt, the enrichment levels were varied to reach these design specifications. The following parameters were varied in our calculations in order to explore the effects on reactivity coefficients: (a) coolant volume fraction (7%, 15%); (b) Er2O3 poison level in the fuel-compact matrix (0, 5 mg/cm3); and (c) 7Li enrichment level

34
(99.995, 99.9). The calculations were also performed with the simplifying assumption that the temperature rise was uniformly distributed over all materials in the core (fuel-coolant-moderator). This assumption is likely to cause an exaggeration of the positive reactivity contributions arising from the salt coolant.
A careful comparison of the results in Table 3.13 reveals that the reactivity coefficients that affect safety, other than CVR, depend more on the coolant fraction and poison content than the choice of salt coolant. Therefore, each of the salt-coolant options can provide adequate protection during a temperature transient if coupled with a properly designed fuel block. When a coolant/fuel-block combination has a positive total coolant temperature coefficient, a coupled neutronics/thermal-hydraulics assessment should be performed to determine the significance of the positive coefficient. It is also apparent that the lithium enrichment is significant for the LiF-BeF2 coolant, but not for the LiF-NaF-ZrF4 coolant because the Zr constituent dominates neutron capture. Therefore, to achieve the optimum neutronic performance, the LiF-NaF-ZrF4 coolant does not have to use extremely high 7Li enrichment (as is typically assumed).
Table 3.13. Effect of key core design parameters on LS-VHTR reactivity coefficientsa
Salt Composition (mol %)
235U enrichment
(wt %)
Coolant void ratio(dollars)
Total coolant coefficient
(dollars per 100ºC)
Salt coolant safety ratio
(%)
Total thermal coefficient
(dollars per 100ºC)
Coefficients without Er2O3 poison, 7% coolant fraction
LiF-BeF2 67-33 14.1 $0.28 $0.00 –0.1 –$0.58 NaF-BeF2 57-43 15.4 $2.71 $0.07 17.0 –$0.32 LiF-NaF-ZrF4 26-37-37 15.5 $2.83 $0.09 21.5 –$0.32 NaF-ZrF4 59.5-40.5 15.8 $3.35 $0.11 30.5 –$0.24 NaF-RbF-ZrF4 33-23.5-43.5 16.5 $4.39 $0.13 53.8 –$0.11
Coefficients with Er2O3 poison, 7% coolant fraction
LiF-BeF2 67-33 14.3 –$0.11 –$0.09 –3.7 –$2.54 NaF-BeF2 57-43 15.6 $2.45 –$0.01 –0.6 –$2.26 LiF-NaF-ZrF4 26-37-37 15.8 $2.89 $0.04 1.9 –$2.23 NaF-ZrF4 59.5-40.5 16.1 $3.44 $0.06 2.9 –$2.14 NaF-RbF-ZrF4 33-23.5-43.5 16.9 $4.91 $0.11 5.1 –$2.00
Coefficients with Er2O3 poison, 7% coolant fraction, 99.9% 7Li
LiF-BeF2 67-33 19.2 $9.56 $0.17 9.4 –$1.62 LiF-NaF-ZrF4 26-37-37 16.9 $4.99 $0.12 5.1 –$2.16
Coefficients with Er2O3 poison, 15% coolant fraction
LiF-BeF2 67-33 15.5 -$0.64 –$0.19 –8.8 –$2.40 NaF-BeF2 57-43 18.0 $4.63 –$0.04 –2.2 –$1.81 LiF-NaF-ZrF4 26-37-37 18.7 $5.83 $0.08 4.2 –$1.78 NaF-ZrF4 59.5-40.5 19.3 $6.98 $0.12 7.2 –$1.57 NaF-RbF-ZrF4 33-23.5-43.5 21.2 $10.41 $0.21 15.0 –$1.21
aAll calculations performed with 99.995 % 7Li unless noted.

35
3.1.10 Short-Term Activation
The parasitic neutron captures in the salt activate various coolant materials, which results in the flow of additional, often radioactive, isotopes throughout the coolant circuit. Alpha and beta radiation cannot travel through the coolant pipes without being absorbed; therefore, the activation products of significant interest are high-energy gamma emitters. Many very short-lived activation products (T1/2 < 1 s) are present but are insignificant because they will decay before traveling out of the reactor vessel. Many of these isotopes will also be filtered out of the coolant during operation. The noble gases (helium, krypton, and most of the tritium) will come out naturally with no removal work required. The last traces of tritium can be gas-sparged under chemically reducing conditions. Carbon will not be in solution and can be removed. Therefore, these isotopes have been removed from our analysis of activation products.
Figures 3.10 and 3.11 show the activation levels of the coolant options and their constituent components, respectively, at three time steps after the irradiation stops (either because the coolant left the core or because the reactor was shut down). The primary activation product in water is 16N (T1/2 = 7 s). Along with 16N, the two isotopes with similar half-lives and high-energy gamma emission that are significant in fluoride salts are 20F (T1/2 = 11 sec) and 19O (T1/2 = 27 s). These two isotopes are the major contributors in the salt with the lowest activation level (LiF-BeF2). Because there are no intermediate-lived activation products in this salt, after a single day, the activation levels are nearly zero, a level similar to water. However, because the 1-min activation levels are 5 orders of magnitude larger than water (on a per-unit-mass basis), online maintenance may be restricted.
1.E-09
1.E-06
1.E-03
1.E+00
1.E+03
Lithium Beryllium Fluorine Sodium Potassium Rubidium Zirconium
Components of Salt Options
Act
ivity
per
Uni
t Mas
s (C
urie
s/gr
am)
One Minute
One Day
Ten Days
Fig. 3.10. Activity levels for candidate coolants and comparison materials.

36
1.E-09
1.E-06
1.E-03
1.E+00
1.E+03
Heavy
Wate
r
Light Wate
r
LiF-BeF
2
LiF-BeF
2-ZrF
4
LiF-ZrF4
LiF-NaF
-ZrF4
NaF-ZrF
4
LiF-BeF
2-NaF
NaF-B
eF2
Sodium
NaF-R
bF-ZrF4
RbF-ZrF4
LiF-NaF
-RbF
LiF-RbF
LiF-KF
LiF-NaF
-KF
Candidate Coolants and Comparison Materials
Gam
ma
Act
ivity
per
Uni
t Mas
s (C
urie
s/gr
am)
1 Minute1 Day10 Days
Fig. 3.11. Activity levels for components of various salt options.
Like sodium coolant, salts with a sodium component have a significant concentration of 24Na (T1/2 = 15 h) when irradiated. This will impede refueling operations because the exposure levels will still be significant after a few days of decay. Potassium is naturally radioactive, due to 40K, but with activation, a substantial amount of 42K (T1/2 = 12 h) is produced (along with several other isotopes). This leads to very large activation levels for several days after irradiation ceases.
Coolants with a rubidium component have several significant activation products (86mRb, 88Rb, and 86Rb) with a range of significant half-lives (1 min, 18 min, and 18 d, respectively) and high-energy (>0.3 MeV) gamma radiation. As shown in Figs. 3.10 and 3.11, the activation level of rubidium salts due to 86Rb is still significantly higher after 10 days than coolants without rubidium. Zirconium contains an even greater number of significant activation products (97mNb, 97Nb, 97Zr, 95Nb, 95Zr) with a range of half lives (1 min, 1 h, 17 h, 35 d, and 64 d), but the activity is less than that of rubidium by an order of magnitude for under 10 days of post-irradiation decay.
Based on activation factors, priority should be given to the LiF-BeF2 salt; however, salts without a rubidium or zirconium component will decay to acceptable levels after several days, so that maintenance and refueling can be performed in close proximity to the coolant. For salts that contain zirconium or rubidium, the activated coolant could be pumped from the core and replaced with a clean salt for planned outages; or robotics could be used for refueling, maintenance, and inspection.
3.1.11 Long-Term Activation
Because of unstable isotopes produced by its prolonged irradiation, disposing of the coolant may present challenges at the end of the lifetime of the reactor. Therefore, we have also considered the transmutation of each coolant and the significant long-lived activation products produced. All types of radiation (alpha, beta, and gamma-ray emissions) were considered significant for long-term disposal.
Tables 3.14 and 3.15 show the activity levels of the coolant salts after 1 or 10 years of cooling following a 60-year exposure. To simplify the table, the activities are nominal values (±50%) for the indicated salt constituents irrespective of the specific coolant salt composition. For example, all candidate salts that contain beryllium were found to have a 1-year activity of 1.5–2.5 × 10⁻⁷ Ci/g. As shown in

37
Table 3.14, the activity of each coolant component is below 300 pCi/g of coolant, and two orders of magnitude less for nonzirconium-containing salts. After 10 years of cooling (Table 3.15), these levels are reduced to the very long-lived isotopes, with 40K (the naturally occurring isotope) being the only high-energy gamma emitter. The highest activity is from 36Cl, produced by the (n,α) reaction with 39K. Therefore, after a modest cooling period, the handling of all nonpotassium salts should be relatively acceptable with minimal shielding. Sodium-22 has a very small activity (2 nCi/g) after 10 years and a comparably short half-life (3 years). Therefore, sodium, like lithium, does not pose a long-term risk for waste disposal.
Table 3.14. Nominal activity level of coolant constituents after 1 year of decay
Level of activation (µCi/g-coolant) (parent elements in coolant) Activated
isotope Decay type
Gamma energy (MeV)
Half-life Be Na K Rb Zr
10Be β− 1.5 × 10⁶ years 0.2 22Na β+, γ 1.3 3 years 0.02 36Cl β− 3 × 10⁵ years 1 40K β−, γ 1.5 1 × 10⁹ years 0.04 84Rb β−, γ 33 d 0.006 86Rb β−, γ 19 d 0.1 87Rb β− 50 × 109 years 0.02 89Sr β−, γ 0.91 51 d 0.02 91Y β−, γ 59 d 0.001 93Zr β−, γ 0.03 1.5 × 10⁶ years 0.4 95Zr β−, γ 0.8 64 d 60 93mNb β−, γ 0.03 1.5 × 10⁶ years 0.3 95Nb β−, γ 0.8 64 d 100 95mNb β−, γ 0.2 64 d 0.7
cumulative activity from coolant-constituent 0.2 0.02 1.04 0.15 161 Total activity level (µCi/g-coolant) 162
Three of the isotopes listed in Table 3.15 (10Be, 36Cl, 93mNb) are not specifically addressed in the 10
CFR 61 regulations for control of low-level waste (Robertson 2000). Chlorine-36 occurs in relatively high concentrations in potassium salts and has a high ingestion dose conversion factor and a high environmental mobility. Therefore, it poses a potential risk for long-term migration from a low-level waste (LLW) disposal facility, especially in a contaminated well/drinking water exposure scenario, which must be analyzed for the licensing of a LLW facility. However, 36Cl can be easily separated from the salt and disposed of separately. Beryllium-10 is a long-lived beta emitter with unknown environmental mobility properties. The parent to 93mNb is 93Zr, which is very long-lived (1.5 million years) and cannot be easily removed from the constituent salt. Although 93mNb poses the greatest long-term disposal risk of the salts considered, its activity level after 60 years of use in an LS-VHTR appears to be sufficiently low to qualify as LLW.

38
Table 3.15. Nominal activity level of coolant constituents after 10 years of decay
Level of activation (µCi/g-coolant) (parent elements in coolant) Activated
isotope Decay type
Gamma energy (MeV)
Half-life Be Na K Rb Zr
10Be β− 1.5 × 10⁶ years 0.2 22Na β+, γ 1.3 3 years 0.002 36Cl β− 3 × 10⁵ years 1 40K β−, γ 1.5 1 × 10⁹ years 0.04
87Rb β− 50 × 109 years 0.02 93Zr β−, γ 0.03 1.5 × 10⁶ years 0.4
93mNb β−, γ 0.03 1.5 × 10⁶ years 0.3 cumulative activity from coolant-constituent 0.2 0.002 1.04 0.02 0.7
Total activity level (µCi/g-coolant) 2
3.1.12 Cost of the Salt
There are many important economic factors to be considered with respect to selecting coolant; however, at this stage of the LS-VHTR design, it is most useful to focus on the cost of acquiring the salt coolant. The most important “salt cost” is that associated with a significant deployment of the LS-VHTR. Unfortunately, we cannot predict this cost because many of the constituents of candidate salts are not commodity chemicals, and the cost associated with deploying significant numbers of LS-VHTRs would swamp the existing markets and change the price that is offered.
However, there are some basic trends and facts that can be used to help understand the classification and costs of various salt constituents. In 1971, ORNL conducted a survey of potential coolants that could be used as the secondary coolant in the MSBR design (Sanders et al. 1971). In the context of this survey, solicitations were made to vendors to provide prices for candidate salts. The goal was to establish an estimate of the unit prices required for supplying the coolant inventory (~280,000 L) for a 1000-MW(e) MSBR plant. Some vendors could not supply estimates for an order this large, and extrapolation methods were employed to refine the estimates when possible. The results of these 1971 price estimates are shown in Table 3.16. A more recent survey of commodity (USGS 2006) pricing for relevant salt constituents is included as Table 3.17.
Based on the 1971 study and the more recent commodity values, it is evident that the constituents of candidate coolants fall into three categories: (a) relatively inexpensive commodity chemicals (NaF); (b) moderately expensive specialty materials produced on a large scale (Zr-metal, LiF); and (c) very expensive specialty materials (7LiF, Be). For the 1971 study, the price of 99.995% 7Li was assumed to be $120/kg-LiF. Some of the values for Zr-prices in Tables 3.16 and 3.17 do not reflect the cost associated with hafnium removal.

39
Table 3.16. Price estimate of salt coolants in 1971 (U.S. dollars)
Coolant Composition (%)
Melting point (ºC)
Cost ($/kg)
Cost ($/L)
LS-VHTR candidate coolant salts NaF-KF-ZrF4
mol % wt %
10-48-42 4-27-69
385
4.6 11.7
7LiF-NaF-KF mol %
wt %
46-11.5-42.5 29-12-59
454
11.3 24.1
7LiF-NaF-BeF2 mol %
wt %
35-27-38 24-46-30
335
17.5 35.0
7LiF-BeF2 mol %
wt %
67-33 53-47
460
26.3 52.2
Other industrial salts NaNO3-NaNO2-KNO3
mol % 7-48-45
142
0.33 0.57
NaF-NaBF4 mol %
8-92
385
0.82 1.5
LiCl-KCl mol %
59-41
355
1.12 1.8
Other low-vapor pressure coolants Pb 327 0.4 4.1 Na 98 0.88 0.72 Pb-Bi 125 7.45 74.4 Bi 271 13.2 129
Table 3.17. Commodity prices for selected materials
aAll prices are from the USGS Minerals Yearbook except NaF. USGS prices are for 2002 except LiF (1995) and Li2CO3 (2004).
bPrice from Chemical Marketing Reporter Volume 267(12), p.18.
Material Commodity
pricea ($/kg)
Price of contained metal
($/kg-metal)
Derived fluoride price
($/kg-fluoride)
World-wide production (ton/year)
LiF 17.00 63.54 63.54 — Li2CO3 1.72 9.16 2.45 ~50,000
BeO 100.00 610.00 117.00 — Be-metal 770.00 770.00 147.4 —
11% BeO-ore 0.080 2.02 — 114 (Be element)
Zr-metal 30.80 30.80 16.80 — ZrO2 8.89 11.89 6.48 — 98% ZrO2-ore Baddeleyite
3.00 4.05 2.2 21,300
NaF 1.37b 2.56 1.32 very large

40
It is possible that this classification could change for some constituents based on market factors not yet considered. For example, there are two alternative raw material sources for obtaining hafnium-free ZrF4: (a) recovery of irradiated cladding and fuel-element hardware and (b) recovery of ZrF4 from spent pickling-solution streams (from cleaning of Zircalloy). It is also possible that the market could change the specialty prices associated with RbF and KF compounds. Alkali ores possess considerable amounts of Rb and K minerals that remain unused and accumulate in tailing piles. Rubidium has an unusual position with respect to markets. While the world market for rubidium is extremely small (4 tons/year), it ranks as the 23rd most abundant element on earth (16th most abundant metal)—more abundant than copper, lead, and zinc; and much more abundant than lithium or cesium.
3.1.13 Chemical Considerations
The purpose of this section is to provide an assessment of key chemical factors related to the choice of the primary coolant for the LS-VHTR. The most important chemical factor in this selection concerns the maintenance of acceptably small levels of corrosion for the metal alloy that will serve as primary containment. Alloy corrosion is the key materials-compatibility issue that is influenced by salt chemistry.
Materials for high-temperature salts. The application of molten salt coolants is based on a 50-year history of molten salt nuclear technology, principally at ORNL. To appreciate the merits of using such high-temperature liquids as coolants in LS-VHTRs, it is worthwhile to review some of that history as it pertains to LS-VHTR applications.
In the 1950s, a nuclear-powered strategic bomber was conceived that could stay aloft for more that a month and be diverted to a target should the necessity arise. To power such an aircraft, a test reactor—the Aircraft Reactor Experiment (ARE)—was constructed (ARE 1957). A major requirement for this reactor was that it have a very high power density to keep the weight in the aircraft at a minimum. Originally, a more conventional design of solid fuel pins with liquid metal (sodium) was planned. However, the need for the high power density and safety could not be met with solid fuel, which might be inadequately cooled in such a design.
Therefore, it was decided to develop a liquid fuel for the ARE that could operate at a high power density and that was inherently safe because of a negative power coefficient. In other words, if the reactor power went up excessively, the thermal expansion of the fluid fuel would cause a natural lowering of the amount of fuel in the core and, thus, decrease the overall reactor power.
A mixture of NaF and ZrF4 was used as the fluoride solvent for the UF4 fuel component to make a solution of NaF-ZrF4-UF4 (53.09-40.73-6.18 mol %) (Cottrell et al. 1955). The containment metal used for this liquid fuel mixture was a nickel-base alloy, Inconel, (15% Cr, 7% Fe, balance Ni.) (Manly et al. 1957). The ARE operated in November 1954 for 221 h at a maximum thermal power of 2.5 MW. Postoperative examination of the reactor components (Cottrell 1958) plus experimental corrosion-loop testing revealed that the Inconel corrosion was excessive but could be improved by adding molybdenum to the alloy. Furthermore, corrosion loop testing indicated that Inconel was more severely corroded with fuel salts made with all alkali-metal fluorides than those made with NaF-ZrF4 mixtures, suggesting that the chemical composition of the fuel salt played a significant role in controlling the corrosion chemistry. Extensive development in materials research (DeVan and Evans 1961) resulted in the production of an improved nickel-base alloy, INOR-8 (17% Mo, 7% Cr, 5% Fe, balance Ni).
The Molten Salt Reactor Experiment (MSRE) was the next major project to use a salt coolant. The MSRE was intended to be a breeder reactor. To this end, it was necessary that the molten solvent components consist of elements with especially low thermal neutron cross-sections in order to achieve the highest possible breeding ratio. The MSRE was constructed of INOR-8 (now identified as Hastelloy N) and fueled with LiF-BeF2-ZrF4-UF4 (64-30-5-1 mol %). The LiF component was enriched Li-7 for better neutron economy. Neutron moderator graphite filled the reactor core in the shape of rectangular

41
stringers that provided channels for the circulating fuel. The fuel was circulated from the reactor core at 650ºC to a heat exchanger operating at 550ºC.
Corrosion in the reactor circuit was controlled by reducing approximately 1% of the UF4 solute to UF3, so that the oxidative equilibrium between the chromium of the Hastelloy N container was shifted to the left:
Cr + 2UF4 ↔ CrF2 + 2UF3 . (3.11)
Postoperative examination of the reactor container showed that corrosion was successfully minimized by this redox method of control. It was observed that the fuel salt produced only very minor, barely detectable levels of corrosion, whereas for the coolant salt, corrosion was not detected at all (McCoy and McNabb 1972).
Further postoperative examination of the MSRE revealed the damaging effects of fission-product tellurium, resulting in the development and testing of modified alloys for future containment purposes. It was found that additions of titanium or niobium produced a modified Hastelloy N alloy that had good resistance to both radiation embrittlement and intergranular cracking by tellurium (McCoy 1978, Keiser 1977a). Furthermore, it was seen that controlling the molten salt oxidation potential had dramatic effects on the extent of cracking (Keiser 1977b), as shown in Fig. 3.12.
Chemistry of molten fluoride salt coolants. The selection and effective use of molten salts as high-temperature coolants depends on an understanding of the chemistry. Of major importance in this understanding are: (1) the ability to produce and maintain a high level of purity, (2) the utilization of acid-base effects, and (3) the control of the redox potential of the salt medium as it affects corrosion and other chemical processes.
Molten salt use typically begins with the acquisition of raw components that are combined to produce a mixture that has the desired properties when melted. However, most suppliers of halide salts do not provide materials that can be used directly. The major impurities that must be removed are moisture/oxide contaminants, to prevent severe corrosion of the container metal. Once removed, these salts must be kept from atmospheric contamination by handling and storage in sealed containers. During the ANP/MSRE era, a considerable effort was devoted to salt purification by HF/H2 sparging of the molten salt. Besides removing moisture/oxide impurities, the purification also removes other halide contaminants, such as chloride and sulfur. The sulfur is usually present in the form of sulfate and is reduced to sulfide ion, which is swept out as H2S in the sparging operation. Methods were also developed to ensure the purity of the reagents used to purify the salts and to clean the container surfaces used for corrosion testing.
Fig. 3.12. Effect of redox potential on tellurium cracking of
Hastelloy-N.

42
Another means of purification that can be performed after sparging involves simply reducing the salt with a constituent active metal such as an alkali metal, beryllium, or zirconium. While such active metals will remove oxidizing impurities such as HF, moisture, or hydroxide, they will not affect the other halide contaminants that affect sulfur removal. Therefore, it seems inevitable that the HF/H2 sparging operation, either by itself or followed by a reducing (active metal) treatment, will be a necessity.
A less obvious but equally important chemical aspect is that of the molten-salt acid-base chemistry. To put it in proper perspective, one should realize that an aqueous chemical process could never be developed without controlling of the acid-base properties of the solution because most chemical processes simply do not work well otherwise. Similarly, this control can be essential in molten salt chemistry. The major obstacle in understanding the acidity effect is in comprehending the nature of this Lewis acid-base property, in which an acid is defined as an electron pair acceptor and a base as an electron pair donor. For molten fluorides, ZrF4, UF4, and BeF2 would be examples of Lewis acids. These acids would interact with a Lewis base, F-, in the following fashion:
ZrF4 + 2F- → ZrF6= . (3.12)
Salts that easily give up their fluoride ions—the alkali metal fluorides—interact with the acidic salts
that accept them to form complexes as shown in Eq. (3.13). The effect of such complexation is a stabilization of the acidic component and a decrease in the chemical (thermodynamic) activity.
Although these concepts were realized in the early developmental stages of molten salt chemistry, a more macroscopic (thermodynamic) view of solvent changes was taken and resulted in the laborious measurement of activity coefficients for individual components in specific salt mixtures. This effort was invaluable for predictions of equilibrium concentrations of reactive components in these solutions. Prior to that, there were such suggestive observations that corrosion of Inconel was much worse with the ternary alkali metal fluoride eutectic (a basic salt solution) than with NaF-ZrF4 (an acidic salt solution) containing UF4. We now explain this as being due to an increase in the stability of the corrosion product by complexation with the higher activity of the fluoride ions in the basic salt mixture. Such acid-base properties are also seen in the viscosity decrease of acidic BeF2 (viscous because of cross-linking through a Be-F-Be bridging network) with additions of the basic component F- to form monomeric BeF4
= ions of normal solution viscosity (~1–10 cP):
BeF2 + 2F- → BeF4= (3.13)
Acid-base effects are also seen in vapor-pressure changes of volatile ZrF4 to form the nonvolatile ZrF6=
ion:
ZrF4 + 2F- → ZrF6= (3.14)
Today, the understanding of the more microscopic coordination chemistry of these systems through the use of various spectroscopies that can identify the coordination behavior of the ions enables a prediction of these chemical equilibrium shifts, at least on a qualitative scale. Acid-base chemistry then becomes an essential factor in the selection of constituents for high-temperature coolants.
Corrosion chemistry. Unlike the more conventional oxidizing media, the products of oxidation of metals by fluoride melts tend to be completely soluble in the corroding media (Manly et al. 1960); hence, passivation is precluded and corrosion depends directly on the thermodynamic driving force of the corrosion reactions (DeVan and Evans 1962). Design of a chemically stable system utilizing molten

43
fluoride salts, therefore, demands the selection of salt constituents that are not appreciably reduced by available structural metals and the development of containers whose components are in near thermodynamic equilibrium with the salt medium.
Examination of the free energies of formation for the various alloy components in Inconel or Hastelloy N shows that chromium is the most active of the metal components. Therefore, any oxidative attachment to these nickel-base alloys should be expected to show selective attack on the chromium. Such oxidation and selective attack follow from reactions such as the following [in Eqs. (3.15–3.18)] (Grimes 1967) for the fuel salt: Impurities in the melt with dissolution of the CrF2 Cr + NiF2 → CrF2 + Ni (3.15)
Cr + 2HF → CrF2 + H2 (3.16) Oxide films on the metal 2NiO + ZrF4 → 2NiF2 + ZrO2 (3.17) These reactions are followed by reaction of NiF2 with Cr: Reduction of UF4 to UF3 Cr + 2UF4 ↔ 2UF3 + CrF2 (3.18)
Of course, in the case of a coolant salt with no fuel component, reaction (19) would not be a factor.
Redox processes responsible for attack by molten fluoride mixtures on these alloys result in selective oxidation of the contained chromium. This removal of chromium from the alloy occurs primarily in regions of highest temperature and results in the formation of discrete voids in the alloy (Richardson et al. 1953). These voids are not, in general, confined to the grain boundaries in the metal but are relatively uniformly distributed throughout the alloy surface in contact with the melt. The rate of corrosion has been measured and was found to be controlled by the rate at which chromium diffuses to the surfaces undergoing attack (DeVan 1969).
Coolant salt selection factors related to corrosion. From the list of potential coolant salts, none are intrinsically corrosive to the metal alloy components. This view is based on the thermodynamic stability of the fluoride components relative to those of the alloy metal and is described in depth by Grimes (1967) and summarized above. Furthermore, it has been demonstrated over the past several decades in systems operating up to 850ºC.
Nevertheless, the evidence for selecting a coolant based on corrosion is not adequate at present. Previous studies focused on the corrosion by salts containing uranium, in which uranium is the key factor in the intensity and nature of alloy corrosion [cf, Eq. (3.19)]. A good understanding of fuel-salt corrosion was developed, but we do not know the precise mechanism of persistent (i.e., mass-transfer) corrosion of nickel alloys with coolant salts. We must assume that redox-sensitive species, such as Cr(II/III) and Fe(II/III), are important factors in this process (Adamson et al. 1961; Jordan et al. 1954). However, with limited analytical resources, other factors apparently present in previous studies must be evaluated to identify all truly significant trends.
During the ANP program, a continuing effort was made to understand the oxidation state of corrosion products such as Cr, Fe, and Ni in different salts (ANC 1955–1958). Although these studies were crude

44
by today's standards, the basic trends of oxidation state stability, shown in Table 3.18, were apparent and helped explain the corrosion phenomena that were being observed in fuel salts.
Table 3.18. Predominant oxidation states of dissolved alloy constituents in various molten salts
FLiNaK Cr(III) Fe(II/III) Ni(II) NaF/ZrF4 Cr(II) Fe(II) Ni(II) 2LiF/BeF2 Cr(II) Fe(II) Ni(II)
It is apparent that FLiNaK has a distinct behavior. As a strongly basic solvent, it would tend to stabilize the M(III) oxidation state and could provide for a stronger corrosion driving force due to the variation between cation [Cr(II/III), Fe(II/III)] oxidation states with temperature.
The equilibrium level of dissolved chromium has been measured for fuel salts but not for coolant salts. Although the information on fuel salts is not directly applicable to coolants, we expect that fuel systems that experience minimal corrosion would also be better coolants. Review of the dissolved chromium levels for various fuel salts in Table 3.19 again reveals that FLiNaK stands somewhat apart from the other salts as supporting a higher degree of corrosion. It also appears that there is some benefit in avoiding a very acid (high-ZrF4 or BeF2-content) system and that a salt mixture that has a nearly complete coordination shell (2:1 ratio of alkali halide to Zr or Be and heavier alkali salt) has the least potential for reduced corrosion based on the temperature sensitivities shown in Table 3.19.
Although less than 10% of all corrosion testing was done with salts that were free of uranium, this small fraction amounts to a significant body of work because of the extensive test program that was carried out. An inspection of this work reveals that Hastelloy N (INOR-8), just as it is for fuel salts, is a superior choice (rather than Inconel or stainless steel) for coolant salts. However, the corrosion is so intense and the duration so short for most Inconel loops that it is hard to make a judgment about which salt supports the least corrosion. It is clear that FLiNaK is certainly among the worst. For INOR-8 loops, the corrosion is so minor that it is hard to sort out corrosion effects due to the salt’s composition. Some additional Inconel loop tests (Jordan et al. 1956, 1957) were conducted with special fuel salt mixtures in which the ZrF4 and BeF2 concentrations were varied in an attempt to select the best composition. However, these tests were somewhat inconclusive because of the short test duration (500 h) and the impurity effects. Within the resolution of these tests, the trends indicated in Table 3.19 were verified: very basic (FLiNaK) and very acidic (LiF-ZrF4) salts showed the worst performance. Nevertheless, the proper control of redox factors, as described above, can make even these salt mixtures acceptable with respect to corrosion.
Table 3.19. Equilibrium level of dissolved metals for pure elements in contact with various fuel salts
Salt mixture Mol % ZrF4 or BeF2
[UF4] mol %
[Cr] at 600ºC(ppm)
[Cr] at 800ºC (ppm)
FLiNaK 0 2.5 1100 2700 LiF-ZrF4 48 4.0 2900 3900 NaF-ZrF4 50 4.1 2300 2550 NaF-ZrF4 47 4.0 1700 2100 NaF-ZrF4 41 3.7 975 1050 KF-ZrF4 48 3.9 1080 1160 NaF-LiF-ZrF4 (22-55-23)
23 2.5 550 750
LiF-BeF2 48 1.5 1470 2260

45
At various periods at ORNL, the control of the oxidation-reduction state of the salt was explored as a means to minimize corrosion. During the ANP period, this approach was found to be somewhat effective. However, it was not practical because strong reductants either reduced zirconium or uranium in the salt to a metal that plated on the alloy wall or resulted in some other undesirable phase segregation. During the MSRE operation, periodic adjustment of the U(III)/U(IV) ratio was effective in limiting the corrosion in the fuel circuit. Keiser (1977) also explored the possibility of using metallic beryllium to reduce corrosion in stainless steel containing a LiF-BeF2 salt. This treatment was effective only as long as the solid beryllium was immersed in the salt. There was little, if any, buffering capacity in this salt to maintain the reducing environment throughout the melt. Del Cul et al. (2002) have identified and tested candidate agents that could be used as redox buffers to maintain a reducing environment in the coolant circuit.
None of these redox-control strategies have been developed to the extent that we can rely on them for a definite salt selection. However, we can make some useful observations in this regard. For a lower-temperature system (<750ºC), it appears that Hastelloy N is fully capable of serving as a containment alloy without the need for a sophisticated redox strategy. Even an alkali fluoride such as FLiNaK could be suitable.
For temperatures in excess of 750ºC and for alloys that will contain more chromium (as most higher-temperature alloys do), it appears that a reducing salt will be needed to minimize corrosion. Inconel without the benefit of a reducing environment was found to be unsuitable for long-term use. Only a mildly reducing environment is possible with a ZrF4-containing salt since a strongly reducing redox potential would reduce ZrF4. Much more reducing systems can be devised with either FLiNaK or BeF2 salts. Some very important material compatibility issues will have to be explored in order to use a highly reducing salt at these higher temperatures because of the potential of other phenomena such as carbide formation and carburization/ decarburization of the alloy become a significant threat.
Should low-chromium/chromium-free alloys or suitable clad systems be devised as a container, then these problems with salt selection will largely disappear. However, in the absence of this solution, it appears that there are two strategies: (1) select a salt that should support the minimum level of corrosion in the absence of a highly reducing environment (some ZrF4 salts, BeF2 salts) or (2) select a salt with a large redox window that can be maintained in a highly reducing state (FLiNaK, BeF2 salts). Given the expense and difficulty of doing development work with beryllium-containing salts, it seems logical to explore the most promising ZrF4 salts without strong reductants and to explore FLiNaK with strong reductants and/or redox buffers.
3.1.14 Reactor Coolant Conclusions and Recommendations
Based on the preceding review of nuclear, physical, chemical, and economic properties of candidate salts for the LS-VHTR, the following conclusions were reached:
• Salts composed of low-atomic-weight constituents (“light” salts) possess superior heat- transfer metrics for use as the LS-VHTR coolant. Heavier salts are also relatively good coolants and would likely prove acceptable for design purposes.
• Analysis indicates that the key reactivity coefficients (and their net effect) that control response to transients are more strongly affected by parameters associated with the fuel-block design (coolant volume fraction, poison level, and distribution) than by the identity of the particular salts under consideration. A computational framework was developed to evaluate these factors and was used to evaluate the various candidate salts. It appears that acceptable fuel-element designs can be found for most of the salts used in this study.
• Activation levels in LS-VHTR candidate coolants appear to be acceptable from both an operational and long-term disposal standpoint. Only the LiF-BeF2 salts are very low-activation
46
materials that support minimal shielding requirements. The other salt coolants have operational characteristics similar to those of sodium-cooled reactors. The disposal of all of the salt candidates as LLW after 60 years of operation and 10 years of cooling should be possible, although some simple pre-treatment may be required for certain coolants.
• No consensus exists to select a particular salt based on its corrosion behavior with high-temperature alloys.
• A number of the ZrF4-containing salts appear to offer the best potential for achieving a low-cost coolant. The economic basis for these judgments is very important for the selection of a candidate and needs to be refined.
The selection of a suitable coolant salt should be based on numerous factors, including chemical,
physical, nuclear, metallurgical, and economic factors. It is evident from past decades of experience that fluoride melts have an established advantage over the few other coolants that had been considered previously for extreme-temperature service (>700ºC). The following remarks are directed primarily toward selection based on chemical factors that relate to corrosion, with the understanding that the overall assessment will need to account for other factors.
Proper selection of a coolant salt based on chemical differences is based largely on the acid-base properties of the combination. Both predictions and measurement of the container-metal-fluoride equilibrium concentrations are higher in basic salts as compared with neutral or acidic media. Some corrosion loop experience tends to corroborate this observation. Unfortunately, however, no systematic study of such a phenomenon has been made during these experiments.
A neutral or slightly acidic salt melt would be predicted to be the most advantageous with respect to corrosion behavior. However, basic salt melts tend to have significantly lower vapor pressures and lower viscosities, and these properties might present a problem (for example, ZrF4 and BeF2). Therefore, any selection of a coolant based on chemical considerations must, necessarily, be a compromise of all factors that might affect performance.
In this regard, it is recommended that two types of salts should be studied in the future:
1. Salts that have been shown in the past to support the least corrosion and are neither strong Lewis acids nor strong Lewis bases (i.e., “neutral”). Salts containing BeF2 and ZrF4 in the concentration range 25–40 mol % fall into this category.
2. Salts that provide the opportunity for controlling corrosion by establishing a very reducing salt environment. The alkali-fluoride (FLiNaK, FLiNaRb) salts and the BeF2-containing salts fall into this category.
It is too early to make final recommendations for exact salt compositions, since the particular salt composition to be chosen will need to be determined from a carefully conducted trade study that balances the various selection factors for a particular reactor design.
3.2 ASSESSMENT OF CANDIDATE SALTS FOR THE SECONDARY HEAT-TRANSFER LOOP
The purpose of this work (Williams 2006) was to provide a review of relevant properties of candidate salts for use in the evaluation and ranking of coolants for the heat-transfer loop that transports heat from the Next Generation Nuclear Plant (NGNP) to the Nuclear Hydrogen Initiative (NHI) hydrogen-production plant. A number of fluoride salt compositions have been examined in detail in previous studies as discussed in Williams et al. (2006) and Section 3.1 above (e.g., eutectic compositions of LiF-BeF2, NaF-BeF2, LiF-NaF-KF, and NaF-ZrF4). For applications that use molten salt outside of a neutron field, additional salts may be considered.

47
The screening logic for selecting secondary salt coolants requires that the elements constituting the coolant must form compounds that:
• have chemical stability at T > 800ºC , • melt at useful temperatures (<525ºC ) and are not volatile, and • are compatible with high-temperature alloys, graphite, and ceramics.
In addition to the fluoride salts considered in Section 3.1 above, two other families of salts fulfill
these three basic requirements: (a) chloride salts and (b) alkali fluoroborates (MBF4, M = alkali element). The properties of these two families of salts are reviewed and evaluated in this report. Other coolants (water, liquid metals, and fluoride salts) are included for the purpose of heat-transfer comparisons.
3.2.1 Melting Point and Vapor Pressure
Without question, the melting (or freezing) point is an important physical property for a candidate coolant. We do not know the exact demands that the NGNP/NHI heat-transfer loop will place on a molten salt coolant. However, a recent report (Davis et al. 2005) has used properties of typical salt coolants, some basic assumptions, and hypothetical heat exchanger designs in order to predict thermal profiles in both the heat-transfer loop and the heat exchangers at each process interface: (a) the intermediate heat exchanger at the reactor and (b) the process heat exchanger at the hydrogen plant. The peak helium temperature was assumed to be 900ºC, the salt was assumed to be supplied to the hydrogen plant at ~870ºC, and the working fluid in the hydrogen plant was assumed to be raised from an inlet temperature of 340 to 850ºC. Various loop/heat-exchanger configurations and cases were analyzed in this report.
For the reference conditions analyzed, considerable thermal margin to freezing exists. The minimum steady-state temperature in the loop under reference conditions is ~680ºC, which represents a margin for freezing of 200ºC for NaF-NaBF4 salt and 130ºC for FLiNaK salt. Grace periods for the onset of freezing were estimated to occur between 65–80 min for an off-site power loss and between 5–7 min for a loss-of-heat-sink transient. These times were deemed reasonable for taking actions to prevent the problems that would occur with substantial freezing of the salt. Therefore, the Davis et al. report (2005) appears to indicate that the properties and freezing points associated with FLiNaK (with a melting point of 454ºC) and NaF-NaBF4 (385ºC) may be acceptable for use in the heat-transfer loop. Other options for heat-transfer agents are identified in this report.
Salts that are useful as secondary coolants have been identified in previous reports (Kelmers 1976; Grimes 1967; Morishita et al. 1996): (a) alkali-fluorides, (b) ZrF4-salt mixtures, (c) fluoroborate salts, and (d) chloride salts. Beryllium fluoride-containing salts have been excluded from this list because of the potential toxicity of beryllium compounds and their high cost. Table 3.20 lists the primary eutectic compositions in each salt family in order of freezing point. Discussion and analysis of phase diagrams and properties of the alkali fluorides and ZrF4-salt mixtures were included in Williams et al. (2006). Phase diagrams of the most important binary fluoroborate and chloride systems are presented in Williams (2006).

48
Table 3.20. Useful salt compositions (mole %) and eutectic temperatures for the NGNP/NHI heat-transfer loop
Alkali fluorides ZrF4 salts Fluoroborate salts Chlorides NaF-ZrF4
(59.5-40.5) 500ºC
LiF-NaF-KF (“FLiNaK”) (46.5-11.5-42) 454ºC
LiF-NaF-ZrF4 (42-29-29) 460ºC
KF-KBF4 (25-75) 460ºC
NaCl-MgCl2 (63-37) 475ºC (58-42) 445ºC
LiF-NaF-ZrF4 (26-37-37) 436ºC
RbF-RbBF4 (31-69) 442ºC
KCl-MgCl2 (68-32) 426ºC
NaF-RbF-ZrF4 (33-24-43) 420ºC
LiCl-KCl-MgCl2 (9-63-28) 402ºC
KF-ZrF4 (58-42) 390ºC
NaF-NaBF4 (8-92) 384ºC
NaCl-KCl-MgCl2 (20-20-60) 396ºC
LiCl-KCl (59.5-40.5) 355ºC
LiCl-KCl-MgCl2 (55-40-5) 323ºC
LiCl-RbCl (58-42) 313ºC
Many salts with reasonably low melting points have been excluded from the list in Table 3.20. The
two primary reasons for exclusion are as follows: either the salts exhibit too high a vapor pressure (for example, AlCl3, ZrCl4, and BeCl2 salts) or they are too corrosive for use at high temperatures [metal halides of Fe, Sn, Bi, Cd, Zn, and Tl, as well as oxygen-containing salts (nitrates, sulfates, and carbonates)]. Two classes of salts that meet the criteria in the previous list and are not necessarily too volatile or too corrosive have also been excluded from Table 3.1: (a) heavy halide salts containing bromine and iodine, and (b) mixed-halide salts with dissimilar halide anions (mixtures of chlorides, fluorides, bromides, and iodides). The poor heat-transfer metrics of heavy salts and the extra expense of bromine and iodine constituents argue against the use of these salts. The mixed-halide candidates do not offer compelling advantages over those salts identified in Table 3.20, and are considerably more complicated systems to prepare and understand. Heavy halide salts (e.g., bromine) are probably not useful because chloride salts represent the lower limit of desirable heat-transfer performance for salts.
Table 3.21 contains a summary of the freezing point, boiling point, and 900ºC vapor-pressure for all pure-component constituents and most of the salt mixtures identified in Table 3.20. In nearly ideal mixtures of the alkali halides, each component exerts its own vapor pressure in proportion to its molar composition. For mixtures of alkali halides with polyvalent elements or with BF3, a dramatic depression of the native vapor pressure of the pure components (i.e., ZrF4) is noted, due to formation of coordination complexes, as illustrated in Fig. 3.13. This depression of native vapor pressure also occurs for the same reasons in the fluoroborate system and the chloride salts and displays the same trends as discussed in Williams et al. (2006) (more effective halide-ion donation/complex formation for the heavier alkali halides). Thus, the mixture of BF3 with heavier alkali fluorides results in a lower-vapor-pressure salt. The data are not as extensive for the chloride salts; however, a significant drop in vapor pressure was measured in the KCl-MgCl2 system as compared with pure MgCl2 and pure KCl (Schrier and Clark 1963). Figure 3.13 demonstrates that, in general, optimized compositions of fluorides have the lowest vapor pressure, followed by chlorides, and then fluoroborates.

49
The report on the heat-transfer-loop application (Davis et al. 2005) considered two salt options for the heat-transfer loop: LiF-NaF-KF eutectic (i.e., “FLiNaK”) and (b) the sodium fluoroborate (NaF-NaBF4) eutectic. Table 3.21 and Fig. 3.13 indicate that the estimated vapor pressure [actually a decomposition pressure of NaBF4 −> NaF + BF3(g)] of sodium fluoroborate at 900ºC is extremely high (~13 atm) and will likely exclude this salt from consideration. Potassium fluoroborate has a much lower vapor pressure at 900ºC (~0.13 atm) and is a better choice for the heat-transfer-loop application. The pressure of potassium fluoroborate at 900ºC is approximately equal to the vapor pressure of sodium fluoroborate at 620ºC [the temperature proposed for use of NaF-NaBF4 in the MSBR]. The vapor pressure of the rubidium fluoroborate eutectic has not been measured, but it will certainly be somewhat less than the value for the potassium fluoroborate eutectic.
10-4
10-2
100
102
104
500 600 700 800 900 1000 1100 1200 1300
KF-ZrF4 (m.p. = 390°C)
NaF-NaBF4 (m.p. = 385°C)
KF-KBF4 (m.p. = 460°C)
LiCl-KCl (m.p. = 355°C)
LiF-NaF-KF (m.p. = 454°C)
KCl-MgCl 2 (m.p. = 435°C)
Vapo
r Pr
essu
re(m
m H
g)
Temperature (°C) Fig. 3.13. Vapor pressure of selected candidate coolant salts.

50
Table 3.21. Selected phase transition properties of salt compounds and key mixtures
Salt constituent(s)
Freezing point (ºC)
Normal boiling point (ºC)
900ºC vapor pressure (mm mercury)
LiF 845 1681 0.1
NaF 995 1704 0.07
KF 856 1502 1.2
RbF 775 1408 0.75
ZrF4 912 905 (sublimes) 722
BF3 −126 −100 NA
NaF-NaBF4 385 694 9500
KF-KBF4 460 1070 100
RbF-RbBF4 442 >1070 <100
LiCl 610 1382 7
NaCl 808 1465 2.5
KCl 772 1407 2.0
RbCl 717 1381 3.8
MgCl2 714 1418 7
LiCl-KCl 355 ~1400a 5.8
NaCl-MgCl2 445 >1465 < 2.5
KCl-MgCl2 426 >1418 < 2 LiF-NaF-KF (46.5-11.5-42) 454 1570a 0.5 NaF-ZrF4 (59.5-40.5) 500 ~1350a 6 KF-ZrF4 (58-42) 390 ~1450a 1.2
aEstimated by extrapolation of lower-temperature data (~1100ºC) or assumption of ideal mixture behavior.
The importance of the identity and behavior of the vapor species of the ZrF4-containing salts was discussed in Section 3.1.2. The recommendation was to consider ZrF4 salts that exhibited very low vapor pressures (i.e., salts with 20–45 mol % ZrF4, depending on the alkali fluoride present and the temperature) to avoid the problems associated with the sublimation and transport of ZrF4. A similar situation may apply to MgCl2-containing salts, and it is likely that a chloride salt composition that minimizes the vapor pressure of MgCl2 (~20–45% MgCl2) will be preferred. This composition range coincides with the location of the low-temperature eutectics containing MgCl2 and alkali halides.
Salt mixtures containing BF3 in the form of a fluoroborate anion (BF4−) present some special features
that merit additional discussion. Fluoroborate salts are a low-cost coolant that exhibit superior heat-

51
transfer properties and a significant pressure (>0.5 atm) of BF3. In order to maintain the eutectic salt composition, it is necessary to monitor and control the BF3 pressure of the cover gas. There are inevitably purge gas streams, for example, those associated with shaft seals and bearings on pumps or other machinery. Therefore, the exhaust from these systems must include a means to trap BF3 or to recycle it. Also, the cover gas in fluoroborate systems contains a significant quantity of toxic BF3 gas that will hydrolyze to form HF and hydroxyfluoroborate upon contact with moist air (or in the lung). Any leakage of moisture into the coolant system will rapidly generate highly corrosive HF and hydroxyfluoroborate. Even simple operations, such as bubbling an inert gas (e.g., helium) in molten fluoroborates, can cause plugging problems because of the local depletion of BF3 from the salt (and the resulting increase in melting point). Potential solutions were found for all of these problems, but it is not clear that one would choose fluoroborates if a simpler salt system could meet the requirements for the coolant.
Many of the candidates listed in Table 3.1 were nominated for study in previous work at ORNL, but the salts containing rubidium and magnesium were not included. Although rubidium options may have been considered to be expensive or unusual, the exclusion of the magnesium chloride salts appears to have been an oversight. The MgCl2-containing salts were considered in previous fast-reactor studies as a fuel salt, and there appears to be no reason to exclude them from consideration as a coolant for the NGNP/NHI loop.
3.2.2 Density
The densities of many of the salt mixtures in Table 3.20 have been measured. The method of additive molar volumes for estimating the density of salt mixtures has also been found to be fairly accurate for many salt mixtures over a wide temperature range. This estimation method and a tabulation of reference molar volumes for fluoride and fluoroborate mixtures were presented in Williams et al. (2006). It is expected that the method of additive molar volumes will also prove useful in chloride-salt systems in the event that reliable experimental information is not available. The density equations for most of the chloride salts in Table 3.20 have been determined experimentally and are summarized along with those of fluorides and fluoroborates in Table 3.22.
Table 3.22. Salt density equations developed from experimental studies or the method of additive molar volumes
Salt constituents Molar composition Density equation
LiF-NaF-KF 46.5-11.5-42 2.530–0.00073 × T (ºC)
NaF-ZrF4 59.5-40.5 3.584–0.000889 × T (ºC)
KF-ZrF4 58-42 3.416–0.000887 × T (ºC)
LiF-NaF-ZrF4 26-37-37 3.533–0.000517 × T (ºC)
LiCl-KCl 59-41 1.8772−0.00087 × T (ºC)
LiCl-RbCl 58-42 2.7416−0.000689 × T (ºC)
NaCl-MgCl2 58-42 2.2971−0.000507 × T (ºC)
KCl-MgCl2 67-33 2.25458−0.000474 × T (ºC)
NaF-NaBF4 8-92 2.2521−0.000711 × T (ºC)
KF-KBF4 25-75 2.258−0.0008026 × T (ºC) a
RbF-RbBF4 31-69 2.946−0.001047 × T (ºC) a aEquation derived from method of additive molar volumes (Grimes et al. 1966).

52
3.1.3 Heat Capacity
The heat capacities of all salt constituents (i.e., compounds) have been measured, and many of the heat capacities for salt mixtures have also been measured. For cases in which experimental determinations are not available, the molar heat capacity is estimated based upon pure-component heat capacities weighted according to mole fraction and any mixing-enthalpy information that is available. Table 3.23 contains predictions based on the empirical equation of Dulong-Petit (Williams et al. 2006) for comparison with experimentally determined, or derived, values of heat capacity. When possible, heat capacity values were evaluated at 700ºC. In some instances no accurate temperature dependence was available from the experimental database. In general, the variation of heat capacity of molten salts with temperature is small.
3.1.4 Viscosity
Chloride salts and fluoroborates are, in general, very low viscosity melts. They do not exhibit large changes in viscosity with salt composition (as BeF2 mixtures do) and are less viscous than most fluoride salt mixtures. It is difficult to measure small values of viscosity at high temperatures, and special methods have been developed for this purpose. However, it should be noted that the difference between low-viscosity systems rarely controls the choice of the particular salt system; rather, certain compositional regions of highly viscous systems (such as BeF2 salts) are identified as forbidden regions (Williams et al. 2006). The viscosities of the salt mixtures in Table 3.20, or mixtures very similar in composition, have been measured. These results, summarized in Fig. 3.14, reflect the general trends cited above.
For some of the salt mixtures in Table 3.20, there are no
Table 3.23. Salt heat capacity from experiments and prediction
Heat capacity (cal/g-ºC) Salt constituents Molar
composition Measured Predicted LiF-NaF-KF 46.5-11.5-42 0.48 0.387 NaF-ZrF4 59.5-40.5 0.28 0.275 KF-ZrF4 58-42 0.251 LiF-NaF-ZrF4 26-37-37 0.296 LiCl-KCl 59-41 0.287 0.289 LiCl-RbCl 58-42 0.213 0.212 NaCl-MgCl2 58-42 0.258 0.262 KCl-MgCl2 67-33 0.276 0.229 NaF-NaBF4 8-92 0.36 0.435 KF-KBF4 25-75 0.312 0.367 RbF-RbBF4 31-69 0.218 0.258
1
10
550 600 650 700 750 800 850 900 950
LiCl-KCl μ(cP) = 0.0861 • exp[2517/T(K)]NaCl-MgCl 2 μ(cP) = 0.0286 • exp[1441/T(K)]
KCl-MgCl 2 μ(cP) = 0.0146 • exp[2230/T(K)]NaF-NaBF4 μ(cP) = 0.0877 • exp[2240/T(K)] KF-KBF4 μ(cP) = 0.0431 • exp[3060/T(K)]FLiNaK μ(cP) = 0.04 • exp[4170/T(K)]KF-ZrF4 μ(cP) = 0.0159 • exp[3179/T(K)]
NaF-ZrF4 μ(cP) = 0.0767 • exp[3977/T(K)]
Visc
osity
(cP)
Temperature (°C)
Fluorides
Chlorides
Fluoroborates
Fig. 3.14. Salt viscosity based upon experimental measurements.

53
experimental measurements of viscosity. For these mixtures, estimates based upon values for pure components and an ideal-mixture viscosity estimation were made using the following equation (Kendall and Monroe 1921): μideal-mix ={ Σ(xi • μi
1/3)}3 , (3.19) where: μi is the dynamic viscosity (cP) of component i, and xi is the mole fraction of component i.
The ideal-mixture viscosity of the eutectic of LiCl-RbCl is predicted by Eq. (3.19) to be very close to the viscosity of the LiCl-KCl eutectic. For the purposes of heat-transfer estimates, the viscosity of the LiCl-KCl eutectic can be used in estimates of viscosity for the LiCl-RbCl eutectic. Most of the other ternary mixtures in Table 3.21 are very slight modifications of binary systems displayed in Fig. 3.14, and the value of the binary system can be used for the purposes of heat-transfer calculations.
3.2.5 Thermal Conductivity
The discussion in Section 3.1.6 and Williams et al. (2006) indicated the difficulties and inaccuracies that have plagued the measurement and our understanding of thermal conductivity of high-temperature molten salts. These metrological difficulties also apply to high-temperature chloride and fluoroborate salts, and corrections similar to those made in fluoride systems have also been necessary for the chloride and fluoroborate systems. Improvements in the measurement of thermal conductivity of high-temperature salts have consistently led to a lower estimate of the actual value. The recent (and more accurate) measurements also indicate a very weak dependence of thermal conductivity on temperature. The general trend that lighter salts (with lower-atomic-number atoms) have higher thermal conductivities has been confirmed by many investigators (Cornwell 1971; McDonald and Davies 1971). It also appears that families of salt compounds fall onto a single correlating curve, based upon the average ionic weight (formula weight divided by number of ionic species), as indicated in Fig. 3.15.
It has been suggested by a number of investigators that mixtures of salt compounds (such as binary or ternary eutectics) should display some type of nonideal behavior and that the conductivity is not characterized by a simple mole-fraction-weighted average of pure-component values. However, the most reliable measurements indicate that the conductivity of a mixture of salt compounds is very close to the mole-fraction average of the pure-compound values (Tufeu et al. 1985). For coolant salt mixtures with no reliable measurements, a mole fraction average has been used to estimate the conductivity in Table 3.24.
10-1
100
20 30 40 50 60 70 80 90 100
Nitrates
chloride
bromide
iodide
Halides
kHalides
= 1.81 * Mi-0.4435
kNitrates
= 7.26 * Mi-0.6975
Ther
mal
Con
duct
ivity
(wat
ts/m
-K)
Mi (mean ionic weight) Fig. 3.15. Thermal conductivity correlation in one-component nitrate
and halide salts.

54
Table 3.24. Comparison of measured and predicted thermal conductivities
3.2.6 Heat-Transfer Comparisons
It is useful to compare the heat-transfer performance of the NGNP/NHI loop candidate coolants with those of other coolants that we have experience with or would like to consider for related applications. With the exception of water, the temperature of 700ºC was selected for comparison because this permits properties to be evaluated more readily. A temperature of 300ºC was selected for water, because this is a typical coolant temperature used in the primary circuit of existing nuclear power plants.
Table 3.25 lists the properties of the additional coolants identified in this report to be used in the heat-transfer comparisons. Properties of fluoride salts and other comparison coolants were examined in detail in Williams et al. (2006) and discussed in Section 3.1 above. The same generalized heat-transfer metrics [figures-of-merit] as discussed in Section 3.1.7 were used here. Table 3.26 summarizes the various figures-of-merit for the comparison and candidate coolants.
In general, we can conclude that the lighter molten salts [those not containing large quantities of higher-atomic-number elements (e.g., rubidium and zirconium)] have somewhat better heat-transfer performance than the heavy salts. The one exception is the laminar regime of natural convection. In many passive cooling situations, the turbulent natural convection component is of primary importance. It is expected that the turbulent-forced-convection metrics are the most important for the purposes of the NGNP/NHI loop application.
Salt composition (mol %)
Formula weight (g/mol)
Melting point (ºC)
Temp (ºC)
Measured conductivity
(W/m-K)
Conductivity-based pure-
compound values (W/m-K)
LiF-NaF-KF 41.3 454 500 0.60 0.68 NaF-ZrF4 92.7 500 700 — 0.36 KF-ZrF4 103.9 390 700 — 0.32 LiF-NaF-ZrF4 84.2 436 700 — 0.36 LiCl-KCl
55.5 355 355 538 700
0.69 0.28 0.38
0.43
LiCl-RbCl 75.4 313 700 — 0.39 NaCl-MgCl2 76.1 450 700 — 0.43 KCl-MgCl2 81.4 435 800 — 0.39 NaF-NaBF4 104.4 385 621 0.4 KF-KBF4 109.0 460 621 — < 0.4 RbF-RbBF4 151.3 442 621 — < 0.4

55
Table 3.25. Estimates of properties for additional secondary coolant candidates
Salt
Melting point (ºC)
FWa
(g/mol) Density(g/cm3)
Heat capacity
(cal/g-ºC) ρ*Cp
(cal/cc-ºC) Viscosity
(cP)
Thermal conductivity
(W/m-K) LiCl-KCl 355 55.47 1.515 0.287 0.435 1.15 0.42 LiCl-RbCl 313 75.37 1.883 0.213 0.401 1.30 0.36 NaCl-MgCl2 450 76.09 1.677 0.262 0.439 1.36 0.50 KCl-MgCl2 435 81.44 1.664 0.276 0.459 1.40 0.40 NaF-NaBF4 385 104.38 1.754 0.360 0.632 0.90 0.40 KF-KBF4 460 108.96 1.696 0.312 0.529 0.90 0.38 RbF-RbBF4 442 151.26 2.213 0.218 0.482 0.90 0.28 aFormula weight.
Table 3.26. Heat-transfer ranking of secondary coolant candidates at 700ºCa
NATURAL CONVECTION TURBULENT FORCED CONVECTION
Laminar Turbulent Pumping factor
Area factor
Water (300ºC) 0.63 Water (300ºC) 4.84 Water (300ºC) 0.20 Na 1.6
Na 3.51 LiF-NaF-KF 13.30 2LiF-BeF2 0.70 Pb 5.4 RbF-RbBF4 4.22 2LiF-BeF2 13.91 NaF-BeF2 0.91 Water (300ºC) 13.0
NaF-NaBF4 4.31 LiF-NaF-ZrF4 13.92 LiF-NaF-BeF2 1.02 2LiF-BeF2 21.5
KF-KBF4 4.60 LiF-ZrF4 14.46 LiF-NaF-KF 1.13 LiF-NaF-KF 21.6
Pb 5.36 NaF-NaBF4 14.71 LiF-NaF-ZrF4 1.42 LiF-NaF-BeF2 22.6
LiF-NaF-KF 6.61 NaF-ZrF4 14.72 LiF-ZrF4 1.82 NaF-BeF2 25.2 LiCl-RbCl 6.86 LiF-NaF-BeF2 15.64 NaF-ZrF4 1.98 NaF-NaBF4 28.0 LiF-NaF-RbF 7.11 KF-KBF4 15.93 NaF-NaBF4 2.20 LiF-NaF-RbF 31.8 LiCl-KCl 7.15 NaF-BeF2 16.48 KF-ZrF4 3.39 NaCl-MgCl2 35.1 KCl-MgCl2 7.74 RbF-RbBF4 16.59 KF-KBF4 3.53 KF-KBF4 35.4
NaCl-MgCl2 7.81 KF-ZrF4 16.74 LiF-NaF-RbF 3.79 LiF-NaF-ZrF4 35.9
LiF-ZrF4 7.90 LiF-NaF-RbF 17.37 RbF-ZrF4 4.82 NaF-ZrF4 37.4 NaF-ZrF4 7.90 RbF-ZrF4 17.62 KCl-MgCl2 5.66 LiCl-KCl 37.5 RbF-ZrF4 8.89 Na 20.33 RbF-RbF4 5.67 LiF-ZrF4 37.5 LiF-NaF-ZrF4 9.01 LiCl-KCl 20.83 LiCl-KCl 5.88 KCl-MgCl2 39.7 KF-ZrF4 9.05 KCl-MgCl2 21.08 NaCl-MgCl2 6.40 KF-ZrF4 42.5 2LiF-BeF2 10.12 LiCl-RbCl 21.26 LiCl-RbCl 8.99 LiCl-RbCl 44.5 LiF-NaF-BeF2 10.66 NaCl-MgCl2 21.70 Na 13.15 RbF-RbBF4 45.4 NaF-BeF2 13.45 Pb 28.53 Pb 33.63 RbF-ZrF4 48.7
aRed bold typeface denotes fluoroborate salts. Blue italics typeface denotes chloride salts.
3.2.7 Cost of Salts
Many important economic factors must be considered with respect to selection of coolant. However, at this stage of the NGNP/NHI loop design, it is most useful to focus on the acquisition cost of the salt coolant. Unfortunately, at present, we cannot predict this cost for all salts, because some of the

56
constituents of candidate salts are not commodity chemicals and the cost associated with the deployment of significant numbers of heat-transfer loops would “swamp” the existing markets and would change the price that is offered.
However, there are some basic trends and facts that can be used to help understand how to classify and evaluate the costs of various salt constituents. ORNL conducted a survey in 1971 of potential coolants that could be used as the secondary coolant in the MSBR design (Sanders 1971). In the context of this survey, solicitations were made to vendors to provide prices for candidate salts. The desire was to establish an estimate of the unit prices required for supplying the coolant inventory (~280,000 L) for a 1000-MW(e) MSBR plant. Some vendors could not supply estimates for an order this large, and extrapolation methods were employed to refine the estimates whenever possible. The results of these 1971 price estimates are shown in Table 3.27. A more recent survey of trade-journal pricing for relevant salt constituents is included as Table 3.28.
Table 3.27. Price estimate of salt coolants (1971 U.S. dollars)
Coolant Composition (%)
Melting point (ºC)
Price ($/kg)
Price ($/L)
NGNP/NHI loop candidate coolant salts LiF-NaF-KF
mol % wt %
46-11.5-42.5 29-12-59
454
11.3 24.1
NaF-KF-ZrF4 mol %
wt %
10-48-42 4-27-69
385
4.6 11.7
NaF-NaBF4 mol %
8-92
385
0.82
1.5
LiCl-KCl mol %
59-41
355
1.12
1.8
Other industrial salts NaNO3-NaNO2-KNO3
mol % 7-48-45
142
0.33
0.57
Other low-vapor-pressure coolants Pb 327 0.4 4.1 Na 98 0.88 0.72 Pb-Bi 125 7.45 74.4 Bi 271 13.2 129

57
Table 3.28. Commodity prices for selected materials
Based on the 1971 study and the more recent trade-journal values, it is evident that the constituents of
candidate coolants fall into two categories: (a) relatively inexpensive commodity chemicals (NaF, NaCl, KCl, and MgCl2) and (b) moderately expensive specialty materials produced on a large scale (zirconium metal, LiF, and LiCl). The zirconium prices in Table 3.27 and 3.28 do not reflect the cost associated with hafnium removal.
Table 3.29 shows the costs of the raw materials associated with the various candidate salt mixtures. Based on these raw material costs, it is clear that many of the chloride salts are the least expensive, followed by fluoroborate salts, and then fluoride salts. It is possible that this classification could change for some constituents based upon market factors not yet considered. For example, there exist two alternative raw material sources for obtaining ZrF4: (a) recovery of irradiated cladding and fuel element hardware and (b) recovery of ZrF4 from spent pickling solution streams (from HF cleaning of Zircalloy). It is also possible that the market could change the specialty prices associated with RbF and KF compounds. Alkali ores possess considerable amounts of rubidium and potassium minerals that currently remain unused and accumulate in tailing piles. Rubidium has an unusual position with respect to markets. While the world market for rubidium is extremely small (4 tons/year), it ranks as the 23rd most abundant element on earth (the 16th most abundant metal). Rubidium is more abundant than copper, lead, and zinc—and much more abundant than lithium or cesium.
Material Commodity price ($/kg)
Price of contained metal
($/kg-metal) Source
LiF 17.00 63.5 USGS Minerals Yearbook 1995 LiCl 11.00 67.2 USGS Minerals Yearbook 2000 Li2CO3 1.72 9.16 USGS Minerals Yearbook 2004 NaF 1.37 2.56 Chemical Marketing Reporter 267(12) (2005) NaCl 0.122 0.310 Kirk-Othmer Encyclopedia 2003 NaBF4 5.00 Kirk-Othmer Encyclopedia 1993 KF 4.54 6.74 Chemical Marketing Reporter 267(12) (2005) KCl 0.125 0.238 Chemical Marketing Reporter 267(12) (2005) KBF4 3.55 Kirk-Othmer Encyclopedia 1993 MgCl2 0.36 1.41 Chemical Marketing Reporter 267(12) (2005) Zr metal 30.80 30.80 USGS Minerals Yearbook 2000 ZrO2 8.89 11.89 USGS Minerals Yearbook 2000 98% ZrO2 ore (baddeleyite)
3.00 4.05 USGS Minerals Yearbook 2000
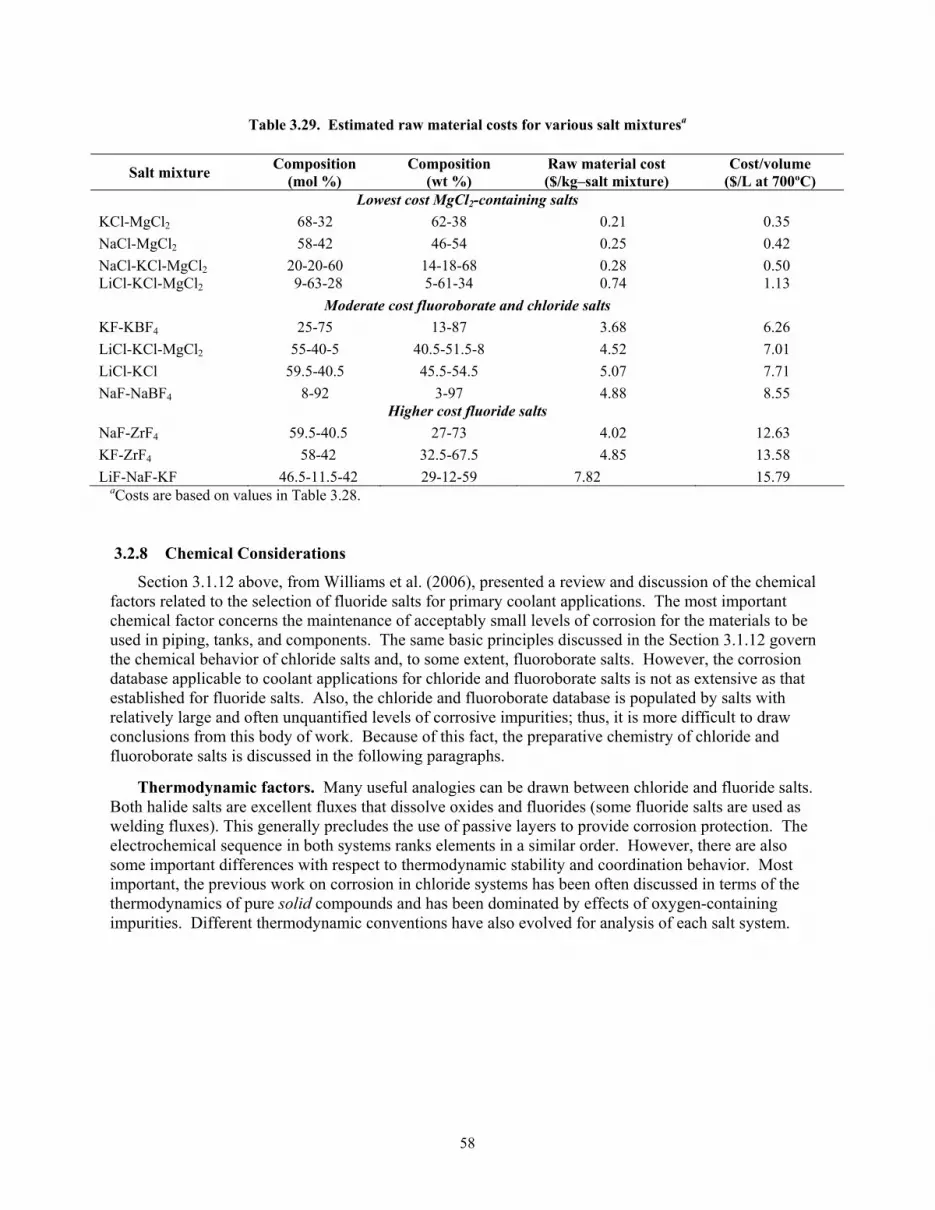
58
Table 3.29. Estimated raw material costs for various salt mixturesa
aCosts are based on values in Table 3.28.
3.2.8 Chemical Considerations
Section 3.1.12 above, from Williams et al. (2006), presented a review and discussion of the chemical factors related to the selection of fluoride salts for primary coolant applications. The most important chemical factor concerns the maintenance of acceptably small levels of corrosion for the materials to be used in piping, tanks, and components. The same basic principles discussed in the Section 3.1.12 govern the chemical behavior of chloride salts and, to some extent, fluoroborate salts. However, the corrosion database applicable to coolant applications for chloride and fluoroborate salts is not as extensive as that established for fluoride salts. Also, the chloride and fluoroborate database is populated by salts with relatively large and often unquantified levels of corrosive impurities; thus, it is more difficult to draw conclusions from this body of work. Because of this fact, the preparative chemistry of chloride and fluoroborate salts is discussed in the following paragraphs.
Thermodynamic factors. Many useful analogies can be drawn between chloride and fluoride salts. Both halide salts are excellent fluxes that dissolve oxides and fluorides (some fluoride salts are used as welding fluxes). This generally precludes the use of passive layers to provide corrosion protection. The electrochemical sequence in both systems ranks elements in a similar order. However, there are also some important differences with respect to thermodynamic stability and coordination behavior. Most important, the previous work on corrosion in chloride systems has been often discussed in terms of the thermodynamics of pure solid compounds and has been dominated by effects of oxygen-containing impurities. Different thermodynamic conventions have also evolved for analysis of each salt system.
Salt mixture Composition (mol %)
Composition (wt %)
Raw material cost ($/kg–salt mixture)
Cost/volume ($/L at 700ºC)
Lowest cost MgCl2-containing salts KCl-MgCl2 68-32 62-38 0.21 0.35 NaCl-MgCl2 58-42 46-54 0.25 0.42 NaCl-KCl-MgCl2 20-20-60 14-18-68 0.28 0.50 LiCl-KCl-MgCl2 9-63-28 5-61-34 0.74 1.13
Moderate cost fluoroborate and chloride salts KF-KBF4 25-75 13-87 3.68 6.26 LiCl-KCl-MgCl2 55-40-5 40.5-51.5-8 4.52 7.01 LiCl-KCl 59.5-40.5 45.5-54.5 5.07 7.71 NaF-NaBF4 8-92 3-97 4.88 8.55
Higher cost fluoride salts NaF-ZrF4 59.5-40.5 27-73 4.02 12.63 KF-ZrF4 58-42 32.5-67.5 4.85 13.58 LiF-NaF-KF 46.5-11.5-42 29-12-59 7.82 15.79

59
The most straightforward comparison can be made based upon the free-energy of formation of the salt constituents and the corresponding metal-halide products that result from corrosion of a container alloy. Table 3.30 indicates that there appears to be somewhat less inherent thermodynamic stability in the chloride system than in the fluoride system (i.e., the difference in free energy between salt fluorides and alloy fluorides is larger for the fluoride system than it is for chloride system).
Many additional factors will influence the corrosion of alloys in contact with salts, but it is useful to keep in mind that the fundamental thermodynamic driving force for corrosion appears to be slightly greater in chloride systems than it is in fluoride systems. This treatment ignores a number of important salt-solution effects, especially for salt mixtures that exhibit large deviations from ideal thermodynamic behavior. Additional study in the laboratory will be needed in order to understand whether chloride salts are fundamentally more corrosive toward alloys than fluorides are and whether corrosion control strategies can be devised that can be used with, or favor, chloride salt systems.
The fluoroborates under consideration are not conventional salt systems that share a common anion (i.e., chlorides, fluorides). Rather, they are reciprocal salt mixtures that contain identical alkali cations (Na+, K+, or Rb+) but a mixture of dissimilar anions (F− or BF4
−). The predominant anion in the fluoroborate eutectic mixture is the BF4− anion. The
BF4− anion has an ionic radius similar to that of I− and an electronic polarizability slightly higher than that
of Cl−. Phase diagrams of analogous systems with BF4− replaced by I− often have a similar character. It
has also been noted that the BF4− anion is similar in size and shape to the perchlorate ion (ClO4
−) and shares the property of not forming coordination compounds with transition metals. The solubility of alloy-metal halides (e.g., CrF3 or Na3CrF6) in fluoroborates is much smaller than in simple halide salt systems and displays a dramatic decrease with decreasing temperatures. This limited solubility (0.46, 0.046, and 0.01 mol % Na3CrF6 at 700, 500, and 385ºC, respectively) presented a potential problem in steam-cycle heat exchangers, because of the likelihood of deposition of corrosion products in the cold spot of the heat exchanger (and plugging the flow channel).
The interaction of trace amounts of oxides, air, or moisture (either in the salt or cover gas) with fluoroborates often controls alloy corrosion, but these chemical interactions are complex and are not completely understood. The hydrolysis of BF3 in the presence of any moisture in the cover gas above the salt is rapid and generates HF that is intensely corrosive to the system, especially when it is absorbed into molten salt. Some of the actual oxygen- and hydrogen-containing species that result from hydrolysis of BF3 in the salt have been identified. However, our understanding of this chemistry is not complete (McNeese 1974), and more work is needed before preparative chemistry and online purification requirements can be defined with confidence.
The behavior of hydrogen- and oxygen-containing species in fluoroborates is also important because it provides a means to sequester tritium in the salt, and thus an intermediate fluoroborate loop could serve as an effective tritium barrier. The species that is likely responsible for holding tritium in the salt was identified by Maya (1976), and an engineering-scale experimental program was conducted that proved the
Table 3.30. Comparison of free energies of constituents in chloride and fluoride systems
Free energy of formation of halide compound at 1000 Ka
(kcal/mol–halide-element) Cation species Fluoride Chloride
Coolant salt constituent Mg2+ — 124.0 Li+ 125 84.0 Na+ 112 81.6 K+ 109 87.4 Zr4+ 96.9
Corrosion-product halide constituent Cr2+ 75.2 71.4 Fe2+ 66.4 58.2 Ni2+ 55.3 49.9
aBased upon values in Plambeck 1967 and Baes 1970.

60
effectiveness of sodium fluoroborate in sequestering tritium (Mays 1977). Thermodynamic free energies that drive corrosion in the fluoroborate system were developed for the actual NaF-NaBF4 solvent system and are shown in Table 3.31.
Because of the potential for coherent metal borides to form on the surface of the container alloy, additional factors must be considered in the fluoroborate system. The oxidation of metal alloy constituent (usually chromium) during a redox-driven corrosion process must be accompanied by reduction of a salt constituent. It is possible to reduce B3+ in the fluoroborate salt to form a metal boride (e.g., CrxB or TiBx) or elemental boron. Boron deposits have been identified on the alloy surface during numerous corrosion tests. The analytical tests performed at the time did not uncover the chemical identity of the deposited boron. It has been suggested that if the deposited boron exists as a boride, it could possibly confer some corrosion resistance as a resistant surface layer. Borides are one of the few classes of ceramics that exhibit stability in the presence of fluoride salts and do not fall victim to a fluoride flux by dissolving into the salt. However, all tests with fluoroborate salts containing large amounts of impurity oxides and moisture have demonstrated intense corrosion and no evidence of passivation of the alloy surface in contact with fluoroborates.
Preparative chemistry. The first step in molten salt work is acquisition of raw components, which are then combined to produce a melt mixture that has the desired properties when melted. However, most suppliers of halide salts do not provide materials that can be used directly. To prevent severe corrosion of the container metal, major impurities must be removed in addition to moisture/oxide contaminants. Hydrofluorination has proven to be a very effective method for the removal of oxygen-containing impurities from fluoride salts. Removal of oxygen-containing impurities from chloride and fluoroborate salts is considerably more difficult because the fluoride ion more readily displaces oxygen from most compounds than does chloride ion and because borate and hydroxyborate impurities are difficult to remove by fluorination with HF.
Nearly all of the chloride salts prepared for corrosion studies have contained relatively high levels of oxygen-containing impurities. The typical salt preparation for these studies involved treatment of reagent chlorides by drying the solid salt under vacuum, followed by prolonged treatment with dry HCl gas, and finishing with an inert gas purge of HCl from the salt. This treatment is not effective in removing the last portion of bound oxygen from the salt. Depending on the salt composition, oxygen contents of up to a few percent may remain. A more effective method for removing oxygen is needed if the basic corrosion mechanism in pure chloride salts is to be investigated; otherwise, the effects of oxygen-containing species will dominate the apparent corrosion response. The use of carbochlorination has been recommended by Cherginets (2001) for removal of oxygen, and it has been claimed that salts with very low levels of oxygen content (~3ppm) can be produced by this method (Cherginets and Rebrova 1999).
A similar type of purification improvement is needed for fluoroborates. Previous treatments with HF and BF3 (to avoid loss of BF3 from the melt) were not as effective as desired. There is also a need for accurate analytical methods for determination of oxygen in melts, and in certain cases it is necessary to identify the oxygen-containing species (oxide type, hydroxyl, etc).
Table 3.31. Relevant free energies of constituents in the NaF-NaBF4 system
Free energy of formation of halide
compound at 1000 K (kcal/mol–halide element)
Cation species Fluoride/fluoroborate Coolant-salt constituent
Na+ (as NaBF4) 122 a Na+ (as NaF) 112
Corrosion-product constituent
Cr3+ (as Na3CrF6) ~100 Fe2+ (as NaFeF3) 84.3 Ni2+ (as NaNiF3) 78.9
a This value for formation was derived from the difference of free energy between NaBF4 and BF3.
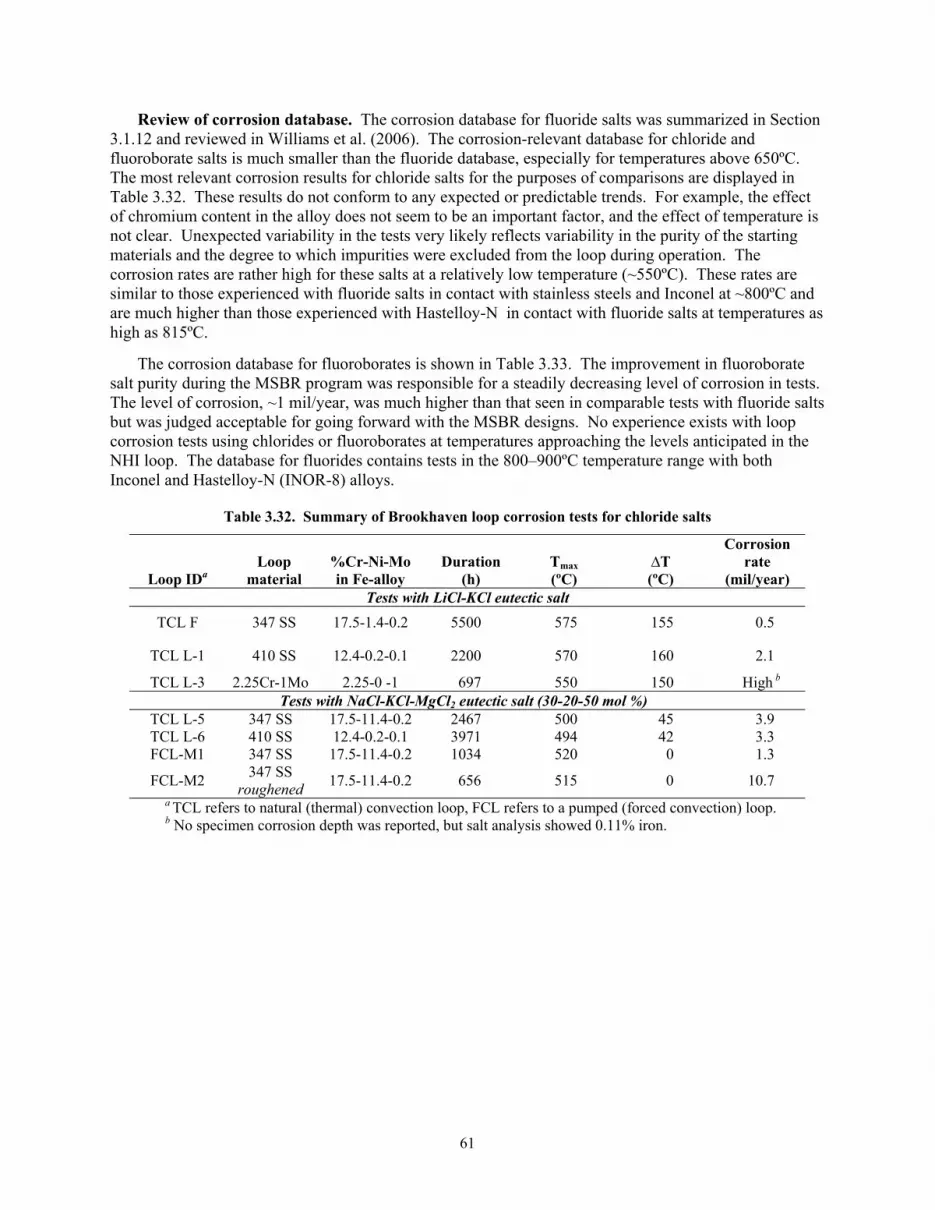
61
Review of corrosion database. The corrosion database for fluoride salts was summarized in Section 3.1.12 and reviewed in Williams et al. (2006). The corrosion-relevant database for chloride and fluoroborate salts is much smaller than the fluoride database, especially for temperatures above 650ºC. The most relevant corrosion results for chloride salts for the purposes of comparisons are displayed in Table 3.32. These results do not conform to any expected or predictable trends. For example, the effect of chromium content in the alloy does not seem to be an important factor, and the effect of temperature is not clear. Unexpected variability in the tests very likely reflects variability in the purity of the starting materials and the degree to which impurities were excluded from the loop during operation. The corrosion rates are rather high for these salts at a relatively low temperature (~550ºC). These rates are similar to those experienced with fluoride salts in contact with stainless steels and Inconel at ~800ºC and are much higher than those experienced with Hastelloy-N in contact with fluoride salts at temperatures as high as 815ºC.
The corrosion database for fluoroborates is shown in Table 3.33. The improvement in fluoroborate salt purity during the MSBR program was responsible for a steadily decreasing level of corrosion in tests. The level of corrosion, ~1 mil/year, was much higher than that seen in comparable tests with fluoride salts but was judged acceptable for going forward with the MSBR designs. No experience exists with loop corrosion tests using chlorides or fluoroborates at temperatures approaching the levels anticipated in the NHI loop. The database for fluorides contains tests in the 800–900ºC temperature range with both Inconel and Hastelloy-N (INOR-8) alloys.
Table 3.32. Summary of Brookhaven loop corrosion tests for chloride salts
Loop IDa Loop
material %Cr-Ni-Mo in Fe-alloy
Duration (h)
Tmax (ºC)
∆T (ºC)
Corrosion rate
(mil/year) Tests with LiCl-KCl eutectic salt
TCL F 347 SS 17.5-1.4-0.2 5500 575 155 0.5
TCL L-1 410 SS 12.4-0.2-0.1 2200 570 160 2.1
TCL L-3 2.25Cr-1Mo 2.25-0 -1 697 550 150 High b Tests with NaCl-KCl-MgCl2 eutectic salt (30-20-50 mol %)
TCL L-5 347 SS 17.5-11.4-0.2 2467 500 45 3.9 TCL L-6 410 SS 12.4-0.2-0.1 3971 494 42 3.3 FCL-M1 347 SS 17.5-11.4-0.2 1034 520 0 1.3
FCL-M2 347 SS roughened 17.5-11.4-0.2 656 515 0 10.7
a TCL refers to natural (thermal) convection loop, FCL refers to a pumped (forced convection) loop. b No specimen corrosion depth was reported, but salt analysis showed 0.11% iron.

62
Table 3.33. Summary of Hastelloy-N corrosion loops with NaF-NaBF4 eutectic salt
Loop IDa Duration (h)
Tmax (ºC)
∆T (ºC)
Corrosion rate
(mil/year) NCL 13A 30,627 607 125 0.66
NCL 14 39,202 607 150 0.55
NCL 17 24,865 607 100 1.0 NCL 20 19,928 688 250 1.0 FCL-1 17,000 621 167 1.2 FCL-2 5,300 621 167 0.94
aNCL refers to natural convection loop, FCL refers to a pumped (forced convection) loop. Source: Reference (Rosenthal 1972).
3.2.9 Heat-Transfer Loop Summary and Recommendations
The key finding of this report is that each class of salt—fluoride, fluoroborate, and chloride— possesses some feature that recommends it for consideration as the NGNP/NHI-loop heat-transfer fluid. However, certain factors are of overriding importance and permit us to rank candidates in an orderly fashion. Certain factors that are important (corrosion performance) remain to be determined.
With respect to basic viability as a heat-transfer-loop fluid, NaF-NaBF4 can be ruled out on the basis of a prohibitively high decomposition pressure of BF3. Both KF-KBF4 and RbF-RbBF4 have acceptable BF3 decomposition pressures at 900ºC but also have much poorer heat-transfer metrics. Even these heavy fluoroborate salts may prove to be impractical because of various nuisance factors described above.
With respect to turbulent-forced-convection heat-transfer performance, the FLiNaK eutectic (with a melting point of 454ºC) is clearly the best salt in Table 3.20. As a class of salts, fluorides tend to be the best heat-transfer fluids, followed by fluoroborates, and finally by chlorides. The other obvious fluoride salt choice, the KF-ZrF4 eutectic (melting point of 390ºC), has roughly the same heat-transfer performance as the KF-KBF4 eutectic (melting point of 460ºC). All chloride salts display poorer heat-transfer performance than fluorides (and most fluoroborates). There is not a great deal of difference in heat-transfer performance between the different chloride salt options.
With respect to raw materials cost, chloride salts that contain MgCl2 are by far the least expensive. All fluoroborates, fluorides, and lithium-containing salts have much larger raw material costs. This factor alone motivates additional work on chlorides if their inferior heat-transfer metrics do not exclude them from consideration.
There is a reasonable expectation (based upon prior experience) that careful alloy design and intelligent salt-chemistry control will permit a 900ºC peak temperature loop to operate with fluoride salts with a tolerable level of corrosion. Our experience with fluoroborates and chlorides at these temperatures is much more limited, and a large degree of uncertainty exists about whether 900ºC loop operation can be achieved with these salts. Such performance must be demonstrated.
The preceding observations lead to the following recommendations:
• The NGNP/NHI loop design study should exclude the previous choice of NaF-NaBF4 as a coolant option and replace this choice with (a) a chloride salt or (b) KF-KBF4.

63
• Because FLiNaK is clearly superior in heat transfer to all other salts in Table 3.20, there is little reason to consider other moderately expensive fluoride salts (e.g., KF-ZrF4), unless a lower melting point is required or a more economical option is identified.
• If a single salt had to be recommended for additional study, the ternary eutectic LiCl-KCl-MgCl2 (melting point of 402ºC, 9-63-28 mol %), appears to be the best compromise between raw material cost, performance, and melting point.
• There is a need to demonstrate and recommend an improved method for purification of chloride salts to be used in corrosion tests. This new method should become a purification standard to be used in conjunction with corrosion tests.
• High-temperature corrosion tests with properly purified chloride salts should be conducted to confirm the possibility of using chloride salts in the NGNP/NHI loop. These tests should include both batch exposures and loop tests and will probably also require the innovative use of redox buffers to minimize corrosion.
3.3 PRELIMINARY MOLTEN SALT PROPERTY TESTS
The ability to design and model the cooling of the LS-VHTR by computer requires knowledge of the properties of the salt. The density, latent heat of fusion, and melting temperature of two eutectic mixtures, FLiNaK (46.5 mol % LiF, 11.5 mol % NaF, and 42 mol % KF) and LiF-KF (50 mol % LiF and 50 mol % KF), and six different compositions of LiF-KF-ZrF4 were examined. The six different salt compositions of LiF-KF-ZrF4 were made by weighing, mixing, and melting different masses of the eutectic LiF-KF and pure ZrF4. These salts contained equal molar compositions of LiF-KF and were identified by the amount of ZrF4 that was in the mixture. The compositions of the salts that were made and examined are 25, 30, 35, 40, 45, and 50 mol % ZrF4.
3.3.1 Salt Preparation
Samples of FLiNaK salt already present at ORNL were used in this study. The LiF-KF and ZrF4 salts were obtained through Electrochemical Systems Inc. located in Oak Ridge, TN. The FLiNaK and LiF-KF salts were purified by hydro-fluorination of commercially obtained raw salts. The hydro-fluorination is done to remove the anion and metal impurities. The ZrF4 salt was purified by using multi-stage sublimation. Different compositions of LiF-KF-ZrF4 salts were made by mixing different masses of the solid LiF-KF with solid ZrF4 salts of each constituent inside a glassy carbon cylinder. The salts were then melted with a clam-shell heater, mixed, and cooled. The salt was then removed from the bottom of the glassy carbon cylinder. The masses of the constituents and the resulting composition of the mixed salt are listed in Table 3.34. All of this work was done in an inert-dry box.
Table 3.34. Masses of the constituents and the resulting composition of the mixed salt
The mass of each sample is known within 0.001 g
Sample mLiF-KF (g)
mZrF4 (g) mol %
25% ZrF4 0.8832 1.1711 24.99 ± 0.01 30% ZrF4 0.6832 1.1734 30.14 ± 0.01 35% ZrF4 0.6603 1.4123 34.96 ± 0.02 40% ZrF4 0.5594 1.4928 40.14 ± 0.03 45% ZrF4 0.4730 1.5301 44.84 ± 0.04 50% ZrF4 0.4028 1.5923 49.83 ± 0.05

64
3.3.2 Density Measurements
A Quanta-Chrome Ultra-Pycnometer 1000 was used to measure the solid density of the FLiNaK, LiF-KF, and the salt mixtures of 25, 30, 35, 40, 45, and 50 mol % ZrF4 salts. The Pycnometer was turned on and left running overnight to allow the system to thermally equilibrate. The following morning the system was calibrated using one of the small calibration spheres, V = 7.0699 cm3, using the small sample holder and small cell with the lid. The samples were then placed in the cell and allowed to sit for thirty minutes before the density run was started. This time allowed the salt and the cell to thermally equilibrate.
A general correlation that can be used to estimate the density of an alloyed material is as follows (Callister 2000):
4
44
44
ZrF
ZrFZrF
KFLiF
KFLiFKFLiF
ZrFZrFKFLiFKFLiFmix ACAC
ACAC
ρρ
ρ+
+=
−
−−
−− (3.20)
Equation (3.20) assumes that the total volume of the mixture is equal to the sum of individual volumes of the salts.
Twenty density measurements were taken in succession and averaged to obtain the density of the salt, see Table 3.35. The temperature of the pycnometer did vary over the course of the day, most likely due to the change in the ambient conditions outside the glove-box. The value of the temperature in Table 3.35 is the temperature at the last of the twenty runs. The zirconium salts had only been molten once before the density measurements, during the making of the salt mixture.
Table 3.35. The solid density of the different salt mixtures increases as the mol % of ZrF4 increases except at 45 mol % ZrF4
Name Date T m (g)
Measured density (g/cm3)
Predicted density Eq (3.21)
FLiNaK 07-27-2006 25.9 1.7259 2.56 ± 0.01 LiF-KF 07-27-2006 26.3 4.6305 2.56 ± 0.01 25% ZrF4 07-27-2006 26.9 1.913 3.01 ± 0.01 3.08 30% ZrF4 07-27-2006 28.1 1.7376 3.14 ± 0.01 3.18 35% ZrF4 07-28-2006 27 1.9872 3.24 ± 0.01 3.27 40% ZrF4 07-28-2006 26 1.9669 3.65 ± 0.01 3.37 45 % ZrF4 07-31-2006 26.2 1.729 3.89 ± 0.18 3.47 50% ZrF4 07-31-2006 26.6 1.8008 3.78 ± 0.05 3.56 ZrF4 (Lewis 2003)
na na na 4.43 ± 0.01
45% ZrF4* 07-31-2006 28.2 1.7006 3.81 ± 0.09 3.47 *This second run was to check the value obtained for the salt from the first run.
Equation (3.21) predicts the density of the salt mixtures to within 2.5% for salt mixtures below 35%
ZrF4. The sharp change in the solid density of the LiF-KF-ZrF4 between 35 and 40 mol % ZrF4, shows that a change in the ionic structure of the salt occurs in that region. The LiF-KF-ZrF4 salt at 40 mol %, is probably coordinating with multiple KF or LiF. The formation of these salts would then change the ionic lattice and density of the mixture.
After examining these results, the density of 45% ZrF4 was rerun to verify the results. This was done since the values were the furthest from the simple correlation of Equation 21. The data for the second set

65
of twenty runs is also listed (last) in Table 3.35. The density measurement decreased in the second run but still was the furthest from the result predicted by Equation 21.
It should be noted that the pycnometer was located in the glove box. Slight variations in the pressure in the glove box during a measurement would cause a large variation in the density measurement. Extra care was taken to avoid working in the glove box while the density measurements were run. However, the data for the 45 and 50% ZrF4 both contain some outliers that influence the standard deviation of the runs.
It is desired to use the solid densities to develop a relationship to estimate the volume change on melting. The melting point and the liquid densities at the melting point are well known. With the measurement of the solid densities and a correlation for the volumetric expansion of the solid salt, the volume change can be predicted, as shown in Fig. 3.16 for FLiNaK.
0.00036
0.00038
0.0004
0.00042
0.00044
0.00046
0.00048
0.0005
0 100 200 300 400 500 600 700
Temperature (C)
Spec
ific
Volu
me
(kg/
m3 )
SolidLiquidMeltingCorrelation for solid density
Volume expansion
Liquid density
Fig. 3.16. FLiNaK volumetric expansion. Figure 3.16 was created by using the solid density measurement of
FLiNaK, the liquid density, and the assumption of an approximate 10 % volume change at the melting temperature (Umesaki & Iwamoto 1981).
3.3.3 Melting Point and Heat of Fusion Measurements
A TA Q-10 Differential Scanning Calorimeter (DSC) was used to determine the melting point and heat of fusion for the eight different salt mixtures: FLiNaK, LiF-KF, and the 25–50% ZrF4 salt mixtures. Graphite capsules were used as the reference and sample holder. The graphite capsules were then placed on top of an Au lid that was inverted to protect the DSC sensor. This was done in case the graphite capsule cracked, the salt would fuse the graphite capsule to the Au lid instead of the DSC sensor. The graphite did crack once without the protection of the Au lid. The salt and the graphite had to be manually removed from the sensor. The graphite also broke once when the capsule was reused to run the LiF-KF sample following the FLiNaK test runs.

66
Fluoride salts are hygroscopic and readily absorb moisture from air. To minimize possible water contamination, each salt sample was weighed in an inert-dry box. The weighed salt was then placed into a glass jar and the lid attached and left in the antechamber until the capsules were ready to be loaded. The glass jar containing the salt was then removed from the antechamber and taken to the DSC. At the DSC, the jar was opened and the salt was placed in the graphite capsule, the lid placed on, and the sensor closed. An ultra-high purity nitrogen sweep of 50 ml/min was recommended by the manufactures and used in the experiments to keep an inert environment in the DSC chamber. There was evidently still some oxygen and water in the chamber that was determined by the oxidation of copper and graphite capsules. The total time that the salt was exposed to the air outside of the DSC chamber was less than 1 min.
The empty graphite capsules were baked out using the DSC up to 700°C until the signal was repeatable. The baseline for the capsules was then measured using a ramp rate of 10°C/min. Cell calibration for temperature and heat of fusion calculations was obtained by melting a piece of Zn through the melting point in the capsule. The Zn was removed and the salt was placed in the capsule and scanned in the heating mode of 10°C/min. The nitrogen purge flow rate was kept at 50 ml/min. The nitrogen either contained a small amount of oxygen or the lids to the sensor chamber allowed enough oxygen in that oxidation of the sample holders occurred.
The salt samples were run in the following order: FLiNaK, LiF-KF, 25% ZrF4, 30% ZrF4, 35% ZrF4, 40% ZrF4, 45% ZrF4, and 50% ZrF4. The FLiNaK, LiF-KF, and 25% ZrF4 all were scanned in the heating mode and allowed to cool as fast as possible. These scans were all run in only the heating mode. The two eutectic mixtures, FLiNaK and LiF-KF, only contained a melting peak. The 25% ZrF4 contained a peak at 264°C in addition to the melting peak. The shape and the intensity of the 264°C peak changed based upon the amount of time that the capsule was below the peak temperature. From this result, it was decided to control the cooling rate of the capsules for the rest of the tests to be able to determine the kinetics of crystallization of the Zr4F salts. The rest of the curves were heated at rates of 5 or 10°C/min and cooled at rates of 5, 10, 15, 20, and (or) 30°C/min.
The initial melting curves of the 30–50 mol % ZrF4 salts showed multiple peaks and transitions that showed characteristics of a glass structure, specifically devitrification peaks were evident in the melt (see Fig. 3.17).
-20
-15
-10
-5
0
175 225 275 325 375 425 475 525 575 625
Temperature (C)
Hea
t Flo
w (m
W)
Fig. 3.17. The initial melt of the sample for the 35% ZrF4 shows a phase transition at 250°C and a
devitrification at 310°C.
After 5–6 runs, the number of peaks as reduced to one or two peaks in the DSC and would remain
constant. The peak and melting temperatures for all the samples are listed in Table 3.36. It should be noted that the 25 mol % ZrF4 peak did not shift over the course of the DSC runs.

67
Table 3.36. The melting and peak temperatures for the salt samples show an initial increase in melting temperature
Sample Tpk (°C)
Tpk (°C)
ORNL measurement Tm,exp (°C)
Published value Tm,lit (°C)
FLiNaK – 470 ± 2 457.6 ± 0.7 454 LiF-KF 496.6 ± 0.5 487.7 ± 0.3 492 25% ZrF4 271 ± 12 530.5 ± 0.5 526 ± 2 - 30% ZrF4 297 ± 8 522 ± 12 508 ± 17 35% ZrF4 290.0 ± 0.1 536.8 ± 5 530.3 ± 1.2 40% ZrF4 288.9 ± 1.9 534 ± 0.5 531.2 ± 0.2 45 % ZrF4 487.6 ± 0.8 485.5 ± 1.2 50% ZrF4 489.3 ± 1.4 483.4 ± 0.4
The values that were obtained for the 45 and 50% ZrF4 samples are suspect. When the DSC was
opened to remove the graphite capsule, the graphite capsule was white with ZrF4 that had recrystallized from the vapor phase. The area under the peak that was assumed to be the melting point, for each successive run increased. It is assumed that the peak that was measured is the LiF-KF peak that is left over after the ZrF4 leaves the system due to a significant vapor pressure. The maximum temperature for the DSC runs was limited to 650 and 600°C for the 45 and 50% runs, respectively. Figure 3.18 shows the view of the capsule after the DSC was opened.
Fig. 3.18. The sample capsule for the 45% ZrF4 salt was covered with ZrF4 that had recrystallized onto
the surface of the capsule.
The LiF-KF-ZrF4 phase diagram has not been examined previously. Using the melting temperatures
of the different salt compositions listed in Table 3.36, an approximate phase diagram for the salt mixture LiF-KF-ZrF4 can be determined. The phase diagram was pieced together by looking at trends in the binary phase diagrams: LiF-ZrF4, KF-ZrF4, NaF-ZrF4, and LiF-KF, and the ternary diagrams: LiF-NaF-ZrF4, KF-NaF-ZrF4, LiF-NaF-ZrF4, and LiF-KF-UF4 (AEC 1964). It was assumed that small additions of composition would not significantly alter the region close to the binary phase line. The temperature data from the DSC runs was added and a rough sketch of the expected phase diagram is shown in Fig. 3.19.
Reference Capsule
Sample Capsule covered in ZrF4

68
Fig. 3.19. A rough boundary for the ternary phase diagram LiF-KF-ZrF4. The KF-ZrF4, KF-LiF, and LiF-
ZrF4 edges came from ternary diagrams for NaF-KF-ZrF4, NaF-LiF-ZrF4, and LiF-KF-UF4 ternary diagrams, respectively.
In looking at and comparing the phase diagrams, the replacement of sodium by potassium in the UF4
ternary diagrams had the tendency to shift the ternary eutectic points closer to the potassium side of the diagram.
The heat of fusion for FLiNaK and LiF-KF was obtained and compared to previously cited values, Table 3.37. The heat of fusion was measured for each of these salts. The values of the heat of fusion for the peaks listed in Table 3.36 for the zirconium-based salts vary significantly and more work needs to be done.
Table 3.37. The latent heat of fusion for the two eutectic mixtures, FLiNaK and LiF-KF, show a slight decrease over published values
Sample ORNL measurement Δhf,exp (J/g)
Published value Δhf.lit (J/g)
FLiNaK 387 ± 9 403 (Rogers et al. 1982), 397 LiF-KF 377 ± 3 389
The values for the FLiNaK salt were taken over two periods. That is, five runs were completed on the
20th of July. The salt was removed from the DSC and then placed in the antechamber overnight. The

69
sample was then removed on the 21st of July and three more runs were completed. The value for the heat of fusion increased from an average of 384.1 ± 1.1 J/g, on the 20th, to 393.0 ± 1.2 J/g on the 21st. The increase in the heat of fusion is most likely due to an increase in impurities of the salt as it was transferred and stored. A further increase in contaminates could cause the heat of fusion to increase until it closely matches the literature values. No significant change in the melting temperature is seen, but there is a shift (2 K increase) in the peak temperature. It is, therefore, assumed that pure FLiNaK and LiF-KF salt eutectics may have a smaller heat of fusion than these salts that contain some anion impurities.
Oxygen contamination in the flow of the nitrogen purge was sufficient to cause oxidation of the copper and graphite sample holders. The weight changes were noticed after runs in which the sample chamber exceeded 600°C. The change in weight data for several successive runs is listed in Table 3.38. The visual appearance of the capsules changed over the course of successive runs. The copper sample holders lost their shine except for the bottom of the pan that would sit on the sensor. The graphite sample holder surface structures had also changed. The graphite would appear fuzzy and black, compared to the shiny gray of new capsules.
Table 3.38. The change in mass in successive runs for copper and carbon (Tmax = 700°C, ramp rate of 20°/min, and sample/reference)
Copper sample holder Graphite sample holder Run m (g) Δm (g) m (g) Δm (g) 0 0.0422/0.0422 0.0227/0.0225 1 0.0422/0.0422 0.0000 0.0226/0.0224 0.0001/0.0001 2 0.0426/0.0427 0.0004/0.0005 0.0224/0.0224 0.0002/0.0001 3 0.0429 0.0003 0.0224/0.0224 0.0000\/0.0000 4 na na 0.0223/0.0224 0.0001/0.0000 5 na na 0.0222/0.0223 0.0001/0.0001 6 (10°/min) na na 0.0220/0.0223 0.0002/0.0000
The oxidation of the graphite is not too rapid, but extended high temperature use should be avoided.
The weight change of the graphite specimens occur mostly above temperatures of 600°C. The oxidation of the sample holders is significant because zirconium has a high affinity for oxygen. That is, if oxygen is present in the system, it will preferentially react with the zirconium. The reaction of zirconium with oxygen could explain why successive DSC runs change shape and peak locations.
In summary, the DSC scans of the eutectic salts, FLiNaK and LiF-KF, showed good agreement with literature values for melting temperature and heat of fusion. There was a slight change in the heat of fusion measurements in FLiNaK from successive days. This increase in heat of fusion measurements could be due to an increase in impurities. The measurements of the LiF-KF-ZrF4 salt mixtures are uncertain due to the likelihood of oxygen contamination of the zirconium. It was also found that the vapor pressure of ZrF4 at 650 and 600°C for 45 and 50 mol % ZrF4 salts was significant enough to cause the graphite capsule to be coated with ZrF4 crystals. Both oxygen contamination and ZrF4 evaporation could be reduced with a better seal on the capsules. The oxidation problem could be solved by making runs in an inert-gas glovebox.

70

71
4. NEW BASELINE DESIGN
This section describes the new baseline primary system design for the LS-VHTR—including the decay heat removal system. The new decay heat removal system and associated system design is based on a design developed at the University of California at Berkeley (UCB), called the Advanced High Temperature Reactor with Metallic Internals (AHTR-MI). This design became the baseline for the LS-VHTR project during FY-06 and differs significantly from earlier LS-VHTR designs because it uses a closed primary loop immersed in a tank containing a separate buffer salt. Figure 4.1 provides a flow diagram. This approach provides several potential advantages, in particular by limiting the number of primary loop components exposed to the core outlet temperature under normal operation, transients, and accidents, and thus allowing the use of metallic reactor vessel internals. Also, the loop configuration minimizes the amount of primary coolant (Table 4.1) and thereby allows the use of more expensive salt options for the primary system, particularly enriched Li salts. In addition, the large amount of buffer salt in the outer tank results in very small temperature rises during any design basis accident.
The AHTR-MI design allows the selection of a range of core outlet temperatures. The lower end of the temperature range allows efficient electricity generation while using materials that are already ASME code qualified for all components. Normally materials testing and qualification requirements set the critical path for the development of innovative reactors. The AHTR-MI provides an opportunity to bypass this issue by selecting sufficiently low operating temperatures for the prototype plant to allow the use materials that are already ASME code qualified and by providing a clear upgrade path to achieve higher core outlet temperatures. This strategy allows early commercialization for electricity production and subsequent upgrade for production of hydrogen.
Clean liquid fluoride salts have a number of highly positive attributes for high-temperature heat transfer: high volumetric heat capacity compared to gases and sodium, high Prandtl numbers that mitigate thermal shock phenomena, transparency similar to water and gases that enables optical in-service
Intermediatesalt (4 loops)
IHXmodules
line
Buffersalt
Primarypumps w/seal bowls(4 loops)DRACS
(8 loops)
Refueling/control-
drivechannel
Buffer saltpool
Equilizing
PHXmodules
with fluidicdiodes
Core
Bypass
Fig. 4.1. Schematic view of the flow distribution in the
AHTR-MI.
Table 4.1. Mass and thermal capacity (at 655°C) of AHTR-MI materials
Mass (MT)
Thermal capacity(GJ/°C)
Graphite/fuel 920 1.6
Metal: reactor vessel, HX’s, pumps
720 0.3 Primary loop Primary salt:
NaF/BeF2 190 0.4
Buffer tank
Buffer salt: NaF/NaBF4
2500 3.8

72
inspection, very low-vapor pressures, and very low corrosion rates with graphite and high-nickel alloys using appropriate chemistry control. Traditionally, the major disadvantages of liquid salts have been their high freezing temperatures (~350 to 500°C) that resulted in highly complex steam-generator designs and their potential corrosiveness when used as solvents for molten salt fuels. The AHTR bypasses the freezing issue by using a high-temperature, closed gas Brayton cycle for power conversion or producing hydrogen, and it bypasses molten-salt fuel corrosion by using solid fuel.
As with high temperature gas-cooled reactors (HTGRs), the coated-particle fuel in the AHTR-MI has large thermal inertia, but the AHTR-MI also derives large, additional thermal inertia due to the high volumetric heat capacity of the primary and buffer salts and due to effective natural-circulation heat transfer from the primary salt to a larger mass of buffer salt in a large buffer-salt tank. Effective natural circulation also allows the AHTR-MI to use a cylindrical core geometry and higher power density (10.2 MW/m3), compared to the annular core geometry required for passively-cooled HTGRs (6.6 MW/m3). This results in a very large increase in power output, as shown by the scaled comparison in Fig. 4.2 contrasting the 600-MW(t) GT-MHR reactor vessel and the 2400-MW(t) AHTR.
Figures 4.3 and 4.4 show elevation and plan views of the AHTR-MI. Our current baseline design of the AHTR-MI adopts the control and safety rod design used in the Fort St. Vrain reactor and GT-MHR, using a cable-drive mechanism to raise and lower strings of control elements into holes in fuel and reflector blocks column, as well as the Fort St. Vrain reserve shutdown and in-core flux mapping systems. Alternative designs can use pebble fuels or stringer fuels and involve different designs for refueling systems and neutron control.
Refueling of the prismatic-fueled AHTR-MI is performed using the same general approach as was developed and demonstrated for the Fort St. Vrain reactor, using a refueling machine with a grappling mechanism to move fuel elements to and from a fuel transfer machine. Fort St. Vrain had a total of 1554 fuel blocks, while designs for larger 3000 MW(t) HTGRs had 3994 fuel blocks compared to 2600 fuel blocks for the AHTR-MI. The prismatic-fueled AHTR-MI design includes a fuel transfer channel, shown in Fig. 4.3, which allows more rapid fuel movement than is possible with the transfer cask systems used for HTGRs.
Inner reflector (GT-MHR only)
AHTR-MI2400 MW(t)
GT-MHR600 MW(t)
31.0 m
Outer reflector
Fuel
19.5 m
Fig. 4.2. Scaled comparison of the 600 MW(t) GT-MHR
reactor and the 2400 MW(t) AHTR-MI.

73
To perform refueling, the reactor cover is unlatched and raised, the same approach as was used for refueling the EBR-II. The control-rod guide tubes remain stationary. As with Fort St. Vrain and the GT-MHR, the core is then refueled in sectors, with control-rod assemblies first being removed from the sector into storage casks and placed in storage wells in the refueling floor. The total primary salt inventory is sufficient to keep the fuel covered.
For normal power operation with forced cooling, the AHTR-MI primary loop operates in forced circulation, transferring heat to four intermediate liquid salt loops using modular, compact intermediate heat exchangers (IHX) located in the buffer salt tank. Upstream of the IHX modules are the four primary pumps, which take suction from the core outlet plenum at near atmospheric pressure.
Fig. 4.3. Elevation view of the AHTR-MI for normal operation (left) and refueling (right) modes.

74
Under loss of forced primary loop circulation, continued heat removal by the IHX modules creates buoyancy forces that drive a natural circulation flow of 1% to 2% of normal primary-loop flow. Reduced heat transfer in the reactor core due to flow laminarization causes the core temperatures to rise and thus to stop fission even if a reactor scram does not occur. When forced circulation stops, heat rejection then occurs to the buffer salt, through Pool Reactor Auxiliary Cooling System (PRACS) heat exchangers. As shown in Fig. 4.1, these PRACS loops include a fluidic diode, which reduces leakage flows under primary loop forced circulation. Fluidic diodes are simple, passive devices that provide large flow resistance in one direction and have been used in the British Advanced Gas Reactors. The simplest fluidic diode devices generate an irreversible loss of kinetic energy by creating a strong vortex flow in one direction, while flow in the opposite direction does not have this effect.
The PRACS heat exchanger (PHX) area is sized to match decay heat generation approximately 1 to 2 hours after loss of forced cooling and circulation occurs. Heat removal from the buffer salt to the environment mostly occurs through Direct Reactor Auxiliary Cooling System (DRACS) heat exchangers (DHX), with some heat removal also occurring through the reactor cavity cooling system. The DRACS heat removal systems are sized to match decay heat generation approximately 12 to 48 h after loss of forced cooling and forced circulation occurs.
Design experience with DRACS heat removal systems exists for both the Experimental Breeder Reactor II (EBR-II) and the European Fast Reactor (EFR). Conversely, the S-PRISM sodium fast reactor uses a Reactor Vessel Auxiliary Cooling System (RVACS) for decay heat removal. The AHTR-MI has selected the modular PRACS/DRACS decay heat removal system, rather than an integrated RVACS, because it allows the decay heat removal capacity to be scaled independent of the reactor vessel size. This allows a single design to be used over a wide range of power levels, including reactors with very high power output. This approach also reduces the distortion in the design of reduced area Integral Effects Test (IET) experiments for the AHTR-MI, which will be required for reactor licensing. Decay heat system performance can be tested by testing modules rather than scaled-down experiments to determine reactor vessel behavior under transient accident conditions as is required for RVACS.
Previous design studies for the AHTR have shown highly effective natural circulation heat transfer that results in relatively small temperature differences between hot and cold locations, around ~50°C. Simple calculations which treat the primary loop and the buffer salt as two interconnected lumped masses have provided a first-order estimate for the transient response that follows loss of forced cooling (LOFC). Table 4.1 shows the total masses and thermal capacities of the primary loop and buffer salt. Figure 4.5 shows the resulting temperature histories, for the case where the PHX modules (Fig. 4.4) are sized with a peak capacity of 25 MW(t), and the DHX modules have a peak capacity of 15 MW(t). The effects of the extremely large thermal capacity provided by the graphite in the primary loop and by the buffer salt are readily seen, with the average temperature of the core rising less the 40°C above the initial average value
Fig. 4.4. Plan view of the AHTR-MI operating deck.

75
of Tc = 655°C during the transient. The very mild thermal response of the AHTR-MI has been verified also with more detailed analysis, as discussed further in Chapter 6.
Sodium fluoroborate salt was selected as the buffer salt and DRACS salt, due to its low cost (it is a commonly used industrial chemical) and low density, resulting in acceptable buoyancy forces on the reactor vessel. The boron provides an intrinsic mechanism to shut down the reactor if a primary pipe break occurs. The relatively high vapor pressure of NaBF4 is acceptable because the buffer salt operates at relatively low temperatures, and there are no areas in the gas space above the buffer salt where deposits from vapor condensation would create problems. Flinak was selected as the intermediate salt, due to its low cost, low toxicity, high boiling temperature, and excellent heat transfer properties.
4.1 DESIGN FEATURES
The AHTR-MI introduces several new design features that differentiate it from earlier AHTR designs. Specifically, the AHTR-MI:
1. Separates the primary loop salt from a larger mass of buffer salt in a buffer salt tank, allowing different, optimal salt compositions to be used for the primary, buffer, and intermediate salt applications. Under this revised design, forced and natural circulation operation in the AHTR-MI more closely matches that in pressurized water reactors (PWRs) than pool-type sodium fast reactors (SFR) such as S-PRISM.
2. Uses metallic construction for the primary loop boundary, pumps, IHX and buffer salt tank. All metallic components, except the primary pumps and IHX, operate at or below the reactor core inlet temperature under normal operation. Under a LOFC, only the primary pumps, IHX, PHX heat exchangers, and reactor cover operate at the core outlet temperature, while the other primary loop structures remain close to the buffer-salt temperature.
Fig. 4.5. Lumped-mass transient temperature response of the 2400 MW(t) AHTR-MI to LOFC.

76
3. Uses a seismically base-isolated reactor building and a water-cooled, refractory lined reinforced concrete reactor cavity with a flat-bottomed, un-insulated tank to contain the buffer salt. The water-cooled reactor cavity liner eliminates the requirement for a guard vessel while minimizing the free volume between the tank and cavity walls. Under a beyond-design-basis accident with rupture of the buffer salt tank, the cavity cooling system provides ultimate heat removal.
4. Has the capability to operate at conservatively low temperatures for electricity production and thus allow the use of existing ASME-code qualified materials for all components. An upgrade path then exists to increase the core outlet temperature for hydrogen production using advanced IHX, primary pump, and PHX materials while continuing to use conventional materials for other components.
5. Uses compact, metallic Heatric-type IHX modules located in the reactor tank to reduce the primary salt volume, hot and cold leg lengths, and radiation shielding requirements.
6. Uses a combination of PHX and DHX heat exchangers to provide modularity for decay heat removal following loss of forced cooling, allowing the AHTR’s thermal power to be scaled independently from the reactor vessel size (as is required for DRACS) and greatly simplifying the design of integral effects test (IET) facilities.
4.2 CORE, PRIMARY VESSEL, AND BUFFER SALT TANK
The current AHTR-MI design uses nearly conventional prismatic fuel elements; the core configuration is shown in Fig. 4.6. (However, other fuel configurations including stringer and pebble bed configurations are also being assessed.) The configuration of startup and operating control rods, and reserve shutdown channels, closely approximates that of the Fort St. Vrain reactor, which had a similar cylindrical core.
The AHTR-MI design uses a closed primary loop with compact intermediate heat exchangers, which minimize the inventory of primary salt. With a closed primary loop, the design requirements for the AHTR-MI closely overlap those of the Molten Salt Breeder Reactor (MSBR) design developed at ORNL in the 1970s. This allows the AHTR-MI reactor vessel to take advantage of large investments made in the design of the MSBR, shown in an elevation view in Fig. 4.7.
Fig. 4.6. AHTR-MI core design has 325 fuel columns with
eight layers (10.2 MW/m3). Control rod, reserve shutdown channel, and fuel handing port locations also shown.

77
Fig. 4.7. Elevation view of the MSBR reactor vessel and reflector and
moderator elements.
The MSBR reactor vessel and graphite reflector system were designed to minimize the total inventory of fuel salt flowing through the graphite moderator blocks. The AHTR-MI primary loop has similar design requirements, although the square moderator blocks of the MSBR are replaced by prismatic block fuel assemblies, or stringer fuels, or pebble fuels. Because the AHTR-MI immerses the reactor vessel in a buffer salt tank, the large mass of buffer salt provides effective heat transfer to maintain the reactor vessel at a uniform temperature.
The 2250-MW(t) MSBR reactor vessel, shown in Fig. 4.7, was 6.7 m (22 ft) in diameter and 6.1 m (20 ft) high, and was designed for an internal pressure of 5.1 atm (75 psig). It had 5-cm-thick walls and 7.5-cm-thick dished heads at the top and bottom. Fuel salt entered at 566°C (1050°F) through four 0.40-m (16-in) diameter nozzles through a lower plenum and upward through passages in graphite moderator blocks, to exit at the top at 704°C (1300°F) through four equally spaced nozzles which connected to 0.51-m (20-in) suction nozzles leading to circulation pumps.
The 2400-MW(t) AHTR-MI vessel is larger than the MSBR with the current design (Figs. 4.3 and 4.4) having a diameter of 9.0 m and a height of 11 m vs 6.7 m and 6.1 m respectively for the 2250-MW(t) MSBR.
The initial design of the AHTR used the S-PRISM reactor vessel design. The S-PRISM uses a seismically isolated, 9-m-diam, 20-m-high pool-type reactor vessel and guard vessel that hung suspended in the reactor cavity. However, for the AHTR there is a need to go to higher normal and peak vessel temperatures, and the buffer salt is about 3 to 4 times denser than sodium, leading to the need for much thicker vessel walls and difficulty with fabrication using the S-PRISM approach.

78
The reference design of the AHTR-MI uses a seismically base-isolated reactor building, with a reactor cavity that holds a flat-bottomed buffer salt tank. The reactor cavity is steel lined and has an active water cooling system using embedded tubes below the liner, using the same design approach for cooling the liner as has been used in reinforced concrete HTGR vessels like FSV. The liner incorporates an internal drip collection system as is used in the HTGRs to detect any condensation or collection of moisture. If the buffer salt tank ruptures, boiling of water in the cavity cooling system continues to remove heat from the liner and provides the ultimate heat removal method. If the cavity cooling system fails, heat removal continues by conduction into the thermal mass provided by reactor building. If the cavity liner fails, leakage through the concrete is restricted by the high freezing temperature of the buffer salt.
During normal operation, the cavity cooling system removes a modest fraction of heat from the buffer salt tank. The cavity is lined with refractory insulating blocks on its bottom and sides (possibly low-thermal conductivity graphite) to control this heat removal rate, and thus, the tank is largely isothermal, reducing thermal stresses. Modular DRACS loops provide the primary mechanism for decay heat removal from the buffer salt. Heat rejection by these loops and the cavity cooling system always maintains the buffer salt at a temperature below the temperature of the primary loop. Under normal operation the temperature of the buffer salt tank can be maintained modestly above the salt freezing temperature to increase the thermal inertia available from the buffer salt and to reduce thermal creep of the buffer salt tank and primary loop components that contact the buffer salt.
For the baseline design, the vessel is a 14.8-m-diam, 13.5-m-high flat-bottomed tank. These dimensions can be compared to the 21-m-diam, 17-m-high reactor vessel of the French Superphenix reactor. Construction may be from a high-temperature alloy like Alloy 800H with a corrosion-resistant cladding on the inside. At the center of the tank bottom, there is a pin that aligns the tank to be centered in the cavity. The tank rests on the refractory blocks lining bottom of the cavity. The pin at the center of the tank bottom accommodates radial thermal expansion the tank by allowing it to slide on the surface of the blocks. All gravity loads from the tank, primary salt, and reactor internals are then transferred through the tank bottom and insulating blocks to the bottom of the cavity.
The tank walls do not carry vertical gravity load, as in the S-PRISM. Instead, the tank walls primarily carry hoop stresses associated with the hydrostatic head of the liquid-salt pool. This reduces the stresses in the tank wall by 33 to 50%, compared to the S-PRISM vessel design, partially mitigating the higher hydrodynamic pressures of the buffer salt.
While the reactor cavity will be largely isothermal, there will likely be some vertical temperature gradients in the tank due to thermal stratification in the liquid salt pool. To strengthen the tank against hoop stresses the tank design may incorporate external circumferential stiffening rings. These help to increase the tank strength for hoop stresses, while minimizing thermal stress generation due to vertical temperature gradients in the tank wall.
The reactor building will be seismically base isolated, which will reduce horizontal seismic loads. Horizontal loads for reactor internals may be transferred through the center pin at the bottom of the tank and potentially transferred by snubbers located inside the tank as well, through the tank wall to snubbers attached to the cavity wall.
Wave motion induced at the pool surface due to seismic forces complicates the dynamic response of the tank. Baffling that would transfer horizontal forces more uniformly through the liquid may be useful to reduce tank sloshing effects and to increase the sloshing resonant frequency.
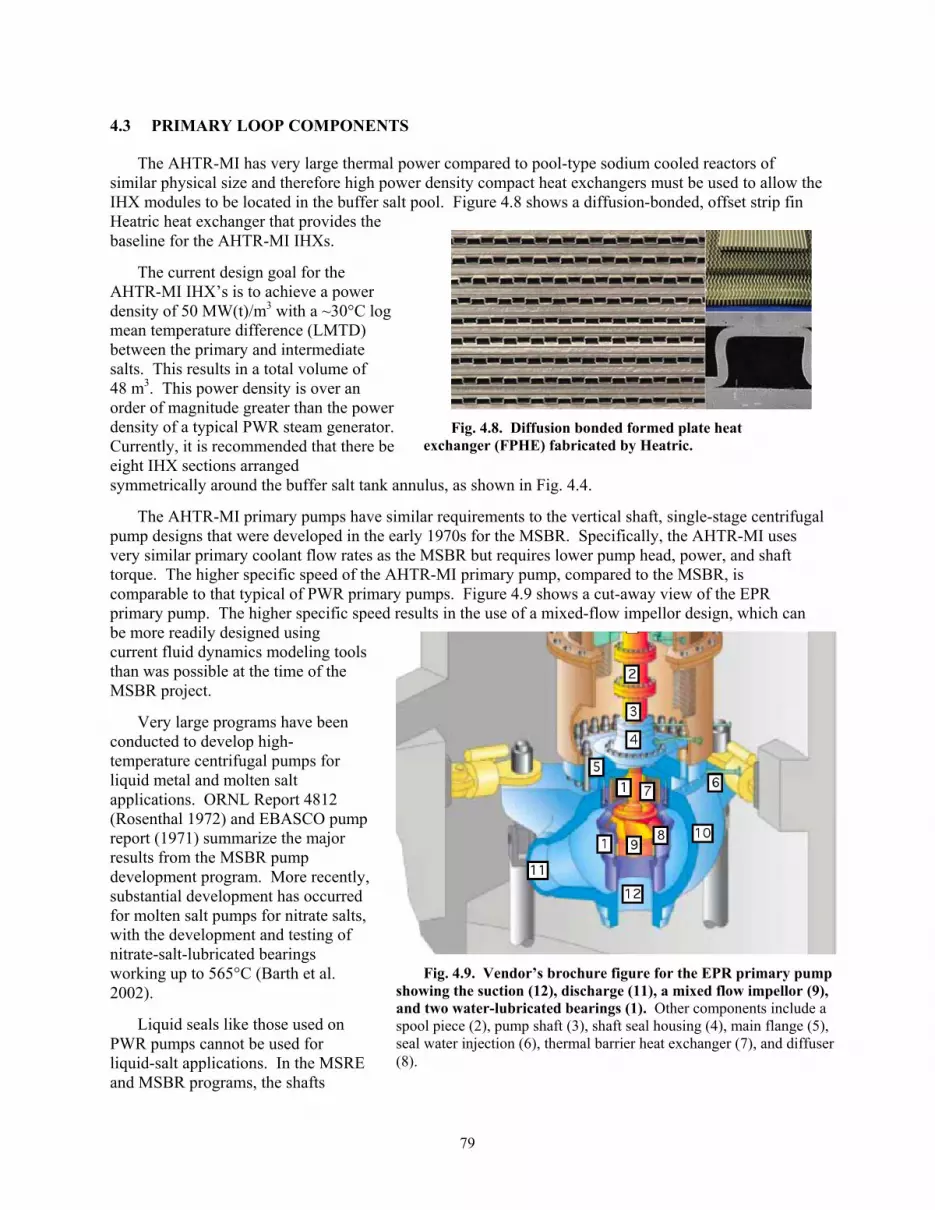
79
4.3 PRIMARY LOOP COMPONENTS
The AHTR-MI has very large thermal power compared to pool-type sodium cooled reactors of similar physical size and therefore high power density compact heat exchangers must be used to allow the IHX modules to be located in the buffer salt pool. Figure 4.8 shows a diffusion-bonded, offset strip fin Heatric heat exchanger that provides the baseline for the AHTR-MI IHXs.
The current design goal for the AHTR-MI IHX’s is to achieve a power density of 50 MW(t)/m3 with a ~30°C log mean temperature difference (LMTD) between the primary and intermediate salts. This results in a total volume of 48 m3. This power density is over an order of magnitude greater than the power density of a typical PWR steam generator. Currently, it is recommended that there be eight IHX sections arranged symmetrically around the buffer salt tank annulus, as shown in Fig. 4.4.
The AHTR-MI primary pumps have similar requirements to the vertical shaft, single-stage centrifugal pump designs that were developed in the early 1970s for the MSBR. Specifically, the AHTR-MI uses very similar primary coolant flow rates as the MSBR but requires lower pump head, power, and shaft torque. The higher specific speed of the AHTR-MI primary pump, compared to the MSBR, is comparable to that typical of PWR primary pumps. Figure 4.9 shows a cut-away view of the EPR primary pump. The higher specific speed results in the use of a mixed-flow impellor design, which can be more readily designed using current fluid dynamics modeling tools than was possible at the time of the MSBR project.
Very large programs have been conducted to develop high-temperature centrifugal pumps for liquid metal and molten salt applications. ORNL Report 4812 (Rosenthal 1972) and EBASCO pump report (1971) summarize the major results from the MSBR pump development program. More recently, substantial development has occurred for molten salt pumps for nitrate salts, with the development and testing of nitrate-salt-lubricated bearings working up to 565°C (Barth et al. 2002).
Liquid seals like those used on PWR pumps cannot be used for liquid-salt applications. In the MSRE and MSBR programs, the shafts
Fig. 4.8. Diffusion bonded formed plate heat exchanger (FPHE) fabricated by Heatric.
Fig. 4.9. Vendor’s brochure figure for the EPR primary pump
showing the suction (12), discharge (11), a mixed flow impellor (9), and two water-lubricated bearings (1). Other components include a spool piece (2), pump shaft (3), shaft seal housing (4), main flange (5), seal water injection (6), thermal barrier heat exchanger (7), and diffuser (8).

80
passed through a salt/inert gas free surface, allowing gas seals to be used. The pump impellors were cantilevered, so that conventional oil-lubricated bearings and gas seals could be applied. The short-shaft design has the advantage of not requiring a salt-lubricated bearing, but this results in the impellor elevation being less than 0.2 below the salt free surface. Limited work was performed to develop salt-lubricated bearings that would permit the use of long-shaft pumps. Recent work for nitrate salt pumps has shown the practicality of long-shaft designs, but additional work will be required to develop and qualify bearing materials for use with fluoride salts.
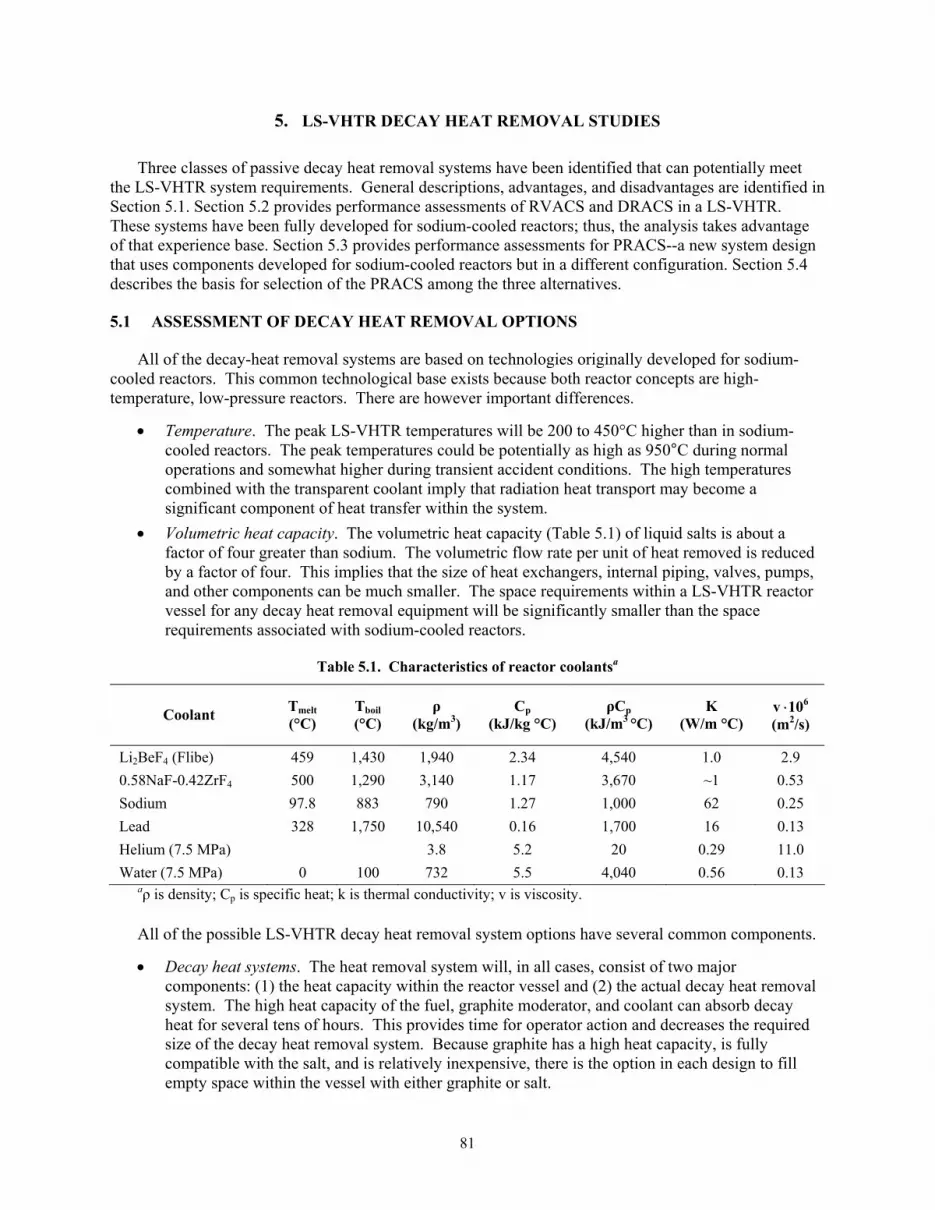
81
5. LS-VHTR DECAY HEAT REMOVAL STUDIES
Three classes of passive decay heat removal systems have been identified that can potentially meet the LS-VHTR system requirements. General descriptions, advantages, and disadvantages are identified in Section 5.1. Section 5.2 provides performance assessments of RVACS and DRACS in a LS-VHTR. These systems have been fully developed for sodium-cooled reactors; thus, the analysis takes advantage of that experience base. Section 5.3 provides performance assessments for PRACS--a new system design that uses components developed for sodium-cooled reactors but in a different configuration. Section 5.4 describes the basis for selection of the PRACS among the three alternatives.
5.1 ASSESSMENT OF DECAY HEAT REMOVAL OPTIONS
All of the decay-heat removal systems are based on technologies originally developed for sodium-cooled reactors. This common technological base exists because both reactor concepts are high-temperature, low-pressure reactors. There are however important differences.
• Temperature. The peak LS-VHTR temperatures will be 200 to 450°C higher than in sodium-cooled reactors. The peak temperatures could be potentially as high as 950°C during normal operations and somewhat higher during transient accident conditions. The high temperatures combined with the transparent coolant imply that radiation heat transport may become a significant component of heat transfer within the system.
• Volumetric heat capacity. The volumetric heat capacity (Table 5.1) of liquid salts is about a factor of four greater than sodium. The volumetric flow rate per unit of heat removed is reduced by a factor of four. This implies that the size of heat exchangers, internal piping, valves, pumps, and other components can be much smaller. The space requirements within a LS-VHTR reactor vessel for any decay heat removal equipment will be significantly smaller than the space requirements associated with sodium-cooled reactors.
Table 5.1. Characteristics of reactor coolantsa
Coolant Tmelt (°C)
Tboil (°C)
ρ (kg/m3)
Cp (kJ/kg °C)
ρCp (kJ/m3 °C)
K (W/m °C)
v ⋅106
(m2/s)
Li2BeF4 (Flibe) 459 1,430 1,940 2.34 4,540 1.0 2.9 0.58NaF-0.42ZrF4 500 1,290 3,140 1.17 3,670 ~1 0.53 Sodium 97.8 883 790 1.27 1,000 62 0.25 Lead 328 1,750 10,540 0.16 1,700 16 0.13 Helium (7.5 MPa) 3.8 5.2 20 0.29 11.0 Water (7.5 MPa) 0 100 732 5.5 4,040 0.56 0.13
aρ is density; Cp is specific heat; k is thermal conductivity; v is viscosity.
All of the possible LS-VHTR decay heat removal system options have several common components.
• Decay heat systems. The heat removal system will, in all cases, consist of two major components: (1) the heat capacity within the reactor vessel and (2) the actual decay heat removal system. The high heat capacity of the fuel, graphite moderator, and coolant can absorb decay heat for several tens of hours. This provides time for operator action and decreases the required size of the decay heat removal system. Because graphite has a high heat capacity, is fully compatible with the salt, and is relatively inexpensive, there is the option in each design to fill empty space within the vessel with either graphite or salt.

82
• Silo siting. All of these systems will be located in a below-grade silo as described in Chapter 1 to meet the beyond-design-basis accident requirements and assure there is no credible accident where the reactor core is uncovered. In a severe accident with vessel failure, the bottom of the silo is covered with salt to above the top of the reactor core. This allows heat to be conducted to the ground (Forsberg and Peterson 2003) and prevent fuel failure from overheating under severe accident conditions.
5.1.1 Reactor Vessel Auxiliary Cooling System (RVACS)
A simplified schematic of an RVACS is shown in Fig. 5.1. The RVACS system was originally developed for the General Electric S-PRSIM sodium-cooled fast reactor. The reactor and decay-heat-cooling system are located in a below-grade silo. The decay heat in the LS-VHTR is (1) transferred from the reactor core to the reactor vessel graphite reflector by natural circulation of the liquid salts, (2) conducted through the graphite reflector and reactor vessel wall, (3) transferred across an argon gap by radiation to a guard vessel, (4) conducted through the guard vessel, and then (5) removed from outside of the guard vessel by natural circulation of ambient air.
The rate of heat removal is controlled primarily by the radiative heat transfer through the argon gas from the reactor vessel to the guard vessel. Radiative heat transfer increases by temperature to the fourth power (T4); thus, a small rise in the reactor vessel temperature (as would occur upon the loss of normal decay-heat-removal systems) greatly increases heat transfer out of the system. Under accident conditions, such as a loss-of-forced-cooling accident, natural circulation flow of liquid salt up the hot fuel channels in the core and down the edge of the core rapidly results in a nearly isothermal core with about a 50°C temperature difference between the top and bottom plenums. For a typical simulation of a 2400-MW(t) reactor with an average coolant exit temperature of 1000°C, the calculated peak fuel temperature in such an accident is ~1160°C, which will occur at ~30 h after loss of pumped coolant flow with a peak reactor vessel temperature of ~750°C at ~45 h. The average core temperature in this accident rises to approximately the same temperature as the hottest fuel during normal operations.
An RVACS has one major advantage:
• Experience. This system as was developed for the General Electric S-PRISM sodium-cooled reactor. Because of the development work on that reactor, the fundamental characteristics of the decay heat system are relatively well understood.
Reactor Vessel
Guard Vessel
Pump
Reactor Core
Hot AirColdAir
RVACS
Radiation Transfer
Cold Salt Hot Salt
Power Conversion
Primary Heat Exchanger(In-Vessel or Ex-Vessel)
Fig. 5.1. Reactor vessel auxiliary cooling system.

83
There are some disadvantages:
• Reactor power output. The ultimate decay heat removal capability and thus the ultimate reactor power output is limited by the reactor vessel size and the maximum allowable vessel temperature under accident conditions. Therefore, the reactor power output may be limited.
• Multifunction reactor vessel. The reactor vessel servers multiple functions: (1) containment of the reactor system and (2) transfer of decay heat under accident conditions. These are two different sets of functional requirements. To maximize vessel integrity, vessel temperatures should be minimized. However, to maximize removal of decay heat the vessel should operate at high temperatures under certain accident conditions. The different requirements demand either a vessel that can operate at very high temperatures or a vessel with an internal insulation system to protect the vessel but at the same time allowing heat rejection under defined conditions.
5.1.2 Direct Reactor Auxiliary Cooling System (DRACS)
The DRACS was originally developed for EBR-II and has been used in multiple fast reactors in multiple countries. As shown in the sketch in Fig. 5.2, a DRACS generally consists of a natural circulation heat transport loop that moves heat from the primary reactor vessel to a heat sink. In most designs, the atmosphere is the heat sink. In sodium-cooled reactors, the heat transfer fluid is usually sodium. A DRACS (1) can operate continuously or (2) can be designed to minimize heat loss during normal operations. In many cases, the air heat exchanger is in a box with a door with an electromagnetic latch that falls open upon the loss of electrical power. The power can be cut by a variety of signals, including overheating of the sodium in the reactor vessel.
Several studies are evaluating alternative DRACS systems for the LS-VHTR (see Section 5.2). There are multiple potential coolants (gases, liquid salts, etc.) and multiple options that can trigger the system into operation based on high temperatures.
The design of DRACS is somewhat more complex than RVACS but it has several advantages:
• Primary vessel integrity. The temperature-limited safety components in the primary system are the reactor vessel and piping. A DRACS, unlike an RVACS, is inside the reactor vessel and can help minimize system temperatures and thus may reduce challenges to the reactor vessel.
• High-temperature DRACS. The decay heat is rejected to the pool where the DRACS heat exchanger is located. The temperatures in the pool will be higher than the temperatures available for an RVACS where the heat must conduct through insulation and the vessel to reach the decay heat removal system. The higher heat rejection temperatures reduce the required size of a DRACS relative to an RVACS.
Pump
Reactor Core
Hot Air
ColdAir
DRACSDRACS
ReactorVessel
GuardVessel
Cold SaltHot Salt
Power ConversionPower Conversion
Pump
Reactor Core
Hot Air
ColdAir
DRACSDRACS
ReactorVessel
GuardVessel
Cold SaltHot Salt
Power ConversionPower Conversion
05-071
Fig. 5.2. Direct reactor auxiliary cooling system.

84
• Reactor power output. The reactor power level with a DRACS is not limited by the ability of the reactor vessel to reject heat as is the case with an RVACS. The modular characteristics of a DRACS allow additional decay heat removal modules to be added as the power level increases.
There is also a potential disadvantage:
• Status. A DRACS for the LS-VHTR is not fully developed. The different chemical characteristics of liquid salts vs sodium and the different temperature operating range imply different system designs. A DRACS system for the LS-VHTR will require evaluating alternative coolants and other design features.
5.1.3 Pool Reactor Auxiliary Cooling System (PRACS)
With a PRACS (Peterson and Zhao. 2006), the primary reactor system is located at the bottom of a liquid salt pool (see Fig. 5.3). Salt coolant from the reactor goes through the reactor core, is heated, goes through the primary pumps, flows to the primary heat exchanger, dumps its heat to the secondary loop, and returns to the reactor core. The primary liquid-salt coolant does not mix with the liquid salt in the pool. The pool has a DRACS cooling system. The pool liquid-salt coolant during normal operation is at the same temperature or a lower temperature than the coldest primary system salt coolant. The concept has many similarities to the proposed ABB PIUS pressurized light-water reactor where the reactor system is in a large pool of colder water.
During normal operation, heat leaks from the primary system to the pool (1) though the reactor vessel and (2) from the uninsulated piping from the heat exchanger back to the bottom of the reactor core. Normally, the heat loses from the uninsulated piping are small because the exit temperature of the primary coolant from the heat exchanger is near the temperature of the pool salt. If the main circulation pumps are shut down, there is natural circulation flow of salt in the primary system. If the primary heat exchangers do not remove the heat for any reason, the primary system coolant heats up. As the hotter coolant exits the heat exchanger, the higher temperature difference between the primary coolant and the pool liquid salt increases and more decay heat is dumped to the pool. The primary coolant piping surface area is adjusted to assure efficient removal of decay heat.
Decay heat removal from the primary system to the pool upon loss of circulation pump can be enhanced by a secondary loop containing a fluidic diode and heat exchanger that is connected between the top and bottom reactor core plenum. The fluidic dioxide is a no-moving parts devise that allows high salt flow in one direction but only low salt flow in the other direction. When the primary pump is operating, the fluidic dioxide minimizes flow in this loop from the bottom to top reactor plenums. If the pump stops, hot salt from near the top of the reactor flows down the loop, through the heat exchanger, dumps its heat to the pool, and enters the bottom of the reactor core plenum. Fluidic valves have been used in a variety of reactors (Forsberg et al. 1989) including sodium fast reactors (Rothfuss and Vogt 1987)
Vessel
Hot Air
ColdAir
DRACSDRACS
Cold SaltHot Salt
Power ConversionPower Conversion
Pump
Reactor CoreFluidic Diode
HeatExchanger
Vessel
Hot Air
ColdAir
DRACSDRACS
Cold SaltHot Salt
Power ConversionPower Conversion
Pump
Reactor CoreFluidic Diode
HeatExchanger
05-072
Fig. 5.3. Pool reactor auxiliary cooling system.

85
The design of a PRACS is somewhat more complex (two salt system) than the other options but it has several advantages:
• Reactivity control. If the reactor control systems fail and the reactor is not shutdown, the reactor will heat up and be shut down because of negative fuel Dopper and moderator temperature coefficients. To aid decay heat removal, the reactor should be shutdown as quickly as possible. With a primary system in a pool of salt, the primary salt volume can be minimized. This provides a design that assures rapid heatup of the primary system and rapid shutdown of the reactor under a wide variety of conditions while retaining the high heat capacity of the cooler pool salt for longer-term decay heat. Under these conditions, the primary salt would remain at significantly higher temperatures than the pool salt. Under severe accident conditions, the boundary between the primary system and pool will ultimately fail. This can allow the pool salt with its higher neutron absorption to mix with the primary salt and provide long term shutdown.
• Heat capacity. Peak system temperatures upon reactor shutdown are limited by the heat capacity of the system and the ability to remove heat with the DRACS. The pool salt is normally at a much lower temperature than the reactor core or primary coolant and thus can absorb very large amounts of decay heat relative to the alternative designs with equal amounts of salt, where almost all the salt is at a higher temperature.
• Primary system integrity. The temperature-limited safety components in the primary system are the reactor vessel and piping. These structures can be protected from extreme temperatures by insulation on the inside; however, assuring insulation integrity under all circumstances is difficult and the insulation becomes the temperature-limited safety component. With PRACS, the outside of the primary reactor vessel and piping is bathed in a cooler buffer-tank salt. This lower temperature salt and the excellent heat transfer provided by a cool liquid provides a method to limit primary metal component temperatures independent of any insulation system. In the alternative decay heat removal systems, the primary system components do not have high-performance coolants on their exteriors to limit temperatures of the components under accident conditions. The secondary benefit is that the stresses on the primary system are reduced.
• High-temperature DRACS. The decay heat that is rejected from the primary system to the pool is rejected at specific locations. The DRACS heat exchangers can be located directly above these locations so the hottest salt in the pool enters the DRACS heat exchanges and is cooled. This maximizes decay heat removal by DRACS by maximizing salt temperatures seen by DRACS while minimizing average pool temperatures.
• Salt capital cost economics. The primary and pool salt can have different compositions optimized for their different functional requirements. Salts containing 7Li have some of the best neutronic properties but are expensive because of the need for lithium isotopic separation. Lower-cost salts have substantially higher nuclear cross sections. The use of a different primary and pool salt can reduce the primary salt inventory and cost. This also has the secondary advantage that if there was a primary system failure, the higher cross section pool salt would enter the primary circuit and provide a secondary reactor shutdown mechanism.
There are several unique disadvantages of a PRACS:
• New system. This is a new system approach with the design uncertainties. • Dual salt system. The primary and pool salt could be the same salt. However, there are
incentives to use alternative salts. In that case, there are two salt systems to manage. The complexity also depends upon the choice of the intermediate heat-transport system salt. If the pool salt is the same as the intermediate heat-transport system salt, operations will be simplified.

86
5.1.4 Decay-Heat Removal System Ranking Criteria
The three alternative decay heat removal systems are ranked based on multiple criteria (Forsberg
2006) as shown in Table 5.2. The criteria were chosen to help understand the strengths and weakness of each option. The choice of decay heat removal system depends upon the reactor size, materials limits, and development program constraints. In many cases, specific technologies are not fully developed and there are major uncertainties. The criteria and rankings should be considered as input to more detailed studies that will better define the performance of these systems and help us choose the preferred system (Section 5.4).
The draft criteria are defined below.
• Experience. Plant designs and decay heat cooling systems that have been tested have relatively small uncertainties. This is a major practical advantage.
• System complexity. All other factors being equal, simpler systems are preferred. • Reactivity control. If there is a failure of the reactor control system with loss of heat sink, the
reactor can be shut down by heating the reactor core to a higher temperature. However, higher temperatures challenge the reactor plant. From a decay heat perspective, the best systems minimize the number of components that must go to higher temperatures for reactor shutdown.
• Structural component temperatures. The temperature limiting safety components within the system are the structural components (vessel, piping, etc.). Designs that protect those components (such as cold salt on one side and hot salt on the other) are preferred.
• Maximize temperature to decay heat removal system. Higher temperature differences between the reactor and the environment reduce the challenge of dumping decay heat to the environment. Decay heat removal systems should cool the hottest fluids.
• Maximum practical reactor output. Economics favors large power outputs and thus designs that can ultimately be scaled to very large reactors [4000 MW(t)].
• Material temperature limits. The high-temperature capabilities of the fuel and salt imply that the temperature limits of the LS-VHTR are associated with heat exchangers, pipes, pumps, and the vessel. Materials limits may control design choices. At the current time, only Hastalloy-N is code qualified and has been fully qualified for service with liquid salts to 750°C. A number of other code-qualified alloys may be viable to 900°C; but, they have not been fully tested and qualified in terms of corrosion in liquid salt systems. Experience shows that carbon-carbon composites are fully compatible with liquid salts to temperatures beyond 1000°C, but these materials have not generally been qualified for structural applications in nuclear systems.
• Minimize insulation requirements. Each of these systems requires insulation to meet economic and safety objectives. There are strong incentives to minimize systems where insulation systems are part of the primary safety case. For example, for a high-temperature RVACS, the insulation system is a new system that has a major safety requirement—provide primary vessel integrity against high temperatures (unless very high-temperature material is used for the reactor vessel).
• System heat capacity. Heat capacity in the reactor system buys time for operators to react before there is equipment damage (investment protection) and it reduces the size of the decay heat removal system (capital cost).
• Modularity. Decay heat removal systems that are modular allow the reactor size to be changed without altering the design of the decay heat removal system—only the number of decay heat removal systems changes. This is a major advantage in the development process for it allows large scale testing of one module and then using that design for the full reactor.

87
Table 5.2. Features of alternative decay heat removal systems (Rating: 1 is best)
Category RVACS DRACS PRACS Detailed Design and Analysis / Experience 1 1 3 System complexity 1 2 3 Reactivity control 3 2 1 Minimize structural component temperatures 3 2 1 Maximize temperature to decay heat removal system 3 2 1 Maximum practical reactor output 3 1 1 Material temperature limits 3 2 1 Minimize insulation requirements 3 2 1 System heat capacity 3 2 1 Modularity (scaleability) 3 1 1
5.2 PERFORMANCE OF RVACS AND DRACS DECAY HEAT REMOVAL SYSTEMS
The viability of the RVACS and DRACS alternate shutdown heat removal approaches for the LS-VHTR were investigated at Argonne National Laboratory (ANL). Both of these systems have been fully developed for sodium-cooled reactors. This information base is used as a starting point for the analysis of these systems.
The analysis of these systems provided part of the information required before a decision was made to choose PRACS as the decay heat removal system. The analysis also provided a better understanding of RVACS and DRACS performance. The choice of decay heat removal system is dependent upon the size of reactor, the peak operating temperatures, and other factors. While PRACS was chosen (Section 5.4) as the preferred option based on LS-VHTR goals, for other missions, RVACS or DRACS could become the preferred options.
Two passive emergency decay heat removal approaches were assessed for a 2400 MW(t) LS-VHTR. The first is a Reactor Vessel Auxiliary Cooling System (RVACS) that removes heat from the outside of the cylindrical surface of the guard vessel surrounding the reactor vessel through the natural circulation of atmospheric air. The second is the utilization of a Direct Reactor Auxiliary Cooling System (DRACS) consisting of heat exchangers that are immersed inside of the liquid salt primary coolant and which activate under accident conditions. The DRACS heat exchanges remove heat from the liquid salt primary coolant to an intermediate coolant circulating under natural circulation, which transports the energy to natural draft air heat exchangers in which the heat is transferred to the atmosphere heat sink. Analyses of decay heat removal were carried out using first principles models and computer codes for the heat removal mechanisms and circuits. In addition, an integrated systems analysis was performed to investigate the performance of the RVACS approach.
5.2.1 RVACS Steady State Performance Analysis
The liquid salt primary coolant flows downwards during normal operation through the graphite prismatic blocks comprising the core (the blocks have cylindrical coolant channels as well as cylindrical fuel compacts) to enter the lower plenum. The coolant is removed from the lower plenum and the reactor vessel through a number of vertical return pipes located in the surrounding graphite reflector. Outside of the reactor vessel, the liquid salt is pumped from the reactor vessel and through the remainder of the primary circuit which incorporates heat exchangers in which heat is transferred to an intermediate coolant. The liquid salt is returned from the heat exchangers to the reactor vessel in the region above the core through a number of vertical delivery pipes.
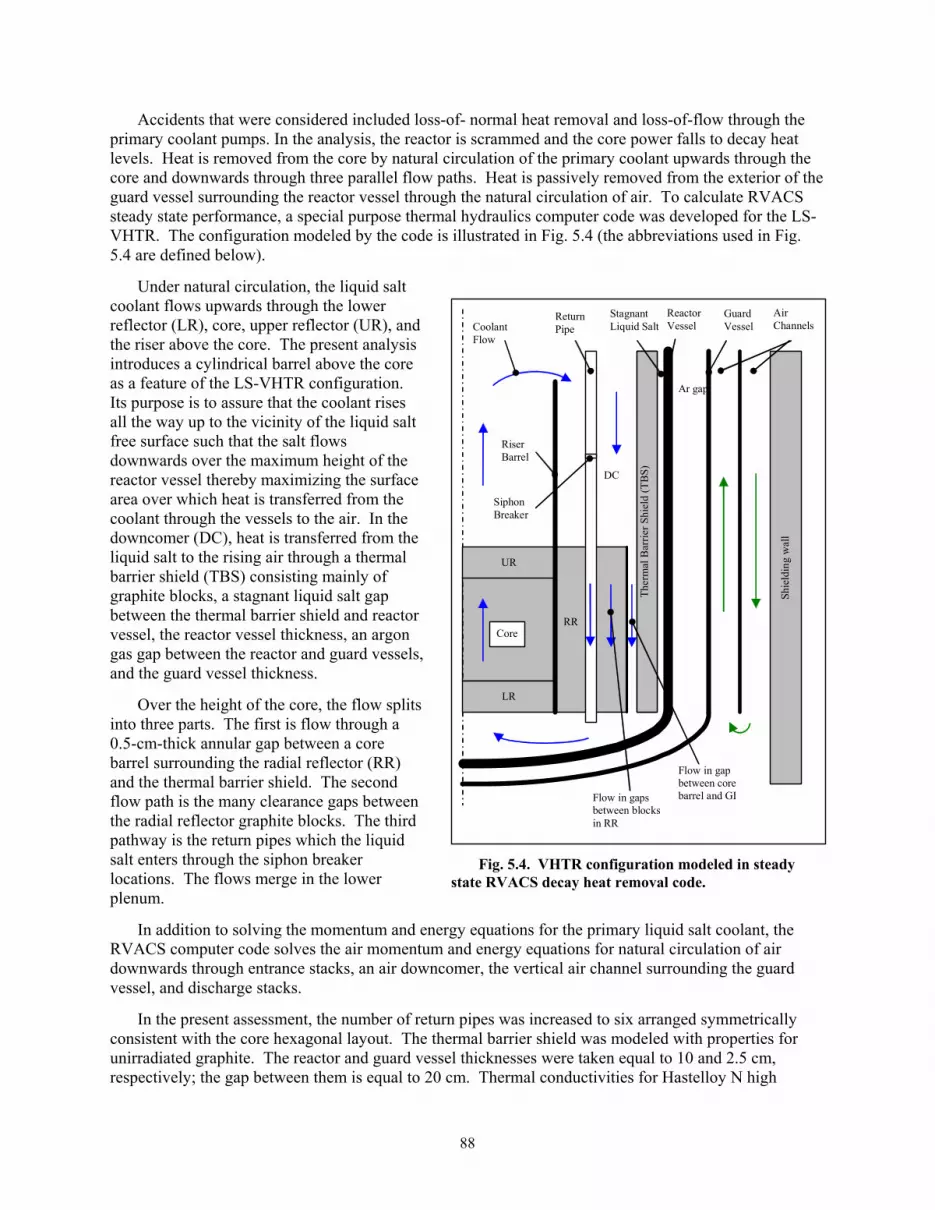
88
Accidents that were considered included loss-of- normal heat removal and loss-of-flow through the primary coolant pumps. In the analysis, the reactor is scrammed and the core power falls to decay heat levels. Heat is removed from the core by natural circulation of the primary coolant upwards through the core and downwards through three parallel flow paths. Heat is passively removed from the exterior of the guard vessel surrounding the reactor vessel through the natural circulation of air. To calculate RVACS steady state performance, a special purpose thermal hydraulics computer code was developed for the LS-VHTR. The configuration modeled by the code is illustrated in Fig. 5.4 (the abbreviations used in Fig. 5.4 are defined below).
Under natural circulation, the liquid salt coolant flows upwards through the lower reflector (LR), core, upper reflector (UR), and the riser above the core. The present analysis introduces a cylindrical barrel above the core as a feature of the LS-VHTR configuration. Its purpose is to assure that the coolant rises all the way up to the vicinity of the liquid salt free surface such that the salt flows downwards over the maximum height of the reactor vessel thereby maximizing the surface area over which heat is transferred from the coolant through the vessels to the air. In the downcomer (DC), heat is transferred from the liquid salt to the rising air through a thermal barrier shield (TBS) consisting mainly of graphite blocks, a stagnant liquid salt gap between the thermal barrier shield and reactor vessel, the reactor vessel thickness, an argon gas gap between the reactor and guard vessels, and the guard vessel thickness.
Over the height of the core, the flow splits into three parts. The first is flow through a 0.5-cm-thick annular gap between a core barrel surrounding the radial reflector (RR) and the thermal barrier shield. The second flow path is the many clearance gaps between the radial reflector graphite blocks. The third pathway is the return pipes which the liquid salt enters through the siphon breaker locations. The flows merge in the lower plenum.
In addition to solving the momentum and energy equations for the primary liquid salt coolant, the RVACS computer code solves the air momentum and energy equations for natural circulation of air downwards through entrance stacks, an air downcomer, the vertical air channel surrounding the guard vessel, and discharge stacks.
In the present assessment, the number of return pipes was increased to six arranged symmetrically consistent with the core hexagonal layout. The thermal barrier shield was modeled with properties for unirradiated graphite. The reactor and guard vessel thicknesses were taken equal to 10 and 2.5 cm, respectively; the gap between them is equal to 20 cm. Thermal conductivities for Hastelloy N high
Core
LR
UR
RR
Ther
mal
Bar
rier S
hiel
d (T
BS)
Riser Barrel
DC
Return Pipe Coolant
Flow
Stagnant Liquid Salt
Reactor Vessel
Ar gap
Guard Vessel
Air Channels
Shie
ldin
g w
all
Siphon Breaker
Flow in gap between core barrel and GI Flow in gaps
between blocks in RR
Fig. 5.4. VHTR configuration modeled in steady
state RVACS decay heat removal code.

89
temperature Nickel-based alloy were assumed for the two vessels. The vessels are assumed to be 19.5 m high.
An initial set of calculations was carried out which served as a basis to optimize the dimensions of the air cooling system to maximize the heat removal from the guard vessel. In this manner, the upward and downward air flow channel thicknesses were determined to be 14 cm, the cylindrical wall thickness between them 2.5 cm, the inlet and outlet air stack/chimney heights 100 m, inlet stack effective circular air flow diameter 1.0 m, outlet stack effective circular air flow diameter 2.0 m, and the atmosphere air inlet temperature 20°C. Nominal emittances of the vessel surfaces are assumed to be 0.8, representative of the presence of oxide layers or roughness. The heat transfer correlation from the guard vessel to air is given by a correlation appropriate for air flow through an annulus multiplied by a factor of two accounting for the effects of incorporating protuberances that enhance heat transfer such as welding of beads around the vessel circumference to trip the boundary layer and promote turbulent exchange.
The model was applied to calculate conditions during normal full power operation with downwards flow through the core. Liquid salt mass flow rate as well as core inlet and outlet temperatures were constrained to match the nominal full power values specified by ORNL. For a 900°C core inlet temperature, a maximum reactor vessel inner surface temperature during normal operation of 752°C is calculated. This value, which reflects the partially insulating effect of the thermal barrier shield, agrees well with the goal of a 750°C limitation specified by ORNL to assure vessel wall strength.
Figures 5.5 through 5.8 present the results for accident conditions calculated with the RVACS computer code as a function of the core inlet temperature. The vessel height was varied parametrically in the calculations; heat transport by liquid salt natural circulation as well as heat removal by natural circulation of air both improve as the vessel height is increased. The liquid salt boiling temperature is about 1400°C. Temperatures above this value are to be excluded.
600
650
700
750
800
850
900
950
1000
1050
1100
800 900 1000 1100 1200 1300 1400 1500 1600
CORE INLET TEMPERATURE, oC
TEM
PER
ATU
RE,
oC
30252015
HRV, m
Fig. 5.5. Steady state maximum reactor vessel inner surface
temperature vs core inlet temperature for RVACS heat removal
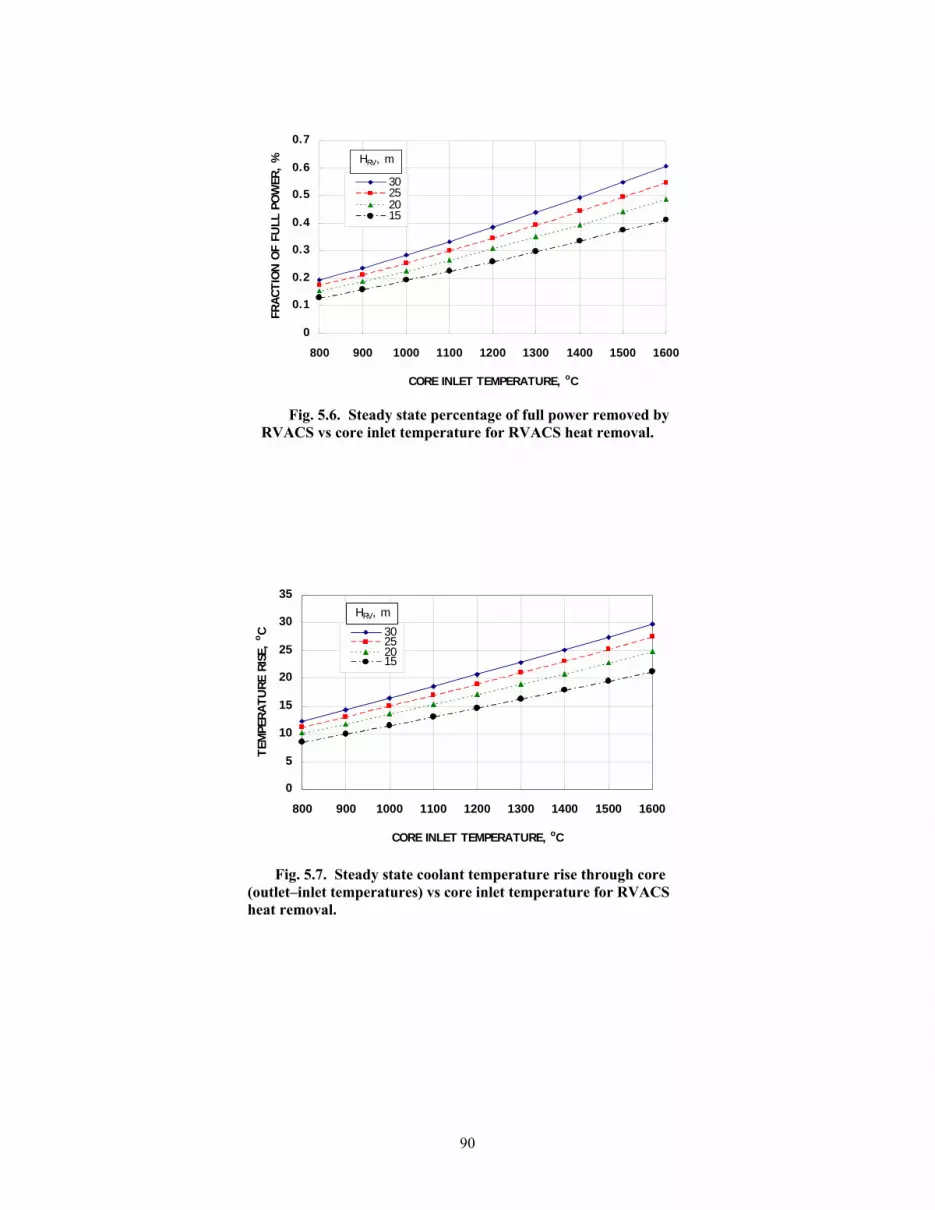
90
0
0.1
0.2
0.3
0.4
0.5
0.6
0.7
800 900 1000 1100 1200 1300 1400 1500 1600
CORE INLET TEMPERATURE, oC
FRA
CT
ION
OF
FULL
PO
WER
, %
30252015
HRV, m
0
5
10
15
20
25
30
35
800 900 1000 1100 1200 1300 1400 1500 1600
CORE INLET TEMPERATURE, oC
TEM
PERA
TURE
RIS
E, o
C 30252015
HRV, m
Fig. 5.6. Steady state percentage of full power removed by RVACS vs core inlet temperature for RVACS heat removal.
Fig. 5.7. Steady state coolant temperature rise through core (outlet–inlet temperatures) vs core inlet temperature for RVACS heat removal.

91
It is observed from Fig. 5.5 that for the 19.5-m vessel height, the assumed reactor vessel maximum temperature limitation of 750°C is calculated for a liquid salt core inlet temperature of about 1050°C. At this inlet temperature, the RVACS in steady state is calculated to remove about 6.2 MW, which is equivalent to 0.26 % of the nominal power (Fig. 5.6). If the vessel height were to be increased to 30 m, the RVACS heat removal would rise to 0.31 % nominal power. Following scram, the decay heat falls off to 1.0 % after about 2.2 h, 0.5 % following 22 h, 0.27 % after 12 d, and 0.24 % after 17 d.
Figures 5.9 through 5.12 show temperature profiles calculated with the code for a 1050°C core inlet temperature; for this case, the heat removal rate is 5.9 MW which is equivalent to 0.24 % nominal power. Liquid salt primary coolant temperatures are shown in Fig. 5.9 where a coordinate of zero corresponds to the bottom of the lower reflector and about 15 m to the liquid salt free surface. The indicated RR clearance gap flow temperatures are also the temperatures of liquid salt inside the return pipes. Figure 5.10 presents the calculated axial temperature profiles in liquid salt, air, and the various structures between them; bulk temperatures are shown for the fluids and both inner and outer surface temperatures for the structures. The structure temperatures are calculated to be higher over the core height due to the small hydraulic diameter for flow through the 0.5-cm annular gap interior to the thermal barrier shield which results in a significantly larger heat transfer coefficient between the liquid salt bulk temperature and the thermal barrier shield than is calculated above the core. Also, axial thermal conduction in the structures is neglected in the calculations. Radial temperatures through the fluids and structures at four axial levels are given in Fig. 5.11, while Fig. 5.12 focuses upon the radial slice encompassing the two vessels.
3
4
5
6
7
800 900 1000 1100 1200 1300 1400 1500 1600
CORE INLET TEMPERATURE, oC
COO
LAN
T VE
LOCI
TY,
cm
/s 30252015
HRV, m
Fig. 5.8. Steady state coolant mean-velocity through core vs core inlet temperature for RVACS heat removal.

92
COOLANT TEMPERATURES
940
960
980
1000
1020
1040
1060
1080
-2 0 2 4 6 8 10 12 14 16
AXIAL POSITION, m
TEM
PERA
TURE
, o C LR
Core
UR
RS
DC
Gap
RR
Fig. 5.9. Steady state liquid salt primary coolant temperatures with RVACS heat removal.
STRUCTURE AND RVACS TEMPERATURES
0
100
200
300
400
500
600
700
800
900
1000
1100
1200
0 2 4 6 8 10 12 14 16
AXIAL POSITION, m
TEM
PERA
TURE
, o C
LS_bulk
TBSi
TBSo
RVi
RVo
GVi
GVo
Air_bulk
Gap Downcomer
Fig. 5.10. Steady state system temperatures with RVACS heat removal.

93
RADIAL TEMPERATURE DISTRIBUTION
RV
GV
GI
LS AirBulk
LSBulk
GapBulk
0
200
400
600
800
1000
1200
1400
5 5.5 6 6.5 7 7.5 8 8.5 9RADIAL POSITION, m
TEM
PERA
TURE
, o C
Top of RRBottom of RRTop of RVAbove RR
Fig. 5.11. Steady state radial temperature distributions with RVACS heat removal.
RADIAL TEMPERATURE DISTRIBUTION
RV
GV
GI
LSAir
BulkGapBulk
0
200
400
600
800
1000
1200
1400
7.6 7.7 7.8 7.9 8 8.1 8.2 8.3 8.4 8.5 8.6 8.7 8.8 8.9RADIAL POSITION, m
TEM
PERA
TURE
, o C
Top of RRBottom of RRTop of RVAbove RR
Fig. 5.12. Steady state radial temperature distributions in vessel region with RVACS heat removal.
5.2.2 RVACS Transient Systems Analysis
An integrated systems analysis model was assembled for the LS-VHTR including thermal and hydraulic representations of the core, the primary and intermediate coolant systems, and the RVACS. The core thermal hydraulic model is coupled to a point kinetics model to permit simulation of reactor scram. The ANS 5.1 decay heat model is integrated with the point kinetics model to represent pretransient irradiation and transient decay heat. A seven-channel core treatment was used for the core and the radial reflector. Each of the channels represents a number of hexagonal fuel columns with similar specific powers. The channel model consists of a detailed radial heat conduction calculation from the fuel compact to the graphite block, and then by convection to the coolant, at many axial locations. Channel coolant flow is simulated with a one-dimensional, axial liquid salt hydraulics computation. During

94
normal operation, coolant flow is downward through the reactor, but in transient conditions corresponding to loss-of-forced-flow, the flow reverses to be upward in the heated channels. Six channels were used for the active core, and one channel was used for the radial reflector. The power produced in each channel was taken from reactor physics calculations for the LS-VHTR performed at ANL.
The coolant systems model used in this study is shown in Fig. 5.13. This model represents the core (S1), the inlet (CV1) and outlet (CV2) plenums, the thermal barrier system (S3, S4, S5), the RVACS, the leakage flow from the siphon breakers (S7, CV3), the primary pumps (E9), the primary piping (S6, S8), the intermediate heat exchanger (IHX), and an intermediate coolant loop (S9). In this model, the single loop made up of segments S6 and S8 represents two physical primary loops with an intermediate loop attached to each one. The siphon breaker (S7) is represented as a leakage path from the inlet plenum. Annular hydraulic segments (S3, S4, S5) with stagnant (i.e., stationary) liquid salt are used to model the thermal barrier shield. The integrated systems model does not contain a treatment for the power conversion cycle or hydrogen production process, but the heat removal from the intermediate loop is represented with a simple heat exchanger model (HX).
In the coolant systems model, the RVACS cools the vertical guard vessel wall and also wraps around to cool the lower head of the guard vessel. At the temperatures encountered in the current LS-VHTR concept, and for the downward flow coolant configuration, the vessel lower head as well as the cylindrical portion need cooling at all times. A thermal barrier is also needed to insulate the reactor vessel lower head from the high temperatures of the liquid salt in the lower plenum. Otherwise, the reactor vessel lower head wall will operate at elevated temperatures greater than the 750°C criterion during normal operation. This differs from the steady state RVACS performance model which calculated heat removal by air solely from the cylindrical guard vessel and not from the vessel lower head.
The thermal barrier shield modeled in the transient calculations consists of a 9-mm gap filled with stagnant liquid salt next to the vessel wall and 60 cm of graphite interior to the stagnant salt. There is a 5-mm gap with flowing coolant between the graphite in the thermal barrier and the outside surface of the core barrel surrounding the radial reflector around the core.
The integrated model was run for a protected loss-of-flow/loss-of-heat-sink (LOF/LOHS) transient. The initial state for the simulation is the normal operating condition of full power and flow. The initial decay heat level is assumed to correspond to infinite irradiation of 235U. At time zero, all coolant pumps
Fig. 5.13. Coolant systems model of the LS-VHTR.

95
are tripped, and heat transfer at the balance-of-plant heat exchanger (HX) is stopped. At 0.5 s, the reactor is scrammed. Subsequently, the reactor power falls to decay heat. Coolant flow through the active core slows and reverses during an oscillatory phase that eventually results in upward flow in the heated fuel channels and downward flow through the siphon breakers and the primary system piping (S6), through the gap between the thermal barrier shield and the radial reflector (S2), and through the radial reflector channel. In the transient, all heat removal is through the reactor vessel by thermal radiation to the guard vessel, and then to the air in the RVACS.
Figure 5.14 shows the normalized reactor power and RVACS heat removal rate for this transient. During the accident, the RVACS heat removal rate is calculated to rise from about 0.20% of nominal reactor power to about 0.36%. The decay heat drops below the RVACS heat removal rate at about 400,000 s (111 h or 4.6 d).
Figure 5.15 presents system temperatures. During normal operation before the start of the transient, the highest vessel wall temperature is calculated to equal 581°C. This temperature is located at a point in the outlet plenum. At decay heat power levels, the maximum fuel temperature is about 1oC hotter than the maximum coolant temperature.
During the accident, the maximum reactor vessel temperature rises to around 670°C; this result is consistent with the first principles steady state analysis. On the other hand, the peak transient core temperatures are close to the boiling point of the coolant. A less thick thermal barrier shield would
Fig. 5.14. Transient reactor power and RVACS heat removal.
Fig. 5.15. Transient coolant and reactor vessel temperatures.

96
result in higher reactor vessel temperatures but would increase the RVACS heat removal rate and lower the peak core temperatures.
5.2.3 DRACS Systems Analysis
As an alternative to reliance upon a RVACS for emergency shutdown heat removal, an investigation was carried out of the viability of removing decay heat using a Direct Reactor Auxiliary Cooling System (DRACS). In the DRACS approach, heat exchangers are directly immersed in the primary liquid salt coolant. Therefore, the DRACS is fast acting with respect to initiation of heat removal from the primary coolant relative to the RVACS approach. The DRACS, which consists of several independent and redundant heat transfer systems, operates solely by natural convection, is independent of electrical power, and passively activates upon loss of site electrical power.
A schematic diagram showing key elements of the system applied to the LS-VHTR is provided in Fig. 5.16. Principal components of each of these systems consist of a small in-vessel Direct Reactor Heat Exchanger (DRHX), a secondary Natural Draft Heat Exchanger (NDHX), an expansion tank, and an exterior stack that forms the natural draft pathway for dissipating the decay heat to the atmosphere. A key feature of this system is cooling solely on the basis of natural convection.
To effectively implement the DRACS in the LS-VHTR, a cylindrical barrel/shroud is installed above the core as was also incorporated in the RVACS approach. The shroud separates the plenum region above the core into two zones; a “hot plenum” directly above the active core, and a “cold plenum” above the radial reflector; of course, “hot” and “cold” refer to the salt conditions in the two regions during natural circulation when the primary coolant flow through the core is upwards. The two zones are connected above the shroud which does not extend all the way up to the liquid salt free surface.
The DRHXs are located in the cold plenum immediately above the radial reflector region. There are no valves or other mechanical devices that isolate the liquid salt coolant from the DRHXs. Thus, during normal operation at power with forced flow, the shell side of each DRHX is open to the liquid salt.
FARMER_REACTOR_SYSTEM_5AC(104)_9/23/05
OLD PLENUM
HOTPLENUM
AIR INLET
NDHX (2)ESEC
ECORE
COVER GAS
EXPANSIONTANK
Ta,o
Ta,i
LATCHED DAMPER(OPENS ON LOSS OF POWER)
SECONDARYLOOP (2)
STACK
EAIR
ACTIVECOREREGION
REFLECTOR
ANNULAR GAP(5mm WIDE)
SHROUD
CTOR VESSEL
AIR EXIT
DRHXHON BREAKER
Fig. 5.16. Schematic illustration of a direct reactor auxiliary cooling
system (DRACS) for the LS-VHTR.

97
However, when the secondary heat sink is activated, then buoyancy-driven natural convection flow of the primary coolant through the DRHX is initiated. Heat from the primary coolant is transferred through the DRHX to the secondary coolant passing through the HX tubes. In turn, natural circulation causes the secondary coolant to circulate through the NDHXs where the air flow transfers the heat from the coolant to the atmosphere.
The secondary coolant flow circuits (one for each of the independent systems) are completely passive without any valves or constrictions to limit the flow during normal operation or shutdown conditions. On the tertiary (air) side of the systems, the natural circulation circuits are passive except for latched dampers that prevent air flow on the air inlet side of the NDHXs. Upon loss of electrical power to the electromagnetic latch (either by site loss of electrical power, or by operator intervention), the dampers fail by gravity in the open position. The DRACS is brought into full operation by opening of these dampers. The dampers are designed to provide an air leak rate that represents a small fraction (typically 1%) of the full design flow rate in the closed position, which results in a parasitic heat loss to the DRACS. This minor heat loss is included in the design to maintain the correct natural convection flow patterns in the primary, secondary, and tertiary sides of the system so that proper natural circulation flow patterns are established immediately upon system activation. Moreover, depending upon the choice of secondary fluid, continuous heat addition to the system may be needed to assure that freeze-up of the secondary coolant circuit does not occur.
Calculations were carried out to roughly size the DRHXs for application to a 2400 MW(t) LS-VHTR. The calculations assume a standard counter-current flow, single-pass, shell-and-tube heat exchanger. Clearly, there is the question of what materials the DRHXs would be manufactured from to perform in liquid salt having temperatures of 1000ºC or higher. It is assumed that suitable materials can be identified or developed; the analysis determines a DRHX configuration that meets the required thermal hydraulic performance. The primary liquid salt flows through the shell side of the DRHX, while secondary coolant flows inside of the tubes.
As a starting point, it is assumed that the entire DRACS can remove 0.5% of the core nominal power which is 12 MW(t). This capacity has typically been assumed for DRACS decay heat removal systems. Dividing this among four DRHXs, then each DRHX is designed for a rating of 3 MW(t). The analysis treats the number of tubes in each DRHX as an independent variable. The required DRHX tube length is then calculated as the key model output, and the minimum heat exchanger cross-sectional area is given by the tube unit cell cross-sectional area multiplied by the total number of tubes. This approach enables the overall DRHX size to be selected on the basis of the available cross-sectional area inside of the reactor vessel, or the available vertical height, whichever is specified as a constraint. For example, if cross-sectional area is the limiting factor, then the corresponding DRHX tube length is determined to achieve the desired thermal rating.
In addition, the pressure drops on the shell and tube sides of the DRHX are calculated using standard techniques to facilitate the selection process since a low ΔP design is required for this natural convection system. The friction coefficient is evaluated as a function of flow Reynolds number using the well known Blasius correlation for fluid flow in smooth tubes. Tube bank entrance and exit loss coefficients are assumed to equal 0.5 and 1.0, respectively. The forced convection heat transfer coefficient on the primary coolant (shell side) of the DRHX is calculated using the classic Dittus-Boelter correlation which should be applicable to liquid salts. The fluid on the secondary (tube) side is assumed to be a liquid metal, since liquid metals are excellent heat transfer fluids and can be selected to have a low melting point well below that of the liquid salt minimizing trace heating requirements as well as the potential for freeze-up, and a high boiling point well above that of the liquid salt. The heat transfer coefficient on the secondary side is assumed given by the Lockhart-Martinelli correlation for forced convection of liquid metals in circular tubes.

98
A tube outer diameter of 2.22 cm and wall thickness of 0.89 mm were selected; the tubes were assumed arranged on a triangular pitch with p/d = 1.71. The heat exchanger primary side inlet and outlet temperatures were taken equal to the nominal core outlet and inlet temperatures of 1000 and 900°C, respectively. The secondary outlet and inlet temperatures are set to 680 and 530°C; these temperatures are significantly below the primary coolant temperatures, in order to maximize the heat transfer rate per unit area and minimize the DRHX size. However, large thermal gradients can give rise to thermal stresses which would need to be
evaluated for the specific DRHX materials, when they are identified.
Figures 5.17 through 5.19 show the calculated tube sheet planar area, tube length, and pressure drops across the shell and tube sides vs the number of tubes. For 250 tubes, the tube sheet planar area is ~ 0.15 m2, which corresponds to an equivalent diameter of ~ 0.5 m. The required heat exchanger active tube length for a 250 tube design is ~1 m. Thus, each DRHX will fit into the annulus above the core reflector with considerable margin. The pressure drops across the primary and secondary sides of the unit are 0.15 and 0.34 MPa, respectively. These low pressure drops will not significantly impede the system natural convection flows.
A computer code incorporating first principles modeling was developed to evaluate the DRACS performance. The code calculates four coupled natural convection flow circuits. As shown in Fig. 5.16, the first flow circuit is within the reactor vessel. The natural circulation flow path is from the core through the hot plenum, into the cold plenum that contains the DRHXs, and through the siphon breaker holes in the primary coolant return flow piping back to the bottom of the core, completing the flow circuit. A second natural convection flow circuit develops in the cold pool surrounding each DRHX. The DRHXs are essentially isolated “cold fingers” residing in the cold pool. The
0.05
0.10
0.15
0.20
0.25
0.30
0.35
100 125 150 175 200 225 250 275 300 325 350 375 400 425 450 475 500
Number of HX Tubes
Tube
She
et P
lana
r Are
a (m
2 )
Fig. 5.17. Tube sheet planar area vs number of tubes for a
3 MW(t) DRHX.
0.50
0.75
1.00
1.25
1.50
1.75
2.00
2.25
2.50
100 150 200 250 300 350 400 450 500
Number of HX Tubes
HX
Act
ive
Tube
Len
gth
(m)
Fig. 5.18. Tube length vs number of tubes for a 3 MW(t)
DRHX.
0.0
0.5
1.0
1.5
2.0
2.5
3.0
100 150 200 250 300 350 400 450 500
Number of HX Tubes
Pres
sure
Dro
p, k
Pad
Secondary (Tube) SidePrimary (Shell) Side
Fig. 5.19. Primary (shell) and secondary (tube) side ΔP vs
number of tubes for a 3 MW(t) DRHX.

99
cold pool liquid salt enters each DRHX through window-type openings in the DRHX outer shroud just below the upper tube sheet. The salt then flows down the shell side while depositing heat and returns to the cold pool at a reduced temperature through a second set of openings just above the lower tube sheet. The thermal centers separation distance for this second circuit is approximately equal to the DRHX tube height (~ 1 m). A third natural circulation flow field develops in the piping system from the tube side of the DRHX to the tube side of the NDHX. Finally, the fourth natural circulation flow field is through the NDHX which serves as the final heat sink for the system. For all four system flow paths, flow resistance to natural circulation is modeled assuming one-dimensional flow behavior in which flow form and frictional losses are calculated using standard (i.e., ΣK + fL/D) engineering methods.
Temperatures within the reactor vessel are determined by solving time dependent coupled differential equations for the core, hot plenum, and cold plenum regions, respectively, using a lumped capacitance method in which each region is characterized by a mass and an effective specific heat. The core decay heat level is evaluated using the ANS Standard decay heat curve assuming a uranium core. Heat transfer within the heat exchangers is evaluated using fairly detailed models that calculate the heat removal rates based on the current mass flow rates on the shell and tube sides of each unit. The heat transfer coefficient correlations used in the transient analysis are identical to those used in the DRHX design calculations. The initial core temperature was set equal to 1050ºC, while the initial temperatures of the hot and cold plena were both set equal to 900ºC. Six 34-cm-ID main coolant return pipes are assumed. The siphon breaker flow area for each pipe is taken equal to 80 cm2. With this information, and the additional assumption that the form loss coefficient for the siphon breaker holes is 1.0, then the effective entrance loss coefficient for each of the six coolant return lines is calculated as 130.5 referenced to the flow velocity in the pipe. Assuming an exit loss coefficient from each pipe of 1.0, then the total form loss coefficient for the pipes is 131.5. Thus, form losses at the siphon breaker
600
700
800
900
1000
1100
0 2 4 6 8 10 12 14 16 18 20 22 24
Time From Scram (Hours)
Tem
pera
ture
(°C
)
Core, 1 DRHXCore, 2 DRHXsCore, 3 DRHXsCold Plenum, 1 DRHXCold Plenum, 2 DRHXsCold Plenum, 3 DRHXs
Fig. 5.20. Core and cold plenum temperatures vs number of
available DRHXs.
0
10
20
30
40
50
0 2 4 6 8 10 12 14 16 18 20 22 24
Time From Scram (Hours)
Pow
er (M
W)
Decay HeatDRHX Heat Removal, 1 DRHXDRHX Heat Removal, 2 DRHXsDecay Heat Removal, 3 DRHXs
Fig. 5.21. DRACS heat removal rate and decay heat vs number of available DRHXs.

100
inlets are found to be the highest pressure drop contributors of the flow circuit within the reactor vessel. Six-in. (15-cm) diameter piping is assumed for the secondary flow system.
Figures 5.20 and 5.21 present the calculated DRACS performance for a protected loss-of-heat sink/loss-of-flow scenario as a function of the number of available DRHXs. Thus, the calculations assume that one or more of the independent systems associated with each DRHX is unavailable. At zero time, the reactor is scrammed from full power and the flow in the primary system is assumed to instantaneously fall to a level consistent with buoyancy-driven natural circulation flow for the given system temperature distribution. As soon as the reactor is scrammed, the dampers on the NDHXs open to bring the DRACS into operation.
Following scram, the average (lumped capacitance) core temperature rises a few degrees in the first few minutes but then decreases. This initial phase of temperature decline during the first hour is due to the massive heat sink provided by the core and primary coolant. However, the temperature subsequently rises for the case of one DRHX or decreases more gradually for two or three DRHXs. Even for the case of one operational DRHX, the core peak temperature is limited to ~1086°C, which occurs at ~18 h following scram. Beyond that time, the heat removal by the single DRHX exceeds the core decay heat. With two DRHXs available, the core temperature decreases monotonically after the first few minutes and the heat removal exceeds the decay heat after only 2.5 h. With three available DRHXs, heat removal exceeds the decay heat within the first hour.
5.2.4 RVACS and DRACS Summary
A first principles analysis of the steady state performance of a RVACS for emergency heat removal for a 2400 MW(t) LS-VHTR reveals that the maximum steady state heat removal capability is only about 0.26% of nominal power. The decay heat does not fall to this power level until about 17 d following reactor scram. This result applies to a RVACS having an optimized configuration with a guard vessel-to-air heat transfer coefficient enhanced to twice that of a smooth surface by the incorporation of surface protuberances.
An integrated transient systems analysis of the RVACS performance for a protected loss-of-heat sink/loss-of-flow scenario was performed assuming that the natural circulation air flow also cools the exterior of the guard vessel lower head. Cooling of the guard vessel lower head and a thermal barrier to insulate the inside of the reactor vessel lower head are required for the LS-VHTR where the coolant normally flows downward through the core and heated liquid salt enters the lower plenum. The analysis indicates that the reactor vessel temperatures would not exceed 670°C, which is below the criterion of 750°C used as a figure of merit. However, coolant temperatures in the core rise to about 1350°C, which is approaching the ~1400°C liquid salt boiling temperature over about 4.6 d before gradually decreasing thereafter. Thus, high coolant and fuel temperatures would be maintained in the LS-VHTR for days.
The use of a DRACS as an alternative to a RVACS for emergency decay heat removal is effective in limiting the peak temperatures attained as well as decreasing the time at which the heat removal exceeds the decay heat beyond which system temperatures subsequently decrease. A first principles analysis calculates that only a single DRHX about 1-m high and 0.5 m in diameter connected to secondary and tertiary cooling circuits limits the peak coolant temperatures to about 1100°C at about 18 h following scram in the protected loss-of-heat sink/loss-of-flow scenario With two available DRHXs, the temperatures only undergo a brief small increase during the first few minutes following scram and decrease thereafter with heat removal exceeding decay heat after only 2.5 h. The identification or development of suitable structural materials for the DRACS components immersed in the high temperatures of the liquid salt will be a challenge.

101
5.3 PERFORMANCE OF PRACS DECAY HEAT REMOVAL SYSTEM
PRACS is a new decay heat removal system that uses components of several other decay heat removal systems. As such, the experience base and refined models that exist for RVACS and DRACS do not currently exist for this system. The analysis and models are at an earlier stage of development.
5.3.1 Decay Heat System Assessment
Decay heat calculations were performed using a lumped parameter model with two nodes: one for the reactor vessel with all the materials inside (fuel, reflector, and coolant) plus the PRACS heat exchanger and the other one for the buffer tank with the DRACS. Heat was added to the first node (the reactor vessel) by the decay heat of the fuel. Heat was removed from this node via the PRACS. The buffer tank node had heat added via the PRACS (from the reactor vessel) and heat removed via the DRACS. The calculated volumes, masses and thermal capacities of the two nodes are shown in Table 5.3.
Table 5.3. Mass and thermal capacity of the LS-VHTR components
Item Material Volume (m3)
Ρ (kg/m3)
Cp (J/kg/K)
Mass (kg)
V*ρ*Cp (kJ/K)
TOTAL (kJ/K)
Vessel SS 34.7 8027 450 278,402 125,281 Coolant Vessel FLiBe 148.6 1926 2394 286,247 685,274 Fuel UOC/SiC/C 46.2 1582 1744 73,088 127,529 C-matrix C 19.7 1200 1820 23,698 43,131 C-Cladding C 28.6 1200 1820 34,363 62,542 C-Blocks C 143.8 1800 1820 258,926 471,245 C-Reflector C 331.7 1800 1820 597,120 1,086,758 Coolant-IHX FLiBe 11.5 1926 2394 22,188 53,117 S-Coolant-IHX LiF/NaF/KF 11.5 Not used 0 Coolant-PHX FLiBe 2.8 1926 2394 5,453 13,053 Coolant Pump FLiBe 2.7 1926 2394 5,270 12,615 Pump SS 2.7 8027 450 219,627 9,883 IHX SS 49.0 7034 450 344,400 154,980 PHX SS 1.8 8051 450 14,242 6,409 2,851,817 Buffer Tank and DHX Buffer Salt NaB 1457.1 1896 1511 2,762,883 4,177,231 DHX SS 2.3 8027 450 18,462.1 8,308 4,185,539
A computer program was developed to calculate the average temperature of the core and of the buffer tank as a function of time with results given in Figs. 5.22 and 5.23. Figure 5.22 shows the temperatures of the two nodes (core/vessel and buffer tank) and Fig. 5.23 shows the values of decay heat and power removed by the PRACS and by the DRACS (as fractions of the total nominal power of the reactor, 2400 MW). The results are very acceptable, with an increase in the average core/vessel temperature of 16ºC peaking at 6.2 h (22,320 s) after transient initiation, and with a buffer tank temperature increase of 85ºC at 13 h (46,500 s) into the transient. The initial average temperatures employed are 900ºC for the core and 500ºC for the buffer tank. Initially, the decay heat input into the core is larger than the heat removed by the PRACS, and the temperature of the core/vessel increases. After 6.2 h, the PRACS removes more heat than the decay heat input into the core, therefore, the core/vessel temperature decreases as a function of time. Similarly, before 13 h, DRACS removes less heat than the heat PRACS inputs into the buffer tank, and the buffer tank temperature increases. After 13 h into the transient, DRACS removes more heat than the PRACS input, and the buffer temperature decreases.

102
750
800
850
900
950
1000
1050
1100
1150
1200
0 10000 20000 30000 40000 50000 60000 70000 80000
Time after shutdown (s)
Tem
pera
ture
(K)
Core/vessel temperature
Buffer tank temperature
Fig. 5.22. Calculated temperatures of the core/vessel and the buffer tank after
reactor shutdown. Temperature in K, not°C.
0.005
0.01
0.015
0.02
0.025
0.03
0.035
0.04
0 10000 20000 30000 40000 50000 60000 70000 80000Time after shutdown (s)
Frac
tion
of N
omin
al P
ower
Decay
PRACS
DRACS
Fig. 5.23. Decay heat and power removed by the PRACS and the DRACS
after reactor shutdown [as fractions of the reactor nominal power, 2400 MW(t)].
The lumped parameter model assumes that the temperatures of every component inside the vessel are the same. In reality, there are temperature variations, with the fuel at the center of the core at the highest temperature (as it generates the most heat if the enrichment is same all the fuel due to the cosine power distribution). Also, fuel temperatures are higher than coolant or graphite block temperatures. Calculations for the coolant temperature leaving the core after reactor shutdown indicates that it increases from the steady state value of 950ºC to a value of about 1300°C and decreases afterwards (Fig. 5.24). The coolant mass flow rate under natural convection conditions has been estimated to reach a maximum value of 150 kg/s, which is about 1.5% of the value at full power.

103
Average Core Temperature
1000
1100
1200
1300
1400
1500
1600
0 10000 20000 30000 40000 50000 60000 70000 80000Time after shutdown (s)
Tem
pera
ture
K
Coolant Exit Temperature
Fig. 5.24. Coolant exit and average core temperature in K after reactor shutdown.
The decay heat curve employed is the same curve employed by the University of California design (Peterson and Zhao 2006). Figure 5.25 shows the decay heat (as fraction of the full power) curve as a function of time after shutdown. The models employed for the PRACS and the DRACS are basically the same models employed by Peterson and Zhao (2006). The PRACS heat removal is a function of the difference of temperatures of the two nodes: the core/vessel and the buffer tank. It removes 24 MW or 1% of the total reactor power when this temperature difference is 220 K. The DRACS model removes heat by radiation. The hot temperature is the temperature of the DRACS coils, which is also the temperature of the salt in the buffer tank (one node with the same temperature), and the cold temperature (sink) is 100ºC.
0.0050.01
0.0150.02
0.0250.03
0.0350.04
0.0450.05
0.0550.06
0.0650.07
0.0750.08
0.0850.09
0.0950.1
0 1000 2000 3000 4000 5000 6000 7000 8000 9000 10000
Time after shutdown (s)
Dec
ay H
eat (
Frac
tion
of N
omin
al P
ower
)
Fig. 5.25. Decay heat as a function of time after shutdown.

104
These calculations demonstrate that this design is acceptable; all the calculated temperatures, either at steady state or under decay heat conditions, are below acceptable limits. However, this design can be improved. The coolant velocity in the core is low, and it can be increased without a heavy penalty on the pressure drop. The current coolant inlet temperature is 850ºC and the coolant exit is 950ºC. By reducing the temperature difference between the inlet and the outlet of the coolant in the core to a value less than the current value of 100ºC, larger coolant velocities can be achieved, resulting in larger heat transfer coefficients and lower fuel centerline temperatures. The coolant exit temperature can be kept at the same value (950ºC), but the inlet temperature can be increased to 875ºC or even 900ºC.
There are considerable uncertainties in these calculations. The actual material properties, in particular, the actual graphite properties (in the blocks, cladding and fuel) may be different than the values employed here. There are many different kinds of graphite, and the graphite properties change with irradiation. These properties influence the calculated values of the temperatures in the fuel and in the blocks. In addition, the models of the PRACS and the DRACS are preliminary, and their effect on the results is also significant. Additional work is needed to complete the design of these components and to select the correct materials and their properties.
5.3.2 RELAP-5 Loss of Forced Cooling (LOFC) Transient Response Modeling for the PB-AHTR
Pebble fuels provide a potentially attractive fuel geometry for the LS-VHTR, due to the ability to operate with continuous refueling which increases the plant capacity factor by eliminating refueling outages, and which increases the efficiency of fuel utilization by minimizing the excess reactivity required to sustain criticality. For this reason, UCB initiated a set of analyses and experiments to support the design of a Pebble Bed Advanced High Temperature Reactor (PB-AHTR), based on the current LS-VHTR baseline AHTR-MI design described in Chapter 4. Research at Delft University has shown that liquid salt cooled pebble bed cores can be designed to have very small or negative void reactivity and strongly negative temperature reactivity feedback when flibe (7Li2BeF4) is used as the primary coolant (de Zwaan 2005). While the baseline LS-VHTR remains the prismatic fuel, the performance of the pebble-bed system is expected to be very similar under accident conditions because the pressure drops across the reactor core for the pebble-bed and prismatic fuel variants are small relative to pressure drops across other system components.
Figure 5.26 provides an elevation view of the PB-AHTR, showing the primary loop (left side) and PRACS/DRACS decay heat removal system (right side). Figure 5.27 shows the plan view, with the location of the major components. The primary pumps have been selected to be identical to the existing MSBR pump design to minimize development work. The PB-AHTR uses metallic Heatric-type compact heat exchangers for the intermediate heat exchangers (IHX). For electricity production, which requires a lower core outlet temperature (710°C, PB-AHTR-E), the IHX modules are constructed from Hastelloy N, a material already ASME code qualified for nuclear applications with liquid salts while for hydrogen production (900°C, PB-AHTR-H) a different high-temperature alloy is required.
Because fuel pebbles have lower density than flibe, fuel pebbles have a positive buoyancy and float in flibe. Therefore, refueling is reversed in the PB-AHTR compared to gas cooled reactors, with pebbles being removed from the top of the reactor vessel. Refueling of the PB-AHTR is discussed in Chapter 7. This section discusses the transient analysis of the PB-AHTR thermal hydraulics for a loss of forced cooling (LOFC) transient.

105
Fig. 5.26. Elevation view of the PB-AHTR showing the elevation and height of the current reference PHX
design.

106
Fig. 5.27. Plan view of the PB-AHTR showing the locations of the four defueling machines.
UCB completed the first full RELAP 5 (RELAP5 2003) modeling for the 2400 MW(t) Pebble Bed (PB) AHTR with a closed primary loop and separate buffer salt for the LOFC transient with scram. The version of RELAP used for the calculations was supplied by INL, who have added liquid salt properties to the code (Davis 2005). The LOFC results may also apply to other fuel forms used with the closed AHTR primary loop configuration (stringer and prismatic) due to the relatively small contribution of the core pressure drop to the total pressure losses under natural circulation and the small impact of the core heat transfer coefficients on the transient.
Table 5.4 lists the key design dimensions of the components used in the simulation. Of particular interest are the parameters for the PHX modules, which have a length that is half of the core height, with the tops of the tubes at the same elevation as the top of the core. This design was selected as the reference design after parametric studies of the sizing of the PHX.
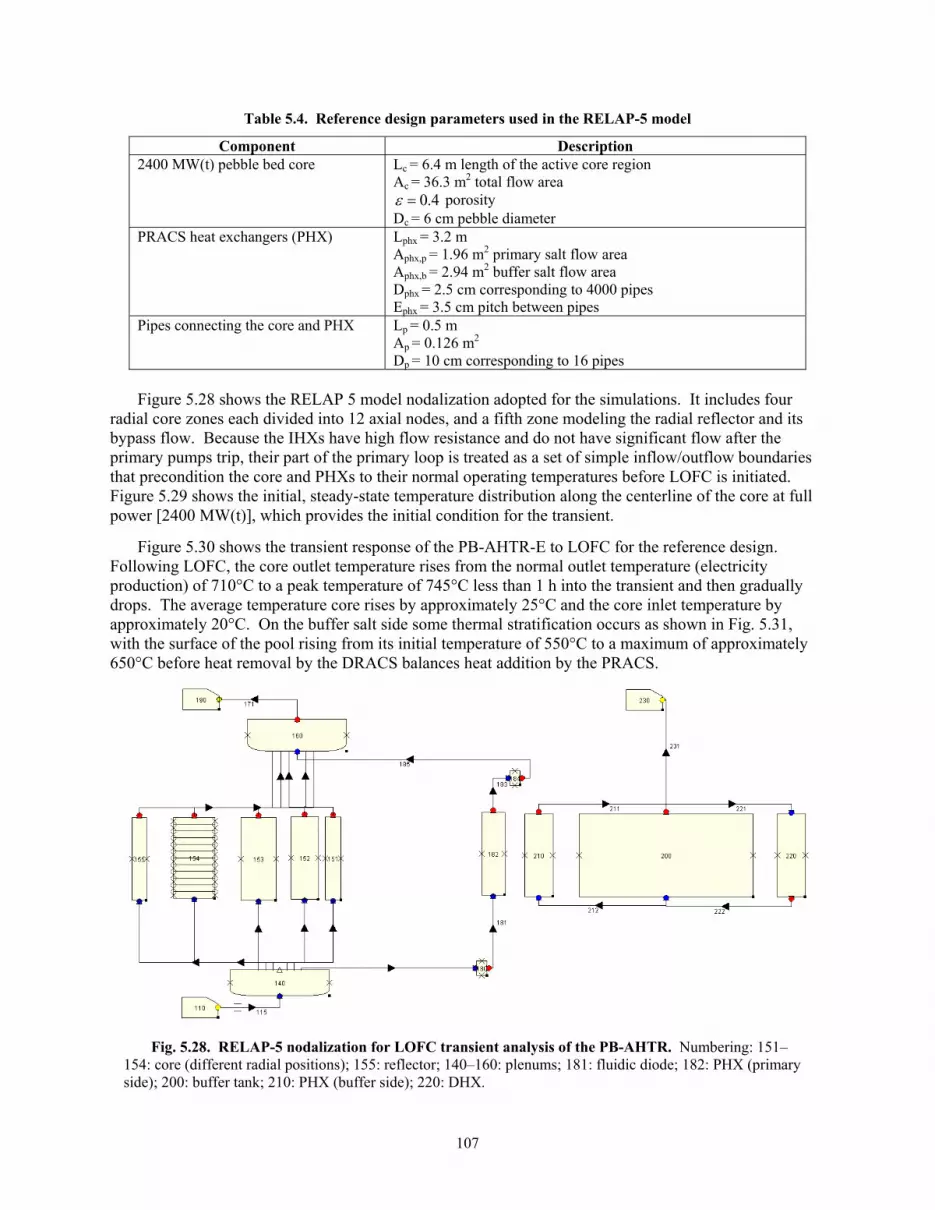
107
Table 5.4. Reference design parameters used in the RELAP-5 model
Component Description 2400 MW(t) pebble bed core
Lc = 6.4 m length of the active core region Ac = 36.3 m2 total flow area
0.4ε = porosity Dc = 6 cm pebble diameter
PRACS heat exchangers (PHX) Lphx = 3.2 m Aphx,p = 1.96 m2 primary salt flow area Aphx,b = 2.94 m2 buffer salt flow area Dphx = 2.5 cm corresponding to 4000 pipes Ephx = 3.5 cm pitch between pipes
Pipes connecting the core and PHX Lp = 0.5 m Ap = 0.126 m2
Dp = 10 cm corresponding to 16 pipes
Figure 5.28 shows the RELAP 5 model nodalization adopted for the simulations. It includes four radial core zones each divided into 12 axial nodes, and a fifth zone modeling the radial reflector and its bypass flow. Because the IHXs have high flow resistance and do not have significant flow after the primary pumps trip, their part of the primary loop is treated as a set of simple inflow/outflow boundaries that precondition the core and PHXs to their normal operating temperatures before LOFC is initiated. Figure 5.29 shows the initial, steady-state temperature distribution along the centerline of the core at full power [2400 MW(t)], which provides the initial condition for the transient.
Figure 5.30 shows the transient response of the PB-AHTR-E to LOFC for the reference design. Following LOFC, the core outlet temperature rises from the normal outlet temperature (electricity production) of 710°C to a peak temperature of 745°C less than 1 h into the transient and then gradually drops. The average temperature core rises by approximately 25°C and the core inlet temperature by approximately 20°C. On the buffer salt side some thermal stratification occurs as shown in Fig. 5.31, with the surface of the pool rising from its initial temperature of 550°C to a maximum of approximately 650°C before heat removal by the DRACS balances heat addition by the PRACS.
Fig. 5.28. RELAP-5 nodalization for LOFC transient analysis of the PB-AHTR. Numbering: 151–154: core (different radial positions); 155: reflector; 140–160: plenums; 181: fluidic diode; 182: PHX (primary side); 200: buffer tank; 210: PHX (buffer side); 220: DHX.

108
0 1 2 3 4 5 6 7 850
900
950
1000
1050
1100
1150
1200
Cen
terli
ne te
mpe
ratu
re (K
)
Position in the core (m) Fig. 5.29. Initial steady state temperature distribution, in Kelvin,
along the centerline of the PB-AHTR core, for the coolant (blue-bottom line), pebble surface (green-middle line), and pebble centers (red-top line).
Fig. 5.30. Transient response of the reference PB-AHTR core inlet (red),
average (blue), and outlet temperatures (green), in Kelvin, during a LOFC transient with scram.

109
Fig. 5.31. Transient response of the reference PB-AHTR buffer salt
temperature, in Kelvin, at various elevations.
Initial parametric studies for the PB-AHTR show that the core outlet, average, and inlet temperature histories can be tuned by adjusting the height of the PHX tubes, the PHX elevation in the buffer salt tank, and the number of PHX tubes. Moving the PHX upward in the buffer salt tank augments the natural circulation mass flow in the primary loop. Increased PHX flow tends to reduce the peak rise in the core outlet temperature and increase the peak rise in the average coolant temperature.
Upcoming work will begin to examine reactivity feedback, so that LOFC without scram can be modeled. In this case, it will be important to optimize the PHX design parameters to provide a relatively low rise in the core outlet temperature, while allowing the average coolant temperature to rise sufficiently for the reactor to shut down on negative temperature feedback. Different fuel configurations, in particular an “annular pebble” design where kernels are concentrated in an annular layer around an inert graphite center in the pebbles, will also be studied to examine the potential to reduce the fuel stored energy and the coolant temperature rise required for reactor shutdown based on negative temperature reactivity feedback.
The reference PB-AHTR-H design for hydrogen production has a target core outlet temperature of 900°C and inlet temperature of 700°C. For the PB-AHTR-H, the goal for the PHX optimization will be to have a very small rise (or even a drop) in core outlet temperature following LOFC, with the average coolant temperature rising sufficiently to provide reactivity shut down due to negative temperature feedback. Preliminary analysis indicates that this PB-AHTR-H goal is achievable.
These preliminary results indicate that the AHTR has a very mild core outlet temperature response to LOFC with scram, consistent with the results of previous thermal hydraulics modeling of earlier AHTR designs. An important conclusion is that the PHX design can be adjusted to tune the relative rise in the core outlet temperature vs the average primary coolant temperature following LOFC.
Along with additional RELAP modeling, design work will be performed for a reduced area, reduced height integral effects test (IET) to validate the LOFC transient response model, using low-temperature heat transfer oil as a simulant fluid for the primary salt to match Pr, Re, Gr, Fr and Nu (Bardet and Peterson 2005). The goal of the AHTR IET will be to provide an integral experiment capability for

110
AHTR LOFC transients similar to that of the 1:1705 scale semiscale IET at INL for PWR LOCA transients, at a total cost two orders of magnitude lower than the semiscale IET.
5.4 BASIS FOR SELECTION OF THE DECAY HEAT REMOVAL SYSTEM
The three alternative decay heat removal systems can all be made to work. The choice of system depends upon the ultimate goals (see Chapter 2) and the strong incentives to minimize the technical challenges. Based on these factors, the PRACS system (with the DRACS system for ultimate heat removal from the buffer pool) was chosen as the baseline decay heat removal system. The basis for that decision is described herein.
1. Reactor power limits. The RVACS (S-PRISM) decay heat cooling system that removes decay heat through the reactor vessel limits the ultimate reactor power level. The surface area of the reactor vessel is limited. The size has not been fully defined; however, it is desired to avoid this constraint. In contrast, the other two systems use DRACS for transfer of heat to the environment. There are no limits to the reactor power level with this type of system.
2. Modularization. DRACS and PRACS are modular systems. This has two major advantages: (1) the size of the decay heat removal system can be easily increased by increasing the number of modules and (2) only a single module needs to be tested for development and licensing. Full-scale tests are possible because they are small relative to the reactor size.
3. Physical protection. There are physical protection concerns about RVACS and the fact that air from the outside atmosphere goes close to the reactor core. In the chemical industry, many accidents are caused by some leak where the gas or vapor is drawn into some piece of equipment with adverse results. The DRACS and PRACS alternatives do not provide potential access within the reactor containment. Both are modular systems where any single reactor would have multiple parallel modes. This provides redundancy in the event of a failure of a single module for any cause.
4. Material limits. PRACS has significantly fewer high-temperature components and constraints than the other decay heat removal systems. In normal operation, the only components at high temperatures are the top of the graphite core, hot ducts, and heat exchangers. Furthermore, under accident conditions the lower temperature pool salt cools the outside of the reactor vessel and assures that it will not fail. High-temperatures in the primary system under accident conditions may damage equipment but will not fail that equipment because of this cooling feature. In the RVACS system, the reactor vessel is protected by an insulation layer from high temperatures. This implies that the insulation system serves a major safety function and imposes major requirements on that insulation. In the DRACS only system there is again no protective cool salt layer.
5. Heat capacity. Reactor temperatures under accident conditions are limited by two factors: (1) the heat capacity of the system and (2) decay heat removal systems. In PRACS the system heat capacity under accident conditions is maximized. The pool operates at lower temperatures. Second, the PRACS design under accident conditions allows the primary coolant system temperature to rise quickly relative to the pool salt. This temperature rise shuts down the reactor and minimizes decay heat that must be removed. In the other systems, all the pool salt must heat up before there is a temperature feedback to shut down the reactor.
6. Economics. The PRACS system with DRACS for ultimate heat removal allows the option of using a different lower-cost salt for the pool. The functional requirements for the ideal pool salt are not the same as for the primary system salt. In particular, there are strong incentives for large volumes of pool salt. Large volumes imply the need for a low cost salt.

111
7. Design freedom. The PRACS system allows the fluidic valve and PRACS heat exchangers to be sized independently of other system components. This provides a method to choose peak core temperatures under accident conditions independent of other design parameters.

112

113
6. LS-VHTR CORE DESIGN STUDIES
There are three high-temperature fuel form options: prismatic, pebble bed, and stringer (rod bundle). Helium-cooled high-temperature reactors have been built and operated using coated-particle prismatic and pebble bed fuels. The work in FY-2005 (Ingersoll et al. 2005) explored the design options for salt-cooled VHTR cores with prismatic fuel and developed workable core designs. These core designs remain the design basis for the LS-VHTR because they are the best understood, allow a wide choice of salt coolants, and are clearly viable. Delft University in the Netherlands has initiated a series of reactor core design studies (deZwaan, 2005) on salt-cooled pebble-bed VHTRs and has identified workable reactor core designs. The University of California at Berkeley has begun to further examine these core design options to better understand the design options. The third option is a stringer (rod bundle) fuel assembly. This type of fuel has potential manufacturing advantages, lower fuel fabrication costs, allows separation of most of the graphite from the fuel with waste management benefits, and allows for online refueling. However, it has never been examined for use in a liquid-salt-cooled reactor. In FY-2006 this core design option was examined in terms of neutronics and thermal hydraulics.
The British developed, deployed, and operate 14 Advanced Gas-Cooled Reactors (AGRs) that use stringer (rod bundle) fuel assemblies. The AGRs are graphite-moderated and cooled with carbon dioxide. The fuel consists of bundles approximately a meter long containing stainless-steel fuel pins with uranium dioxide pellets (see Chapter 7). A series of bundles are coupled together to form a stringer that is the full length of the reactor core. Before the British nuclear R&D program ended for unconnected reasons (the discovery of large quantities of North Sea natural gas), they partly developed higher-temperature coated-particle fuel rods and bundles. The relatively short pin length is similar to the length of coated-particle graphite-clad pins used in the Japanese High-Temperature Test Reactor (HTTR). The combination of British and Japanese experience strongly suggests that such a fuel bundle and stringer assembly could be built for a salt-cooled reactor. The FY-2006 studies by ORNL and ANL that are reported herein were initiated to determine the neutronics and thermal hydraulic characteristics of such design. This is the first step in determining the viability of this advanced fuel-assembly option. ORNL examined solid-rod configurations while ANL examined annular-rod designs similar to the Japanese HTTR fuel pins. Preliminary base-line designs and performance characteristics were developed for each configuration. ORNL separately evaluated radiation levels associated with the LS-VHTR.
6.1 ORNL NEUTRONICS STUDIES
The neutronics analysis performed in 2006 initially focused on an assessment of the coolant salts. The results of that work are presented in Sections 3.1.8 and 3.1.9 above. The design emphasis then shifted to more operation issues including that of refueling. Therefore, alternate core designs incorporating a clustered-rod configuration were considered at both ORNL and ANL. ORNL studied solid-rod configurations while ANL studied annular designs. Preliminary base-line designs and performance characteristics were developed for each configuration. The ORNL work is documented in Section 6.1.2. Finally, Section 6.1.3 presents analyses of the neutron fluxes, heating rates, and reaction rates throughout the vessel. This information is needed for thermal analysis of the vessel internals and assessment of the lifetime of the structural components.
6.1.1 Analysis Methods and Data
The physics analysis at ORNL was performed with tools contained within the SCALE5.1 system (2004). The SCALE system consists of data libraries, cross-section processing codes, radiation transport codes, and fuel depletion and activation routines that are used in a modular manner to perform comprehensive reactor analyses. The lattice physics and core calculations were performed using the

114
TRITON depletion sequence, which combines the BONAMI/CENTRM resonance processing, the NEWT or KENO-VI neutron transport, and the ORIGEN-S depletion and activation tools.
All analyses were performed with a 238-group ENDF/B-VI cross-section library that was processed with AMPX. The resonance processing procedure uses the Bondarenko methodology (BONAMI) for the unresolved resonance region and a continuous energy methodology for the resolved resonance region (CENTRM). The CENTRM resonance processing tool performs a near-continuous energy (point wise), one-dimensional, discrete-ordinates (S8, P3) transport calculation for each pin-cell type in the problem. This leads to a highly-accurate, problem-dependent flux spectrum incorporating resonance interference effects that is used as a weighting function for the near-continuous energy cross sections from ENDF/B-VI to create a problem-dependent 238-group cross-section library using the PMC code.
Recent additions to TRITON include the ability to perform resonance processing of cross sections for doubly heterogeneous fuel. This utilizes two CENTRM/PMC calculations in series: (1) to determine the spectrum of a particle and weight the particle cross sections, and then (2) to determine the spectrum in the compact/pebble and re-weight the cross sections accordingly. This is necessary for a proper analysis of the multiplication factor (kinf) in the LS-VHTR, which utilizes particle fuel within compacts. However, the reactivity change due to voiding proved insensitive to the double heterogeneity of the fuel, so many calculations within the study did not utilize this more complex option.
Two transport methods are available within TRITON: KENO-VI and NEWT. KENO-VI is a three-dimensional, multi-group stochastic transport code that was recently added to the TRITON depletion sequence. Three-dimensional analyses of the full LS-VHTR core were performed using KENO-VI, along with many of the other three-dimensional analyses, such as the parfait core design. The two-dimensional analyses were performed using NEWT, a two-dimensional, multi-group deterministic transport code that was originally developed for use in TRITON. It utilizes Extended Step-Characteristics (ESC) discretization to solve the characteristics form of the transport equation on an arbitrary polygonal mesh.
The TRITON depletion sequence utilizes the ORIGEN-S module to calculate fuel depletion, actinide transmutation, fission product buildup and decay, and associated radiation source terms. This tool was necessary for both the activation/transmutation of the salt coolant options and the dependence of the reactivity change due to coolant voiding on fuel burnup. Branch calculations were performed using TRITON to determine the change in the multiplication factor due to voiding as a function of fuel depletion for every time-step in the depletion sequence.
The radiation transport analysis methods are based on the DOORS system and specific tools and libraries are discussed in Section 6.1.3.
6.1.2 Parametric Study of a Clustered-Fuel Rod Assembly for the LS-VHTR
The FY-05 neutronics analyses of the LS-VHTR core optimized the Fort St. Vrain type fuel block for a liquid salt coolant. This design is shown below in Fig. 6.1.

115
Two issues that arose in the development of the FY-05 design were the buoyancy of the fuel block in liquid salt and the amount of high level waste produced when the whole fuel block is disposed of as a unit. The density of a Fort St. Vrain type fuel block is less than the density of Flibe or the other potential liquid salt coolants. This creates an issue during refueling, because when a block is being removed, the blocks below it may start floating around in the salt. Also, when disposing of the spent fuel from a Fort St. Vrain-type fuel block, the entire fuel block would be disposed resulting in the graphite occupying a significant portion of the spent fuel storage space.
One way to address both of these concerns is to replace the current design with a stringer-type fuel assembly of clustered fuel rods surrounded by a graphite block. In this design the fuel assembly would be the full height of the core, allowing it and the surrounding graphite blocks to be firmly secured thereby eliminating any buoyancy issues. This design would also allow the graphite block around the outside to be left in the core when the fuel assembly is removed or possibly separated from the fuel assembly after removal to be reused for a later reloading. Reusing the graphite block can allow the volume of spent fuel storage to be cut by as much as half.
An optimization study of a stringer-type fuel assembly focusing on maximizing excess reactivity and cycle length has led to a dual-annulus design composed of 91 pins in a hexagonal array. The target fuel cycle length is 18 months for a two-batch core, although this design could be used for online refueling also. To achieve the target cycle length, some excess reactivity must be given up. Balancing the desired fuel cycle length and maximized excess reactivity has lead to the following baseline design presented in Fig. 6.2.
Initial parameters. To begin the parametric study of the clustered-rod fuel assembly, several parameters were based on the FY-05 design including the reference temperatures, UCO fuel particle materials, a packing fraction of 25%, a fuel enrichment of 15%, and Flibe coolant enriched to 99.995% 7Li. The rods were arranged in a hexagonal array, although circular arrangements are also possible. The design parameters (with ranges) for the study included:
Fig. 6.1. FY-05 baseline LS-VHTR fuel block.

116
Fig. 6.2. Assembly baseline design for LS-VHTR.
• fuel rod diameter (0.5 cm–4.0 cm), • number of fuel rows (2–7), • pitch of fuel rods (1×–4× fuel diameter), • block pitch, and • use of graphite blocks in place of some fuel pins.
The initial evaluation of these designs looked at optimizing the multiplication factor (k), further analysis then looked at the cycle length.
Narrowing the possible designs. A list of possible configurations based on changing the fuel rod diameter, number of fuel rows, and pitch of the fuel rods was compiled for the initial parametric analysis. The clad thickness was set to one-third the diameter of the fuel compact, with the optimal thickness to be determined during later analysis. The coolant fraction of the total block was set to 15%. This initial list contained over three hundred possible designs. To narrow the list, the diameter of the fuel cluster was limited to 20–60 cm. The diameter of the fuel cluster was determined as (2 × n–1) times the fuel pitch, where n is the number of rows in the fuel array. The diameter of the fuel cluster represents the smallest circular hole needed to contain the fuel array. This limitation on the fuel cluster diameter reduced the possible configurations by half. The number of configurations can be halved again by eliminating designs with the distance between consecutive pins greater than one mean free path of a neutron in the system.
Since the goal of the study was to produce a fuel element that will perform as well as or better than the FY-05 design, three parameters were chosen as a basis to compare new designs to the old design: size of the total block, percent of block that will be fuel compact, and ratio of graphite to 235U (C/235U). The FY-05 design was 36 cm across the flats and the range of possible diameters of the fuel cluster was chosen to be 25–35 cm. This range for the cluster diameter limits the final element and block design to be the same size or slightly bigger than the previous design. The reason for placing a limit on size is that the core must still fit in the same 9.2-m-diam reactor vessel as the previous design. Another parameter for
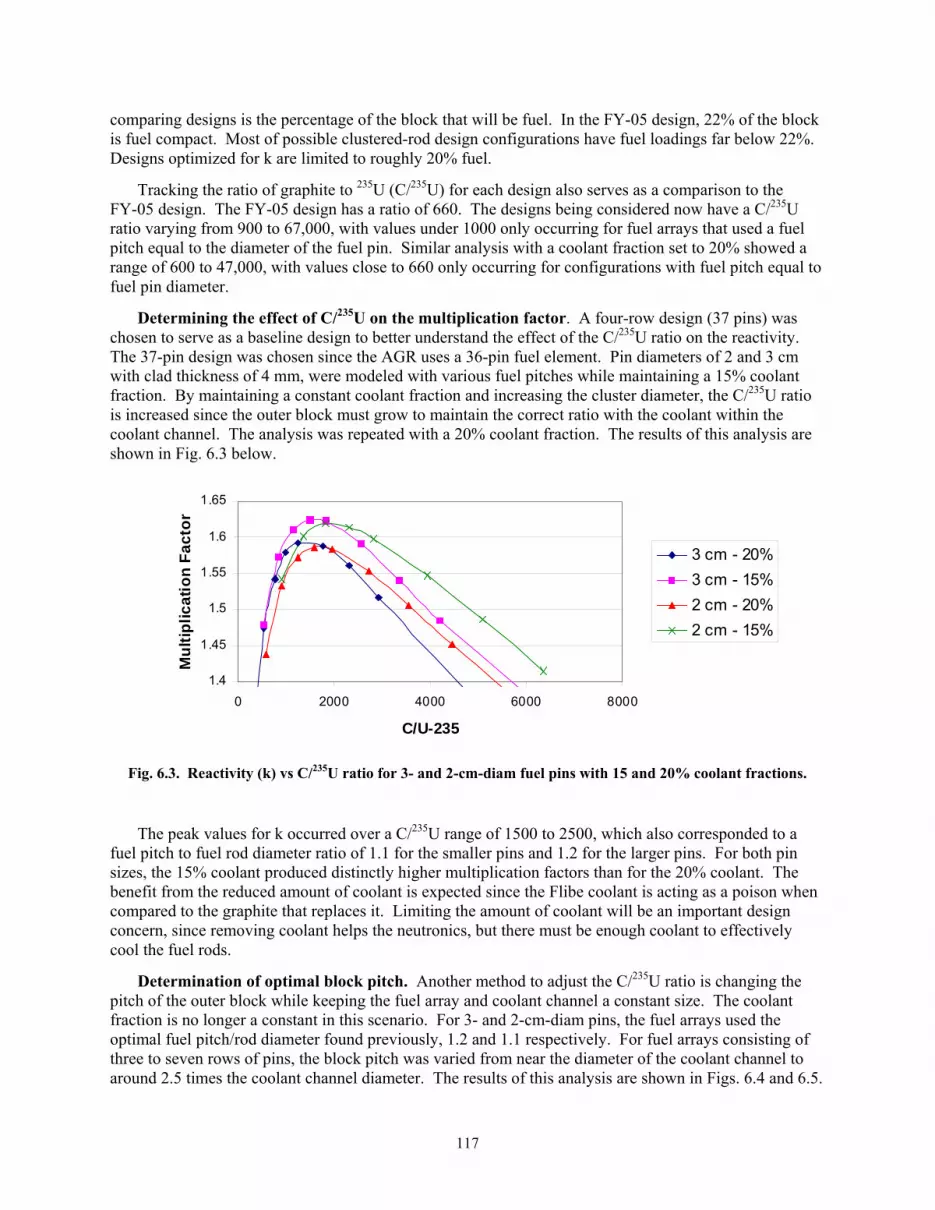
117
comparing designs is the percentage of the block that will be fuel. In the FY-05 design, 22% of the block is fuel compact. Most of possible clustered-rod design configurations have fuel loadings far below 22%. Designs optimized for k are limited to roughly 20% fuel.
Tracking the ratio of graphite to 235U (C/235U) for each design also serves as a comparison to the FY-05 design. The FY-05 design has a ratio of 660. The designs being considered now have a C/235U ratio varying from 900 to 67,000, with values under 1000 only occurring for fuel arrays that used a fuel pitch equal to the diameter of the fuel pin. Similar analysis with a coolant fraction set to 20% showed a range of 600 to 47,000, with values close to 660 only occurring for configurations with fuel pitch equal to fuel pin diameter.
Determining the effect of C/235U on the multiplication factor. A four-row design (37 pins) was chosen to serve as a baseline design to better understand the effect of the C/235U ratio on the reactivity. The 37-pin design was chosen since the AGR uses a 36-pin fuel element. Pin diameters of 2 and 3 cm with clad thickness of 4 mm, were modeled with various fuel pitches while maintaining a 15% coolant fraction. By maintaining a constant coolant fraction and increasing the cluster diameter, the C/235U ratio is increased since the outer block must grow to maintain the correct ratio with the coolant within the coolant channel. The analysis was repeated with a 20% coolant fraction. The results of this analysis are shown in Fig. 6.3 below.
The peak values for k occurred over a C/235U range of 1500 to 2500, which also corresponded to a fuel pitch to fuel rod diameter ratio of 1.1 for the smaller pins and 1.2 for the larger pins. For both pin sizes, the 15% coolant produced distinctly higher multiplication factors than for the 20% coolant. The benefit from the reduced amount of coolant is expected since the Flibe coolant is acting as a poison when compared to the graphite that replaces it. Limiting the amount of coolant will be an important design concern, since removing coolant helps the neutronics, but there must be enough coolant to effectively cool the fuel rods.
Determination of optimal block pitch. Another method to adjust the C/235U ratio is changing the pitch of the outer block while keeping the fuel array and coolant channel a constant size. The coolant fraction is no longer a constant in this scenario. For 3- and 2-cm-diam pins, the fuel arrays used the optimal fuel pitch/rod diameter found previously, 1.2 and 1.1 respectively. For fuel arrays consisting of three to seven rows of pins, the block pitch was varied from near the diameter of the coolant channel to around 2.5 times the coolant channel diameter. The results of this analysis are shown in Figs. 6.4 and 6.5.
1.4
1.45
1.5
1.55
1.6
1.65
0 2000 4000 6000 8000
C/U-235
Mul
tiplic
atio
n Fa
ctor
3 cm - 20%3 cm - 15%2 cm - 20%2 cm - 15%
Fig. 6.3. Reactivity (k) vs C/235U ratio for 3- and 2-cm-diam fuel pins with 15 and 20% coolant fractions.

118
From Figs. 6.4 and 6.5, it can be seen that there is a different optimal block pitch to channel diameter ratio for each different fuel array size. In both cases, the optimal values fall in a range of 1.5 to 2 times the diameter of the coolant channel. This range will serve as a starting point for later design development and also corresponds closely with the optimal C/235U ratio range found earlier, 1500–2500.
The maximum value of the multiplication factor drops as rows of fuel are added, which is expected because of spatial self-shielding of the fuel. Figures 6.4 and 6.5 also seem to indicate that as the fuel rod diameter gets smaller there is less of an effect from adding rows. To further explore this trend the analysis was performed for 1.5-cm-diam fuel rods with the results shown in Fig. 6.6.
1.4
1.45
1.5
1.55
1.6
1.65
1.00 1.50 2.00 2.50
block pitch / channel diameter
Mul
tiplic
atio
n Fa
ctor
3 rows
4 rows5 rows
6 rows
7 rows
1.4
1.45
1.5
1.55
1.6
1.65
1.00 1.50 2.00 2.50
block pitch / channel diameter
Mul
tiplic
atio
n Fa
ctor
3 rows4 rows5 rows6 rows7 rows
Fig. 6. 4. Reactivity (k) vs block pitch/coolant channel diameter for 3-cm-diam fuel rods with a fuel pitch of 3.6 cm (fuel pitch/rod diam = 1.2).
Fig. 6.5. Reactivity (k) vs block pitch/coolant channel diameter for 2-cm-diam fuel rods with a fuel pitch of 2.2 cm (fuel pitch/rod diam = 1.1).

119
The results for the 1.5-cm-diam fuel rods confirms that as the fuel rods become smaller, adding rows has less effect on the multiplication factor. This confirms that the effect seen in Figs. 6.4 and 6.5 is the result of resonance self-shielding in the fuel because as the fuel rods become smaller less fuel is present to do the shielding.
Fuel burnup changes the ratio of carbon to fissile material as a function of time. As the fuel element is irradiated, 235U is burned out and other fissile isotopes such as 239Pu are created. However, the creation of fissile isotopes is slower than the fission of 235U, resulting in a decline in the amount of fissile material and, therefore, an increase in the C/fissile ratio and a reduction in k separate from the burnout of fissile materials. By starting a fuel element near or below the low end of the optimal C/235U range, the C/fissile ratio stays in an optimal range during more of the fuel lifetime resulting in a longer lifetime and fuel cycle.
Graphite cladding thickness. For this initial design work the cladding thickness was allowed to vary with the fuel rod size, with bigger fuel rods having thicker cladding. As the analyses continued, the cladding thickness was set to 4 mm since that is the cladding thickness that has been used for the Japanese high-temperature test reactor (HTTR). To explore the effect of cladding thickness on the fuel, various simulations were ran with fuel rods composed of a 2.2-cm-diam fuel compact and cladding thicknesses varying from 2 to 7 mm. The first calculations were performed with a constant fuel to coolant ratio, meaning that as cladding is added it replaces coolant near the fuel rods resulting in the rods needing to be spaced farther apart to maintain enough coolant around the fuel. The addition of 1 mm of cladding resulted in the loss of 0.5% reactivity and removing 1 mm of cladding adding 0.5% reactivity.
Additional simulations were performed with three different fuel pitches and the cladding thickness varying from 2 to 8 mm. The purpose of these calculations was to look at the effect of changing cladding thickness while maintaining a specific fuel pitch. Analysis of this data showed that, for all fuel pitches, removing 1 mm of cladding results in a 0.5% loss of reactivity, with the addition of 1 mm of cladding adding 0.5% reactivity. The results are shown in Fig. 6.7.
1.4
1.45
1.5
1.55
1.6
1.65
1.00 1.50 2.00 2.50
block pitch / channel diameter
Mul
tiplic
atio
n Fa
ctor
3 rows4 rows5 rows6 rows7 rows
Fig. 6.6. Reactivity (k) vs block pitch/coolant channel diameter for 1.5-cm-diam fuel rods with a fuel pitch of 1.65 cm (fuel pitch/rod diam = 1.1).

120
Based on the previous data, adjusting the cladding thickness has a small effect on the neutronics of the system. Therefore, the cladding was assumed to be 4-mm thick during most of the analyses, since that is known to be an acceptable thickness for manufacturing. Later refinement to arrive at the assembly baseline design reduced the clad thickness to 3 mm to increase the amount of coolant between the fuel rods, while maintaining a desirable fuel pitch.
Replacement of fuel pins with graphite pins. The purpose behind replacing some fuel pins with graphite pins is to flatten the power peaking within the fuel assembly and reduce the overall block size while maintaining the desired graphite to 235U ratio. The best use of graphite pins would be to replace fuel pins that are not contributing significantly to the power production of the assembly. The locations of the fuel pins with lowest power production are determined by determining the pin by pin power peaking within the fuel assembly. Examining the power peaking also serves as a safety check to ensure that no pins are producing significantly more than the average pin power.
Based on the diameter limitation of the fuel assembly (25–35 cm) and the optimal fuel pitches, possible configurations using 3-cm-diam fuel pins are limited to 4, 5, or 6 rows of pins. Similarly the 2-cm-diam configurations are limited to 6 or 7 rows of pins.
The relatively flat power peaking for the 2-cm designs and the 3-cm, 4-row designs, as shown in Table 6.1, indicates that the addition of graphite pins will have less of an effect than it would for the 3 cm, 5- and 6-row configurations. The greatest benefit occurs for the 3-cm, 6-row configurations. The replacement of the middle pin and the fourth row from the center with graphite pins, the same size as the fuel pins, results in 1% reactivity gain and Pmin/Pave and Pmax/Pave values of 0.9 and 1.05, respectively. This design also results in a flat power peaking across the fuel element over the whole life of the element, as shown in Fig. 6.8 below.
0.36
0.365
0.37
0.375
0.38
0.385
0.39
0.395
0.4
0.405
0 0.2 0.4 0.6 0.8 1
clad thickness (cm)
Rea
ctiv
ityconstant fuel/salt3.35 cm fuel pitch3.6 cm fuel pitch3.9 cm fuel pitch
Fig. 6.7. Reactivity vs cladding thickness for various fuel pitches using 2.2-cm-diam fuel compacts.

121
Table 6.1. Power peaking values for possible fuel designs
Fuel pin diameter Rows Pmin/Pave Pmax/Pave
3 cm 4 0.89 1.11 5 0.84 1.16 6 0.79 1.24
2 cm 6 0.92 1.10 7 0.88 1.13
Fuel cycle length. One-batch burnup calculations were performed using the TRITON/NEWT depletion sequence. The results are shown in Fig. 6.9. Calculations were performed for three different lengths of the baseline design, 8, 9. 3, and 10 m. The 8-m core height corresponds to the core height of the FY-05 design. The 9.3-m height corresponds to a core with a similar burnup rate (150 MW/MTHM) as the FY-05 design. A 10-m core height was analyzed to determine any gains from extending the height of the core. Three percent neutron leakage was assumed for the cycle length calculations. From the one-batch cycle lengths, two-batch cycle lengths can be calculated and are shown in Table 6.2. The cycle lengths shown in Table 6.2 do not include down time for refueling, so the 513-d life of the 9.3-m-tall element would be 18 months if 1 month is added for the refueling outage.
Table 6.2. One- and two-batch cycle lengths for various core heights
Cycle length (d) Element
height One-batch
Two-batch
8 m 650 433 9.3 m 770 513 10 m 820 547
-9%
-6%
-3%
0%
3%
6%
9%
1 2 3 4 5 6
Pin Row
Rel
ativ
e Po
wer
Pea
king
BOLMOLEOL
Fig. 6.8. Power peaking in baseline clustered-rod fuel assembly.

122
Core layout and final fuel element design. The reactor vessel diameter was assumed to be 9.2 m, the same as the FY-05 vessel. The assembly baseline design, as shown again in Fig. 6.10, can be arranged within this vessel as shown in Fig. 6.11. The core consists of 211 fuel blocks surrounded by a graphite reflector with a minimum thickness of 0.78 m. Table 6.3 provides a final comparison of the design parameters of the clustered-rod design and the FY-05 design.
Fig. 6.10. Clustered-rod baseline fuel element design.
0
0.05
0.1
0.15
0.2
0.25
0.3
0.35
0.4
0 200 400 600 800
Effective Full Power Days
Rea
ctiv
ity 9.3 m8 m10 m
Fig. 6.9. Reactivity vs full power days for a one-batch core loading.
Fig. 6.11. Core layout using clustered-rod baseline fuel blocks and solid graphite reflector blocks.
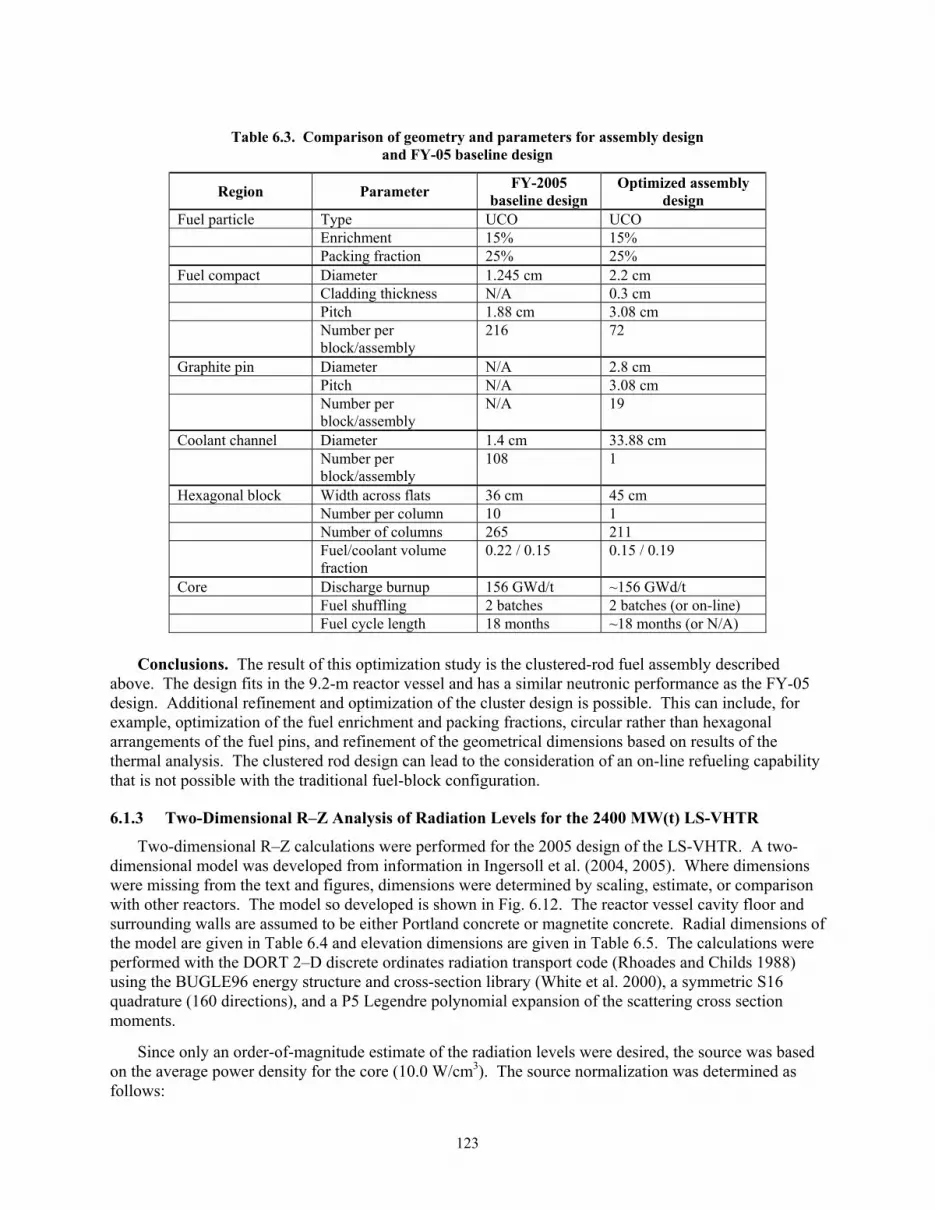
123
Table 6.3. Comparison of geometry and parameters for assembly design and FY-05 baseline design
Region Parameter FY-2005 baseline design
Optimized assembly design
Fuel particle Type UCO UCO Enrichment 15% 15% Packing fraction 25% 25% Fuel compact Diameter 1.245 cm 2.2 cm Cladding thickness N/A 0.3 cm Pitch 1.88 cm 3.08 cm Number per
block/assembly 216 72
Graphite pin Diameter N/A 2.8 cm Pitch N/A 3.08 cm Number per
block/assembly N/A 19
Coolant channel Diameter 1.4 cm 33.88 cm Number per
block/assembly 108 1
Hexagonal block Width across flats 36 cm 45 cm Number per column 10 1 Number of columns 265 211 Fuel/coolant volume
fraction 0.22 / 0.15 0.15 / 0.19
Core Discharge burnup 156 GWd/t ~156 GWd/t Fuel shuffling 2 batches 2 batches (or on-line) Fuel cycle length 18 months ~18 months (or N/A)
Conclusions. The result of this optimization study is the clustered-rod fuel assembly described
above. The design fits in the 9.2-m reactor vessel and has a similar neutronic performance as the FY-05 design. Additional refinement and optimization of the cluster design is possible. This can include, for example, optimization of the fuel enrichment and packing fractions, circular rather than hexagonal arrangements of the fuel pins, and refinement of the geometrical dimensions based on results of the thermal analysis. The clustered rod design can lead to the consideration of an on-line refueling capability that is not possible with the traditional fuel-block configuration.
6.1.3 Two-Dimensional R–Z Analysis of Radiation Levels for the 2400 MW(t) LS-VHTR
Two-dimensional R–Z calculations were performed for the 2005 design of the LS-VHTR. A two-dimensional model was developed from information in Ingersoll et al. (2004, 2005). Where dimensions were missing from the text and figures, dimensions were determined by scaling, estimate, or comparison with other reactors. The model so developed is shown in Fig. 6.12. The reactor vessel cavity floor and surrounding walls are assumed to be either Portland concrete or magnetite concrete. Radial dimensions of the model are given in Table 6.4 and elevation dimensions are given in Table 6.5. The calculations were performed with the DORT 2–D discrete ordinates radiation transport code (Rhoades and Childs 1988) using the BUGLE96 energy structure and cross-section library (White et al. 2000), a symmetric S16 quadrature (160 directions), and a P5 Legendre polynomial expansion of the scattering cross section moments.
Since only an order-of-magnitude estimate of the radiation levels were desired, the source was based on the average power density for the core (10.0 W/cm3). The source normalization was determined as follows:

124
Neutron Source = 10.0 W/cm3 × 3.1 × 1010 fissions/W-s × 2.45 n/fission = 7.595 × 1011 cm−3 s−1
For a volume equal to 2.3586 × 108 cm3, this results in a total source of 1.7914 × 10²⁰ s−1 (which is the
same total source that DORT calculates when the source density given above is input uniformly throughout the core region of the model). The total power for a 10 W/cm3 density is about 2359 MW(t).
Cross-section mixtures for transport as well as for reaction rates were calculated using the AXMIX computer code (Haynes 1974). The vessel and other metal components were assumed to be composed of Hastelloy-N. The fuel specifications in Ingersoll et al. (2005) were used to obtain smeared densities for the fuel pins, and those densities were smeared across the fuel block along with the smeared densities for the coolant and the graphite block to obtain the composition for the core. An enrichment of 10.36% was used. The composition of the Portland concrete was obtained from Slater et al. (1979) and that for the magnetite concrete was obtained from Abbott et al. (1975). The composition of the Hastelloy-N was obtained from Hollenbach and Hopper (1994). Compositions for the other materials were obtained through calculations based on the material densities and the volume fractions of the materials within the homogenized regions. Since the BUGLE96 library contains cross sections for isotopes of chromium, iron, and nickel, nuclide densities for those elements are given for each isotope, although, in AXMIX, the cross sections are mixed into elemental compositions prior to the reactor mixtures being calculated.
Fig. 6.12. Two-dimensional R-Z geometry model for the LS-VHTR.

125
Thirty-eight response functions were used, although only 12 categories of responses were calculated. Some of the response functions were zone dependent. For each of the seven nonvoid materials (see Table 6.5), there was a response function that consisted of the energy-dependent macroscopic kerma factors for the materials. Most of the kerma factors were extracted from data sets described in White et al. (2000). Since neutron kerma factors for titanium and molybdenum are zero in the BUGLE96 library, neutron kerma factors for these elements were obtained from the DABL69 library (Ingersoll et al. 1989) and converted to the BUGLE96 structure using the AMP code (Engle 1975).
Table 6.4. Radial dimensions for the 2-D R-Z model of the LS-VHTR
Description Dimension (cm)
Inner radius of the coolant return regiona 34.088 Outer radius of the coolant return regiona 49.112 Outer radius of the core 307.692 Outer radius of the reflector 429.772 Inner radius of the vessel 450.0 Outer radius of the vessel 460.0 Inner radius of the guard vessel 480.0 Outer radius of the guard vessel 482.5 Inner radius of the baffle 532.5 Outer radius of the baffle 537.5 Inner radius of the concrete liner 587.5 Outer radius of the concrete liner 593.5 Outer radius of the concrete (for calculational purposes only) 653.5 Radius of reactor head 508.0
aAssumed the two return pipes had a 50-cm diameter and could be represented by an annulus centered at a radius of 41.6 cm (twice the length of a side of a hex block).
An all-zero response function was used for the heating response function for void regions and as the
response function for the other response types in any region where the response should be zero. Response functions for six neutron flux integrals (E > 1.0 MeV, E > 0.1 MeV, E > 0.414 eV, 0.414 eV < E < 0.1 MeV, E < 0.414 eV, and total) were included. In addition to these 14 response functions, there were:
1. a dose-rate response function with units of rem·cm2·s/h, 2. hydrogen and helium production macroscopic cross sections for the seven materials, 3. tritium production cross sections for six materials (none for graphite), and 4. 3He production cross sections for three materials (Hastelloy-N, and Portland and magnetite
concretes). The twelve categories of responses are:
1. heating, 2. E > 1.0 MeV neutron flux, 3. E > 0.1 MeV neutron flux, 4. E > 0.414 eV neutron flux, 5. 0.414 eV < E < 0.1 MeV neutron flux, 6. E < 0.414 eV (thermal) neutron flux, 7. total neutron flux, 8. the total dose rate, 9. hydrogen production,

126
10. helium production, 11. tritium production, and 12. 3He production.
The last four reactions have units of cm−3 s−1.
Table 6.5. Elevations for various components in the 2-D R-Z model of the LS-VHTR
Description Elevation (cm)
Bottom of concrete (for calculational purposes only) −2176.0 Bottom of cavity liner −2116.0 Top of cavity liner −2110.0 Bottom of guard vessel/baffle −2090.0 Top of guard vessel floor −2087.5 Bottom of reactor vessel −2067.5 Bottom of graphite liner −2057.5 Bottom of lower plenum −2037.5 Bottom of the reflector −1820.0 Bottom of the core −1740.7 Top of the core −947.7 Top of the reflector −868.4 Base of cavity inlet cooling channel −370.0 Top of cavity inlet cooling channel −320.0 Bottom of cavity outlet cooling channel −315.0 Top of cavity outlet cooling channel − 265.0 Top of upper plenum −220.0 Top of floor/bottom of reactor vessel flange −110.0 Bottom of reactor head −60.0 Top of reactor head 0.0
While some quantities of the light nuclides are produced from the fission reaction, the VITAMIN-B6
library does not give any production values for 235U or 238U. So production from the fission reaction is not included in the calculated quantities. The appropriate response function for those reactions would be the energy-dependent macroscopic fission cross sections times the fission yield of those particles. The yields are not readily available. Also not included in the helium production is the alpha decay from 238U. In addition, production due to secondary particle emissions from inelastic neutron collisions or collisions with multiple neutron emissions is not included.
Results. Fluxes along with the responses described above are supplied for the Portland concrete shielded model. The responses were calculated with the code ACTCMP31. The calculated responses for some zones were zero because the response function values for the zone were zero (e.g., no reactions in void zones or no tritium production in zones without nuclides having nonzero tritium production cross sections). For these cases, the response value assigned to mesh within those zones was 0.01 times the smallest nonzero response value. This was an artificial device to prevent plotting difficulties with the ISOPLOT code that was used to plot the response contours. On the figures, these zones are shaded with the > 0.0 contour color. Contours of the total neutron flux (cm−2 s−1) are shown in Fig. 6.13.
1ACTCMP3 is an unpublished code written by C. O. Slater. It calculates responses at DORT mesh using zone-dependent
response functions and DORT flux files.

127
Fig. 6.13. Contours of the total neutron flux (cm−2 s−1) for a 2-D R–Z model of the LS-VHTR.
Contours of the heating rates (W/cm3) are shown in Fig. 6.14 and contours of the total dose rate (mrem/h) are shown in Fig. 6.15. As can be seen from the figures, the coolant in the upper plenum attenuates the neutron fluxes and other responses several orders of magnitude (at least 20 orders for the E > 0.1 MeV neutron flux). It is believed that this made it difficult to achieve the desired convergence for the DORT calculations. Key fluxes at the top center of the model were generally converged after the last iteration for each group. For the dose rate contours, the maximum dose rate above the floor is about 0.15 mrem/h. The maximum dose rate from the magnetite concrete shielded model is approximately 0.2 mrem/h. Neutron spectra at key locations were also calculated and are plotted in Figs. 6.16 and 6.17 for the Portland concrete shielded model.

128
Fig. 6.14. Contours of the heating rates (W/cm3) for a 2-D R-Z model of the LS-VHTR.

129
Fig. 6.15. Contours of the total dose rate (mrem/h) for a 2-D R-Z model of the LS-VHTR.

130
Fig. 6.16. Neutron flux spectra at key locations for the Portland concrete shielded LS-VHTR.
Fig. 6.17. Neutron flux spectra at key locations for the Portland concrete shielded LS-VHTR.

131
6.2 ORNL THERMAL/HYDRAULIC ANALYSES
The new core design employing separate fuel pins in direct contact with the coolant was checked for thermal-hydraulic limits. Calculations were completed at full power steady state conditions and under decay heat conditions after reactor shutdown.
The basic core design values provided by the neutronics calculations are as follows:
Graphite block: 45 cm across flats, 8 m height, 33.88 cm diameter inside hole for coolant and pins. Pins (per block): 72 fuel, 19 graphite, 91 total (in six radial rows, with rows 1 and 4 being graphite pins). Fuel pin pitch: 3.08 cm. Fuel pin length (height): 8 m, same as blocks. Fuel pin diameter: 2.8 cm, with 0.3 cm cladding, and 2.2 cm diameter fuel compact. Graphite pin diameter: 2.8 cm (same outside diameter as the fuel pin). Core: 211 graphite blocks (9 radial rows minus 6 corner blocks). Radial reflector: 3 rows of solid graphite blocks surrounding the core. Vessel inside diameter: 9.2 m. Coolant: Flibe (2LiF-BeF2). Coolant temperatures: 850ºC input, 950ºC output. Total power: 2400 MW(t).
Cross sectional views of one assembly (graphite block) and of the full core, including the reflector blocks, are provided in Figs. 6.10 and 6.11, in Section 6.1 above. A general view of the previous concept with short prismatic graphite fuel blocks (with fuel compacts embedded in the graphite blocks) is given in Figs. 1.2 and 1.3 in the introduction to this report.
In order to prepare the T/H model, additional components and dimensions needed to be defined. Thus, some additional input values were assumed as follows:
Top and bottom reflector: 1-m thick. For the 211 blocks on top and below the core blocks, half of their cross sectional area is open for coolant flow. Vessel upper and lower plenums: 1 m height, the total vessel height is 12 m (8 m core plus 2 m reflector and 2 m plena). Upper plenum volume: 60% open for coolant, 40% control rods and other structures. Lower plenum volume: 100% open for the coolant. Buffer tank dimensions: 16 m diameter, 14 m height, initial temperature: 500ºC. PRACS and DRACS: similar to the University of California design (Peterson and Zhao 2006). PRACS: eight sectors with 275 tubes each, 2-cm outside diameter, 2-mm wall thickness, 10-m height. Total number of tubes: 2200.
The pipes connecting the vessel with each PRACS sector are 20 cm inside diameter and 1.5 m long. There are eight pipes at the top and eight pipes at the bottom of the vessel, each pair of pipes connecting with each sector of the PRACS. The material properties used in the analyses are as follows:

132
Fuel, ρ= 1582 kg/m3, cp = 1744.87 J/kgK, k = 10.0 W/mK Cladding, ρ= 1200 kg/m3, cp = 1820 J/kgK, k= 30.0 W/mK Graphite blocks, ρ= 1800 kg/m3, cp = 1820 J/kgK, k = 30.0 W/mK Coolant salt, FLiBe, ρ= 1840 kg/m3 at 900ºC , cp = 2386 J/kgK, k = 1.1 W/mK. Buffer salt, NaB, ρ= 1896 kg/m3, cp = 1512 J/kgK Stainless steel, ρ= 8027 kg/m3, cp = 450 J/kgK
The density and the viscosity of the coolant salt were calculated as a function of the temperature. The heat capacity and the thermal conductivity of the coolant sere not varied with the temperature. The properties of the solid components were not varied with temperature.
6.2.1 Steady State Flow and Temperature Results
For the conditions given, the total mass flow rate in the core is calculated by
Power (W) = m cp ΔT
With a power of 2400 MW and a temperature drop across the core of 100ºC, the mass flow rate is 10,059 kg/s. The mass flow rate per assembly (211 assemblies or blocks) is 48.55 kg/s.
The flow area per assembly is 314.1882 cm2, the total core flow area (211 assemblies) is 7.199 m2. A cosine power distribution was employed in the axial direction and constant power in the radial direction. Using an average coolant density of 1840 kg/m3 (at 900ºC), the calculated coolant velocity in the core is 0.76 m/s, resulting in a pressure drop of 8.74 kPa in the core region (8 m height). The calculated Reynolds numbers are between 6400 and 8400, the convective heat transfer coefficients (coolant/fuel) are between 4100 and 4560 W/m2K, and the radial temperature drop (coolant-fuel centerline) is between 100ºC and 310ºC, with a maximum fuel centerline temperature of 1214ºC at a core elevation of 4.5 m. These results are shown in Figs. 6.18 and 6.19. All these calculated values are acceptable. Table 6.6 summarizes these results.
Coolant and Fuel Centerline Temperatures
800
900
1000
1100
1200
1300
0 100 200 300 400 500 600 700 800Position (cm)
T (C
)
Coolant Fuel Center
Fig. 6.18. Calculated coolant and fuel centerline temperatures along the
core height at 100% power under steady state conditions.

133
This flow configuration has open areas without pins in the periphery of the assembly (Fig. 6.10), resulting in larger coolant flows in these areas and lower flows in the center of the assembly with uneven cooling of the pins. In order to avoid this undesirable situation, the cross-sectional area has been reduced by cutting the sides of the coolant circular area inside the graphite blocks. The central hole is changed from circular (with radius 33.88/2 = 16.94 cm) to hexagonal with a side of 16.94 cm. This new configuration eliminates coolant flow bypass around the peripheral fuel pins and increases the average coolant velocity. The reduced coolant flow area is 185.2188 cm2 per block, vs 341.1882 cm2 for the original design. The average coolant velocity is increased by this change to 1.39 m/s. Heat transfer coefficients (coolant/fuel) increase to values around 8000 W/m2K, and the maximum fuel centerline temperature is now 1184ºC (30ºC less than the previous configuration). The total pressure drop in the core region increases to 54.3 kPa, still a very acceptable value.
Table 6.6. LS-VHTR steady state calculations
Parameter Value Power 2400 MW(t) Fuel volume 42.2 m3
Core volume 296.024 m3
Specific Power Fuel 51.95 MW/m3
Core 8.1 MW/m3
Coolant temperatures Inlet 850ºC Outlet 950ºC Coolant flow 10059 kg/s (5.467 m3/s) Coolant area 7.199 m2
Coolant velocity 0.75–0.77 m/s Re 6412–8415 Nu 56–62 h-coolant (W/m2C) 4093–4563 ΔT, coolant (ºC) 69 ΔT, cladding (ºC) 33 ΔT, fuel (ºC) 208 ΔT, total-max (ºC) 310 at 4 m elevation T-fuel-max (ºC) 1214 (at 4.5 m) ΔP, total (kPa) 8.74 (core only)
Radial Temperature Distribution: coolant - cladding - fuel at elevation 450 cm from bottom
900
950
1000
1050
1100
1150
1200
1250
0 0.1 0.2 0.3 0.4 0.5 0.6 0.7 0.8 0.9 1 1.1 1.2 1.3 1.4 1.5
Radial Position (cm)
T (C
)
GRAPHITE CLADDING FUEL IN GRAPHITE MATRIX
Fig. 6.19. Calculated radial temperature profile in the fuel pin with the largest fuel centerline temperature (at 4.5 m elevation). The temperature varies from the coolant at 908ºC (left) to the fuel centerline at 1214ºC (right).
134
6.2.2 Transient State Flow and Temperature
The thermal-hydraulic RELAP5-3D/ATHENA code (RELAP 2003), that has the properties of molten salts incorporated (Davis, 2005), has been used to model the LS-VHTR. The primary coolant salt employed is FLIBE (2LiF-BeF2), one of the four salts incorporated into the code. The coolant flow area per assembly is 185.2188 cm2, which is the reduced value with the hexagonal coolant channel (Section 6.2.1). Different RELAP5 models were completed. The first model consisted of only one average-power assembly under normal operation, forced convection conditions. A pressure boundary condition was employed at the exit (atmospheric pressure) and a temperature and flow boundary conditions at the inlet. Subsequent models were more complex by incorporating additional assemblies in parallel to the first one. Two-ring and tree-ring cores were modeled. The final RELAP5 model consists of 26 assemblies in three core rings (with 1, 10, and 15 assemblies respectively) and one PRACS module. This models is approximately 1/8 of the complete reactor system, as the complete system consists of 8 PRACS and 211 assemblies (211/8 = 26.37 assemblies). Each ring has a different peaking factor. The central assembly is the hottest one, with a radial peaking factor of 1.4. The core rings are subdivided into 10 axial nodes.
A cosine power distribution is used in the axial direction, with an axial peaking factor of 1.4. The buffer tank and the DRACS are not modeled. Heat is removed from the PRACS by specifying heat flux vs time. A schematic of this model is given in Fig. 6.20 (obtained with the SNAP program of the RELAP5 package) and an isometric view of the model is given in Fig. 6.21. The three rings of the core are at on the left of the figures and the PRACS loop is on the right side.
Steady-state and transient conditions were simulated. During normal operation at full power, the PRACS loop is inactive and forced convection through the core takes place. A flow of 1,250 kg/s was calculated for the model through the three rings of the core, it corresponds to a flow of 10,000 kg/s for the whole core. Coolant temperatures are 850ºC (inlet, input) and 950ºC (outlet, calculated). A maximum fuel temperature of 1248ºC (below the limit of 1250ºC) is calculated for the hottest assembly at the center of the core with the highest power. Figure 6.22 shows the temperature distribution calculated by RELAP5 for an average power assembly; it is similar to the one given in Fig. 6.18 that was calculated using 80 axial nodes and the larger (circular) coolant channel. The maximum fuel temperature calculated by RELAP5 was 1186ºC vs 1184ºC from the previous hand calculation (Section 6.2.1) with the same reduced coolant channel area.
A LOFC with scram transient was simulated, with reactor power falling to decay heat levels and heat removed by the PRACS into the buffer tank. During the first 200 s, the model is run at steady-state full power and at 200 s the transient is initiated by stopping the forced flow through the core, reducing the power to decay heat levels, and opening the PRACS loop. The transient is terminated at 10,000 s (less than 3 h). Natural convection flows between 36 and 17.5 kg/s were calculated by the model, they correspond to flows between 290 and 140 kg/s for the whole core. Figure 6.23 shows the calculated flow through the PRACS module during the LOFC. During the first hour of the transient, PRACS removal capabilities are below decay heat levels, and the temperature of the coolant leaving the vessel increases by about 30ºC. After that time, the coolant temperature decreases. Figure 6.24 shows the temperatures of the coolant leaving the reactor vessel (entering the PRACS module), the average core temperature, and the temperature of the coolant entering the vessel (or leaving the PRACS module).

135
Fig. 6.20. Schematic view of the RELAP5–3D model of the AHTR.

136
Fig. 6.21. Isometric view of the RELAP5–3D model of the AHTR.

137
Fig. 6.22. Axial temperatures calculated by RELAP5–3D for an average assembly.
Fig. 6.23. Natural convection mass flow rate through a PRACS module.
Average assembly RELAP5-3D
850
900
950
1000
1050
1100
1150
1200
0 1 2 3 4 5 6 7 8
Position (m)
Tem
pera
ture
(C)
Coolant
Surface
Center

138
6.3 ANL NEUTRONIC ASSESSMENT OF STRINGER FUEL ASSEMBLY DESIGN
Earlier project studies had indicated that the LS-VHTR designs using fuel blocks similar to those employed for the Fort Saint Vrain and GT-MHR cores could result in the blocks floating during refueling (Forsberg et al. 2006). This is because of the lower density of the fuel block relative to the liquid salt coolant. Consequently, it was decided to evaluate assembly designs that allow more effective restraint of the fuel assemblies. Based on this requirement, and the desire to reduce the number of fuel movements during refueling, it was proposed that effort be devoted to the stringer assembly design similar to that used in the United Kingdom advanced gas-cooled reactor (AGR) system. In this design, the graphite moderator and fuel material are decoupled, with the two removed from the core at different intervals. In the AGR design, this allows the on-line (at power) refueling of the core.
A study has been conducted to confirm the feasibility of the fuel stringer design from a neutronic perspective. The target values for the fuel discharge burnup and cycle length that were used in the FY 2005 study (Kim et al. 2005) have been retained. Specifically, the discharge burnup and cycle length should be at least 100 GWd/t and 1-1/2 years, respectively, with the uranium enrichment constrained to less than 20% 235U.
The characteristics of the LS-VHTR core and stringer fuel assembly are briefly described in Section 6.3.1. The lattice physics tools and models employed in this study are discussed in Section 6.3.2. The
Fig. 6.24. System temperatures in Kelvin vs time calculated by RELAP5–3D.

139
results of sensitivity and parametric studies are summarized in Section 6.3.3. Finally, the conclusions from the work are provided in Section 6.3.4.
6.3.1 LS-VHTR Core Using Stringer Fuel Assembly
The radial core layout consists of 265 fuel assemblies, arranged similarly to the fuel columns evaluated in the FY-05 LS-VHTR study (see Fig. 6.25). The FY-05 study used the GT-MHR fuel elements that are 79.3 cm high, of which ten were stacked vertically in each fuel column. The fuel assembly blocks have a pitch of 36 cm (measured across the flats). The GT-MHR standard assembly design contains holes for fuel compacts and liquid-salt coolant passage. In the current study, the fuel column consists vertically of hexagonal graphite blocks (moderators) that have a large central hole. The blocks in the column are restrained to ensure that they do not float in the liquid-salt coolant. The block pitch is still 36 cm, but each block now has a height of 1 m. The active core height is, however, 8 m (similar to the original design, 793 cm).
Fuel stringers pass through the large central holes. In the current study, graphite is assumed for the material of the stringer unit, but in reality the stringer structural material might be carbon-carbon composites to provide the required strength. Each fuel stringer contains eight fuel elements stacked vertically, each 1 m high. Figure 6.26 shows sketches of the fuel stringers and graphite moderator (graphite block in a core column) for designs containing 18 and 36 fuel pins in the fuel stringer. For simplification, the stringer material and the graphite block have been modeled as a single graphite material. By separating the graphite block and the fuel stringer, the fuel stringer that sees much harsher conditions (temperature gradients, neutron dose, etc.) could be replaced periodically, while the blocks could stay longer in the core (note that the graphite blocks in the United Kingdom AGRs are permanent).
Fig. 6.26. Radial layouts of new 18-pin (left) and 36-pin (right) stringer assemblies.
Fig. 6.25. LS-VHTR core layout.

140
The reference assembly design has 18 fuel pins and a tie rod in the center (Fig. 6.26). For this design, the inner diameter of the fuel stringer is 20 cm. The fuel rods are arranged in two circular rings. The inner ring has six rods that are displaced 60o apart, while the 12 rods in the outer ring are displaced 30o apart. The central tie rod shown in Fig. 6.26 is used for forming the 8 fuel elements (arranged vertically) into a stringer unit. Due to high temperature considerations, the tie rod would not be made of metal (some alloys might be useable). It might however be a carbon-carbon composite due to potential material strength requirements for the LS-VHTR. In the current study, it is assumed to be graphite. In the United Kingdom AGRs the tie rod is made of stainless steel.
An annular pin design similar to that used for the HTTR has been considered in this study to reduce the fuel center-line temperature. The pin contains annular fuel compacts that are stacked end-to-end vertically in a graphite or carbon-carbon composite sleeve (graphite assumed in this study). The inner diameter of the fuel compact is 1.0 cm and the outer diameter is 2.6 cm. The graphite sleeve outer diameter is 3.4 cm. The distance between each ring is 3.75 cm.
The fuel compacts are assumed to contain TRISO coated fuel particles in a graphite matrix similar to that used for the FY-05 design study. In the current work, the coated fuel particles each have a central uranium oxycarbide fuel kernel and layers of carbon and silicon carbide. A kernel diameter of 425 μm is assumed. The coated fuel particle packing fraction in the compact graphite matrix is a variable that is determined in the current work. From a fuel performance point of view a conservative limit of 35% has been imposed in this study. The liquid salt coolant passes through the space external to the fuel pins in the fuel stringer. The coolant assumed in the study is Flibe (Li2BeF4) that is enriched to 99.995% 7Li in the lithium.
A 36-pin design was also considered for the purpose of increasing the fuel loading. This configuration was obtained by adding an extra outer ring containing 18 fuel pins arranged 20o apart on an imaginary circle 11.25 cm from the center of the assembly. Figure 6.26 also shows the configuration with 36 fuel pins. The pin dimensions are the same as those for the 18-pin design. To contain the 36 fuel pins in the fuel stringer, the inner diameter of the fuel stringer is increased to 26.6 cm; this radius was derived from an optimization study discussed below.
Design data for the stringer fuel assemblies used in the current study and the block design used in the FY-05 study are summarized in Table 6.7. Finally, for the calculations at hot, full-power conditions, the material temperatures assumed are fuel = 1027°C, moderator = 977°C, and coolant = 927°C. These are also consistent with FY-05 data.
6.3.2 Computational Methods and Model Verification
The calculations done for this study have mostly used the linear reactivity model (Driscoll 1990) and the lattice code WIMS9 (1999) to represent the LS-VHTR core. WIMS9 does not explicitly allow treatment of the double heterogeneity effect of the coated fuel particles in the graphite matrix during assembly-level calculations, but this can be done in a two-step process described below. Prior to the final calculations, the performance of the code model was evaluated by comparing results with those obtained using the Monte Carlo code MCNP4C (1993).
The linear reactivity model assumes that the core reactivity behavior with burnup (keff let-down) is linear and can be predicted using a series of unit assembly calculations. The approach is particularly useful for getting estimates of the enrichment requirements and fuel compositions with burnup. In this regard, estimates of the required fuel enrichment can be obtained for the critical burnup states. The linear reactivity model cannot, however, be used for accurately estimating the core power peaks.

141
In the following sections, the linear reactivity model and the WIMS9 lattice codes and models are briefly discussed. The results of the WIMS9 code model compared to the MCNP4C results are then presented.
Estimation of Core Reactivity and Cycle Length. If the assumption of a linear relationship between the core excess reactivity and burnup is acceptable, the linear reactivity model can be used to predict the reactivity behavior of various multi-batch fuel management schemes. Assembly-level calculations with reflective boundary conditions were utilized to model the performance of a reactor loaded entirely with LS-VHTR stringer fuel and reflector assemblies. In this case, the linear reactivity model gives the relationship between the core critical burnup ( cB ) and the assembly discharge burnup ( dB ):
dc Bn
nB2
1+= , (6.1)
where n denotes the number of fuel management batches.
Table 6.7. Comparison of design data for LS-VHTR cores using block and stringer fuel assemblies
Block 18-pin stringer 36-pin stringer Core power, MW(t) 2400 2400 2400 Core power density, MW/m3 10.2 10.1 10.1 Active height, cm 793 800 800 Coolant Li2BeF4 Li2BeF4 Li2BeF4 Fuel element
– width across flats, cm – height, cm – density, g/cm3 – fuel rod channel OD, cm – fuel rod inner/outer diameter, cm – coolant channel OD, cm – fuel compact pitch, cm – number of fuel compacts
36.0 79.3 1.74 1.27
—/1.245 0.953 1.8796
216
36.0 100.0 1.74 n/a
0.5/1.3 20.0 3.75 18
36.0 100.0 1.74 n/a
0.5/1.3 26.6 3.75 36
Fuel compact
– kernel – 1st coating – 2nd coating – 3rd coating – 4th coating
425 μm, UC0.5O1.5, 10.50 g/cm3 Carbon buffer, 100 μm thickness, 1.0 g/cm3 Inner pyretic carbon, 35 μm thickness, 1.90 g/cm3 SiC, 35 μm thickness, 3.2 g/cm3 Outer pyretic carbon, 40 μm thickness, 1.87 g/cm3
Coolant temperature (inlet/outlet, oC) 900/1000 900/1000 900/1000 Average temperatures for core calculations (oC) – fuel – graphite – coolant
1027 977 927
1027 977 927
1027 977 927

142
In Eq. (6.1) above, the critical burnup is equivalent to the core average burnup at the end of cycle. For example, in a three-batch core with a cycle length of 33.3 GWd/t, the discharge burnup is 100 GWd/t, and according to Eq. (6.1), the critical burnup is 66.67 GWd/t.
Generally, the core fuel loading at beginning of cycle is designed such that the effective multiplication factor (keff) of the core reaches 1.00 when the core average burnup is identical to the critical burnup (in other words, when core reaches the end of cycle). In order to represent the whole-core state adequately with an assembly-level calculation, the effect of neutron leakage through the core boundary must be accounted for in the assembly kinf value. The FY-05 study (Kim et al. 2005) indicated that the linear reactivity model gives a good estimate of the LS-VHTR reactivity letdown when an appropriate core leakage approximation is utilized. That study indicated that the LS-VHTR neutron leakage is a reactivity penalty of ~1 to 2% Δk. Thus, the fuel cycle length and discharge burnup were evaluated using the WIMS9 lattice code and a 1.5% neutron leakage approximation; i.e. the assembly kinf must be 1.015 at the critical burnup point.
Deterministic lattice codes and models. The WIMS9 code provides an extensive software package for neutronics calculations. Methods for the neutron flux solution in WIMS9 include collision probability (1-D or 2-D), method of characteristics, Sn method (1-D or 2-D), diffusion theory, and hybrid methods. The code also provides an integrated Monte Carlo method (MONK) for the purpose of internal validation. WIMS9 is supplied with 69- and 172-group libraries based on the validated JEF2.2 nuclear data. It is noted that the WIMS9 code has the PROCOL module that provides a capability for calculating the collision probabilities of particulate fuel in cylindrical geometry that could be used in flux solvers to model the double heterogeneity effect of that fuel form.
However, the WIMS9 code does not provide a direct treatment of the particulate-fuel double heterogeneity at the assembly level. A two-step scheme is, therefore, utilized in the WIMS9 calculation. In the first step, the PROCOL module is used for detailed treatment of the double heterogeneity at the pin-cell level; other items, such as Doppler and resonance treatments are considered. A super-cell calculation is performed at this stage. The result of this calculation is homogenized fuel pin-cell cross sections. These cross sections are then used in the second step, which embodies the full-assembly calculation. Besides the homogenized geometry of the fuel pin-cell, the detailed geometries of the other cells are retained in the assembly calculation.
As noted above, the WIMS9 code has many modules that could be used for calculating the spatial lattice solution for the LS-VHTR stringer assembly design. These include both the more accurate and efficient CACTUS method of characteristics solution approach and the sufficiently accurate PIJ collision probability approach (which does not support hexagonal boundary). Unfortunately, the CACTUS approach only supports Cartesian XYZ and hexagonal lattices. To use the CACTUS module for this work a model employing a hexagonal arrangement of pins (vs the circular arrangement) that is representative of the stringer assembly was first developed. The schematic representation of this model is presented in Fig. 6.27 (for the two-step approach).
Lattice code verification by comparison to Monte Carlo results. To show how well the CACTUS model is representative of the LS-VHTR stringer assembly, MCNP calculations were done with the circular and hexagonal pin arrangement models and their results were compared to the WIMS9 CACTUS results using the hexagonal pin arrangement model.
The MCNP4C calculations for the fuel assembly were performed using the ENDF/B-VI nuclear data library distributed with the code. The calculations were for the cold state (21°C) and have been performed without S(α,β) data for the light nuclides in the liquid-salt coolant because the data do not exist currently in both the MCNP4C and WIMS9. A lithium enrichment value of 99.995% was used. Figures 6.28 and 6.29 show the details of the MCNP models. The lattice arrangement in the fuel compact has been explicitly modeled as shown in Fig. 6.28. Figure 6.29 also shows the details of each of the
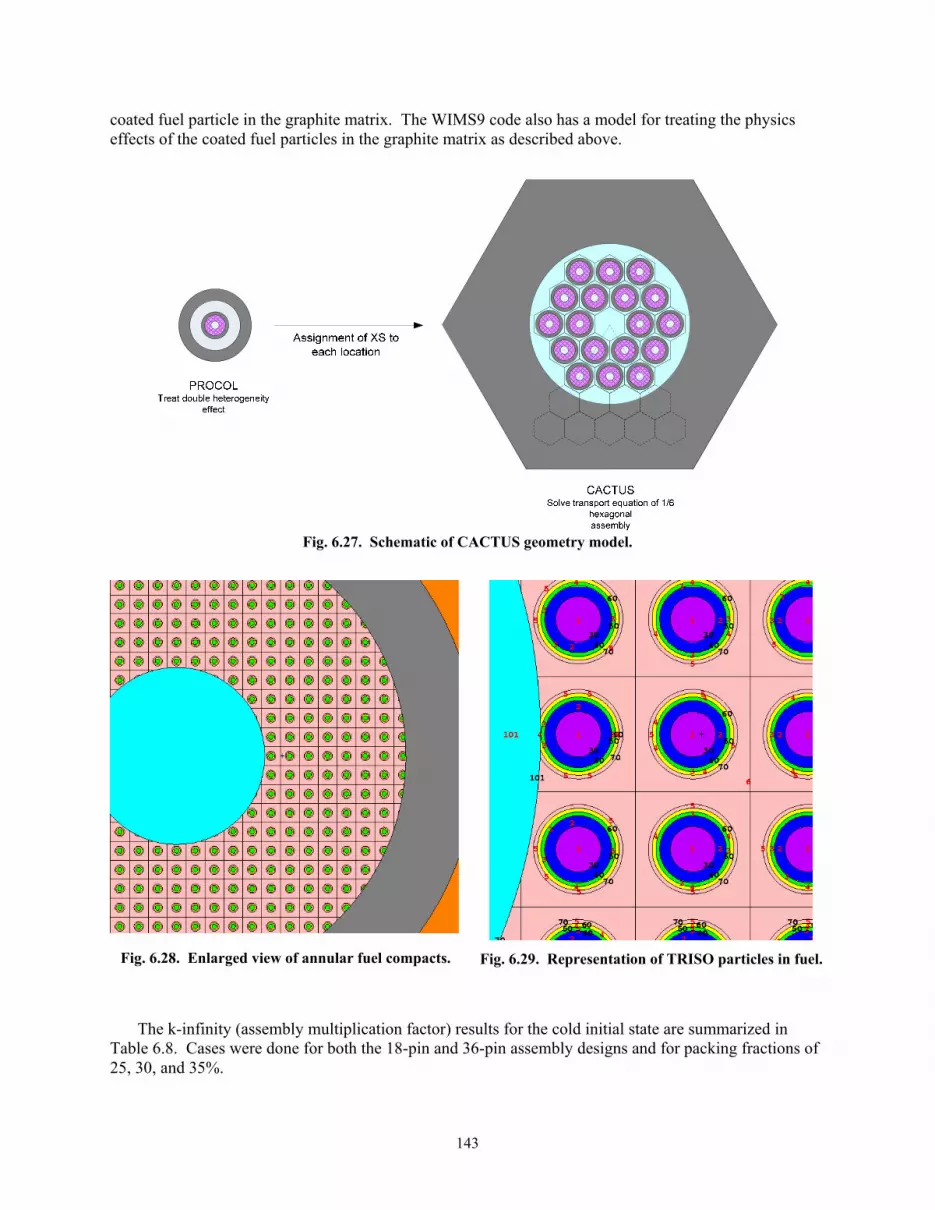
143
coated fuel particle in the graphite matrix. The WIMS9 code also has a model for treating the physics effects of the coated fuel particles in the graphite matrix as described above.
Fig. 6.27. Schematic of CACTUS geometry model.
Fig. 6.28. Enlarged view of annular fuel compacts.
Fig. 6.29. Representation of TRISO particles in fuel.
The k-infinity (assembly multiplication factor) results for the cold initial state are summarized in Table 6.8. Cases were done for both the 18-pin and 36-pin assembly designs and for packing fractions of 25, 30, and 35%.

144
Table 6.8. Comparison of k-infinity values for fuel element at cold state
18-pin assembly
Packing fraction, % 25 30 35
Circular stringer 1.6437 1.6622 1.6722 MCNP
Hexagonal stringer 1.6385 1.6572 1.6672
WIMS9 hexagonal 1.6592 1.6739 1.6821
36-pin assembly
Packing fraction, % 25 30 35
Circular stringer 1.6204 1.6169 1.6088 MCNP
Hexagonal stringer 1.6160 1.6127 1.6067
WIMS9 hexagonal 1.6248 1.6160 1.6049
The results show that the impact of the circular fuel pin arrangement vs a hexagonal layout is at most
~0.2% for a single assembly model in MCNP. This indicates that the hexagonal arrangement model could be used in the WIMS9 code to represent the circular pin arrangement. It is also observed that the agreement between the WIMS9 and MCNP results is quite good for the hexagonal arrangement of fuel pins, with a largest difference of ~800 pcm for the case with 18 pins and a packing fraction of 25%; much lower differences are obtained for the 36-pin design. Components of these differences come from the different nuclear data files used in the calculations (e.g., JEF2.2 for WIMS9).
6.3.3 Performance of LS-VHTR Stringer Fuel Assembly
Parametric studies for the LS-VHTR using a stringer fuel assembly have been performed to ascertain that the constraint on the fuel enrichment will be met for the target cycle length of 18 months and discharge burnup greater than 100 GWd/t, similar to the FY2005 LS-VHTR studies (Kim et al. 2005). The linear reactivity model developed and discussed above was used for the study. The performance characteristics of the LS-VHTR core with 1-batch and 2-batch fuel management have also been evaluated. The results are presented in the following subsections.
Sensitivity study on number of pins. The cycle length and discharge burnup were evaluated as functions of uranium enrichment, packing fraction, and number of fuel pins. Initially, a fuel enrichment of 15% was assumed and the packing fraction was varied from 25 to 35%. The lower value of the packing fraction is based on that derived in FY-05 for the LS-VHTR block design and our current estimation that the stringer fuel design would require a higher value. Similar judgment was used for setting the initial enrichment value.
Results for the assembly k-infinity as a function of burnup are presented in Fig. 6.30 for both the 18-pin and 36-pin stringer assembly configurations. Results for the LS-VHTR block design obtained in FY-05 are also included for comparison. It is observed that the beginning of life k-infinity decreases with increase in the number of fuel pins in the stringer assembly. This is due to the decrease in the amount of neutron moderation arising from the larger stringer-hole diameter for the 36-pin configuration, which reduces the amount of graphite moderator by almost 30%.

145
An interesting effect of using the stringer fuel assembly can be observed in Fig. 6.30. Although the beginning-of-life k-infinity is much higher for the stringer assemblies (compared to the block design), the stringer assembly k-infinity values are lower than that of the block assembly later in life. This is due to the reduced fuel loading per assembly in the stringer designs. The 36-pin, 15%-enriched, and 25%-packing fraction stringer assembly contains 672 g of 235U per assembly, compared to an average of ~900–1200 g for the block design. The 18-pin configuration has a 235U loading of 336 g per assembly, much lower than for the block design.
The results have also been summarized as a function of cycle length and are shown in Fig. 6.31. Though the 18-pin configuration has a larger amount of moderator and its beginning-of-life k-infinity is higher, its reactivity however burns out more quickly than the other cases. The reactivity of the 36-pin configuration trends similarly as the block design, but burns out more quickly because it has a lower fissile mass.
The results in Figs. 6.30 and 6.31 indicate that the stringer fuel assembly would achieve a discharge burnup greater than 100 GWd/t with a packing factor of 25%, even with a 1-batch fuel management. Contrarily, the cycle length requirement cannot be met with this enrichment.
p
0.8
0.9
1.0
1.1
1.2
1.3
1.4
1.5
1.6
1.7
1.8
0 20 40 60 80 100 120 140 160 180 200
burnup in GWd/MT
k-in
finity
Block 18 pins 36 pins Fig. 6.30. Comparison of k-infinity vs burnup for 25% packing fraction.
p y
0.8
0.9
1.0
1.1
1.2
1.3
1.4
1.5
1.6
1.7
1.8
0 100 200 300 400 500
effective full-power days (EFPD)
k-in
finity
Block 18 pins 36 pins Fig. 6.31. Comparison of k-infinity vs cycle length for 25% packing fraction.

146
Sensitivity study on fuel-to-moderator ratio. The fuel-to-moderator number density ratio (NU/NC) is a key physics parameter in the study of graphite moderated systems. Figure 6.32 shows the effect of the NU/NC ratio on the beginning-of-life k-infinity trend. Results are presented for both the 18-pin and 36-pin configurations and for enrichments of 15% and 19.7%. Additional calculations were performed for the reference 15% enrichment cases to show trends; results for 10% packing fraction was included for the 36-pin configuration, while that for 50% packing fraction was included for the 18-pin configuration.
There appears to be an optimum NU/NC for the beginning-of-life k-infinity. This optimum is indistinguishable for the 18-pin configuration in the range evaluated. The optimum beginning-of-life k-infinity value is obtained with a packing fraction between 30 and 35% (NU/NC around 0.0015) for the 36-pin configuration. This packing fraction range seems appropriate also for the 18-pin configuration.
Impact of fuel-to-moderator ratio on cycle length. As is quite well known, optimizing an assembly design for the beginning-of-life k-infinity does not necessarily imply optimization for the discharge burnup and cycle length. Consequently, due to the difficulty of meeting the cycle length requirement, its trend with the fuel-to-moderator ratio has been studied. Results are presented in Fig. 6.33. Clearly, the optimum fuel-to-moderator ratio has not been reached for these stringer fuel assemblies, in terms of cycle length, which is quite dependent on the amount of uranium per assembly. A higher packing fraction could be desirable, but 35% was chosen as the upper limit for this study. In addition, the beginning-of-life eigenvalues are sufficiently high that the design goals can be satisfied with increased enrichment and packing fraction.
Within the constraint on the packing fraction (less than 35%), the results of Figs. 6.32 and 6.33 indicate that a packing fraction in the range of 30 to 35% is a reasonable choice.
1.52
1.54
1.56
1.58
1.60
1.62
1.64
1.66
1.68
1.70
1.72
0.0000000 0.0005000 0.0010000 0.0015000 0.0020000 0.0025000
NU/NC
BO
L k-
infin
ity
15% enriched 18 pins 15% enriched 36 pins19.7% enriched 18 pins 19.7% enriched 36 pins
Fig. 6.32. Trend of beginning-of-life k-infinity vs fuel-to-moderator ratio.

147
0
200
400
600
800
1000
1200
0.00000 0.00050 0.00100 0.00150 0.00200 0.00250
NU/NC
cycl
e le
ngth
in d
ays
15% enriched 18 pins 15% enriched 36 pins19.7% enriched 18 pins 19.7% enriched 36 pins
Fig. 6.33. Cycle length vs fuel-to-moderator ratio.
Flux spectrum for LS-VHTR fuel assembly. A comparison of the beginning-of-life spectra for the
block design and the 18- and 36-pin stringer assembly designs has been performed and is summarized in Fig. 6.34. It is observed that while both the stringer-type assemblies have slightly softer spectra than the block design, the decreased moderation (and increased NU/NC ratio) in the 36-pin configuration gives a spectrum closer to that of the reference block-type fuel assembly. This finding is also consistent with the explanations presented above for the increased beginning-of-life and decreased end-of-life k-infinity values, and for the beneficial impact of increased number of pins on the core cycle length and discharge burnup.
0.00
0.10
0.20
0.30
0.40
0.50
0.60
0.70
0.80
0.001 0.1 10 1000 100000 10000000 1000000000Energy (eV)
Spec
trum
, Eφ(
E)
Block18 Pin Stringer36 Pin Stringer
Fig. 6.34. Variation of neutron spectrum with assembly design.

148
Sensitivity study of pin pitch. Sensitivity analysis for the fuel pin spacing was performed using the CACTUS model shown in Fig. 6.27. With this model it is possible to change the fuel pin spacing by changing the fuel pin pitch. The sensitivity analysis showed a 1.2% decrease in k-infinity for a 36-pin stringer assembly with a 4.0-cm pin pitch vs a 3.75-cm pin pitch (15% enrichment and 25% packing fraction were used); increasing the fuel pin pitch, therefore, does not yield any benefit. However, the fuel pin pitch could be reduced a small amount from 3.75 cm, but the slight benefit of doing so could have consequences mechanically at high burnup; studies of the fuel pin swelling and expansion were not undertaken as part of this study, but with a 3.75-cm pitch, there is only 0.35-cm space between the fuel pins and between the outer ring of fuel pins and the 13.3-cm radius stringer hole wall.
Sensitivity study of fuel stringer diameter. Changing the size of the fuel stringer hole had a significant impact on k-infinity values, as a small change significantly impacts the fuel/moderator ratio. For example, the difference in k-infinity for a 13.3-cm radius stringer hole and a 14-cm radius hole represents an overall change of less than 11%, in coolant area, which works out to a decrease of just over 5% of the amount of graphite per assembly. This change, however, reduces the k-infinity by 2-3%. Therefore, a 26.6-cm-diam hole was chosen to increase k-infinity by 2 to 3% and extend the cycle length.
Performance results for 1- and 2-batch cores. Using the linear reactivity model, the performance characteristics for the LS-VHTR cores utilizing the stringer fuel assembly design and 1-batch or 2-batch fuel management have been determined. The results are summarized in Table 6.9. Two fuel enrichments were used for generating the results; the initial reference value (15%) and the limiting value (~20%).
The results show that the discharge burnup and core cycle length requirements cannot both be met simultaneously with an 18-pin stringer assembly design. Much higher packing fraction and enrichment than considered in this study would be required to meet the cycle length requirement.
Within the 20% constraint on the fuel enrichment, the discharge burnup and cycle length can both be met using the 36-pin stringer fuel assembly design. The results indicate that with a packing fraction of 30%, the discharge burnup and cycle length target values of >100 GWd/t and 18 months, respectively, can be obtained with an enrichment of 15%. For a 2-batch fuel management, an enrichment of 19.7% and a packing fraction greater than 25% can be used to meet both requirements.

149
Table 6.9. Cycle length and discharge burnup (linear reactivity model with 1.5% leakage approximation)
18 pins, 15% enriched 1-batch 2-batch Packing fraction
(%) Discharge burnup (GWd/t)
Cycle length (d)
Discharge burnup (GWd/t)
Cycle length (d)
25 108 230 144 153 30 112 287 149 191 35 116 345 154 230
18 pins, 19.7% enriched 1-batch 2-batch Packing fraction
(%) Discharge burnup (GWd/t)
Cycle length (d)
Discharge burnup (GWd/t)
Cycle length (d)
25 146 312 195 208 30 151 386 201 257 35 154 460 205 307
36 pins, 15% enriched 1-batch 2-batch Packing fraction
(%) Discharge burnup (GWd/t)
Cycle length (d)
Discharge burnup (GWd/t)
Cycle length (d)
25 121 518 162 345 30 124 633 165 422 35 124 741 165 494
36 pins, 19.7% enriched 1-batch 2-batch Packing fraction
(%) Discharge burnup (GWd/t)
Cycle length (d)
Discharge burnup (GWd/t)
Cycle length (d)
25 161 688 215 459 30 163 834 217 556 35 162 970 217 647
6.3.4 Annular Pin Assembly Conclusions
Neutronic evaluations of the 18-pin and 36-pin LS-VHTR stringer fuel assemblies have been performed using the deterministic lattice code WIMS9 and the linear reactivity model. Calculations were done to evaluate the core cycle length and fuel discharge burnup and to determine the optimum uranium enrichment and packing fractions. The accuracy of the WIMS9 code for this evaluation was confirmed by comparing the code results to those obtained using the Monte Carlo code, MCNP4C.
The cycle length and discharge burnup were evaluated as a function of uranium enrichment, packing fraction, and the number of fuel pins per assembly. The fuel-to-moderator number density factor was used as a parameter for quantifying the results. From this sensitivity study, it was found that the optimum packing fraction to maximize the beginning of life k-infinity is greater than 30% for the 18-pin stringer fuel assembly design and greater than 25% for the 36-pin design. Additionally, the optimum fuel stringer hole diameter was determined to be 26.6 cm for the 36-pin fuel stringer.
The required uranium enrichment to obtain the target core cycle length (18 months) and fuel discharge burnup (>100 GWd/t) were determined from parametric studies. It was found that the 18-pin configuration would not meet the combined demands on the cycle length and discharge burnup, even with an enrichment of about 20% and a 35% packing fraction. Using the 36-pin configuration and a 1-batch fuel management scheme, both core cycle length and fuel discharge burnup requirements can be met utilizing an enrichment of 15% and a packing fraction of 30%. For a 2-batch fuel management, these requirements can be met using an enrichment of ~20% and a packing fraction of 30%.

150
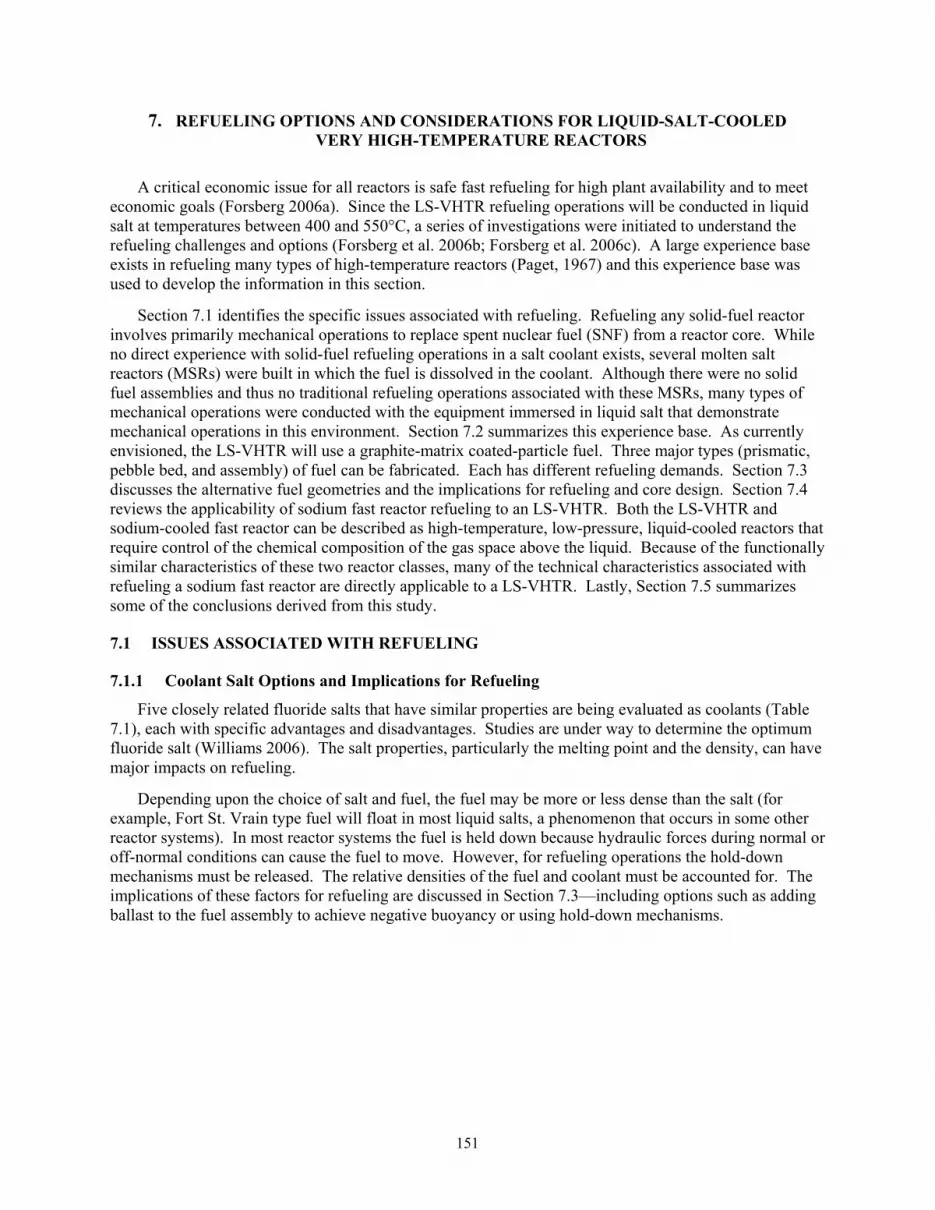
151
7. REFUELING OPTIONS AND CONSIDERATIONS FOR LIQUID-SALT-COOLED VERY HIGH-TEMPERATURE REACTORS
A critical economic issue for all reactors is safe fast refueling for high plant availability and to meet economic goals (Forsberg 2006a). Since the LS-VHTR refueling operations will be conducted in liquid salt at temperatures between 400 and 550°C, a series of investigations were initiated to understand the refueling challenges and options (Forsberg et al. 2006b; Forsberg et al. 2006c). A large experience base exists in refueling many types of high-temperature reactors (Paget, 1967) and this experience base was used to develop the information in this section.
Section 7.1 identifies the specific issues associated with refueling. Refueling any solid-fuel reactor involves primarily mechanical operations to replace spent nuclear fuel (SNF) from a reactor core. While no direct experience with solid-fuel refueling operations in a salt coolant exists, several molten salt reactors (MSRs) were built in which the fuel is dissolved in the coolant. Although there were no solid fuel assemblies and thus no traditional refueling operations associated with these MSRs, many types of mechanical operations were conducted with the equipment immersed in liquid salt that demonstrate mechanical operations in this environment. Section 7.2 summarizes this experience base. As currently envisioned, the LS-VHTR will use a graphite-matrix coated-particle fuel. Three major types (prismatic, pebble bed, and assembly) of fuel can be fabricated. Each has different refueling demands. Section 7.3 discusses the alternative fuel geometries and the implications for refueling and core design. Section 7.4 reviews the applicability of sodium fast reactor refueling to an LS-VHTR. Both the LS-VHTR and sodium-cooled fast reactor can be described as high-temperature, low-pressure, liquid-cooled reactors that require control of the chemical composition of the gas space above the liquid. Because of the functionally similar characteristics of these two reactor classes, many of the technical characteristics associated with refueling a sodium fast reactor are directly applicable to a LS-VHTR. Lastly, Section 7.5 summarizes some of the conclusions derived from this study.
7.1 ISSUES ASSOCIATED WITH REFUELING
7.1.1 Coolant Salt Options and Implications for Refueling
Five closely related fluoride salts that have similar properties are being evaluated as coolants (Table 7.1), each with specific advantages and disadvantages. Studies are under way to determine the optimum fluoride salt (Williams 2006). The salt properties, particularly the melting point and the density, can have major impacts on refueling.
Depending upon the choice of salt and fuel, the fuel may be more or less dense than the salt (for example, Fort St. Vrain type fuel will float in most liquid salts, a phenomenon that occurs in some other reactor systems). In most reactor systems the fuel is held down because hydraulic forces during normal or off-normal conditions can cause the fuel to move. However, for refueling operations the hold-down mechanisms must be released. The relative densities of the fuel and coolant must be accounted for. The implications of these factors for refueling are discussed in Section 7.3—including options such as adding ballast to the fuel assembly to achieve negative buoyancy or using hold-down mechanisms.

152
Table 7.1. Candidate liquid salts
Fluoride salt
Composition (mole %)
Melting point (ºC)
Density (g/cm3) Notes
7LiBe 67–33 460 1.94 Best neutronics, Be toxicity, high Li cost, experience: MSRE,a no gamma emitters, low density (fuel buoyancy)
NaBe 57–43 340 2.01 Low MP, Be toxicity, low density (fuel buoyancy)
7LiNaZr 26–37–37 436 2.79 Small addition of expensive Li (2 wt %), low toxicity
NaZr 59.5–40.5 500 3.14 Inexpensive, low toxicity, experience: aircraft nuclear propulsion salt
NaRbZr 33–23.5–43.5 420 Inexpensive, max freeze protection with minimum Rb, max Zr without high ZrF4 vapor pressure, neutronic questions
aMSRE = Molten Salt Reactor Experiment
The fuel density is dependent upon the details of the fuel design and the fabrication process. Most, but not all, graphite-matrix coated-particle fuels have densities between 1.7 and 1.8 g/cm3, values that are significantly lower than the theoretical densities of the coolant materials. This density reflects both design and manufacturing requirements. An example of a design requirement in the fuel microspheres is for a low-density carbon buffer layer that (1) stores fission product gases and (2) allows thermal expansion or contraction of the harder silicon carbide layer without failure.
7.1.2 Fuel Designs and Implications for Refueling
Three alternative fuel designs (prismatic, pebble bed, and stringer-assembly) are being considered. As discussed in Section 7.3, each fuel design requires a different refueling strategy. Historically in gas-cooled reactors, prismatic fuels use off-line refueling while pebble and stringer refueling can be performed online.
In last 40 years, the fuel burnup in light-water reactors (LWRs) has increased from ~20,000 to ~60,000 MWd/ton. This increased burnup has reduced refueling operations primarily by increasing the time between refueling options (i.e., reducing the number of refueling operations per unit of electricity produced). The same economic drivers exist for the LS-VHTR and may result in significant reductions in refueling time as the technology is developed.
Coated particle fuels have been shown to be capable of sustaining much higher burn up levels than LWR fuels. Time between refueling for reactors with offline refueling will ultimately be constrained by the limitation to keep initial enrichment levels below 20% 235U. Preliminary analysis suggests that the prismatic fuel LS-VHTR can achieve 18-month refueling intervals, as in current LWRs. Pebble and stringer fuel LS-VHTRs may be refueled online and will not require refueling outages. However, periodic graphite reflector replacement will be required but at much longer intervals than required for LWR refueling.
7.1.3 Decay Heat and Implications on Refueling
Reactors that are refueled offline are refueled shortly after reactor shutdown, which means that the decay heat levels are very high. In many reactors, the decay heat from the SNF is a major design and operational constraint in refueling. In sodium-cooled fast reactors, it is usually the primary design constraint in terms of refueling. For the LS-VHTR, however, this major refueling challenge will be significantly less than in water-cooled and sodium-cooled power reactors for the following reasons.

153
• Power density. The expected power density of the LS-VHTR is about 10 W/cm3 vs 50 W/cm3 for boiling-water reactors, 100 W/cm3 for pressurized water reactors, and several hundred watts per cubic centimeter for sodium-cooled fast reactors. The decay heat from SNFs is roughly in proportion to the power densities during operations.
• Peak fuel temperatures. TRISO coated reactor fuels will not fail at temperatures below about 1600°C. This factor makes it much more difficult to cause fuel failure during refueling by overheating than is the case with other types of SNF.
To support a scoping analysis of the LS-VHTR refueling system designs, the adiabatic temperature rise per unit time in a prismatic fuel element during the core refueling was calculated (Cahalan and Taiwo 2006) and is shown in Fig. 7.1. These calculations provide input for the determination of the in-vessel post-shutdown cool-down times prior to refueling, as well as selection of ex-vessel cooling requirements during SNF transport from the reactor to the SNF storage facility. The decay heat curves generated for the LS-VHTR core were generated by Kim, Taiwo, and Yang (2005) based on a design by Ingersoll et al. (2005). The reference LS-VHTR design has a power density of 10 MW/m3. For this study, power densities bounding this value have been considered, because there would be a distribution in core power densities for fuel elements at operating conditions. For this reason, estimates of temperature rises have been made for cases with fuel-element initial power densities of 6.6, 10, and 15 MW/m3. Results are presented in Fig. 7.1 for the range of 1 to 50 days.
A temperature rise greater than 500 K/h was observed immediately after shutdown in the three cases, suggesting that some days of post-irradiation cooling would be required for prismatic graphite block type of SNF if no cooling path is available (natural, forced, etc.) at various stages of the refueling operation. Obviously, some cooling approaches would be deployed. These estimates provide a conservative upper bound for the type of temperature rises that would be obtained. For pebble and stringer fuels that will be refueled online, reliable cooling of the removed SNF will be required as is done for gas-cooled high-temperature reactors.
7.2 MECHANICAL OPERATIONS IN LIQUID SALT: EXPERIENCE FROM MOLTEN SALT REACTORS
The fuel is dissolved in the salt in an MSR. The billion-dollar MSR programs in the United States built two reactors at ORNL (Nuclear Applications and Technology 1970; Forsberg 2006d) between the mid-1950s and the early 1970s. The Aircraft Reactor Experiment, a 2.5-MW(t) reactor that operated in
0
20
40
60
80
100
120
0 10 20 30 40 50 60
Cooling Time (Days)
Tem
pera
ture
Ris
e (d
eg-K
/hr)
PD = 6.6 MW/m3PD = 10 MW/m3PD = 15 MW/m3
Fig. 7.1. Temperature rise per unit time as a function of
cooling time. PD = power density.

154
1954 at a peak temperature of 882°C, was part of a large effort to develop an aircraft nuclear propulsion system.
This was followed by the Molten Salt Reactor Experiment (MSRE), a highly successful 8-MW(t) reactor that operated for several years at peak temperatures of 654ºC and demonstrated most of the key technologies required for a power reactor. This included 21,788 h of pump operating time and 17,655 h with energy production. The MSRE was part of an effort to develop a commercial breeder reactor that used the 233U/thorium cycle. In the corresponding development programs, there were hundreds of thousands of hours of operating time on a variety of high-temperature salt loops. Detailed plans for a large commercial reactor were developed. Table 7.2 (Rosenthal 1972) lists the pump tests associated with these programs and gives some perspective on the operational experience that was gained.
These large programs developed the base technology for handling liquid fluoride salts including pumps, bearings (Smith 1961), valves, filters, and a wide variety of other mechanical equipment. This initiative also included extensive work with graphite. The MSR uses graphite in the reactor core as a moderator. Key results of these programs included (1) the excellent compatibility of graphite with liquid salts, (2) the viability of handling liquid salts in nuclear reactors, (3) the development of compatible metal alloys of construction up to 750ºC, and (4) the stability of liquid salts in intense radiation fields. This experience base provides engineering confidence that mechanical operations can be conducted in nuclear-reactor liquid-salt environments at temperatures substantially above the refueling temperature of an LS-VHTR.
Table 7.2. Characteristics and operation time for ORNL salt and liquid metal pumps
aMS refers to tests in liquid salts (clean salts) and molten salts that contained uranium, thorium, and fission products.
Model Fluida Head(ft)
Flow (gal/min)
Speed (rpm)
Temperature (°F)
Number built
Total hours
LFB Na, NaK, and MS 92 5 6000 1100–1400 46 466,000
DANA Na, NaK, and MS 300 150 3750 1000–1500 10 57,000
DAC MS 50 60 1450 1000–1400 3 4,000
In-Pile Loop MS 10 1 3000 8 14,000
MF NaK and MS 50 700 3000 1100–1500 3 41,000
PKA NaK and MS 400 375 3550 700–1500 2 21,500
PKP NaK and MS 380 1500 3500 700–1500 4 45,000
MSRE fuel salt pump
MS and Helium 50 1200 1175 1000–1225
100–1200 2 31,600 6,000
MSRE coolant salt pump
MS and Helium 78 800 1775 1000–1225
100–1200 2 24,600 4,000
MSRE Mark-2 fuel salt pump MS 50 1200 1175 1000–1300 1 14,000
ALPHA MS 300 30 6500 850–1400 1 6,000
Total 82 734,700

155
Corrosion testing was conducted for a wide variety of materials in both clean salt systems and molten salt systems (liquid salts with high concentrations of dissolved uranium and fission products). Nuclear code-qualified materials of construction were developed for liquid salts up to temperatures of 750°C. Corrosion rates in clean salt (Williams 2006) were very low compared with those in uranium-bearing salts and compared to corrosion rates seen in other power reactors. The ORNL experience provides real-world data on operations with liquid salts that have compositions similar to those being considered for the LS-VHTR.
Because it is a liquid-fuel reactor, the MSR did not require traditional refueling equipment. The fuel was simply drained or pumped from the reactor. However, the graphite moderator in the reactor core was expected to be damaged by high-energy neutrons and to require replacement one or more times in the lifetime of a commercial reactor. Although studies were conducted to determine how to replace the graphite, both by removal as a single unit attached to the reactor cover and removal as individual moderator assemblies, these processes were not demonstrated. For pebble bed and stringer fuels, which are refueled online, similar methods for replacement of graphite reflectors will be required. For prismatic fuel, the reflector elements will be replaced using similar methods as used to replace the prismatic fuel elements.
7.3 HIGH-TEMPERATURE REACTOR REFUELING EXPERIENCE
Three types of gas-cooled, graphite-moderated, high-temperature reactors have been built: (1) high-temperature gas-cooled reactors (HTGRs) with prismatic fuel elements, (2) pebble-bed reactors (PBRs), and (3) advanced gas-cooled reactors (AGRs) with stringer fuel assemblies. The fuel forms are shown in Fig. 7.2. Each reactor type has a different fuel geometry and uses a different approach for refueling. A corresponding LS-VHTR variant exists for each reactor and fuel geometry using graphite-matrix coated-particle fuel. Descriptions of the refueling systems are provided for the three-demonstrated gas-cooled reactor types that have proven refueling systems, along with observations about the equivalent LS-VHTR variants that incorporate salt cooling.

156
Pebble BedStringer
Stringer(not to scale)
Fuel Element
Prismatic Fuel Block
Fuel Block
Fuel Elements in Reactor
Core
Fuel Transfer Mechanism
Fuel
Ele
men
tsP
lug
Uni
t(~
8 m
)(~
14 m
)
25 cm
1 m
Tie Bar(~1-cm diam)
Graphite Sleeve
Stainless Steel Pins
Fuel-Handling Probe
Grapple Head
20-mStroke
06-032R
Fig. 7.2. High-temperature reactor fuel types and core configurations.
All of these fuel designs as currently envisioned for the LS-VHTR use coated-particle fuels in which
the uranium oxide, carbide, or oxycarbide fuel is in the form of small microspheres that have multiple coatings of carbon and silicon carbide. These coatings act as a high-temperature equivalent of the metallic cladding found in more-traditional fuels. The microspheres are then incorporated into some type of graphite matrix, which can be in one of many geometric forms. This fuel is the only type that has been demonstrated to be capable of operations at high-temperatures with high burnups for extended periods of time. The fuel can operate at normal conditions without failure at temperatures up to ~1250ºC for extended periods of time and up to 1600ºC under accident conditions without failure for extended periods of time. It is the coated-particle fuel in the graphite matrix that makes high-temperature reactors viable. Graphite-based fuel and graphite components are chemically compatible with two coolants: (1) noble gases, such as helium, and (2) fluoride liquid salts.
7.3.1 Prismatic-Graphite-Fuel High-Temperature Reactors
The graphite-matrix coated-particle fuel can be incorporated into prismatic graphite blocks (Fig. 7.3) that are the fuel assemblies for HTGRs. Several variants of this specific fuel form exist. The graphite block has coolant channels. Typically, the microspheres are incorporated into graphite fuel compacts in which the microspheres are mixed with graphite powder and compressed. The compacts are then placed in fuel holes drilled into the prismatic graphite block.

157
The fuel is in the form of prismatic assemblies to allow the blocks to lock together into a reactor core. The Fort St. Vrain fuel-block dimensions were 36-cm width across the flats and 79-cm height. The reactor core was a three-dimensional stack of blocks. This geometric form allows three-dimensional refueling strategies that maximize fuel burnup and flatten the power distribution relative to the two-dimensional refueling strategies used in LWRs. The fuel form gives the reactor-core designer great freedom in choosing (1) the ratio of the fuel to the moderator and to the coolant and (2) the three dimensional neutronic characteristics of the reactor core. However, this freedom in core design options comes at the cost of more-complicated three-dimensional fuel-handling operations and a fuel assembly that also contains the moderator. To date, prismatic graphite block fuel has been the baseline for the LS-VHTR and thus the neutronics for prismatic fuels with liquid salt coolants have been studied more extensively than pebble or stringer fuel.
Two helium-cooled high-temperature reactors have been built using prismatic fuel blocks: (1) the Fort St. Vrain reactor, which was built in Colorado and later decommissioned, and (2) the operating Japanese High Temperature Test Reactor (HTTR). The Fort St. Vrain reactor was a medium-size demonstration power reactor; thus, this refueling experience is most relevant to the LS-VHTR. In addition, eight large HTGRs were sold, with the orders later being cancelled. While these reactors were not built, the design and engineering studies associated with their refueling are directly applicable to the AHTR.
In terms of refueling, the Fort St. Vrain reactor and the planned commercial reactors had similar design characteristics (U.S. Nuclear Regulatory Commission 1991). The refueling was off-line at low pressure and relatively low temperatures. The technical specifications were <1 psig and helium-coolant reactor-core inlet temperatures of <74ºC (165ºF). The refueling machine is shown in Fig. 7.4.
Fig. 7.3. Prismatic high-temperature fuel.

158
06-014R2Drive Sprockets
Fuel Transfer Mechanism
Shielding
Grapple Head
Counterweight
Cask Valve
Hoisting Chains
Fuel Elements in Storage Rack
Top of Reactor
Refueling Sleeve
Reactor Isolation Valve
Fuel-Handling Probe
Grapple Head
20-mStroke
Fuel Elements in Reactor Core
Reactor Core
Refueling Machine
Reactor Vessel
The refueling machine was mounted on top of the prestressed-concrete reactor vessel, removed the SNF blocks via a robotic arm that was lowered from the refueling machine, withdrew the SNF from the reactor vessel, and then placed the SNF in a transfer cask. The operations were controlled by computer with operators monitoring the progress. This strategy results in short refueling outages for movement of the SNF. The SNF in the cask was then transferred to dry storage wells with water-cooled walls. To avoid the potential for fire if the SNF were exposed to air, the SNF temperature in the transfer cask and storage facilities was limited to ~400ºC (750ºF). Fresh fuel was then loaded in the reverse order.
Because refueling was performed on a prestressed-concrete reactor vessel with a limited number of penetrations, each refueling channel through the vessel head was used to refuel multiple columns of blocks in the reactor core. The large distance between the top of the reactor core and the top of the prestressed-concrete reactor vessel implies that HTGRs have large refueling machines. The Fort St. Vrain reactor refueling machine is shown in Fig. 7.5. While there were other mechanical difficulties with the Fort St. Vrain reactor, the refueling machine was successful and reliable. Studies (Paget, 1967) were initiated for development of online high-temperature refueling; however, with the cancellation of the high-temperature reactor program, online refueling for these gas-cooled reactors was not developed.
Fig. 7.4. Schematic of Fort St. Vrain refueling machine. Shown are in-vessel robotic arm over the reactor core (left); relationship of refueling machine, reactor vessel top, and reactor core (center); and refueling machine placing fuel element in transfer cask (right).
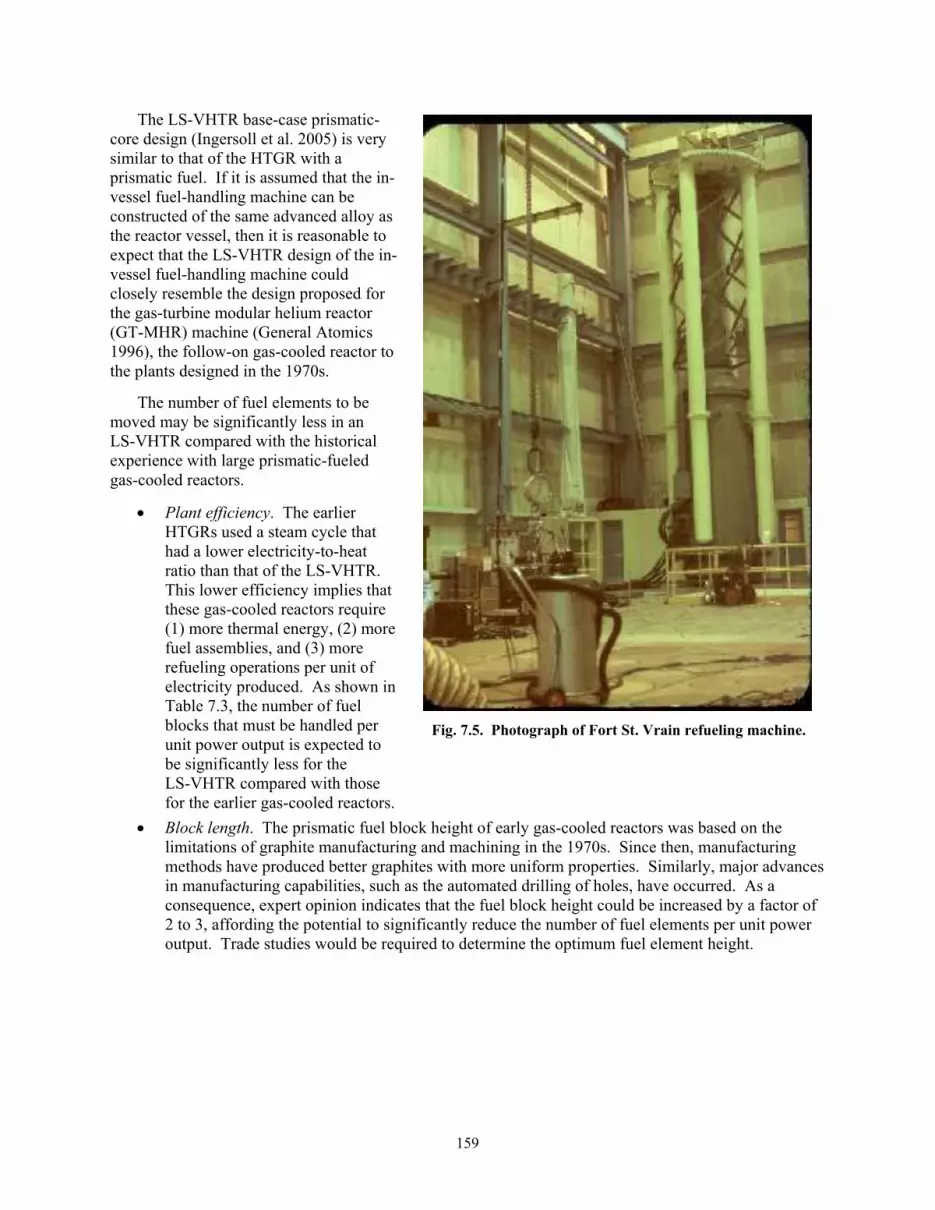
159
The LS-VHTR base-case prismatic-core design (Ingersoll et al. 2005) is very similar to that of the HTGR with a prismatic fuel. If it is assumed that the in-vessel fuel-handling machine can be constructed of the same advanced alloy as the reactor vessel, then it is reasonable to expect that the LS-VHTR design of the in-vessel fuel-handling machine could closely resemble the design proposed for the gas-turbine modular helium reactor (GT-MHR) machine (General Atomics 1996), the follow-on gas-cooled reactor to the plants designed in the 1970s.
The number of fuel elements to be moved may be significantly less in an LS-VHTR compared with the historical experience with large prismatic-fueled gas-cooled reactors.
• Plant efficiency. The earlier HTGRs used a steam cycle that had a lower electricity-to-heat ratio than that of the LS-VHTR. This lower efficiency implies that these gas-cooled reactors require (1) more thermal energy, (2) more fuel assemblies, and (3) more refueling operations per unit of electricity produced. As shown in Table 7.3, the number of fuel blocks that must be handled per unit power output is expected to be significantly less for the LS-VHTR compared with those for the earlier gas-cooled reactors.
• Block length. The prismatic fuel block height of early gas-cooled reactors was based on the limitations of graphite manufacturing and machining in the 1970s. Since then, manufacturing methods have produced better graphites with more uniform properties. Similarly, major advances in manufacturing capabilities, such as the automated drilling of holes, have occurred. As a consequence, expert opinion indicates that the fuel block height could be increased by a factor of 2 to 3, affording the potential to significantly reduce the number of fuel elements per unit power output. Trade studies would be required to determine the optimum fuel element height.
Fig. 7.5. Photograph of Fort St. Vrain refueling machine.

160
Table 7.3. Comparison of FSV, commercial HTGR, and LS-VHTR reactor cores
Property Fort St. Vrain reactor
Commercial HTGRa LS-VHTR
Gross power [MW(t)] 842 3000 2400 Net power [MW(e)] 342 1160 1300b Number of fuel columns 259 493 265 Number of fuel blocks per column 6 8 10 Total number of fuel blocks 1554 3944 2650 Number of blocks per MW(e) 4.5 3.4 2.0
aCommercial HTGRs were ordered and partly designed but not built. bWith a multireheat helium-cooled Brayton power cycle, the power output is 1357 MW(e) for salt exit
temperatures of 1000ºC and 1235 MW(e) for salt exit temperatures of 800ºC. Several coolant exit temperatures are being considered.
Beyond the obvious difference that the salt-cooled reactor will refuel at higher temperatures in liquid
salt, potentially significant differences are noted for refueling HTGRs when compared with LS-VHTRs.
Refueling machine size. The LS-VHTR is a low-pressure reactor with a flat vessel lid above the reactor core; the distance between the top of the reactor core and the top of the reactor vessel is only a few meters. The height of the refueling machine (assuming the same approach is used) will be short in comparison with HTGRs with prismatic fuel and the associated thick prestress concrete reactor vessel to withstand the high operating pressures. This factor will simplify some of the mechanical features.
Alternative fuel transfer options. The LS-VHTR offers the unique refueling option of horizontal transfer of the SNF to a storage facility through a horizontal transport port near the top of the reactor vessel. This option is possible because of two characteristics of this design: (1) a low-pressure reactor in which horizontal transfer ports through the reactor vessel wall are a potentially viable option and (2) a relatively short SNF block height that allows horizontal transfer of the fuel assembly or rotation of the fuel assembly from vertical to horizontal within the reactor vessel. This option is described below.
Several variants of the AHTR are being examined (Forsberg, 2006e). One variant (Peterson and Zhao, 2006) is the AHTR with metallic internals (AHTR-MI), which has a design strategy to minimize the number of high-temperature components. The proposed refueling method for this design variant is described as an example of an option for refueling a prismatic-fuel LS-VHTR. Figure 4.3 shows a vertical cross section of the reactor during normal operation and during refueling operations, while Fig. 4.4 shows a horizontal cross section. As in the Fort St. Vrain reactor, the prismatic fuel blocks (325 fuel columns, 8 blocks high) with control rods are offset downward 0.15 m to counteract shear motion across the core and maintain column alignment.
The initial steps in refueling are somewhat similar to those for the EBR-II (see Section 7.4). The control rod drives are disconnected, and the vessel lid is partly raised. Refueling of the AHTR-MI is performed using the same general approach that was developed and demonstrated for the Fort St. Vrain reactor, using a refueling machine with a grappling mechanism, and refueling the core by sector. However, unlike that for HTGRs, the AHTR-MI design includes a horizontal fuel transfer channel, shown in Fig. 1.4 in Chapter 1 of this report, which allows more-rapid fuel movement than is possible with the transfer cask systems used for HTGRs. The fuel elements do not require transfer to a shielded cask; they can be directly transferred from the primary reactor vessel to an intermediate storage facility that is located outside the primary reactor vessel.
This option has the potential to significantly reduce refueling time by avoiding SNF cask operations that include (1) transferring SNF to a cask, (2) closing the cask, (3) decoupling the cask from the reactor

161
lid, (4) moving the cask to the SNF storage area, (5) coupling the cask to the SNF storage area, (6) opening the cask, (7) transferring the SNF to the storage area, and (8) each of these operations in reverse for the fresh fuel. This direct-transfer option exists because (1) the prismatic fuel blocks are short, which allows transfer of SNF via a relatively small horizontal penetration through the side of the reactor vessel, (2) the lower power density of the SNF reduces the need to cool the SNF during transfer operations, and (3) the reactor is a low-pressure machine that makes practical a horizontal transfer tube through the reactor vessel wall.
Fuel hold-down options. The average fuel density may be less than or greater than that of the salt. If the fuel density is less than that of the salt (such would be the case with Fort St. Vrain type fuel), ballast or hold-down mechanisms are required to hold the fuel in place—as are used in a number of other types of reactors.
A variety of options are available to hold fuel in place. One or more of these features would likely be adopted if prismatic fuel is used.
• Lock-down mechanisms. One option is a mechanical locking device on the bottom of each fuel block that would engage the fuel-handling indent on the next lower fuel block. The bottom reflector block would be locked to the vessel bottom. The grapple portion of the device would closely resemble the grapple on the in-vessel fuel-handling machine. Such a device could be engaged and released by mechanical linkages manipulated by simple vertical motions of the in-vessel handling machine. The device could be constructed of high-strength high-temperature alloy (molybdenum, etc.) or a carbon−carbon composite material to withstand the high core temperature. At the same-time, this device could be relatively lightweight, since only modest strength would be needed to overcome the small buoyancy forces. Such a low-mass device would not significantly alter the nuclear or structural performance of the existing LS-VHTR design.
• Top-lock mechanism. Locking mechanisms to hold the core in place can be installed above the reactor core. Figure 7.6 shows one set of options, in which the fuel is held down by a series of beams that slide sideways to allow access to one column of fuel assemblies at a time. (LWRs use a top core plate and fuel assembly springs to hold the LWR fuel assemblies in place.)
• Ballast fuel element. The fuel assembly density can be increased by addition of weights within the fuel assemblies. Potential weight options include zirconium, molybdenum, and other metals or compounds encapsulated in molybdenum or carbon−composite jackets. Ideally, the ballast would be a single slug near the bottom of the fuel assembly to minimize neutron absorption.
Fig. 7.6. Example of a top-locking mechanism for a prismatic-fuel reactor.
An initial assessment of the neutronic penalty associated with the use of ballast was conducted by ANL using the current LS-VHTR baseline design prismatic fuel, Flibe as a coolant, and the assumption
Beams slide as necessary to access fuel assemblies
06-065
Pins slide

162
that the ballast was homogeneously distributed throughout the fuel block. Under these assumptions, ANL has shown that zirconium is the only reasonable ballast material and that use of zirconium ballast would result in a 6-month reduction in (2-batch) cycle length. This initial analysis disregarded the benefit of lumping the ballast material to increase self-shielding thereby reducing the reactivity impact.
A more detailed analysis was performed at ORNL to assess the reactivity effect for various lumped and homogeneously-distributed ballast materials at beginning of life. Zirconium, molybdenum, and enriched molybdenum were analyzed for homogenously-distributed ballast and two geometries of lumped ballasts. The single-block ballast consisted of a single horizontal plate of ballast material attached to the bottom of a standard fuel block (~0.9 m between ballasts). The double-ballast was twice as thick and twice as far apart (~1.8 m). The mass and density of the ballast materials were consistent with those used in the ANL study. For proper comparison, a plate of graphite was added to the bottom of a single block to determine the reactivity effect of basic graphite. These analyses were performed with fresh fuel and either no burnable poison or with erbium-oxide poison. The results are shown in Tables 7.4 and 7.5, respectively.
Table 7.4. Reactivity effect of ballast materials when lumped or distributed homogeneously with fresh fuel that contains no poison
Beginning-of-life multiplication factor (%Δρ) Ballast material
“Ballast thickness”
(cm)
10-block core height
(m) Homogeneously distributed
Single-block ballast
Double-block ballast
None 0 7.93 1.49 (0.0) Graphite 6.6 8.60 1.52 (1.3) Zirconium 6.6 8.60 1.38 (–5.3) 1.41 (–3.8) 1.42 (–3.3) Natural Moly 3.6 8.29 0.56 (–111) 1.11 (–23.) 1.31 (–9.2) Enriched Moly 3.6 8.29 0.92 (–41.) 1.22 (–14.) 1.34 (–7.5)
Tables 7.4 and 7.5 show that use of a lumped ballast of zirconium rather than a homogeneously distributed zirconium ballast reduced the reactivity effect by 40% (from –5.3 to –3.3%). This would be approximately equivalent to a 16-month 2-batch cycle length. In addition, the ANL analysis showed molybdenum to be too great of an absorber to be considered a viable option for a ballast material. The homogenous results presented confirm the ANL analysis (the reactivity is much less than unity for both natural and enriched molybdenum). However, the neutronics performance of molybdenum ballast substantially improved through the use of a lumped configuration. These results show that additional lumped configuration ballast materials can be considered, and the effect on the neutronics performance of a block with lumped zirconium ballast is not very large.

163
Table 7.5. Reactivity effect of ballast materials when lumped or distributed homogeneously with fresh fuel that contains erbium-oxide poison
Beginning-of-life multiplication factor (%Δρ) Ballast material
“Ballast thickness”
(cm)
10-block core height
(m) Homogeneously distributed
Single-block ballast
Double-block ballast
None 0 7.93 1.28 (0.0) Graphite 6.6 8.60 1.31 (1.8) Zirconium 6.6 8.60 1.18 (–6.6) 1.21 (–4.5) 1.22 (–3.8) Natural Moly 3.6 8.29 0.51 (–118) 0.97 (–25.) 1.10 (–13.) Enriched Moly 3.6 8.29 0.81 (–45.) 1.05 (–17.) 1.15 (–8.8)
7.3.2 Pebble-Bed Reactor
PBRs use the coated-particle fuel in a graphite matrix compacted into pebbles—typically about 6 cm in diameter (Fig. 7.7). Current estimates indicate that pebbles have the lowest fabrication cost of any of the three fuel geometry options. The reactor core is a bed of pebbles. The THTR core is shown in Fig. 7.8. The vertical structures are channels for control rods.
7.3.2.1 Gas-cooled pebble-bed reactor refueling
Two helium-cooled PBRs have been built, operated, and decommissioned in Germany; a small pebble-bed test reactor [the high-temperature reactor (HTR)] has been recently built in China; and a precommercial pebble-bed modular reactor (PBMR) is being built in South Africa (Table 7.6). These reactors are refueled online at temperatures up to 950ºC at full pressure. A slow continuous flow of pebbles occurs through the reactor core, with pebbles added at the top of the core and removed at the bottom. The pebbles go through the reactor core several times before being fully burnt. Extracted pebbles are sent through a radiation detector that determines burnup as well as the disposition of the pebble as SNF for disposal or for recycle back to the core for additional burnup. PBRs operate with very low excess reactivity and relatively low enrichments. A simplified schematic of the refueling system is shown in Fig. 7.9.

164
Fig. 7.8. Pebble-bed fuel.
Fig. 7.7. German THTR core.

165
Helium Flow
Helium FlowGasPlenum
Fresh Fuel
Recycled Pebble
Fuel
Pebbles Exiting ReactorSorter
Spent Nuclear Fuel
Elevator
06-051
Table 7.6. Pebble-bed reactorsa
Characteristic AVR THTR HTR PBMR
Country Germany Germany China South Africa
Initial Operation 1967 1984 2004 2011
Shutdown 1988 1990 Not applicable Not applicable
Heat [MW(t)] 10 400
Power [MW(e)] 15 300 Not applicable 165
Tout (ºC) 950 750 700 900
Tin (ºC) 270 250 250 500
Pressure (bar) 11 40 30 90
Fig. 7.9. Refueling of a helium-cooled pebble-bed reactor.
7.3.2.2 Liquid-salt-cooled pebble-bed reactor refueling
Limited studies (deZwaan 2005) have been performed on the large liquid-salt-cooled PBRs with power outputs from 2400 to 4000 MW(t). In addition, more detailed Russian studies have been conducted on a small [16 MW(t)] salt-cooled reactor for production of electric power [6 MW(e)] at remote sites. For most salt coolants, the pebbles will float under almost all conditions (at sufficiently high temperature, salt density may drop below the pebble density). This will alter the refueling operations (Fig. 7.10) compared with those for a helium-cooled PBRs. A salt-cooled PBR could have a zone under

166
06-052
Sorter
Spent Nuclear
Fuel
Fresh Fuel
Recycled Pebble Fuel
Hot Liquid Salt Out
Cold Liquid Salt In
Low PressureReactor Vessel
Neutron Absorber
Grid Structure
Pebbles Exiting Reactor
Pebble Bed
Hydraulic or Mechanical
Delivery
Sorter
Spent Nuclear
Fuel
Fresh Fuel
Recycled Pebble Fuel
Hot Liquid Salt Out
Cold Liquid Salt In
Low PressureReactor Vessel
Neutron Absorber
Grid Structure
Pebbles Exiting Reactor
Pebble Bed
Pebble Bed
Hydraulic or Mechanical
Delivery
the reactor that contains vertical neutron absorbers. If the coolant level is decreased or the salt temperature increases sufficiently, the pebbles would go into a subcritical environment. A graphite outlet plenum structure with a metallic reactor cover would be located at the top of the reactor core to allow coolant flow out of the reactor core and collect the pebbles for transfer to the fueling machine. The pebbles flow toward the refueling machine rather than having the refueling machine reach into the reactor core to recover the pebbles.
With a salt-cooled PBR, the pebbles would be removed from near the top of the core and reinjected under the reactor core. Because the terminal rise velocity of the pebbles is quite low (<0.5 m/s), returned pebbles can be injected into the primary coolant piping to be carried to the reactor core, so the process of refueling may be greatly simplified. A more detailed schematic of one approach is shown in Fig. 7.11. The option also exists to add mass to the pebbles, causing them to sink in the coolant and permitting refueling via a process similar to that for the existing PBRs.
Fig. 7.10. Refueling of a salt-cooled pebble-bed reactor.

167
7.3.2.3 Proof-of-principle experimental testing of liquid-cooled pebble-bed refueling
A series of tests have been initiated at the University of California at Berkeley to understand pebble-bed refueling in liquid-cooled reactors. Standard HTR pebble fuels are 6.0 cm diameter, with a typical mass of 6.0 g of uranium and total mass of 202.2 g, giving a pebble density of 1.789 g/cm3. This can be compared to the density of flibe (7Li2BeF4), which is 1.938 g/cm3 at 700°C and 1.792 g/cm3 at 1000°C. The density of the graphite in the pebble can be controlled, so that this density, or somewhat lower densities, can be achieved as desired to provide sufficient buoyancy in the liquid salt coolant.
Because pebbles have a positive buoyancy in flibe the PB-AHTR core floats up against the top reflector where pebbles are removed. An initial preconceptual design for refueling assumed four 40-cm diameter defueling chutes similar to the three defueling chutes used in the South African PBMR. A schematic of this PB-AHTR preconceptual design is shown in Fig. 7.12.
To demonstrate pebble recirculation processes, UCB has constructed and performed a series of Pebble Recirculation Experiments (PREX). The PREX experiments take advantage of the fact that it is
Fig. 7.12. The 7.25-m diameter upper reflector
of the PB-AHTR showing the four 40-cm diameter defueling chutes and two of the four 82-cm diameter hot leg ports.
IHXmodules(typ. 8)
To pebble sortingOverflow
Pebbleinsertion
port
Pebbleinsertionstandpipe(typ. 32)
Primarypump
(typ. 4)
Cold legs(typ. 32)
Injectionplunger
ΔHcore
Injectorfree
surface
Fig. 7.11. Schematic of pebble recirculation system
being studied at UCB showing pebble insertion into the coolant cold legs for injection at 32 locations around the bottom inlet plenum of the reactor.

168
possible to match the hydrodynamics of the liquid salt flibe, and fuel pebbles, using water as a simulant fluid (Bardet and Peterson 2005). By selecting a length scale of approximately 50% for the scaled experiments, the Reynolds number, Froude number, and the density ratio of the salt to the pebbles can be matched using water with polypropylene spheres. The friction coefficient for high temperature pebbles in liquid salts, where the salt may provide some lubricity, is not known; thus, the primary sources of distortion in the PREX experiments arises from uncertainty in the effects of pebble-to-pebble friction and in the use of partial area/partial height configurations.
In July 2006, UCB completed its first series of PREX-0 proof-of-principal experiments, as illustrated by Fig. 7.13, showing that pebbles can be removed from the top of the reactor with a suitably sloped reflector and sufficiently large defueling opening. In this simplified two-dimensional experiment, extensive parametric variations were made to study the effects of the reflector slope and the defueling chute width. Figure 7.14 shows examples of a subset of the geometries studied, where pebble trajectories have been plotted using a particle-tracking algorithm developed at UCB.
0 s 0.4 s 18 s
Fig. 7.13. PREX-0 experiments have provided proof-of-principle for the extraction of floating pebbles in a liquid-cooled core under scaled experimental conditions that match Re, Fr, and pebble/salt density ratio.
A PREX-1 experiment was also designed and constructed, and it is now undergoing shakedown testing. PREX-1, shown schematically in Fig. 7.15, will provide an integral test and demonstration for pebble recirculation, including pebble injection and removal processes. PREX-1 will therefore demonstrate the viability of pebble refueling for the LS-VHTR.
Qualitative experiments to insert simulated control rods into floating pebble beds have shown very low insertion forces, as can be expected given the small positive buoyancy of the spheres. The low insertion force would suggest that compressive stresses imparted to pebbles during rod insertion are acceptable. The PREX-1 experiments will also include accurate measurements of control rod insertion forces for different control rod geometries.

169
Fig. 7.14. Examples of PREX-0 pebble pathways after video capture analysis using particle tracking for
three of the geometries studied.
Fromprimarypump
ΔHcore
Pebbleinjection
standpipe
Pebbleinjectionplunger
De-fuelingchute
Toprimarypump
Controlrod
Perforatedcone
Injectorfree
surface
Proof-of-PrinciplePebble Recirculation
Experiment (PREX-1)
Overflow
Insertion tube
Fig. 7.15. Schematic illustration of the PREX-1 experiment, and figure showing final design.

170
7.3.3 Stringer or Assembly High-Temperature Reactors
The AGRs are graphite-moderated, carbon-dioxide cooled, high-temperature reactors that use stainless-steel-clad uranium-dioxide fuel assemblies. Because of advances in technology, a liquid-salt cooled variant of these reactors appears feasible, provided that the metal components of the fuel assembly are replaced with carbon composite materials. The AGRs are described, as well as a potentially suitable fuel assembly for a liquid-salt variant.
The United Kingdom has built and currently operates 14 AGRs. The 14 plants are similar but not identical. An example is the two-unit Dungeness B station. The first unit started operation in 1983 with the second unit coming online in 1985. Each reactor has an electric power output of 555 MW(e). The bulk gas exit temperature is ~640ºC, with a peak channel temperature of ~750°C. The operating pressure is ~43.3 bar. The reactors have steam power conversion cycles.
The graphite AGR core is located within a thin steel structure with thermal insulation that, in turn, is located in a large pre-stressed concrete reactor vessel. The reactor vessel has vertical holes for fuel stringers (Fig. 7.16). A stringer consists of multiple fuel assemblies, neutron moderator sections, radiation shielding, thermal insulation, pressure seals, and other components. It extends from the bottom of the reactor core to the top of the pre-stressed concrete reactor vessel. The stringer includes, at the bottom, eight 1-m-long fuel assemblies with a graphite sleeve and 36 stainless steel-clad fuel pins with uranium dioxide fuel pellets. A 1-cm nimonic® alloy PE16 tie bar goes through each fuel assembly and holds them together as a single unit on a stringer. The graphite sleeve provides a gas flow channel, serves as part of the assembly with the grid structure that holds the fuel pins in the proper geometry, and provides some radiation shielding to reduce the rate of radiation damage to the permanent graphite in the reactor core. The sleeve is part of the SNF and is separated from the SNF pins for the purposes of disposal. It is not reused.
The reactors were designed to be refueled online with a refueling machine located on top of the pre-stressed concrete reactor vessel (Mottershead et al. 1995; Cornell et al. 1995; Dixon and Penny 1995). The refueling machine couples to the reactor vessel with seals between the high-pressure prestressed concrete reactor vessel and the high-pressure components in the refueling machine. SNF stringers, which extend from the bottom of the reactor core to the pre-stressed concrete reactor vessel pressure boundary, are removed as a single piece from individual channels in the reactor core. The Dungeness B refueling machine is shown in Fig. 7.17. There is one machine for the two reactors.
Stringer(not to scale)
Fuel
Ele
men
tsPl
ug U
nit
Advanced Gas-Cooled Reactor
Fuel Element
(~8
m)
(~14
m)
25 cm
1 m
Tie Bar(~1-cm diam)
Graphite Sleeve
Stainless Steel Pins
Graphite Reactor Core
Prestressed-Concrete Reactor Vessel
06-025R
Fig. 7.16. Advanced gas-cooled reactor stringer and fuel element.

171
When the plants were originally built, the AGRs were refueled online at full power for several years. A cracked graphite sleeve in one of the Hinkley Point B reactors led to a change in the refueling strategy. At a certain point when fresh fuel was being loaded into the operating reactor, the gas pressure inside the graphite sleeves in the reactor core exceeded the external coolant pressure, leading to tensile stresses and cracking in the graphite sleeve. The evaluations indicated that the full-power online refueling was practical but that the cost of in-core retrofits to modify the gas flow dictated different solutions for different stations. The 14 AGRs are not identical. Some of the AGRs are now refueled off-line, while others are refueled at full temperature and pressure but with the reactors at partial load─typically 25 to 30% of full power.
The core design and stringer approach is potentially applicable to the LS-VHTR, as shown in Fig. 7.18, with the fuel assembly shown in Fig. 7.19. The AGR fuel assembly would be replaced by an all-carbon fuel assembly capable of very high temperature operation.
Stringer
Fuel Element
Fuel
Ele
men
ts(~
8 m
)Fu
el E
lem
ents
(~8
m)
25 cm
1 m
Tie Bar(~1 cm dia.)
Graphite Sleeve
Pins
Moderator Elements in
Reactor Core
Fig. 7.18. Stringer for an LS-VHTR.
Fig. 7.17. Dungeness B advanced gas-cooled reactor. (Courtesy of British Energy)
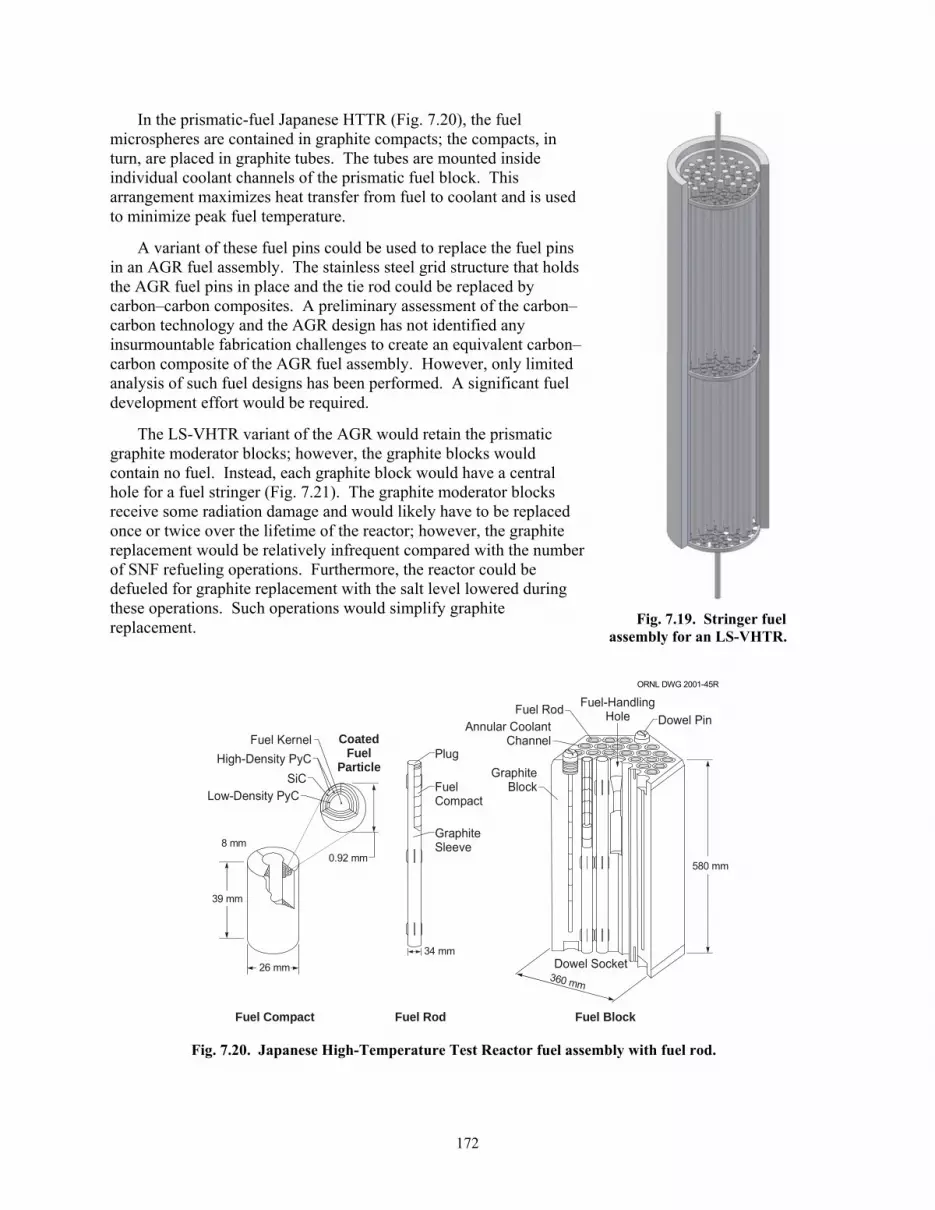
172
Fuel KernelPlug
Dowel Pin
GraphiteBlock
Annular CoolantChannel
Fuel Rod Fuel-HandlingHole
FuelCompact
GraphiteSleeve
High-Density PyC
0.92 mm
SiCLow-Density PyC
8 mm
39 mm
26 mm34 mm
Dowel Socket
Fuel Compact Fuel Rod
CoatedFuel
Particle
Fuel Block
360 mm
580 mm
ORNL DWG 2001-45R
In the prismatic-fuel Japanese HTTR (Fig. 7.20), the fuel microspheres are contained in graphite compacts; the compacts, in turn, are placed in graphite tubes. The tubes are mounted inside individual coolant channels of the prismatic fuel block. This arrangement maximizes heat transfer from fuel to coolant and is used to minimize peak fuel temperature.
A variant of these fuel pins could be used to replace the fuel pins in an AGR fuel assembly. The stainless steel grid structure that holds the AGR fuel pins in place and the tie rod could be replaced by carbon–carbon composites. A preliminary assessment of the carbon–carbon technology and the AGR design has not identified any insurmountable fabrication challenges to create an equivalent carbon–carbon composite of the AGR fuel assembly. However, only limited analysis of such fuel designs has been performed. A significant fuel development effort would be required.
The LS-VHTR variant of the AGR would retain the prismatic graphite moderator blocks; however, the graphite blocks would contain no fuel. Instead, each graphite block would have a central hole for a fuel stringer (Fig. 7.21). The graphite moderator blocks receive some radiation damage and would likely have to be replaced once or twice over the lifetime of the reactor; however, the graphite replacement would be relatively infrequent compared with the number of SNF refueling operations. Furthermore, the reactor could be defueled for graphite replacement with the salt level lowered during these operations. Such operations would simplify graphite replacement.
Fig. 7.19. Stringer fuel
assembly for an LS-VHTR.
Fig. 7.20. Japanese High-Temperature Test Reactor fuel assembly with fuel rod.

173
Graphite
Coolant Channel
Fuel Pins
Moderator Handling Hole
Graphite Sleeve
Graphite
Coolant Channel
Fuel Pins
Moderator Handling Hole
Graphite Sleeve
06-026
7.4 FAST REACTOR EXPERIENCE
7.4.1 Common Sodium and Salt Refueling Characteristics
Excluding military and space reactors, approximately 20 sodium-cooled fast reactors have been built in a variety of sizes and configurations. These vary from small test reactors to the French Super-Phenix plant, which had an output of 1240 MW(e). In the United States, several fast reactors were built. These included the EBR-II and the Fast-Flux Test Facility (FFTF)─a 400-MW(t) reactor. The Clinch River Breeder Reactor Plant (CRBRP), a commercial demonstration reactor, was designed and partly built before being cancelled. These machines provide a large experience base in refueling operations (Romrell et al. 1989; Althaus and Brahy 1987).
The facility designs and many of the refueling characteristics of the LS-VHTR are similar to those of sodium-cooled fast reactors. As a consequence, much of the refueling technology for sodium-cooled fast reactors is applicable to an LS-VHTR with relatively minor changes required. This technology is reviewed herein. The reactors have the following similarities.
• Low pressure. Both types of reactors use coolants with vapor pressures significantly <1 atm. The low pressure allows the use of reactor vessels with flat lids and rotating plugs in the lids. These rotating plugs allow refueling machines to be positioned above any location in the reactor core—unlike high-pressure gas-cooled reactors, in which the access is limited. This is a major advantage for refueling and maintenance operations.
• Controlled atmosphere. Sodium reacts rapidly with air and water, while liquid salts react very slowly (see Chapter 3 of this report). In both cases, an inert atmosphere must be maintained above the liquid coolant to ensure coolant purity. Argon has been traditionally used as the cover gas in fast reactors because it is chemically inert, inexpensive, and dense relative to air. A heavy gas will remain in place whereas a light gas such as helium tends to move upward through the seals in the reactor-lid plugs while air tends to move downward. It is likely that argon will also be the cover gas for the LS-VHTR for similar reasons. Both sodium and liquid-salt vapors can “freeze out” on cold surfaces. This is avoided by the use of inert-gas purge flows to keep joints (such as in the rotating plug) free of frozen coolant.
Fig. 7.21. Moderator block with stringer fuel assembly.

174
• High temperatures. Both reactors operate at high temperatures. The peak refueling temperatures in some sodium-cooled fast reactors are similar to those of the LS-VHTR. The EBR-II in Idaho had a nominal refueling temperature of 370ºC, whereas the FFTF at the Hanford site in Washington had a nominal refueling temperature of 315ºC. However, the peak allowable fuel-handling temperatures for moving SNF from in-vessel storage to out of the vessel (Cabell 1980; FFTF 1983) were much higher. For the FFTF, the allowable peak element fuel temperature during handling operations was 538°C (1000°F). The high temperature has several implications for both sodium-cooled and salt-cooled reactors. For example, all motors and control equipment associated with refueling and maintenance are located outside the reactor vessel in a low-temperature environment with mechanical linkages to refueling equipment inside the reactor vessel. The fresh fuel must be preheated before insertion into the reactor vessel. Insulation becomes a major design requirement.
7.4.2 Fast Reactor Refueling Experience
The design and performance characteristics of the EBR-II, FFTF, and CRBRP fuel-handling systems have been reviewed for potential relevance to the LS-VHTR (Cahalan and Taiwo 2006). All these systems used liquid sodium as coolant. Fuel-handling operations were performed in a closed primary system at temperatures sufficiently high to maintain coolant liquidity and with an inert cover gas to avoid chemical reactions between the sodium and the air that contains oxygen and water. This summary provides brief descriptions of the fuel-handling systems and their operations, as well as discussion of design requirements relevant to the LS-VHTR.
The fuel-handling system designs for the EBR-II, FFTF, and CRBRP reflected the requirements imposed by the individual facility missions and reactor system designs. The EBR-II was intended as a developmental prototype for a breeder reactor power station. The FFTF was designed as an irradiation test facility for fuels and materials. The CRBRP was to be a medium-sized demonstration commercial breeder reactor power station.
The pool-type EBR-II design features a large primary system tank containing the reactor and all primary coolant systems, including the reactor, the pumps, and the intermediate heat exchanger (IHX). This layout is similar to that for the LS-VHTR, which was described earlier. The EBR-II primary tank also contained an SNF storage basket that can hold a discharge SNF batch for an extended period (typically 100 days) of decay-heat cool down. The provision for in-vessel SNF storage simplifies ex-vessel handling and storage requirements.
The FFTF testing mission imposed requirements for relatively frequent refueling and handling of large test components, as well as handling of standard reactor fuel assemblies. The FFTF was designed as a loop-type primary system, with the reactor in a vessel connected by piping to the pumps and intermediate heat exchangers. The configuration limits in-vessel SNF storage capability and places additional requirements on ex-vessel fuel-handling equipment, relying on discharge to ex-vessel storage for routine cool-down operations.
The CRBRP was designed, licensed, and partly constructed before being cancelled. It was designed with strong reliance on FFTF experience, taking into account the CRBRP mission of power production, in contrast to the FFTF mission of fuel testing. The CRBRP mission required relatively infrequent refueling outages of minimum duration, during which a large fraction of the core would be refueled. The loop-type CRBRP primary system design provides only minimal in-vessel fuel storage; routine operations require immediate SNF discharge and transfer to ex-vessel storage for cool down.
Temperature requirements for liquid-metal reactor fuel-handling system designs are typically set on the basis of maintaining spent fuel integrity (or test sample integrity for the case of the FFTF), and operational temperature requirements vary depending on mission. Actual system capabilities are set by

175
materials compatibility and strength characteristics. In liquid-sodium systems, the structural material is typically stainless steel (316 or 304), which has excellent strength properties to 550oC and beyond.
EBR-II fuel-handling system. The EBR-II fuel-handling system is designed to facilitate loading of fresh fuel into the reactor and removal of SNF from the reactor to the adjacent fuel cycle facility (EBR-II 1971, Koch). The fuel-handling system is displayed in Fig. 7.22, which shows the reactor, the fuel gripper, and the hold-down mechanisms, the transfer arm, the storage basket, and the fuel-unloading machine.
Fig. 7.22. EBR-II fuel-handling system.

176
During normal operation, the EBR-II reactor was enclosed within an inner vessel that caused hot coolant to flow from the reactor outlet plenum through a pipe to the IHX, where heat was transferred to the secondary coolant. Cold primary coolant exiting the IHX flowed into the primary tank, which held all the primary coolant, the reactor, the IHX, and two primary coolant pumps, as well as provide short-term SNF storage.
For refueling operations, the control rod drive shafts were disconnected and lifted, and the inner reactor vessel cover was raised. To remove a subassembly, the gripper was lowered to the reactor, where it grasped the subassembly to be lifted. Concurrently, the hold-down mechanism was lowered to prevent inadvertent extraction or movement of subassemblies adjacent to the gripped subassembly. The gripper drive mechanism raised the subassembly to be discharged above the reactor core, and plugs in the primary tank lid were rotated into a position in which the transfer arm mechanism could grasp the subassembly. During plug rotations, the hold-down mechanism provided support to the subassembly bottom, in addition to the top support provided by the gripper mechanism.
After grasping the assembly, the manually operated transfer arm rotated to locate the subassembly above one of three rows of positions in the storage basket, which rotated to provide correct positioning. For insertion of a subassembly into the storage basket, the transfer arm mechanism first lowered the subassembly partly into the basket and the storage basket was then raised to seat the subassembly. The transfer arm released the subassembly, and the storage basket was then lowered to the storage position.
Transfers of SNF to the fuel cycle facility from the in-vessel storage basket were conducted during reactor power operation. The SNF was stored for some time in the reactor vessel to reduce the decay heat loads. The transfer arm was used to remove a subassembly from the storage basket and move it to a location where it was grasped by the gripper of the fuel unloading machine. The fuel-unloading machine then raised the subassembly (1) to a dripping elevation, (2) to an argon-blowing station for additional sodium removal, and (3) into a shielded argon-cooled coffin through a transfer port in the primary tank cover. The rail-mounted fuel-unloading machine then traveled to the interbuilding transfer station, where it lowered the subassembly into a second interbuilding coffin, also cooled by argon. This coffin subsequently traveled to the fuel cycle facility. During all fuel-handling operations, the maximum fuel pin temperature was maintained below 650°C (1200ºF).
Loading of fresh fuel is accomplished with the inverse operation. Fuel subassemblies loaded into the reactor are first heated to 232°C (450°F) in the fuel-unloading machine prior to insertion into the primary tank sodium, which is maintained at 371°C (700°F).
FFTF fuel-handling system. The FFTF refueling system (Cabell 1980; FFTF 1983) includes facilities for the receipt, conditioning, storage, installation in and removal from the core of all core components (driver fuel assemblies, control assemblies) and test assemblies that are routinely removable. The reactor refueling system handled three types of core assemblies: 12-ft assemblies such as driver fuel; 40-ft assemblies such as fuels open test assemblies; and 40-ft assemblies such as materials open test assemblies.
An overall plan view of the FFTF reactor refueling facilities is shown in Fig. 7.23. The principal ex-reactor component is the closed loop ex-vessel machine (CLEM), shown in Fig. 7.24. The CLEM loads all components into the reactor vessel and removes all components from the reactor core. Fresh driver fuel and all SNF is transferred to and from the reactor in a core component pot (CCP) that can be inserted or removed through one of three fuel transfer ports in the reactor vessel top cover. The in-reactor components consist of three in-vessel handling machines (IVHMs) plus the three in-vessel storage modules. The FFTF requires three IVHMs because of closed test loops in the reactor core which interfere with direct access to the entire reactor core with one machine.

177
In the handling of 12-ft. assemblies such as driver fuel (Figs. 7.25 and 7.26), a fresh incoming assembly is first lowered by the crane into one of the two core component conditioning stations. In this station, the assembly is flooded with argon and heated to ~232oC (450°F). The assembly is then picked up by the bottom-loading transfer cask and is transported, in an argon atmosphere, to the interim decay storage vessel. The assembly is then lowered into a sodium-filled CCP in the interim decay storage vessel. The assembly is held in liquid sodium at 260°C (500°F) to 316°C (600°F) until the reactor is shut down for refueling.
Fig. 7.23. General arrangement of FFTF reactor refueling facilities.
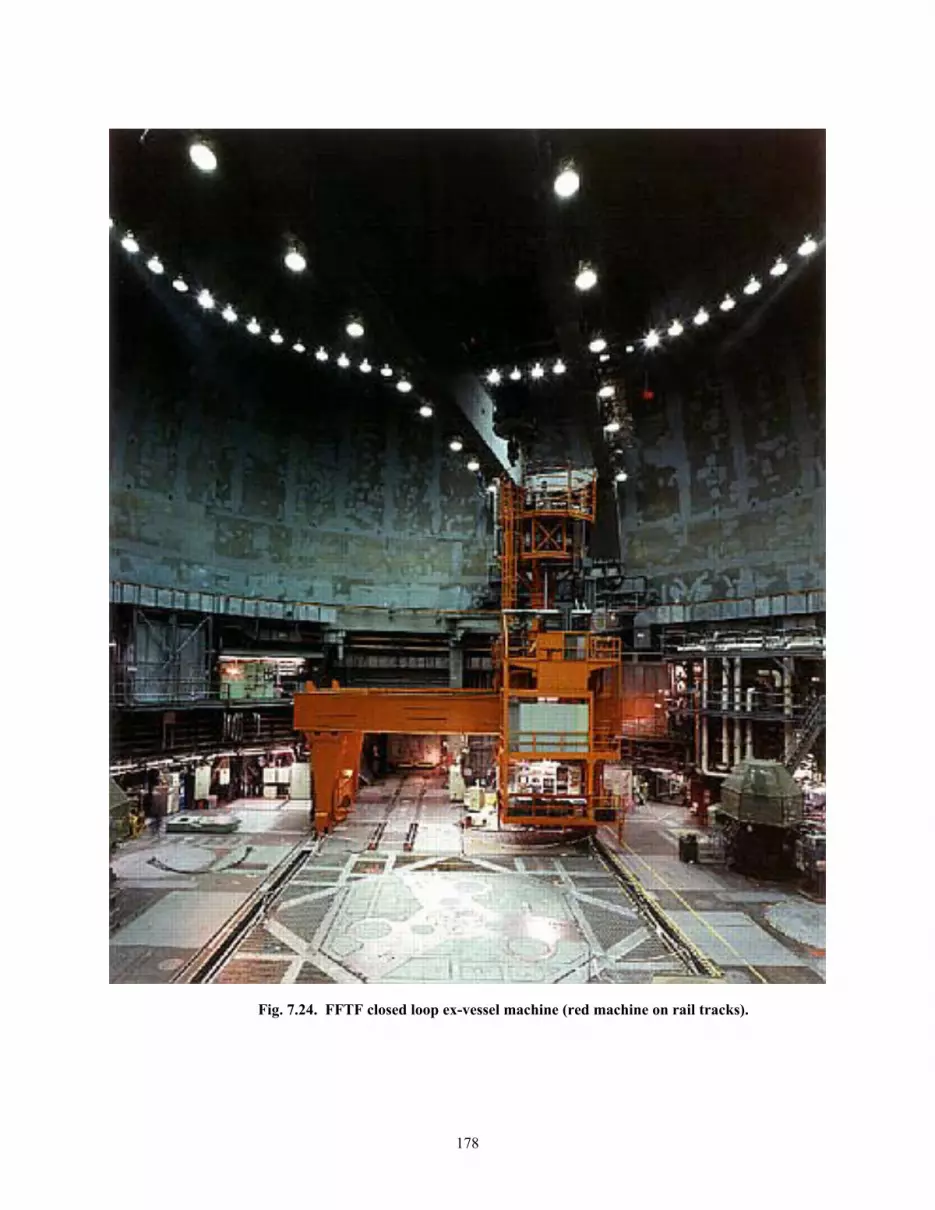
178
Fig. 7.24. FFTF closed loop ex-vessel machine (red machine on rail tracks).

179
Fig. 7.25. FFTF driver fuel-handling sequence.
Fig. 7.26. FFTF driver fuel-handling sequence between interim decay storage and reactor vessel.
After reactor shutdown, the refueling plug in the reactor vessel lid is removed from the fuel transfer port and an adapter and floor valve are installed on the port. The control rod drive shafts are also disconnected, and the instrument trees are moved to their stored positions. The CLEM then picks up the CCP (with the fresh-fuel assembly) from the interim decay storage vessel, transports it to the reactor, and lowers it into the reactor through a fuel transfer port.

180
Inside the reactor vessel, the IVHM removes an SNF assembly from the reactor core and places it into an in-vessel storage position. The IVHM then removes the new assembly from the CCP and places the new assembly into the reactor core. Finally, the IVHM removes an SNF assembly from an in-vessel storage position and places it into the CCP.
The CLEM then removes the CCP with the SNF assembly from inside the reactor vessel and transfers the loaded CCP to the interim decay storage vessel. The SNF immediately after reactor shutdown generates significant quantities of decay heat. The SNF is transferred in a sodium-filled CCP to assure effective cooling of the hot SNF during transfer operations. After a suitable decay period, the bottom loading transfer cask picks up the SNF assembly from the interim decay storage vessel and transfers it out of containment to the long-term fuel-storage facility.
Before reactor startup, the IVHMs are placed in their stored positions in the reactor. The instrument trees and control rod shafts are restored to power-operation status, the adapter and floor valve are removed, and the fuel transfer port is sealed with its plug.
CRBRP fuel handling system. The CRBRP fuel-handling system (CRBRP 1974a, 1974b, 1983) was designed to provide for replacement of fuel, blanket, control, reflector, and restraint assemblies. The system was to consist of the facilities and equipment needed to accomplish the normal scheduled refueling operations, as well as all other functions incident to handling of core components. Refueling operations involved transfer of core components between positions within the reactor vessel and between the reactor and the ex-vessel storage tank (EVST). Refueling operations could be accomplished only when the reactor was shut down.
A view of the general arrangement of the fuel-handling system is shown in Fig. 7.27. New fuel assemblies were to arrive at the plant in shielded and cushioned containers. They were then unloaded and inspected in a shielded new fuel-handling facility located in the reactor service building (RSB). Upon acceptance of a core component, it was to be stored in a subcritical array in a storage facility located in the floor of the new fuel-handling facility.
In preparation for the refueling cycle, new fuel assemblies were to be removed from the storage facility in a shielded transfer machine and inserted into a gas-filled thimble in the EVST. During the course of this operation, the air atmosphere in the shielded transfer cask was to be exchanged for an inert, dry argon atmosphere, which would be compatible with the liquid sodium environment in the EVST. The new core components would then be loaded into preheat tubes in the EVST at 246°C (475°F). After preheating, the EVTM would be used to transfer the fresh fuel assemblies to sodium-filled core component pots (CCPs) that were to be also located in the EVST. There was to be one fuel assembly in each CCP. The process continued until a reactor-reload quantity of fuel had been accumulated for refueling.
After the reactor was shut down, the ex-vessel transfer machine (EVTM) transferred a new fuel assembly, in a sodium-filled CCP, from the EVST to the reactor through a 44.5-ft hatch in the reactor containment building (RCB) wall. When the new fuel assembly arrives at the reactor, it was discharged from the EVTM into a transfer position on the periphery of the reactor core in the reactor vessel.

181
Fig. 7.27. CRBRP reactor refueling system.

182
At this point, the new core component was available for handling by the in-vessel transfer machine (IVTM). The IVTM withdraws an SNF assembly from its position in the reactor core and deposits it into an empty CCP. The IVTM then picks up a new fuel assembly from the CCP and inserts the assembly into position in the reactor core. Horizontal motion of the IVTM is accomplished by means of triple rotating plugs mounted in the reactor head (Fig. 7.28). By rotating these plugs in sequence, the IVTM, which is a simple straight-pull tubular device mounted on a port in the innermost rotating plug, can be indexed over any core or transfer position in the reactor.
When a CCP is full, the EVTM transfers the CCP with the SNF assembly in sodium from the reactor vessel to the EVST. After a suitable decay period, the SNF can be removed from the EVST and prepared for shipment from the plant.
7.4.3 Liquid-Salt-Cooled Refueling
Refueling differences exist between sodium-cooled reactors and the LS-VHTR. For the LS-VHTR, refueling temperatures are somewhat higher, the fuel geometry is different, the power density of the prismatic-block fuel-type SNF is 1 to 2 orders of magnitude lower, and the vapor pressures of the liquid salts are much lower than those of sodium. This section provides discussions of design considerations for the LS–VHTR fuel-handling system relative to sodium-cooled fast reactors.
Primary-system refueling temperatures. This survey of the EBR-II, FFTF, and CRBRP fuel-handling design, operation, and experience has shown that the temperature at which fuel handling was conducted in these systems was dictated by design choices. For example, in the EBR-II, fuel handling was conducted at 371°C (700°F), because this was the design bulk temperature for the primary tank environment (i.e., the normal operating reactor coolant inlet temperature). This temperature was selected to provide margin above the coolant melting temperature (98°C) in cold (peripheral, low-flow) locations within the large primary tank of the EBR-II. Fuel handling at this temperature is feasible because the structural materials used in EBR-II, primarily 304 and 316 stainless steels, have very good strength characteristics up to temperatures of 550°C and above. (The normal operating outlet temperature of the EBR-II is 473°C.)
In contrast, the loop-type FFTF primary-system design has a compact reactor vessel that does not have the large coolant volumes subject to stratification and flow stagnation like those of the EBR-II. Hence, the fuel-handling temperature is not based on prevention of coolant freezing, since this is less of an issue in the FFTF design, but rather upon maximum allowable fuel temperatures during refueling. This criterion arises because of the fuel-testing mission of the FFTF and the need to preserve test fuel integrity after irradiation. Figure 7.29 shows a thermal profile for a specified fuel assembly during FFTF fuel-handling operations (FFTF 1983). Note that short-term assembly temperatures (cladding temperatures) as high as 538°C (1000°F) are allowed during fuel handling. (For comparison, the coolant temperature range in the FFTF during normal operation is 360 to 503°C.) The normal recommended fuel assembly refueling temperatures range is 204°C (400°F) to 249°C (480°F).

183
Fig. 7.28. CRBRP reactor vessel head rotating plugs.

184
Based on liquid-sodium reactor design and operating experience, the process for determining the recommended fuel-handling temperature for the LS–VHTR should be based on assessments of the following: (1) thermal-hydraulic studies to determine the minimum acceptable temperature margin above the coolant melting temperature to maintain coolant flow in natural circulation during refueling, (2) stress analysis of metallic structure temperatures (both reactor vessel structure and in-vessel fuel-handling machine structure) that are required to maintain acceptable margins below material design-basis limits, and (3) thermal analysis of the fuel-element refueling temperatures to determine acceptable margins below the fuel temperature limit.
In-vessel fuel-handling equipment design and fuel restraint design. If it is assumed that the in-vessel fuel-handling machine can be constructed of the same advanced alloy as the reactor vessel (750°C operating temperature), then it is reasonable to expect that the LS–VHTR design of the in-vessel fuel-handling machine could closely resemble the design proposed for the GT-MHR machine (General Atomics 1996) if the core is composed of prismatic graphite block type of fuel.
Design requirements relevant to the LS-VHTR. Many of the design requirements for the EBR-II, FFTF, and CRBRP fuel handling systems have relevance to the proposed prismatic-fuel LS-VHTR design and operating characteristics. Some elements are also relevant to the online refueling systems for the pebble bed and stringer fuel designs and for reflector and moderator replacement in these designs.
• All in-vessel fuel-handling operations are conducted remotely at high temperatures. • Fuel-handling mechanisms are designed to operate for extended periods with very high reliability.
The mechanisms are repairable and replaceable, have low failure rates, and sustain failures only
CCCS Inerting and Preheating
(Typical for Core Components)
BLTC Transfer (Maintains Preheat
Temperature)
Interim Decay
Storage
CEM Transfer (Maintains Preheat
Temperature)
Refuel Reactor Operation
1050ºF Max Na Outlet (Rated
Operation)
Refuel CLEM Transfer
1000ºF Maximum for Short Term Transfer
of All Fueled Assemblies
Interim Decay
Storage
BLTC Transfer of Irradiated Fuel
Fuel Storage Facility
480ºF
400ºFNormal Ass’yTemp Range
1.4 KWt500ºF
400ºFNom
370ºF
800ºFNom
400ºF Min Na400ºF Nom
500ºF
300ºF
Max Na 500ºF
400ºF Nom
Assemble Temp
Min Na 370ºF350ºF Nom
1-8 hrs
Inser
t & P
rehea
t
70ºF
Tem
pera
ture
(ºF) Normal
Ass’yTemp Range
680ºF Min Na
Inlet (Initial Core)
1000ºF Max Ass’y
Post IrradiationPreirradiation
Increasing Time
Note: The core component or test ass’ytemperature indicated refers to the cladding and for post irradiation handling is the center pin.
Time break, temperature remains constant
Facility or fluid temperaturesAssembly temperatures
Original Figure: HEDL 8009-191.1
782ºF Rated
Operation
06-068
Fig. 7.29. Thermal profile for FFTF fuel and test assembly handling.

185
at very long time intervals. Mechanisms are constructed from materials (mostly stainless steel) that are appropriate for the mission requirements.
• Fuel-handling mechanisms are designed for precise alignment that can be maintained for prolonged periods of operation, since remote realignment is difficult while the equipment is submerged. Note that this requirement is more critical for a sodium reactor with an opaque coolant than it is for a liquid salt cooled reactor where optical techniques can be used to monitor and guide the refueling process.
• Positioning of grippers for fuel elements is performed with automated computer control; components are designed with guides (funnels, slides, ports) to facilitate mating and gripping operations.
• To the extent possible, sensing mechanisms are employed to verify all positioning, grasping, movement, transfer, and release functions. Such mechanisms include instrumentation on rotating and elevating machinery, as well as manual “feel” through mechanical links.
• Fuel-handling and transfer equipment is designed to handle one subassembly at a time. • Grasping and gripping mechanisms are designed to minimize the potential for dropping a
subassembly. • Transfer operations are accomplished with positive, mechanically-actuated displacement actions
(without reliance on gravity). • In-vessel fuel handling-mechanisms are designed to have drive mechanisms with vertical and
rotary motion. • For the EBR-II, shaft penetrations through the primary tank cover are equipped with packing-
gland seals to minimize escape of argon cover gas and prevent air in-leakage. For the FFTF and the CRBRP, vessel head ports are mated to special removable valves to control leakage. Similar methods will be required for salt-cooled reactors.
• Wherever possible, fuel-handling mechanisms are designed with additional capability to accommodate nonstandard operations with bent, damaged, or incorrectly positioned subassemblies.
• To minimize reactor shutdown time, the overall system configuration is selected on the basis of time-motion studies and the refueling interval requirement.
7.5 CONCLUSIONS
A review of historical experience with other types of high-temperature reactors provides confidence that refueling of an LS-VHTR is practical and can be accomplished in a reasonable period of time. Three principal options for refueling three basic types of reactor cores (prismatic, pebble, and stringer fuel geometries) have been identified. However, the development of the refueling machinery for this reactor, with its relatively high refueling temperatures, will require a major effort. Trade studies necessary for the selection of the fuel geometry will require consideration of reactor core behavior, fuel fabrication, and online vs off-line refueling.

186
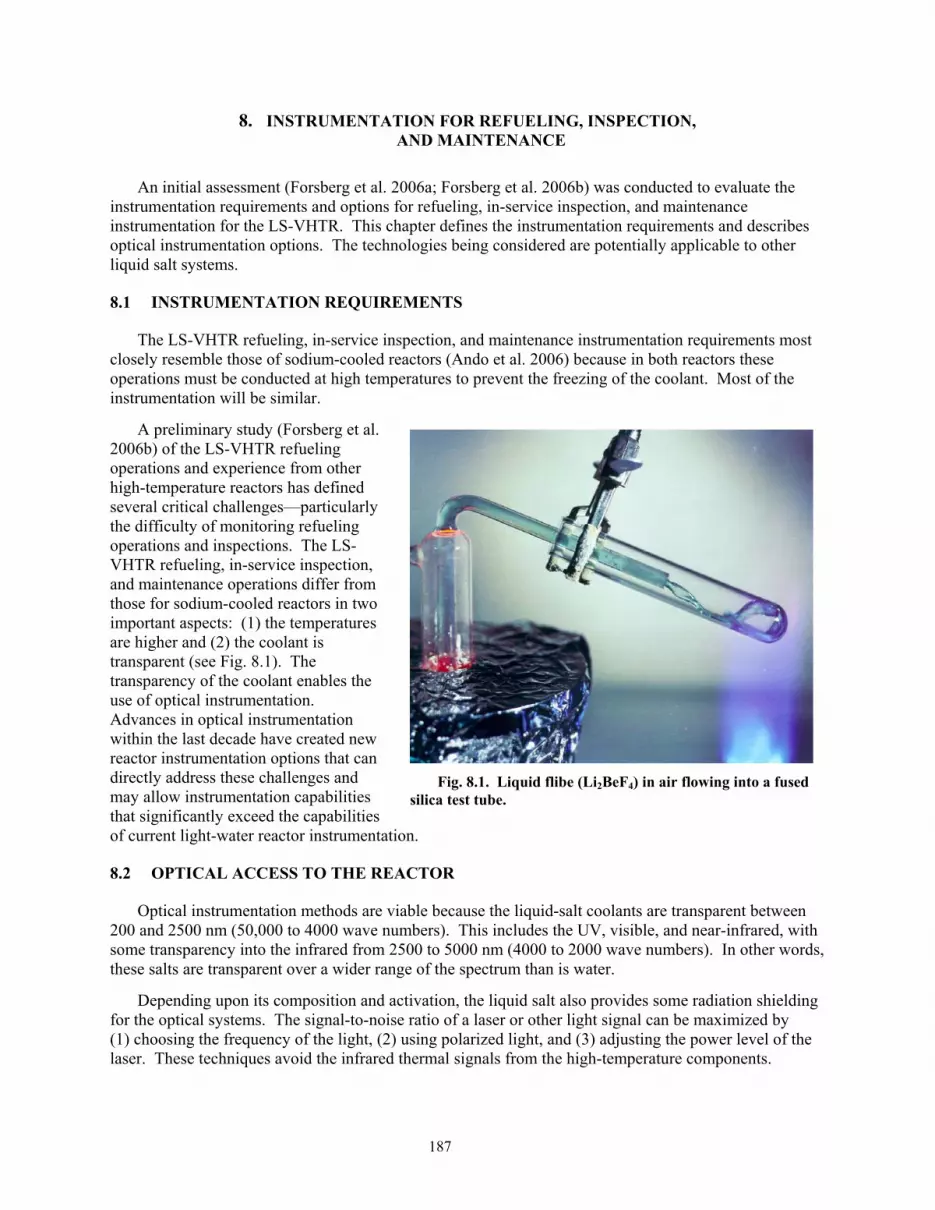
187
8. INSTRUMENTATION FOR REFUELING, INSPECTION, AND MAINTENANCE
An initial assessment (Forsberg et al. 2006a; Forsberg et al. 2006b) was conducted to evaluate the instrumentation requirements and options for refueling, in-service inspection, and maintenance instrumentation for the LS-VHTR. This chapter defines the instrumentation requirements and describes optical instrumentation options. The technologies being considered are potentially applicable to other liquid salt systems.
8.1 INSTRUMENTATION REQUIREMENTS
The LS-VHTR refueling, in-service inspection, and maintenance instrumentation requirements most closely resemble those of sodium-cooled reactors (Ando et al. 2006) because in both reactors these operations must be conducted at high temperatures to prevent the freezing of the coolant. Most of the instrumentation will be similar.
A preliminary study (Forsberg et al. 2006b) of the LS-VHTR refueling operations and experience from other high-temperature reactors has defined several critical challenges—particularly the difficulty of monitoring refueling operations and inspections. The LS-VHTR refueling, in-service inspection, and maintenance operations differ from those for sodium-cooled reactors in two important aspects: (1) the temperatures are higher and (2) the coolant is transparent (see Fig. 8.1). The transparency of the coolant enables the use of optical instrumentation. Advances in optical instrumentation within the last decade have created new reactor instrumentation options that can directly address these challenges and may allow instrumentation capabilities that significantly exceed the capabilities of current light-water reactor instrumentation.
8.2 OPTICAL ACCESS TO THE REACTOR
Optical instrumentation methods are viable because the liquid-salt coolants are transparent between 200 and 2500 nm (50,000 to 4000 wave numbers). This includes the UV, visible, and near-infrared, with some transparency into the infrared from 2500 to 5000 nm (4000 to 2000 wave numbers). In other words, these salts are transparent over a wider range of the spectrum than is water.
Depending upon its composition and activation, the liquid salt also provides some radiation shielding for the optical systems. The signal-to-noise ratio of a laser or other light signal can be maximized by (1) choosing the frequency of the light, (2) using polarized light, and (3) adjusting the power level of the laser. These techniques avoid the infrared thermal signals from the high-temperature components.
Fig. 8.1. Liquid flibe (Li2BeF4) in air flowing into a fused
silica test tube.

188
ReactorCore
Reactor Vessel
Liquid Salt Level
Mirror
Laser and Electronics
Refueling Machine
Laser Light
ReactorCore
Reactor Vessel
Liquid Salt Level
Mirror
Laser and Electronics
Refueling Machine
Laser Light
Optical instrumentation methods require that optical signals be transmitted into the reactor vessel and the signals returned to the instrumentation systems, which will be in a room temperature environment with low radiation levels outside the reactor. Several options exist for transmission and receipt of optical signals. For example, laser signals into the reactor vessel and return signals can be transmitted by the use of mirrors placed either in a periscope with a diamond or other window or directly in the liquid salt (Fig. 8.2). Polished noble-metal mirrors can also be immersed in the salt. Because fluoride salts are fluxing agents, the mirrors are expected to remain clean (something that would not occur in water or in most other fluids). The alternative to using mirrors to transmit light signals is the use of fiber optics. Currently available fiber optic spectroscopy systems for chemical plant operations are rated for temperatures up to 650ºC —significantly above the LS-VHTR operating temperatures (Liauw et al. 2006).
Fig. 8.2. Mirror system for transmitting signals into and out of the reactor vessel.
8.3 PRECISION METROLOGY
Precision metrology is the use of multiple laser range finders at defined locations with appropriate software systems to map three-dimensional environments. This technology is used today to map everything from chemical refineries to railroad right-of-way clearances to the inside of fusion energy machines (Kugel et al. 2001; Menon and Slotwinski 2004). Multiple lasers at well-defined locations measure the direction and range to each object. The laser frequency and power levels are chosen by the designer or, in high-end systems, selected by the operator. A massive industrial experience base exists for this technology and multiple commercial suppliers are available for a variety of applications.
However, the technology has not been developed for liquid-salt systems and development would be required for this specific application. Operational frequencies would be selected for the best transmission of light through the salt and where there are no other significant sources of light at those frequencies (such as from thermal radiation) that could degrade instrumentation capabilities. Polarized light can be used to further boost the signal-to-noise ratio. Software programs can create a three-dimensional model of the environment, and identify changes in the dimensions of the components and surfaces with high precision (due to corrosion and other aging or wear mechanisms) if measurements are repeated over time. In the computerized displays, locations where the changes in component and surface dimensions have occurred can be highlighted with artificial colors.

189
For systems measuring a few tens of meters in scale, experience with non-salt systems indicates that visible surfaces can be mapped to a resolution as small as 0.1 mm. Figure 8.3 shows an example image of a dime obtained by laser scanning of the surface from a distance of 4.2 m. The x and y axis scales in the figure are only to identify locations while the shaded scale at the right measures distance to the dime. The technology in a commercial form has become possible only within the last decade, with the availability of low-cost computers that allow rapid creation of three-dimensional images with a precision of ~5 mm. Special systems are designed for much higher resolution and more-challenging conditions. Systems for fusion experiments are being designed and tested for radiation levels of 106 rad/h under vacuum conditions and 6-T magnetic fields. Computers and associated electronics are located outside, while the laser scan is deployed in a hostile environment.
Fig. 8.3. Image of a dime obtained by laser scanning of the surface from a distance of 4.2 m.
Precision metrology has multiple potential applications for an LS-VHTR.
• Refueling. Precision metrology will allow operators to see operations and provide the refueling machine with information concerning the location of all components with high resolution. Modern robotic systems, including refueling machines, have control systems to prevent collisions with solid objects. Precision metrology creates three-dimensional maps to provide the input to these systems.
• Vibration analysis. The system detects component vibrations that may indicate potential problems.
• Inspection. Regular scans of the reactor interior can confirm that no significant unplanned changes in geometry have occurred. This includes finding loose parts and conducting inspections to see that no significant changes in surfaces have occurred—similar to the application in fusion devices. The high-precision systems being developed for fusion applications are designed to find cracks and other damage on the interior surfaces of fusion machines, as shown in Fig. 8.4.
• Fluid flow. If small nanoparticles are present in the fluid, the liquid-salt flow velocities can be measured by laser Doppler velocimetry or digital particle imaging velocimetry. These techniques are used in the laboratory and in parts of the chemical industry. However, some questions are

190
associated with the application of this technology to the LS-VHTR. The operation of a reactor with graphite-based fuels will generate very small particles of graphite in the coolant salt. But, the number density and optical properties of these particles have not been measured to determine if the reflected optical signal of the particles is sufficiently large to allow reliable fluid flow measurement in the reactor.
Precision metrology is applicable for all operations when the reactor is shut down. It may also be applicable for monitoring during power operations; however, there would be significant additional challenges. The temperatures will be higher as will the neutron and gamma radiation levels. However, the liquid-salt coolant provides radiation shielding for the system optics (mirrors) and other components. Online monitoring, if proven feasible, would provide an extraordinary and unique diagnostic tool.
8.4 SPECTROSCOPY
Spectroscopy is the measurement of light intensity vs frequency. If metrology systems are deployed, the metrology system can be augmented to include spectroscopy. Remote high-temperature measurement systems often use some form of spectroscopy to measure temperatures. In the laboratory, high-temperature salt properties (purity, composition, etc.) are measured by spectroscopy. This is a standard technique used in the chemical industry for online monitoring of the chemical composition of flowing streams in chemical plants (Menon and Slotwinski 2004). Properties that can be measured include the following:
• Temperature. Remote high-temperature measurement systems traditionally use some form of spectroscopy to determine temperature.
• Salt purity, density, chemical composition, and other properties. In the laboratory, high-temperature salt properties are measured by spectroscopy. Laser or other light is sent through the
Fig. 8.4. Precision metrology surface inspection of the first-wall component of a fusion reactor: photograph (left) and metrology scan of the surface (right).

191
salt, and the transmission of the light is measured as a function of frequency. In more sophisticated systems, secondary emission lines are measured. Salt impurities that can be measured to very low concentrations include uranium, the actinides, iron, chromium, and nickel. The chemical valence state can also be measured. Spectroscopy is likely to be the preferred method for monitoring the concentration of impurities and the redox potential of the salt and, thus, the performance of the salt cleanup systems. Such technology is the functional equivalent of the instrumentation used to monitor water chemistry in a light-water reactor.
• Radiation decay. In some salts, neutron activation of the salt leads to a radioactive decay process that creates high-energy electrons (Williams et al. 2006). As the electrons in the salt slow down, photons are emitted that peak in the blue part of the visible spectrum. Because this part of the spectrum is far from the thermal infrared signal caused by the high temperatures, it will be detectable. Depending upon half-lives of the activated nuclides and flow velocities, this phenomenon may allow mapping of salt flow patterns above the reactor core.
8.5 TELEVISION
Television cameras have been developed for a wide variety of hostile environments and are applicable to refueling. Although they represent an alternative optical method, they can not provide the clarity of view of precision metrology. Specialized television cameras such as fiberscopes have been developed with high radiation resistance and enable the electronics to be positioned in cooled low-radiation zones.
8.6 CONCLUSIONS
The LS-VHTR is a new reactor concept with potentially unique capabilities. The optically clear high-temperature coolant, combined with advances in optical instrumentation, creates the potential for advanced reactor instrumentation with capabilities significantly beyond those of existing reactor refueling, in-service inspection, and maintenance instrumentation systems. Significant work and experiments are required to determine which options are the most viable for implementation, and a major development program would be required for implementation.

192

193
9. LS-VHTR SPENT-FUEL CHARACTERISTICS AND REPOSITORY IMPACTS
An initial examination (Forsberg 2006) of LS-VHTR spent nuclear fuel (SNF) characteristics and the potential repository impacts was completed during FY-06. The characteristics and repository impacts of direct disposal of the LS-VHTR SNF with a burnup of 150,000 MWd/t were compared with those of light-water-reactor (LWR) SNF with a burnup of 50,000 MWd/t and modular high-temperature gas-cooled reactor (MHTGR) SNF with a burnup of 100,000 MWd/t. All the comparisons were made on the basis of a unit of electricity produced.
9.1 PLANT EFFICIENCY VS REPOSITORY SIZE
A primary design constraint for a SNF repository is temperature (Forsberg 2000). Peak temperatures must be limited to avoid unacceptably rapid degradation of the SNF, the waste package, and the geological structure. To limit temperatures, the quantity of decay heat per unit area of the repository must be limited. This consideration, in turn, limits the quantity of SNF than can be disposed of per unit area of the repository. For a repository with a fixed area, such as the planned Yucca Mountain repository, the capacity is then limited by total SNF decay heat. Consequently, if one reactor type is more efficient than another reactor type at converting heat to electricity, more electricity can be produced for the same total decay heat in the SNF or equivalent area in a repository.
The electrical-to-thermal efficiency of a typical LWR is ~33%, whereas the electrical-to-thermal efficiency of the LS-VHTR is ~50%. The higher efficiency reflects the higher reactor coolant temperatures (750 to 950°C vs ~300°C). For the analysis herein, it is assumed that the MHTGR has the same efficiency as the LS-VHTR; however, it is expected that in optimized systems, the MHTGR will have slightly lower efficiencies for the same peak coolant temperatures (Forsberg et al. 2004) Liquid-cooled reactors (such as the LS-VHTR) deliver all of their heat over a relatively small temperature range (50 to 150°C), whereas gas-cooled reactors deliver their heat over a ~350 to 450°C range. This is a consequence of the high coolant pumping costs in gas-cooled reactors. To minimize this cost, gas-cooled reactors must be optimized to have larger temperature rises across the reactor core than liquid-cooled reactors. A gas-cooled reactor that has the same peak coolant temperatures as a liquid-cooled reactor will have a lower average temperature of delivered heat to the power conversion system and, thus, a somewhat lower plant efficiency.
The LWR generates 1 kWh of electricity for every 3 kWh of thermal energy, whereas a high-temperature reactor produces 1 kWh of electricity for every 2 kWh of thermal energy. During reactor operations, the LWR SNF must produce 50% more thermal energy per unit of electricity generated. As a result, its SNF also produces 50% more decay heat in the repository per unit of electricity produced compared with that from a high temperature reactor, and thus it requires a repository area that is 50% larger per unit of electricity. There are also smaller second-order effects due to the differences in SNF burnup, fuel design, and the neutron spectrum, which are ignored in this preliminary assessment.
9.2 FUEL CYCLE CHARACTERISTICS VS REPOSITORY SIZE
The LS-VHTR and MHTGR use the same type of graphite-matrix coated-particle fuel; however, the LS-VHTR fuel burnup is ~50% higher than that of an MHTGR (MacDonald et al., 2003, Ingersoll et al. 2005). This is because the LS-VHTR is a large reactor [2400 MW(t)] relative to the current designs for the MHTGRs [600 MW(t)]. The baseline LS-VHTR core is a large right cylinder, whereas the MHTGR has a smaller annular reactor core to assure decay heat removal during any accident condition. Figure 9.1 shows the core layout of prismatic fuel blocks for both core types. The small annular core of the MHTGR implies high neutron leakage (3.5 to 6%), both inward toward a center graphite reflector and outward toward the reactor vessel. In contrast, the small surface-to-volume ratio of the large LS-VHTR core

194
results in relatively small neutron leakage (1 to 2%). Therefore, the average enrichment of the MHTGR core must be higher than in an LS-VHTR for nuclear criticality to be maintained. If the two reactors have similar initial fuel enrichments, the LS-VHTR can have a lower end-of-life SNF enrichment and a corresponding higher SNF burnup. Table 9.1 shows relative SNF burnups for the two reactors with similar initial fuel enrichments.
Table 9.1. Relative core and fuel cycle parameters for the MHTGR and LS-VHTR with two batch refueling
Parameter MHTGR LS-VHTR
Power, MW(t) 600 2400
Total number of fuel columns 102 265
Power density, MW/m3 6.6 10.2
Specific power density, MW/t 103 158
235U enrichment, % 14.0 15.3
Burnup, GWd/t 100 156
The different reactor core designs are a consequence of the choice of coolants and the common
requirement that these advanced reactors have passive decay-heat-removal systems—systems that do not
Fig. 9.1. Differences in liquid-salt-cooled LS-VHTR and helium-cooled MHTG reactor cores.

195
depend upon human actions or active components to ensure removal of decay heat and thus ensure that fuel temperature limits are not exceeded during any possible accident situation. For both the gas-cooled and liquid-salt-cooled reactors, decay heat must be removed from the hottest fuel elements in the reactor core and ultimately dumped to the atmosphere. Different types of systems are used, as also shown in Fig. 9.1.
• Helium cooled. Under accident conditions, decay heat is removed by conduction of heat from the fuel in the reactor core to the reactor vessel. In accidents involving depressurization of the reactor, natural circulation of helium does not transfer significant heat from the reactor core to the vessel. For a maximum allowable fuel temperature, the heat can only be conducted through a limited thickness of fuel blocks to the reactor vessel. While the annular zone can be made longer, the maximum size is limited by the size of practical pressure vessels. The requirement for passive decay heat removal systems restricts the power output to ~600 MW(t), with the core shown in Fig. 9.1.
• Liquid salt cooled. Natural circulation of liquid salts can efficiently move heat from anywhere in the reactor core to the decay heat removal system be it RVACS, DRACS, or PRACS.. Reactor size is limited by the ability to remove heat from the vessel, not the ability to move heat from the fuel to the vessel wall by conduction. Reactors can be built with passive safety, large reactor cores, and more efficient burning of nuclear fuel.
This difference in core design, a consequence of the same passive safety requirements for both
reactors, has several implications in terms of the fuel cycle and repository.
• SNF volumes. The LS-VHTR SNF volumes are reduced by one-third relative to those of MHTGRs per unit of electricity produced due to the higher fuel burnup for the same fuel enrichments. LS-VHTR core with stringer fuel will have much less SNF volume because the graphite moderator can be left in the core for extended periods of time.
• Nuclear criticality. LWRs and the LS-VHTR are both large reactors with large reactor cores and little neutron leakage from the core. In contrast, MHTGR has high neutron leakage and its SNF has a relatively high end-of-life uranium enrichment of 5.6% (Kim et al. 2005). The high enrichment is necessary to maintain nuclear criticality during normal operation.
• Uranium resources and depleted uranium. The LS-VHTR and LWRs have somewhat similar natural uranium demands and generate similar quantities of depleted uranium. The uranium consumption per kilowatt (electric) is lower for the LS-VHTR than for the LWR because of its higher efficiency in converting heat to electricity and its much higher burnup, but the LS-VHTR requires much higher initial enrichments than LWRs. So overall, the uranium demands of the LS-VHTR and the LWR are similar. The natural uranium demands and the quantities of depleted uranium that are generated in the enrichment processes are ~15% higher per unit of electricity for the MHTGR (Lotts et al. 1992) compared with those for an LWR because of the high residual uranium enrichments in the SNF sent to the repository.
9.3 SNF VOLUME
While the SNF decay heat load determines repository area, the waste volume determines the size and number of waste packages required. Because three alternative SNF strategies are currently being assessed, the waste volume per unit of electricity for the LS-VHTR can not yet be determined.
• Whole-block disposal of traditional prismatic block. The entire fuel block may be disposed of. • Separation of fuel compact. Fort St. Vrain type high-temperature reactor fuel is a prismatic
graphite block where fuel holes and coolant channels are drilled into the block. Fuel compacts in

196
the form of coated particles in a graphite matrix fill the fuel holes. The fuel compacts can be mechanically separated from the graphite SNF block. There have been limited experimental and theoretical investigations of this option for separation and direct disposal (Lotts et al. 1992) of the SNF compacts and as a front-end step for reprocessing the SNF (Del Cul et al. 2002).
• Single and multi-pin fuel assemblies. Alternative fuel designs use a prismatic graphite block where coolant holes are drilled into the graphite block with fuel pins in the coolant holes. The Japanese High-Temperature Test Reactor (HTTR) has small coolant holes with a single graphite fuel pin in each hole. For the LS-VHTR, there is also the option of having a multi-pin fuel assembly in large holes in the graphite blocks (Fig. 9.1). Results of our initial design work on these designs are presented in Chapter 6 of this report. The concept of a multi-pin fuel assembly may not be viable for a VHTR, because—should an accident occur—the decay heat must be conducted out of the reactor through the graphite blocks. With a fuel assembly concept in a VHTR, there are large temperature drops between the middle of the multi-pin fuel assemblies and the graphite blocks. This results in higher fuel temperatures under accident conditions. This factor is not a concern for an LS-VHTR because the fuel assembly is cooled by the natural circulation of the liquid salt in the reactor vessel. Studies have identified separate disposal options for the irradiated graphite.
For traditional prismatic fuel blocks, Table 9.2 shows the electricity generation per unit volume of
SNF measured in gigawatt-days (electrical) per cubic meter. LWRs generate the most electricity per unit volume of SNF, followed by the LS-VHTR, and then the MHTGR. Alternative fuel designs or separation of the fuel compacts from the graphite matrix would likely result in the LS-VHTR generating the largest quantity of electricity per unit volume of SNF.
Table 9.2. SNF characteristics
Property LWR MHTGR LS-VHTR
Fuel burnup, GWd(t)/ton uranium 50 100 150
Electrical efficiency, % 33 50 50
Electricity per unit volume SNF, GWd(e)/m 20 3.3 5
In the development of LWR fuel, the electricity generation per unit volume of SNF has increased by
about a factor of 3 since the 1960s and has now leveled off. The development of high-temperature fuel is at a much earlier stage of development, but it offers the potential to increase fuel loadings per fuel assembly and to optimize the fuel design. The same economic incentives (longer fuel cycles and less SNF) exist to increase the capabilities of high-temperature reactor fuel. The expectation is that the electricity generation per unit volume of high-temperature reactor SNF will also significantly increase with experience.
In terms of repository design, the different characteristics of the graphite-matrix SNF compared with those LWR SNF allow for multiple strategies to compensate for the higher SNF volumes.
• Waste package size. To avoid SNF fuel degradation, the maximum LWR waste package temperature limit is set at 350ºC. There is no incentive to use large waste packages because the peak LWR SNF temperature limits would then be exceeded. The equivalent temperature limits for graphite-matrix fuel have not been determined but are likely to be significantly above 500ºC. This allows the use of much larger waste packages without the risk of overheating the SNF.

197
• Placement. To spread out the heat load and avoid exceeding near-field temperature limits, the traditional LWR waste package placement is horizontal. For high-temperature reactor fuel with its lower decay heat per unit volume, the heat load per package does not drive package placement strategy. Alternative options, such as vertical placement, are available to place more waste packages per unit length of disposal tunnel.
9.4 REPOSITORY PERFORMANCE
Studies on the repository performance of high-temperature reactor fuel (Owens 1999, Gray 1982) suggest that this SNF may be a multimillion-year waste form, orders of magnitude better than traditional LWR SNF. If fully confirmed, this performance would radically reduce the requirements and costs for the waste package and alter the licensing requirements for a repository with these graphite-based fuels. There are two major barriers to the release of radionuclides from these SNFs.
• Graphite. The fuel is incorporated into a graphite block. Graphite is an extremely inert material in the natural environment. Graphite is used in the chemical industry in heat exchangers and other applications for highly corrosive environments. Because of its inertness, it has been considered as a waste package option for the planned Yucca Mountain repository (Richards 2002). Projections of graphite performance under oxidizing conditions similar to those expected in the Yucca Mountain repository indicate potential lifetimes of tens of millions of years. Potential treatment options exist to improve performance, including methods to address uncertainties in repository performance that may be created by fuel irradiation. There has been significant work on reducing the permeability of irradiated graphite moderator blocks from gas-cooled reactors by this method (Morris and Bauer 2005). Many of the earlier gas-cooled reactors had metal-clad fuel and graphite moderator blocks. Fuel failures and the relatively-permeable moderator graphite that was used resulted in significant quantities of fission products in the blocks; thus, a need to seal the radionuclides into the graphite to make a waste with low leachability to groundwater. This experience and the investigations of graphite as a waste package material indicate the need to consider waste management implications in the choice of graphite. Because of the potential of the graphite as a major barrier to radionuclide releases, it is unclear whether it is desirable to separate the fuel compacts from the graphite matrix.
• Silicon carbide. The uranium, fission products, and actinides are incorporated into microspheres with graphite and silicon carbide coatings that are all relatively inert to the repository environment (IAEA 1999; Richards 2002; Morris and Bauer 2005). This represents a second potential barrier, and initial analysis and experiments indicate orders-of-magnitude better performance than with LWR SNF with Zircalloy cladding or high-level-waste glass.
9.5 GRAPHITE-MATRIX SNF REPOSITORY
Repository design and capacity depend upon the geology, waste characteristics, and requirements. The Yucca Mountain design is based on LWR SNF. If the quantities of graphite-matrix fuel are small, the repository design will remain unchanged. If large quantities of graphite-matrix SNF are present, a section of the repository should be optimized for this specific SNF. The inert high-temperature characteristics of this SNF, compared with those of LWR SNF, may allow repository designs with many times the capacity of an equivalent LWR repository measured as repository area per unit electricity produced.
9.6 CONCLUSIONS
Compared to LWR SNF, the LS-VHTR SNF will require less repository area per unit of electricity produced because of the higher efficiency in converting heat to electricity. Fewer radionuclides are

198
produced per unit of electricity. The LS-VHTR will also have lower SNF volumes and a lower SNF fissile content than the MHTGR because of the higher SNF burnup for the same initial uranium enrichment levels. The LS-VHTR SNF volumes per kilowatt (electrical) are larger than those of high-burnup LWR SNF. Based on limited data, the potential performance of the graphite-matrix coated-particle SNF in a repository is several orders of magnitude better than that of LWR SNF.

199
10. LS-VHTR SAFETY AND LICENSING ANALYSES AND TESTING PROGRAM
Safety analysis and licensing of the LS-VHTR will be performed using the Code Scaling and Applicability Methodology (CSAU 1989). The Phenomena Identification and Ranking Table (PIRT) process required for CSAU has not yet been performed for the LS-VHTR, but the general experimental program required for the LS-VHTR can be described. In many areas the experimental data developed for HTGRs also applies to the LS-VHTR, such as fuel performance data. However, unique issues also exist that create new experimental requirements for the LS-VHTR. In the LS-VHTR the fuel temperatures will always be well below the damage threshold of 1600°C, so a major goal of the safety analysis will be to predict peak metal temperatures for various operating transients and accidents. The overall structure of the safety analysis and licensing test and development program is described in Section 10.1. Section 10.2 presents recent progress in the design and analysis of scaled thermal hydraulics experiments for liquid salt systems.
10.1 SAFETY AND LICENSING ANALYSES AND TESTING PROGRAM
In general, code validation for CSAU requires a combination of separate effects tests, integral effects tests, and component tests. The validated codes then provide the basis for design and licensing of an LS-VHTR pilot plant. With proper scaling the pilot plant can provide reliability and safety data allowing subsequent licensing of a prototypical-scale demonstration plant.
In general, corrosion and component tests will be performed at prototypical temperatures with liquid salts. But for LS-VHTR fluid mechanics and heat transfer phenomena, both separate effects and integral effects experiments will be performed with simulant fluids.
Fortuitously, the Prandtl number of liquid salts in the range from 500 to 1000°C can be matched by white mineral oils and commonly used industrial heat transfer fluids like Dowtherm and Therminol, at temperatures ranging from 50 to 240°C. This makes it possible to design geometrically scaled heat transfer experiments using these simulant fluids, allowing the Prandtl (Pr), Reynolds (Re), Grashof (Gr) and Froude (Fr) numbers to be matched identically at greatly reduced pumping and heating powers, typically at 1 to 4% of the prototypical power levels (Bardet and Peterson 2005). Likewise, for liquid salt phenomena where only fluid mechanics are important (such as pebble recirculation dynamics or vortex fluid diode performance), Froude and Reynolds numbers can be matched simultaneously using water, with similar scaling for reduced pumping power as with the oils.
Separate effects experiments will be required to measure mixed convection heat transfer coefficients and friction factors for heated flows in vertical channels, where current experimental data does not cover the required range of the Pr number, and to study fluid mechanics and mixing processes in the LS-VHTR core outlet plenum.
System transient response will be studied in reduced height, reduced area integral-effects tests. For prismatic fuels, individual fuel channels in the integral effects tests can be scaled in the same manner used for numerical modeling with codes like RELAP (Ingersoll et al., 2005), using the equivalent annular system shown in Fig. 10.1. In the experimental system, proper selection of the material properties of the tube material, which is wrapped with a heater element, can allow replication of the steady state and transient thermal response of the fuel. For example, a 20- to 40-kW integral experiment using Dowtherm A, at an average temperature of 100°C, would be capable of replicating 700°C full-power flow and heat transfer, in a reduced area integral effects test simulating 15 to 30 core subchannels (height scaling of 0.49). The fact that a 20- to 40-kW integral effects test flow loop could would replicate Pr, Re, Gr, and Fr in full power transient tests is clearly unprecedented for nuclear systems design and points toward another unique advantage provided by liquid salts as reactor coolants. Likewise, similar scaled experiments can

200
be designed to replicate transient heat transfer and fluid mechanics response in stringer and pebble bed core designs.
Data from component, separate effects, and integral effects experiments will be used to develop the design for a pilot plant. The conceptual design for the prismatic-fueled pilot plant is a 1/4-scale LS-VHTR reactor. The prismatic-fuel pilot plant design will use prototypical-size prismatic fuel elements, with two rows (2/8 = 0.25) and 19 columns (19/325)1/2 = 0.24). Figure 10.2 shows the pilot plant core configuration.
The pilot plant will use time acceleration to replicate natural circulation phenomena occurring in the prototypical system and thus operate at peak powers approaching 75 MW(t) in simulating transient response (20.4 MW/m3).
For loss of forced cooling (LOFC) transients and other transient experiments, the pilot plant power and flow will be ramped upward over a 24-h period to maintain a constant core inlet and outlet temperature while generating a fission-product inventory with reduced quantities of longer-lived fission products. The reactor will be tripped when peak power is reached, initiating the LOFC transient with a correctly time-scaled decay heat generation rate to replicate, in accelerated time, the temperature history that would occur in a 48-h period following LOFC in the full-scale prototypical system.
2.65 m IDBuffer salt annulus
Replacable reflector (18)Fuel column (19)
Reactor vesselPermanent reflector
Control assembly (3) Fig. 10.2. One-fourth-scale LS-VHTR pilot plant core
arrangement.
9.53
CoolantChannel
FuelCompact
FuelCompact
FuelCompact
FuelCompact
FuelCompact
FuelCompact
HeliumGap
GraphiteMatrix
12.45
12.70
18.80 mmCoolantChannel
GraphiteMatrix
HeliumGapResidual Graphite
Fuel Compact
Fig. 10.1. RELAP5-3D annular model of a unit cell in a fuel block also used as the geometry for the LS-VHTR integral effects experiment.

201
To generate reliability-related data during steady-state operation, the pilot plant could be run at reduced power level (~50 MW(t), 14.5 MW/m3). With the larger longer-lived fission product inventory from steady state operation, under a LOFC transient the same peak core outlet temperature will be reached (at a later time) providing the same safety characteristics. Because the reflector will be scaled to match the thermal inertia, its thickness is substantially reduced and neutron irradiation damage to structural components is accelerated, allowing irradiation effects to be studied over a shorter operating lifetime than in the prototypical plant.
10.2 DESIGN OF SCALED INTEGRAL EXPERIMENTS FOR HIGH TEMPERATURE LIQUID SALT MECHANICS AND HEAT TRANSFER
High temperature heat transport phenomena with liquid salts will play important roles in the steady-state, transient, and accident response of the LS-VHTR (Bardet and Peterson 2005). Fortuitously, these fluid mechanics and heat transport phenomena can be studied using scaled experiments with reduced size, temperature, and power. Data from scaled experiments can then be used to validate analytical models and benchmark numerical codes. To design a scaled experiment, one normalizes the governing differential equations for mass, momentum conservation, energy conservation, their boundary, and their initial conditions using appropriately selected length, velocity, time, and temperature scales (Kline, 1986).
From the momentum differential governing equation with a forced-convection velocity scale U, the Strouhal ( LUSr τ≡ ), Reynolds ( νULRe ≡ ) and Froude ( gLUFr 2≡ ) numbers emerge. Sr compares the transient phenomena time scale, τ, with the convection time scale ULτconv ≡ , where L and U are the system length and velocity scales. Re represents the ratio of inertia forces to viscous forces, where ν is the kinematic viscosity. Fr represents the ratio of inertia forces to gravitational forces, where g is the acceleration of gravity. If forced-convection heat transport is of interest, nondimensionalization of the energy equation gives the Prandtl number, ανPr ≡ , where α is the thermal diffusivity. Pr represents the ratio of viscous diffusion of momentum to the thermal diffusion of heat. Heat transfer is characterized by the Nusselt number, Nu. When the flow is driven by buoyancy, the Grashof number, 23 νβΔTgLGr ≡ , where β is the coefficient of thermal expansion and ΔT the temperature-difference scale, replaces the Reynolds number when the energy and momentum equations are nondimensionalized. Gr represents the ratio of buoyant to viscous forces.
To take into account the variation of properties with temperature, the dimensionless numbers βΔT, γΔT and κΔT are introduced. They represent the linear changes of density, viscosity and thermal conductivity with temperature respectively. The physical property χ (β, γ or κ) is defined as
00
1
P,TT∂∂
−=ϕ
ϕχ ,
where φ is the thermophysical property, ρ, μ or k.
Finally, the nondimensional differential boundary conditions lead to two dimensionless groups. For interface hydrodynamics, the Weber number arises, σLρUWe 2≡ , where σ is the surface tension and ρ the fluid density. For heat transfer, a modified Biot number arises that is defined in this paper as
LλlkBi* ⋅⋅≡ , where k and λ are the fluid and solid thermal conductivities and L and l the fluid and solid length scales. Bi* describes the heat transfer at the liquid-solid interface.
In the following sections, the subscript m designates the scaled model and p the prototype. First the general scaling approach is presented for a liquid, then a concise list of potential candidate fluids to

202
simulate high temperature liquid salts and then candidate container materials are introduced. The last part of this section provides representative values of the major scaling parameters.
10.2.1 Nomenclature Cp isobaric specific heat g acceleration of gravity k fluid thermal conductivity l solid characteristic length scale L fluid characteristic length scale P pressure Q volumetric flow rate Qh heating power, QΔTρCQh P ⋅= Qp mechanical pumping power, QΔPQp ⋅= T temperature U velocity scale Ub buoyant velocity scale, ( ) 21TgLU Δ≡ βb Greek symbols
α thermal diffusivity
β coefficient of thermal expansion, 00
1
P,TT∂∂
−=ρ
ρβ
γ coefficient of viscosity linear thermal change, 00
1
P,TT∂∂
−=μ
μγ
ΔP pressure drop across the system ΔT temperature-difference scale
κ coefficient of thermal conductivity linear thermal change, 00 P,TT
kk1κ
∂∂
−=
λ solid thermal conductivity μ dynamic viscosity ν kinematic viscosity ρ density τ time scale σ surface tension Dimensionless groups
Bi* modified Biot number, LλlkBi* ⋅⋅≡ Fo Fourier number, ατlFo 2≡ Fr Froude number, gLUFr 2≡ Gr Grashoff number, 23 νβΔTgLGr ≡ Pr Prandtl number, ανPr ≡ Re Reynolds number, νULRe ≡ Sr Sroudhal number, LUSr τ≡ We Weber number, σLρUWe 2≡

203
Subscripts
0 reference absolute value conv convection m model p prototype
10.2.2 Scaling Laws If one has the good fortune to identify a simulant fluid with suitable properties, it is possible to match
prototypical values of dimensionless groups in a scaled experiment operating with reduced power and length scales. For single-phase liquids there are four degrees of freedom to design a scaled experiment: the average operating temperature, velocity, length, and temperature difference scales.
For liquids, the viscosity, density and thermal conductivity decrease with increasing temperature. The specific heat can normally be considered constant over a wide range of temperature. The Prandtl number, Pr, which is solely dependent on the fluid properties, is temperature dependent. Pr dictates the selection of the simulant liquid and its operating temperature for scaled thermo-fluids experiments where heat transfer phenomena are important.
For forced convection, the Reynolds number, Re, represents the balance between inertia and viscous forces, and thus matching Re allows scaled experiments to reproduce flow transitions from laminar to turbulent and wall shear stresses. This imposes a condition relating the length and velocity scales.
mp
pm
p
m
pp
mmpm ρμ
ρμνν
LULUReRe ==⇔= . (10.1)
If Pr is also matched, the Nusselt number for forced convection heat transfer is also matched.
Because liquid salts have very high boiling temperature (>1300ºC) and a very low volatility, phase change phenomena are typically not important. However, in cases where free surfaces exist between the liquid and a gas, as at the free surface of liquid pools or centrifugal pump bowls, or in cases where liquid jets or droplets are sprayed through a gas, gravity forces may play an important role. In these cases the Froude number should also be matched, which imposes another condition relating the length and velocity scales,
2
1
⎟⎟⎠
⎞⎜⎜⎝
⎛=⇒=
p
m
p
mpm L
LUU
FrFr . (10.2)
In the case where the Reynolds and Froude numbers are matched simultaneously, Eqs. (10.1) and
(10.2) then specify the model length scale value, as a function of properties of the prototypical and model fluids,
mp
pm
p
m
p
m
pm
pm
ρμρμ
νν
LL
FrFr
ReRe==⎟
⎟⎠
⎞⎜⎜⎝
⎛⇒⎟
⎟⎠
⎞
=
= 23
. (10.3)
Transient hydrodynamics phenomena, such as oscillating flow forcing functions, are preserved by
matching the Strouhal number,

204
pconv,
mconv,
p
p
m
m
p
mpm τ
τLU
UL
ττSrSr ==⇔= , (10.4)
where τ is the time scale for the transient phenomena and the convective time is defined as ULτconv = . The relative acceleration of transient phenomena in the scaled experiment is then given by the ratio of convective times UL .
For the case of buoyancy driven flows, the scaling procedure is identical except that now the Grashof number must be matched in place of the Reynolds number. The Prandtl number must also be matched to obtain similitude. The Grashof number can be algebraically decomposed into two dimensionless groups,
23 νgL and βΔT. In the last group, ΔT is the system temperature-difference scale, typically taken to be the difference between the maximum and minimum fluid temperature in the system. To simulate natural or mixed convection, the βΔT dimensionless group imposes:
( ) ( )m
p
p
mpm ΔT
ΔTββ
βΔTβΔT =⇔= , (10.5)
thus the temperature-difference scale ratio is fixed by the thermal expansion coefficient ratio. The other group imposes:
p
m2
3
p
m
p2
3
m2
3
νν
LL
νgL
νgL
=⎟⎟⎠
⎞⎜⎜⎝
⎛⇒⎟⎟
⎠
⎞⎜⎜⎝
⎛=⎟⎟
⎠
⎞⎜⎜⎝
⎛, (6)
which is identical to the length-scale requirement to simultaneously match Re and Fr, Eq. (10.3). If transients are investigated the Stroudhal number should also be matched as for forced convection, and the scaling is identical except that the velocity scale is defined based on the buoyant velocity
( ) 21TgLU Δ≡ βb .
In high-temperature heat transfer where large temperature changes may occur, the variation of fluid properties with temperature may be important. Matching this variation imposes other restrictions on the temperature difference scale that can be compared with Eq. (10.5) to estimate the degree of distortion in the scaled experiment.
As stated earlier, matching the governing differential equations is not sufficient to reproduce fluid mechanics and heat transfer; the boundary and initial conditions also must be properly scaled. For heat transfer, this scaling determines the optimal thermal properties of container materials in the scaled facility. For steady-state heat flux similitude, the modified Biot number must be matched. For heat transfer through thin structures (l<<L), such as heat exchanger tubes, the option exists to adjust the scaled structure thickness using a different scaling ratio than that for the other system dimensions.
mp
pm
p
m
p
mpm Ll
Llkk
λλ
BiBi ⋅=⇒= ** . (10.7)
To accurately scale the heat flux through an interface, the ratio of the solid thermal conductivity λ,
must be similar to the ratio of the liquid thermal conductivity k multiplied by the ratios of length scales. This is the only condition for steady state heat transfer, while for transients, the response of the container must be reproduced as well. The Fourier number must also be matched

205
m
2p
p2m
p
mpm τl
τlααFoFo =⇒= , (10.8)
placing a constraint on the model container thermal diffusivity, αm.
Because the time scales, τ, are determined in scaling the fluid mechanics, matching the Strouhal number introduces the convective time scales in Eq. (10.8).
pm
2p
mp2m
p
mpm ULl
ULlααFoFo =⇒= . (10.9)
The length and velocity scales having already been defined, so this last condition determines the
optimal thermal diffusivity for the scaled container material.
Finally, one must check that the scaled container material is compatible with the simulant fluid when used at the desired experimental temperatures. Due to the potential for pressurizing the experiment, stress analysis of the container material may be required for gases. If it is not possible to obtain a desirable material for the scaled container, one can perform iterations by selecting another fluid or accept some distortion in the experiment phenomenology.
When surface-tension dominated free surface effects are present, the condition on the Weber number imposes.
mp
pm
p2p
m2m
pm ρσρσ
LULUWeWe =⇔= . (10.10)
Combined with matching the Froude number (10.2), free surface effects resulting from the balance of inertia, gravity, and surface tension forces can be simulated.
10.2.3 Potential Simulant-Fluid Candidates Scaling for several categories of liquid fluoride salts, beryllium, zirconium, sodium fluoroborate and
alkali based salts (Table 10.1) is studied here. The thermophysical properties of these liquid salts have been characterized in the past but not at very high temperatures (>750ºC). Also, while the thermal conductivity of flibe has been measured accurately, the measurement of thermal conductivity at high temperatures with transparent fluids is challenging, and significantly greater uncertainty exists for the other salts.

206
Table 10.1. Approximated liquid salt thermophysical properties, after D. Williams (2006)a
T (ºC)
Ρ (kg/m3)
CP (kJ/kg-K)
ρ CP (kJ/m3-K)
ν (m2/s·106)
Σ (N/m·103)
k (W/m-K) Pr Β
(1/K·10-4) Flibe 600 1990 2.34 4650 4.3 190 1.1 18.2 2.46 900 1840 2.34 4300 1.8 160 1.1 7.0 2.65 NaF-ZrF4 700 3140 1.17 3670 1.6 No data ~1 ~5.9 2.96 NaF-NaBF4 700 1750 1.51 2640 0.5 77 ~0.5 ~2.6 4.05 Flinak 700 2020 1.89 3820 1.4 No data ~0.6–1 ~8.9–.3 3.62 Helium 700 3.7 5.2 19 12.4 0.36 0.65 10.2 Water 290 732 5.5 4040 0.13 16.7 0.56 0.94 - Sodium 700 790 1.27 1000 0.25 No data 62.0 0.004 3.11
aThe salts compositions are in mole percent: flibe, (66 mol% LiF–34 mol%BeF2), NaF-ZrF4 (50–50), NaF-NaBF4 (8–92) and flinak, LiF-NaF-KF (46.5–11.5–42). Shown for reference is values for 7.5 MPa helium, 7.5 MPa saturated water, and sodium.
To simulate liquid fluoride salts in scaled integral experiments, two classes of simulant fluids have been identified. Table 10.2 provides their properties. The first fluid category is low viscosity mineral oils such as Drakesol 260-AT, manufactured by Penreco. The Drakesol 260-AT is inexpensive, odorless, colorless, stable, nontoxic, food-grade mineral oil. It has a high index of refraction, n=1.4498 at room temperature, which nearly matches that of fused silica (1.4575) and of Pyrex (1.47), allowing the use of optical investigation techniques such as Particle Image Velocimetry (PIV) for flow field characterization and Laser Induced Fluorescence (LIF) for temperature gradient measurements. The high refractive index of this light mineral oil and its low viscosity makes it an unusual fluid, and render it attractive to conduct fluid dynamics as well as heat transfer experiments. It has a high boiling temperature, 268ºC . This oil has moderate flammability and special precautions must be deployed when it is employed at high temperature. The Drakesol is similar to the oil used by Stoots et al. (2001) in the Matched Index of Refraction Facility at Idaho National Laboratory.
Table 10.2. Liquid salt potential simulants
T (ºC)
ρ (kg/m3)
ν (m2/s·106)
Σ (N/m·103)
CP (kJ/kg-K)
k (W/m-K) Pr Β
(1/K·10-4) Drakesol® 260 40 7951 3.81 251 2.002 ~0.0982 61.7 6.71 80 7751 1.91 221 2.002 ~0.0982 30.1 6.90 150 7403 0.53 153 2.002 ~0.0982 7.6 7.25 Therminol® 724 40 1060 5.7 No data 1.61 0.14 69.5 9.34 100 1010 1.6 No data 1.77 0.13 22.0 9.90 200 920 0.5 No data 2.04 0.12 7.82 11.0
1Measurements made by the authors. 2Adapted from Stoots et al. (2001). 3Extrapolated values from our measurements. 4Given by the manufacturer.

207
Heat transfer fluids, such as Solutia Therminol 72, constitute the second class of liquid salt simulants. However they are not optically clear, which forbids optical investigation methods. On the other hand, they have lower flammability than mineral oils, but similar precautions for fire safety must be employed. Its boiling temperature is 271ºC.
For liquid fluoride salts, high nickel alloys and carbon-based materials are commonly used materials for construction. Here Haynes 214 and 316 stainless-steel are selected as representative of potential metallic container materials, and graphite for carbon based materials. Their thermal properties at high temperature are summarized in Table 10.3, as well as properties of candidate model materials. It is commonly desirable to build models in glass, which aides flow visualization. Thus, fused silica and Pyrex are considered here. Also, certain high-thermal-conductivity epoxies and thermoplastics may offer improved scaling of the prototype materials, particularly graphite. Furthermore, the thermal conductivity and diffusivity of such epoxies and thermoplastics can be adjusted by changing their additives and processing methods, and they can be cast and machined into complex shapes, for example to simulate graphite blanket blocks and fuel elements.
Table 10.3. Thermal properties of candidate materials of construction for the prototype and for the model
T (ºC)
Ρ (kg/m3)
CP (kJ/kg-K)
K (W/m-K)
α (m2/s·106)
Tmax (ºC)
Prototype Haynes® 2141 700 8000 0.67 26.9 5.0 1300 Stainless Steel 3162 700 8200 0.43 24.2 6.9 850 Graphite H-4513 700 1700 1.90 32.4 9.9 3000
Model Fused Silica4 25 2200 0.90 1.6 0.81 1000 Pyrex 77404 25 2230 1.18 1.4 0.53 290 Thermally conductive epoxy4 25 1800 2.5 350 Thermally conductive PPS4 25 2200 1.0 3.5 2.3 350 Tmax indicates the maximum operating temperature. PPS stands for polyphenylene sulfide. 1Given by the manufacturer. 2Adapted from Incropera et al. (1981). 3INEEL/GA values. 4Typical values.
10.2.4 Scaling
Carefully scaled experiments can provide data on the coupling between important thermal and hydraulics phenomena. All scaled experiments involve some distortion of phenomena, so appropriate scaling requires the identification of the most important phenomena that govern the integral system response. It also involves the appropriate selection of the available adjustable parameter values to reproduce the important phenomena at reduced geometric scale, recognizing that other phenomena may suffer distortion. Methods for scaling for integral experiments have been extensively developed for light-water reactor accident studies, where it is too expensive to perform integrated experiments at full scale and power, so reduced scale facilities are studied instead to provide the basis for licensing (Zuber 1991). Similar methods can be applied to high-temperature systems using liquid salts as heat-transport fluids.
The size, complexity, and expense of experiments increases with the number of phenomena the experiments reproduce. Experimental programs thus focus initially on studying coupling between limited subsets of phenomena at reduced geometric scale and energy. Subsequent experiments integrate larger numbers of phenomena, and they typically require larger size, flow, and energy to control distortions.

208
Several options are available for selecting the geometry of scaled integral experiments. In general, the geometry of transport systems can be scaled to adjust the length and the cross-sectional configuration of flow paths. In addition, scaling can be used to adjust the boundary conditions (mass and energy fluxes, or specific power) at the surfaces of the geometric region being studied, the volumetric energy deposition (if any), the thermodynamic state and chemical composition of the materials, and the initial conditions that start the temporal phase being studied. With careful selection of these adjustable parameters, the distortion of the coupling of the most important phenomena being studied can be minimized.
For the simulant fluids discussed here, reduced height experiments are used to preserve Fr at reduced length and power scales. Because the flow path length drops faster than the velocity, reduced geometric scale requires time acceleration. Three primary approaches are available for scaling the cross-sectional dimensions of scaled experiments. Geometric scaling can be used which preserves the ratios of all geometric dimensions in the system. To further reduce the experiment power and flow rates, the flow areas can be further reduced. In modular systems, where flow occurs in multiple, similar parallel channels, the natural choice is to replicate geometrically a subset of the flow channels. The primary distortions from reducing the number of modules come from potential interactions between the parallel flow paths, such as effects that would cause nonuniform flow distribution between channels or coupling and instability effects.
Where modularity is not available or where coupling effects are expected to be important, the stream-tube approach can be used to reduce the flow-path area. Here a physical flow boundary is substituted along a surface that would have (at least time averaged) parallel flow in the prototypical systems. Distortions here come primarily from the incorrect momentum and heat fluxes introduced by the artificial solid boundaries.
Because scaled experiments inherently involve some distortions of phenomena, the designs often include the capability to vary parameters such as power, temperature, flow velocity or geometric configuration. The response of the system to such parametric variations can often identify the relative roles of different phenomena and increase the confidence in the capability of models to predict the integral system performance.
The primary goals of integral experiment scaling are to reproduce dominant system phenomena with low distortion in experiments performed at reduced power, length, temperature and power scales. The mechanical pumping power can be estimated as
23LρUQΔPQp =⋅= , (10.11) where ΔP is the pressure drop across the system and Q is the volumetric flow rate. The heating power is
2PP ΔTULρCQΔTρCQh =⋅= . (10.12)
The scaling laws derived previously to design a scaled model are now applied. The temperature of
the model liquid is selected to match Prandtl number. With the exception of NaF-NaBF4, the light mineral oil simultaneously reproduces the Reynolds, Froude, Prandtl and Grashof numbers for the key liquid salts studied here with scales reduced to 40% for the length, 63% for the velocity, and about 40% for the temperature difference (Table 10.4). The scaled system accelerates time to 63% of prototypical times. Since the NaF-NaBF4 thermal conductivity is smaller than the other salts, it requires a larger model length scale. Table 10.4 shows that the scaled systems require only a small fraction of the prototype pumping and heating power, typically below 2%, which can be economically attractive particularly when simulating protracted transients. Because the temperature difference scale ratio is similar to the length scale ratio, one can conclude according to the argument in Section 10.2.1 above that the thermal expansion phenomena are accurately reproduced by this similitude. However the variation of

209
viscosity is not reproduced as accurately, varying by a ratio from 1.4 to 4.7. The viscosity of the oil does not change sufficiently with increasing temperature to accurately simulate the viscosity change of the liquid salts. This can have effects on phenomena controlled by viscosity changes, such as in the salt flow distribution in compact plate heat exchangers operating with large salt temperature changes, as occurs in the NGNP intermediate heat exchanger.
The free surface effects are reproduced with a slight mismatch: the oil surface tension is too high at these length and velocity scales. This can be corrected by adding a surfactant to the oil, or increasing the length scale or velocity scale and accepting distortion of the Reynolds and/or Froude numbers instead. The distortion of the surface tension forces varies between 40 and 15% depending on the salt. Physically this means that the model capillary waves have a longer wavelength and atomized droplets have larger diameters relative to the prototype. Finally, liquid salts do not wet most solids container materials whereas mineral oil does. The different wetting characteristics of oil (usually wetting) and liquid salts (usually non-wetting) may have an effect especially for liquid-gas flows through porous medium. However, boiling phenomena where the contact angle commonly plays a key role are not expected to be important in liquid salt systems, where the extremely low volatility of the salts normally precludes any boiling phase change.
Table 10.4. Liquid salts simulated by Drakesol® 260a
Flibe 600ºC
Flibe 900ºC
NaF-ZrF4 700ºC
NaF-NaBF4 700ºC
Flinak 700ºC
Mineral oil temperature 110ºC 165ºC 165ºC 210ºC 145–170ºC Length-scale Lm/Lp 0.40 0.39 0.38 0.48 0.53–0.39 Velocity-scale Um/Up 0.63 0.62 0.62 0.69 0.73–0.62 ΔT-scale ΔT m/ ΔT p 0.36 0.40 0.43 0.57 0.54–0.52 Reynolds number Rem/Rep 1 1 1 1 1–1 Froude number Frm/Frp 1 1 1 1 1–1 Weber number Wem/Wep 0.63 0.72 No data 0.85 No data Prandtl number Prm/Prp 1 1 ~1 ~1 ~1–1 βΔT βmΔT m/ βpΔT p 1 1 1 1 1–1 γΔT γmΔT m/ γpΔT p 1.42 2.86 1.91 4.68 2.38–2.31 κΔT κmΔT m/ κpΔT p No data No data No data No data No data Rayleigh number Ram/Rap 1 1 1 1 1–1 Nusselt number Num/Nup 1 1 ~1 ~1 ~1–1 Pumping power Qpm/Qpp 0.015 0.015 0.008 0.031 0.040–0.013 Heating power Qhm/Qhp 0.012 0.013 0.015 0.049 0.043–0.019
aThe bold italic entries—oil temperature, length-scale, velocity scale, and ΔT scale—are adjustable parameters. κΔT can not be evaluated because there are no information on the temperature dependence of liquid salts thermal conductivities.
The oil scaling sets the desired thermal properties of the container material. For Eq. (10.11) for heat
transfer similitude to be respected, in the case where the solid and fluid length-scales ratio is conserved, the model container material thermal conductivity must be
m p m pλ λ k k 0.091= = , when the salt is flibe. If the solid thermal conductivity of the model container λm is too small, the dimensionless heat transfer through the model wall is also too small. This can be corrected by using a scaled container with thinner walls, thus adjusting the ratio
m pl l in Eq. (10.7). Adjusting the wall thickness can be expected to have small effects when the wall is thin compared to other system dimensions, lL >> For transient response, requirement for Fourier number similarity, Eq. (10.9), imposes the container thermal diffusivity:
m pα α 0.25= . If this ratio is too small, the model solid structures have a slower response time to

210
transients than the liquid, and their action as heat source or sink is reduced. Again the model solid structures can be made thinner to compensate for this effect, thus adjusting the ratio
m pl l in Eq. (10.9).
Thermally conductive epoxies and plastics provide the best similitude because their properties can be adjusted upon request to the manufacturer. In contrast to fused silica and Pyrex, they are not transparent.
In scaled experiments, the thermal properties of the oil and the liquid salts are also a source of uncertainty. For example, the oil viscosity at the temperatures indicated has not been measured yet and instead is extrapolated from lower temperature measurements. Because the salts are transparent and have a high volumetric heat capacity, radiation heat transfer, which increases with T4, becomes important at high temperature. This interferes with thermal conductivity measurements, explaining the uncertainty on their values. This uncertainty creates a potential source of distortion.
If the model uses heat transfer fluids like Therminol 72, the scaling is similar to the mineral oil, except that the average model temperatures becomes higher and the temperature difference scale is reduced as can be seen in Table 10.5. The input power to the heat transfer fluids is larger than for mineral oils.
Table 10.5. Liquid salts simulated by Therminol® 72a
Flibe 600ºC
Flibe 900ºC
Heat transfer fluid temperature 120ºC 250ºC Length-scale Lm/Lp 0.43 0.39 Velocity-scale Um/Up 0.66 0.62 ΔT-scale ΔT m/ ΔT p 0.27 0.26 Reynolds number Rem/Rep 1 1 Froude number Frm/Frp 1 1 Weber number Wem/Wep No data No data Prandtl number Prm/Prp 1 1 βΔT βmΔT m/ βpΔT p 1 1 γΔT γmΔT m/ γpΔT p 0.56 0.04 κΔT κmΔT m/ κpΔT p No data No data Rayleigh number Ram/Rap 1 1 Nusselt number Num/Nup 1 1 Pumping power Qpm/Qpp 0.026 0.018 Heating power Qhm/Qhp 0.013 0.011
a The bold italic entries—oil temperature, length-scale, velocity scale, and ΔT scale—are adjustable parameters. κΔT can not be evaluated because there are no information on the temperature dependence of liquid salts thermal conductivities.
10.2.5 Integral Experiment Designs
Low viscosity mineral oils and heat transfer fluids offer advantageous scaled thermal-hydraulics experiments simulating liquid salts. However when working with oil at high temperatures certain precautions are required that are introduced next. Then an example of a scaled integral experiment that simulates both liquid salt and helium is presented.
While working with hydrocarbons the risk of fire and burns must be considered. This is true for mineral oils and heat transfer fluids. The flammability risk is characterized by the flash and auto-ignition points. The flash point is the minimum temperature at which the fumes above a heated fluid ignite in air in the presence of a flame. The auto-ignition point is defined as the minimum temperature at which spontaneous combustion occurs (i.e., the fumes in contact with hot air ignite without an external source of

211
ignition). Those temperatures are given by the fluid manufacturer and help select the liquid. Further, in the event of a leak from pressurized pipes, another fire hazard is the atomization of the liquid jet upon exiting. Such droplets can auto-ignite at temperatures lower than the flash point.
By taking certain precautions, those fluids can be employed at temperatures greater than the flash point and even the auto-ignition point. In this case, the experiment must be performed either in an inert environment, in an enclosure filled with nitrogen, or under vacuum. Furthermore the enclosure has to be relatively large to allow the fumes to cool down and condense in case of leaks. One can also equip the recirculation flow loop with double containment piping.
The Drakesol 260 flash and auto-ignition temperatures are 127ºC and 220ºC respectively. For the Therminol 72 they are 132ºC and 585ºC. The Therminol is safer to use in high temperature applications, but it still requires precautions due to relatively low flash point. Furthermore, because it is more viscous it needs to be run at higher temperature than the oil. For both oils, provisions must be provided to prevent accidental contact with the oil, which could result in burns. Both liquids have high boiling temperature and low vapor pressure; hence the flow loop does not need to be pressurized.
10.2.6 Conclusions Two new categories of fluids and structural materials have been presented that allow the simulation of
transient fluid mechanics and heat transfer phenomena in systems with liquid salts and their structures in scaled facilities with relatively small distortion. Light mineral oils are particularly promising due to their excellent optical properties, which permit scaled fluid mechanics and heat transfer experiments at substantially reduced length, velocity, temperature and power scales. When used with fused silica or Pyrex, these oils can simulate liquid salts and their surrounding metallic structures with an uncommonly small distortion. This permits the design of scaled integral liquid salts experiments with low distortions. Light mineral oil thermophysical properties must be investigated further to reduce the uncertainty at higher temperatures. Liquid salt thermal properties also need to be better characterized at high temperatures, particularly the thermal conductivity and surface tension.

212

213
11. REFERENCES
CHAPTERS 1 AND 2:
Del Cul, G. D., B. B. Spencer, C. W. Forsberg, and E. D. Collins (2002), Triso-Coated Fuel Processing to Support High-Temperature Gas-Cooled Reactors, ORNL/TM-2002/156, Oak Ridge National Laboratory, Oak Ridge, TN, September 2002.
Forsberg, C. W., D. L. Moses, E. B. Lewis, R. Gibson, R. Pearson, W. J. Reich, G. A. Murphy, R. H. Staunton, and W. E. Kohn (1989), Proposed and Existing Passive and Inherent Safety-Related Structures, Systems, and Components (Building Blocks) for Advanced Light-Water Reactors, ORNL-6554, Oak Ridge National Laboratory, Oak Ridge, TN, October 1989.
Forsberg, C. W., and P. F. Peterson (2003), “Making Core-Melt Accidents Impossible in a Large 2400-MW(t) Reactor,” Proceedings Global 2003, Embedded Topical: American Nuclear Society 2003 Winter Meeting, New Orleans, Louisiana, November 16–20, 2003, American Nuclear Society, La Grange Park, IL, 2003.
Forsberg, C. W. (2005), “The Advanced High-Temperature Reactor: High-Temperature Fuel, Liquid Salt Coolant, and Liquid-Metal-Reactor Plant,” Progress in Nuclear Energy, 47(1–4), pp. 32–43 (2005).
Forsberg, C. W., (2006a), “Goals, Requirements, and Design Implications for the Advanced High-Temperature Reactor”, Proceedings of 14th International Conference on Nuclear Energy, American Society of Mechanical Engineers, Miami, Florida, July 17–20, 2006, ICONE14-89305, CD-ROM, American Society of Mechanical Engineers, 2006.
Forsberg, C. W., (2006b), “Advanced-High-Temperature-Reactor Spent-Fuel Characteristics and Repository Impacts,” Proceedings of the 2006 International High-Level Radioactive Waste Management Conference, Las Vegas, Nevada, April 30–May 4, 2006, American Nuclear Society, La Grange Park, IL, 2006.
Ingersoll, D. T., C. W. Forsberg, L. J. Ott et al. (2004), Status of Preconceptual Design of the Advanced High-Temperature Reactor, ORNL/TM-2004/104, Oak Ridge National Laboratory, Oak Ridge, TN, May 2004.
International Atomic Energy Agency (IAEA) (1991), Safety Related Terms for Advanced Nuclear Plants, IAEA-TECDOC-626, International Atomic Energy Agency, Vienna, 1991.
International Atomic Energy Agency (IAEA) (2006), Advanced Nuclear Plant Design Options to Cope with External Events, IAEA-TECDOC-1487, International Atomic Energy Agency, Vienna, February 2006.
Nuclear Energy Agency (NEA) (2003), Proceedings of the OECD/NEA Second Information Exchange Meeting on Nuclear Production of Hydrogen, Paris, France, 2003.
Peterson, P. F., and J. Zhao (2004), “Material Input for Advanced Brayton Cycle Power Conversion Systems,” Transactions of the 2004 American Nuclear Society Winter Meeting, Washington, D.C., November 14–18, 2004, American Nuclear Society, La Grange Park, IL, 2004.
Peterson, P. F. and H. Zhao (2006), “A Flexible Baseline Design for the Advanced High-Temperature Reactor Using Metallic Internals (AHTR-MI),”, Proceedings of the 2006 International Congress on Advances in Nuclear Power Plants (ICAPP ’06), Reno, Nevada. June 4–8, 2006, Paper 6052 (CD-ROM) American Nuclear Society, La Grange Park, IL, 2006.

214
Topsoe, Haldor A/S (2005), “Topsoe Awarded Contract for Largest Hydrogen Production Capacity in the World for KNPC, Kuwait,” press release, Lyngby, Denmark, Aug. 3, 2005.
U.S. Department of Energy (DOE) (2002), A Technology Roadmap for Generation IV Nuclear Energy Systems, U.S. Department of Energy Nuclear Energy Research Advisory Committee and the Generation IV International Forum, December 2002.
U.S. National Research Council (2004), The Hydrogen Economy: Opportunities, Costs, Barriers, and R&D Needs, National Academy Press, Washington, DC, 2004.
Williams, D. F. (2006), “Salt Selection of the LS-VHTR,” Proc. 2006 International Congress on Advances in Nuclear Power Plants (ICAPP ’06), Reno, Nevada, June 4–8, 2006, Paper 6160 (CD-ROM), American Nuclear Society, La Grange Park, IL, 2006.
Williams, D. F., L. M. Toth, and K. T. Clarno (2006), Assessment of Candidate Molten Salt Coolants for the Advanced High-Temperature Reactor, ORNL/TM-2006/12, Oak Ridge National Laboratory, Oak Ridge, TN, March 2006.
Williams, P. M., T. L. King, and J. N. Wilson (1989), Draft Preapplication Safety Evaluation Report for the Modular High-Temperature Gas-Cooled Reactor, NUREG-1338, U.S. Nuclear Regulatory Commission, Washington, DC, March 1989.
CHAPTER 3:
Adamson, G. M., R. S. Crouse, and W. D. Manly (1961), Interim Report on Corrosion by Zirconium-Base Fluorides, ORNL-2338, Oak Ridge National Laboratory, Oak Ridge, TN, 1961.
ANC (1955–1958), “Chemical Reactions in Molten Salts: Stability of Structural Metal Fluorides,” Section in series of Aircraft Nuclear Propulsion Project Quarterly Progress Reports, ORNL-1816, 1864, 1896, 1947, 2012, 2257, 2221, 2274, and 2387, Oak Ridge National Laboratory, Oak Ridge, TN, 1955–1058.
ARE (1957), Nuclear Science and Engineering, 2, pp. 797–853; special issue devoted to the ARE.
Baes, F. (1970), “The Chemistry and Thermodynamics of Molten Salt Reactor Fuels,” Nuclear Metallurgy, 15, p. 617, Symposium on Nuclear Fuel Reprocessing, ed. P. Chiotti (1970).
Bonilla, C. F. (1958), “Comparison of Coolants,” Nuclear Engineering Handbook, ed. H. Etherington, Sect. 9-3, Chap. 6.5, pp. 9–9011 (1958).
Braiko, V. V., V. V. Ignat´ev et al. (1990), “Tests on a Setup with Natural Circulation of LiF-BeF2-UF4 Liquid Salt Fuel,” Atomnaya Énergiya, 69, No 4, pp. 211–215 (October 1990).
Callister, Jr, W. D. (2000), Materials Science and Engineering, John Wiley & Sons, New Yory, NY, 2000.
Cantor, S., W. T. Ward, and C. T. Moynihan (1969), “Viscosity and Density in Molten LiF-BeF2 Solutions,” Journal of Chemical Physics, 50(7), p. 2874 (1969).
Cherginets V. L., and T. P. Rebrova (1999), “Studies of Some Acid-Base Equilibria in the Molten Eutectic Mixture KCl-LiCl at 700 Degrees C,” Electrochimica Acta, 45(3), pp. 469–76 (1999).
Cherginets, V. L. (2001), “Acid-Base Equilibria in Ionic Solvents,” Chapter 10.4, pp. 633–35 in Handbook of Solvents, ed. G. Wypych, ChemTec Publishing, Toronto, 2001.
Cohen, S. I., W. D. Powers, and N. D. Greene (1957), Viscosity Measurements on Molten Fluoride Mixtures, ORNL-2278, Oak Ridge National Laboratory, Oak Ridge, TN, 1957.
215
Cornwell, K. (1971), “The Thermal Conductivity of Molten Salts,” Journal of Physics D: Applied Physics, 4, pp. 441–45 (1971).
Cottrell, W. B., et al. (1955), Operation of the Aircraft Reactor Experiment, ORNL-1845, Oak Ridge National Laboratory, Oak Ridge, TN, 1955.
Cottrell, W. B. (1958), Disassembly and Postoperative Examination of the Aircraft Reactor Experiment, ORNL-1868, Oak Ridge National Laboratory, Oak Ridge, TN, 1958.
Davis, C. B. (2005), Implementation of Molten Salt Properties into RELAP5-3D/ATHENA, INEEL/EXT-05-20658, Idaho National Laboratory, Idaho Falls, ID, January 2005.
Davis, C. B., C. H. Oh, R. B. Barner, and D. F. Wilson (2005), Thermal-Hydraulic Analyses of Heat Transfer Fluid Requirements and Characteristics for Coupling a Hydrogen Production Plant to a High-Temperature Nuclear Reactor, INL-EXT-05-00453, Idaho National Laboratory, Idaho Falls, ID, 2005.
Del Cul, G. D., et al. (2002), “Redox Potential of Novel Electrochemical Buffers Useful for Corrosion Prevention in Molten Fluorides,” Proceedings of the Thirteenth International Symposium on Molten Salts Held During the 201st Meeting of the Electrochemical Society, Philadelphia, PA, May 12–17, 2002.
DeVan, J. H. (1960), Effect of Alloying Additions on Corrosion Behavior of Nickel-Molybdenum Alloys in Fused Fluoride Mixtures, University of Tennessee Thesis, 1960.
DeVan, J. H., and R. B. Evans III (1961), “Corrosion Behavior of Reactor Materials in Fluoride Salt Mixtures,” Corrosion of Reactor Materials Vol. II, Proceedings of the Conference on Corrosion of Reactor Materials, June 4–8, 1962, IAEA, Vienna, pp. 557–79 (1961)
DeVan, J. H., and R. B. Evans III (1962), Corrosion Behavior of Reactor Materials in Fluoride Salt Mixtures, ORNL/TM-328, Oak Ridge National Laboratory, Oak Ridge, TN, 1962.
DeVan, J. H. (1969), “Effect of Alloying Additions on Corrosion Behavior of Nickel-Molybdenum Alloys in Fused Fluoride Mixtures,” University of Tennessee Thesis, August 1960, also ORNL/TM-2021, Oak Ridge National Laboratory, Oak Ridge, TN, 1969.
Gambill, W. R. (1959), “Fused Salt Thermal Conductivity,” Chemical Engineering, pp. 129–30 (August 1959).
Glatron, C. A., and P. J. Wood (1968), Determination of Molten Salt Flow Velocity in a Natural Convection Loop, ORNL-MIT-58, May 29, 1968.
Grande, T., H. A. Oye, and S. Julsrud (1993), “Viscosity and Density of Molten Barium Zirconate and Related Melts,” J. Non-Crystalline Solids, 161, p. 152 (1993).
Grande, T., S. Aasland, and S. Julsrud (1995), “Some Comments on the Thermodynamic Aspects of Glass Formation in Fluoride Systems,” Journal of Non-Crystalline Solids, 184, p. 114 (1995).
Grimes, W. R., et al. (1958), “Chemical Aspects of Molten Fluoride Salt Reactor Fuels,” Chapter 12 of Fluid-Fueled Reactors, ed. J. A. Lane et al., Addison-Wesley, New York, NY, 1958.
Grimes, W. R. (1966), Reactor Chemistry Division Annual Progress Report for Period Ending December 31, 1965, ORNL-3913, Oak Ridge National Laboratory, Oak Ridge, TN, 1966.
Grimes, W. R. (1967), Chemical Research and Development for the Molten-Salt Breeder Reactor, ORNL/TM-1853, Oak Ridge National Laboratory, Oak Ridge, TN, 1967.

216
Grimes, W. R. (1970), “Molten Salt Reactor Chemistry,” Nuclear Applications and Technology, 8(2), pp. 137–155 (1970).
Ignat´ev, V. V., V. M. Novikov, and A. I. Surenkov (1989), “Heat Transfer in Closed Thermosyphons as Applied to Molten Salt Reactor Designs,” Kerntechnik, 54, No 1, pp. 44–50 (June 1989).
Ignat’ev, V. V., et al. (2002), “Transport Properties of Molten Salt Reactor Fuel Mixtures,” paper presented at Actinide and Fission Product Partitioning Transmutation—7th Information Exchange Meeting, Jeju, Korea, October 14–16, 2002.
Ingersoll, D. T. (2005), Status of the Physics and Safety Analyses for the Liquid-Salt-Cooled Very High-Temperature Reactor (AHTR), ORNL/TM-2005/218, Oak Ridge National Laboratory, Oak Ridge, TN, 2005.
Janz, G. J. (1967), Molten Salts Handbook, Academic Press, New York, NY, 1967.
Jordan, W. H., et al. (1954), Aircraft Nuclear Propulsion Project Quarterly Progress Report for Period Ending March 10, 1954, ORNL-1692, p. 69, Oak Ridge National Laboratory, Oak Ridge, TN, 1954.
Jordan, W. H., et al. (1956), Aircraft Nuclear Propulsion Project Quarterly Progress Report for Period Ending September 10, 1956, ORNL-2157, p.145, Oak Ridge National Laboratory, Oak Ridge, TN, 1956.
Jordan, W. H., et al. (1957), Aircraft Nuclear Propulsion Project Quarterly Progress Report for Period Ending December, 31, 1956, ORNL-2221, p. 182, Oak Ridge National Laboratory, Oak Ridge, TN, 1957.
Keiser, J. R., et al. (1977), The Corrosion of Type 316 Stainless Steel to Li2BeF4, ORNL/TM-5782, Oak Ridge National Laboratory, Oak Ridge, TN, 1977.
Keiser, J. R. (1977a), Compatibility Studies of Potential Molten-Salt Breeder Reactor Materials in Molten Fluoride Salts, ORNL-TM-5783, Oak Ridge National Laboratory, Oak Ridge, TN, 1977.
Keiser, J. R. (1977b), Status of Tellurium-Hastelloy N Studies in Molten Fluoride Salts, ORNL-TM-6002, Oak Ridge National Laboratory, Oak Ridge, TN, 1977.
Kelmers, D. (1976), Evaluation of Alternate Secondary (and Tertiary) Coolants for the Molten-Salt Breeder Reactor, ORNL/TM-5325, Oak Ridge National Laboratory, Oak Ridge, TN, 1976.
Kendall, J., and K. Monroe (1921), “The Viscosity of Liquids–Part V,” J. Amer. Chem. Soc., 43, p. 115 (1921).
Khoklov, V. A. (1998), “Thermal Conductivity in Cryolitic Melts: New Data and Its Influence on Heat Transfer in Aluminum Cells,” Light Metals, p. 111 (1998).
Lewis, R. J. (2003), Hawley’s Condensed Chemical Dictionary 14th Ed., John Wiley & Sons, New York, NY, 2003.
Lucas, J. (1989), “Fluoride Glasses,” J. Material Sci., 24, p. 1 (1989).
Manly, W. D., et al. (1957), ARE–Metallurgical Aspects, ORNL-2349, Oak Ridge National Laboratory, Oak Ridge, TN, 1957.
Manly, W. D., et al. (1960), “Metallurgical Problems in Molten Fluoride Systems,” Progress in Nuclear Energy, Series IV, 2, pp. 164–179 (1960).

217
Maya, L. (1976), “Identification of Polyborate and Fluoropolyborate Ions in Solution by Raman-Spectroscopy,” Inorganic Chemistry, 15(9), pp. 2179–84 (1976).
Mays, G. T. (1977), Distribution and Behavior of Tritium in the Coolant-Salt Technology Facility, ORNL/TM-5759, Oak Ridge National Laboratory, Oak Ridge, TN, 1977).
McCoy, Jr., H. E., and B. McNabb (1972), Postirradiation Examination of Materials from the MSRE, ORNL/TM-4174, Oak Ridge National Laboratory, Oak Ridge, TN, 1972.
McCoy, Jr., H. E. (1978), Status of Materials Development for Molten Salt Reactors, ORNL-TM-5920, Oak Ridge National Laboratory, Oak Ridge, TN, 1978.
McDonald, J., and H. T. Davis (1971), “Determination of the Thermal Conductivities of Several Molten Alkali Halides by Means of a Sheathed Hot Wire Technique,” Physics and Chemistry of Liquids, 2, pp. 119–34 (1971).
McMurdie, H. F., et al. (2006), Phase Diagrams for Ceramists, National Bureau of Standards multivolume compilation starting in 1964 and continuing to the present, published by the American Ceramic Society, 2006.
McNeese, L. E., (1974), Program Plan for Development of Molten-Salt Breeder Reactors, ORNL-5018, pp. 5–37, Oak Ridge National Laboratory, Oak Ridge, TN, 1974.
McNeese, L. E., (1976), Molten-Salt Reactor Program Semi-Annual Progress Report for Period Ending August 31, 1976, ORNL-5078, pp. 42–3, Oak Ridge National Laboratory, Oak Ridge, TN, 1976.
Morishita, M., K. Koyama, M. Murase, and Y. Mori (1996), “Improvement in the Electrodeposition of Corrosion Resistance of Zinc-Plated Magnesium from a Molten Salt,” ISIJ International, 36(6), pp. 714–19 (1996).
Moynihan, C. T., and S. Cantor (1958), “Viscosity and Its Temperature Dependence in Molten BeF2,” Journal of Chemical Physics, 48(1), p. 115 (1958).
Plambeck, J. A., (1967), “Electromotive Force Sequence in Molten Salts,” Journal of Chemical and Engineering Data, 12(1), p. 78 (1967).
Richardson, L. S., D. E. Vreeland, and W. D. Manly (1953), Corrosion by Molten Fluorides, ORNL-1491, Oak Ridge National Laboratory, Oak Ridge, TN, 1953.
Robertson, D. E., et al. (2000), Low-Level Radioactive Waste Classification, Characterization, and Assessment: Waste Streams and Neutron-Activated Metals, NUREG/CR-6567 (PNNL-11659), Pacific National Laboratory, Richland, WA, 2000.
Rogers, D. J., T. Yoko, and G. J. Janz (1982), “Fusion Properties and Heat Capacities of the Eutectic LiF-NaF-KF,” J. Chem. Eng. Data, 27, p. 366 (1982).
Rosenthal, M. W., et al. (1969), Molten Salt Reactor Program Semi-Annual Progress Report for Period Ending August 31, 1968, ORNL-4344, p. 103, Oak Ridge National Laboratory, Oak Ridge, TN, 1969.
Rosenthal, M. W., (1972), The Development Status of Molten-Salt Breeder Reactors, ORNL-4812, Oak Ridge National Laboratory, Oak Ridge, TN, 1972.
Sanders, J. P., (1971), A Review of Possible Choices for Secondary Coolants for Molten Salt Reactors, ORNL CF-71-8-10, Oak Ridge National Laboratory, Oak Ridge, TN, 1971.
Schrier, E., and H. Clark (1963), “Interaction of Salt Vapors and Activity Coefficients in the Potassium Chloride–Magnesium Chloride System,” J. Phys. Chem., 67, p. 1259 (1963).

218
Sense, K. A., et al. (1957, 1958), Series of articles in Journal of Physical Chemistry, 61, p. 337 (1957); 62, pp. 96, 453, 1411 (1958).
Thoma, R. E., (1975), “Phase Diagrams of Binary and Ternary Fluoride Systems,” in Advances in Molten Salt Chemistry, Vol. 3, Chap. 6, ed. J. Braunstein et al., Plenum Press, New York, NY, 1975.
Tufeu, R., J. P. Petitet, L. Denielou et al. (1985), “Experimental-Determination of the Thermal-Conductivity of Molten Pure Salts and Salt Mixtures,” International Journal of Thermophysics, 6(4) pp. 315–30 (1985).
U.S. Atomic Energy Commission (AEC) (1964), Reactor Handbook, Vol. 4: Engineering, ed. S. McLain and J. H. Martens, U.S. Atomic Energy Commission, Interscience Publishers, NY, p. 53 (1964).
Umesaki, N., and N. Iwamoto (1981) “Self-Diffusion of Lithium, Sodium, Potassium, and Fluorine in a Molten LiF + NaF + KF Eutectic Mixture,” J Chem Soc., Faraday Trans., 1(77), pp. 169–75 (1981).
United States Geological Service (USGS) (2006), United States Geological Service Minerals Yearbooks: http://minerals.usgs.gov/minerals/pubs/mcs/, 2006.
Williams, D. F., et al. (2001), “The Influence of Lewis Acid/Base Chemistry on the Removal of Gallium by Volatility from Weapons Grade Plutonium Dissolved in Molten Chlorides,” Nuclear Technology, 136, p. 367 (2001).
Williams, D. F. (2006), Assessment of Candidate Molten Salt Coolants for the NGNP/NHI Heat-Transfer Loop, ORNL/TM-2006/69, Oak Ridge National Laboratory, Oak Ridge, TN, 2006.
Williams, D. F., L. M. Toth, and K. T. Clarno (2006), Assessment of Candidate Molten Salt Coolants for the Advanced High-Temperature Reactor (AHTR), ORNL/TM-2006/12, Oak Ridge National Laboratory, Oak Ridge, TN, 2006.
CHAPTER 4:
Barth, D.L., J. E. Pacheco, W. J. Kolb, and E. E. Rush (2002), “Development of a High-Temperature, Long-Shafted, Molten-Salt Pump for Power Tower Applications,” Journal of Solar Energy Engineering, 124, pp. 170–75 (May 2002).
EBASCO Pump Report (1971), (see PDF file: MSR.Ebasco_PumpValve.pdf), December 1971.
Rosenthal, M. W., P. N. Haubenreich, and R. B. Briggs (1972), The Development Status of Molten-Salt Breeder Reactors, ORNL-4812, pp. 222, Oak Ridge National Laboratory, Oak Ridge, TN, August 1972.
CHAPTER 5:
Bardet, P., and P. F. Peterson (2005), “Design of Scaled Integral Experiments for High Temperature Liquid Salt and Helium Fluid Mechanics and Heat Transfer,” Eleventh International Topical Meeting on Nuclear Reactor Thermal Hydraulics, NURETH 11, Avignon, France, October 2–6, 2005.
Davis, C. B. (2005), Implementation of Molten Salt properties into RELAP5-3D/ATHENA, Report INEEL/EXT-05-02658, Idaho National Laboratory, Idaho Falls, ID, 2005.
de Zwaan, S. J. (2005), The Liquid Salt Pebble Bed Reactor: A New High-Temperature Nuclear Reactor, Masters Thesis, Delft University, PNR-131-2005-008, November 2005.
Forsberg, C. W., D. L. Moses, E. B. Lewis, R. Gibson, R. Pearson, W. J. Reich, G. A. Murphy, R. H. Staunton, and W. E. Kohn (1989), Proposed and Existing Passive and Inherent Safety-Related

219
Structures, Systems, and Components (Building Blocks) for Advanced Light-Water Reactors, ORNL-6554, Oak Ridge National Laboratory, Oak Ridge, Tennessee, October 1989.
Forsberg, C. W., and P. F. Peterson (2003), “Making Core-Melt Accidents Impossible in a Large 2400-MW(t) Reactor,” Proceedings of the Global 2003, Embedded Topical: American Nuclear Society 2003 Winter Meeting, New Orleans, Louisiana, November 16–20, 2003, American Nuclear Society, La Grange Park, IL, 2003.
Forsberg, C. W. (2006), “Alternative Passive Decay-Heat Systems for the Advanced High-Temperature Reactor,”, Embedded Topical: 2006 International Congress on the Advances n Nuclear Power Plants (ICAPP06), 2006 American Nuclear Society Annual Meeting, Reno, Nevada, June 4–8, 2006, Paper 6055, CD-ROM, 2006.
Peterson, P. F., and H. Zhao (2006), “A Flexible Baseline Design for the Advanced High Temperature Reactor Using Metallic Internals (AHTR-MI),”, Proceedings of ICAPP 06, Reno, Nevada, June 4–8, 2006, Paper 6052, 2006
RELAP5 (2003), RELAP5-3D Code Manuals, RELAP5 Code Development Team, INEEL-EXT-98-00834, Rev. 2.2, Idaho National Laboratory, Idaho Falls, ID, 2003.
Rothfuss, H., and F. Vogt (1987), “Reactor Vessel System,” Nuclear Technology, 78, pp. 245–54, September 1987.
CHAPTER 6:
Abbott, L. S., et al. (1975), Review of ORNL Radiation Shielding Analyses of the Fast Flux Test Facility Reactor, ORNL-5027, Oak Ridge National Laboratory, Oak Ridge, TN, July 1975.
Davis, C. B. (2005), Implementation of Molten Salt properties into RELAP5-3D/ATHENA, Report INEEL/EXT-05-02658, Idaho National Laboratory, Idaho Falls, ID, 2005.
de Zwaan, S. J., (2005), The Liquid Salt Pebble Bed Reactor: A New High-Temperature Nuclear Reactor, Masters Thesis, Delft University, PNR-131-2005-008, November 2005.
Driscoll, M. J., et al. (1990), The Linear Reactivity Model for Nuclear Fuel Management, American Nuclear Society, 1990.
Engle, Jr., W. W. (1975), AMP (Activity Manipulation Program), ORNL/TM-5296, July 1975 (also in RSIC Computer Code Collection package PSR-75).
Forsberg, C. W., D. T. Ingersoll, P. F. Peterson, H. Zhao, J. E. Cahalan, T. Taiwo, J. A. Enneking, R. A. Kochendarfer, and P. E. MacDonald (2006), Refueling Options and Considerations for Liquid-Salt-Cooled Very High-Temperature Reactors, ORNL/TM-2006/92, Oak Ridge National Laboratory, Oak Ridge, TN, June 2006.
Haynes, G. C. (1974), “The AXMIX Program for Cross Section Mixing and Library Arrangement,” in RSIC Computer Code Collection package PSR-75, December 1974.
Hollenbach, D. F., and C. M. Hopper (1994), Criticality Safety Study of the MSRE Drain Tank Cell in Building 7503, ORNL/TM-12642, Oak Ridge National Laboratory, Oak Ridge, TN, January 1994.
Ingersoll, D. T., and C. O. Slater (1980), DOGS—A Collection of Graphics for Support of Discrete Ordinates Codes, ORNL/TM-7188, Oak Ridge National Laboratory, Oak Ridge, TN, March 1980.

220
Ingersoll, D. T., R. W. Roussin, C. Y. Fu, and J. E. White (1989), DABL69: A Broad-Group Neutron/Photon Cross-Section Library for Defense Nuclear Applications, ORNL/TM-10568, Oak Ridge National Laboratory, Oak Ridge, TN, June 1989.
Ingersoll, D. T., et al. (2004), Status of Preconceptual Design of the Advanced High-Temperature Reactor (AHTR), ORNL/TM-2004/104, Oak Ridge National Laboratory, Oak Ridge, TN, 2004.
Ingersoll, D. T., et al. (2005), Status of Physics and Safety Analyses for the Liquid-Salt-Cooled Very High-Temperature Reactor (LS-VHTR), Draft of ORNL/TM-2005/218, Oak Ridge National Laboratory, Oak Ridge, TN, September 2005.
Kim, T. K., T. A. Taiwo, and W. S. Yang (2005), “Preliminary Neutronic Studies for the Liquid-Salt-Cooled Very High Temperature Reactor (LS-VHTR),” ANL-GenIV-052, Argonne National Laboratory, Argonne, IL, August 31, 2005.
MCNP (1993), MCNP—A General Monte Carlo N-Particle Transport Code, Version 4C, LA-13709-M, Los Alamos National Laboratory, Albuquerque, NM, 1993.
Peterson, P. F., and H. Zhao (2006), “A Flexible Baseline Design for the Advanced High Temperature Reactor Using Metallic Internals (AHTR-MI),”, Proceedings of ICAPP 06, Reno, Nevada, June 4–8, 2006, Paper 6052, 2006
RELAP5 (2003), RELAP5-3D Code Manuals, RELAP5 Code Development Team, INEEL-EXT-98-00834, Rev. 2.2, Idaho National Laboratory, Idaho Falls, ID, 2003..
Rhoades, W. A., and R. L. Childs (1988), “The DORT Two-Dimensional Discrete Ordinates Transport Code,” Nucl. Sci. & Eng., 99(1), pp. 88-9 (May 1988).
SCALE (2004), SCALE: A Modular Code System for Performing Standardized Computer Analysis for Licensing Evaluation, NUREG/CR-0200, Rev. 7 (ORNL/NUREG/CSD-2/R7), Vols. I, II, and III, Oak Ridge National Laboratory, Oak Ridge, TN, June 2004; (available from Radiation Safety Information Computational Center at Oak Ridge National Laboratory as CCC-725).
Slater, C. O., S. N. Cramer, and D. T. Ingersoll (1979), Analysis of the ORNL/TSF Grid-Plate Shield Design Confirmation Experiment, ORNL-5551, Oak Ridge National Laboratory, Oak Ridge, TN, August 1979.
White, J. E., et al. (2000), Production and Testing of the Revised VITAMIN-B6 Fine-Group and the BUGLE-96 Broad-Group Neutron/Photon Cross-Section Libraries Derived From ENDF/B-VI.3 Nuclear Data, NUREG/CR-6214, Rev. 1(ORNL/TM-6795/R1), Oak Ridge National Laboratory, Oak Ridge, TN, April 2000.
WIMS, WIMS—A Modular Scheme for Neutronics Calculations, User’s Guide for Version 8, ANSWER/WIMS(99)9, The ANSWERS Software Package, AEA Technology.
CHAPTER 7:
Althaus, D., and N. Brahy (1987,) “Refueling System Fabrication and Testing,” Nuclear Technology, 78, pp. 284–94 (September 1987).
Bardet, P., and P. F. Peterson (2005), “Design of Scaled Integral Experiments for High Temperature Liquid Salt and Helium Fluid Mechanics and Heat Transfer,” Eleventh International Topical Meeting on Nuclear Reactor Thermal Hydraulics, NURETH 11, Avignon, France, October 2–6, 2005.
Cabell, C. P. (1980), A Summary Description of the Fast Flux Test Facility, HEDL-400, Hanford Engineering Development Laboratory, Richland, WA, December 1980.

221
Cahalan, J. E., and T. A. Taiwo (2006), Liquid Salt—Very High-Temperature Reactor: Survey of Sodium-Cooled Fast Reactor Fuel Handling Systems for Relevant Design and Operating Characteristics, ANL-GenIV-069, Argonne National Laboratory, Argonne, IL, March 31, 2006.
Cornell, R. M., N. F. Haines, and S. B. Fisher (1995), “Facilities and Techniques for On-Site and Off-Site Inspection of Irradiated Fuel Elements and Components from Nuclear Electric’s Advanced Gas-Cooled Reactors,” Paper 54, Proceedings of the International Conference on Fuel Management and Handling, Edinburgh, March 20–22, 1995, British Nuclear Energy Society, London, 1995.
CRBRP (1974a), Clinch River Breeder Reactor Plant Reference Design Report, Vol. 1, June 1974.
CRBRP (1974b), Clinch River Breeder Reactor Project: 1974 Technical Progress Report, 1974.
CRBRP (1983), Clinch River Breeder Reactor Plant System Design Description, Reactor Refueling System, SDD-41, Rev. 27, July 1983.
deZwaan, S. J. (2005), The Liquid Salt Pebble Bed Reactor: A New High-Temperature Nuclear Reactor, Department of Radiation, Radionuclides and Reactors, Delft University of Technology, Delft, The Netherlands, November 2005.
Dixon, G., and N. Penny (1995), “Underwater Fuel Inspection Capabilities at AEA Technology, Windscale,” Paper 55, Proceedings of the International Conference on Fuel Management and Handling, Edinburgh, March 20–22, 1995, British Nuclear Energy Society, London, 1995.
EBR-II (1971), EBR-II System Design Descriptions, Volume II, “Chapter 5: Fuel Handling System,” Argonne National Laboratory, Argonne, IL, June 15, 1971.
FFTF (1983), Fast Flux Test Facility System Design Description, No. 41, Part 1: Reactor Refueling System, Rev. 11, April 6, 1983.
Forsberg, C. W. (2006a), “Goals, Requirements, and Design Implications for the Advanced High-Temperature Reactor,” Proceedings of the 14th International Conference on Nuclear Energy, American Society of Mechanical Engineers, Miami, Florida, July 17–20, 2006, ICONE14-89305 (CD-ROM), American Society of Mechanical Engineers, New York, NY, July 2006.
Forsberg, C. W., et al. (2006b), Refueling Options and Considerations for Liquid-Salt-Cooled Very High-Temperature Reactors, ORNL/TM-2006/92, Oak Ridge National Laboratory, Oak Ridge, TN, 2996.
Forsberg, C. W., P. F. Peterson, J. E. Cahalan, J. A. Enneking, and P. E. MacDonald (2006c) “Refueling Liquid-Salt-Cooled Very High-Temperature Reactors”, Proceedings of the 14th International Conference on Nuclear Energy, Miami, Florida, July 17–20, 2006, ICONE14-89471 (CD-ROM), American Society of Mechanical Engineers, New York, NY, July 2006.
Forsberg, C. W. (2006d), “Developments in Molten Salt and Liquid-Salt-Cooled Reactors, International Congress on Advanced Nuclear Power Plants, Reno, Nevada, June 4–8, 2006, Paper 6292 (CD-ROM), 2006.
Forsberg, C. W. (2006e), “Alternative Passive Decay-Heat Systems for the Advanced High-Temperature Reactor,” International Congress on Advanced Nuclear Power Plants, Reno, Nevada, June 4–8, 2006, Paper 6055 (CD-ROM), 2006.
General Atomics (1996), Gas Turbine-Modular Helium Reactor (GT-MHR) Conceptual Design Description Report, General Atomics Report 910720, Rev. 1, San Diego, CA, July1996.

222
Ingersoll, D. T., et al. (2005), Status of Physics and Safety Analyses for the Liquid-Salt-Cooled Very High-Temperature Reactor (LS-VHTR), ORNL/TM-2005/218, Oak Ridge National Laboratory, Oak Ridge TN, December 2005.
Ingersoll, D. T., and C. W. Forsberg (2006), “Overview and Status of the Advanced High-Temperature Reactor,” Proceedings of the International Congress on Advanced Nuclear Power Plants, Reno, Nevada, June 4–8, 2006, Paper 6264 (CD-ROM), June 2006.
Kim, T. K., T. A. Taiwo, and W. S. Yang (2005), Preliminary Neutronic Studies for the Liquid-Salt-Cooled Very High Temperature Reactor (LS-VHTR), ANL-GenIV-052, Argonne National Laboratory, Argonne, IL, August 31, 2005.
Koch, L. J. (1971) Experimental Breeder Reactor-II (EBR-II): An Integrated Experimental Fast Reactor Power Station, Argonne National Laboratory, Argonne, IL, 1971.
Mottershead, K. J., D. W. Beardsmore, and G. Money (1995), “Dropped Fuel Damage Prediction Techniques and the DROFU Code,” Proceedings of the International Conference on Fuel Management and Handling, Edinburgh, March 20–22, 1995, Paper 43, British Nuclear Energy Society, London, 1995.
Nuclear Applications and Technology (now Nuclear Technology), 8(2) (entire issue), 1970.
Paget, J. A. (1967), A Survey of Technical Considerations Applicable to an On-Line Refueling System for Large HTGRs, GA-8075, General Atomics, San Diego, CA, June 30, 1967.
Peterson, P. F., and H. Zhao (2006), “A Flexible Baseline Design for the Advanced High Temperature Reactor Using Metallic Internals (AHTR-MI),” Proceedings of the International Congress on Advanced Nuclear Power Plants, Reno, Nevada, June 4–8, 2006, Paper 6086 (CD-ROM), 2006.
Romrell, D. M., D. M. Art, R. D. Redekopp, J. B. Waldo, and J. L. Marshall (1989), “Fast Flux Test Facility Fuel Handling Experience—November 1979 to August 1988,” Nuclear Technology, 86, pp. 264–74 (September 1989).
Rosenthal, M. W., P. N. Haubenreich, and R. B. Briggs (1972), The Development Status of Molten Salt Breeder Reactors, ORNL-4812, Oak Ridge National Laboratory, Oak Ridge, TN, 1972.
Smith, P. G. (1961). “High-Temperature Molten-Salt Lubricated Hydrodynamic Journal Bearings,” ASLE Transactions, 4, pp. 263–74 (1961).
U.S. Nuclear Regulatory Commission (1991), Fort St. Vrain Final Safety Analysis Report, Rev. 9, Washington, D.C., July 22, 1991.
Williams, D. F., L. M. Toth, and K. T. Clarno (2006), Assessment of Candidate Molten Salt Coolants for the Advanced High-Temperature Reactor (AHTR), ORNL/TM-2006/12, Oak Ridge National Laboratory, Oak Ridge, TN, 2006.
CHAPTER 8:
Ando, M., S. Kubo, Y. Kamishima, and T. Iitsuka (2006), “Study on In-Service Inspection Program and Inspection Technologies for Commercialized Sodium-Cooled Fast Reactor,” Proceedings of the 14th
International Conference on Nuclear Energy, Miami, Florida, July 17–20, 2006, Paper ICONE14-89558 (CD-ROM), American Society of Mechanical Engineers, New York, NY, 2006.
Forsberg, C. W., V. K. Varma, and T. W. Burgess (2006a), “Three-Dimensional Imaging and Precision Metrology for Liquid-Salt-Cooled Reactors,” Proceedings of the 5th International Topical Meeting on Nuclear Plant Instrumentation, Controls, and Human Machine Interface Technology, Embedded

223
Topical in American Nuclear Society 2006 Winter Meeting, Albuquerque, New Mexico, November 12–16, 2006, American Nuclear Society, La Grange Park, IL, 2006.
Forsberg, C. W., et al. (2006b), Refueling Options and Considerations for Liquid-Salt-Cooled Very High-Temperature Reactors, ORNL/TM-2006/92, Oak Ridge National Laboratory, Oak Ridge, TN, 2006.
Kugel, H. W., D. Loesser, A. L. Roquemore, M. M. Menon, and R. E. Barry (2001), “Precision Metrology of NSTX Surfaces Using Coherent Laser Radar Ranging,” Review of Scientific Instruments, 72(1), pp. 533–36 (January 2001).
Liauw, M. A., B. Oderkerk, and D. Treu (2006), “Putting Fiber-Optical Spectroscopy to Work,” Chemical Engineering, 113(7), pp. 56–60 (July2006).
Menon, M. M., and A. Slotwinski (2004), “Novel Doppler Laser Radar for Diagnostics in Fusion Reactors,” Review of Scientific Instruments, 75, pp, 4100–02 (2004).
Williams, D. F., L. M. Toth, and K. T. Clarno (2006), Assessment of Candidate Molten Salt Coolants for the Advanced High-Temperature Reactor, ORNL/TM-2006/12, Oak Ridge National Laboratory, Oak Ridge, TN (March 2006).
CHAPTER 9:
Del Cul, G. D., B. B. Spencer, C. W. Forsberg, E. D. Collins, and W. S. Rickman (2002), Triso-Coated Fuel Processing to Support High-Temperature Gas-Cooled Reactors, ORNL/TM-2002/156, Oak Ridge National Laboratory, Oak Ridge, TN (September 2002).
Forsberg, C. W. (2000), “Rethinking High-Level Waste Disposal: Separate Disposal of High-Heat Radionuclides (90Sr and 137Cs),” Nuclear Technology, 131, (August 2000).
Forsberg, C. W., P. F. Peterson, and L. Ott (2004), “The Advanced High-Temperature Reactor (AHTR) for Producing Hydrogen to Manufacture Liquid Fuels,” Proceedings of the 2004 Americas Nuclear Energy Symposium, Miami Beach, Florida, October 2004, American Nuclear Society, La Grange Park, IL, 2004.
Forsberg, C. W. (2006), “Advanced-High-Temperature-Reactor Spent-Fuel Characteristics and Repository Impacts”, Proceedings of the 2006 International High-Level Radioactive Waste Management Conference, Las Vegas, Nevada, April 30–May 4, 2006, American Nuclear Society, La Grange Park, IL, 2006.
Gray, W. J. (1982), “A Study of the Oxidation of Graphite in Liquid Water for Radioactive Waste Storage Applications,” Radioactive Waste Management and the Nuclear Fuel Cycle, 3(2), pp, 137–49 (December 1982).
Ingersoll, D. T., K. T. Clarno, C. W. Forsberg, J. C. Gehin, R. Chrisensen, C. B. Davis, G. L. Hawkes, J. W. Sterbentz, T. K. Kim, T. A. Taiwo, and W. S. Yang (2005), Status of Physics and Safety Analyses for the Liquid-Salt-Cooled Very High-Temperature Reactor (LS-VHTR), ORNL/TM-2005/218, Oak Ridge National Laboratory, Oak Ridge, TN (September 2005).
International Atomic Energy Agency (IAEA) (1999), Technical Committee Meeting on Nuclear Graphite Waste Management (entire meeting proceedings) Manchester, England, October 18–20, 1999, International Atomic Energy Agency, Vienna, 1999.
Kim, T. K., T. A. Taiwo, R. N. Hill, and J. A. Stillman (2005), “Spent Nuclear Fuel Characterization for the VHTR,” Proceedings of the Global 2006, Tsukuba, Japan, October 9–13, 2005, Paper 67, American Nuclear Society, La Grange Park, IL, 2005.

224
Lotts, A. L., et al. (1992), Options for Treating High-Temperature Gas-Cooled Reactor Fuel for Repository Disposal, ORNL/TM-12027, Oak Ridge National Laboratory, Oak Ridge, TN, May 1992.
MacDonald, P. E., et al. (2003), NGNP Point Design─Results of the Initial Neutronics and Thermo-Hydraulic Assessments During FY-03, INEEL/EXT-0300870, Rev. 1, Idaho National Engineering and Environmental Laboratory, Idaho Falls, ID (September 2003).
Morris, E. E., and T. H. Bauer (2005), Modeling of the Repository Behavior of TRISO Fuel, ANL-AFCI-160, Argonne National Laboratory, Argonne, IL (September 29, 2005).
Owens, P. E. (1999), “Waste Characteristics of Spent Nuclear Fuel from a Pebble Bed Reactor,” Master of Science Thesis, Massachusetts Institute of Technology, Cambridge, Massachusetts, June 1999.
Richards, M. (2002), GT-MHR, Assessment of GT-MHR Spent Fuel Characteristics and Repository Performance, PC-000502, Rev. 0, General Atomics, San Diego, CA, April 2002.
CHAPTER 10:
Bardet, P., and P.F. Peterson (2005), “Design of Scaled Integral Experiments for High Temperature Liquid Salt and Helium Fluid Mechanics and Heat Transfer,” Proceedings of the Eleventh International Topical Meeting on Nuclear Reactor Thermal Hydraulics, NURETH 11, Avignon, France, October 2–6, 2005.
CSAU (1989), “Application of Code Scaling, Applicability, and Uncertainty Evaluation Methodology to a Large Break, Loss of Coolant Accident,” NUREG/CR-4249 (EGG-2552), U.S Nuclear Regulatory Commission, Washington, DC, 1989.
Incropera, F. P., and D. P. DeWitt (1981), Fundamentals of Heat and Mass Transfer, 2nd Ed., John Wiley and Sons, New York, NY, 1981.
Ingersoll, D. T., et al. (2005), Status of Physics and Safety Analyses for the Liquid-Salt-Cooled Very High-Temperature Reactor (LS-VHTR), ORNL/TM-2005/218 (Draft), Oak Ridge National Laboratory, Oak Ridge, TN, September 2005.
Kline, S. J. (1986). Similitude and Approximation Theory. Springer-Verlag, 1986.
Stoots, C., S. Becker, K. Condie, F. Durst, and D. McEligot (2001), “A Large-Scale Matched Index of Refraction Flow Facility for LDA Studies Around Complex Geometries,” Exp. in Fluids, 30, pp. 391–98 (2001).
Williams, D. F., Oak Ridge National Laboratory, personal communication.
Zhao, H., and P. F. Peterson (2005), “Optimization of Advanced High-Temperature Brayton Cycles with Multiple Reheat Stages”, Proceedings of the 11th International Topical Meeting on Nuclear Reactor Thermal-Hydraulics, NURETH-11, Paper: 187, Popes’ Palace Conference Center, Avignon, France, October 2–6, 2005.
Zuber, N. (1991), An Integrated Structure and Scaling Methodology for Severe Accident Technical Issue Resolution, NUREG/CR-5809 (Appendix D), U.S. Nuclear Regulatory Commission, Washington, DC, 1991.
APPENDIX A:
Forsberg, C. W., P. F. Peterson, and D. F. Williams (2005), “Practical Aspects of Liquid-Salt-Cooled Fast-Neutron Reactors,” Proceedings of the 2005 International Conference on Advances in Nuclear

225
Power Plants, Seoul, Korea, May 15–19, 2005, Paper 5643, American Nuclear Society, La Grange Park, IL, May 2005.
Forsberg, C. W. (2006), “High-Temperature Reactors for In Situ Recovery of Oil from Oil Shale,” Proceedings of the 2006 International Congress on the Advances in Nuclear Power Plants (ICAPP’06), Reno, Nevada, June 4–8, 2006, American Nuclear Society, La Grange Park, IL, June 2006.
Forsberg, C. W., and J. C. Conklin (2007), “A Nuclear-Fossil Combined-Cycle Power Plant for Base-Load and Peak Electricity,” Transactions of the American Nuclear Society, Boston, Massachusetts, June 24–28, 2007, La Grange Park, IL, 2007.
Peterson, P. F. (2001), “Design Methods for Thick-Liquid Protection of Inertial Fusion Chambers,” Fusion Technology, 39(2), pp. 702–10 (2001).

226

227
APPENDIX A
ORGANIZATIONS AND DEVELOPMENT ACTIVITIES ASSOCIATED WITH THE LIQUID-SALT-COOLED VERY-HIGH-TEMPERATURE
REACTOR AND RELATED CONCEPTS
There are an expanding number of organizations worldwide that are conducting work on the liquid-salt-cooled very-high-temperature reactor and related concepts. Table A1 shows those groups with efforts to develop this reactor concept. Appendix B lists the published papers from these organizations. Only some of these organizations are funded by the DOE.
Table A.1. Organizations conducting research on the liquid-salt-cooled very-high-temperature reactor
Organization Experiments Analysis
Oak Ridge National Laboratory X X
U.C. Berkeley X X
Areva-NP X
Argonne National Laboratory X
U. of Wisconsin X X
Westinghouse X
U. of Tennessee X
Idaho National Laboratory X
Sandia National Laboratory X
U. of Nevada X
Netherlands (Delft U. of Tech.) X
Sweden (KTH) X
In parallel, the use of liquid salts is being investigated for a wide variety of other applications. Much
of the technology is in common. These other applications are listed below as an introduction to related work.
1. Hydrogen production. The DOE is developing thermochemical and other hydrogen production methods that convert heat and water to hydrogen and oxygen. The high-temperature heat must be transported hundreds of meters from the reactor to the chemical plant. Heat transport distances are defined by the safety requirement to separate the nuclear plant from the chemical plant and the large physical size of the chemical plant. Liquid salts are preferred to minimize the equipment size in the heat transport system and the chemical plant. The reactor could be a gas-cooled or salt-cooled high-temperature reactor.
2. Shale oil and tertiary oil recovery. Within the United States is sufficient oil shale to meet domestic oil demands at current consumption rates for a century. New methods for shale oil recovery are being developed that involve drilling wells into oil shale, using electrical heaters to raise the bulk temperature of the oil shale deposit to initiate chemical reactions that produce light crude oil, and then pumping the oil to the surface. The longer-term option (Forsberg 2006) involves using high-temperature reactors to directly provide the high-temperature heat and thus avoid the losses of converting heat to electricity and then back to heat. Direct heating
228
of the oil shale requires transferring the heat down wells.. To minimize the diameter of the well and pumping costs, a high-temperature heat-transfer fluid that has a very high volumetric heat capacity is required. Liquid fluoride salts have these properties. The technology is also potentially applicable to tertiary oil recovery. From 50 to 70% of the oil remains in an oil field after oil recovery. It is held in place by capillary forces. This oil could be removed by heating the oil field, vaporizing the trapped oil, and condensing it near the production wells using the same technology described above.
3. Nuclear-fossil combined cycle plants. Traditional air combined-cycle power plants are being evaluated (Forsberg 2007) that uses heat from a high-temperature reactor and natural gas to meet base-load and peak electrical demands. For base-load electricity production, heat from a high-temperature reactor is delivered through heat exchangers to a high-temperature air-breathing gas turbine to raise the compressed air inlet temperatures to between 700 and 850°C. The high-temperature gas turbine produces electricity. The hot exhaust is then fed to a heat recovery steam generator (HRSG) that provides steam to a steam turbine for added electrical power production. To meet peak electrical demand, natural gas or jet fuel is burnt after the nuclear heating of the compressed air to increase power levels. This process raises the inlet temperatures to both the gas turbine and the steam turbine. In this mode of operation, the peak gas-turbine inlet temperature is ~1300°C─about the same temperatures and operating conditions of a standard natural-gas-fired utility Brayton-cycle gas turbine that exhausts its heat to a bottoming Rankine steam turbine. However, the expensive natural gas is only used to raise temperatures above 700°C, rather than heating air from atmospheric temperatures. Such systems may have economic advantages and better match utility requirements to utility loads; but, require liquid-salt heat transport loops to move the heat from the reactor to the combined cycle systems.
4. Liquid-salt-cooled fast reactor (LSFR). The LSFR is a new reactor (Forsberg 2005) concept that is less than 2 years old. The design is similar to the liquid-salt-cooled VHTR except that the reactor core is replaced by a modified metal-clad fast reactor core and a fluoride salt is chosen (such as a sodium-zirconium salt) to minimize neutron moderation in the core. The fuel-clad materials limitations imply significantly lower operating temperatures between 700 and 800°C.
5. Molten salt reactor (MSR). In a MSR, the fuel is dissolved in the fluoride salt. This was the first salt-cooled reactor concept. The technology was first developed for aircraft propulsion in the 1950s and then as a breeder reactor in the 1960s. These billion dollar programs created the base technology, and two test reactors were subsequently built. Significant work is being conducted in France, with significant programs in the Czech Republic, and in the Russia at the Kurchotov Institute. Limited work is being done in the United States at Oak Ridge National Laboratory and at the University of California at Berkeley.
6. Fusion. Liquid salts (primarily lithium beryllium fluoride salts) are serious candidates for fusion energy machines to remove heat from the fusion reactor, breed tritium, and provide a renewable material for neutron shielding to reduce the mass of solid material exposed to damaging fusion neutron fluences (Peterson 2001). Liquid salts are also being considered for one other application in inertial fusion machines where heavy-ion beams, pulsed electrical power, or lasers are used to compress small pellets to extreme temperatures and cause a fusion explosion. This type of fusion machine produces an impulse on the fusion reactor wall that damages the wall over time. Liquid salts may be used to form a liquid wall inside the fusion machine to shield structures from fusion neutrons and to absorb shock loads from targets.

229
APPENDIX B
BIBLIOGRAPHY
This bibliography lists published and accepted in-press papers describing research on liquid-salt-cooled high-temperature reactors by date (most recent date first). It includes both papers that are part of the DOE program and other publications.
1. C. W. Forsberg, “Fuel Geometry Options for Salt-Cooled Advanced High-Temperature Reactors,”
Proceedings of the International Conference on Advances Nuclear Power Plants: ICAPP 2007, Nice Acropolis, France, May 13–18, 2007, Paper 7405 CD-ROM, May 2007.
2. C. W. Forsberg, P. F. Peterson and H. Zhao, “Sustainability and Economics of the Advanced High-Temperature Reactor,” J. of Energy Engineering, American Society of Civil Engineers, Reston Virginia, December 2006.
3. C. W. Forsberg, V. K. Varma, and T. W. Burgess, “Three-Dimensional Imaging and Precision Metrology for Liquid-Salt-Cooled Reactors,” Proceedings of the 5th International Topical Meeting on Nuclear Plant Instrumentation, Controls, and Human Machine Interface Technology, Embedded Topical in American Nuclear Society 2006 Winter Meeting, Albuquerque, New Mexico, November 12–16, 2006.
4. K. T. Clarno and J.C. Gehin, “Physics Analysis of the LS-VHTR: Salt Coolant and Fuel Block Design,” PHYSOR-2006, Vancouver, BC, Canada, September 10–14, 2006, American Nuclear Society, September 2006.
5. S. J. de Zwaan, B. Boer, D. Lathouwers, and J. L. Kloosterman, “Neutronic Design of a Liquid Salt-Cooled Pebble Bed Reactor (LSPBR),” PHYSOR-2006, Vancouver, BC, Canada, September 10–14, 2006, American Nuclear Society, September 2006.
6. F. Fardin and F. Koenig, Preliminary Study of the Pebble Bed Advanced High-Temperature Reactor, UCBTH-06-001, Department of Nuclear Engineering, University of California at Berkeley, Berkeley, CA, August 2006.
7. F. J. Szakaly, T. K. Kim, and T. A. Taiwo, Neutronic Assessment of Stringer Fuel Assembly Design for Liquid-Salt-Cooled Very High Temperature Reactor (LS-VHTR), ANL-GenIV-074, Argonne National Laboratory, August 31, 2006.
8. C. W. Forsberg, P. F. Peterson, J. E. Cahalan, J. A. Enneking, and P. E. MacDonald, “Refueling Liquid-Salt-Cooled Very High-Temperature Reactors,” Proceedings of the 14th International Conference on Nuclear Energy, Miami, Florida, July 17–20,2006, ICONE14-89471, CD-ROM, American Society of Mechanical Engineers, July 2006.
9. C. W. Forsberg, “Goals, Requirements, and Design Implications for the Advanced High-Temperature Reactor”, Proceedings of the 14th International Conference on Nuclear Energy, American Society of Mechanical Engineers, Miami, Florida, July 17–20, 2006, ICONE14-89305, CD-ROM, American Society of Mechanical Engineers, 2006.
10. D. F. Williams, Assessment of Candidate Molten Salt Coolants for the NGNP/NHI Heat-Transfer Loop, ORNL/TM-2006/69, June 2006
11. C. W. Forsberg, D. Ingersoll, P. Peterson, H. Zhao, J.E. Cahalan, T. Taiwo, J. A. Enneking, R. A. Kochendarfer, and P. E. MacDonald, Refueling Options and Considerations for Liquid-Salt-Cooled Very High-Temperature Reactors, ORNL/TM-2006/92, June 2006.
12. W. A. Casino Jr., “Effects of Coolant Temperature Changes on Reactivity for Various Coolants in a Liquid Salt Cooled Very High Temperature Reactor,” Embedded topical: 2006 International Congress on the Advances in Nuclear Power Plants (ICAPP06), 2006 American Nuclear Society

230
Annual Meeting, Reno, Nevada, June 4–8, 2006, Paper 6464, CD-ROM, American Nuclear Society, June 2006.
13. W. A. Casino Jr., “Investigation of an Alternative Fuel Form for the Liquid Salt Very High Temperature Reactor,” Embedded Topical: 2006 International Congress on the Advances in Nuclear Power Plants (ICAPP06), 2006 American Nuclear Society Annual Meeting, Reno, Nevada, June 4–8, 2006, Paper 6244, CD-ROM, American Nuclear Society, June 2006
14. C. B. Davis and G. L. Hawkes, “Thermal-Hydraulic Analyses of the LS-VHTR,” Embedded Topical: 2006 International Congress on the Advances in Nuclear Power Plants (ICAPP06), 2006 American Nuclear Society Annual Meeting, Reno, Nevada, June 4–8, 2006, Paper 6208, CD-ROM, American Nuclear Society, June 2996.
15. C. W. Forsberg, “Fuel Characteristics and Requirements for the Advanced High-Temperature Reactor,” Embedded Topical: Transactions: Nuclear Fuels and Structural Materials for the Next Generation Nuclear Reactors, 2006 American Nuclear Society Annual Meeting, Reno, Nevada, June 4–8, 2006, American Nuclear Society, June 2006.
16. C. W. Forsberg, “Developments in Molten Salt and Liquid-Salt-Cooled Reactors,” Embedded Topical: 2006 International Congress on the Advances in Nuclear Power Plants (ICAPP06), 2006 American Nuclear Society Annual Meeting, Reno, Nevada, June 4–8, 2006, Paper 6292, CD-ROM, American Nuclear Society, June 2006.
17. C. W. Forsberg, “Alternative Passive Decay-Heat Systems for the Advanced High-Temperature Reactor,” Embedded Topical: 2006 International Congress on the Advances in Nuclear Power Plants (ICAPP06), 2006 American Nuclear Society Annual Meeting, Reno, Nevada, June 4–8, 2006, Paper 6055, CD-ROM, American Nuclear Society, June 2006.
18. D. T. Ingersoll and C. W. Forsberg, “Overview and Status of the Advanced High-Temperature Reactor,” Embedded Topical: 2006 International Congress on the Advances in Nuclear Power Plants (ICAPP06), 2006 American Nuclear Society Annual Meeting, Reno, Nevada, June 4–8, 2006, Paper 6264, CD-ROM, American Nuclear Society, June 2006.
19. P. F. Peterson and H. Zhao, “A Flexible Base-Line Design for the Advanced High-Temperature Reactor Utilizing Metallic Reactor Internals,” Embedded Topical: 2006 International Congress on the Advances in Nuclear Power Plants (ICAPP06), 2006 American Nuclear Society Annual Meeting, Reno, Nevada, June 4–8, 2006, Paper 6052, CD-ROM, American Nuclear Society, June 2006
20. A. L. Qualls and T. L. Wilson, Jr., “Dynamic System Model of the LS-VHTR to Estimate Design Parameter Impacts on Safety Margin and Reactor Economics,” , Embedded Topical: 2006 International Congress on the Advances in Nuclear Power Plants (ICAPP06), 2006 American Nuclear Society Annual Meeting, Reno, Nevada, June 4–8, 2006, Paper 6292, CD-ROM, American Nuclear Society, June 2006.
21. J. J. Sienicki, A. Moisseytsev, M. T. Farmer, F. E. Dunn, and J. E. Cahalan, “Performance of Decay Heat Removal Systems in the LS-VHTR,” Embedded Topical: 2006 International Congress on the Advances in Nuclear Power Plants (ICAPP06), 2006 American Nuclear Society Annual Meeting, Reno, Nevada, June 4–8, 2006, Paper 6086, CD-ROM, American Nuclear Society, June 2006.
22. D. F. Williams and K. T. Clarno, “Salt Selection for the LS-VHTR,” Embedded Topical: 2006 International Congress on the Advances in Nuclear Power Plants (ICAPP06), 2006 American Nuclear Society Annual Meeting, Reno, Nevada, June 4–8, 2006, Paper 6160, CD-ROM, American Nuclear Society, June 2006.
23. J. Zakava and A. Talamo, “Optimization of the Neutronics of the Advanced High-Temperature Reactor,” Embedded Topical: 2006 International Congress on the Advances in Nuclear Power Plants (ICAPP06), 2006 American Nuclear Society Annual Meeting, Reno, Nevada, June 4–8, 2006, Paper 6472, CD-ROM, American Nuclear Society, June 2006.

231
24. C. W. Forsberg, “Advanced-High-Temperature-Reactor Spent-Fuel Characteristics and Repository Impacts,” Proceedings of the 2006 International High-Level Radioactive Waste Management Conference, Las Vegas, Nevada April 30–May 4, 2006.
25. J. E. Cahalan and T. A. Taiwo, Liquid Salt–Very High Temperature Reactor: Survey of Sodium-cooled Fast Reactor Fuel Handling Systems for Relevant Design and Operating Characteristics, ANL-GenIV-069, Argonne National Laboratory, March 31, 2006.
26. D. F. Williams, L. M. Toth, and K. T. Clarno, Assessment of Candidate Molten Salt Coolants for the Advanced High-Temperature Reactor (AHTR), ORNL/TM-2006/12, March 2006.
27. C. W. Forsberg, “Chapter XXVII: The Advanced High-Temperature Reactor—AHTR,” ed. V. V. Kuznetsov, Status of Innovative Small and Medium Sized Reactor Designs 2005: Reactors with Conventional Refueling Systems, IAEA-TECDOC-1485, International Atomic Energy Agency, Vienna, March 2006.
28. C. W. Forsberg. “The Advanced High-Temperature Reactor: High-Temperature Fuel, Liquid Salt Coolant, and Liquid-Metal-Reactor Plant,” Progress in Nuclear Energy 47(1–4), pp. 32–43, ed. T. Yano, Elsevier Ltd. (2005).
29. D. T. Ingersoll, K. T. Clarno, C. W. Forsberg, J. C. Gehin, R. W. Christiansen, C. B. Davis, G. L. Hawkes, J. W. Sterbentz, T. K. Kim, T. A. Taiwo, and W. S. Yang, Status of Physics and Safety Analysis for the Liquid-Salt-Cooled Very High-Temperature Reactor (LS-VHTR), ORNL/TM-2005/218, December 2005.
30. S. J. de Zwaan , The Liquid Salt Pebble Bed Reactor: A New High-Temperature Reactor, PNR-131-2005-008, Delft University of Technology, Delft, Netherlands, November, 2005
31. G. Aliberti, G. Palmiotti, M. Salvatores, T. K. Kim, and T. A. Taiwo, “Sensitivity and Uncertainty Assessment of Coolant Void Reactivity Coefficient for Liquid-Salt-Cooled VHTR,” Trans. Am. Nucl. Soc. 93 (November 2005).
32. K. T. Clarno, J. C. Gehin, and C. W. Forsberg, “Physics Analysis of Coolant Voiding in the Advanced High-Temperature Reactor (AHTR),” 2005 American Nuclear Society Winter Meeting, Nov. 13–17, 2005, Trans. Am. Nuclear Soc. 93, pp. 977-80 (November 2005).
33. T. K. Kim, T. A. Taiwo, W. S. Yang and G. Palmiotti, “Sensitivity Study of Design Parameters for Liquid-Salt-Cooled VHTR,” Trans. Am. Nucl. Soc. 93 (November 2005).
34. J. E. Cahalan, J. J. Sienicki, A. Moisseytsev, M. T. Farmer, F. E. Dunn, A. Milicevic, and Y. D. Bodnar, “Initial Study of Decay Heat Removal Systems Performance for the Liquid Salt-Cooled–Very High Temperature Reactor (LS-VHTR),” ANL-GenIV-067, Argonne National Laboratory, September 30, 2005.
35. T. K. Kim, T. A. Taiwo, and W. S. Yang, “Preliminary Neutronic Studies for the Liquid-Salt-Cooled Very High Temperature Reactor (LS-VHTR),” ANL-GenIV-052, Argonne National Laboratory, August 31, 2005.
36. C. B. Davis, C. H. Oh, R. B Barner, S. R. Sherman, and D. F. Wilson, Thermal-Hydraulic Analyses of Heat Transfer Fluid Requirements and Characteristics for Coupling A Hydrogen Production Plant to a High-Temperature Nuclear Reactor, INL/EXT-05-00453, June 2005.
37. S. J. de Zwaan , Selection of Preferred Salt for the Liquid Salt Pebble Bed Reactor, PNR-131-2005-004, Delft University of Technology, Delft, Netherlands, June 2005
38. D. F. Williams, L. M. Toth, K. T. Clarno, and C. W. Forsberg, Assessment of Properties of Candidate Liquid Salt Coolants for the Advanced High-Temperature Reactor (AHTR), ORNL/GEN4/LTR-05-001. June 30, 2005
39. C. W. Forsberg, “Brayton Power Cycles and High-Temperature Salt-Cooled Reactors,” Proceedings of the American Nuclear Society 2005 Summer Meeting, San Diego, California, June 5–9, 2005, American Nuclear Society, June 2005.

232
40. C. W. Forsberg, P. F. Peterson, and D. F. Williams, “Liquid-Salt-Cooled Advanced High-Temperature Reactor (AHTR),” Proceedings of the 2005 International Conference on Advances in Nuclear Power Plants, Seoul, Korea, May 15–19, 2005, Paper 5401, American Nuclear Society, (2005).
41. D. T. Ingersoll, E. J. Parma, C. W. Forsberg, and J. P. Renier, “Core Physics Characteristics and Issues for the Advanced High-Temperature Reactor (AHTR) Concept,” Workshop on Advanced Reactors with Innovative Fuels (ARWIF-2004), Oak Ridge, Tennessee, February 16–18, 2005, Nuclear Science Committee, OECD Nuclear Energy Agency, Paris, France (in press).
42. C. B. Davis, Implementation of Molten Salt Properties into RELAP5-3D/ATHENA, INEEL/EXT-05-02658, Idaho National Engineering and Environmental Laboratory, January 2005
43. C. W. Forsberg, P. F. Peterson, and H. Zhao, “Sustainability, Water, Dry Cooling, and the Advanced High-Temperature Reactor,” Trans. 2004 American Nuclear Society Annual Winter Meeting, Washington, D. C., November 14–18, 2004, American Nuclear Society, La Grange Park, Illinois, 2004.
44. C. W. Forsberg, P. F. Peterson, and L. Ott, “The Advanced High-Temperature Reactor (AHTR) for Producing Hydrogen to Manufacture Liquid Fuels,” Proceedings of the 2004 Americas Nuclear Energy Symposium, Miami Beach, Florida, October 3–6, 2004, American Nuclear Society, La Grange Park, Illinois, 2004.
45. S. J. Ball and C. W. Forsberg, “Advanced High-Temperature Reactor (AHTR) Loss of Forced Circulation Accidents,” Proceedings of the 2nd International Topical Meeting on High-Temperature Reactor Technology (HTR2004), Beijing, China, September 22–24, 2004. Paper F07, 2004.
46. C. W. Forsberg, “Reactors with Molten Salts: Options and Missions,” The 2004 Frederic Joliot & Otto Han Summer School on Nuclear Reactors: Physics, Fuels, and Systems: Generation IV: Reactors, Fuels, and Fuel Cycles, CD-ROM, August 25–September 3, 2004, Cadarache, France.
47. C. W. Forsberg, P. F. Peterson, and H. Zhao. “An Advanced Molten Salt Reactor Using High-Temperature Reactor Technology,” Proceedings of the 2004 International Congress on Advances in Nuclear Power Plants: ICAPP=04, Embedded Topical: 2004 American Nuclear Society Annual Meeting, Pittsburg, Pa, June 13–17, 2004, American Nuclear Society, La Grange Park, Illinois, 2004.
48. C. W. Forsberg, P. F. Peterson, and P. Pickard, “Maximizing Temperatures of Delivered Heat From the Advanced High-Temperature Reactor,” Proceedings of the 2004 International Congress on Advances in Nuclear Power Plants: ICAPP=04, Embedded Topical: 2004 American Nuclear Society Annual Meeting, Pittsburg, Pa, June 13–17, 2004, American Nuclear Society, La Grange Park, Illinois, June 2004.
49. C. W. Forsberg and M. Feltus, “Fuel Requirements for the Advanced High-Temperature Reactor: Graphite Coated-Particle Fuel and Molten Fluoride Salt Coolant”, Technical Meeting on Current Status and Future Prospects of Gas-Cooled Reactor Fuels, International Atomic Energy Agency, Vienna, Austria, June 7-9, 2004.
50. D. Ingersoll, C. W. Forsberg, L. J. Ott, D. F. Williams, J. P. Renier,, D. F. Wilson, S. J. Ball, L. Reid, W. R. Corwin, G. D. DelCul, P. F. Peterson, H. Zhao, P. S. Pickard, E. J. Parma, and M. Vernon, Status of Preconceptual Design of the Advanced High-Temperature Reactor (AHTR), ORNL/TM-2004/104, May 2004
51. C. W. Forsberg, “A Large Low-Pressure Advanced High-Temperature Reactor (AHTR),” Proceedings of the 14th Pacific Basin Nuclear Conference, Honolulu, Hawaii, March 21–25, 2004, American Nuclear Society, La Grange Park, Illinois, March 2004.
233
52. C. W. Forsberg, P. S. Pickard, and P. F. Peterson, “Molten-Salt-Cooled Advanced High-Temperature Reactor for Production of Hydrogen and Electricity,” Nuclear Technology, 144, pp. 289–302 (December 2003).
53. C. W. Forsberg and P. F. Peterson, “Making Core-Melt Accidents Impossible in a Large 2400-MW(t) Reactor,” Proceedings of the Global 2003, Embedded Topical: American Nuclear Society 2003 Winter Meeting, New Orleans, Louisiana, November 16–20, 2003, American Nuclear Society, La Grange Park, Illinois, November 2003.
54. C. W. Forsberg, P. S. Pickard, and P. Peterson, “The Advanced High-Temperature Reactor,” Nuclear Engineering International, 48(585), pp. 32–4 (April 2003).
55. C. W. Forsberg, P. S. Pickard, and P. Peterson, “The Advanced High-Temperature Reactor for Production of Hydrogen and Electricity,” Nuclear News, 46(2), pp.30–2 (February 2003).
56. C. W. Forsberg and P. L. Pickard, “Advanced High-Temperature Reactor: Molten-Salt Coolant and Graphite Fuelm” American Nuclear Society 2001 Winter Meeting, Reno, Nevada, November 11–15, 2001.

234
ORNL/TM-2006/140
INTERNAL DISTRIBUTION S. J. Ball ([email protected]) J. L. Binder ([email protected]) J. J. Carbajo ([email protected]) K. T. Clarno ([email protected]) W. R. Corwin ([email protected]) C. W. Forsberg ([email protected]) J. C. Gehin ([email protected]) S. R. Greene ([email protected]) G. E. Kulynych ([email protected]) G. T. Mays ([email protected]) G. E. Michaels ([email protected]) C. V. Parks ([email protected]) A. L. Qualls ([email protected]) J. E. Rushton ([email protected]) C. O. Slater ([email protected]) D. F. Williams ([email protected]) D. F. Wilson ([email protected]) T. L. Wilson Jr. ([email protected]) G. L. Yoder Jr. ([email protected]) ORNL Central Research Library ([email protected]) ORNL Laboratory Records—RC ([email protected])
EXTERNAL DISTRIBUTION
J. Ambrosek, University of Wisconsin, 1500 Engineering Drive, Madison, WI 53706 ([email protected])
J. E. Cahalan, Argonne National Laboratory, 9700 S. Cass Avenue, Argonne, IL 60439 ([email protected]).
T. L. Cook, NE-20/Germantown Building, U.S. Department of Energy, 1000 Independence Ave., S.W., Washington, DC 20585-1290 ([email protected]).
C. B. Davis, Idaho National Laboratory, 2525 N. Fremont Avenue, P. O. Box 1625, Idaho Falls, ID 83415 ([email protected]).
F. Dunn, Argonne National Laboratory, 9700 S. Cass Avenue, Argonne, IL 60439 ([email protected]).
M. Farmer, Argonne National Laboratory, 9700 S. Cass Avenue, Argonne, IL 60439 ([email protected]).

E. Greenspan, University of California, Berkeley, Nuclear Engineering Department, 4153 Etcheverry Hall, Berkeley, CA 94720-1730 ([email protected]).
R. Kochendarfer, 3315 Old Forest Road, P.O. Box 10935, Lynchburg, VA 24506-0935 ([email protected]).
T. K. Kim, Argonne National Laboratory, 9700 S. Cass Avenue, Argonne, IL 60439 ([email protected]).
P. E. MacDonald, 2943 Sonterra Drive, Cedar Hill, TX 75104 ([email protected]). A. Moisseytsev, Argonne National Laboratory, 9700 S. Cass Avenue, Argonne, IL 60439
([email protected]). P. F. Peterson, University of California, Berkeley, Nuclear Engineering Department,
4153 Etcheverry Hall, Berkeley, CA 94720-1730 ([email protected]). P. S. Pickard, Sandia National Laboratories, P. O. Box 5800, Albuquerque, NM 87185-1136
([email protected]). R. Price, NE-20/Germantown Building, U.S. Department of Energy, 1000 Independence Ave.,
S.W., Washington, DC 20585-1290 ([email protected]). R. Schultz, Idaho National Laboratory, 2525 N. Fremont Avenue, P. O. Box 1625, Idaho Falls,
ID 83415 ([email protected]). J. Sienicki, Argonne National Laboratory, 9700 S. Cass Avenue, Argonne, IL 60439
([email protected]). K. Sridharan, University of Wisconsin, 1500 Engineering Drive, Madison, WI 53706
([email protected]) J. W. Sterbentz, Idaho National Laboratory, 2525 N. Fremont Avenue, P. O. Box 1625, Idaho
Falls, ID 83415 ([email protected]). F. Szakaly, Argonne National Laboratory, 9700 S. Cass Avenue, Argonne, IL 60439
([email protected]). T. A. Taiwo, Argonne National Laboratory, 9700 S. Cass Avenue, Argonne, IL 60439
([email protected]). R. M. Versluis, NE-20/Germantown Building, U.S. Department of Energy, 1000 Independence
Ave., S.W., Washington, DC 20585-1290 ([email protected]). H. Zhao, Idaho National Laboratory, P.O. Box 1625, Idaho Falls, ID 83415


