Embed Size (px)
Citation preview
Traffic Assignment Using IBM Computations And Summation R.M. BROWN, and H. H. WEAVER, Indiana State Highway Department
Any traffic assignment problem from orgin -destination data involves two basic operations: the determination of the percent of usage for each of two more routes for each separate 0-D movement and the summation of a usage for each segment of each route. IBM machines can remove the dudgery and human errors from both of these operations. Given the governing criteria in numeric values and the computation formulas to apply to these criteria, they can make the computations with amazing speed and almost infallible accuracy. They cannot, however, exercise engineering judgment nor can they get right answers from erroneous criteria.
This report deals with the probable distribution of traffic on the arterial street systems of Lafayette and West Lafayette, Indiana which could be expected to follow the construction of a new bridge across the Wabash River.
River crossings were assigned to the new and present bridges by a formula of our own development using both the time ratio between terminals via the new bridge and whichever of the present bridges now carries the largest segment of the specific movement and the present ratio of usage of existing bridges by that movement.
A l l movements within or through the area on either side of the river (including river crossings) were assigned to the arterial street system on the basis of the time ratio between points of choice via the two most reasonable yet substantially different routes.
Assigned volumes to each segment of the arterial street systems were developed from suitable summary and tabulation of the computed cards.
• ANY problem of traffic assignment, from origin-destination data, involves two prin -cipal operations. First is the basic individual assignment, or numeric distribution, of each O-D movement to the routes of choice available to that movement. Second is the summation of these individual assignments in terms of total flow on each segment of each route and of turning movements at principal intersections.
IBM machines can remove the drudgery and human errors from both of these operations. Given the governing criteria in numeric values and codes, and the "instructions" as to the use of those values and codes, they can make the computations with amazing speed and almost infallible accuracy.
The "instructions" to the machine evolve from prior decisions of engineering judgment and proceedural detail. Those decisions include:
1. Selection of the basis for comparison of one route with another. Will it be travel-time, distance, weighted combination, or others?
2. Maximum number of routes of choice to be considered for any one movement. 3. The mathematical formula for application to the selected criteria to determine
route usage ratios. 4. The statistical-card layout that wi l l provide for most efficient performance of the
several proceedural steps of assignment and summation. With those of us who work with traffic assignment, there remains minor uncertainty
and difference of opinion as to the relative effect of travel-time, distance and other factors on the driver's choice of routes. Each assignment problem involves special conditions of facility and traffic characteristics. The nature and extent of factual data available to the assignment engineer is not always the same. For these reasons, it would be presumptuous for us to describe one single assignment procedure and say, "This is i t " , for any and all circumstances. Rather we propose to narrate what was actually done in one assignment problem; what compromises were made between precision and expedience, and what conclusions were reached as to the end result.
47
48
The Situation For this purpose we have chosen our Lafayette - West Lafayette traffic survey of
1952. This was not a large study, as O-D surveys go (metropolitan population of about 50,000), but it is the one on which our most comprehensive, and most extensively mechanized, traffic assignment operation was performed. Lafayette, the business and industrial city, and West Lafayette, the university city, are separated by the Wabash River.
There now exists two good bridges across the river. The Main Street bridge is centrally located at the west edge of the Lafayette business district and leads directly to the south part of the Purdue University Campus. The US 52 by-pass bridge is about two miles upstream at the extreme north edge of the urban area. A third bridge, Brown Street, is quite close to the Main Street bridge. It is structurally obsolete with a very low load limit. Its location is unsuitable for a replacement structure.
The ma]or highway of the area is US 52, the Indianapolis-Chicago route. It is a dual highway to the northwest and southeast and skirts the north and east edges of the urban area on a two-lane by-pass. The east leg of this by-pass has degenerated to complete inadequacy for its primary function from lack of entrance control in the development of abutting property.
The analysis of our O-D Survey showed the need for two major unrelated facilities and their respective connections, as well as other improvements of lesser importance.
A new bridge was proposed at a site six blocks north of Main Street. Its east approat would be a one-way pair of existing streets extending eastward. This approach would be connected with a one-way pair southward to and across the business district for highway connections to the south. Its west approach would be a new four lane facility leading to a one-way pair of existing streets and thence to the north part of the Purdue Campus. This approach would connect, via improved existing streets, with US 52 to the northwest to divert traffic, between that highway and the Lafayette business district, from its present route alongside the Campus.
Relocation of the US 52 by-pass as a dual highway was proposed on a line one-half mile east of the present east leg and meeting approximately the present alignment near the northeast corner of the area.
State route 43 now enters the area from the north on the West Lafayette side, crosse the river at Main Street and thence proceeds southward to the area limits. A relocation of this highway north of the city was proposed from a point about three miles north of US 52 to enter and traverse the urban area entirely on the east side of the river. This relocation would shorten the route and, more important, would permit direct interchange with US 52 which is not now possible because of the terrain of the present route.
The Assignment Problem and Available Data The assignment problem was to determine the redistribution of traffic, not only on
the proposed and improved facilities, but also on the entire arterial street system of the urban area and the highway approaches at its perimeter. It was also desired to deter mine turning movements at all important intersections, and to handle SR 43 movements in such a way as to trace the effect of its relocation throughout the entire pattern.
The survey data available for application to the problem included: 1. O-D survey summary cards in which were punched, (a) terminal codes of the
movement (Points of perimeter crossing were coded as terminals), (b) trips between terminals by vehicle type, direction and total,(c) distance between terminals, (d) travel-time between terminals.
2. Travel-time.data on sufficient numbers and kinds of arterial streets and highways to permit reasonable projection to the whole.
3. Travel-time contour maps centered on each present and proposed bridge (except the Brown Street bridge which, for assignment purposes, was considered identical with the Main Street bridge.)
4. Tabulations of screen line (Wabash River) interviews showing the number of each O-D movement crossing at each existing bridge.
49
The Assignment Operation The total trips, terminal codes, travel-time for each movement within or through the
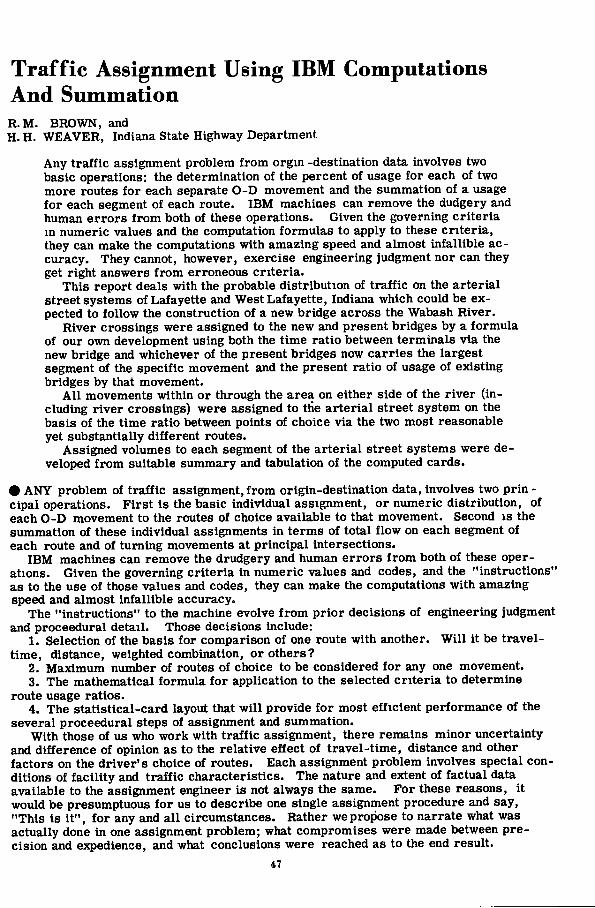
area and other data had previously been reproduced from the survey summary cards to standard 27-column mark-sense cards (card columns 1-42). These cards, which were used for two unrelated purposes, were titled "Major Desire Line and Bridge Assignment Cards". (See Appendix — Figure "A"). The cards were first used for major desire line development (mark-sense columns 1-6 and punch columns 43-48).
A manual analysis and reassignment for the relocation of SR 43 to the north was made. A second assignment card was prepared for each movement which would be mcreased or decreased by this proposed relocation. These cards were identified for mechanical distinction from the main or regular deck.
The first step of the primary assignment operation was the redistribution of river-crossing movements to the proposed and existing bridges, a three way choice. It was decided to make the assignment on the basis of the travel-time between terminals, comparing the route via the proposed bridge with that via the existing bridge now carrying the greater portion of the specific movement. This comparison would f ix the ratio of usage between the proposed and the presently most used bridge for that movement. The completion of the three-way assignment depended upon our hypothesis that, no matter what portion of a total movement is diverted to a new facility, the residue of that movement wi l l continue to divide itself over existing facilities in the same ratios as the total movement was previously divided.
The mechanics of this assignment involved: 1. Selection of the cards of river crossing movements. 2. Mark-sense coding of travel-time between terminals via the proposed bridge. 3. Mark-sense coding of the present usage-factor for the bridge now most used by
that movement and the identification code for that bridge. 4. Mark-sense punching of these items. (Punch columns 49-55). 5» Computation and punching of the distribution of the movement to the three bridges
of choice. This was done in two passages through the computer at 100 cards per minute (two more passages for checking). The separate steps within the computation included: (a) compute (and punch in 56-58) the usage-factor for the proposed bridge from a formula using the two travel-time values and the present usage-factor of the best alternate bridge. (b) This usage-factor was applied to total trips to determine (and punch in 59-62) the number of trips assigned to the new bridge, (c) The usage-factor of the best alternate bridge was applied to trip residue to determine and punch the trips assigned to that bridge, (d) The residue then remaining was punched and assigned to the second alternate bridge.
The second step of the primary assignment was the distribution of all trips, both river-crossings and non-crossings, to the arterial street systems on each side of the river. For this operation certain decisions of judgment and choices between precision and expedience were necessary. Those decisions and choices were:
1. The three bridges, to which assignments were made in the f i rs t step, would be treated as terminals and each river-crossing trip would thus become two trips, one on each side of the river.
2. Not more than two routes of choice, one the fastest reasonable route and the other the fastest yet substantially different alternate, would be considered for any one move -ment.
3. Assignment would be based on travel-time between points of choice. In addition to these decisions and choices, certain mechanical and manual prepara
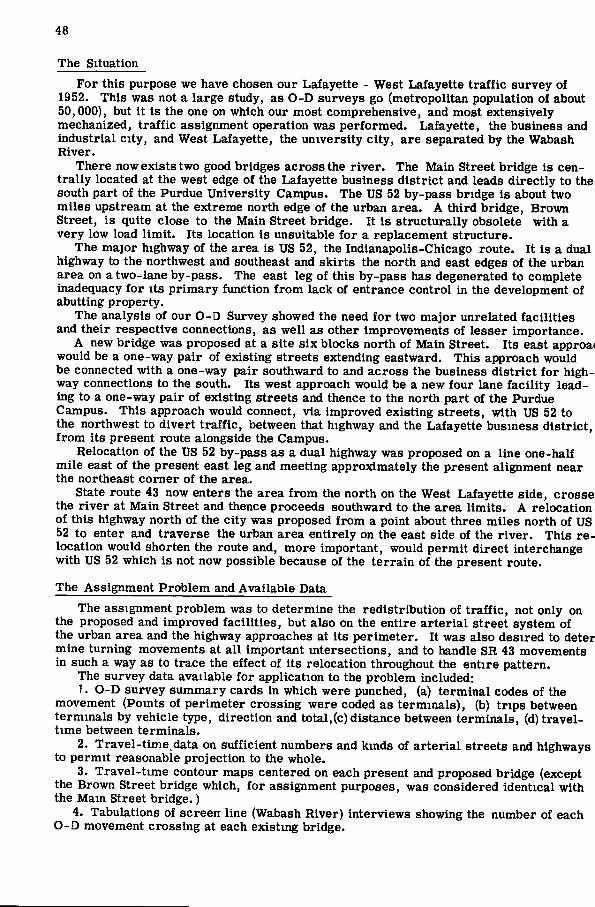
tions were necessary prior to the actual assignment task: 1. A second assignment-card layout titled, "Traffic Assignment —Arterial Streets",
(See Appendix— Figure "B") was designed to apply to the standard 27-column mark-sense card.
2. Trip terminal codes, kind of trip and number of trips were reproduced in these cards (columns 66-84) from the Major Desire Line and Bridge Assignment cards for non-crossing trips. The same data for river-crossing trips were placed in cards of the new deck by summary punching the redistribution to bridges as made in the f i rs t step.
50
(It wil l be noted that this card provides two total-trip fields, one for the present and one for the proposed route of SR 43).
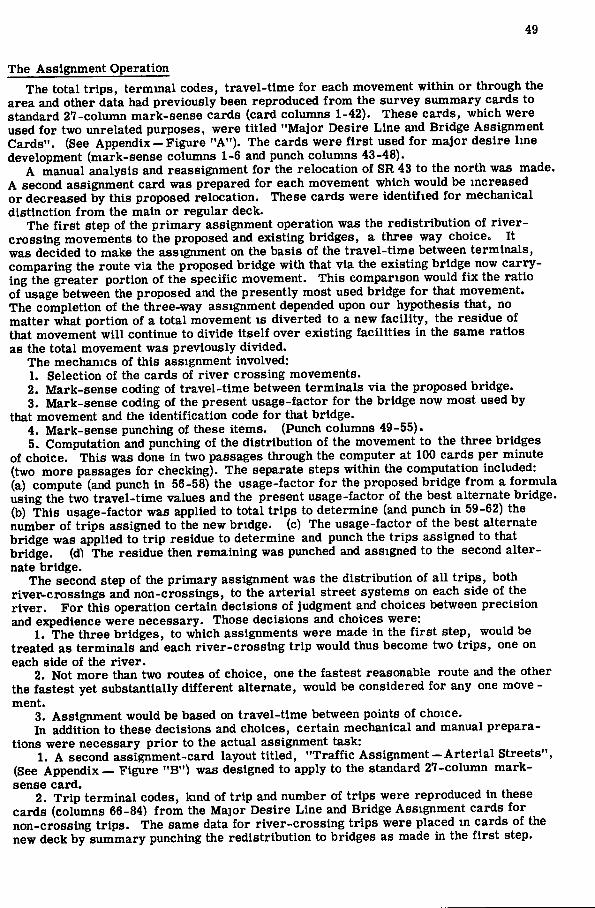
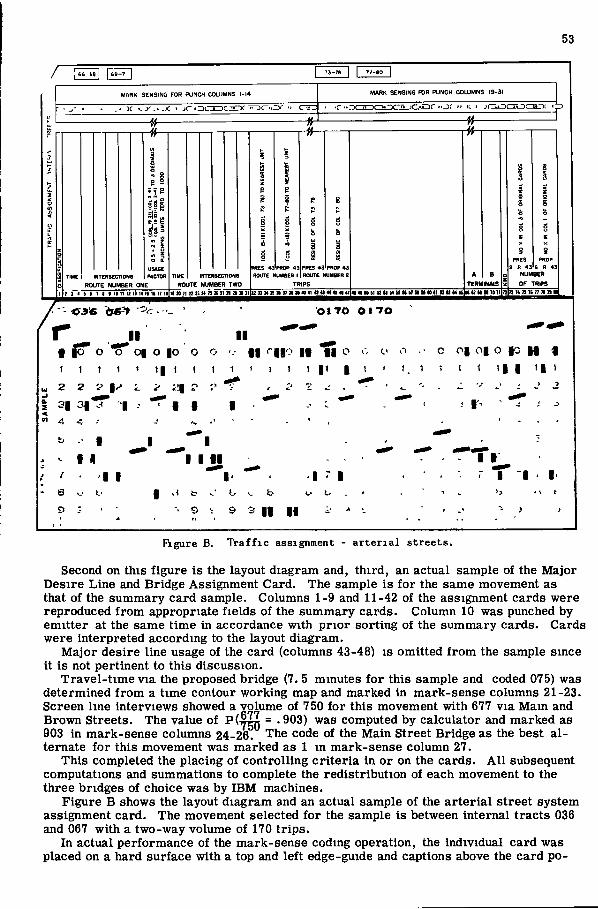
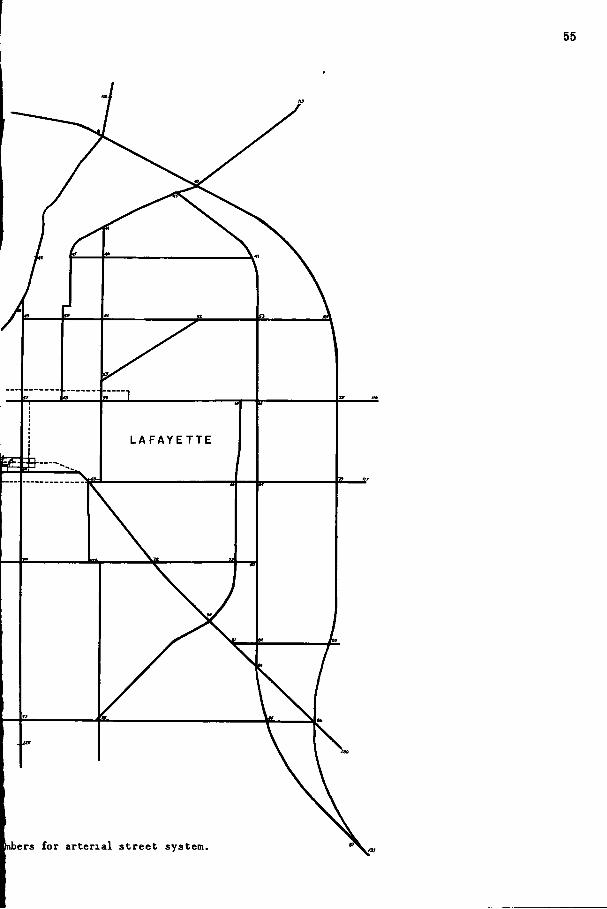
3. A skeleton layout of the arterial street system was prepared. Each intersection was assigned a two-digit number and the terminal codes of perimeter-crossing and river-crossing points were shown. (See Appendix — Figure "C"). The location and code of internal terminals and the travel-time in minutes and hundredths for each segment between intersections were added to the work print. (Total time to the nearest tenth was used in assignment).
4. The 27-column mark-sense capacity of the card made it necessary to limit the definition of each route to the intersection of entry, not more than 3 intersections of turning and the intersection of exit. Although each card actually represented a two-way movement, it was presumed, for assignment purposes, to be a one-way movement from the f i rs t to the second terminal.
5. Classification codes (column 1) were defined to indicate: (a) the movement would use some part of the arterial street system; (b) the movement would cross but not use the arterial street system; (c) the movement would not use or cross the arterial street system.
6. Other codes were defined to indicate only one route of choice and similar details to facilitate computations and tabulations.
The actual assignment procedure then involved decisions of judgment with respect to each movement, the coding of these decisions and subsequent mechanical procedures: (It is imperative that the assignment personnel be personally familiar with the area involved, yet sufficiently objective to disregard pure personal prejudice or opinion as to route desirability).
1. The f i rs t decision was whether or not the specific movement would use the arterial street system. By definition, usage implied that at least a major part of the movement would traverse at least one segment of the system between numbered intersections. This decision was coded and, if there were no usage, the card was segregated without further processing prior to final tabulations.
2. For a movement with usage of the system, the next decision was selection of the fastest reasonable route and of the fastest yet substantially different alternate; determination of respective travel-times between points of choice, and the appropriate coding of these items.
3. The mark-sense coding was punched into the cards. Appropriate mechanical check were made as to completeness and intra-card consistency of the coding.
4. Cards were processed to compute and punch the usage-factor and the distribution of the movement between the two routes by that factor.
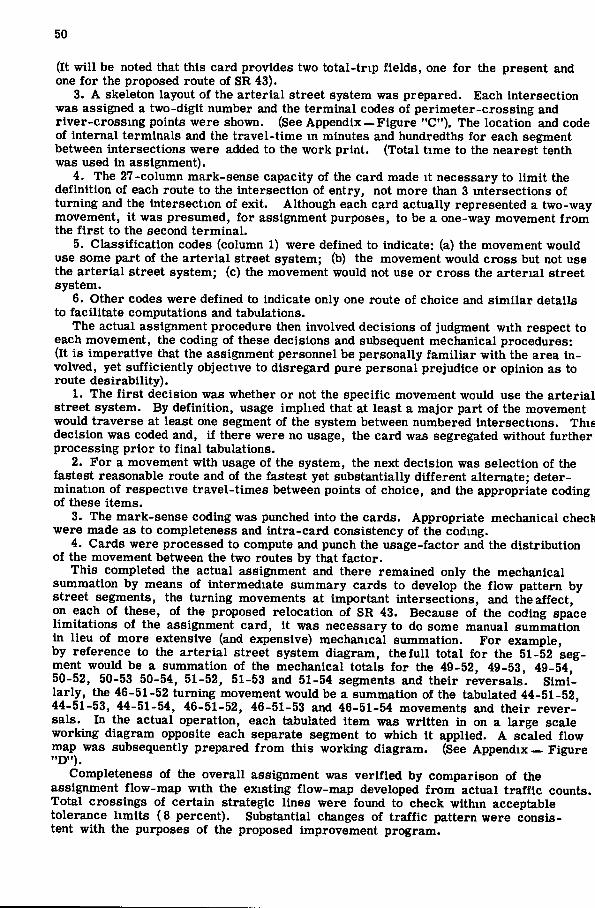
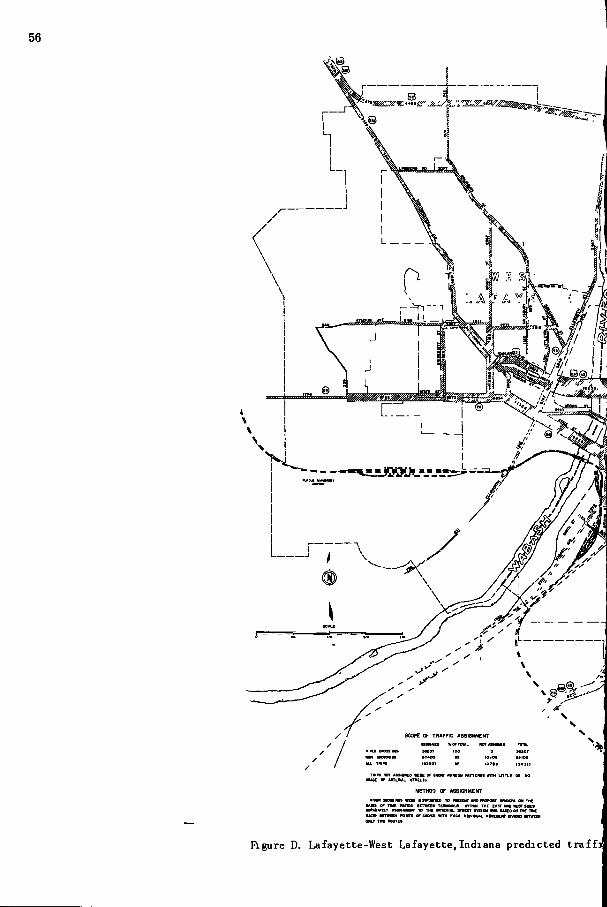
This completed the actual assignment and there remained only the mechanical summation by means of intermediate summary cards to develop the flow pattern by street segments, the turning movements at important intersections, and the affect, on each of these, of the proposed relocation of SR 43. Because of the coding space limitations of the assignment card, it was necessary to do some manual summation in lieu of more extensive (and expensive) mechanical summation. For example, by reference to the arterial street system diagram, thefuU total for the 51-52 segment would be a summation of the mechanical totals for the 49-52, 49-53, 49-54, 50-52, 50-53 50-54, 51-52, 51-53 and 51-54 segments and their reversals. Similarly, the 46-51-52 turning movement would be a summation of the tabulated 44-51-52, 44-51-53 , 44-51-54 , 46-51-52 , 46-51-53 and 46-51-54 movements and their reversals. In the actual operation, each tabulated item was written in on a large scale working diagram opposite each separate segment to which i t applied. A scaled flow map was subsequently prepared from this working diagram. (See Appendix — Figure "D").
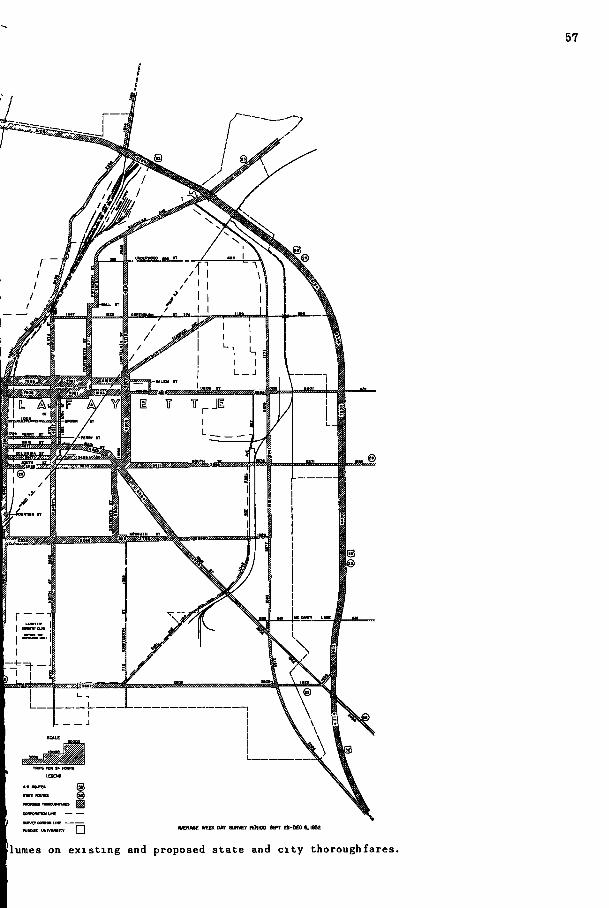
Completeness of the overall assignment was verified by comparison of the assignment flow-map with the existing flow-map developed from actual traffic counts. Total crossings of certain strategic lines were found to check within acceptable tolerance limits (8 percent). Substantial changes of traffic pattern were consistent with the purposes of the proposed improvement program.
51
Formulae The basic formula used in this assignment job was a mathematical approximation of
published experience curves.^ It was simplified in the belief that such simplification was necessary for more efficient machine computation. Later experience proved that a more refined formula such a U = 1 could very well have been used.
l + ( - ^ )
1. Definitions A = travel-time via study route. B = travel-time via the only or best alternate route. P = fractional part of the total movement carried by the best alternate in the ab
sence of the study route and in the presence of one or more lesser alternates. U = usage-factor of the study route or the fraction of the whole to be assigned to
that route. 2. Formulae
(a) Only two routes of choice
U = 0.5 + 2.5 B+A
(b) Three or more routes of choice
U = — — — in which X = 0. 5 + 2. 5-^'^ 1+PX-X B+A
CONCLUSIONS 1. The time reciuired to determine and record numeric values of travel-time and other
governing criteria is the same for either manual or IBM computations but, in the latter case, it is not necessary to transcribe number of trips and other known values from a tabulation to a computation sheet with the consequent chance of human error.
2. The mechanical computation of usage-factors has decided advantages over manual computations, (a) It is faster to the point of there being no real comparison, (b) It is infallibly accurate so long as the data is correctly supplied, (c) No human errors of estimating or intei'polating from a graph are involved, (d) The record of the computation remains for future review or check.
3. By IBM mettiods, i t is more difficult to detect errors in original criteria. Such errors produce answers that would be ridiculous to the human operator but not to the machine, because the machine cannot go back of the data which it is given.
4. For the tabulations of traffic flow, subsequent to the assignment of movements, the IBM card method again has distinct advantages, (a) It is more accurate; (b) it is faster and cheaper; (c) i t is more flexible, in that rapid regrouping for t r ial situations is possible, (d) Human errors of erroneous entry to line or column are eliminated.
5. The statistical-card method has the very valuable advantage of being a separate record for each movement, capable of mechanical rearrangement and regrouping, to take off, at later elates, details or data not originally contemplated.
6. Economically, the choice of methods hinges on the number of repetitive computations to be made and whether the fixed costs of IBM methods are spread over a sufficient volume. This same basic condition governs the decision between statistical-card and manual methods, whether in traffic assignment or any other field.
7. Subject only to these economic considerations, we e^^ect to continue the use of the basic principles involved. There wil l be variations, of course, to meet the special features of specific assignment problems. The assignment formula wil l be changed as our knowledge of the subject increases. And, finally, we expect, from experience, to be able to devise procedural refinements to take further advantage of the statistical card possibilities.
^See Highway Research Board Bulletin 61.
52
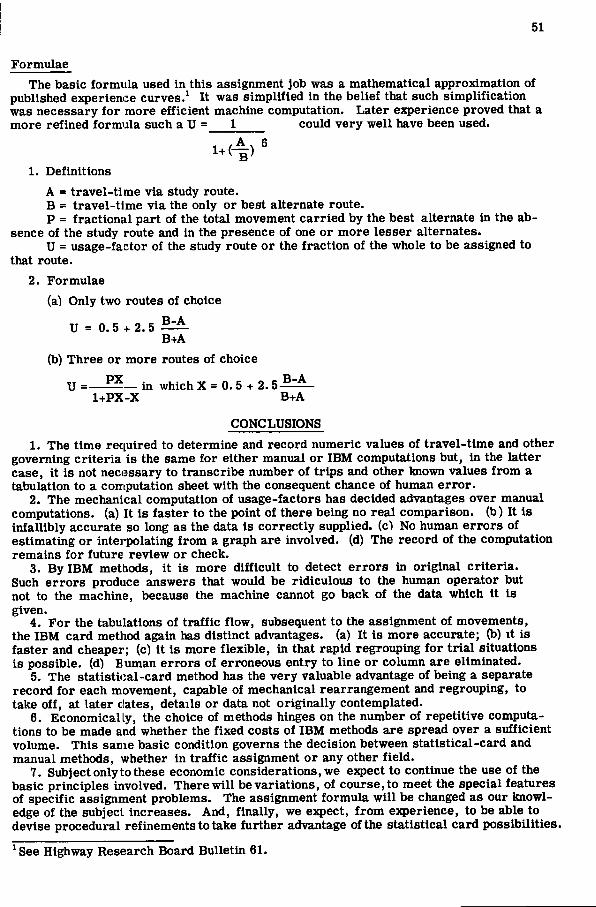
A p p e n d i x
Figure A shows a sample survey summary card for the movement between internal tract 036 (one of three comprising the Lafayette business district) and perimeter station 105 (US 52 to the northwest). Its punching and interpreted values are apparent from the printed captions.
OCT AO."" Q05«" OO7 94r":t,''j03S"'l.t40*,
t ' ;:| 0 J t l oi 0 s l l t i l l g o i l a 0 a| a I! c1 t | i i i np; i i | t 11 i j i < t i l n n 11 n I n !M I n
i i l l o i l s o i l / o i i i K ' nc c ' l l l s i l G u l l D 0 g ' f •
l i l t M l i | i ! 11 I t I ; 1 1 1 1 1 1 1 ! i 11 n I n 11
^ i2 2 ; : J 2|2 ; 2j2|2 2 21 2 2 i p ? 2|7 2 2 | 2 2 2 ? ? 2 2 2 2'2 / ? ; 2 1 ' 2 2 12 2 2 2 2 2 2 2 2 2 ? 2 2;2 2 2 2,2 2 2 2̂ 2 2 2 2 2.
13 3 3 3 | 3'-. 3 3 ; 3 | 3 3 3 | j ' s 3 s'j 3 3 3 3 3 | 3 3 3 31 3 3 2 3 3 3 3I3 3 3 3 3 3 3 3 3 3 3 3 3 3'3 3 s'l 3 3 3 3 1 3 3'3 3 3 3 3' ' i I I I I ' I ' ' I ; : ' ' i ' • S 4 4 i 4 « 4 M 4 M 4 4 4 4 4 4,4 4| '4 t | 4 4 4 4 | | « | 4 < 4 4 (.4 4 444 4 4 4 4 | 4 1,14 < | 4 t | 4 4 4 1 4 4 4 | 4 4 4 4 | ; I I • I , I 1 ' ' ' I I t T i | 5 i 5 5 5|b i | ; - ; 5 5 5 5 !ib;5 5 5|5 5 5 5 5 5 5 5 5 5 5 5 5-> 05, ib 5 5 5 5 t 5 51 5j5 5 5 5 S 5 i 5 5 5 5 | 5 5 5 5 5 5 5 ' i , ' ' ' i I > b
s B | b t | V s c J ge i ( E g e l , ; £ t ^ g ( ( s I , ( ( ( , J s ( : 1 ; ; e s i 6 s c b e I i > 6 6 0 b 6 b G s40 V ^ l ' ( e K n s c ; t
n : , n ii 11 n n i n • ii 11 i i : m ' - n • i ii m : m > i n§i t • n ni t ni ' | : ; ,8 8 3 St . S i l S e e s | ? l ! k , 3 8 8 S e S 8 ! 8 3 3 3 | 8 8 - 8 8 U U 3 M i ! e t a S 6 S S K . | 3 i i t ' > < . i ' |
. <i .) I r.
H .V,', I , I I .i
5 • n '
/ . ' '
8 ' 8 •
1
j S S 8 : 1 3 9 9 11 J J , S i >. 9 I 9 9 11 9 9 8 9 E 6 3 , S' '.'•J , . « cmoN c w N c c s -
/ I MARK SENSING FDR T (MNCH COLUMNS 43-48
MARK SENSING FOR PUNCH GOtUMNS 49 55
7 A I s 1^1 r
I-'
ITZj_il4k.uu » • > • ! I . » a . | - i . i » K ; t ; i - > i i i Q i l i i j i M b i j i ; j i a < i | . i « l « i 4 . « « < 7 < i | « i » i | K i i > . | » | i > i ' » | a i ! i t i i > o w B i > : T i i h ; i < t i n n T 4 i a » n 7 i n i » |
'OJ« t09 00740.009* 0079* 33 08S
TRIPS BY VEHWLE TYPE
DESIRE UNES AT
TERMINAL-.
TRIPS USING E A C H ROUTE
H?.OOE ASSIGNMENT
c 10 t M c f io IM M '^ |o t I I ' o . o I t c 1 o | ( n " ^ o o . | < | i
^ i
I o 3
1 I
i fl .1
. | . | t I ' ' I '
( t
t
i 2
J
•» I ' G r- '5
6 e | u
I 7 7
* | 9 S
1 1
I < r -•I >-
a c
b
t5 i. | u
I 7 r r. 9
I i
| > / / 7
J> f t . 8 8
y 9 9 9
1 1
I '
r.
I 1
. 1 2
-•I . J
4 4
> b
. b
r 7
O >=!
9 9
3 4
; * j i j . i ' ^ i j ' T j 3 3 ? « « tf^ a * « j * . M J M « . < . « i f
Figure A. Major desire l ine and bridge assignment cards.
53
r , 6 6 6B 6 9 - 7
MORK SENSING FOR PUNCH COLUMNS 1-14 MARK SENSING FOR PUNCH COLUMNS 19-31
•c • • ->' - i i - ir - ! . -v"r. i r . 5 - ) r . O f •
7. INTERSECTIONS
S 5
o £ USAGE
I FACTOR ROUTE NUMBER ONE
? a < i ( T I I ID 11 11 13 14 IS It 17 llj
trriEitsccTiONs ROUTE NUMBER TWO
[PRES AVvmP 43| ROUTE NUMBER I
i PRES * ROUTE NUMBER 8
62B3n5 3H7 3Ht40 414l4i4«ti4l4T|
WES Is R 43 '
PROP S R 43]
NUMBER OF TRIPS
|<l 41 W i l B M M » M M M M IB II 62 M M t i l l 3 74 H K 77 Tl 71 ml
II
•0»*70 0170
f io" O *S* 0| o |o o 1 1 1 1 « t l t I
u, 2 2 1^ L ; ! | :>
I 3| 3 |*r I " ^ 1 1
II • I ^ir If tl o 1 ! I t | 1 I
o | o | o |o H 1 t 1 ! | I ^1 t
« 4
I
8
9
t I 11 I I I I
t
9
V . b S If 11
Figure B. T r a f f i c assignment - ar ter ia l streets.
Second on this figure is the layout diagram and, third, an actual sample of the Major Desire Line and Bridge Assignment Card. The sample is for the same movement as that of the summary card sample. Columns 1-9 and 11-42 of the assignment cards were reproduced from appropriate fields of the summary cards. Column 10 was punched by emitter at the same time in accordance with prior sorting of the summary cards. Cards were interpreted according to the layout diagram.
Major desire line usage of the card (columns 43-48) is omitted from the sample since it is not pertinent to this discussion.
Travel-time via the proposed bridge (7. 5 minutes for this sample and coded 075) was determined from a time contour working map and marked in mark-sense columns 21-23. Screen line interviews showed a volume of 750 for this movement with 677 via Main and Brown Streets. The value of P(w?Z = .903) was computed by calculator and marked as 903 in mark-sense columns 24-26. The code of the Main Street Bridge as the best alternate for this movement was marked as 1 in mark-sense column 27.
This completed the placing of controlling criteria in or on the cards. A l l subsequent computations and summations to complete the redistribution of each movement to the three bridges of choice was by IBM machines.
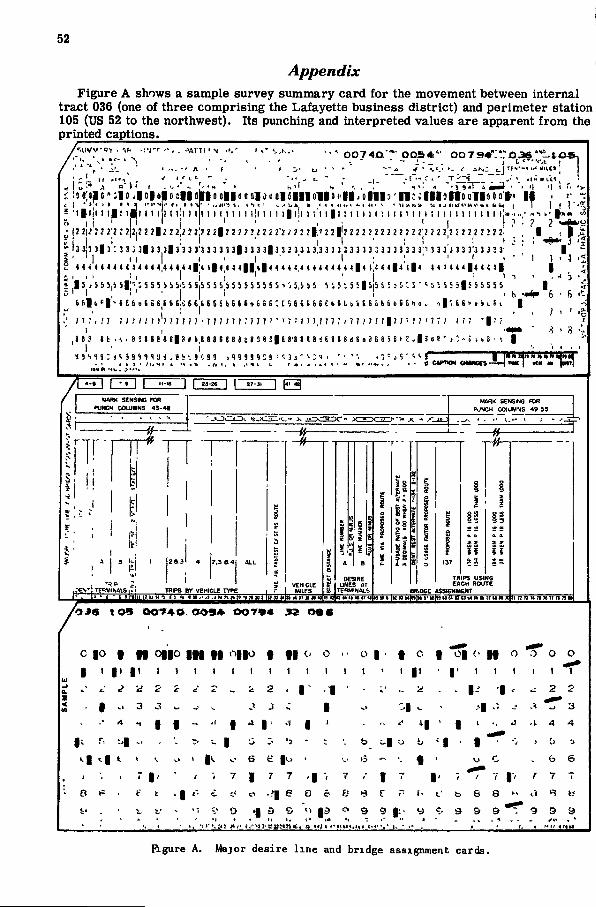
Figure B shows the layout diagram and an actual sample of the arterial street system assignment card. The movement selected for the sample is between internal tracts 036 and 067 with a two-way volume of 170 trips.
In actual performance of the mark-sense coding operation, the individual card was placed on a hard surface with a top and left edge-guide and captions above the card po-
54
LAF/U¥,ETTE
Figure C. Terminal and perimet
55
LAFAYETTE
^bers for ar ter ia l s t r e e t system
56
SCOPE OF TRAFFIC ASSIGNMENT
METHOO OF ASSIGNMENT
*ivCTom»BNGa « n nmnutut n HKIEIIT MO PMMIC BMIDGES M n c
HMHILT AHHNHENT ID TMi •KTEHML STUeiT WtttEU <M» UUD ON IHC THE NATO KTVCEH WKIl V GHOW >ITK E«CH HDIVWWL •OVUKNT DWDCD KTWCEH ONLV TWO WUTEB
Figure D. Lafayette-West Lafayette, Indiana predicted traff i l
57
CMiraMrniuw •
nnnuE UNivEHiTv «ERAGC WEEK DAY SURVEY P£RHX> SEFT SB-DEC 6, l9Se
Blumes on e x i s t i n g and proposed s t a t e and c i t y t h o r o u g h f a r e s .
58
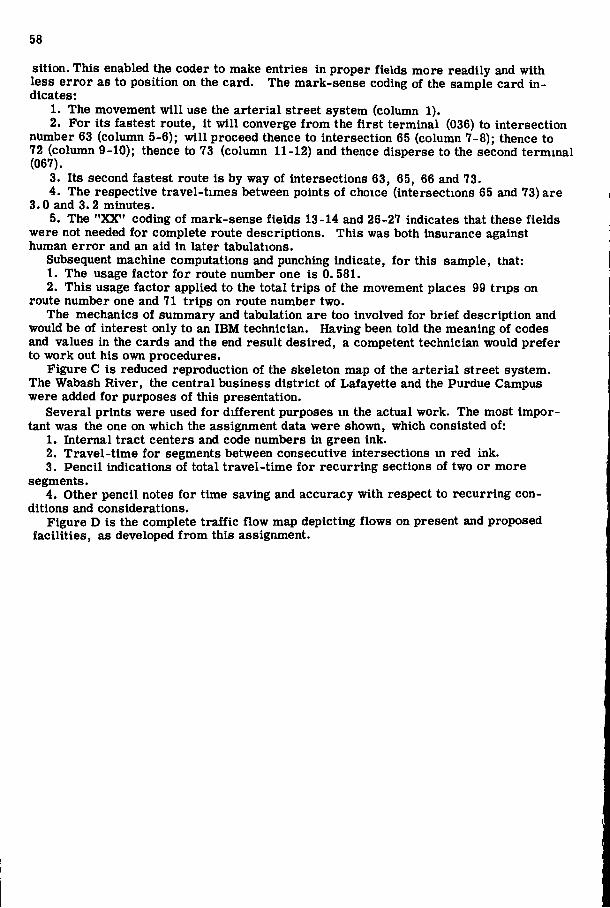
sition. This enabled the coder to make entries in proper fields more readily and with less error as to position on the card. The mark-sense coding of the sample card indicates:
1. The movement wi l l use the arterial street system (column 1). 2. For its fastest route, it wil l converge from the first terminal (036) to intersection
number 63 (column 5-6); wi l l proceed thence to intersection 65 (column 7-8); thence to 72 (column 9-10); thence to 73 (column 11-12) and thence disperse to the second terminal (067).
3. Its second fastest route is by way of intersections 63, 65, 66 and 73. 4. The respective travel-times between points of choice (intersections 65 and 73) are
3.0 and 3.2 minutes. 5. The "XX" coding of mark-sense fields 13-14 and 26-27 indicates that these fields
were not needed for complete route descriptions. This was both insurance against human error and an aid in later tabulations.
Subsequent machine computations and punching indicate, for this sample, that: 1. The usage factor for route number one is 0. 581. 2. This usage factor applied to the total trips of the movement places 99 trips on
route number one and 71 trips on route number two. The mechanics of summary and tabulation are too involved for brief description and
would be of interest only to an IBM technician. Having been told the meaning of codes and values in the cards and the end result desired, a competent technician would prefer to work out his own procedures.
Figure C is reduced reproduction of the skeleton map of the arterial street system. The Wabash River, the central business district of Lafayette and the Purdue Campus were added for purposes of this presentation.
Several prints were used for different purposes in the actual work. The most important was the one on which the assignment data were shown, which consisted of:
1. Internal tract centers and code numbers in green ink. 2. Travel-time for segments between consecutive intersections in red ink. 3. Pencil indications of total travel-time for recurring sections of two or more
segments. 4. Other pencil notes for time saving and accuracy with respect to recurring con
ditions and considerations. Figure D is the complete traffic flow map depicting flows on present and proposed
facilities, as developed from this assignment.