Embed Size (px)
Citation preview

RESEARCH ARTICLE Open Access
Transcriptome sequencing and wholegenome expression profiling of hexaploidsweetpotato under salt stressMohamed Hamed Arisha1,2, Hesham Aboelnasr1,3, Muhammad Qadir Ahmad1,4, Yaju Liu1, Wei Tang1, Runfei Gao1,Hui Yan1, Meng Kou1, Xin Wang1, Yungang Zhang1 and Qiang Li1*
Abstract
Background: Purple-fleshed sweetpotato (PFSP) is one of the most important crops in the word which helps tobridge the food gap and contribute to solve the malnutrition problem especially in developing countries. Salt stressis seriously limiting its production and distribution. Due to lacking of reference genome, transcriptome sequencingis offering a rapid approach for crop improvement with promising agronomic traits and stress adaptability.
Results: Five cDNA libraries were prepared from the third true leaf of hexaploid sweetpotato at seedlings stage(Xuzi-8 cultivar) treated with 200 mM NaCl for 0, 1, 6, 12, 48 h. Using second and third generation technology,Illumina sequencing generated 170,344,392 clean high-quality long reads that were assembled into 15,998 unigeneswith an average length 2178 base pair and 96.55% of these unigenes were functionally annotated in the NR proteindatabase. A number of 537 unigenes failed to hit any homologs which may be considered as novel genes. Thecurrent results indicated that sweetpotato plants behavior during the first hour of salt stress was different than theother three time points. Furthermore, expression profiling analysis identified 4, 479, 281, 508 significantly expressedunigenes in salt stress treated samples at the different time points including 1, 6, 12, 48 h, respectively as comparedto control. In addition, there were 4, 1202, 764 and 2195 transcription factors differentially regulated DEGs by saltstress at different time points including 1, 6, 12, 48 h of salt stress. Validation experiment was done using 6 randomlyselected unigenes and the results was in agree with the DEG results. Protein kinases include many genes which werefound to play a vital role in phosphorylation process and act as a signal transductor/ receptor proteins in membranes.These findings suggest that salt stress tolerance in hexaploid sweetpotato plants may be mainly affected by TFs, PKs,Protein Detox and hormones related genes which contribute to enhance salt tolerance.
Conclusion: These transcriptome sequencing data of hexaploid sweetpotato under salt stress conditions can provide avaluable resource for sweetpotato breeding research and focus on novel insights into hexaploid sweetpotato responsesto salt stress. In addition, it offers new candidate genes or markers that can be used as a guide to the future studiesattempting to breed salt tolerance sweetpotato cultivars.
Keywords: Hexaploid sweetpotato, Salt stress, Expression profile, RNA-sequencing, Transcriptome
© The Author(s). 2020 Open Access This article is distributed under the terms of the Creative Commons Attribution 4.0International License (http://creativecommons.org/licenses/by/4.0/), which permits unrestricted use, distribution, andreproduction in any medium, provided you give appropriate credit to the original author(s) and the source, provide a link tothe Creative Commons license, and indicate if changes were made. The Creative Commons Public Domain Dedication waiver(http://creativecommons.org/publicdomain/zero/1.0/) applies to the data made available in this article, unless otherwise stated.
* Correspondence: [email protected] Institute of Agricultural Sciences in Jiangsu Xuhuai District / KeyLaboratory of Biology and Genetic Improvement of Sweetpotato, Ministry ofAgriculture / Sweetpotato Research Institute, CAAS, Xuzhou 221131, Jiangsu,ChinaFull list of author information is available at the end of the article
Arisha et al. BMC Genomics (2020) 21:197 https://doi.org/10.1186/s12864-020-6524-1

BackgroundSweetpotato (Ipomoea batatas (L.) Lam.), the only cropplant belongs to Convolvulaceae family with starchystorage roots. Purple-fleshed sweetpotato (PFSP) consid-ered to be an important source for anthocyanin whichdisplays strong antioxidant properties [1]. It is also con-sidered as an important staple source of calories andproteins which consumed by all age groups. In terms ofagricultural production sweetpotato considered as theseventh most important food crop in the world [2].Salinity is a global problem caused vast area of lands
remaining uncultivated. Exposure of sweetpotato plants tosalt stress resulting in problems such as ion imbalance,mineral deficiency, osmotic stress, ion toxicity and oxidativestress [3]. Ultimately, these conditions interact with severalcellular components including DNA, protein, lipids andpigments. That’s in rule impeding plant development andaffect sweetpotato production [4]. Therefore, introducing ofsalt tolerant sweetpotato cultivar became necessary.With the fact of environmental stress and climate change
there is an urgent need to accelerate crops breeding withhigher production and stress tolerance traits [5]. In sweet-potato transcriptome sequencing offers a rapid approachfor crop improvement with promising agronomic traits andstress adaptability. Several transcriptome sequencing stud-ies have been conducted on hexaploid sweetpotato genome[6–8]. However, having a complex genome structures(2n = 6x = 90), sweetpotato still didn’t achieve a referencegenome which covered a few percent of genome, so still along way from the reference genome [9].Currently, referring to the potential advantages of
anthocyanin for health, more attention was paid to tran-scriptome analysis of purple flesh sweetpotato [10]. Mostof conducted transcriptome sequencing on PFSP focusedon genes related to anthocyanins biosynthesis and theirregulation mechanism [11, 12]. While, few researches havebeen done on the effect of biotic or abiotic stress on PFSP.In the present study, second and third generation se-
quencing technology were used to establish a useful data-base of transcriptomes sequencing as well as differentiallyexpressed genes in sweetpotato leaves under salt stressconditions. In total 102,845,433 high quality reads wereassembled into 16,856 transcripts giving 15,998 unigenes.Our results provide novel insights into hexaploid sweet-potato response to salt stress and identified numerousspecific genes involved in salt stress defense mechanisms.That’s in role can be used to guide future efforts towardsbreeding of sweetpotato salt resistant cultivars.
ResultsSequencing and de novo assembly of sweetpotatotranscriptome under salt stress conditionsFor NGS, five cDNA libraries were prepared from thethird true leaf of PFSP seedlings (Xuzi-8 cultivar) treated
with 200mM NaCl for 0, 1, 6, 12, 48 h. These libraries wereseparately sequenced using Illumina high-throughput sec-ond generation sequencing platform. After removing thelow-quality reads and all possible contaminations, a total of170,344,392 clean reads with Q20 > 96.73% and GC per-centage between 45.07 and 46.50% were used for furtherstudy (Table 1). Each library was represented by over than30 million high-quality reads, with number ranging from32,830,183 to 35,663,873. For 3rd GS, four time pointsRNA samples including1, 6, 12 and 48 h were mixed toproduce one library beside to the control library. Theselibraries were separately sequenced using Illumina high-throughput third generation sequencing platform. TPM,FPKM, RPKM and fold change (FC) were recorded for eachreplicate of each library separately on both NGS and 3rdGS. Obtained sequence from NGS and 3rd GS were alignedand similar sequence data from all libraries/samples werepooled. Due to the lack of a reference genome, the cleanreads resulted in from the transcriptome sequences werealigned and assembled using Trinity software. After furtherclustering and assembly, a total of 21,497,466; 20,272,643;21,954,725; 19,121,890 and 19,998,709 mapped reads wereobtained with percentage 60.26, 61.79, 61.62, 59.33 and58.87% of total reads at different time points (0, 1, 6, 12, 48h), respectively. As shown in Table 1 that the averagelength of transcripts and unigenes was more than 2000 bpwhich indicate that the obtained data are high quality data.Statistics on unigenes and transcripts length resulted frommixed second and third generations sequencing were per-formed using PacBio’s officially recommended cogent soft-ware (Tables 1 and 2, Fig. 1). In addition, the total numberof CDS was 30,615 of which 23,245 CDS mapped to theprotein database.
Functional annotationTo annotate the obtained unigenes, a BlastX searchagainst the NR NCBI protein database with cut-off E-value of 10− 5 based on sequence similarity was per-formed. In total, 15,461 unigenes were detected (Table 3)that showed comparability with known gene sequence inall databases corresponding to approximately 96.64% oftotal unigenes including Clusters of orthologous groups(COG), Gene ontology (GO), Kyoto encyclopaedia ofgenes and genomes (KEGG), eukaryotic orthologousgroup (KOG), protein family (PFAM), Swiss-Prot., NCBInon-redundant protein sequences (Nr). According toFig. 1b, the species that gave the best BlastX matcheswere Nicotiana sylvestris (21.30%) followed by Nicotianatomentosiformis (20.69%), Solanum tuberosum (9.16%),Sesamum indicum (7.46%), Coffea canephora (6.00%),Solanum lycopersicum (4.74%), Solanum penellii (4.58%),Ipomoea batatas (3.07%), Vitis vinifera (2%), Ipomoea nil(1.57%) and others (19.22%).
Arisha et al. BMC Genomics (2020) 21:197 Page 2 of 18
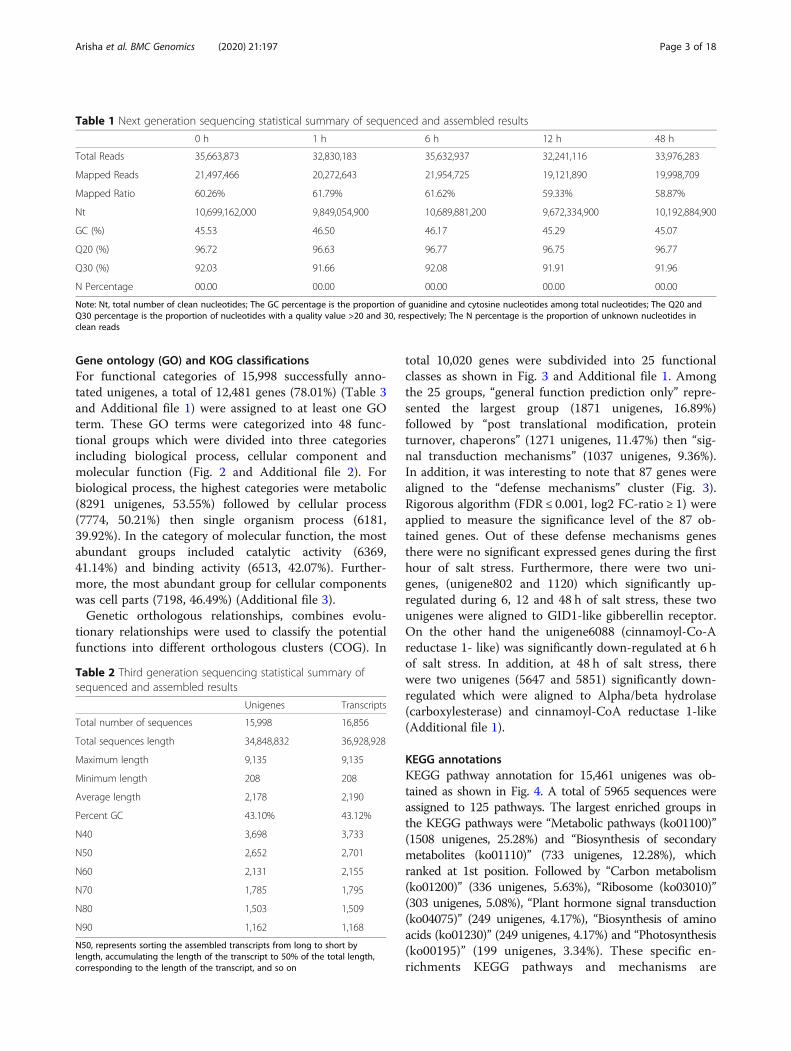
Gene ontology (GO) and KOG classificationsFor functional categories of 15,998 successfully anno-tated unigenes, a total of 12,481 genes (78.01%) (Table 3and Additional file 1) were assigned to at least one GOterm. These GO terms were categorized into 48 func-tional groups which were divided into three categoriesincluding biological process, cellular component andmolecular function (Fig. 2 and Additional file 2). Forbiological process, the highest categories were metabolic(8291 unigenes, 53.55%) followed by cellular process(7774, 50.21%) then single organism process (6181,39.92%). In the category of molecular function, the mostabundant groups included catalytic activity (6369,41.14%) and binding activity (6513, 42.07%). Further-more, the most abundant group for cellular componentswas cell parts (7198, 46.49%) (Additional file 3).Genetic orthologous relationships, combines evolu-
tionary relationships were used to classify the potentialfunctions into different orthologous clusters (COG). In
total 10,020 genes were subdivided into 25 functionalclasses as shown in Fig. 3 and Additional file 1. Amongthe 25 groups, “general function prediction only” repre-sented the largest group (1871 unigenes, 16.89%)followed by “post translational modification, proteinturnover, chaperons” (1271 unigenes, 11.47%) then “sig-nal transduction mechanisms” (1037 unigenes, 9.36%).In addition, it was interesting to note that 87 genes werealigned to the “defense mechanisms” cluster (Fig. 3).Rigorous algorithm (FDR ≤ 0.001, log2 FC-ratio ≥ 1) wereapplied to measure the significance level of the 87 ob-tained genes. Out of these defense mechanisms genesthere were no significant expressed genes during the firsthour of salt stress. Furthermore, there were two uni-genes, (unigene802 and 1120) which significantly up-regulated during 6, 12 and 48 h of salt stress, these twounigenes were aligned to GID1-like gibberellin receptor.On the other hand the unigene6088 (cinnamoyl-Co-Areductase 1- like) was significantly down-regulated at 6 hof salt stress. In addition, at 48 h of salt stress, therewere two unigenes (5647 and 5851) significantly down-regulated which were aligned to Alpha/beta hydrolase(carboxylesterase) and cinnamoyl-CoA reductase 1-like(Additional file 1).
KEGG annotationsKEGG pathway annotation for 15,461 unigenes was ob-tained as shown in Fig. 4. A total of 5965 sequences wereassigned to 125 pathways. The largest enriched groups inthe KEGG pathways were “Metabolic pathways (ko01100)”(1508 unigenes, 25.28%) and “Biosynthesis of secondarymetabolites (ko01110)” (733 unigenes, 12.28%), whichranked at 1st position. Followed by “Carbon metabolism(ko01200)” (336 unigenes, 5.63%), “Ribosome (ko03010)”(303 unigenes, 5.08%), “Plant hormone signal transduction(ko04075)” (249 unigenes, 4.17%), “Biosynthesis of aminoacids (ko01230)” (249 unigenes, 4.17%) and “Photosynthesis(ko00195)” (199 unigenes, 3.34%). These specific en-richments KEGG pathways and mechanisms are
Table 1 Next generation sequencing statistical summary of sequenced and assembled results
0 h 1 h 6 h 12 h 48 h
Total Reads 35,663,873 32,830,183 35,632,937 32,241,116 33,976,283
Mapped Reads 21,497,466 20,272,643 21,954,725 19,121,890 19,998,709
Mapped Ratio 60.26% 61.79% 61.62% 59.33% 58.87%
Nt 10,699,162,000 9,849,054,900 10,689,881,200 9,672,334,900 10,192,884,900
GC (%) 45.53 46.50 46.17 45.29 45.07
Q20 (%) 96.72 96.63 96.77 96.75 96.77
Q30 (%) 92.03 91.66 92.08 91.91 91.96
N Percentage 00.00 00.00 00.00 00.00 00.00
Note: Nt, total number of clean nucleotides; The GC percentage is the proportion of guanidine and cytosine nucleotides among total nucleotides; The Q20 andQ30 percentage is the proportion of nucleotides with a quality value >20 and 30, respectively; The N percentage is the proportion of unknown nucleotides inclean reads
Table 2 Third generation sequencing statistical summary ofsequenced and assembled results
Unigenes Transcripts
Total number of sequences 15,998 16,856
Total sequences length 34,848,832 36,928,928
Maximum length 9,135 9,135
Minimum length 208 208
Average length 2,178 2,190
Percent GC 43.10% 43.12%
N40 3,698 3,733
N50 2,652 2,701
N60 2,131 2,155
N70 1,785 1,795
N80 1,503 1,509
N90 1,162 1,168
N50, represents sorting the assembled transcripts from long to short bylength, accumulating the length of the transcript to 50% of the total length,corresponding to the length of the transcript, and so on
Arisha et al. BMC Genomics (2020) 21:197 Page 3 of 18

involved in response to salt stress in sweetpotato (Xuzi-8cultivar) (Additional file 4).
Expression patterns of hexaploid sweetpotato unigenesin response to salt stressThe results in Fig. 5 (a-d) showed the phenotypic changesduring salt stress exposure as compared to control. Saltstress visual symptoms in the form of welting startedslightly at 12 h and increased gradually showing slightleaves folding at 48 h. The highest number of DEGs wasinduced at 48 h of salt stress followed by 6 h and 12 h,respectively, while 1 h gave the lowest number of DEGs.Transcriptional level at 1, 6, 12, 48 h as compared tocontrol induced expression values 4, 529, 341 and 663 asup-regulated unigenes, and 0, 672, 422 and 1531 as down-regulated, respectively. Furthermore, there were 15,534;14,450; 14,703 and 13,330 normally expressed unigenesduring 1, 6, 12 and 48 h of salt stress. In addition, therewere 119 up-regulated genes, 87 down-regulated genes,12,384 genes normal and 211 unknown genes commonunder all durations of salt stress (Fig. 5 e-h).
Detection of salt-induced genes related to salt toleranceRPKM read counts were used to identify DEGs signifi-cance level between control and salt-stressed samplesusing the rigorous algorithm (FDR ≤ 0.001, log2 FC-ratio ≥ 1) for significantly up-regulated unigenes and(FDR ≤ 0.001, log2 FC-ratio ≤ − 1) for significantly downregulated genes. Furthermore, number of 4, 479, 281,508 unigenes were up-regulated with significant expres-sion level in salt stress treated samples at the differenttime points of salt stress including 1, 6, 12, 48 h, respect-ively. On the other hand, there were 567, 301, 1335unigenes significantly down-regulated at 6, 12, 48 h ofsalt stress (Fig. 7).During the first hour of salt stress there were four
significantly expressed unigenes including SBP-domain,HSP-70, pectin methyl esterase inhibitor, and unchar-acterized protein sequence gene families, respectively(Fig. 6 and Table 4).After 6 h a number of 479 unigenes were significantly
up-regulated, these genes belong to 45 different proteinfamilies and most of these families are involved in stresstolerance or defense mechanisms and metabolism, etc.
Fig. 1 a Assembly result sequence length distribution map of transcripts and unigenes in Xuzi-8 sweetpotato cultivar. The horizontal axis representsthe length intervals of the transcripts and unigenes, and the vertical axis represents the number of transcripts and unigenes. b Species distribution ofthe top BlastX matches of the transcriptome unigenes of Xuzi-8 sweetpotato cultivar in the non-redundant protein database (Nr) data base
Table 3 Statistics of unigenes annotated in public database
Annotated Database Annotated NumberValue (%)
300<=length<1000Value (%)
length>=1000Value (%)
COG 6982 (43.64%) 853 (12.22%) 6129 (87.78%)
GO 12480 (78.01%) 1750 (14.02%) 10728 (85.96%)
KEGG 5965 (37.29%) 806 (13.51%) 5159 (86.49%)
KOG 10020 (62.63%) 1164 (11.62%) 8856 (88.38%)
Pfam 13569 (84.82%) 1725 (12.71%) 11844 (87.29%)
Swiss-Prot. 13428 (83.94%) 1675 (12.47%) 11751 (87.51%)
Nr 15446 (96.55%) 2115 (13.69%) 13329 (86.29%)
All 15461 (96.64%) 2125 (13.74%) 13334 (86.24%)
Arisha et al. BMC Genomics (2020) 21:197 Page 4 of 18
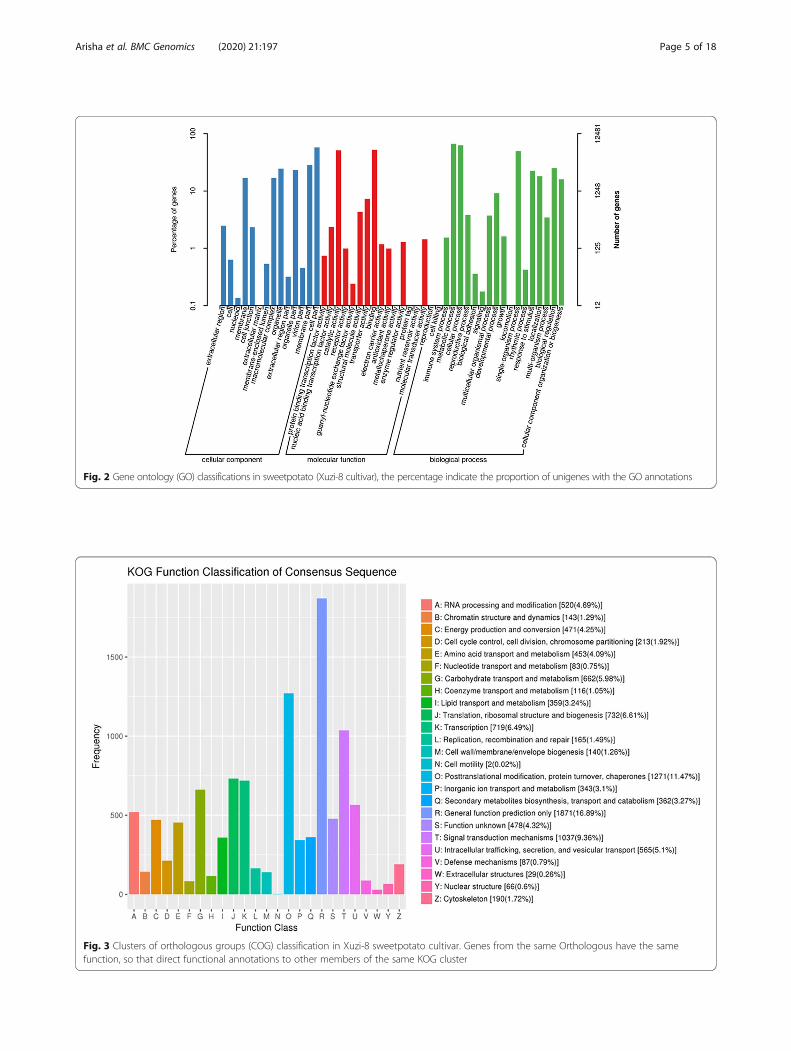
Fig. 2 Gene ontology (GO) classifications in sweetpotato (Xuzi-8 cultivar), the percentage indicate the proportion of unigenes with the GO annotations
Fig. 3 Clusters of orthologous groups (COG) classification in Xuzi-8 sweetpotato cultivar. Genes from the same Orthologous have the samefunction, so that direct functional annotations to other members of the same KOG cluster
Arisha et al. BMC Genomics (2020) 21:197 Page 5 of 18

Fig. 4 The most enriched KEGG clusters in Xuzi-8 sweetpotato cultivar. The most enriched 22 clusters out of 123 clusters were presented in this figure
Fig. 5 Phenotypic variations in Xuzi-8 sweetpotato seedlings as related to fold change (FC) and false discovery rate (FDR) under salt stress (200Mm NaCL). a, b, c and d; phenotypic variations at 0, 1, 6, 12 48 hours of salt stress, respectively. e, f, g and h; fold change (FC) and false discoveryrate (FDR) at four libraries 1, 6, 12 48 hours, respectively as compared to control
Arisha et al. BMC Genomics (2020) 21:197 Page 6 of 18

Between these 479 unigenes there were 5 unigenesdirectly related to salt stress including bZIP-8 transcrip-tion factor, EID1-like F-box protein-3, WCOR-413 likecold acclimation protein and putative low temperatureand salt responsive protein isoform with fold changevalues 1.8, 1.9, 3.6, 1.6 and 2.1 higher than control.Furthermore, among all significantly expressed genes therewere 9 genes which gave the highest expression level.These nine genes were included under three differentprotein families i.e., malate synthase, glyoxysomal; proteinTRANSPARENT TESTA-12, detoxification; SNF-1 relatedprotein kinase and two dehydrin unigenes (Table 4).While, there were 567 unigenes significantly down-
regulated at 6 h of salt stress. Among these genes therewere 15 salt stress response unigenes belonging to differ-ent protein families including plastid glutamine synthase,Cellulose synthase A-catalytic (UDP-forming), decarb-oxylase transporter-1 (chloroplast), Indole-3 acetic acidamino synthase (GH3), tubulin alpha-2 chain-like, proteinWALLSARE THIN-1 like and aquaporin protein-12. Thehighest down regulated unigenes (4 folds lower thancontrol) were two unigenes belong to nitrate reductase(NADH) protein family (Table 4).At 12 h of salt stress, a number of 281 unigenes were
significantly expressed and up-regulated which belong to32 different gene families. Between these genes therewere 5 genes directly respond to salt stress treatment
which were aligned to BEL-1 like homes domainprotein-1 (BLH-1), bZIP-8 transcription factor and EID-1 like F-box protein-3. Moreover, the superior expressedgenes were belonged to nucleoredoxin2 isoform X-1(AhpC/TSA gene family). On the other hand, a numberof 301 unigenes were significantly down-regulated in-cluding six unigenes involved in response to salt stress.These 6 unigenes belong to four different gene familiesi.e., cellulose synthase A catalytic (UDP forming), Tubulinalpha-2 chain-like isoform × 2 and enol-[acyl-carrier-pro-tein] reductase (NADH)- chloroplast-like. Furthermore,four unigenes were expressed four folds higher thancontrol which included under four different gene families(elongation factor [TSF], ACT-domain containing protein[ACR-11], proline rich protein and protein like isoformand pectin methyl-esterase inhibitor (Table 4).There were 508 unigenes significantly up-regulated in
leaf tissues after 48 h of salt stress belonging to 63 differ-ent gene families. The unigenes which responded to saltstress were included under Cystein-rich receptor-likeprotein kinase-2, bZIP-8 transcription factor, EID-1 likeF-box protein-3 and low temperature and salt responsiveprotein isoform. Furthermore, the highest expressedgenes in leave tissues were belong to importin-5 malatesynthase, glyoxysomal, protein phosphatase 2C-37 like,O-acyltransferase WSD-1-like, EID1-like F-box protein-3and NADH-dehydrogenase. In addition there were 1335
Fig. 6 Comparison of four transcriptomes for classification of DEGs and statistics of sequence annotation of DEGs. a; Statistical chart of DEGstranscriptome in response to salt stress. Transcriptional level of five libraries including 1, 6, 12 and 48 hours of salt stress treatment as comparedto control. b and c; Venn diagram analysis of up-regulated unigenes and all induced unigenes, respectively.
Arisha et al. BMC Genomics (2020) 21:197 Page 7 of 18

Table 4 Salt stress defence mechanism related genes, Genes involved in physiological processes related to response to salt stressand highest significantly expressed genes that were significantly up and down regulated under different durations (1, 6, 12, 48hours) of salt stress (200 mM NaCl) as compared to control
Library UnigeneID
Foldchange
Nr. annotation UnigeneID
Foldchange
Nr. annotation
Up-regulated Down-regulated
C1 vsS1
g11357 1.1 SBP-domain - - -
g15171 1.3 Hsp70
g16391 1.1 plant invertase/ pectin (methyl-esteraseinhibitor)
g7424 1.4 Uncharacterized protein family
C4 vsS4
Salt stress defence mechanism related genes
g1120 GID1- like gibberellin receptor g6088 1.1 Cinnamoyl-Co-A reductase-1 like
g802 GID1- like gibberellin receptor
Genes involved in physiological processes related to response to salt stress
g243 1.8 ABA-insensitive like protein (bZIP-TF) g1047 1.1 Plastid glutamine synthase
g3644 1.9 ABA-insensitive like protein (bZIP-TF) g10527 2.0 Cellulose synthase A-catalytic [UDP-forming]
g7343 3.6 EID-like F-box protein-3 g11093 1.9 Cellulose synthase A-catalytic [UDP-forming]
g7826 1.6 WCOR-413-like cold accumulation protein g11199 2.0 Cellulose synthase A-catalytic [UDP-forming]
g9718 2.1 Putative low temperature and salt responsiveprotein isoform-1
g11449 1.9 Cellulose synthase A-catalytic [UDP-forming]
g146 1.4 Dicarboxylate transporter-1, chloroplast
g14716 2.1 Indole-3 acetic acid amino synthase [GH3]
g15096 1.1 Indole-3 acetic acid amino synthase [GH3]
g15564 1.1 Indole-3 acetic acid amino synthase [GH3]
g1634 1.3 Tubulin alpha-2 chain-like
g16418 1.6 Dicarboxylate transporter-1, chloroplast
g16788 1.4 Dicarboxylate transporter-1, chloroplast
g1835 1.1 Protein WALLS ARE THIN-1 like
g6333 2.3 Aquaporin protein-12
g6414 2.0 Aquaporin protein-12
Highest significantly expressed genes (more than four folds higher than control)
g128 4.4 Protein TRANSPARENT TESTA-12 (MaTEprotein detoxification)
g12981 4.5 Nitrate reductase [NADH]
g16087 4.6 Malate synthase, glyoxysomal [PRUPE] g13113 4.5 Nitrate reductase [NADH]
g16131 4.3 Malate synthase, glyoxysomal [PRUPE
g2278 5.2 Malate synthase, glyoxysomal [PRUPE]
g4002 4.3 SNF-1 related protein kinase
g55 4.4 Malate synthase, glyoxysomal [PRUPE]
g5655 4.6 Malate synthase, glyoxysomal [PRUPE]
g9231 4.2 Dehydrin
g9447 4.1 Dehydrin
C5 vsS5
Salt stress defence mechanism related genes
g1120 GID1- like gibberellin receptor - - -
g802 GID1- like gibberellin receptor
Genes involved in physiological processes related to response to salt stress
g13368 1.2 BEL-like homes domain protein-1 (BLH-1) g10527 1.8 Cellulose synthase A-catalytic [UDP-forming]
g13566 1.0 BEL-like homes domain protein-1 (BLH-1) g11199 2.0 Cellulose synthase A-catalytic [UDP-forming]
g243 2.9 ABA-insinsative like protein (bZIP1-TF) g11449 2.0 Cellulose synthase A-catalytic [UDP-forming]
Arisha et al. BMC Genomics (2020) 21:197 Page 8 of 18

significantly down-regulated unigenes at 48 h of salt stress.Furthermore, a number of 14 unigenes were directly in-volved in response to salt stress included under plastidglutamine synthase-2, cellulose synthase A- catalytic
[UDP-forming], dicarboxylate transporter-1 [chloroplast],serine-glycosylate aminotransferase, chlorophyll a-b bind-ing protein CP2410-A and one uncharacterized proteinsequence. Out of the significantly down-regulated
Table 4 Salt stress defence mechanism related genes, Genes involved in physiological processes related to response to salt stressand highest significantly expressed genes that were significantly up and down regulated under different durations (1, 6, 12, 48hours) of salt stress (200 mM NaCl) as compared to control (Continued)
Library UnigeneID
Foldchange
Nr. annotation UnigeneID
Foldchange
Nr. annotation
g3644 3.3 ABA-insinsative like protein (bZIP1-TF) g1634 1.3 Tubulin alpha-2 chain-like
g7343 3.9 EID-like F-box protein-3 g2681 1.1 Enoyl-[acyl-carrier-rotein] reductase [NADH],chloroplast-like
g11093 2.0 Cellulose synthase A-catalytic [UDP-forming]
Highest significantly expressed genes (more than four folds higher than control)
g3153 AphC/TSA family g11772 4.2 Elongation Factor [TSF]
g3480 AphC/TSA family g5817 4.5 ACT-domain containing protein [ACR11]
g3682 Intercellular signal transduction g8657 4.2 Proline rich protein [DC2]
g9421 5.5 Protein like isoform (plant invvertase/ pectinmethylesterase inhibitor)
D6 vsS6
Salt stress defence mechanism related genes
g1120 GID1- like gibberellin receptor g5647 1.0 Alpha/beta hydrolase (carboxylesterase)
g802 GID1- like gibberellin receptor g5851 1.2 Cinnamoyl-Co-A reductase-like
Genes involved in physiological processes related to response to salt stress
g15315 Cysteine rich receptor-like protein kinase-2 g1047 1.8 Plastid glutamine synthase
g243 ABA-insensitive like protein (bZIP1-TF) g11093 1.4 Cellulose synthase A-catalytic [UDP-forming]
g3644 ABA-insensitive like protein (bZIP1-TF) g11199 1.5 Cellulose synthase A-catalytic [UDP-forming]
g7343 EID-like F-box protein-3 g11449 1.5 Cellulose synthase A-catalytic [UDP-forming]
g9718 Putative low temperature and salt responsive proteinisoform-1
g146 1.5 Dicarboxylate transporter-1, chloroplast
g16196 1.5 Dicarboxylate transporter-1, chloroplast
g16418 1.7 Dicarboxylate transporter-1, chloroplast
g16788 1.3 Dicarboxylate transporter-1, chloroplast
g2795 1.0 Serine-glyoxylate aminotransferase
g3130 1.1 Serine-glyoxylate aminotransferase
g4724 1.1 Uncharacterized protein sequence
g7120 1.1 Serine-glyoxylate aminotransferase
g7168 1.9 Chlorophyll a-b binding protein CP2410-A
g7762 1.2 Serine-glyoxylate aminotransferase
Highest significantly expressed genes (more than four folds higher than control)
g10431 Energy production and conservation g4007 5.4 Magnisium-chelatase [ChlH], Chloroplast
g16087 Energy production and conservation g4581 4.6 Alpha expansin
g16288 Energy production and conservation
g2278 Energy production and conservation
g2618 Signal transduction mechanisms
g2863 Signal transduction mechanisms
g675 reverse transcription
g7343 EID-like F-box protein-3
g9017 Energy production and conservation
Arisha et al. BMC Genomics (2020) 21:197 Page 9 of 18

unigenes there were two unigenes which showed morepronounced effect include unigene4007 and 4581 whichhave been identified as Magnesium-chelatase [ChlH] inchloroplast and alpha expansin protein (Table 4).As shown in Fig. 5 there were 119 up-regulated genes
present in various durations of salt stress (6, 12, 48 h).Out of these 119 unigenes, 92 genes were significantlyexpressed at 6, 12, 48 h of salt stress. Pfam resultsshowed that among these 92-salt induced genes, 77 uni-genes (83.69%) were found to have a known function. Anumber of 5 unigenes (5.43%) out of the significantlyexpressed genes showed no homology with known se-quence. Furthermore, three unigenes belong to bZIP-8transcription factor and EID-1 like F-box protein-3 weresignificantly expressed in leave tissues and involved inresponse to salt stress at 6, 12, 48 h of salt stress. On theother hand, there were 87 down-regulated unigenes inleave tissues during 6, 12, 48 h of salt stress and out ofthese 87 unigenes there were 42 significantly down-regulated as compared to control (Fig. 6).Based on the above mentioned results, all of these sig-
nificantly unigenes during the three time points of saltstress (6, 12, 48 h) definitely have a role under salt stressconditions or may be contribute in regulating the salt re-sponse in Xuzi-8 sweetpotato cultivar.
Differential expression of transcription factors (TFs)regulated by salt stressThere were 4, 1202, 764 and 2195 transcription factorsdifferentially regulated DEGs by salt stress at differenttime points including 1, 6, 12, 48 h of salt stress. Duringthe first hour of salt stress there were 4 different TFsup-regulated in the salt treated plants which were in-cluded under SBP, LIM, NAC and FAR1 TFs families.At 6 h of salt stress the number of TFs increased
giving 1202 TFs including 529 up-regulated and 672down-regulated TFs. The most pronounced TFs regu-lated after 6 h of salt stress (expressed 5 folds than con-trol) was aligned to malate synthase which is responsiblefor energy production and conversion. Followed by 9unigenes expressed with 4 folds higher than controlwhich were included under mTERF and WRKY TFsfamilies. Furthermore, 38 unigenes belongs to NF-Y- >NF-YC, C2C2- > C2C2-GATA, DBP, C3H, WRKY, Tify,SNF2 and HB- > HB-HD-ZIP TFs families were up-regulated with 3 folds than control. On the other hand672 TFs down regulated in leaf tissues of treated plantslower than control. The lowest down regulated unigeneswere belonged to C3H and SET TFs families (namely:Nitrate reductase [NADH] and Auxin-binding protein)which are involved in oxidation-reduction process andauxin-activated signalling pathway, respectively. Uni-genes belong to GNAT TF family including AquaporinPIP2–7 and Chlorophyll a-b binding protein 48 were
down regulated as compared to control. GNAT TFfamily are involved in Carbohydrate transport and me-tabolism, water transport and water channel activity.MADS- >MADS-M-type TF family aligned unigenes(down-regulated with 3 folds lower the control) are in-volved in lipid transport and metabolism.After 12 h of salt stress, a number of 673 TFs were dif-
ferentially regulated in treated plants than control plantsincluding 341 up-regulated and 422 down-regulated TFs.The up-regulated TFs were aligned to different TF fam-ilies including HB- > HB-HD-ZIP (13 unigenes), C2C2-> C2C2-GATA (12 unigenes), DBP (11 unigenes), SNF2(10 unigenes), bZIP and C2H2 (8 unigenes), NF-Y- >NF-YC (6 unigenes) and WRKY (5unigenes). The high-est up-regulated TFs (4 folds higher than control) wasaligned to C2C2- > C2C2-GATA family namely nucleore-doxin 2 including Thioredoxin-like domain which is in-volved in intracellular signal transduction. Followed byDBP, bZIP and SNF2 TFs families including genesnucleoredoxin 2, protein phosphatase 2C, ABSCISICACID-INSENSITIVE 5-like protein 5 (bZIP8) and EID1-like F-box protein, respectively. On the other hand, therewere 422 unigenes down regulated were classified as TFsincluding AP2/ERF- > AP2/ERF-ERF (31 unigenes), MYB->MYB-related (22 unigenes), GNAT (15unigenes), C3H(13 unigenes), LIM (11 unigenes), Trihelix (11unigenes)and SWI/SNF-BAF60b (10 unigenes). MYB- >MYB-re-lated (ACT domain-containing protein ACR11) andTrihelix (14 kDa proline-rich protein DC2.15-like) TFsfamilies were the lowest expressed among all. In additionthere were a number of 14 unigenes significantly down-regulated 3 folds less than control which were aligned togeraniol 10-hydroxylase-like protein, Elongation factor Ts,cytochrome P450, Expansin-A1, photosystem II proteinD2, abscisic acid receptor PYL4-like, 14 kDa proline-richprotein DC2.15-like and gibberellin induced protein.These genes were belonged to HB- >HB-other, bHLH,LIM, MYB, Trihelix and mTERF TF families.The number of TFs induced by exposure to 48 h of
salt stress was the highest among all time points (2194TFs) including 663 up-regulated and 1531 down-regulated unigenes. The up-regulated TF families wereC3H (26 unigenes), WRKY (16 unigenes), bZIP (15uni-genes), NAC (15 unigenes), FAR1 (15 unigenes), HB- >HB-HD-ZIP (13 unigenes), PHD (13 unigenes), C2H2(12 unigenes), SNF2 (11 unigenes), AP2/ERF- > AP2/ERF-ERF (11 unigenes) and B3- > B3 (11 unigenes). Onthe contrary, there were 1531 down regulated TFsincluded under different TFs families. One unigeneencoded magnesium-chelatase subunit ChlH (chloro-plastic) was expressed five folds lower than control wasbelonging to Jumonji TF family which is involved inchlorophyll biosynthetic process and work as a co-enzyme transport and metabolism. A unigene aligned to
Arisha et al. BMC Genomics (2020) 21:197 Page 10 of 18

Expansin-A2 belongs to LIM TFs family was down-regulated 4 folds lower than control which found to beplant-type cell wall organization. In addition, there were33 unigene expressed with 3 folds lower than control.
Protein kinases (PKs) differentially expressed under saltstressIn sweetpotato at the time of salt stress, PKs includemany genes and play a vital role in phosphorylationprocess and act as a signal transductor/receptor proteinsin membranes.SNF1-related protein kinase was up-regulated during 6 h
(7 unigenes) and 48 h (4 unigenes) of salt stress expressedin two forms including SNF1-related protein kinase cata-lytic subunit alpha KIN10-like and SNF1-related proteinkinase regulatory subunit gamma-1. One unigene alignedto Phosphatidylinositol 4-phosphate 5-kinase was up-regulated during 6 and 48 h after salt stress. A number of19 unigenes were aligned to cyclin-dependent kinase whichwere up-regulated at 6 and 48 h of salt stress. CBL-interacting protein kinase 10 aligned genes were down-regulated. Cysteine-rich repeat secretory protein 3 is a saltstress response gene was up-regulated starting from 6 h ofsalt stress. G-type lectin S-receptor-like serine/threonine-protein kinase aligned genes (14 unigene) were up-regulated only at 12 h of salt stress. A number of 6 unigenesaligned to wall-associated receptor kinase were down-regulated starting from 6 till 48 h of salt stress. A numberof 46 unigenes were classified under LRR receptor-like pro-tein kinase were up-regulated at 12 and 48 h of salt stress.
Photosynthesis related genes under salt stressLeaf is the factory of the plant that provide the plant withnecessary energy for different physiological processesthrough photosynthesis. Genes related to photosyntheticparameters including gas exchange, pigments are affectedseriously by salt stress. The current transcriptome sequen-cing results showed that there were 441 unigenes identifiedto be involved in photosynthetic related processes or path-ways. Exposing he plant for 200mM of Nacl for 1 h didn’tsignificantly affect photosynthesis process or its relatedgenes. Most of genes involved in photosynthesis processwere down regulated including 88, 20 and 239 DEGs at 6,12, 48 h of salt stress as compared to control. While, a verylow number of DEGs were up-regulated including 8 and 5DEGs at 6 and 48 h of salt stress as compared to control.At 6 h of salt stress a number of 8 unigene aligned toFructose-1,6-bisphosphatase (cytosolic) were up-regulated.Furthermore, after 48 h there were only 5 up-regulatedDEGs which were aligned to Aconitate hydratase (cyto-plasmic) and heme oxygenase 1 (chloroplastic). In additionthere was one gene was up-regulated during 6 and 48 h ofsalt stress which is encoded to stress enhanced protein 2(chloroplastic). On the other hand, there were 10 unigenes
down regulated at 6, 12, 48 h which were aligned to ADP-glucose pyrophosphorylase beta, thylakoid lumenal 29 kDaprotein (chloroplastic), chlorophyll a-b binding protein(chloroplastic) and rhodanese-like domain-containing pro-tein 9 (chloroplastic). At 6 h the most pronounced down-regulated gene as compared to control was chlorophyll a-bbinding protein which is common in all time points besideProtochlorophyllide reductase (chloroplastic). At 12 h be-side to the common genes, serine hydroxymethyltransferase(mitochondrial), mitogen-activated protein kinase, photo-system II protein D2, Photosystem I reaction center subunitXI (chloroplastic) and NAD(P)H-quinone oxidoreductase(chloroplastic) were down regulated. At 48 h the lowestdown-regulated gene was magnesium-chelatase subunitChlH (chloroplastic) followed by chlorophyll a-b bindingprotein and photosystem I reaction center subunit XI(chloroplastic).
SSR and SNP identificationFor further application of sweetpotato SSRs and SNPswere discovered using assembled transcriptomes (Fig. 7aand b). A total of 24,559 SSRs were identified in transcrip-tomes present in 15,976 sequences. Furthermore, thenumbers of sequence containing more than one SSR were5762 and the numbers of SSRs present in compoundformation were 2215. In addition, the major types of theidentified SSRs were mono-nucleotide (19,380), di-nucleotide (2791), tri-nucleotide (2199), tetra-nucleotide(123), penta-nucleotide (33) and hexa-nucleotide (25).The most SSR motif was A/T (19282) followed by AG/CT(1964), AT/AT (669), AAG/CTT (596), CCG/CGG (330),AAT/ATT (309), ATC/ATG (247) and AGC/CTG (217).A total of 562,174 SNPs between transcriptomes wereidentified, among which 348,495 were transitions, and213,679 were transversions. These SSRs and SNPs identi-fied in this study provided a valuable resource for futurestudies on genetic linkage mapping and the analysis ofinteresting traits in sweetpotato.
Experimental validation by qRT-PCRTo confirm the reliability of the illumine sequencing, sixunigenes were randomly selected for quantitative RT-PCR assays including unigene299, 2083, 2359, 3153,6075 and 6453. The results showed that the DEG resultsand expression levels have the same tendency among allunigenes (Fig. 8). The unigenes 299, 2359, 3153 and6075 were up-regulated in both qPCR results and DEGanalysis giving the lowest values at the first time point(1 h of salt stress) then started to increase till 48 h of saltstress. On the other hand, the unigenes 2083 and 6453were down regulated with an expression level one foldlower than control samples which was in agree with theDEG results (Fig. 8a-f).
Arisha et al. BMC Genomics (2020) 21:197 Page 11 of 18

DiscussionSweetpotato is a hexaploid heterozygous non-modelcrop with a complex genome lacking high quality refer-ence genome [13]. To date the current understanding ofthe complex physiological and molecular mechanisms ofsalt tolerance in sweetpotato remains limited [14, 15].High throughput RNA sequencing is required for identi-fication of candidate genes involved in salt stress toler-ance. In addition, it will be helpful for betterunderstanding of salts stress tolerance mechanisms insweetpotato [5].In the present study, deep sequencing analyses of PFSP
under different durations of salt stress were character-ized as compared to control. Using second and third
generation technology, Illumina sequencing generated170,344,392 clean high-quality long reads that were as-sembled into 15,998 unigenes with an average length2178 base pair which considered relatively longer thanonly NGS studies which ranged between 1000 and 1300base pairs as an average length for the obtained se-quence [16–19]. A percent of 96.55% of the obtainedunigenes were functionally annotated in the NR proteindatabase, while there were 537 unigenes failed to hit anyhomologs which may be considered as new protein se-quence which had not been characterized previously insweetpotato.The current results revealed that there are similarity
with the available sweetpotato genome sequence at a
Fig. 7 Simple sequence repeat (SSRs) and single nucleotide polymorphism (SNPs) detected in the obtained sequences in Xuzi-8 sweetpotatocultivar under salt stress conditions (200mM NaCL) with 5 libraries (0, 1, 6, 12, 48 hours). a; Frequency and distribution of SSRs in coding sequenceand untranslated region (UTRs). b; Frequency and substitution types of the identified SNPs in the five libraries (three replicates per each library)
Fig. 8 qRT-PCR validation of the salt induced fold changes detected in Xuzi-8 sweetpotato cultivar using RNA-seq. Standard error bars are showed forthe expression values determined by qRT-PCR. The expression levels determined by qRT-PCR and DEG values of the genes (protein disulfide isomerase,Actin-12 (ACT12), nucleoredoxin 2 isoform X1, Thioredoxin-like domain, CTD small phosphatase-like protein 2 and Redoxinwere presented) at (a), (b),(c), (d), (e) and (f), respectively. Expression values determined by qRT-PCR are presented as columns and DEGs are presented as curves
Arisha et al. BMC Genomics (2020) 21:197 Page 12 of 18

percent of 3.07%. That’s mean that 96.93% of our ob-tained sequence are not present on the sweetpotatoavailable online data. Therefore, the current results willcontribute to improve sweetpotato genome annotationand facilitate the discovery of genetic resources that areresponsible for salt stress in hexaploid sweetpotato.The results in Fig. 3 showed that the most dominant
Go-terms which were identified during the differentdurations of salt stress included metabolic, cellular, sin-gle organism and response to stimulants. These resultsare in agree with [20] in diploid halophytic sweetpotato,[21] in Ipomoea imperati [22]. Furthermore, COGresults indicated that the highest number of genes wascategorized as “post-translational modification, proteinturnover, chaperones” in our study. Which mean that,sweetpotato plants under salt stress conditions, startsthe key mechanisms of chemical modifications includingregulating of enzymes activity, localization and inter-action with other cellular molecules such as proteins,nucleic acid, lipids and co-factors [23]. Furthermore,protein turnover related genes control the balance be-tween protein biosynthesis and degradation, which isvery important for determining the resistance or sensi-tivity of the plant to salt stress. That’s may be due to ifthe protein biosynthesis is more than breakdown indi-cates an anabolic state, in this case the plant tolerance tostress will be enriched [24–27]. Moreover, Protein chap-erones’ major function is to prevent or correct damagecaused by miss-folding due to salt stress [28–31]. Thesecond COG group of genes involved in “signal trans-duction mechanisms” which is mainly transforming thecertain stimulus induced by salt stress into a biochemicalsignal which activates more genes specifically involved insalt stress tolerance [32].
The regulatory mechanisms and salt resistance relatedgenes in sweetpotatoFrom the molecular aspects, salt tolerance in sweetpo-tato starts when the plant exposed to salt stress, the ac-tion taken including activating the transcriptionalcontrol inside the nucleus of the cells, sensing and sig-naling, cellular influx and detoxification mechanisms ac-tivated [33].TFs play an essential role in regulating many different
signal transduction pathways in plants under stress byactivating the expression of specific genes [34]. In thecurrent study, the response of leaf tissues was lower dur-ing the first hours of salt stress and there were only fourTFs significantly up-regulated with one fold higher thancontrol. These four unigenes including SBP TFs haveimportant role in leaf development, vegetative phasechange and may be have a role in stress response [35].The second unigene was aligned to HSP70 which is es-sential regulator to maintain internal cell stability and
prevent aggregation under physical or chemical pressure[36]. The plant invertase/ pectin methyl-esterase inhibi-tor affects growth and development consisting with itsactivities such as stress response. In addition, pectinmethyl-esterase determines the solidity of cell wall in-cluding root development and permeability [37]. Thesefour genes considered as early response genes for stressin leaf tissues [38] which can improve stress tolerance atthe first phase of stress. This indicate that Xuzi-8 sweet-potato as a tolerant cultivar slightly sensed osmoticstress at the first hour of salt stress. However, only fourTFs were up-regulated which considered necessary inlinking salt sensory pathways to salt tolerance as well asother types of stress.In addition the current results showed that a core sets
of TF family genes were differentially expressed in leaftissues during 6, 12 and 48 h of salt stress includingC3H, WRKY, bZIP, NAC, FAR1, HD-ZIP, PHD, C2H2,SNF2, AP2/ERF, MYB and B3. In agree with our resultsGeng Y. et al., [39] reported that most of stress inducedtranscriptional changes occurs at least after 3 h of saltstress exposure. These TFs in turn are regulating theexpression levels of different genes that may ultimatelyenrich salt tolerance in sweetpotato [39].In the current study, at 6 h of salt stress the most pro-
nounced TFs were malate synthase, mTERF and WRKY.These three TFs have an important role in plant physi-ology under salt stress conditions [40]. Followed bySNF-1 related protein kinase (represent an interface be-tween metabolic and stress signaling) [41] and dehydrin(play a major role in recovery of drought and salt stress)[42]. In addition to TFs, at 6 h, there were proteinTRANSPARENT TESTA-12 which control flavonoid se-questration [43] and Protein DETOXIFICATION isdelay the development of disorders associated with stress[43]. Furthermore, ABA insensitive-like protein is actingas a positive component in glucose signal transduction[43] and EID-like F-box protein family is a knowndrought and salt response regulation after 6 h. WCOR413-like protein is responsible for protection of plasmamembrane against dehydration which has been discov-ered earlier in sweetpotato genome, these findings are inagree with [43] in wheat. The putative salt stress respon-sive protein isoform-1, which play a critical role in saltstress tolerance after 6 h, has been discovered before insweetpotato genome [44]. Thus, we can conclude that at6 h the plant start to activate the TFs which regulategenes involved in salt stress tolerance, protein kinasesthat save the metabolic activity and activate stress signal-ing beside protein detoxifications which delay the harm-ful effect of salt stress and reduce the excess absorptionof NaCL.The highest regulated TFs at 12 h of salt stress as
compared to control was nucleoredoxin 2 including
Arisha et al. BMC Genomics (2020) 21:197 Page 13 of 18

Thioredoxin-like domain (AhpC/TSA TFs) which isresponsible for signal transduction which in roleconstitutes an enzymatic defense against salt stress. Inaddition, at 12 h of salt stress, BEL-1 like homes domainprotein-1 (BLH-1) contribute in regulating a range ofdevelopmental processes under salt stress, bZIP-8transcription factor is a key components in response to awide range of abiotic stresses, including high salinitythrough regulating ABA concentration. In addition ABAis responsible for preventing the lateral root elongationinto surrounding media with high salt concentration.Furthermore, EID-1 like F-box protein-3 were expressedwith high level as compared to control [43]. Therefore,at 12 h the genes involved in sensing and signaling weremore expressed, beside the TFs which are involved inhormonal regulation which have a major role in defensemechanisms against salt stress.In the current study, as compared to control, among
the other time points, the number and expression levelof TFs at 48 h was the highest. These TFs families whichhave a strong relation with salt stress tolerance at 48 hincluding C3H, WRKY, bZIP, NAC, FAR1, HB- > HB-HD-ZIP, PHD, C2H, SNF2, AP2/ERF- > AP2/ERF-ERF,EID-1 like F-box protein-3 and B3- > B3. In addition, theunigenes which responded to salt stress were Cystein-rich receptor-like protein kinase-2, low temperature andsalt responsive protein isoform. Furthermore, the highestexpressed genes in leave tissues were belong toimportin-5 malate synthase, glyoxysomal, protein phos-phatase 2C-37 like, O-acyltransferase WSD-1-like, andNADH-dehydrogenase [45–48].
Photosynthesis related genesPhotosynthesis is the most significant physiologicalprocess for the plant life and during all growth stagesis affected by stress factors [33]. In the current re-sults, it was interesting to note that most of DEGs re-lated to photosynthesis were down-regulated, while, avery low number of unigenes were up-regulated. Thestress enhanced protein 2 (chloroplastic) was signifi-cantly up-regulated at 6 and 48 h of salt stress. Inaddition, fructose-1,6-bisphosphatase (cytosolic) wasup-regulated after 6 h of salt stress which is involvedin carbohydrate transport and metabolism and Aconi-tate hydratase (cytoplasmic) and Heme oxygenase 1(chloroplastic) were up-regulated at 48 h of salt stress.According to our results, Heme oxygenase 1 (chloro-plastic) was up-regulated which is responsible for in-organic ion transport and metabolism that’s in rolecounteract the reduction of water potential resultingfrom osmotic components of enhanced salinity [39].On the other hand, the number of genes related tophotosynthesis was 88 at 6 h off salt stress decreasinginto only 20 unigenes at 12 h and reached to the
maximum at 48 h of salt stress. There were 10 uni-genes common in the three time points 6, 12, 48 h in-cluding ADP-glucose pyrophosphorylase beta, thylakoidlumenal 29 kDa protein (chloroplastic), chlorophyll a-bbinding protein (chloroplastic) and rhodanese-likedomain-containing protein 9 (chloroplastic). Further-more, the down-regulated unigenes were involved inamino acid transport and metabolism, carbohydratetransport and metabolism, cell wall/membrane/enve-lope biogenesis, secondary metabolites biosynthesis,transport and catabolism, energy production and con-version, inorganic ion transport and metabolism andcoenzyme transport and metabolism. To some extent,genes involved in the above mention physiological pro-cesses are mediated by dynamic changes in photosynthesis[39]. Therefore, according to hour results and in agreewith previous researches, photosynthesis process severelyaffected by salt stress starting from 6 h and the effectincrease with increasing the stress duration.Taken together, TFs (bHLH, bZIP, C2H2, C3H, C3H4,
ERF, MYB, NAC, TSA and WRKY) regulates the differ-entially expressed genes that related to salt stress toler-ance and PKs act as a signal transductor/receptorproteins in membranes. Furthermore, protein detoxifica-tions have damage control and repair associated withstress. In addition genes related to hormonal balancehave a major role in determining the level of plant toler-ance. According to our results, due to the high expres-sion of these genes including TFs, PKs, Protein Detoxand hormones related genes enriched the salt tolerancein Xuzi-8 sweetpotato cultivar.
ConclusionsIn the present study, de novo was constructed and char-acterized the transcriptomes of sweetpotato challengedwith salt stress and identified 15,976 unigenes, generat-ing a broad survey of genes involved in salt stress resist-ance. DEG profiling analysis at the significance levelidentified number of 4, 479, 281, 508 up-regulated and0, 567, 301, 1335 down-regulated unigenes. Functionalanalysis of the obtained sequence showed that the mainTFs families involved salt stress tolerance includingbHLH, bZIP, C2H2, C3H, C3H4, ERF, MYB, NAC, TSAand WRKY. PKs act as a signal transductor/receptorproteins in membranes and protein detoxifications havedamage control and repair associated with stress. Thecurrent transcriptome sequencing data of hexaploidsweetpotato under salt stress conditions can provide avaluable resource for sweetpotato breeding researchand focus on novel insights into sweetpotato re-sponses to salt stress. In addition, it offers new candi-date genes or markers that can be used as a guide tothe future studies attempting to breed salt tolerancesweetpotato cultivars.
Arisha et al. BMC Genomics (2020) 21:197 Page 14 of 18

MethodsPlant materialsXuzi-8, a high quality, early mature cultivar with greenleaves and purple flesh storage roots, and salt tolerance,was used in this experiment. Its storage roots contain6% soluble sugar and more than 80 mg anthocyanin/100 g fresh weight. It have a strong vegetative growthand its leaves contain 398.31, 130.75 and 39.27 mg/100 gdry weight of chlorophyll a, chlorophyll b and caroten-oids, respectively [49]. This cultivar was obtained fromXuzhou Institute of Agricultural Sciences in JiangsuXuhuai District, China.
Treatments and experimental designApical stem cuttings (15–20 cm) of Xuzi-8 cultivartaken from 2 months age healthy sweetpotato plantsgrowing in the field. Stem cuttings were let to growin hydroponics culture using Hoagland nutrientmedium till having 1 cm pencil roots (about 3 weeks).Seedlings were exposed to salt stress (200 mM NaClwere added to Hoagland solution) for 0, 1, 6, 12, 48 hwhich were chosen according to our previous study[50]. 0.1 g sample (three replicates per each sample)was taken from the upper third leaf after 0, 1, 6, 12,48 h from salt treated and untreated plants for thenext generation sequencing. For the third-generationsequencing, samples was collected from the upperthird leaf at the same time points (three replicatesfor each sample). All collected samples were imme-diately frozen in liquid nitrogen and stored at − 80 °Cuntil processing for RNA extraction and all treatmentswere done in triplicate.
RNA extractionTotal RNA was extracted from collected samples withthe TRIZOL method (Life technologies, Carlsbad, CA)according to the manufacturer’s protocol. RNA degrad-ation and contamination were monitored on 1% agarosegels. RNA purity was checked using the Nanophot-ometer® spectrophotometer (IMPLEN, CA, USA). RNAconcentration was measured using Qubit® RNA AssayKit in Qubit® 2.0 Fluorometer (Life Technologies, CA,USA). RNA integrity was assessed using the RNA Nano6000 Assay Kit of the Agilent Bioanalyzer 2100 system(Agilent Technologies, CA, USA).
Library preparation for Transcriptome analysisFor second generation sequencing, a total amount of3 μg RNA per sample was used as input material forthe RNA sample preparations. Sequencing librarieswere generated using NEBNext® Ultra™ RNA LibraryPrep Kit for Illumina® (NEB, USA) following manufac-turer’s protocol and index codes were added to attri-bute sequences to each sample. For third generation
sequencing RNA was extracted from different timepoints and equal amount of each sample were mixedto produce one library beside to the control library.Briefly, mRNA was purified from total RNA usingpoly-T oligo-attached magnetic beads. Fragmentationwas carried out using divalent cations under elevatedtemperature in NEBNext First Strand Synthesis Reac-tion Buffer(5X). First strand cDNA was synthesizedusing random hexamer primer and M-MuLV ReverseTranscriptase (RNase H-). Second strand cDNA syn-thesis was subsequently performed using DNA Poly-merase I and RNase H. Remaining overhangs wereconverted into blunt ends via exonuclease/polymeraseactivities. After adenylation of 3′ ends of DNA frag-ments, NEBNext Adaptor with hairpin loop structurewere ligated to prepare for hybridization. In order toselect cDNA fragments of preferentially 150~200 bpin length, the library fragments were purified withAMPure XP system (Beckman Coulter, Beverly, USA).Then 3 μl USER Enzyme (NEB, USA) was used withsize-selected, adaptor-ligated cDNA at 37 °C for 15min followed by 5 min at 95 °C before PCR. ThenPCR was performed with Phusion High-Fidelity DNApolymerase, Universal PCR primers and Index (X) Pri-mer. At last, PCR products were purified (AMPureXP system) and library quality was assessed on theAgilent Bioanalyzer 2100 system.
Clustering and sequencingThe clustering of the index-coded samples wasperformed on a cBot Cluster Generation System usingTruSeq PE Cluster Kit v3-cBot-HS (Illumia) accordingto the manufacturer’s instructions. After clustergeneration, the library preparations were sequencedon an Illumina platform and paired-end reads weregenerated.
Data analysis quality controlRaw data (raw reads) of fastq format were firstly proc-essed through in-house perl scripts. In this step, cleandata (clean reads) were obtained by removing reads con-taining adapter, reads containing ploy-N and low-qualityreads from raw data. At the same time, Q20, Q30, GC-content and sequence duplication level of the clean datawere calculated. All the downstream analyses were basedon clean data with high quality.
Transcriptome assemblyTranscriptome sequencing was accomplished based onboth NGS and 3rd GS, and TPM, FPKM, RPKM andfold change (FC) were recorded for each replicate ofeach library separately. Obtained sequence from NGSand 3rd GS was aligned and similar sequence data fromall libraries/samples were pooled [51] and ultimately
Arisha et al. BMC Genomics (2020) 21:197 Page 15 of 18

used for further analysis using Trinity [52] with min_kmer_cov set to 2 by default and all other parametersset default.
Gene functional annotationGene function was annotated based on the following data-bases: Nr (NCBI non-redundant protein sequences,https://www.ncbi.nlm.nih.gov/) with E-value cut-off of le-5; Nt (NCBI non-redundant nucleotide sequences https://www.ncbi.nlm.nih.gov/) with E-value cut-off of le-5 ; Pfam(Protein family, http://pfam.sanger.ac.uk/) with E-valuecut-off of le-2; KOG/COG (Clusters of OrthologousGroups of proteins, https://www.ncbi.nlm.nih.gov/cog/)with E-value cut-off of le-3 and Swiss-Prot (A manuallyannotated and reviewed protein sequence database, http://www.ebi.ac.uk/uniprot/) with E-value cut-off of le-5.Based on the NR and Pfam annotations, Blast2GO
(v2.5) was used to obtain GO (Gene Ontology) annota-tions (http://www.geneontlology.org) according to themolecular functions, biological processes and cellularcomponent ontologies [53]. GO enrichment analysis ofthe differentially expressed genes (DEGs) was imple-mented by the GO-seq R packages based Walleniusnon-central hyper-geometric distribution [54], whichcan adjust for gene length bias in DEGs. KOBAS soft-ware (http://www.genome.jp/kegg/) were used to test thestatistical enrichment of DEGs in KEGG [55].9. SNPcalling and SSR detection.Picard - tools v1.41 and samtools v0.1.18 were used to
sort, remove duplicated reads and merge the bam align-ment results of each sample. GATK software was used toperform SNP calling. Variants were kept for quality usingthe following parameters (1) mapping quality filter equalto PASS; (2) Quality Depth (QD) > 2; (3) Mapping Quality(MQ) > 40; (5) QUAL > 30; Moreover, variants were
further filtered if coverage < 10, if cluster SNPs more than2 in 5 bp window, if SNP around Indel within 5 bp.SSR of the transcriptome were identified using MISA
(http://pgrc.ipk-gatersleben.de/misa/misa.html), and pri-mer for each SSR was designed using Primer3(http://primer3.sourceforge.net/releases.php).
Quantification of gene expression levels and differentialexpression analysisGene expression levels were estimated by RSEM [56] foreach sample. Clean data were mapped back onto the as-sembled transcriptome. Read count for each gene wasobtained from the mapping results.Differential expression analysis of two conditions/
groups was performed using the DESeq2R packageDESeq2 rovide statistical routines for determining differ-ential expression in digital gene expression data using amodel based on the negative binomial distribution. Theresulting P values were adjusted using the Benjaminiand Hochberg’s approach for controlling the false dis-covery rate. Genes with an adjusted P-value ≤0.001found by DESeq2 were assigned as differentiallyexpressed [57]. Q-value≤0.001& |log2FC(foldchange)| ≥1 was set as the threshold for significantly differentialexpression.
Quantitative and real time (qRT-PCR) validationTo confirm the reliability of the illumine sequencing, sixunigenes were randomly selected for quantitative RT-PCR assays. Total RNA was extracted from collectedsamples with the TRIZOL method (Life technologies,Carlsbad, CA) and reverse transcription were doneaccording to the manufacturer’s protocol. RT-qPCR wasperformed using the method described by [58] and Ubi3(AY486137.1) was used as internal control (referencegene) [59]. qPCR primers of each unigene were designed
Table 5 RT-qPCR primers for validation experiment
Unigene code Direction Sequence (5'->3') Length
g299 Forward TTTTCGTAATCCTGGCGGCG 20
Reverse ACCGTGTCGGAGAAGTTGGT 20
g2083 Forward CCGCCCGAGAGGAAGTACAG 20
Reverse GGGCCAGACTCGTCGTACTC 20
g2359 Forward GGAGGCGTTTGCTGCTTACC 20
Reverse TGCCCTCGACGTTGAACCTT 20
g3153 Forward TTCGACGCCTACTTCGGGAC 20
Reverse GTCCGGCCCGAGAATTACCA 20
g6075 Forward TCTAGCAATGGTGCTGCGGA 20
Reverse AGCCCTACTGCTCCAACTACG 21
g6453 Forward TATGGTGTCGGTACGGCGTC 20
Reverse TGACTCAGTTCTAGCGGCCC 20
Arisha et al. BMC Genomics (2020) 21:197 Page 16 of 18

using primer 5 software are shown in Table 5. All re-actions were prepared in triplicates and relative expressionwas calculated using 2^(−ΔΔCt) method with theexpression normalised against the internal reference gene(Tubulin2) [60].
Supplementary informationSupplementary information accompanies this paper at https://doi.org/10.1186/s12864-020-6524-1.
Additional file 1. GO function annotations including number ofunigenes and unigenes ID; COG classes and functions with unigenes ID.
Additional file 2. Detailed GO function classification of differentiallyexpressed unigenes between control and different treatments.
Additional file 3. The Most enriched GO terms during the differenttime points as compared to the control.
Additional file 4. KEGG different pathways including unigenesbelonging for different pathways.
Abbreviations3rd GS: Third generation sequencing; FDR: False discovery rate;FPKM: Fragments per kilo base million; GO: Gene ontology; KOG/COG: Clusters of orthologous groups of proteins; NGS: Next generationsequencing; Nr: NCBI non-redundant protein sequences; Nt: NCBI non-redundant nucleotide sequences; PFSP: Purple flesh sweetpotato;RPKM: Reads per kilo base million; TPM: Transcripts per kilo base million
AcknowledgementsNot applicable.
Authors’ contributionsLQ, and MHA designed the study. MHA conducted the experiments,analyzed the results, performed the figures and wrote the manuscript. LQ,LY, HA and MQ revised the manuscript. TW, KM, YH, GF, WX and ZY assistedin the experimental procedures. All authors have read and approved themanuscript.
Authors’ informationNot applicable
FundingThis work was supported by the earmarked fund for China AgricultureResearch System (CARS-10, Sweetpotato), the “333 talent project” fund ofJiangsu Province (BRA2016265), China, Talented Young Scientist Program ofMinistry of Science and Technology and the Natural Science Foundation ofJiangsu Province (Grants No BK20161162). The funding bodies played no rolein the design of the study and collection, analysis, and interpretation of dataand in writing the manuscript.
Availability of data and materialsNot applicable.
Ethics approval and consent to participateNot applicable.
Consent for publicationNot applicable.
Competing interestsThe authors declare that they have no competing interests.
Author details1Xuzhou Institute of Agricultural Sciences in Jiangsu Xuhuai District / KeyLaboratory of Biology and Genetic Improvement of Sweetpotato, Ministry ofAgriculture / Sweetpotato Research Institute, CAAS, Xuzhou 221131, Jiangsu,China. 2Department of Horticulture, Faculty of Agriculture, Zagazig University,Zagazig, Sharkia 44511, Egypt. 3Plant pathology department, Agriculture and
Biology research division, National research center, Giza, Egypt. 4Departmentof Plant Breeding and Genetics, Bahauddin Zakariya University, Multan 60000,Pakistan.
Received: 18 October 2019 Accepted: 21 January 2020
References1. Troung VD, Avula RY, Pecota K, Yencho CG. Sweet potatoes. In: SINHA NK,
editor. Handbook of vegetables and vegetable processing. New Jersey:Wiley-Blackwell; 2011. p. 717–37.
2. Bouwkamp JC. Introduction-part 1. In: Bouwkamp JC, editor. Sweet potatoproducts: a natural resource for the tropics. Boca Raton: CRC Press; 1985. p. 3–7.
3. Zörb C, Geilfus CM, Dietz KJ. Salinity and crop yield. Plant Biol German SocPlant Sci. 2019;21:31–8.
4. Majeed A, Muhammad Z. Salinity: a major agricultural problem—causes,impacts on crop productivity and management strategies. In:Hasanuzzaman M, Hakeem K, Nahar K, Alharby H, editors. Plant abiotic stresstolerance. Cham: Springer; 2019. p. 83–99.
5. Bhadauria V. Next-generation sequencing and bioinformatics for plantscience. Wymondham: Caister Academic Press; 2017.
6. Tao X, Gu Y, Wang H, Zheng W, Li X, Zhao C, Zhang Y. Digital geneexpression analysis based on integrated de novo transcriptome assembly ofsweet potato [Ipomoea batatas (L.) Lam.]. PLoS ONE. 2012;7(4):e36234.
7. Lin Y, Zou W, Lin S, Onofua D, Yang Z, Chen H, Wang S, Chen XJP.Transcriptome profiling and digital gene expression analysis of sweet potatofor the identification of putative genes involved in the defense responseagainst Fusarium oxysporum f. sp. batatas. PLoS One. 2017;12(11):e0187838.
8. Li R, Zhai H, Kang C, Liu D, He S, Liu Q. De novo transcriptome sequencingof the orange-fleshed sweet potato and analysis of differentially expressedgenes related to carotenoid biosynthesis. Int J Genomics. 2015:843802–12.
9. Loebenstein G, Thottappilly G. Origin, distribution and economicimportance. In: Loebenstein G, Thottappilly G, editors. The sweetpotato.Netherlands: Springer; 2009. p. 9–12.
10. Su X, Griffin J, Xu J, Ouyang P, Zhao Z, Wang W. Identification andquantification of anthocyanins in purple-fleshed sweet potato leaves.Heliyon. 2019;5(6):e01964.
11. Ma P, Bian X, Jia Z, Guo X, Xie Y. De novo sequencing and comprehensiveanalysis of the mutant transcriptome from purple sweet potato (Ipomoeabatatas L.). Gene. 2016;575(2):641–9.
12. Xie F, Burklew CE, Yang Y, Liu M, Xiao P, Zhang B, Qiu D. De novosequencing and a comprehensive analysis of purple sweet potato(Impomoea batatas L.) transcriptome. Planta. 2012;236(1):101–13.
13. Kumpatla SP, Buyyarapu R, Abdurakhmonov IY, Mammadov JA. Genomics-assisted plant breeding in the 21st century: technological advances andprogress. In: Abdurakhmonov IY, editor. Plant Breeding, InTech; 2012. p.131–84.
14. Gupta B, Huang B. Mechanism of salinity tolerance in plants: physiological,biochemical, and molecular characterization. Int J Genomics. 2014;V2014:701596–614.
15. Sunkar R. Plant stress tolerance. Methods Mol Biol. 2010;639:401.16. Nong Q, Zhang M, Chen J, Zhang M, Cheng H, Jian S, Lu H, Xia K. RNA-Seq De
Novo Assembly of Red Pitaya (Hylocereus polyrhizus) Roots and DifferentialTranscriptome Analysis in Response to Salt Stress. Trop Plant Biol. 2019;12(2):55–66.
17. Deng S, Ma J, Zhang L, Chen F, Sang Z, Jia Z, Ma L. De novo transcriptomesequencing and gene expression profiling of Magnolia wufengensis inresponse to cold stress. BMC Plant Biol. 2019;19(1):321.
18. Parchman TL, Geist KS, Grahnen JA, Benkman CW, Buerkle CA.Transcriptome sequencing in an ecologically important tree species:assembly, annotation, and marker discovery. BMC Genomics. 2010;11(1):180.
19. Zhou A, Ma H, Liu E, Jiang T, Feng S, Gong S, Wang J. Transcriptomesequencing of Dianthus spiculifolius and analysis of the genes involvedin responses to combined cold and drought stress. Int J Mol Sci. 2017;18(4):849.
20. Luo Y, Reid R, Freese D, Li C, Watkins J, Shi H, Zhang H, Loraine A, Song B-H.Salt tolerance response revealed by RNA-Seq in a diploid halophytic wildrelative of sweet potato. Sci Rep. 2017;7(1):9624.
21. Solis J, Baisakh N, Brandt SR, Villordon A, La Bonte D. Transcriptome Profilingof Beach Morning Glory (Ipomoea imperati) under Salinity and ItsComparative Analysis with Sweetpotato. PLoS ONE. 2016;11(2):e0147398.
Arisha et al. BMC Genomics (2020) 21:197 Page 17 of 18

22. Luo Q, Teng W, Fang S, Li H, Li B, Chu J, Li Z, Zheng Q. Transcriptomeanalysis of salt-stress response in three seedling tissues of common wheat.Crop J. 2019;7(3):378–92.
23. Alberts B, Bray D, Hopkin K, Johnson AD, Lewis J, Raff M, Roberts K, Walter P.Essential cell biology: Garland Science; CRC Press; 2013. https://books.google.com.eg/books?id=Cg4WAgAAQBAJ.
24. Mahajan S, Tuteja N. Cold, salinity and drought stresses: An overview. ArchBiochem Biophys. 2005;444(2):139–58.
25. Murata N, Takahashi S, Nishiyama Y, Allakhverdiev SI. Photoinhibition ofphotosystem II under environmental stress. Biochim Biophys Acta (BBA)Bioenerg. 2007;1767(6):414–21.
26. Mittler R, Vanderauwera S, Gollery M, Van Breusegem F. Reactive oxygengene network of plants. Trends Plant Sci. 2004;9(10):490–8.
27. Parida AK, Das AB. Salt tolerance and salinity effects on plants: a review.Ecotoxicol Environ Saf. 2005;60(3):324–49.
28. Botella MA, Rosado A, Bressan RA, Hasegawa PM. Plant adaptive responsesto salinity stress. Plant Abiotic Stress. 2005;21:38–70.
29. Wang W, Vinocur B, Shoseyov O, Altman AJT. Role of plant heat-shockproteins and molecular chaperones in the abiotic stress response. TrendsPlant Sci. 2004;9(5):244–52.
30. Wang W, Vinocur B, Altman AJP. Plant responses to drought, salinity andextreme temperatures: towards genetic engineering for stress tolerance.Planta. 2003;218(1):1–14.
31. Zhu J-K. Abiotic stress signaling and responses in plants. Cell. 2016;167(2):313–24.32. Zhu J-K. Salt and drought stress signal transduction in plants. Annu Rev
Plant Biol. 2002;53(1):247–73.33. Deinlein U, Stephan AB, Horie T, Luo W, Xu G, Schroeder JI. Plant salt-
tolerance mechanisms. Trends Plant Sci. 2014;19(6):371–9.34. Lata C, Yadav A, Prasad M. Role of plant transcription factors in abiotic stress
tolerance. Abiotic Stress Response Plants Physiol Biochem Genet Perspect.2011;10:269–96. https://doi.org/10.5772/23172 Arun Shanker and B.Venkateswarlu, INTECH Open Access Publishers.
35. Yang Z, Wang X, Gu S, Hu Z, Xu H, Xu C. Comparative study of SBP-boxgene family in Arabidopsis and rice. Gene. 2008;407(1-2):1–11.
36. Mayer MP, Bukau B. Hsp70 chaperones: cellular functions and molecularmechanism. Cell Mol Life Sci. 2005;62(6):670–84.
37. Hothorn M, Wolf S, Aloy P, Greiner S, Scheffzek K. Structural Insights into theTarget Specificity of Plant Invertase and Pectin Methylesterase InhibitoryProteins. Plant Cell. 2004;16(12):3437–47.
38. Negrao S, Schmöckel S, Tester M. Evaluating physiological responses ofplants to salinity stress. Ann Bot. 2016;119(1):1–11.
39. Geng Y, Wu R, Wee CW, Xie F, Wei X, Chan PMY, Tham C, Duan L, DinnenyJR. A spatio-temporal understanding of growth regulation during the saltstress response in Arabidopsis. Plant Cell. 2013;25(6):2132–54.
40. Guex N, Henry H, Flach J, Richter H, Widmer F. Glyoxysomal malatedehydrogenase and malate synthase from soybean cotyledons (Glycinemax L.): enzyme association, antibody production and cDNA cloning. Planta.1995;197(2):369–75.
41. Halford Nigel G, Hey Sandra J. Snf1-related protein kinases (SnRKs) actwithin an intricate network that links metabolic and stress signalling inplants. Biochem J. 2009;419(2):247–59.
42. Chen J, Gao L, Baek D, Liu C, Ruan Y, Shi H. Detoxification function of theArabidopsis sulphotransferase AtSOT12 by sulphonation of xenobiotics.Plant Cell Environ. 2015;38(8):1673–82.
43. Cushman JC, Bohnert HJ. Genomic approaches to plant stress tolerance.Curr Opin Plant Biol. 2000;3(2):117–24.
44. Hussain S, Zhu C, Bai Z, Huang J, Zhu L, Cao X, Nanda S. iTRAQ-BasedProtein Profiling and Biochemical Analysis of Two Contrasting RiceGenotypes Revealed Their Differential Responses to Salt Stress. Int J Mol Sci.2019;20(3):547.
45. Marrocco K, Zhou Y, Bury E, Dieterle M, Funk M, Genschik P, Krenz M, StolpeT, Kretsch T. Functional analysis of EID1, an F-box protein involved inphytochrome A-dependent light signal transduction. Plant J Cell Mol Biol.2006;45(3):423–38.
46. Hartmann L, Pedrotti L, Weiste C, Fekete A, Schierstaedt J, Göttler J, KempaS, Krischke M, Dietrich K, Mueller MJ, et al. Crosstalk between Two bZIPSignaling Pathways Orchestrates Salt-Induced Metabolic Reprogramming inArabidopsis Roots. Plant Cell. 2015;27(8):2244–60.
47. Kazanietz MG, Wang S, Milne GW, Lewin NE, Liu HL, Blumberg PM. Residuesin the second cysteine-rich region of protein kinase C delta relevant to
phorbol ester binding as revealed by site-directed mutagenesis. J BiolChem. 1995;270(37):21852–9.
48. Idänheimo N, Gauthier A, Salojärvi J, Siligato R, Brosché M, Kollist H,Mähönen AP, Kangasjärvi J, Wrzaczek M. The Arabidopsis thalianacysteinerich receptor-like kinases CRK6 and CRK7 protect against apoplasticoxidative stress. Biochem Biophys Res Commun. 2014;445(2):457–62.
49. Meng K, Yun-gang Z, Ya-ju L, Xin W, Wei T, Hui Y, Dai-fu M, Qiang L.Breeding and characterization of a New Sweetpotato Cultivar Xuzi 8 withHigh Anthocyanin Content for Table Use and Processing. Southwest China JAgric Sci. 2019;6(27):633–9.
50. Arisha MH, Qiang YQ, Fei GR, Hui Y, Meng K, Wei T, Ju LY, Xin W, Gang ZY,Qiang L. Stress signals determination in different sweet potato cultivars atseedling stage under salt stress conditions. Zagazig J Agric. 2019;4(1):150–62.
51. Grabherr MG, Haas BJ, Yassour M, Levin JZ, Thompson DA, Amit I, Adiconis X,Fan L, Raychowdhury R. Zeng QJNb: Full-length transcriptome assembly fromRNA-Seq data without a reference genome. Nat Biotechnol. 2011;29(7):644.
52. Haas BJ, Papanicolaou A, Yassour M, Grabherr M, Blood PD, Bowden J,Couger MB, Eccles D, Li B. Lieber MJNp: De novo transcript sequencereconstruction from RNA-seq using the Trinity platform for referencegeneration and analysis. Nat Protoc. 2013;8(8):1494.
53. Götz S, García-Gómez JM, Terol J, Williams TD, Nagaraj SH, Nueda MJ,Robles M, Talón M, Dopazo J. Conesa AJNar: High-throughput functionalannotation and data mining with the Blast2GO suite. Nucleic Acids Res.2008;36(10):3420–35.
54. Young MD, Wakefield MJ, Smyth GK. Oshlack AJGb: Gene ontology analysisfor RNA-seq: accounting for selection bias. Genome Biol. 2010;11(2):R14.
55. Mao X, Cai T, Olyarchuk JG, Wei LJB. Automated genome annotation andpathway identification using the KEGG Orthology (KO) as a controlledvocabulary. Bioinformatics. 2005;21(19):3787–93.
56. Li B. Dewey CNJBb: RSEM: accurate transcript quantification from RNA-Seqdata with or without a reference genome. BMC Bioinformatics. 2011;12(1):323.
57. Storey JD. Tibshirani RJPotNAoS: Statistical significance for genomewidestudies. Proc Natl Acad Sci. 2003;100(16):9440–5.
58. Guo M, Liu J-H, Ma X, Zhai Y-F, Gong Z-H, Lu M-H. Genome-wideanalysis of the Hsp70 family genes in pepper (Capsicum annuum L.)and functional identification of CaHsp70-2 involvement in heat stress.Plant Sci. 2016;252:246–56.
59. Wan H, Yuan W, Ruan M, Ye Q, Wang R, Li Z, Zhou G, Yao Z, Zhao J, Liu S.Identification of reference genes for reverse transcription quantitative real-time PCR normalization in pepper (Capsicum annuum L.). Biochem BiophysRes Commun. 2011;416(1-2):24–30.
60. Livak KJ, Schmittgen TD. Analysis of relative gene expression data usingreal-time quantitative PCR and the 2− ΔΔCT method. Methods. 2001;25(4):402–8.
Publisher’s NoteSpringer Nature remains neutral with regard to jurisdictional claims inpublished maps and institutional affiliations.
Arisha et al. BMC Genomics (2020) 21:197 Page 18 of 18


