Embed Size (px)
Citation preview

MMT Observatory • The University of Arizona • Tucson, Arizona 85721 • PHONE: 520. 621. 1558 • FAX: 520. 670. 5740
S m i t h s o n i a n A s t r o p h y s i c a l O b s e r v a t o r y & S t e w a r d O b s e r v a t o r y , T h e U n i v e r s i t y o f A r i z o n a
Trimester Summary
January - April 2008
This aerial view of the MMT provides a “bird’s eye” view of the new roof that was installed inApril. Photo by Stephen Criswell (FLWO).

2
Personnel Mountain day crew engineer Tom Gerl is working toward a degree in electrical engineering, and has nearly completed his first semester at UA. To help assuage his increased absence from the mountain, various town electronic staff fill in during the week. On January 24, Creighton Chute and Tom Gerl attended a safety product show in Tucson at White Cap Construction Supply.
Talks and Conferences In preparation for the first fly-by of the planet Mercury by NASA’s MESSENGER spacecraft on January 14, MESSENGER science team member Faith Vilas participated in a NASA mediacon on January 10. Faith was also interviewed by Time Magazine and participated in a live interview on Seattle radio station KOOL 1000 AM on January 14. Faith also gave a talk entitled “New from Mercury: The MESSENGER Mission” on March 26 to an audience at the Green Valley Community Center as part of the Whipple Observatory New Vistas in Astronomy series. Faith Vilas attended the 39th Lunar and Planetary Conference, where she presented a talk entitled “Ultraviolet Reflectance Spectra of Mercury’s Surface Acquired with the UltraViolet and Visible Spectrometer During the First MESSENGER Flyby,” by Faith Vilas et al. in the MESSENGER at Mercury I Special Session. She co-chaired the MESSENGER at Mercury II special session. Faith also presented a poster entitled “Predictions for Future X-Ray Fluorescence Measurements of Mercury’s Surface from Apollo Orbital XRF Data.” Faith co-authored the following talks:
• McClintock et al., “Spectroscopic Observations of Mercury’s Surface by the Mercury Atmospheric and Surface Composition Spectrometer During the First MESSENGER Flyby.”
• Holsclaw, G. M., et al., “Integration of Surface Spectra and Multispectral Imaging During
the First MESSENGER Flyby.”
• Izenberg, N. R., et al., “High-Spatial-Resolution Visible to Near-Infrared Reflectance of Mercury’s Surface Obtained During the First MESSENGER Flyby.”
• Bertrand, M., et al., “Amino Acid Degradation after Meteoritic Impact Simulation.”
• Abe, M., et al., “Ground-based Observational Campaign for Asteroid 162173 1999 JU3”.
The last talk includes MMTO observations.

3
Primary Mirror Systems Aluminization In preparation for aluminization of the MMT primary mirror, some changes were made to the aluminization monitoring box. Internal terminal boards were covered with Lexan covers for safety, and a new latching relay circuit was added. Also, all internal connections are in the process of being moved onto the case to preclude having to regularly access the box interior. The monitoring box has been fully documented, and Tom Gerl will add the drawings to SiteScape. Modification of the glow discharge power supply (otherwise known as J. T.’s Black Magic Box) has begun. Modifications/additions include a new switch panel, voltage and amperage panel meters, a Plexiglas panel to allow viewing of the light bulbs, and a general clean-up. This should be completed by the beginning of May 2008. Primary Mirror Support RTV test stand experimentation continued through January 2008. Tests show that the RTV bond tends to detach if the tension exceeds 30 psi. Tests also showed that as the pressure increased, the RTV bond degraded exponentially and eventually sheared. Currently, a LabVIEW program is being written to automate the testing process for future experimentation. A new load cell test tool was created to allow testing of multiple different load cells from one box, without the need to convert the number, or use a separate multimeter. Thermal System Significant progress was made on the T-series thermocouple electronics. We received the full set of bare PCBs for the readout system, and several boards were populated and epoxied. In order to thermally isolate the thermocouples from any fluctuations in temperature, a method for pouring the epoxy into a mold was designed. The firmware for the onboard RCM3305 Rabbit Semiconductor embedded processor was brought up to date with the new hardware in hand. This work extended the software to access more than a single thermocouple readout board, added functionality to deal with the boards’ identification EEPROM, and was ported over to use MMTO private network addresses. With this in hand, evaluation of the individual boards’ accuracy began. Using our controlled Peltier cooler with six thermocouples embedded in a copper block attached, we were able to start evaluation of the absolute thermocouple card. In order to have a temperature reference for checking the thermocouple readings, the copper block also has a platinum thermal resistor (RTD) bonded into it, which is read with an HP 34401A 6½-digit DMM. We await construction of another copper block with thermocouples and a pair of reference RTDs to begin testing of the differential thermocouple boards. For the thermal cards that measure absolute temperature, a pair of platinum RTDs are bonded via thermally-conductive epoxy to all six available thermocouple connector leads for cold-junction compensation of the copper-constantan junctions on the boards. This cold-junction measurement and the raw thermocouple junction voltage measurement are then compensated to each other using a cubic fit to the ITS-90 temperature standard over a much larger interval than we will see with the

4
hardware in use for low residual error. With this, the only additional error sources are reduced to gain, offset, and noise on each analog-to-digital converter channel. Early data in testing showed that simple linear fit (y = mx + b) compensation then suffices to bring the RTD reference and thermocouple data into agreement. Since the A-to-D has an internal sinc4 filter, noise is currently of no concern. A small Java script was written to collect data via UDP from the RCM3305 unit and the reference platinum RTD in the copper test block using MMTO’s 6½-digit DMM. The platinum RTD reference temperature and the measurement of the T-series absolute board measurements are then directly comparable for evaluation of the overall measurement accuracy. The RCM3305 firmware runs µC-OSII real-time kernel (Jean Labrosse’s), with tasks to support reading the A-to-D data, applying the floating-point ITS-90 and gain/offset corrections, and TCP/IP connections via telnet (for administrative use) and UDP (for ascii data transmission). To date, this firmware has run for weeks without a problem. The variance in the thermocouple data represents very small deviations of the A-to-D voltage reading, since there is no amplification of the thermocouple signals — they are all digitized directly. The RTD reference is very smooth and quite useful as a check. The table below summarizes the data statistics for the above graph (all in Centigrade).
Channel Mean Temperature
Range Standard Deviation
RTD reference 23.99 0.051 0.015 Channel 1 23.96 0.161 0.04 Channel 2 23.97 0.153 0.038 Channel 3 23.93 0.145 0.027 Channel 4 23.93 0.181 0.039 Channel 5 23.95 0.129 0.033 Channel 6 23.98 0.131 0.033
The desired standard deviation of 0.1°C for the thermocouple measurement error has been met. We need to test all the thermocouple boards to gain statistical knowledge of the distribution of y = mx + b coefficients, which can then be stored in each board’s calibration EEPROM. While this is a time-consuming process, it will no doubt be necessary to achieve the desired ultimate accuracy of 0.1°C or better. Ventilation An internal tech memo ITM 08-1, “Minimum Daily Ambient Air Temperatures at the MMT Observatory, Mt. Hopkins, Arizona, December 2003 through January 2008” by J. Duane Gibson, Dusty Clark, Brian Comisso, Tom Gerl, Cory Knop, Ricardo Ortiz, Tim Pickering, Dallan Porter, Dennis Smith, Peter Spencer, Tom Trebisky, Ken Van Horn, Grant Williams, and J. T. Williams was published in March 2008. This tech memo summarizes minimum outside ambient air temperature at the MMTO over a five-year period. For this data set, air temperatures reached sub-freezing level on roughly 25% of the days throughout the year. This makes potential freezing and icing of equipment and facilities a major concern. In addition, the thermal ventilation system must be able to chill the

5
primary mirror well below freezing in order to minimize air to mirror temperature differences. These data suggest that the current ventilation system will not be able to chill air sufficiently over several nights during the coldest portion of winter. An internal tech memo ITM 08-2, “MMT Primary Mirror Ventilation System Temperatures Versus Carrier Chiller Setpoint Values: A Linear Regression Analysis, January through December, 2007” by J. Duane Gibson, Dusty Clark, Brian Comisso, Tim Pickering, Grant Williams, Shawn Callahan, Creighton Chute, Tom Gerl, Cory Knop, Ricardo Ortiz, Dennis Smith, Tom Trebisky, Ken Van Horn, Bill Stangret, and J. T. Williams was released in March 2008. This tech memo attempts to characterize the air temperatures at various locations along the primary mirror ventilation system for a given Carrier setpoint. Linear regressions are presented at seven locations from the exit of the shop heat exchanger to the lower plenum in the primary mirror cell. Although the ventilation air temperatures are strongly correlated with the Carrier setpoint, standard errors of up to 1.5C are found for these linear models. This suggests that the 95% confidence level for delivering conditioned air with a specific air temperature to the lower plenum is ± 3C. Further work is needed on the ventilation system for better control of ventilation air temperatures.
Telescope Tracking and Pointing Servos We have been running the Simulink-based elevation servo since December 5, 2007. Some enhancements were made to the telemetry and data capture facilities, and there were some minor bug fixes related to that. One significant change was made to allow elevation velocity limits to be adjusted on the fly without the need to rebuild the servo model each time. We collect tracking data nightly, and with assistance from Dallan Porter, these tracking data have a web interface that collects the tracking, wind data, and skycam into a single page on the MMTO Engineering website. Under the right atmospheric conditions, the elevation tracking is quite good. Viz:
Figure 1: Elevation tracking under favorable atmospheric conditions.

6
The elevation servo still needs work. We have a problematic 2.25 Hz and 35 Hz oscillation present in the servo. The first is the interaction between the high tracking gains and the disturbance decoupling signal path (which uses a non-rigid body observer model). The second is a non-suppressed motor mount structural frequency. Simulink models heretofore used to drive the servo design do not predict either jitter frequency, so Dusty Clark generated a new telescope model that at least captures the 2.25 Hz jitter frequency, and closed-loop simulations agreed with the measured closed loop response. Keith Powell was brought in to assist with development of updated servo gains and an improved disturbance-decoupling path. We find that models that include the disturbance decoupling path are, at best, marginally stable. Our current plan of attack is to a) improve the position and velocity loop PID gains; b) adjust notch filters as needed to improve the 6 and 35 Hz modal suppression; and c) change the disturbance decoupling portion of the controller to use a strictly rigid-body telescope model. Once we have in hand a controller version that is validated through testing with the xPC Target test system, we will implement the proposed changes on the mount VxWorks servo controller.
Seeing Tim Pickering has been analyzing archived wavefront sensor data to build a consistent database of seeing measurements. The earliest data dates back to March 2003, and through the end of April, 2008, we have 51469 WFS frames that provide some measure of seeing and 50497 that provide seeing that can be corrected for airmass. Figure 2 shows histograms of all of the data both raw and corrected for airmass. The seeing values are all normalized to a wavelength of 6500 A. Data with mean spot ellipticities of greater than 0.4 were omitted to mitigate effects of tracking problems. The airmass correction used is the standard relation:
Seeing(z=0) = Seeing(z)/airmass**0.6 Figure 3 shows a plot of raw seeing versus airmass. The red line is a seeing of 0.7" at zenith extrapolated to higher airmass using the above relation. Qualitatively, at least, the standard relation seems to do a good job of defining the peak of the seeing histogram as a function of airmass. On average, the airmass-corrected seeing values should provide a representative measure of site seeing. The raw values provide a more direct measure of delivered seeing since WFS data are generally taken close to science data both in time and place. Tim Pickering is writing a tech memo that describes this work in detail and looks at trends in seeing as a function of time of year, time of night, and other factors. Figure 4 shows histograms of seeing for each month this past trimester. Future trimester summaries will include similar plots.

7
Figure 2: Histograms of seeing values derived with the f/9 and f/5 wavefront sensors. The top plot shows raw seeing values uncorrected for airmass,while the bottom plot includes the standard airmass**0.6 correction. Obviously elongated data are excluded, and the seeing values are normalized to 6500 A.

8
Figure 4: Histograms of airmass-corrected seeing values for each month from this past trimester.
Figure 3: Plot of measured seeing versus airmass. The red line is a zenithal seeing value of 0.7" extrapolated to higher airmass using the standard airmass**0.6 relation.
9
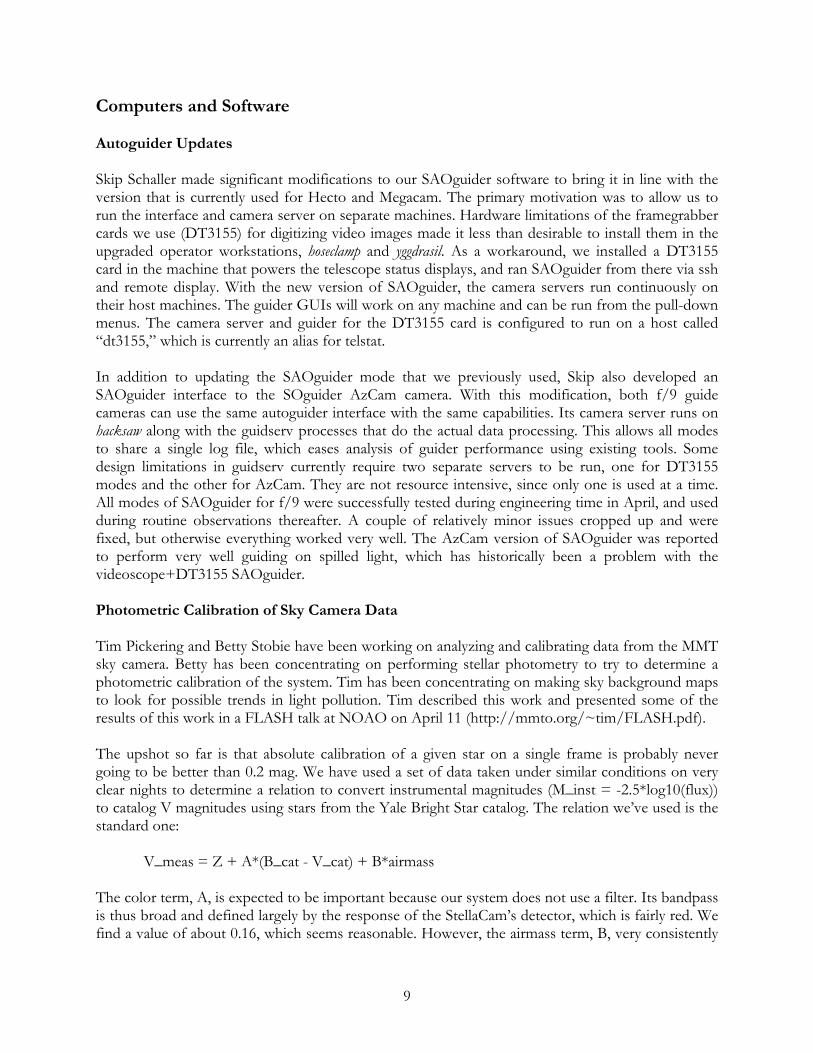
Computers and Software Autoguider Updates Skip Schaller made significant modifications to our SAOguider software to bring it in line with the version that is currently used for Hecto and Megacam. The primary motivation was to allow us to run the interface and camera server on separate machines. Hardware limitations of the framegrabber cards we use (DT3155) for digitizing video images made it less than desirable to install them in the upgraded operator workstations, hoseclamp and yggdrasil. As a workaround, we installed a DT3155 card in the machine that powers the telescope status displays, and ran SAOguider from there via ssh and remote display. With the new version of SAOguider, the camera servers run continuously on their host machines. The guider GUIs will work on any machine and can be run from the pull-down menus. The camera server and guider for the DT3155 card is configured to run on a host called “dt3155,” which is currently an alias for telstat. In addition to updating the SAOguider mode that we previously used, Skip also developed an SAOguider interface to the SOguider AzCam camera. With this modification, both f/9 guide cameras can use the same autoguider interface with the same capabilities. Its camera server runs on hacksaw along with the guidserv processes that do the actual data processing. This allows all modes to share a single log file, which eases analysis of guider performance using existing tools. Some design limitations in guidserv currently require two separate servers to be run, one for DT3155 modes and the other for AzCam. They are not resource intensive, since only one is used at a time. All modes of SAOguider for f/9 were successfully tested during engineering time in April, and used during routine observations thereafter. A couple of relatively minor issues cropped up and were fixed, but otherwise everything worked very well. The AzCam version of SAOguider was reported to perform very well guiding on spilled light, which has historically been a problem with the videoscope+DT3155 SAOguider. Photometric Calibration of Sky Camera Data Tim Pickering and Betty Stobie have been working on analyzing and calibrating data from the MMT sky camera. Betty has been concentrating on performing stellar photometry to try to determine a photometric calibration of the system. Tim has been concentrating on making sky background maps to look for possible trends in light pollution. Tim described this work and presented some of the results of this work in a FLASH talk at NOAO on April 11 (http://mmto.org/~tim/FLASH.pdf). The upshot so far is that absolute calibration of a given star on a single frame is probably never going to be better than 0.2 mag. We have used a set of data taken under similar conditions on very clear nights to determine a relation to convert instrumental magnitudes (M_inst = -2.5*log10(flux)) to catalog V magnitudes using stars from the Yale Bright Star catalog. The relation we’ve used is the standard one:
V_meas = Z + A*(B_cat - V_cat) + B*airmass The color term, A, is expected to be important because our system does not use a filter. Its bandpass is thus broad and defined largely by the response of the StellaCam’s detector, which is fairly red. We find a value of about 0.16, which seems reasonable. However, the airmass term, B, very consistently
10
works out to be very close to 0. It’s not entirely clear why this should be the case, though we suspect it’s a combination of projection effect and optics. Figure 5 shows a comparison of measured V magnitudes using our best-fit relation versus catalog V magnitudes. The measured magnitudes are determined using average fluxes over the course of a clear night. The plot shows significant scatter, as well as the effects of saturation becoming important for stars much brighter than second magnitude. However, making similar plots for different nights gives very similar results. The scatter is systematic and likely due to some combination of color effects and, in some cases, blending.
Our main goal for doing stellar photometry is for building extinction maps. To do so, we’d like to get differential photometry to at least 0.1 magnitude. We are currently attempting to build lookup tables for each standard star as a function of LST. The lookup tables consist of 5-minute bins, which should be sufficient to average out pixel-to-pixel variations. We have laid out the data structures for doing this and have begun to populate the lookup tables, but haven’t yet tried to use the results to build extinction maps. The sky brightness measurements are done using the same SExtractor configuration that we use for doing stellar photometry, but with the background determined globally versus locally. The global background maps that this generates are then masked to remove edges of the field and are saved as FITS files. An example is shown in Figure 6. The background images can then be used to track light pollution from different sources by looking at patches of sky above those sources. The three sources
Figure 5: Plot of predicted V mag based on measured flux and best-fit photometric relation and catalog magnitude for representative photometric night of sky camera data.

11
of most interest to the MMT are Tucson, Green Valley, and Nogales. Figure 7 shows an example from April 8 comparing the sky brightness of the three locations compared to the darkest portion of each image. The Green Valley data start off brightest and dim quickly due to the presence of a setting crescent moon. Figure 8 shows similar data from March 29, the night of the IDA Lights Out! initiative. No clear signature is seen of any significant darkening from this. After looking at a few months’ worth of data, it is clear that night-to-night variations are fairly significant. Another way of looking at sky brightness is to sum the background images to obtain some measure of total sky brightness. Figure 9 shows the results of doing this for six nights that bracket new moon during late March and early April. The effects of moonlight are seen in the latter parts of March 29 and 31 and the early part of April 8. March 31 also has patchy light cirrus passing through during the night. The other nights show about a 0.1 to 0.15 magnitude spread during the dark parts of the nights, and show clear minima at or around sidereal midnight, which is between 00:30 and 01:00 MST (07:30-8:00 UT). It is clear for both local and total sky brightness measurements that we need a significant baseline of data to sort out trends from natural variations. Toward this end we are in the process of analyzing all archived sky camera data dating back to early October 2006.
Figure 6: Example of a sky background map generated by SExtractor. Local sky brightness is determined by averaging fluxes within specific regions. Total sky brightness is determined by integrating total flux within background image.

12
Figure 7: Plot of sky brightness in regions located over Tucson, Green Valley, and Nogales over the night of April 8, 2008.
Figure 8: Plot of sky brightness in regions located over Tucson, Green Valley, and Nogales over the night of March 29, 2008.

13
Web Browser Performance An abstract entitled “Optimizing real-time web-based user interfaces for observatories” by J. Duane Gibson, Timothy E. Pickering, Dallan Porter, and Skip Schaller was submitted and accepted to the SPIE Astronomical Telescopes and Instrumentation conference to be held in June 2008. This work is driven by web browser performance issues when migrating from desktop- to web-based applications at the MMT. The study investigates approximately thirty different programming approaches to: 1) update web page content in a table-like layout, 2) parse new data returned from the web server, and 3) minimize total round-trip elapsed time in requesting new data from the web server. Execution times for the various programming approaches were recorded on nine different web browser/operating system combinations, including Windows, Linux, and Mac. Recommendations for optimization of web-based applications are obtained from these tests. A draft of the manuscript for the conference proceedings has been peer-reviewed. The poster and manuscript will be presented at the conference in June. Miniservers Excessive memory usage by the ~30 miniservers running on hacksaw, the main server at the telescope, prompted work to start on a major upgrade of miniserver software. A miniserver, generally, is a protocol translator for some piece of equipment, sometimes with a serial interface, but equally often with a network interface. The miniserver provides uniform and multithreaded protocol access to data produced by a device. We have also augmented the servers to support web access and logging.
Figure 9: Plot of total sky brightness over the course of six nights in late March and early April 2008.

14
Our current model runs two processes per miniserver, yielding a large number of processes, along with a substantial memory footprint. We developed a scheme to implement a miniserver with a single process, in the process reducing memory requirements (as well as dealing with some bugs that produced memory leaks). (We have also gone to some lengths to make the miniserver framework table-driven, so that we can use a common code library for all servers, making it possible to set up each server with only a few lines of code specific to each device.) A MySQL database that contains five tables of miniserver configuration data was created. Work has started on input details for the approximately 30 miniservers and 1200 parameters into this database. We are now using the new scheme with a limited number of our servers, and have begun the task to convert them all. Conversion of the remaining miniservers to use the new Perl classes and MySQL database will take several weeks. In addition, numerous web pages need to be updated to use these miniserver configuration tables. Work was started on a “derived parameters” server. This server will obtain its configuration data from the new MySQL miniserver configuration database. Values published by the server will be derived from raw data, for example, by conversion to different units or by averaging several related values into one value. The resulting data will be subjected to a number of checks, including a determination of staleness for the data and whether the data are within allowed maximum and minimum values. DNS for VxWorks We have written a DNS client for VxWorks. This allows us to avoid having fixed IP numbers compiled in code or in startup scripts, making our operation more robust (and foolproof) as we reconfigure our network, and in various failover scenarios when we may need to configure backup servers. VxWorks Console Logging For some time, we have used a Lantronix network-to-serial unit to allow us to log information sent to the system console on our computers running VxWorks. This information can be invaluable in many situations when unexpected things happen and we need to do post-mortem problem analysis. The new mount computer does not use a serial console, and we have suffered from not having a console log from that machine on several occasions. For this reason, we wrote a script that emulates the rlogin protocol to establish a connection to one of these machines, and then listens and logs any output. This allows us to record a console log from the new mount computer, and replaces the Lantronix-based logging, freeing up two of these units. Adaptive Optics The TSS (thin shell safety) is a component of the f/15 adaptive optics (AO) secondary. It is controlled and monitored via a serial connection over an optical fiber. A miniserver-like multithreaded server was written to act as middle-man between the TSS and other software components. At the present time, only one connection can be active to the TSS, and care must be taken to shut down one connection before starting a new one. The new scheme will allow us to keep

15
the TSS status display GUI running at all times. It will also simplify operation by eliminating the requirement that the operator ensure that only a single connection is made to the TSS. A MySQL database, “aologs,” was created for event and background log data from the f/15 AO system. Further work is needed to start filling this database with new data. The ao-neslab cyclades was switched to a Lantronix unit. A new web-based loft Neslab control GUI was created for AO operations. Engineering Web Pages Various engineering web pages were updated during this reporting period. A memory leak was addressed in the Flash version of the thermal transect web page. Work has begun on implementing web page optimizations that result from the study to be presented at the SPIE conference.
Instruments f/15 Instrumentation Natural Guide Star (NGS): The MMT day crew deserves high praise for their efficient instrument changes. During the April run the complete changeover from f/5 to f/15 was finished, and the AO system ready to close the loop at 4:30 in the afternoon. This is a major improvement from years past when getting the AO system on the sky before midnight was an accomplishment. One problem that has limited the correction is the nominal 20Hz vibrations of the secondary. The new elevation servos prevent the elevation drives from exciting these modes, but there is still some power remaining due to wind buffeting. A few years ago, accelerometers were installed on the reference body of the mirror in the hopes that the tip/tilt error could be measured and a correction computed and applied to the mirror. This project has recently been restarted by Thomas Stalcup. When comparing the wavefront sensor slopes to the accelerometer signals, a very good correlation is seen, which indicates that the major component of the tip/tilt image motion is due to motion of the secondary. Unfortunately, when an attempt was made to apply corrections to the mirror, the accelerometers picked up the reaction force of the mirror on the reference body, creating an unwanted feedback loop. This feedback was strong enough to break the correction loop before any positive effects were noted. Following this setback, more data were collected using an alternate method to reconstruct the accelerometer signals into mirror commands that was only sensitive to motions perpendicular to the telescope axis. This seemed to reduce the feedback, but due to bad weather on the M&E night it is unclear if this method produced usable correction. Further testing is planned. Part of the long term plan for the f/15 secondary involves using the test stand in the common building basement to recalibrate the actuators. In the past, running the mirror in the clean room has required quite a bit of electronics shuffling between different racks and wiring changes. All of the necessary equipment to operate the mirror was moved into the single tall electronics rack, and the wiring was cleaned up with the help of Brian Comisso. Creighton Chute made low-profile casters for the rack after we discovered that it was slightly too tall to fit in the instrument air-ride truck.

16
The test stand has also seen some improvements. Creighton made a protective aluminum skirt for the mirror to protect against accidental contact while on the test stand. This has made test stand work much safer. Brackets used to couple the support legs of the f/15 while it is on the test stand were designed, fabricated, and tested. Coupling the support legs makes for easier translational adjustments during alignment. Finally, software to command actuator movements and to record mirror shapes from the interferometer is nearing completion. This will measure the relationship between commanded position and actual mirror position, allowing new reconstructors to be created that should produce better image correction. The ability to measure the actuator calibration also means that it will be possible to work on the actuators themselves and attempt to revive some of the dead and noisy actuators. Tim Pickering has started to examine problems with the seeing monitor that has prevented it from running properly since some major AO software upgrades were made several months ago. Loop data were saved for all of the time during this trimester. This is the start of a database that will include corresponding images from the science cameras. The data will eventually be used to test various algorithms that predict the corrected image size to allow gathering image quality statistics in real time without relying on the science camera images. Not only will this allow generation of real performance data in the form of corrected vs. uncorrected seeing, but it will also help determine the optimum loop gain. Tip/tilt only correction using a cold infrared sensor in ARIES was successfully tested for the first time during the April run. This will allow some correction with targets that are too faint in the visible for the wavefront sensor to lock on. More batteries were ordered for the TSS power supply to enable a 24-hour hold time. Currently six hours is the limit, which can be a problem on the weekend with no day crew, and storms come in during the day and the AO operator wants to leave the electronics disconnected for fear of lightning. The batteries are still in transit. Vidhya Vaitheeswaran (Steward) has continued to support and improve the PCR code. During this trimester, she supported the tip/tilt correction mode for ARIES, and the accelerometer tip/tilt commands. She also implemented initial testing with a different operating mode for the PCR that allows controlling the DM with absolute commands. This enables adding an integral and derivative term to the current proportional-only control loop. Upgrading to a full PID controller should increase the correction bandwidth. This work was done with help from Keith Powell. Vidhya also fixed a few bugs in the PCR, one that caused the camera data to be corrupted when changing camera biases, and one that prevented the most recent loop data from being written to disk when the loop crashed. There were a few other problems with the loop data saving routines that Vidhya also fixed. Due to work over the last several months to reduce the wavefront sensor read noise, and to increase control over the camera bias levels, the April run saw the loop lock onto the faintest targets in quite some time. At the full rate of 527 Hz, the loop locked on a V=13.3 star; while using a reduced rate of 150 Hz, the loop was locked on a V=13.8 star.

17
Laser Guide Star (LGS): The big news is that in February at the MMT, a high order correction loop was closed around multiple laser beacons for the first time anywhere in the world. The correction produced a stable psf across the entire two-arcminute field. The goal of this run, which was successfully completed, was to get stable closed loop operation. However, as expected, since the method used to calibrate the wavefront sensor used a long term average of the open-loop wavefront, there were static aberrations present in the images. During the next run in May, a system to correct the static aberrations will be implemented. A baffle for the laser inlet of the pupil box of the LGS system was designed, fabricated, and installed. The entrance of the laser to the pupil box was not perpendicular, and therefore reflected a portion of the laser onto the primary mirror. Brian Comisso and Tom Gerl hooked up several lasers on an alignment jig to help align the LGS instrument to the telescope pupil during the day. f/9 Instrumentation Red Channel Spectrograph During the upgrade of the Red Channel detector to a fully depleted device, there were a number of iterations between MMTO and Imaging Technology Lab (ITL) to measure and position the detector to the optimal location within the dewar. The most recent attempt resulted in a detector position that was too far forward in the dewar. To compensate for this, a 0.0125" shim was installed between the dewar and the instrument. The shim thickness necessary to properly position the detector was determined through an iterative process of replacing the shim and measuring the resultant astigmatism. The optimal detector position minimizes astigmatism. HeNeAr comparison spectra using the “comb” aperture, a line of eighteen 1.0" pinholes on 10.0" centers, were obtained at several collimator focus positions. Morag Hastie used IRAF and IDL routines to identify all the spots in the images, and calculate the FWHM of the spots in both the spatial and spectral direction. Zero astigmatism occurs when the minima in both directions occur at the same collimator position. The results for the 0.0125" shim are plotted in Figure 10. The figure plots the FWHM of the spots for both the spatial direction and dispersion direction as a function of position on the chip. The two minima are at nearly the same collimator position near the center of the chip, but are more discrepant towards the ends of detector. We plan to compare these results with Zemax predictions.

18
Although a shim was used to properly position the chip, during the fall of 2007 the detector temperature was equilibrating near -110 C, warmer than the optimal -143 C. Of additional concern was the temperature changing intermittently during the night, getting as warm as -95 C. This provided strong evidence that there was a thermal short inside the dewar. The detector package was likely contacting the “snout,” an area in the center of the dewar that protrudes out from the mounting flange toward the spectrograph. To determine if the detector was tilted and thereby causing its package to touch the snout, Grant Williams and Thomas Stalcup performed a lab test. The dewar was mounted on an optical bench and a laser was aligned to the optical axis using the return from the entrance window optics (which have some power). The return from the other surfaces, including the CCD face, showed that the CCD is perpendicular to the optical axis to within measurement errors. Since the snout protrudes beyond the mounting flange, a flat first-surface mirror was held parallel to the dewar mounting flange using a spacer. The results indicated that there is a slight misalignment between the mounting flange/spacer and the optical axis of 0.177 degrees at a position angle of 30 degrees west of north (looking into the dewar with the controller on the south side). The dewar was returned to ITL, and the detector was repositioned using a more accurate process. The dewar was moved approximately 0.010" back away from the entrance window. A 0.002" shim
Figure 10: Results for the 0.0125" shim installed between the dewar and the instrument.

19
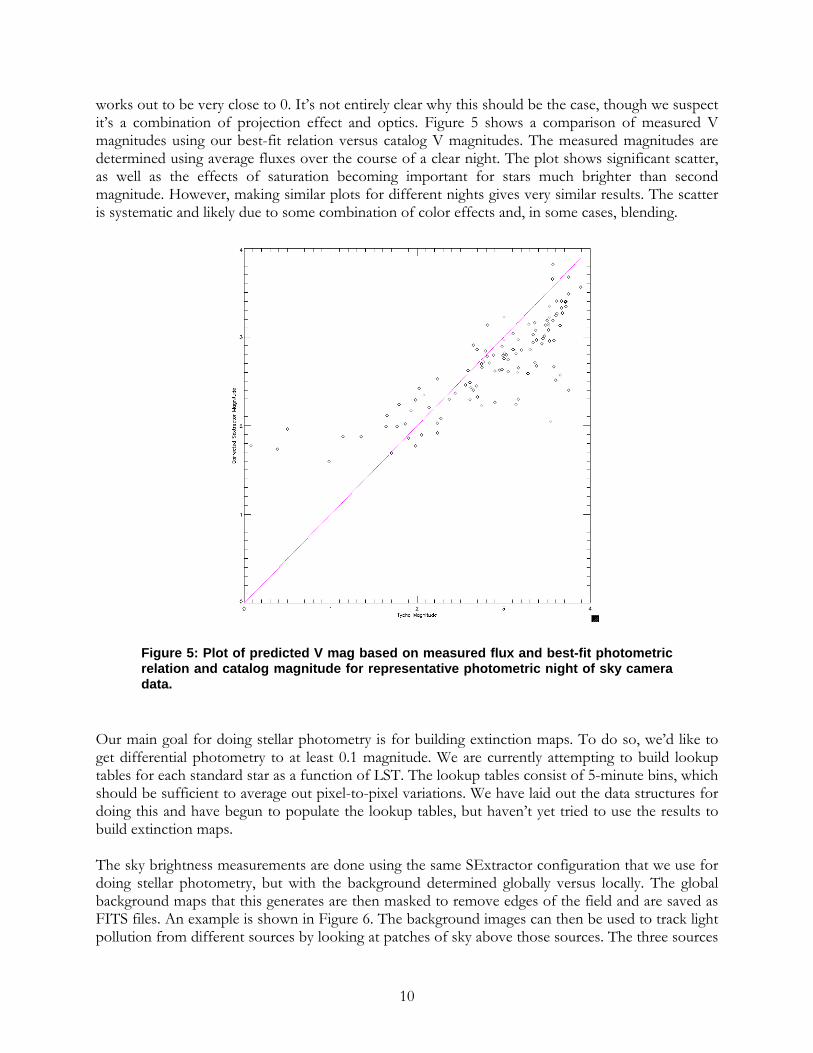
was installed between the dewar and spectrograph, and the best focus was found at a collimator position of 3.84, which agrees with the value in Figure 10. Blue Channel Spectrograph In the fall of 2007, observers encountered problems in adjusting the tilt of the Blue Channel grating. Inspection revealed that the sprocket on the end of the motor shaft, which by way of a chain drives the encoder shaft, appeared worn. A new sprocket and chain were purchased and installed. However, during the repair work there were indications that the problem was more significant. The motor that drives the tilt of the Blue Channel gratings turns a worm that then rotates a large brass worm wheel. A smaller spur gear is mounted on the opposite end of the worm wheel shaft. The spur gear simultaneously drives three segment gears. The segment gears effectively rotate the grating mounts, thereby tilting all gratings simultaneously by the same amount. The photos below show the mechanism.
Figure 11: The spur gear and the three sector gears that tilt the Blue Channel gratings.

20
Figure 12: The brass worm wheel. The aluminum cylinder on the left triggers both the forward and reverse limit switches. The aluminum screw on the left triggers the optical indexer.
Figure 13: The encoder drive train. The sprocket on the right is mounted on the end of the motor shaft worm gear. The sprocket on the left is connected to the encoder shaft.
21
The limits of the tilt motor are triggered by a cylindrical cam block mounted on the brass worm wheel that can close both the forward and reverse limit switches as the brass gear rotates through approximately 330 degrees. During normal operation, one full rotation of brass worm wheel, which corresponds to the same rotation of the spur gear, would result in an end-to-end motion of the sector gears. At some time in the past, however, the clocking of the cam block relative to the ends of the sector gears became misaligned. The result was that one end of the sector gear was being reached before the limit switch was tripped, causing a hard stop in the motion of the brass worm wheel. Because the tilt motor would continue to turn, the worm would walk off the brass worm wheel. This caused a misalignment between the sprocket on the motor shaft and the sprocket on the encoder shaft, therefore grinding and wearing. Some tinkering with the mechanism revealed that if the motor/worm assembly is lowered away from the brass worm wheel (by removing its mounting screws) the brass worm wheel can be pushed in to disengage the spur gear from the sector gears. The sector gears could then be properly re-clocked relative to the brass worm wheel. This was done so that the limit switches would trip just before reaching the end of the sector gears. The clocking has probably been off for a very long time since the zero point DVM value of the gratings, determined during calibration work done a few years ago, has not changed. The following equation describes the relationship between the DVM voltage and the angle of diffraction, beta:
DVM voltage = 0.06844 * ß + 1.80206 where ß is the angle of diffraction in the grating equation: m λ = d * (sin α + sin ß)
Figure 14: The Blue Channel grating tilt motor assembly removed from the instrument. The worm gear and idler wheels are in the center of the image. The limit switches are near the bottom of the assembly.

22
and for Red channel: α - ß = γ (constant) = 32º
The two coefficients, the slope of 0.06844, and the zero point of 1.80206, were determined empirically. The recent work resulted in a significant change of the zero point from 1.80206 to approximately 2.500. Although the new value has not yet been precisely measured, normal setup of the spectrograph allows the value to be modified dynamically. f/9 Top Box The videoscope developed a gain/black level control problem. Troubleshooting revealed that the control cables were the likely cause of the discrepancy. The connector for the camera was found to have a recessed pin. Replacing the pin resolved the problem, but the connector also did not have the correct type of pins installed for the manufacturer of the connector. A 26-pin high density Positronic connector was installed. No problems have been noted since the repair. f/5 Instrumentation Megacam and SWIRC There were two Megacam runs, January 4-8 and January 28 - February 5. During the first run there were some issues with the focus shifting due to an errant temperature sensor on the telescope OSS. The weather was poor, but science data were obtained on three of the five nights. During the second run there were some startup software issues when biases were started without telserver, but the problems cleared up with a camera server restart. The short SWIRC run in mid March was limited by water on the roof, but one night’s worth of data was obtained. Hecto In late February, a problem was identified with the Chelle camera board, whereby it did not always report the presence of the highest order bit. A new board was sent from Cambridge and installed. The connector wiring problem on the old board was fixed by Steve Amato (SAO), and the board was returned. On February 27, clean power was turned off and then on again to check the ground circuits at the MMT. Unfortunately, this happened while the SAO rack was on, and the observers were confused by the state of the instrument upon startup. After this there were several instances where the pulizzi power control boxes unexpectedly rebooted. The pulizzi that controls the calibration lamps had additional problems, and was replaced on March 19. The ethernet switch in the yoke room also needed to be replaced in late March. The hecto fiber positioner had a problem with one of the gimbal actuators beginning in late February. On March 2, the positioner experienced multiple P1 following errors for robot one while trying to configure fibers in the afternoon. It was decided that the problem needed to be addressed before any serious damage occurred. On Monday March 3, an MMT crew dismounted the

23
instrument and separated the top robot unit from the fiber unit. An SAO crew of Bob Fata, John Roll, and Ed Hertz traveled to Arizona on March 3 and, along with Marc Lacasse (FLWO), began debugging the problem on the 4th. They checked out the cabling and the mechanicals of the robot unit, and replaced one actuator in robot 1. They also swapped the other gimbal actuator because it was discovered that the most recently purchased actuators were not configured properly. The positioner was reassembled and checked out on Thursday and remounted on Friday. While the positioner was separated, a sticky guide probe brake actuator was cleaned, and has worked fine since. For completeness, Marc Lacasse replaced the motor controller on the problem axis the following week, and things have since worked smoothly. Bill Stangret, Dennis Smith, and Creighton Chute adjusted the brackets on the Hecto cart that hold the fiber transition box. The connection of the brackets to the cart was loose and untrue. The adjustment improved the alignment of the hole pattern to the mating brackets on the fiber transition box. Transition from the cart to the fixed ladder should now proceed more smoothly. We also adjusted the height of the fiber transition box to a previous location. The length of the tether that supports the fiber chain was also adjusted. Hecto railing posts, which protect the fiber chain, were installed in the new floor. MMIRS MMIRS is making significant progress through the instrument integration and testing period. During February 2008, Morag Hastie traveled to CfA to see how things were progressing, and to participate in some detector testing. During this time, Brian McLeod and Joe Zajac were installing the optics for the 6-element camera into their assemblies. Since then they have done a double-pass warm test of the camera, and the performance agreed very well with the Zemax predictions for a perfectly aligned warm system. The next step is to do a similar test of the collimator once the optics, which have been installed in their individual cells, have been mated together to form the finished collimator assembly. Morag also assisted Warren Brown (SAO) with some performance testing of the single Hawaii-II detector and investigations of optimal voltages/temperatures to run the system. The projected delivery and commissioning date for MMIRS is now February 2009.
Figure 15: MMIRS on its cart in the lab at the Cambridge Discovery Park. The lower half is the “camera dewar,” which houses the camera and collimator optics, grisms, filters, and detector. Thetop half is the “MOS dewar,” which contains the mask wheel and guide cameras. The two dewars are separated, but a gate valve allows the MOS dewar to be warmed up daily to interchange slit masks, while the camera dewar remains at operating temperature.

24
MAESTRO The MAESTRO spectrograph was used for its first science-targeted run at the MMT April 3-7, 2008. Of the five nights allocated, three were lost to telescope problems (hardpoint failure) and weather. The MAESTRO team made progress since the November 2007 run, but found additional problems when the instrument was used in science mode for the first time. Summary of improvements made, problems identified, and future work:
• During the November 2007 run, the guide camera was found to have an inappropriate plate scale, making it difficult to see the slits and to acquire targets. The plate scale was changed by the purchase of a new focusing lens for the guide camera, which reduced the field of view by a factor of two.
• With the new plate scale, another problem with the slits became apparent. The MAESTRO guide camera works by using spilled light off the slit plates; however, the MAESTRO slit plates are incorrectly tilted, and during the first night, only 6th magnitude stars could be detected on the guide camera. John Di Miceli mocked-up a bracket that tilted the slit plate in its holder. Stars down to 17th magnitude could then be seen on the guide camera, but performance was not sufficient to successfully guide using the internal guide camera. The MAESTRO team is addressing how to deal with this.
• Between the November 2007 and April 2008 runs, the magnets that keep the slit holders in place at the slit plane were replaced with smaller magnets. The new magnets are weaker, and although they keep the slits in place while observing, the task of changing slits is now even more difficult. Some slits were dropped into the spectrograph when attempting to change them. This resulted in an hour’s work to remove covers and recover the slit. This has to be addressed before the general community uses the instrument.
• More of the spectrograph covers and baffles were completed for this run, which further reduced scattered light; however, many of the panels need further work to make them practical for extended use.
• John Di Miceli designed, fabricated, and installed a new bracket and mechanism for the internal flip mirror, which was found to be much superior to the previous design.
• Flexure still proves to be a problem for MAESTRO. After the November 2007 run, Shawn Callahan designed a number of brackets to stiffen the connection between the weldment and the space frame. Stiffer brackets were also placed at the grating platform mounting, and shims and brackets were used to stiffen the grating cell attachment to the grating platform. The grating motor was replaced with a shaft of aluminium to stiffen this connection. With this modification, the grating was fixed in placed so the PZT stages for grating control were not hooked up. Flexure was measured and has greatly improved in the dispersion direction since the November run; however, more testing should be done to identify where the flexure is and how to further improve it.
• There was intermittent excess charge on some CCD exposures that rendered them unusable. Work is ongoing in the lab to identify the root of the problem.
Overall, the run highlighted areas that need further work, but even with instrument issues, telescope issues, and bad weather, the MAESTRO team was able to obtain a number of good observations of science targets, and further demonstrate scientific potential of MAESTRO.

25
Documentation and Safety The majority of all paper drawings, technical data, and all other documentation relevant to the operation of the MMT has been converted to digital format and posted in SiteScape. The original drawings are being stored by the Smithsonian Institution, and can be retrieved if necessary. The on-line safety training program was implemented in February. This program allows individuals to complete basic safety training requirements on their schedule. The program is designed to create a training record of every individual assigned to the MMTO. This allows supervisors to track the progress of safety training, see who is up to date, and identify what training is required. This system is being implemented throughout Steward Observatory.
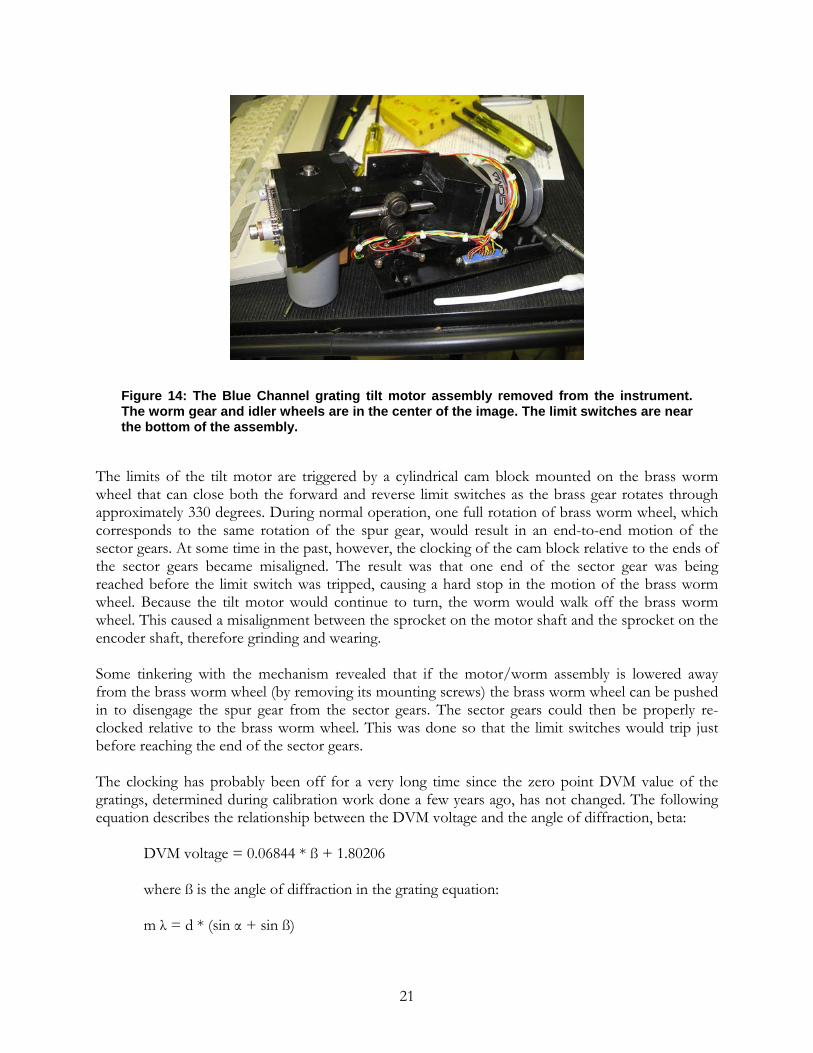
LOTIS Project On March 19, 2008, the 6.5-m LOTIS mirror was successfully coated after months of testing, and more than three weeks of extra cleaning due to silicon contamination from faulty Hartman mirror seals. Our stringent cleaning requirements paid off; excellent adhesion was achieved. The witness plates withstood 90 degree peel-tests with PeelCoat Blue #33 film, Scotch tape #810, and 3M #764 (the tough yellow stuff). Extensive (45 minute) “glow discharge” ion cleaning of the mirror surface with partial pressures of oxygen, followed by argon, appears to have enhanced adhesion. Reflectance measures taken on witness slides, using the Minolta 2002 spectrophotometer, show r=91+% across the blue and green. Indicated scattering is about 0.35%, normal for evaporated aluminum coatings.
Figure 16: MAESTRO was mounted on the MMT for its first science run during April 2008. The end closest to the chamber shutters houses the injection optics, slit plate and dewar. At the opposite end is the prism and grating. MAESTRO can rotate to any given rotator angle as it utilizes the ADC and f/5 WFS.

26
Total film thickness is estimated at 99.9nm +/- 2.5nm, based on empirical calibration of both Sycon STM-100 MF thickness monitors using step-slides from the LOTIS test shot #2, and detectable solar transmission. Aluminum deposition reached an ideal rate of 5.6nm/sec at the end, with chamber pressure maintained in the 10-7 to 10-6 Torr range. We recorded correlated RGA, pressure, power, and deposition rate data, as with the fall test shot. We are pleased to report the coating is successful, and compares favorably with evaporated aluminum coatings on other large astronomical telescope mirrors. Reflectance and scattering plots are shown in Figures 17 and 18. Our new LabVIEW data acquisition system was used, as part of the LOTIS aluminization project, for the first time on a 6.5-m mirror to collect time-coherent data of all available coating process parameters (e.g., pressure, deposition, welder power) and images of the filament system in action. The electronics and power supply based on the Miller welders performed as flawlessly as in the previous test coatings. Although the electronics systems performed well, we identified some issues with their operation and packaging that need attention. This effort will benefit the MMT primary coating process. Software support was also provided for the coating process. Data were logged at one-second intervals during preparations for aluminization and during the aluminization process itself. Webcam images were recorded inside the vacuum chamber prior to and during aluminization. Webcam images from a 100-second period, which included aluminization, were converted into a movie with narration by J. T. Williams. The video and narrative may be viewed at:
http://hacksaw.mmto.arizona.edu/engineering/data/video_19Mar2008/

27
LOTIS 6.5-m Mirror Aluminization MMTO Vacuum Coating Chamber
March 19, 2008
Notes: *Slide 14 before peel coat was applied, adjusted using MMT SS1 standard >Slide 14 after peel coat #33 was removed, calibrated to HCL color standard ~Slide 18 calibrated to HCL color standard
Figure 17: Reflectance measurements were made over the visual spectrum (400 nm – 700 nm) on witness slides immediately after they were exposed to room air, adhesive peel tests, and oxidation of the fresh aluminum.
88
88.5
89
89.5
90
90.5
91
91.5
92
92.5
93
400
410
420
430
440
450
460
470
480
490
500
510
520
530
540
550
560
570
580
590
600
610
620
630
640
650
660
670
680
690
700
Wavelength in nanometers
% R
efl
ect
an
ce
IDEAL ALUMINUM (Haas
LOTIS SLIDE 14 03/21/08
LOTIS SLIDE 18 03/31/08
LOTIS SLIDE 14 after PeelCoat #33 03/31/08
28
0.250
0.350
0.450
0.550
0.650
0.750
400
420
440
460
480
500
520
540
560
580
600
620
640
660
680
700
Wavelength in nanometers
% S
catt
eri
ng
LOTIS SLIDE 14 03/21/08
LOTIS SLIDE 2 after Tape tests 03/24/08
LOTIS SLIDE 14 after peelCoat #33 03/31/08
LOTIS SLIDE 18 03/31/08
General Facility Facility Upgrades Approximately 100 guard rail posts on the Mt. Hopkins road were reset in concrete, and a new section above Rocky Point (~3.5 km) was completed. All cables were re-tensioned. Thermoplastic roof installation began, and new shutter seals were installed. New roof heaters, with an automated snow melt detector, were installed and tested. The roof passed inspection by the manufacturer (Duralast), and is warranted against leaks or wind damage for 15 years. One remaining task is to change the color of the stair tread to off-white. After several meetings, the instrument repair facility 35% review was completed, allowing M3 Engineering to continue to the 65% review. This report is due in mid May.
LOTIS 6.5-m Mirror Aluminization MMTO Vacuum Coating Chamber
March 19, 2008
Figure 18: Scattering measurements were made over the visual spectrum (400 nm – 700 nm) on witness slides immediately after they were exposed to room air, adhesive peel tests, and oxidation of the fresh aluminum.

29
In order to allow independent development and review, the second-floor loading dock is a separate project from the instrument repair facility. The addition of new rolling doors on the east wall in the back of the chamber, and the removal of a column in the back of the chamber, will be included in this new project. Project plans will be reviewed in mid May. The chamber floor installation is complete. The added insulation in the chamber has a noticeably shorter thermal time constant. Heavy equipment is now much easier to move throughout the chamber. The new floor was verified to be properly grounded. The weight of the new floor panels required new spring actuators to be installed on the chamber hatch. These have arrived, and installation has begun. A new safety latch has also been purchased and will be installed after the spring actuators. The new shutters seals were shimmed to seal the chamber against light leaks. The chamber is now darker than ever, allowing calibration data to be collected during the day. Further improvements under the shutter rails are planned for next trimester. MMT enclosure paint samples were sent to EMSL Analytical to be tested for lead. The three samples measure 0.01%, 0.02%, and <0.01%. The acceptable EPA levels are 0.50%. However, since lead was detected, the Smithsonian Industrial Hygiene officer requires a full-metal analysis to be performed before going out for bid. Heat Exchangers Preliminary analysis was made of shop and pit heat exchanger data. Most significantly, this work led to investigation of the T-series thermocouples in the pit heat exchanger. The thermal plots did not show the systematic sawtooth temperature indications that are present at the Carrier unit. Upon inspection of the temperature well probe assemblies in the pit heat exchanger, it was discovered that the thermocouples were not inserted into the probe section and were not effectively insulated from the air temperature. The thermocouples were never really reading the air temperature inside of the heat exchanger. A better description would be to say that we were measuring the temperature of the heat exchanger walls. This explains much of the poor data quality of air temperatures from the pit heat exchanger. Each probe was removed, the long section was cut off, an oversized hole was drilled, and the probe was reinstalled. The thermocouples were inserted into a plastic cap with 3-4 inches of exposed cable. Each cap was then sealed with RTV to prevent air leaks and reinstalled into the probe. The thermocouples now more accurately reflect changes in air temperature, and closely follow the Carrier water temperature changes. In addition, the pit heat exchanger has been instrumented with an 8-probe TempTrax digital thermometer (TempTrax5). At the present time, five of the eight probes for this unit are being used. These two temperature sets can now be used to better understand temperature variations within the pit heat exchanger. Additional instrumentation and telemetry is needed on the flow rates of glycol from the Carrier chiller in the pit heat exchanger in order to more completely understand the thermodynamics for that heat exchanger. Data are now being gathered to investigate the use of the pit Neslab during normal operations to help reduce the large variability in conditioned air temperatures at the exit of the pit heat exchanger. Flow telemetry is also needed at the shop heat exchanger to better understand the coolant/air heat transfer at that location.

30
Telescope Quiet Power While taking ground resistance measurement readings for the telescope ground grid, a current of 5 to 6 amps was measured on the quiet power isolated ground node in the pit. Both a DET10C and a clamp-on ammeter were used to verify the current. Equipment on quiet power was turned off, and the current on the isolated ground dropped to 1.2A. This measurement was made at the MGE circuit breaker box in the first-floor hallway. The main breaker in each quiet power panel (Q2, Q3, and Q4) was turned off with no change in the current. The MGE knife disconnect in the pit was opened, effectively turning off all quiet power into the building. The wiring from the MGE circuit breaker (in the hallway) to the junction box in the pit was verified to be wired correctly. There had been a question as to the neutral and the isolated ground being swapped in this stretch of cable. The isolated ground cable from the pit junction box to the first-floor MGE circuit breaker box was then disconnected inside of the MGE circuit breaker box. This cable was causing a ground loop due to a redundant cable inside the quiet power transfer switch. The power was turned back on, and the current at the transfer switch isolated ground cable was 0.3 amps. All systems were turned on and the current remained at 0.3A. This appears to be a significant improvement. A new 2/0 isolated ground cable (the current cable is only a #6) was run from the quiet power transfer switch to the main ground node in the pit. It will be connected when MGE and quiet power are turned off. The wiring in the pit quiet power transformer still needs to be repaired. There are several ground loops inside of the transformer, the transformer lacks a safety knife switch on its input side, and the ground line has several splices in it. All of this will be fixed when the MGE is turned off and the knife switch is installed. Additionally, the chassis (earth) ground out of the pit quiet power transformer has about 5A on it. This was discovered after the repair of the ground loop at the MGE circuit breaker panel. Since a measurement was never taken on this cable, it is unknown if this current was there prior to this date. This current could also be caused by ground loops between the transformer and the transformer output disconnect. Data Acquisition Units (DAU) The MMTO uses numerous Data Acquisition Units (DAUs) to monitor, record, and analyze data from a variety of sub-systems associated with the operation of the telescope. Obscure and erroneous data began to randomly appear in the different subsystems, spawning a search for the cause of these flawed data. Each DAU and its associated expansion cards use relays to monitor each cycle. These relays have a life frame of a 1,000,000 cycles, and although this may seem like a lot, these units reach that count in less than six months, depending on which subsystem is being monitored. Procedures were developed for the removal and installation of new relays to ensure the integrity of the data being gathered. This procedure involves the careful de-soldering of the relays that have reached their life expectancy, and installation of a modified IC carrier header. Installation of the header allows for fast removal/replacement of the relays. It also prolongs the life of the associated circuit card assembly from the continuous heating up of the solder joint, which would eventually cause the layers of the CCA to delaminate (crazing), which would jeopardize the electrical integrity of the circuit. Similar procedures were developed to remove three relays that are internal to the DAU. They provide a step-by-step guide to allow even the most novice technician to complete this task without damaging the DAU or the associated expansion boards.

31
Local Area Network Numerous hours were spent cleaning up and identifying local area network (LAN) locations. All the backbone cables coming out of the master switch in the drive room have been identified, labeled, and converted to Cat6 cable. Each room at the MMT has at least one network switch connected to the Cat6 backbone, and every Cat5 and Cat6 cable that has been branched off is now identified and labeled. New documentation reflects network switches used, drop location, and available expansion room. Wind Statistics In December 2007, another Vaisala WXT510 ultrasonic wind sensor was installed on the west flagpole. This allows us, finally, to record prevailing wind conditions digitally. Our existing Vaisala WXT510 is located behind the shop and is obstructed from the wind for all but a limited range of wind directions, generally near due east. Figure 19 shows histograms of wind speed and direction data from the west wind sensor. Figure 20 shows the same data for the east wind sensor excluding January when the unit was off-line. To mitigate diurnal effects, the data are limited to between 6 PM and 6 AM MST. The obvious difference is that the west wind sensor shows higher wind speeds. The mean average wind speed is more than twice as strong, 19 mph vs. 9 mph. The mean wind gusts are similar, though, 21 mph vs. 19 mph. The fact that the west wind sensor reports average wind speeds of > 35 mph 10% of the time and > 20 mph more than half the time should be a consideration when defining performance specifications for the telescope. It is not immediately clear how useful the histograms of wind direction are for each sensor. The east sensor is blocked in many directions so it’s not clear which peaks are real and which are due to local environment. The dip in the west sensor’s histogram centered at an azimuth of 260 is due to the flagpole. For balance purposes, the Vaisala unit was mounted on an arm that extends to the east of the pole to offset the arm extending west that holds the R. M. Young anemometer. Unfortunately, the arm isn’t very long, and the wind shadow of the pole is clearly evident. Work is underway to rectify this.

32
Other Facility Improvements and Repairs Our two Gardner-Denver air compressors were stacked on a steel rack. This provides easier access to service both units, and saves floor space. The drain lines were also modified to help with a freezing issue. Previously, when a drain line froze it would back up. Now it will drain inside the building no matter how cold it gets. Shorts in the road heater mats caused most of the road heater GFI circuits to fail. Stark Electric was brought to the mountain to isolate the shorted mats. This work brought all twelve GFT circuits back on line, returning 69 out of the original 94 mats on line. The cable tray on the west drive arc arm was repaired. The tray had lowered under load and ripped the yoke drape. It also ripped the snakeskin cover over the blower hose. The tray was re-hung with new hardware, and support and foam were added to the ends.
Figures 19 and 20: The histograms on the left show data from west wind sensor; those on the right show same data for east wind sensor.

33
While troubleshooting a noise power problem, evidence of overheated wiring was discovered in a power quick disconnect. It is believed that this power box provided power to the AO top box, but it is unknown the last time it was used. There was evidence of charring on the power cable connected to the power box. At that time, lockout/tagout procedures were implemented, so risk of injury to personnel and equipment was eliminated. There was no apparent damage to the AO top box, which was later installed with no problems noted. The power cable was disconnected from the power box, and all the electrical wires were capped and isolated to prevent any further chance of damage. The spare hydraulic cylinder for the chamber floor lift was rebuilt. This provides us with a swappable spare if needed. An intermittent problem in the loading dock chain turned out to be contamination (insect parts) in the switch inside the post. It was thoroughly cleaned, and has worked well since. After researching the operator’s monitor problem, a BNC to VGA adapter was purchased. This allows the operators to use any standard computer monitor in place of the specialized BNC monitor they were using. However, it was recently pointed out that the old CCTV monitors used by the consoles for direct video monitoring are considered superior to computer monitors. These devices are becoming less readily available and more expensive as time goes on. We ordered one as a replacement and will be ordering two more for spares. A new maintenance plan was enacted to monitor UPS battery life, including keeping a proper number of hot spares on hand. Our main source of quiet power, the MGE UPS, had an internal failure that prevents data-display on the front panel. Replacement parts were received, and repairs will be scheduled in May. Also, in response to problems during the MAESTRO run, a new drive arc air flow alarm was installed in the control room to inform the operators when air flow is lost. The front shutter festoon cable was cleaned up after the catastrophic failure of the tensioning spring. The rear shutter seals were rebuilt. The stairs on the roof were modified for scheduled roof work. The leak in the outside ventilation pipe was repaired. Ken Van Horn will retire on June 27. Town electronic staff is working to absorb his knowledge on various telescope systems and the 26V rack. The information is being documented for future reference.
34
Visitors April 24: Tyson Hare (mechanical engineer) and Alan Uomoto (Magellan technical manager) of OCIW, escorted at various times by Laird Close and Victor Gasho of Steward and Thomas Stalcup of MMTO. They observed our f/15 dismount procedure.
Publications MMTO Internal Technical Memoranda 08-1 Minimum Daily Ambient Air Temperatures at the MMT Observatory, Mt. Hopkins,
Arizona, December 2003 through January 2008 J. D. Gibson, D. Clark, B. Comisso, T. Gerl, C. Knop, R. Ortiz, T. Pickering, D. Porter, D. Smith, P. Spencer, T. Trebisky, K. Van Horn, G. Williams, J. T. Williams
08-2 MMT Primary Mirror Ventilation System Temperatures Versus Carrier Chiller Setpoint
Values: A Linear Regression Analysis, January through December, 2007 J. D. Gibson, D. Clark, B. Comisso, T. Pickering, G. Williams, S. Callahan, C. Chute, T. Gerl, C. Knop, R. Ortiz, D. Smith, T. Trebisky, K. Van Horn, B. Stangret, J. T. Williams
MMTO Technical Memoranda None MMTO Technical Reports None Scientific Publications 08-1 Observations of the 599 Hz Accreting X-Ray Pulsar IGR J00291+5934 during the 2004
Outburst and in Quiescence M. A. P. Torres et al.
ApJ, 672, 1079 08-2 Oxygen Abundances of Luminous and Ultraluminous Infrared Galaxies
D. S. N. Rupke, S. Veilleux, A. J. Baker ApJ, 674, 172
08-3 Constraints on Extrasolar Planet Populations from VLT NACO/SDI and MMT SDI and
Direct Adaptive Optics Imaging Surveys: Giant Planets are Rare at Large Separations E. L. Nielsen et al.
ApJ, 674, 466

35
08-4 MMT Extremely Metal-Poor Galaxy Survey. I. An Efficient Technique for Identifying
Metal-Poor Galaxies W. R. Brown, L. J. Kewley, M. J. Geller AJ, 135, 92 08-5 Rotational and Radial Velocities for a Sample of 761 Hipparcos Giants and the Role of
Binarity A. Massarotti, D. W. Latham, R. P. Stefanik, J. Fogel AJ, 135, 209 08-6 The Sloan Digital Sky Survey Quasar Lens Search. II. Statistical Lens Sample from the Third
Data Release N. Inada et al.
AJ, 135, 496 08-7 Evidence for Early Circumstellar Disk Evolution in NGC 2068/71 K. M. Flaherty, J. Muzerolle
AJ, 135, 966 08-8 A Survey of z ~ 6 Quasars in the Sloan Digital Sky Survey Deep Stripe. I. A Flux-Limited
Sample at zAB < 21 L. Jiang et al. AJ, 135, 1057 08-9 Spectral Characteristics of Hayabusa 2 Near-Earth Asteroid Targets 162173 1999 JU3 and
2001 QC35 F. Vilas
AJ, 135, 1101 08-10 Mass Outflow and Chromospheric Activity of Red Giant Stars in Globular Clusters. I. M15 Sz. Meszaros, A. K. Dupree, A. Szentgyorgyi
AJ, 135, 1117 08-11 Measured Metallicities at the Sites of Nearby Broad-Lined Type Ic Supernovae and
Implications for the Supernovae Gamma-Ray Burst Connection M. Modjaz et al. AJ, 135, 1136 08-12 Optical Spectroscopy of Type Ia Supernovae T. Matheson et al. AJ, 135, 1598 08-13 The Velocity Dispersion Profile of the Remote Dwarf Spheroidal Galaxy Leo I: A Tidal Hit
and Run? M. Mateo, E. W. Olszewski, M. G. Walker ApJ, 675, 201

36
08-14 Deep MMT Transit Survey of the Open Cluster M37. I. Observations and Cluster Parameters
J. D. Hartman et al. ApJ, 675, 1233 08-15 Deep MMT Transit Survey of the Open Cluster M37. II. Variable Stars J. D. Hartman et al. ApJ, 675, 1254 08-16 Low-Resolution Spectral Templates for Galaxies from 0.2 to 10 μm R. J. Assef et al. ApJ, 676, 286 08-17 Evidence for Misaligned Disks in the T Tauri Triple System: 10 μm Superresolution with
MMTAO and Markov Chains A. J. Skemer et al. ApJ, 676, 1082 08-18 Kinematic Structure of the Orion Nebula Cluster and its Surroundings G. Furész et al. ApJ, 676, 1109 08-19 The Flux Auto- and Cross-Correlation of the Lyα Forest. I. Spectroscopy of QSO Pairs with
Arcminute Separations and Similar Redshifts A. R. Marble et al. ApJ Supp, 175, 29 Non MMT Scientific Publications by MMT Staff Late Light Curves of Normal Type Ia Supernovae J. C. Lair, M. D. Leising, P. A. Milne, G. G. Williams AJ, 132, 2024 The Inner Jet of an Active Galactic Nucleus as Revealed by a Radio-to-γ-Ray Outburst A. P. Marscher, G. G. Williams et al. Nature, 452, 966 The 2004 Las Campanas/Lowell Observatory Itokawa Campaign: I. Simultaneous Visible and Near-Infrared Photometry of the Hayabusa Mission Target J. E. Thomas-Osip et al. with F. Vilas Earth Planets Space, 60, 39 The 2004 Las Campanas/Lowell Observatory Itokawa Campaign II. Surface Properties of Hayabusa Target Asteroid 25143 Itokawa Inferred from Hapke Modeling S. M. Lederer et al. with F. Vilas Earth Planets Space, 60, 49
37
A Newly-Identified Spectral Reflectance Signature Near the Lunar South Pole and the South Pole-Aitken Basin F. Vilas et al. Earth Planets Space, 60, 67 Local Topographic Effects on Photometry and Reflectance Spectra of Planetary Surfaces: An Example Based on Lunar Photometry D. Domingue, F. Vilas Meteoritics & Planetary Science, 42, 1801 Mineralogical Composition of (25143) Itokawa 1998 SF36 from Visible and Near-Infrared Reflectance Spectroscopy: Evidence for Partial Melting P. A. Abell et al. with F. Vilas Meteoritics & Planetary Science, 42, 2165 Multi-Wavelength Observations of Asteroid 2100 Ra-Shalom M. K. Shepard et al. with F. Vilas Icarus, 193, 20 Near-Infrared Spectrophotometry of Asteroid 25143 Itokawa from NIRS on the Hayabusa Spacecraft K. Kitazato et al. with F. Vilas Icarus, 194, 137 Observing Reports Copies of these publications are available from the MMTO office. We remind MMT observers to submit observers’ reports, as well as preprints of publications based on MMT research, to the MMTO office. Such publications should have the standard MMTO credit line: “Observations reported here were obtained at the MMT Observatory, a facility operated jointly by the Smithsonian Institution and the University of Arizona.” Submit publication preprints to [email protected] or to the following address: MMT Observatory P.O. Box 210065 University of Arizona Tucson, AZ 85721-0065 MMTO in the Media No activity to report. MMTO Home Page The MMTO maintains a web site (http://www.mmto.org) that includes a diverse set of information about the MMT and its use. Documents that are linked to include:

38
• What’s New at MMTO. • General information about the MMT and Mt. Hopkins. • Telescope schedule. • User documentation, including instrument manuals, detector specifications, and observer’s
almanac. • Scientific and technical publications • A photo gallery of the Conversion Project as well as specifications related to the Conversion. • Information for visiting astronomers, including maps to the site. • The MMTO staff directory.
Observing Database The MMTO maintains a database containing relevant information pertaining to the operation of the telescope, facility instruments, and the weather. Details are given in the June 1985 monthly summary. The data attached to the back of this report are taken from that database. NOTE: Beginning January 2005, the formula for accounting lost time on the telescope has been changed. Previously, time lost to weather was deducted from the total observing time before calculating time lost to instrument, telescope, and facility from the remaining balance. From now on, the time lost to each source is computed as a fraction of the total scheduled time. And beginning June 2005, a new category, environment, was added to account for time lost to natural, uncontrollable, non-weather events such as flying insects melting in laser beams, and forest fires.

Use of MMT Scientific Observing Time
January 2008
Nights Hours Lost to Lost to * Lost to Lost to Lost toInstrument Scheduled Scheduled Weather Instrument Telescope Gen'l Facility Environment Total Lost
MMT SG 12.00 142.70 46.80 1.25 0.00 0.00 0.00 48.05PI Instr 16.00 187.30 124.00 2.50 0.70 0.00 0.00 127.20Engr 3.00 35.00 11.50 0.00 0.00 0.00 0.00 11.50Sec Change 0.00 0.00 0.00 0.00 0.00 0.00 0.00 0.00Total 31.00 365.00 182.30 3.75 0.70 0.00 0.00 186.75
Time Summary * Breakdown of hours lost to telescopesoftware 0.7
Percentage of time scheduled for observing 90.4Percentage of time scheduled for engineering 9.6Percentage of time scheduled for sec/instr change 0.0Percentage of time lost to weather 49.9Percentage of time lost to instrument 1.0Percentage of time lost to telescope 0.2Percentage of time lost to general facility 0.0Percentage of time lost to environment (non-weather) 0.0Percentage of time lost 51.2
February 2008
Nights Hours Lost to Lost to * Lost to ** Lost to Lost toInstrument Scheduled Scheduled Weather Instrument Telescope Gen'l Facility Environment Total Lost
MMT SG 9.00 101.30 16.45 0.50 0.33 0.00 0.00 17.28PI Instr 18.00 199.50 73.10 5.00 1.45 1.00 0.00 80.55Engr 2.00 22.10 18.60 0.00 0.00 0.00 0.00 18.60Sec Change 0.00 0.00 0.00 0.00 0.00 0.00 0.00 0.00Total 29.00 322.90 108.15 5.50 1.78 1.00 0.00 116.43
Time Summary * Breakdown of hours lost to telescopeprimary support 1.03
Percentage of time scheduled for observing 93.2 mount crate code 0.75Percentage of time scheduled for engineering 6.8Percentage of time scheduled for sec/instr change 0.0 ** Breakdown of hours lost to facilityPercentage of time lost to weather 33.5 reservoir tank hose 1.0Percentage of time lost to instrument 1.7Percentage of time lost to telescope 0.6Percentage of time lost to general facility 0.3Percentage of time lost to environment (non-weather) 0.0Percentage of time lost 36.1


March 2008
Nights Hours Lost to Lost to Lost to Lost to Lost toInstrument Scheduled Scheduled Weather Instrument Telescope Gen'l Facility Environment Total Lost
MMT SG 4.00 39.30 0.00 3.50 0.00 0.00 0.00 3.50PI Instr 27.00 279.20 58.80 57.20 0.00 0.00 0.00 116.00Engr 0.00 0.00 0.00 0.00 0.00 0.00 0.00 0.00Sec Change 0.00 0.00 0.00 0.00 0.00 0.00 0.00 0.00Total 31.00 318.50 58.80 60.70 0.00 0.00 0.00 119.50
Time Summary
Percentage of time scheduled for observing 100.0Percentage of time scheduled for engineering 0.0Percentage of time scheduled for sec/instr change 0.0Percentage of time lost to weather 18.5Percentage of time lost to instrument 19.1Percentage of time lost to telescope 0.0Percentage of time lost to general facility 0.0Percentage of time lost to environment (non-weather) 0.0Percentage of time lost 37.5
April 2008
Nights Hours Lost to Lost to * Lost to Lost to Lost toInstrument Scheduled Scheduled Weather Instrument Telescope Gen'l Facility Environment Total Lost
MMT SG 7.00 64.20 8.25 0.00 0.50 0.00 0.00 8.75PI Instr 21.00 194.30 21.55 2.25 17.60 0.00 0.00 41.40Engr 2.00 18.10 5.50 0.00 0.00 0.00 0.00 5.50Sec Change 0.00 0.00 0.00 0.00 0.00 0.00 0.00 0.00Total 30.00 276.60 35.30 2.25 18.10 0.00 0.00 55.65
Time Summary * Breakdown of hours lost to telescope0.5 telserver
Percentage of time scheduled for observing 93.5 16.6 primary supportPercentage of time scheduled for engineering 6.5 1 cell cratePercentage of time scheduled for sec/instr change 0.0Percentage of time lost to weather 12.8Percentage of time lost to instrument 0.8Percentage of time lost to telescope 6.5Percentage of time lost to general facility 0.0Percentage of time lost to environment (non-weather) 0.0Percentage of time lost 20.1
Year to Date April 2008
Nights Hours Lost to Lost to Lost to Lost to Lost toInstrument Scheduled Scheduled Weather Instrument Telescope Gen'l Facility Environment Total Lost
MMT SG 32.00 347.50 71.50 5.25 0.83 0.00 0.00 77.58PI Instr 82.00 860.30 277.45 66.95 19.75 1.00 0.00 365.15Engr 7.00 75.20 35.60 0.00 0.00 0.00 0.00 35.60Sec Change 0.00 0.00 0.00 0.00 0.00 0.00 0.00 0.00Total 121.00 1283.00 384.55 72.20 20.58 1.00 0.00 478.33
Time Summary
Percentage of time scheduled for observing 94.1Percentage of time scheduled for engineering 5.9Percentage of time scheduled for sec/instr change 0.0Percentage of time lost to weather 30.0Percentage of time lost to instrument 5.6Percentage of time lost to telescope 1.6Percentage of time lost to general facility 0.1Percentage of time lost to environment (non-weather) 0.0Percentage of time lost 37.3


