Embed Size (px)
Citation preview

Trust and Transparency from an Alignment Perspective
Gryning, Morten
Document VersionFinal published version
Publication date:2015
LicenseCC BY-NC-ND
Citation for published version (APA):Gryning, M. (2015). Trust and Transparency from an Alignment Perspective. Copenhagen Business School[Phd]. PhD series No. 31.2015
Link to publication in CBS Research Portal
General rightsCopyright and moral rights for the publications made accessible in the public portal are retained by the authors and/or other copyright ownersand it is a condition of accessing publications that users recognise and abide by the legal requirements associated with these rights.
Take down policyIf you believe that this document breaches copyright please contact us ([email protected]) providing details, and we will remove access tothe work immediately and investigate your claim.
Download date: 18. Sep. 2022

TRUST AND TRANSPARENCY FROM AN ALIGNMENT PERSPECTIVE
Morten Gryning
The PhD School of LIMAC PhD Series 31.2015
PhD Series 31-2015TRUST AN
D TRANSPAREN
CY FROM AN
ALIGNM
ENT PERSPECTIVE
COPENHAGEN BUSINESS SCHOOLSOLBJERG PLADS 3DK-2000 FREDERIKSBERGDANMARK
WWW.CBS.DK
ISSN 0906-6934
Print ISBN: 978-87-93339-44-6 Online ISBN: 978-87-93339-45-3

TRUST AND TRANSPARENCY FROM AN ALIGNMENT PERSPECTIVE
Morten Gryning
Vejleder:
Mogens Kühn Pedersen John Gøtze
Ph.d.-skolen LIMAC, Program for Informatik Copenhagen Business School

Morten GryningTRUST AND TRANSPARENCY FROM AN ALIGNMENT PERSPECTIVE
1st edition 2015PhD Series 31.2015
© Morten Gryning
ISSN 0906-6934
Print ISBN: 978-87-93339-44-6Online ISBN: 978-87-93339-45-3
LIMAC PhD School is a cross disciplinary PhD School connected to researchcommunities within the areas of Languages, Law, Informatics,Operations Management, Accounting, Communication and Cultural Studies.
All rights reserved.No parts of this book may be reproduced or transmitted in any form or by any means,electronic or mechanical, including photocopying, recording, or by any informationstorage or retrieval system, without permission in writing from the publisher.

Page 2/245
ABSTRACT
The academic literature suggests that firms cannot stay competitive if their business and IT departments are not aligned. Several theories have provided insights into how to achieve alignment, yet most IT and business departments still struggle to fulfill each other’s expectations, with dissatisfaction and low trust as a result. Some scholars argue that alignment is about finding the right mechanical configuration for a given organization. Others argue that alignment theory should move away from a focus on processes, structures, and roles, instead looking at concepts such as communication, trust, and service quality. This Ph.D. thesis features an analysis of the relationship between the IT department and the business departments at the global brewery Carlsberg. The analysis is centered on how trust, transparency, and service quality enter into this relationship, and how these interactions affect the level of alignment between the company departments. Concurrent with the analysis and data collection, a framework was developed based on qualitative and quantitative data. The qualitative data collected via interviews and observations provided insights into the interactions between the concepts, whereas quantitative data collected via survey instruments and experiments provided insights into the correlations between concepts as well as their relational causality. The primary findings include the identification of causality between certain dimensions of transparency, trust, and service quality, with expectation matching playing a significant role in the relationship. The study also found that the relationship between transparency and trust was mutually reinforced, and that factors such as organizational complexity, organizational change, and lack of cross-domain engagement from the business employees had a negative impact on alignment. The findings of the thesis have implications for theory as well as praxis. In terms of theory, the findings provide a refinement of the normative claim that organizations should merely establish communication mechanisms to improve alignment. While such mechanisms can be useful, the roles of employee expectations, barriers, and the context of the organization must also be considered in order to achieve greater success. In terms of practice, the implementation of a transparency tool led to an increase of 16% in competence-based trust and an increase of 21% in the assurance dimension of service quality. For organizations similar to Carlsberg, such a tool could be a possible means to obtain similar results.

Page 3/245
ABSTRAKT
Den videnskabelige litteratur hævder at firmaer ikke kan bibeholde deres konkurrenceevne hvis deres IT og forretningsenheder ikke er aligned. Forskellige videnskabelige teorier har frembragt viden omkring hvordan alignment kan opnås, men trods dette, kæmper mange IT og forretningsafdelinger stadig med at opfylde hinandens forventninger, hvilket typisk giver en lav grad af tillid og tilfredshed i det indbyrdes forhold. Nogle forskere mener at alignment teorien skal bevæge sig væk fra at fokusere på processer, strukturer og roller, og I stedet fokusere på den uformelle organisationsstruktur og koncepter såsom kommunikation og tillid. Denne Ph.d. afhandling indeholder en analyse af forholdet mellem IT afdelingen og forretningsafdelingerne i koncernen Carlsberg. Analysen er fokuseret på hvordan tillid, transparens og service kvalitet indgår i dette forhold og hvordan denne interaktion påvirker graden af alignment. Sideløbende med analysen og dataindsamlingen blev der udviklet et rammeværk, baseret på de kvalitative og kvantitative data indsamlet. De kvalitative data indsamlet gennem interviews og observationer bidrog til viden omkring samspillet mellem begreberne, mens de kvantitative data indsamlet gennem spørgeskemaer og et eksperiment bidrog til viden omkring hvordan begreberne var korreleret og deres indbyrdes kausalitet. De primære fund blev indfanget i rammeværket. Disse fund var en identifikation af kausalitet mellem specifikke dimensioner af transparens, tillid og service kvalitet; at forventninger havde en signifikant rolle i forholdet; at forholdet mellem transparens og tillid var cyklisk; og at faktorer som organisatorisk kompleksitet, organisatoriske ændringer, og manglen på engagement fra forretningen havde en negativ indvirkning på alignment. Disse fund har konsekvenser for teorien og for praksis. Vedrørende teorien giver de opnåede fund yderligere viden omkring de normative anbefalinger der påstår at organisationer skal etablere kommunikations-mekanismer for at forbedre graden af alignment. Selvom sådanne mekanismer kan være brugbare, bør implementeringen af dem medtage overvejelser om forventninger, barriere, og organisationens kontekst. For praksis viste interventionen at øge den kompetence-baserede tillid med 16% og forsikrings-dimensionen af service kvalitet med 21%. For organisationer identiske med Carlsberg, kan værktøjet måske være med til at forbedre graden af alignment på en tilsvarende måde.

Page 4/245
ACKNOWLEDGMENTS
Writing this thesis has been a great experience. I had the chance to work with an interesting topic, observe and reflect on the topic within Carlsberg, and even test my own ideas and propositions about the topic in practice. None of these accomplishments would have been possible without the support of my supervisors, my colleagues at Carlsberg, my family, and my friends.
I would like to thank my supervisors, Mogens Kühn Pedersen and John Gøtze. Mogens offered excellent support and guidance throughout the entire project, and proposed new perspectives on the matter when they were needed the most. Drawing on his knowledge about the topics investigated was incredibly useful. John offered knowledge on a more abstract level than Mogens, and some of his suggestions have been crucial to the current version of the thesis. Together, my supervisors constituted a great team.
I would also like to thank my company supervisor, Emma Adolfson. Emma provided guidance and support throughout the whole project, and helped me navigate the case organization. The meetings held with Emma helped me customize my theory to the context of Carlsberg and she provided me with much practical knowledge.
Besides Emma, I would like to thank the employees from IT and the business departments at Carlsberg who supported me or displayed interest in my project. These employees include the CIO and managers in the IT department who provided me with the possibility of starting this industrial Ph.D. project, and who allowed me a great deal of freedom to collect data. They also include the employees willing to sit for interviews or enter into discussions about my findings, even if they did not believe in my ideas. I am grateful to most of the IT employees, as well as those from the business side that sat for interviews, especially Jan Staack, Kenneth Egelund Schmidt, Mads Madsbjerg, Steen Søegaard, Thomas Steinmetz, Peter Willkan Thomas Kofoed, and Asbjørn Vinther.
I would also like to thank my review committee for giving me the chance to resubmit my thesis. It is, of course, not especially exciting to be told to resubmit, but looking at the thesis now compared to when I first handed it in, it is clear that the thesis is now much more coherent and clear. I feel that I have learned a great deal based on the critiques received, and have achieved a far greater understanding of how to compose a sound thesis.
Lastly, I would like to thank my friends and family for their support. They have been willing to listen to my thoughts and ideas for more than three years, and have supported me during the entire process.

PART 1
Page 5/245
PART 1

INTRODUCTION
Page 6/245
1 INTRODUCTION The academic literature suggests that firms cannot stay competitive if their business and IT departments are not aligned. Creating business value from IT requires a fit between IT and business resources (Irani, 2002; Kearns and Lederer, 2003), and if such alignment is not in place, it may seriously hamper a firm’s performance (Venkatraman, 2000). To improve IT-business alignment, various approaches have been proposed, with the most dominant approach being alignment theory (e.g. Henderson & Venkatraman, 1993). Alignment theory first emerged from a focus on strategic business and IT planning, and encompassed the relationships between structures, processes, and strategies. Since then, the theory has been expanded and many useful insights have been gathered. Different dimensions have been identified, frameworks have been proposed, and antecedents of alignment have been identified and explored. The conceptualization of the theory has also changed, and today alignment is viewed both as an on-going process that requires specific capabilities and actions, and as an end state focusing on measurements and outcomes.
Notwithstanding how alignment is viewed, and despite the insights gathered, achieving alignment between business and IT remains persistently difficult to realize in practice (Wong, 2012). Despite many attempts, IT is still, in many instances, considered a necessary evil (Hirschheim et al., 2006), and during the past 30 years, the relationship between IT departments and their business customers has remained troubled (Ward & Peppard, 1996). Opponents to alignment theory argue that the mechanical element of alignment theory is incorrect—that alignment cannot be achieved due to organizational complexity, and that alignment theory is too theoretical because scholars do not go into the field for insights (Ciborra, 1997). Proponents to alignment theory argue that more research is required that goes beyond the utilization of survey instruments and extends the scope of the theory to novel concepts and contexts. Today, only a few such studies exist.
Among the articles that have ventured into this new alignment path is the work of Wagner et al. (2012). The authors argue that operational alignment is equally, if not more, important than strategic alignment, and they explain the shortcomings of alignment theory with a rigid focus on infrastructure and services. Their argument builds on the work by Chan (2002), who found that the informal organizational structure plays a large role when trying to align business and IT, as compared to the role of the formal organizational structure. Both Chan and Wagner et al. have found that factors such as communication, knowledge, and trust should be explored in more detail from an alignment perspective in order to improve alignment. The better the interactions between IT and business departments, the more likely the IT department can offer relevant services, proactively address challenges, and solve problems.
The aim of this thesis is to continue the stream of alignment research that focuses on the informal organizational structure while considering the critique of alignment theory as being too theoretical. More precisely, the thesis will explore how the concepts of communication, trust, and service quality influence the relationship between the IT department and the business departments of a large organization, doing so using methods closely connected to the field. Several articles (e.g. Bassellier & Benbasat, 2004) have proposed that firms should increase communication in order to enhance alignment, but these articles seldom specify the conditions, barriers, and circumstances of such activity; and some scholars have even discouraged communication activities after finding that more information leads to less understanding.

INTRODUCTION
Page 7/245
With its basis in the alignment literature and the data gathered from a single organization, this thesis will attempt to provide additional knowledge on how communication, trust, and service quality interact within an alignment perspective, thus moving the new stream of alignment research forward.
1.1 Research question The purpose of the research question is to guide the project in exploring how the informal structure of an organization affects alignment. Similar to the work by Wagner et al. (2012), this study differs from older alignment research by looking at alignment in terms of mechanisms and activities that increase IT-business interaction, understanding, and collaboration. The overall research question is as following:
� How do trust, transparency, and service quality interact within an alignment perspective, and what are the barriers in the process?
This research question is broken down into propositions and hypotheses in Part II and Part V of the thesis.
1.2 Background The inspiration for this thesis was a master’s thesis on enterprise architecture that I wrote prior to this project. In writing that thesis, several issues regarding the relationship between the IT and business departments caught my attention. Several of the interviewees in the case organization proclaimed that the reasons they did not perform according to expectations were that the other party did not trust them and that the general level of alignment was poor. Having heard similar stories from other organizations where trust and alignment were also an issue, this seemed like a general trend worth exploring.
To learn more about the problem, I looked into the academic literature and discovered alignment theory. It seemed like a good theory to use in order to understand the issues, but it had also received some critique due to the mechanical focus adopted. Some scholars called for alignment studies that featured new concepts and utilized different methods to gather and analyze data. To see whether alignment theory could be used to understand the issues at hand, and whether I could contribute to the theory, I asked several companies for their interest in being the subject of an industrial Ph.D. project. The most promising company to respond was Carlsberg. Carlsberg was found to be a good case study subject because they are a global company, and were the subject of my master’s thesis. I already knew that some of the problems I was interested in were present in the organization.
After some discussion, Carlsberg agreed to be the subject of a three-year case study. The Ph.D. project began in the IT department, with a promise to introduce me to the business employees as well.
1.3 Terminology For each chapter in this thesis, any specific terminology used will be defined. For the thesis as a whole, the terms found in Table 1 are used.

INTRODUCTION
Page 8/245
Table 1: The terms used in the thesis and their intended meaning
Terms Meaning
Thesis This document
Ph.D. project The three-year project that resulted in this thesis
Chapter Each part of the thesis is divided into a number of chapters. Chapters are prefixed by a number.
Dimension A dimension of a concept. For instance, the integrity aspect of trust. The term dimension is sometimes used for a specific concept in an analysis.
IT context A specific context that encompasses changing or delivering products based on Information technology (IT).
The business The business customers of the IT department. For instance, employees in logistics or marketing.
Case organization The organization where interviews and field experiments were performed.
Field of research An established, segmented field of research.
Entity An object such as a department, a unit, an organization, or a group. Something that has a defined boundary with the outside world.
Unit The same as entity
DV Dependent variable that the independent variable predicts
Scholar Author of a book or an article. Someone who is typically employed as a researcher.
IV Independent variables used to predict dependent variables
Customer/Stakeholder Used to denote people who rely on a department or organization. In this thesis, customer and stakeholder are used interchangeably.
Relationship Relationship is defined as the mutual dealings, connections, or feelings that exist between two parties.
Mutually reinforced A relationship between two concepts, in which an increase in one of the concepts entails an increase in the other, leading to a further increase in the first concept, and so on. Mutually reinforced concepts normally enter into a virtuous or vicious cycle.
The definition of concepts related to the research question will be provided in Part II, in the chapter ALIGMENT THEORY, and in the chapter TRUST THEORY. Please note the use of the term transparency in the research question and thesis. Communication is part of the transparency concept: one must

INTRODUCTION
Page 9/245
communicate in some way in order to be transparent, but being transparent includes more dimensions than communication. The difference is accounted for in the section titled “The distinction between communication and transparency” in the literature view.
1.4 Delimitation Some topics were ignored because they would result in too broad a focus for the thesis. The following topics were considered outside the scope of this thesis:
1. Reflection on morals and ethics regarding communication and transparency—e.g. whether it is morally wrong to be lax regarding a person's right to privacy or ethically wrong to withhold information because a fair trade was not considered. The inclusion of an ethics perspective was thought to bring more confusion than benefit.
� Reflection on the cultural aspect of alignment. This exclusion was due to data being collected from countries with very similar culture, such as Denmark, Sweden, Norway, Germany, and England. Including a cultural dimension would be interesting if data from cultures with greater differences was collected, but this was not done in the current thesis.
Some delimitations are specific to each chapter. These delimitations will be specified in the chapters individually.
1.5 Thesis structure The overall structure of the thesis includes six sequential parts. These parts, and the individual chapters associated with them, are displayed in the following table. The names of some of the chapters have been shortened for readability.
Table 2: Thesis structure
Part Main chapters Content
I Introduction Part I outlines the theoretical position of the thesis in the literature, the problem of interest to be researched, and the background of the study.
II The theoretical framework Alignment theory Trust theory Framework & propositions
Part II features the justification, discussion, and outline of the theoretical framework used, and a segmentation of the research problem into propositions to be addressed in the following chapters.
III Methodology About Carlsberg
Part III features a discussion of the methods used to create knowledge and research the propositions, including a discussion of the philosophical considerations of such methods. In addition, the third part features a presentation of the case company that is the subject of data collection.
IV The interpretive approach Relationship from IT perspective
Part IV features a description of the interpretive methods used to collect and analyze data from the case organization

INTRODUCTION
Page 10/245
Relationship from business perspective Relationship from observer perspective The interpretive analysis
according to the overall methodological framework. In addition, this part provides an overview of the data and an analysis of the data.
V The positivistic approach Hypotheses Pre-measurements The intervention Post-measurements The positivistic analysis
Part V describes the positivistic methods used to collect and analyze data from the case organization. In addition, this part provides an overview and analysis of the data collected and elaborates on the positivistic understanding formed.
VI Research criteria Discussion Conclusion
Part VI of the thesis elaborates on the research criteria relevant for the findings. This part also discusses how the results can be generalized and how the results contribute to the alignment field. Lastly, a conclusion is provided to summarize the main findings and the contribution to the field.
The thesis structure was inspired by the mixed-method framework of Lee (1991). This framework will be discussed in Part III, in the chapter METHODOLOGY. The overall path of the thesis is as follows: 1) the thesis is introduced; 2) a review of the main theories are presented; 3) a review of the methodology is presented; 4) an interpretive approach featuring data analysis is presented; 5) a positivistic approach featuring data analysis is presented; 6) a discussion of the thesis findings and conclusion are presented. These parts constitute the complete thesis.

PART II
Page 11/245
PART II

THE THEORETICAL FRAMEWORK
Page 12/245
2 THE THEORETICAL FRAMEWORK In the introduction it was clarified that the context of the thesis is the IT-business relationship in global organizations. Moreover, alignment theory was found to be the most promising theory with which to understand this relationship and was therefore chosen as the theoretical framework. To provide more justification for the choice of alignment theory, this chapter will feature a discussion of the available theories and present the reasons for choosing alignment theory.
In the process of choosing a theoretical framework, the following criteria were established:
� The theory can be utilized to understand the IT-business relationship in the case organization. � Gaps exist in the theory that the current project can help narrow. � The theory has some practical value for the case organization.
Based on these properties, theories in communications, economics, sociology, and psychology were reviewed. The common denominators for the reviewed theories were that they focused on the relationship between two groups of people. An overview of the theories is presented in Table 3.
Table 3: Available theories
Theory View on relationships
Information economics Relationships are formed based on information that has economic value, as this information allows individuals to make choices that yield higher expected payoffs. Parties in the relationship can possess different levels of information, a concept that is referred to as information asymmetry.
Transaction cost theory Transactions between parties in a relationship are undertaken based on information cost, bargaining cost, and policing and enforcement costs. Individuals in the relationship display bounded rationality. The amount of transactions will depend on how costly they are to make.
Principal-agent theory Relationships can show conflict of interest when a principal hires an agent to perform specific duties that are in the best interest of the principal but may be costly, or not in the best interests of, the agent. This situation can be solved by creating an environment in which an agent has the incentive to align its interests with those of the principal.
Alignment theory Alignment within a relationship can be optimized based on the configuration of different elements such as governance, roles, processes, and communication. Alignment theory often takes place in an IT-business context and is often concept-based. Some of the newer alignment research is focused on the informal structure and concepts such as communication, knowledge, and trust.
Relational signaling theory Relationships are context dependent and guided by the social context in which the individual operates. An individual is generally able to pursue one goal in

THE THEORETICAL FRAMEWORK
Page 13/245
any given situation, bringing this main goal into the foreground of the individual’s attention.
Social exchange theory Relationships are formed based on the use of a subjective cost-benefit analysis and the comparison of alternatives. Happiness within a relationship is therefore not only dependent on how it is perceived, but also whether alternatives exist and how they are perceived as well.
Social penetration As a relationship develops, interpersonal communication moves from relatively shallow, non-intimate levels to deeper, more intimate ones. The greater the depth of information shared, the more the relationship will develop.
The theories presented in Table 3 hold different views regarding relationships between groups of people. Theories based on economics view a relationship in a very calculating way. The theory of signaling sees a relationship as interpreting actions or signals. The theory of social penetration focuses on communication and information whereas the greater amount of information participants share, the stronger the relationship becomes. Lastly, alignment theory focuses on the organizational alignment between two units. If the relationship is aligned strategically and operationally, the departments will become more effective. If the requirements of one department towards another are not understood or adapted to, or the department is unable to express its requirements, mistrust will likely emerge.
The reasons for choosing alignment theory was that a theoretical framework that concerns structures and formal entities such as information, work roles, reports, and congruence between organizations was found to be most appropriate compared to theories that are confined more to transaction-based or social relationships. Social penetration theory and exchange theory were interesting theories, yet they lose some of their utility in a context as complex as that of the case organization. The context for most of the theories was diffuse, spanning relationships in marketing, logistics, finance, and more. However, the context used in most studies of alignment theory has been the relationship between IT and business departments (e.g. Chan & Reich, 2007). As this context was the same as the context of the research project, this constituted a strong argument for choosing alignment theory as the theoretical framework. In addition, the performance implications of the alignment between business and IT have been demonstrated empirically and have been found by several studies to improve IS performance (Chan, 2002; Irani, 2002; Kearns and Lederer, 2003). Good alignment leads to a more focused and strategic use of IT, which in turn leads to increased performance (Chan & Reich, 2007). Of all the theories considered, alignment was found to be the most suited to the interests of the stakeholders and to the research context. Even if scholars such as Ciborra (1997), Silvius (2007), and Grant (2010) have expressed a critical stance towards the theory, such critique points to areas where alignment theory can be refined. Because alignment theory can be utilized to understand the IT-business relationship, because it has practical and academic value, and because it contains gaps that this project can narrow, it was chosen as the theoretical framework of the thesis.

REVIEWING ALIGNMENT THEORY
Page 14/245
3 REVIEWING ALIGNMENT THEORY With alignment theory chosen as the theoretical framework for the thesis, the next step was to review and account for the status of the theory, and to uncover areas where additional research was needed. This was done by conducting a literature review. To aid in the construction of a sound literature review, the method suggested by Webster et al. (2002) was used. The steps in this method are as follows:
1. Start by identifying major contributions published in leading journals by using keyword searches for the primary concept. Because IS is an interdisciplinary field straddling other disciplines, the author should not only look within the IS discipline but also outside the field where appropriate.
2. Go back by reviewing the citations for the articles identified in Step 1 to determine prior articles. 3. Go forward to identify articles citing the key articles identified in the previous steps. Determine
which of these articles should be included in the review.
The stop criteria for this method are fulfilled when no new concepts are found in the pool of articles and books collected. Besides using keywords to filter irrelevant articles, Webster et al. (2002) also suggests narrowing the search by clarifying the scope in terms of level of analysis, temporal and contextual limitations, and implicit values.
3.1 Selecting journals After formulating a rough outline of the review method, the boundaries for the review was clarified. These boundaries were set as follows:
� The unit of analysis was the relationship between the IT department (constituted by IT employees) and the business department (constituted by business employees), at the organizational level.
� The context for the review was confined to an organizational context. Research on alignment between NGOs or other types of institutions was not included.
� The primary field of the literature review was confined to the IS field. However, the field of organizational design was included because IS is seen as an interdisciplinary field.
With these boundaries clarified, major journals publishing in the IS/ICT discipline was selected based on their impact score. This score was found on the Web of Science page by Thomas Reuters. However, it was recognized that journals that appeared in the (short) list of “top” journals were likely to be relatively conservative in terms of research approaches and themes covered (Introna, 2003). Only selecting these journals as the starting point could result in overlooking important contributions. Therefore, other relevant journals were also included if they were found to be “outlets” focusing more on the social study of IS/ICT, while at the same time still having a sufficient impact score (greater than or equal to 1.5). A list of journals having the necessary impact score was provided by Willcocks et al. (2008). This list was used to select the journals for the review of alignment theory. The journals of interest can be found in Table 4.

REVIEWING ALIGNMENT THEORY
Page 15/245
Table 4: Journals of interest
Besides the journals in Table 4 additional journals were included if they were found to be relevant for the research topic. Yet, the above journals constituted the main journals where articles were identified.
3.2 Searching for articles To search for articles three databases were used. The databases used to discover articles were Escohost, Web of Science, and Google Scholar. These databases were chosen because they featured the highest number of journals and because they were cross-database sites. Web of Science was particularly interesting because it featured the possibility of “mapping” the citations of articles backwards and forwards. The keywords used in the search were “alignment OR aligning AND (IS or IT or ICT)” and “Business-IT AND (alignment OR aligning).” The latter was added because merely searching for alignment yielded very diffuse results that included disciplines such as biology and physics, which also utilize the term “alignment.”
Through the search conducted via the databases and keywords specified, the articles in Table 5 were identified. Twenty-seven articles were found in the selected journals that complied with the boundaries chosen. For the full information on each article, see the chapter REFERENCES.

REVIEWING ALIGNMENT THEORY
Page 16/245
Table 5: Initial pool of articles
Year Author(s) Title
1993 N. Venkatraman, & Henderson, J.
Strategic alignment: Leveraging information technology for transforming organizations
1997 Ciborra, C. U. Deconstructing the concept of strategic alignment.
1999 Luftman, J., & Brier, T. Achieving and Sustaining Business-IT Alignment
1999 Luftman, J. N., Papp, R., & Brier, T.
Enablers and inhibitors of business-IT alignment
2000 Reich, B., Benbasat, I. Factors That Influence the Social Dimension of Alignment between Business and Information Technology Objectives
2000 Luftman, J. Assessing business-it maturity
2001 Hirschheim, R., & Sabherwal, R. Detours in the Path toward Strategic Information Systems Alignment
2001 Sabherwal, R., & Chan, Y. E. Alignment between business and IS strategies: A study of prospectors, analyzers, and defenders.
2002 Chan, Y. E. Why haven’t we mastered alignment? The importance of the informal organizational structure
2002 Cragg, P., King, M., & Hussin, H. IT alignment and firm performance in small manufacturing firms
2003 Luftman, J. IT/Business alignment
2004 Avison, D., Jones, J., Powell, P., & Wilson, D.
Using and validating the strategic alignment model
2007 Chan, Y. E., & Reich, B. H. IT alignment: what have we learned?
2007 Huang, C. D., & Hu, Q. Achieving IT-Business Strategic Alignment via Enterprise-Wide Implementation of Balanced Scorecards
2007 Kearns, G. S., & Sabherwal, R. Strategic Alignment Between Business and Information Technology: A Knowledge-Based View of Behaviors, Outcome, and Consequences
2007 Luftman, J. An update on business-it alignment: a line has been drawn
2007 Silvius, A. J. G. Exploring Differences in the Perception of Business & IT Alignment

REVIEWING ALIGNMENT THEORY
Page 17/245
2008 Chen, H.-M. Towards Service Engineering: Service Orientation and Business-IT Alignment.
2009 De Haes, S., & Van Grembergen, W.
An Exploratory Study into IT Governance Implementations and its Impact on Business/IT Alignment
2009 Haes, S. De, & Van Grembergen, W.
Exploring the relationship between IT governance practices and business / IT alignment through extreme case analysis in Belgian mid-to-large size financial enterprises
2009 Tarafdar, M., & Qrunfleh, S. IT-Business Alignment: A Two-Level Analysis
2010 Smith, H. A., & McKeen, J. D. Developments in Practice XXXVI : How to Talk So Business Will Listen … And Listen So Business Will Talk
2011 Bradley, R. V., & Byrd, T. A The role of enterprise architecture in the quest for it value
2011 Wang, N., Xue, Y., Liang, L., Ge, S.
The Road to Business-IT Alignment : A Case Study of Two Chinese Companies
2012 Wagner, H., Weitzel, T. How to Achieve Operational Business-IT Alignment : Insights from a global aerospace firm
2012 Ragowsky, A., Licker, P. S., & Gefen, D.
Organizational IT Maturity (OITM): A Measure of Organizational Readiness and Effectiveness to Obtain Value from Its Information Technology
2012 Wong, T. C., Ngan, S.-C., Chan, F. T. S., & Chong, A. Y.-L.
A two-stage analysis of the influences of employee alignment on effecting business–IT alignment.
Hereafter, the task was to expand the selection by going forward and back from the 27 identified articles. When going back, an article was included in the article pool if the topic of the article was about alignment in some way and:
� The journal the article was published in was listed in Table 4, or � The article was in a peer-reviewed journal and had a citation count above 20.
When going forward, an article was included in the article pool if the topic was about alignment and:
� The journal the article was published in was listed in Table 4, or � The conference where the article was presented had a good reputation, or � The article was in a peer-reviewed journal and had a citation count above 20.
While searching for articles, a concept matrix was used to assess the concepts introduced. This matrix featured the title of the articles and the main concepts introduced. According to Webster et al. (2002), a search can be terminated when no new concepts are identified. After 87 articles were added to the article
ALIGMENT THEORY
Page 18/245
pool, the literature search was terminated because no new concepts emerged and the same set of articles was found with each new forward and backward search. After carefully investigating each article, four articles were excluded from the article pool because they were found to be irrelevant. The final article pool therefore featured 83 articles. According to Leonard & Seddon (2012), the IS/IT strategic alignment literature is extremely extensive and covers more than 150 articles produced over a period of more than 25 years. The selection of 83 articles from high-end journals was found to be adequate to cover the field. Of these 83 articles, 33 analyzed survey data, 22 analyzed the literature, 16 were case studies, 10 analyzed interview data, 1 was a longitudinal study, and 1 was a quasi-experiment.
3.3 Writing the review The next step was to structure and write the review. The goal of the review was twofold: firstly, to help other scholars make sense of the accumulated knowledge on alignment (Webster et al., 2002); and second, to include knowledge that could be utilized to collect and analyze data by identifying critical knowledge gaps (Webster et al., 2002) that the researcher can attempt to narrow.
The approach taken to organize the review was concept-centric rather than author-centric. The result was a review organized based on concepts rather than high-ranking articles by specific authors. The concepts were examined based on the articles identified in the concept matrix. This concept matrix was used to identify the different dimensions of the concepts encountered in the articles. The literature review of alignment theory is presented in the next chapter.
4 ALIGMENT THEORY When reviewing the theory of alignment, it became clear that different words were used that were equivalent to alignment. These words included fit, integration, bridging, and harmony. In this review, I will treat these words as having the same meaning because their definitions are very similar. This decision is supported by Chan & Reich (2007), who found the terms to be equivalent, with only subtle differences.
Virtually all of the articles identified in the literature search researched the concept of alignment and one or two other concepts. The top 20 concepts mentioned in the articles about alignment are displayed in Figure 1. The concepts are sorted by frequency of occurrence.

ALIGMENT THEORY
Page 19/245
Figure 1: Concept matrix for alignment theory. The full pool of alignment articles can be found in APPENDIX I.
As can be seen in Figure 1, the concepts of communication and knowledge sharing are often linked to alignment. The same applies to structure, partnerships between business and IT, leadership, trust, roles, governance, and service quality. The majority of alignment studies are based on large surveys or literature reviews. The consequence is that they view alignment in a rational top-down approach (Yetton et al., 1995) and often do not include the operational level of analysis. The large number of concepts linked with alignment1 indicates a broad field whose focus is on improving alignment by looking at other concepts. Since a link between alignment and performance is found in several studies (Luftman & Brier, 1999; Papp, 1993; Sabherwal & Chan, 2001), many researchers often use alignment as a mediator between antecedents of alignment and performance. This is most common in studies that see alignment as an end state, but is also found in alignment studies that view alignment as a process.
4.1 Definition of alignment To identify the dimensions and elements of alignment, several definitions found in the literature were noted. These definitions are displayed in Table 6.
Table 6: A summary of alignment definitions
Definition of alignment By Author(s)
The basic principle is that IT should be managed in a way that mirrors the management of the business.
Sauer and Yetton (1997)
1 About 50 concepts were identified.
28
23
19 19
15 15 15 15 1411 11 11 10 10 10 10 9 9 8 8
0
5
10
15
20
25
30
Tim
es c
once
pt fe
atur
ed in
an
artic
le
Concepts
Alignment concept matrix

ALIGMENT THEORY
Page 20/245
The degree to which the mission, objectives, and plans contained in the business strategy are shared and supported by the IT strategy
Reich and Benbasat (1996)
The degree of fit and integration among business strategy, IT strategy, business infrastructure, and IT infrastructure.
Henderson and Venkatraman (1993)
Strategic alignment of IT exists when an organization’s goals and Activities, and the information systems that support them, remain in harmony.
McKeen and Smith (2003)
Good alignment means that the organization is applying appropriate IT in given situations in a timely way, and that these actions are congruent with the business strategy, goals, and needs.
Luftmann and Brier, 1999
Alignment is the business and IT working together to reach a common goal.
Campbell (2005)
The degree of coherence between realized business strategy and realized IT strategy.
Chan & Huff, 1993
The relationship between external business strategy and internal infrastructure and processes
Henderson and Venkatraman (1993)
Reviewing the definitions of alignment does not provide a precise definition of the concept. Take, for example, the definition used by Luftman & Brier (1999):
Good alignment means that the organization is applying appropriate IT in given situations in a timely way, and that these actions are congruent with the business strategy, goals, and needs.
Appropriate IT could encompass IT resources, IT structures, and IT investments. Timeliness could mean that the entities are being allocated and put to use within a timeframe accepted by the business. Congruency means that IT resources and investments are made in such a way that they support, or at least do not contradict, the business’s needs, goals, and strategy. Looking at Luftmann & Brier’s definition and those found in Table 6, a common denominator in the alignment concept is the ability of the IT department to remain congruent with the business’s mission, vision, and goals. Most definitions of IT alignment see IT as the pivot (i.e. the affected domain) and the business as the anchor (i.e. the affecting domain). It should be noted, however, that some definitions also recognize that the IT department can drive business strategy. Notwithstanding, the definitions in Table 6 do not reveal a clear definition of alignment. Most definitions see IT as the entity that should be congruent with, and provide support for, the business’s goals, visions, and requirements. Chan & Reich (2007) argue that there exists a lack of theoretical foundation in the alignment concept, and that there exist an incoherent body of knowledge. This makes it difficult to identify how each study on alignment contributes to the field as a whole. On an overall level, good alignment means that the IT department(s) and the business department(s) are structured or managed in such a way that they support each other’s objectives, strategy, and goals. A

ALIGMENT THEORY
Page 21/245
lack of alignment is therefore a situation in which the IT department and the business departments cannot fulfill each other’s requirements due to misalignment between their strategies or infrastructures. Because of this broad definition of alignment, the items used to measure the concept are quite broad as well. For instance, the widely used survey instrument of Luftman (2003) features 38 items spanning the areas of communication, competence, governance, partnership, technology, scope, and skills. In another study by Reich & Benbasat (2000), long-term alignment is measured as “the state in which business and IT executives share a common vision of the way in which IT contributes to the success of the business unit.” It seems that different dimensions of alignment are explored in the literature but are denoted only as alignment; and because no overall definition exists, these studies are all considered as contributing to the field.
4.2 An overview of the alignment field The alignment literature is exhaustive, and features studies of alignment models, issues, antecedents, and correlations to other concepts. The first mention of alignment was in a series of surveys produced between 1982 and 1996 in MIS Quarterly (Leonard & Seddon, 2012). Research conducted in the 1980s at MIT served as an initial attempt to harness the strategic power of IT (Chan & Reich, 2007). In 1990, Henderson and Venkatraman used the previous research to develop a model of IS/IT alignment that was used as basis for future studies by scholars such as Luftman and Avison et al. (2004). The segmentation of the business and IT departments according to strategy and infrastructure stands as the dominant view in the field today.
Historically, the belief in the alignment field was that alignment was an end state. The goal of alignment was to find a configuration of structure and strategy in the IT department that would yield optimal value from IT. More recently, this view has been challenged, for instance by the work of Benbya and McKelvey (2006), who do not see alignment as an end state, but rather as a series of co-evolutionary moves that align IS over time. This view is commonly referred to as the process perspective of alignment. Notwithstanding which perspective is taken, alignment has generally been perceived as something good and worth pursuing. This has led to numerous studies investigating the antecedents of alignment. Since alignment has been linked to performance (Chan et al., 1997; Cragg et al., 2002; Luftman, 2007), researchers have sought to determine how the IT department (and sometimes the business departments) could be configured to obtain the highest level of IT-business alignment. This is evident from the concept-matrix constructed during the literature review, which featured more than 50 different concepts related to the concept of alignment.
Since the alignment concept emerged in 1980, several insights have been added to the field. For instance, the link between alignment and performance (Luftman, 2007), the link between federated IT structures and alignment maturity (Luftman, 2007), and the relationship between alignment and flexibility (Gerow et al., 2014) have been identified. Moreover, the importance of the informal organizational structure (Chan et al., 2002; Wagner et al., 2012), the importance of shared domain knowledge (Coughlan et al., 2005), and several challenges in achieving alignment have been studied. These challenges include a lack of business knowledge, having an unknown corporate strategy, and a lack of belief in the value of achieving alignment. In such a broad field, a new study should try to find gaps in the theory where additional research is required. Recall from the introduction that this thesis is centered on the concepts

ALIGMENT THEORY
Page 22/245
of communication, trust, and service quality. In the next section, I will justify why communication is interesting from an alignment perspective and why it was chosen as one of the concepts to be studied.
4.3 Alignment gaps Looking at the gaps in the alignment literature that can be narrowed, several suggestions have been provided by leading authors. No overall theme seems to guide these suggestions, but they all tend to aim for a more narrow and specific investigation of alignment. For instance, Chan & Reich (2007) suggest that more investigations of alignment are required to explore the subtleties concerning how, when, and where IT alignment really matters. Other scholars state that many of the alignment studies have been broad, typically using survey methods to find correlations between chosen concepts and alignment. While such studies are insightful and useful in guiding research, more in-depth studies are required in order to explore the contexts and real-life roles of these concepts. This viewpoint has been expressed by Baets (1996) and Ciborra (1997). A common critique of alignment theory is that the simplicity of the models is inconsistent with the real world. The majority of articles on alignment investigate correlations on an abstract scale and do not go into depth to explain why the correlations exist. Baets and other scholars suggest that additional research should be aimed at exploring discrepancies between the theoretical knowledge of IT issues and the capacity to translate these into real-world action. New methods seldom used in the field, such as longitudinal studies, quasi-experimental studies, and even interviews, have thus been requested, as they would provide a more granulated knowledge of alignment and could explore the established correlations in more detail. Furthermore, new studies should be normative and focus on the “daily work” of the firm. For instance, Wagner et al. (2012) state that “existing frameworks are not sufficient to implement and assimilate alignment into daily work life because they often do not provide actionable recommendations.” The focus on operational knowledge is in line with the arguments of Baets and Ciborra that alignment theory should move away from simple models and encompass the complexity of organizations.
Taking into account the request for more in-depth studies, there are several possible directions for future research. In fact, because alignment has been linked to numerous other concepts, almost any study that provides an extensive examination of such a linkage in a real-world setting would be interesting2. One area that seems particularly interesting, however, is the relationship between the informal organizational structure and alignment. As mentioned in the introduction of this thesis, Chan (2002) found that the configuration of formal organizational structures does not always improve IS performance. The informal organization structure, on the other hand, was found to play a far more important role than expected in improving alignment. In Chan’s (2002) study, the informal structure comprises the various informal structures, connections, and procedures that people use to get their work done, such as social networks, communities of practice, tools, and inter-departmental relationships. While formal structures were found to be inconsistent or not the same across firms, informal structures were repeatedly mentioned in relation to alignment. The author thus suggests that the informal structure is an important alignment component that requires additional emphasis in future studies (Chan, 2002). This thought is echoed in a later literature review by Chan & Reich (2007) and in studies by Wagner et al. (2012) and van den Hooff
2 Under the assumption that such a study has not been conducted before.

ALIGMENT THEORY
Page 23/245
et al. (2011). For instance, Van den Hooff et al. writes that, “by focusing on the social capital between IT and Business professionals, we highlight the importance of the social dynamics … rather than the strategic alignment of IT and Business as perceived by their managers (which is the focus of much literature addressing the relationship between Business and IT). These social dynamics have been explored before, but to a very limited degree.”
Of the concepts related to the informal structure in the alignment literature, knowledge sharing and communication have been mentioned several times (e.g. Palowski et al., 2004; Peppard, 2001; van den Hooff et al., 2011; Wagner et al., 2012). In fact, of all the concepts identified in the literature, knowledge sharing and communication are the concepts that appear most frequently. The studies on knowledge sharing often see it the independent variable, while alignment is the dependent variable. Furthermore, such studies nearly always use a survey-based method to collect and analyze data3. The result is valuable knowledge on how communication is correlated to alignment, but a lack of knowledge on the mechanisms involved in the correlations. For example, how exactly does communication improve alignment, and how does a lack of communication reduce alignment in various contexts? Currently, it is difficult to answer these questions using the current literature, as few attempts have been made to understand the relationship between communication and alignment in depth.
Based on the literature review performed, the communication aspect of alignment theory was selected as the primary focus of this thesis. Communication was chosen because it has been featured in several articles, it is part of the informal structure, and it has been understudied. The remainder of literature review will discuss communication from an alignment perspective, while ignoring aspects of alignment theory that were found to be irrelevant.
4.4 Alignment and communication Communication has been positively associated with alignment in several studies. For instance, a study performed in 2001 by Bassellier et al. found that shared domain knowledge originating from communication is the most important factor in explaining the alignment of IT and business strategies. In a subsequent study performed in 2004, Bassellier & Benbasat found that the interpersonal communication competencies of IT professionals are important for the achievement of alignment.
In a similar vein, Reich & Benbasat (2000) found that shared domain knowledge leads to more frequent communication between IT and business employees, enhancing mutual understanding between the departments and thereby leading to alignment4. The author argues that “the biggest distinction found between business units with high and low levels of short-term alignment was the frequency of structured and unstructured communication between IT and line executives.” Organizations with infrequent communication between the IT management team and the business line managers experienced a lesser degree of alignment and had a less successful history of IT implementations.
3 Only 2 of the 23 studies on knowledge sharing, and 3 of the 28 studies on communication, used a method other than survey or literature review.
4 Defined as short-term alignment by the author.

ALIGMENT THEORY
Page 24/245
One argument for why communication is important in creating alignment is provided by Vermeulen & Dankbaar (2002). In their study, the authors found that poor communication and collaboration tend to be the norm between IT specialists and business line managers, and that the lack of such communication create IT and business camps and a lack of shared domain knowledge. When the parties do not understand each other, they become less aligned. The same was found by Day (2007), who reports that the sharing of knowledge regarding goals and plans helps form adequate expectations of the IT department. Unrealistic promises, on the other hand, can lead to false expectations that can undermine confidence and even breed hostility between the business and IT sides.
Communication is also important in the relationship between the CIO and CEO. Johnson (2010) and Feeny et al. (1992), for example, found that the level of mutual understanding between the CEO and CIO leads to enhanced business-IT alignment. In these studies, increased communication improved mutual understanding regarding the current role of IT, and richer communication channels improved mutual understanding regarding the future role of IT.
Barriers to communication If communication is important in achieving alignment, what are the barriers to communication? Smith et al. (2010) provides three arguments regarding this question. The first argument is that the nature of IT work has changed. Global IT departments now act as intermediaries between third-party contract staff, global staff, or external stakeholders and vendors, as well as traditional business users. When multiple cultures, different political contexts, diverse time zones, and virtual relationships are added into the mix, communication simply becomes more multi-faceted and challenging. The second argument is that IT departments are generally staffed by people that are introverted and socially disruptive. Employing persons with such lack of communication skills does not aid the requirement of cross-domain knowledge sharing and good communication. The third argument regards the nature and frequency of communication. While more frequent contact with the business side leads to improved communication, the language used by IT is often so full of jargon, techno-centric and inappropriate that many organizations have sought ways to limit the amount of communication between the two groups5.
Coughlan et al. (2005) investigated these findings further and found several themes that account for the lack of communication. These themes include a lack of information exchange, gaps in understanding, and adversity between business and IT camps. To overcome the issues, the authors suggest that mechanisms should be implemented that allow a mutual understanding to be created between business and IT and their respective areas of operation. One interesting remark from a study by Coughlan et al. (2005) is that all the critical remarks gathered during the study came from business managers towards IT, even though several IT managers were also interviewed. None of the IT managers criticized the business side, and IT was, as the author’s state, their own worst critic. This created a very one-sided relationship, where the business demanded things like more proactive communication, but simultaneously stated that they did not want to include IT because they spoke a “language they did not understand.” The problem was not that business employees were unable to understand technical language, but that IT employees were
5 Much of this paragraph is taken directly from Smith et al. (2010), but is not quoted because it has been edited slightly.

ALIGMENT THEORY
Page 25/245
unable to speak a proper business language. In that study, it was quite clear that the business side wanted IT to get closer to the business operations, but without taking steps to become closer to IT. This might point to another barrier to communication, namely non-engagement from the business side.
Another study on barriers was performed by Huang et al. (2007), who argues that because of language barriers, cultural differences, and stereotypical perceptions associated with IT specialists, concepts such as relationship management, trust, and communication can have a stronger effect on IT alignment than the effects of structures and processes. IT and business must communicate well and often, and they need to establish a partnership instead of an “us-and-them” perception. This insight is supported by Dunne et al. (2002), who found that limiting the focus to formal interactions, e.g., through IT governance processes, is the least effective means of achieving alignment.
Antecedents of communication If the aforementioned barriers were overcome, what would be the antecedents of communication from an alignment perspective? Benbasat (2000) argues that managers who are respected are able to get involved in activities that are well outside their sphere of influence. Those who are not tend to be left out, either through not being invited into senior committees or by not being involved in discussions about important business issues. Respect, Benbasat argues, comes from either shared domain knowledge, or from IT implementation success. If IT is perceived as being successful in the eyes of the business, the business is more inclined to listen to IT’s input during meetings. This notion is echoed by Feeny et al. (1992), who found that CIOs who are perceived to contribute beyond their functional responsibilities are often invited into important meetings, which has a positive influence on business-IT alignment. The importance of IT implementation success is furthermore stressed in a study by Kaarst-Brown and Robey (1999), who found that, at a deep level, organizations see themselves as either able to manage and use IT or not. Therefore, creating alignment between business and IT objectives is not just a matter of configuring the IT organization. Over the long term, the culture and stories within the organization must move from those of failure and defeat to those of mastery and success. In other words, the IT organization should emphasize communication of their successes, and provide ample explanation when failures occur.
Tools can also be used to improve alignment via communication. Huang et al. (2007), for example, focus on tools to enhance communication, especially the balanced scorecard. The authors found that the case organization in their study had success using a balanced scorecard approach to create effective communication. The authors argue that because crucial communication is often entrusted, by default, to a few individuals in the IT department who interface regularly with other business functions, other forms of communication mechanisms are required in order to foster effective exchange of information between business and IT. The balanced scorecard provides a good way to increase the frequency of communication.
On a more abstract level, Weiss & Anderson (2004) found that to achieve alignment, organizations should focus on the four C’s: clear direction, commitment, communication, and cross-functional integration. This is illustrated in the figure below.

ALIGMENT THEORY
Page 26/245
Figure 2: Path to alignment, the Four C's (Weiss & Anderson, 2004)
According to the model presented in Figure 2, communication must begin with a clear outline of expectations and a description of what the organization intends to gain through alignment.
Requested types of information Areas where communication often fails and where more information is required include information about project and change requests. In a study by Coughlan et al. (2005), the most requested piece of information was about why projects failed to start on time and why they exceeded the budget. A focus on operational alignment stands in contrast with the general focus on strategic alignment often adopted in the alignment field. Based on the literature review performed, it seems that a focus on operational alignment is becoming increasingly important and is often sought by practitioners. For example, in a recent study, Wagner et al. (2012) found that “while most research and practice has focused on strategic alignment to synchronize IT and business plans among the executive team, our research suggests that operational alignment is equally, if not more, important. Operational alignment brings strategic plans into everyday life and creates value from daily operations.”
Creating operational business-IT alignment is challenging, as Wagner et al. note, since it involves fostering cross-domain communication and knowledge flows among staff in different departments. To create such

ALIGMENT THEORY
Page 27/245
a flow, three areas must interact, namely communication, knowledge sharing, and trust. This is illustrated in the figure below.
Figure 3: The operA framework by Wagner et al. (2012)
The point of Wagner et al.’s (2012) study, as displayed in Figure 3, is that frequent cross-departmental communication regarding operations leads to enhanced cross-domain knowledge, which then leads to enhanced trust. The new level of trust enables new alignment mechanisms for communication on a higher level. The link identified between communication and knowledge was also identified by Benbasat in 2000. However, while Benbasat relates knowledge sharing directly to alignment, Wagner relates knowledge sharing to trust, which is then found to have a positive influence on communication.
Importance of communication While performing the literature review, most studies about communication were found to be pro-communication and argued that communication plays an important role in creating shared domain knowledge and mutual understanding. In contrast, Luftman et al. (1999) found that just 3% of business executives saw “good IT-business communication” as an enabler of business-IT alignment. Furthermore, only 2% of the executives believed that “IT does not communicate well” was an inhibitor of business-IT alignment. This finding is interesting because it points to a gap between what executives find important for building alignment and what scholars find important for building alignment, even if the study by Luftman is somewhat outdated.
Communication summary Nearly all of the studies identified were pro-communication. The majority of the studies did identify correlations between communication and alignment, but mediation and modulation were seldom controlled for, and no studies on causality were found.

ALIGMENT THEORY
Page 28/245
Communication was linked to alignment in several different ways. The most frequently found correlations were between communication, shared domain knowledge, and alignment. Increased communication between IT and business managers leads to enhanced shared domain knowledge, which then leads to improved business-IT alignment. Some of the concepts that were found to have an influence on this set of correlations were IT implementation success, trust, and IT competencies.
In the majority of cases, communication between the IT department and business departments was found to be poor. Arguments for why this was the case included that IT was complex, that IT people communicated in a very technical language, that IT people were introverts, that an “us-and-them” perception existed, and that IT managers did not have sufficient respect from managers and executives in the business departments. No further investigation of these reasons was done, however, as data from the studies was gathered primarily using survey instruments.
4.5 The distinction between communication and transparency So far, the word communication has been used in relation to trust and service quality. One issue in focusing on communication, however, is the nature of the concept. Take, for instance, the communication model by Shannon & Weaver shown in Figure 4. Although this is a very technical model, it is used in numerous studies on communication. The model features a sender, a transmitter, a channel, some noise, a decoder and a receiver. The sender uses the transmitter to send a message through a channel that may contain some noise. The message is then decoded and received by the receiver, which can then choose to send feedback back to the sender.
Figure 4: Shannon and Weaver's model of communication. In Shannon (1948).
In the model’s perception of communication, the sender holds the primary role. The consequence of this is that communication is seen as a sender pushing out information, instead of a receiver using the information to enhance decision-making. Therefore, more communication will not necessarily lead to more understanding, but could also lead to more confusion. For instance, if the receiver does not interpret a message in the way the sender intended, more confusion might arise instead of more clarity.

ALIGMENT THEORY
Page 29/245
As previously mentioned, some scholars have found that problems with IT-business alignment emerge when the business and IT departments are unable to understand each other (Smith et al. 2010) and that poor communication tends to be the norm between IT specialists and business line managers (Vermeulen & Dankbaar, 2002). When this is the case, it seems paramount for a study on communication to try to capture both sides of communication—that is, the information disclosed by the sender as well as the understanding gained by the receiver.
This distinction between the disclosure of information and the understanding created from information is commonly referred to as the distinction between communication and transparency. In discussing communication and transparency, Heald (2006) writes that it is possible for organizations to be open about a document without being transparent to relevant audiences if the information is perceived as incoherent. The author argues that the concept of transparency focuses on the receiver’s understanding, whereas the concept of communication is focused on the sender. This thought is echoed by Finel & Lord (1999), who warn against conflating communication with information used for assessment and decision-making. As such, the authors argue that research should study the two concepts individually. Wall (1996) also argues for a distinction between communication and transparency for the reason that transparency is only useful when it enhances understanding and not just increases the flow of information.
Based on the observation that IT and business languages often differ, the current study is not confined to a focus on communication alone. The communication aspect must be included because it is featured in the alignment literature, but this research expands the concept to focus on the receiver of the information as well. Thus, the research will include the communication concept found in the alignment literature, but with the addition of a transparency dimension. As an example of how this affects the research project, consider the quantitative measurement of communication. Looking at some of the studies that measure communication, the following survey items are commonly used:
1. The department facilitates communication among all levels and functions. 2. The department keeps employees informed about how the organization is progressing toward
its goals.
These items do not consider how the information is used by the employees, but only that the employees are being kept informed. Then, consider some of the items measuring transparency in the study of Rawlins (2008a):
1. The department informs about changes and how they affect me. 2. The department makes it easy to find the information I need. 3. The department provides operational information that is relevant for me.
Here, the focus is on how the information provides value to the receiver of the information, and not only the amount of information transmitted. I will attempt to capture transparency and not communication in this thesis. This has consequences for the collection and analysis of data. From a qualitative perspective, I will not only focus on the disclosure of information, but also how different employees (in different roles) value and use this information. From a quantitative perspective, I will use survey items to measure both the information disclosed and enhanced understanding, with a basis in existing surveys items such as those used by Rawlins (2008a).

ALIGMENT THEORY
Page 30/245
4.6 Chapter summary The alignment literature is exhaustive and features studies of alignment models, issues, antecedents, and correlations to other concepts. In the past, the alignment field has been primarily concerned with formal structures, such as governance boards and processes, while recent studies have had a greater focus on the informal structure. Communication is a concept that is mentioned frequently in studies on alignment. Most often, communication has been found to increase shared domain knowledge and alignment. Based on the literature review, a study about communication could contribute to the alignment field. Such a study could help validate models such as those of Wagner et al. (2012) and Weiss & Anderson (2004), and would pave the way for more studies about the importance of the informal organizational structure. Moreover, a study about communication could draw on the insights provided in the alignment literature, such as the barriers to achieving alignment and antecedents affecting alignment in different contexts. When looking at the concept of communication, however, one issue is that the focus is often placed on the sender as the one responsible for communicating, while ignoring the value of the information disclosed. Because the relationship between IT and business departments is often marked by language barriers, the concept of communication is expanded to include the concept of transparency.

REVIEWING TRUST THEORY
Page 31/245
5 REVIEWING TRUST THEORY The previous chapter mentioned that more in-depth studies and more studies on the informal structure have been requested in the alignment field. Moreover, the previous chapter justified and discussed why transparency was chosen as a primary research focus. However, the introduction of the thesis stated that the aim of the thesis is to explore how communication, trust, and service quality interact from an alignment perspective. What is the justification for introducing trust and service quality into the equation?
When alignment theory was reviewed, it was determined that the most straightforward way to contribute to the theory was to study the relationship between transparency and alignment. However, this approach was found to have some constraints. For one, the definition of alignment is rather broad (see ALIGMENT THEORY for discussion of the definition). An extensive study about the interplay between transparency and the alignment concept would be vague, since it would be challenging to say how the concepts were related. Does transparency affect the governance part of alignment, the role part of alignment, the technological part of alignment, or does it affect the sharing of visions and goals? To take advantage of the possibility to perform an extensive case study, a more specific relationship was required. Here, it was decided that the relationship between transparency and trust would be a far more interesting focus.
Trust is mentioned in several of the alignment articles identified and it is included as one of the dimensions of alignment (Luftman, 2000). Articles that mention trust from an alignment perspective include that of Wagner et al. (2012), who argue that the level of trust influences the organizational communication mechanisms, and that the level of communication influences operational alignment. Furthermore, van de Hooff (2012) argues that influence and mutual trust shape a common set of goals and values that affect alignment, and Huang et al. (2007) argue that “softer” concepts such as trust can influence alignment more so than the effects of processes and roles. Trust is important from an alignment perspective because the occurrence of frequent interactions between IT and business departments require special care in order to establish a level of trust that facilitates communication (Greenberg et al., 2007), and such communication can significantly increase the level of alignment (Nelson et al., 1996).
By centering this thesis on the relationship between communication and trust, not only correlation but also causality could be investigated. A focus on trust also mirrors the shift occurring in the alignment field. Authors such as van de Hooff (2012), Benbasat (2000), and Chen (2002) have mentioned that researchers should investigate the notion of trust because more research is required on the subject. By investigating the relationship between transparency and trust, this study contributes to the alignment field, for instance, by validating parts of the models proposed by Wagner et al. (2012) and van de Hooff (2012). The decision to include trust positions this study in both the alignment field and the trust field, with alignment theory as the main theory used. A concern in choosing this path, however, is that both transparency and trust can be seen as independent variables. Having a designated dependent variable that outlines the specific value from increasing transparency or trust can provide useful to tell about the value of the study, and to help generalize the findings.
To address this issue, the concept of service quality was included as a dependent variable. The primary focus in the thesis therefore remains the interaction between transparency and trust, but with the inclusion of the service quality concept. The question is, then, what dimensions of trust exist, and what

REVIEWING TRUST THEORY
Page 32/245
the literature says about the relationship between trust and transparency. The answer to this question will be provided in the following chapter, after the review methodology has been discussed.
5.1 Performing the review As mentioned in the previous chapter, very little has been written about trust in the alignment field, even if the concept has been related to alignment on numerous occasions. As a result, I needed to look outside the alignment field for more information regarding the definition and real-life examples of trust. What I found was that trust figured into several different fields, such as public administration, management, sociology, psychology, and economics. Furthermore, I noticed that most recent definitions of trust were multi-disciplinary. Because of this, I emphasized multi-disciplinary studies of trust in the review.
Similar to the review of alignment theory, I used the review method suggested by Webster et al. (2002) to perform the literature review of trust. The following steps were taken:
1. Start by identifying major contributions in leading journals using keyword searches for the primary concept.
2. Go backwards by reviewing the citations for the articles identified in Step 1 to identify prior articles. 3. Go forward by identifying articles citing the key articles found in the previous steps. Determine
which of these articles should be included in the review.
The usual stop criteria for this method are met when no new concepts are found in the pool of articles and books collected. However, because I wanted to focus on the relationship between trust and communication only, I used a different stop criterion. I ended the literature search when no new definitions of trust were found, and when I could not find more information about the link between trust and communication.
5.2 Selecting the journals To collect sources, I started by determining the following boundaries for the review:
� The unit of analysis was at the organizational level and the personal level. Both levels were included in the review because most trust articles argue that the amount of organizational trust is related to the amount of personal trust between organizational departments.
� Only sources that contain either a definition of trust or information on the relationship between trust and communication were included.
With these boundaries clarified, the next step was to identify the major journals in the trust literature. Because of my little knowledge of journals outside the IS/IT discipline, I used the impact score of the journals for sorting purposes. The impact score was found using Thomas Reuters Web of Science.
5.3 Searching for articles The databases used to discover relevant articles were Escohost, Web of Science, and Google Scholar. These databases were chosen because they had the most archived journals and were cross-database sites. Web of Science was particularly interesting because it featured the possibility of “mapping” the citations of articles backwards and forwards. The keywords used in the search were “trust AND (communication OR transparency),” “trust AND definition,” and just “trust.” The start condition was to

REVIEWING TRUST THEORY
Page 33/245
gather around 20 articles of interest. Through the search conducted, the articles in Table 7 were identified. For the full information on each article, see the chapter REFERENCES.
Table 7: First pool of articles about trust and communication
Year Author(s) Title
2010 Kramer, R. M., & Lewicki, R. J.
Repairing and Enhancing Trust: Approaches to Reducing Organizational Trust Deficits.
2010 Six, F., & Skinner, D.
Managing trust and trouble in interpersonal work relationships: evidence from two Dutch organizations
2009 Dirks, K. T., Lewicki, R., & Zaheer, A.
Repairing relationships within and between organizations: building a conceptual foundation
2008 Six, F., & Sorge, A. Creating a High-Trust Organization: An Exploration into Organizational Policies that Stimulate Interpersonal Trust Building.
2007 Cristina Costa, A., & Bijlsma-Frankema, K.
Trust and Control Interrelations: New Perspectives on the Trust Control Nexus
2007 Schoorman, F. D., Mayer, R. C., & Davis, J. H.
An Integrative Model of Organizational Trust: Past, Present and Future
2007 Seppänen, R., Blomqvist, K., & Sundqvist, S.
Measuring inter-organizational trust—a critical review of the empirical research in 1990–2003
2006 Dietz, G., & Hartog, D. N. Measuring trust inside organizations
2005 Mayer, R. C., & Gavin, M. B Trust in Management and Performance: Who minds the Shop while the Employees Watch the Boss?
2004 Inkpen, A. C. & Currall, S. C. The Coevolution of Trust , Control , and Learning in Joint Ventures
2001 Das, T. K., & Teng, B.-S.
Trust, Control, and Risk in Strategic Alliances: An Integrated Framework
2001 McKnight, D. H., & Chervany, N. L.
Trust and Distrust Definitions : One Bite at a Time
2001 Mollering, G.
The Nature of Trust: From Georg Simmel to a Theory of Expectation, Interpretation and Suspension
1998 Lewicki, R. J., McAllister, D. J., & Bies, R. J.
Trust and Distrust: New Relationships and Realities

REVIEWING TRUST THEORY
Page 34/245
1998 Rousseau, D. M., Sitkin, S. B., Burt, R. S., & Camerer, C.
Not so Different after All: A Cross-Discipline view of trust.
1998 Zaheer, A., Mcevily, B., Perrone, V., & Barney, J. B.
Does of Trust Matter? Exploring the Effects of Interorganizational and Interpersonal Trust on Performance
1996 Nooteboom, B. Trust, Opportunism and Governance: A Process and Control Model
1995 Mayer, R. C., Davis, J. H., & Schoorman, F. D.
An integrative Model of Organizational Trust
1995 McAllister, Daniel J. Affect- and Cognition-Based Trust As Foundations for Interpersonal Cooperation in Organizations
1972 Zand, D. E. Trust and Managerial Problem Solving.
Thereafter, the task was to expand the selection by going forward and backwards based on the 20 articles identified. When going back, an article was included in the article pool if the topic of the article was inside the boundaries specified and the journal had a sufficiently high impact score. When going forward, an article was included in the article pool if the topic was relevant and the article had an impact score higher than 2.0.
After 56 articles were added to the article pool, the literature search was terminated when no new concepts emerged and the same set of articles was found at each new forward and backwards search. The final article pool therefore featured 56 articles.
5.4 Writing the review The approach taken to organize the review was based on the aim of studying the relationship between transparency and trust. The focus in the trust review was therefore to 1) provide a formal definition of trust that could be used in subsequent quantitative research designs, and 2) provide information on the relationship between trust and transparency. The first aim was achieved by reviewing and comparing each definition of trust to identify a consensus. To find the most prominent definition of trust, the articles were sorted by citation count. This procedure included a review of established models of trust. The second aim, to tell about the relationship between transparency and trust, was achieved by selecting articles in the trust field that featured the concept of communication or transparency. The knowledge in these articles was then analyzed and discussed.

TRUST THEORY
Page 35/245
6 TRUST THEORY This chapter will review the definitions of trust found in the literature, and discuss the different dimensions of trust. Moreover, the chapter will feature a discussion of the relationship between trust and transparency, as these concepts are central to the thesis.
6.1 Terminology During the literature review, I frequently encountered the terms trustor and trustee, which will be used in this chapter. A trustor is someone who has chosen to trust another entity. A trustee can refer to any person who holds property, authority, or a position of trust or responsibility for the benefit of another person6.
6.2 Trust dimensions Scholars from different disciplines have attempted to adopt a multidisciplinary view on trust, as a reaction to the lack of agreement on a definition of the concept. These multidisciplinary views emphasize discrepancies that exist between the disciplines and those assumptions that are generally accepted. Three often-cited multidisciplinary perspectives on trust are from McKnight et al. (2001), Rousseau et al. (1998) and Mayer et al. (1995). These sources will be used as starting points in this review.
In an article from 2001, McKnight et al. found that most research on trust could be classified according to referent and conceptual type. The referent is typically the characteristics of the trustee, for example, goodwill, honesty, morality, expertness, and caring. Conceptual type includes attitude, intention, belief, expectancy, behaviors, and disposition. The reasons for disagreement on the definition of trust have been ascribed to the different worldviews held by different disciplines. As McKnight et al. (2001) argue: "Based on the differences among their definition of trust, it appears that psychologists analyzed the personality side, sociologists interviewed the social structural side, and economists calculated the relational choice side of the trust elephant." Notwithstanding these differences, some authors have described a high-level multidisciplinary concept. McKnight et al. (2001) found that the different views in the trust literature could be classified according to 1) disposition to trust, 2) institutional trust, 3) trusting beliefs, 4) trusting intentions, and 5) trust related behavior. These trust constructs are illustrated in Figure 5 and described in the following section.
6 Definition is from: http://en.wikipedia.org/wiki/Trustee

TRUST THEORY
Page 36/245
Figure 5: Interdisciplinary model of trust constructs (McKnight et al., 2001)
Disposition to trust & institutions based trust Disposition to trust, also denoted by other scholars as propensity to trust (Meyer et al., 1995), refers to "the extent to which one displays consistent tendency to be willing to depend on general others across a broad spectrum of situations and persons" (McKnight et al., 2001). Disposition to trust is not directed towards a particular individual, but rather towards all new encounters that will be experienced in the future. This can be understood as a trust memory based on previous encounters. Institutional trust descends from the sociology tradition and refers to "the feeling of relative security, that favorable conditions are in place that are conducive to situational success in a risky endeavor or aspect of one's life" (McKnight et al., 2001).
Institutional trust is trust based on structures, situations, or roles that provide assurance. For instance, rigorous auditing rules combined with severe punishment for failing to comply with such rules may make information more trustworthy. Institutional trust is directed towards impersonal objects, such as auditing and rules.
Trusting beliefs Trusting beliefs refers to “the extent to which one believes, with feelings of relative security, that the other person has characteristics beneficial to one” (McKnight et al., 2001). Many attributes have been ascribed to the trustworthiness of a person, such as loyalty, skill, competence, expertness, and honesty. In contemporary literature on trust, there is agreement (Rawlins, 2008a) that these attributes can be collapsed into competencies, integrity, and benevolence (McKnight et al., 2001; Rousseau et al., 1998; Mayer, 1995), with slightly different meanings depending on the context. Trusting beliefs means believing in others based on different attributes and is one of the most emphasized aspects of trust in the literature. Note the difference between integrity based trust and competence-based trust. If a person does not trust the integrity of another person, this will affects the former’s trust in every situation dealing with that other person. For the competence part, this only applies to specific situations. In other words, I might trust someone to babysit my children, for example, but not trust them to hit a home run in a baseball game.

TRUST THEORY
Page 37/245
Trusting intentions Trusting intentions means that "one is willing to depend, or intends to depend, on the other party with a feeling of relative security, in spite of lack of control over that party, and even though negative consequences are possible" (McKnight et al., 2001). Trusting intentions encompasses a willingness to be vulnerable to the actions of others, without the ability to deliberately control these actions. Thus, this term describes an assessment of whether one intends to trust, but not that one becomes vulnerable to the actions of others. Trusting intentions is not associated with risk, because no action is taken. Lastly, trust-related behavior is the outcome of the four preceding aspects of trust shown in Figure 5 and denotes that "a person voluntarily … depends on another person with a feeling of relative security even though negative consequences are possible" (Rousseau et al., 1998). Mayer et al. (1995) refer to this as the "behavioral manifestation of the willingness to be vulnerable."
Trusting behavior Combined, disposition to trust, trusting beliefs, and trusting intentions make up the definition of trust of McKnight et al. (2001). Based on the disposition to trust held by the trustor, structures, situations and roles, and the trustworthiness of the trustee (integrity, competence and benevolence), the trustor can intend to become vulnerable to the actions of the trustee without the ability to control him, and may take the risk of doing so, resulting in trusting behavior and risk taking. In the trust model described, the crucial element is the willingness to become vulnerable. Johnson-George and Swap (1982), who wrote about trust from a psychological point of view, found that the willingness to take risks might be one of the few characteristics common to all trust situations. An implication of this finding is that trust is only needed when there is neither total knowledge nor total uncertainty. If total knowledge is present and all is known, there is full certainty and no risk. If total uncertainty is present, then "there is no basis upon which to rationally trust" (McAllister, 1995). Available knowledge and good reasons serve as foundations for trust decisions, and are the platform people use to make leaps of faith (Luhmann, 2000; Simmel, 1964)7. In the model constructed by Mayer et al. (1995), which has several resemblances to the above model of trust, vulnerability is also a crucial element. This model is illustrated in Figure 6.
7 References from McAllister (1995).

TRUST THEORY
Page 38/245
Figure 6: Model of trust by Mayer et al. (1995)
The model in Figure 6 encompasses perceived trustworthiness of the trustee, which is constituted by integrity, competence, and benevolence. These factors are similar to McKnight’s et al. trusting beliefs. The trustor’s propensity to trust is also similar to McKnight’s et al. disposition to trust. Comparing the two models reveals that the only difference is McKnight’s et al. inclusion of institutional factors, which Mayer et al. (1995) omit.
In summary, trust is segmented into three primary dimensions: competence, integrity, and benevolence; trust requires some kind of perceived risk and uncertainty; and trust can entail trusting behavior/outcomes based on the different factors. Moreover, it is safe to say that trust takes place in the mind of the trustor, which differentiates the concept from transparency. Transparency is about communication and disclosed documents, whereas trust is about the experiences and opinions in the minds of employees and people in general.
6.3 Definition of trust Before exploring the relationship between transparency and trust, a review of some of the definitions of trust are provided. The purpose of this review is to identify how trust can be measured in the quantitative part of the thesis. The definitions of trust, as found in the literature, are listed in Table 8.
Table 8: Definition of trust
Source Definition
Mayer et al. (1995) The willingness of a party to be vulnerable to the actions of another party based on the expectation that the other will perform a particular action important to the trustor, irrespective of the ability to monitor or control that other party.
Lewis & Weigert (1985)
Undertaking a risky course of action on the confident expectation that all persons involved in the action will act competently and dutifully.

TRUST THEORY
Page 39/245
Robinson (1996) A person’s “expectations, assumptions, or beliefs about the likelihood that another’s future actions will be beneficial, favorable, or at least not detrimental to one’s interests.”
Barber (1983) A set of “socially learned and socially confirmed expectations that people have of each other, of the organizations and institutions in which they live, and of the natural and moral social orders that set the fundamental understandings for their lives.”
Dasgupta (2000) Trust is associated with expectations regarding the other’s choice of actions that have a bearing on one’s own choice of action. Such expectations may have a strong or weak basis, ranging from assurance through objective facts and logical reasons, belief, which is less firmly based on experience and argument, to unsubstantiated faith.
Nooteboom (1996) X trusts Y to the extent that X chooses to cooperate with Y on the basis of a subjective probability that Y will choose not to employ opportunities for defection that X considers damaging, even if it is in the interests of Y to do so. The trustworthiness of Y depends on Y’s true propensity to employ those opportunities.
Common to most of these definitions is the concept of vulnerability and expectations. Trust carries vulnerability because trust includes a choice (Nooteboom, 1996), uncertainty and a dependency. If full certainty is present, then trust is simply not required. Since trust is a choice, a reason must exist for making a choice that reflects that the trustor expects an important or favorable action from the trustee (Robinson, 1996). This expectation can have a weak or strong basis (Dasgupta, 2000), and concerns the trustee’s trustworthiness factors (Mayer et al., 1995). These factors include integrity, benevolence, competence, and previous encounters with the trustor. These encounters can be relational encounters with the trustee or with others, and can influence the trustor’s propensity or disposition to trust.
Based on the definitions of trust found in the literature, the following definition of trust is used in this thesis:
The willingness of a party to be vulnerable to the actions of another party based on the expectation that the other will perform a particular action important to the trustor, irrespective of the ability to monitor or control that other party. The act of trusting always entails an acceptance of risk because of uncertainty.
This definition is compatible with McKnight’s et al. (2001) trust model, which includes the trustor's propensity to trust and identifies the trustworthiness factors of integrity, benevolence, and competence. This segmentation of trust into competence-based, integrity-based, and benevolence-based trust will be adopted in this thesis.
6.4 Trust and transparency The purpose of this section is to discuss how transparency and trust are related, with a basis in articles from the trust literature. This is different from the previous chapter, which viewed how transparency and alignment were related within the alignment literature. Because trust is assumed to be part of the

TRUST THEORY
Page 40/245
definition of alignment (Luftman, 2000), the previous chapter and this one both elaborate on the relationship between transparency and trust, but from two differing perspectives. Of course, the findings from the alignment section cannot be taken for granted, since they are about alignment and transparency, and not about transparency and trust. Still, the alignment insights can be used in combination with the trust insights to form propositions, since the informal structure seems to have a significant influence alignment. In the text below, I used an author-centric categorization of the topics and articles, as I found this approach to better emphasize the viewpoints of the authors.
Trust and transparency inside the organizational boundaries At an overall level, Wong, Then & Skitmore (2000) performed a comprehensive review of the literature on trust to identify its primary antecedents. The authors report three main antecedents related to trust building: 1) achieving results; 2) acting with integrity and demonstrating concern; and 3) honest communications. The authors argue that sustaining an appropriate level of trust requires the “judicious balancing of the three antecedents – even when they come into conflict with each other.” It is, however, not an easy task to find such a balance, because many interactions between IT and business are not reoccurring. Swift and fragile trust can emerge and just as easily disappear. Without proper mechanisms, or face-to-face meetings, special care is required to establish a level of trust that facilitates communication and alignment (Greenberg et al., 2007).
On a more specific level, Rawlins (2008a; 2008b) studied the relationship between transparency and trust in details. The author found strong empirical evidence that the concepts of trust and transparency are positively related. The three components of trust (competence, integrity, and goodwill) were found to be positively correlated with three identified components of transparency, namely participation, substantial information, and accountability. Certain components of transparency were found to have a stronger explanatory power in predicting the relationship between trust and transparency. Sharing information that was found to be useful and that made the organization accountable were the transparency component with the highest explanatory power. Sharing substantial information was the most important transparency component in evaluating competence. When evaluating the integrity of an organization, the transparency components of accountability and sharing substantial information were found to be most important. Similar results were achieved in another study in 2008, also by Rawlins (Rawlins, 2008b).
A study similar to that of Rawlins was performed by Six (2005). The author reviewed the literature on the activities associated with trust building and found four overall categories that had a positive effect on trust. These areas were 1) being open, 2) sharing influence, 3) delegating work, and 4) managing mutual expectations. To investigate these activities in more detail, two organizations with low and high trust were studied. The results of the study can be found in Table 9. The numbers in column two and three show the average rating of the actions specified in the first column. The maximum value was five and the minimum value was one.
Table 9: Trust building actions explored by Six (2005) with their mean and T-value
Action High trust org. Low trust org. T-value
Pay a compliment at a public meeting 4 3,12 5,17

TRUST THEORY
Page 41/245
Give positive feedback at a private meeting 4,19 3,29 5,01
Clarify general expectations early on in a new relationship 3,96 3,03 4,52
Process and evaluate your cooperation at regular intervals 3,67 2,83 3,92
Reveal and settle differences in expectations 3,65 2,98 3,59
Explore expectations in detail 3,7 3,12 2,64
Be open and direct about task problems 3,85 3,51 2,04
Seek the counsel of others 3,89 3,61 1,68
Be honest about your motives 3,67 2,33 1,67
Disclose information in an accurate and timely fashion 3,56 3,48 0,44
The information in Table 9 shows that disclosing information in an accurate and timely fashion does not differ significantly between high and low trust organizations, but being honest about motives and open about task problems does. In addition, actions such as clarifying expectations do differ greatly, implying that expectation matching might have a significant impact on trust building. One insight gained from the study is that the sharing information alone is not sufficient to build trust.
On a similar level but with a different focus, Wakefield et al. (2010) investigated the relation between transparency and trust within a large organization, with an emphasis on the limitations of transparency. During the study, three limitations of transparency were identified:
� Transparency is not the same thing as truth. All the interviewees agreed that the primary objective of transparency should be to get at the truth. They also agreed, however, that transparency could reveal facts to a greater extent than it reveals truth. The problem with transparency is that each statement can be a fact, but collectively do not convey the truth. The danger is that some might take transparency for truth, when in fact, it is only facts.
� Transparency—when it provides information that is incomplete or out of context—can diminish, rather than improve, understanding and effectiveness. Some professionals felt that information offered in the name of transparency, particularly when overwhelming and under-explained, served to obfuscate rather than clarify issues and facts. When presented with a plethora of information, persons may decide that it is all they need and work directly toward a conclusion that may turn out to be inaccurate.
� An attitude of authenticity is more important than an act of transparency. Technical compliance with transparency (e.g., producing large volumes of un-contextualized documents in response to a request for information) is not helpful in establishing long-term trust with stakeholders. In such cases, the act of communicating may leave the stakeholders feeling that their needs

TRUST THEORY
Page 42/245
weren‘t considered at all. Consequently, while the approach might have been very transparent, it was not at all authentic and authenticity counts the most when trying to build trust. The key to achieving authenticity is not only to talk, but also to listen—and then adjust when appropriate. The power of authenticity lies in the fact that the communicator listens to feedback from stakeholders—and then demonstrates to those stakeholders that what they said matters.
The study by Wakefield et al. (2010) contains some interesting insights. One of the key insights is that being transparent, in itself, does not create trust, at least not in all circumstances. If an organization is transparent about its poor performance without doing something about it, the transparency will not create trust, because “the key to achieving authenticity is not only to talk, but also to listen—and then adjust when appropriate” (Wakefield et al., 2010).
Some of the studies identified in the review also looked at the mechanisms for how trust and transparency are related, as opposed to only establishing correlations between the concepts. One such study is the work by Nelson et al. (1996), who found that shared domain knowledge mediates the relationship between trust and IT performance. The sharing of information leads to enhanced technical knowledge, which leads to a more complete understanding and appreciation of the other party’s reality. As Nelson et al. (1996) argue, “shared knowledge plays a mediating role in the achievement of IS group performance through mutual trust and influence.”
This point is also found in a study by Akkermans et al. (2004), who investigated how one moves from limited information sharing to full transparency and how this affects the level of trust. The authors found that information sharing and trust are related, yet unlike other studies, they take their investigation one-step further. Using an action-research method, the authors track the performance, trust, transparency, and decision-making of several large projects over a period. Several insights were gained from the study:
� If performance is low, trust and transparency remain low. If this vicious cycle is somehow broken and trust and transparency start to increase, an upward spiral over steadily improving performance can be achieved.
� Even if significant amounts of data were exchanged between the parties, the level of trust that existed between the parties remained relatively low. One of the root causes for this lack of trust was a lack of understanding for each other’s planning and business processes.
� To increase trust, the information shared needs to be on a high level. This higher level of transparency included topics such as how the parties planned, who was involved in the planning, and so forth. This kind of information created a common domain knowledge across departments.
� Creating an atmosphere where transparency can be achieved requires significant effort: breaking the vicious cycle is not easy, and organizations can easily succumb within an environment that is pervaded by a lack of trust and transparency.
The study by Akkermans et al. (2004) points to the important of disclosing information that can be easily understood and is relevant for the other party. Looking at the quality versus the quantity of information, Thomas et al. (2009) found that communication matters the most for top management

TRUST THEORY
Page 43/245
and supervisors, and less so for coworkers. The authors found that the relationship between quality of information, quantity of information and trust was insignificant for coworkers, significant for supervisors with regard to the quality of information and significant for top management regarding both quality and quantity of information. In all three cases, quality, and not quantity, best predicted trust. Trust was closely tied to perceptions of organizational openness, which in turn predicted employee involvement (Thomas et al., 2009).
Regarding transparency behaviors that create and maintain trust, Abrams et al. (2003) found several actions that could be performed. These actions were based on interviews and were not tested in the field. The behaviors are presented in the table below.
Table 10: Selection of trusting behaviors from Abrams et al. (2003)
Behavior Description
Be consistent between word and deed
When people do not say one thing and do another,
they are perceived as being both caring about others and competent enough to follow through
Ensure frequent and rich communication
Frequent, close interactions typically lead to positive feelings of caring about each other and an improved understanding of each other’s expertise.
Engage in collaborative
communication
People are more willing to trust someone who shows a willingness to listen and share, i.e., to get involved and talk things through. In contrast, people are wary of someone who seems closed and will only answer clear-cut questions or discuss complete solutions.
Establish and ensure shared vision and language
People who have similar goals and who think alike find it easier to form a closer bond and to understand one another’s communications and expertise.
Disclose your expertise and limitations
Being candid about your limitations gives people confidence that they can trust what you say are your strengths. If you claim to know everything, then no one is sure when to believe you.
While the behaviors in the above table have not been tested and are characterized by personal opinion, they outline different areas where transparency can have an effect on trust. These areas include consistently between shared information and actions, establishing a shared vision, and disclosing limitations as well as expertise.
Trust and transparency across organizational boundaries Whereas Abrams et al.’s (2003) review is centered on trust and transparency inside the organization, the following articles explore the relationship between transparency and trust between an

TRUST THEORY
Page 44/245
organization/government and its customers/citizens. The insights from these articles were found to be relevant, even if the context differs slightly from that of this thesis.
The first interesting article is by Kang and Hustvedt (2013), who found a positive relationship between consumers’ perceptions of a corporation’s efforts to be transparent and the level of trust. It was not the amount of disclosed information that mattered, but the initiative taken to disclose information in the first place. This finding is in contrast to that of Dando & Swift (2003), who found that “the current upward trend in levels of disclosure of social, ethical, and environmental performance by corporations and other organizations is not being accompanied by simultaneously greater levels of public trust.” Dando & Swift (2003) explain this finding via the low level of confidence in the information communicated via public reporting. In other words, if trust in what is communicated is lacking, transparency does not build trust because the information will be perceived in a skeptical light.
Another argument identified in several of the articles on transparency and trust is that the mediating factor in the relationship is factual knowledge about government performance. A study by Mason & Hillenbrand (2013) supports this argument, as the authors found that being informed of performance data affected citizens’ trust significantly. Respondents, who initially perceived the governments’ performance to be poor, expressed the greatest degree of change in trust, while those who had the best initial opinion of the governments’ performance registered the smallest degree of change. One article that rejects the argument is that of Grimmelikhuijsen (2012), who found that the interaction between transparency and performance outcomes did not have a significant effect. Even if a negative outcome was presented to citizens, this did not negatively affect their trust. The author concludes that more research regarding the relationship is required to better account for the different factors affecting it.
In summary, most of the studies were positive about the relationship between transparency and trust. A general trend, however, was that information did not, by itself, build trust. Factors such as authenticity, relevance, performance outcomes, expectations, shared domain knowledge, and acting on the information disclosed all seemed to have an effect in the relatiosnh in the relationship. Moreover, trust is not just trust. Competence-based trust and integrity-based trust seem to be affected differently by transparency, for instance, when looking at the quality versus the quantity of the information shared.
6.5 Trust and service quality One problem with the focus on transparency and trust, as mentioned previously, is that both concepts can be seen as independent variables. Some studies propose that trust is related to transparency, and some studies propose that transparency is related to trust. To provide more substance to my findings and the subsequent generalization, I have included the concept of service quality.
Service quality is often defined as the consumer’s judgment about an entity’s overall excellence or superiority (Zeithaml, 1987). Service quality is sometimes measured as a comparison of expectations and perceptions of performance (Parasuraman et al., 1988), although this comparison is debated in the literature. In recent years, several studies have shown that service quality is best measured using performance items only (e.g., Lewlyn, 2013). In the service quality literature, these dimensions include credibility, responsiveness, security, and understanding customers. Parasuraman et al. developed a

TRUST THEORY
Page 45/245
survey containing a set of items in 1988 for measuring service quality that has been used and tested in numerous studies. This survey used five dimensions of service quality, which are displayed in Table 11.
Table 11: Dimensions of service quality
Dimension Description
Tangibles Physical facilities, equipment, and appearance of personnel.
Reliability Ability to perform the promised services dependably and accurately
Responsiveness Willingness to help customers and provide prompt service
Assurance Knowledge and courtesy of employees and their ability to inspire trust and confidence
Empathy Caring, individualized attention that the firm provides its customers.
The five dimensions were developed based on factor analysis. This means that the factors encompass other dimensions such as credibility and security. Based on these items, service quality is defined as:
The consumer’s judgment of an organization’s overall performance according to reliability, responsiveness, assurance, tangibles, and empathy expressed as an attitude.
Parasuman et al. (1988) also identifies five gaps that can explain why service quality is not adequate in an organization. These gaps are 1) different expectations between the consumer and management, 2) difference between management perception and service quality specification, 3) difference between service quality specification and service delivery, 4) difference between service delivery and external communication, and 5) difference between expected service and experienced service. When looking at the gaps, it becomes clear that service quality and trust are similar in some respects. This claim is supported by several studies that have found a strong correlation between the reliability, responsiveness, and assurance dimensions of service quality and the concept trust (e.g. Chang et al., 2013). The inclusion of service quality provides a means to take findings about the relationship between transparency and trust, and generalize them (as the data allows) to other contexts.
6.6 Chapter summary When reviewing the trust literature, it became clear that much time has been spent on defining the concept of trust. Unlike communication, and in part, transparency, which is easier to grasp, trust does not exist in messages and documents. Trust takes place in the mind of the trustor and is based on beliefs and intentions that can entail trust-related behavior. Trusting someone carries uncertainty and vulnerability, which are concepts that are far from those used in the alignment literature. The link between trust and transparency is interesting because several insights have been gained in the trust field, yet the area is still considered to be under-investigated (Garsten et al., 2008; Park et al., 2011), mainly because information is lacking on how the concepts are related. It is evident from the articles on transparency and trust that merely sharing information is not enough to create trust. Factors such as
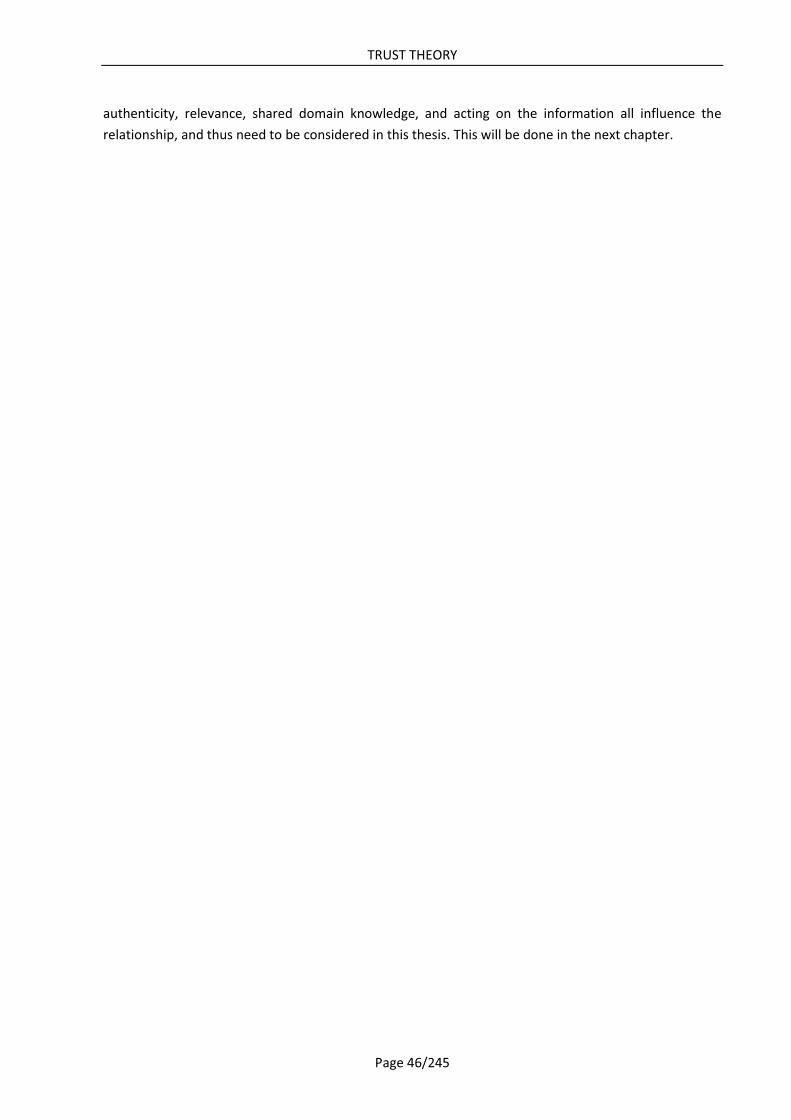
TRUST THEORY
Page 46/245
authenticity, relevance, shared domain knowledge, and acting on the information all influence the relationship, and thus need to be considered in this thesis. This will be done in the next chapter.

FRAMEWORK & PROPOSITIONS
Page 47/245
7 FRAMEWORK & PROPOSITIONS Thus far, I have reviewed the theory of alignment, the theory of trust, and have argued that the link between transparency and trust is relevant to investigate from an alignment perspective. It is currently unclear how transparency and trust are related with regards to alignment, due to the paucity of studies that go beyond survey instruments to explore this relationship in detail. As Thomas et al. (2009) state: “While a number of researchers have studied the relationship of trust and transparency, little is known about the specific linkages among quality of information, quantity of information, openness, trust, and outcomes…”. This chapter will synthesize the current knowledge on this topic and provide a set of hypotheses that can be used to generate knowledge about the conceptual relationship between trust and transparency.
7.1 Terminology In this chapter, the term proposition will be used to define a proposed link between two concepts in a situation, where the link cannot be verified by an experiment. As such, a proposition relies on prior research, assumptions, and interpretation. A proposition can be used to guide research and ultimately be used to create testable hypotheses, yet cannot itself be tested. The term researched is used to indicate that I will look into the proposition and test its validity. Furthermore, I define a hypothesis as an educated guess that can be tested using statistical analysis. Both a proposition and a hypothesis attempt to explain relationships or associations between concepts.
7.2 Synthesis of current knowledge The two chapters ALIGMENT THEORY and TRUST THEORY each contained insights about the relationship between transparency and trust. As these insights were extensive, the beginning of this chapter will attempt to synthesize the insights and form a common understanding. This understanding will then be used to create a transparency-trust framework. To aid in the syntheses, the main insights from the two chapters were combined in a table that can be found in APPENDIX K.
From the syntheses, it is evident that most of the work on the trust and alignment theories has found that transparency and trust are correlated in some way. The most frequent explanation for the correlation is that transparency increases shared domain knowledge or shared vision. When the parties in a relationship learn about the other’s domain, they are able to understanding each other’s work, constraints, and possibilities. With this knowledge, they are more likely to build and maintain a trusting relationship because they can better adapt to and support each other. Exactly how information leads to shared domain knowledge has only been vaguely described.
Besides the creation of shared knowledge, some authors emphasize the communication of performance outcomes. The argument is that when an organization shares information about itself, it renders itself open to control, and receivers of the information can gain a more accurate picture of the organization than if they had to estimate the performance themselves. Whether the actual performance of the organization matters is debated, and the research findings are conflicting. Some scholars have found that only performance that exceeds expectations builds trust, whereas other have found that it is the initiative to disclose information in the first place that builds trust. Some have even found that the disclosure of

FRAMEWORK & PROPOSITIONS
Page 48/245
inferior performance outcomes can lower trust because it “reinforces people’s worst fears” (Mason & Hillenbrand, 2013).
Some authors argue that expectation matching mediates the relationship between transparency and trust. The argument is almost the same as the argument for shared domain knowledge. If the parties in the relationship understand the other party’s normative expectations (what should be expected considering their environment, complexity, and constraints), they are more likely to build a trusting relationship because they can use this information when collaborating and interacting with one other. Predictive expectations are also emphasized, for instance by Wagner et al. (2012), but not nearly as much as the importance of aligning normative expectations.
Lastly, several factors were found to have an effect on the relationship between transparency and trust. These factors are acting on the information shared; showing consistency between actions and disclosed information; current gaps in understanding; introverted employees; separate IT and business languages; organizational complexity; IT failures; and mistrust in the information. Mistrust in the information was found to be especially important. If the parties do not find the information honest, the information will have little or a negative effect on trust and probably other factors.
To provide a better overview of the synthesized knowledge, the insights gained were plotted into a graph, with transparency and trust as the two axes. The graph shows what might account for a situation where, for example, trust is low but transparency and high, or the opposite, where trust is high but transparency is low. The graph is presented below.

FRAMEWORK & PROPOSITIONS
Page 49/245
Figure 7: Transparency/trust relationship model
Figure 7 suggests that if transparency and trust are both high, the organization is in a situation where the different domains are understood, where performance can be adequately perceived, where expectations are clear and understood, and where the departments makes themselves open for control. On the other hand, if transparency is high but trust is low, another situation is more likely. In that case, information might not be trusted, performance is shared but found to be below expectations, there might be a difference between what is communicated and what is done, or one or both parties do not want to learn about the other’s differences and constraints.
If transparency and trust are low, the explanation could be that unrealistic normative or predictive expectations exist in the relationship (the parties lack shared domain knowledge), that the parties have adopted an “us-and-them” perception of the relationship, or that the level of trust is based more on rumors and anecdotes than information and statistics. Lastly, if trust is high but transparency is low, it points to a relationship where the level of uncertainty is low, where there are few risks and interdependencies, and where performance is stable. In such a context, there is no requirement for transparency regarding operations or strategies.
7.3 Forming a theory In synthesizing the literature on transparency and trust, and as apparent from Figure 7, it became clear that the relationship between transparency and trust is often influenced by a second factor. Akkermans et al. (2004) and Wagner et al. (2012) argue that the factor is shared domain knowledge, Mason &

FRAMEWORK & PROPOSITIONS
Page 50/245
Hillenbrand (2013) argue that the factor is performance outcomes, and Day & Six (2006) argue8 that the factor is expectation matching. Moreover, the relationship does not seem to be as simple as some studies perceive. For instance, Thomas et al. (2009) found that the kind of expectations people have help determine what kind of information helps build trust, and Six (2005) found that two organizations that were rated as equal in terms of openness and information disclosed varied significantly when comparing the level of departmental trust. Because of these findings, I will not argue for an increase in transparency in the top-down sense that is advocated for in some parts of alignment theory. Transparency and trust seem to be related, yet transparency does not always build trust, and other concepts seem to enter into the equation, such as the ones discussed so far in this chapter.
An example A finding that has been supported by several studies is that transparency seems to have an effect on trust when it touches upon the understanding of the other party’s work; when it enhances shared domain knowledge or communicates the performance outcomes. However, why is this so? I will provide a possible explanation based on the following example:
Imagine that you are waiting for the train to arrive so you can get to work and attend an important meeting. If the train arrives 20 minutes late, and your expectation of a timely arrival is broken, you will find the train company more untrustworthy in the future. Your interpretation of why your expectations were not fulfilled means that you will doubt that they will be fulfilled in the future. If you had access to information about the delay of the train, you could have arrived 20 minutes later. You would still have missed your meeting, but the consequences of the train delay could have been mitigated (e.g. you could report your delay in advance). The expectation towards the train company would still be broken, but the decrease in trust might not be as severe compared to a situation where you were not informed of the delay. If the train company disclosed information about delays and explained why the train was late, your trust of the company would be a matter of believing the information they provided, rather than drawing your own conclusions. You could form an understanding of the circumstances and conditions for company (shared domain knowledge), and you could use this knowledge to avoid similar situation in the future.
The example contains three points in the context of transparency and trust:
� Transparency is most useful when it concern the expectations of the receiver. When you are waiting for the train, you do not care whether another train is delayed unless it will have consequence for the train you are waiting on.
� Your trust of the train company is partly based on how well you understand them. If the train company is always delayed in the winter because they are not provided with money by the government to heat the rails, you could still trust their competences to manage train even when they arrive later in snowy weather. In fact, you would properly include the consideration in your own planning.
8 For Six, the argument is indirect, yet it is evident from his data and interpretations.

FRAMEWORK & PROPOSITIONS
Page 51/245
� Your trust of the train company is partly based on how well they inform about operations. If the train company inform about delays, you as a passenger can better accommodate these delays and plan your day accordingly. The consequences of the delays on the level of trust could be rendered less because the overall consequence for you as a passenger are reduced.
In an IT setting, transparency regarding operational expectations such as project delivery time or project cost might lead to fewer surprises and fewer unrealistic promises. Transparency about planning and performance will lead to an increased mutual understanding of the other party’s world and mindset. In other words, transparency in planning will help form the normative 9 and predictive 10 expectations between two parties, whereas operational transparency will mitigate the consequences when expectations are broken. This talk about normative and predictive expectations are quite far from the topics typically covered in the alignment field, yet it is still necessary to include these concepts in order to investigate the relationship between transparency and trust in depth. Understanding expectations seems to be part of the explanation of how transparency can enhance trust. The train example and the above points are quite similar to the argument of scholars such as Six (2005) and Nelson et al. (1996) that expectations are important. However, while these scholars argue that expectations are required to build a shared domain knowledge, I would argue that both normative and predictive expectations are required to build and create trust. It is not enough to understand the other party’s mindset and constraints; you also need to alleviate broken expectations when they arise. This is especially important in an IT context, where the barriers to achieving alignment include complexity, multiple vendors, and introverted employees (Huang et al., 2007).
Through the literature review, it was found that the relationship between IT and business is often pervaded by a lack of transparency and poor collaboration. One explanation provided in the literature is that IT and business camps exist, and that IT employees speak in a technical jargon that the business side finds difficult to understand. When transparency regarding planning and operations is lacking, this will most likely lead to low trust (see Figure 7). If promises are broken because they are made on false premises, or expectations exist that are unrealistic or do not consider the constraints of the other party, it will hurt the relationship and create a low trust-low transparency vicious cycle, as described by Akkermans et al. (2004). The solution seems simple: increase the amount of shared domain knowledge. Yet, this might not prove simple if the mindset of the business side is that IT should only accommodate the business requirements. In such a case, the business would have no interest in learning about IT. It could therefore be argued that changing the mindset of the business side is a major part of using transparency to create trust.
7.4 The framework To help analyze the empirical data that was gathered during this project, a framework was constructed. The framework includes the central idea of how transparency and trust are related, and the barriers that influence the relationship. In the subsequent chapters, the framework is used to understand and
9 Normative expectations can be understood as expectations regarding how things should be.
10 Predictive expectations can be understood as expectations regarding how things will be.
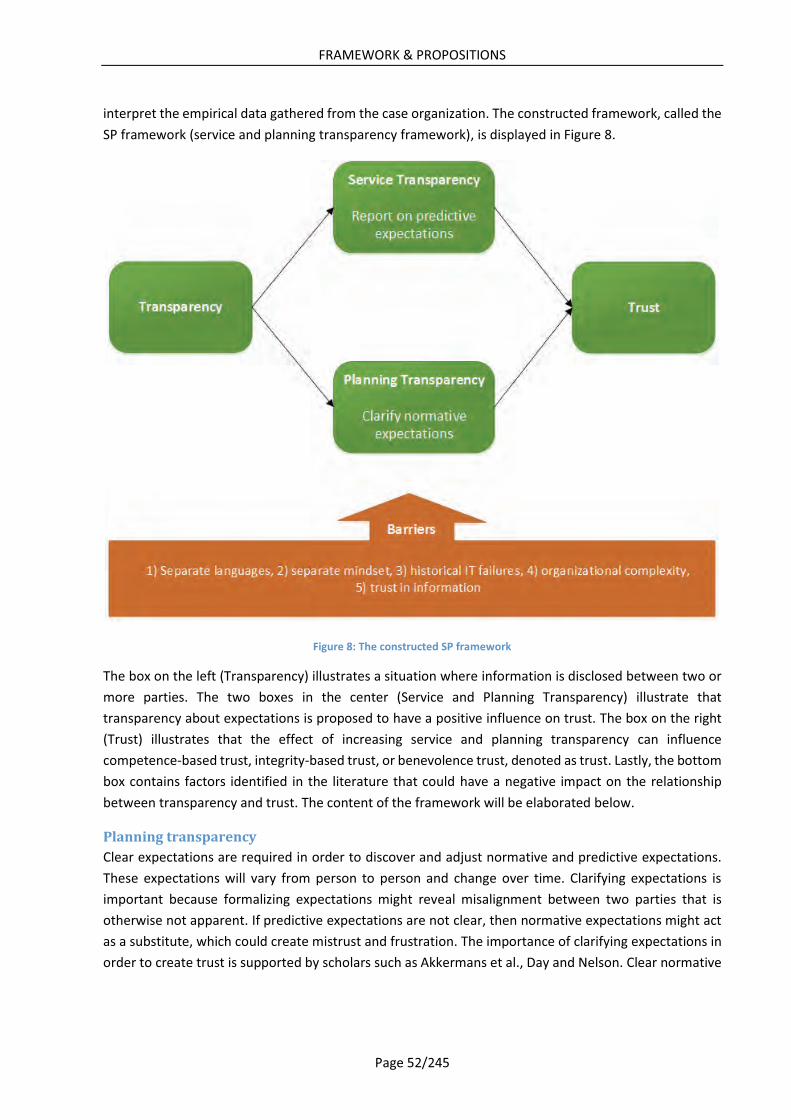
FRAMEWORK & PROPOSITIONS
Page 52/245
interpret the empirical data gathered from the case organization. The constructed framework, called the SP framework (service and planning transparency framework), is displayed in Figure 8.
Figure 8: The constructed SP framework
The box on the left (Transparency) illustrates a situation where information is disclosed between two or more parties. The two boxes in the center (Service and Planning Transparency) illustrate that transparency about expectations is proposed to have a positive influence on trust. The box on the right (Trust) illustrates that the effect of increasing service and planning transparency can influence competence-based trust, integrity-based trust, or benevolence trust, denoted as trust. Lastly, the bottom box contains factors identified in the literature that could have a negative impact on the relationship between transparency and trust. The content of the framework will be elaborated below.
Planning transparency Clear expectations are required in order to discover and adjust normative and predictive expectations. These expectations will vary from person to person and change over time. Clarifying expectations is important because formalizing expectations might reveal misalignment between two parties that is otherwise not apparent. If predictive expectations are not clear, then normative expectations might act as a substitute, which could create mistrust and frustration. The importance of clarifying expectations in order to create trust is supported by scholars such as Akkermans et al., Day and Nelson. Clear normative

FRAMEWORK & PROPOSITIONS
Page 53/245
expectations increase shared domain knowledge, where the parties learn about what is possible, what is not, and why such constraints exist (Abrams et al., 2003).
In an IT context, the importance of clarifying expectations can be emphasized by an example. In IT, there is often a difference between visualization and implementation. Most business people can quickly visualize how they want their application or system to be. A business user might want a new column added to SAP11, which would seem very simple, so his normative expectations is that this will take one day. Yet, adding this column might break other programs, the database might be protected and thus difficult to change, or IT might have to consider how the change fits into their already complex architecture. Therefore, the work might take several weeks. If expectations are not clarified, it could result in mistrust and frustration because of the difference in performance and expected performance.
The clarification of expectations includes selecting areas to clarify and prioritize. Employees in different business units will have different expectations depending on where they are located and their current role in the organization. These expectations will be predictive if the employees have any dependencies on the IT department, and normative if they do not. Not every expectation can be clarified, and certainly not every expectation can be met. Therefore, IT and business managers must make a choice. Which expectations do we accommodate, and which do we ignore? In some cases, the expectations will be conflicting. Meeting stakeholders’ demands is not a static process, but rather entail negotiation and balancing of expectations. The process is, however, important because it determines how the IT department can be congruent with its stakeholders.
Clarifying expectations build trusts because when expectations are negotiated, both parties can agree on what acceptable behavior entails and they can understand each other’s constraints.
Service transparency In an IT setting, stakeholders must be regularly communicated with about expectations. This is particularly important when expectations are about to be broken. Unlike the creation of shared domain knowledge and clarification of normative expectations, few scholars have written about the importance of service transparency. Of the sources identified in the literature review, only Wagner et al. (2012) emphasize how communication regarding operations creates alignment and trust. Several arguments can be made for the importance of reporting on expectations:
� The work of the IT department is complex (Thomas et al., 2009) and initial estimates can be far from the correct or might change over time. If stakeholders are left in the dark regarding what is happening, they will feel deceived and unable to respond to transgressions. If, however, they can follow the progress of the project, they can adjust their own expectations according to the information. In other words, the consequence of occurrences such as exceeded deadlines, budget overflow, or insufficient functionality is reduced.
� Disclosing information is an act of goodwill and candor. Disclosing information that can be used to control you signals that you have nothing to hide, and perhaps more importantly, that you know what is going on. Creating accountability and control with oneself is deemed a good
11 A popular Enterprise Resource Planning system

FRAMEWORK & PROPOSITIONS
Page 54/245
counter against accusations of opportunism that can sometimes be present in a misaligned relationship. Scholars such as Kang & Hustvedt (2013) even found that the act of becoming transparent in itself creates trust.
� Information about broken expectations can help manage and justify how the stakeholders perceive the IT department. For instance, if an IT project is delayed because the business has not provided adequate information to begin development, it is impractical for the business to think they should trust the IT department less in similar situations. Similar to Figure 7, if transparency regarding operations is lacking, the actions of the IT or business department will be based on rumors and anecdotes.
Reporting on progress builds trust because being transparent allows the parties to mitigate the consequences of broken promises such as late deliveries and exceeded budgets. The deliveries might still be delayed, but the receiver can cancel activities that are dependent on the delivery and inform his supervisors or management in due time. Moreover, the receiver can better judge the performance instead of guessing why things went wrong. I define communication and reporting on predictive expectations as service transparency.
Barriers Besides the two dimensions (service and planning transparency) in the SP framework, the review of the literature also revealed several barriers that could affect the relationship between transparency and trust. As I have already elaborated on these barriers in the previous chapters, ALIGMENT THEORY and TRUST THEORY, I will not go into depth here. The following table presents the barriers included in the SP framework.
Table 12: Barriers for using transparency as a mean to create trust
Barrier Description Effect Source
Separate languages The business side does not understand the technical language used by IT, or IT does not understand the language used by the business employees.
The lack of a proper language has a severe impact on the interpretation of disclosed information
Smith et al. (2010)
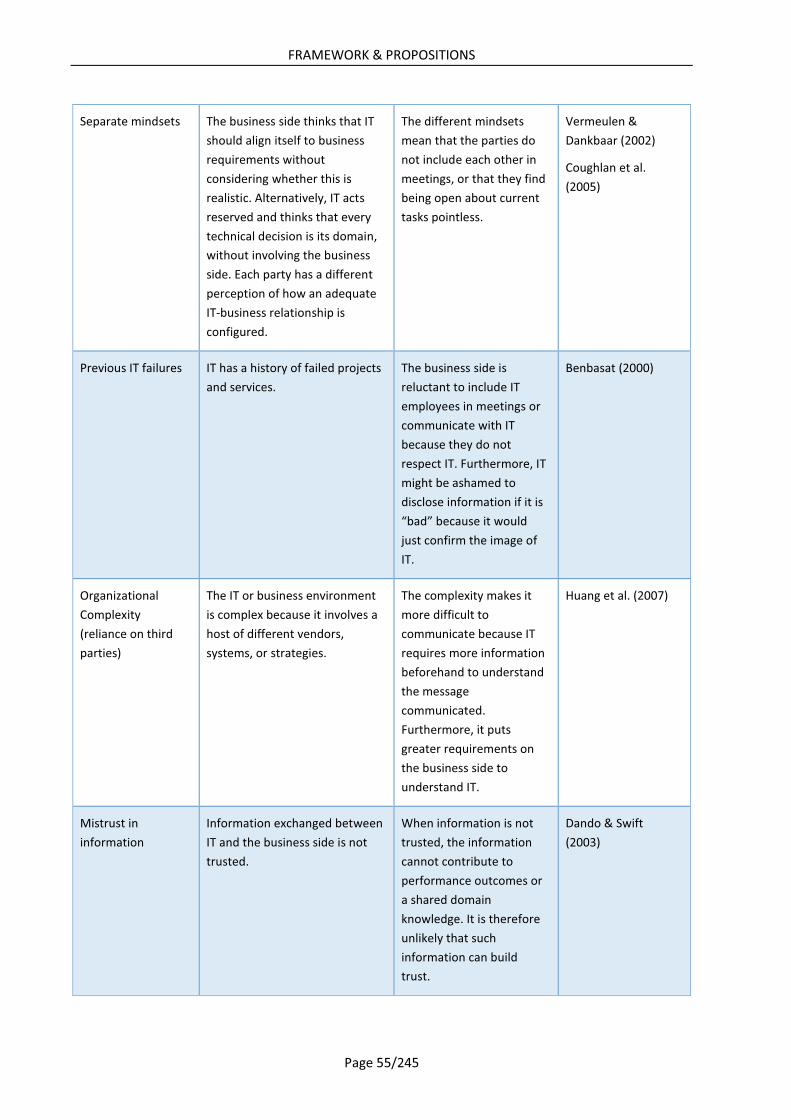
FRAMEWORK & PROPOSITIONS
Page 55/245
Separate mindsets The business side thinks that IT should align itself to business requirements without considering whether this is realistic. Alternatively, IT acts reserved and thinks that every technical decision is its domain, without involving the business side. Each party has a different perception of how an adequate IT-business relationship is configured.
The different mindsets mean that the parties do not include each other in meetings, or that they find being open about current tasks pointless.
Vermeulen & Dankbaar (2002)
Coughlan et al. (2005)
Previous IT failures IT has a history of failed projects and services.
The business side is reluctant to include IT employees in meetings or communicate with IT because they do not respect IT. Furthermore, IT might be ashamed to disclose information if it is “bad” because it would just confirm the image of IT.
Benbasat (2000)
Organizational Complexity (reliance on third parties)
The IT or business environment is complex because it involves a host of different vendors, systems, or strategies.
The complexity makes it more difficult to communicate because IT requires more information beforehand to understand the message communicated. Furthermore, it puts greater requirements on the business side to understand IT.
Huang et al. (2007)
Mistrust in information
Information exchanged between IT and the business side is not trusted.
When information is not trusted, the information cannot contribute to performance outcomes or a shared domain knowledge. It is therefore unlikely that such information can build trust.
Dando & Swift (2003)

FRAMEWORK & PROPOSITIONS
Page 56/245
The barriers listed in Table 12 will be used in the subsequent analysis to interpret the empirical data.
7.5 Propositions To guide this Ph.D. project, a set of propositions were put forward based on a synthesis of the literature and the SP framework. The following section will elaborate on these propositions.
Some of the work covered in the literature review argues that transparency is important for achieving alignment. Scholars such as Bassellier & Benbasat (2004) and Day (2007) have found that shared domain knowledge originating from transparency is the most important factor in explaining the alignment of IT and business strategies, and that such knowledge helps in forming adequate expectations of performance. Mason & Hillenbrand (2013) found that information about performance outcomes is important as well. Only Wagner et al. (2012) emphasize the notion of operational alignment (service transparency) as important in creating trust and alignment. The purpose of the first and second proposition is to study whether planning or service transparency has an impact on trust in the case organization. The first proposition looks at the importance of a shared domain knowledge, whereas the other proposition looks at the effect of operational information. The two propositions are as follows:
� Proposition 1: If planning transparency is low in the relationship between the IT and business departments, it will have a negative influence on the level of trust.
� Proposition 2: If service transparency is low in the relationship between the IT and business departments, it will have a negative influence on the level of trust.
Besides the main ideas tested in the propositions above, the framework also contains several barriers that could influence the relationship between transparency and trust. Scholars such as Smith et al. (2010) and Huang et al. (2007) argue that separate languages, separate mindsets, organizational complexity, and historical IT project failures have a negative impact on the relationship. To test whether these barriers are present in the case organization, and to determine whether they influence the relationship between transparency and trust, the following four propositions were formulated:
� Proposition 3: If the business side cannot understand the language used by the IT department, or if the IT department cannot understand the language used by the business side, it will have a negative influence on the level of service and planning transparency.
� Proposition 4: If the business environment is complex, it will have a negative influence on the level of service and planning transparency.
� Proposition 5: If IT has a history of bad IT projects, it will have a negative influence on the level of service and planning transparency.
� Proposition 6: If the mindset of the IT employees or the mindset of the business employees is that it is solely the other party’s responsibility to adapt to their demands or way of working, it will have a negative influence on the level of service and planning transparency.
Lastly, it was decided to include the concept of service quality in the thesis to have a designated dependent variable and to be able to associate the findings of the thesis with a more easily generalizable

FRAMEWORK & PROPOSITIONS
Page 57/245
concept (due to the vast amount of articles that have measured service quality in different contexts). The purpose of the final proposition is therefore to study the effect of service quality in the case organization:
� Proposition 7: If the level of trust or transparency is low in the relationship between the IT and business departments, it will have a negative influence on the level of service quality.
These propositions will be addressed in the interpretive part of the thesis.
7.6 Chapter summary Based on a synthesis of the literature, Table 7 provides an overview of the literature and accounts for different situations that might emerge under different levels of transparency and trust. In addition, a framework of the relationship between transparency and trust was constructed. The key idea behind this framework is that merely increasing transparency does not necessity increase trust and alignment. Transparency activities should focus on the normative and predictive expectations in the IT-business relationship to be effective in increasing trust. In addition, several of the barriers identified in the literature were added to the SP framework so that they could be used in the subsequent analysis. Based on the framework, a set of propositions was developed that will be studied in the interpretive part of the thesis.

PART III
Page 58/245
PART III

METHODOLOGY
Page 59/245
8 METHODOLOGY With a set of propositions ready to be researched, the next task was to select one or more methods to research the propositions. The purpose of this chapter is to account for the different methods available and provide some justification for the methods and design chosen. However, before moving on, I would like to highlight how the thesis is structured. This chapter is about the process of selecting one or more guiding methods for how the research was carried out. This included selecting whether the nature of the research should be quantitative, qualitative or mixed, and determining the objectives of acquiring knowledge. Moreover, it includes a discussion of the strength and weaknesses of the chosen design and in what contexts the methods were valid. It does not include detailed specifications on how data was collected or analyzed. This is provided separately at the beginning of Part IV and Part V. The reason for this structure is to improve readability. I found that it made more sense to provide detailed specifications directly before the analysis and data collection, instead of placing these in a separate methodology chapter.
This chapter is structured as follows: first, the stakeholders of the project are presented. Thereafter, the knowledge objectives are discussed. Then, the chosen approach is justified, along with the research design. Lastly, I discuss how the design was tailored to the thesis as well as the philosophical assumptions and implications of the design.
8.1 Terminology In this chapter, I define methodology as a systematic analysis of the methods applied to a field of study. I define a method as a general framework guiding the thesis. The method tells something about the tools used, but does not go into detail about the specifications of the method’s utilization. The research design, on the other hand, is defined as a specific outline detailing how one or more methods will be combined and used to answer a particular research question. A research design contains one or more methods.
I will use the word interpretive to denote approaches associated with constructivism, hermeneutics, case studies, and more. Moreover, I will use the word positivist or post-positivistic to denote approaches associated with statistics, hypothesis testing, and experimental design.
8.2 Stakeholders in the research project Before elaborating on the different research designs identified, the different stakeholders involved in this thesis will be discussed. The stakeholders in this Ph.D. project were Copenhagen Business School (CBS), Forskning and Innovations Styrelsen (FI) and The Carlsberg Group. CBS was interested in a dissertation that would comply with the national Ph.D. regulations, combined with knowledge dissemination activities. This would entail a certain academic level of writing, as well as knowledge that would contribute to the already existing body of knowledge on the dissertation topic. FI was interested in me passing the industrial Ph.D. course and completing the Ph.D. dissertation within the three years allocated to the study. Looking ahead, FI is also interested in success stories in which the industrial Ph.D. student has provided value for the company providing employment during the Ph.D. program. Carlsberg was interested in normative knowledge that could be directly applied in order to yield value for the company. Because the company underwent frequent organizational changes, Carlsberg was interested in small bits of knowledge that could be provided to the company during the dissertation work, rather than having to

METHODOLOGY
Page 60/245
wait for three years to get results. The relationship between the stakeholders’ interests is illustrated in Figure 9.
Figure 9: The stakeholders’ interests in the project.
When combined, the interests of Carlsberg, CBS and FI were contradictory. The normative and specific aim of knowledge production required by Carlsberg was not fully congruent with CBS’s requirement of general knowledge production and a contribution to science. FI was positioned in between, supporting the production of both specific and general knowledge. CBS was more interested in a large contribution to science in the form of extensive articles or the dissertation itself, whereas Carlsberg was more interested in “hands-on” knowledge that could be directly applied to the company. The contradiction between the stakeholders’ interests necessitated the use of a multi-methods approach (Campbell et al., 1959). Qualitative studies are often exploratory or explanatory, whereas quantitative studies are often descriptive or normative. The stakeholders’ interests suggested the use of a multi-methods approach having a qualitative exploratory phase followed by a quantitative normative phase. Combining the two phases would help ensure that the requirements of both CBS and Carlsberg were met.
8.3 Knowledge objectives When knowledge is produced, it is crucial that the objective for obtaining the knowledge is clear (Andersen, 2002). Three main objectives can be the basis for a research study. These are classified according to their approach to the data and the analysis of the data, as follows:
1. Descriptive approach (past or present investigations in which facts are investigated without asking why things are as they are)
2. Explorative approach (investigating circumstances that are less understood and where knowledge is lacking)
3. Explanatory approach (investigating which factor x causes factor y, or which factor y is a consequence of x. Predicting that if X is present, then Y will also be eventually present, or vice versa)
As presented in the previous part of this thesis (FRAMEWORK & PROPOSITIONS), one of the results of the literature review was the development of a framework. Based on this framework a set of propositions was formulated. These propositions were included in the criteria for selecting the research design.
METHODOLOGY
Page 61/245
A descriptive approach was not found to be adequate considering that the propositions set the stage for an explanation of the relationship between transparency and trust. Using a descriptive approach would simply not provide an answer to the research questions asked.
Using an exploratory approach would generate knowledge that could extend the SP framework and ideas already proposed, but that was not all what I was interested in doing. I was not seeking to explore the concepts of trust and transparency overall, as this has already been done in the literature, but rather to determine their relationship to one other in the chosen research context. To determine this relationship, however, would require some exploration before the relationship in the specific context could be explained. Based on this, an exploratory phase leading to an explanatory phase was thought to be best suited to the aim of the thesis.
As the overall approach, an explanatory approach was found to be most appropriate because it concerns how concepts are related. The constructed transparency framework predicts that transparency regarding normative and predictive expectations will have a positive influence on the level of trust. Taking an explanatory approach was a good way to research the propositions and subsequently operationalize them into a hypothesis that could be tested quantitatively. It should be noted, however, that the hypothesis contains propositions regarding the causality of the relationship. To test causality, an intervention is typically required12. Some authors would say that the introduction of an intervention defines an action-oriented approach. In this thesis, the objective of the thesis was to produce explanatory knowledge, and one tool to produce such explanatory knowledge is the use of an intervention.
8.4 Choosing an approach The objective of knowledge generation in this thesis was to provide explanatory knowledge, that is, to provide knowledge about the relationship between transparency, trust, and service quality in the research context. Furthermore, the propositions presented in Part II of the thesis could be investigated using a qualitative method and then operationalized into hypotheses that could be tested using a quantitative explanatory method. This suggested the use of a mixed-method design. However, the question became, why should the propositions be operationalized? Could I not just stick with the propositions? One could argue that the propositions point to gaps in current knowledge, thereby indicating where research is required. Much of the alignment research has been done from a positivistic perspective, i.e. finding correlations between concepts such as performance and alignment, governance and alignment and so on using quantitative data. However, at the same time, newer alignment research has suggested that studies should move away from this mechanical configuration and that researchers should conduct deeper and more extensive studies. In this light, I would argue that a combination of an interpretive and positivistic understanding would contribute more to the alignment field than an interpretive or positivistic part alone. In fact, I would make the claim that a major drawback of current alignment theory is that the theory is not grounded in a subjective understanding of the research subjects. Doing survey analysis is adequate, but it does not capture the complexity of the organization. This is also the point of several opponents of alignment theory, such as Silvius (2007) and Ciborra (1999).
12 This is the only way to see how a conceptual relationship changes over time.

METHODOLOGY
Page 62/245
Another argument for using a mixed-method design was that such a design could help generalize the findings of the thesis, and at the same time avoid the use of a solely positivistic approach, which is not based on the subjective understanding of the employees at the case organization. Creswell & Clark (2007) mention that when “a researcher … wants to both generalize the findings to a population and develop a detailed view of the meaning of a phenomenon or concept for individuals,” a mixed-method design is most suitable.
8.5 Choosing a design Today, several mixed-method methodologies have been developed and used, and the mixed-method field as a whole is more accepted today than previously (Creswell & Clark, 2007). Creswell et al. (2003) and Creswell & Clarke (2007) have provided a list of design strategies for mixed-method research based on a comprehensive review of the method literature. According to Creswell & Clarke (2007), mixed-method research is a research design with philosophical assumptions as well as specific methods of inquiry. As a methodology, it involves philosophical assumptions that guide the collection and analysis of data, and the mixture of qualitative and quantitative approaches in many phases of the research process. As a method, it focuses on collecting, analyzing, and mixing both quantitative and qualitative data in a single study or series of studies. Its central premise is that the use of quantitative and qualitative approaches in combination provides a better understanding of research problems than either approach alone (Creswell and Clark, 2007).
I found this point by Creswell and Clark to be fitting. Uniting a qualitative method with a quantitative method provides a deeper understanding of the problem because the interpretive understanding formed based on, for example, interviews in the qualitative research can be analyzed from a quantitative positivistic perspective. The positivistic perspective can then be used to validate the underlying theoretical understanding, and the interpretive understanding can be challenged and changed if necessary. Only using a quantitative or qualitative method would not provide this level of understanding. The combination, however, also poses some challenges that will be discussed later in this chapter.
The combination of an interpretive (qualitative) and positivist (quantitative) understanding can be found in several of the mixed-method designs presented by Creswell et al. (2003). However, one design that fit well with the ambition of this thesis was the mixed-method framework presented by Lee (1991). This framework is illustrated in Figure 10.

METHODOLOGY
Page 63/245
Figure 10: A mixed-method framework by Lee (1991)
A key point of Lees’ (1991) framework is to construct a positivistic understanding based on an accurate interpretive understanding, which is based on the subjective understanding of the research object. That is, the subjective understanding consists of the common sense and meanings of the employees in the case organization, and this is then used to form the interpretive understanding. The arrows in Figure 10 have the following meaning: the subjective understanding provides the basis for the interpretive understanding (arrow 1), which provides the basis for the positivist understanding (arrow 3), from which follow predictions (arrow 5) about the subjects. The actions that the subjects display are outward signs or artifacts of their own subjective understanding (Lee, 1991). The subjective understanding can either confirm of disconfirm the predictions of the positivist understanding (arrow 6). A disconfirmation would call for an improvement in the antecedent interpretive understanding (arrow 4), which in turn would call for a fresh reading of the subjective understanding (arrow 2). The subjective understanding can then be interpreted again to form a new interpretive understanding, and so on.
The intent of the framework is that the results of the interpretive understanding can help to develop or inform the subsequent positivistic understanding, and that a disconfirmation of the positivistic understanding leads to a reevaluation of the interpretive understanding. A mixed-method beginning with the qualitative phase is best suited for exploring a phenomenon or theory (Creswell et al., 2003). This exploration can later be expanded to use quantitative data. Such a design is found most useful when the purpose of the research is to test an instrument or to identify important variables to study quantitatively. The design is also expedient when the researcher wants to test aspects of a theory or classification, or enhance a theory (Morgan, 1998).
As mentioned earlier, I wanted to research the propositions and later operationalize them into hypotheses using the interpretive understanding as a basis. The hypotheses could then be tested using an intervention. Lee’s (1991) design fits well in this context, because the interpretive phase provides information that I could use to develop my intervention and then validate the intervention using quantitative analysis. Furthermore, the framework does not require both phases to be equal in strength. As Lee (1991) writes: “This paper [the framework] does not advocate that a given organizational study must pursue the interpretive approach and the positivist approach with equal emphasis […]. Rather, this

METHODOLOGY
Page 64/245
paper is simply making the point that the two different approaches are mutually supportive, not mutually exclusive.”
Furthermore, the design opens up the possibility of doing different numbers of iterations of the subjective-interpretive-positivistic cycle. If the research ends up taking a long time, one cycle could be executed, and if more time is available, several cycles can be performed to provide more accurate data13.
8.6 Tailoring the mixed-method design to the thesis Lee’s (1991) framework does not provide detailed information on data gathering and analysis, and neither should it. It is described at an abstract level. Therefore, a tailored version of the framework containing tasks that are more specific was used in the thesis. The tailored design is illustrated in Figure 11. Note that the framework contains arrows to and from the different understandings. If the predictions from the positivistic understanding are not identified in the subjective understanding, this calls for a reinterpretation of the theory.
Figure 11: The tailored research design
In the above figure, I have attached the various tasks that were conducted in the research project. An overview of the tasks can be found in Table 13.
13 This is only necessary if the positivistic predictions are fully confirmed by the subjective understanding.

METHODOLOGY
Page 65/245
Table 13: The task in the research design
Task Description
1+2 A set of propositions is formed based on a comprehensive review of the literature.
3 Semi-structured interviews are performed in the case organization to collect qualitative data. This data will be used to investigate the propositions.
4+5 The interviews are analyzed and an interpretive understanding is formed.
6 The interpretive understanding is used to see whether the proposed link between the concepts (propositions) is valid (i.e. the propositions are reserached).
7 The interpretive understanding help create the positivistic understanding.
8 The interpretive understanding is used to operationalize the propositions into hypotheses, which make predictions about the subjects in the research organization.
9 An intervention is created based on the interpretive understanding. The goal of the intervention is to test the hypotheses.
10 Pre-qualitative data is gathered before the intervention is introduced
11 The intervention is implemented in the case organization.
12 Post-qualitative data is gathered after the intervention is introduced and the predictions are tested based on the subjective understanding. As Lee (1991) writes: “the formal and experimental procedures of the positivist approach, derived from the natural sciences, are fully recognized and incorporated into the proposed framework, as embodied in arrow 5 (the derivation of predictions from the theory) and arrow 6 (the testing of predicted behaviors against actual behaviors, arising from the subjective understanding)”.
13 The hypotheses are tested and are either confirmed or rejected. If the hypotheses are rejected, this calls for a reinterpretation of the subjective understanding.
The task list in Table 13 provides an overview of the tasks completed in the thesis. As mentioned previously, this chapter will not go into detail about each task, as these descriptions will be featured in Part IV, Part V, and Part VI, respectively. A key aspect of the design is the transition from the interpretive to the positivistic portion of the research. The intention was to use the interpretive understanding to help create a positivistic understanding. This would allow me to accommodate for some of the critique of alignment theory, meet the requirements of the stakeholders, and provide research that fits my level of ambition.

METHODOLOGY
Page 66/245
8.7 Philosophical considerations regarding the research design In the previous sections, I discussed the methodology of the mixed-method research design. However, a design also carries philosophical assumptions. This section will feature a discussion of the underlying philosophical assumptions of the design chosen.
Scientists interested in mixing methods have inherited a legacy that makes it difficult to integrate qualitative and quantitative approaches on a more profound level (Bergman, 2008). This is because the mixed-method encompasses qualitative and quantitative methods, each featuring their own philosophical assumptions. Because of this, scientists wanting to do mixed-method research “usually have to take refuge in a rather freely interpreted form of philosophical pragmatism” (Morgan, 2007).
The philosophical assumptions of quantitative research have their roots in a school of thought within the philosophy of science denoted as “logical empiricism,” or positivism. These methods operate with the requirements of falsifiability, logical consistency, explanatory power, and survival (Lee, 1991) and include hypothesis testing, mathematical analysis, and inferential statistics. Qualitative methods, on the other hand, typically have their roots in disciplines such as hermeneutics or ethnography and operate based on the interpretation and understanding of people, events, and artifacts (Lee, 1991).
The interpretive approach to organizational research maintains that the methods of natural science (i.e. positivist) are inadequate for the study of social reality. The argument is that people, and the physical and social artifacts that they create, are fundamentally different from the physical reality examined by natural science (Lee, 1991). In contrast, positivist approaches maintain that the methods of natural science constitute the only legitimate methods for use in social science. An interpretive approach cannot be validated and generalized to an adequate extent and cannot provide reliable data.
As Madey (1982) state, “One camp extolls the virtues of hard, generalizable data […] and the other extolls the superiority of deep, rich observational data […]”. The two camps are based on two different and competing ways of understanding the world, which are seen in the way the research data is collected (words versus numbers) and in the perspective of the researcher (perspectival versus objective) (Maykut and Morehouse, 1994). When doing mixed-method research, both camps are represented, which is disapproved of by some scholars.
Yet, despite the existence of these “camps,” mixed-method research has gained popularity in recent years (Creswell & Clark, 2007, Bergman, 2008). One reason for this is that mixed-method research aims to take the best of qualitative and quantitative methods and combine them. However, this is not as straightforward as it might sound. Linking constructivism14 and positivism15 has led to “paradigm wars” (Bergman, 2008) in the past, since the underlying assumptions of the perspectives are largely incompatible. A possible solution suggested by some methodological researchers is to adopt pragmatism. Pragmatism, which has some resemblance to rationalism, does not seek to describe or mirror reality, but rather to use thought as an instrument for prediction, action, and problem solving. Therefore, knowledge,
14 An example of a research method utilized for doing qualitative research
15 An example of a research method utilized for doing quantitative research.

METHODOLOGY
Page 67/245
language, and concepts such as transparency and trust, are best viewed in terms of their practical utilization16 in specific contexts. It could be argued, however, that adopting pragmatism as a way to avoid evaluating the strengths and weaknesses of interpretive and positivist research sends a signal of ‘anything goes’ (Bergman, 2008), and seems to question whether methodological concerns ought to preoccupy the researcher at all. In addition, being pragmatic does not make the inherent assumptions of the research disciplines go away; it just says that they do not matter.
Instead of ignoring the proposed issues when combining qualitative and quantitative research, I will attempt to analyze and examine the consequences of the combination. This will provide a discussion about the strengths and weaknesses of a mixed-method design, which is one of the purposes of this chapter.
Quantitative and qualitative research qualities One of the main differences between qualitative research (schools such as constructivism and critical theory) and quantitative research (schools such as positivism and post-positivism) is the level of subjectivity and objectivity. Qualitative researchers argue that quantitative research reproduces only a certain kind of science, a science that silences too many voices. In response, quantitative researchers argue that what they do is good science, free of individual bias and subjectivity (Denzin & Lincoln, 2005).
Besides the main difference of being either subjective or objective in nature, Bergman (2008), Cresswell (2007), and Morgan (2007), among others, list various research qualities for quantitative and qualitative research. These qualities are listed in Table 14.
Table 14: Qualities of qualitative and quantitative research
Qualitative research Quantitative research
A belief in a constructed reality, multiple (constructed) realities, or a non-existent reality.
A belief in a single reality
An interdependence between the knower and the known, i.e. the impossibility of separating the researcher from the research subject
The possibility and necessity of separating the knower from the known
The inadvertent value-ladenness of the research process and its output, i.e. the impossibility of conducting research and interpreting research findings objectively.
The possibility and necessity of value-free research.
The centrality of the context to the research process and findings, e.g. time, space, politics, specific situation during data production, interpretation, presentation, etc.
The possibility of generalizing findings beyond the contextual limits of the researched units and research situation.
16 Inspired by http://en.wikipedia.org/wiki/Pragmatism

METHODOLOGY
Page 68/245
The impossibility of generalizing research findings beyond the limits of the immediate context.
The pursuit to identify universal, causal laws
The impossibility of distinguishing between causes and effects.
The possibility of distinguishing between causes and effects using statistical analysis and making changes to the research object.
The explicit focus on inductive, exploratory research approaches
An emphasis on deductive research via falsifiable hypotheses and formal hypothesis testing.
The tendency to work with small, non-representative samples.
The tendency to work with large, representative samples
Looking at the strengths and weaknesses of the two research approaches, two points come to mind. First, given that the research process is often iterative, messy, and complex, why are the qualities so diametrically opposed? The qualitative tradition originates from the quantitative tradition, as historically, “qualitative research was defined within the positivist paradigm, where qualitative researchers attempted to do good positivist research with less rigorous methods and procedures” (Denzin & Lincoln, 2005). Given the clear difference between the qualities, it seems that the distinction is not only based on specific boundaries, but is also a truce between two factions (Bergman, 2008). Each field has some unique advantages not existing in the other field that can be emphasized for that kind of research.
The second point is that people using mixed-methods must use a “strangely schizophrenic position” (Bergman, 2008). On the one hand, they must accept and emphasize the divergent qualities attributed to each paradigm, which, on ontological and epistemological grounds, are clearly incompatible. On the other hand, they put forward the proposal that the strength of each paradigm can be combined fruitfully within one single research design.
With these points in mind, the emergence of mixed-method research in recent years is peculiar. Mixing methods has become a popular way of thinking about how to approach research questions. Indeed, it has almost become a distinctive approach in its own right, with a growing number of books and articles devoted to outlining its fundamentals (Creswell, 2007). If the philosophical assumptions of the two “schools of thought” are incompatible, how can studies using mixed-methods be justified other than through pragmatism? One explanation is that even if the field of mixed-methods is growing, the amount of systematic research on mixed-methods is not nearly as large as that of mono methods (Bergman, 2008). As a result, it becomes more difficult to specify what should, and what should not, be avoided when combining quantitative and qualitative methods. Another explanation is that the assumption of impermeable boundaries between qualitative and quantitative research has been relaxed, paving the way for multi-method research.
I will now attempt to discuss the strengths and weaknesses of the design chosen, as well as some issues with mixed-method research identified by other authors. I will take the points brought up by various authors regarding mixed-methods and apply them to the project at hand.

METHODOLOGY
Page 69/245
Combining a subjective and objective perspective The primary issue with mixed-methods is the combination of two different schools of thought. In this thesis, two phases will be performed: a qualitative phase, where I will interview employees in the case organization about their issues in relation to the thesis concepts and constructed framework, and an quantitative phase, where I will collect survey data using survey items and perform an experiment.
In the first phase of the research, some of the assumptions are that an interdependence between the knower and the known makes it impossible to be objective, that it is impossible or very difficult to generalize research findings beyond the limits of the immediate context, and that the explicit focus is exploratory rather than explanatory. Furthermore, doing interviews assumes that several constructed realities exist based on the interviewees’ beliefs and mind-sets.
When the interpretive phase is completed, I switch to the quantitative phase, which carries assumptions that a single reality exists, that conclusions can be generalized, and that the primary aim of the research is explanatory in nature. Setting aside the personal view of the researcher, the issue with mixed-methods is not each phase individually, but rather the combination of the phases. In other words, there is no issue in assuming that performing interviews entails a subjective attachment to the knowledge generated whereas collecting survey data does not. The area where the researcher must to take caution is in the transition from the qualitative phase to the quantitative phase.
It is my point of view that a core requirement of using mixed-method research is to accept and acknowledge the fundamental concepts of the interpretive and positivist approaches. However, how can the transition from interpretive research to positivistic research then be carried out to enjoy the benefits of both schools without invalidating the research?
Here, I turn to the work of Lee (1991) and Bergman (2008). Lee has proposed a framework that bridges the “gap” between qualitative and quantitative research. The idea of the framework is that three levels of understanding are interchanged: the subjective understanding, the interpretive understanding, and the positivistic understanding. The subjective understanding provides the basis for the interpretive understanding, which then provides the basis from the positivistic understanding, from which follows predictions about the research subjects. The positivistic predictions are then compared to the subjects’ behavior, which either confirms or disconfirms the predictions. If a disconfirmation occurs, the finding would require a refinement of the positivistic understanding, which would require an alteration of the interpretive understanding, which would in turn call for a fresh reading of the subjective understanding.
This cycle could then be performed again to form a new interpretive understanding, and so on. The main argument that Lee (1991) proposes is that the interpretive and positivistic understanding can be combined if the positivistic understanding is based on the interpretive understanding; a disconfirmation of the positivistic understanding would call for a reinterpretation of the interpretive understanding. That is, the philosophical assumptions of each are maintained, and the combination is made done by basing

METHODOLOGY
Page 70/245
the positivistic understanding on the interpretive understanding. More specifically, a number of criteria17 must be satisfied:
1. The interpretive understanding should be properly based on the subjective understanding. 2. The subjective meanings recorded in the interpretive understanding should have been built into
the positivist understanding. 3. The confirmation or disconfirmation of the predictions formed in the positivistic understanding
should be used as indicators of the validity of interpretive understanding. 4. The actions, theorized by the positivist understanding, should be understandable to the
observed human subjects themselves, in terms of their own subjective understanding. 5. The predictions formed in the positivistic understanding should match observations in the
research context.
I find that the design advocated by Lee (1991) constitutes a sound way to carry out mixed-method research. A drawback, however, is that the design assumes that researchers accept both ways of doing research. This is actually a drawback of all mixed-method designs, since they all employ both qualitative and quantitative research, as the name would suggest.
Bergman (2008) does not propose a framework, but rather argues that division of labor between quantitative and qualitative research is artificial. For instance, Bergman argues: “It is often claimed that QL18 research is based on the assumption that reality is either constructed or does not exist, while QN19 research supposedly assumes the existence of one single reality. In practice, however, this ontological proposition is often inconsistent with research applications.” As an example, Bergman use textual material such as documents and interview transcripts. These documents can be analyzed with regard to what was said by whom and in what particular context. The textural material may be studied from different analytic perspectives, without one approach being superior. How the data is understood and analyzed must be based on the consistency between the understanding of the data and the specific research question, rationale, and aims. Only in connection with the specificities of the research goals does it make sense to delimit the nature of reality (Bergman, 2008). Thus, researchers decide which truth claims they will make in relation to their data and findings. As Bergman argues,
“The research focus may well delineate ontological and epistemological constraints. A Foucauldian discourse analysis demands an interpretive approach to the research but it does not change the nature of the textual data. The same textual data can be used for other, ontologically and epistemologically different, positions, which are derived from different research agendas. The decision on whether the researcher deals (or, better, wants to deal) with one single reality, a constructed reality, multiple realities, multiple constructed realities, a co-constructed reality between the
17 Lee (1991) uses the term test, but I have reformulated them in a normative manner for readability.
18 Qualitative
19 Quantitative

METHODOLOGY
Page 71/245
researcher and the researched, or no reality at all is unrelated to whether patterns in the data are detected via statistical analysis or otherwise.”
My understanding of Bergman’s argument is that it is not the data (such as textual material) that defines the ontological and epistemological position, but rather a combination of choices (perhaps unknown to the researcher), and research goals. As such, I find that the approaches of Lee (1991) and Bergman (2008) are aligned. If the goal of a mixed-method design is to use different methods in the same context, there are no apparent issues, as long as the constraints of the interpretive and positivistic understandings are satisfied. That is, the criteria proposed by Lee are satisfied, and the requirements of falsifiability, logical consistency, relative explanatory power, and survival are met.
Using the arguments of Lee and Bergman, I have accounted for methodological and philosophical implications of the overall mixed-method research design used in this thesis. I will not argue, however, that I have found the best design or that I have answered all the identified critiques of mixed-method research. Based on the literature and the “paradigm wars” mentioned, discussing and accounting for every part of the critique would be a thesis in itself.
Summary of the philosophical considerations Scientists interested in mixing methods have inherited a legacy that makes it difficult to integrate qualitative and quantitative approaches on a more profound level (Bergman, 2008). Qualitative research makes ontological and epistemological assumptions such as the existence of several constructed realities, and an interdependence between the knower and the known, whereas quantitative research stresses that only a single reality exists and that it is necessary to separate the knower from the known.
One way to overcome this conflict is to accept the core concepts of each approach, at the same time taking care to properly transition from the qualitative to the quantitative approach. In this process, the five criteria proposed by Lee (1991) are very useful and will be used in the subsequent parts of this thesis. Using these criteria, the conflict is averted, partly because the positivistic/quantitative understanding is built on the same subjective understanding as the interpretive/qualitative understanding, and any disconfirmation of the positivistic understanding calls for a modification of the interpretive understanding.
Still, using a mixed-method research design has its strengths and weaknesses. The main strength of the chosen design is the ability to put the findings from different methods into a dialogue that can result in a more fine-grained understanding. Furthermore, the combination of different approaches fits more with practical inquiry, which is appropriate when doing an industrial Ph.D., and makes the presentation of the data easier because some people might prefer qualitative data while others might prefer quantitative, statistical data. The weaknesses, on the other hand, are the need to be precise about how the different approaches are combined; it might spark a paradigm war (Bergman, 2008); and it requires that people accept both the qualitative and quantitative research approaches as valid when doing organizational research.
8.8 Chapter summary The research question posed in the introduction of this thesis was: How do trust, transparency, and service quality interact within an alignment perspective, and what are the barriers in the process? The

METHODOLOGY
Page 72/245
current chapter has argued that this research question can be answered using a mixed-method design. As such, the mixed-method design of Lee (1991) was tailored to the research project. The reason for choosing this design was that uniting a qualitative method with a quantitative method was found to provide a deeper understanding of the problem compared to only having a single qualitative or quantitative part. Even if the combination of quantitative and qualitative methods introduces challenges and might spark the paradigm war (Bergman, 2008), these challenges can be mitigated by adhering to the research criteria proposed by Lee (1991). These criteria are addressed in Part VI of the thesis.

ABOUT CARLSBERG
Page 73/245
9 ABOUT CARLSBERG Before going into the interpretive portion of the thesis, the case organization will be presented. The case organization used in this thesis is the company Carlsberg. The specific research context is the relationship between business employees involved in IT development and changes, and IT employees at Carlsberg. In this context, involvement indicates that the business employees are dependent on Carlsberg IT. Examples of involvement include the business employees sponsoring a project that involves IT, making a request for an IT change, or wishing to initiate an IT project. The following text will provide an overview of the case organization, with a focus on the area responsible for IT development and change: the change request area. Furthermore, a brief history of the Company will be provided, along with a description of a large-scale standardization project currently being implemented at Carlsberg. This latter description is given because of the effect that the standardization project has on all areas at Carlsberg, including the change request area.
9.1 A brief history of Carlsberg Carlsberg was founded in Denmark in 1847 by J. C. Jacobsen. The company originally started selling beer inspired by foreign countries to Copenhagen citizens, who were used to a softer type of beer. The beer introduced by Carlsberg was a success, and over time, the company expanded to the whole country. After World War II, and especially since the late 1990s, Carlsberg began to establish beer production in foreign countries. The expansion was primarily done through mergers and acquisitions with other breweries, where operations in the local markets were left untouched. Because of these acquisitions and mergers, the overall complexity of the organization increased greatly.
Today, Carlsberg is the fourth largest brewery in the world, operating in 150 markets and competing with over 500 different beer brands. The organization employs about 45,000 people worldwide on three continents. The Carlsberg Group headquarters is located in Denmark, together with most of Carlsberg IT and Carlsberg Denmark. Different business units are located in Northern Europe, Western Europe, Eastern Europe, and Asia. The business units in the various countries consist of on-and-off trade, logistics, sales, marketing, finance, and controlling. The IT department, denoted One Carlsberg IT (CIT), employs about 200 individuals. Although most of these employees are from Denmark, people from other European countries also work in the IT department.
9.2 Standardizing Carlsberg Due to the increasing complexity of the Carlsberg group, the Carlsberg headquarters has adopted a large standardization program called the Business Standardization Program (BSP). The goal of the BSP is to introduce a process-centric view at Carlsberg and standardize the different processes to support the company’s strategy. The standardization will align with the overall strategy of becoming the fastest growing beer company in the world, because it is meant to make Carlsberg faster, smarter, and leaner.
Besides the goal of standardization, the BSP also aims to create operational excellence using internal and external best practices. By creating the necessary transparency and integrated end-to-end processes, the BSP will make it possible to optimize and focus on the operational areas that add the most value. So far, the geographical scope of the BSP includes Denmark, Sweden, Germany, the United Kingdom, Finland, Norway, and Switzerland. The process scope of the BSP includes most of the business processes in the

ABOUT CARLSBERG
Page 74/245
various countries, with different grades of standardization depending on the operational area. The BSP will affect the countries with regards to organization, processes, governance, and IT. The program’s extended time span, cross-country coordination, and huge impact on the organization’s different work areas are highlighted as the most critical factors. Since the program was announced in 2009-2010, several delays have been reported. These delays have pushed the project back at least 3 years, which means that the program will finish in 2018.
9.3 History of the IT department at Carlsberg Over the lifespan of Carlsberg, the IT department (CIT) has grown from separate independent departments to a global department, in response to external requirements. The most important events in the history of the IT department are displayed in the below table.
Table 15: Important IT department events
Time Event
Until 2002 - IT exists as separate independent departments, without any standardization or coordination.
2002-2005 - A shared SAP system between the countries of Denmark, Sweden, and Norway is implemented.
- A shared network and active directory solution is created for the countries of Denmark, Sweden, Norway, Switzerland, Poland, Italy, and England.
- The IT departments of Denmark, Sweden and Norway are merged into Carlsberg Nordic IT Services (CNITS)
2005-2006 - IT maintenance is outsourced to IBM across 9 European countries.
- IT systems are standardized where possible.
2009-2010 - CNITS become One CIT and now encompass the countries of Denmark, Sweden, Norway, Switzerland, Germany, Poland, Italy, England, France, and Greece.
- The consulting company Accenture is hired to create an organizational structure for One CIT.
2010-2011 - New roles and boards are established to implement a unified structure for the IT department.
2011-2012 - McKinsey is hired to identify savings, which results in several employees being fired and several departmental units either removed or merged with other units. The organizational structure is still process-based.
- The CIO is fired and a former CFO takes his place.

ABOUT CARLSBERG
Page 75/245
2013-2014 - The organizational structure changes from process-based to functional based. This is done to make accountability clearer. In this process, 9 people are fired, including the head of business relations.
2014-Present - IBM is replaced as a vendor.
- The remaining countries where Carlsberg operates are also to be served by an external vendor.
- One CIT is planned to encompass all local IT departments.
Today, the IT department at Carlsberg consists of departments in several countries. Most of the controlling activities are grounded in Denmark. The organizational structure defined by Accenture in 2010 was replaced in February 2013 by a more structural focus. As of February 2013, CIT consists of the following departments:
Figure 12: Organizational structure of CIT
IT strategy and sourcing are responsible for the architecture, strategy and sourcing of the IT department. IT application development is responsible for developing applications (minor changes). IT project management is responsible for developing larger changes (projects). IT infrastructure management is responsible for vendor management, portfolio management, and infrastructure IT changes. Lastly, two departments focus on IT projects and services regarding Asia and Eastern Europe. The areas involved in IT development and change are IT application development, IT project management, IT infrastructure management, and IT application management.
9.4 Change Request and Deliverables The responsibilities of CIT (Carlsberg IT) towards the business can be divided into three areas:

ABOUT CARLSBERG
Page 76/245
1. Changing and developing new functionality. 2. Maintaining and repairing existing functionality. 3. Miscellaneous tasks such as configuring user-access, on- and off-boarding, and contract
negotiation.
Changing and developing new functionality is about creating new systems, making changes to existing systems, or creating bridges between applications and systems. Maintenance is about repairing what no longer works due to system breakdowns, changes, or other circumstances. This area is outsourced to external vendors such as IBM. Miscellaneous tasks include the activities that are considered part of IT, but which are not part of the department’s focus. This includes negotiating licenses and providing people with IT equipment. The three areas, the type of area, and examples of work in each area are displayed in Table 16.
Table 16: Work areas and examples in Carlsberg-IT
Area Type Example
Changing and developing new functionality
IT development and change Changes to SAP Adjust firewall rules Application upgrade
Maintaining and repairing existing functionality
Support SAP memory / runtime issue User-access to system removed.
Miscellaneous Miscellaneous Providing system access to a new employee Negotiating a new contract with an external vendor
As stated previously, this thesis focuses on the change request area. Apart from the reasons stated previously, an additional reason for choosing this area is that it provided an opportunity to enhance transparency. Transparency could be increased at the operational level (e.g. delivery times and work done), at the tactical level (e.g. scope and expected resources), or at the strategic level (e.g. road maps and overall plans). To provide an answer to the second research question, an intervention was required. CIT’s first area (changing and developing functionality) was found to be most appropriate for an intervention. This is because the support area is outsourced to external vendors, which made access to raw data onerous. The miscellaneous area constitutes a small part of the IT department, and an intervention here would have had little effect.
9.5 What is a change request? A change request is a “package” containing the software and hardware that need to be handed over to the business customers upon request. A change request is segmented into Minors (small requests) and Projects (large requests). This segmentation is performed based on the cost and complexity of the request. The process for making a change request is displayed in Figure 13. The following example from Carlsberg illustrates what a change request is: A change request with the tracking number 7233 was created on 06-

ABOUT CARLSBERG
Page 77/245
02-2013. This change request concerned a change in a SAP transaction code. The outcome of the change was that an email address would be visible on customer balance confirmations. The change request was requested by the financial department in Lithuania. After the change request was assessed by the change request manager, it was approved for development by the local demand board on 15-04-2013. Thereafter, development started, and on 08-05-2013, the change request entered acceptance testing (evaluation) and was closed some days after.
Figure 13: The Change request process at CIT, from idea to close
Figure 13 illustrates the change request process from idea (on the left) to hand-over. Omada, which is mentioned in step 4, is a piece of software used to track changes. In the prioritization in step 7, the change request is either accepted or rejected. This prioritization is performed by a board of employees consisting of IT employees and business employees, called a local demand board (LDB). If a change request is accepted, resources are allocated and development is started. Lastly, the change is evaluated and handed over to the business. Local demand boards are present in most countries. If they are not present, the decision on whether to continue with a change request is handled by a board called the strategic investment board (SIB). For comprehensive change requests, the decision is always made by the strategic investment board. Every business department at Carlsberg is forced to use Carlsberg’s IT department for IT development, and is therefore not allowed to utilize alternatives.
Change request responsibility The responsibility for moving the change request further along in the change request process depends on the step. The responsibilities are displayed in Table 17.
Table 17: Change request responsibility
State Description Responsibility
1.0 Creation Business relationship manager
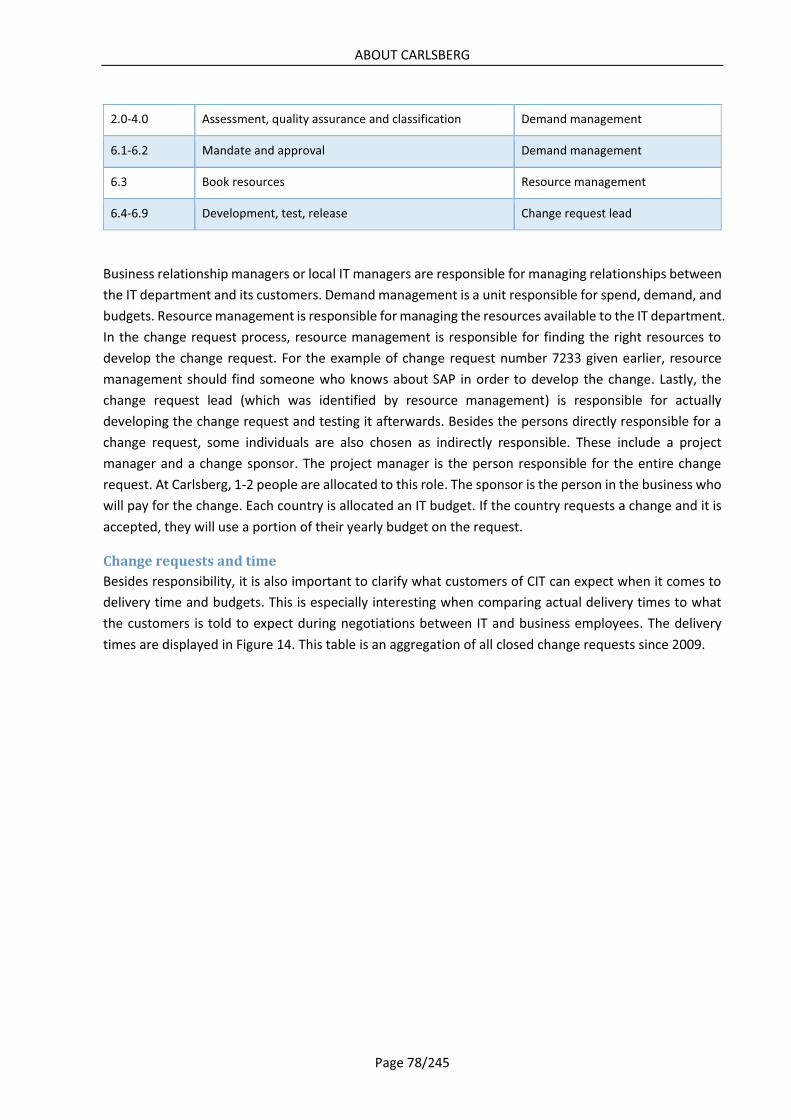
ABOUT CARLSBERG
Page 78/245
2.0-4.0 Assessment, quality assurance and classification Demand management
6.1-6.2 Mandate and approval Demand management
6.3 Book resources Resource management
6.4-6.9 Development, test, release Change request lead
Business relationship managers or local IT managers are responsible for managing relationships between the IT department and its customers. Demand management is a unit responsible for spend, demand, and budgets. Resource management is responsible for managing the resources available to the IT department. In the change request process, resource management is responsible for finding the right resources to develop the change request. For the example of change request number 7233 given earlier, resource management should find someone who knows about SAP in order to develop the change. Lastly, the change request lead (which was identified by resource management) is responsible for actually developing the change request and testing it afterwards. Besides the persons directly responsible for a change request, some individuals are also chosen as indirectly responsible. These include a project manager and a change sponsor. The project manager is the person responsible for the entire change request. At Carlsberg, 1-2 people are allocated to this role. The sponsor is the person in the business who will pay for the change. Each country is allocated an IT budget. If the country requests a change and it is accepted, they will use a portion of their yearly budget on the request.
Change requests and time Besides responsibility, it is also important to clarify what customers of CIT can expect when it comes to delivery time and budgets. This is especially interesting when comparing actual delivery times to what the customers is told to expect during negotiations between IT and business employees. The delivery times are displayed in Figure 14. This table is an aggregation of all closed change requests since 2009.

ABOUT CARLSBERG
Page 79/245
Figure 14: Average time in days that a change request stays in each process state
The breakdown of delivery times reveals that it takes about 63 days before development is started after creating a change request. When development is started, 150 days are used on actual development. This means that almost one half (42%) of a change request’s life cycle is spent on administrative tasks. In total, the average delivery time of a change request is 213 days.

ABOUT CARLSBERG
Page 80/245
9.6 Cost and spend The amount of IT services that CIT can deliver to each country is based on the country’s beer sales. The more beer a country sell, the more IT services it can buy. The current spend allowed for each country is displayed in Figure 15.
Figure 15: Total spend for CIT in 2012
The above figure shows that most of the IT development is performed for the following: the Carlsberg headquarters (Breweries), the IT department (CIT) itself, the Global Carlsberg Supply Chain program (CSC) and the global Business Standardization Program (BSP SL3). The remaining IT development is spread out among the countries. In total, approximately 150,000,000 DKK is spent on IT development each year. This is approximately 40% of the total IT budget. The remaining 60% is used on licenses, maintenance, and other activities. Besides the IT development being done by Carlsberg IT, some of the countries and HQs have also created small IT units. These units include Business-IT in Denmark and CEO back-office at HQ. These units were created because some needs were not being met by Carlsberg IT, even though this violates the principle that all IT development should take place within CIT.
9.7 Trust in the relationship Historical analysis of documents reveals that the customers of the IT department have been very dissatisfied with IT deliveries and IT in general. This was a conclusion of a previous study on the IT-business relationship at Carlsberg (Gryning et al., 2010). Even if that study only scratched the surface of the relationship, it was evident that issues with trust existed. The business department perceived the IT department as reactive and slow, whereas the IT department found that they could only be effective if the business departments trusted them (Gryning et al., 2010). The low level of trust was found to have negative consequences for satisfaction, cost, cooperation, and performance.
9.8 Chapter summary This chapter introduced the case organization Carlsberg. Carlsberg was founded in 1847 as a small brewery in Copenhagen. Since then, the brewery has experienced a rapid transition into a global company.

ABOUT CARLSBERG
Page 81/245
This expansion has entailed acquisitions of other breweries with redundant and complex processes. Similar to most global companies, the IT department at Carlsberg has struggled to achieve alignment with the business departments. As a previous study indicates, the IT-business relationship at Carlsberg is pervaded by dissatisfaction and a lack of trust. Carlsberg has attempted to fix this relationship using different initiatives and by employing additional employees, yet the relationship still seems to be in a poor condition.

PART IV
Page 82/245
PART IV

THE INTERPRETIVE METHOD
Page 83/245
10 THE INTERPRETIVE METHOD PART III clarified why a mixed-method research design was chosen as the primary research design. This research design encompassed a subjective portion, an interpretive portion, and a positivistic portion. The chapters of PART IV present the interpretive research of this thesis. The goal of the interpretive chapters is twofold: first, the chapters aim to account for the interpretive understanding formed; and second, the chapters provide answers to the propositions stated in FRAMEWORK & PROPOSITIONS.
10.1 Terminology In this part of the thesis, I use “the relationship” to refer to the context of the research: the relationship between the IT department and business departments at Carlsberg.
The term case organization is sometimes used as a substitute for Carlsberg and the term CIT is used for the IT department at Carlsberg. I also use the abbreviation CR for change request. A change request is a package of functionality to be delivered by the IT department to the business departments (see ABOUT CARLSBERG).
The term record is used to refer to formalized examinations or investigations performed within the IT department or business departments. Records can be textual reports done by consultants, managers, or employees.
10.2 Qualitative method To provide answers for the propositions and a basis for the positivistic understanding, three sources of data were used. For each source of data, any relational issues identified were discussed and the reasons behind the issues were analyzed in light of the SP framework. The structure of the interpretive chapters is as follows: first, the IT-business relationship from the IT point of view is described, as well as the identification, gathering, and analysis of archival records; second, the IT-business relationship from the business point of view is described, along with the semi-structured interviews that were conducted at the case organization and their transcription and analysis; third, the IT-business relationship is described based on the experiences gathered during project work and the researcher’s own experiences; and lastly, a chapter is devoted to answering the propositions and validating the SP framework based on the collected data and analysis. The methods for the data collection and analysis will be discussed below.
Collecting and analyzing archival records – Data source one In searching for material, several records were found to be relevant to the study. Criteria for inclusion were that the records be related to the framework or to the issues of the IT-business relationship at Carlsberg. The records were made available to me upon request by managers in the IT department and business departments. Besides the record itself, the purpose of the records were also described, as recommended by Yin (2003). After a selection process, the included records were:
� A survey of stakeholder satisfaction regarding change requests, which was collected by the Project Management team in 2012-2013
� A survey called xQ, which was devised by the consultancy firm Franklin Covey in May 2012 � A list of suggestions provided by Carlsberg employees in 2012 for improving the relationship with
stakeholders

THE INTERPRETIVE METHOD
Page 84/245
� A survey of satisfaction scores collected in 2011 by the Business Relationship Management team
Stakeholder satisfaction survey: The data for the stakeholder satisfaction survey was collected at different time intervals. The collection was done by sending out emails when change requests were completed. These emails asked for feedback regarding different aspects such as whether delivery times and planned estimates were met. This feedback included quantitative data based on Likert-style ratings. Data was available for the following months: 01-03-2012, 01-06-2012, 01-09-2012, 01-11-2012, 01-12-2012, and for the first month of 2013. The purpose of the stakeholder satisfaction survey was to gain a quantitative picture of how effectively CIT operated at the time. The general perception then was that the IT department underperformed, but very little quantitative data existed to support this claim.
Franklin Covey survey: The survey included 27 questions. 129 out of 240 individuals answered, giving a response rate of 54%. 39% of the respondents were managers, 19% were team leads, and 42% were without management responsibilities. All respondents were employed in Carlsberg-IT. Some of the questions were quantitative in nature, and some were qualitative. The survey focused on six overall areas: clarify, commitment, translation into action, enabling, synergy, and accountability. The purpose of the survey was to get an idea of areas where the IT department could improve, which the IT managers could use to implement changes.
Employee suggestions: The list of suggestions by Carlsberg employees was the result of a management initiative. Each employee of Carlsberg-IT was encouraged to come up with three suggestions to improve the relationship between IT and the business departments. The final list included 75 suggestions spanning areas of accountability and transparency. The employees were given 3 weeks to come up with suggestions. The purpose of the suggestions was to pinpoint areas that could be changed to improve the relationship with the business departments at Carlsberg.
Satisfaction scores: The stakeholder satisfaction scores were collected by relationship managers in CIT. Scores were collected every quarter when the relationship manager met with stakeholders located in the different countries that Carlsberg-IT served. Twenty-two countries were asked to rate Carlsberg-IT. Data were available for the first quarter of 2011 and the last quarter of 2011. The scores reflected the quarterly performance of CIT in each country served, in terms development, stability of existing systems, and IT support. The purpose of the satisfaction scores was to keep an eye on the progress of the IT department.
For each record, any issues identified in the relationship were noted and categorized.
Conducting semi-structured interviews and analyzing the results – Data source two To explore the relationship between CIT and the business customers, 20 qualitative, semi-structured interviews were conducted. A semi-structured approach was chosen because I already possessed some knowledge about the area under investigation. The interview guide that was utilized can be found in APPENDIX B. The selection of interviewees was focused on achieving a good representation of the different countries that CIT worked with. The following countries were represented: Denmark, Sweden, England, Germany, Norway, and Poland (Exlid). Carlsberg’s Headquarters (HQ) was also represented and is classified as a country in the data. The position and roles of the people who were interviewed are displayed in Figure 16.

THE INTERPRETIVE METHOD
Page 85/245
Figure 16: Participants in the interviews.
Besides the interviewees from the countries’ business departments, four employees working within IT were also selected for interviews. These employees were selected because they wished to participate, because they had each been employed by Carlsberg for more than 5 years, and because they had been employed in both the business side as well as the IT department. The actual selection of participants was done in the following way: for each of the countries mentioned, the business relationship manager at CIT that was responsible for the country was asked to name three of their main contact points. These contact points were asked to sit for an interview, and the ones who accepted the invitation were interviewed. This approach was chosen to focus on the main contact points between CIT and their customers with regards to IT development and change. The questionnaire was tested on a “test-participant” beforehand to ensure that the language was clear and that the questions made sense in the research context. Based on the test interview, several of the questions were changed. All questions were open and not leading, in accordance with the interview guidelines of Andersen (2002). During the interviews, the main themes of the research were discussed. In addition, any additional themes that the interviewees wanted to address were also included if they related to the framework or propositions.

THE INTERPRETIVE METHOD
Page 86/245
The interviewees’ answers were analyzed to consider new angles and explanations. After all of the interviews were completed, the recorded conversations were transcribed. As this content is rather voluminous, it is not included in the appendices. When the transcription was done, the data was analyzed. The analysis consisted of categorization of the issue according to the research concepts, followed by categorization of aspects of the IT-Business relationship that worked well. The result was a thematic list of the perceived issues.
Observation by the researcher – Data source three During my three-year stay at Carlsberg, I observed several issues in the IT-business relationship. The experiences gathered were included as a data source as well. These observations were found to be important because they captured some of the complexity present when working with alignment, transparency, and trust, which can be difficult to capture in interviews or archival records. Furthermore, since Yin (2003) encourages observation mixed with interviews, I found that the observations provided a good extension of the data. The primary observations were from three projects that I participated in. These projects were 1) a standardization of the company intranet, 2) creation of a cost report for change requests for the customer, and 3) management of the change request area in the IT department. During my work on these projects, I periodically recorded my experience. Like with the analysis of archival records and interviews, the experiences were analyzed based on relational issues and the reasons behind these issues.
Comparing the SP framework to the data - Analysis The last step of the interpretive portion of the research was to perform the data analysis. This was done using a corroboratory mode, where “data is collected from multiple sources but aimed at corroborating the same fact or phenomenon” (Yin, 2003). The benefit of corroboratory data collection is that “the quality of the results is usually higher than if only a single source of data is used” (Yin, 2003). Few fixed formulas exist to guide the novice regarding qualitative data analysis (Yin, 2003). This is because qualitative analysis is not about testing correlational strength using rigid statistical methods, but rather about interpretation, categorization and coding. The researcher is not entirely on his own, however, as several scholars have provided strategies for qualitative analysis.
Yin (2003), who advocates a deductive qualitative method, provides guidelines for methods containing qualitative analysis. These guidelines consist of five important components that must first be clarified:
1. The study’s questions 2. Its unit(s) of analysis 3. Its propositions, if any 4. The logic linking the data to the proposition 5. The criteria for interpreting the findings
In the following text, I will discuss these components for the current research project as an outline of the method used in the qualitative part of the research.
The study’s questions: The first component is the primary research questions. Yin states that the case study research is appropriate when it concern a process or relationship. Since the context for the study was the relationship between the IT and business departments at Carlsberg, this criteria was met. The

THE INTERPRETIVE METHOD
Page 87/245
primary research question was presented and justified at the beginning of the thesis. It is “How do trust, transparency, and service quality interact within an alignment perspective, and what are the barriers in the process?”.
The unit of analysis: The unit of analysis was the relationship between IT and the business departments, based on how interviewees perceived the relationship. The perception of the relationship by aggregating the understanding of each individual in the IT department and those in the business involved in IT development and change.
The propositions: The propositions were based on the primary research question, the literature, and the SP framework. Seven propositions were created.
The logic linking the data to the propositions: This is a more challenging area for most qualitative research (Yin, 2003). The data collected must be used to answer the propositions in some way. Yin presents four general strategies to link the data to the propositions: 1) relying on theoretical propositions, 2) case descriptions, 3) a duality of qualitative and quantitative data, and 4) rival explanations.
The option of using both qualitative and quantitative methods here was discarded because it required statistical analysis (Yin, 2003), and because the overall methodology selected (see METHODOLOGY) ruled out such an idea. Even though some of the records that were included contained quantitative data, these reports were used to support the interpretation of the qualitative data, not as a statistical argument. The case descriptions approach was discarded as well. This approach is most suitable if the purpose is descriptive. As discussed for in the chapter METHODOLOGY, this was not the case.
Of the remaining strategies, rival explanations were found to be most fitting, although theoretical propositions could have been used as well, since a set of propositions had already been formed. Using the rival explanations approach provided another layer of explanation building compared to theoretical propositions alone. This layer helped build the interpretive understanding pursued in the methodology of Lee (1991). Yin argues that rival explanations can be used as a substitute for theoretical propositions, case description, and a duality of qualitative and quantitative data. Rival explanations were therefore chosen to provide answers to the propositions stated in FRAMEWORK & PROPOSITIONS.
When using the rival explanations approach, several different rivals can be used, as shown in the figure below.

THE INTERPRETIVE METHOD
Page 88/245
Figure 17: Different kinds of rival explanations (Yin, 2013)
In looking at case study research, Yin (2013) found that most case studies use rival theories. This type of rival was also selected for this thesis, as it is found to bring the most value. The theory behind the framework was compared to the subjective understanding of the employees at Carlsberg using explanation building. Any conformity between what the data revealed and what the framework predicted was noted and used to validate the propositions. Thus, the issues in the relationship were explored and explained via the SP framework, and they were explained via the subjective understanding of the employees. The search for “discrepant evidence” via rival explanations was done according to the recommendations of Yin (2013). That is, I did not seek to discredit the rival explanations, but rather to establish their potency. After the rival explanations and issues had been discussed, it was determined which of the propositions that were valid.
The criteria for interpreting the findings: For the mixed-methodology as a whole, the five research criteria of Lee (1991) were used (see METHODOLOGY). These criteria are discussed at the end of the thesis. One specific criterion, however, was that the case should not be extreme or unique. As shown in the discussion of the case in the chapter ABOUT CARLSBERG, this condition was met. Carlsberg is similar to other global companies in many ways. More details about this will be provided in the chapter DISCUSSION. Another criterion was that any data bias should be eliminated. This was mainly done by using multiple data sources.
Together, the five guidelines of Yin constitute the method for the qualitative part of the research.

THE INTERPRETIVE METHOD
Page 89/245
10.3 Chapter summary This chapter introduced the methods used in the interpretive portion of the research. The three data sources used were archival records, semi-structured interviews, and observations from project work performed in Carlsberg. The analysis included a comparison of the SP framework to the analyzed data using a rival-theory approach. The combination of the data sources and the analysis fulfilled the goal of the interpretive portion, namely to provide an adequate interpretive understanding that could be the basis for the subsequent positivistic understanding, and to provide an answer to the propositions stated in FRAMEWORK & PROPOSITIONS.

THE RELATIONSHIP FROM THE PERSPECTIVE OF IT
Page 90/245
11 THE RELATIONSHIP FROM THE PERSPECTIVE OF IT In this chapter, I will discuss and analyze the gathered archival records. The aim of the chapter is to provide answers to the following questions:
1. How is the IT-business relationship perceived by people in CIT? 2. What issues exist regarding transparency, trust, and service quality? 3. What are the reasons behind these issues? 4. How is expectation matching performed in the IT-business relationship?
The first and second questions were included to outline relational issues. It is important to understand these issues in order to determine how well the SP framework can account for the issues. The third question was included to gather additional data on any reasons identified. For instance, if a lack of resources is identified as an inhibitor for performance, then why is there a lack of resources? Is it due to unclear expectations, misalignment, a strategic choice, or something else? Asking “why?” makes the analysis more precise, rather than just accepting any answer up front. The fourth question was included in the analysis because it is directly related to one of the core ideas of the constructed framework. The current chapter will first describe the data sources (records) used and then provide an analysis of the sources according to the four questions above.
11.1 Record: xQ report by Franklin Covey The xQ report consisted of questions that the respondents could answer as true or false. The results therefore show how many of the respondent found a specific question to hold true. The most important questions and their scores are displayed in Table 18. The score represents the percentage of the employees who agreed with the statement.
Table 18: xQ scores for selected areas
Statement Score (max=100)
I feel safe in expressing my opinions openly without fear of retribution 87
We hold ourselves accountable for reaching out commitments on time 84
I have a good relationship with my manager 84
We express our views respectfully 81
Our managers actively seek our opinions on how to do things better 77
People are treated fairly – favoritism is not a problem 74
We do not undermine each other 71
We genuinely listen to each other, honestly seeking to understand the viewpoints of others
68
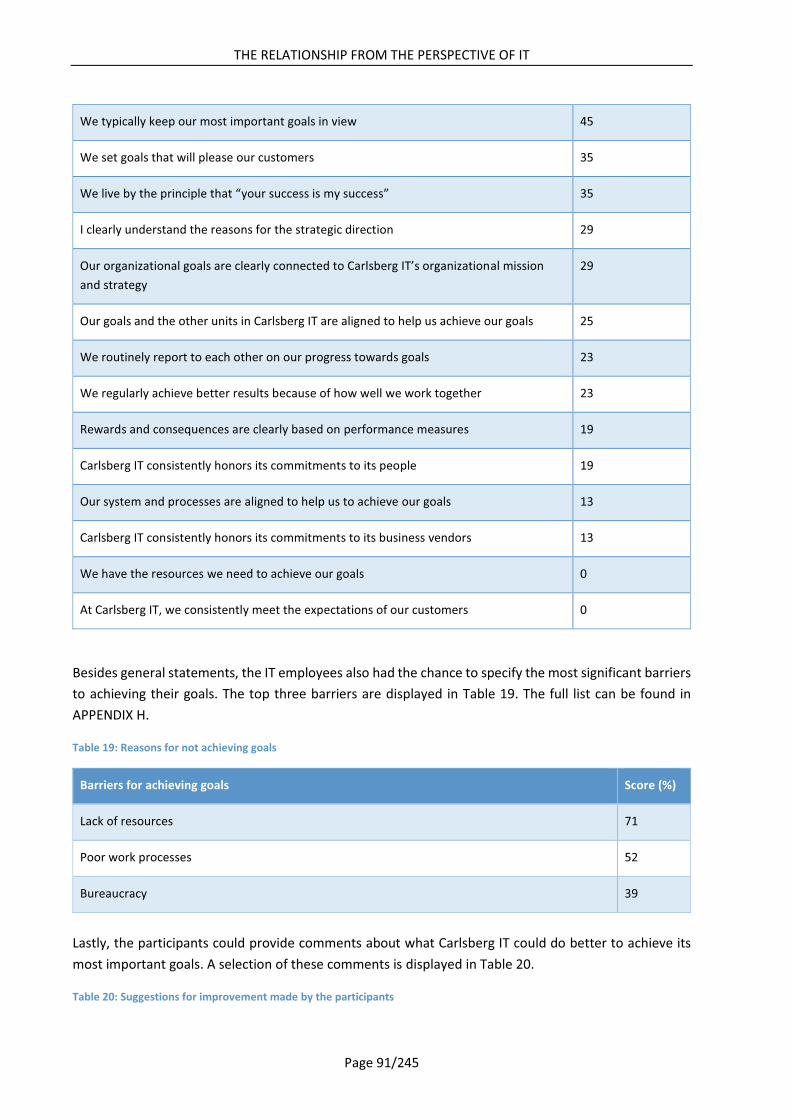
THE RELATIONSHIP FROM THE PERSPECTIVE OF IT
Page 91/245
We typically keep our most important goals in view 45
We set goals that will please our customers 35
We live by the principle that “your success is my success” 35
I clearly understand the reasons for the strategic direction 29
Our organizational goals are clearly connected to Carlsberg IT’s organizational mission and strategy
29
Our goals and the other units in Carlsberg IT are aligned to help us achieve our goals 25
We routinely report to each other on our progress towards goals 23
We regularly achieve better results because of how well we work together 23
Rewards and consequences are clearly based on performance measures 19
Carlsberg IT consistently honors its commitments to its people 19
Our system and processes are aligned to help us to achieve our goals 13
Carlsberg IT consistently honors its commitments to its business vendors 13
We have the resources we need to achieve our goals 0
At Carlsberg IT, we consistently meet the expectations of our customers 0
Besides general statements, the IT employees also had the chance to specify the most significant barriers to achieving their goals. The top three barriers are displayed in Table 19. The full list can be found in APPENDIX H.
Table 19: Reasons for not achieving goals
Barriers for achieving goals Score (%)
Lack of resources 71
Poor work processes 52
Bureaucracy 39
Lastly, the participants could provide comments about what Carlsberg IT could do better to achieve its most important goals. A selection of these comments is displayed in Table 20.
Table 20: Suggestions for improvement made by the participants

THE RELATIONSHIP FROM THE PERSPECTIVE OF IT
Page 92/245
Participant comment
CIT should be more flexible and agile, have more "fast track" processes. CIT has become too bureaucratic and needs to come closer to the businesses. That goes for CIT, not only the BRMs.
Harmonize more and more, global setup around countries
I think that Project Management delivers what is possible within the current CIT frames.
Level of communication within the team should be better, together with functional CIT processes.
Make the goals known to employees. Have management support employees in achieving these goals. Get a management team (in SP) that actually want to do people management.
Manage IT savings plan on topics under our responsibility and handle customer satisfaction.
More team meetings, more visibility from management, more discussion within team on relevance of goals
Most important goals must be agreed upon with local business to understand and accept all impacts. This must take place before announcement and implementation. All employees should understand and accept it to support the achievement of these goals.
Project Management’s goals are defined by the projects they are engaged with.
Speed up demand management - requests, minors, changes.
After aggregating the scores for all questions asked in the xQ survey, the total score for Carlsberg-IT was 46 for all areas. For an average company, this score was 58, while the top 10% of organizations taking the xQ test had a score of 81. The conclusion was therefore that Carlsberg was performing below average according to the employees in the IT department.
11.2 Record: Employee suggestions To improve the relationship between the IT and the business side, 75 suggestions were provided by employees of CIT. A selection of interesting suggestions is displayed in Table 21. Some of these suggestions have been shortened or edited for the sake of readability. The full list of the suggestions can be found in APPENDIX A.
Table 21: CIT employee suggestions
Employee suggestion
Everybody knows that IT people are boring and geeky. Everybody knows that IT projects are always delayed and exceed budgets—and never deliver what they were supposed to deliver! I suggest that we make a presentation of our staff, where we present ourselves as competent colleagues with several competencies. Break out of the grey mass and become individuals. A picture, a small presentation of his/her skills, a description of which type of project(s) he/she has worked in. Maybe also which challenges the person has met.

THE RELATIONSHIP FROM THE PERSPECTIVE OF IT
Page 93/245
We should move away from "one-liners" where we guess wildly on project cost & duration for something that is hardly described. This does not require new staff – we can assign current staff. Establish a sort of a presales-function in CIT, staffed by experienced colleagues. The output is a document describing the whole project and the effort required on the business side. Special focus on data & integration, where we often are mistaken. This will make estimation & scheduling far more precise – and we should describe the cost range and timeline with respect to the identified risks and uncertainties.
I have experienced many times that our colleagues are afraid or not very eager to make direct contact with our customers/end users, resulting in issues or questions being delayed, as the dialogue is not happening and a lot of time is wasted. Pick up the phone and contact the customer/end-user and they will be very happy about someone from CIT contacting them
When asking the businesses what they think we could improve, it is to be faster in delivering our services, mostly our changes. If we could optimize our deliverables on these changes, I believe that we will experience much more satisfied customers.
In some cases, the business needs CIT’s support within days and in that respect, it doesn't work to refer to our Demand processes or other processes, as the business needs decisions right away. In relation to these cases, we need to deliver specialist knowledge at once, even though we have to re-prioritize internally in CIT.
Create clear communication packs to the key business stakeholders about what CIT offers as far as services and most importantly – what we do not offer. What can the business expect when contacting Service Planning – and what do we not support (rightly or wrongly, depending on viewpoint). Show examples of how a service is delivered (set expectations for lead times, etc.). What is our bandwidth? Can we scale up in any area or do we have clear limitations? Explain our mandate (standard solutions instead of perfectly tailor-made local solutions).
There is a expectation that CIT should provide all the answers (solutions) immediately to all the business questions and needs. One way to learn how to improve on answers and solutions is to dive into reasons behind the business requests. Ask questions of the business to better understand their needs and requests. Sometimes we can actually offer "quick solutions" or "workarounds" that provide some immediate support / satisfaction whilst delivering the full service requested.
Apparently, many of the business people I talk to regard CIT very well but are somewhat confused about how they should interact with us. Who is a BRM and what is a service manager, and how do I create a ticket, what am I supposed to receive when I create a ticket or a CR? … So I guess the interface can be more visible and somewhat easier. The business does not understand what it is we can deliver apart from a PC and fixing server problems. What other quality do we deliver? That is not visible or “just the name CIT” means ordinary IT and not the professionalism we also have! About the value and cost: The other day I learned CIT’s goal for our blended rates. This also has to be communicated or agreed upon with the business. I guess we will see that the business is more focused on value and we are focused on cost. We need to find a way to “mix this” and agree so that both “sides” better understand the parameters impacting cost and value.
1. Budget/invoice/Service Line transparency. This includes: more details to ensure the business, the BRM and the Tax Auditors can understand the fees (e.g. it is not enough to have one line for all Microsoft licenses). Also, more transparency of invoice workflow (local to central, central to local).

THE RELATIONSHIP FROM THE PERSPECTIVE OF IT
Page 94/245
Communicating in advance what we are doing, why, in which manner, and how it will affect the business. Communicate proactively on issues; people are reassured when they know that their problem is being addressed and an action plan is being created. Communicate our successes (make our own marketing). Have regular business-oriented CIT communication packs and enhance our communication skills
In most situations, the business seems to view CIT as a technology provider in projects and initiatives. We have the skills and ability to both advise and drive initiatives that are changing both the business and IT landscape. Therefore, we should work towards establishing more 'complete/whole projects,' where we can drive both business and technology changes. We have the skills to do this. And we could do this on small as well as big projects.
Have clear transparency on deliverables, responsibilities, knowledge that each CIT person has and possess – but in a very concrete form. Make it a habit to update your list of tasks solved. This constitutes, then, a database for searching for help. And make it possible for everybody to update this list, incl. users in the business. Get away from doing the coordination we spend a lot of our time on. Be responsible and try to solve the tasks and questions coming in. When you then figure out who possess the capability to solve the task – update their database (from above).
Improve clarity regarding ownership of different elements (processes, infrastructure components). Especially after recent changes, it seems there are still some 'grey zones' (e.g. handling of local infrastructure refresh, system upgrades/patches, RFS/TCR process and roles within it). If needed, communicate/agree on it with external vendors (e.g. IBM, Verizon).
The remainder of the chapter will provide an analysis of the data based on the above two data sources (xQ survey and employee suggestions) and the questions asked in the beginning of the chapter. This analysis will be used in the subsequent analysis.
11.3 How is the IT-business relationship perceived in CIT? (Q1) The image painted by the Franklin Covey report is that of a relationship with a very poor perceived performance. None of the IT employees stated that they consistently meet customer expectations and only 13% agreed that they honor their commitments to their business vendors. Moreover, only a few of the employees believed that systems and processes are aligned to achieve the right goals. The problem, according to the IT employees, is that they lack resources to do the job properly and that the department has poor working processes. The poor performance is not ascribed to the work environment, however. The IT employees stated that they can express their opinions freely, that they are treated fairly and a good relationship exists between the employees and their managers. The perception is that IT projects are always delayed, exceed budgets, and never deliver what they are supposed to deliver.
When looking at the IT employees’ suggestions for improving the relationship, the suggestions were about making contact with the business side, communicating more frequently with the business employees, and being more flexible regarding development, among others. The most repeated suggestions were to improve transparency, for example, by creating “communication packs,” “communicating in advance what we are doing,” and “improving clarity of ownership of different elements after organizational changes.” A few of the suggestions also suggested improving communication internally within the IT department to align goals and discuss the goals’ relevance.

THE RELATIONSHIP FROM THE PERSPECTIVE OF IT
Page 95/245
Summary of first question The general impression of the IT-business relationship is a relationship with poor performance. Expectations for change requests are not met, commitments to the business are not honored, and communication could be better, since this concept was so frequently emphasized. The working environment in the IT department, however, is good, as employees can voice their opinions freely and feel that they are treated fairly by their managers.
11.4 What issues exist regarding trust, transparency, and service quality? (Q2) To identify relational issues, the entire list of employee suggestions were categorized based on issue type. For example, a suggestion to provide more agility and flexibility in CIT was categorized as a performance issue. After all the issues had been categorized, the categories that concerned trust, transparency, and service quality were selected. The table below lists the categories and the associated issues.
Table 22: Issues regarding trust, transparency, and service quality
Issue Category Description
Transparency The communication from managers to customers is poor and the internal communication between employees is lacking. Lack of communication of what IT offers and does not offer. Severe lack of communication about how changes and delays affect the customers and the persons accountable for deliveries. The strategic direction of IT is unclear and its goals are not clearly connected to group’s strategy. The communication from management about the direction and structural changes is inadequate and sometimes completely absent.
Trust We lose credibility in the business when estimating “like the wind blows”. Ask questions to the business to understand their needs and requests. We need to have predictability and trust in the work we do. Ensure that the contracts are fulfilled, define measures, and take appropriate actions if not. This will increase the trust of the customers.
Service Quality The change request process is rigid and complex. Bottlenecks exist when waiting for vendors, allocating the right resources, or doing development. End-to-end process time is too long, resulting stakeholder expectations not being met.

THE RELATIONSHIP FROM THE PERSPECTIVE OF IT
Page 96/245
The internal processes are used wrongly. The input and outputs for each process are informal and confusing.
For transparency, two types of communication issues stood out. The first type was a lack of communication about what IT offered and did not offer, and a lack of strategic information. This type has some of the characteristics of planning transparency in the SP framework (FRAMEWORK & PROPOSITIONS). The employees requested information that told about the domain of the IT department and what could be expected of the department in terms of services. The other type of communication requested was information about how changes and delays (to projects) affected the customers and the persons accountable for deliveries. This type has is similar to service transparency in the SP framework (FRAMEWORK & PROPOSITIONS).
For trust, the main issue was predictability. Poor estimation, instability, and not understanding the business needs were negatively associated with trust in the suggestions. Moreover, the IT department should establish measures to track their performance on contracts and make sure the contracts are fulfilled.
For service quality, the main issue was the change request process. This process was found to be rigid, complex, misaligned with stakeholder expectations, and sometimes used wrongly by the IT employees. The consequence is that the level of service quality in the relationship between IT and business suffers and that the business has to wait far longer than expected when initiating and implementing IT changes. This situation was also identified in comments like the following: “In some cases the business needs CIT’s support within days and in that respect it doesn't work to refer to our Demand processes or other processes, as the business needs decisions right away”.
Summary of second question Issues regarding transparency, trust, and service quality were identified in the data. These issues included poor communication regarding planning and service transparency, a lack of predictability and poor estimation of cost and time required to develop change request, and a change request process that was misaligned to the expectations and needs of the business customers.
11.5 What are the reasons behind the issues? (Q3) In the xQ report, the employees were asked to provide reasons for the main issues in the relationship between IT and their stakeholders. A fragment of this list is displayed in the table below.
Table 23: Main reasons for issues
Barriers to achieving goals Score %
Lack of resources 71
Poor work processes 52
Bureaucracy 39

THE RELATIONSHIP FROM THE PERSPECTIVE OF IT
Page 97/245
Unfortunately, this list was not complemented by qualitative data. Therefore, it was difficult to unfold each perceived reason in detail. The data in Table 23 show that the biggest barrier to achieving goals was a lack of resources. Based on the comments in Record: Employee suggestions, these resources include:
� Time for estimating the work required to develop and implement a change requests. � Amount of people with the right skillset available for IT related work. � Time available to conduct meta-tasks such as creating overviews.
It is interesting that a lack of resources was found to be the biggest barrier to achieving goals. Currently, the overall budget for CIT is determined jointly by the headquarters in Carlsberg (HQ) and the top managers in CIT (cf. ABOUT CARLSBERG). This means that the number of employees hired and consultants used is decided jointly by CIT and their stakeholders. When employees in CIT emphasize that resources to satisfy the requirements of customers are lacking, and the customer have a say in the total available resources, this suggests a gap in alignment or transparency. Two explanations can be provided for this observation: 1) expectations are not managed properly. If expectations were clear between stakeholders and the IT department, it would also be clear what resources would be required by CIT to deliver according to these expectations; or 2) managers are under the impression that the resources allocated should result in a higher service level than currently experienced.
The second largest perceived barrier was poor working processes. The processes were described as slow and rigid (Record: Employee suggestions). The change request processes do not scale with requirements, as indicated by one of the suggestions. If the business requests a very small change, such as changing a text field on a webpage, a complex and rigid process must be followed. The process is considered a “one size fits all” process. The consequence is that even small changes can take half a year to complete. In addition, many people are involved in the change request process, which is a consequence of the many steps from start to finish (cf. ABOUT CARLSBERG), adding to the management and coordination activities required.
The third largest perceived barrier was bureaucracy. It is unknown what bureaucracy means in this context. Yet, having observed the IT department’s work for three years, I believe bureaucracy should most likely be understood as complex work roles, processes, and specific requirements that slow down work. One of the comments by an IT manager was that people should “get away from doing the coordination we spend a lot of our time on. Be responsible and try to solve the tasks and question coming in.”
Summary of third question The three primary reasons for the issues were a lack of resources, poor work processes, and bureaucracy. Lack of resources is interesting because CIT determines the amount of resources jointly with the headquarters in Carlsberg. If Carlsberg IT can choose the amount of resources it has access to, but still does not perform consistently, then this points to a lack of expectation matching. Poor working processes were another reason why a lack of resources was such a great barrier. If the management finds that the problem is the structure and not the people, then it is possible that they will try to repair the structure instead of assigning new resources. The third greatest barrier was bureaucracy. Some of the comments

THE RELATIONSHIP FROM THE PERSPECTIVE OF IT
Page 98/245
mentioned that people hide behind the process and therefore do not take responsibility. While this comment concerns employees in the IT department, it could also point to overly complex processes, such as the change request process.
11.6 How is expectation matching performed in the relationship? (Q4) Expectations are part of the definition of trust and service quality (TRUST THEORY) and it was hypothesized that expectations constitute an important part of the trust/transparency relationship in the SP framework. To explore whether expectation matching influences the IT-business relationship at Carlsberg, the concept was investigated further. The general level of expectation matching was assessed to be below average, since the Franklin Covey survey found that 0% of the employees in IT felt they met the expectations of the business. Moreover, the IT employees’ suggestions contained hints about the level of expectation matching performed. Some of the suggestions below emphasize areas where expectation matching are inadequate.
� What can the business expect when contacting IT - and what do we not support? � Which services are delivered? � What is the bandwidth? � Can CIT scale up in any area or are there clear limitations? � What is the mandate and principles (standard solutions instead of tailor-made local solutions)?
Based on the suggestions, it seems that several important areas are not clear within the IT-business relationship. For example, it is not clear what IT can deliver, what the limitations to their deliveries are, and what their principles for development are. These areas indicate that the amount of planning transparency between IT and the business is low, and the SP framework would predict that this would have a negative effect on transparency and trust. This idea will be explored in the chapter THE INTERPRETIVE ANALYSIS.
Summary of question 4 Based on the suggestions of the IT employees, expectation matching is lacking for several areas. What can be expected and not expected from a customer point of view is not clear in terms of services, bandwidth, limitations, and principles.
11.7 Chapter summary The general impression of the relationship between CIT and the business, according to the archival records, is a relationship with poor performance. Expectations for change requests are not met and commitments to the business are not honored. The poor performance was ascribed to a lack of resources, poor work processes, and bureaucracy. Regarding the concepts of trust, transparency, and service quality, issues were identified concerning all of the three concepts. These issues include poor communication about planning and service transparency, a lack of predictability and proper estimation, and a change request process that was misaligned to the expectations and needs of the business customers. For the expectations of the business in general, it was found that expectations are not clear for areas such as services offered, bandwidth, limitations, and principles.

THE RELATIONSHIP FROM THE PERSPECTIVE OF THE BUSINESS
Page 99/245
12 THE RELATIONSHIP FROM THE PERSPECTIVE OF THE BUSINESS The purpose of this chapter is to elaborate on the relationship between the IT department and its business customers at Carlsberg. The previous chapter focused on the relationship from the IT point of view based on archival records. This chapter focuses on the relationship from the business point of view based on interviews and records. The aim of the chapter is to answer the following questions:
1. How is the IT-business relationship perceived by employees in the business departments? 2. What relational issues exist regarding transparency, trust, and service quality?
These questions will be answered below, after the data sources have been presented.
12.1 Record: Stakeholder satisfaction survey The stakeholder satisfaction scores are displayed in Table 24. These scores measure the business employees’ satisfaction with change requests after they have been delivered. Whenever a change request is handed over to the business, they are asked to rate the delivery. The maximum score is five and the lowest is one.
Table 24: Summary of key performance indicators for the change request area. 5 is highest and 1 is lowest
KPI (n=79) Score (max=5)
Did the delivery meet business requirements? 3.78
Did the delivery meet your expectations? 3.65
Did the IT department act with a proper sense of urgency? 3.22
Were you properly informed about changes during development? 3.08
The scores in Table 24 points to an above average satisfaction with change requests, where the weakest area is the area measuring whether the business was properly informed. Examining the numbers in detail yields the following statistics.
Table 25: Frequency statistics for satisfaction
Satisfaction with change request Number
A satisfaction score between 1 and 2 6 (6%)
A satisfaction score between 2 and 3 14 (17%)
A satisfaction score between 3 and 4 26 (32%)
A satisfaction score of 4 or more 36 (45%)
The statistics in Table 25 reveal that most change requests were delivered with a satisfaction score of 3 or higher. Besides the quantitative data presented, stakeholders also supplied comments about the

THE RELATIONSHIP FROM THE PERSPECTIVE OF THE BUSINESS
Page 100/245
delivery of change requests. A selection of these comments and total scores for the change requests are outlined in Table 26. The total scores are the average score given by the individual commenter for the four areas shown in Table 24. Higher is better.
Table 26: Comments supplied with change request scores
Comments Score (max=5)
The [developed] system cannot go live because the customer has electronic invoicing. Therefore, the customer does not have what is required.
2.3
Slow process in understanding requirements and coordinating activity. 3.3
1. CR was created on 05.12.2011, delivery was one year later. [scored on 09.12.2012] 2
1. CR was created on 10.11.2011, delivery was one year later. [scored on 09.12.2012] 2.3
It took too long before the right resource was found. 2.3
The completion has been taking an excessively long time. 3.3
Delivery time too long 3
I do not know if it was Verizon or CIT – but I know we got our access point mounts after we expected it.
1.3
Poor communication from lead 3.3
It was one of the promised CRs for June, but delivered in September. 2.3
The date of delivery for the Verizon Switch is far too late 2.6
Process "end to end" time should be decreased 5
A lot of re-testing was done due to the QA system not being properly maintained. 2.3
It is always a pleasure to work with people who are competent and who know what’s possible and what’s not.
3.3
Delivery time far exceeds what is acceptable for requests of this kind. 1
This CR should have been unnecessary, because “what was working yesterday and is not working today is an incident.”
2.6
CIT is always in control. 2.6
A quick examination of Table 26 reveals that most comments concerned delivery time. In fact, 11 of the 17 comments were about delivery time being exceeded or not meeting expectations. The remaining

THE RELATIONSHIP FROM THE PERSPECTIVE OF THE BUSINESS
Page 101/245
comments were about requirements not being met, poor communication, or wrong use of the change request end-to-end process. Only 2 of the 19 comments were positive.
12.2 Record: Country satisfaction scores Satisfaction scores for the IT department were measured in the first and last quarters of 2011. These scores were collected from the different countries served by CIT. Only one person was surveyed for each country. Hence, the scores only represent the view of the main contact person in each country and are therefore dependent on that person’s individual viewpoint. Notwithstanding this bias, these scores are included to identify the range of satisfaction scores for the countries. The total scores for each country are displayed in Table 27.
Table 27: Scores for each country served
Country Average score (max=10)
Italy 7.5
Finland 7.0
Serbia 7.0
France 6.88
Greece 6.13
Switzerland 5.75
Sweden 5.2
Germany 5.0
Poland 4.88
Norway 4.25
Estonia 4.13
CGP 3.88
UK 3.75
Headquarter (HQ) 3.38
Denmark 2.13

THE RELATIONSHIP FROM THE PERSPECTIVE OF THE BUSINESS
Page 102/245
The data in Table 27 reveal a high variance for the satisfaction scores. The mean is 5.21, which is a little above average. The standard deviation is 1.37. Although the standard deviation is low, there is quite a difference between the lowest (2.13) and highest (7.5) score.
12.3 How is the relationship perceived by the business departments? (Q1) When looking at the data from the records for each individual country, there was a huge spread regarding how the relationship is perceived. The countries with the lowest satisfaction scores (HQ, Denmark, and the UK) had an average total score of only 3.08, whereas the top country had a satisfaction score of 7.5. For customers who were very dissatisfied, the dissatisfaction seemed to emerge from change requests that did not meet the estimates or estimates that did not correspond to the customers’ requests. In general, however, the IT department scored above average on how well they delivered change requests, with an average satisfaction score of 3.43 out of 5.
When looking at the data from the 20 interviews conducted (cf. THE INTERPRETIVE METHOD), the interviewees generally began the interview by emphasizing positive elements in the relationship. These elements primarily related to the integrity of the employees in the IT department. Several interviewees stated that people in the IT department work hard, are truthful, and act with candor. The interviewees also stated that they trust the information received in most situations. In the latter portions of the interviews, however, the relationship with Carlsberg IT was perceived as being very poor. In 18 of the 20 interviews, issues with delivery time and broken expectations were emphasized. The main themes were that the IT department cannot be trusted regarding deliveries, that they have a negative record of accomplishment, and that they are very far from the business side’s mindset. When contacting CIT, it seems like “the right hand [does] not know what the left hand [is] doing” (Business IT manager in Denmark), which results in frustration because it is uncertain when delays will be resolved.
Summary of the first question According to the interviewees, the relationship between the IT department and business departments is perceived as inferior and unsatisfactory. All of the interviewees emphasized negative elements and only about half of the interviewees emphasized positive elements. The positive elements were that the integrity of the employees can be trusted, that the employees work hard, and that information disclosed by the IT department can be trusted. The negative elements were that delivery times are often exceeded, that large projects have failed, and that the IT department is slow and rigid in responding to requests from the business. The consequences of the negative elements were a low degree of trust and frustration from the business side. The business needs to address and implement changes quickly to stay competitive in the market, but this is made difficult if the IT department is perceived as cumbersome and rigid. The opinions of the interviewees were not supported by the archival records. These records showed that the general satisfaction with change requests was above average. Moreover, the records showed that the satisfaction scores varied greatly between the different countries.
12.4 What issues exist regarding transparency, trust, and service quality? (Q2) Besides questions about the relationship in general, some of the interview questions also concerned current issues in the relationship. To process the large amount of data, each issue was coded according to the type of issue and the data was then synthesized. Then, the issues regarding the primary concepts of transparency, trust, and service quality were selected. Besides these issues, issues with understanding

THE RELATIONSHIP FROM THE PERSPECTIVE OF THE BUSINESS
Page 103/245
and expectation matching were also included, since these concepts are part of the SP framework. An overview of the issue categories is provided in Table 28.
Table 28: A merged list of issues emphasized by the business interviewees.
Issue category Description
Trust The business customers do not trust the IT department based on experiences and rumors.
Service quality In some situations, the IT department has been unable to deliver changes of adequate quality, because they are unable to function according to what the business has requested.
Transparency The level of communication has fluctuated, resulting in the business often being “left in the dark,” even when they are greatly depending on a delivery from the IT department.
Shared understanding The IT department does not have a sufficient understanding of the business and the business’s prioritization. The business does not have the knowledge that IT demands.
Expectations The IT department has not provided an adequate overview of what the business can expect regarding services and costs.
In the following section, I will expand on each category based on the comments made by the interviewees.
Trust Two interviewees (Business manager, Norway; Business developer, Sweden) found that IT delivered successful changes and provided adequate support, yet the rest of the interviewees were dissatisfied with IT’s services in some way. Fourteen of the interviewees directly expressed that IT had acted in such a way that had negatively influenced the level of trust. A major concern regarding trust was the delivery of change requests. A financial manager in Carlsberg HQ elaborated: “The relationship between IT and business is good, but I’m not satisfied with the delivery […]. The worst you can get is surprises regarding delivery time and economy. And when IT delivers late, and you expect to start from a certain date, and you have promised someone some things, and you have said that this is ready for test at a certain point in time, and schedule training in this new system or setup, and people have reserved the time, then [when IT is delayed] it throws away all plans, and people waste their time, and it gets more expensive.” Because the consequences of broken promises are great, only a small number of transgressions were required before trust deteriorated.
An area that was frequently emphasized by the interviewees was that IT would never delivered within time or within budget. Projects were always late, or if they were delivered on time, they would cost more than initially estimated. In fact, four areas were often emphasized that accounted for the low degree of trust. One interviewee (Business development manager, HQ) proclaimed that “the estimates [for the development of change requests] we have been provided have not been kept at all. And it’s not only

THE RELATIONSHIP FROM THE PERSPECTIVE OF THE BUSINESS
Page 104/245
estimates on man days, also budgets are wrong. Scope, timing, budget, and functionality are wrong. But the worst is functionality, when you use a system which does not work.” The areas responsible for the perceived low degree of trust—scope, timing, budget, and functionality—were emphasized by several of the interviewees. One interviewee (Financial Director, Germany) emphasized delivery time and economy, one interviewee (Vice President NE, HQ) emphasized functionality, and two others emphasized scope (Financial manager, Exlid; Business IT manager, Denmark). When asking the interviewees how much they trusted CIT, the initial answer was to ask what I meant by trust. When given the definition provided in TRUST THEORY, the interviewees would generally say that they did not trust the IT department because of experiences with late deliveries, wrong functionality, lack of transparency, and exceeding cost. One of the interviewees (IBM Relationship Manager, Denmark) had only been in the organization for 1½ months. Yet, when talking with her, she still emphasized issues from 2 years prior and found the IT department “to be very slow and problematic.” When asked why she found IT to be slow and problematic, she mentioned that is was because of all the stories she had heard from colleagues at Carlsberg Denmark. Due to these rumors, she trusted the IT department less, and was less inclined to meet and align with the department regarding new projects and change requests.
Based on the statements by the interviewees, the issues with trust concerned the competence-based dimension of trust in the relationship (see TRUST THEORY). There were no issues regarding integrity or benevolence-based trust.
Service quality A general view that 18 of the interviewees held was that CIT has trouble delivering on time, within budget or delivering the agreed-upon functionality. Statements about the level of service quality included: “CIT is simply not fast enough”, “We had three projects where we worked with CIT […]. For the first project we got an estimate of 46 man days, and it took 40 months to complete” and “We have had some requests that have been delivered very late, or at a much large price than first estimated.” One employee (Financial Director, Germany) jokingly recounted a rumor that you should always double the cost estimated by CIT to get the actual cost. Not delivering according to estimates had large consequences for the business because the business had typically planned for training (associated with the change) in advance. Several of the interviewees emphasized that the frequent failure of CIT to keep its promises was the main reason for the lack of trust.
When speaking about service quality, sometimes the conversation concerned the services delivered by IBM. Two interviewees (Communication Consultant, HQ; Migration Manager, Denmark) reported that they were satisfied with the services from IBM and thought that the IBM helpdesk was professional. Others who used the helpdesk more frequently found the quality to be very inconsistent. The problem was, as told by one interviewee (Business development NE, HQ), that sometimes you would get a hold of a very qualified person in the helpdesk who was able to solve the issues fast and effectively, but you could also get a person who did not understand the business department’s setup. One interviewee (Business & IT development manager, Sweden) also emphasized that the culture at CIT was different from that of the business departments and gave an example where an IT employee would not help because he was off work in 5 min. In the business, the culture was that you would use the time available to make things work even if you are off work in 5 minutes. As a result, CIT was perceived to have a different mindset than the general mindset in the business. Another issue relating to service quality was that CIT had a

THE RELATIONSHIP FROM THE PERSPECTIVE OF THE BUSINESS
Page 105/245
tendency to forget tasks such as change requests. For instance, one interviewee (Business IT manager, Denmark) said, “When I participated in my first steering meeting we went through the change requests with CIT, and then we stopped at one of the famous change requests which we have requested for almost 1½ year. And the message was that, well it is only 10 min work, but we don’t have the resources available.” The interviewee respected the fact that no resources were available, but now with so much time having passed, she found that either IT should “do the damn assignment” or they should tell the business that it would not be done.
Based on the statements of the interviewees, the main issues were related to the reliability, responsiveness, and the assurance dimensions of service quality (see Trust and service quality). The issues were that agreements were not adhered to (reliability), that CIT did not provide fast support (responsiveness), and that the business did not feel secure in their transactions with CIT (assurance). No issues associated with the empathy or tangibles dimensions of service quality were found.
Transparency Lack of transparency was an issue that ten of the interviewees emphasized. These interviewees were from Denmark, Sweden, HQ, and Poland (Exlid). The following three claims were frequently made: 1) there was a lack of task information, 2) there was a lack of overview data (data to better understand the situation of CIT), and 3) there was a lack of relevant communication.
Task information was an area that was frequently emphasized as being problematic. Several of the interviewees gave examples of breakdowns in services, where the amount of transparency was inadequate. For instance, one employee (Business IT Manager, Denmark) could not work because her Outlook application was offline. Calling CIT started the incident process but she had no knowledge of when Outlook would be repaired and no information was provided during the repair process. As a result, she wondered whether anything was being done at all. For changes and projects, the information disclosed was perceived as being very inconsistent with regard to quality. Sometimes, the project manager on a project would provide adequate and relevant information and sometimes the amount of information received was very limited or was the wrong type of information. For minors, the quality fluctuated even more. As one interviewee (Business Developer, Denmark) emphasized, “It takes a very long time for doing change requests and that kind of stuff. And I don’t know what the time is used on because transparency is lacking. The functionality is typically OK, but the time required is not very good.” In a similar vein, one employee (VP Group Finance, HQ) perceived CIT as a black-box communications-wise. The most important information was information about overrun of budgets and delays. Delays especially should be communicated instantly when known. “No surprises” was a mantra that several of the interviewees at HQ repeated. However, information was also necessary in order for the business to evaluate whether they had done things in the right way. As one interviewee (Business & IT development manager, Sweden) stated, “Sometimes, there are requests which are never being developed. And you can’t really say why they are not done. Is it because the demands we provide are stupid? Or is it perhaps they don’t know how to make the requested change?”
Lack of overview data was found to be a problem mainly for financial reports, performance, and processes. For financial reports, the problem was that although a specific report would contain the required values, it would be impossible to see how some of these values were calculated. For instance, one interviewee

THE RELATIONSHIP FROM THE PERSPECTIVE OF THE BUSINESS
Page 106/245
(Vice president NE, HQ) said that it was “fine to know how much they had to pay for incidents, but when they could not see how the value was calculated, and how the cost was split between their department and other departments, then the information was less valuable.” Regarding performance, two employees (VP Group Finance, HQ; Business developer, Denmark) found that they lacked data about how CIT performed in terms of delivering change requests within budget and time, and how many incidents they solved: “Earlier, you got an overview of projects delivered on time, to price, etc., but I don’t see those statistics anymore. And I think this is important information to get, for me, and to manage expectations.” Other missing data included information on what time was spent on in the development and implementation of changes. This was echoed by several of the interviewees. For instance, the business process manager at Carlsberg Denmark stated, “I don’t think the IT processes are proper and provide the right overview. They lack transparency about what IT uses money on, and what’s going on in general.” Regarding change requests, four of the interviewees requested more transparency when starting up a change in cooperation with CIT. When asked to elaborate, they said that what they really needed was a one-page overview of the phases that they had to go through when starting up a change request. This could also help them clarify what they needed to do so that the change would be successful.
The relevance of data was also brought up. Three of the interviewees (Vice president NE, HQ; Financial manager, Exlid; Business developer, HQ) found that much of the information communicated was not relevant. This issue was illustrated in an example where a 30-page project report was received, of which only half a page was read and the other pages discarded. When asked which information the interviewees would like from CIT, one interviewee (Business IT manager, Denmark) said that she had never been asked that by CIT directly, indicating that CIT had never evaluated whether what they communicated was of value to the business employees. Information disclosed by CIT was found to be trustworthy by most interviewees. Regarding a lack of relevant transparency, the inability of IT to promote the IT department was emphasized. One interviewee (VP Group Finance, HQ) elaborated, “I don’t hear about many successful stories with the IT department, but I hear about many things where it didn’t work. And it doesn’t have to be like that, as the things are too banal to accept.” Another issue was the link between transparency and accountability. One interviewee (Business & IT Development Manager, Sweden) said, “When I create requests I don’t know who is accountable, […] and when I cannot trust the estimates, I want to see what the status is. Why isn’t something happening and when will I get what I need?”
When asked about how transparent the business was towards IT, most of the business interviewees stated that they were transparent but could improve. It was difficult to be transparent when they had experienced all these issues with the IT department, because why should they? Two of the managers (Business & IT, Denmark; Financial Manager, Sweden) admitted that IT was informed last, or in some cases not at all, because the business did not want anything to do with IT.
Based on the statements of the interviewees, the issue concerning transparency was mainly about operational information (Alignment and communication). The interviewees perceived CIT as a black box and they wanted to know about delays and budgets overrides so that they could adjust accordingly. Moreover, some of the issues revolved around the lack of an overview of CIT performance and what the interviewees could expect. The types of transparency included in the SP framework fit well with the requests made by the interviewees. The interviewees lacked information about predictive expectations (when will my request be finished?), and information about normative expectations (what can I expect

THE RELATIONSHIP FROM THE PERSPECTIVE OF THE BUSINESS
Page 107/245
when I start a new project?). Lastly, there was an issue with communicating the wrong information, since the information needs of the business had not been considered.
Shared understanding Eight interviewees emphasized that IT lacked an adequate business understanding and that IT was very far from the business. These employees were located in Denmark, Sweden, and HQ. When asked to elaborate on what being far from the business meant, the most frequent answers were that IT did not understand the critical areas that the business focused on, and that they did not have an adequate understanding of the business architecture, and as a result, could not correctly translate business goals into IT specifications and requirements. One interviewee (Business Developer, HQ) stated, “IT and business seems like two separate functions […]. And these two functions are completely detached from each other. And each function finds that their reality is the right reality. The main difference between IT and the business is that IT does not have a proper business understanding. What is important, who is the customer, what knowledge do we have, and how can we be flexible?” This was echoed by another interviewee (Business IT manager, HQ): “IT has to be closer to the business […]. You need people who understand the business and can translate that to IT language. Quite often, you have people who speak IT language, but do not speak the business language. Or who speak business language, but does not understand IT. Right now the capabilities are not there.” IT employees were also found to include the business too much in technical issues. Two interviewees (Vice President NE, HQ; Business & IT Development Manager, Sweden) found that CIT asked about things that they should know themselves. This resulted in a great deal of communication that the business did not expect. Furthermore, one interviewee (Vice president NE, HQ) emphasized that it seemed as though CIT assumed that the business had a more extensive knowledge of the technology aspect of their projects than they really had. This was based on, for instance, the templates, which they had to fill out when starting change requests. Three of the interviewees could not see the value in submitting the templates because they could not understand what the information was used for, while another employee (Business IT Manager, HQ) found the task too complex and difficult due to lack of information. One example was provided by the business-IT manager at HQ: “Some days ago I wanted to order a database. It would take me […] six minutes to do myself but I have to use the IT department. After three hours, I had created the change request in the IT system. Then it took three days before the IT department returned and said that it would cost 52,000 DKK.” The manager considered the three hours an utter waste of time since it would have only taken him six minutes to do the actual work. According to the interviewee, IT seemed to expect a much greater technical understanding of him than he had. This was echoed by another interviewee (Business process manager, Denmark), who stated, “Sometimes I get a feeling that we are expected to know a lot about IT, but we are only business people, we are not into IT.”
Another example provided that indicated that CIT was far from the business was that CIT acted as an opponent and not a partner. For instance when developing changes, the business view was that CIT should support the business and “do as they are told” (Vice President NE, HQ), but CIT was sometimes seen as seeking conflict and acting as an opponent, questioning the idea and business plan that the business had produced. This was a particular problem when CIT interfered in business matters about which they were perceived to have little understanding. For one of the interviewees (Financial Manager, Norway), IT was perceived as a know-it-all department when the business came with suggestions or

THE RELATIONSHIP FROM THE PERSPECTIVE OF THE BUSINESS
Page 108/245
changes they would like to have implemented. Another interviewee (Business Developer, Denmark) emphasized that CIT did not request alignment meetings where business representatives and CIT could discuss the status of change requests and provide feedback to one other. The choice of not holding such meetings was perceived as a signal that CIT was not interested in improving its service. The role of the BRM20 was found to be adequate and valuable, but two of the interviewees (Business IT Manager, Denmark; Migration Manager, Denmark) wished for someone with a better understanding of their specific area. As there was only one BRM for each country, they were found to be too busy and to cover too broad of an area. One of the interviewees (Business Development Manager, HQ) suggested that CIT should create a service partner for each critical business area, who would be responsible for advising and managing the contact with the business.
Expectations Six of the interviewees mentioned issues with expectations not being met. These employees were located in Denmark, Sweden, and HQ. The most frequent claim was that the business did not know what they could expect from IT regarding services and cost. For instance, one interviewee (Business & IT Manager, Sweden) mentioned, “The relationship between IT and business could be a lot better. I think that the business expects a very high level of service and they do not get that [level of service]. We have an agreement with CIT for a certain service level, but it is lower than before. And we are not informed about why.” This statement was confirmed by another interviewee (Business IT manager, Denmark), who mentioned, “I would have expected that IT would have performed a lot better than I’ve experienced so far.” During the interviews, three employees gave examples of initial expectations of the IT department that were later proven wrong. For instance, one interviewee (Vice President NE, HQ) said that he wanted to utilize the IT department because he wanted internal project managers. However, he later realized that IT used external project managers and therefore the initial reasons for choosing CIT were incorrect. The same interviewee thought of CIT as an electrical retailer, where you say what you need, order it and then come back later to pick it up. However, he found that CIT wanted to involve him in discussions about the project and consulted him frequently throughout the development process “with things he had no knowledge about.” This resulted in much frustration. Because of the lack of expectation matching, two interviewees (Business IT Manager, Denmark; Migration Manager, Denmark) wished they had contracts with CIT about what should be delivered: “We don’t have contracts with CIT about what they expect to deliver, what their cost is and so on.” The lack of expectation matching resulted in problems with planning. CIT was always found to be behind schedule, so “you never knew what to expect” (Migration Manager, Denmark). When you do not know what to expect, it is impossible to schedule training.
Another issue was that several of the employees at Carlsberg Denmark (Business IT Manager, Business Process Manager, Business Developer) could not understand why they could not get IT changes accepted when they had the required money to pay for the changes and a solid business case. Currently, each country had a fixed amount of money available each year to spend on IT development. This number was determined by the amount of beer each country sold (cf. ABOUT CARLSBERG). The fact that the interviewees were limited by the IT department, even though they were willing to pay for IT services, was difficult to accept. The interviewees expected that IT would be like a retailer and if you had the money
20 Business relationship manager (see operating model in

THE RELATIONSHIP FROM THE PERSPECTIVE OF THE BUSINESS
Page 109/245
required, you could get the service. One interviewee (VP group finance, HQ) compared the IT department to a retail shop: “Does a shop refuse customers if they are willing to pay for the products?” Even if some of the interviewees knew about IT’s structure and the reasons for utilizing such a structure, they were still unsympathetic about the way it was done. The structure was not found to “live up to what you would expect of a modern IT company.” For those interviewees who did not know about CIT’s cost allocation model, the fact that CIT refused to implement their projects resulted in mistrust and confusion. Because CIT could never accept requested changes, they were perceived as always over-allocated and ineffective.
Differences across countries Table 29 provides an overview of the frequency of issues cited by the interviewees in each country. The last column gives the percentage of total interviewees who emphasized that issue (rounded down). In order to focus on the issues from the business perspective, data from the four employees of the IT department were not included in the table.

THE RELATIONSHIP FROM THE PERSPECTIVE OF THE BUSINESS
Page 110/245
Table 29: Emphasized issues for each country.
Issue type DK (5) SE (2) NO (2) HQ + Exlid (6) GE/DE (1) N=16
Trust 4 1 2 6 1 87.5%
Expectations 1 1 5 43%
Shared understanding 2 1 5 50%
Transparency 3 2 5 62%
Service Quality 1 1 2 6 1 68%
The data reveal that trust was the issue most emphasized in the interviews (87.5%). This was followed by service quality (68%) and transparency (62%).
Summary of second question Five issues were identified in the IT-business relationship based on interviews with the business employees. In order of frequency mentioned, the issues revolved around trust, service quality, transparency, shared understanding, and expectations.
The trust issues mainly regarded the operations and performance of the IT department. According to the interviewees, they did not trust the CIT department regarding its competence. No issues concerning integrity were identified. Regarding service quality, the issues concerned the inability to respect the agreements made (reliability), that CIT did not provide quick support (responsiveness), and that the business did not feel secure in their transactions with CIT (assurance). No issues were found regarding the empathy or tangibles of the IT department. For shared understanding and transparency, the issues mainly concerned operational transparency. The interviewees perceived CIT as a black box and they wanted to know about delays and exceeded budgets so that they could adjust accordingly. Moreover, some of the issues revolved around the lack of overview data on CIT’s performance and what the interviewees could expect. The IT and business departments seemed like two separate functions with separate mindsets and cultures. Lastly, for expectations, the issue was that expectations were not clear, and that the business employees did not know what they could expect regarding IT services and their cost. Moreover, the business side frustrated that they could not initiate IT projects despite having the money to pay for them.
12.5 Chapter summary The relationship between the IT department and business departments was perceived as inferior and unsatisfactory by business employees, as shown through the archival records and interviews. The few positive elements of the relationship were that the integrity of the IT employees could be trusted, that the IT employees worked hard, and that information disclosed by the IT department could be trusted. The negative elements were that delivery times were often exceeded, that large projects had failed, and that the IT department was slow and rigid in responding to requests from the business. During the interviews, five issues were discovered that related to the thesis research problem, namely issues with

THE RELATIONSHIP FROM THE PERSPECTIVE OF THE RESEACHER
Page 111/245
trust, service quality, transparency, shared understanding, and expectations. These issues will be included in the subsequent chapter, THE INTERPRETIVE ANALYSIS.
13 THE RELATIONSHIP FROM THE PERSPECTIVE OF THE RESEACHER Any observations21 made in the case organization were found to be important because they caught some of the complexity present within the company that can be difficult to capture during interviews or in archival records. During the three-year stay at Carlsberg, I participated in two projects: 1) standardization of the company intranet, and 2) management of the change request area. These projects will be used as data sources in this chapter. The aim of the chapter is to answer the following question:
1. What relational issues regarding transparency, trust, and service quality were observed during the projects?
13.1 Standardization of the company intranet When the standardization project was initiated, each country that the IT department served had its own IT section on the intranet. This section contained information on how to start a project, how to request technical support, important contact persons, and so forth. When the intranet was originally created, managers from each country were tasked with translating and providing content. This resulted in 17 intranet parts in different languages, and a large amount of outdated content. The purpose of the standardization project was therefore to standardize these 17 parts. A rough timeline for the project is shown in Table 30.
Table 30: Timeline for the intranet standardization project
Time Event
March 2012 An evaluation of the IT section of the intranet was performed
July 2012 The standardization project was anchored with the CIO and a workshop was held with current owners.
August 2012 New owners who would be responsible for the global content were identified and contacted
September 2012 Owners were requested to come up with a plan for their area before October 2012
October 2012 As only half of the owners had made a plan, the deadline was pushed to December 2012
January 2013 The project was highly prioritized at a managerial meeting. Most owners had handed in their plan
21 As the chapter headline indicates, the data discussed in this chapter is data that I have generated as a participant and observer within the case organization.

THE RELATIONSHIP FROM THE PERSPECTIVE OF THE RESEACHER
Page 112/245
February 2013 The manager responsible for the project and another employee involved in the project were fired. All progress stopped because there was no champion to carry the project forward.
Marts 2013 The project was handed over to an external consultant and his team.
May 2013 The idea to standardize the intranet was abandoned. Instead, a simplified version was implemented, in which users could create their own news.
From the timeline, it is evident that much of the work done on the project was wasted. However, there were no way to know that the project would be abandoned at the beginning. The two employees working on the project were fired because a new CIO was hired. The new CIO had a new vision for the structure of the global IT department. In this new structure, the business relationship managers were called local IT managers and the head of the BRMs was no longer needed. As a result, the head of department was fired, which led to the abandonment of the intranet standardization project. When the new external consultant took over, all previous work was ignored, and the consultant started from scratch. As he did not have much time for the task, a low-cost solution was implemented and the standardization project stopped.
13.2 Managing the change request area I studied and helped govern the area of change requests for the final one and a half years of my stay at Carlsberg. I call this a project for the sake of readability, even though it is more like an area within the IT department.
What I experienced during that time was that several managers came and left the project. In total, six different employees held the title of change request manager in the one and a half years I observed the project. The reason for the substitution of employees was twofold. Firstly, some employees left the company because they were offered a better position elsewhere. Secondly, employees were fired based on organizational changes. The consequence of the high turnover of employees was unclear ownership and accountability. For instance, at the end of 2013, 151 out of 493 change requests had the previous change request managers (who had left the company) listed as responsible in the change request system used. Thirteen change requests still had the change request manager from before the previous manager as responsible for some part of the change request. Each time a new person entered the field, they needed to learn about the area and clean up after the other. The allocating of responsibility and accountability suffered each time, and it took a lot of time before things became settled. Another experience was the informal knowledge exchange. One of the first managers of the area told me that many change requests were moved from the state “Design” directly to “Closed” because the developers did not care to use and do the “Build,” “Test,” “Acceptance Test,” “Release,” or “Stabilization” phases of the change request process. For them, it was easier to avoid the complex process and just focus on development. This was also necessary because the business required the change requests to be developed quickly. The result was that when a new manager entered the area, the information used to manage the area was inaccurate because the knowledge was not collected from the previous manager and the information in the change request system was incomplete and deprecated.

THE RELATIONSHIP FROM THE PERSPECTIVE OF THE RESEACHER
Page 113/245
13.3 Which issues regarding transparency, trust, and service quality were observed during the projects? (Q1)
The organizational structure of the IT department changed four times during the three-year employment. Each change was fueled by a different managerial focus. One change was due to an end-to-end process perspective, while another change aimed to create accountability. Yet another changed focused on centralization, and yet another on standardization. The overall goals of each change were to improve alignment and better support the business. The CIO was replaced one time, and had also changed shortly before the PhD project began. The near constant change in leadership resulted in issues with accountability and transparency. It was difficult for the IT managers to keep up with the changes, and the frequent changes acted as a barrier to establishing an adequate level of communication. Regarding the business environment, the overall strategy was often modified based on changes in the macro environment, such as tax regulations, new markets, new competitors, or a change in a competitor’s strategy. The business managers also updated their perceptions of strategy and operations several times. At some point in time, the focus was on innovation and digital management; later, the focus was cost savings and efficiency. The constant changes and complexities of the business environment led to increased pressure on the IT department. Yet, because the IT department was complex as well, it could not accommodate all of the requirements of the business. To make the ends meet, the IT department abandoned some of its processes, leading to the issues with incomplete information and maintenance. Another issue was that when the IT department attempted to be proactive and align with the business, much uncertainty was present. For instance, a large business standardization project was estimated to be completed around 2014. To be ready for the project, the IT department restructured several of its structures and work roles in 2013, which made the department more complex. The idea was that when the BSP was complete in 2014, the IT department would be ready to support the BSP implementation instantly instead of needing time to adapt. However, because the BSP was delayed several years, the IT department found that they utilized processes and structures that were more advanced than required. This led to issues because deliveries were slower and process steps were performed that were close to superfluous. In an attempt to be proactively aligned, the IT department became less aligned because the business strategy was not executed at the planned time.
13.4 Chapter summary Two sets of issues were identified through observation. The first issue was that the change of CIO and managers within the IT department resulted in issues with transparency. Whenever the organization changed, effort was required in order for the IT employees to keep up. Frequent changes acted as a barrier to proper communication with the business employees. The second issue was that the constant change and complexity of the business environment led to increased pressure on the IT department. Yet, because the IT department was complex as well, it could not accommodate all of the requirements of the business. This led to an inadequate level of service quality because IT and the business were not structurally aligned.

THE INTERPRETIVE ANALYSIS
Page 114/245
14 THE INTERPRETIVE ANALYSIS The purpose of this chapter is to link the data discussed in the previous interpretive chapters to the propositions stated in FRAMEWORK & PROPOSITIONS. To do this, the method described in THE INTERPRETIVE METHODTHE INTERPRETIVE was used. This included a comparison of the identified issues with the SP framework, and the use of the transparency/trust model (FRAMEWORK & PROPOSITIONS) to understand the relationship. Moreover, any relation between transparency, trust, and service quality identified in the data was be explored. The structure of this chapter is as follows: each of the issues identified in the previous chapters is explained using the SP framework and a possible rival explanation. At the end of each section, a sub-conclusion is provided that determines which explanation is most adequate. After the explanations have been provided, the strength of the SP framework in explaining the data, in combination with the transparency/trust relationship model, is determined. Lastly, the propositions are addressed based on this discussion. The process is displayed in Figure 18.
Figure 18: The interpretive analysis
The key idea behind the process is to explore the interplay of transparency, trust, and service quality based on the issues identified. If the theory of the SP framework (the predicted relationship between the concepts) adequately explains the issues, this serves as an indicator of the frameworks validity.
14.1 Terminology I use the terms weakly supported and strongly supported for the hypotheses. Weakly supported means that the data indicates that the proposition is supported, but that a conclusion is difficult to make with certainty, or that only one of the dimensions of the underlying concept is supported. Strongly supported means that the data indicate that the proposition is supported for all dimensions of the underlying concept or term.
14.2 Explanations The five issues identified in the previous chapters will be discussed below. For each issue, a small description of the issue, an explanation according to the SP framework, and an explanation according to the employees at Carlsberg will be provided. In some cases, the two explanations overlap. In these cases, I will attempt to explain the issue using alternate points provided by the rival explanation. In this way, the explanations provided by the framework can be challenged by other possible scenarios.

THE INTERPRETIVE ANALYSIS
Page 115/245
Issue 1: Trust Description: The majority of business employees did not trust the IT department regarding their competences. The business employees were dissatisfied with the services from IT in some way, and directly expressed that IT had historically acted in such a way that had negatively influenced the level of trust. An area that was frequently emphasized by the interviewees was that IT never delivered within time, budget, or scope, or within the functionality promised.
Issue explained by the framework: The framework and the theory behind it propose that a lack of service and planning transparency will result in lower levels of trust. When looking at the issues most emphasized by the IT and business departments, several of them involved transparency. The IT department found that communication from managers to customers was poor and that the business was not informed of changes and delays to change requests. The business found that operational information from the IT department was lacking and perceived CIT as a black box communication-wise. Both parties emphasized a lack of planning transparency and service transparency as an issue in the relationship that had negative consequences. One interviewee directly mentioned that the lack of transparency negatively impacted her trust of CIT. The finding of a low level of trust in the relationship along with issues concerning transparency support the theory of the SP framework.
Rival explanation: The employees of the IT department acknowledged that trust was an issue and that expectations were not consistently met (see THE RELATIONSHIP FROM THE PERSPECTIVE OF IT). When asked why they were not meeting expectations, and thus why trust was low, the employees in the IT department emphasized a lack of resources, poor working processes, and bureaucracy as the primary reasons. Unfolding the explanations revealed that the employees would have liked to have more time to do project estimates, have more people working in the IT department, and a more flexible work process that could accommodate the requirements of the customers. In sum, the problem with trust existed for two reasons. The first reason was that the number of employees did not match the number of assignments. If the change request process were more effective, or if there were more employees working in the IT department, more resources would be available to work on requests, leading to faster delivery. The second reason was that the process did not match the requirements of the business. Some of the IT employees described their process as rigid and pointed out that “in some cases the business needs CIT’s support within days and in that respect, it doesn't work to refer to our demand processes or other processes, as the business needs decisions right away” (see THE RELATIONSHIP FROM THE PERSPECTIVE OF IT). As such, it seems that the requirement of the IT department to stay in control22 conflicted with the need of the business department to respond quickly to market opportunities and threats. When the business employees were asked why the level of trust was low, they stated some of the same reasons as the IT employees. The primary reason for the low degree of trust was lack of information, and that the structure and configuration of the IT department did not match the requirements of the business. Moreover, the business employees emphasized that the IT employees did not want to collaborate with the business and sometimes acted as opponents to the business rather than partners.
22 Via the change request process, see the chapter ABOUT CARLSBERG.

THE INTERPRETIVE ANALYSIS
Page 116/245
Summary of the trust issue: The framework and the rival explanation each provide an adequate explanation for why the level of trust is low in the relationship. On one hand, the lack of transparency was emphasized by both sides in the relationship and one of the interviewees directly said that the lack of transparency had a negative influence on trust. On the other hand, the current processes were found to be inadequate to respond to the complexity and requirements of the business departments. A lack of resources, or processes that are made solely with the IT department in mind, could also explain the low level of trust. The two perspectives represent two different mindsets. The first mindset is centered on the mitigation of transgressions of trust and the creation of a mutual and realistic understanding between parties. The other mindset is centered on improving performance in order to avoid transgressions and fulfill the requirements of the business customers. The conclusion is that both explanations seem valid, and that it cannot be inferred which has the greatest predictive power without collecting additional data. With that said, the data does support the theory of the SP framework because the low trust could be directly associated with the lack of transparency.
Issue 2: Service quality Description: Employees in the business and in the IT department emphasized issues with service quality. The areas that were found to be problematic in the IT-business relationship were reliability, assurance, and responsiveness. The issues were that agreements were not adhered to (reliability), that CIT did not provide quick support (responsiveness), and that the business did not feel secure in their transactions with CIT (assurance). No issues were found that were associated with the empathy or tangibles dimension of service quality.
Issue explained by the framework: When satisfaction with change requests was measured via surveys, CIT achieved scores of good to moderate regarding delivery of the change request and most business employees agreed or strongly agreed that change requests met their business requirements. Yet, in the interviews with business employees, they painted a picture of CIT as an organization that never fulfills the expectations of the business. This was a finding that the employees of CIT agreed with based on the xQ survey.
This difference in perception can be explained by a lack of planning transparency via the SP framework. If CIT does not create transparency about what the business can expect, the business will look elsewhere for this information. An alternative source of information can be from colleagues that have had previous encounters with CIT, or from similar situations with other companies. This was observed in the empirical data, where a business manager at Carlsberg Denmark, who had only been at the company for one and half month, commented on the inferior performance of IT. She had not experienced the issues herself, but had heard about them from other colleagues. Thus, her perception of the service quality of the IT department was not based on their actual performance, but rather on rumors. The colleagues she talked with recounted historical projects that had failed horribly and cost the business “lots of money.” The empirical data indicates that such projects had existed, but that most projects were delivered on time, within budget, and with the right functionality.
Besides the IT manager in Denmark, several of the interviewees wanted additional planning transparency, including an overview of the change request process, information on how CIT performed with regard to delivering change requests, and what time was spent on during development and implementation of

THE INTERPRETIVE ANALYSIS
Page 117/245
changes. When such information was not available, it make the business feel less secure in their transactions with the IT department.
Rival explanation: Another explanation for the lack of service quality is related to the decision to centralize the IT department as part of the global decision to centralize Carlsberg as a group. This was a decision made at the Carlsberg headquarters (HQ) and resulted in the BSP project (see ABOUT CARLSBERG for more information). The BSP project is to be implemented in all the countries where Carlsberg operates over a period of several years. When the BSP began, CIT decided to transform itself into a global department. This global department would include more bureaucracy, which was required due to the need to centralize local processes and work. Such a global setup would be ideal for supporting Carlsberg after the BSP implementation. Yet, because the BSP was delayed for years and only implemented in small segments, one IT manager stated: “We still have a world where we aren’t very adequately equipped to support [the business]. And we just have to accept this for the next couple of years”. Carlsberg IT is now running a centralized setup that covers some customers with local structures and work, and other customers with a global setup. Because of this, it is not surprising that the change request process is perceived as rigid by a subset of customers. Here, the problem is not one of finding the right fit. The problem originates from the uncertainty and complexity of the strategic decision to standardize Carlsberg. Because of the sheer size of the standardization program, the program must be implemented in bits and pieces. This gradual implementation of the program, combined with the complexity and uncertainty of the initiative, has resulted in heterogeneous business departments. The consequence is obvious from some of the comments made by interviewees. For instance, one interviewee (Financial Director, Germany) stated that “the idea of One IT is to have one IT system and one IT resource, and then if someone from Greece is coming to Germany and working on an IT system, it will not work, because all the ‘global’ systems are different. The effectiveness of One CIT at the current is not very good because things are still so local.” The explanation for the issue with service quality is therefore that it is not possible to find the right “fit” by which the IT infrastructure will become congruent with the business strategy because 1) heterogeneous business departments at Carlsberg operated under different strategies, and 2) it is uncertain exactly when and how the business will be transformed. The business strategy is therefore not just “the business strategy,” but also involves a host of conflicting strategies and demands.
Summary of the service quality issue: The issue with service quality can best be explained by the SP framework. According to the framework, the issue with service quality originated from a lack of planning transparency. When CIT did not communicate about performance outcomes, the business side based its perceptions of the department’s performance on rumors and anecdotes. These negative rumors were far from the good satisfaction scores the IT department achieved when they measured their actual performance. Regarding the rival explanation, the complexity of the business departments and the heterogeneous business strategies could explain the low level of service quality. The IT department has attempted to align itself to the business departments with a “one size fits all” approach. However, because the business departments have been changing and because they are heterogeneous, the approach does not fit every requirement. The drawback of the rival explanation is that according to the satisfaction scores, CIT has obtained above average ratings on delivery, which fits poorly with an inability to deliver requests due to the circumstances listed.

THE INTERPRETIVE ANALYSIS
Page 118/245
Issue 3: Transparency Description: The issues with transparency identified were poor communication from IT managers to the business employees, a lack of communication about how changes and delays will affect the customers, and a lack of transparency about strategy and IT operations.
Issue explained by the framework: The constructed framework includes several barriers that can account for why transparency is lacking. These barriers are previous IT failures; separate mindsets; separate languages; organizational complexity; and mistrust in information. When looking at the empirical data, several of these barriers are present.
Several of the interviewees emphasized scenarios where they had to stop the production of beer because of failures in IT systems, leading to a loss in profits. This reputation of failed IT projects can lead to a reduction in transparency. When IT has a history of failed projects, IT managers are not included in business meetings and the department is not informed about business changes. In fact, two of the interviewees stated that IT was informed last because the business did not want anything to do with IT due to their poor performance. This can lead to a vicious cycle where the parties become more and more separated from each other, as described by Akkermans et al. (2004) (see ALIGMENT THEORY). If IT is perceived as being unsuccessful in the eyes of the business, the business is less inclined to listen to their input from IT in committees and meetings (Benbasat, 2000).
The business said that IT lacked a proper business understanding and did not have a business mindset (see THE RELATIONSHIP FROM THE PERSPECTIVE OF THE BUSINESS). Having separate mindsets can lead to less transparency because IT will not know what to inform the business about, or the business will not specify for which areas CIT should disclose information. This situation can be seen in the empirical data. One business manager (Vice President NE, HQ) received a lengthy report about an IT project, but only a half page of text was relevant. The rest was technical language that he could not understand or did not need. Employees in the IT department thought that the information would be useful to him. However, because they did not understand his mindset, the information disclosed actually resulted in frustration instead of trust and clarity. Similar situations were identified several times in the empirical data. IT was said to communicate using a technical language that was hard for the business to understand, resulting in less transparency instead of more.
Lastly, the complexity of the various business departments was high, leading to challenges with communicating the right information to the right business employees. Different departments had different requirements and it was difficult for CIT to tailor the information to the receivers. This was evident in the interviews, where the business employees requested more than one relationship manager for each country. They wished for someone with a better understanding of their specific area. As there was only one manager for each country, the relationship managers were found to be too busy and to cover too broad an area.
Rival explanation: The data gathered from the three projects I participated in (see THE RELATIONSHIP FROM THE PERSPECTIVE OF THE RESEACHER) indicate that initiatives to create transparency have often been disrupted by externally driven changes. Each time the business changed strategy, or when a new CIO was hired, or when IT changed its strategy in response to the business, transparency was impacted.

THE INTERPRETIVE ANALYSIS
Page 119/245
Take, for instance, the intranet standardization project. This main aim of the project was to increase transparency, yet the project was stopped because IT changed focus. A cost report, which created transparency about the actual cost of development, was suddenly lost because the person who made the report changed work roles as part of an organizational restructuring. Furthermore, the change request area has suffered each time a new manager has been hired because resources were required to update the systems, assign new roles, and communicate to the business that a new manager was now responsible for the area. The resources to do these things were often not available, which resulted in the change request containing outdated information. For instance, in mid-2013, 151 out of 493 change requests had a previous change request manager (who had left the company) listed as accountable for some part of the request. During my stay at the case organization, the organization was impacted by frequent changes. These changes originated from changes in the business strategy, new leadership, new employees being hired and old ones retiring. When IT did not deliver according to expectations, managers introduced changes (or were fired), which had a negative impact on transparency.
Summary of the transparency issue: The issue with transparency can be explained by the SP framework and the rival explanation. Four of the barriers included in the framework are seen in the empirical data and these barriers could account for why transparency is lacking. Regarding the rival explanation, it was found that the lack of transparency originated from frequent organizational changes. These changes were fueled by changes to the macro environment, new employees, and the desire of managers to ameliorate the relationship between IT and the business. Each time a change was introduced, it was found to negatively impact the level of transparency. Thus, both the identified barriers and the frequent changes could account for the low level of transparency.
Issue 4: Common understanding Description: IT lacks an adequate business understanding and is very far from the business mindset. IT does not understand the critical areas that the business focuses on, and does not have an adequate understanding of the business architecture.
Issue explained by the framework: In the literature review and in the SP framework, shared domain knowledge is seen as a mediator between transparency and trust (e.g. Wagner et al., 2012). When the parties in a relationship lack a common knowledge about one other’s constraints and competencies—which translate into service and planning transparency in the framework—the level of trust and service quality is lowered. What follows from this argument is that a lack of common understanding leads to a low level of relational transparency. Such a low level of transparency was emphasized by both the business and IT employees. For instance, one business employee stated that the departments lacked a common understanding because “CIT did not request alignment meetings where business representatives and CIT could discuss the status of change requests and provide feedback to each other.” According to the model of Wagner et al. (2012), the relationship between transparency, knowledge, and trust forms a vicious cycle. If issues with trust exist, these issues will lead to less transparency, which will in turn lead to less shared domain knowledge. The lack of shared domain knowledge, here manifested as a lack of understanding, will lead to even less transparency, and so on. This will go on until the departments somehow break the vicious cycle. The lack of a common understanding can therefore be explain via the lack of trust and transparency.

THE INTERPRETIVE ANALYSIS
Page 120/245
Rival explanation: To create and maintain good relationships with the business departments, IT created a role called the business relationship manager (BRM). The BRM was tasked with handling questions from the business, following up on change requests, handling budget, and other areas found to be important by the IT managers. However, only one BRM was allocated to each country. The consequence was that the countries did not get access to the amount of business understanding from IT that they wanted. The reason for only having one BRM per country was that IT did not have resources to cover every country. For IT to cope with business requirements, they had to rely on business knowing about IT. However, this knowledge was not something the business thought they should possess. This problem was expressed by one of the interviewees, who stated that “sometimes I get a feeling that we are expected to know a lot about IT, but we are only business people, we are not into IT” and “The main difference between IT and the business is that IT does not have a proper business understanding” (THE RELATIONSHIP FROM THE PERSPECTIVE OF THE BUSINESS). These comments indicate a situation in which the business believes that IT should be better at understanding the business’s goals, architecture, and vision, but where they believe that the business does not require insight into IT. In other words, IT should be closer to the business, without the business taking steps to become closer to IT. In the empirical data, all of the relational critique (from IT and the business employees) was directed at CIT, very similar to the finding by Coughlan et al. (2005) that IT often take the role as ‘scapegoat’. This pointed to a very one-sided relationship, where the business demanded things like more proactive communication, but simultaneously stated that they did not want to include IT because IT spoke a “language they did not understand.” The business wanted IT to become like them, without considering whether this was even possible.
The issue of IT lacking a proper business understanding can be explained by the complexity and size of the business landscape, and by the mindset of the business. The cost of assigning a BRM for every stakeholder within the business department would be too much of a cost for the IT department. Therefore, the IT department needs to involve the business more in the development process. Yet, most of the business employees interviewed were convinced that they should not need to understand or interact with the IT department.
Summary of the common understanding issue: Both explanations provided adequate explanation for the lack of a common understanding between business and IT. According to the SP framework, the lack of transparency identified in the empirical data accounts for the lack of shared domain knowledge. With a low degree of transparency, a low degree of common understanding follows. On the other hand, the reluctance of the business to understand the IT domain, in combination with the business comprising a host of heterogeneous business units, also provides an adequate explanation. It is certainly more difficult to understand the business when the business consists of various different units or when they are not willing to learn about the IT department.
Issue 5: Expectations Description: An issue that both the business and IT acknowledged was the inability of IT to meet the expectations of the business. The business employees did not know what they could expect from IT regarding services and cost, and they were not informed when a project was delayed or exceeded budget. The IT employees acknowledged this, for instance in the xQ survey, which found that only 13% of the employees believed that IT honored its commitments to its business customers.

THE INTERPRETIVE ANALYSIS
Page 121/245
Issue explained by the framework: According to the business interviewees, expectations were not managed in a sufficient manner23. This was evident from the comments in the section “How is expectation matching performed in the relationship? (Q4)”. The IT department lacked transparency regarding expectations and did not inform the business about what should be expected and what should not be expected. The issue with expectations can therefore be ascribed to a low degree of planning and service transparency and the reasons behind this low degree of transparency. When the IT department does a poor job communicating, it has negative consequences for the matching of normative and predictive expectations, as well as for the parties’ perception of the relationship.
Rival explanation: IT operates with an allocation model that includes a fixed level of resources with the possibility of hiring and firing when demand changes. The amount of employees that can be hired is thus constrained by the maximum number of resources allowed. The model is illustrated in Figure 19.
Figure 19: The resource allocation model at Carlsberg IT
The baseline represents the resources employed by the IT department. If demand exceeds the baseline, external employees can then be hired to fill the gap, typically in form of consultants. These consultants can be more easily terminated when the demand decreases.
In the xQ survey, lack of resources was the primary reason given for why IT could not fulfill the expectations of the business. Following this argument, the maximum resources allowed (see Figure 19) for the IT department must be set too low. Not enough resources are available to handle all the assignments from the business and fulfill their requirements. IT decides jointly with the business the level of resources they are allocated. This means that the business has a say in what the maximum amount of resources available will be. If a lack of resources was emphasized as the primary reason for the failure to meet expectations, this means that some in the business consider low IT cost to be more important than
Demand
Baseline
Time
Maximum resources allowed

THE INTERPRETIVE ANALYSIS
Page 122/245
better service. This was indeed the case in the years 2011-2012, when the financial crisis reached Carlsberg. Every department and unit at Carlsberg was directed to cut costs, including the IT department, even if it was already having trouble completing the existing assignments. Yet, from the interviews, only some of the business employees believed that IT should cut costs. Half of the respondents argued for an increase in IT spending and the other half argued for decreasing IT costs. The failure of IT to fulfill expectations is therefore a result of having a centralized IT department and heterogeneous, decentralized business units with conflicting demands.
Summary of the expectation issue: The SP framework suggests that expectations are an issue due to the low degree of transparency. Transparency is vital part in expectation matching, as suggested by scholars such as Six (2005). The rival explanation is that the different business units have different perceptions about how IT should be managed. Some stated that IT’s current performance was adequate given the cost of running the department, whereas others found that the department should use more resources to improve performance. This difference in perception can be seen in the empirical data: the average satisfaction of the IT department (with a maximum of ten) was 5,21, the highest being 7.5 and the lowest being 2.13. Both explanations adequately account for the issue of unmatched expectations between the IT and business departments.
Explanations summary Five issues have been explained based on the SP framework and a rival theory. A summary of this analysis is provided in Table 31 below. For each issue, the key points of the SP framework explanation and the rival explanation are provided.
Table 31: Summary comparison of SP framework explanation and rival explanation
# Issue Framework explanation Rival explanation
1 Trust The low degree of trust originated from a lack of planning (normative, shared understanding) and service (operations) transparency.
IT’s processes were inadequate to respond to the complexity and requirements of the business departments. IT lacked resources, and they used a process that was made solely with the IT department in mind.
2 Service Quality
The issue with service quality originated from a lack of planning transparency. When CIT did not communicate about its performance outcomes, the business based its perception of the department’s performance on rumors and anecdotes.
The heterogeneous business departments and their different strategies resulted in issues with service quality. The IT department attempted to align to the business departments with a “one size fits all” approach, resulting in a low degree of service quality.
3 Transparency Four of the barriers included in the SP framework could account for why transparency was low. These barriers were failed IT projects, separate
The lack of transparency originated from frequent organizational changes. These changes were fueled by changes in the macro environment, new employees, and

THE INTERPRETIVE ANALYSIS
Page 123/245
mindsets, separate languages, and business complexity.
the desire of managers to ameliorate the relationship between IT and the business. Each time a change was introduced, it was found to negatively impact transparency.
4 Understanding
The lack of transparency identified in the empirical data accounted for the lack of shared domain knowledge. With a low degree of transparency, a low degree of shared domain knowledge followed.
The lack of a shared domain knowledge was due to the reluctance of the business to understand the IT domain.
5 Expectations Expectations were an issue due to the low degree of transparency. Transparency was found to be vital for expectation matching.
The different business units had different perceptions of how IT should be managed. Some found that IT’s current performance was adequate given the cost of running the department, whereas others found that the department should spend more resources to improve performance. With the existence of different opinions, it was impossible to fulfill the expectations of all the business employees from the various countries.
The summary presented in Table 31 reveals that the SP framework theory cannot be rejected based on the analysis. The low degree of trust in the relationship can be explained by a lack of transparency, and the lack of transparency can be explained by four of the barriers to transparency identified in the literature review. The framework’s key proposition was identified in the empirical data: issues existed at Carlsberg regarding trust, transparency, service quality, and expectations, which points to a connection between these concepts. When transparency was lacking, the business based its expectations of CIT on rumors and previous encounters with other departments, with could be far from reality. These mismanaged expectations led to unrealistic estimates and assumptions, which created mistrust and a perception of poor performance because the IT department could not meet expectations. Furthermore, any departure from the negotiated estimates had negative consequences, because the level of service transparency was low. If the IT department did not properly inform the business about delays, the business could not proactively respond to the delays. The importance of planning and service transparency was emphasized in the types of information the interviewees desired. The interviewees wanted information about what the IT department could deliver and about their own change requests. The information important to them was based on the predictive and normative expectations they had of the IT department, as theorized in the chapter FRAMEWORK & PROPOSITIONS. With that said, the rival explanations also provided a sound explanation for why some these issues existed in the relationship. The rival explanations were not solely based on transparency or trust. Rather, they were based on how the IT department was configured, on the existence of several heterogeneous business units, and on the lack of engagement from the business side to seek alignment with IT.

THE INTERPRETIVE ANALYSIS
Page 124/245
Taking a step back, there seem to exist two overall ways to explain the data. One perspective is that of the SP framework: the level of trust is low because the level of transparency is low. The level of transparency is low because the parties have separate mindsets; because they use separate languages; because of organizational complexity; and because of previous IT failures. When the amount of trust and transparency is low, the parties do not share domain knowledge and they do not align their expectations. This results in issues with service quality and poor performance. IT becomes a necessary evil (Hirschheim et al., 2006) in the eyes of the business employees and to repair the relationship and restore trust requires much effort (Akkermans et al., 2004).
The other perspective is that the configuration of the IT department is infeasible. The issues originate from badly designed processes, the inability to align to the complexity of the business environment, conflicting and heterogeneous business strategies, and a lack of resources. When the configuration of the IT department is not aligned to the environment, this leads to poor performance and a failure to meet expectations.
Both of these perspectives will be discussed in PART V of the thesis.
14.3 The current situation Before addressing the propositions, the trust/transparency model from the chapter FRAMEWORK & PROPOSITIONS is used to rate the IT-business relationship at Carlsberg. One of the purposes of positioning the relationship with this model is to gain more knowledge about how the concepts relate to one other, and to predict what would happen if transparency were increased. The model is displayed below.

THE INTERPRETIVE ANALYSIS
Page 125/245
Figure 20: The trust/transparency model
Recall from FRAMEWORK & PROPOSITIONS that the above model is a synthesis of selected literature on the interplay between transparency, alignment, and trust. The model shows what might account for a situation where, e.g., trust is low but transparency is high, or the opposite, where trust is high but transparency is low.
Positioning CIT in the model Based on the empirical data, it is evident that the relationship between CIT and the business departments is located in the lower left part of the model. The level of relational trust was low, as stated by several of the interviewees, and the level of service and planning transparency was low as well.
When the relationship is placed in the lower left corner of the model, the prediction of the model is that the relationship is influenced by rumors and uncertainty, an “us and them” perception, and unrealistic expectations. The first of these is definitely true in the case organization. The empirical data provided several examples in which the perception of the relationship was based on rumors from colleagues and stories, rather than on information. One clear example was the IT manager from Denmark, who had a strong negative opinion of CIT without having had much contact with the department. An “us and them” perception was also identified. For example, a Business Developer at HQ stated, “IT and business seem like two separate functions […]. And these two functions are completely detached from each other. And each function finds that their reality is the right reality. The main difference between IT and the business is that IT does not have a proper business understanding. What is important, who is the customer, what

THE INTERPRETIVE ANALYSIS
Page 126/245
knowledge do we have, and how can we be flexible?”. That the two parties had different domain knowledge was evident in the reasons that were provided for the low perceived performance of CIT. Employees of CIT emphasized that they lacked resources and that the processes were wrong. With the business employees, the general perception was that CIT should have been able to perform with the amount of resources it had. Even if both parties emphasized that CIT’s processes were inadequate, the main reasons given for the poor perception were different. The business employees found that the structure and configuration of the IT department led to low performance, whereas CIT employees found that a lack of resources made it impossible to meet the business’s requirements. Lastly, unrealistic expectations were also identified. For instance, one of the business interviewees said that he was of the impression that the IT department used internal project managers, but later realized that IT used external project managers. An additional example from the IT perspective was that the business only expected CIT to be a technology provider, but the employees in CIT wanted to advise and drive initiatives that were changing both the business and IT landscape (see THE RELATIONSHIP FROM THE PERSPECTIVE OF IT).
A low degree of trust combined with a low degree of transparency led to a situation in the case organization where rumors, “us-and-them” camps, and unrealistic expectations flourished. This was visible in the empirical data, and it was predicted by the literature.
Increasing transparency Based on the model, an increase in transparency (for the relationship) could lead to two possible outcomes. Either the relationship would move to the upper right corner of the model and trust would increase, or the relationship would move to the lower right corner and trust would more or less stay the same.
Based on the empirical data, I believe the most likely scenario is that trust would increase. Currently, the business employees have trust in the information they receive from IT. The relational issues identified in the data are more associated with the competence-based dimension of trust, and neither IT nor the business employees question the other party’s integrity. Mistrust in information is therefore not seen as barrier. Performance below expectations is not seen as a barrier either. The empirical data indicate that the performance of CIT is actually much higher than the perceived performance, as seen through the satisfaction survey conducted (THE RELATIONSHIP FROM THE PERSPECTIVE OF IT). A difference between information and actions is not seen as a barrier either, although it is difficult to tell whether increased transparency would be accompanied by proper action on the part of CIT. The only barrier assessed to have an effect on the relationship between transparency and trust is lack of engagement from the business side. The business interviews strongly indicate that the business is not interested in learning about the mindset of IT and does not believe that IT should be included in the business processes. For example, a Vice President at HQ stated that CIT should “do as they are told” and that CIT should stop questioning ideas and business plans. Another business interviewee compared the IT department to a retailer: you go in, you order what you want, and they let you know when they are done. This lack of engagement can make it difficult to create a proper degree of shared domain knowledge and therefore acts as a barrier to creating trust via transparency.
If the lack of engagement is overcome, an increase in transparency is predicted to result in improved shared domain knowledge, clarified normative and predictive expectations, and accurate performance

THE INTERPRETIVE ANALYSIS
Page 127/245
outcomes. The absence of all of these factors was found to have a negative influence on trust in the empirical data. The act of increasing transparency could, in itself, also have a positive impact on trust, as indicated by scholars such as Kang and Hustvedt (2013). In their study, it was not the content of the information disclosed that built trust, but the act of disclosing the information. The causality between transparency, trust, and service quality will be further explored in the next part of the thesis.
14.4 Answering the propositions Seven propositions were presented in the chapter FRAMEWORK & PROPOSITIONS. Based on the current analysis, I will examine whether or not these propositions were supported by the empirical data. Because a proposition does not rely on testable data, it only needs to be convincing and internally consistent to appear valid (Yin, 2003). I used the following method to determine whether a proposition was supported by the data. First, all of the propositions predicted a relationship between the different concepts. The first criterion was that this relationship was also present in the data. The next criterion was that the empirical data provided direct support for the proposition. The third criterion was that the empirical data could be explained by the theory formed (e.g. the trust/transparency model or the SP framework) and that this explanation indirectly supported the proposition. These three criteria were assessed and it was determined whether each proposition was strongly supported, weakly supported, or not supported.
Propositions one and two The first two propositions addressed the core idea of the SP framework, namely that planning and service transparency have a significant influence on trust. Planning transparency is seen as the clarification of normative expectations and the forming of a shared domain knowledge via information. Service transparency involves regularly providing information about expectations, e.g. via operational information on change requests. The two propositions were as follows:
Proposition 1: If planning transparency is low in the relationship between the IT and business departments, it will have a negative influence on the level of trust.
Proposition 2: If service transparency is low in the relationship between the IT and business departments, it will have a negative influence on the level of trust.
For Carlsberg, the level of trust and the levels of service and planning transparency were low. Issues emphasized by IT and business employees included a lack of task information, a lack of overview data, a lack of relevant communication, and a lack of clarity regarding expectations. One business employee stated that IT had never asked to do expectation matching, and the low degree of trust was seen in both the archival records and in the interviews. This fulfills the first criterion, that the conceptual relationships predicted in the propositions was also present in the data.
For the second criterion, the empirical data provided some direct support for the two propositions. The most frequently cited reasons for the lack of trust on the business side were exceeded budgets and the provision of the wrong functionality—in other words, elements related to service quality. However, two of the business interviewees also pointed out that the lack of transparency regarding operations (service transparency) made them trust CIT less, and another interviewee said that they did not know what to expect of CIT (planning transparency), which made them trust the department less. On the IT side, some of the employees directly linked trust with transparency. In the suggestions, transparency in order “to

THE INTERPRETIVE ANALYSIS
Page 128/245
better understand [the business’s] needs and requests” was said to build trust over time, and the importance of creating transparency to build predictability for operations was also emphasized.
For the third criterion, many of the identified issues could be indirectly explained by the SP framework and the model. Rumors and uncertainty, unrealistic expectations, and an “us-and-them” perception were identified in the relationship, and all of these scenarios were linked to transparency and trust. Moreover, an inaccurate perception of the performance of the IT department was also identified based on a comparison between satisfaction scores and interviewee perceptions of the IT-business relationship. If the IT department did not communicate about budgets or delivery time being exceeded, the business could not proactively deal with these situations; ‘no surprises’ was a key phrase that emerged in several of the business interviews.
Based on the above criteria, propositions one and two are weakly supported. In general, the empirical data and theory support the propositions, but not all of the dimensions of trust were related to transparency. More precisely, only the competence-based dimension of trust was related to transparency. The business and IT employees found that CIT acted with integrity and benevolence and that integrity-based trust was high. Only competence-based trust was found to be an issue and only competence-based trust could therefore be linked to the findings.
Propositions three to five The next three propositions addressed the barriers to using transparency to create trust, as identified in the literature. These propositions were as follows:
Proposition 3: If the business cannot understand the language used by the IT department, or the IT department cannot understand the language used by the business, it will have a negative influence on the level of planning and service transparency. Proposition 4: If the business environment is complex, it will have a negative influence on the level of planning and service transparency. Proposition 5: If IT has a history of bad IT projects, it will have a negative influence on the level of planning and service transparency.
For proposition three, two examples were identified in the data as relevant to the proposition. Firstly, one of the interviewees (Vice President, HQ) received a lengthy project report from the IT department but only ended up reading a half page of text. The rest was technical language that he could not understand or did not need. Second, the business IT manager at HQ stated, “You need people who understand the business and can translate that to IT language. Quite often, you have people who speak IT language, but do not speak the business language. Or who speak business language, but do not understand IT. Right now the capabilities are not there.” The two interviewees did not directly associate the separate languages with transparency. Indirectly, however, it was clear that CIT had tried to be transparent, for example via the project report, but because they did not communicate in the correct language, the communication did not lead to greater transparency but rather to frustration, as also found

THE INTERPRETIVE ANALYSIS
Page 129/245
by Wakefield et al. (2010). Based on the criteria, proposition three was strongly supported based on the two examples, the literature, and the established low level of transparency in the case organization.
For proposition four, the complexity of the business and IT environments was high and the level of transparency was low. None of the employees directly linked this complexity to transparency but the link was present in the observation made during my project participation in the case organization. Here, the constant changes and complexities of the business environment led to an increased pressure on the IT department. Yet, because the IT department was complex as well, the IT department could not accommodate the requirements of all of the business units. The result was that the processes adopted by the IT department were more complex and cumbersome than required at the time. The complex processes made it more difficult to disclose information in a language that the business employees could understand and to notify the right stakeholders about changes. For instance, two interviewees (Business IT Manager, Denmark; Migration Manager, Denmark) found that the relationship managers from CIT covered too broad an area; however, due to the complexity of the business, it was impossible for IT to hire a sufficient number of managers24. Based on the data and my observations, proposition four is weakly supported. While some of the data supports the proposition, the lack of any direct data from the employees means that it lacks strong support.
For proposition five, both IT and business employees emphasized that large IT projects had failed and recounted the negative consequence of these failures. Several of the employees linked these failures to transparency. For instance, the IBM relationship manager in Denmark was unwilling to meet with CIT or include CIT in meetings because of the stories she had heard from colleagues about projects that had went very wrong. Several of the business employees stated that it was difficult to be transparent when they had experienced all of these issues with the IT department, for why should they? Two of the managers (Business & IT, Denmark; Financial Manager, Sweden) admitted that IT was informed last, or in some cases not at all, because the business did not want anything to do with IT due to its bad reputation. Moreover, the previous section found that the IT-business relationship involved rumors and uncertainty. These rumors can be amplified when IT projects fail and can lead to less transparency. Based on the empirical data, proposition five is strongly supported.
Proposition six The sixth proposition regarded the ability of the parties to approach one other.
Proposition 6: If the mindset of either of the parties is that it is solely the other party’s responsibility to adapt to the former’s demands or way of working, it will have a negative influence on the level of planning and service transparency.
For proposition six, it was difficult to associate the data with the proposed outcome. With that said, it was striking that all of the issues in the relationship were ascribed to the IT department. This pointed to a very one-sided relationship, where the business demanded things like improved transparency but simultaneously stated that they did not want to include IT because IT spoke a “language they did not understand” or had a history of failed projects. From the interviews, it was clear that the business
24 According to the Vice President of CIT.

THE INTERPRETIVE ANALYSIS
Page 130/245
employees were not interested in learning about the mindset of IT. As previously mentioned, the Vice President at HQ stated that CIT should “do as they are told” and that CIT should stop questioning the business’s ideas and plans. The general perception of CIT was that of a retailer and not a partner. According to the literature, such a lack of engagement has a negative influence on shared domain knowledge because the parties are unwilling to learn about each other’s domain. Based on the data, proposition six is not supported for service transparency but is supported for planning transparency. The business employees requested operational information, even if they were not interested in learning about CIT, but they did not request information regarding the constraints, possibilities, and mindset of the CIT employees and department. The effect of transparency for the purpose of creating shared domain knowledge critically decreases when the two parties in a relationship are not willing to learn about one other.
Proposition seven The seventh and final proposition addressed the relationship between transparency, trust, and service quality.
Proposition 7: If the level of trust or transparency is low in the relationship between the IT and business departments, it will have a negative influence on the level of service quality.
For proposition seven, the level of trust, the level of transparency, and the level of service quality were all found to be low. For the different dimensions of service quality, several sources provided direct support for the proposition. For instance, the poor communication between employees in the IT department and the low level of transparency present in the relationship were found to “create a black box” that made it difficult for the business to know what to expect from the IT department and to foresee delays or budget overflows. This had a negative impact on the assurance and reliability dimensions of service quality. Moreover, the empirical data revealed a difference between the satisfaction surveys (THE RELATIONSHIP FROM THE PERSPECTIVE OF THE BUSINESS) and the opinions of the business employees interviewed. The satisfaction surveys revealed above average scores for CIT on the delivery of change requests, but this satisfaction was not expressed by the majority of the employees interviewed. The scenario where performance and the perception of performance differs is present in the trust/transparency model and can account for why the level of perceived service quality is low. Based on the data and the literature, proposition seven is weakly supported. The levels of trust, transparency, and service quality were all low, and several examples provided direct support for the proposition. However, as there were no issues with the empathy and tangibles dimensions of service quality, the proposition is not strongly supported.
Proposition summary The following table features an overview of the propositions and their status (whether they were supported by the data).

THE INTERPRETIVE ANALYSIS
Page 131/245
Table 32: The status of the propositions
Proposition Status Comments
Proposition 1: If planning transparency is low in the relationship between the IT and business departments, it will have a negative influence on the level of trust.
Weakly supported
Only for competence-based trust
Proposition 2: If service transparency is low in the relationship between the IT and business departments, it will have a negative influence on the level of trust.
Weakly supported
Only for competence-based trust
Proposition 3: If the business cannot understand the language used by the IT department, or the IT department cannot understand the language used by the business, it will have a negative influence on the level of planning and service transparency.
Strongly supported
Proposition 4: If the business environment is complex, it will have a negative influence on the level of planning and service transparency.
Weakly supported
Strong support requires more data
Proposition 5: If IT has a history of bad IT projects, it will have a negative influence on the level of planning and service transparency.
Strongly supported
Proposition 6: If the mindset of either party is that it is solely the other party’s responsibility to adapt to the former’s demands or way of working, it will have a negative influence on the level of planning and service transparency.
Weakly supported
Only for planning transparency
Proposition 7: If the level of trust or transparency is low in the relationship between the IT and business departments, it will have a negative influence on the level of service quality.
Weakly supported
Only for the assurance, reliability, and responsiveness dimensions of service quality.
The above table reveals that all of the propositions were supported, but with some limitations. Only the competence-based dimension of trust was affected, and only the assurance, reliability, and responsiveness dimensions of service quality were influenced. Also, the lack of engagement on the part of IT or business employees was a barrier to planning transparency but not service transparency.
14.5 Chapter summary In the transparency/trust model, the IT-business relationship at Carlsberg is positioned at the lower left corner of the model. Thus, it was predicted that an increase in transparency could increase trust if some barriers were overcome. This prediction was supported by the finding that all seven of the propositions were supported. Some of the propositions were weakly supported and some were strongly supported.

THE INTERPRETIVE ANALYSIS
Page 132/245
Transparency, trust, and service quality seemed to be intertwined at Carlsberg, and the causal mechanisms predicted by the SP framework and model seemed to hold true. Regarding the explanations, these were used to provide answers to the propositions. The rival explanations were found to be insightful. They challenged the SP framework and several of the rival explanations could not be rejected. Some of these explanations were outside the boundaries of the framework, but some were also ideas that could extend the interpretive understanding. The next chapter will explore the explanations provided and use them to form a positivistic understanding. Because trust is seen as a dimension of alignment (Luftman, 2000) and an element of the informal organizational structure, the importance of transparency is clear. Since Carlsberg is in the lower corner of the transparency/trust model, increasing transparency could help increase the level of trust and alignment between the IT and business departments in the organization.

PART V
Page 133/245
PART V

THE POSITIVISTIC METHOD
Page 134/245
15 THE POSITIVISTIC METHOD As described in the METHODOLOGY chapter, a mixed-method research design was selected, encompassing an interpretive phase and a positivistic phase. This and the following chapters constitute the positivistic portion of the research design. As for the interpretive phase, the goal of this part is twofold: first, to form a positivistic understanding based on the interpretive understanding gained through the preceding phase, and second, to provide additional data to confirm or reject the constructed SP framework. The answers to the propositions given in the previous chapters indicated that the framework and propositions could be used to understand the relationship between transparency, trust, and service quality at Carlsberg. This indication was obtained using qualitative methods such as categorization, interviews, and interpretation. To provide additional validation of the SP framework, methods associated with positivistic research are used in the subsequent chapters. This includes the use of survey instruments, statistical analysis, and a quasi-experiment. The structure of the positivistic portion of the thesis is as follows: this chapter will discuss the method and data sources used, the next chapter will extend the interpretive understanding and form hypotheses, the subsequent three chapters will discuss the data sources, and the final chapter will provide the overall positivistic analysis.
15.1 Terminology The term quasi-experiment is used to refer to the introduction of an intervention at Carlsberg. I will use the term intervention for the introduced change. Other scholars might have used the word manipulation.
The term party or parties is used to denote one or both of the objects in a relationship. The parties in the IT-business relationship at Carlsberg are the IT department and the various business departments.
15.2 Quantitative method To operationalize and test the formed hypotheses, three data sources were used. The first data source was the interpretive understanding formed through the interpretive research and presented in the preceding part of the thesis. This understanding was used to extend the framework and to construct an intervention. The second and third data sources were two identical web-based surveys. These surveys were used to test the effect of the intervention and any correlations between transparency, trust, and service quality. The data sources were utilized to determine whether the survey was valid for measuring the concepts, and whether the intervention led to any significant changes within the case organization.
The interpretive understanding – data source one To extend the interpretive understanding, I looked at the explanations and rival explanations from the interpretive phase and investigated whether the SP framework could be extended. More specifically, I evaluated each rival explanation and determined whether this explanation should be included in the SP framework. The result of this analysis can be found in the following chapter.
Measuring transparency, trust, and service quality – data sources two and three To test the SP framework from a positivistic perspective, I needed to measure the levels of transparency, trust, and service quality in the IT-business relationship at Carlsberg. To do so, I selected 328 business employees involved in IT development or change requests. Each employee held one of three roles: change request driver, change request sponsor, and change request responsible user. The change request driver was responsible for managing a change request on the business side, the sponsor was accountable

THE POSITIVISTIC METHOD
Page 135/245
for the financial cost of the change request, and the change request responsible user was accountable for the flow of the change request through the delivery process. The three roles were selected because they constituted the main contact points between the IT department and the business regarding IT development and change. To collect data, I used a web-based survey, which can be found in APPENDIX C. The survey featured items that measured trust, transparency, and service quality according to the definitions provided in the chapters ALIGMENT THEORY and TRUST THEORY. The survey was sent to 328 employees. After two weeks, 154 employees had answered, for a response rate of 47%. Fifteen of the received answers were incomplete because they had only answered the first five questions. These incomplete surveys were excluded. After exclusion, 139 surveys were left for analysis. To ensure that no violations of the assumptions of normality, linearity, and homoscedasticity were present, preliminary analysis was performed. The presence of outliers was also checked and accounted for. Because of a high non-response rate, non-response bias was tested by comparing the group that answered with the group that did not. No significant differences were identified between the two groups in terms of variables such as location, role, or length of employment. The final survey included 48 Likert scale items, of which the scale points were labeled as follows: 1 = strongly disagree, 2 = disagree, 3 = neither agree nor disagree, 4= agree and 5= strongly agree. Items were also included that recorded the role of the employee being surveyed. These items were used as control variables. To determine the reliability of the survey items, factor analysis was performed. Factor loadings lower than 0.3 were excluded and the remaining loadings were used to determine the conceptual dimensions. Items loaded into each factor were determined by the highest loading score. The factor loadings are included in APPENDIX D. Below, I will briefly discuss how each concept was quantitatively measured.
Measuring trust During the literature review, it was established that trust could be segmented into three dimensions—competence, integrity, and benevolence (see TRUST THEORY). Seppänen et al. (2007) reviewed a list of survey items measuring trust from the years 1990-2003 and found “a lot of differences in both the conceptualization and operationalization of trust.” Looking at these survey items from empirical studies, the items were about keeping promises, being honest, not being opportunistic, not exploiting people, and the ability to do what is requested. Items measuring knowledge and skills were sometimes also included. In the current thesis, a customized version of the survey by Rawlins (2008a) was used. Based on the definition of trust selected in this thesis, the study by Rawlins, and the items listed by Seppänen et al. (2007), the items listed in Table 33 were used to measure the trust concept.
Table 33: Items used to measure the trust concept
# Item description Dimension
1 CIT has the ability to accomplish what they say they will do. Competence
2 CIT is known to be successful at the things they try to do. Competence
3 CIT makes me feel confident about their skills. Competence
4 CIT makes me want to make myself dependent on their work. Competence

THE POSITIVISTIC METHOD
Page 136/245
5 CIT treats people like me fairly and justly. Integrity
6 CIT can be relied on to keep their promises. Integrity
7 CIT does not mislead or exploit people like me. Integrity
8 CIT is concerned with people like me whenever a strategic decision is made. Benevolence
9 CIT uses opportunities that arise to profit at my expense. Benevolence
Measuring transparency Only a paucity of sources was available for quantitatively measuring transparency. In this thesis, the work of Rawlins (2008a; 2008b) and Six (2005) was used as a basis for measuring transparency. The reason for this was twofold. Firstly, the survey items used by Rawlins had been validated using statistical analysis, which made them more reliable. Secondly, Rawlins was one of the only sources that had measured transparency multiple times. Items by Six (2005) were included to focus more on planning transparency; these items mainly concerned expectation matching and evaluation.
Recall from the chapter FRAMEWORK & PROPOSITIONS that the SP framework contains two types of transparency: planning and service transparency. Planning transparency concerns discovering and clarifying expectations, while service transparency involves reporting on the expectations already stated, especially if those expectations are to be broken. To see whether Rawlins’s survey items could be used to measure planning and service transparency, factor analysis was performed on the items after the first measurement had been performed. The factor analysis, which can be found in APPENDIX J, revealed three dimensions:
� Dimension 1: General transparency. Is the information useful, relevant, timely, and easy to find?
� Dimension 2: Planning transparency. Are employees open and honest, are expectations clarified and explored, and are differences negotiated and settled?
� Dimension 3: Service transparency. Are employees open about task problems, do they disclose damaging information, are they open to criticism, and do they admit mistakes and failures to meet expectations?
Based on the items identified in each dimension, the items were found to fit well with the distinction between planning and service transparency in the SP framework. Therefore, the items validated by Rawlins could be used to measure the types of transparency that I found interesting. The items are displayed in
Table 34. The dimension in the right column in
Table 34 is the dimension that the items are mapped to, based on the factor analysis.

THE POSITIVISTIC METHOD
Page 137/245
Table 34: Items measuring transparency and expectation matching
# Item description Dimension
1 CIT discloses information in an accurate and timely fashion. General transparency
2 CIT is open and direct about task/operational problems. Service transparency
3 CIT is honest and open about motives and problems. Service transparency
4 CIT clarifies general expectations early on in a new relationship. Planning transparency
5 CIT evaluates at regular intervals the effectiveness of its work. Planning transparency
6 CIT reveals and settles differences in expectations. Planning transparency
7 CIT explores specific expectations in detail as the relationship develops. Planning transparency
8 CIT provides information that is useful for making decisions. General transparency
9 CIT informs me about IT changes and how they affect me. Planning transparency
10 CIT asks for feedback about the quality of the information shared. Planning transparency
11 CIT makes it easy to find the information I need. General transparency
12 CIT provides operational information that is relevant for me. General transparency
13 CIT provides information that is easy for me to understand. General transparency
14 CIT provides accurate and timely information. General transparency
15 CIT provides information that is trustworthy. General transparency
16 CIT provides information that might be damaging to CIT's reputation. Service transparency
17 CIT is open to criticism from people like me. Service transparency
18 CIT freely admits when it has made mistakes. Service transparency
Measuring service quality Service quality was measured according to a customized version of Parasuramans et al.’s (1988) survey of service quality. The customization consisted of two major changes. Firstly, the dimensions of tangibles and empathy were removed. Tangibles were removed because the relationship between IT and business was occurring within the same organizational boundary, and because no issues were identified with this

THE POSITIVISTIC METHOD
Page 138/245
specific dimension of service quality in the interpretive research (THE INTERPRETIVE ANALYSIS). Sometimes people meet at the HQ, sometimes at the business units, and sometimes at the IT department. Based on this, investigating tangibles was assessed to be irrelevant to the current research project. Empathy was removed because no issues were found regarding empathy in the interpretive analysis, and because I wanted to focus on the dimensions of reliability, responsiveness, and reassurance. Empathy covers items such as convenient opening hours and individual attention. While convenient openings hours are irrelevant to the research context, measuring whether individual attention was given could have provided some value. Unfortunately, the decision to exclude empathy was made at a point in time such that I could not go back and include it. The decision to exclude empathy was also based on the total size of the web-based survey. With all of the items in the survey, it was voluminous and an increased size could have had a negative effect on the response rate. As a result, I decided to remove empathy from the survey. Based on this decision, the conclusion drawn from the positivistic research should be read with the assumption that service quality does not include the dimensions of empathy (or tangibles). To further reduce the survey size, I excluded the expectation portion of the SERVQUAL scale. Babakus and Boller (1992) found that the expectation portion of the SERVQUAL scale adds ‘‘no additional information’’ beyond that which is obtained from performance perceptions alone. Parasuraman et al. (1994) compared the performance of four alternative measures and found that the performance-only measurement outperforms SERVQUAL. Based on these investigations, and to trim down the survey, only the performance dimensions were included in the below items. With a basis in the SERVQUAL scale by Parasuraman, the items shown in Table 35 were used to measure service quality.
Table 35: Items measuring service quality
# Item description Dimension
1 CIT provides deliveries as promised. Reliability
2 CIT can be depended upon when handling IT problems and issues. Reliability
3 CIT delivers the right product/service the first time. Reliability
4 CIT provides deliveries at the promised time. Reliability
5 CIT keeps customers informed about when deliveries will be made and delays. Reliability
6 CIT provides prompt service to users. Responsiveness
7 CIT is willing to help users. Responsiveness
8 CIT is ready to respond to users' requests. Responsiveness
9 CIT makes customers feel secure in their transactions with Carlsberg IT. Reassurance
10 CIT has the right knowledge to answer customers’ questions Reassurance
The items in Table 33,

THE POSITIVISTIC METHOD
Page 139/245
Table 34 and Table 35 were included in the web-based survey. Besides these items, a few items were included as control variables. The full survey can be found in APPENDIX C.
Performing an analyzing the experiment To explore the causal effects of service and planning transparency on trust and service quality, a quasi-experiment was performed. According to Campbell et al. (1959), several methods exist for conducting experimental research. The common denominator in these methods is the use of some kind of intervention. Possible forms of intervention include a change in the organizational structure, introduction of a new process, or development of a new tool that the employees could use. One of the simpler methods of conducting experimental research is to select a group of participants, measure certain variables (denoted as O1), introduce an intervention (X), and then measure the concepts again (O2). However, this method suffers from several weaknesses, the biggest of which is that the observations made in the post measurement period (O2) are not directly linked to the intervention. External changes besides the intervention might result in the changes seen at O2, which would render the results invalid. In such a case, it would be impossible to distinguish what other than X caused the changes. A solution to this problem is to control for external changes by including extra variables. However, in a complex context such as the relationship between large and complex departments, it is infeasible to control for all possible changes that could happen between O1 and O2. A more appropriate method is to define a control group. Using the symbolic representations of Campbell et al. (1959) described above, this design is outlined as:
O1 X O2
O1 O2
The essence of this experimental design is that two groups are established (the two lines above). One group is the experimental group, which is exposed to the intervention. The other group is the control group, which is not exposed to the intervention. If both groups consist of people from the same population, then any external changes affecting the experimental group should also affect the control group. This field experiment design requires two conditions to be met: 1) a large sample is necessary to achieve statistical significance, and 2) randomization is required to make sure the assigned groups’ best represents the total population. For instance, if 25 persons from the design department were assigned to a specific group and 25 from another department to another group, then the problem with comparison and external changes would still be present because changes to the design department would not affect the other department. Any changes to the groups could therefore be a result of external changes to one of the department instead of an effect of the manipulation introduced. To overcome this problem, it is necessary to perform participant randomization. Using the terminology of Campbell et al. (1959), the research design with randomization would look like:
R O1 X O2
O1 O2
Using randomization (R), and establishing a control group eliminates the weaknesses of quasi-experiments and allows the assessment of how variation within a set of independent variables affects the dependent variables (Zmud et al., 1989). In this thesis, a randomized experiment was selected
THE POSITIVISTIC METHOD
Page 140/245
because the design constituted a sound method that could be used in an inter-organizational context, and because the method was found to be feasible for hypothesis testing.
To conduct the actual experiment, the web-based survey was used to collect data about transparency, trust, and service quality. The participants who answered the first survey (O1) were used as potential participants for the experiment. Since the participants were found to be evenly distributed according to role, country, and length of employment, no non-response bias was identified. After the data from O1 had been analyzed, the intervention was introduced. This introduction was done in a number of steps. The first step was to assign an incrementally increasing number to each employee who had answered O1. Then, a random number generator was used to assign half of the numbers to one group, which was denoted the experimental group. The remaining participants were assigned to the control group. A total of 139 participants completed the pre-measurement (O1), which resulted in a group of 69 individuals for the control group and a group of 70 for the experimental group. Randomization ensured that both groups represented the relevant departments at Carlsberg and that the sample was large enough to test for significance. (e.g. participants from Denmark were represented in both the control group and the experimental group). No switching of the participants between groups was needed, as all of the countries were represented in both groups. After the experimental and control groups had been determined, an email was sent to the experimental group. The message featured a link to the intervention and a brief introduction. After three months, the survey was again sent to both groups, with the same survey (denoted as O2). Besides the items used in the pre-measurement, additional items were included to determine whether the participant had used the intervention and to what degree. After three weeks has passed, the data from the pre- and post-measurements were gathered from Survey Monkey25 and added to SPSS26. Unfortunately, it was difficult to get the participants to answer the survey a second time. Despite several reminders being sent by email, only 99 participants completed the O2 survey. Besides analysis of reliability, statistical analysis was performed using t-tests to compare the results from the control and experiment groups. Because several employees in the experimental group had not used the intervention, these individuals were added to the control group27. This helped identify only the effects of the intervention tool on the primary research concepts and mitigate the effects of unrealistically raising expectations (this is discussed later in this chapter). After those who had not used the tool were added to the control group, 31 individuals remained in the experimental group, 68 were in the control group, and a test was added to evaluate this approach (Was there a significant difference between the pre and post scores for people in the experimental group who used the tool? (Q2)). The total number of participants who provided complete data was therefore 99. To determine whether the empirical data was significant when testing correlations and causality, a significance level of 0.05 was selected. This means that if the probability of obtaining a result equal to or greater than what actually occurred, under the assumption of no effect, is less than 5%. During the experiment, no employees in IT were allowed access to the tool.
25 A web-based tool to collect survey responses.
26 A tool for statistical analysis by developed by IBM.
27 More information about this decision can be found in APPENDIX L.
THE POSITIVISTIC METHOD
Page 141/245
The use of an experiment enabled the development of causal models based on information gathered in natural—and hence more generalizable—settings for studying phenomena (Zmud et al., 1989). However, the performance of such an experiment also carries weaknesses and pitfalls. Zmud et al. (1989) and Campbell et al. (1959) summarize some of the issues with performing experiments. The most important issues are listed below:
� Withholding beneficial treatment to certain participants. � Unintentionally causing harm to certain participants. � Unintentionally changing participants’ values. � Unrealistically altering participants’ expectations. � Violating participants’ privacy or rights. � Inter-unit transfers/interaction can contaminate the effects of the intervention on experimental
groups.
The issues of withholding beneficial treatment and unintentionally causing harm can be ignored because this field experiment was about introducing transparency, which constitutes an additional option for the participants. The participants in the control group were not informed about the transparency tool. Therefore, their opinions could not have been altered because they were unaware of the tool that was withheld from them. Violating privacy rights was also safe to ignore because the disclosed information was accessible in another (although more cumbersome) way. Changing the values of the participants was not assessed to be an issue either, neither by the company nor by me. Transparency had been on the agenda for more than a year within the case organization. Even if it had only been approached strategically rather than operationally, by IT and business managers, talking about transparency was not something new to the organization. Therefore, only two issues needed to be considered: unrealistically altering the participants’ expectations, and contamination via interaction.
Unrealistically altering the participants’ expectations In an organizational experiment, an intervention is introduced to alter something within the case organization. The intervention makes it possible to induce changes in the organization, and can cause an increase or decrease in specific variables. A positive effect of an intervention is often used as justification for its introduction. The justification serves a purpose, since few managers would allow an intervention with a negative effect, yet it can also raise the expectations of the participants in an unrealistic way. For example, with the introduction of transparency, experimental participants would expect some sort of change. This can affect how much time the participants use in trying to understand the disclosed information, the interpretation of the information, and how valid the information is perceived to be. It is possible that in a real life scenario, increased transparency would not provide the same effects as transparency introduced by a Ph.D. student, because the former is not accompanied by a “scientific approach.” Artificially altering the expectations of the participants in a field experiment can affect the results of the experiment, which is important to keep in mind when results are being interpreted. To accommodate for the altering of expectations, the intervention performed in the experiment was tracked over a longer period. Although this would be expected to mitigate some the “Ph.D.” effect, the effect cannot be completely disregarded.

EXTENDING THE FRAMEWORK
Page 142/245
Contamination of interaction It may be impossible to prohibit contact among participants assigned to distinct experimental groups in field experiments (Zmud et al., 1989). When a treatment or intervention is perceived as beneficial and interaction occurs, the data from the control group may no longer be used as a valid comparison. If the control group is indirectly exposed to the same treatment as the experimental group, the results from both groups should match, leaving no observable difference. This means that if a difference between the control and experimental groups is seen, even with interaction present, it can be concluded that the treatment was effective (Zmud et al., 1989). On the other hand, no difference in values, with interaction either not controlled for or maybe present, makes it difficult to draw any conclusions regarding the effects of the treatment. The effect of contamination can be mitigated by telling participants not to talk to other participants, or by giving the participants a special login (for IT systems). For the manipulation introduced in Carlsberg, a special key was provided to the participants assigned to the experimental group. This key made it possible to gain access to the tool. Furthermore, the participants were told not to share the tool or key with anyone else. This combination was found to limit contamination via interaction.
15.3 Chapter summary This chapter introduced the methods used in the positivistic portion of the research. The two methods used were quantitative research via a survey instrument, and the introduction of a transparency intervention. These methods were used to fulfill the goal of the positivistic research, namely to form a positivistic understanding based on the interpretive understanding previously formed and to provide additional data to confirm or reject the underlying theory of the proposed framework. Moreover, the methods provide help in assessing whether an increase in transparency can move Carlsberg from the lower left corner (low trust/low transparency) of the trust/transparency model to the right upper corner (high trust/high transparency).
16 EXTENDING THE FRAMEWORK The SP framework proposes that service and planning transparency have an influence on the level of trust. Moreover, the framework identifies several barriers that could hinder the utilization of transparency to create trust. The propositions, which were formed based on the SP framework, were supported in the previous part of the thesis. This acted as a validation of the framework.
Yet, even if the framework was validated, some of the rival explanations revealed mechanisms and factors that the framework did not account for. These rival explanations touched on the relationship between transparency, trust, and service quality. The explanations and the elements therein were not included in the framework because they were not identified within the alignment or trust literature. As such, the framework could benefit from including these mechanisms because they provide information about how the concepts interact, with the caveat that they should be further validated in other studies. In total, three rival explanations were identified that can extend the scope of the framework:
1. Delayed or fragmented business projects have a negative influence on transparency. 2. Frequent organizational changes have a negative influence on transparency.

EXTENDING THE FRAMEWORK
Page 143/245
3. The reluctance of one of the parties to learn about the other’s domain has a negative influence on transparency.
These (rival) explanations will be discussed below.
16.1 Delayed or fragmented business projects The first explanation was included in framework because it highlights a topic that was not identified in the alignment literature. Although the literature emphasized that complexity has a negative influence on transparency, complexity and fragmented/delayed business projects are not similar concepts. Complexity can originate from fragmented or unfinished projects, but an organization can be complex and but have no such projects. At Carlsberg, a large business standardization project was severely delayed. To prepare for the standardization project, the IT department had changed its processes to prepare for the project’s completion. However, because the project was delayed, the IT department suddenly had processes that did not fit the business departments, leading to problems with transparency and compatibility, amongst other things. This was not the first time a large business project had been delayed. In general, the business departments at Carlsberg were found to be heterogeneous and complex. This made it increasingly difficult for the IT department to provide the right type of information and to communicate in an adequate manner because they could not tailor their processes to the different departments’ requirements. When CIT choose to implement a “one-size-fits-all” process (THE RELATIONSHIP FROM THE PERSPECTIVE OF IT), this had a negative impact on relational transparency.
16.2 Frequent organizational changes The second explanation is that frequent organizational changes decrease transparency. The empirical data indicated that at Carlsberg, the low level of trust present in the relationship contributed to frequent organizational changes. For instance, the chapter THE RELATIONSHIP FROM THE PERSPECTIVE OF THE RESEACHER describes four major changes that occurred during the writing of this thesis. Each change was fueled by a different managerial focus. One change was due to an end-to-end process perspective, while another change aimed to create accountability. Yet another changed focused on centralization, and yet another standardization. These changes included the hiring and firing of managers, change in IT systems, and a change in strategy. All of the changes that were observed—be they changes in management, new ways to lead, new ways to assess performance, or new processes—resulted in a period in which transparency suffered. When there was not enough time to adapt to the changes, the level of transparency continuously declined.
16.3 Lack of engagement The final rival explanation, regarding one party’s unwillingness to move closer to the other, was also included in the framework. At Carlsberg, all of the problems emphasized by IT and business employees concerned the IT side of the relationship. This is not unique to Carlsberg. Coughlan et al. (2005) observed the same pattern in a similar study. Historically, IT had several failed projects that the business interviewees remembered and stressed. However, even if IT had an inferior reputation, why did they themselves not mention any issues with the business side? The surveys conducted in the IT department contained little to no mention of the business being stubborn, failing to understand them, or having unrealistic expectations. It could be argued that the relationship between IT and the business is locked into an understanding that IT should supply and the business should receive: the business makes the

EXTENDING THE FRAMEWORK
Page 144/245
money; the IT department adapts to the business’s requirements. This understanding frames the direction that the IT department is heading. Instead of asking what IT employees can do to improve the IT-business relationship, they ask what they can do to improve their own performance. However, put to the extreme, if the performance sought after by business is built on unrealistic expectations, or the business has a false perception of CIT’s performance, CIT will never succeed, leading to one unsuccessful change after the other. To overcome the barriers of separate languages, separate mindsets, and a complex organizational environment, both parties need to be engaged and willing to learn about the other’s environment and constraints.
Rival summary The three explanations above constituted significant barriers to transparency within the case organization that had a negative influence on how transparency was used to create trust and service quality. It should be stressed, however, that the inclusion of these explanations is based on single case study. As such, the barriers will be included in the framework, but with the remark that they should be tested and confirmed by other scholars in future studies to ensure their validity.
16.4 Other additions Besides the three barriers, other additions were performed. These additions will be discussed below.
Mutual reinforcement From the second explanation just discussed follows another insight. Several examples were found in the data indicating that the relationship between transparency and trust is mutually reinforced (see the terminology section in the chapter INTRODUCTION for a definition). For instance, at Carlsberg, the low degree of trust led to organizational changes, which led to less transparency, which again led to low trust. One interviewee said that because of rumors about IT’s past failures, she was more reluctant to communicate and involve the IT department in business matters. In other words, the low degree of trust between the departments influenced the level of transparency. Moreover, when asking the business how transparent they were, two managers said that IT was informed last, or in some cases not at all, because the business did not want anything to do with IT. In general, the business admitted that they could be more transparent, but also that they had difficulty justifying an increase in transparency because of the inferior relationship with the IT department and the poor performance of the IT department (THE RELATIONSHIP FROM THE PERSPECTIVE OF THE BUSINESS). Because of these examples, I found that the framework should reflect that the interaction between transparency and trust was mutually reinforcing. An increase in transparency could result in greater trust, and an increase in trust could result in greater transparency. This reflection is consistent with the findings of authors such as Wagner et al. (2012) and others, who argue that the relationship between trust and transparency constitutes a virtuous/vicious cycle.
Limitations Another extension, or rather change, to the framework was to specify the conditions for the conceptual relationships. Here, two conditions were noted from the answering of the propositions in the chapter THE INTERPRETIVE ANALYSIS. First, no problems with integrity-based trust were identified. It was only the competence-based trust that was found to be low. Therefore, the framework cannot state that service and planning transparency affects all dimensions of trust, but it can argue that service and

EXTENDING THE FRAMEWORK
Page 145/245
planning transparency affect the level of competence-based trust. The other condition is that the parties in the relationship find the information they receive trustworthy. If any parties in a relationship find that the service or planning transparency cannot be trusted, this information cannot be used to create trust, much like the prediction in the trust/transparency model. At Carlsberg, none of the employees rejected the information disclosed by IT due to mistrust.
Service quality One of the supported propositions (proposition 7) was that a low level of transparency has a negative influence on the level of service quality. The argument is that when transparency is low, a gap exists between the perception of performance and actual performance. This was identified in the empirical data, in which the IT department had above average scores on delivery of change requests, yet received severe critiques from the business employees interviewed. Moreover, the business employees felt less secure when they could not obtain the status of their deliveries. Because this proposition was supported, and because support for the proposition was identified in the literature (e.g. Mason & Hillenbrand, 2013), the link between transparency and service quality was added to the framework.
16.5 The extended SP framework Based on the above discussion, the framework from FRAMEWORK & PROPOSITIONS was extended. This extended framework is displayed in Figure 21.
Figure 21: The extended SP framework
In total, the following changes were made to the framework: the number of barriers was extended to include delayed business projects, organizational changes, a lack of engagement, and mistrust in

EXTENDING THE FRAMEWORK
Page 146/245
information; only competence-based trust interacts with transparency; the relationship between transparency and trust is mutual reinforced; and service quality is linked to transparency. These changes were supported by the qualitative analysis and data.
Despite these changes, the core idea behind the framework remains the same as the original framework presented in FRAMEWORK & PROPOSITIONS. When comparing the idea of the framework with the interviews, two overall approaches to obtain IT-business alignment were identified. 1) The first approach was centered on the mitigation of transgressions of trust and the creation of a mutual and realistic understanding between parties; and the 2) second perspective was centered on improving performance in order to avoid transgressions and to fulfill the requirement of the business customers. The approach to achieve alignment identified in older alignment research, and the approach identified in the empirical data, were mainly weighed towards improving performance by changing the organizational setting and processes (that is, the second approach). It was evident that the IT and business employees were more focused on efficiency rather than evaluating whether they were doing the right things, and they did not consider whether they could be better at collaborating. The idea was that if the IT department could just be stable and predictable in their delivery to the business, and function exactly like the business wanted, no issues would emerge. The perspective of the framework is different. Instead of advocating for finding the “right” mechanical fit between business and IT, the underlying approach of the framework is to acknowledge that the perfect fit does not exist—or at least that finding such a fit is increasingly difficult in a volatile and complex environment such as that of Carlsberg. Instead of searching for the right fit, transparency is required because expectations will inevitably be broken, the organization will change often, and demands from stakeholders and customers are often conflicting. Rather than assuming that a perfect fit can be created in such a way that issues never emerge, a better approach is to assume that issues will emerge, and then try to create a means to alleviate issues in such a context. This requires that the parties are willing to learn about one other, that they trust the information disclosed by the other party, and that resources are used to promote the level of transparency between them. The idea of the framework builds on the importance of the informal structure in obtaining alignment. As Chen (2002) argues, the better the interaction between IT and the business departments, the more likely that IT department can offer relevant services, proactively address challenges, and solve problems. This argument does not say that the second approach of improving performance by configuration is insignificant. The performance of the IT department at Carlsberg could quite possibly be enhanced by looking at the configuration of processes, roles, and structures, which would increase alignment. The argument states that such a perspective cannot stand by itself. In some studies, the informal structure is found to be more important for alignment than the formal structure (Chen, 2002; Wagner et al., 2012) and initiatives to enhance alignment should review both. The SP framework features a way to look at the interplay between transparency, trust, and service quality with regard to the informal structure.
16.6 Hypotheses The interpretive chapters addressed the propositions stated in FRAMEWORK & PROPOSITIONS using interpretive methods such as interviews, categorization, and the proposal of rival explanations. One of the results of this portion of the research was the validation of the SP framework. In the positivistic phase, the SP framework was also validated, but using a different toolset. This toolset included surveys to collect quantitative data, an experiment, and statistical analysis. To use these methods, the propositions needed

EXTENDING THE FRAMEWORK
Page 147/245
to be operationalized into testable hypotheses. Unlike propositions, which can never be truly tested (Yin, 2003) hypotheses take the form of an “affirming antecedent.” This means that they consist of a premise and a conclusion. The hypotheses are only supported if the premise and the conclusion are both supported.
For a number of reasons, not all of the propositions were operationalized into hypotheses. One justification for this choice was that the introduction of an intervention is a resource dependent process. To keep things simple, the focus should be kept on the core idea behind the framework, namely that transparency can lead to trust and service quality. However, another reason that was just as important was that some of the propositions were formulated after the survey data had been collected. This was unfortunate, since it would have been interesting to confirm or reject all of the propositions using a positivistic toolset. The consequence of this choice is discussed in the final part of the thesis, Part VI. In total, three hypotheses were constructed. The null hypothesis (H0) contained a premise. If that premise was found to be false, the other hypotheses were to be considered false as well. I write considered because it would be possible, albeit very unlikely, to have hidden variables that would render the premise of the null hypothesis false but still allow causality to exist. The hypotheses used to test the SP framework were the following:
� H0: Transparency is not significantly correlated to either trust or service quality in the research context.
� H1: An increase in planning or service transparency will have a significant effect on trust in the research context.
� H2: An increase in planning or service transparency will have a significant effect on service quality in the research context.
The first hypothesis (H0) acted as the null hypothesis that could disconfirm the idea of the framework in an early stage: if no correlation were found between transparency, trust, and service quality, then no causality could be found either. The aim of the other hypotheses was to explain the detailed effects of the framework. H1 tested whether the introduction of service and planning transparency28 would have a significant effect on trust. Recall from the literature review Akkermans’ et al. (2004) finding that travail was required to bring an organization out of a vicious low trust/low transparency cycle. The introduction of the intervention was a way to effect a significant increase in transparency. Based on the literature, such an increase would be unlikely to happen by itself because of the low degree of trust found. Hypotheses 1 therefore measured whether this artificial interference could break the vicious trust/transparency cycle identified by Akkermans et al. and increase trust. If this were found to be true, it would provide further validation for Propositions 1 and 2, which were found to be supported in the chapter THE INTERPRETIVE ANALYSIS.
H2 tested whether the introduction of service and planning transparency29 would have a significant effect service quality. It should be noted here, as has previously been argued, that service quality is included in
28 Via the intervention
29 Via the intervention

EXTENDING THE FRAMEWORK
Page 148/245
the surveys and thesis because of the need to generalize, and to avoid the risk of increasing transparency or trust for their own sake. Since service quality has been measured and tested in many different settings30, the inclusion of service quality would help to generalize the findings of the thesis and compare the findings to other contexts. If H2 were found to be true, it would provide further support for Proposition 7, which was found to be weakly supported in the chapter THE INTERPRETIVE ANALYSIS.
Limitations Regarding the ability to apply the hypotheses outside the boundaries of Carlsberg, it should be noted that every argument has some limitations that can provide grounds for rebutting or refuting the claim (Van de Ven, 2007). One limitation of the hypotheses is that they only test whether conceptual relationship exist in the context of Carlsberg. If other scholars applied the theory elsewhere, it would be uncertain whether the same results could be achieved. The conditions for using the theory in other contexts will be discussed in the chapter DISCUSSION.
Another limitation of the analysis is that only some of the propositions were operationalized into hypotheses. More precisely, only Propositions 1, 2, and 7 were turned into hypotheses. This means that the positivistic research does not provide further validation for the barriers in the SP framework, which are addressed in Propositions 3-6, but only explores the relationships between the primary concepts.
16.7 Chapter summary This chapter extended the SP framework based on the interpretive understanding formed in the earlier phase of the research. The updated version of the framework can be seen in Figure 21. The three interpretive findings that were used to extend the framework were that the following had a negative effect on transparency: 1) delayed or fragmented business projects, 2) frequent organizational changes, and 3) the reluctance of one of the parties to learn about the other’s domain. These findings were added to the framework as barriers to transparency affecting the relationship between transparency, trust, and service quality. Moreover, the relationship between transparency and trust was adjusted to be mutually reinforcing and service quality was added to the framework. The dimensions of the concepts in the framework were also refined. Only the competence-based dimension of trust and the assurance, responsiveness, and reliability dimensions of service quality are included as being influenced by transparency.
To provide further validation of the framework, three of the propositions stated in FRAMEWORK & PROPOSITIONS were operationalized into hypotheses. The first hypothesis (H0) was used as the null hypotheses, and the other two hypotheses were used to explore the relationship between transparency trust, and service quality from a positivistic perspective.
30 Using the Servqual scale by Parasuraman et al. (1988)

FIRST MEASUREMENT
Page 149/245
17 FIRST MEASUREMENT The purpose of the first measurement was twofold: first, to test whether the survey instrument developed to measure transparency, trust, and service quality was reliable and could be used to track the effect of the intervention; and second, to examine whether a correlation between transparency, trust, and service quality existed at Carlsberg. If no correlation could be identified, there would be no need to search for causality, and the experiment could be abandoned. Four questions needed to be answered, namely:
1. Are the components of transparency, trust, expectation matching and service quality reliable? 2. What dimensions of transparency contribute most to trust and to each dimension of trust? 3. Does expectation matching have an effect on the relationship between transparency and trust? 4. Does transparency contribute to service quality?
The aim of the first question was to explore whether the components of transparency, trust, expectation matching and service quality were reliable constructs. This question served as a validation check to see whether the constructed survey and constructs were reliable. In addition, the inquiry served as a check to see whether the items were measuring the same or different concepts. The aim of the second question was to identify what dimension of transparency contributed most, or at all, to trust and to each dimension of trust in the case organization. The aim of this question was to reject or confirm the null hypothesis. The aim of the third question was to explore whether expectation matching had an effect on the relationship between transparency and trust. This exploration was required because of the assumptions in the SP framework that expectation matching has a significant effect on the relationship. If expectation matching did not have a significant effect on the relationship between transparency and trust, the interpretive understanding formed would need to be reevaluated. The aim of the fourth and final question was to explore whether transparency contributed to service quality. This question was included because service quality is part of the SP framework, and because Proposition 7 in the chapter THE INTERPRETIVE ANALYSIS was supported.
17.1 Are the components of transparency, trust, expectation matching and service quality reliable? (Q1)
The performance of factor analysis on the items measuring trust, transparency, expectation matching, and service quality suggested seven independent dimensions. Two of the three dimensions of service quality were found to overlap with the dimensions of trust. The performance of factor analysis on the items not measuring service quality, followed by factor analysis on the items measuring service quality, suggested nine independent dimensions for the concepts. The factor loadings for these dimensions are displayed in APPENDIX D. The dimensions and their calculated alpha values are displayed in Table 36.
Table 36: Conceptual dimensions identified through factor analysis.
Dimension Survey items # Alpha Mean / sd.
Competence-based Trust (5 items) 1,2,3,4,6 .86 2.66 / .74
Integrity-based Trust (4 items) 5,7,8,13 .8 3.21 / .66

FIRST MEASUREMENT
Page 150/245
Expectation Matching (4 items) 13,14,15,16 .84 2.81 / .72
Reliability (5 items) 28,29,30,31,32 .9 2.55 / .83
Responsiveness (3 items) 33,34,35 .76 3.01 / .75
Assurance (2 items) 36,37 .77 2.66 / .84
General transparency (9 items) 10,17,18,19,20,21,22,23,24 .90 2.86 / .73
Planning transparency (5 items) 12,13,14,15,16 .85 2.88 / .70
Service transparency (4 items) 11,25,26,27 .78 2.94 / .75
As Table 36 reveals, none of the alpha values for any of the dimensions was below .75. This indicated a good internal reliability for the survey. For the construct of transparency, three dimensions were identified: general transparency, planning transparency, and service transparency. General transparency measured whether the information was useful, relevant, timely, and easy to find; planning transparency measured whether employees were open and honest, whether expectations were clarified and explored, and whether differences were negotiated and settled. Service transparency measured whether employees were open about task problems, whether they disclosed damaging information, whether they were open to criticism, and whether they admitted mistakes regarding broken expectations. These dimensions were found to correspond well with the dimensions of the SP framework (FRAMEWORK & PROPOSITIONS).
For the construct of trust, two of the dimensions identified in the literature review of trust (see TRUST THEORY) were also present in the data. These dimensions were integrity and competence. For the construct measuring expectation matching, no significant interdependence was found with other concepts (alpha = .84) and three dimensions were discovered, namely reliability, responsiveness, and assurance. Based on the alpha values calculated, the items measuring trust, transparency, expectation matching, and service quality were found to be reliable and could be used to reject or confirm the null hypothesis and evaluate the effect of the intervention.
17.2 What dimensions of transparency contribute most to trust and to each dimension of trust? (Q2)
The results of performing bivariate analysis on transparency and trust are displayed in Table 37. The numbers in parenthesis are the reliability coefficients for each scale.
Table 37: Pearson correlations between the dimensions constituted by the survey items.*=p < .001
Measure 1 2 3 4 5 6
1. Competence-based trust (1) .595* .905* .714* .588* .628*
2. Integrity-based trust (1) .881* .641* .655* .693*

FIRST MEASUREMENT
Page 151/245
3. Overall trust (1) .761* .694* .737*
4. General transparency (1) .637* .713*
5. Service transparency (1) .614*
6. Planning transparency (1)
As shown in Table 37, large and significant correlations between the dimensions of transparency and trust were identified. To test these correlations further, three iterations of regression analysis were performed with overall trust, competence-based trust, and integrity-based based trust as dependent variables. The variance explained by the models were 69% for overall trust as a dependent variable (r=.83), 55% for competence-based trust as a dependent variable (r=.75), and 50% for integrity-based trust as a dependent variable (r=.58). The standardized beta coefficients and the significance are displayed in Table 38.
Table 38: Regression analysis with dimensions of trust as dependent variables. * = p < 0.001
Model DV: Overall trust DV: Competence trust
DV: Integrity trust
Beta Sig. Beta Sig. Beta Sig.
1. General transparency .370 p < .001 .472 p < .001 .173 p < 0.05
2. Service transparency .268 p < .001 .173 p < .05 .313 p < .001
3. Planning transparency
.309 p < .001 .185 p < .05 .377 p < .001
The regression analysis found that general transparency best predicted competence-based trust, whereas planning transparency best predicted integrity-based trust. All three of the dimensions had a significant contribution to overall trust, competence-based trust, and integrity-based trust and could explain up to 69% of the variance in overall trust. That general transparency contributed more towards competence-based trust (beta= .472, p < .001) than service and planning transparency (beta= .173, p < 0.05, beta= .185, p < .05) was not surprising. The items measuring general transparency concerned how well the information was received, whether it was relevant, and whether it was useful. Hence, these items overlapped with planning and service transparency. For instance, informing customers about change requests and normative expectations could both be relevant for the receiver. Still, in combination, the three dimensions of transparency better explained the variance in overall trust, competence-based trust, and integrity-based trust compared to the individual dimensions.
Based on the analysis, it was found that general transparency and planning transparency contributed most to overall trust. General transparency contributed most to competence-based trust, and planning and service transparency contributed most to integrity-based trust. All of the dimensions had a significant

FIRST MEASUREMENT
Page 152/245
effect on the two dimensions of trust identified, and the null hypotheses (H0) could therefore be rejected. With a basis in Cohen’s (1988) guidelines for relational strength, transparency was strongly correlated to trust and to each dimension of trust at Carlsberg.
17.3 Does expectation matching have an effect on the relationship between transparency and trust? (Q3)
The effect of expectation matching on the relationship between transparency and trust can take the form of moderation or mediation. Mediation refers to a sequence of causal relations by which X exerts its effect on Y by influencing intervening variables. Moderation describes a situation in which X’s effect on Y varies as a function of some third variable (Hayes, 2009).
To test whether expectation matching had a moderating effect, the following method was used: regression analysis was performed to assess whether expectation matching interacted with transparency to predict trust. Before forming a product term to represent the interaction between transparency and expectation matching, scores for both variables were centered by subtracting the sample mean. This approach is recommended by Aiken & West (1991) for obtaining a meaningful interpretation of results in interaction analysis. The regression included overall transparency (general, planning, and service transparency), expectation matching, and a transparency X expectation matching term as predictors of trust. Selected output from the regression is displayed in Table 39. The overall regression model showed a good fit (r = .812, F = 85.3). Transparency and expectation matching each contributed significantly to trust. However, the interaction term was found not to be statistically significant (beta = .048, p = .344). Because the interaction term was statistically insignificant, no moderating effect of expectation matching was found.
Table 39: Regression analysis on the dependent variable ‘overall trust’ with an interaction term
Independent variable Beta Std. Error Sig. T
Overall transparency .593 .061 p < .005 8.69
Expectation Matching .293 .059 p < .005 4.36
Transparency x Expectation M. .044 .061 p = .361 .944
To test for a mediating relationship, the bootstrap method described by Hayes (2009) was followed: the effect of transparency on expectation matching and the effect of transparency on trust were calculated. Then, the effect of transparency on trust was calculated, controlling for expectation matching. The standardized coefficients are shown in Figure 22.

FIRST MEASUREMENT
Page 153/245
Figure 22: Mediation effect of expectation matching on the relationship between transparency and trust. *=p<.001,
**=effect after controlling for expectation matching.
All of the beta values were found to be significant. The indirect effect of transparency via expectation matching on trust was significant. However, since the relationship between transparency and trust was still significant after controlling for expectation matching (beta = .584, p < .001), only partial mediation was identified. The standardized indirect effect with 5000 bootstrap resamples was .198 (p < .001, 95% CI = .09 to .31). The indirect effect accounted for 25% of the total effect. Based on the analysis, expectation matching was found have a statistically significant effect on the relationship between transparency and trust by acting as a mediating variable. Performing the Sobel test yielded a result of z=4.47, e=0.04 (p < .001), which supported the indirect effect of expectation matching on trust. Transparency had an effect on expectation matching, which had a positive impact on trust. However, transparency still contributed strongly to trust besides the indirect effect of expectation matching (beta = .584, p < .001). This result does not invalidate the SP framework. While expectation matching measures how well expectations are clarified and settled, this is only equivalent to the planning transparency component of the framework. The finding that expectation matching has a significant effect on the relationship between transparency and trust confirms that planning transparency is important, but that service transparency (and perhaps other forms of transparency) is important as well. This is in line with the finding that a model containing general transparency, service transparency, and planning transparency could account for almost 70% of the variance in the overall level of trust.
17.4 Does transparency contribute to service quality? (Q4) Regression analysis was performed to explore whether service quality and transparency were correlated. The dependent variable of service quality was made up of the dimensions of reliability, responsiveness, and assurance. The regression model included the independent variables of general transparency, planning transparency, and service transparency. After entering the variables, the model explained 64% of the variance in service quality. The individual contributions of each variable were the following: general transparency had a beta value of .480 (p < .001), planning transparency had a beta value of .182 (p < .05), and service transparency had a beta value of .235 (p < .001). Each of the transparency dimensions was significant.

FIRST MEASUREMENT
Page 154/245
The effects on each dimension of service quality are displayed in Table 40.
Table 40: Regression models for service quality.
DV: Service Quality (assurance, reliability, responsiveness) Beta Sig.
General transparency .480 p < .001
Planning transparency .182 p < .05
Service transparency .235 p < .001
The results show that general transparency was most strongly correlated with service quality. Service transparency was more weakly correlated to service quality and planning transparency had the weakest correlation. All of the independent variables were significant. Based on the analysis, transparency was found to have a large effect on service quality, with the largest contributions coming from general transparency and service transparency (beta = .480, p < .001 and beta = .254, p < .001, respectively).
17.5 Chapter summary This chapter assessed whether the developed survey was reliable. Furthermore, the chapter tested whether transparency was correlated to trust, whether expectation matching had an effect on the relationship between transparency and trust, and whether transparency was correlated to service quality. Using statistical analysis, the constructed survey was found to be a reliable instrument for measuring the selected concepts. With small adjustments based on the factor loadings, good alpha values were achieved. Regarding the correlations, transparency was significantly correlated with trust and service quality. This correlation was strong and positive. In other words, employees in the business departments who found that Carlsberg IT was transparent also found that they could trust Carlsberg IT and rated their service quality highly. This finding is sufficient to reject the null hypothesis that transparency is not significantly correlated to trust or service quality in the research context. Transparency via expectation matching was found to have a significant indirect effect on trust, supporting the theory of the SP framework. The effect of expectation matching was not complete (beta = .584, p < .001), however, indicating that both planning and service transparency were important when trying to improve trust. The best model to explain the level of trust via transparency accounted for 69% of the variance in the items used to measure the concepts.
THE INTERVENTION
Page 155/245
18 THE INTERVENTION The intervention, a “transparency tool,” was created in the programming language C#. This language was selected because it features a rapid application development environment (RAD). The tool was implemented using a SaaS approach (Software as a Service), where users could access the tool from anywhere within Carlsberg if they had the right key. The tool was located at the web address http://www.CarlsbergCR.Net.
The basis for the intervention was the interpretive understanding formed in the interpretive analysis (THE INTERPRETIVE ANALYSIS). The following considerations, among others, were included when the tool was being developed:
1. Support found for proposition one: If planning transparency is low in the relationship between the IT and business departments, it will have a negative influence on the level of trust.
2. Support found for proposition two: If service transparency is low in the relationship between the IT and business departments, it will have a negative influence on the level of trust.
3. Support found for proposition seven: If the level of trust or transparency is low in the relationship between the IT and business departments, it will have a negative influence on the level of service quality.
4. Support found for proposition three: If the business cannot understand the language used by the IT department, or the IT department cannot understand the language used by the business, it will have a negative influence on the level of planning and service transparency.
5. Significant effort is required: Akkermans (2004) et al. found that travail was required to bring an organization out of a vicious low trust/low transparency cycle. The intervention was to entail an increase in transparency that would have a very little chance of happening on its own.
These considerations shaped the development of tool. The first two points meant that the intervention would need to increase planning and service transparency to be effective31. The third point implied that service quality should be measured before and after the experiment to see whether the intervention had an effect on this concept. The fourth point entailed that the tool should have a layout that was simple and intuitive: it should take the data from the IT department and apply it in neutral terms that both parties could understand. The fifth and final point emphasized that an initiative to increase transparency would be interesting because it would create an artificial situation that could break the vicious cycle described in the chapter EXTENDING THE FRAMEWORK, but also that I as a researcher should be wary of artificially increasing expectations.
18.1 The situation before the intervention Before the intervention was introduced, the use of three different systems was required to obtain an overview of the change request area. These systems were difficult to navigate, they were only accessible to a few people, and only a few employees knew about them. Furthermore, they only provided access to service transparency and not planning transparency. The aim of the intervention tool was therefore to provide easy and intuitive access to information about change requests in an understandable language
31 According to the interpretive understanding

THE INTERVENTION
Page 156/245
that built on the interpretive understanding formed from the research. Figure 23 provides a conceptual illustration of the tool. As the figure shows, the tool enabled the stakeholders (the eye) to obtain an improved overview of change requests, from the initial request to the delivery of the change. This was similar to the popular “track-and-trace” feature offered by some postal services: users could follow their package all the way from the vendor to delivery at their home address. The complete change request process was described in the chapter ABOUT CARLSBERG.
Figure 23: An illustration of the tools scope
One example of the tool’s use is when a stakeholder wants to know how far into the development phase a change request is. The stakeholder can then go to the tool via the web, find the change request, and view the amount of hours registered and the current estimated delivery date. The tool is segmented into three main areas: overview of change requests, details of a specific change request, and a dashboard.
The tracking of a specific change request was how the tool improved service transparency. After the business and IT employees had agreed to deliver a change request to the business, the business could track the request. In this way, the predictive expectations of the business employee could be compared to the information in the system. An overview of every open change request and the information provided in the dashboard were how the tool improved planning transparency. By being able to view aggregated information and statistics about delivery times and schedules, the business employees could develop an image of the IT department based on actual information. This image could be compared to a situation in which the business employee bases his or her perception of the relationship on rumors or stories. The three areas of the tool will be discussed below.
18.2 Overview of change requests The front page of the tool provided users with an overview of all open change requests. A change request is considered open when development is still ongoing. The status of the change requests were plotted in

THE INTERVENTION
Page 157/245
the change request process so users could identify which step their own change request was in. The front page of the tool is displayed in Figure 24
Figure 24: The overview page in the change request tool.
The overview page was the first page seen by users of the tool. The top of the page contained methods to filter the change requests based on criteria such as date created, country, or type. For instance, if a user only wanted to see open change requests for Denmark, he could click on “Denmark” and only change requests developed for Denmark would be displayed. Furthermore, the user could search for open and closed requests in the search box. Each of the boxes represented a change request. For example, in the image above, two change requests were currently in the fourth phase of “Dispatch.” The change requests (boxes) were colored based on associated KPIs32. When a change request was green, all KPIs were met. When it was red, the KPIs were not met. In addition, the user could change view to see a different KPI. For example, if a user wanted to see how many currently open change request had exceeded budget, he could click on “budget view” and those change requests that had exceeded budget would be colored red. He could then click on each of the red change requests to view specific information about it. This process (user clicked on a change request in the tool) will be described in the following section.
32 Key Performance Indicator. KPIs evaluate the success of an organization for a specific area.

THE INTERVENTION
Page 158/245
18.3 Details of a specific change request When a user clicked on a specific change request (box) in the overview, the page seen in Figure 25 was displayed.
Figure 25: Information about a specific change request
This page contained information about estimated delivery date, current actual spend, and the estimated price for the specific change request. Furthermore, users could see who had worked on the change requests and view the communication log between developers. It was also possible to find information about who was accountable, such as the current project manager and change request driver. Lastly, the top of the page featured key performance indicators, which provided a quick overview of the change request status. For the example change request shown in Figure 25, the delivery date had been exceeded by more than three days and thus the first KPI was red. Spend was within budget and a project manager was specified, so the second and third KPI indicators were green. Because the change request had been in the same phase for more than 25 days (51 days), the fourth KPI was yellow, indicating that no progress had been made recently. Besides an overview of open change requests and specific details, the user could also find performance statistics about the area as a whole. This will be elaborated on in the next section.

THE INTERVENTION
Page 159/245
18.4 Dashboard The dashboard contained information about average delivery time for change requests, total amount of resources available, total work in person-hours, total spent that year, segmented by business department, and current satisfaction with delivery, among other information. In general, the dashboard contained aggregated information about the change request area as a whole.
Figure 26: The dashboard with summarized information.
Figure 26 shows a subset of the dashboard page. The first graph shows open change requests sorted by type for each month. The second graph shows open change requests divided according to estimated man-hours. Using the dashboard, customers could get an overall impression of the change request area. This

THE INTERVENTION
Page 160/245
included the average time until delivery and when one could expect that a new change would be completed. It was also possible to view how much each business unit had spent on change requests, so the units could plan and coordinate their IT development with the IT department. Furthermore, users could see the results of satisfaction surveys for the change request area. This is displayed in Figure 27.
Figure 27: Customer satisfaction scores
Each time a change request was closed, a manager would use the tool to send out a survey to measure satisfaction according to the dimensions displayed in Figure 27, building on historical satisfaction scores gathered before the tool was developed. This provided a way to see whether customers’ expectations were being met.
18.5 System data The data in the tool was provided by different IT systems in CIT. The data was manually extracted from these systems (which few IT and business employees had access to) and imported into the tool. This procedure was performed by the researcher daily during the experiment.
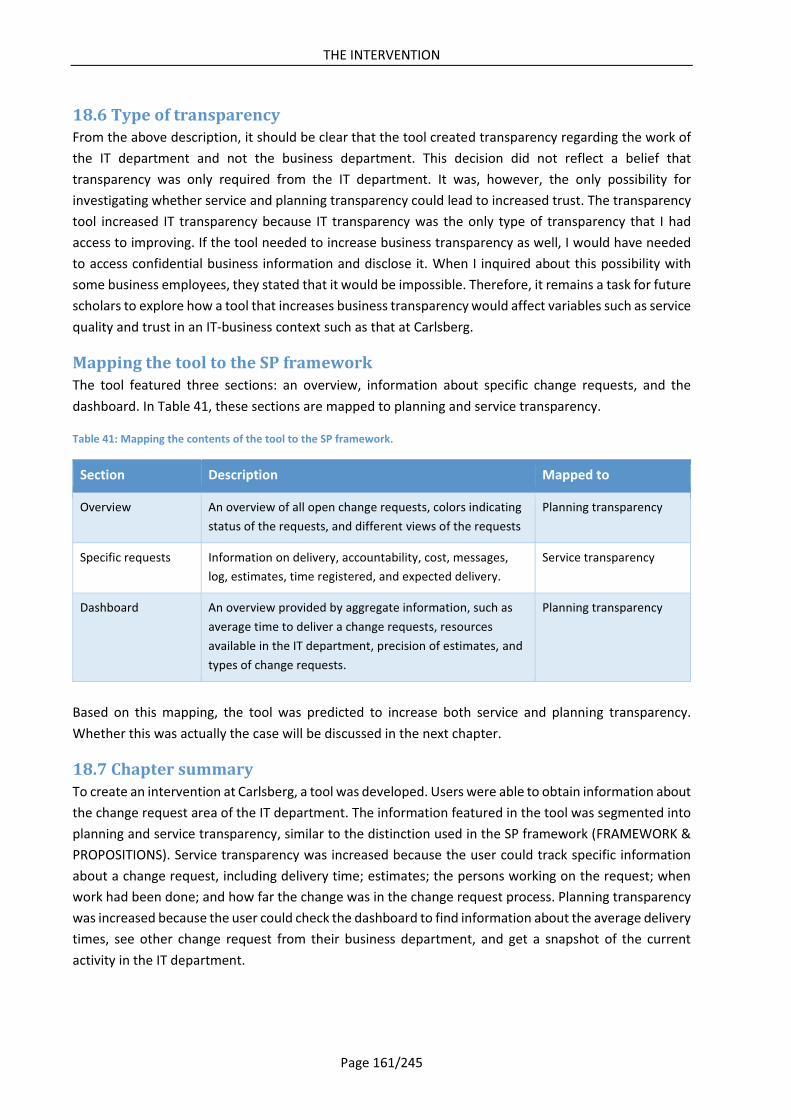
THE INTERVENTION
Page 161/245
18.6 Type of transparency From the above description, it should be clear that the tool created transparency regarding the work of the IT department and not the business department. This decision did not reflect a belief that transparency was only required from the IT department. It was, however, the only possibility for investigating whether service and planning transparency could lead to increased trust. The transparency tool increased IT transparency because IT transparency was the only type of transparency that I had access to improving. If the tool needed to increase business transparency as well, I would have needed to access confidential business information and disclose it. When I inquired about this possibility with some business employees, they stated that it would be impossible. Therefore, it remains a task for future scholars to explore how a tool that increases business transparency would affect variables such as service quality and trust in an IT-business context such as that at Carlsberg.
Mapping the tool to the SP framework The tool featured three sections: an overview, information about specific change requests, and the dashboard. In Table 41, these sections are mapped to planning and service transparency.
Table 41: Mapping the contents of the tool to the SP framework.
Section Description Mapped to
Overview An overview of all open change requests, colors indicating status of the requests, and different views of the requests
Planning transparency
Specific requests Information on delivery, accountability, cost, messages, log, estimates, time registered, and expected delivery.
Service transparency
Dashboard An overview provided by aggregate information, such as average time to deliver a change requests, resources available in the IT department, precision of estimates, and types of change requests.
Planning transparency
Based on this mapping, the tool was predicted to increase both service and planning transparency. Whether this was actually the case will be discussed in the next chapter.
18.7 Chapter summary To create an intervention at Carlsberg, a tool was developed. Users were able to obtain information about the change request area of the IT department. The information featured in the tool was segmented into planning and service transparency, similar to the distinction used in the SP framework (FRAMEWORK & PROPOSITIONS). Service transparency was increased because the user could track specific information about a change request, including delivery time; estimates; the persons working on the request; when work had been done; and how far the change was in the change request process. Planning transparency was increased because the user could check the dashboard to find information about the average delivery times, see other change request from their business department, and get a snapshot of the current activity in the IT department.

SECOND MEASUREMENT
Page 162/245
19 SECOND MEASUREMENT The purpose of this chapter is to elaborate on the first and second hypotheses stated in the chapter EXTENDING THE FRAMEWORK. Providing an answer to these hypotheses will tell whether the tool used to introduce transparency had an effect on trust and service quality. The data used in this chapter was collected three months after the intervention had been introduced at Carlsberg. By comparing the first and second measurements, it was possible to see and isolate the changes caused by the intervention. Besides providing an answer to the two hypothesis, the chapter also aims to explore whether the intervention had any negative effect on the IT or business departments. In total, this chapter will answer the following questions:
1. Did the experimental group rate transparency, trust, or service quality differently than the pre-measurement and control groups?
2. Was there a significant difference between the pre and post scores for people in the experimental group who used the tool?
3. Did the tool cause a significant increase in trust, service quality, or satisfaction? 4. Did the introduction of the tool have any negative effects?
The aim of the first research question was to explore whether participants in the experimental group rated the concepts of transparency, trust, and service quality differently than control group. Moreover, the aim of the question was to compare the scores from the first measurement (cf. FIRST MEASUREMENT) and the second measurement. This research question was included to explore the effect of the intervention. If no difference was found, then no reason existed to conduct further analysis. In addition, the question explored whether service and planning transparency had increased within the experimental group. If no increases were identified, the predicted effect of the tool would be invalid. The research question was answered by calculating mean values for the items measuring the primary concepts and conducting t-tests.
The aim of the second research questions was to explore whether there was a difference between the pre and post scores for those in the experimental group who used the tool. This research question was included to validate the method used to divide the groups. If there was no difference in scores between the pre and post measurements, then any further results could be explained by selection bias: people who chose to use the tool already found the IT department trustworthy/transparent/as having good service quality. If a difference did exist, it would support the method used to divide the groups because the difference would likely be caused by the introduction of the intervention (tool). The question was answered using an independent paired t-test.
The aim of the third research question was to explore whether the introduction of the tool caused a significant increase in trust or service quality. This question was required to confirm or reject Hypotheses 1 and 2. The question was answered using an independent t-test.
The aim of the fourth research question was to explore any negative effects of increasing transparency. In other word, which of the items in the survey showed worse scores in the experimental group compared to the control group? Besides signaling goodwill, transparency might also carry negative outcomes. A concern that I encountered often while initiating the experiment in the case organization was that the
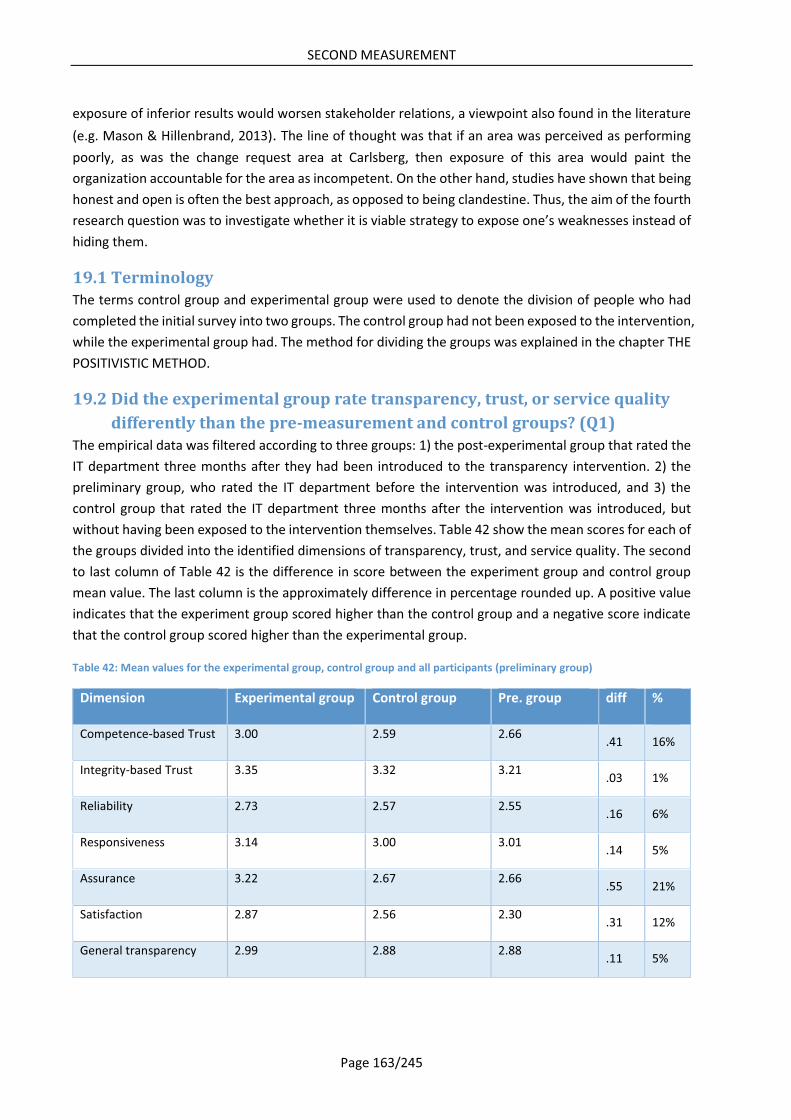
SECOND MEASUREMENT
Page 163/245
exposure of inferior results would worsen stakeholder relations, a viewpoint also found in the literature (e.g. Mason & Hillenbrand, 2013). The line of thought was that if an area was perceived as performing poorly, as was the change request area at Carlsberg, then exposure of this area would paint the organization accountable for the area as incompetent. On the other hand, studies have shown that being honest and open is often the best approach, as opposed to being clandestine. Thus, the aim of the fourth research question was to investigate whether it is viable strategy to expose one’s weaknesses instead of hiding them.
19.1 Terminology The terms control group and experimental group were used to denote the division of people who had completed the initial survey into two groups. The control group had not been exposed to the intervention, while the experimental group had. The method for dividing the groups was explained in the chapter THE POSITIVISTIC METHOD.
19.2 Did the experimental group rate transparency, trust, or service quality differently than the pre-measurement and control groups? (Q1)
The empirical data was filtered according to three groups: 1) the post-experimental group that rated the IT department three months after they had been introduced to the transparency intervention. 2) the preliminary group, who rated the IT department before the intervention was introduced, and 3) the control group that rated the IT department three months after the intervention was introduced, but without having been exposed to the intervention themselves. Table 42 show the mean scores for each of the groups divided into the identified dimensions of transparency, trust, and service quality. The second to last column of Table 42 is the difference in score between the experiment group and control group mean value. The last column is the approximately difference in percentage rounded up. A positive value indicates that the experiment group scored higher than the control group and a negative score indicate that the control group scored higher than the experimental group.
Table 42: Mean values for the experimental group, control group and all participants (preliminary group)
Dimension Experimental group Control group Pre. group diff %
Competence-based Trust 3.00 2.59 2.66 .41 16%
Integrity-based Trust 3.35 3.32 3.21 .03 1%
Reliability 2.73 2.57 2.55 .16 6%
Responsiveness 3.14 3.00 3.01 .14 5%
Assurance 3.22 2.67 2.66 .55 21%
Satisfaction 2.87 2.56 2.30 .31 12%
General transparency 2.99 2.88 2.88 .11 5%

SECOND MEASUREMENT
Page 164/245
Service transparency 3.15 2.97 2.94 .10 6%
Planning transparency 3.1 2.93 2.88 .8 7%
Total mean 3.06 2.83 2.79 .4 2%
The data in Table 42 reveal that every dimension was rated higher by the experimental group than the control and preliminary groups. While this was no guarantee of statistical significance, it called for further analysis of the data. A comparison between the control group and preliminary group revealed a total mean difference of 0.4. The low difference between the control group and the preliminary group indicates that no significant changes or events occurred during the experiment that could render the results invalid. When looking at the mean differences between the experimental group and the control group, the data reveals that assurance and competence-based trust improved the most (difference of .55 and .41, respectively). The total change in transparency, if transparency was seen as planning, service, and general transparency, was 18%. The independent samples t-test showed that the intervention significantly increased transparency under the assumption of equal variance (p < .05, t=2.174)33. General transparency, service transparency, and planning transparency were all significantly increased. These results supported the prediction presented in the chapter THE INTERVENTION that the tool could be used to evaluate the effect of increasing planning and service transparency at Carlsberg.
19.3 Was there a significant difference between the pre and post scores for people in the experimental group who used the tool? (Q2)
This research question was included to validate the field experiment. If there was no difference in scores between the pre and post measurements for the people who did use the tool, then the difference between the experimental group and control group could be coincidence34. To provide an answer to this question, the significant items measuring the primary concepts were summarized (i.e. added together) for the preliminary group and the experimental group. After the summarization had been performed, only cases in which the participant had used the tool were included. That is, only people who were in the experimental group and said they had used the tool were included in the analysis. The result a paired t-test is displayed in Table 43 (n=31).
Table 43: Comparison of the participants who used the tool in post measurements by all primary items
Mean diff. S.d. t Sig. Eta Sqr. Lower/upper
.38 .653 3.145 .004 .09 .132/.635
The significance (p=.004) was below the selected alpha value of 0.05, indicating that there was a significant difference between the participants before and after the intervention. These differences can
33 The tool also increased transparency significantly when equal variances were not assumed, p=.045
34 This would be very unlikely, but still a possibility.

SECOND MEASUREMENT
Page 165/245
be due to the tool or, less likely, to external circumstances. Notwithstanding, the findings reported in Table 43 reject the argument that there was no difference between the pre and post measurements for people who used the transparency tool. The eta value of .09 indicates a medium to strong effect (according to the definitions of Cohen, 1988). Cohen considered a p-value above .05 to be a medium effect and above .13 to be a strong effect. Hence, a significant difference was found between the pre and post scores for the participants who said they used the tool. The findings reported in this section supported a further analysis of the data and validated that the method used to divide the groups was adequate. If no difference had been found, the method used to divide the participants would have been invalid.
19.4 Did the tool cause a significant increase in trust, service quality, or satisfaction? (Q3)
To explore whether the tool had a significant effect on trust or service quality, independent t-tests were performed on the items measuring trust and service quality. The results are displayed in Table 44. A positive mean difference indicates that the experimental group scored higher than the control group and a negative mean difference indicates that the control group scored higher than the experimental group.
Table 44: Individual t-tests measuring difference between the control group and experimental group
Dimension T value Sig. Mean dif. 95% Con L-U Eta Sqr.
Competence-based Trust
2.217 .029 .415 .04/.78 .048
Integrity-based Trust
0.152 .880 .023 -.28/.33 .000
Reliability 0.904 .368 .160 -.19/.51 .000
Responsiveness 0.835 .406 .144 -.20/.49 .000
Assurance 2.80 .005 .545 .17/.92 .074
Satisfaction 1.34 .182 .309 -.14/.76 .018
Based on the results displayed in Table 44, the following dimensions were found to have a significant difference between the control group and experimental group: the competence-based dimension of trust and the assurance dimension of service quality. The strength of each effect (effect size, as defined by Cohen) is displayed in Table 45.
Table 45: The strength of the effect for dimensions with a significant difference
Dimension T value Sig. Eta Sqr Effect size
Competence-based Trust 2.217 .041 .048 Small-Medium

SECOND MEASUREMENT
Page 166/245
Assurance 2.80 .008 .074 Medium
The data in Table 45 reveal that the significant effects were of small to medium strength. The strongest effect was for assurance, followed by competence-based trust. The implications are that the introduction of the tool caused a significantly positive effect on the two dimensions shown in Table 45. Use of the tool led to a significant increase in trust and service quality. However, only the competence-based part of trust was improved, and only the assurance dimension of service quality was improved. Integrity-based trust, reliability, and responsiveness had higher mean values for the experimental group compared to the control group, but the effects were not found to be significant.
Using the data in Table 45 as a basis, the answer to H1 is that an increase in transparency had a significant positive effect on trust, but only for the competence dimension of trust. The increase in transparency via the tool was not found to have any effect on integrity-based trust. The answer to H2 is that an increase in transparency had a significant effect on service quality, but only for the assurance dimension. The increase in transparency via the tool was not found to significantly increase reliability or responsiveness. Based on these findings, the first and second hypotheses were partially supported. If the hypothesis were to be fully supported, every dimension of the concepts needed to have been significantly different between the control and experimental groups.
19.5 Did the introduction of the tool have any negative effects? (Q4) To answer this question, an independent t-test was performed. Any instance where the score of the experimental group was lower than that of the control group was regarded as a negative effect.
When looking at the data, no items were found where the score was significantly lower for the experimental group compared to the control group. Many of the items were on par, and none of the differences were large enough to be significant. Since the experimental group and control group had been exposed to the same external changes and events, the lack of lower scores supports the validity of the study. Based on the data, it is concluded that the tool did not have any negative effects on the measured concepts. This finding confirms the idea that transparency regarding operations—even if they are inadequate or below expectations—provides positive results. Even if the case organization created transparency for an area that often failed to meet expectations and did not accommodate the customers’ normative expectations, the tool increased trust and service quality without affecting any of the measured dimensions negatively.
19.6 Chapter summary This purpose of this chapter was to test whether hypotheses H1 and H2 could be rejected. Moreover, the chapter tested whether the intervention had any negative effects on the IT-business relationship at Carlsberg. Based on the data, the tool significantly increased transparency, H1 and H2 were partially supported, and it was found that the tool did not introduce any measurable negative effects. The reason that H1 and H2 were only partially supported was that only the competence dimension of trust was improved, and only the assurance dimension of service quality was improved. Based on the data, the introduction of planning and service transparency caused a significant increase in competence-based trust and assurance at Carlsberg.
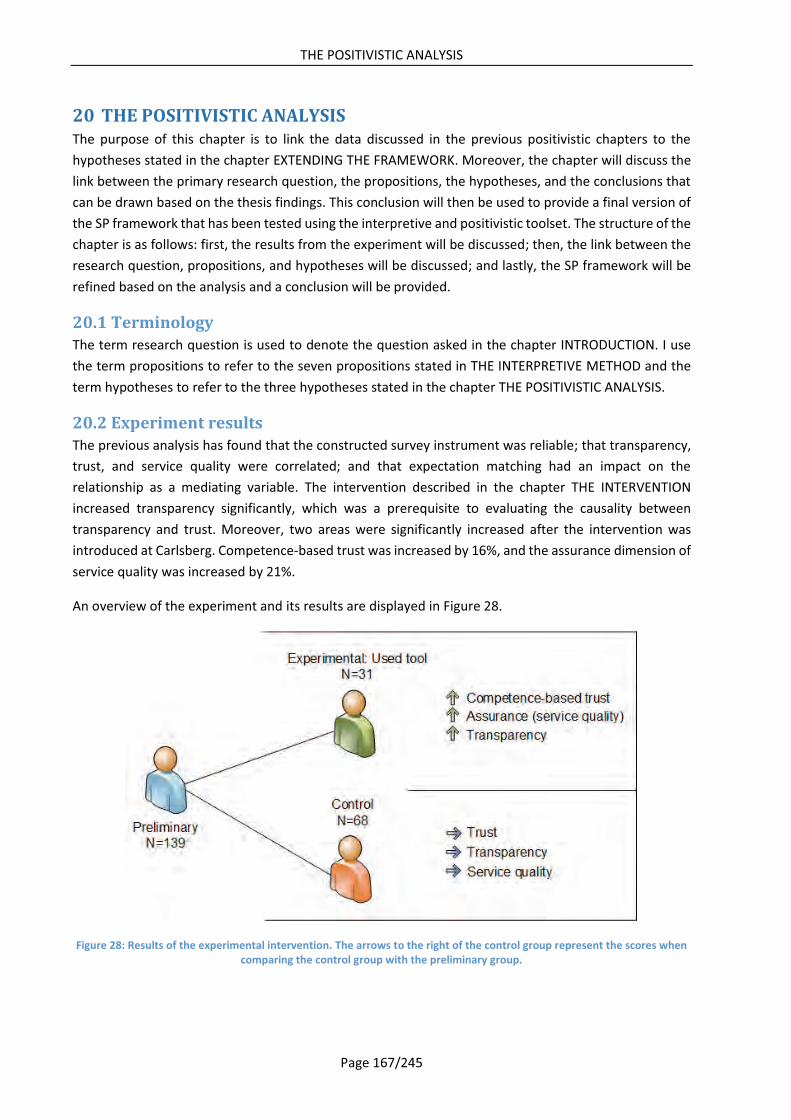
THE POSITIVISTIC ANALYSIS
Page 167/245
20 THE POSITIVISTIC ANALYSIS The purpose of this chapter is to link the data discussed in the previous positivistic chapters to the hypotheses stated in the chapter EXTENDING THE FRAMEWORK. Moreover, the chapter will discuss the link between the primary research question, the propositions, the hypotheses, and the conclusions that can be drawn based on the thesis findings. This conclusion will then be used to provide a final version of the SP framework that has been tested using the interpretive and positivistic toolset. The structure of the chapter is as follows: first, the results from the experiment will be discussed; then, the link between the research question, propositions, and hypotheses will be discussed; and lastly, the SP framework will be refined based on the analysis and a conclusion will be provided.
20.1 Terminology The term research question is used to denote the question asked in the chapter INTRODUCTION. I use the term propositions to refer to the seven propositions stated in THE INTERPRETIVE METHOD and the term hypotheses to refer to the three hypotheses stated in the chapter THE POSITIVISTIC ANALYSIS.
20.2 Experiment results The previous analysis has found that the constructed survey instrument was reliable; that transparency, trust, and service quality were correlated; and that expectation matching had an impact on the relationship as a mediating variable. The intervention described in the chapter THE INTERVENTION increased transparency significantly, which was a prerequisite to evaluating the causality between transparency and trust. Moreover, two areas were significantly increased after the intervention was introduced at Carlsberg. Competence-based trust was increased by 16%, and the assurance dimension of service quality was increased by 21%.
An overview of the experiment and its results are displayed in Figure 28.
Figure 28: Results of the experimental intervention. The arrows to the right of the control group represent the scores when comparing the control group with the preliminary group.

THE POSITIVISTIC ANALYSIS
Page 168/245
The reasons for the difference in size between the experimental and control groups (n=39 and n=68, respectively) were that the size depended on the participants answering the post survey and using the intervention tool. Of the 139 participants who answered the preliminary survey, 40 participants did not answer the follow-up survey. This left 99 individuals that could be used for the experimental evaluation. Moreover, not every participant in the experimental group used the tool. This left an experimental group of 31 participants and a control group of 68 participants.
Based on the correlations discovered in the first survey conducted, the null hypothesis (H0) was rejected. A significant correlation was found between general transparency, planning transparency, service transparency and the two dimensions of trust. The two hypotheses, H1 and H2, were partially confirmed. They were only partially confirmed because only the assurance dimension of service quality and the competence dimension of trust were increased. Failure to reject H1 and H2 provided additional support for the SP framework.
20.3 Comparing the qualitative and quantitative data The overall research question asked in this thesis was: How do trust, transparency, and service quality interact within an alignment perspective, and what are the barriers in the process? The answer to this question was constituted by the SP framework. In this framework, service and planning have a significant influence on the relationship, while several barriers also exist to influence the relationship. To test the framework, seven propositions were formed.
Through the interpretive portion of the research, all seven propositions were supported using the empirical data as a basis. Some of the propositions required refinement, which entailed changes to the SP framework. None of the changes opposed the underlying idea that both service and planning transparency were important, but they did add more mechanisms to the framework, for instance, the existence of a mutually reinforced relationship between transparency and trust, and more barriers that could influence the relationship.
To further test the framework, three of the propositions were operationalized into hypotheses. Using the empirical data as a basis, the null hypothesis was rejected and correlation and causality between transparency, trust, and service quality, was established. This confirmed Hypotheses 1 and 2 and provided additional support for the validity of the framework. The positivistic portion of the research also provided refinements to the framework. In general, the interpretive and positivistic research provided similar findings using two different toolsets.
20.4 Refining the SP framework The first refinement to the framework was to include correlation strength between the concepts. This provides information regarding strengths of the relationships and how the concepts interact. These correlations were obtained from the first measurement of the concepts. Secondly, the dimensions of the concepts were further narrowed. The extended SP framework (see EXTENDING THE FRAMEWORK) predicted that service and planning transparency would entail an increase in all dimensions of service quality, but the empirical data revealed that only the assurance dimension was significantly increased. Therefore, the dimensions of responsiveness and reliability were removed from the service quality portion of the framework. Thirdly, the factor analysis identified three dimensions of transparency:

THE POSITIVISTIC ANALYSIS
Page 169/245
general transparency, service transparency, and planning transparency. These dimensions were able to explain 69% of the variance in trust. General transparency can be seen as a dimension that overlaps with service and planning transparency. Hence, the transparency concept in the framework was renamed to general transparency. Factors such as the relevance of information, the timeliness of information, and usefulness of information all had an effect on service and planning transparency. This was also confirmed by the first measurement, where large, significant correlations between service transparency and general transparency (r=.637, p < .001) and between planning transparency and general transparency (r=.713, p < .001) were discovered. The fourth and final addition to the framework was to specify that transparency caused significant changes in competence-based trust and assurance. The final version of the SP framework can be seen below.
Figure 29: The final version of the SP framework
With the additions to the framework, the empirical investigation and analysis can be considered complete. The final version of the SP framework seen in Figure 29 constitute an answer to how transparency, trust, and service quality interact from an alignment perspective. The framework has been constructed with a basis in the literature, and refined based on the empirical data and analysis from the interpretive and positivistic portions of the research.

THE POSITIVISTIC ANALYSIS
Page 170/245
The next step is to discuss the thesis findings: what were the criteria for the results, how can the results be generalized, and how do the results contribute to and extend the alignment literature? These questions will be answered in the subsequent part of the thesis.
20.5 Chapter summary This chapter summarized and discussed the results from the positivistic research conducted. Moreover, the chapter provided a final version of the SP framework that constitutes an answer to the research question posed in the thesis introduction. The changes made to the framework were the inclusion of the correlations between concepts, a narrowing down of the concepts’ dimensions, and the inclusion of the general transparency dimension to the framework. Moreover, the causality discovered through the experiment was added. Based on the empirical data and analysis, the null hypotheses H0 was rejected, H1 was partially supported, and H2 was partially supported as well. These hypotheses were only partially supported because not all of the predicted dimensions were related.

PART VI
Page 171/245
PART VI

RESEACH CRITERIA
Page 172/245
21 RESEACH CRITERIA The methodology used in this thesis included several criteria that the research needed to comply to. These criteria were required as a means to validate the thesis findings, and to ensure that the interpretive and positivistic portions of the thesis were properly aligned. Recall from the chapter METHODOLOGY that five criteria were mentioned by Lee (1991), as follows:
1. The interpretive understanding should be properly based on the subjective understanding. 2. The subjective meanings recorded in the interpretive understanding should be built into the
positivistic understanding. 3. The confirmation or disconfirmation of the predictions formed in the positivistic understanding
should be used as indicators of the validity of interpretive understanding. 4. The actions theorized by the positivist understanding should be understandable to the observed
human subjects themselves, in terms of their own subjective understanding. 5. The predictions formed in the positivistic understanding should match observations made in the
research context.
The remainder of this chapter will discuss each criterion and discuss whether the criterion has been met. Please note that the article by Lee (1991) also mentions other underlying criteria for the interpretive and positivistic parts of the research individually. These criteria were discussed in the method chapters for each type of research (qualitative/quantitative) and will not be covered here35.
21.1 The interpretive understanding is based on the subjective understanding (C1)
The first criterion was required to avoid the methodological error of anachronism, where the researcher mistakenly applies the subjective meanings that exist in his or her own culture or organization, rather than the subjective meanings that exist in the culture or organization of the observed human subjects (Lee, 1991).
To base the interpretive understanding on the subjective understanding in the case organization, three local data sources were used: archival records, interviews, and case observation. The archival records provided a snapshot of the time before the Ph.D. project was initialized. The interviewees provided views and opinions that reflected on the current IT-business relationship. The case observations provided information that would be difficult to capture through structured interviews or records. Use of the three sources ensured that the interpretive understanding was properly based on the subjective understanding present at Carlsberg. Furthermore, and equally important, I talked and held meetings with numerous employees (from both IT and the business) about my perspectives and understanding of their issues during the three years that I spent at Carlsberg. This helped me to ground the interpretive understanding in their subjective understanding.
35 The methods are described in THE INTERPRETIVE METHOD and THE POSITIVISTIC METHOD.

RESEACH CRITERIA
Page 173/245
21.2 The subjective meanings recorded in the interpretive understanding should be built into the positivist understanding (C2)
The next criterion ensures that (1) the subjective meanings the human subjects themselves attach to their own actions—as recorded earlier by the researcher in the interpretive understanding—are similar to (2) the subjective meanings that the positivist understanding assigns, explicitly or implicitly, to the actions of the subjects (Lee, 1991). This is particularly important because the methodology sets the stage for a reinterpretation of the interpretive understanding if the predictions of the positivistic understanding fail to hold.
To construct the positivistic understanding in this research, the interpretive understanding was used as basis. That is, the intervention and surveys were created with the interpretive understanding in mind (based on the support of propositions one to seven) and design choices were made using this understanding. Moreover, the SP framework was extended to match the interpretive understanding formed so that it could best be used to form the positivistic understanding and link back to the interpretive understanding.
What were not tested in the positivistic phase of the research, however, were the barriers presented by the SP framework. This was a design error, since I did not think to include them at the time I constructed the quantitative survey. As such, the positivistic understanding is indeed build on the interpretive understanding, but the complete interpretive understanding is not found in the positivistic understanding. The main idea behind the SP framework is included in both understandings.
21.3 The confirmation or disconfirmation of the positivistic understanding should be used as indicators of the validity of the interpretive understanding (C3)
The third criterion was required so that a disconfirmed positivist prediction about behavior would cast doubt on the adequacy of the interpretive understanding, upon which the positivist understanding was based (Lee, 1991).
In this thesis, the predictions formed were constituted by hypotheses H0, H1 and H2. The predicted effects of the intervention were that it would cause a significant increase in transparency, trust, and service quality. The hypotheses were operationalized based on the propositions formulated in the interpretive phase. Because the propositions were supported by the qualitative data, and because the hypotheses could not be rejected by the quantitative data, there was no case for disconfirmation and no requirement to reinterpret the interpretive understanding. The interpretive understanding was found to be valid because the predictions held true, and this was reflected in the final extension of the SP framework presented in the chapter THE POSITIVISTIC ANALYSIS. Based on the support for the hypotheses, the validity of the interpretive understanding was strengthened.
21.4 The actions theorized by the positivist understanding should be understandable to the observed human subjects (C4)
The fourth criterion was required to ensure that a connection between the positivistic understanding and the subjects’ own understanding was present. In the words of Lee, "a scientific model of human action

RESEACH CRITERIA
Page 174/245
must be constructed in such a way that a human act performed within the real world by an individual actor … would be understandable to the actor himself as well as to his fellow-men in terms of common-sense interpretation of everyday life.”
To ensure that the fourth criterion had been met, an inquiry was performed to see how the intervention affected employees at Carlsberg. To explore the effects of the intervention on employees in the IT department, five qualitative, semi-structured interviews were conducted. Some of these interviews were done as focus groups, where two or three of the interviewees were present. In total, seven people were interviewed. The interview guide used can be found in APPENDIX E. The interviewees were selected with the goal of obtaining a good representation of the different hierarchical levels present in the IT department. One problem with meeting criterion four—which was only realized after the interviews had been performed—was that only people in the IT department had been interviewed. Even though the context of the research project was the IT-business relationship at Carlsberg, only the business employees were included in the experiment, and not the IT employees. The decision to confine the interviews to people within IT was due to time constraints. It was much faster to meet with people in IT rather than people from the business. The interviews with the IT employees did investigate whether the positivistic understanding was understandable to the subjects there, but the inclusion of business employees would have painted a more comprehensive picture. Therefore, this is regarded as a design error, but not one that invalidates the findings of the thesis. After all, the intervention was based on some of the requests of the business employees gathered through the qualitative research, such as the ability to follow change requests from start to finish.
When the interviews with IT were performed, the following hierarchical levels were represented: relationship managers, department managers, change request managers, change request leads, and demand/governance managers. Change request managers are responsible for the overall change request area, and change request leads are responsible for individual change requests. Before the interviews were conducted, the questions were tested on a “test-participant” to ensure that the language was clear and the questions made sense. Based on the test interview, one of the questions was modified. All questions were open and not leading, according to the interview guidelines provided by Andersen (2002). After all of the interviews were completed, the recorded conversations were transcribed. The transcriptions were then coded using a priori and inductive codes. The master code list is shown in APPENDIX F. After coding was done, the data was analyzed based on the codes. Finally, enumeration was performed to level the data. Two main questions were asked during the interviews:
1. How is the introduced intervention perceived? 2. What will the effect of the transparency introduced by the tool be?
These questions will be discussed below.
How is the introduced transparency perceived? (Q1) The aim of the first research question was to investigate how the introduction of the intervention influenced employees in the IT department. When asked directly about the transparency introduced by the tool, three of the seven interviewees said that the tool helped them in their work. Different areas that provided some value for the interviewees were emphasized. These areas were:

RESEACH CRITERIA
Page 175/245
� Overview: The manager could now obtain a detailed overview of the change request area instead of guessing.
� Exposure: Organizational areas that were not working well could be clearly seen. � Facts: The tool presented facts that might have been different from how people perceived the
change request area. � Platform: The tool could be used as a communication platform in meetings.
The overview was found to provide improved management of the change request area. Previously, the managers had to search several systems in order to identify errors. This process was described by one manager (change request manager): “Before [the tool], it was about hunting for errors. You had an indication that somehow, something was wrong, but you could not see it clearly. And there was always something to hunt for.” Using the overview provided by the tool, the manager found it to be much faster to see where errors were located and act accordingly. This saved time that could then be used on other tasks. The same finding was confirmed by another manager, who stated: “The tool helps me a lot to get the information very quickly.” Two managers working as business relationship managers found that the tool was useful as a platform for communication. One BRM stated: “I have an advantage of this tool, because every month I participate in a board meeting with not only the CIO but all other board managers. And I use this tool to produce some reports just to emphasize the most important figures about our performance.” The value identified was the savings of time because the manager did not need to construct the reports himself. Furthermore, when the information was displayed by a third party source, it appeared more trustworthy. The head of the IT department found that the tool provided him with several benefits. However, he also found that there was a great risk that others would find the tool harmful. The main reason for this was that while he really liked that the tool provided KPIs based on facts, the transparency generated did not describe every detail. Focusing on KPIs alone allowed the manager to ignore the excuses but on the other hand, some of these excuses might not be bad and actually be necessary to include. The manager elaborated: “The tool is very pleasant because it’s just numbers. If the numbers are not how they are supposed to be, it demands an explanation. Of course, some of those who work with the area daily might have a different opinion, because there are 1000 reasons and reservations.” When asked about the primary benefit of the tool, the manager cited the reduction in complexity. The tool allowed him to bypass explanations and just look at the status of each request: was it green or was it red? The last benefit emphasized by the interviewees was the exposure of areas that were not working well. This was perceived as a benefit because it allowed a holistic overview of what needed to be fixed. The change request manager emphasized: “When the tool was introduced it was clear that we had some places where we had gigantic problems … For a few areas, we had enormous overflow on budget and it just looked bad. Therefore, until we got that cleaned up via the tool, it was unpleasant because it was so obvious. But my personal opinion is that it’s fine.” The opinion that it was fine originated from a mind-set that although the tool displayed the inferior aspects of the area, the benefit of having a clearer picture outweighed the disadvantages of exposing the area’s weaknesses.
Regarding negative aspects of the tool, only two of the seven interviewees cited these when asked about how the introduced transparency had affected them. When asked about it directly, the following areas were mentioned as negative aspects: 1) low frequency of data updates and 2) representation.

RESEACH CRITERIA
Page 176/245
The first negative aspect was that the receivers expected the data to be real-time, but it was actually only updated once a day (or once a week, for financial data). The consequence was that people got confused about what the truth was regarding the introduced transparency. One manger stated: “Even if you can find information about the update frequency of the data, people do not look at that […] And there were some who approached me and said that the data is not correct and so on and so forth.” However, the manager found that even though the introduced transparency could only represent a single point in time, this was not too problematic because the update frequency reflected the update frequency of the underlying data. On the other hand, since the actual financial data was updated once a day, the manager thought that the introduced transparency should also be updated at a similar interval. The other negative aspect cited by two managers was the representational aspect of transparency. The first manager found that for employees unfamiliar with the change request process, some of the items displayed could seem wrong, even though they were right. For instance, “estimates [for cost] are first performed at a certain state. So to use the tool and the information the tool provides, you should be introduced to some key points about the [change request] process. I can’t see how it can become better, but I can see that the data can express something which is not the intention.” The point here was that the tool only displayed whether an estimate was provided or not36. If an employee looked at the tool and saw that an estimate was not provided, he or she could interpret this as the estimate being wrong. The other manager in IT, who mentioned representation as a problem with the tool, emphasized that sometimes the process steps (see ABOUT CARLSBERG for the change request process) were skipped. This was done because of escalations requiring change requests to be developed quickly. Therefore, multiple stages would be performed rapidly without moving the change request through the process steps in the project portfolio tool. When people looked at the tool, it appeared that a change request was not following the right process and this was perceived as an error37.
In summary, the transparency introduced by the tool was perceived as positive. The tool was found to improve stakeholder communication, management of the change request area, and free up time that could be used on other tasks. Even though the tool exposed the negative aspects of the change request area, this exposure led to quick improvement because managers could suddenly see exactly what was wrong. The negative aspects of the tool included the frequency of data updates since some employees expected real-time data, and that the tool did not represent every detail of the change request process. Before employees unfamiliar with the change request process could reap the full benefits of the transparency, it was necessary for them to understand the key points behind the process.
What will the effect of the transparency introduced by the tool be? (Q2) The aim of the second question was to investigate whether the IT employees believed the tool could improve the relationship between the IT department and the business departments. One manager (Demand manager) stated that the transparency could improve the relationship but that it should only be used according to demand. Sometimes transparency could create noise that could actually worsen the
36 This feature was later improved. The tool now only displays that an estimate has not been provided if it should have been. If not, the tool displays that “an estimate is first provided in the process stage design.”
37 The request was not following the process, but this was on purpose and not an actual error.

RESEACH CRITERIA
Page 177/245
relationship instead of enhancing it. For example, statements like “damn, you should see what I just received from this vendor, the network could break within 14 days“, would decrease congruency because employees receiving the information would act on it, even if it was just a rumor. On the other hand, transparency regarding planned strategic changes and KPIs was found to improve the relationship. One manager (Change request manager) emphasized: “If we take a basis in organizational changes, if there was more transparency … then the employees would also have more trust in [the changes] … especially if they were involved in the changes.” Transparency via KPIs was found to be an area that could improve the relationship; however, the KPIs could also lead to dissatisfaction if they were not evaluated regularly. One manger (Department manager) proclaimed: “You have to remember that when you establish a KPI, then it’s because things are going badly. And if you are not adjusting regularly, then the world has changed, i.e. you measure old problems which are no longer relevant”. The point here is that if you create transparency about relevant areas, then transparency can improve the situation because the transparency will elucidate how well the IT department is adhering to the expectations of its stakeholders. However, if transparency is created for poorly performing areas, it would reveal that the IT department does not know what is going on.
One interviewee (Business relationship manager) stated that several of the business employees would attend workshops hosted by CIT, and would say that it was difficult to know who to contact in the IT department or where to go for help. To explain why this was the case, the manager emphasized the frequent organizational changes that had occurred. Each time the organization changed the degree of accountability and knowledge became more diffuse. The Business relationship manager argued that the customers could not see any status on their expectations. “If I have a request or an assignment, then what happens, […] what am I going to expect of time, who is responsible, who do I contact if I feel like nothing is happening or would like a status now? Right now it’s very difficult to find information about what is actually happening.” When this information was lacking, it was difficult to work with the IT department because stakeholders did not know what to expect and were unable to plan their own work since they could not obtain a status report. Furthermore, the manager emphasized that it was important to enhance transparency when changes were made to the IT organization. Organizational changes decreased accountability and made it harder to find the right resource and entrance point into the organization. Therefore, it was important to create transparency not only internally but also externally towards the customers, so they would know who to contact regarding the change request and to obtain a status.
The managers responsible for the relationship with the business also found that the introduced transparency could improve the relationship. Their belief was that transparency should reflect the expectations of the customer. One manager said, “You need to focus on what you hope will be expected from you, narrow [the requirements] down, again its expectations.” If transparency concerned the expectations of the customers, they would consider the IT department more as a partner. On the other hand, if the IT department was reluctant to be transparent, then the stakeholder might infer that IT had something to hide. For instance, one business relationship manager said, “I just had a conversion with the Norwegian customers, and in terms of economy and budgets, we are so complicated, […] and they feel that they have been cheated in some kind of way, because they can’t see through the figures.” The underlying theme emphasized was that when communication is not clear, or if there is not enough

RESEACH CRITERIA
Page 178/245
transparency, the lack of transparency could influence expectations in a negative way. Actions and events will be interpreted from a negative mindset, which could lead to deterioration of the relationship.
Another problem with lack of transparency was emphasized by the head of IT department. If stakeholders were experiencing individual issues, they had a tendency to make their issue representative of all cases, especially if performance outcomes were not communicated. For instance, if a business employee found that “the printer in Poland does not work,” then suddenly it would become “the printers in Europe don’t work, and next time he goes to Excom38 he says that the shit doesn’t work altogether.” This would create false information that could influence the relationship in a negative manner. If IT is transparent about what the customers can expect, then these cases can be avoided. If not, the customers’ expectations will be based on rumors and isolated issues experienced by single individuals.
Summary The aim of the inquiry described above was to see whether the predictions theorized through the positivist understanding were understandable to the observed human subjects. More specifically, the aim was to investigate whether the predictions (H1 and H2) made sense to the actual subjects at Carlsberg.
According to the data, the intervention (and thereby the increase in general, planning, and service transparency), was found to improve the relationship between the IT department and the business departments in the following ways:
� Provided stakeholders with information on who to contact regarding change requests, how to obtain a status of these requests, and who to contact if things were not going satisfactorily.
� Provided information to combat the use of rumors and isolated experiences to form perceptions.
� Created clarity about what the stakeholders could expect. This helped with planning and execution and made the IT department a partner instead of a “vendor.”
� Lessened the cost of organizational changes for the stakeholders, since organizational changes result in less accountability and transparency.
� Provided a detailed overview of the change request area for IT managers, so that they would not have to rely on hunches about how things are going.
� Provided a communication platform, with information that could be used in external and internal meetings.
The improvements cited by IT employees had many of the same elements as the SP framework. The employees emphasized the need for service transparency and planning transparency with their stakeholders, as well as some advantages that were only relevant inside the IT department. Based on the data, the predictions of the SP framework made sense for the employees of the IT department. The increases in trust and service quality were adequately explained by the employees, and the explanations were somewhat similar to those formed in the interpretive and positivistic portions of the research. Some concerns regarding the tool were mentioned by a few of the IT employees, but these concerns were not 38 An executive board at Carlsberg for the top management.

RESEACH CRITERIA
Page 179/245
investigated in more detail. It would therefore be interesting to investigate the concerns in a future study to see whether they would necessitate a change to the SP framework.
21.5 The predictions formed in the positivistic understanding should match observations made in the research context (C5)
The purpose of the fifth criterion was to “confirm […] or disconfirm […] the theoretical propositions through controlled empirical testing” (Lee, 1991). Confirmation of the operationalized propositions (hypotheses) was conducted in the chapters FIRST MEASUREMENT, SECOND MEASUREMENT, and THE POSITIVISTIC ANALYSIS. The method for doing this was described in THE POSITIVISTIC METHOD, and the conclusion was that hypotheses H1, and H2 were confirmed based on the empirical data (observations) and that the null hypotheses was rejected. Based on this conclusion, the predictions are assessed to match the observations in the research context. With that said, and as mentioned previously, the barriers presented in the SP framework were not tested. These barriers were identified in the interpretive analysis and in the literature review but were not included in the positivistic analysis. As such, the predictions formed through the positivistic understanding did match the observations, but it should also be noted that no predictions were made about the barriers included in the SP framework.
21.6 The effect of the intervention was not caused by altered expectations (C6) The last criterion is not part of Lee’s (1991) methodology, but was required to address some of the pitfalls present when doing experimental research. More specifically, when an intervention is introduced, effects can arise from altered expectations in addition to the changes caused by the intervention. The experiment can created an unrealistic setting that is used as basis for generalization (Moore, 1991). In the current study, one attempt to avoid this risk was to measure whether the intervention caused an increase in transparency. If this were the case, the effects of the intervention would not solely have stemmed from the intervention’s introduction, but also from the intervention changing the degree of transparency. Since the change in transparency was significant, it could be concluded that the intervention had some effect other than altering the expectations of the receivers. Another attempt to avoid the risk was to see whether the tool was still used three months after the experiment had ended. The reason for this test was that the intervention could have entailed employees using a tool they otherwise would not have if it were introduced by IT employees. If the tool were still used after the experiment had ended, this would reinforce the notion that the increase in transparency was useful to the receivers, and that they used the intervention not because of altered expectations, but because of the increase in general, service, and planning transparency.
To see whether the tool was used, its utilization was analyzed. The assumption was that a difference in usage between the end of the experimental period and three months after the end of the experiment would provide information about the effect of the tool. To gather this data, the use of a tracking device (Google Analytics) was implemented. This tracking device saved information about each user when they used the tool, including their name and the frequency of use. The data from the tracking device was then compared for the period just after the experiment ended and three months after that time.
Results of the comparison During the experiment, 31 participants in the experimental group used the tool (THE POSITIVISTIC ANALYSIS). The remaining participants chose not to use the tool at all. After three months, a comparison

RESEACH CRITERIA
Page 180/245
of the active user list and the experiment participant list revealed that 15 of these participants were still frequently using the transparency tool. No participant in the experimental group who said they did not use the tool during the experiment had started to use the tool by three months after the experiment had ended. The drop in the number of users was approximately 50%. Possible reasons for this drop include: 1) the employees no longer had any change requests and therefore no current need for information from the change request area, 2) the users had forgotten about the tool and could not locate it again, or 3) the users had changed positions in the company and no longer interacted with Carlsberg IT. It was also possible that they only used the tool because their expectations were artificially altered by the researcher.
Besides the participants in the experimental group, other people also had the possibility to use the tool after the experimental period. This also included employees in the IT department. No special marketing effort was performed, so most knowledge about the tool travelled by word-of-mouth. Three month after the experiment ended, 58 individuals were using the tool. Compared to the original 31 people, this was an increase of approximately 70%. This finding suggests that there was a previously unfulfilled need for transparency. Even if only 50% of the participants in the experimental group used the tool after three month, other employees had begun to use it as well. When the experiment was conducted, 328 individuals were found to be involved in the interaction between Carlsberg IT and the business departments. If 58 people were frequently using the tool after the three-month period, this means that about 20% of the people handling interactions were benefitting from the intervention in some way.
When the 58 users were categorized according to whether they belonged to Carlsberg IT or the business departments, 23 belonged to the IT department, and 35 belonged to the business departments. This means that the number of business users three months after the experiment was a little higher than when the experiment was conducted and included 20 new business users who had not taken part in the experiment.
Summary Because 15 of the original experimental participants still used the tool three months after the experiment had ended, the effect of the tool could not be ascribed to altering the expectations of the users alone. Moreover, because 35 users from the business used the tool after the experiment ended, this further lowers the possibility that the effect of the tool originated solely from unrealistically raising the participants expectations. Although the usage alone does not provide any direct information about the effect of the tool, it is evident that the business users found the tool useful in their daily work. Based on this finding, and the finding that the tool significantly increased transparency for the users, the observed effects of the tool are concluded to have resulted from the increase in transparency.
21.7 Chapter summary The aim of this chapter was to list the methodological criteria used and discuss whether these criteria had been met in the research. In general, all of the criteria were met. There were some areas where the criteria were not fully satisfied because of design errors. These areas were that the positivistic understanding should be understandable to the observed human subjects, and that the interpretive understanding should be built into the positivistic understanding. For the first area, the business employees were not interviewed to see whether the positivistic understanding made sense to the subjects; only employees in the IT department were interviewed. While the interviews of IT employees

DISCUSSION
Page 181/245
provided some confirmation that the positivistic understanding made sense for the employees, a more comprehensive test could have been performance if the business employees had been included. For the second area, the barriers discovered in the interpretive understanding were not fully included in the positivistic understanding, since they were not operationalized into hypotheses. If they had been operationalized and tested, the validation of the SP framework would have been more complete. While the two design errors did not render the thesis findings invalid, they did affect the strength of the arguments made.
22 DISCUSSION The purpose of this chapter is to discuss how the findings of the research project support or contradict the existing literature, and to outline the contribution of the thesis to the field. Furthermore, the chapter will discuss some of the weaknesses of the methods utilized, the limitations of the findings, the novelty of the findings, and whether the findings can be generalized outside the context of Carlsberg.
22.1 Terminology In this chapter, business-IT alignment is perceived to span concepts such as trust and service quality. This perspective is found in some of the newer alignment literature (see ALIGMENT THEORY).
22.2 Position As stated in the chapter THE THEORETICAL FRAMEWORK, the main theory underlying the research was alignment theory. The current alignment literature is exhaustive, and features studies of alignment models, issues, antecedents, and correlations to other concepts. The past studies in the alignment field have been concerned with finding the right configuration of strategy, including the configuration of roles, processes, and structures between departments that can maximize alignment and performance. Recently, studies in the alignment field have also begun to focus on the operational element of alignment, and “softer” concepts, such as every-day communication and trust, have been further studied. As Wagner et al. (2012) state: “While most research and practice [in the alignment field] has focused on strategic alignment to synchronize IT and business plans among the executive team, our research suggests that operational alignment is equally, if not more, important. Operational alignment brings strategic plans into everyday life and creates value from daily operations.”
For 30 years, information technology (IT) executives have identified IT–business alignment as a top management concern (Gerow et al., 2014). Even with the amount of current research, achieving alignment remains a challenge for firms worldwide (Tallon, 2007). Opponents to alignment theory argue that alignment theory is too simple and that when “alignment adopts a mechanistic perspective, the state of alignment envisaged is equivalent to a mirage, seeming to exist … but in reality, actually non-existent” (Grant, 2010). Moreover, opponents of alignment theory, such as Ciborra (1999), criticize the alignment concept for the often-futile attempts made to control the relationship between IT and the business. Ciborra (1999) argues that the perception of alignment offered by current models does not fully represent the complexity of real-world efforts to apply IT to business effectiveness. According to the author, the modeling between business strategy and IT infrastructure, which is the backbone of many alignment models, is an attempt to bridge two extremely unstable variables (Ciborra, 1997).

DISCUSSION
Page 182/245
The alignment field has not completely dismissed the aforementioned critique. In Chen & Reich’s (2007) summation of the current alignment research39, they argue that the critique can be seen as more of a challenge in pursuing alignment, rather than a reason that alignment should not be pursued or studied. The authors further argue that instead of merely listing antecedents, researchers should explore the inter-relationships among them in details using extensive methods. This study is positioned within the bounds of alignment theory. More specifically, this study attempts to continue the stream of alignment studies focusing on the operational side of alignment and the informal structure of the organization. By focusing on the concepts of transparency, trust, and service quality, the thesis provides input into alignment models such as Wagner et al.’s (2012) and the work of other scholars who claim that transparency is important in bridging business and IT (e.g. Luftman, 2000). As such, this study is positioned in the area of alignment research that is moving away from alignment perceived as finding the right organizational configuration. Due to the choice of concepts and the choice of methodology, the thesis’s contribution to alignment theory is not so much on a technical level but rather on a social level. That is, its focus was not on finding the right configuration of roles and structures to improve alignment, but rather to explore and explain how transparency, trust, and service quality interact from an alignment perspective.
An alignment perspective on trust, transparency, and service quality What were the implications of exploring the concepts of trust, transparency, and service quality from an alignment perspective? The first implication for this study was that alignment theory was used as the theoretical framework, and insights from alignment theory were used to shape the SP framework, the propositions, and the hypotheses. The first step was thus to identify gaps in the current theory and to develop a new framework based on alignment theory. The other implication was that the study was focused on the dimensions of alignment associated with trust, transparency, and service quality. When Luftman’s (2003) widely-used items for measuring alignment were used as basis, these dimensions were represented in 14 of the 38 items. The thesis was centered on transparency, trust, and service quality because these concepts are commonly used to measure alignment, and because they had not been studied much in an alignment context. Hence, alignment was used to tie the concepts together and to make them relevant in an IT-business setting. Since transparency was found to increase competence-based trust and assurance, it can also be said to enhance the (social) level of alignment. Based on the interpretive and positivistic data, the interaction between trust, transparency, and service quality was found to significantly affect alignment.
22.3 Impact The large number of concepts linked with alignment tells of a broad field in which the focus is on improving alignment by looking at other concepts. Since more than 50 concepts have been explored thus far in the literature, one of the impacts of this study was the finding of yet another correlation between alignment and other concepts (in this case, trust and service quality). However, a main difference
39 Still found to be relevant even if the article is from 2007

DISCUSSION
Page 183/245
between this study and studies using survey data 40 is that the correlations were investigated both qualitatively and quantitatively. As a result, the thesis findings not only shows that trust and transparency were related, but also that transparency caused trust. Moreover, the inclusion of the qualitative data provided additional input on this relationship and identified a set of barriers that could be useful in understanding the interaction between transparency and trust. To envision how the thesis contributed to the alignment field, four articles from the field were selected. For each of these articles, it will be discussed how the thesis findings extend the point of the article and whether the findings contradict the article in any way. The following articles were selected:
� Luftman (2000): ASSESSING BUSINESS-IT ALIGNMENT MATURITY. � Wagner et al. (2012): How to Achieve Operational Business-IT Alignment: Insights from a global
aerospace firm. � Coughlan et al. (2005): Understanding the business–IT relationship. � Grant (2010): Reconceptualizing the Concept of Business and IT Alignment: From Engineering to
Agriculture. Each of these articles will be discussed below. The articles were chosen because they feature a link between transparency and alignment. The articles were not chosen to specifically emphasize how their findings are individually extended, but rather to illustrate how the findings in this thesis extend or contradict the general perception in the alignment field.
ASSESSING BUSINESS-IT ALIGNMENT MATURITY (Luftman, 2000) Luftman used some of his earlier work (e.g., Luftman et al., 1999) to identify concepts important to alignment. He found that “achieving alignment is evolutionary and dynamic. It requires strong support from senior management, good working relationships, strong leadership, appropriate prioritization, trust, and effective communication, as well as a thorough understanding of the business and technical environments.” (Luftman et al., 1999). Based on these findings, Luftman created a model to assess an enterprise’s alignment maturity. An evaluation team in the enterprise then “uses the results [of the model] to converge on an overall assessment level of the maturity for the firm. Then [they] apply the next higher level of maturity as a roadmap to identify what they should do next.” Trust and service quality is a significant part of this model and thus a significant part of how Luftman perceives alignment.
One of the key areas in the model is communication. Luftman emphasizes effective exchange of ideas and a clear mutual understanding between parties as important in achieving alignment. Given the dynamic environment in which most organizations find themselves, ensuring ongoing knowledge sharing across organizations is considered paramount.
The findings of the current thesis extend Luftman’s study in two ways. Firstly, while Luftman argues that communication is necessary from an alignment perspective, he does not provide specific input on how
40 Most of the studies of alignment theory use survey data

DISCUSSION
Page 184/245
to achieve alignment via communication. The high-level suggestion is to “establish effective business function/IT liaisons that facilitate sharing of knowledge and ideas.” While the possibilities for enhancing communication are many, this thesis provides a way to enhance communication using the SP framework and the transparency tool. The point of the framework is that it is not communication, per se, that is important, but rather communication about expectations. Luftman’s suggestion of communication’s importance should therefore be seen in terms of communication’s specific properties: some, but not all, of these properties enhance alignment. If alignment is measured partly by trust and service quality, the SP framework provides a more precise way to increase alignment.
The other contribution of this thesis is the set of barriers to transparency identified in the qualitative/interpretive part of the research. The quantitative portion of the thesis supports the claim by Luftman that communication and transparency are important. However, the qualitative phase identified barriers that affect the ability of transparency to increase trust. The two identified barriers that are relevant to the work of Luftman are organizational changes and situations in which the business does not want to engage with IT.
The first barrier was important at Carlsberg because the observed organizational changes severely affected IT-business transparency. When the organization changed, the consequence of the already poor business-IT relationship was that the business did not know whom to contact and who was accountable for the individual change requests. Luftman’s proposal to establish liaisons between IT and the business is adequate, but cannot stand alone in a context where trust or service quality is assessed to be inadequate. The findings of this thesis indicate that organizational changes should be implemented with care and that such changes should be accompanied by initiatives to maintain communication and interdepartmental transparency. The second barrier relevant to extending Luftman’s findings was that the business did not want to be engaged with IT. This was a major obstacle to achieving alignment at Carlsberg, but was not something that Luftman discusses. One of the effects of communication is the establishment of a mutual understanding between parties41. At Carlsberg, the transparency tool featured information on the total number of change requests and the available man-days and resources. This information was presented in business terms. However, the tool could have been more useful if technical information was presented as well, or information about the inner workings of the IT department. Yet, based on the business interviews, it was apparent that the business only wanted IT to learn about the business domain, and not the other way around. In a situation like this, it is not only important to communicate, but also to assess and evaluate how the relationship is perceived by both parties. Alignment can be best achieved when both parties work towards creating a shared domain knowledge. If one part is stubborn, or considers itself the “master” in the relationship, this can make communication initiatives less effective.
How to Achieve Operational Business-IT Alignment: Insights from a global aerospace firm (Wagner & Weitzel., 2012) Wagner and Weitzel (2012) followed an alignment project at a global company. Based on their findings here, they constructed a framework for establishing operational IT-business alignment, called operA. This
41 This concept is referred to as planning transparency in the thesis.

DISCUSSION
Page 185/245
framework had three dimensions: knowledge, communication, and trust. The authors argued that it was the interplay between the dimensions that improved alignment, and not the dimensions individually.
Wagner et al. focused on the interaction between knowledge, communication, and trust in creating shared domain knowledge. The goal was to “create formal and informal interactions between IT and business staff and thus establish regular patterns of interaction to facilitate knowledge transfer and exchange.” If the IT staff understood the business processes and the firm’s market, it was more likely to develop solutions that fit the business’s needs and fully exploited IT’s potential from a market perspective. Enhanced shared domain knowledge would foster trust and mutual respect among IT and business people and enable the joint development of IT solutions, hence increasing alignment.
While the findings of this thesis strongly support those of Wagner and Weitzel, the thesis findings also point to a dimension that is not included in the authors’ work. Wagner et al. focused on what is referred to as planning transparency in this thesis—if the parties understand one other and align their normative expectations, they will be better aligned. However, the findings from Carlsberg also indicate that service transparency is an important element in the equation. The relationship between IT and business is often complex, which Wagner et al. also mentions, and in such a context is it equally important to discover expectations and report on them. If expectations are to be broken, which is inevitable in an IT-business context, it is necessary for the IT department or the business departments to report on this so that the other party can mitigate the consequences. As several of the business employees mentioned in the interviews: no surprises!
The contribution of this thesis to the work of Wagner et al. is therefore the suggestion to extend the operA framework to focus on both planning and service transparency as means to increase IT-business alignment. Both types of transparency were required to achieve an adequate level of alignment at Carlsberg.
Understanding the business–IT relationship (Coughlan et al., 2005) To investigate the effect of communication on alignment, Coughlan et al. performed a case study of a large UK bank. From the qualitative data collected, the authors identified themes and arrived at a set of issues. Their approach was similar to the interpretive method used in this thesis (THE INTERPRETIVE METHOD). They found issues with the organizational structure, location of IT, business and IT camps, IT understanding, gaps in understanding, information exchange, customer contact, and frequency of meetings. Based on these issues, they made three normative suggestions that organizations should follow to improve alignment:
1. Implement explicit mechanisms to allow a mutual understanding to be created between business and IT and their respective areas of operations.
2. Show that IT is a tool for achieving business goals and not just an add-on function. 3. Couple business and IT together early on in the relationship process. Buy-in from all parties
needs to be secured from the outset to enable the commitment of stakeholders to grow.
This thesis makes two contribution to the work of Coughlan et al. Firstly, while the authors’ suggestions seem valid, the situation at the UK bank appears to have been similar to that of Carlsberg, thus requiring additional considerations. Coughlan et al. state: “while the criticism levelled at IT was strong, IT was its

DISCUSSION
Page 186/245
own harshest critic, as they upheld everything that was said about them by business.” The problem thus seems to have stemmed not only from a lack of communication, but also from relational barriers such as those identified in the SP framework. The data obtained by Coughlan et al. indicate problems with separate languages, separate mindsets, organizational complexity, and a one-sided relationship, where IT was expected to move towards the business, but without the business needing to move towards IT. Thus, while the suggestion of Coughlan et al. (2005) to implement explicit mechanisms to improve communication seems valid, these mechanisms should also be accompanied by mechanisms that address the barriers to communication.
The other contribution this thesis makes to the work of Coughlan is that it provides an actual framework for improving transparency that has been tested in a context similar to the UK bank. The SP framework and the manipulation presented in this thesis were used by business relationship managers and IT managers at Carlsberg, with good results (see RESEACH CRITERIA and THE POSITIVISTIC ANALYSIS). Furthermore, whereas Coughlan et al. do not specify exactly how the communication mechanisms should be formed to improve alignment, this thesis provides an example of how such mechanisms can be implemented and provides evidence that transparency increases trust and service quality.
Reconceptualizing the Concept of Business and IT Alignment: From Engineering to Agriculture (Grant, 2010) The last article argues that even through strategic alignment between business and IT has been talked about for at least two decades, we are still far from achieving the business-IT “nirvana” promised. Based on this contention, Grant advocates a shift—by both researchers and practitioners—from an engineering perspective of IT-business alignment to one that embraces a more agricultural view. As Grant (2010) states: “There is a need to shift the focus away from seeking alignment as an end goal to that of developing an organization’s dynamic capabilities […] to harness and harvest the affordances and value of information technology.”
While the work of Grant is theoretical in nature, its main argument is that alignment researchers should move away from looking for the correct formula for blending IT and business, and instead look for an approach by which to deploy, cultivate, nurture, and harvest IT investments. According the Grant, researchers should not use time to identify the set of facilitators or inhibitors of alignment because these will not resolve the alignment conundrum. These combinations are constantly in flux (Agarwal and Sambamurthy, 2002) and therefore what may seem to work today in one particular context might be ineffective under a different set of circumstances. Purely quantitative studies seeking definitive answers to alignment issues will necessarily have shortcomings (Grant, 2010).
From the perspective taken in this thesis, some of Grant’s critique is warranted. A host of quantitative studies has provided valuable knowledge on alignment, but adding purely quantitative studies to the mix does not provide additional value. Moreover, qualitative studies do not identify how the concepts, and the barriers to using them, can be used in real life to achieve alignment. The findings of this thesis suggest that alignment is not just the act of finding the correct mechanical configuration. The relationship between IT and business observed at Carlsberg is far too complex for such an approach to be viable. This does not mean that research identifying how concepts are related to alignment is superfluous, but rather

DISCUSSION
Page 187/245
that such studies should be accompanied by qualitative and longitudinal studies to identify how alignment develops over time.
The viewpoint of older alignment studies that IT can be “fixed” by finding the right configuration was also seen in some of the managers at Carlsberg. These managers implemented several changes to the IT environment that had a negative influence on the relationship with the business (see THE RELATIONSHIP FROM THE PERSPECTIVE OF THE RESEACHER for more details). These changes were fueled by a mechanical perspective of the relationship and were made based on, for example, an organizational model presented in 33 slides depicting exactly how the organization should look. Based on the qualitative and quantitative data collected in this thesis, this seems to be the wrong approach. While the right processes and the right work roles are certainly important, shared domain knowledge, transparency, and mutual understanding between parties play a huge part in a complex relationship such as the one between IT and business. The findings of this thesis emphasize that alignment should encompass a social component as well as a mechanical component to be truly effective.
Impact summary The main contribution of this thesis to the alignment field is the constructed SP framework. The specific contributions of the SP framework are:
� Identification of correlation and causality between the concepts of transparency, trust, and service quality
� Segmentation of transparency into service and planning transparency, and the finding that expectation matching has a mediating role in the relationship
� Identification of a mutually reinforced relationship between transparency and trust � Identification of several barriers that influence the relationship between transparency and trust � A specific and tested42 approach by which other scholars can create a transparency platform to
be used for research in similar contexts.
These contributions add to the current alignment literature in various ways. One of the contributions is the refinement of normative claims that organizations should establish liaisons and transparency mechanisms to improve alignment. While communication is important, not all communication initiatives improve alignment. In this thesis, it was found that communication regarding expectations had a significant impact on trust. That is not to say that only communication about expectations has such an effect, but it shows that a segmentation of transparency into planning and service transparency is useful. Moreover, it was found that both planning and service transparency played a role in restoring alignment. Several studies on alignment have identified the need to create shared domain knowledge (planning transparency), without considering that the expectations should also be made transparent and be frequently communicated about (service transparency). Both exploring and communicating about expectations has an impact on the ability of transparency to create trust and service quality. The normative suggestion to utilize communication to repair a broken relationship (e.g. Wagner et al., 2012) is supported, but the barriers that might exist in this process should also be considered. For example,
42 Albeit only in a single case study

DISCUSSION
Page 188/245
separate mindsets, separate languages, a business that does not care about IT, and organizational changes are all factors that could affect the relationship. Especially in a situation in which the business one-sidedly believes that IT should meet the business’s requirements and mindset, such consideration seems crucial. Alignment research should not only look at how IT aligns to the business, but also how the business aligns to IT. While the transparency tool was effective in improving trust in context where the business was reluctant to understand the mindset of IT, the effect is expected to be greater if both parties in the relationship are prepared to learn about the other’s domain. Lastly, from a holistic perspective, the qualitative and quantitative findings support the general direction of one part of the alignment field. While the right processes and the right work roles are certainly important in alignment, shared domain knowledge, transparency, and mutual understanding between parties also seem to play a huge part. The findings of this thesis emphasize that alignment should encompass a social component as well as a mechanical component, and this inclusion can perhaps address some of the critiques of alignment theory and move the field forward.
22.4 To what extent can the data be generalized? If the insights gained from this study were placed in another context, would they still be valid? The concept of generalizability refers to the ability to extent the validity of a case study’s conclusions to other similar cases. More commonly, generalizability refers to a broad concern that arises when researchers have studied one or a few cases and then ask: Do the findings apply to other cases? (Mills et al., 2010).
As previously discussed, one of the often emphasized distinctions between interpretive and positivistic research is the ability to generalize. Simplified, interpretive research stresses the central importance of context to the study’s process and findings. For example, factors such as time, space, politics, and people all influence the results. Based on this notion, Yin (2003) argues that case study designs are vulnerable because the uniqueness or artificial conditions surrounding the case might reduce external validity. Case studies are generalizable to theoretical propositions and not to populations or universes. Positivistic research, on the other hand, emphasizes the possibility of going beyond the contextual limits and generalizing to the general population—if caution is taken to select a proper sample. However, data collected inside an organization, even if it is quantitative in nature, might not extend to the general population because the population from which the sample is drawn does not reflect the general population in the first place. Taking a step back, the interpretive and positivistic methods seem to be challenged by the same issues, even if the ability to generalize their results differs between them. These issues include 1) how one can move from the sample population (e.g. interview data, survey answers) to the accessible population (e.g. total number of employees in the case study organization), and 2) how one can move from the accessible population to the target population (the total group of subjects about which we attempt to learn something).
In this thesis, I have based my research on a single case, Carlsberg, using a mixed-method design. This choice was based on the two rationales for single case studies provided by Yin (2003). The first rationale was that the case was a representative or a typical case. The identified issue between the IT department and the business at Carlsberg was not unique to the case, as I have also observed such issues in other organizations, and because I often hear complaints about IT from friends and colleagues in business. The second rationale was that the case was special because I had access to a great deal of in-depth data. The

DISCUSSION
Page 189/245
managers at Carlsberg would allow me to introduce an intervention at the organization if I wanted to take this approach, thus providing me with further avenues to investigate the research questions. Moreover, I did not find that the case study was unique or that there were any artificial conditions surrounding the case. Because of the decision to only study a single organization, the ability to generalize is determined by the constraints (and possibilities) of the qualitative and quantitative methods individually and combined. To discuss the generalizability of the data and findings, the two parts of the thesis research will be discussed below.
Generalizing the results of the interpretive research A case study should not be limited to the case in isolation but should examine the likely interaction between the case and its context. Therefore, the number of cases (even for large multiple case studies) will be far outnumbered by the number of variables under study (Yin, 2013). As a result, analytic techniques that are based on having a large number of cases to be able to generalize and a small number of variables are likely to be irrelevant. How does one, then, generalize the data?
Yin (2013) provides two approaches based on a comprehensive review of the literature on qualitative generalization. The first approach is called sample-to-population logic. As Yin writes, “The widespread assumption […] interprets case study generalization as an effort to generalize from a small number of cases to a larger population of cases […]. The common quest has been, first, to establish a sufficiently precise definition of the ‘case’ being studied and then to (retrospectively) define the broader population of relevant cases.” This can happen either by deducting and stating the context for which the research is viable, or by selecting more cases after the context and properties of the first case are known. However, selecting more cases can be troublesome because “the only way of increasing the number of cases to some substantial level would mean sacrificing the in-depth and contextual nature of the insights inherent in using the case study method in the first place” (Yin, 2013).
The other approach mentioned by Yin is to perform analytic generalization. Analytic generalization is the extraction of a more abstract level of ideas from a set of case study findings—ideas that nevertheless can pertain to situations other than the case(s) in the original case study (Yin, 2013). While these ideas might still be bound to the context of the studies, they can also be connected to the literature, or alternatively, used to explain the gaps and weaknesses in the literature. In this way, generalizations from a single case study can be interpreted with greater meaning and lead to a desired cumulative knowledge (Yin, 2013).
Based on the Yin’s (2013) description, analytic generalization was performed via the propositions stated in the chapter FRAMEWORK & PROPOSITIONS. These propositions were tested in the interpretive phase of the research and will be brought back to the relevant literature in this chapter. The generalizations—e.g., “If planning transparency is low in the relationship between the IT and business departments, it will have a negative influence on the level of trust”—can be researched in other organizations that have IT and business departments. As such, the theoretical propositions can be generalized to the alignment literature and researched in other contexts according to analytic generalization. With that said, even if the context-specific findings can be made into general propositions, the background for these propositions is still the case(s) being studied. The proposition might help other scholars in future studies, but the contexts and circumstances should be clarified in order to understand how the propositions work

DISCUSSION
Page 190/245
and under what circumstances they were developed. These circumstances will be provided after the positivistic research has been discussed.
Generalizing the results of the positivistic research When generalizing positivistic data from surveys and experiments, two steps are required (Bracht et al., 1968). The first step is to go from the sample to the experimentally accessible population. The second step is to go from the accessible population to the target population. The first jump usually presents no problem if the experimenter has selected his sample randomly from the accessible population (Bracht et al., 1968). The other jump can only be made with relatively less confidence and rigor than the first jump. The only basis for the second jump is a thorough knowledge of the characteristics of both populations.
Based on the method described in the chapter THE POSITIVISTIC , the jump from the sample to the experimentally accessible population can be successfully made. The participants in the experiment were randomized before they were assigned to either the control group or experiment group. Non-response bias was tested after the initial survey data was received by comparing the group that answered with the group that did not, and no bias was identified. In addition, the size of the sample was large enough to ensure that the sample adequately represented the accessible population.
The jump from the accessible population to the target population was more difficult to make, as it required knowledge of the target population. This knowledge was not easy to gather, since “the degree of confidence with which an experimenter can generalize to the target population is never known because the experimenter is never able to sample randomly from the true target population. Even if we could draw a random sample from the target population, by the time the results were analyzed the target population would not be that which had been sampled” (Kempthorne, 1961).
It would seem that the interpretive and positivistic methods both face the same challenges when it comes to generalization. When the data collection is confined to a single organization, generalization from the accessible population to the target population is difficult. This, of course, has consequences for the strengths of the arguments made in the thesis. The choice to study a single organization comprehensively, however, is not regretted when viewed from a generalization perspective, but does carry some weaknesses represented by the challenges of generalizing to other cases. Notwithstanding, I will provide the circumstances under which the thesis findings can be applied to other contexts.
Generalization summary When only a single organization is selected as case, it has consequences for the ability to generalize the findings. The choice to limit the data in a single case was therefore made by balancing the level of depth sought for with the desired ability to generalize the findings. Selecting a single case does not mean that the findings cannot be used by other researchers or that they are invalid, but it does mean that other scholars and practitioners should interpret the findings with the circumstances of the original case in mind. In the description of circumstances provided below, “the population” is used to refer to the total group of subjects about which we want to learn something, while “the organization” refers to the organization where the findings of this thesis are to be applied.
Regarding population validity, the population should be employed in medium or large company. If the company is small and all the people have very frequent interactions, this might affect the mechanics of

DISCUSSION
Page 191/245
the relationship between trust and transparency, since general uncertainty would be very low. Moreover, the population should primarily perform professional, managerial, or administrative work. If the employees perform manual labor43, the interdependencies between individuals might not exist, or the complexity of the work would not necessitate transparency. Furthermore, the population in the business departments should be unwilling to learn about the domain knowledge of IT. If they were more willing to learn about IT, this would remove several of the barriers identified in the SP framework. Transparency might be stronger in such a context, but since this has not been investigated, it cannot be stated with certainty. Lastly, for population validity, the relationship between the IT and business employees should be in the lower left corner of the trust/transparency model (see FRAMEWORK & PROPOSITIONS for the model). Trust should be low and transparency should be low as well. If elements such as infrequent interactions, low interdependence, or stable performance exist, it could have a strong influence on relationships described in the SP framework.
Regarding ecological validity, the organization should be divided into an IT department and several business departments, where the business department is dependent on the IT department for some tasks. Moreover, since the findings in this thesis were based on an IT-business relationship where mistrust was pervasive, the organization should have a similar relationship between IT and the business. If the initial level of trust is high, the effect of transparency might be different. This also means that the level of integrity-based trust should be high in the organization because integrity is required in order to trust the information disclosed. If issues with integrity exist between IT and the business, the relationships in the SP framework could very well be different, even if mistrust in information is present as a barrier in the framework. Another factor that might influence the findings is the segmentation of Carlsberg into a HQ, business departments, and an IT department. The centralized steering from HQ could influence the relationship between the IT department and business departments, leading to frequent unmatched expectations. If Carlsberg were decentralized, this would perhaps influence its decision-making and improve transparency.
In summary, the thesis findings can be generalized to other organizations that are medium or large in size and where the employees perform professional, managerial, or administrative work. The organization should have a centralized IT department and the business relationship to this IT department should be marked by low competence-based trust and high integrity-based trust. Moreover, the business side of the organization should have little or no interest in learning about IT but still be dependent on IT for some of its work. Lastly, the relationship should be positioned in the lower-left corner of the transparency/trust model. If these criteria are fulfilled, the findings of this thesis can possibly be generalized to the context. Other factors might exist, however, that were controlled for in the study. If other scholars use these results elsewhere and find similar results, the specific circumstances in which the framework is valid would become clearer.
22.5 Novelty of the findings Some of the findings in this thesis were novel, while some were identified in the existing literature. The existing findings were that transparency and trust form a mutually reinforced relationship, that
43 Also referred to as ”blue collar work”

DISCUSSION
Page 192/245
transparency is correlated with trust, and that barriers such as separate mindsets, separate languages, and historical IT failures have an impact on alignment. These findings were identified in articles and books in the alignment literature (ALIGMENT THEORY, TRUST THEORY), and the fact that the effects of these findings were the same in this thesis reinforces their validity.
The findings of this thesis that were novel were that transparency about planning and service expectations led to trust and that transparency caused an increase in service quality. Also novel were several of the barriers added to the SP framework and the complete SP framework in general.
Currently, the research on transparency in an organizational context is limited, and so far, few experiments have been conducted with the purpose of exploring how transparency can be used as a means to reach goals and objectives (Garsten et al., 2008). Studies on transparency have defined the concept very broadly (e.g. O’Toole et al., 2008) and the concept often concerns the ability of customers to view the mechanics and structure of an organization, rather than being seen as something to be used internally. The findings in this study add to the new stream of alignment literature by providing an additional way to influence alignment. Instead of looking at alignment as an end state where one needs to find the right configuration of processes and structures, alignment can be seen as a process. The perfect configuration that would eliminate all problems with delivery and performance in an IT department is simply impossible to find. Another approach, then, which is advocated for in this thesis, is to anticipate that such problems will inevitably emerge and try to mitigate the consequences. The novel aspect of this thesis is a theory for doing this, which is featured in the SP framework.
22.6 Limitations This section will discuss some of the limitations of the thesis findings. These limitations are related to the design, methods, and thesis findings. The area of generalization will not be considered here, as it has already been discussed.
Limitations based on reactions One of the findings of the experiment was that none of the measured dimensions was significantly lower for the experimental group than for the control group. This finding, however, was dependent on the actions initiated after transparency was increased via the tool. The follow-up interviews conducted (THE INTERPRETIVE METHOD) included a comment about how the increased transparency led to changes in the change request area. During the experiment, the managers in IT did not have access to the tool. However, I did talk about the tool at meetings, discussed the tool with the IT department managers, and made several presentations to IT employees about the tool and its functionality. It is possible that I had altered the management of the change request area via my focus on the tool. If the employees responsible for the area knew that the area would soon be made visible, they might have been inclined to make changes to the area. Such improvement to the area does not jeopardize the findings that transparency leads to trust, since the changes to the area would be the same for both the experimental and control groups. However, if such changes were made, I cannot say whether service and planning transparency would have increased trust and service quality if the areas that were made transparent had been left unchanged. Since I did not control for how the change request area changed during the experiment compared to earlier, some uncertainty exists regarding the conditions for the relationship between transparency, trust, and service quality. One of the comments in the follow-up interviews was:

DISCUSSION
Page 193/245
“When the tool was introduced, it was clear that we had some places where we had gigantic problems … For a few areas, we had enormous overflow on budget and it just looked bad.” This comment indicates that the area that was made transparent changed after the experiment ended and when the IT employees were allowed to access the tool. However, smaller changes could still have been made during the experiment, which could have affected the identified causality. Therefore, it cannot be said with complete certainty that transparency regarding an area has been effective without considering whether the area had been altered or not.
Limitations based on the methods and findings In the experiment performed, transparency was found to be significantly related to trust and service quality. However, what would happen if the experiment were repeated? The confidence intervals for the significant dimensions express the true mean difference if the experiment were to be repeated. That is, the mean difference would lie within the range of the lower and upper confidence intervals. These intervals were found to be quite large. For instance, for the dimension of competence-based trust, whose mean difference was .415, the lower limit was .04, and the upper limit was .78. These numbers show that if the experiment were repeated, the mean difference would lie anywhere between .04 and .78, 95% percent of the time. Thus, scholars contemplating conducting an experiment similar to the one in this thesis should not expect specific findings similar to the mean differences found in this thesis. Moreover, when implementing the tools in practice, managers should acknowledge that the effect was significant yet uncertain regarding strength. In extreme cases, the managers could find that satisfaction only increases by 1%, or if they are luckier, it could increase by an entire 30%. The broad span between the upper and lower confidence limits constitute a limitation to the findings. This limitation could be reduced by conducting a similar experiment with more participants.
Another finding that constitutes a limitation to the hypotheses in the thesis was that transparency, trust, and service quality were only partially related. Why did the dimensions of integrity, reliability, and responsiveness not improve?
Reliability included items that measured whether CIT delivered the right service, whether they delivered services at the promised time, and whether IT could be depended upon. Responsiveness included items about the willingness to help users and providing prompt service to users. These items concerned the performance of the IT department. The management of CIT did not have access to the tool during the experiment. The overview of the tool was therefore not used internally in the IT department for improving performance of the change request area. In this light, the finding that reliability and responsiveness were not significantly enhanced makes good sense. For the business employees, transparency regarding the change request area makes them feel more secure in their transactions and makes it easier for them to get their questions answered (the two dimensions of assurance). However, since the increased transparency was not used to improve the area, the reliability and responsiveness could not be expected to increase. Indeed, such was the case, as performance did not increase significantly.
The finding that integrity-based trust was not significantly different between the control and experiment groups could be explained by the high level of integrity already present within the organization (THE INTERPRETIVE ANALYSIS). The items measuring integrity-based trust included whether CIT treated people

DISCUSSION
Page 194/245
fairly and justly, and that CIT did not act opportunistically. If the business employees already found that the integrity of CIT was high, increased planning and service transparency would not be expected to change this. The issues with CIT included that a lack of competencies, an overly bureaucratic organizational setup, and a mindset was too far from the business. None of the seven issues identified in the relationship concerned the integrity of the department. The items measuring competence-based trust included CIT making the business feel confident, CIT being known to be successful, and CIT keeping its promises. Like assurance, these items measured how the business felt in the relationship: whether they were willing to be dependent on the IT department, whether they felt confident in CIT, and whether IT had the ability to accomplish what they said they would do. Since the introduced transparency was not used to manage the change request area, but only provided enhanced knowledge for the business employees, the finding that only competence-based trust increased makes sense.
One last finding that should be mentioned was that the ratings of the participants in the experimental group who chose not to use the tool failed to improve. The finding was not surprising: if the employees did not use the tool, they could not benefit from the transparency introduced. The implication of this finding is that mere disclosure of information does not provide benefits; the transparency has to be utilized. As such, this finding rejects the argument made by Kang and Hustvedt (2013) that taking the initiative towards transparency in itself creates trust and alignment.
Limitations based on design errors Two errors were discovered during the writing of the thesis. The first error was that the barriers identified in the interpretive understanding were not tested in the positivistic understanding. The other error was that the business employees were not interviewed after the intervention had been implemented. The consequence of these errors is that the strength of the arguments in the thesis is weakened.
Regarding the first error, the mixed-method design of Lee (1991) sets the stage for a subjective-interpretive-positivistic cycle. One of the ideas of the design is that results that have been explored from two different perspectives are more robust. Since the identified barriers were only researched from one perspective, this corresponds to doing a case study only. Results from case studies are certainly valid (Yin, 2003), but opponents of case study research methods would argue against the validity of the findings. As such, the error does not invalidate the findings about the barriers, but Lee’s idea of uniting qualitative and quantitative research was not fulfilled for these findings.
Regarding the second error, Lee (1991) argues that the positivistic understanding formed should be understandable to the observed human subjects. In this thesis, several interviews were conducted with employees in IT regarding the positivistic understanding formed and the intervention. These interviews confirmed that the positivistic understanding was valid and that the predictions from the understanding could be identified and agreed on by the subjects. However, it was not employees in the IT department, but employees in the business departments, who were exposed to the intervention. The interviews conducted did test the positivistic understanding with employees at Carlsberg. However, the employees in IT and those in the business might see things in a different light. The intervention was developed based on interviews with the business. As such, it is very likely that the positivistic understanding and predictions would be understandable to the business subjects. However, since no inquiries with the business were performed, this cannot be said with certainty.

DISCUSSION
Page 195/245
22.7 Practical implications Over the past 30 years, the relationships between IT departments and their business customers have been troubled (Ward & Peppard, 1996), and different solutions have been proposed to ameliorate the relationship. Noting that scholars and practitioners have been continuously attempting to “repair” this relationship for the last 30 years, it would be quite naïve to conclude that this study has finally found the silver bullet to fix the relationship. Instead, it is my contention that the theory and findings proposed here constitute a valid supplement to the alignment literature. With a focus on alleviation and reduction of consequences, as opposed to finding the right configuration, the theory of the SP framework can e used, together with for instance ITIL44 or other initiatives, in a complex organizational context.
The results most relevant for practitioners were that the intervention caused significant increases in trust and service quality. Since trust and service quality have been directly related to revenue and profit in the literature, the findings have implications for practice. If another company should undertake a similar approach and develop a transparency tool, that tool might also lead to an increase in trust and service quality. In developing such a tool, the employees should be aware of whether their organization is similar to Carlsberg. The trust/transparency model and the sections about generalization in this thesis can be used for the evaluation.
22.8 Future work During the experiment, only the business employees had access to the transparency tool. After the experiment was completed, a number of qualitative interviews were conducted with employees from the IT department and the number of people who were currently using the tool was assessed. Since the numbers of users had increased, this revealed that the tool was still being utilized three months after the experiment had ended. Furthermore, besides the business employees, several IT employees had begun to use the tool’s functionality. The benefits emphasized by IT employees included that the tool saved time because errors could be more easily recognized, that information could be more easily extracted, and that the organization and change request area were easier to navigate. Due to time constraints, I did not resend the quantitative survey (cf. APPENDIX C) to the business employees three months after the experiment ended. The survey could have revealed whether the additional utilization by IT managers increased the effect of the enhanced transparency above the effect already identified. With the tool being used for management of the change request area within IT, in combination with improved visibility for business employees, I propose that the mean score of the items measuring reliability and responsiveness would have been higher. Six of the seven IT managers interviewed found that the tool helped them in their work, and one manager said that the tool had made them clean up substantial errors. Causality was identified between transparency, competence-based trust, and assurance in the research context. However, this causality was not affected by how IT used the tool internally. It would be interesting to see a study that increased service and planning transparency for a specific area and provided information to all parties involved.
Another interesting study would be to explore why some of the participants in the experimental group refused to use the tool. Since transparency about expectations should be relevant to most, what was the
44 Information Technology Infrastructure Library: a framework to manage the processes in the IT department.
DISCUSSION
Page 196/245
reason that those 16 employees did not use the tool? Perhaps they simple did not have any change requests when the experiment was running, and thus no current expectations of the IT department. Alternatively, they might not have understood the functionality of the tool, or they believed that most offers from the IT department were a waste of time. A study examining the reasons could have shed light on conditions for using transparency to increase trust and service quality. Since the effect of transparency was only significant for those who had used the tool, perhaps the creation of awareness could amplify the “transparency effect”?
22.9 Chapter summary This chapter discussed the primary findings of the thesis, including how they are related to the existing alignment literature, and how they could be generalized to other contexts. Moreover, the findings’ limitations were discussed and directions were given for scholars who wanted to extend the work performed. In general, the findings were found to extend the new stream of the alignment literature by providing specific mechanisms to increase alignment via the SP framework. The notion that expectations are linked to transparency was tested and confirmed at Carlsberg. The mixed-method design was useful for in-depth study, but the decision to confine the study to a single organization had negative implications for the ability to generalize the findings. Moreover, some design errors were made using the mixed-method design that might have been avoided if a more simple design had been utilized. The design errors did not invalidate the findings of the thesis, but they weakened the argument.

CONCLUSION
Page 197/245
23 CONCLUSION Similar to most global companies, the IT department at Carlsberg was established in the last decade. Also similar to most companies, this IT department has since struggled to align with the business departments. During the course of this project, the IT-business relationship at Carlsberg was pervaded by low performance and a lack of trust. The low degree of trust was acknowledged by business employees and by IT employees. Everyone agreed that IT demonstrated inferior performance, and even though IT persistently initiated projects to enhance the IT-business relationship, the perception was that IT never fulfilled the business’s expectations.
The situation at Carlsberg was not unique to the company. Over the last 30 years, the relationship between IT departments and their business customers has been troubled (Ward & Peppard, 1996) and IT is still, in many instances, considered a necessary evil (Hirschheim et al., 2006). The alignment literature has explored how concepts such as processes, roles, structures, and strategies affect alignment, and while such research has provided useful insights, the achievement of organizational alignment remains challenging. To obtain new insights and advance the field, a new branch of alignment research has begun to explore the more social aspects of alignment, such as trust, transparency, and service quality.
To see how such concepts interacted in Carlsberg, seven propositions and a framework were constructed. The propositions were answered using qualitative interviews with business employees, archival records, and project observations. The result was the identification of a set of categorical issues that were explained using alignment theory and rival explanations. The explanations were used to provide answers to the stated propositions and it was concluded that the underlying theory of the constructed SP framework could be used to account for how transparency, trust, and service quality interacted at Carlsberg. Moreover, some of rival explanations extended the understanding formed. Factors such as delayed strategic implementations, heterogeneous business units, and constant changes had an effect on the framework’s concepts, in ways that were not identified in the literature.
Based on the interpretive understanding formed, the SP framework was extended and three of the developed propositions were operationalized into hypotheses. To test the hypotheses, an intervention was developed based on the framework and interpretive research. To test the intervention, a group of 328 business employees was selected of which 99 was used in the final evaluation of the tool.
The results of the intervention revealed that the transparency tool had increased competence-based trust by about 16% and assurance by about 21% when used by the business employees. Moreover, the experimental group reported a significant increase in general transparency, service transparency, and planning transparency (18%) compared to the control group. Follow-up interviews indicated that the tool was also used by IT managers as a platform for communication and for reporting on expectations.
Based on the analysis in the interpretive and positivistic portions of the thesis, the following contributions were made to alignment theory:
� Identification of correlation and causality between the concepts of transparency, trust, and service quality.

CONCLUSION
Page 198/245
� Segmentation of transparency into service and planning transparency, and the finding that expectation matching has a mediating role in the relationship between transparency and trust.
� Identification of a mutually reinforced relationship between transparency and trust. � Identification of several barriers influencing the relationship between transparency and trust. � A specific and tested approach that other scholars can use to create a transparency platform to
perform research in similar contexts. � A specific framework—the SP framework—that contributes to the new stream of alignment
research.
Based on these contributions, it can be argued that the SP framework and the underlying propositions and hypotheses are a viable addition to alignment theory. The main notion of the framework is that organizations should not just establish liaisons and communication mechanisms to improve alignment, as some scholars argue. IT and business departments should be transparent about their normative and predictive expectations and be wary of the barriers blocking effective communication.

REFERENCES
Page 199/245
24 REFERENCES The references are presented using Harvard Referencing Style. The format for this style is the following.
For articles: Surname, initials. (Publication year). Title of article. Title of journal. Volume number:page number if available“.
For books: Surname, initials. (Publication year). Book title. Series title or volume if applicable. Publisher.
24.1 Sources Abrams, C., Cross, R., Lesser, E., Levin, D. (2003). Nurturing interpersonal trust in knowledge-sharing networks. Academy of management executive. 17(4).
Agarwall R., Sambamurthy, V. (2002). Principles and models for organizing the IT function. MIS Quarterly Executive. 1(1).
Aiken, L. S., & West, S. G. (1991). Multiple regression: Testing and interpreting interactions. Newbury Park: Sage.
Akkermans, H., Bogerd, P., von Doremalen, J. (2004). Travail, transparency and trust: A case study of computer-supported collaborative supply chain planning in high-tech electronics. European Journal of Operational Reseach. 153:445-456.
Andersen, I. (2002). Den skinbarlige virkelighed. Videns produktion inden for samfundsvidenskaberne. Samfundslitteratur.
Avison, D., Jones, J., Powell, P., & Wilson, D. (2004). Using and validating the strategic alignment model. The Journal of Strategic Information Systems, 13(3):223–246
Babakus E., Boller G. W. (1992). An empirical assessment of the SERVQUAL scale. Journal of Business Research 24:253–68.
Baets, W. (1992). Aligning Information Systems with Business. The Journal of Strategic Information Systems 1(4):207.
Baets, W. (1996). Some Empirical Evidence on IS Strategy Alignment in Banking, Information and Management. 30(4):155-77.
Barber, B. (1983). The Logic and Limits of Trust. New Brunswick: Rutgers University Press.
Bassellier, G., Reich, B., Benbasat, I. (2001). Information Technology Competence of Business Managers: A Definition and Research Model. Journal of Management Information Systems. 17(4):159-182.
Bassellier, G., Benbasat, I. (2004). Business Competence of Information Technology Professionals: Conceptual Development and Influence on IT-Business Partnerships. MIS Quarterly. 28(4):673-694.
Bebya, H., McKelvey B. (2006). Using coevolutionary and complexity theories to improve IS alignment: a multi-level approach. Journal of Information Technology. 21:284-298.

REFERENCES
Page 200/245
Bennis, W., Goleman, D., & Biederman, P. W. (2008). Creating a culture of Candor. The Journal of perinatal education : an ASPO/Lamaze publication, 19(2):50–4
Bennis, W., O’Toole, J. (2009). What’s needed next: A Culture of Candor. Harvard Business Review. 87(6):54-61.
Bergman, M. M. (Ed.) (2008). Advances in mixed methods research: Theories and applications. Thousand Oaks, CA: Sage Publications.
Bracht, G., Glass, G. (1968). The External Validity of Experiment. American Research Education Journal. 5(4):article 1.
Brandy et al. (2002). Performance-only measurement of service quality: a replication and extension. Journal of Business Research. 55:17-33.
Buttle, F. (1996). SERVQUAL: review, critique, research agenda. European Journal of Marketing. 30(1):8-32.
Byrd, T. A., Lewis, B.R. and Bryan, R.W. (2006). The leveraging influence of strategic alignment on IT investment: An empirical examination. Information & Management. 43(3):308-321.
Campbell, B., Kay, R. & Avison, D. (2005). Strategic Alignment: A Practitioner's Perspective. Journal of Enterprise Information Management 18(6):653-664.
Campbell, D. T., Stanley, J. C. (1963). Experimental and Quasi-Experimental Designs for Research, Rand McNally, Chicago, IL USA.
Campell, B., Fiske, D. (1959). Convergent and discriminant validation by the multitrait-multimethod matrix. Psychological Bulletin. 56(2)-81-105.
Canning, M., O’Dwyer, B. (2001). Professional Accounting Bodies’ Disciplinary Procedures: Accountable, Transparent and in the Public Interest? European Accounting Review 10(4):725–50.
Chan, Y.E. and Huff, S.L. (1993). Investigating Information Systems Strategic Alignment, Proceedings of the Fourteenth International Conference on Information Systems, Orlando, FL. 345–363.
Chan, Y. E., Huff, S.L., Barclay, D.W., & Copeland, D.G. (1997). Business Strategic Orientation, Information Systems Strategic Orientation, and Strategic Alignment, Information Systems Research 8(2):125–150.
Chan, Y. E. (2002). Why haven't we mastered alignment? The importance of the informal organization structure. MIS Quarterly Executive. 1(2):97-112.
Chan, Y. E., Reich, B. H. (2007). IT alignment: what have we learned? Journal of Information Technology. 22(4):297–315.
Chan Y. E, Reich B. (2011) Rethinking Business-IT Alignment. In: Galliers R, Currie W (eds) Management Information Systems, Critical Perspectives and New Directions. Oxford University Press, New York

REFERENCES
Page 201/245
Chang, C., Chen, S., Lan, Y. (2013). Service quality, trust, and patient satisfaction in interpersonal-based medical service encounters. BMC Health Services Research. 13(22).
Ciborra, C. (1997). De Profundis? Deconstructing the concept of strategic alignment. Scandinavian Journal of Information Systems. 9(1):67-82.
Ciborra, C. U. (1997a). Crisis and Foundation: An Inquiry into the Nature and Limits of Models and Methods in the IS Discipline, in R. Galliers et al. (Eds.), Proceedings of the 5th European Conference on Information Systems, Cork/Ireland, June 19-21 1997, Vol. 3, Cork Publishing Limited, pp. 1549-1560.
Cohen, J. (1988). Statistical Power Analysis for the Behavioral Sciences. Lawrence Erlbaum assoc.
Costa, A. C. (2003). Work team trust and effectiveness. Personnel Review. 32(5):605-22.
Costa, A. C., Bijlsma-Frankeman, K. (2007). Trust and Control Interrelations: New Perspectives on the Trust Control Nexus. Group and Organization Management. 32(4):392-406.
Coughlan, J., Lycett, M., Macredie, R.D. (2005). Understanding the business-IT relationship. International Journal of Information Management, 25(4):303-319.
Cragg, P., King, M., Hussin, H. (2002). IT Alignment and Firm Performance in Small Manufacturing Firms, Strategic Information Systems 11(2):109–132.
Creswell, J. W., Tashakkori, A., Jensen, K. D., & Shapley, K. L. (2003). Teaching mixed methods research: Practices, dilemmas, and challenges. In A. Tashakkori & C. Teddlie (Eds.), Handbook of mixed methods in social & behavioral research. 619-637. Thousand Oaks, CA: Sage
Cresswell, J. (2003). Research Design: Qualitative, Quantitative and Mixed Methods Approaches. London: Sage.
Creswell, J. W. (2007). Qualitative inquiry and research design: Choosing among five traditions. Second edition. Thousand Oaks, CA: Sage.
Creswell, J. W. (2009). Research design: Qualitative, quantitative, and mixed methods approaches. Third edition. Thousand Oaks, CA: Sage.
Cronin, J. J., Taylor, S. A. (1992). Measuring Service Quality : A Reexamination and Extension. Quality, 56:55–68.
Dando, N., Swift, T. (2003). Transparency and Assurance: Minding the Credibility Gap. Journal of Business Ethics. 44:195-2000.
Das, T. K., Teng, B., S. (2001). Trust, Control, and Risk in Strategic Alliances: An Integrated Framework. Organization Studies, 22(2):251–283.
Dasgupta, P. (2000). Trust as a Commodity, in Gambetta, Diego (ed.) Trust: Making and Breaking Cooperative Relations, electronic edition, Department of Sociology University of Oxford. 4:49-72.

REFERENCES
Page 202/245
Day., J. (2007). Strangers on the train. The relationship of the IT department with the rest of the business. Information Technology & People. 20(1):6-31.
Denzin, N. K., Lincoln, Y. S. (2005). Introduction: The discipline and practice of qualitative research. In N. K. Denzin & Y. S. Lincoln (Eds.), The SAGE handbook of qualitative research (3rd edition). 1-13. Thousand Oaks, CA: Sage.
Dominic, H., Goh, K., Wong, D., Chen, Y. (2010). The importance of service quality for competitive advantage – with special reference to industrial product. International Journal of Business Information Systems archive. 6(3):378-397.
Dore, R. (1983). Goodwill and the spirit of market capitalism. British Journal of Sociology. 34:459-482.
Drew, C. (2004). Transparency of Environmental Decision Making: A Case of Soil Cleanup Inside the Hanford 100 Area. Journal of Risk Research 7(1):33–71.
Dune, M., Helliar, C. (2002). The Ludwig report: implications for corporate governance. The international journal of business in society. 2(3):26-31.
Earl, M. J., Feeny, D. F. (1994). Is your CIO adding value? Sloan Management Review. 35:11-20.
Etzioni, A. (2010). Is Transparency the Best Disinfectant? Journal of Political Philosophy. 18(4):389–404.
Feeny, D., Edwards, B., Simpson, K. (1992). Understanding the CEO/CIO Relationship. MIS Quarterly. 16(4):435-448.
Finel, B. I., Lord, K. M. (1999). The Surprising Logic of Transparency. International Studies Quarterly. 43(2): 315–339.
Garsten, C., de Montoya, L. (2008). Transparency in a new global order: Unveiling organizational visions. Edward Elgar Publishing.
Gerow, J.E., Thatcher, J.B. and Grover, V. (2014). Six Types of IT-Business Strategic Alignment: An investigation of the constructs and their measurement, European Journal of Information Systems. 24(3):1–27.
Gower, K. K. (2006). Truth and transparency. In K. Fitzpatrick & C. Bronstein (Eds.), Ethics in public relations. 89-105. Thousand Oaks, CA: Sage.
Grant, G. (2010). Reconceptualizing the Concept of Business and IT Alignment: From Engineering to Agriculture. European Journal of Information Systems. 19:619-624.
Green, J. C. (2007). Mixed methods in social inquiry. San Francisco: Jossey-Bass.
Greenberg, P., Greenberg, R., Antonucci, Y. (2007). Creating and sustaining trust in virtual teams. Business Horizons. 50:325-333.

REFERENCES
Page 203/245
Greene, J. C., Caracelli, V. J., & Graham, W. F. (1989) Toward a Conceptual Framework for Mixed-method Evaluation Designs. Educational Evaluation and Policy Analysis. 11(3):255-274.
Grimmelikhuijsen, S. (2012). Linking transparency, knowledge and citizen trust in government: an experiment. International Review of Administrative Sciences 78(1):50–73.
Grøn, C. (2010). Same procedure as last year? An analysis of constellations of trust and control in management in the European Commission. Ph.D. thesis.
Gryning, M., Metz, M., Khan, A. (2010). Improve Cooperation and Alignment by Involving the Enterprise in the Architectural Development. Journal of Enterprise Architecture. 6(4).
Hall, P. (2003). Aligning ontology and methodology in comparative politics. In J, Mahoney and D. Rueschmeuer (eds): Comparative Historical Analysis in the Social Sciences. Cambridge: Cambridge University Press.
Hayes, A. F. (2009). Beyond Baron and Kenny: Statistical mediation analysis in the new millennium. Communication Monographs. 76:408-420.
Heald, D. (2003). Fiscal Transparency: Concepts, Measurement and UK Practice. Public Administration. 81(4): 723–759.
Heald, D. (2006). Varieties of Transparency. Proceedings of the British Academy. 135:24-43.
Heise, J. A. (1985). Toward closing the confidence gap: An alternative approach to communication between public and government. Public Affairs Quarterly. 9:196–217.
Henderson, J., Venkatramen, N. (1990). Strategic Alignment: A Model for Organisational Transformation. CISR WP No. 217. Sloan WP no. 3223-90.
Hirschheim, R., Sabherwal, R. (2001). Detours in the Path toward Strategic Information Systems Alignment. California Management Review. 44(1):87–108.
Hirschheim, R., Lacity, M. (2006). Four stories of information system insourcing. Information Systems Outsourcing. 1:303-346.
Hood, C. (2007). What happens when transparency meets blame-avoidance? Public Management Review, 9(2):191–210.
Hooks, J., Coy, D., Davey, H. (2002). The information gap in annual reports. Accounting, Auditing & Accountability Journal. 15(4):501–522.
Huang, C. D., Hu, Q. (2007). Achieving IT-Business Strategic Alignment via Enterprise-Wide Implementation of Balanced Scorecards. Information Systems Management. 24(2):173–184.
Inkpen, A. C., Currall, S. C. (2004). The Coevolution of Trust, Control, and Learning in Joint Ventures. Organization Science. 15(5):586–599.

REFERENCES
Page 204/245
Introna, L. (2003) Disciplining information systems: truth and its regimes. European Journal of Information Systems 12(3), 235–240.
Irani, Z. (2002). Information Systems Evaluation: Navigating through the problem domain. Information Management. 40(1):11–24.
John, G. (1984). An Empirical Investigation of Some Antecedents of Opportunism in a Marketing Channel. Journal of Marketing Research. 21(3):278-289.
Johnson, A. M., & Lederer, A. L. (2010). CEO/CIO mutual understanding, strategic alignment, and the contribution of IS to the organization. Information & Management. 47(3):138–149.
Johnson-George, C., & Swap, W. (1982). Measurement of specific interpersonal trust: Construction and validation of a scale to assess trust in a specific other. Journal of Personality and Social Psychology. 43(1):1306–1317.
Jones, M. C., Taylor, G. S. and Spencer, B. A. (1995). The CEO/CIO relationship revisited: An empirical assessment of satisfaction with IS. Information & Management. 29:123-130.
Kaarst-Brown, M., Robey, D. (1999). More on myth, magic and metaphor: Cultural insights into the management of information technology in organizations. Information Technology & People. 12(2):192-218.
Kadefors, A. (2004). Trust in project relationships—inside the black box. International Journal of Project Management. 22(3):175–182.
Kang J., Hustvedt G. (2013). Building Trust Between Consumers and Corporations: The Role of Consumer Perceptions of Transparency and Social Responsibility. Journal of Business Ethics. 125:253-265.
Kearns, G. S., Lederer, A. L. (2000). The Effect of Strategic Alignment on the use of IS-Based Resources for Competitive Advantage. Journal of Strategic Information Systems. 9(4):265–293.
Kearns, G. S. and Lederer, A. L. (2003). A Resource-Based View of Strategic IT Alignment: How knowledge sharing creates competitive advantage. Decision Sciences. 34(1):1–29.
Kearns, G., Sabherwal, R. (2007). Strategic Alignment between Business and Information Technology: A Knowledge-Based View of Behaviors, Outcome, and Consequences. Journal of Management Information Systems, 23(3):129-162.
Kelley, H. H., Thibaut, J. W. (1978). Interpersonal relations: A theory of interdependence. New York: Wiley.
Kempthorne, O. The Design and Analysis of Experiments with Some Reference to Educational Research. In Raymond O. Collier, Jr., and Stanley M. Elam, (Eds.), Research Design and Analysis: Second Annual Phi Delta Kappa Symposium on Educational Research. 97-126.
Kochan, T., Unseem, M. (1992). Transforming Organisations. OUP, New York

REFERENCES
Page 205/245
Lederer, A., Sethi, V. (1988). The implementation of strategic information systems planning methodologies. MIS Quarterly. 12(3):445-461.
Lederer, A. L., Sethi, V. (1996). Key Prescriptions for Strategic Information Systems Planning. Journal of Management Information Systems. 13:35-62.
Lee, A. (1989). A scientific methodology for MIS case studies. MIS Quarterly. 13(1):33-50.
Lee, A. (1991). Integrating positivist and interpretive approaches to organizational research. Organization Science. 2(4):342-365.
Leonard J., Seddon., P. (2012). A meta-model of alignment. Communications of the Association for Information Systems. 31(1):article 11.
Lewis, J. D., Weigert, A. (1985). Trust as a social reality. Social Forces. 63:967-985.
Lewlyn, L. R. (2013). Service Quality Measurement: Issues and Perspectives. Anchor Academic Publishing.
Luftman, J., Brier, T. (1999). Achieving and Sustaining Business–IT Alignment. California Management Review. 42(1):109–122.
Luftman, J.A., Papp, R., & Brier, T. (1999). Enablers and Inhibitors of Business–IT Alignment. Communications of the Association for Information Systems. 1(3)–article 1.
Luftman, J. (2000). Assessing business-IT alignment maturity. Communications of the Association for Information Systems. 4(1):51.
Luftman, J. (2003). Assessing IT business alignment. Information Systems Management. 4:article 14.
Luftman, J., Kempaiah, R., & Nash, E. (2005). Key Issues for IT Executives 2005. MIS Quarterly Executive. 5(2): 81–101.
Luftman, J. (2007). An update on business-it alignment: a line has been drawn. MIS Quarterly Executive. 6(3).
Luhmann, N. (2000). Familiarity, Confidence, Trust: Problems and Alternatives. In Gambetta, Diego (ed.) Trust: Making and Breaking Cooperative Relations, electronic edition. Chapter 6:94-107.
Madey, D. L. (1982). Some benefits of integrating qualitative and quantitative methods in program evaluation, with illustrations. Educational Evaluation and Policy Analysis. 4(2):223-236.
Madsen, B. (2012). Statistik for ikke-statistikere. Samfunds litteraure. 2 . udgave.
Maes, R., Rijsenbrij, D., Truijens, O., & Goedvolk, H. (2000). Redefining Business–IT Alignment through A Unified Framework. Universiteit van Amsterdam/Cap gemini White Paper. Unpublished manuscript.
Mason, D., Hillenbrand, C., Money, K. (2013). Are Informed Citizens More Trusting? Transparency of Performance Data and Trust Towards a British Police Force. Journal of Business Ethics. 122:321–341.

REFERENCES
Page 206/245
Mayer, R. C., Davis, J. H., & Schoorman, F. D. (1995). An integrative Model of Organizational Trust. The Academy of Management Review. 20(3):709-734.
Mayer, R. C., Gavin, M. B. (2005). Trust in Management and Performance: Who minds the Shop while the Employees Watch the Boss?. The academy of Management Journal. 48(5):874–888.
Maykut, P., Morehouse, R. (1994). Beginning Qualitative Research: A Philosophic and Practical Guide. Volume 6 of Falmer Press teachers' library series. Psychology Press.
McAllister, D. (1995). Affect and cognition-based trust as foundations for interpersonal cooperation in organizations. Academy of Management Journal. 38(1):24–59.
McKeen, J.D., Smith, H. (2003). Making IT Happen: Critical issues in IT management. Wiley Series in Information Systems. First edition.
Mcknight, D. H., Chervany, N. L. (2001). Trust and Distrust Definitions : One Bite at a Time. Trust in cyber-societies. 2246:27-56.
McKnight, H., Chervany, N. (2001). Trust and Distrust Definitions:One Bite at a Time. R. Falcone, M. Singh, and Y.-H. Tan (Eds.): Trust in Cyber-societies. 27-54.
Mertz, M., Gryning, M., Khan, A. (2010). Coherency Management in Carlsberg. Published online.
Mills, A., Durepos, G., Wiebe, E. (2010). Encyclopedia of Case Study Research. Sage Research Methods. Published Online (Online ISBN: 9781412957397).
Möllering, G. (2005): The Trust/Control Duality: An Integrative Perspective on Positive Expectations of Others. International Sociology. 20(3):283-305.
Moore, G. C., Benbasat, I. (1991). Development of an Instrument to Measure the Perceptions of Adopting an Information Technology Innovation. Information Systems Research. 2:192-222.
Morgan, D. (1998). Practical strategies for combining qualitative and quantitative methods: Applications to health research. Qualitative Health Research, 8(3), 362-376
Morgan, D. (2007). Paradigms Lost and Pragmatism Regained: Methodological Implications of Combining Qualitative and Quantitative Methods. Journal of Mixed Methods Research. 1(1):48-76.
Nahapiet, J., Ghoshal, S. (1998). Social Capital, Intellectual Capital, and the Organizational Advantage. The Academy of Management Review. 23(2):242-266.
Nelson, B. K. M., & Cooprider, J. G. (1996). The Contribution of Shared Knowledge to IS Group Performance. MIS Quarterly. 20(4):409-423.
Neyland, D. (2007). Achieving Transparency: The Visible, Invisible and Divisible in Academic Accountability Networks. Organization. 14(4):499–516.

REFERENCES
Page 207/245
Nooteboom, B. (1996). Trust, Opportunism and Governance: A Process and Control Model. Organization Studies. 17(6):985-1010.
O’Toole, G. (2008). Communication: Core Interpersonal Skills for Health Professionals. Elsevier Australia.
Oliver, R. W. (2004). What is Transparency? New York: McGraw-Hill. First edition.
Palanski, M. E., Kahai, S. S., Yammarino, F. J. (2010). Team Virtues and Performance: An Examination of Transparency, Behavioral Integrity, and Trust. Journal of Business Ethics. 99(2):201–216.
Palowski, S., Robey, D. (2004). Bridging User Organizations: Knowledge Brokering and the Work of Information Technology Professionals. MIS Quarterly. 28(4).
Papp, R. (1993). Business-IT alignment : productivity paradox payoff? Industrial Management & Data Systems. 367–373
Parasuraman, A., Zeithaml, V. A., & Berry, L. (1985). A Conceptual Model of Service Quality and Its Implications for Future Research. Journal of Marketing. 49(4):41–50.
Parasuraman, A., Zeithaml, V. A., & Berry, L. (1988). SERVQUAL: A Multiple-Item Scale for Measuring Consumer Perceptions of Service Quality. 64(1):12-40.
Parasuraman, A; Valarie A., Zeithaml; Leonard, B. (1994). Reassessment of Expectations as A Comparison Standard in Measuring Service Quality: Implications for Further Research. Journal of Marketing. 58(1):111-124.
Park, H., & Blenkinsopp, J. (2011). The roles of transparency and trust in the relationship between corruption and citizen satisfaction. International Review of Administrative Sciences. 77(2):254–274.
Pennings, J. M., & Woiceshyn, J. (1987). A typology of organizational control and its metaphors. In S. B. Bacharach & S. M. Mitchell (Eds.), Research in the sociology of organizations. 5:75-104.
Peppard, J. (2001). Bridging the gap between the IS organization and the rest of the business: plotting a route. Journal of Info Systems. 11:249–270.
Powell, T. C. (1992). Organizational Alignment as Competitive Advantage. Strategic Management Journal 13(2): 119–134.
Ranganathan, C., & Sethi, V. (2002). Rationality in strategic information technology decisions: The impact of shared domain knowledge and IT unit structure. Decision Sciences. 33(1):59-86.
Rawlins, Brad R. (2008a). Measuring the relationship between organizational transparency and employee trust All Faculty Publications. Paper 885.
Rawlins, B. L. (2008b). Give the Emperor a Mirror: Toward Developing a Stakeholder Measurement of Organizational Transparency. Journal of Public Relations Research. 21(1):71–99.

REFERENCES
Page 208/245
Reich, B. H. and Benbasat, I. (1996). Measuring the Linkage between Business and Information Technology Objectives. MIS Quarterly. 20(1):55–81.
Reich, B. H. and Benbasat, I. (2000). Factors that Influence the Social Dimension of Alignment between Business and Information Technology Objectives. MIS Quarterly. 24(1): 81–113.
Ring, P. S., Van de Ven, A. H. (1992). Structuring cooperative relationships between organizations. Strategic Management Journal. 13(7):483–498.
Ring, P., van de Ven, A. (1994). Developmental Processes of Cooperative Interorganizational Relationships. 19(1):90-118.
Robinson, S. (1996). Trust and Breach of the Psychological Contract. Administrative Science Quarterly. 41(4):574-599.
Robinson, S. L. (1996). Trust and breach of the psychological contract. Administrative Science Quarterly. 41: 574- 599.
Rockart, J.F., Earl, M.J., & Ross, J.W. (1996). Eight imperatives for the new IT organization. Sloan Management Review. 38(1), 43-52.
Rousseau, D. M. (1985). Issues of level in organizational research: Multi-level and cross-level perspectives. Research in Organizational Behavior. 7(1):–1-37.
Rousseau, D. M., Sitkin, S. B., Burt, R. S., & Camerer, C. (1998). Not so Different after All: A Cross-Discipline view of trust. Academy of Management Review. 23(3):393–404.
Sabherwal, R., & Chan, Y.E. (2001). Alignment between Business and IS Strategies: A study of prospectors, analyzers, and defenders, Information Systems Research. 12(1):11–33.
Sabherwal, R., Hirschheim, R., & Goles, T. (2001). The Dynamics of Alignment: Insights from a punctuated equilibrium model. Organization Science. 12(2):179–197.
Sauer, C., Burn, J. (1997). The Pathology of Strategic Alignment. In C. Sauer and P. W. Yetton (eds.). Steps to the Future: Fresh Thinking on the Management of IT-Based Organizational Transformation. Pp. 89-111.
Sauer, C., Yetton, P. (1997). Steps to the future: Fresh thinking on the management of IT-based organizational transformation. Jossey-Bass. 1st edition.
Schwarz, A., Kalika, M., Kefi, H., Schwarz, C. (2010). A Dynamic Capabilities Approach to Understanding the Impact of IT-Enabled Businesses Processes and IT-Business Alignment on the Strategic and Operational Performance of the Firm. Communications of the Association for Information Systems. 26(1):article 4.
Sengun, A. E., Nazli Wasti, S. (2007). Trust, Control, and Risk: A Test of Das and Teng’s Conceptual Framework for Pharmaceutical Buyer-Supplier Relationships. Group & Organization Management. 32(4): 430–464.

REFERENCES
Page 209/245
Seppänen, R., Blomqvist, K., & Sundqvist, S. (2007). Measuring inter-organizational trust—a critical review of the empirical research in 1990–2003. Industrial Marketing Management. 36(2):249:265.
Shannon, C. E. (1948). A Mathematical Theory of Communication. The Bell System Technical Journal. 27: 379–423 and 623–656.
Shapiro, D. L., Sheppard, B. H., & Cheraskin, L. (1992). In theory: Business on a handshake. Negotiation Journal, 8:365-377.
Silvius, A. (2007). Business & IT Alignment in theory and practice. Proceedings of the 40th annual Hawaii conference on System Sciences. 1:from 221b.
Simmel, G. (1964). The sociology of George Simmel (K. H Wolff, trans). New York: Free press
Simonsen, J. (1999). How do we take care of strategic alignment? Constructing a design approach. Scandinavian Journal of Information Systems. 11(2):51-72.
Six, F. (2005). The trouble with trust: The dynamics of interpersonal trust building. First edition. Edgar Elgar Publishing.
Smith, H., McKeen, J. (2010). Developments in Practice XXXVI: How to Talk So Business Will Listen . . . And Listen So Business Will Talk. Communications of the Association for Information Systems. 27:article 13.
Tagiuri, R., Kogan, N., & Bruner, J. (1955). The Transparency of Interpersonal Choice. American Sociological Association. 18(4):368–79.
Tallon, P. P. (2007). A Process-Oriented Perspective on the Alignment of Information Technology and Business Strategy. Journal of Management Information Systems. 24(3):227–268.
Tallon, P., Kreamer, K. (2003). Investigating the Relationship between Strategic Alignment and IT Business Value: The Discovery of a Paradox. Idea Group Publishing.
Tan, F.B., Gallupe, R. (2006). Aligning business and information systems thinking: A cognitive approach. IEEE Transactions on Engineering Management. 53(2):223-237.
Teo, T.S.H., King, W.R. (1997). Integration between business planning and information systems planning: An Evolutionary-Contingency Perspective. Journal of Management Information Systems. 14(1):185-214.
Teo, T.S.H., Ang, J.S.K. (1999). Critical Success Factors in the Alignment of IS Plans with Business Plans. International Journal of Information Management. 19(1):173–185.
Thomas, G. F., Zolin, R., & Hartman, J. L. (2009). The Central Role of Communication in Developing Trust and Its Effect On Employee Involvement. Journal of Business Communication. 46(3):287–310.
Van de Ven, A. H. (2007). Engaged Scholarship: A Guide to Organizational and Social Research. Oxford University Press.

REFERENCES
Page 210/245
Van den Hooff, B., de Winter, M. (2011). Us and them: a social capital perspective on the relationship between the business and IT departments. European Journal of Information Systems. 20:255-266.
Venkatraman, N. & Henderson, J. (1993). Strategic alignment: Leveraging information technology for transforming organizations. IBM Systems Journal. 38(1):472–484.
Venkatraman, N., 2000. Five Steps to a Dot-Com strategy: How to find your footing on the web. Sloan Management Review. 41(3):15–28.
Vermeulen, P.A.M. & Dankbaar, B. (2002). The organisation of product innovation in the financial sector. The Service Industries Journal. 22(3):77-98.
Wagner, H., Weitzel, T. (2012). How to Achieve Operational Business-IT Alignment: Insights from a Global Aerospace Firm. MIS Quarterly Executive. 11(1):25-36
Wakefield, R. I., Walton, S. B. (2010). The Translucency Corollary : Why Full Transparency is Not Always the Most Ethical Approach. Public Relations Journal. 4(4):1–23.
Wall, S. (1996). Public Justification and the Transparency Argument. The Philosophical Quarterly. 46(184): 501–7.
Ward, J., & Peppard, J. (1996). Reconciling the IT/Business Relationship: A Troubled Marriage in Need of Guidance. The Journal of Strategic Information Systems. 5(1):37–65.
Webster, J., & Watson, R. (2002). Analyzing the past to prepare for the future: writing a literature review. MIS Quarterly. 26(2):xiii-xxiii.
Weiss, J. W., St, F., & Anderson, D. (2004). Aligning Technology and Business Strategy : Issues & Frameworks, A Field Study of 15 Companies. HICSS '04 Proceedings of the Proceedings of the 37th Annual Hawaii International Conference on System Sciences (HICSS'04). 8:track 8.
Willcocks, L., Whitley, E., Avgerou, C. (2008). The ranking of top IS journals: a perspective from the London School of Economics. European Journal of Information Systems. 17:163-168.
Williamson, O. E. (1993). Calculativeness, trust, and economic organization. Journal of Law and Economics. 36:453-486.
Wong, J.E.S.,Then, D., Skitmore, R.M. (2000). Antecedents of trust in intra-organizational relationships within three Singapore public sector construction project management agencies. Construction Management and Economics. 18(7):797-806.
Wong, T. C., Ngan, S.-C., Chan, F. T. S., & Chong, A. Y.-L. (2012). A two-stage analysis of the influences of employee alignment on effecting business–IT alignment. Decision Support Systems. 53(3):490–498.
Yayla, A., Hu, Q. (2007). Antecedents and drivers of IT-business strategic alignment: Empirical validation of a theoretical model. ECIS Proceeding. Paper 56.

APPENDICES
Page 211/245
Yetton, P.W. (1994). False Prophecies, Successful Practice and Future Directions in IT Management, Proceedings of the IFIP TC8 Open Conference: Business Process Re-Engineering: Information systems opportunities and challenges. Australia. 103–112.
Yetton, P.W., Craig, J. F., Johnston, K. D. (1995). Fit, Simplicity and Risk: Multiple Paths to Strategic IT Change. In J.I. DeGross et al. (Eds.), Proceedings of the Sixteenth International Conference on Information Systems (ICIS’95). 10(13):1-11.
Yetton, P.W., & Johnston, K.D. (2001). Competing Forms of Fit in a Professional Bureaucracy: IT management dilemmas, International Journal of Healthcare Management and Technology. 3(2):142–159.
Yin, R. K. (2003). Case study research: Design and methods. Third edition. Thousand Oaks, CA: Sage.
Yin, R. K. (2013). Case study research: Design and Methods. Fifth edition. SAGE publications inc.
Zeithaml, V. (1987). Defining and Relating Price, perceived quality, and perceived value. Journal of marketing. 52(2):87-101.
Zipf, G.K. (1949). Human Behavior and the Principle of Least Effort: an Introduction to Human Ecology. First edition. Addison-Wesley, Cambridge.
Zmud R., Hauser, R. (1989). Field experimentation in MIS research. In The information system research challenge: experimental research methods. Harvard Business School Review Colloquium. 2(1):97-112.
Zuboff, S. (1988). In the Age of the Smart Machine: The Future of Work and Power. New York: Basic Books.
25 APPENDICES
25.1 APPENDIX A A full list of the employee suggestions. The suggestions have been lightly edited for readability:
Description
Improve focus on business issues by regular updates to IT Board on business escalation list (Mads Madsbjerg) I think we can increase focus on the issues that really matter for the business by ensuring that the IT Board is aware of the issues and can help assign resources to fix them. This could be done by having a monthly walkthrough of the list by Thomas Kofoed or a BRM at the IT Board.
Inviting business staff to our department meetings to give a frontline view of how our services works will give us better insight into whether we are doing the right thing list (Mads Madsbjerg)
Closing the rumor/performance gap (Morten Gryning)

APPENDICES
Page 212/245
When talking to people from the business, I found that many of the perceptions of IT were based on rumors. Rumors which affected how CIT was seen included in decision-making and being judged. And in the end, how CIT should operate and be. This is not an uncommon phenomenon, and surely the rumors don't emerge by themselves (they are based on something). However, I still think there's a gain for Carlsberg IT in closing this gap between rumors and performance. People will always demand different information depending on their job and the situation which they are operating in - be it financial data, strategic data or when the next Friday bar is held :). But people are always interested in information that directly or indirectly affects their dependencies and expectations against another person or organization. Two concepts very related to trust-building. I think CIT could improve the relationship with the business by closing the rumor gap. This could be done by disclosing information about the areas of: 1) project on/not on schedule (milestones reached), minors on schedule (delivered/not delivered) and incidents (rate of solving or similar). The medium could be the newsletter, on the intranet IT portal, or even in an email to people with interactions and dependencies towards IT. The important thing is to do it regularly, as this data was frequently requested by those from the business I had the chance to talk to.
Present CIT staff as colleagues that actually are contributing to the business (Peter Willkan) Everybody knows that IT people are boring! Everybody knows that IT people are geeky! Everybody knows that IT projects are always delayed and exceed budgets-and never deliver what they were supposed to deliver! I suggest that we make a presentation of our staff (not necessarily everyone) where we present ourselves as competent colleagues with several competencies. Break out of the grey mass and become individuals. A picture, a small presentation of our skills, a description of which type of project(s) he/she has worked in. Maybe also which challenges they have met. Publish it on the Intranet, one profile weekly. Continue for the entire 2012 so we become individual colleagues and not just IT people.
Ask the externals! (Peter Willkan) We have many very competent external suppliers in CIT. Invite maybe 20 - 30 of them to participate in 5 - 10 meetings (max 4 participants in a meeting) and ask them where CIT differs from other companies they have worked in. They must be granted absolution - so the interview/meeting should not be with their normal daily

APPENDICES
Page 213/245
CB-manager present. This would lead to a more neutral and objective view on what we do well in CIT and where we could improve.
Think the entire project from the beginning! (Peter Willkan) We should move away from "one-liners" where we guess wildly on project cost & duration on something that is hardly described. This does not need new staff - we can assign present staff. Establish a sort of a presales function in CIT, staffed by experienced colleagues. 1 PM: who understands and can explain the necessity of project governance and organizational Implementation 1 Enterprise Architect: who understands our platform & technology, our IT roadmap and the integration issues. 1 Solution Architect and 1 Designer: who can devise and describe the solution from the customers’ functional & non-functional requirements. The output is a document describing the whole project and the effort required also on the business's side. Special focus on data & integration where we often are mistaken. This will make estimation & scheduling far more precise - and we should describe the span in cost and timeline with respect to the identified risks and uncertainties.
The business will understand and accept there is a lead time on doing this analysis.
How we in CIT can service our business better : Let's ask Business (Snezana) Create an Idea bank SharePoint site for business stakeholders to submit their own ideas/input on areas/topics they would like CIT to provide better service.
Don't be afraid of our customers (Steen Soegaard) I have experienced many times that our colleagues are afraid or not very eager to make direct contact with our customers/end users, resulting in issues or questions are being delayed, as the dialogue is not happening and a lot time is wasted. Conclusion: pick up the phone and contact the customer/end-user and they will be very happy about a person from CIT contacting them
Faster in our deliverables (Steen Soegaard)

APPENDICES
Page 214/245
When asking the businesses what they think we could improve, it is to be faster in delivering our services, mostly our changes, which could be small/standard/TCRs. If we could optimize our deliverables on these changes, I believe that we will experience much more satisfied customers. They understand when they ask for complex changes or projects but if they only need a port in a switch to be opened or a table to be enhanced, we should be able to deliver this within days.
More agility and flexibility in CIT (Steen Soegaard) In some cases the business needs CIT’s support within days and in that respect, it doesn't work to refer to our Demand processes or other processes, as the business needs decisions right away. In relation to these cases, we need to deliver specialist knowledge at once, even though we have to re-prioritize internally in CIT. The BRM can support cases like this but they need to be able to make direct contact with the specialists and prioritize on behalf of the business and CIT.
Improve the quality and speed of our minor estimates and enforce re-approval on minors when they move from design to build (Marcel Olsen) We lose credibility in the business when estimating like the wind blows. Also, once a minor is LDB approved the budget is rarely revisited when moving from design to build and suddenly the CR will likely go over budget without formal business approval. Furthermore, it takes too much time to find prices on whatever we need to estimate, meaning a long lead time for more precise estimates - and if you need to shortcut due to time constraints, you will end up guesstimating. This is the trade-off of only having 1.5 hours allotted by the business for the Red Estimate. How to improve: Ensure that Demand Management, ITAM, etc. will provide a public price catalog on IBM services, Verizon Services, license cost, labor cost, CIT cost, etc. for the people responsible for estimating minors. We also need to enforce that before a CR moves from design to build, the budget is revised and approved by the business. Anticipated result: Shorter lead times on Red estimates, gaining goodwill from the business for managing their money with respect, less frustration for CR Leads and PG resources. When it comes to estimates we must be aware of that the business has external consultants hanging around that have a tendency toward discrediting our price structure and estimates without knowing what constitutes the figures. I think it is very important to stress towards the business that it is easy for an external consultant to quietly whisper in their ears "how bad CIT are at estimating and how expensive CIT is when compared to the market prices and how much better/cheaper the externals can do the supposedly exact same thing." This specific point is something I've experienced over the last 1½ years and it creates an even bigger distance between CIT and our customers
Evaluate our service offerings against business needs (Maria Barlev) At any given time, we should aim at offering best support in the areas where our services are mostly needed. If we control all service requests (formalized and unformulated ones) we should be able to

APPENDICES
Page 215/245
see where the business requests the most services and focus on short delivery times here and measure feedback. Understanding the business focus areas should allow us to scale and focus against expected demands.
Communication packs to key business stakeholders (Maria Barlev) Create clear communication packs to the key business stakeholders about what CIT (Service Planning) offers in services and most importantly - what we do not offer. What can the business expect when contacting Service Planning - and what do we not support (rightly or wrongly, depending on views). Show examples of how a service is delivered (set expectations for lead times, etc.) What is our bandwidth? Can we scale up in any area or do we have clear limitations? Explain our mandate (standard solutions instead of perfectly tailor-made local solutions)
Optimize the Time Registration process (Thomas Steinmetz) Time registration is today something everybody everyday uses in CIT. Time approval is something PMs, Managers, Directors, Leads and VPs spend time on every week. Time registration is important for our current setup, but our IT tool for supporting this process needs a face-lift. Today we spend time approving hours we mostly have no chance of double-checking and if we want to reject the hours we cannot do this in the system. All this "admin" time we could turn towards our colleagues in Carlsberg Group and created magic. Fix the tool and free the people.
Viva la revolution!
Take responsibility (Thomas Steinmetz) My experience within CIT is that we are a bunch of very dedicated and skilled employees, but we also have a tendency only to focus on our own "small" area, which means we miss the big picture. Taking responsibility is, for me … The one that picks up the phone has the responsibility. We need to focus on service for our colleagues in the business. Even though you are not the right contact in CIT, you "take the call" and instead of pushing them in a different direction, you make sure that you personally find the right connection and get them connected.
Accept the Baton (Thomas Steinmetz) If we are the misunderstood organization in Carlsberg Group (just reading the other ideas in the list related to rumors etc.), then why not accept the Baton on the next meeting at the Malteri? Let’s show them that we are something different than geeks, cola and pizza
Ask questions! (Maria Barlev)

APPENDICES
Page 216/245
There is a tendency that CIT should provide all the answers (solutions) immediately to all the business questions and needs. One way to learn how to improve on answers and solutions is to dive into reasons behind the business requests. Ask questions of the business to better understand their needs and requests. Sometimes we can actually offer "quick solutions" or "workarounds" that provide some immediate support / satisfaction whilst delivering the full service requested. This builds trust over time.
Stop emailing (Thomas Steinmetz) The use of email is getting more and more dominant in the way we communicate with our colleagues in CIT and in the rest of the Group I would recommend that every second email is replaced by a phone call or a physical drop-by if possible. I know this is a change in behavior, but I also think that most cases could be solved quicker than ever. Emails are used today for many purposes, but are also a very misunderstood media. Let’s try to use our mouths instead of our fingers :)
Increase predictability - Vi sir hvad vi gør og vi gør hvad vi sir. (Peter Willkan) What are the top 5 things our users would like us to improve if they could decide? 1) We understand the business and can advise on how they could do it faster - using IT where it makes sense a) read the intro to the department b) Spend 1 week every half year in the department together with the business. 2) Our estimates are so solid that they can be relied upon and decisions taken from them. HTGT: Spend the necessary time to do quality estimation by a skilled team. Yes - it costs up front but saves in the end. Take decisions on firm basis. 3) Frequent simple communication on key topics besides the heavy STC-reporting. HTGT: Use a standard template 4) Deliver faster, cheaper, better This is almost a mantra. My experience is that if you demonstrate professionalism in the work you get the necessary credit. HTGT: a) Skilled people at all levels. b) Consequent up-skilling, as necessary. c) Zone-coverage, meaning that more staff can do the same job (This is up-skilling). d) Establish skilled autonomous teams with specific responsibility areas instead of handling all activities on a 1:1 basis. Too much is wasted doing this. e) Consequent decommissioning of "odd" systems.

APPENDICES
Page 217/245
5) Predictability and trust in the work we do. HTGT: Skillful Project Managers. Full control and transparency in driving the project.
Automate Component test to save manual testing and get better quality (Else, Qwist) If Regression test on Component level is automated and done on regular basis, we can save a lot of manual testing and the defects will be discovered before UAT. That will make the customers happy. This applies to BSP-releases.
Centralize Quality Assurance and Compliance to meet the objectives (Else, Qwist) Quality Assurance activities like static and dynamic testing, audits and Technical Inspections happening at random levels and timings. If this is planned to support CIT at the right timing, and gaps are identified and mitigated with a prioritization of the activities to best meet the objectives, we could save money and make customers more confident in our quality.
Communicate our professionalism (Johan) Apparently many of the business people I talk to regard CIT very well, but are somewhat confused on how they should interact with us. Who is a BRM and what is a service manager, and how do I create a ticket, what am I supposed to receive when I create a ticket or a CR? … So I guess that the interface can be more visible and somewhat easier. The business does not understand what it is we can deliver apart from a PC and fixing server problems. What other quality do we deliver? That is not visible or “just the name CIT” means ordinary IT and not the professionalism we also have! Overall I think that we are considered a function “outside” of Carlsberg and not a part of HQ or the group. We would need to agree on and share models/methods and together with the business work on and agree on our roles and how we work together. Often we come and present something business has not been part of deciding and that is hard in our culture!! About the value and cost: The other day I learned CIT’s goal for our blended rates. This also has to be communicated or agreed on with the business. I guess we will see that the business is more focused on value and we are focused on cost. We need to find a way to “mix this” and agree across so both “sides” better understand the parameters impacting cost and value. Lastly it is also much about relationships and walking the talk. Maybe we should encourage people more to act as ambassadors for what we can bring of value.
Feedback on requests (Dejan, Havaic)

APPENDICES
Page 218/245
Often when we have some request from the business, even though it might be just a request for information, and this request gets forwarded to the department or person responsible within the CIT organization, there is no reply to this. Maybe the person that was contacted is actually working on this, but it would be very helpful to have some feedback on what’s going on to know how to communicate to business.
Our business perceives us as one. Therefore, we have to stand as one. (Fariborz) Our business perceives us as one. Therefore, we have to stand as one. A solution does not add any value to the business while it is being developed (project). It is after the go-live that the business begins harvesting the investment that they have made. This can only happen if the handover to maintenance is successful and the team assigned to maintaining the solution is capable of doing so. We have to improve the handover process by bringing together the people who are familiar with the overall solution and the people who understand how a solution should be maintained at the right time in order to ensure a complete handover and successful maintenance after the go-live. Action: Set up a task force to assess the current set-up and provide recommendations
Budget/invoice/Service Line transparency (Thomas Meyer) 1. Budget/invoice/Service Line transparency. This includes: - more Service Line 1-8 transparency, which means, more details to ensure the business, the BRM and the Tax Auditors can understand the fees (e.g. it is not enough to have one line for all Microsoft licenses) - more transparency of invoice workflow (local to central, central to local) - Estimate 1-3 and planning
Communication from CIT to the local management should always include the BRM in CC (Thomas Meyer) Communication from CIT to the local management should always include the BRM in CC. Additional the BRM should get more details/documentation to know and explain. This includes - IT service changes - IT budget - projects, rollouts or initiatives
BRM tasks should be clear (Thomas Meyer) BRM tasks should be clear. This means everybody has to know what exactly is her/his task and what not. Only then can the BRM put out the right effort to handle all important tasks.
IT Service Catalogue process (Thomas Meyer) IT Service Catalogue process. This includes also the way of update, contact, changes, communication, etc.

APPENDICES
Page 219/245
TCR process (Thomas Meyer) TCR process. This includes also the escalation and the monitoring, like RFS.
Escalation process for incidents, SLA breaches and minors. (Thomas Meyer) Escalation process for incidents, SLA breaches and minors.
Business Case process (Thomas Meyer) Business Case process. Today, everybody who creates a CR in Omada, can define the business case as they want. To be successful and to have a clear picture, it is necessary to have a standard process. This includes also the business case revision after fulfilling the CR.
CIT aligned internally (Carsten Møller) CIT needs to act extremely professionally on all our critical touch points with business - i.e. the processes where we, and only we, can drive the process. These are, in my view: Process for Vendor/Tool selection: We have a defined and communicated process that everybody in CIT lives and takes responsibility for delivering according to IT support: We are communicating to "customers" that the incident is received, when are we obligated to have the incident solved. We also inform the user frequently the progress of the incident. Ensuring clear objectives and rationales BEFORE starting any IT task: Achieved via BRMs that will not initiate any tasks in CIT without a business case and an objective that has been clearly defined. Driving and delivering IT tasks as promised: Achieved via strong project managers that master all PM disciplines, stakeholder management and possess excellent communication skills
Understanding business lingo/processes (Carsten Møller) Assign 1-2 from each department in CIT as a customer interface who will be responsible for 1 business process. Train this person and make him/her responsible for knowledge sharing on the matter.
Change our mindset: we need to be business oriented not only in our words but also in our actions (Christian Kraemer) We have customer in front of us and not only IT users (matter of survival for an IT organization in today’s world). We need to be much more proactive (execution oriented), take questions/issues/problems/claims from the business, and even if it is not under "my" direct responsibility, try to help the business by finding the right people who can help in our IT organization. In addition, sometimes if it is also not clear for us, involving senior management could also be a good way for them to have the feedback on whether the process/role/responsibility is rightly understood or not.
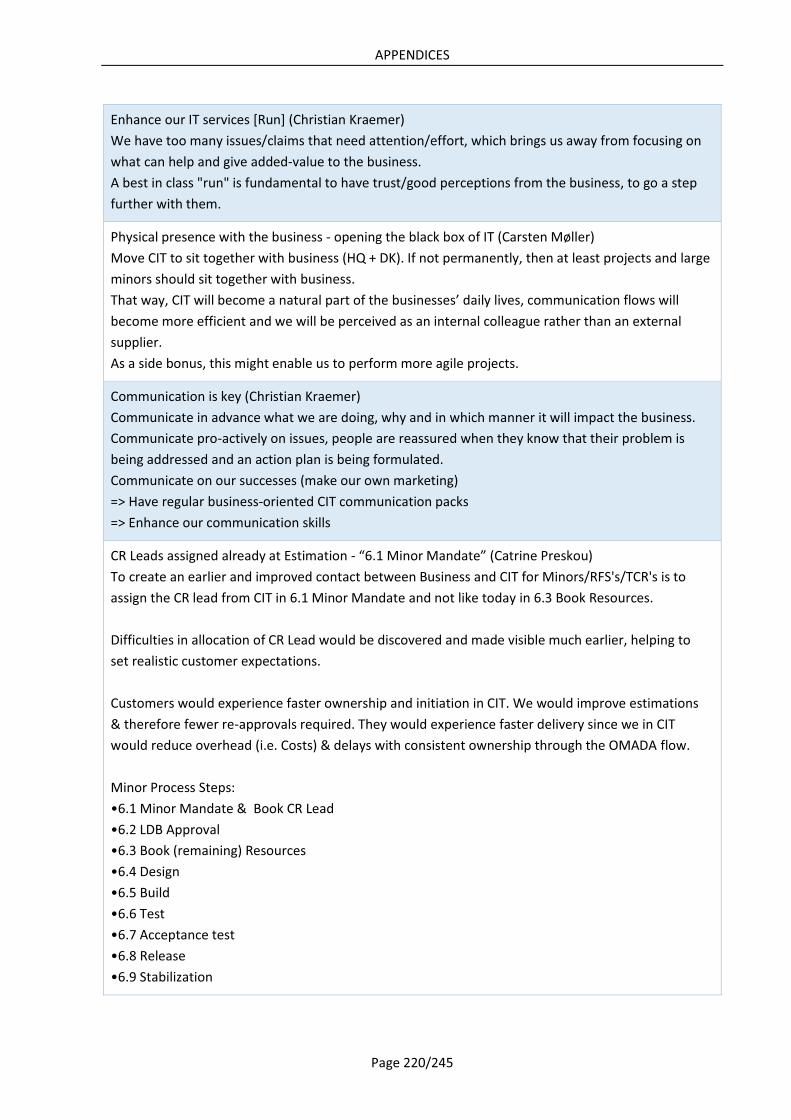
APPENDICES
Page 220/245
Enhance our IT services [Run] (Christian Kraemer) We have too many issues/claims that need attention/effort, which brings us away from focusing on what can help and give added-value to the business. A best in class "run" is fundamental to have trust/good perceptions from the business, to go a step further with them.
Physical presence with the business - opening the black box of IT (Carsten Møller) Move CIT to sit together with business (HQ + DK). If not permanently, then at least projects and large minors should sit together with business. That way, CIT will become a natural part of the businesses’ daily lives, communication flows will become more efficient and we will be perceived as an internal colleague rather than an external supplier. As a side bonus, this might enable us to perform more agile projects.
Communication is key (Christian Kraemer) Communicate in advance what we are doing, why and in which manner it will impact the business. Communicate pro-actively on issues, people are reassured when they know that their problem is being addressed and an action plan is being formulated. Communicate on our successes (make our own marketing) => Have regular business-oriented CIT communication packs => Enhance our communication skills
CR Leads assigned already at Estimation - “6.1 Minor Mandate” (Catrine Preskou) To create an earlier and improved contact between Business and CIT for Minors/RFS's/TCR's is to assign the CR lead from CIT in 6.1 Minor Mandate and not like today in 6.3 Book Resources. Difficulties in allocation of CR Lead would be discovered and made visible much earlier, helping to set realistic customer expectations. Customers would experience faster ownership and initiation in CIT. We would improve estimations & therefore fewer re-approvals required. They would experience faster delivery since we in CIT would reduce overhead (i.e. Costs) & delays with consistent ownership through the OMADA flow. Minor Process Steps: •6.1 Minor Mandate & Book CR Lead •6.2 LDB Approval •6.3 Book (remaining) Resources •6.4 Design •6.5 Build •6.6 Test •6.7 Acceptance test •6.8 Release •6.9 Stabilization

APPENDICES
Page 221/245
Complete projects; business AND IT (Trond Abelseth) In most situations the business seems to view CIT as a technology provider in projects and initiatives. We have the skills and ability to both advise and drive initiatives that are changing both the business and IT landscape. Therefore we should work towards establishing more 'complete/whole projects,' where we can drive both business AND technology changes. We have the skills to do this. And we could do this on small as well as big projects. Our business partners will then see us, and treat us, more as a colleagues than as providers.
Educate/communicate more about how we work (Trond Abelseth) If there is a perceived 'black box' called CIT, we need to do more to come out of that box. On all levels of the organization we could be more 'out there' talking about how we do things, e.g.; Educate them about project model and development model when we start projects. Educate them about incident processes when relevant - like when a project ends, at LDB meetings where there are escalations. Educate them about how we work with partners (ibm, idc, verizon etc.) …
Proactive advice (Trond Abelseth) We appear to be quite defensive and reactive towards the business, and yes it is difficult to be proactive if the basics of operations don't work as intended. However, to start becoming more proactive, we could come up with concrete proposals for changes business units can act on to either reduce their cost, improve efficiency, or improve the quality. It can be small and big proposals. Could use LDBs as a forum for this, or perhaps start a Task list like this one to get ideas.
Change CIT (Michael Folkmann) -Turn CIT into a pure application maintenance unit in HQ, and make the rest dedicated and solid development teams in the specific business areas. There are very few different activities in Carlsberg, it's P1 and BSP, and we need to adapt to that. The organization of CIT does not conform to servicing business optimally on this - this is more than Service planning scope.
Forget the idea of considering business as a customer (Michael Folkmann) Forget the idea of considering business as a customer - Service planning must explain that development is a joint effort between business and technology, and we cannot set a deadline 7 months ahead with a fixed scope, a fixed deadline, a detailed plan and high quality - as would some external consultancy. We are one company and the idea of 'best IT services etc' in the world and things like NNIT is passed; we cannot do it. We have only one company to support and that's Carlsberg, and the technological part of a solution is living in symbiosis with the business knowledge. CIT cannot be a delivery organization - it is proven - in principle there is no different from production IT employees, which by some reasons it part of the business.

APPENDICES
Page 222/245
Have the business to visit the daily life of IT (Michael Folkmann) Have the business to visit the daily life of IT to understand what the service has as its circumstances
Have clear transparency on deliverables, responsibilities, knowledge (Michael Folkmann) Have clear transparency on deliverables, responsibilities, and knowledge that each CIT person has and possesses - but in a very concrete formulation. Make it a habit to update your list of tasks solved. This constitutes, then, a database for search on help. And make it possible for everybody to update this list, incl. users in the business.
Use externals smarter (Michael Folkmann) The high number of external consultants makes the internals reactive on their deliverables, as externals are much more focused on delivering in the short term. Internals should be able to adapt and benefit from the knowledge and skills that externals are coming with (and cost a lot of money), and not focusing on gathering their deliverables and statements. -replace externals with students to do more trivial work, e.g. secretary assignments, and PMO tasks.
Improve our collaboration with our vendors is to improve delivery to our customer (Catrine Preskou) CIT has outsourced many of its services to vendors like IBM and Verizon, etc. To improve delivery to our customer, a quarterly internal CIT Vendor meeting could be an idea. Employees/Teams in CIT working closely with the vendor could meet and share knowledge and facts. A Verizon CIT quarterly meeting, for example, would give CIT a cross-team and department knowledge. What are the key issues and successes with the collaboration for the different teams in CIT? Is there a pattern, so it should overall be raised with Verizon? Good as well as bad. It would give an understanding of the different responsibilities, goals, workflows and discussions on the account within CIT. The meeting could also highlight where our internal collaboration with Verizon could be better to improve delivery to our customers. The responsibility for the meetings agenda could go on turn in CIT. For example if it was Sourcing’s turn then topics could be: What is the contract stating? What is the idea behind the contract Sourcing has made? What are they working on improving? What is the departments in CIT's experience with the contract on a daily bases? What could be contractual wishes for the future?
Be responsible and try to solve the tasks and question coming in (Michael Folkmann) Get away from doing the coordination we spend a lot of our time on. Be responsible and try to solve the tasks and questions coming in. When you then figure out who possess the capability to solve the task - update their database (from above).
Fewer emails (Michael Folkmann) Reduce the amount of email communication; understand what people need to know when you write an email. Do not put in cc to many people, not even if you get it with a lot of cc's. What people really need is the result of the dialogue, not the dialogue itself. Ask yourself what value each cc receiver gets from the mail and avoid non-value. CIT got an attitude on this subject also.
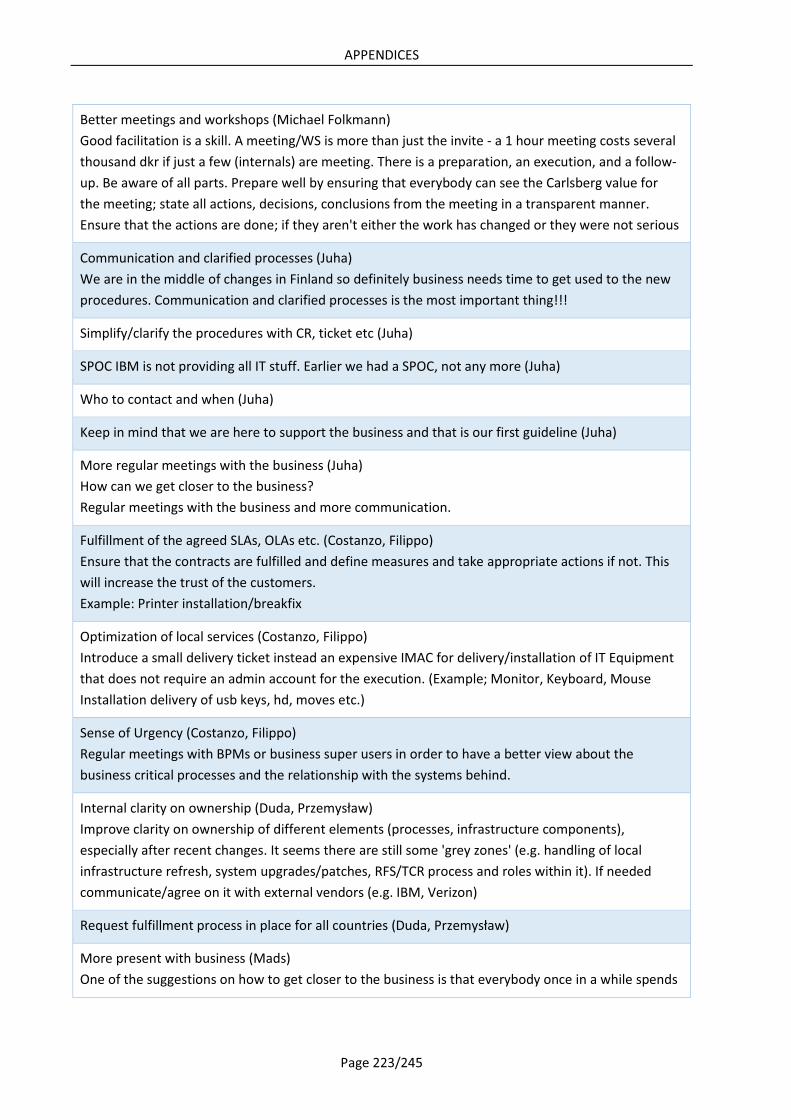
APPENDICES
Page 223/245
Better meetings and workshops (Michael Folkmann) Good facilitation is a skill. A meeting/WS is more than just the invite - a 1 hour meeting costs several thousand dkr if just a few (internals) are meeting. There is a preparation, an execution, and a follow-up. Be aware of all parts. Prepare well by ensuring that everybody can see the Carlsberg value for the meeting; state all actions, decisions, conclusions from the meeting in a transparent manner. Ensure that the actions are done; if they aren't either the work has changed or they were not serious
Communication and clarified processes (Juha) We are in the middle of changes in Finland so definitely business needs time to get used to the new procedures. Communication and clarified processes is the most important thing!!!
Simplify/clarify the procedures with CR, ticket etc (Juha)
SPOC IBM is not providing all IT stuff. Earlier we had a SPOC, not any more (Juha)
Who to contact and when (Juha)
Keep in mind that we are here to support the business and that is our first guideline (Juha)
More regular meetings with the business (Juha) How can we get closer to the business? Regular meetings with the business and more communication.
Fulfillment of the agreed SLAs, OLAs etc. (Costanzo, Filippo) Ensure that the contracts are fulfilled and define measures and take appropriate actions if not. This will increase the trust of the customers. Example: Printer installation/breakfix
Optimization of local services (Costanzo, Filippo) Introduce a small delivery ticket instead an expensive IMAC for delivery/installation of IT Equipment that does not require an admin account for the execution. (Example; Monitor, Keyboard, Mouse Installation delivery of usb keys, hd, moves etc.)
Sense of Urgency (Costanzo, Filippo) Regular meetings with BPMs or business super users in order to have a better view about the business critical processes and the relationship with the systems behind.
Internal clarity on ownership (Duda, Przemysław) Improve clarity on ownership of different elements (processes, infrastructure components), especially after recent changes. It seems there are still some 'grey zones' (e.g. handling of local infrastructure refresh, system upgrades/patches, RFS/TCR process and roles within it). If needed communicate/agree on it with external vendors (e.g. IBM, Verizon)
Request fulfillment process in place for all countries (Duda, Przemysław)
More present with business (Mads) One of the suggestions on how to get closer to the business is that everybody once in a while spends

APPENDICES
Page 224/245
a day with the business. This will: a) Increase business understanding b) Give a first-hand impression of how IT services are perceived c) Grow your network in Carlsberg Some of you already do this; either because you are sitting right next to the business, because you work on a project located with the business, because you are in workshops or because you as a BRM naturally spend a lot of time on business premises. Let’s make it a target that we all (employees and managers) at least spend one day with the business before the Summer vacation. How the time is spent I will leave up to each of you to agree with your manager. It could be related to specific activities, it could be because you want to get insight into a specific business area that is using the services you work with, it could be that you simply borrow a desk at business premises for a day and see what happens. If you need inspiration, the BRMs can also help you. When you come back, share the input with the rest of us on the team site. Grab hold of your manager or me and tell us what will work for you. But remember: You are the one accountable for this happening. We will follow up late June that this has been done for everybody.
Cost recovery model prevents us from doing the right thing (Emma) The focus on utilization is limiting, and hence the cost recovery model we have.
One CIT building in Carlsberg (Catrine Preskou) Have CIT in one building in Valby - Carlsberg and other sites. It does not need to be a fancy new building just KB building or gærkælderen. Business would know physically where we were and could visit.
Business visits to CIT (Catrine Preskou) CIT could have a yearly open house day the same day every year on all locations in Europe...
Support to customers regarding request types (Maria Finotello) We need one entry point for our customers / CIT employees to find the right request type so they can raise a request without being pushed back and forth. This can be solved by a Sharepoint site with Enduser requests and Technical requests listed in a simple manner that gives an overview for the viewer no matter if they are CIT or a customer.
Request Fulfillment process missing (Maria Finotello) We need to state where this process is now placed. The process is very much needed when you read what a Request Fulfillment Manager is responsible for:

APPENDICES
Page 225/245
Providing information to users and customers about the availability of services and the procedure for obtaining them · Sourcing and delivering the components of requested standard services (e.g. licenses and software media) · Assisting with general information, complaints or comments · Provide a channel for users to request and receive standard services for which a pre-defined approval and qualification process exist · Define what kind of standard services need the users · Define who should approve which request · Define which process will be used to fulfill the request · Ensure standard services for users to avoid congestion and obstruction the normal Incident and Change Management. We cannot have a Service Management without this position when we have so many requests flowing through. This person is the one to ensure the contracts are implemented on an operational level.
Service Planning to be familiar with the Procedures Manual (Maria Finotello) A lot of the answers to questions raised by BRMs can be found in the quite detailed Procedures Manual created in cooperation with our vendors. When a question arises regarding operational issues, first look in the Procedures Manuals and seek for the answer.
Periodic CIT senior management and local business meetings (Dejan Havaic) In order to have a clearer insight into how the business breaths, CIT senior management could talk to business on a periodic time schedule, maybe two times per year.
25.2 APPENDIX B The interview guide below provides an overview of the different questions and sub-questions that were asked during the semi-structured interviews.
Overall
1) What is your current work role and responsibilities? 2) What is your general impression of Carlsberg? 3) What works well in Carlsberg from your point of view? 4) What does not work well in Carlsberg?
Relationship between the Business and IT departments
1) How would you describe the current relationship between the business and IT department in Carlsberg?
2) What do you think about the IT setup and structure?

APPENDICES
Page 226/245
a. One Carlsberg IT (CIT)? b. The outsourcing of services to IBM, Accenture, and other suppliers? c. The current relationship between IT and HQ?
3) Which issues exist, if any, in the relationship between the business departments and IT
department? a. Can you give me some recent examples? b. Are these issues related to the IT department, the suppliers of the IT department, or
are these the same in your eyes?
4) What is the level of trust between the departments? a. (If mistrust) Is this mistrust related to: b. Mistrust of competences (lack of necessary skills or competences to perform the work)? c. Mistrust of integrity (incorrect behavior, exploitation of trust, being lazy)? d. Other?
5) Do you find that the IT department fulfills the expectations of their customers?
a. If not, why do you think it is like that?
6) What are your general expectations of IT?
7) Are the businesses open about their problems and motives when dealing with IT?
8) How is the IT department doing communication-wise? a. Regarding Projects? b. Regarding Minors? c. Other areas? d. Should IT communicate actively or passively?
9) In general, do the employees in Carlsberg share information in an orderly and timely fashion?
10) Do you have any suggestion for improving the relationship between the business and IT
department, e.g.: a. Increased control? b. More collaboration? c. More communication? d. Other?
11) Do you think that the IT department has improved in the last year?
12) Is there any information that you find is missing when you make decisions regarding IT such as:
a. Internal relations (e.g. employees, projects, status on initiatives, progress)?

APPENDICES
Page 227/245
b. External relations (e.g. the consumer market, strategic partners)?
13) Do you trust the information you receive from the IT department?
14) How do you see the relationship between the business and IT three years from now?
25.3 APPENDIX C The main research items included in the research survey are displayed below. The case organization is abbreviated as CIT. Other items were added to filter the answers but these were not used.
# Question
1 CIT has the ability to accomplish what they say they will do
2 CIT is known to be successful at the things they try to do.
3 CIT makes me feel confident about their skills.
4 CIT makes me want to make myself dependent on their work.
5 CIT treats people like me fairly and justly.
6 CIT can be relied on to keep their promises.
7 CIT does not mislead or exploit people like me.
8 CIT is concerned with people like me whenever a strategic decision is made.
9 CIT uses opportunities that arise to profit at my expense.
10 CIT discloses information in an accurate and timely fashion
11 CIT is open and direct about task/operational problems.
12 CIT is honest and open about their motives and problems.
13 CIT clarifies general expectations early on in a new relationship.
14 CIT evaluates at regular interval how effectively they are at working with people like me.
15 CIT reveals and settles differences in expectations.
16 CIT explores specific expectations in detail as a relationship develops.
17 CIT provides information that is useful for making decisions about IT matters.
18 CIT provides information about IT changes (i.e. strategic, operational) and how these affect me.
29 CIT asks for feedback about the quality of the information shared.
20 CIT makes it easy to find the information I need.
21 CIT provides information that is relevant for me.

APPENDICES
Page 228/245
22 CIT provides information that is easy for me to understand.
23 CIT provides accurate and timely information.
24 CIT provides information that is trustworthy.
25 CIT is forthcoming with information that might be damaging to CIT's reputation.
26 CIT is open to criticism from people like me.
27 CIT freely admits when they have made mistakes.
28 CIT provides deliveries as promised.
29 CIT can be depended upon when handling IT problems and issues.
30 CIT delivers the right delivery/service the first time.
31 CIT provides deliveries at the promised time.
32 CIT keeps customers informed about when deliveries will be performed and delays.
33 CIT provides prompt service to users.
34 CIT is willing to help users.
35 CIT is ready to respond to users' requests.
36 CIT makes customers feel secure in their transactions with Carlsberg IT.
37 CIT has the right knowledge to answer customer's questions.
25.4 APPENDIX D Varimax rotated component loading for 27 items. These are items measuring trust, transparency, and expectation matching. Items included in each dimension are marked in bold.
Factor
2 3 6 4 1 5
T_AbilityToAccomplishWhatTheS ,651 ,327 ,097 ,144 ,216 ,262
T_KnownToBeSuccessfull ,785 ,145 ,050 ,194 ,217 ,262
T_ConfidentInCITSkills ,634 ,213 ,050 ,203 ,353 ,138
T_IWantToBeDependentOnCIT ,412 ,015 -,115 ,095 ,347 ,061
T_TreatsMeFairly ,237 ,623 ,221 ,233 ,143 ,299
T_KeepTheirPromises ,567 ,416 ,164 ,307 ,342 ,091

APPENDICES
Page 229/245
T_DoesNotMisleadPeople ,222 ,704 ,018 ,098 ,180 ,231
T_IsConcernedWithPeopleLikeMe ,130 ,434 -,225 -,024 ,358 ,381
T_IsNotOppertunistic -,055 ,034 -,056 -,398 ,057 -,118
A_DiscloseAccurateAndTimelyInf. ,224 ,332 ,033 ,162 ,351 ,165
A_IsOpenTaskProblems ,300 ,127 ,091 ,316 ,401 ,407
A_IsHonestAndOpenAboutMotives ,103 ,415 ,034 ,347 ,244 ,394
A_ClarifiesExpectationsEarlyOn ,164 ,359 -,147 ,427 ,366 ,247
A_EvaluateCooperationRegularly ,157 ,325 -,027 ,513 ,367 -,052
A_RevealsAndSettingsExpectations ,200 ,203 ,028 ,652 ,294 ,207
A_ExploreExpectationsInDetail ,229 ,226 ,012 ,703 ,340 ,140
I_ProvideUsefullInformation ,256 ,308 ,251 ,338 ,452 ,292
I_InformsAboutITChanges ,189 ,200 ,188 ,240 ,559 ,152
I_AskForInformationFeedback ,225 ,175 ,011 ,274 ,582 ,012
I_MakesItEasyToFindInformation ,205 ,088 -,159 ,024 ,805 ,208
I_ProvidesRelevantInformation ,223 ,171 ,040 ,043 ,757 ,239
I_ProvidesInformationEasyToUnd. ,219 ,225 ,016 ,168 ,682 ,277
I_ProvidesAccurateAndTimelyInf. ,200 ,191 ,211 ,232 ,640 ,180
I_ProvidesTrustworthyInformation ,350 ,253 ,468 ,185 ,569 ,209
I_DiscloseDamagingInformation ,117 ,282 -,017 ,124 ,201 ,390
I_IsOpenToCritisicm ,150 ,215 -,003 ,221 ,183 ,685
I_AdmitMistakes ,199 ,146 ,103 ,130 ,159 ,738

APPENDICES
Page 230/245
Varimax rotated component loading for 10 items. These are items measuring service quality
25.5 APPENDIX E The questionnaire used to validate the research criteria.
1) What is your current work role? (establish context)
2) Have you used the transparency tool introduced in Carlsberg? a. If no: Why not? b. If yes: What value, if any, has the tool provided you with?
i. Expectation matching? ii. Reduction of consequences?
iii. Control? iv. Other?
3) Could the IT department be more transparent?
a. Towards internal stakeholders / towards external stakeholders? b. If yes: In which way and why?
4) What kind of IT transparency would you benefit from - if any?
a. If none: Why would transparency not benefit you? b. If some: How would this transparency benefit you in your current work?
5) Alignment is a condition which describes when an IT department is aligned to the current
business requirements. Researchers divide alignment into strategic alignment and structural alignment.
a. Do you find alignment important? b. Do you see any barriers to alignment in Carlsberg? c. Do you see any barriers, communication- or transparency-wise?

APPENDICES
Page 231/245
d. Do you find that transparency can improve alignment?
6) In general, do you find that trust and transparency are related in theory, and if so, how?
7) Do you see any negative consequences of the IT department being transparent? a. If yes: Which? b. If no: Do you find that transparency always leads to an improved relationship?
8) Do you think that transparency might be more useful if you had a different role in the
organization? a. Which role do you think would benefit most from transparency?
9) In your current role, what could transparency bring?
10) Transparency can only reveal part of the world, like drawing a map where you have to omit
some details; do you see any negative or positive sides to this?
11) Do you find that information is currently missing in your work role, or that the problem is the structuring/visualization of information?
25.6 APPENDIX F The master code list is based on five interviews with nine participants. Times mentioned represent how many times the coding occurred during the interviews.
Table 46: Coding’s for the qualitative date used in research design 5
Code Times mentioned
Alignment 11111111111111111 (17)
Trust 111111111111 (12)
Transparency 1111111111111111111111111111111111111111111 (43)
Consolidation 1
Interaction 1111111 (7)
Representation 11
Relevance (of information disclosed) 111
Justice 1
Noise (in relation to transparency) 1
Decision making 111

APPENDICES
Page 232/245
Organizational changes 111
Dependence 1
Confinement (“us” and “them” culture) 1
Communication 11
Tool 111111111 (9)
Control 11
Objective and subjective understanding / KPI 111
Expectation Matching 111111111111111 (15)
Performance 11111111 (8)
Acting (on behalf of information) 1
Overview 11111 (5)
Satisfaction 1
Understanding information disclosed 1
25.7 APPENDIX G Areas that BSP will affect and critical risk factors for the project.
� Organization: The organizational structure will change within some functions. Some employees will change work place, job, responsibility and some activities might be superfluous.
� Processes: The work will be the same, but it will be done more efficiently. � Governance: Individual countries will no longer be able to change the process independently.
Responsibility will change because of the new business models. � IT: Many systems in the countries will be replaced with a common solution. IT system language
will mostly be English.
The BSP will be implemented in several iterations. Carlsberg has identified several critical risk factors that can happen during the implementation:
� Resistance from country management may hinder program progress. � The length of the program may make it hard to maintain focus and motivation. � The approach in the BSP becomes IT driven and rather than focusing on realizing the transition
for people/the organizational. � Risk of making the wrong decisions due to lack of BSP history and insight. � Local incentives that contradict the BSP’s objectives may lead to stakeholders working against
the BSP initiative.

APPENDICES
Page 233/245
25.8 APPENDIX H The full list of barriers identified by employees in IT for achieving a good relationship with the business departments.
Barriers for achieving goals Score (%)
Lack of resources 71
Poor work processes 52
Bureaucracy 39
Unclear/shifting work priorities 29
Authority issues 23
Political issues 16
Overwhelming workload 16
Poor information systems 13
Unproductive meetings 13
Training and development issues 6
Information overload 6
Lack of recognition or reward 3

APPENDICES
Page 234/245
25.9 APPENDIX I
Authors Year Title Journal
Cao, G 2010 A Four-Dimensional View of IT Business Value System Resources
Tallon, P. P. 2007 A Process-Oriented Perspective on the Alignment of Information Technology and Business Strategy
Journal of Management Information Systems, 24(3), 227–268
Kearns, G. S., & Lederer, A. L.
2003 A Resource-Based View of Strategic IT Alignment: How Knowledge Sharing Creates Competitive Advantage
Decision Sciences, 34(1), 1–29
Khaiata, M., & Zualkernan, I. A.
2009 A Simple Instrument to Measure IT-Business Alignment Maturity
Information Systems Management, 26(2), 138–152
Wong, T. C., Ngan, S.-C., Chan, F. T. S., & Chong, A. Y.-L
2012 A two-stage analysis of the influences of employee alignment on effecting business–IT alignment
Decision Support Systems, 53(3), 490–498
Luftman, J., & Brier, T.
1999 Achieving and Sustaining Business-IT Alignment California Management Review, 42(1), 109–122
Huang, C. D., & Hu, Q.
2007 Achieving IT-Business Strategic Alignment via Enterprise-Wide Implementation of Balanced Scorecards
Information Systems Management, 24(2), 173–184
Roepke, R., & Ferratt, T. W.
2000 Aligning the IT human resource with business vision: The leadership initiative at 3M
MIS Quarterly, 24(2), 327–353
Sabherwal, R., & Chan, Y. E.
2001 Alignment between business and IS strategies: A study of prospectors, analyzers, and defenders
Information Systems Research, 12(1), 11–33
Brown, B. C. V, & Magiil S. L.
1994 Alignment of the IS Functions With the Enterprise : Toward a Model of Antecedents
MIS Quarterly, (December)
Drazin, R., & Andrew H. Van de Ven
1985 Alternative Forms of Fit in Contingency Theory Administrative Science Quarterly, 30, 514–539
De Haes, S., & Van
2009 An Exploratory Study into IT Governance Implementations and its Impact on Business/IT Alignment
Information Systems Management, 26(2), 123–137

APPENDICES
Page 235/245
Grembergen, W
Croteau, A.-M., & Bergeron, F
2001 An information technology trilogy: business strategy, technological deployment and organizational performance
The Journal of Strategic Information Systems, 10(2), 77–99
Luftman, J 2007 An update on business-it alignment: a line has been drawn MIS Quarterly Executive, 6(3)
Sambamurthy, V., & Zmud, R. W.
1999 Arrangements for Information Technology Governance: A Theory of Multiple Contingencies
MIS Quarterly, 23(2), 261
Luftman, J. 2000 Assessing business-IT alignment maturity Communications of the Association for Information Systems, 4(December), 1–51
Luftman, J. 2003 Assessing IT business alignment Information Systems Management
Peppard, J. 2001 Bridging the gap between the IS organization and the rest of the business: plotting a route
Journal of Info Systems, 11, 249–270
Taylor-Cummings, A.
1998 Bridging the user-IS gap : a study of major information systems projects
Journal of Information Technology, 13, 29–54
Pawlowski, S. D., & Robey, D.
2004 Bridging User Organizations : and the Work of Brokering Technology Knowledge Information
MIS Quarterly, 28(4), 645–672
Karlsen, J. T., Græe, K., & Massaoud, M. J.
2008 Building trust in project-stakeholder relationships Baltic Journal of Management, 3(1), 7–22
Bassellier, G., & Benbasat, I.
2004 Business Competence of Information Technology Professionals : Conceptual Development and Influence on IT-Business Partnerships
MIS Quarterly, 28(4), 673–694
Chan, Y. E., & Copeland, sid L. H. D. W. B. D. G.
1997 Business strategic orientation, information systems strategic orientation, and strategic alignment
Information Systems Research, 8

APPENDICES
Page 236/245
Papp, R. 1993 Business-IT alignment : productivity paradox payoff? Industrial Management & Data Systems, 367–373
Johnson, A. M., & Lederer, A. L.
2010 CEO/CIO mutual understanding, strategic alignment, and the contribution of IS to the organization
Information & Management, 47(3), 138–149
Rockart, J. F. 1979 Chief executives define their own data needs Harvard Business Review, 57(2), 81–93
Feeny, D. F., & Willcocks, L. P.
1998 Core IS Capabilities for Exploiting Information Technology Sloan Management Review, (Spring)
Greenberg, P. S., Greenberg, R. H., & Antonucci, Y. L.
2007 Creating and sustaining trust in virtual teams Business Horizons, 50(4), 325–333
Ciborra, C. U. 1997 Deconstructing the concept of strategic alignment Scandinavian Journal of Information Systems, 9(1993), 67–82
Hirschheim, R., & Sabherwal, R.
2001 Detours in the Path toward Strategic Information Systems Alignment
California Management Review, 44(1), 87–108
Johnston, B. H. R., & Carrico, S. R.
1988 Developing Capabilities to Use Information Strategically MIS Quarterly, (March), 37–49
Smith, H. A., & Mckeen, J. D.
2010 Developments in Practice XXXVI : How to Talk So Business Will Listen … And Listen So Business Will Talk
Communications of the Association for Information Systems, 27(August 2010), 207–216
Rockart, J. E., Earl, M. J., & Ross, J. W.
1996 Eight Imperatives for the New IT Organization Sloan Management Review, 43–56
Luftman, J., Papp, R., & Brier, T.
1999 Enablers and inhibitors of business-IT alignment Communications of the Association for Information Systems

APPENDICES
Page 237/245
Raymond, L., & Bergeron, F.
2008 Enabling the business strategy of SMEs through e-business capabilities: A strategic alignment perspective
Industrial Management & Data Systems, 108(5), 577–595
Tallon, P. P., & Kraemer, K. L.
2000 Executives’ Perceptions of the Business Value of Information Technology : A Process-Oriented Approach
Journal of Management Information Systems, 16(4), 145–173
Silvius, A. J. G. 2007 Exploring Differences in the Perception of Business & IT Alignment
Communications of the IIMA, 7(2), 21–32
Haes, S. De, & Van Grembergen, W.
2009 Exploring the relationship between IT governance practices and business / IT alignment through extreme case analysis in Belgian mid-to-large size financial enterprises
Journal of Enterprise Information Management, 22(5), 615–637
Almajali, D., & Dahalin, Z.
2011 Factors influencing IT-Business Strategic Alignment and Sustainable Competitive Advantage: A Structural Equation Modelling Approach
Communications of the IBIMA, 2011, 1–12
Reich, B., Benbasat, I.
2000 Factors That Influence the Social Dimension of Alignment between Business and Information Technology Objectives
MIS Quarterly, 24(1), 81–113
Doty, D. H., Glick, W. H., & Huber, G. P.
1993 Fit, Equifinality, and Organizational Effectiveness: a Test of Two Configurational Theories
Academy of Management Journal, 36(6), 1196–1250
F, A., & Germany, L.
2012 How to Achieve Operational Business-IT Alignment : Insights from a global aerospace firm
MIS Quarterly Executive, 11(1)
Bergeron, F., Raymond, L., & Rivard, S.
2004 Ideal patterns of strategic alignment and business performance
Information & Management, 41(8), 1003–1020
Huang, R., Zmud, R. W., & Price, R. L.
2010 Influencing the effectiveness of IT governance practices through steering committees and communication policies
European Journal of Information Systems, 19(3), 288–302
Merali, Y., Papadopoulos, T., & Nadkarni, T.
2012 Information systems strategy: Past, present, future? The Journal of Strategic Information Systems, 21(2), 125–153
Chen, B. D. Q., Worth, F., Preston, D. S., & Teubner, A.
2010 Information systems strategy: Reconceptualization, measurement, and implications
MIS Quarterly, 34(2), 233–259

APPENDICES
Page 238/245
Delone, W. H., & Mclean, E. R.
1992 Information Systems Success: The Quest for the Dependent Variable
Information Systems Research, (4)
Sambamurthy, C. P. A. V.
1999 Information Technology Assimilation in Firms : The Influence of Senior Leadership and IT Infrastructures
Information Systems Research, 10(4), 304–327
Bassellier, G., & Benbasat, B. H. R. I.
2001 Information Technology Competence of Business Managers: A Definition and Research Model
Journal of Management Information Systems, 17(4), 159–182
Das, S. R., Zahra, S. a., & Warkentin, M. E.
1991 Integrating the Content and Process of Strategic MIS Planning with Competitive Strategy*
Decision Sciences, 22(5), 953–984
Cragg, P., King, M., & Hussin, H
2002 IT alignment and firm performance in small manufacturing firms
The Journal of Strategic Information Systems, 11(2), 109–132
Chan, Y. E., & Reich, B. H
2007 IT alignment: what have we learned? Journal of Information Technology, 22(4), 297–315
Joshi, A 2013 IT Governance Transparency An Empirical Assessment of Information Disclosure on IT Governance
Thesis
Tarafdar, M., & Qrunfleh, S
2009 IT-Business Alignment: A Two-Level Analysis Information Systems Management, 26(4), 338–349
Watson, R. T., Kelly, G. G., & Galliers, R. D
1997 Key Issues in Information Systems Management: An International Perspective
Journal of Management Information Systems, 13(4), 91–115
Kogut, B., & Zander, U.
1992 Knowledge of the Firm, Combinative Capabilities, and the Replication of Technology
Organization Science, 3(3), 383–397
Tavakolian, H. 1989 Linking the information technology structure with organizational competitive strategy: A survey
MIS Quarterly, (September), 309–318
Pyburn, P. J. 1983 Linking the MIS Plan with Corporate Strategy : An Exploratory Study
MIS Quarterly, (June)

APPENDICES
Page 239/245
Miller, J. 1993 Measuring and aligning information with the organization: A case study
Information & Management, 25, 217–228
Reich, B. H., & Benbasat, I.
1996 Measuring the Linkage between Business and Information Technology Objectives
MIS Quarterly, 20(1), 55–81
Peppard, J., & Ward, J.
1999 Mind the Gap: diagnosing the relationship between the IT organisation and the rest of the business
Journal of Strategic Information Systems, 8, 29–60
Kathuria, R., Joshi, M. P., & Porth, S. J.
2007 Organizational alignment and performance: past, present and future
Management Decision, 45(3), 503–517
Ragowsky, A., Licker, P. S., & Gefen, D.
2012 Organizational IT Maturity (OITM): A Measure of Organizational Readiness and Effectiveness to Obtain Value from Its Information Technology
Information Systems Management, 29(2), 148–160
Segards, A. H., & Grover, V.
1999 Profiles of Strategic Information Systems Planning Information Systems Research, 10(3), 199–232
Grant, G. 2010 Reconceptualizing the Concept of Business and IT Alignment: From Engineering to Agriculture
European Journal of Information Systems
Ward, J., & Peppard, J.
1996 Reconciling the IT/Business Relationship: A Troubled Marriage in Need of Guidance
The Journal of Strategic Information Systems, 5(1), 37–65
Maes, R., Rijsenbrij, D., Truijens, O., & Goedvolk, H.
2000 Redefining business – IT alignment through a unified framework
In Landelijk Architectuur Congres
Day, J. 2007 Strangers on the train: The relationship of the IT department with the rest of the business
Information Technology & People, 20(1), 6–31
Kearns, G. S., & Sabherwal, R.
2007 Strategic Alignment Between Business and Information Technology: A Knowledge-Based View of Behaviors, Outcome, and Consequences
Journal of Management Information Systems, 23(3), 129–162
Venkatraman, N. & Henderson, J.
1993 Strategic alignment: Leveraging information technology for transforming organizations
IBM Systems Journal, 38(1), 472–484

APPENDICES
Page 240/245
Venkatraman, N.
1990 The Concept of Fit in Strategy Research: Toward Verbal and Statistical Correspondence
Academy of Management Review, 14(3), 423–444
Nelson, B. K. M., & Cooprider, J. G.
1996 The Contribution of Shared Knowledge to IS Group Performance
MIS Quarterly, (December)
Sabherwal, R., Hirschheim, R., & Goles, T.
2001 The Dynamics of Alignment: Insights from a Punctuated Equilibrium Model
Organization Science, 12(2), 179–197
Johnson, A. M., & Lederer, A. L.
2005 The Effect of Communication Frequency and Channel Richness on the Convergence Between Chief Executive and Chief Information Officers
Journal of Management Information Systems, 22(2), 227–252
Newkirk, H. E., & Lederer, A. L.
2006 The effectiveness of strategic information systems planning under environmental uncertainty
Information & Management, 43(4), 481–501
Jarvenpaa, S. L., & Ives, B.
1994 The Global Network Organization of the Future: Information Management Opportunities and Challenges
Journal of Management Information Systems, 10(4), 25–57
Bassellier, G., Benbasat, I., Reich, B.
2003 The Influence of Business Managers’ IT Competence on Championing IT
Information Systems Research, 14(4), 317–336
Boynton, B. A. C., Hill, C., Carolina, N., Zmud, R. W., & Jacobs, G. C.
1994 The Influence of IT Management Practice on IT Use in Large Organizations
MIS Quarterly, (September)
Wang, N., & Xue, Y.
2011 The Road to Business-IT Alignment : A Case Study of Two Chinese Companies
Communications of the Association for Information Systems, 28(May 2011), 415–436
Bradley, R. V, & Byrd, T. A.
2011 THE ROLE OF ENTERPRISE ARCHITECTURE IN THE QUEST FOR IT VALUE
MIS Quarterly Executive, 10(2)
Henderson, B. J. C., Sifonis, J.
1988 The Value of Strategic IS Planning: Understanding Consistency, Validity, and IS Markets
MIS Quarterly, (June), 187–201
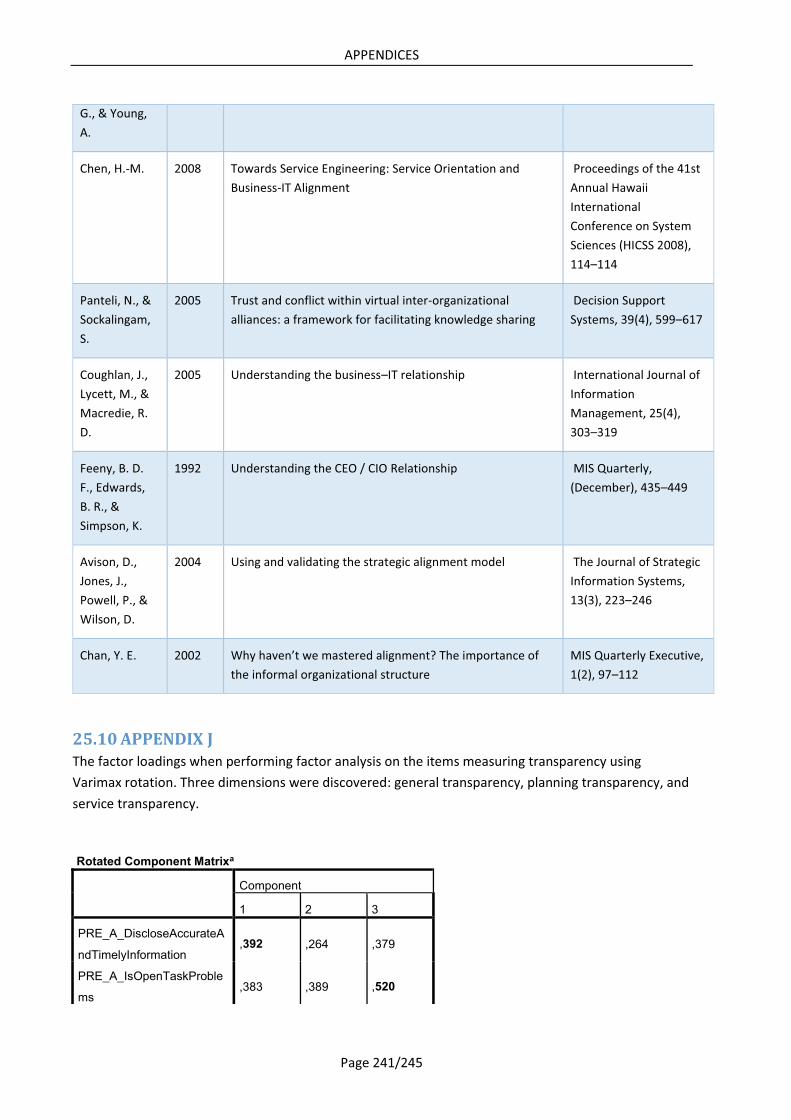
APPENDICES
Page 241/245
G., & Young, A.
Chen, H.-M. 2008 Towards Service Engineering: Service Orientation and Business-IT Alignment
Proceedings of the 41st Annual Hawaii International Conference on System Sciences (HICSS 2008), 114–114
Panteli, N., & Sockalingam, S.
2005 Trust and conflict within virtual inter-organizational alliances: a framework for facilitating knowledge sharing
Decision Support Systems, 39(4), 599–617
Coughlan, J., Lycett, M., & Macredie, R. D.
2005 Understanding the business–IT relationship International Journal of Information Management, 25(4), 303–319
Feeny, B. D. F., Edwards, B. R., & Simpson, K.
1992 Understanding the CEO / CIO Relationship MIS Quarterly, (December), 435–449
Avison, D., Jones, J., Powell, P., & Wilson, D.
2004 Using and validating the strategic alignment model The Journal of Strategic Information Systems, 13(3), 223–246
Chan, Y. E. 2002 Why haven’t we mastered alignment? The importance of the informal organizational structure
MIS Quarterly Executive, 1(2), 97–112
25.10 APPENDIX J The factor loadings when performing factor analysis on the items measuring transparency using Varimax rotation. Three dimensions were discovered: general transparency, planning transparency, and service transparency.
Rotated Component Matrixa
Component
1 2 3
PRE_A_DiscloseAccurateA
ndTimelyInformation ,392 ,264 ,379
PRE_A_IsOpenTaskProble
ms ,383 ,389 ,520

APPENDICES
Page 242/245
PRE_A_IsHonestAndOpen
AboutMotives ,180 ,514 ,508
PRE_A_ClarifiesExpectatio
nsEarlyOn ,303 ,571 ,371
PRE_A_EvaluateCooperati
onRegularly ,316 ,757 -,007
PRE_A_RevealsAndSetting
sExpectationsDifferences ,183 ,753 ,311
PRE_A_ExploreExpectation
sInDetail ,249 ,796 ,235
PRE_I_ProvideUsefullInfor
mation ,503 ,455 ,386
PRE_I_InformsAboutITCha
nges ,643 ,358 ,145
PRE_I_AskForInformationF
eedback ,626 ,468 -,004
PRE_I_MakesItEasyToFindI
nformation ,822 ,120 ,213
PRE_I_ProvidesRelevantInf
ormation ,828 ,136 ,280
PRE_I_ProvidesInformation
EasyToUnderstand ,717 ,282 ,320
PRE_I_ProvidesAccurateAn
dTimelyInformation ,696 ,308 ,254
PRE_I_DiscloseDamagingI
nformation ,192 ,101 ,640
PRE_I_IsOpenToCritisicm ,177 ,210 ,787
PRE_I_AdmitMistakes ,167 ,100 ,805
Extraction Method: Principal Component Analysis.
Rotation Method: Varimax with Kaiser Normalization.
a. Rotation converged in 6 iterations.
25.11 APPENDIX K Table 47: Insights from the alignment and trust field on the relationship between transparency and trust
Insight (shortened for readability) Authors
The sharing of information between IT and business leads to enhanced technical knowledge, which leads to a more complete understanding and appreciation of the other’s reality. This understanding increases alignment.
Nelson et al. (1996)
Expectations might act as a mediator between transparency and trust. Six (2006)

APPENDICES
Page 243/245
Travail is required to bring an organization out of the vicious low trust-low transparency cycle. Increasing transparency does not lead to increased trust unless the information contributes to a shared domain knowledge on how each party plans and performs.
Akkermans et al. (2004)
Quality of the communication matters the most when it came from coworkers or supervisors. If the information was from top management, it was not the quality but the adequacy of the information that mattered the most.
Thomas et al. (2009)
Certain components of transparency were found to have a stronger explanatory power in predicting the relationship between trust and transparency. Sharing information that was useful and that holds the organization accountable were the transparency coefficients with the highest explanatory power in the relationship between transparency and trust.
Rawlins (2008b)
Trust, communication, and shared knowledge are required to establish operational alignment. The three concepts form a virtuous cycle.
Wagner et al. (2012)
Honest communication is correlated to trust. Wong, Then & Skitmore (2000)
Transparency in itself is not able to create trust, at least not in all circumstances. The organization should also act on the information, e.g. if the information displays inferior performance outcomes.
Wakefield et al. (2010)
The following behaviors related to communication are found to increase trust: 1) be consistent between word and deed, 2) ensure frequent and rich communication, 3) engage in collaborative communication, 4) establish and ensure shared vision and language, and 5) disclose your expertise and limitations.
Abrams et al. (2003)
The consumers’ perceptions of a corporation’s efforts to be transparent and the level of trust are correlated. It is not the amount of disclosed information that matters the most, but the initiative taken to disclose information in the first place.
Kang and Hustvedt (2013).
A low level of confidence in the information communicated voids the relationship between transparency and trust. If the information cannot be trusted, it has little or a negative effect on trust.
Dando & Swift (2003)
The mediating factor in the relationship between transparency and trust is factual knowledge about performance outcomes.
Mason & Hillenbrand (2013)
Shared domain knowledge originating from communication is the most important factor in explaining the alignment of IT and business strategies. Shared domain knowledge leads to communication that is more frequent between IT and business employees,
Bassellier & Benbasat (2004)

APPENDICES
Page 244/245
enhancing the mutual understanding between the departments and thereby creating alignment.
Poor communication and collaboration tends to be the norm between IT specialists and business line managers. Such a lack of communication results in IT and business camps and a low degree of shared domain knowledge. When the parties do not understand one other, they become less aligned.
Vermeulen & Dankbaar (2002).
Three factors affect the relationship between trust and transparency negatively, namely: a lack of information exchange, gaps in understanding, and business and IT camps.
Coughlan et al. (2005)
Communication between IT and business is difficult for three reasons: 1) IT departments are intermediaries between third-party contract staff, global staff, external stakeholders and vendors, as well as traditional business users. When multiple cultures exist, communication becomes more multi-faceted and challenging. 2) IT hires people that are introverted and socially disruptive. Employing these individuals does not correspond to the requirement for cross-domain knowledge sharing and inhibits good communication. 3) IT communication is often so techno-centric, inappropriate, and full of jargon that many organizations have sought ways to limit the amount of communication between the two groups.
Smith et al. (2010)
The informal organizational structure is related to alignment because of language barriers, cultural differences, and stereotypical perceptions associated with IT specialists. When such barriers exists, concepts such as relationship management, trust, and communication have a stronger effect on IT alignment than the effects of structures and processes, because they can help overcome the barriers.
Huang et al. (2007)
25.12 APPENDIX L Participants who did not use the tool in the experimental group were added to the control group. This decision was made to maximize the number of participants in the study. However, if the participants who chose not to use the tool differed significantly from the total population, adding these participants to the control group would create imbalance. To see whether the participants who chose not to use the tool differed from the population, I compared their preliminary scores to the control group. I found no significant differences. Furthermore, I compared the scores of the subset of participants in the experimental group who did not use the tool to the control group (without these participants) and found no significant differences. The most likely reason why the participants chose not to use the tool was that they simply had no use for it when the experiment was conducted. This is supported by the finding that useful information was significantly increased, but relevant information was not. To perform an additional validation check for my decision, the data from the control group and data from the first measurement of transparency, trust, and service quality were compared. If the addition of participants that did not use the tool created an imbalance, it would most likely show up in the total rating of the control group. The total difference when comparing the preliminary group with the control group was
APPENDICES
Page 245/245
only 0.04. Since all tests showed that the participants who did not use the tool were similar to the control group when measured on all variables, they were assessed as safe to add to the control group.

TITLER I PH.D.SERIEN:
20041. Martin Grieger Internet-based Electronic Marketplaces and Supply Chain Management
2. Thomas Basbøll LIKENESS A Philosophical Investigation
3. Morten Knudsen Beslutningens vaklen En systemteoretisk analyse of mo-
derniseringen af et amtskommunalt sundhedsvæsen 1980-2000
4. Lars Bo Jeppesen Organizing Consumer Innovation A product development strategy that
is based on online communities and allows some firms to benefit from a distributed process of innovation by consumers
5. Barbara Dragsted SEGMENTATION IN TRANSLATION
AND TRANSLATION MEMORY SYSTEMS An empirical investigation of cognitive segmentation and effects of integra-
ting a TM system into the translation process
6. Jeanet Hardis Sociale partnerskaber Et socialkonstruktivistisk casestudie af partnerskabsaktørers virkeligheds-
opfattelse mellem identitet og legitimitet
7. Henriette Hallberg Thygesen System Dynamics in Action
8. Carsten Mejer Plath Strategisk Økonomistyring
9. Annemette Kjærgaard Knowledge Management as Internal Corporate Venturing
– a Field Study of the Rise and Fall of a Bottom-Up Process
10. Knut Arne Hovdal De profesjonelle i endring Norsk ph.d., ej til salg gennem Samfundslitteratur
11. Søren Jeppesen Environmental Practices and Greening Strategies in Small Manufacturing Enterprises in South Africa – A Critical Realist Approach
12. Lars Frode Frederiksen Industriel forskningsledelse – på sporet af mønstre og samarbejde
i danske forskningsintensive virksom-heder
13. Martin Jes Iversen The Governance of GN Great Nordic – in an age of strategic and structural transitions 1939-1988
14. Lars Pynt Andersen The Rhetorical Strategies of Danish TV Advertising A study of the first fifteen years with special emphasis on genre and irony
15. Jakob Rasmussen Business Perspectives on E-learning
16. Sof Thrane The Social and Economic Dynamics of Networks – a Weberian Analysis of Three Formalised Horizontal Networks
17. Lene Nielsen Engaging Personas and Narrative Scenarios – a study on how a user- centered approach influenced the perception of the design process in
the e-business group at AstraZeneca
18. S.J Valstad Organisationsidentitet Norsk ph.d., ej til salg gennem Samfundslitteratur

19. Thomas Lyse Hansen Six Essays on Pricing and Weather risk
in Energy Markets
20. Sabine Madsen Emerging Methods – An Interpretive Study of ISD Methods in Practice
21. Evis Sinani The Impact of Foreign Direct Inve-
stment on Efficiency, Productivity Growth and Trade: An Empirical Inve-stigation
22. Bent Meier Sørensen Making Events Work Or, How to Multiply Your Crisis
23. Pernille Schnoor Brand Ethos Om troværdige brand- og virksomhedsidentiteter i et retorisk og
diskursteoretisk perspektiv
24. Sidsel Fabech Von welchem Österreich ist hier die
Rede? Diskursive forhandlinger og magt-
kampe mellem rivaliserende nationale identitetskonstruktioner i østrigske pressediskurser
25. Klavs Odgaard Christensen Sprogpolitik og identitetsdannelse i flersprogede forbundsstater Et komparativt studie af Schweiz og Canada
26. Dana B. Minbaeva Human Resource Practices and Knowledge Transfer in Multinational Corporations
27. Holger Højlund Markedets politiske fornuft Et studie af velfærdens organisering i perioden 1990-2003
28. Christine Mølgaard Frandsen A.s erfaring Om mellemværendets praktik i en
transformation af mennesket og subjektiviteten
29. Sine Nørholm Just The Constitution of Meaning – A Meaningful Constitution? Legitimacy, identity, and public opinion
in the debate on the future of Europe
20051. Claus J. Varnes Managing product innovation through rules – The role of formal and structu-
red methods in product development
2. Helle Hedegaard Hein Mellem konflikt og konsensus – Dialogudvikling på hospitalsklinikker
3. Axel Rosenø Customer Value Driven Product Inno-
vation – A Study of Market Learning in New Product Development
4. Søren Buhl Pedersen Making space An outline of place branding
5. Camilla Funck Ellehave Differences that Matter An analysis of practices of gender and organizing in contemporary work-
places
6. Rigmor Madeleine Lond Styring af kommunale forvaltninger
7. Mette Aagaard Andreassen Supply Chain versus Supply Chain Benchmarking as a Means to Managing Supply Chains
8. Caroline Aggestam-Pontoppidan From an idea to a standard The UN and the global governance of accountants’ competence
9. Norsk ph.d.
10. Vivienne Heng Ker-ni An Experimental Field Study on the

Effectiveness of Grocer Media Advertising Measuring Ad Recall and Recognition, Purchase Intentions and Short-Term
Sales
11. Allan Mortensen Essays on the Pricing of Corporate
Bonds and Credit Derivatives
12. Remo Stefano Chiari Figure che fanno conoscere Itinerario sull’idea del valore cognitivo
e espressivo della metafora e di altri tropi da Aristotele e da Vico fino al cognitivismo contemporaneo
13. Anders McIlquham-Schmidt Strategic Planning and Corporate Performance An integrative research review and a meta-analysis of the strategic planning and corporate performance literature from 1956 to 2003
14. Jens Geersbro The TDF – PMI Case Making Sense of the Dynamics of Business Relationships and Networks
15 Mette Andersen Corporate Social Responsibility in Global Supply Chains Understanding the uniqueness of firm behaviour
16. Eva Boxenbaum Institutional Genesis: Micro – Dynamic Foundations of Institutional Change
17. Peter Lund-Thomsen Capacity Development, Environmental Justice NGOs, and Governance: The
Case of South Africa
18. Signe Jarlov Konstruktioner af offentlig ledelse
19. Lars Stæhr Jensen Vocabulary Knowledge and Listening Comprehension in English as a Foreign Language
An empirical study employing data elicited from Danish EFL learners
20. Christian Nielsen Essays on Business Reporting Production and consumption of
strategic information in the market for information
21. Marianne Thejls Fischer Egos and Ethics of Management Consultants
22. Annie Bekke Kjær Performance management i Proces- innovation – belyst i et social-konstruktivistisk perspektiv
23. Suzanne Dee Pedersen GENTAGELSENS METAMORFOSE Om organisering af den kreative gøren
i den kunstneriske arbejdspraksis
24. Benedikte Dorte Rosenbrink Revenue Management Økonomiske, konkurrencemæssige & organisatoriske konsekvenser
25. Thomas Riise Johansen Written Accounts and Verbal Accounts The Danish Case of Accounting and Accountability to Employees
26. Ann Fogelgren-Pedersen The Mobile Internet: Pioneering Users’ Adoption Decisions
27. Birgitte Rasmussen Ledelse i fællesskab – de tillidsvalgtes fornyende rolle
28. Gitte Thit Nielsen Remerger – skabende ledelseskræfter i fusion og opkøb
29. Carmine Gioia A MICROECONOMETRIC ANALYSIS OF MERGERS AND ACQUISITIONS

30. Ole Hinz Den effektive forandringsleder: pilot, pædagog eller politiker? Et studie i arbejdslederes meningstil-
skrivninger i forbindelse med vellykket gennemførelse af ledelsesinitierede forandringsprojekter
31. Kjell-Åge Gotvassli Et praksisbasert perspektiv på dynami-
ske læringsnettverk i toppidretten Norsk ph.d., ej til salg gennem Samfundslitteratur
32. Henriette Langstrup Nielsen Linking Healthcare An inquiry into the changing perfor- mances of web-based technology for asthma monitoring
33. Karin Tweddell Levinsen Virtuel Uddannelsespraksis Master i IKT og Læring – et casestudie
i hvordan proaktiv proceshåndtering kan forbedre praksis i virtuelle lærings-miljøer
34. Anika Liversage Finding a Path Labour Market Life Stories of Immigrant Professionals
35. Kasper Elmquist Jørgensen Studier i samspillet mellem stat og
erhvervsliv i Danmark under 1. verdenskrig
36. Finn Janning A DIFFERENT STORY Seduction, Conquest and Discovery
37. Patricia Ann Plackett Strategic Management of the Radical Innovation Process Leveraging Social Capital for Market Uncertainty Management
20061. Christian Vintergaard Early Phases of Corporate Venturing
2. Niels Rom-Poulsen Essays in Computational Finance
3. Tina Brandt Husman Organisational Capabilities, Competitive Advantage & Project-
Based Organisations The Case of Advertising and Creative Good Production
4. Mette Rosenkrands Johansen Practice at the top – how top managers mobilise and use non-financial performance measures
5. Eva Parum Corporate governance som strategisk kommunikations- og ledelsesværktøj
6. Susan Aagaard Petersen Culture’s Influence on Performance Management: The Case of a Danish Company in China
7. Thomas Nicolai Pedersen The Discursive Constitution of Organi-
zational Governance – Between unity and differentiation
The Case of the governance of environmental risks by World Bank
environmental staff
8. Cynthia Selin Volatile Visions: Transactons in Anticipatory Knowledge
9. Jesper Banghøj Financial Accounting Information and
Compensation in Danish Companies
10. Mikkel Lucas Overby Strategic Alliances in Emerging High-
Tech Markets: What’s the Difference and does it Matter?
11. Tine Aage External Information Acquisition of Industrial Districts and the Impact of Different Knowledge Creation Dimen-
sions

A case study of the Fashion and Design Branch of the Industrial District of Montebelluna, NE Italy
12. Mikkel Flyverbom Making the Global Information Society Governable On the Governmentality of Multi-
Stakeholder Networks
13. Anette Grønning Personen bag Tilstedevær i e-mail som inter-
aktionsform mellem kunde og med-arbejder i dansk forsikringskontekst
14. Jørn Helder One Company – One Language? The NN-case
15. Lars Bjerregaard Mikkelsen Differing perceptions of customer
value Development and application of a tool
for mapping perceptions of customer value at both ends of customer-suppli-er dyads in industrial markets
16. Lise Granerud Exploring Learning Technological learning within small manufacturers in South Africa
17. Esben Rahbek Pedersen Between Hopes and Realities: Reflections on the Promises and Practices of Corporate Social Responsibility (CSR)
18. Ramona Samson The Cultural Integration Model and European Transformation. The Case of Romania
20071. Jakob Vestergaard Discipline in The Global Economy Panopticism and the Post-Washington Consensus
2. Heidi Lund Hansen Spaces for learning and working A qualitative study of change of work, management, vehicles of power and social practices in open offices
3. Sudhanshu Rai Exploring the internal dynamics of
software development teams during user analysis
A tension enabled Institutionalization Model; ”Where process becomes the objective”
4. Norsk ph.d. Ej til salg gennem Samfundslitteratur
5. Serden Ozcan EXPLORING HETEROGENEITY IN ORGANIZATIONAL ACTIONS AND OUTCOMES A Behavioural Perspective
6. Kim Sundtoft Hald Inter-organizational Performance Measurement and Management in
Action – An Ethnography on the Construction
of Management, Identity and Relationships
7. Tobias Lindeberg Evaluative Technologies Quality and the Multiplicity of Performance
8. Merete Wedell-Wedellsborg Den globale soldat Identitetsdannelse og identitetsledelse
i multinationale militære organisatio-ner
9. Lars Frederiksen Open Innovation Business Models Innovation in firm-hosted online user communities and inter-firm project ventures in the music industry – A collection of essays
10. Jonas Gabrielsen Retorisk toposlære – fra statisk ’sted’
til persuasiv aktivitet
11. Christian Moldt-Jørgensen Fra meningsløs til meningsfuld
evaluering. Anvendelsen af studentertilfredsheds- målinger på de korte og mellemlange
videregående uddannelser set fra et psykodynamisk systemperspektiv
12. Ping Gao Extending the application of actor-network theory Cases of innovation in the tele- communications industry
13. Peter Mejlby Frihed og fængsel, en del af den
samme drøm? Et phronetisk baseret casestudie af frigørelsens og kontrollens sam-
eksistens i værdibaseret ledelse! 14. Kristina Birch Statistical Modelling in Marketing
15. Signe Poulsen Sense and sensibility: The language of emotional appeals in
insurance marketing
16. Anders Bjerre Trolle Essays on derivatives pricing and dyna-
mic asset allocation
17. Peter Feldhütter Empirical Studies of Bond and Credit
Markets
18. Jens Henrik Eggert Christensen Default and Recovery Risk Modeling
and Estimation
19. Maria Theresa Larsen Academic Enterprise: A New Mission
for Universities or a Contradiction in Terms?
Four papers on the long-term impli-cations of increasing industry involve-ment and commercialization in acade-mia
20. Morten Wellendorf Postimplementering af teknologi i den
offentlige forvaltning Analyser af en organisations konti-
nuerlige arbejde med informations-teknologi
21. Ekaterina Mhaanna Concept Relations for Terminological
Process Analysis
22. Stefan Ring Thorbjørnsen Forsvaret i forandring Et studie i officerers kapabiliteter un-
der påvirkning af omverdenens foran-dringspres mod øget styring og læring
23. Christa Breum Amhøj Det selvskabte medlemskab om ma-
nagementstaten, dens styringstekno-logier og indbyggere
24. Karoline Bromose Between Technological Turbulence and
Operational Stability – An empirical case study of corporate
venturing in TDC
25. Susanne Justesen Navigating the Paradoxes of Diversity
in Innovation Practice – A Longitudinal study of six very different innovation processes – in
practice
26. Luise Noring Henler Conceptualising successful supply
chain partnerships – Viewing supply chain partnerships
from an organisational culture per-spective
27. Mark Mau Kampen om telefonen Det danske telefonvæsen under den
tyske besættelse 1940-45
28. Jakob Halskov The semiautomatic expansion of
existing terminological ontologies using knowledge patterns discovered

on the WWW – an implementation and evaluation
29. Gergana Koleva European Policy Instruments Beyond
Networks and Structure: The Innova-tive Medicines Initiative
30. Christian Geisler Asmussen Global Strategy and International Diversity: A Double-Edged Sword?
31. Christina Holm-Petersen Stolthed og fordom Kultur- og identitetsarbejde ved ska-
belsen af en ny sengeafdeling gennem fusion
32. Hans Peter Olsen Hybrid Governance of Standardized
States Causes and Contours of the Global
Regulation of Government Auditing
33. Lars Bøge Sørensen Risk Management in the Supply Chain
34. Peter Aagaard Det unikkes dynamikker De institutionelle mulighedsbetingel-
ser bag den individuelle udforskning i professionelt og frivilligt arbejde
35. Yun Mi Antorini Brand Community Innovation An Intrinsic Case Study of the Adult
Fans of LEGO Community
36. Joachim Lynggaard Boll Labor Related Corporate Social Perfor-
mance in Denmark Organizational and Institutional Per-
spectives
20081. Frederik Christian Vinten Essays on Private Equity
2. Jesper Clement Visual Influence of Packaging Design
on In-Store Buying Decisions
3. Marius Brostrøm Kousgaard Tid til kvalitetsmåling? – Studier af indrulleringsprocesser i
forbindelse med introduktionen af kliniske kvalitetsdatabaser i speciallæ-gepraksissektoren
4. Irene Skovgaard Smith Management Consulting in Action Value creation and ambiguity in client-consultant relations
5. Anders Rom Management accounting and inte-
grated information systems How to exploit the potential for ma-
nagement accounting of information technology
6. Marina Candi Aesthetic Design as an Element of Service Innovation in New Technology-
based Firms
7. Morten Schnack Teknologi og tværfaglighed – en analyse af diskussionen omkring indførelse af EPJ på en hospitalsafde-
ling
8. Helene Balslev Clausen Juntos pero no revueltos – un estudio
sobre emigrantes norteamericanos en un pueblo mexicano
9. Lise Justesen Kunsten at skrive revisionsrapporter. En beretning om forvaltningsrevisio-
nens beretninger
10. Michael E. Hansen The politics of corporate responsibility: CSR and the governance of child labor
and core labor rights in the 1990s
11. Anne Roepstorff Holdning for handling – en etnologisk
undersøgelse af Virksomheders Sociale Ansvar/CSR

12. Claus Bajlum Essays on Credit Risk and Credit Derivatives
13. Anders Bojesen The Performative Power of Competen-
ce – an Inquiry into Subjectivity and Social Technologies at Work
14. Satu Reijonen Green and Fragile A Study on Markets and the Natural
Environment
15. Ilduara Busta Corporate Governance in Banking A European Study
16. Kristian Anders Hvass A Boolean Analysis Predicting Industry
Change: Innovation, Imitation & Busi-ness Models
The Winning Hybrid: A case study of isomorphism in the airline industry
17. Trine Paludan De uvidende og de udviklingsparate Identitet som mulighed og restriktion
blandt fabriksarbejdere på det aftaylo-riserede fabriksgulv
18. Kristian Jakobsen Foreign market entry in transition eco-
nomies: Entry timing and mode choice
19. Jakob Elming Syntactic reordering in statistical ma-
chine translation
20. Lars Brømsøe Termansen Regional Computable General Equili-
brium Models for Denmark Three papers laying the foundation for
regional CGE models with agglomera-tion characteristics
21. Mia Reinholt The Motivational Foundations of
Knowledge Sharing
22. Frederikke Krogh-Meibom The Co-Evolution of Institutions and
Technology – A Neo-Institutional Understanding of
Change Processes within the Business Press – the Case Study of Financial Times
23. Peter D. Ørberg Jensen OFFSHORING OF ADVANCED AND
HIGH-VALUE TECHNICAL SERVICES: ANTECEDENTS, PROCESS DYNAMICS AND FIRMLEVEL IMPACTS
24. Pham Thi Song Hanh Functional Upgrading, Relational Capability and Export Performance of
Vietnamese Wood Furniture Producers
25. Mads Vangkilde Why wait? An Exploration of first-mover advanta-
ges among Danish e-grocers through a resource perspective
26. Hubert Buch-Hansen Rethinking the History of European
Level Merger Control A Critical Political Economy Perspective
20091. Vivian Lindhardsen From Independent Ratings to Commu-
nal Ratings: A Study of CWA Raters’ Decision-Making Behaviours
2. Guðrið Weihe Public-Private Partnerships: Meaning
and Practice
3. Chris Nøkkentved Enabling Supply Networks with Colla-
borative Information Infrastructures An Empirical Investigation of Business
Model Innovation in Supplier Relation-ship Management
4. Sara Louise Muhr Wound, Interrupted – On the Vulner-
ability of Diversity Management

5. Christine Sestoft Forbrugeradfærd i et Stats- og Livs-
formsteoretisk perspektiv
6. Michael Pedersen Tune in, Breakdown, and Reboot: On
the production of the stress-fit self-managing employee
7. Salla Lutz Position and Reposition in Networks – Exemplified by the Transformation of
the Danish Pine Furniture Manu- facturers
8. Jens Forssbæck Essays on market discipline in commercial and central banking
9. Tine Murphy Sense from Silence – A Basis for Orga-
nised Action How do Sensemaking Processes with
Minimal Sharing Relate to the Repro-duction of Organised Action?
10. Sara Malou Strandvad Inspirations for a new sociology of art:
A sociomaterial study of development processes in the Danish film industry
11. Nicolaas Mouton On the evolution of social scientific
metaphors: A cognitive-historical enquiry into the
divergent trajectories of the idea that collective entities – states and societies, cities and corporations – are biological organisms.
12. Lars Andreas Knutsen Mobile Data Services: Shaping of user engagements
13. Nikolaos Theodoros Korfiatis Information Exchange and Behavior A Multi-method Inquiry on Online
Communities
14. Jens Albæk Forestillinger om kvalitet og tværfaglig-
hed på sygehuse – skabelse af forestillinger i læge- og
plejegrupperne angående relevans af nye idéer om kvalitetsudvikling gen-nem tolkningsprocesser
15. Maja Lotz The Business of Co-Creation – and the
Co-Creation of Business
16. Gitte P. Jakobsen Narrative Construction of Leader Iden-
tity in a Leader Development Program Context
17. Dorte Hermansen ”Living the brand” som en brandorien-
teret dialogisk praxis: Om udvikling af medarbejdernes
brandorienterede dømmekraft
18. Aseem Kinra Supply Chain (logistics) Environmental
Complexity
19. Michael Nørager How to manage SMEs through the
transformation from non innovative to innovative?
20. Kristin Wallevik Corporate Governance in Family Firms The Norwegian Maritime Sector
21. Bo Hansen Hansen Beyond the Process Enriching Software Process Improve-
ment with Knowledge Management
22. Annemette Skot-Hansen Franske adjektivisk afledte adverbier,
der tager præpositionssyntagmer ind-ledt med præpositionen à som argu-menter
En valensgrammatisk undersøgelse
23. Line Gry Knudsen Collaborative R&D Capabilities In Search of Micro-Foundations

24. Christian Scheuer Employers meet employees Essays on sorting and globalization
25. Rasmus Johnsen The Great Health of Melancholy A Study of the Pathologies of Perfor-
mativity
26. Ha Thi Van Pham Internationalization, Competitiveness
Enhancement and Export Performance of Emerging Market Firms:
Evidence from Vietnam
27. Henriette Balieu Kontrolbegrebets betydning for kausa-
tivalternationen i spansk En kognitiv-typologisk analyse
20101. Yen Tran Organizing Innovationin Turbulent
Fashion Market Four papers on how fashion firms crea-
te and appropriate innovation value
2. Anders Raastrup Kristensen Metaphysical Labour Flexibility, Performance and Commit-
ment in Work-Life Management
3. Margrét Sigrún Sigurdardottir Dependently independent Co-existence of institutional logics in
the recorded music industry
4. Ásta Dis Óladóttir Internationalization from a small do-
mestic base: An empirical analysis of Economics and
Management
5. Christine Secher E-deltagelse i praksis – politikernes og
forvaltningens medkonstruktion og konsekvenserne heraf
6. Marianne Stang Våland What we talk about when we talk
about space:
End User Participation between Proces-ses of Organizational and Architectural Design
7. Rex Degnegaard Strategic Change Management Change Management Challenges in
the Danish Police Reform
8. Ulrik Schultz Brix Værdi i rekruttering – den sikre beslut-
ning En pragmatisk analyse af perception
og synliggørelse af værdi i rekrutte-rings- og udvælgelsesarbejdet
9. Jan Ole Similä Kontraktsledelse Relasjonen mellom virksomhetsledelse
og kontraktshåndtering, belyst via fire norske virksomheter
10. Susanne Boch Waldorff Emerging Organizations: In between
local translation, institutional logics and discourse
11. Brian Kane Performance Talk Next Generation Management of
Organizational Performance
12. Lars Ohnemus Brand Thrust: Strategic Branding and
Shareholder Value An Empirical Reconciliation of two
Critical Concepts
13. Jesper Schlamovitz Håndtering af usikkerhed i film- og
byggeprojekter
14. Tommy Moesby-Jensen Det faktiske livs forbindtlighed Førsokratisk informeret, ny-aristotelisk
τηθος-tænkning hos Martin Heidegger
15. Christian Fich Two Nations Divided by Common Values French National Habitus and the Rejection of American Power
16. Peter Beyer Processer, sammenhængskraft
og fleksibilitet Et empirisk casestudie af omstillings-
forløb i fire virksomheder
17. Adam Buchhorn Markets of Good Intentions Constructing and Organizing Biogas Markets Amid Fragility
and Controversy
18. Cecilie K. Moesby-Jensen Social læring og fælles praksis Et mixed method studie, der belyser
læringskonsekvenser af et lederkursus for et praksisfællesskab af offentlige mellemledere
19. Heidi Boye Fødevarer og sundhed i sen-
modernismen – En indsigt i hyggefænomenet og
de relaterede fødevarepraksisser
20. Kristine Munkgård Pedersen Flygtige forbindelser og midlertidige
mobiliseringer Om kulturel produktion på Roskilde
Festival
21. Oliver Jacob Weber Causes of Intercompany Harmony in
Business Markets – An Empirical Inve-stigation from a Dyad Perspective
22. Susanne Ekman Authority and Autonomy Paradoxes of Modern Knowledge
Work
23. Anette Frey Larsen Kvalitetsledelse på danske hospitaler – Ledelsernes indflydelse på introduk-
tion og vedligeholdelse af kvalitetsstra-tegier i det danske sundhedsvæsen
24. Toyoko Sato Performativity and Discourse: Japanese
Advertisements on the Aesthetic Edu-cation of Desire
25. Kenneth Brinch Jensen Identifying the Last Planner System Lean management in the construction
industry
26. Javier Busquets Orchestrating Network Behavior
for Innovation
27. Luke Patey The Power of Resistance: India’s Na-
tional Oil Company and International Activism in Sudan
28. Mette Vedel Value Creation in Triadic Business Rela-
tionships. Interaction, Interconnection and Position
29. Kristian Tørning Knowledge Management Systems in
Practice – A Work Place Study
30. Qingxin Shi An Empirical Study of Thinking Aloud
Usability Testing from a Cultural Perspective
31. Tanja Juul Christiansen Corporate blogging: Medarbejderes
kommunikative handlekraft
32. Malgorzata Ciesielska Hybrid Organisations. A study of the Open Source – business
setting
33. Jens Dick-Nielsen Three Essays on Corporate Bond
Market Liquidity
34. Sabrina Speiermann Modstandens Politik Kampagnestyring i Velfærdsstaten. En diskussion af trafikkampagners sty-
ringspotentiale
35. Julie Uldam Fickle Commitment. Fostering political
engagement in 'the flighty world of online activism’

36. Annegrete Juul Nielsen Traveling technologies and
transformations in health care
37. Athur Mühlen-Schulte Organising Development Power and Organisational Reform in
the United Nations Development Programme
38. Louise Rygaard Jonas Branding på butiksgulvet Et case-studie af kultur- og identitets-
arbejdet i Kvickly
20111. Stefan Fraenkel Key Success Factors for Sales Force
Readiness during New Product Launch A Study of Product Launches in the
Swedish Pharmaceutical Industry
2. Christian Plesner Rossing International Transfer Pricing in Theory
and Practice
3. Tobias Dam Hede Samtalekunst og ledelsesdisciplin – en analyse af coachingsdiskursens
genealogi og governmentality
4. Kim Pettersson Essays on Audit Quality, Auditor Choi-
ce, and Equity Valuation
5. Henrik Merkelsen The expert-lay controversy in risk
research and management. Effects of institutional distances. Studies of risk definitions, perceptions, management and communication
6. Simon S. Torp Employee Stock Ownership: Effect on Strategic Management and
Performance
7. Mie Harder Internal Antecedents of Management
Innovation
8. Ole Helby Petersen Public-Private Partnerships: Policy and
Regulation – With Comparative and Multi-level Case Studies from Denmark and Ireland
9. Morten Krogh Petersen ’Good’ Outcomes. Handling Multipli-
city in Government Communication
10. Kristian Tangsgaard Hvelplund Allocation of cognitive resources in
translation - an eye-tracking and key-logging study
11. Moshe Yonatany The Internationalization Process of
Digital Service Providers
12. Anne Vestergaard Distance and Suffering Humanitarian Discourse in the age of
Mediatization
13. Thorsten Mikkelsen Personligsheds indflydelse på forret-
ningsrelationer
14. Jane Thostrup Jagd Hvorfor fortsætter fusionsbølgen ud-
over ”the tipping point”? – en empirisk analyse af information
og kognitioner om fusioner
15. Gregory Gimpel Value-driven Adoption and Consump-
tion of Technology: Understanding Technology Decision Making
16. Thomas Stengade Sønderskov Den nye mulighed Social innovation i en forretningsmæs-
sig kontekst
17. Jeppe Christoffersen Donor supported strategic alliances in
developing countries
18. Vibeke Vad Baunsgaard Dominant Ideological Modes of
Rationality: Cross functional

integration in the process of product innovation
19. Throstur Olaf Sigurjonsson Governance Failure and Icelands’s Financial Collapse
20. Allan Sall Tang Andersen Essays on the modeling of risks in interest-rate and infl ation markets
21. Heidi Tscherning Mobile Devices in Social Contexts
22. Birgitte Gorm Hansen Adapting in the Knowledge Economy Lateral Strategies for Scientists and
Those Who Study Them
23. Kristina Vaarst Andersen Optimal Levels of Embeddedness The Contingent Value of Networked
Collaboration
24. Justine Grønbæk Pors Noisy Management A History of Danish School Governing
from 1970-2010
25. Stefan Linder Micro-foundations of Strategic
Entrepreneurship Essays on Autonomous Strategic Action
26. Xin Li Toward an Integrative Framework of
National Competitiveness An application to China
27. Rune Thorbjørn Clausen Værdifuld arkitektur Et eksplorativt studie af bygningers
rolle i virksomheders værdiskabelse
28. Monica Viken Markedsundersøkelser som bevis i
varemerke- og markedsføringsrett
29. Christian Wymann Tattooing The Economic and Artistic Constitution
of a Social Phenomenon
30. Sanne Frandsen Productive Incoherence A Case Study of Branding and
Identity Struggles in a Low-Prestige Organization
31. Mads Stenbo Nielsen Essays on Correlation Modelling
32. Ivan Häuser Følelse og sprog Etablering af en ekspressiv kategori,
eksemplifi ceret på russisk
33. Sebastian Schwenen Security of Supply in Electricity Markets
20121. Peter Holm Andreasen The Dynamics of Procurement
Management - A Complexity Approach
2. Martin Haulrich Data-Driven Bitext Dependency Parsing and Alignment
3. Line Kirkegaard Konsulenten i den anden nat En undersøgelse af det intense
arbejdsliv
4. Tonny Stenheim Decision usefulness of goodwill
under IFRS
5. Morten Lind Larsen Produktivitet, vækst og velfærd Industrirådet og efterkrigstidens
Danmark 1945 - 1958
6. Petter Berg Cartel Damages and Cost Asymmetries
7. Lynn Kahle Experiential Discourse in Marketing A methodical inquiry into practice
and theory
8. Anne Roelsgaard Obling Management of Emotions
in Accelerated Medical Relationships

9. Thomas Frandsen Managing Modularity of
Service Processes Architecture
10. Carina Christine Skovmøller CSR som noget særligt Et casestudie om styring og menings-
skabelse i relation til CSR ud fra en intern optik
11. Michael Tell Fradragsbeskæring af selskabers
fi nansieringsudgifter En skatteretlig analyse af SEL §§ 11,
11B og 11C
12. Morten Holm Customer Profi tability Measurement
Models Their Merits and Sophistication
across Contexts
13. Katja Joo Dyppel Beskatning af derivater En analyse af dansk skatteret
14. Esben Anton Schultz Essays in Labor Economics Evidence from Danish Micro Data
15. Carina Risvig Hansen ”Contracts not covered, or not fully
covered, by the Public Sector Directive”
16. Anja Svejgaard Pors Iværksættelse af kommunikation - patientfi gurer i hospitalets strategiske
kommunikation
17. Frans Bévort Making sense of management with
logics An ethnographic study of accountants
who become managers
18. René Kallestrup The Dynamics of Bank and Sovereign
Credit Risk
19. Brett Crawford Revisiting the Phenomenon of Interests
in Organizational Institutionalism The Case of U.S. Chambers of
Commerce
20. Mario Daniele Amore Essays on Empirical Corporate Finance
21. Arne Stjernholm Madsen The evolution of innovation strategy Studied in the context of medical
device activities at the pharmaceutical company Novo Nordisk A/S in the period 1980-2008
22. Jacob Holm Hansen Is Social Integration Necessary for
Corporate Branding? A study of corporate branding
strategies at Novo Nordisk
23. Stuart Webber Corporate Profi t Shifting and the
Multinational Enterprise
24. Helene Ratner Promises of Refl exivity Managing and Researching
Inclusive Schools
25. Therese Strand The Owners and the Power: Insights
from Annual General Meetings
26. Robert Gavin Strand In Praise of Corporate Social
Responsibility Bureaucracy
27. Nina Sormunen Auditor’s going-concern reporting Reporting decision and content of the
report
28. John Bang Mathiasen Learning within a product development
working practice: - an understanding anchored
in pragmatism
29. Philip Holst Riis Understanding Role-Oriented Enterprise
Systems: From Vendors to Customers
30. Marie Lisa Dacanay Social Enterprises and the Poor Enhancing Social Entrepreneurship and
Stakeholder Theory
31. Fumiko Kano Glückstad Bridging Remote Cultures: Cross-lingual
concept mapping based on the information receiver’s prior-knowledge
32. Henrik Barslund Fosse Empirical Essays in International Trade
33. Peter Alexander Albrecht Foundational hybridity and its
reproduction Security sector reform in Sierra Leone
34. Maja Rosenstock CSR - hvor svært kan det være? Kulturanalytisk casestudie om
udfordringer og dilemmaer med at forankre Coops CSR-strategi
35. Jeanette Rasmussen Tweens, medier og forbrug Et studie af 10-12 årige danske børns
brug af internettet, opfattelse og for-ståelse af markedsføring og forbrug
36. Ib Tunby Gulbrandsen ‘This page is not intended for a
US Audience’ A fi ve-act spectacle on online
communication, collaboration & organization.
37. Kasper Aalling Teilmann Interactive Approaches to
Rural Development
38. Mette Mogensen The Organization(s) of Well-being
and Productivity (Re)assembling work in the Danish Post
39. Søren Friis Møller From Disinterestedness to Engagement Towards Relational Leadership In the
Cultural Sector
40. Nico Peter Berhausen Management Control, Innovation and
Strategic Objectives – Interactions and Convergence in Product Development Networks
41. Balder Onarheim Creativity under Constraints Creativity as Balancing
‘Constrainedness’
42. Haoyong Zhou Essays on Family Firms
43. Elisabeth Naima Mikkelsen Making sense of organisational confl ict An empirical study of enacted sense-
making in everyday confl ict at work
20131. Jacob Lyngsie Entrepreneurship in an Organizational
Context
2. Signe Groth-Brodersen Fra ledelse til selvet En socialpsykologisk analyse af
forholdet imellem selvledelse, ledelse og stress i det moderne arbejdsliv
3. Nis Høyrup Christensen Shaping Markets: A Neoinstitutional
Analysis of the Emerging Organizational Field of Renewable Energy in China
4. Christian Edelvold Berg As a matter of size THE IMPORTANCE OF CRITICAL
MASS AND THE CONSEQUENCES OF SCARCITY FOR TELEVISION MARKETS
5. Christine D. Isakson Coworker Infl uence and Labor Mobility
Essays on Turnover, Entrepreneurship and Location Choice in the Danish Maritime Industry
6. Niels Joseph Jerne Lennon Accounting Qualities in Practice
Rhizomatic stories of representational faithfulness, decision making and control
7. Shannon O’Donnell Making Ensemble Possible How special groups organize for
collaborative creativity in conditions of spatial variability and distance

8. Robert W. D. Veitch Access Decisions in a
Partly-Digital WorldComparing Digital Piracy and Legal Modes for Film and Music
9. Marie Mathiesen Making Strategy Work An Organizational Ethnography
10. Arisa Shollo The role of business intelligence in organizational decision-making
11. Mia Kaspersen The construction of social and
environmental reporting
12. Marcus Møller Larsen The organizational design of offshoring
13. Mette Ohm Rørdam EU Law on Food Naming The prohibition against misleading names in an internal market context
14. Hans Peter Rasmussen GIV EN GED! Kan giver-idealtyper forklare støtte til velgørenhed og understøtte relationsopbygning?
15. Ruben Schachtenhaufen Fonetisk reduktion i dansk
16. Peter Koerver Schmidt Dansk CFC-beskatning I et internationalt og komparativt
perspektiv
17. Morten Froholdt Strategi i den offentlige sektor En kortlægning af styringsmæssig kontekst, strategisk tilgang, samt anvendte redskaber og teknologier for udvalgte danske statslige styrelser
18. Annette Camilla Sjørup Cognitive effort in metaphor translation An eye-tracking and key-logging study
19. Tamara Stucchi The Internationalization
of Emerging Market Firms: A Context-Specifi c Study
20. Thomas Lopdrup-Hjorth “Let’s Go Outside”: The Value of Co-Creation
21. Ana Alačovska Genre and Autonomy in Cultural Production The case of travel guidebook production
22. Marius Gudmand-Høyer Stemningssindssygdommenes historie
i det 19. århundrede Omtydningen af melankolien og
manien som bipolære stemningslidelser i dansk sammenhæng under hensyn til dannelsen af det moderne følelseslivs relative autonomi.
En problematiserings- og erfarings-analytisk undersøgelse
23. Lichen Alex Yu Fabricating an S&OP Process Circulating References and Matters
of Concern
24. Esben Alfort The Expression of a Need Understanding search
25. Trine Pallesen Assembling Markets for Wind Power An Inquiry into the Making of Market Devices
26. Anders Koed Madsen Web-Visions Repurposing digital traces to organize social attention
27. Lærke Højgaard Christiansen BREWING ORGANIZATIONAL RESPONSES TO INSTITUTIONAL LOGICS
28. Tommy Kjær Lassen EGENTLIG SELVLEDELSE En ledelsesfi losofi sk afhandling om
selvledelsens paradoksale dynamik og eksistentielle engagement

29. Morten Rossing Local Adaption and Meaning Creation in Performance Appraisal
30. Søren Obed Madsen Lederen som oversætter Et oversættelsesteoretisk perspektiv på strategisk arbejde
31. Thomas Høgenhaven Open Government Communities Does Design Affect Participation?
32. Kirstine Zinck Pedersen Failsafe Organizing? A Pragmatic Stance on Patient Safety
33. Anne Petersen Hverdagslogikker i psykiatrisk arbejde En institutionsetnografi sk undersøgelse af hverdagen i psykiatriske organisationer
34. Didde Maria Humle Fortællinger om arbejde
35. Mark Holst-Mikkelsen Strategieksekvering i praksis – barrierer og muligheder!
36. Malek Maalouf Sustaining lean Strategies for dealing with organizational paradoxes
37. Nicolaj Tofte Brenneche Systemic Innovation In The Making The Social Productivity of Cartographic Crisis and Transitions in the Case of SEEIT
38. Morten Gylling The Structure of Discourse A Corpus-Based Cross-Linguistic Study
39. Binzhang YANG Urban Green Spaces for Quality Life - Case Study: the landscape
architecture for people in Copenhagen
40. Michael Friis Pedersen Finance and Organization: The Implications for Whole Farm Risk Management
41. Even Fallan Issues on supply and demand for environmental accounting information
42. Ather Nawaz Website user experience A cross-cultural study of the relation between users´ cognitive style, context of use, and information architecture of local websites
43. Karin Beukel The Determinants for Creating Valuable Inventions
44. Arjan Markus External Knowledge Sourcing and Firm Innovation Essays on the Micro-Foundations of Firms’ Search for Innovation
20141. Solon Moreira Four Essays on Technology Licensing
and Firm Innovation
2. Karin Strzeletz Ivertsen Partnership Drift in Innovation Processes A study of the Think City electric car development
3. Kathrine Hoffmann Pii Responsibility Flows in Patient-centred Prevention
4. Jane Bjørn Vedel Managing Strategic Research An empirical analysis of science-industry collaboration in a pharmaceutical company
5. Martin Gylling Processuel strategi i organisationer Monografi om dobbeltheden i tænkning af strategi, dels som vidensfelt i organisationsteori, dels som kunstnerisk tilgang til at skabe i erhvervsmæssig innovation

6. Linne Marie Lauesen Corporate Social Responsibility in the Water Sector: How Material Practices and their Symbolic and Physical Meanings Form a Colonising Logic
7. Maggie Qiuzhu Mei LEARNING TO INNOVATE: The role of ambidexterity, standard, and decision process
8. Inger Høedt-Rasmussen Developing Identity for Lawyers Towards Sustainable Lawyering
9. Sebastian Fux Essays on Return Predictability and Term Structure Modelling
10. Thorbjørn N. M. Lund-Poulsen Essays on Value Based Management
11. Oana Brindusa Albu Transparency in Organizing: A Performative Approach
12. Lena Olaison Entrepreneurship at the limits
13. Hanne Sørum DRESSED FOR WEB SUCCESS? An Empirical Study of Website Quality
in the Public Sector
14. Lasse Folke Henriksen Knowing networks How experts shape transnational governance
15. Maria Halbinger Entrepreneurial Individuals Empirical Investigations into Entrepreneurial Activities of Hackers and Makers
16. Robert Spliid Kapitalfondenes metoder og kompetencer
17. Christiane Stelling Public-private partnerships & the need, development and management of trusting A processual and embedded exploration
18. Marta Gasparin Management of design as a translation process
19. Kåre Moberg Assessing the Impact of Entrepreneurship Education From ABC to PhD
20. Alexander Cole Distant neighbors Collective learning beyond the cluster
21. Martin Møller Boje Rasmussen Is Competitiveness a Question of Being Alike? How the United Kingdom, Germany and Denmark Came to Compete through their Knowledge Regimes from 1993 to 2007
22. Anders Ravn Sørensen Studies in central bank legitimacy, currency and national identity Four cases from Danish monetary history
23. Nina Bellak Can Language be Managed in
International Business? Insights into Language Choice from a Case Study of Danish and Austrian Multinational Corporations (MNCs)
24. Rikke Kristine Nielsen Global Mindset as Managerial Meta-competence and Organizational Capability: Boundary-crossing Leadership Cooperation in the MNC The Case of ‘Group Mindset’ in Solar A/S.
25. Rasmus Koss Hartmann User Innovation inside government Towards a critically performative foundation for inquiry

26. Kristian Gylling Olesen Flertydig og emergerende ledelse i
folkeskolen Et aktør-netværksteoretisk ledelses-
studie af politiske evalueringsreformers betydning for ledelse i den danske folkeskole
27. Troels Riis Larsen Kampen om Danmarks omdømme
1945-2010 Omdømmearbejde og omdømmepolitik
28. Klaus Majgaard Jagten på autenticitet i offentlig styring
29. Ming Hua Li Institutional Transition and Organizational Diversity: Differentiated internationalization strategies of emerging market state-owned enterprises
30. Sofi e Blinkenberg Federspiel IT, organisation og digitalisering: Institutionelt arbejde i den kommunale digitaliseringsproces
31. Elvi Weinreich Hvilke offentlige ledere er der brug for når velfærdstænkningen fl ytter sig – er Diplomuddannelsens lederprofi l svaret?
32. Ellen Mølgaard Korsager Self-conception and image of context in the growth of the fi rm – A Penrosian History of Fiberline Composites
33. Else Skjold The Daily Selection
34. Marie Louise Conradsen The Cancer Centre That Never Was The Organisation of Danish Cancer Research 1949-1992
35. Virgilio Failla Three Essays on the Dynamics of
Entrepreneurs in the Labor Market
36. Nicky Nedergaard Brand-Based Innovation Relational Perspectives on Brand Logics
and Design Innovation Strategies and Implementation
37. Mads Gjedsted Nielsen Essays in Real Estate Finance
38. Kristin Martina Brandl Process Perspectives on
Service Offshoring
39. Mia Rosa Koss Hartmann In the gray zone With police in making space for creativity
40. Karen Ingerslev Healthcare Innovation under
The Microscope Framing Boundaries of Wicked
Problems
41. Tim Neerup Themsen Risk Management in large Danish
public capital investment programmes
20151. Jakob Ion Wille Film som design Design af levende billeder i
fi lm og tv-serier
2. Christiane Mossin Interzones of Law and Metaphysics Hierarchies, Logics and Foundations
of Social Order seen through the Prism of EU Social Rights
3. Thomas Tøth TRUSTWORTHINESS: ENABLING
GLOBAL COLLABORATION An Ethnographic Study of Trust,
Distance, Control, Culture and Boundary Spanning within Offshore Outsourcing of IT Services
4. Steven Højlund Evaluation Use in Evaluation Systems – The Case of the European Commission

5. Julia Kirch Kirkegaard AMBIGUOUS WINDS OF CHANGE – OR FIGHTING AGAINST WINDMILLS IN CHINESE WIND POWER A CONSTRUCTIVIST INQUIRY INTO CHINA’S PRAGMATICS OF GREEN MARKETISATION MAPPING CONTROVERSIES OVER A POTENTIAL TURN TO QUALITY IN CHINESE WIND POWER
6. Michelle Carol Antero A Multi-case Analysis of the
Development of Enterprise Resource Planning Systems (ERP) Business Practices
Morten Friis-Olivarius The Associative Nature of Creativity
7. Mathew Abraham New Cooperativism: A study of emerging producer
organisations in India
8. Stine Hedegaard Sustainability-Focused Identity: Identity work performed to manage, negotiate and resolve barriers and tensions that arise in the process of constructing or ganizational identity in a sustainability context
9. Cecilie Glerup Organizing Science in Society – the conduct and justifi cation of resposible research
10. Allan Salling Pedersen Implementering af ITIL® IT-governance - når best practice konfl ikter med kulturen Løsning af implementerings- problemer gennem anvendelse af kendte CSF i et aktionsforskningsforløb.
11. Nihat Misir A Real Options Approach to Determining Power Prices
12. Mamdouh Medhat MEASURING AND PRICING THE RISK OF CORPORATE FAILURES
13. Rina Hansen Toward a Digital Strategy for Omnichannel Retailing
14. Eva Pallesen In the rhythm of welfare creation A relational processual investigation
moving beyond the conceptual horizon of welfare management
15. Gouya Harirchi In Search of Opportunities: Three Essays on Global Linkages for Innovation
16. Lotte Holck Embedded Diversity: A critical ethnographic study of the structural tensions of organizing diversity
17. Jose Daniel Balarezo Learning through Scenario Planning
18. Louise Pram Nielsen Knowledge dissemination based on
terminological ontologies. Using eye tracking to further user interface design.
19. Sofi e Dam PUBLIC-PRIVATE PARTNERSHIPS FOR
INNOVATION AND SUSTAINABILITY TRANSFORMATION
An embedded, comparative case study of municipal waste management in England and Denmark
20. Ulrik Hartmyer Christiansen Follwoing the Content of Reported Risk
Across the Organization
21. Guro Refsum Sanden Language strategies in multinational
corporations. A cross-sector study of fi nancial service companies and manufacturing companies.
22. Linn Gevoll Designing performance management
for operational level - A closer look on the role of design
choices in framing coordination and motivation

23. Frederik Larsen Objects and Social Actions– on Second-hand Valuation Practices
24. Thorhildur Hansdottir Jetzek The Sustainable Value of OpenGovernment Data Uncovering the Generative Mechanismsof Open Data through a MixedMethods Approach
25. Gustav Toppenberg Innovation-based M&A – Technological-IntegrationChallenges – The Case ofDigital-Technology Companies
26. Mie Plotnikof Challenges of CollaborativeGovernance An Organizational Discourse Studyof Public Managers’ Struggleswith Collaboration across the Daycare Area
27. Christian Garmann Johnsen Who Are the Post-Bureaucrats? A Philosophical Examination of theCreative Manager, the Authentic Leaderand the Entrepreneur
28. Jacob Brogaard-Kay Constituting Performance Management A fi eld study of a pharmaceuticalcompany
29. Rasmus Ploug Jenle Engineering Markets for Control:Integrating Wind Power into the DanishElectricity System
30. Morten Lindholst Complex Business Negotiation:Undestanding Preparation andPlanning
31. Morten Grynings Trust and transparency from an alignment perspective

TITLER I ATV PH.D.-SERIEN
19921. Niels Kornum Servicesamkørsel – organisation, øko-
nomi og planlægningsmetode
19952. Verner Worm Nordiske virksomheder i Kina Kulturspecifi kke interaktionsrelationer ved nordiske virksomhedsetableringer i Kina
19993. Mogens Bjerre Key Account Management of Complex Strategic Relationships An Empirical Study of the Fast Moving Consumer Goods Industry
20004. Lotte Darsø Innovation in the Making Interaction Research with heteroge-
neous Groups of Knowledge Workers creating new Knowledge and new Leads
20015. Peter Hobolt Jensen Managing Strategic Design Identities The case of the Lego Developer Net-
work
20026. Peter Lohmann The Deleuzian Other of Organizational Change – Moving Perspectives of the Human
7. Anne Marie Jess Hansen To lead from a distance: The dynamic interplay between strategy and strate-
gizing – A case study of the strategic management process
20038. Lotte Henriksen Videndeling – om organisatoriske og ledelsesmæs-
sige udfordringer ved videndeling i praksis
9. Niels Christian Nickelsen Arrangements of Knowing: Coordi-
nating Procedures Tools and Bodies in Industrial Production – a case study of the collective making of new products
200510. Carsten Ørts Hansen Konstruktion af ledelsesteknologier og effektivitet
TITLER I DBA PH.D.-SERIEN
20071. Peter Kastrup-Misir Endeavoring to Understand Market Orientation – and the concomitant co-mutation of the researched, the re searcher, the research itself and the truth
20091. Torkild Leo Thellefsen Fundamental Signs and Signifi cance
effects A Semeiotic outline of Fundamental Signs, Signifi cance-effects, Knowledge Profi ling and their use in Knowledge Organization and Branding
2. Daniel Ronzani When Bits Learn to Walk Don’t Make Them Trip. Technological Innovation and the Role of Regulation by Law in Information Systems Research: the Case of Radio Frequency Identifi cation (RFID)
20101. Alexander Carnera Magten over livet og livet som magt Studier i den biopolitiske ambivalens