Embed Size (px)
Citation preview
................BM-BMECMYK
TUESDAY • FEBRUARY 22, 2022
MUMBAI
₹�10 • Pages 12 • Volume 29 • Number 52 Bengaluru Chennai Coimbatore Hubballi Hyderabad Kochi Kolkata Madurai Malappuram Mangaluru Mumbai Noida Thiruvananthapuram Tiruchirapalli Tirupati Vijayawada Visakhapatnam Regd. TN/ARD/14/09-11, RNI No. 55320/94
................BM-BMECMYK
MUMBAI
BusinessLineJ2 TUESDAY • FEBRUARY 22 • 2022
................BM-BMECMYK
Bengaluru Chennai Coimbatore Hubballi Hyderabad Kochi Kolkata Madurai Malappuram Mangaluru Mumbai Noida Thiruvananthapuram Tiruchirapalli Tirupati Vijayawada Visakhapatnam
TUESDAY • FEBRUARY 22, 2022
MUMBAI
₹�10 • Pages 12 • Volume 29 • Number 52
DATA FOCUS
The pace of administering booster
doses of Covid19 vaccination is
yet to pick up in India p2
COVID VAX FOR ADOLESCENTS
Biological E’s Corbevax has received
emergencyuse authorisation from the DCGI for
use in adolescents aged 12 to 18 years p10
MONDAY BLUES
More than 2,800 stocks ended in
the red on BSE as Sensex, Nifty fell
for the fourth straight day p6
SHISHIR SINHA
New Delhi, February 21
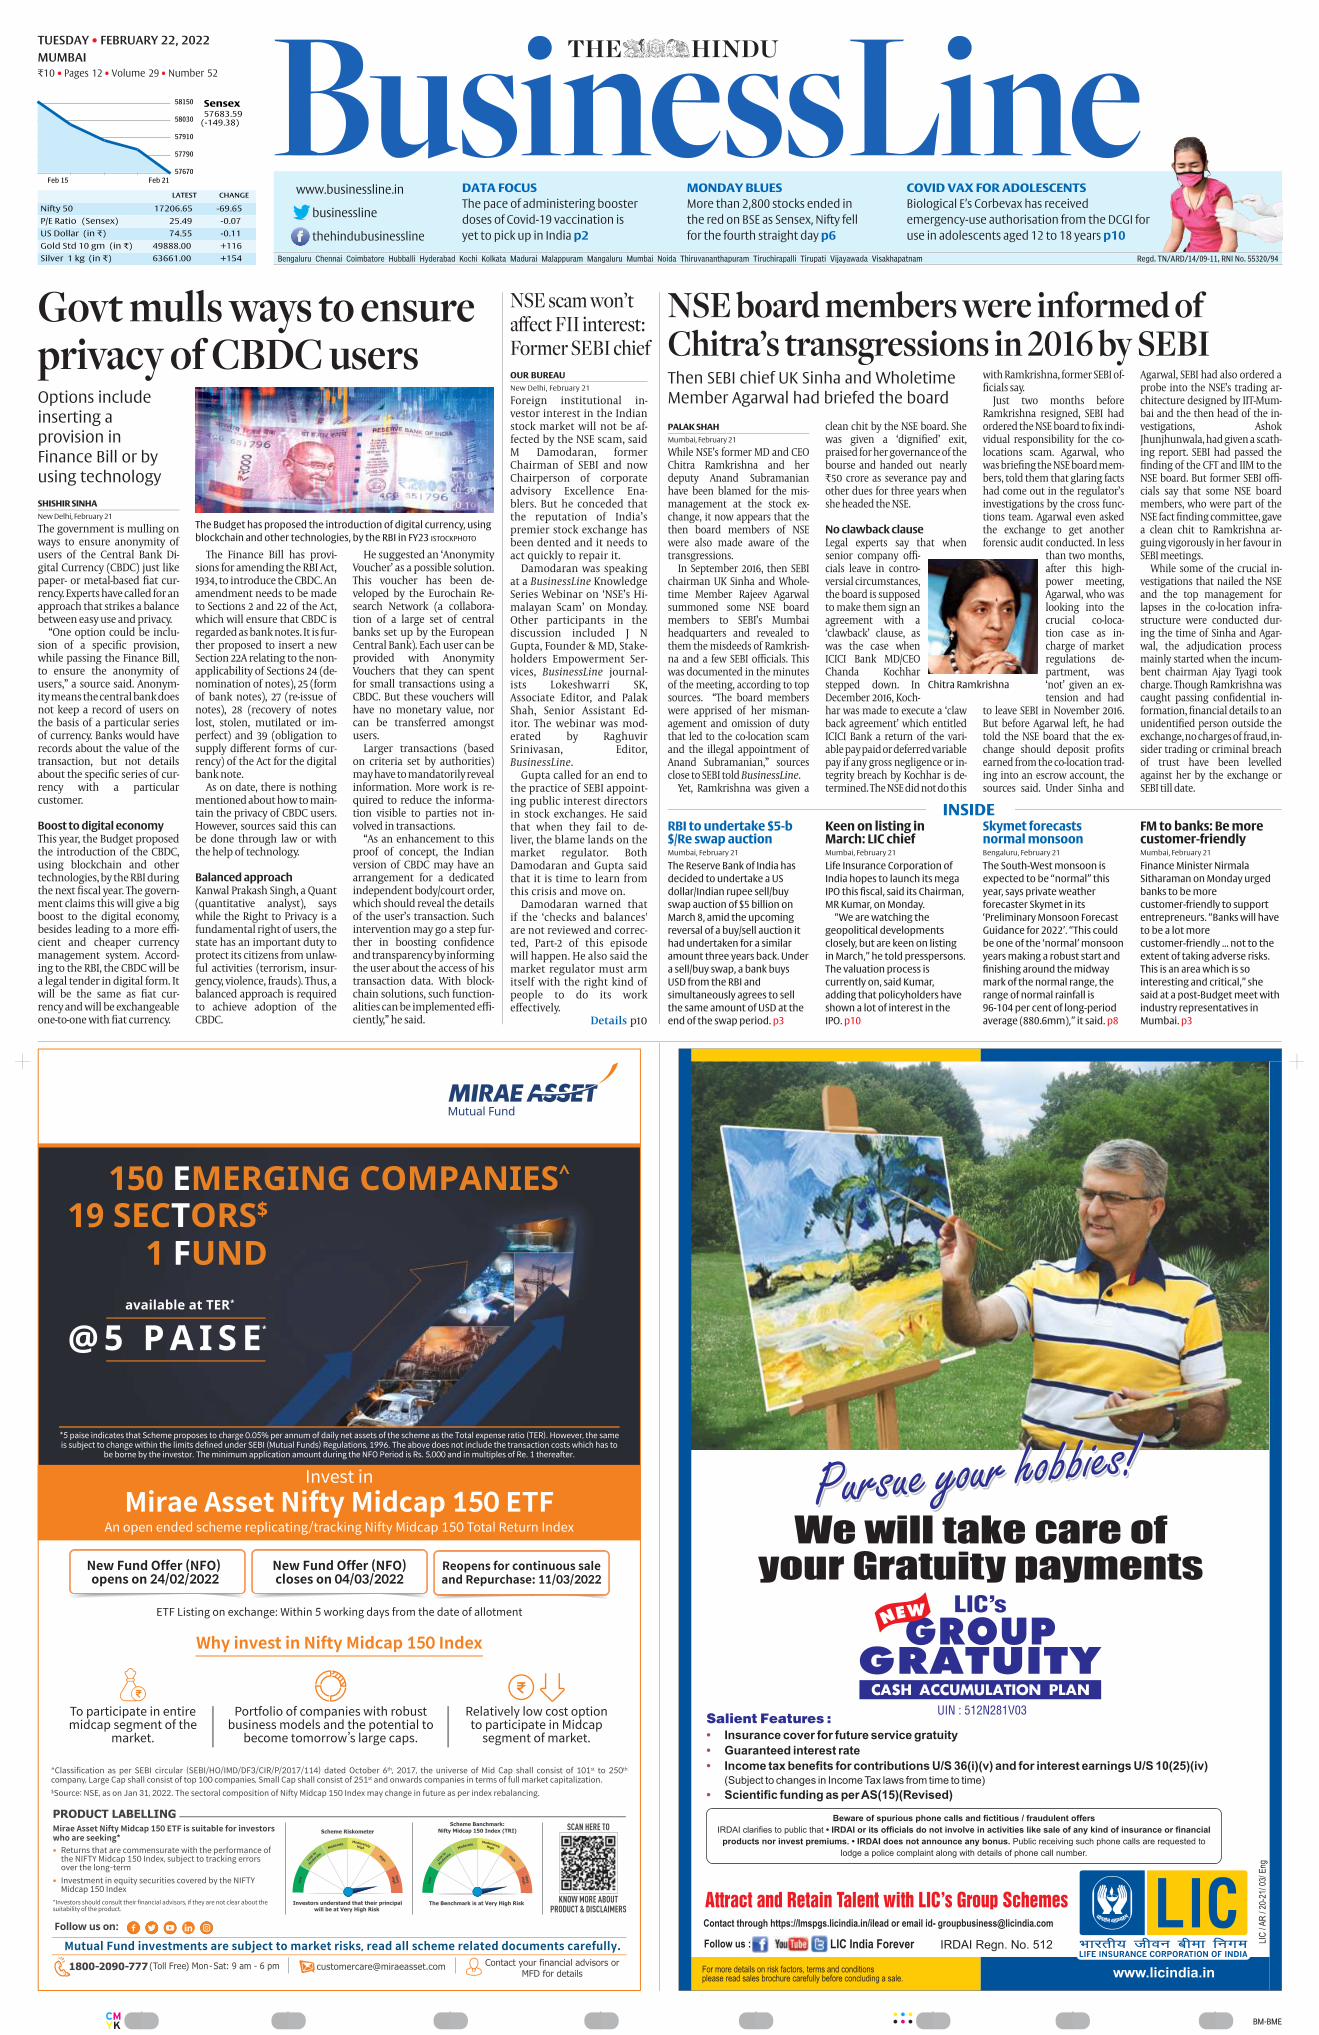
The government is mulling onways to ensure anonymity ofusers of the Central Bank Digital Currency (CBDC) just likepaper or metalbased fi�at currency. Experts have called for anapproach that strikes a balancebetween easy use and privacy.
“One option could be inclusion of a specifi�c provision,while passing the Finance Bill,to ensure the anonymity ofusers,” a source said. Anonymity means the central bank doesnot keep a record of users onthe basis of a particular seriesof currency. Banks would haverecords about the value of thetransaction, but not detailsabout the specifi�c series of currency with a particularcustomer.
Boost to digital economyThis year, the Budget proposedthe introduction of the CBDC,using blockchain and othertechnologies, by the RBI duringthe next fi�scal year. The government claims this will give a bigboost to the digital economy,besides leading to a more effi�cient and cheaper currencymanagement system. According to the RBI, the CBDC will bea legal tender in digital form. Itwill be the same as fi�at currency and will be exchangeableonetoone with fi�at currency.
The Finance Bill has provisions for amending the RBI Act,1934, to introduce the CBDC. Anamendment needs to be madeto Sections 2 and 22 of the Act,which will ensure that CBDC isregarded as bank notes. It is further proposed to insert a newSection 22A relating to the nonapplicability of Sections 24 (denomination of notes), 25 (formof bank notes), 27 (reissue ofnotes), 28 (recovery of noteslost, stolen, mutilated or imperfect) and 39 (obligation tosupply diff�erent forms of currency) of the Act for the digitalbank note.
As on date, there is nothingmentioned about how to maintain the privacy of CBDC users.However, sources said this canbe done through law or withthe help of technology.
Balanced approach Kanwal Prakash Singh, a Quant(quantitative analyst), sayswhile the Right to Privacy is afundamental right of users, thestate has an important duty toprotect its citizens from unlawful activities (terrorism, insurgency, violence, frauds). Thus, abalanced approach is requiredto achieve adoption of theCBDC.
He suggested an ‘AnonymityVoucher’ as a possible solution.This voucher has been developed by the Eurochain Research Network (a collaboration of a large set of centralbanks set up by the EuropeanCentral Bank). Each user can beprovided with AnonymityVouchers that they can spentfor small transactions using aCBDC. But these vouchers willhave no monetary value, norcan be transferred amongstusers.
Larger transactions (basedon criteria set by authorities)may have to mandatorily revealinformation. More work is required to reduce the information visible to parties not involved in transactions.
“As an enhancement to thisproof of concept, the Indianversion of CBDC may have anarrangement for a dedicatedindependent body/court order,which should reveal the detailsof the user’s transaction. Suchintervention may go a step further in boosting confi�denceand transparency by informingthe user about the access of histransaction data. With blockchain solutions, such functionalities can be implemented effi�ciently,” he said.
Govt mulls ways to ensureprivacy of CBDC users Options include
inserting a
provision in
Finance Bill or by
using technology
The Budget has proposed the introduction of digital currency, using
blockchain and other technologies, by the RBI in FY23 ISTOCKPHOTO
OUR BUREAU
New Delhi, February 21
Foreign institutional investor interest in the Indianstock market will not be affected by the NSE scam, saidM Damodaran, formerChairman of SEBI and nowChairperson of corporateadvisory Excellence Enablers. But he conceded thatthe reputation of India’spremier stock exchange hasbeen dented and it needs toact quickly to repair it.
Damodaran was speakingat a BusinessLine KnowledgeSeries Webinar on ‘NSE’s Himalayan Scam’ on Monday.Other participants in thediscussion included J NGupta, Founder & MD, Stakeholders Empowerment Services, BusinessLine journalists Lokeshwarri SK,Associate Editor, and PalakShah, Senior Assistant Editor. The webinar was moderated by RaghuvirSrinivasan, Editor,BusinessLine.
Gupta called for an end tothe practice of SEBI appointing public interest directorsin stock exchanges. He saidthat when they fail to deliver, the blame lands on themarket regulator. BothDamodaran and Gupta saidthat it is time to learn fromthis crisis and move on.
Damodaran warned thatif the ‘checks and balances'are not reviewed and corrected, Part2 of this episodewill happen. He also said themarket regulator must armitself with the right kind ofpeople to do its workeff�ectively.
Details p10
NSE scam won’t
affect FII interest:
Former SEBI chief
PALAK SHAH
Mumbai, February 21
While NSE’s former MD and CEOChitra Ramkrishna and herdeputy Anand Subramanianhave been blamed for the mismanagement at the stock exchange, it now appears that thethen board members of NSEwere also made aware of thetransgressions.
In September 2016, then SEBIchairman UK Sinha and Wholetime Member Rajeev Agarwalsummoned some NSE boardmembers to SEBI’s Mumbaiheadquarters and revealed tothem the misdeeds of Ramkrishna and a few SEBI offi�cials. Thiswas documented in the minutesof the meeting, according to topsources. “The board memberswere apprised of her mismanagement and omission of dutythat led to the colocation scamand the illegal appointment ofAnand Subramanian,” sourcesclose to SEBI told BusinessLine.
Yet, Ramkrishna was given a
clean chit by the NSE board. Shewas given a ‘dignifi�ed’ exit,praised for her governance of thebourse and handed out nearly₹�50 crore as severance pay andother dues for three years whenshe headed the NSE.
No clawback clauseLegal experts say that whensenior company offi�cials leave in controversial circumstances,the board is supposedto make them sign anagreement with a‘clawback’ clause, aswas the case whenICICI Bank MD/CEOChanda Kochharstepped down. InDecember 2016, Kochhar was made to execute a ‘clawback agreement’ which entitledICICI Bank a return of the variable pay paid or deferred variablepay if any gross negligence or integrity breach by Kochhar is determined. The NSE did not do this
with Ramkrishna, former SEBI offi�cials say.
Just two months beforeRamkrishna resigned, SEBI hadordered the NSE board to fi�x individual responsibility for the colocations scam. Agarwal, whowas briefi�ng the NSE board members, told them that glaring factshad come out in the regulator’sinvestigations by the cross functions team. Agarwal even askedthe exchange to get anotherforensic audit conducted. In less
than two months,after this highpower meeting,Agarwal, who waslooking into thecrucial colocation case as incharge of marketregulations department, was‘not’ given an extension and had
to leave SEBI in November 2016.But before Agarwal left, he hadtold the NSE board that the exchange should deposit profi�tsearned from the colocation trading into an escrow account, thesources said. Under Sinha and
Agarwal, SEBI had also ordered aprobe into the NSE’s trading architecture designed by IITMumbai and the then head of the investigations, AshokJhunjhunwala, had given a scathing report. SEBI had passed thefi�nding of the CFT and IIM to theNSE board. But former SEBI offi�cials say that some NSE boardmembers, who were part of theNSE fact fi�nding committee, gavea clean chit to Ramkrishna arguing vigorously in her favour inSEBI meetings.
While some of the crucial investigations that nailed the NSEand the top management forlapses in the colocation infrastructure were conducted during the time of Sinha and Agarwal, the adjudication processmainly started when the incumbent chairman Ajay Tyagi tookcharge. Though Ramkrishna wascaught passing confi�dential information, fi�nancial details to anunidentifi�ed person outside theexchange, no charges of fraud, insider trading or criminal breachof trust have been levelledagainst her by the exchange orSEBI till date.
Then SEBI chief UK Sinha and Wholetime
Member Agarwal had briefed the board
NSE board members were informed ofChitra’s transgressions in 2016 by SEBI
Chitra Ramkrishna
RBI to undertake $5-b$/Re swap auctionMumbai, February 21
The Reserve Bank of India has
decided to undertake a US
dollar/Indian rupee sell/buy
swap auction of $5 billion on
March 8, amid the upcoming
reversal of a buy/sell auction it
had undertaken for a similar
amount three years back. Under
a sell/buy swap, a bank buys
USD from the RBI and
simultaneously agrees to sell
the same amount of USD at the
end of the swap period. p3
FM to banks: Be morecustomer-friendly Mumbai, February 21
Finance Minister Nirmala
Sitharaman on Monday urged
banks to be more
customer-friendly to support
entrepreneurs. “Banks will have
to be a lot more
customer-friendly ... not to the
extent of taking adverse risks.
This is an area which is so
interesting and critical,” she
said at a post-Budget meet with
industry representatives in
Mumbai. p3
Skymet forecastsnormal monsoonBengaluru, February 21
The South-West monsoon is
expected to be “normal” this
year, says private weather
forecaster Skymet in its
‘Preliminary Monsoon Forecast
Guidance for 2022’. “This could
be one of the ‘normal’ monsoon
years making a robust start and
finishing around the midway
mark of the normal range, the
range of normal rainfall is
96-104 per cent of long-period
average (880.6mm),” it said. p8
Keen on listing inMarch: LIC chiefMumbai, February 21
Life Insurance Corporation of
India hopes to launch its mega
IPO this fiscal, said its Chairman,
MR Kumar, on Monday.
“We are watching the
geopolitical developments
closely, but are keen on listing
in March,” he told presspersons.
The valuation process is
currently on, said Kumar,
adding that policyholders have
shown a lot of interest in the
IPO. p10
INSIDE
Regd. TN/ARD/14/09-11, RNI No. 55320/94
................BM-BMECMYK
MUMBAI
2 BusinessLine TUESDAY • FEBRUARY 22 • 2022NEWS
BusinessLineDisclaimer: Readers are requested to verify& make appropriate enquiries to satisfythemselves about the veracity of anadvertisement before responding to anypublished in this newspaper. THGPUBLISHING PVT LTD., the Publisher &Owner of this newspaper, does not vouchfor the authenticity of any advertisementor advertiser or for any of the advertiser’sproducts and/or services. In no event canthe Owner, Publisher, Printer, Editor,Director/s, Employees of thisnewspaper/company be heldresponsible/liable in any mannerwhatsoever for any claims and/or damagesfor advertisements in this newspaper.
PARVATHI BENU
Chennai, February 21
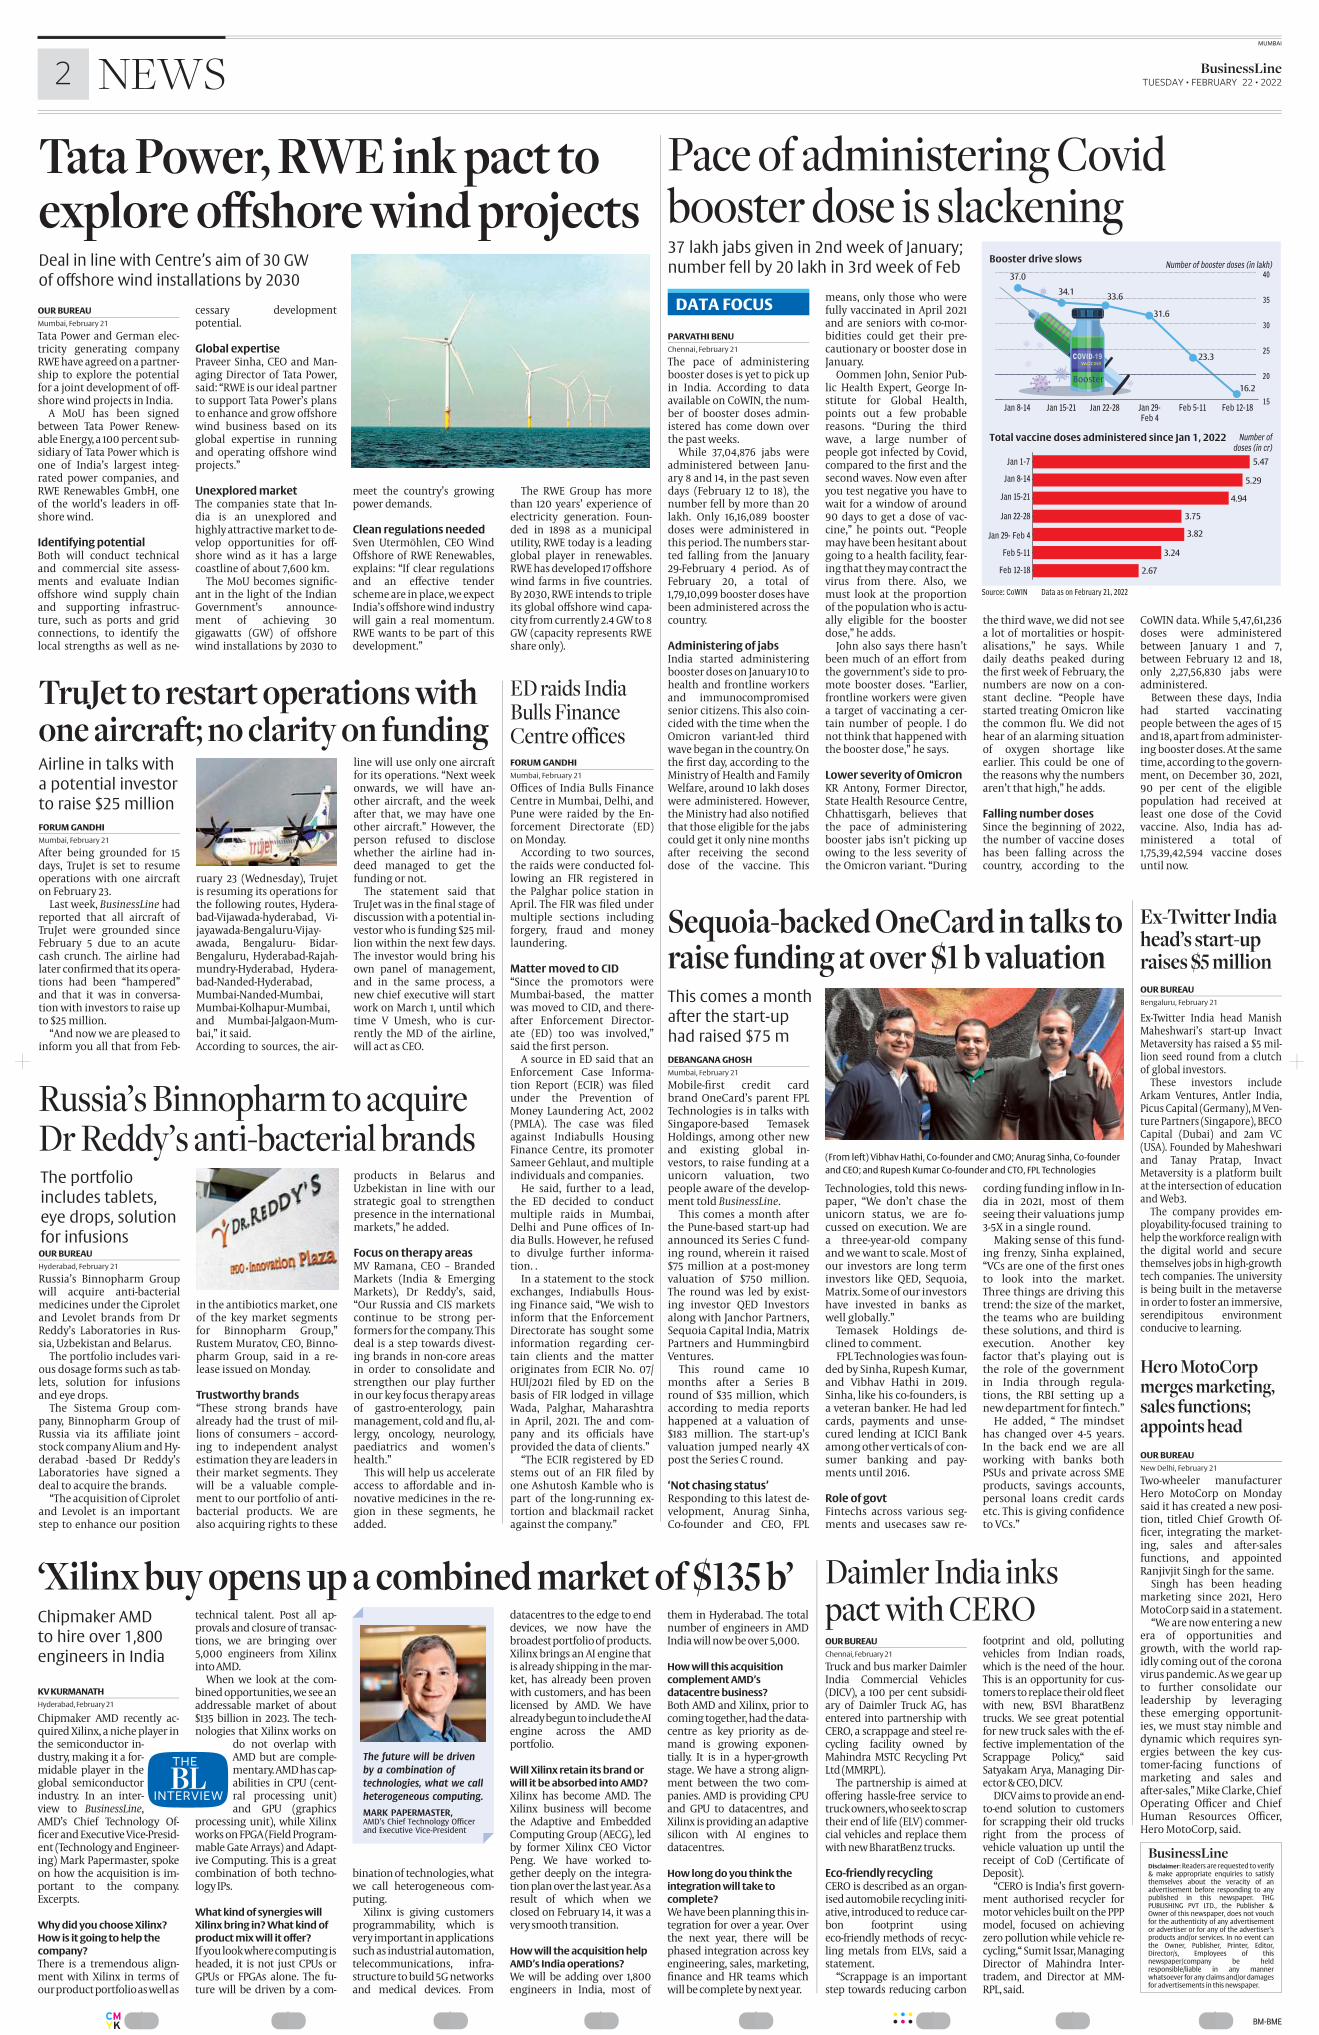
The pace of administeringbooster doses is yet to pick upin India. According to dataavailable on CoWIN, the number of booster doses administered has come down overthe past weeks.
While 37,04,876 jabs wereadministered between January 8 and 14, in the past sevendays (February 12 to 18), thenumber fell by more than 20lakh. Only 16,16,089 boosterdoses were administered inthis period. The numbers started falling from the January29February 4 period. As ofFebruary 20, a total of1,79,10,099 booster doses havebeen administered across thecountry.
Administering of jabsIndia started administeringbooster doses on January 10 tohealth and frontline workersand immunocompromisedsenior citizens. This also coincided with the time when theOmicron variantled thirdwave began in the country. Onthe fi�rst day, according to theMinistry of Health and FamilyWelfare, around 10 lakh doseswere administered. However,the Ministry had also notifi�edthat those eligible for the jabscould get it only nine monthsafter receiving the seconddose of the vaccine. This
means, only those who werefully vaccinated in April 2021and are seniors with comorbidities could get their precautionary or booster dose inJanuary.
Oommen John, Senior Public Health Expert, George Institute for Global Health,points out a few probablereasons. “During the thirdwave, a large number ofpeople got infected by Covid,compared to the fi�rst and thesecond waves. Now even afteryou test negative you have towait for a window of around90 days to get a dose of vaccine,” he points out. “Peoplemay have been hesitant aboutgoing to a health facility, fearing that they may contract thevirus from there. Also, wemust look at the proportionof the population who is actually eligible for the boosterdose,” he adds.
John also says there hasn’tbeen much of an eff�ort fromthe government’s side to promote booster doses. “Earlier,frontline workers were givena target of vaccinating a certain number of people. I donot think that happened withthe booster dose,” he says.
Lower severity of OmicronKR Antony, Former Director,State Health Resource Centre,Chhattisgarh, believes thatthe pace of administeringbooster jabs isn’t picking upowing to the less severity ofthe Omicron variant. “During
the third wave, we did not seea lot of mortalities or hospitalisations,” he says. Whiledaily deaths peaked duringthe fi�rst week of February, thenumbers are now on a constant decline. “People havestarted treating Omicron likethe common fl�u. We did nothear of an alarming situationof oxygen shortage likeearlier. This could be one ofthe reasons why the numbersaren’t that high,” he adds.
Falling number dosesSince the beginning of 2022,the number of vaccine doseshas been falling across thecountry, according to the
CoWIN data. While 5,47,61,236doses were administeredbetween January 1 and 7,between February 12 and 18,only 2,27,56,830 jabs wereadministered.
Between these days, Indiahad started vaccinatingpeople between the ages of 15and 18, apart from administering booster doses. At the sametime, according to the government, on December 30, 2021,90 per cent of the eligiblepopulation had received atleast one dose of the Covidvaccine. Also, India has administered a total of1,75,39,42,594 vaccine dosesuntil now.
37 lakh jabs given in 2nd week of January;
number fell by 20 lakh in 3rd week of Feb
Pace of administering Covid booster dose is slackening
DATA FOCUSOUR BUREAU
Mumbai, February 21
Tata Power and German electricity generating companyRWE have agreed on a partnership to explore the potentialfor a joint development of off�shore wind projects in India.
A MoU has been signedbetween Tata Power Renewable Energy, a 100 percent subsidiary of Tata Power which isone of India’s largest integrated power companies, andRWE Renewables GmbH, oneof the world’s leaders in off�shore wind.
Identifying potentialBoth will conduct technicaland commercial site assessments and evaluate Indianoff�shore wind supply chainand supporting infrastructure, such as ports and gridconnections, to identify thelocal strengths as well as ne
cessary developmentpotential.
Global expertisePraveer Sinha, CEO and Managing Director of Tata Power,said: “RWE is our ideal partnerto support Tata Power’s plansto enhance and grow off�shorewind business based on itsglobal expertise in runningand operating off�shore windprojects.”
Unexplored marketThe companies state that India is an unexplored andhighly attractive market to develop opportunities for off�shore wind as it has a largecoastline of about 7,600 km.
The MoU becomes signifi�cant in the light of the IndianGovernment’s announcement of achieving 30gigawatts (GW) of off�shorewind installations by 2030 to
meet the country’s growingpower demands.
Clean regulations neededSven Utermöhlen, CEO WindOff�shore of RWE Renewables,explains: “If clear regulationsand an eff�ective tenderscheme are in place, we expectIndia’s off�shore wind industrywill gain a real momentum.RWE wants to be part of thisdevelopment.”
The RWE Group has morethan 120 years’ experience ofelectricity generation. Founded in 1898 as a municipalutility, RWE today is a leadingglobal player in renewables.RWE has developed 17 off�shorewind farms in fi�ve countries.By 2030, RWE intends to tripleits global off�shore wind capacity from currently 2.4 GW to 8GW (capacity represents RWEshare only).
Deal in line with Centre’s aim of 30 GW
of offshore wind installations by 2030
Tata Power, RWE ink pact toexplore offshore wind projects
OUR BUREAU
Chennai, February 21
Truck and bus marker DaimlerIndia Commercial Vehicles(DICV), a 100 per cent subsidiary of Daimler Truck AG, hasentered into partnership withCERO, a scrappage and steel recycling facility owned byMahindra MSTC Recycling PvtLtd (MMRPL).
The partnership is aimed atoff�ering hasslefree service totruck owners, who seek to scraptheir end of life (ELV) commercial vehicles and replace themwith new BharatBenz trucks.
Eco-friendly recycling CERO is described as an organised automobile recycling initiative, introduced to reduce carbon footprint usingecofriendly methods of recycling metals from ELVs, said astatement.
“Scrappage is an importantstep towards reducing carbon
footprint and old, pollutingvehicles from Indian roads,which is the need of the hour.This is an opportunity for customers to replace their old fl�eetwith new, BSVI BharatBenztrucks. We see great potentialfor new truck sales with the effective implementation of theScrappage Policy,“ saidSatyakam Arya, Managing Director & CEO, DICV.
DICV aims to provide an endtoend solution to customersfor scrapping their old trucksright from the process ofvehicle valuation up until thereceipt of CoD (Certifi�cate ofDeposit).
“CERO is India’s fi�rst government authorised recycler formotor vehicles built on the PPPmodel, focused on achievingzero pollution while vehicle recycling,“ Sumit Issar, ManagingDirector of Mahindra Intertradem, and Director at MMRPL, said.
Daimler India inks pact with CERO
OUR BUREAU
Hyderabad, February 21
Russia’s Binnopharm Groupwill acquire antibacterialmedicines under the Ciproletand Levolet brands from DrReddy’s Laboratories in Russia, Uzbekistan and Belarus.
The portfolio includes various dosage forms such as tablets, solution for infusionsand eye drops.
The Sistema Group company, Binnopharm Group ofRussia via its affi�liate jointstock company Alium and Hyderabad based Dr Reddy’sLaboratories have signed adeal to acquire the brands.
“The acquisition of Ciproletand Levolet is an importantstep to enhance our position
in the antibiotics market, oneof the key market segmentsfor Binnopharm Group,”Rustem Muratov, CEO, Binnopharm Group, said in a release issued on Monday.
Trustworthy brands“These strong brands havealready had the trust of millions of consumers – according to independent analystestimation they are leaders intheir market segments. Theywill be a valuable complement to our portfolio of antibacterial products. We arealso acquiring rights to these
products in Belarus andUzbekistan in line with ourstrategic goal to strengthenpresence in the internationalmarkets,” he added.
Focus on therapy areasMV Ramana, CEO – BrandedMarkets (India & EmergingMarkets), Dr Reddy’s, said,“Our Russia and CIS marketscontinue to be strong performers for the company. Thisdeal is a step towards divesting brands in noncore areasin order to consolidate andstrengthen our play furtherin our key focus therapy areasof gastroenterology, painmanagement, cold and fl�u, allergy, oncology, neurology,paediatrics and women’shealth.”
This will help us accelerateaccess to aff�ordable and innovative medicines in the region in these segments, headded.
The portfolio
includes tablets,
eye drops, solution
for infusions
Russia’s Binnopharm to acquire Dr Reddy’s anti-bacterial brands
DEBANGANA GHOSH
Mumbai, February 21
Mobilefi�rst credit cardbrand OneCard’s parent FPLTechnologies is in talks withSingaporebased TemasekHoldings, among other newand existing global investors, to raise funding at aunicorn valuation, twopeople aware of the development told BusinessLine.
This comes a month afterthe Punebased startup hadannounced its Series C funding round, wherein it raised$75 million at a postmoneyvaluation of $750 million.The round was led by existing investor QED Investorsalong with Janchor Partners,Sequoia Capital India, MatrixPartners and HummingbirdVentures.
This round came 10months after a Series Bround of $35 million, whichaccording to media reportshappened at a valuation of$183 million. The startup’svaluation jumped nearly 4Xpost the Series C round.
‘Not chasing status’Responding to this latest development, Anurag Sinha,Cofounder and CEO, FPL
Technologies, told this newspaper, “We don’t chase theunicorn status, we are focussed on execution. We area threeyearold companyand we want to scale. Most ofour investors are long terminvestors like QED, Sequoia,Matrix. Some of our investorshave invested in banks aswell globally.”
Temasek Holdings declined to comment.
FPL Technologies was founded by Sinha, Rupesh Kumar,and Vibhav Hathi in 2019.Sinha, like his cofounders, isa veteran banker. He had ledcards, payments and unsecured lending at ICICI Bankamong other verticals of consumer banking and payments until 2016.
Role of govtFintechs across various segments and usecases saw re
cording funding infl�ow in India in 2021, most of themseeing their valuations jump35X in a single round.
Making sense of this funding frenzy, Sinha explained,“VCs are one of the fi�rst onesto look into the market.Three things are driving thistrend: the size of the market,the teams who are buildingthese solutions, and third isexecution. Another keyfactor that’s playing out isthe role of the governmentin India through regulations, the RBI setting up anew department for fi�ntech.”
He added, “ The mindsethas changed over 45 years.In the back end we are allworking with banks bothPSUs and private across SMEproducts, savings accounts,personal loans credit cardsetc. This is giving confi�denceto VCs.”
This comes a month
after the start-up
had raised $75 m
(From left) Vibhav Hathi, Co-founder and CMO; Anurag Sinha, Co-founder
and CEO; and Rupesh Kumar Co-founder and CTO, FPL Technologies
Sequoia-backed OneCard in talks toraise funding at over $1 b valuation
FORUM GANDHI
Mumbai, February 21
After being grounded for 15days, TruJet is set to resumeoperations with one aircrafton February 23.
Last week, BusinessLine hadreported that all aircraft ofTruJet were grounded sinceFebruary 5 due to an acutecash crunch. The airline hadlater confi�rmed that its operations had been “hampered”and that it was in conversation with investors to raise upto $25 million.
“And now we are pleased toinform you all that from Feb
ruary 23 (Wednesday), Trujetis resuming its operations forthe following routes, HyderabadVijawadahyderabad, VijayawadaBengaluruVijayawada, Bengaluru BidarBengaluru, HyderabadRajahmundryHyderabad, HyderabadNandedHyderabad,MumbaiNandedMumbai,MumbaiKolhapurMumbai,and MumbaiJalgaonMumbai,” it said. According to sources, the air
line will use only one aircraftfor its operations. “Next weekonwards, we will have another aircraft, and the weekafter that, we may have oneother aircraft.” However, theperson refused to disclosewhether the airline had indeed managed to get thefunding or not.
The statement said thatTruJet was in the fi�nal stage ofdiscussion with a potential investor who is funding $25 million within the next few days.The investor would bring hisown panel of management,and in the same process, anew chief executive will startwork on March 1, until whichtime V Umesh, who is currently the MD of the airline,will act as CEO.
Airline in talks with
a potential investor
to raise $25 million
TruJet to restart operations with one aircraft; no clarity on funding
KV KURMANATH
Hyderabad, February 21
Chipmaker AMD recently acquired Xilinx, a niche player inthe semiconductor industry, making it a formidable player in theglobal semiconductorindustry. In an interview to BusinessLine,AMD’s Chief Technology Offi�cer and Executive VicePresident (Technology and Engineering) Mark Papermaster, spokeon how the acquisition is important to the company.Excerpts.
Why did you choose Xilinx?
How is it going to help the
company?
There is a tremendous alignment with Xilinx in terms ofour product portfolio as well as
technical talent. Post all approvals and closure of transactions, we are bringing over5,000 engineers from Xilinxinto AMD.
When we look at the combined opportunities, we see anaddressable market of about$135 billion in 2023. The technologies that Xilinx works on
do not overlap withAMD but are complementary. AMD has capabilities in CPU (central processing unit)and GPU (graphics
processing unit), while Xilinxworks on FPGA (Field Programmable Gate Arrays) and Adaptive Computing. This is a greatcombination of both technology IPs.
What kind of synergies will
Xilinx bring in? What kind of
product mix will it offer?
If you look where computing isheaded, it is not just CPUs orGPUs or FPGAs alone. The future will be driven by a com
bination of technologies, whatwe call heterogeneous computing.
Xilinx is giving customersprogrammability, which isvery important in applicationssuch as industrial automation,telecommunications, infrastructure to build 5G networksand medical devices. From
datacentres to the edge to enddevices, we now have thebroadest portfolio of products.Xilinx brings an AI engine thatis already shipping in the market, has already been provenwith customers, and has beenlicensed by AMD. We havealready begun to include the AIengine across the AMDportfolio.
Will Xilinx retain its brand or
will it be absorbed into AMD?
Xilinx has become AMD. TheXilinx business will becomethe Adaptive and EmbeddedComputing Group (AECG), ledby former Xilinx CEO VictorPeng. We have worked together deeply on the integration plan over the last year. As aresult of which when weclosed on February 14, it was avery smooth transition.
How will the acquisition help
AMD’s India operations?
We will be adding over 1,800engineers in India, most of
them in Hyderabad. The totalnumber of engineers in AMDIndia will now be over 5,000.
How will this acquisition
complement AMD’s
datacentre business?
Both AMD and Xilinx, prior tocoming together, had the datacentre as key priority as demand is growing exponentially. It is in a hypergrowthstage. We have a strong alignment between the two companies. AMD is providing CPUand GPU to datacentres, andXilinx is providing an adaptivesilicon with AI engines todatacentres.
How long do you think the
integration will take to
complete?
We have been planning this integration for over a year. Overthe next year, there will bephased integration across keyengineering, sales, marketing,fi�nance and HR teams whichwill be complete by next year.
‘Xilinx buy opens up a combined market of $135 b’
O
ZY
The future will be driven
by a combination of
technologies, what we call
heterogeneous computing.
MARK PAPERMASTER,AMD’s Chief Technology Officerand Executive Vice-President
YZ
Chipmaker AMD
to hire over 1,800
engineers in India
FORUM GANDHI
Mumbai, February 21
Offi�ces of India Bulls FinanceCentre in Mumbai, Delhi, andPune were raided by the Enforcement Directorate (ED)on Monday.
According to two sources,the raids were conducted following an FIR registered inthe Palghar police station inApril. The FIR was fi�led undermultiple sections includingforgery, fraud and moneylaundering.
Matter moved to CID“Since the promotors wereMumbaibased, the matterwas moved to CID, and thereafter Enforcement Directorate (ED) too was involved,”said the fi�rst person.
A source in ED said that anEnforcement Case Information Report (ECIR) was fi�ledunder the Prevention ofMoney Laundering Act, 2002(PMLA). The case was fi�ledagainst Indiabulls HousingFinance Centre, its promoterSameer Gehlaut, and multipleindividuals and companies.
He said, further to a lead,the ED decided to conductmultiple raids in Mumbai,Delhi and Pune offi�ces of India Bulls. However, he refusedto divulge further information. .
In a statement to the stockexchanges, Indiabulls Housing Finance said, “We wish toinform that the EnforcementDirectorate has sought someinformation regarding certain clients and the matteroriginates from ECIR No. 07/HUI/2021 fi�led by ED on thebasis of FIR lodged in villageWada, Palghar, Maharashtrain April, 2021. The and company and its offi�cials haveprovided the data of clients.”
“The ECIR registered by EDstems out of an FIR fi�led byone Ashutosh Kamble who ispart of the longrunning extortion and blackmail racketagainst the company.”
ED raids IndiaBulls FinanceCentre offices
OUR BUREAU
Bengaluru, February 21
ExTwitter India head ManishMaheshwari’s startup InvactMetaversity has raised a $5 million seed round from a clutchof global investors.
These investors includeArkam Ventures, Antler India,Picus Capital (Germany), M Venture Partners (Singapore), BECOCapital (Dubai) and 2am VC(USA). Founded by Maheshwariand Tanay Pratap, InvactMetaversity is a platform builtat the intersection of educationand Web3.
The company provides employabilityfocused training tohelp the workforce realign withthe digital world and securethemselves jobs in highgrowthtech companies. The universityis being built in the metaversein order to foster an immersive,serendipitous environmentconducive to learning.
Ex-Twitter Indiahead’s start-upraises $5 million
OUR BUREAU
New Delhi, February 21
Twowheeler manufacturerHero MotoCorp on Mondaysaid it has created a new position, titled Chief Growth Offi�cer, integrating the marketing, sales and aftersalesfunctions, and appointedRanjivjit Singh for the same.
Singh has been headingmarketing since 2021, HeroMotoCorp said in a statement.
“We are now entering a newera of opportunities andgrowth, with the world rapidly coming out of the coronavirus pandemic. As we gear upto further consolidate ourleadership by leveragingthese emerging opportunities, we must stay nimble anddynamic which requires synergies between the key customerfacing functions ofmarketing and sales andaftersales,” Mike Clarke, ChiefOperating Offi�cer and ChiefHuman Resources Offi�cer,Hero MotoCorp, said.
Hero MotoCorp merges marketing,sales functions;appoints head
................BM-BMECMYK
MUMBAI
BusinessLineTUESDAY • FEBRUARY 22 • 2022 3NEWS
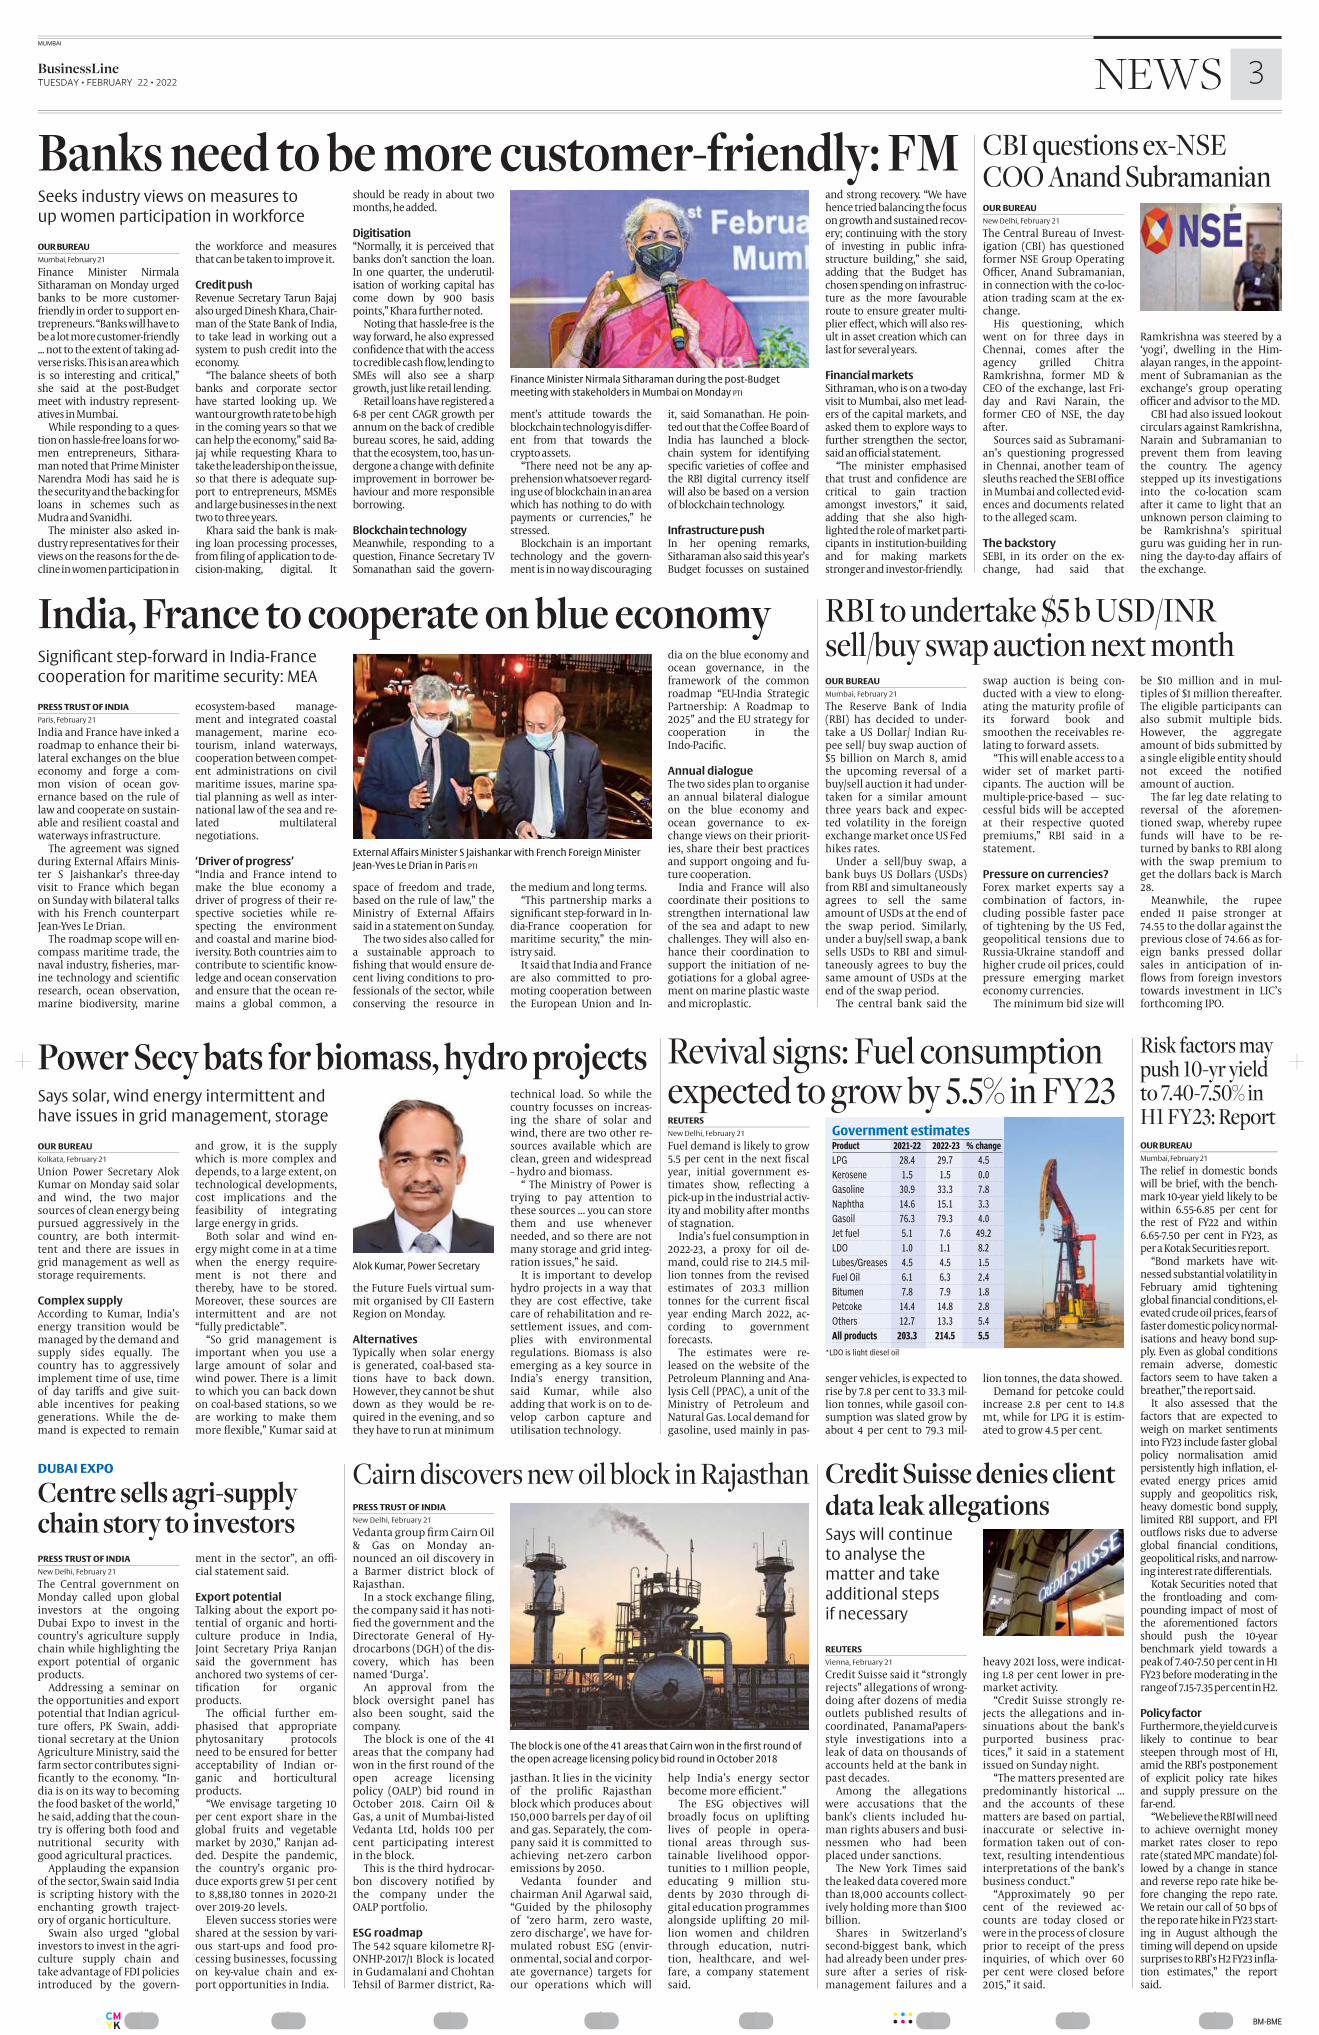
OUR BUREAU
Mumbai, February 21
Finance Minister NirmalaSitharaman on Monday urgedbanks to be more customerfriendly in order to support entrepreneurs. “Banks will have tobe a lot more customerfriendly... not to the extent of taking adverse risks. This is an area whichis so interesting and critical,”she said at the postBudgetmeet with industry representatives in Mumbai.
While responding to a question on hasslefree loans for women entrepreneurs, Sitharaman noted that Prime MinisterNarendra Modi has said he isthe security and the backing forloans in schemes such asMudra and Svanidhi.
The minister also asked industry representatives for theirviews on the reasons for the decline in women participation in
the workforce and measuresthat can be taken to improve it.
Credit pushRevenue Secretary Tarun Bajajalso urged Dinesh Khara, Chairman of the State Bank of India,to take lead in working out asystem to push credit into theeconomy.
“The balance sheets of bothbanks and corporate sectorhave started looking up. Wewant our growth rate to be highin the coming years so that wecan help the economy,” said Bajaj while requesting Khara totake the leadership on the issue,so that there is adequate support to entrepreneurs, MSMEsand large businesses in the nexttwo to three years.
Khara said the bank is making loan processing processes,from fi�ling of application to decisionmaking, digital. It
should be ready in about twomonths, he added.
Digitisation “Normally, it is perceived thatbanks don’t sanction the loan.In one quarter, the underutilisation of working capital hascome down by 900 basispoints,” Khara further noted.
Noting that hasslefree is theway forward, he also expressedconfi�dence that with the accessto credible cash fl�ow, lending toSMEs will also see a sharpgrowth, just like retail lending.
Retail loans have registered a68 per cent CAGR growth perannum on the back of crediblebureau scores, he said, addingthat the ecosystem, too, has undergone a change with defi�niteimprovement in borrower behaviour and more responsibleborrowing.
Blockchain technologyMeanwhile, responding to aquestion, Finance Secretary TVSomanathan said the govern
ment’s attitude towards theblockchain technology is diff�erent from that towards thecrypto assets.
“There need not be any apprehension whatsoever regarding use of blockchain in an areawhich has nothing to do withpayments or currencies,” hestressed.
Blockchain is an importanttechnology and the government is in no way discouraging
and strong recovery. “We havehence tried balancing the focuson growth and sustained recovery; continuing with the storyof investing in public infrastructure building,” she said,adding that the Budget haschosen spending on infrastructure as the more favourableroute to ensure greater multiplier eff�ect, which will also result in asset creation which canlast for several years.
Financial marketsSithraman, who is on a twodayvisit to Mumbai, also met leaders of the capital markets, andasked them to explore ways tofurther strengthen the sector,said an offi�cial statement.
“The minister emphasisedthat trust and confi�dence arecritical to gain tractionamongst investors,” it said,adding that she also highlighted the role of market participants in institutionbuildingand for making marketsstronger and investorfriendly.
it, said Somanathan. He pointed out that the Coff�ee Board ofIndia has launched a blockchain system for identifyingspecifi�c varieties of coff�ee andthe RBI digital currency itselfwill also be based on a versionof blockchain technology.
Infrastructure pushIn her opening remarks,Sitharaman also said this year’sBudget focusses on sustained
Seeks industry views on measures to
up women participation in workforce
Finance Minister Nirmala Sitharaman during the post-Budget
meeting with stakeholders in Mumbai on Monday PTI
Banks need to be more customer-friendly: FM
OUR BUREAU
Kolkata, February 21
Union Power Secretary AlokKumar on Monday said solarand wind, the two majorsources of clean energy beingpursued aggressively in thecountry, are both intermittent and there are issues ingrid management as well asstorage requirements.
Complex supplyAccording to Kumar, India’senergy transition would bemanaged by the demand andsupply sides equally. Thecountry has to aggressivelyimplement time of use, timeof day tariff�s and give suitable incentives for peakinggenerations. While the demand is expected to remain
and grow, it is the supplywhich is more complex anddepends, to a large extent, ontechnological developments,cost implications and thefeasibility of integratinglarge energy in grids.
Both solar and wind energy might come in at a timewhen the energy requirement is not there andthereby, have to be stored.Moreover, these sources areintermittent and are not“fully predictable”.
“So grid management isimportant when you use alarge amount of solar andwind power. There is a limitto which you can back downon coalbased stations, so weare working to make themmore fl�exible,” Kumar said at
the Future Fuels virtual summit organised by CII EasternRegion on Monday.
AlternativesTypically when solar energyis generated, coalbased stations have to back down.However, they cannot be shutdown as they would be required in the evening, and sothey have to run at minimum
technical load. So while thecountry focusses on increasing the share of solar andwind, there are two other resources available which areclean, green and widespread– hydro and biomass.
“ The Ministry of Power istrying to pay attention tothese sources ... you can storethem and use wheneverneeded, and so there are notmany storage and grid integration issues,” he said.
It is important to develophydro projects in a way thatthey are cost eff�ective, takecare of rehabilitation and resettlement issues, and complies with environmentalregulations. Biomass is alsoemerging as a key source inIndia’s energy transition,said Kumar, while alsoadding that work is on to develop carbon capture andutilisation technology.
Says solar, wind energy intermittent and
have issues in grid management, storage
Alok Kumar, Power Secretary
Power Secy bats for biomass, hydro projects
PRESS TRUST OF INDIA
New Delhi, February 21
Vedanta group fi�rm Cairn Oil& Gas on Monday announced an oil discovery ina Barmer district block ofRajasthan.
In a stock exchange fi�ling,the company said it has notifi�ed the government and theDirectorate General of Hydrocarbons (DGH) of the discovery, which has beennamed ‘Durga’.
An approval from theblock oversight panel hasalso been sought, said thecompany.
The block is one of the 41areas that the company hadwon in the fi�rst round of theopen acreage licensingpolicy (OALP) bid round inOctober 2018. Cairn Oil &Gas, a unit of MumbailistedVedanta Ltd, holds 100 percent participating interestin the block.
This is the third hydrocarbon discovery notifi�ed bythe company under theOALP portfolio.
ESG roadmapThe 542 square kilometre RJONHP2017/1 Block is locatedin Gudamalani and ChohtanTehsil of Barmer district, Ra
jasthan. It lies in the vicinityof the prolifi�c Rajasthanblock which produces about150,000 barrels per day of oiland gas. Separately, the company said it is committed toachieving netzero carbonemissions by 2050.
Vedanta founder andchairman Anil Agarwal said,“Guided by the philosophyof ‘zero harm, zero waste,zero discharge’, we have formulated robust ESG (environmental, social and corporate governance) targets forour operations which will
help India’s energy sectorbecome more effi�cient.”
The ESG objectives willbroadly focus on upliftinglives of people in operational areas through sustainable livelihood opportunities to 1 million people,educating 9 million students by 2030 through digital education programmesalongside uplifting 20 million women and childrenthrough education, nutrition, healthcare, and welfare, a company statementsaid.
Cairn discovers new oil block in Rajasthan
The block is one of the 41 areas that Cairn won in the first round of
the open acreage licensing policy bid round in October 2018
OUR BUREAU
Mumbai, February 21
The relief in domestic bondswill be brief, with the benchmark 10year yield likely to bewithin 6.556.85 per cent forthe rest of FY22 and within6.657.50 per cent in FY23, asper a Kotak Securities report.
“Bond markets have witnessed substantial volatility inFebruary amid tighteningglobal fi�nancial conditions, elevated crude oil prices, fears offaster domestic policy normalisations and heavy bond supply. Even as global conditionsremain adverse, domesticfactors seem to have taken abreather,” the report said.
It also assessed that thefactors that are expected toweigh on market sentimentsinto FY23 include faster globalpolicy normalisation amidpersistently high infl�ation, elevated energy prices amidsupply and geopolitics risk,heavy domestic bond supply,limited RBI support, and FPIoutfl�ows risks due to adverseglobal fi�nancial conditions,geopolitical risks, and narrowing interest rate diff�erentials.
Kotak Securities noted thatthe frontloading and compounding impact of most ofthe aforementioned factorsshould push the 10yearbenchmark yield towards apeak of 7.407.50 per cent in H1FY23 before moderating in therange of 7.157.35 per cent in H2.
Policy factorFurthermore, the yield curve islikely to continue to bearsteepen through most of H1,amid the RBI’s postponementof explicit policy rate hikesand supply pressure on thefarend.
“We believe the RBI will needto achieve overnight moneymarket rates closer to reporate (stated MPC mandate) followed by a change in stanceand reverse repo rate hike before changing the repo rate.We retain our call of 50 bps ofthe repo rate hike in FY23 starting in August although thetiming will depend on upsidesurprises to RBI’s H2 FY23 infl�ation estimates,” the reportsaid.
Risk factors maypush 10-yr yieldto 7.40-7.50% inH1 FY23: ReportREUTERS
New Delhi, February 21
Fuel demand is likely to grow5.5 per cent in the next fi�scalyear, initial government estimates show, refl�ecting apickup in the industrial activity and mobility after monthsof stagnation.
India’s fuel consumption in202223, a proxy for oil demand, could rise to 214.5 million tonnes from the revisedestimates of 203.3 milliontonnes for the current fi�scalyear ending March 2022, according to governmentforecasts.
The estimates were released on the website of thePetroleum Planning and Analysis Cell (PPAC), a unit of theMinistry of Petroleum andNatural Gas. Local demand forgasoline, used mainly in pas
senger vehicles, is expected torise by 7.8 per cent to 33.3 million tonnes, while gasoil consumption was slated grow byabout 4 per cent to 79.3 mil
lion tonnes, the data showed.Demand for petcoke could
increase 2.8 per cent to 14.8mt, while for LPG it is estimated to grow 4.5 per cent.
Revival signs: Fuel consumptionexpected to grow by 5.5% in FY23
PRESS TRUST OF INDIA
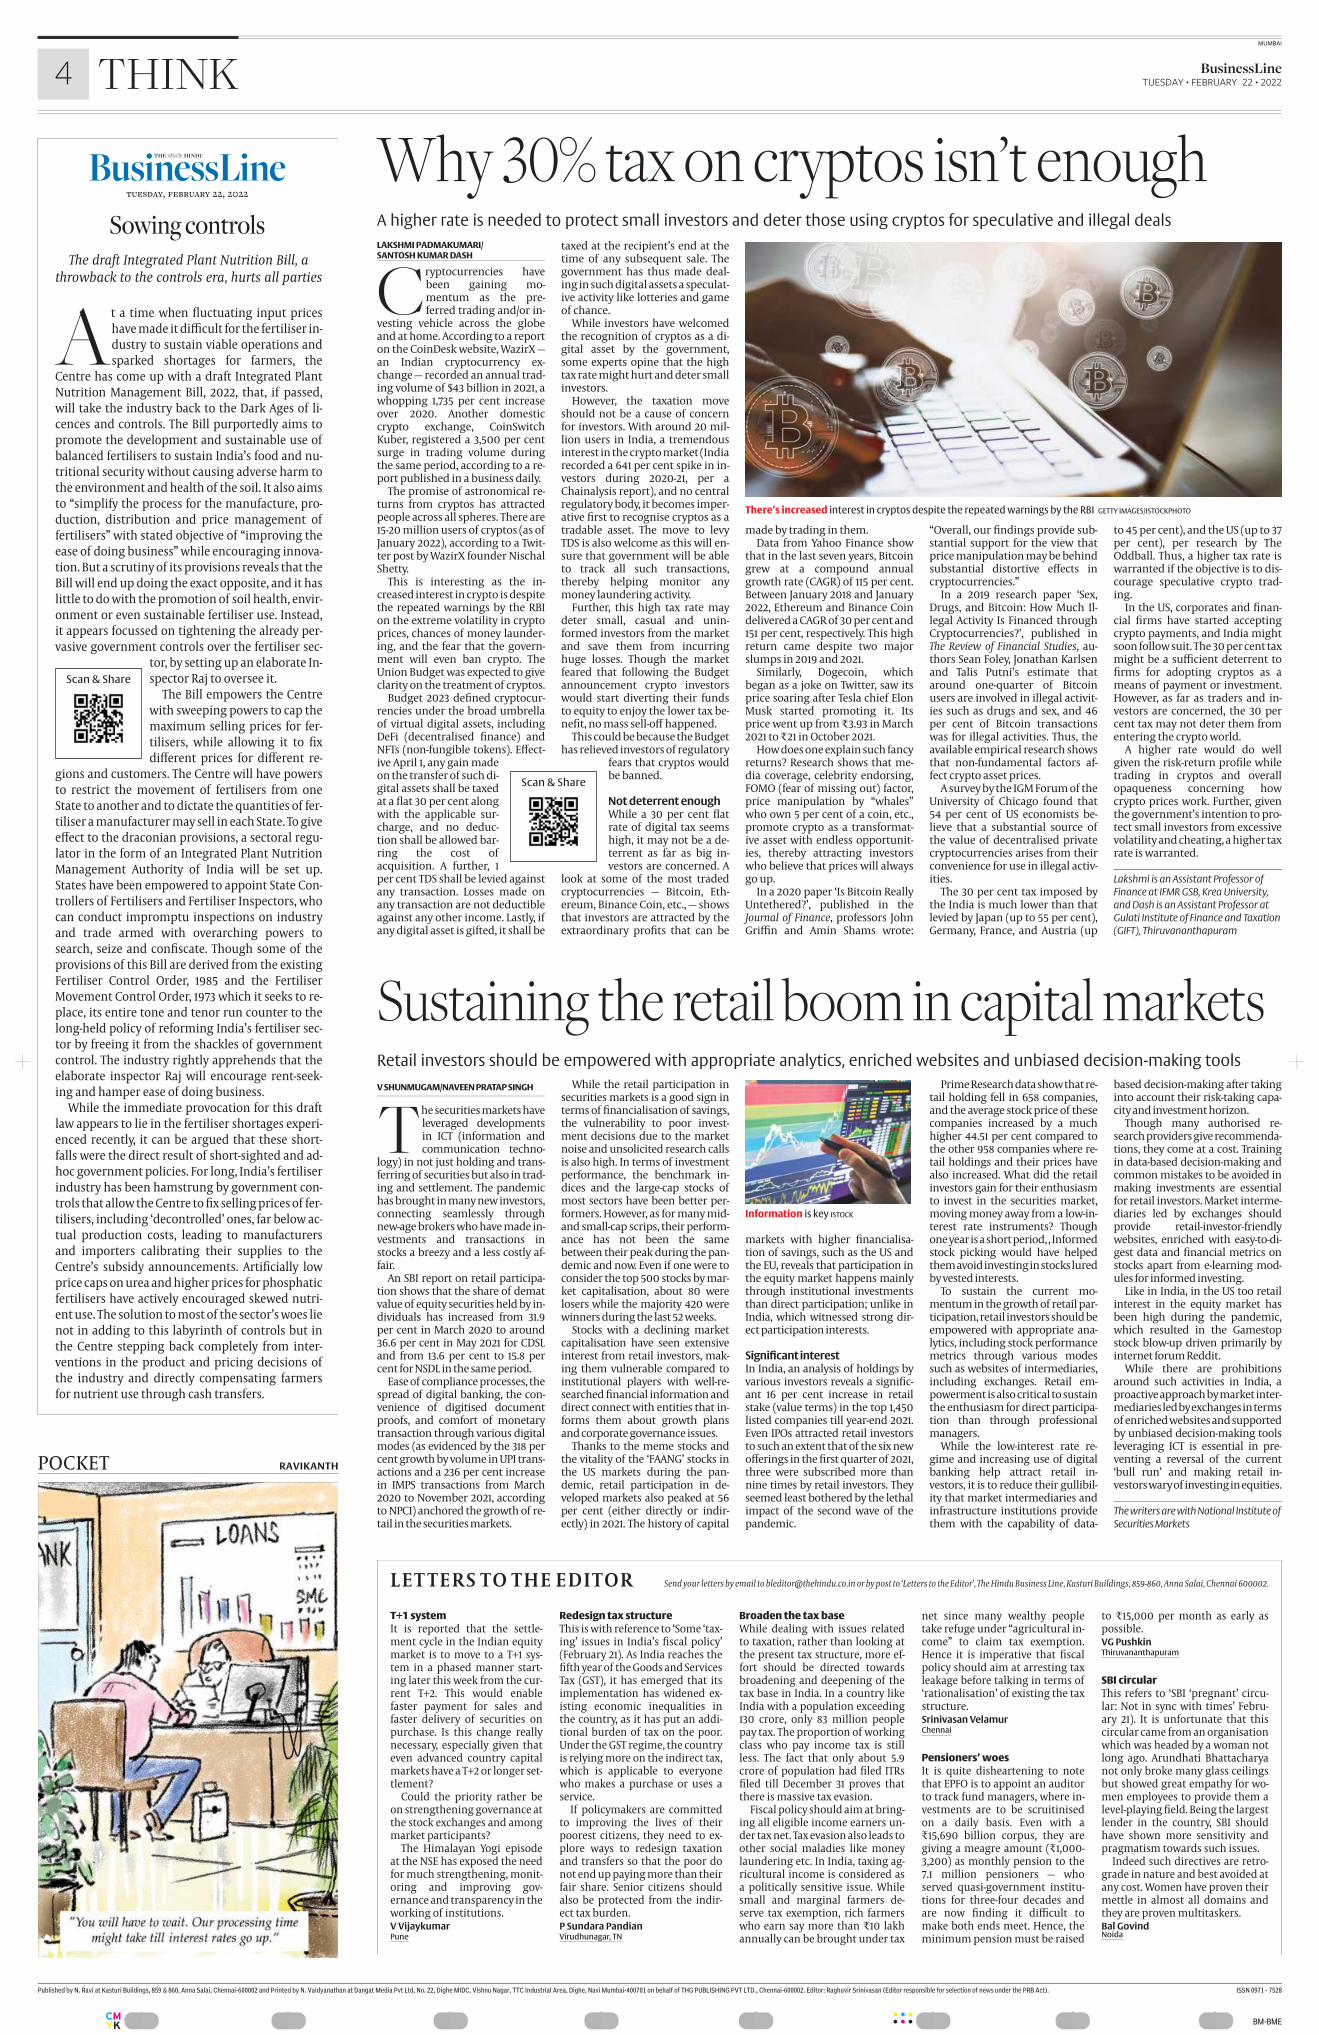
Paris, February 21
India and France have inked aroadmap to enhance their bilateral exchanges on the blueeconomy and forge a common vision of ocean governance based on the rule oflaw and cooperate on sustainable and resilient coastal andwaterways infrastructure.
The agreement was signedduring External Aff�airs Minister S Jaishankar’s threedayvisit to France which beganon Sunday with bilateral talkswith his French counterpartJeanYves Le Drian.
The roadmap scope will encompass maritime trade, thenaval industry, fi�sheries, marine technology and scientifi�cresearch, ocean observation,marine biodiversity, marine
ecosystembased management and integrated coastalmanagement, marine ecotourism, inland waterways,cooperation between competent administrations on civilmaritime issues, marine spatial planning as well as international law of the sea and related multilateralnegotiations.
‘Driver of progress’“India and France intend tomake the blue economy adriver of progress of their respective societies while respecting the environmentand coastal and marine biodiversity. Both countries aim tocontribute to scientifi�c knowledge and ocean conservationand ensure that the ocean remains a global common, a
space of freedom and trade,based on the rule of law,” theMinistry of External Aff�airssaid in a statement on Sunday.
The two sides also called fora sustainable approach tofi�shing that would ensure decent living conditions to professionals of the sector, whileconserving the resource in
the medium and long terms.“This partnership marks a
signifi�cant stepforward in IndiaFrance cooperation formaritime security,” the ministry said.
It said that India and Franceare also committed to promoting cooperation betweenthe European Union and In
dia on the blue economy andocean governance, in theframework of the commonroadmap “EUIndia StrategicPartnership: A Roadmap to2025” and the EU strategy forcooperation in theIndoPacifi�c.
Annual dialogueThe two sides plan to organisean annual bilateral dialogueon the blue economy andocean governance to exchange views on their priorities, share their best practicesand support ongoing and future cooperation.
India and France will alsocoordinate their positions tostrengthen international lawof the sea and adapt to newchallenges. They will also enhance their coordination tosupport the initiation of negotiations for a global agreement on marine plastic wasteand microplastic.
Significant step-forward in India-France
cooperation for maritime security: MEA
External Affairs Minister S Jaishankar with French Foreign Minister
Jean-Yves Le Drian in Paris PTI
India, France to cooperate on blue economy
PRESS TRUST OF INDIA
New Delhi, February 21
The Central government onMonday called upon globalinvestors at the ongoingDubai Expo to invest in thecountry’s agriculture supplychain while highlighting theexport potential of organicproducts.
Addressing a seminar onthe opportunities and exportpotential that Indian agriculture off�ers, PK Swain, additional secretary at the UnionAgriculture Ministry, said thefarm sector contributes signifi�cantly to the economy. “India is on its way to becomingthe food basket of the world,”he said, adding that the country is off�ering both food andnutritional security withgood agricultural practices.
Applauding the expansionof the sector, Swain said Indiais scripting history with theenchanting growth trajectory of organic horticulture.
Swain also urged “globalinvestors to invest in the agriculture supply chain andtake advantage of FDI policiesintroduced by the govern
ment in the sector”, an offi�cial statement said.
Export potentialTalking about the export potential of organic and horticulture produce in India,Joint Secretary Priya Ranjansaid the government hasanchored two systems of certifi�cation for organicproducts.
The offi�cial further emphasised that appropriatephytosanitary protocolsneed to be ensured for betteracceptability of Indian organic and horticulturalproducts.
“We envisage targeting 10per cent export share in theglobal fruits and vegetablemarket by 2030,” Ranjan added. Despite the pandemic,the country’s organic produce exports grew 51 per centto 8,88,180 tonnes in 202021over 201920 levels.
Eleven success stories wereshared at the session by various startups and food processing businesses, focussingon keyvalue chain and export opportunities in India.
Centre sells agri-supplychain story to investors
DUBAI EXPO
REUTERS
Vienna, February 21
Credit Suisse said it “stronglyrejects” allegations of wrongdoing after dozens of mediaoutlets published results ofcoordinated, PanamaPapersstyle investigations into aleak of data on thousands ofaccounts held at the bank inpast decades.
Among the allegationswere accusations that thebank’s clients included human rights abusers and businessmen who had beenplaced under sanctions.
The New York Times saidthe leaked data covered morethan 18,000 accounts collectively holding more than $100billion.
Shares in Switzerland’ssecondbiggest bank, whichhad already been under pressure after a series of riskmanagement failures and a
heavy 2021 loss, were indicating 1.8 per cent lower in premarket activity.
“Credit Suisse strongly rejects the allegations and insinuations about the bank’spurported business practices,” it said in a statementissued on Sunday night.
“The matters presented arepredominantly historical ...and the accounts of thesematters are based on partial,inaccurate or selective information taken out of context, resulting intendentiousinterpretations of the bank’sbusiness conduct.”
“Approximately 90 percent of the reviewed accounts are today closed orwere in the process of closureprior to receipt of the pressinquiries, of which over 60per cent were closed before2015,” it said.
Says will continue
to analyse the
matter and take
additional steps
if necessary
Credit Suisse denies clientdata leak allegations
OUR BUREAU
New Delhi, February 21
The Central Bureau of Investigation (CBI) has questionedformer NSE Group OperatingOffi�cer, Anand Subramanian,in connection with the colocation trading scam at the exchange.
His questioning, whichwent on for three days inChennai, comes after theagency grilled ChitraRamkrishna, former MD &CEO of the exchange, last Friday and Ravi Narain, theformer CEO of NSE, the dayafter.
Sources said as Subramanian’s questioning progressedin Chennai, another team ofsleuths reached the SEBI offi�cein Mumbai and collected evidences and documents relatedto the alleged scam.
The backstorySEBI, in its order on the exchange, had said that
Ramkrishna was steered by a‘yogi’, dwelling in the Himalayan ranges, in the appointment of Subramanian as theexchange’s group operatingoffi�cer and advisor to the MD.
CBI had also issued lookoutcirculars against Ramkrishna,Narain and Subramanian toprevent them from leavingthe country. The agencystepped up its investigationsinto the colocation scamafter it came to light that anunknown person claiming tobe Ramkrishna’s spiritualguru was guiding her in running the daytoday aff�airs ofthe exchange.
CBI questions ex-NSECOO Anand Subramanian
OUR BUREAU
Mumbai, February 21
The Reserve Bank of India(RBI) has decided to undertake a US Dollar/ Indian Rupee sell/ buy swap auction of$5 billion on March 8, amidthe upcoming reversal of abuy/sell auction it had undertaken for a similar amountthree years back and expected volatility in the foreignexchange market once US Fedhikes rates.
Under a sell/buy swap, abank buys US Dollars (USDs)from RBI and simultaneouslyagrees to sell the sameamount of USDs at the end ofthe swap period. Similarly,under a buy/sell swap, a banksells USDs to RBI and simultaneously agrees to buy thesame amount of USDs at theend of the swap period.
The central bank said the
swap auction is being conducted with a view to elongating the maturity profi�le ofits forward book andsmoothen the receivables relating to forward assets.
“This will enable access to awider set of market participants. The auction will bemultiplepricebased — successful bids will be acceptedat their respective quotedpremiums,” RBI said in astatement.
Pressure on currencies?Forex market experts say acombination of factors, including possible faster paceof tightening by the US Fed,geopolitical tensions due toRussiaUkraine standoff� andhigher crude oil prices, couldpressure emerging marketeconomy currencies.
The minimum bid size will
be $10 million and in multiples of $1 million thereafter.The eligible participants canalso submit multiple bids.However, the aggregateamount of bids submitted bya single eligible entity shouldnot exceed the notifi�edamount of auction.
The far leg date relating toreversal of the aforementioned swap, whereby rupeefunds will have to be returned by banks to RBI alongwith the swap premium toget the dollars back is March28.
Meanwhile, the rupeeended 11 paise stronger at74.55 to the dollar against theprevious close of 74.66 as foreign banks pressed dollarsales in anticipation of infl�ows from foreign investorstowards investment in LIC’sforthcoming IPO.
RBI to undertake $5 b USD/INRsell/buy swap auction next month
................BM-BMECMYK
THINKMUMBAI
4 BusinessLine TUESDAY • FEBRUARY 22 • 2022
At a time when fl�uctuating input priceshave made it diffi�cult for the fertiliser industry to sustain viable operations andsparked shortages for farmers, the
Centre has come up with a draft Integrated PlantNutrition Management Bill, 2022, that, if passed,will take the industry back to the Dark Ages of licences and controls. The Bill purportedly aims topromote the development and sustainable use ofbalanced fertilisers to sustain India’s food and nutritional security without causing adverse harm tothe environment and health of the soil. It also aimsto “simplify the process for the manufacture, production, distribution and price management offertilisers” with stated objective of “improving theease of doing business” while encouraging innovation. But a scrutiny of its provisions reveals that theBill will end up doing the exact opposite, and it haslittle to do with the promotion of soil health, environment or even sustainable fertiliser use. Instead,it appears focussed on tightening the already pervasive government controls over the fertiliser sec
tor, by setting up an elaborate Inspector Raj to oversee it.
The Bill empowers the Centrewith sweeping powers to cap themaximum selling prices for fertilisers, while allowing it to fi�xdiff�erent prices for diff�erent re
gions and customers. The Centre will have powersto restrict the movement of fertilisers from oneState to another and to dictate the quantities of fertiliser a manufacturer may sell in each State. To giveeff�ect to the draconian provisions, a sectoral regulator in the form of an Integrated Plant NutritionManagement Authority of India will be set up.States have been empowered to appoint State Controllers of Fertilisers and Fertiliser Inspectors, whocan conduct impromptu inspections on industryand trade armed with overarching powers tosearch, seize and confi�scate. Though some of theprovisions of this Bill are derived from the existingFertiliser Control Order, 1985 and the FertiliserMovement Control Order, 1973 which it seeks to replace, its entire tone and tenor run counter to thelongheld policy of reforming India’s fertiliser sector by freeing it from the shackles of governmentcontrol. The industry rightly apprehends that theelaborate inspector Raj will encourage rentseeking and hamper ease of doing business.
While the immediate provocation for this draftlaw appears to lie in the fertiliser shortages experienced recently, it can be argued that these shortfalls were the direct result of shortsighted and adhoc government policies. For long, India’s fertiliserindustry has been hamstrung by government controls that allow the Centre to fi�x selling prices of fertilisers, including ‘decontrolled’ ones, far below actual production costs, leading to manufacturersand importers calibrating their supplies to theCentre’s subsidy announcements. Artifi�cially lowprice caps on urea and higher prices for phosphaticfertilisers have actively encouraged skewed nutrient use. The solution to most of the sector’s woes lienot in adding to this labyrinth of controls but inthe Centre stepping back completely from interventions in the product and pricing decisions ofthe industry and directly compensating farmersfor nutrient use through cash transfers.
Sowing controls The draft Integrated Plant Nutrition Bill, a
throwback to the controls era, hurts all parties
0x y z
tuesday, february 22, 2022
LAKSHMI PADMAKUMARI/SANTOSH KUMAR DASH
Cryptocurrencies havebeen gaining momentum as the preferred trading and/or in
vesting vehicle across the globeand at home. According to a reporton the CoinDesk website, WazirX —an Indian cryptocurrency exchange — recorded an annual trading volume of $43 billion in 2021, awhopping 1,735 per cent increaseover 2020. Another domesticcrypto exchange, CoinSwitchKuber, registered a 3,500 per centsurge in trading volume duringthe same period, according to a report published in a business daily.
The promise of astronomical returns from cryptos has attractedpeople across all spheres. There are1520 million users of cryptos (as ofJanuary 2022), according to a Twitter post by WazirX founder NischalShetty.
This is interesting as the increased interest in crypto is despitethe repeated warnings by the RBIon the extreme volatility in cryptoprices, chances of money laundering, and the fear that the government will even ban crypto. TheUnion Budget was expected to giveclarity on the treatment of cryptos.
Budget 2023 defi�ned cryptocurrencies under the broad umbrellaof virtual digital assets, includingDeFi (decentralised fi�nance) andNFTs (nonfungible tokens). Eff�ective April 1, any gain madeon the transfer of such digital assets shall be taxedat a fl�at 30 per cent alongwith the applicable surcharge, and no deduction shall be allowed barring the cost ofacquisition. A further, 1per cent TDS shall be levied againstany transaction. Losses made onany transaction are not deductibleagainst any other income. Lastly, ifany digital asset is gifted, it shall be
taxed at the recipient’s end at thetime of any subsequent sale. Thegovernment has thus made dealing in such digital assets a speculative activity like lotteries and gameof chance.
While investors have welcomedthe recognition of cryptos as a digital asset by the government,some experts opine that the hightax rate might hurt and deter smallinvestors.
However, the taxation moveshould not be a cause of concernfor investors. With around 20 million users in India, a tremendousinterest in the crypto market (Indiarecorded a 641 per cent spike in investors during 202021, per aChainalysis report), and no centralregulatory body, it becomes imperative fi�rst to recognise cryptos as atradable asset. The move to levyTDS is also welcome as this will ensure that government will be ableto track all such transactions,thereby helping monitor anymoney laundering activity.
Further, this high tax rate maydeter small, casual and uninformed investors from the marketand save them from incurringhuge losses. Though the marketfeared that following the Budgetannouncement crypto investorswould start diverting their fundsto equity to enjoy the lower tax benefi�t, no mass selloff� happened.
This could be because the Budgethas relieved investors of regulatory
fears that cryptos wouldbe banned.
Not deterrent enoughWhile a 30 per cent fl�atrate of digital tax seemshigh, it may not be a deterrent as far as big investors are concerned. A
look at some of the most tradedcryptocurrencies — Bitcoin, Ethereum, Binance Coin, etc., — showsthat investors are attracted by theextraordinary profi�ts that can be
made by trading in them.Data from Yahoo Finance show
that in the last seven years, Bitcoingrew at a compound annualgrowth rate (CAGR) of 115 per cent.Between January 2018 and January2022, Ethereum and Binance Coindelivered a CAGR of 30 per cent and151 per cent, respectively. This highreturn came despite two majorslumps in 2019 and 2021.
Similarly, Dogecoin, whichbegan as a joke on Twitter, saw itsprice soaring after Tesla chief ElonMusk started promoting it. Itsprice went up from ₹�3.93 in March2021 to ₹�21 in October 2021.
How does one explain such fancyreturns? Research shows that media coverage, celebrity endorsing,FOMO (fear of missing out) factor,price manipulation by “whales”who own 5 per cent of a coin, etc.,promote crypto as a transformative asset with endless opportunities, thereby attracting investorswho believe that prices will alwaysgo up.
In a 2020 paper ‘Is Bitcoin ReallyUntethered?’, published in theJournal of Finance, professors JohnGriffi�n and Amin Shams wrote:
“Overall, our fi�ndings provide substantial support for the view thatprice manipulation may be behindsubstantial distortive eff�ects incryptocurrencies.”
In a 2019 research paper ‘Sex,Drugs, and Bitcoin: How Much Illegal Activity Is Financed throughCryptocurrencies?’, published inThe Review of Financial Studies, authors Sean Foley, Jonathan Karlsenand Talis Putni’s estimate thataround onequarter of Bitcoinusers are involved in illegal activities such as drugs and sex, and 46per cent of Bitcoin transactionswas for illegal activities. Thus, theavailable empirical research showsthat nonfundamental factors affect crypto asset prices.
A survey by the IGM Forum of theUniversity of Chicago found that54 per cent of US economists believe that a substantial source ofthe value of decentralised privatecryptocurrencies arises from theirconvenience for use in illegal activities.
The 30 per cent tax imposed bythe India is much lower than thatlevied by Japan (up to 55 per cent),Germany, France, and Austria (up
to 45 per cent), and the US (up to 37per cent), per research by TheOddball. Thus, a higher tax rate iswarranted if the objective is to discourage speculative crypto trading.
In the US, corporates and fi�nancial fi�rms have started acceptingcrypto payments, and India mightsoon follow suit. The 30 per cent taxmight be a suffi�cient deterrent tofi�rms for adopting cryptos as ameans of payment or investment.However, as far as traders and investors are concerned, the 30 percent tax may not deter them fromentering the crypto world.
A higher rate would do wellgiven the riskreturn profi�le whiletrading in cryptos and overallopaqueness concerning howcrypto prices work. Further, giventhe government’s intention to protect small investors from excessivevolatility and cheating, a higher taxrate is warranted.
Lakshmi is an Assistant Professor of
Finance at IFMR GSB, Krea University,
and Dash is an Assistant Professor at
Gulati Institute of Finance and Taxation
(GIFT), Thiruvananthapuram
A higher rate is needed to protect small investors and deter those using cryptos for speculative and illegal deals
There’s increased interest in cryptos despite the repeated warnings by the RBI GETTY IMAGES/ISTOCKPHOTO
Why 30% tax on cryptos isn’t enough
V SHUNMUGAM/NAVEEN PRATAP SINGH
The securities markets haveleveraged developmentsin ICT (information andcommunication techno
logy) in not just holding and transferring of securities but also in trading and settlement. The pandemichas brought in many new investors,connecting seamlessly throughnewage brokers who have made investments and transactions instocks a breezy and a less costly affair.
An SBI report on retail participation shows that the share of dematvalue of equity securities held by individuals has increased from 31.9per cent in March 2020 to around36.6 per cent in May 2021 for CDSLand from 13.6 per cent to 15.8 percent for NSDL in the same period.
Ease of compliance processes, thespread of digital banking, the convenience of digitised documentproofs, and comfort of monetarytransaction through various digitalmodes (as evidenced by the 318 percent growth by volume in UPI transactions and a 236 per cent increasein IMPS transactions from March2020 to November 2021, accordingto NPCI) anchored the growth of retail in the securities markets.
While the retail participation insecurities markets is a good sign interms of fi�nancialisation of savings,the vulnerability to poor investment decisions due to the marketnoise and unsolicited research callsis also high. In terms of investmentperformance, the benchmark indices and the largecap stocks ofmost sectors have been better performers. However, as for many midand smallcap scrips, their performance has not been the samebetween their peak during the pandemic and now. Even if one were toconsider the top 500 stocks by market capitalisation, about 80 werelosers while the majority 420 werewinners during the last 52 weeks.
Stocks with a declining marketcapitalisation have seen extensiveinterest from retail investors, making them vulnerable compared toinstitutional players with wellresearched fi�nancial information anddirect connect with entities that informs them about growth plansand corporate governance issues.
Thanks to the meme stocks andthe vitality of the ‘FAANG’ stocks inthe US markets during the pandemic, retail participation in developed markets also peaked at 56per cent (either directly or indirectly) in 2021. The history of capital
markets with higher fi�nancialisation of savings, such as the US andthe EU, reveals that participation inthe equity market happens mainlythrough institutional investmentsthan direct participation; unlike inIndia, which witnessed strong direct participation interests.
Significant interestIn India, an analysis of holdings byvarious investors reveals a signifi�cant 16 per cent increase in retailstake (value terms) in the top 1,450listed companies till yearend 2021.Even IPOs attracted retail investorsto such an extent that of the six newoff�erings in the fi�rst quarter of 2021,three were subscribed more thannine times by retail investors. Theyseemed least bothered by the lethalimpact of the second wave of thepandemic.
Prime Research data show that retail holding fell in 658 companies,and the average stock price of thesecompanies increased by a muchhigher 44.51 per cent compared tothe other 958 companies where retail holdings and their prices havealso increased. What did the retailinvestors gain for their enthusiasmto invest in the securities market,moving money away from a lowinterest rate instruments? Thoughone year is a short period, , Informedstock picking would have helpedthem avoid investing in stocks luredby vested interests.
To sustain the current momentum in the growth of retail participation, retail investors should beempowered with appropriate analytics, including stock performancemetrics through various modessuch as websites of intermediaries,including exchanges. Retail empowerment is also critical to sustainthe enthusiasm for direct participation than through professionalmanagers.
While the lowinterest rate regime and increasing use of digitalbanking help attract retail investors, it is to reduce their gullibility that market intermediaries andinfrastructure institutions providethem with the capability of data
based decisionmaking after takinginto account their risktaking capacity and investment horizon.
Though many authorised research providers give recommendations, they come at a cost. Trainingin databased decisionmaking andcommon mistakes to be avoided inmaking investments are essentialfor retail investors. Market intermediaries led by exchanges shouldprovide retailinvestorfriendlywebsites, enriched with easytodigest data and fi�nancial metrics onstocks apart from elearning modules for informed investing.
Like in India, in the US too retailinterest in the equity market hasbeen high during the pandemic,which resulted in the Gamestopstock blowup driven primarily byinternet forum Reddit.
While there are prohibitionsaround such activities in India, aproactive approach by market intermediaries led by exchanges in termsof enriched websites and supportedby unbiased decisionmaking toolsleveraging ICT is essential in preventing a reversal of the current‘bull run’ and making retail investors wary of investing in equities.
The writers are with National Institute of
Securities Markets
Sustaining the retail boom in capital markets Retail investors should be empowered with appropriate analytics, enriched websites and unbiased decision-making tools
Information is key ISTOCK
Scan & Share
Scan & Share
T+1 system
It is reported that the settlement cycle in the Indian equitymarket is to move to a T+1 system in a phased manner starting later this week from the current T+2. This would enablefaster payment for sales andfaster delivery of securities onpurchase. Is this change reallynecessary, especially given thateven advanced country capitalmarkets have a T+2 or longer settlement?
Could the priority rather beon strengthening governance atthe stock exchanges and amongmarket participants?
The Himalayan Yogi episodeat the NSE has exposed the needfor much strengthening, monitoring and improving governance and transparency in theworking of institutions. V VijaykumarPune
Redesign tax structure
This is with reference to ‘Some ‘taxing’ issues in India’s fi�scal policy’(February 21). As India reaches thefi�fth year of the Goods and ServicesTax (GST), it has emerged that itsimplementation has widened existing economic inequalities inthe country, as it has put an additional burden of tax on the poor.Under the GST regime, the countryis relying more on the indirect tax,which is applicable to everyonewho makes a purchase or uses aservice.
If policymakers are committedto improving the lives of theirpoorest citizens, they need to explore ways to redesign taxationand transfers so that the poor donot end up paying more than theirfair share. Senior citizens shouldalso be protected from the indirect tax burden. P Sundara PandianVirudhunagar, TN
Broaden the tax base
While dealing with issues relatedto taxation, rather than looking atthe present tax structure, more effort should be directed towardsbroadening and deepening of thetax base in India. In a country likeIndia with a population exceeding130 crore, only 83 million peoplepay tax. The proportion of workingclass who pay income tax is stillless. The fact that only about 5.9crore of population had fi�led ITRsfi�led till December 31 proves thatthere is massive tax evasion.
Fiscal policy should aim at bringing all eligible income earners under tax net. Tax evasion also leads toother social maladies like moneylaundering etc. In India, taxing agricultural income is considered asa politically sensitive issue. Whilesmall and marginal farmers deserve tax exemption, rich farmerswho earn say more than ₹�10 lakhannually can be brought under tax
net since many wealthy peopletake refuge under “agricultural income” to claim tax exemption.Hence it is imperative that fi�scalpolicy should aim at arresting taxleakage before talking in terms of‘rationalisation’ of existing the taxstructure. Srinivasan VelamurChennai
Pensioners’ woes
It is quite disheartening to notethat EPFO is to appoint an auditorto track fund managers, where investments are to be scruitinisedon a daily basis. Even with a₹�15,690 billion corpus, they aregiving a meagre amount (₹�1,0003,200) as monthly pension to the7.1 million pensioners — whoserved quasigovernment institutions for threefour decades andare now fi�nding it diffi�cult tomake both ends meet. Hence, theminimum pension must be raised
to ₹�15,000 per month as early aspossible.VG PushkinThiruvananthapuram
SBI circular
This refers to ‘SBI ‘pregnant’ circular: Not in sync with times’ February 21). It is unfortunate that thiscircular came from an organisationwhich was headed by a woman notlong ago. Arundhati Bhattacharyanot only broke many glass ceilingsbut showed great empathy for women employees to provide them alevelplaying fi�eld. Being the largestlender in the country, SBI shouldhave shown more sensitivity andpragmatism towards such issues.
Indeed such directives are retrograde in nature and best avoided atany cost. Women have proven theirmettle in almost all domains andthey are proven multitaskers.Bal GovindNoida
LET TERS TO THE EDITOR Send your letters by email to [email protected] or by post to ‘Letters to the Editor’, The Hindu Business Line, Kasturi Buildings, 859-860, Anna Salai, Chennai 600002.
POCKET RAVIKANTH
Published by N. Ravi at Kasturi Buildings, 859 & 860, Anna Salai, Chennai-600002 and Printed by N. Vaidyanathan at Dangat Media Pvt Ltd, No. 22, Dighe MIDC, Vishnu Nagar, TTC Industrial Area, Dighe, Navi Mumbai-400701 on behalf of THG PUBLISHING PVT LTD., Chennai-600002. Editor: Raghuvir Srinivasan (Editor responsible for selection of news under the PRB Act). ISSN 0971 - 7528
................BM-BMECMYK
It is obvious that theCovid19 pandemic hashad a deep, searing impact on the Indian eco
nomy, in terms of both totaleconomic activity and livelihoods. It is true that the economy had been struggling forseveral years before then,with falling investment andemployment, sharply growing inequalities and worsening conditions of health andnutrition. But the pandemicand the policy response led tosharp aggravation of all ofthese problems.
As Figure 1 shows, per capita income in real terms,whether measured as GDP perperson or as net national income per person (which isGDP after subtracting taxesand adding subsidies) fell bynearly 9 per cent in 202021compared to the previousyear. Indeed, per capita in
come in 202021 was lowerthan even four years earlier,and just barely above the levelof fi�ve years before, undermining the growth of the intervening period.
Meanwhile, since we knowthat India also had some ofthe most rapid increases in income inequality anywhere inthe world, even this decliningincome was much more unequally distributed. Thismeant signifi�cant worseningof the material conditions ofthe bulk of the population,with the bottom half of thepopulation (around 650 million people) probably beingthe worst aff�ected on theplanet in terms of deteriorating economic circumstances.
Bouncing back?In offi�cial circles, much hasbeen made of the economicrecovery since then. It has
been argued that the pandemic year, and especially theperiod of the national lockdown, was especially hard,but thereafter the economyhas supposedly “bouncedback”. The government’s Eco-nomic Survey for 202122claims that the Indian economy has already grown beyond prepandemic levels and“is well placed to take on thechallenges of 202223” (page3). So it is worth examining recent trends in output, as described in the offi�cial National Accounts Statisticsquarterly estimates.
One important caveat: Theadvance estimates are verymuch “guesstimates” andtend to be revised over time,with fi�rst and second revisions often showing quite signifi�cant variation from theadvance estimates. Quite often in the recent past, the revision has been downward: forexample, the annual declinein GDP in AprilJune 2020 wasestimated to be 23.9 per centin the advance estimates, buthas now been revised downwards to 24.4 per cent. So themost recent data provided bythe CSO, and its advance estimates for 202122 that havebeen used in Budget202223,need to be treated with appro
priate caution. Note that thisis quite apart from all theother concerns with the CSO’snew method of estimatingGDP that have been widelycommented upon.
Figure 2 suggests that whilethere was indeed a recovery ofboth GDP at market pricesand Gross Value Added at basic prices from the trough ofAprilJune 2020 to JanuaryMarch 2021, this was followedby subsequent decline. InJulySeptember 2021, GDP wasstill 7 per cent below the levelof JanuaryMarch 2020, thelast prepandemic quarter.Some of the decline in AprilJune 2021 can be attributed tothe impact of the disastroussecond wave of the pandemicthat proved to be more lethalin India than the fi�rst wave.But there are other, deeperproblems with the socalledrecovery that cannot be ignored. This becomes more apparent when a sectoral breakdown of the GDP trends isexamined. Figure 3 providesdata on quarterly output ofthe socalled “material producing sectors”: agriculture, industry and services. In Figure4, data on the services sectorare shown. The two taken together are both instructiveand alarming.
Agriculture was the sectorthat provided the only ray ofhope for the Indian economyin 202021, as a good monsoonenabled agricultural outputto rise dramatically even asother sectors were in decline.But thereafter, the value added in agriculture has beendeclining continuously. InJulyDecember 2021, agricultural value added was 34 percent lower than the peak ofOctoberDecember 2020, 23per cent lower than JanuaryMarch 2020, and even lower(by 9 per cent) than the levelin AprilJune 2019.
Similarly, manufacturingwas supposed to have swungback into higher activity. Butdespite a temporary jump inJanuaryMarch 2021, by JulySeptember 2021 the sector’svalue added was still lowerthan in the prepandemicquarter JanuaryMarch 2020.Even construction, whichshowed a big jump in JanuaryMarch 2021, fell thereafter,so that by JulySeptember itwas 13 per cent lower than thelevel reached just before thepandemic.
Uneven services recoveryThe services sector on thewhole appears to have performed slightly better, but
mestic demand because offalling employment, wagesand incomes of selfemployed, as the informal economy and small and microenterprises continue to bearthe brunt of the economic diffi�culties.
The growing inequalitiescan create more consumption by the superrich, butthat will not be enough to digthe economy out of its current hole. A government indenial of this obvious fact canonly make things worse.
still remained 7.5 per cent below the prepandemic level,suggesting a real curtailmentof domestic eff�ective demand. In such a context, it isnot surprising that investment also has not really recovered. In the most recentquarter, investment was still 5per cent below the prepandemic level.
These trends do not suggest a robust economic recovery. The basic macroeconomic problem remains thesame: a contraction of do
here too the “recovery” hasbeen extremely uneven atbest. The only consistent increases after the lockdownslump have been in public administration, defence andother services — largely asState governments steppedup their spending to deal atleast partially with themassive humanitarian crisisthat was unfolding. But trade,transport communicationand other services that areclosely related to materialeconomic activity did not recover in the same way: in JulySeptember 2021 the value added was 21 per cent lower thanin the prepandemic quarter.
However, most recently fi�nance, real estate and professional services have shown arecovery, which may not be acause for celebration if it indicates a speculative bubbleunmoored to the realeconomy.
The performance of particular sectors is the counterpartof trends in consumption andinvestment. In this regard,the data in Figure 5 are telling.Private consumption, whichwas already sluggish beforethe pandemic, collapsed inAprilJune 2020 and thenshowed very uncertain recovery. In JulySeptember 2021, it
The government’s hollow claims of economic recovery A granular look of the quarterly national accounts data shows weak recovery, and consumption and investment still below pre-pandemic levels
CP CHANDRASHEKHAR JAYATI GHOSH
MACROSCAN
THINKMUMBAI
BusinessLineTUESDAY • FEBRUARY 22 • 2022 5
ACROSS
01. Fence of stakes (8) 04. Cease (4) 08. Part of circle circumference (3) 09. Young horses (5) 10. Limo (3) 11. Ease, quiet enjoyment (7) 12. Utter fool (5) 13. Part of radio receiver (4,7) 17. Scene of fi�ghting (5) 18. Short, stiff� hair (7) 20. Cha(r) (3) 21. German industrial centre (5) 22. Prohibit (3) 23. Anger one (4) 24. Laughs halfsuppressedly (8)
DOWN
01. Dance on the hind legs (6) 02. Doctor's standin (5) 03. Handed out cards(5) 05. Concerning touch (7) 06. Unadulterated state (6) 07. Lofty aim, hope (10) 09. Stormwater sluices (10) 14. Protective clothing (7) 15. One suff�ering for a cause (6) 16. Real or lawn game (6) 18. Washbowl (5) 19. Each half of folding board (5)
ACROSS
01. Friend has other ideas whenconstructing fence (8)
04. Lots of money is returned, butone must call a halt (4)
08. Part of a circle included inmarching order (3)
09. Young creatures mare produces(5)
10. Saloon in America raided (3) 11. Almost arrive at stronghold to off�er
solace (7) 12. Fool gets board to prompt TV
speaker (5) 13. He may talk without a mike but
this will amplify the sound (4,7) 17. Where people fi�ght it takes an age
to get it back (5) 18. Have a bit of a brush and show
one's indignation (7) 20. Cuppa tempts eternally arid
beginners (3) 21. German industry seen to be
disposed around the South here(5)
22. Pinch something back by way ofembargo (3)
23. Make one cross gun that hasn't gota middle (4)
24. Guess grin is nonu and upsettingif one laughs like this (8)
DOWN
01. Caper around the Northand get up on one's hindlegs (6)
02. Place man when doctor'saway (5)
03. Handed out cards andcoped with the situation (5)
05. In a hat, play one's partwith this sort of feeling (7)
06. Shame about your halfunadulterated quality (6)
07. Lofty aim Pa is achievingwith food allowance (10)
09. Sluices overfl�ow at adiff�erent stage (10)
14. Protective clothing on topof everything else (7)
15. Spoil converted try and hewill die for the cause (6)
16. Couples courted may seelove means nothing in it(6)
18. Depression due tograduate wrongdoing (5)
19. Put down motion with aset of fi�gures (5)
easy not so easy
ACROSS 1. Sergeants 5. Tip 7. Mess 8. .Starling 10. Visitors 11. Skin 13. Resort 15. Appear 18. Bank 19. Precious 22. Roadways23. Mill 24. Ass 25. Run to seed DOWN 1. Samovar 2. Roses 3. Nature 4. Spry 5. Trickle 6. Pagan 9. Stork 12. Space 14. Sandals 16. Rustled 17. Crayon 18. Burma 20. Olive 21. Ewer
bl two-way crossword 2069
SOLUTION: BL Two-way Crossword 2068
February 22, 2002
State guarantees not final word: RBITime was when the State was considered the fi�nal word inguarantees. The RBI however on Thursday issued a circular oninfrastructure funding to chiefs of all banks and fi�nancialinstitutions (FIs) stating that Government guarantees do notnecessarily mean that the credit is good. It has advised banksand FIs to spare no eff�orts in appraisal while fi�nancinginfrastructure projects undertaken by Governmentownedentities. It has also asked the fi�nanciers to keep a watch on theend use of advances. Banks and FIs should “ensure that loansand investments are not used for fi�nancing the budget of theState Governments.”
Cabinet to clear major labour reforms todayJust a day after the completion of the last phase of elections tothe Uttar Pradesh Assembly, the BJPled Government at theCentre is set to implement yet another round of bigticketeconomic reforms this time in the politicallysensitive arenaof labour and industrial relations. The Cabinet is scheduled tomeet on Friday to approve the amendments to the IndustrialDisputes Act, 1947 proposed by the Finance Minister, MrYashwant Sinha, in the 200102 Union Budget.
ADR issue to follow domestic offer for Nalco divestmentThe Union Government is fi�rming up its plan fordisinvestment in National Aluminium Company Ltd (Nalco)through a proposed 30 per cent public off�er of its equity. Thestrategy is to go in for a domestic off�ering fi�rst, which will bein the range of 510 per cent of the Government's equity. Thiswill be followed by an American depository receipts (ADR)issue of about 2025 per cent of the Government's equity inNalco, Government sources said. The domestic off�ering willtake about two months while the ADR off�ering will take aminimum of six months.
TWENTY YEARS AGO TODAY
BusinessLine
AMITI SEN
Why is the India-UAE trade deal
significant?
The IndiaUAE CEPA is the fi�rst comprehensive trade agreementsigned by the Modi governmentsince it came to power in 2014. Withfree trade agreements and regionaltrading blocs mushroomingworldwide, India has been feelingthe need to get into such arrangements with suitable trade partners.
Although the UAE’s average tariff�s on goods are low, the highestslab being 5 per cent, the fact thatthese tariff�s will be immediatelyeliminated on 90 per cent of tradedgoods is encouraging. This woulderode the tariff� advantage enjoyedby smaller economies such asBangladesh and Vietnam in itemslike garments, foot wear and gems& jewellery, benfi�ting India.
The pact will also provide wideraccess to the much larger Arab andAfrican markets for Indian businesses.
What are the salient features?
The IndiaUAE CEPA covers commitments in trade in goods, trade inservices, technical barriers to trade,dispute settlement, telecom, cus
toms procedures and pharmaceuticals. Chapters on digital trade, government procurement and IPRhave been included for the fi�rsttime. But these would be followedmostly only on a ‘best endeavour’basis where disputes cannot befi�led.
Also, a separate annexe on pharmaceuticals has been incorporatedto facilitate access toIndian pharmaceutical products for thefi�rst time. The agreement has stringent rules of originand value addition norms to prevent thirdcountry imports formaking their way into India fromthe UAE.To protect sensitive sectors, Indiahas placed 10 per cent of tariff� linesin the negative list that would notbe subject to tariff� cuts. The itemsinclude dairy, fruits, vegetables, cereals, tea, coff�ee, sugar, food preparation, tobacco, petroleum waxes,auto and auto components, coke,dyes, soaps, natural rubber, tyres,footwear, processed marbles, toys,plastics, and medical devices.
What is the extent of tariff
reduction in goods?
Import duties will be brought
down to zero per cent on 90 percent of India’s exports to the UAE(over 80 per cent of total tariff�lines) immediately on implementation of the pact and 97 per cent oftariff� lines over the next fi�ve years.India will bring down import duties on about 65 per cent of tariff�lines immediately and on 90 percent of tariff� lines in 10 years. India
has also agreed togive the UAE a tariff�rate quota of200 tonnes on
gold, where import duty will be onepercentage point less than the tariff� charged for the rest of the world.
Which are the sectors that are
going to benefit from this deal?
Indian exporters are likely to makesubstantial gains in labourintensive sectors such as gems and jewellery, textiles, leather, footwear,sports goods, plastics, furniture, agricultural and wood products, engineering products, pharmaceuticals & medical devices andautomobiles. The CEPA is likely toincrease the competitiveness of Indian products worth an estimated$26 billion that are currently subjected to 5 per cent import duty bythe UAE. The services sector could
also see substantial gains.
What is the current level of
India-UAE trade?
The IndiaUAE bilateral trade declined to $44 billion in 202021 dueto the pandemic compared to theprepandemic levels of about $60billion. In 202122, however, thereseems to be a recovery with twoway trade in AprilDecember at$52.76 billion. Exports from Indiawere at $20 billion, while importsfrom the UAE were $32.7 billion. India’s signifi�cant import from theUAE was petroleum and relatedproducts, precious metals, stones,gems & jewellery and chemicalproducts while it exported mineralfuels and oils, pearls, preciousstones, metals, and coins, electric &electronic equipment and apparel.
How is it expected to grow post
the trade agreement?
Both countries hope to nearlydouble bilateral trade in goods to$100 billion over fi�ve years andachieve services trade worth $15 billion. The increased trade is likely tocreate 10 lakh jobs in India in sectors such as textiles, pharmaceuticals, gems & jewellery, plasticproducts, auto and leather.
India-UAE Comprehensive Economic Partnership Agreement
Almost everybody needs orwants to work in their 50s
and most need to work into their60s. But the pandemic hasn'tbeen kind to older workers.
The “Great Resignation” — aterm that describes those whohave been emboldened to seekraises or discover better things todo than work — mostly applies toyoung and mobile workers. Onlyemployees ages 16 to 24 haveseen big wage gains, while olderworkers' wages have been stagnant. In addition, a sizeablechunk of older workers, about 15per cent, lost their jobs in 2020compared to 14 per cent ofprimeage workers. That iscounter to the trend of olderworker job loss usually beinglower compared to other agegroups during a recession.
A greaterthanexpected shareof older workers in their mid60sand over (presumably with padded retirement accounts andCovid19 fears) did in fact chooseto retire. But younger older workers, or those ages 55 to 64, seemto have been forced out of work —often without substantial retirement assets.
The median retirement account balance for older workersis $15,000, which means it islikely many of those workers arelooking to jump right back intothe labour pool. During a bipartisan congressional economichearing recently, Senator AmyKlobuchar asked what everyoneis thinking, the gist of which is: Ifemployers need workers andthere are millions of older workers who were forced out of work,how can older workers securethose open jobs?
While it sounds prettystraightforward, factors such asemployer bias and mismatchedskills are diffi�cult hurdles to overcome. But there are a few thingsthat older workers, employers and even Oprah can do to improve their prospects.
First, older workers on the jobhunt should take advantage ofavailable services geared to themspecifi�cally. AARP sponsors online and inperson workshops forjob seekers 50 and over. Anotherresource is Encore Network,which connects professionalworkers in that demographic.BLOOMBERG
How to get hiredif you're an older worker
SHORT TAKE
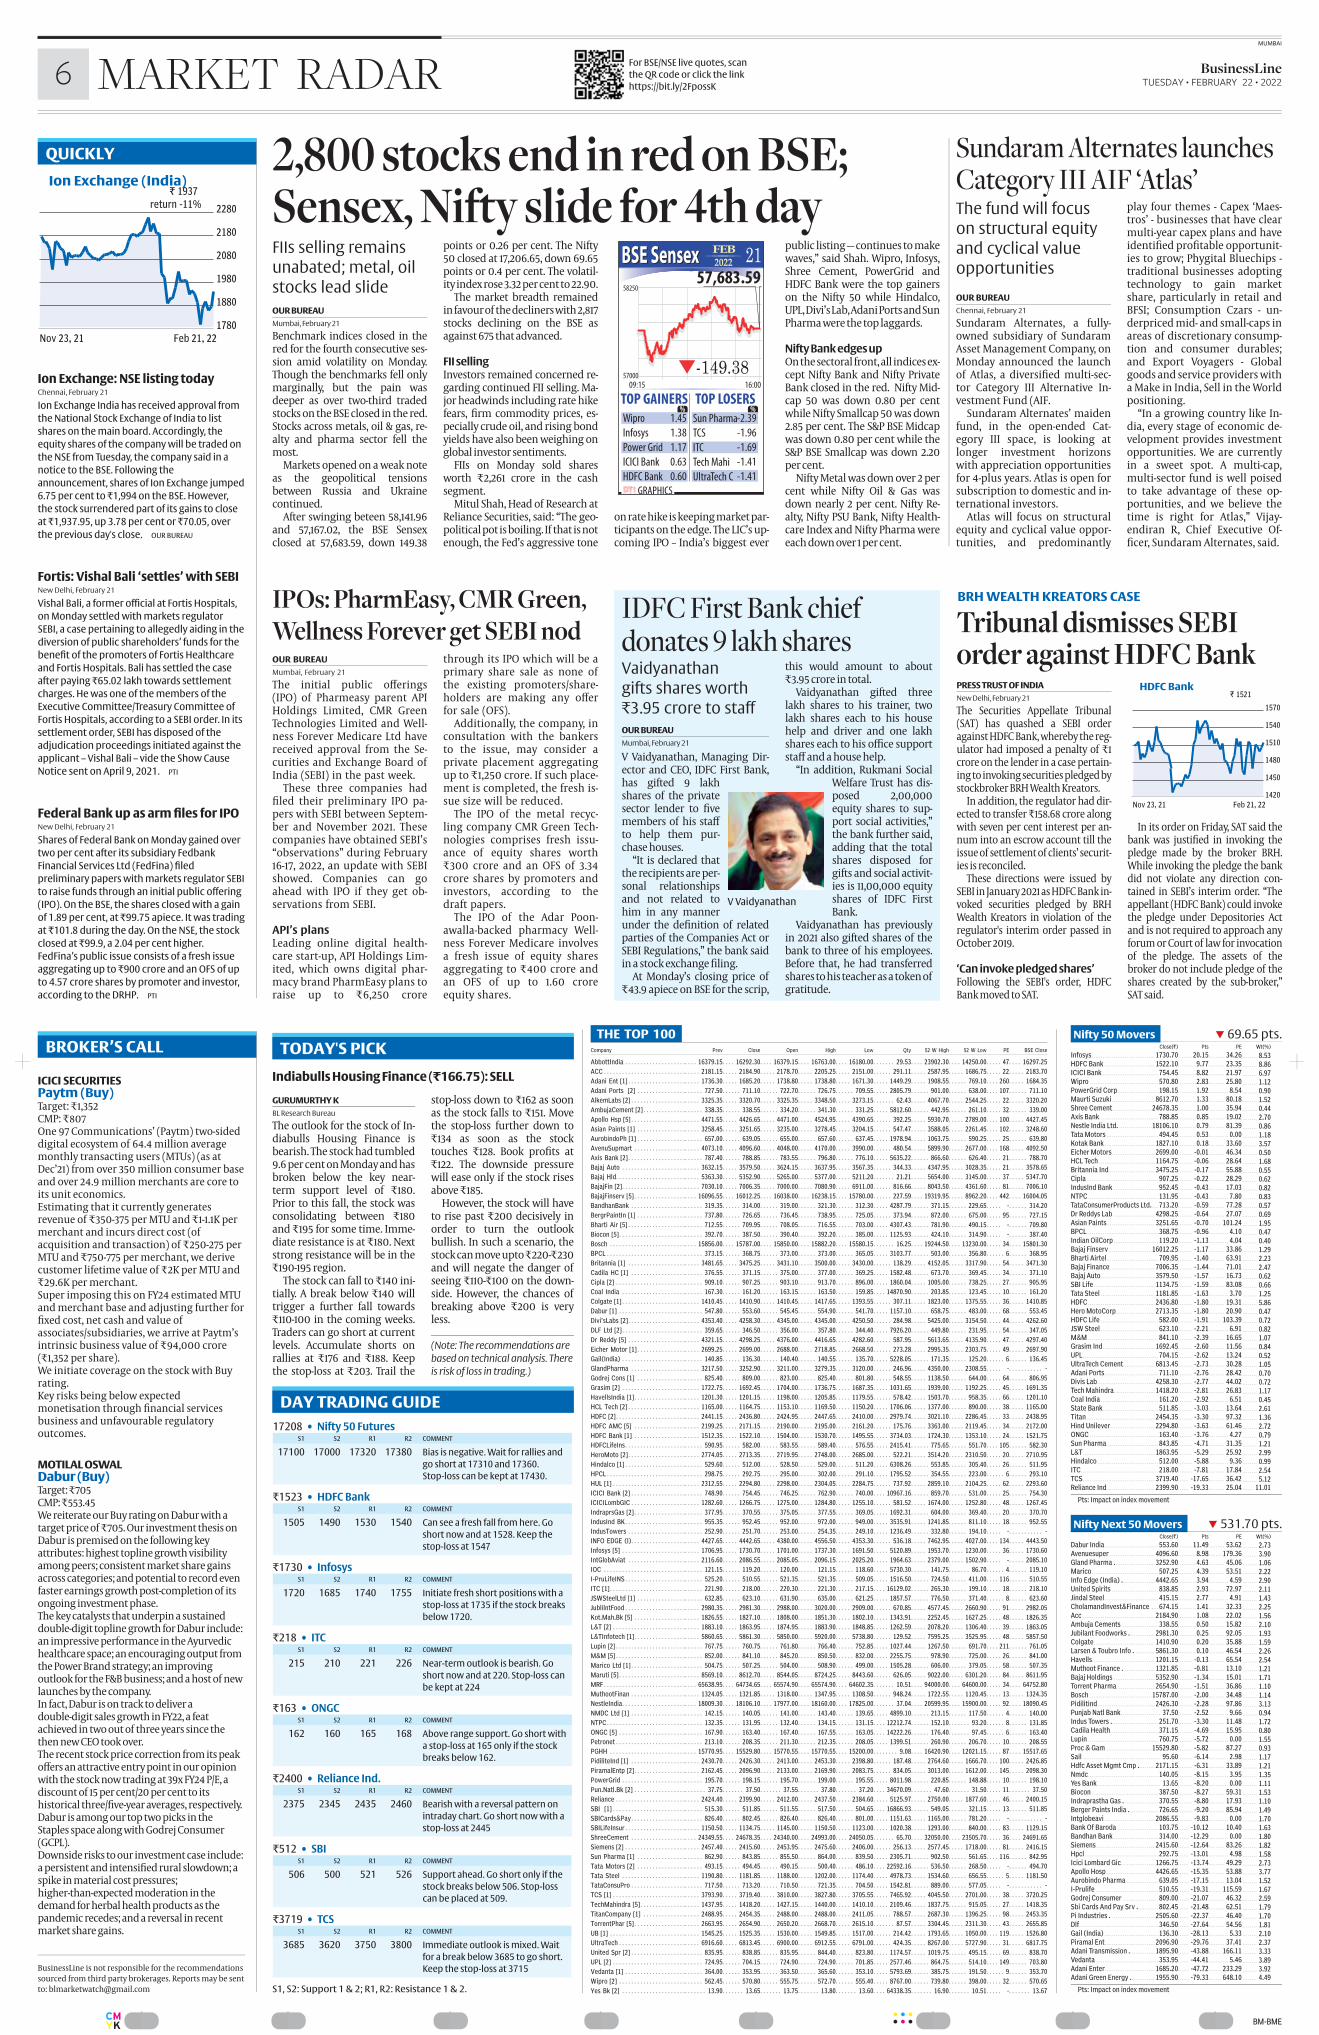
................BMBMECMYK
MUMBAI
6 BusinessLine TUESDAY • FEBRUARY 22 • 2022MARKET RADAR
For BSE/NSE live quotes, scan
the QR code or click the link
https://bit.ly/2FpossK
Ion Exchange: NSE listing today Chennai, February 21
Ion Exchange India has received approval from
the National Stock Exchange of India to list
shares on the main board. Accordingly, the
equity shares of the company will be traded on
the NSE from Tuesday, the company said in a
notice to the BSE. Following the
announcement, shares of Ion Exchange jumped
6.75 per cent to ₹�1,994 on the BSE. However,
the stock surrendered part of its gains to close
at ₹�1,937.95, up 3.78 per cent or ₹�70.05, over
the previous day's close. OUR BUREAU
Fortis: Vishal Bali ‘settles’ with SEBINew Delhi, February 21
Vishal Bali, a former official at Fortis Hospitals,
on Monday settled with markets regulator
SEBI, a case pertaining to allegedly aiding in the
diversion of public shareholders’ funds for the
benefi�t of the promoters of Fortis Healthcare
and Fortis Hospitals. Bali has settled the case
after paying ₹�65.02 lakh towards settlement
charges. He was one of the members of the
Executive Committee/Treasury Committee of
Fortis Hospitals, according to a SEBI order. In its
settlement order, SEBI has disposed of the
adjudication proceedings initiated against the
applicant – Vishal Bali – vide the Show Cause
Notice sent on April 9, 2021. PTI
Federal Bank up as arm fi�les for IPO New Delhi, February 21
Shares of Federal Bank on Monday gained over
two per cent after its subsidiary Fedbank
Financial Services Ltd (FedFina) fi�led
preliminary papers with markets regulator SEBI
to raise funds through an initial public offering
(IPO). On the BSE, the shares closed with a gain
of 1.89 per cent, at ₹�99.75 apiece. It was trading
at ₹�101.8 during the day. On the NSE, the stock
closed at ₹�99.9, a 2.04 per cent higher.
FedFina’s public issue consists of a fresh issue
aggregating up to ₹�900 crore and an OFS of up
to 4.57 crore shares by promoter and investor,
according to the DRHP. PTI
QUICKLY
THE TOP 100Company Prev Close Open High Low Qty 52 W High 52 W Low PE BSE Close
AbbottIndia . . . . . . . . . . . . . . . . . . . .. . . . 16379.15. . . . 16292.30. . . . 16379.15. . . . 16763.00. . . . 16180.00. . . . . . . 29.53. . . . 23902.30. . . . 14250.00. . . . . 47 . . . . 16297.25
ACC . . . . . . . . . . . . . . . . . . . . . . . . . . .. . . . . 2181.15. . . . . 2184.90. . . . . 2178.70. . . . . 2205.25. . . . . 2151.00. . . . . . 291.11. . . . . 2587.95. . . . . 1686.75. . . . . 22 . . . . . 2183.70
Adani Ent [1] . . . . . . . . . . . . . . . . . . .. . . . . 1736.30. . . . . 1685.20. . . . . 1738.80. . . . . 1738.80. . . . . 1671.30. . . . . 1449.29. . . . . 1908.55. . . . . . 769.10. . . . 260 . . . . . 1684.35
Adani Ports [2] . . . . . . . . . . . . . . . .. . . . . . 727.50. . . . . . 711.10. . . . . . 722.70. . . . . . 726.75. . . . . . 709.55. . . . . 2805.79. . . . . . 901.00. . . . . . 638.00. . . . 107 . . . . . . 711.10
AlkemLabs [2] . . . . . . . . . . . . . . . . . .. . . . . 3325.35. . . . . 3320.70. . . . . 3325.35. . . . . 3348.50. . . . . 3273.15. . . . . . . 62.43. . . . . 4067.70. . . . . 2544.25. . . . . 22 . . . . . 3320.20
AmbujaCement [2]. . . . . . . . . . . . . .. . . . . . 338.35. . . . . . 338.55. . . . . . 334.20. . . . . . 341.30. . . . . . 331.25. . . . . 5812.60. . . . . . 442.95. . . . . . 261.10. . . . . 32 . . . . . . 339.00
Apollo Hsp [5]. . . . . . . . . . . . . . . . . .. . . . . 4471.55. . . . . 4426.65. . . . . 4471.00. . . . . 4524.95. . . . . 4390.65. . . . . . 392.25. . . . . 5930.70. . . . . 2789.00. . . . 100 . . . . . 4427.45
Asian Paints [1] . . . . . . . . . . . . . . . .. . . . . 3258.45. . . . . 3251.65. . . . . 3235.00. . . . . 3278.45. . . . . 3204.15. . . . . . 547.47. . . . . 3588.05. . . . . 2261.45. . . . 102 . . . . . 3248.60
AurobindoPh [1] . . . . . . . . . . . . . . . .. . . . . . 657.00. . . . . . 639.05. . . . . . 655.00. . . . . . 657.60. . . . . . 637.45. . . . . 1978.94. . . . . 1063.75. . . . . . 590.25. . . . . 25 . . . . . . 639.80
AvenuSupmart . . . . . . . . . . . . . . . . .. . . . . 4073.10. . . . . 4096.60. . . . . 4048.00. . . . . 4170.00. . . . . 3990.00. . . . . . 480.54. . . . . 5899.90. . . . . 2677.00. . . . 168 . . . . . 4092.50
Axis Bank [2]. . . . . . . . . . . . . . . . . . .. . . . . . 787.40. . . . . . 788.85. . . . . . 783.55. . . . . . 796.80. . . . . . 776.10. . . . . 5635.22. . . . . . 866.60. . . . . . 626.40. . . . . 21 . . . . . . 788.70
Bajaj Auto . . . . . . . . . . . . . . . . . . . . .. . . . . 3632.15. . . . . 3579.50. . . . . 3624.15. . . . . 3637.95. . . . . 3567.35. . . . . . 344.33. . . . . 4347.95. . . . . 3028.35. . . . . 21 . . . . . 3578.65
Bajaj Hld. . . . . . . . . . . . . . . . . . . . . . .. . . . . 5363.30. . . . . 5352.90. . . . . 5265.00. . . . . 5377.00. . . . . 5211.20. . . . . . . 21.21. . . . . 5654.00. . . . . 3145.00. . . . . 37 . . . . . 5347.70
BajajFin [2]. . . . . . . . . . . . . . . . . . . . .. . . . . 7030.10. . . . . 7006.35. . . . . 7000.00. . . . . 7080.90. . . . . 6911.00. . . . . . 816.66. . . . . 8043.50. . . . . 4361.60. . . . . 81 . . . . . 7006.10
BajajFinserv [5]. . . . . . . . . . . . . . . . .. . . . 16096.55. . . . 16012.25. . . . 16038.00. . . . 16238.15. . . . 15780.00. . . . . . 227.59. . . . 19319.95. . . . . 8962.20. . . . 442 . . . . 16004.05
BandhanBank . . . . . . . . . . . . . . . . . .. . . . . . 319.35. . . . . . 314.00. . . . . . 319.00. . . . . . 321.30. . . . . . 312.30. . . . . 4287.79. . . . . . 371.15. . . . . . 229.65. . . . . . . . . . . 314.20
BergrPaintIn [1] . . . . . . . . . . . . . . . .. . . . . . 737.80. . . . . . 726.65. . . . . . 736.45. . . . . . 738.95. . . . . . 725.05. . . . . . 373.94. . . . . . 872.00. . . . . . 675.00. . . . . 95 . . . . . . 727.15
Bharti Air [5] . . . . . . . . . . . . . . . . . . .. . . . . . 712.55. . . . . . 709.95. . . . . . 708.05. . . . . . 716.55. . . . . . 703.00. . . . . 4307.43. . . . . . 781.90. . . . . . 490.15. . . . . . . . . . . 709.80
Biocon [5]. . . . . . . . . . . . . . . . . . . . . .. . . . . . 392.70. . . . . . 387.50. . . . . . 390.40. . . . . . 392.20. . . . . . 385.00. . . . . 1125.93. . . . . . 424.10. . . . . . 314.90. . . . . . . . . . . 387.40
Bosch . . . . . . . . . . . . . . . . . . . . . . . . .. . . . 15856.00. . . . 15787.00. . . . 15850.00. . . . 15882.20. . . . 15580.15. . . . . . . 16.25. . . . 19244.50. . . . 13230.00. . . . . 34 . . . . 15801.30
BPCL . . . . . . . . . . . . . . . . . . . . . . . . . .. . . . . . 373.15. . . . . . 368.75. . . . . . 373.00. . . . . . 373.00. . . . . . 365.05. . . . . 3103.77. . . . . . 503.00. . . . . . 356.80. . . . . . 6 . . . . . . 368.95
Britannia [1] . . . . . . . . . . . . . . . . . . .. . . . . 3481.65. . . . . 3475.25. . . . . 3431.10. . . . . 3500.00. . . . . 3430.00. . . . . . 138.29. . . . . 4152.05. . . . . 3317.90. . . . . 54 . . . . . 3471.30
Cadila HC [1] . . . . . . . . . . . . . . . . . .. . . . . . 376.55. . . . . . 371.15. . . . . . 375.00. . . . . . 377.00. . . . . . 369.25. . . . . 1582.48. . . . . . 673.70. . . . . . 369.45. . . . . 34 . . . . . . 371.10
Cipla [2] . . . . . . . . . . . . . . . . . . . . . . .. . . . . . 909.10. . . . . . 907.25. . . . . . 903.10. . . . . . 913.70. . . . . . 896.00. . . . . 1860.04. . . . . 1005.00. . . . . . 738.25. . . . . 27 . . . . . . 905.95
Coal India . . . . . . . . . . . . . . . . . . . . .. . . . . . 167.30. . . . . . 161.20. . . . . . 163.15. . . . . . 163.50. . . . . . 159.85. . . . 14870.90. . . . . . 203.85. . . . . . 123.45. . . . . 10 . . . . . . 161.20
Colgate [1]. . . . . . . . . . . . . . . . . . . . .. . . . . 1410.45. . . . . 1410.90. . . . . 1410.45. . . . . 1417.65. . . . . 1393.55. . . . . . 307.11. . . . . 1823.00. . . . . 1375.55. . . . . 36 . . . . . 1410.85
Dabur [1] . . . . . . . . . . . . . . . . . . . . . .. . . . . . 547.80. . . . . . 553.60. . . . . . 545.45. . . . . . 554.90. . . . . . 541.70. . . . . 1157.10. . . . . . 658.75. . . . . . 483.00. . . . . 68 . . . . . . 553.45
Divi'sLabs [2]. . . . . . . . . . . . . . . . . . .. . . . . 4353.40. . . . . 4258.30. . . . . 4345.00. . . . . 4345.00. . . . . 4250.50. . . . . . 284.98. . . . . 5425.00. . . . . 3154.50. . . . . 44 . . . . . 4262.60
DLF Ltd [2]. . . . . . . . . . . . . . . . . . . . .. . . . . . 359.65. . . . . . 346.50. . . . . . 356.00. . . . . . 357.80. . . . . . 344.40. . . . . 7926.20. . . . . . 449.80. . . . . . 231.95. . . . . 54 . . . . . . 347.05
Dr Reddy [5] . . . . . . . . . . . . . . . . . . .. . . . . 4321.15. . . . . 4298.25. . . . . 4376.00. . . . . 4416.65. . . . . 4282.60. . . . . . 587.95. . . . . 5613.65. . . . . 4135.90. . . . . 47 . . . . . 4297.40
Eicher Motor [1]. . . . . . . . . . . . . . . .. . . . . 2699.25. . . . . 2699.00. . . . . 2688.00. . . . . 2718.85. . . . . 2668.50. . . . . . 273.28. . . . . 2995.35. . . . . 2303.75. . . . . 49 . . . . . 2697.90
Gail(India) . . . . . . . . . . . . . . . . . . . . .. . . . . . 140.85. . . . . . 136.30. . . . . . 140.40. . . . . . 140.55. . . . . . 135.70. . . . . 5228.05. . . . . . 171.35. . . . . . 125.20. . . . . . 6 . . . . . . 136.45
GlandPharma . . . . . . . . . . . . . . . . . .. . . . . 3217.50. . . . . 3252.90. . . . . 3211.00. . . . . 3279.35. . . . . 3120.00. . . . . . 246.96. . . . . 4350.00. . . . . 2308.55. . . . . . . . . . . . . . . .
Godrej Cons [1] . . . . . . . . . . . . . . . .. . . . . . 825.40. . . . . . 809.00. . . . . . 823.00. . . . . . 825.40. . . . . . 801.80. . . . . . 548.55. . . . . 1138.50. . . . . . 644.00. . . . . 64 . . . . . . 806.95
Grasim [2] . . . . . . . . . . . . . . . . . . . . .. . . . . 1722.75. . . . . 1692.45. . . . . 1704.00. . . . . 1736.75. . . . . 1687.35. . . . . 1031.65. . . . . 1939.00. . . . . 1192.25. . . . . 45 . . . . . 1691.35
HavellsIndia [1]. . . . . . . . . . . . . . . . .. . . . . 1201.30. . . . . 1201.15. . . . . 1198.00. . . . . 1205.85. . . . . 1179.55. . . . . . 578.42. . . . . 1503.70. . . . . . 958.35. . . . . 66 . . . . . 1201.10
HCL Tech [2] . . . . . . . . . . . . . . . . . . .. . . . . 1165.00. . . . . 1164.75. . . . . 1153.10. . . . . 1169.50. . . . . 1150.20. . . . . 1706.06. . . . . 1377.00. . . . . . 890.00. . . . . 38 . . . . . 1165.00
HDFC [2]. . . . . . . . . . . . . . . . . . . . . . .. . . . . 2441.15. . . . . 2436.80. . . . . 2424.95. . . . . 2447.65. . . . . 2410.00. . . . . 2979.74. . . . . 3021.10. . . . . 2286.45. . . . . 33 . . . . . 2438.95
HDFC AMC [5] . . . . . . . . . . . . . . . . .. . . . . 2199.25. . . . . 2171.15. . . . . 2190.00. . . . . 2195.00. . . . . 2161.20. . . . . . 175.76. . . . . 3363.00. . . . . 2119.45. . . . . 34 . . . . . 2172.00
HDFC Bank [1] . . . . . . . . . . . . . . . . .. . . . . 1512.35. . . . . 1522.10. . . . . 1504.00. . . . . 1530.70. . . . . 1495.55. . . . . 3734.03. . . . . 1724.30. . . . . 1353.10. . . . . 24 . . . . . 1521.75
HDFCLifeIns. . . . . . . . . . . . . . . . . . . .. . . . . . 590.95. . . . . . 582.00. . . . . . 583.55. . . . . . 589.40. . . . . . 576.55. . . . . 2415.41. . . . . . 775.65. . . . . . 551.70. . . . 105 . . . . . . 582.30
HeroMoto [2]. . . . . . . . . . . . . . . . . . .. . . . . 2774.05. . . . . 2713.35. . . . . 2719.95. . . . . 2748.00. . . . . 2685.00. . . . . . 522.21. . . . . 3514.20. . . . . 2310.50. . . . . 20 . . . . . 2710.95
Hindalco [1] . . . . . . . . . . . . . . . . . . . .. . . . . . 529.60. . . . . . 512.00. . . . . . 528.50. . . . . . 529.00. . . . . . 511.20. . . . . 6308.26. . . . . . 553.85. . . . . . 305.40. . . . . 26 . . . . . . 511.95
HPCL . . . . . . . . . . . . . . . . . . . . . . . . . .. . . . . . 298.75. . . . . . 292.75. . . . . . 295.00. . . . . . 302.00. . . . . . 291.10. . . . . 1795.52. . . . . . 354.55. . . . . . 223.00. . . . . . 6 . . . . . . 293.10
HUL [1] . . . . . . . . . . . . . . . . . . . . . . . .. . . . . 2312.55. . . . . 2294.80. . . . . 2298.00. . . . . 2304.05. . . . . 2284.75. . . . . . 737.92. . . . . 2859.10. . . . . 2104.25. . . . . 62 . . . . . 2293.60
ICICI Bank [2] . . . . . . . . . . . . . . . . . .. . . . . . 748.90. . . . . . 754.45. . . . . . 746.25. . . . . . 762.90. . . . . . 740.00. . . . 10967.16. . . . . . 859.70. . . . . . 531.00. . . . . 25 . . . . . . 754.30
ICICILombGIC . . . . . . . . . . . . . . . . . .. . . . . 1282.60. . . . . 1266.75. . . . . 1275.00. . . . . 1284.80. . . . . 1255.10. . . . . . 581.52. . . . . 1674.00. . . . . 1252.80. . . . . 48 . . . . . 1267.45
IndraprsGas [2]. . . . . . . . . . . . . . . . .. . . . . . 377.95. . . . . . 370.55. . . . . . 375.05. . . . . . 377.55. . . . . . 369.05. . . . . 1692.31. . . . . . 604.00. . . . . . 369.40. . . . . 20 . . . . . . 370.70
IndusInd BK. . . . . . . . . . . . . . . . . . . .. . . . . . 955.35. . . . . . 952.45. . . . . . 952.00. . . . . . 972.00. . . . . . 949.00. . . . . 3535.91. . . . . 1241.85. . . . . . 811.10. . . . . 18 . . . . . . 952.55
IndusTowers . . . . . . . . . . . . . . . . . . .. . . . . . 252.90. . . . . . 251.70. . . . . . 253.00. . . . . . 254.35. . . . . . 249.10. . . . . 1236.49. . . . . . 332.80. . . . . . 194.10. . . . . . . . . . . . . . . .
INFO EDGE (I). . . . . . . . . . . . . . . . . .. . . . . 4427.65. . . . . 4442.65. . . . . 4380.00. . . . . 4556.50. . . . . 4353.30. . . . . . 536.18. . . . . 7462.95. . . . . 4027.00. . . . 134 . . . . . 4443.50
Infosys [5] . . . . . . . . . . . . . . . . . . . . .. . . . . 1706.95. . . . . 1730.70. . . . . 1701.00. . . . . 1737.30. . . . . 1691.50. . . . . 5120.89. . . . . 1953.70. . . . . 1230.00. . . . . 36 . . . . . 1730.60
IntGlobAviat . . . . . . . . . . . . . . . . . . .. . . . . 2116.60. . . . . 2086.55. . . . . 2085.05. . . . . 2096.15. . . . . 2025.20. . . . . 1964.63. . . . . 2379.00. . . . . 1502.90. . . . . . . . . . 2085.10
IOC . . . . . . . . . . . . . . . . . . . . . . . . . . .. . . . . . 121.15. . . . . . 119.20. . . . . . 120.00. . . . . . 121.15. . . . . . 118.60. . . . . 5730.30. . . . . . 141.75. . . . . . . 86.70. . . . . . 4 . . . . . . 119.10
IPruLifeINS. . . . . . . . . . . . . . . . . . . .. . . . . . 525.20. . . . . . 510.55. . . . . . 521.35. . . . . . 521.35. . . . . . 509.05. . . . . 1516.50. . . . . . 724.50. . . . . . 411.00. . . . 116 . . . . . . 510.55
ITC [1]. . . . . . . . . . . . . . . . . . . . . . . . .. . . . . . 221.90. . . . . . 218.00. . . . . . 220.30. . . . . . 221.30. . . . . . 217.15. . . . 16129.02. . . . . . 265.30. . . . . . 199.10. . . . . 18 . . . . . . 218.10
JSWSteelLtd [1] . . . . . . . . . . . . . . . .. . . . . . 632.85. . . . . . 623.10. . . . . . 631.90. . . . . . 635.00. . . . . . 621.25. . . . . 1857.57. . . . . . 776.50. . . . . . 371.40. . . . . . 8 . . . . . . 623.60
JublilntFood . . . . . . . . . . . . . . . . . . . .. . . . . 2980.35. . . . . 2981.30. . . . . 2988.00. . . . . 3020.00. . . . . 2909.00. . . . . . 670.85. . . . . 4577.45. . . . . 2660.90. . . . . 91 . . . . . 2982.05
Kot.Mah.Bk [5] . . . . . . . . . . . . . . . . .. . . . . 1826.55. . . . . 1827.10. . . . . 1808.00. . . . . 1851.30. . . . . 1802.10. . . . . 1343.91. . . . . 2252.45. . . . . 1627.25. . . . . 48 . . . . . 1826.35
L&T [2] . . . . . . . . . . . . . . . . . . . . . . . .. . . . . 1883.10. . . . . 1863.95. . . . . 1874.95. . . . . 1883.90. . . . . 1848.85. . . . . 1262.59. . . . . 2078.20. . . . . 1306.40. . . . . 39 . . . . . 1863.05
L&TInfotech [1]. . . . . . . . . . . . . . . . .. . . . . 5860.65. . . . . 5861.30. . . . . 5850.00. . . . . 5920.00. . . . . 5738.80. . . . . . 129.52. . . . . 7595.25. . . . . 3525.95. . . . . 48 . . . . . 5857.50
Lupin [2] . . . . . . . . . . . . . . . . . . . . . . .. . . . . . 767.75. . . . . . 760.75. . . . . . 761.80. . . . . . 766.40. . . . . . 752.85. . . . . 1027.44. . . . . 1267.50. . . . . . 691.70. . . . 211 . . . . . . 761.05
M&M [5] . . . . . . . . . . . . . . . . . . . . . . .. . . . . . 852.00. . . . . . 841.10. . . . . . 845.20. . . . . . 850.50. . . . . . 832.00. . . . . 2255.75. . . . . . 978.90. . . . . . 725.00. . . . . 26 . . . . . . 841.00
Marico Ltd [1]. . . . . . . . . . . . . . . . . .. . . . . . 504.75. . . . . . 507.25. . . . . . 504.00. . . . . . 508.90. . . . . . 499.00. . . . . 1505.28. . . . . . 606.00. . . . . . 379.05. . . . . 58 . . . . . . 507.35
Maruti [5]. . . . . . . . . . . . . . . . . . . . . .. . . . . 8569.10. . . . . 8612.70. . . . . 8544.05. . . . . 8724.25. . . . . 8443.60. . . . . . 626.05. . . . . 9022.00. . . . . 6301.20. . . . . 84 . . . . . 8611.95
MRF . . . . . . . . . . . . . . . . . . . . . . . . . . .. . . . 65638.95. . . . 64734.65. . . . 65574.90. . . . 65574.90. . . . 64602.35. . . . . . . 10.51. . . . 94000.00. . . . 64600.00. . . . . 34 . . . . 64752.80
MuthootFinan . . . . . . . . . . . . . . . . . .. . . . . 1324.05. . . . . 1321.85. . . . . 1318.00. . . . . 1347.95. . . . . 1308.50. . . . . . 948.24. . . . . 1722.55. . . . . 1120.45. . . . . 13 . . . . . 1324.35
NestleIndia. . . . . . . . . . . . . . . . . . . . .. . . . 18009.30. . . . 18106.10. . . . 17977.00. . . . 18160.00. . . . 17825.00. . . . . . . 37.04. . . . 20599.95. . . . 15900.00. . . . . 92 . . . . 18090.45
NMDC Ltd [1] . . . . . . . . . . . . . . . . . .. . . . . . 142.15. . . . . . 140.05. . . . . . 141.00. . . . . . 143.40. . . . . . 139.65. . . . . 4899.10. . . . . . 213.15. . . . . . 117.50. . . . . . 4 . . . . . . 140.00
NTPC. . . . . . . . . . . . . . . . . . . . . . . . . .. . . . . . 132.35. . . . . . 131.95. . . . . . 132.40. . . . . . 134.15. . . . . . 131.15. . . . 12212.74. . . . . . 152.10. . . . . . . 93.20. . . . . . 8 . . . . . . 131.85
ONGC [5] . . . . . . . . . . . . . . . . . . . . . .. . . . . . 167.90. . . . . . 163.40. . . . . . 167.40. . . . . . 167.55. . . . . . 163.05. . . . 14222.26. . . . . . 176.40. . . . . . . 97.45. . . . . . 6 . . . . . . 163.40
Petronet . . . . . . . . . . . . . . . . . . . . . . .. . . . . . 213.10. . . . . . 208.35. . . . . . 211.30. . . . . . 212.35. . . . . . 208.05. . . . . 1399.51. . . . . . 260.90. . . . . . 206.70. . . . . 10 . . . . . . 208.55
PGHH . . . . . . . . . . . . . . . . . . . . . . . . .. . . . 15770.95. . . . 15529.80. . . . 15770.55. . . . 15770.55. . . . 15200.00. . . . . . . . 9.08. . . . 16420.90. . . . 12021.15. . . . . 87 . . . . 15517.65
PidiliteInd [1] . . . . . . . . . . . . . . . . . .. . . . . 2430.70. . . . . 2426.30. . . . . 2413.00. . . . . 2453.30. . . . . 2398.80. . . . . . 187.48. . . . . 2764.60. . . . . 1666.70. . . . 100 . . . . . 2426.85
PiramalEntp [2]. . . . . . . . . . . . . . . . .. . . . . 2162.45. . . . . 2096.90. . . . . 2133.00. . . . . 2169.90. . . . . 2083.75. . . . . . 834.05. . . . . 3013.00. . . . . 1612.00. . . . 145 . . . . . 2098.30
PowerGrid . . . . . . . . . . . . . . . . . . . . .. . . . . . 195.70. . . . . . 198.15. . . . . . 195.70. . . . . . 199.00. . . . . . 195.55. . . . . 8011.98. . . . . . 220.85. . . . . . 148.88. . . . . 10 . . . . . . 198.10
Pun.Natl.Bk [2] . . . . . . . . . . . . . . . . .. . . . . . . 37.75. . . . . . . 37.50. . . . . . . 37.55. . . . . . . 37.80. . . . . . . 37.20. . . . 34670.09. . . . . . . 47.60. . . . . . . 31.50. . . . . 11 . . . . . . . 37.50
Reliance . . . . . . . . . . . . . . . . . . . . . . .. . . . . 2424.40. . . . . 2399.90. . . . . 2412.00. . . . . 2437.50. . . . . 2384.60. . . . . 5125.97. . . . . 2750.00. . . . . 1877.60. . . . . 46 . . . . . 2400.15
SBI [1] . . . . . . . . . . . . . . . . . . . . . . . .. . . . . . 515.30. . . . . . 511.85. . . . . . 511.55. . . . . . 517.50. . . . . . 504.65. . . . 16866.93. . . . . . 549.05. . . . . . 321.15. . . . . 13 . . . . . . 511.85
SBICards&Pay. . . . . . . . . . . . . . . . . .. . . . . . 826.40. . . . . . 802.45. . . . . . 826.40. . . . . . 826.40. . . . . . 801.00. . . . . 1151.63. . . . . 1165.00. . . . . . 781.20. . . . . . . . . . . . . . . .
SBILifeInsur . . . . . . . . . . . . . . . . . . . .. . . . . 1150.50. . . . . 1134.75. . . . . 1145.00. . . . . 1150.50. . . . . 1123.00. . . . . 1020.38. . . . . 1293.00. . . . . . 840.00. . . . . 83 . . . . . 1129.15
ShreeCement . . . . . . . . . . . . . . . . . .. . . . 24349.55. . . . 24678.35. . . . 24340.00. . . . 24993.00. . . . 24050.05. . . . . . . 65.70. . . . 32050.00. . . . 23505.70. . . . . 36 . . . . 24691.65
Siemens [2] . . . . . . . . . . . . . . . . . . . .. . . . . 2457.40. . . . . 2415.60. . . . . 2453.95. . . . . 2475.60. . . . . 2406.00. . . . . . 256.13. . . . . 2577.45. . . . . 1718.00. . . . . 81 . . . . . 2416.15
Sun Pharma [1] . . . . . . . . . . . . . . . .. . . . . . 862.90. . . . . . 843.85. . . . . . 855.50. . . . . . 864.00. . . . . . 839.50. . . . . 2305.71. . . . . . 902.50. . . . . . 561.65. . . . 116 . . . . . . 842.95
Tata Motors [2] . . . . . . . . . . . . . . . .. . . . . . 493.15. . . . . . 494.45. . . . . . 490.15. . . . . . 500.40. . . . . . 486.10. . . . 22592.16. . . . . . 536.50. . . . . . 268.50. . . . . . . . . . . 494.70
Tata Steel . . . . . . . . . . . . . . . . . . . . .. . . . . 1190.80. . . . . 1181.85. . . . . 1188.00. . . . . 1202.00. . . . . 1174.40. . . . . 4978.73. . . . . 1534.60. . . . . . 656.55. . . . . . 5 . . . . . 1181.50
TataConsuPro . . . . . . . . . . . . . . . . . .. . . . . . 717.50. . . . . . 713.20. . . . . . 710.50. . . . . . 721.35. . . . . . 704.50. . . . . 1542.81. . . . . . 889.00. . . . . . 577.05. . . . . . . . . . . . . . . .
TCS [1] . . . . . . . . . . . . . . . . . . . . . . . .. . . . . 3793.90. . . . . 3719.40. . . . . 3810.00. . . . . 3827.80. . . . . 3705.55. . . . . 7465.92. . . . . 4045.50. . . . . 2701.00. . . . . 38 . . . . . 3720.25
TechMahindra [5]. . . . . . . . . . . . . . .. . . . . 1437.95. . . . . 1418.20. . . . . 1427.15. . . . . 1440.00. . . . . 1410.10. . . . . 2109.46. . . . . 1837.75. . . . . . 915.05. . . . . 27 . . . . . 1418.35
TitanCompany [1] . . . . . . . . . . . . . .. . . . . 2488.95. . . . . 2454.35. . . . . 2488.00. . . . . 2488.00. . . . . 2411.05. . . . . . 788.57. . . . . 2687.30. . . . . 1396.25. . . . . 98 . . . . . 2453.35
TorrentPhar [5]. . . . . . . . . . . . . . . . .. . . . . 2663.95. . . . . 2654.90. . . . . 2650.20. . . . . 2668.70. . . . . 2615.10. . . . . . . 87.57. . . . . 3304.45. . . . . 2311.30. . . . . 43 . . . . . 2655.85
UB [1] . . . . . . . . . . . . . . . . . . . . . . . . .. . . . . 1545.25. . . . . 1525.35. . . . . 1530.00. . . . . 1549.85. . . . . 1517.00. . . . . . 214.42. . . . . 1793.65. . . . . 1050.00. . . . 119 . . . . . 1526.80
UltraTech . . . . . . . . . . . . . . . . . . . . . .. . . . . 6916.60. . . . . 6813.45. . . . . 6900.00. . . . . 6912.55. . . . . 6791.00. . . . . . 424.35. . . . . 8267.00. . . . . 5727.90. . . . . 31 . . . . . 6817.75
United Spr [2] . . . . . . . . . . . . . . . . . .. . . . . . 835.95. . . . . . 838.85. . . . . . 835.95. . . . . . 844.40. . . . . . 823.80. . . . . 1174.57. . . . . 1019.75. . . . . . 495.15. . . . . 69 . . . . . . 838.70
UPL [2] . . . . . . . . . . . . . . . . . . . . . . . .. . . . . . 724.95. . . . . . 704.15. . . . . . 724.90. . . . . . 724.90. . . . . . 701.85. . . . . 2577.46. . . . . . 864.75. . . . . . 514.10. . . . 149 . . . . . . 703.80
Vedanta [1] . . . . . . . . . . . . . . . . . . . .. . . . . . 364.00. . . . . . 353.95. . . . . . 363.50. . . . . . 365.60. . . . . . 353.10. . . . . 5793.69. . . . . . 385.75. . . . . . 191.50. . . . . . 9 . . . . . . 353.70
Wipro [2] . . . . . . . . . . . . . . . . . . . . . .. . . . . . 562.45. . . . . . 570.80. . . . . . 555.75. . . . . . 572.70. . . . . . 555.40. . . . . 8767.00. . . . . . 739.80. . . . . . 398.00. . . . . 32 . . . . . . 570.65
Yes Bk [2] . . . . . . . . . . . . . . . . . . . . .. . . . . . . 13.90. . . . . . . 13.65. . . . . . . 13.75. . . . . . . 13.80. . . . . . . 13.60. . . . 64338.35. . . . . . . 16.90. . . . . . . 10.51. . . . . . . . . . . . 13.67
BusinessLine is not responsible for the recommendations
sourced from third party brokerages. Reports may be sent
ICICI SECURITIESPaytm (Buy) Target: ₹�1,352CMP: ₹�807One 97 Communications’ (Paytm) twosideddigital ecosystem of 64.4 million averagemonthly transacting users (MTUs) (as atDec’21) from over 350 million consumer baseand over 24.9 million merchants are core toits unit economics.Estimating that it currently generatesrevenue of ₹�350375 per MTU and ₹�11.1K permerchant and incurs direct cost (ofacquisition and transaction) of ₹�250275 perMTU and ₹�750775 per merchant, we derivecustomer lifetime value of ₹�2K per MTU and₹�29.6K per merchant. Super imposing this on FY24 estimated MTUand merchant base and adjusting further forfi�xed cost, net cash and value ofassociates/subsidiaries, we arrive at Paytm’sintrinsic business value of ₹�94,000 crore(₹�1,352 per share). We initiate coverage on the stock with Buyrating. Key risks being below expectedmonetisation through fi�nancial servicesbusiness and unfavourable regulatoryoutcomes.
BROKER’S CALL
MOTILAL OSWAL Dabur (Buy) Target: ₹�705CMP: ₹�553.45We reiterate our Buy rating on Dabur with atarget price of ₹�705. Our investment thesis onDabur is premised on the following keyattributes: highest topline growth visibilityamong peers; consistent market share gainsacross categories; and potential to record evenfaster earnings growth postcompletion of itsongoing investment phase.The key catalysts that underpin a sustaineddoubledigit topline growth for Dabur include:an impressive performance in the Ayurvedichealthcare space; an encouraging output fromthe Power Brand strategy; an improvingoutlook for the F&B business; and a host of newlaunches by the company. In fact, Dabur is on track to deliver adoubledigit sales growth in FY22, a featachieved in two out of three years since thethen new CEO took over.The recent stock price correction from its peakoff�ers an attractive entry point in our opinionwith the stock now trading at 39x FY24 P/E, adiscount of 15 per cent/20 per cent to itshistorical three/fi�veyear averages, respectively.Dabur is among our top two picks in theStaples space along with Godrej Consumer(GCPL).Downside risks to our investment case include:a persistent and intensifi�ed rural slowdown; aspike in material cost pressures;higherthanexpected moderation in thedemand for herbal health products as thepandemic recedes; and a reversal in recentmarket share gains.
OUR BUREAU
Mumbai, February 21
Benchmark indices closed in thered for the fourth consecutive session amid volatility on Monday.Though the benchmarks fell onlymarginally, but the pain wasdeeper as over twothird tradedstocks on the BSE closed in the red.Stocks across metals, oil & gas, realty and pharma sector fell themost.
Markets opened on a weak noteas the geopolitical tensionsbetween Russia and Ukrainecontinued.
After swinging beteen 58,141.96and 57,167.02, the BSE Sensexclosed at 57,683.59, down 149.38
points or 0.26 per cent. The Nifty50 closed at 17,206.65, down 69.65points or 0.4 per cent. The volatility index rose 3.32 per cent to 22.90.
The market breadth remainedin favour of the decliners with 2,817stocks declining on the BSE asagainst 675 that advanced.
FII sellingInvestors remained concerned regarding continued FII selling. Major headwinds including rate hikefears, fi�rm commodity prices, especially crude oil, and rising bondyields have also been weighing onglobal investor sentiments.
FIIs on Monday sold sharesworth ₹�2,261 crore in the cashsegment.
Mitul Shah, Head of Research atReliance Securities, said: “The geopolitical pot is boiling. If that is notenough, the Fed’s aggressive tone
on rate hike is keeping market participants on the edge. The LIC’s upcoming IPO – India’s biggest ever
public listing — continues to makewaves,” said Shah. Wipro, Infosys,Shree Cement, PowerGrid andHDFC Bank were the top gainerson the Nifty 50 while Hindalco,UPL, Divi’s Lab, Adani Ports and SunPharma were the top laggards.
Nifty Bank edges upOn the sectoral front, all indices except Nifty Bank and Nifty PrivateBank closed in the red. Nifty Midcap 50 was down 0.80 per centwhile Nifty Smallcap 50 was down2.85 per cent. The S&P BSE Midcapwas down 0.80 per cent while theS&P BSE Smallcap was down 2.20per cent.
Nifty Metal was down over 2 percent while Nifty Oil & Gas wasdown nearly 2 per cent. Nifty Realty, Nifty PSU Bank, Nifty Healthcare Index and Nifty Pharma wereeach down over 1 per cent.
FIIs selling remains
unabated; metal, oil
stocks lead slide
2,800 stocks end in red on BSE;Sensex, Nifty slide for 4th day
PRESS TRUST OF INDIA
New Delhi, February 21
The Securities Appellate Tribunal(SAT) has quashed a SEBI orderagainst HDFC Bank, whereby the regulator had imposed a penalty of ₹�1crore on the lender in a case pertaining to invoking securities pledged bystockbroker BRH Wealth Kreators.
In addition, the regulator had directed to transfer ₹�158.68 crore alongwith seven per cent interest per annum into an escrow account till theissue of settlement of clients’ securities is reconciled.
These directions were issued bySEBI in January 2021 as HDFC Bank invoked securities pledged by BRHWealth Kreators in violation of theregulator's interim order passed inOctober 2019.
‘Can invoke pledged shares’Following the SEBI's order, HDFCBank moved to SAT.
In its order on Friday, SAT said thebank was justifi�ed in invoking thepledge made by the broker BRH.While invoking the pledge the bankdid not violate any direction contained in SEBI’s interim order. “Theappellant (HDFC Bank) could invokethe pledge under Depositories Actand is not required to approach anyforum or Court of law for invocationof the pledge. The assets of thebroker do not include pledge of theshares created by the subbroker,”SAT said.
Tribunal dismisses SEBIorder against HDFC Bank
BRH WEALTH KREATORS CASE
GURUMURTHY K
BL Research Bureau
The outlook for the stock of Indiabulls Housing Finance isbearish. The stock had tumbled9.6 per cent on Monday and hasbroken below the key nearterm support level of ₹�180.Prior to this fall, the stock wasconsolidating between ₹�180and ₹�195 for some time. Immediate resistance is at ₹�180. Nextstrong resistance will be in the₹�190195 region.
The stock can fall to ₹�140 initially. A break below ₹�140 willtrigger a further fall towards₹�110100 in the coming weeks.Traders can go short at currentlevels. Accumulate shorts onrallies at ₹�176 and ₹�188. Keepthe stoploss at ₹�203. Trail the
stoploss down to ₹�162 as soonas the stock falls to ₹�151. Movethe stoploss further down to₹�134 as soon as the stocktouches ₹�128. Book profi�ts at₹�122. The downside pressurewill ease only if the stock risesabove ₹�185.
However, the stock will haveto rise past ₹�200 decisively inorder to turn the outlookbullish. In such a scenario, thestock can move upto ₹�220₹�230and will negate the danger ofseeing ₹�110₹�100 on the downside. However, the chances ofbreaking above ₹�200 is veryless.
(Note: The recommendations are
based on technical analysis. There
is risk of loss in trading.)
TODAY'S PICK
Indiabulls Housing Finance (₹�166.75): SELL
17208 • Nifty 50 FuturesS1 S2 R1 R2 COMMENT
17100 17000 17320 17380 Bias is negative. Wait for rallies and
go short at 17310 and 17360.
Stoploss can be kept at 17430.
S1, S2: Support 1 & 2; R1, R2: Resistance 1 & 2.
₹�1523 • HDFC BankS1 S2 R1 R2 COMMENT
1505 1490 1530 1540 Can see a fresh fall from here. Go
short now and at 1528. Keep the
stoploss at 1547
₹�1730 • InfosysS1 S2 R1 R2 COMMENT
1720 1685 1740 1755 Initiate fresh short positions with a
stoploss at 1735 if the stock breaks
below 1720.
₹�218 • ITCS1 S2 R1 R2 COMMENT
215 210 221 226 Nearterm outlook is bearish. Go
short now and at 220. Stoploss can
be kept at 224
₹�163 • ONGCS1 S2 R1 R2 COMMENT
162 160 165 168 Above range support. Go short with
a stoploss at 165 only if the stock
breaks below 162.
₹�2400 • Reliance Ind. S1 S2 R1 R2 COMMENT
2375 2345 2435 2460 Bearish with a reversal pattern on
intraday chart. Go short now with a
stoploss at 2445
₹�512 • SBIS1 S2 R1 R2 COMMENT
506 500 521 526 Support ahead. Go short only if the
stock breaks below 506. Stoploss
can be placed at 509.
₹�3719 • TCSS1 S2 R1 R2 COMMENT
3685 3620 3750 3800 Immediate outlook is mixed. Wait
for a break below 3685 to go short.
Keep the stoploss at 3715
DAY TRADING GUIDE
Nifty 50 Movers H 69.65 pts.Close(₹�) Pts PE Wt(%)
Infosys . . . . . . . . . . . . . . . . . . . . . . . . . . . . . . . . .. . 1730.70. . . . . . . . 20.15. . . . . . . . . 34.26 . . . . . . . . 8.53HDFC Bank . . . . . . . . . . . . . . . . . . . . . . . . . .. . 1522.10. . . . . . . . . . 9.77. . . . . . . . . 23.35 . . . . . . . . 8.86ICICI Bank . . . . . . . . . . . . . . . . . . . . . . . . . . .. . . . 754.45. . . . . . . . . . 8.82. . . . . . . . . 21.97 . . . . . . . . 6.97Wipro . . . . . . . . . . . . . . . . . . . . . . . . . . . . . . . . . .. . . . 570.80. . . . . . . . . . 2.83. . . . . . . . . 25.80 . . . . . . . . 1.12PowerGrid Corp . . . . . . . . . . . . . . . . . . .. . . . 198.15. . . . . . . . . . 1.92. . . . . . . . . . . 8.54 . . . . . . . . 0.90Maurti Suzuki . . . . . . . . . . . . . . . . . . . . . .. . 8612.70. . . . . . . . . . 1.33. . . . . . . . . 80.18 . . . . . . . . 1.52Shree Cement. . . . . . . . . . . . . . . . . . . . . .24678.35. . . . . . . . . . 1.00. . . . . . . . . 35.94 . . . . . . . . 0.44Axis Bank. . . . . . . . . . . . . . . . . . . . . . . . . . . . .. . . . 788.85. . . . . . . . . . 0.85. . . . . . . . . 19.02 . . . . . . . . 2.70Nestle India Ltd. . . . . . . . . . . . . . . . . . .18106.10. . . . . . . . . . 0.79. . . . . . . . . 81.39 . . . . . . . . 0.86Tata Motors . . . . . . . . . . . . . . . . . . . . . . . . .. . . . 494.45. . . . . . . . . . 0.53. . . . . . . . . . . 0.00 . . . . . . . . 1.18Kotak Bank . . . . . . . . . . . . . . . . . . . . . . . . . .. . 1827.10. . . . . . . . . . 0.18. . . . . . . . . 33.60 . . . . . . . . 3.57Eicher Motors . . . . . . . . . . . . . . . . . . . . . .. . 2699.00. . . . . . . . 0.01. . . . . . . . . 46.34 . . . . . . . . 0.50HCL Tech . . . . . . . . . . . . . . . . . . . . . . . . . . . . .. . 1164.75. . . . . . . . 0.06. . . . . . . . . 28.64 . . . . . . . . 1.68Britannia Ind. . . . . . . . . . . . . . . . . . . . . . . .. . 3475.25. . . . . . . . 0.17. . . . . . . . . 55.88 . . . . . . . . 0.55Cipla . . . . . . . . . . . . . . . . . . . . . . . . . . . . . . . . . . . .. . . . 907.25. . . . . . . . 0.22. . . . . . . . . 28.29 . . . . . . . . 0.62IndusInd Bank . . . . . . . . . . . . . . . . . . . . .. . . . 952.45. . . . . . . . 0.43. . . . . . . . . 17.03 . . . . . . . . 0.82NTPC . . . . . . . . . . . . . . . . . . . . . . . . . . . . . . . . . . .. . . . 131.95. . . . . . . . 0.43. . . . . . . . . . . 7.80 . . . . . . . . 0.83TataConsumerProducts Ltd.. . . . 713.20. . . . . . . . 0.59. . . . . . . . . 77.28 . . . . . . . . 0.57Dr Reddys Lab . . . . . . . . . . . . . . . . . . . . .. . 4298.25. . . . . . . . 0.64. . . . . . . . . 27.07 . . . . . . . . 0.69Asian Paints. . . . . . . . . . . . . . . . . . . . . . . . .. . 3251.65. . . . . . . . 0.70. . . . . . . 101.24 . . . . . . . . 1.95BPCL. . . . . . . . . . . . . . . . . . . . . . . . . . . . . . . . . . . .. . . . 368.75. . . . . . . . 0.96. . . . . . . . . . . 4.10 . . . . . . . . 0.47Indian OilCorp . . . . . . . . . . . . . . . . . . . . .. . . . 119.20. . . . . . . . 1.13. . . . . . . . . . . 4.04 . . . . . . . . 0.40Bajaj Finserv . . . . . . . . . . . . . . . . . . . . . . . .16012.25. . . . . . . . 1.17. . . . . . . . . 33.86 . . . . . . . . 1.29Bharti Airtel. . . . . . . . . . . . . . . . . . . . . . . . .. . . . 709.95. . . . . . . . 1.40. . . . . . . . . 63.91 . . . . . . . . 2.23Bajaj Finance . . . . . . . . . . . . . . . . . . . . . . .. . 7006.35. . . . . . . . 1.44. . . . . . . . . 71.01 . . . . . . . . 2.47Bajaj Auto . . . . . . . . . . . . . . . . . . . . . . . . . . . .. . 3579.50. . . . . . . . 1.57. . . . . . . . . 16.73 . . . . . . . . 0.62SBI Life . . . . . . . . . . . . . . . . . . . . . . . . . . . . . . . .. . 1134.75. . . . . . . . 1.59. . . . . . . . . 83.08 . . . . . . . . 0.66Tata Steel . . . . . . . . . . . . . . . . . . . . . . . . . . . .. . 1181.85. . . . . . . . 1.63. . . . . . . . . . . 3.70 . . . . . . . . 1.25HDFC . . . . . . . . . . . . . . . . . . . . . . . . . . . . . . . . . . .. . 2436.80. . . . . . . . 1.80. . . . . . . . . 19.31 . . . . . . . . 5.86Hero MotoCorp. . . . . . . . . . . . . . . . . . . .. . 2713.35. . . . . . . . 1.80. . . . . . . . . 20.90 . . . . . . . . 0.47HDFC Life . . . . . . . . . . . . . . . . . . . . . . . . . . . .. . . . 582.00. . . . . . . . 1.91. . . . . . . 103.39 . . . . . . . . 0.72JSW Steel . . . . . . . . . . . . . . . . . . . . . . . . . . . .. . . . 623.10. . . . . . . . 2.21. . . . . . . . . . . 6.91 . . . . . . . . 0.82M&M . . . . . . . . . . . . . . . . . . . . . . . . . . . . . . . . . . .. . . . 841.10. . . . . . . . 2.39. . . . . . . . . 16.65 . . . . . . . . 1.07Grasim Ind . . . . . . . . . . . . . . . . . . . . . . . . . . .. . 1692.45. . . . . . . . 2.60. . . . . . . . . 11.56 . . . . . . . . 0.84UPL . . . . . . . . . . . . . . . . . . . . . . . . . . . . . . . . . . . . . .. . . . 704.15. . . . . . . . 2.62. . . . . . . . . 13.24 . . . . . . . . 0.52UltraTech Cement. . . . . . . . . . . . . . . .. . 6813.45. . . . . . . . 2.73. . . . . . . . . 30.28 . . . . . . . . 1.05Adani Ports . . . . . . . . . . . . . . . . . . . . . . . . . .. . . . 711.10. . . . . . . . 2.76. . . . . . . . . 28.42 . . . . . . . . 0.70Divis Lab . . . . . . . . . . . . . . . . . . . . . . . . . . . . . .. . 4258.30. . . . . . . . 2.77. . . . . . . . . 44.02 . . . . . . . . 0.72Tech Mahindra. . . . . . . . . . . . . . . . . . . . .. . 1418.20. . . . . . . . 2.81. . . . . . . . . 26.83 . . . . . . . . 1.17Coal India . . . . . . . . . . . . . . . . . . . . . . . . . . . .. . . . 161.20. . . . . . . . 2.92. . . . . . . . . . . 6.51 . . . . . . . . 0.45State Bank . . . . . . . . . . . . . . . . . . . . . . . . . . .. . . . 511.85. . . . . . . . 3.03. . . . . . . . . 13.64 . . . . . . . . 2.61Titan . . . . . . . . . . . . . . . . . . . . . . . . . . . . . . . . . . . .. . 2454.35. . . . . . . . 3.30. . . . . . . . . 97.32 . . . . . . . . 1.36Hind Unilever. . . . . . . . . . . . . . . . . . . . . . .. . 2294.80. . . . . . . . 3.63. . . . . . . . . 61.46 . . . . . . . . 2.72ONGC . . . . . . . . . . . . . . . . . . . . . . . . . . . . . . . . . .. . . . 163.40. . . . . . . . 3.76. . . . . . . . . . . 4.27 . . . . . . . . 0.79Sun Pharma . . . . . . . . . . . . . . . . . . . . . . . . .. . . . 843.85. . . . . . . . 4.71. . . . . . . . . 31.35 . . . . . . . . 1.21L&T . . . . . . . . . . . . . . . . . . . . . . . . . . . . . . . . . . . . . .. . 1863.95. . . . . . . . 5.29. . . . . . . . . 25.92 . . . . . . . . 2.99Hindalco . . . . . . . . . . . . . . . . . . . . . . . . . . . . . .. . . . 512.00. . . . . . . . 5.88. . . . . . . . . . . 9.36 . . . . . . . . 0.99ITC . . . . . . . . . . . . . . . . . . . . . . . . . . . . . . . . . . . . . . .. . . . 218.00. . . . . . . . 7.81. . . . . . . . . 17.84 . . . . . . . . 2.54TCS . . . . . . . . . . . . . . . . . . . . . . . . . . . . . . . . . . . . . .. . 3719.40. . . . . . 17.65. . . . . . . . . 36.42 . . . . . . . . 5.12Reliance Ind. . . . . . . . . . . . . . . . . . . . . . . . .. . 2399.90. . . . . . 19.33. . . . . . . . . 25.04 . . . . . . 11.01
Pts: Impact on index movement
Nifty Next 50 Movers H 531.70 pts.Close(₹�) Pts PE Wt(%)
Dabur India . . . . . . . . . . . . . . . . . . . . . . . . . .. . . . 553.60. . . . . . . . 11.49. . . . . . . . . 53.62 . . . . . . . . 2.73Avenuesuper . . . . . . . . . . . . . . . . . . . . . . .. . 4096.60. . . . . . . . . . 8.98. . . . . . . 179.36 . . . . . . . . 3.90Gland Pharma . . . . . . . . . . . . . . . . . . . . .. . 3252.90. . . . . . . . . . 4.63. . . . . . . . . 45.06 . . . . . . . . 1.06Marico . . . . . . . . . . . . . . . . . . . . . . . . . . . . . . . . .. . . . 507.25. . . . . . . . . . 4.39. . . . . . . . . 53.51 . . . . . . . . 2.22Info Edge (India) .. . . . . . . . . . . . . . . .. . 4442.65. . . . . . . . . . 3.94. . . . . . . . . . . 4.59 . . . . . . . . 2.90United Spirits . . . . . . . . . . . . . . . . . . . . . .. . . . 838.85. . . . . . . . . . 2.93. . . . . . . . . 72.97 . . . . . . . . 2.11Jindal Steel . . . . . . . . . . . . . . . . . . . . . . . . . .. . . . 415.15. . . . . . . . . . 2.77. . . . . . . . . . . 4.91 . . . . . . . . 1.43CholamandInvest&Finance .. . . . 674.15. . . . . . . . . . 1.41. . . . . . . . . 32.33 . . . . . . . . 2.25Acc . . . . . . . . . . . . . . . . . . . . . . . . . . . . . . . . . . . . . .. . 2184.90. . . . . . . . . . 1.08. . . . . . . . . 22.02 . . . . . . . . 1.56Ambuja Cements . . . . . . . . . . . . . . . . .. . . . 338.55. . . . . . . . . . 0.50. . . . . . . . . 15.82 . . . . . . . . 2.10Jubilant Foodworks . . . . . . . . . . . . .. . 2981.30. . . . . . . . . . 0.25. . . . . . . . . 92.05 . . . . . . . . 1.93Colgate . . . . . . . . . . . . . . . . . . . . . . . . . . . . . . . .. . 1410.90. . . . . . . . . . 0.20. . . . . . . . . 35.88 . . . . . . . . 1.59Larsen & Toubro Info . . . . . . . . . .. . 5861.30. . . . . . . . . . 0.10. . . . . . . . . 46.54 . . . . . . . . 2.26Havells. . . . . . . . . . . . . . . . . . . . . . . . . . . . . . . . .. . 1201.15. . . . . . . . 0.13. . . . . . . . . 65.54 . . . . . . . . 2.54Muthoot Finance . . . . . . . . . . . . . . . .. . 1321.85. . . . . . . . 0.81. . . . . . . . . 13.10 . . . . . . . . 1.21Bajaj Holdings . . . . . . . . . . . . . . . . . . . . .. . 5352.90. . . . . . . . 1.34. . . . . . . . . 15.01 . . . . . . . . 1.71Torrent Pharma . . . . . . . . . . . . . . . . . . .. . 2654.90. . . . . . . . 1.51. . . . . . . . . 36.86 . . . . . . . . 1.10Bosch . . . . . . . . . . . . . . . . . . . . . . . . . . . . . . . . . .15787.00. . . . . . . . 2.00. . . . . . . . . 34.48 . . . . . . . . 1.14Pidilitind . . . . . . . . . . . . . . . . . . . . . . . . . . . . . .. . 2426.30. . . . . . . . 2.28. . . . . . . . . 97.86 . . . . . . . . 3.13Punjab Natl Bank . . . . . . . . . . . . . . . . .. . . . . 37.50. . . . . . . . 2.52. . . . . . . . . . . 9.66 . . . . . . . . 0.94Indus Towers .. . . . . . . . . . . . . . . . . . . . . .. . . . 251.70. . . . . . . . 3.30. . . . . . . . . 11.48 . . . . . . . . 1.72Cadila Health. . . . . . . . . . . . . . . . . . . . . . .. . . . 371.15. . . . . . . . 4.69. . . . . . . . . 15.95 . . . . . . . . 0.80Lupin . . . . . . . . . . . . . . . . . . . . . . . . . . . . . . . . . . .. . . . 760.75. . . . . . . . 5.72. . . . . . . . . . . 0.00 . . . . . . . . 1.55Proc & Gam . . . . . . . . . . . . . . . . . . . . . . . . .15529.80. . . . . . . . 5.82. . . . . . . . . 87.27 . . . . . . . . 0.93Sail . . . . . . . . . . . . . . . . . . . . . . . . . . . . . . . . . . . . . .. . . . . 95.60. . . . . . . . 6.14. . . . . . . . . . . 2.98 . . . . . . . . 1.17Hdfc Asset Mgmt Cmp .. . . . . . .. . 2171.15. . . . . . . . 6.31. . . . . . . . . 33.89 . . . . . . . . 1.21Nmdc . . . . . . . . . . . . . . . . . . . . . . . . . . . . . . . . . . .. . . . 140.05. . . . . . . . 8.15. . . . . . . . . . . 3.95 . . . . . . . . 1.35Yes Bank . . . . . . . . . . . . . . . . . . . . . . . . . . . . . .. . . . . 13.65. . . . . . . . 8.20. . . . . . . . . . . 0.00 . . . . . . . . 1.11Biocon . . . . . . . . . . . . . . . . . . . . . . . . . . . . . . . . .. . . . 387.50. . . . . . . . 8.27. . . . . . . . . 59.31 . . . . . . . . 1.53Indraprastha Gas . . . . . . . . . . . . . . . .. . . . 370.55. . . . . . . . 8.80. . . . . . . . . 17.93 . . . . . . . . 1.10Berger Paints India . . . . . . . . . . . . .. . . . 726.65. . . . . . . . 9.20. . . . . . . . . 85.94 . . . . . . . . 1.49Intglobeavi . . . . . . . . . . . . . . . . . . . . . . . . . .. . 2086.55. . . . . . . . 9.83. . . . . . . . . . . 0.00 . . . . . . . . 1.70Bank Of Baroda . . . . . . . . . . . . . . . . . . .. . . . 103.75. . . . . . 10.12. . . . . . . . . 10.40 . . . . . . . . 1.63Bandhan Bank . . . . . . . . . . . . . . . . . . . . .. . . . 314.00. . . . . . 12.29. . . . . . . . . . . 0.00 . . . . . . . . 1.80Siemens. . . . . . . . . . . . . . . . . . . . . . . . . . . . . . .. . 2415.60. . . . . . 12.64. . . . . . . . . 83.26 . . . . . . . . 1.82Hpcl . . . . . . . . . . . . . . . . . . . . . . . . . . . . . . . . . . . . .. . . . 292.75. . . . . . 13.01. . . . . . . . . . . 4.98 . . . . . . . . 1.58Icici Lombard Gic . . . . . . . . . . . . . . . . .. . 1266.75. . . . . . 13.74. . . . . . . . . 49.29 . . . . . . . . 2.73Apollo Hosp . . . . . . . . . . . . . . . . . . . . . . . . .. . 4426.65. . . . . . 15.35. . . . . . . . . 53.88 . . . . . . . . 3.77Aurobindo Pharma . . . . . . . . . . . . . .. . . . 639.05. . . . . . 17.15. . . . . . . . . 13.04 . . . . . . . . 1.52IPrulife . . . . . . . . . . . . . . . . . . . . . . . . . . . . . . .. . . . 510.55. . . . . . 19.31. . . . . . . 115.59 . . . . . . . . 1.67Godrej Consumer . . . . . . . . . . . . . . . .. . . . 809.00. . . . . . 21.07. . . . . . . . . 46.32 . . . . . . . . 2.59Sbi Cards And Pay Srv . . . . . . . .. . . . 802.45. . . . . . 21.48. . . . . . . . . 62.51 . . . . . . . . 1.79Pi Industries . . . . . . . . . . . . . . . . . . . . . . .. . 2505.60. . . . . . 22.37. . . . . . . . . 46.40 . . . . . . . . 1.70Dlf. . . . . . . . . . . . . . . . . . . . . . . . . . . . . . . . . . . . . . . .. . . . 346.50. . . . . . 27.64. . . . . . . . . 54.56 . . . . . . . . 1.81Gail (India) . . . . . . . . . . . . . . . . . . . . . . . . . .. . . . 136.30. . . . . . 28.13. . . . . . . . . . . 5.33 . . . . . . . . 2.10Piramal Ent. . . . . . . . . . . . . . . . . . . . . . . . . .. . 2096.90. . . . . . 29.76. . . . . . . . . 37.41 . . . . . . . . 2.37Adani Transmission .. . . . . . . . . . . .. . 1895.90. . . . . . 43.88. . . . . . . 166.11 . . . . . . . . 3.33Vedanta . . . . . . . . . . . . . . . . . . . . . . . . . . . . . . .. . . . 353.95. . . . . . 44.41. . . . . . . . . . . 5.46 . . . . . . . . 3.89Adani Enter. . . . . . . . . . . . . . . . . . . . . . . . . .. . 1685.20. . . . . . 47.72. . . . . . . 233.29 . . . . . . . . 3.92Adani Green Energy . . . . . . . . . . . .. . 1955.90. . . . . . 79.33. . . . . . . 648.10 . . . . . . . . 4.49
Pts: Impact on index movement
OUR BUREAU
Mumbai, February 21
The initial public off�erings(IPO) of Pharmeasy parent APIHoldings Limited, CMR GreenTechnologies Limited and Wellness Forever Medicare Ltd havereceived approval from the Securities and Exchange Board ofIndia (SEBI) in the past week.
These three companies hadfi�led their preliminary IPO papers with SEBI between September and November 2021. Thesecompanies have obtained SEBI’s“observations” during February1617, 2022, an update with SEBIshowed. Companies can goahead with IPO if they get observations from SEBI.
API’s plansLeading online digital healthcare startup, API Holdings Limited, which owns digital pharmacy brand PharmEasy plans toraise up to ₹�6,250 crore
through its IPO which will be aprimary share sale as none ofthe existing promoters/shareholders are making any off�erfor sale (OFS).
Additionally, the company, inconsultation with the bankersto the issue, may consider aprivate placement aggregatingup to ₹�1,250 crore. If such placement is completed, the fresh issue size will be reduced.
The IPO of the metal recycling company CMR Green Technologies comprises fresh issuance of equity shares worth₹�300 crore and an OFS of 3.34crore shares by promoters andinvestors, according to thedraft papers.
The IPO of the Adar Poonawallabacked pharmacy Wellness Forever Medicare involvesa fresh issue of equity sharesaggregating to ₹�400 crore andan OFS of up to 1.60 croreequity shares.
IPOs: PharmEasy, CMR Green,Wellness Forever get SEBI nod
OUR BUREAU
Chennai, February 21
Sundaram Alternates, a fullyowned subsidiary of SundaramAsset Management Company, onMonday announced the launchof Atlas, a diversifi�ed multisector Category III Alternative Investment Fund (AIF.
Sundaram Alternates’ maidenfund, in the openended Category III space, is looking atlonger investment horizonswith appreciation opportunitiesfor 4plus years. Atlas is open forsubscription to domestic and international investors.
Atlas will focus on structuralequity and cyclical value opportunities, and predominantly
play four themes Capex ‘Maestros’ businesses that have clearmultiyear capex plans and haveidentifi�ed profi�table opportunities to grow; Phygital Bluechips traditional businesses adoptingtechnology to gain marketshare, particularly in retail andBFSI; Consumption Czars underpriced mid and smallcaps inareas of discretionary consumption and consumer durables;and Export Voyagers Globalgoods and service providers witha Make in India, Sell in the Worldpositioning.
“In a growing country like India, every stage of economic development provides investmentopportunities. We are currentlyin a sweet spot. A multicap,multisector fund is well poisedto take advantage of these opportunities, and we believe thetime is right for Atlas,” Vijayendiran R, Chief Executive Offi�cer, Sundaram Alternates, said.
Sundaram Alternates launchesCategory III AIF ‘Atlas’ The fund will focuson structural equity
and cyclical valueopportunities
OUR BUREAU
Mumbai, February 21
V Vaidyanathan, Managing Director and CEO, IDFC First Bank,has gifted 9 lakhshares of the privatesector lender to fi�vemembers of his staff�to help them purchase houses.
“It is declared thatthe recipients are personal relationshipsand not related tohim in any mannerunder the defi�nition of relatedparties of the Companies Act orSEBI Regulations,” the bank saidin a stock exchange fi�ling.
At Monday’s closing price of₹�43.9 apiece on BSE for the scrip,
this would amount to about₹�3.95 crore in total.
Vaidyanathan gifted threelakh shares to his trainer, twolakh shares each to his househelp and driver and one lakhshares each to his offi�ce supportstaff� and a house help.
“In addition, Rukmani SocialWelfare Trust has disposed 2,00,000equity shares to support social activities,”the bank further said,adding that the totalshares disposed forgifts and social activities is 11,00,000 equityshares of IDFC FirstBank.
Vaidyanathan has previouslyin 2021 also gifted shares of thebank to three of his employees.Before that, he had transferredshares to his teacher as a token ofgratitude.
IDFC First Bank chief donates 9 lakh sharesVaidyanathan gifts shares worth
₹�3.95 crore to staff
V Vaidyanathan
................BM-BMECMYK
MUMBAI
BusinessLineTUESDAY • FEBRUARY 22 • 2022 7NEWS
OUR BUREAU
Mumbai, February 21
Gold loan auctions by nonbanking fi�nance companies(NBFCs) would normalise inQ4 (JanuaryMarch) FY22 asNBFCs with a large portfolioare seen adopting aggressivestrategies to maintain andexpand their gold loan franchise in the face of intensecompetition from banks, according to India Ratings(IndRa).
The rating agency attributed the expected normalisation to gold prices stabilisingsince October 2021, after periods of corrections seen sinceDecember 2020, along withnormalcy returning in business activities.
IndRa assessed that asNBFCs may expand theirgold loan franchise, thiscould result in comprom
ising on margins while off�ering lower yield loans, especially large ticket size loans,to retain customers, incurring higher operating expenditure, and probablydriving fl�exible loan terms,thus impacting operatingperformance.
Jinay Gala, Associate Director, IndRa, in a report, observed that gold loan auctions by NBFCs rose in 9MFY22, perhaps highest sinceFY14 when gold saw largervolatility in its prices.
Delinquent loansNBFCs off�ering gold loansfaced higher auction pressures in 9M FY22, largely dueto the Covid19 impact onborrowers’ cash fl�ows andthe gold price correcting byaround 10 per cent duringmidJune to September 30,
2021, he said, adding a similar fall was seen in Q4 FY21.
A sizeable proportion ofloans turned delinquent,leading to auctions in therange of 4 per cent to 13 percent of gold assets undermanagement (AUM) in 9MFY22 across lenders with subsequent buildup in grossstage3 assets, the reportsaid.
“...As gold loan borrowers,especially smallticket ones,are generally among the fi�nancially weaker segments,the auction data also indicates high stress among these
borrowers largely due topandemic,” Gala said.
“This is corroborated bythe high delinquencies observed in microfi�nance loansin 9M FY22. The sharp rise indelinquencies and auctionsare a reminder that the assetclass performance remainsvulnerable to sharp volatilityin gold loan prices and income volatility among weakborrowers,” Gala added.
Regulations controlWhile NBFCs have seen asharp rise in loan auctions,the situation at banks hasbeen less intensive as theregulations ensure that theloantovalue (LTV) ratio re
mains lower throughout thetenor of the loans, increasingthe incentive for borrowersto arrange for the redemption of gold loans fromlenders.
IndRa noted that the general practice among NBFCsfi�nancing gold loans is tolimit the LTV ratio at 75 percent at disbursal and thisbuff�er could reduce on abuildup of interest. However, banks are required tomaintain LTV of 75 per centduring the entire tenor ofloans.
As per the respective internal risk policies, NBFCslargely send auction noticesto borrowers if the accruedinterest plus principal dueslead to a rise in LTV to 9095per cent, thereby necessitating borrowers to either topup the collateral or close theloan. In case of a shortfall inboth cases, the borrower collateral goes for an auction,the agency said.
IndRa sees shadow banking sector
facing intense competition from banks
‘NBFCs may pursue aggressive growth strategies’WX
NBFCs offering gold loans
faced higher auction
pressures in 9M FY22,
largely due to the
Covid-19 impact on
borrowers’ cash flows
BLOOMBERG
February 21
Companies want the capitalmarket regulator to changeproposed rules on transactions between group fi�rms,founders and related entitiesas they will lead to an increasein compliance costs and delayin decision making.
Engineering major Larsen& Toubro Ltd and lobbygroups including the Confederation of Indian Industry(CII) want the Securities andExchange Board of India(SEBI) to scrap the mandatoryshareholder approval fordeals beyond ₹�10 billion. Instead, the existing rule of 10per cent of annual turnovershould prevail even after thenew rules kick in on April 1.
Late last year, SEBItightened rules on related
party transactions to curb siphoning of funds by foundersand ensure better corporategovernance. These transactions are essentially conducted between a listed companyand its founders, entities related to the owners or withlarge shareholders.
Leads to inefficiencies“The proposals announced bySEBI makes compliance quitetedious and complicated particularly for large companies,” L&T’s Chief Financial Offi�cer, R Shankar Raman, said.
“Thresholds should have hada linkage to the size of thecompany. Approaching shareholders on multiple occasions in the course of the yearfor approval is not effi�cienttime wise.” Emails sent to SEBIdid not receive a response.The regulator tightened thenorms after alleged irregularities were observed in the caseof some companies includingDHFL and Fortis Healthcare.The regulator set up a working group in November 2019to strengthen regulatorynorms and notifi�ed theamendments for implementation from April 2022.
“While SEBI norms intendto set a higher governance barfor listed companies to predominantly limit cash stripping and to ensure fraud andsiphoning of funds can be reduced, it comes with its ownpractical challenges, especially for large conglomerates,” said Gaurav Mistry, Associate Partner, DSK Legal.
Companies tell SEBI
it will lead to a rise
in compliance cost
‘Proposals announced by SEBI
makes compliance quite
tedious and complicated’
‘Reverse related-party rule’
OUR BUREAU
Mumbai, February 21
Wego, an online travel marketplace in the Middle Eastand North Africa (MENA) region, on Monday announcedit has signed a defi�nitiveagreement with Flipkart to acquire Cleartrip’s Middle Eastbusiness.
This transaction also includes the sale of Flyin.comand a technology cooperation agreement betweenWego and Flipkart. The boardsof directors of Wego and Flipkart have approved the transaction which is expected toclose in the second half of2022, subject to customary
closing conditions and regulatory approvals. Cleartrip is apioneer of online travel in India. It expanded organicallyinto the Middle East in 2010and acquired RiyadhbasedFlyin.com in 2018.
‘A crucial role to play’Ross Veitch, CEO & CoFounder of Wego, said, “Weare excited to welcomeCleartrip Middle East andFlyin into the Wego group.The Middle East is set to beone of the most excitinggrowth stories of the next decade with the travel and technology sectors taking centrestage and with the Wegogroup playing a very crucialrole. Stuart Crighton, CoFounder and Head ofCleartrip’s International Business, said, “Our focus is tobuild a worldclass onlinetravel business.”
Transaction also
includes the sale
of Flyin.com, tech
cooperation deal
Wego to acquire Cleartrip’sMiddle East biz from Flipkart
OUR BUREAU
New Delhi, February 21
Bharti Airtel on Monday saidthat it has joined the SEAMEWE6 undersea cable consortium to scale up its highspeedglobal network capacity to serveIndia’s fast growing digital economy.
The 19,200 Rkm SEAMEWE6will connect Singapore andFrance, and will be amongst thelargest undersea cable systemsglobally, Airtel said.
Through SEAMEWE6, Airtelwill add 100 TBps capacity to itsglobal network. Airtel has acquired one fi�ber pair on themain SEAMEWE6 system andwill cobuild four fi�ber pairsbetween SingaporeChennaiMumbai as part of the cable system. Airtel will land the SEAMEWE6 cable system in India atnew landing stations in Mumbai and Chennai, it said.
Airtel joinsundersea cableconsortium
OUR BUREAU
Mumbai, February 21
Reliance Jio Infocomm Ltd(Jio) will land the nextgeneration multiterabit IndiaAsiaXpress (IAX) undersea cablesystem in Hulhumale, Maldives, the company announced onMonday.
The projectwill land in theisland nationMaldives incollaborationwith OceanConnect Maldives. The IAX system will connect Hulhumale’directly with the world’s major internet hubs in India andSingapore.
To be ready by 2023The IAX system originates inMumbai in the west and connects directly to Singapore, in
cluding additional landings inIndia, Malaysia, and Thailand.
The India EuropeXpress(IEX) system connects Mumbai to Milan, landing inSavona, Italy.
It includes additional landings in the MiddleEast, North Africa andthe Mediterranean.
IAX is expected tobe ready for serviceby end2023, whileIEX will be ready forservice in mid2024,the company said.
“These high capacities and highspeed systemswill provide more than200Tb/s of capacity at speedsof 100Gb/s, stretching over16,000 km. Employing opensystem technology and thelatest wavelength switchedRoADM/branching units ensures rapid upgrade deployment...,” it said.
Reliance Jio’s IAX undersea cable system to land in Maldives
BLOOMBERG
February 21
If COP26 was about countriesmaking promises to avoid catastrophic climate change,COP27 will be about raisingmoney so developing nationscan do their part. Alok Sharma,who presided over the lastUnited Nations climate summit hosted by the UK in Glasgow, in the past week visited Vietnam and Indonesia — twomiddleincome countries thathave said they couldstrengthen their climatepledges under the Paris Agreement. Both are seeking fi�nancial packages from rich countries that will allow them totransition away from coal.
As he prepares to hand overthe COP presidency, Sharmaisn’t taking his foot off� the gas.Neither is John Kerry, the US climate envoy, who visited Cairoon Monday to launch the US
Egypt Climate Working Group,which will seek to advancegoals ahead of COP27 hosted byEgypt. This year’s meeting willfocus less on raising targets tocut emissions and more on getting climate funding to developing countries — both to decarbonise and deal with theimpacts of a warmer planet.
Faster implementation“This is not the big bang kind ofCOP where you’re laying out abold new set of commitments,”said Alden Meyer, a veteran ofthe climate meetings who’s asenior associate with researchgroup E3G. “This is really ‘rollup your sleeves and get downto business’ and start to implement some of the things you’vealready committed to.”
The Glasgow Pact creatednew deadlines that will have tobe met, he said. There will be aministerial roundtable on cut
ting emissions, and countrieswill have to set a post2025 goalfor fi�nancial contributionsfrom rich countries. Makingprogress on the contentious issue of loss and damage, whatpoor nations say is owed tothem for damage alreadybaked in, is another task that remains unresolved after years oftalks.
The sense of frustration waspalpable as the meeting drewto a close in Glasgow. A globalcommitment to end the use ofcoal was watered down and developed countries failed to deliver on their promise to raise$100 billion a year in climate
fi�nance by 2020. In the end, aseries of pledges just kept alivethe chance of holding warming at 1.5°C above preindustriallevels. Without a signifi�cant increase in action, the target will“wither on the vine,” Sharmasaid at the World SustainableDevelopment Summit onThursday.
Sharma also visited Indonesia because it is this year’s president of the Group of 20 countries, which is responsible for80 per cent of global emissions.Last year, these countries failedto agree Sharma’s lofty goal of“consigning coal to history”and instead only settled on a
more modest plan to end fi�nancing of foreign coal fi�red powerplants.
Egypt’s commitmentSo far, the only other countrythat publicly promised to update its pledge under the ParisAgreement is Egypt. It’s expected to turn the spotlight on toAfrican nations. The Horn ofAfrica, which includesEthiopia, Kenya and parts ofSomalia, is currently experiencing its most severe droughtfor 40 years, that has killedmore than 1.5 million livestock.
Leena Nandan, an offi�cialfrom India’s Environment Ministry, also spoke at the WorldSustainable DevelopmentSummit on Thursday. She saidthe focus on helping developing nations adapt to the impacts of climate change is moreimportant than pressuringthem to cut emissions faster.“Climate justice has to be a partof it,” she told the conference.“Where is the equityotherwise?”
COP27 will turn attention to climate justice for poor nationsCountries will have to set a post2025 goal
for fi�nancial contributions from rich nations
US climate envoy John Kerry and Egypt’s Foreign Minister Sameh
Shoukri hold a joint press conference in Cairo on February 21
KR SRIVATS
New Delhi, February 21
IIFL Home Finance Ltd (IIFLHFL) has signed a $68millionloan agreement with AsianDevelopment Bank (ADB) toimprove fi�nancial access to affordable green housing forlowerincome groups inIndia.
The funding comprises adirect ADB loan of up to $58million and a $10million concessional loan by the Canadian Climate Fund for thePrivate Sector in Asia (CFPS).The Canadian funding willalso be routed through ADB.
This is ADB’s fi�rst suchagreement with the privatesector in the country. From
ADB’s loan, 80 per cent will beearmarked for lending to women borrowers or coborrowers and 20 per cent will be allocated to fi�nancingmortgages for greencertifi�edhomes. The CFPS loan will support IIFL HFL’s green housingportfolio, specifi�cally towardsincentivising developers toadopt green certifi�cationstandards in building aff�ordable housing. Monu Ratra, MD& CEO, IIFL HFL, said, “Funding
from ADB will help us to improve the penetration ofgreen aff�ordable housing indeeper markets of India andfulfi�ll the dreams of many Indian families to own theirown homes. We are glad to bepartnering with ADB in ourgrowth journey.”
Fighting climate change“By leveraging IIFL HFL’s focuson fi�nancial inclusion andCPFS’ leadership on climateresilient housing, ADB canhelp lowincome communities to manage the impacts ofclimate change,” said ADB Director General, Private SectorOperations Suzanne Gaboury.
IIFL HFL provides aff�ordablehome loans to the economically weaker section (EWS),lowincome group (LIG) andmiddleincome group (MIG).
To boost affordable
green housing
This is ADB’s first such pact with
the private sector in India
IIFL Home Finance inks $68 mloan agreement with ADB
MEENAKSHI VERMA AMBWANI
New Delhi, February 21
Homegrown femtech startupSirona Hygiene has decided toacquire pepperspray brand‘IMPOWER’ from Donna FMCGPvt Ltd in an allcash deal for anundisclosed amount. Thismarks Sirona Hygiene’s foray inthe women safety products segment and comes close on theheels of its SeriesB fund roundfrom the Good Glamm Group.
Deep Bajaj, Cofounder &CEO, Sirona Hygiene told Busi-nessLine, “This acquisition fi�tsin with our overall strategy tooff�er a gamut of solutions forwomen across diff�erent lifestages from puberty to menopause. Our focus has been to address various neglected areasby off�ering unique solutions.The pepper spray segment isstill in its nascent stage in Indiaand has strong growth poten
tial in the country.” The startuphas so far been focusing onfeminine hygiene space and isknown for products such asPeeBuddy, herbal femininepain relief patches, menstrualcups, etc.
Increasing presence “We will be strategically deploying funds to amplify the presence of IMPOWER both onlineas well as offline to make itmore accessible. There hasbeen a signifi�cant adoption ofpepper sprays in the market forselfdefense purposes in recenttimes... We believe it can become a ₹�50 crore brand in thenext three years,” Bajaj said.
The company said thatnearly half a million IMPOWERbranded pepper sprays havebeen sold so far.
“We believe there is potentialto evolve the brand’s portfolioto a range of other solutionsbeyond pepper sprays in thissegment in the long run andtherefore, we have a dedicatedteam that will focus on scalingthe brand,” Bajaj added.
Sirona Hygiene acquires pepperspray brand IMPOWER Expects IMPOWER
to become a ₹�50 cr
brand in three years
Deep Bajaj, Co-founder & CEO,
Sirona Hygiene
I, DINI Nishad Kaithakkal D/o ofDevadas Kuttamkulangara R/o Flat3E, Endura Apartments, OppositeMasjid, Sreekariyam P.O. Thiru-vananthapuram−695017 has changedmy name to Dini K. Devadas for allfuture purpose
PERSONAL
CHANGE OF NAME
................BM-BMECMYK
MUMBAI
8 BusinessLine TUESDAY • FEBRUARY 22 • 2022COMMODITIES/AGRI-BUSINESS
FUTURES TRACKER
Symbol Delivery CentrePriceUnit
PreviousClose (₹�)
Close (₹�)%
ChangeOI
MCX
ALUMINIUM Thane 1 Kg 260.4 262.3 0.7 7215
COPPER Thane 1 Kg 763.5 762.4 -0.1 4467500
COTTON Rajkot 1 Bale 37720.0 36950.0 -2.0 96075
CPO* Cash Settled 10 Kgs 1275.0 1275.0 0.0 3770
CRUDEOIL Cash Settled 1 BBL 6730.0 6730.0 0.0 677000
GOLD Ahmedabad 10 grms 50112.0 50050.0 -0.1 11019
GOLDGUINEA Ahmedabad 8 grms 39803.0 39706.0 -0.2 9.528
GOLDM Ahmedabad 10 grms 50034.0 49967.0 -0.1 643
GOLDPETAL Ahmedabad 1 grm 4954.0 4938.0 -0.3 15.525
KAPAS* Cash Settled 20 Kgs 2021.0 2012.5 -0.4 152
LEAD Thane / Chennai 1 Kg 184.2 183.2 -0.5 3045
MENTHAOIL Chandausi 1 Kg 951.8 955.4 0.4 177.84
NATURALGAS Cash Settled 1 mmBtu 337.2 347.9 3.2 2173750
NICKEL Thane 1 Kg 1809.3 1822.6 0.7 2167500
RUBBER Palakkad 100 Kgs 16269.0 16407.0 0.8 34
SILVER Ahmedabad 1 Kg 63902.0 63526.0 -0.6 207060
SILVERM Ahmedabad 1 Kg 64008.0 63685.0 -0.5 51210
SILVERMIC Ahmedabad 1 Kg 64016.0 63694.0 -0.5 37371
ZINC Thane 1 Kg 296.6 296.7 0.0 3330
NCDEX
CASTOR DEESA Quintal 7114.0 6986.0 -1.8 25195
CHANA BIKANER Quintal 3248.0 3183.0 -2.0 97560
COCUDAKL AKOLA Quintal 37650.0 37650.0 0.0 0
COTTON RAJKOT Bales 11068.0 10832.0 -2.1 15845
DHANIYA KOTA Quintal 11869.0 11623.0 -2.1 52015
GUARGUM5 JODHPUR Quintal 6338.0 6204.0 -2.1 77180
GUARSEED10 JODHPUR Quintal 22115.0 21830.0 -1.3 11055
JEERAUNJHA UNJHA Quintal 2044.0 2002.0 -2.1 3516
KAPAS RAJKOT 20 kgs 49500.0 49880.0 0.8 40
STEEL GOBINDGARH Quintal 7040.0 7090.0 0.7 1505
SYBEANIDR INDORE Quintal 1274.0 1274.0 0.0 20
SYOREF INDORE 10 kgs 10218.0 10006.0 -2.1 11810
TMCFGRNZM NIZAMABAD Quintal 7114.0 6986.0 -1.8 25195
Source: MCX and NCDEX; all contracts are current month/near month; closing prices are taken fromprovisional bhav copy (as of 17.00 hours); *delivery option available
■ China's state planner has approved two coal mines Shaanxi
province with annual capacity at six million tonnes and five
million tonnes each, it said on Monday. The three coal mines
involve total investment at 24.12 billion yuan ($3.81 billion).
■ Exports of Malaysian palm oil products for February 1-20 rose
between 24.9% and 29% from the same week in January,
according to cargo surveyors Intertek Testing Services and
Amspec Agri.
MCX COMPDEX C 10 pts (0.08%) MCX BULLDEX D -42 pts (-0.28%) MCX METLDEX C 42 pts (0.22%) NCDEX GUAREX D -197 pts (-2.46%)
PR. CLOSE HIGH LOW CLOSE PR. CLOSE HIGH LOW CLOSE PR. CLOSE HIGH LOW CLOSE PR. CLOSE HIGH LOW CLOSE
12941.51 12963.92 12887.48 12951.62 14634.53 14622.28 14523.70 14592.85 18736.32 18789.73 18653.56 18778.32 7997.30 8025.60 7791.00 7800.60
OUR BUREAU
Bengaluru, February 21
The southwest monsoon,which is crucial for agricultural production and ruraleconomy, is expected to be“normal” this year, saysprivate weather forecasterSkymet.
In its “Preliminary Monsoon Forecast Guidance for2022” on Monday, Skymetsaid the negative sea surfacetemperature anomalies inthe equatorial Pacifi�c Oceanare weakening.
This warming inclinationof the Pacifi�c Ocean, albeitwithin neutral limits, maynot lead to an abovenormalor excess rainfall. Still,chances of a ‘corrupt’ monsoon are also ruled out.
“This could be one of the‘normal’ monsoon yearsmaking a robust start andfi�nishing around the midway mark of the normalrange, the range of normalrainfall is 96104 per cent oflongperiod average(880.6mm),” Skymet said ina statement.
tion has exceeded kharifoutput, which had at onepoint of time contributed60 per cent of the total foodgrains production.
Good agricultural production helps lift the rural economy with good sales ofwhite goods, fastmovingconsumer goods, twowheelers, cars and gold. This, inturn, helps the country’soverall economy to performwell.
With regard to theweather prediction this year,Skymet said ENSO predictability decreases during theupcoming “spring barrier”and at times leads to an unstable ENSO regime. This willget factored in its April forecast. While the monsoontrough is over the SouthTropical Indian Ocean, IODevents are typically unableto form till April. Reliabletrends of “Indian Ocean Dipole” emerge in the latterhalf of it. Early indicationssuggest it to be “neutral” butleaning close to the negativethreshold. IODENSO interaction will hold the key tothe overall health of Indiansummer monsoon 2022,said Sharma.
continued La Nina will fall.”
Good for agri outputThe projection of a normalmonsoon also augurs goodfor agricultural production,which has witnessed newhighs since 201617. Duringthe current crop year (July2021June 2022), the Ministryof Agriculture, in its secondadvanced estimates, projected total foodgrains production at 316.06 million tonnes(mt) against 310.74 mt lastyear.
Foodgrains production isprojected higher on recordwheat, rice, and pulses output. According to the estimates, rice production hasbeen projected at 127.93 mt(124.37 mt last year), wheatoutput at 111.32 mt (109.59)and pulses at 26.96 mt (25.46mt).
Over the last two years,the country experiencedheavy rains during September and November. Last year,unseasonal rains lashedmany parts of the countryduring December and earlyJanuary. Heavy rains haveproved benefi�cial for rabicrops production. Over thelast six years, rabi produc
gauge its health during thefourmonthlong season.
The last two monsoon seasons have been driven bybacktoback La Nina events,shrinking now. It also meansthat the monsoon this yearwill be a devolving La Ninato start with and turn neutral later.
AVM GP Sharma, President– Meteorology and ClimateChange, Skymet Weather,said: “After observing backtoback La Nina during 2020and 2021, the chances of yetanother episode is ruled out,statistically. The sea surfacetemperatures in the equatorial Pacifi�c are likely to risesoon and the probability of
data sets pertinent for acomprehensive monsoonforecast. “Ascertaining theauthenticity is absolutely essential and that is a longdrawn procedure. Therefore,it is a bit premature to sharethe collated fi�gures but suffi�ce to present preliminaryguidance,” Skymet said.
La Nina eventsFurther, Skymet said monsoon has large interannualfl�uctuations in its arrival, intensity, duration, and withdrawal. It is relatively earlyto decode all these aspects atthis stage.
But there are precursorsto get an early glimpse and
Skymet has been projecting the southwest monsoonsince 2012, though it abstained from making anyprojection in 2020 for “strategic reasons”.
Last year, it had predicteda normal monsoon and wasright in its projections. Theprivate forecaster intends torelease a detailed report onthe prospects of the monsoon in April.
If the forecast proves correct, it will be the fourth consecutive year that India willhave a normal monsoon.
The South West monsoonmakes up nearly 70 per centof the country’s annual rainfall, which is crucial for keykharif crops such as rice, cotton, oilseeds, pulses and sugarcane.
Robin Shaw, sugar analystat UKbased Marex Spectron,which provides commodities brokerage services, said aneutral El Nino outlook removes at least one elementof danger to the Indianmonsoon.
Skymet said it is gathering
S-W monsoon likely to be normal: Skymet If the forecast holds true, it will be a
normal one for the 4th consecutive year
South-West monsoon makes up nearly 70% of the country’s
annual rainfall, which is crucial for key kharif crops such as rice,
cotton, oilseeds, pulses and sugarcane
SUBRAMANI RA MANCOMBU
Chennai, February 21
Farmers across India have begun to shift to online platformsand their transformation towards technology is takingplace at a great speed, saysPankajj Ghode, Chief ExecutiveOffi�cer (CEO), Agri10x.
“The belief of farmers istransforming and the adoption of online platforms is happening. It is being acceptedand adopted for its convenience. They are busy with farming and we (online platforms)help them assist sell their produce,” said Ghode, whoseAgri10x helps farmers sell various farm produce online.
Mandis no more dominant Farmers dependence on agriculture terminal markets or agricultural produce marketingcommittee (APMC) mandis hasbegun to reduce. This is because mandis are no more a“dominant factor” for pricing.“That has been eliminated. Pri
cing is important and it plays avital factor. Farmers put in hardwork for six months and don’tget the right price, they get demotivated,” he said, explainingthe reasons why farmers aretransforming to the onlineplatform, a blockchaindrivenagricultural ecosystem.
That way, the repeal of thefarm reform laws in Decemberhave not impacted or raisedconcern among farmers.“Farmers do not really careabout all these. For them, convenience and money factorsmatter,” Ghode said.
The problem with themandis is that payments aremanual and prices are defi�ned
by traders. This was whyAgri10x decided to get onlineand “create momentum fromthe farmgate”.
Ghode’s views are supportedby the increasing sales and participation in online platformssuch as Krishify andPraman.Ai.
Agri10x took a leaf out of theelectronic National Agricultural Market to launch its operations in 2018. But it took another two years before it couldfl�ag off� its fi�rst trading. “It tooktwo years to build ourproduct,” he said.
POGG businessThe Punebased fi�rm started itsoperations with 10 farmershelping them sellpomegranate. “Today, we havetwo lakh farmers selling various produce online,” Ghodesaid, adding that the turnoversince its launch has topped₹�250 crore.
The fi�rm, run with 250 staff�,also has around 7,000 traders
buying from farmers on itsweb and app links. Agri10x haswidened its products portfolioto onion, potato, soyabean,maize, chilli, rice (a recent addition), garlic and ginger. Potato,onion, ginger and garlic(POGG) is “a value and volumebusiness” for it.
“POGG is the best for us asthe supply is available acrossthe country and they are consistent in nature. Seasonabilitydoes not aff�ect these,” the startup CEO said, adding that 112commodities are being totallytraded on its platform now.
Agri10x has defi�ned the parameters for the quality of produce and the standard operational procedures are in placefor manually checking thequality.
“We are currently in talkswith an Israeli fi�rm for an artifi�cial intelligencedriven mobileapp for quality checks. FromApril onwards, we could be deploying it for farmers,” Ghodesaid.
Farmers shifting to online platforms frommandis at ‘great speed’, says Agri10X CEO
Pankajj Ghode, CEO, Agri10X
REUTERS
February 21
Gold prices edged lower in volatile trade on Monday as a possiblesummit between the US and Russian presidents to discussUkraine encouraged risk sentiment and nudged investorsaway from safehaven assets.
Spot gold fell 0.1 per cent to$1,896.43 per ounce by 1025GMT,down from a session high of$1,908.03, its best level since June3. US gold futures were fl�at at$1,899.10.
Russia-Ukraine tensionUS President Joe Biden and Russian President Vladimir Putinhave agreed in principle to asummit over Ukraine, Frenchleader Macron said on Monday,off�ering a possible path out ofone of the most dangerous
European crises in decades, lifting risk sentiment across majormarkets. The potential meeting,while easing demand for gold,also led a slight move away fromits rival safehaven the US dollar,limiting losses in the greenbackpriced bullion.
“(Gold) is holding up well. Thelast time we moved up to theselevels it ended up being a bulltrap and the market came off�very sharply. We’ve seen somegood fl�ows into the ETFs,which isencouraging,” independent analyst Ross Norman said. SPDRGold Trust , the world’s largest
goldbacked exchangetradedfund, said its holdings rose 0.5per cent to 1,024.09 tonnes onFriday. “The next few days will bekey in determining whetherfears over Ukraine can outweighthe encouraging data on the economic front as well as the likelihood of a series of interest ratehikes this year by central banks,”analysts at Kinesis Money said.
Federal Reserve offi�cials on Friday quelled what had beenrising market expectations foran aggressive initial response to40yearhigh US infl�ation, signalling that steady interest ratehikes should be enough.
Other metalsRising interest rates increase theopportunity cost of holdingnonyielding bullion. Spot silverfell 0.8 per cent to $23.77 perounce, while platinum rose 0.6per cent to $1,073.72, and palladium gained 1 per cent to$2,367.93.
Gold off 8-month highs asinvestors monitor developments Dollar also eases,restricting losses
OUR BUREAU
Kochi, February 21
The Ernakulam Krishi VigyanKendra (KVK) is set to popularise snap melon — a highly nutritious local variety — as oneof the best remedies for heat,even as demand for fruit juicesis on the rise to beat the summer heat.
Snap melon (pottu vellari) isa locally grown fruit duringthe summer. The KVK, functioning under the Central Marine Fisheries Research Institute (CMFRI), focuses oncreating awareness of its nutritional value and promotingfruit and its juice among thepublic.
“Many are still unaware ofthe nutritional value and effi�cacy of snap melon during thesummer season. This fruit isan excellent source of betacarotene, folic acid, potassium
and vitamin C”, said ShinojSubramanian, head of theKVK.
Precision farmingSnap melon is cultivated inpaddy fi�elds sprawling about600 acres in many parts of the
district namely, Nedumbasseri, Manjali, Kadungalloor,Alangad, Karumalloor followed by the paddy harvest.“This year the KVK with theparticipation of local farmersis demonstrating precisionfarming of snap melon to re
duce labour requirement andenhance productivity”, Subramanian said.
As part of its awarenesscumpromotional campaign,the KVK will organise a megaharvest festival of snap meloncultivated in various parts ofAlangad Grama Panchayat onFebruary 24. During the , KVKwill display the snap melonand introduce its juices in different fl�avours to the public.In addition, the experts willlead sessions on the preparation of the juice varieties usingdiff�erent recipes at the fest.
“KVK’s initiative is alsoaimed at supporting the fruitfarmers and popularising theprecision farming of snapmelon. KVK will provide necessary guidance to those interested in taking up the snapmelon farming,” Shinoj Subramanian said.
Kerala KVK to popularise snap melon
Precision farming being carried out at the KVK in Alangad in
Ernakulam district, Kerala
VISHWANATH KULKARNI
Bengaluru, February 21
Agritech fi�rm Cropin Technology Solutions is setting up twooverseas subsidiaries in the USand Singapore to tap the markets in the region.
Last year, Cropin Technologyhad set up a subsidiary in theNetherlands to off�er agritechsolutions in the EuropeanUnion.
Krishna Kumar, Founder andCEO, said the two new subsidiaries will be operational in thenext few months.
The Singapore subsidiary will
tap the markets in AsiaPacifi�c,including countries such as Japan and Australia, where thecompany sees good potentialfor adoption of technologies inthe agri ecosystem.
Cropin Technology, a B2Bagritech platform, leverages digitisation, predictive intelligence and data sciences alongwith technologies such as artifi�cial intelligence and machine
learning to increase effi�ciency,productivity in the farm sector.
The Bengaluruheadquartered company workswith some of the biggestbrands globally covering farming companies, agriinput providers, food processing companies, retailers, fi�nancialservice providers, governmentsand development agencies tohelp them make more eff�ectivedecisions, improve predictability and mitigate risk.
Global operationsCropin Technology works withover 250 customers and has digitised 16 million acres of farmland, improving the livelihoodsof more than seven millionfarmers, Krishna Kumar said.
The company has built datasets and intelligence for over
400 crops and 10,000 crop varieties across 56 countries.
“We are also looking at acquiring companies in areas ofdeep technologies such as computer vision and artifi�cial intelligence to augment our capabilities,” he added.
The company is looking forpotential acquisition targets inseveral countries including theUS and Israel.
Set up in 2010, the companyhas raised $33 million in funding, so far, from investors including The Bill & MelindaGates Foundation’s Strategic Investment Fund, ABC World Asia,Chiratae Ventures, Invested Development, and Ankur Capital.Krishna Kumar said the company will soon start the DSeriesfund raising exercise to fi�nanceits expansion and growth plans.
After Netherlands, agtech player Cropin to set up units in the US, Singapore
Krishna Kumar, Founder and
CEO, Cropin Technology
Eyes acquisitions in deep-tech space to boostcapabilities
REUTERS
Melbourne, February 21
Crude oil prices calmed downafter fl�uctuating initially onMonday, as investors eyed contrasting scenarios of tighterRussian energy supplies due tothe Ukraine crisis and morecrude coming to the market ona possible nuclear dealbetween Iran and worldpowers.
Brent crude futures and USWest Texas Intermediate (WTI)crude rose more than $1 a barrelat the start of Asian trade andsubsequently swung to nearly$1 loss on news of a possiblesummit between the UnitedStates and Russia.
Brent crude futures were at$93.39 a barrel at 0445GMT,down 15 cents after earliertouching $95, while US WestTexas Intermediate (WTI) crudefutures had climbed 7 cents to$91.14 a barrel.
Analysts at Singapore’s OCBCbank said Brent could test $100in the short term, possibly before the end of fi�rst quarter.
Crude oil steadies,Iran n- talks weigh
BEATING THE SUMMER HEAT
OUR BUREAU
Mangaluru, February 21
The Solvent Extractors’ Association of India (SEA)has asked its members toreduce the maximum retail price (MRP) on edibleoils by ₹�3,000 to ₹�5,000 atonne with immediate effect as a Holi gift to consumers. This reductionwould work out to ₹�35 akg.
In a statement, AtulChaturvedi, SEA President,
well and we are expectingan alltime record cropduring the current year,which may bring some relief to consumers,” he said.
The Centre has also beenvery proactive in takingprompt measures to cooldown prices before thenew mustard crop hits themarket yards. The recentreduction in import dutyon crude palm oil by 2.5per cent is a case in point,he said.
the Black Sea regionbetween Russia andUkraine has added fuel tothe fi�re, with respect tothe sunfl�ower oil complexwhich comes from that region. Inclement weatherin Brazil on account of LaNiña has also reduced thesoya crop drastically inLatin America.
“In this scenario, what isheartening to note is thatthe domestic mustardcrop is shaping up quite
palm oil by way oflicensing.
He said the tension in
before Diwali in November, and later in December,the association had askedits members to reducecooking oil pricest.
Geopolitical worriesStating that edible oilprices are skyrocketingglobally, he added that theprices show no immediatesigns of moderating. Someexporting countries suchas Indonesia have startedregulating exports of
said members of the association, though strugglingto maintain a smooth supply chain of edible oils, arealigned to the proactivedecisions of the Government. SEA has requestedand advised its membersto reduce the MRP on edible oils with immediateeff�ect to soften prices.
This is the third time infour months that the association has asked its members to cut prices. Earlier,
Holibonanza: SEA asks members to cut MRP on edible oils, again
UKRAINE CRISIS
................BM-BMECMYK
MUMBAI
BusinessLineTUESDAY • FEBRUARY 22 • 2022 9NEWS
PRESS TRUST OF INDIA
Dubai, February 21
The Comprehensive Economic Partnership Agreement inked between Indiaand the United Arab Emirates last week is a milestoneand will be a gamechangerin bilateral trade, a leadingremittance and forex company offi�cial has said, predicting a boost to fi�ntechcompanies and startup unicorns in the region.
India and the UAE on Friday last signed the CEPAtrade pact after concludingnegotiations in a short timeof 88 days. The pact aims totake the twoway commerceto the $100 billion in overfi�ve years and create about 10lakh jobs in apparel, plastic,leather and pharma sectors.
Adeeb Ahamed, managingdirector of Abu DhabibasedLuLu Financial Holdings
said, at a time when inclusivetrade and economic cooperation are cornerstones of a robust economy, the dealsignifi�es the commitment ofthe UAE and India to strivefor greater growth througheconomic cooperation.
Historical ties“The UAE and India have historically shared a close bondin several areas of trade andcommerce, and CEPA will encourage the investor community, both regionally andglobally, to also look intoemerging sectors in bothcountries, notable of whichis fi�ntech,” Ahamed told PTI.
“The Indian fi�ntech industry is estimated to touch$150 billion by 2025, and theUAE is home to over 50 percent of the fi�ntech companies in the Middle East andNorth Africa region. Com
bine the potential of thesetwo markets, and the possibilities to generate employment, value and ecosystemgrowth are endless,” he said.
According to Ahamed, thepotential for interoperablesolutions exists and the CEPAmay well pave the way forcompanies in the UAE to seekinvestments and expand into
India, and vice versa.The volume of crossbor
der remittances between thetwo countries has oftengrabbed headlines, with 33per cent of the outward remittances from the UAE going to India.
India and the UAE havebeen riding the startup unicorn wave in recent months,
and Ahamed expressed optimism that the CEPA, whichis expected to boost UAEIndia trade to over $100 billionover the next fi�ve years,would open a doorway forboth countries to exportlocal technology in fi�ntechsolutions for the benefi�t ofboth economies.
Fintech unicorns“The UAE and India are hometo several unicorns, especially in the fi�ntech space.The timely signing of CEPAenables better market accessand is bound to encouragefaster technology exchange.This will ultimately inspirefi�ntech companies to buildmeaningful payment solutions for people in both thecountries,” said Ahamed.
With global investor sentiment leaning towards scalable fi�ntech solutions,Ahamed also feels that CEPAwill serve as a curtain raiserfor closer collaboration andpartnerships in the sector.
He cites the example of several recent developments, including the signing betweenNational Payments Corporation of India (NPCI) and Network International, as well asinvestments by bluechip investors from both countries,which are focused on bolstering the reliability and effi�ciency of the paymentssector.
The segment has benefi�tedgreatly from the thrust on infrastructure developmentand robust processes, andthe CEPA will fast trackmuchneeded investmentsinto the fi�nancial servicessector.” LuLu Financial Holdings presently holds severalinvestments in both the UAEand India — which includes anetwork of 83 branches ofLuLu Exchange and the digital payments applicationLuLu Money in the UAE, apartfrom 29 branches of LuLuForex and the newly startedNBFC entity LuLu Finserv inIndia.
Adeeb Ahamed predicts a boost to fintech
firms, start-up unicorns in the region
Commerce Minister Piyush Goyal and UAE Economy Minister
Abdulla bin Touq Al-Mari signed the CEPA trade pact after
concluding negotiations in a short time of 88 days PTI
CEPA with UAE a game changer: Lulu Fin MD
PRESS TRUST OF INDIA
Ranchi, February 21
A special CBI court onMonday sentenced RJD Supremo Lalu Prasad Yadav tofi�ve years in prison andslapped a fi�ne of ₹�60 lakh inconnection with the ₹�139crore fodder scam.
The court pronounced thequantum of sentence afterhearing arguments online.
“Lalu Prasad has been sentenced to fi�ve years imprisonment while a penalty of ₹�60lakh has also been imposedon him. Apart from Prasad,fi�ve years imprisonment eachwas announced by the Courtfor fi�ve convicts, four yearseach for 32 convicts and threeyears each for three convicts,”CBI counsel BMP Singh toldPTI.
“Fine imposed on convictsranges from ₹�1 lakh to ₹�2crore,” Singh said adding thatthe highest amount of ₹�2
crore penalty was imposedon supplier Tripurari MohanPrasad.
After his conviction in the₹�139.35 crore Doranda treasury embezzlement case, thefi�fth and fi�nal one againsthim in the multicrore fodderscam on February 15, the ailing 73year old former chiefminister of Bihar was lodgedin the Birsa Munda CentralJail and then shifted to staterun Rajendra Institute ofMedical Sciences (RIMS) inRanchi on health grounds.
The ebullient leader suff�ers
from multiple ailments, including renal problems.
In jail since December 2017,Prasad served most of his sentence period at the RIMS. Hewas taken to All India Institute of Medical Sciences, NewDelhi in January last yearafter his health conditiondeteriorated.
Prasad’s counsel said theywill appeal this order in theHigh Court. He (Lalu) hasalready completed 36months of his jail term”.
Prasad had earlier beensentenced to 14 years in jail infour other fodder scam cases.The fi�nal case was related towithdrawals of ₹�139.35 crorefrom Doranda treasury during his tenure as the chiefminister of undivided Bihar.
Of the 99 accused in thecase, 24 were acquitted.
The CBI had examined 575witnesses in the case, andfi�led charge sheet against 170
people. However, only 99 accused, including Prasad,faced trial which had commenced in 1996.
In the course of the 22yearlong trial, 55 accused died,while eight turned government approvers. As many assix accused are stillabsconding.
Special CBI Judge Sudhanshu Kumar Shashi had onJanuary 29 completed thehearing.
Apart from Prasad, formerMP Jagdish Sharma, the thenPublic Accounts Committee(PAC) chairman DhruvBhagat, Animal HusbandrySecretary Beck Julius and Animal Husbandry AssistantDirector KM Prasad were themain accused.
The fodder scam, pegged at₹�950 crore, was fi�rst unearthed by the then Chaibasadeputy commissioner AmitKhare.
Lalu gets 5-year prison term in fodder scam
Lalu Prasad Yadav
PRESS TRUST OF INDIA
New Delhi, February 21
Prime Minister Narendra Modion Monday said the Budget for202223 will be of great help inimplementing the NationalEducation Policy on the groundand asserted that the decisionto set up a National Digital University can solve the problem ofshortage of seats in educationalinstitutions in the country.
Addressing a webinar on thepositive impact of the Budget202223, Modi said the budgetfocuses on fi�ve aspects relatedto the education sector universalisation of quality education, skill development, urbanplanning and design, internationalisation and AVGC (Animation Visual Eff�ects GamingComic).
Digital University“Digital university is an innovative and unprecedented stepthat has the potential of fullyaddressing the problem ofseats in the universities. I call
upon the Education Ministry,UGC and AICTE and all the stakeholders to work with speed onthe project. I emphasised onthe need to keep internationalstandards in mind while creating institutes,” he said.
“It was digital connectivitythat kept the country’s education system going during thepandemic. We are seeing howthe digital divide is rapidlyshrinking in India. Innovationis ensuring inclusion for us.Educational infrastructuresuch as eVidya, One Class, OneChannel, Digital Labs and Digital University are going tohelp the youth a lot,” he said.
‘Budget will help implementNational Education Policy’
Prime Minister Narendra Modi
KR SRIVATS
New Delhi, February 21
The Delhi High Court hasstayed the operation of theReserve Bank of India communication against execution of ₹�4,000crore debt recast of Religare Finvest Ltd,the troubled NBFC arm and awhollyowned subsidiary ofReligare Enterprises Ltd.
The RBI had on February 11said in a communicationthat the restructuring of Religare Finvest cannot be implemented with Religare Enterprises continuing as itspromoter since RFL has beendeclared as “fraud” exposureby lenders.
Following this communication, RFL had fi�led a writ petition with Delhi High Court. The Delhi HC has in its order dated February 18 notedthat it prima-facie appearsthat the RBI has ignored thevital fact that the erstwhilepromoters of REL are no
longer in charge of the affairs of either the petitioneror of REL.
“In case the impugned order is not stayed, grave andirreparable prejudice will becaused to the petitioner asthe banks are likely to takeprecipitative steps againstthe petitioner. It is, accordingly, directed that till thenext date, the operation ofthe impugned communication dated February 11, 2022will remain stayed”, theDelhi High Court order said.REL, which is a listed entity,
on Sunday conveyed to thebourses the court stay order.
REL had also earlier contested the lenders decisionto categorise its loans to RFLas “fraud” exposure, arguingthat the NBFC was a victim offraud perpetuated by itsformer management.
It maybe recalled that RFLis barred from undertakingfresh business as it has beenunder a corrective actionplan of the RBI since January2018. RFL had hit a roughpatch four years ago andfaced financial distress dueto alleged misappropriationof funds by erstwhile promoters Shivinder Singh andhis brother MalvinderSingh.
Already several investigative agencies of the government are looking into the alleged misappropriation offunds to the tune of ₹� 4,000crore by the erstwhilepromoters.
Religare Finvest: Delhi HC staysRBI’s order against debt recast plan
Naval might on display
Sailors and cadets man the rails of a naval ship as the Presidential Yacht passes during the Presidential Fleet Review in
Visakhapatnam on Monday. The parade also showcased the preparedness of the Indian Navy for any contingency. As part of
the Fleet Review, the President reviewed the mobile submarine column that included INS Vela, a recently-inducted
Kalvari class submarine made in India DEEPAK KR
OUR BUREAU
New Delhi, February 21
Staterun NTPC on Monday saidthat it has paid the government an interim dividend of₹�3,878.67 crore for the fi�nancialyear 202122. The dividend paidwas 40 per cent of the paidupequity share capital of the company. This is the 29th consecutive year that the genco has paiddividend.
The total installed capacityof the company is 67,832.30MW with 23 coalbased, sevengasbased, one hydro and 19 renewable energy projects. Under JV, NTPC has nine coalbased, four gasbased, eight hydro and fi�ve renewable energyprojects.
Last week, the company saidit has achieved an alltime highgeneration of 314.89 billionunits (BU) up to February 18,surpassing its earlier record of314 BU achieved for the entireFY21. In FY22 till February 18,2021, the generation stood at270 BU, indicating improvedperformance and increased a
demand for power in the current fi�nancial year. NTPC grouprecorded a gross generation of87.92 BU in Q3 FY22 and 264.70BU in nine months (9M) FY22 asagainst 76.53 BU and 222.41 BUduring the previous corresponding periods of last year, respectively.
NTPC’s board of directorshas approved an interim dividend for FY22 at the rate of 40per cent of paidup share capital at ₹�4 per equity share offace value of ₹�10 each.
NTPC pays interim dividend of ₹�3,878 crore to government
FORUM GANDHI
Mumbai, February 21
After seven quarters of profits
and growth, Shoppers Stop has
an aggressive plan to expand
with focus on private label,
omni-channel, beauty business
and expansion of stores, says
Venu Nair, MD & CEO, Shoppers
Stop.
Speaking to BusinessLine,
Nair deep dives into all four of
these “strategic pillars
of growth,” as he calls
them and shares his
views on the retail
industry.s
What’s your view
about the retail industry
today, and what are your
expectations in 2022?
The retail industry in India isstill in the initial growthphase, and I will give you acouple of stats to explain whyI say that.
Today, roughly 29 per centof India’s total retail is in theorganised sector. Retail itselfis massive in the country, Itjust shows the amount of
growth that is yet to happen.The increase in the retail industry over the last few yearsis coming in two forms; one isthe absolute growth in theGDP itself and the second partis the conversion from unorganised to organised retail.So, we believe that the next 10to 15 years will see high singledigit to low doubledigitgrowth year on year for the
entire industry.Secondly, the futureof retail is Omni.While we have seenhigh carriers fromthe online players,
the absolute percentage ofonline as a part of the total retail is still small, which willcontinue to grow.
In summary, there’s a hugemarket which is yet to betapped and that growth willcontinue across all the chainswith Tier II and Tier III beingstronger than the Tier I interms of growth numbers.Still, an absolute proportionof retail, obviously Metro andTier I, is immense.
What is Shoppers Stop’s
target in store expansion?
Our target is to open 10 to 12new department stores everyyear, and apart from the SSBeauty stores, this year in thethird quarter, we openedthree stores, and in Februarywe have four stores that aredue to open and one more inMarch/April.
So in net, we expect to haveopen between 810 stores inFY22. We would expect to doat least 12 to 15 stores in FY23.
There has been a lot of focus
on growing the private
labels. Is growing private
label the way forward for
the company?
We have a mix of national andinternational brands. Shoppers Stop, as a brand, is focused on the family, and itcaters to the middle class. .Our private brands fi�ll in aspace where we provide agood product at attractiveprices to our customers, andincreasing the share ofprivate brands in our entire
business is a strategic pillarfor us, and we are makinggood progress on that.
What’s the current share of
your private label mix?
See a few quarters back, it wasaround 11 per cent. We are currently in the last quarter we
were at 14 per cent. Our ambition is to continue its momentum and get to about 20to 25 per cent of our total mixin the next 3 years (from2022).
The absolute percentage while it’s important, what ismore signifi�cant is the off�ering that we can give to a customer fi�lling in a separatelifestyle that we do.
What are your plans on the
beauty business segment,
which seems to be going
strong?
Beauty is our second strategicpillar. Private brands, beingthe fi�rst one which we talkedabout. Today 17 per cent ofour sales come from the segment.
We have also just openedstandalone beauty storescalled SS Beauty.
This is something we intend to double down on andmultiply and open anywherebetween 10 to 15 SS Beautyoutlets every year.
In the last quarter alone,
we brought in 28 new brands.We’ve set our target forourselves to have 90 brandsfor the full fi�nancial year, andwe are well on track toachieve that.
Are you getting into new
categories in beauty?
Arcelia is our private beautylabel that we’re doublingdown on. We started withBath and Body, which we hadlaunched in Q2 of last year.
In December, we launchedour fragrances and thismonth, we will be launchingnail polishes which will befollowed by products for lips,eyes and skin to complete theentire makeup portfolio byMay. So that’s the plan that wehave for our own privatebrand Arcelia which is something that we will continue togrow anywhere between 200to 250 options we would haveon this as we go forward. Ourown private brand apparel iswell established, and Beautyis something we have growing at the moment.
Shoppers Stop and its four-pillared plan for growth
O
ZY
Our private brands fill in a
space where we provide a
good product at attractive
prices to our customers,
and increasing the share
of private brands in our
entire business is a
strategic pillar for us
VENU NAIRMD & CEOShoppers Stop
YZ
P MANOJ
Mumbai, February 21
A joint venture led by Hyderabadbased Vishwa SamudraHoldings Pvt Ltd has won a₹�2,949.70 crore EPC (engineering, procurement and construction) contract from theAndhra Pradesh governmentfor a new port atBhavanapadu in Srikakulamdistrict.
“We have issued a letter ofintent to Vishwa SamudraHoldings for the EPC contractfor Bhavanapadu port project,” said K Muralidharan,Chief Executive Offi�cer, APMaritime Board.
Visakhapatnambased RRConstructions Pvt Ltd is a partner in the joint venture thatpipped Megha Engineering &Infrastructure Ltd (MEIL) towin the EPC deal. The AndhraPradesh government plans tobuild an allweather, deep water, multipurpose port, cost
ing ₹�3,670 crore atBhavanapadu.
Vishwa Samudra Holdingsis promoted by Chinta Sasidhar, a former managing director of Krishnapatnam PortCo Ltd and the youngest sonof Chinta Visweswara Rao, thefounder of Navayuga Engineering Co Ltd, the fl�ag shipcompany ofthe CVR Group.
In April 2021,Adani Portsand SpecialEconomicZone Ltd(APSEZ)bought the 25per cent stakeheld by VishwaSamudra Holdings in KrishnapatnamPort Co Ltd for₹�2,800 crore. It previouslyheld 75 per cent it acquired inthe port operating company
from the Navayuga Group inOctober 2020. Bhavanapadu isone of the four new portsidentifi�ed by the State government to expand the port capacity to 400 million tonnes(mt) by 2024 from 110 mt.
Ramayapatnam portIn July 2021, the AP Maritime
Board awardedthe EPC contractfor a new port atRamayapatnamin Prakasam district to a jointventure betweenHyderabadbased Aurobindo Realty andInfrastructurePvt Ltd andNavayuga Engineering Co Ltd, for₹�2,634.65crore.
The AP Maritime Board hasreceived environment andcoastal regulation zone clear
ances from the Centre a fewdays ago to start constructionwork on the Ramayapatnamport.
The Ramayapatnam portwill be developed in twophases, with phase I costing₹�3,736 crore having a capacityto handle 24.91 mt of cargo ayear. In phase 2, the cargohandling capacity will be expanded by 113.63 mt with aninvestment of ₹�6,904 crore totake the total capacity to138.54 mt a year from 19berths. After the EPC work iscompleted, the AP government plans to bid out cargohandling operations atRamayapatnam,Bhavanapadu and Machilipatnam ports to specialists in thefi�eld.
The AP Maritime Board hasapplied to the Centre seekingenvironment and CRZ clearances for the Bhavanapaduport project.
Vishwa Samudra’s JV wins ₹�2,950 cr port deal in AP
WXState govt plans to
build ₹�3,670 crore
allweather, deep
water port at
Bhavanapadu. The AP
Maritime Board has
received
environment and
coastal regulation
zone clearances from
the Centre
PRESS TRUST OF INDIA
New Delhi, February 21
The Delhi Metro Rail Corporation on Monday assured theDelhi High Court that it willdeposit ₹�600 crore withintwo days in an escrow accountfor Delhi Airport Metro Express Private Limited, whichhad initiated execution proceedings against DMRC concerning an arbitral award ofover ₹�4,600 crore in itsfavour.
Justice Suresh Kumar Kaittook on record DMRC’s statement and reserved the orderon the execution petition.
Senior advocate Parag Tripathi, representing DMRC,initially submitted that thecorporation will pay ₹�600crore in 72 hours and askedfor time to raise loan for paying the arbitral award.
The court, however, askedthe DMRC to deposit ₹�600crore within two days.
‘Delhi Metro todeposit ₹�600 cr inescrow forDAMEPL in 2 days’
................BM-BMECMYK
MUMBAI
10 BusinessLine TUESDAY • FEBRUARY 22 • 2022NEWS
OUR BUREAU
Mumbai, February 21
Life Insurance Corporation ofIndia is preparing for its megainitial public off�ering, which ithopes to launch this fi�scal, saidits Chairman, MR Kumar, onMonday.
“We are watching the geopolitical developments closely,but are keen on listing inMarch,” he told media persons.
The valuation process is currently on, said Kumar, addingthat policyholders have showna lot of interest in the IPO.
Meanwhile, the life insureralso wants to retain some stake
in IDBI Bank, where the government is expected to commencethe stake sale process soon.
“It is up to the governmentand DIPAM to kick off� the exercise. Since it was a strategicpartnership, we may continuewith stake for our bancassurance,” said Kumar.
IDBI Bank has been thelargest contributor to the insurer’s banca channel and, going forward, will help it growthe channel further. He, however, did not quantify theamount of stake that LICwould like to hold in IDBIBank.
Centre’s stakeWhile the Centre holds 45.48per cent stake in IDBI Bank, LICowns 49.24 per cent stake in
the lender as of December 31,2021.
Housing finance businessKumar said the stakesale inIDBI Bank will also determinethe future for the housing fi�nance business. According toLIC’s draft red herring prospectus, either IDBI Bank or LIC
Housing Finance will have tostop conducting housing fi�nance activities, in order tomeet regulatory requirements.
“The Reserve Bank of Indiahas given a fi�veyear timeperiod till November 2023. Wewill have to take a call onwhether we want LIC HousingFinance to source the businessfrom IDBI Bank, which will beallowed,” said Kumar.
The other scenario would bethe disinvestment of IDBIBank, on which DIPAM mayhave some announcementsoon, he said.
On questions on the changein surplus distribution, Kumarstressed that there will be noshortchanging of anyone andpolicyholders’ interests will betaken care of.
Would like to continue holdingstake in IDBI Bank: LIC chiefMR Kumar says the
insurer is keen to
float IPO this fiscal
MR Kumar, Chairman, LIC
On standby mode
Spain's Defence Minister Margarita Robles and Bulgarian counterpart Stefan Yanev pose in front of Spanish soldiers at Graf
Ignatievo airbase near Plovdiv on Monday. Spain has deployed four fighter jets to NATO member Bulgaria. NATO allies have put
forces on standby to bolster Europe's eastern defences as tensions soar over Russia's military build-up around Ukraine AFP
TE RAJA SIMHAN
Chennai, February 21
There is a cautious optimismin the air travel industry withairline ticket sales rebounding in the four largest domestic markets – India, US,China and Russia – in earlyFebruary, after the previousweakness caused by Omicronlead to disruptions in demand, capacity and labourforce, said International AirTransport Association (IATA),a trade association of globalairlines.
As air travel increases, IATAhas urged countries to remove travel barriers, including quarantine and testing,for those fully vaccinatedwith a WHOapproved vaccine, and enabling quarantinefree travel for nonvaccin
ated travellers with anegative predeparture antigen test result. The four markets saw their combinedshare of total traffi�c rise substantially during the crisis(50 per cent of global passenger numbers in 2021 versus34 per cent in 2019). Thismeans their recovery fromthe Omicron wave will helpshape the industrywide performance, said IATA.
Since travellers tend tobook closer to the travel dateamid pandemic uncertainty,the increase in bookingsbodes well for actual traffi�cvolumes in February andMarch, said the airline body.
The US has been thestrongest performer, withticket sales for all futuretravel reaching 98 per cent of2019 levels in early February;India was at 60 per cent; andChina 80 per cent and Russiaat 75 per cent.
In India and the US, Covidcases have been falling fromtheir January peak, but the
pandemic continues to escalate in Russia.
The recent rise in bookingsin three of the four key domestic markets gives areason for cautious optimism about the nearterm recovery in global domestictraffi�c. However, evidencefrom Russia shows thattraffi�c improvement will notbe broadbased across allmarkets, said IATA.
Domestic air travelPassengers travelling to andfrom the metro capitals of India can vouch that domesticair travel has changeddrastically and perhaps permanently, said P Murugesan,Director, Pioneer Aero Travels
(Madras) Pvt Ltd. In the coming days, the demand for domestic fl�ights will surge, butservices will remain unpredictable for a number of reasons. But travel insurancepolicies should be an essential prerequisite for your domestic travel, he said.
“Travel restrictions havehad a severe impact onpeople and on economies.They have not, however,stopped the spread of thevirus. And it is time for theirremoval as we learn to liveand travel in a world that willhave risks of Covid for theforeseeable future.
“This means putting a stopto the singling out of the travelling population for specialmeasures. In nearly all cases,travellers don’t bring anymore risk to a market than isalready there. Many governments have recognised thisalready and removed restrictions. Many more need to follow,” said Willie Walsh, IATA’sDirector General.
‘Ticket sales rebound in India, US, China, Russia’ IATA urges
countries to
remove travel
restrictions
AIR TRAVEL
OUR BUREAU
Hyderabad, February 21
Corbevax, Biological E Ltd’s(BE) Covid vaccine, has received emergencyuse authorisation (EUA) from theDrug Controller General ofIndia (DCGI) for use in adolescents aged 12 to 18 years.This is based on interim results of the ongoing Phase II/III clinical study, said thecompany on Monday.
DCGI had approvedCorbevax for restricted usein emergency situation inadults on December 28,2019. “We are pleased withthis signifi�cant development, which helps extendthe reach of our vaccine to
the age group of 12 to 18years in our country,” saidMahima Datla, ManagingDirector, Biological E Limited, in a release.
“We truly believe thatwith this approval we areeven more closer to fi�nishing our global fi�ght againstthe Covid19 pandemic.Once fully vaccinated, children can resume their activities and educational pursuits in schools and collegeswithout any apprehension.”Last September, BE received
approval to conduct a PhaseII/III clinical trial onCorbevax in children andadolescents aged 5 to 18years.
Based on the noobjectioncertifi�cate, BE initiated theclinical study in October2021, and evaluated theavailable safety and immunogenicity results of the ongoing phase II/III study,which indicated that thevaccine is “safe and immunogenic”, according to the release.
The vaccine is administered through an intramuscular route with twodoses scheduled 28 daysapart, and is stored at 2 to 8degrees’ Celsius temperature and presented as 0.5 ml(single dose) and 5 ml (10doses) vial and 10 mL (20doses) vial pack.
Corbevax gets DCGI green light foremergency use in 12-18 age group
Mahima Datla, MD, Biological E
Vaccine is safe
and immunogenic,
says Biological E
AGENCE FRANCE-PRESSE
Kyiv, February 21
The Kremlin warnedMonday there are no concrete plans for a summitbetween the Russian andUS leaders, as diplomatsscambled to head off� thethreat of a Russian invasionof Ukraine.
To avoid a warThe idea of a meetingbetween presidents Vladimir Putin and Joe Biden hasbeen championed byFrance and cautiously welcomed by Ukraine as a wayto avert a catastrophic warin Europe.
But Putin’s spokesmanDmitry Peskov said: “It’spremature to talk aboutany specifi�c plans for organising any kind of summits”, adding that no concrete plans had been put inplace. France’s President
Emmanuel Macron calledPutin on Sunday and afterwards his offi�ce said thatboth the Russian and Bidenwere open to the idea.
The summit would goahead, however, only “onthe condition that Russiadoes not invade Ukraine”.
“There is a diplomatichope,” said France’s minister for European aff�airs,Clement Beaune. “If there isstill a chance to avoid war,to avoid a confrontationand build a political anddiplomatic solution, thenwe need to take it,” he said.
But in Washington, asenior US administrationoffi�cial said: “Timing to bedetermined. Format to bedetermined. So it’s all completely notional.”
Visiting Brussels,Ukraine’s foreign ministerwelcomed the French effort. “We believe that everyeff�ort aimed a diplomaticsolution is worth trying,”Dmytro Kuleba said aheadof a meeting with EU coun
terparts. “We hope that thetwo presidents will walkout from the room with anagreement about Russiawithdrawing its forcesfrom Ukraine,” he said.
Defence Minister OleksiyReznikov said there was nosign of Russian forces withdrawing from the border,and that Moscowbackedrebels continue to shellUkrainian positions.
“Since the beginning ofthis day, as of 09:00, 14 attacks have already been recorded , 13 of them fromweapons prohibited by theMinsk agreements,” he toldreporters in Kyiv.
“One of our soldiers waswounded,” he said.
Russia annexed theUkrainian region of Crimeain 2014 and Moscowbacked separatists hold anenclave in the eastern distracts of Lugansk andDonetsk.
In recent weeks, according to US intelligence, Moscow has massed more
than 150,000 troops andsailors around Ukraine’sborders in Belarus, Russia,Crimea and the Black Sea.
Invasion of UkraineBiden has said that US intelligence believes that Putinhas made a decision to invade Ukraine and that commanders are readying unitsto attack within days.
Russia has long deniedthis, but state media accuses Kyiv of preparing amurderous assault againstthe rebel enclave, and hasstarted evacuating civiliansfrom the area.
Kyiv and Washington accuse the Russians of plotting a false fl�ag operationto fake Ukrainian atrocitiesin order to serve as a pretext for an all out assault.
Meanwhile, Ukraine andRussia continue to blameeach other for a spike inshellings on the front lineseparating Kyiv's forcesfrom Moscowbackedseparatists.
There is diplomatic
hope, says France
No plans for summit with Biden over Ukraine: Russia
KR SRIVATS
New Delhi, February 21
The spate of governance failures at the country’s largestbourse National Stock Exchange — made public by SEBIon February 11 — was “unlikelyto signifi�cantly damage” theequity markets, nor will it endup disturbing foreign portfolio investors’ interest in India,said M Damodaran, formerSEBI Chairman, and Chairman, Excellence Enablers.
A new dispensation Participating in BusinessLineKnowledge Series webinar on‘NSE’s Himalayan Scam’,Damodaran, who left SEBI 14years ago, asserted that foreign investors are “intelligentenough” to understand thatthere is now a new dispensation in the exchange and several corrective steps have beentaken in recent years, after theexit of the scamtaintedformer MD & CEO, ChitraRamkrishna, in December
2016. “Some of them (foreigninvestors) would have alreadytried to fi�gure out what NSEhas done to address the issuesat that time. Retail Indian investors anyway seem to becoming to the market in largenumbers,” he said.
Damodaran said that hewas “disagreeably shocked” atthe revelation in the latestSEBI order, and said that whathappened at NSE till the year2016 were not lapses, butmuch more than that. Damodaran highlighted the practiceof packing a board with
people who had distinguished themselves in thepast — having ‘fl�ower vase’ directors that grace boardroomswill not help.
“You need people who canperform in your board. Publicinterest directors in NSE didnot clearly do what was expected of them. You cannot have asystem of peaceful coexistence between board and management. This NSE case seemsto be a matter of peaceful coexistence,” he said.
He highlighted that NSE’sreputation has been damagedby the recent unravelling, andthat the current NSE management should be more communicative so as to “signal to amuch larger audience” as tohow the situation has improved, and thereby bringmore investor confi�dence inthem.
“You think the rest of theworld is happy that NSE hasgrown to become the largestderivatives exchange in the
world. They are not happy.They would like body blows tobe administered to such institutions that threaten the oncefamous institutions in thisarea.
“Therefore, we need to address the reputational damage. There is clearly somereputational damage. I don’tthink it is going to go away. Tothe extent possible, you needto fi�x it very quickly. There isno escape,” he said. He also
said that SEBI needs to ask itself if it has the right numberof people and the right kind ofpeople in three areas — surveillance, investigation and enforcement. SEBI is not a regulator that only has to policethe market, it has to focus ondeveloping the market as wellbesides regulating themarket.
“SEBI must arm itself withthe right kind of people withright experience and skill sets
to be on top of the job”, hesaid. Damodaran said therewas a need for a system whereyoung qualifi�ed people canget attracted andgive the kind of energy levels that anorganisation needs.“If energy levels inan organisation aresapped, it does notmatter what kindof expertise lies init,” he said.
Damodaran also highlighted that the same two persons (Chitra Ramkrishna andRavi Narain) had run NSE fornearly two decades, leading toconcentration of power. Thisshould not have been allowedand ensured that it is notrepeated.
J N Gupta, Founder andManaging Director, Stakeholders Empowerment Services, aproxy advisory fi�rm, suggested that there is a need to keepSEBI away from the appointment of public interest direct
ors (PIDs) in stock exchanges.He felt that PIDs should be appointed by a third party.Gupta’s contention was that if
SEBI were to appoint PIDs and ifsome governancefailures were to occur due to lapsesof PIDs, then itcould always beargued that SEBIwas equally responsible for the
situation as it had appointedthe PIDs.
‘World-class exchanges’Gupta also felt that it wouldnot be right to painteverything black and pointedout that NSE had in recent decades grown to be a large institution.
“Our exchanges are worldclass. Systems we have are better than the NYSE. We have tolearn to distinguish betweenindividuals and institutions.”
He also highlighted the cul
ture aspect which preventedboard members — who mostlyowed their existence in boardsto company promoters —from being vocal or raising issues at boardrooms.
Except for one or two cases,one rarely saw independentdirectors or other nomineedirectors coming out to talkor convey the governancelapses of their companies inwhich they are performingtheir role as directors, henoted. If the identity of anysuch whistleblower is known,then they would fi�nd it diffi�cult to get a board seat in theremaining listed companiesuniverse, he added.
BusinessLine EditorRaghuvir Srinivasan moderated the webinar, which alsosaw the participation ofLokeshwarri SK, Associate Editor, and Palak Shah, Senior Assistant Editor, BusinessLine.You can watch the webinarthrough the linkbit.ly/3LMQD2S.
‘NSE scam unlikely to end up disturbing foreign portfolio investors’ interest in India’
Clockwise from top left: Palak Shah, Senior Assistant Editor,
BusinessLine; Raghuvir Srinivasan, Editor, BusinessLine;
M Damodaran, former SEBI Chairman; J N Gupta, Founder and
Managing Director, Stakeholders Empowerment Services; and
Lokeshwarri SK, Associate Editor, BusinessLine, at the webinar
REUTERS
Sydney, February 21
Australia, on Monday, fully reopened its international borders to travellers vaccinatedagainst Coronavirus afternearly two years of pandemicrelated closings as tourists returned and hundreds ofpeople were reunited withfamily and friends.
More than 50 internationalfl�ights will reach the countrythrough the day, including 27touching down in Sydney, itslargest city, as the tourism andhospitality sectors look to rebuild after getting hammeredby Covid restrictions.
‘An exciting day’“It is a very exciting day, onethat I have been looking forward to for a long time, fromthe day that I fi�rst shut thatborder right at the start of thepandemic,” said Prime Minister Scott Morrison in the island state of Tasmania, whichrelies heavily on tourism.
Airports witnessed emotional reunions, including
that of SueWitton, who hadnot seen her son Simon fortwo years.
“Seven hundred andtwentyfour days apart and itmeans the world to me. I don’twant to let him go, it’s justbeautiful. Thank you for having me back. I’m just so grateful, so, so grateful,” she told reporters at the Melbourneairport.
Tourism is one of Australia’sbiggest industries, worthmore than A$60 billion ($43billion) and employing about
5 per cent of the country’sworkforce. But the sector wascrippled after the countryshut its borders in March2020.
“It is a party out here, musicplaying, smiles on people’sfaces, they will be dancingsoon, I’m sure,” Tourism Minister Dan Tehan told broadcaster ABC from Sydney airport as he gave travellers giftjars of Vegemite, an iconicAustralian condiment, andstuff�ed koala toys.
Tehan said he was hopeful
for a very strong rebound inthe tourism market, withQantas looking to fl�y morethan 14,000 passengers intoAustralia this week. VirginAustralia said it was seeingpositive trends in domesticbookings and continued to assess demand for internationalfl�ights.
Pay disputesAll trains in Sydney, meanwhile, were cancelled onMonday after pay disputesbetween the union and thestate government, takingsome shine off� the reopening.
Once a champion of Covidsuppression strategy, Australia shifted away from itsfortressstyle controls and relentless lockdowns since latelast year and began livingwith the virus after reachinghigher vaccination levels.Skilled migrants, international students and backpackers have been allowed to fl�yinto Australia since November in a staggered reopeningexercise.
Australia fully reopens borders, welcomes tourists
A man hugs his granddaughter upon arriving at the
Sydney International Airport on Monday AFP
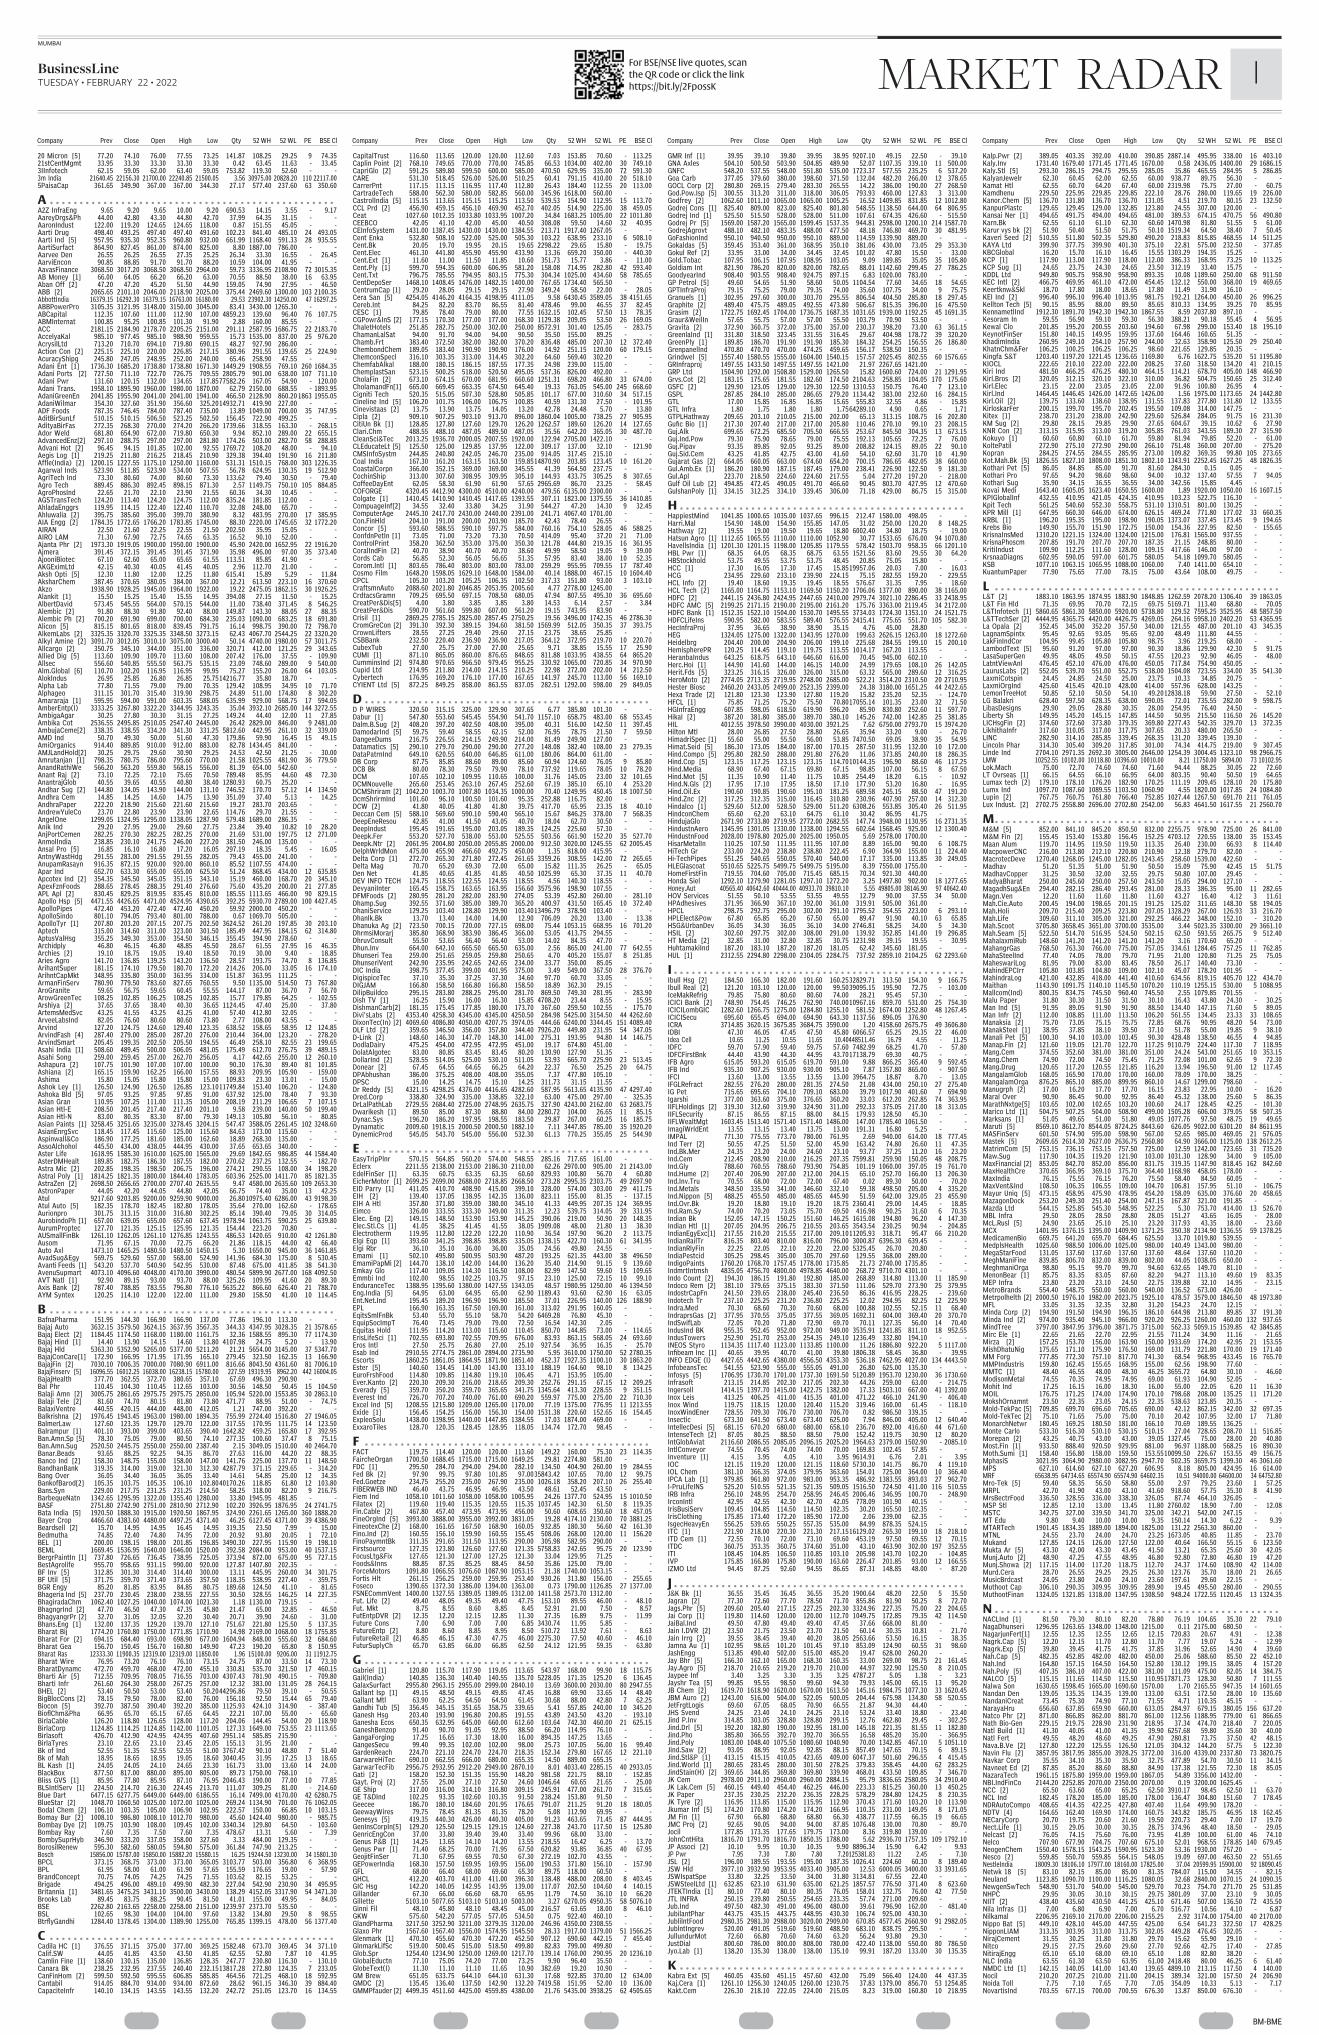
................BM-BMECMYK
Company Prev Close Open High Low Qty 52 WH 52 WL PE BSE Cl Company Prev Close Open High Low Qty 52 WH 52 WL PE BSE Cl Company Prev Close Open High Low Qty 52 WH 52 WL PE BSE Cl Company Prev Close Open High Low Qty 52 WH 52 WL PE BSE Cl
Kalp.Pwr [2] 389.05 403.35 392.00 410.00 390.85 2887.14 495.95 338.00 16 403.10Kaly.Inv 1731.40 1679.40 1771.45 1771.45 1670.00 0.58 2436.05 1400.00 29 1686.15Kaly.Stl [5] 293.30 286.15 294.75 295.55 285.05 35.86 465.55 284.95 5 286.85KalyanJewelr 62.30 60.45 62.00 62.55 60.00 938.77 89.75 56.30 - - Kamat Htl 62.55 60.70 64.20 67.40 60.00 2319.98 75.75 27.00 - 60.75Kamdhenu 229.50 225.95 229.85 229.85 222.10 28.76 280.00 119.65 19 226.00Kanor.Chem [5] 136.70 131.80 136.70 136.70 131.05 4.51 219.70 80.15 23 132.50KanpurPlastc 129.65 129.45 129.00 132.85 123.80 24.55 307.00 120.00 - - Kansai Ner [1] 494.65 491.75 494.00 494.65 481.00 389.53 674.15 470.75 56 490.80Karn.Bk 62.55 61.10 61.10 62.30 60.60 1470.98 81.80 51.55 5 61.00Karur vys bk [2] 51.90 50.40 51.50 51.75 50.10 1519.34 64.50 38.40 7 50.45Kaveri Seed [2] 510.55 511.80 502.35 529.80 490.20 218.83 815.85 468.55 14 511.25KAYA Ltd 399.90 377.75 399.90 401.30 375.10 22.81 575.00 232.50 - 377.85KBCGlobal 16.20 15.70 16.10 16.45 15.55 1303.29 194.35 15.25 - - KCP [1] 117.90 113.00 117.90 118.00 112.00 386.33 168.95 73.25 10 113.25KCP Sug [1] 24.65 23.75 24.30 24.65 23.50 312.19 33.40 15.75 - - KDDL Ltd 949.80 905.75 958.90 958.90 893.35 10.08 1189.60 250.00 68 911.50KEC Intl [2] 466.75 469.95 461.10 472.00 454.45 132.12 550.00 368.00 19 469.65Keertknw&Skl 18.70 17.80 18.00 18.65 17.80 11.49 31.90 16.10 - - KEI Ind [2] 996.40 996.10 996.40 1013.95 981.75 192.21 1264.00 450.00 26 996.25Kellton Tech [5] 90.15 85.95 88.00 89.50 85.65 810.33 134.95 39.25 70 85.95KennametlInd 1912.30 1891.70 1942.30 1942.30 1867.55 8.59 2037.80 897.10 - - Kesoram In 59.55 56.90 59.10 59.30 56.30 388.21 90.18 55.45 4 56.95Kewal Clo 201.85 195.20 200.55 203.60 194.60 67.98 299.00 153.40 18 195.10KeynotFinSer 151.80 140.15 149.95 159.95 137.60 164.46 160.65 51.35 - - KhadimIndia 260.95 249.10 254.10 257.90 244.00 32.63 358.90 125.50 29 250.40KhatnChm&Fer 106.25 100.25 106.25 106.25 98.60 221.65 129.85 20.35 - - Kingfa S&T 1203.40 1197.20 1221.45 1236.65 1169.80 6.76 1622.75 535.20 51 1195.80KIOCL 222.65 210.10 222.00 222.00 208.25 37.60 318.50 134.20 41 210.15Kiri Ind 481.50 466.25 476.25 480.30 464.15 114.21 678.70 405.00 148 466.90Kirl.Bros [2] 320.05 312.15 320.10 322.10 310.00 36.82 504.75 150.65 25 312.40Kirl.Elec 23.15 22.00 23.05 23.05 22.00 91.96 100.80 26.95 4 - Kirl.Ind 1464.45 1446.45 1426.00 1472.65 1426.00 1.56 1975.00 1173.65 24 1442.80Kirl.Oil [2] 139.75 133.60 138.60 138.95 131.55 137.83 277.80 131.80 12 133.55KirloskarFer 200.15 199.70 195.70 202.45 195.50 109.08 314.00 147.75 - - Kitex [1] 238.70 231.20 238.00 242.90 229.60 526.84 284.05 91.75 16 231.30KM Sug [2] 29.80 28.15 29.85 29.90 27.65 604.67 39.15 10.62 6 27.90KNR Con [2] 313.15 315.95 313.00 319.20 305.85 761.03 343.55 189.30 27 315.90Kokuyo [1] 60.60 60.80 60.10 61.70 59.80 81.94 79.85 52.20 - 61.00KoltePatil 272.90 275.10 272.90 290.00 266.10 751.48 360.00 207.00 - 275.20Kopran 284.25 274.55 284.55 285.95 273.00 109.82 369.35 99.80 105 273.65Kot.Mah.Bk [5] 1826.55 1827.10 1808.00 1851.30 1802.10 1343.91 2252.45 1627.25 48 1826.35Kothari Pet [5] 86.05 84.85 85.00 91.70 81.60 284.30 0.15 0.05 - - Kothari Pro 97.65 94.20 98.60 98.60 94.00 10.32 137.40 57.55 7 94.05Kothari Sug 35.90 34.15 36.55 36.55 34.00 342.56 15.85 4.45 - - Kovai Medi 1643.40 1605.05 1623.40 1650.55 1600.00 1.89 1920.00 1050.00 16 1607.15KPIGlobalInf 432.55 410.95 421.05 424.35 410.95 103.23 522.75 116.30 - - Kpit Tech 561.25 540.60 552.30 558.75 531.10 1310.51 801.00 130.25 - - KPR Mill [1] 647.95 660.30 646.00 674.00 626.15 469.24 771.80 177.02 33 660.35KRBL [1] 196.20 195.35 195.00 198.90 190.05 1373.07 337.45 173.45 9 194.65Krebs Bio 149.90 155.70 151.90 172.75 150.00 154.36 227.95 82.50 - 155.65KrisnaInsMed 1310.20 1221.15 1324.00 1324.00 1215.00 176.81 1565.00 937.55 - - KrisnaPhoscm 207.85 191.70 207.70 207.70 187.35 21.15 248.85 80.00 - - KritiIndust 109.90 112.25 111.60 128.00 109.15 417.66 146.00 97.00 - - KrsnaaDiagns 602.95 590.05 597.00 601.75 580.05 54.18 1099.70 580.05 - - KSB 1077.10 1063.15 1065.95 1088.00 1060.00 7.40 1411.00 654.10 - - KuantumPaper 77.90 75.65 77.00 78.15 75.00 43.64 108.00 49.75 - -
L . . . . . . . . . . . . . . . . . . . . . . . . . . . . . . . . . . . . . . . . . . . . . . . .L&T [2] 1883.10 1863.95 1874.95 1883.90 1848.85 1262.59 2078.20 1306.40 39 1863.05L&T Fin Hld 71.35 69.95 70.70 72.15 69.75 5169.71 113.40 68.80 - 70.05L&TInfotech [1] 5860.65 5861.30 5850.00 5920.00 5738.80 129.52 7595.25 3525.95 48 5857.50L&TTechSer [2] 4444.95 4365.75 4420.00 4426.75 4269.05 264.16 5958.10 2402.20 53 4365.95La Opala [2] 352.45 345.00 352.20 357.50 340.00 121.55 487.00 201.10 43 345.35LagnamSpintx 95.45 92.65 93.05 95.65 92.00 48.49 111.80 44.55 - - LakFinIndCor 104.95 99.45 105.80 105.80 98.75 3.96 219.25 68.00 - - LambodText [5] 95.60 91.20 97.00 97.00 90.30 18.86 129.90 42.30 5 91.75LasaSuperGen 49.95 48.05 49.50 50.15 47.55 120.23 92.90 46.05 - 48.00LatntViewAnl 476.45 452.10 476.00 476.00 450.05 717.84 754.90 450.05 - - LaurusLabs [2] 552.05 539.70 551.00 552.75 538.00 1504.08 723.55 334.00 35 541.30LaxmiCotspin 24.45 24.85 24.50 25.00 23.75 10.33 34.85 20.75 - - LaxmiOrgInd 425.60 415.45 420.10 428.00 414.00 557.96 628.00 143.25 - - LemonTreeHot 50.85 52.10 50.50 54.10 49.2012838.18 59.90 27.50 - 52.10LG Balakri 628.40 597.50 628.35 638.00 590.05 72.01 735.55 282.00 9 598.75LibasDesigns 29.90 29.05 28.80 30.35 28.00 254.95 76.40 24.50 - - Liberty Sh 149.95 145.20 145.15 147.85 144.50 50.95 215.50 116.50 26 145.20LICHsgFin [2] 374.60 372.60 373.80 379.35 369.80 2277.43 542.35 329.70 13 372.35LikhithaInfr 317.60 310.05 317.00 317.75 307.65 20.33 480.00 265.50 - - LINC 282.90 314.10 285.85 339.45 268.35 131.20 339.45 139.30 - - Lincoln Phar 314.30 305.40 309.20 317.85 301.00 74.34 414.75 219.00 9 307.45Linde Ind 2704.10 2971.35 2692.30 3005.00 2646.00 1254.39 3004.45 1323.10 98 2966.75LMW 10252.55 10102.00 10118.80 10396.60 10010.00 8.21 11750.00 5894.00 73 10102.95Lok.Mach 75.00 72.70 74.60 74.60 71.60 94.44 88.25 30.05 22 72.60LT Ovrseas [1] 66.15 64.55 66.10 66.95 64.00 803.35 90.40 50.50 19 64.65Lumax tech [2] 179.10 178.10 176.20 182.90 170.25 111.19 209.45 128.10 20 175.80Lumx Ind 1097.70 1087.60 1089.55 1103.50 1060.90 4.55 1820.00 1017.85 24 1084.80Lupin [2] 767.75 760.75 761.80 766.40 752.85 1027.44 1267.50 691.70 211 761.05Lux Indust. [2] 2702.75 2558.80 2696.00 2702.80 2542.00 56.83 4641.50 1617.55 21 2560.70
M. . . . . . . . . . . . . . . . . . . . . . . . . . . . . . . . . . . . . . . . . . . . . . . .M&M [5] 852.00 841.10 845.20 850.50 832.00 2255.75 978.90 725.00 26 841.00M&M Fin [2] 155.45 153.40 153.80 156.45 152.25 4703.12 220.55 138.00 35 153.45Maan Alum 119.70 114.95 119.50 119.50 113.35 26.40 230.00 66.93 8 114.40MacpowerCNC 216.00 213.80 212.10 220.80 210.90 12.38 279.70 82.00 - - MacrotecDeve 1270.40 1268.05 1245.00 1282.05 1243.45 258.60 1539.00 422.60 - - Madhav 51.20 51.35 51.00 51.90 50.50 15.09 75.90 42.45 15 51.75MadhavCopper 31.25 30.50 32.00 32.55 29.75 50.80 107.00 29.45 - - MadyaBharat 250.00 245.60 250.00 257.50 243.50 15.05 294.00 127.10 - - MagadhSug&En 294.40 282.15 286.40 293.45 281.00 28.33 386.35 95.00 11 282.65Magn.Ven 12.20 11.60 11.60 11.80 11.60 43.27 16.40 4.12 3 11.61Mah.Cie.Auto 200.45 194.00 198.65 201.15 191.25 125.02 311.65 148.30 58 194.05Mah.Holi 209.70 215.40 209.25 223.80 207.05 1328.29 267.00 126.93 33 216.70Mah.Life 309.60 311.10 305.00 321.00 292.25 466.22 348.00 152.10 - 310.20Mah.Scoot 3705.80 3658.45 3651.00 3700.00 3535.00 3.44 5023.35 3300.00 29 3661.10Mah.Seam [5] 522.50 514.70 516.95 524.50 502.15 62.50 593.55 265.75 9 512.40MahalaxmiRub 148.60 141.20 141.20 141.20 141.20 3.16 170.60 65.20 - - MahangrGas 768.50 763.30 766.00 775.00 757.05 334.61 1284.45 757.25 11 762.85MahaSteelInd 77.40 74.05 78.00 79.70 71.95 21.00 120.80 71.25 25 75.05MaheswariLog 81.95 79.00 83.00 83.45 78.50 26.17 140.40 73.30 - - MahindEPCIrr 105.80 103.85 104.80 109.00 102.10 45.07 178.20 101.95 - - MahindraLog 421.00 432.85 418.00 441.40 410.60 634.56 819.15 405.70 122 434.70Maithan 1143.90 1091.75 1140.10 1145.50 1070.20 110.19 1255.15 530.00 5 1088.95Mallcom(Ind) 800.35 834.75 745.50 960.40 745.50 2.55 1079.85 701.55 - - Malu Paper 31.80 30.30 31.50 31.50 30.10 16.43 43.80 24.30 - 30.25Man Ind [5] 91.95 89.05 91.90 91.90 88.50 134.40 147.15 71.60 5 89.05Man Infr [2] 112.00 108.85 111.00 113.50 106.20 561.55 134.45 23.33 33 108.65Manaksia [2] 75.70 73.05 75.15 75.75 72.85 68.76 90.95 48.20 54 73.00ManakSteel [1] 38.95 37.85 38.10 39.50 37.10 51.78 55.00 19.85 9 38.10Manali Pet [5] 100.30 94.10 103.00 103.45 90.30 428.48 138.50 46.55 4 94.85Manap.Fin [2] 121.60 119.05 121.70 122.70 117.25 9110.79 224.40 117.30 7 118.95Mang.Cem 374.55 352.60 381.00 381.00 351.00 24.24 543.00 251.65 10 353.15Mang.Chem 74.90 72.00 74.50 75.45 71.25 72.08 101.00 62.65 9 72.30Mang.Drug 120.65 117.20 120.55 121.85 116.20 13.94 196.50 91.00 12 117.45MangalamGlob 168.05 165.90 170.00 170.00 160.00 78.09 170.00 38.25 - - MangalamOrga 876.25 865.10 885.00 899.95 860.10 14.67 1299.00 798.60 - - Manugrph [2] 17.00 16.20 17.70 17.70 16.15 23.83 22.95 10.00 - 16.20Maral Over 90.90 86.45 90.00 92.95 86.40 45.32 138.00 25.60 5 86.35MarathNxtge[5] 103.65 102.00 102.65 103.20 100.60 24.17 128.45 42.25 - 101.30Marico Ltd [1] 504.75 507.25 504.00 508.90 499.00 1505.28 606.00 379.05 58 507.35Marksans [1] 51.05 49.65 51.00 51.80 49.05 1077.76 97.50 48.75 19 49.65Maruti [5] 8569.10 8612.70 8544.05 8724.25 8443.60 626.05 9022.00 6301.20 84 8611.95MASFinServ 601.50 574.90 595.00 598.90 567.00 52.65 985.00 469.05 21 576.05Mastek [5] 2609.65 2614.30 2627.00 2636.75 2560.80 64.90 3666.00 1125.00 138 2612.25MatrimCom [5] 753.15 736.15 753.15 757.50 725.00 12.59 1242.00 723.65 31 735.20Maw.Sug 117.90 104.35 119.20 121.90 103.00 1031.30 128.90 34.00 9 105.00MaxFinancial [2] 853.05 842.70 852.00 856.00 831.75 319.35 1147.90 818.45 162 842.60MaxHealthCre 370.65 366.95 369.10 375.70 364.40 1168.98 458.05 178.00 - - MaxIndia 76.15 75.55 76.15 76.20 75.50 58.40 84.50 60.05 - - MaxVent&Ind 108.50 106.35 106.55 109.00 104.70 106.81 157.95 51.10 - 106.75Mayur Uniq [5] 473.15 458.95 475.90 478.95 454.20 158.09 635.00 376.60 20 458.65MazagonDock 253.20 249.30 251.40 254.00 247.15 167.87 321.00 191.85 - - Mazda Ltd 544.15 525.85 545.30 548.95 522.25 5.30 753.70 414.00 13 526.70MBL Infra 29.50 28.05 28.50 28.80 28.05 151.27 43.65 16.05 - 28.00McL.Rusl [5] 24.90 23.65 25.10 25.10 23.20 317.93 43.35 18.00 - 23.60MCX 1401.95 1376.15 1395.00 1409.90 1371.25 350.38 2134.90 1336.55 59 1378.25MedicamenBio 669.75 641.20 659.70 684.45 625.50 13.70 1019.80 539.55 - - MedplsHealth 1025.60 988.50 1006.00 1025.00 980.00 140.49 1343.00 980.00 - - MegaStarFood 131.05 137.60 137.60 137.60 137.60 48.64 137.60 110.20 - - MeghManiFine 839.85 806.70 832.00 839.00 802.00 44.05 1038.05 650.00 - - MeghmaniOrga 98.80 95.15 99.70 99.70 94.60 632.65 149.70 81.10 - - MenonBear [1] 85.75 83.35 83.05 87.60 82.20 94.27 113.10 49.60 19 83.35MEP Infra 23.80 23.20 23.10 24.50 22.75 339.88 32.10 14.95 - 23.15MetroBrands 554.40 548.75 550.00 560.00 540.00 136.52 673.00 426.00 - - Metrpolhelth [2] 2000.50 1976.10 1982.00 2023.75 1925.10 478.57 3579.00 1846.50 48 1973.80MFL 33.05 31.35 32.35 32.80 31.20 154.23 24.70 12.15 - - Minda Corp [2] 194.90 191.50 194.90 196.35 186.10 644.98 213.80 89.85 37 191.30Minda Ind [2] 974.00 935.40 945.10 966.00 920.20 926.25 1260.00 460.00 132 937.65MindTree 3797.00 3847.95 3796.00 3871.75 3715.00 562.33 5059.15 1539.85 42 3845.85Mirc Ele [1] 22.65 21.65 22.70 22.95 21.55 711.24 34.90 11.16 - 21.65Mirza [2] 157.25 153.70 156.00 163.90 150.00 1933.69 174.20 42.95 21 153.55MishDhatuNig 175.65 171.10 175.90 176.50 169.00 131.79 221.80 170.00 19 171.40MM Forg 777.85 772.30 757.10 817.70 741.30 68.54 968.95 433.45 16 765.70MMPIndustris 159.80 162.45 155.65 168.95 155.00 62.56 198.90 77.60 - - MMTC [1] 48.40 46.55 48.00 48.30 46.25 3655.72 64.80 30.10 - 46.60ModisonMetal 74.55 70.35 74.95 74.95 69.00 61.93 104.90 52.05 - - Mohit Ind 17.25 16.15 16.00 18.30 16.00 55.00 22.05 6.20 11 16.30MOIL 176.75 171.25 174.00 174.90 170.10 798.68 208.00 135.25 11 171.20MokshOrnamnt 23.50 22.35 23.05 24.15 22.35 538.63 123.85 20.35 - - Mold-TekPac [5] 709.85 699.70 696.60 705.65 690.00 42.12 862.15 342.00 32 697.35Mold-TekTec [2] 75.10 71.65 75.00 75.00 70.10 20.42 107.95 32.00 17 71.80MonarchNetwr 180.45 169.25 180.50 181.00 166.10 70.69 189.55 136.25 - - Monte Carlo 533.30 516.30 530.10 530.15 510.15 27.04 728.65 208.70 11 516.85Morepan [2] 43.25 40.75 43.00 43.00 39.05 1327.45 75.00 28.00 20 40.80Most.Fin [1] 933.50 888.40 920.50 929.95 881.00 96.97 1188.00 568.25 16 890.30Moth.Sumi [1] 158.40 156.80 158.00 159.50 153.5510099.50 226.67 153.55 49 156.75MphasiS 3021.95 3064.90 2980.00 3082.95 2947.70 502.35 3659.75 1399.30 46 3061.60MPS 627.10 614.60 627.10 627.20 606.95 8.18 805.00 424.95 16 614.00MRF 65638.95 64734.65 65574.90 65574.90 64602.35 10.51 94000.00 64600.00 34 64752.80Mro-Tek [5] 59.40 58.35 56.50 58.80 55.00 2.97 79.25 23.60 1 57.25MRPL 42.70 41.90 43.00 43.10 41.60 918.60 57.75 35.30 8 41.90MrsBectrFood 336.50 328.55 336.00 338.30 326.05 87.74 464.10 326.05 - - MSP Stl 12.85 12.10 13.00 13.45 11.80 2760.02 18.90 7.00 - 12.08MSTC 342.75 327.00 339.50 341.70 325.00 342.21 542.00 247.15 - - MT Edu 9.80 9.40 10.00 10.00 9.35 150.14 14.30 6.22 - 9.39MTARTech 1901.45 1834.35 1889.00 1894.00 1825.00 131.22 2563.30 860.00 - - MTNL 24.55 23.70 24.00 24.70 23.25 1673.05 40.85 11.85 - 23.70Mukand 127.85 124.15 126.00 127.50 122.00 40.64 166.50 55.15 6 123.50Mukta Ar [5] 43.30 42.00 43.30 43.45 41.50 13.21 65.35 25.60 30 42.05Munj.Auto [2] 48.90 47.25 47.55 48.95 46.80 92.80 72.80 46.80 19 47.20Munj.Showa [2] 117.15 114.00 117.20 118.75 112.70 24.37 174.60 108.90 42 114.00Murd.Cera 28.70 26.55 29.25 29.25 26.30 123.76 35.70 18.00 21 26.65MusicBrdcast 24.05 23.80 24.00 24.10 23.60 197.61 29.60 22.15 - - Muthoot Cap 306.10 290.35 309.95 309.95 289.90 19.45 495.50 280.00 - 290.55MuthootFinan 1324.05 1321.85 1318.00 1347.95 1308.50 948.24 1722.55 1120.45 13 1324.35
N . . . . . . . . . . . . . . . . . . . . . . . . . . . . . . . . . . . . . . . . . . . . . . . .NACLInd [1] 81.50 79.30 80.10 82.20 78.80 76.19 104.65 35.30 22 79.10NagaDhunseri 1296.95 1263.65 1348.00 1348.00 1215.00 0.11 2175.00 680.50 - - NagarjunFert[1] 12.55 12.35 12.55 12.65 12.15 720.83 20.67 4.91 - 12.38Nagrk.Cap [5] 12.20 12.15 11.70 12.80 11.70 7.77 19.07 5.24 - 12.99Nagrk.Exp [5] 39.80 39.45 41.75 41.75 37.85 31.96 52.65 14.90 4 39.60Nah.Cap [5] 482.35 452.85 482.00 482.00 450.00 25.06 588.60 85.50 22 452.10Nah.Ind 164.80 157.15 164.50 164.50 152.80 130.12 199.15 38.05 4 157.20Nah.Poly [5] 407.35 386.10 407.00 422.00 381.00 111.09 475.00 82.05 14 384.75NALCO [5] 115.15 111.65 114.50 115.50 110.9517871.73 128.30 50.80 7 111.55Nalwa Son 1630.65 1598.45 1665.00 1690.60 1570.00 1.70 2165.55 947.35 14 1601.65Nandan Den 139.05 135.35 134.35 139.00 133.00 63.51 172.50 28.00 10 135.60NandaniCreat 73.45 75.30 74.90 77.10 71.55 4.71 110.35 45.15 - - NarayaHru 656.60 637.85 659.90 660.00 633.05 284.97 679.15 380.05 156 637.20Natco Phr [2] 871.00 866.85 862.00 881.70 861.00 112.56 1188.95 779.00 61 866.65Nath Bio-Gen 229.15 219.75 228.90 231.90 218.95 37.34 474.70 218.40 7 220.05Natl Build [1] 41.30 40.05 41.00 41.35 39.90 6257.68 59.80 35.60 30 40.00Natl Fert 49.55 48.20 48.60 49.25 47.90 280.81 73.75 37.50 42 48.15Nava.B.Ve [2] 127.80 122.20 125.55 126.50 121.05 304.32 144.20 57.75 5 122.30Navin Flu [2] 3857.95 3817.95 3855.00 3928.25 3772.00 316.00 4339.00 2337.80 73 3820.75Navkar Corp 35.55 34.10 35.30 35.50 32.75 477.89 54.70 30.50 11 34.15Navneet Ed [2] 87.85 85.20 88.60 88.80 84.90 137.38 121.55 72.30 18 85.05NazaraTech 1961.15 1875.80 1959.00 1959.00 1867.05 54.89 3356.00 1432.00 - - NBI.IndFinCo 2144.20 2252.85 2070.00 2350.00 2070.00 0.19 3200.00 1625.45 - - NCC [2] 65.50 63.60 65.00 65.25 62.50 3910.17 98.45 62.50 11 63.70NCL Ind 182.45 178.20 185.00 185.00 178.00 136.47 304.80 151.60 7 178.45NDRAutoCompo 408.65 414.35 422.25 427.80 407.40 11.64 499.90 178.20 - - NDTV [4] 164.65 162.40 169.90 174.00 160.75 343.82 185.75 46.95 18 162.45NECaryCorp 20.70 19.75 20.60 21.60 19.50 220.73 29.40 7.00 17 19.70Nect.Life [1] 30.15 29.05 30.00 30.35 28.75 374.96 48.40 18.50 - 29.05Nelcast [2] 76.05 74.15 75.60 76.00 73.95 41.89 100.00 61.00 46 74.10Nelco 707.90 677.90 704.75 707.60 675.10 52.01 968.55 178.85 140 679.45NeogenChem 1550.40 1578.15 1543.25 1590.95 1523.30 53.36 1930.00 757.20 - - Nesco [2] 559.85 550.70 559.85 564.15 548.05 19.09 697.00 463.50 22 551.65NestleIndia 18009.30 18106.10 17977.00 18160.00 17825.00 37.04 20599.95 15900.00 92 18090.45Netwk 18 [5] 83.10 82.15 85.00 85.00 81.35 784.07 115.00 34.55 - 82.15Neuland 1123.85 1090.70 1100.00 1116.25 1080.05 32.68 2840.00 1070.15 24 1090.35NewgenSwTech 548.90 531.70 540.00 545.00 529.70 70.23 754.70 271.70 25 531.85NHPC 29.95 30.05 30.10 30.15 29.75 3801.09 37.00 23.10 9 30.05NIIT [2] 438.40 435.60 430.50 441.25 425.10 671.46 507.00 136.50 72 435.50Nila Infras [1] 7.00 6.80 6.90 7.00 6.70 516.77 10.56 4.10 - 6.87Nilkamal 2206.95 2169.10 2170.00 2206.00 2155.25 2.92 3174.00 1754.00 40 2170.00Nippo Bat [5] 449.10 428.10 445.00 447.55 425.00 6.54 641.23 322.50 17 428.25NipponLIAM 313.35 303.95 313.00 313.75 302.05 449.28 476.45 302.05 - - NirajCement 31.55 30.25 31.80 31.80 29.70 15.62 55.90 29.10 - - Nitco 29.15 27.75 29.60 29.60 27.70 92.66 42.75 17.40 - 27.85NitirajEngg 65.10 65.10 68.00 69.10 65.10 1.08 82.80 38.20 - - NLC India 63.55 61.30 63.50 63.95 61.00 2418.48 80.00 46.25 6 61.40NMDC Ltd [1] 142.15 140.05 141.00 143.40 139.65 4899.10 213.15 117.50 4 140.00Nocil 210.20 207.25 210.00 211.00 204.15 389.34 321.00 157.50 24 206.90Noida Toll 7.75 7.10 7.65 7.70 7.05 354.09 10.33 5.13 - 7.17NovartisInd 703.55 677.15 700.00 700.55 676.30 13.87 850.00 676.30 - -
20 Micron [5] 77.20 74.10 76.00 77.55 73.25 141.87 108.25 29.25 9 74.3521stCentMgmt 33.95 33.30 33.30 33.30 33.30 0.42 63.45 11.63 - 33.453IInfotech 62.15 59.05 62.00 63.40 59.05 753.82 119.30 52.60 - - 3m India 21640.45 22156.30 21700.00 22240.85 21500.05 3.56 30975.00 20828.20 110 22117.005PaisaCap 361.65 349.90 367.00 367.00 344.30 27.17 577.40 237.60 63 350.60
A . . . . . . . . . . . . . . . . . . . . . . . . . . . . . . . . . . . . . . . . . . . . . . . .A2Z InfraEng 9.65 9.20 9.65 10.00 9.20 690.53 14.15 3.55 - 9.17AareyDrgs&Ph 44.00 42.80 43.30 44.80 42.70 37.99 64.35 31.15 - - AaronIndust 122.00 119.20 124.65 124.65 118.00 0.87 151.55 45.05 - - Aarti Drug 498.40 493.25 497.40 497.40 491.60 102.23 841.40 485.10 24 493.05Aarti Ind [5] 957.95 935.30 952.35 960.80 932.00 661.99 1168.40 591.33 28 935.55AartiSurfact 864.90 827.45 861.00 874.00 825.00 8.80 1887.00 786.00 - - Aarvee Den 26.55 26.25 26.55 27.35 25.25 26.34 33.30 16.55 - 26.45AarviEncon 90.85 88.85 91.70 91.70 88.20 10.59 104.00 41.95 - - AavasFinance 3068.50 3017.20 3068.50 3068.50 2964.00 59.73 3336.95 2108.90 72 3015.35AB Money [1] 66.00 64.05 66.20 66.20 63.00 70.55 88.50 38.00 16 63.95Aban Off [2] 47.20 47.20 45.20 51.50 44.90 159.05 74.90 27.95 - 46.50ABB [2] 2065.65 2101.10 2046.00 2118.90 2025.00 375.44 2469.60 1300.00 103 2100.35AbbottIndia 16379.15 16292.30 16379.15 16763.00 16180.00 29.53 23902.30 14250.00 47 16297.25ABBPowerPro 3105.35 3121.95 3148.00 3150.00 3045.00 83.41 3430.00 1265.30 - - ABCapital 112.35 107.60 111.00 112.90 107.00 4859.23 139.60 96.40 76 107.75ABMInternat 100.85 95.25 100.85 101.30 91.90 2.88 160.00 85.55 - - ACC 2181.15 2184.90 2178.70 2205.25 2151.00 291.11 2587.95 1686.75 22 2183.70AccelyaKal 985.10 977.45 985.10 988.90 959.55 15.73 1535.00 837.00 25 976.20AcrysilLtd 713.20 710.70 694.10 719.80 690.15 48.27 927.90 286.00 - - Action Con [2] 225.15 225.10 220.00 226.85 217.15 380.96 291.55 139.65 25 224.90AcuracyShipg 245.80 247.05 248.95 252.00 240.00 65.46 258.90 47.55 - - Adani Ent [1] 1736.30 1685.20 1738.80 1738.80 1671.30 1449.29 1908.55 769.10 260 1684.35Adani Ports [2] 727.50 711.10 722.70 726.75 709.55 2805.79 901.00 638.00 107 711.10Adani Pwr 131.60 120.15 132.00 134.65 117.8577582.26 167.05 54.90 - 120.00Adani Trans. 1958.10 1895.90 1960.00 1980.00 1870.00 62.79 2150.00 688.55 - 1893.95AdaniGreenEn 2041.85 1955.90 2041.00 2041.00 1941.00 466.50 2128.90 860.20 1863 1955.05AdaniWilmar 354.30 327.60 351.90 356.60 325.2014932.71 419.90 227.00 - - ADF Foods 787.35 746.45 784.00 787.40 735.00 13.89 1049.00 700.00 35 747.95AditBirSunLf 510.15 510.15 506.50 523.25 502.50 156.45 722.90 499.25 - - AdityaBirFas 272.35 268.30 270.00 274.20 266.20 1739.66 318.55 163.30 - 268.15Ador Weld 681.80 654.90 672.00 719.80 650.30 9.94 852.10 289.00 22 655.15AdvancedEnz[2] 297.10 288.75 297.00 297.00 281.80 174.26 503.00 282.70 58 288.85Advani Hot [2] 96.45 94.15 101.85 102.00 92.55 1769.72 108.20 48.00 - 94.10Aegis Log [1] 219.25 211.80 216.25 218.45 210.90 329.38 394.40 191.90 16 211.80Affle(India) [2] 1200.15 1227.55 1175.10 1250.00 1160.00 531.31 1510.15 768.00 303 1226.35Agarwal Inds 523.90 511.85 523.90 534.00 507.55 56.78 624.95 130.35 19 512.90AgriTech Ind 73.30 80.60 74.00 80.60 73.30 133.62 79.40 30.50 - 79.40Agro Tech 889.45 886.30 892.45 898.15 871.30 2.57 1149.75 750.10 105 884.85AgroPhosInd 22.65 21.70 22.10 23.90 21.55 60.36 34.30 10.45 - - AGSTransTech 124.20 113.40 124.20 124.75 112.00 835.24 181.85 112.00 - - AhladaEnggrs 119.95 114.15 122.40 122.40 110.70 32.08 248.00 65.70 - - Ahluwalia [2] 395.75 385.60 395.00 399.70 380.90 8.32 483.95 270.00 17 385.95AIA Engg [2] 1784.35 1772.65 1766.20 1783.85 1745.00 88.30 2220.00 1745.65 32 1772.20AIRAN 22.50 21.60 22.25 22.55 21.50 202.50 35.95 15.05 - - AIRO LAM 71.30 67.90 72.75 74.65 63.35 16.52 90.10 52.00 - - Ajanta Phr [2] 1973.30 1919.05 1900.00 1950.00 1900.00 45.90 2420.00 1652.95 22 1916.20Ajmera 391.45 372.15 391.45 391.45 371.90 35.98 496.00 97.00 35 373.40AjooniBiotec 67.10 62.60 65.00 65.65 61.55 113.51 85.85 41.90 - - AKGEximLtd 42.15 40.30 40.05 41.45 40.05 2.96 112.70 21.00 - - Aksh Opti [5] 12.30 11.80 12.00 12.25 11.80 615.41 15.89 5.29 - 11.84AksharChem 387.45 370.65 380.05 384.00 367.00 12.21 613.50 223.10 16 370.60Akzo 1938.90 1928.25 1945.00 1964.00 1922.00 19.22 2475.05 1862.15 30 1926.25Alankit [1] 15.50 15.25 15.40 15.55 14.95 394.08 27.15 11.50 - 15.25AlbertDavid 573.45 545.55 564.00 570.15 544.00 11.00 738.40 371.45 8 546.25Alembic [2] 91.80 88.30 91.80 92.40 88.00 149.87 143.30 88.05 27 88.35Alembic Ph [2] 700.20 691.90 699.00 700.00 684.30 235.03 1090.00 683.25 18 691.80Alicon [5] 815.15 801.65 818.00 839.45 791.75 16.14 998.75 390.00 72 798.70AlkemLabs [2] 3325.35 3320.70 3325.35 3348.50 3273.15 62.43 4067.70 2544.25 22 3320.20Alkyl Amine [2] 3091.70 3012.05 3010.10 3075.00 3000.40 50.14 4740.00 1980.00 57 3011.75Allcargo [2] 350.75 345.10 344.00 351.00 336.00 320.71 412.00 121.25 29 343.65Allied Dig [5] 113.60 109.90 109.70 113.60 108.00 207.42 176.00 37.55 - 109.90Allsec 556.60 540.85 555.50 563.75 535.15 23.09 748.60 289.00 9 540.00Alm.Global [6] 110.70 102.20 116.95 116.95 99.95 75.27 155.20 26.00 64 103.05AlokIndus 26.95 25.85 26.80 26.85 25.7514216.77 35.80 18.70 - - Alpha Lab 77.80 71.55 79.00 79.00 70.35 129.42 108.95 34.95 10 71.70Alphageo 311.15 301.70 315.40 319.90 298.75 24.89 511.00 174.80 8 302.20Amararaja [1] 595.95 594.00 591.00 603.35 588.05 635.99 929.00 568.75 17 594.05AmberEntp(I) 3333.25 3267.80 3322.20 3344.95 3243.35 35.04 3932.10 2685.00 144 3272.55AmbigaAgar 30.25 27.80 30.30 31.15 27.25 149.24 44.40 12.00 11 27.85Ambika Cot 2536.55 2495.85 2510.05 2547.40 2445.00 26.42 2829.00 846.00 9 2481.00AmbujaCeme[2] 338.35 338.55 334.20 341.30 331.25 5812.60 442.95 261.10 32 339.00AMD Ind 50.70 49.30 50.00 51.60 47.30 179.86 59.90 16.45 15 49.15AmiOrganics 914.40 889.85 910.00 912.00 883.00 82.78 1434.45 841.00 - - AMJLandHold[2] 30.25 29.75 29.60 30.90 29.25 24.53 42.50 21.25 - 30.00Amrutanjan [1] 798.35 780.75 786.00 795.60 770.00 21.58 1025.55 481.90 36 779.50AnandRathiWe 566.20 563.20 559.80 568.15 556.00 81.39 654.00 542.60 - - Anant Raj [2] 73.10 72.25 72.10 75.65 70.50 789.48 85.95 44.60 48 72.30AnantrajGlob 40.55 39.65 40.55 40.80 38.40 1280.93 60.75 25.20 - - Andhar Sug [2] 144.80 134.05 143.90 144.00 131.10 746.52 170.70 57.12 14 134.50Andhra Cem 14.85 14.25 14.60 14.75 13.90 351.09 37.40 5.13 - 14.25AndhraPaper 222.20 218.90 215.60 221.60 215.60 19.27 283.70 203.65 - - AndrewYuleCo 23.70 22.80 23.90 23.90 22.65 114.76 29.70 21.55 - - AngelOne 1299.05 1324.95 1295.00 1338.05 1287.90 579.48 1689.00 286.35 - - Anik Ind 29.20 27.95 29.00 29.60 27.75 23.84 39.40 10.82 10 28.20AnjPortCemen 282.25 270.30 282.25 282.25 270.00 21.69 531.00 197.75 12 271.00AnmolIndia 238.85 230.10 241.75 246.00 227.20 381.50 246.00 135.00 - - Ansal Pro [5] 16.85 16.10 16.80 17.20 16.05 297.19 18.35 5.45 - 16.05AntnyWastHdg 291.55 283.00 291.55 291.55 282.05 79.43 455.00 241.00 - - AnupamRasayn 916.35 872.15 920.00 920.00 860.10 85.52 1107.55 474.00 - - Apar Ind 652.70 633.30 655.00 655.00 625.50 51.24 868.45 434.00 12 635.85Apcotex Ind [2] 354.35 345.50 345.05 351.15 343.10 15.19 460.00 168.70 20 345.10ApexFznFoods 288.65 278.45 288.35 291.40 276.60 75.60 435.20 200.00 21 277.85APL Apl [2] 830.45 829.25 819.95 835.45 810.00 185.55 1113.65 466.00 90 829.15Apollo Hsp [5] 4471.55 4426.65 4471.00 4524.95 4390.65 392.25 5930.70 2789.00 100 4427.45ApolloPipes 472.40 453.20 472.40 472.40 450.20 59.92 2000.00 450.20 - - ApolloSindo 801.10 794.05 793.40 801.00 788.00 0.67 1069.70 505.00 - - ApolloTyr [1] 207.80 203.20 207.15 207.75 202.50 3624.52 261.20 197.85 30 203.10Aptech 315.00 314.60 311.00 323.00 301.50 185.49 447.95 184.15 62 314.80AptusValHsg 355.25 349.30 353.00 354.50 346.15 355.45 394.90 278.60 - - Archidply 46.80 46.15 46.80 48.85 45.50 28.67 61.55 27.95 16 46.35Archies [2] 19.10 18.75 19.05 19.40 18.50 70.19 30.00 9.40 - 18.85Aries Agro 141.70 136.85 139.25 143.20 136.50 28.57 193.75 74.70 8 136.85ArihantSuper 181.15 174.10 179.50 180.70 172.20 214.26 206.00 33.05 16 174.10ArihntCapMkt 348.95 335.80 350.00 363.95 334.00 151.87 363.95 111.25 - - ArmanFinServ 780.90 779.50 783.60 827.65 760.55 9.50 1135.00 514.50 73 767.80AroGranite 59.65 56.75 59.65 60.45 55.55 144.17 87.00 36.70 7 56.70ArowGreenTec 108.25 102.85 106.25 108.25 102.85 15.77 179.85 64.25 - 102.55Arshiya [2] 37.65 37.65 38.40 40.30 36.65 1124.45 47.40 25.00 - 37.80ArtemsMedSvc 43.25 41.55 43.25 43.25 41.00 57.40 412.80 32.05 - - ArveeLabsInd 82.05 76.60 80.60 80.60 73.80 2.77 108.00 43.55 - - Arvind 127.20 124.75 124.60 129.40 123.35 638.52 158.65 58.95 12 124.85ArvindFash [4] 287.40 279.00 285.00 287.20 276.00 210.44 364.00 123.20 - 278.20ArvindSmart 205.45 199.35 202.50 205.50 194.55 46.49 258.10 82.55 23 199.65Asahi India [1] 508.60 489.45 500.00 506.05 481.05 175.49 612.70 276.75 39 489.15Asahi Song 259.00 259.45 257.00 262.70 256.05 4.17 442.65 255.00 12 260.10Ashapura [2] 107.75 101.90 107.00 107.00 100.00 90.30 176.30 89.40 81 101.85Ashiana [2] 165.15 159.90 162.25 166.00 157.55 88.93 209.95 105.90 - 159.00Ashima 15.80 15.05 15.80 15.80 15.00 109.83 23.30 13.01 - 15.00Ashok Ley [1] 126.50 124.90 126.50 126.85 123.1011749.84 153.40 106.20 - 124.80Ashoka Bld [5] 97.05 93.25 97.85 97.85 91.00 637.92 125.00 78.40 7 93.30Asian Gran 110.95 107.25 111.00 111.35 105.00 208.19 211.29 106.65 7 107.15Asian Htl-E 208.50 201.45 217.40 217.40 201.10 9.58 239.00 140.00 50 199.40Asian Htl-N 83.00 80.35 83.30 87.00 79.30 149.13 105.80 56.10 - 80.85Asian Paints [1] 3258.45 3251.65 3235.00 3278.45 3204.15 547.47 3588.05 2261.45 102 3248.60AsianEnrgSvc 118.45 117.45 115.60 125.00 115.60 84.63 173.00 115.60 - - Aspinwall&Co 186.90 177.25 181.60 185.00 162.60 18.89 268.30 135.00 - - AssoAlchohol 445.50 434.00 438.05 444.95 430.00 37.65 653.65 340.00 - - Aster Life 1618.95 1585.30 1610.00 1625.00 1565.00 29.69 1842.65 986.85 44 1584.40AsterDMHealt 189.85 182.75 186.30 187.55 182.00 270.62 237.25 132.55 - 182.70Astra Mic [2] 202.85 198.35 198.50 206.75 196.00 274.21 290.55 108.00 34 198.20Astral Poly [1] 1814.25 1821.35 1800.00 1844.40 1783.05 603.96 2525.00 1411.70 85 1821.35AstraZen [2] 2698.50 2656.65 2700.00 2707.40 2635.55 9.47 4580.00 2635.60 109 2653.30AstronPaper 44.05 42.20 44.05 44.80 42.05 66.75 74.40 35.00 13 42.25Atul 9217.60 9203.85 9200.00 9259.90 9000.00 26.8010975.40 6286.00 43 9198.30Atul Auto [5] 182.35 178.70 182.45 182.80 178.05 35.64 270.00 162.60 - 178.65Aurionpro 301.75 313.15 310.00 316.80 302.25 85.14 390.40 79.05 30 314.05AurobindoPh [1] 657.00 639.05 655.00 657.60 637.45 1978.94 1063.75 590.25 25 639.80AurumProptec 127.70 121.35 125.15 125.95 121.35 154.44 223.20 70.80 - - AUSmallFinBk 1261.10 1262.05 1261.10 1276.85 1243.55 486.53 1420.65 910.00 42 1261.80Ausom 71.95 67.15 70.00 72.75 66.20 21.86 118.15 44.00 42 66.40Auto Axl 1473.10 1465.25 1480.50 1480.50 1450.15 5.30 1650.00 945.00 36 1461.85AvadSug&Egy 569.75 529.60 557.00 568.00 524.90 141.96 684.30 175.00 8 530.45Avanti Feeds [1] 543.20 537.70 540.90 542.95 530.00 87.48 675.00 411.85 38 541.30AvenuSupmart 4073.10 4096.60 4048.00 4170.00 3990.00 480.54 5899.90 2677.00 168 4092.50AVT Natl [1] 92.90 89.15 93.00 93.70 88.00 325.26 109.95 41.60 20 89.30Axis Bank [2] 787.40 788.85 783.55 796.80 776.10 5635.22 866.60 626.40 21 788.70AYM Syntex 120.25 114.10 122.00 122.00 111.00 29.80 158.50 41.00 10 114.45
B . . . . . . . . . . . . . . . . . . . . . . . . . . . . . . . . . . . . . . . . . . . . . . . .BafnaPharma 151.95 144.30 166.90 166.90 137.00 77.86 196.10 113.30 - - Bajaj Auto 3632.15 3579.50 3624.15 3637.95 3567.35 344.33 4347.95 3028.35 21 3578.65Bajaj Elect [2] 1184.45 1174.50 1168.00 1180.00 1161.75 32.36 1588.55 895.30 77 1174.30Bajaj Hind [1] 14.40 13.90 14.15 14.60 13.80 4107.98 24.75 5.20 - 13.90Bajaj Hld 5363.30 5352.90 5265.00 5377.00 5211.20 21.21 5654.00 3145.00 37 5347.70BajajConCare[1] 172.90 166.95 171.95 171.95 165.10 279.45 323.50 162.35 13 166.90BajajFin [2] 7030.10 7006.35 7000.00 7080.90 6911.00 816.66 8043.50 4361.60 81 7006.10BajajFinserv [5] 16096.55 16012.25 16038.00 16238.15 15780.00 227.59 19319.95 8962.20 442 16004.05BajajHealth 377.70 362.55 372.70 380.65 357.10 67.69 496.30 290.90 - - Bal Phr 110.45 104.30 110.45 112.65 103.00 30.56 148.50 50.45 15 104.50Balaji Amn [2] 3005.75 2861.65 2975.75 2975.75 2850.00 105.94 5220.00 1553.85 30 2863.10Balaji Tele [2] 81.60 74.70 80.15 81.80 73.80 471.77 88.95 51.00 - 74.75BalaxiVentre 440.55 420.15 444.00 448.00 412.05 1.21 747.00 392.20 - - Balkrishna [2] 1976.45 1943.45 1963.00 1980.00 1894.35 755.99 2724.40 1516.80 27 1946.05BalmerLaw 127.60 123.35 129.70 129.70 122.00 317.55 170.95 111.75 14 123.50Balrampur [1] 401.10 393.00 399.00 403.65 390.40 1642.82 459.25 165.80 17 392.95Ban.Amn.Sp [5] 78.30 75.05 79.00 80.50 74.10 277.35 100.60 37.47 8 75.15Ban.Amn.Sug 2520.50 2445.75 2550.00 2550.00 2387.40 2.15 3049.05 1510.00 40 2464.70Banar.Beads 93.65 88.25 92.25 94.35 86.70 27.63 116.00 44.20 22 88.35Banco Ind [2] 158.30 148.75 155.00 158.00 147.00 141.76 225.00 137.70 11 148.50BandhanBank 319.35 314.00 319.00 321.30 312.30 4287.79 371.15 229.65 - 314.20Bang Over 36.05 34.40 36.05 36.05 33.40 14.61 54.85 25.00 12 34.35BankofBarod[2] 105.35 103.75 105.35 106.10 102.8040170.26 118.85 61.80 12 103.80Bans.Syn 229.00 217.75 231.25 231.25 214.50 58.25 318.00 82.20 9 216.75BarbequeNatn 1342.65 1295.95 1322.00 1355.40 1280.00 33.80 1945.95 481.85 - - BASF 2751.80 2742.90 2751.00 2810.90 2712.90 102.20 3926.95 1876.95 24 2741.75Bata India [5] 1920.50 1888.30 1915.00 1920.50 1867.95 324.90 2261.65 1265.00 360 1888.20Bayer Crop 4466.60 4383.60 4480.00 4497.25 4371.40 46.25 6127.45 4371.00 39 4386.90Beardsell [2] 15.70 14.95 14.95 16.45 14.95 319.35 23.50 7.99 - 15.00Bedmutha 74.85 72.40 74.80 74.95 72.00 20.92 93.80 20.05 1 72.10BEL [1] 200.00 198.15 198.00 201.85 196.85 3490.30 227.95 115.90 19 198.10BEML 1669.45 1536.95 1640.00 1646.00 1520.00 392.58 2084.00 953.00 40 1537.15BergrPaintIn [1] 737.80 726.65 736.45 738.95 725.05 373.94 872.00 675.00 95 727.15BestAgrolife 955.70 958.65 931.15 990.00 920.00 127.87 1407.80 202.35 - - BF Inv [5] 312.85 301.30 314.40 314.40 300.00 13.11 445.95 260.00 34 301.75BF Util [5] 371.75 359.70 371.40 373.65 357.50 118.35 538.95 227.40 - 359.75BGR Engy 85.20 81.85 83.95 84.85 80.75 189.68 124.50 41.10 - 81.65Bhageria Ind [5] 237.70 230.45 238.00 238.55 227.55 30.50 328.55 146.25 14 227.35BhagiradaChm 1062.40 1027.25 1040.00 1074.00 1021.30 1.18 1130.00 719.15 - - BhagngrInd [2] 47.70 46.50 47.30 47.35 45.80 21.47 65.00 32.85 - 46.50BhagyangrPr [2] 32.70 31.05 32.05 32.20 30.40 20.71 39.90 24.60 - 31.00Bhans.Eng [1] 132.00 137.35 129.20 139.70 127.10 751.67 221.80 125.50 5 137.35Bharat Bij 1774.20 1760.80 1750.00 1771.85 1710.90 14.98 2169.00 1068.00 18 1755.85Bharat For [2] 694.15 684.40 693.00 698.90 677.00 1604.94 848.00 555.60 32 684.60Bharat Gea 156.70 150.45 156.70 160.80 149.90 47.23 190.20 65.80 8 150.95Bharat Ras 12333.30 11900.35 12319.00 12319.00 11850.00 1.96 15100.00 9206.00 31 11912.75Bharat Wire 76.95 73.20 76.10 76.10 73.15 24.75 87.00 33.50 14 73.30BharatDynamc 472.70 459.70 468.00 472.00 455.10 330.81 535.70 321.50 17 460.15Bharti Air [5] 712.55 709.95 708.05 716.55 703.00 4307.43 781.90 490.15 - 709.80Bharti Infr 261.60 264.30 258.00 267.25 257.00 12.32 383.00 131.05 28 264.15BHEL [2] 53.40 50.50 53.00 53.40 50.2044296.86 79.50 39.10 - 50.55BigBlocCons [2] 78.15 79.50 78.00 82.00 76.00 156.18 92.50 15.44 65 79.40Biocon [5] 392.70 387.50 390.40 392.20 385.00 1125.93 424.10 314.90 - 387.40BioflChm&Pha 66.95 65.70 65.15 67.65 64.45 22.21 107.00 55.00 - 65.60BirlaCable 126.20 118.80 126.65 128.00 117.20 204.06 144.45 54.00 20 118.90BirlaCorp 1124.85 1114.25 1124.85 1142.00 1101.05 127.33 1649.00 753.55 23 1113.65Birlasoft 426.70 412.90 424.95 424.95 407.60 2951.14 585.85 215.90 - - BirlaTyres 23.10 22.65 23.10 23.45 22.05 155.13 31.95 21.00 - - Bk of Ind 52.55 51.35 52.55 52.55 51.00 3767.42 90.10 48.80 7 51.40Bk of Mah 18.95 18.65 18.95 19.05 18.60 3040.45 31.95 17.25 13 18.65BL Kash [1] 24.05 24.05 24.10 24.65 23.30 161.73 33.00 13.60 14 24.00BlackBox 877.50 817.00 880.00 895.00 805.00 89.73 1750.00 768.10 - - Bliss GVS [1] 85.95 77.80 85.95 87.10 76.95 2046.43 190.00 77.00 10 77.85BLSIntlServ [1] 224.50 214.70 216.30 224.45 213.70 111.07 309.25 81.00 - 214.60Blue Dart 6477.15 6277.75 6449.00 6449.00 6186.55 16.14 7499.00 4170.00 42 6280.75BlueStar [2] 1048.70 1060.50 1025.00 1072.00 1025.00 269.24 1134.90 701.00 76 1062.05Bodal Chem [2] 106.10 103.35 105.00 106.90 102.95 222.57 150.00 66.85 10 103.15Bomay Bur [2] 1008.10 986.80 1008.10 1012.70 980.00 45.60 1424.40 980.00 - 985.75Bombay Dye [2] 109.75 103.90 108.00 109.45 102.00 3340.34 129.80 64.50 - 103.60Bombay Ray 7.60 7.35 7.50 7.60 7.35 478.67 13.31 5.60 - 7.39BombySuprHyb 346.90 333.20 337.05 358.00 327.60 3.33 484.00 129.35 - - BorosilRenew 595.30 582.60 580.05 594.80 575.00 361.84 747.90 213.25 - - Bosch 15856.00 15787.00 15850.00 15882.20 15580.15 16.25 19244.50 13230.00 34 15801.30BPCL 373.15 368.75 373.00 373.00 365.05 3103.77 503.00 356.80 6 368.95BPL 61.95 58.00 61.00 61.90 57.65 155.59 176.65 19.00 - 57.90BrandConcept 70.75 74.05 74.25 74.25 71.55 103.62 82.15 53.25 - - Brigade 494.25 496.00 489.10 499.90 482.30 227.04 542.90 230.90 34 495.95Britannia [1] 3481.65 3475.25 3431.10 3500.00 3430.00 138.29 4152.05 3317.90 54 3471.30Brooks Lab 89.45 83.75 88.25 90.45 81.50 41.01 155.00 49.95 - 84.05BSE 2262.80 2163.65 2258.00 2258.00 2151.00 1239.97 2373.70 535.50 - - BSL 102.65 98.30 104.00 104.00 97.60 13.82 134.80 29.50 8 98.55BtrflyGandhi 1284.40 1378.45 1304.00 1389.90 1255.00 765.85 1399.15 478.00 56 1377.40
C . . . . . . . . . . . . . . . . . . . . . . . . . . . . . . . . . . . . . . . . . . . . . . . .Cadila HC [1] 376.55 371.15 375.00 377.00 369.25 1582.48 673.70 369.45 34 371.10Calif.SW 44.05 41.85 43.50 43.50 41.85 62.55 52.80 7.87 10 41.95Camlin Fine [1] 138.60 130.15 135.00 136.85 128.35 247.77 230.80 116.30 - 130.10Canara Bk 238.25 232.95 237.55 240.40 232.1513817.28 272.80 124.35 7 233.05CanFinHom [2] 599.50 592.50 595.55 606.85 585.85 464.56 721.25 468.10 18 592.95Cantabil 914.05 884.70 934.00 934.00 872.60 28.62 961.15 346.30 39 884.40CapaciteInfr 140.10 134.15 143.55 143.55 132.20 242.72 251.05 123.70 16 134.55
CapitalTrust 116.60 113.65 120.00 120.00 112.60 7.03 153.85 70.60 - 113.25Caplin Point [2] 768.10 749.65 770.00 770.00 745.85 66.53 1034.00 402.00 30 749.10CapriGlo [2] 591.25 589.80 599.50 600.00 585.00 470.50 629.95 335.00 72 591.30CARE 531.30 518.45 526.00 526.00 510.25 60.41 791.15 410.00 20 518.10CarrerPnt 117.15 113.15 116.95 117.40 112.80 26.43 184.40 112.55 20 113.00CartradeTech 588.00 562.30 580.00 582.85 560.00 345.96 1618.00 560.00 - - CastrolIndia [5] 115.15 113.65 115.15 115.25 113.50 539.53 154.90 112.95 15 113.70CCL Prd [2] 456.90 459.15 456.10 469.90 452.70 402.05 514.90 225.00 38 459.05Ceat 1027.60 1012.35 1033.80 1033.95 1007.20 34.84 1683.25 1005.00 22 1011.80CEEBCO 42.05 41.10 42.00 45.00 40.50 308.08 59.50 14.60 32 40.95CEInfoSystem 1431.00 1387.45 1430.00 1430.00 1384.55 213.71 1917.40 1267.05 - - Cent Enka 532.80 508.10 522.00 525.00 505.30 103.22 638.95 233.10 6 508.10Cent.Bk 20.05 19.70 19.95 20.15 19.65 2298.22 29.65 15.80 - 19.75Cent.Elec 461.30 441.80 455.90 455.90 433.90 13.36 659.20 350.00 - 440.30Cent.Ext [1] 11.60 11.00 11.50 11.85 10.60 351.73 15.77 3.86 - 11.00Cent.Ply [1] 599.70 594.35 600.00 606.95 581.20 158.08 714.95 282.80 42 593.40Cent.Txt 796.75 785.55 794.95 803.15 775.30 304.34 1025.00 434.60 58 785.65CentDepoSer 1468.10 1408.45 1476.00 1482.35 1400.00 767.65 1734.40 565.50 - - CentrumCap [1] 29.20 28.05 29.15 29.15 27.90 349.24 58.50 22.00 - 28.05Cera San [5] 4254.05 4146.20 4164.35 4198.95 4111.05 9.58 6430.45 3589.05 38 4151.65Cereb.Int 84.25 82.20 83.70 86.55 81.40 478.46 99.00 46.55 37 82.45CESC [1] 79.85 78.40 79.00 80.00 77.55 1632.15 102.45 57.50 13 78.35CGPowr&InS [2] 177.15 170.30 177.00 177.00 168.30 1129.38 209.05 53.50 26 169.05ChaletHotels 251.85 282.75 250.00 302.00 250.00 8572.91 301.40 125.05 - 283.75ChamanLalSat 94.00 91.70 94.00 94.00 90.50 35.50 155.00 89.25 - - Chamb.Frt 383.40 372.50 382.00 382.00 370.20 836.48 485.00 207.30 12 372.40ChembondChem 189.05 183.40 190.90 190.90 176.00 14.92 251.15 120.00 60 179.15ChemconSpecl 316.10 303.35 313.00 314.45 302.20 64.60 569.40 302.20 - - ChemfabAlkal 188.00 180.15 186.15 187.55 177.35 24.98 239.00 115.00 - - ChemplastSan 523.15 500.25 518.00 520.50 495.05 537.36 826.00 492.00 - - CholaFin [2] 673.10 674.15 670.00 681.95 660.60 1251.31 698.20 466.80 33 674.00CholamandFn[1] 665.00 669.45 663.35 674.50 645.40 19.33 763.05 545.00 245 668.60Cigniti Tech 520.35 515.05 507.30 528.80 505.85 101.17 677.00 310.60 34 517.15Cineline Ind [5] 106.20 101.75 106.00 106.75 100.85 40.59 131.30 27.50 - 101.95Cinevistaas [2] 13.75 13.90 13.75 14.05 13.20 42.78 24.48 5.70 - 13.80Cipla [2] 909.10 907.25 903.10 913.70 896.00 1860.04 1005.00 738.25 27 905.95CitiUn Bk [1] 128.85 127.80 127.60 129.70 126.20 1262.57 189.60 126.20 14 127.65Clari.Chm 488.55 488.10 487.05 489.50 487.05 35.56 642.20 365.05 30 487.70CleanSci&Tec 2013.25 1936.70 2000.05 2007.55 1920.00 122.94 2705.00 1422.10 - - CLEducateLt [5] 125.50 125.00 129.85 137.95 122.00 309.17 137.00 32.10 - 121.90CMSInfoSystm 244.85 240.80 242.05 246.70 235.00 914.05 317.45 215.10 - - Coal India 167.30 161.20 163.15 163.50 159.8514870.90 203.85 123.45 10 161.20CoastalCorpn 366.00 352.15 369.00 369.00 345.55 41.39 564.50 237.75 - - CochinShip 313.00 307.60 308.95 309.95 305.10 144.93 433.75 305.25 8 307.65CoffeeDayEnt 62.05 58.30 61.90 61.90 57.65 2965.69 86.70 23.25 - 58.45COFORGE 4320.45 4412.90 4300.00 4510.00 4240.00 479.56 6135.00 2300.00 - - Colgate [1] 1410.45 1410.90 1410.45 1417.65 1393.55 307.11 1823.00 1375.55 36 1410.85CompuageInf[2] 34.55 32.40 33.80 34.25 31.90 544.27 47.20 14.30 9 32.45ComputerAge 2445.30 2417.70 2430.00 2440.00 2391.00 241.71 4067.40 1701.00 - - Con.FinHld 204.10 191.00 200.00 203.90 185.70 42.43 78.40 26.55 - - Concor [5] 593.60 588.55 590.10 597.75 584.00 760.16 754.10 528.05 46 588.25ConfdnPetIn [1] 73.05 71.00 73.20 73.30 70.50 414.09 95.40 37.20 21 71.00ControlPrint 358.20 362.50 353.00 375.00 350.30 121.78 444.80 219.35 16 361.95CoralIndFin [2] 40.70 38.90 40.70 40.70 38.60 49.99 58.50 19.05 9 39.00Cords Cab 56.85 52.30 56.05 56.65 51.35 57.95 83.40 38.00 10 52.35Corom.Intl [1] 803.65 786.40 803.00 803.00 783.00 259.29 955.95 709.55 17 787.40Cosmo Film 1648.20 1598.05 1629.10 1648.00 1584.00 40.14 1888.00 467.15 10 1604.40CPCL 105.30 103.20 105.25 106.35 102.50 317.33 151.80 93.00 3 103.10CraftsmnAuto 2088.60 2021.80 2046.85 2053.95 2005.60 4.77 2778.00 1245.00 - - CrdtacsGramn 709.25 695.50 697.15 708.50 680.05 47.94 807.55 495.30 36 695.60CreatPer&Dis[5] 4.00 3.80 3.85 3.85 3.80 14.53 6.14 2.57 - 3.84CreatPer&Dis 590.70 561.60 599.80 607.00 561.20 19.15 743.95 83.90 - - Crisil [1] 2869.25 2785.15 2825.00 2857.45 2750.25 19.56 3496.00 1742.35 46 2786.30CromGreCon [2] 391.30 392.30 389.15 394.60 381.50 1569.99 512.05 350.35 37 393.75CrownLifters 28.55 27.25 29.40 29.60 27.15 23.75 38.65 25.85 - - CSBBank 232.50 220.40 236.90 236.90 217.05 364.12 372.95 219.70 10 220.70CubexTub 27.00 25.75 27.00 27.00 25.65 9.71 38.85 15.55 17 25.90CUMI [1] 871.10 865.05 860.00 876.65 848.65 811.88 1033.95 438.55 64 865.20CumminsInd [2] 974.80 970.65 966.50 979.45 955.25 330.92 1065.00 720.85 34 970.90Cupid Ltd 214.95 211.80 214.00 214.15 210.25 22.98 272.00 202.00 14 212.50Cybertech 176.95 169.20 176.10 177.00 167.65 141.97 245.70 113.00 56 169.10CYIENT Ltd [5] 872.25 849.25 858.00 863.55 837.05 282.51 1292.00 598.00 29 849.05
D . . . . . . . . . . . . . . . . . . . . . . . . . . . . . . . . . . . . . . . . . . . . . . . .D P WIRES 320.50 315.15 325.00 329.90 307.65 6.77 385.80 101.30 - - Dabur [1] 547.80 553.60 545.45 554.90 541.70 1157.10 658.75 483.00 68 553.45Dalm.B.Sug [2] 408.20 397.20 402.50 408.00 395.00 40.31 516.00 142.50 11 397.45DamodarInd [5] 59.75 59.40 58.55 62.15 52.00 76.95 78.75 21.50 7 59.50DangeeDums 216.75 226.55 214.15 249.90 214.00 81.49 249.90 127.00 - - Datamatics [5] 290.10 279.70 290.00 290.00 277.20 148.08 382.40 108.00 23 279.35DataPatrnInd 649.10 620.55 640.00 646.85 611.00 180.06 864.00 611.00 - - DB Corp 87.75 85.85 88.60 89.00 85.60 60.94 124.60 76.05 9 85.80DCB Bk 80.00 78.30 79.50 79.90 78.10 737.92 119.65 78.05 10 78.20DCM 107.65 102.10 109.95 110.65 100.00 31.76 145.05 23.00 32 101.65DCMNouvelle 265.60 253.45 263.10 267.45 252.60 67.19 385.10 65.10 4 253.20DCMShriram [2] 1042.20 1003.70 1007.80 1034.35 1000.00 70.40 1249.95 450.45 18 1007.50DcmShrirmInd 101.60 96.10 100.50 101.60 95.35 252.88 116.75 82.00 - - DCW [2] 41.80 40.05 41.80 41.80 39.75 417.70 65.95 23.35 18 40.10Deccan Cem [5] 588.10 569.60 590.10 590.40 565.10 15.67 846.25 378.00 7 568.35DeepEneResou 42.85 41.00 41.50 43.05 40.70 18.04 62.70 30.50 - - DeepIndust 195.45 191.65 195.00 203.05 189.35 124.25 225.60 57.30 - - Deepk.Fer 553.20 527.70 538.00 553.00 525.55 503.56 661.90 152.20 35 527.70Deepk.Ntr [2] 2061.95 2004.80 2050.00 2055.85 2000.00 912.50 3020.00 1245.55 62 2005.45DelphWrldMon 475.00 455.90 466.60 492.75 450.00 1.35 818.00 415.95 - - Delta Corp [1] 272.70 265.30 271.80 272.45 261.65 3359.26 308.55 142.00 72 265.65Delta Mag 70.70 65.20 69.30 72.00 65.00 15.82 111.35 26.25 - 65.05Den Net 41.85 40.65 41.85 41.85 40.50 1025.99 65.30 37.35 11 40.70DEV INFO TECH 124.75 118.55 122.55 124.55 118.55 4.56 140.30 118.55 - - DevyaniInter 165.45 158.75 163.65 163.95 156.60 3575.96 198.90 107.55 - - DFMFoods [2] 280.95 281.20 282.00 283.90 274.05 53.39 452.80 260.00 - 281.10Dhamp.Sug 392.55 371.60 385.00 389.70 365.20 400.97 431.50 165.45 10 372.40DhaniService 129.25 103.40 128.80 129.90 103.4013496.79 378.90 103.40 - - Dhanlk.Bk 13.70 13.40 14.00 14.00 12.90 706.09 20.20 13.00 - 13.38Dhanuka Ag [2] 723.50 700.15 720.00 727.15 698.00 75.44 1053.15 668.95 16 701.20DhrmsiMorarj 385.80 368.90 383.90 386.45 366.00 53.05 413.75 294.55 - - DhruvConsult 55.50 53.65 56.40 56.40 53.00 14.02 84.35 47.70 - - Dhun.Inv 664.00 642.10 665.50 665.50 635.00 2.56 865.00 241.00 77 642.55Dhunseri Tea 259.00 251.65 259.05 259.80 250.65 4.70 405.20 155.07 8 251.85DhunseriVent 242.90 235.95 242.65 242.65 234.00 33.77 350.00 85.05 - - DIC India 398.75 377.45 399.00 401.95 375.00 3.49 549.00 367.50 28 376.70DigispiceTec 37.10 35.30 37.25 37.30 34.60 97.70 60.70 33.05 - - DIGJAM 166.80 158.50 166.80 166.80 158.50 18.89 362.30 29.15 - - DilipBuildco 295.15 283.80 288.25 295.00 281.70 869.50 749.30 281.95 - 283.90Dish TV [1] 16.25 15.90 16.00 16.30 15.85 4708.20 23.44 8.55 - 15.95DishmanCarb[2] 181.35 175.45 177.85 180.00 173.70 367.60 259.50 102.55 - 175.70Divi'sLabs [2] 4353.40 4258.30 4345.00 4345.00 4250.50 284.98 5425.00 3154.50 44 4262.60DixonTec(In) [2] 4069.60 4086.80 4050.00 4207.75 3974.05 444.66 6240.00 3344.45 151 4089.40DLF Ltd [2] 359.65 346.50 356.00 357.80 344.40 7926.20 449.80 231.95 54 347.05D-Link [2] 148.60 146.30 147.70 148.30 141.00 275.31 193.95 94.80 14 146.75DodlaDairy 475.25 454.00 472.95 472.95 451.00 19.17 674.80 451.00 - - DolatAlgotec 83.00 80.85 83.45 83.45 80.20 130.90 127.90 51.35 - - DollarInd [2] 528.55 514.05 525.00 530.10 511.05 53.93 665.70 225.90 23 513.45Donear [2] 67.45 64.55 64.65 66.25 64.20 22.37 76.50 25.25 20 64.75DPAbhushan 386.00 375.25 408.00 408.00 355.05 7.37 477.80 105.10 - - DPSC 15.00 14.25 14.75 15.10 14.25 311.73 31.15 11.55 - - Dr Reddy [5] 4321.15 4298.25 4376.00 4416.65 4282.60 587.95 5613.65 4135.90 47 4297.40Dred.Corp 338.80 324.90 335.00 338.85 322.10 63.00 475.00 297.00 - 325.35DrLalPathLab 2729.55 2684.40 2725.00 2748.95 2635.75 327.90 4243.00 2162.00 63 2683.75Dwarikesh [1] 89.50 85.00 87.30 88.80 84.00 2280.72 104.00 26.65 11 85.15Dynac.Sys 196.20 186.20 197.95 198.55 183.50 29.87 267.00 60.25 16 185.75Dynamatic 2009.60 1918.15 2000.50 2000.50 1882.10 7.11 3447.85 785.00 35 1920.20DynemicProd 545.05 543.70 545.00 556.00 532.30 61.13 770.25 355.05 25 544.90
E . . . . . . . . . . . . . . . . . . . . . . . . . . . . . . . . . . . . . . . . . . . . . . . .EasyTripPlnr 570.15 564.85 560.20 574.00 548.55 285.16 717.65 161.00 - - Eclerx 2211.55 2138.00 2153.00 2186.30 2110.00 62.26 2970.00 905.00 21 2143.00EdelFinSer [1] 63.35 60.75 63.35 63.35 60.60 829.93 100.80 56.70 4 60.80EicherMotor [1] 2699.25 2699.00 2688.00 2718.85 2668.50 273.28 2995.35 2303.75 49 2697.90EID Parry [1] 411.05 410.70 408.90 415.00 399.10 328.00 574.00 303.00 29 411.75EIH [2] 139.40 137.05 138.95 142.35 136.00 823.11 155.00 81.35 - 137.15EIH A Htl 357.80 371.80 359.00 380.00 345.10 41.33 449.95 207.35 124 369.95Eimco 326.00 333.55 333.30 349.00 311.35 12.23 539.75 314.05 39 331.95Elec. Eng [2] 149.15 148.50 153.90 153.90 145.25 390.06 219.00 50.90 20 148.35Elec.Stl.Cs [1] 41.05 38.25 41.45 41.55 38.05 1909.08 48.00 21.80 13 38.30Electrotherm 119.95 112.80 122.20 122.20 110.90 36.54 197.90 96.20 2 113.75Elgi Eqp [1] 393.60 341.25 398.85 398.85 335.05 1338.15 422.70 160.30 61 341.95Elgi Rbr 36.10 35.10 36.00 36.00 35.05 24.56 49.80 24.55 - - Emami [1] 502.10 495.80 500.95 503.90 487.20 193.25 621.35 443.00 38 496.50EmamiPapMi [2] 144.70 138.10 142.00 144.00 136.20 35.40 214.90 91.15 9 139.60Emkay Glo 117.40 109.05 114.30 116.50 108.00 82.99 147.50 59.60 15 109.65Emmbi Ind 102.00 98.55 102.25 103.75 97.15 23.10 125.00 72.15 10 99.10EnduranceTec 1388.95 1395.60 1380.00 1427.55 1343.05 48.57 1980.95 1250.00 46 1394.50Eng.India [5] 64.95 63.00 64.95 65.00 62.90 1189.43 93.60 62.90 16 63.05Ent.Net.Ind 195.45 189.20 196.90 196.90 185.50 37.01 226.95 140.00 126 188.90EPL 166.90 163.35 167.50 169.00 161.00 313.02 291.95 160.05 - - EqitsSmlFnBk 53.40 55.70 55.10 58.70 54.20 6469.28 76.80 45.30 - - EquipSocImpT 76.40 73.45 79.00 79.00 72.50 16.54 142.30 2.05 - - Equitas Hold 111.95 114.20 113.00 115.60 110.45 850.70 144.85 73.00 - 114.65ErisLifeSci [1] 702.55 693.80 702.55 709.95 676.00 83.93 863.15 568.05 24 693.60Eros Intl 27.50 25.75 26.80 27.00 25.10 927.54 36.95 16.35 - 25.70Esab Ind 2910.55 2774.75 2861.00 2894.00 2735.90 5.95 3610.00 1750.00 52 2780.35Escorts 1860.25 1861.05 1864.95 1871.90 1851.40 452.37 1927.35 1100.10 30 1863.20Ester [5] 140.60 134.45 141.00 143.00 133.10 188.19 164.60 98.10 8 134.25EuroFrshFood 114.80 109.85 114.80 119.10 106.45 4.71 153.95 105.00 - - Ever.Kanto [2] 220.30 209.30 216.00 218.65 209.30 252.76 291.15 67.15 12 209.25Everady [5] 359.70 350.20 359.70 365.65 341.75 1345.64 413.30 228.55 9 351.15Everest Ind 726.70 707.20 740.00 761.00 690.20 559.97 775.00 275.00 22 710.30Excel Ind [5] 1208.55 1215.80 1209.00 1265.00 1170.00 77.19 1375.00 776.95 11 1213.55Exide [1] 156.45 154.25 156.00 156.30 154.00 1531.38 220.60 152.65 16 154.45ExpleoSolu 1438.00 1398.95 1440.00 1447.85 1384.55 17.03 1874.00 469.00 - - ExxaroTiles 128.70 120.35 128.45 128.95 118.05 134.74 172.70 98.45 - -
F . . . . . . . . . . . . . . . . . . . . . . . . . . . . . . . . . . . . . . . . . . . . . . . .FACT 119.75 114.40 120.00 120.00 113.60 149.22 160.00 75.30 23 114.35FaircheOrgan 1700.50 1688.45 1715.00 1715.00 1649.25 29.81 2274.80 581.00 - - FDC [1] 295.50 284.70 294.00 294.00 282.10 134.50 404.90 260.00 19 284.55Fed Bk [2] 97.90 99.75 97.80 101.85 97.0035843.42 107.65 70.00 12 99.75Fed.Goetze 234.75 255.20 235.00 267.90 235.00 1026.18 358.20 207.10 26 255.40FIBERWEB IND 46.40 43.75 46.95 46.95 43.50 48.61 52.45 43.50 - - Fiem Ind 1058.10 1011.60 1058.00 1058.00 1005.95 24.26 1377.70 524.95 15 1010.50Filatex [2] 119.60 119.40 115.35 120.55 115.35 1037.45 142.30 61.50 8 119.35Fin.Cable [2] 467.80 457.40 473.95 473.95 456.00 50.60 608.65 350.60 18 457.05FineOrgInd [5] 3993.00 3888.00 3955.00 3992.00 3831.05 19.28 4174.10 2130.00 70 3881.25FineotexChe [2] 168.00 161.65 167.50 168.90 160.05 932.85 180.30 56.60 42 161.30Fino.Ind [2] 160.55 156.10 159.90 160.55 155.45 508.06 268.00 120.00 11 156.20FinoPaymntBk 311.35 291.65 311.50 313.95 290.00 305.98 582.95 290.00 - - Firstsource 127.35 123.80 126.60 127.60 121.35 5758.83 242.65 95.75 20 123.90FocusLtg&Fix 127.65 121.30 127.00 127.25 121.30 33.04 129.95 71.25 - - Foods&Inns 88.85 87.35 85.25 88.45 84.50 35.86 125.00 79.00 - - ForceMotors 1091.80 1066.55 1076.60 1087.90 1053.15 21.38 1740.00 1053.15 - - Fortis Hlt 261.15 256.25 259.00 259.95 253.40 930.26 313.80 156.00 - 255.65Foseco 1390.65 1372.30 1386.00 1394.00 1363.00 0.73 1790.00 1126.85 27 1377.00FSNECommVent 1400.00 1327.55 1389.05 1389.05 1312.00 1411.58 2573.70 1312.00 - - Fut. Life [2] 49.40 48.05 49.35 49.40 47.75 153.10 89.55 46.00 - 48.10Fut. Mkt 8.75 8.55 8.60 8.85 8.45 52.91 21.00 7.50 - 8.57FutEntpDVR [2] 12.35 12.20 12.15 12.85 11.30 27.35 16.89 9.75 - 11.99Future Cons 7.00 6.90 7.00 7.00 6.85 3430.74 11.95 5.85 - - FutureEntp [2] 8.80 8.60 8.85 8.95 8.50 510.72 13.92 7.61 - 8.63FutureRetail [2] 46.85 46.15 47.30 47.75 46.00 2275.30 77.50 40.60 - 46.10FuturSuplyCh 65.70 63.85 66.00 66.85 62.50 24.12 121.95 59.35 - 63.80
G . . . . . . . . . . . . . . . . . . . . . . . . . . . . . . . . . . . . . . . . . . . . . . . .Gabriel [1] 120.80 115.70 117.90 119.05 113.65 543.97 168.00 99.90 18 115.75Gail(India) 140.85 136.30 140.40 140.55 135.70 5228.05 171.35 125.20 6 136.45GalaxSurfact 2955.80 2963.15 2955.00 2999.00 2840.10 13.69 3600.00 2030.00 80 2947.55Gallant Isp [1] 49.15 48.50 49.15 49.85 47.45 16.88 69.90 33.65 14 48.40Gallant Mtl 63.90 62.25 64.50 64.50 61.45 30.68 88.00 42.80 7 62.25Gandhi Tub [5] 356.45 345.15 351.65 358.75 339.65 5.41 557.85 240.00 10 345.20Ganesh Hsg 203.40 193.90 196.80 200.85 191.55 43.89 243.50 43.20 - 193.10Ganesha Ecos 650.35 632.95 645.00 660.00 612.60 103.64 742.30 460.00 21 625.15GaneshBenzop 91.40 90.70 91.05 92.95 88.50 66.20 114.95 76.10 - - GangaForging 17.25 16.65 17.30 18.00 16.00 894.35 147.25 13.65 - - GangesSecu 99.40 99.35 102.00 102.00 98.00 25.73 107.05 56.00 16 99.40GardenReach 224.70 221.10 224.70 224.70 218.35 152.34 279.80 167.65 12 221.10GarwareHiTec 690.10 662.55 666.00 680.00 655.35 14.50 889.00 655.35 - - GarwarTecFib 2956.75 2932.95 2912.20 2949.00 2870.10 8.01 4033.40 2285.15 40 2933.05Gati [2] 158.20 152.30 151.35 155.90 148.20 981.58 221.75 88.10 - 152.85Gayt. Proj [2] 27.55 25.00 27.10 27.50 24.60 1046.64 60.65 21.65 - 25.00GE Ship 317.00 316.00 314.10 316.80 309.15 245.91 477.00 261.70 7 315.65GE T&DInd 102.25 93.35 102.60 103.35 91.50 238.24 153.80 91.50 - - Geecee 186.70 180.10 184.60 201.95 176.65 791.07 211.25 91.20 18 180.05GeewayWires 79.75 78.45 81.35 81.35 78.20 5.08 112.90 69.95 - - Genesys [5] 419.35 440.30 426.00 440.30 405.00 91.23 463.65 71.45 87 444.95GenInsCorpIn[5] 129.20 125.50 129.15 129.15 124.60 227.38 243.70 117.50 15 125.80GenricEngCon 37.00 33.80 39.40 39.40 33.40 99.96 68.00 33.00 - - Genus P&B [1] 14.25 13.65 14.10 14.20 13.55 218.55 16.42 6.25 - 13.70Genus Pwr [1] 71.40 68.25 70.00 71.95 67.50 620.82 93.85 36.85 40 67.95GeojitFinSer 71.30 67.95 69.55 70.50 67.30 272.19 102.70 43.55 - - GEPowerIndia 168.30 157.50 169.95 169.95 156.00 190.53 371.80 156.10 - 157.90GFL 68.00 66.40 68.00 69.60 65.30 89.75 118.00 60.50 - - GHCL 412.20 403.70 411.00 411.00 396.30 138.48 488.00 208.00 8 403.45GIC Hsg 142.20 140.05 142.95 143.95 139.00 117.07 202.50 104.60 4 140.15Gillander 67.30 66.00 66.60 68.70 65.95 11.79 74.50 36.10 10 66.20Gillette 5103.10 5077.65 5103.10 5103.10 5003.00 3.27 6270.05 4950.35 58 5076.10Ginni Fil 48.10 45.80 48.10 48.45 45.00 216.57 63.65 18.00 8 46.10GKW 575.60 542.20 577.05 577.05 534.50 0.75 922.40 460.10 - - GlandPharma 3217.50 3252.90 3211.00 3279.35 3120.00 246.96 4350.00 2308.55 - - Glaxo Phr 1567.60 1567.40 1556.00 1574.95 1545.50 28.33 1917.00 1379.00 51 1566.25Glenmark [1] 470.30 455.60 470.30 472.20 452.50 907.12 690.60 442.15 7 455.40GlnmarkLifSc 519.00 500.45 515.00 518.50 499.80 82.83 799.00 499.80 - - Glob.Spr 1254.40 1234.90 1250.00 1269.00 1217.70 139.14 1760.00 290.95 20 1236.10GlobalEductn 77.10 75.05 74.20 77.00 73.25 9.90 96.40 35.50 - - GlobeText(I) 11.30 11.10 11.10 11.65 10.90 382.69 19.20 10.90 - - GM Brew 651.05 633.75 644.10 644.10 631.30 17.68 922.85 370.00 12 634.00GMDC [2] 135.45 136.40 137.50 142.90 132.20 7419.58 151.95 52.00 10 136.00GMMPfauder [2] 4499.35 4511.60 4425.00 4559.85 4380.00 21.76 5435.00 3938.25 62 4505.65
GMR Inf [1] 39.95 39.10 39.80 39.95 38.95 9207.10 49.15 22.50 - 39.10GNA Axles 504.10 500.50 503.90 504.85 489.90 52.07 1107.35 339.10 11 500.00GNFC 548.20 537.55 548.00 551.80 535.00 1723.37 577.55 235.25 6 537.20Goa Carb 377.05 379.60 380.00 398.60 371.50 132.04 482.20 266.00 12 378.65GOCL Corp [2] 280.80 269.15 279.40 283.30 265.55 14.22 386.00 190.00 27 268.50God.Pow.Isp [5] 300.55 313.20 311.00 318.00 306.05 793.93 460.00 127.83 3 313.00Godfrey [2] 1062.60 1011.10 1065.00 1065.00 1005.25 16.52 1409.85 831.85 12 1012.80Godrej Cons [1] 825.40 809.00 823.00 825.40 801.80 548.55 1138.50 644.00 64 806.95Godrej Ind [1] 525.50 515.50 528.00 528.00 511.00 107.61 674.35 426.60 - 515.50Godrej Pr [5] 1569.00 1587.20 1565.00 1599.45 1537.35 944.81 2598.00 1200.10 214 1587.70GodrejAgrovt 488.10 482.10 483.35 488.00 477.50 48.18 746.80 469.70 30 481.95GoFashionInd 950.10 940.50 950.00 950.10 889.00 114.59 1339.90 889.00 - - Gokaldas [5] 359.45 353.40 361.00 368.95 350.10 381.06 430.00 73.05 29 353.30Gokul Ref [2] 33.95 33.00 34.00 34.45 32.45 101.02 47.80 15.50 - 33.00Gold.Tobac 107.95 106.15 107.95 108.95 103.05 9.09 189.85 35.05 35 105.80Goldiam Int 821.90 786.20 820.00 820.00 782.65 88.01 1142.60 299.45 27 786.25GoodyearInd 908.40 903.55 908.40 924.75 897.15 6.83 1020.00 783.00 - - GP Petrol [5] 49.60 54.65 51.90 58.60 50.05 1104.54 77.60 34.65 18 54.65GPTInfraProj 79.15 75.25 79.00 79.35 74.00 35.60 107.75 34.00 9 75.75Granuels [1] 302.95 297.60 300.00 303.70 295.55 806.54 404.50 285.80 18 297.45Graphite [2] 489.40 475.75 489.05 492.55 473.80 506.67 815.35 396.00 16 475.50Grasim [2] 1722.75 1692.45 1704.00 1736.75 1687.35 1031.65 1939.00 1192.25 45 1691.35Graur&WeilIn 57.65 55.75 57.00 57.00 55.50 103.79 70.90 53.50 - - Gravita [2] 372.90 360.75 372.00 375.00 357.00 230.37 398.20 73.00 63 361.15GreenlaInd [1] 331.80 318.50 323.45 331.55 316.45 29.67 404.98 178.72 39 320.20GreenPly [1] 189.85 186.70 191.90 191.90 185.30 184.32 254.25 156.55 26 186.80GrenpanelInd 470.80 470.70 470.00 474.25 459.65 156.17 538.50 150.35 - - Grindwel [5] 1557.40 1580.55 1555.00 1604.00 1540.15 157.57 2025.45 802.55 60 1576.65GRInfraproj 1497.55 1433.50 1497.55 1497.55 1421.00 21.97 2267.65 1421.00 - - GRP Ltd 1504.90 1292.00 1508.80 1529.00 1265.50 15.82 1600.60 724.00 21 1291.95Grvs.Cot [2] 183.15 175.65 181.55 182.60 174.50 2104.63 258.85 104.05 170 175.60GSFC [2] 129.90 123.05 129.00 129.30 122.50 1310.53 150.75 76.40 7 123.10GSPL 287.85 284.10 285.00 286.65 279.20 1134.42 383.00 232.60 16 284.15GTL 17.00 15.85 16.85 16.85 15.65 555.83 32.55 4.86 - 15.85GTL Infra 1.80 1.75 1.80 1.80 1.7564289.10 4.90 0.65 - 1.71GTPLHathway 209.65 203.10 210.05 215.00 202.00 65.13 313.15 108.75 16 202.80Gufic Bio [1] 217.30 207.40 217.00 217.00 205.80 110.46 270.10 99.10 23 208.15Guj.Alk 699.65 672.25 685.50 705.50 666.55 253.67 845.50 304.35 13 673.15Guj.Ind.Pow 79.30 75.90 78.65 79.00 75.55 192.13 105.65 72.25 7 76.00Guj.Pipav 93.35 89.85 92.05 93.25 89.00 208.82 124.15 89.05 22 90.10Guj.Sid.Cem 43.25 41.85 42.75 43.00 41.60 54.10 62.60 31.70 10 41.90Gujarat Gas [2] 664.05 660.05 663.00 674.60 654.20 700.15 786.65 482.05 38 660.00Gul.Amb.Ex [1] 186.20 180.90 187.15 187.45 179.00 238.41 226.90 122.50 9 181.30Gul.Apl 223.70 218.50 224.60 224.60 217.55 5.04 277.20 197.20 - 218.00Gulf Oil Lub [2] 494.85 472.45 490.05 491.70 466.60 90.45 803.70 427.95 12 470.60GulshanPoly [1] 334.15 312.25 334.10 339.45 306.00 71.18 429.00 86.75 15 315.00
H . . . . . . . . . . . . . . . . . . . . . . . . . . . . . . . . . . . . . . . . . . . . . . . .HappiestMind 1041.85 1000.65 1035.00 1037.65 996.15 212.47 1580.00 498.05 - - Harri.Mal 154.90 148.00 154.90 155.85 147.05 31.02 250.00 120.20 8 148.25Hathway [2] 19.55 19.00 19.50 19.65 18.80 6002.40 34.80 18.75 - 19.00Hatsun Agro [1] 1112.65 1065.55 1110.00 1110.00 1052.90 30.77 1533.65 676.00 94 1070.80HavellsIndia [1] 1201.30 1201.15 1198.00 1205.85 1179.55 578.42 1503.70 958.35 66 1201.10HBL Pwr [1] 68.35 64.05 68.35 68.75 63.55 1521.56 83.60 29.55 30 64.20HBStockhold 53.75 49.55 53.75 53.75 48.45 20.85 75.05 15.80 - - HCC [1] 17.30 16.05 17.30 17.45 15.8519957.06 20.03 7.00 - 16.03HCG 234.95 229.60 233.10 239.90 224.15 75.15 282.55 159.20 - 229.55HCL Info [2] 19.40 18.60 19.35 19.45 18.55 576.67 31.35 7.95 - 18.60HCL Tech [2] 1165.00 1164.75 1153.10 1169.50 1150.20 1706.06 1377.00 890.00 38 1165.00HDFC [2] 2441.15 2436.80 2424.95 2447.65 2410.00 2979.74 3021.10 2286.45 33 2438.95HDFC AMC [5] 2199.25 2171.15 2190.00 2195.00 2161.20 175.76 3363.00 2119.45 34 2172.00HDFC Bank [1] 1512.35 1522.10 1504.00 1530.70 1495.55 3734.03 1724.30 1353.10 24 1521.75HDFCLifeIns 590.95 582.00 583.55 589.40 576.55 2415.41 775.65 551.70 105 582.30HecInfraProj 37.95 36.65 38.90 38.90 35.15 4.76 45.00 28.80 - - HEG 1324.05 1275.00 1322.00 1343.95 1270.00 199.63 2626.15 1263.00 18 1272.60Heidelbrg 204.40 200.00 204.90 206.00 199.10 225.68 284.55 199.10 15 200.10HemispherePR 120.25 114.45 119.10 119.75 113.55 1014.17 167.20 113.55 - - HeranbaIndus 643.25 618.75 643.10 646.60 616.00 70.45 945.00 602.10 - - Herc.Hoi [1] 144.90 141.60 144.00 146.15 140.00 24.99 179.65 108.10 26 142.05Herit.Fds [5] 323.25 316.15 326.00 326.00 315.00 63.32 565.00 289.60 12 316.25HeroMoto [2] 2774.05 2713.35 2719.95 2748.00 2685.00 522.21 3514.20 2310.50 20 2710.95Hester Biosc 2460.20 2433.05 2499.00 2523.35 2399.00 24.38 3180.00 1651.25 44 2422.65Hexa Trade [2] 121.80 123.30 123.90 127.80 119.20 15.82 235.20 52.35 - 124.70HFCL [1] 75.85 71.25 75.20 75.50 70.8017055.14 101.35 23.00 32 71.50HGInfraEngg 607.85 598.05 618.50 619.90 596.20 85.90 830.80 252.60 11 597.70Hikal [2] 387.20 381.80 385.00 389.70 380.10 145.26 742.00 142.85 25 381.85HIL 4012.55 3978.50 3990.00 4030.00 3921.25 7.62 6750.00 2793.70 15 3974.20Hilton Mtl 28.00 26.85 27.50 28.80 26.65 35.94 33.20 9.00 - 26.70HimadriSpec [1] 55.60 55.00 55.50 56.00 53.85 7470.50 69.05 38.90 35 54.95Himat.Seid [5] 186.30 173.05 184.00 187.00 170.15 287.50 311.95 132.00 10 172.00Hind.Compo [5] 295.80 282.50 288.00 291.80 276.20 11.06 373.85 240.00 18 286.35Hind.Cop [5] 123.15 117.25 123.15 123.15 114.7010144.35 196.90 88.60 46 117.25Hind.Media 68.90 67.40 67.15 69.80 67.15 98.85 107.00 56.15 8 67.50Hind.Mot [5] 11.35 10.90 11.40 11.75 10.85 254.49 18.20 6.15 - 10.92Hind.N.Gls [2] 17.95 17.10 17.95 18.50 17.10 177.90 53.20 16.80 - 16.95Hind.Oil.Ex 190.60 190.85 190.60 195.10 181.25 689.58 245.15 88.50 47 191.20Hind.Znc [2] 317.25 312.35 315.00 316.45 310.80 230.96 407.90 257.00 14 312.30Hindalco [1] 529.60 512.00 528.50 529.00 511.20 6308.26 553.85 305.40 26 511.95HindconChem 65.60 62.20 63.10 64.75 61.10 30.42 86.95 41.75 - - HindujaGlo 2671.90 2733.80 2719.95 2772.00 2682.55 147.74 3948.00 1130.95 16 2731.35HindustnAero 1345.95 1301.05 1330.00 1338.00 1294.55 602.64 1568.45 925.00 12 1300.40HindustnFood 2028.00 1978.80 2025.00 2025.00 1950.05 5.69 2578.00 1700.00 - - HisarMetalIn 110.25 107.50 111.95 111.95 107.00 8.89 165.00 90.00 6 108.75HiTech Gr 233.00 224.20 238.80 238.80 222.45 6.90 364.90 155.00 11 224.40Hi-TechPipes 551.25 540.65 550.05 570.40 540.00 17.17 335.00 113.85 30 249.05HLEGlascoat 5510.65 5225.75 5499.75 5499.75 5195.00 8.39 7550.00 1755.00 - - HomeFirstFin 719.55 704.60 705.00 715.45 685.15 70.34 921.30 440.00 - - Honda Siel 1292.10 1279.90 1281.05 1297.10 1272.20 3.25 1497.80 902.00 18 1277.65Honey.Aut 40565.40 40642.60 40444.00 40933.70 39810.10 5.55 49805.00 38146.90 97 40642.40HOV Services 51.55 50.10 53.55 53.55 49.55 12.79 90.00 37.55 34 50.00HPAdhesives 371.95 366.90 367.10 392.00 361.00 319.91 505.00 361.00 - - HPCL 298.75 292.75 295.00 302.00 291.10 1795.52 354.55 223.00 6 293.10HPLElect&Pow 67.80 65.85 65.20 67.50 65.00 89.47 91.90 40.10 63 65.85HSG&UrbanDev 36.05 34.30 36.05 36.10 34.00 2746.81 58.25 34.00 5 34.30HSIL [2] 302.60 297.75 302.00 308.00 291.00 139.92 352.85 141.00 19 296.85HT Media [2] 32.85 31.00 32.80 32.85 30.75 1231.98 39.15 19.55 - 30.95HuhtamakiInd 187.20 183.10 187.20 187.20 181.05 62.42 345.60 181.05 - - HUL [1] 2312.55 2294.80 2298.00 2304.05 2284.75 737.92 2859.10 2104.25 62 2293.60
I . . . . . . . . . . . . . . . . . . . . . . . . . . . . . . . . . . . . . . . . . . . . . . . . .Ibull Hsg [2] 184.50 166.30 182.00 191.60 160.2532829.71 313.50 154.30 9 166.75Ibull Real [2] 121.20 103.10 120.00 120.00 99.5039095.15 195.90 72.75 - 103.00IceMakRefrig 79.85 75.80 80.60 80.60 74.00 28.21 95.45 57.30 - - ICICI Bank [2] 748.90 754.45 746.25 762.90 740.0010967.16 859.70 531.00 25 754.30ICICILombGIC 1282.60 1266.75 1275.00 1284.80 1255.10 581.52 1674.00 1252.80 48 1267.45ICICISecu 695.60 655.45 694.00 694.90 643.30 1137.56 896.05 376.90 - - ICRA 3714.85 3620.15 3675.85 3684.75 3590.00 1.20 4158.60 2675.75 49 3606.80IDBI 47.30 46.05 47.45 47.50 45.80 6066.57 65.25 29.35 22 46.00Idea Cell 10.65 11.25 10.55 11.65 10.40448511.46 16.79 4.55 - 11.25IDFC 59.70 57.90 59.40 59.75 57.60 7482.99 68.25 41.70 - 57.80IDFCFirstBnk 44.40 43.90 44.30 44.95 43.7017138.79 69.30 40.75 - - IFB Agro 615.05 593.20 615.05 619.70 591.00 9.88 866.25 365.40 9 592.45IFB Ind 935.30 907.25 930.00 930.00 905.10 7.87 1357.80 865.00 - 907.50IFCI 13.60 13.00 13.55 13.55 13.00 3964.75 18.87 8.70 - 13.05IFGLRefract 282.55 276.20 280.00 281.35 274.50 21.08 434.00 250.10 27 275.40IG Pet 715.65 695.65 704.10 709.10 683.00 39.79 1017.90 401.60 7 694.90Igarshi 377.00 363.60 375.00 376.65 360.20 33.03 612.20 262.85 74 363.95IIFLHoldings [2] 319.30 312.60 319.90 324.90 311.00 292.33 375.05 217.00 18 313.05IIFLSecurity 87.15 86.55 87.15 88.00 84.15 179.93 128.50 45.30 - - IIFLWealtMgt 1603.45 1513.40 1571.40 1571.40 1486.00 147.00 1785.40 1061.50 - - ImagiWrldEnt 13.55 13.15 13.40 13.75 13.00 191.31 16.80 5.25 - - IMPAL 771.30 775.55 773.70 780.00 761.95 2.69 940.00 614.00 18 777.45Ind Terr [2] 50.55 47.25 51.50 52.00 45.90 163.42 74.80 26.60 11 47.35Ind.Bk.Mer 24.35 23.20 24.00 24.60 23.10 93.77 37.25 11.20 16 23.20Ind.Cem 212.45 208.90 210.00 216.25 207.35 7599.81 259.90 150.05 48 208.75Ind.Gly 788.60 760.55 788.60 793.90 754.85 101.19 1060.00 397.05 19 761.70Ind.Hume [2] 207.40 206.90 207.00 212.00 204.15 65.10 252.70 166.00 13 206.30Ind.Inv.Tru 70.55 68.00 72.00 72.00 67.40 0.02 89.30 50.00 - 70.20Ind.Metals 348.50 335.50 341.00 346.60 332.10 59.38 498.50 205.00 4 335.20Ind.Nippon [5] 488.25 455.50 485.00 485.65 445.90 51.59 642.00 329.05 23 455.90Ind.Ovr.Bk 19.20 18.80 19.10 19.20 18.75 2360.41 29.00 14.45 - 18.85Ind.Ram.Sy 74.00 70.20 73.05 75.70 69.50 416.98 90.25 31.60 6 70.35Indian Bk 152.05 147.15 150.25 151.60 146.25 1615.08 194.80 96.20 4 147.30Indian Htl [1] 207.05 204.95 206.75 210.55 203.65 3543.54 230.25 90.94 - 204.85IndianEgyExc[1] 217.55 210.20 215.55 217.00 209.1011205.93 318.71 95.47 66 210.20IndianRailTr 816.35 803.40 810.00 816.00 796.00 3000.87 6396.30 639.45 - - IndianRlyFin 22.25 22.05 22.10 22.20 22.00 5325.45 26.70 20.80 - - IndiaPestcid 305.25 298.45 305.00 305.70 297.60 129.55 368.00 289.00 - - IndigoPaints 1760.20 1768.70 1757.45 1778.00 1735.85 21.73 2740.00 1735.85 - - IndmrtIntmsh 4835.05 4756.70 4800.00 4978.85 4640.00 268.72 9710.70 4301.10 - - Indo Count [2] 194.30 186.15 191.80 192.80 185.00 268.89 314.80 113.00 11 185.90Indoco Rem [2] 381.10 379.65 375.15 383.30 371.50 111.06 529.70 273.90 25 379.95IndostrCapFn 241.50 239.65 238.00 245.40 236.50 86.36 416.95 228.25 - 239.60Indotech Tr 237.10 225.25 231.20 236.80 225.25 12.02 294.95 82.25 12 225.90Indra.Med 70.30 68.60 70.30 70.60 68.00 100.88 102.55 52.15 11 68.40IndraprsGas [2] 377.95 370.55 375.05 377.55 369.05 1692.31 604.00 369.40 20 370.70IndSwifLab 72.05 70.20 71.80 72.90 69.70 70.11 127.35 56.00 14 70.40IndusInd BK 955.35 952.45 952.00 972.00 949.00 3535.91 1241.85 811.10 18 952.55IndusTowers 252.90 251.70 253.00 254.35 249.10 1236.49 332.80 194.10 - - INEOS Styro 1134.35 1117.40 1123.00 1133.85 1100.00 11.26 1886.80 922.20 5 1117.00Infibeam Inc [1] 40.65 39.95 40.70 41.00 39.80 1806.38 58.45 36.80 - 39.95INFO EDGE (I) 4427.65 4442.65 4380.00 4556.50 4353.30 536.18 7462.95 4027.00 134 4443.50InfobeansTec 541.55 523.90 555.00 555.05 491.00 26.80 625.00 135.30 - - Infosys [5] 1706.95 1730.70 1701.00 1737.30 1691.50 5120.89 1953.70 1230.00 36 1730.60Infrasoft 213.15 214.85 202.30 217.05 202.30 44.26 259.00 63.00 - 214.75Ingersoll 1414.15 1397.70 1415.00 1422.75 1382.00 17.33 1503.10 667.00 41 1392.00Inox Leis 413.25 406.25 411.00 415.35 401.00 471.22 466.10 241.90 - 406.40Inox Wind 119.75 118.15 120.00 120.40 115.20 319.46 160.00 61.45 - 118.10InoxWindEner 728.55 709.30 706.70 730.00 706.70 0.82 986.50 339.35 - - Insectic 673.30 641.50 673.40 673.40 625.00 7.94 846.00 405.00 12 640.40IntellecDesi [5] 681.15 670.20 680.00 680.00 658.10 236.70 892.00 416.60 44 671.60IntenseTech [2] 87.05 80.25 88.50 88.50 79.00 152.42 119.75 30.90 12 80.20IntGlobAviat 2116.60 2086.55 2085.05 2096.15 2025.20 1964.63 2379.00 1502.90 - 2085.10IntlConveyor 74.55 70.45 74.00 74.00 70.00 169.83 102.45 57.85 - - Inventure [1] 4.15 3.95 4.05 4.10 3.95 9614.91 6.76 2.01 - 3.95IOC 121.15 119.20 120.00 121.15 118.60 5730.30 141.75 86.70 4 119.10IOL Chem 381.10 366.35 374.05 379.95 363.60 154.01 725.00 364.00 10 366.40IPCA Lab [1] 979.85 961.80 972.00 983.00 953.35 486.92 1383.55 893.03 27 962.70I-PruLifeINS 525.20 510.55 521.35 521.35 509.05 1516.50 724.50 411.00 116 510.55IRB Infra 256.10 248.95 254.70 258.95 246.45 2006.46 346.95 100.70 - 248.90IrconIntl 42.95 42.55 42.30 42.70 42.05 778.09 101.90 40.15 - - IrisBusiServ 109.45 104.85 114.50 114.50 102.35 30.20 165.50 102.35 - - IrisClothing 175.85 173.40 172.20 185.90 172.00 2.06 239.00 62.35 - - IsgecHeavyEn 556.25 539.65 550.25 557.35 535.00 84.99 878.35 524.15 - - ITC [1] 221.90 218.00 220.30 221.30 217.1516129.02 265.30 199.10 18 218.10ITD Cem [1] 72.55 70.10 72.00 73.10 69.60 453.19 97.50 69.55 12 70.15ITDC 360.75 353.35 360.75 374.60 351.00 43.10 463.90 302.00 197 352.55ITI 108.45 104.85 106.50 110.85 103.10 205.98 143.70 102.20 - 104.85IVP 175.85 166.80 175.80 190.00 163.60 226.47 201.85 93.00 12 166.55IZMO Ltd 94.45 87.25 92.60 94.55 86.65 87.31 148.85 48.00 - 87.20
J . . . . . . . . . . . . . . . . . . . . . . . . . . . . . . . . . . . . . . . . . . . . . . . . .J&K Bk [1] 36.55 35.45 36.45 36.55 35.20 1900.64 48.20 22.50 5 35.50Jagran [2] 77.30 72.60 77.70 78.50 71.70 855.86 81.90 50.25 8 72.70Jags.Phr [5] 209.60 205.40 217.15 227.25 202.30 3324.96 227.35 75.00 22 204.65Jai Corp [1] 119.80 114.60 120.00 120.00 112.70 1049.75 172.85 79.35 42 114.50JaiBal.Ind 49.50 47.80 49.40 49.40 47.45 37.66 668.00 81.00 - - Jain I.DVR [2] 23.50 21.75 23.50 23.70 21.50 60.14 30.35 10.81 - 21.70Jain Irrg [2] 39.55 38.45 39.40 40.20 38.05 2563.66 53.50 16.15 - 38.35Jamna Au [1] 102.95 98.65 101.20 101.45 97.10 853.09 124.90 60.55 31 98.60JashEngg 513.85 490.40 502.00 515.00 485.20 19.47 628.00 260.20 - - Jay Bhr [5] 166.30 162.10 165.00 168.30 160.35 33.00 269.00 98.75 21 161.45Jay.Agro [5] 218.70 210.65 219.20 219.70 210.00 44.97 322.90 125.50 8 210.05Jaypee Inf 3.40 3.25 3.30 3.35 3.25 4787.27 5.05 1.38 - 3.23Jayshr Tea [5] 99.85 95.55 98.50 99.60 94.30 79.93 145.00 65.15 13 95.20JB Chem [2] 1619.70 1618.90 1620.00 1670.00 1613.50 145.16 1984.75 1077.30 33 1620.45JBM Auro [2] 1243.00 516.00 504.00 522.05 500.05 204.44 675.98 134.80 58 520.55JetFrgtLogis 69.60 67.05 68.05 70.90 66.55 21.87 94.30 44.40 - - JHS Svend 24.25 23.40 24.10 24.25 23.10 53.24 33.40 18.80 - 23.40Jind P.Inv 314.85 303.05 328.80 328.80 299.15 12.76 462.80 29.45 - 302.25Jind.Drl [5] 192.20 182.80 190.00 192.95 181.00 145.18 221.35 81.55 11 182.80Jind.Pho 385.80 366.55 392.70 392.70 366.55 16.58 485.20 35.00 - 366.95Jind.Poly 1083.00 1048.40 1075.50 1080.60 1040.90 70.00 1342.85 467.10 5 1051.10Jind.Saw [2] 93.05 88.95 92.05 92.85 88.15 857.49 147.65 70.15 6 89.15Jind.Stl&P [1] 413.15 415.15 410.05 423.65 409.00 6047.37 501.60 296.55 4 415.45Jind.World [1] 280.65 283.45 280.00 301.50 278.25 379.83 358.45 44.00 62 283.25JindStain(H) [2] 369.65 344.85 369.80 369.80 339.90 468.01 433.50 109.85 7 346.70JK Cem 2978.00 2911.10 2960.00 2960.00 2884.15 95.79 3836.65 2580.05 34 2910.40JK Lak.Cem [5] 460.15 449.40 454.40 462.25 446.00 223.33 815.25 360.00 13 450.25JK Paper 237.35 230.25 232.20 236.35 228.25 578.29 284.80 124.25 8 230.35JK Tyre [2] 116.95 113.85 115.00 115.95 112.90 370.43 171.60 103.20 10 113.90Jkumar Inf [5] 174.20 170.80 174.20 174.20 166.95 110.35 231.00 149.05 8 171.05JM Fin [1] 67.90 66.80 68.80 68.80 66.30 438.77 117.55 66.35 19 66.65JMC Proj [2] 92.65 90.05 94.00 94.00 87.85 1076.48 130.00 70.80 - 89.70Jocil 177.85 173.35 177.65 179.75 173.00 8.36 319.80 139.00 - - JohnCntHita 1816.70 1791.70 1816.70 1850.35 1788.00 5.62 2936.70 1757.35 109 1792.10JP Associ [2] 10.10 9.95 10.30 10.35 9.90 8896.34 15.90 6.42 - 9.93JP Pwr 7.95 7.30 7.80 7.80 7.20125381.83 11.22 2.45 - 7.30JSL [2] 196.00 189.55 193.55 195.00 187.35 1026.41 224.60 60.30 8 189.40JSW Hld 3977.10 3932.90 3953.95 4033.40 3905.00 12.53 6000.05 3400.00 33 3931.65JSWIspatSpe 33.80 32.25 33.50 34.00 31.80 3134.81 67.55 22.40 - - JSWSteelLtd [1] 632.85 623.10 631.90 635.00 621.25 1857.57 776.50 371.40 8 623.60JTEKTIndia [1] 80.10 77.40 80.10 80.35 76.05 158.01 132.75 76.00 42 77.50JTL INFRA 250.15 239.80 250.55 254.65 233.35 57.74 271.00 209.60 - - Jub.Ind 497.50 482.30 491.00 496.00 480.00 39.61 796.90 162.00 - 481.40JubilantPhar 443.75 435.15 443.75 448.95 430.30 106.74 925.00 430.30 - - JublilntFood 2980.35 2981.30 2988.00 3020.00 2909.00 670.85 4577.45 2660.90 91 2982.05JublntIngrev 520.00 491.05 519.60 519.60 488.50 683.10 838.75 295.50 - - JullundurMot 72.60 66.80 70.60 74.60 63.20 56.24 93.80 29.30 - - JustDial 800.60 786.00 800.00 808.00 780.00 422.40 1138.00 550.00 80 786.50Jyo.Lab [1] 138.20 135.30 138.00 138.00 135.10 99.91 187.20 133.00 30 135.35
K . . . . . . . . . . . . . . . . . . . . . . . . . . . . . . . . . . . . . . . . . . . . . . . .Kabra Ext [5] 460.05 435.60 451.15 457.60 432.00 75.09 566.40 124.00 44 437.35Kaj.Cera [1] 1261.10 1256.30 1240.05 1260.00 1230.75 37.83 1379.00 856.70 53 1254.85Kakt.Cem 226.30 218.10 222.05 224.00 215.05 8.23 319.00 160.80 10 218.95
MUMBAI
BusinessLineTUESDAY • FEBRUARY 22 • 2022 IMARKET RADAR
For BSE/NSE live quotes, scan
the QR code or click the link
https://bit.ly/2FpossK
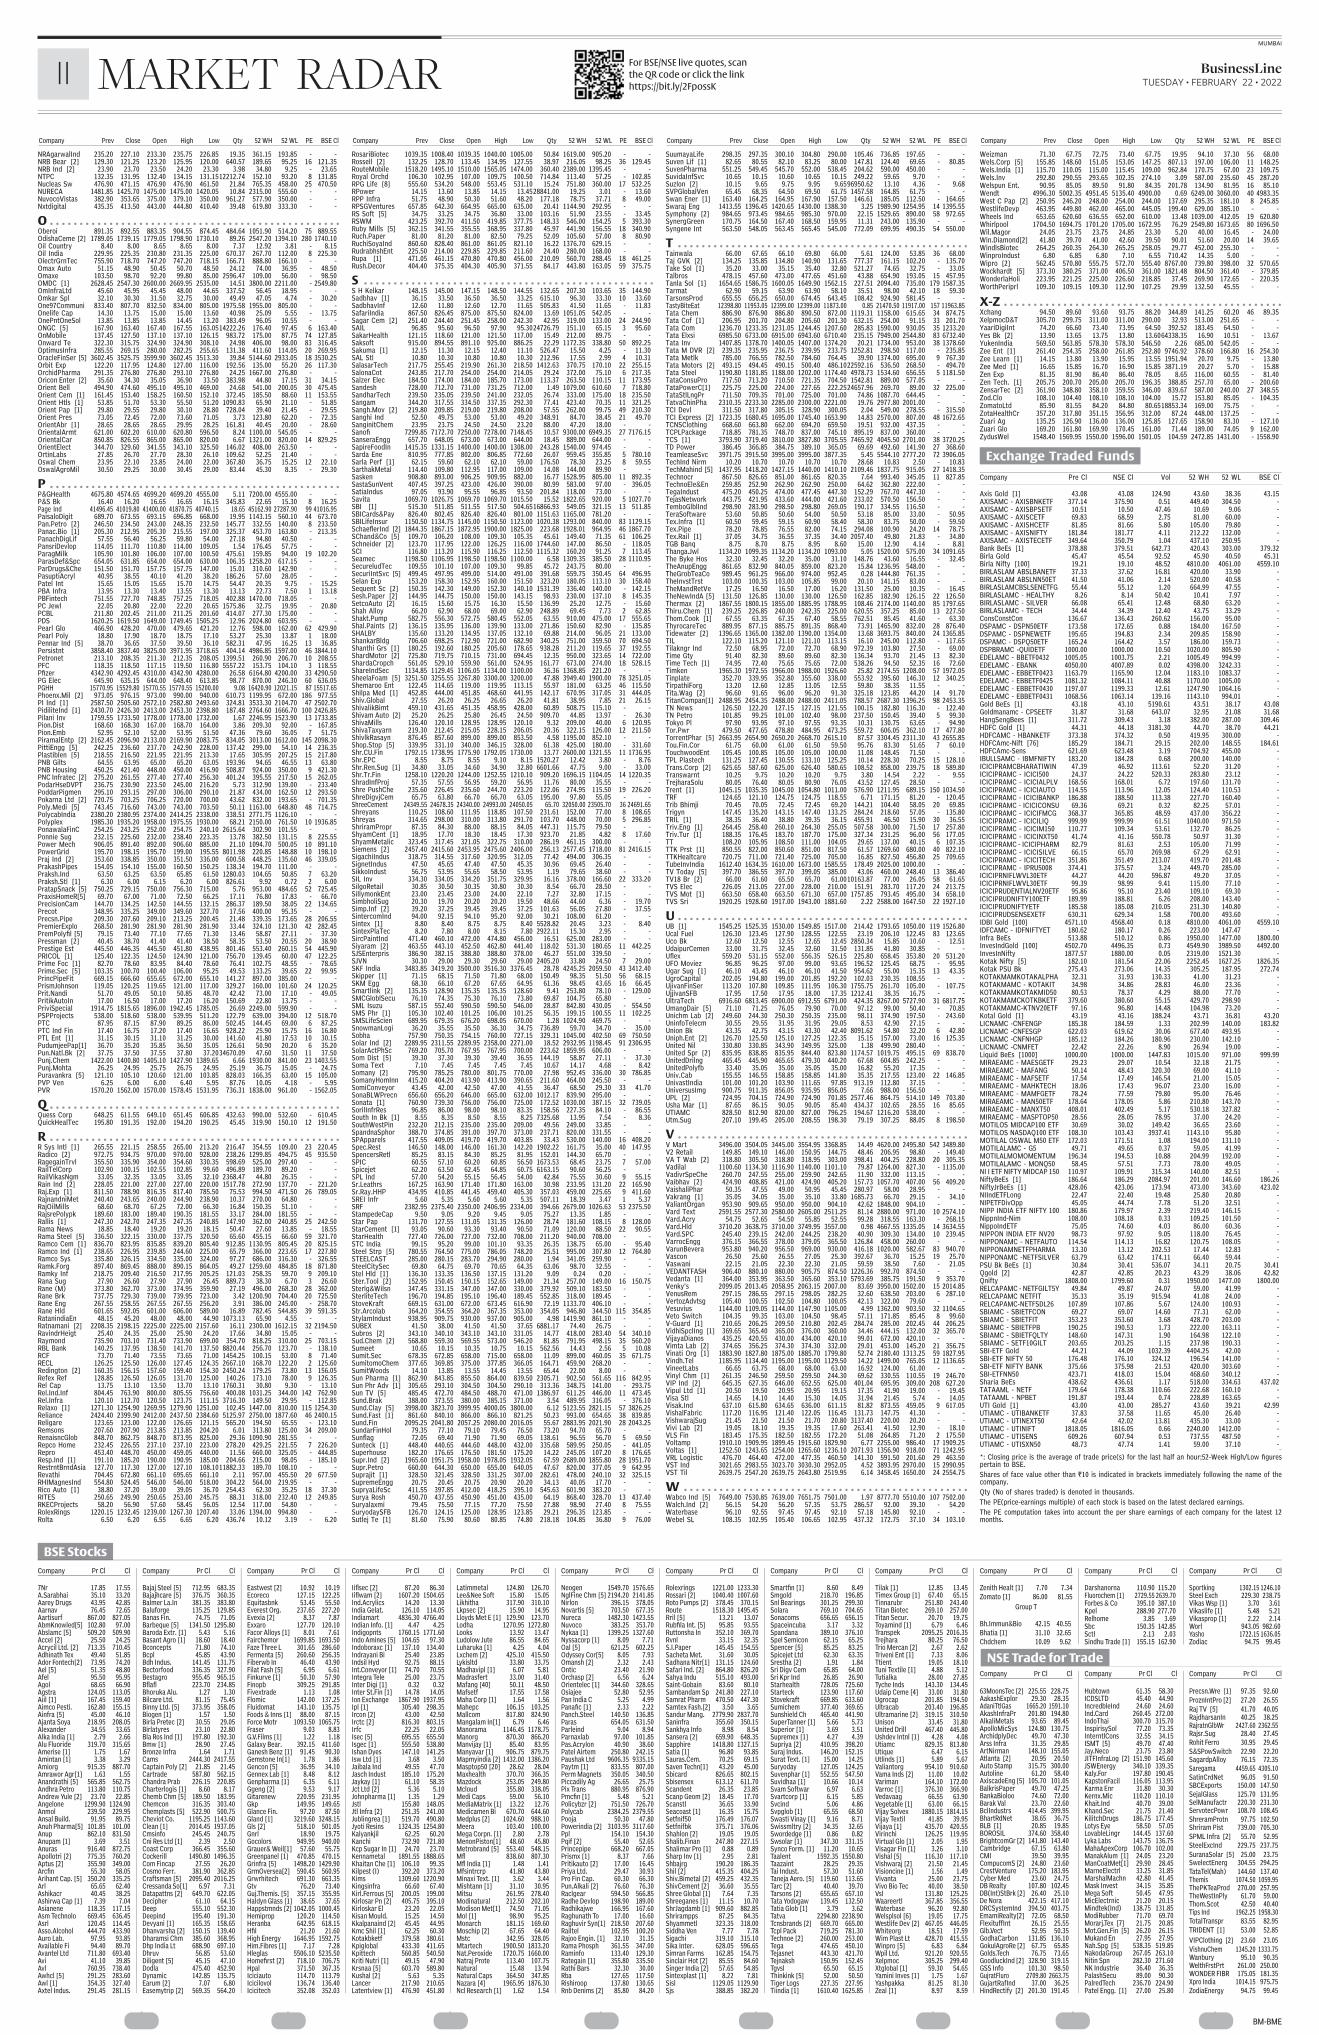
................BMBMECMYK
Company Prev Close Open High Low Qty 52 WH 52 WL PE BSE Cl Company Prev Close Open High Low Qty 52 WH 52 WL PE BSE Cl Company Prev Close Open High Low Qty 52 WH 52 WL PE BSE Cl Company Prev Close Open High Low Qty 52 WH 52 WL PE BSE Cl
NRAgarwalInd 235.20 227.10 233.30 235.75 226.85 19.35 361.15 193.85 NRB Bear [2] 129.30 121.25 123.20 125.95 120.00 640.57 189.65 95.25 16 121.35NRB Ind [2] 23.90 23.70 23.50 24.20 23.30 3.98 34.80 9.25 23.65NTPC 132.35 131.95 132.40 134.15 131.1512212.74 152.10 93.20 8 131.85Nucleas Sw 476.90 471.15 476.90 476.90 461.50 21.84 765.35 458.00 25 470.50NURECA 1481.85 1425.70 1475.00 1475.00 1420.05 10.84 2315.00 555.60 NuvocoVistas 382.90 353.65 375.00 379.10 350.00 961.27 577.90 350.00 Nxtdigital 435.35 413.50 443.00 444.80 410.40 39.48 619.80 333.30
O . . . . . . . . . . . . . . . . . . . . . . . . . . . . . . . . . . . . . . . . . . . . . . . . .Oberoi 891.35 892.55 883.35 904.55 874.45 484.64 1051.90 514.20 75 889.55OdishaCeme [2] 1789.05 1739.15 1779.05 1798.90 1730.10 89.26 2547.20 1394.10 280 1740.10Oil Country 8.40 8.00 8.65 8.65 8.00 7.37 12.92 3.81 8.15Oil India 229.95 225.35 230.80 231.35 225.00 670.37 267.70 112.00 8 225.30OlectrGrnTec 755.90 718.70 747.20 747.20 718.15 166.71 888.80 166.10 Omax Auto 51.15 48.90 50.45 50.70 48.50 24.12 74.00 36.95 48.50Omaxe 103.50 98.70 92.20 99.80 85.00 2596.47 109.00 56.00 98.50OMDC [1] 2628.45 2547.30 2600.00 2669.95 2535.00 14.51 3800.00 2211.00 2549.80OmInfraLtd 45.60 45.95 45.45 48.00 44.65 337.52 56.45 18.95 Omkar Spl 32.10 30.30 31.50 32.75 30.00 49.49 47.05 4.74 30.20One97Communi 833.40 807.70 832.50 834.00 805.00 1975.58 1955.00 805.00 Onelife Cap 14.30 13.75 15.00 15.00 13.60 40.98 25.09 5.55 13.75OnePntOneSol 13.85 13.85 13.85 14.45 13.20 383.49 96.05 10.55 ONGC [5] 167.90 163.40 167.40 167.55 163.0514222.26 176.40 97.45 6 163.40OnMobile 137.45 127.50 137.10 137.10 126.15 983.72 175.00 87.75 74 127.85Onward Te 322.30 315.75 324.90 324.90 308.10 24.98 406.00 98.00 83 316.45OptimusInfra 285.55 269.15 280.00 282.25 255.65 131.38 411.60 114.05 20 269.95OracleFinSer [5] 3602.45 3525.75 3599.90 3602.45 3513.30 39.84 5144.60 2933.05 18 3530.25Orbit Exp 122.20 117.95 124.80 127.00 116.00 192.56 135.00 55.20 26 117.30OrchidPharma 291.35 276.80 276.80 293.10 276.80 24.25 1667.00 276.80 Oricon Enter [2] 35.60 34.30 35.05 36.90 33.50 383.98 44.80 17.15 31 34.15Orient Bell 494.90 474.60 495.10 495.10 469.00 24.68 541.00 200.05 30 475.45Orient Cem [1] 161.45 153.40 158.25 160.50 152.10 372.45 185.50 88.60 11 153.55Orient Htls [1] 53.85 51.70 53.30 55.50 51.20 1090.83 65.90 21.10 51.85Orient Pap [1] 29.80 29.55 29.80 30.10 28.80 728.04 39.40 21.45 29.55Orient Pres 73.05 72.45 72.00 73.60 71.05 3.73 123.80 62.20 72.35OrientAbr [1] 28.65 28.65 28.65 29.95 28.25 161.81 40.45 20.00 28.60OrientalArmt 621.00 602.20 610.00 620.80 596.50 8.24 1100.00 545.05 OrientalCar 850.85 826.55 865.00 865.00 820.00 6.67 1321.00 820.00 14 829.25OrientElect 344.70 329.60 341.55 343.10 325.50 146.02 408.00 263.50 OrtinLabs 27.85 26.70 27.70 28.30 26.10 109.62 52.25 21.40 Oswal Chem 23.95 22.10 23.85 24.00 22.00 367.80 36.75 15.25 12 22.10OswalAgroMil 30.50 29.25 30.00 30.45 29.00 83.44 45.30 8.35 29.30
P . . . . . . . . . . . . . . . . . . . . . . . . . . . . . . . . . . . . . . . . . . . . . . . . .P&GHealth 4675.80 4574.65 4699.20 4699.20 4555.00 5.11 7200.00 4555.00 P&S Bk 16.40 16.20 16.65 16.65 16.15 345.83 22.65 15.30 8 16.25Page Ind 41496.45 41019.80 41400.00 41870.75 40740.15 18.65 45162.90 27287.90 99 41016.95PaisaloDigit 689.70 673.55 693.15 696.85 668.00 19.95 1143.15 560.10 44 673.70Pan.Petro [2] 246.50 234.50 243.00 248.35 232.50 145.77 332.55 140.00 8 233.50Panac.Bio [1] 205.30 212.95 205.30 215.55 197.00 325.37 453.70 163.80 213.35PanachDigLif 57.55 56.40 56.25 59.80 54.00 27.18 94.80 40.50 PansriDevlop 114.05 111.70 110.80 114.00 109.05 1.54 176.45 57.75 ParagMilk 105.90 101.80 106.00 107.00 100.50 475.61 159.85 94.00 19 102.20ParasDef&Spc 654.05 631.85 654.00 654.00 630.00 106.35 1258.20 617.15 ParDrugs&Che 151.50 151.70 157.75 157.75 147.00 15.01 310.60 142.90 PasuptiAcryl 40.95 38.55 40.10 41.20 38.20 186.26 57.60 28.05 Patel Int 15.65 15.05 15.65 15.70 14.75 54.47 20.35 9.75 15.25PBA Infra 13.95 13.30 13.40 13.55 13.30 13.13 22.73 7.50 1 13.18PBFintech 751.55 727.70 748.85 757.25 718.05 402.88 1470.00 718.05 PC Jewl 22.05 20.80 22.00 22.20 20.65 1575.86 32.75 19.95 20.80PCBL 211.80 202.45 211.00 211.25 201.60 414.07 277.30 175.00 PDS 1620.25 1619.50 1649.00 1749.45 1505.25 12.96 2024.80 603.95 Pearl Glo 466.90 428.20 470.00 479.65 421.20 12.76 598.00 162.00 62 429.90Pearl Poly 18.80 17.90 18.70 18.75 17.10 53.27 25.30 13.87 1 18.00Pennar Ind [5] 38.70 36.65 37.50 39.50 36.10 582.31 47.95 16.25 13 36.85Persistnt 3858.40 3837.40 3825.00 3971.95 3718.65 404.14 4986.85 1597.00 46 3844.10Petronet 213.10 208.35 211.30 212.35 208.05 1399.51 260.90 206.70 10 208.55PFC 118.35 118.50 117.15 119.50 116.80 5557.22 153.75 104.10 3 118.55Pfi�zer 4342.90 4292.45 4310.00 4342.90 4280.00 26.58 6164.80 4200.00 33 4290.50PG Elec 645.90 635.15 644.00 648.40 613.85 98.77 870.00 246.30 60 636.05PGHH 15770.95 15529.80 15770.55 15770.55 15200.00 9.08 16420.90 12021.15 87 15517.65Phoenx.Mil [2] 973.05 976.15 973.00 990.00 940.00 610.73 1199.95 672.00 186 977.55PI Ind [1] 2587.50 2505.60 2572.10 2582.80 2493.60 324.81 3533.30 2104.70 47 2502.70PidiliteInd [1] 2430.70 2426.30 2413.00 2453.30 2398.80 187.48 2764.60 1666.70 100 2426.85Pilani Inv 1759.55 1733.50 1778.00 1778.00 1732.00 1.67 2246.95 1523.90 13 1733.85Pion.Dist 168.60 168.30 167.00 168.70 164.00 3.86 209.30 92.00 167.85Pion.Emb 52.95 52.10 52.00 53.95 51.50 47.36 79.60 36.05 7 51.75PiramalEntp [2] 2162.45 2096.90 2133.00 2169.90 2083.75 834.05 3013.00 1612.00 145 2098.30PittiEngg [5] 242.25 236.60 237.70 242.90 228.00 137.42 299.00 54.10 14 236.35Plastiblen [5] 218.55 216.50 221.95 221.95 213.30 17.65 305.95 207.25 15 217.80PNB Gilts 64.55 63.95 65.00 65.20 63.05 193.96 94.65 46.55 13 63.80PNB Housing 450.25 421.40 448.00 450.00 416.90 508.87 924.00 350.00 9 421.30PNC Infratec [2] 275.20 261.55 277.40 277.40 256.30 401.24 395.55 217.50 15 262.05PodarHseDVPT 236.75 230.90 223.50 245.00 216.20 5.73 312.90 139.00 233.40PoddarPigmen 295.10 293.15 297.00 306.00 290.10 21.87 434.00 162.50 12 293.50Pokarna Ltd [2] 720.75 703.25 706.25 720.00 700.00 43.62 832.00 193.65 701.35Poly.Medi [5] 743.45 716.60 743.00 743.00 703.50 50.11 1163.00 648.80 48 714.75PolycabIndia 2380.20 2380.95 2374.00 2414.25 2338.00 338.51 2771.75 1126.10 Polyplex 1985.30 1935.20 1958.00 1975.55 1930.00 68.21 2150.00 761.50 10 1936.85PonawalaFinC 254.25 243.25 252.00 254.75 240.10 2615.64 302.90 101.55 Ponnie Sug 232.15 225.60 232.00 238.40 223.35 13.78 382.50 131.15 8 225.55Power Mech 906.05 891.40 892.00 906.60 885.00 21.10 1094.70 500.05 10 891.10PowerGrid 195.70 198.15 195.70 199.00 195.55 8011.98 220.85 148.88 10 198.10Praj Ind [2] 353.60 338.85 350.00 351.50 336.00 600.58 448.25 135.60 46 339.05PrakashPipes 154.05 154.10 155.00 160.50 150.25 138.34 194.70 111.00 Praksh.Ind 63.50 63.25 63.50 65.85 61.50 1280.03 104.65 50.85 7 63.20Praksh.Stl [1] 6.30 6.00 6.15 6.20 6.00 826.61 9.92 0.72 2 6.00PratapSnack [5] 750.25 729.15 750.00 756.30 715.00 5.76 953.00 484.65 52 725.45PraxisHomeR[5] 69.70 67.00 71.00 72.50 66.25 17.11 76.80 17.83 66.70PrecisionCam 144.70 134.25 142.50 144.55 132.15 286.37 189.50 38.05 22 134.65Precot 348.95 335.25 349.00 349.60 327.70 17.56 400.00 95.35 Precsn.Pipe 209.30 207.60 209.10 213.25 200.45 21.48 339.35 173.65 28 206.55PremierExplo 268.50 281.90 281.90 281.90 281.90 33.44 324.10 121.30 42 282.45PremPolyfi�l [5] 79.15 73.40 77.10 77.65 71.30 13.46 58.87 27.11 37.30Pressman [2] 40.45 38.70 41.40 41.40 38.50 58.35 53.50 20.55 20 38.90Prestige Est 445.50 446.35 445.50 451.80 438.95 801.46 553.40 260.15 54 445.90PRICOL [1] 125.40 122.35 124.50 124.90 121.00 756.70 139.45 60.00 47 122.25Prime Foc [1] 82.70 78.60 83.95 84.40 78.60 76.41 102.75 48.55 78.65Prime.Sec [5] 103.35 100.70 100.40 106.00 95.25 49.53 133.25 39.65 22 99.95PrincPipeFit 669.15 666.60 655.65 672.00 655.10 141.27 897.00 385.00 PrismJohnson 119.05 120.25 119.65 121.00 117.00 329.27 160.00 101.60 24 120.25Prit.Nandi 51.70 49.05 50.10 50.85 48.70 42.42 73.00 17.10 49.05PritikAutoIn 17.00 16.50 17.00 17.20 16.20 150.69 22.80 13.75 PriviSpecial 1914.75 1815.65 1896.00 1942.45 1785.05 26.69 2249.00 599.90 PSPProjects 538.00 518.60 538.00 539.95 511.20 122.79 639.00 394.00 12 518.70PTC 87.95 87.15 87.90 89.25 86.00 502.45 144.45 69.00 6 87.25PTC Ind Fin 17.40 16.75 17.20 17.40 16.65 928.22 25.90 15.75 16 16.80PTL Ent [1] 31.15 30.15 31.10 31.25 30.00 141.60 41.80 17.53 10 30.15PudumjeePap[1] 36.70 35.20 35.85 36.50 35.05 126.61 50.90 20.20 6 35.20Pun.Natl.Bk [2] 37.75 37.50 37.55 37.80 37.2034670.09 47.60 31.50 11 37.50Punj.Chem 1422.00 1400.80 1405.10 1427.90 1389.65 6.66 1930.00 841.00 23 1403.55Punj.Mohta 26.25 24.95 25.75 26.75 24.95 25.19 36.75 15.05 24.75Puravankra [5] 121.10 105.10 120.60 121.00 103.85 828.03 166.35 63.00 15 105.00PVP Ven 6.25 6.00 6.00 6.40 5.95 87.76 10.05 4.18 5.95PVR 1570.20 1562.00 1570.00 1578.45 1531.95 736.31 1838.00 961.00 1562.05
Q . . . . . . . . . . . . . . . . . . . . . . . . . . . . . . . . . . . . . . . . . . . . . . . . .Quess Corp 648.25 611.55 649.10 651.45 606.85 432.63 990.00 532.60 610.45QuickHealTec 195.80 191.35 192.00 194.20 190.25 45.45 319.90 150.10 12 191.50
R . . . . . . . . . . . . . . . . . . . . . . . . . . . . . . . . . . . . . . . . . . . . . . . . .R Sys Intl [1] 265.55 221.15 258.55 265.00 213.20 216.47 354.55 109.00 23 220.45Radico [2] 972.75 934.75 970.00 970.00 928.00 238.26 1299.85 494.75 45 935.50RagegainTrvl 355.50 335.90 354.00 354.60 330.35 598.69 525.00 297.40 RailTelCorp 102.90 100.15 102.55 102.85 99.60 496.89 189.70 89.20 RailVikasNgm 33.05 32.35 33.05 33.05 32.10 2368.47 44.80 26.35 Rain Ind [2] 228.05 221.00 227.00 227.00 220.00 1517.78 272.90 137.70 221.20Raj.Exp [1] 811.50 788.90 816.35 817.40 785.50 75.53 994.50 471.50 26 789.05RajnandniMet 240.40 243.65 240.00 244.90 238.90 10.37 270.00 64.80 RajOilMills 68.60 68.70 67.25 72.00 66.30 16.84 150.35 51.10 RajsrePolypk 189.60 183.00 189.40 190.35 181.55 33.17 284.00 181.55 Rallis [1] 247.30 242.70 247.35 247.35 240.85 147.90 362.00 240.85 25 242.50Rama News 18.85 18.40 19.20 19.20 18.15 50.47 27.60 13.85 18.55Rama Steel [5] 336.50 322.15 330.00 337.75 320.50 65.60 455.15 66.60 59 321.70Ramco Cem [1] 836.70 823.95 835.85 839.20 805.40 912.85 1130.95 805.45 20 825.15Ramco Ind [1] 238.65 226.95 239.85 244.60 225.00 65.79 366.00 223.65 17 227.80Ramco Sys 335.80 326.15 334.50 335.00 324.00 97.27 686.00 316.30 326.55Ramk.Forg 897.40 869.45 888.00 890.15 864.05 49.27 1259.60 484.85 18 871.80Ramky Inf 218.75 209.40 216.50 217.95 205.25 121.03 258.35 59.70 9 209.10Rana Sug 27.90 26.60 27.90 27.90 26.45 889.73 38.30 6.70 3 26.60Rane (M) 373.80 362.70 373.00 374.95 359.90 27.19 496.00 268.30 28 362.00Rane Brk 737.75 729.30 739.00 739.95 723.00 3.42 1200.90 704.40 20 725.50Rane Eng 267.55 258.55 267.55 267.55 256.20 3.91 386.00 245.00 258.70Rane Hld 601.65 592.05 601.00 606.00 589.00 16.89 782.45 544.85 39 591.35RatanindiaEn 48.15 45.20 48.00 48.00 44.90 1073.13 65.90 4.55 Ratnamani [2] 2208.35 2198.15 2225.00 2225.00 2157.60 16.11 2300.00 1612.15 32 2194.50RavindrHeigt 25.40 24.35 25.00 25.90 24.20 17.66 34.80 15.05 Raymond 735.90 703.10 731.40 733.90 699.00 354.70 818.25 310.00 25 703.15RBL Bank 140.25 137.95 138.50 141.70 137.50 8820.44 256.70 123.70 138.10RCF 73.70 71.40 73.55 73.65 71.00 1454.25 100.15 53.00 8 71.40RECL 126.25 125.50 126.00 127.45 124.35 2667.10 168.70 122.20 2 125.60Redington [2] 160.35 156.15 157.60 159.40 154.30 2450.24 179.25 73.80 13 156.05Refex Ref 128.85 126.50 126.05 131.70 125.00 140.26 173.10 78.00 9 126.35Rel Cap 13.75 13.10 13.50 13.70 13.10 1760.31 30.80 9.30 13.10Rel.Ind.Inf 804.45 763.90 800.00 805.55 756.60 400.08 1031.25 344.00 142 762.90Rel.Infra 120.10 112.70 120.50 123.75 111.15 3716.30 149.50 29.95 112.85Relaxo [1] 1271.30 1254.90 1269.95 1279.90 1251.00 102.45 1447.00 810.00 115 1254.30Reliance 2424.40 2399.90 2412.00 2437.50 2384.60 5125.97 2750.00 1877.60 46 2400.15Religare 123.65 123.00 122.00 126.65 121.15 565.20 194.50 65.55 123.10Remsons 207.60 207.90 213.85 213.85 204.20 6.01 313.80 125.00 34 209.00RenaisncGlob 848.70 862.75 848.70 873.95 825.00 29.36 1090.90 281.55 Repco Home 232.45 226.55 237.10 237.10 223.00 278.20 429.25 221.55 7 226.20Repro 453.40 448.70 450.00 459.05 440.00 11.56 660.00 325.05 444.85Resp.Ind [1] 191.10 185.20 190.00 190.95 185.00 204.66 215.00 98.05 185.10RestrntBrndAsia 127.70 117.30 127.00 127.10 108.1011882.33 189.70 108.10 Revathi 704.45 672.80 661.10 695.65 661.10 2.11 957.00 455.50 20 677.50RHIMagnesInd 554.80 524.45 546.00 546.00 518.00 304.22 564.00 219.95 Rico Auto [1] 38.80 37.20 39.00 39.05 36.70 254.43 62.30 35.25 18 37.30RITES 250.65 249.90 250.65 253.00 245.75 88.31 318.00 232.40 12 249.85RKECProjects 58.20 56.90 57.60 58.45 56.05 12.54 117.00 54.80 RolexRings 1220.15 1232.45 1239.00 1267.30 1207.40 33.06 1394.00 994.80 Rolta 6.50 6.20 6.55 6.65 6.20 436.74 10.12 3.19 6.20
RosariBiotec 1039.35 1008.40 1039.35 1040.00 1005.00 50.84 1619.00 905.20 Rossell [2] 132.25 128.70 133.45 134.95 127.55 38.97 216.05 98.25 36 129.45RouteMobile 1518.20 1495.10 1510.00 1565.05 1474.00 360.40 2389.00 1395.45 Royal Orchd 106.30 102.95 107.00 109.75 100.50 714.84 113.40 57.25 102.85RPG Life [8] 555.60 534.20 548.00 553.45 531.10 15.24 751.80 360.00 17 532.25RPower 14.15 13.60 13.85 14.15 13.4528841.00 19.25 3.01 13.60RPP Infra 51.75 48.90 50.30 51.60 48.20 177.18 78.75 37.71 8 49.00RPSGVentures 657.85 642.30 664.95 665.00 635.00 20.41 1144.90 292.95 RS Soft [5] 34.75 33.25 34.75 36.80 33.00 103.16 51.90 23.55 33.45RSWM 423.25 392.70 411.50 419.85 377.75 148.33 546.00 154.25 5 393.30Ruby Mills [5] 362.15 341.55 355.55 368.95 337.80 45.97 441.90 156.55 18 340.90Ruch.Paper 81.00 81.20 81.00 82.50 79.25 52.09 105.60 57.00 8 80.90RuchiSoyaInd 860.60 828.40 861.00 861.05 821.10 16.22 1376.70 629.15 RudrabhshEnt 225.50 214.00 229.85 229.85 211.60 24.40 280.00 168.00 Rupa [1] 471.05 461.15 470.80 470.80 456.00 210.09 560.70 288.45 18 461.25Rush.Decor 404.40 375.35 404.30 405.90 371.55 84.17 443.80 163.05 59 375.75
S . . . . . . . . . . . . . . . . . . . . . . . . . . . . . . . . . . . . . . . . . . . . . . . . .S H Kelkar 148.15 145.00 147.15 148.50 144.55 132.65 207.30 103.65 35 144.90Sadbhav [1] 36.15 33.50 36.50 36.50 33.25 615.10 96.30 33.30 10 33.60SadbhavInf 12.60 11.80 12.60 12.70 11.65 505.83 41.50 11.65 11.83SafariIndia 867.50 826.45 875.00 875.50 824.00 13.69 1051.05 542.05 Sagar Cem [2] 251.40 244.40 251.45 258.00 242.30 42.95 319.00 133.00 24 244.90SAIL 96.85 95.60 96.50 97.90 95.3024726.79 151.10 65.15 3 95.60SakarHealth 121.15 118.60 121.00 121.50 117.00 15.49 212.00 89.75 Saksoft 915.00 894.55 891.10 925.00 886.25 22.29 1172.35 338.80 50 892.25Sakuma [1] 12.15 11.30 12.15 12.40 11.10 526.47 15.50 4.25 11.30SAL Stl 10.80 10.30 10.80 10.80 10.30 212.96 17.55 2.99 4 10.31SalasarTech 217.75 255.45 219.90 261.30 218.50 1412.63 370.75 170.10 22 255.15SalonaCot 243.85 217.70 254.00 254.00 214.05 29.24 372.00 75.10 6 217.35Salzer Elec 184.50 174.00 184.00 185.70 173.00 113.37 263.50 110.15 11 173.95Sandesh 728.00 712.70 731.00 731.25 712.00 1.49 1079.00 610.60 7 718.80SandharTech 239.50 235.05 239.50 241.00 232.05 26.74 333.00 175.00 18 235.50Sangam 344.20 317.55 334.50 337.35 292.30 77.41 423.40 70.35 11 321.25Sangh.Mov [2] 219.80 209.85 219.00 219.80 208.00 57.55 262.00 99.75 49 210.30Sanghi Ind 52.50 49.75 53.00 53.00 49.20 348.91 84.70 38.45 21 49.70SanginitChem 23.95 23.75 24.50 24.50 23.20 88.00 47.20 18.00 Sanofi� 7299.85 7172.70 7250.00 7278.00 7148.45 10.57 9300.00 6949.35 27 7176.15SanseraEngg 657.70 648.05 673.00 673.00 644.00 18.45 889.00 644.00 SapireFoodIn 1415.35 1331.15 1400.00 1400.00 1308.00 243.28 1540.00 974.45 Sarda Ene 810.95 777.85 802.00 806.85 772.60 26.07 959.45 355.85 5 780.10Sarla Perf [1] 62.15 59.60 62.10 62.10 59.00 176.50 78.30 23.25 8 59.55SarthakMetal 114.40 109.80 112.95 117.00 109.00 14.08 144.00 89.90 Sasken 908.80 893.00 906.25 909.95 882.00 16.77 1528.95 805.00 11 892.35SastaSunVent 407.45 397.25 423.00 426.00 390.00 80.99 583.00 97.00 396.05SatiaIndus 97.05 93.90 95.55 96.85 93.50 201.84 118.00 73.00 Savita 1069.70 1026.75 1069.70 1069.70 1015.50 15.52 1822.65 920.00 5 1027.70SBI [1] 515.30 511.85 511.55 517.50 504.6516866.93 549.05 321.15 13 511.85SBICards&Pay 826.40 802.45 826.40 826.40 801.00 1151.63 1165.00 781.20 SBILifeInsur 1150.50 1134.75 1145.00 1150.50 1123.00 1020.38 1293.00 840.00 83 1129.15Schaefl�erInd [2] 1844.35 1867.15 1872.95 1900.00 1825.00 223.68 1928.01 964.95 46 1867.70SChand&Co [5] 109.70 106.20 108.00 109.30 105.35 45.61 149.40 71.35 61 106.25Schneider [2] 123.70 117.95 122.00 126.25 116.00 1744.60 147.00 86.50 118.05SCI 116.80 113.20 115.90 116.25 112.50 1115.32 160.20 91.25 7 113.45Seamec 1198.50 1106.95 1198.50 1198.50 1100.00 6.58 1309.35 385.50 28 1110.95SecureludTec 109.55 101.10 107.00 109.30 99.85 45.72 243.75 80.00 SecuriIntSvc [5] 499.45 497.95 499.00 514.00 491.00 391.68 559.75 350.45 64 496.95Selan Exp 153.20 158.30 152.95 160.00 151.50 323.20 180.05 113.10 30 158.40Sequent Sc [2] 150.35 142.30 149.00 152.30 140.10 1531.39 336.40 140.00 142.15Sesh.Paper [2] 144.95 144.75 150.00 150.00 143.15 98.93 230.00 137.10 8 145.35SetcoAuto [2] 16.15 15.60 15.75 16.30 15.50 136.99 25.20 12.75 15.60Shah Alloy 66.20 62.90 68.00 69.00 62.90 248.89 69.45 7.73 2 62.85Shakt.Pump 582.75 556.30 572.75 580.45 552.05 63.55 910.00 475.00 17 555.65Shal.Paints [2] 136.15 135.95 136.00 139.90 133.00 271.86 150.60 82.90 135.85SHALBY 135.60 133.20 134.95 137.05 132.10 69.88 214.00 96.05 21 133.00ShankarBldg 706.60 698.25 712.90 721.00 682.90 340.25 751.00 359.50 70 694.50Shanthi Grs [1] 180.25 192.60 180.25 205.60 178.65 938.28 211.20 119.65 37 192.55ShardMotor [2] 725.80 719.75 710.15 731.00 694.45 12.35 950.00 323.65 14 722.00ShardaCropch 561.05 529.10 559.90 561.00 524.95 161.77 673.00 274.00 18 528.15ShareIndSec 1134.85 1129.45 1106.05 1134.00 1100.00 36.36 1368.85 221.20 SheelaFoam [5] 3251.50 3255.55 3267.80 3300.00 3200.00 47.88 3949.40 1900.00 78 3251.05Shemaroo Ent 122.45 114.65 119.00 119.95 113.15 55.97 181.00 63.25 46 115.50Shilpa Med [1] 452.85 444.00 451.85 468.60 441.95 142.17 670.95 317.05 31 444.05Shiv.Global 27.55 26.20 26.25 26.65 26.20 41.81 38.95 7.85 21 26.15ShivalikBimt 459.10 431.65 451.35 458.95 428.00 60.89 508.75 115.10 Shivam Auto [2] 25.20 26.25 25.80 26.45 24.50 909.70 44.85 13.97 26.30ShivaMills 126.40 120.10 128.95 128.95 120.10 9.32 209.00 40.00 6 120.95ShivaTaxyarn 219.30 212.45 215.05 228.15 206.05 20.36 322.15 126.00 12 211.50ShivlkRasayn 876.45 857.60 899.00 899.00 853.50 4.58 1195.00 852.10 Shop.Stop [5] 339.95 331.10 340.00 346.15 328.00 61.38 425.00 180.00 331.60Shr.CU.Fin 1792.15 1738.95 1775.90 1792.05 1730.00 13.77 2600.00 1321.55 11 1736.95Shr.EPC 8.55 8.75 8.55 9.10 8.15 1520.27 12.42 3.80 8.76Shr.Ren.Sug [1] 34.80 33.05 34.60 34.90 32.80 6601.66 47.75 9.00 33.00Shr.Tr.Fin 1258.10 1220.20 1244.00 1252.55 1210.10 909.20 1696.15 1104.05 14 1220.35ShradInfProj 57.35 57.55 56.95 59.20 56.95 11.76 80.00 35.55 Shre PushChe 235.60 226.45 235.60 244.70 223.20 122.06 274.95 115.50 19 226.20ShreDigvjCem 65.75 63.80 66.70 66.70 63.05 195.00 97.80 55.05 ShreeCement 24349.55 24678.35 24340.00 24993.00 24050.05 65.70 32050.00 23505.70 36 24691.65Shreyans 110.25 108.60 111.95 118.85 107.50 231.61 152.00 77.00 8 108.65Shreyas 314.65 298.00 310.00 313.80 291.70 103.70 448.00 70.00 5 296.85ShriramPropr 87.35 84.30 88.00 88.15 84.05 447.31 115.75 79.50 ShyamCent [1] 18.95 17.70 18.30 18.45 17.30 923.70 21.85 4.82 8 17.60ShyamMetalic 323.45 317.45 321.05 322.75 310.00 286.19 461.15 300.00 Siemens [2] 2457.40 2415.60 2453.95 2475.60 2406.00 256.13 2577.45 1718.00 81 2416.15SigachiIndus 318.75 314.55 317.60 320.95 312.05 77.42 494.00 306.35 SignetIndus 47.50 45.65 47.40 47.50 45.35 30.96 69.45 26.40 SikkoIndust 56.75 53.95 55.65 58.50 53.95 1.19 79.65 38.60 SIL Inv 334.30 334.05 334.20 351.75 329.95 16.16 378.00 166.60 22 333.20SilgoRetail 30.85 30.50 30.35 30.80 30.30 8.54 66.70 28.50 SillymonkEnt 23.00 23.45 23.00 24.00 22.10 7.27 32.80 17.15 SimbholiSug 20.30 19.70 20.20 20.20 19.50 48.66 44.60 6.36 19.70Simp.Inf [2] 39.20 37.25 39.45 39.45 37.25 101.63 56.05 27.80 37.55SintercomInd 94.00 92.15 94.10 95.20 92.00 30.21 108.00 61.20 Sintex [1] 8.80 8.40 8.75 8.75 8.40 5528.82 20.45 3.23 8.40SintexPlaTec 8.20 7.80 8.00 8.15 7.80 2922.11 15.30 2.95 SircPaintInd 471.40 460.10 472.00 474.80 456.00 16.51 625.00 283.00 Siyaram [2] 463.55 443.10 452.50 462.80 441.40 118.02 531.30 180.65 11 442.25SJSEnterpris 386.90 382.15 388.80 388.80 378.00 46.27 551.00 339.50 SJVN 30.30 29.00 29.30 29.60 29.00 2405.20 33.80 24.50 7 29.00SKF India 3483.85 3419.20 3500.00 3516.30 3376.45 28.78 4245.25 2059.50 43 3412.40Skipper [1] 71.15 68.15 71.50 71.80 68.00 150.49 98.35 51.50 56 68.15SKM Egg 68.30 66.10 67.20 67.65 64.95 61.36 98.45 43.65 16 66.45Smartlink [2] 135.35 128.90 135.35 135.35 128.60 9.41 253.80 78.10 129.00SMCGloblSecu 76.10 74.35 75.30 76.10 73.80 69.87 104.75 65.80 SML Isuzu 587.15 552.40 590.50 590.50 546.00 28.87 842.80 430.05 554.50SMS Phr [1] 105.30 102.40 101.25 106.00 101.25 56.35 199.15 100.55 11 102.25SMSLifeScien 689.95 679.35 676.20 698.05 670.00 1.28 1024.90 469.75 SnowmanLogi 36.20 35.55 35.50 36.30 34.75 736.89 59.70 34.70 35.00Sobha 757.90 750.35 754.15 760.00 727.15 329.31 1045.00 402.50 69 750.50Solar Ind [2] 2289.95 2311.55 2289.95 2358.00 2271.00 18.52 2932.95 1198.45 91 2306.95SolarActPhSc 769.20 705.70 767.95 767.95 700.00 223.62 1859.95 606.00 Som Dist [5] 39.30 37.30 39.30 39.40 36.55 144.19 58.87 27.11 37.30Soma Text 7.10 7.45 7.45 7.45 7.45 10.67 14.17 4.68 8.42Somany [2] 795.90 785.25 780.00 801.75 770.00 27.98 952.45 336.00 30 786.85SomanyHomInn 415.20 404.20 413.90 413.90 390.65 211.60 464.00 245.50 SomiConveyor 43.45 42.00 42.50 47.00 41.55 36.47 68.50 29.30 33 41.70SonaBLWPrecn 656.60 656.20 646.00 665.00 632.00 1012.17 839.90 295.00 Sonata [1] 760.90 739.30 756.00 756.00 725.00 172.52 1030.00 387.15 32 739.05SorilInfrRes 96.85 86.00 98.00 98.10 83.35 158.56 227.35 84.10 86.55South In Bk [1] 8.55 8.35 8.50 8.55 8.25 7325.68 13.95 7.54 8.36SouthWestPin 232.20 212.15 235.00 235.00 209.00 49.56 249.00 33.85 SpandnaSphor 388.70 374.85 391.00 397.70 373.00 237.71 820.00 331.55 SPApparels 417.55 409.05 419.70 419.70 403.85 33.43 530.00 140.00 16 408.20Spec.Rest 146.50 148.00 146.00 161.30 142.20 1902.22 161.75 35.00 40 147.95SpencersRetl 85.25 83.15 84.30 85.25 81.95 152.01 144.30 65.70 SPIC 60.55 57.10 60.20 60.85 56.50 1673.53 68.45 23.75 7 57.00Spicejet 62.20 63.50 62.45 64.85 60.75 6163.15 90.60 56.25 SPL Ind 57.00 54.20 55.15 56.45 54.00 42.84 75.55 30.60 9 55.15Sr.Leathrs 167.25 163.90 171.40 171.80 163.00 30.98 233.95 131.20 22 165.90Sr.Ray.HHP 434.95 410.85 441.45 459.40 405.30 357.03 459.00 225.65 9 411.60SREI Infr 5.60 5.35 5.60 5.60 5.35 507.11 18.39 3.47 1 5.37SRF 2382.95 2375.40 2350.00 2406.95 2334.00 394.66 2679.00 1026.63 53 2375.50StampedeCap 9.50 9.05 9.20 9.45 9.05 75.27 13.35 1.85 Star Pap 131.70 127.55 131.05 131.35 126.00 28.74 181.60 108.15 8 128.00StarCement [1] 93.05 90.60 93.30 93.40 90.50 71.09 120.00 88.50 22 90.55StarHealth 727.40 726.00 727.00 732.00 708.00 211.20 940.00 708.00 STC India 99.15 95.20 99.00 101.10 93.35 26.35 138.75 65.00 95.40Steel Strp [5] 780.55 764.50 775.00 786.05 748.20 25.51 995.00 307.80 12 764.80STEELCAST 285.00 280.15 283.70 294.90 280.00 1.94 341.05 259.90 SteelCitySec 69.80 64.75 69.70 70.65 64.35 63.06 98.70 32.55 Stel Hld [1] 136.30 133.35 136.50 137.15 131.20 9.09 0.24 0.20 Ster.Tool [2] 152.95 150.45 150.15 152.65 149.00 21.34 257.00 149.00 16 150.75Sterlg&Wilsn 347.45 331.15 347.00 347.00 330.00 379.92 509.10 183.50 SterliteTech 196.70 194.85 195.10 196.40 189.45 552.85 318.00 189.45 StoveKraft 669.15 631.00 672.00 673.45 616.90 72.19 1133.70 406.10 Str.Arcolab 364.20 354.55 364.20 367.35 353.00 354.05 946.80 344.50 115 354.85StylamIndust 938.95 909.75 930.00 937.00 905.00 4.98 1419.90 861.10 SUBEX 41.50 38.00 41.50 41.50 37.65 6881.17 74.40 26.75 Subros [2] 343.10 340.10 343.10 343.10 331.05 14.77 418.00 283.40 54 340.10Sud.Chem [2] 568.80 559.30 569.55 573.00 546.20 81.85 791.95 498.15 35 560.20Sumeet 10.65 10.15 10.35 10.75 10.15 562.56 14.43 2.56 5 10.08Sumit.Sec 678.35 672.85 658.00 715.00 658.00 11.09 899.00 460.05 35 671.75SumitomoChem 377.65 369.85 375.00 377.85 366.05 164.71 459.90 268.20 SumitWoods 14.10 13.85 13.55 14.45 13.55 65.44 22.00 8.00 Sun Pharma [1] 862.90 843.85 855.50 864.00 839.50 2305.71 902.50 561.65 116 842.95Sun Phr Adv [1] 305.65 293.10 304.50 304.50 290.10 313.36 348.75 141.00 293.75Sun TV [5] 485.45 472.70 484.50 488.70 471.00 1386.97 611.25 446.00 11 473.45Sund.Brak 388.00 373.55 380.00 385.15 371.00 3.54 489.95 316.05 376.10Sund.Clay [5] 3998.00 3823.70 3999.95 4000.05 3800.00 6.12 5123.55 2821.15 57 3826.25Sund.Fast [1] 861.60 840.10 866.00 866.10 821.25 50.23 993.00 654.65 38 839.85Sund.Fin 2095.25 2041.80 2057.25 2080.00 2016.05 55.67 2883.95 2021.90 28 2043.25SundarFinHol 79.35 77.10 79.10 79.45 76.50 73.20 94.70 65.70 Sunfl�ag 72.05 69.40 71.90 71.90 69.05 138.61 96.55 56.70 5 69.50Sunteck [1] 448.40 440.65 444.60 448.00 432.00 335.68 589.95 250.05 441.05Superhouse 182.20 176.65 176.50 181.50 175.20 14.22 245.05 107.20 8 176.65Supr.Ind [2] 1965.60 1951.75 1958.00 1978.05 1932.05 67.59 2689.00 1855.80 28 1951.70Supr.Petro 660.00 644.30 650.00 655.00 640.05 47.67 820.00 377.05 9 642.95Suprajit [1] 328.50 321.45 328.50 331.25 307.00 282.61 478.00 240.10 32 325.15SupremeEngg 20.75 20.45 20.75 20.90 20.20 34.13 40.05 17.70 SupryaLifeSc 411.55 397.85 412.00 418.25 395.10 545.63 601.90 383.20 Surya Rosh 450.70 437.55 450.90 451.00 435.00 64.19 868.40 328.70 13 437.40Suryalaxmi 79.45 75.50 77.15 77.20 75.50 27.88 98.90 27.40 8 75.55SuryodaySFB 126.70 124.15 125.00 128.95 123.85 29.21 296.35 123.85 Sutlej Te [1] 81.60 75.90 80.60 80.85 74.80 218.18 104.85 36.80 9 76.00
SuumayaLife 298.35 297.35 300.10 304.80 290.00 105.46 736.85 197.65 Suven Lif [1] 82.65 80.55 82.10 83.25 80.00 147.81 124.40 69.65 80.85SuvenPharma 551.25 549.45 545.70 552.00 538.45 204.62 590.00 450.00 SuvidaInfSvc 10.65 10.15 10.60 10.65 10.15 249.22 59.65 9.70 Suzlon [2] 10.15 9.65 9.75 9.95 9.6596950.62 13.10 4.36 9.68SVPGlobalVen 65.45 68.35 64.50 69.50 61.75 1457.58 164.85 61.75 Swan Ener [1] 163.40 164.25 164.95 167.90 157.50 146.61 185.05 112.50 164.65Swaraj Eng 1413.55 1396.45 1420.65 1430.00 1388.30 3.25 1989.90 1254.95 14 1395.55Symphony [2] 984.65 973.45 984.65 985.30 970.00 22.15 1529.65 890.00 58 972.65SynergGreen 170.75 164.50 167.40 168.50 159.95 11.31 243.00 135.90 Syngene Int 563.50 548.05 563.45 565.45 545.00 772.09 699.95 490.35 54 550.00
T . . . . . . . . . . . . . . . . . . . . . . . . . . . . . . . . . . . . . . . . . . . . . . . . .Tainwala 66.00 67.65 66.10 69.80 66.00 5.61 124.00 53.85 36 68.00Taj GVK [2] 134.25 135.85 134.80 140.90 131.65 777.37 161.15 102.20 135.70Take Sol [1] 35.20 33.00 35.15 35.40 32.80 521.27 74.65 32.75 33.05Talbros 478.15 457.60 473.00 477.65 451.60 43.88 654.90 193.05 15 457.95Tanla Sol [1] 1654.65 1586.75 1600.05 1649.90 1562.15 227.51 2094.40 735.00 179 1587.35Tarmat 62.90 59.15 63.90 63.90 58.10 35.51 98.00 42.10 18 59.30TarsonsProd 655.55 656.25 650.00 674.45 643.45 108.42 924.90 581.45 TastyBiteEat 12398.80 11953.05 12399.00 12399.00 11873.00 0.85 21470.50 11917.00 157 11963.85Tata Chem 886.90 876.90 886.80 890.50 872.00 1119.31 1158.00 615.65 34 874.75Tata Cof [1] 206.95 201.70 204.80 205.60 201.30 632.15 254.00 91.15 33 201.70Tata Com 1236.70 1233.35 1231.05 1244.45 1207.60 285.83 1590.00 930.05 35 1233.20Tata Elxsi 6985.50 6733.00 6915.00 6943.60 6710.40 235.15 7949.00 2544.80 83 6732.40Tata Inv 1407.85 1378.70 1400.05 1407.00 1374.20 20.21 1734.00 953.00 38 1378.60Tata M DVR [2] 239.35 235.95 236.75 239.95 233.75 1252.81 298.50 117.00 235.85Tata Metlk 785.00 766.55 782.50 784.60 764.45 39.90 1374.00 695.00 9 767.30Tata Motors [2] 493.15 494.45 490.15 500.40 486.1022592.16 536.50 268.50 494.70Tata Steel 1190.80 1181.85 1188.00 1202.00 1174.40 4978.73 1534.60 656.55 5 1181.50TataConsuPro 717.50 713.20 710.50 721.35 704.50 1542.81 889.00 577.05 TataPowerC[1] 225.75 225.00 224.00 227.65 222.2524657.96 269.70 89.00 32 225.00TataStlLngPr 711.50 709.35 701.00 725.00 701.00 74.86 1087.70 644.45 TatvaChinPha 2310.35 2233.30 2285.00 2300.00 2221.00 19.76 2977.80 2001.00 TCI Devl 311.50 317.80 305.15 328.90 300.05 2.04 549.00 278.55 315.50TCI Express [2] 1723.35 1680.45 1695.00 1745.40 1653.90 14.83 2570.00 807.00 48 1672.65TCNSClothing 668.60 663.80 662.00 694.20 659.50 19.51 932.00 437.35 TCPLPackage 718.85 781.35 748.70 837.00 745.10 895.19 837.00 360.00 TCS [1] 3793.90 3719.40 3810.00 3827.80 3705.55 7465.92 4045.50 2701.00 38 3720.25TD Power 386.45 366.85 384.75 389.10 365.05 69.69 492.60 141.90 27 368.60TeamleaseSvc 3971.75 3915.50 3995.00 3995.00 3877.35 5.45 5544.10 2777.20 72 3906.05TechInd Nirm 10.20 10.70 10.70 10.70 10.70 28.68 10.83 2.50 10.83TechMahind [5] 1437.95 1418.20 1427.15 1440.00 1410.10 2109.46 1837.75 915.05 27 1418.35Technocr 867.50 826.65 851.00 861.65 820.35 7.64 993.40 345.05 11 827.85TechnoEle&En 259.85 252.90 262.90 262.90 250.00 64.62 362.80 222.00 TegaIndust 475.20 450.25 474.00 477.45 447.30 152.29 767.70 447.30 TejasNetwork 443.75 421.95 433.60 444.00 421.60 233.02 570.50 156.50 TemboGlblInd 298.90 283.90 298.50 298.80 269.05 190.17 334.55 116.50 TeraSoftware 53.60 50.85 50.60 54.00 50.50 53.18 85.00 33.00 50.95Tex.Infra [1] 60.50 59.45 59.15 60.90 58.40 58.30 83.75 50.00 59.50Tex.Pipe 78.20 78.85 76.55 82.00 74.15 294.08 100.90 24.20 14 78.75Tex.Rail [1] 37.05 34.75 36.55 37.35 34.40 2057.40 49.80 21.83 34.80TGB Banq 8.75 8.70 8.75 8.95 8.60 15.00 12.90 4.14 8.81Thanga.Jwl 1134.20 1099.35 1134.20 1134.20 1093.00 5.05 1520.00 575.00 34 1091.65The Byke Hos 32.30 32.45 32.20 35.00 31.10 148.76 43.60 16.55 32.45TheAnupEngg 861.65 832.90 840.05 859.00 823.20 15.84 1236.95 548.00 TheGrobTeaCo 989.45 961.25 966.00 974.00 952.45 0.28 1444.80 761.35 TheInvstTrst 103.00 100.35 103.00 105.85 99.00 20.10 141.15 83.00 TheMandRetVe 17.25 16.50 16.50 17.00 16.20 131.50 25.00 10.35 16.45TheNewIndA [5] 131.50 126.85 130.00 130.00 126.50 162.85 182.90 126.15 22 126.50Thermax [2] 1867.55 1800.15 1855.00 1885.95 1788.95 108.46 2174.00 1140.00 85 1797.65Thiru.Chem [1] 239.25 226.85 240.00 242.35 225.00 620.55 357.25 85.00 13 227.50Thom.Cook [1] 67.55 63.35 67.35 67.40 58.55 762.51 85.45 41.60 63.30ThyrocareTec 889.95 877.15 885.75 891.35 868.40 73.91 1465.90 832.00 28 876.40Tidewater [2] 1396.65 1365.00 1382.00 1390.00 1354.00 13.68 3693.75 840.00 24 1365.85TIL 122.10 115.20 121.10 121.10 113.15 16.10 245.00 112.80 117.65Tilakngr Ind 72.50 68.95 72.00 72.70 68.90 972.39 103.80 27.50 69.00Time Gty 91.40 82.30 89.60 89.60 82.30 136.34 93.70 21.45 13 82.30Time Tech [1] 74.95 72.40 75.65 75.65 72.00 538.26 94.50 52.35 16 72.60Timken 1965.30 1972.55 1966.00 1988.00 1926.60 25.82 2174.55 1208.00 57 1972.05Tinplate 352.70 339.95 352.80 355.60 338.00 553.92 395.60 146.30 12 340.25TirpathiForg 13.20 12.60 12.85 13.05 12.55 59.80 38.35 11.55 Tita.Wag [2] 96.60 91.65 96.00 96.20 91.30 325.18 123.85 44.20 14 91.70TitanCompan[1] 2488.95 2454.35 2488.00 2488.00 2411.05 788.57 2687.30 1396.25 98 2453.35TN News 126.50 122.20 127.15 127.15 121.55 100.15 182.80 116.30 122.40TN Petro 101.85 99.25 101.00 102.40 98.00 237.50 150.45 39.40 5 99.30Tokyo Pl 97.90 93.95 97.10 97.55 93.35 10.31 130.75 63.65 94.90Tor.Pwr 479.50 477.65 478.80 484.95 473.25 559.72 606.05 362.10 17 477.80TorrentPhar [5] 2663.95 2654.90 2650.20 2668.70 2615.10 87.57 3304.45 2311.30 43 2655.85Tou.Fin.Cor 61.75 60.00 61.00 61.50 59.50 95.76 83.30 51.65 7 60.10TouchwoodEnt 105.45 100.85 105.00 105.00 100.00 11.08 148.45 71.50 TPL Plastech 131.25 127.45 130.55 133.10 125.25 10.14 228.30 70.25 15 128.10Trans.Corp [2] 625.65 587.60 625.00 626.40 580.65 108.52 858.00 239.75 18 589.80Transwarnt 10.25 9.75 10.20 10.20 9.75 3.80 14.54 2.22 9.55TrejharaSolu 80.05 76.40 80.05 80.90 76.05 43.52 127.45 28.50 Trent [1] 1045.15 1035.35 1045.00 1054.80 1011.00 576.90 1211.95 689.15 150 1034.50TRF 124.65 121.10 124.75 124.75 118.55 6.71 171.15 81.20 120.45Trib Bhimji 70.45 70.05 72.45 72.45 69.20 144.21 104.40 58.05 20 69.85Trigyn 147.45 135.20 143.15 147.40 133.25 284.24 218.60 57.05 135.80TRIL [1] 38.35 36.40 38.80 39.35 36.15 455.91 46.50 15.90 30 36.55Triv.Eng [1] 264.45 258.40 260.10 264.30 255.05 507.58 300.00 71.50 17 257.80Triv.Tur [1] 188.35 176.45 183.70 187.70 175.00 327.34 231.25 96.00 56 177.05TT 108.20 105.95 108.50 111.00 104.05 29.65 137.00 40.15 6 107.35TTK Prst [1] 850.55 822.00 850.60 851.00 817.50 61.57 1269.60 680.00 40 822.10TTKHealtcare 720.75 711.00 721.40 725.00 705.00 16.85 827.50 456.80 25 709.65TubeInvIndia 1612.40 1634.35 1610.00 1673.00 1585.55 178.49 2025.00 1000.00 TV Today [5] 397.70 386.55 397.70 399.05 385.00 43.06 460.00 248.40 13 386.40TV18 Br [2] 66.00 61.60 65.50 65.70 61.0010163.87 77.00 26.05 58 61.65TVS Elec 226.05 213.05 227.00 228.00 210.00 151.91 283.70 117.20 24 213.75TVS Mot [1] 663.50 658.40 663.50 671.30 657.00 1757.85 793.45 495.00 34 658.10TVS Sri 1920.25 1928.60 1917.00 1943.00 1881.60 2.22 2588.00 1647.50 22 1927.10
U . . . . . . . . . . . . . . . . . . . . . . . . . . . . . . . . . . . . . . . . . . . . . . . . .UB [1] 1545.25 1525.35 1530.00 1549.85 1517.00 214.42 1793.65 1050.00 119 1526.80Ucal Fuel 126.30 123.45 127.90 128.55 122.55 23.19 206.10 122.45 83 123.65Uco Bk 12.60 12.50 12.55 12.65 12.45 2850.34 15.85 10.60 12.51UdaipurCemen 33.00 31.75 32.45 32.60 31.50 131.85 41.80 30.85 Ufl�ex 559.20 531.15 552.00 556.35 526.15 225.80 658.45 353.80 20 531.20UFO Moviez 96.85 96.25 97.00 99.00 93.65 196.52 125.45 68.75 95.95Ugar Sug [1] 46.10 43.45 46.10 46.10 41.50 954.62 55.00 15.35 13 43.35UgroCapital 202.05 194.80 199.00 201.85 192.20 102.03 230.35 108.55 UjivanFinSer 113.20 107.80 109.85 111.95 106.30 1755.75 261.70 105.00 107.75UjjivanSFB 17.95 17.50 17.95 18.00 17.35 1212.41 38.35 16.75 UltraTech 6916.60 6813.45 6900.00 6912.55 6791.00 424.35 8267.00 5727.90 31 6817.75UmangDair [5] 71.10 71.25 76.05 79.90 70.00 97.12 99.00 50.40 70.85Unichm Lab [2] 249.60 244.30 250.30 250.35 235.00 98.11 374.90 197.50 243.60UninfoTelecm 30.55 29.55 31.95 31.95 29.05 8.53 42.90 27.15 Union Bk 43.35 42.75 43.15 43.30 42.40 8091.62 54.80 32.20 6 42.80Uniph.Ent [2] 126.70 125.50 125.10 127.25 122.35 15.15 157.00 73.00 16 125.35United Nil 330.80 330.85 343.90 349.95 325.00 1.38 499.90 280.40 United Spr [2] 835.95 838.85 835.95 844.40 823.80 1174.57 1019.75 495.15 69 838.70UnitedDrilng 465.45 445.90 465.65 479.30 440.20 67.68 604.85 242.25 UnitedPolyfb 33.40 35.05 35.00 35.05 35.00 16.82 55.20 17.35 Univ.Cab 155.55 146.55 158.85 158.85 141.80 35.35 217.55 123.00 22 146.85UnivastIndia 101.00 101.20 103.90 111.65 97.85 913.19 112.80 37.15 UniversusImg 900.75 911.35 856.05 935.95 856.05 7.66 988.00 156.50 UPL [2] 724.95 704.15 724.90 724.90 701.85 2577.46 864.75 514.10 149 703.80Usha Mar [1] 87.65 86.15 90.05 90.05 85.40 434.37 102.65 28.55 16 85.65UTIAMC 828.50 812.90 820.00 827.00 796.25 194.67 1216.20 538.00 Utm.Sug 207.10 199.45 205.00 208.55 198.30 79.19 307.25 88.05 8 198.50
V . . . . . . . . . . . . . . . . . . . . . . . . . . . . . . . . . . . . . . . . . . . . . . . . .V Mart 3496.00 3504.05 3445.00 3554.95 3368.85 14.49 4620.00 2495.80 542 3489.80V2 Retail 149.85 149.10 146.00 150.95 144.75 48.46 206.95 98.80 149.40VA T Wab [2] 318.80 305.50 318.80 318.95 303.00 398.41 404.25 228.80 20 305.35Vadilal 1100.60 1134.30 1116.90 1140.00 1101.10 79.87 1264.00 827.30 1135.00VadivrSpeChe 260.70 247.55 255.00 259.90 242.65 11.90 332.00 113.15 Vaibhav [2] 424.90 408.85 421.00 424.90 405.20 157.73 1057.70 407.00 56 409.20VaishaliPhar 50.35 47.55 49.00 50.95 45.45 280.97 58.00 28.95 Vakrang [1] 35.05 34.05 35.00 35.10 33.80 1685.73 66.70 29.15 34.10ValiantOrgan 953.90 909.65 950.00 950.00 904.10 42.62 1848.00 904.10 Vard Text 2591.55 2577.30 2580.00 2605.00 2511.25 81.14 2880.00 971.00 10 2574.10Vard.Acry 54.75 52.65 54.50 55.85 52.55 99.28 318.55 163.30 268.15Vard.Hld 3710.20 3638.75 3710.00 3749.95 3557.00 0.98 4667.55 1335.05 14 3634.55Vard.SPC 245.40 239.15 242.00 244.25 238.20 40.90 309.30 134.00 10 239.45VarrocEngg 376.15 366.55 378.00 379.05 365.50 126.84 458.00 260.00 VarunBevera 953.80 940.20 956.50 969.00 930.00 416.18 1020.00 582.67 83 940.70Vascon 26.50 25.60 26.55 27.05 25.30 392.67 36.70 15.25 19 25.70Vaswani 22.15 21.05 22.30 22.30 21.05 59.59 38.50 7.60 21.05VEDANTFASH 906.40 880.10 880.00 905.75 874.50 1226.36 992.70 874.50 Vedanta [1] 364.00 353.95 363.50 365.60 353.10 5793.69 385.75 191.50 9 353.70Venky's 2099.05 2013.45 2058.95 2063.15 2007.00 83.69 3950.00 1502.00 15 2014.85VenusRem 297.15 286.55 297.15 298.05 282.25 32.60 638.50 203.00 6 287.10VertozAdvtsg 105.40 100.55 102.50 104.80 100.05 42.13 322.00 79.60 Vesuvius 1144.00 1109.05 1144.00 1147.90 1105.00 4.99 1362.00 903.50 32 1104.65Veto Switch 104.35 99.35 103.00 104.50 98.45 57.11 171.85 85.45 8 99.60VGuard [1] 210.65 206.25 209.50 210.80 202.45 284.74 285.00 202.45 44 206.25VidhiSpclIng [1] 369.65 365.40 365.00 376.00 360.00 34.46 444.15 132.00 32 365.70VijayaDianos 435.25 420.55 430.00 434.00 420.10 99.01 672.00 420.10 Vimta Lab [2] 374.65 356.25 374.30 374.30 332.00 29.01 453.00 145.20 21 356.75Vinati Org [1] 1883.90 1827.80 1875.00 1885.70 1799.80 52.74 2180.40 1313.25 59 1827.95Vindh.Tel 1185.95 1134.40 1195.00 1195.00 1129.50 14.22 1499.00 765.05 12 1136.65VineetLabs 66.65 63.75 68.00 68.00 63.00 16.92 124.00 61.00 Vinyl Chm [1] 261.35 246.50 259.50 259.50 244.30 69.62 330.55 110.55 19 246.70VIP Ind [2] 645.35 627.35 646.00 652.55 625.00 401.04 695.95 309.00 208 627.20Vipul Ltd [1] 20.50 19.50 20.95 20.95 19.15 17.35 41.90 19.00 19.45Visa Stl 14.65 14.10 14.40 15.30 14.05 31.94 21.45 5.74 14.05Visak.Ind 637.10 615.80 634.65 636.00 611.15 81.82 873.55 459.05 9 617.05VishalFabric 117.20 116.95 121.40 122.05 116.45 131.73 147.75 41.30 VishwarajSug 21.45 21.50 21.50 21.70 20.80 3137.40 220.00 20.20 Vivi Lab [2] 19.05 18.10 19.35 19.35 17.60 263.41 41.50 12.90 18.10VLS Fin 183.45 175.35 182.50 182.55 172.20 51.08 264.85 71.20 2 175.50Voltamp 1910.10 1909.95 1899.45 1915.60 1829.90 6.77 2255.00 986.40 17 1909.25Voltas [1] 1252.50 1243.65 1254.00 1265.60 1236.10 2071.93 1356.90 918.00 71 1242.95VRL Logistic 476.70 464.40 472.00 477.35 460.50 141.30 591.50 201.60 29 463.50VST Ind 3021.65 2983.55 3023.70 3030.30 2952.05 4.52 3893.95 2970.00 15 2990.95VST Til 2639.75 2547.20 2639.75 2643.80 2519.95 6.14 3458.45 1650.00 24 2554.75
W . . . . . . . . . . . . . . . . . . . . . . . . . . . . . . . . . . . . . . . . . . . . . . . .Wabco Ind [5] 7649.00 7530.85 7639.00 7651.75 7501.00 1.97 8777.70 5510.00 107 7502.00Walch.Ind [2] 56.15 54.20 56.20 57.35 53.75 286.57 92.00 39.30 54.20Waterbase 96.10 92.55 97.45 97.45 92.10 57.18 145.80 92.10 Webel SL 108.35 102.95 105.40 106.65 102.95 437.32 172.75 37.10 34 103.10
Weizman 71.30 67.75 72.75 73.40 67.75 19.95 94.10 37.30 56 68.00Wels.Corp [5] 155.85 148.60 151.05 153.05 147.25 807.13 197.00 106.00 11 148.25Wels.India [1] 115.70 110.05 115.00 115.45 109.00 962.84 170.75 67.00 23 109.75Wels.Inv 292.80 290.55 293.65 302.35 274.10 3.09 587.00 235.60 45 287.20Welspun Ent. 90.95 85.05 89.50 91.80 84.35 201.78 134.90 81.95 16 85.10Wendt 4996.30 5002.35 4951.45 5135.40 4900.00 0.69 6249.00 3060.00 40 4983.35West C Pap [2] 250.95 246.20 248.00 254.00 244.00 137.69 295.35 181.10 8 245.85WestlifeDevp 463.95 449.80 462.00 465.00 445.05 199.40 629.00 385.10 Wheels Ind 653.65 620.60 636.55 652.00 610.00 13.48 1039.00 412.05 19 620.80Whirlpool 1704.50 1694.75 1701.20 1705.00 1672.95 76.29 2549.80 1673.65 80 1696.50Wil.Magor 24.05 23.75 23.75 24.85 23.30 5.20 40.00 16.45 24.00Win.Diamond[2] 41.80 39.70 41.00 42.60 39.50 90.01 51.60 20.00 14 39.65WindlsBiotec 264.25 260.35 264.30 265.25 258.05 29.77 452.00 255.30 WinproIndust 6.80 6.85 6.80 7.10 6.55 710.42 14.35 5.00 Wipro [2] 562.45 570.80 555.75 572.70 555.40 8767.00 739.80 398.00 32 570.65Wockhardt [5] 373.30 380.25 371.00 406.50 361.00 1821.48 804.50 361.40 379.85WonderlaHoli 223.95 221.25 225.00 226.60 218.85 37.45 269.90 172.65 220.35WorthPeriprl 109.30 109.15 109.30 112.90 107.25 29.99 132.50 45.55
X-Z . . . . . . . . . . . . . . . . . . . . . . . . . . . . . . . . . . . . . . . . . . . . . . .Xchang 94.50 89.60 93.60 93.75 88.20 344.89 141.25 60.20 46 89.35XelpmocD&T 305.70 299.75 311.00 311.00 290.00 32.93 513.00 251.65 YaariDigiInt 74.20 66.60 73.40 73.95 64.50 392.52 183.45 64.50 Yes Bk [2] 13.90 13.65 13.75 13.80 13.6064338.35 16.90 10.51 13.67YukenIndia 569.50 563.85 578.30 578.30 546.50 2.26 685.00 542.05 Zee Ent [1] 261.40 254.35 258.00 261.85 252.80 9746.92 378.60 166.80 16 254.30Zee Learn [1] 14.15 13.80 13.90 15.95 13.55 1951.94 20.70 9.75 13.80Zee Med [1] 16.65 15.85 16.70 16.90 15.85 3871.19 20.27 5.70 15.88Zen Exp 81.35 81.90 86.40 86.40 78.05 8.65 116.00 60.55 81.40Zen Tech. [1] 205.75 200.70 205.00 205.70 196.35 388.85 257.70 65.00 200.60ZensarTec [2] 361.90 348.80 358.10 359.55 346.00 839.67 587.00 240.00 27 348.55Zod.Clo 108.10 104.40 108.10 108.10 104.00 15.72 153.80 85.05 104.35ZomatoLtd 85.90 81.55 84.20 84.80 80.6518853.34 169.00 75.75 ZotaHealthCr 357.20 317.80 351.15 356.95 312.00 87.24 448.00 137.25 Zuari Ag 135.25 126.90 136.00 136.00 125.85 127.65 158.90 83.30 127.10Zuari Glo 169.20 161.80 169.90 170.45 161.00 71.44 189.00 74.05 9 162.00ZydusWel 1548.40 1569.95 1550.00 1596.00 1501.05 104.59 2472.85 1431.00 1558.90
Exchange Traded Funds
Company Pre Cl NSE Cl Vol 52 WH 52 WL BSE Cl
Axis Gold [1] 43.08 43.08 124.90 43.60 38.36 43.15AXISAMC AXISBNKETF 377.14 375.90 0.51 449.40 304.50 AXISAMC AXISBPSETF 10.51 10.50 47.46 10.69 9.06 AXISAMC AXISCETF 69.83 68.59 2.75 81.00 60.00 AXISAMC AXISHCETF 81.85 81.66 5.80 105.00 79.80 AXISAMC AXISNIFTY 181.84 181.77 4.11 212.22 132.00 AXISAMC AXISTECETF 349.64 350.79 1.04 437.10 250.95 Bank BeEs [1] 378.88 379.51 642.73 420.43 303.00 379.32Birla Gold 45.47 45.54 92.52 45.90 40.50 45.31Birla Nifty [100] 19.21 19.10 48.52 4810.00 4061.00 4559.10BIRLASLAM ABSLBANETF 37.33 37.62 16.81 420.00 33.90 BIRLASLAM ABSLNN50ET 41.50 41.06 2.14 520.00 40.58 BIRLASLAMCBSLSENETFG 55.44 55.12 1.20 664.99 47.55 BIRLASLAMC HEALTHY 8.26 8.14 50.42 10.41 7.97 BIRLASLAMC SILVER 66.08 65.41 12.48 68.80 63.20 BIRLASLAMC TECH 34.44 34.39 12.40 43.75 33.29 ConsConstCon 136.67 136.43 260.62 156.00 95.00 DSPAMC DSPN50ETF 173.58 172.65 0.88 184.00 167.50 DSPAMC DSPNEWETF 195.65 194.83 2.34 209.85 158.90 DSPAMC DSPQ50ETF 165.24 164.42 3.57 186.00 159.73 DSPBRAMC QUIDETF 1000.00 1000.00 10.50 1020.00 805.90 EDELAMC BBETF0432 1005.05 1003.75 2.21 1005.49 994.99 EDELAMC EBANK 4050.00 4007.89 0.02 4398.00 3242.33 EDELAMC EBBETF0423 1163.79 1165.90 12.04 1183.10 1083.37 EDELAMC EBBETF0425 1081.32 1084.11 40.88 1170.00 1005.00 EDELAMC EBBETF0430 1197.07 1199.33 12.61 1247.90 1064.16 EDELAMC EBBETF0431 1068.56 1063.14 139.16 1143.10 994.01 Gold BeEs [1] 43.18 43.10 5190.61 43.51 38.17 43.08Goldmanamc CPSEETF 31.87 31.68 643.07 32.95 21.08 31.68HangSengBees [1] 311.72 309.43 3.18 382.00 287.00 309.46HDFC Gold [1] 44.31 44.18 3181.30 44.70 38.70 44.21HDFCAMC HBANKETF 373.38 374.32 0.50 419.95 300.00 HDFCAmcNift [76] 185.29 184.71 29.15 202.00 148.55 184.61HDFCAmcSens 621.69 623.48 3.19 704.92 455.00 IBULLSAMC IBMFNIFTY 183.20 184.28 0.68 200.00 140.00 ICICIPRAMCBHARATIWIN 47.39 46.92 113.61 52.20 31.20 ICICIPRAMC ICICI500 24.37 24.22 520.33 283.80 23.12 ICICIPRAMC ICICIALPLV 168.56 168.01 6.72 197.60 131.70 ICICIPRAMC ICICIAUTO 114.55 113.96 12.05 124.40 110.53 ICICIPRAMC ICICIBANKP 186.88 188.50 113.38 227.70 160.40 ICICIPRAMC ICICICONSU 69.36 69.21 0.32 82.25 57.01 ICICIPRAMC ICICIFMCG 368.37 365.85 48.59 437.00 356.22 ICICIPRAMC ICICILIQ 999.99 999.99 61.51 1040.00 971.50 ICICIPRAMC ICICIM150 110.77 109.34 53.61 132.70 86.25 ICICIPRAMC ICICINXT50 41.74 41.16 550.78 50.97 31.30 ICICIPRAMC ICICIPHARM 82.79 81.63 2.53 105.00 71.99 ICICIPRAMC ICICISILVE 66.15 65.70 269.98 67.29 62.91 ICICIPRAMC ICICITECH 351.86 351.49 213.07 419.70 201.48 ICICIPRAMC IPRU5008 374.41 375.57 3.24 449.70 285.00 ICICIPRNIFLWVL30ETF 44.27 44.20 596.87 49.20 37.05 ICICIPRNIFLWVL30ETF 99.39 98.99 9.41 115.00 77.10 ICICIPRUDENTIALNV20ETF 95.86 95.10 23.40 109.10 69.30 ICICIPRUDNIFTY100ETF 189.99 188.81 6.26 208.00 143.40 ICICIPRUDNIFTYETF 185.58 185.08 210.05 231.30 140.80 ICICIPRUDSENSEXETF 630.31 629.34 1.58 700.00 493.60 IDBI Gold [100] 4571.10 4568.40 0.18 4810.00 4061.00 4559.10IDFCAMC IDFNIFTYET 180.62 180.17 0.26 223.00 147.47 Infra BeEs 513.88 510.12 0.86 1950.00 1477.00 1800.00InvesIndGold [100] 4502.70 4496.35 0.73 4549.90 3989.50 4492.00InvesInNifty 1877.57 1880.00 0.05 2319.00 1521.30 Kotak Nifty [5] 182.10 181.54 22.06 2252.45 1627.25 1826.35Kotak PSU Bk 275.43 273.06 14.35 305.25 187.95 272.74KOTAKMAMKOTAKALPHA 32.31 31.93 130.33 41.00 31.23 KOTAKMAMC KOTAKIT 34.98 34.86 28.83 46.00 23.36 KOTAKMAMKOTAKMID50 80.53 78.37 4.29 88.00 77.70 KOTAKMAMCKOTKBKETF 379.60 380.60 55.15 429.70 298.90 KOTAKMAMCKTNV20ETF 97.16 96.80 14.48 104.98 73.20 Kotal Gold [1] 43.19 43.16 188.24 43.71 36.81 43.20LICNAMC CNFENGP 185.38 184.59 1.33 202.99 140.00 183.82LICNAMC CNFESGP 622.03 619.62 30.06 677.40 493.95 LICNAMC CNFNHGP 185.12 184.26 180.96 230.00 142.10 LICNAMC CNMFET 22.42 22.26 8.90 26.94 19.00 Liquid BeEs [1000] 1000.00 1000.00 1447.83 1015.00 971.00 999.99MIRAEAMC MAESGETF 29.23 29.07 10.54 32.18 21.75 MIRAEAMC MAFANG 50.14 48.43 320.30 69.00 41.10 MIRAEAMC MAFSETF 17.54 17.49 146.54 21.00 15.05 MIRAEAMC MAHKTECH 18.06 17.43 96.07 23.00 16.00 MIRAEAMC MAMFGETF 78.24 77.59 79.80 95.00 76.46 MIRAEAMC MAN50ETF 178.64 178.05 5.86 210.80 143.70 MIRAEAMC MANXT50 408.01 402.49 5.17 530.18 327.82 MIRAEAMC MASPTOP50 28.56 28.05 78.95 37.00 24.20 MOTILOS MIDCAP100 ETF 30.69 30.02 149.42 36.65 23.60 MOTILOS NASDAQ100 ETF 108.30 103.43 3937.41 1143.10 95.80 MOTILAL OSWAL M50 ETF 172.03 171.51 1.08 194.00 131.10 MOTILALAMC G5 49.71 49.65 0.37 59.05 41.99 MOTILALMOMOMENTUM 196.34 194.53 10.88 204.99 192.00 MOTILALAMC MONQ50 58.45 57.51 7.73 78.00 49.05 NI I ETF NIFTY MIDCAP 150 110.97 109.91 315.34 140.00 82.51 NiftyBeEs [1] 186.64 186.29 2084.97 201.00 146.60 186.26NiftyJrBeEs [1] 428.06 423.06 173.94 473.00 343.60 423.02NIIndETFLong 22.47 22.40 19.48 25.80 20.80 NIPETFDivOpp 45.05 44.74 7.78 51.20 32.51 NIPP INDIA ETF NIFTY 100 180.86 179.97 2.39 219.40 146.15 NippnIndNim 108.00 108.18 0.33 109.25 101.50 NippoIndETF 75.05 74.60 4.03 86.00 60.36 NIPPON INDIA ETF NV20 98.73 97.92 9.05 118.00 76.45 NIPPONAMC NETFAUTO 114.54 114.13 16.82 120.75 108.05 NIPPONAMNETFPHARMA 13.30 13.12 202.53 17.44 12.83 NIPPONAMC NETFSILVER 63.79 63.42 174.11 66.40 59.44 PSU Bk BeEs [1] 30.84 30.41 536.07 34.11 20.75 30.41Qgold [2] 42.87 42.85 20.23 43.29 38.06 42.82Qnifty 1808.00 1799.60 0.31 1950.00 1477.00 1800.00RELCAPAMC NETFGILT5Y 49.84 49.87 24.07 59.00 41.99 RELCAPAMC NETFIT 35.33 35.19 915.94 41.08 24.00 RELCAPAMCNETFSDL26 107.89 107.86 5.67 124.00 100.93 SBIAMC SBIETFCON 69.27 69.07 14.60 77.31 62.00 SBIAMC SBIETFIT 353.23 353.60 3.68 428.70 203.00 SBIAMC SBIETFPB 190.25 190.53 1.73 222.00 163.11 SBIAMC SBIETFQLTY 148.60 147.31 1.90 164.98 122.10 SBIAMC SETF10GILT 203.65 203.25 1.15 237.98 190.33 SBIETF Gold 44.21 44.09 1032.39 4404.25 42.00 SBIETF NIFTY 50 176.48 176.10 324.12 196.54 141.00 SBIETF NIFTY BANK 375.66 375.98 21.53 420.00 303.60 SBIETFNN50 423.71 418.03 15.04 468.60 340.12 Sharia BeEs 438.62 436.61 1.17 518.00 334.63 437.02TATAAML NETF 179.64 178.38 110.66 222.68 160.10 TATAAML NPBET 191.87 193.44 0.74 228.89 163.65 UTI Gold [1] 43.00 43.00 285.27 43.60 39.21 42.99UTIAMC UTIBANKETF 37.83 37.58 11.65 45.00 26.40 UTIAMC UTINEXT50 42.64 42.02 13.81 435.30 33.00 UTIAMC UTINIFT 1818.05 1816.05 0.66 2240.00 1412.00 UTIAMC UTISENS 609.26 607.94 0.53 737.55 487.50 UTIAMC UTISXN50 48.73 47.74 1.41 59.00 37.10
*: Closing price is the average of trade price(s) for the last half an hour;52Week High/Low fi�gurespertain to BSE.
Shares of face value other than ₹�10 is indicated in brackets immediately following the name of thecompany.
Qty (No of shares traded) is denoted in thousands.
The PE(priceearnings multiple) of each stock is based on the latest declared earnings.
The PE computation takes into account the per share earnings of each company for the latest 12months.
BSE Stocks
7Nr 17.85 17.55A.Sarabhai 35.10 33.20Aarey Drugs 43.95 42.85Aarnav 76.45 72.65Aartisurf 867.00 827.05AbmKnowled[5] 102.80 97.00Abslamc [5] 509.20 509.90Accel [2] 25.50 24.25Acrycil Ltd. [2] 713.35 710.45Adhinath Tex 49.40 51.85Ador Fontech[2] 73.95 74.20Ael [5] 51.35 48.80Afel 95.50 95.95Agol 68.65 66.90Agstra 124.05 113.05Aiil [1] 167.45 159.40Aimco Pesti. 162.80 155.15Ainfra [5] 45.00 46.10Ajanta Soya 218.95 208.05Alexander 34.55 33.65Alka India [1] 2.79 2.66Alu Fluoride 319.70 315.65Amerise [1] 1.75 1.67Amintan [1] 3.38 3.29Amiorg 915.35 887.70Amrawor Agr[1] 1.63 1.55Anandrathi [5] 565.85 562.75Andhra Petro 113.80 110.75Andrew Yule [2] 23.70 22.85Angelone 1299.90 1324.90Anmol 239.50 229.95Ansal Build. 91.95 89.75Anuh Pharma[5] 101.85 101.00Anup 862.10 831.50Anupam [1] 3.69 3.51Anuras 916.40 872.75Apollotri [2] 775.35 760.20Aptus [2] 355.90 349.00Arcfi�n 55.30 58.05Arihant Cap. [5] 350.20 335.25Arl 65.65 62.40Ashikacr 40.45 38.25Ashirwa Cap [1] 7.39 7.04Asianene 118.35 117.15Asm Technolo 669.45 636.45Asrl 120.45 114.45Asso.Alcohol 444.70 433.90Auro Lab. 97.95 93.85Available Fi 94.40 89.70Avantel Ltd 711.80 693.40Avi 41.10 39.85Avl 760.95 738.40Awhcl [5] 291.25 283.60Awl [1] 354.35 327.40Axtel Indus. 291.45 281.15
Bajaj Steel [5] 712.95 683.35Bajajhcare [5] 376.75 360.35Balmer La.In 381.35 383.80Baluforge 135.25 129.85Banas Fin. 74.75 71.05Barbeque [5] 1341.50 1295.80Baroda Extr. [1] 5.43 5.16Basant Agro [1] 18.60 18.40Bconcepts 71.80 74.10Bcpl 45.85 43.90Bdh Indus. 141.45 131.75Bectorfood 336.35 327.90Bestagro 955.45 965.15Bfl�afl� 223.70 234.85Bhoruka Alu. 1.27 1.30Bilcare Ltd. 81.15 75.45Binny Ltd. [5] 373.95 358.05Biogen [1] 1.57 1.50Birla Pretec [2] 30.55 29.05Birlatyres 23.10 22.80Bla Ros Ind [1] 197.80 192.30Bmw [1] 28.90 27.45Bronze Infra 1.64 1.71Cams 2444.30 2417.55Captain Poly [2] 21.85 21.45Cartrade 587.80 562.15Chandra Prab 226.15 220.85Charterlogis [1] 8.60 8.17Chemb Chm [5] 189.50 183.95Chemcon 316.35 303.40Chemplasts [5] 522.90 500.75Cheviot Co. 1195.25 1143.60Clean [1] 2014.45 1937.05Cmsinfo 245.45 240.75Cni Res Ltd [1] 2.39 2.50Coast Corp 366.45 355.60Cockerill 1490.80 1496.35Com Fincap 27.55 26.20Cosmo Ferr. 381.90 362.85Craftsman [5] 2095.40 2016.25Cressanda So[1] 6.97 7.31Datapattns [2] 649.70 622.05Decipher 61.10 64.15Deep 555.10 552.30Deepind 195.40 191.30Devyani [1] 165.35 158.65Dhanvarsha [2] 150.15 139.40Dharamsi Chm 385.60 368.95Dhp India Lt 688.90 697.10Dhruv 56.85 53.60Diligent [5] 45.15 47.10Dodla 475.40 452.90Dynamic 142.85 135.75Earum [2] 7.07 6.80Easemytrip [2] 569.35 564.20
Eastwest [2] 10.92 10.19Ecoreco 127.15 122.25Equitasbnk 53.45 55.50Everest Org. 237.65 227.20Evexia [2] 8.37 7.87Exxaro 127.70 120.10Facor Alloys [1] 8.01 7.61Fairchemor 1699.85 1693.50Faze Three L 301.65 286.60Fermenta [5] 260.60 256.35Fiberwb In 46.40 43.90Filat Fash [5] 6.95 6.61Finkurve [1] 50.30 57.90Finopb 309.25 291.85Fivextrade 1.13 1.08Flomic 142.00 137.25Fluidomat 143.10 135.75Foods & Inns [1] 88.00 87.15Force Motr 1093.50 1065.75Fraser 9.03 8.83G.V.Films [1] 1.22 1.18Galaxy Bear. 392.15 411.60Ganesh Benz [1] 91.45 90.30Gemstone In[1] 1.78 1.86Gencon [5] 36.95 34.10Gennex Lab [1] 8.48 8.12Genpharma [1] 6.35 6.11Ggeng [2] 9.53 9.17Gitarenew 220.95 231.95Gkp 149.95 149.65Glance Fin. 97.20 87.50Gland [1] 3219.60 3248.15Gls [2] 518.10 501.05Gnrl 18.90 19.75Gocolors 949.95 940.00Grauer& Weil[1] 57.60 55.75Greenpanel [1] 470.85 470.15Grinfra [5] 1498.20 1429.90GrmOversea[2] 590.45 560.95Grwrhitech 691.30 663.35Gtv 76.20 73.40Guj.Themis. [5] 357.15 355.95Haldyn Glass [1] 38.65 37.65Happstmnds [2] 1042.05 1000.45Hemiprop 120.20 114.50Heranba 642.95 618.15Hfi�l 21.20 21.60High Energy 1646.95 1592.75Him.Fibres [1] 7.17 7.28Hleglas 5506.10 5235.50Homefi�rst [2] 718.10 706.75Hpal 371.50 367.35Iciciauto 114.70 113.79Icicilovol 136.74 136.40Icicitech 352.08 352.03
Iifl�sec [2] 87.20 86.30Iifl�wam [2] 1607.20 1504.65Ind.Acrylics 14.20 13.30India Gelat. 126.10 114.05Indiamart 4836.30 4766.40Indian Info. [1] 4.47 4.25Indigopnts 1760.15 1771.60Indo Amines [5] 104.65 97.30Indoboraxc [1] 137.10 134.40Indrayani Bi 25.40 23.85Indsil Hyd 92.75 88.15Int.Conveyor [1] 74.70 70.55Integra Tele 25.00 23.75Inter Digi [1] 0.32 0.32Inter St.Fin [1] 14.78 14.05Ion Exchange 1867.90 1937.95Ipl [1] 305.40 298.35Ircon [2] 43.00 42.50Irctc [2] 816.30 803.15Irfc 22.25 22.05Isec [5] 695.55 655.50Isgec [1] 555.50 538.80Ishan Dyes 147.10 141.25Isw Ltd [1] 3.68 3.50Jaibala Ind 49.55 47.70Jasch Indust 185.10 175.20Jaykay [1] 61.10 58.35Jct Ltd [2] 5.36 5.10Johnpharma [1] 1.35 1.29Jstl 155.80 148.05Jtl Infra [2] 251.35 241.00Jublingrea [1] 519.70 490.80Jyoti Resins 1324.35 1254.80Kalyankjil 62.25 60.20Kanchi 732.90 721.80Kcp Sugar In [1] 24.70 23.70Kennametal 1891.55 1888.65Khaitan Che [1] 106.10 99.35Kilpest (I) 392.20 373.20Kims 1309.60 1220.90Kingsinfra 66.60 67.40Kirl.Ferrous [5] 200.05 199.00Kirlosar Pn [2] 405.75 395.10Kirloskar El 23.20 22.05Kisan Mould. 15.25 14.50Kkalpanaind [2] 45.45 44.95Kmc Shil [1] 62.25 60.30Kotakbketf 379.58 380.61Kpiglobal 433.30 411.65Kpittech 560.85 540.50Kriti Nutri [1] 49.15 47.90Krsnaa [5] 603.70 589.80Kushal [2] 5.63 5.35Lancer 217.90 210.65Latentview [1] 476.90 451.80
Latimmetal 124.80 126.70Lee&Nee Soft 15.80 15.05Likhitha 317.90 310.10Lkpsec [2] 15.90 14.95Lloyds Met E [1] 129.90 123.70Lodha 1270.95 1272.80Looks 13.92 13.47Ludolow Jute 86.55 84.65Luharuka [1] 4.25 4.04Lxchem [2] 425.10 415.50Lykisltd 33.80 33.75Madhavipl [1] 6.07 5.81Madrasfert 33.00 31.40Mafang [40] 50.11 48.50Mafsetf 17.55 17.58Maha Corp [1] 1.64 1.56Mahepc 106.15 103.25Mallcom 817.80 824.90Mangalam In[1] 6.79 6.46Manorama 1146.45 1178.75Manorg 870.30 866.20Manvijay [1] 85.40 83.95Manyavar [1] 906.75 879.75Mapmyindia [2] 1432.00 1386.20Masptop50 [20] 28.62 28.04Maxhealth 370.70 366.35Mazdock 253.05 249.80Mcloud 355.80 338.05Medi Caps 59.00 56.10MediaMatrix [1] 13.22 12.76Medicamen Bi 670.70 644.60Medplus [2] 1024.60 988.10Meera 103.40 100.00Mega Corpn. [1] 2.80 2.78MenonPiston[1] 48.60 45.80Metrobrand [5] 553.40 548.15Mfl� 838.60 807.30Mfl� India [1] 1.48 1.41Mfsintrcrp 41.80 43.80Minaxi Text. [1] 3.62 3.44Mishtann [1] 31.10 30.95Mitsu 261.95 278.40Modinatural 212.50 202.10Modison Met[1] 74.50 71.05Mol [1] 98.90 95.25Monarch 181.15 169.60Moschip [2] 67.65 64.40Mstc 342.95 328.05Mtartech 1900.50 1833.20Nat.Peroxide 1720.75 1660.00Natraj Prote 113.40 107.75Natural 15.48 13.94Natural Caps 364.50 347.85Nazara [4] 1965.95 1876.30Ncl Research [1] 1.62 1.54
Neogen 1549.70 1576.65NglFine Chm [5] 2194.20 2141.85Nirlon 396.15 378.05Novartis [5] 703.50 677.35Nureca 1482.30 1423.55Nuvoco 383.25 353.70Nykaa [1] 1399.25 1327.60Nyssacorp [1] 8.09 7.71Oal [5] 621.25 602.25Odyssey Cor[5] 8.05 7.93Omansh [2] 2.32 2.43Ontic 23.40 21.90Orchasp [2] 6.56 6.24Orientelec [1] 344.60 328.65Osiajee 52.80 52.95Pan India C 5.25 4.99Panafi�c [1] 2.33 2.22Panch.Steel 140.50 136.85Paras 654.05 631.50Parleind 9.04 8.94Parnaxlab 97.00 101.85Pas.Acrylon 40.90 38.60Patel Airtem 250.80 242.15Paushak Ltd 9606.35 9335.15Paytm [1] 833.55 807.00Perm Magnets 350.05 340.50Piccadily Ag 26.65 25.75Pix Trans 880.95 876.90Pmcfi�n [1] 5.48 5.21Policybzr [2] 751.50 726.70Polycab 2384.25 2379.55Pooja 50.30 47.80Powerindia [2] 3103.95 3117.60Ppl 154.10 154.30Pqif [2] 55.40 52.65Princepipe 668.20 667.05Prismx [1] 8.37 7.66Pritikauto [2] 17.00 16.45Priya Ltd. 29.47 30.93Pro Fin Cap. 60.30 66.30Pun.Alkali [2] 76.60 76.30Raclgear 594.50 566.85Radhe Devlop 198.90 189.00Radhikajwe 166.95 167.60Raghunath To 17.00 16.60Raghuvir Syn[1] 218.50 207.60Railtel 102.95 100.20Rajoo Engin. [1] 32.10 31.35Rama Phosph 361.55 347.00Raminfo 133.40 129.30Rategain [1] 355.80 335.50Rathi Bars 32.30 30.00Rba 127.65 117.50Rishiroop 137.80 130.65Rnb Denims [2] 85.80 84.20
Rolexrings 1221.00 1233.30Rossari [2] 1040.40 1007.60Roto Pumps [2] 378.45 370.15Route 1518.30 1495.45Rril [5] 13.21 13.07Rubfi�la Int. [5] 95.85 93.55Ruttonsha In 352.10 369.70Rvnl 33.15 32.35S.I.Paper 145.45 154.55Sacheta Met. 31.60 30.05Sadhana Nitr[1] 131.15 124.60Safari Ind. [2] 864.80 826.20Sahya Indu 515.10 493.00SaintGobain 83.60 80.10Sambandam Sp 241.80 227.10Samrat Pharm 470.50 447.30Samtex Fash.[2] 3.50 3.65Sandur Mang. 2779.90 2837.70Saninfra 355.60 350.15Sankhya Info 8.98 8.54Sansera [2] 659.90 648.35Sapphire 1418.80 1327.15Satia [1] 96.80 93.85Sauras.Cem. 70.25 69.15Saven Techn[1] 43.20 45.00Sbicard 826.65 802.15Sbisensex 613.12 611.70Scandent 26.35 23.85Scanp Geom [2] 18.45 17.70Scanstl 36.65 33.90Seacoast [1] 16.35 15.75Setfnif50 176.49 176.07Setfnifbk 375.71 376.06Shahlon [2] 19.05 19.05Shalib.Finan 247.80 227.15Shalimar Pro [1] 0.88 0.89Sharp Inv [1] 2.95 2.81Shbajrg 190.20 186.35Shil [2] 415.35 404.25Shiv.Bimetal [2] 459.25 432.35ShivCement [2] 36.60 35.55Shree Global [1] 7.64 7.35Shreeganes [1] 11.15 10.70ShrJagdamb [1] 909.60 882.85Shrirampps 87.25 84.35Shyammetl 323.35 318.00Siddha Ven 7.77 7.78Sigachi 319.10 315.10Sika Inter. 628.05 596.65Simran Farms 162.85 154.75Sinclair Hot [2] 85.55 84.60Singer India [2] 57.65 54.85Sintexplast [1] 8.22 7.81Sisl 1129.05 1129.90Sjs 388.85 382.20
Smartfi�n [1] 8.60 8.49Smgold 218.70 196.85Snl Bearings 301.25 299.30Solara 769.10 704.65Sonacoms 656.65 656.15Spaceincuba 3.17 3.32Spandana 389.10 376.10Spel Semicon 62.15 65.25Spencer [5] 85.25 83.25Spicejet Ltd 62.30 63.35Srestha [2] 1.91 1.84Sri Digv Cem 65.85 64.00Sri Kpr Ind 26.85 26.90Starhealth 728.05 725.60Starteck 123.90 117.60Stovekraft 669.85 633.60Sumichem 377.40 369.65Sunshield Ch 465.40 441.90SuperTanner [1] 5.66 5.73Superior [1] 3.69 3.51Supremex [1] 4.27 4.39Supriya [2] 410.95 398.20Suraj Indus. 146.20 152.15Surat Text. [1] 15.00 14.25Suryoday 127.05 124.25Suvenphar [1] 552.55 547.50Suvidhaa [1] 10.66 10.14Svam Softwar 6.97 6.63Svartcorp [1] 6.15 5.85Svcind 5.06 4.86Svpglob [1] 65.55 68.50Swasti Vinay [1] 9.16 8.71Swissmltry [2] 34.35 32.65Swordedge [1] 0.86 0.82Swsolar [1] 347.30 331.15Synco Form. [1] 11.20 10.65Taalent 1592.35 1550.80Taazaint 28.25 29.35Tai Indust. 57.30 51.60Taneja Aero. [5] 119.60 113.65Tarc [2] 40.40 39.70Tarsons [2] 655.65 657.10Tata Yodogaw 139.45 132.50Tatia Glob [1] 3.79 3.62Tatva 2294.80 2238.90Tcnsbrands [2] 669.70 665.00Tcpl Pack 719.25 781.30Technoe [2] 260.00 253.00Tega 474.65 450.10Tejasnet 443.30 421.70Tejnaksh 150.95 152.45Tgvsl 65.50 65.15Thinkink [5] 52.00 50.50Tiger Logs 227.35 227.95Tiindia [1] 1610.40 1625.85
Sportking 1302.15 1246.10Steel Exch 229.30 238.75Vikas Wsp [1] 3.70 3.61Vikaslife [1] 5.48 5.21Vikasprop [1] 2.22 2.14Worl 943.05 982.60Yasho 1722.15 1636.05Zodiac 94.75 99.45
Darshanorna 110.90 115.20Fluorochem [1] 2729.55 2639.70Forbes & Co 395.10 387.10Kpel 288.90 277.70Relhome 3.85 3.69Sbc 150.35 142.85Sctl 2.13 2.03Sindhu Trade [1] 155.15 162.90
Zenith Healt [1] 7.70 7.34
Zomato [1] 86.00 81.55
Group T
Bh.Immun&Bio 42.15 40.55
Bhatia [1] 31.10 32.65
Chdchem 10.09 9.62
Tilak [1] 12.85 13.45Timex Group [1] 67.40 65.15Tinnarubr 251.80 243.40Titan Biotec 269.10 257.00Titan Secur. 20.70 19.75Toyamind [1] 6.79 6.46Transpek 2095.25 2016.35Trejhara 80.25 76.50Trio Mercan [2] 2.67 2.62Triveni Ent [1] 7.33 8.06Ttient 19.05 18.10Tuni Textile [1] 4.88 5.12Tutialka 28.00 27.85Tyche Inds 143.30 134.45Udaip Ceme [4] 33.00 31.80Ugrocap 201.85 194.50Ultracab 203.40 196.85Ultramarine [2] 319.15 310.50Unison 33.45 31.80United Drill 467.40 445.80Ushdev Intnl [1] 4.28 4.08Utiamc 829.35 813.80Utique 6.47 6.15Utlinds [1] 5.89 5.67Valiantorg 954.10 910.60Vama Inds [2] 11.00 10.02Variman 164.10 172.00Varroc [1] 376.30 366.90Vedavaag 66.55 63.90Vegetable [1] 63.00 66.15Vijay Solvex 1880.15 1814.15Vijay Textil 41.85 39.95Vijaya [1] 435.70 420.55Virinchi 126.25 119.95Virtual Glo [1] 2.05 1.95Visagar Fin [1] 3.26 3.10Vishal [5] 116.30 117.10Vishwaraj [2] 21.50 21.45Visioncine [1] 1.56 1.49Vivanta 25.00 23.75Vivo Bio Tec 40.00 38.50Vsl 131.80 125.25Waareertl 367.85 356.55Waterbase 96.20 92.80Welsplsol [6] 19.05 17.75Westlife Dev [2] 467.05 446.05Whiteorg 18.51 17.59Wim Plast Lt 428.70 415.55Winpro [5] 6.83 6.84Wpil Ltd. 921.20 920.55Xelpmoc 305.25 299.40Xtglobal [1] 59.30 54.65Yamini Inves [1] 1.75 1.67Yashpakka 81.25 81.30Zeal [1] 8.97 8.59
Precsn.Wre [1] 97.35 92.60
ProznIntPro [2] 27.20 26.55
Raj TV [5] 41.70 40.05RajdharsanIn 40.25 38.25RajratnGlbWr 2427.60 2362.55Rajsr.Sug 28.40 27.45
Rohit Ferro 30.95 29.45
S&SPowSwitch 22.90 22.20SagardpAlloy 76.15 72.35
Saregama 4459.65 4305.10
SatinCrdNet 96.05 91.50SBCExports 150.00 147.50
SejalGlass 125.70 131.95SelManufactr 220.30 231.30ServotecPowr 108.70 108.45
ShreramProtn 97.75 102.50Shriram Pist 739.00 705.30
SPML Infra [2] 55.70 52.95
SteelExcInd 229.75 237.75
SuranaSolar [5] 25.00 23.75SwelectEnerg 304.55 294.25
TataTel(Mah) 144.60 137.40Themis 1074.50 1059.95ThePKTeaProd 270.00 257.95TheWestInPly 61.70 59.00Thom.Scot 42.50 40.40Tips Ind 1962.25 1958.30
TotalTranspr 83.55 82.95
TRIDENT [1] 53.00 52.85
VIPClothing [2] 23.60 23.05
VishnuChem 1345.20 1333.75Wanbury 95.10 90.35WelthFrstPrt 261.00 250.00WONDER FIBR 175.05 181.35Xpro India 1014.15 975.75
ZodiaEnergy 94.75 99.45
Hubtown 61.35 58.30ICDSLTD 45.40 44.90IncredbleInd 24.60 24.60Ind.Card 260.45 272.00IndoThai 300.70 315.70InspirisySol 77.20 73.35InterntlCons 32.55 34.15ISMT [5] 49.70 47.40Jay.Neco 23.75 23.80JITFInfraLog [2] 151.90 145.60JSWEnergy 340.10 339.35Kaly.For 197.80 190.45KapstonFacil 116.05 113.95Karma Enr 31.80 30.30Kernx.Mic 110.20 110.10Khait.Ind 40.70 39.00Khand.Sec 21.75 21.40KilitchDrugs 186.75 177.45Lotys Eye 58.50 57.05LovableLingr 144.45 137.60Lyka Labs 143.75 136.75MahaApexCorp 106.70 102.00ManakAlum [1] 24.05 23.20ManCoatMet[1] 29.90 28.45MarneElectrl 33.25 31.85MarshalMachn 42.80 41.45Mask Invest 34.15 35.85Mega Soft 50.45 47.95MicElectrnic 21.20 20.15Mindtek(Ind) 138.75 131.85ModiRubber 71.70 69.70Morarj.Tex [7] 21.75 20.85Mot.Gen.Fin [5] 26.20 26.15Mukand En 27.95 27.95Nah.Spg [5] 538.35 519.85NakodaGroup 267.05 263.10Nitin Spn 282.30 271.60NK Industrie 36.40 36.35PalashSecu 89.00 90.30PalredTech 236.70 224.90Patel Engg. [1] 27.00 25.80
63MoonsTec [2] 225.55 228.75AakashExplor 29.30 28.35AdaniTtlGas 1665.20 1591.10AkashInfraPr 201.80 194.80AlkaliMetals 93.65 89.45ApolloMicSys 124.80 130.75ArchidplyDec 49.70 47.30Arss Infra 31.35 29.85ArtNirman 148.10 155.05Atlanta [2] 20.95 20.50Auto Stamp 315.75 300.00Autoline 61.20 58.40AxiscadeEng [5] 105.70 101.05BalkrisPaper 49.70 47.25BankaBioloo 74.60 72.00Barak Val 23.70 22.60BclIndustrs 414.45 399.95BhartRdNet 38.65 36.75BLB [1] 20.85 19.85BOROSIL 374.60 358.40BrightcomGr [2] 141.80 143.40Cambridge 67.15 63.80CMI 39.50 39.95CompucomS [2] 24.80 23.60CrestVenture 175.20 183.95Cyber Med 23.60 24.75DB Realty 107.80 102.45DB(Int)StBrk [2] 26.40 25.10De Nora 422.15 417.10DRCSystemInd 394.50 403.75EmamiRealty[2] 72.05 68.50FlexituffInt 26.15 25.55Glb.Vect 52.95 50.35GodhaCarbon 131.85 136.10GokulAgroRe [2] 67.75 65.85Golds.Tech 76.75 73.65GoodluckInd [2] 328.90 319.15GSS Info 101.30 98.50GujratFluro 2709.80 2663.75GujartRafInd 37.00 36.25HindRectify [2] 201.30 191.45
Company Pr Cl Cl Company Pr Cl Cl Company Pr Cl Cl Company Pr Cl Cl Company Pr Cl Cl Company Pr Cl Cl Company Pr Cl Cl Company Pr Cl Cl
Company Pr Cl ClCompany Pr Cl Cl
Company Pr Cl Cl
Company Pr Cl Cl
Company Pr Cl Cl Company Pr Cl Cl Company Pr Cl Cl
NSE Trade for Trade
MUMBAI
II BusinessLine TUESDAY • FEBRUARY 22 • 2022MARKET RADAR
For BSE/NSE live quotes, scan
the QR code or click the link
https://bit.ly/2FpossK


