Embed Size (px)
Citation preview

Tumor Volume as an Alternative Response Measurementfor Imatinib Treated GIST PatientsGaia Schiavon1,7*, Alessandro Ruggiero2, Patrick Schoffski3, Bronno van der Holt4, Dave J. Bekers5,
Karel Eechoute1, Vincent Vandecaveye6, Gabriel P. Krestin2, Jaap Verweij1, Stefan Sleijfer1,
Ron H. J. Mathijssen1
1 Department of Medical Oncology, Erasmus University Medical Center - Daniel den Hoed Cancer Center, Rotterdam, The Netherlands, 2 Department of Radiology,
Erasmus University Medical Center, Rotterdam, The Netherlands, 3 Department of General Medical Oncology, University Hospitals Leuven, Catholic University Leuven,
Leuven Cancer Institute, Leuven, Belgium, 4 Department of Trials and Statistics, Erasmus University Medical Center - Daniel den Hoed Cancer Center, Rotterdam, The
Netherlands, 5 TNO Technical Sciences, The Hague, The Netherlands, 6 Department of Radiology, University Hospitals Leuven, Catholic University Leuven, Leuven,
Belgium, 7 Breast Unit, The Royal Marsden Hospital, London, United Kingdom
Abstract
Background: Assessment of tumor size changes is crucial in clinical trials and patient care. We compared imatinib-inducedvolume changes of liver metastases (LM) from gastro-intestinal stromal tumors (GIST) to RECIST and Choi criteria and theirassociation with overall survival (OS).
Methods: LM from 84 GIST patients (training and validation set) were evaluated using manual and semi-automatedComputed Tomography measurements at baseline, after 3, 6 and 12 months of imatinib. The ability of uni-dimensional (1D)and three-dimensional (3D) measurements to detect size changes (increase/decrease) $20% was evaluated. Volumetricresponse cut-offs were derived from minimally relevant changes (+20/230%) by RECIST, considering lesions as spherical orellipsoidal.
Results: 3D measurements detected size changes $20% more frequently than 1D at every time-point (P#0.008). 3D andChoi criteria registered more responses than RECIST at 3 and 6 months for 3D-spheres (P#0.03) and at all time-points for3D-ellipsoids and Choi criteria (P,0.001). Progressive disease by 3D criteria seems to better correlate to OS at late time-points than other criteria.
Conclusion: Volume criteria (especially ellipsoids) classify a higher number of patients as imatinib-responders than RECIST.Volume discriminates size changes better than diameter in GIST and constitutes a feasible and robust method to evaluateresponse and predict patient benefit.
Citation: Schiavon G, Ruggiero A, Schoffski P, van der Holt B, Bekers DJ, et al. (2012) Tumor Volume as an Alternative Response Measurement for Imatinib TreatedGIST Patients. PLoS ONE 7(11): e48372. doi:10.1371/journal.pone.0048372
Editor: Maurizio D’Incalci, Istituto di Ricerche Farmacologiche Mario Negri, Italy
Received May 15, 2012; Accepted September 24, 2012; Published November 2, 2012
Copyright: � 2012 Schiavon et al. This is an open-access article distributed under the terms of the Creative Commons Attribution License, which permitsunrestricted use, distribution, and reproduction in any medium, provided the original author and source are credited.
Funding: The authors have no support or funding to report.
Competing Interests: Gabriel P. Krestin has served as a consultant or has been on the Advisory Board for GEHC-Europe, and has received research funding fromSiemens AG. The other co-authors have declared that no competing interests exist. This does not alter the authors’ adherence to all the PLOS ONE policies onsharing data and materials.
* E-mail: [email protected]
Introduction
Assessing anti-tumor effects of systemic therapy is particularly
important to estimate activity of novel therapies in clinical trials,
but it is also a key element to guide treatment changes in day-to-
day routine cancer care. The Response Evaluation Criteria In
Solid Tumors (RECIST), created in the late 1990s and updated in
2009, are currently considered as the ‘gold standard’ in most
oncology settings [1–3]. They are based on uni-dimensional (1D)
measurements (maximum diameter of target lesions) and their
relative decrease or increase during therapy. Mathematically
derived from the World Health Organization (WHO) criteria,
which used the product of perpendicular cross-sectional diameters
(bi-dimensional; 2D), RECIST is easier to use in daily clinical
practice and is considered appropriate to assess tumor response in
solid tumors [2,3]. Therefore, RECIST has been adopted by
academic institutes, cooperative groups, and industry for clinical
trials with objective response or tumor progression as primary
endpoints [1,3].
However, with the recent improvements in technology both in
radiology and informatics, a possible switch from anatomic 1D
assessments of tumor burden to either functional assessment with
Positron Emission Tomography (PET)/Magnetic Resonance
Imaging (MRI) or volumetric (three-dimensional; 3D) assessments
is a subject of debate [4]. At present, there is no validated
alternative to RECIST, but the RECIST Working Group strongly
encourages the development of novel markers/tools to predict
potential therapeutic benefit for cancer patients [3].
A novel method to assess response to imatinib (GlivecH,
GleevecTM) in gastrointestinal stromal tumors (GIST) patients was
described by Choi et al [5]. ‘Choi criteria’ combines morphologic
PLOS ONE | www.plosone.org 1 November 2012 | Volume 7 | Issue 11 | e48372

tumor response and biologic response (in terms of tumor density,
as determined by measuring the Computed Tomography (CT)
attenuation coefficient (Hounsfield units [HU]) [5,6]. With the
Choi criteria, smaller size changes than RECIST are sufficient to
classify a size reduction as partial response (PR) (Figure 1). Choi
criteria have been correlated to time to progression and disease
specific-free survival [7]. However, other studies, comparing
RECIST and Choi criteria in advanced GIST patients treated
with sunitinib, found that discrimination of PR from stable disease
(SD) with Choi criteria did not have prognostic value in terms of
progression-free survival (PFS) and overall survival (OS) [8,9].
Moreover, response evaluation according to RECIST sufficiently
identified patients with a survival benefit merely by the absence of
progressive disease (PD) [8].
The primary objective in this study was to develop a new
approach for the assessment of volumetric changes of liver
metastases in GIST during imatinib treatment. A well-defined,
homogeneous single center cohort of patients (training set) was
studied, and subsequently the same method was applied to an
independent cohort from another institute (validation set).
We aimed to 1) evaluate the ability of 3D and 1D measurements
to discriminate size changes of liver lesions, 2) compare volume,
RECIST, and Choi criteria in early response evaluation, or lack of
response, to treatment and 3) determine the correlation of
response according to these different criteria with OS.
As first study, we tested our hypothesis on one type of
anatomical lesions (liver metastases) since they generally exhibit
regular shapes and wide size ranges.
This is the first systematic approach with selection of two
independent homogeneous populations to study the role of 3D
measurements in response assessment in GIST.
Patients and Methods
Study PopulationIn order to test the hypothesis that volumetric measurements
are more precise in assessing tumor response and detecting size
changes than other criteria, we collected data and images from two
independent populations: a training and validation cohort. The
inclusion criteria for both cohorts were: histological diagnosis of
GIST, liver metastases (with or without metastases in other sites),
first-line imatinib therapy, and no previous (neo)adjuvant imatinib
treatment. Imatinib was given until PD (assessed by RECIST) or
unacceptable toxicity. The patients should have had standard
contrast-enhanced CT scans at baseline, and at least one of the
following time-points: 3, 6, and 12 months after the start of
imatinib. In case of multiple available scans, the closest CT (in
terms of number of days) to the corresponding time-point was
chosen (Table 1). The study-design was retrospective, non-
interventional and based on historically collected images and
clinical data. The study was approved by the Institutional Review
Board (commissie voor medische ethiek of University Hospitals of
Leuven) at Leuven University Hospitals. The submission for this
retrospective study to the Ethic Committee at Erasmus University
Medical Center was not mandatory, since scans performed at the
time of the diagnosis and during treatment were retrospectively
retrieved, made anonymous and coded. No informed consent
Figure 1. Size-based and Choi criteria. Different size-based criteria and Choi criteria with relative geometrically derived-cut-offs for partialresponse (PR) and progressive disease (PD). Corresponding geometrical shapes are shown at the left side of the figure. Stable disease (SD)corresponds to intermediate changes between PR and PD. Abbreviations: CT, computed tomography; D, tumor density; HU, Hounsfield unit; r, ri
(i = 1,2,3), radius; RECIST, Response Evaluation Criteria in Solid Tumors; S, size. Symbols: *appearance of a new lesion, **new intra-tumoral nodules orincrease in the size of the existing intra-tumoral nodules, *** the sum of the longest diameters of target lesions as defined in RECIST [30].doi:10.1371/journal.pone.0048372.g001
Response Assessment with 3D Criteria in GIST
PLOS ONE | www.plosone.org 2 November 2012 | Volume 7 | Issue 11 | e48372
statement from patients was obtained, being retrospective. The
Institutional Review Board in Leuven approved this procedure.
OS was used as the primary outcome measure, as PFS was
based on RECIST and consequently was not an independent
variable. OS was calculated according to the landmark method,
that is from the fixed time-point (date of CT) to the day of death
(or last follow-up) [10]. For survival analyses, data collection was
closed on July 20th 2011 for both cohorts.
Data AnalysisCT examinations were performed using multi-detector scanners
(SOMATOM Sensation 64, 16, Plus 4 and Volume Zoom,
Siemens AG; Philips Brilliance 64, Philips Medical System) with
3–5 mm section thickness and reconstruction intervals were
studied. When patients were scanned with tri-phasic techniques,
the portal-venous phase (70 seconds after administration of non-
ionic iodinated contrast material) was studied.
Original Digital Imaging and Communications in Medicine
(DICOM) files of all available CTs at the defined time-points were
exported from a PACS workstation and images were anonymized.
Manual measurements of all liver lesions were independently
performed both by a medical oncologist (G.S.) and a radiologist
(A.R.) by using the open source OsiriXH Imaging Software version
3.9 (Geneva, Switzerland) [11,12]. Semi-automated measurements
were acquired by the radiologist with the commercially available
software ‘syngo CT OncologyH’ version 2009E (Siemens Medical
Solutions, Inc.) using a Siemens Workstation [13]. In principle,
this software is based on an extended version of the lung lesion
segmentation approach previously described [14]. In that
approach the density of lesions and surrounding parenchyma is
known and can be used for the definition of a fixed threshold to
separate them [14]. Such a discriminating technique may also be
applied to liver lesions [15,16]. The validation cohort was studied
solely with semi-automated measurements, since they demonstrat-
ed robust correlation with manual measurements in our training
cohort, which is consistent with literature data (Figure S1)
[14–17].
Manual and Semi-automated MeasurementsAfter uploading the DICOM files in OsiriXH Imaging Software,
manual measurements were performed according to our previ-
ously described method [18].
DICOM files were then uploaded in syngo CT OncologyHsoftware. After displaying the segmentation results, lesions could
be verified visually using the implemented 3D viewer, which
provided multi-planar reconstructions (MPR) and orthogonal
views [13]. Unsatisfactory segmentation results could be modified
by assisting the segmentation process manually. Qualitatively
insufficient segmentation after the third attempt was considered
inadequate and excluded from further analysis. The following
parameters were documented: volume (mL), RECIST diameter
(mm), mean HU (HU).
Evaluation of Size Changes and Cut-offs for ResponseAssessment
According to Zhao et al, 1D and 3D tumor measurements were
compared in two ways: ‘unadjusted/unscaled’ and ‘adjusted/
scaled’ method [19].
With the unadjusted/unscaled method, the percentage changes
of each measurement are directly compared [19]. Based on the
literature, the ability of 3D and 1D measures to discriminate size
changes (decrease or increase) $20% was compared [19,20].
Comparisons of differences in measurements with the unadjusted/
unscaled method identify clear disparities [19]. On the other hand,
the adjusted/scaled method is a comparison of the measurements
in assessing tumor response, thus after conversion of 1D
measurements to an equivalent volume by using the standard
published method [21,22]. Considering geometrical formulas, a
given percentage of change in diameter corresponds to a larger
change in volume (Figure 1). These geometric correlations are
determined by assuming that tumors are spherical and are the
basis for the relationships between 1D (RECIST), 2D (WHO), and
suggested volumetric response guidelines [2].
The ability of 1D and 3D measures to assess response was
evaluated on up to two target lesions, defined according to
RECIST 1.1 [1]. Classical 3D cut-offs (spheres) have been
established and applied before and are based on the volume
formulas of geometric objects, as was done from the transition
from WHO criteria to RECIST criteria (Figure 1) [2,22].
For example, if the RECIST diameter reduces by 30%, this
implies a spherical volume reduction of 65%, indicating tumor
response (Figure 1). If tumor lesions were always spherical, we
would expect that 1D and 3D classical criteria perform in a similar
manner in identifying response to treatment, given the direct
relationship between RECIST and 3D-spheres’ cut-offs. In fact,
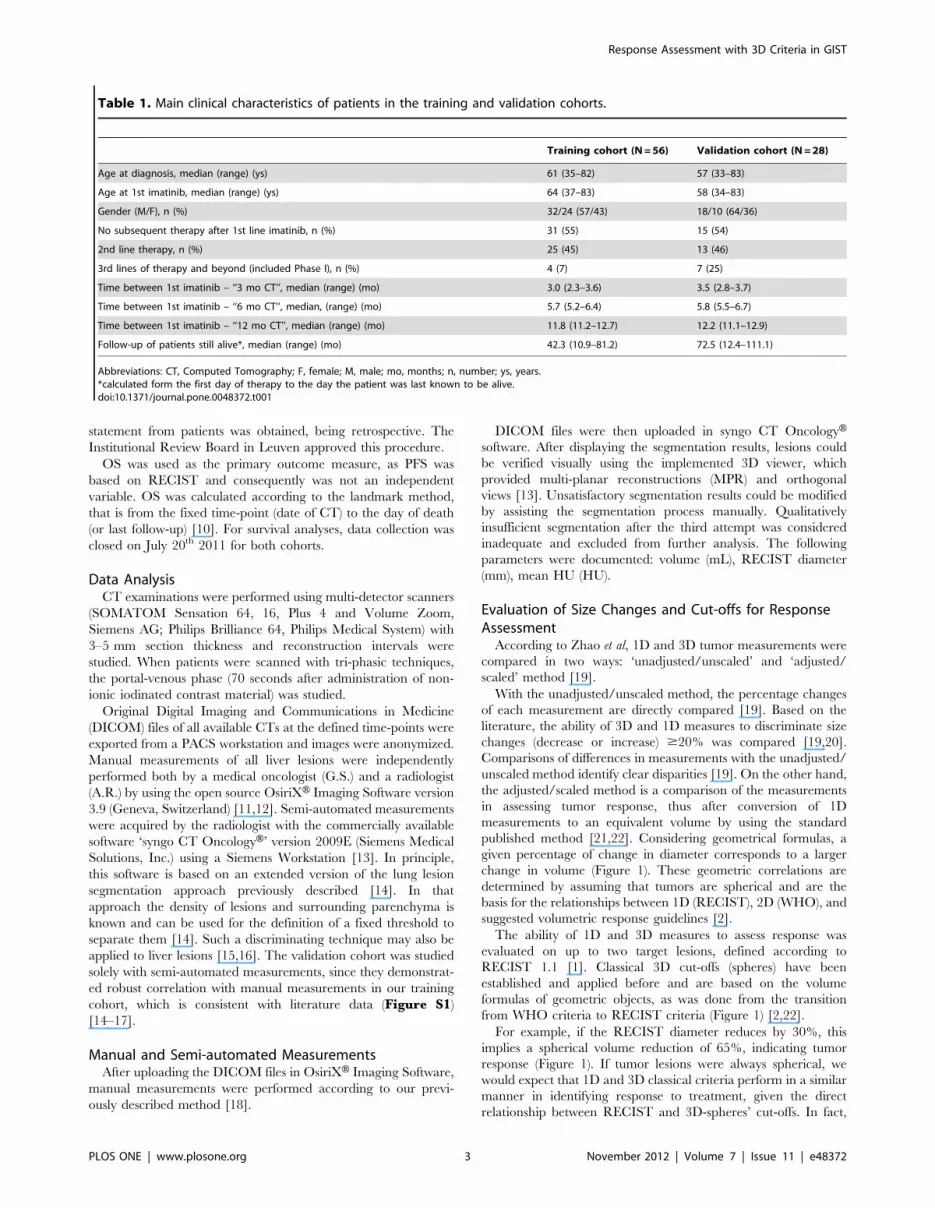
Table 1. Main clinical characteristics of patients in the training and validation cohorts.
Training cohort (N = 56) Validation cohort (N = 28)
Age at diagnosis, median (range) (ys) 61 (35–82) 57 (33–83)
Age at 1st imatinib, median (range) (ys) 64 (37–83) 58 (34–83)
Gender (M/F), n (%) 32/24 (57/43) 18/10 (64/36)
No subsequent therapy after 1st line imatinib, n (%) 31 (55) 15 (54)
2nd line therapy, n (%) 25 (45) 13 (46)
3rd lines of therapy and beyond (included Phase I), n (%) 4 (7) 7 (25)
Time between 1st imatinib – ‘‘3 mo CT’’, median (range) (mo) 3.0 (2.3–3.6) 3.5 (2.8–3.7)
Time between 1st imatinib – ‘‘6 mo CT’’, median, (range) (mo) 5.7 (5.2–6.4) 5.8 (5.5–6.7)
Time between 1st imatinib – ‘‘12 mo CT’’, median (range) (mo) 11.8 (11.2–12.7) 12.2 (11.1–12.9)
Follow-up of patients still alive*, median (range) (mo) 42.3 (10.9–81.2) 72.5 (12.4–111.1)
Abbreviations: CT, Computed Tomography; F, female; M, male; mo, months; n, number; ys, years.*calculated form the first day of therapy to the day the patient was last known to be alive.doi:10.1371/journal.pone.0048372.t001
Response Assessment with 3D Criteria in GIST
PLOS ONE | www.plosone.org 3 November 2012 | Volume 7 | Issue 11 | e48372

the description of a tumor according to RECIST and to 3D-
spheres should amount to the same description because the single
degree of freedom of RECIST (the diameter) equals the single
degree of freedom of a sphere (also its diameter).
However, there is evidence showing that solid bodies are better
described by ellipsoidal than spherical shapes [23], supported by
our observation that liver metastases in GIST patients can be
either spherical or ellipsoidal and they can change morphology
during imatinib therapy [24]. Since a model with only 1 degree of
freedom is too constrained to capture such changes in morphol-
ogy, we decided to explore the benefits of employing a volumetric
description. The easiest alternative in the sense of mathematical
description is offered by an ellipsoidal description, which has 3
degrees of freedom instead of 1. To establish our model, which we
refer to as ‘3D-ellipsoids’, we had first to choose the type of
ellipsoidal body and next to determine appropriate cut-off criteria.
Ellipsoids can be of three different types: 1) r1 = r2.r3 oblate
spheroids (disk-shaped), 2) r1 = r2,r3 prolate spheroids (like a
rugby ball), 3) r1?r2?r3 scalene ellipsoids (‘three unequal sides’),
r1, r2, r3 being the radii of the three axes of the ellipsoid, whose
formula for volume is 4/3 p r1 r2 r3. Prolate spheroids seem to be a
suitable choice for our model, since they offer the possibility to
maintain 2 axes fixed and to allow the largest axis to change size.
Therewith we may capture the most significant volume changes
and are able to relate the largest radius r3 to the RECIST radius.
To establish appropriate cut-off criteria we reasoned as follows.
Assume that at a certain time point the RECIST diameter and the
radius r3 (.r2 = r1) in the ellipsoidal description are equal and
measured along the same axis. If the subsequent tumor changes
occur only along this axis, the actual volume may change as little
as 30% for a change in RECIST diameter of 30%. Requiring that
our model provides the same result as RECIST in case tumor
changes occur along one and the same axis, we choose the same
cut-off criteria, or in other words, the cut-offs for ellipsoidal shapes
correspond to 30% (PR) and 20% (PD). This reasoning explains
the PR and PD values listed in Figure 1. Change (decrease or
increase) in only one axis (r3) would be necessary and sufficient to
create these values.
Responses by Choi criteria were defined according to the
method (mean HU of the region of interest (ROI) semi-
automatically obtained on the CT slice of the longest diameters
and approved by the reader) [5–7]. The mean values of the
absolute and relative changes in CT density of target lesions from
the baseline to each time-point were computed [25].
Statistical AnalysisStatistical analyses were performed with GraphPad Prism
software version 5.0a (San Diego, CA) and Stata version 11.1
(College Station, Tx). Linear regression and Spearman rank
correlation (r), whichever appropriate, were performed to assess
the correlations between measurements of target lesions from two
independent readers, and between volumes and diameters.
Agreement between readers and techniques (manual and semi-
automated) was evaluated with Bland-Altman plots [26]. Percent-
ages of cases with size changes $20% assessed by 3D and 1D
measures and response assessment (RECIST versus other criteria)
were compared by an exact test of table symmetry (recommended
for sparse tables). Comparisons with Choi criteria included
patients with availability of semi-automated measurements (for
HU). Associations with OS were determined by Log-rank test and
illustrated by Kaplan-Meier survival curves [27]. Hazard ratios
and 95% confidence intervals were estimated by Mantel-Haenszel
method [28]. A two-sided P-value ,0.05 indicated statistical
significance.
Results
Patient PopulationsThe training cohort was selected from a total of 175 GIST
patients treated at Erasmus University Medical Center from
January 2001 until October 2010, partly participating in
previously reported clinical trials [18,29–32]. Among them, we
identified 56 patients with liver metastases treated with first-line
imatinib, availability of CT scans at baseline and at least one
follow-up time-point.
The validation cohort was obtained from the Leuven Connec-
tive Tissue Oncology BioRepository (LECTOR), a single institu-
tion database for mesenchymal tumors, kept at the Leuven
University Hospitals, Catholic University Leuven, Leuven Cancer
Institute. Among 59 eligible patients with liver metastases from
GIST, 28 patients had available CTs and were included in the
analysis. Table 1 shows the main clinical characteristics of patients
in both cohorts.
Semi-automated analysis was not technically feasible for 5
patients in the training set, leaving the following comparisons
available: 50, 54, and 46 patients (manual method) and 45, 50, and
42 patients (semi-automated method) at 3, 6, and 12 months,
respectively. Available comparisons (both methods) for the
validation cohort were: 28, 27, and 25 patients at 3, 6, and 12
months, respectively.
Robustness of Manual and Semi-automated TechniquesA strong correlation exists between the two readers for 1D and
3D manual measurements (R2 = 0.99, P,0.0001, n = 363 lesions)
and a low mean inter-observer variability exists in the training
cohort (0.2% for 1D and 3.2% for 3D) (data not shown).
Correlation between diameters and volumes is high, both for
manual and semi-automated measurements (r = 0.97 and 0.98,
P,0.0001; Figure S1A–B). The two methods provide clinically
consistent similar measures with variability of 0.15% for 1D and
9.6% for 3D (n = 341 lesions, Figure S1C–D).
Evaluation of Size Changes (Unadjusted/unscaledMethod)
A size change (decrease and increase) of $20% was detected
more frequently by 3D measurements than 1D measurements at
any-time point in the training cohort (P#0.008, Table 2,
Figure 2). The difference seemed to be higher at earlier time-
points. In particular, 57% (16/28), 51% (18/35) and 18% (5/28)
of the decreases detected with 3D measurements were classified by
1D measurements as ‘‘no change’’ at 3, 6 and 12 months,
respectively. Among the discordant measurements, 3D and 1D
detected changes in the same direction (decrease or increase of
size) in 91% (50/55) of cases, where 96% of the cases showed that
3D measurements facilitate a superior identification of size
changes (data not shown).
In the validation cohort, a higher number of size changes
$20% are detected by 3D measurements than by 1D measure-
ments. This difference in terms of percentage reached significance
after 3 months of therapy (P,0.001) (Table 2).
Response Assessment (Adjusted/scaled Method)To compare the criteria in assessing response, two different 3D
cut-offs were used (Figure 1). A statistically significant difference in
classification of response was found between RECIST and the
other criteria at 3 and 6 months in the training cohort (P#0.03,
Table 3). In particular, an almost tripling of the PR was observed
by using 3D-spheres as compared to RECIST and an even (much)
Response Assessment with 3D Criteria in GIST
PLOS ONE | www.plosone.org 4 November 2012 | Volume 7 | Issue 11 | e48372
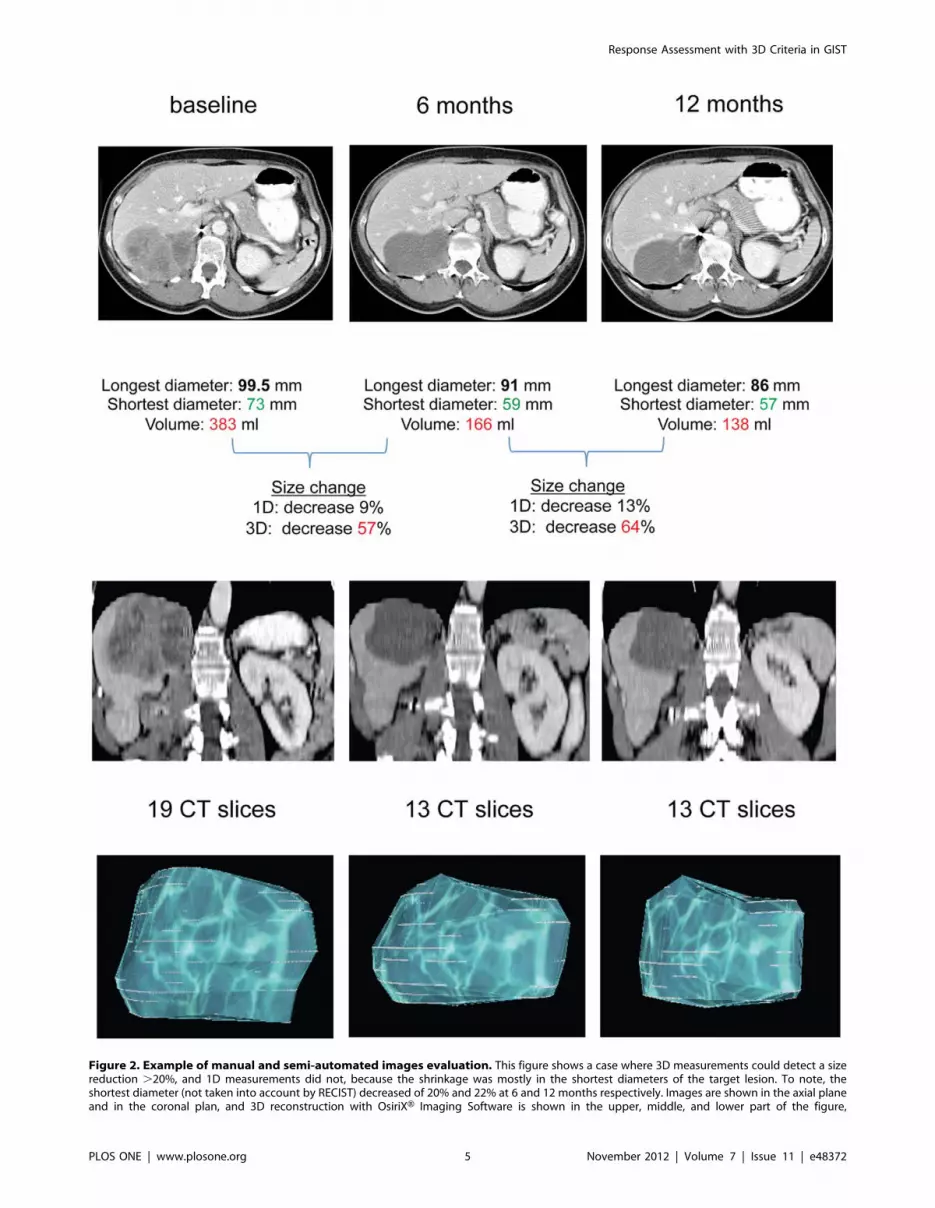
Figure 2. Example of manual and semi-automated images evaluation. This figure shows a case where 3D measurements could detect a sizereduction .20%, and 1D measurements did not, because the shrinkage was mostly in the shortest diameters of the target lesion. To note, theshortest diameter (not taken into account by RECIST) decreased of 20% and 22% at 6 and 12 months respectively. Images are shown in the axial planeand in the coronal plan, and 3D reconstruction with OsiriXH Imaging Software is shown in the upper, middle, and lower part of the figure,
Response Assessment with 3D Criteria in GIST
PLOS ONE | www.plosone.org 5 November 2012 | Volume 7 | Issue 11 | e48372

higher number by using 3D-ellipsoids and Choi criteria. Also at 12
months these two criteria classified more PR than RECIST.
Regarding the validation cohort, only 3D-ellipsoids and Choi
performed differently than RECIST (P#0.03), classifying PR
more frequently than RECIST at any time-point. Importantly, all
criteria assessed a similar number of PD in both cohorts.
Prediction of SurvivalFigure 3 shows the ability of all the response criteria to predict
survival in the training cohort at the studied time-points. When
RECIST and 3D criteria were used in tumor response evaluations,
significantly different OS was observed at 3 months between
patients having a PD versus patients without a PD. At 6 months,
only 3D-ellipsoids and Choi criteria appropriately predicted OS.
Only 3D criteria (ellipsoids more than spheres) could significantly
predict survival at 12 months. Figure 4 shows the survival curves
when patients are divided in three groups (SD, PR and PD).
Kaplan-Meier curves for the validation cohort are shown in
Figure S2 and S3. Differences in OS were observed between
patients with PD versus patients without PD at 6 and 12 months
by using all the studied criteria.
Discussion
In this study we demonstrated that volumetric criteria detect a
size change of $20% in liver metastases more frequently than
RECIST in imatinib-treated GIST patients, confirming previous
findings on lung lesions [19]. When response criteria were applied,
the results showed a significant difference, primarily in terms of
response (not progression), showing that volume criteria (3D-
spheres) classify a size reduction as PR more frequently than
RECIST. 3D-ellipsoids were comparable to Choi criteria in
assessing PR. These findings were anticipated, as the unadjusted
scale does not apply geometrical corrections and thus reflects and
maximizes absolute differences between measurement methods.
However, the findings at the unadjusted scale show that even by
taking into account the known geometric relationship between
shapes (adjusted scale), different measurement methods do not
necessarily produce equivalent results. Tumors do not always have
a spherical shape or change in a spherical manner.
In addition, the feasibility of a simple semi-automated technique
to assess tumor volume was shown.
Regarding survival, acknowledging the limitations of the
relatively small sample size of the studied populations, it seems
that volume measurements tended to be better associated with OS
than RECIST.
Until now, there has been no alternative to anatomical 1D
assessments of tumor burden validated on large sets of patients,
although several limitations of 1D and 2D evaluations are widely
known (e.g. irregular or confluent lesions, errors due to discrepant
scan planes and patient positioning, intra2/inter-observer vari-
ability) [29,33,34] and an increasing awareness of the importance
of their clinical implications is appearing [34]. As Gilles points out:
‘‘After all, for treatment outcomes, the RECIST classification is a
convention, not an actual assessment of tumor burden. The key is
the reliability of these metrics to minimize variability and
ultimately reduce sample sizes’’ [35].
Volume changes were found to be more sensitive than 1D
changes in phantom studies due to their wider dynamic range
[36,37]. Clinical studies on primary and secondary lesions
concluded that, although more laborious and time-consuming,
smaller changes in tumor burden may be detected earlier and
respectively. The number of CT slices where the lesion could be identified at different time-points is indicated. Interestingly, this lesion was classifiedas SD according to RECIST and 3D-sphere criteria, and as PR according to 3D-ellipsoid and Choi criteria at both time-points.doi:10.1371/journal.pone.0048372.g002
Table 2. Sensitivity in discrimination of size change # (%) (unadjusted/unscaled method).
TRAINING COHORT VALIDATION COHORT
Volume (3D) Volume (3D)
Time-Point(mo)
Change$20% Decrease No Increase Tot P* Decrease No Increase Tot P*
3 1D Decrease 12 (24) 1 (2) 1 (2) 14 (28) ,.001 7 (25) – – 7 (25) ,.001
No 16 (32) 11 (22) 6 (12) 33 (66) 14 (50) 1 (4) 3 (11) 18 (64)
Increase – 1 (2) 2 (4) 3 (6) – – 3 (11) 3 (11)
Tot 28 (56) 13 (26) 9 (18) 50 21 (75) 1 (4) 6 (21) 28
6 1D Decrease 17 (31) 1 (2) – 18 (33) ,.001 12 (44) 1 (4) – 13 (48) .13
No 18 (33) 10 (19) 2 (4) 30 (56) 6 (22) 3 (11) 1 (4) 10 (37)
Increase – – 6 (11) 6 (11) – – 4 (15) 4 (15)
Tot 35 (65) 11 (20) 8 (15) 54 18 (67) 4 (15) 5 (19) 27
12 1D Decrease 23 (50) – – 23 (50) .008 15 (60) – – 15 (60) .50
No 5 (11) 7 (15) 4 (9) 16 (35) 1 (4) 3 (12) 2 (8) 6 (24)
Increase – – 7 (15) 7 (15) – – 4 (16) 4 (16)
Tot 28 (61) 7 (15) 11 (24) 46 16 (64) 3 (12) 6 (24) 25
Abbreviations: 1D, maximum diameter 1 D; mo, months; tot, total.*3D and 1D were compared in the ability to discriminate size changes (decrease and increase) $20% by an exact test of table symmetry, which is recommended forsparse tables.doi:10.1371/journal.pone.0048372.t002
Response Assessment with 3D Criteria in GIST
PLOS ONE | www.plosone.org 6 November 2012 | Volume 7 | Issue 11 | e48372

Ta
ble
3.
Re
spo
nse
asse
ssm
en
tb
yd
iffe
ren
tcr
ite
ria
#(%
)(a
dju
ste
d/s
cale
dm
eth
od
).
TR
AIN
ING
CO
HO
RT
Vo
lum
esp
he
res
(S)
Vo
lum
ee
llip
soid
s(E
)C
ho
i
Tim
e-p
oin
t(m
o)
RE
SP
ON
SE
PR
SD
PD
To
tP
*P
RS
DP
DT
ot
P*
PR
SD
PD
To
tP
*
3R
EC
IST
PR
4(8
)–
–4
(8)
4(8
)–
–4
(8)
3(7
)1
(2)
–4
(9)
SD
6(1
2)
34
(68
)1
(2)
41
(82
)2
2(4
4)
15
(30
)4
(8)
41
(82
)2
3(5
1)
11
(24
)4
(9)
38
(84
)
PD
––
5(1
0)
5(1
0)
––
5(1
0)
5(1
0)
–1
(2)
2(4
)3
(7)
To
t1
0(2
0)
34
(68
)6
(12
)5
0.0
32
6(5
2)
15
(30
)9
(18
)5
0,
.00
12
6(5
8)
13
(29
)6
(13
)4
5,
.00
1
6R
EC
IST
PR
6(1
1)
––
6(1
1)
6(1
1)
––
6(1
1)
5(1
0)
––
5(1
0)
SD
10
(19
)3
0(5
6)
–4
0(7
4)
24
(44
)1
3(2
4)
3(6
)4
0(7
4)
23
(46
)1
4(2
8)
1(2
)3
8(7
6)
PD
––
8(1
5)
8(1
5)
––
8(1
5)
8(1
5)
1(2
)1
(2)
5(1
0)
7(1
4)
To
t1
6(3
0)
30
(56
)8
(15
)5
4.0
02
30
(56
)1
3(2
4)
11
(20
)5
4,
.00
12
9(5
8)
15
(30
)6
(12
)5
0,
.00
1
12
RE
CIS
TP
R1
2(2
6)
––
12
(26
)1
2(2
6)
––
12
(26
)1
0(2
4)
––
10
(24
)
SD
3(7
)1
7(3
7)
3(7
)2
3(5
0)
13
(28
)5
(11
)5
(11
)2
3(5
0)
13
(31
)7
(17
)2
(5)
22
(52
)
PD
–1
(2)
10
(22
)1
1(2
4)
––
11
(24
)1
1(2
4)
1(2
)1
(2)
8(1
9)
10
(24
)
To
t1
5(3
3)
18
(39
)1
3(2
8)
46
.25
25
(54
)5
(11
)1
6(3
5)
46
,.0
01
24
(57
)8
(19
)1
0(2
4)
42
,.0
01
Re
spo
nse
PR
SD
PD
To
tP
RS
DP
DT
ot
PR
SD
PD
To
t
3R
EC
IST
PR
1(4
)–
–1
(4)
1(4
)–
–1
(4)
1(4
)–
–1
(4)
SD
–2
4(8
6)
–2
4(8
6)
16
(57
)5
(18
)3
(11
)2
4(8
6)
21
(75
)2
(7)
1(4
)2
4(8
6)
PD
––
3(1
1)
3(1
1)
––
3(1
1)
3(1
1)
2(7
)–
1(4
)3
(11
)
To
t1
(4)
24
(86
)3
(11
)2
81
.00
17
(61
)5
(18
)6
(21
)2
8,
.00
12
4(8
6)
2(7
)2
(7)
28
,.0
01
6R
EC
IST
PR
5(1
9)
1(4
)–
6(2
2)
6(2
2)
––
6(2
2)
6(2
2)
––
6(2
2)
SD
3(1
1)
14
(52
)–
17
(63
)1
1(4
1)
5(1
9)
1(4
)1
7(6
3)
15
(56
)2
(7)
–1
7(6
3)
PD
––
4(1
5)
4(1
5)
––
4(1
5)
4(1
5)
3(1
1)
–1
(4)
4(1
5)
To
t8
(30
)1
5(5
6)
4(1
5)
27
.63
17
(63
)5
(19
)5
(19
)2
7.0
01
24
(89
)2
(7)
1(4
)2
7,
.00
1
12
RE
CIS
TP
R9
(36
)–
–9
(36
)9
(36
)–
–9
(36
)9
(36
)–
–9
(36
)
SD
1(4
)9
(36
)1
(4)
11
(44
)5
(20
)4
(16
)2
(8)
11
(44
)9
(36
)1
(4)
1(4
)1
1(4
4)
PD
––
5(2
0)
5(2
0)
––
5(2
0)
5(2
0)
3(1
2)
–2
(8)
5(2
0)
To
t1
0(4
0)
9(3
6)
6(2
4)
25
1.0
01
4(5
6)
4(1
6)
7(2
8)
25
.03
21
(84
)1
(4)
3(1
2)
25
.00
1
Ab
bre
viat
ion
s:m
o,
mo
nth
s;P
R,
par
tial
resp
on
se;
SD,
stab
led
ise
ase
;P
D,
pro
gre
ssio
no
fd
ise
ase
;R
ECIS
T,
Re
spo
nse
Eval
uat
ion
Cri
teri
ain
Solid
Tu
mo
rs;
tot,
tota
l.*P
valu
es
refe
rto
the
com
par
iso
nw
ith
REC
IST
1.1
.A
ne
xact
test
of
tab
lesy
mm
etr
yw
asu
sed
toco
mp
are
the
sen
siti
vity
inas
sess
ing
resp
on
seb
etw
ee
nR
ECIS
Tan
dth
eo
the
rcr
ite
ria.
Co
mp
aris
on
sre
late
dto
Ch
oi
incl
ud
ed
on
lyp
atie
nts
wit
hav
aila
bili
tyo
fH
U(s
em
i-au
tom
ate
d).
do
i:10
.13
71
/jo
urn
al.p
on
e.0
04
83
72
.t0
03
Response Assessment with 3D Criteria in GIST
PLOS ONE | www.plosone.org 7 November 2012 | Volume 7 | Issue 11 | e48372

more accurately by manual 3D measurements than by 1D and 2D
measurements [33,36,37]. Moreover, semi-automated approaches
make numerically large-scale volumetric quantification feasible, by
offering time advantage, limited variability and improved repro-
ducibility [38–40]. This is crucial for large multi-institutional trials
where, for instance, the complex Choi criteria cannot be easily
applied.
Interestingly, studies on computer-aided volumetric measure-
ments identified circumstances and tumors (childhood cancers,
mesothelioma, and GIST) where volumetric CT image analyses
confer clear advantages in response assessment and additional
prognostic information [19,29,33,36,37,41,42].
Due to the heterogeneity in the studied populations (e.g.
different primary tumor, metastatic spread, treatment), studied
lesions (e.g. lymph nodes, liver, lung metastases) and cut-off
definitions, it is difficult to compare the data of previously
published studies and draw general conclusions [19,29,41,42].
Additionally, PFS has often been used in these studies as the
endpoint for clinical outcome, which introduces the bias that PFS
is estimated on the basis of RECIST and, consequently, PFS does
not serve as an independent variable in this context.
Several years ago, Choi et al. succeeded in detecting responses
earlier in GISTs, in line with PET but in contrast to RECIST
readouts [5,7]. However, Choi criteria are not yet incorporated
into routine clinical practice or in Phase III oncology trials by
regulatory agencies as primary method for disease assessment.
This is probably due to their complexity, technical limitations (e.g.
heterogeneity in hypoxic regions), and their unclear advantages to
date [9,43].
Nevertheless, novel criteria for response assessment in GIST
(and solid tumors in general) may have important clinical
consequences in drug development and routine patient care. An
early and precise identification of response may limit the number
of false-negatives in early-phase clinical studies, preventing the
premature cessation of drug development. In routine clinical
practice, early response assessment can have potential health
economic benefits, given the high costs of innovative anticancer
agents. Conversely, detecting an early lack of response may
prevent unnecessary treatment continuation (and drug-related
toxicity) in individual patients [44].
Although our volume criteria were tested only on liver
metastases from GIST patients treated with a targeted agent,
Figure 3. Overall survival by different criteria in the training cohort (2 curves). Overall survival (OS) shown up to 72 months (mo) of allassessable patients by response criteria, divided in progressed versus not progressed (SD+PR) at 3, 6 and 12 months of imatinib therapy. To note,survival curves related to Choi criteria include only patients assessable with both manual and semi-automated method, thus they should beevaluated separately and not directly compared with the other criteria (Panels D,H,L). Panels A–C: When the tumor response is evaluated on thebasis of RECIST and 3D criteria, a statistically significant difference is observed in the long-term prognosis between patients with and without PD at 3months. Panels E–G: Significant difference is observed in the long-term prognosis between patients with and without PD at 6 months only by 3D-ellipsoids. Panels I–K: A difference is observed in the long-term prognosis between patients with and without PD at 12 months only by 3D-spheresand 3D-ellipsoids, but no significant difference is observed by RECIST. Panels D,H,L: Significant difference is observed in the long-term prognosisbetween patients with and without PD by Choi criteria only at 6 months.doi:10.1371/journal.pone.0048372.g003
Response Assessment with 3D Criteria in GIST
PLOS ONE | www.plosone.org 8 November 2012 | Volume 7 | Issue 11 | e48372

they could also be relevant for other sites of disease (e.g. peritoneal,
primary) in GIST. Moreover, they will be tested in the response
assessment to cytotoxic therapies in other tumor types, where the
response depends more on morphological/dimensional changes
than density changes. We will also prospectively incorporate the
method based on our volume criteria as a response evaluation in
addition to RECIST, in early clinical trials at our drug
development unit.
Unfortunately, the lack of semi-automated data for some
patients and the low number of patients in both cohorts prevent
us from assessing the sensitivity of different methods in estimating
PD, especially considering the long-term benefit typical for
imatinib-treated GIST patients (median PFS of 21 months,
irrespectively from mutation status) [30]. However, the population
target was homogeneous and the relatively low incidence of the
disease complicates patient accrual for larger study cohorts.
In summary, the initial results suggest that changes in tumor
volume can be assessed as early as 3 months after initiation of
imatinib treatment, whereas a lower magnitude of changes in
diameters is seen during the same time period. This is due to the
fact that the assumption that the tumor response will be
comparable along all three tumor axes is not always correct [24].
Thus, 3D changes may have the potential to be a more sensitive
and precise marker of regression or progression, although this
should be demonstrated in prospective studies recruiting large
populations. We are currently refining this method to discover the
biologically optimal 3D cut-off to use in clinical studies for
correlation with biomarkers and prognosis.
In fact, measurement change as a continuous variable is a
technique increasingly considered as a way of better expressing a
therapy’s antitumor activity.33
3D assessments could be a more rational strategy to define
response criteria and corresponding cut-offs than the conventional
criteria, which were based on an experiment of tumor measure-
ments conducted by 16 clinicians, using solid spheres covered by
foam rubber pads [45]. As Choi et al. suggested, now that we can
measure the size of lesions to a precision of tenths of millimeters on
cross-sectional images, the accuracy of current response criteria
should be re-examined [5]. Therefore, this new method,
incorporating volumetric evaluations of tumor response in
metastatic GIST, has been shown to be very precise. In
conclusion, although premature in terms of ability to set new
cut-offs for response assessment criteria, our work is preliminary
evidence that 3D measurements can be considered as a potential
tool to observe response more efficiently than RECIST in solid
tumors.
Supporting Information
Figure S1 Robustness of manual and semi-automatedmeasurements. Statistical analysis shows the robustness of the
Figure 4. Overall survival by different criteria in the training cohort (3 curves). Overall survival (OS) shown up to 72 months (mo) of allassessable patients by response criteria, divided in PD versus SD versus PR, at 3, 6 and 12 months of imatinib therapy. To note, survival curves relatedto Choi criteria include only patients assessable with both manual and semi-automated method, thus they should be evaluated separately and notdirectly compared with the other criteria (Panels D,H,L).doi:10.1371/journal.pone.0048372.g004
Response Assessment with 3D Criteria in GIST
PLOS ONE | www.plosone.org 9 November 2012 | Volume 7 | Issue 11 | e48372
manual and semi-automated methods in the training cohort.
Correlation between diameters and volumes for manual (A) and
semi-automated (B) measurements (both P,0.0001; R2 = 0.97 and
0.98, respectively). Bland-Altman plots show the agreement
between manual and semi-automated technique for diameters
(C) and volumes (D) of target lesions. The two methods provide
clinically consistent similar measures with variability of 0.15% and
9.6% for 1D and 3D respectively. Abbreviation: LoA, limits of
agreement.
(TIF)
Figure S2 Overall survival by different criteria in thevalidation cohort (2 curves). Overall survival (OS) shown up
to 72 months (mo) of all assessable patients by response criteria,
divided in progressed versus not progressed (SD+PR) at 3, 6 and
12 months of imatinib therapy. Panels A–D: No significant
difference is observed in the long-term prognosis between patients
with PD and not PD at 3 months by any criteria. Panels E–L:Every criterion significantly divides patients with and without PD
at 6 and 12 months.
(TIF)
Figure S3 Overall survival by different criteria in thevalidation cohort (3 curves). Overall survival (OS) shown up
to 72 months (mo) of all assessable patients by response criteria,
divided in PD versus SD versus PR, at 3, 6 and 12 months of
imatinib therapy.
(TIF)
Acknowledgments
This study was partly presented at the 2011 Annual Meeting of the
American Society of Clinical Oncology, June 3–7, 2011, Chicago, IL
(abstract number 10059).
We thank Leen de Baat (Dept. of Informatics, Erasmus University
Medical Center, Rotterdam) for retrieving a part of the DICOM files of the
training cohort and Ronald Booij (Dept. of Radiology, Erasmus University
Medical Center, Rotterdam) for his technical support with the syngo CT
OncologyH software. Furthermore, we thank Evelien Biesmans (Dept. of
General Medical Oncology, Catholic University Leuven) for collecting
clinical data of the validation set and Peter Barry (Dept. of Surgery, Breast
Unit, The Royal Marsden Hospital, London) for discussion and for his
assistance in proofreading and editing the manuscript.
Author Contributions
Conceived and designed the experiments: GS AR GPK JV SS RHM.
Performed the experiments: GS AR. Analyzed the data: GS AR PS BVDH
DJB KE VV JV SS RHM. Contributed reagents/materials/analysis tools:
GS AR PS KE BVDH. Wrote the paper: GS AR PS BVDH DJB KE VV
GPK JV SS RHM.
References
1. Eisenhauer EA, Therasse P, Bogaerts J, Schwartz LH, Sargent D, et al. (2009)New response evaluation criteria in solid tumours: revised RECIST guideline
(version 1.1). Eur J Cancer 45(2): 228–247.
2. Therasse P, Arbuck SG, Eisenhauer EA, Wanders J, Kaplan RS, et al. (2000)
New guidelines to evaluate the response to treatment in solid tumors. J NatlCancer Inst 92(3): 205–216.
3. Therasse P, Eisenhauer EA, Verweij J (2006) RECIST revisited: a review ofvalidation studies on tumour assessment. Eur J Cancer 42(8): 1031–1039.
4. Higgins LJ, Pomper MG (2011) The evolution of imaging in cancer: currentstate and future challenges. Semin Oncol 38(1): 3–15.
5. Choi H, Charnsangavej C, Faria SC, Macapinlac HA, Burgess MA, et al. (2007)
Correlation of computed tomography and positron emission tomography in
patients with metastatic gastrointestinal stromal tumor treated at a singleinstitution with imatinib mesylate: proposal of new computed tomography
response criteria. J Clin Oncol 25(13): 1753–1759.
6. Choi H, Charnsangavej C, de Castro Faria S, Tamm EP, Benjamin RS, et al.
(2004) CT evaluation of the response of gastrointestinal stromal tumors afterimatinib mesylate treatment: a quantitative analysis correlated with FDG PET
findings. Am J Roentgenol 183(6): 1619–1628.
7. Benjamin RS, Choi H, Macapinlac HA, Burgess MA, Patel SR, et al. (2007) We
should desist using RECIST, at least in GIST. J Clin Oncol 25(13): 1760–1764.
8. Le Cesne A, Van Glabbeke M, Verweij J, Casali PG, Findlay M, et al. (2009)
Absence of progression as assessed by response evaluation criteria in solid tumorspredicts survival in advanced GI stromal tumors treated with imatinib mesylate:
the intergroup EORTC-ISG-AGITG phase III trial. J Clin Oncol 27(24): 3969–
3974.
9. Dudeck O, Zeile M, Reichardt P, Pink D (2011) Comparison of RECIST and
Choi criteria for computed tomographic response evaluation in patients withadvanced gastrointestinal stromal tumor treated with sunitinib. Ann Oncol 22(8):
1828–1833.
10. Anderson JR, Cain KC, Gelber RD (2008) Analysis of survival by tumor
response and other comparisons of time-to-event by outcome variables. J ClinOncol 26(24): 3913–3915.
11. Rosset A, Spadola L, Ratib O (2004) OsiriX: an open-source software fornavigating in multidimensional DICOM images. J Digit Imaging 17(3): 205–
216.
12. van der Vorst JR, van Dam RM, van Stiphout RS, van den Broek MA,
Hollander IH, et al. (2010) Virtual Liver Resection and Volumetric Analysis ofthe Future Liver Remnant using Open Source Image Processing Software.
World J Surg 34(10): 2426–2433.
13. Beyer F, Buerke B, Gerss J, Scheffe K, Puesken M, et al. (2010) Prediction of
lymph node metastases in NSCLC. Nuklearmedizin 49(1): 41–48; quiz N1.
14. Kuhnigk JM, Dicken V, Bornemann L, Bakai A, Wormanns D, et al. (2006)
Morphological segmentation and partial volume analysis for volumetry of solidpulmonary lesions in thoracic CT scans. IEEE Trans Med Imaging 25(4): 417–
434.
15. Keil S, Behrendt FF, Stanzel S, Suhling M, Koch A, et al. (2008) Semi-
automated measurement of hyperdense, hypodense and heterogeneous hepatic
metastasis on standard MDCT slices. Comparison of semi-automated and
manual measurement of RECIST and WHO criteria. Eur Radiol 18(11): 2456–
2465.
16. Keil S, Plumhans C, Behrendt FF, Stanzel S, Suehling M, et al. (2009a) Semi-
automated quantification of hepatic lesions in a phantom. Invest Radiol 44(2):82–88.
17. Keil S, Behrendt FF, Stanzel S, Suehling M, Jost E, et al. (2009b) RECIST and
WHO criteria evaluation of cervical, thoracic and abdominal lymph nodes inpatients with malignant lymphoma: manual versus semi-automated measure-
ment on standard MDCT slices. Rofo 181(9): 888–895.
18. Eechoute K, Fransson MN, Reyners AK, de Jong FA, Sparreboom A, et al.
(2012) A long-term prospective population pharmacokinetic study on imatinibplasma concentrations in GIST patients. Clin Cancer Res 18 (20): 5780–5787.
19. Zhao B, Schwartz LH, Moskowitz CS, Ginsberg MS, Rizvi NA, et al. (2006)
Lung cancer: computerized quantification of tumor response–initial results.Radiology 241(3): 892–898.
20. Pietanza M, James LP, Schwartz LH, Ginsberg MS, Zhao B, et al. (2008)Assessing changes in tumor size with CT scans in lung cancer: are volumetric
measurements better than unidimensional (1D) and bidimensional (2D)assessments? J Clin Oncol 26 (May 20 suppl; abstr 14562).
21. James K, Eisenhauer E, Christian M, Terenziani M, Vena D, et al. (1999)
Measuring response in solid tumors: unidimensional versus bidimensionalmeasurement. J Natl Cancer Inst 91(6): 523–528.
22. Padhani AR, Ollivier L (2001) The RECIST (Response Evaluation Criteria inSolid Tumors) criteria: implications for diagnostic radiologists. Br J Radiol
74(887): 983–986.
23. Levine ZH, Borchardt BR, Brandenburg NJ, Clark CW, Muralikrishnan B, et
al. (2010) RECIST versus volume measurement in medical CT using ellipsoids
of known size. Opt Express 18(8): 8151–8159.
24. Schiavon G, Ruggiero A, Sleijfer S, Eechoute K, Krestin GP, et al. (2012)
Single-dimension CT measurements with RECIST 1.1 to evaluate livermetastases in GIST patients on imatinib. J Clin Oncol 30 (suppl; abstr 10091).
25. Prasad SR, Jhaveri KS, Saini S, Hahn PF, Halpern EF, et al. (2002) CT tumormeasurement for therapeutic response assessment: comparison of unidimen-
sional, bidimensional, and volumetric techniques initial observations. Radiology
225(2): 416–419.
26. Bland JM, Altman DG (1986) Statistical methods for assessing agreement
between two methods of clinical measurement. Lancet 1: 307–310.
27. Kaplan EL, Meier P (1958) Non parametric estimation from incomplete
observations. J Am Stat Assoc 53: 457–481.
28. Machin D, Cheung YB, Parmar MKB (2006) Survival Analysis: A Practical
Approach, 2nd edition. Chichester, West Sussex, UK: John Wiley and Sons, Ltd.
29. van Oosterom AT, Judson I, Verweij J, Stroobants S, Donato di Paola E, et al.(2001) Safety and efficacy of imatinib (STI571) in metastatic gastrointestinal
stromal tumours: a phase I study. Lancet 358(9291): 1421–1423.
30. Verweij J, Casali PG, Zalcberg J, LeCesne A, Reichardt P, et al. (2004)
Progression-free survival in gastrointestinal stromal tumours with high-doseimatinib: randomised trial. Lancet 364(9440): 1127–1134.
31. Van Glabbeke M, Verweij J Casali PG, Le Cesne A, Hohenberger P, et al.
(2005) Initial and late resistance to imatinib in advanced gastrointestinal stromal
Response Assessment with 3D Criteria in GIST
PLOS ONE | www.plosone.org 10 November 2012 | Volume 7 | Issue 11 | e48372
tumors are predicted by different prognostic factors: a European Organisation
for Research and Treatment of Cancer-Italian Sarcoma Group-AustralasianGastrointestinal Trials Group study. J Clin Oncol 23(24): 5795–5804.
32. Eechoute K, Franke RM, Loos WJ, Scherkenbach LA, Boere I, et al. (2011)
Environmental and Genetic Factors Affecting Transport of Imatinib byOATP1A2. Clin Pharmacol Ther 89(6): 816–820.
33. Tran LN, Brown MS, Goldin JG, Yan X, Pais RC, et al. (2004) Comparison oftreatment response classifications between unidimensional, bidimensional, and
volumetric measurements of metastatic lung lesions on chest computed
tomography. Acad Radiol 11(12): 1355–1360.34. Oxnard GR, Zhao B, Sima CS, Ginsberg MS, James LP, et al. (2011) Variability
of lung tumor measurements on repeat computed tomography scans takenwithin 15 minutes. J Clin Oncol 29(23): 3114–3119.
35. Gilles EM (2012) Radiologic reviews: more second guessing from armchairscannot lead the way. J Clin Oncol 30(1): 116.
36. Schwartz LH, Curran S, Trocola R, Randazzo J, Ilson D, et al. (2007)
Volumetric 3D CT analysis - an early predictor of response to therapy. J ClinOncol 25 (18S) (June 20 suppl; abstr 4576).
37. Yankelevitz DF, Reeves AP, Kostis WJ, Zhao B, Henschke CI (2000) Smallpulmonary nodules: volumetrically determined growth rates based on CT
evaluation. Radiology 217(1): 251–256.
38. Fabel M, von Tengg-Kobligk H, Giesel FL, Bornemann L, Dicken V, et al.(2008) Semi-automated volumetric analysis of lymph node metastases in patients
with malignant melanoma stage III/IV – a feasibility study. Eur Radiol 18:
1114–1122.39. Wormanns D, Kohl G, Klotz E, Marheine A, Beyer F, et al. (2004) Volumetric
measurements of pulmonary nodules at multi-row detector CT: in vivo
reproducibility. Eur Radiol 14: 86–92.40. Marten K, Auer F, Schmidt S, Kohl G, Rummeny EJ, et al. (2006) Inadequacy
of manual measurements compared to automated CT volumetry in assessmentof treatment response of pulmonary metastases using RECIST criteria. Eur
Radiol 16: 781–790.
41. Liu F, Zhao B, Krug LM, Ishill NM, Lim RC, et al. (2010) Assessment oftherapy responses and prediction of survival in malignant pleural mesothelioma
through computer-aided volumetric measurement on computed tomographyscans. J Thorac Oncol 5(6): 879–884.
42. Mozley PD, Schwartz LH, Bendtsen C, Zhao B, Petrick N, et al. (2010) Changein lung tumor volume as a biomarker of treatment response: a critical review of
the evidence. Ann Oncol 21(9): 1751–1755.
43. Schuetze SM, Baker LH, Benjamin RS, Canetta R (2008) Selection of responsecriteria for clinical trials of sarcoma treatment. Oncologist 13 Suppl 2: 32–40.
44. Sekine I, Yamamoto N, Kunitoh H, Ohe Y, Tamura T, et al. (2002)Relationship between objective responses in phase I trials and potential efficacy
of nonspecific cytotoxic investigational new drugs. Ann Oncol 13: 1300–1306.
45. Moertel CG, Hanley JA (1976) The effect of measuring error on the results oftherapeutic trials in advanced cancer. Cancer 38: 388–394.
Response Assessment with 3D Criteria in GIST
PLOS ONE | www.plosone.org 11 November 2012 | Volume 7 | Issue 11 | e48372


