Embed Size (px)
Citation preview

Experimental study of continuum loweringM. Nantel, G. Ma, S. Gu, C.Y. Côté, J. Itatani, T. Buma, A. Maksimchuk and D. Umstadter
Center for Ultrafast Optical Science University of Michigan1006 1ST Building, 2200 Bonisteel Blvd
Ann Arbor, MI 48 109-2099
ABSTRACT
We present time- and space-resolved XUV spectra of boron and carbon plasmas created by focusing100-fs laser pulses on a solid target to an intensity of 10 17 W/cm2. Emission lines originating from He-like and H-like excited states from n = 2 to the ionisation limit are observed with a spatial resolution of100 jim in the direction normal to the target plane and with a temporal resolution of up to 4 ps. Theposition of the ionisation limit is seen to depend very crucially on the plasma parameters of density andtemperature, and is explained through continuum lowering effects. We observed the dynamics of thecontinuum lowering for plasma slices at different distances from the target, and record a maximumlowering of 40 eV in He-like carbon (10% of the ionisation potential) from the disappearance of thelsnp-1 S2 line and from the position of the continuum edge.
Keywords: laser-produced plasma, ultrashort laser, atomic physics, continuum lowering, plasmadiagnostics, plasma simulation, carbon, boron
1. INTRODUCTION
The atomic physics of high-density plasmas is studied extensively for its relevance toastrophysics, inertial confinement fusion, X-ray lasers,1 and to the interaction of ultrashort lasers withsolids.24 The structure and behaviour of atoms and ions in high-density plasmas can be radicallyaffected by the presence of strong fields in the 5 One particularly important effect of the plasmafields on the ions is the ionisation potential depression, or continuum lowering.68 In a plasma, thepotential well of an ion is perturbed by the fields produced by the neighbouring ions and free electrons,who 'loosen" the excited bound electrons by attracting them (neighbouring ions) or by masking part ofthe ion's nuclear charge (Debye shielding from the free electrons). As a result, the ion sheds its excitedstates from the highest on down as the plasma fields increase, and the energy required to promote one ofits electrons to the continuum (to ionise it) lowers accordingly. This is illustrated schematically in figure1 . Continuum lowering is then a fundamental concept of atomic physics in plasmas, defining the ionssizes, their existing energy states, and their emission and absorption properties. In laser-producedplasma, continuum lowering has been observed in solid-density compressed plasmas through shifts inabsorption 1 and in high-density ablation plasmas as a merging of the emission lines with thecontinuum,8'12'13 where it has been used as a density diagnostic. Since it has an impact on the ionisationstate and radiation transfer in the plasma, continuum lowering is included in most comprehensive plasmaatomic physics simulations, and several models are being used to account for it. 7,14-17
The simpler continuum lowering models6'4 usually define a cut-off for the excited state levels nfrom the average plasma fields without considering the plasma fluctuation perturbations (Fig. ib). Moresophisticated models16 take into account these microfield plasma fluctuations -essentially the Starkeffect - which are particularly important for the last few existing levels below the lowered continuum.The fluctuations lead to broadened levels that merge into one another to further lower the apparentionisation potential (fig. ic).
SPIEVol. 3157 • 0277-786X/97/$1O.OO 93
Downloaded From: http://proceedings.spiedigitallibrary.org/ on 08/21/2013 Terms of Use: http://spiedl.org/terms

a) b) c)
94
continuum
n=7n=6n=5
n=4
n=3
n=2
Fig.! Schematic representation of the effect of continuum lowering. a) In vacuum, the continuum is at the vacuumionisation potential of the ion, and all the excited states exist. b) When the ion is immersed in a plasma, the average fields ofthe free electrons and of the other ions bring down the energy necessary to ionise the ion and the continuum lowers,eliminating the higher excited states. c) When the fluctuating microfields in the plasma are also taken into account, there is afurther lowering of the continuum due to merging of the broadened energy states near the continuum.
Three simple continuum lowering models that are used often are the ion-cell model, the Debye-Huckel model and the Stewart-Pyatt model. 14,15,18 Each of these calculates the ionisation potentialdepression, AE, as a function of the plasma conditions:
Tii
(3r =1
1/2
TDTD
kT
( [(re lTD )3 + i]-
1)kT
2/3
2(+1)
where Z is the charge of the emitting ion, z is the average plasma ionization, r is the ion radius, asdefined by the ion density N, rj is the Debye radius, Ne and T are the electron density and temperature,respectively. These models describe a continuum lowering of the type illustrated in Fig. ib, without theplasma microfield fluctuation effects. Figure 2 shows the continuum lowering in a He-like boronplasma, as calculated with the three models in equation (1). The ion-cell model (Equ. (la), solid line inFig. 2) is valid for high-density plasmas, where the size of an ion - and hence its last bound state - isdetermined by the proximity of the neighbouring ions. The radius of the last bound orbit is then r and isindependent of the temperature. For lower density plasmas where the ions are distant and don'tsignificantly affect one another, it is the free electron population that will mostly determine the lastbound orbit radius, rD, through Debye shielding, and the continuum lowering is calculated with Equ.(!b) as a function of the temperature (long dashes in Fig. 2, for T = 5 and 20 eV). The Stewart-Pyatt
ground, n=1
low density high density
Ion-cell model (IC) AE1 =
Debye-Huckel model (DH) AEDH =
Stewart-Pyatt model (SP) AE. =
( la)
(ib)
(ic)
Downloaded From: http://proceedings.spiedigitallibrary.org/ on 08/21/2013 Terms of Use: http://spiedl.org/terms
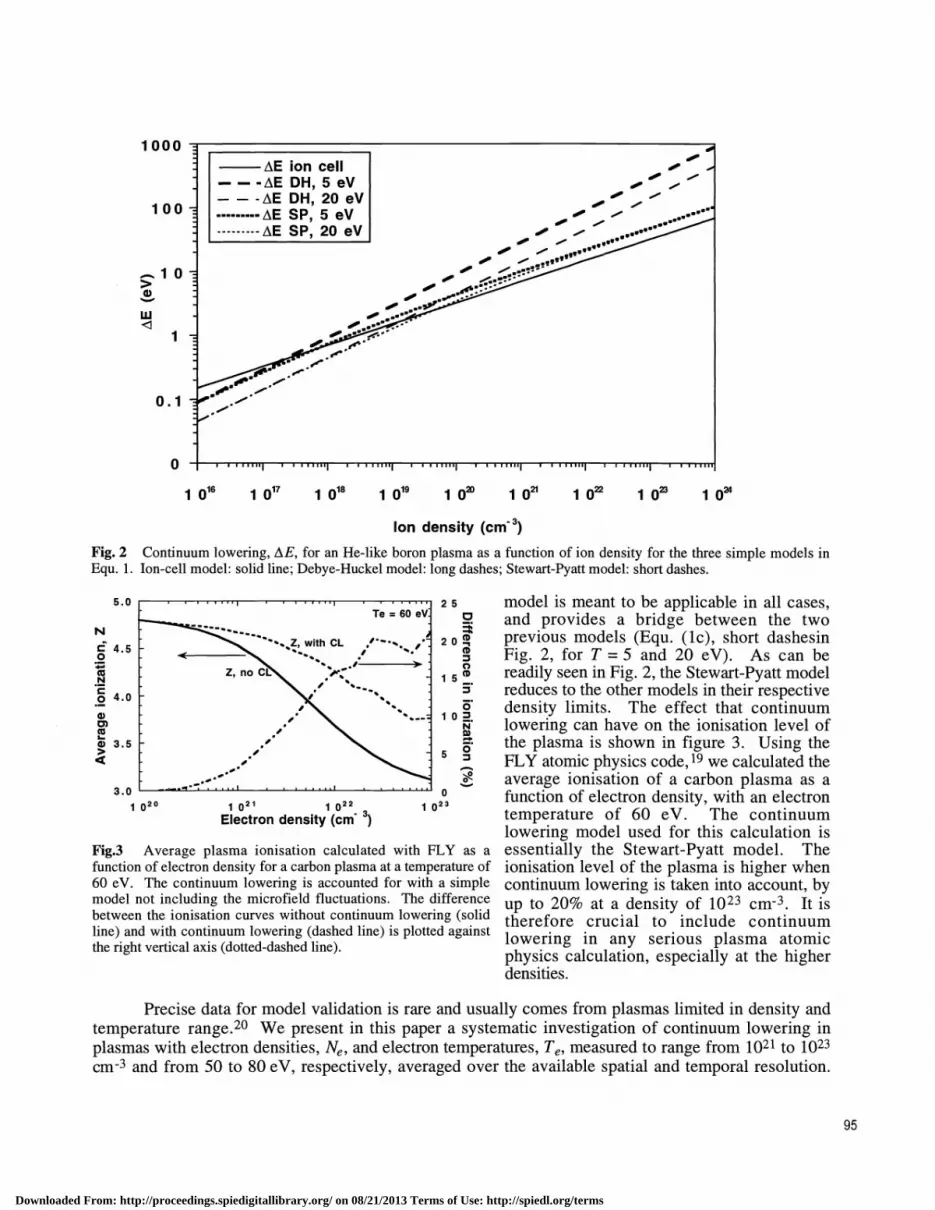
2 5 model is meant to be applicable in all cases,and provides a bridge between the two
2 0 previous models (Equ. (ic), short dashesinFig. 2, for T = 5 and 20 eV). As can be
1 5 readily seen in Fig. 2, the Stewart-Pyatt model. reduces to the other models in their respective1 0 density limits. The effect that continuum
lowering can have on the ionisation level of: the plasma is shown in figure 3. Using the
5 - FLY atomic physics 19 we calculated theaverage ionisation of a carbon plasma as a
1 23 function of electron density, with an electron0 temperature of 60 eV. The continuum
lowering model used for this calculation isessentially the Stewart-Pyatt model. Theionisation level of the plasma is higher whencontinuum lowering is taken into account, byup to 20% at a density of 1023 cm3. It istherefore crucial to include continuumlowering in any serious plasma atomicphysics calculation, especially at the higherdensities.
Precise data for model validation is rare and usually comes from plasmas limited in density andtemperature range.2° We present in this paper a systematic investigation of continuum lowering inplasmas with electron densities, Ne, and electron temperatures, Te, measured to range from 1021 to 1023cm3 and from 50 to 80 eV, respectively, averaged over the available spatial and temporal resolution.
95
1000
100
_.1 0>w
1
0.1
0
1 016 1 i Q18 i 019 1 0 1 0' 1 O 1 0 1 0Ion density (cm3)
Fig. 2 Continuum lowering, for an He-like boron plasma as a function of ion density for the three simple models inEqu. 1. Ion-cell model: solid line; Debye-Huckel model: long dashes; Stewart-Pyatt model: short dashes.
5.0
N4.50
(5NCo 4.00)0)(50) 3.5>4
3.01 020 1021 1022
Electron density (cm 3)
Fig.3 Average plasma ionisation calculated with FLY as afunction of electron density for a carbon plasma at a temperature of60 eV. The continuum lowering is accounted for with a simplemodel not including the microfield fluctuations. The differencebetween the ionisation curves without continuum lowering (solidline) and with continuum lowering (dashed line) is plotted againstthe right vertical axis (dotted-dashed line).
Downloaded From: http://proceedings.spiedigitallibrary.org/ on 08/21/2013 Terms of Use: http://spiedl.org/terms

The plasmas were created by focusing high-intensity ultrafast laser pulses onto solid targets. The 100-fslaser pulses have the advantage over nanosecond pulses of depositing the energy of the laserimpulsively, in a small target layer. Thus, the continuum lowering measurements are conducted after thelaser pulse, in a freely expanding, cooling plasma, without the added complication of laser heating. Wediscuss the importance of spatial and temporal resolutions in measurements using continuum lowering asa plasma diagnostic, compare our time- and space-resolved data to FLY atomic physics simulations, andexamine the relative contributions of the average fields and fluctuations to the continuum lowering.
2. EXPERIMENTAL RESULTS AND ANALYSIS
The experiments were conducted with the 10-Hz, 100-fs Ti:sapphire laser at the Center forUltrafast Optical Science. Laser pulses of 25-to-50-mJ in energy at 780 nm were focused with a MgF2lens on solid targets to an intensity of 1017 W/cm2. The emission spectra from the plasma were recordedwith a grazing-incidence flat-field imaging XUV spectrometer coupled to an x-ray streak camera withCCD readout. With this system, shown schematically in figure 4, we had a spatial resolution of 100 imor better in the direction normal to the target plane and a spectral resolution of 0. 1 -0.2 A.
2.1 Boron targets experiments
In the first experimental run, the 25-mJ laser pulses were focused on solid boron wire targets.The laser intensity contrast ratio was measured to be i0, both with a 3rdorder autocorrelator21 and witha jitter-free plasma-shuttered picosecond visible streak camera.22 The boron XUV spectra were time-dispersed with a single-shot Kentech x-ray streak camera, and the temporal resolution was limited to 50ps by the streak camera slit width and a relatively slow 0sweep speed chosen in an effort to maximize thesignal-to-noise ratio. The spectral resolution was -P0.2 A, limited by the spectrometer slit
Fig. 4 Experimental set-up. Most of the laser energy is sent to the target (T) on which it is focused by a lens (L). Theemission from the expanding plasma plume is spatially resolved in the direction normal to the target and spectrally dispersedby the flat-field grazing incidence XUVspectrometer onto the slit of the streak camera. The data acquisition is done with aCCD camera. For the carbon experiment, the streak camera was operated in "jitter-free" mode: a small part of the laserenergy was separated by a beam-splitter (BS), and sent through a variable delay line (DL) to an electro-optic switch (EOS) totrigger the sweep of the camera. A lens (L) was used to focus the trigger beam through a saturable absorber (SA) to anoptical fiber relay system (OF) for the electro-optic switch. PD stands for P-I-N diode.
96
STREAK+CCD
L SA OF
Downloaded From: http://proceedings.spiedigitallibrary.org/ on 08/21/2013 Terms of Use: http://spiedl.org/terms

Fig. 5 XUV spectra in H-like and He-like boron from aplasma created by focusing the laser to an intensity of1017 W/cm2 . a) From a slice centered 200 im away fromthe target plane, at the start of its emission (500 ps); b)from a slice centered at 50 xm away from the targetplane, at the start of its emission (85 p5); c) from the sameslice shown in b), but later in time, at 250 ps. Time 0 Psis arbitrary and corresponds to the start of the emission inthe plasma slice near the target.
width and the spatial resolution of the streak camera along the wavelength axis.
Lineouts of space- and time-resolved spectra are shown in figure 5 for wavelengths between 47and 55 A. Emission lines from the boron He-like lsnp-l s2 (n � 3) series are identified, as well as the H-like 2p-l s line. The spectrum shown in Fig. 5a is from a plasma slice centered 200 jim from the targetplane 500 ps after the laser pulse, and features He-like emissions from levels at least as high as n =6.The He-like 7p-l s and 8p-l s lines cannot be identified as they coincide with the H-like 2p-l s line. Theemission in this region is expected to come from a plasma with low density and temperature, but thestrong presence of H-like emissions suggests that the ionisation balance was established at a higherdensity and temperature near the target, during the laser pulse, and "frozen" in the plasma expansion.23Closer to the target, in the slice centered at 50 jim, the plasma emission is shown in Fig. 5b (100 ps afterthe laser pulse) and Fig. 5c (250 ps after the laser pulse). The spectrum in Fig. 5b exhibit an ionisationbalance similar that in Fig. 5a, but the emission suffers from the absence of the 5p- 1 s and 6p- 1 s lines.The remaining He-like lines are noticeably wider, even with the limited spectral resolution, a sign ofsignificant Stark broadening which is indicative of a high plasma density. In the same slice but at a latertime, the spectrum in Fig. 5c shows the reappearance of the 5p- 1 s and 6p-l s lines, as well as emissionfrom higher states which are seen unresolved as a peak on the short wavelength side of the H-like 2p-l s.
We attribute the presence or absence of the He-like emission originating from high-n states in thespectra in Fig. 5 to the dynamics of the continuum lowering. In Fig. 5b, the last line of the 1 snp-1 s2series is the 4p-l s transition. This corresponds to a continuum lowering of 8.7 eV < AE < 13.5 eV, orbetween 3.3% and 5.2% of the ionisation potential for He-like boron (259.4 eV).24 It has been verifiedwith FLY calculations that collisional depopulation of these high-n levels in the dense plasma cannot
97
8
6
Cl)
.0
U)
Cl)
C
4
8
2
6
Cl)
C
LiCU
Cl)CCl)
C
4
a)10 b) 10
0
C) 1
Cl)
C
LiCU
U)CCl)
C
2
47 48 49 50 51 53 54 55
Wavelength (A)
047 48 49 50 51 52 53 54 55
Wavelength (A)
47 48 49 50 51 52 53 54 55Wavelength (A)
Downloaded From: http://proceedings.spiedigitallibrary.org/ on 08/21/2013 Terms of Use: http://spiedl.org/terms
explain the absence of the series' lines above 4p-l s in the experimental spectra. At the same spatialposition but later in time (Fig. 5c), the plasma expansion reduces the density, the continuum loweringbecomes less important and the reappearance of the high-n levels is observed through the presence of thecorresponding emission lines. We also observe a change in the relative intensities of the He-like and H-like emission, as the plasma cools and recombines. Far from the target (Fig. 5a), the density is low andthe plasma exhibits less continuum lowering, even in the early time of the X-ray emission. From theabsence of the 9p-l s line and higher, we infer a continuum lowering between 3 eV and 6 eV, with alarge uncertainty due to the presence of the H-like line masking the 7p-l s and 8p-l s lines.
Continuum lowering has been used in the past as a density diagnostic in laboratory plasmas.This has been done with spatially-and temporally-integrated spectra,8'13'25 or with spatially-integratedbut temporally-resolved spectra.12 However, the experimental data presented in Fig. 5 emphasizes theimportance of the spatio-temporal evolution of the lowering. Integrating the emission over one or bothof these coordinates will likely lead to a lower bound for the observed continuum lowering, andsimilarly for the inferred plasma density. Under the same laser and target conditions as those used whenrecording the spectra shown in Fig. 5, time-integrated spectra taken in an earlier experimental run failedto show comparable continuum lowering.
To further investigate the dynamics of the continuum lowering and extract quantitative data,experiments with better spectral and temporal resolutions were needed. Indeed, the continuum loweringmeasurements presented above are limited in energy resolution by the gap between adjacent transitions,and they are limited in temporal resolution by the need to integrate the temporal sweep over a time longenough to give a decent signal-to-noise ratio in single-shot acquisitions. Furthermore, the laser pulsecontrast of iO — typical on Ti:sapphire laser systems of this class — limited the density at which themeasurements were made. The nanosecond-scale pedestal in this case would be focused to intensities ontarget of up to 1012 W/cm2, which will likely create a low-density preplasma with which the main pulsewill interact. A higher laser pulse contrast ratio would allow the main pulse to deposit its energy at ahigher density, which would permit the study of the continuum lowering in a more interesting parameterspace. Also, reliable independent temperature and density diagnostics could be used to derive thecontinuum lowering in the plasma and corroborate the measurement done here through directobservation of the presence or absence of the high-n emission lines.
2.2 Carbon targets experiments
In this experiment, we tried to address the concerns expressed at the end of the last section. Thelaser contrast was improved by a factor of 100 through high-energy seeding of the regenerative
21 This higher contrast of iO" much improved the quality of the solid-target interaction. Thetargets were solid disks of carbon on a rotating stage. To improve the temporal resolution and thesignal-to-noise figure of our spectra, we replaced the single-shot Kentech camera with a subpicosecondx-ray streak camera26'27 which we coupled to a jitter-free accumulation sweep system28 (see Fig. 4).This new camera (recently made available commercially through AXIS Photonique, Inc.) has a single-shot temporal resolution of 800 femtoseconds, and has been operated with the jitter-free system toresolutions as good as 1 ps over 5000-shot accumulations. In our experiment, the temporal resolutionwas limited to 4 ps over up to 1200 accumulated shots, mostly due to laser pulse energy variations and aslight rotating target wobble (less than 25 xm over a full turn). The spectral resolution was improved to0. 1 A by carefully refocusing the imaging optics of the XUV spectrometer and by the higher spatialresolution of the new streak camera (25 lp/mm). The continuum lowering measurement resolution wasimproved by looking at the position of the continuum emission edge as a function of time.
To concentrate on the plasma region exhibiting the most continuum lowering, we will show hereonly data taken in a slice near the target, centered at 50 jim from the target plane. Figure 6 shows acomposite graph including three carbon spectra taken at 0 p5, 50 ps and 225 ps. These lineouts areintegrated over 4 ps, and t= 0 ps is arbitrarily defined as the time of the start of the emission. The He-
98
Downloaded From: http://proceedings.spiedigitallibrary.org/ on 08/21/2013 Terms of Use: http://spiedl.org/terms

H-like np-isl...l I
He-like isnp-is2l...I I
Fig. 6 XUV spectra in H-like and He-like carbon from a plasma created by focusing the laser to an intensity of 10 17W/cm2.The three spectra have been offset vertically to improve visibility, and correspond to the emission in a plasma slice centeredat 50 im from the target plane, for 4-ps integrations starting at times 0 ps, 50 ps, and 225 ps. Time 0 ps is arbitrary andcorresponds to the start of the emission. The position of the vacuum ionisation potential (IP) of He-like carbon is marked bythe solid vertical line at 3 1 .62 A, and the position of the lowered IP is indicated for each spectrum by a dashed vertical line.The continuum lowering is the difference of the two, in the shaded area.
like andH-like np-i s transition series are identified, starting with the is2p-i s2 at 40.268 A and 2p-i s33.737 A, respectively. The vacuum ionisation potential (IP) of the He-like ion is marked at 3 1 .62 A(392.09 eV). One of the most striking differences beteen the three spectra is in the position of thecontinuum edge, which has been measured to be at 35.3 A (35 1 .3 eV) for 0 ps, at 33.0 A (375.2 eV) for50 ps, and at 32.3 A (383.6 eV) at 225 ps. The shaded area between the vacuum IP and the continuumedge highlights for each spectrum the region of continuum lowering, which can be as high as 40.8 eV, or>10% of the IP for the spectrum at 0 ps. To the best of our knowledge, this is among the highestpercentage of continuum lowering recorded. Also, one can identify the presence of He-like emissionline from i s2p-i s2 to 1 s7p-1 s2 at least for the spectrum at 225 ps, while only the 1 s2p-i s2 line isunambiguously identified at 0 ps, which gives continuum lowering values in agreement with thecontinuum edge position measurement. For the spectrum at 50 ps, one can readily see the ls3p-i s2 line,and the 1 s4p-i s2 is in the low-wavelength shoulder of the H-like 2p-i s line.
It would be interesting to compare the values of the continuum lowering obtained directly fromexamination of the spectra to those calculated using the Stewart-Pyatt model and the electrontemperature and density plasma parameters diagnosed from the corresponding spectra. We firstestablish the electron temperature by the slope of the He-like continuum. We then generate artificialspectra using FLY and find a match for the experimental spectrum by varying the density in the
99
Cl)
C
Cl)CC).-C
i
i
i
i 0225 30 35 40
Wavelength (A)
45
Downloaded From: http://proceedings.spiedigitallibrary.org/ on 08/21/2013 Terms of Use: http://spiedl.org/terms

Cl)
Cl)
0)
Wavelength (A)Fig. 7 Example of comparison between the experimental spectrum at 225 ps and an artificial spectrum generated usingFLY. There is good agreement for an electron temperature of 50 eV (determined experimentally from the slope of the He-like continuum) and an electron density of 2 x 1021 cm3 . An instrumental broadening of 0. 1 A is included in the calculatedspectrum, as well as Stewart-Pyatt continuum lowering and Stark broadening.
simulation. Figure 7 gives an example of such a match. The artificial spectrum includes instrumentalbroadening, Stewart-Pyatt continuum lowering and Stark broadening.
The dynamics of the electron temperature and density is plotted in figure 8a, and the plasmacoupling parameter F = (Ze2/r)/kT is plotted in figure 8b, for the first 225 ps of the emission from theslice near the carbon target. A highest density of about 5 x 1022 cm3 is inferred, which corresponds toone-tenth of the solid density for a carbon plasma of average ionisation z =4.5. There is good reason toexpect that a 1017 W/cm2 intensity on target with a io contrast ratio will produce some preplasma fromthe 10 10 WIcm2 irradiation in the ns-scale pedestal. It is therefore not surprising that the electron densitybe less than that of a solid. Nonetheless, the severe continuum lowering observed at earlier time in theemission indicates that the improvements to the laser chain implemented between the boron and carbonexperiments were beneficial. The intermediate value of the coupling parameter 0.5 < F' < 1 .5 indicatesthat the most appropriate simple model from Equ. 1 to calculate the continuum lowering is indeed theStewart-Pyatt model.
Figure 9 shows the continuum lowering measured from the position of the He-like continuum edge andthat calculated using the Stewart-Pyatt (SP) model (Equ. lc) and the plasma parameters from Fig. 8a.Two curves are shown for the SP calculations, for average plasma ionisations of4 (dotted line) and 5(full line). The error bar on the measured continuum lowering includes the 0.1 A spectral resolution.While the temporal behaviour of the measured and calculated curves are qualitatively similar, the
106
io5
io4
io3
10225 30 35 40 45
100
Downloaded From: http://proceedings.spiedigitallibrary.org/ on 08/21/2013 Terms of Use: http://spiedl.org/terms

Fig. 9 Dynamics of the continuum lowering. Experimentallowering measured from the position of the He-like continuumedge (solid line); calculated using the Stewart-Pyatt model(Equ. ic) with the densities and temperatures from diagnosticsof the experimental spectra and z =4 (long-dashe line) and z =5 (short-dashed line).
a ) o 1 023 continuum lowering measured from the edgeis consistently higher. While this difference
m could be due to a systematic error in the8O 2. determination of the edge position, wea) -'E7o 0 consider it unlikely that this error be that. large. Instead, we attribute this discrepancy
. 1 O22 to the lowering due to the plasmaU)
'< microfields, which are not taken into account' in the average-field Stewart-Pyatt model.I— 50 3. Stark broadening of the levels near the., continuum will be such that they will start to
4 0 • ' • ' . I , . , I . . • I . , • 02 1 overlap - and their emission lines merge - at0 5 0 1 0 0 1 5 0 2 0 0 2 5 0 a lower energy than that given by the simple
Time (ps) continuum model. A more realistic physical1.5 picture of the continuum lowering, as
b) illustrated in Fig. ic, will include both thecontributions from the average andfluctuating fields in the plasma. To betterillustrate this point, figure 10 shows the
I:! 1comparison of three artificial spectracalculated with different contributions, for an
w electron temperature and density of 72 eVand 4 x 1021 cm3, respectively. The topspectrum corresponds to the emission withno continuum lowering at all. The positions
0.5 of the H-like and He-like continuum edges0 50 100 150 200 250are at their respective vacuum series' limitTime (ps)position (25.30 A or 490.0 eV for H-like, and
Fig. 8 Electron temperature and density as a function of time for a .62 A or 392.09 eV for He-like). Thecarbon plasma created with a 100-fs laser pulse at an intensity of width of the lines is due solely to the1017 W/cm2. b) Plasma coupling parameter (ratio of the potential-to- instrumental and
Doppler broadening (at thiskinetic energy of the plasma) as a function of time. temperature, the latter is negligeablecompared to the former). In the middle spectrum, the Stewart-Pyatt average-field lowering is turned onand the continuum edges are lowered accordingly. Note that in the absence of Stark broadening theemission lines retain the shape they have in the top spectrum. Finally, in the lower spectrum, bothcontributions (Stewart-Pyatt and Stark) are included and the resultant spectrum shows still morecontinuum lowering.
40
w
a)C
0E
C
C0C.)
35
30
25
20
15
10
0 50 100 150 200 250
Time (ps)
101
Downloaded From: http://proceedings.spiedigitallibrary.org/ on 08/21/2013 Terms of Use: http://spiedl.org/terms

102
Wavelength (A)Fig. 10 Comparison of artificial spectra generated with the same plasma parameters (electron temperature and density of72 eV and 4 x 1021 cm3 , respectively), but with different continuum lowering contributions included. Top spectrum: nocontinuum lowering; middle spectrum: only Stewart-Pyatt average-field lowering; bottom spectrum: both Stewart-Pyattaverage-field and Stark microfield fluctuations lowering.
3. CONCLUSION
We presented time- and space-resolved XUV spectra of boron and carbon plasmas created by focusing100-fs laser pulses on a solid target to an intensity of 10 17 W/cm2. Emission lines originating from He-like and H-like excited states from n = 2 to the ionisation limit are observed. The position of theionisation limit was seen to depend very crucially on the plasma parameters, and this was explainedthrough continuum lowering effects. We observed the dynamics of the continuum lowering for plasmaslices at different distances from the target, and established that spatial and temporal resolutions arecrucial for rigorous use of continuum lowering as a density diagnostic. We recorded a maximumlowering of 40 eV in He-like carbon (10% of the ionisation potential) from the disappearance of thels3p-1 s2 line and from the position of the continuum edge. The dynamics of the experimentalcontinuum lowering were compared to calculations, and it was found that simple models neglectingmicrofield fluctuations in the plasma are not sufficient to completely account for the measured lowering.A good agreement was found between artificial spectra generated with FLY when both average-field(simple model) and fluctuations (Stark broadening) were taken into account.
ACKNOWLEDGEMENTS
This work is supported by the Centre for Ultrafast Optical Science under NSF Grant No. STC PHY8920108, and by DOE contract DE-FGO2-96ER14685. M. Nantel is supported in parts by the FCARfund. We would like to thank J.B. Workman, S. Pikuz and M. Naudeau for fruitful discussions, J. Faureand M. Finlayson for help with the experiment, and Spectrogon for the laser compressor gratings.
Cl)
C
.dL.
>Cl)
a)
io-3
1
1
1
1 011
1 013
1 01525 30 35 40 45
Downloaded From: http://proceedings.spiedigitallibrary.org/ on 08/21/2013 Terms of Use: http://spiedl.org/terms

REFERENCES
1. Atomic Processes in Plasma, AlP Conf. Proc. 257, E.S. Marmar, J.L. Terry, eds. (AmericanInstitute of Physics, New York, 1992), and references therein.
2. A. Rousse, P. Audebert, J.P. Geindre, F. Falliès, J.C. Gauthier, A. Mysyrowicz, G. Grillon, and A.Antonetti, Phys. Rev. E 50, 2200 (1994).
3. Z. Jiang, J.C. Kieffer, J.P. Matte, M. Chaker, 0. Peyrusse, D. Gilles, G. Korn, A. Maksimchuk, S.Coe, and G. Mourou, Phys. Plasma 2, 1702 (1995).
4. J. Workman, A. Maksimchuk, X. Liu, U. Ellenberger, J.S. Coe, C.Y. Chien, and D. Umstadter,Phys. Rev. Lett. 75, 2324 (1995).
5. Spectral Line Broadening by Plasmas, H.R. Griem (Academic Press, New York, 1974).6. S. Brush and B.H. Armstrong, Proc. Workshop on Lowering ofthe Ionization Potential, JILA report
79, (Univ. of Colorado, Boulder, CO 1965).7. R.M. More, J. Quant. Spectrosc. Radiat. Transfer 27, 345 (1982).8. C.M. Lee and A. Hauer, Appl. Phys. Left. 33, 692 (1978).9. D.K. Bradley, J. Kilkenny, S. Rose, and J.D. Hares, Phys. Rev. Left. 59, 2995 (1987).10. L. DaSilva, A. Ng, B.K. Godwal, G. Chiu, and F. Cottet, Phys. Rev. Lett. 62, 1623 (1989).1 1. J. Workman, M. Nantel, A. Maksimchuk, and D. Umstadter, Appl. Phys. Lett. 70, 312 (1997).12. D. Riley, L.A. Gizzi, F.Y. Khattak, A.J. Mackinnon, S.M. Viana, and 0. Willi, Phys. Rev. Lett. 69,
3739 (1992).
13. G.A. Kyrala, R.D. Fulton, E.K. Wahlin, L.A. Jones, G.T. Shappert, J.A. Cobble, and A.J. Taylor,Appl. Phys. Lett. 60, 2195 (1992).
14. J.C. Stewart and K.D. Pyatt Jr., Astrophys. J. 144, 1203 (1966).15. J.A. Kunc and W.H. Soon, Astrophys. J. 396, 364 (1992).16. B.J.B. Crowley, Phys. Rev. A 41, 2179 (1990).17. M.W.C. Dharma-wardana and F. Perrot, Phys. Rev. A 45, 5883 (1992).18. D.J. Heading, J.S. Wark, G.R. Bennett, and R.W. Lee, J. Quant. Spectrosc. Radiat. Transfer 54, 167
(1995).19. R.W. Lee, B.L. Whitten, and R.E. Stout, II, J. Quant. Spectrosc. Radiat. Transfer 32, 91 (1984).20. D.J. Heading, G.R. Bennett, J.S. Wark, and R.W. Lee, Phys. Rev. Lett. 74, 3616 (1995).21 . J. Itatani, J. Faure, M. Nantel, G. Mourou, and S. Watanabe, submitted to Opt. Lett. (1997).22. A.C. Tien, M. Nantel, G. Mourou, D. Kaplan, and M. Bouvier, accepted for publication in Opt. Lett.
(1997).23. R.A. London and M.D. Rosen, Phys. Fluids 29, 38 13 (1986).
24. R.L. Kelly, J. Phys. Chem. Ref. Data 16, suppl. 1, 1 (1987). All atomic transition wavelengths andenergies in the present paper are derived from Kelly's.
25. P.G. Burkhalter, G. Mehiman, D.A. Newman, M. Krishnana, and R.R. Prasad, Rev. Sci. Instrum.63, 5052 (1992).
26. C.Y. Côté, J.C. Kieffer, P. Gallant, J.C. Rebuffie, C. Goulmy, A. Maksimchuk, G. Mourou, D.Kaplan, and M. Bouvier, SPIE Proc. 2869,956(1997).
27. P. Gallant, Z. Jiang, J. Fuchs, J.C. Kieffer, H. Pépin, D. Gontier, A. Mens, N. Blanchot, J.L. Miquel,J.F. Pelletier, and M. Sutton, in these proceedings.
28. A. Maksimchuk, M. Kim, J. Workman, G. Korn, J. Squire, D. Du, D. Umstadter, G. Mourou, andM. Bouvier, Rev. Sci. Instrum. 67, 697 (1996).
103
Downloaded From: http://proceedings.spiedigitallibrary.org/ on 08/21/2013 Terms of Use: http://spiedl.org/terms


