Embed Size (px)
Citation preview

UCLAUCLA Electronic Theses and Dissertations
TitleThe Effect of Party Networks on Congressional Primaries
Permalinkhttps://escholarship.org/uc/item/56c3v42q
AuthorPatterson, Shawn Thomas
Publication Date2018 Peer reviewed|Thesis/dissertation
eScholarship.org Powered by the California Digital LibraryUniversity of California

UNIVERSITY OF CALIFORNIA
Los Angeles
The Effect of Party Networks on Congressional Primaries
A dissertation submitted in partial satisfaction
of the requirements for the degree
Doctor of Philosophy in Political Science
by
Shawn Thomas Patterson, Jr.
2018

c© Copyright by
Shawn Thomas Patterson, Jr.
2018

ABSTRACT OF THE DISSERTATION
The Effect of Party Networks on Congressional Primaries
by
Shawn Thomas Patterson, Jr.
Doctor of Philosophy in Political Science
University of California, Los Angeles, 2018
Professor Kathleen Bawn, Chair
The scholarship on political parties has largely focused on their declining influence. Specif-
ically, many claim that through the widespread adoption of the partisan primary, control
over the nomination of candidates has been largely relegated to the ambitions and talents of
the office-seekers themselves. I challenge this perspective, arguing that networks of partisan
interests still play a major role in determining a party’s nominee. To support this claim, I
combine field interviews, journalistic accounts, election results, and campaign finance disclo-
sures to demonstrate the systematic effect of political networks on the electoral prospects of
primary candidates. I provide a series of case studies to show the impact of party networks
and to demonstrate the underlying mechanism – the diverse campaign resources that these
networks are able to marshal on behalf of their candidates. To generalize these findings, I use
campaign finance data for candidates between 1980 and 2014 to construct a novel measure of
group support – existing network density – derived from the degree of coordination present
among a candidate’s campaign contributors. I find that greater network support provides a
significant benefit to candidates seeking consequential open-seat nominations for the House
of Representatives. These effects remain over time and across parties after controlling for
measures of candidate viability, such as fundraising and previous elected experience. This
suggests that while the party organizations may have fewer formal powers over the selection
of candidates for office, the constellation of organized interests constituting these political
parties have lost little of their clout in the electoral process.
ii

The dissertation of Shawn Thomas Patterson, Jr. is approved.
John R Zaller
Lynn Vavreck Lewis
Seth Masket
Kathleen Bawn, Committee Chair
University of California, Los Angeles
2018
iii

To my grandparents
Anne, Edward, Bill, and Nancy
iv

TABLE OF CONTENTS
1 Introduction . . . . . . . . . . . . . . . . . . . . . . . . . . . . . . . . . . . . . . 1
1.1 Requiem for the Smoke-Filled Rooms . . . . . . . . . . . . . . . . . . . . . . 1
1.2 Overview . . . . . . . . . . . . . . . . . . . . . . . . . . . . . . . . . . . . . . 7
2 Primary Elections and Political Parties . . . . . . . . . . . . . . . . . . . . . 11
2.1 Overview . . . . . . . . . . . . . . . . . . . . . . . . . . . . . . . . . . . . . . 11
2.2 A Textbook Theory of Party Nominations . . . . . . . . . . . . . . . . . . . 12
2.3 A Group-Centered Alternative . . . . . . . . . . . . . . . . . . . . . . . . . . 13
2.4 Coordination and Competition in the Extended Network . . . . . . . . . . . 19
2.5 A Toy Example . . . . . . . . . . . . . . . . . . . . . . . . . . . . . . . . . . 21
2.6 The Importance of Consequential Open-Seat Nominations . . . . . . . . . . 28
3 Networks on the Ground . . . . . . . . . . . . . . . . . . . . . . . . . . . . . . 31
3.1 Parties on the Ground . . . . . . . . . . . . . . . . . . . . . . . . . . . . . . 31
3.2 Groups within the Extended Party Network . . . . . . . . . . . . . . . . . . 34
3.3 The Party Sometimes Decides . . . . . . . . . . . . . . . . . . . . . . . . . . 37
3.3.1 Party Conventions . . . . . . . . . . . . . . . . . . . . . . . . . . . . 38
3.3.2 ‘Firehouse’ Primaries . . . . . . . . . . . . . . . . . . . . . . . . . . . 40
3.3.3 The County Line . . . . . . . . . . . . . . . . . . . . . . . . . . . . . 44
3.3.4 The Party’s Primary . . . . . . . . . . . . . . . . . . . . . . . . . . . 47
3.3.5 Party Capture and the Formal Powers of Local Organizations . . . . 50
3.4 Candidate-Centered Informal Party Networks . . . . . . . . . . . . . . . . . 56
3.4.1 Bill Schuette’s ‘Midland Team’ . . . . . . . . . . . . . . . . . . . . . 56
3.4.2 Charlotte’s Empty Bench . . . . . . . . . . . . . . . . . . . . . . . . 60
v

3.5 National Interest Groups . . . . . . . . . . . . . . . . . . . . . . . . . . . . . 66
3.5.1 EMILY’s List . . . . . . . . . . . . . . . . . . . . . . . . . . . . . . . 66
3.5.2 The Chamber of Commerce . . . . . . . . . . . . . . . . . . . . . . . 71
3.6 Local Interest Groups . . . . . . . . . . . . . . . . . . . . . . . . . . . . . . . 74
3.6.1 IBEW Local 98 . . . . . . . . . . . . . . . . . . . . . . . . . . . . . . 74
3.6.2 Cajun Industries . . . . . . . . . . . . . . . . . . . . . . . . . . . . . 79
3.7 Activist Networks . . . . . . . . . . . . . . . . . . . . . . . . . . . . . . . . . 86
3.7.1 Meddling Marcel . . . . . . . . . . . . . . . . . . . . . . . . . . . . . 86
3.8 Networks At Work . . . . . . . . . . . . . . . . . . . . . . . . . . . . . . . . 90
4 Measuring Group Support . . . . . . . . . . . . . . . . . . . . . . . . . . . . . 96
4.1 It’s Hard to See into a Smoke-Filled Room . . . . . . . . . . . . . . . . . . . 96
4.2 Network Resources . . . . . . . . . . . . . . . . . . . . . . . . . . . . . . . . 98
4.2.1 Recruitment, Dissuasion, and Field Shaping . . . . . . . . . . . . . . 99
4.2.2 Training and Campaign Management . . . . . . . . . . . . . . . . . . 100
4.2.3 Ground Game and GOTV Efforts . . . . . . . . . . . . . . . . . . . . 101
4.2.4 Endorsements and Voting Cues . . . . . . . . . . . . . . . . . . . . . 103
4.2.5 Formal Powers . . . . . . . . . . . . . . . . . . . . . . . . . . . . . . 104
4.2.6 Financial Support . . . . . . . . . . . . . . . . . . . . . . . . . . . . . 104
4.3 Difficulties Measuring Group Support . . . . . . . . . . . . . . . . . . . . . . 105
4.4 Groups in the Extended Party Network . . . . . . . . . . . . . . . . . . . . . 108
4.5 Measuring Support through Donor Networks . . . . . . . . . . . . . . . . . . 111
4.5.1 Network Density . . . . . . . . . . . . . . . . . . . . . . . . . . . . . 112
4.5.2 Existing Network Density . . . . . . . . . . . . . . . . . . . . . . . . 114
4.5.3 Limitations and Alternatives . . . . . . . . . . . . . . . . . . . . . . . 117
vi

4.6 Dealing with Endogeneity . . . . . . . . . . . . . . . . . . . . . . . . . . . . 119
4.7 Summary . . . . . . . . . . . . . . . . . . . . . . . . . . . . . . . . . . . . . 122
5 Clearing the Field . . . . . . . . . . . . . . . . . . . . . . . . . . . . . . . . . . 124
5.1 The Political Influence of Candidate Dissuasion . . . . . . . . . . . . . . . . 124
5.2 Research Design . . . . . . . . . . . . . . . . . . . . . . . . . . . . . . . . . . 127
5.2.1 Data . . . . . . . . . . . . . . . . . . . . . . . . . . . . . . . . . . . . 127
5.2.2 Hypotheses . . . . . . . . . . . . . . . . . . . . . . . . . . . . . . . . 130
5.2.3 Model Specification . . . . . . . . . . . . . . . . . . . . . . . . . . . . 131
5.3 Results . . . . . . . . . . . . . . . . . . . . . . . . . . . . . . . . . . . . . . . 133
5.4 Discussion . . . . . . . . . . . . . . . . . . . . . . . . . . . . . . . . . . . . . 139
6 Winning the Nomination . . . . . . . . . . . . . . . . . . . . . . . . . . . . . . 144
6.1 The Influence of Political Networks in Primary Elections . . . . . . . . . . . 144
6.2 Research Design . . . . . . . . . . . . . . . . . . . . . . . . . . . . . . . . . . 146
6.2.1 Data . . . . . . . . . . . . . . . . . . . . . . . . . . . . . . . . . . . . 146
6.2.2 Hypotheses . . . . . . . . . . . . . . . . . . . . . . . . . . . . . . . . 146
6.2.3 Model Specification . . . . . . . . . . . . . . . . . . . . . . . . . . . . 147
6.3 Networks on the Ground Revisited . . . . . . . . . . . . . . . . . . . . . . . 149
6.4 Network Density and Primary Outcomes . . . . . . . . . . . . . . . . . . . . 154
6.5 Bandwagons or Gatekeepers? Issues of Endogeneity . . . . . . . . . . . . . . 164
6.6 Discussion . . . . . . . . . . . . . . . . . . . . . . . . . . . . . . . . . . . . . 169
7 Conclusion . . . . . . . . . . . . . . . . . . . . . . . . . . . . . . . . . . . . . . . 171
7.1 Party Networks and Primary Elections . . . . . . . . . . . . . . . . . . . . . 171
7.2 Implications . . . . . . . . . . . . . . . . . . . . . . . . . . . . . . . . . . . . 174
vii

7.2.1 Nominations and Representation . . . . . . . . . . . . . . . . . . . . 174
7.2.2 Contributing to the Divide . . . . . . . . . . . . . . . . . . . . . . . . 176
7.3 Next Steps . . . . . . . . . . . . . . . . . . . . . . . . . . . . . . . . . . . . . 182
7.3.1 Champions in the Arena . . . . . . . . . . . . . . . . . . . . . . . . . 182
7.3.2 Beyond Density . . . . . . . . . . . . . . . . . . . . . . . . . . . . . . 183
7.3.3 ENDless Possibilities . . . . . . . . . . . . . . . . . . . . . . . . . . . 184
7.4 Summary . . . . . . . . . . . . . . . . . . . . . . . . . . . . . . . . . . . . . 185
viii

LIST OF FIGURES
1.1 Campaign Contributions to Elizabeth Fletcher and Laura Moser . . . . . . . . . 5
2.1 An Example Network Strategy with Competitive General Election . . . . . . . . 25
2.2 Expected Utility of Group Participation in Nominations . . . . . . . . . . . . . 26
2.3 Competition in Consequential Open-Seat Primaries . . . . . . . . . . . . . . . . 27
2.4 Open Seat Congressional Races Since 2006 . . . . . . . . . . . . . . . . . . . . . 30
3.1 Political Parties as Enduring Multi-Layered Coalitions . . . . . . . . . . . . . . 35
3.2 Canvass Locations in Virginia’s 10th District Republican Primary . . . . . . . . 43
3.3 Sample Ballots from New Jersey’s 12th District Democratic Primary . . . . . . 45
3.4 Overlap in Donors between Ken Buck, Corey Garnder, and the RNC . . . . . . 48
3.5 North Carolina’s 12th District Democrat Primary Results . . . . . . . . . . . . 65
3.6 Michigan’s 14th District Democratic Primary Results . . . . . . . . . . . . . . . 68
3.7 U.S. Chamber’s Advertisement Against Woody White . . . . . . . . . . . . . . . 72
3.8 Pennsylvania’s 13th District Democratic Primary Results . . . . . . . . . . . . . 78
3.9 A Conservative Diagram of Lane Grigsby’s Network in Support of Graves . . . . 83
3.10 Campaign Contributors to Louisiana’s 6th District Republicans . . . . . . . . . 84
3.11 Campaign Contributions to Pennsylvania’s 6th District Democrats . . . . . . . . 89
4.1 An Illustration of Network Density . . . . . . . . . . . . . . . . . . . . . . . . . 114
4.2 Calculating A Candidate’s Existing Network Density . . . . . . . . . . . . . . . 115
4.3 Distribution of Existing Network Density (END) Scores . . . . . . . . . . . . . . 116
4.4 Network Structure and Density . . . . . . . . . . . . . . . . . . . . . . . . . . . 118
5.1 Predicted Probabilities of Candidate Drop-out by Candidate Quality . . . . . . 137
ix

5.2 Candidate Drop-out Over Time by Party . . . . . . . . . . . . . . . . . . . . . . 138
6.1 Network Density and Campaign Finance in Pennsylvania’s 13th District . . . . 150
6.2 Network Density for Boyle and Arkoosh . . . . . . . . . . . . . . . . . . . . . . 153
6.3 Network Density and Likelihood of Winning Primary . . . . . . . . . . . . . . . 157
6.4 Network Density and Likelihood of Winning Primary by Candidate Quality . . . 158
6.5 ROC Diagnostics for Model 6.2.4 . . . . . . . . . . . . . . . . . . . . . . . . . . 159
6.6 Network Density and Likelihood of Winning Primary by Political Party . . . . . 161
6.7 Network Density and Primary Outcomes Over Time . . . . . . . . . . . . . . . . 163
7.1 Partisan Divide in Individual Contributors . . . . . . . . . . . . . . . . . . . . . 179
7.2 Partisan Divide in PAC Contributors . . . . . . . . . . . . . . . . . . . . . . . . 180
7.3 Modularity of State Primary Donor Networks . . . . . . . . . . . . . . . . . . . 181
x

LIST OF TABLES
2.1 A Toy Example of Group Preferences . . . . . . . . . . . . . . . . . . . . . . . . 22
3.1 County Results in New Jersey’s 12th District Democratic Primary . . . . . . . . 46
3.2 County Results in Michigan’s 14th District Democratic Primary . . . . . . . . . 70
4.1 Granger Causality Tests of Fundraising Share and Party Support . . . . . . . . 121
5.1 Existing Network Density’s Relationship with Primary Drop-out . . . . . . . . . 134
5.2 Existing Network Density’s Effect on Primary Drop-out . . . . . . . . . . . . . . 136
5.3 Primary Drop-out by Fundraising Levels . . . . . . . . . . . . . . . . . . . . . . 139
6.1 END Scores for Case Study Winners and Runners-Up . . . . . . . . . . . . . . . 150
6.2 Existing Network Density’s Effect on Likelihood of Winning a Primary . . . . . 156
6.3 Existing Network Density’s Effect on Primary Vote Share . . . . . . . . . . . . . 162
6.4 Networks Beating the Odds . . . . . . . . . . . . . . . . . . . . . . . . . . . . . 166
6.5 Granger Causality Tests of Fundraising Share and Party Support . . . . . . . . 168
xi

ACKNOWLEDGMENTS
Beginning in the summer of 2013, under the direction of my phenomenal advisors Kath-
leen Bawn and John Zaller, I began interviewing candidates, interest groups, party leaders,
campaign operatives, local activists, journalists, and primary voters in an open-ended at-
tempt to understand party nominations. In my work for the Parties on the Ground project,
I traveled to ten states, conducted interviews in over twenty congressional districts, and
spoke to dozens of people over hundreds of hours. These experiences tore down my intu-
itions, inspired my work and motivated this dissertation. It is impossible to overstate just
how valuable this hands-on political education in American politics was to my academic
development.
Because of the uniqueness of this experience, my thanks go first to the unsung heroes of
this project: the countless interviewees who had no business talking to our team, but did so
anyway. Whether out of a sense of civic duty, professional courtesy, or simple curiosity, these
individuals opened up a world seldom seen and even more rarely understood by academics.
Thank you all for sharing your time, your expertise, and your passions with us. Your
contributions inspired this work and brought depth and color to all that follows.
But inspiration carries you only so far. The perspiration (and luck) needed to bring this
project to fruition came from Kathy and John. They are the mentors that every student
hopes for in grad school. They were generous with their time, advice, and support. They
pushed me when I needed it and were patient with me far more often than I deserved. They
inspired in me a passion for factions and all their mischief, and set examples as scholars
that I work every day to emulate. And most importantly, they demonstrated that all this
was possible while remaining unwaveringly thoughtful and caring colleagues and friends.
Any contribution this works makes is a direct result of their innumerable contributions, any
failings a result of the advice I failed to take, and the fact that it sits before you at all a
testament to their guidance.
To Kathy in particular, I owe more thanks than words can convey. As my dissertation
xii

chair, she was the sounding board for nearly every idea, a source of order to my rather
chaotic, freewheeling research, and an advocate of this project when even I had doubts. She
provided the whetstone on which I sharpened the logic and execution of everything included
in these pages. But Kathy’s impact can be felt far beyond these pages – from field papers to
field work; from 200B to filing this dissertation, Kathy guided me through graduate school. I
cannot imagine surviving this process without her. My only hope is that in my own career I
am able to marshal the same energy, attention, and dedication on behalf of my own students.
John deserves both the thanks and blame for encouraging the at times lofty ambitions
of my research. Only under his mentorship could I imagine having the confidence and
ability to execute exit polls with three days notice, interview countless politicos far above
my pay grade, and undertake a project as broad as this. Not to mention make it out of
Orange County, TX in one piece. He made shooting for the moon an acceptable baseline
and convinced me that I was capable of reaching those expectations.
Many in the UCLA Political Science Department contributed to me finishing this
project, but Lynn Vavreck deserves particular mention. Lynn was always a fresh set of
eyes that could help clarify an argument, refine a paper, and package a finding. Grad stu-
dents rarely need help starting projects, but Lynn was instrumental in getting this over the
finish line. Most importantly, she pushed me to see myself as a scholar in my own right.
The impostor syndrome is real, but a push here and there from Lynn, knocks that out of
you pretty quick.
This work in particular owes many thanks to many people who provided feedback and
data at various stages. Seth Masket provided great feedback in the early stages of designing
this project and helped me avoid some of the pitfalls of network analysis. This work would
have been impossible without the heavy lifting of Adam Bonica’s DIME dataverse – a real
service to the discipline. I also owe Hans Hassell thanks for the data on candidate elective
experience presented in Chapter 5. Early drafts of these chapters have benefited from the
conference feedback of Rachel Blum, Suzanne Robbins, and Jennifer Victor, and a handful
of other extremely helpful MPSA co-panelists. And of course, many thanks to my intrepid
RA, Mellissa Meisels, for coding more articles, websites, biographies, and advertisements
xiii

than could possibly be advisable for one’s long-term mental health.
While some poor unfortunate souls may traverse the horrors of grad school alone, I was
fortunate enough to be surrounded by some of the brightest, and more importantly, kindest,
colleagues and friends throughout my time at UCLA. To the Vikings – Becca, Bryan, Caleb,
Liz, and Tyler – thank you for helping me feel at home through all the madness. To the
Squad – Kevin, Laura, Meg, and Michelle – thank you for bringing Delaware to me when I
needed it most. To Team POG – Angela, Knox, and John – thank you for helping get me
into the field and back in one piece. To Galen, Jesse, Paasha, Ryan, and Steve – thanks for
being the pals. To Angie, Christine, Erik, Shakari, and Klugies past, present, and future, –
thank you for your friendship, advice, and monthly snack assignments. I caught a lot of lucky
breaks in the program, but none more so than meeting Soumi Chatterjee. I can safely say
I learned more about the actual art of politics from our conversations than any class, book,
or article. Not to mention all that I learned about the O’s, 24-hour donut establishments,
and the distribution of karaoke bars in West LA. For all that and more, thanks CNT.
Finally, an acknowledgments section would be incomplete without thanking the loved
ones who put up with monstrously inexcusable behavior in the final months. Sarah and
Kevin, thank you for the boxed wine, professor suites, pizza rolls, and tarot cards that
helped me blow off steam and for Mir and RoLo who never fail to make me smile. Hannah,
thank you for holding our lives together for the past six months and not judging me too
harshly when I stress ate Reese’s for two meals in a row and cried watching Netflix docu-
mentaries. Mom and Dad, I’ll never be able to describe how thankful I am for all you’ve
done for me over the past twenty-eight years and how proud I am to have you as my parents.
I would be nowhere without you all.
Shawn Patterson, Jr.May 30, 2018
xiv
VITA
2012 B.A. (Political Science), with honors, Brown University.
2012 Philo Sherman Bennet Prize, Brown University.
2012 – 2014 Graduate Dean’s Scholar Award, ULCA.
2015 M.A. (Political Science), UCLA.
2015 Graduate Research Mentorship Award, UCLA
2015 – 2018 Teaching Assistant, Political Science Department, UCLA.
2016 Dirksen Center Congressional Research Grant.
2016 – 2018 Lecturer, Political Science Department, UCLA.
2016 – 2017 Teaching Fellow, Freshman Cluster Program, UCLA.
2018 Dissertation Year Fellowship, UCLA
xv

CHAPTER 1
Introduction
1.1 Requiem for the Smoke-Filled Rooms
After Donald Trump won the presidency, Democratic candidates began out-performing
expectations in many special and off-cycle elections. In Kansas’s 4th, Montana’s At-Large,
and Georgia’s 6th, Democrats came within striking distance in congressional districts that
had long been impregnable Republican strongholds. Democrats won the governors’ man-
sions and numerous state legislative seats in New Jersey and Virginia – coming within one
seat of taking back control in Virginia’s House of Delegates. Most dramatically, Democrat
Doug Jones won an open special election for the Senate in Alabama – a state that hadn’t
elected a Democrat to the Senate in 25 years. As a result of these bullish performances,
Democrats no longer felt that retaking the House of Representatives in the 2018 midterms
was inconceivable. Once safe Republican seats were increasingly seen as Democratic targets,
including Representative John Culberson’s (R-TX) 7th district.
Despite being reelected in 2016 with a comfortable 56% of the vote, Culberson’s previ-
ously safe district voted for Hillary Clinton 49-47 over Donald Trump. Democrats nationally
believed that his district was a prime pick-up opportunity, and so did the seven Democratic
candidates that filed to run in the primary. As The Houston Chronicle (2018) described,
“[e]ach one of the seven candidates running in this Democratic primary bringssomething impressive to the race. Jason Westin, 40, is a cancer researcher steepedin the details of health care policy. Lizzie Pannill Fletcher, 42, is a Phi BetaKappa graduate who edited the William and Mary Law Review before becomingthe first woman partner in a prominent local law firm. Alex Triantaphyllis, 33,is an eloquent young executive at a major non-profit who’s attracted widespreadsupport among the party faithful. Laura Moser, 40, is a lively progressive activist
1

who launched a national anti-Trump action movement. Ivan Sanchez, 30, is ayoung and energetic former congressional staffer who hopes his candidacy willinspire Hispanic voters. Joshua Butler, 32, is an administrator at the UT HealthScience Center who talks about party unity with striking grace and eloquence.James Cargas, 51, an assistant city attorney specializing in energy issues, hasinvested years of sweat equity by running for this position in three previouselection years.”
Some observers worried that this diverse and divided pool of candidates would allow for
a nominee too ideologically extreme to win the competitive general election. To the surprise
of many, the Democratic Congressional Campaign Committee (DCCC) decided to take a
controversial stand against one of the primary candidates, Laura Moser, to help nominate a
candidate they felt more electable in November. The DCCC published a document online
containing its opposition research against Moser. They posted a section from an op-ed in
which Moser had parenthetically noted she’d “sooner have my teeth pulled out without
anesthesia” than live in Paris, Texas. They claimed she was a carpetbagger, who was still
“receiving the DC homestead exemption on her property,” who only moved to the district to
run for Congress. They criticized campaign expenditures made to her husband’s consulting
firm (DCCC 2018). In a press conference, DCCC communications director Meredith Kelly
responded that they “are working every day at the DCCC to win the 24 seats that we need
to take back the House, and we believe that voters who have been organizing for more than
a year to hold their Republican representative accountable, they deserve to have a fighting
chance in November” (Bownam 2018).
Moser did not take these attacks sitting down: “We’re used to tough talk here in Texas,
but it’s disappointing to hear it from Washington operatives trying to tell Texans what to
do. These kind of tactics are why people hate politics. The days where party bosses picked
the candidates in their smoke filled rooms are over. DC needs to let Houston vote.” And
unfortunately for the DCCC, nor did her progressive supporters, such Jim Hightower, a
boardmember of Our Revolution, the progressive network formed from supporters of Bernie
Sander’s presidential campaign: “The DCCC’s ridiculous attacks on Laura Moser are why
Democrats nationally have lost over 1,100 seats. Laura is a rising progressive advocate
that the workaday people of Texas desperately need” (Nilsen 2018a). Their de-facto leader,
2
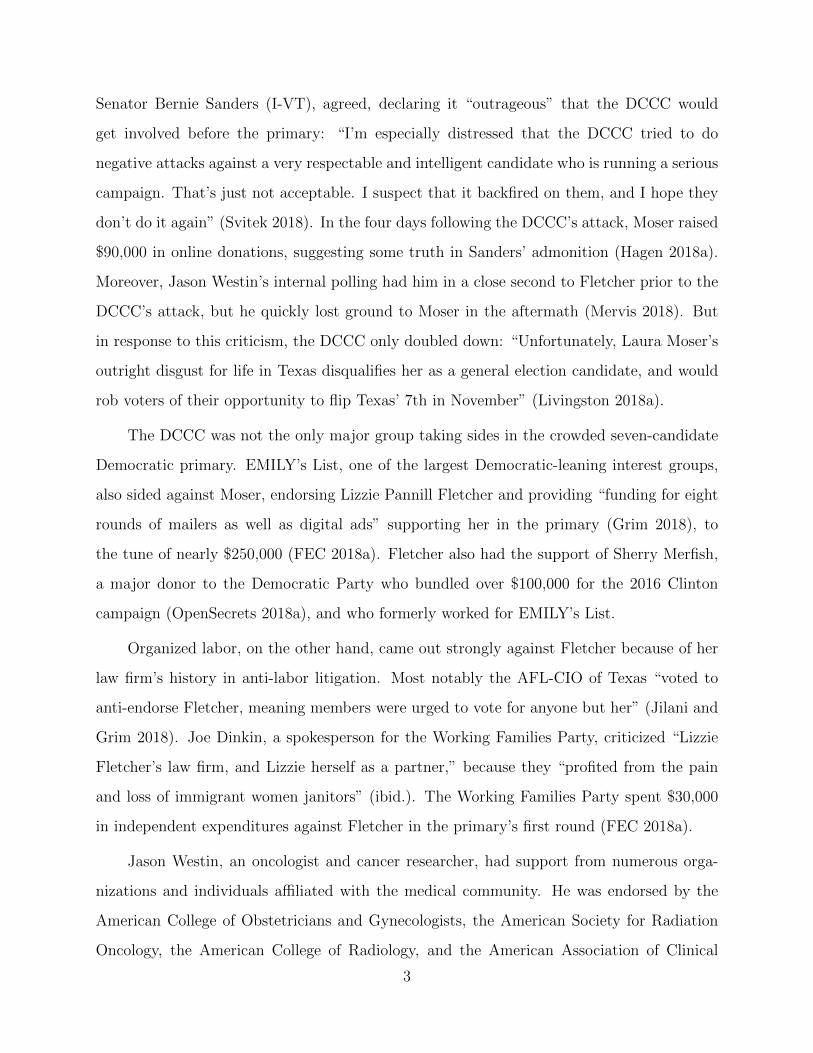
Senator Bernie Sanders (I-VT), agreed, declaring it “outrageous” that the DCCC would
get involved before the primary: “I’m especially distressed that the DCCC tried to do
negative attacks against a very respectable and intelligent candidate who is running a serious
campaign. That’s just not acceptable. I suspect that it backfired on them, and I hope they
don’t do it again” (Svitek 2018). In the four days following the DCCC’s attack, Moser raised
$90,000 in online donations, suggesting some truth in Sanders’ admonition (Hagen 2018a).
Moreover, Jason Westin’s internal polling had him in a close second to Fletcher prior to the
DCCC’s attack, but he quickly lost ground to Moser in the aftermath (Mervis 2018). But
in response to this criticism, the DCCC only doubled down: “Unfortunately, Laura Moser’s
outright disgust for life in Texas disqualifies her as a general election candidate, and would
rob voters of their opportunity to flip Texas’ 7th in November” (Livingston 2018a).
The DCCC was not the only major group taking sides in the crowded seven-candidate
Democratic primary. EMILY’s List, one of the largest Democratic-leaning interest groups,
also sided against Moser, endorsing Lizzie Pannill Fletcher and providing “funding for eight
rounds of mailers as well as digital ads” supporting her in the primary (Grim 2018), to
the tune of nearly $250,000 (FEC 2018a). Fletcher also had the support of Sherry Merfish,
a major donor to the Democratic Party who bundled over $100,000 for the 2016 Clinton
campaign (OpenSecrets 2018a), and who formerly worked for EMILY’s List.
Organized labor, on the other hand, came out strongly against Fletcher because of her
law firm’s history in anti-labor litigation. Most notably the AFL-CIO of Texas “voted to
anti-endorse Fletcher, meaning members were urged to vote for anyone but her” (Jilani and
Grim 2018). Joe Dinkin, a spokesperson for the Working Families Party, criticized “Lizzie
Fletcher’s law firm, and Lizzie herself as a partner,” because they “profited from the pain
and loss of immigrant women janitors” (ibid.). The Working Families Party spent $30,000
in independent expenditures against Fletcher in the primary’s first round (FEC 2018a).
Jason Westin, an oncologist and cancer researcher, had support from numerous orga-
nizations and individuals affiliated with the medical community. He was endorsed by the
American College of Obstetricians and Gynecologists, the American Society for Radiation
Oncology, the American College of Radiology, and the American Association of Clinical
3

Endocrinologists (Westin for Congress 2018). He also had the support of 314 Action, an or-
ganization focused on electing doctors and scientists to elected office. In addition to financial
support, 314 Action offers campaign training boot camps and actively recruits candidates
from STEM fields. Their executive director, Joshua Morrow, explained that their “goal is
not to get through 2018 and that’s it, but to eventually be an EMILY’s List for scientists”
(Pathe 2017). All of these organizations also made financial contributions to his campaign.
And of his itemized financial contributions, Westin raised over $235,000 from individuals
listing medical occupations (FEC 2018b). His medical credentials were featured prominently
in his campaign. His website header and campaign yard signs featured “Jason Westin, MD
for Congress.”
The local political establishment largely coalesced behind Alex Triantaphyllis, co-founder
of a mentoring nonprofit for refugees in Houston, who at 33 was the youngest candidate in
the race. He was considered the early frontrunner and was able to raise a staggering amount
of money – over $1,000,000 with very less than $10,000 coming from PAC contributions
(Schneider 2017a; 2017b). He had the support of many of the local Houston politicians,
including endorsements from members of the Houston city council and trustees from the city
Board of Education (Nilsen 2018a). He also had the endorsement and financial backing of
Michael Skelly, a clean energy company CEO (and former Democratic candidate in the 7th
district). In addition to his own contribution, multiple individuals from his company, Clean
Line Energy, and his wife made contributions to his campaign as well.
In Texas, if no candidate wins a majority in the primary, the top two candidates then
compete in a run-off. Both Fletcher and Moser qualified for the run-off, setting the Democrats
on a path to re-fight the party wars of the 2016 presidential primary between Hillary Clinton
and Bernie Sanders, with EMILY’s List and the party establishment on one side, progressive
activists and organized labor on the other. Moser herself lamented that there was “a lot
of re-litigating of the 2016 campaign” and that attacks on her may have been connected
to her previous support of Sanders’ campaign (Guttenplan 2018). Given the vitriol of that
campaign and the abundance of op-eds criticizing the Democrat’s “gift for self-immolation”
(Swartz 2018) and ability to “snatch defeat from the jaws of victory” (Nichols 2018), we could
4

forgive the DCCC any mourning over the loss of smoke-filled rooms and party conventions
of the past.
From 30,000 feet, this race seems a prime example of political parties in decline. Moser’s
case seems a textbook example of the candidate-centered primary where “few congressional
candidates find opposition from the local party leaders to be a significant handicap; neither
is their support very helpful” (Jacobson 2009). The Houston Chronicle described each can-
didate based on their own qualities and ambitions with little mention of party officials and
interest group leaders. Moser claimed that the party’s opposition was actually helping her
campaign (Dugyala 2018) and her advancement to the runoff was not in spite of, but because
of backlash to the party’s efforts. The crowded, chaotic field of candidates would appear as
a party unable to coordinate.
Figure 1.1: Campaign Contributions to Elizabeth Fletcher and Laura Moser
Laura Moser
Date
Item
ized
Fun
drai
sing
(10
00$)
490
500
510
520
530
540
550
560
Feb−01 Feb−08 Feb−15 Feb−22 Mar−01 Mar−08
Elizabeth Fletcher
Date
Item
ized
Fun
drai
sing
(10
00$)
700
710
720
730
740
750
760
770
780
790
800
Feb−01 Feb−08 Feb−15 Feb−22 Mar−01 Mar−08
Note: The daily totals from itemized fundraising for the two candidates are presented above.The dashed line is a linear projection of fundraising expectations based on the rate offundraising prior to the DCCC’s attack on Moser on Feb. 23, 2018. The grey shadedarea is the period of time between the attack and the primary.
But if we look a little closer, it’s clear that Moser’s success was not driven solely by
5

her ambitions and talents, but relied heavily on the support of a powerful coalition of actors
within the Democratic party. Yes, her campaign faced opposition from the formal party or-
ganization through its fundraising arm, the DCCC, and a prominent national interest group,
EMILY’s List, but she was simultaneously supported by prominent national politicians like
Bernie Sanders, a grassroots network of party activists, like Our Revolution, and a series
of local interest groups, such as the Working Families Party and the Texas AFL-CIO – all
groups firmly within the extended Democratic Party network. And that support was not
inevitable. Figure 1.1 provides the daily fundraising totals for Fletcher and Moser during
the run-up to the primary. In the aftermath of the DCCC’s attack, Moser witnessed a sig-
nificant increase in fundraising that her opponent lacked. This support had to be mobilized
(or perhaps counter-mobilized in this case) in support of their candidate.
This mobilization, however, was short-lived. Months “after the DCCC derided her as a
D.C. carpetbagger and furious activists leaped to her defense ahead of Texas primary,” the
negativity and conflict largely dissipated with both Fletcher and Moser focused on Culberson.
Moreover, the “gush of online money” from Sanders’ network never materialized into a long-
term financial benefit for Moser, who entered the final week of the runoff with four times less
cash on hand than Fletcher (Schneider 2018). On election day, the DCCC’s and EMILY’s
List’s investements paid off. Fletcher bested Moser by over a 2 to 1 margin on the May
22nd runoff (Livingston 2018b). Moser’s concession fit with the new-found congeniality of
the runoff: “The key objective here is to beat John Culberson. If this night turns out like
it looks like it’s going to turn out, I encourage everyone to support Lizzie Fletcher” (Hagen
2018b). In the end, the national Democratic Party network got their candidate.
***
This dissertation is about political parties and their attempts to control the nomination
of candidates in primary elections. It is about how networks of activists, interest groups,
elected officials, and party operatives – the constellation of actors constituting the modern
extended party – coordinate resources behind their chosen candidates to the benefit of those
campaigns. It is about these organized networks of partisan actors that “own the party”
6

and “make nominations” (Schattschnieder 1942, p. 64). It is an attempt to show that these
diffuse coalitions of political actors have not lost their influence over nominations to the
talents and ambitions of individual candidates. It is, in sum, and attempt to show that
in congressional primaries, the behavior of organized groups holds significant influence over
who wins the nomination.
1.2 Overview
Toward that aim, this dissertation is organized as follows. In Chapter 2, I outline a
theory of political parties that encompasses the network of party actors at work in party
primaries and justify why these actors would be so motivated to compete in primaries.
This work relies heavily on the theoretical contributions of previous work viewing parties as
extended networks (Bawn et al. 2012; Cohen et al. 2008; Koger, Noel, and Masket 2009;
2010; Desmarais, La Raja, and Kowal 2015; Schwartz 1990; among others). I extend this
conception of a party network both theoretically and methodologically. Theoretically, I push
back on the assumption of network cooperation and suggest that under many circumstances
actors within the extended party network have every incentive to compete among themselves.
Methodologically, I expand the universe of potential network members to include a greater
variety of actors with a greater variety of resources available to influence nomination contests.
Consider just the array of actors involved in the Texas’s 7th primary. The DCCC
attempted to pressure Moser out of the race. EMILY’s List endorsed and ran independent
advertisements for Fletcher, while Sherry Merfish, a major Democratic bundler, helped her
raise money. Our Revolution and Bernie Sander’s national network worked with the Texas
AFL-CIO and the Working Families Party to support Moser’s campaign. In one race, the
national party, local and national interest groups, elected officials, grassroots activists, and
major campaign donors – all prominent players in an extended party network – marshaled
resources and competed on behalf of their preferred nominee. While Moser may not have been
the preferred candidate of the party’s central player, her advancement to the runoff is not a
sign of party atrophy, but a sign of changes in factional strength within the Democratic Party.
7

Any definition of party that ignores the diversity of potential players and their willingness to
compete among themselves in these primaries misses critical sources of power and influence.
In Chapter 3, I provide an overview of the different types networks observed in the field
during the 2014 primary election season. I provide detailed case studies of these types of
party networks in action, both summarizing the general dynamics of the nomination contest
while highlighting the resources marshaled by these networks on behalf of their preferred
candidates. These case studies provide qualitative evidence that networks of party actors
were in fact wielding tremendous influence in party nominations and that they did so by
providing campaigns with benefits rarely available to candidates without network support.
The data for this chapter comes primarily from interviews with local journalists, party
officials, activists, political consultants, interest groups, major donors, candidates, campaign
staffers, local academics, and even the occasional primary voter – a snowball sample not
inaccurately described as anyone and everyone who would talk to us – conducted as part of
the larger Parties on the Ground project at UCLA. Data from these interviews are combined
with journalistic accounts, political histories of the region, campaign finance disclosures, and
eventual primary and convention vote outcomes to describe a holistic account of the political
systems in which each contest takes place.
Chapter 4 begins by summarizing and expanding on the resources these networks have
available to them in party primaries. Gathering evidence of party network support, however,
is impractical for a large number of races. Many of the resources are simply difficult to
track, like endorsements, where no centralized record source is available, and the universe
of potential endorsers is unknown beforehand (not to mention interest groups propensity to
scrub their support for candidates who lose elections). Other resources, like elite attempts to
clear the field or pressure candidates out of the race, are usually purposefully kept out of the
public eye. Therefore, I propose a novel measure to determine the degree of group support
derived from the network of campaign contributors supporting a particular candidate. The
strict, standardized reporting requirements in combination with the importance of financial
support among networks of all types allow for a measure that transcends the particularities
of individual races, and allows us to speak to the impact of organized party network support
8

in a more systematic fashion.
To construct the existing network density (END) score for a particular candidate, I
compile a list of every donor who made a contribution to that candidate during the primary
(t1). For each donor in this list, I then find every donation they made in the previous election
cycle (t0). I limit these contributions to those made in the primary to all non-presidential
federal campaigns. I next construct a network where these donors are connected to each other
if they donated to the same candidate in this prior primary cycle (t0). Finally, I calculate
that network’s density – the ratio of the ties within the network to the number of possible
ties for a network of that size. I focus on the behavior of donors in the election cycle prior in
order to establish that these donors are not simply re-election coalitions pulled together in a
particular election by a particular candidate. Candidates who score higher on this measure
are those whose supporters are frequently coordinated in their party’s primary. Those who
score low on this measure do not have the support of a consistently activated network of
contributors. By demonstrating that these donors have consistent patterns of giving over
time, I can show that these networks are organized and durable – signaling group support.
In Chapter 5, I use this new measure to account for variation in candidates’ likelihoods
of dropping out of a primary contest. Given how important the field of candidates in a
primary is in determining the eventual winner, the party network’s ability to shape the
field is one of it’s most influential, if difficult to observe, resources. I find that candidates
with denser networks of support – those candidates with the support of more donors who
frequently work together in their party’s primary – are on average more likely to drop-out
of the race. In other words, all else equal, candidates more connected to elements of the
party network are more likely to capitulate to field clearing efforts. Given how central these
networks are in facilitating an individual’s political career, it makes sense that candidates
with the support of factions within the extended party network would be most likely to
respond to field clearing pressures of the party at-large. More generally, this finding suggests
that party actors influence the political prospects of primary candidates long before voters
head to the polls by shaping the pool of candidates from which they will be able to choose.
The finding that candidates with higher END scores are more likely to drop out may
9

seem at odds with this dissertation’s overall argument that network support is a political ad-
vantage to individuals seeking their party’s nomination. But as I will demonstrate, dropping
out is not always a disadvantage for ambitious candidate with the support of an organized
groups. Individuals able to maintain relationships with these networks and who acquiesce
to the pressures not to run for Congress are often rewarded with support in pursuit of other
offices or future congressional runs. For example, in Pennsylvania’s 13th district, speculation
was that Jon Saidel dropped out to have union’s support for his mayoral bid the following
year (see Otterbein 2015). And in Arizona, the UFCW explicitly compelled a candidate
to drop out in exchange for support seeking a county supervisor position (Ocampo 2017).
Increasing the likelihood of dropping out may appear a “disadvantage” for candidates with
networked support, but in reality this often signals the maintenance of a mutually beneficial
relationship between a group and their would-be agent.
I next turn to the nomination contest itself. Chapter 6 presents estimates of the effect of
a candidate’s END score has on their likelihood of winning consequential open-seat primaries
to the House of Representatives between 1982 and 2014. I find that those candidates with
the support of organized portions of the party network are significantly more likely to win
their primary contest. Importantly, these effects remain over time and across party after
controlling for traditional measures of candidate success, such as fundraising and candidate
quality. To address some concerns of endogeneity, I perform a series of Granger causality
tests to suggest that network support is driving electoral prospects, and not the other way
around. In sum, I argue that party networks, broadly defined, are still powerful forces in
choosing the party’s nominees for Congress. They often (although not always) lack the
formal power to select the nominee, but they do have access to scarce campaign resources
that can significantly impact the outcome of a particular primary.
Lastly, in Chapter 7, I discuss the implications of a nominating system dominated by
intense policy-demanding groups. As both a conclusion and jumping-off point for future
work, I discuss what effects a group-centered nominations could have on polarization and
representation more broadly.
10

CHAPTER 2
Primary Elections and Political Parties
“He who can make the nominations is the owner of the party.”
– E. E. Schattschneider1
2.1 Overview
This dissertation is an attempt to push back on the predominant, candidate-centered
view of political parties and elections. Yes, the political environment rewards the talented
politician. But the supply of ambitious candidates, while not infinite, far exceeds the number
of seats in Congress. This provides parties and the constellation of interests that constitute
them with the potential to serve as gatekeepers to elected office. The decision to run may or
may not lay solely under the volition of a self-motivated politician, but the ability to succeed
in those endeavors is another matter entirely. I aim to demonstrate that members of the
extended network of the major political parties still hold influence over the nomination of
candidates in Congressional primaries. But to make this argument requires a broader, more
inclusive definition of political parties than Downs’ team of politicians. In this chapter, I
briefly summarize the literature on the extended party network, expand on this theoretic
framework to account for recent empirical findings, and conclude by highlighting the impor-
tance of open-seat nominations as a critical test of this theory.
1Schattschneider, E.E. 1942. Party Government. New York: Rinehart & Company, Inc.
11

2.2 A Textbook Theory of Party Nominations
Some of the most salacious stories of political intrigue involve the machinations of
parties in pursuit of power and in no realm have those efforts stood more memorable than in
their attempts to control the nomination process. From the political machines and smoke-
filled rooms of Daley’s Chicago and Tweed’s New York, to the Democratic Party’s more
recent forays into the Texas 7th district primary, examples of parties exerting control over
nominations of candidates for elected office are the anecdotal lifeblood of party scholars.
Often, however, these instances of party influence are presented as merely foils to con-
ventional experience. Jacobson notes that these stories are “noteworthy because they are so
atypical...the nomination is [no longer] something to be awarded by the party but rather a
prize to be fought over,” with the lack of party support rarely “a significant handicap; nei-
ther is their support very helpful” (2009, p. 19). Jacobson’s conclusion mirror Key’s (1956,
p. 271) conclusion from half a century prior that “to assert that party leadership develops
candidates is more an attribution of a duty noted in the textbooks than a description of real
activity.” The national party has no formal role in the selection of congressional nominees,
few states hold any sway in the process, and local political machines have largely faded
into history. Primary elections, these scholars believe, have “deprived parties of their most
important source of influence over elected officials” (Jacobson 2009, p. 14).
Surveys of congressional candidates in the late-1960s and early-1970s largely supported
these conclusions. The findings “all demonstrated that individual motivations and expecta-
tions were critical in differentiating winners and losers” (Fowler 1993, p. 59), questioning the
importance of party elites in the recruitment, training, and success of potential candidates
(see Fishel 1973; Kingdon 1968; Leuthold 1968; Sullivan and O’Connor 1972). This in turn
lead many to conclude that the nomination of candidates has become primarily “candidate-
centered,” in that “the desire, skills, and resources that candidates bring to the table in
the electoral arena are the most important criteria separating serious candidates from those
who have little chance of getting elected” (Herrnson 2011, p. 41). It was “the self-starter,
the freebooting entrepreneur, the strategic politician” (Fowler 1993, p. 60), not the political
12

party, that drove outcomes in primary elections.
These conclusions arise from a view of political parties focused on Downs’ “team of
men [sic] seeking to control the governing apparatus by gaining office” (1957, p. 25). As
Aldrich (1995 p. 5) summarizes, “the major political party is the creature of the politicians,
the ambitious office seeker and the officeholder. They have created and maintained, used
or abused, reformed or ignored the political party when doing so has furthered their goals
and ambitions.” In this tradition parties “formulate policies in order to win elections, rather
than win elections in order to formulate policies” (Downs 1957, p. 28), as winning elections
“has to be the proximate goal of everyone, the goal that must be achieved over and over if
other ends are to be entertained” (Mayhew 1972, p. 16).
Progressive reforms to the electoral process and the implementation of direct primaries
in particular were proposed to loosen the hold of these very parties and politicians over the
electoral process. The implementation of the direct primary would “remove control of the
nominating process (and thus the recruitment of office holders) from the hands of party
officials” (Maisel 2001, 107). As primary elections transferred the authority to make nomi-
nations from conventions dominated by party officers and elected officials to the electorate,
parties would increasingly take a back seat to “the desire, skills, and resources” of individual
candidates (Herrnson 2011). This candidate-centered view of parties and nominations is the
predominant perspective in the field, featured prominently in the authoritative textbooks
on political parties and congressional elections (see Herrnson 2009; Jacobson 2009; Hershey
2014). Given its prevalence, it should come as no surprise that “modern scholarship on
parties rarely affords them any attention in the nomination process” (Hassell 2018).
2.3 A Group-Centered Alternative
Recent scholarship has pushed back against some of the candidate-centered findings of
previous research. Calling into question many of the findings from early surveys of primary
candidates, scholars have demonstrated the importance of party actors in the recruitment
of women (Fox and Lawless 2005), minority (Ocampo 2017), and working-class candidates
13

(Carnes 2018). Others have noted how even without the power to formally nominate candi-
dates, the national parties are still able to marshal important resources on behalf of candi-
dates to their primary campaigns, including providing talented campaign staff (Cain 2013;
see Robbins 2017), elite and interest group endorsements (Dominguez 2011), and the strate-
gic recruitment and dissuasion of candidates (Broockman 2014; Ocampo 2017).
What these works have in common is a view of formal party organizations as only part
of an extended party network of interest groups, advocacy organizations, candidates, and
activists. Relying heavily on Bawn et al.’s (2012) group-centric theory of parties, these
works return to Schattschneider’s view of interest groups as the “raw materials of politics”
(1942, pg. 17). Contesting the contemporary view of parties as “a team of politicians
whose paramount goal is to win electoral office,” these authors instead posit that parties
“are best understood as coalitions of interest groups and activists seeking to capture and use
government for their particular goals.” In other words, these authors reverse Downs central
premise that parties choose policy positions in order to win election and argue that they
“cede as little policy to voters as possible” in pursuit of electing “candidates sympathetic to
their goals, goals typically not shared by most ordinary voters” (Bawn et al. 2012).
But what is a “group” or a “network”? Again, borrowing from Bawn et al. (2015),
“an organized group is one that has previously solved a collective action problem prior to
supporting the candidate in question.” This definition has three central components. First,
the group is organized. These are not the coincidental actions of similarly motivated indi-
viduals, but the actions of a group. The bonds of this organizing principle form ties between
individuals just as ‘friending’ connects social networks on Facebook and ‘following’ builds
social networks on Twitter. They may be organized around particular interests or sweeping
ideologies, but regardless of how they are organized, the key is they that are organized.
Second, this act of organizing provides some resource or social benefit. Out of material
self-interest, social incentives, or high-minded ideals, these co-motivated individuals have
overcome the pathologies inhibiting collective action in order to provide an endorsement,
coordinated campaign contributions, a call to action among their supporters, or even apolit-
ical benefits like information, advocacy, or coordination. Finally, this organization occurred
14

prior to supporting the candidate in question, meaning that the organizing principle of the
organization is not loyalty to the particular candidate, per se. This has implications in the
balance of power between organized interests and politicians in the political system. If the
organization exists prior to and independent of individual campaigns, then these groups can
serve as gatekeepers. If the organizations exist only in relation to a particular candidate,
this would signal that they are less actors in their own right, and simply the electoral con-
stituencies of a particular ambitious politician. A group, therefore, is a durable network of
supporters consistently organized around a common goal.
Bawn et al. (2012) build their group-centered theory in a world in which there are
no parties but there are organized interests hoping to “promote policies that benefit group
members but impose costs on society as a whole.” It would be hard to argue this an unrea-
sonable assumption. Even before the formation of our first political parties, the Founders
worried about organized interests believing that the “causes of faction are sown in the na-
ture of man,” and that these coalitions, “united and actuated by some common impulse
of passion,” would pursue policies “adversed to the rights of other citizens, or to the per-
manent and aggregate interests of the community” (Madison 1787). Whether these worries
were necessary aside, they were not ill-founded. Despite the conscious effort on their part
to mitigate the “mischief of faction,” in little over a decade following the ratification of the
Constitution, two major parties – the most fearsome of faction – had taken hold over the
politics of the Republic.
From this pre-party world, individual interests should find it profitable to join forces with
other groups in support of a candidate receptive and supportive of their policy demands as “a
candidate supported by multiple groups is even more likely to win” (Bawn et al. 2012). The
cumulative benefits of maintaining this cooperation election cycle after election cycle provides
the powerful incentive necessary to establish a long coalition of electoral cooperation – a
political party. This cooperation, in turn, creates a single cohesive, if diffuse, party structure.
Bawn et al. (2012) admit that the resulting coalitions may represent diverse interests, but
argue that their desire to control government would push them toward compromise on a
single nominee.
15

The platforms and ideologies of these political parties are then the result of bargaining
among the policy-demanding factions within the party (see Karol 2009; Noel 2013, respec-
tively), not an attempt to appease voters. While interests are constrained by voters’ coarse
and limited ability to monitor and sanction elected behavior, the complexity of the policy
making process allows legislators to hide all but the most egregious “special interest boon-
doggles” in an “electoral blind spot” – a wide range of potential outcomes in which “voters
are unable to reliably ascertain policy positions or evaluate party performance” (Bawn et al.
2012). In several studies of major changes to party platforms, scholars have found that the
shifting strength of interest group factions within the parties, particularly on issues of civil
rights (Baylor 2017), abortion (Cohen 2005), and gun control (Karol 2009), have explained
the changes in behavior. This perspective also fits the first-hand narrative accounts of LGBT
activists fighting for inclusion in the Democratic Party (O’Leary 2000).
While these authors admit that evidence assessing these competing hypotheses is hard
to find, many scholars have provided evidence supportive of the central thrust of this the-
ory. Cohen et al. (2008) found that party insiders have remained largely influential in the
presidential nominating process (with perhaps a notable exception of the 2016 Republican
nomination, see Cohen et al. 2016). Masket (2009) found that coalitions of policy-demanding
groups often formed durable networks of support for nominating candidates in five regions
of California. Rauch and La Raja (2017) find that in the modern primary environment,
independent groups control much of the “recruitment, training, networking, [and] grassroots
cultivation...grooming candidacies from the very earliest stages.” So influential do they find
these organizations in the “invisible primary” that “by the time the primary ballot is printed,
it’s often too late” for candidates lacking such organized support.
In comparison, a central prediction of the Downsian party – namely the convergence
of party platforms toward some ideological center – fails to materialize in empirical studies.
While scholars have recognized this failure to converge, they argue that the divergence is
simply the byproduct of candidates attempting to appeal to two different audiences, the
primary and general electorate (Aldrich 2011). However, evidence here too is lacking. Studies
of primary voters find them lacking the information about primary candidates necessary to
16

reward or penalize ideological extremity (Alher, Citrin, and Lenz 2016; DeMora et al. 2015)
and not altogether dissimilar from their general election co-partisans (Sides et al. 2018).
Even if “in the absence of the primary electoral pressures, politicians could adhere more
to the political center in classic Downsian fashion” (McGhee et al. 2014), this would not
explain why members of Congress appear to be more ideologically extreme than even their
district’s co-partisans (Bufami and Herron 2010).
Moreover, scholars have increasingly found that these deviations from moderation are
costly – the sanctioning of voters is biased in favor of moderation and not the “party brand”
(see Cox and McCubbins 2005). Carson et al. (2010) find an electoral cost of party loyalty
on divisive bills. Similarly, Canes-Wrone et al. (2002) find that voters punish members for
taking more ideologically distant positions on roll-call legislation, and Ansolabhere and Jones
(2010) show that unpopular positions on controversial legislation hurts members of Congress
on election day. For specific pieces of legislation, Nyhan et al. (2012) find that support for the
Affordable Care Act caused constituents to view incumbents as more ideological, and thus
lowered their support for these candidates. Rep. Marjorie Margolies (D-PA)’s defeat in 1994
is widely cited to have been the result of her tie-breaking vote for President Bill Clinton’s 1993
budget (ibid., see Heidom 1994).2 Yes, members of congress attempt to position themselves
in order to assist in their reelection, but in light of Snyder and Groseclose’s (2000) finding
that members often vote with their constituents against their party when their votes are not
needed, but rarely otherwise, the policy preferences and ideological positioning of members
of Congress does not seem to be motivated by primarily by electoral incentives.
If we accept that party behavior is best accounted for as a coalition of policy-demanding
organized interests, then we must be willing to concede “that real American parties are
broader and less hierarchical than the formal party...a modern ‘party’ includes interest
groups, consultants, 527s, and perhaps even partisan media” (Koger et al. 2010). And
given this diversity of potential actors, there remains many avenues by which the party net-
work could still control or at least significantly influence the nomination process shy of the
2A fact readers will be reminded of in Chapter 3.
17

formal control derived from party conventions. While the party organizations may no longer
have the formal power to nominate candidates, the constellation of interests and actors in
this extended, diffuse party network have a diverse array of resources at their disposal that
can be marshaled on behalf of their chosen candidates. From this standpoint, instances that
would be previously viewed as failures on the part of parties, could simply be successes of
different factions within a party coalition. Moser’s primary win from Chapter 1’s opening
anecdote was less the result of a “freebooting political entrepreneur,” and more so the suc-
cess of a competing faction within the extended Democratic party network, albeit a faction
less closely affiliated with the formal party organization.
But the Texas example points to one empirical shortcoming in Bawn et al. (2012)
group-centered theory of parties. This theory predicts that interest groups within the party
coalitions would “do better by cooperating in electoral politics than by competing against
each other.” And indeed when studying the general election behavior of partisan actors,
this is largely what scholars find. By analyzing agreements to share mailing lists between
elements of the party network, Koger, Masket, and Noel (2009) observe that “beneath the
intraparty disagreements we observe in primary elections and policy debates there is a sub-
terranean pattern of organizational cooperation” between the party organizations, partisan
media outlets, and interest groups within the extended networks of the Democratic and
Republican parties. Between 1994 and 2010, Desmarais, La Raja, and Kowal (2015) gener-
ally find two connected networks of donors – Republicans and Democrats – among general
election contributors.
But in an overview of open-seat primaries during the 2014 election cycle we found that
“different groups [often] support their own champions, and many nominations remain free-
for-alls until the day of the primary” (Bawn et al. 2015). In the next section, I extend
this theory of party behavior to include variations in electoral competition, and explain
why competition, not cooperation, should be the modal expectation of the party network in
congressional primaries.
18

2.4 Coordination and Competition in the Extended Network
How can we observe a largely cooperative national party network (Koger et al. 2010),
yet simultaneous observe widespread factional conflict in open-seat primary contests (Bawn
et al. 2014; 2015)? The answer lies in the confluence of non-competitive general elections
and the high degree of homogeneity in co-partisan voting behavior in Congress.
Competition in the general election underlies the incentive to cooperate in party nomina-
tions. The costs associated with losing control of government drive members of the coalition
to accept less-than-perfect nominees in exchange for the benefits of coordination – the con-
formity costs of maintaining the coalition. Bawn et al.’s (2012) theory drew heavily on the
empirical and theoretical contributions of Cohen et al.’s (2008) study of presidential nomina-
tions, so it should be no surprise that competition was almost assumed into their theory, as all
presidential general elections are at least somewhat competitive. Even elections that ended
in landslides, like Reagan’s 1984 reelection, were surrounded by some initial uncertainty –
polling by Gallup in January of 1983 had both Sen. John Glenn (D-OH) and former Vice
President Walter Mondale (D-MN) besting Reagan in the general election (Collier 1983).
Should we anticipate similar cooperation if the chances of losing a particular seat are
exceedingly slim? Most House elections are easy to predict on the basis of party and there
are few districts in which both parties are competitive. Despite the perception of electoral
volatility, incumbent reelection rates have only dipped below 90% twice in the past 40 years
(OpenSecrets 2018b). After the 2016 election, only 35 members are from districts won
by the opposing parties presidential nominee (Cook 2017). And this lack of competition
is not an artifact of modern polarization or gerrymandering. Even during the “textbook
Congresses” of the 1960s and 70s fewer than 20% of congressional elections were decided by
fewer than 10%, with the average winning candidate besting her opponent by over 36 points
(CQ 2018). Among those few competitive general elections, national trends – presidential
approval, retrospective evaluations, and inter-branch partisan balancing (Campbell 1960;
Erikson 1988; Jacobson 1990; Rogers 2016; Tufte 1975) – explain a majority of the outcomes.
The fundamentals are so strong in congressional elections, that observers were speculating
19

about the difficulties Senate Democrats would face in the 2018 midterms before the 2016
primaries had begun (Cillizza 2015). Surprising Senate elections in Massachusetts (2010)
and Alabama (2017) may suggest that all races can be competitive in the general under some
circumstances, but these anomalies are even more rare in the House. Outside of districts
altered by redistricting, only one incumbent has lost in a district deemed safe for his or her
party since 2010.
The lack of competition in the general election for many seats causes the dominant
party’s nomination to be tantamount to election. But in many ways the legislative behavior
of these candidates is determined even before the primary concludes. The vast majority
of co-partisans vote identically on all roll calls. Moreover, roll calls that allow co-partisans
to differentiate themselves are often lopsided roll calls where the outcome is all but certain
(Groseclose and Snyder 2000) – meaning that the slight deviations in co-partisan voting have
little impact on the outcome of particular pieces of policy. The historic levels of polarization
that currently describe both legislative chambers have been driven in part by increased
homogeneity within parties (Poole and Rosenthal 2006) particularly on procedural votes
(Theriault 2008). Many of those party insiders we interviewed in our overview of the 2014
primary cycle struggled to present policy issues on which the candidates would disagree
(Bawn et al. 2014). In sum, the marginal benefit of nominating a particular candidate is
not derived from their behavior on the House floor.
Instead, the benefit to organized interests competing in the primary comes from nomi-
nating a candidate seen as “one of us” – a candidate that would “champion” particular issues
and actively serve the group beyond individual roll calls. This is not the first time it has been
claimed that voters reward or punish incumbents for activities beyond policy. Fiorina (1989,
p. 36) argued that the decline in competitive seats was due to the rise of a “Washington
establishment” – a cabal of congressional “incumbents who deemphasize controversial policy
positions and instead place heavy emphasis on nonpartisan, nonprogrammatic, constituency
service” with congressmen that “would rather be reelected as an errand boy than not re-
elected at all.” More recently, Grimmer et al. (2012) found that voters respond positively to
legislator credit claims and constituent services even if the legislator had little to do with the
20

underlying legislation that generated the benefit. But the rewards of electing a champion go
far beyond constituency service and ribbon cutting ceremonies. Common across districts and
parties was a motivation among groups to support someone “who will actively represent the
group’s interest in committee deliberations, in formulating the technical details of legislative
language, in behind-the-scene work that moves or block potential policy change” (Bawn et
al. 2014).
Therefore groups, activists, and voters in primary elections have three considerations
in determining whom to support: First, what are the chances of losing the general election?
Second, what are the marginal benefits of electing your preferred nominee? And third, what
are the risks or costs associated with supporting your preferred candidate? As described
above, the risk of losing the general election is usually rare, and the marginal benefit of
a particular candidate winning the nomination toward the party keeping or winning the
seat is usually slim. The benefits of having a true “champion” in office are usually great.
Activists were often able to recall in detail seemingly obscure efforts that previous elected
officials made on their interests behalf. And while the risk of electing a least preferred
candidate through non-strategic voting was often high (see Bawn et al. 2015 §10; Chapter 4
§4.6.1.), the costs were usually low. Even if a groups least preferred candidate was victorious
in the primary, supporting thier champion carried little peril, knowing that regardless of
the primary’s outcome, a reliable partisan would be sent to Washington. Therefore, when
competition is low, the marginal benefit of your preferred nominee is high, and the risk or cost
of inadvertently electing a least preferred candidate are low, we should observe competition,
not coordination, between the party factions.
2.5 A Toy Example
Consider the toy example in Table 2.1. In this example there are three groups: A,
B, and C. There are also three potential nominees vying for their support: x, y, and z.
The expected payoff for each potential nominee is provided in the table. Notably, each
nominee has a positive payoff for each group. As members of the party coalition, each
21

Table 2.1: A Toy Example of Group Preferences
A B Cx 9 1 3y 3 9 1z 1 3 9
would experience the benefit of profitable roll call votes if any co-partisan candidate wins
the general election. And given how few competitive general elections nominees face, we can
assume that the nominee will win the general election come November.
Each group has one of their own competing in the primary who would champion their
particular issues, has developed longstanding relationships with the group, and has demon-
strated themselves to be particularly faithful agents. The payoff for nominating this can-
didate is much higher for the respective groups (9 vs. 3 or 1). But the likelihood of a
particular candidate securing the nomination is affected by whether or not the group’s net-
work supports their candidate’s campaign. Without their support, the candidate will not
win the primary. With their support, the candidate will be competitive, but with the large
degree of uncertainty present in primary contests, their support will guarantee no more than
competitiveness. The expected payoffs for A would be
EUA = px(Ux) + py(Uy) + pz(Uz).
If we assume sincere support among the networks, meaning that each group competes
in the primary on behalf of their champion, then the likelihood of an individual candidate
winning the primary is roughly equal (A∗ : pi = pj).3 In this sincere scenario, the payoffs
3This assumption may strike the reader as unreasonable, but in many of the primary races we observed inthe 2014 election cycle, party insiders were unsure how a race would unfold even days prior to the election.Low turnout, little media coverage, weak and conflicting cues, and numerous candidate – all facts that hinderthe academic study of primaries – also hinder even the most attuned politico’s ability to predict outcomes.For example, in an e-mail to my co-authors a week before the PA-13 Democratic primary, I predicted Boyle33%, Leach 29%, Margolies 21%, Arkoosh 17%. Respectable, but after months of field work, dozens ofinterviews, and two months living in Philadelphia, I was not even able to predict the correct rank orderingof the actual Boyle 40%, Margolies 27%, Leach 17%, Arkoosh 16%.
22

would be
EUA∗ =1
3(Ux) +
1
3(Uy) +
1
3(Uz)− C
EUA∗ =1
3(9) +
1
3(3) +
1
3(1)− C
EUA∗ = 4.33− C,
where C is the cost necessary to support the network’s preferred candidate.
In isolation, this is uninformative, as adjustment to the magnitude of the payoffs even
while holding the rank ordering constant would alter EUA. But if we compare it to the
scenario in which A strategically supports their second most preferred candidate (A’ : px=0,
but py � pz), we can see the comparative value in competition over coordination:
EUA′ = 0(Ux) +9
10(Uy) +
1
10(Uz)− C.
EUA′ =9
10(3) +
1
10(1)− C.
EUA′ = 2.8− C.
Even if the strategic choice all but guarantees the election of their second choice candidate,
the added value of a champion exceeds the potential risks of potentially electing a least
preferred candidate (4.33 > 2.8) as long as the marginal benefit of a first choice candidate
to a second choice remains high.
But competition or strategic cooperation are not a networks only options. It is possible
that groups would instead choose abstention. Here too their preferred candidate would not
secure the nomination (A¬ : px=0), but without their support, their second most preferred
23
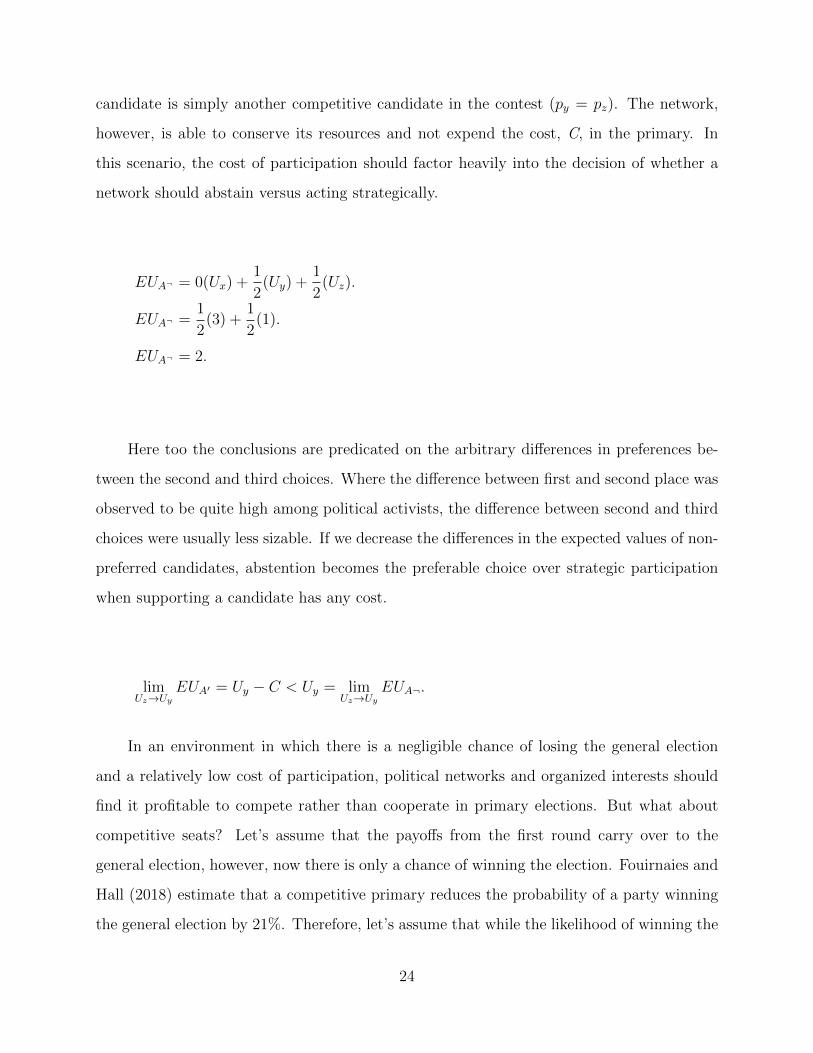
candidate is simply another competitive candidate in the contest (py = pz). The network,
however, is able to conserve its resources and not expend the cost, C, in the primary. In
this scenario, the cost of participation should factor heavily into the decision of whether a
network should abstain versus acting strategically.
EUA¬ = 0(Ux) +1
2(Uy) +
1
2(Uz).
EUA¬ =1
2(3) +
1
2(1).
EUA¬ = 2.
Here too the conclusions are predicated on the arbitrary differences in preferences be-
tween the second and third choices. Where the difference between first and second place was
observed to be quite high among political activists, the difference between second and third
choices were usually less sizable. If we decrease the differences in the expected values of non-
preferred candidates, abstention becomes the preferable choice over strategic participation
when supporting a candidate has any cost.
limUz→Uy
EUA′ = Uy − C < Uy = limUz→Uy
EUA¬.
In an environment in which there is a negligible chance of losing the general election
and a relatively low cost of participation, political networks and organized interests should
find it profitable to compete rather than cooperate in primary elections. But what about
competitive seats? Let’s assume that the payoffs from the first round carry over to the
general election, however, now there is only a chance of winning the election. Fouirnaies and
Hall (2018) estimate that a competitive primary reduces the probability of a party winning
the general election by 21%. Therefore, let’s assume that while the likelihood of winning the
24

general is equal (WU = .5) for candidates nominated unanimously, it is reduced by 20% for
those who experience a primary (WP = .4). From the perspective of a party-affiliated group
the election of an the opposition is an outcome best avoided, so assume the utility of that
outcome to be negative (lets say EL = -5). Figure 2.1 provides a diagram of the strategic
considerations for group support under these conditions.
Figure 2.1: An Example Network Strategy with Competitive General Election
A
A¬ EUA¬(WU) + EL(1−WU)
Abstain
A’ EUA′(WU) + EL(1−WU)Cooperate
A* EUA∗(WP ) + EL(1−WP )
Compete
If we assume that the cost of participating in a primary is small in relation to the value
of electing a champion (C = 1), we can compare the value of different strategies, as
EUA∗ = (4.33− 1)(.4) + (−5)(.6) ≈ −1.7
EUA′ = (2.8− 1)(.5) + (−5)(.5) = −1.6
EUA¬ = 2(.5) + (−5)(.5) = −1.5,
which shows how in an environment of electoral competition, the preference for competition
can be replaced with a strategy that rewards individual groups for not supporting their own
candidate. And to show that this is not an artifact of the cost of primary participation, Figure
25

Figure 2.2: Expected Utility of Group Participation in Nominations
0.0 0.5 1.0 1.5 2.0
Cost of Primary Participation
Exp
ecte
d U
ntili
ty fo
r N
etw
ork
A
−2.0
−1.9
−1.8
−1.7
−1.6
−1.5
−1.4
−1.3
−1.2
−1.1
−1.0 CompeteCooperateAbstain
2.2 shows the expected utility for a range of costs. While there is a shift from cooperation
to abstention as costs increase, the most beneficial strategies across the range (in bold) are
always a non-competitive result.
The parameters for these toy examples, while entirely plausible, are admittedly arbitrary
(to see a more generalized discussion of the topic, see Bawn et al. 2015). The purpose of
this exercise is not to estimate when groups should or should not cooperate in primary
elections, but to only suggest that groups may or may not have the incentive to cooperate
in congressional primaries and that competition in the general election can influence those
incentives. This is especially important given how few seats are competitive in the general
election and how frequently we observe competition in the primary. Figure 2.3 provides
the number of candidates receiving more than 5% of the vote in all consequential open-
26

Figure 2.3: Competition in Consequential Open-Seat Primaries
1 2 3 4 5 6 7 8
Number of Candidates Receiving 5% of the Vote
Sha
re o
f Cas
es
0.00
0.05
0.10
0.15
0.20
0.25
●●
●
●
●
●
●
●
●
●
●
●
●
●
●
●
●
●●
●
●
●
●
●
●
●
●●
●
●
●
●
●●
●●
●
●
●
●
●
●
●
● ●
●
●
●●
● ●
●
●
●
●●
●
●
●
●
●
●
●
●
●
●
●
●
●
●
●
●
●
●
●
●
●
●
●
●
●
●
●
●
●
●
●
●
●
●
●
●
●
●
●
●
●
●
●
●
●
●
●
●
●
●
●
●
●
●
●
●
●
●
●
●
●
●
●
●
●
●
●
●
●
●
●
●
●
●●
●
●
●
●
●
●
●
●
●
●
●
●
●
●
●
●
●
●
●
●
●
●
●
●
●
●
●
●
●
●
●
●
●
●
●
●
●
●●
●
●
●
●
●
●
●
●
●
●
●
●
●
●
●
●
●
●
●
●
●
●
●
●
●
●
●
●
●
●
●
●
●
●
●
●
●●
●
●
●
●
●
●
●
●
●
●
●
●
●
●
●
●
●
●
●
●
●
●
●
●
●
●
●
●
●
●
●
●
●
●
●
●
●
●
●
●
●
●
●
●
●
●
●
●
●
●
●
●
●
●
●
●
●
●
●
●
●
●●
●
●
●
●
●
●
●
●
●
●
●●
●
● ●
●
●
●
●
●
●
●
●
●
●
●
●
●
●
●●
●
●
●
●
●
●●
●
●
●
●
●
●
●
●
●
●
●
●
●
●
●
●
●●
● ●
●
●
●
●
●
●●
●
●
●●
●
●
●
●
●●
●
●
●
●
●
●
●
●
●
●
●
●
●
●
●
●
●
●
●
●
●
●
● ●
●
●
●
●
●
●
●
●
●
●
●
●
●
●●
● ●
●
●●
●
●
●●
●
●
●
●
●
●
●
●
●
●
●
●
●
●
● ●
●
●
●
●
●
●
●
●
●
●
●
●●
●
●
●●
●●
●
●
●
●
●
●●
●
●
●
●
●
●
●
●
●
●
●
●●
●
●
●
●
●
●
●
●
●
●
●●
●
●
●
●
●
●
●
●
●
●
●
●●
●
●
●
●
●
●
●
●
●
●●
●
●
●
●
●
●
●
●
●
●
●
●
●
●
●
●
●
●
●
●
●
●
●
●
●
●
●
●
●
●
●
●
●
●
●
●
●
●
●
●
●
●
●
●
●●
●
●
●
●
●
●
●
●
●
●
●
●
●
●
●
●
●
●
●
●●
●
●
●
●
●●
●●
●
●
●
●
●
●
●
●
●
●
●
●
●
●
●
●
●
●
●
●
●
●
●
●
●
●
●
●
●
●
●
●
●
●
●
●
●
●
●
●
●
●
●
●
●
●
●
●
●
●
●
●
●
●
●
●
●
●
●
●●
●
●
●
●
●
●
●
●
●
●
●
●
●
●
●
●
●
●
●
●
●
●
●
●
● ●
●
●
●
●
●
●●
●
●
●
●
●
●●
●
●
● ●
●●
●
●
●●
●
●
●
●
●
●
●
●
●
●
●
●
●
●
●
●
●
●
●
●
●
●
●
●
●●
●
●
●
●
●
●
●
●
●
●
●
●
●
● ●
●
●
●
●
●
● ●
●
●
●
●
●
●
●
●
●
●
●
●
●
●
●
●
●
●
●
●
●
●
●
●●
●
●
●
●
●
●
●
●
●
●
●
●
●
●
●
●
●
●
●
●
●
●
●
●
●
●
●
●
● ●
●
●
●
●
●
●
● ●
●
●
●
●
●
●
●
●
●
●
●
●
●
●
●
●
●
● ●
●
●
●
●
●
●
●
●
●
●
●
●
●
●●
●
●
●●
●●
●
●
●
●
●
●
●
●●
●
●
●
●
●
●
●
●
●
●
●
●
●
●
●
●
●
●
●
●
●
●
●
●
●
●
●
●
●
●
●
●
●
●
●
●
●
●
●
●●
●
●
●
●
●
●
●
●
●
●
●
●
●
●
●●
●
●
●
●
●
●
●
●
●●
●
●
●
●
●
●
●
●
●
●
●
●
●
●
●●●
●
●
●
●
●●
●
●
●
●
●
●
●
●
●●
●
●
●
●
●
●
●●
Number of Candidates Receiving 5% of the Vote
Co−
Par
tisan
Pre
side
ntia
l Vot
e S
hare
45
50
55
60
65
70
75
80
85
90
95
1 2 3 4 5 6 7 8
Note: The first graph in Figure 2.3 presents a histogram of the number of candidates receivingmore than 5% of the vote in consequential open-seat primaries between 1980 and 2014. Thesecond graph plots the relationship between this number and the share that party receivedfor president in the previous election. The number of candidates is jittered around thevalue for visualization. The linear relationship is statistically significant (p≈0), but explainsrelatively little variation (R2 ≈ 0.03).
seat primaries (a definition that will be unpacked in §2.6.) between 1980 and 2014. In the
majority of races, 3 or more candidates received more than 5% of the vote. There is also a
significant positive relationship between the number of candidates and the lack of partisan
competition in a district.
In our attempts to understand the role of party networks on the nomination of candi-
dates for Congress, then, we should look beyond the actions of the formal party organizations
to also include the diverse actions and resources used by the interest groups, activist net-
works, and policy-demanding organizations that constitute the expanded party network, as
it will be the competition of these groups that influence the outcomes of primary elections.
27

2.6 The Importance of Consequential Open-Seat Nominations
In the analyses to follow, I set out to systematically measure the impact of network
support on the electoral prospects of primary candidates. Yet not all primaries are created
equal. The only thing more uncommon than an incumbent member of Congress losing reelec-
tion is an incumbent member of Congress losing renomination. This creates an endogeneity
problem, when support for an incumbent is likely driven by the inevitability of their success.
Therefore the universe of cases that would constitute the most critical test of this group
hypothesis would be consequential open-seat primaries.
I define a consequential primary as one in which the eventual nominee could possibly
win the general election – races with candidates sufficiently viable to justify investment from
supporters. This would include the primaries for both parties in the handful of competitive
districts, as well as the primaries for the dominant party in the majority of districts safe
for either Democrats or Republicans. The primary itself could be highly contentious or
uncontested; it could have a field of 9 candidates or have one nominated unanimously by
convention. What is important is that the eventual nominee has a realistic chance in the
general election. While studying the prospects and motivations of electoral long-shots is
worthy in its own right, this project focuses only on those candidates with a realistic chance
of impacting the composition of Congress.
Most analyses use The Cook Report ’s ‘Partisan Voting Index’ (PVI) as a measure of
general election competition. This variable compares how a district voted in the most recent
two presidential elections in relation to the nation as a whole. While PVI scores are only
available for elections after 1996, I use a similar metric and consider a district to be compet-
itive for a party if the average two-party vote share of that party’s presidential candidates
in the two most recent elections is at least 45% of the two-party vote. Districts where both
presidential candidates receive between 45% and 55% of the vote are considered competitive
for both parties.
An open seat primary is one in which an incumbent is not seeking renomination
either because they have retired, resigned, died, or are seeking higher office. These races
28

are “where the action is,” with nearly two-thirds of congresspeople winning membership
through and the majority of party-switches occurring in open seats (Gaddie and Bullock
2000). Open-seat races are the most common gateway into Congress for potential candidates
because of incumbents’ high renomination and reelection rates (Boatright 2013). Primaries
for open seats are more competitive contests (Hogan 2003; Ocampo 2017) as the absence of
an incumbent effects both on the levels of recruitment (Maestas et al. 2005) and ambition
of potential candidates (Rohde 1979). Figure 2.4 presents a map of U.S. Congressional
districts based on when it was last open. Despite Congress’s reputation as an institution
in which members retire from the House to a ‘home,’ nearly two-thirds (286) of districts
have experienced open-seat contests in the previous decade. This would exclude the opening
anecdote of Texas’s 7th district, where Moser and Fletcher hope to challenge an incumbent
in November.
Bawn et al. (2012) argue that nominations are the “natural focus” of the political
parties, and open-seat contests provide a particular incentive for the competing factions to
participate. These races often receive very little media coverage and attention from scholars
(Bawn et al. 2017), limiting the amount of information available to voters. This creates an
environment in which primary voters are more susceptible to campaign efforts at persuasion
and mobilization (Bawn et al. 2012). Without party identification or incumbency advantage,
voters are increasingly susceptibile to campaign efforts. Without the attention of national
party organizations (see Rauch and La Raja 2017) the cost of those efforts in primaries is
also diminished.
Without an incumbent competing in the contest, it is easier to parse the influence of
groups and candidates. Disentangling whether a support network of an incumbent is more
compatible with either a candidate-centered or group-centered theory of parties is difficult
if not impossible. Their high reelection rates almost predicate that all active groups within
that party network would support their reelection. But in an open seat, this inevitability is
removed. If determinative actions in the election are conducted by existing groups, it can
be safely said that they are organized beyond an individual candidacy as these candidates
had never competed previously. Instead these groups get to serve as gatekeepers to up-and-
29

Figure 2.4: Open Seat Congressional Races Since 2006
coming ambitious politicians.
Measuring these campaign efforts, however, is easier said than done. In the next chapter
I provide a series of case studies describing the various resources and strategies used by
organized groups to influence the outcomes of eleven nomination contests during the 2014
primary election cycle. These cases will highlight the diversity both in actors and resources
mobilized in these primaries, and hopefully provide compelling qualitative evidence that
party networks are still influential players in nominations.
30

CHAPTER 3
Networks on the Ground
“There’s only one way to hold a district: you must study human nature and actaccordin’. You can’t study human nature in books. Books is a hindrance morethan anything else. If you have been to college, so much the worse for you. You’llhave to unlearn all you learned before you can get right down to human nature,and unlearnin’ takes a lot of time. Some men can never forget what they learnedat college...To learn real human nature you have to go among the people, seethem and be seen.”
– George W. Plunkitt1
3.1 Parties on the Ground
If one accepts this more diffuse definition of political parties, we should forgive an initial
sense of pessimism or despondency toward our ability to study their behavior in a systematic
fashion. The diversity of potential actors – from party organizations, to activist networks;
from interest groups, to old-fashioned machines – multiplies both the potential environments
and potential resources available for electoral intervention. And worse yet, the actions of
these extended party networks are often purposefully kept from the public eye. The choice to
recruit candidates for office, pressure others out of a contest, or expend resources in support
of particular campaigns are at best highly sensitive decisions and at worst skirt the borders of
legality.2 Moreover, the individual state primary and nomination contests are scattered over
1Riordan, William. 1905. Plunkitt of Tammany Hall. The Project Gutenberg.
2For example, the same union officials central to the coming example in Pennsylvania’s 13th district arecurrently under a FBI investigation covering “virtually every aspect of the union’s operations, as well as [theunion leader’s] personal finances” (Phillips and Fazlollah 2017).
31

the calendar from March until November, take place under a variety of rules and procedures,
and have historically received little media or scholarly attention – all forces that hinder the
systematic study of party activities.
However, it is the failure to focus on these obscured behaviors that gives occasion to
critically paint political science as a “a drunk who looks for his lost car keys under a lamppost
because that’s where the light is best” (Masket 2009). Given how important recruitment and
dissuasion factor into a candidate’s decision to seek elected office (Carnes 2018; Fowler and
McClure 1989; Fox and Lawless 2005; Ocampo 2017) and the central role that party actors
play in nominations (Cohen et al. 2008; Masket 2009; Hassell 2016; 2018), understanding
their behavior is most important in these opaque primary environments.
With these challenges in mind, six researchers from UCLA, myself included, undertook a
mixed-method and relatively unstructured investigation into the dynamics behind open-seat
nominations for the House of Representatives during the 2014 election cycle (see Bawn et al.
2015). The Parties on the Ground project made field trips to over 40 congressional districts
to conduct hundreds of interviews with local journalists, party officials, activists, political
consultants, interest groups, major donors, candidates, campaign staffers, local academics,
and even the occasional primary voter – a snowball sample not inaccurately described as
anyone and everyone who would talk to us – to determine how nomination contests worked
across the country. Our efforts began in the summer of 2013 and continue to present. While
we took initial inspiration for the interviews from the works of Fenno (1978), Fowler and
McClure (1989), and Masket (2009), our approach remained flexible enough to account for
the wide variation in activities and political actors. We gave our subjects the luxury of
anonymity3 in the hopes that this produced more forthcoming responses and only cite them
by name when granted explicit permission. While there is some concern of selection bias in
those subjects who were willing to speak with us, data from these interviews are combined
with journalistic accounts, political histories of the region, campaign finance disclosures, and
3All quotations from these interviews will be cited as part of Parties on the Ground (POG 2014). Tran-scripts of individual conversations with identifying information redacted will be provided upon request.Following publication, we will host the audio files in an archive for other scholars to investigate.
32

eventual primary and convention vote outcomes to describe a holistic account of the political
systems in which each contest takes place.
The purpose of this chapter is not to summarize the findings of this larger project, but
to highlight one specific pattern observed across these races that inspired this dissertation:
the influence of both formal and informal party networks on the electoral prospects of can-
didates in pursuit of nomination. From national labor unions to small bands of like-minded
business owners, from local party machines to informal mailing lists, organized interests mo-
bilized their networks of support to influence nomination contests in their favor. In many
cases, those interviewed concluded that with voters unable to rely on party identification or
detailed media coverage of these races, it was the efforts of these networks that determined
a primary’s outcome. While the specific structure, composition, and motivations of these
networks varied across districts and parties in substantively important ways, their general
function as coordinating agents for donors and activists was consistent across nearly all of
these races. Successful candidates in primaries were not “electoral self-starters” (Herrnson
2011), but agents competing for and on behalf of particular organized interests. These in-
terests then in turn provided their candidates with resources unavailable to “freebooting
political entrepreneurs” (Jacobson 2009), which in turn aided them in their primary and
nominations contests.
Toward this aim, this chapter begins by providing a typology of party networks active
in the 2014 cycle. Across these different races formal party organizations, national and
local interest groups, and party activist networks succeeded in nominating a congressional
candidate. For each type of network, I provide case studies detailing the general dynamics of
the nomination contest while highlighting the methods and means used by these networks in
support of their chosen candidates. Finally, I distill the commonalities across these different
races to highlight how organized networks succeed in nominating their chosen candidates.
33

3.2 Groups within the Extended Party Network
A diverse array of actors with various levels of connection to the formal parties activated
their networks and deployed resources on behalf of candidates in consequential open-seat
primaries during the 2014 election cycle. Party networks were often centered around the
usual suspects of partisan actors – EMILY’s List and the Chamber of Commerce, trade
unions and pro-life groups, members of Congress and county parties – but also included local
networks of women mayors, maritime development industrialists, homeschooling advocates,
and other informal organizations lacking the traditional “brick and mortar” interest group
structure. It was this wide range of organizations and political structures that provided the
resources and support that set their candidates apart from the “electoral self-starters” in
primary contests.
Traditionally, this collection of organizations have been described by their relationship to
the formal party organization. Herrnson (2009) defined political parties as “enduring multi-
layered coalitions,” with the formal party organization at its core, surrounded by “party
allies that routinely work with one party in pursuit of their common goal” and the “party’s
base” in the electorate. Similarly, Koger, Masket, and Noel (2009; 2010) conceive of parties
as “networks of co-operating actors,” including “candidates and office holders; its formal
apparatus; loyal donors, campaign workers and activists; allied interest groups; and friendly
media outlets.” In studying patterns of data exchanges between partisan actors, they observe
largely cooperative party coalitions with the formal party organizations situated centrally
in the network. Figure 3.1 provides a rough structure for the party networks described by
these authors which highlights their relationship to the formal party organization.
Formal party organizations, politician-centered machines, local and national interest
groups, and activist networks – the types of networks described in this structure – were
all instrumental in the primary campaigns of candidates during the 2014 nominating cycle.
While they may play a more muted role in particular nominations in particular districts,
the formal party organizations are still central organizing institutions for national politics
(Hassell 2016; 2018, Koger, Masket, Noel 2009; 2010). These organizations include the party
34

Figure 3.1: Political Parties as Enduring Multi-Layered Coalitions
Note: A similar diagram is developed by Herrnson (2009). I recreate it here and renamesome categories to include actors described in Koger, Masket, and Noel (2009; 2010).
congressional fundraising committees and the national party committee leadership. On the
Democratic side, this includes the Democratic National Committee (DNC), the Democratic
Senatorial Campaign Committee (DSCC), the Democratic Governors Association (DGA),
the Democratic Congressional Campaign Committee (DCCC), the Democratic Legislative
Campaign Committee (DLCC), the Association of State Democratic Chairs, and the state,
county, congressional district, and local Democratic party organizations. Parallel organiza-
tions can be found for the Republican Party.
Closely related to these national party organizations are the party officers and elected
35

officials who represent them around the country. These actors often have sway in their
own right. The federal structure of party leaders – the national, state, county, and local
party organizations – usually provides an array of actors individual autonomy in making
particular decisions. For example, elected officials have more control over the management
of their own campaigns and local party officials have more control over particular resources,
such as endorsements and volunteers. This autonomy allows these actors to participate in
nomination contests in their own right, not simply as tools of the national party organization.
Party allies and affiliated interest groups constitute the most closely connected layer of
the “party periphery” – those actors without a formal/legal connection to the party archi-
tecture. These actors are recognizable players in partisan politics: EMILY’s List, the Sierra
Club, and organized labor, among others, for the Democrats; Right to Life, the Chamber of
Commerce, and the National Rifle Association, among others, for the Republicans. These
groups, while organized around particular policy demands, are deeply embedded in the net-
works of particular parties.4 The path to political success for these groups travels through
their influence within one of the political parties. As someone familiar with EMILY’s List’s
organization reported: “we’re not trying to control a majority in Congress, we’re trying to
control a majority within the Democratic caucus” (POG 2014).
Beyond these partisan interest groups exists the network of loyalists and party activists.
These are individuals with no formal positions as elected officials or party officers, that lack
the structure of an organized interest or pressure group, but are involved in the political pro-
cess beyond the ballot box. Unlike interest groups and elected officials which can straddle
the local/national divide, activist networks of this variety are almost always locally bound.
These are the frequent donors, convention delegates, political club members, and campaign
volunteers that provide the financing and “boots on the ground” for most political activities.
These actors are more often supporters than drivers of party activity – numerous activists
described the social nature of “party work” and were more invested in supporting the “home
4There are exceptions. These groups will occasionally work with incumbents on the other side of the aisle,such as Pro-Life Susan B. Anthony List’s assistance for Dan Lipinski’s renomination in Illinois (Desanctis2018) or the Teamster’s support of Rob Portman’s (R-OH) reelection (Garcia 2016). These examples,however, are the exception, and even more rarely extended to races without entrenched incumbents.
36

team” rather than pressuring the party toward particular actions. As we will see in Pennsyl-
vania’s 6th district, however, their numbers in comparison to party officials and their focus in
comparison to the electorate make them an influential, if rarely activated, type of network.
But, in the oft repeated adage of the late Tip O’Neill, “all politics is local.” While
these various actors may have a hierarchical or radial structure within the national party
network, in individual nomination contests, these various types of groups often competed
among themselves in order to support particular candidates. With competitive general
elections a rarity, these organizations were able to compete freely, knowing that regardless of
the outcome, a reliable partisan will be sent to Washington. The competition is driven not
by a desire for support on particular votes, but by a desire to nominate a champion of their
particular cause. Each type of network attempted to marshal resources to tip the scales in
favor of “one of us,” but the resources available to these networks and the environments in
which they could be deployed varied by their nature.
Reflecting back on the motivating anecdote from Chapter 1, the groups and organiza-
tions supporting candidates competing in the primary were not cooperating, nor were the
centrally organized around the formal party organization. The DCCC and EMILY’s List
were both supporting one candidate, Bernie Sander’s and local organized labor another,
while a national activist network of doctors and scientists supported yet another. These
organizations often cooperate in the general election (Koger, Masket, Noel 2010) and see
themselves as part of the larger party (e.g. Pathe 2017), but when the potential to nominate
one of their own is on the line, this diverse assortment of actors are more than willing to
compete among themselves.
3.3 The Party Sometimes Decides
Perhaps one of the most surprising discoveries from these investigations was the degree to
which formal party organizations still hold sway over nominations for office. In Connecticut
and Utah, party conventions have long been the primary means of nominating candidates
37

for office.5 In Virginia, the state party can choose cycle-by-cycle, race-by-race what method
they would prefer to select their nominee. Iowa uses party conventions to select nominees in
the event that no candidate receives 35% of the vote. While not formally in control of the
selection of nominees, New Jersey’s county parties have the ability to provide their endorsed
candidates with a preferential ballot placement that rarely, if ever, fails to secure them the
plurality of support in the primary. These three resources – party conventions, control over
voting methods, and preferential ballot placement – give local formal parties tremendously
powerful resources in nomination contests.
The national parties, in comparison, had a more muted, but not imperceptible impact on
these races. In the 2014, the Democratic Congressional Campaign Committee only made one
endorsement in a contested open-seat primary, and their Republican counterparts avoided
endorsements altogether. This is not to suggest, however, that either party’s presence is not
felt (see Hassell 2018). As I describe in Colorado, their behind the scenes efforts often shape
the outcomes in congressional nominations.
3.3.1 Party Conventions
In 2014, Republican Mia Love had her eyes set on Utah’s 4th district. Having lost to
Democrat Jim Matheson by fewer than 800 votes in 2012, Love was considered the favorite
for the GOP nomination following Matheson’s decision to retire. Two insiders we spoke to
described Love as essentially the nominee from when she announced – “the 2014 nomination
was sewn up in 2012” (POG 2014). They mentioned that some state legislators, party offi-
cials, and major donors made calls to other candidates, discouraging them from challenging
Love at the 2014 convention. Some in the party were concerned that the dysfunctions of
Love’s 2012 campaign would keep her from taking back the heavily Republican seat. In her
previous campaign, she had three different campaign managers, occasionally missed events
due to scheduling errors, and according to some party officials had trouble developing a
5In late-2014, Utah passed SB54, which would allow candidates to gather signatures and move directly tothe primary, avoiding the convention. The legality of this act is still being considered in the courts (Davidsonand Harrie 2018), but would undoubtedly weaken the ability of formal parties to select their nominees inUtah.
38
message beyond national talking points (Canham 2014). But those concerns were clearly
limited. Love received the support of 662 (78%) delegates on the first ballot at the Utah
Republican convention – beating her opponent, Utah’s Director of Business and Economic
Development Bob Fuehr, and finishing well above the threshold needed to avoid a primary
(Gehrke 2014). With the nomination in hand, Love went on to win the general election in a
wave Republican year.
Love owed her 2014 nomination to the network of supporters that gained her the nomi-
nation in 2012 – a network of supporters brought to the convention by Senator Orrin Hatch.
Early polls of the 2012 Utah Republican convention delegates suggested there was little
chance of Orrin Hatch winning renomination. Hoping to avoid the fate of his junior col-
league Bob Bennett, who lost renomination at the convention the previous cycle because
his support of the Troubled Asset Relief Program (TARP) angered the dominant Tea Party
faction in the party, Hatch sought to elect more moderate supporters to the convention. Ac-
cording to Dave Hansen, Hatch’s campaign manager, 2012 was “not going to be a campaign
of persuading delegates...it is going to be a campaign of replacing delegates” (Kane 2012).
The team of 25 campaign staffers organized between 20,000 and 35,000 pro-Hatch activists
to vote in 2,000 precinct level contests to select delegates to the national convention.
He also benefited from the tacit support of the Mormon Church:
“For example, the Church of Jesus Christ of Latter-day Saints sent its usualletter to Mormon churches urging its faithful to attend the party caucuses, butthis time church leaders encouraged that the letter to be read to congregationsmultiple times. Then, Mormon leaders canceled church activities for the caucusnights of March 13 (Democrats) and March 15 (Republicans). In addition, mostUtah Republicans had come to view former Massachusetts governor Mitt Rom-ney not just as a favorite son who ran the 2002 Olympics in Salt Lake City, hehad become the likely next president in their eyes, the first Mormon to do so.
Romney made an ad supporting Hatch, who is also a Mormon, that ran re-peatedly in the three weeks leading up to the caucus. Touting Hatch’s possiblechairmanship of the Finance Committee if Republicans win the Senate majority,Romney told voters to ‘keep Orrin fighting for Utah’.” (ibid).
Hatch’s efforts were largely successful. Only 20% of those at the convention had been
39

delegates to the previous convention. And where surveys of delegates had initially shown
Hatch with levels of support similar to Bennett in 2010, after the selection of the new
delegates internal polling showed them within reach of the nomination threshold of 60%.
These more moderate delegates were central to Love’s nomination in 2012. Those close
to her campaign admitted that her opponent, Carl Wimmer, was the early favorite for the
nomination in 2012, and drew much of his support from the same pool of delegates behind
Bennett’s 2010 loss. But with a more pro-Hatch, pro-Mormon pool of delegates, Love, the
more moderate candidate who was also a member of the Church of Latter-day Saints, became
the candidate to beat. While they stressed that Love had a path to victory regardless – she
held numerous one-on-one meetings with delegates, was a charismatic speaker, and because
of her race had garnered national media attention – they also admitted that after the influx
of Hatch supporters her polling among convention delegates increased nearly 10 points. Love
eventually won 53% of delegates on the first ballot among the five candidates. The three
bottom placing candidates all dropped out and endorsed Love, and she was able to win the
nomination with 70% of the convention delegates.
In states with party conventions, the party still has the formal ability to select their
nominee. In terms of resources that can benefit a candidate’s pursuit of nomination, these
formal powers can’t be beat. In these examples, the networks of supporters behind a candi-
date always win.
3.3.2 ‘Firehouse’ Primaries
In Virginia, political parties have the ability to select the method by which the choose
their nominees on a race-by-race and cycle-by-cycle basis. For example, for Congress, the
Virginia Republican Party is divided into 11 districts. Each district has an executive com-
mittee that consists of an elected chair, members of the state committee, and representatives
of local Republican organizations. In the 10th district this includes a chairman, five state
committee members, and one representative from the college Republicans, the young Repub-
licans, and the district federation of Republican women. These individuals can vote to hold
40

a state primary, a party canvass, a mass meeting, or a convention to select their nominees.
For example, while the state GOP selected their gubernatorial nominee, Ken Cuccinelli
by convention in 2013, they selected their 2017 nominee, Ed Gillespie, in a state run primary.
The choice is often a political one. Conventions tend to “attract the party’s most ardent
conservatives,” where a “primary, because it is extended and draws a larger electorate –
including Democrats, Republicans and independents – favors well-financed establishment
candidates” (Schwartzman 2015). This ability to chose their nominating procedures gives
the formal party organizations within each individual district the potential to benefit different
types of candidates in different races.
A method unique to Virginia, the ‘Firehouse Primary’ or party canvass, was used to
select the nominee for the open 10th district contest in 2014. A party canvass is a primary
election run by party officials and volunteers, rather than the state. Beau Correll, chair of a
local county Republican committee, described it as “a middle ground between a convention
or a conventional primary” (Badcock 2014). Because the primary is run by the party, they
can choose where, when, and how many polling stations will be used. For example, the 10th
district ‘firehouse’ primary had 10 polling locations across the district (Olivo 2014), whereas
Loudon County – the largest county entirely within the 10th district – alone has 96 polling
locations in a normal election (Loudon County 2018). Additionally, whereas Virginia has an
open primary system, allowing potential out-party participation, parties can require a loyalty
pledge from voters under this system. As John Whitebeck, chair of the districts Republican
committee described, “[w]e set up voting locations around the district, and as long as you’re
a registered voter who’s willing to sign a statement confirming that you’re going to support
the Republican nominee, you can vote in the process” (Badcock 2014).
The more moderate faction of the party preferred the eventual-nominee Barbara Com-
stock. She had endorsements from members of the 10th district Republican committee and
the chairman of the state party. The 10th district committee was also considered to be
a more pro-establishment committee than the statewide party which had more Tea Party
support. Dody Stottlemyer, president of a local Tea Party network, said that she was clearly
“the establishment candidate” (Pershing 2014), a label used in many of our interviews to
41

describe Comstock. One local pro-life activist reported that her main opponent, Bob Mar-
shall, was “more outspoken and ha[d] a longer track record” on conservative causes, and was
“certainly not a member of the establishment.” He was in many ways “Tea Party before the
Tea Party” (POG 2014).
Media coverage and local experts were divided over whether the decision to use a ‘fire-
house’ primary in the 10th district was to prevent a more conservative state convention from
supporting a more extreme candidate who would be less viable in the general election or was
simply a matter of practicality. Some party officials we spoke to said that candidates who
performed worse in the primary had been advocating for a convention since it was their only
viable path to victory. One local activist mentioned how the primary system with plurality
rule benefited Comstock, as there would likely be a majority of more ardent Tea Party sup-
porters at the convention, even if there was not a majority for any one particular Tea Party
candidate. But a state party official was confident that Comstock would have won under any
circumstance, but that the party canvass method would give the party more control while
preventing criticisms of a closed-party process (ibid.).
There is some evidence that the party canvass was designed to help the party establish-
ment. The choice of which polling locations to use is a choice to determine which voters will
be convenienced and inconvenienced by the process. In the 10th district, the selection of the
particular canvass locations was biased against Tea Party voters. By way of background, in
the previous election cycle, former Senator George Allen sought to reclaim his U.S. Senate
seat when Senator Jim Webb announced his retirement. While he won the nomination by
a comfortable margin – 66% of the vote in a four person primary – President of the Rich-
mond Tea Party and co-founder of the Virginia Tea Party Patriots Federation Jamie Radke
won 23% of the vote statewide, a figure that far exceeded expectations set by public polling
(WaPo Poll 2012). Figure 3.2 maps Radke’s vote share by precinct in Virginia’s 10th dis-
trict, and also plots the locations chosen by the 10th district Republican committee for the
2014. The average precinct with a canvass location cast 16.2% of their ballots for the Tea
Party candidate, in comparison to the district at large which cast 19.5% of their ballots in
support of Radke – a statistically significant bias against Tea Party supporting precincts. If
42

the committee were randomly selecting polling locations from all available polling locations
in the district, we would expect this degree of pro-establishment bias to occur only around
8% of the time.6 Admittedly, this evidence is only suggestive. However, whether the selec-
tion of the locations was done intentionally or coincidentally, and whether the benefit was
determinative or not, it was an available tool for the party to use in benefit of her campaign.
Figure 3.2: Canvass Locations in Virginia’s 10th District Republican Primary
Taken together, Comstock’s network of establishment supporters – those officials in
charge of deciding how the party will select it’s nominee – whether intentionally or not, helped
6The difference in Radke’s primary vote share between precincts with canvass locations and those withoutis statistically significant under a Welch two sample t-test (p≈ 0.013). Using 100,000 simulated draws fromthe list of 210 potential polling locations within the district, I find only 8.22% of draws with Radke’s averageless than or equal to the 16.2% observed. Geocoding of the polling locations was conducted using the GoogleMaps API and the geo-spacial subsetting was conducted using QGIS. Using the number of potential pollinglocations accounts for variations in population, as precincts with more polling locations are those with largervoting populations.
43

create an electoral environment more favorable to their chosen candidate. They designed a
party canvass requiring voters from areas with larger concentrations of Tea Party support
to travel further and use polling locations different from their usual location. Both of these
factors could have easily benefited Comstock on the margins. And these are the decisions
we can easily observe. For example, there were 10 locations in the firehouse primary, but
party rules only dictate that each electoral unit has one location. Why then were Loudon
and Fairfax counties given multiple locations? Any explanation would, at this point, be
speculation. But regardless of whether that tool was used to support Comstock’s particular
nomination, it is sufficient to note the rang of resources Comstock’s establishment network
could have used if circumstances demanded.
3.3.3 The County Line
In New Jersey, the county party’s endorsement is key to nomination. Before I could
ask my first question in regards to the Democratic primary in New Jersey’s 1st district, a
political consultant declared that “the most important thing to keep in mind for New Jersey
primary politics is the case Lautenberg v. Kelly.” He went on to explain how this court
case allowed county parties to start placing statewide office seekers at the top of the ‘party
line’ and not in a separate column. Befuddled, I asked “umm...what is the party line?” He
laughed. “Oh, you really don’t know Jersey” (POG 2014).
The “party line” in New Jersey is the preferential ballot placement that comes with the
endorsement of the county party organization. Figure 3.3 provides a sample ballot from the
2014 Democratic Primary in Mercer and Middlesex counties. In Column A, voters can find
the county’s “slate” – the candidates who are running with the county endorsement, or have
been given “the county line.” In Middlesex County, Linda Greenstein won the endorsement
of the county party, whereas Bonnie Watson Coleman did so in her home county of Mercer.
The advantage to the line comes predominantly from the ballot design. Candidate’s in full
columns simply “look like they belong there,” and are more likely to be selected, all else
equal. Some counties also identify that column separately, as Burlington County does with
44

Figure 3.3: Sample Ballots from New Jersey’s 12th District Democratic Primary
45

the label “Burlington County Regular Democrats.” Following Lautenberg v. Kelly (1994),
the top of these columns were headed by the endorsed candidates for statewide office, which
added the value of higher name recognition to the county line. While this process ostensibly
leaves the power of nominations in the hands of voters, those interviewed could only recall
two or three instances ever in which a candidate won a primary “off the line,” and my own
research nominations could find no such exceptions for congressional primaries.
The county line was critical in securing the party’s nomination in the open-seat contests
in the 2014 cycle. When Representative Rush Holt announced that he would not seek reelec-
tion to New Jersey’s heavily Democratic 12th district in 2014, four candidates quickly filed
to run for the Democratic nomination: State Sen. Linda Greenstein, State Rep. Upendra
Chivukula, State Rep. Bonnie Watson Coleman, and Princeton Physicist Andrew Zwicker.
Greenstein, Chivukula, and Watson Coleman were each endorsed by their home county’s
Democratic party. On March 11, 2014, the three major candidates all met at Giovanna’s
Restaurant in Plainfield, NJ to meet with the Democratic chairpeople of the three Union
County towns in the 12th District – Assemblyman Jerry Green, Mayor Colleen Mahr, and
Assemblywoman Linda Stender (Spoto 2014). In a private room in this Italian Restaurant
the three party leaders decided to endorse Watson Coleman. She would go on to win the nom-
ination in no small part due to her 76% of the vote from Union County. Table 3.1 presents
the county-level results for that contest, as well as the counterfactual in which Greenstein
had performed as well as Watson Coleman in Union County. It is not inconceivable that the
Union County endorsement determined the outcome of this race.
Table 3.1: County Results in New Jersey’s 12th District Democratic Primary
County Watson Coleman Greenstein Chivukula Zwicker
Mercer 10,908 2,837 1,693 1,648Middlesex 772 6,466 2,789 708Somerset 790 418 2,923 169
Union 3,133 368 485 143
Total 15,603 10,089 7,890 2,668Counterfactual 12,838 12,854 – –
46
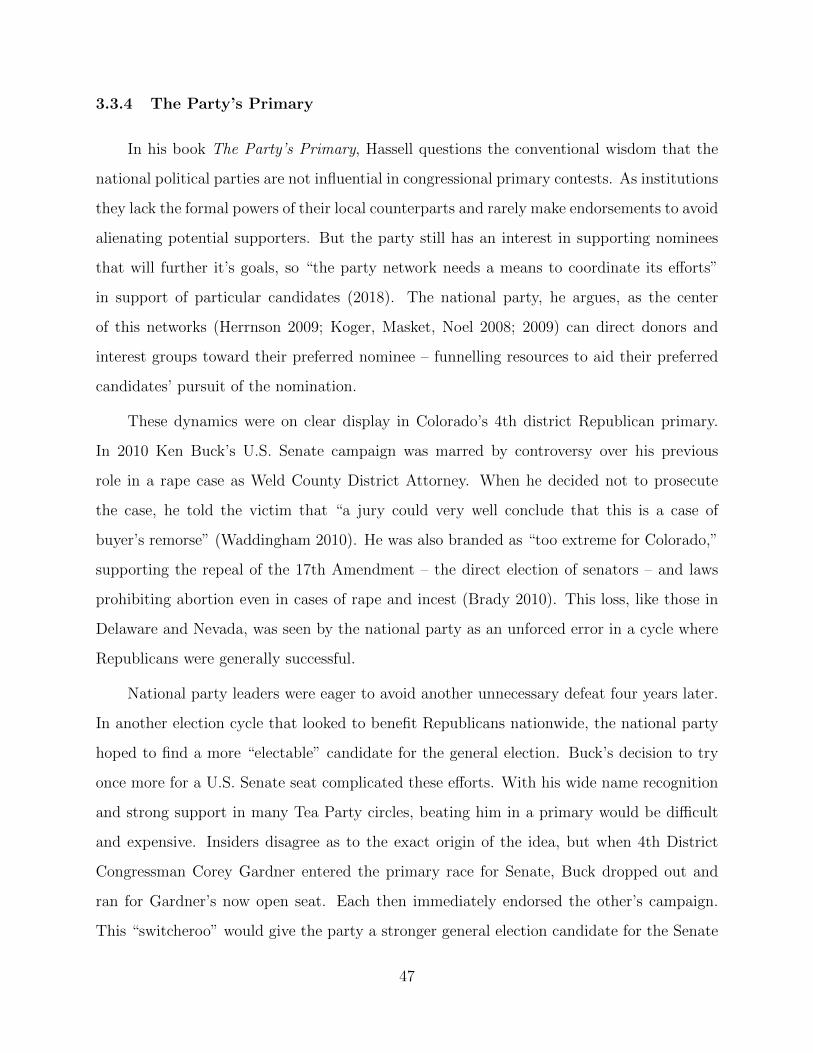
3.3.4 The Party’s Primary
In his book The Party’s Primary, Hassell questions the conventional wisdom that the
national political parties are not influential in congressional primary contests. As institutions
they lack the formal powers of their local counterparts and rarely make endorsements to avoid
alienating potential supporters. But the party still has an interest in supporting nominees
that will further it’s goals, so “the party network needs a means to coordinate its efforts”
in support of particular candidates (2018). The national party, he argues, as the center
of this networks (Herrnson 2009; Koger, Masket, Noel 2008; 2009) can direct donors and
interest groups toward their preferred nominee – funnelling resources to aid their preferred
candidates’ pursuit of the nomination.
These dynamics were on clear display in Colorado’s 4th district Republican primary.
In 2010 Ken Buck’s U.S. Senate campaign was marred by controversy over his previous
role in a rape case as Weld County District Attorney. When he decided not to prosecute
the case, he told the victim that “a jury could very well conclude that this is a case of
buyer’s remorse” (Waddingham 2010). He was also branded as “too extreme for Colorado,”
supporting the repeal of the 17th Amendment – the direct election of senators – and laws
prohibiting abortion even in cases of rape and incest (Brady 2010). This loss, like those in
Delaware and Nevada, was seen by the national party as an unforced error in a cycle where
Republicans were generally successful.
National party leaders were eager to avoid another unnecessary defeat four years later.
In another election cycle that looked to benefit Republicans nationwide, the national party
hoped to find a more “electable” candidate for the general election. Buck’s decision to try
once more for a U.S. Senate seat complicated these efforts. With his wide name recognition
and strong support in many Tea Party circles, beating him in a primary would be difficult
and expensive. Insiders disagree as to the exact origin of the idea, but when 4th District
Congressman Corey Gardner entered the primary race for Senate, Buck dropped out and
ran for Gardner’s now open seat. Each then immediately endorsed the other’s campaign.
This “switcheroo” would give the party a stronger general election candidate for the Senate
47

contest and wouldn’t endanger the heavily Republican 4th district (Hohmann et al. 2014).
Figure 3.4: Overlap in Donors between Ken Buck, Corey Garnder, and the RNC
Ken Buck
2013 −− 2014 Campaign Cycle
Num
ber
of P
arty
Don
ors
●●●●●●●●●●●●●●●●●●●●●●●●●●●●●●
●●●●
●●●●●●●
●●●●●
●●●●●●●●●●●●
●●●●●●
●●
●●●●●●●●●
●●●●
●●●●●●●●●●●●●
●●●●●●●●●●●●●●●●●
●●●●●●●●●●●●●●●●●●●●
●●●●●●●●●●●●●●●●●●●
●●●●●●
●●●●●●●●●
●●●●●●●●●●●●●●●●●●●●
●●●●●●●●●●●●
●●●●●●●●●●
●
●●●
●●
●●●●
●●●
●●●●●
●●●●●●●●●●●●
●●●●●●●●●
●●●●●●●●●
●●●●●
●●●●●●●
●●
●●●●●●●●●●●●
●●●●●●●●●●●●●●
●●●●●
●●●●
●●●●●●●
●●●●●
●●●●
●●●
●●
●●●●●●●●●●
●●●●●
●
●●●●●
0
50
100
150
Oct Nov Dec Jan Feb Mar Apr May Jun
Buck & Gardner
2013 −− 2014 Campaign Cycle
Num
ber
of S
hare
d D
onor
s●●●●●●●●●●●●●●●●●●●●●●●●●●●●●●●●●●●●●●●●●●●●●●●●●●●●●●●●●●●●●●●●●●●●●●●●●●●●●●●●●●●●●●●●●●●●●●●●●●●●●●●●●●●●●●●●●●●●●●●●●●●●●●●●●●●●●●●●●●●●●●●●●●●●●●●●●●●●●●●●●●●●●●●●●●●●●●●●●●●●●●●●●●●●●●●●●●●●●●●●●●●●●●●●●●●●●●●●●●●
●●●●●●●●●●●●●●●●●●●●●●●●●●●●●●●●●●●●
●●●●●●●●●●●●●●●●●●●●●●●●●●●●●●●●●●●●●●●●●●●●●●●●
●●●●●●●●●●●●●●●●●●●●●●●●●●●●●●●●●●●●●●●●●●
●●●●●●●●●●●●●●●●●●●●●●●●●●●●●●●●●●●●●●●●●
●●●●●●●●●●●●●●●●●●●●●●
●●●●●●●●●●●●●●●●●●
●●●
●●●●
●●
●●●●●
●●
●
●
●●●
●●●●●●●●●
●
●●●●●●●●●●●
●●●●●●●
●●●●●●●
●●●●●●●●
●
●●
●●●●●●
●●●●
●●●●
●●●
●
●
●●●●●
●
●●●●●●●●
●●
●●●
●●
0
20
40
60
80
100
120
140
160
180
Oct Nov Dec Jan Feb Mar Apr May Jun
Gardner
2013 −− 2014 Campaign Cycle
Num
ber
of P
arty
Don
ors
●●●●●●●●●●●●●●●●●●●●●●●●●●●●●●●●●●●●●●●●●●●●●
●●●●●●●●●●●●●●●●●●●●●●●●●●●●
●●●●●●●●●●●●●●●●●●●●●●●●●●●●●●●●●●●●●●●●●●●●●●●●●●●●●●●●●●●●
●●●●●●●●●●●●●●●●●●●●●●●●●●●●●●
●●●●●●●●●●●●●●●●●●●●●●●●●●●●●●●●●●●●●●●●●●●●●●●●●●●●●●●●
●●●●●●●●●●●
●●●●●●●●●
●●●●●
●●●●
●●●
●●
●●●
●●
●●●●●●●●●●
●●●●●●●●
●●●●●
●●●●●
●●●●●●●●●●
●
●●●●●
●●
●●●●●●●
●●●●●●●●●●
●●
●●●●●●●
●●●●●
●●●
●●●●
●
●
0
100
200
300
400
500
600
700
Oct Nov Dec Jan Feb Mar Apr May Jun
Note: Panel 1 provides the number of donors Ken Buck shared with the national party’sfundraising committees over the course of the campaign. The greyed area is the period beforethe “switcheroo.” The dotted line is a linear projection based on the rate prior to the switch.Panel 2 provides a similar plot, but with the number of donors Ken Buck shared with CoreyGardner’s campaign. Similarly, Panel 3 provides Gardner’s number of party donors acrossthe primary cycle.
48

Regardless of who approached who with the idea for the candidate swap, it was or-
chestrated and financially supported by the national party. RNC Chairman Reince Priebus
publicly disclosed that discussions between the two campaigns had been going on for weeks,
and much of the political coverage of the switch referenced the major role that prominent na-
tional Republican strategist Karl Rove played in pressuring Buck to agree to the switch (Pols
2014b). Figure 3.4 provides some initial evidence that the party did in fact move behind
and support Buck once he shifted to the House contest. The first figure plots the cumulative
number of donors that contributed to the Buck campaign who also contributed to one of
the national Republican fundraising committees – the RNC, RSCC, or RCCC. The second
figure shows the cumulative number of donors that contributed to both Gardner and Buck’s
campaign. The grayed areas are the time during which Buck was running for the Senate
seat, and the dotted lines are a linear projection based solely on rate of donors prior to the
switch. As a result of the switch, Buck’s campaign began to receive the support from signif-
icantly more national donors – a support network that increasingly overlapped with that of
Gardner. Importantly, the shift in national donors appears to begin just before details of the
switch went public, supporting Preibus’s claim that these efforts began behind the scenes
prior to the announcement. While these data alone are somewhat speculative, they conform
to insider reports that the national party moved behind Buck to encourage him to switch to
the House contest. In sum, following the switch, the national party came to support Buck’s
candidacy in the contested 4th district primary and Corey Gardner’s campaign.
The increase in Ken Buck’s number of national party donors in the first week after
the switch (+10) was greater than the total number of national party donations any of his
house primary opponents received during the duration of the primary. The shift toward
Buck by national party donors is important as it signals that the national parties are still
able to marshal important resource networks behind their chosen candidates and are not
simply the falling in line behind the presumptive nominee. The national party had no fear
of losing the 4th district in the general election, and would have been well represented by
any of Buck’s 4th district opponents. If anything, his opponents had less electoral baggage
and weren’t subject to the criticisms of the switching “back room deal” (Fasano 2014). But
49

in exchange for assisting their preferred Senate contest, the party was willing to expend it’s
scares resources – campaign donations and endorsements – to help nominate Buck.
3.3.5 Party Capture and the Formal Powers of Local Organizations
It could be tempting to view these as instances in which networks of support had little
sway over the outcome of the nominations. Love’s ability to win the nomination in Utah could
have simply come from her abilities to persuade delegates. Watson Coleman’s charm could
have allowed her to win over the Union County committee. Comstock’s talents as a politician
and fundraiser could have convinced the formal party to get behind her. These could easily
be viewed as textbook examples of the candidate-centered parties that are “maintained,
used or abused, reformed or ignored” when doing so furthers the goals of politicians and
ambitious office-seekers (Aldrich 1995 p.4; see Schwartz 1989). However, when the formal
party holds such significant influence over the process, it provides ample incentive to seek
control over that party’s formal apparatus. When these organized interests gain sufficient
control to use the party’s levers of power to their own advantage, the parties are essentially
“captured” by the network. Two noteworthy examples of party capture – the trade unions
in the Democratic Party in southern New Jersey and the Tea Party in the Virginia state
Republican Party – factored heavily into nomination contests in those states and suggest
that even in these states with formal party powers, the networks of supporters behind the
party are critical.
3.3.5.1 An Electrician with a Tie
Within moments of Representative Rob Andrew’s retirement announcement, State Sen-
ator Donald Norcross announced his own intentions to seek the Democratic nomination for
the first district of New Jersey with the endorsement of dozens of local, county, and state offi-
cials, including Senators Bob Menendez and Corey Booker, Congressmen Pallone, Andrews,
Sires, Pascrell, Holt, and Payne – the entirety of the state’s federal Democratic delegation
(PolitickerNJ 2014). This overwhelming show of support was in no small part driven by
50

George Norcross, the undisputed boss of South Jersey’s Democratic Party. To describe his
influence, one Republican operative confessed
“People joke around about Hague, and some of the other classic New JerseyBosses, that everyone says during his time period in Hudson County, Hague wasthe boss of all bosses, ya know, you see Boardwalk Empire, and that’s based ona true character...but George [Norcross] probably is the best and the greatestone of all time. He’s taken it to a level those guys never could have dreamedit could go. And I’m not talking about illegal stuff, just how his power, hisstrength, getting stuff done, and also just the money...the money he raises isbeyond anything anyone in Jersey has ever seen...he’s impossible to beat, andwhen he’s personally involved like this [referring to his brother’s Congressionalcampaign], I truly mean impossible to beat” (POG 2014).
A piece in Philadelphia Magazine described the reach of his influence:
“Norcross holds unshakable influence over offices from the mayor of Collingswoodto the Camden County freeholders to the state senate. Within New Jersey, heboasts true omnipotence – his alliances with North Jersey Democrats are sostrong that no governor can ignore his wants, and he is second only to GovernorChris Christie in terms of influence” (Volk 2013).
According to a senior political consultant for the Camden County Democratic party,
the political influence of the Norcross family is not limited to George “Donald is a player
in his own right.” In a much more behind the scenes fashion, Donald Norcross has been a
crucial player in merging the South Jersey labor movement and the Democratic Party into
a single force. “Donald is the union movement,” and as a result of his efforts and organizing
“the union movement and the Democratic Party are now often one and the same” (POG
2014).
Donald Norcross began his professional career as a union electrician. He would rise
through the ranks and go on to serve as the president of the South New Jersey Branch of the
AFL-CIO’s Central Labor Council, and has spent the last 15 years working for the Inter-
national Brotherhood of Electrical Workers (IBEW), most recently serving as the assistant
business manager of IBEW Local 351. Norcross is most known for his work bridging the
efforts of public service charities and union organizations.
51

One program that Norcross was instrumental in bringing to New Jersey was the 2-1-1
initiative – a state program to help connect the public with government and private resource
services. Norcross’s work on this program established beneficial relationships between the
trade unions, the charitable organizations, and the community, while also building both his
reputation and network of supporters and allies.
Potential candidates frequently sought his advice when seeking office and members of the
legislature would seek his advice when considering legislation. Through these interactions,
Norcross realized that too few members of the unions were represented in local planning
boards, public works commissions, and county offices, and began recruiting members of the
trade unions to seek these offices. “He would sit at a diner all day making his pitch to
potential candidates,” and through the years brought enough trade union members into the
process to make them the central players in the Democratic party (POG 2014).
One such candidate Norcross recruited was his family friend and member of the local
ironworkers union, Stephen Sweeney, who Norcross convinced and supported in his run for
the Gloucester County Board of Freeholders. Now the President of the New Jersey Senate,
Sweeney is one of the most influential policy makers in the Garden State. His first run for
the State Senate was the most expensive state legislative race in New Jersey history, costing
nearly $2.4 million (Smith 2007). Much of Sweeney’s fundraising strength and his eventual
victory are often attributed to George Norcross’s political machine, but it was Donald behind
the scenes pushing trade union workers to run for office that brought Sweeney into the
electoral arena.
Donald and George’s work built the unions into the most influential group in New
Jersey Democratic politics. Donald forced labor to the center of the Democratic party by
directly recruiting and supporting union members and labor supporters pursuing office, and
George used his fundraising strength to make sure that these candidates were successful. For
example: “[George Norcross] raised $2 million, for the 2003 state senate race that installed
unknown challenger [and police union member] Fred Madden over Republican incumbent
George Geist” in the most expensive state legislative race in Jersey history (Volk 2013).
52

When State Assembly Speaker Joe Roberts decided to retire, he approached Donald
Norcross, so often the recruiter, and convinced him to run for the seat in the Assembly.
Roberts was renominated for the office in the primary, but then announced that he would
not seek re-election in the general election. This allowed the party organization to select
a replacement candidate for the general election. Considering the number of members of
the committee that Norcross had originally recruited to get involved, and the influence his
brother’s fundraising ability still had over the organization, Donald getting on the ballot
was no more difficult than signaling that he was interested in the position. In the same
general election, 5th district State Senator Dana Reed was elected Mayor of Camden, creating
another vacancy, which the party then decided to fill with...Donald Norcross.
Five years later, at his congressional campaign launch, Norcross declared that he was
“an electrician with a tie,” running “because South Jersey needs to continue to have an
effective advocate” in Washington (Arco 2014). His close ties with the labor movement
were on full display. The Senate President Sweeney was on hand to endorse Norcross at
the announcement event. “Donald is a true champion of the people, [and] one of us,” said
Sweeney. “I cant believe an ironworker is saying such nice things about an electrician,” he
joked as a childhood friend of the Norcross family. Sweeney went on to say, “but it’s time
we send a union electrician to Washington” (Caffrey 2014).
While Logan Township Mayor Frank Minor competed in the primary, Norcross won
the Camden County party endorsement, the support of dozens of local elected official, the
Democratic nomination with five times as many votes as his nearest opponent, and the
general election with ease. It is difficult to disaggregate the impact of the party line from
the support of the larger Norcross operation, but these forces are far from independent. The
support of the Norcross machine secured him the support of the formal party. When I asked
someone familiar the Camden County endorsement how they decided to endorse Norcross,
he just looked over his glasses and laughed. Through years of organizing union candidates,
the Norcross family had created an unbeatable party organization in which “Democrat” and
“Union” were essentially synonymous.
53

3.3.5.2 The Most Powerful Man You’ve Never Heard Of
Russ Moulton, the leader of the grassroots conservative wing of the Virginia Republican
Party – the Conservative Fellowship – has been described as “the most powerful man in
Virginia you’ve never heard of” (Martin 2015). Moulton
“shares his beliefs with his conservative network through e-mail, chiding suchRepublicans as [former] House of Delegates Speaker William J. Howell for sup-porting a tax increase that ‘destroyed our brand.’ In one e-mail, he warnedlegislators they’d be ‘Cantor’d!’ if they didn’t oppose Virginia’s same-sex mar-riage law...The way to ‘save our Republic,’ he wrote, is ‘conservatives organizingprecinct-by-precinct, and seat-by-seat’.” (Schwartzman 2015).
Moulton was instrumental in organizing the Tea Party takeover of the Virginia Repub-
lican Party. During the 2009 gubernatorial primary, Lt. Governor Bill Bolling agreed to
support the establishment candidate Bob McDonnell’s candidacy under the condition that
he supported Bolling to replace him in 2013. Moulton, however, preferred a more conser-
vative alternative to Bolling. Moulton used this local activist strategy to seize control of
the Virginia Republican Party. He and his network supported thirteen candidates to run for
internal party elections across the state. Twelve of these “conservative grass-roots and tea
party activists” candidates won against candidates from the “establishment wing,” giving
Moulton’s Fellowship a majority of seats on the state committee (Nolan 2016).
A state primary is organized and run by state government as with most other states.
Virginia, however, does not have voter party registration, and concerns about Democrats
participating in Republican primaries and the lack of control for party officials causes party
leaders to often look elsewhere. A party canvass, or a “firehouse” primary, is a private pri-
mary run by the party in which any voter who signs a statement of intent to vote Republican
can participate. A mass meeting is similar to a traditional convention, but it is open to any-
one in the district who wishes to attend – these are often avoided because of the logistical
difficulties. Finally, parties can opt to use political conventions in which each county and
municipality elects and sends delegates to a state convention to choose nominees.
54

Moulton hoped to use this new control over the party organization to conduct conven-
tions rather than primaries for choosing Republican nominees. Conventions tend to “attract
the party’s most ardent conservatives,” where a “primary, because it is extended and draws a
larger electorate including Democrats, Republicans and independents – favors well-financed
establishment candidates” (Schwartzman 2015). Moulton’s new Fellowship majority reversed
the decision to hold a gubernatorial primary – disadvantaging Bolling who hoped to mir-
ror McDonnell’s electoral strategy. Instead, Ken Cuccinelli, a close Moulton ally, won the
Republican nomination at the party’s convention.
Cuccinelli’s convention win and general election loss was taken by establishment Re-
publicans as evidence that the convention strategy was a not in the party’s best interest.
Using Moulton’s own playbook against him, the more establishment faction of the party
regained a one seat majority on the state committee in 2016. By a 41-40 vote, “the GOP’s
State Central Committee effectively upended a compromise agreement reached last year by
factions within the state party that called for a primary in the 2016 race for president to be
followed by a nominating convention for statewide offices in 2017” and “voted to select their
2017 statewide candidates in a primary rather than at a convention” (Nolan 2016).
These dynamics are currently playing out in Virginia’s 6th congressional district. After
Eric Cantor’s surprising 2014 primary defeat, establishment candidates became increasingly
hesitant to put their electoral fate in the hands of primary voters. The 6th district’s party
committee voted to hold a convention to choose the 2018 nominee to replace retiring Rep.
Bob Goodlatte, but only knowing that the majority of delegates supported the establishment
faction. “That was until the committee decided the nominee would be chosen by a plurality of
the vote rather than a majority,” which the establishment candidate, Ben Cline, complained
was an attempt “to rig the convention to help their chosen candidate because they do not
believe their candidate of choice is strong enough to win a majority of delegates under the
standard Convention rules” (Leahy 2018). By relaxing the requirement that a candidate be
nominated by a majority of delegates, Tea Party supporters hope to put their thumb on
the scale for the more conservative candidate, Virginia’s GOP national committeewoman,
Cynthia Dunbar.
55

The amount of influence the method of selecting nominees has over the outcome of
particular contests provides organized interests with ample incentive to attempt to control
the formal party organizations in Virginia. The Tea Party and establishment factions of
the Republican Party have become well aware of this dynamic, and have increasingly taken
to competing in internal party elections to help control the levers of party power. While
the particular faction in control has varied from cycle to cycle lately, this has not stopped
ideologically motivated networks of supporters from “capturing” the parties to further their
goals.
3.4 Candidate-Centered Informal Party Networks
In Masket’s overview of five party networks in California, he noted that “officehold-
ers...are often the builders of and top players in [informal party organizations]...They provide
much of the effort to forge alliance with other officeholders and to get their own proteges
elected” (2009, p. 129). We observed a similar dynamic in some 2014 primary races, with
regional elected officials playing central roles in the recruitment, dissuasion, and support of
candidates in primary elections. In Michigan’s 4th district, Bill Schuette’s political network
was seen as critical to overcoming the wide name recognition and self-fundraising abilities
of an outsider candidate, while in North Carolina’s 12th district, the atrophy of Charlotte’s
Democratic establishment allowed for an outsider candidate to succeed in a crowded field.
3.4.1 Bill Schuette’s ‘Midland Team’
Bill Schuette has been a major player in Michigan Republican politics for the past thirty-
five years. First elected to Congress in 1984 at the age of 31, he served three terms before
unsuccessfully challenging incumbent Democrat, Carl Levin, in the 1990 Senate election.
Fellow Republican and then-Governor John Engler then appointed Schuette to head the
Michigan Department of Agriculture, where her served until running for the Michigan State
Senate in 1994, where he served until 2003. From here he was elected to the Michigan 4th
District Court of Appeals, until he was chosen by the Michigan Republican convention as
56

their nominee for state Attorney General in 2010. When he sought re-election to the position
in 2014, he had represented some portion of Michigan’s current 4th congressional district
continuously for nearly 30 years.
When Schuette decided to challenge Levin for the Senate seat in 1990, he encouraged
Dave Camp to run to replace him in Congress. Before serving as Schuette’s chief of staff,
Camp served on the Midland County Board of Canvassers and was a member of the Midland
County Republican Committee, and had served one term in the Michigan House of Repre-
sentatives. In the Republican primary his major opponents consisted of former congressman
James Dunn, and former state legislators Alan Cropsey and Richard Allen. Despite trail-
ing Dunn in early polls, Camp won the Republican primary with a plurality of 33%, which
sources attributed largely to the support of Schuette. He went on to win the general election
easily.
Since 1990, Schuette and Camp have built an impressive grassroots Republican machine
based out of their home county of Midland. As one Schuette associate put it:
“The 4th district, from a party stand point, has always been controlled by thealliance of Dave Camp...and Bill Schuette...They have built a strong grassrootsoperation throughout the district...They know who the activists are, who to putinto different places, and who to talk to in order to get things done...they weretrusted in the district...if they said this is our guy, then people would say ‘if DaveCamp likes him, then he must be the right one”’ (POG 2014).
They built this machine slowly over the years by tending to and fostering relationships
among Midland County elected Republicans and the major business interests in the district,
particularly Dow Chemical. Bill Schuette would hold townhall-style meetings where business
leaders, local officials, and activists could come and ask him questions while he poured them
coffee. He was a central player in organizing the “4th District Round-up” – an annual
dinner hosted by Schuette on behalf of Camp to bring together the various party officials
and activists to continue to foster those relationships.
But those we interviewed were quick to point out that this machine was not “like
Tammany Hall or anything untoward,” simply the bi-product of years of “relationships”
57

reinforced by cooperation on “many projects for the district.” That said, political consultants
“call it a machine, because when it comes to convention politics...if we want the 4th district
to be locked up, we get Schuette’s blessing” (POG 2014).
Realizing, as one campaign adviser put it, “the importance of keeping this a Midland
seat,” Schuette again took an active role in supporting a Midland County based nominee
when Camp decided to retire in 2014. As he described:
“Between Bill [Schuette] and Dave [Camp] there was a sense that it’s nice to havesomeone from Midland, who knows the concerns of Midland, who will keep aneye out for Midland, who’s going to make sure that Midland’s best interests arelooked after first and foremost, because that’s the hometown team.
We want someone who is going to make sure that Midland gets its fair share,whether that is highway funds, new exchanges, pilot projects to fix infrastructure,maybe tax changes. [Who will consider] what that will do to the biggest employerin town ...if Dow sneezes, Midland County catches a cold” (ibid.).
The obvious choice was John Moolenaar, the state senator representing a large chunk
of the district and a former Dow Chemical Company chemist. Moolenaar had been a part
of the “Midland Team” for many years.
“Politically, the 4th district is a tight district. Everybody knows everybody. AndBill Schuette was friends with everybody. Dave Camp was friends with every-body. [John] Moolenaar was friends with everybody. So there was a built innetwork that he could tap into...
We all knew Moolenar, because he had a long history. He had been state rep. Hehad been state senator. He was a longtime activist in the party. My wife knewJohn going back to the Headlee [gubernatorial] campaign going back to 1982.What’s that like 35 years we’ve known John? John was just a known quantity”(ibid.).
But Schuette and Moolenaar had to overcome one obstacle between them and the nom-
ination: the self-financing former Ross Education CEO, Paul Mitchell. While Mitchell had
no elected experience, it would have been difficult if not impossible to compete with Mitchell
on the airwaves given the $3.5 million dollars he loaned his campaign. And this disadvantage
58

kept Moolenaar as the underdog for the bulk of the campaign – early public polling had Paul
Mitchell at 50% to Moolenaar’s 23% (Roelofs 2014). So
“they got a bus, some sort of vehicle or RV...and they hit all the high points,the bars, restaurants, attractions in the 4th district. Bill knows the district likethe back of his hand...he’s represented it by and large his whole life, whetheras a Congressman, or a state senator, certainly as a judge, and now as Attor-ney General he has the whole state as part of his portfolio...he knows the 4thdistrict backwards and forwards, all the coffee shops and gathering spots wherepeople get together to talk about politics...and that’s where you want to takeyour candidate...like Don’s in Mt. Pleasant and Pizza Sam’s and Charlene’s inMidland...each community has one of these places, and that’s what Bill was verygood at...”
“Moolenaar did not have the money that his primary opponent did. We neededto counteract that with something else. Bill [Schuette] felt that we could havea better ground game, a more localized ground game, with more local supportfor John [Moolenaar]...John and Bill had more long standing relationships in thecommunity...so we could better capitalize on that and go to these local commu-nities...” (POG 2014).
This description may falsely convey an image of some sort of shoe-string operation. Be-
tween independent expenditures made on Moolenaar’s behalf and the expenditures of his own
campaign, over $1 million dollars went toward securing him the nomination. Importantly,
most of this money came from the “Midland Team” network. Of those itemized contri-
butions made to Moolenaar during the primary, more than 52% (253/489) had previously
contributed to one of Bill Schuette’s campaigns (Bonica 2015, MI SOS 2018). 36% (174/489)
of these donors had contributed to Schuette before he was elected Attorney General. And
about 10% (45/489) had been consistently active in the network back to David Camp’s 1990
primary campaign, including Dow Chemical Presidents Paul Oreffice and Macauley Whit-
ing, The Michigan Farm Bureau, Midland Cogeneration Venture CEO Rodney Boulanger,
the Narton Corporation Chairman Norman Rautiola, Midland County GOP Chair Judy
Rapanos, and of course, Bill Schuette.
It was Schuette’s network that allowed Moolenaar to overcome his financial disadvan-
tages and win the primary. By tapping into this network, Moolenaar had access to endorse-
59

ments, campaign contributions, and a grassroots network of supporters that allowed him
to compete with Paul Mitchell. Initially down in the polls and considerably outspent, it
would be a mistake to conclude that this result was preordained, or that this network was
simply falling in line behind the eventual nominee. It was the network marshaling powerful
resources behind their candidate that allowed Moolenaar to win the nomination.
3.4.2 Charlotte’s Empty Bench
Politician-centered networks also featured prominently in Democratic nominations, but
the most informative example of their influence came in the form of a network’s failure.
Through a series of retirements and federal appointments, the bench of African-American
politicians in Charlotte, North Carolina emptied too quickly for new leadership to emerge.
As a result, they lacked the structure necessary coalesce around one candidate, which allowed
a candidate from outside the city, Alma Adams of Greensboro, to take the seat.
On January 17, 2014, Charlotte gathered to mourn the loss of civil rights icon, Franklin
McCain. McCain had been one of the four North Carolina A & T students who staged
the famous sit-in at a whites-only lunch counter in Greensboro, North Carolina (Morrill
2014). Sadly, this was the second time in recent months that Charlotte had come together
to bury one of its heroes. Only four months prior, the community lost Julius Chambers, a
civil rights lawyer instrumental in many of the Supreme Court victories surrounding deseg-
regation, school busing, and employment discrimination. Sitting in the pews for the service
sat his numerous proteges and partners: Former Charlotte Mayor Harvey Gantt, prominent
civil rights James Ferguson, Former Representative and FHFA Director Mel Watt, Former
Mayor and Current U.S. Transportation Secretary Anthony Foxx, and city councilman James
Mitchell.
All of these men stood as monumental figures in their own right. Mayor Gantt was the
first African-American mayor of Charlotte, ran for the Senate twice in campaigns against
Jesse Helms, and serves as a “father figure” to both the Democratic establishment and the
city at large (POG 2014). His Senate campaigns, some of the earliest competitive state
60

wide races made by an African-American candidate, would inspire countless young African
Americans to pursue careers in public service and elected office, including a then Harvard law
student, Barack Obama. James Ferguson, a partner with Julius Chambers at the prominent
law firm Ferguson, Chambers, and Sumter, had a reputation both in the Charlotte and
legal communities second to none. Among their more illustrious proteges, Representative
Mel Watt, or “Mel, just Mel,” as he’s known in the district, was the first congressman
to represent the newly created district and developed such a reputation for gravitas and
leadership that many people I interviewed referred to him simply as “the man.” Anthony
Foxx had distinguished himself during his tenure on the city council and as mayor as a rising
Democratic star, and was widely viewed as the heir-apparent to replace Watt were he to
retire or seek another office.
While activist networks in most congressional districts are often small and tightly knit
communities, in North Carolina’s 12th district, political power remained in the hands of
individuals with deeply personal connections. Watt and Ferguson worked at the same law
firm, and Watt and Gantt were next-door neighbors. All three were close family friends. An-
thony Foxx’s grandfather was Gantt’s political mentor, and was himself almost an “adoptive
son” of Mel Watt. From the mayor’s office to Congress, from city council to planning the
2012 DNC convention, Democratic politics in Charlotte was a family affair. As Jim Morrill
(2012), the long-time political reporter for The Charlotte Observer, writes:
‘Like Gantt, Ferguson and Watt had been part of a new generation of blackprofessionals in Charlotte. The three became good friends. So did their kids.Watt and Gantt even lived side by side...Sometimes the historical continuum ranthrough their kitchens...Their kids hung out at each other’s homes. They wentto good colleges. They played tennis on the backyard court Gantt and Wattshared...And since elementary school the kids counted in their group a friendnamed Anthony Foxx, whose grandfather, James Foxx, had been Gantt’s ownpolitical mentor...Anthony Foxx would go on to the city council in 2005. Twoyears later he confided to Gantt that he wanted to run for mayor. And whenhe did in 2009, it was in Gantt’s living room that he sought advice. ‘Harveyblazed a trail for a lot of people including me,’ Foxx says. ‘The great advantageI have...that he didn’t have is I have him’.”
The first generation of African-American political leaders helped revitalized Charlotte,
61

and North Carolina more generally, into a region rich in political and economic energy. They
broke down many of the racial barriers and built up a legal community to provide starts
for many African-American lawyers and public servants – Gantt, Watt, and Foxx among
the most illustrious examples. Given how few African Americans are elected to statewide
office, a congressional seats and mayorships are often considered the “crown jewels” for
black politicians. One House Democrat confided that “[b]efore Barack Obama, if you were
elected to Congress, it was like being a king, African-Americans weren’t elected as senator
or governor. So you had to be mayor or a [House] member. That was the pinnacle of
power” (Bresnahan 2014). From these position of influence, Gantt and Watt held tremendous
influence over Democractic politics in the region.
But by early 2014, however, this second generation had begun taking a step back from
the city it helped build. Mayor Gantt has increasingly taken a less active role in politics,
and his influence was less pronounced – his endorsed candidate, James Mitchell, lost the
primary for mayor just the year before. Mel Watt, the only congressman the 12th district
has ever known, and the “reigning king” of Charlotte for the past 20 years, was nominated by
President Obama to serve as the Director of the Federal Housing Finance Agency. His “heir
apparent,” the individual most assumed would run for Watt’s seat upon his retirement,
Mayor Anthony Foxx, was also nominated by the Obama Administration to serve as his
Secretary of Transportation. With these two appointments in particular, Charlotte and the
12th Congressional District, lost the bulk of its political leadership, creating a vacuum in
the political hierarchy of the region that the next generation of leaders was eager to fill. As
one local official noted:
“For years and years you’ve had a certain group that are known to be the powerplayers...but that’s changing...kid’s today don’t know who Julius Chambers is...itwasn’t passed on to the next generation, and so now there is a generational gapin that leadership (POG 2014).”
Without the guiding hand of these political leaders, there was nothing short of a free-
for-all for the Democratic nomination. Seven Democrats filed to run for the open seat, four
of whom hailed from Charlotte. This does not take into consideration the four or five other
62

candidates who had publicly explored making a run for the office. Two candidates vying
for the seat, Curtis Osborne and Rajive Patel, were not considered “serious candidates” by
anyone interviewed, but the remaining five all had reason to believe they could be the next
Mel Watt.
In a crowded field of five credible candidates, three came from the Charlotte: George
Battle, Malcolm Graham, and James Mitchell. Formerly associate general counsel for Caroli-
nas Healthcare System, Battle was currently serving as the general counsel for the Charlotte
Mecklenburg School Board when he announced his candidacy. Having never been elected to
prior office, Battle positioned himself to run as an outsider with experience in education – an
issue every interviewee noted would be particularly important in this race. Battle’s greatest
strength came from the name recognition he enjoyed courtesy of his father. As the Bishop
of the AME Zion church, George Battle, Jr. was very well known throughout the district.
The initial frontrunner from the Charlotte area was State Senator Malcolm Graham.
Of all the officeholders seeking the 12th district nomination, Graham’s district encompassed
the largest portion of the 12th district, and included the large financial sector in uptown
Charlotte. He was often described as “more moderate,” a “corporate Democrat” with a
track record of advocating for Charlotte’s larger employers. The only publicly released poll
found Graham to be the early lead with 31%, with Adams nine points behind (PPP 2013).
Former City Council Member and Mayoral Candidate James Mitchell was the last of the
“competitive” candidates to enter the race. Ironically, it was his late entry into the previous
mayoral primary that was summarily judged to be the cause of his narrow defeat against
Patrick Cannon, and it was his late entry into the race for the 12th district nomination that
handicapped him in this contest as well. “There just wasn’t room for another Charlotte
candidate at that point,” one potential candidate told us. Besides his name recognition and
association with Gantt, Mitchell had few other forces working in his direction.
In North Carolina, if no candidate receives 40% of the vote in a primary, the two top
candidates then compete in a run-off election. All those believed that if the race went to
a run-off that the Charlotte candidate would be able to win the race against the outsider.
63

But without Foxx, the fractured city Democratic structure lacked an obvious candidate to
rally around, and without Gantt or Watt taking a central role in the nomination, they
lacked any source of coordination. As a result, all three of these candidates competed among
themselves for the same 50% of the vote that came from Charlotte, and gave an opening for
a non-Charlottean.
State Representative Alma Adams of Greensboro had represented one of the northern
branches of the 12th district for twenty years and had served as the chair of the North
Carolina Legislative Black Caucus since 2008. Prior to her election to the state house, Adams
served one term on the Greensboro City School Board and four terms on the Greensboro
City Council. When asked as to the reputation Adams has developed in Raleigh, most
politicos point to her background as an art teacher and her legislative track record focusing
on education and issues affecting teachers. As the only woman in the race, EMILY’s List was
quick to support her campaign, and conducted a large independent expenditure campaign
on her behalf.
Marcus Brandon was the other candidate running from outside of Charlotte. Represent-
ing an area including parts of High Point in the State Legislature, Brandon has developed a
reputation as an independent thinker, and as the candidate least likely to toe the party line.
Having been elected to the state house only in 2010, Brandon has only served in the minority,
but has been willing to work with Republicans on some pieces of legislation, including school
vouchers. As the only openly gay member of the North Carolina state legislature, Brandon
also had the endorsement of national LGBT advocacy groups, such as the Gay & Lesbian
Victory Fund. Some individuals we spoke to worried that even in this heavily Democratic
district, Brandon’s sexuality could hinder his campaign – the district voted narrowly in fa-
vor the controversial Amendment 1 in 2012, which prohibited the state from recognizing
same-sex marriages.
In the end, Adams was able to eke out a 44% plurality by running up large margins
outside of Mecklenberg County while the four Charlotte candidates split the most populous
64

county.7 The county level results for this contest can be seen in Figure 3.5. Almost every
subject we spoke with mentioned how the divided field of candidates was critical in allowing
a candidate from outside the city to win. Not only did the Charlotte candidates outper-
form Adams (albeit narrowly, with 45% of the vote), the negative campaigning among the
Charlotte candidates was also blamed for the relative decrease in turnout in Charlotte. For
example, Charlotte’s Mecklenberg County constituted 50% of the Democratic vote in the
2012 general election, but only 45% of the vote in the 2014 primary. Had Charlotte still had
the party infrastructure that would have allowed for coalescing behind a single candidate, it
is highly unlikely that Alma Adams would have been elected to Congress in 2014.
Figure 3.5: North Carolina’s 12th District Democrat Primary Results
Note: Each county is shaded by Adam’s vote share in the county.
7This was undoubtedly aided by the nearly $250,000 in independent expenditure mailing’s conducted byEMILY’s List and Progressive KICK, but for a clearer example of EMILY’s List network at work, see theMI-14 Democratic Primary case study in section 2.3.
65

3.5 National Interest Groups
National interest groups played a major role in numerous nomination contests in the
2014 cycle. With the formal party organization reserving its resources for competitive seats
and their reticence to appear heavy handed in local contests, national interest groups often
find open-seat primaries as prime opportunities to elect an ally to Congress. In Michigan’s
14th district, EMILY’s List strategically targeted voters with massive independent expen-
ditures and helped staff Brenda Lawrence’s campaign, which allowed her to overcome the
local political machine and win the nomination. In North Carolina’s 7th district, the over-
whelming support of the Chamber of Commerce allowed David Rouzer to overcome the
controversial Tea Party-esque Woody White in an area with little Republican organization.
3.5.1 EMILY’s List
The three R’s of Michigan’s 14th district Democratic primary were reapportionment,
redistricting, and retirement. Due to continued population loss, Michigan lost another con-
gressional seat in the 2010 reapportionment, continuing a pattern of seat loss started in
1980. Having gained control of the legislature and the governor’s mansion in 2010, Republi-
cans designed the new map to cut one Democratic seat from the Detroit metropolitan area.
This in turn placed three incumbents, John Conyers, Hansen Clark, and Gary Peters, in
a position to decide between two districts. Neither Clark nor Hansen found a viable path
to nomination in challenging Conyers, so both competed in the newly drawn 14th district.
However, the newly borders included a sizable portion of suburban Oakland county, which
encouraged Brenda Lawrence, mayor of Southfield, to also seek the nomination.
Gary Peters was seen as the logical choice for Democrats to nominate for Governor in
2014 to challenge Republican incumbent Rick Snyder. In order to keep him a strong, viable
candidate, the unions, a major player in Michigan Democratic politics, felt it necessary to
keep Peters in Congress: A congressman challenging an incumbent governor was better than
a former congressman challenging an incumbent governor (POG 2014). Their efforts paid
off and Peters beat Hansen 47% to 35% with Brenda Lawrence coming in a distant third.
66

As predicted, Peters sought statewide office in the following election (although it ended
up being the less challenging contest of the open Senate seat as a result of Carl Levin’s re-
tirement), opening the 14th district once again. In many ways, the 2014 Democratic primary
was a replay of 2012. Hansen Clarke and Brenda Lawrence both sought the nomination once
again. Rudy Hobbs, a former employee of Rep. Sander Levin and ally of Gary Peters, took
up the mantel as the “establishment” replacement.
Hansen Clarke was in many ways an “accidental” incumbent – his nomination and
election to the 13th district in 2010 was more related to his opponent’s, Congresswoman’s
Carolyn Cheeks Kilpatrick, political scandal involving her son, Detroit Mayor Kwame Kil-
patrick. One insider noted that whatever candidate had been “crazy” enough to challenge
Kilpatrick’s safe seat would have lucked into the nomination following the scandal. While he
had a small cadre of loyal followers, he lacked institutional connections to the “Democratic
stakeholders” and the organizational support necessary to compete in a truly contested pri-
mary (POG 2014). His previous tenure as a Congressman from 2011 – 2013 gave him access
to some national donors, but he was vastly outspent by his opponents. Those we spoke with
often noted that the only element making him competitive was his wide name recognition
from his previous runs for office and that geographically, he was the only candidate from
the Detroit half of the district. No one we spoke with was surprised Clarke failed to win the
nomination in 2014. In fact, the only surprise was how close his 3rd place finish was.
Rudy Hobbs was seen as the one to beat throughout much of the campaign. He was
the first candidate to declare his candidacy, and quickly secured the support of Congress-
man Sander Levin’s political organization, which came with “almost all of the institutional
support” from the Michigan “Democratic party stakeholders” (POG 2014). In addition
to the $225,000 independent expenditure campaign conducted on his behalf by the Levin-
affiliated GOALPAC, this support gained him the endorsements of former Governor Jennifer
Granholm, former Lt. Governor John Cherry, and outgoing Senator Carl Levin, in addition
to the almost unanimous support of the labor community. One insider noted that “run of the
mill Democrats will usually defer to the endorsements of the unions,” where another men-
tioned that when it came to the unions’ endorsements, “Democrats tend to be more sheep
67

than goats, more likely to follow than lead.” Knowing this, the union’s would often support
their candidates with large, early shows of support in order to “box out other candidates,”
or “starve out the competition” (ibid.).
Figure 3.6: Michigan’s 14th District Democratic Primary Results
Note: Each precinct is shaded in proportion to the size of each candidate’s plurality. Palerprecincts are just plurality winners, whereas the darkest of each color represent greater thanmajority support.
Where Rudy Hobbs had help from the Levin Democratic “establishment,” Brenda
Lawrence drew her local base of support from “people that she had developed a relationship
with during her [mayoralty] who weren’t concerned about getting out in front of the unions.”
Most prominently, Lawrence was supported by a network of women mayors, many of whom
her campaign team had helped elect and re-elect. Deirdre Waterman, mayor of Pontiac,
Marian McClellan, mayor of Oak Park, Karen Majewski, mayor of Hamtramck, and Brenda
68

Jones, president of the Detroit City Council, were all early, vocal supporters of Lawrence
in the primary. This network was connected by a close group of campaign advisors, most
notably, Christine Jensen, who served as the campaign manager for Lawrence, Waterman,
McClellan, and as a political advisor to Jones. The recent reelection campaigns of these
mayors allowed the Lawrence campaign to tap into existing infrastructure and support at
the grassroots level. This also allowed the campaign to have a “more local focus, we could
run mailers in Pontiac with Deirdre [Waterman] standing with Brenda [Lawrence]” (ibid.).
While many other factors could explain Lawrence’s success in these areas, it was in Pontiac,
Southfield, and Hamtramck that she ran ahead of her opponents, as demonstrated in Figure
3.6.
This local support was supplemented by national support from EMILY’s List. In ad-
dition to nearly $300,000 dollars in independent expenditures on her behalf, EMILY’s List
donors – those donors who contributed to both Lawrence’s campaign and EMILY’s List –
contributed nearly $70,000 directly to her campaign and were roughly 9% of her primary
donors overall (Bonica 2015). With Hobbs and Lawrence both representing the Oakland
County portion of the district, their relative performance in the Detroit/Wayne County
portion of the district was particularly crucial. Even though Hobbs and Lawrence both
had independent expenditure mail campaigns conducted on their behalf, insiders noted that
EMILY’s List was more strategic with their advertisements. They focused more heavily on
criticizing Clarke in Wayne County, knowing that was his base of support, and mailed the
bulk of their literature to coincide with the period in which absentee voters were receiving
their vote-by-mail ballots. One source mentioned that in comparison to union canvassers,
who were active only out of professional obligations, the EMILY’s List staff were more well-
trained and productive than the competition. When questioned as to how EMILY’s List
helped Lawrence, another source noted:
“EMILY’s list mailing being so heavy and seemed to have come so early. RudyHobbs had mailings, [but they] didn’t seem to happen until most absentee ballotshad been out for two weeks, a week or two. So there was a gap that helped[Lawrence]” (POG 2014).
69

Table 3.2: County Results in Michigan’s 14th District Democratic Primary
Wayne County Total Votes % Election Day Absentee
Hansen Clarke 16,743 40.50 9,198 7,545Burgess Foster 429 1.04 259 170
Rudy Hobbs 11,025 26.67 8,108 2,917Brenda Lawrence 12,988 31.41 7,764 5,224
Oakland County Total Votes % Election Day Absentee
Hansen Clarke 6,123 18.61 3,663 2,460Burgess Foster 402 1.02 237 165
Rudy Hobbs 12,971 39.43 8,878 4,093Brenda Lawrence 13,399 40.73 8,784 4,615
Table 3.2 provides the county level results disaggregated by election day and absentee
voting. While Hobbs edged Lawrence by a few hundred votes on election day, Lawrence’s
eventual 2,391 winning vote margin came entirely from her 2,829 lead in absentee votes, and
almost all of that came from Wayne County.
In a race as close as this primary, it is easy to justify any individual factor as critical to
explaining the outcome. But the fact that the race was close is surprising in and of itself.
Running with the reputation of a previous third place finish against a former member of
Congress with large name recognition and a frontrunner with the support of the majority
of the party establishment, Lawrence was still able to eke out a win. And while EMILY’s
List was active in numerous Democratic primaries in 2014, it was in Michigan’s 14th that
their efforts were most critical. By supplying Lawrence with a comparable independent
expenditure campaign and providing a network of donors for Lawrence, they provided her
campaign with the resources needed to overcome the more obvious replacements for Gary
Peters. As one Wayne County politico noted:
“EMILY’s List was her saving grace because they poured a ton of money in formedia, they poured a ton of money in for literature, and it worked. Withoutthem, she’s not a U.S. Congresswoman” (ibid.).
70

3.5.2 The Chamber of Commerce
The dynamics behind the Republican primary in North Carolina’s 7th district began
in a similar fashion to the contest in Utah’s 4th. In 2012, Democratic Representative Mike
McIntyre narrowly bested Republican state senator David Rouzer by less than 700 votes
to hold his seat for another term. With Republicans expected to make large gains in the
2014 midterm cycle, Rouzer initially sought a rematch with McIntyre. Most suspect that
McIntyre realized he was unlikely to win reelection and announced his retirement in January
of 2014. Prior to the announcement of his retirement, Rouzer was considered the hands-down
favorite for renomination. Closely aligned with the more “establishment,” business-oriented
faction of the Republican party, Rouzer had the early support of the NRCC, who placed
him “On the Radar” in December 2013 and following McIntyre’s retirement up-graded him
to their “Young Guns” program (Livingston 2013; NRCC 2014).
The lure of an open-seat contest, however, kept Rouzer from walking to the nomina-
tion. Chairman of the New Hanover County Commission, Woody White, had filed to run
for the seat a few days before the retirement, and publicly declared his campaign following
McIntyre’s announcement (Hilburn 2014). He ran his campaign as the more conservative
candidate in the race, running with the support of former Arkansas Gov. Mike Huckabee
(Isenstadt 2014). This, according to some insiders, raised concerns among the more “estab-
lishment” forces in the party:
“After the 2012 election, the U.S. Chamber identified that in many Republicanprimaries the strongest candidate for the general was not surviving [because]...of the things the Republican candidate was saying, because of the Republicancandidate’s background...so the U.S. Chamber said ‘we need to get involved inthe primaries”’ (POG 2014).
Woody White was in many ways the type of candidate that worried the Chamber. A
political strategist for the U.S. Chamber, Scott Reed, noted that the Chamber will now “look
at everything they say...If you say something stupid, we’re not going to support you” (Rauch
and La Raja 2017). As law student, Woody White testified to many controversial beliefs
71

toward homosexuals. When asked whether he believed homosexuals should be treated as
criminals before a Nebraska legislative committee, White said, “I come from a state in the
South where it is still a crime to engage in sodomy. I would, as a personal choice, I would
say, yes” (WECT 2014).
Given how likely the district was to switch to the Republicans in the fall, however, his
occupation as a trial lawyer likely proved more salient than his positioning on social issues.
The U.S. Chamber of Commerce and most Republicans had long stood in conflict with the
Association of Trial Lawyers of America (see Segal 1997).
“We have this interesting dynamic emerging in our politics in North Carolinawhere we have this cohort of Republican trial lawyers...and we’ve had to grapplewith the historic antagonism between the trial lawyers and the business commu-nity...but Republican trial lawyers...are still trial lawyers at the end of the dayand still carry that perceived threat to the business community...” (ibid).
Figure 3.7: U.S. Chamber’s Advertisement Against Woody White
72

This hostility between establishment Republicans and trial lawyers was not unique to
North Carolina. In Louisiana, one major donor noted once candidate’s viability because “he
didn’t raise any money from the wrong people...he didn’t have any trial lawyers money.”
Another noted that “prior to 2008, 2009 you never saw a plaintiff attorney contributing” to
a particular Republican candidate (ibid.).
With their new-found dedication to get involved in primaries and their historic animosity
toward trial lawyers, the U.S. Chamber needed little persuasion to support Rouzer’s primary
campaign. They ran a $300,000 independent expenditure attacking Woody White. Their
ad claimed that “the last thing Congress needs is another trial lawyer like Woody White”
(Wesleyan Media Project 2014a, see Figure 3.7). The more establishment elements of the
Republican Party followed the Chamber’s lead. American Action Network, a “center-right”
think tank chaired by former Senator Norm Coleman, invested $50,000 on a radio ad with
the same message, while the YG Network, a 501(4)c organization started by former staffers
of then-majority leader Eric Cantor (Conradis 2013), spent $100,000 on mailers and phone
calls accusing White of being part of the “lawsuit bonanza that destroys jobs” (Isenstadt
2014).
Most insiders attributed these nationally coordinated efforts as what pushed Rouzer
over the edge. While no polls were made publicly available, insiders viewed the race as
close, perhaps slightly leaning toward Rouzer, but “the Chamber’s ad put the nail in the
coffin.” Rouzer bested White 53% to 40%, and went on to win the general election with
little opposition. This national interest group, in coordination with establishment Republican
organizations, was able to provide it’s chosen candidate with the resources necessary to win
the nomination and eventually take a seat in Congress. In an area with historically less
developed formal parties (Mayhew 1986), these groups acted in the primaries not via the
party, but individually, as their is little incentive. While Rouzer was definitely an ambitious
and talented candidate, it was the support of this network of party actors that set his
campaign on a path to success.
73

3.6 Local Interest Groups
Local interest groups often have access to a range of campaign resources beyond the
reach of their national counterparts. In Pennsylvania’s 13th district, local trade unions were
able to marshal a massive ground game organization on behalf of underdog Brendan Boyle
and held enough sway in the political environment to keep Boyle’s area of the district free
from electoral competition, allowing him to handedly win the primary. In Louisiana’s 6th
district, Lane Grigsby’s network of support – centered around the maritime construction
industry in which he made his fortune – allows him to serve as a one-man party, marshaling
field clearing and financial resources behind his chosen candidate, Garret Graves.
3.6.1 IBEW Local 98
Pennsylvania Congresswoman Allyson Schwartz began laying the groundwork to chal-
lenge incumbent Republican Governor Tom Corbett quietly following her reelection in 2012.
By early 2014 four individuals emerged as candidates in the Democratic primary to fill her
now open seat. The list of candidates for the nomination was in many ways unsurpris-
ing – each candidate coming from commonly recognized interests within the Democratic
Party. Valarie Arkoosh, a health care activist, was an early advocate of the Affordable
Care Act and the president of the National Physicians Alliance, a progressive health care
organization. State Representative Brendan Boyle, elected from the largely blue-collar area
of Northeast Philadelphia, ran proudly as the “union candidate.” Daylin Leach, a state
senator from suburban Montgomery County, was an unabashed “liberal lion,” was known
throughout Pennsylvania for his progressive policy positions, including marriage equality,
strict environmental regulations, and expanded abortion access. Former Congresswoman
Marjorie Margolies built her campaign around her national star-power derived from her pre-
vious tenure in the House and her close relationship with Bill and Hillary Clinton. Given
her national connections, name recognition, public polling, and early fundraising dominance,
Margolies was considered the frontrunner for the duration of the campaign.
The outcome of the race, however, surprised many political observers. Despite Margolies
74

front-runner status and wide name recognition, she was unable to carry that momentum over
the finish line. Neither were Arkoosh, the candidate who raised the most money, nor Leach,
the candidate with the greatest PAC support, able to secure the nomination. Behind in the
polls, out-raised and out-spent by his opponents, Boyle won the Democratic primary with
41% of the vote to runner-up Margolies’ 27%. The heavy Democratic lean of the district
overall comfortably carried Boyle into Congress come November.
How was Boyle able to overcome these disadvantages to become the Democratic nom-
inee? Boyle benefited from the overwhelming support of organized labor. As a campaign
staffer summarized, he “had an existing relationship with organized labor, which is very
strong in southeast Pennsylvania, and particularly strong in northeast Philly” (POG 2014).
Endorsements, campaign donations, mailers, independent expenditures, campaign advisers,
canvassers, phone-bank operators, election day door-knockers – all of this and more were
marshaled by the Philadelphia unions in support of Boyle’s campaign. Five months prior
to the primary, Brendan Boyle had already secured over 20 endorsements from major trade
unions in the district, and was endorsed by the state legislators most closely affiliated with
the labor movement (Boyle for Congress 2014).
Most notably, Boyle was supported by the International Brotherhood of Electrical Work-
ers (IBEW). With over 5,000 members and an average election cycle budget of 3-4 million dol-
lars, the IBEW is one of the most influential political groups in the state. While an electrical
workers union, they also represent line-runners, the mechanical crew at TastyKakes bakery,
the broadcasters of all Philadelphia sporting events, and many other trades in Philadelphia.
The IBEW provided numerous key resources to support the Boyle campaign. First,
they “push hard” on their membership to vote in every election: According to a high ranking
political operative of the union, they can expect nearly 80% turnout among their members
even in generally low turnout elections. Second, both union officials and those affiliated with
the Boyle campaign spoke to the massive canvassing efforts union volunteers performed for
the Boyle campaign. One individual affiliated with the unions described a ground game
operation that dwarfed that of Arkoosh, Leach, and Margolies combined. In the month
leading up to the primary, the IBEW had 10-20 people each weekday and nearly 50 people
75

on the weekends making phone calls, knocking on doors, passing out literature, and serving
as a central hub for smaller unions to coordinate their own political outreach. On Election
Day, the efforts were even more impressive. Around 1,000 union members spent the day
making phone calls, knocking on doors, helping individuals get to the polls, passing out
literature at polling locations, and canvassing low-turnout areas. He estimated that every
registered Democrat had their door knocked on at least once by a union canvasser (POG
2014). Verifying these efforts in retrospect is difficult, but while conducting an exit poll on
election day, my fellow surveyors and I saw union workers passing out literature near all of
the selected polling locations first hand, and some reported seeing vans driving seniors to
the polls (see DeMora et al. 2015).
Labor groups also put their financial resources behind Boyle. Building a Better Penn-
sylvania, a political action committee affiliated with the trade unions of Philadelphia, spent
over $350,000 on independent expenditures on behalf of his campaign, with over 2/3 of that
coming from the IBEW (Brennan 2014). The strong support of the dominant IBEW en-
couraged other regional unions to coordinate behind Boyle. In addition to the $5,000 direct
contribution from the IBEW, nineteen other local unions maxed out in their support, which
alone raised $100,000 for the Boyle campaign.
In addition to these visible efforts, elites interviewed in the lead up to the primary
believed that pressure from unions and city party officials kept other candidates from en-
tering the race. Boyle won the endorsement of Rep. Bob Brady, chair of the Philadelphia
Democratic Party, which discouraged other candidates from the city from entering the race
(Gibson 2013). This provided Boyle with a geographic monopoly over the Philadelphia half
of the district. Campaign operatives expressed the importance of keeping candidates like
Jonathan Saidel, former Philadelphia City Controller, and state Rep. Mark Cohen out of
the race to Boyle’s eventual success. In sum, Boyle had the unwavering support of an or-
ganized interest group within the larger party network, which provided him with numerous
campaign resources beyond the reach of political “self-starters.”
This is not to suggest that the other candidates lacked any group support, or were
motivated solely by their own ambition for office. Both Arkoosh and Leach had long standing
76

relationships with an existing network of support within the Democratic Party. Arkoosh
received the endorsement of many medical organizations including the American Medical
Association, and received as much as 75% of her campaign contributions from people working
in medical fields (DeMora et al. 2015). Leach received the endorsements of many liberal
leaning interest groups like the Progressive Change Campaign Committee. Margolies, while
political inactive in recent years, was an early success story for and long time supporter of
EMILY’s List and maintained strong connections to it’s founding members, and her support
of the Clinton network brought in numerous large donors (Gibson 2014a) and helped clear
some competitors out of the race (Gibson 2014b).
But many big interests within the traditional Democratic coalition sat out of the race.
EMILY’s List decided not to choose between the two female candidates in the race because
both had a long history with the organization. EMILY’s List and NARAL Pro-Choice
America coordinated a series of independent expenditures against Boyle for his ambiguous
position on abortion rights (Field 2014a), but without an endorsed candidate to benefit from
their efforts, most political observers in the district felt the efforts were a waste. An individual
affiliated with a leading LGBT rights group in Pennsylvania noted that the strong records
of all the Montgomery County candidates made issuing an endorsement difficult. Leach, a
long-time vocal advocate for pro-choice and progressive LGBT policies, expressed frustration
that he didn’t have the support of more liberal advocacy groups in the crowded primary.
In comparison to the city party organization, the less centralized decision-making process of
the Montgomery County Democratic Committee made coordination behind one candidate
difficult and any attempt to push a candidate out of the race impossible.
How much impact did Boyle’s coalition of support have on the outcome of the race?
Boyle dominated the half of the district located in the city of Philadelphia, winning 70% of
the vote in the city, while the remaining three candidates divided up Montgomery County,
as demonstrated in Figure 3.8. Leach won the precincts in his state senate district near
Norristown and Arkoosh won her home of Springfield Township, where Margolies won the
remainder of Montgomery County. One really can’t tell whether these results were driven
by the campaigns and not just voters’ preferences for home-town candidates. But even if we
77

assume that voters reflexively choose the candidate from their area, the benefit to the Boyle
campaign came from his geographic monopoly over Philadelphia and the intense mobilization
of these supporters, which was the result of union actions discouraging other Philadelphia
challengers and turning out voters in the city.
Figure 3.8: Pennsylvania’s 13th District Democratic Primary Results
Note: Each precinct is shaded in proportion to the size of each candidate’s plurality. Palerprecincts are just plurality winners, whereas the darkest of each color represent greater thanmajority support.
Understanding this predisposition, the unions focused their efforts on the Philadelphia
portion of the district, canvassing nearly exclusively in Philadelphia. Using a geographic
regression discontinuity model on the turnout of Democratic voters in the 13th district, I
find a nearly 3% increase in turnout among those from the district in Philadelphia compared
to those in Philadelphia but not in the district, but no difference for those in Montgomery
78

County.8 While it is not possible to parse the impact of the Boyle campaign itself versus
the trade unions, given that both both organizations agree to the major role of labor in the
campaign efforts, it is safe to assume that the canvassing and GOTV efforts of the unions
had a tangible impact on voter turnout in pro-Boyle areas, contributing to if not securing
his nomination.
3.6.2 Cajun Industries
Lane Grigsby, the founder and former Chairman of Cajun Industries, a construction
company engaged in projects involving “oil, gas and energy; refining; chemical processing;
power; manufacturing and buildings; governmental infrastructure; alternative energy; emer-
gency preparedness and disaster response; communication; water quality; and more” (Cajun
Industries 2018), is one of the most prolific donors and “opinion leaders” in Louisiana Re-
publican politics. He has spent millions of dollars supporting candidates, pushing particular
policies, and supporting political and charitable organizations. He conducts his own polling,
opposition research, and candidate vetting operations. Journalists at The Times-Picayune
found that of the 400 biggest campaign donors in Louisiana, Grigsby was third, coming in
right after the Democratic Party and right before the Republican Party, bundling at least
$1.3 million between 2009 and 2012 (Zurik 2013). When asked about Grigsby, one campaign
fundraiser noted that
“there are certain people in the community, especially in Baton Rouge, that arekind of the main players in politics, they max out their personal donations, theyhave companies, they max out their PAC donations, they’re the big players. Oncethey give you the go ahead, they write you the big checks, and then they branchout and tell their employees ‘this is a good guy, you might want to donate tohim”’ (POG 2014).
In many ways, Grigsby and his construction industry network are a party unto themselves.
U.S. Senator Bill Cassidy’s political career has been greatly helped by Grisby’s support.
Grigsby and his company contributed to his first run for the state Senate, after the incumbent
8See §3.6 and Appendix A for a more detail.
79

ran for Lt. Governor. Grigsby dissuaded Cassidy from running in the special election to
replace Republican Congressman Richard Baker. When the Democrat surprisingly won that
special election, Grigsby recruited Cassidy to challenge the incumbent, Dan Cazayoux. He
had an “ace up his sleeve” to make sure that Republicans took back the seat with Cassidy.
While Grigsby helped finance his campaign, he also recruited another Democrat, Michael
Jackson, to run as an independent to siphon off Democratic votes (Kraushaar 2008). By
his own accounting, he spent $87,000 on an independent expenditure campaign on Jackson’s
behalf. His political network also helped Jackson raise over $20,000 dollars (Moses 2008).
As he explained:
“I can only give $2,600 as an individual,” but added with a laugh, “my wife cangive $2,600, my son and two daughters can give $2,600, oh and their spousescan give $2,600, my grand kids can give $2,600...I’ve got a company of 2,200employees, with the top 100 being pretty well paid executives – I can go aroundsaying ‘hello, this is my friend Jackson, he sure could use your support...and yourwife’s!’.”
Others we spoke to largely attributed Bill Cassidy’s congressional win to Grisby’s efforts.
And when then-Congressman Cassidy was considering challenging Mary Landrieu in the
2014 U.S. Senate contest, it was Grigsby who he called for advice.
Politically, Grigsby is primarily motivated by a desire to limit the influence of unions
over business. He expressed disappointment in former Rep. Alexander’s voting in support of
Project Labor Agreements during the Hurricane Katrina reconstruction (see McKay 2011).
One conservative commentator noted that he was involved in pushing for the merger of the
police departments and the sheriff’s office because the sheriff’s office was not unionized, and
how he pushed for the abolition of the plumbing certification board as a limitation on trade
(POG 2014). He is also active in the charter school movement in Louisiana and has spent
hundreds of thousands of dollars on electing pro-charter school boardmembers (Sentell 2015).
In interviews he noted that a former moderate Democratic Congressman Don Cazayoux’s
“only drawback is the fact that the labor unions gave him three hundred andeighty thousand dollars to run...they own him...the one thing that I’m interested
80

in is the labor votes. I’m a non-union contractor. I went through right to workwith Louisiana and all those wars and...I don’t want that to ever come back. Andso Cazayoux’s only black mark is that he’s owned by the labor unions.”
Considering himself “very active in the district,” it was no surprise that he was an
active player in the search for Cassidy’s replacement in Louisiana’s 6th district. Initially,
he actively recruited candidates into the race, but “finding someone qualified for this open
seat proved to be impossible. Therefore, [he] sat back and said ‘let’s see what individuals
are interested’.” And given his reputation, these interested candidates all made their pitch
to Grigsby.
Grigsby claimed to have dissuaded three candidates from entering the race. One city
council member who approached Grigsby was informed that he “can’t raise the money to be
a serious candidate.” He talked a district attorney from the state out of the race because
“almost everything you’ve done in your past history, no matter how far back it goes, is
going to come forth in a campaign.” After conducting his own opposition research, he also
convinced a socially conservative activist that running for Congress was not a good idea,
because it would allow him to be “painted as the devil himself.”
The founder and CEO of Anedot, a fundraising software company, and the grandson
of former LSU football coach, Paul Dietzel was the first to publicly announce his intention
to seek Cassidy’s seat. Most people we spoke to described him as a successful businessman,
a traditional conservative, and a talented fundraiser. He had held no prior elected office,
but had impressive name recognition “thanks to his family’s background in LSU football.
Dietzel’s grandfather led LSU to the 1958 college football championship after a perfect
season and is a member of the state’s sports hall of fame” (Trygstad 2013). As an investor
in Dietzel’s company, however, Grigsby was skeptical that an individual who had recently
started a business should be pursuing higher office:
“I said ‘Paul, you’ve gotten an awful lot of money from an awful lot of investors tomake a successful businesses. It’s not yet successful. And here you are thinkingabout running for Congress? Anyway, he’s still running. But I have questions oftrust.”
81

In December of 2014, State Senator Dan Claitor joined Dietzel in the primary election.
Claitor had developed a reputation as an “unpredictable legislator known to weigh each
individual bill based on merit and conscience” (McGaughy 2013). Grigsby described him as
“intellectually gifted...he sees things from every angle and he doesn’t wear the conservative
blinders,” but that “eclectic nature of his just [wouldn’t] fit in Washington,” not to mention
that he was “as lovable as a porcupine.” He came from an old Baton Rouge family, and had
a good deal of name recognition from his state senate campaigns, but “Congress is a young
person’s game” because you need a long tenure to develop the seniority to be effective.
But Garret Graves had potential. He had served as an aide for Representative Billy
Tauzin and Senator David Vitter, focusing on coastal policy and mitigating climate change
impact, eventually rising to chief legislative aide to the U.S. Senate Committee on Environ-
mental and Public Works. Republican Governor Bobby Jindal then appointed Graves to
head the Louisiana Coastal Protection and Restoration Authority. In this capacity “Garrett
has been up and down the coast... knows the local politicians...and they’re more more likely
to gather their constituency behind somebody that they have rapport with.” A local jour-
nalist described him as “very well spoken, not a down the line conservative...he’s very good
at finding pots of federal money that he can apply to a problem and he’s very good at the
legislative process up in D.C.”
In our first interview, Grigsby hinted that there were some tensions between Graves
and elements of his construction network. As a result he invited Graves in to be vetted
by his “team” – the executives from Cajun Industries and its affiliates. During our second
interview, he claimed that Graves had ameliorated any concerns – “had owned his mistakes”
– and that Grigsby “elected to round up as much resources as I can through my family and
my friends, and we’ve made a sizable contribution to Garrett Graves...I made a decision to
support Garrett Graves significantly.”
He estimated that just from his personal and professional network, he could bundle a
maximum of $250,000 dollars for a particular candidate, and if he then extended his reach
to his peripheral business networks of “electrical and mechanical contractors” he could raise
another $250,000. Figure 3.9 provides an extremely conservative estimate of the amount his
82

network was able to raise for Garret Graves in 2014. Graves was able to raise over $40,000
from those who Grigsby mentioned as his immediate family (whose names are anonymized for
confidentiality) and those who listed Cajun Industries, LLC or one of its subsidiaries as their
employer in FEC records. While Grigsby did not mention these organizations specifically,
he raised another $30,000 from Baton Rouge based construction firm executives within the
first three months of his campaign. But these numbers likely underestimate the financial
resources his network can activate. As he described:
“I’ve seen some estimates [of his network’s contributions] and I just laugh atthem...they’ll say we contributed $40,000 in [a particular] race...and I’ll say theymissed another 200,000, now didn’t they! ... It’s hard to know that [nameredacted] is my daughter...they didn’t see all the tentacles that tie it all together.”
Figure 3.9: A Conservative Diagram of Lane Grigsby’s Network in Support of Graves
Those shaded in purple are executives at Cajun Industries, LLC. Those shaded in red areexecutives from Baton Rouge based construction firms. Donors in green are Lane Grigsby’sfamily members. All donors besides Grigsby’s immediate family contributed within the firstthree months of Graves’ campaign.
Donors quickly moved to support Graves campaign. In one month, Graves gathered
more contributions and more money than any of his opponents, as demonstrated in Figure
83

3.10, including Paul Dietzel who had been campaign for over a year. These early contributors
included Michael Graugnard, Todd Grigsby, and Ken Jacob, executives at Cajun Industries,
Clark Boyce, Chairman of Louisiana Machinery, John Fife, President of Arkel Constructors,
Art Favre of Performance Contractors, and George Schaffer, President of Crompion Inter-
national, Ed Rispone (and his wife Linda), founder and chairman of ISC Constructors – all
executives of Baton Rouge based construction firms – most of whom contributed the max-
imum federal amount. While Grigby’s network is the most visible network in the district,
Graves’ father’s engineering firm also activated a similar network of support on his behalf –
he received numerous, early, maximum donations from executives at engineering firms based
in Baton Rouge.
Figure 3.10: Campaign Contributors to Louisiana’s 6th District Republicans
Date
Num
ber
of C
ampa
ign
Con
trib
utor
s
0
500
1000
1500
2000
2500
3000 GravesDietzelClaitorWhitney
Feb Mar Apr May Jun Jul Aug Sept Oct Nov
Date
Item
ized
Cam
paig
n C
ontr
ibut
ions
(m
il. $
)
050010001500200025003000
GravesDietzelClaitorWhitney
Feb Mar Apr May Jun Jul Aug Sept Oct Nov
0
0.5
1
1.5
2
Despite this early and sizable financial support, it would be wrong to have considered
him the frontrunner at this point. Having never served in public office, he had no natural
base of support upon which to build a campaign. He had little name recognition of his
own, although his father’s engineering firm was a familiar local business. In the public
polls released in early 2014, Graves received 3% in February, 4% in March, and 2% in April
84

compared to Claitor’s and Dietzel’s 11-20% (Alford 2014; JMC 2014).
But the support of Grigby’s network went beyond the financial contributions. Grigsby’s
support alone was a “sign of legitimacy” to conservatives and Republicans in the district
given his “principled” reputation. And the very act of activating the network increased
his name recognition and approval across employees in these industries. While fewer lower
level employees at many of these firms contributed directly to Graves’ campaign, they knew
that he was supported by their companies’ leadership – stealing a quote from the labor
organizers in Philadelphia – “people tend to vote their jobs.” Moreover, as one candidate
put it, “anybody who puts money in your campaign...they’re going to do a little more than
just write a check...they’re going to tell their friends...you for sure count on them to roll out
and on election day vote for you.”
Louisiana has a unique “jungle primary” system in which all candidates run in a single
primary election, which occurs on general election day in November, and then if no candi-
date receives a majority, the top two candidates, regardless of party, compete in a run-off
election the first week in December. This creates a uniquely long primary campaign cycle in
Louisiana. So while these professional networks quickly moved to support Graves after his
announcement, the more traditional measures of group support – endorsements, mailers, etc.
– came much later in the cycle. In October, the Business-Industry Political Action Com-
mittee (BIPAC) – “the largest grassroots business network in the United States” – endorsed
Graves for Congress (Graves 2014). But even here, Grigsby’s impact could be felt. The press
release announcing the endorsement included additional praise from Grigsby: “Garret un-
derstands what drives the economy in South Louisiana. He has a proven record of breaking
through the bureaucracy and dysfunction of Washington.”
While many factors contributed to Graves making it into the December run-off, Grigsby’s
personal/professional/political network organized around the construction industry was cen-
tral to Graves’ raising the resources and name recognition necessary to surpass his more
well-known opponents. By channeling a significant number of campaign contributions, con-
necting Graves to the important business industries in the district, and facilitating important
business and political endorsements for Graves, Grigsby’s network was able to marshal the
85

resources necessary to push his chosen candidate over the line.
3.7 Activist Networks
While traditional interest groups like the Chamber of Commerce and EMILY’s List,
local businesses and labor unions, formal parties and candidate-centered machines made up
a bulk of the networks we observed supporting candidates, in some cases we observed truly
grassroots networks of activists and party faithful organizing in important ways to support
their preferred candidates. These networks were significantly more difficult to observe from
35,000 feet. They often lacked formal organization, and so the telltale signs of group support
– PAC contributions and independent expenditures – were absent. However, those tools are
powerful insofar as they provide the resources to reach their supporters and turn them out to
the pools. As the primary contest in Pennsylvania’s 6th district demonstrates, the influence
of these local groups can, under the right circumstances, carry more weight than these more
visible resources.
3.7.1 Meddling Marcel
Montgomery County Democratic Chairman, Marcel Groen, thought he had found the
perfect candidate to take back Jim Gerlach’s seat for Democrats. Obama had won the
district by nearly 10% in 2008, and lost it by about a point in 2012. It was one of the
few pick-up opportunities in a midterm election where the Democrats were poised to fight
against voters’ six-year itch toward the Obama presidency.
Mike Parrish, however, had the resume of an exception. He was a West Point graduate
with 14 years of active duty service as an Army Aviator. He had advanced degrees from
prestigious universities, but in the “practical fields” of engineering and business. He worked
for General Electric and eventually founded his own environmental services company and
then served as CEO of Environmental Infrastructure Holdings Corporation. As a former
Republican, he had a conservative to non-existent record on the more controversial social
issues. A handsome, moderate, veteran, business-owner – what more could a party leader
86

hope for?
Groen wasn’t alone. Democratic Minority Leader Nancy Pelosi quickly endorsed Par-
rish, sent a fundraising e-mail on his behalf, and held a fundraiser for him in Philadel-
phia shortly after he announced (Field 2014b). Minority Whip Steny Hoyer held another
fundraiser for him later that month (Foster 2014a). Congressman Bob Brady, chair of the
powerful Philadelphia Democratic Party, quickly followed suit and endorsed Parrish (Smith
2014a). With eyes on the general election, the national party quickly converged on the
candidate they found most electable.
The landscape changed when Gerlach decided to retire rather than seek reelection.
Manan Trivedi, who had previously challenged Gerlach in 2010 and 2012, announced that he
too would be seeking the Democratic nomination in the 6th district following Gerlach’s an-
nouncement. In Trivedi’s announcement, he touted the endorsement of dozens of local Demo-
cratic politicians and interest groups, including Wendell Young IV, President UFCW Local
1776; Kate Michelman, President Emerita, NARAL Pro-Choice America; Dennis Bomberger,
Business Agent, Chocolate Workers Local 464; State Representative Mark Painter; Micah
Mahjoubian, LGBT Rights Activist; Frank Burstein, Chairman of the Limerick Township
Democratic Committee; and many other local Democratic committee people.
Regardless, the national and county party leaders were initially confident that voters
would choose the more electable Parrish over the “perennial loser” Trivedi. Upon Trivedi’s
entrance into the race, Parrish commented that “I welcome Manan into the race...and I have
confidence that voters in the primary will select the strongest nominee to ensure a Democrat
wins this very tough district in November” (Foster 2014c).
But after Trivedi’s announcement, local Democrats began to express greater skepticism
toward Parrish’s candidacy. As one activist explained, “Parrish was a Republican. I know
gay Republicans who switched, and I get that. I know environmental Republicans who
became Democrats, and I get that! This guy works producing fracking chemicals. I don’t
get that, I don’t trust that” (POG 2014) One campaign worker in the neighboring district
complained about “Meddling Marcel” trying to push a nominee on the district “House of
87

Cards style” (ibid.). A readers poll on the ostensibly non-partisan, but essentially Democratic
political blog PoliticsPA9, also showed growing dissatisfaction with Parrish: Trivedi bested
Parrish, 53% to 48%.
Donors were also more hesitant to support Parrish than Trivedi. Figure 3.11 presents
the number of national party donors – those donors who had gave to both Trivedi and a
national Democratic campaign committee – as well as the in-state and out-of-state donors
supporting each candidate over the course of the primary. The blue line are Trivedi’s donors,
and the black line is Parrish’s donors. The greyed area is the period of time between Trivedi’s
announcement and Parrish’s withdrawal from the race. Trivedi gained the support of among
all subsets of donors at much faster rates than Parrish, but Trivedi only surpassed Parrish
with out-of-state donors after Parrish dropped out. Together, these graphs provide additional
evidence that the surge in support for Trivedi was driven by primarily local forces.
It was the county conventions that finally undid the party’s plans. The party leaders
suspected (and rightly so) that the convention delegates would be more apt to support
Trivedi over Parrish given his long-time relationships with the members derived from his
previous runs for office. Groen and his Chester County compatriot, Michele Vaughn, hoped
to keep the delegates from making an endorsement at each county’s party conventions and
to allow the voters to decide in the primary. Trivedi, however, reached out to many of the
delegates beforehand and persuaded them to support him. One delegate at the Chester
County convention reported that the chairs motion to not consider an endorsement in the
race was overturned by a voice vote. Another delegate couldn’t recall the series of events, but
admitted that the party leaders had wished to avoid the endorsement. In either situation,
the results were the same, Trivedi earned the Committee’s endorsement, receiving 74% of
the vote over Parrish (Carrozza 2014). “It is because of Manan’s lifetime commitment to
fighting for working families and improving education, true Democrat values, that I fully
support him, and I am sure the Chester County Democrats endorsed him by such a large
9While the ownership team holds no editorial influence, it’s predominantly left-leaning and Democratic.For example, Larry Ceisler, was named him one of the most influential Democrats in Pennsylvania in 2010by Politics Magazine (Roarty and Coit 2010).
88

Figure 3.11: Campaign Contributions to Pennsylvania’s 6th District Democrats
Date
Num
ber
of N
atio
nal P
arty
Don
ors
0
50
100
150
Jan Feb Mar Apr
Date
Num
ber
of In
−S
tate
Don
ors
0
50
100
150
Jan Feb Mar Apr
Date
Out
−of
−S
tate
Don
ors
0
50
100
150
Jan Feb Mar Apr
TrivediParrish
Note: The three figures provide the number of national party, in-state, and out-of-statedonors contributing to Manan Trivedi’s and Mike Parrish’s campaign over the course of theprimary. The greyed area is the period of time during which both candidates were in therace.
majority for those very same reasons.” Democratic committeeperson Diane O’Dwyer said of
the Chester County endorsement (emphasis added, Smith 2014b). Two days later, a similar
89

dynamic played out at Groen’s Montgomery County convention. It was reported as “highly
possible [that] his familiarity with local politicos contributed to his massive total of 97% of
the vote from Montgomery County’s Democrats” (Field 2014c).
In Pennsylvania’s 6th district, a coordinated network of donors and activists coordinated
behind their preferred candidate, made sure he had the financial resources to compete with
the national party’s preferred candidate, and organized to make sure he had access to the
powerful endorsements of the party committees. This network of activists was not a formal
party or organized around an elected official, nor was it driven by an organized interest
group. It was a local grassroots network of party activists built on their shared long-term
relationships.
3.8 Networks At Work
This typology describes less a series of discrete actors than a constellation of diverse,
interconnected actors with varied relationships that are difficult to disentangle. In Utah,
while the formal party controls the nomination, the composition of that formal party was
the direct result of a politician-centered network’s efforts to elect their supportive activists.
In Michigan, much of the Levin machine’s strength came from its close relationships with
local organized labor. In Virginia, the borders between the Tea Party activists and the
formal party organization were blurred and constantly in flux. In Pennsylvania, much of the
IBEW’s strength came from the financial leverage it held over the city Democratic Party.
But it was these diverse party networks marshaling resources on behalf of their cho-
sen candidates that helped propel them to the nomination. These networks were often the
“intense policy demanding” coalitions hypothesized by Bawn et al. (2012). The structure
of these networks, however, varied across the different districts. Rather than a hierarchical
structure in which the formal party organizes a diverse array of party actors, competition
between formal party organizations, politician-centered machines, interest groups, and ac-
tivist networks was more common. This competition was driven by a lack of concern for a
competitive general election and the expected value of a “champion” in Congress.
90

While the overlapping nature of these categorizes makes distinguishing the nature of the
party difficult, they are extremely useful for highlighting the variety of resources available to
different types of networks. Different types of networks are able to use different resources on
behalf of their chosen candidates. The use of different resources was often predicated by the
particular structure of a network. A group like EMILY’s List may provide campaign staffers
for a candidate, but have no formal powers of the nomination process in each district. The
national parties, unwilling to appear heavy handed and step on the toes of local organi-
zations, rarely make endorsements in a competitive primary, but may funnel resources to
their preferred candidates behind the scenes (Hassell 2016; 2018). Local activists may have
the grassroots support to knock on doors for their candidates, but rarely have the financial
resources to pursue the five- and six-figure independent expenditure campaigns increasingly
common in the post-Citizen United era.
But these resources are exceptionally difficult to measure systematically. In order to
describe the dynamics in a mere dozen races took close to five years of field work, hundreds
of interviews, and untold amounts of primary source research. It is an impractical method
for measuring general patterns and relationships in primary nominations at large. In the
next chapter, I will highlight these resources, stress the difficulties in systematically mea-
suring them, and provide an alternative measure that I believe allows us to systematically
assess the impact of party network support on the electoral prospects of primary candidates
based on the one resource all networks were able to provide for their candidates – campaign
contributions.
91

Chapter 3 Appendix A: Geographic Regression Discontinuity
Data Sources
Data for this analysis come from three sources. First, the Pennsylvania Voter File, pur-
chased from the Pennsylvania Secretary of State’s Office, provides both the home address
and voter history for all registered voters in Pennsylvania. This will be used to determine
individual level voter turnout in the 2014 Pennsylvania Democratic Primary. Second, the
U.S. Census Bureau provides geographic shapefile data for state, county, congressional dis-
trict, and state legislative district boundaries. Third, the Data Science Toolkit provides
geocoding services which allow me to determine the latitude and longitude coordinates of
voters from their addresses. These data sources together will allow me to calculate the dis-
tance of individual voters from political borders – in this case the distance between a voter
and the border of their congressional district. Finally, over 50 hours of elite interviews were
conducted with the candidates, campaign staff, interest groups, and local activists during
the campaign season to better understand the underlying dynamics of the race.
Compound Treatment Reduction
In geographic regression discontinuity models, researchers are often presented with sit-
uations in which more than one geographic ‘treatment’ affects the outcome of interest at
the same time. In the primary in question, voters were exposed to primary campaigns for
governor, congress, state senate, and state legislature. Election law in the United States is
often administered at the county level, and exposure to campaign advertisements is often
confined to particular media markets which are unique combinations of counties. In many of
these instances the borders between these politically salient districts are the same. As Keele
and Titiunik describe, this “poses a serious challenge if the researcher is interested in only
one of those treatments since, absent any restrictions or assumptions, it will not be possible
to separate the effect of the treatment of interest on the outcome from the effect of all other
‘irrelevant’ treatments” (2015).
92

In order to eliminate the issue of compound treatments, this project isolates areas that
are within the same county, state senate, and state legislative district, that also contain
portions both within and outside of the 13th Congressional district. Fortunately all of the
13th district falls within the Philadelphia media market, and is therefore held constant. By
holding all other relevant political boundaries constant, we are essentially controlling for the
effects of these alternative boundaries. I am able to isolate 16 regions along the border of
the 13th district that meet these characteristics: six in Philadelphia and ten in Montgomery
County. This provides us with 68,021 registered Democrats in Philadelphia, respectively,
and 113,184 in Montgomery County. Figure A1 provides an example of a region within
Philadelphia County that is within the 3rd State Senate district and the 179th State House
district. The light blue area represents areas within this geographic subset that is within the
13th Congressional district, while the darker blue is within the 2nd Congressional district,
which importantly did not have a contested Democratic primary. Each small dot represents
a household with a registered voter.
Figure A1: Example of Compound Treatment Reduction
Measuring Geographic Distance
In order to measure the distance between each voter and the discontinuity (the con-
gressional district boundary), I first geocoded the registered address of the voters that fell
93

within these compound treatment reduction geographies. Less than 0.5% of voters were
dropped because of incomplete addresses. Next, I converted the census provided shapefile
of the district into a geometric polygon. From here I use the geosphere package in R to
calculate the shortest geographic distance between each voter and the congressional district
border. This package allows one to take into consideration the ellipsoidal shape of the earth
when calculating geographic distance for greater accuracy.
Measuring Turnout
Voter turnout is measured as the percentage of registered voters recorded as voting
either at the polling location or absentee. Because Pennsylvania is a closed primary state,
turnout in the primary is measured only among registered Democrats.
Results
Table A1 provides the results of the geoRDD model for turnout in the primary. All
models are estimated with the rdrobust package. The results present both the initial es-
timates and the estimates with fixed-effects for each compound reduction geography. The
effective number of observations on each side of the threshold are also provided.
What is immediately apparent is the difference in outcomes between the counties. In
Philadelphia there is roughly a 3% increase in turnout in the presence of a ground game
operation. While 3% may seem modest given the race was eventually decided by an over
10 point margin, given that turnout in these sections was only 21%, that constitutes a 14%
change in turnout. No such effect is observed in Montgomery County, where no discernible
ground game occurred. Figure A2 provides this trend graphically.
94
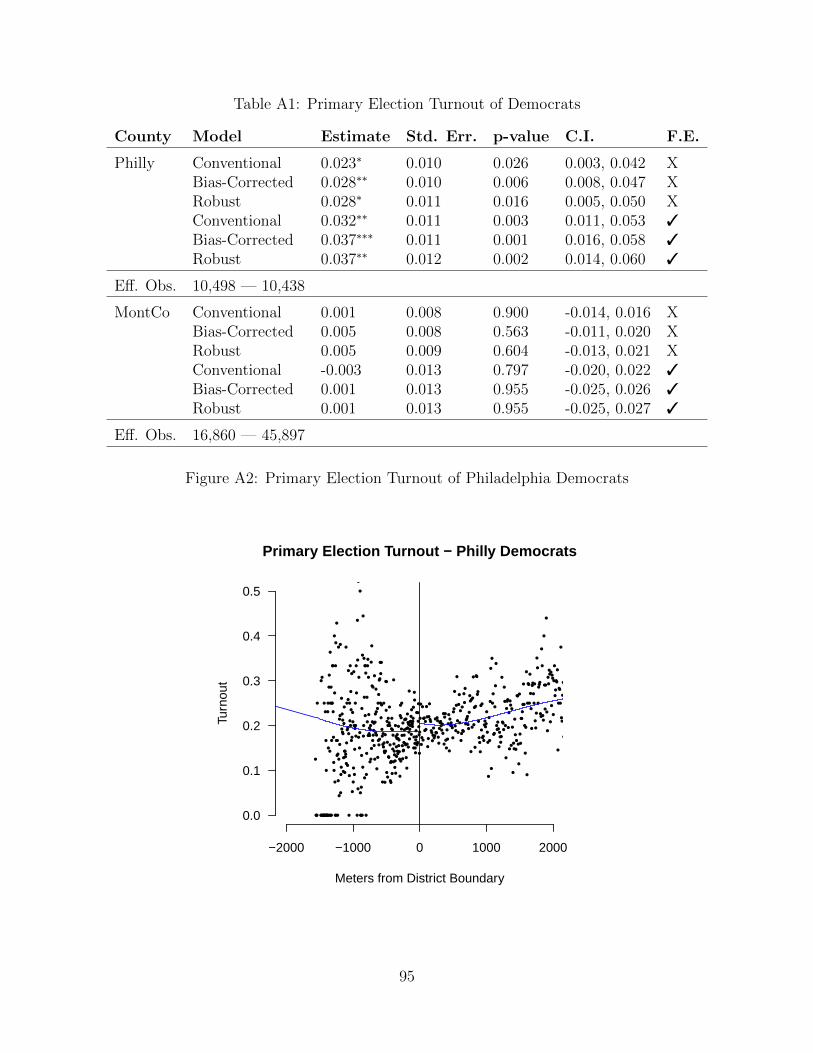
Table A1: Primary Election Turnout of Democrats
County Model Estimate Std. Err. p-value C.I. F.E.
Philly Conventional 0.023∗ 0.010 0.026 0.003, 0.042 XBias-Corrected 0.028∗∗ 0.010 0.006 0.008, 0.047 XRobust 0.028∗ 0.011 0.016 0.005, 0.050 XConventional 0.032∗∗ 0.011 0.003 0.011, 0.053 3
Bias-Corrected 0.037∗∗∗ 0.011 0.001 0.016, 0.058 3
Robust 0.037∗∗ 0.012 0.002 0.014, 0.060 3
Eff. Obs. 10,498 — 10,438
MontCo Conventional 0.001 0.008 0.900 -0.014, 0.016 XBias-Corrected 0.005 0.008 0.563 -0.011, 0.020 XRobust 0.005 0.009 0.604 -0.013, 0.021 XConventional -0.003 0.013 0.797 -0.020, 0.022 3
Bias-Corrected 0.001 0.013 0.955 -0.025, 0.026 3
Robust 0.001 0.013 0.955 -0.025, 0.027 3
Eff. Obs. 16,860 — 45,897
Figure A2: Primary Election Turnout of Philadelphia Democrats
●
●●●
●
●
●
●●
●
●●●●
●
●●
●
●
●
●
●●●●
●
●
●
●
●
●
●
●
●
●
●
●
●
●
●●
●●
●
●
●
●
●
●
●
●
●
●
●
●
●
●
●
●
●
●
●
●
●
●
●
●
●
●
●
●
●
●
●
●
●
●
●
●
●
●
●
●
●
●●
●
●
●
●
●
●
●
●
●
●
●
●
●
●
●
●
●
●
●
●
●
●
●
●
●
●
●
●
●
●
●
●
●
●
●
●
●
●
●
●
●
●
●
●
●
●
●
●
●●
●
●
●
●
●
●
●
●
●
●
●
●
●
●
●
●
●
●
●
●
●
●
●
●
●
●
●
●
●
●
●
●
●
●
●
●
●
●
●
●
●
●
●
●
●
●
●
●
●
●
●
●
●
●
●
●
●
●
●
●
●
●
●
●
●
●
●
●
●
●
●
●
●
●
●
●
●
●●
●
●
●
●
●
●
●
●
●
●
●
●
●●
●
●
●
●
●
●
●
●
●
●
●
●
●
●
●
●
●
●
●
●
●
●
●
●
●
●
●
●
●●
●
●
●
●
●
●
●
●
●
●
●
●
●
●
●
●
●
●●
●
●
●
●
●
●
●
●
●
●
●
●
●
●
●
●
●
●
●
●
●
●
●
●
●
●
●
●●●
●●
●
●
●
●
●
●
●
●
●
●
●
●
●●●
●
●
●
●
●
●
●
●
●
●
●
●
●
●●
●
●
●
●
●
●
●
●
●
●●
●●
●
●
●
●●
●
●●
●●
●
●
●
●●
●
●
●
●
●
●
●
●
●
●
●
●
●
●
●
●
●●●●
●
●●
●
●
●
●
●
●
●
●
●
●
●
●
●
●
●●
●
●
●
●
●●●
●
●
●
●
●
●
●
●
●
●
●
●
●
●
●●
●●
●
●
●
●
●
●
●
●●
●
●
●
●●
●
●
●
●
●
●
●
●
●
●
●
●
●●
●
●
●
●
●
●
●
●
●
●
●
●
●
●●
●
●
●
●
●
●
●●
●
●
●
●
●
●
●
●
●
●
●
●
●
●
●
●●
●
●
●
●
●
●●
●
●
●
●
●
●
●
●
●
●
●●
●
●
●
●
●
●●
●
●
●
●
●
●
●
●
●
●●●
●●
●
●
●
●
●
●
●
●
●
●
●
●
●
●
●
●
●
●
●●
●
●
●
●
●
●●
●
●
●
●●
●
●
●
●
●
●
●
●
●
●
●
●
●
●
●
●
●
●●●
●
●
●
●
●
●
●
●
●
●
●
●
●
●
●
●●
●
●
●
●
●
●
●
●
●
●
●
●
●
●
●
●
●
●
●
●
●
●
●
●
●
−2000 −1000 0 1000 2000
Primary Election Turnout − Philly Democrats
Meters from District Boundary
Turn
out
0.0
0.1
0.2
0.3
0.4
0.5
95

CHAPTER 4
Measuring Group Support
4.1 It’s Hard to See into a Smoke-Filled Room
When Representative Rush Holt announced that he would not seek reelection to New
Jersey’s heavily Democratic 12th district in 2014, four candidates quickly filed to run for the
Democratic nomination. In New Jersey, the county party’s endorsement is key to nomination.
Getting the endorsement comes with a preferential ballot placement – the county line – that
all but guarantees the plurality of votes from that county.1 State Sen. Linda Greenstein,
State Rep. Upendra Chivukula, and State Rep. Bonnie Watson Coleman were each endorsed
by their respective county’s Democratic party. Hoping to follow the same career path as Holt,
Princeton physicist Andrew Zwicker ran as a scientist hoping to replace a scientist, but was
not endorsed by any of the counties. On March 11, 2014, the three major candidates all met
at Giovanna’s Restaurant2 in Plainfield, NJ to meet with the Democratic chairpeople of the
three Union County towns in the 12th District – Assemblyman Jerry Green, Mayor Colleen
Mahr, and Assemblywoman Linda Stender. In a private room in this Italian Restaurant the
three party leaders determined who to endorse. “I think very highly of all three. In fact, I
served with all three. It was a very tough decision” Green said, but in the end the committee
decided on Watson Coleman (Spoto 2014). She would go on to win the nomination in no
small part due to her 76% of the vote from Union County, and won the general election with
1Those interviewed could think of only three instances in New Jersey history in which a candidate wonnomination for any office without the support of the plurality of counties in that office’s jurisdiction. Myown research into congressional nominations has found no exceptions to the rule.
2Their website advertises a ‘Party Meeting Room’ for “small weddings, parties, and get-togethers.” Thepolitical scientist in me hopes that this was the type of party they had in mind. As part of my ‘soak andpoke’ method, I visited Giovanna’s in the summer of 2015. I’d recommend the stuffed mushrooms.
96

only nominal opposition.
In the same year across the Rockies, Republican Mia Love had her eyes set on Utah’s
4th district. Having lost to Democrat Jim Matheson by fewer than 800 votes in 2012, Love
was considered the favorite for the GOP nomination following Matheson’s decision to retire.
Some in the party were concerned that the dysfunctions of Love’s previous campaign would
keep her from taking back the heavily Republican seat. In her previous campaign, she had
three different campaign managers, occasionally missed events due to scheduling errors, and
according to some party officials had trouble developing a message beyond national talking
points (Rolly 2014). These concerns aside, Love recieved 78% of the delegates at the Utah
Republican convention – beating her opponent, Utah’s Director of Business and Economic
Development Bob Fuehr, and finishing above the threshold needed to avoid a primary.3 With
the nomination, Love went on to easily win the general election in a wave Republican year.
These more visible examples of party strength have generally become the exception
to the rule. Only Connecticut, Utah, and Virginia still use party conventions with any
regularity, and only the handful of counties in New Jersey have party organizations with
such unilateral ability to shape primaries. The smoke-filled rooms and convention halls of
political lore may be largely gone, but the party’s ability to influence the selection of their
nominees is far from it. In Chapter 3, I provided case studies from the 2014 primary election
cycle detailing how elements of the extended party network use its resources to push their
chosen candidates toward nomination.
But data on these individual resources are usually much more difficult to gather than
a candidate’s ballot placement or the vote counts from a party convention. In this chapter,
I summarize the resources made available to candidates with the support of networks as-
sociated with the parties’ respective groups. I also described how difficult measuring these
resources can be. I then develop an original measure – existing network density (END) scores
– that can more generally asses the presence of organized support. Finally, I provide some
initial diagnostics on this measure to suggest that the relationship between network support
3In Utah, a candidate can bypass a primary election in Utah if they obtain 60 percent or more of thevote during their convention.
97

and electoral prospects is not endogenous to canddiate viability. The measure developed in
this chapter will be the focus of the analysis presented in the chapters to follow.
4.2 Network Resources
The support of organized interests within the larger party network can provide can-
didates with a variety of resources. The types of resources that can be used on behalf of
particular candidates is often predicated by the type of group or interest supporting that
candidate. As mentioned in the conclusion of the previous chapter, a group like EMILY’s List
may provide campaign staffers for a candidate, but have no formal powers of the nomination
process in each district. The national parties, unwilling to appear heavy handed and step on
the toes of local organizations, rarely make endorsements in a competitive primary, but may
funnel resources to their preferred candidates behind the scenes (Hassell 2016; 2018). Local
party organizations may have access to all of the potential resources, but rarely possess the
massive budgets of their national counterparts necessary to implement them. Morover the
idiosyncrasies of particular districts may make different resources more or less effective in
particular races.
These group resources – campaign advice, field management, get out the vote efforts,
endorsements, and financial support – have all been demonstrated as influential resources
in primary contests (Cain 2013; Desmarais et al. 2015; Dominguez 2011; Hassell 2016;
2018; Ocampo 2017), but they vary in the ease with which scholars can observe them (see
Bawn et al. 2012). The efforts of party actors to shape the field by encouraging particular
candidates to run or dissuading others are the most difficult resource to observe directly.
These internal decisions are often publicly kept from the public eye. Providing campaign
management training and campaign workers is slightly more visible, but is still difficult
to observe systematically. Endorsements are a resource that benefits from being publicly
disseminated as wide as possible, but the lack of a central repository of endorsements or a pre-
determined universe of potential endorsers makes collecting these data difficult. The strict
financial reporting requirements, in comparison, makes the financial support of a candidate
98

much more easy to observe. That said, there is sometimes some ambiguity as to who is
supporting the groups that are conducting independent expenditures. And of course the
nomination of a candidate by the formal party is the most visible, albeit the least common.
4.2.1 Recruitment, Dissuasion, and Field Shaping
Recruitment and discouragement of candidates is one of the most important predictors
of candidate emergence and success (Carnes 2018; Fowler and McClure 1989; Lawless and
Fox 2005). While central to the prospects of would-be candidates, these behind the scene
efforts by interest groups and party organizations are extremely difficult to measure sys-
tematically. Schwartz (1990) noted efforts by the Illinois business community to dissuade a
candidate from challenging their preferred candidate. Masket (2009) describes the roles of
5 “informal party organizations” in California and their attempts to recruit candidates and
dissuade others from seeking party nominations. Ocampo (2017) demonstrates the impact
of political networks and interest group support on the emergence and electoral success of
Latino candidates in plurality-Latino open seat primary races.
In many of the 2014 cases, primary candidates have described receiving pressure, some-
times explicitly, to run or to reconsider running from party leaders, interest groups, and other
elected officials. In Pennsylvania’s 13th district, the weakness of the Montgomery County
Democratic Party in comparison to it’s Philadelphia counterpart, helps explain why Boyle
was able to benefit from his geographic monopoly in the city. In Louisiana’s 6th district,
Grigsby’s ability to convince candidates against running (or in some cases encouraging them
to run as spoilers) can shape the field to the advantage of his chosen candidates. The lack
of a network in North Carolina’s 12th district prevented the candidates from Charlotte from
coordinating on a single candidate. The “switcheroo” in Colorado’s 4th district, organized by
the national Republican Party, benefited the electoral prospects of the party in two contests.
Who runs is as important as who doesn’t in multi-candidate races like open-seat primaries.
But heavy handed attempts by party officials to shape the field can have also be detri-
mental to a candidate’s prospects. “Meddling” Marcel Groen’s efforts in Pennsylvania’s 6th
99

districts raised the ire of party activists. In this case, the activists organized in support of
a candidate they knew to be “one of us”, circumventing the party’s preferred candidate and
endorsing Trivedi. More recently, the DCCC’s efforts to wade into a primary to pressure
Laura Moser out of Texas’s 7th district’s Democratic primary may have had the unintended
effect of galvanizing her supporters and pushing her support high enough to make it into the
summer runoff (Bowman 2018).
4.2.2 Training and Campaign Management
Another resource available to candidates within the the party network is campaign staff
and advisers. In Hassell’s (2016) interviews of party officials, one individual noted that “the
smart campaign people get behind the party’s candidate and there’s no one left for the can-
didate that wants to challenge the party’s candidate.” As political campaigns have become a
billion dollar industry, professional campaign consultants have become central players in the
party network (Herrnson 2009; Robbins 2017) and successful campaign strategies are often
shared through these connections (Nyhan and Montgomery 2015). While nothing prevents
candidates from hiring their own talented staff, the task of finding staff for an insurgent
campaign can become exceedingly difficult. Moreover, access to party-centric consultants
has been shown to increase a candidates electoral prospects (Cain 2013).
These campaign staffers and advisers vary in their thoroughness and effectiveness, but
can be tremendously involved in primary elections. On Democratic activist described the
candidate training used by a major interest group:
“The Thursday training lasted from 8am to 6pm, and they worked throughmeals...trainers went through every aspect of a campaign in no-nonsense, intenseworkshops. The began with how to get your personal life ready for a campaign:work, family, internet presence, etc. Then they coached candidates about usingtheir strengths in choosing a first office, i.e. teachers for school board. Nextthey walked through all the paper work involved in launching a campaign, filing,opening campaign accounts, etc. Next campaign launch, slogans vs. messaging,websites, speaking in public, etc. Next they developed fundraising plans (thereis another weekend training just about raising money). They spoke about thechronology of successful campaigns, when to fundraise, when to spend and on
100

what. Finally, they walked through a successful GOTV [get out the vote] fieldoperation and election week activities (POG).”
While these trainings are focused more at first-time candidates for lower offices, interest group
leaders and party activists told us that in these open-seat congressional primaries they would
“sit at [the candidate’s] kitchen table and help them layout the entire campaign.”
Maintaining a professional campaign operation is difficult, even for electoral veterans.
One journalistic account of Marjorie Margolies campaign noted:
“Throughout the spring, she’s declined to participate in three debates that therest of the candidates attended. In the two debates she has shown up to, she’sbeen criticized for reading canned answers off index cards. While Leach andBrendan Boyle have been airing ads since April 22nd, the Margolies campaignonly ran its first TV spot last Wednesday during the Flyers game. The “Whatsthe deal with Marjorie” impression was captured well by an April Fools Day poston Politics PA that compared her campaign presence to the infamous missingMalaysian airplane” (Van Zuylen-Wood 2014).
This example only reiterates the importance this network resource – campaign organization
and support – can provide even the most experienced candidate.
4.2.3 Ground Game and GOTV Efforts
In numerous studies, electoral activities on Election Day have been shown to aid candi-
dates in their pursuit of nomination. Miller, Bositis, and Baer (1981) found large effects for
mail, telephone, and canvassers on primary election turnout. Gerber, Green, and Larimer
(2008) found evidence that non-partisan and interest group mailers can increase turnout
in primaries. Arceneaux and Nickerson (2009) reanalyze 11 turnout field experiments and
conclude that in-person contact generally has a positive impact on voter turnout in a variety
of contexts. While nothing prevents electoral “self-starters” from delivering mailers, knock-
ing on doors, and calling supporters on behalf of their own campaigns, research suggests
that efforts made by advocacy groups are at least (Panagopolous 2008) if not more effective
(Gerber and Green 2017), particularly in the low-information environments (Arceneaux and
Kolodny 2009), like primary campaigns.
101

Lacking the driving cue of party identification, primary voters are also more open to
persuasion than voters in general elections. Primary voters have been found lack sufficient
information about candidates to make ideological distinctions between candidates (DeMora
et al. 2014; Citrin Ahler and Lenz 2013). In a field experiment involving primary cam-
paign mailers, Gerber (2004) found that the “incumbent’s vote margin was increased by
approximately 2.7% of the total number of registered voters in those wards that received the
campaign mailings.” This was in comparison to statistically insignificant 0.2% in the general
election. Arceneaux (2007) found that “[b]oth the door-to-door canvassing and commercial
phone bank efforts increased support for the candidate among subjects in the survey sample”
of primary voters in an open-seat primary for county commissioner.
Existing organizations within a party’s network often have infrastructure in place mak-
ing these efforts more efficient and effective than when conducted by individual campaigns.
EMILY’s List’s strategic use of mailers in Michigan’s 14th district was credited with giv-
ing Brenda Lawrence a slight advantage among absentee voters. But EMILY’s List did
not need to find vendors, design the mailers, and send them to voters because they had
existing partnerships with Moxie Media and the Pivot Group – two Democratic consulting
firms specializing in direct mail campaigns. In 2014, EMILY’s LIst hired these two firms for
the mailing campaigns in California, Hawaii, Massachusetts, Michinga, North Carolina, and
Pennsylvania. This frequent collaboration gives these organizations a slide edge with cost
efficiency and effectiveness of mailers. The IBEW’s ground game operation on behalf of the
Boyle campaign increased turnout in the city by between 2 and 6% (see Appendix 3A). One
official close to the unions reported the IBEW had 10-20 people each weekday and nearly 50
people on the weekends making phone calls, knocking on doors, passing out literature, and
serving as a central hub for smaller unions to coordinate their own political outreach. The
manpower that the unions are able to marshal given their membership likely far exceeds the
number of volunteers even an impressive campaign could amass. After speaking with insiders
close to all four campaigns, it is likely that the unions had more boots on the ground than
all four candidates’ campaigns combined. Again, while nothing prevents individual candi-
dates from running effective ground campaigns, the experience and existing infrastructure of
102

many actors within the party networks provides efficiency gains for candidates in nomination
contests.
4.2.4 Endorsements and Voting Cues
Network support can send a signal of in-group status to other donors and voters. Explicit
endorsements, are perforce only available to candidates with the support of some element
of the party network. In The Party Decides, Cohen et al. (2008) argue that pre-primary
endorsements allowed the party elites to coordinate behind and nominate their chosen presi-
dential candidates. Hannagan et al. (2010) finds mixed results for the electoral benefits of an
EMILY’s List endorsement – electoral long-shots benefit significantly, while there is a more
ambiguous impact for high quality candidates. Two studies found that Oprah’s endorsement
of Obama increased both turnout and support for Obama in the 2008 Democratic primary
(Garthwaite and Moore 2013; Pease and Brewer 2008). Dominguez (2011) finds that a candi-
date’s share of the endorsements from a primary race significantly increases the candidate’s
vote share, even controlling for a battery of other measures of candidate success. Shaw,
de la Garza, and Lee (2000) find that Latino group endorsements often increase turnout
among Latino voters. Endorsements have been shown as important heuristics to attentive
(Lau and Redlawsk 2001) and low-information voters (Arceneaux and Kolodny 2009; Lupia
1994) alike. In sum, endorsements are an electoral resource that provides candidates with a
tangible benefit.
Just as a donation from Lane Grigsby was a “sign of legitimacy” to business-oriented
conservatives, and the support of Bill Schutte could signal that a candidate was “the right
one” for “Team Midland,” and the backing of the IBEW could remind union members to
“vote their job,” so too can networks more generally signal to sympathetic audiences that
this candidate is “one of us” and worthy of support. Given the lack of party identification
as a voting cue and the limited information available to voters in primaries, the signal of
network support can be a powerful tool for the party faithful and political activists in primary
contests even without a formal endorsement.
103

4.2.5 Formal Powers
One unique tool available to some local parties are the formal legal tools to either select
or stack the deck in favor of their preferred candidates. It may seem tautological, but as far
as resources with the potential to influence the selection of a nominee go, the formal power
to select the nominee or the ability to shape the election to one candidate’s benefit is hard
to beat. In Tennessee, for example, the state Republican party can remove candidates from
the primary ballot that the state party committee believes are not “bona fide” Republicans
(Rau 2018). In action, this allowed Marsha Blackburn to win the Republican nomination
for the Senate contest without opposition. Whether this is the ability of party conventions
to select nominees, the luxury of choice in terms of nomination procedures, the ability to
control ballot access, or preferential ballot placement – parties, and the networks that control
them, that have access to these tools are powerful forces in primary elections.
4.2.6 Financial Support
The most common resource that campaign networks provide their candidates is financial
support. Networked contributions provides efficiency gains for candidates fundraising efforts.
The support of a single actor can signal to other donors that this candidate deserves their
support. Even with campaign finance limits, the support of Lane Grigsby in Louisiana
can come with as much a $1,000,000 from his network of marine construction executives.
Once the IBEW endorsed Boyle, most of the Philadelphia trade unions followed suit. Bill
Schutte’s support of John Moolenaar tapped into a durable network of contributors who had
long supported the “Midland Team.”
The close relationships between major donors and the party network also allows the
network to “starve out the competition” by signaling that a candidate is on the outside.
The unions and the Levin network in Michigan and the IBEW in Philadelphia are a prime
examples of this strategy – by supporting their candidates fully and early, they signaled to
the rest of the field who to get behind. In this way they used their financial support to both
directly assist a particular candidate, but to also keep other potential competitors on the
104

sidelines.
Groups within the party network can also support candidates through their own efforts
– independent expenditures – far exceeding the legal limits for direct contributions. In 2014,
EMILY’s List’s independent expenditure arm, Women Vote!, alone spent over $800,000 on
behalf of five candidates in open-seats primaries. This includes the nearly $300,000 and
$250,000 spent on mailers supporting Brenda Lawrence in Michigan and Alma Adams in
North Carolina. The magnitude of financial support available to candidates with the support
of party network actors far exceeds what is available outside the network.
And most central to this analysis, organized contributing is a resource available to all
types of actors within the extended party network. A group may lack the numbers for boots
on the ground mobilization or the public presence for a valuable endorsement, they may not
have the budgets for large independent expenditures or the formal powers to nominate a
candidate, but all networks, by their nature as an organized group, have a set of individuals
who can be called upon to donate to and support candidates for office. In this way organized
campaign contributions are the most universal, if conservative, signal of group support.
4.3 Difficulties Measuring Group Support
Organized group support of primary candidates helps drive electoral success. Groups
have this influence through their ability to marshal electoral resources on behalf of their cho-
sen candidate – resources often unavailable to a ‘free-agent’ candidate. However, as Hassell
(2016) notes, most of these studies have either focused solely on presidential nominations
(Cohen et al. 2008), been forced to rely on a small number of cases (Dominguez 2011;
Masket 2009), or only considered general elections (Desmarais et al. 2015; Hannagan et al.
2010) because of the intractability of gathering the data systematically for a representative
sample of primaries. In discussing the difficulties in measuring the impact of party efforts on
primary outcomes, Dominguez (2011) admits the need for “other proxies” as other measures
of party influence are “cumbersome to gather for large numbers of candidates.”
Consider the difficulties in measuring endorsements. Dominguez (2011) relies on a
105

survey of candidates in 2002 open-seat congressional primaries to systematically measure
the endorsements they received. Assuming that candidates’ endorsements did not impact
their likelihood of responding to the survey, it still leaves many races without observations
due to non-response. The relatively few observations limited the author’s ability to address
the role of electoral competition on the influence of endorsements in primaries and prevented
her ability to generalize beyond that election cycle. Endorsements are also extremely difficult
to measure retrospectively. Dominguez found “that about half the time the candidate had
received at least some endorsements that were not listed on the Web page” and had to be
confirmed through direct contact with the campaign. This direct contact would constitute
a massive undertaking to gather for a larger sample of races. Looking at endorsements from
the perspective of the groups would be just as difficult. The universe of potential endorsing
groups is often unknown beforehand, and determining their behavior in retrospect often
misses activity. As Hassell notes in his analysis of EMILY’s List endorsements, endorsing
“groups tend to scrub their institutional memories of any candidates which they supported
that lose the election” (2018, p. 75, fn. 32). Similarly, the Library of Congress’s “United
States Elections Web Archive” tends to maintain only the websites of those candidates who
won the primary. For example, Brendan Boyle’s website is archived, while Val Arkoosh,
Daylin Leach, and Marjorie Margolies are not. These limitations together make the effects
endorsements – a resource campaigns have an incentive to make visible – difficult to observe.
The difficulties in gathering the data on endorsements pale in comparison to the task
of systematically gaining access to the more opaque (and at times objectionable) aspects
of network support. With national parties hesitant to appear heavy-handed in local races,
records of staff and consulting assistance are often buried in financial disclosures and not
widely reported (see Cain 2013). The informal, behind-the-scenes politicking of party elites
to encourage and discourage candidates from running is often purposefully kept out of the
public eye (Bawn et al. 2014). Given how central recruitment and discouragement are in the
decision to run for office, its inscrutable nature handicaps our ability to understand party
network influence nomination contests more generally.
The case studies from the preceding chapter further highlight these difficulties. Recall
106

Pennsylvania’s 13th district, for example. The field shaping efforts by party officials from
both counties, national political figures and the labor unions played a significant and perhaps
deterministic role in the outcome of the primary. But even after considerable primary source
research and dozens of interviews, some of the finer details about why certain candidates
ran and others did not remains unclear. For example, Rep. Mark Cohen’s (another labor-
affiliated state legislator) failure to mount a serious campaign and eventual endorsement of
Boyle was seen by interview subjects as evidence of union’s pressuring candidates to keep
the Philadelphia field open for Boyle. But no one with direct knowledge of this decision
agreed to speak with me. To further complicate the story, while in an interview Saidel
openly admitted to dropping out when asked to by the Clintons, multiple staffers from other
campaigns suggested that Saidel, closely affiliated with Bob Brady, initially filed to run only
to keep Boyle out of the race and dropped out when Boyle announced his campaign anyway.
And given Brady’s simultaneous endorsement of Boyle and staffing of Margolies’ campaign,
muddies the direct benefit of a fairly clear endorsement. These examples further highlight the
difficulties in systematically observing the purposely clandestine behaviors of party actors.
The various incentives, motivations, and tools available to different types of groups
within the party network provide one last obstacle for the measuring of group support gen-
erally. Lacking a theory of which group resources should be more important than others,
researchers would need to gather data systematically on all avenues of possible support, or
develop an alternative measure that detects group support more generally. Having observed
numerous races first hand, it is unlikely that a single resource universally dominates all oth-
ers. And having attempted to gather all information systematically for only a handful of
races, that route would be herculean if not impossible for a larger sample. In the next section,
I propose a network-based method to systematically measure the presence of group support
in primary campaigns that would be present for candidates with party network support, but
unavailable to those without it.
107

4.4 Groups in the Extended Party Network
It is natural to think of organized interests within political parties in terms of networks
of supporters. Interest groups regularly see themselves as individuals connected through
their collective political goals, like EMILY’s List, which describes their founding as “25
women, rolodexes in hand, gathered in Ellen R. Malcolm’s basement to send letters to their
friends about a network they were forming to raise money for pro-choice Democratic women
candidates” (EMILY’s List 2017, emphasis added). The EMILY’s List operation has come
quite far since these more humble beginnings (running candidate training and recruiting
seminars, staffing and organizing individual campaigns, spending millions of dollars per
election cycle on dozens of races, etc.), but the basic network structure remains. When
EMILY’s List supports a candidate, the first resource made available is their network of
supporters. In Brenada Lawrence’s primary campaign, over $70,000 or 15% of her fundraising
came from EMILY’s List donors. This dynamic is not confined to EMILY’s List. Hassell
(2018) reports that for a range of interest groups, including EMILY’s List, the Sierra Club,
Club for Growth, and the Campaign for Working Families, that an endorsement increases
the number donations from group supporters. In other words, candidates with the support
of these organizations were more likely to tap into their network of contributors.
Moreover, a network-based view of organized interests allows for the consideration of po-
litically active groups that lack the established PAC infrastructure of most interest groups.
Built over decades of work in the maritime construction, Cajun Industries founder Lane
Grigsby developed a large network of political active executives and business managers.
When activated his network can by his own estimates raise between $100,000 and $1,000,000
in individual donations depending on what a race requires. One analysis found that between
2009 and 2012, Grigsby, his family, his companies and key employees made 423 contributions
totaling nearly $1.3 million (Zurik 2017). Grigsby also interviews and vets potential candi-
dates, channels money into independent expenditure campaigns on behalf of his supported
candidates, and rallies public support behind policies important to him (Kunzelman 2016;
Spencer 2015). This network has no official name, no office on K Street, and no formal lead-
108
ership roles, but still holds significant influence in Louisiana Republican politics. If parties
are the networks of organized interests attempting to gain control of government, then any
measure that excludes the efforts of network’s like Grigsby’s misses a significant electoral
resource.
Many scholars have attempted to measure the impact of political networks on candi-
dates’ electoral prospects. Desmarais et al. (2015) construct networks of candidates based
on PAC contributions to their campaigns in the general election. Candidates are considered
tied within that network if they have a PAC contributor in common. They find that chal-
lengers located within the extended party network had better general election prospects than
those candidates on the periphery of the network. Importantly, these results persist after
controlling for campaign resources and candidate quality. They argue that the support of
the party network sends a signal to voters that these candidates will faithfully represent the
interests of their party coalition. These authors present these results as evidence that parties
are still able to shape electoral outcomes. However, by focusing on general elections, these
authors are unable to directly address whether parties are able to choose their nominees in
the first place.
Ocampo (2017) systematically looks at the impact of group support on the primary
prospects of candidates in districts with large Latino populations. Using a dataset of Latino
and non-Latino candidates running in all open seats from 2004 to 2014 in congressional
districts with a Latino population of at least 15 percent, including 367 candidates from
forty-six congressional contests, the author finds that a candidate’s share of PAC and party
contributions has a positive and significant impact on the likelihood of winning an open-
seat primary. She concludes that the effect “group-level support has on electoral success is
quite meaningful as it substantially increases the chances of Latino candidates winning their
respective primary.”
This analysis provides many contributions to our understanding of party network sup-
port in primaries. By focusing on open seats it effectively overcomes many problems that
looking at incumbents raises. In gathering data for a large number of races systematically,
the findings are more easily generalizable to other contexts. The work is admittedly focused
109

on the role of political networks and interest groups on minority representation, and thus
focuses only on races in districts with sizable Latino populations. Her findings on the impor-
tance of group support, therefore, may or may not apply to other types of districts. Nor does
she consider the extent to which individual candidate qualities, namely prior elected office,
play in the potentially endogenous relationship of network support and electoral outcomes.
While clearly addressed in the case studies, her empirical analysis does not address whether
the sizable effect of PAC contributions is driven by PACs contributing to those candidates
who are most likely to win or if the contributions driving candidates on to victory.
In his analysis of primary elections, Hassell finds that candidates for the Senate (2016;
2018) and the House (2018) benefit significantly from party network support. Using the
number of donors that a primary candidate shares with their national party congressional
fundraising committee (i.e. the Democratic Congressional Campaign Committee for Demo-
cratic primary candidates for Congress, etc.) as his measure of party support, he finds that
this count predicts which candidates will drop out of the contest before the primary and
which candidates will go on to become the nominee. He argues that this “measure of party
support is an excellent proxy for a [party] endorsement” (2015, fn. 10).
He also directly addresses the issue of causality. He demonstrates through the use
of a Granger causality test that early party support drove future fundraising success (his
measure of electoral viability) and party support, but that early fundraising success did not
drive later party support. With this evidence he concludes that party supporters are not
simply bandwagoning onto the campaigns of successful candidates. He supplements these
empirical findings with qualitative interviews from party operatives to support his conclusion
that party support drives and does not follow electoral success.
However, even though Hassell cites the literature on the extended party network exten-
sively, his measure is derived from the behavior of donors to the national party organizations,
limiting his reach to only those actors connected to the center of the network. As Rauch
and La Raja point out in their Brookings report on activist groups, the interest groups and
activists that constitute the majority of the extended party are “organizing in regions where
party organizations lack resources or incentives to invest,” leaving the formal parties to focus
110

their efforts on competitive races (2017, p. 3, emphasis added). This fits with much of what
we observed in the field. In our overview of the 2014 cycle, we found very little evidence of
coordination or cooperation across the party network, and more often observed free-for-all
contests among the many party factions within a district (Bawn et al. 2015). The national
parties were rarely involved in safe-seat contests, and these safe-seats constituted the ma-
jority of open-seats in that cycle. This could contribute to Hassell’s more qualified findings
in the House – whereas he finds that the share of party donors predicts which candidates
will remain in and which candidates will win in all Senate primaries, he finds a similar effect
only for House races in competitive districts where the candidates have the same electoral
experience (2018, p. 124). It is not that parties are only active in competitive House pri-
maries, it is that different components of the extended party network are active in different
electoral environments – the national party focused on seats that will be competitive in the
general election, with the remainder of the extended party network focusing on the majority
of seats safe for one party.
Candidates with access to the contribution networks of groups within the extended
party network will be the candidates most likely to receive the campaign resources exclusive
to organized support. Different organizations undoubtedly pursue different strategies when
utilizing campaign resources, but all of these groups use their network of supporters to
direct campaign contributions to their preferred candidates. While not all candidates with
the support of networked contributors will have additional benefits of group support, all
candidates with those benefits should have the support of their network. In that light, this
should be seen as a systematic, yet conservative estimate of group support.
4.5 Measuring Support through Donor Networks
To test the hypothesis that extended party support is driving the electoral prospects of
primary contenders, a more tractable measure of organized group support is needed that is
both accessible for a representative sample of races and takes into consideration the differ-
ent electoral environments in which the party network could operate. Ideally this measure
111

would demonstrate the degree of organization within a particular candidate’s coalition of
supporters. By conceptualizing the extended party as a network of groups and individuals
who consistently work together in their party’s primary, I can then use the structure of a
candidate’s contribution network to infer the nature of a particular campaign’s supporters.
More specifically, I will argue that the density of a candidate’s contribution network can
serve as a proxy for the degree to which durable and cohesive elements of the extended party
network have invested in a candidate’s campaign.
While fundraising successes and candidate quality are important characteristics for elec-
toral victory, candidates with the support of individuals and organizations that frequently
cooperate in their party’s primary are those candidates most likely to have access to the afore-
mentioned campaign resources beyond the reach of the “free-booting” political entrepreneur.
In addition, while the various resources and motives of groups may push them to pursue dif-
ferent electoral efforts on behalf of their candidate, the support of any group will direct
contributions to their preferred candidates from their group members. Even groups like
anesthesiologists, not the traditional politically active interest groups, are likely to coordi-
nate their donations like they did for one of their own, Valerie Arkoosh, in PA-13. While not
all candidates with the support of networked contributors will have additional benefits of
group support, all candidates with those benefits should have the support of their network.
4.5.1 Network Density
But what is network density? Density is a measure of overall connectedness within a
network (Scott 2017). A network’s density is defined as the fraction of the total possible
number of ties within a network that occur within the network. This statistic ranges from
0 to 1, where 0 would be a network in which no actors are tied to one another and 1 would
have every actor tied to every other actor. Formally, if
112

A =
− a12 · · · a1n
a21 − · · · a2n...
.... . .
...
an1 an2 · · · −
is an n x n adjacency matrix for n donors where
aij =
1, if donor i and donor j contributed to the same candidate
0, otherwise
−, if i=j (no self-ties)
then
density(A) =
n∑i=1
n∑j=1
aij/2
n(n− 1)/2.
For example, consider the network graph in Figure 4.1. Network graphs provide visual
representations of relationships between different actors. Actors are referred to as “nodes”
and the connections between these actors as “ties” or “edges.” In the context of this project,
the actors involved are campaign donors, and the ties between them determined by whether
or not they contributed to the same candidate. Below, nodes are represented as points on
the graph which are considered tied if connected by a solid dark line. In this hypothetical
network of six donors, there are nine ties out of a possible fifteen. The density of this network
is therefore 915
= 0.6.
The generalized concept of network density has obvious implications for the study of
organized groups with contribution networks. Individuals associated with groups are likely
to give to the same sets candidates over election cycles as they receive the cue of support
from their respective groups. This would result in dense, durable networks of donors with
113

Figure 4.1: An Illustration of Network Density
●
●●
●●
●●
●●
●●
●
consistent patterns of contributions. In comparison, individual donors who are mobilized
by individual campaigns may be equally likely to give in the future, but less likely to share
similar patterns of contribution overtime given the ad hoc nature of their initial activation.
4.5.2 Existing Network Density
To construct each candidate’s donor network, I compile a list of every donor who made
a contribution to a House candidate during the primary (t1). For each donor in this list,
I then find every donation they made in the previous election cycle (t0). While I again
limit these contributions to those made in the primary, I include all non-presidential federal
contributions. I next construct a network where these donors are connected to each other if
they donated to the same candidate in this prior primary cycle (t0). Finally, I calculate that
network’s density – the ratio of the ties within the network to the number of possible ties
for a network of that size. This value is a candidate’s existing network density (END) score.
Candidates who score higher on this measure are those whose supporters frequently work
together in their party’s primary. I focus on the behavior of donors in the election cycle prior
114

in order to establish that these donors are not simply re-election coalitions pulled together
in a particular election by a particular candidate. By demonstrating that these donors have
consistent patterns of giving over time, I can show that these networks are organized and
durable. And because this analysis focuses on open-seat contests, I can conclude that these
networks were organized prior to an individual becoming a candidate for that office.
Figure 4.2: Calculating A Candidate’s Existing Network Density
Note: In the first row, six contributors donate to Barney Frank in 1982. In the second row,the behavior of these six donors in the prior election cycle is described, and then convertedinto a network where donors are tied if they share a common campaign to which theycontributed.
Figure 4.2 provides another visual example of how this measure is calculated. Imagine
that donors A, B, C, D, E, and F contributed to Barney Frank during the 1982 primary.
To determine the existing network density of Frank’s contribution network, I would first
determine what contributions these contributors made in the 1980 primary cycle. For this
example, lets assume that contributors A, B, C, and D contributed to Ed Markey and
115

donors E and F contributed to Paul Tsongas. In this case, donors A, B, C, and D would
be connected, and donors E and F would be connected. This would create seven ties in a
network of six actors. If every donor in a six member network was connected, this would
result in 15 ties. Therefore the END score for this network would be 715
or ≈ 0.47.
Figure 4.3: Distribution of Existing Network Density (END) Scores
END Score
Per
cent
age
of O
bser
vatio
ns
0.0 0.2 0.4 0.6 0.8 1.0
0
2
4
6
8
10
12 WinnersLosers
Figure 4.3 provides a histogram of END scores for candidates who raised primary funds
116

in consequential open-seats between 1982 and 2014. The green bars represent the share of
those candidates that lost their primary, whereas the blue bars are those who won. The
distribution is roughly symmetric, with a slight right skew, and a disproportionate number
of candidates with network densities of 0 or 1. Those candidates with network densities of 0
often had no donor activity in the previous cycle, whereas those candidates with density of 1
often had very small networks. While theoretically these observations are valid, the results
presented in the proceeding chapters hold if these outliers are omitted.
4.5.3 Limitations and Alternatives
Some limitations of network density as a measure should be discussed. First, the mea-
sure is not sensitive to variations in the cohesiveness with the structure of a network. The
networks presented in Figure 4.4 have identical measures of density, but obviously different
structures. The network in the first row consists of three densely connected communities –
distinct sub-groups within a larger network – whereas the network in the second row consists
of one larger, but more sparsely connected network. While future work could consider the
differences between many small, cohesive groups and one larger less connected group, at
this point the exploration would be exploratory, lacking a theoretically based hypothesis for
which network structure should be more beneficial to a candidate.
This raises a second and related concern. Measures of network density are sensitive
to the size of a network. In social networks, this makes comparing the density of networks
of different sizes difficult (Scott 2017). For example, there is likely a limit to the time
and energy individuals can spend maintaining social relationships. Therefore the theoretic
maximum density of a network decreases as does the size of the network. In fact, Mayhew
and Levinger (1978) use models of random choice to suggest that for large social networks,
the maximum density value likely to be found is closer to 0.5.
But unlike social relations, donor patterns are less exhaustive in expectation because
of how they are constructed. Given that donors are tied through their donations to other
117

Figure 4.4: Network Structure and Density
●
●
●
●
● ●
●
●
●
●
Network Density 0.28
● ●
●
●
●
●●
●
●
●
●
●
●
●
●
●
●
●
●
●
Network Density 0.28
candidates, they are in a sense indirectly tied.4 Individual donors are not directly inter-
acting with one another. A single action – all the contributors donating to one campaign
in the previous cycle – could bind the entire network. Therefore the amount of time and
energy needed to maintain a large, dense donor network is far less than the organizational
requirements for similar levels of density among a traditional social network. While there
is no single agreed upon method for comparing densities across various sizes, one common
4In network analysis, this is considered a bi-partite or two-mode network – a network wherein the tiesbetween actors are mediated by their actions toward another set of actors.
118

approach is to weight the networks by the number of actors. In the analyses to follow, I
therefore interact the density measures with the number of donors in the network.
Density is not the only measure that summarizes the structure of a network. For exam-
ple, Desmarais et al. (2015) uses community detection methods to determine whether or not
a challenger candidate is integrated within the extended party’s general election contribu-
tion network. They find that those candidates included in the network fare better than their
equally well-funded, but excluded counterparts. In the Annual Review of Political Science,
Ward et al. (2011) describe 16 different “descriptive measures of complete graphs that cap-
tured key structural features of networks.” However, common measures like betweenness,
centrality, prestige, and homophily are all node-level measures, which in the context of this
project would mean that the statistic is calculated for each individual candidate within the
network. This project, however, is interested in the structure of the contributors’ network.
This requires a graph-level metric – and of such measures, network density is most closely
paralleled in my theory of group support.
4.6 Dealing with Endogeneity
One obvious concern is that existing network density is not causing candidates to be
more electorally successful, but that more viable and successful candidates attract the sup-
port of dense networks. Unfortunately, polling in congressional primaries is sparse and rarely
conducted with the rigor required for academic consideration. Fundraising reports, however,
are widely available and occur with the granularity necessary to analyze trends over time.
Not to mention that fundraising success is one of the strongest predictors of primary elections
for non-incumbents (Jacobson 1980). Therefore, I use a Granger test of causality between
END scores and candidate fundraising to demonstrate that END scores are Granger-causing
candidate viability and not the other way around. This technique is used by Hassell (2016;
2018) in his analyses of national party primary coordination.
Existing network density scores can be said to Granger-cause fundraising share if the
lagged value predicts both future fundraising share and END scores, but the lagged value
119

of fundraising do not predict party support when both lagged values are included in the
models (Hassell 2016; see Woolridge 2012). In other words, if early END scores predict
future fundraising – a value we know to be endogenous and directly affected by a candidate’s
viability – but END scores at the end of the primary are not predicted by early fundraising
successes, then we can conclude that END scores are not driven by early perceptions of a
candidate’s viability.
For these Granger causality tests, I only consider candidates seeking nominations in
consequential open-seat contests. As the dependent variables in the model, I use the share
of fundraising5 and the END score for candidates based off of the donations made to their
campaign in the last 90 days of the campaign. I then estimate models with three sets
of lagged independent variables. I calculate the END scores and fundraising shares for
candidates based on donations made more than 90, 180, and 360 days prior to primary day,
as t-1, t-2, and t-3, respectively.
Table 4.1 provides the results of these Granger causality tests. As predicted, early
fundraising advantages predict future fundraising advantages, as does the early support
from dense networks predict future support from dense networks. More importantly, the
results suggest that END scores Granger-cause candidate fundraising shares in the three
months before primary day, in that early support from dense networks also predicts future
fundraising share. This provides us with some evidence that network support is in fact
driving the relationships, and not following perceptions of candidate viability. The results
are most clear for donations made 90 and 180 days prior to the primary, but near conventional
levels of significance even at a year prior to the primary when a large portion of the sample
is missing – only about half of candidates have raised any funds a year prior to the primary
(1869/3961).
These results conform with Hassell’s (2016; 2018) findings, but also recent studies that
have largely found donor motivations to be expressive rather than instrumental (Barber
5In this model I use share of fundraising for ease of interpretation as it puts fundraising and END scoreson the same scale. The findings hold if I instead use logged fundraising values. Logged fundraising is used inthe models presented in Chapters 5 & 6 to allow for ease of comparison between this work and the existingliterature. Here too the effects and certainty remain if fundraising shares are used instead.
120

Table 4.1: Granger Causality Tests of Fundraising Share and Party Support
Fund END Fund END Fund ENDShare Score Share Score Share Score
(1) (2) (3) (4) (5) (6)
ENDt−1 0.103∗∗∗ 0.530∗∗∗
(0.026) (0.016)
Fund 0.619∗∗∗ 0.003Sharet−1 (0.014) (0.008)
ENDt−2 0.108∗∗∗ 0.495∗∗∗
(0.029) (0.016)
Fund 0.555∗∗∗ 0.005Sharet−2 (0.017) (0.009)
ENDt−3 0.065† 0.406∗∗∗
(0.036) (0.018)
Fund 0.401∗∗∗ 0.016Sharet−3 (0.021) (0.010)
Constant 0.123∗∗∗ 0.223∗∗∗ 0.150∗∗∗ 0.263∗∗∗ 0.234∗∗∗ 0.319∗∗∗
(0.023) (0.014) (0.025) (0.014) (0.032) (0.016)
Observations 2,539 2,461 2,356 2,297 1,869 1,850R2 0.449 0.569 0.330 0.563 0.182 0.550Adjusted R2 0.446 0.566 0.325 0.559 0.175 0.546Year Fixed Effects
†p<0.1; ∗p<0.05; ∗∗p<0.01; ∗∗∗p<0.001
Notes : The dependent variables are fundraising share and END-score of the candidatesduring the last 90 days of the primary. The independent variables are the same metricscalculated based on donations before times t-1, t-2, and t-3, or 90 days, 180 days, and 360days before the primary, respectively. All models include year fixed effects.
121

2016a; 2016b; Gimple, Lee, and Pearson-Merkowitz 2008). This is not to suggest that donors
are not strategic. They are responsive to the competitiveness of the election (Hill and Huber
2017) and give more frequently in races with the potential to increase their party’s seat share
(Boatright 2013). However, they “appear to give out of desire to support causes they believe
in rather than extract material benefits from politicians” (Albert et al. 2018). In sum, little
evidence suggests that primary donors exhibit significant bandwagoning tendencies.
And, moreover, there are numerous examples of when durable, influential networks came
in against the clear frontrunner. Consider Marjorie Margolies campaign. She had previous
Congressional experience, name recognition, fundraising strength, early endorsements and
TV ads with Bill Clinton. But groups like EMILY’s List and Equality Pennsylvania, rather
than follow the frontrunner, decided instead to sit out the race. And other groups, namely
the unions, came out in support of her underdog opponent. This is not to suggest that there
was not some bandwagoning present among some donors, only that it is not sufficiently
present to prevent deviations toward Boyle by the unions, or encourage pro-choice and
LGBT groups to participate. More generally, if bandwagoning was the dominant driver of
network behavior, we would have anticipated seeing Margolies in PA-13, Mitchell in MI-4,
Clarke in MI-14, Graham in NC-12, and Dietzel in LA-06 – all leaders in early public polling
– to have had the support of the densest networks, but each was bested by their opponents.
These examples will be explored in greater detail in Chapter 6, where I analyze the impact
of END scores on a candidate’s likelihood of winning a primary.
4.7 Summary
In most situations, parties have lost the ability to formally nominate candidates for
office. But this is not to suggest that they are unable to influence the primary elections that
select these nominees. Organized interests within the extended party network hold access
to a variety of powerful resources, including field shaping pressures, campaign training and
management, ground game and GOTV efforts, endorsements and persuasion campaigns,
and financial support, that are often either unavailable or much more difficult to acquire for
122

candidates without the support of these network actors. Studying the systematic influence
of these efforts, however, is difficult because gathering data on this diverse pool of resources
is nearly impossible.
Therefore, I proposed a new measure – existing network density (END) scores – which
measure the degree to which the financial supporters of a candidate have a history of cooper-
ating in their party’s primaries. Those candidates with high END scores have the support of
donors who frequently work together in support of primary candidates. The consistency with
which they cooperate signals organization, and that organization in turn signals membership
within the extended party network. Those candidates with the support of individuals within
the extended party network are those candidates most likely to have access to the diverse
range of alternative resources which help propel them to the nomination.
One could easily question whether this measure of network support is simply endoge-
nous: rather than causing a candidate to win, dense networks of supporters are simply
bandwagoning behind candidates already bound for success. To alleviate those concerns, I
present the results from a Granger causality test that suggests END scores Granger-cause
fundraising success (a proxy for candidate viability). This, in conjunction with the anecdotal
accounts of network behavior in the 2014 primary cycle, suggests that these networks are in
fact the drivers of this relationship. In the following two chapters, I demonstrate how these
networks have the ability to both shape the field of candidates that compete in the primary
and to then help nominate the candidates whom they support.
123

CHAPTER 5
Clearing the Field
5.1 The Political Influence of Candidate Dissuasion
In primary elections, who runs is often as important as who does not. In Pennsylvania’s
13th district, most insiders agreed that had only one of the candidates from Montgomery
County – any one of them – squared off against Boyle, then they would have won the
primary. But with three candidates dividing up the support in the suburban portion of
the district, Brendan Boyle was able to win with 41% of the vote. Had Jon Saidel or Mark
Cohen, two well known Philadelphia Democrats who had publicly explored running, actually
competed, they likely would have siphoned off sufficient support from Philadelphia to throw
the election to Margolies. A similar dynamic played out in North Carolina, where Alma
Adams benefited from running against a divided pool of Charlotte-based candidates. Had
the Charlotte political community been able to coordinate behind a single candidate, or had
more non-Charlotte candidates pulled votes from Adams, she very likely would have failed
to secure the nomination.
The outcomes of elections with three or more candidates are notoriously difficult to
predict. These multi-candidate contests have been described as little different from “poorly
designed lotteries” (Brady 1993). Even under the strict (perhaps implausible, see Schwartz
2011) assumptions of preference one-dimensionality, the addition of a third candidate creates
instability. While multiple equilibrium patterns are possible (Denzau, Kats, and Slutsky
1985), “none of them are ‘convergent’ in the sense that we expect candidates to adopt
positions toward the center of a distribution of voters” (Cooper and Munger 2000). As
Brams (2008) demonstrates, “there are no positions in a two-candidate race...in which at
124

least one of the two candidates cannot be beaten by a third (or fourth) candidate.” The
structural instability of multi-candidate contests under plurality rule (as voting in nearly all
U.S. elections uses) allows for the possibility of ‘spoiler’ candidates – those whose presence
in the pool of candidates allows for the nomination of a candidate who would otherwise
have lost (Bawn et al. 2015). Therefore, attempts to understand the outcome of a primary
elections require an understanding of both the candidates and potential candidates.
Much of the scholarship on candidate emergence stresses the importance of the ambition
of the individual office-seeker. Earlier work found that recruitment activities by the formal
party were rather limited (Kazee and Thornberry 1990). Interviews and surveys of candi-
dates found them to be primarily self-motivated (Kazee 1980; Maisel et al. 1990), finding the
decision to run for office “extremely personal” (Herrnson 1988). Fowler (1993, p. 59) summa-
rized the characterizations of this textbook candidate as a “purposive actor...the self-starter,
the freebooting entrepreneur, the strategic politician...an autonomous individual.”
These studies left little room for parties – and by extension party networks – to influence
the candidacy decision. But recent scholarship has pushed back, demonstrating the impor-
tance of recruitment on the decision to run. Fox and Lawless (2010) analyze how gendered
differences in candidate recruitment efforts affect candidate emergence. Sanbonmatsu (2006)
finds that in states with more competition between the two parties, the parties in the leg-
islature are more actively engaged in recruitment. Carnes (2018) forthcoming book focuses
on the representational implications of the limited recruitment of working-class candidates.
In all of these works, the role of party recruitment is key to the composition of potential
candidates.
While few party networks still posses the authority to formally choose their nominee,
many of the politically active groups observed during the 2014 primary campaign were still
able to influence the field of candidates to benefit their preferred candidates. For example,
in Louisiana one city council member who approached Lane Grigsby was informed that he
“can’t raise the money to be a serious candidate.” He talked a district attorney from the
state out of the race because “almost everything you’ve done in your past history, no matter
how far back it goes, is going to come forth in a campaign.” After conducting his own
125

opposition research, he also convinced a leader of a socially conservative interest group that
running for Congress was not a good idea, because it would allow him to be “painted as the
devil himself” (see McGaughy 2013). Grigsby was forthcoming about how this dissuasion
aided Garret Graves, his preferred candidate:
“Graves wouldn’t have gotten into the race if [name redacted] had. He’d havebeen dominant enough to keep most of the good candidates out... So we said no,pull that banner down, and he pulled it down...”
Much of the scholarly work on candidate emergence has focused on candidate recruit-
ment. Early work recognized the importance of candidate recruitment as “one of the more
important functions performed by the party” as “recruiting candidates determines the per-
sonnel and, more symbolically, the groups to be represented among the decision-making
elite” (Crotty 1968, p. 260). However, as the Louisiana example highlights, this influence
often comes in the form of dissuasion. Grigsby convincend numerous candidates not to run.
Jon Saidel was asked not to run by the Clintons. Mike Parrish was pushed out of the pri-
mary by the county activists who mobilized in support of Trivedi. In another 2014 contest,
the United Food and Commercial Workers union worked hard to push Steve Gallardo out
of Arizona’s 7th district Democratic primary (Ocampo 2017). Acts of political dissuasion
are rarely approached in the study of candidate emergence (see Niven 2006 as a notable
exception), but serve as powerful resources for candidates in congressional primaries.
Critically, candidate recruitment and dissuasion are extremely difficult to observe –
candidates, party operatives, and organized groups expend great efforts to keep the inter-
nal workings of recruitment and dissuasion out of the public eye. The recent controversy
with Minority Whip Steny Hoyer discouraging a candidate in Colorado from competing in
the primary shows just how valuable keeping these pressures hidden can be for the party
(Fang 2018). In this chapter, I use a candidate’s existing network density (END) scores to
demonstrate that party networks are able to systematically influence the pool of candidates
available for the voters to choose between. Specifically, I show that, all else equal, candidates
with denser networks are more likely to drop out of a primary. Candidates with network
126

support are more likely to be connected to the party, concerned about their reputation within
the small world of local politics, and hopeful about future political opportunities. As a party
insider summarized: “Why piss off a bunch of people you’re going to need someday? That’s
the other thing, when you run against the ‘anointed on’ all you end up doing is pissing off
people you might need someday, and you look like the hero when you announce you’re not
going to run”(quoted in Hassell 2016).
This finding may seem at odds with my central hypothesis that network support is a
political advantage to individuals seeking their party’s nomination. However, by revisiting
cases from Arizona, Michigan, and Pennsylvania, we can see how what may appear as a
“disadvantage” is actually a small price to pay for the maintenance of a profitable relationship
between a group and it’s would-be agent. While a network may choose to nominate another
candidate, accepting rather than attacking that decision is often rewarded with help seeking
other office or in future congressional runs.
5.2 Research Design
5.2.1 Data
Data for this analysis comes from the following sources. Individual level campaign con-
tributions come from Bonica’s (2015) Database on Ideology, Money in Politices, and Elec-
tions (DIME). This database consists of the over 130 million political contributions made
by individuals and organizations to candidates and committees between 1979 and 2014. For
each individual contribution, this data provides the amount, the date the contribution was
reported, the recipient and the contributor, as well as many other characteristics of the re-
cipients and donors, such as the office sought and the party identification of the candidate. It
also designates whether a contribution was for the primary or general elections. Importantly,
entity resolution techniques were used to create unique identifiers for both committees and
individuals – a monumental undertaking, which allows the donation behavior of contributors
to be bridged between election cycles. Previous work has focused solely on the behavior of
127

PACs because of the ease of tracking there behavior over time, but here I will be able to
include the behavior of individual level donors, who constitute the vast majority of political
donors.
House primary election results between 1982 and 2010 come from the Pettigrew, Owen,
and Wanless (2014) database of House primary election results. For election years 2012
and 2014, the electoral and incumbency data came from the Federal Election Commission’s
archive of election results (FEC 2018). These data provide both the vote share received by
each candidate in the race, but also whether or not that candidate was an incumbent seeking
re-election.
Pettigrew et al. (2014) also provide each candidate’s co-partisan presidential candidate
in the previous election for elections between 1982 and 2010, while the presidential vote
shares for 2012 and 2014 come from the DailyKos’s Election data repository (DailyKos 2018).
While some states do not report this data by congressional districts, the DailyKos maintains
a detailed explanation of their imputation strategy. This is used to append similar data to
the FEC elections data that is available in Pettigrew et al. (2014) for previous elections.
This data, in combination with the incumbency data from the election returns, facilitates
designating a primary contest as consequential (the underlying partisanship of the district
creates a realistic possibility that the winner of the primary could win the general election)
and/or open (there is no incumbent seeking reelection). As described in detail in Chapter
2, by focusing on consequential open-seat contests, this analysis avoids the complications of
incumbency advantage while focusing on the path to Congress taken by most members.
For years 2004 through 2010, Pettigrew et al. (2014) also provide detailed histories of
prior occupations for candidates, which allows us to determine which primary candidates had
previously held office. Data for candidates in 2012 and 2014 were gathered by hand using
internet searches of candidate biographies and news coverage of individual primary contests.
Hans Hassell generously provided the elector history for the candidates that dropped out
between 2004 and 2014 (see Hassell 2018). Together these data allow me to control for which
candidates have held prior office, a binary frequently used to account for candidate quality
or viability (see Jacobson 1989; 2009).
128

Bridging between individual contributions and primary election results is straightfor-
ward for candidates in 2012 and 2014 both Bonica and the FEC maintain unique FEC
candidate identifiers. However, no such identifier exists between Pettigrew et al.’s primary
election data and Bonicas campaign contribution data. In order to bridge these I generate
my own identifiers in both data sources based on the the district, year, party, and name of
each candidate (e.g., AL01-1980-D-SMITH). The vast majority of candidates could then be
exactly matched between years. However, inconsistencies and typos in last names prevented
1,109 candidates from matching. From here I use a fuzzy matching technique that considers
the total number of insertions, deletions, and substitutions required to transform one into a
match in the other data1. I limit the tolerance to less than 10% of the total string, which for
an identifier of average length is a change of 1 character. From here only 268 candidates were
not matched. For these I found their FEC identifiers by hand from the raw FEC candidate
files. The most common causes requiring hand matching were candidates with hyphenated
last names and inversions of first names and last names. For example, candidate Daylin
Leach is recorded in the FEC as Daylin, Leach and Bonnie Watson Coleman is recorded as
Coleman, Bonnie Watson. 42 of 23,501 candidates are dropped due to missingness in the
FEC records.
Once I have generated bridging identifiers between the two sources of data, I am able
to merge the existing network density scores from campaign finance records with election
outcomes. The method for calculating END scores is described in detail in the previous
chapter, but I will summarize it again briefly. For each candidate in the FEC candidate
master file, I find every contributor to their campaign. I then take this list of donors and
find all of the donations they made in the previous election cycle. I restrict these donations
to include only those made in federal non-presidential contests during the primary.2 For
example, I take all of Brendan Boyle’s primary donors in 2014 and find all the donations
1The minimum number of insertions, deletions, and substitutions to change one string to another is calledit’s Levenshtein edit distance. For example, RATTERSON has a Levenshtein edit distance of 1 to the namePATTERSON. As a tolerance of the total string, that is 1/9 characters, or 11%.
2The first year of availability for state campaign finance data varies, but rarely precedes 2000. Futurework will attempt to extend this concept to include donor behavior at the sub-federal level.
129

they made in 2012. I then use this data to construct a network wherein donors are connected
if they donated to the same candidate or campaign committee. I then calculate the density
of this network to measure how connected this network of supporters is in the previous cycle.
This measure of density is a candidate’s END score.
Determining the dependent variable – which candidates dropped out of the primary – is
not as straightforward as determining which candidate won the primary. Many candidates
may publicly express interest in running for a seat, but never ‘pull the trigger.’ As a con-
servative and systematic estimate, I consider only candidates who filed paperwork with the
FEC to run in a particular district in a given year. Each election cycle the FEC prepares a
master candidate list which includes “one record for each candidate who has either registered
with the [FEC] or appeared on a ballot list prepared by a state elections office” (FEC 2018).
This list includes candidates running for the House, the Senate, and President, and includes
candidates who are preemptively filing for future elections. First, I remove all non-House
candidates. Second, I remove all House candidates who filed for a different election cycle.
Finally, I compare this list to the list of candidates with recorded votes in the primary. I
consider those candidates who filed, but did not compete, as to have dropped out of the
primary.
5.2.2 Hypotheses
What effect should party network support have on a candidate’s likelihood of dropping
out? Hassell finds that House candidates with the same level of elected experience in districts
competitive in the general election are less likely to withdraw from the primary contest as
their share of national party donors increases (2018). In other words, candidates with greater
support from donors who also gave to the national party fundraising committees were more
likely to remain in the primary. Given that my central argument is that network support
provides candidates with resources that benefit their pursuit of the nomination, it would
not be unreasonable to assume that candidates with greater network support would be less
likely to drop out of the primary. If so, then the average candidate who drops out should
130

have the support of less dense networks than those candidates who remain in the contest.
But this is not the true quantity of interest. What is important is the influence of
network support on candidates who are otherwise of similar quality in these largely non-
competitive districts. If two candidates both have prior elected experience, both raised the
similar amounts of money from similar numbers of donors, which candidate should be more
likely to drop out? Would it be the candidate with the support of an organized group of
supporters or the “freebooting political entrepreneur?” I argue that candidates with net-
work support should be more likely to acquiesce in the face of party pressures to clear the
field in pursuit of maintaining that relationship. Perhaps Jon Saidel was willing to go along
with the party’s preference in hopes of leveraging those relationships for a future mayoral
bid (Otterbein 2015). Steve Gallardo’s decision to dropout was less ambiguous – the unions
explicitly offered to help him run (and eventually win) a seat on the county Board of Su-
pervisors instead of Congress (Ocampo 2017). As Hassell (2016) notes, “candidates who
aspire to elected office recognize that fighting against elite party preferences reduces future
opportunities for elected office and positions of influence within the party network.” In this
situation, we would then expect that all else equal, candidates with greater network density
to be more likely to drop out.
5.2.3 Model Specification
My analysis addresses the likelihood of dropping out of an consequential open-seat
primary. A consequential open-seat primary is one in which there is no incumbent seeking
the nomination (open-seat) and the presidential candidate of that party won at least 45% of
the vote in the previous election where the winner of the primary has a competitive shot in the
general election (consequential). Open-seat primaries eliminate the confounding influence of
incumbency on the electoral outcomes. These races are also “where the action is,” with over
two-thirds of members of Congress entering by winning open-seat races (Gaddie and Bullock
2000; see Bawn et al. 2014). I focus on consequential open-seats, as these are the only races
in which the winner of the primary has a realistic chance of success in the general election.
131
However, the results presented hold when I consider all open-seat races and all consequential
races.
I estimate a series of logistic regressions on the likelihood of dropping out of a primary
election controlling for a range of potentially confounding variables. In different specifica-
tions, I include the log of a candidate’s total primary fund-raising, a candidate’s total number
of unique and party donors, and whether the candidates had been previously elected to of-
fice. Candidate fundraising is one of the strongest predictors of candidate success in both
primary and general elections for Congress (Jacobson 1980). And as Hassell (2015) argues,
by “[u]sing fund-raising as a measure of candidate viability, we can assess whether connec-
tions to [the network] are largely determined by perceived candidate viability or whether
party donors support candidates through different coordination mechanisms.”
The support of a large dense network should be more valuable than the support of
a small dense network, all else equal, as those groups with the resources and organization
necessary to maintain larger groups are likely to be the same groups with access to more
electoral resources. A union that has 100 members who consistently contribute to the same
candidates is likely to have more boots on the ground and larger campaign coffers than
a union with only 10 such members. With this consideration in mind, I also interact a
candidate’s END score with the number of their donors who also made a contribution in the
previous cycle – or the size of their overall existing network.
Party donors are donors that also contributed both to the candidate and to one of the
national party committees.3 In order to make inferences about the preferences of the formal
party organization, we need an alternative measures of the relationships between party elites
and individual candidates, because the parties themselves rarely make endorsements in a
primary (Hassell 2018). The number of shared donors between the national parties and the
individual candidates is a straightforward measure of how connected these sets of actors are
3The Republican National Committee, Democratic National Committee, National Republican Congres-sional Committee, Democratic Congressional Campaign Committee, National Republican Senatorial Com-mittee, and the Democratic Senate Campaign Committee constitute the national party committees for thisanalysis. Hassell restricted his analysis to only the federal party committees responsible for the office inquestion. The results of my analysis hold in both cases.
132

in a particular election. I include this measure to control for the influence of the national
party in primaries and to compare the magnitude of influence with previous studies (Hassell
2016; 2018).
The data for candidate quality and electoral experience is only available for House
primary candidates between 2004 and 2014 and therefore model specifications controlling
for candidate quality only consider campaigns during this time period. Candidate quality
is a binary variable for whether a candidate has held previous office. While the data would
allow us to make a more granular scale of quality given different levels of previous experience,
more nuanced measures are often found to explain little additional variation (Jacobson and
Kernell 1981). Gathering this data before 2004 is exceptionally difficult, given the same
problems that plague the study of contemporary primary elections – limited news coverage
and previous attention by scholars – but those efforts continue for future work.
5.3 Results
First, I present the relationship between existing network density and the likelihood
of a candidate dropping out in Table 5.1. I provide the bi-variate relationship between
existing network density and the likelihood of dropping out of a primary for all candidates
in consequential open-seat contests between 1982 and 2014 (1 & 2), for Democrats (D) and
Republicans (R) separately, and for candidates running in the 1980s (80), 1990s (90), and
since 2000 (00). Across all specifications, there is a negative bi-variate relationship between
a candidate’s END score and the likelihood of them dropping out of the primary. In other
words, donors supported by dense networks of support were, on average, less likely to drop
out of the primary.
It is likely, however, that this relationship is spurious. The intrinsic viability of a
particular candidacy likely holds significant influence over a candidates decision to drop out.
Specifically, the bi-variate model considers the serious and vanity, “also-ran” candidates
equally, where the decision to enter and remain in a race vary between these two groups of
candidates (Canon 1990). The true quantity of interest is how changes in END scores affect
133

Tab
le5.
1:E
xis
ting
Net
wor
kD
ensi
ty’s
Rel
atio
nsh
ipw
ith
Pri
mar
yD
rop-o
ut
Pri
mar
yD
rop-o
ut
(1)
(2)
(D)
(R)
(80)
(90)
(00)
EN
DSco
re−
1.28∗∗∗−
1.24∗∗∗−
1.02∗∗∗−
1.50∗∗∗−
1.58∗∗∗−
1.39∗∗∗−
0.96∗∗∗
(0.1
3)(0
.13)
(0.1
9)(0
.18)
(0.2
8)(0
.20)
(0.2
2)
Inte
rcep
t−
0.13∗∗
−0.
31∗
−0.
50∗
−0.
10−
0.11
−0.
04−
0.23∗∗
(0.0
5)(0
.15)
(0.2
1)(0
.22)
(0.1
3)(0
.08)
(0.0
8)
Obse
rvat
ions
5,47
45,
474
2,98
52,
489
942
2,06
02,
472
Pse
udo-
R2
0.04
0.05
0.05
0.07
0.08
0.05
0.02
Log
Lik
elih
ood
−3,
585.
8−
3,56
7.1−
1,61
2.4−
1,93
2.6−
589.
4−
1,35
3.0−
1,63
9.0
Aka
ike
Inf.
Cri
t.7,
175.
57,
170.
13,
260.
83,
901.
21,
182.
82,
710.
03,
281.
9Y
ear
Fix
edE
ffec
tsX
XX
X
Not
e:∗ p<
0.05
;∗∗
p<
0.01
;∗∗∗ p<
0.00
1Sta
ndar
der
rors
clust
ered
by
pri
mar
yco
nte
st.
134

otherwise equivalent candidacies. Table 5.2 then provides the estimates for a series of logistic
regressions which control for the aforementioned measures of candidate viability. Again, I
estimate these models for the sample of all candidates in consequential open-seat contests
(1); just the Democratic (D) and Republican (R) candidates; those candidates running in
the 1980s (80), 1990s (90), and 2000s (00); and finally those candidates running between
2004 and 2012 where prior office data is available for those candidates who dropped out (Q).
The results from model (Q) are displayed visually in Figure 5.1.
As predicted, all else equal, candidates with the support of denser party networks are
more likely to drop out of their primary. A END score increase of two standard deviations (≈
0.49), increases the likelihood of a candidate dropping out by about 10%, where candidates
who held prior office are overall approximately 5% less likely to drop out than electoral
novices. To put those rates in perspective, Figure 5.2 provides the distribution of candidates
dropping out of consequential open-seat primaries by party over the time period analyzed.
Over this period, approximately 18% of candidates who filed drop-out. Notably, this is
slightly larger (18% vs. 11%) than what Hassell finds for all House primaries. This is
likely a combination of open-seats attracting more candidates to begin with (Gaddie and
Bullock 2000) and the inclusion of incumbents who are rarely ‘primaried.’ (Boatright 2013).
However, these base rates show that the influence of party networks is not just statistically
significant, but carries a substantively important impact.
The influence of candidate viability – here measured by primary fundraising – is very
important for mediating the effect of network support on the likelihood of primary dropouts.
The bi-variate models estimated in Table 5.1 are re-estimated for candidates who raised at
least $10,000 (+) and less than $10,000 dollars (–) in their primary campaign. Among non-
viable candidates, party support has no discernible effect, but the relationship is negative.
It is these low-quality candidates that are driving the spurious relationships in Table 5.1.
Even in the bi-variate case, those candidates meeting this threshold of viability become more
likely to drop out as their network of contributors become increasingly organized.
135

Tab
le5.
2:E
xis
ting
Net
wor
kD
ensi
ty’s
Eff
ect
onP
rim
ary
Dro
p-o
ut
Pri
mar
yD
rop-o
ut
(1)
(D)
(R)
(80)
(90)
(00)
(Q)
EN
DSco
re1.
974∗∗∗
2.04
3∗∗∗
1.96
3∗∗∗
1.22
6∗∗
2.91
4∗∗∗
2.49
7∗∗∗
2.57
4∗∗∗
(0.1
77)
(0.2
63)
(0.2
49)
(0.4
00)
(0.3
41)
(0.3
23)
(0.4
09)
Don
ors t0
0.00
10.
001
−0.
002
0.00
70.
001
0.00
10.
0001
(0.0
01)
(0.0
01)
(0.0
01)
(0.0
06)
(0.0
02)
(0.0
005)
(0.0
01)
Log
Funds
−0.
300∗∗∗−
0.30
7∗∗∗−
0.30
0∗∗∗−
0.30
1∗∗∗−
0.42
6∗∗∗−
0.27
1∗∗∗−
0.22
4∗∗∗
(0.0
10)
(0.0
16)
(0.0
13)
(0.0
30)
(0.0
22)
(0.0
13)
(0.0
15)
Par
tyD
onor
s−
0.00
1∗−
0.00
2∗0.
007∗∗
0.02
6∗∗
0.01
5∗∗
−0.
0004
0.00
003
(0.0
01)
(0.0
01)
(0.0
02)
(0.0
09)
(0.0
05)
(0.0
005)
(0.0
01)
Pri
orO
ffice
−1.
101∗∗∗
(0.1
90)
EN
D*D
onor
s t0
0.00
8∗∗∗
0.00
5∗0.
010∗∗∗
−0.
009
0.01
0∗0.
004∗∗∗
0.00
5∗∗
(0.0
01)
(0.0
02)
(0.0
02)
(0.0
10)
(0.0
04)
(0.0
01)
(0.0
01)
Inte
rcep
t0.
239
0.32
00.
210
0.48
2∗1.
050∗∗∗
0.72
5∗∗∗
0.88
0∗∗∗
(0.1
70)
(0.2
40)
(0.2
43)
(0.2
03)
(0.2
77)
(0.1
74)
(0.2
17)
Obse
rvat
ions
5,47
42,
489
2,98
594
22,
060
2,47
21,
487
Pse
udo-
R2
0.34
50.
348
0.36
20.
324
0.46
70.
320
0.32
1L
ogL
ikel
ihood
−2,
861.
7−
1,30
4.6−
1,52
5.9
−48
9.4
−95
3.3
−1,
322.
0−
787.
0A
kaik
eIn
f.C
rit.
5,76
7.4
2,65
3.2
3,09
5.8
996.
81,
926.
72,
670.
01,
595.
9Y
ear
Fix
edE
ffec
tsX
XX
Not
e:∗ p<
0.05
;∗∗
p<
0.01
;∗∗∗ p<
0.00
1
136

Figure 5.1: Predicted Probabilities of Candidate Drop-out by Candidate Quality
0.0 0.2 0.4 0.6 0.8 1.0
0.0
0.2
0.4
0.6
0.8
1.0
Existing Network Density (END) Score
Pre
dict
ed P
roba
bilit
y of
Dro
ppin
g ou
t of a
Prim
ary
Prior OfficeElectoral Novice
137

Figure 5.2: Candidate Drop-out Over Time by Party
Year
Dro
pout
Sha
re
1982 1986 1990 1994 1998 2002 2006 2010 2014
0.0
0.1
0.2
0.3
0.4
0.5DemocratsRepublicans
138

Table 5.3: Primary Drop-out by Fundraising Levels
Primary Drop-out
(–) (+)
END Score −0.26 3.09∗∗∗
(0.19) (0.25)
Intercept 0.02 −3.95∗∗∗
(0.18) (0.31)
Observations 2,503 2,971Pseudo-R2 0.03 0.13Log Likelihood −1,651.232 −1,400.373Akaike Inf. Crit. 3,338.464 2,836.746Year Fixed Effects
Note: ∗p<0.05; ∗∗p<0.01; ∗∗∗p<0.001Standard errors clustered by primary contest.
5.4 Discussion
In this chapter I sought to demonstrate the systematic influence of party network sup-
port on the field of candidates in consequential open-seat primaries for Congress. To do so,
I estimate the impact of an original measure of group or network support – existing network
density (END) scores – on the likelihood of individuals dropping out of the primary. I find
that, all else equal, candidates with the support of party networks are more likely to drop
out of primaries. Across time, party, and numerous model specifications, the effect remained
both substantively and statistically significant. A two-standard deviation increase in exist-
ing network density makes a candidate approximately 10% more likely to drop out of the
primary. In sum, candidates with the support of networks affiliated with groups within the
larger extended party network were more likely to succumb to party pressures to clear the
field.
At risk of spoiling the surprise from Chapter 6 – How can we observe some variable
make a candidate both more likely to drop out, but also more likely to win their primary?
The best analogy may come from a slightly harder science. Exposure to antibiotics causes
139

many bacteria to die, but those who survive are much more likely to thrive. If we look at
the dosing stage, we would see antibiotics reductions to the population, but if we look at
later stages of the bacteria’s life, we would observe better outcomes for the bacteria who had
been exposed to the bacteria. In the case of network pressures, during the invisible primary
they attempt to thin the pool of candidates in support of their preferred nominee, but in the
primary stage they turn their resources toward supporting that candidate. Importantly, the
only candidates exposed to the “treatment” are those viable candidates who are supported
by a network of supporters within the larger party network.
Again, the finding that greater END scores is associated with an increased likelihood
of dropping out of the primary may seem at odds with my central hypothesis that network
support is a political advantage to individuals seeking their party’s nomination. But consider
the future prospects of candidates who dropped out: Vincent Gregory was able to win a
competitive state senate primary in Michigan after dropping out of the 14th district primary;
Mike Parrish won the nomination without opposition in the 6th district the following cycle;
Jon Saidel from Pennsylvania’s 13th district had early union support in his mayoralty bid
(although he dropped out of this contest too). This pattern could be seen in other races
from 2014 as well. John Moorlach was nominated to replace Mimi Walters in the California
state senate after she won an open-seat race in the 45th district. Ocampo (2017) provides
the details of how the United Food and Commercial Workers (UFCW) union in Arizona
convinced Steve Gallardo to drop out of the primary and in stead run for county supervisor.
There are exceptions. Val Arkoosh, who likely spoiled Margolies chances of winning
the nomination by dividing the Montgomery County vote and keeping EMILY’s List out
of the race, was rewarded with a plumb appointment to the Montgomery County Commit-
tee. Andrew Zwicker, who was less influential on the eventual nominee from New Jersey’s
12th district, was given the county line for a state assembly seat in the next cycle. Most
notably, Paul Mitchell won the nomination in the neighboring 10th district the next cycle
with Moolenaar’s endorsement, despite not only challenging Moolenaar the previous cycle,
but running a generally negative campaign.
While there is a surplus of high quality, talented, and ambitious candidates, that pool
140

is not infinite, a consideration to which party networks are obviously not immune. The
campaigns themselves can serve as opportunities for ambitious candidates to demonstrate
themselves as champions. Zwicker, a physicist himself, ran a positive campaign and molded
himself after the former popular Congressman and rocket scientist Rush Holt. This en-
deared him to the network of progressive activists, primarily faculty and staff of Princeton
University, who helped him secure the nomination and eventually win an Assembly seat for
a traditionally Republican seat. Marcel Groen, the Montgomery County Democratic Chair-
man at the time, noted how talented Arkoosh was on the campaign trail and how he hoped to
find some office for her in the future as a good face for the party. Arkoosh herself noted that
the support she had in her commissioner races came from the positive campaign she ran in
2014. These races provided opportunities for previously unknown candidates to demonstrate
themselves as potentially effective champions for groups within the party network. In these
instances, it may be worth the risk to buck the party.
The Mitchell example, is more concerning. Mitchell ran an extremely negative air war
against Moolenaar, claiming he raised taxes, supported Obamacare, and other damning in-
dictments for a Republican primary. Why then would “Team Midland” endorse his campaign
in the neighboring district? Perhaps it’s better to have a self-funding millionaire opponent
in office in another district? Perhaps they were simply bandwagoning behind the eventual
nominee. Unfortunately, our sources provided little insight into this question.
In combination with the Granger causality tests from the previous chapter, this finding
also provides some defense against reverse causality. If party networks were simply falling
behind the inevitable candidate, then we should see no effect of network support on the
likelihood of dropping out, or at the very least, the effect should be that support is associated
with not dropping out of the primary. Also, the very presence of field shaping efforts on the
part of these networks is evidence against bandwagoning. There would be no need to recruit
candidates into the primary or push others out if the motivation behind such efforts was
just to win the primary. These efforts show that networks are concerned with nominating
candidates supportive of their agendas and candidates who will be competitive in the general
election – the value of which they find worth the costs and criticisms of party meddling (see
141

Diaz 2018). Together, these data present a strong case for the influence of party networks
in shaping the fields of congressional primaries.
The data available for studying candidate withdrawal does qualify the conclusions of
this analysis. In a sense, these are conservative estimates of party influence over the field
of candidates – it only includes the systematic influence of network support on candidates
withdrawing from a race after they have filed to compete. It does not include those candidates
who never filed to run because they were preemptively responding to those party pressures or
the difficulties in mounting a campaign against the supported candidates. For example, State
Senator Burt Johnson, who had filed to run in Michigan’s 13th district when it appeared that
Rep. John Conyers would either retire or run in the newly drawn 14th district. When Conyers
changed course and ran for re-election in the 13th district, Burt Johnson began exploring
a run for the 14th district instead. However, the change in paperwork never occurred, and
he never formally entered the race. Someone familiar with Johnson’s campaign cited the
inability to raise campaign funds in the face of unified union support of Hobbs as a central
reason he remained out of the race.
This approach also misses the handful of candidates who reacted quickly to party pres-
sures. Jon Saidel had filed to run in Pennsylvania’s 13th district, but suspended his campaign
and endorsed Margolies before he raised any money (resulting in an END score of 0). Con-
sidering he was able to raise close to a million dollars as he considered running for mayor
in 2007 (City of Philadelphia 2018; see Dunn 2015), it is unlikely that an inability to raise
funds pushed him to reconsider his campaign. Insiders speculated that his “heart wasn’t in
it” and that he wanted to “keep the powder dry” for another shot at the mayorship in 2015
(Otterbein 2015). Similarly, it is unlikely that State Rep. Mark Cohen, one of the longest
serving state legislator in the country at the time, was deterred by an inability to raise the
money necessary. In his 2012 re-election campaign, he was able to raise nearly $100,000 for
an uncontested general election. While we know from insider accounts that Saidel’s decision
was influenced by party pressures, we only know that insiders speculated a similar calculus
for Cohen. But as a general limitation to this method, this approach would view both Cohen
and Saidel as candidate’s without connections to the party network, when the opposite is
142

likely the case. In this sense, we are underestimating the influence of party networks on field
shaping efforts.
143
CHAPTER 6
Winning the Nomination
6.1 The Influence of Political Networks in Primary Elections
The nomination of candidates for office is at the heart of party behavior. In determin-
ing whether an organization is a political party, the first criteria considered by the Federal
Elections Commission is whether it is engaged in “nominating qualified candidates for Pres-
ident and various Congressional offices in numerous states” (FEC 2018). The key purpose
of a party, according to many scholars, is the nomination of candidates for office (Key 1958;
Schattschneider 1942).
Despite the central role of nominations play in their definition, parties are often viewed
as having little control over the process. Jacobson describes candidates in primary elections
as “freebooting political entrepreneurs,” whose success and failures are based on the their
own strengths and weaknesses (2009). Herrnson (2011, p. 41) similarly argues that
“most successful candidates are self-starters because the electoral system lacksa tightly controlled party-recruitment process...Because the system is candidate-centered, the desire, skills, and resources that candidates bring to the table inthe electoral arena are the most important criteria separating serious candidatesfrom those who have little chance of getting elected.”
However, as I demonstrated in Chapter 3, the constellation of actors that constitute the
modern party still hold influence over the selection of candidates – these supposedly “free-
booting entrepreneurs do not fight with bare knuckles” (Bawn et al. 2012). The support of
groups within the party network provides powerful campaign resources to their chosen can-
didates. Support from these networks provided candidates with campaign staff and advisers,
144

canvassers and get-out-the-vote resources, independent expenditure campaigns, field-clearing
efforts, fund-raising assistance, and numerous other benefits often beyond the reach of can-
didates without group support. In numerous studies, these resources have individually been
found to aid candidates in their pursuit of nomination (Desmarais et al. 2015; Hassell 2016;
2018; Ocampo 2017). Moreover, in an environment lacking party cues, media coverage,
and public engagement, group endorsements are themselves a signal to voters in these low
information elections (Arceneaux and Kolodney 2009; Dominguez 2011).
These groups were not simply falling behind the winning nominee, but were actively
pushing candidates who had histories advocating for their policies and positions. Where
previous studies posited an incentive to coordinate behind a nominee mutually agreeable to
the various factions within a party, what was observed on the ground more closely resembled
a free-for-all among the relevant stakeholders. Labor unions, EMILY’s List, and minority
groups would marshal support behind their chosen candidates in Democratic primaries, and
business interests, Tea Party organizations, and evangelical activists would similarly compete
on the Republican side. Those competing did so knowing that the stakes were relatively low
– any co-partisan nominee would be generally supportive of the party’s platform – but
the potential pay-offs – a nominee who was a champion for their particular issue – were
tremendously valuable.
Systematically observing the benefits of group support, however, is difficult. As Hassell
(2016) notes, most of these studies have either focused solely on presidential nominations
(Cohen et al. 2008), been forced to rely on a small number of cases (Dominguez 2011; Masket
2009; Ocampo 2017), or only considered general elections (Desmarais et al. 2015; Hannagan
et al. 2010; Gerber and Green 2000) because of the intractability of gathering the data
systematically for a representative sample of primaries. Exacerbating these limitations, the
informal, behind-the-scenes politicking of party elites is often purposefully kept out of the
public eye (Bawn et al. 2014). In discussing the difficulties in measuring the impact of party
efforts on primary outcomes, Dominguez (2011) admits the need for “other proxies” as other
measures of party influence are “cumbersome to gather for large numbers of candidates.”
In the previous chapter I demonstrated how political networks are able to systematically
145

shape the pool of potential candidates competing for the nomination. In this chapter, I use
the existing network density of a candidate’s campaign contribution network to show that
these party networks are still able to help nominate their preferred candidate.
6.2 Research Design
6.2.1 Data
Data for this analysis comes from the same sources as Chapter 5. Individual level cam-
paign contributions come from Bonica’s (2015) Database on Ideology, Money in Politices,
and Elections (DIME). House primary election results between 1982 and 2014 come from
Pettigrew, Owen, and Wanless (2014) database of House primary election results the Federal
Election Commission’s archive of election results (FEC 2018). Pettigrew et al. (2014) also
provide each candidate’s co-partisan presidential candidate in the previous election for elec-
tions between 1982 and 2010, while the presidential vote shares for 2012 and 2014 come from
the DailyKos’s Election data repository (DailyKos 2018). For years 2000 through 2010, Pet-
tigrew et al. (2014) also provide detailed histories of prior occupations for candidates, which
allows us to determine which primary candidates had previously held office. I personally
gathered the data for candidates in 2012 and 2014 using web archives of local newspapers
and a variety of other primary sources. The variable of interest in this chapter will again be
a candidate’s existing network density (END) score. For a more detailed explanation for the
data sources and methods, see §5.2.1.
6.2.2 Hypotheses
The central hypothesis of this analysis is that candidates with a greater END score
should be more likely to win consequential open-seat primaries. These effects should remain
after controlling for measures of electoral viability, such as campaign fundraising and can-
didate quality. Additionally, because a large dense network should signal a greater value to
a candidate than a small dense network, the interaction between the number of donors and
146

the candidates END should also be positive.
Secondary hypotheses can also be investigated given the breadth of data available with
this approach. First, the underlying mechanism of organized group support is partisan inso-
far as it involves the behavior of party networks, but doesn’t theorize a difference between
Democratic and Republican candidates. Second, in contrast to the parties in decline liter-
ature, the tools available to actors within the extended party network exists equally across
time, and so the effect of network density should be stable across time.
6.2.3 Model Specification
My analysis addresses the likelihood of winning an consequential open-seat primary. A
consequential open-seat primary is one in which there is no incumbent seeking the nomination
(open-seat) and the presidential candidate of that party won at least 45% of the vote in the
previous election (consequential). Open-seat primaries eliminate the confounding influence
of incumbency on the electoral outcomes. These races are also “where the action is,” with
over two-thirds of members of Congress entering by winning open-seat races (Gaddie and
Bullock 2000; see Bawn et al. 2014). I focus on consequential open-seats, as these are the
only races in which the winner of the primary has a realistic chance of success in the general
election.1
I estimate a series of logistic regressions considering the likelihood of winning a primary
election controlling for a range of potentially confounding variables. In different specifica-
tions, I include measures of a candidate’s primary fund-raising, a candidate’s total number
of unique and national party donors, and whether the candidates have previously held office.
Candidate fundraising is one of the strongest predictors of candidate success in both pri-
mary and general elections for Congress (Jacobson 1980). And as Hassell (2016) argues, by
“[u]sing fund-raising as a measure of candidate viability, we can assess whether connections
to [the network] are largely determined by perceived candidate viability or whether party
1The results of the analyses presented below hold for the full sets of all open seats and all consequentialprimaries, but are subject to greater concerns of endogeneity.
147

donors support candidates through different coordination mechanisms.” Because a larger
dense network is obviously a greater resource than a smaller dense network, I also interact
the number of primary donors with the END score.
As further verification, I also estimate a series of ordinary least squares models with
a dependent variable of a candidate’s vote share in the primary. These models are only
presented as further evidence of the underlying trends from the logistic models. The compo-
sitional nature of candidate vote share data, however, makes direct interpretations of these
findings more limited.
Party donors are donors that also contributed both to the candidate and to one of the
national party committees.2 In order to make inferences about the preferences of the formal
party organization, we need an alternative measures of the relationships between party elites
and individual candidates, because the parties themselves rarely make endorsements in a
primary (Hassell 2018). The number of shared donors between the national parties and the
individual candidates is a straightforward measure of how connected these sets of actors are
in a particular election. I include this measure to control for the influence of the national
party in primaries and to compare the magnitude of influence with previous studies (Hassell
2016; 2018).
The data for candidate quality and electoral experience is only available for House
primary candidates between 2000 and 2014 and therefore model specifications controlling
for candidate quality only consider this time period. Candidate quality is a binary variable
for whether a candidate has held previous office. While the data would allow us to make
a more granular scale of quality given different levels of previous experience, more nuanced
measures are often found to explain little additional variation (Jacobson and Kernell 1981).
Gathering this data before 2000 is exceptionally difficult, given the same problems that
plague the study of contemporary primary elections – limited news coverage and previous
2The Republican National Committee, Democratic National Committee, National Republican Congres-sional Committee, Democratic Congressional Campaign Committee, National Republican Senatorial Com-mittee, and the Democratic Senate Campaign Committee constitute the national party committees for thisanalysis. Hassell restricted his analysis to only the federal party committees responsible for the office inquestion. The results of my analysis hold in both cases.
148

attention by scholars.
6.3 Networks on the Ground Revisited
Before investigating the systematic influence of existing network density on electoral
outcomes, how do END scores perform as a measure for understanding the case studies
from 2014? Table 6.1 provides the END score and the number of donors in their existing
network for the winners and runners-up of the 11 case studies from Chapter 4. In 7 of the
11 contests, the candidate with the densest network won the primary. In three contests, the
top two candidates had the support of roughly equal networks, but the winner’s network
was many at least 50% larger. Only in Michigan’s 14th district did the eventual nominee
win with the support of a noticeably more sparse network.
While few political science theories hope to account for every case, this exception should
be explored further. The Michigan district provides the clear limitation to this approach.
While Lawrence barely bested Hobbs on primary day, his network was both larger and more
structure as measured by the number of contributors and its END score. More than a
mere anomaly, it points to a possible weakness in this approach. Primaries for Congress are
often a candidate’s first attempt for federal office. If a candidate had the support of a solely
local network – perhaps, like Lawrence, a network of women mayors and their local campaign
supporters – who rarely participate in federal elections, then measuring their networks based
solely on federal contribution records could miss an underlying durable organization. Ideally
this measure would include the contribution behavior beyond federal offices, but this data is
only available for a large sample of states in more recent years.
Returning again to the example of Pennsylvania’s 13th district, we can see how network
density played out in detail for one race. One of the more anomalous aspects of this race
was the inverse relationship between fundraising and electoral outcomes. The trend could
not even be considered inconclusive – the vote share of the individual candidates was the
opposite of their fundraising prowess. Figure 6.1 provides the relationship between END
scores and vote share in comparison to the relationship between fundraising and vote share.
149
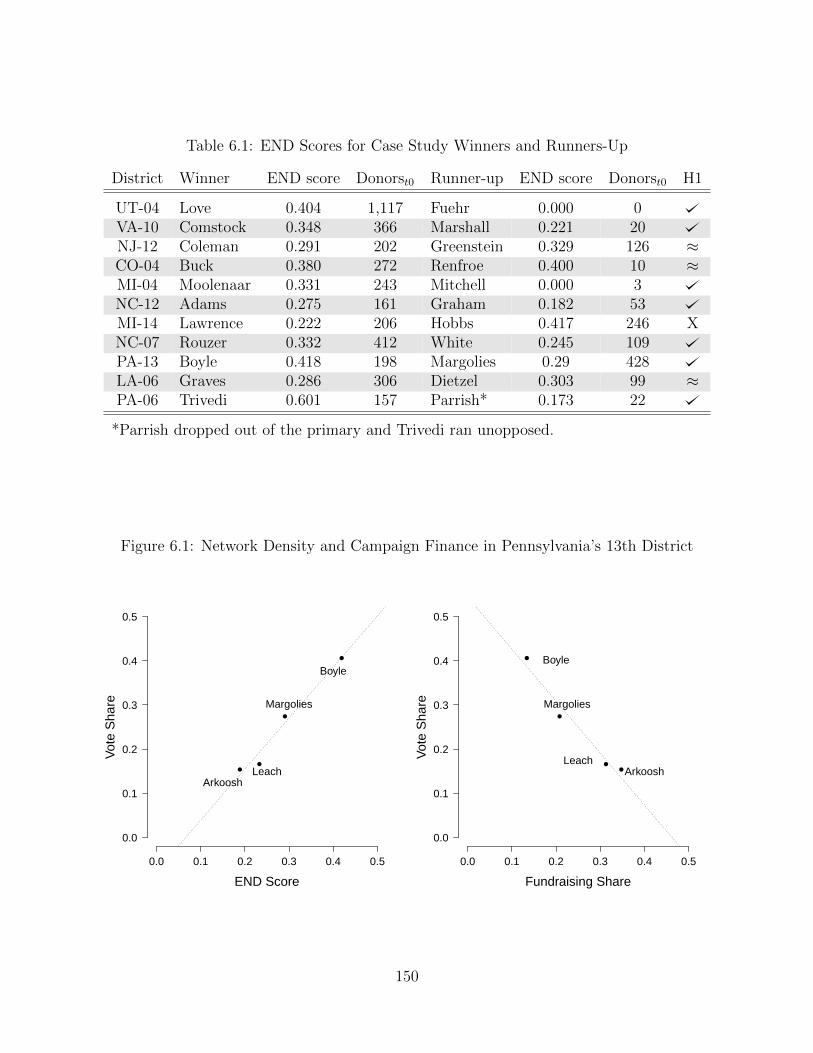
Table 6.1: END Scores for Case Study Winners and Runners-Up
District Winner END score Donorst0 Runner-up END score Donorst0 H1
UT-04 Love 0.404 1,117 Fuehr 0.000 0VA-10 Comstock 0.348 366 Marshall 0.221 20NJ-12 Coleman 0.291 202 Greenstein 0.329 126 ≈CO-04 Buck 0.380 272 Renfroe 0.400 10 ≈MI-04 Moolenaar 0.331 243 Mitchell 0.000 3NC-12 Adams 0.275 161 Graham 0.182 53MI-14 Lawrence 0.222 206 Hobbs 0.417 246 XNC-07 Rouzer 0.332 412 White 0.245 109PA-13 Boyle 0.418 198 Margolies 0.29 428LA-06 Graves 0.286 306 Dietzel 0.303 99 ≈PA-06 Trivedi 0.601 157 Parrish* 0.173 22
*Parrish dropped out of the primary and Trivedi ran unopposed.
Figure 6.1: Network Density and Campaign Finance in Pennsylvania’s 13th District
●●
●
●
0.0 0.1 0.2 0.3 0.4 0.5
END Score
Vot
e S
hare
0.0
0.1
0.2
0.3
0.4
0.5
ArkooshLeach
Margolies
Boyle
●●
●
●
0.0 0.1 0.2 0.3 0.4 0.5
Fundraising Share
Vot
e S
hare
0.0
0.1
0.2
0.3
0.4
0.5
Boyle
Margolies
LeachArkoosh
150

While Arkoosh was able to raise a significant amount of money for her campaign, 49% of
those funds came from outside of Pennsylvania the vast majority of which came from fellow
doctors, particularly anesthesiologists. The medical community was able to help her raise
money but was more reactive to her candidacy than a central player in creating it. In other
words, the medical community is more than willing to help one of their own in a primary, but
is not actively recruiting doctors nor necessarily contributing in primaries without doctors.
This hands-off style of participation means that on a cycle to cycle basis Arkoosh’s network
likely works together less regularly, resulting in a less dense network of support. The sporadic
nature of the medical communities support means that they have fewer resources that active
or full-time networks possess. For example, the union’s that supported Boyle are consistently
active cycle after cycle and have a full-time political operation with large numbers of boots
on the ground to help their candidates.
Similarly, while Leach was able to raise a good deal of money from online progressive
organizations like the PCCC and MoveOn.org, these endorsements were not connected to
the local political community and came with few campaign volunteers or canvassers. These
groups also did not engage in any large scale advertising or GOTV efforts on his behalf.
And Margolies, while widely panned for running an absent-minded campaign, was obviously
well connected to the Clinton fundraising network, and had the behind the scenes assistance
of both the Philadelphia and Montgomery County Democratic parties. While these efforts
were not visible to anyone but the most politically connected, they were still powerful forces
shaping the field to benefit Margolies.
Boyle, in comparison, benefited from the unequivocal and dedicated support of organized
labor. Endorsements, campaign donations, mailers, independent expenditures, campaign
advisers, canvassers, phone-bank operators, election day door-knockers – all of this and
more were marshaled by the Philadelphia unions in support of Boyle’s campaign. Five
months prior to the primary, Brendan Boyle had already secured over 20 endorsements
from major trade unions in the district, and was endorsed by the state legislators most
closely affiliated with the labor movement (Boyle for Congress 2014). Building a Better
Pennsylvania, a political action committee affiliated with the trade unions of Philadelphia,
151

spent over $350,000 on independent expenditures on behalf of his campaign (Brennan 2014).
One individual affiliated with the unions reported to me that they had 50 people either
knocking on doors, passing out fliers, or making phone calls every day the month leading up
to the primary. In addition to these visible efforts, elites interviewed in the lead up to the
primary believed that pressure from party actors kept other candidates from entering the
race, securing Boyle a geographic monopoly in Philadelphia (Gibson 2013). Given how active
unions are in Democratic primaries, we would expect that those supporters who donated to
Boyle due to his union support have a durable history of supporting the same labor-backed
candidates.
Figure 6.2 displays a sample of Boyle’s and Arkoosh’s network to visualize the differences
in density. One common pathology of large network visualizations is the “hairball” problem
– the number of actors in the network crowd the figure to the point where it appears as
an unintelligible hairball. When I plot all of the contributors for any candidate, it becomes
difficult to see any clear relationship. Therefore, I only display those donors who made at
least 3 contributions in the previous election cycle. While reducing the graph to this subset
leaves both candidates with more active donors, the density ratio between the full pool and
the sub-sample is approximately the same.3
Fitting the qualitative impressions this race, the most central actor in Arkoosh’s network
is the American Medical Association, whereas the most central donor in Boyle’s network is
the Boilermakers and Blacksmiths PAC (the IBEW was among the 10 most central donors).
These sub-graphs display two noteworthy trends. First, while Arkoosh raised more money
from more individuals in the primary, more of Boyle’s primary donors (61%) gave to multiple
campaigns in the previous cycle than Arkoosh’s (36%). Not only did a larger share of Boyle’s
supporters contribute in the previous cycle, they worked together more consistently. Boyle’s
supporters are more likely to be connected to one another – to have contributed to the
same campaign as one another – than Arkoosh’s donors, as is demonstrated by the denser
3Boyle’s END score is ≈ .41 in the full sample, and ≈ .43 in the sub-sample. Arkoosh’s END score is ≈.19 in the full sample, and ≈ .13 in the sub-sample. In both situations, Boyle’s network is more than twiceas dense.
152

Figure 6.2: Network Density for Boyle and Arkoosh
●●●
●
●
●
●
●●
●
●●
●●
●●
●●
●● ●
●
●● ●●
●
●
●
●
●
●●●
●
●
●
●●
●
●
●●
●
●● ●● ●
●
●
●
●
●●
●
●
●●●
●
●
●
●
●●
●
●
●
●
●
●
●
●
●
●●●
●●
●●
● ●
●
●
●●●
●
●
●
●
●
●●
●
●●
●●
●
●
●
●
●
● ●
●
●●
●
●●
●
●
●
●
●
●
●
Boyle Arkoosh
Note: These graphs display the networks of Brendan Boyle’s (blue circles) and Val Arkoosh’sdonors (red squares) from the 2012 election cycle. For visualization, donors are only tied ifthey contributed to 2 of the same candidates in the previous primary cycle.
153

clustering and more numerous ties between actors in his network. The radial structure of
Arkoosh’s network shows a lack of connections between many members of her network. In
comparison to Arkoosh’s supporters, Boyle’s supporters work together more consistently in
their party’s primary.
The results from one race are insufficient to conclude that dense networks of support
help determine the outcomes of congressional primaries. This is especially true given how
instrumental these cases were in the development of the underlying theory. While anecdotally
illustrative, these examples also fail to sufficiently address concerns of endogeneity. In the
following sections I will show that the support of the extended party network significantly
and substantively affects the electoral prospects of candidates in pursuit of nomination, and
that this support is driving this relationship.
6.4 Network Density and Primary Outcomes
The main results of the logistic regressions are presented in Table 6.2.4 In the first spec-
ification, (1), I provide the simply bi-variate relationship between existing network density
and the likelihood of winning a consequential open-seat primary. The sizable, positive, and
statistically significant coefficient provides initial evidence in support of the central hypothe-
sis. In the second specification, (2), I include controls for the logged value of total fundraising
in the primary and the total number of donors who also contributed to the national party,
but the results remain consistent. Not surprisingly, increased fundraising performance was
also associated with increased likelihood of primary victory. Fitting with Hassell’s (2018)
findings, larger numbers of national party donors also increases the likelihood of winning.
But larger dense networks should be more valuable than small dense networks, so in the
third model, (3), I interact the density of the network with the number of individuals in
that network. As anticipated, this interaction is positive and significiant. While one may be
concerned by the decrease in the magnitude of the END score coefficient, if we consider that
4As part of the philosophy that the data used to form a hypothesis shouldn’t be used to test thathypothesis, it should be noted that while the cases from 2014 are included in these models, all of the findingsare consistent if only years 1982 – 2012 are used.
154

the average number of donors in an existing network is approximately 70, that provides an
estimated coefficient of 3.82.5 Even after controlling for prior office, (4), the effect remains
robust. As noted prior, the data on electoral history is only available after 2000, and so the
sample in this model is reduced by two-thirds and only considers this time frame.
Figure 6.3 provides the results of model (3) graphically. The predicted probabilities
of primary victory where covariates are held at their means and medians are plotted with
solid and dotted lines, respectively. While convention is to hold covariates at their means,
I also present the model with covariates held at their medians on account of right-skew in
the distribution of donor counts. The shading around the line signifies the 95% confidence
intervals around those estimates. A two standard deviation increase in network density,
moving from 0 to ≈ 0.5, increases the likelihood of winning a primary by approximately 15
percentage points for the median candidate, and nearly 50 percentage points for the average
candidate. This model also correctly classifies candidates as either winners or losers 2,978
out of 3,742 times, or in 80% of all cases. Figure 6.4 provides the results of model (4)
graphically. The predicted probabilities of primary victory where covariates are held at their
medians are presented and where candidate’s vary as to whether or not they have held prior
office. Even with the reduced sample size, the effect remains similar to effects from model
(3). While omitted for brevity, these results also hold if modeled on experienced and novice
candidates separately. The additional information of prior office explains little additional
variation in outcomes: of the 1,119 cases, this model correctly classifies 922, or 82%.
Figure 6.5 provides the receiver operating characteristic (ROC) curve for full specifi-
cation of the model presented in Table 6.2. A ROC curve is a graphical illustration of the
ability of a binary classifier, such as a logistic regression model, to correctly classify outcomes
as its discrimination threshold is varied. The plot is created by plotting the true positive
rate against the false positive rate at various thresholds (Swets 1996). A perfect predictor
would be a perpendicular curve. The area under the curve (AUC) is the probability that the
classifier will rank a randomly chosen affirmative instance higher than a randomly chosen
51.420 + 0.034*70.55 ≈ 3.819.
155

Table 6.2: Existing Network Density’s Effect on Likelihood of Winning a Primary
Primary Win
(1) (2) (3) (4)
END Score 3.425∗∗∗ 2.194∗∗∗ 1.420∗∗∗ 1.350∗
(0.178) (0.176) (0.211) (0.545)
Donorst0 −0.006∗ −0.006∗
(0.002) (0.003)
Log Funds 0.194∗∗∗ 0.161∗∗∗ 0.192∗
(0.036) (0.030) (0.083)
Party Donors 0.012∗∗ 0.001 0.004(0.004) (0.001) (0.007)
Prior Office 0.464∗∗
(0.170)
END*Donorst0 0.034∗∗∗ 0.028∗∗
(0.005) (0.009)
Intercept −1.948∗∗∗ −3.339∗∗∗ −2.915∗∗∗ −3.972∗∗∗
(0.061) (0.384) (0.286) (0.853)
Observations 3,755 3,742 3,742 1,119Psuedo-R2 0.194 0.342 0.384 0.427Log Likelihood −2,017.869 −1,770.451 −1,695.830 −472.992Akaike Inf. Crit. 4,039.738 3,580.903 3,435.659 969.983Year Fixed Effects X
Note: ∗p<0.05; ∗∗p<0.01; ∗∗∗p<0.001Standard errors clustered by primary contest.
156

Figure 6.3: Network Density and Likelihood of Winning Primary
0.0 0.2 0.4 0.6 0.8 1.0
0.0
0.2
0.4
0.6
0.8
1.0
Existing Network Density (END) Score
Pre
dict
ed P
roba
bilit
y of
Win
ning
a P
rimar
y
MeansMedians
157

Figure 6.4: Network Density and Likelihood of Winning Primary by Candidate Quality
0.0 0.2 0.4 0.6 0.8 1.0
0.0
0.2
0.4
0.6
0.8
1.0
Existing Network Density (END) Score
Pre
dict
ed P
roba
bilit
y of
Win
ning
a P
rimar
y
Electoral NovicePrior Office
158

negative one. In the context of this project, it is the probability that the model will cor-
rectly rank a winning candidate as more likely to win their primary than a candidate who
lost their contest. While there is no conventional rule of thumb, models with AUC’s greater
than .85 are generally considered reliable predictors in the social sciences (Ekelund 2012).
The symmetric nature of the curve in Figure 6.5 also suggests that the model is not biased
toward Type-I or Type-II errors. In sum, the models from Table 6.2 are reliable predictors
of candidate victory in congressional primaries.
Figure 6.5: ROC Diagnostics for Model 6.2.4
Specificity (%)
Sen
sitiv
ity (
%)
100 80 60 40 20 0
020
4060
8010
0
AUC: 86.3% (83.8%...88.7%)AUC: 86.3% (83.8%...88.7%)
159

Conventional wisdom describes the two major political parties as structurally different
institutions. The Democratic Party is often portrayed as a diverse coalition of economic and
social issues with numerous internal factions, where the Republican Party is often described
as more homogeneous. Regardless of the veracity of these claims (see Bartels 2018), it is
worth investigating whether the effect of group support works differently across political
parties. Figure 6.6 provides the results of model (4)’s specification estimated on Democratic
and Republican candidates separately. For both parties the effect is positive and statistically
significant even after including the controls for candidate viability. While the point estimates
for Democrats is less than their Republican counterparts, we could not reject the hypothesis
that these estimates are drawn from equivalent distributions. In sum, the density of a
candidate’s network appears to be of bi-partisan value to candidates seeking their party’s
nomination.
Table 6.3 provides the results for similar models estimating the impact on a candidates
vote share. The relative magnitudes, directions, and significance of the coefficients in this
model are comparable to Table 6.2’s logit models. A two standard deviation increase in
a candidate’s existing network density is associated with an increase of nearly 10% of the
vote. Given that the average difference between first and second place in primaries over
this time period is also approximate 10%, network density has the potential to influence
the outcomes of many contests. I present these results mainly because the more granular
dependent variable allows for more precise estimates, which provides leverage in considering
the time trends.
The four plots in Figure 6.7 present the results of Table 6.2’s and Table 6.3’s model (3)
estimated annually from 1982 to 2014. The estimate for END scores impact on the likelihood
of winning a primary are presented in row 1 and the effect on candidate vote share in row 2.
In column 1 the effects for consequential open-seats are presented, where column 2 provides
the estimates for all consequential primaries. This includes primary campaigns by opposition
party members hoping to challenge incumbents in competitive districts. Point estimates are
shaded blue if they are positive and statistically significant, grey if they are positive but
statistically indistinguishable from 0, and red if they are negative. Of the 68 individual
160

Figure 6.6: Network Density and Likelihood of Winning Primary by Political Party
0.0 0.2 0.4 0.6 0.8 1.0
0.0
0.2
0.4
0.6
0.8
1.0
Existing Network Density (END) Score
Pre
dict
ed P
roba
bilit
y of
Win
ning
a P
rimar
y
DemocratsRepublicans
161

Table 6.3: Existing Network Density’s Effect on Primary Vote Share
Candidate Vote Share
(1) (2) (3) (4)
END Score 0.449∗∗∗ 0.285∗∗∗ 0.194∗∗∗ 0.197∗∗∗
(0.020) (0.023) (0.024) (0.053)
Donorst0 −0.0005∗ −0.0003(0.0002) (0.0002)
Log Funds 0.012∗∗∗ 0.011∗∗∗ 0.009∗∗∗
(0.001) (0.001) (0.002)
Party Donors 0.001∗∗∗ 0.0001 −0.0002(0.0002) (0.0001) (0.0004)
Prior Office 0.044∗∗
(0.016)
END*Donorst0 0.003∗∗∗ 0.002∗∗∗
(0.0004) (0.001)
Intercept 0.162∗∗∗ 0.134∗∗∗ 0.160∗∗∗ 0.097∗∗∗
(0.006) (0.025) (0.024) (0.025)
Observations 3,755 3,742 3,742 1,119R2 0.183 0.271 0.331 0.387Adjusted R2 0.183 0.267 0.327 0.381Year Fixed Effects X
Note: ∗p<0.05; ∗∗p<0.01; ∗∗∗p<0.001Standard errors clustered by primary contest.
162

Figure 6.7: Network Density and Primary Outcomes Over Time
Open District
Years
EN
D S
core
Est
. Effe
ct
1982 1990 1998 2006 2014
−6
−4
−2
0
2
4
6
8
10
Log
Like
lihoo
d of
Win
ning
Prim
ary
Open Race
YearsE
ND
Sco
re E
st. E
ffect
1982 1990 1998 2006 2014
−6
−4
−2
0
2
4
6
8
10 p<.05p>.05beta<0
Open District
Years
EN
D S
core
Est
. Effe
ct
●
●
●
●●
●
●
●●
●
●
●
● ● ●
●
●
1982 1990 1998 2006 2014
−0.25
0.00
0.25
0.50
0.75
Est
imat
ed P
rimar
y V
ote
Sha
re
Open Race
Years
EN
D S
core
Est
. Effe
ct
●
●
●
●
●
●
●
●●
●●
●
●
●
●●
●
1982 1990 1998 2006 2014
−0.25
0.00
0.25
0.50
0.75
The first row of figures provide the estimated effect of a candidate’s END score on the log-likelihood of them winning a consequential primary. The second row of figures provides theestimated effect of a candidate’s END score on their vote share in a consequential primary.The first column provides the estimates for only consequential open-seat primaries. Thesecond column provides the estimates for consequential open-seat primaries and the primariesfor out-partisans challenging incumbents in competitive districts.
163

estimates, only 1 is negative, whereas 39 are positive and statistically significant.
Breaking the data into such small sub-samples leaves us with relatively few cases in a
given year, and to maintain comparability across time, no models control for prior elected
office. As a result, these models may be somewhat uninformative individually. But col-
lectively they speak to the declining parties hypothesis. Not only are the effects of party
network support generally positive across time, there is no evidence to suggest that there is
a decline in that relationship. The estimates are roughly equivalent both before and after
the Republican take-over of the House in 1994 and changes in campaign finance laws in
2004 – two cut-points that often demarcate shifts in political phenomena. So while there
formal party organizations may have a reduced role in the nomination of candidates, this
analysis finds little evidence that the network of party actors is at risk for losing sway over
the primary process.
***
Taken together, the results from this section suggest that existing network density is,
in fact, systematically benefiting candidates electoral prospects in congressional primaries.
These effects appear consistent across time and parties at sufficient magnitudes to substan-
tively impact their campaigns. However, one obvious criticism is that these dense networks
are not causing their candidates to perform better in primaries, but are merely falling be-
hind the eventual nominee. In the next section, I summarize the evidence suggesting that
networks are, in fact, driving this relationship.
6.5 Bandwagons or Gatekeepers? Issues of Endogeneity
Are dense networks causing candidates to be more successful in primaries, or are more
successful candidates attracting denser networks of support? Without addressing the poten-
tial for reverse causality, this analysis would be unable to speak to the underlying importance
of group support. While far from the ideal, the following pieces of evidence suggest that net-
works are the drivers of this relationship.
164

First, recent studies have largely found donor motivations to be expressive rather than
instrumental (Barber 2016a; 2016b; Gimple, Lee, and Pearson-Merkowitz 2008). This is not
to suggest that donors are not strategic. They are responsive to the competitiveness of the
election (Hill and Huber 2017) and give more frequently in races with the potential to increase
their party’s seat share (Boatright 2013). However, they “appear to give out of desire to
support causes they believe in rather than extract material benefits from politicians” (Albert
et al. 2018). In his study of national party donors to House (2018) and Senate (2016) primary
candidates, Hassell finds little evidence of bandwagoning in support of leading candidates.
Using a Granger causality model, he finds that early national party support appears to drive
later fundraising, rather than following early fundraising successes. In sum, little evidence
suggests that primary voters exhibit bandwagoning tendencies.
Second, as we can see in the PA-13 example, network support does not always coordi-
nate behind the frontrunner. If bandwagoning was the dominant driver of network behavior,
we would have anticipated seeing Margolies with the densest network. She had the pre-
vious Congressional experience, the name recognition, the fundraising strength, the early
endorsements, and TV ads featuring Bill Clinton. Table 6.4 surveys the (limited) public
polling available from the 11 cases studies in Chapter 4.6 Only 7 races had publicly available
polling, and only in Virginia’s 10th did the eventual winner lead in all available polls. In
North Carolina’s 12th and Michigan’s 14th the polling was inconclusive with large numbers
of undecided voters. In the remaining races the eventual primary winner was not the early
frontrunner.
Third, the models presented above control for three variables traditionally associated
with candidate viability: the number of campaign donors, the total fundraising of that
campaign, and the quality of the candidate as measured by previous electoral experience. If
donors are motivated solely by the desire to support the most viable candidate, we should see
the effect of existing network density absorbed in models controlling for candidate viability.
6These are the polls archived on Ballotpedia’s entries for each contests and those that could be found onlinethrough Google searches. It is possible that I am missing others, but like most data regarding congressionalprimaries, there are no central repositories, nor is the universe of potential polling organizations knownbeforehand to standardize monitoring.
165

Table 6.4: Networks Beating the Odds
Lawrence Hobbs Clarke Foster DK
MIRS 25% 38% 22% 2% 13%Lake Research 35% 27% 6% 0% 32%Taret Insyght 22% 32% 15% 0% 31%
Boyle Margolies Leach Arkoosh
Global Strategy 15% 43% 7% 2% -
Graves Dietzel Claitor McCollough DK
JMC Analytics* 2% 11% 11% 1% 30%Glascock Group* 4% 19.2% 20.3% 4.4% –
Moolenaar Mitchell Konetchy
EPIC-MRA 23% 50% 7%
Comstock Marshall Hollingshead Lind DK
Citizen’s United 44% 10% 3% 3% 30%
W. Coleman Greenstein Chivukula Zwicker DK
Monmouth 24% 25% 11% 6% 34%
Adams Graham Battle Brandon DK
PP Polling 22% 36% 8% 5% 15%Hamilton Campaigns 26% 19% 9% 4% 29%*Democratic candidates omitted from polls of LA’s Jungle Primary.Note: Winning candidates in bold.
166

Yet across model specifications the effect remains positive, significant, and of roughly the
same magnitude.
Fourth, Table 6.5 again provides the results of the Granger causality tests described in
Chapter 4. As predicted, early fundraising advantages predict future fundraising advantages,
as does the early support from dense networks predict future support from dense networks.
More importantly, the results suggest that END scores Granger-cause candidate fundrais-
ing shares on primary day, in that early support from dense networks also predicts future
fundraising share. This provides us with some evidence that network support is in fact driv-
ing the relationships, and not following perceptions of candidate viability. The results are
most clear for donations made 90 and 180 days prior to the primary, but near conventional
levels of significance even at a year prior to the primary when a large portion of the sample
is missing – only about half of candidates have raised any funds a year prior to the primary
(1869/3961).
Finally, the trends presented in the previous chapter also help alleviate concerns of
endogeneity. If networks are simply supporting the candidates most likely to win, we should
observe candidates with network support, all else equal, dropping out of primaries less often.
Yet as the results of Chapter 5 demonstrate, all else equal, candidates with network support
are more likely to drop out than those without it. These results signal that the balance
of power between candidates and the networks that support them is biased in favor of the
organized interests. Jacobson’s “freebooting political entrepreneur” has no obligations and
a limited relationship with the party network, and as a result is immune to the pressures
to support the network’s preferred candidate. But those candidates tied into the party
network understand the important gatekeeping role these networks play in the distribution
of campaign resources necessary for this and any future contests. Those with future political
aspirations know that doing so after alienating the party is at best an uphill battle. Therefore,
these candidates are more likely to acquiesce in the face of party pressures. In sum, the party
networks are driving the relationship.
167

Table 6.5: Granger Causality Tests of Fundraising Share and Party Support
Fund END Fund END Fund ENDShare Score Share Score Share Score
(1) (2) (3) (4) (5) (6)
ENDt−1 0.103∗∗∗ 0.530∗∗∗
(0.026) (0.016)
Fund 0.619∗∗∗ 0.003Sharet−1 (0.014) (0.008)
ENDt−2 0.108∗∗∗ 0.495∗∗∗
(0.029) (0.016)
Fund 0.555∗∗∗ 0.005Sharet−2 (0.017) (0.009)
ENDt−3 0.065† 0.406∗∗∗
(0.036) (0.018)
Fund 0.401∗∗∗ 0.016Sharet−3 (0.021) (0.010)
Constant 0.123∗∗∗ 0.223∗∗∗ 0.150∗∗∗ 0.263∗∗∗ 0.234∗∗∗ 0.319∗∗∗
(0.023) (0.014) (0.025) (0.014) (0.032) (0.016)
Observations 2,539 2,461 2,356 2,297 1,869 1,850R2 0.449 0.569 0.330 0.563 0.182 0.550Adjusted R2 0.446 0.566 0.325 0.559 0.175 0.546Year Fixed Effects
†p<0.1; ∗p<0.05; ∗∗p<0.01; ∗∗∗p<0.001
Notes : The dependent variables are fundraising share and END-score of the candidatesduring the last 90 days of the primary. The independent variables are the same metricscalculated based on donations before times t-1, t-2, and t-3, or 90 days, 180 days, and 360days before the primary, respectively. All models include year fixed effects.
168

6.6 Discussion
This chapter sought to demonstrate the systematic influence of party network support
on the electoral prospects of candidates in consequential open-seat primaries for Congress. To
do so, I estimate the impact of an original measure of group or network support – existing
network density (END) scores – on the likelihood of winning a primary election. Across
time, party, and numerous model specifications, the effect remained both substantively and
statistically significant. A two-standard deviation increase in existing network density more
than doubles the likelihood of winning a primary for the average candidate. And in contrast
to the declining parties hypothesis – these effects generally do not appear to be decreasing
or weakening overtime. While the potential endogeneity of network support is cause for
concern, I provide evidence that suggests that network support is not bandwagoning behind
the most viable candidate. Most importantly, the results of the models presented in Tables
6.1 and 6.2 are robust to numerous controls of candidate viability (fundraising and prior
office), and the Granger causality tests suggest that END scores are driving viability, and
not the other way around. Together, these data present a strong case for the influence of
party networks in congressional primaries.
Some of the limitation of this approach bear repeating. First, these networks are derived
entirely from federal campaign contributions, which while systematic, still limits the range
of potential networks that can be detected. It requires that these networks both make
contributions and do so to federal offices – two conditions that may not always be true. For
example, Brenda Lawrence’s network was primarily local in structure, consisting of local
female mayors and relationships she’d built during her tenure as mayor. Rudy Hobbs and
Hansen Clarke, in comparison, were tapped into primarily federal networks, through Hobbs
connection to Rep. Sander Levin and Clarke’s previous tenure in Congress. This may have
the effect of artificially reducing the appearance of networked support among Lawrence’s
contributors in relation to her competitors. Future work will begin to incorporate state level
campaign finance data into these networks, but even this may miss some truly local donor
networks being activated at the federal level for the first time.
169

While few networks observed in the field could be argued to fit this description, it is
possible that some networks do not use campaign contributions as a method of supporting
their chosen candidate. One possible example of this was the network of homeschoolers
and church activists that supported Barry Loudermilk’s campaign in Georgia’s 11th district.
Only a handful of insiders were willing to speak to us in this district, and so many of the
conclusions are quite speculative, but those we did talk to stressed the grassroots nature
of Loudermilk’s support. This was a group that was not frequently activated in primary
elections, but was well organized to advocate on behalf of homeschooling and faith-based
issues. The resources they brought to Loudermilk were believed to be primarily in the form
of labor: canvassers, phonebankers, and outreach to friends and family. Without knowing
more it is impossible to say for sure exactly how his network of supporters operated, but it is
possible that they eschewed financial support and instead focused on campaign volunteering.
Networks of this nature would not be detected by the methods presented in this chapter.
But these two limitations, while important to address for future work, systematically
underestimate the influence of networks of support. This method misses connections between
local contribution networks and overlooks networks of support not of a financial nature.
Therefore the effect of network support on primary election outcomes is likely to be greater
than what is presented here.
170

CHAPTER 7
Conclusion
7.1 Party Networks and Primary Elections
With the prospects of a “Blue Wave” on the horizon, historic numbers of well-funded
candidates have “flooded Republican House districts” ahead of the midterms (Schneider
2017a). But with their eyes on the general election, many national interest groups and in
some instances the formal parties themselves, have been actively trying to shape the field in
favor of the most electable candidates. This has left a lot of the Democrats on the receiving
end of party pressures rather unhappy. Paul Perry, a progressive black candidate with no
elected experience vying for the open seat in Pennsylvania’s 7th district, lamented that the
DCCC “didn’t take an interest in [him] until they started to have doubts about the other top
candidates: two white men who had already raised hundreds of thousands of dollars and a
white woman who would loan her campaign $170,000” (Perry 2018). Running in the nearby
16th district, Jess King, supported by many local immigrants’ rights and criminal justice
reform groups, was distraught when EMILY’s List began supporting Christina Hartman
despite her under-performing Hillary Clinton in her run for the same seat in the previous
cycle (Grim and Fang 2018). Mai Khanh Tran’s interactions with the party were more blunt
– “they showed her a discouraging poll and argued that she could not win – and risked
fracturing the party” in the June primary for California’s 39th district (Burns 2018).
But few candidates had interactions with the party network as visible as Levi Tilleman’s
in his Colorado 6th contest. Despite the DCCC’s promise to remain neutral in the primary,
they added his opponent, Jason Crow, to their “Red to Blue” program, which while not an
official endorsement, does aim to help the candidates deemed most likely to flip seats come
171
November (CBS 2018). Tilleman later met with Minority Whip Steny Hoyer to discuss his
campaign. Tilleman provided a rare (if not uncouth) insight to these interactions by secretly
recording their conversation. In it, Hoyer admitted that the party had come to support Crow
early, that it was providing him with fundraising assistance, polling information, and access
to interest group endorsements, like the Sierra Club, and encouraged Tilleman to drop out
of the contest (Pierce 2018). As Hoyer summarized, “staying out of primaries sounds small-
D democratic, very intellectual, and very interesting, but if you stay out of primaries, and
somebody wins in the primary who can’t possibly win in the general...” He then came to
the point of the conversation: “You keep saying I would like you to get out of the race, and
of course that’s correct” (Fang 2018) Even after these recordings were leaked to the press,
most in the party stood behind Hoyer’s comments. Minority Leader Nancy Pelosi noted
that “if the realities of life is that some candidates can do better in the general than others,
then that’s a clear-eyed conversation that we should be having” (Caygle 2018). While Perry
eventually dropped out of the primary, King, Tran, and Tilleman are all pushing forward
with their campaigns against the headwinds of opposition from the extended party network.
These unfolding primaries reiterate the the three themes discussed throughout this dis-
sertation. First, despite losing their formal power to make nominations, the constellation of
organized interests constituting these parties continue to exercise influence over primary nom-
inations. Of course the process still benefits the driven candidate, the talented fundraiser,
and the electoral self-starter, but in the face of an abundance of ambition, party networks
can still serve as influential field-shapers and gatekeepers.
Second, they hint at the underlying mechanism by which party network’s wield their
influence – the diverse array of resources that can help set candidates in primary elections
over the top. Tilleman was distressed that the DCCC was assisting his opponent with
fundraising, providing him polling information, securing him endorsements, and trying to
push him out of the race. Efforts to clear the field, manage the competition in the primary,
and navigate a candidate to the nomination are all tools at the network’s disposal. Once
they have shaped the field to the benefit of their preferred candidates, those candidates then
have greater access to endorsements, fundraising assistance, polling information, campaign
172

staffers and volunteers, and numerous other resources that they can boost their primary
prospects. Importantly, while these resources are not necessarily exclusive to candidacies
with the support of party networks – they are available in greater abundance and delivered
with greater effectiveness and efficiency. Therefore, any attempt to understand how these
diverse actors with diverse resources are able to structure electoral outcomes should develop
a measure that considers that variation.
Finally, they highlight just how difficult it is to observe party behavior in congressional
nominations. Perry’s observations only became public after he dropped out and wrote a tell-
all piece about his experiences. King’s and Tran’s stories are only covered by the media with
any detail because of how competitive the general election is expected to be. And Tilleman’s
case is only front-page news because of the extraordinary step he took in recording what are
usually private conversations. As for the hundreds of other congressional primary campaign
underway, little is reported. The blind spot is even more severe in nominations for seats
that will not be competitive in the general election – the vast majority of seats in Congress.
Despite the fact that less than 20% of congressional seats ever have the potential to be won
by either party, these contests are those to receive the most news coverage and to factor most
heavily into our theories and empirical investigations. Of those congressional primary races
with local or national media coverage for the 2018 midterm cycle, few if any were safe seats.
And thus far, only the media coverage of incumbent Dan Lipinski’s competitive primary
challenge provided any insight into a safe-seat. If our wish, however, is to understand the
processes impacting the composition of Congress at large, then our approach has to consider
how nominations work in these difficult to observe environments.
This project has attempted to do just that. By using the structure of campaign contri-
bution networks to infer the existence of group support for individual primary candidates,
this dissertation shows how political parties and the constellation of interest groups, partisan
activists, and policy-demanding organizations that animate them still hold influence over the
primary process. They can use their resources to push or pull candidates out of crowded pri-
maries and then turn their attention toward securing their candidate the nomination. While
the party networks may lack the formal powers to make nominations, they still possess the
173

resources and organization necessary to control the process.
To conclude, I briefly consider the implications of these findings and attempt to con-
nect these results to larger questions of representation: How do interest-group controlled
nominations affect the policy-making process in the United States? And how does the be-
havior of these groups contribute to the growing polarization we observe between the parties
in Congress? Finally, I outline the next steps for this research agenda and summarize the
conclusions of this project.
7.2 Implications
7.2.1 Nominations and Representation
Interest group control over nominations has important implications for studying public
policy in the U.S. If organized groups are in fact mobilizing their support networks to help
nominate, and later elect, candidates to Congress, than these groups must have reason to
suspect some benefit from that candidate’s election. Simply, why would these groups expend
resources to nominate candidates who were not going to provide them some benefit in return?
And given how determinative party membership is in roll call voting, what is the marginal
benefit of electing a particular Democrat or a particular Republican?
According to numerous authors, members of Congress are more responsive to the policy
demands of their more affluent constituents. Bartels (2008) find that Senators from 1988–
1992 were more responsive to the policy the views of their constituents in the top third of the
income distribution. Gilens (2012) also finds that policies tend to more strongly correlate
with the preferences of the affluent more so than the poor. Gilens and Page (2014) go as far
as to warn that “Americas claims to being a democratic society are seriously threatened,” by
the inequities they find in representation. The logic of this argument is compelling. Wealthier
constituents are nearly 33% more likely to vote than their less affluent neighbors, are more
likely to contact their legislators, are more likely to have crystallized issue preferences, have
greater access to resources necessary for political participation, and are more likely and
174

able to monitor their representatives behaviors (Bartels 2008, Converse 1990, Delli Carpini
and Keeter 1996), all factors that one would expect to influence the congruence between
legislative behavior and constituent preferences.
The wealthy are also more likely to contribute to political campaigns (Confessore et
al. 2015), with over 75% of donations coming from those in the top quarter of the income
distribution (Verba et al. 1995). Previous research has found that campaign donors are
more likely to be granted meetings with policy makers (Brookman and Kalla 2016), and
that among legislative staff, their recall of relevant issues in the district “is biased in favor of
active and resource-rich constituents” (Miler 2009). Additionally, overlap between a donors’
employment and a congressperson’s committee membership increases the likelihood of re-
ceiving a campaign contribution (Canes-Wrone, Thrower, and Barber n.d.). In comparing
the representational congruence for donors, co-partisans, supporters, and registered voters,
Barber (2016b) finds that “senators’ preferences reflect the preferences of the average donor
better than any other group.”
Yet recent studies have largely found the motivations of individual to be expressive
rather than instrumental (Barber 2016a; 2016b; Gimple, Lee, and Pearson-Merkowitz 2008).
They instead “appear to give out of desire to support causes they believe in rather than
extract material benefits from politicians” (Albert et al. 2018). Even lobbying efforts and
PAC contributions have been found to be primarily motivated at maintaining existing re-
lationships with legislators (Victor and Koger 2016), and not attempts to “buy” votes or a
legislator’s time.
These two sets of findings, the representational congruence of campaign contributor
preferences with legislative behavior and the non-instrumental motivations for donating to
a campaign, in combination with the results of this analysis, suggest that any representa-
tional shortcomings would not be ameliorated by decreasing economic inequality or strictly
regulating campaign finance. The congruence comes from organized interests nominating
champions to elected office, who then pursue their true preferences. Just as Poole (2007)
posits that legislators “die in their ideological boots,” I would posit that legislative champions
are forever “one of us” to their network of supporters.
175

This should affect how scholars study the policy-making process. As Fiorina (1989, p.
35) noted, “for every voter a congressman pleases by a policy stand he will displease some-
one else.” Any efforts to pursue legislation would alienate some voters while attracting the
support of others. But given the central role interest groups and activists in the nomina-
tion of candidates, legislators pursuing policies and developing voting records more extreme
than even their co-partisan constituents should not be surprising. These efforts are made on
behalf of the party coalitions, who should be viewed as the audience for most consequential
legislative activity. As Bawn et al. (2012) note, if we accept the role that policy demanding
interest play in nomination than the “agenda of policy demanders external to the institu-
tion [of Congress] would be examined in context of legislative party leaders’ decisions and
actions.” For example, Republican reticence on requiring background checks for purchasing
firearms despite the approval of the vast majority of Republicans becomes less anomalous
if we consider the National Rifle Association as a central player in the Republican Party
network. Understanding the factional composition of nominating coalitions can therefore
help explain a party’s legislative agenda.
And with the amounts of time and effort required to pass legislation and the discour-
aging odds of final passage, only the most committed to a policy would make the long-shot
investment. This in turn could create an extreme policy agenda for a party composed pri-
marily of moderate members. If each official holds only a single extreme position, but that
is the sole position that holds sufficient weight to justify the commitment, then the final roll
calls considered by the entire body would all be more extreme than the median preference
of even the median co-partisan. This divergence is the subject of the next section.
7.2.2 Contributing to the Divide
Why have the parties diverged so dramatically? Despite the consensus surrounding the
existence of elite polarization, a definitive cause for this shift has remained elusive. The most
direct explanation is that legislators are representing increasingly divided electorates. But
the evidence is inconclusive (see Abramowitz 2010, Fiorina, Abrams, and Pope 2010). Voters
176

are often found to have predominantly moderate policy views (Ansolabehere, Rodden, and
Snyder 2006; Levendusky, Pope, and Jackman 2008) and representatives have been found
to have positions considerably more extreme than their constituents (Clinton 2006; Gerber
and Lewis 2004). Hill and Tausanovitch (2013) compare polarization trends within both the
general public and the U.S. Senate between 1956 and 2012 and conclude that the increasing
dispersion of views between the parties in Congress has occurred in the absence of similar
divergence among the public, suggesting that “it is unlikely that changes in public preferences
alone explain the widening gulf between the two parties.”
What about changes in party activists? Aldrich accounts for the divergence as a balance
“between appealing for general election support by moving toward the policy center of the
whole electorate and appealing for nomination support by moving toward the center of the
party activists” (1995, p. 190). The evidence that primary voters are driving polarization
is limited (see Alher, Citrin, Lenz 2015; DeMora et al. 2015; Sides et al. 2018). Moreover,
elected officials have been found to be more extreme than even their co-partisan constituents
(Bafumi and Herron 2010). In sum, elected officials do not appear more responsive to the
primary electorate as a whole, but to the activists and supporters who provide them with
the resources necessary to secure office.
If we assume that representatives are responsive to the preferences of their contributors,
then changes in the preferences of these actors could help explain the changes in polariza-
tion. Figure 7.1 provides the density plots for the distribution of partisanship in individual
campaign contribution behavior. For each individual who made more than one contribu-
tion in each year, I calculate the average share of those donations that went to Democratic
candidates. The plots provide the distribution of this share among all donors. While there
is a small population of individuals who make bi-partisan, across time the modal behavior
of individuals is entirely partisan. A shift can be seen, however, in the behavior of PACs,
as displayed in Figure 7.2. Here, the shift from the bi-partisan behavior of the 1980s has
given way to the much more polarized contributions of recent years. This data alone cannot
determine how the polarization of PAC contributions and legislators is related, but these
two trends appear to be moving in tandem, particularly with the dramatic shift following
177

the Republican takeover of the House in 1994.
If we instead conclude that elected officials are representative of the networks of sup-
porters that secured them the nomination, then we would look to changes in the behavior of
these party networks to explain the historically recent surge in polarization. Modularity is a
measure of how clearly divided a network is into sub-groups (see Newman and Girvan 2004).1
Figure 7.3 provides the modularity of campaign contribution networks in nine medium sized
states.2 For each network, I include all donors who made primary contributions to candidates
competing in that state or were from that state. Donors are connected if they contributed to
two or more of the same candidates. Mirroring the results from Figure 7.2, these networks at
the state level have become increasingly partitioned into two sub-groups – Republicans and
Democrats – overtime. Taken together, it is safe to conclude that the networks of campaign
contributors have become progressively more divided over the past thirty five years, and that
this division has been driven more so by changes in PAC and networked behavior than that
of individuals.
The importance of these networks in determining the nominee would place increased
importance on the factional composition of the party networks on the ideological positioning
of the parties. A Congress composed of group-supported legislators could result in a parties
of single-issue champions pursuing a collective legislative agenda not empirically dissimilar
from a platform pursued by one composed of ideological extremists. If the interest groups
and activists within the party coalition have become more cooperative, then the expected the
expected preference profile of a given nominee from that party would also become increasingly
homogeneous, which would present itself as increasingly divided parties.
This is of particular concern to scholars who present strengthening parties as a potential
means of addressing polarization (La Raja and Schaffner 2015; Pildes 2011; Weiner and
1For example, in Figure 4.4 from §4.5.3, the first network would be extremely modular, as it consists ofthree distinct sub-groups. The second network would have a very low modularity, as there appear to be nodistinct groups within the network.
2Because I restrict the network to those who donated to multiple of the candidates, I did not analyzestates with less than three congressional districts, fearing that the relatively few number of candidates inthe state might artificially deflate the measures. While I present the findings for a random sample of thoseremaining states, the trend is common across them – always positive, usually significant.
178

Figure 7.1: Partisan Divide in Individual Contributors
2014
2012
2010
2008
2006
2004
2002
2000
1998
1996
1994
1992
1990
1988
1986
1984
1982
1980
0.0 0.5 1.0
Share of Donations to Democrats
Year
0.0
0.3
0.6
0.9
Partisanship
179

Figure 7.2: Partisan Divide in PAC Contributors
2014
2012
2010
2008
2006
2004
2002
2000
1998
1996
1994
1992
1990
1988
1986
1984
1982
1980
0.0 0.5 1.0
Share of Donations to Democrats
Year
0.0
0.4
0.8
Partisanship
180

Figure 7.3: Modularity of State Primary Donor Networks
Arizona
Year
Mod
ular
ity
●
● ●
●
●
●
● ●
●
●
●
●
● ●●
●
1980 1986 1992 1998 2004 2010
0.1
0.2
0.3
0.4
0.5
0.6
Pr(>|t|) =0.24
Colorado
YearM
odul
arity ●
●
●
●
●
● ●
●
●
●
●
●●
●
●
●
1980 1986 1992 1998 2004 2010
0.1
0.2
0.3
0.4
0.5
0.6
Pr(>|t|) =0.29
Georgia
Year
Mod
ular
ity
●
●
●
●
●●
●
●●
●
●
●
●●
●
●
1980 1986 1992 1998 2004 2010
0.1
0.2
0.3
0.4
0.5
0.6
Pr(>|t|) =0.01
Louisiana
Year
Mod
ular
ity
●
● ●
●●
●●
●
●
●●
●
●
●
●
●
1980 1986 1992 1998 2004 2010
0.1
0.2
0.3
0.4
0.5
0.6
Pr(>|t|) =0.02
Minnesota
Year
Mod
ular
ity
●
● ●
● ●
●
●
●
●●
● ●
●
●
●
●
1980 1986 1992 1998 2004 2010
0.1
0.2
0.3
0.4
0.5
0.6
Pr(>|t|) =0.06
New Jersey
YearM
odul
arity ●
●
●●
●● ●
●
●
●
●
●●
●
● ●
1980 1986 1992 1998 2004 2010
0.1
0.2
0.3
0.4
0.5
0.6
Pr(>|t|) =0.05
Ohio
Year
Mod
ular
ity
●● ●
●
●
●
●
●
●
●●
●
●
●
●
●
1980 1986 1992 1998 2004 2010
0.1
0.2
0.3
0.4
0.5
0.6
Pr(>|t|) =0.01
Pennsylvania
Year
Mod
ular
ity
●
● ●
●
●●
●
●
● ●
●
● ●
● ●
●
1980 1986 1992 1998 2004 2010
0.1
0.2
0.3
0.4
0.5
0.6
Pr(>|t|) =0
Washington
Year
Mod
ular
ity
● ●●
●
● ●
●
●
●
●
●●
● ●
●
●
1980 1986 1992 1998 2004 2010
0.1
0.2
0.3
0.4
0.5
0.6
Pr(>|t|) =0
Vandewalker 2015). As Hassell noted “[e]mpowering a party seem, perhaps unsurprisingly,
to empower those who control the institution” (2018, p. 190). If the factional composition of
political parties increasingly sorts to two camps of intense, but non-confrontational interest
groups, then strengthening their ability to select the nominee would only increase their ability
to nominate dedicated champions of their cause. Even reforms to direct greater authority
181

only to the formal party organization would be quickly circumvented by the weak incentives
to participate in primaries for safe-seats. For example, one proposed reform involves requiring
the formal party to ratify the decision of primary elections. This, however, would put the
parties in the same untenable position that currently limits their participation in primaries
– attempts to circumvent the “popular will” are widely criticized by the public (or more
accurately the members of the ill-favored faction posing as the public). Parties would only
find the incentive to participate in the handful of competitive seats that could determine
party control of the House (races where they already participate, and do so with a great deal
of success, see Hassell 2018).
More work is necessary to untangle this complex relationship. However, the congruence
of legislative behavior with donor preferences, the central role donors play in the construction
of party networks, and the polarization of party networks, are all at least suggestive of a
relationship between political polarization and the factional composition of party coalitions.
These remarks are obviously meant more as a jumping off point than a a definitive statement
on the subject. The need for greater attention to the role organized interests play in the
platforms of parties, the policy positioning of legislators, and the legislative agendas of
governing majorities, however, is more concrete.
7.3 Next Steps
7.3.1 Champions in the Arena
If we accept this view, how do group-supported nominees differ in their specific legisla-
tive behavior? Does the nature of these support networks effect how effective (see Volden
and Wiseman 2014) particular congressman are in the legislative process? Are candidates
supported by particular interest groups more likely to win coveted committees seats? party
leadership posts? nomination for higher office? Given the obstacles to passing legislation, in
what other ways do members of Congress pursue their supporters goals? Do they facilitate
interactions with the bureaucracy? Do they provide access to other supportive members? Is
182

bi-partisanship a byproduct of bi-partisan coalitions or a lack of organized interests?
These questions are only a truncated list of unanswered research questions. Given the
prevalence of candidate-centered theories of political parties and elections, much of the work
on congressional behavior is due to be re-evaluated or at least replicated under more policy-
forward assumptions on behalf of legislators. If the actions of legislators are not those of
single-minded seekers of re-election and the behaviors of policy champions thrown into the
legislative leviathan, we must reconsider many of our foundational assumptions about how
Congress operates.
7.3.2 Beyond Density
As I mentioned in §4.5.3, there are alternative ways to consider the organization of
factions within a party network. While I focus on the density of the density of existing
networks of support on a candidate’s electoral prospects, it would be possible to consider
these individual networks within the larger party network. For example, are networks of
donors located more toward the center of a party network more influential in the primary
process? Desmarais, La Raja, and Kowal (2015) find that House challengers closer to the
center of the party’s network are more likely to win their general election campaigns. My
initial investigation finds a similar relationship in the primary election. Importantly, both
the END score and centrality measure of a primary candidate’s donor network significantly
increase the likelihood of winning an open-seat primary. These findings together suggest that
while organized interests are important in determining the outcome of primary elections, so
too does that organization’s relationship to the party network at-large.
These larger networks also have the potential to tell us more about the dynamics of
candidate emergence. I would argue that areas with more divided partisan networks should
be more ripe for partisan competition, whereas areas with more cooperative party networks
should see greater cooperation. In other words, regardless of the number of interest groups
or activist networks within a particular district, the relationship between those networks
should influence the number of potentially viable candidacies. If unions and pro-choice
183

organizations do not frequently cooperate, then there exists two distinct networks of support
that could support two different candidates in a primary. The business community and
religious evangelicals may both be organized in a district, but if the network of supporters
largely overlaps, then we should see the network move behind a single nominee. While strictly
exploratory at this point, in the districts I have analyzed from 1982–2002, this appears to be
the case. More candidates file to run for office in districts with more factionalized networks
of primary contributors. By including outcomes before the primary in my analysis, I would
provide more general evidence for my underlying theory of the importance of group support,
and further alleviate concerns about network bandwagoning.
While this project addresses the influence party networks have over the nomination of
candidates, another question is how these party networks influence a candidate’s likelihood of
winning the general election. In the handful of competitive seats, does having a more unified
party network benefit a candidate in the general election? Can losing the support of a party’s
coalition make a safe seat competitive? Fouirnaies and Hall (2018) find that divisive primaries
decrease the nominees eventual vote share and likelihood of winning the primary in the
general election, but are these effects predicated on a type of primary environment? Would
we observe differences based on whether the competition was within the party coalition or
between the party coalition and an outsider?
7.3.3 ENDless Possibilities
And finally, I wish to extend the applicability of END scores to a wider range of electoral
phenomenon. I am currently extending the analysis beyond primaries for the House of
Representatives to also include gubernatorial, senatorial, and state legislative primaries. The
data for statewide primaries has been generously provided by Hirano et al. (2010), but is still
being gathered for state legislative primaries. Demonstrating the versatility of this theory to
explain party behavior, and connecting the motivations of these actors across electoral offices,
will help further solidify the notion that interest groups and policy-demanders are driving
these relationships and that the organization and durability of these networks transcends
184

the individual candidacies and campaigns of particular politicians.
END scores also have the potential to help us understand another source of incumbency
advantage. For example, in addition to the relationships presented previously, incumbents
with lower END scores are more likely to experience a competitive primary, more likely
to lose their primary, and more likely to lose their general election. Much more work is
necessary to alleviate massive concerns of endogeneity in these particular relationships – the
networks for incumbents are inherently endogenous considering they ran for office in the
previous election cycle, and therefore difficult if not impossible to separate the influence of
organized groups and re-mobilized candidate-centered re-election constituencies – but the
initial findings suggest that the while it is easiest to observe the influence of party networks
in open-seat contests, this is not the only avenue by which they attempt to shape the political
system.
An important extension would attempt to not only account for the structure of party
networks, as these scores do, but to also account for their content. As briefly mention in
Chapter 5, Arkoosh’s network was structured around the centrally located American Med-
ical Association, whereas Boyle’s had a core of organized labor. Perhaps by leveraging the
occupational information in campaign finance disclosures or integrating public occupational
directories, similar to what previous work has done for doctors (Bonica, Rosenthal, and Roth-
man 2015), lawyers (Bonica and Sen 2017), and bureaucrats (Bonica, Chen, and Johnson
2015), it would be possible to account for the industry or policy of interest motivating the
organization of these interest groups. If one could demonstrate that these groups were orga-
nized by these particular policy demands, then one could be more confident in concluding
that they were in fact driving the relationships observed in Chapters 4 and 5.
7.4 Summary
I set out with three goals in this project. First, I wanted to demonstrate that networks
are influential players in congressional nominations. Through a series of case studies from
the 2014 primary election cycle, I demonstrate that formal parties, candidate-centered ma-
185

chines, interest groups, and activist networks all have the potential to shape the political
environment in favor of their preferred candidate. They do this by systematically influenc-
ing the field of candidates – recruiting those supportive of their ambitions and dissuading
those candidates seen less as champions of their cause – and by marshaling scarce campaign
resources – campaign staff, endorsements, campaign funds, and voter mobilization efforts –
on behalf of their campaign. In an electoral environment lacking media coverage, scholarly
attention, and voter participation, these resources were often able to determine the outcome
of these contests.
Second, given the difficulties of observing the efforts of these networks, I sought to de-
velop a novel measure of group support that could be gathered systematically for a large
number of representative races. I create a measure – existing network density – that at-
tempts to assess the degree to which a candidate’s supporters consistently work together in
their party’s primary. By observing the behavior of a candidate’s donor poll over time, I can
isolate a durable contingent of supporters. By considering how inter-connected their network
is, I can account for how organized this group is in the political process. With the stan-
dardized reporting requirements and the ubiquity of fundraising as a measure of candidate
strength, using campaign finance records allows us to assess the presence of group support
systematically among nearly every candidate who competed in a primary since 1980.
Third, I wanted to test whether this measure of support significantly and substantively
impacted the electoral prospects of candidates competing in primary elections. I find that
all else equal, candidates with the support of durable networks with greater density are
more likely to drop out of their party’s primary. Those candidates with the support of
groups within the larger party network are more likely to respond to party pressures to clear
the field for another candidate than those electoral self-starters unconnected to the party
infrastructure. The finding that candidates with higher END scores are more likely to drop
out may seem at odds with this dissertation’s overall argument that network support is a
political advantage to individuals seeking their party’s nomination. But as the examples in
Arizona’s 7th, Pennsylvania’s 6th, and Pennsylvania’s 13th district show, what may in the
short-term appear a disadvantage for a candidate is often a long-term benefit in the form of
186

a maintained relationship with the group network.
In the primary, however, I find that candidates with the support of denser durable
networks and thus more likely to have access to the diverse array of campaign resources are
more likely to win the nomination. I alleviate some concerns of endogeneity by demonstrating
that existing network density Granger causes future candidate viability as measured by future
fundraising successes and that the effects from my models are robust in the face of numerous
controls for candidate viability. Moreover, if networks were simply bandwagoning behind
the inevitable winner, than we would not observe existing network density encouraging
candidates to drop out of primaries.
Together these three exercises demonstrate that political parties – broadly defined –
still maintain influence over the selection of nominees. Primary elections may have taken
the most powerful tool for selecting a nominee from all but a handful of parties, but these
efforts only changed the mechanism by which parties control the nomination. What was
once a conflict contained to a smoke-filled back room negotiation or a lively floor debate at
a convention, has simply been dragged out into light. Despite the prevalence of candidate-
centered theories of congressional nominations, these coalitions of interest groups, politicians,
activists appear to still decide.
187

BIBLIOGRAPHY
Abramowitz, Alan. 2010. The Disappearing Center: Engaged Citizens, Polarization andAmerican Democracy. Yale University Press.
Ahler, Douglas, Jack Citrin, and Gabriel Lenz. 2016. “Do Open Primaries Improve Repre-sentation? An Experimental Test of California’s 2012 Top-Two Primary.” LegislativeStudies Quarterly 41: 237–268.
Albert, Zachary, Fridolin Linder, Raymond La Raja, and Bruce Desmarais. 2018. “Diffu-sion of Candidates in Campaign Finance Networks.” Meetins of the Southern PoliticalScience Association.
Aldrich, John. 1995 & 2011. Why Parties? 1st and 2nd eds. University of Chicago Press.
Alford, Jeremy. 2014. “Edwards Leads Congressional Poll.” La Politics. March 20, 2014.
Ansolabehere, Stephen, Jonathan Rodden, and James Snyder. 2006. “Purple America.”Journal of Economic Perspectives 20: 97–118.
Arceneaux, Kevin, and David Nickerson. 2009. “Who is Mobilized to Vote? A Re-analysisof 11 Field Experiments.” American Journal of Political Science 53: 1–16.
Arceneaux, Kevin, and Robin Kolodny. 2009. “Educating the least Informed: Group En-dorsements in a Grassroots Campaign.” American Journal of Political Science 53:755–770.
Arceneaux, Kevin. 2007. “I’m Asking for Your Support: The Effects of Personally DeliveredCampaign Messages on Voting Decisions and Opinion Formation.” Quarterly Journalof Political Science 2: 43–65.
Arco, Matthew. 2014. “Norcross Formally Kicks Off Congressional Campaign.” Politick-erNJ. February 17, 2014.
Badcock, Merris. 2014. “VA 10th District GOP Ready for Firehouse Primary.” Local DVMNews. April 18, 2014. http://www.localdvm.com/news/va-10th-district-gop-ready-for-firehouse-primary/203306915
Bafumi, Joseph, and Michael Herron. 2010. “Leapfrog represenation and extremism: Astudy of American voters and their members of Congress.” American Political ScienceReview 104: 519–542.
Barber, Michael. 2016a. “Donation Motivations: Testing Theories of Access and Ideology.”Political Research Quarterly 69: 148–159.
Barber, Michael. 2016b. “Representing the Preferences of Donors, Partisans, and Voters inthe U.S. Senate.” Public Opinion Quarterly 80: 225–249.
Bartels, Larry. 2008. Unequal Democracy. Princeton University Press.
Bawn, Kathleen, Knox Brown, Angela Ocampo, Shawn Patterson, John Ray, and JohnZaller. 2014. “Parties on the Ground: A Preliminary Report on Open Seat HouseNominations in 2014.” Meetings of the American Political Science Association.
188

Bawn, Kathleen, Knox Brown, Angela Ocampo, Shawn Patterson, John Ray, and JohnZaller. 2015. “Social Choice and Coordination Problems in Open House Primaries.”Meetings of the American Political Science Association.
Bawn, Kathleen, Martin Cohen, David Karol, Seth Masket, Hans Noel, and John Zaller.2012. “A Theory of Political Parties: Groups, Policy Demands and Nominations inAmerican Politics.” Perspectives on Politics 10: 571–597.
Bawn, Kathleen, Stephanie DeMora, Andrew Dowdle, Spencer Hall, Shawn Patterson, andJohn Zaller. 2017. “Ideology and Vote Choice in House Primaries.” Meetings of theState of the Parties Conference.
Baylor, Christopher. 2017. First to the Party: The Group Origins of Political Transforma-tion. University of Pennsylvania Press.
Boatright, Robert G. 2013. Getting Primaried: The Changing Politics of CongressionalPrimary Challenges. University of Michigan Press.
Bonica, Adam and Maya Sen. 2017. “A Common-space Scaling of the American Judiciaryand Legal Profession.” Political Analysis 21: 114–121.
Bonica, Adam, Howard Rosenthal and David Rothman. 2015. “The Political Alignment ofPhysicians in the United States: An Update of Campaign Contributions to the Congres-sional Midterm Federal Elections in 2014.” JAMA Internal Medicine 175: 1236–1237.
Bonica, Adam, Jowei Chen and Timothy Johnson. 2015. “Institutions and Ideology inthe Presidential Appointment of Public Bureaucrats.” Quarterly Journal of PoliticalScience 10: 5–40.
Bonica, Adam. 2015. “Database on Ideology, Money in Politics, and Elections (DIME)”,doi:10.7910/DVN/O5PX0B, Harvard Dataverse, V2.
Bowman, Bridget. 2018. “DCCC Unloads on Democratic Candidate in Texas.” Roll Call.February 23, 2018.
Brady, Henry. 1993. “Knowledge, Strategy, and Momentum in Presidential Primaries.”Political Analysis 5: 1–38.
Brady, Jeff. 2010. “Money Has Poured Into Colorado’s Senate Race.” NPR. October 27,2010.
Brams, Steven. 2008. The Presidential Election Game. 2nd Edition. Yale University Press.
Brennan, Chris. 2014. “Union PAC spends big for Boyle.” The Philadelphia Inquirer. July18, 2014.
Bresnahan, John. 2014. “Black Caucus: Bastion of seniority.” Politico. March 2, 2014.
Broockman, David E. 2014. “Mobilizing Candidates: Political Actors Strategically Shapethe Candidate Pool with Personal Appeals.” Journal of Experimental Political Science1: 104–119.
Brookman, David and Joshua Kalla. 2016. “Campaign Contributions Facilitate Access toCongressional Officials: A Randomized Experiment.” American Journal of PoliticalScience 60: 545–558.
Burns, Alexander. 2018. “Fearing Chaos, National Democrats Plunge Into Midterm Primary
189

Fights.” The New York Times. April 21, 2018.
Caffrey, Michelle. 2014. “Donald Norcross Kicks off Congressional Campaign, May StillFace Challenge from Logan Township Mayor.” The South Jersey Times. February 17,2014.
Cahn, Emily. 2013. “DCCC Taking Sides in 2014 Primaries.” Roll Call. September 11,2013.
Cain, Sean. 2013. “Political Consultants and Party-Centered Campaigning: Evidence fromthe 2010 U.S. House Primary Election Campaigns.” Election Law Journal 12: 2–17.
Cajun, Industries. 2018. “About Cajun.” http://www.cajunusa.com/about/about-cajun/.Accessed May 1, 2018.
Canes-Wrone, Brandice, David Brady, and John Cogan. 2002. “Out of Step, Out of Of-fice: Electoral Accountability and House Members’ Voting.” American Political ScienceReview 96: 127–140.
Canes-Wrone, Brandice, Sharece Thrower, and Michael Barber. “Sophisticated Donors:Which Candidates Do Individual Contributors Finance?” R& R American Journal ofPolitical Science.
Canham, Matt. 2014. “Excerpt: Mia Love’s never-ending campaign goes for the win.” TheSalt Lake Tribune. December 23, 2014.
Canon, David. 1990. Actors, Athletes, and Astronauts: Political Amateurs in the UnitedStates Congress. University of Chicago Press.
Carnes, Nicholas. 2018. The Cash Ceiling: Why Only the Rich Run for Office – And WhatWe Can Do About It. Princeton University Press.
Carrozza, Kyle. 2014. “County Democrats give McCord endorsement for Governor.” TheUnionville Times. February 22, 2014.
Carson, Jamie, Gregory Koger, Mathew Lebo, and Everett Young. 2010. “The ElectoralCosts of Party Loyalty in Congress.” American Journal of Political Science 54: 598–616.
Caygle, Heather. 2018. “Pelosi defends Hoyer’s comments in secret recording.” Politico.April 26, 2018.
CBS News. 2018. “Report: Steny Hoyer encouraged Democrat to leave congressional race.”CBS News. April 26, 2018.
Cillizza, Chris. 2015. “Why Joe Manchin’s Decision to Run Again is a Huge Deal forDemocrats.” The New York Times, April 21, 2015.
Clinton, Joshua. 2006. “Representation in Congress: Constituents and Roll Calls in the106th House.” The Journal of Politics 68: 397–409.
Cohen, Marty, David Karol, Hans Noel, and John Zaller. 2008. The Party Decides: Presi-dential Nominations Before and After Reform. University of Chicago Press.
Cohen, Marty. 2005. Moral Victories: Cultural Conservatism and the Creation of a NewRepublican Congressional Majority. PhD dissertation, University of California, LosAngeles.
190

Collier, Anne. 1983. “Gallup: Reagan the loser in Mondal or Glenn race.” The ChristianScience Monitor. January 7, 1983.
Confessore, Nicholas, Sarah Cohen, and Karen Yourish. 2015. “Buying Power.” The NewYork Times. October 10, 2015.
Conradis, Brandon. 2013. “YG Network Has a Big Haul, and Pays a Big Salary.” OpenSe-crets.org. November 21, 2013.
Converse, Philip. 1990. “Popular Representation and the Distribution of Information.”In Information and Democratic Processes, eds. John Ferejohn and James Kuklinski.University of Illinois Press.
Converse, Philip. 1990. “Popular Representation and the Distribution of Information.”In Information and Democratic Processes. ed. John Ferejohn and James Kuklinski.University of Illinois Press.
Cook Political Report. 2017. “2018 House Race Ratings.” Accessed November 1, 2017.(www.cookpolitical.com/ratings/house-race-ratings).
Cooper, Alexandra and Michael Munger. 2000. “The (un)predictability of Primaries withMany Candidates: Simulation Evidence.” Public Choice 103: 337 – 355.
Cox, Gary, and Mathew McCubbins. 2005. Setting the Agenda. Cambridge University Press.
CQ Press. 2018. “Election Results.” CQ Press Voting and Elections Collection. AccessedMay 1, 2018.
Crotty, William. 1968. “The Party Organization and Its Activities.” In Approaches to theStudy of Party Organization. ed. William Crotty. pg. 247–306. Boston: Allyn andBacon.
Daily Kos. 2018. “Daily Kos Elections 2008 & 2012 presidential election results for congres-sional districts used in 2012 & 2014 elections.” Accessed January 1, 2017. (https://www.dailykos.com/stories/2012/11/19/1163009/-Daily-Kos-Elections-presidential-results-by-congressional-district-for-the-2012-2008-elections).
DCCC. 2018. “Laura Moser.” https://dccc.org/races/laura-moser/.
Delli Carpini, Michael, and Scott Keeter. 1996. What Americans Know About Politics andWhy It Matters. Yale University Press.
DeMora, Stephanie, Andrew Dowdle, Spencer Hall, Angela Ocampo, and John Zaller. 2015.“Who Owns Nominations for the House of Representatives? Evidence from Four CaseStudies.” Meetings of the American Political Science Association.
Denzau, Arthur, Amoz Kats, Steven Slutsky. 1985. “Multi-agent Equilibria with MarketShare and Ranking Objectives.” Social Choice and Welfare 2: 95–117.
Desanctis, Alexandra. 2018. “Student Canvassers Get out the Vote for Pro-Life DemocratLipinski in Illinois.” The National Review. March 18, 2018.
Desmarais, Bruce, Raymond La Raja, and Michael Kowal. 2015. “The Fates of Challengersin U.S. House Elections: The Role of Extended Party Networks in Supporting Can-didates and Shaping Electoral Outcomes.” American Journal of Political Science 59:194–211.
191
Diaz, Kevin. 2018. “Ouch: DCCC ‘drafting error’ endorses Fletcher over Moser in Demo-cratic runoff.” The Houston Chronicle. April 18, 2018.
Dominguez, Casey. 2011. “Does the Party Matter? Endorsements in Congressional Pri-maries.” Political Research Quarterly 64: 534–544.
Downs, Anthony. 1957. An Economic Theory of Democracy. New York: Harper and Row.
Dugyala, Rishika. 2018. “At Houston campaign events, Moser says national Democraticopposition is helping her congressional bid.” The Texas Tribune. February 24, 2018.
Dunn, Mike. 2015. “Jonathan Saidel Decides Against 2015 Run For Philadelphia Mayor.”CBS Philly. January 26, 2015.
Ekelund, Suzanne. 2012. “ROC Curves–What are They and How are They Used?.” Pointof Care 11: 16–21.
EMILY’s List. 2017. “Our History.” Accessed November 1, 2017. (https://www.emilyslist.org/pages/entry/our-history).
Erikson, Robert S. 1988. “The Puzzle of Midterm Loss.” The Journal of Politics 50:10111029.
Fang, Lee. 2018. “Secretly Taped Audio Reveals Democratic Leadership Pressuring Pro-gressive to Leave Race.” The Intercept. April 26, 2018.
Fasano, T.M. 2014. “Weld District Attorney Ken Buck, Rep. Cory Gardner swap politicalraces.” The Greeley Tribune. March 1, 2014.
FEC. 2018a. “Independent Expenditures.” https://www.fec.gov/data/
FEC. 2018b. “Westin, Jason.” https://www.fec.gov/data/candidate/H8TX07132/. Ac-cessed May 1, 2018.
Fenno, Richard. 1978. Home Style: House Members in their Districts. Longman Press.
Field, Nick. 2014a. “PA-13: EMILY’s List and NARAL Join Together to Take Down Boyle.”PoliticsPA. May 8, 2014.
Field, Nick. 2014b. “Pelosi To Hold Fundraiser For Parrish and Strouse.” PoliticsPA.January 29, 2014.
Field, Nick. 2014c. “PA-6: Montco Dems Endorse Trivedi.” PoliticsPA. February 26, 2014.
Fiorina, Morris, Samuel Abrams, and Jeremy Pope. 2010. Culture War? The Myth of aPolarized America. 3rd ed. Longman Press.
Fiorina, Morris. 1989. Congress: Keystone of the Washington Establishment. 2nd ed. YaleUniversity Press.
Fishel, Jeff. 1973. Party and Opposition. New York: David McKay, Inc.
Foster, Brittany. 2014a. “Pike and Parrish Promoted in PA-6.” PoliticsPA. January 9th,2014.
Foster, Brittany. 2014b. “PA-6: Trivedi to Announce Candidacy Tuesday.” PoliticsPA.February 10, 2014.
Fouirnaies, Alexander, and Andrew Hall. 2018. “How Divisive Primaries Hurt Parties:Evidence from Near Runoffs.” Forthcoming. Journal of Politics.
192

Fowler, Linda, and Robert McClure. 1989. Political Ambition: Who Decides to Run forCongress. Yale University Press.
Fowler, Linda. 1993. Candidates, Congress, and the American Democracy. University ofMichigan.
Fox, Jennifer, and Richard Fox. 2010. It Still Takes a Candidate: Why Women Don’t Runfor Office. Cambridge University Press.
Gaddie, Ronald, and Charles Bullock. 2000. Elections to Open Seats in the U.S. House:Where the Action Is. Rowman & Littlefield Press.
Garcia, Eric. 2016. “Ohio Teamsters Endorse Republican Portman for Senate.” Roll Call.July 25, 2016.
Garthwaite, Craig, and Timothy Moore. 2012. “Can celebrity endorsements affect politicaloutcomes? Evidence from the 2008 US democratic presidential primary.” The Journalof Law, Economics, & Organization 29: 355–384.
Gehrke, Robert. 2014. “Mia Love clinches Republican nomination in Utah convention.” TheSalt Lake Tribune. April 28, 2014.
Gerber, Alan, and Donald Green. 2000. “The Effects of Canvassing, Telephone Calls, andDirect Mail on Voter Turnout: A Field Experiment.” American Political Science Review94: 653–663.
Gerber, Alan, and Donald Green. 2017. “Field Experiments and Voter Mobilization: AnOverview of a Burgeoning Literature.” Handbook on Economic Field Experiments. El-sevier Press.
Gerber, Alan, Donald Green, and Christopher Larimer. 2008. “Social Pressure and VoterTurnout: Evidence from a Large-scale Field Experiment.” American Political ScienceReview 102: 33–48.
Gerber, Alan. 2004. “Does campaign spending work? Field experiments provide evidenceand suggest new theory.” American Behavioral Scientist 47: 541–574.
Gerber, Elisabeth, and Jeffrey Lewis. 2004. “Beyond the Median: Voter Preferences, DistrictHeterogeneity, and Political Representation.” Journal of Political Economy 112: 1364–1383.
Gibson, Keegan. 2013. “Saidel Drops PA-13 Bid, Brady Backs Boyle, Cohen Files.” Poli-ticsPA. April 16, 2013.
Gibson, Keegan. 2014a. “Q2: Margolies Raises $185K in PA-13.” PoliticsPA. July 14, 2013.
Gibson, Keegan. 2014b. “Saidel Drops PA-13 Bid, Brady Backs Boyle, Cohen Files.” Poli-ticsPA. April 16, 2013.
Gilens, Martin, and Benjamin Page. “Testing theories of American politics: Elites, interestgroups, and average citizens.” Perspectives on politics 12: 564–581.
Gilens, Martin. 2012. Affluence and Influence. Princeton University Press.
Gimpel, James, Frances Lee and Shanna Pearson-Merkowitz. 2008. “The Check Is in theMail: Interdistrict Funding Flows in Congressional Elections.” American Journal ofPolitical Science 52: 373-394.
193

Graves, Garret. 2014. “Nation’s Largest Grassroots Business Network Identifies Graves as‘Pro-Prosperity’ Candidate.” Garret Graves for U.S. Congress. October 6, 2014.
Grim, Ryan, and Lee Fang. 2018. “The Dead Enders.” The Intercept. January 23, 2018.
Grimmer, Justin, Solomon Messing, and Sean J. Westwood. 2012. “How words and moneycultivate a personal vote: The effect of legislator credit claiming on constituent creditallocation.” American Political Science Review 106: 703–719.
Guttenplan, D.D. 2018. “When the DCCC Calls, Hang Up the Phone.” The Nation. March2, 2018.
Hagen, Lisa. 2018a. “Texas Dem raises nearly $90K after attack from House Dem campaignarm.” The Hill. February 26, 2018.
Hagen, Lisa. 2018b. “Dem targeted by party establishment loses Texas primary.” The Hill.May 22, 2018.
Hannagan, Rebecca, Jamie Pimlott, and Levente Littvay. 2010. “Does an EMILY’s List En-dorsement Predict Electoral Success, or Does EMILY Pick the Winners?” PS: PoliticalScience & Politics 43: 503–508.
Hassel, Hans. 2016. “Party Control of Party Primaries: Party Influence in Nominations forthe U.S. Senate.” The Journal of Politics 78: 75–87.
Hassel, Hans. 2018. The Partys Primary: Control of Congressional Nominations. Cam-bridge University Press.
Heidom, Rich. 1994. “Margolies-Mezvinsky: Voted out of office but hardly defeated.”Philadelphia Inquirer. December 24, 1994.
Herrnson, Paul. 1988. Party Campaigning in the 1980s. Harvard University Press.
Herrnson, Paul. 2009. “The Roles of Party Organizations, Party-Connected Committees,and Party Allies in Elections.” The Journal of Politics 71: 1207–1224.
Herrnson, Paul. 2011. Congressional Elections: Campaigning at Home and in Washington.6th Ed. CQ Press.
Hershey, Marjorie. 2014. Party Politics in America. Longman Press.
Hilburn, Rachel Lewis. 2014. “McIntyre Won’t Run Again for U.S. Rep. of NC’s 7th Con-gressional District.” 91.3 HQR News. January 9, 2014. http://whqr.org/post/mcintyre-wont-run-again-us-rep-ncs-7th-congressional-district#stream/0.
Hilburn, Rachel. 2014. “McIntyre Won’t RUn Again for U.S. Rep. of NC’s 7th CongressionalDistrict.” 91.3 WHQR News. January 8, 2014.
Hill, Seth, and Chris Tausanovitch. 2013. “A Disconnect in Representation? Comparison ofTrends in Congressional and Public Polarization.” Meetings of the Midwestern PoliticalScience Association.
Hill, Seth, and Gregory Huber. “Representativeness and motivations of the contemporarydonorate: Results from merged survey and administrative records.” Political Behavior39: 3–29.
Hirano, Shiego, James Snyder, Stephen Ansolabehere, and Mark Hansen. 2010. “Primariesand Polarization in the U.S. Congress.” Quarterly Journal of Political Science. 5:
194

169–191.
Hogan, Robert. 2003. “Sources of Competition in State Legislative Primary Elections.”Legislative Studies Quarterly 28: 103–26.
Hohmann, James, Alexander Burns, and Jake Sherman. 2014. “Gardner to run for Senatein Colo.” Politico. February 26, 2014.
https://www.opensecrets.org/overview/reelect.php. Accessed: May 1, 2018.
Isenstadt, Alex. 2014. “Groups back Rouzer for McIntyre seat.” Politico. April 30, 2014.
Jacobson, Gary, and Samuel Kernell. 1981. Strategy and Choice in Congressional Elections.Yale University Press.
Jacobson, Gary. 1980. Money in Congressional Elections. Yale University Press.
Jacobson, Gary. 1989. “Strategic Politicians and the Dynamics of House Elections, 1946-86.”American Political Science Review 83: 773–793.
Jacobson, Gary. 2009. The Politics of Congressional Elections. 7th ed. Longman Press.
Jilani, Zaid, and Ryan Grim. “Labor Rallies Behind Laura Moser After She OvercomesParty Effort to Stop out Her Congressional Bid.” The Intercept. March 7, 2018.
JMC Analytics. 2014. “6th Congressional District Polling.” April 12, 2014.
Kane, Paul. 2012. “Orrin Hatch in strong position heading into Utah GOP convention.”The Washington Post. April 20, 2012.
Karol, David. 2009. Party Position Change in American Politics. Cambridge UniversityPress.
Kazee, Thomas, and Mary Thornberry. 1990. “Where’s the Party? Congressional CandidateRecruitment and American Party Organizations.” Political Research Quarterly 43: 61–80.
Kazee, Thomas. 1980. “The Decision to Run for the U.S. Congress.” Legislative StudiesQuarterly 5: 79–100.
Keele, Luke, and Rocio Titiunik. 2015. “Geographic Boundaries as Regression Discontinu-ities.” Political Analysis 23: 127–155.
Key, V.O. 1956. American State Politics. New York: Alfred A. Knopf.
Key, V.O. 1958. Politics, Parties, and Pressure Groups. Crowell.
Kingdon, John. 1968. Candidates for Office: Beliefs and Strategies. New York: RandomHouse.
Koger, Greg, Seth Masket, and Hans Noel. 2009. “Partisan Webs: Information Exchangeand Party Networks.” British Journal of Political Science 39: 633–653.
Koger, Greg, Seth Masket, and Hans Noel. 2010. “Cooperative Party Factions in AmericanPolitics.” American Politics Research 38: 33–53.
Krasushaar, Josh. 2008. “Strange bedfellows in Louisiana.” Politico. October 24, 2008.
Kraushaar, Josh. 2008. “Louisiana special election primaries head to runoffs.” Politico.March 9, 2008.
195

Kunzelman, Michael. 2016. “Turbulent summer mars Louisiana’s capital’s mayoral race.”The Times Standard. November 2, 2016.
La Raja, Raymond, and Brian Schaffner. 2015. Campaign Finance and Political Polariza-tion. University of Michigan Press.
Larson, Leslie. 2014. “Chelsea Clinton’s mom-in-law Marjorie Margolies a no-show at fund-raiser where Hillary stumped for her.” New York Daily News. May 16, 2014.
Lau, Richard, and David Redlawsk. 2001. “Advantages and Disadvantages of CognitiveHeuristics in Political Decision Making.” American Journal of Political Science 45:951–971.
Lawless, Jennifer and Richard Fox. 2005. It Takes a Candidate: Why Women Don’t Runfor Office. Cambridge University Press.
Leahy, Norman. 2018. “How to put a safe congressional seat in play.” The WashingtonPost. January 11, 2018.
Leuthold, David. 1968. Electioneering in a Democracy: Campaigns for Congress. New York:Wiley.
Levendusky, Matthew, Jeremy Pope, and Simon Jackman. 2008. “Measuring District- LevelPartisanship with Implications for the Analysis of U.S. Elections.” The Journal ofPolitics 70: 736–753.
Livingston, Abby. 2013. “House Republicans Put 36 Recruits ‘On the Radar’.” Roll Call.November 21, 2013.
Livingston, Abby. 2018a. “National Democrats come out against primary candidate LauraMoser in bid for Culberson’s seat.” The Texas Tribune. February 22, 2018.
Livingston, Abby. 2018b. “Lizzie Pannill Fletcher defeats Laura Moser in Texas Democraticprimary runoff; Gina Ortiz Jones seals nomination.” The Texas Tribune. May 22, 2018.
Loudon County, Virginia. 2018. “Polling Places.” https://www.loudoun.gov/pollingplaces.Accessed: April 27, 2018.
Lupia, Arthur. 1994. “Shortcuts versus encyclopedias: Information and voting behavior inCalifornia insurance reform elections.” American Political Science Review 88: 63-76.
Madison, James. 1787. “Federalist 10.” The Federalist Papers.
Maestas, Cherie, Sandy Maisel, and Walter Stone. 2005. “National Party Efforts to RecruitState Legislators to Run for the US House.” Legislative Studies Quarterly 30: 277–300.
Maisel, Sandy, Linda Fowler, Ruth Jones, and Walter Stone. 1990. “The Naming of Candi-dates: Recruitment or Emergence?” In The Parties Respond: Changes in the AmericanParty System. ed. Sandy Maisel. pg. 137–159. Boulder: Westview Press.
Maisel, Sandy. 2001. “American Political Parties: Still Central to a Functioning Democ-racy?” in Cohen, Jeffrey, Richard Fleisher, and Paul Kantor, (eds.), American PoliticalParties: Decline or Resurgence?. CQ Press.
Martin, Jeanine. 2015. “The Most Powerful Man in Virginia You’ve Never Heard Of.” TheBull Elephant. May 11, 2015.
196

Masket, Seth. 2009. No Middle Ground: How Informal Party Organizations Control Nomi-nations and Polarize Legislatures. University of Michigan Press.
Mayhew, Bruce, and Roger Levinger. 1976. “Size and the Density of Interaction in HumanAggregates.” American Journal of Sociology 82: 86–110.
Mayhew, David. 1972. Congress: The Electoral Connection. Yale University Press.
Mayhew, David. 1986. Placing Parties in American Politics. Princeton University Press.
McGaughy, Lauren. 2013. “Baton Rouge lawmaker Dan Claitor will run in Louisiana’s 6thCongressional District.” The Times-Picayune. December 4, 2013.
McGhee, Eric, Seth Masket, Boris Shor, Steven Rogers, Nolan McCarty. 2014. “A Pri-mary Cause of Partisanship? Nomination Systems and Legislator Ideology.” AmericanJournal of Political Science 58: 337–351.
McKay, Scott. 2011. “Project-Labor Agreement Bill Provides First Fireworks of Lege Ses-sion.” The Hayride. April 27, 2011.
Mervis, Jeffrey. 2018. “Oncologist Jason Westin looks back – and ahead – after defeat inTexas primary.” Science Magazine. March 9, 2018.
Michigan Secretary of State. 2018. “Campaign Finance Disclosures.” Elections in Michigan.Accessed May 1, 2018.
Miler, Kristina. 2009. “The Limitations of Heuristics for Political Elites.” Political Psychol-ogy 30: 863894.
Miller, Roy, David Bositis, and Denise Baer. 1981. “Stimulating Voter Turnout in a Primary:Field Experiment with a Precinct Committeeman.” International Political Science Re-view 2: 445–459.
Morrill, Jim. 2012. “President Obama: Harvey Gantt Helped Set Course for Young BlackLeaders.” The Charlotte Observer. September 5, 2012.
Morrill, Jim. 2014. “Dignitaries Pay Tribute to Civil Rights Pioneer Franklin McCain.” TheCharlotte Observer. January 17, 2014.
Moses, Caroline. 2008. “Democratic Party believes Republican contributor aided Indepen-dent candidate to split Democratic vote.” 9 WAFB News. November 18, 2008.
Moses, Caroline. 2008. “Democratic Party believes Republican contributor aided Inde-pendent candidate to split Democratic vote.” WAFB 9 News. November 18, 2008.http://www.wafb.com/Global/story.asp?s=9310443&clienttype=printable.
Newman, Mark, and Michelle Girvan. 2004. “Finding and evaluating community structurein networks.” Physical Review 69: 026113.
Nichols, John. 2018. “Texas Progressive Laura Moser is Beating Democratic Insiders.” TheNation. March 7, 2018.
Nilsen, Ella. 2018a. “Bernieworld fires back in the DCCC’s war on a Texas Democrat.”Vox. March 1, 2018.
Nilsen, Ella. 2018b. “Top Texas fundraisers were also some of the biggest losers in the 2018primary.” Vox. March 7, 2018.
197

Niven, David. “Throwing your hat out of the ring: Negative recruitment and the genderimbalance in state legislative candidacy.” Politics & Gender 2: 473–489.
Noel, Hans. 2013. Political Ideologies and Political Parties in America. Cambridge Univer-sity Press.
Nolan, Jim. 2016. “Va. GOP votes to switch from convention convention to primary tonominate 2017 candidates.” Richmond Times-Dispatch. August 27, 2016.
NRCC. 2014. “Meet the NRCC Patriots and Young Guns Joining the 114th Congress.”NRCC Press Updates. November 4, 2014.
Nyhan, Brendan, and Jacob Montgomery. 2015. “Connecting the Candidates: ConsultantNetworks and the Diffusion of Campaign Strategy in American Congressional Elections.”American Journal of Political Science 59: 292–308.
Nyhan, Brendan, Eric McGhee, John Sides, Seth Masket, and Steven Greene. 2010. “Onevote out of step? The effects of salient roll call votes in the 2010 election.” AmericanPolitics Research 40: 844–879.
O’Leary, Jean. 2000. “From Agitator to Insider: Fighting for Inclusion in the Demo-cratic Party,” in Creating Change: Sexuality, Public Policy, and Civil Rights, eds. JohnD’Emilio, William B. Turner, and Urvashi Vaid. New York: St. Martin’s Press.
Ocampo, Angela. 2017. “The Wielding Influence of Political Networks: Representation inMajority-Latino Districts.” Political Research Quarterly 1–15.
Olvio, Antonio. 2014. “Barbara Comstock wins GOP nomination for Virginia’s 10th Con-gressional District.” The Washington Post. April 26, 2014.
OpenSecrets. 2018a. “Hillary Clinton’s Bundlers.” OpenSecrets.org. https://www.opensecrets.org/pres16/bundlers.Accessed: May 1, 2018.
OpenSecrets. 2018b. “Reelection Rates Over the Years.” OpenSecrets.org. https://www.opensecrets.org/overview/reelect.php.Accessed: May 1, 2018.
Otterbein, Holly. 2015. “Jonathan Saidel Is Thinking About Running for Mayor.” Philadel-phia Magazine. January 14, 2015.
Panagopoulos, Costas. 2008. “Emotions, Motivation and Prosocial Behavior: Field Ex-perimental Tests of the Effects of Alternative Civic Duty Appeals on Voter Turnout.”Meeting of the 40th ISPS Conference.
Pathe, Simone. 2017. “314 Action Hopes to be the ‘EMILY’s List for Scientists’.” Roll Call.September 18, 2017.
Pease, Andrew, and Paul Brewer. 2008. “The Oprah factor: The effects of a celebrity en-dorsement in a presidential primary campaign.” The International Journal of Press/Politics13: 386–400.
Perry, Paul. 2018. “What It’s Like to be Rolodexed: One Candidate’s Journey into theReality of Political Fundraising.” The Intercept. January 31, 2018.
Pershing, Ben. 2014. “Del. Barbara Comstock under fire from both sides in crowded raceto succeed Rep. Wolf.” The Washington Post. February 18, 2014.
Peters, Jeremy and Michael Shear. 2012. “Democrats Draft Gay Marriage Platform.” The
198

New York Times. July 30, 2012.
Pettigrew, Stephen, Karen Owen, and Emily Wanless. 2014. “U.S. House Primary ElectionResults (1956-2010).” Harvard Dataverse, V4.
Phillips, Nancy and Mark Fazlollah. 2017. “FBI digs deep in probe of Dougherty and union.”The Philadelphia Inquirer. July 1, 2017.
Pierce, Charles. 2018. “This isn’t ‘Election Rigging,’ It’s Politics 101.” Esquire. April 27,2018.
Pildes, Richard. 2011. “Why the Center Does Not Hold: The Causes of HyperpolarizedDemocracy in America.” California Law Review 99.
Plumer, Brad. 2013. “The U.S. has few farmers. So why does Congress love farm subsidies?”The Washington Post. July 12, 2013.
POG. Parties on the Ground. 2014. Field Interviews conducted by Knox Brown, AngelaOcampo, Shawn Patterson, John Ray, and John Zaller.
PolitickerNJ. 2014. “Norcross Basks in List of Statewide Support for his CD1 Run.” Poli-tickerNJ. February 7, 2014.
PoliticsPA. 2014. “PA-13: Authorities Widen Search Area for Marjorie Margolies.” Politic-sPA. April 1, 2014.
Pols, Colorado. 2014a. “The Grand Gardner Gamble: Enter Karl Rove?” Colorado Pols:Politics, News & Inside Information. February 28, 2014.
Pols, Colorado. 2014b. “Cory Gardner Loves Him Some Ken Buck.” Colorado Pols: Politics,News & Inside Information. March 20, 2014.
Poole, Keith T., and Howard Rosenthal. 1996. “Are legislators ideologues or the agents ofconstituents?.” European Economic Review 40: 707–717.
Poole, Kieth. 2007. “Changing minds? Not in Congress!” Public Choice 131: 435–451.
PPP. 2013. “Graham, Adams lead in NC-12.” Public Policy Polling. July 9, 2013.
Rau, Nate. 2018. “State GOP removes 7 Senate candidates, 1 governor candidate fromprimary ballot.” The Tennessean. April 7, 2018.
Rauch, Jonathan, and Raymond La Raja. 2017. “Re-engineering politicians: How activistgroups choose our candidates – long before we vote.” Brookings. December 7, 2017.
Riordan, William. 1905. Plunkitt of Tammany Hall. The Project Gutenberg.
Roarty, Alex, and Sean Coit. 2010. “Pennsylvania Influencers.” Politics Magazine. January2010.
Robbins, Suzanne. 2017. “Implicit Coordination? Mapping Consultants across PoliticalOrganizations in American Federal Elections.” Meetings of the Midwestern PoliticalScience Association.
Roelofs, Ted. 2014. “Battle between Tea Party and traditional Republicans to play out inprimaries.” Bridge Magazine. July 31, 2014.
Rohde, David. 1979. “Risk-bearing and progressive ambition: The case of members of theUnited States House of Representatives.” American Journal of Political Science 23:
199

1–26.
Rolly, Paul. 2014. “Mia Love gets off to a rocky start with media.” The Salt Lake Tribune.
Sanbonmatsu, Kira. 2006. “The legislative party and candidate recruitment in the Americanstates.” Party Politics 12: 233–256.
Schattschnieder, E. E. 1942. Party Government. New York: Rinehart & Company, Inc.
Schneider, Elena. 2017a. “The top 10 House races to watch in 2018.” Politico. December25, 2017.
Schneider, Elena. 2017b. “Democrats’ early money haul stuns GOP.” Politico. October 23,2017.
Schneider, Elena. 2017c. “GOP strategists worry incumbents aren’t ready for a blue wave.”Politico. November 15, 2017.
Schneider, Elena. 2018. “Democrats clash over partys direction in key Texas race.” Politico.May 19, 2018.
Schwartz, Mildred. 1990. The Party Network: The Robust Organization of Illinois Republi-cans. University of Wisconsin Press.
Schwartz, Thomas. 1989. “Why Parties?” Manuscript.
Schwartz, Thomas. 2011. “One-dimensionality and Stability in Legislative Voting.” PublicChoice 148: 197–214.
Schwartzman, Paul. 2015. “Va. GOP’s power broker unelected but never ignored.” TheWashington Post. May 10, 2015.
Scott, John. 2017. Social Network Analysis. SAGE Press.
Segal, David. 1997. “U.S. Chamber of Commerce to Take On Trial Lawyers.” The Wash-ington Post. December 12, 1997.
Sentell, Will. 2015. “Group led by Baton Rouge businessman Lane Grigsby has more than$1 million for BESE races.” The Advocate. October 2, 2015.
Shaw, Daron, Rodolfo De La Garza, and Jongho Lee. 2000. “Explaining Latino Turnoutin 1996: A Three-state, Validated Survey Approach.” American Journal of PoliticalScience 44: 338–346.
Sides, John, Chris Tausanovitch, Lynn Vavreck, and Christopher Warshaw. 2018. “On therepresentativeness of primary electorates.” British Journal of Political Science : 1-9.
Smith, Joseph. 2007. “Zane Paid a Price for Defying the Party.” The Asbury Park Press.August 21, 2007.
Smith, Vincent. 2014a. “PA-6: Rep. Bob Brady Backs Parrish.” PoliticsPA. February 10,2014.
Smith, Vincent. 2014b. “PA-6: Chester County Dems Back Trivedi.” PoliticsPA. February24, 2014.
Snyder, James, and Tim Groseclose. 2000. “Estimating Party Influence in CongressionalRoll-Call Voting.” American Journal of Political Science 44: 193–211.
Spencer, Kyle. 2015. “Louisiana’s Common Core Debacle.” Politico. January 12, 2015.
200
Spoto, MaryAnn. 2014. “Union County Democrats endorse Bonnie Watson Coleman tosucceed Rush Holt.” NJ.com. March 12, 2014.
Sullivan, John and Robert O’Connor. 1972. “Electoral Choice and Popular Control of PublicPolicy: The Case of the 1966 House Elections.” American Political Science Review 57:1256–1268.
Svitek, Patrick. 2018. “U.S. Sen. Bernie Sanders defends Laura Moser against nationalDemocrats ahead of Texas trip.” The Texas Tribune. March 8, 2018.
Swartz, Mimi. 2018. “A Certain Party’s Gift for Self-Immolation.” The New York Times.February 27, 2018.
Swet, John. 1996. Signal Detection Theory and ROC Analysis in Psychology and Diagnos-tics: Collected Papers. Mahwah, NJ: Lawrence Erlbaum Associates.
The Houston Chronicle. 2018. “For the 7th Congressional District: Jason Westin or LizziePannill Fletcher.” The Houston Chronicle. February 9, 2018.
Theriault, Sean. 2008. Party Polarization in Congress. Cambridge University Press.
Trygstad, Kyle. 2013. “First Republican Enters Race for Cassidy’s House Seat #LA06.”Roll Call. May 2, 2013.
Van Zuylen-Woon, Simon. 2014. “The Bizzare, Mysterious Campaign of Marjorie Mar-golies.” Philadelphia Magazine. May 5, 2014.
Vanacore, Andrew. 2011. “Baton Rouge businessman plowing money into BESE races.”The Times-Picayune. October 16, 2011.
Verba, Sidney, Kay Schlozman, and Henry Brady. 1995. Voice and Equality: Civic Volun-tarism in American Politics. Harvard University Press.
Victor, Jennifer, and Gregory Koger. 2016. “Financing Friends: How lobbyists create a webof relationships among members of Congress.” Interest Groups & Advocacy 5: 224–262.
Volden, Craig, and Alan Wiseman. 2014. Legislative Effectiveness in the United StatesCongress: The Lawmakers. Cambridge University Press.
Volk, Steve. 2013. “George Norcross: The Man Who Destroyed Democracy.” PhiladelphiaMagazine. March 29, 2013.
Waddingham, Rebecca. 2010. “Woman angry that her sex assault case won’t be prosecuted.”The Greeley Tribune. October 15, 2010.
Ward, Michael, Katherine Stovel, and Audrey Sacks. 2011. “Network Analysis and PoliticalScience.” Annual Review of Political Science 14: 245–264.
Washington Post. 2012. “May 2012 Virginia Poll.” The Washington Post. May 8, 2012.
WECT. 2014. “As law student, Woody White testified that homosexuals should be treatedas criminals.” WECT 6 News. N.D. http://www.wect.com/story/24602424/as-law-student-woody-white-testified-that-homosexuals-should-be-treated-as-criminals.
Weiner, Daniel, and Ian Vandewalker. 2015. “Strengthen the Parties to Strengthen Democ-racy.” Brennan Center for Justice. September 28, 2015.
Wesleyan Media Project. Fowler, Erika Franklin, Michael M. Franz, and Travis N. Ridout.
201

2017. “Political Advertising in 2014” Version 1.0 [dataset]. Middletown, CT: TheWesleyan Media Project, Department of Government at Wesleyan University.
Westin for Congress. 2018. “Endorsements.” https://westinforcongress.com/endorsements/.
Woolridge, Jeffrey. 2012. Introduction to Econometrics: A Modern Approach. New York:Cenege Learning.
Zurik, Lee. 2013. “Louisiana’s top 400 campaign donors get around legal limits to magnifypolitical influence.” The Times-Picayune. August 23, 2017.
202


