Embed Size (px)
Citation preview


UMTS Performance MeasurementA Practical Guide to KPIs for the UTRAN Environment
Ralf KreherTektronix MPT Berlin GmbH & Co. KGGermany

UMTS Performance Measurement

UMTS Performance MeasurementA Practical Guide to KPIs for the UTRAN Environment
Ralf KreherTektronix MPT Berlin GmbH & Co. KGGermany

Copyright � 2006 Ralf Kreher
Published in 2006 by John Wiley & Sons Ltd, The Atrium, Southern Gate, Chichester,West Sussex PO19 8SQ, England
Telephone (+44) 1243 779777
Email (for orders and customer service enquiries): [email protected] our Home Page on www.wiley.com
All Rights Reserved. No part of this publication may be reproduced, stored in a retrieval system or transmitted inany form or by any means, electronic, mechanical, photocopying, recording, scanning or otherwise, except underthe terms of the Copyright, Designs and Patents Act 1988 or under the terms of a licence issued by theCopyright Licensing Agency Ltd, 90 Tottenham Court Road, London W1T 4LP, UK, without the permissionin writing of the Publisher. Requests to the Publisher should be addressed to the Permissions Department,John Wiley & Sons Ltd, The Atrium, Southern Gate, Chichester, West Sussex PO19 8SQ, England, oremailed to [email protected], or faxed to (þ44) 1243 770620.
Designations used by companies to distinguish their products are often claimed as trademarks. All brand namesand product names used in this book are trade names, service marks, trademarks or registered trademarks oftheir respective owners. The Publisher is not associated with any product or vendor mentioned in this book.
This publication is designed to provide accurate and authoritative information in regard to the subjectmatter covered. It is sold on the understanding that the Publisher is not engaged in rendering professional services.If professional advice or other expert assistance is required, the services of a competent professional shouldbe sought.
Other Wiley Editorial Offices
John Wiley & Sons Inc., 111 River Street, Hoboken, NJ 07030, USA
Jossey-Bass, 989 Market Street, San Francisco, CA 94103-1741, USA
Wiley-VCH Verlag GmbH, Boschstr. 12, D-69469 Weinheim, Germany
John Wiley & Sons Australia Ltd, 42 McDougall Street, Milton, Queensland 4064, Australia
John Wiley & Sons (Asia) Pte Ltd, 2 Clementi Loop #02-01, Jin Xing Distripark, Singapore 129809
John Wiley & Sons Canada Ltd, 6045 Freemont Blvd, Mississauga, Ontario, Canada L5R 4J3
Wiley also publishes its books in a variety of electronic formats. Some content that appears in print may not beavailable in electronic books.
Library of Congress Cataloging-in-Publication Data
British Library Cataloguing in Publication Data
A catalogue record for this book is available from the British Library
ISBN-13 978-0-470-03249-7 (HB)ISBN-10 0-470-03249-9 (HB)
Typeset in 10/12 pt Times by Thomson Digital.Artwork by Brit Kreher, Berlin, Germany.Printed and bound in Great Britain by Antony Rowe Ltd., Chippenham, Wiltshire.This book is printed on acid-free paper responsibly manufactured from sustainable forestry in which at least twotrees are planted for each one used for paper production.
Contents
Preface ix
Acknowledgements xi
1 Basics of Performance Measurement in UMTS Terrestrial RadioAccess Network (UTRAN) 11.1 General Ideas of Performance Measurement 2
1.1.1 What is a KPI? 4
1.1.2 KPI Aggregation Levels and Correlations 6
1.1.3 Basic Approach to Capture and Filter Performance-Related
Data in UTRAN 7
1.1.4 Performance Measurement Definitions of 3GPP 13
1.1.5 User Experience vs. 3GPP Performance Measurement
Definitions 16
1.1.5.1 Problems with Registration and Call Setup 17
1.1.5.2 Dropped Calls 19
1.1.5.3 Poor Transmission Speed 20
1.1.5.4 Corrupted Data 25
1.1.6 Basics of PS Call Analysis in UTRAN 27
1.2 Basic Architectural Concept of Performance Measurement Equipment
Based on Protocol Analysis 34
1.2.1 Protocol Decoding and Protocol Stacks 37
1.2.2 Diversity Combining and Filtering 39
1.2.3 State Transition Analysis 44
1.3 Aggregation Levels/Dimensions 47
1.3.1 SGSN Dimension 47
1.3.2 MSC Dimension 48
1.3.3 SRNC Dimension 48
1.3.4 DRNC Dimension 48
1.3.5 CRNC Dimension 48
1.3.6 Node B Dimension 49
1.3.7 Cell Dimension 49
1.3.8 Call/Connection Dimension 51
1.3.9 UE Dimensions 51
1.3.10 Radio Bearer/Radio Access Bearer Type Dimensions 52
1.4 Statistics Calculation and Presentation 54
1.4.1 Sampling Period 54
1.4.2 Bins 56
1.4.3 The 95th Percentile 57
1.4.4 Gauges and Distribution Functions 58
2 Selected UMTS Key Performance Parameters 612.1 Block Error Rate (BLER) Measurements 61
2.1.1 Uplink Block Error Rate (UL BLER) 62
2.1.1.1 Uplink Transport Channel BLER 62
2.1.1.2 UL BLER per Call 65
2.1.1.3 UL BLER per Call Type 65
2.1.2 Downlink Block Error Rate (DL BLER) 65
2.1.2.1 DL BLER per Call or Service 68
2.1.3 Correlation of BLER and Other Measurements 69
2.2 Radio-Related Measurements 71
2.2.1 Radio Link Quality Parameters and Flow Control in Lub
Frame Protocol (FP) 71
2.2.2 NBAP Common Measurements 74
2.2.2.1 Transmitted Carrier Power 76
2.2.2.2 NBAP Common Measurement Enhancements in Release 5 77
2.2.2.3 Received Total Wideband Power 78
2.2.3 NBAP Dedicated Measurements 81
2.2.3.1 Signal-to-Interference Ratio (SIR) 82
2.2.3.2 Signal-to-Interference Ratio Error (SIR Error) 83
2.2.3.3 Uplink SIR Target 85
2.2.3.4 Transmitted Code Power 86
2.2.3.5 Round Trip Time (RTT) 87
2.2.4 RRC Measurements and UE Measurement Abilities 87
2.3 Throughput Measurements 100
2.3.1 RLC Throughput 101
2.3.2 Transport Channel Throughput 102
2.3.3 Packet Switched User Perceived Throughput 112
2.3.4 Application Throughput 114
2.4 Transport Channel Usage Ratio 115
2.5 Primary and Secondary Traffic 118
2.6 Active Set Size Distribution 122
2.7 Soft Handover Success and Failure Analysis 127
2.8 Inter-Frequency Hard Handover Success and Failure Rates 132
2.9 Core Network Hard Handover Success and Failure Rates 137
2.9.1 Intra-MSC and Inter-MSC Hard Handover (3G-3G) 138
2.9.2 3G-2G Inter-RAT Handover for CS and PS Services 143
2.9.2.1 CS 3G-2G Inter-RAT Handover 144
2.9.2.2 PS 3G-2G Inter-RAT Handover 146
2.10 State Transitions and Channel Type Switching 147
2.11 Call Establish Success and Failure Rates 151
2.11.1 RRC Connection Establishment 152
2.11.2 Radio Bearer and Radio Access Bearer Establishment and Release 155
2.12 Call Drop Rates 160
2.13 NBAP Radio Link Failure Analysis and RRC Re-Establishment
Success Rate 165
2.14 Cell Matrices 171
vi Contents
2.15 Miscellaneous Protocol Procedures and Events that Indicate Abnormal
Behaviour of Protocol Entities on Different Layers 174
2.15.1 Miscellaneous RRC Failure Indications and Ratio KPIs 175
2.15.1.1 RRC UTRAN Mobility Information Failure 175
2.15.1.2 RRC Measurement Control Failure 175
2.15.1.3 RRC Status 175
2.15.1.4 RRC Security Mode Failure 176
2.15.1.5 RRC Transport Format Combination Control Failure 176
2.15.1.6 RRC Paging Response 176
2.15.2 SCCP Failure Analysis 177
2.15.2.1 Connection Refused (CREF) 177
2.15.2.2 Inactivity Check Failure 178
2.15.3 RANAP Failure Analysis 178
2.15.3.1 RANAP Reset Resource 178
2.15.3.2 RANAP Reset 178
2.15.3.3 RANAP Overload 178
2.15.4 NBAP Failure Analysis 178
2.15.5 RLC Acknowledge Mode Retransmission Rate 180
3 Call Establishment and Handover Procedures of PS Callsusing HSDPA 1813.1 HSDPA Cell Set Up 181
3.2 HSDPA Basic Call 182
3.2.1 Call Set Up and Measurement Initialisations 182
3.2.2 Call Release 187
3.3 Mobility Management and Handover Procedures in HSDPA 188
3.3.1 Serving HS-DSCH Cell Change without Change of Active Set 189
3.3.2 Inter-Node B Serving HS-DSCH Cell Change 191
3.3.3 HSDPA Cell Change After Soft Handover 193
Glossary 197
References 205
Index 207
Contents vii

Preface
Having dealt with in-depth analysis of SS#7, GSM and GPRS networks I started to monitor
UTRAN interfaces approximately four years ago. Monitoring interfaces means decoding
the data captured on the links and analysing how the different data segments and messages
are related to each other. In general I wanted to trace all messages belonging to a single
call to prove if the network elements and protocol entities involved worked fine or if there
had been failures or if any kind of suspicious events had influenced the normal call
proceeding or the call’s quality of service. Cases showing normal network behaviour have
been documented in Kreher and Ruedebusch (UMTS Signaling. John Wiley & Sons, Ltd,
2005), which provides examples for technical experts investigating call flows and network
procedures.
While still writing the last paragraphs of UMTS Signaling it became obvious that the focus
of leading UMTS technology experts was changing more and more from the investigation of
functional behaviour to the analysis of huge data streams supplied by signalling information
and user data/payload. As a result the idea of a second book was already born before the first
one was ready to be published. Some major customer projects I have been involved in
pushed my ideas and knowledge further into this field. Indeed, if one compares radio-related
information in UMTS and GSM radio access network protocols, e.g. the contents of
measurement reports sent to the network by mobile stations and base stations, it is obvious
that in UMTS much more radio-specific measurements are executed. Reports are sent more
frequently and by using more sophisticated methods than in GSM to guarantee the quality of
service in UMTS networks.
The radio technology behind UMTS is seen in two different varieties: frequency duplex
division (FDD, also known as WCDMA), where uplink and downlink data is transmitted on
two different frequency bands; and time division duplex (TDD), where uplink and downlink
channels are separated using timeslots. TDD is actually beyond the scope of this book,
because it has not been introduced in European and North American networks so far. The
Chinese solution of a low chip rate TDD (TD-SCDMA) has not yet been deployed in the
field, and although deployment may start during 2006 it will take a while before performance
measurement becomes crucial for TD-SCDMA operators. First they have to set emphasis on
the execution of functional tests. Nevertheless, many measurement definitions and key
performance indicators presented in this book will also be valid in TDD networks apart from
mostly radio-related measurements and soft handover analysis, because there is no soft
handover in TDD.
Many ideas and definitions in UMTS performance measurement scenarios are not
described in international standards. There is a big grey zone that covers a wide range
of proprietary definitions. An examination of these proprietary requirements written by
network equipment manufacturers and network operators was a main impetus to write
this book. As a result more than three-quarters of the contents deal with descriptions and
definitions that cannot be found in any international standard document. And very often

proprietary requirements do not entirely depict all necessary measurement details. It is
another aim of this book to close the gap between proprietary and 3GPP performance
measurement definitions as well as the gap between the theory of measurements and
actual implementation.
Ralf Kreher
Berlin, Germany
x Preface
Acknowledgements
I would like to take the chance to acknowledge the effort of all who participated directly or
indirectly in creating and publishing this book.
First of all a special ‘thank you’ goes to my spouse Grit who volunteered for initial
proofreading of all texts and to my sister Brit who created and formatted all the figures you
will find in this book. Also my daughters Alva and Luise must be mentioned who brightened
a couple of hard working days with their smiles.
This book would not exist without the ideas, questions and requirements contributed by
customers, colleagues, subcontractors and competitors. Besides all others that cannot be
personally named I would like to express thanks especially to the following people listed in
alphabetical order:
Alessio Biasutto
Roberto Cappon
Ilija Cutura
Norbert Eggert
Kaushik Gohel
Rajasekhar Gopalan
Steffen Hulpusch
Per Kangru
Spiros Kapoulas
Uwe Keuthe
Jens Kunzel
Johnson Liu
Martin McDonald
Andrea Nicchio
Marco Onofri
Jurgen Placht
Christian Rust
Alexander Seifarth
Christopher Semturs
Alberto Visetti
Mike Wiedemann
A very important input for this book was the data collected in laboratories and live
networks all around the world by Tektronix staff and subcontractors. Thanks go to Daniele
Rampazzo, Bhal Vyas, Than Aye, Bernd Wessling and Oliver Schwarz who provided most
of the recordings. Analysis of this data would have been impossible without the work of the
engineers who participated in creating an amazing software called the Tektronix UTRAN
Network and Service Analyzer.

In addition thanks go to former Tektronix MPT director of marketing Othmar Kyas and
present director of marketing Toni Piwonka-Cole who supported the idea of writing this
book and approved usage of Tektronix material in the contents.
Last but not least I also would like to express my thanks to the team at John Wiley & Sons,
Ltd, especially Mark Hammond, Jennifer Beal, Tessa Hanford and Sarah Hinton, for their
strong support.
xii Acknowledgements
1
Basics of PerformanceMeasurement in UMTS TerrestrialRadio Access Network (UTRAN)
Performance measurement represents a new stage of monitoring data. In the past monitoring
networks meant decoding messages and filtering which messages belong to the same call.
Single calls were analysed and failures were often only found by chance. Performance
measurement is an effective means of scanning the whole network at any time and
systematically searching for errors, bottlenecks and suspicious behaviour.
Performance measurement procedures and appropriate equipment have already been
introduced in GSM and 2.5G GSM/GPRS radio access networks as well as in core networks,
however, compared to the performance measurement requirements of UTRAN those legacy
requirements were quite simple and it was relatively easy to collect the necessary protocol
data as well as to compute and aggregate appropriate measurement results.
Nowadays even Technical Standard 3GPP 32.403 (Telecommunication Management.
Performance Management (PM). Performance Measurements – UMTS and Combined
UMTS/GSM) contains only a minimum set of requirements that is not much more than
the tip of an iceberg. The definitions and recommendations of 3GPP explained in this chapter
do not cover a wide enough range of possible performance measurement procedures, some
descriptions are not even good enough to base a software implementation, and in some cases
they lead to completely wrong measurement results. To put it in a nutshell it looks like the
specification of performance measurement requirements for UTRAN is still in an early
phase. This first part of the book will explain what is already defined by 3GPP, which
additional requirements are of interest and which prerequisites and conditions always have to
be kept in mind, because they have an impact on many measurement results even if they are
not especially highlighted.
By the way, in the author’s humble opinion, the biggest error in performance measure-
ment is the copy and paste error. This results from copying requirements instead of
developing concepts and ideas of one’s own. As a result this book will also not contain
ready-to-use performance measurement definitions, but rather discuss different ideas and
UMTS Performance Measurement: A Practical Guide to KPIs for the UTRAN Environment Ralf Kreher
# 2006 Ralf Kreher
offer possible solutions for a number of problems without claiming to cover all possibilities
and having the only solutions.
1.1 GENERAL IDEAS OF PERFORMANCE MEASUREMENT
Performance measurement is fairly unique. There are many parameters and events that can
be measured and many measurements that can be correlated to each other. The number of
permutations is infinite. Hence, the question is: what is the right choice?
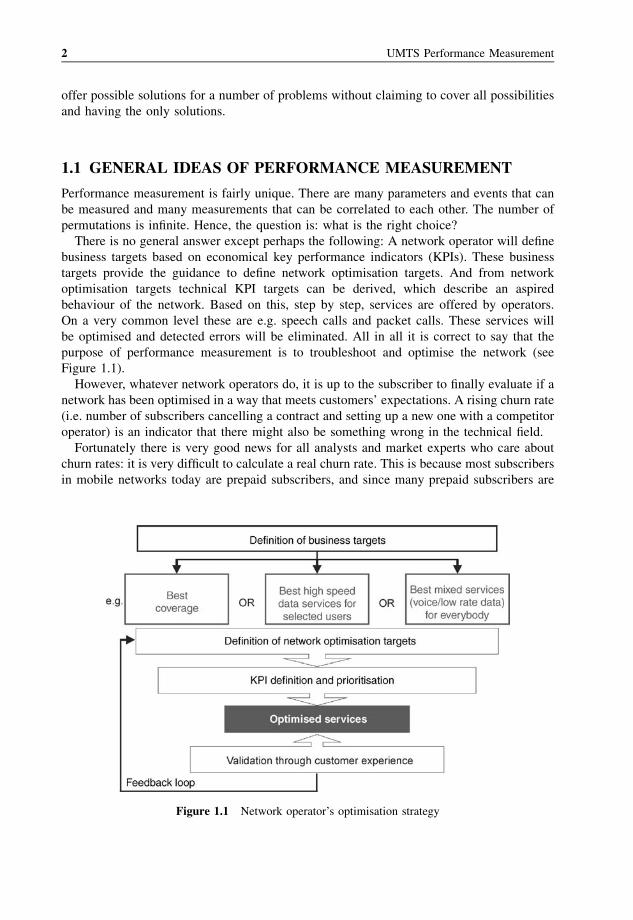
There is no general answer except perhaps the following: A network operator will define
business targets based on economical key performance indicators (KPIs). These business
targets provide the guidance to define network optimisation targets. And from network
optimisation targets technical KPI targets can be derived, which describe an aspired
behaviour of the network. Based on this, step by step, services are offered by operators.
On a very common level these are e.g. speech calls and packet calls. These services will
be optimised and detected errors will be eliminated. All in all it is correct to say that the
purpose of performance measurement is to troubleshoot and optimise the network (see
Figure 1.1).
However, whatever network operators do, it is up to the subscriber to finally evaluate if a
network has been optimised in a way that meets customers’ expectations. A rising churn rate
(i.e. number of subscribers cancelling a contract and setting up a new one with a competitor
operator) is an indicator that there might also be something wrong in the technical field.
Fortunately there is very good news for all analysts and market experts who care about
churn rates: it is very difficult to calculate a real churn rate. This is because most subscribers
in mobile networks today are prepaid subscribers, and since many prepaid subscribers are
Figure 1.1 Network operator’s optimisation strategy
2 UMTS Performance Measurement
people who temporarily stay abroad, and based on the fact that prepaid tariffs are often
significantly cheaper than roaming tariffs, such subscribers become temporary customers, so
to speak. Once they go back to their home countries their prepaid accounts remain active
until their contracts expire. Therefore not every expired contract is a churn. The actual
number of churns is expected to be much less, but how much less? Additional information is
necessary to find out about this.
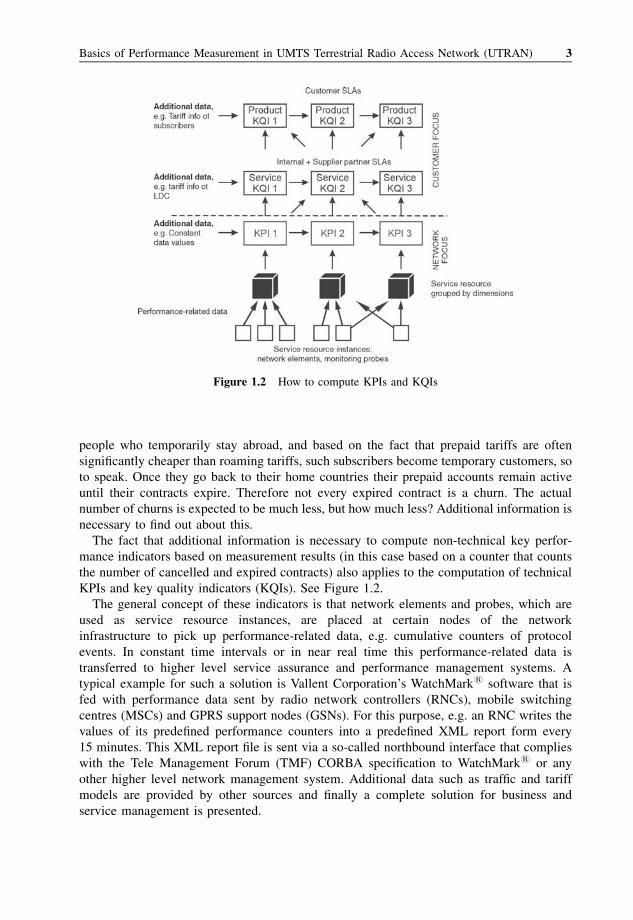
The fact that additional information is necessary to compute non-technical key perfor-
mance indicators based on measurement results (in this case based on a counter that counts
the number of cancelled and expired contracts) also applies to the computation of technical
KPIs and key quality indicators (KQIs). See Figure 1.2.
The general concept of these indicators is that network elements and probes, which are
used as service resource instances, are placed at certain nodes of the network
infrastructure to pick up performance-related data, e.g. cumulative counters of protocol
events. In constant time intervals or in near real time this performance-related data is
transferred to higher level service assurance and performance management systems. A
typical example for such a solution is Vallent Corporation’s WatchMark1 software that is
fed with performance data sent by radio network controllers (RNCs), mobile switching
centres (MSCs) and GPRS support nodes (GSNs). For this purpose, e.g. an RNC writes the
values of its predefined performance counters into a predefined XML report form every
15 minutes. This XML report file is sent via a so-called northbound interface that complies
with the Tele Management Forum (TMF) CORBA specification to WatchMark1 or any
other higher level network management system. Additional data such as traffic and tariff
models are provided by other sources and finally a complete solution for business and
service management is presented.
Figure 1.2 How to compute KPIs and KQIs
Basics of Performance Measurement in UMTS Terrestrial Radio Access Network (UTRAN) 3
As pointed out in www.watchmark.com the overall solution:
. . . provides benefits across a service provider’s entire customer base including pre-paid, post-paid
and enterprise customers:
� Service quality management provides an end-to-end visibility of service quality on the network
to ensure that each service (e.g. MMS, WiFi, iMode, SMS and GPRS etc.) is functioning
correctly for each user on the network.
� Internal and 3rd Party service level agreements (SLAs) allow Service Providers to test, evaluate
and monitor service levels within the organization to ensure that optimum service quality is
delivered to customers.
� Corporate SLAs enable Service Providers to establish specific agreements with their corporate
customers where they undertake to deliver customized end-to-end levels of service quality.
However, there is one major problem with this concept: network elements that feed
higher level network management systems with data are basically designed to switch
connections. It is not the primary job of an RNC to measure and report performance-
related data. The most critical part of mobile networks is the radio interface, and the
UTRAN controlled by RNCs is an excellent place to collect data giving an overview of
radio interface quality considering that drive tests that can do the same job are expensive
(at least it is necessary to pay two people per day and a car for a single drive test
campaign). Secondly, performance data measured during drive tests cannot be reported
frequently and directly to higher layer network management systems. Therefore a great
deal of important performance measurement data that could be of high value for service
quality management is simply not available. This triggers the need for a new generation of
measurement equipment that is able to capture terabytes of data from UTRAN interfaces,
performs highly sophisticated filtering and correlation processes, stores key performance
data results in databases and is able to display, export and import these measurement
results using standard components and procedures.
Before starting to discuss the architecture of such systems it is beneficial to have a look at
some definitions.
1.1.1 WHAT IS A KPI?
Key performance indicators can be found everywhere, not just in telecommunications. A
KPI does not need to deal with only technical things. There are dozens of economical KPIs
that can be seen every day, for example the Dow Jones Index and exchanges rates. The
turnover of a company should not be called a KPI, because it is just a counter value,
however, the gross margin is a KPI. Hence, what makes the difference between performance-
related data and a KPI is the fact that a KPI is computed using a formula.
There are different kinds of input for a KPI formula: cumulative counter values, constant
values, timer values seem to be the most important ones. Also KPI values that have been
already computed are often seen in new KPI formulas.
Most KPI formulas are simple. The difficulties are usually not in the formula itself, but
e.g. in the way that data is first filtered and then collected. This shall be demonstrated by
using a simple example. Imagine a KPI called NBAP Success Rate. It indicates how many
4 UMTS Performance Measurement
NBAP (Node B application part) procedures have been completed successfully and how
many have failed.
NBAP is a protocol used for communication between Node B (the UMTS base station)
and its CRNC (controlling radio network controller). To compute a NBAP Success Rate a
formula needs to be defined. In 3GPP 25.433 standard for Node B Application Part (NBAP)
protocol or in technical books dealing with the explanation of UMTS signalling procedures
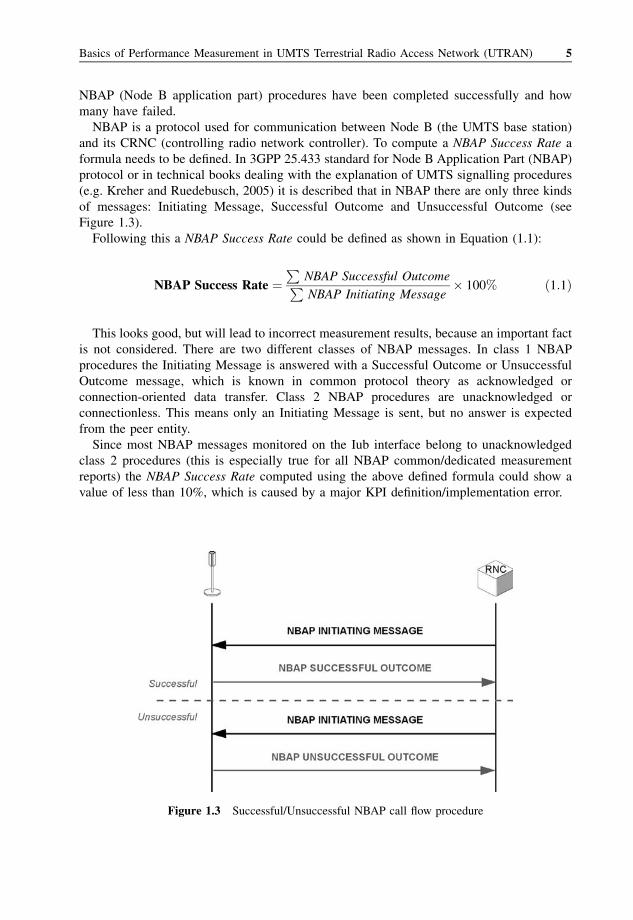
(e.g. Kreher and Ruedebusch, 2005) it is described that in NBAP there are only three kinds
of messages: Initiating Message, Successful Outcome and Unsuccessful Outcome (see
Figure 1.3).
Following this a NBAP Success Rate could be defined as shown in Equation (1.1):
NBAP Success Rate ¼P
NBAP Successful OutcomePNBAP Initiating Message
� 100% ð1:1Þ
This looks good, but will lead to incorrect measurement results, because an important fact
is not considered. There are two different classes of NBAP messages. In class 1 NBAP
procedures the Initiating Message is answered with a Successful Outcome or Unsuccessful
Outcome message, which is known in common protocol theory as acknowledged or
connection-oriented data transfer. Class 2 NBAP procedures are unacknowledged or
connectionless. This means only an Initiating Message is sent, but no answer is expected
from the peer entity.
Since most NBAP messages monitored on the Iub interface belong to unacknowledged
class 2 procedures (this is especially true for all NBAP common/dedicated measurement
reports) the NBAP Success Rate computed using the above defined formula could show a
value of less than 10%, which is caused by a major KPI definition/implementation error.
Figure 1.3 Successful/Unsuccessful NBAP call flow procedure
Basics of Performance Measurement in UMTS Terrestrial Radio Access Network (UTRAN) 5
Knowing the difference between NBAP class 1 and class 2 procedures a filter criteria
needs to be defined that could be expressed as follows:
NBAP Class 1 Success Rate ¼P
NBAP Successful OutcomePNBAP Class 1 Initiating Message
� 100% ð1:2Þ
An exact definition is usually not expressed in formulas, but more often by fully
explaining in writing the KPI definition. A couple of examples can be found in Chapter 2
of this book. The lesson learnt from the NBAP Success Rate example is that one cannot
compare KPIs based on their names alone. KPIs even cannot be compared based on their
formulas. When KPIs are compared it is necessary to know the exact definition, especially
the filter criteria used to select input and – as explained in next chapter – the aggregation
levels and parameter correlations.
Never trust the apparently endless lists of names of supported KPIs that can be found in
marketing documents of network and measurement equipment manufacturers. Often these
lists consist of simple event counters. Therefore, it must be kept in mind that additional data
is always necessary as well as simple counter values to compute meaningful KPIs and KQIs.
1.1.2 KPI AGGREGATION LEVELS AND CORRELATIONS
KPIs can be correlated to each other or related to elements in the network topology. The
correlation to a certain part of the network topology is often called the aggregation level.
Imagine a throughput measurement. The data for this measurement can be collected for
instance on the Iub interface, but can then be aggregated on the cell level, which means that
the measurement values are related to a certain cell. This is meaningful because several cells
share the same Iub interface and in the case of softer handover they also share the same data
stream transported in the same Iub physical transport bearer that is described by AAL2 SVC
address (VPI/VCI/CID). So it may happen that a single data stream on the Iub interface is
transmitted using two radio links in two or three different cells. If the previously mentioned
throughput measurement is used to get an impression of the load in the cell it is absolutely
correct to correlate the single measurement result with all cells involved in this softer
handover situation.
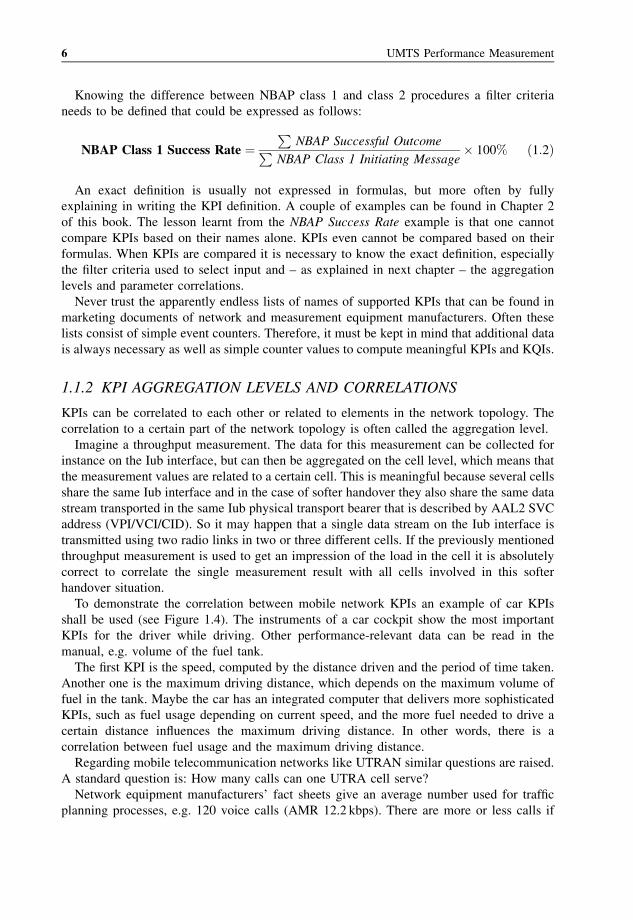
To demonstrate the correlation between mobile network KPIs an example of car KPIs
shall be used (see Figure 1.4). The instruments of a car cockpit show the most important
KPIs for the driver while driving. Other performance-relevant data can be read in the
manual, e.g. volume of the fuel tank.
The first KPI is the speed, computed by the distance driven and the period of time taken.
Another one is the maximum driving distance, which depends on the maximum volume of
fuel in the tank. Maybe the car has an integrated computer that delivers more sophisticated
KPIs, such as fuel usage depending on current speed, and the more fuel needed to drive a
certain distance influences the maximum driving distance. In other words, there is a
correlation between fuel usage and the maximum driving distance.
Regarding mobile telecommunication networks like UTRAN similar questions are raised.
A standard question is: How many calls can one UTRA cell serve?
Network equipment manufacturers’ fact sheets give an average number used for traffic
planning processes, e.g. 120 voice calls (AMR 12.2 kbps). There are more or less calls if
6 UMTS Performance Measurement
different services such as 384 kbps data calls or different AMR codecs with lower data
transmission rates are used. The capacity of a cell depends on the type of active services and
the conditions on the radio interface, especially on the level of interference. Hence, it makes
sense to correlate interference measurements with the number of active calls shown per
service. This combination of RF measurements requires sophisticated KPI definitions and
measurement applications. The first step could start with the following approach: Count the
number of active connections per cell and the number of services running on those active
connections in the cell.
Before continuing with this example it is necessary to explain the frame conditions of this
measurement, looking at where these counters can be pegged under which conditions and
how data can be filtered to display counter subsets per cell and per service.
1.1.3 BASIC APPROACH TO CAPTURE AND FILTERPERFORMANCE-RELATED DATA IN UTRAN
The scope of this book is UTRAN performance measurement. Within UTRAN four
interfaces exist where performance-related data can be captured: the Iub interface between
Node Bs and RNC; the Iur interface between different RNCs; the IuCS interface between
RNCs and the CS core network domain; and the IuPS interface between RNCs and the PS
core network domain. For each interface a specific protocol stack is necessary to decode all
layers of captured data as explained in detail in Section 1.2, which deals with the functions
and architecture of performance measurement equipment. Usually this equipment is able to
automatically detect to which specific interfaces a probe is connected and which protocol
stacks are necessary to decode captured data. If necessary it can also detect on which
particular channel data is transmitted. This especially refers to dedicated and common
transport channels on the Iub interface. In addition, it can be assumed that the same
equipment also provides a function that is commonly known as call trace, which allows for
the automatic detection and filtering of all messages and data packets belonging to a
particular connection between a single UE and the network. For a detailed overview of all
interfaces, channels and call procedures it is recommended to read the appropriate chapters
Figure 1.4 Correlation between car KPIs
Basics of Performance Measurement in UMTS Terrestrial Radio Access Network (UTRAN) 7
in Kreher and Ruedebusch (2005). From a performance measurement expert’s perspective it
is expected that these functions are provided and work as required to decode and aggregate
performance-related data. Nevertheless, in this chapter a few basic network procedures need
to be explained, that apply to all scenarios, because they may be relevant for any call or at
any time during an active connection.
Our approach is as already defined in the previous section. Count all connections in a cell
and provide a set of sub-counters that is able to distinguish which services are used during
these connections. From a subscriber’s perspective this scenario is simple. They switch on
their mobile phones, set up calls, walk around or drive by car (which could result in a couple
of mobility management procedures) and finish their calls whenever they want.
Now from a network operator’s perspective it is necessary to find out in which cell the
calls are active and identify the type of service related to each particular call. It sounds easy,
but due to the specific nature of the UTRAN procedure it is indeed a fairly complicated
analysis.
When the term ‘service’ is used in the context of performance measurement this usually
applies to end-user services such as voice calls, data calls and – if available in network and if
the UE is capable – video-telephony calls. All kinds of supplementary services such as
conference calls or multi-party connections are seen as special cases of the above categories
and are not analysed in detail. However, when looking at data calls the type of service can
also be determined from the TCP/IP application layer, e.g. file transfer (FTP) or web
browsing (HTTP). These specific services are beyond the scope of this basic approach for
two reasons. Firstly they require a more complex correlation of measurement data, secondly
it makes no sense to define a TCP/IP analysis at cell level, because even the smallest email or
website is segmented by the RLC into a number of different transport blocks and
theoretically each transport block set can be transmitted using a different cell.
There is another well-known service from GSM, which is also available in UMTS. This
service is called short message service (SMS). A short message is not sent using a dedicated
traffic channel, it is sent piggybacked on signalling messages. Plain signalling is also
necessary to register a mobile phone to the network after being switched on. There is no
payload transmitted between subscriber and network, but nevertheless signalling is essential
and for this reason another service type called ‘signalling’ will be defined in addition to
‘voice’, ‘data’ and ‘video-telephony’ in this basic approach.
Now the question is how to distinguish the four different services by monitoring protocol
messages.
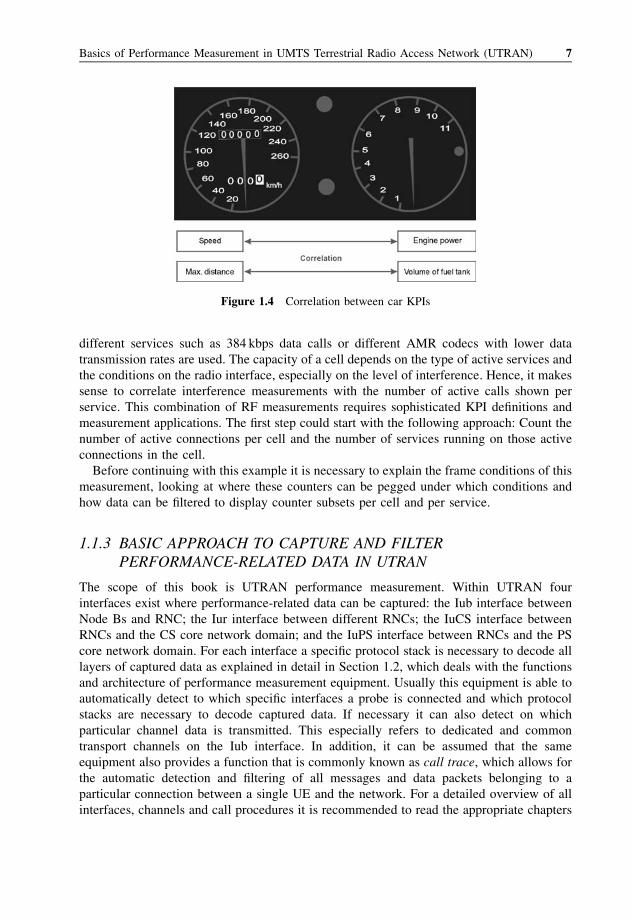
A CS call set up always starts with a Call Control Setup message as specified in 3GPP
24.008. The ‘decision maker’ that distinguishes between voice calls and video-telephony
calls is the value of the bearer capability information element within this Setup message. If
the bearer capability information element shows the value ‘unrestricted digital info’ the call
is a video-telephony call. Another indicator is the signalling access protocol I.440/450 and
rate adaptation following H.223 & H.245 mentioned in the same message. See Figure 1.5.
It is difficult to explain what a bearer is. Maybe the following definition is the best one: A
bearer is a temporary channel used to transport a data stream (user or network data) with a
defined quality of service. (All definitions in this book are given by the author using his own
words. Standard definitions may be more exact, but are often not very understandable.)
This is true for both GSM and UMTS, but in UMTS the bearer concept covers all possible
data streams in each part and layer of the network while in ISDN/GSM it is only used to
8 UMTS Performance Measurement
define the characteristics of traffic channels between subscribers. A service from the point of
view of UTRAN is always bound to a certain type of (radio) bearer and hence, analysing
characteristics of UMTS bearer services is another possible definition of ‘call type’ and is
completely different from the approach given in this chapter which is based on NAS
signalling analysis.
Looking back to the specific signalling used between the UE and the CS core network
domain it emerges that in contrast to video-telephony calls voice calls have the bearer
capability value ‘speech’ in the Call Control Setup message. A PS connection (data call)
always starts with a Service Request message. This Service Request indicates that there is
data (IP payload) to be transmitted, but it should be noted that this definition might not
always fit to the user’s perspective of an active PS call.
Imagine a subscriber starting a mobile web-browsing application. For this purpose a PDP
context is established between the UE and the SGSN and a traffic channel, which is called
the radio access bearer (RAB) is provided. Now a website is downloaded and the user starts
to read its contents. This may take a while. Besides the user may switch to another
application while keeping the web-browser open. This is not a problem in fixed data
networks. IP data is only transmitted when necessary, if there is no data transfer no network
resources of the fixed line are occupied. That does not apply to UTRAN. Here dedicated
resources (these are the codes used to identify channels on the radio interface) need to be
provided for each RAB. And those resources are limited. That is the reason why the network
needs to identify which resources are really used. All other resources are released to prevent
Figure 1.5 Call Control Setup message for video-telephony call
Basics of Performance Measurement in UMTS Terrestrial Radio Access Network (UTRAN) 9
shortage and guarantee subscriber satisfaction. This leads to a situation that a PDP Context
that is bound to the open web-browsing application remains active in the UE and SGSN
while a RAB is released if the network detects that no data is transmitted for a certain time.
Based on this a PS connection in UTRAN is defined, whereas an active PS RAB and RAB
assignment is always triggered by a Session Management Service Request message.
RABs are also set up for CS connections, but for conversational calls they are active as
long as a call is active. Indeed, there are several ways to count the number of active
connections, which means that there are different protocol messages from different protocol
layers. The advantages of the method described in this chapter are:
1. Non-access stratum (NAS) signalling messages can be found on both Iub and Iu
interfaces.
2. NAS messages contain information elements that allow direct identification of the call
type. In the case of e.g. an RANAP RAB Assignment Request it can only be guessed from
the UL/DL maximum bit rate and traffic class mentioned in this message which call type
is related to the RAB. This requires additional mapping tables running in the background
of the performance measurement application (note that this is an alternative option).
3. Setup and Service Request messages may contain user identifiers that allow further filter
options (e.g. count all active connections per cell, per call type, per UE) and are helpful
for troubleshooting.
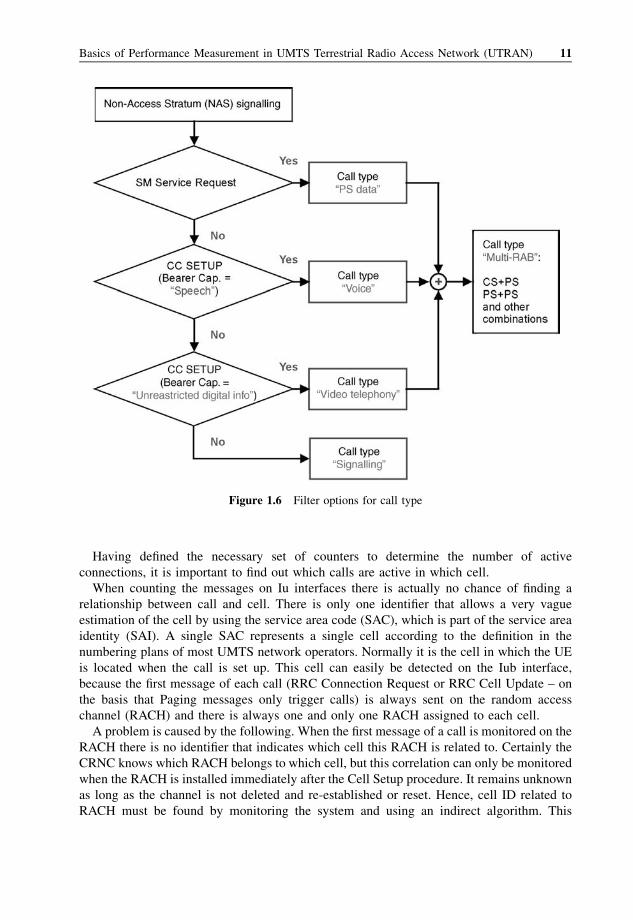
To complete the call type definition, ‘signalling’ constitutes all call flows between the UE
and core network domains that do not contain Setup or Service Request messages. It is also
necessary to define another category that is usually called ‘Multi-RAB’ and describes a UE
that has at least two active connections (RABs) simultaneously. Multi-RAB calls can be a
combination of CS and PS services for one UE, but multiple PS RABs are also possible, for
instance if PS streaming video requires the set up of a secondary PDP context that triggers
the establishment of a second PS RAB for the same UE. This second RAB provides a
different traffic class (¼ different delay sensitivity) and different maximum bit rates. An
example for such a kind of Multi-RAB PSþPS would be a GPRS session management
message Activate Secondary PDP Context Request. Figure 1.6 shows the different filter
options.
Protocol events used to determine the call type cannot immediately be used to count the
number of active connections, because they only describe connection attempts. Therefore, it
is necessary to check if the attempted connection has been set up successfully. This can be
done on the RRC, RANAP or NAS layer. On the Iub interface the RRC Radio Bearer Setup
Complete message indicates that a traffic channel has been established successfully.
Following this the RANAP RAB Assignment Response is sent on the Iu interface while
the NAS layer indicates that the connection between A-party and B-party has been
established. For PS calls the session management Service Accept and PDP Context
Activation Accept messages could be used as additional indicators for a successful
connection. It should be noted that in the case of video telephony calls via the CS domain
in-band signalling is also necessary to really get the service running. This in-band signalling
is transmitted using the radio (access) bearer and the example proves that there are different
perspectives of user and network and it clarifies the need to have different KPIs for those
different perspectives.
10 UMTS Performance Measurement
Having defined the necessary set of counters to determine the number of active
connections, it is important to find out which calls are active in which cell.
When counting the messages on Iu interfaces there is actually no chance of finding a
relationship between call and cell. There is only one identifier that allows a very vague
estimation of the cell by using the service area code (SAC), which is part of the service area
identity (SAI). A single SAC represents a single cell according to the definition in the
numbering plans of most UMTS network operators. Normally it is the cell in which the UE
is located when the call is set up. This cell can easily be detected on the Iub interface,
because the first message of each call (RRC Connection Request or RRC Cell Update – on
the basis that Paging messages only trigger calls) is always sent on the random access
channel (RACH) and there is always one and only one RACH assigned to each cell.
A problem is caused by the following. When the first message of a call is monitored on the
RACH there is no identifier that indicates which cell this RACH is related to. Certainly the
CRNC knows which RACH belongs to which cell, but this correlation can only be monitored
when the RACH is installed immediately after the Cell Setup procedure. It remains unknown
as long as the channel is not deleted and re-established or reset. Hence, cell ID related to
RACH must be found by monitoring the system and using an indirect algorithm. This
Figure 1.6 Filter options for call type
Basics of Performance Measurement in UMTS Terrestrial Radio Access Network (UTRAN) 11
algorithm is based on the fact that one or more forward access channels (FACHs) belong to
the same cell as the RACH and the messages sent on an FACH are called RRC Connection
Setup or Cell Update Complete. These messages contain a cell identifier and have a 1 : 1
relationship with RRC Connection Request or RRC Cell Update Request messages
previously monitored on the RACH. Using this principle the cell identity related to a certain
RACH can be investigated and the results are stored in a special database of the performance
measurement system. This database is often named the ‘topology module’. It contains
necessary information to correlate protocol events with network elements and their identifiers.
Due to the fact that the phone is a mobile it moves and may change the cell, which causes
another problem. The footprint of UMTS cells is on average 10 times smaller than the
footprint of GSM cells and therefore cell changes, called ‘handovers’ in UMTS, occur much
more often. In addition, most currently deployed UMTS networks in Europe and North
America work in FDD mode. FDD stands for frequency division duplex and means that the
uplink and downlink channels use different frequency bands. This applies for instance for the
already mentioned RACH (uplink) and FACH (downlink).
A special kind of handover, the soft handover, is possible between FDD cells working on
the same frequency bands for uplink and downlink radio transmission. A hard handover as
known from GSM – also defined for UMTS – is characterised by the fact that first a call is
deleted in the old cell (also named ‘source cell’) during handover and interrupted for a very
short time frame of max. 200ms before it is continued in a new cell (called ‘target cell‘).
However, in the case of a soft handover there is no interruption, instead the user equipment
(UE) is connected to several cells simultaneously. The UE has a radio link to each cell
involved in a soft handover situation. A bundle of all radio links belonging to a single UE is
called its active set.
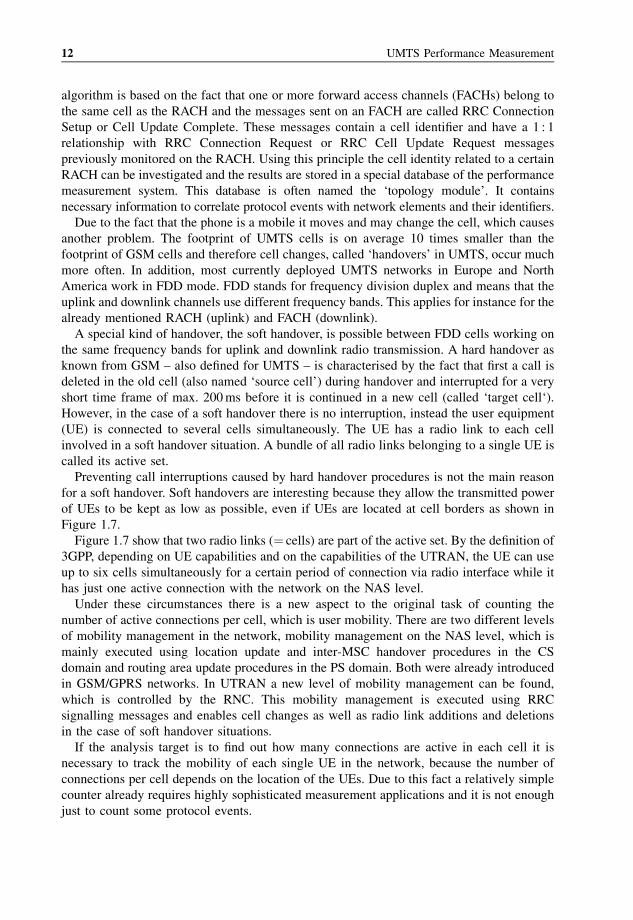
Preventing call interruptions caused by hard handover procedures is not the main reason
for a soft handover. Soft handovers are interesting because they allow the transmitted power
of UEs to be kept as low as possible, even if UEs are located at cell borders as shown in
Figure 1.7.
Figure 1.7 show that two radio links (¼ cells) are part of the active set. By the definition of
3GPP, depending on UE capabilities and on the capabilities of the UTRAN, the UE can use
up to six cells simultaneously for a certain period of connection via radio interface while it
has just one active connection with the network on the NAS level.
Under these circumstances there is a new aspect to the original task of counting the
number of active connections per cell, which is user mobility. There are two different levels
of mobility management in the network, mobility management on the NAS level, which is
mainly executed using location update and inter-MSC handover procedures in the CS
domain and routing area update procedures in the PS domain. Both were already introduced
in GSM/GPRS networks. In UTRAN a new level of mobility management can be found,
which is controlled by the RNC. This mobility management is executed using RRC
signalling messages and enables cell changes as well as radio link additions and deletions
in the case of soft handover situations.
If the analysis target is to find out how many connections are active in each cell it is
necessary to track the mobility of each single UE in the network, because the number of
connections per cell depends on the location of the UEs. Due to this fact a relatively simple
counter already requires highly sophisticated measurement applications and it is not enough
just to count some protocol events.
12 UMTS Performance Measurement
The next sections will give an overview of the requirements for UTRAN performance
measurement which have been defined by 3GPP and of additional measurement procedures
that have not been defined by standard organisations, but are also necessary to deliver useful
performance measurement results.
1.1.4 PERFORMANCE MEASUREMENT DEFINITIONS OF 3GPP
Anyone searching for KPI definitions in 3GPP specifications will be disappointed. 3GPP has
not defined any key performance indicators. However, there are definitions of performance-
related data that is either transmitted between network elements using measurement report
messages or data measured in network elements and provided for analysis in higher level
network management systems. Basically those definitions cover two major groups of
performance-related data: radio-related measurements and protocol event counters.
Also only a fairly general framework document exists that describes performance
measurement tasks from a high level perspective. This document is 3GPP 32.401 ‘Concepts
and Requirements for Performance Measurement’. It defines all tasks for measurement job
administration, e.g. the start and stop of measurement procedures and how measurement jobs
are initialised, modified and terminated. The second part deals with measurement type
definitions and measurement result generation. It contains e.g. descriptions of how gauges
are measured (e.g. max/min/mean values of response time measurements and when
cumulative counters need to be reset). In addition, there are some interesting statements
about granularity and accuracy, e.g. a success event will always belong to the same sampling
Figure 1.7 The soft handover advantage
Basics of Performance Measurement in UMTS Terrestrial Radio Access Network (UTRAN) 13
period as the attempt event to which it is bound. All in all, this standard document gives a
good overview on how to store and transport performance data that is already available, but
is says nothing about how to get such data or about how to compute and analyse it.
Measurement definition can be found in 3GPP 32.403 ‘Performance Measurement –
UMTS and Combined UMTS/GSM’. The title sounds like a perfect compendium, but
actually it is just a list of protocol event counter definitions. It is highly recommended to look
for the latest available document version, because in some older versions (e.g. v4.5.0) even
the protocol events are not always well defined, as the following example shows. It defines
for instance a single counter that counts NBAP and RNSAP radio link addition events, but in
the two protocols – despite the procedures having the same name – they have totally
different functions. Newer versions like v5.8.0 have corrected this error and define separate
counters for NBAP and RNSAP radio link addition.
All in all the main limitations of 3GPP 32.403 remain the same, no matter which specific
document version is used:
� Only counters for higher layer protocol layers are defined – no events are defined that
indicate that problems might appear on transport layers, for instance if AAL2 SVCs
cannot be set up or are dropped.
� From an RNC perspective only the RRC, NBAP and RNSAP dealing with connection set
up and handover are taken into account. There is no definition of ALCAP events, neither
are counters for other interesting events defined (e.g. NBAP radio link failure indication).
� There is no multi-interface perspective, e.g. it is not possible to distinguish between
NBAP radio link setup for intra-RNC soft handover and inter-RNC soft handover
(triggered by the RNSAP radio link setup or radio link addition procedures).
� There is no multi-layer perspective, e.g. it is not possible to have combined soft handover
analysis based on NBAP, ALCAP and RRC events that interact to perform this mobility
management procedure.
� And finally there is no relation between defined protocol events and network services as
they can be found in service level agreements between network operator and subscriber.
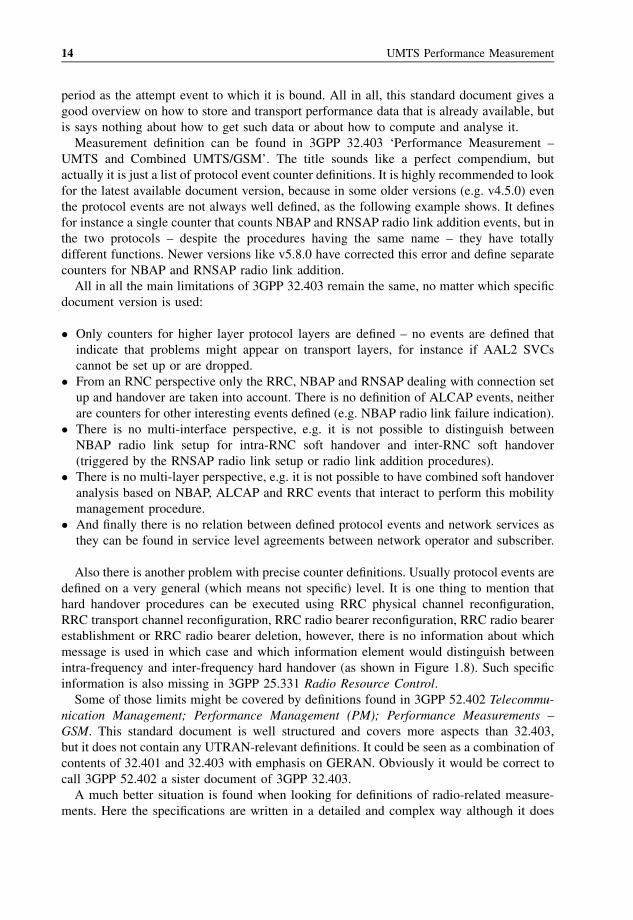
Also there is another problem with precise counter definitions. Usually protocol events are
defined on a very general (which means not specific) level. It is one thing to mention that
hard handover procedures can be executed using RRC physical channel reconfiguration,
RRC transport channel reconfiguration, RRC radio bearer reconfiguration, RRC radio bearer
establishment or RRC radio bearer deletion, however, there is no information about which
message is used in which case and which information element would distinguish between
intra-frequency and inter-frequency hard handover (as shown in Figure 1.8). Such specific
information is also missing in 3GPP 25.331 Radio Resource Control.
Some of those limits might be covered by definitions found in 3GPP 52.402 Telecommu-
nication Management; Performance Management (PM); Performance Measurements –
GSM. This standard document is well structured and covers more aspects than 32.403,
but it does not contain any UTRAN-relevant definitions. It could be seen as a combination of
contents of 32.401 and 32.403 with emphasis on GERAN. Obviously it would be correct to
call 3GPP 52.402 a sister document of 3GPP 32.403.
A much better situation is found when looking for definitions of radio-related measure-
ments. Here the specifications are written in a detailed and complex way although it does
14 UMTS Performance Measurement
take a lot of knowledge to understand what is measured, how measurement results are
computed, transmitted and finally presented.
It starts with 3GPP 25.215 Physical Layer – Measurements (FDD). This standard
document gives a comprehensive overview of measurement abilities on UE and UTRAN.
It is very useful to understand which parameters are measured in and reported by UE (using
RRC measurement reports) and cell/Node B (using NBAP measurement reports). For each
measurement parameter a clear definition is given including exceptions and limitations.
3GPP 25.216 is a comparable document of 3GPP 25.215 for UTRAN TDD mode but details
of radio quality measurement in TDD mode are beyond the scope of this book.
The most important radio measurement abilities defined in 3GPP 25.215 are:
From Node B (NBAP measurement reports):
� Common measurements – related to a cell, not to a single connection:
– Received total wideband power (RTWP)¼ total UTRA uplink frequency noise on cell
antenna
– Transmitted carrier power¼ total downlink Tx power of cell antenna
– Preambles of PRACH¼ number of connection request attempts on radio interface
necessary until network reacts by sending either positive or negative confirmation. In
the case of positive confirmation UE is allowed to send an RRC Connection Request as
the first higher layer message.
� Dedicated measurements – related to a single connection or single radio link, but not
related to a single cell:
– SIR (signal-to-interference ratio)¼ ratio between measured uplink RSCP of a
single UE’s signal and the interference code power (ISCP) after spreading of received
signals
Figure 1.8 Same protocol message used for different handovers procedures
Basics of Performance Measurement in UMTS Terrestrial Radio Access Network (UTRAN) 15
– SIR error – measured difference between uplink SIR target set by SRNC and measured
SIR
– Transmitted code power¼ transmitted power for one downlink dedicated physical
channel (DPCH) sent by a single cell/antenna
– Round trip time on Uu interface¼ estimation based on time difference between RLC
frames and appropriate RLC Acknowledgement (RLC AM)
From UE (RRC measurement reports). All those measurements are related to a single radio
link (¼ single cell) used for a single connection, because they all depend on the location of
the UE related to a single cell at the time of measurement:
� Chip energy over noise (Ec/N0)¼ downlink equivalent of SIR, but based on measure-
ment of common pilot channel (CPICH)
� Received signal code power (RSCP) – Rx level of downlink dedicated physical channel
(DPCH) on UE antenna
� UTRA received signal strength indicator (RSSI) – total UTRA downlink frequency
noise on UE antenna, downlink equivalent to RTWP.
� Event-IDs – used to report predefined measurement events measured downlink frequency.
There are other measurement abilities defined in the same 3GPP standard document, but
they have not been implemented yet in UTRAN, which can be understood as a sign of lower
priority.
All the above-mentioned radio-related measurements will be explained in more detail in
Section 2.2.
While 3GPP 25.215 defines the measurement parameters there is another interesting
specification named 3GPP 25.133 Requirements for Support of Radio Resource Management
(FDD). It explains how the measurement results of 3GPP 25.215 parameters are reported,
which reporting ranges are defined and how these measurement results are encoded in
signalling messages (measurement reports). There are also some formula definitions that
describe how radio-specific measurement values are computed in UE or Node B, but these
formulas are not KPI definitions. Additionally, measurement requirements for all UTRAN
mobility management procedures such as cell (re-)selection and handovers and RRC
connection control are described including timing and signalling characteristics related to
these procedures.
These few standard documents contain what is defined for UTRAN performance
measurement in 3GPP standards and it is always a good idea to remember these standard
documents when talking about KPI definitions.
1.1.5 USER EXPERIENCE VS. 3GPP PERFORMANCEMEASUREMENT DEFINITIONS
Remembering the network operator’s optimisation strategy (Figure 1.1) it is a fact that the
subscriber’s experience – often called user perceived quality of service or user quality of
experience – is a key factor of business success. Hence, it is important for network operators
to measure this quality of experience (QoE). From the previous section one question arises:
16 UMTS Performance Measurement
Are 3GPP performance measurement definitions of an acceptable standard to measure the
user quality of experience?
This leads to another question: What do users recognise when they use network services?
Imagine a subscriber using a UMTS mobile phone. All he wants is to switch it on, make a
voice call, make a data call and switch it off. If everything works fine the subscriber’s
impression is positive. If there are problems they will most likely fall into one of the
following five categories:
� Subscribers are not able to register to the network.
� Subscribers are not able to set up calls.
� The calls made are dropped before the calling or the called party hangs up.
� Poor information transmission speed is measured especially for data calls, e.g. by file
transfer software.
� The quality of transmitted information is bad, which especially has an impact on
conversation calls (voice, video-telephony).
While subscribers are not interested in the details of problem analysis, technicians and
engineers working for network operators need to find the root causes and measure the
occurrence of problems.
1.1.5.1 Problems with Registration and Call Setup
For registration and call setup procedures it is first necessary that the UE has an active RRC
connection with its serving RNC (SRNC). This connection either needs to be set up or it
needs to be pushed into RRC states CELL_DCH or CELL_FACH, because only in those
states is it possible to exchange NAS messages between UE and network. Also NAS
messages are necessary to register and to set up calls.
Following this there is a number of possibilities why the UE is not able to perform
registration or call setup procedure:
� RRC Connection cannot be set up because network does not answer UE’s request or
connection setup request is rejected by the network due to blocking.
� Once signalling radio bearers (the dedicated control channels (DCCHs) that carry RRC
messages) are established it is possible that they are dropped, e.g. due to failures on radio
interface, handover problems on RRC mobility management level or other reasons.
� Although the RRC connection is working properly problems with establishment of Iu
signalling connections using RANAP might turn up.
� And finally problems on the NAS layer may occur that lead to exceptions in registration
and call setup procedures. In part 2 of Kreher and Ruedebusch (2005) a troubleshooting
example has been given in which a Location Update procedure (a CS registration) is
rejected by the MSC due to ‘network failure‘ and root cause analysis has proven that RNC
has failed to execute a security mode request sent by CS domain. This example may stand
as a typical failure belonging to this group.
All in all there are several dozen single-interface single-layer procedures that could
block successful registration or call setup procedures. Most of these single-layer
Basics of Performance Measurement in UMTS Terrestrial Radio Access Network (UTRAN) 17
procedures are analysed if performance measurement counters defined in 3GPP 32.403
are implemented in network elements (RNC, MSC, SGSN). However, usually these
counter values do not reflect the customer’s experience, because highly sophisticated
filtering and correlation functions are not implemented in statistics functions of network
elements.
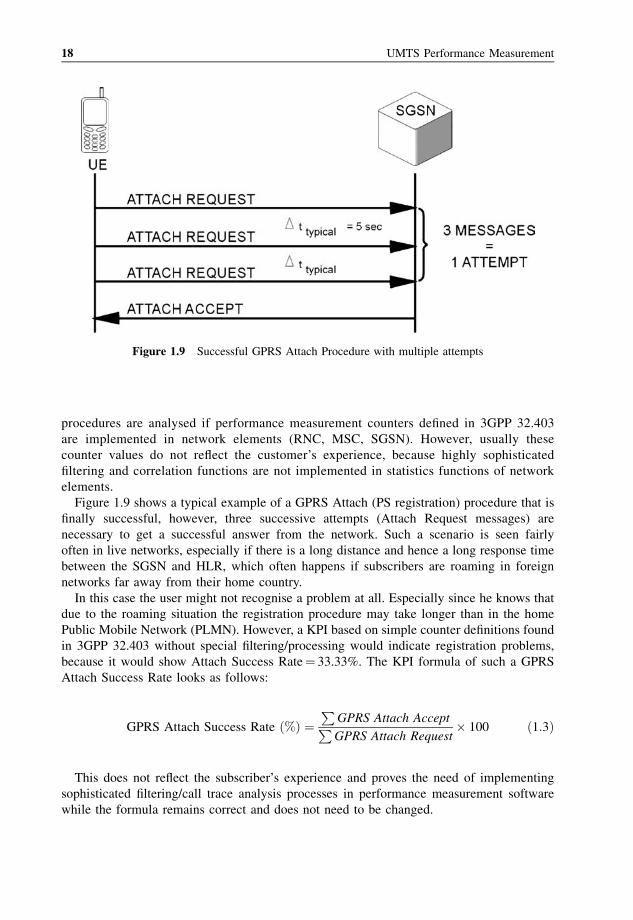
Figure 1.9 shows a typical example of a GPRS Attach (PS registration) procedure that is
finally successful, however, three successive attempts (Attach Request messages) are
necessary to get a successful answer from the network. Such a scenario is seen fairly
often in live networks, especially if there is a long distance and hence a long response time
between the SGSN and HLR, which often happens if subscribers are roaming in foreign
networks far away from their home country.
In this case the user might not recognise a problem at all. Especially since he knows that
due to the roaming situation the registration procedure may take longer than in the home
Public Mobile Network (PLMN). However, a KPI based on simple counter definitions found
in 3GPP 32.403 without special filtering/processing would indicate registration problems,
because it would show Attach Success Rate¼ 33.33%. The KPI formula of such a GPRS
Attach Success Rate looks as follows:
GPRS Attach Success Rate ð%Þ ¼P
GPRS Attach AcceptPGPRS Attach Request
� 100 ð1:3Þ
This does not reflect the subscriber’s experience and proves the need of implementing
sophisticated filtering/call trace analysis processes in performance measurement software
while the formula remains correct and does not need to be changed.
Figure 1.9 Successful GPRS Attach Procedure with multiple attempts
18 UMTS Performance Measurement
1.1.5.2 Dropped Calls
Subscribers recognise that calls are dropped, that is to say an ongoing connection (defined as
successfully established RAB in Section 1.1.3) is terminated for abnormal reasons. Most
likely those reasons are found on the radio interface, for instance bad coverage or
unsuccessful handovers. There is a signalling message that indicates such problems on
lub. It is the NBAP Radio Link Failure Indication containing the cause value ‘synchroniza-
tion failure’.
In 3GPP 32.403 a counter for this protocol event is not defined. Most likely because 3GPP
authors have in mind that it is sufficient to analyse cause values found in RANAP Iu-Release
Request or RAB-Release Request messages that trigger the RANAP Iu-Release or single
RAB Release procedure. Usually a RANAP cause value like ‘radio connection with UE lost’
indicates that a particular release request was triggered by an NBAP Radio Link Failure
Indication, but not every NBAP Radio Link Failure Indication indicates a dropped call –
especially if the user’s experience is taken into account. This is true because if a problem on
a single radio link of an active set occurs other radio links of the same active set will still
continue to transmit data. However, in such cases a bit error rate (BER) and block error rate
(BLER) of the connection may arise. For this reason BER and BLER are often seen as
indicators of a user’s quality of experience. However, even if a radio connection was totally
dropped in UMTS it can be re-established. The procedure used for this purpose is called
RRC re-establishment, but it does not only include re-establishment of RRC signalling
connection – all previously used dedicated transport channels (DCHs) for radio bearers can
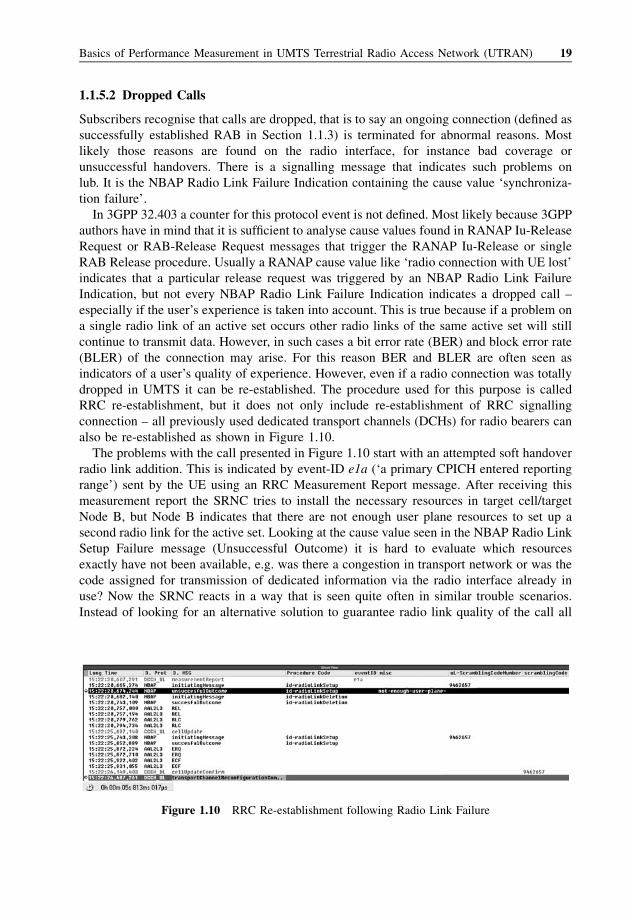
also be re-established as shown in Figure 1.10.
The problems with the call presented in Figure 1.10 start with an attempted soft handover
radio link addition. This is indicated by event-ID e1a (‘a primary CPICH entered reporting
range’) sent by the UE using an RRC Measurement Report message. After receiving this
measurement report the SRNC tries to install the necessary resources in target cell/target
Node B, but Node B indicates that there are not enough user plane resources to set up a
second radio link for the active set. Looking at the cause value seen in the NBAP Radio Link
Setup Failure message (Unsuccessful Outcome) it is hard to evaluate which resources
exactly have not been available, e.g. was there a congestion in transport network or was the
code assigned for transmission of dedicated information via the radio interface already in
use? Now the SRNC reacts in a way that is seen quite often in similar trouble scenarios.
Instead of looking for an alternative solution to guarantee radio link quality of the call all
Figure 1.10 RRC Re-establishment following Radio Link Failure
Basics of Performance Measurement in UMTS Terrestrial Radio Access Network (UTRAN) 19
radio links are terminated – without informing UE about this radio link deletion (it could
have been done using RRC signalling connection). What happens from the UE’s perspective
is that dedicated radio links are suddenly gone, the mobile phone finds itself alone in the
field, falls into CELL_FACH state and sends RRC Cell Update (cause¼ ‘radio link failure’)
to the best available cell using the RACH of this cell.
The reselected cell forwards this Cell Update message to its controlling RNC (CRNC). By
chance in this case it is the same RNC that used to be the serving RNC of the abnormally
terminated RRC connection. Hence, this RNC establishes the radio link again using the RRC
Cell Update Complete message and after approximately 6 seconds the previously dropped
connection becomes active again. Final statement: the call is not really dropped, but only
interrupted for approximately 6 seconds.
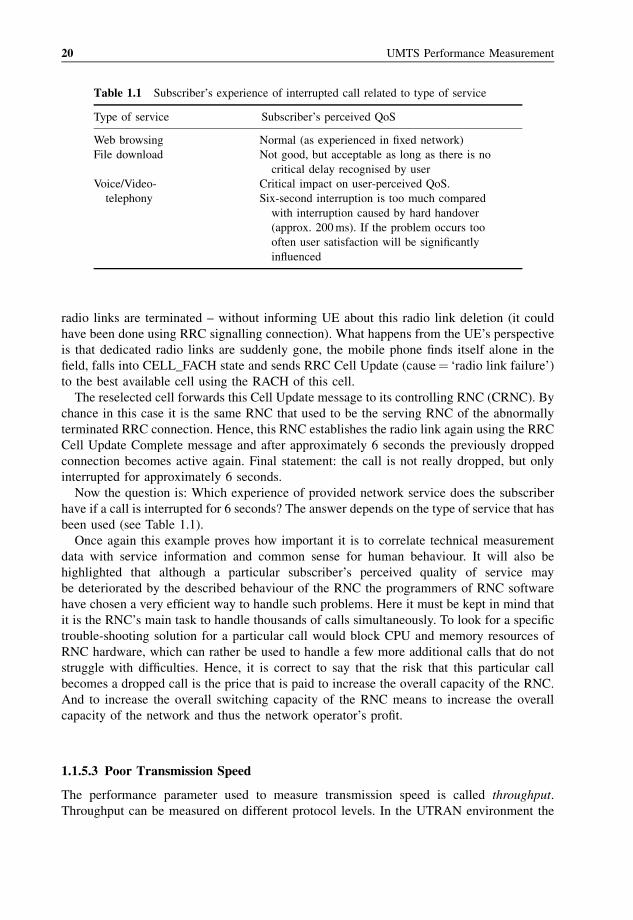
Now the question is: Which experience of provided network service does the subscriber
have if a call is interrupted for 6 seconds? The answer depends on the type of service that has
been used (see Table 1.1).
Once again this example proves how important it is to correlate technical measurement
data with service information and common sense for human behaviour. It will also be
highlighted that although a particular subscriber’s perceived quality of service may
be deteriorated by the described behaviour of the RNC the programmers of RNC software
have chosen a very efficient way to handle such problems. Here it must be kept in mind that
it is the RNC’s main task to handle thousands of calls simultaneously. To look for a specific
trouble-shooting solution for a particular call would block CPU and memory resources of
RNC hardware, which can rather be used to handle a few more additional calls that do not
struggle with difficulties. Hence, it is correct to say that the risk that this particular call
becomes a dropped call is the price that is paid to increase the overall capacity of the RNC.
And to increase the overall switching capacity of the RNC means to increase the overall
capacity of the network and thus the network operator’s profit.
1.1.5.3 Poor Transmission Speed
The performance parameter used to measure transmission speed is called throughput.
Throughput can be measured on different protocol levels. In the UTRAN environment the
Table 1.1 Subscriber’s experience of interrupted call related to type of service
Type of service Subscriber’s perceived QoS
Web browsing Normal (as experienced in fixed network)
File download Not good, but acceptable as long as there is no
critical delay recognised by user
Voice/Video- Critical impact on user-perceived QoS.
telephony Six-second interruption is too much compared
with interruption caused by hard handover
(approx. 200ms). If the problem occurs too
often user satisfaction will be significantly
influenced
20 UMTS Performance Measurement
following throughput measurements are useful:
� RLC throughput to have a traffic measurement that reflects uplink/downlink traffic load
on a cell. RLC throughput includes all kinds of user plane/control plane traffic transmitted
via the radio interface, no matter if identical information is simultaneously transmitted in
any neighbour cells due to soft handover situations.
� Transport channel throughput is the data transmission speed measured on a single
transport channel (usually the dedicated transport channel (DCH)) that can be compared
with the theoretical possible transport channel throughput derived from used transport
format set definitions.
� User perceived throughput is the throughput of RLC payload excluding payload
information that is retransmitted due to RLC AM. Secondary traffic due to soft handover
situations transmitted on the radio interface need to be subtracted as well.
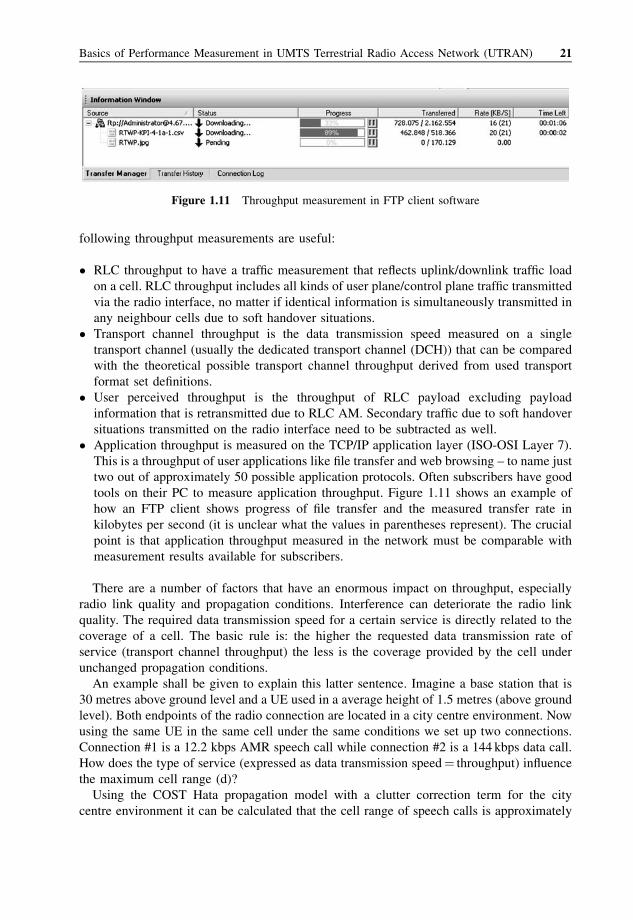
� Application throughput is measured on the TCP/IP application layer (ISO-OSI Layer 7).
This is a throughput of user applications like file transfer and web browsing – to name just
two out of approximately 50 possible application protocols. Often subscribers have good
tools on their PC to measure application throughput. Figure 1.11 shows an example of
how an FTP client shows progress of file transfer and the measured transfer rate in
kilobytes per second (it is unclear what the values in parentheses represent). The crucial
point is that application throughput measured in the network must be comparable with
measurement results available for subscribers.
There are a number of factors that have an enormous impact on throughput, especially
radio link quality and propagation conditions. Interference can deteriorate the radio link
quality. The required data transmission speed for a certain service is directly related to the
coverage of a cell. The basic rule is: the higher the requested data transmission rate of
service (transport channel throughput) the less is the coverage provided by the cell under
unchanged propagation conditions.
An example shall be given to explain this latter sentence. Imagine a base station that is
30 metres above ground level and a UE used in a average height of 1.5 metres (above ground
level). Both endpoints of the radio connection are located in a city centre environment. Now
using the same UE in the same cell under the same conditions we set up two connections.
Connection #1 is a 12.2 kbps AMR speech call while connection #2 is a 144 kbps data call.
How does the type of service (expressed as data transmission speed¼ throughput) influence
the maximum cell range (d)?
Using the COST Hata propagation model with a clutter correction term for the city
centre environment it can be calculated that the cell range of speech calls is approximately
Figure 1.11 Throughput measurement in FTP client software
Basics of Performance Measurement in UMTS Terrestrial Radio Access Network (UTRAN) 21
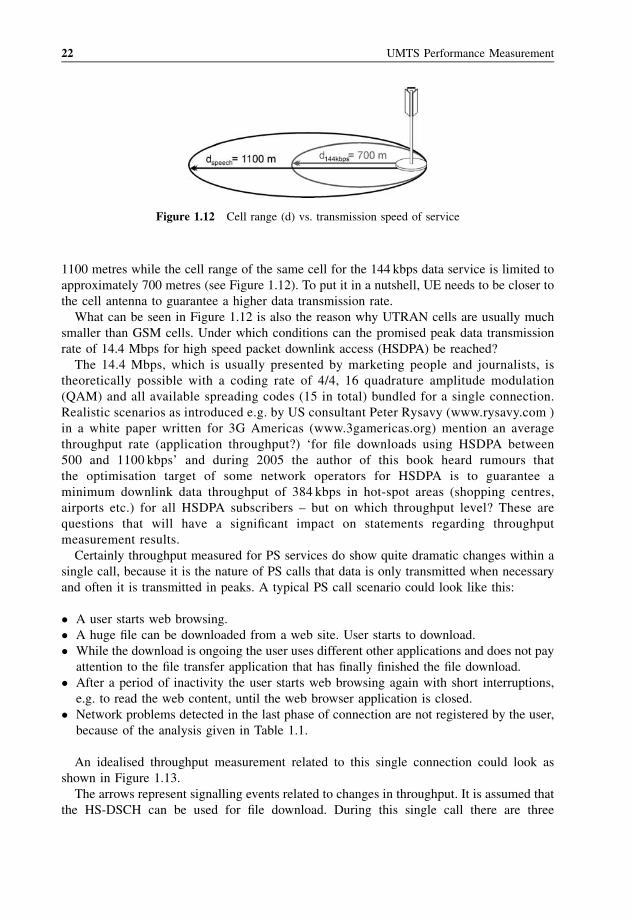
1100 metres while the cell range of the same cell for the 144 kbps data service is limited to
approximately 700 metres (see Figure 1.12). To put it in a nutshell, UE needs to be closer to
the cell antenna to guarantee a higher data transmission rate.
What can be seen in Figure 1.12 is also the reason why UTRAN cells are usually much
smaller than GSM cells. Under which conditions can the promised peak data transmission
rate of 14.4 Mbps for high speed packet downlink access (HSDPA) be reached?
The 14.4 Mbps, which is usually presented by marketing people and journalists, is
theoretically possible with a coding rate of 4/4, 16 quadrature amplitude modulation
(QAM) and all available spreading codes (15 in total) bundled for a single connection.
Realistic scenarios as introduced e.g. by US consultant Peter Rysavy (www.rysavy.com )
in a white paper written for 3G Americas (www.3gamericas.org) mention an average
throughput rate (application throughput?) ‘for file downloads using HSDPA between
500 and 1100 kbps’ and during 2005 the author of this book heard rumours that
the optimisation target of some network operators for HSDPA is to guarantee a
minimum downlink data throughput of 384 kbps in hot-spot areas (shopping centres,
airports etc.) for all HSDPA subscribers – but on which throughput level? These are
questions that will have a significant impact on statements regarding throughput
measurement results.
Certainly throughput measured for PS services do show quite dramatic changes within a
single call, because it is the nature of PS calls that data is only transmitted when necessary
and often it is transmitted in peaks. A typical PS call scenario could look like this:
� A user starts web browsing.
� A huge file can be downloaded from a web site. User starts to download.
� While the download is ongoing the user uses different other applications and does not pay
attention to the file transfer application that has finally finished the file download.
� After a period of inactivity the user starts web browsing again with short interruptions,
e.g. to read the web content, until the web browser application is closed.
� Network problems detected in the last phase of connection are not registered by the user,
because of the analysis given in Table 1.1.
An idealised throughput measurement related to this single connection could look as
shown in Figure 1.13.
The arrows represent signalling events related to changes in throughput. It is assumed that
the HS-DSCH can be used for file download. During this single call there are three
Figure 1.12 Cell range (d) vs. transmission speed of service
22 UMTS Performance Measurement
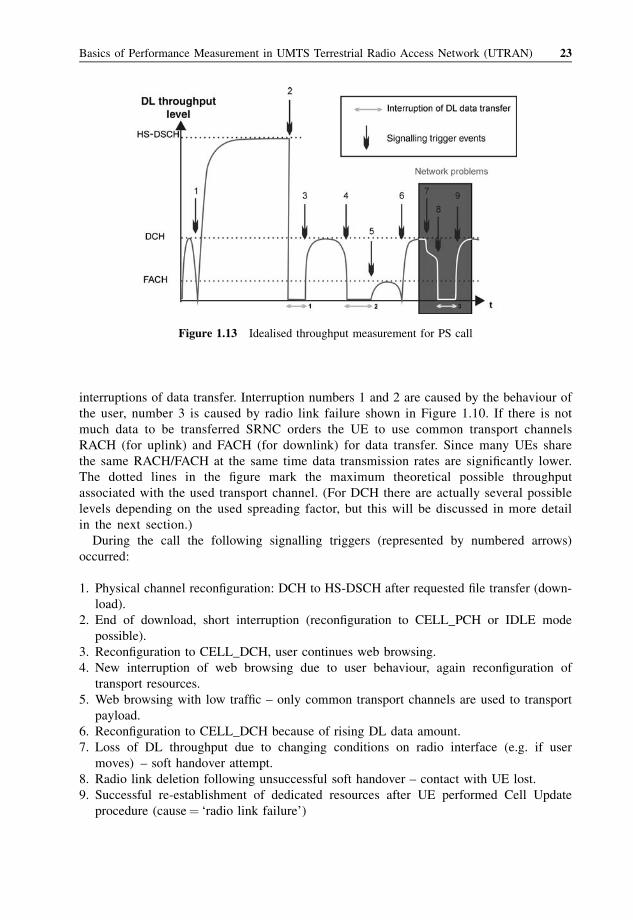
interruptions of data transfer. Interruption numbers 1 and 2 are caused by the behaviour of
the user, number 3 is caused by radio link failure shown in Figure 1.10. If there is not
much data to be transferred SRNC orders the UE to use common transport channels
RACH (for uplink) and FACH (for downlink) for data transfer. Since many UEs share
the same RACH/FACH at the same time data transmission rates are significantly lower.
The dotted lines in the figure mark the maximum theoretical possible throughput
associated with the used transport channel. (For DCH there are actually several possible
levels depending on the used spreading factor, but this will be discussed in more detail
in the next section.)
During the call the following signalling triggers (represented by numbered arrows)
occurred:
1. Physical channel reconfiguration: DCH to HS-DSCH after requested file transfer (down-
load).
2. End of download, short interruption (reconfiguration to CELL_PCH or IDLE mode
possible).
3. Reconfiguration to CELL_DCH, user continues web browsing.
4. New interruption of web browsing due to user behaviour, again reconfiguration of
transport resources.
5. Web browsing with low traffic – only common transport channels are used to transport
payload.
6. Reconfiguration to CELL_DCH because of rising DL data amount.
7. Loss of DL throughput due to changing conditions on radio interface (e.g. if user
moves) – soft handover attempt.
8. Radio link deletion following unsuccessful soft handover – contact with UE lost.
9. Successful re-establishment of dedicated resources after UE performed Cell Update
procedure (cause¼ ‘radio link failure’)
Figure 1.13 Idealised throughput measurement for PS call
Basics of Performance Measurement in UMTS Terrestrial Radio Access Network (UTRAN) 23
Following this there are three major factors that have an impact on the measured PS
transport channel throughput:
� user behaviour;
� radio resources (channels, codes) assigned by network;
� network failures.
User behaviour cannot be measured, it can only be estimated based on measurement
events. For the other two factors it is necessary to define a number of useful measurements
and KPIs.
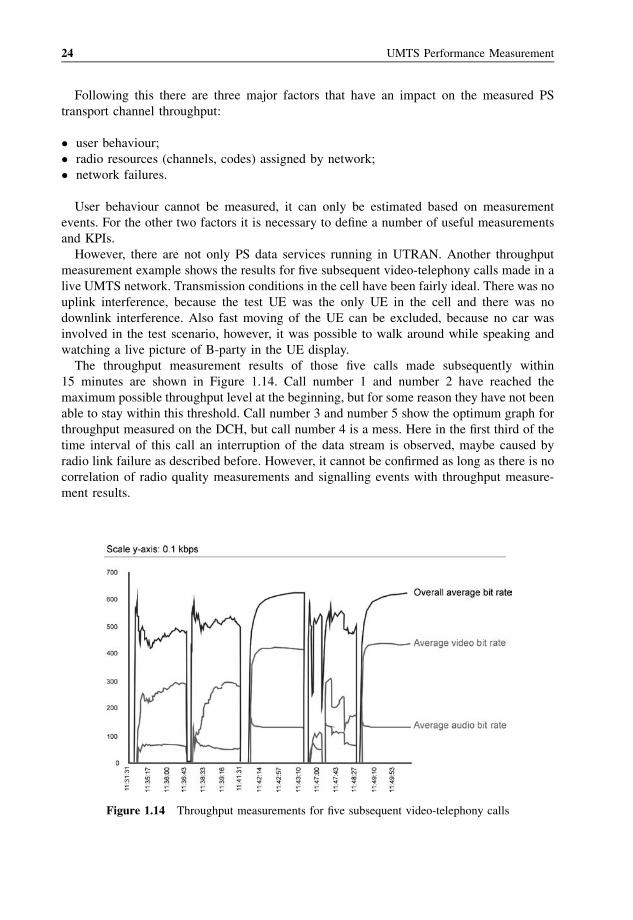
However, there are not only PS data services running in UTRAN. Another throughput
measurement example shows the results for five subsequent video-telephony calls made in a
live UMTS network. Transmission conditions in the cell have been fairly ideal. There was no
uplink interference, because the test UE was the only UE in the cell and there was no
downlink interference. Also fast moving of the UE can be excluded, because no car was
involved in the test scenario, however, it was possible to walk around while speaking and
watching a live picture of B-party in the UE display.
The throughput measurement results of those five calls made subsequently within
15 minutes are shown in Figure 1.14. Call number 1 and number 2 have reached the
maximum possible throughput level at the beginning, but for some reason they have not been
able to stay within this threshold. Call number 3 and number 5 show the optimum graph for
throughput measured on the DCH, but call number 4 is a mess. Here in the first third of the
time interval of this call an interruption of the data stream is observed, maybe caused by
radio link failure as described before. However, it cannot be confirmed as long as there is no
correlation of radio quality measurements and signalling events with throughput measure-
ment results.
Figure 1.14 Throughput measurements for five subsequent video-telephony calls
24 UMTS Performance Measurement
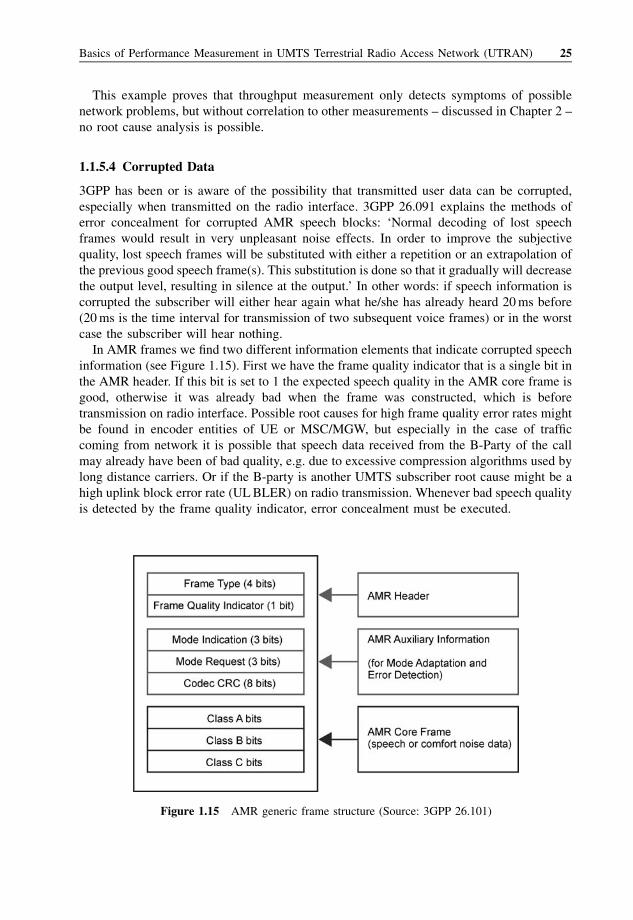
This example proves that throughput measurement only detects symptoms of possible
network problems, but without correlation to other measurements – discussed in Chapter 2 –
no root cause analysis is possible.
1.1.5.4 Corrupted Data
3GPP has been or is aware of the possibility that transmitted user data can be corrupted,
especially when transmitted on the radio interface. 3GPP 26.091 explains the methods of
error concealment for corrupted AMR speech blocks: ‘Normal decoding of lost speech
frames would result in very unpleasant noise effects. In order to improve the subjective
quality, lost speech frames will be substituted with either a repetition or an extrapolation of
the previous good speech frame(s). This substitution is done so that it gradually will decrease
the output level, resulting in silence at the output.’ In other words: if speech information is
corrupted the subscriber will either hear again what he/she has already heard 20ms before
(20ms is the time interval for transmission of two subsequent voice frames) or in the worst
case the subscriber will hear nothing.
In AMR frames we find two different information elements that indicate corrupted speech
information (see Figure 1.15). First we have the frame quality indicator that is a single bit in
the AMR header. If this bit is set to 1 the expected speech quality in the AMR core frame is
good, otherwise it was already bad when the frame was constructed, which is before
transmission on radio interface. Possible root causes for high frame quality error rates might
be found in encoder entities of UE or MSC/MGW, but especially in the case of traffic
coming from network it is possible that speech data received from the B-Party of the call
may already have been of bad quality, e.g. due to excessive compression algorithms used by
long distance carriers. Or if the B-party is another UMTS subscriber root cause might be a
high uplink block error rate (ULBLER) on radio transmission. Whenever bad speech quality
is detected by the frame quality indicator, error concealment must be executed.
Figure 1.15 AMR generic frame structure (Source: 3GPP 26.101)
Basics of Performance Measurement in UMTS Terrestrial Radio Access Network (UTRAN) 25
Besides the frame quality indicator there is also a codec CRC field consisting of 8 bits. A
CRC check is performed for Class A bits of the core frame only, because Class A speech
information is most sensitive to errors. By using CRC, data that is transmitted via radio
interface is protected. The receiving AMR entity in the UE (after downlink transmission) or
the MSC/MGW (after UL data transmission) are able to detect radio transmission errors. If a
CRC error is detected 3GPP 26.101 defines that the erroneous AMR frame ‘should not be
decoded without applying appropriate error concealment’.
Based on the results of CRC checks in the receiving AMR entity a frame error rate (FER)
is defined as follows.
Frame Error Rate ðFERÞ ¼P
AMR CRC ErrorsPReceived AMR Frames with Codec CRC
� 100% ð1:4Þ
Harri Holma and Antti Toskala have outlined that the FER must be below 1% to guarantee
sufficient speech quality using AMR (see Holma and Toskala, 2004). The same rule applies
to block error rates measured after radio interface transmission, because it must be assumed
that a RLC transport block containing currupted speech information on AMR layer is
handled like an AMR CRC error.
Unfortunately, quality indicators similar to those defined for AMR are missing for video-
telephony. One reason for this is that video-telephony standards have not been defined by
3GPP. A video-telephony call via the CS core network domain is seen by UTRAN as an
unspecified symmetric-bidirectional radio access bearer with an uplink/downlink maximum
bit rate of 64 kbps (remember bearer capability information contents in the Setup message
shown in Figure 1.5). In other words: for UTRAN a video-telephony RAB at the beginning is
just an empty channel with a theoretical transmission capacity of 64 kbps in uplink and
downlink. Then additional in-band signalling is necessary to start a call between two video-
telephones using this previously empty RAB. Following this in-band signalling two logical
channels (one for audio, the other one carrying video information bits) are established inside
the RAB, but for UTRAN these are just plain data streams, which are transmitted using RLC
transparent mode. Hence, there is no error detection/correction executed by UTRAN and
also not by any network element in UMTS core network domains. The problem is that video
information is very sensitive to transmission errors and in addition used video codices are
sensitive as well. Here again BLER measurement results can help to measure the user
perceived quality of this service. An alternative way is to reassemble voice and video
information captured on UTRAN interfaces to analyse the contents, but this method is only
applicable for single call analysis.
Most UMTS handsets are equipped with an MPEG-4 video-telephony codec. MPEG-4
adapts its compression algorithms to enable transmission bandwidth. This bandwidth is
equivalent to transport channel throughput. Comparing throughput measurement results
presented in Figure 1.13 for call number 1 with the reassembled picture sequence of this call
(Figure 1.16), it emerges that resolution of the picture deteriorates if throughput goes down.
Some pictures only seem to consist of big 8� 8 pixel blocks with sharp edges; therefore the
whole picture looks like a chessboard. These effects are caused by a higher compression rate
due to lower throughput.
In addition, transmission errors on the radio interface extinguish information of single
pixels or pixel blocks. These blocks are missed in subsequent pictures and shown either as
26 UMTS Performance Measurement
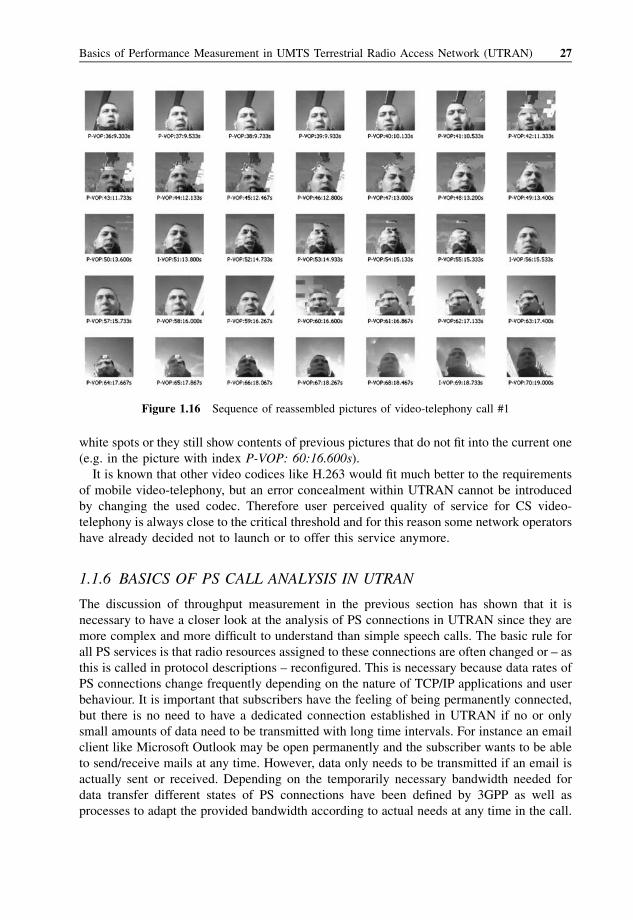
white spots or they still show contents of previous pictures that do not fit into the current one
(e.g. in the picture with index P-VOP: 60:16.600s).
It is known that other video codices like H.263 would fit much better to the requirements
of mobile video-telephony, but an error concealment within UTRAN cannot be introduced
by changing the used codec. Therefore user perceived quality of service for CS video-
telephony is always close to the critical threshold and for this reason some network operators
have already decided not to launch or to offer this service anymore.
1.1.6 BASICS OF PS CALL ANALYSIS IN UTRAN
The discussion of throughput measurement in the previous section has shown that it is
necessary to have a closer look at the analysis of PS connections in UTRAN since they are
more complex and more difficult to understand than simple speech calls. The basic rule for
all PS services is that radio resources assigned to these connections are often changed or – as
this is called in protocol descriptions – reconfigured. This is necessary because data rates of
PS connections change frequently depending on the nature of TCP/IP applications and user
behaviour. It is important that subscribers have the feeling of being permanently connected,
but there is no need to have a dedicated connection established in UTRAN if no or only
small amounts of data need to be transmitted with long time intervals. For instance an email
client like Microsoft Outlook may be open permanently and the subscriber wants to be able
to send/receive mails at any time. However, data only needs to be transmitted if an email is
actually sent or received. Depending on the temporarily necessary bandwidth needed for
data transfer different states of PS connections have been defined by 3GPP as well as
processes to adapt the provided bandwidth according to actual needs at any time in the call.
Figure 1.16 Sequence of reassembled pictures of video-telephony call #1
Basics of Performance Measurement in UMTS Terrestrial Radio Access Network (UTRAN) 27
The fastest data transmissions are possible using high speed downlink packet access
(HSDPA) and – in the future – high speed uplink packet access (HSUPA). This requires the
best conditions on the radio interface (pico cells, minimal path loss between sender and
receiver and minimal interference) as well as special capabilities of UE and UTRAN. Both
parties need to support new modulation techniques like 16 QAM and transport format sets
that are different from those used on dedicated channels.
Dedicated transport channels (DCHs) are standard channels for all kinds of data
transmission between UE and UTRAN. In the case of voice calls the radio bearer will
always be mapped onto DCHs, and will be carried by a set of dedicated physical channels.
Dedicated in a sense that those channels are exclusively assigned to a single UE while in
HSDPA the radio bearer is mapped onto a high speed downlink shared channel (HS-DSCH)
and this HS-DSCH is used by all UEs using HSDPA in the serving HS-DSCH cell. Hence,
additional signalling is necessary on the radio interface to inform these UEs which packets
sent on HS-DSCH belong to which mobile phone.
Dedicated physical channels are identified by channelisation codes that are also called
spreading codes. Scrambling codes provide additional identification of the sender in the
uplink or downlink direction.
Channelisation codes and scrambling codes are the radio resources that the UTRAN deals
with. Radio resources are assigned by radio network controllers (RNCs).
Unfortunately, the number of available codes is limited and based on requirements of code
allocation (e.g. orthogonality) not every possible code can be used. Used channelisation
codes also depend on the required data transmission rate. An AMR 12.2 kbps voice channel
will work with a spreading factor (SF) of 128 while a 128 kbps PS connection needs SF¼ 16.
However, theoretically only 16 UEs can use a connection with SF¼ 16 simultaneously in
one cell. Indeed, the real number is usually lower due to the necessary orthogonality of
codes. The smallest possible spreading factor in UTRAN is SF¼ 4. Theoretically four UEs
can use a channel with SF¼ 4 at same time in one cell.
Higher data transmission rates require a smaller spreading factor of channelisation codes.
The smaller the spreading factor is the fewer codes are available.
Now imagine what happens if spreading factors that allow high data transmission rates are
already used and another user wants to set up a PS call in same cell. There are two options.
Either the cell is blocked, because it cannot serve the high-speed data transmission request of
the subscriber or the UE must accept a lower data transmission rate due to the fact that only
codes with higher spreading factors are available.
Due to this shortage of available codes a highly flexible assignment of these critical radio
resources has been defined by 3GPP and assigned spreading factors as well as channel
mapping options can be changed at any moment of the call.
If only very small amounts of data need to be transmitted there are no dedicated resources
assigned at all, because for this purpose, common transport channels RACH (uplink) and
FACH (downlink) are used to transport IP payload in addition to the signalling information
they usually carry.
If the PDP context remains active, but it is detected that in active connection for a certain
time no data is transferred at all, it is also possible to sent the UE back to IDLE mode or to
CELL_PCH or URA_PCH mode. In all three modes there is no radio bearer/radio access
bearer assigned to the active PDP context – purely for resource usage optimisationreasons.
The admission control function of an RNC frequently measures the data volume sent in
DL to the UE and requests traffic volume measurement reports of the UE. Depending on the
28 UMTS Performance Measurement
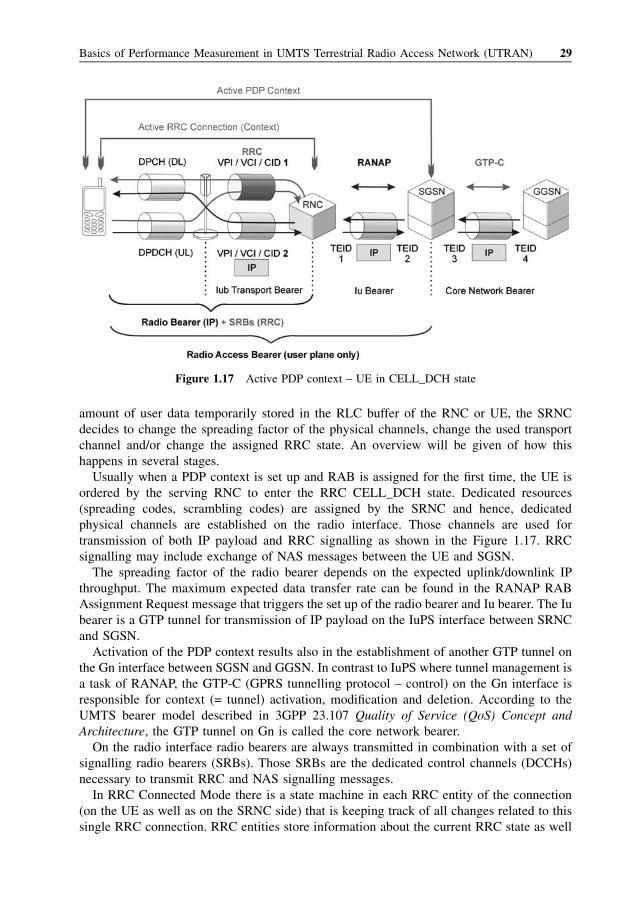
amount of user data temporarily stored in the RLC buffer of the RNC or UE, the SRNC
decides to change the spreading factor of the physical channels, change the used transport
channel and/or change the assigned RRC state. An overview will be given of how this
happens in several stages.
Usually when a PDP context is set up and RAB is assigned for the first time, the UE is
ordered by the serving RNC to enter the RRC CELL_DCH state. Dedicated resources
(spreading codes, scrambling codes) are assigned by the SRNC and hence, dedicated
physical channels are established on the radio interface. Those channels are used for
transmission of both IP payload and RRC signalling as shown in the Figure 1.17. RRC
signalling may include exchange of NAS messages between the UE and SGSN.
The spreading factor of the radio bearer depends on the expected uplink/downlink IP
throughput. The maximum expected data transfer rate can be found in the RANAP RAB
Assignment Request message that triggers the set up of the radio bearer and Iu bearer. The Iu
bearer is a GTP tunnel for transmission of IP payload on the IuPS interface between SRNC
and SGSN.
Activation of the PDP context results also in the establishment of another GTP tunnel on
the Gn interface between SGSN and GGSN. In contrast to IuPS where tunnel management is
a task of RANAP, the GTP-C (GPRS tunnelling protocol – control) on the Gn interface is
responsible for context (= tunnel) activation, modification and deletion. According to the
UMTS bearer model described in 3GPP 23.107 Quality of Service (QoS) Concept and
Architecture, the GTP tunnel on Gn is called the core network bearer.
On the radio interface radio bearers are always transmitted in combination with a set of
signalling radio bearers (SRBs). Those SRBs are the dedicated control channels (DCCHs)
necessary to transmit RRC and NAS signalling messages.
In RRC Connected Mode there is a state machine in each RRC entity of the connection
(on the UE as well as on the SRNC side) that is keeping track of all changes related to this
single RRC connection. RRC entities store information about the current RRC state as well
Figure 1.17 Active PDP context – UE in CELL_DCH state
Basics of Performance Measurement in UMTS Terrestrial Radio Access Network (UTRAN) 29
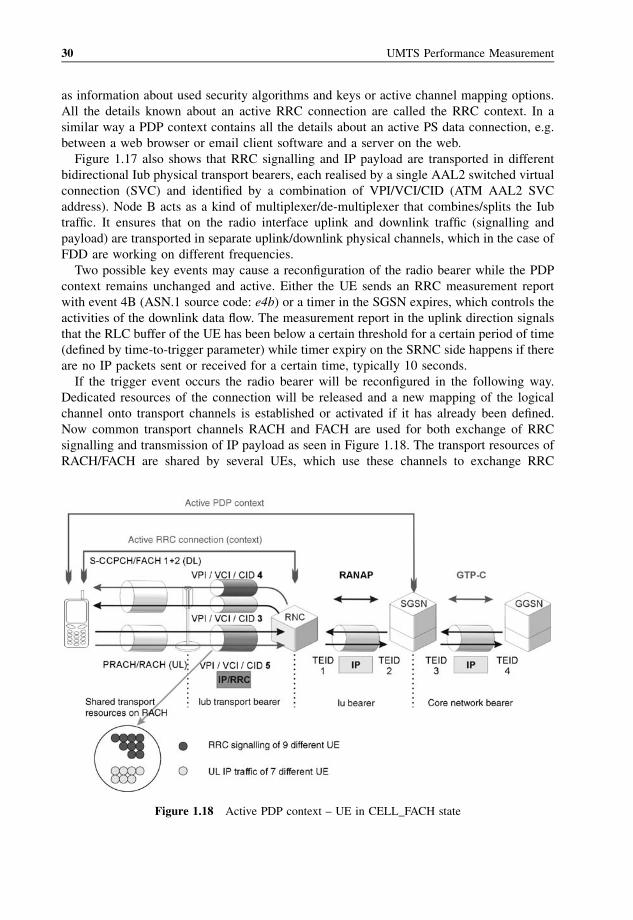
as information about used security algorithms and keys or active channel mapping options.
All the details known about an active RRC connection are called the RRC context. In a
similar way a PDP context contains all the details about an active PS data connection, e.g.
between a web browser or email client software and a server on the web.
Figure 1.17 also shows that RRC signalling and IP payload are transported in different
bidirectional Iub physical transport bearers, each realised by a single AAL2 switched virtual
connection (SVC) and identified by a combination of VPI/VCI/CID (ATM AAL2 SVC
address). Node B acts as a kind of multiplexer/de-multiplexer that combines/splits the Iub
traffic. It ensures that on the radio interface uplink and downlink traffic (signalling and
payload) are transported in separate uplink/downlink physical channels, which in the case of
FDD are working on different frequencies.
Two possible key events may cause a reconfiguration of the radio bearer while the PDP
context remains unchanged and active. Either the UE sends an RRC measurement report
with event 4B (ASN.1 source code: e4b) or a timer in the SGSN expires, which controls the
activities of the downlink data flow. The measurement report in the uplink direction signals
that the RLC buffer of the UE has been below a certain threshold for a certain period of time
(defined by time-to-trigger parameter) while timer expiry on the SRNC side happens if there
are no IP packets sent or received for a certain time, typically 10 seconds.
If the trigger event occurs the radio bearer will be reconfigured in the following way.
Dedicated resources of the connection will be released and a new mapping of the logical
channel onto transport channels is established or activated if it has already been defined.
Now common transport channels RACH and FACH are used for both exchange of RRC
signalling and transmission of IP payload as seen in Figure 1.18. The transport resources of
RACH/FACH are shared by several UEs, which use these channels to exchange RRC
Figure 1.18 Active PDP context – UE in CELL_FACH state
30 UMTS Performance Measurement
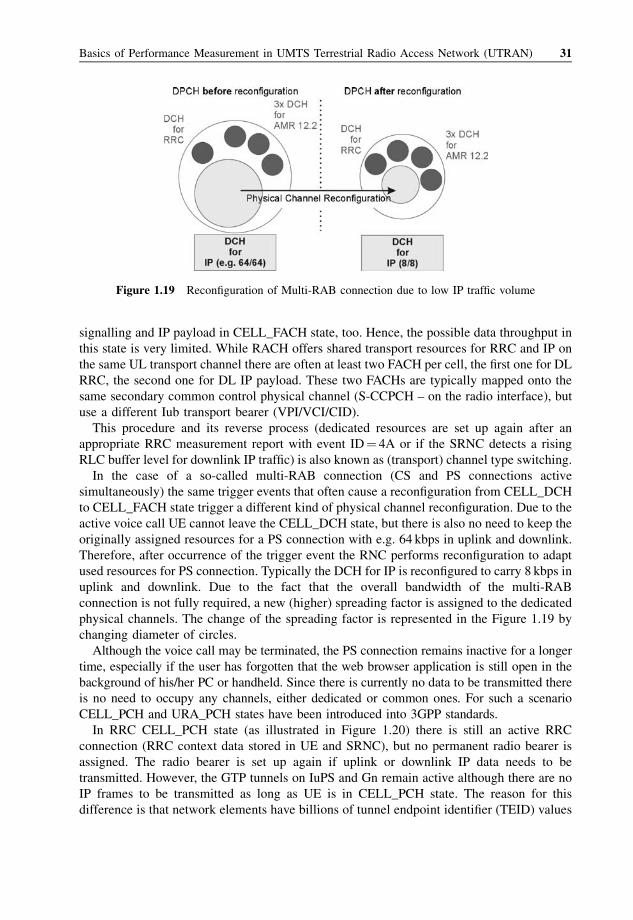
signalling and IP payload in CELL_FACH state, too. Hence, the possible data throughput in
this state is very limited. While RACH offers shared transport resources for RRC and IP on
the same UL transport channel there are often at least two FACH per cell, the first one for DL
RRC, the second one for DL IP payload. These two FACHs are typically mapped onto the
same secondary common control physical channel (S-CCPCH – on the radio interface), but
use a different Iub transport bearer (VPI/VCI/CID).
This procedure and its reverse process (dedicated resources are set up again after an
appropriate RRC measurement report with event ID¼ 4A or if the SRNC detects a rising
RLC buffer level for downlink IP traffic) is also known as (transport) channel type switching.
In the case of a so-called multi-RAB connection (CS and PS connections active
simultaneously) the same trigger events that often cause a reconfiguration from CELL_DCH
to CELL_FACH state trigger a different kind of physical channel reconfiguration. Due to the
active voice call UE cannot leave the CELL_DCH state, but there is also no need to keep the
originally assigned resources for a PS connection with e.g. 64 kbps in uplink and downlink.
Therefore, after occurrence of the trigger event the RNC performs reconfiguration to adapt
used resources for PS connection. Typically the DCH for IP is reconfigured to carry 8 kbps in
uplink and downlink. Due to the fact that the overall bandwidth of the multi-RAB
connection is not fully required, a new (higher) spreading factor is assigned to the dedicated
physical channels. The change of the spreading factor is represented in the Figure 1.19 by
changing diameter of circles.
Although the voice call may be terminated, the PS connection remains inactive for a longer
time, especially if the user has forgotten that the web browser application is still open in the
background of his/her PC or handheld. Since there is currently no data to be transmitted there
is no need to occupy any channels, either dedicated or common ones. For such a scenario
CELL_PCH and URA_PCH states have been introduced into 3GPP standards.
In RRC CELL_PCH state (as illustrated in Figure 1.20) there is still an active RRC
connection (RRC context data stored in UE and SRNC), but no permanent radio bearer is
assigned. The radio bearer is set up again if uplink or downlink IP data needs to be
transmitted. However, the GTP tunnels on IuPS and Gn remain active although there are no
IP frames to be transmitted as long as UE is in CELL_PCH state. The reason for this
difference is that network elements have billions of tunnel endpoint identifier (TEID) values
Figure 1.19 Reconfiguration of Multi-RAB connection due to low IP traffic volume
Basics of Performance Measurement in UMTS Terrestrial Radio Access Network (UTRAN) 31
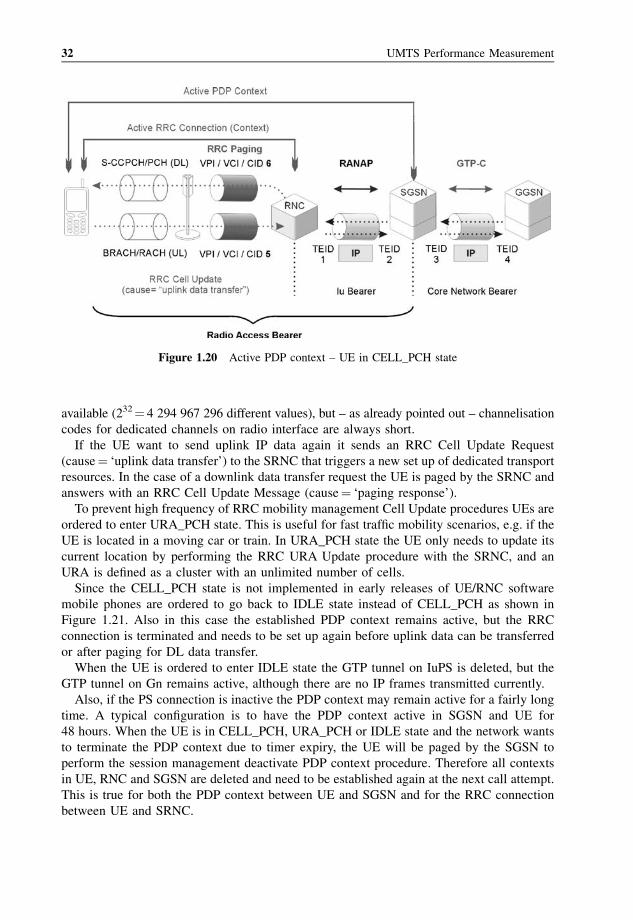
available (232¼ 4 294 967 296 different values), but – as already pointed out – channelisation
codes for dedicated channels on radio interface are always short.
If the UE want to send uplink IP data again it sends an RRC Cell Update Request
(cause¼ ‘uplink data transfer’) to the SRNC that triggers a new set up of dedicated transport
resources. In the case of a downlink data transfer request the UE is paged by the SRNC and
answers with an RRC Cell Update Message (cause¼ ‘paging response’).
To prevent high frequency of RRC mobility management Cell Update procedures UEs are
ordered to enter URA_PCH state. This is useful for fast traffic mobility scenarios, e.g. if the
UE is located in a moving car or train. In URA_PCH state the UE only needs to update its
current location by performing the RRC URA Update procedure with the SRNC, and an
URA is defined as a cluster with an unlimited number of cells.
Since the CELL_PCH state is not implemented in early releases of UE/RNC software
mobile phones are ordered to go back to IDLE state instead of CELL_PCH as shown in
Figure 1.21. Also in this case the established PDP context remains active, but the RRC
connection is terminated and needs to be set up again before uplink data can be transferred
or after paging for DL data transfer.
When the UE is ordered to enter IDLE state the GTP tunnel on IuPS is deleted, but the
GTP tunnel on Gn remains active, although there are no IP frames transmitted currently.
Also, if the PS connection is inactive the PDP context may remain active for a fairly long
time. A typical configuration is to have the PDP context active in SGSN and UE for
48 hours. When the UE is in CELL_PCH, URA_PCH or IDLE state and the network wants
to terminate the PDP context due to timer expiry, the UE will be paged by the SGSN to
perform the session management deactivate PDP context procedure. Therefore all contexts
in UE, RNC and SGSN are deleted and need to be established again at the next call attempt.
This is true for both the PDP context between UE and SGSN and for the RRC connection
between UE and SRNC.
Figure 1.20 Active PDP context – UE in CELL_PCH state
32 UMTS Performance Measurement
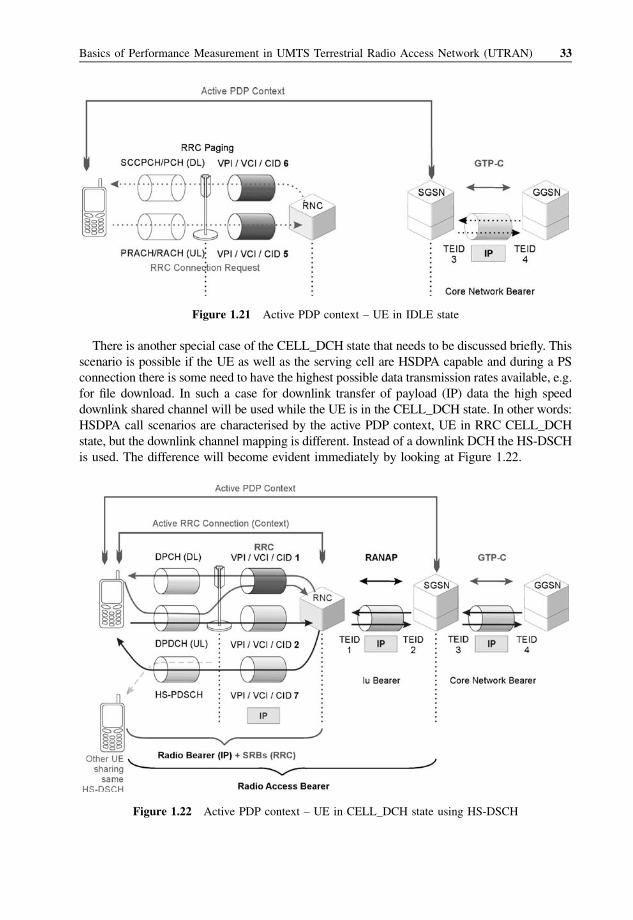
There is another special case of the CELL_DCH state that needs to be discussed briefly. This
scenario is possible if the UE as well as the serving cell are HSDPA capable and during a PS
connection there is some need to have the highest possible data transmission rates available, e.g.
for file download. In such a case for downlink transfer of payload (IP) data the high speed
downlink shared channel will be used while the UE is in the CELL_DCH state. In other words:
HSDPA call scenarios are characterised by the active PDP context, UE in RRC CELL_DCH
state, but the downlink channel mapping is different. Instead of a downlink DCH the HS-DSCH
is used. The difference will become evident immediately by looking at Figure 1.22.
Figure 1.21 Active PDP context – UE in IDLE state
Figure 1.22 Active PDP context – UE in CELL_DCH state using HS-DSCH
Basics of Performance Measurement in UMTS Terrestrial Radio Access Network (UTRAN) 33
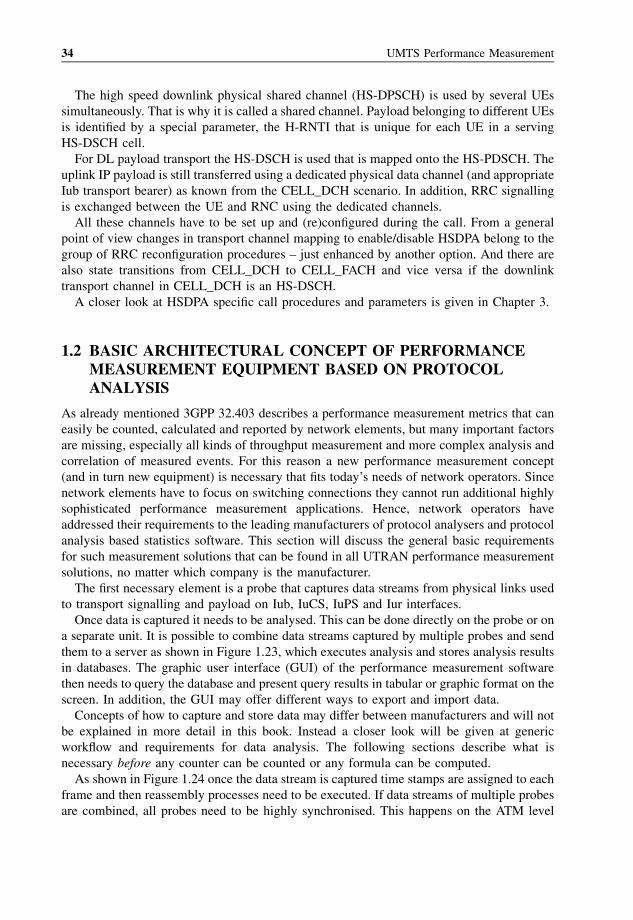
The high speed downlink physical shared channel (HS-DPSCH) is used by several UEs
simultaneously. That is why it is called a shared channel. Payload belonging to different UEs
is identified by a special parameter, the H-RNTI that is unique for each UE in a serving
HS-DSCH cell.
For DL payload transport the HS-DSCH is used that is mapped onto the HS-PDSCH. The
uplink IP payload is still transferred using a dedicated physical data channel (and appropriate
Iub transport bearer) as known from the CELL_DCH scenario. In addition, RRC signalling
is exchanged between the UE and RNC using the dedicated channels.
All these channels have to be set up and (re)configured during the call. From a general
point of view changes in transport channel mapping to enable/disable HSDPA belong to the
group of RRC reconfiguration procedures – just enhanced by another option. And there are
also state transitions from CELL_DCH to CELL_FACH and vice versa if the downlink
transport channel in CELL_DCH is an HS-DSCH.
A closer look at HSDPA specific call procedures and parameters is given in Chapter 3.
1.2 BASIC ARCHITECTURAL CONCEPT OF PERFORMANCEMEASUREMENT EQUIPMENT BASED ON PROTOCOLANALYSIS
As already mentioned 3GPP 32.403 describes a performance measurement metrics that can
easily be counted, calculated and reported by network elements, but many important factors
are missing, especially all kinds of throughput measurement and more complex analysis and
correlation of measured events. For this reason a new performance measurement concept
(and in turn new equipment) is necessary that fits today’s needs of network operators. Since
network elements have to focus on switching connections they cannot run additional highly
sophisticated performance measurement applications. Hence, network operators have
addressed their requirements to the leading manufacturers of protocol analysers and protocol
analysis based statistics software. This section will discuss the general basic requirements
for such measurement solutions that can be found in all UTRAN performance measurement
solutions, no matter which company is the manufacturer.
The first necessary element is a probe that captures data streams from physical links used
to transport signalling and payload on Iub, IuCS, IuPS and Iur interfaces.
Once data is captured it needs to be analysed. This can be done directly on the probe or on
a separate unit. It is possible to combine data streams captured by multiple probes and send
them to a server as shown in Figure 1.23, which executes analysis and stores analysis results
in databases. The graphic user interface (GUI) of the performance measurement software
then needs to query the database and present query results in tabular or graphic format on the
screen. In addition, the GUI may offer different ways to export and import data.
Concepts of how to capture and store data may differ between manufacturers and will not
be explained in more detail in this book. Instead a closer look will be given at generic
workflow and requirements for data analysis. The following sections describe what is
necessary before any counter can be counted or any formula can be computed.
As shown in Figure 1.24 once the data stream is captured time stamps are assigned to each
frame and then reassembly processes need to be executed. If data streams of multiple probes
are combined, all probes need to be highly synchronised. This happens on the ATM level
34 UMTS Performance Measurement
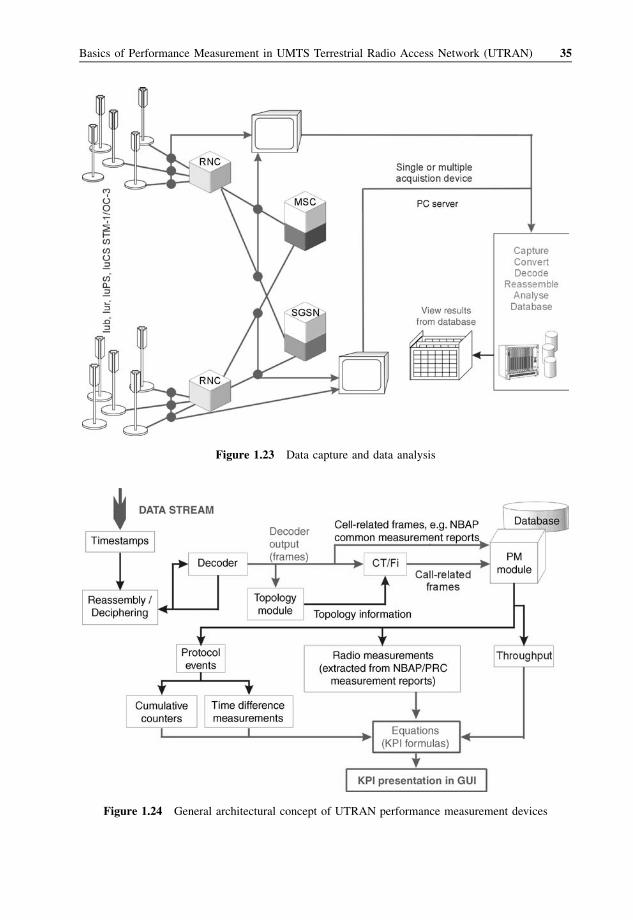
Figure 1.23 Data capture and data analysis
Figure 1.24 General architectural concept of UTRAN performance measurement devices
Basics of Performance Measurement in UMTS Terrestrial Radio Access Network (UTRAN) 35
first, since what was captured on the line are basically ATM cells. Ideally an autoconfigura-
tion application detects if data is transmitted using AAL5 or AAL2 data streams, because
different reassembly methods apply for both types. Finally, after the first stage of reassembly,
reassembled packets containing bits and bytes are available, which are ready to be decoded.
Packets coming out of AAL5 data streams can be decoded using special decoder applica-
tions and displayed as SSCOP frames on the monitor screen of the protocol analyser while
AAL2 data streams become visible first as either Iub or Iu frame protocol packet data units
(PDUs). However, SSCOP and frame protocol decoder output is not enough for a detailed
analysis. A look at the protocol stacks shows that for instance Node B Application Part
(NBAP), a very interesting signalling protocol, is running on top of SSCOP. Hence, it is
necessary to extract the payload field of an SSCOP sequenced data PDU and run another
decoding application to see NBAP on the monitor screen.
Frame protocol transport blocks as transmitted via the radio interface can be extracted
from Iub. These transport blocks contain radio link control (RLC) data. RLC is the layer 2
protocol on the radio interface that carries RRC/NAS signalling and all kinds of payload
(voice, IP). However, to see RRC messages another reassembly process needs to be executed
and of course it takes another decoder application to decode the RRC that is encoded using
ASN.1 packed encoding rules (PER). ASN.1 PER is a different encoding method compared
to methods used for SSCOP and RLC. As a result the architecture of the decoder also needs
to be completely different. All in all, this example shows that multiple stages of decoding
and reassembly are necessary to get decoder output frames that can be analysed using
performance measurement applications. In the case of RLC frames there is another function
necessary before decoding takes place, which is deciphering. Deciphering is necessary to
make RLC data decodable again, which has been encrypted for transmission via Uu/Iub.
Encrypted frames cannot be used for performance measurement purposes (which would
otherwise lead to incomplete or incorrect results in higher protocol layer analysis).
It should be noticed that reassembly is not only necessary on the RLC level. Other
protocols that have segmentation/reassembly functions are for instance the signalling
connection control part (SCCP) used on Iur and IuCS/PS interfaces and the IP used for
payload transport across multiple interfaces.
Note: errors in reassembly and deciphering applications are most critical to the following
measurement processes. Even if just a single message cannot be reassembled or deciphered
correctly this may result in problems of call tracing/filtering and correlation of measurement data.
Correctly decoded frames need to be filtered and sorted. This job is performed by a call
trace/filter application (CT/Fi). The topology module runs in parallel to the call trace
module, which detects the correlation of ATM virtual connections to UTRAN network
elements. In addition the topology application can often display a graphical overview of the
network structure and in the future it is possible to combine this topology information with
geographical information available in radio network planning tools or location intelligence
software like MapInfo software. Topology information will later help to display performance
measurement data correlated to network elements and paths.
Not all frames analysed need to be filtered by the call tracer, because not all data is
explicitly call-related. A typical example of such data are NBAP common measurement
procedures that are reported by each cell of the network to its controlling RNC (CRNC).
Because there is a fixed cell-CRNC relation for these procedures, they do not need to be
filtered by a call tracer. However, since especially measurement reports need to be filtered per
36 UMTS Performance Measurement
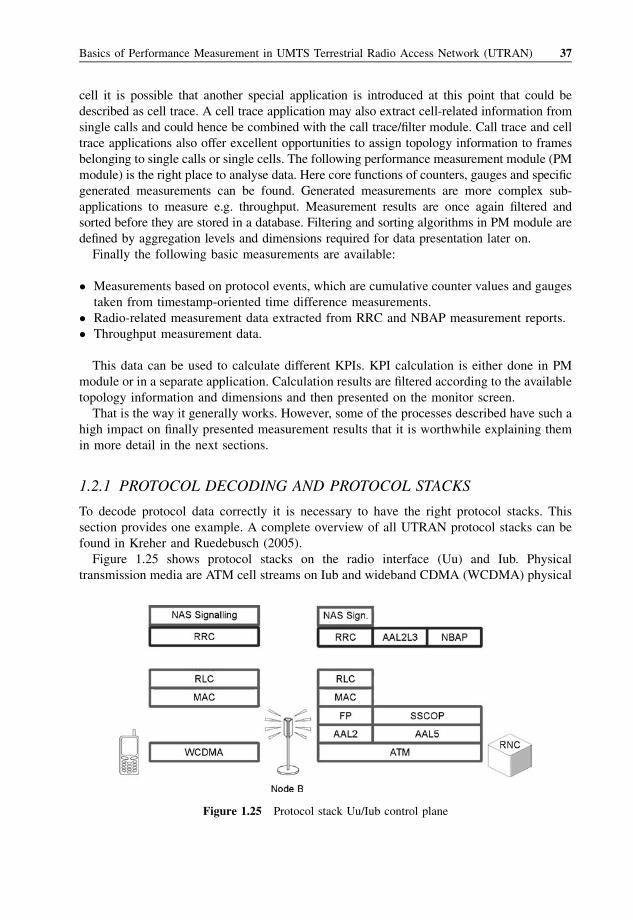
cell it is possible that another special application is introduced at this point that could be
described as cell trace. A cell trace application may also extract cell-related information from
single calls and could hence be combined with the call trace/filter module. Call trace and cell
trace applications also offer excellent opportunities to assign topology information to frames
belonging to single calls or single cells. The following performance measurement module (PM
module) is the right place to analyse data. Here core functions of counters, gauges and specific
generated measurements can be found. Generated measurements are more complex sub-
applications to measure e.g. throughput. Measurement results are once again filtered and
sorted before they are stored in a database. Filtering and sorting algorithms in PM module are
defined by aggregation levels and dimensions required for data presentation later on.
Finally the following basic measurements are available:
� Measurements based on protocol events, which are cumulative counter values and gauges
taken from timestamp-oriented time difference measurements.
� Radio-related measurement data extracted from RRC and NBAP measurement reports.
� Throughput measurement data.
This data can be used to calculate different KPIs. KPI calculation is either done in PM
module or in a separate application. Calculation results are filtered according to the available
topology information and dimensions and then presented on the monitor screen.
That is the way it generally works. However, some of the processes described have such a
high impact on finally presented measurement results that it is worthwhile explaining them
in more detail in the next sections.
1.2.1 PROTOCOL DECODING AND PROTOCOL STACKS
To decode protocol data correctly it is necessary to have the right protocol stacks. This
section provides one example. A complete overview of all UTRAN protocol stacks can be
found in Kreher and Ruedebusch (2005).
Figure 1.25 shows protocol stacks on the radio interface (Uu) and Iub. Physical
transmission media are ATM cell streams on Iub and wideband CDMA (WCDMA) physical
Figure 1.25 Protocol stack Uu/Iub control plane
Basics of Performance Measurement in UMTS Terrestrial Radio Access Network (UTRAN) 37
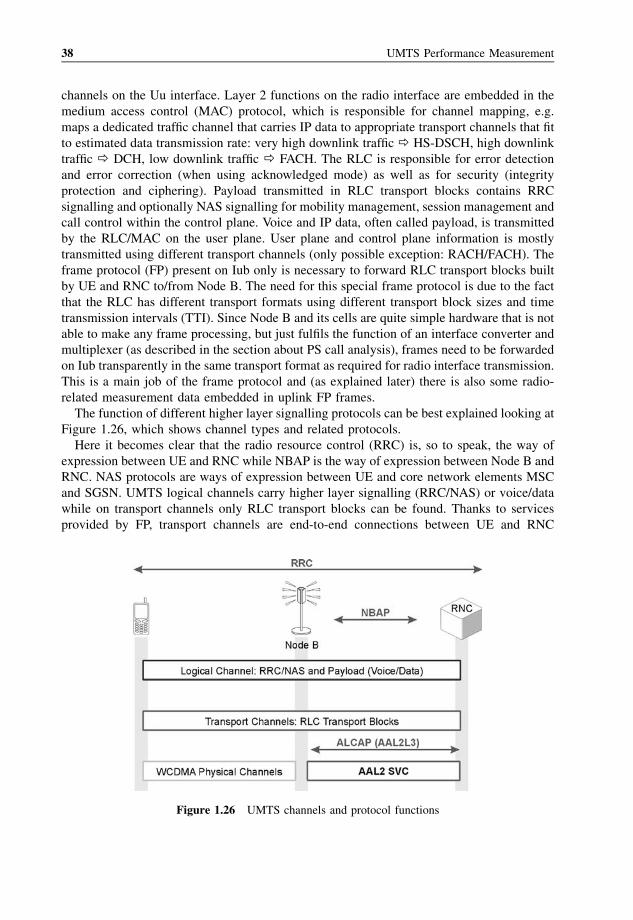
channels on the Uu interface. Layer 2 functions on the radio interface are embedded in the
medium access control (MAC) protocol, which is responsible for channel mapping, e.g.
maps a dedicated traffic channel that carries IP data to appropriate transport channels that fit
to estimated data transmission rate: very high downlink traffic � HS-DSCH, high downlink
traffic � DCH, low downlink traffic � FACH. The RLC is responsible for error detection
and error correction (when using acknowledged mode) as well as for security (integrity
protection and ciphering). Payload transmitted in RLC transport blocks contains RRC
signalling and optionally NAS signalling for mobility management, session management and
call control within the control plane. Voice and IP data, often called payload, is transmitted
by the RLC/MAC on the user plane. User plane and control plane information is mostly
transmitted using different transport channels (only possible exception: RACH/FACH). The
frame protocol (FP) present on Iub only is necessary to forward RLC transport blocks built
by UE and RNC to/from Node B. The need for this special frame protocol is due to the fact
that the RLC has different transport formats using different transport block sizes and time
transmission intervals (TTI). Since Node B and its cells are quite simple hardware that is not
able to make any frame processing, but just fulfils the function of an interface converter and
multiplexer (as described in the section about PS call analysis), frames need to be forwarded
on Iub transparently in the same transport format as required for radio interface transmission.
This is a main job of the frame protocol and (as explained later) there is also some radio-
related measurement data embedded in uplink FP frames.
The function of different higher layer signalling protocols can be best explained looking at
Figure 1.26, which shows channel types and related protocols.
Here it becomes clear that the radio resource control (RRC) is, so to speak, the way of
expression between UE and RNC while NBAP is the way of expression between Node B and
RNC. NAS protocols are ways of expression between UE and core network elements MSC
and SGSN. UMTS logical channels carry higher layer signalling (RRC/NAS) or voice/data
while on transport channels only RLC transport blocks can be found. Thanks to services
provided by FP, transport channels are end-to-end connections between UE and RNC
Figure 1.26 UMTS channels and protocol functions
38 UMTS Performance Measurement
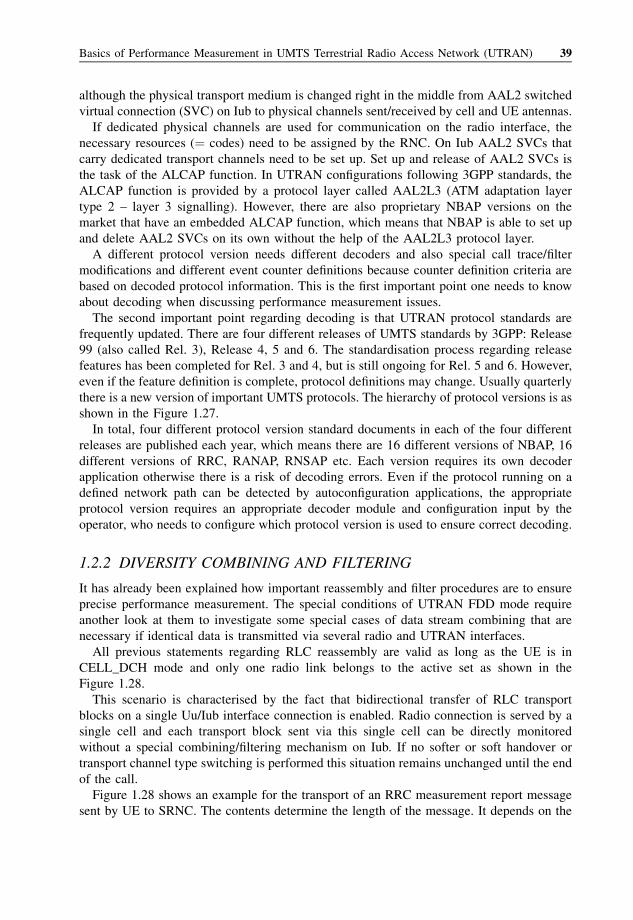
although the physical transport medium is changed right in the middle from AAL2 switched
virtual connection (SVC) on Iub to physical channels sent/received by cell and UE antennas.
If dedicated physical channels are used for communication on the radio interface, the
necessary resources (¼ codes) need to be assigned by the RNC. On Iub AAL2 SVCs that
carry dedicated transport channels need to be set up. Set up and release of AAL2 SVCs is
the task of the ALCAP function. In UTRAN configurations following 3GPP standards, the
ALCAP function is provided by a protocol layer called AAL2L3 (ATM adaptation layer
type 2 – layer 3 signalling). However, there are also proprietary NBAP versions on the
market that have an embedded ALCAP function, which means that NBAP is able to set up
and delete AAL2 SVCs on its own without the help of the AAL2L3 protocol layer.
A different protocol version needs different decoders and also special call trace/filter
modifications and different event counter definitions because counter definition criteria are
based on decoded protocol information. This is the first important point one needs to know
about decoding when discussing performance measurement issues.
The second important point regarding decoding is that UTRAN protocol standards are
frequently updated. There are four different releases of UMTS standards by 3GPP: Release
99 (also called Rel. 3), Release 4, 5 and 6. The standardisation process regarding release
features has been completed for Rel. 3 and 4, but is still ongoing for Rel. 5 and 6. However,
even if the feature definition is complete, protocol definitions may change. Usually quarterly
there is a new version of important UMTS protocols. The hierarchy of protocol versions is as
shown in the Figure 1.27.
In total, four different protocol version standard documents in each of the four different
releases are published each year, which means there are 16 different versions of NBAP, 16
different versions of RRC, RANAP, RNSAP etc. Each version requires its own decoder
application otherwise there is a risk of decoding errors. Even if the protocol running on a
defined network path can be detected by autoconfiguration applications, the appropriate
protocol version requires an appropriate decoder module and configuration input by the
operator, who needs to configure which protocol version is used to ensure correct decoding.
1.2.2 DIVERSITY COMBINING AND FILTERING
It has already been explained how important reassembly and filter procedures are to ensure
precise performance measurement. The special conditions of UTRAN FDD mode require
another look at them to investigate some special cases of data stream combining that are
necessary if identical data is transmitted via several radio and UTRAN interfaces.
All previous statements regarding RLC reassembly are valid as long as the UE is in
CELL_DCH mode and only one radio link belongs to the active set as shown in the
Figure 1.28.
This scenario is characterised by the fact that bidirectional transfer of RLC transport
blocks on a single Uu/Iub interface connection is enabled. Radio connection is served by a
single cell and each transport block sent via this single cell can be directly monitored
without a special combining/filtering mechanism on Iub. If no softer or soft handover or
transport channel type switching is performed this situation remains unchanged until the end
of the call.
Figure 1.28 shows an example for the transport of an RRC measurement report message
sent by UE to SRNC. The contents determine the length of the message. It depends on the
Basics of Performance Measurement in UMTS Terrestrial Radio Access Network (UTRAN) 39
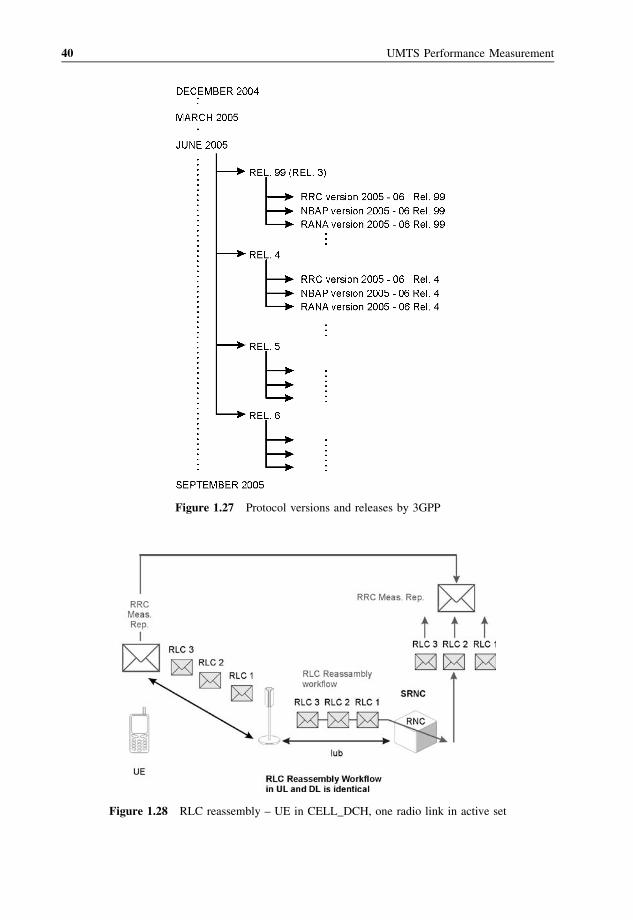
Figure 1.27 Protocol versions and releases by 3GPP
Figure 1.28 RLC reassembly – UE in CELL_DCH, one radio link in active set
40 UMTS Performance Measurement
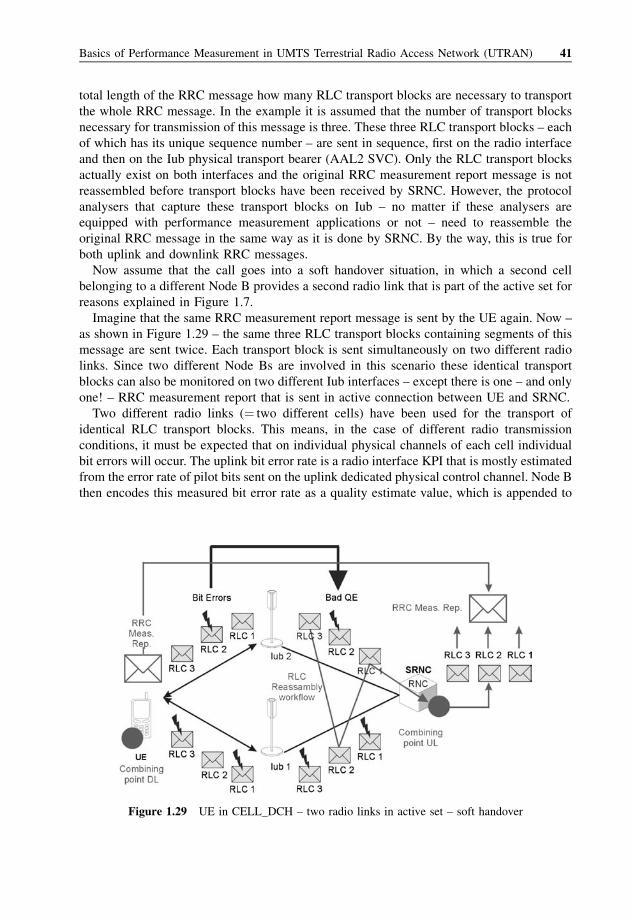
total length of the RRC message how many RLC transport blocks are necessary to transport
the whole RRC message. In the example it is assumed that the number of transport blocks
necessary for transmission of this message is three. These three RLC transport blocks – each
of which has its unique sequence number – are sent in sequence, first on the radio interface
and then on the Iub physical transport bearer (AAL2 SVC). Only the RLC transport blocks
actually exist on both interfaces and the original RRC measurement report message is not
reassembled before transport blocks have been received by SRNC. However, the protocol
analysers that capture these transport blocks on Iub – no matter if these analysers are
equipped with performance measurement applications or not – need to reassemble the
original RRC message in the same way as it is done by SRNC. By the way, this is true for
both uplink and downlink RRC messages.
Now assume that the call goes into a soft handover situation, in which a second cell
belonging to a different Node B provides a second radio link that is part of the active set for
reasons explained in Figure 1.7.
Imagine that the same RRC measurement report message is sent by the UE again. Now –
as shown in Figure 1.29 – the same three RLC transport blocks containing segments of this
message are sent twice. Each transport block is sent simultaneously on two different radio
links. Since two different Node Bs are involved in this scenario these identical transport
blocks can also be monitored on two different Iub interfaces – except there is one – and only
one! – RRC measurement report that is sent in active connection between UE and SRNC.
Two different radio links (¼ two different cells) have been used for the transport of
identical RLC transport blocks. This means, in the case of different radio transmission
conditions, it must be expected that on individual physical channels of each cell individual
bit errors will occur. The uplink bit error rate is a radio interface KPI that is mostly estimated
from the error rate of pilot bits sent on the uplink dedicated physical control channel. Node B
then encodes this measured bit error rate as a quality estimate value, which is appended to
Figure 1.29 UE in CELL_DCH – two radio links in active set – soft handover
Basics of Performance Measurement in UMTS Terrestrial Radio Access Network (UTRAN) 41
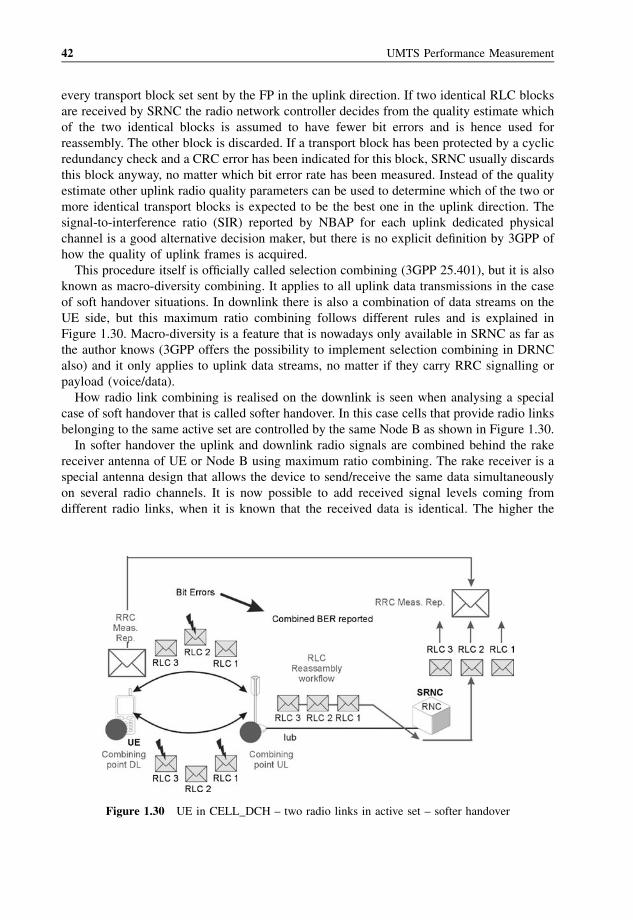
every transport block set sent by the FP in the uplink direction. If two identical RLC blocks
are received by SRNC the radio network controller decides from the quality estimate which
of the two identical blocks is assumed to have fewer bit errors and is hence used for
reassembly. The other block is discarded. If a transport block has been protected by a cyclic
redundancy check and a CRC error has been indicated for this block, SRNC usually discards
this block anyway, no matter which bit error rate has been measured. Instead of the quality
estimate other uplink radio quality parameters can be used to determine which of the two or
more identical transport blocks is expected to be the best one in the uplink direction. The
signal-to-interference ratio (SIR) reported by NBAP for each uplink dedicated physical
channel is a good alternative decision maker, but there is no explicit definition by 3GPP of
how the quality of uplink frames is acquired.
This procedure itself is officially called selection combining (3GPP 25.401), but it is also
known as macro-diversity combining. It applies to all uplink data transmissions in the case
of soft handover situations. In downlink there is also a combination of data streams on the
UE side, but this maximum ratio combining follows different rules and is explained in
Figure 1.30. Macro-diversity is a feature that is nowadays only available in SRNC as far as
the author knows (3GPP offers the possibility to implement selection combining in DRNC
also) and it only applies to uplink data streams, no matter if they carry RRC signalling or
payload (voice/data).
How radio link combining is realised on the downlink is seen when analysing a special
case of soft handover that is called softer handover. In this case cells that provide radio links
belonging to the same active set are controlled by the same Node B as shown in Figure 1.30.
In softer handover the uplink and downlink radio signals are combined behind the rake
receiver antenna of UE or Node B using maximum ratio combining. The rake receiver is a
special antenna design that allows the device to send/receive the same data simultaneously
on several radio channels. It is now possible to add received signal levels coming from
different radio links, when it is known that the received data is identical. The higher the
Figure 1.30 UE in CELL_DCH – two radio links in active set – softer handover
42 UMTS Performance Measurement
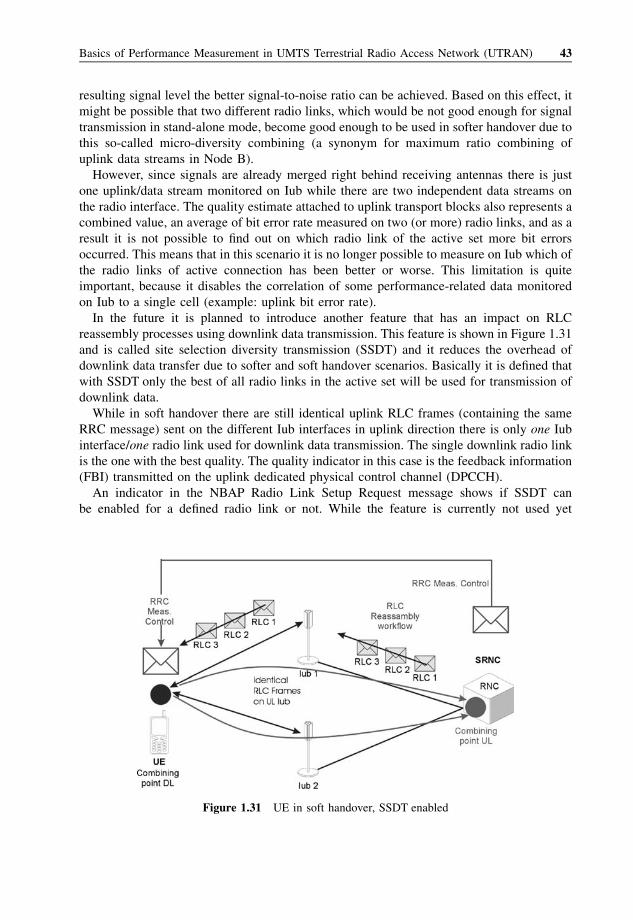
resulting signal level the better signal-to-noise ratio can be achieved. Based on this effect, it
might be possible that two different radio links, which would be not good enough for signal
transmission in stand-alone mode, become good enough to be used in softer handover due to
this so-called micro-diversity combining (a synonym for maximum ratio combining of
uplink data streams in Node B).
However, since signals are already merged right behind receiving antennas there is just
one uplink/data stream monitored on Iub while there are two independent data streams on
the radio interface. The quality estimate attached to uplink transport blocks also represents a
combined value, an average of bit error rate measured on two (or more) radio links, and as a
result it is not possible to find out on which radio link of the active set more bit errors
occurred. This means that in this scenario it is no longer possible to measure on Iub which of
the radio links of active connection has been better or worse. This limitation is quite
important, because it disables the correlation of some performance-related data monitored
on Iub to a single cell (example: uplink bit error rate).
In the future it is planned to introduce another feature that has an impact on RLC
reassembly processes using downlink data transmission. This feature is shown in Figure 1.31
and is called site selection diversity transmission (SSDT) and it reduces the overhead of
downlink data transfer due to softer and soft handover scenarios. Basically it is defined that
with SSDT only the best of all radio links in the active set will be used for transmission of
downlink data.
While in soft handover there are still identical uplink RLC frames (containing the same
RRC message) sent on the different Iub interfaces in uplink direction there is only one Iub
interface/one radio link used for downlink data transmission. The single downlink radio link
is the one with the best quality. The quality indicator in this case is the feedback information
(FBI) transmitted on the uplink dedicated physical control channel (DPCCH).
An indicator in the NBAP Radio Link Setup Request message shows if SSDT can
be enabled for a defined radio link or not. While the feature is currently not used yet
Figure 1.31 UE in soft handover, SSDT enabled
Basics of Performance Measurement in UMTS Terrestrial Radio Access Network (UTRAN) 43
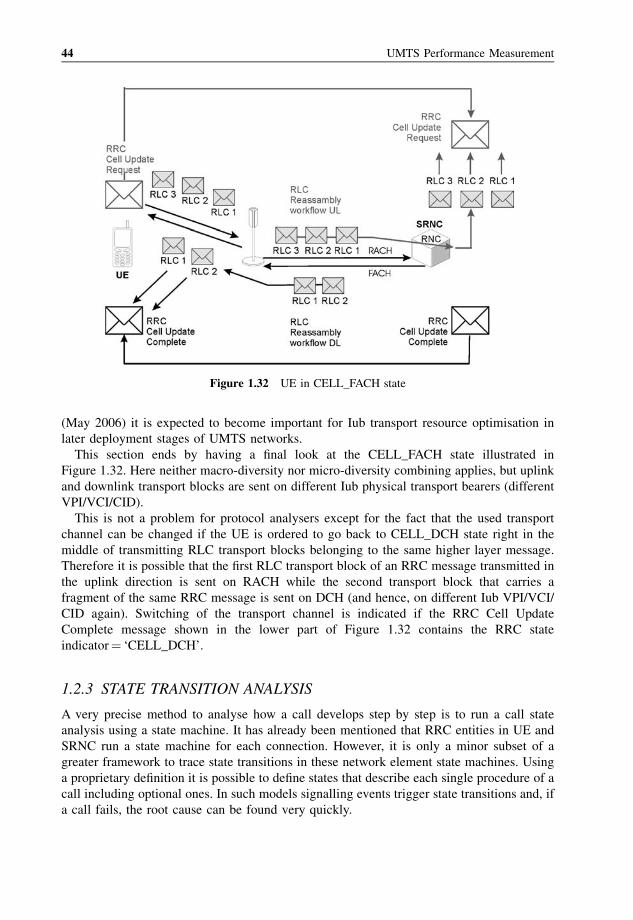
(May 2006) it is expected to become important for Iub transport resource optimisation in
later deployment stages of UMTS networks.
This section ends by having a final look at the CELL_FACH state illustrated in
Figure 1.32. Here neither macro-diversity nor micro-diversity combining applies, but uplink
and downlink transport blocks are sent on different Iub physical transport bearers (different
VPI/VCI/CID).
This is not a problem for protocol analysers except for the fact that the used transport
channel can be changed if the UE is ordered to go back to CELL_DCH state right in the
middle of transmitting RLC transport blocks belonging to the same higher layer message.
Therefore it is possible that the first RLC transport block of an RRC message transmitted in
the uplink direction is sent on RACH while the second transport block that carries a
fragment of the same RRC message is sent on DCH (and hence, on different Iub VPI/VCI/
CID again). Switching of the transport channel is indicated if the RRC Cell Update
Complete message shown in the lower part of Figure 1.32 contains the RRC state
indicator¼ ‘CELL_DCH’.
1.2.3 STATE TRANSITION ANALYSIS
A very precise method to analyse how a call develops step by step is to run a call state
analysis using a state machine. It has already been mentioned that RRC entities in UE and
SRNC run a state machine for each connection. However, it is only a minor subset of a
greater framework to trace state transitions in these network element state machines. Using
a proprietary definition it is possible to define states that describe each single procedure of a
call including optional ones. In such models signalling events trigger state transitions and, if
a call fails, the root cause can be found very quickly.
Figure 1.32 UE in CELL_FACH state
44 UMTS Performance Measurement
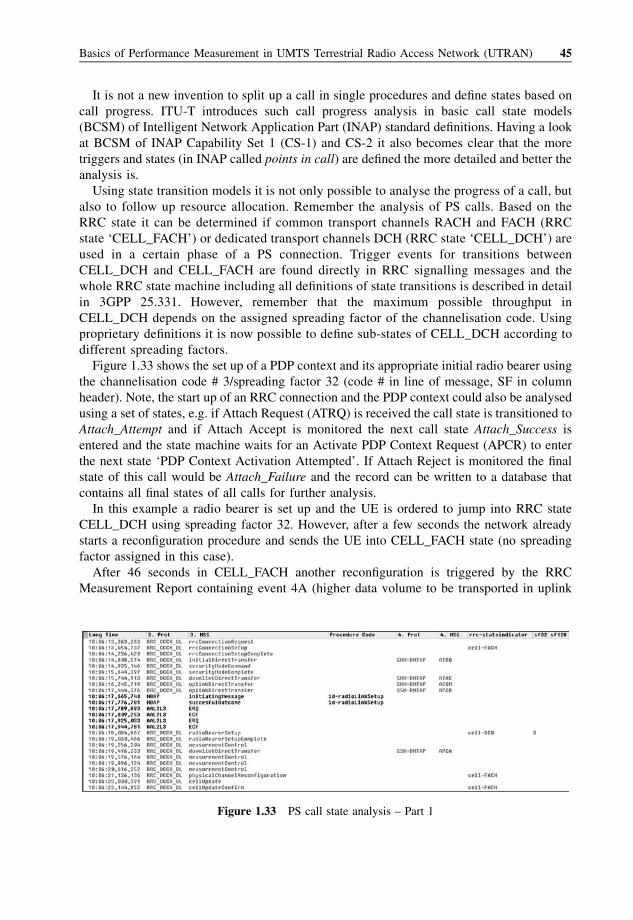
It is not a new invention to split up a call in single procedures and define states based on
call progress. ITU-T introduces such call progress analysis in basic call state models
(BCSM) of Intelligent Network Application Part (INAP) standard definitions. Having a look
at BCSM of INAP Capability Set 1 (CS-1) and CS-2 it also becomes clear that the more
triggers and states (in INAP called points in call) are defined the more detailed and better the
analysis is.
Using state transition models it is not only possible to analyse the progress of a call, but
also to follow up resource allocation. Remember the analysis of PS calls. Based on the
RRC state it can be determined if common transport channels RACH and FACH (RRC
state ‘CELL_FACH’) or dedicated transport channels DCH (RRC state ‘CELL_DCH’) are
used in a certain phase of a PS connection. Trigger events for transitions between
CELL_DCH and CELL_FACH are found directly in RRC signalling messages and the
whole RRC state machine including all definitions of state transitions is described in detail
in 3GPP 25.331. However, remember that the maximum possible throughput in
CELL_DCH depends on the assigned spreading factor of the channelisation code. Using
proprietary definitions it is now possible to define sub-states of CELL_DCH according to
different spreading factors.
Figure 1.33 shows the set up of a PDP context and its appropriate initial radio bearer using
the channelisation code # 3/spreading factor 32 (code # in line of message, SF in column
header). Note, the start up of an RRC connection and the PDP context could also be analysed
using a set of states, e.g. if Attach Request (ATRQ) is received the call state is transitioned to
Attach_Attempt and if Attach Accept is monitored the next call state Attach_Success is
entered and the state machine waits for an Activate PDP Context Request (APCR) to enter
the next state ‘PDP Context Activation Attempted’. If Attach Reject is monitored the final
state of this call would be Attach_Failure and the record can be written to a database that
contains all final states of all calls for further analysis.
In this example a radio bearer is set up and the UE is ordered to jump into RRC state
CELL_DCH using spreading factor 32. However, after a few seconds the network already
starts a reconfiguration procedure and sends the UE into CELL_FACH state (no spreading
factor assigned in this case).
After 46 seconds in CELL_FACH another reconfiguration is triggered by the RRC
Measurement Report containing event 4A (higher data volume to be transported in uplink
Figure 1.33 PS call state analysis – Part 1
Basics of Performance Measurement in UMTS Terrestrial Radio Access Network (UTRAN) 45
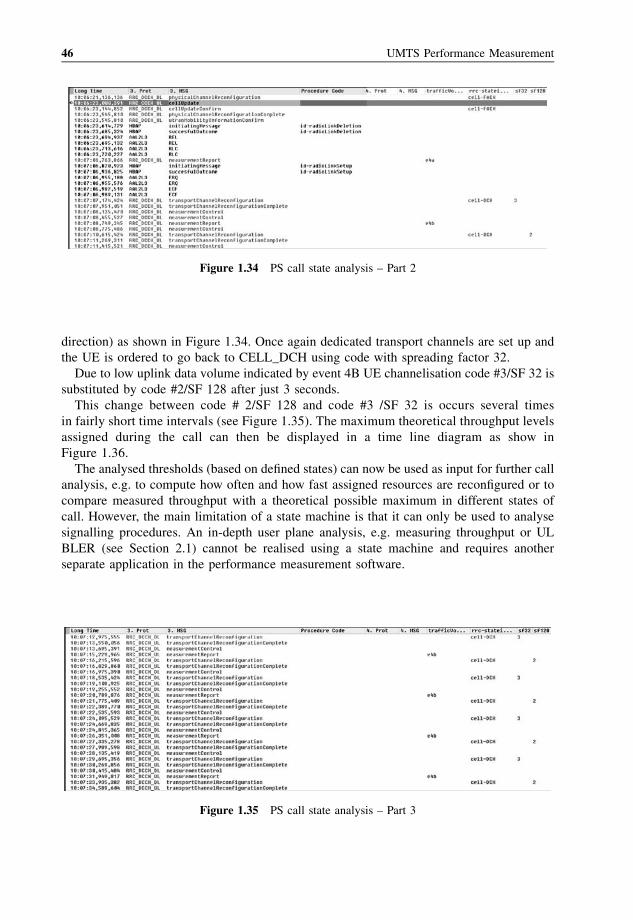
direction) as shown in Figure 1.34. Once again dedicated transport channels are set up and
the UE is ordered to go back to CELL_DCH using code with spreading factor 32.
Due to low uplink data volume indicated by event 4B UE channelisation code #3/SF 32 is
substituted by code #2/SF 128 after just 3 seconds.
This change between code # 2/SF 128 and code #3 /SF 32 is occurs several times
in fairly short time intervals (see Figure 1.35). The maximum theoretical throughput levels
assigned during the call can then be displayed in a time line diagram as show in
Figure 1.36.
The analysed thresholds (based on defined states) can now be used as input for further call
analysis, e.g. to compute how often and how fast assigned resources are reconfigured or to
compare measured throughput with a theoretical possible maximum in different states of
call. However, the main limitation of a state machine is that it can only be used to analyse
signalling procedures. An in-depth user plane analysis, e.g. measuring throughput or UL
BLER (see Section 2.1) cannot be realised using a state machine and requires another
separate application in the performance measurement software.
Figure 1.35 PS call state analysis – Part 3
Figure 1.34 PS call state analysis – Part 2
46 UMTS Performance Measurement
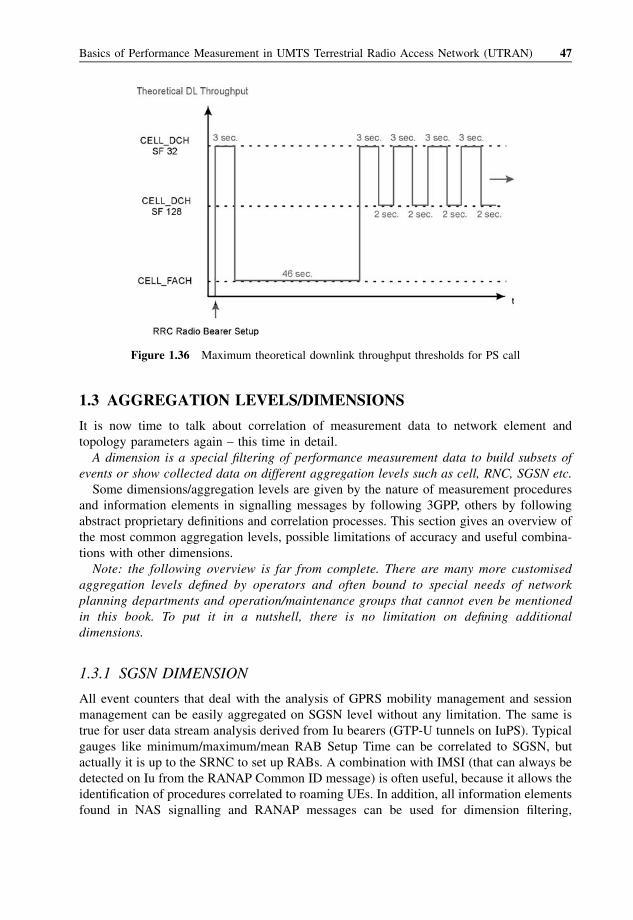
1.3 AGGREGATION LEVELS/DIMENSIONS
It is now time to talk about correlation of measurement data to network element and
topology parameters again – this time in detail.
A dimension is a special filtering of performance measurement data to build subsets of
events or show collected data on different aggregation levels such as cell, RNC, SGSN etc.
Some dimensions/aggregation levels are given by the nature of measurement procedures
and information elements in signalling messages by following 3GPP, others by following
abstract proprietary definitions and correlation processes. This section gives an overview of
the most common aggregation levels, possible limitations of accuracy and useful combina-
tions with other dimensions.
Note: the following overview is far from complete. There are many more customised
aggregation levels defined by operators and often bound to special needs of network
planning departments and operation/maintenance groups that cannot even be mentioned
in this book. To put it in a nutshell, there is no limitation on defining additional
dimensions.
1.3.1 SGSN DIMENSION
All event counters that deal with the analysis of GPRS mobility management and session
management can be easily aggregated on SGSN level without any limitation. The same is
true for user data stream analysis derived from Iu bearers (GTP-U tunnels on IuPS). Typical
gauges like minimum/maximum/mean RAB Setup Time can be correlated to SGSN, but
actually it is up to the SRNC to set up RABs. A combination with IMSI (that can always be
detected on Iu from the RANAP Common ID message) is often useful, because it allows the
identification of procedures correlated to roaming UEs. In addition, all information elements
found in NAS signalling and RANAP messages can be used for dimension filtering,
Figure 1.36 Maximum theoretical downlink throughput thresholds for PS call
Basics of Performance Measurement in UMTS Terrestrial Radio Access Network (UTRAN) 47
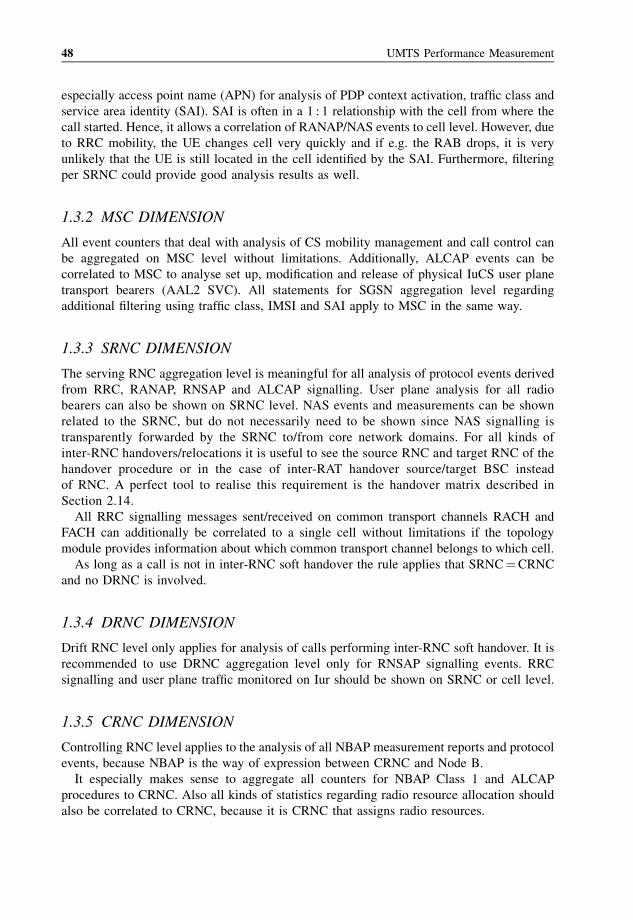
especially access point name (APN) for analysis of PDP context activation, traffic class and
service area identity (SAI). SAI is often in a 1 : 1 relationship with the cell from where the
call started. Hence, it allows a correlation of RANAP/NAS events to cell level. However, due
to RRC mobility, the UE changes cell very quickly and if e.g. the RAB drops, it is very
unlikely that the UE is still located in the cell identified by the SAI. Furthermore, filtering
per SRNC could provide good analysis results as well.
1.3.2 MSC DIMENSION
All event counters that deal with analysis of CS mobility management and call control can
be aggregated on MSC level without limitations. Additionally, ALCAP events can be
correlated to MSC to analyse set up, modification and release of physical IuCS user plane
transport bearers (AAL2 SVC). All statements for SGSN aggregation level regarding
additional filtering using traffic class, IMSI and SAI apply to MSC in the same way.
1.3.3 SRNC DIMENSION
The serving RNC aggregation level is meaningful for all analysis of protocol events derived
from RRC, RANAP, RNSAP and ALCAP signalling. User plane analysis for all radio
bearers can also be shown on SRNC level. NAS events and measurements can be shown
related to the SRNC, but do not necessarily need to be shown since NAS signalling is
transparently forwarded by the SRNC to/from core network domains. For all kinds of
inter-RNC handovers/relocations it is useful to see the source RNC and target RNC of the
handover procedure or in the case of inter-RAT handover source/target BSC instead
of RNC. A perfect tool to realise this requirement is the handover matrix described in
Section 2.14.
All RRC signalling messages sent/received on common transport channels RACH and
FACH can additionally be correlated to a single cell without limitations if the topology
module provides information about which common transport channel belongs to which cell.
As long as a call is not in inter-RNC soft handover the rule applies that SRNC¼CRNC
and no DRNC is involved.
1.3.4 DRNC DIMENSION
Drift RNC level only applies for analysis of calls performing inter-RNC soft handover. It is
recommended to use DRNC aggregation level only for RNSAP signalling events. RRC
signalling and user plane traffic monitored on Iur should be shown on SRNC or cell level.
1.3.5 CRNC DIMENSION
Controlling RNC level applies to the analysis of all NBAP measurement reports and protocol
events, because NBAP is the way of expression between CRNC and Node B.
It especially makes sense to aggregate all counters for NBAP Class 1 and ALCAP
procedures to CRNC. Also all kinds of statistics regarding radio resource allocation should
also be correlated to CRNC, because it is CRNC that assigns radio resources.
48 UMTS Performance Measurement
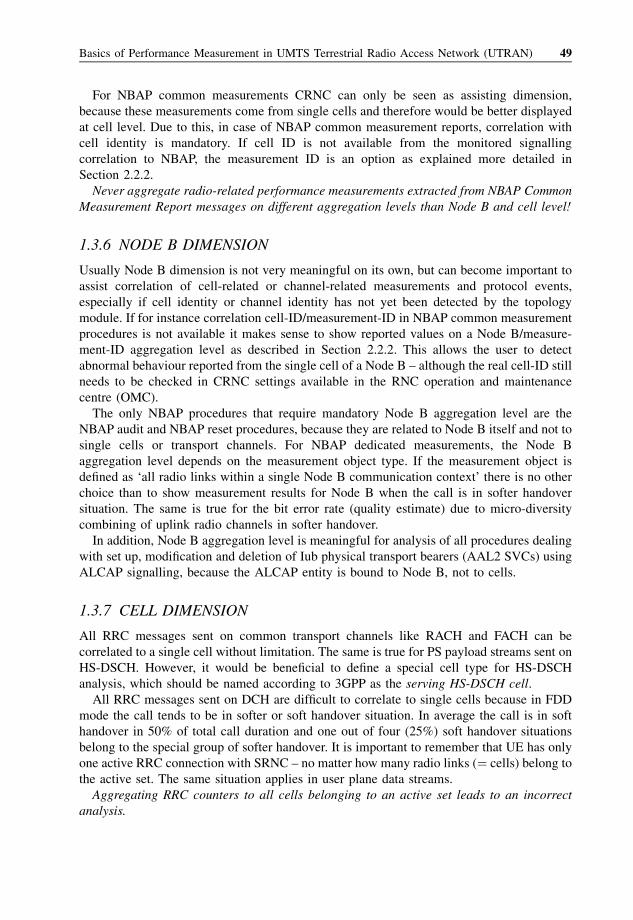
For NBAP common measurements CRNC can only be seen as assisting dimension,
because these measurements come from single cells and therefore would be better displayed
at cell level. Due to this, in case of NBAP common measurement reports, correlation with
cell identity is mandatory. If cell ID is not available from the monitored signalling
correlation to NBAP, the measurement ID is an option as explained more detailed in
Section 2.2.2.
Never aggregate radio-related performance measurements extracted from NBAP Common
Measurement Report messages on different aggregation levels than Node B and cell level!
1.3.6 NODE B DIMENSION
Usually Node B dimension is not very meaningful on its own, but can become important to
assist correlation of cell-related or channel-related measurements and protocol events,
especially if cell identity or channel identity has not yet been detected by the topology
module. If for instance correlation cell-ID/measurement-ID in NBAP common measurement
procedures is not available it makes sense to show reported values on a Node B/measure-
ment-ID aggregation level as described in Section 2.2.2. This allows the user to detect
abnormal behaviour reported from the single cell of a Node B – although the real cell-ID still
needs to be checked in CRNC settings available in the RNC operation and maintenance
centre (OMC).
The only NBAP procedures that require mandatory Node B aggregation level are the
NBAP audit and NBAP reset procedures, because they are related to Node B itself and not to
single cells or transport channels. For NBAP dedicated measurements, the Node B
aggregation level depends on the measurement object type. If the measurement object is
defined as ‘all radio links within a single Node B communication context’ there is no other
choice than to show measurement results for Node B when the call is in softer handover
situation. The same is true for the bit error rate (quality estimate) due to micro-diversity
combining of uplink radio channels in softer handover.
In addition, Node B aggregation level is meaningful for analysis of all procedures dealing
with set up, modification and deletion of Iub physical transport bearers (AAL2 SVCs) using
ALCAP signalling, because the ALCAP entity is bound to Node B, not to cells.
1.3.7 CELL DIMENSION
All RRC messages sent on common transport channels like RACH and FACH can be
correlated to a single cell without limitation. The same is true for PS payload streams sent on
HS-DSCH. However, it would be beneficial to define a special cell type for HS-DSCH
analysis, which should be named according to 3GPP as the serving HS-DSCH cell.
All RRC messages sent on DCH are difficult to correlate to single cells because in FDD
mode the call tends to be in softer or soft handover situation. In average the call is in soft
handover in 50% of total call duration and one out of four (25%) soft handover situations
belong to the special group of softer handover. It is important to remember that UE has only
one active RRC connection with SRNC – no matter how many radio links (¼ cells) belong to
the active set. The same situation applies in user plane data streams.
Aggregating RRC counters to all cells belonging to an active set leads to an incorrect
analysis.
Basics of Performance Measurement in UMTS Terrestrial Radio Access Network (UTRAN) 49
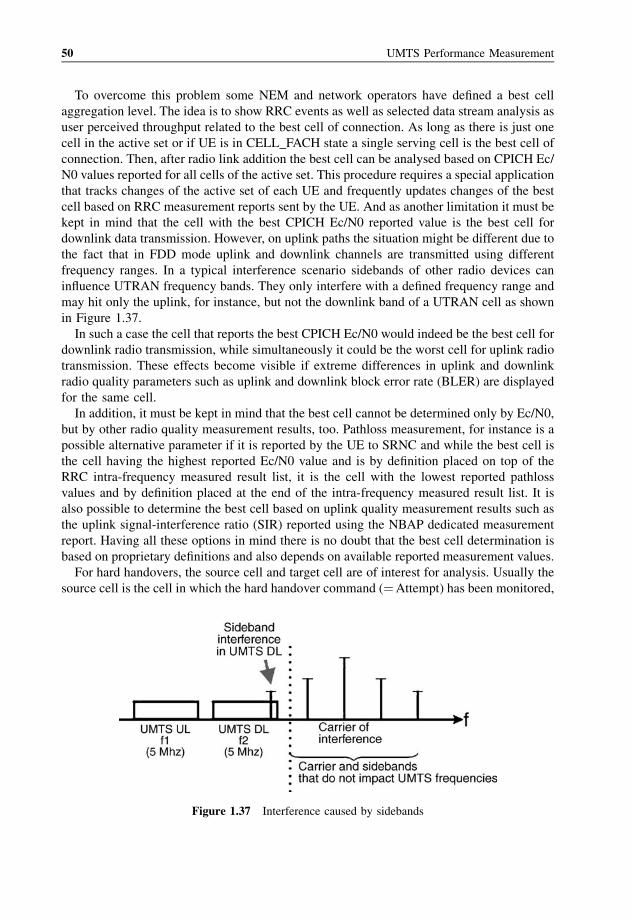
To overcome this problem some NEM and network operators have defined a best cell
aggregation level. The idea is to show RRC events as well as selected data stream analysis as
user perceived throughput related to the best cell of connection. As long as there is just one
cell in the active set or if UE is in CELL_FACH state a single serving cell is the best cell of
connection. Then, after radio link addition the best cell can be analysed based on CPICH Ec/
N0 values reported for all cells of the active set. This procedure requires a special application
that tracks changes of the active set of each UE and frequently updates changes of the best
cell based on RRC measurement reports sent by the UE. And as another limitation it must be
kept in mind that the cell with the best CPICH Ec/N0 reported value is the best cell for
downlink data transmission. However, on uplink paths the situation might be different due to
the fact that in FDD mode uplink and downlink channels are transmitted using different
frequency ranges. In a typical interference scenario sidebands of other radio devices can
influence UTRAN frequency bands. They only interfere with a defined frequency range and
may hit only the uplink, for instance, but not the downlink band of a UTRAN cell as shown
in Figure 1.37.
In such a case the cell that reports the best CPICH Ec/N0 would indeed be the best cell for
downlink radio transmission, while simultaneously it could be the worst cell for uplink radio
transmission. These effects become visible if extreme differences in uplink and downlink
radio quality parameters such as uplink and downlink block error rate (BLER) are displayed
for the same cell.
In addition, it must be kept in mind that the best cell cannot be determined only by Ec/N0,
but by other radio quality measurement results, too. Pathloss measurement, for instance is a
possible alternative parameter if it is reported by the UE to SRNC and while the best cell is
the cell having the highest reported Ec/N0 value and is by definition placed on top of the
RRC intra-frequency measured result list, it is the cell with the lowest reported pathloss
values and by definition placed at the end of the intra-frequency measured result list. It is
also possible to determine the best cell based on uplink quality measurement results such as
the uplink signal-interference ratio (SIR) reported using the NBAP dedicated measurement
report. Having all these options in mind there is no doubt that the best cell determination is
based on proprietary definitions and also depends on available reported measurement values.
For hard handovers, the source cell and target cell are of interest for analysis. Usually the
source cell is the cell in which the hard handover command (¼Attempt) has been monitored,
Figure 1.37 Interference caused by sidebands
50 UMTS Performance Measurement
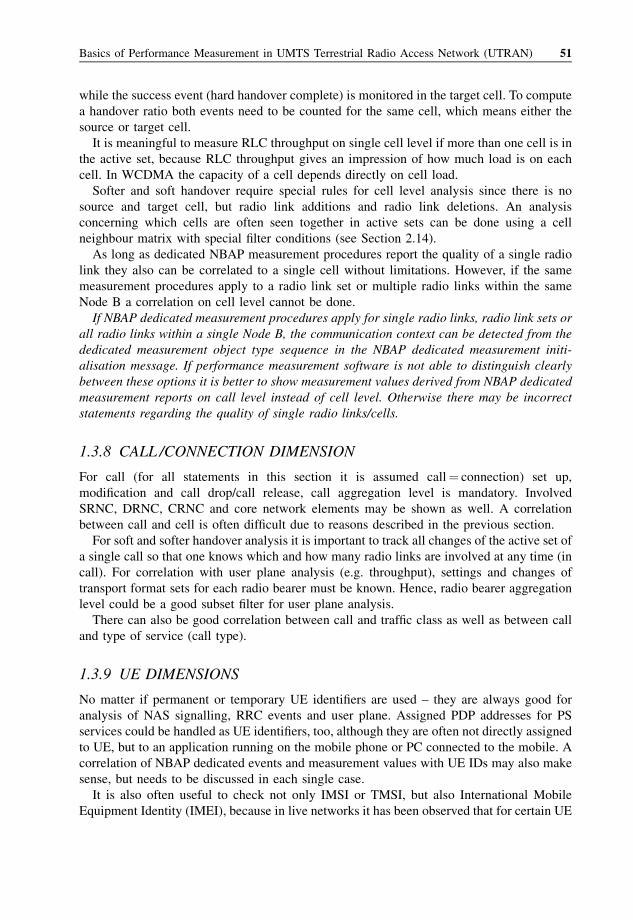
while the success event (hard handover complete) is monitored in the target cell. To compute
a handover ratio both events need to be counted for the same cell, which means either the
source or target cell.
It is meaningful to measure RLC throughput on single cell level if more than one cell is in
the active set, because RLC throughput gives an impression of how much load is on each
cell. In WCDMA the capacity of a cell depends directly on cell load.
Softer and soft handover require special rules for cell level analysis since there is no
source and target cell, but radio link additions and radio link deletions. An analysis
concerning which cells are often seen together in active sets can be done using a cell
neighbour matrix with special filter conditions (see Section 2.14).
As long as dedicated NBAP measurement procedures report the quality of a single radio
link they also can be correlated to a single cell without limitations. However, if the same
measurement procedures apply to a radio link set or multiple radio links within the same
Node B a correlation on cell level cannot be done.
If NBAP dedicated measurement procedures apply for single radio links, radio link sets or
all radio links within a single Node B, the communication context can be detected from the
dedicated measurement object type sequence in the NBAP dedicated measurement initi-
alisation message. If performance measurement software is not able to distinguish clearly
between these options it is better to show measurement values derived from NBAP dedicated
measurement reports on call level instead of cell level. Otherwise there may be incorrect
statements regarding the quality of single radio links/cells.
1.3.8 CALL /CONNECTION DIMENSION
For call (for all statements in this section it is assumed call¼ connection) set up,
modification and call drop/call release, call aggregation level is mandatory. Involved
SRNC, DRNC, CRNC and core network elements may be shown as well. A correlation
between call and cell is often difficult due to reasons described in the previous section.
For soft and softer handover analysis it is important to track all changes of the active set of
a single call so that one knows which and how many radio links are involved at any time (in
call). For correlation with user plane analysis (e.g. throughput), settings and changes of
transport format sets for each radio bearer must be known. Hence, radio bearer aggregation
level could be a good subset filter for user plane analysis.
There can also be good correlation between call and traffic class as well as between call
and type of service (call type).
1.3.9 UE DIMENSIONS
No matter if permanent or temporary UE identifiers are used – they are always good for
analysis of NAS signalling, RRC events and user plane. Assigned PDP addresses for PS
services could be handled as UE identifiers, too, although they are often not directly assigned
to UE, but to an application running on the mobile phone or PC connected to the mobile. A
correlation of NBAP dedicated events and measurement values with UE IDs may also make
sense, but needs to be discussed in each single case.
It is also often useful to check not only IMSI or TMSI, but also International Mobile
Equipment Identity (IMEI), because in live networks it has been observed that for certain UE
Basics of Performance Measurement in UMTS Terrestrial Radio Access Network (UTRAN) 51
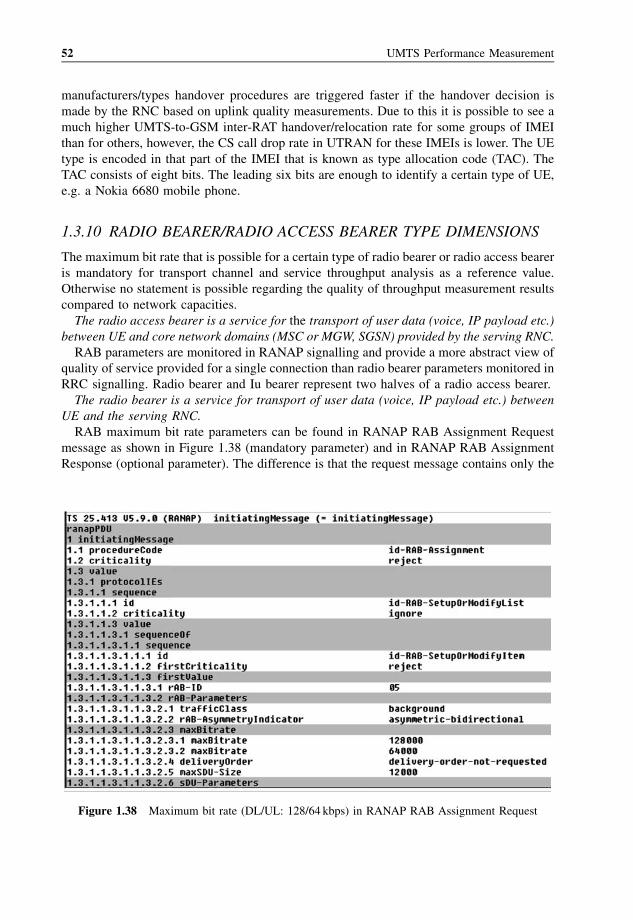
manufacturers/types handover procedures are triggered faster if the handover decision is
made by the RNC based on uplink quality measurements. Due to this it is possible to see a
much higher UMTS-to-GSM inter-RAT handover/relocation rate for some groups of IMEI
than for others, however, the CS call drop rate in UTRAN for these IMEIs is lower. The UE
type is encoded in that part of the IMEI that is known as type allocation code (TAC). The
TAC consists of eight bits. The leading six bits are enough to identify a certain type of UE,
e.g. a Nokia 6680 mobile phone.
1.3.10 RADIO BEARER/RADIO ACCESS BEARER TYPE DIMENSIONS
The maximum bit rate that is possible for a certain type of radio bearer or radio access bearer
is mandatory for transport channel and service throughput analysis as a reference value.
Otherwise no statement is possible regarding the quality of throughput measurement results
compared to network capacities.
The radio access bearer is a service for the transport of user data (voice, IP payload etc.)
between UE and core network domains (MSC or MGW, SGSN) provided by the serving RNC.
RAB parameters are monitored in RANAP signalling and provide a more abstract view of
quality of service provided for a single connection than radio bearer parameters monitored in
RRC signalling. Radio bearer and Iu bearer represent two halves of a radio access bearer.
The radio bearer is a service for transport of user data (voice, IP payload etc.) between
UE and the serving RNC.
RAB maximum bit rate parameters can be found in RANAP RAB Assignment Request
message as shown in Figure 1.38 (mandatory parameter) and in RANAP RAB Assignment
Response (optional parameter). The difference is that the request message contains only the
Figure 1.38 Maximum bit rate (DL/UL: 128/64 kbps) in RANAP RAB Assignment Request
52 UMTS Performance Measurement
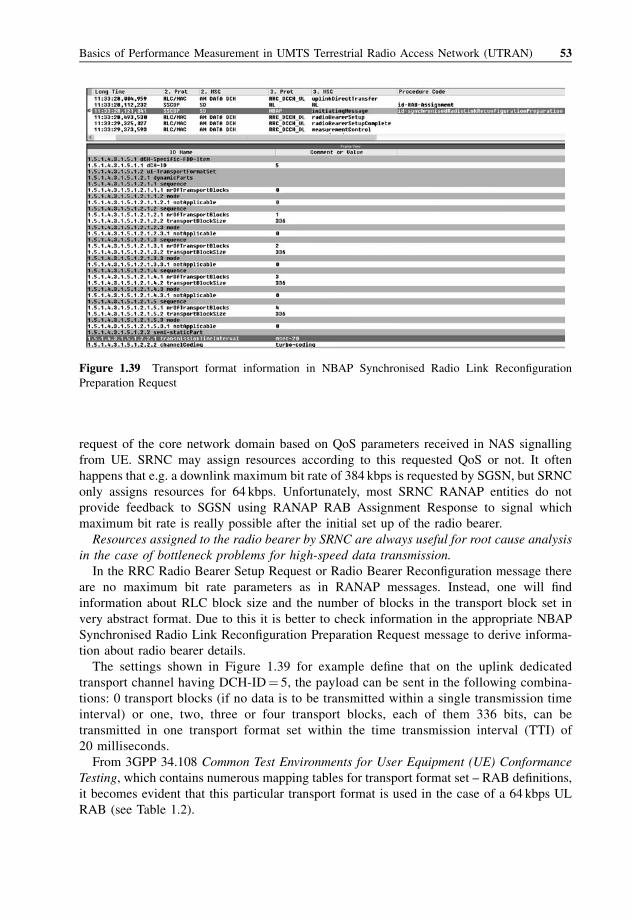
request of the core network domain based on QoS parameters received in NAS signalling
from UE. SRNC may assign resources according to this requested QoS or not. It often
happens that e.g. a downlink maximum bit rate of 384 kbps is requested by SGSN, but SRNC
only assigns resources for 64 kbps. Unfortunately, most SRNC RANAP entities do not
provide feedback to SGSN using RANAP RAB Assignment Response to signal which
maximum bit rate is really possible after the initial set up of the radio bearer.
Resources assigned to the radio bearer by SRNC are always useful for root cause analysis
in the case of bottleneck problems for high-speed data transmission.
In the RRC Radio Bearer Setup Request or Radio Bearer Reconfiguration message there
are no maximum bit rate parameters as in RANAP messages. Instead, one will find
information about RLC block size and the number of blocks in the transport block set in
very abstract format. Due to this it is better to check information in the appropriate NBAP
Synchronised Radio Link Reconfiguration Preparation Request message to derive informa-
tion about radio bearer details.
The settings shown in Figure 1.39 for example define that on the uplink dedicated
transport channel having DCH-ID¼ 5, the payload can be sent in the following combina-
tions: 0 transport blocks (if no data is to be transmitted within a single transmission time
interval) or one, two, three or four transport blocks, each of them 336 bits, can be
transmitted in one transport format set within the time transmission interval (TTI) of
20 milliseconds.
From 3GPP 34.108 Common Test Environments for User Equipment (UE) Conformance
Testing, which contains numerous mapping tables for transport format set – RAB definitions,
it becomes evident that this particular transport format is used in the case of a 64 kbps UL
RAB (see Table 1.2).
Figure 1.39 Transport format information in NBAP Synchronised Radio Link Reconfiguration
Preparation Request
Basics of Performance Measurement in UMTS Terrestrial Radio Access Network (UTRAN) 53
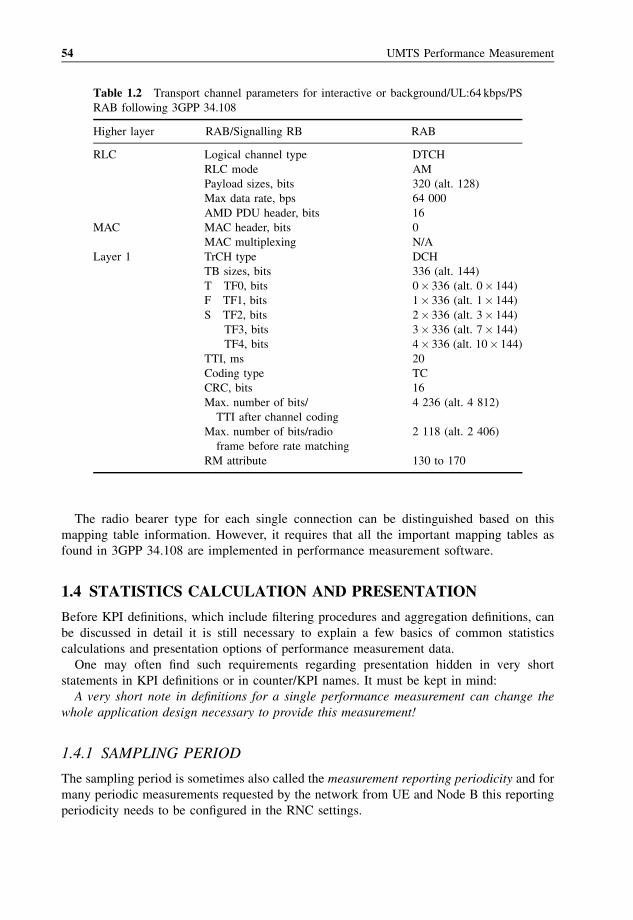
The radio bearer type for each single connection can be distinguished based on this
mapping table information. However, it requires that all the important mapping tables as
found in 3GPP 34.108 are implemented in performance measurement software.
1.4 STATISTICS CALCULATION AND PRESENTATION
Before KPI definitions, which include filtering procedures and aggregation definitions, can
be discussed in detail it is still necessary to explain a few basics of common statistics
calculations and presentation options of performance measurement data.
One may often find such requirements regarding presentation hidden in very short
statements in KPI definitions or in counter/KPI names. It must be kept in mind:
A very short note in definitions for a single performance measurement can change the
whole application design necessary to provide this measurement!
1.4.1 SAMPLING PERIOD
The sampling period is sometimes also called the measurement reporting periodicity and for
many periodic measurements requested by the network from UE and Node B this reporting
periodicity needs to be configured in the RNC settings.
Table 1.2 Transport channel parameters for interactive or background/UL:64 kbps/PS
RAB following 3GPP 34.108
Higher layer RAB/Signalling RB RAB
RLC Logical channel type DTCH
RLC mode AM
Payload sizes, bits 320 (alt. 128)
Max data rate, bps 64 000
AMD PDU header, bits 16
MAC MAC header, bits 0
MAC multiplexing N/A
Layer 1 TrCH type DCH
TB sizes, bits 336 (alt. 144)
T TF0, bits 0� 336 (alt. 0� 144)
F TF1, bits 1� 336 (alt. 1� 144)
S TF2, bits 2� 336 (alt. 3� 144)
TF3, bits 3� 336 (alt. 7� 144)
TF4, bits 4� 336 (alt. 10� 144)
TTI, ms 20
Coding type TC
CRC, bits 16
Max. number of bits/ 4 236 (alt. 4 812)
TTI after channel coding
Max. number of bits/radio 2 118 (alt. 2 406)
frame before rate matching
RM attribute 130 to 170
54 UMTS Performance Measurement
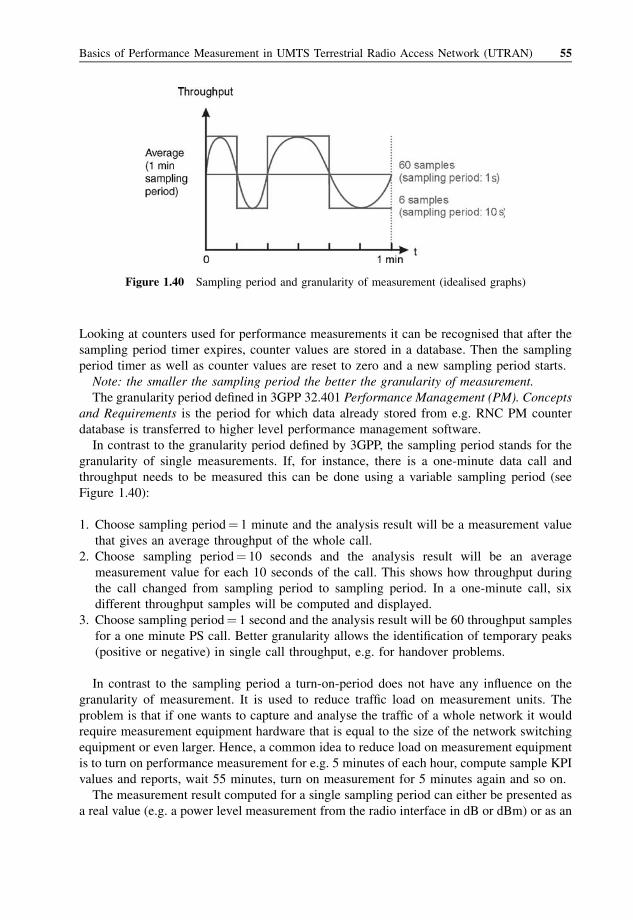
Looking at counters used for performance measurements it can be recognised that after the
sampling period timer expires, counter values are stored in a database. Then the sampling
period timer as well as counter values are reset to zero and a new sampling period starts.
Note: the smaller the sampling period the better the granularity of measurement.
The granularity period defined in 3GPP 32.401 Performance Management (PM). Concepts
and Requirements is the period for which data already stored from e.g. RNC PM counter
database is transferred to higher level performance management software.
In contrast to the granularity period defined by 3GPP, the sampling period stands for the
granularity of single measurements. If, for instance, there is a one-minute data call and
throughput needs to be measured this can be done using a variable sampling period (see
Figure 1.40):
1. Choose sampling period¼ 1 minute and the analysis result will be a measurement value
that gives an average throughput of the whole call.
2. Choose sampling period¼ 10 seconds and the analysis result will be an average
measurement value for each 10 seconds of the call. This shows how throughput during
the call changed from sampling period to sampling period. In a one-minute call, six
different throughput samples will be computed and displayed.
3. Choose sampling period¼ 1 second and the analysis result will be 60 throughput samples
for a one minute PS call. Better granularity allows the identification of temporary peaks
(positive or negative) in single call throughput, e.g. for handover problems.
In contrast to the sampling period a turn-on-period does not have any influence on the
granularity of measurement. It is used to reduce traffic load on measurement units. The
problem is that if one wants to capture and analyse the traffic of a whole network it would
require measurement equipment hardware that is equal to the size of the network switching
equipment or even larger. Hence, a common idea to reduce load on measurement equipment
is to turn on performance measurement for e.g. 5 minutes of each hour, compute sample KPI
values and reports, wait 55 minutes, turn on measurement for 5 minutes again and so on.
The measurement result computed for a single sampling period can either be presented as
a real value (e.g. a power level measurement from the radio interface in dB or dBm) or as an
Figure 1.40 Sampling period and granularity of measurement (idealised graphs)
Basics of Performance Measurement in UMTS Terrestrial Radio Access Network (UTRAN) 55
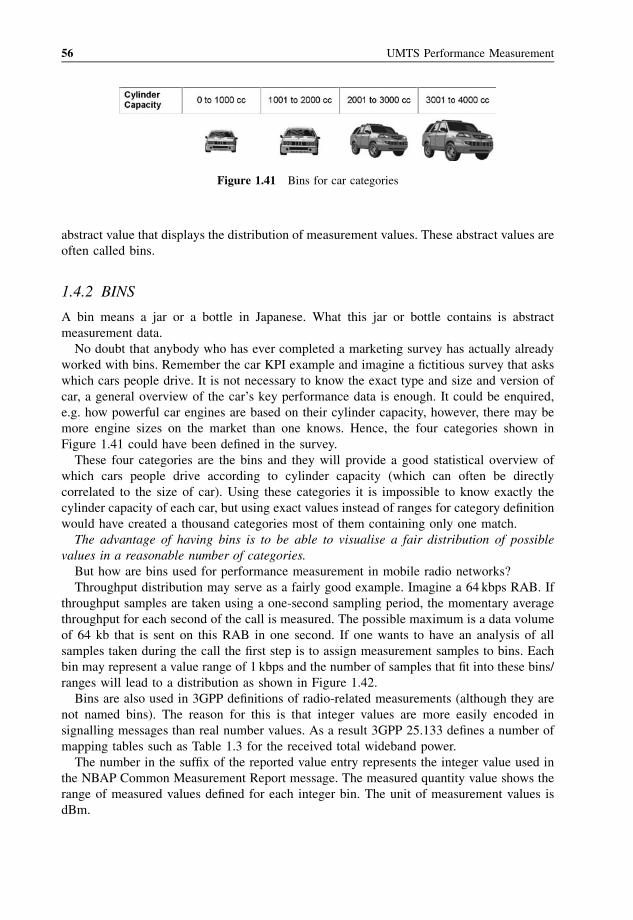
abstract value that displays the distribution of measurement values. These abstract values are
often called bins.
1.4.2 BINS
A bin means a jar or a bottle in Japanese. What this jar or bottle contains is abstract
measurement data.
No doubt that anybody who has ever completed a marketing survey has actually already
worked with bins. Remember the car KPI example and imagine a fictitious survey that asks
which cars people drive. It is not necessary to know the exact type and size and version of
car, a general overview of the car’s key performance data is enough. It could be enquired,
e.g. how powerful car engines are based on their cylinder capacity, however, there may be
more engine sizes on the market than one knows. Hence, the four categories shown in
Figure 1.41 could have been defined in the survey.
These four categories are the bins and they will provide a good statistical overview of
which cars people drive according to cylinder capacity (which can often be directly
correlated to the size of car). Using these categories it is impossible to know exactly the
cylinder capacity of each car, but using exact values instead of ranges for category definition
would have created a thousand categories most of them containing only one match.
The advantage of having bins is to be able to visualise a fair distribution of possible
values in a reasonable number of categories.
But how are bins used for performance measurement in mobile radio networks?
Throughput distribution may serve as a fairly good example. Imagine a 64 kbps RAB. If
throughput samples are taken using a one-second sampling period, the momentary average
throughput for each second of the call is measured. The possible maximum is a data volume
of 64 kb that is sent on this RAB in one second. If one wants to have an analysis of all
samples taken during the call the first step is to assign measurement samples to bins. Each
bin may represent a value range of 1 kbps and the number of samples that fit into these bins/
ranges will lead to a distribution as shown in Figure 1.42.
Bins are also used in 3GPP definitions of radio-related measurements (although they are
not named bins). The reason for this is that integer values are more easily encoded in
signalling messages than real number values. As a result 3GPP 25.133 defines a number of
mapping tables such as Table 1.3 for the received total wideband power.
The number in the suffix of the reported value entry represents the integer value used in
the NBAP Common Measurement Report message. The measured quantity value shows the
range of measured values defined for each integer bin. The unit of measurement values is
dBm.
Figure 1.41 Bins for car categories
56 UMTS Performance Measurement
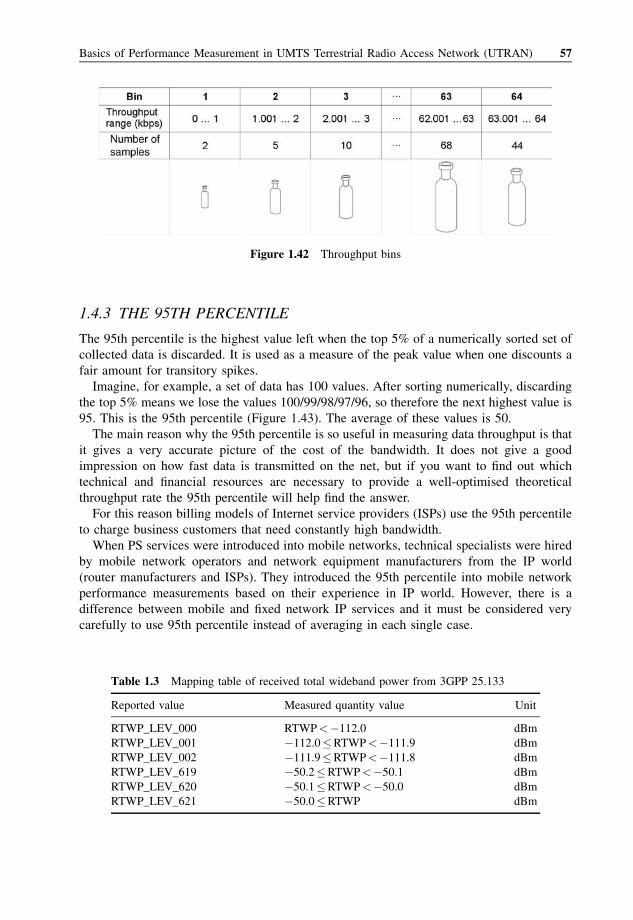
1.4.3 THE 95TH PERCENTILE
The 95th percentile is the highest value left when the top 5% of a numerically sorted set of
collected data is discarded. It is used as a measure of the peak value when one discounts a
fair amount for transitory spikes.
Imagine, for example, a set of data has 100 values. After sorting numerically, discarding
the top 5% means we lose the values 100/99/98/97/96, so therefore the next highest value is
95. This is the 95th percentile (Figure 1.43). The average of these values is 50.
The main reason why the 95th percentile is so useful in measuring data throughput is that
it gives a very accurate picture of the cost of the bandwidth. It does not give a good
impression on how fast data is transmitted on the net, but if you want to find out which
technical and financial resources are necessary to provide a well-optimised theoretical
throughput rate the 95th percentile will help find the answer.
For this reason billing models of Internet service providers (ISPs) use the 95th percentile
to charge business customers that need constantly high bandwidth.
When PS services were introduced into mobile networks, technical specialists were hired
by mobile network operators and network equipment manufacturers from the IP world
(router manufacturers and ISPs). They introduced the 95th percentile into mobile network
performance measurements based on their experience in IP world. However, there is a
difference between mobile and fixed network IP services and it must be considered very
carefully to use 95th percentile instead of averaging in each single case.
Figure 1.42 Throughput bins
Table 1.3 Mapping table of received total wideband power from 3GPP 25.133
Reported value Measured quantity value Unit
RTWP_LEV_000 RTWP<�112.0 dBm
RTWP_LEV_001 �112.0�RTWP<�111.9 dBm
RTWP_LEV_002 �111.9�RTWP<�111.8 dBm
RTWP_LEV_619 �50.2�RTWP<�50.1 dBm
RTWP_LEV_620 �50.1�RTWP<�50.0 dBm
RTWP_LEV_621 �50.0�RTWP dBm
Basics of Performance Measurement in UMTS Terrestrial Radio Access Network (UTRAN) 57
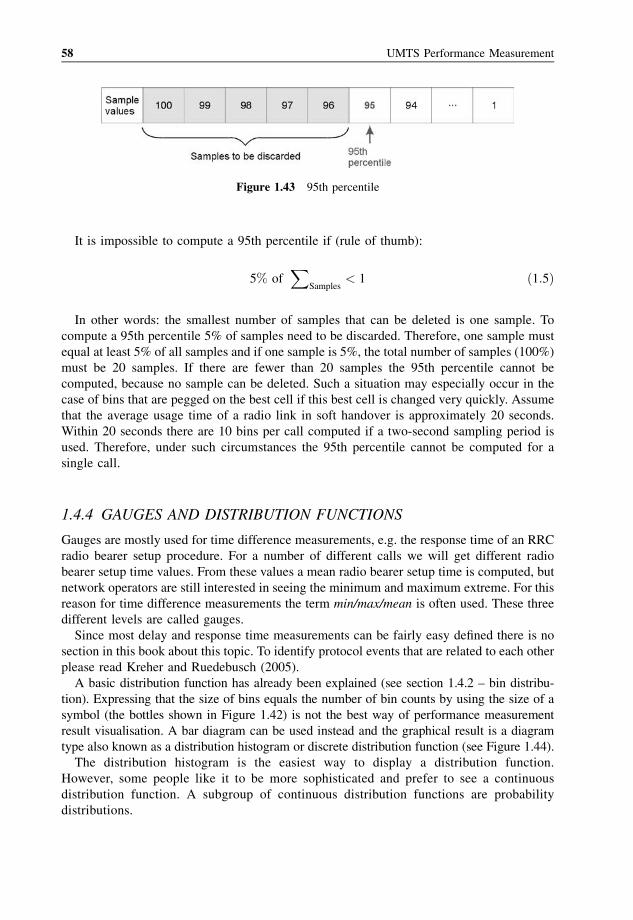
It is impossible to compute a 95th percentile if (rule of thumb):
5% ofX
Samples< 1 ð1:5Þ
In other words: the smallest number of samples that can be deleted is one sample. To
compute a 95th percentile 5% of samples need to be discarded. Therefore, one sample must
equal at least 5% of all samples and if one sample is 5%, the total number of samples (100%)
must be 20 samples. If there are fewer than 20 samples the 95th percentile cannot be
computed, because no sample can be deleted. Such a situation may especially occur in the
case of bins that are pegged on the best cell if this best cell is changed very quickly. Assume
that the average usage time of a radio link in soft handover is approximately 20 seconds.
Within 20 seconds there are 10 bins per call computed if a two-second sampling period is
used. Therefore, under such circumstances the 95th percentile cannot be computed for a
single call.
1.4.4 GAUGES AND DISTRIBUTION FUNCTIONS
Gauges are mostly used for time difference measurements, e.g. the response time of an RRC
radio bearer setup procedure. For a number of different calls we will get different radio
bearer setup time values. From these values a mean radio bearer setup time is computed, but
network operators are still interested in seeing the minimum and maximum extreme. For this
reason for time difference measurements the term min/max/mean is often used. These three
different levels are called gauges.
Since most delay and response time measurements can be fairly easy defined there is no
section in this book about this topic. To identify protocol events that are related to each other
please read Kreher and Ruedebusch (2005).
A basic distribution function has already been explained (see section 1.4.2 – bin distribu-
tion). Expressing that the size of bins equals the number of bin counts by using the size of a
symbol (the bottles shown in Figure 1.42) is not the best way of performance measurement
result visualisation. A bar diagram can be used instead and the graphical result is a diagram
type also known as a distribution histogram or discrete distribution function (see Figure 1.44).
The distribution histogram is the easiest way to display a distribution function.
However, some people like it to be more sophisticated and prefer to see a continuous
distribution function. A subgroup of continuous distribution functions are probability
distributions.
Figure 1.43 95th percentile
58 UMTS Performance Measurement
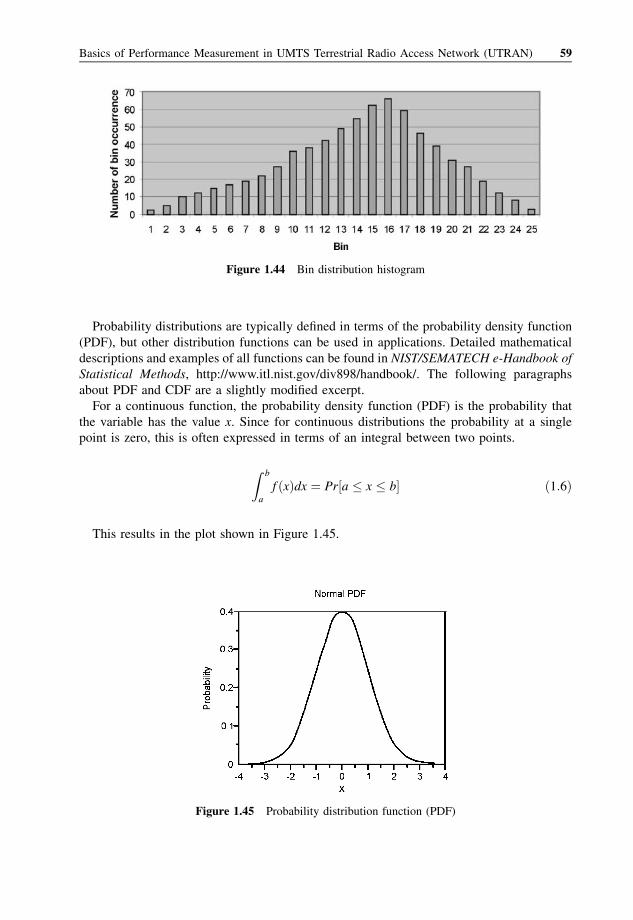
Probability distributions are typically defined in terms of the probability density function
(PDF), but other distribution functions can be used in applications. Detailed mathematical
descriptions and examples of all functions can be found in NIST/SEMATECH e-Handbook of
Statistical Methods, http://www.itl.nist.gov/div898/handbook/. The following paragraphs
about PDF and CDF are a slightly modified excerpt.
For a continuous function, the probability density function (PDF) is the probability that
the variable has the value x. Since for continuous distributions the probability at a single
point is zero, this is often expressed in terms of an integral between two points.
Z b
a
f ðxÞdx ¼ Pr½a � x � b� ð1:6Þ
This results in the plot shown in Figure 1.45.
Figure 1.44 Bin distribution histogram
Figure 1.45 Probability distribution function (PDF)
Basics of Performance Measurement in UMTS Terrestrial Radio Access Network (UTRAN) 59
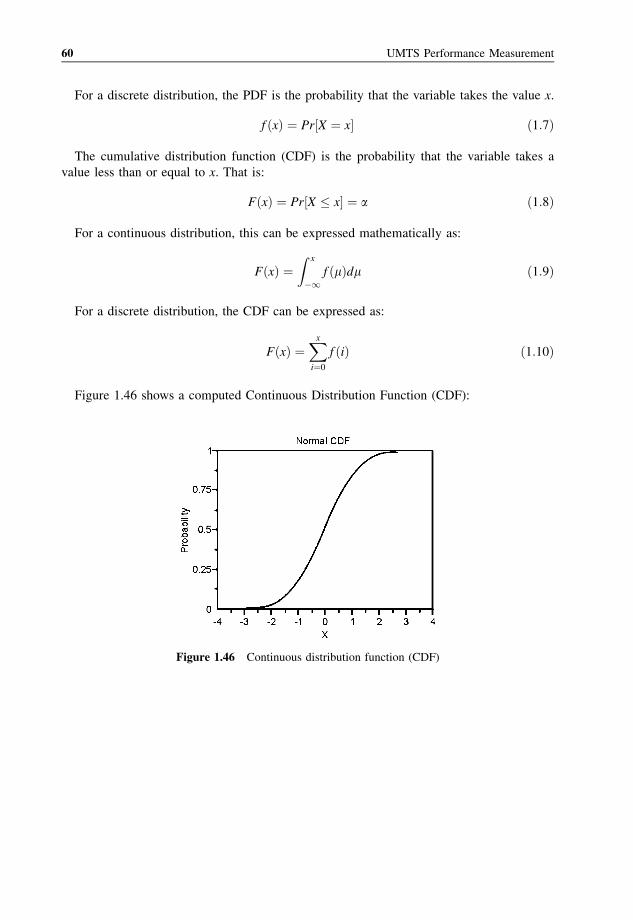
For a discrete distribution, the PDF is the probability that the variable takes the value x.
f ðxÞ ¼ Pr½X ¼ x� ð1:7Þ
The cumulative distribution function (CDF) is the probability that the variable takes a
value less than or equal to x. That is:
FðxÞ ¼ Pr½X � x� ¼ a ð1:8Þ
For a continuous distribution, this can be expressed mathematically as:
FðxÞ ¼Z x
�1f ðmÞdm ð1:9Þ
For a discrete distribution, the CDF can be expressed as:
FðxÞ ¼Xxi¼0
f ðiÞ ð1:10Þ
Figure 1.46 shows a computed Continuous Distribution Function (CDF):
Figure 1.46 Continuous distribution function (CDF)
60 UMTS Performance Measurement
2
Selected UMTS KeyPerformance Parameters
There are three major challenges in performance measurement:
1. Defining performance measurements and KPIs.
2. Verifying measurement results.
3. Explaining measurement results.
This chapter deals with these challenges and offers solutions based on measurement scenarios
and case studies. It explains how data is captured, filtered and computed, which statements can
be derived from measurement analysis and which limitations apply. Furthermore, the
necessary protocol knowledge to verify measurement results is presented. Once again, this
is neither a perfect nor a complete overview, but a guided walkthrough. It is not a ready-to-use
implementation guide, but a path to individual measurement definition and analysis.
2.1 BLOCK ERROR RATE (BLER) MEASUREMENTS
Block error rate (BLER) is an analysis of transmission errors on the radio interface. Using
formal definitions BLER is a KPI, because it is a formula. It is based on analysis of cyclic
redundancy check (CRC) results for radio link control (RLC) transport blocks and computed
by defining the relation between the numbers of RLC transport blocks with CRC error indi-
cation and the total number of transmitted transport blocks as expressed in Equation (2.1).
Block Error Rate ðBLERÞ ¼P
RLC TransportBlocks with CRCErrorPRLC TransportBlocks
� 100% ð2:1Þ
BLER is measured separately on the uplink and downlink direction, which is mandatory,
because in UTRAN frequency division duplex (FDD) mode uplink and downlink data is
transmitted using different frequency bands.
There are several options for BLER filtering and computing, which will be explained in
the following two sections.
UMTS Performance Measurement: A Practical Guide to KPIs for the UTRAN Environment Ralf Kreher
# 2006 Ralf Kreher
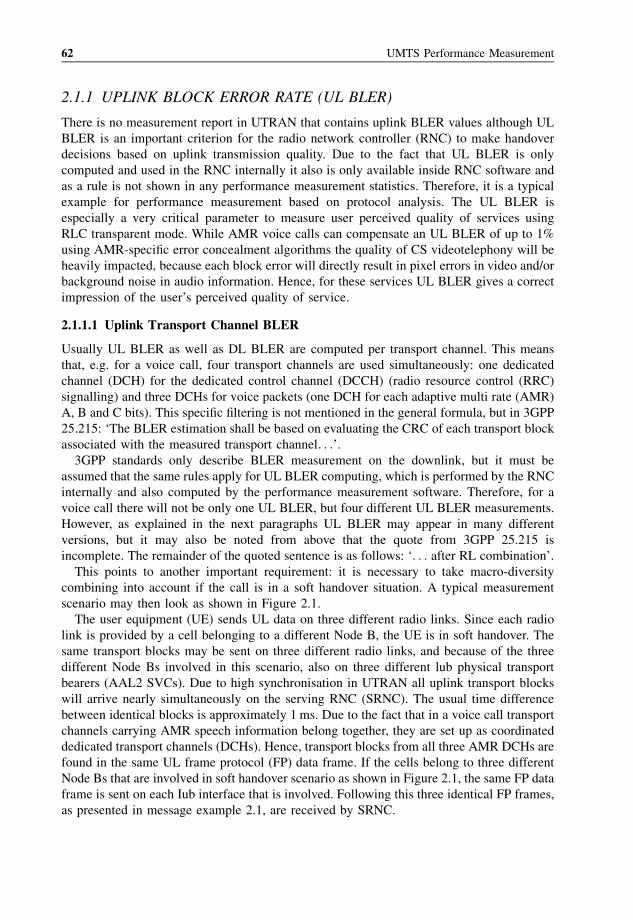
2.1.1 UPLINK BLOCK ERROR RATE (UL BLER)
There is no measurement report in UTRAN that contains uplink BLER values although UL
BLER is an important criterion for the radio network controller (RNC) to make handover
decisions based on uplink transmission quality. Due to the fact that UL BLER is only
computed and used in the RNC internally it also is only available inside RNC software and
as a rule is not shown in any performance measurement statistics. Therefore, it is a typical
example for performance measurement based on protocol analysis. The UL BLER is
especially a very critical parameter to measure user perceived quality of services using
RLC transparent mode. While AMR voice calls can compensate an UL BLER of up to 1%
using AMR-specific error concealment algorithms the quality of CS videotelephony will be
heavily impacted, because each block error will directly result in pixel errors in video and/or
background noise in audio information. Hence, for these services UL BLER gives a correct
impression of the user’s perceived quality of service.
2.1.1.1 Uplink Transport Channel BLER
Usually UL BLER as well as DL BLER are computed per transport channel. This means
that, e.g. for a voice call, four transport channels are used simultaneously: one dedicated
channel (DCH) for the dedicated control channel (DCCH) (radio resource control (RRC)
signalling) and three DCHs for voice packets (one DCH for each adaptive multi rate (AMR)
A, B and C bits). This specific filtering is not mentioned in the general formula, but in 3GPP
25.215: ‘The BLER estimation shall be based on evaluating the CRC of each transport block
associated with the measured transport channel. . .’.3GPP standards only describe BLER measurement on the downlink, but it must be
assumed that the same rules apply for UL BLER computing, which is performed by the RNC
internally and also computed by the performance measurement software. Therefore, for a
voice call there will not be only one UL BLER, but four different UL BLER measurements.
However, as explained in the next paragraphs UL BLER may appear in many different
versions, but it may also be noted from above that the quote from 3GPP 25.215 is
incomplete. The remainder of the quoted sentence is as follows: ‘. . . after RL combination’.
This points to another important requirement: it is necessary to take macro-diversity
combining into account if the call is in a soft handover situation. A typical measurement
scenario may then look as shown in Figure 2.1.
The user equipment (UE) sends UL data on three different radio links. Since each radio
link is provided by a cell belonging to a different Node B, the UE is in soft handover. The
same transport blocks may be sent on three different radio links, and because of the three
different Node Bs involved in this scenario, also on three different lub physical transport
bearers (AAL2 SVCs). Due to high synchronisation in UTRAN all uplink transport blocks
will arrive nearly simultaneously on the serving RNC (SRNC). The usual time difference
between identical blocks is approximately 1 ms. Due to the fact that in a voice call transport
channels carrying AMR speech information belong together, they are set up as coordinated
dedicated transport channels (DCHs). Hence, transport blocks from all three AMR DCHs are
found in the same UL frame protocol (FP) data frame. If the cells belong to three different
Node Bs that are involved in soft handover scenario as shown in Figure 2.1, the same FP data
frame is sent on each Iub interface that is involved. Following this three identical FP frames,
as presented in message example 2.1, are received by SRNC.
62 UMTS Performance Measurement
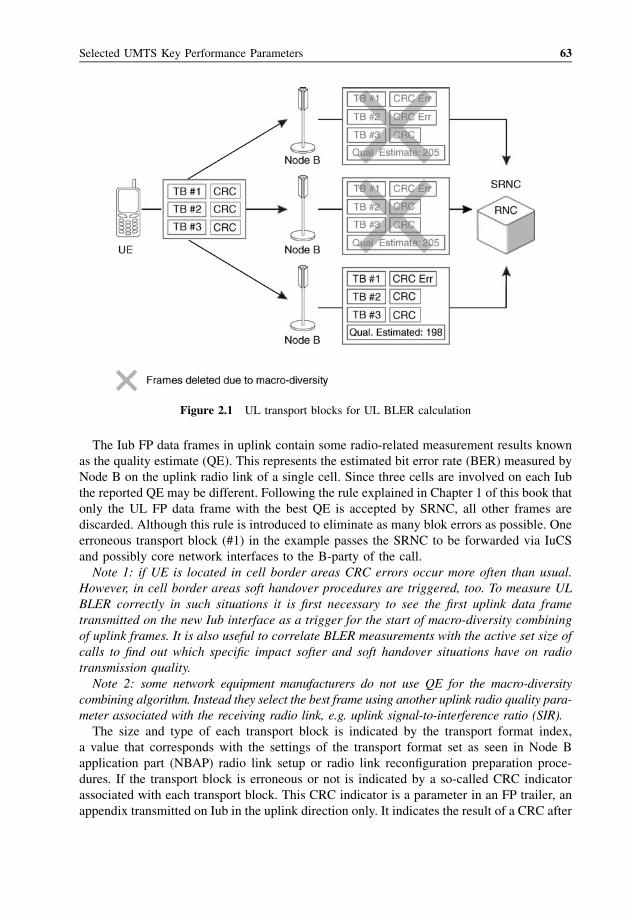
The Iub FP data frames in uplink contain some radio-related measurement results known
as the quality estimate (QE). This represents the estimated bit error rate (BER) measured by
Node B on the uplink radio link of a single cell. Since three cells are involved on each Iub
the reported QE may be different. Following the rule explained in Chapter 1 of this book that
only the UL FP data frame with the best QE is accepted by SRNC, all other frames are
discarded. Although this rule is introduced to eliminate as many blok errors as possible. One
erroneous transport block (#1) in the example passes the SRNC to be forwarded via IuCS
and possibly core network interfaces to the B-party of the call.
Note 1: if UE is located in cell border areas CRC errors occur more often than usual.
However, in cell border areas soft handover procedures are triggered, too. To measure UL
BLER correctly in such situations it is first necessary to see the first uplink data frame
transmitted on the new Iub interface as a trigger for the start of macro-diversity combining
of uplink frames. It is also useful to correlate BLER measurements with the active set size of
calls to find out which specific impact softer and soft handover situations have on radio
transmission quality.
Note 2: some network equipment manufacturers do not use QE for the macro-diversity
combining algorithm. Instead they select the best frame using another uplink radio quality para-
meter associated with the receiving radio link, e.g. uplink signal-to-interference ratio (SIR).
The size and type of each transport block is indicated by the transport format index,
a value that corresponds with the settings of the transport format set as seen in Node B
application part (NBAP) radio link setup or radio link reconfiguration preparation proce-
dures. If the transport block is erroneous or not is indicated by a so-called CRC indicator
associated with each transport block. This CRC indicator is a parameter in an FP trailer, an
appendix transmitted on Iub in the uplink direction only. It indicates the result of a CRC after
Figure 2.1 UL transport blocks for UL BLER calculation
Selected UMTS Key Performance Parameters 63
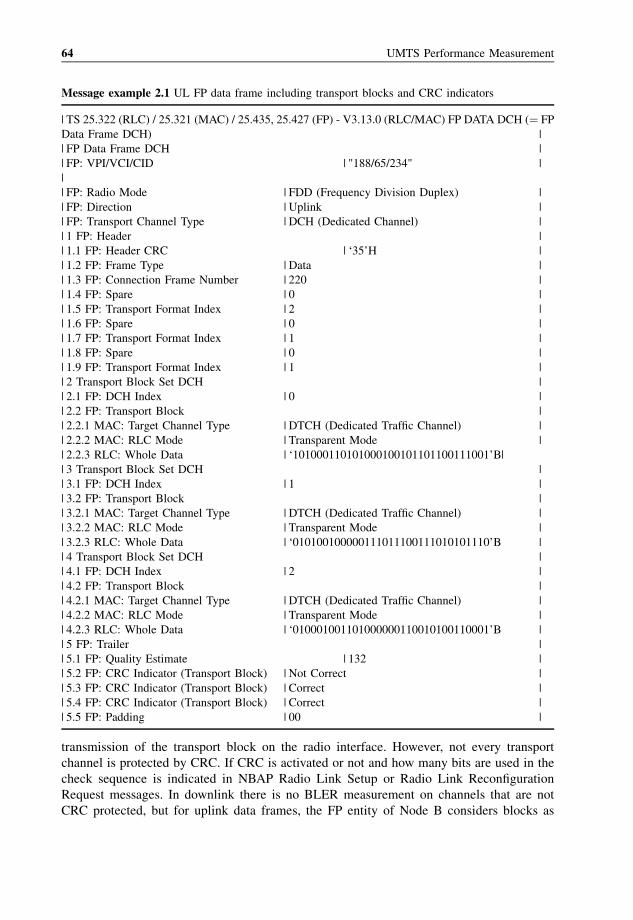
transmission of the transport block on the radio interface. However, not every transport
channel is protected by CRC. If CRC is activated or not and how many bits are used in the
check sequence is indicated in NBAP Radio Link Setup or Radio Link Reconfiguration
Request messages. In downlink there is no BLER measurement on channels that are not
CRC protected, but for uplink data frames, the FP entity of Node B considers blocks as
Message example 2.1 UL FP data frame including transport blocks and CRC indicators
| TS 25.322 (RLC) / 25.321 (MAC) / 25.435, 25.427 (FP) - V3.13.0 (RLC/MAC) FP DATA DCH (¼ FP
Data Frame DCH) |
| FP Data Frame DCH |
| FP: VPI/VCI/CID | "188/65/234" |
|
| FP: Radio Mode | FDD (Frequency Division Duplex) |
| FP: Direction | Uplink |
| FP: Transport Channel Type | DCH (Dedicated Channel) |
| 1 FP: Header |
| 1.1 FP: Header CRC | ‘35’H |
| 1.2 FP: Frame Type | Data |
| 1.3 FP: Connection Frame Number | 220 |
| 1.4 FP: Spare | 0 |
| 1.5 FP: Transport Format Index | 2 |
| 1.6 FP: Spare | 0 |
| 1.7 FP: Transport Format Index | 1 |
| 1.8 FP: Spare | 0 |
| 1.9 FP: Transport Format Index | 1 |
| 2 Transport Block Set DCH |
| 2.1 FP: DCH Index | 0 |
| 2.2 FP: Transport Block |
| 2.2.1 MAC: Target Channel Type | DTCH (Dedicated Traffic Channel) |
| 2.2.2 MAC: RLC Mode | Transparent Mode |
| 2.2.3 RLC: Whole Data | ‘101000110101000100101101100111001’B|
| 3 Transport Block Set DCH |
| 3.1 FP: DCH Index | 1 |
| 3.2 FP: Transport Block |
| 3.2.1 MAC: Target Channel Type | DTCH (Dedicated Traffic Channel) |
| 3.2.2 MAC: RLC Mode | Transparent Mode |
| 3.2.3 RLC: Whole Data | ‘010100100000111011100111010101110’B |
| 4 Transport Block Set DCH |
| 4.1 FP: DCH Index | 2 |
| 4.2 FP: Transport Block |
| 4.2.1 MAC: Target Channel Type | DTCH (Dedicated Traffic Channel) |
| 4.2.2 MAC: RLC Mode | Transparent Mode |
| 4.2.3 RLC: Whole Data | ‘010001001101000000110010100110001’B |
| 5 FP: Trailer |
| 5.1 FP: Quality Estimate | 132 |
| 5.2 FP: CRC Indicator (Transport Block) | Not Correct |
| 5.3 FP: CRC Indicator (Transport Block) | Correct |
| 5.4 FP: CRC Indicator (Transport Block) | Correct |
| 5.5 FP: Padding | 00 |
64 UMTS Performance Measurement
transmitted correctly if no CRC is executed. If the target is to measure UL BLER with
highest precision, the BLER measurement application must check if CRC is defined for each
transport channel set up by NBAP. Otherwise CRC indicator values reported for this
transport channel in frame protocol will be ignored for UL BLER measurement.
Note: UL transport channel BLER is usually not measured on the random access channel
(RACH) although it is theoretically possible. This is to be aligned with 3GPP 25.215 that
says: ‘The measurement Transport channel BLER does not apply to transport channels
mapped on a P-CCPCH and a S-CCPCH’. Transport channels mapped on mentioned
common physical channels are the broadcast channel (BCH) and forward access channels
(FACHs). If BLER is not measured on FACHs (downlink) a corresponding measurement on
RACHs (uplink) does not seem to make much sense.
2.1.1.2 UL BLER per Call
UL BLER can also be used to estimate the uplink transmission quality of a call. In this case
it is not necessary to differentiate between transport channels that carry user plane and
control plane information. Merely count transport blocks and their CRC indicators according
to the standard formula given at the beginning of this chapter, no matter to which transport
channel single transport blocks belong.
2.1.1.3 UL BLER per Call Type
Another possibility is to map UL BLER to the type of call: voice, packet switched (PS) data,
video-telephony, multi-RAB, signalling. Depending on differentiation based on higher layer
information more types of call may be defined according to end-user services. However,
definitions should be considered carefully. Transmitting a short message in uplink direction
only requires a few transport blocks. In addition it must be considered that quality of end-
user services like speech can only be measured on user plane transport channels. Especially
for voice calls it is further necessary to define filter functions or special algorithms if there is
no CRC on transport channels that carry AMR B and C class bits.
2.1.2 DOWNLINK BLOCK ERROR RATE (DL BLER)
Compared to uplink block error rate DL BLER does not need to be computed by any
performance measurement equipment based on transport block counters. Neither it is
meaningful to compute it on lub, because transmission errors will appear on Uu – afterdata has been sent to the cell via Iub in downlink.
The job to compute and report DL BLER is assigned to UE using the RRC measurement
control message (message example 2.2).
The measurement can be reported periodically or if a predefined threshold of CRC errors
on downlink transport channels is exceeded. For a threshold event triggered reporting using
event 5A will be monitored. From the performance monitoring point of view the disadvan-
tage of event-triggered reporting is that one can no longer follow a certain measurement over
a long period of time. Instead only single peak values (exceptions) are reported while all
normal values are hidden to lower load on SRNC caused by measurement tasks. In the case
of DL BLER measurements presented in Figure 2.2 only the extreme values shown on the
right side of the histogram have a chance of being reported.
Selected UMTS Key Performance Parameters 65
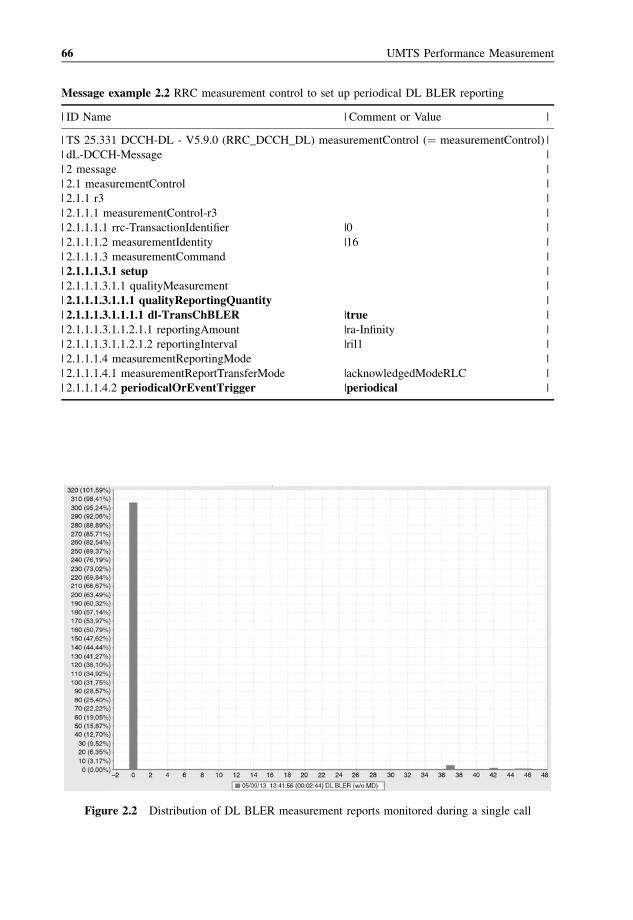
Message example 2.2 RRC measurement control to set up periodical DL BLER reporting
| ID Name | Comment or Value |
| TS 25.331 DCCH-DL - V5.9.0 (RRC_DCCH_DL) measurementControl (¼ measurementControl) |
| dL-DCCH-Message |
| 2 message |
| 2.1 measurementControl |
| 2.1.1 r3 |
| 2.1.1.1 measurementControl-r3 |
| 2.1.1.1.1 rrc-TransactionIdentifier |0 |
| 2.1.1.1.2 measurementIdentity |16 |
| 2.1.1.1.3 measurementCommand |
| 2.1.1.1.3.1 setup |
| 2.1.1.1.3.1.1 qualityMeasurement |
| 2.1.1.1.3.1.1.1 qualityReportingQuantity |
| 2.1.1.1.3.1.1.1.1 dl-TransChBLER |true |
| 2.1.1.1.3.1.1.2.1.1 reportingAmount |ra-Infinity |
| 2.1.1.1.3.1.1.2.1.2 reportingInterval |ril1 |
| 2.1.1.1.4 measurementReportingMode |
| 2.1.1.1.4.1 measurementReportTransferMode |acknowledgedModeRLC |
| 2.1.1.1.4.2 periodicalOrEventTrigger |periodical |
Figure 2.2 Distribution of DL BLER measurement reports monitored during a single call
66 UMTS Performance Measurement
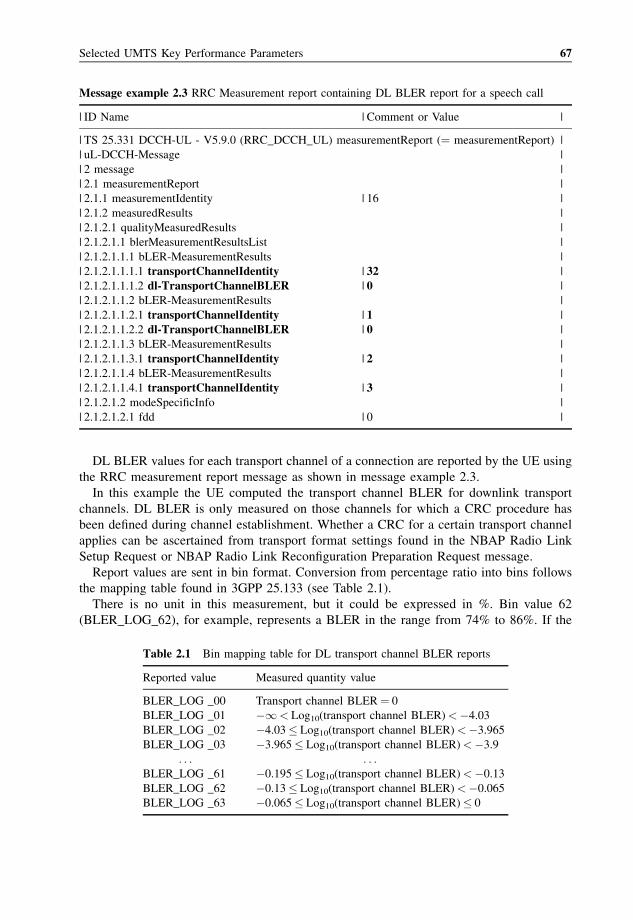
DL BLER values for each transport channel of a connection are reported by the UE using
the RRC measurement report message as shown in message example 2.3.
In this example the UE computed the transport channel BLER for downlink transport
channels. DL BLER is only measured on those channels for which a CRC procedure has
been defined during channel establishment. Whether a CRC for a certain transport channel
applies can be ascertained from transport format settings found in the NBAP Radio Link
Setup Request or NBAP Radio Link Reconfiguration Preparation Request message.
Report values are sent in bin format. Conversion from percentage ratio into bins follows
the mapping table found in 3GPP 25.133 (see Table 2.1).
There is no unit in this measurement, but it could be expressed in %. Bin value 62
(BLER_LOG_62), for example, represents a BLER in the range from 74% to 86%. If the
Message example 2.3 RRC Measurement report containing DL BLER report for a speech call
| ID Name | Comment or Value |
| TS 25.331 DCCH-UL - V5.9.0 (RRC_DCCH_UL) measurementReport (¼ measurementReport) |
| uL-DCCH-Message |
| 2 message |
| 2.1 measurementReport |
| 2.1.1 measurementIdentity | 16 |
| 2.1.2 measuredResults |
| 2.1.2.1 qualityMeasuredResults |
| 2.1.2.1.1 blerMeasurementResultsList |
| 2.1.2.1.1.1 bLER-MeasurementResults |
| 2.1.2.1.1.1.1 transportChannelIdentity | 32 |
| 2.1.2.1.1.1.2 dl-TransportChannelBLER | 0 |
| 2.1.2.1.1.2 bLER-MeasurementResults |
| 2.1.2.1.1.2.1 transportChannelIdentity | 1 |
| 2.1.2.1.1.2.2 dl-TransportChannelBLER | 0 |
| 2.1.2.1.1.3 bLER-MeasurementResults |
| 2.1.2.1.1.3.1 transportChannelIdentity | 2 |
| 2.1.2.1.1.4 bLER-MeasurementResults |
| 2.1.2.1.1.4.1 transportChannelIdentity | 3 |
| 2.1.2.1.2 modeSpecificInfo |
| 2.1.2.1.2.1 fdd | 0 |
Table 2.1 Bin mapping table for DL transport channel BLER reports
Reported value Measured quantity value
BLER_LOG _00 Transport channel BLER¼ 0
BLER_LOG _01 �1< Log10(transport channel BLER)<�4.03
BLER_LOG _02 �4.03� Log10(transport channel BLER)<�3.965
BLER_LOG _03 �3.965� Log10(transport channel BLER)<�3.9
. . . . . .BLER_LOG _61 �0.195� Log10(transport channel BLER)<�0.13
BLER_LOG _62 �0.13� Log10(transport channel BLER)<�0.065
BLER_LOG _63 �0.065� Log10(transport channel BLER)� 0
Selected UMTS Key Performance Parameters 67
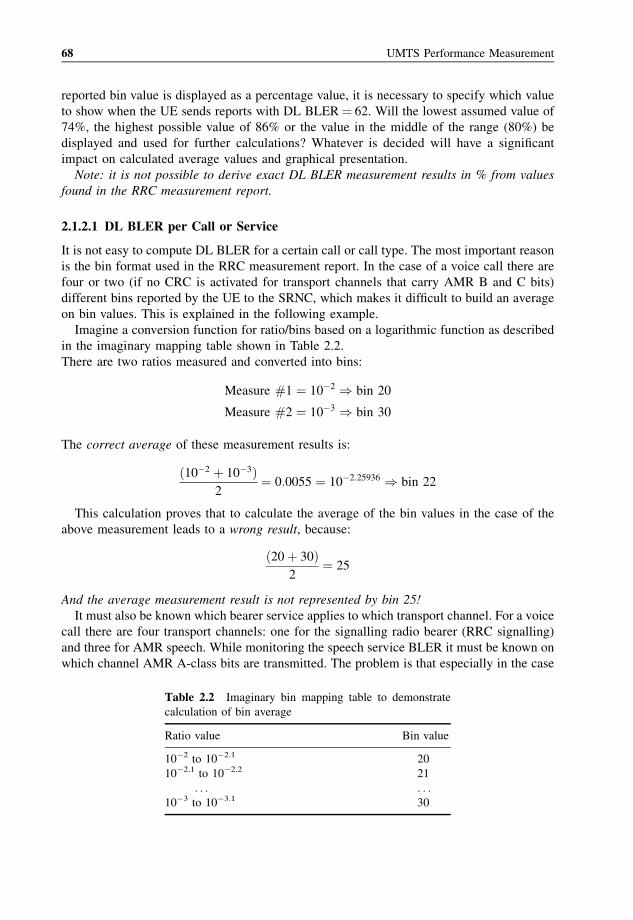
reported bin value is displayed as a percentage value, it is necessary to specify which value
to show when the UE sends reports with DL BLER¼ 62. Will the lowest assumed value of
74%, the highest possible value of 86% or the value in the middle of the range (80%) be
displayed and used for further calculations? Whatever is decided will have a significant
impact on calculated average values and graphical presentation.
Note: it is not possible to derive exact DL BLER measurement results in % from values
found in the RRC measurement report.
2.1.2.1 DL BLER per Call or Service
It is not easy to compute DL BLER for a certain call or call type. The most important reason
is the bin format used in the RRC measurement report. In the case of a voice call there are
four or two (if no CRC is activated for transport channels that carry AMR B and C bits)
different bins reported by the UE to the SRNC, which makes it difficult to build an average
on bin values. This is explained in the following example.
Imagine a conversion function for ratio/bins based on a logarithmic function as described
in the imaginary mapping table shown in Table 2.2.
There are two ratios measured and converted into bins:
Measure #1 ¼ 10�2 ) bin 20
Measure #2 ¼ 10�3 ) bin 30
The correct average of these measurement results is:
ð10�2 þ 10�3Þ2
¼ 0:0055 ¼ 10�2:25936 ) bin 22
This calculation proves that to calculate the average of the bin values in the case of the
above measurement leads to a wrong result, because:
ð20þ 30Þ2
¼ 25
And the average measurement result is not represented by bin 25!
It must also be known which bearer service applies to which transport channel. For a voice
call there are four transport channels: one for the signalling radio bearer (RRC signalling)
and three for AMR speech. While monitoring the speech service BLER it must be known on
which channel AMR A-class bits are transmitted. The problem is that especially in the case
Table 2.2 Imaginary bin mapping table to demonstrate
calculation of bin average
Ratio value Bin value
10�2 to 10�2.1 20
10�2.1 to 10�2.2 21
. . . . . .10�3 to 10�3.1 30
68 UMTS Performance Measurement
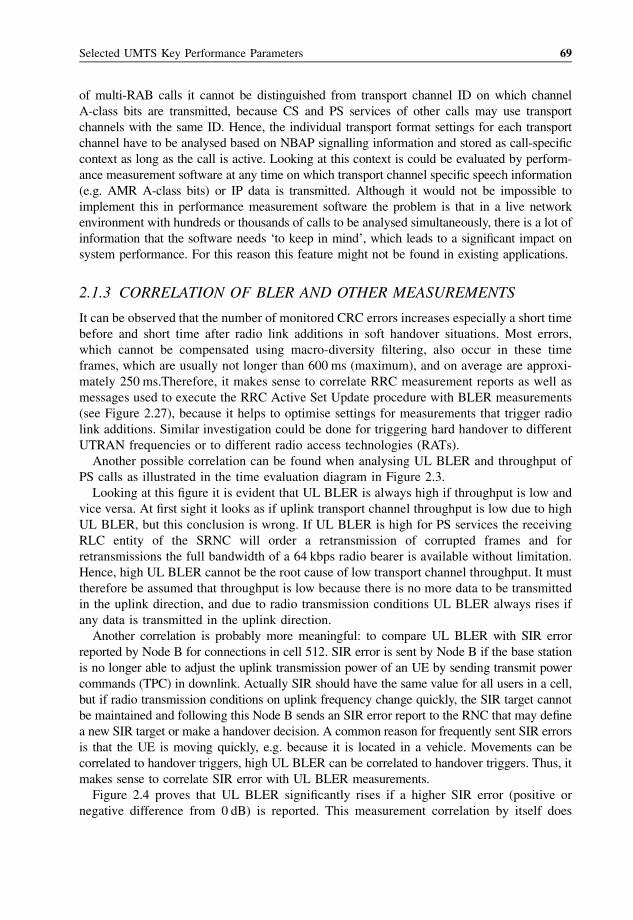
of multi-RAB calls it cannot be distinguished from transport channel ID on which channel
A-class bits are transmitted, because CS and PS services of other calls may use transport
channels with the same ID. Hence, the individual transport format settings for each transport
channel have to be analysed based on NBAP signalling information and stored as call-specific
context as long as the call is active. Looking at this context is could be evaluated by perform-
ance measurement software at any time on which transport channel specific speech information
(e.g. AMR A-class bits) or IP data is transmitted. Although it would not be impossible to
implement this in performance measurement software the problem is that in a live network
environment with hundreds or thousands of calls to be analysed simultaneously, there is a lot of
information that the software needs ‘to keep in mind’, which leads to a significant impact on
system performance. For this reason this feature might not be found in existing applications.
2.1.3 CORRELATION OF BLER AND OTHER MEASUREMENTS
It can be observed that the number of monitored CRC errors increases especially a short time
before and short time after radio link additions in soft handover situations. Most errors,
which cannot be compensated using macro-diversity filtering, also occur in these time
frames, which are usually not longer than 600 ms (maximum), and on average are approxi-
mately 250 ms.Therefore, it makes sense to correlate RRC measurement reports as well as
messages used to execute the RRC Active Set Update procedure with BLER measurements
(see Figure 2.27), because it helps to optimise settings for measurements that trigger radio
link additions. Similar investigation could be done for triggering hard handover to different
UTRAN frequencies or to different radio access technologies (RATs).
Another possible correlation can be found when analysing UL BLER and throughput of
PS calls as illustrated in the time evaluation diagram in Figure 2.3.
Looking at this figure it is evident that UL BLER is always high if throughput is low and
vice versa. At first sight it looks as if uplink transport channel throughput is low due to high
UL BLER, but this conclusion is wrong. If UL BLER is high for PS services the receiving
RLC entity of the SRNC will order a retransmission of corrupted frames and for
retransmissions the full bandwidth of a 64 kbps radio bearer is available without limitation.
Hence, high UL BLER cannot be the root cause of low transport channel throughput. It must
therefore be assumed that throughput is low because there is no more data to be transmitted
in the uplink direction, and due to radio transmission conditions UL BLER always rises if
any data is transmitted in the uplink direction.
Another correlation is probably more meaningful: to compare UL BLER with SIR error
reported by Node B for connections in cell 512. SIR error is sent by Node B if the base station
is no longer able to adjust the uplink transmission power of an UE by sending transmit power
commands (TPC) in downlink. Actually SIR should have the same value for all users in a cell,
but if radio transmission conditions on uplink frequency change quickly, the SIR target cannot
be maintained and following this Node B sends an SIR error report to the RNC that may define
a new SIR target or make a handover decision. A common reason for frequently sent SIR errors
is that the UE is moving quickly, e.g. because it is located in a vehicle. Movements can be
correlated to handover triggers, high UL BLER can be correlated to handover triggers. Thus, it
makes sense to correlate SIR error with UL BLER measurements.
Figure 2.4 proves that UL BLER significantly rises if a higher SIR error (positive or
negative difference from 0 dB) is reported. This measurement correlation by itself does
Selected UMTS Key Performance Parameters 69
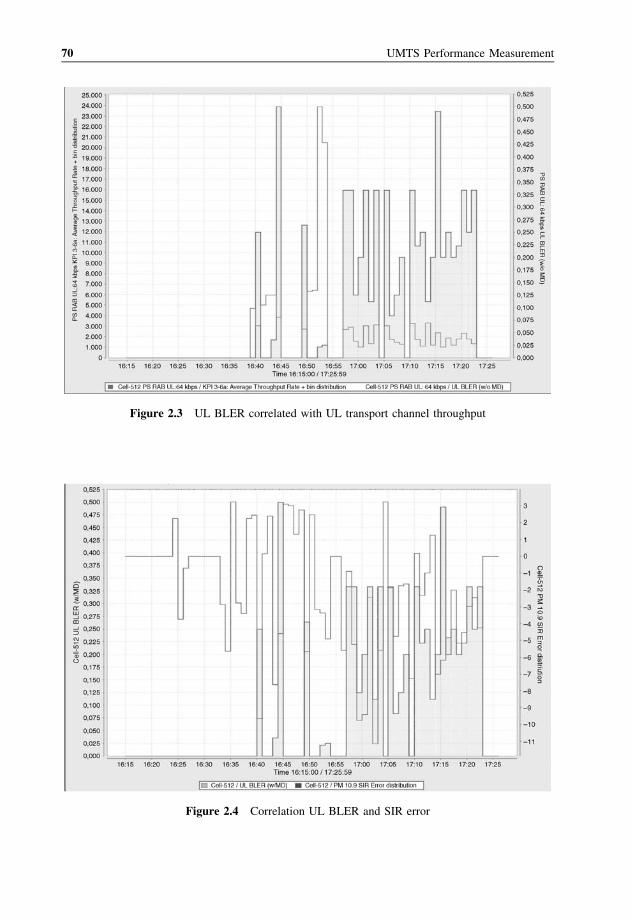
Figure 2.4 Correlation UL BLER and SIR error
Figure 2.3 UL BLER correlated with UL transport channel throughput
70 UMTS Performance Measurement
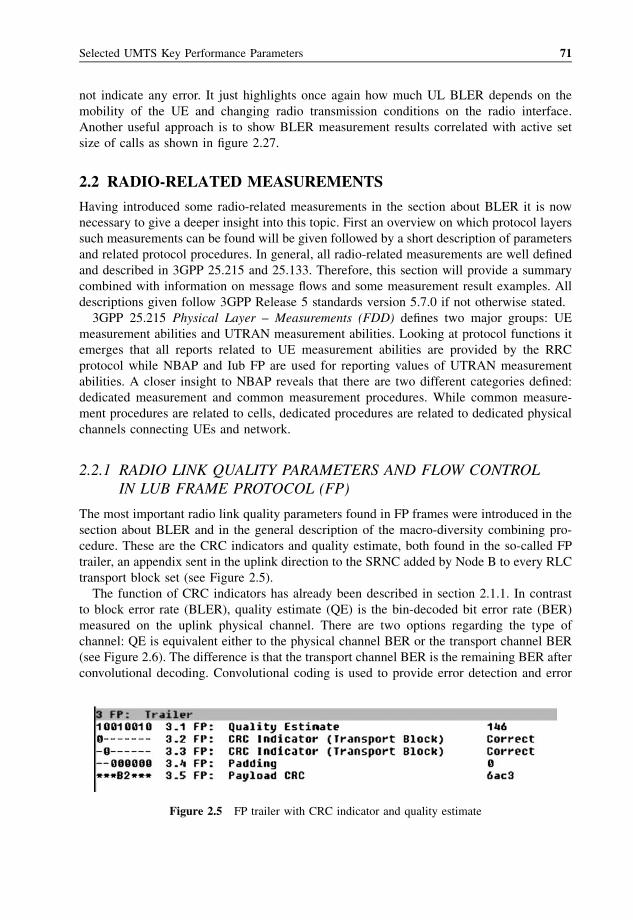
not indicate any error. It just highlights once again how much UL BLER depends on the
mobility of the UE and changing radio transmission conditions on the radio interface.
Another useful approach is to show BLER measurement results correlated with active set
size of calls as shown in figure 2.27.
2.2 RADIO-RELATED MEASUREMENTS
Having introduced some radio-related measurements in the section about BLER it is now
necessary to give a deeper insight into this topic. First an overview on which protocol layers
such measurements can be found will be given followed by a short description of parameters
and related protocol procedures. In general, all radio-related measurements are well defined
and described in 3GPP 25.215 and 25.133. Therefore, this section will provide a summary
combined with information on message flows and some measurement result examples. All
descriptions given follow 3GPP Release 5 standards version 5.7.0 if not otherwise stated.
3GPP 25.215 Physical Layer – Measurements (FDD) defines two major groups: UE
measurement abilities and UTRAN measurement abilities. Looking at protocol functions it
emerges that all reports related to UE measurement abilities are provided by the RRC
protocol while NBAP and Iub FP are used for reporting values of UTRAN measurement
abilities. A closer insight to NBAP reveals that there are two different categories defined:
dedicated measurement and common measurement procedures. While common measure-
ment procedures are related to cells, dedicated procedures are related to dedicated physical
channels connecting UEs and network.
2.2.1 RADIO LINK QUALITY PARAMETERS AND FLOW CONTROLIN LUB FRAME PROTOCOL (FP)
The most important radio link quality parameters found in FP frames were introduced in the
section about BLER and in the general description of the macro-diversity combining pro-
cedure. These are the CRC indicators and quality estimate, both found in the so-called FP
trailer, an appendix sent in the uplink direction to the SRNC added by Node B to every RLC
transport block set (see Figure 2.5).
The function of CRC indicators has already been described in section 2.1.1. In contrast
to block error rate (BLER), quality estimate (QE) is the bin-decoded bit error rate (BER)
measured on the uplink physical channel. There are two options regarding the type of
channel: QE is equivalent either to the physical channel BER or the transport channel BER
(see Figure 2.6). The difference is that the transport channel BER is the remaining BER after
convolutional decoding. Convolutional coding is used to provide error detection and error
Figure 2.5 FP trailer with CRC indicator and quality estimate
Selected UMTS Key Performance Parameters 71
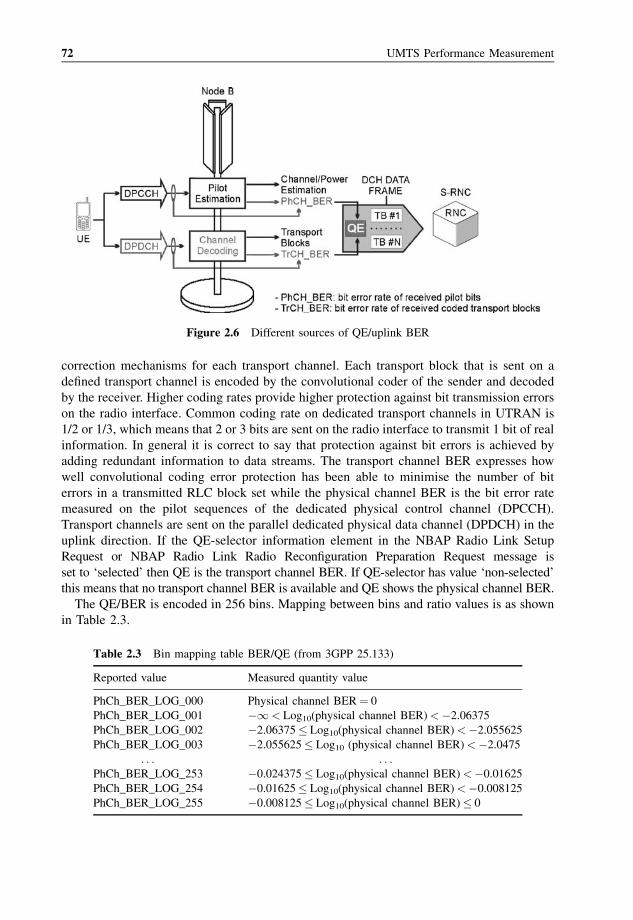
correction mechanisms for each transport channel. Each transport block that is sent on a
defined transport channel is encoded by the convolutional coder of the sender and decoded
by the receiver. Higher coding rates provide higher protection against bit transmission errors
on the radio interface. Common coding rate on dedicated transport channels in UTRAN is
1/2 or 1/3, which means that 2 or 3 bits are sent on the radio interface to transmit 1 bit of real
information. In general it is correct to say that protection against bit errors is achieved by
adding redundant information to data streams. The transport channel BER expresses how
well convolutional coding error protection has been able to minimise the number of bit
errors in a transmitted RLC block set while the physical channel BER is the bit error rate
measured on the pilot sequences of the dedicated physical control channel (DPCCH).
Transport channels are sent on the parallel dedicated physical data channel (DPDCH) in the
uplink direction. If the QE-selector information element in the NBAP Radio Link Setup
Request or NBAP Radio Link Radio Reconfiguration Preparation Request message is
set to ‘selected’ then QE is the transport channel BER. If QE-selector has value ‘non-selected’
this means that no transport channel BER is available and QE shows the physical channel BER.
The QE/BER is encoded in 256 bins. Mapping between bins and ratio values is as shown
in Table 2.3.
Figure 2.6 Different sources of QE/uplink BER
Table 2.3 Bin mapping table BER/QE (from 3GPP 25.133)
Reported value Measured quantity value
PhCh_BER_LOG_000 Physical channel BER¼ 0
PhCh_BER_LOG_001 �1< Log10(physical channel BER)<�2.06375
PhCh_BER_LOG_002 �2.06375� Log10(physical channel BER)<�2.055625
PhCh_BER_LOG_003 �2.055625� Log10 (physical channel BER)<�2.0475
. . . . . .PhCh_BER_LOG_253 �0.024375� Log10(physical channel BER)<�0.01625
PhCh_BER_LOG_254 �0.01625� Log10(physical channel BER)<�0.008125
PhCh_BER_LOG_255 �0.008125� Log10(physical channel BER)� 0
72 UMTS Performance Measurement
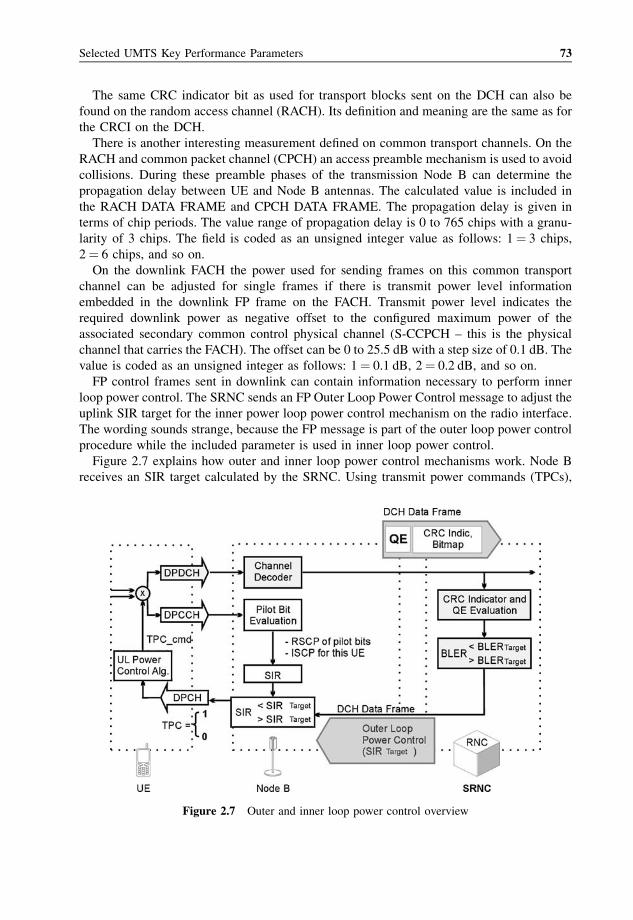
The same CRC indicator bit as used for transport blocks sent on the DCH can also be
found on the random access channel (RACH). Its definition and meaning are the same as for
the CRCI on the DCH.
There is another interesting measurement defined on common transport channels. On the
RACH and common packet channel (CPCH) an access preamble mechanism is used to avoid
collisions. During these preamble phases of the transmission Node B can determine the
propagation delay between UE and Node B antennas. The calculated value is included in
the RACH DATA FRAME and CPCH DATA FRAME. The propagation delay is given in
terms of chip periods. The value range of propagation delay is 0 to 765 chips with a granu-
larity of 3 chips. The field is coded as an unsigned integer value as follows: 1¼ 3 chips,
2¼ 6 chips, and so on.
On the downlink FACH the power used for sending frames on this common transport
channel can be adjusted for single frames if there is transmit power level information
embedded in the downlink FP frame on the FACH. Transmit power level indicates the
required downlink power as negative offset to the configured maximum power of the
associated secondary common control physical channel (S-CCPCH – this is the physical
channel that carries the FACH). The offset can be 0 to 25.5 dB with a step size of 0.1 dB. The
value is coded as an unsigned integer as follows: 1¼ 0.1 dB, 2¼ 0.2 dB, and so on.
FP control frames sent in downlink can contain information necessary to perform inner
loop power control. The SRNC sends an FP Outer Loop Power Control message to adjust the
uplink SIR target for the inner power loop power control mechanism on the radio interface.
The wording sounds strange, because the FP message is part of the outer loop power control
procedure while the included parameter is used in inner loop power control.
Figure 2.7 explains how outer and inner loop power control mechanisms work. Node B
receives an SIR target calculated by the SRNC. Using transmit power commands (TPCs),
Figure 2.7 Outer and inner loop power control overview
Selected UMTS Key Performance Parameters 73
sent 1500 times per second on downlink dedicated physical channel (DPCH), Node B tries
to control the uplink Tx power of UE in a way that means there is no difference to the
previously set SIR target. TPCs consist of a single control bit. This bit set to ‘1’ means that
UE will increase Tx power, ‘0’ means UE will decrease power before sending the next
uplink data block. In soft handover scenarios 1500 TPCs per second are received on the UE
side from every cell involved in the active set. The UE needs to combine all TPC signals
from different cells and compute a summary TPC command (TPC_cmd). The TPC_cmd can
have the following values: þ1 (increase UL power), �1 (decrease UL power) and 0 (keep
UL power).
Using CRC indicators included in uplink FP data frames the SRNC computes UL BLER
and compares this value internally with the UL BLER target, which is also used internally to
calculate the SIR target. In addition, it is checked if the QE/BER is in a predefined range.
Node B calculates SIR for each active connection and optionally reports these values using
NBAP dedicated measurement reports (please read section dealing with dedicated NBAP
measurements to learn how SIR is computed).
If the SIR target needs to be adjusted an FP Outer Loop Power Control message is sent
containing the new SIR target. Transmission of SIR error reports using NBAP procedures
provides additional protection against fast fading effects.
These are all radio-related frame protocol procedures found in the so-called R99 cells:
cells that do not support high-speed downlink packet access (HSDPA). In an HSDPA-
capable R5 cell, in addition to the described FP, a special HS-DSCH (high speed downlink
shared channel) frame protocol is running, which provides some flow control mechanisms
for HS-DSCH defined in 3GPP 25.877 High Speed Downlink Packet Access: lub/lur Proto-
col Aspects. It might be interesting to monitor these capacity allocation procedures and
compare their settings with throughput measurements on the HD-DSCH.
Note: despite the protocol name HS-DSCH FP (D¼ ‘downlink’) the HS-DSCH Capacity
Allocation Response message is sent in the uplink direction. Actually there is no reason to be
confused, because on AAL2 SVC for FACH frame protocol Uplink Synchronisation control
frames are also sent. The difference is that FP control frames are signalling messages
exchanged bidirectionally between FP entities while FP data frames transport RLC trans-
port block sets across the lub, which in the case of FACH and HS-DSCH are of course only
sent in the downlink direction via the radio interface.
2.2.2 NBAP COMMON MEASUREMENTS
NBAP common measurement procedures are either related to a single cell or to a defined
common transport channel within a single cell. Hence, the required aggregation level of
these measurements is always per cell.
NBAP common measurement reports containing values of received total wideband power
(RTWP) and transmitted carrier power have been monitored in live networks since the
earliest phases of deployment. The number of acknowledged physical random
access channel (PRACH) preambles is monitored more often. Detected and acknowledged
preambles on the CPCH are also defined by 3GPP, but usually the CPCH is not used in
current network installations and hence this measurement is not monitored.
All NBAP common measurement procedures are initialised in the same way using the
NBAP common measurement initialisation procedure.
74 UMTS Performance Measurement
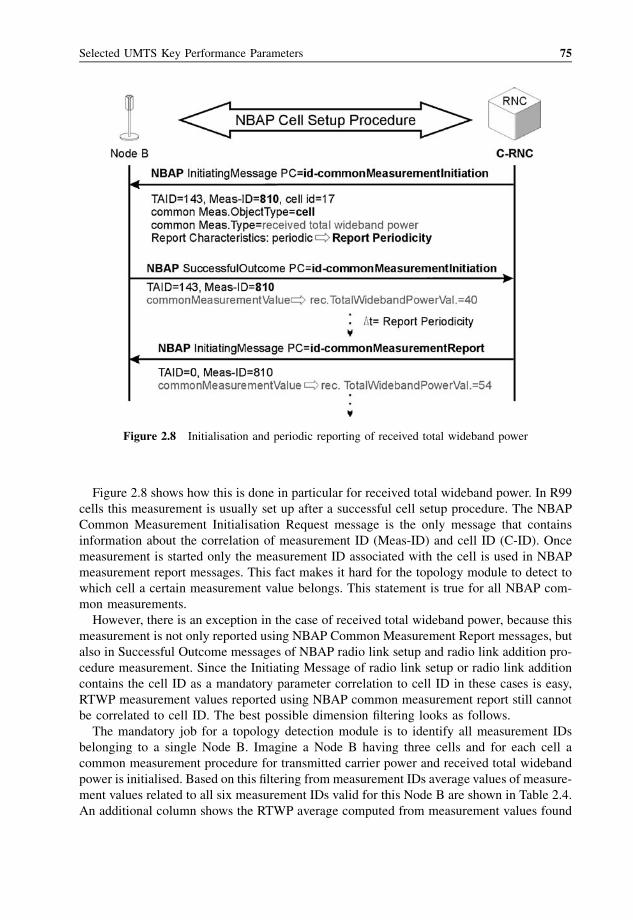
Figure 2.8 shows how this is done in particular for received total wideband power. In R99
cells this measurement is usually set up after a successful cell setup procedure. The NBAP
Common Measurement Initialisation Request message is the only message that contains
information about the correlation of measurement ID (Meas-ID) and cell ID (C-ID). Once
measurement is started only the measurement ID associated with the cell is used in NBAP
measurement report messages. This fact makes it hard for the topology module to detect to
which cell a certain measurement value belongs. This statement is true for all NBAP com-
mon measurements.
However, there is an exception in the case of received total wideband power, because this
measurement is not only reported using NBAP Common Measurement Report messages, but
also in Successful Outcome messages of NBAP radio link setup and radio link addition pro-
cedure measurement. Since the Initiating Message of radio link setup or radio link addition
contains the cell ID as a mandatory parameter correlation to cell ID in these cases is easy,
RTWP measurement values reported using NBAP common measurement report still cannot
be correlated to cell ID. The best possible dimension filtering looks as follows.
The mandatory job for a topology detection module is to identify all measurement IDs
belonging to a single Node B. Imagine a Node B having three cells and for each cell a
common measurement procedure for transmitted carrier power and received total wideband
power is initialised. Based on this filtering from measurement IDs average values of measure-
ment values related to all six measurement IDs valid for this Node B are shown in Table 2.4.
An additional column shows the RTWP average computed from measurement values found
Figure 2.8 Initialisation and periodic reporting of received total wideband power
Selected UMTS Key Performance Parameters 75
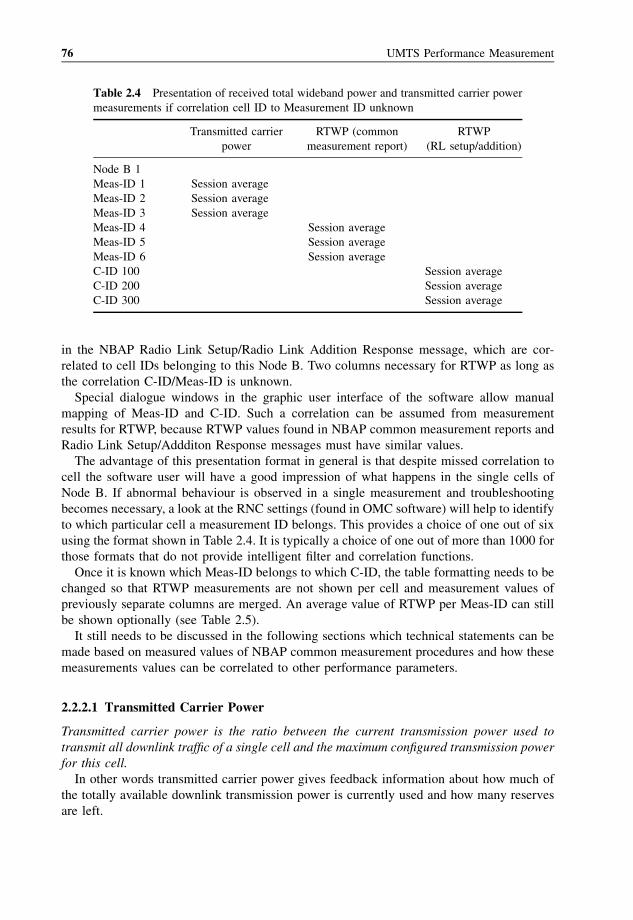
in the NBAP Radio Link Setup/Radio Link Addition Response message, which are cor-
related to cell IDs belonging to this Node B. Two columns necessary for RTWP as long as
the correlation C-ID/Meas-ID is unknown.
Special dialogue windows in the graphic user interface of the software allow manual
mapping of Meas-ID and C-ID. Such a correlation can be assumed from measurement
results for RTWP, because RTWP values found in NBAP common measurement reports and
Radio Link Setup/Addditon Response messages must have similar values.
The advantage of this presentation format in general is that despite missed correlation to
cell the software user will have a good impression of what happens in the single cells of
Node B. If abnormal behaviour is observed in a single measurement and troubleshooting
becomes necessary, a look at the RNC settings (found in OMC software) will help to identify
to which particular cell a measurement ID belongs. This provides a choice of one out of six
using the format shown in Table 2.4. It is typically a choice of one out of more than 1000 for
those formats that do not provide intelligent filter and correlation functions.
Once it is known which Meas-ID belongs to which C-ID, the table formatting needs to be
changed so that RTWP measurements are not shown per cell and measurement values of
previously separate columns are merged. An average value of RTWP per Meas-ID can still
be shown optionally (see Table 2.5).
It still needs to be discussed in the following sections which technical statements can be
made based on measured values of NBAP common measurement procedures and how these
measurements values can be correlated to other performance parameters.
2.2.2.1 Transmitted Carrier Power
Transmitted carrier power is the ratio between the current transmission power used to
transmit all downlink traffic of a single cell and the maximum configured transmission power
for this cell.
In other words transmitted carrier power gives feedback information about how much of
the totally available downlink transmission power is currently used and how many reserves
are left.
Table 2.4 Presentation of received total wideband power and transmitted carrier power
measurements if correlation cell ID to Measurement ID unknown
Transmitted carrier RTWP (common RTWP
power measurement report) (RL setup/addition)
Node B 1
Meas-ID 1 Session average
Meas-ID 2 Session average
Meas-ID 3 Session average
Meas-ID 4 Session average
Meas-ID 5 Session average
Meas-ID 6 Session average
C-ID 100 Session average
C-ID 200 Session average
C-ID 300 Session average
76 UMTS Performance Measurement
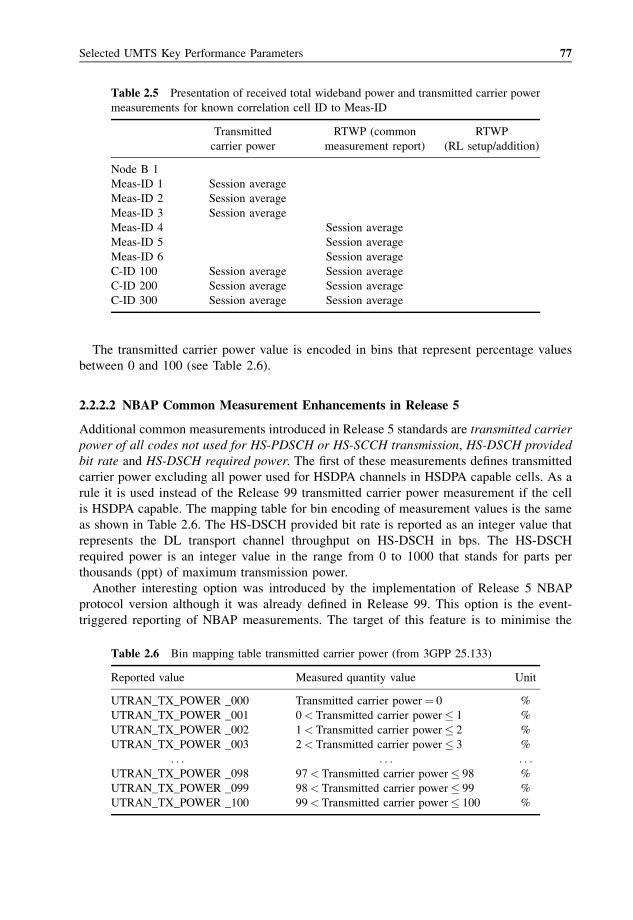
The transmitted carrier power value is encoded in bins that represent percentage values
between 0 and 100 (see Table 2.6).
2.2.2.2 NBAP Common Measurement Enhancements in Release 5
Additional common measurements introduced in Release 5 standards are transmitted carrier
power of all codes not used for HS-PDSCH or HS-SCCH transmission, HS-DSCH provided
bit rate and HS-DSCH required power. The first of these measurements defines transmitted
carrier power excluding all power used for HSDPA channels in HSDPA capable cells. As a
rule it is used instead of the Release 99 transmitted carrier power measurement if the cell
is HSDPA capable. The mapping table for bin encoding of measurement values is the same
as shown in Table 2.6. The HS-DSCH provided bit rate is reported as an integer value that
represents the DL transport channel throughput on HS-DSCH in bps. The HS-DSCH
required power is an integer value in the range from 0 to 1000 that stands for parts per
thousands (ppt) of maximum transmission power.
Another interesting option was introduced by the implementation of Release 5 NBAP
protocol version although it was already defined in Release 99. This option is the event-
triggered reporting of NBAP measurements. The target of this feature is to minimise the
Table 2.5 Presentation of received total wideband power and transmitted carrier power
measurements for known correlation cell ID to Meas-ID
Transmitted RTWP (common RTWP
carrier power measurement report) (RL setup/addition)
Node B 1
Meas-ID 1 Session average
Meas-ID 2 Session average
Meas-ID 3 Session average
Meas-ID 4 Session average
Meas-ID 5 Session average
Meas-ID 6 Session average
C-ID 100 Session average Session average
C-ID 200 Session average Session average
C-ID 300 Session average Session average
Table 2.6 Bin mapping table transmitted carrier power (from 3GPP 25.133)
Reported value Measured quantity value Unit
UTRAN_TX_POWER _000 Transmitted carrier power¼ 0 %
UTRAN_TX_POWER _001 0< Transmitted carrier power� 1 %
UTRAN_TX_POWER _002 1< Transmitted carrier power� 2 %
UTRAN_TX_POWER _003 2< Transmitted carrier power� 3 %
. . . . . . . . .UTRAN_TX_POWER _098 97< Transmitted carrier power� 98 %
UTRAN_TX_POWER _099 98< Transmitted carrier power� 99 %
UTRAN_TX_POWER _100 99< Transmitted carrier power� 100 %
Selected UMTS Key Performance Parameters 77
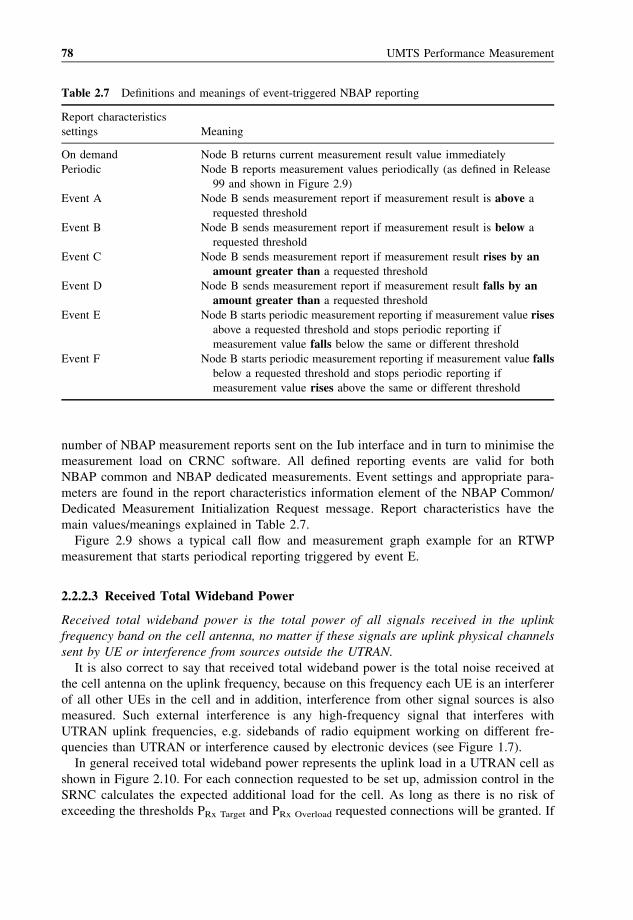
number of NBAP measurement reports sent on the Iub interface and in turn to minimise the
measurement load on CRNC software. All defined reporting events are valid for both
NBAP common and NBAP dedicated measurements. Event settings and appropriate para-
meters are found in the report characteristics information element of the NBAP Common/
Dedicated Measurement Initialization Request message. Report characteristics have the
main values/meanings explained in Table 2.7.
Figure 2.9 shows a typical call flow and measurement graph example for an RTWP
measurement that starts periodical reporting triggered by event E.
2.2.2.3 Received Total Wideband Power
Received total wideband power is the total power of all signals received in the uplink
frequency band on the cell antenna, no matter if these signals are uplink physical channels
sent by UE or interference from sources outside the UTRAN.
It is also correct to say that received total wideband power is the total noise received at
the cell antenna on the uplink frequency, because on this frequency each UE is an interferer
of all other UEs in the cell and in addition, interference from other signal sources is also
measured. Such external interference is any high-frequency signal that interferes with
UTRAN uplink frequencies, e.g. sidebands of radio equipment working on different fre-
quencies than UTRAN or interference caused by electronic devices (see Figure 1.7).
In general received total wideband power represents the uplink load in a UTRAN cell as
shown in Figure 2.10. For each connection requested to be set up, admission control in the
SRNC calculates the expected additional load for the cell. As long as there is no risk of
exceeding the thresholds PRx Target and PRx Overload requested connections will be granted. If
Table 2.7 Definitions and meanings of event-triggered NBAP reporting
Report characteristics
settings Meaning
On demand Node B returns current measurement result value immediately
Periodic Node B reports measurement values periodically (as defined in Release
99 and shown in Figure 2.9)
Event A Node B sends measurement report if measurement result is above a
requested threshold
Event B Node B sends measurement report if measurement result is below a
requested threshold
Event C Node B sends measurement report if measurement result rises by anamount greater than a requested threshold
Event D Node B sends measurement report if measurement result falls by anamount greater than a requested threshold
Event E Node B starts periodic measurement reporting if measurement value risesabove a requested threshold and stops periodic reporting if
measurement value falls below the same or different threshold
Event F Node B starts periodic measurement reporting if measurement value fallsbelow a requested threshold and stops periodic reporting if
measurement value rises above the same or different threshold
78 UMTS Performance Measurement
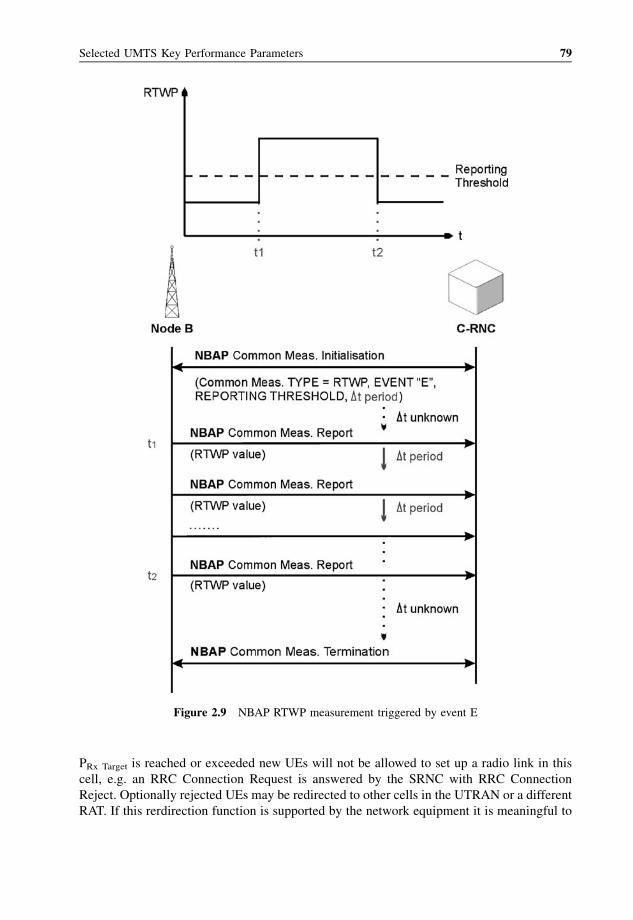
PRx Target is reached or exceeded new UEs will not be allowed to set up a radio link in this
cell, e.g. an RRC Connection Request is answered by the SRNC with RRC Connection
Reject. Optionally rejected UEs may be redirected to other cells in the UTRAN or a different
RAT. If this rerdirection function is supported by the network equipment it is meaningful to
Figure 2.9 NBAP RTWP measurement triggered by event E
Selected UMTS Key Performance Parameters 79
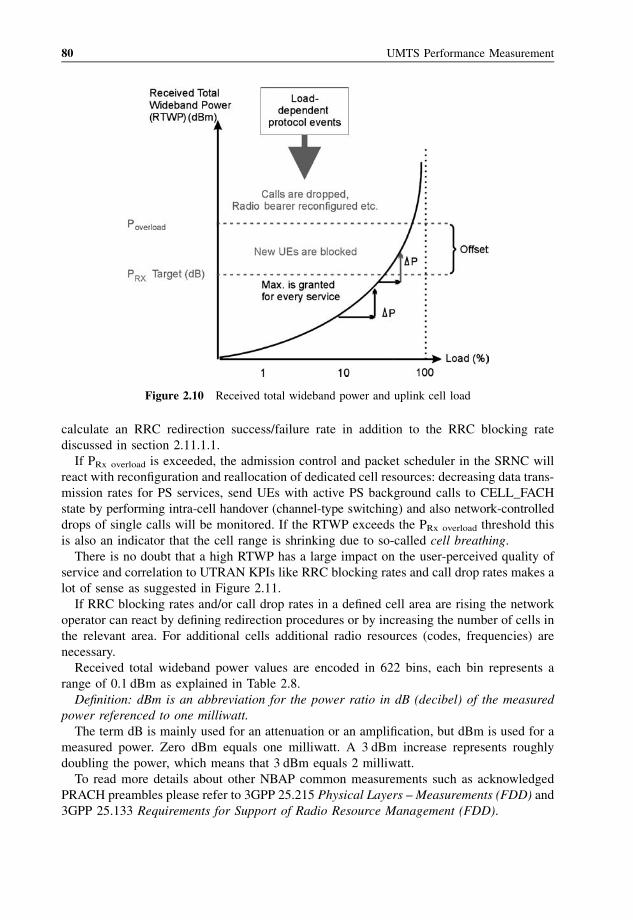
calculate an RRC redirection success/failure rate in addition to the RRC blocking rate
discussed in section 2.11.1.1.
If PRx overload is exceeded, the admission control and packet scheduler in the SRNC will
react with reconfiguration and reallocation of dedicated cell resources: decreasing data trans-
mission rates for PS services, send UEs with active PS background calls to CELL_FACH
state by performing intra-cell handover (channel-type switching) and also network-controlled
drops of single calls will be monitored. If the RTWP exceeds the PRx overload threshold this
is also an indicator that the cell range is shrinking due to so-called cell breathing.
There is no doubt that a high RTWP has a large impact on the user-perceived quality of
service and correlation to UTRAN KPIs like RRC blocking rates and call drop rates makes a
lot of sense as suggested in Figure 2.11.
If RRC blocking rates and/or call drop rates in a defined cell area are rising the network
operator can react by defining redirection procedures or by increasing the number of cells in
the relevant area. For additional cells additional radio resources (codes, frequencies) are
necessary.
Received total wideband power values are encoded in 622 bins, each bin represents a
range of 0.1 dBm as explained in Table 2.8.
Definition: dBm is an abbreviation for the power ratio in dB (decibel) of the measured
power referenced to one milliwatt.
The term dB is mainly used for an attenuation or an amplification, but dBm is used for a
measured power. Zero dBm equals one milliwatt. A 3 dBm increase represents roughly
doubling the power, which means that 3 dBm equals 2 milliwatt.
To read more details about other NBAP common measurements such as acknowledged
PRACH preambles please refer to 3GPP 25.215 Physical Layers –Measurements (FDD) and
3GPP 25.133 Requirements for Support of Radio Resource Management (FDD).
Figure 2.10 Received total wideband power and uplink cell load
80 UMTS Performance Measurement
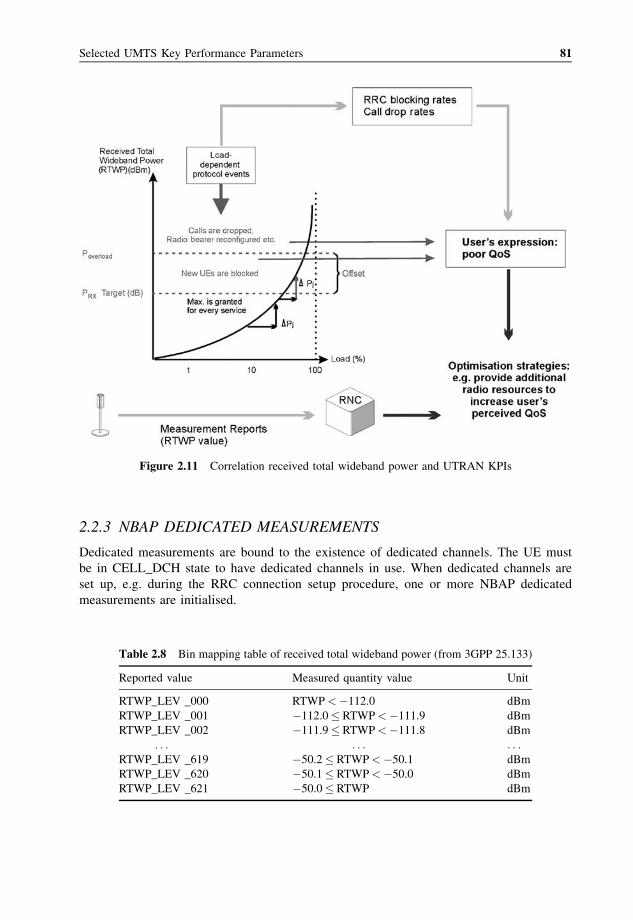
2.2.3 NBAP DEDICATED MEASUREMENTS
Dedicated measurements are bound to the existence of dedicated channels. The UE must
be in CELL_DCH state to have dedicated channels in use. When dedicated channels are
set up, e.g. during the RRC connection setup procedure, one or more NBAP dedicated
measurements are initialised.
Figure 2.11 Correlation received total wideband power and UTRAN KPIs
Table 2.8 Bin mapping table of received total wideband power (from 3GPP 25.133)
Reported value Measured quantity value Unit
RTWP_LEV _000 RTWP<�112.0 dBm
RTWP_LEV _001 �112.0� RTWP<�111.9 dBm
RTWP_LEV _002 �111.9� RTWP<�111.8 dBm
. . . . . . . . .RTWP_LEV _619 �50.2� RTWP<�50.1 dBm
RTWP_LEV _620 �50.1� RTWP<�50.0 dBm
RTWP_LEV _621 �50.0� RTWP dBm
Selected UMTS Key Performance Parameters 81
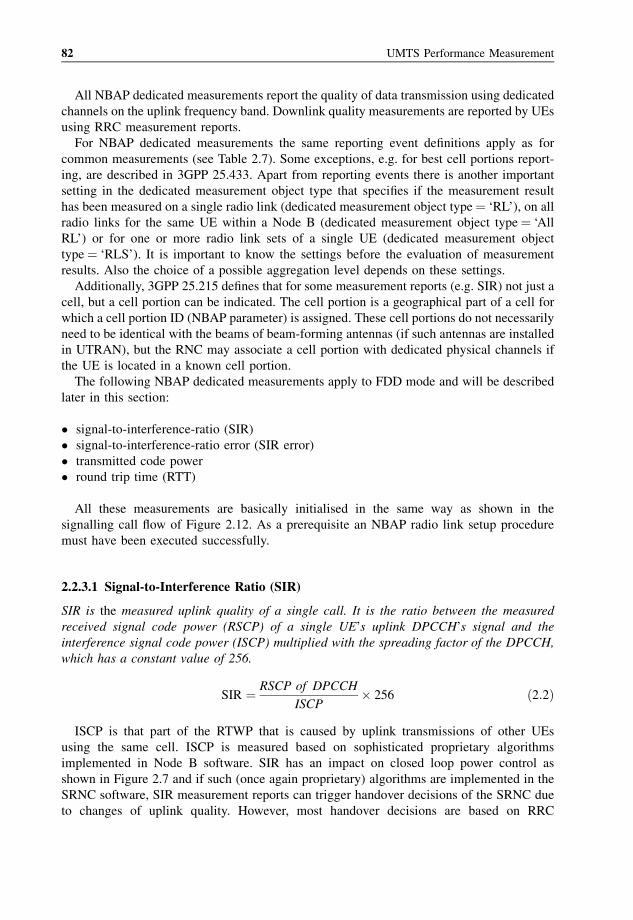
All NBAP dedicated measurements report the quality of data transmission using dedicated
channels on the uplink frequency band. Downlink quality measurements are reported by UEs
using RRC measurement reports.
For NBAP dedicated measurements the same reporting event definitions apply as for
common measurements (see Table 2.7). Some exceptions, e.g. for best cell portions report-
ing, are described in 3GPP 25.433. Apart from reporting events there is another important
setting in the dedicated measurement object type that specifies if the measurement result
has been measured on a single radio link (dedicated measurement object type¼ ‘RL’), on all
radio links for the same UE within a Node B (dedicated measurement object type¼ ‘All
RL’) or for one or more radio link sets of a single UE (dedicated measurement object
type¼ ‘RLS’). It is important to know the settings before the evaluation of measurement
results. Also the choice of a possible aggregation level depends on these settings.
Additionally, 3GPP 25.215 defines that for some measurement reports (e.g. SIR) not just a
cell, but a cell portion can be indicated. The cell portion is a geographical part of a cell for
which a cell portion ID (NBAP parameter) is assigned. These cell portions do not necessarily
need to be identical with the beams of beam-forming antennas (if such antennas are installed
in UTRAN), but the RNC may associate a cell portion with dedicated physical channels if
the UE is located in a known cell portion.
The following NBAP dedicated measurements apply to FDD mode and will be described
later in this section:
� signal-to-interference-ratio (SIR)
� signal-to-interference-ratio error (SIR error)
� transmitted code power
� round trip time (RTT)
All these measurements are basically initialised in the same way as shown in the
signalling call flow of Figure 2.12. As a prerequisite an NBAP radio link setup procedure
must have been executed successfully.
2.2.3.1 Signal-to-Interference Ratio (SIR)
SIR is the measured uplink quality of a single call. It is the ratio between the measured
received signal code power (RSCP) of a single UE’s uplink DPCCH’s signal and the
interference signal code power (ISCP) multiplied with the spreading factor of the DPCCH,
which has a constant value of 256.
SIR ¼ RSCP of DPCCH
ISCP� 256 ð2:2Þ
ISCP is that part of the RTWP that is caused by uplink transmissions of other UEs
using the same cell. ISCP is measured based on sophisticated proprietary algorithms
implemented in Node B software. SIR has an impact on closed loop power control as
shown in Figure 2.7 and if such (once again proprietary) algorithms are implemented in the
SRNC software, SIR measurement reports can trigger handover decisions of the SRNC due
to changes of uplink quality. However, most handover decisions are based on RRC
82 UMTS Performance Measurement
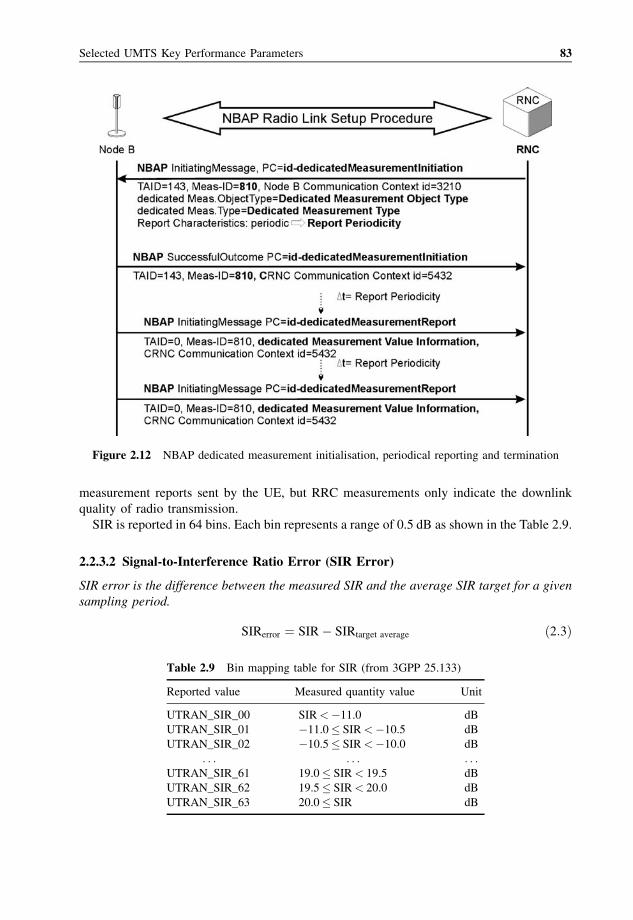
measurement reports sent by the UE, but RRC measurements only indicate the downlink
quality of radio transmission.
SIR is reported in 64 bins. Each bin represents a range of 0.5 dB as shown in the Table 2.9.
2.2.3.2 Signal-to-Interference Ratio Error (SIR Error)
SIR error is the difference between the measured SIR and the average SIR target for a given
sampling period.
SIRerror ¼ SIR� SIRtarget average ð2:3Þ
Figure 2.12 NBAP dedicated measurement initialisation, periodical reporting and termination
Table 2.9 Bin mapping table for SIR (from 3GPP 25.133)
Reported value Measured quantity value Unit
UTRAN_SIR_00 SIR<�11.0 dB
UTRAN_SIR_01 �11.0� SIR<�10.5 dB
UTRAN_SIR_02 �10.5� SIR<�10.0 dB
. . . . . . . . .UTRAN_SIR_61 19.0� SIR< 19.5 dB
UTRAN_SIR_62 19.5� SIR< 20.0 dB
UTRAN_SIR_63 20.0� SIR dB
Selected UMTS Key Performance Parameters 83
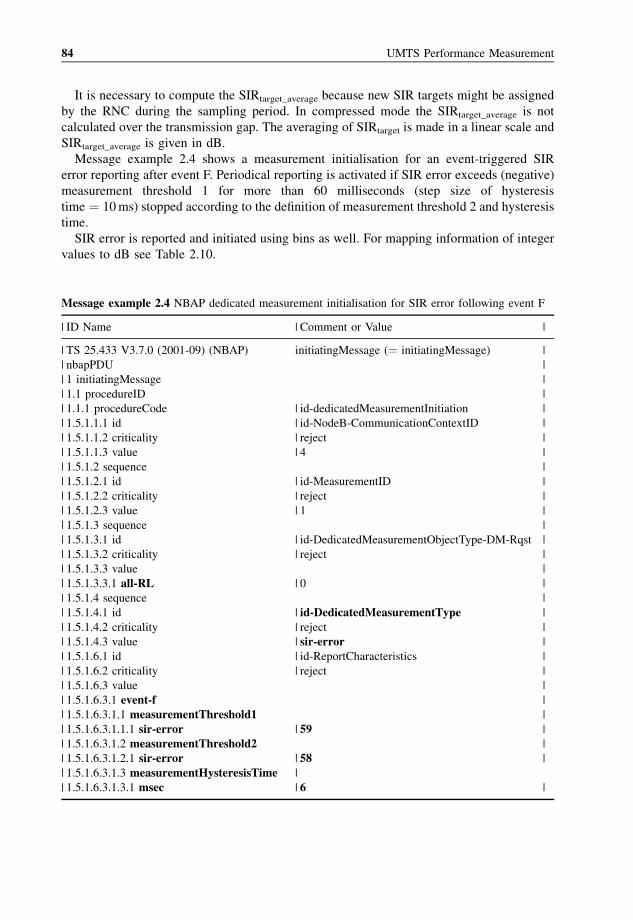
It is necessary to compute the SIRtarget_average because new SIR targets might be assigned
by the RNC during the sampling period. In compressed mode the SIRtarget_average is not
calculated over the transmission gap. The averaging of SIRtarget is made in a linear scale and
SIRtarget_average is given in dB.
Message example 2.4 shows a measurement initialisation for an event-triggered SIR
error reporting after event F. Periodical reporting is activated if SIR error exceeds (negative)
measurement threshold 1 for more than 60 milliseconds (step size of hysteresis
time ¼ 10ms) stopped according to the definition of measurement threshold 2 and hysteresis
time.
SIR error is reported and initiated using bins as well. For mapping information of integer
values to dB see Table 2.10.
Message example 2.4 NBAP dedicated measurement initialisation for SIR error following event F
| ID Name | Comment or Value |
| TS 25.433 V3.7.0 (2001-09) (NBAP) initiatingMessage (¼ initiatingMessage) |
| nbapPDU |
| 1 initiatingMessage |
| 1.1 procedureID |
| 1.1.1 procedureCode | id-dedicatedMeasurementInitiation |
| 1.5.1.1.1 id | id-NodeB-CommunicationContextID |
| 1.5.1.1.2 criticality | reject |
| 1.5.1.1.3 value | 4 |
| 1.5.1.2 sequence |
| 1.5.1.2.1 id | id-MeasurementID |
| 1.5.1.2.2 criticality | reject |
| 1.5.1.2.3 value | 1 |
| 1.5.1.3 sequence |
| 1.5.1.3.1 id | id-DedicatedMeasurementObjectType-DM-Rqst |
| 1.5.1.3.2 criticality | reject |
| 1.5.1.3.3 value |
| 1.5.1.3.3.1 all-RL | 0 |
| 1.5.1.4 sequence |
| 1.5.1.4.1 id | id-DedicatedMeasurementType |
| 1.5.1.4.2 criticality | reject |
| 1.5.1.4.3 value | sir-error |
| 1.5.1.6.1 id | id-ReportCharacteristics |
| 1.5.1.6.2 criticality | reject |
| 1.5.1.6.3 value |
| 1.5.1.6.3.1 event-f |
| 1.5.1.6.3.1.1 measurementThreshold1 |
| 1.5.1.6.3.1.1.1 sir-error | 59 |
| 1.5.1.6.3.1.2 measurementThreshold2 |
| 1.5.1.6.3.1.2.1 sir-error | 58 |
| 1.5.1.6.3.1.3 measurementHysteresisTime |
| 1.5.1.6.3.1.3.1 msec | 6 |
84 UMTS Performance Measurement
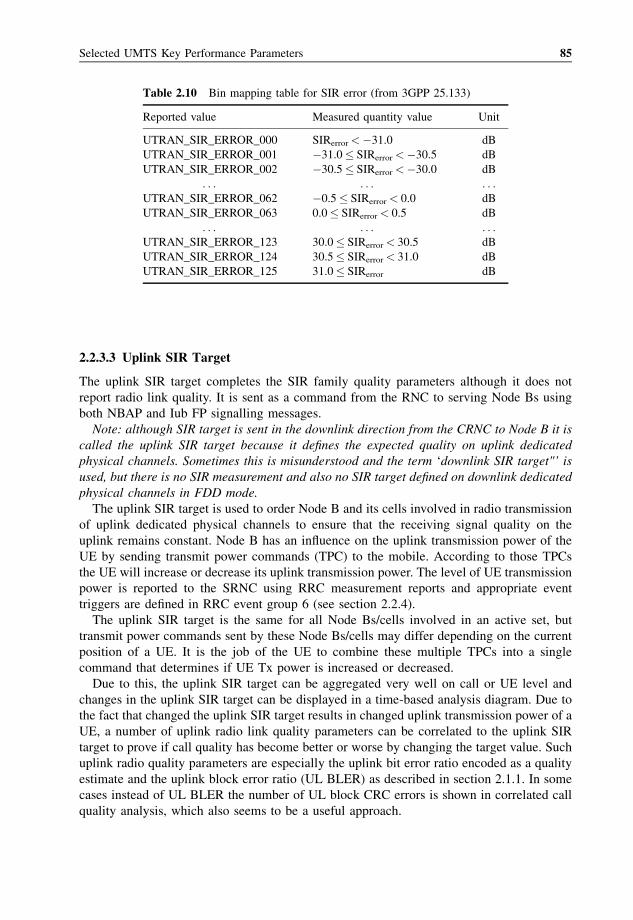
2.2.3.3 Uplink SIR Target
The uplink SIR target completes the SIR family quality parameters although it does not
report radio link quality. It is sent as a command from the RNC to serving Node Bs using
both NBAP and Iub FP signalling messages.
Note: although SIR target is sent in the downlink direction from the CRNC to Node B it is
called the uplink SIR target because it defines the expected quality on uplink dedicated
physical channels. Sometimes this is misunderstood and the term ‘downlink SIR target"’ is
used, but there is no SIR measurement and also no SIR target defined on downlink dedicated
physical channels in FDD mode.
The uplink SIR target is used to order Node B and its cells involved in radio transmission
of uplink dedicated physical channels to ensure that the receiving signal quality on the
uplink remains constant. Node B has an influence on the uplink transmission power of the
UE by sending transmit power commands (TPC) to the mobile. According to those TPCs
the UE will increase or decrease its uplink transmission power. The level of UE transmission
power is reported to the SRNC using RRC measurement reports and appropriate event
triggers are defined in RRC event group 6 (see section 2.2.4).
The uplink SIR target is the same for all Node Bs/cells involved in an active set, but
transmit power commands sent by these Node Bs/cells may differ depending on the current
position of a UE. It is the job of the UE to combine these multiple TPCs into a single
command that determines if UE Tx power is increased or decreased.
Due to this, the uplink SIR target can be aggregated very well on call or UE level and
changes in the uplink SIR target can be displayed in a time-based analysis diagram. Due to
the fact that changed the uplink SIR target results in changed uplink transmission power of a
UE, a number of uplink radio link quality parameters can be correlated to the uplink SIR
target to prove if call quality has become better or worse by changing the target value. Such
uplink radio quality parameters are especially the uplink bit error ratio encoded as a quality
estimate and the uplink block error ratio (UL BLER) as described in section 2.1.1. In some
cases instead of UL BLER the number of UL block CRC errors is shown in correlated call
quality analysis, which also seems to be a useful approach.
Table 2.10 Bin mapping table for SIR error (from 3GPP 25.133)
Reported value Measured quantity value Unit
UTRAN_SIR_ERROR_000 SIRerror<�31.0 dB
UTRAN_SIR_ERROR_001 �31.0� SIRerror<�30.5 dB
UTRAN_SIR_ERROR_002 �30.5� SIRerror<�30.0 dB
. . . . . . . . .UTRAN_SIR_ERROR_062 �0.5� SIRerror< 0.0 dB
UTRAN_SIR_ERROR_063 0.0� SIRerror< 0.5 dB
. . . . . . . . .UTRAN_SIR_ERROR_123 30.0� SIRerror< 30.5 dB
UTRAN_SIR_ERROR_124 30.5� SIRerror< 31.0 dB
UTRAN_SIR_ERROR_125 31.0� SIRerror dB
Selected UMTS Key Performance Parameters 85
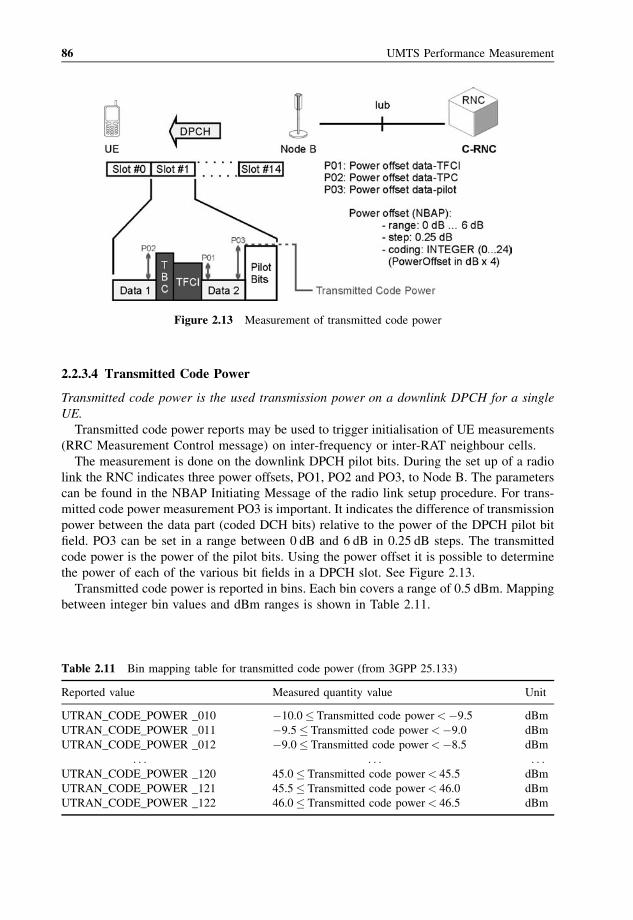
2.2.3.4 Transmitted Code Power
Transmitted code power is the used transmission power on a downlink DPCH for a single
UE.
Transmitted code power reports may be used to trigger initialisation of UE measurements
(RRC Measurement Control message) on inter-frequency or inter-RAT neighbour cells.
The measurement is done on the downlink DPCH pilot bits. During the set up of a radio
link the RNC indicates three power offsets, PO1, PO2 and PO3, to Node B. The parameters
can be found in the NBAP Initiating Message of the radio link setup procedure. For trans-
mitted code power measurement PO3 is important. It indicates the difference of transmission
power between the data part (coded DCH bits) relative to the power of the DPCH pilot bit
field. PO3 can be set in a range between 0 dB and 6 dB in 0.25 dB steps. The transmitted
code power is the power of the pilot bits. Using the power offset it is possible to determine
the power of each of the various bit fields in a DPCH slot. See Figure 2.13.
Transmitted code power is reported in bins. Each bin covers a range of 0.5 dBm. Mapping
between integer bin values and dBm ranges is shown in Table 2.11.
Figure 2.13 Measurement of transmitted code power
Table 2.11 Bin mapping table for transmitted code power (from 3GPP 25.133)
Reported value Measured quantity value Unit
UTRAN_CODE_POWER _010 �10.0� Transmitted code power<�9.5 dBm
UTRAN_CODE_POWER _011 �9.5� Transmitted code power<�9.0 dBm
UTRAN_CODE_POWER _012 �9.0� Transmitted code power<�8.5 dBm
. . . . . . . . .UTRAN_CODE_POWER _120 45.0� Transmitted code power< 45.5 dBm
UTRAN_CODE_POWER _121 45.5� Transmitted code power< 46.0 dBm
UTRAN_CODE_POWER _122 46.0� Transmitted code power< 46.5 dBm
86 UMTS Performance Measurement
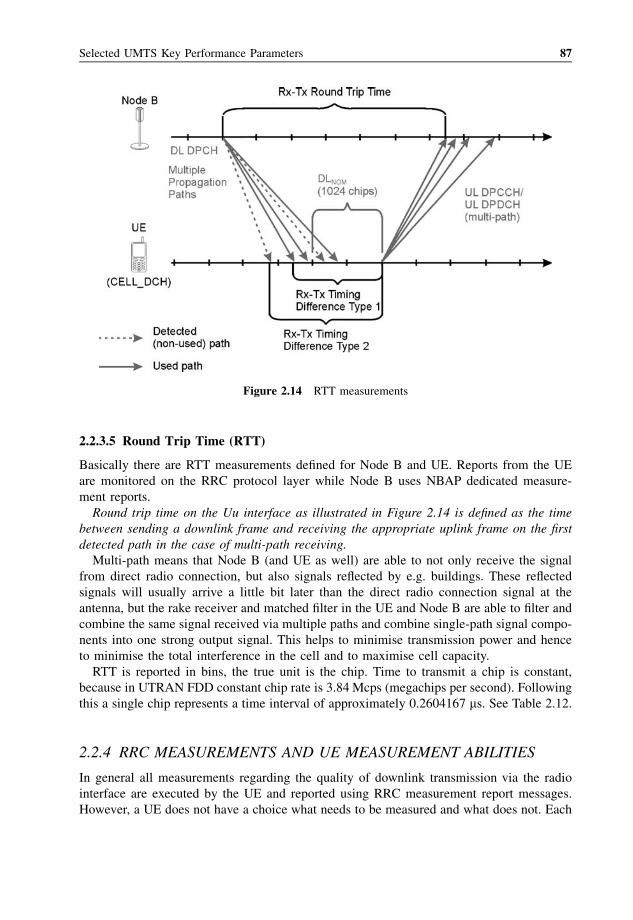
2.2.3.5 Round Trip Time (RTT)
Basically there are RTT measurements defined for Node B and UE. Reports from the UE
are monitored on the RRC protocol layer while Node B uses NBAP dedicated measure-
ment reports.
Round trip time on the Uu interface as illustrated in Figure 2.14 is defined as the time
between sending a downlink frame and receiving the appropriate uplink frame on the first
detected path in the case of multi-path receiving.
Multi-path means that Node B (and UE as well) are able to not only receive the signal
from direct radio connection, but also signals reflected by e.g. buildings. These reflected
signals will usually arrive a little bit later than the direct radio connection signal at the
antenna, but the rake receiver and matched filter in the UE and Node B are able to filter and
combine the same signal received via multiple paths and combine single-path signal compo-
nents into one strong output signal. This helps to minimise transmission power and hence
to minimise the total interference in the cell and to maximise cell capacity.
RTT is reported in bins, the true unit is the chip. Time to transmit a chip is constant,
because in UTRAN FDD constant chip rate is 3.84 Mcps (megachips per second). Following
this a single chip represents a time interval of approximately 0.2604167 ms. See Table 2.12.
2.2.4 RRC MEASUREMENTS AND UE MEASUREMENT ABILITIES
In general all measurements regarding the quality of downlink transmission via the radio
interface are executed by the UE and reported using RRC measurement report messages.
However, a UE does not have a choice what needs to be measured and what does not. Each
Figure 2.14 RTT measurements
Selected UMTS Key Performance Parameters 87
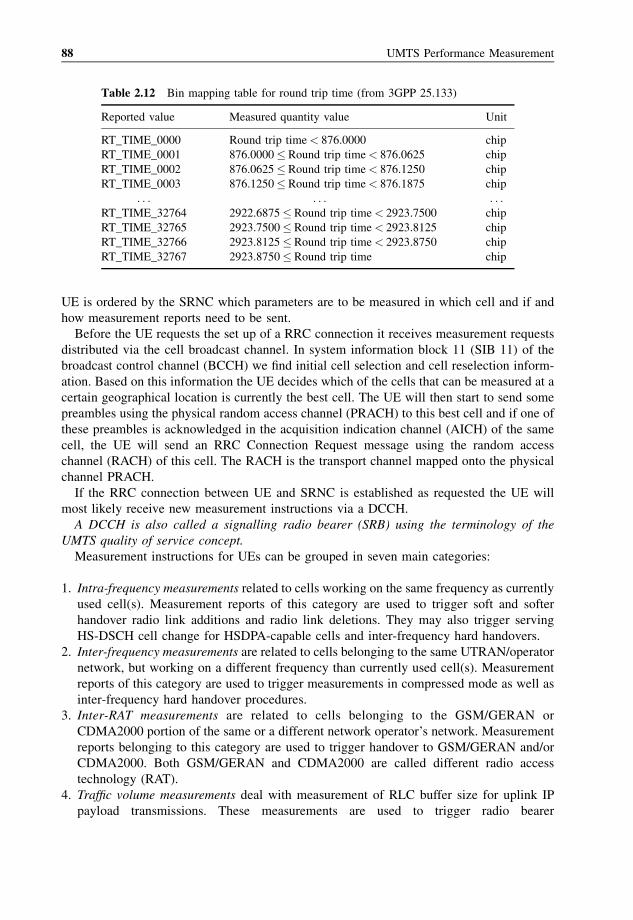
UE is ordered by the SRNC which parameters are to be measured in which cell and if and
how measurement reports need to be sent.
Before the UE requests the set up of a RRC connection it receives measurement requests
distributed via the cell broadcast channel. In system information block 11 (SIB 11) of the
broadcast control channel (BCCH) we find initial cell selection and cell reselection inform-
ation. Based on this information the UE decides which of the cells that can be measured at a
certain geographical location is currently the best cell. The UE will then start to send some
preambles using the physical random access channel (PRACH) to this best cell and if one of
these preambles is acknowledged in the acquisition indication channel (AICH) of the same
cell, the UE will send an RRC Connection Request message using the random access
channel (RACH) of this cell. The RACH is the transport channel mapped onto the physical
channel PRACH.
If the RRC connection between UE and SRNC is established as requested the UE will
most likely receive new measurement instructions via a DCCH.
A DCCH is also called a signalling radio bearer (SRB) using the terminology of the
UMTS quality of service concept.
Measurement instructions for UEs can be grouped in seven main categories:
1. Intra-frequency measurements related to cells working on the same frequency as currently
used cell(s). Measurement reports of this category are used to trigger soft and softer
handover radio link additions and radio link deletions. They may also trigger serving
HS-DSCH cell change for HSDPA-capable cells and inter-frequency hard handovers.
2. Inter-frequency measurements are related to cells belonging to the same UTRAN/operator
network, but working on a different frequency than currently used cell(s). Measurement
reports of this category are used to trigger measurements in compressed mode as well as
inter-frequency hard handover procedures.
3. Inter-RAT measurements are related to cells belonging to the GSM/GERAN or
CDMA2000 portion of the same or a different network operator’s network. Measurement
reports belonging to this category are used to trigger handover to GSM/GERAN and/or
CDMA2000. Both GSM/GERAN and CDMA2000 are called different radio access
technology (RAT).
4. Traffic volume measurements deal with measurement of RLC buffer size for uplink IP
payload transmissions. These measurements are used to trigger radio bearer
Table 2.12 Bin mapping table for round trip time (from 3GPP 25.133)
Reported value Measured quantity value Unit
RT_TIME_0000 Round trip time< 876.0000 chip
RT_TIME_0001 876.0000� Round trip time< 876.0625 chip
RT_TIME_0002 876.0625� Round trip time< 876.1250 chip
RT_TIME_0003 876.1250� Round trip time< 876.1875 chip
. . . . . . . . .RT_TIME_32764 2922.6875� Round trip time< 2923.7500 chip
RT_TIME_32765 2923.7500� Round trip time< 2923.8125 chip
RT_TIME_32766 2923.8125� Round trip time< 2923.8750 chip
RT_TIME_32767 2923.8750� Round trip time chip
88 UMTS Performance Measurement
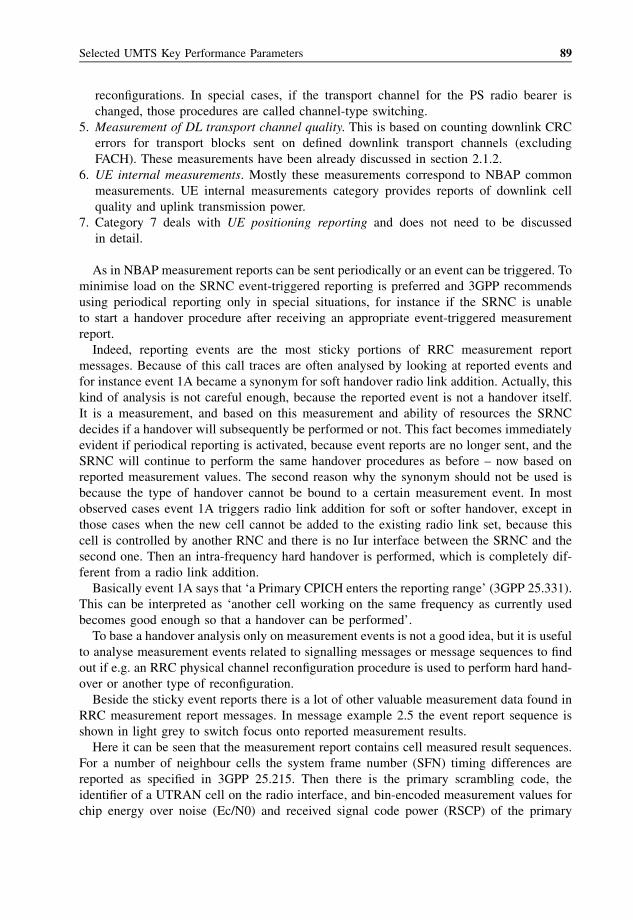
reconfigurations. In special cases, if the transport channel for the PS radio bearer is
changed, those procedures are called channel-type switching.
5. Measurement of DL transport channel quality. This is based on counting downlink CRC
errors for transport blocks sent on defined downlink transport channels (excluding
FACH). These measurements have been already discussed in section 2.1.2.
6. UE internal measurements. Mostly these measurements correspond to NBAP common
measurements. UE internal measurements category provides reports of downlink cell
quality and uplink transmission power.
7. Category 7 deals with UE positioning reporting and does not need to be discussed
in detail.
As in NBAP measurement reports can be sent periodically or an event can be triggered. To
minimise load on the SRNC event-triggered reporting is preferred and 3GPP recommends
using periodical reporting only in special situations, for instance if the SRNC is unable
to start a handover procedure after receiving an appropriate event-triggered measurement
report.
Indeed, reporting events are the most sticky portions of RRC measurement report
messages. Because of this call traces are often analysed by looking at reported events and
for instance event 1A became a synonym for soft handover radio link addition. Actually, this
kind of analysis is not careful enough, because the reported event is not a handover itself.
It is a measurement, and based on this measurement and ability of resources the SRNC
decides if a handover will subsequently be performed or not. This fact becomes immediately
evident if periodical reporting is activated, because event reports are no longer sent, and the
SRNC will continue to perform the same handover procedures as before – now based on
reported measurement values. The second reason why the synonym should not be used is
because the type of handover cannot be bound to a certain measurement event. In most
observed cases event 1A triggers radio link addition for soft or softer handover, except in
those cases when the new cell cannot be added to the existing radio link set, because this
cell is controlled by another RNC and there is no Iur interface between the SRNC and the
second one. Then an intra-frequency hard handover is performed, which is completely dif-
ferent from a radio link addition.
Basically event 1A says that ‘a Primary CPICH enters the reporting range’ (3GPP 25.331).
This can be interpreted as ‘another cell working on the same frequency as currently used
becomes good enough so that a handover can be performed’.
To base a handover analysis only on measurement events is not a good idea, but it is useful
to analyse measurement events related to signalling messages or message sequences to find
out if e.g. an RRC physical channel reconfiguration procedure is used to perform hard hand-
over or another type of reconfiguration.
Beside the sticky event reports there is a lot of other valuable measurement data found in
RRC measurement report messages. In message example 2.5 the event report sequence is
shown in light grey to switch focus onto reported measurement results.
Here it can be seen that the measurement report contains cell measured result sequences.
For a number of neighbour cells the system frame number (SFN) timing differences are
reported as specified in 3GPP 25.215. Then there is the primary scrambling code, the
identifier of a UTRAN cell on the radio interface, and bin-encoded measurement values for
chip energy over noise (Ec/N0) and received signal code power (RSCP) of the primary
Selected UMTS Key Performance Parameters 89
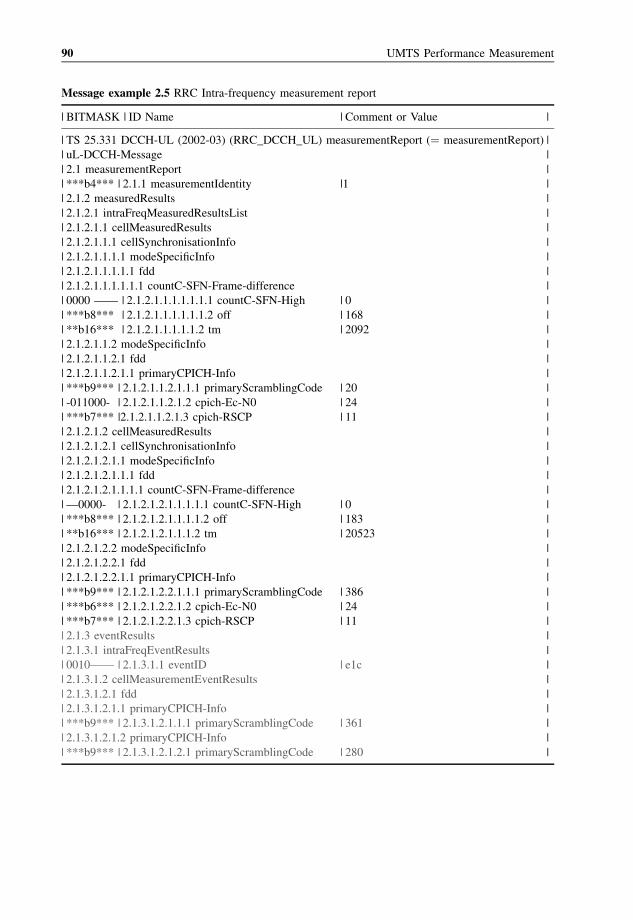
Message example 2.5 RRC Intra-frequency measurement report
| BITMASK | ID Name | Comment or Value |
| TS 25.331 DCCH-UL (2002-03) (RRC_DCCH_UL) measurementReport (¼ measurementReport) |
| uL-DCCH-Message |
| 2.1 measurementReport |
| ***b4*** | 2.1.1 measurementIdentity |1 |
| 2.1.2 measuredResults |
| 2.1.2.1 intraFreqMeasuredResultsList |
| 2.1.2.1.1 cellMeasuredResults |
| 2.1.2.1.1.1 cellSynchronisationInfo |
| 2.1.2.1.1.1.1 modeSpecificInfo |
| 2.1.2.1.1.1.1.1 fdd |
| 2.1.2.1.1.1.1.1.1 countC-SFN-Frame-difference |
| 0000 —— | 2.1.2.1.1.1.1.1.1.1 countC-SFN-High | 0 |
| ***b8*** | 2.1.2.1.1.1.1.1.1.2 off | 168 |
| **b16*** | 2.1.2.1.1.1.1.1.2 tm | 2092 |
| 2.1.2.1.1.2 modeSpecificInfo |
| 2.1.2.1.1.2.1 fdd |
| 2.1.2.1.1.2.1.1 primaryCPICH-Info |
| ***b9*** | 2.1.2.1.1.2.1.1.1 primaryScramblingCode | 20 |
| -011000- | 2.1.2.1.1.2.1.2 cpich-Ec-N0 | 24 |
| ***b7*** |2.1.2.1.1.2.1.3 cpich-RSCP | 11 |
| 2.1.2.1.2 cellMeasuredResults |
| 2.1.2.1.2.1 cellSynchronisationInfo |
| 2.1.2.1.2.1.1 modeSpecificInfo |
| 2.1.2.1.2.1.1.1 fdd |
| 2.1.2.1.2.1.1.1.1 countC-SFN-Frame-difference |
| —0000- | 2.1.2.1.2.1.1.1.1.1 countC-SFN-High | 0 |
| ***b8*** | 2.1.2.1.2.1.1.1.1.2 off | 183 |
| **b16*** | 2.1.2.1.2.1.1.1.2 tm | 20523 |
| 2.1.2.1.2.2 modeSpecificInfo |
| 2.1.2.1.2.2.1 fdd |
| 2.1.2.1.2.2.1.1 primaryCPICH-Info |
| ***b9*** | 2.1.2.1.2.2.1.1.1 primaryScramblingCode | 386 |
| ***b6*** | 2.1.2.1.2.2.1.2 cpich-Ec-N0 | 24 |
| ***b7*** | 2.1.2.1.2.2.1.3 cpich-RSCP | 11 |
| 2.1.3 eventResults |
| 2.1.3.1 intraFreqEventResults |
| 0010—— | 2.1.3.1.1 eventID | e1c |
| 2.1.3.1.2 cellMeasurementEventResults |
| 2.1.3.1.2.1 fdd |
| 2.1.3.1.2.1.1 primaryCPICH-Info |
| ***b9*** | 2.1.3.1.2.1.1.1 primaryScramblingCode | 361 |
| 2.1.3.1.2.1.2 primaryCPICH-Info |
| ***b9*** | 2.1.3.1.2.1.2.1 primaryScramblingCode | 280 |
90 UMTS Performance Measurement
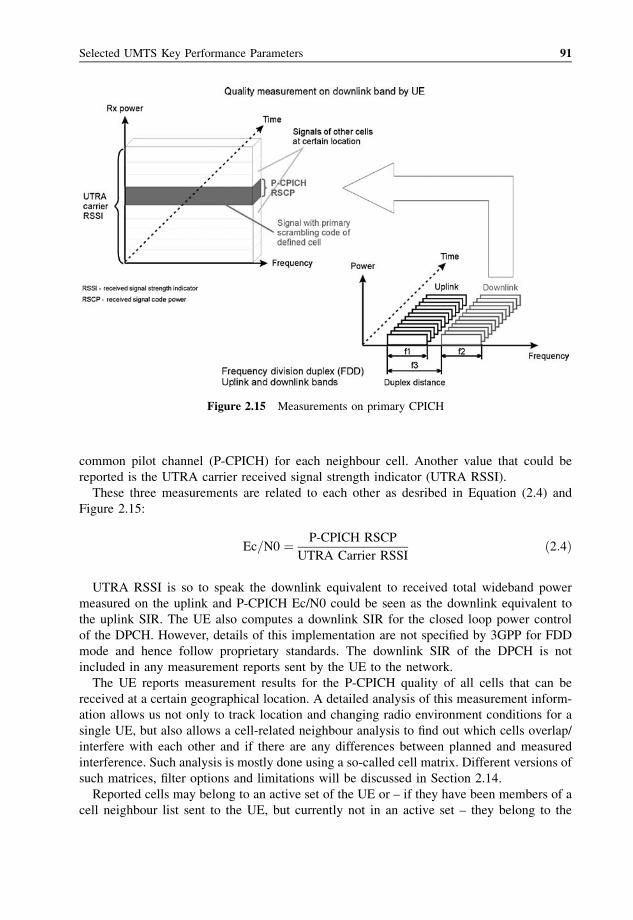
common pilot channel (P-CPICH) for each neighbour cell. Another value that could be
reported is the UTRA carrier received signal strength indicator (UTRA RSSI).
These three measurements are related to each other as desribed in Equation (2.4) and
Figure 2.15:
Ec=N0 ¼ P-CPICH RSCP
UTRA Carrier RSSIð2:4Þ
UTRA RSSI is so to speak the downlink equivalent to received total wideband power
measured on the uplink and P-CPICH Ec/N0 could be seen as the downlink equivalent to
the uplink SIR. The UE also computes a downlink SIR for the closed loop power control
of the DPCH. However, details of this implementation are not specified by 3GPP for FDD
mode and hence follow proprietary standards. The downlink SIR of the DPCH is not
included in any measurement reports sent by the UE to the network.
The UE reports measurement results for the P-CPICH quality of all cells that can be
received at a certain geographical location. A detailed analysis of this measurement inform-
ation allows us not only to track location and changing radio environment conditions for a
single UE, but also allows a cell-related neighbour analysis to find out which cells overlap/
interfere with each other and if there are any differences between planned and measured
interference. Such analysis is mostly done using a so-called cell matrix. Different versions of
such matrices, filter options and limitations will be discussed in Section 2.14.
Reported cells may belong to an active set of the UE or – if they have been members of a
cell neighbour list sent to the UE, but currently not in an active set – they belong to the
Figure 2.15 Measurements on primary CPICH
Selected UMTS Key Performance Parameters 91
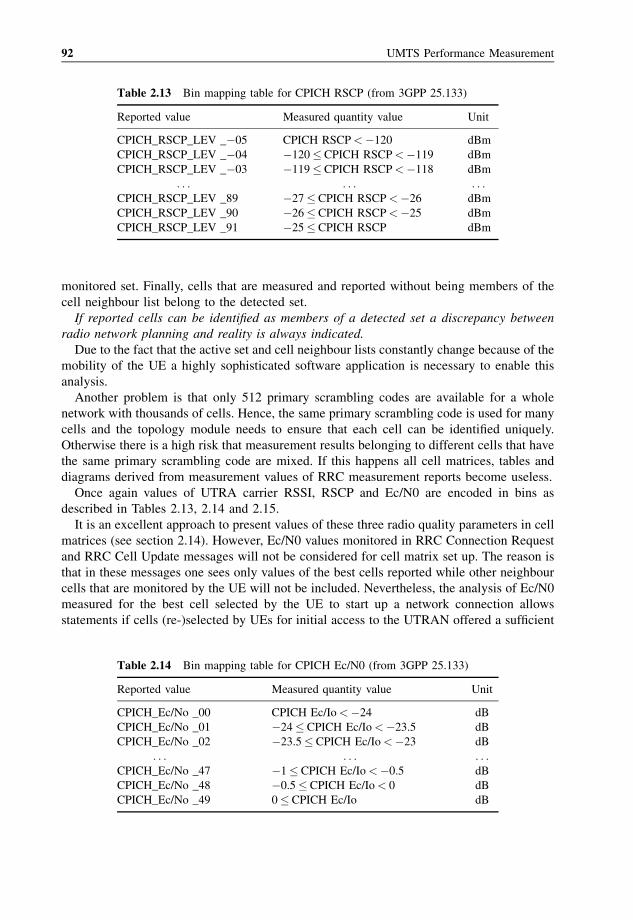
monitored set. Finally, cells that are measured and reported without being members of the
cell neighbour list belong to the detected set.
If reported cells can be identified as members of a detected set a discrepancy between
radio network planning and reality is always indicated.
Due to the fact that the active set and cell neighbour lists constantly change because of the
mobility of the UE a highly sophisticated software application is necessary to enable this
analysis.
Another problem is that only 512 primary scrambling codes are available for a whole
network with thousands of cells. Hence, the same primary scrambling code is used for many
cells and the topology module needs to ensure that each cell can be identified uniquely.
Otherwise there is a high risk that measurement results belonging to different cells that have
the same primary scrambling code are mixed. If this happens all cell matrices, tables and
diagrams derived from measurement values of RRC measurement reports become useless.
Once again values of UTRA carrier RSSI, RSCP and Ec/N0 are encoded in bins as
described in Tables 2.13, 2.14 and 2.15.
It is an excellent approach to present values of these three radio quality parameters in cell
matrices (see section 2.14). However, Ec/N0 values monitored in RRC Connection Request
and RRC Cell Update messages will not be considered for cell matrix set up. The reason is
that in these messages one sees only values of the best cells reported while other neighbour
cells that are monitored by the UE will not be included. Nevertheless, the analysis of Ec/N0
measured for the best cell selected by the UE to start up a network connection allows
statements if cells (re-)selected by UEs for initial access to the UTRAN offered a sufficient
Table 2.13 Bin mapping table for CPICH RSCP (from 3GPP 25.133)
Reported value Measured quantity value Unit
CPICH_RSCP_LEV _�05 CPICH RSCP<�120 dBm
CPICH_RSCP_LEV _�04 �120� CPICH RSCP<�119 dBm
CPICH_RSCP_LEV _�03 �119� CPICH RSCP<�118 dBm
. . . . . . . . .CPICH_RSCP_LEV _89 �27� CPICH RSCP<�26 dBm
CPICH_RSCP_LEV _90 �26� CPICH RSCP<�25 dBm
CPICH_RSCP_LEV _91 �25� CPICH RSCP dBm
Table 2.14 Bin mapping table for CPICH Ec/N0 (from 3GPP 25.133)
Reported value Measured quantity value Unit
CPICH_Ec/No _00 CPICH Ec/Io<�24 dB
CPICH_Ec/No _01 �24� CPICH Ec/Io<�23.5 dB
CPICH_Ec/No _02 �23.5� CPICH Ec/Io<�23 dB
. . . . . . . . .CPICH_Ec/No _47 �1� CPICH Ec/Io<�0.5 dB
CPICH_Ec/No _48 �0.5� CPICH Ec/Io< 0 dB
CPICH_Ec/No _49 0� CPICH Ec/Io dB
92 UMTS Performance Measurement
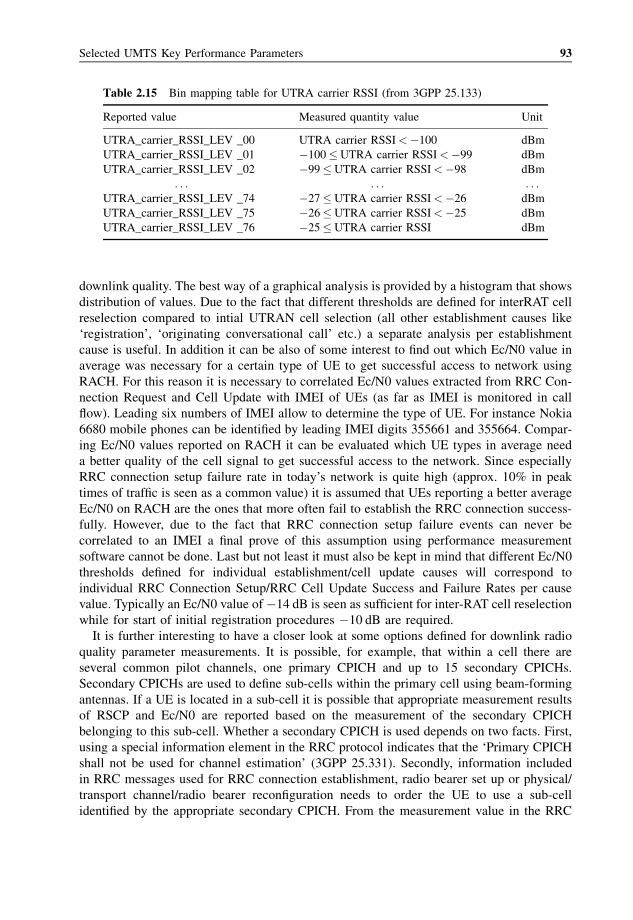
downlink quality. The best way of a graphical analysis is provided by a histogram that shows
distribution of values. Due to the fact that different thresholds are defined for interRAT cell
reselection compared to intial UTRAN cell selection (all other establishment causes like
‘registration’, ‘originating conversational call’ etc.) a separate analysis per establishment
cause is useful. In addition it can be also of some interest to find out which Ec/N0 value in
average was necessary for a certain type of UE to get successful access to network using
RACH. For this reason it is necessary to correlated Ec/N0 values extracted from RRC Con-
nection Request and Cell Update with IMEI of UEs (as far as IMEI is monitored in call
flow). Leading six numbers of IMEI allow to determine the type of UE. For instance Nokia
6680 mobile phones can be identified by leading IMEI digits 355661 and 355664. Compar-
ing Ec/N0 values reported on RACH it can be evaluated which UE types in average need
a better quality of the cell signal to get successful access to the network. Since especially
RRC connection setup failure rate in today’s network is quite high (approx. 10% in peak
times of traffic is seen as a common value) it is assumed that UEs reporting a better average
Ec/N0 on RACH are the ones that more often fail to establish the RRC connection success-
fully. However, due to the fact that RRC connection setup failure events can never be
correlated to an IMEI a final prove of this assumption using performance measurement
software cannot be done. Last but not least it must also be kept in mind that different Ec/N0
thresholds defined for individual establishment/cell update causes will correspond to
individual RRC Connection Setup/RRC Cell Update Success and Failure Rates per cause
value. Typically an Ec/N0 value of�14 dB is seen as sufficient for inter-RAT cell reselection
while for start of initial registration procedures �10 dB are required.
It is further interesting to have a closer look at some options defined for downlink radio
quality parameter measurements. It is possible, for example, that within a cell there are
several common pilot channels, one primary CPICH and up to 15 secondary CPICHs.
Secondary CPICHs are used to define sub-cells within the primary cell using beam-forming
antennas. If a UE is located in a sub-cell it is possible that appropriate measurement results
of RSCP and Ec/N0 are reported based on the measurement of the secondary CPICH
belonging to this sub-cell. Whether a secondary CPICH is used depends on two facts. First,
using a special information element in the RRC protocol indicates that the ‘Primary CPICH
shall not be used for channel estimation’ (3GPP 25.331). Secondly, information included
in RRC messages used for RRC connection establishment, radio bearer set up or physical/
transport channel/radio bearer reconfiguration needs to order the UE to use a sub-cell
identified by the appropriate secondary CPICH. From the measurement value in the RRC
Table 2.15 Bin mapping table for UTRA carrier RSSI (from 3GPP 25.133)
Reported value Measured quantity value Unit
UTRA_carrier_RSSI_LEV _00 UTRA carrier RSSI<�100 dBm
UTRA_carrier_RSSI_LEV _01 �100�UTRA carrier RSSI<�99 dBm
UTRA_carrier_RSSI_LEV _02 �99�UTRA carrier RSSI<�98 dBm
. . . . . . . . .UTRA_carrier_RSSI_LEV _74 �27�UTRA carrier RSSI<�26 dBm
UTRA_carrier_RSSI_LEV _75 �26�UTRA carrier RSSI<�25 dBm
UTRA_carrier_RSSI_LEV _76 �25�UTRA carrier RSSI dBm
Selected UMTS Key Performance Parameters 93
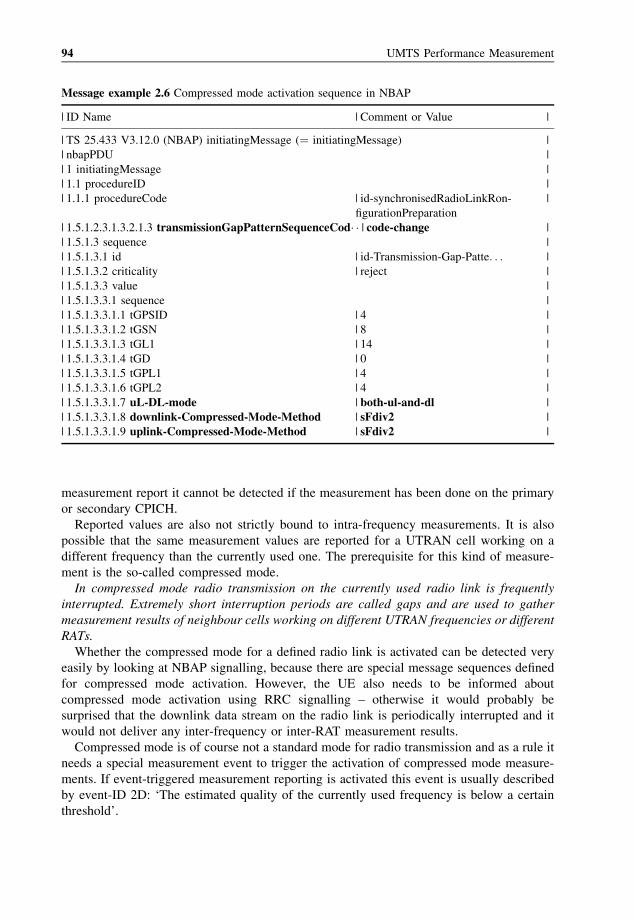
measurement report it cannot be detected if the measurement has been done on the primary
or secondary CPICH.
Reported values are also not strictly bound to intra-frequency measurements. It is also
possible that the same measurement values are reported for a UTRAN cell working on a
different frequency than the currently used one. The prerequisite for this kind of measure-
ment is the so-called compressed mode.
In compressed mode radio transmission on the currently used radio link is frequently
interrupted. Extremely short interruption periods are called gaps and are used to gather
measurement results of neighbour cells working on different UTRAN frequencies or different
RATs.
Whether the compressed mode for a defined radio link is activated can be detected very
easily by looking at NBAP signalling, because there are special message sequences defined
for compressed mode activation. However, the UE also needs to be informed about
compressed mode activation using RRC signalling – otherwise it would probably be
surprised that the downlink data stream on the radio link is periodically interrupted and it
would not deliver any inter-frequency or inter-RAT measurement results.
Compressed mode is of course not a standard mode for radio transmission and as a rule it
needs a special measurement event to trigger the activation of compressed mode measure-
ments. If event-triggered measurement reporting is activated this event is usually described
by event-ID 2D: ‘The estimated quality of the currently used frequency is below a certain
threshold’.
Message example 2.6 Compressed mode activation sequence in NBAP
| ID Name | Comment or Value |
| TS 25.433 V3.12.0 (NBAP) initiatingMessage (¼ initiatingMessage) |
| nbapPDU |
| 1 initiatingMessage |
| 1.1 procedureID |
| 1.1.1 procedureCode | id-synchronisedRadioLinkRon- |
figurationPreparation
| 1.5.1.2.3.1.3.2.1.3 transmissionGapPatternSequenceCod� � | code-change |
| 1.5.1.3 sequence |
| 1.5.1.3.1 id | id-Transmission-Gap-Patte. . . |
| 1.5.1.3.2 criticality | reject |
| 1.5.1.3.3 value |
| 1.5.1.3.3.1 sequence |
| 1.5.1.3.3.1.1 tGPSID | 4 |
| 1.5.1.3.3.1.2 tGSN | 8 |
| 1.5.1.3.3.1.3 tGL1 | 14 |
| 1.5.1.3.3.1.4 tGD | 0 |
| 1.5.1.3.3.1.5 tGPL1 | 4 |
| 1.5.1.3.3.1.6 tGPL2 | 4 |
| 1.5.1.3.3.1.7 uL-DL-mode | both-ul-and-dl |
| 1.5.1.3.3.1.8 downlink-Compressed-Mode-Method | sFdiv2 |
| 1.5.1.3.3.1.9 uplink-Compressed-Mode-Method | sFdiv2 |
94 UMTS Performance Measurement
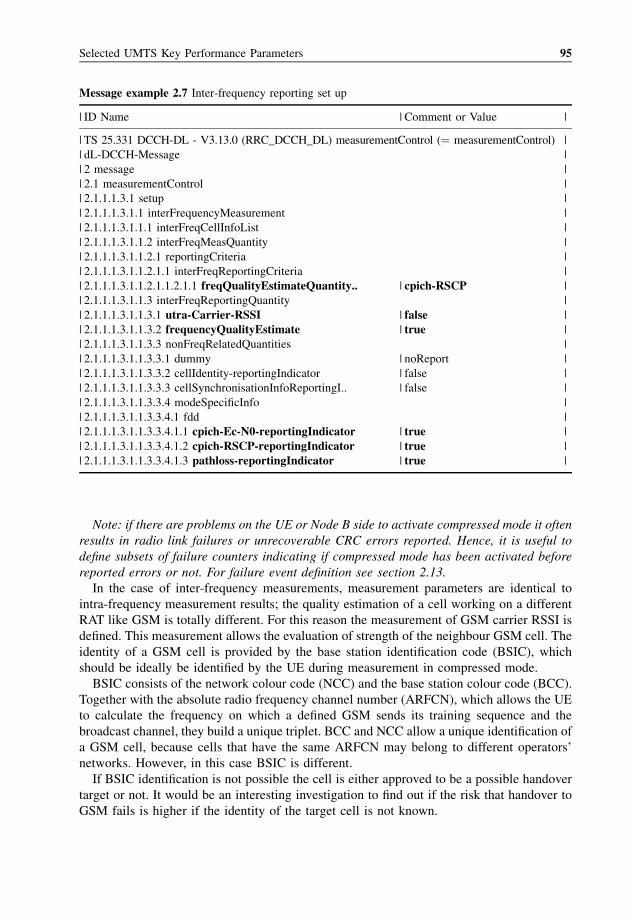
Note: if there are problems on the UE or Node B side to activate compressed mode it often
results in radio link failures or unrecoverable CRC errors reported. Hence, it is useful to
define subsets of failure counters indicating if compressed mode has been activated before
reported errors or not. For failure event definition see section 2.13.
In the case of inter-frequency measurements, measurement parameters are identical to
intra-frequency measurement results; the quality estimation of a cell working on a different
RAT like GSM is totally different. For this reason the measurement of GSM carrier RSSI is
defined. This measurement allows the evaluation of strength of the neighbour GSM cell. The
identity of a GSM cell is provided by the base station identification code (BSIC), which
should be ideally be identified by the UE during measurement in compressed mode.
BSIC consists of the network colour code (NCC) and the base station colour code (BCC).
Together with the absolute radio frequency channel number (ARFCN), which allows the UE
to calculate the frequency on which a defined GSM sends its training sequence and the
broadcast channel, they build a unique triplet. BCC and NCC allow a unique identification of
a GSM cell, because cells that have the same ARFCN may belong to different operators’
networks. However, in this case BSIC is different.
If BSIC identification is not possible the cell is either approved to be a possible handover
target or not. It would be an interesting investigation to find out if the risk that handover to
GSM fails is higher if the identity of the target cell is not known.
Message example 2.7 Inter-frequency reporting set up
| ID Name | Comment or Value |
| TS 25.331 DCCH-DL - V3.13.0 (RRC_DCCH_DL) measurementControl (¼ measurementControl) |
| dL-DCCH-Message |
| 2 message |
| 2.1 measurementControl |
| 2.1.1.1.3.1 setup |
| 2.1.1.1.3.1.1 interFrequencyMeasurement |
| 2.1.1.1.3.1.1.1 interFreqCellInfoList |
| 2.1.1.1.3.1.1.2 interFreqMeasQuantity |
| 2.1.1.1.3.1.1.2.1 reportingCriteria |
| 2.1.1.1.3.1.1.2.1.1 interFreqReportingCriteria |
| 2.1.1.1.3.1.1.2.1.1.2.1.1 freqQualityEstimateQuantity.. | cpich-RSCP |
| 2.1.1.1.3.1.1.3 interFreqReportingQuantity |
| 2.1.1.1.3.1.1.3.1 utra-Carrier-RSSI | false |
| 2.1.1.1.3.1.1.3.2 frequencyQualityEstimate | true |
| 2.1.1.1.3.1.1.3.3 nonFreqRelatedQuantities |
| 2.1.1.1.3.1.1.3.3.1 dummy | noReport |
| 2.1.1.1.3.1.1.3.3.2 cellIdentity-reportingIndicator | false |
| 2.1.1.1.3.1.1.3.3.3 cellSynchronisationInfoReportingI.. | false |
| 2.1.1.1.3.1.1.3.3.4 modeSpecificInfo |
| 2.1.1.1.3.1.1.3.3.4.1 fdd |
| 2.1.1.1.3.1.1.3.3.4.1.1 cpich-Ec-N0-reportingIndicator | true |
| 2.1.1.1.3.1.1.3.3.4.1.2 cpich-RSCP-reportingIndicator | true |
| 2.1.1.1.3.1.1.3.3.4.1.3 pathloss-reportingIndicator | true |
Selected UMTS Key Performance Parameters 95
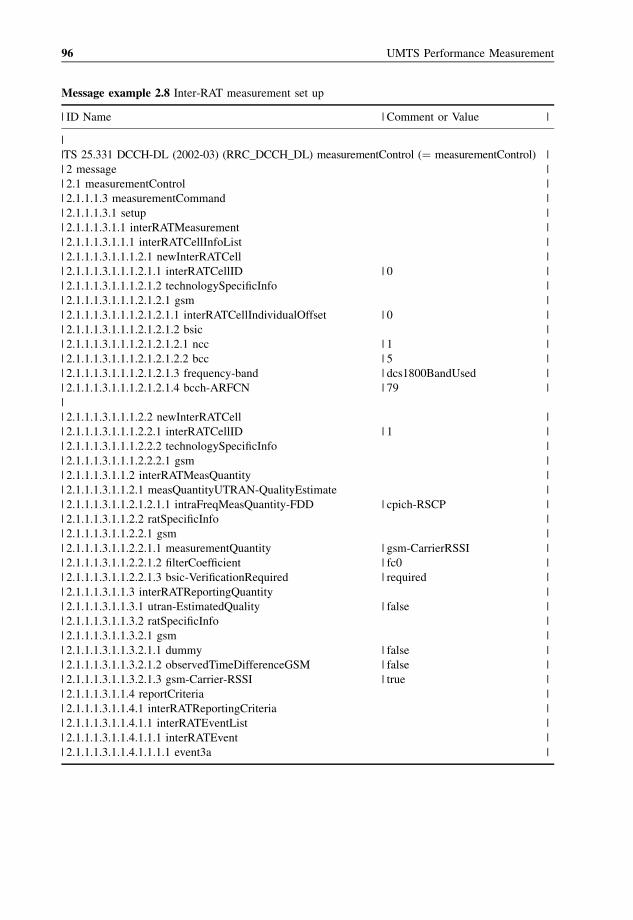
Message example 2.8 Inter-RAT measurement set up
| ID Name | Comment or Value |
|
|TS 25.331 DCCH-DL (2002-03) (RRC_DCCH_DL) measurementControl (¼ measurementControl) |
| 2 message |
| 2.1 measurementControl |
| 2.1.1.1.3 measurementCommand |
| 2.1.1.1.3.1 setup |
| 2.1.1.1.3.1.1 interRATMeasurement |
| 2.1.1.1.3.1.1.1 interRATCellInfoList |
| 2.1.1.1.3.1.1.1.2.1 newInterRATCell |
| 2.1.1.1.3.1.1.1.2.1.1 interRATCellID | 0 |
| 2.1.1.1.3.1.1.1.2.1.2 technologySpecificInfo |
| 2.1.1.1.3.1.1.1.2.1.2.1 gsm |
| 2.1.1.1.3.1.1.1.2.1.2.1.1 interRATCellIndividualOffset | 0 |
| 2.1.1.1.3.1.1.1.2.1.2.1.2 bsic |
| 2.1.1.1.3.1.1.1.2.1.2.1.2.1 ncc | 1 |
| 2.1.1.1.3.1.1.1.2.1.2.1.2.2 bcc | 5 |
| 2.1.1.1.3.1.1.1.2.1.2.1.3 frequency-band | dcs1800BandUsed |
| 2.1.1.1.3.1.1.1.2.1.2.1.4 bcch-ARFCN | 79 |
|
| 2.1.1.1.3.1.1.1.2.2 newInterRATCell |
| 2.1.1.1.3.1.1.1.2.2.1 interRATCellID | 1 |
| 2.1.1.1.3.1.1.1.2.2.2 technologySpecificInfo |
| 2.1.1.1.3.1.1.1.2.2.2.1 gsm |
| 2.1.1.1.3.1.1.2 interRATMeasQuantity |
| 2.1.1.1.3.1.1.2.1 measQuantityUTRAN-QualityEstimate |
| 2.1.1.1.3.1.1.2.1.2.1.1 intraFreqMeasQuantity-FDD | cpich-RSCP |
| 2.1.1.1.3.1.1.2.2 ratSpecificInfo |
| 2.1.1.1.3.1.1.2.2.1 gsm |
| 2.1.1.1.3.1.1.2.2.1.1 measurementQuantity | gsm-CarrierRSSI |
| 2.1.1.1.3.1.1.2.2.1.2 filterCoefficient | fc0 |
| 2.1.1.1.3.1.1.2.2.1.3 bsic-VerificationRequired | required |
| 2.1.1.1.3.1.1.3 interRATReportingQuantity |
| 2.1.1.1.3.1.1.3.1 utran-EstimatedQuality | false |
| 2.1.1.1.3.1.1.3.2 ratSpecificInfo |
| 2.1.1.1.3.1.1.3.2.1 gsm |
| 2.1.1.1.3.1.1.3.2.1.1 dummy | false |
| 2.1.1.1.3.1.1.3.2.1.2 observedTimeDifferenceGSM | false |
| 2.1.1.1.3.1.1.3.2.1.3 gsm-Carrier-RSSI | true |
| 2.1.1.1.3.1.1.4 reportCriteria |
| 2.1.1.1.3.1.1.4.1 interRATReportingCriteria |
| 2.1.1.1.3.1.1.4.1.1 interRATEventList |
| 2.1.1.1.3.1.1.4.1.1.1 interRATEvent |
| 2.1.1.1.3.1.1.4.1.1.1.1 event3a |
96 UMTS Performance Measurement
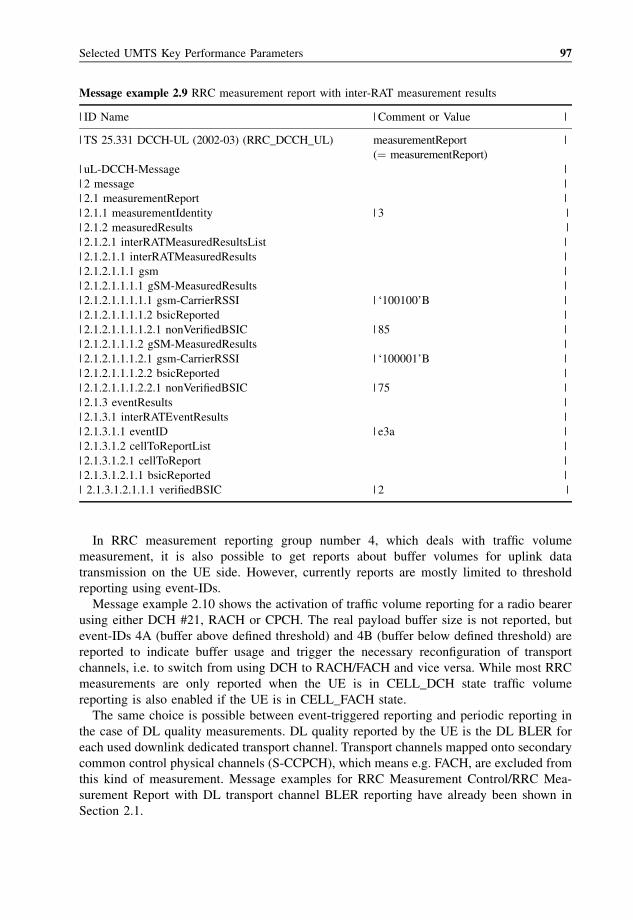
In RRC measurement reporting group number 4, which deals with traffic volume
measurement, it is also possible to get reports about buffer volumes for uplink data
transmission on the UE side. However, currently reports are mostly limited to threshold
reporting using event-IDs.
Message example 2.10 shows the activation of traffic volume reporting for a radio bearer
using either DCH #21, RACH or CPCH. The real payload buffer size is not reported, but
event-IDs 4A (buffer above defined threshold) and 4B (buffer below defined threshold) are
reported to indicate buffer usage and trigger the necessary reconfiguration of transport
channels, i.e. to switch from using DCH to RACH/FACH and vice versa. While most RRC
measurements are only reported when the UE is in CELL_DCH state traffic volume
reporting is also enabled if the UE is in CELL_FACH state.
The same choice is possible between event-triggered reporting and periodic reporting in
the case of DL quality measurements. DL quality reported by the UE is the DL BLER for
each used downlink dedicated transport channel. Transport channels mapped onto secondary
common control physical channels (S-CCPCH), which means e.g. FACH, are excluded from
this kind of measurement. Message examples for RRC Measurement Control/RRC Mea-
surement Report with DL transport channel BLER reporting have already been shown in
Section 2.1.
Message example 2.9 RRC measurement report with inter-RAT measurement results
| ID Name | Comment or Value |
| TS 25.331 DCCH-UL (2002-03) (RRC_DCCH_UL) measurementReport |
(¼ measurementReport)
| uL-DCCH-Message |
| 2 message |
| 2.1 measurementReport |
| 2.1.1 measurementIdentity | 3 |
| 2.1.2 measuredResults |
| 2.1.2.1 interRATMeasuredResultsList |
| 2.1.2.1.1 interRATMeasuredResults |
| 2.1.2.1.1.1 gsm |
| 2.1.2.1.1.1.1 gSM-MeasuredResults |
| 2.1.2.1.1.1.1.1 gsm-CarrierRSSI | ‘100100’B |
| 2.1.2.1.1.1.1.2 bsicReported |
| 2.1.2.1.1.1.1.2.1 nonVerifiedBSIC | 85 |
| 2.1.2.1.1.1.2 gSM-MeasuredResults |
| 2.1.2.1.1.1.2.1 gsm-CarrierRSSI | ‘100001’B |
| 2.1.2.1.1.1.2.2 bsicReported |
| 2.1.2.1.1.1.2.2.1 nonVerifiedBSIC | 75 |
| 2.1.3 eventResults |
| 2.1.3.1 interRATEventResults |
| 2.1.3.1.1 eventID | e3a |
| 2.1.3.1.2 cellToReportList |
| 2.1.3.1.2.1 cellToReport |
| 2.1.3.1.2.1.1 bsicReported |
| 2.1.3.1.2.1.1.1 verifiedBSIC | 2 |
Selected UMTS Key Performance Parameters 97
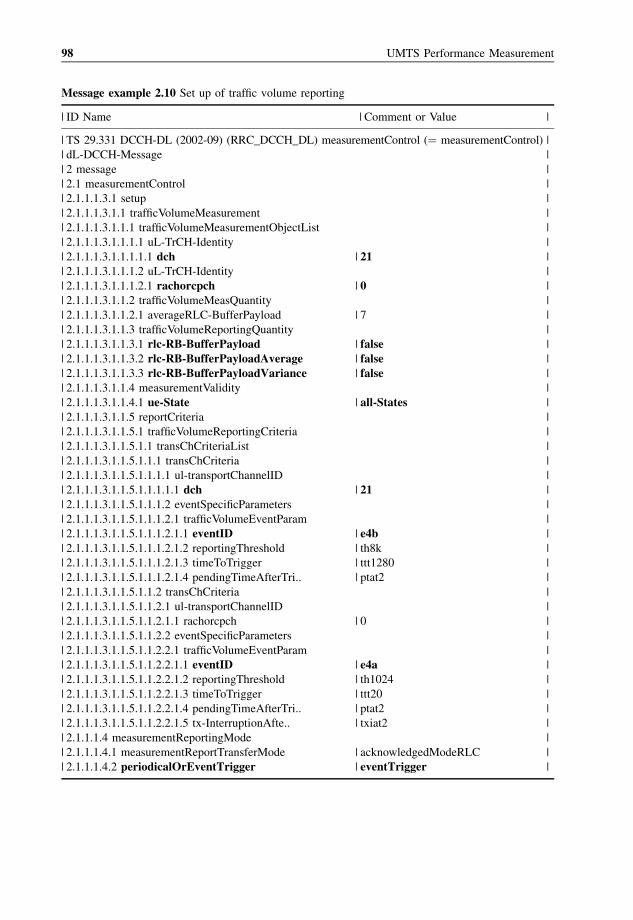
Message example 2.10 Set up of traffic volume reporting
| ID Name | Comment or Value |
| TS 29.331 DCCH-DL (2002-09) (RRC_DCCH_DL) measurementControl (¼ measurementControl) |
| dL-DCCH-Message |
| 2 message |
| 2.1 measurementControl |
| 2.1.1.1.3.1 setup |
| 2.1.1.1.3.1.1 trafficVolumeMeasurement |
| 2.1.1.1.3.1.1.1 trafficVolumeMeasurementObjectList |
| 2.1.1.1.3.1.1.1.1 uL-TrCH-Identity |
| 2.1.1.1.3.1.1.1.1.1 dch | 21 |
| 2.1.1.1.3.1.1.1.2 uL-TrCH-Identity |
| 2.1.1.1.3.1.1.1.2.1 rachorcpch | 0 |
| 2.1.1.1.3.1.1.2 trafficVolumeMeasQuantity |
| 2.1.1.1.3.1.1.2.1 averageRLC-BufferPayload | 7 |
| 2.1.1.1.3.1.1.3 trafficVolumeReportingQuantity |
| 2.1.1.1.3.1.1.3.1 rlc-RB-BufferPayload | false |
| 2.1.1.1.3.1.1.3.2 rlc-RB-BufferPayloadAverage | false |
| 2.1.1.1.3.1.1.3.3 rlc-RB-BufferPayloadVariance | false |
| 2.1.1.1.3.1.1.4 measurementValidity |
| 2.1.1.1.3.1.1.4.1 ue-State | all-States |
| 2.1.1.1.3.1.1.5 reportCriteria |
| 2.1.1.1.3.1.1.5.1 trafficVolumeReportingCriteria |
| 2.1.1.1.3.1.1.5.1.1 transChCriteriaList |
| 2.1.1.1.3.1.1.5.1.1.1 transChCriteria |
| 2.1.1.1.3.1.1.5.1.1.1.1 ul-transportChannelID |
| 2.1.1.1.3.1.1.5.1.1.1.1.1 dch | 21 |
| 2.1.1.1.3.1.1.5.1.1.1.2 eventSpecificParameters |
| 2.1.1.1.3.1.1.5.1.1.1.2.1 trafficVolumeEventParam |
| 2.1.1.1.3.1.1.5.1.1.1.2.1.1 eventID | e4b |
| 2.1.1.1.3.1.1.5.1.1.1.2.1.2 reportingThreshold | th8k |
| 2.1.1.1.3.1.1.5.1.1.1.2.1.3 timeToTrigger | ttt1280 |
| 2.1.1.1.3.1.1.5.1.1.1.2.1.4 pendingTimeAfterTri.. | ptat2 |
| 2.1.1.1.3.1.1.5.1.1.2 transChCriteria |
| 2.1.1.1.3.1.1.5.1.1.2.1 ul-transportChannelID |
| 2.1.1.1.3.1.1.5.1.1.2.1.1 rachorcpch | 0 |
| 2.1.1.1.3.1.1.5.1.1.2.2 eventSpecificParameters |
| 2.1.1.1.3.1.1.5.1.1.2.2.1 trafficVolumeEventParam |
| 2.1.1.1.3.1.1.5.1.1.2.2.1.1 eventID | e4a |
| 2.1.1.1.3.1.1.5.1.1.2.2.1.2 reportingThreshold | th1024 |
| 2.1.1.1.3.1.1.5.1.1.2.2.1.3 timeToTrigger | ttt20 |
| 2.1.1.1.3.1.1.5.1.1.2.2.1.4 pendingTimeAfterTri.. | ptat2 |
| 2.1.1.1.3.1.1.5.1.1.2.2.1.5 tx-InterruptionAfte.. | txiat2 |
| 2.1.1.1.4 measurementReportingMode |
| 2.1.1.1.4.1 measurementReportTransferMode | acknowledgedModeRLC |
| 2.1.1.1.4.2 periodicalOrEventTrigger | eventTrigger |
98 UMTS Performance Measurement
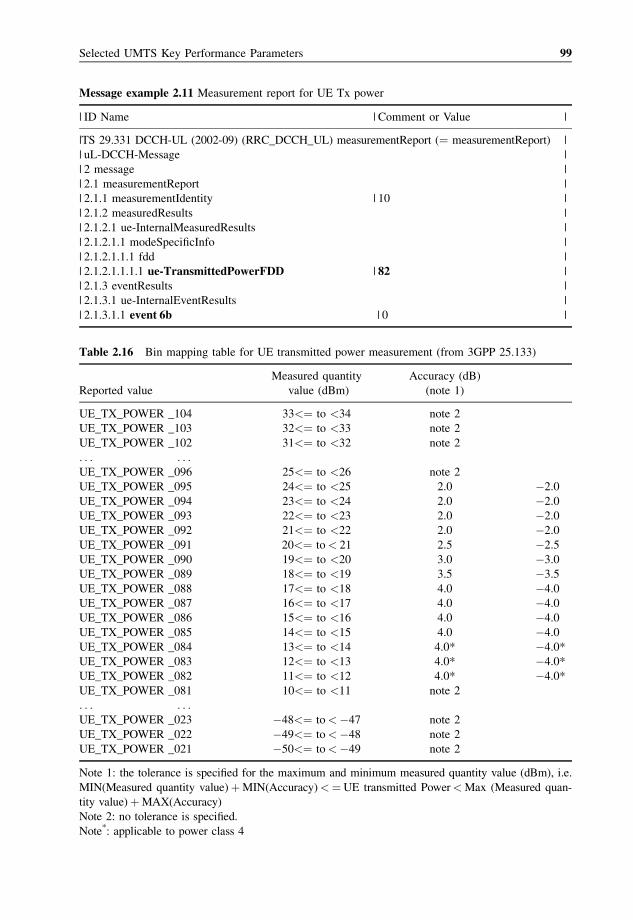
Message example 2.11 Measurement report for UE Tx power
| ID Name | Comment or Value |
|TS 29.331 DCCH-UL (2002-09) (RRC_DCCH_UL) measurementReport (¼ measurementReport) |
| uL-DCCH-Message |
| 2 message |
| 2.1 measurementReport |
| 2.1.1 measurementIdentity | 10 |
| 2.1.2 measuredResults |
| 2.1.2.1 ue-InternalMeasuredResults |
| 2.1.2.1.1 modeSpecificInfo |
| 2.1.2.1.1.1 fdd |
| 2.1.2.1.1.1.1 ue-TransmittedPowerFDD | 82 |
| 2.1.3 eventResults |
| 2.1.3.1 ue-InternalEventResults |
| 2.1.3.1.1 event 6b | 0 |
Table 2.16 Bin mapping table for UE transmitted power measurement (from 3GPP 25.133)
Measured quantity Accuracy (dB)
Reported value value (dBm) (note 1)
UE_TX_POWER _104 33<¼ to <34 note 2
UE_TX_POWER _103 32<¼ to <33 note 2
UE_TX_POWER _102 31<¼ to <32 note 2
. . . . . .UE_TX_POWER _096 25<¼ to <26 note 2
UE_TX_POWER _095 24<¼ to <25 2.0 �2.0
UE_TX_POWER _094 23<¼ to <24 2.0 �2.0
UE_TX_POWER _093 22<¼ to <23 2.0 �2.0
UE_TX_POWER _092 21<¼ to <22 2.0 �2.0
UE_TX_POWER _091 20<¼ to< 21 2.5 �2.5
UE_TX_POWER _090 19<¼ to <20 3.0 �3.0
UE_TX_POWER _089 18<¼ to <19 3.5 �3.5
UE_TX_POWER _088 17<¼ to <18 4.0 �4.0
UE_TX_POWER _087 16<¼ to <17 4.0 �4.0
UE_TX_POWER _086 15<¼ to <16 4.0 �4.0
UE_TX_POWER _085 14<¼ to <15 4.0 �4.0
UE_TX_POWER _084 13<¼ to <14 4.0* �4.0*
UE_TX_POWER _083 12<¼ to <13 4.0* �4.0*
UE_TX_POWER _082 11<¼ to <12 4.0* �4.0*
UE_TX_POWER _081 10<¼ to <11 note 2
. . . . . .UE_TX_POWER _023 �48<¼ to<�47 note 2
UE_TX_POWER _022 �49<¼ to<�48 note 2
UE_TX_POWER _021 �50<¼ to<�49 note 2
Note 1: the tolerance is specified for the maximum and minimum measured quantity value (dBm), i.e.
MIN(Measured quantity value)þMIN(Accuracy)<¼UE transmitted Power<Max (Measured quan-
tity value)þMAX(Accuracy)
Note 2: no tolerance is specified.
Note*: applicable to power class 4
Selected UMTS Key Performance Parameters 99
For deeper analysis it might be interesting to note that the setup message does not contain
a transport channel ID. The allocation of quality measurement tasks to new transport
channels added to active connection is done automatically. This means as long as the only
connection between an UE and the network is a transport channel for stand-along signalling
radio bearers there is also only one downlink BLER value reported that is related to this
single DCH. After radio bearer set up the quality reporting for all payload DCHs that have
been added to the connection is started immediately. Now each RRC Measurement Report
contains as many DL BLER measuremet results as dedicated transport channels are active
for the connection. Another limitation is that measurement values can only be reported for
those DCHs that have a CRC check defined in their transport format settings.
The measurement set up may also order the UE to measure its transmitted power, which is
the uplink equivalent to the transmitted code power of the cell reported using the NBAP
common measurement report. Event-IDs 6A and 6B indicate that UE Tx power becomes
more or less than a defined threshold. In RRC measurement report message example 2.11
threshold values as well as measurement results are encoded in bins as defined in 3GPP
25.133. This measurement report shows the UE Tx power is in range between 11 and 12 dB
and is below a certain threshold defined for event-ID 6B.
As one can see in Table 2.16 a standard measurement tolerance is defined. These measure-
ment tolerances (or as a confirmed sceptic would say: ‘measurement failures’) will be
discussed in the following sections.
2.3 THROUGHPUT MEASUREMENTS
Throughput measurements can be done in many different ways on many different levels.
This section will introduce the most common requirements.
The goal is to look at throughput measured on four different protocol levels and explain
specific problems of correlation and aggregation. The four basic and most common
throughput measurements for UTRAN analysis are:
� RLC throughput per cell. This is the throughput of all RLC transport blocks per cell, no
matter if transport blocks carry user plane or control plane data or if they are retransmitted
or not.
� Transport channel throughput per call is especially valuable for those dedicated transport
channels that carry IP payload. To evaluate if measured throughput results are satisfying
or not it is necessary to know the maximum possible throughput for a transport channel
at a certain time in a call, because this maximum is a variable due to different reconfigu-
ration strategies.
� User perceived throughput per call delivers results of filtered user plane traffic throughput
without retransmissions, RLC/MAC header information and padding bits.
� Application throughput is measured on the application layer of the TCP/IP protocol stack
and used to evaluate e.g. transmission speed for file transfer and video streaming
applications.
Aggregating the last three throughput measurements at cell level is only possible using
special implementations and filtering procedures that will be discussed in the following
sections.
100 UMTS Performance Measurement
2.3.1 RLC THROUGHPUT
The first problem with measuring RLC throughput in a cell is related to software
architecture. As discussed in chapter 1 all call-related data is filtered using the call trace
application. However, not all RLC traffic in a cell is call related. Nor can all RLC traffic on
radio interface be measured on the Iub interface. Hence, there will always be a difference
between real RLC throughput on the Uu interface and RLC throughput measured on the Iub
interface.
This statement addresses the difficulty of handling broadcasted information sent on the
BCH and the paging channel (PCH). On the BCH system information is sent frequently
in the downlink direction encoded in system information blocks (SIBs). These SIBs contain
RRC signalling information and are constructed by the CRNC. However, since these SIBs
are sent frequently on the radio interface they are stored in Node B according to cells. Due
to this concept most SIBs on the Iub interface can only be monitored during Node B setup
or reset procedure. In contrast to other RRC information this special kind of RRC signalling
is not transmitted on separate Iub physical transport bearers (AAL2 SVC), it is sent across
the Iub interface piggybacked on NBAP (!) messages. To learn more about the details of this
transport procedure it is recommended to read the chapter about Node B setup scenario in
Kreher and Ruedebusch (2005).
In addition to SIBs sent on the BCH, the PCH is also used to send system information
to UEs camping on a cell. In this scenario not every paging message contains real
paging information. Paging messages can also be used to distribute information about when
and how to read data from the BCH. These paging messages cannot be filtered by a call trace
application.
Note: many call trace applications currently used in monitoring equipment do not filter
paging messages belonging to mobile terminated connections and show paging response as
the first message of such connections instead.
All in all these known problems regarding the measurement of RLC throughput per cell
(and some similar cell-related measurements) require an application that is able to filter RLC
frames transported on all transport channels belonging to a single cell. Which channel
belongs to which cell needs to be detected by a topology module. A software module that
filters traffic from these channels is often called a cell trace application.
Channels that are involved in cell trace filtering are:
� random access channel (RACH)
� if available in cell: common packet channel (CPCH)
� variable number of forward access channels (FACH)
� paging channel (PCH)
� variable number of dedicated transport channels (DCH)
� if available in cell: high speed downlink shared channel(s) (HS-DSCH)
The bit rate on the HS-DSCH must be taken from NBAP common measurement reports
and cannot be measured on the Iub interface. This is because retransmissions of hybrid
automatic repeat request (HARQ) error correction require a fairly high percentage of
HS-DSCH throughput, but HARQ only works on the radio interface between the UE and
Node B.
Selected UMTS Key Performance Parameters 101
The BCH is beyond the scope of cell trace application and therefore it must be carefully
considered if it is really worthwhile spending a lot of effort on the development and testing
of cell trace software compared to the value of better, but still not absolutely precise
measurement results.
2.3.2 TRANSPORT CHANNEL THROUGHPUT
Transport channel throughput can also be seen as a kind of RLC throughput, but related to
single calls/connections. It especially makes sense to measure it on dedicated transport
channels. Throughput measurement on RACH and FACH is also possible, but does not
increase in value as long as the transport channel usage ratio is not computed (see later) due
to the mix of signalling and IP payload on RACH and FACH as discussed in the section
about PS call scenarios in chapter 1 of this book.
Separate dedicated transport channels are used to transport SRBs and radio bearers (RBs)
across the radio interface. Radio bearers are used for the transport of user plane data, e.g.
speech and PS data.
To analyse the throughput of the DCHs carrying RRC signalling is not very significant,
because the bandwidth of these DCHs is quite low (typically 1.7 or 3.4 kbps) and how much
signalling data is transported using these channels depends on how many signalling messages
need to be exchanged between the UE and the network. If the UE does not change its location
and does not periodically send measurement reports there is not much signalling to be
transmitted and hence the transport channel throughput to be measured is quite low.
Measurement on the DCHs used to transport AMR speech packets is also not very
meaningful, because due to the nature of the AMR codec the provided bandwidth of the
transport channels is either fully loaded, if there are voice packets to be transmitted, or the
throughput is very low if voices are silent and only a few frames containing artificial noise
are sent. Under these circumstances high or low throughput only indicates how many words
have been spoken.
To put it in a nutshell, throughput measurement on signalling transport channels and on
speech transport channels does not make sense, but a good approach is to measure the
throughput for transport channels that carry IP payload. These measurements are really
important, because the transmission speed is one of the most crucial performance parameters
of customer-perceived quality of service, and if there are problems with transmission
speeds these problems will most likely have their origin on the radio interface since this is
the natural bottleneck for all kinds of data transmission using UMTS. However, to determine if
the bottleneck has really been on the radio interface or somewhere else in UTRAN it is
necessary to compare throughput measurement results with transport channel parameter
settings.
Note: there is no value for any transport channel throughput measurement without
knowing and comparing transport channel parameter settings with measurement results.
The theoretically possible data transmission rate or throughput on a UTRAN DCH is
defined as follows:
Max number of transport blocks per T TI
T TI� transport block payload size ð2:5Þ
102 UMTS Performance Measurement
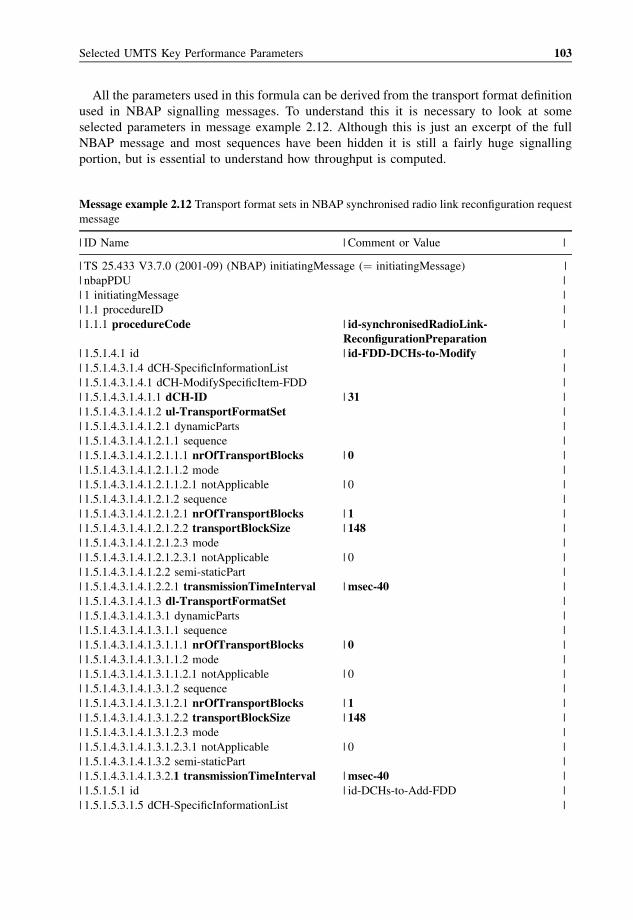
All the parameters used in this formula can be derived from the transport format definition
used in NBAP signalling messages. To understand this it is necessary to look at some
selected parameters in message example 2.12. Although this is just an excerpt of the full
NBAP message and most sequences have been hidden it is still a fairly huge signalling
portion, but is essential to understand how throughput is computed.
Message example 2.12 Transport format sets in NBAP synchronised radio link reconfiguration request
message
| ID Name | Comment or Value |
| TS 25.433 V3.7.0 (2001-09) (NBAP) initiatingMessage (¼ initiatingMessage) |
| nbapPDU |
| 1 initiatingMessage |
| 1.1 procedureID |
| 1.1.1 procedureCode | id-synchronisedRadioLink- |
ReconfigurationPreparation| 1.5.1.4.1 id | id-FDD-DCHs-to-Modify |
| 1.5.1.4.3.1.4 dCH-SpecificInformationList |
| 1.5.1.4.3.1.4.1 dCH-ModifySpecificItem-FDD |
| 1.5.1.4.3.1.4.1.1 dCH-ID | 31 |
| 1.5.1.4.3.1.4.1.2 ul-TransportFormatSet |
| 1.5.1.4.3.1.4.1.2.1 dynamicParts |
| 1.5.1.4.3.1.4.1.2.1.1 sequence |
| 1.5.1.4.3.1.4.1.2.1.1.1 nrOfTransportBlocks | 0 |
| 1.5.1.4.3.1.4.1.2.1.1.2 mode |
| 1.5.1.4.3.1.4.1.2.1.1.2.1 notApplicable | 0 |
| 1.5.1.4.3.1.4.1.2.1.2 sequence |
| 1.5.1.4.3.1.4.1.2.1.2.1 nrOfTransportBlocks | 1 |
| 1.5.1.4.3.1.4.1.2.1.2.2 transportBlockSize | 148 |
| 1.5.1.4.3.1.4.1.2.1.2.3 mode |
| 1.5.1.4.3.1.4.1.2.1.2.3.1 notApplicable | 0 |
| 1.5.1.4.3.1.4.1.2.2 semi-staticPart |
| 1.5.1.4.3.1.4.1.2.2.1 transmissionTimeInterval |msec-40 |
| 1.5.1.4.3.1.4.1.3 dl-TransportFormatSet |
| 1.5.1.4.3.1.4.1.3.1 dynamicParts |
| 1.5.1.4.3.1.4.1.3.1.1 sequence |
| 1.5.1.4.3.1.4.1.3.1.1.1 nrOfTransportBlocks | 0 |
| 1.5.1.4.3.1.4.1.3.1.1.2 mode |
| 1.5.1.4.3.1.4.1.3.1.1.2.1 notApplicable | 0 |
| 1.5.1.4.3.1.4.1.3.1.2 sequence |
| 1.5.1.4.3.1.4.1.3.1.2.1 nrOfTransportBlocks | 1 |
| 1.5.1.4.3.1.4.1.3.1.2.2 transportBlockSize | 148 |
| 1.5.1.4.3.1.4.1.3.1.2.3 mode |
| 1.5.1.4.3.1.4.1.3.1.2.3.1 notApplicable | 0 |
| 1.5.1.4.3.1.4.1.3.2 semi-staticPart |
| 1.5.1.4.3.1.4.1.3.2.1 transmissionTimeInterval |msec-40 |
| 1.5.1.5.1 id | id-DCHs-to-Add-FDD |
| 1.5.1.5.3.1.5 dCH-SpecificInformationList |
Selected UMTS Key Performance Parameters 103
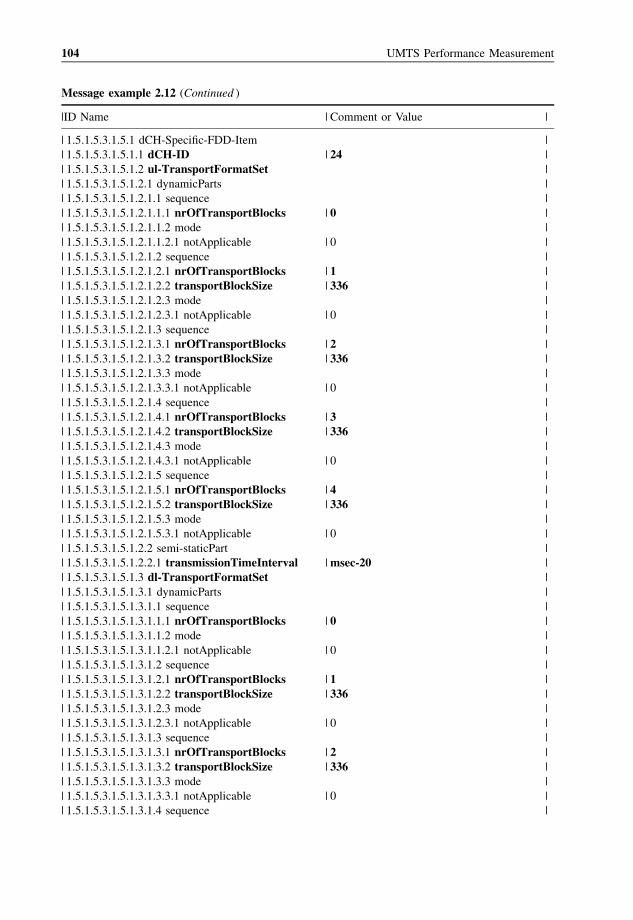
Message example 2.12 (Continued )
|ID Name | Comment or Value |
| 1.5.1.5.3.1.5.1 dCH-Specific-FDD-Item |
| 1.5.1.5.3.1.5.1.1 dCH-ID | 24 |
| 1.5.1.5.3.1.5.1.2 ul-TransportFormatSet |
| 1.5.1.5.3.1.5.1.2.1 dynamicParts |
| 1.5.1.5.3.1.5.1.2.1.1 sequence |
| 1.5.1.5.3.1.5.1.2.1.1.1 nrOfTransportBlocks | 0 |
| 1.5.1.5.3.1.5.1.2.1.1.2 mode |
| 1.5.1.5.3.1.5.1.2.1.1.2.1 notApplicable | 0 |
| 1.5.1.5.3.1.5.1.2.1.2 sequence |
| 1.5.1.5.3.1.5.1.2.1.2.1 nrOfTransportBlocks | 1 |
| 1.5.1.5.3.1.5.1.2.1.2.2 transportBlockSize | 336 |
| 1.5.1.5.3.1.5.1.2.1.2.3 mode |
| 1.5.1.5.3.1.5.1.2.1.2.3.1 notApplicable | 0 |
| 1.5.1.5.3.1.5.1.2.1.3 sequence |
| 1.5.1.5.3.1.5.1.2.1.3.1 nrOfTransportBlocks | 2 |
| 1.5.1.5.3.1.5.1.2.1.3.2 transportBlockSize | 336 |
| 1.5.1.5.3.1.5.1.2.1.3.3 mode |
| 1.5.1.5.3.1.5.1.2.1.3.3.1 notApplicable | 0 |
| 1.5.1.5.3.1.5.1.2.1.4 sequence |
| 1.5.1.5.3.1.5.1.2.1.4.1 nrOfTransportBlocks | 3 |
| 1.5.1.5.3.1.5.1.2.1.4.2 transportBlockSize | 336 |
| 1.5.1.5.3.1.5.1.2.1.4.3 mode |
| 1.5.1.5.3.1.5.1.2.1.4.3.1 notApplicable | 0 |
| 1.5.1.5.3.1.5.1.2.1.5 sequence |
| 1.5.1.5.3.1.5.1.2.1.5.1 nrOfTransportBlocks | 4 |
| 1.5.1.5.3.1.5.1.2.1.5.2 transportBlockSize | 336 |
| 1.5.1.5.3.1.5.1.2.1.5.3 mode |
| 1.5.1.5.3.1.5.1.2.1.5.3.1 notApplicable | 0 |
| 1.5.1.5.3.1.5.1.2.2 semi-staticPart |
| 1.5.1.5.3.1.5.1.2.2.1 transmissionTimeInterval |msec-20 |
| 1.5.1.5.3.1.5.1.3 dl-TransportFormatSet |
| 1.5.1.5.3.1.5.1.3.1 dynamicParts |
| 1.5.1.5.3.1.5.1.3.1.1 sequence |
| 1.5.1.5.3.1.5.1.3.1.1.1 nrOfTransportBlocks | 0 |
| 1.5.1.5.3.1.5.1.3.1.1.2 mode |
| 1.5.1.5.3.1.5.1.3.1.1.2.1 notApplicable | 0 |
| 1.5.1.5.3.1.5.1.3.1.2 sequence |
| 1.5.1.5.3.1.5.1.3.1.2.1 nrOfTransportBlocks | 1 |
| 1.5.1.5.3.1.5.1.3.1.2.2 transportBlockSize | 336 |
| 1.5.1.5.3.1.5.1.3.1.2.3 mode |
| 1.5.1.5.3.1.5.1.3.1.2.3.1 notApplicable | 0 |
| 1.5.1.5.3.1.5.1.3.1.3 sequence |
| 1.5.1.5.3.1.5.1.3.1.3.1 nrOfTransportBlocks | 2 |
| 1.5.1.5.3.1.5.1.3.1.3.2 transportBlockSize | 336 |
| 1.5.1.5.3.1.5.1.3.1.3.3 mode |
| 1.5.1.5.3.1.5.1.3.1.3.3.1 notApplicable | 0 |
| 1.5.1.5.3.1.5.1.3.1.4 sequence |
104 UMTS Performance Measurement
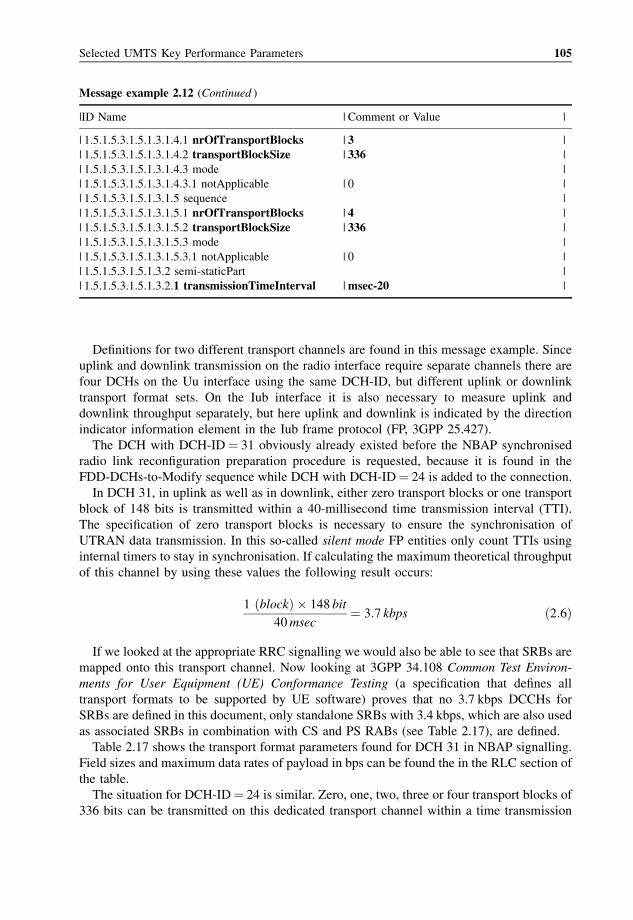
Definitions for two different transport channels are found in this message example. Since
uplink and downlink transmission on the radio interface require separate channels there are
four DCHs on the Uu interface using the same DCH-ID, but different uplink or downlink
transport format sets. On the Iub interface it is also necessary to measure uplink and
downlink throughput separately, but here uplink and downlink is indicated by the direction
indicator information element in the Iub frame protocol (FP, 3GPP 25.427).
The DCH with DCH-ID¼ 31 obviously already existed before the NBAP synchronised
radio link reconfiguration preparation procedure is requested, because it is found in the
FDD-DCHs-to-Modify sequence while DCH with DCH-ID¼ 24 is added to the connection.
In DCH 31, in uplink as well as in downlink, either zero transport blocks or one transport
block of 148 bits is transmitted within a 40-millisecond time transmission interval (TTI).
The specification of zero transport blocks is necessary to ensure the synchronisation of
UTRAN data transmission. In this so-called silent mode FP entities only count TTIs using
internal timers to stay in synchronisation. If calculating the maximum theoretical throughput
of this channel by using these values the following result occurs:
1 ðblockÞ � 148 bit
40msec¼ 3:7 kbps ð2:6Þ
If we looked at the appropriate RRC signalling we would also be able to see that SRBs are
mapped onto this transport channel. Now looking at 3GPP 34.108 Common Test Environ-
ments for User Equipment (UE) Conformance Testing (a specification that defines all
transport formats to be supported by UE software) proves that no 3.7 kbps DCCHs for
SRBs are defined in this document, only standalone SRBs with 3.4 kbps, which are also used
as associated SRBs in combination with CS and PS RABs (see Table 2.17), are defined.
Table 2.17 shows the transport format parameters found for DCH 31 in NBAP signalling.
Field sizes and maximum data rates of payload in bps can be found the in the RLC section of
the table.
The situation for DCH-ID¼ 24 is similar. Zero, one, two, three or four transport blocks of
336 bits can be transmitted on this dedicated transport channel within a time transmission
Message example 2.12 (Continued )
|ID Name | Comment or Value |
| 1.5.1.5.3.1.5.1.3.1.4.1 nrOfTransportBlocks | 3 |
| 1.5.1.5.3.1.5.1.3.1.4.2 transportBlockSize | 336 |
| 1.5.1.5.3.1.5.1.3.1.4.3 mode |
| 1.5.1.5.3.1.5.1.3.1.4.3.1 notApplicable | 0 |
| 1.5.1.5.3.1.5.1.3.1.5 sequence |
| 1.5.1.5.3.1.5.1.3.1.5.1 nrOfTransportBlocks | 4 |
| 1.5.1.5.3.1.5.1.3.1.5.2 transportBlockSize | 336 |
| 1.5.1.5.3.1.5.1.3.1.5.3 mode |
| 1.5.1.5.3.1.5.1.3.1.5.3.1 notApplicable | 0 |
| 1.5.1.5.3.1.5.1.3.2 semi-staticPart |
| 1.5.1.5.3.1.5.1.3.2.1 transmissionTimeInterval |msec-20 |
Selected UMTS Key Performance Parameters 105
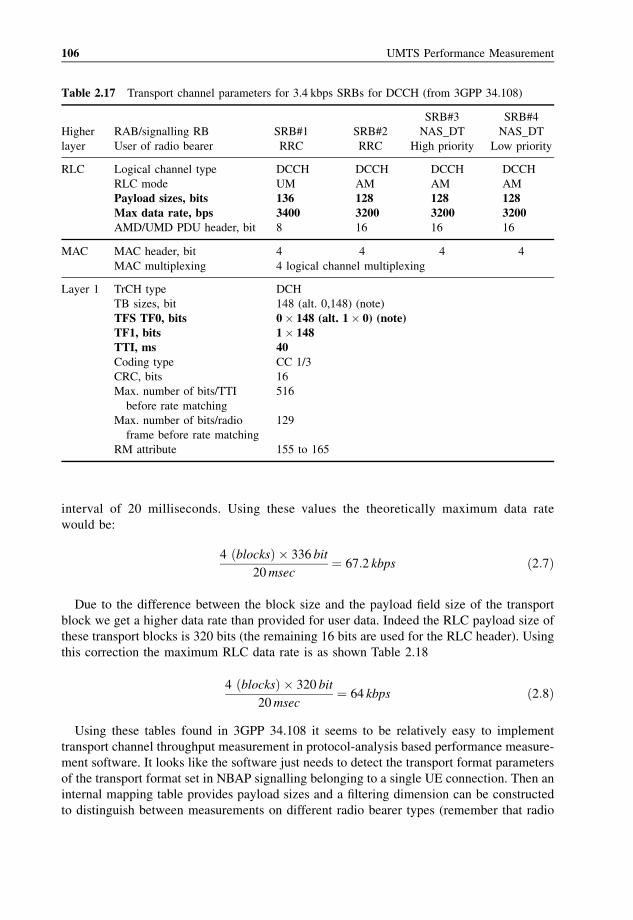
interval of 20 milliseconds. Using these values the theoretically maximum data rate
would be:
4 ðblocksÞ � 336 bit
20msec¼ 67:2 kbps ð2:7Þ
Due to the difference between the block size and the payload field size of the transport
block we get a higher data rate than provided for user data. Indeed the RLC payload size of
these transport blocks is 320 bits (the remaining 16 bits are used for the RLC header). Using
this correction the maximum RLC data rate is as shown Table 2.18
4 ðblocksÞ � 320 bit
20msec¼ 64 kbps ð2:8Þ
Using these tables found in 3GPP 34.108 it seems to be relatively easy to implement
transport channel throughput measurement in protocol-analysis based performance measure-
ment software. It looks like the software just needs to detect the transport format parameters
of the transport format set in NBAP signalling belonging to a single UE connection. Then an
internal mapping table provides payload sizes and a filtering dimension can be constructed
to distinguish between measurements on different radio bearer types (remember that radio
Table 2.17 Transport channel parameters for 3.4 kbps SRBs for DCCH (from 3GPP 34.108)
SRB#3 SRB#4
Higher RAB/signalling RB SRB#1 SRB#2 NAS_DT NAS_DT
layer User of radio bearer RRC RRC High priority Low priority
RLC Logical channel type DCCH DCCH DCCH DCCH
RLC mode UM AM AM AM
Payload sizes, bits 136 128 128 128Max data rate, bps 3400 3200 3200 3200AMD/UMD PDU header, bit 8 16 16 16
MAC MAC header, bit 4 4 4 4
MAC multiplexing 4 logical channel multiplexing
Layer 1 TrCH type DCH
TB sizes, bit 148 (alt. 0,148) (note)
TFS TF0, bits 0� 148 (alt. 1� 0) (note)TF1, bits 1� 148TTI, ms 40Coding type CC 1/3
CRC, bits 16
Max. number of bits/TTI 516
before rate matching
Max. number of bits/radio 129
frame before rate matching
RM attribute 155 to 165
106 UMTS Performance Measurement
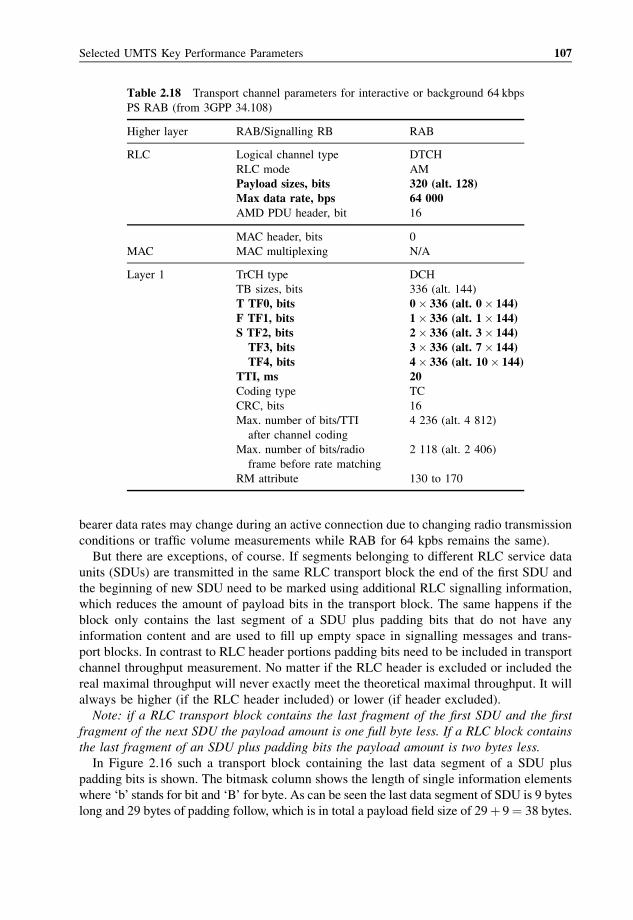
bearer data rates may change during an active connection due to changing radio transmission
conditions or traffic volume measurements while RAB for 64 kpbs remains the same).
But there are exceptions, of course. If segments belonging to different RLC service data
units (SDUs) are transmitted in the same RLC transport block the end of the first SDU and
the beginning of new SDU need to be marked using additional RLC signalling information,
which reduces the amount of payload bits in the transport block. The same happens if the
block only contains the last segment of a SDU plus padding bits that do not have any
information content and are used to fill up empty space in signalling messages and trans-
port blocks. In contrast to RLC header portions padding bits need to be included in transport
channel throughput measurement. No matter if the RLC header is excluded or included the
real maximal throughput will never exactly meet the theoretical maximal throughput. It will
always be higher (if the RLC header included) or lower (if header excluded).
Note: if a RLC transport block contains the last fragment of the first SDU and the first
fragment of the next SDU the payload amount is one full byte less. If a RLC block contains
the last fragment of an SDU plus padding bits the payload amount is two bytes less.
In Figure 2.16 such a transport block containing the last data segment of a SDU plus
padding bits is shown. The bitmask column shows the length of single information elements
where ‘b’ stands for bit and ‘B’ for byte. As can be seen the last data segment of SDU is 9 bytes
long and 29 bytes of padding follow, which is in total a payload field size of 29þ 9¼ 38 bytes.
Table 2.18 Transport channel parameters for interactive or background 64 kbps
PS RAB (from 3GPP 34.108)
Higher layer RAB/Signalling RB RAB
RLC Logical channel type DTCH
RLC mode AM
Payload sizes, bits 320 (alt. 128)Max data rate, bps 64 000AMD PDU header, bit 16
MAC header, bits 0
MAC MAC multiplexing N/A
Layer 1 TrCH type DCH
TB sizes, bits 336 (alt. 144)
T TF0, bits 0� 336 (alt. 0� 144)F TF1, bits 1� 336 (alt. 1� 144)S TF2, bits 2� 336 (alt. 3� 144)TF3, bits 3� 336 (alt. 7� 144)TF4, bits 4� 336 (alt. 10� 144)
TTI, ms 20Coding type TC
CRC, bits 16
Max. number of bits/TTI 4 236 (alt. 4 812)
after channel coding
Max. number of bits/radio 2 118 (alt. 2 406)
frame before rate matching
RM attribute 130 to 170
Selected UMTS Key Performance Parameters 107
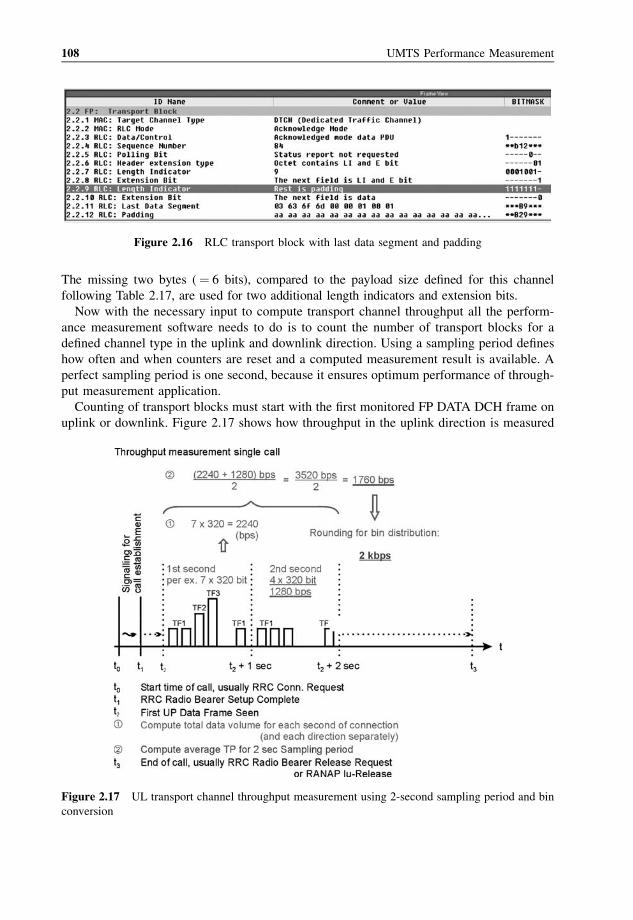
The missing two bytes (¼ 6 bits), compared to the payload size defined for this channel
following Table 2.17, are used for two additional length indicators and extension bits.
Now with the necessary input to compute transport channel throughput all the perform-
ance measurement software needs to do is to count the number of transport blocks for a
defined channel type in the uplink and downlink direction. Using a sampling period defines
how often and when counters are reset and a computed measurement result is available. A
perfect sampling period is one second, because it ensures optimum performance of through-
put measurement application.
Counting of transport blocks must start with the first monitored FP DATA DCH frame on
uplink or downlink. Figure 2.17 shows how throughput in the uplink direction is measured
Figure 2.16 RLC transport block with last data segment and padding
Figure 2.17 UL transport channel throughput measurement using 2-second sampling period and bin
conversion
108 UMTS Performance Measurement
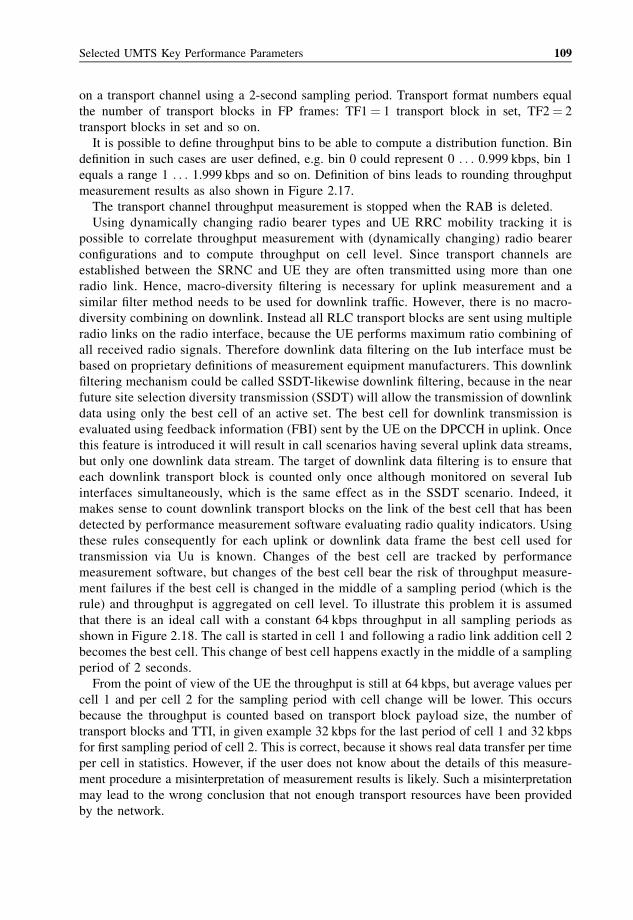
on a transport channel using a 2-second sampling period. Transport format numbers equal
the number of transport blocks in FP frames: TF1¼ 1 transport block in set, TF2¼ 2
transport blocks in set and so on.
It is possible to define throughput bins to be able to compute a distribution function. Bin
definition in such cases are user defined, e.g. bin 0 could represent 0 . . . 0.999 kbps, bin 1
equals a range 1 . . . 1.999 kbps and so on. Definition of bins leads to rounding throughput
measurement results as also shown in Figure 2.17.
The transport channel throughput measurement is stopped when the RAB is deleted.
Using dynamically changing radio bearer types and UE RRC mobility tracking it is
possible to correlate throughput measurement with (dynamically changing) radio bearer
configurations and to compute throughput on cell level. Since transport channels are
established between the SRNC and UE they are often transmitted using more than one
radio link. Hence, macro-diversity filtering is necessary for uplink measurement and a
similar filter method needs to be used for downlink traffic. However, there is no macro-
diversity combining on downlink. Instead all RLC transport blocks are sent using multiple
radio links on the radio interface, because the UE performs maximum ratio combining of
all received radio signals. Therefore downlink data filtering on the Iub interface must be
based on proprietary definitions of measurement equipment manufacturers. This downlink
filtering mechanism could be called SSDT-likewise downlink filtering, because in the near
future site selection diversity transmission (SSDT) will allow the transmission of downlink
data using only the best cell of an active set. The best cell for downlink transmission is
evaluated using feedback information (FBI) sent by the UE on the DPCCH in uplink. Once
this feature is introduced it will result in call scenarios having several uplink data streams,
but only one downlink data stream. The target of downlink data filtering is to ensure that
each downlink transport block is counted only once although monitored on several Iub
interfaces simultaneously, which is the same effect as in the SSDT scenario. Indeed, it
makes sense to count downlink transport blocks on the link of the best cell that has been
detected by performance measurement software evaluating radio quality indicators. Using
these rules consequently for each uplink or downlink data frame the best cell used for
transmission via Uu is known. Changes of the best cell are tracked by performance
measurement software, but changes of the best cell bear the risk of throughput measure-
ment failures if the best cell is changed in the middle of a sampling period (which is the
rule) and throughput is aggregated on cell level. To illustrate this problem it is assumed
that there is an ideal call with a constant 64 kbps throughput in all sampling periods as
shown in Figure 2.18. The call is started in cell 1 and following a radio link addition cell 2
becomes the best cell. This change of best cell happens exactly in the middle of a sampling
period of 2 seconds.
From the point of view of the UE the throughput is still at 64 kbps, but average values per
cell 1 and per cell 2 for the sampling period with cell change will be lower. This occurs
because the throughput is counted based on transport block payload size, the number of
transport blocks and TTI, in given example 32 kbps for the last period of cell 1 and 32 kbps
for first sampling period of cell 2. This is correct, because it shows real data transfer per time
per cell in statistics. However, if the user does not know about the details of this measure-
ment procedure a misinterpretation of measurement results is likely. Such a misinterpretation
may lead to the wrong conclusion that not enough transport resources have been provided
by the network.
Selected UMTS Key Performance Parameters 109
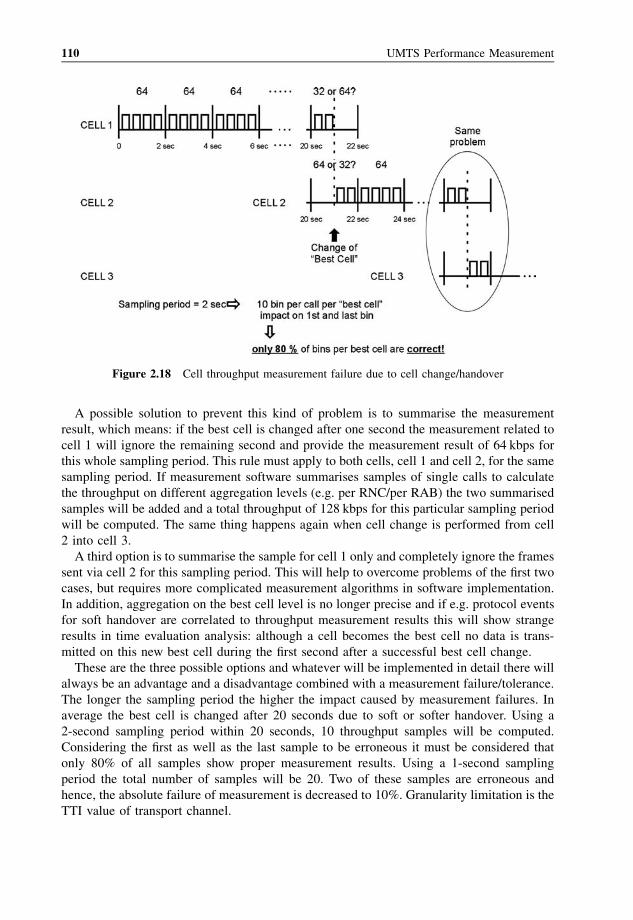
A possible solution to prevent this kind of problem is to summarise the measurement
result, which means: if the best cell is changed after one second the measurement related to
cell 1 will ignore the remaining second and provide the measurement result of 64 kbps for
this whole sampling period. This rule must apply to both cells, cell 1 and cell 2, for the same
sampling period. If measurement software summarises samples of single calls to calculate
the throughput on different aggregation levels (e.g. per RNC/per RAB) the two summarised
samples will be added and a total throughput of 128 kbps for this particular sampling period
will be computed. The same thing happens again when cell change is performed from cell
2 into cell 3.
A third option is to summarise the sample for cell 1 only and completely ignore the frames
sent via cell 2 for this sampling period. This will help to overcome problems of the first two
cases, but requires more complicated measurement algorithms in software implementation.
In addition, aggregation on the best cell level is no longer precise and if e.g. protocol events
for soft handover are correlated to throughput measurement results this will show strange
results in time evaluation analysis: although a cell becomes the best cell no data is trans-
mitted on this new best cell during the first second after a successful best cell change.
These are the three possible options and whatever will be implemented in detail there will
always be an advantage and a disadvantage combined with a measurement failure/tolerance.
The longer the sampling period the higher the impact caused by measurement failures. In
average the best cell is changed after 20 seconds due to soft or softer handover. Using a
2-second sampling period within 20 seconds, 10 throughput samples will be computed.
Considering the first as well as the last sample to be erroneous it must be considered that
only 80% of all samples show proper measurement results. Using a 1-second sampling
period the total number of samples will be 20. Two of these samples are erroneous and
hence, the absolute failure of measurement is decreased to 10%. Granularity limitation is the
TTI value of transport channel.
Figure 2.18 Cell throughput measurement failure due to cell change/handover
110 UMTS Performance Measurement
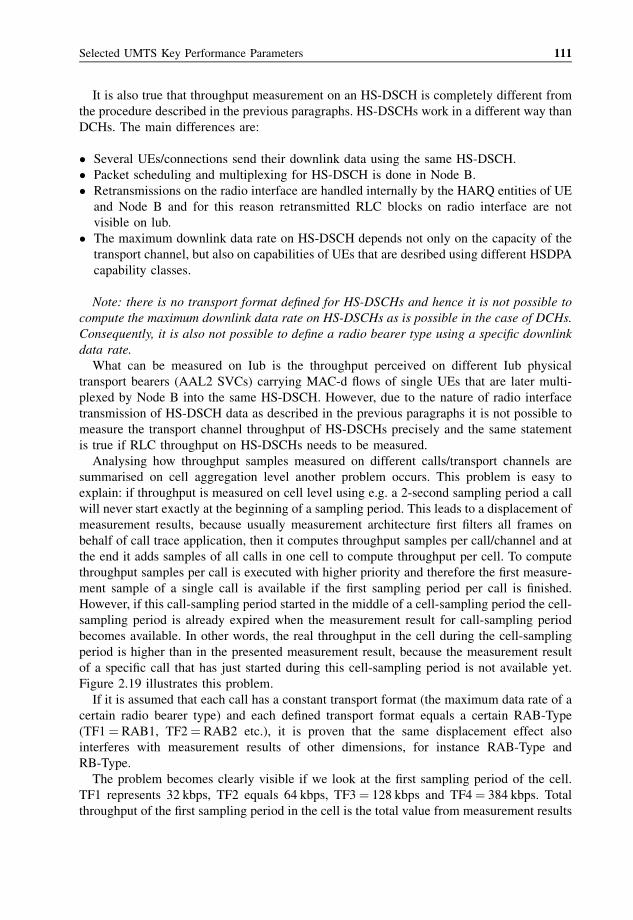
It is also true that throughput measurement on an HS-DSCH is completely different from
the procedure described in the previous paragraphs. HS-DSCHs work in a different way than
DCHs. The main differences are:
� Several UEs/connections send their downlink data using the same HS-DSCH.
� Packet scheduling and multiplexing for HS-DSCH is done in Node B.
� Retransmissions on the radio interface are handled internally by the HARQ entities of UE
and Node B and for this reason retransmitted RLC blocks on radio interface are not
visible on lub.
� The maximum downlink data rate on HS-DSCH depends not only on the capacity of the
transport channel, but also on capabilities of UEs that are desribed using different HSDPA
capability classes.
Note: there is no transport format defined for HS-DSCHs and hence it is not possible to
compute the maximum downlink data rate on HS-DSCHs as is possible in the case of DCHs.
Consequently, it is also not possible to define a radio bearer type using a specific downlink
data rate.
What can be measured on Iub is the throughput perceived on different Iub physical
transport bearers (AAL2 SVCs) carrying MAC-d flows of single UEs that are later multi-
plexed by Node B into the same HS-DSCH. However, due to the nature of radio interface
transmission of HS-DSCH data as described in the previous paragraphs it is not possible to
measure the transport channel throughput of HS-DSCHs precisely and the same statement
is true if RLC throughput on HS-DSCHs needs to be measured.
Analysing how throughput samples measured on different calls/transport channels are
summarised on cell aggregation level another problem occurs. This problem is easy to
explain: if throughput is measured on cell level using e.g. a 2-second sampling period a call
will never start exactly at the beginning of a sampling period. This leads to a displacement of
measurement results, because usually measurement architecture first filters all frames on
behalf of call trace application, then it computes throughput samples per call/channel and at
the end it adds samples of all calls in one cell to compute throughput per cell. To compute
throughput samples per call is executed with higher priority and therefore the first measure-
ment sample of a single call is available if the first sampling period per call is finished.
However, if this call-sampling period started in the middle of a cell-sampling period the cell-
sampling period is already expired when the measurement result for call-sampling period
becomes available. In other words, the real throughput in the cell during the cell-sampling
period is higher than in the presented measurement result, because the measurement result
of a specific call that has just started during this cell-sampling period is not available yet.
Figure 2.19 illustrates this problem.
If it is assumed that each call has a constant transport format (the maximum data rate of a
certain radio bearer type) and each defined transport format equals a certain RAB-Type
(TF1¼ RAB1, TF2¼ RAB2 etc.), it is proven that the same displacement effect also
interferes with measurement results of other dimensions, for instance RAB-Type and
RB-Type.
The problem becomes clearly visible if we look at the first sampling period of the cell.
TF1 represents 32 kbps, TF2 equals 64 kbps, TF3¼ 128 kbps and TF4¼ 384 kbps. Total
throughput of the first sampling period in the cell is the total value from measurement results
Selected UMTS Key Performance Parameters 111
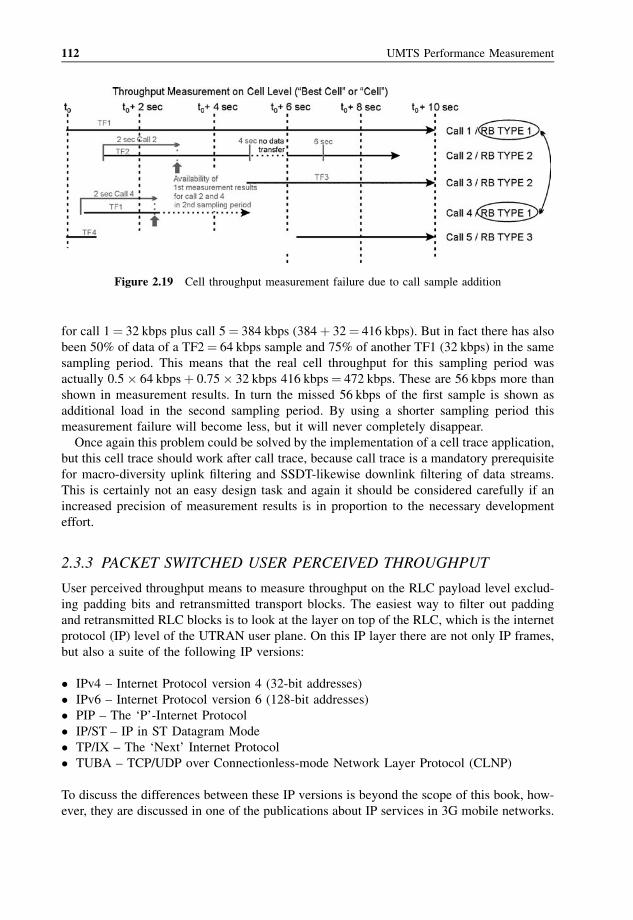
for call 1¼ 32 kbps plus call 5¼ 384 kbps (384þ 32¼ 416 kbps). But in fact there has also
been 50% of data of a TF2¼ 64 kbps sample and 75% of another TF1 (32 kbps) in the same
sampling period. This means that the real cell throughput for this sampling period was
actually 0.5� 64 kbpsþ 0.75� 32 kbps 416 kbps¼ 472 kbps. These are 56 kbps more than
shown in measurement results. In turn the missed 56 kbps of the first sample is shown as
additional load in the second sampling period. By using a shorter sampling period this
measurement failure will become less, but it will never completely disappear.
Once again this problem could be solved by the implementation of a cell trace application,
but this cell trace should work after call trace, because call trace is a mandatory prerequisite
for macro-diversity uplink filtering and SSDT-likewise downlink filtering of data streams.
This is certainly not an easy design task and again it should be considered carefully if an
increased precision of measurement results is in proportion to the necessary development
effort.
2.3.3 PACKET SWITCHED USER PERCEIVED THROUGHPUT
User perceived throughput means to measure throughput on the RLC payload level exclud-
ing padding bits and retransmitted transport blocks. The easiest way to filter out padding
and retransmitted RLC blocks is to look at the layer on top of the RLC, which is the internet
protocol (IP) level of the UTRAN user plane. On this IP layer there are not only IP frames,
but also a suite of the following IP versions:
� IPv4 – Internet Protocol version 4 (32-bit addresses)
� IPv6 – Internet Protocol version 6 (128-bit addresses)
� PIP – The ‘P’-Internet Protocol
� IP/ST – IP in ST Datagram Mode
� TP/IX – The ‘Next’ Internet Protocol
� TUBA – TCP/UDP over Connectionless-mode Network Layer Protocol (CLNP)
To discuss the differences between these IP versions is beyond the scope of this book, how-
ever, they are discussed in one of the publications about IP services in 3G mobile networks.
Figure 2.19 Cell throughput measurement failure due to call sample addition
112 UMTS Performance Measurement
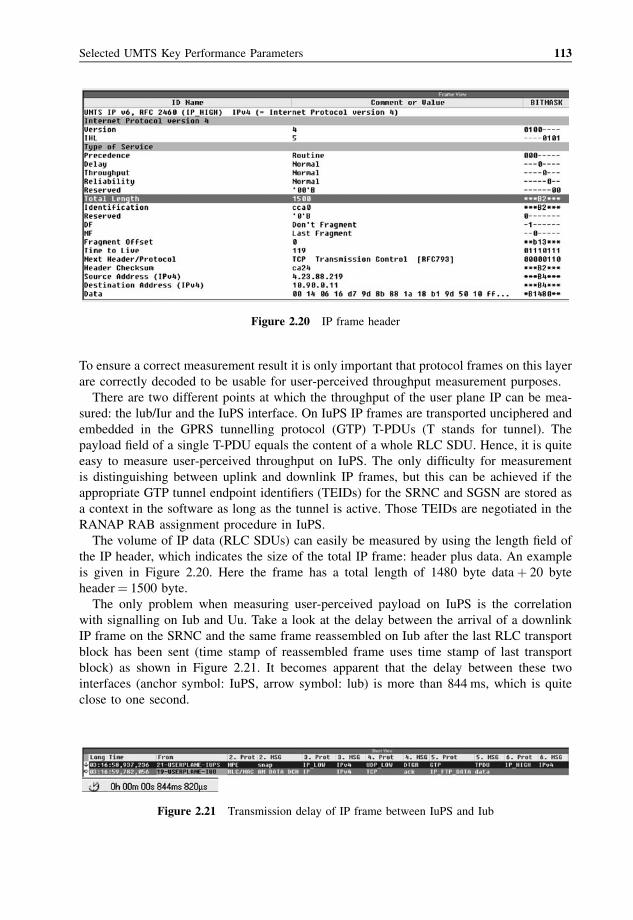
To ensure a correct measurement result it is only important that protocol frames on this layer
are correctly decoded to be usable for user-perceived throughput measurement purposes.
There are two different points at which the throughput of the user plane IP can be mea-
sured: the lub/Iur and the IuPS interface. On IuPS IP frames are transported unciphered and
embedded in the GPRS tunnelling protocol (GTP) T-PDUs (T stands for tunnel). The
payload field of a single T-PDU equals the content of a whole RLC SDU. Hence, it is quite
easy to measure user-perceived throughput on IuPS. The only difficulty for measurement
is distinguishing between uplink and downlink IP frames, but this can be achieved if the
appropriate GTP tunnel endpoint identifiers (TEIDs) for the SRNC and SGSN are stored as
a context in the software as long as the tunnel is active. Those TEIDs are negotiated in the
RANAP RAB assignment procedure in IuPS.
The volume of IP data (RLC SDUs) can easily be measured by using the length field of
the IP header, which indicates the size of the total IP frame: header plus data. An example
is given in Figure 2.20. Here the frame has a total length of 1480 byte dataþ 20 byte
header¼ 1500 byte.
The only problem when measuring user-perceived payload on IuPS is the correlation
with signalling on Iub and Uu. Take a look at the delay between the arrival of a downlink
IP frame on the SRNC and the same frame reassembled on Iub after the last RLC transport
block has been sent (time stamp of reassembled frame uses time stamp of last transport
block) as shown in Figure 2.21. It becomes apparent that the delay between these two
interfaces (anchor symbol: IuPS, arrow symbol: lub) is more than 844 ms, which is quite
close to one second.
Figure 2.20 IP frame header
Figure 2.21 Transmission delay of IP frame between IuPS and Iub
Selected UMTS Key Performance Parameters 113
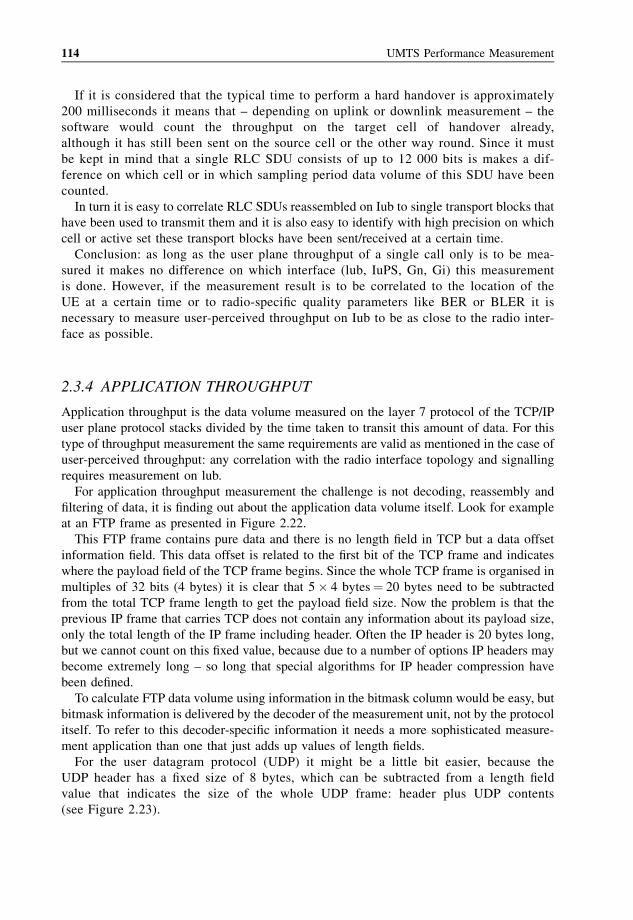
If it is considered that the typical time to perform a hard handover is approximately
200 milliseconds it means that – depending on uplink or downlink measurement – the
software would count the throughput on the target cell of handover already,
although it has still been sent on the source cell or the other way round. Since it must
be kept in mind that a single RLC SDU consists of up to 12 000 bits is makes a dif-
ference on which cell or in which sampling period data volume of this SDU have been
counted.
In turn it is easy to correlate RLC SDUs reassembled on Iub to single transport blocks that
have been used to transmit them and it is also easy to identify with high precision on which
cell or active set these transport blocks have been sent/received at a certain time.
Conclusion: as long as the user plane throughput of a single call only is to be mea-
sured it makes no difference on which interface (lub, IuPS, Gn, Gi) this measurement
is done. However, if the measurement result is to be correlated to the location of the
UE at a certain time or to radio-specific quality parameters like BER or BLER it is
necessary to measure user-perceived throughput on Iub to be as close to the radio inter-
face as possible.
2.3.4 APPLICATION THROUGHPUT
Application throughput is the data volume measured on the layer 7 protocol of the TCP/IP
user plane protocol stacks divided by the time taken to transit this amount of data. For this
type of throughput measurement the same requirements are valid as mentioned in the case of
user-perceived throughput: any correlation with the radio interface topology and signalling
requires measurement on lub.
For application throughput measurement the challenge is not decoding, reassembly and
filtering of data, it is finding out about the application data volume itself. Look for example
at an FTP frame as presented in Figure 2.22.
This FTP frame contains pure data and there is no length field in TCP but a data offset
information field. This data offset is related to the first bit of the TCP frame and indicates
where the payload field of the TCP frame begins. Since the whole TCP frame is organised in
multiples of 32 bits (4 bytes) it is clear that 5� 4 bytes¼ 20 bytes need to be subtracted
from the total TCP frame length to get the payload field size. Now the problem is that the
previous IP frame that carries TCP does not contain any information about its payload size,
only the total length of the IP frame including header. Often the IP header is 20 bytes long,
but we cannot count on this fixed value, because due to a number of options IP headers may
become extremely long – so long that special algorithms for IP header compression have
been defined.
To calculate FTP data volume using information in the bitmask column would be easy, but
bitmask information is delivered by the decoder of the measurement unit, not by the protocol
itself. To refer to this decoder-specific information it needs a more sophisticated measure-
ment application than one that just adds up values of length fields.
For the user datagram protocol (UDP) it might be a little bit easier, because the
UDP header has a fixed size of 8 bytes, which can be subtracted from a length field
value that indicates the size of the whole UDP frame: header plus UDP contents
(see Figure 2.23).
114 UMTS Performance Measurement
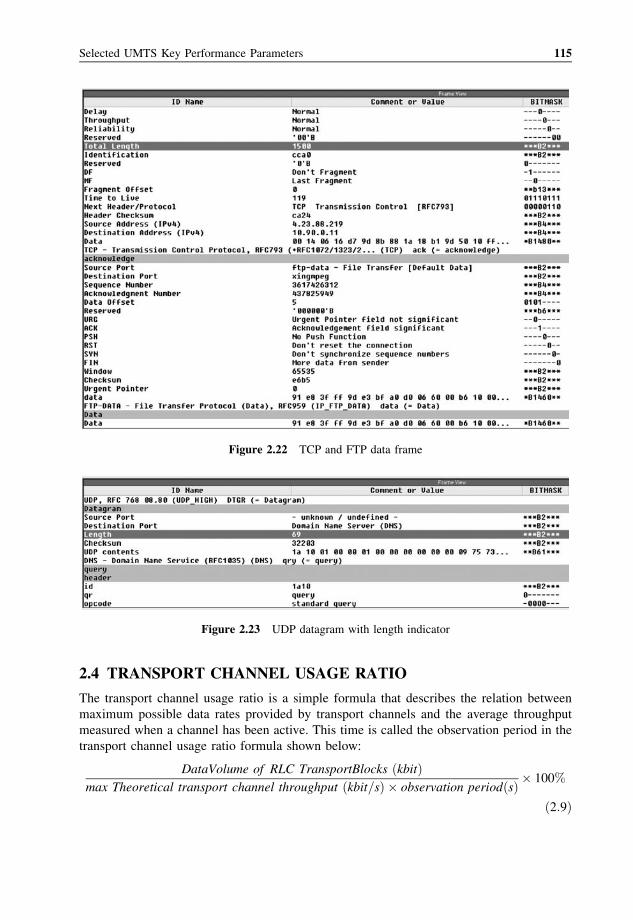
2.4 TRANSPORT CHANNEL USAGE RATIO
The transport channel usage ratio is a simple formula that describes the relation between
maximum possible data rates provided by transport channels and the average throughput
measured when a channel has been active. This time is called the observation period in the
transport channel usage ratio formula shown below:
DataVolume of RLC TransportBlocks ðkbitÞmax Theoretical transport channel throughput ðkbit=sÞ � observation periodðsÞ � 100%
ð2:9Þ
Figure 2.22 TCP and FTP data frame
Figure 2.23 UDP datagram with length indicator
Selected UMTS Key Performance Parameters 115
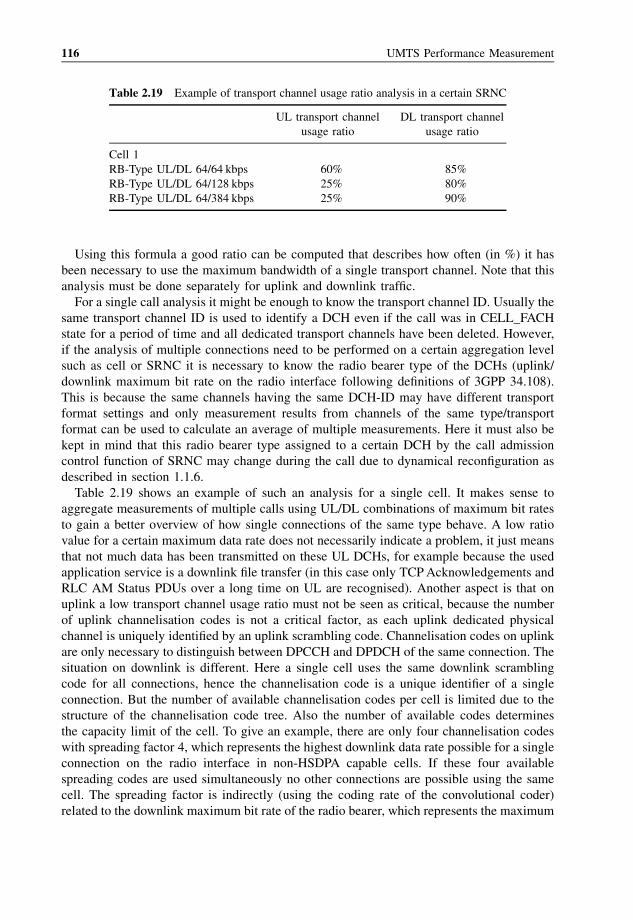
Using this formula a good ratio can be computed that describes how often (in %) it has
been necessary to use the maximum bandwidth of a single transport channel. Note that this
analysis must be done separately for uplink and downlink traffic.
For a single call analysis it might be enough to know the transport channel ID. Usually the
same transport channel ID is used to identify a DCH even if the call was in CELL_FACH
state for a period of time and all dedicated transport channels have been deleted. However,
if the analysis of multiple connections need to be performed on a certain aggregation level
such as cell or SRNC it is necessary to know the radio bearer type of the DCHs (uplink/
downlink maximum bit rate on the radio interface following definitions of 3GPP 34.108).
This is because the same channels having the same DCH-ID may have different transport
format settings and only measurement results from channels of the same type/transport
format can be used to calculate an average of multiple measurements. Here it must also be
kept in mind that this radio bearer type assigned to a certain DCH by the call admission
control function of SRNC may change during the call due to dynamical reconfiguration as
described in section 1.1.6.
Table 2.19 shows an example of such an analysis for a single cell. It makes sense to
aggregate measurements of multiple calls using UL/DL combinations of maximum bit rates
to gain a better overview of how single connections of the same type behave. A low ratio
value for a certain maximum data rate does not necessarily indicate a problem, it just means
that not much data has been transmitted on these UL DCHs, for example because the used
application service is a downlink file transfer (in this case only TCPAcknowledgements and
RLC AM Status PDUs over a long time on UL are recognised). Another aspect is that on
uplink a low transport channel usage ratio must not be seen as critical, because the number
of uplink channelisation codes is not a critical factor, as each uplink dedicated physical
channel is uniquely identified by an uplink scrambling code. Channelisation codes on uplink
are only necessary to distinguish between DPCCH and DPDCH of the same connection. The
situation on downlink is different. Here a single cell uses the same downlink scrambling
code for all connections, hence the channelisation code is a unique identifier of a single
connection. But the number of available channelisation codes per cell is limited due to the
structure of the channelisation code tree. Also the number of available codes determines
the capacity limit of the cell. To give an example, there are only four channelisation codes
with spreading factor 4, which represents the highest downlink data rate possible for a single
connection on the radio interface in non-HSDPA capable cells. If these four available
spreading codes are used simultaneously no other connections are possible using the same
cell. The spreading factor is indirectly (using the coding rate of the convolutional coder)
related to the downlink maximum bit rate of the radio bearer, which represents the maximum
Table 2.19 Example of transport channel usage ratio analysis in a certain SRNC
UL transport channel DL transport channel
usage ratio usage ratio
Cell 1
RB-Type UL/DL 64/64 kbps 60% 85%
RB-Type UL/DL 64/128 kbps 25% 80%
RB-Type UL/DL 64/384 kbps 25% 90%
116 UMTS Performance Measurement
theoretical transport channel throughput used to compute the transport channel usage ratio.
If the transport channel usage ratio of channels with the highest available downlink bit rate is
low, this means that these transport resources are not efficiently administrated by the SRNC
and high-speed transport resources are blocked by users that need much lower bit rates, but
for lower bit rates higher spreading factors are used. And the higher the spreading factor the
more connections can be served in a cell at the same downlink bit rate.
If a cell is HSDPA capable the transport channel usage ratio of HS-DSCH cannot be
computed, because it is very difficult to estimate the theoretical maximum throughput of an
HS-DSCH. Large parts of data volume transported on this channel are hidden when monitor-
ing the Iub interface. This is because retransmissions on the radio interface due to hybrid
ARQ (HARQ) error detection/correction cannot be monitored on lub, but will most likely
require a huge portion of HS-DSCH transport capabilities.
If the data volume of RLC transport blocks is counted, analysis algorithms run again into
a problem discussed in the section about transport channel throughput. As it was pointed
out in this section an RLC transport block contains not only the payload to be transported,
but also RLC/MAC header bits. If the transport channel throughput is measured related to a
64 kbps radio bearer using full transport block size of 336 bits, it must also calculate the
maximum theoretical transport channel throughput using 336 bits. To base the measurement
on a transport block size of 336 bits leads to a maximum value of 67.2 kbps for a 64 kbsp
radio bearer. The advantage of this variant of measurement is that it reflects the real traffic
situation on the DCH, which is also used to transport the RLC header and padding bits as
well as retransmitted RLC frames and RLC signalling messages (status PDUs). The resulting
volume of all these different kinds of data finally also determines which spreading factor
needs to be chosen for radio interface transmission.
Some radio network planners have a different point of view of this KPI and say it must be
based on the data volume of RLC SDUs instead of the data volume of RLC transport blocks
as shown in Equation (2.10):
DataVolume of RLC SDUs ðkbitÞmax Theoretical transport channel throughput ðkbit=sÞ � observation periodðsÞ � 100%
ð2:10Þ
An explanation of this requirement is that the target of transport channel usage ratio
analysis is to find out how well the RNC admission control function is able to assign the
necessary transport resources for a particular payload bit stream. If the data volume of RLC
SDUs is in the numerator the maximum theoretical transport channel throughput must be
computed in a different way. Instead of the size of transport blocks it must be based on the
available payload size of transport blocks. For transport channel throughput measurements it
has already been demonstrated that the payload size of transport blocks is not a fixed value
as assumed in 3GPP 34.108, but for a 336-bit transport block the payload size varies for
single transport blocks between 38 bytes (304 bits) and 40 bytes (320 bits). If the maximum
theoretical transport channel throughput is calculated using 320 bits, a maximum is defined
that can never be reached. Hence, the maximum ratio calculated using this approach is not at
100%, but instead at 98 or 99%, which needs to be taken into account as a natural
measurement tolerance. If the admission control function in SRNC software really uses user-
perceived throughput (because this is what the data volume of SDUs stands for) to assign
Selected UMTS Key Performance Parameters 117
necessary radio resources to a connection is a question that can only be answered by network
equipment manufacturers (NEMs) and this answer – if given at all – will always be a pro-
prietary one.
Finally there is another aspect that may cause tolerance in measurement results in the
range of up to approximately 10%: it is difficult to agree on a common definition when a
transport channel is really available to transport data. Some measurement manufacturers use
the ALCAP Establish Confirm message, which acknowledges the set up of an appropriate
lub/Iur physical transport bearer (AAL2 SVC); others wait until a number of FP synchro-
nisation frames have been sent on the uplink/downlink of this AAL2 connection. However,
there is no signalling message that indicates that the synchronisation process is finished. And
in addition FP synchronisation frames are also sent as a check during long periods of DCH
activity. A third option is to define the first user plane frame seen on AAL2 SVC as the start
of availability, but in this case it is possible that in two directions (uplink or downlink) the
first DCH frame will be seen quite late if there is no initial data to be transmitted in this
direction. The time difference between ALCAP Establish Confirm and the first DCH frame
is usually not more than a few hundred milliseconds. However, for PS connections with
multiple channel type switching procedures these tolerance time frames also need to be
multiplied, which leads to the fairly high measurement tolerance as mentioned at the
beginning of this paragraph.
2.5 PRIMARY AND SECONDARY TRAFFIC
In Chapter 1 the benefits and disadvantages of soft handover in UMTS FDD mode were
discussed. Now two KPIs are defined that measure the percentage of disadvantages: primary
and secondary RLC traffic. As will be demonstrated these KPIs can only be calculated at cell
level and a mandatory prerequisite is that during an active connection the performance
measurement software always knows which cells belong to the active set of this connection.
Primary traffic is the traffic that is necessary to transmit data between the UE and the
network and vice versa. If the UE is in a softer or soft handover situation identical RLC
transport blocks are sent/received via each radio link belonging to the active set of the UE.
One radio link is always related to a single cell. If there are e.g. two radio links related to two
cells in an active set, double the amount of uplink and downlink RLC transport blocks is sent
on the radio interface to benefit from the advantages of the soft handover scenario. One-half
of this doubled traffic volume is called primary traffic, the other half is called the secondary
traffic. It is important to understand that calculation of primary and secondary traffic follows
straightforward statistical rules. There is no preference of a single radio link or a single cell
in this formula.
Note: a logical failure that is often heard when discussing primary and secondary traffic
is the assumption that all primary traffic is sent via the best cell of connection while all other
links in the active set are only used to transmit secondary traffic.
The truth is that errors in radio transmission can occur on each link belonging to an active
set. Hence, for the transmission of a certain RLC transport block it is not known which cell
is the best cell to transmit this block error-free. If a cell offered such a high quality that
transmission errors could be excluded the ongoing connection would not be in a soft hand-
over situation. Following this statistically, primary and secondary traffic are seen as distri-
buted to all radio links of the active set. The basic rule that is illustrated in Figure 2.24 says:
118 UMTS Performance Measurement
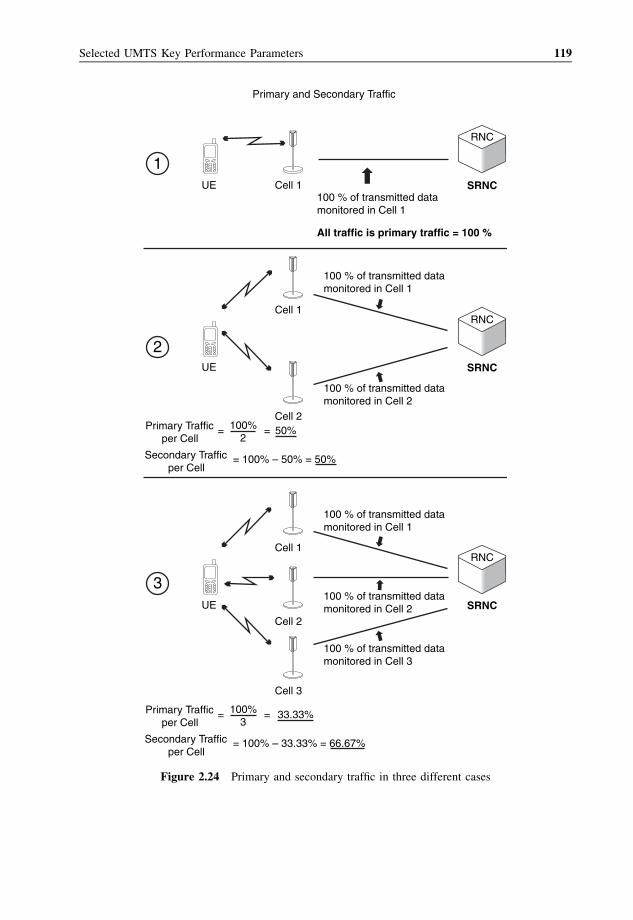
1
2
3
RNC
RNC
UE
UE
UE
Cell 1
Cell 1
Cell 1
Cell 2
Cell 3
Cell 2
100 % of transmitted datamonitored in Cell 1
100 % of transmitted datamonitored in Cell 1
100 % of transmitted datamonitored in Cell 1
100 % of transmitted datamonitored in Cell 2
100 % of transmitted datamonitored in Cell 2
100 % of transmitted datamonitored in Cell 3
SRNC
SRNC
RNC
SRNC
All traffic is primary traffic = 100 %
Primary and Secondary Traffic
Primary Trafficper Cell
Secondary Trafficper Cell
=
= 100% – 50% = 50%
=100% 50%2
Primary Trafficper Cell
Secondary Trafficper Cell
=
= 100% – 33.33% = 66.67%
=100% 33.33%3
Figure 2.24 Primary and secondary traffic in three different cases
Selected UMTS Key Performance Parameters 119
the more radio links a UE has in its active set the more secondary traffic and the less primary
traffic is measured for this single UE connection.
To calculate primary and secondary traffic it is not necessary to measure the data volume
or throughput of a connection. Looking at the different situations shown in Figure 2.24 it
becomes clear that primary and secondary traffic as a percentage value can be calculated
based on the average active set size of a single connection as shown in Equations (2.11) and
(2.12). To aggregate primary and secondary traffic at a different aggregation level than the
call (e.g. per cell or per SRNC) requires the average active set size of all connections that
have been active using these network resources during a defined time period.
Primary Traffic ¼ 1
Average Active Set Size of connection� 100% ð2:11Þ
Secondary Traffic ¼ 100%� Primary Traffic ð%Þ ð2:12Þ
It can be assumed that network operators would like to express how much radio trans-
mission capacity is provided to transmit primary and secondary traffic, because minimising
the secondary traffic component indicates the increase of the total capacity of the network.
For this reason percentage values are combined with uplink and downlink RLC throughput
measured on lub/Iur physical transport bearers (AAL2 SVC) used to transport data streams
of dedicated traffic channels (other channels are not involved when the UE is in soft hand-
over). Although this calculation does not take into account the throughput caused by the FP
header and trailer information bits it allows a good estimation of how much bandwidth is
necessary to provide transport resources for secondary traffic in soft handover situations. For
softer handover scenarios (cells involved in soft handover are located in the same Node B)
this calculation does not apply, because usually Node B performs the combining of radio
links and hence only a single AAL2 SVC is used on the Iub interface, but data is transmitted
on two radio links in parallel.
Now the target is to find out how many additional resources are necessary to transmit
secondary traffic. On wired interfaces, Iub and Iur, this is the bandwidth of electrical or opti-
cal cables, on the radio interface, Uu, bandwidth is correlated with the channelisation codes
used in downlink. The number of available downlink channelisation codes limits the number
of possible connections and services per cell.
Code utilisation per cell should rather be analysed by using a separate KPI, but transport
overhead due to secondary traffic on Iub and Iur can be computed if the following preposi-
tions are fulfilled:
� Performance measurement software must be able to distinguish between softer handover
when diversity splitting/combining is done in Node B and soft handover situations when
diversity splitting/combining is done in RNC.
� The overall measured transport channel throughput based on the size of transport blocks
must be associated to each physical transport bearer of a single connection.
� Instead of the average active set size the average size of the used transport bearer set
of connection must be known, which requires a special application that works in a
similar way as the active set size tracking, but instead of the set up and deletion of
120 UMTS Performance Measurement
radio links per connection this other application must track the set up and deletion of
VPI/VCI/CID per connection.
Secondary traffic on lub/Iur physical transport resources could then be computed as shown
in Equation (2.13):
1� 1
Average Size of TransportBearerSet
� �� Transport Channel Throughput ½kbps�
ð2:13Þ
Whether the separation of uplink and downlink measurements is necessary may be
decided for each particular case. In an ideal case the throughput on physical transport bearers
can be measured at frame protocol level (including FP header and trailer information bits)
and a topology detection tool provides additional information about which VPI/VCI/CID
belong to which physical wire or fibre between network elements. Measurement results can
be correlated with fixed costs of transport network resources, which especially in the case of
leased lines can be expressed in costs per kbps bandwidth. The optimisation of secondary
traffic can help to minimise these fixed costs. However, it must be kept in mind that the
minimisation of secondary traffic is only possible as far as overall radio transmission is
guaranteed and smooth soft handover procedures are guaranteed. Thus the optimisation of
primary/secondary traffic is one of the most complex and most difficult procedures.
Another idea that is sometimes seen in requirement documents is the correlation of
primary/secondary traffic percentage with transmitted data volume at the RLC SDU level,
which is the level of user-perceived throughput. The objective behind such formulas is to
estimate for how much traffic transmitted on UTRAN interfaces the user will be charged and
how much ‘payload’ needs to be transmitted free of charge due to soft handover. Depending
on how the fixed costs of network operation are distributed (e.g. per cell or per wire/fibre) the
data volume of SDUs transmitted on uplink and downlink need to be measured and
measurement values need to be distributed in the same way as cost (also per cell or per
wire/fibre). If measurement results are computed at cell level, active set size tracking is
necessary; at transport bearer level the same prerequisites apply as described for transport
channel throughput.
The data volume of charged payload at cell level can be computed as shown in Equa-
tion (2.14):
DataVolume of ULþ DL RLC SDUs per cell
Average Active Set Size per cellð2:14Þ
The ‘per cell’ aggregation level in this formula is realised by calculating an average (active
set size) or total value (data volume) of all connections that use dedicated radio links
provided by this cell. There must be a high measurement tolerance taken into account due
to fact that large SDUs are segmented into a huge number of transport blocks and the cell
used for the transmission of these transport blocks can be changed with every transport block
set that is sent or received.
Selected UMTS Key Performance Parameters 121
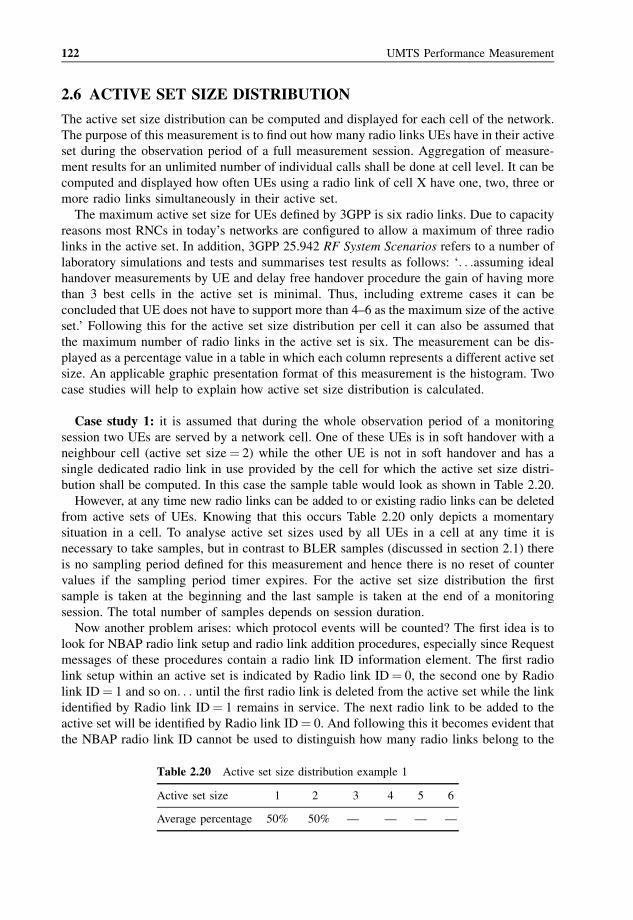
2.6 ACTIVE SET SIZE DISTRIBUTION
The active set size distribution can be computed and displayed for each cell of the network.
The purpose of this measurement is to find out how many radio links UEs have in their active
set during the observation period of a full measurement session. Aggregation of measure-
ment results for an unlimited number of individual calls shall be done at cell level. It can be
computed and displayed how often UEs using a radio link of cell X have one, two, three or
more radio links simultaneously in their active set.
The maximum active set size for UEs defined by 3GPP is six radio links. Due to capacity
reasons most RNCs in today’s networks are configured to allow a maximum of three radio
links in the active set. In addition, 3GPP 25.942 RF System Scenarios refers to a number of
laboratory simulations and tests and summarises test results as follows: ‘. . .assuming ideal
handover measurements by UE and delay free handover procedure the gain of having more
than 3 best cells in the active set is minimal. Thus, including extreme cases it can be
concluded that UE does not have to support more than 4–6 as the maximum size of the active
set.’ Following this for the active set size distribution per cell it can also be assumed that
the maximum number of radio links in the active set is six. The measurement can be dis-
played as a percentage value in a table in which each column represents a different active set
size. An applicable graphic presentation format of this measurement is the histogram. Two
case studies will help to explain how active set size distribution is calculated.
Case study 1: it is assumed that during the whole observation period of a monitoring
session two UEs are served by a network cell. One of these UEs is in soft handover with a
neighbour cell (active set size¼ 2) while the other UE is not in soft handover and has a
single dedicated radio link in use provided by the cell for which the active set size distri-
bution shall be computed. In this case the sample table would look as shown in Table 2.20.
However, at any time new radio links can be added to or existing radio links can be deleted
from active sets of UEs. Knowing that this occurs Table 2.20 only depicts a momentary
situation in a cell. To analyse active set sizes used by all UEs in a cell at any time it is
necessary to take samples, but in contrast to BLER samples (discussed in section 2.1) there
is no sampling period defined for this measurement and hence there is no reset of counter
values if the sampling period timer expires. For the active set size distribution the first
sample is taken at the beginning and the last sample is taken at the end of a monitoring
session. The total number of samples depends on session duration.
Now another problem arises: which protocol events will be counted? The first idea is to
look for NBAP radio link setup and radio link addition procedures, especially since Request
messages of these procedures contain a radio link ID information element. The first radio
link setup within an active set is indicated by Radio link ID¼ 0, the second one by Radio
link ID¼ 1 and so on. . . until the first radio link is deleted from the active set while the link
identified by Radio link ID¼ 1 remains in service. The next radio link to be added to the
active set will be identified by Radio link ID¼ 0. And following this it becomes evident that
the NBAP radio link ID cannot be used to distinguish how many radio links belong to the
Table 2.20 Active set size distribution example 1
Active set size 1 2 3 4 5 6
Average percentage 50% 50% — — — —
122 UMTS Performance Measurement
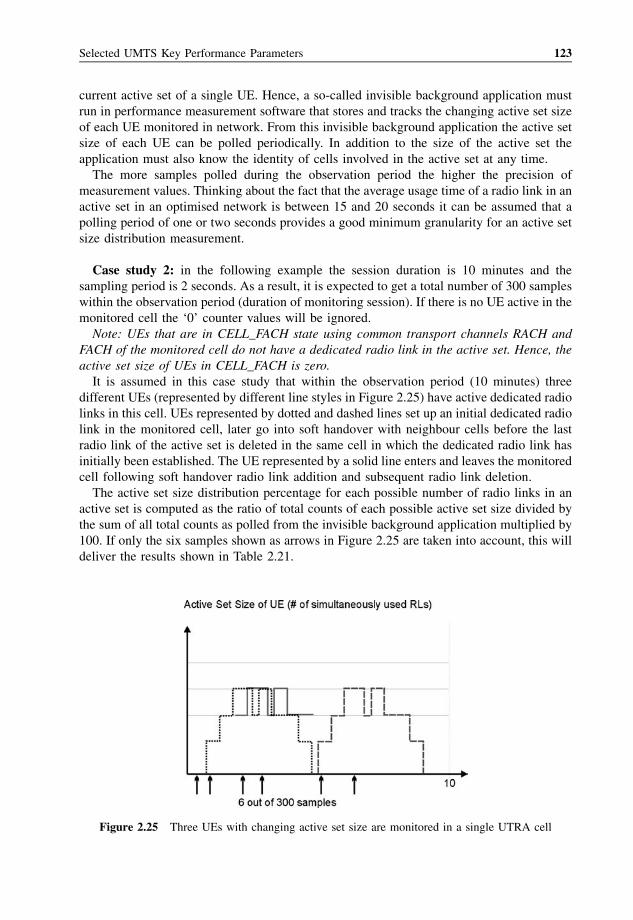
current active set of a single UE. Hence, a so-called invisible background application must
run in performance measurement software that stores and tracks the changing active set size
of each UE monitored in network. From this invisible background application the active set
size of each UE can be polled periodically. In addition to the size of the active set the
application must also know the identity of cells involved in the active set at any time.
The more samples polled during the observation period the higher the precision of
measurement values. Thinking about the fact that the average usage time of a radio link in an
active set in an optimised network is between 15 and 20 seconds it can be assumed that a
polling period of one or two seconds provides a good minimum granularity for an active set
size distribution measurement.
Case study 2: in the following example the session duration is 10 minutes and the
sampling period is 2 seconds. As a result, it is expected to get a total number of 300 samples
within the observation period (duration of monitoring session). If there is no UE active in the
monitored cell the ‘0’ counter values will be ignored.
Note: UEs that are in CELL_FACH state using common transport channels RACH and
FACH of the monitored cell do not have a dedicated radio link in the active set. Hence, the
active set size of UEs in CELL_FACH is zero.
It is assumed in this case study that within the observation period (10 minutes) three
different UEs (represented by different line styles in Figure 2.25) have active dedicated radio
links in this cell. UEs represented by dotted and dashed lines set up an initial dedicated radio
link in the monitored cell, later go into soft handover with neighbour cells before the last
radio link of the active set is deleted in the same cell in which the dedicated radio link has
initially been established. The UE represented by a solid line enters and leaves the monitored
cell following soft handover radio link addition and subsequent radio link deletion.
The active set size distribution percentage for each possible number of radio links in an
active set is computed as the ratio of total counts of each possible active set size divided by
the sum of all total counts as polled from the invisible background application multiplied by
100. If only the six samples shown as arrows in Figure 2.25 are taken into account, this will
deliver the results shown in Table 2.21.
Figure 2.25 Three UEs with changing active set size are monitored in a single UTRA cell
Selected UMTS Key Performance Parameters 123
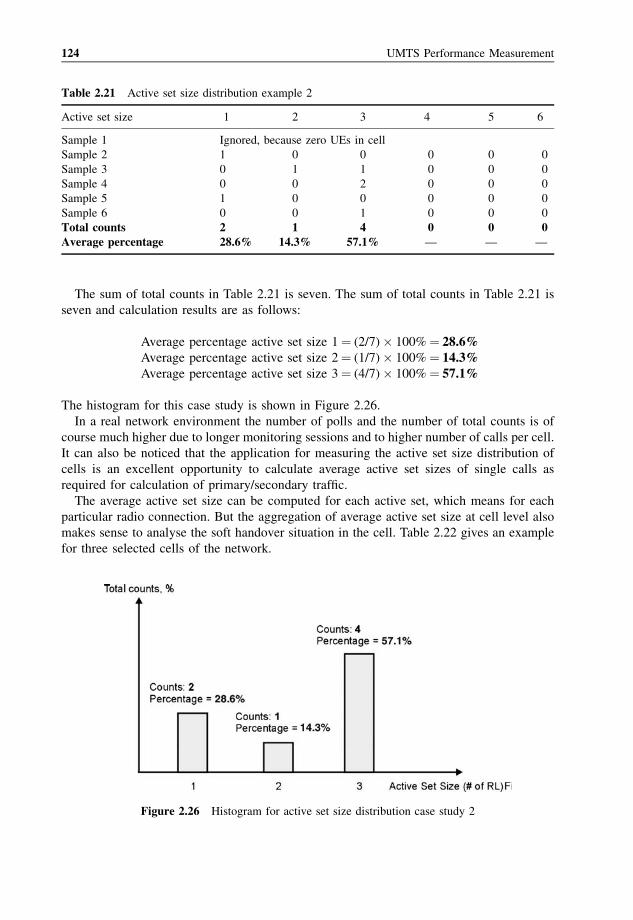
The sum of total counts in Table 2.21 is seven. The sum of total counts in Table 2.21 is
seven and calculation results are as follows:
Average percentage active set size 1¼ (2/7)� 100%¼ 28.6%Average percentage active set size 2¼ (1/7)� 100%¼ 14.3%Average percentage active set size 3¼ (4/7)� 100%¼ 57.1%
The histogram for this case study is shown in Figure 2.26.
In a real network environment the number of polls and the number of total counts is of
course much higher due to longer monitoring sessions and to higher number of calls per cell.
It can also be noticed that the application for measuring the active set size distribution of
cells is an excellent opportunity to calculate average active set sizes of single calls as
required for calculation of primary/secondary traffic.
The average active set size can be computed for each active set, which means for each
particular radio connection. But the aggregation of average active set size at cell level also
makes sense to analyse the soft handover situation in the cell. Table 2.22 gives an example
for three selected cells of the network.
Table 2.21 Active set size distribution example 2
Active set size 1 2 3 4 5 6
Sample 1 Ignored, because zero UEs in cell
Sample 2 1 0 0 0 0 0
Sample 3 0 1 1 0 0 0
Sample 4 0 0 2 0 0 0
Sample 5 1 0 0 0 0 0
Sample 6 0 0 1 0 0 0
Total counts 2 1 4 0 0 0Average percentage 28.6% 14.3% 57.1% — — —
Figure 2.26 Histogram for active set size distribution case study 2
124 UMTS Performance Measurement
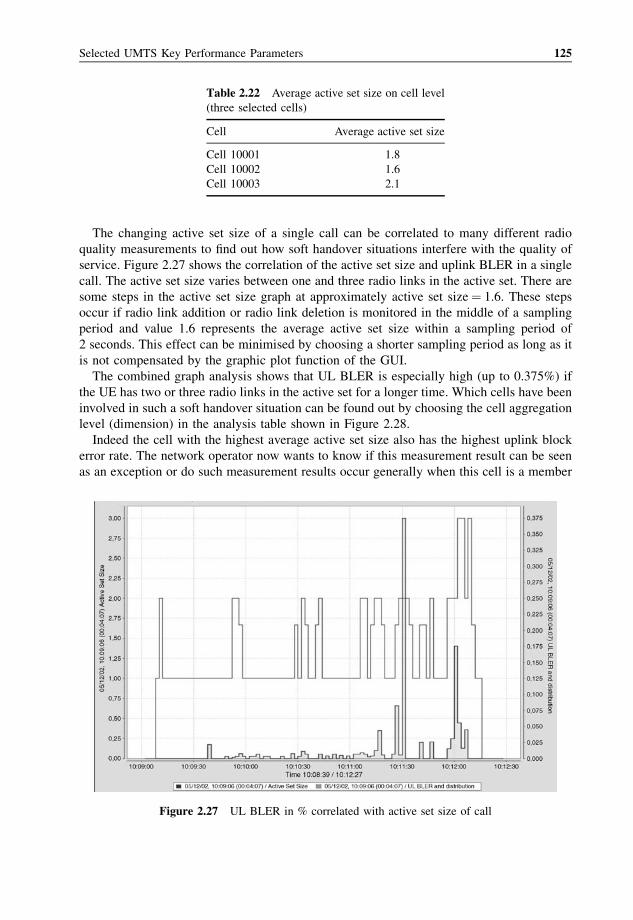
The changing active set size of a single call can be correlated to many different radio
quality measurements to find out how soft handover situations interfere with the quality of
service. Figure 2.27 shows the correlation of the active set size and uplink BLER in a single
call. The active set size varies between one and three radio links in the active set. There are
some steps in the active set size graph at approximately active set size¼ 1.6. These steps
occur if radio link addition or radio link deletion is monitored in the middle of a sampling
period and value 1.6 represents the average active set size within a sampling period of
2 seconds. This effect can be minimised by choosing a shorter sampling period as long as it
is not compensated by the graphic plot function of the GUI.
The combined graph analysis shows that UL BLER is especially high (up to 0.375%) if
the UE has two or three radio links in the active set for a longer time. Which cells have been
involved in such a soft handover situation can be found out by choosing the cell aggregation
level (dimension) in the analysis table shown in Figure 2.28.
Indeed the cell with the highest average active set size also has the highest uplink block
error rate. The network operator now wants to know if this measurement result can be seen
as an exception or do such measurement results occur generally when this cell is a member
Table 2.22 Average active set size on cell level
(three selected cells)
Cell Average active set size
Cell 10001 1.8
Cell 10002 1.6
Cell 10003 2.1
Figure 2.27 UL BLER in % correlated with active set size of call
Selected UMTS Key Performance Parameters 125
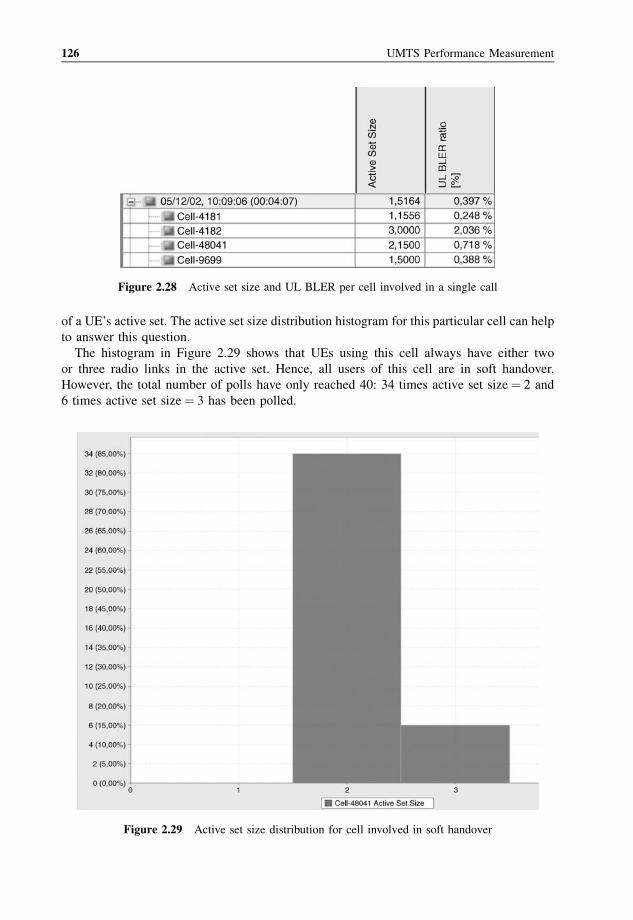
of a UE’s active set. The active set size distribution histogram for this particular cell can help
to answer this question.
The histogram in Figure 2.29 shows that UEs using this cell always have either two
or three radio links in the active set. Hence, all users of this cell are in soft handover.
However, the total number of polls have only reached 40: 34 times active set size¼ 2 and
6 times active set size¼ 3 has been polled.
Figure 2.28 Active set size and UL BLER per cell involved in a single call
Figure 2.29 Active set size distribution for cell involved in soft handover
126 UMTS Performance Measurement
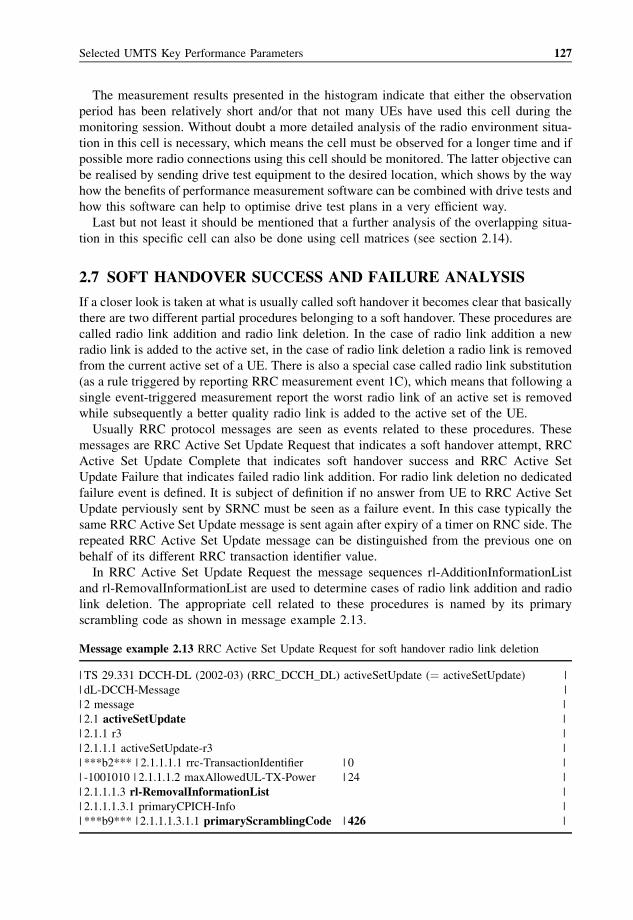
The measurement results presented in the histogram indicate that either the observation
period has been relatively short and/or that not many UEs have used this cell during the
monitoring session. Without doubt a more detailed analysis of the radio environment situa-
tion in this cell is necessary, which means the cell must be observed for a longer time and if
possible more radio connections using this cell should be monitored. The latter objective can
be realised by sending drive test equipment to the desired location, which shows by the way
how the benefits of performance measurement software can be combined with drive tests and
how this software can help to optimise drive test plans in a very efficient way.
Last but not least it should be mentioned that a further analysis of the overlapping situa-
tion in this specific cell can also be done using cell matrices (see section 2.14).
2.7 SOFT HANDOVER SUCCESS AND FAILURE ANALYSIS
If a closer look is taken at what is usually called soft handover it becomes clear that basically
there are two different partial procedures belonging to a soft handover. These procedures are
called radio link addition and radio link deletion. In the case of radio link addition a new
radio link is added to the active set, in the case of radio link deletion a radio link is removed
from the current active set of a UE. There is also a special case called radio link substitution
(as a rule triggered by reporting RRC measurement event 1C), which means that following a
single event-triggered measurement report the worst radio link of an active set is removed
while subsequently a better quality radio link is added to the active set of the UE.
Usually RRC protocol messages are seen as events related to these procedures. These
messages are RRC Active Set Update Request that indicates a soft handover attempt, RRC
Active Set Update Complete that indicates soft handover success and RRC Active Set
Update Failure that indicates failed radio link addition. For radio link deletion no dedicated
failure event is defined. It is subject of definition if no answer from UE to RRC Active Set
Update perviously sent by SRNC must be seen as a failure event. In this case typically the
same RRC Active Set Update message is sent again after expiry of a timer on RNC side. The
repeated RRC Active Set Update message can be distinguished from the previous one on
behalf of its different RRC transaction identifier value.
In RRC Active Set Update Request the message sequences rl-AdditionInformationList
and rl-RemovalInformationList are used to determine cases of radio link addition and radio
link deletion. The appropriate cell related to these procedures is named by its primary
scrambling code as shown in message example 2.13.
Message example 2.13 RRC Active Set Update Request for soft handover radio link deletion
| TS 29.331 DCCH-DL (2002-03) (RRC_DCCH_DL) activeSetUpdate (¼ activeSetUpdate) |
| dL-DCCH-Message |
| 2 message |
| 2.1 activeSetUpdate |
| 2.1.1 r3 |
| 2.1.1.1 activeSetUpdate-r3 |
| ***b2*** | 2.1.1.1.1 rrc-TransactionIdentifier | 0 |
| -1001010 | 2.1.1.1.2 maxAllowedUL-TX-Power | 24 |
| 2.1.1.1.3 rl-RemovalInformationList |
| 2.1.1.1.3.1 primaryCPICH-Info |
| ***b9*** | 2.1.1.1.3.1.1 primaryScramblingCode | 426 |
Selected UMTS Key Performance Parameters 127
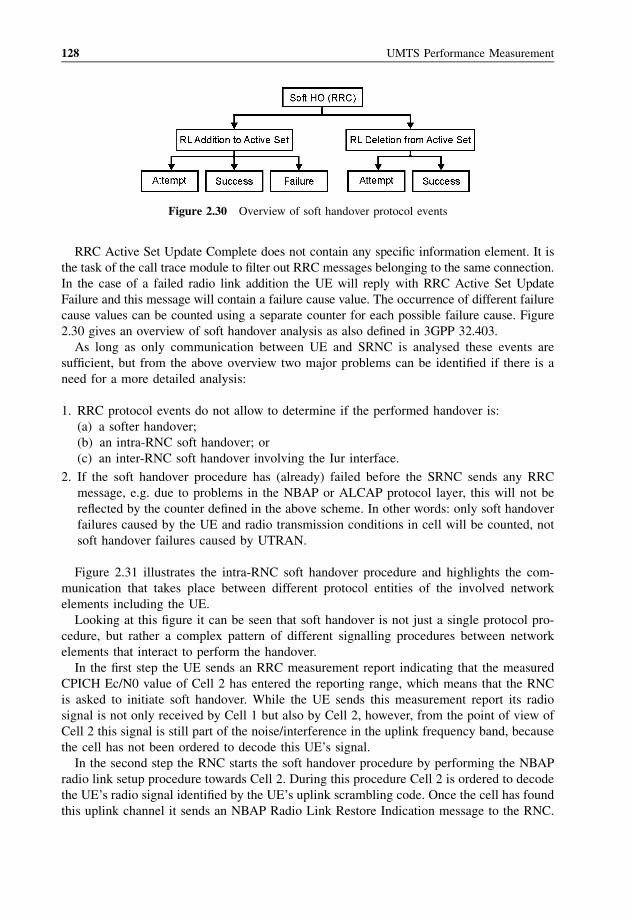
RRC Active Set Update Complete does not contain any specific information element. It is
the task of the call trace module to filter out RRC messages belonging to the same connection.
In the case of a failed radio link addition the UE will reply with RRC Active Set Update
Failure and this message will contain a failure cause value. The occurrence of different failure
cause values can be counted using a separate counter for each possible failure cause. Figure
2.30 gives an overview of soft handover analysis as also defined in 3GPP 32.403.
As long as only communication between UE and SRNC is analysed these events are
sufficient, but from the above overview two major problems can be identified if there is a
need for a more detailed analysis:
1. RRC protocol events do not allow to determine if the performed handover is:
(a) a softer handover;
(b) an intra-RNC soft handover; or
(c) an inter-RNC soft handover involving the Iur interface.
2. If the soft handover procedure has (already) failed before the SRNC sends any RRC
message, e.g. due to problems in the NBAP or ALCAP protocol layer, this will not be
reflected by the counter defined in the above scheme. In other words: only soft handover
failures caused by the UE and radio transmission conditions in cell will be counted, not
soft handover failures caused by UTRAN.
Figure 2.31 illustrates the intra-RNC soft handover procedure and highlights the com-
munication that takes place between different protocol entities of the involved network
elements including the UE.
Looking at this figure it can be seen that soft handover is not just a single protocol pro-
cedure, but rather a complex pattern of different signalling procedures between network
elements that interact to perform the handover.
In the first step the UE sends an RRC measurement report indicating that the measured
CPICH Ec/N0 value of Cell 2 has entered the reporting range, which means that the RNC
is asked to initiate soft handover. While the UE sends this measurement report its radio
signal is not only received by Cell 1 but also by Cell 2, however, from the point of view of
Cell 2 this signal is still part of the noise/interference in the uplink frequency band, because
the cell has not been ordered to decode this UE’s signal.
In the second step the RNC starts the soft handover procedure by performing the NBAP
radio link setup procedure towards Cell 2. During this procedure Cell 2 is ordered to decode
the UE’s radio signal identified by the UE’s uplink scrambling code. Once the cell has found
this uplink channel it sends an NBAP Radio Link Restore Indication message to the RNC.
Figure 2.30 Overview of soft handover protocol events
128 UMTS Performance Measurement
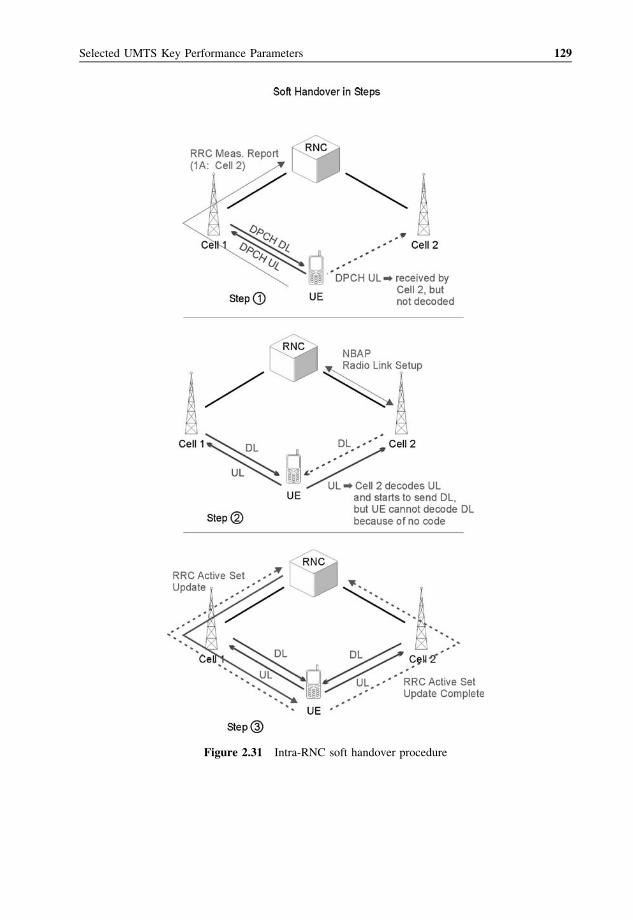
Figure 2.31 Intra-RNC soft handover procedure
Selected UMTS Key Performance Parameters 129
In addition, Cell 2 starts to send the downlink dedicated physical channel (DPCH) of the
new radio link. However, this DL DPCH cannot be decoded by the UE, because the UE
still does not know downlink channelisation code of new radio link.
The downlink channelisation code and primary scrambling code of the new cell, which
has already sent the downlink DPCH, are now transmitted to the UE by the RNC using the
RRC Active Set Update Request message. After receiving this message the UE adds a
new radio link to its active set and starts to decode the DPCH sent by Cell 2. To confirm that
radio link addition on the UE side has been successful the UE sends an RRC Active Set
Update Complete message, which is usually seen as a soft handover success event by per-
formance measurement software. Due to the special nature of radio transmission in soft
handover situation, transport blocks containing portions of the RRC Active Set Update
Complete message are transmitted using both uplink dedicated physical (data) channels
(DPDCH) simultaneously. By performing macro-diversity combining the RNC will delete
duplicated transport blocks and reassemble the single RRC Active Set Update Complete
message as sent by the UE. The dotted line used in step 3 of Figure 2.31 visualises this
process.
It is important to know that there is no rule that NBAP Radio Link Restore Indication will
always be monitored before RRC Active Set Update Complete, because synchronisation
processes necessary to send/receive radio signals in a proper manner are running indepen-
dently from each other on uplink and downlink physical channels. Hence, it is also possible
that RRC Active Set Update Complete is received before NBAP Radio Link Restore
Indication, but in this case transport blocks that carry RRC messages are only monitored on
the Iub interface of Cell 1.
Finally it must be taken into account that similar rules apply to soft handover radio link
removal. Here the RRC active set update procedure is executed before NBAP radio link
deletion. Hence, as a rule the UE stops to receive the DL physical channel earlier than the
cell stops to receive the UL signal of the UE. As a result it can be expected that on Iub of the
cell that is already deleted from the UE’s active set there are still some uplink transport
blocks that can be monitored for which macro-diversity filtering rules apply and that may
have an impact on UL BLER measurement results as well as being used to reassemble
higher layer messages.
Now it is a question of definition which message is seen as an initial soft handover attempt.
The RRC measurement report including event-ID is a good candidate, but there is one
limitation. In the case that these reports are sent periodically instead of event-triggered
(no event-ID included in message) it is very difficult to identify which measurement report
should have triggered the start of the handover procedure that is executed and controlled
by the SRNC. To detect a potentially soft handover situation that has been ignored by the
SRNC for periodic measurement reports is not impossible, but very hard to do. It requires
the follow up of measurement results reported for different neighbour cells and parameter
settings that allow performance measurement software to recognise the handover trigger
point as internally calculated by SRNC software. Basically the software assumes a soft
handover margin of 3 dB. The cell for which soft handover is triggered is identified by the
rule that the received pilot of the new cell must be stronger than the received pilot of the best
cell in the active set subtracted by the soft handover margin. Certainly parameters such as
hysteresis time, which have an decisive impact on soft handover trigger, need to be taken
into account and can only be defined by manual configuration of performance measurement
130 UMTS Performance Measurement
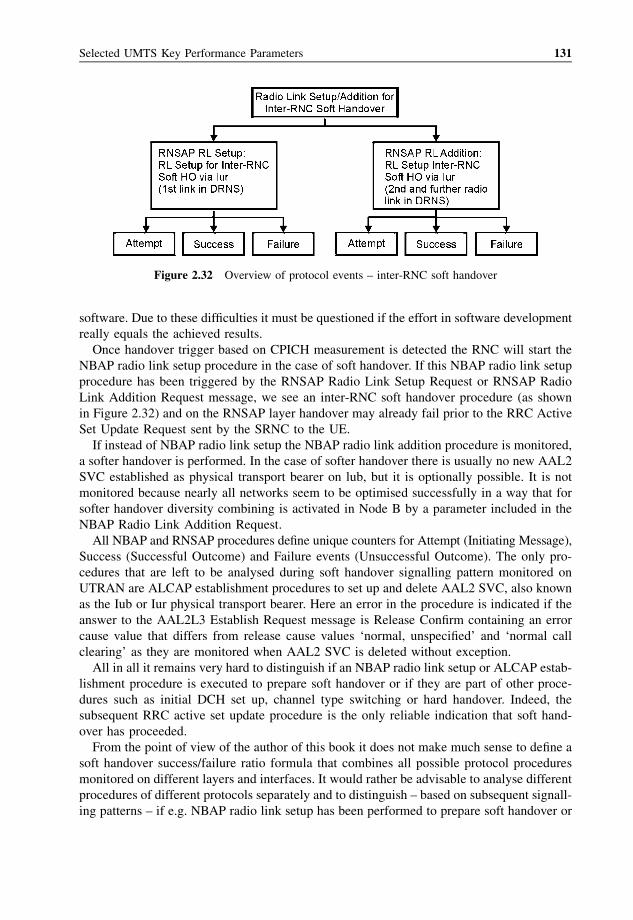
software. Due to these difficulties it must be questioned if the effort in software development
really equals the achieved results.
Once handover trigger based on CPICH measurement is detected the RNC will start the
NBAP radio link setup procedure in the case of soft handover. If this NBAP radio link setup
procedure has been triggered by the RNSAP Radio Link Setup Request or RNSAP Radio
Link Addition Request message, we see an inter-RNC soft handover procedure (as shown
in Figure 2.32) and on the RNSAP layer handover may already fail prior to the RRC Active
Set Update Request sent by the SRNC to the UE.
If instead of NBAP radio link setup the NBAP radio link addition procedure is monitored,
a softer handover is performed. In the case of softer handover there is usually no new AAL2
SVC established as physical transport bearer on lub, but it is optionally possible. It is not
monitored because nearly all networks seem to be optimised successfully in a way that for
softer handover diversity combining is activated in Node B by a parameter included in the
NBAP Radio Link Addition Request.
All NBAP and RNSAP procedures define unique counters for Attempt (Initiating Message),
Success (Successful Outcome) and Failure events (Unsuccessful Outcome). The only pro-
cedures that are left to be analysed during soft handover signalling pattern monitored on
UTRAN are ALCAP establishment procedures to set up and delete AAL2 SVC, also known
as the Iub or Iur physical transport bearer. Here an error in the procedure is indicated if the
answer to the AAL2L3 Establish Request message is Release Confirm containing an error
cause value that differs from release cause values ‘normal, unspecified’ and ‘normal call
clearing’ as they are monitored when AAL2 SVC is deleted without exception.
All in all it remains very hard to distinguish if an NBAP radio link setup or ALCAP estab-
lishment procedure is executed to prepare soft handover or if they are part of other proce-
dures such as initial DCH set up, channel type switching or hard handover. Indeed, the
subsequent RRC active set update procedure is the only reliable indication that soft hand-
over has proceeded.
From the point of view of the author of this book it does not make much sense to define a
soft handover success/failure ratio formula that combines all possible protocol procedures
monitored on different layers and interfaces. It would rather be advisable to analyse different
procedures of different protocols separately and to distinguish – based on subsequent signall-
ing patterns – if e.g. NBAP radio link setup has been performed to prepare soft handover or
Figure 2.32 Overview of protocol events – inter-RNC soft handover
Selected UMTS Key Performance Parameters 131
any other multi-layer procedure. This would result in a definition of a subset of counters for
NBAP radio link setup attempt/success/failure events involved in soft handover, another
subset of the same event involved in initial DCH set up, another subset for events involved in
hard handover etc. Such an implementation also allows a better and faster root cause analysis
to troubleshoot the network compared to a combined soft handover failure ratio that does not
indicate in which particular network element or protocol entity the failure has occurred. The
same implementation strategy can also be used to identify root causes of e.g. radio link
failures that often indicate dropped calls and may also be seen as a final result of erroneous
soft handover procedures as shown in Figure 1.10.
2.8 INTER-FREQUENCY HARD HANDOVERSUCCESS AND FAILURE RATES
When discussing inter-frequency handover scenarios the most important question is: Which
message is used to perform inter-frequency handover? This problem is caused by missing
detailed descriptions of inter-frequency handover scenarios in 3GPP standards. 3GPP 25.331
Radio Resource Control contains only a very generic description of how to perform hard
handovers. It says that basically the following RRC procedures can be used to perform hard
handover: radio bearer Setup, radio bearer deletion, radio bearer reconfiguration, transport
channel reconfiguration and physical channel reconfiguration. It is the classical problem
already highlighted in Figure 1.8 and the authors of 3GPP 32.403 have just copied generic
definitions written in 3GPP 25.331. There is no answer to the above question in these
documents.
To find the answer an understanding of radio interface procedures is necessary. To perform
inter-frequency handover (which is always a hard handover) means that the UE is moving
from a source cell working on UTRAN frequency f1 into a target cell working on UTRAN
frequency f2. To perform this change it is not necessary to set up a new radio bearer, because
the radio bearer was already set up when the UE starts to work on frequency f1. There is also
no need to delete the radio bearer, because there is no need to stop transmission of user data
via UTRAN, the target is merely to change the frequency used for transmission. Due to these
two facts the RRC radio bearer setup and radio bearer deletion procedures can be excluded,
because it is very unlikely that they will be used for inter-frequency hard handover. There
might be a possible scenario when the radio bearer is deleted in the source cell and a new
radio bearer is set up in the target cell, but this would take much more time than a reconfigu-
ration procedure and hence would not be very efficient.
Looking at the radio bearer reconfiguration procedure it becomes clear that the main
purpose of this procedure is to change the quality of service attributes assigned to radio
links, e.g. to adjust the window size and timer parameters of radio bearers using RLC
acknowledged mode. This is again not what we are looking for in the case of inter-frequency
handover.
A similar statement is given after looking at transport channel reconfiguration, which is
usually used to change the transport format sets of DCHs, e.g. to provide higher data
transmission rates on the radio interface or to perform channel type switching, which means
changing the mapping of the DTCH onto underlying transport channels.
If it is necessary to change the physical parameters of connections such as used codes
without changing transport channel parameters the physical channel reconfiguration
132 UMTS Performance Measurement
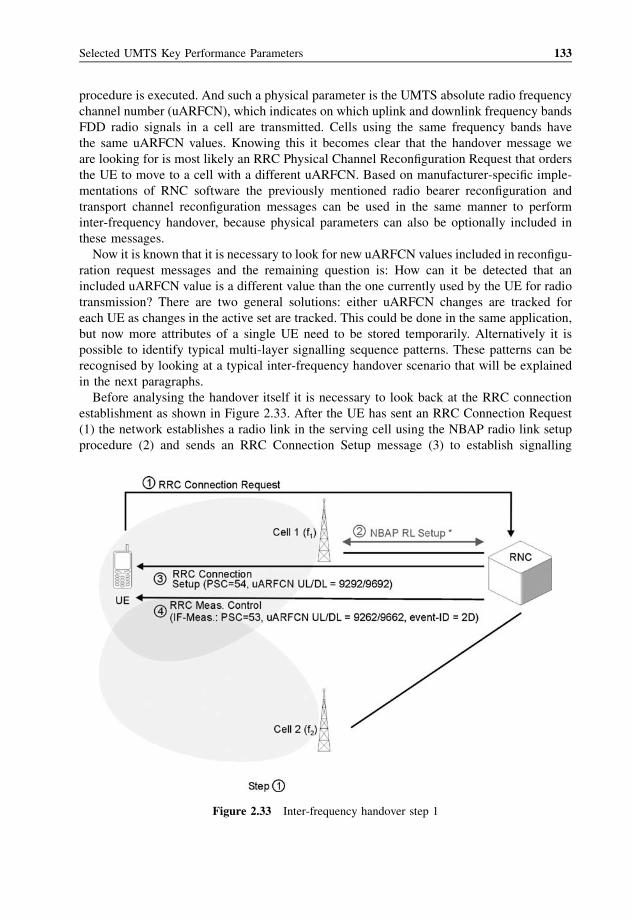
procedure is executed. And such a physical parameter is the UMTS absolute radio frequency
channel number (uARFCN), which indicates on which uplink and downlink frequency bands
FDD radio signals in a cell are transmitted. Cells using the same frequency bands have
the same uARFCN values. Knowing this it becomes clear that the handover message we
are looking for is most likely an RRC Physical Channel Reconfiguration Request that orders
the UE to move to a cell with a different uARFCN. Based on manufacturer-specific imple-
mentations of RNC software the previously mentioned radio bearer reconfiguration and
transport channel reconfiguration messages can be used in the same manner to perform
inter-frequency handover, because physical parameters can also be optionally included in
these messages.
Now it is known that it is necessary to look for new uARFCN values included in reconfigu-
ration request messages and the remaining question is: How can it be detected that an
included uARFCN value is a different value than the one currently used by the UE for radio
transmission? There are two general solutions: either uARFCN changes are tracked for
each UE as changes in the active set are tracked. This could be done in the same application,
but now more attributes of a single UE need to be stored temporarily. Alternatively it is
possible to identify typical multi-layer signalling sequence patterns. These patterns can be
recognised by looking at a typical inter-frequency handover scenario that will be explained
in the next paragraphs.
Before analysing the handover itself it is necessary to look back at the RRC connection
establishment as shown in Figure 2.33. After the UE has sent an RRC Connection Request
(1) the network establishes a radio link in the serving cell using the NBAP radio link setup
procedure (2) and sends an RRC Connection Setup message (3) to establish signalling
Figure 2.33 Inter-frequency handover step 1
Selected UMTS Key Performance Parameters 133
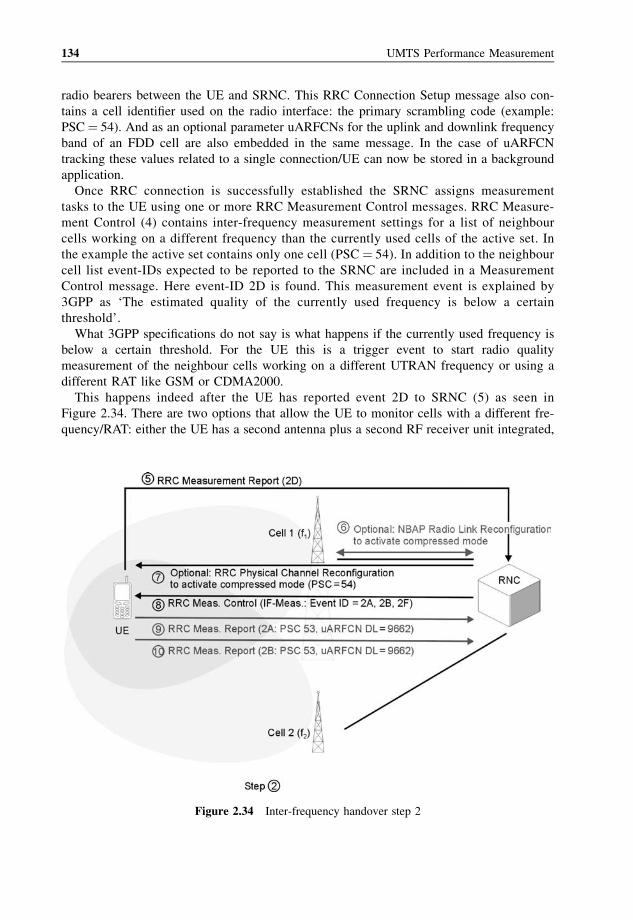
radio bearers between the UE and SRNC. This RRC Connection Setup message also con-
tains a cell identifier used on the radio interface: the primary scrambling code (example:
PSC¼ 54). And as an optional parameter uARFCNs for the uplink and downlink frequency
band of an FDD cell are also embedded in the same message. In the case of uARFCN
tracking these values related to a single connection/UE can now be stored in a background
application.
Once RRC connection is successfully established the SRNC assigns measurement
tasks to the UE using one or more RRC Measurement Control messages. RRC Measure-
ment Control (4) contains inter-frequency measurement settings for a list of neighbour
cells working on a different frequency than the currently used cells of the active set. In
the example the active set contains only one cell (PSC ¼ 54). In addition to the neighbour
cell list event-IDs expected to be reported to the SRNC are included in a Measurement
Control message. Here event-ID 2D is found. This measurement event is explained by
3GPP as ‘The estimated quality of the currently used frequency is below a certain
threshold’.
What 3GPP specifications do not say is what happens if the currently used frequency is
below a certain threshold. For the UE this is a trigger event to start radio quality
measurement of the neighbour cells working on a different UTRAN frequency or using a
different RAT like GSM or CDMA2000.
This happens indeed after the UE has reported event 2D to SRNC (5) as seen in
Figure 2.34. There are two options that allow the UE to monitor cells with a different fre-
quency/RAT: either the UE has a second antenna plus a second RF receiver unit integrated,
Figure 2.34 Inter-frequency handover step 2
134 UMTS Performance Measurement
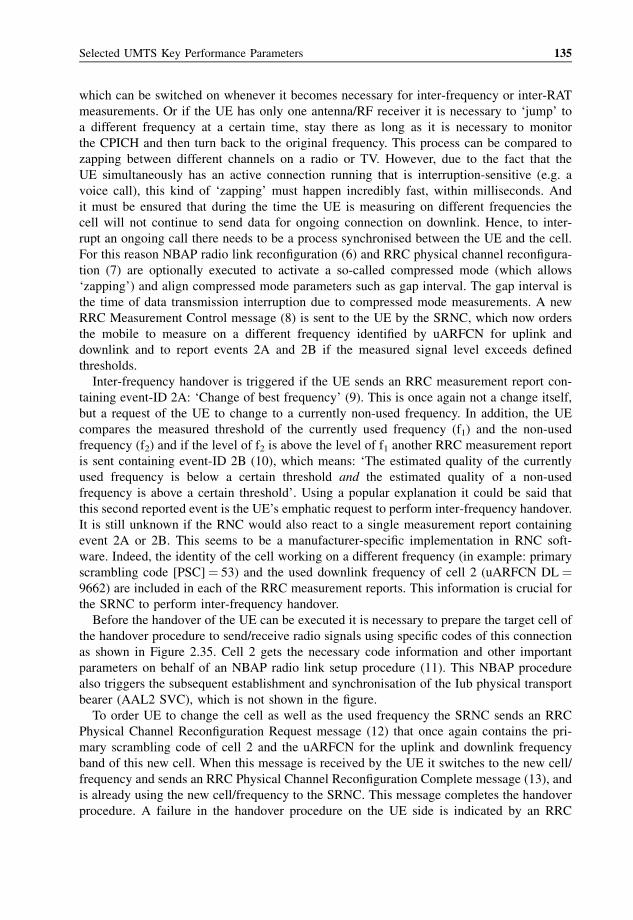
which can be switched on whenever it becomes necessary for inter-frequency or inter-RAT
measurements. Or if the UE has only one antenna/RF receiver it is necessary to ‘jump’ to
a different frequency at a certain time, stay there as long as it is necessary to monitor
the CPICH and then turn back to the original frequency. This process can be compared to
zapping between different channels on a radio or TV. However, due to the fact that the
UE simultaneously has an active connection running that is interruption-sensitive (e.g. a
voice call), this kind of ‘zapping’ must happen incredibly fast, within milliseconds. And
it must be ensured that during the time the UE is measuring on different frequencies the
cell will not continue to send data for ongoing connection on downlink. Hence, to inter-
rupt an ongoing call there needs to be a process synchronised between the UE and the cell.
For this reason NBAP radio link reconfiguration (6) and RRC physical channel reconfigura-
tion (7) are optionally executed to activate a so-called compressed mode (which allows
‘zapping’) and align compressed mode parameters such as gap interval. The gap interval is
the time of data transmission interruption due to compressed mode measurements. A new
RRC Measurement Control message (8) is sent to the UE by the SRNC, which now orders
the mobile to measure on a different frequency identified by uARFCN for uplink and
downlink and to report events 2A and 2B if the measured signal level exceeds defined
thresholds.
Inter-frequency handover is triggered if the UE sends an RRC measurement report con-
taining event-ID 2A: ‘Change of best frequency’ (9). This is once again not a change itself,
but a request of the UE to change to a currently non-used frequency. In addition, the UE
compares the measured threshold of the currently used frequency (f1) and the non-used
frequency (f2) and if the level of f2 is above the level of f1 another RRC measurement report
is sent containing event-ID 2B (10), which means: ‘The estimated quality of the currently
used frequency is below a certain threshold and the estimated quality of a non-used
frequency is above a certain threshold’. Using a popular explanation it could be said that
this second reported event is the UE’s emphatic request to perform inter-frequency handover.
It is still unknown if the RNC would also react to a single measurement report containing
event 2A or 2B. This seems to be a manufacturer-specific implementation in RNC soft-
ware. Indeed, the identity of the cell working on a different frequency (in example: primary
scrambling code [PSC]¼ 53) and the used downlink frequency of cell 2 (uARFCN DL¼9662) are included in each of the RRC measurement reports. This information is crucial for
the SRNC to perform inter-frequency handover.
Before the handover of the UE can be executed it is necessary to prepare the target cell of
the handover procedure to send/receive radio signals using specific codes of this connection
as shown in Figure 2.35. Cell 2 gets the necessary code information and other important
parameters on behalf of an NBAP radio link setup procedure (11). This NBAP procedure
also triggers the subsequent establishment and synchronisation of the Iub physical transport
bearer (AAL2 SVC), which is not shown in the figure.
To order UE to change the cell as well as the used frequency the SRNC sends an RRC
Physical Channel Reconfiguration Request message (12) that once again contains the pri-
mary scrambling code of cell 2 and the uARFCN for the uplink and downlink frequency
band of this new cell. When this message is received by the UE it switches to the new cell/
frequency and sends an RRC Physical Channel Reconfiguration Complete message (13), and
is already using the new cell/frequency to the SRNC. This message completes the handover
procedure. A failure in the handover procedure on the UE side is indicated by an RRC
Selected UMTS Key Performance Parameters 135
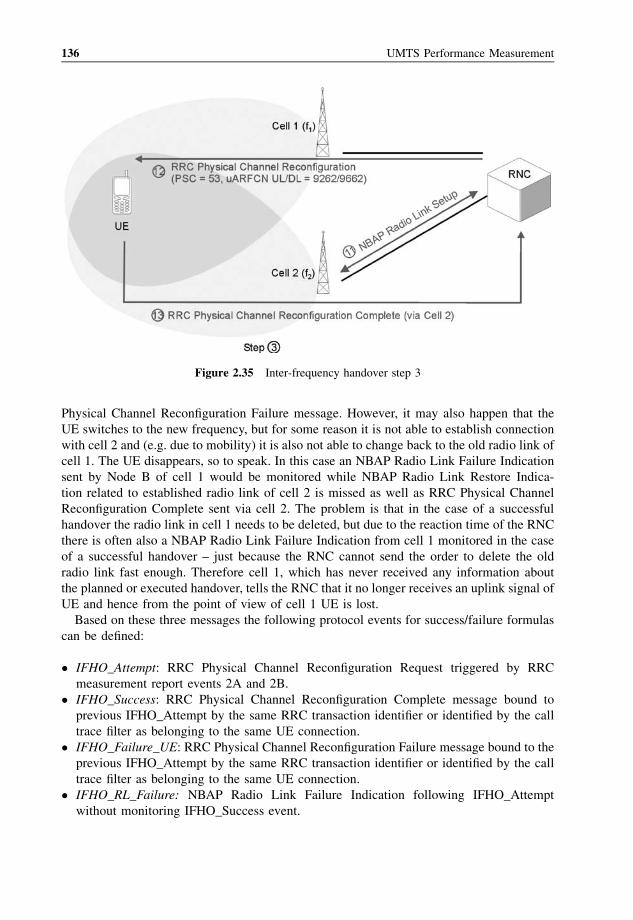
Physical Channel Reconfiguration Failure message. However, it may also happen that the
UE switches to the new frequency, but for some reason it is not able to establish connection
with cell 2 and (e.g. due to mobility) it is also not able to change back to the old radio link of
cell 1. The UE disappears, so to speak. In this case an NBAP Radio Link Failure Indication
sent by Node B of cell 1 would be monitored while NBAP Radio Link Restore Indica-
tion related to established radio link of cell 2 is missed as well as RRC Physical Channel
Reconfiguration Complete sent via cell 2. The problem is that in the case of a successful
handover the radio link in cell 1 needs to be deleted, but due to the reaction time of the RNC
there is often also a NBAP Radio Link Failure Indication from cell 1 monitored in the case
of a successful handover – just because the RNC cannot send the order to delete the old
radio link fast enough. Therefore cell 1, which has never received any information about
the planned or executed handover, tells the RNC that it no longer receives an uplink signal of
UE and hence from the point of view of cell 1 UE is lost.
Based on these three messages the following protocol events for success/failure formulas
can be defined:
� IFHO_Attempt: RRC Physical Channel Reconfiguration Request triggered by RRC
measurement report events 2A and 2B.
� IFHO_Success: RRC Physical Channel Reconfiguration Complete message bound to
previous IFHO_Attempt by the same RRC transaction identifier or identified by the call
trace filter as belonging to the same UE connection.
� IFHO_Failure_UE: RRC Physical Channel Reconfiguration Failure message bound to the
previous IFHO_Attempt by the same RRC transaction identifier or identified by the call
trace filter as belonging to the same UE connection.
� IFHO_RL_Failure: NBAP Radio Link Failure Indication following IFHO_Attempt
without monitoring IFHO_Success event.
Figure 2.35 Inter-frequency handover step 3
136 UMTS Performance Measurement
The formulas are defined as follows:
IFHO Success Rate ¼P
IFHO SuccessPIFHO Attempt
� 100% ð2:15Þ
IFHO Failure Rate ¼P
ðIFHO Failure UE þ IFHO RL FailureÞPIFHO Attempt
� 100% ð2:16Þ
However, as easy as it is to define and write a formula, it is as difficult to understand
and implement the check of a signalling pattern indicating Attempt and Failure events.
Another problem might come up when discussing the aggregation level of these KPIs. It
is useful to analyse it per call, this is clear, and there are three options: since it is an RRC
protocol procedure and RRC messages can be exchanged in soft handover situations it is
possible that there is not just a single source cell, but a source active set. Due to this, Attempt
event could be shown related to the best cell of this active set, but the best cell is changed
during handover and hence, Success event would be displayed to a new best cell that is the
target cell. If Attempt counters are counted in source cell(s) while Success counters are
counted in the target cell it might become difficult for performance measurement software to
compute Success ratio per cell. One possible solution is to aggregate protocol event counters
not at the cell at which they have been monitored, but at a cell defined by identifiers found in
handover procedure messages: either show all events related to the source cell or related to
the target cell. A variant to showing counters as well as ratios related to the target cell is
probably the most meaningful, because if handover is not successful it is much more often
due to radio conditions in the target cell than due to errors in UE software (that occur
according to load/stress test results in fewer than 1 out of 10 000 cases). Finally, there is
another option that displays both source and target cell of the handover procedure. This
option is the handover cell matrix as described at the end of section 2.14.
2.9 CORE NETWORK HARD HANDOVERSUCCESS AND FAILURE RATES
The handover procedures discussed so far in the previous chapters have been always
executed within the UTRAN, which means that UEs have never left the area controlled
by a single core network element such as the MSC or SGSN and Iub and Iur interfaces
have been involved in handover signalling procedures. Now emphasis is set on the
analysis of handover procedures switching in the core network. The following scenarios
will be discussed:
3. 3G-3G Intra-frequency hard handover/relocation
4. 3G-2G Inter-RAT Handover for CS and PS services
5. 2G-3G Inter-RAT Handover for CS and PS services
2G in this context stands as a synonym for GSM, inter-RAT handover to/from CDMA2000 is
beyond the scope of this book.
Selected UMTS Key Performance Parameters 137
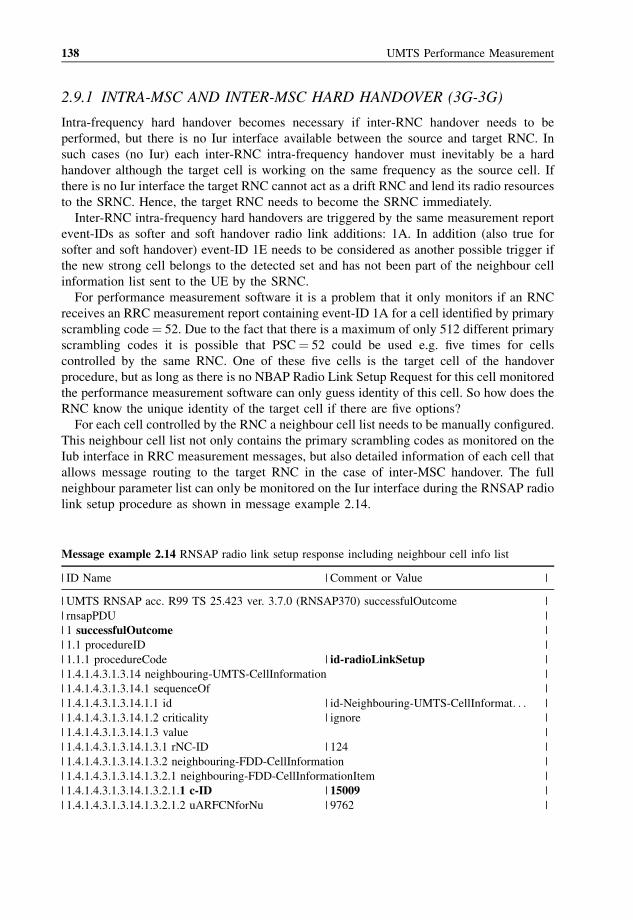
2.9.1 INTRA-MSC AND INTER-MSC HARD HANDOVER (3G-3G)
Intra-frequency hard handover becomes necessary if inter-RNC handover needs to be
performed, but there is no Iur interface available between the source and target RNC. In
such cases (no Iur) each inter-RNC intra-frequency handover must inevitably be a hard
handover although the target cell is working on the same frequency as the source cell. If
there is no Iur interface the target RNC cannot act as a drift RNC and lend its radio resources
to the SRNC. Hence, the target RNC needs to become the SRNC immediately.
Inter-RNC intra-frequency hard handovers are triggered by the same measurement report
event-IDs as softer and soft handover radio link additions: 1A. In addition (also true for
softer and soft handover) event-ID 1E needs to be considered as another possible trigger if
the new strong cell belongs to the detected set and has not been part of the neighbour cell
information list sent to the UE by the SRNC.
For performance measurement software it is a problem that it only monitors if an RNC
receives an RRC measurement report containing event-ID 1A for a cell identified by primary
scrambling code¼ 52. Due to the fact that there is a maximum of only 512 different primary
scrambling codes it is possible that PSC¼ 52 could be used e.g. five times for cells
controlled by the same RNC. One of these five cells is the target cell of the handover
procedure, but as long as there is no NBAP Radio Link Setup Request for this cell monitored
the performance measurement software can only guess identity of this cell. So how does the
RNC know the unique identity of the target cell if there are five options?
For each cell controlled by the RNC a neighbour cell list needs to be manually configured.
This neighbour cell list not only contains the primary scrambling codes as monitored on the
Iub interface in RRC measurement messages, but also detailed information of each cell that
allows message routing to the target RNC in the case of inter-MSC handover. The full
neighbour parameter list can only be monitored on the Iur interface during the RNSAP radio
link setup procedure as shown in message example 2.14.
Message example 2.14 RNSAP radio link setup response including neighbour cell info list
| ID Name | Comment or Value |
| UMTS RNSAP acc. R99 TS 25.423 ver. 3.7.0 (RNSAP370) successfulOutcome |
| rnsapPDU |
| 1 successfulOutcome |
| 1.1 procedureID |
| 1.1.1 procedureCode | id-radioLinkSetup |
| 1.4.1.4.3.1.3.14 neighbouring-UMTS-CellInformation |
| 1.4.1.4.3.1.3.14.1 sequenceOf |
| 1.4.1.4.3.1.3.14.1.1 id | id-Neighbouring-UMTS-CellInformat. . . |
| 1.4.1.4.3.1.3.14.1.2 criticality | ignore |
| 1.4.1.4.3.1.3.14.1.3 value |
| 1.4.1.4.3.1.3.14.1.3.1 rNC-ID | 124 |
| 1.4.1.4.3.1.3.14.1.3.2 neighbouring-FDD-CellInformation |
| 1.4.1.4.3.1.3.14.1.3.2.1 neighbouring-FDD-CellInformationItem |
| 1.4.1.4.3.1.3.14.1.3.2.1.1 c-ID | 15009 |
| 1.4.1.4.3.1.3.14.1.3.2.1.2 uARFCNforNu | 9762 |
138 UMTS Performance Measurement
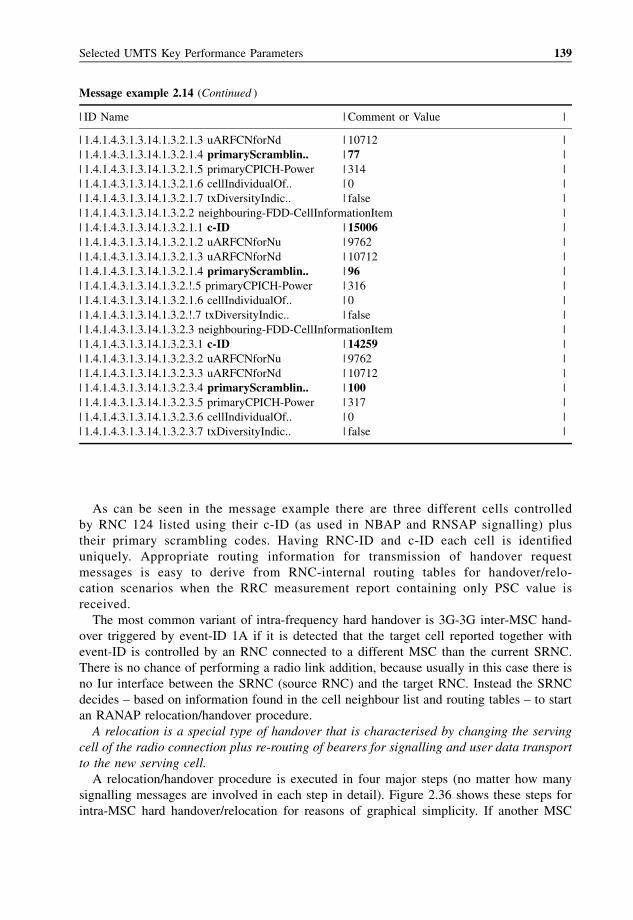
As can be seen in the message example there are three different cells controlled
by RNC 124 listed using their c-ID (as used in NBAP and RNSAP signalling) plus
their primary scrambling codes. Having RNC-ID and c-ID each cell is identified
uniquely. Appropriate routing information for transmission of handover request
messages is easy to derive from RNC-internal routing tables for handover/relo-
cation scenarios when the RRC measurement report containing only PSC value is
received.
The most common variant of intra-frequency hard handover is 3G-3G inter-MSC hand-
over triggered by event-ID 1A if it is detected that the target cell reported together with
event-ID is controlled by an RNC connected to a different MSC than the current SRNC.
There is no chance of performing a radio link addition, because usually in this case there is
no Iur interface between the SRNC (source RNC) and the target RNC. Instead the SRNC
decides – based on information found in the cell neighbour list and routing tables – to start
an RANAP relocation/handover procedure.
A relocation is a special type of handover that is characterised by changing the serving
cell of the radio connection plus re-routing of bearers for signalling and user data transport
to the new serving cell.
A relocation/handover procedure is executed in four major steps (no matter how many
signalling messages are involved in each step in detail). Figure 2.36 shows these steps for
intra-MSC hard handover/relocation for reasons of graphical simplicity. If another MSC
Message example 2.14 (Continued )
| ID Name | Comment or Value |
| 1.4.1.4.3.1.3.14.1.3.2.1.3 uARFCNforNd | 10712 |
| 1.4.1.4.3.1.3.14.1.3.2.1.4 primaryScramblin.. | 77 |
| 1.4.1.4.3.1.3.14.1.3.2.1.5 primaryCPICH-Power | 314 |
| 1.4.1.4.3.1.3.14.1.3.2.1.6 cellIndividualOf.. | 0 |
| 1.4.1.4.3.1.3.14.1.3.2.1.7 txDiversityIndic.. | false |
| 1.4.1.4.3.1.3.14.1.3.2.2 neighbouring-FDD-CellInformationItem |
| 1.4.1.4.3.1.3.14.1.3.2.1.1 c-ID | 15006 |
| 1.4.1.4.3.1.3.14.1.3.2.1.2 uARFCNforNu | 9762 |
| 1.4.1.4.3.1.3.14.1.3.2.1.3 uARFCNforNd | 10712 |
| 1.4.1.4.3.1.3.14.1.3.2.1.4 primaryScramblin.. | 96 |
| 1.4.1.4.3.1.3.14.1.3.2.!.5 primaryCPICH-Power | 316 |
| 1.4.1.4.3.1.3.14.1.3.2.1.6 cellIndividualOf.. | 0 |
| 1.4.1.4.3.1.3.14.1.3.2.!.7 txDiversityIndic.. | false |
| 1.4.1.4.3.1.3.14.1.3.2.3 neighbouring-FDD-CellInformationItem |
| 1.4.1.4.3.1.3.14.1.3.2.3.1 c-ID | 14259 |
| 1.4.1.4.3.1.3.14.1.3.2.3.2 uARFCNforNu | 9762 |
| 1.4.1.4.3.1.3.14.1.3.2.3.3 uARFCNforNd | 10712 |
| 1.4.1.4.3.1.3.14.1.3.2.3.4 primaryScramblin.. | 100 |
| 1.4.1.4.3.1.3.14.1.3.2.3.5 primaryCPICH-Power | 317 |
| 1.4.1.4.3.1.3.14.1.3.2.3.6 cellIndividualOf.. | 0 |
| 1.4.1.4.3.1.3.14.1.3.2.3.7 txDiversityIndic.. | false |
Selected UMTS Key Performance Parameters 139
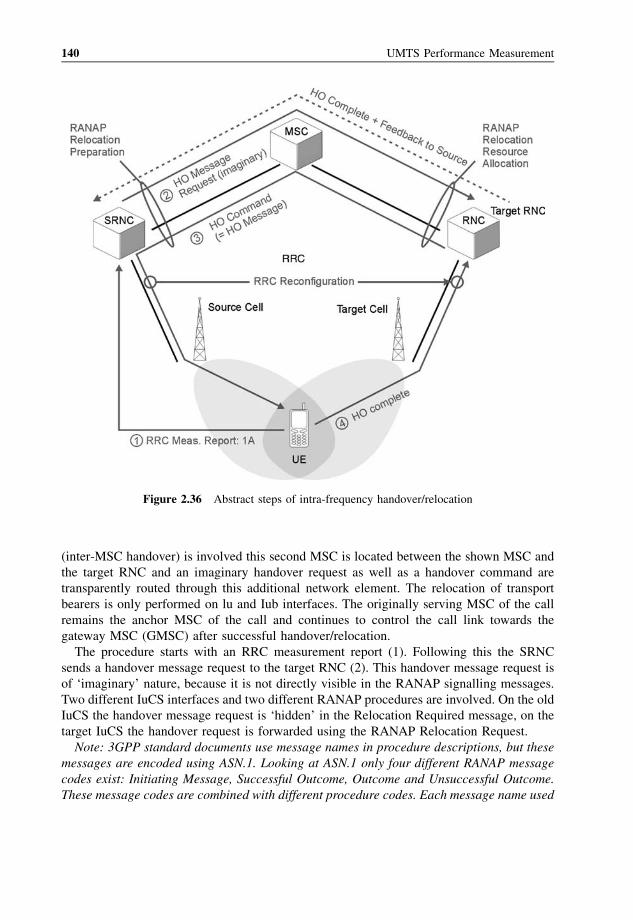
(inter-MSC handover) is involved this second MSC is located between the shown MSC and
the target RNC and an imaginary handover request as well as a handover command are
transparently routed through this additional network element. The relocation of transport
bearers is only performed on lu and Iub interfaces. The originally serving MSC of the call
remains the anchor MSC of the call and continues to control the call link towards the
gateway MSC (GMSC) after successful handover/relocation.
The procedure starts with an RRC measurement report (1). Following this the SRNC
sends a handover message request to the target RNC (2). This handover message request is
of ‘imaginary’ nature, because it is not directly visible in the RANAP signalling messages.
Two different IuCS interfaces and two different RANAP procedures are involved. On the old
IuCS the handover message request is ‘hidden’ in the Relocation Required message, on the
target IuCS the handover request is forwarded using the RANAP Relocation Request.
Note: 3GPP standard documents use message names in procedure descriptions, but these
messages are encoded using ASN.1. Looking at ASN.1 only four different RANAP message
codes exist: Initiating Message, Successful Outcome, Outcome and Unsuccessful Outcome.
These message codes are combined with different procedure codes. Each message name used
Figure 2.36 Abstract steps of intra-frequency handover/relocation
140 UMTS Performance Measurement
in 3GPP specifications has its unique ASN.1 message code/procedure code combination.
Hence, RANAP Relocation Required message is encoded as RANAP InitiatingMessage(ProcedureCode: RelocationPreparation). This principle is also valid for other UTRAN
protocols. In message example 2.14, for instance, RNSAP Radio Link Setup Response
message is presented, which is encoded as RNSAP SuccessfulOutcome (ProcedureCode:
Radio Link Setup).
From the ‘imaginary’ request coming from the SRNC the target RNC constructs
a handover command message to be sent to the UE. However, the target RNC does not
have a radio connection with the UE – but the SRNC has! Following this, the handover
command (which is the previously requested handover message) is sent via the
MSC, SRNC and source cell to the UE, because this is the only available radio con-
nection (3).
Typically for Intra-frequency hard handover this handover command message is an RRC
Physical Channel Reconfiguration Request containing new codes to be used for the radio
link in the target cell and additional new identifiers such as a new u-RNTI, which will
change due to the fact that the SRNC of connection will change.
After the UE has received the hard handover command message (e.g. RRC Physical
Channel Reconfiguration Request) it starts to send/receive data using configuration
parameters received in this message. For successful reconfiguration the UE sends the
handover complete message (e.g. RRC Physical Channel Reconfiguration Complete
message) via the new cell/new Iub to the target RNC. At the target RNC, which has
now become the new SRNC of the connection, the loop between the handover command
and handover complete is closed and from the point of view of the radio connection
handover was successful. There is just one more thing to do: the transport resources on the
previously used interfaces (old IuCS, old Iub) need to be deleted as well as all call-
specific information in RNC and MSC protocol entities. This information to be deleted
includes all the parameters of the RRC context of the UE and assigned (and now suc-
cessfully relocated) RABs.
To delete the RRC context and RABs in the old SRNC the feedback of successfully
completed handover (4) is delivered by the target RNC (new SRNC) to the core network
element (MSC) and from core network back to source RNC (old SRNC). Once again
RANAP messages are used to forward this information and subsequently radio links in the
old cell are deleted as well as RABs.
Regarding the processing time of NBAP radio link deletion the same problem as already
described in for inter-frequency handovers is true: if it takes too long until the old SRNC
starts NBAP radio link deletion triggered by feedback about successful relocation the
source cell will complain by sending NBAP Radio Link Failure Indication that contact
with the UE has been lost. On the other hand the same risk exists that the UE is really lost
due to the handover attempt and the handover complete message is not monitored on the
new lub.
The RAB is released and performs the RANAP Iu-Release procedure. An appropriate
release cause used in this procedure following a successful handover is ‘successful relo-
cation’. In the past it was observed that some NEM implemented cause value ‘normal
release’, but this is not compliant with 3GPP standards, because ‘normal release’ belongs to
the group of NAS causes that should only be used if an NAS protocol event (e.g. Call
Selected UMTS Key Performance Parameters 141
Control DISCONNECT) is the reason for terminating an active connection. A relocation/
handover is a radio network related procedure, because it is performed due to the mobility of
the UE. Following this the radio network layer cause ‘successful relocation’ must be used in
an appropriate Iu-Release procedure.
All details of the procedure are now known and protocol event counters and KPI formulas
can be defined, but there are different approaches. On the one hand it is possible to define
easy success rates for the procedure using the following protocol events:
� InFHHO_Attempt: RANAP Relocation Required containing sourceRNC-to-targetRNC-
transparent-container. This container is used to transmit necessary RRC context
parameters from source to target RNC and as explained in the next section a similar
container for inter-RAT handover looks completely different. Hence, based on the
existence of this transparent container 3G-3G handover/relocation can be identified
easily.
Note: The same sourceRNC-to-targetRNC-transparent-container can also be used
for 3G_Intra-/Inter-MSC inter-frequency handover – if the target cell is working on
a different UTRAN frequency than the source cell. If such a handover is possible in the
network (depends on network architecture) separate counters for intra- and inter-
frequency handover switching in the core network can be defined by checking the
event-IDs in the RRC measurement report that triggered the sending of RANAP
Relocation Required or are based on the check of uARFCN values provided by the active
set tracking the background application (as discussed in the section about inter-frequency
handover).
� InFHHO_Success: an overall success rate KPI RANAP Iu-Release Command including
cause value ‘successful relocation‘ can be seen as a good success event, because on the
one hand following the reception of this message the RNC will delete all resources related
to included RAB-IDs and on the other hand monitoring this message indicates that hard
handover/relocation to target cell/RNC has been successful without any doubt. In the
(unlikely) case that the SRNC has some problems relaeasing the old RABs and related
radio resources this will not have any impact on the active connection between the UE and
the network.
� InFHHO_Failure_UE: any RRC Reconfiguration Failure message sent as response to
RRC Reconfiguration Request (used as handover command message) must be seen as a
failure indication from the UE side.
� InFHHO_RL_Failure: if the UE loses contact with the network after it has received the
handover command an NBAP Radio Link Failure Indication is expected to be monitored
while InFHHO_Success event is missed. Due to the possibility that an NBAP Radio Link
Failure Indication may also be sent in the case of successful handover it is necessary to
perform a careful check to see if this message indicates a failure event or not. If NBAP
Radio Link Failure Indication is monitored for a UE that has already received a handover
command (Attempt) it needs to be checked if RAB(s) related to this UE have already been
ordered to be deleted by the MSC using RANAP Iu-Release (cause¼ ‘successful
relocation’). If RANAP Iu-Release has not been monitored a timer needs to be started
to check if the success event is monitored within a certain time frame. Otherwise
handover is considered to have failed and subsequently it needs to be considered to drop
the call, too.
142 UMTS Performance Measurement
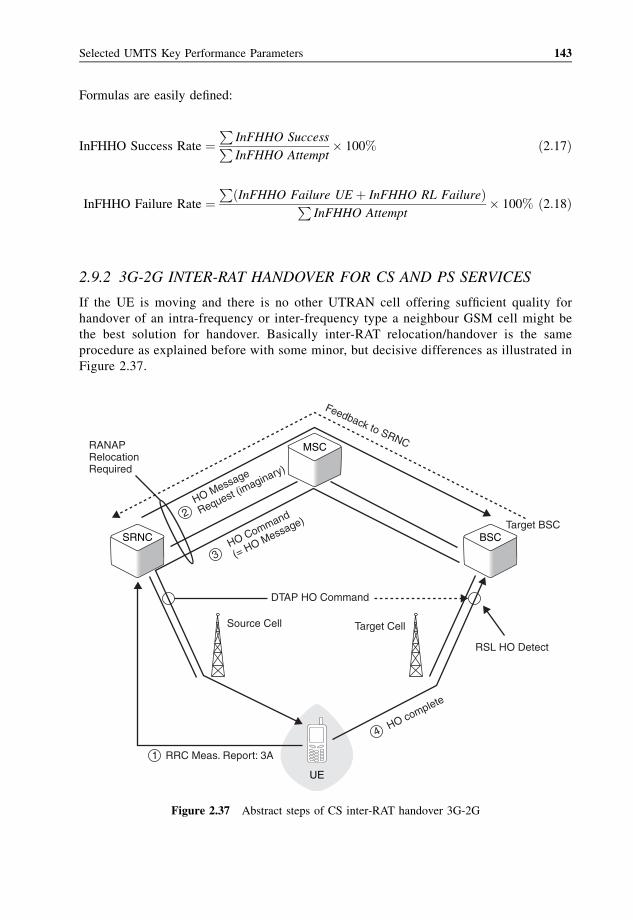
Formulas are easily defined:
InFHHO Success Rate ¼P
InFHHO SuccessPInFHHO Attempt
� 100% ð2:17Þ
InFHHO Failure Rate ¼P
ðInFHHO Failure UE þ InFHHO RL FailureÞPInFHHO Attempt
� 100% ð2:18Þ
2.9.2 3G-2G INTER-RAT HANDOVER FOR CS AND PS SERVICES
If the UE is moving and there is no other UTRAN cell offering sufficient quality for
handover of an intra-frequency or inter-frequency type a neighbour GSM cell might be
the best solution for handover. Basically inter-RAT relocation/handover is the same
procedure as explained before with some minor, but decisive differences as illustrated in
Figure 2.37.
BSC
MSC
SRNC
UE
RANAPRelocationRequired
Feedback to SRNC
HO Message
Request (imaginary)
HO Command
(= HO Message)
HO complete
2
3
4
1
Source Cell
RRC Meas. Report: 3A
RSL HO Detect
Target BSC
Target Cell
DTAP HO Command
Figure 2.37 Abstract steps of CS inter-RAT handover 3G-2G
Selected UMTS Key Performance Parameters 143
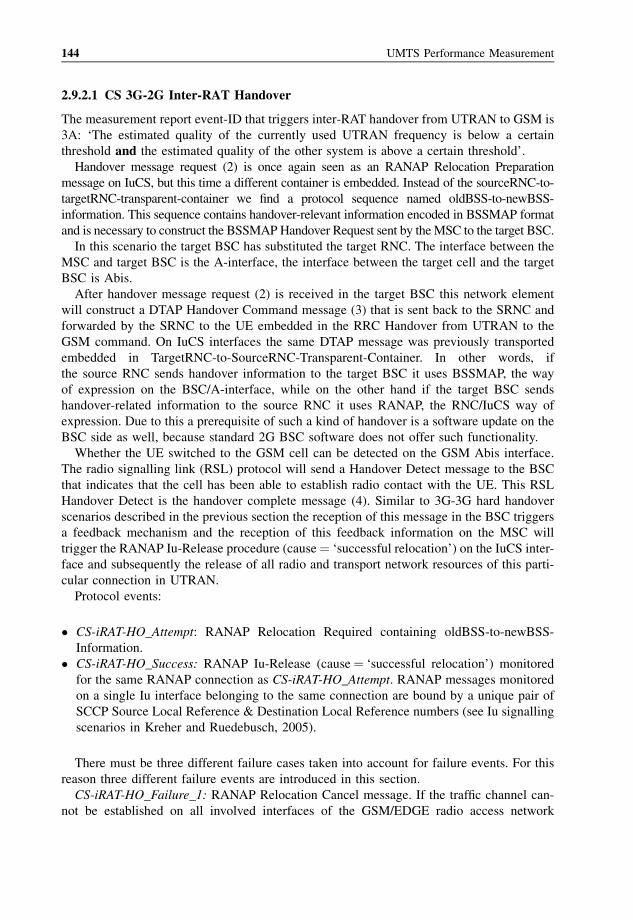
2.9.2.1 CS 3G-2G Inter-RAT Handover
The measurement report event-ID that triggers inter-RAT handover from UTRAN to GSM is
3A: ‘The estimated quality of the currently used UTRAN frequency is below a certain
threshold and the estimated quality of the other system is above a certain threshold’.
Handover message request (2) is once again seen as an RANAP Relocation Preparation
message on IuCS, but this time a different container is embedded. Instead of the sourceRNC-to-
targetRNC-transparent-container we find a protocol sequence named oldBSS-to-newBSS-
information. This sequence contains handover-relevant information encoded in BSSMAP format
and is necessary to construct the BSSMAPHandover Request sent by theMSC to the target BSC.
In this scenario the target BSC has substituted the target RNC. The interface between the
MSC and target BSC is the A-interface, the interface between the target cell and the target
BSC is Abis.
After handover message request (2) is received in the target BSC this network element
will construct a DTAP Handover Command message (3) that is sent back to the SRNC and
forwarded by the SRNC to the UE embedded in the RRC Handover from UTRAN to the
GSM command. On IuCS interfaces the same DTAP message was previously transported
embedded in TargetRNC-to-SourceRNC-Transparent-Container. In other words, if
the source RNC sends handover information to the target BSC it uses BSSMAP, the way
of expression on the BSC/A-interface, while on the other hand if the target BSC sends
handover-related information to the source RNC it uses RANAP, the RNC/IuCS way of
expression. Due to this a prerequisite of such a kind of handover is a software update on the
BSC side as well, because standard 2G BSC software does not offer such functionality.
Whether the UE switched to the GSM cell can be detected on the GSM Abis interface.
The radio signalling link (RSL) protocol will send a Handover Detect message to the BSC
that indicates that the cell has been able to establish radio contact with the UE. This RSL
Handover Detect is the handover complete message (4). Similar to 3G-3G hard handover
scenarios described in the previous section the reception of this message in the BSC triggers
a feedback mechanism and the reception of this feedback information on the MSC will
trigger the RANAP Iu-Release procedure (cause¼ ‘successful relocation’) on the IuCS inter-
face and subsequently the release of all radio and transport network resources of this parti-
cular connection in UTRAN.
Protocol events:
� CS-iRAT-HO_Attempt: RANAP Relocation Required containing oldBSS-to-newBSS-
Information.
� CS-iRAT-HO_Success: RANAP Iu-Release (cause¼ ‘successful relocation’) monitored
for the same RANAP connection as CS-iRAT-HO_Attempt. RANAP messages monitored
on a single Iu interface belonging to the same connection are bound by a unique pair of
SCCP Source Local Reference & Destination Local Reference numbers (see Iu signalling
scenarios in Kreher and Ruedebusch, 2005).
There must be three different failure cases taken into account for failure events. For this
reason three different failure events are introduced in this section.
CS-iRAT-HO_Failure_1: RANAP Relocation Cancel message. If the traffic channel can-
not be established on all involved interfaces of the GSM/EDGE radio access network
144 UMTS Performance Measurement
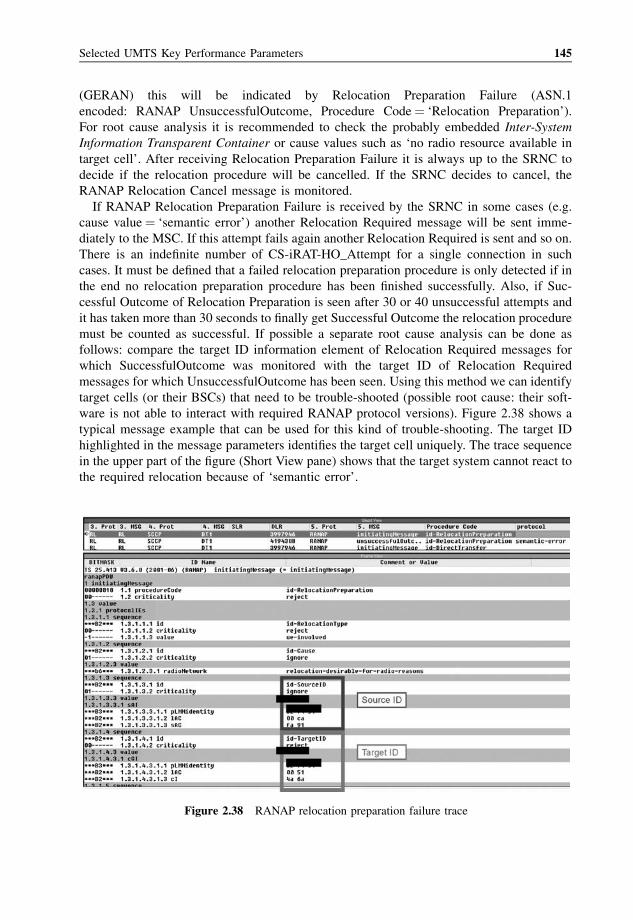
(GERAN) this will be indicated by Relocation Preparation Failure (ASN.1
encoded: RANAP UnsuccessfulOutcome, Procedure Code¼ ‘Relocation Preparation’).
For root cause analysis it is recommended to check the probably embedded Inter-System
Information Transparent Container or cause values such as ‘no radio resource available in
target cell’. After receiving Relocation Preparation Failure it is always up to the SRNC to
decide if the relocation procedure will be cancelled. If the SRNC decides to cancel, the
RANAP Relocation Cancel message is monitored.
If RANAP Relocation Preparation Failure is received by the SRNC in some cases (e.g.
cause value¼ ‘semantic error’) another Relocation Required message will be sent imme-
diately to the MSC. If this attempt fails again another Relocation Required is sent and so on.
There is an indefinite number of CS-iRAT-HO_Attempt for a single connection in such
cases. It must be defined that a failed relocation preparation procedure is only detected if in
the end no relocation preparation procedure has been finished successfully. Also, if Suc-
cessful Outcome of Relocation Preparation is seen after 30 or 40 unsuccessful attempts and
it has taken more than 30 seconds to finally get Successful Outcome the relocation procedure
must be counted as successful. If possible a separate root cause analysis can be done as
follows: compare the target ID information element of Relocation Required messages for
which SuccessfulOutcome was monitored with the target ID of Relocation Required
messages for which UnsuccessfulOutcome has been seen. Using this method we can identify
target cells (or their BSCs) that need to be trouble-shooted (possible root cause: their soft-
ware is not able to interact with required RANAP protocol versions). Figure 2.38 shows a
typical message example that can be used for this kind of trouble-shooting. The target ID
highlighted in the message parameters identifies the target cell uniquely. The trace sequence
in the upper part of the figure (Short View pane) shows that the target system cannot react to
the required relocation because of ‘semantic error’.
Figure 2.38 RANAP relocation preparation failure trace
Selected UMTS Key Performance Parameters 145
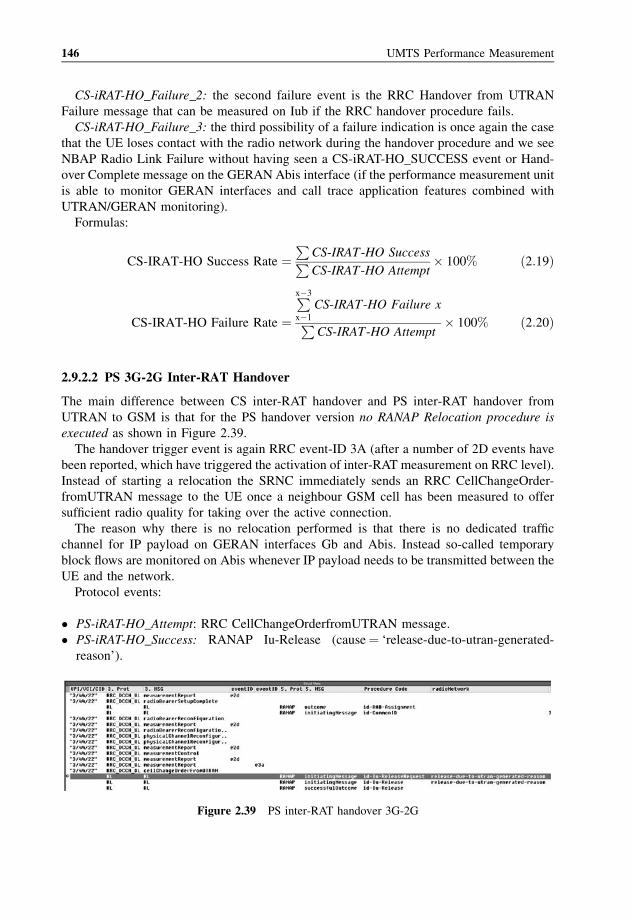
CS-iRAT-HO_Failure_2: the second failure event is the RRC Handover from UTRAN
Failure message that can be measured on Iub if the RRC handover procedure fails.
CS-iRAT-HO_Failure_3: the third possibility of a failure indication is once again the case
that the UE loses contact with the radio network during the handover procedure and we see
NBAP Radio Link Failure without having seen a CS-iRAT-HO_SUCCESS event or Hand-
over Complete message on the GERAN Abis interface (if the performance measurement unit
is able to monitor GERAN interfaces and call trace application features combined with
UTRAN/GERAN monitoring).
Formulas:
CS-IRAT-HO Success Rate ¼P
CS-IRAT-HO SuccessPCS-IRAT-HO Attempt
� 100% ð2:19Þ
CS-IRAT-HO Failure Rate ¼
Px�3
x�1
CS-IRAT-HO Failure x
PCS-IRAT-HO Attempt
� 100% ð2:20Þ
2.9.2.2 PS 3G-2G Inter-RAT Handover
The main difference between CS inter-RAT handover and PS inter-RAT handover from
UTRAN to GSM is that for the PS handover version no RANAP Relocation procedure is
executed as shown in Figure 2.39.
The handover trigger event is again RRC event-ID 3A (after a number of 2D events have
been reported, which have triggered the activation of inter-RAT measurement on RRC level).
Instead of starting a relocation the SRNC immediately sends an RRC CellChangeOrder-
fromUTRAN message to the UE once a neighbour GSM cell has been measured to offer
sufficient radio quality for taking over the active connection.
The reason why there is no relocation performed is that there is no dedicated traffic
channel for IP payload on GERAN interfaces Gb and Abis. Instead so-called temporary
block flows are monitored on Abis whenever IP payload needs to be transmitted between the
UE and the network.
Protocol events:
� PS-iRAT-HO_Attempt: RRC CellChangeOrderfromUTRAN message.
� PS-iRAT-HO_Success: RANAP Iu-Release (cause¼ ‘release-due-to-utran-generated-
reason’).
Figure 2.39 PS inter-RAT handover 3G-2G
146 UMTS Performance Measurement
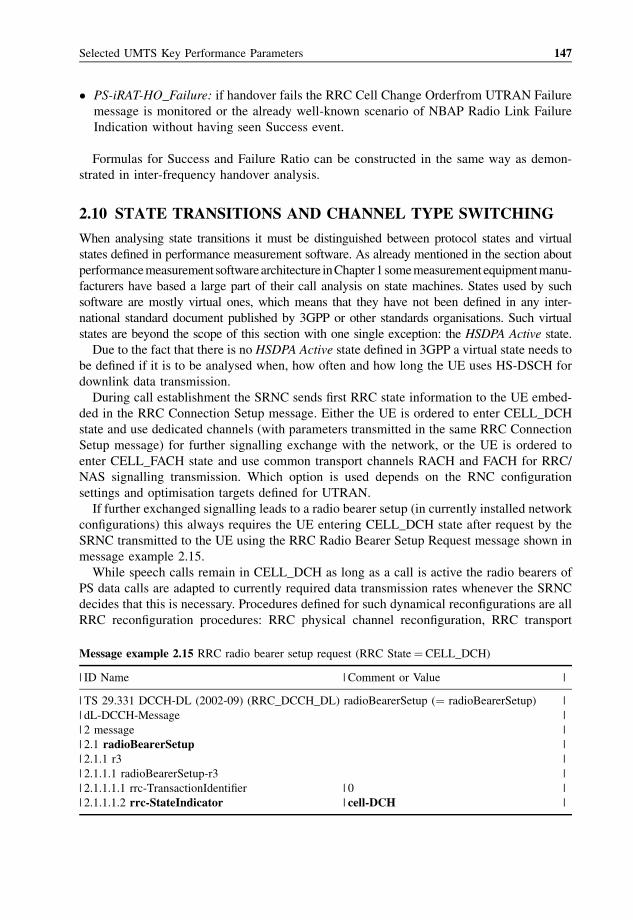
� PS-iRAT-HO_Failure: if handover fails the RRC Cell Change Orderfrom UTRAN Failure
message is monitored or the already well-known scenario of NBAP Radio Link Failure
Indication without having seen Success event.
Formulas for Success and Failure Ratio can be constructed in the same way as demon-
strated in inter-frequency handover analysis.
2.10 STATE TRANSITIONS AND CHANNEL TYPE SWITCHING
When analysing state transitions it must be distinguished between protocol states and virtual
states defined in performance measurement software. As already mentioned in the section about
performancemeasurement softwarearchitecture inChapter1somemeasurementequipmentmanu-
facturers have based a large part of their call analysis on state machines. States used by such
software are mostly virtual ones, which means that they have not been defined in any inter-
national standard document published by 3GPP or other standards organisations. Such virtual
states are beyond the scope of this section with one single exception: the HSDPA Active state.
Due to the fact that there is no HSDPA Active state defined in 3GPP a virtual state needs to
be defined if it is to be analysed when, how often and how long the UE uses HS-DSCH for
downlink data transmission.
During call establishment the SRNC sends first RRC state information to the UE embed-
ded in the RRC Connection Setup message. Either the UE is ordered to enter CELL_DCH
state and use dedicated channels (with parameters transmitted in the same RRC Connection
Setup message) for further signalling exchange with the network, or the UE is ordered to
enter CELL_FACH state and use common transport channels RACH and FACH for RRC/
NAS signalling transmission. Which option is used depends on the RNC configuration
settings and optimisation targets defined for UTRAN.
If further exchanged signalling leads to a radio bearer setup (in currently installed network
configurations) this always requires the UE entering CELL_DCH state after request by the
SRNC transmitted to the UE using the RRC Radio Bearer Setup Request message shown in
message example 2.15.
While speech calls remain in CELL_DCH as long as a call is active the radio bearers of
PS data calls are adapted to currently required data transmission rates whenever the SRNC
decides that this is necessary. Procedures defined for such dynamical reconfigurations are all
RRC reconfiguration procedures: RRC physical channel reconfiguration, RRC transport
Message example 2.15 RRC radio bearer setup request (RRC State¼ CELL_DCH)
| ID Name | Comment or Value |
| TS 29.331 DCCH-DL (2002-09) (RRC_DCCH_DL) radioBearerSetup (¼ radioBearerSetup) |
| dL-DCCH-Message |
| 2 message |
| 2.1 radioBearerSetup |
| 2.1.1 r3 |
| 2.1.1.1 radioBearerSetup-r3 |
| 2.1.1.1.1 rrc-TransactionIdentifier | 0 |
| 2.1.1.1.2 rrc-StateIndicator | cell-DCH |
Selected UMTS Key Performance Parameters 147
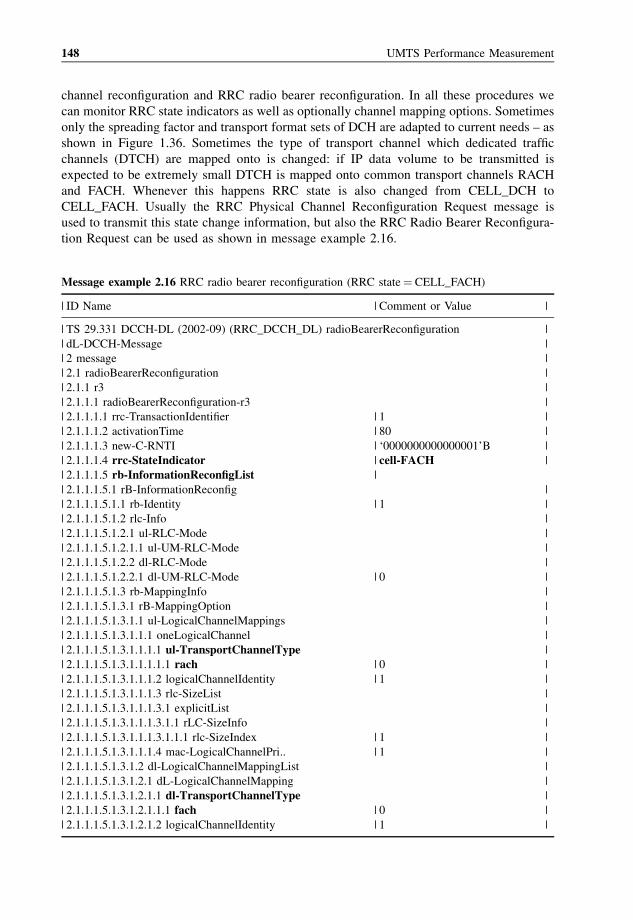
channel reconfiguration and RRC radio bearer reconfiguration. In all these procedures we
can monitor RRC state indicators as well as optionally channel mapping options. Sometimes
only the spreading factor and transport format sets of DCH are adapted to current needs – as
shown in Figure 1.36. Sometimes the type of transport channel which dedicated traffic
channels (DTCH) are mapped onto is changed: if IP data volume to be transmitted is
expected to be extremely small DTCH is mapped onto common transport channels RACH
and FACH. Whenever this happens RRC state is also changed from CELL_DCH to
CELL_FACH. Usually the RRC Physical Channel Reconfiguration Request message is
used to transmit this state change information, but also the RRC Radio Bearer Reconfigura-
tion Request can be used as shown in message example 2.16.
Message example 2.16 RRC radio bearer reconfiguration (RRC state¼ CELL_FACH)
| ID Name | Comment or Value |
| TS 29.331 DCCH-DL (2002-09) (RRC_DCCH_DL) radioBearerReconfiguration |
| dL-DCCH-Message |
| 2 message |
| 2.1 radioBearerReconfiguration |
| 2.1.1 r3 |
| 2.1.1.1 radioBearerReconfiguration-r3 |
| 2.1.1.1.1 rrc-TransactionIdentifier | 1 |
| 2.1.1.1.2 activationTime | 80 |
| 2.1.1.1.3 new-C-RNTI | ‘0000000000000001’B |
| 2.1.1.1.4 rrc-StateIndicator | cell-FACH |
| 2.1.1.1.5 rb-InformationReconfigList |
| 2.1.1.1.5.1 rB-InformationReconfig |
| 2.1.1.1.5.1.1 rb-Identity | 1 |
| 2.1.1.1.5.1.2 rlc-Info |
| 2.1.1.1.5.1.2.1 ul-RLC-Mode |
| 2.1.1.1.5.1.2.1.1 ul-UM-RLC-Mode |
| 2.1.1.1.5.1.2.2 dl-RLC-Mode |
| 2.1.1.1.5.1.2.2.1 dl-UM-RLC-Mode | 0 |
| 2.1.1.1.5.1.3 rb-MappingInfo |
| 2.1.1.1.5.1.3.1 rB-MappingOption |
| 2.1.1.1.5.1.3.1.1 ul-LogicalChannelMappings |
| 2.1.1.1.5.1.3.1.1.1 oneLogicalChannel |
| 2.1.1.1.5.1.3.1.1.1.1 ul-TransportChannelType |
| 2.1.1.1.5.1.3.1.1.1.1.1 rach | 0 |
| 2.1.1.1.5.1.3.1.1.1.2 logicalChannelIdentity | 1 |
| 2.1.1.1.5.1.3.1.1.1.3 rlc-SizeList |
| 2.1.1.1.5.1.3.1.1.1.3.1 explicitList |
| 2.1.1.1.5.1.3.1.1.1.3.1.1 rLC-SizeInfo |
| 2.1.1.1.5.1.3.1.1.1.3.1.1.1 rlc-SizeIndex | 1 |
| 2.1.1.1.5.1.3.1.1.1.4 mac-LogicalChannelPri.. | 1 |
| 2.1.1.1.5.1.3.1.2 dl-LogicalChannelMappingList |
| 2.1.1.1.5.1.3.1.2.1 dL-LogicalChannelMapping |
| 2.1.1.1.5.1.3.1.2.1.1 dl-TransportChannelType |
| 2.1.1.1.5.1.3.1.2.1.1.1 fach | 0 |
| 2.1.1.1.5.1.3.1.2.1.2 logicalChannelIdentity | 1 |
148 UMTS Performance Measurement
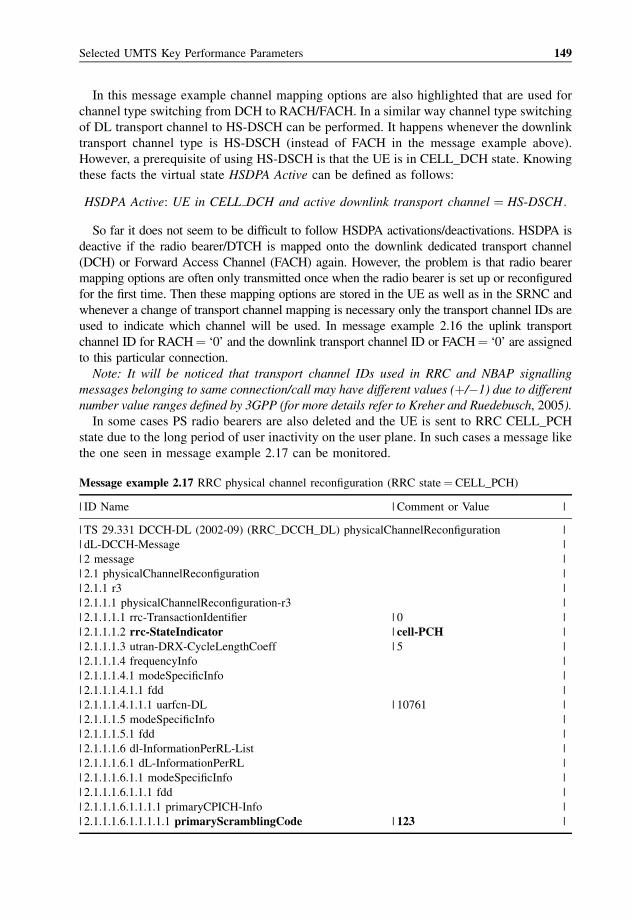
In this message example channel mapping options are also highlighted that are used for
channel type switching from DCH to RACH/FACH. In a similar way channel type switching
of DL transport channel to HS-DSCH can be performed. It happens whenever the downlink
transport channel type is HS-DSCH (instead of FACH in the message example above).
However, a prerequisite of using HS-DSCH is that the UE is in CELL_DCH state. Knowing
these facts the virtual state HSDPA Active can be defined as follows:
HSDPA Active: UE in CELL DCH and active downlink transport channel ¼ HS-DSCH:
So far it does not seem to be difficult to follow HSDPA activations/deactivations. HSDPA is
deactive if the radio bearer/DTCH is mapped onto the downlink dedicated transport channel
(DCH) or Forward Access Channel (FACH) again. However, the problem is that radio bearer
mapping options are often only transmitted once when the radio bearer is set up or reconfigured
for the first time. Then these mapping options are stored in the UE as well as in the SRNC and
whenever a change of transport channel mapping is necessary only the transport channel IDs are
used to indicate which channel will be used. In message example 2.16 the uplink transport
channel ID for RACH¼ ‘0’ and the downlink transport channel ID or FACH¼ ‘0’ are assigned
to this particular connection.
Note: It will be noticed that transport channel IDs used in RRC and NBAP signalling
messages belonging to same connection/call may have different values (þ/�1) due to different
number value ranges defined by 3GPP (for more details refer to Kreher and Ruedebusch, 2005).
In some cases PS radio bearers are also deleted and the UE is sent to RRC CELL_PCH
state due to the long period of user inactivity on the user plane. In such cases a message like
the one seen in message example 2.17 can be monitored.
Message example 2.17 RRC physical channel reconfiguration (RRC state¼ CELL_PCH)
| ID Name | Comment or Value |
| TS 29.331 DCCH-DL (2002-09) (RRC_DCCH_DL) physicalChannelReconfiguration |
| dL-DCCH-Message |
| 2 message |
| 2.1 physicalChannelReconfiguration |
| 2.1.1 r3 |
| 2.1.1.1 physicalChannelReconfiguration-r3 |
| 2.1.1.1.1 rrc-TransactionIdentifier | 0 |
| 2.1.1.1.2 rrc-StateIndicator | cell-PCH |
| 2.1.1.1.3 utran-DRX-CycleLengthCoeff | 5 |
| 2.1.1.1.4 frequencyInfo |
| 2.1.1.1.4.1 modeSpecificInfo |
| 2.1.1.1.4.1.1 fdd |
| 2.1.1.1.4.1.1.1 uarfcn-DL | 10761 |
| 2.1.1.1.5 modeSpecificInfo |
| 2.1.1.1.5.1 fdd |
| 2.1.1.1.6 dl-InformationPerRL-List |
| 2.1.1.1.6.1 dL-InformationPerRL |
| 2.1.1.1.6.1.1 modeSpecificInfo |
| 2.1.1.1.6.1.1.1 fdd |
| 2.1.1.1.6.1.1.1.1 primaryCPICH-Info |
| 2.1.1.1.6.1.1.1.1.1 primaryScramblingCode | 123 |
Selected UMTS Key Performance Parameters 149
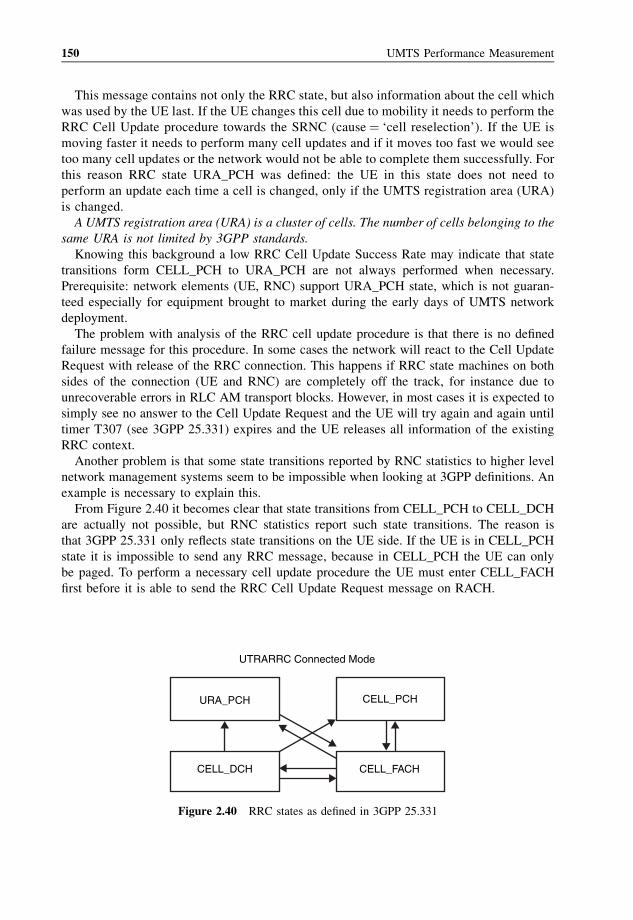
This message contains not only the RRC state, but also information about the cell which
was used by the UE last. If the UE changes this cell due to mobility it needs to perform the
RRC Cell Update procedure towards the SRNC (cause¼ ‘cell reselection’). If the UE is
moving faster it needs to perform many cell updates and if it moves too fast we would see
too many cell updates or the network would not be able to complete them successfully. For
this reason RRC state URA_PCH was defined: the UE in this state does not need to
perform an update each time a cell is changed, only if the UMTS registration area (URA)
is changed.
A UMTS registration area (URA) is a cluster of cells. The number of cells belonging to the
same URA is not limited by 3GPP standards.
Knowing this background a low RRC Cell Update Success Rate may indicate that state
transitions form CELL_PCH to URA_PCH are not always performed when necessary.
Prerequisite: network elements (UE, RNC) support URA_PCH state, which is not guaran-
teed especially for equipment brought to market during the early days of UMTS network
deployment.
The problem with analysis of the RRC cell update procedure is that there is no defined
failure message for this procedure. In some cases the network will react to the Cell Update
Request with release of the RRC connection. This happens if RRC state machines on both
sides of the connection (UE and RNC) are completely off the track, for instance due to
unrecoverable errors in RLC AM transport blocks. However, in most cases it is expected to
simply see no answer to the Cell Update Request and the UE will try again and again until
timer T307 (see 3GPP 25.331) expires and the UE releases all information of the existing
RRC context.
Another problem is that some state transitions reported by RNC statistics to higher level
network management systems seem to be impossible when looking at 3GPP definitions. An
example is necessary to explain this.
From Figure 2.40 it becomes clear that state transitions from CELL_PCH to CELL_DCH
are actually not possible, but RNC statistics report such state transitions. The reason is
that 3GPP 25.331 only reflects state transitions on the UE side. If the UE is in CELL_PCH
state it is impossible to send any RRC message, because in CELL_PCH the UE can only
be paged. To perform a necessary cell update procedure the UE must enter CELL_FACH
first before it is able to send the RRC Cell Update Request message on RACH.
UTRARRC Connected Mode
URA_PCH
CELL_DCH CELL_FACH
CELL_PCH
Figure 2.40 RRC states as defined in 3GPP 25.331
150 UMTS Performance Measurement
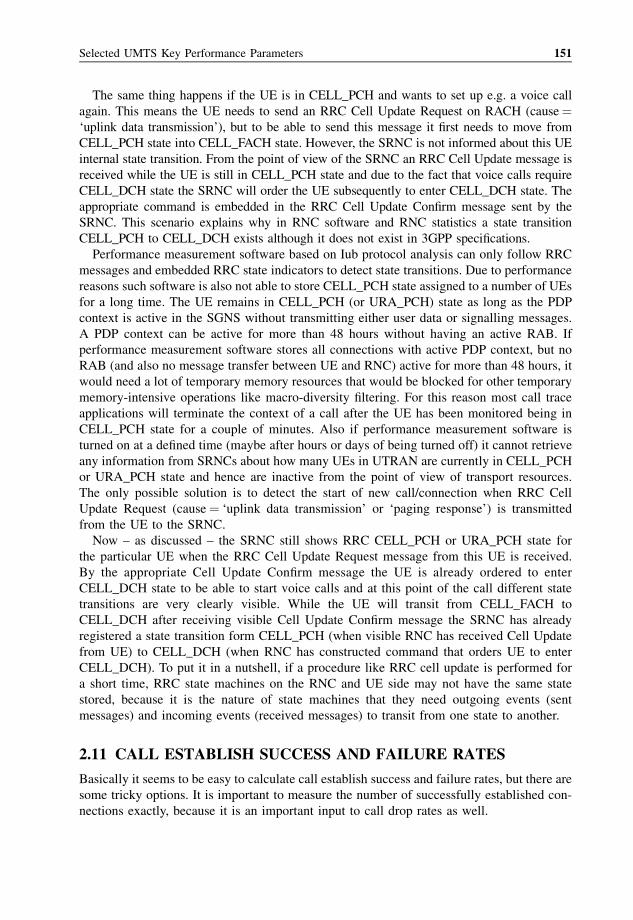
The same thing happens if the UE is in CELL_PCH and wants to set up e.g. a voice call
again. This means the UE needs to send an RRC Cell Update Request on RACH (cause¼‘uplink data transmission’), but to be able to send this message it first needs to move from
CELL_PCH state into CELL_FACH state. However, the SRNC is not informed about this UE
internal state transition. From the point of view of the SRNC an RRC Cell Update message is
received while the UE is still in CELL_PCH state and due to the fact that voice calls require
CELL_DCH state the SRNC will order the UE subsequently to enter CELL_DCH state. The
appropriate command is embedded in the RRC Cell Update Confirm message sent by the
SRNC. This scenario explains why in RNC software and RNC statistics a state transition
CELL_PCH to CELL_DCH exists although it does not exist in 3GPP specifications.
Performance measurement software based on Iub protocol analysis can only follow RRC
messages and embedded RRC state indicators to detect state transitions. Due to performance
reasons such software is also not able to store CELL_PCH state assigned to a number of UEs
for a long time. The UE remains in CELL_PCH (or URA_PCH) state as long as the PDP
context is active in the SGNS without transmitting either user data or signalling messages.
A PDP context can be active for more than 48 hours without having an active RAB. If
performance measurement software stores all connections with active PDP context, but no
RAB (and also no message transfer between UE and RNC) active for more than 48 hours, it
would need a lot of temporary memory resources that would be blocked for other temporary
memory-intensive operations like macro-diversity filtering. For this reason most call trace
applications will terminate the context of a call after the UE has been monitored being in
CELL_PCH state for a couple of minutes. Also if performance measurement software is
turned on at a defined time (maybe after hours or days of being turned off) it cannot retrieve
any information from SRNCs about how many UEs in UTRAN are currently in CELL_PCH
or URA_PCH state and hence are inactive from the point of view of transport resources.
The only possible solution is to detect the start of new call/connection when RRC Cell
Update Request (cause¼ ‘uplink data transmission’ or ‘paging response’) is transmitted
from the UE to the SRNC.
Now – as discussed – the SRNC still shows RRC CELL_PCH or URA_PCH state for
the particular UE when the RRC Cell Update Request message from this UE is received.
By the appropriate Cell Update Confirm message the UE is already ordered to enter
CELL_DCH state to be able to start voice calls and at this point of the call different state
transitions are very clearly visible. While the UE will transit from CELL_FACH to
CELL_DCH after receiving visible Cell Update Confirm message the SRNC has already
registered a state transition form CELL_PCH (when visible RNC has received Cell Update
from UE) to CELL_DCH (when RNC has constructed command that orders UE to enter
CELL_DCH). To put it in a nutshell, if a procedure like RRC cell update is performed for
a short time, RRC state machines on the RNC and UE side may not have the same state
stored, because it is the nature of state machines that they need outgoing events (sent
messages) and incoming events (received messages) to transit from one state to another.
2.11 CALL ESTABLISH SUCCESS AND FAILURE RATES
Basically it seems to be easy to calculate call establish success and failure rates, but there are
some tricky options. It is important to measure the number of successfully established con-
nections exactly, because it is an important input to call drop rates as well.
Selected UMTS Key Performance Parameters 151
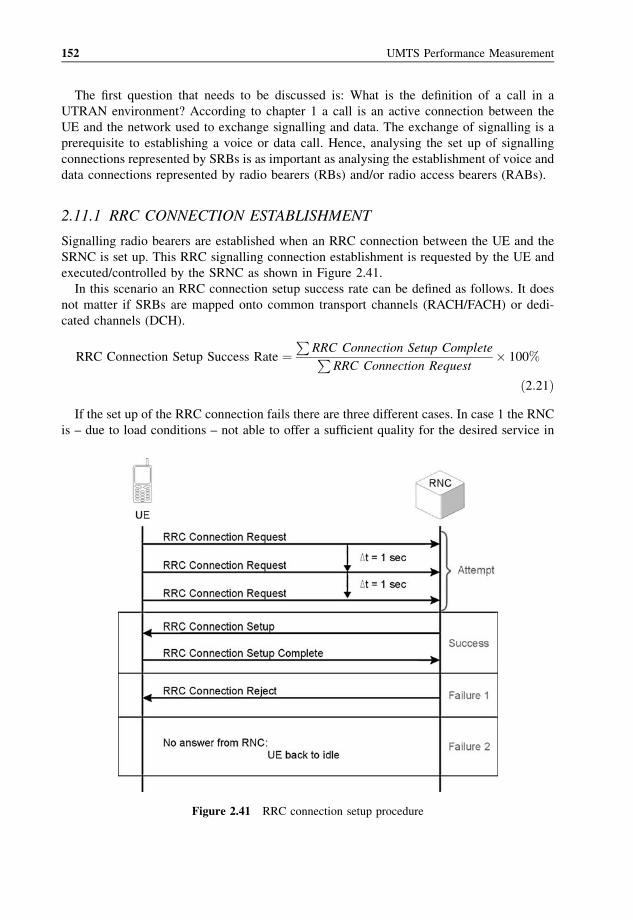
The first question that needs to be discussed is: What is the definition of a call in a
UTRAN environment? According to chapter 1 a call is an active connection between the
UE and the network used to exchange signalling and data. The exchange of signalling is a
prerequisite to establishing a voice or data call. Hence, analysing the set up of signalling
connections represented by SRBs is as important as analysing the establishment of voice and
data connections represented by radio bearers (RBs) and/or radio access bearers (RABs).
2.11.1 RRC CONNECTION ESTABLISHMENT
Signalling radio bearers are established when an RRC connection between the UE and the
SRNC is set up. This RRC signalling connection establishment is requested by the UE and
executed/controlled by the SRNC as shown in Figure 2.41.
In this scenario an RRC connection setup success rate can be defined as follows. It does
not matter if SRBs are mapped onto common transport channels (RACH/FACH) or dedi-
cated channels (DCH).
RRC Connection Setup Success Rate ¼P
RRC Connection Setup CompletePRRC Connection Request
� 100%
ð2:21Þ
If the set up of the RRC connection fails there are three different cases. In case 1 the RNC
is – due to load conditions – not able to offer a sufficient quality for the desired service in
Figure 2.41 RRC connection setup procedure
152 UMTS Performance Measurement
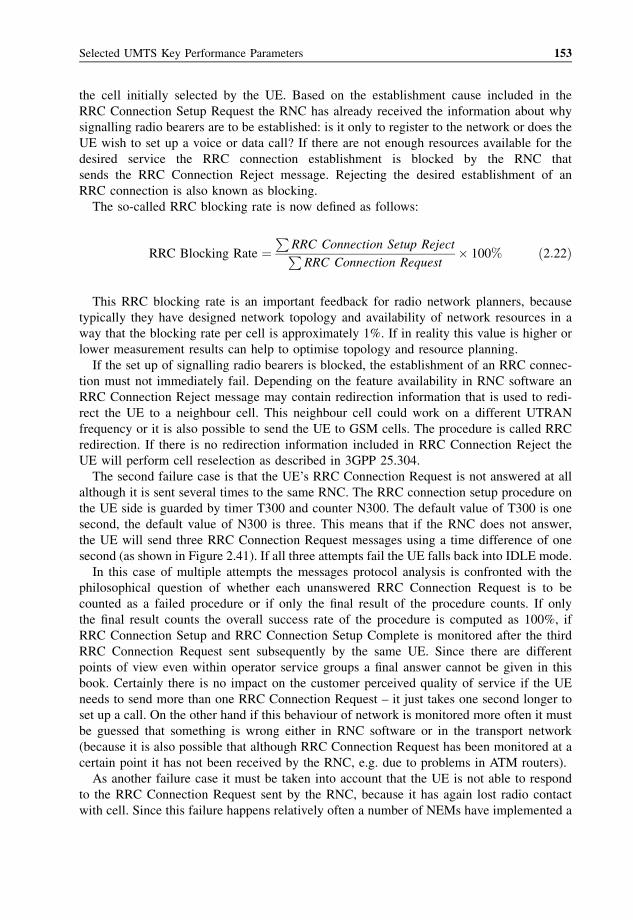
the cell initially selected by the UE. Based on the establishment cause included in the
RRC Connection Setup Request the RNC has already received the information about why
signalling radio bearers are to be established: is it only to register to the network or does the
UE wish to set up a voice or data call? If there are not enough resources available for the
desired service the RRC connection establishment is blocked by the RNC that
sends the RRC Connection Reject message. Rejecting the desired establishment of an
RRC connection is also known as blocking.
The so-called RRC blocking rate is now defined as follows:
RRC Blocking Rate ¼P
RRC Connection Setup RejectPRRC Connection Request
� 100% ð2:22Þ
This RRC blocking rate is an important feedback for radio network planners, because
typically they have designed network topology and availability of network resources in a
way that the blocking rate per cell is approximately 1%. If in reality this value is higher or
lower measurement results can help to optimise topology and resource planning.
If the set up of signalling radio bearers is blocked, the establishment of an RRC connec-
tion must not immediately fail. Depending on the feature availability in RNC software an
RRC Connection Reject message may contain redirection information that is used to redi-
rect the UE to a neighbour cell. This neighbour cell could work on a different UTRAN
frequency or it is also possible to send the UE to GSM cells. The procedure is called RRC
redirection. If there is no redirection information included in RRC Connection Reject the
UE will perform cell reselection as described in 3GPP 25.304.
The second failure case is that the UE’s RRC Connection Request is not answered at all
although it is sent several times to the same RNC. The RRC connection setup procedure on
the UE side is guarded by timer T300 and counter N300. The default value of T300 is one
second, the default value of N300 is three. This means that if the RNC does not answer,
the UE will send three RRC Connection Request messages using a time difference of one
second (as shown in Figure 2.41). If all three attempts fail the UE falls back into IDLE mode.
In this case of multiple attempts the messages protocol analysis is confronted with the
philosophical question of whether each unanswered RRC Connection Request is to be
counted as a failed procedure or if only the final result of the procedure counts. If only
the final result counts the overall success rate of the procedure is computed as 100%, if
RRC Connection Setup and RRC Connection Setup Complete is monitored after the third
RRC Connection Request sent subsequently by the same UE. Since there are different
points of view even within operator service groups a final answer cannot be given in this
book. Certainly there is no impact on the customer perceived quality of service if the UE
needs to send more than one RRC Connection Request – it just takes one second longer to
set up a call. On the other hand if this behaviour of network is monitored more often it must
be guessed that something is wrong either in RNC software or in the transport network
(because it is also possible that although RRC Connection Request has been monitored at a
certain point it has not been received by the RNC, e.g. due to problems in ATM routers).
As another failure case it must be taken into account that the UE is not able to respond
to the RRC Connection Request sent by the RNC, because it has again lost radio contact
with cell. Since this failure happens relatively often a number of NEMs have implemented a
Selected UMTS Key Performance Parameters 153
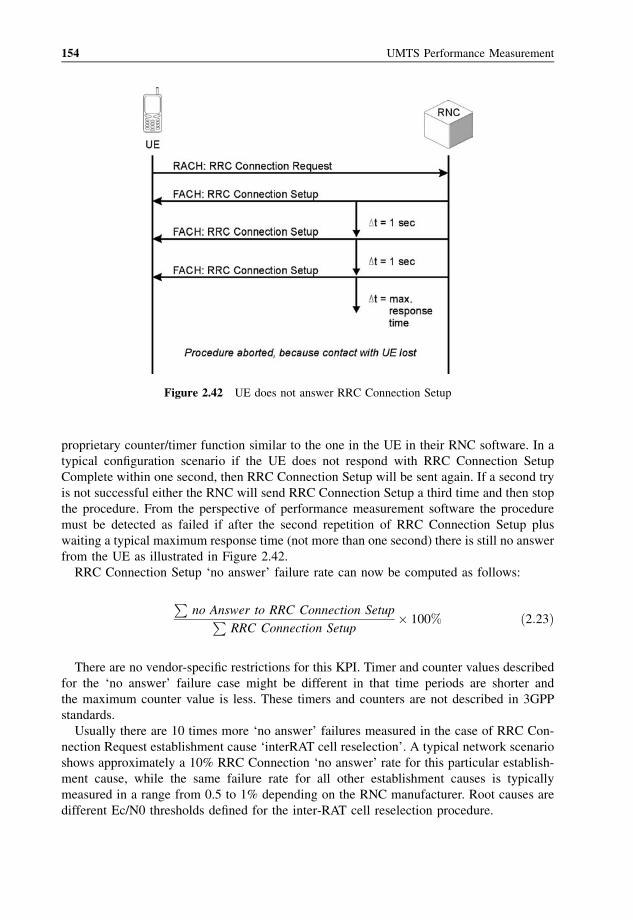
proprietary counter/timer function similar to the one in the UE in their RNC software. In a
typical configuration scenario if the UE does not respond with RRC Connection Setup
Complete within one second, then RRC Connection Setup will be sent again. If a second try
is not successful either the RNC will send RRC Connection Setup a third time and then stop
the procedure. From the perspective of performance measurement software the procedure
must be detected as failed if after the second repetition of RRC Connection Setup plus
waiting a typical maximum response time (not more than one second) there is still no answer
from the UE as illustrated in Figure 2.42.
RRC Connection Setup ‘no answer’ failure rate can now be computed as follows:
Pno Answer to RRC Connection SetupP
RRC Connection Setup� 100% ð2:23Þ
There are no vendor-specific restrictions for this KPI. Timer and counter values described
for the ‘no answer’ failure case might be different in that time periods are shorter and
the maximum counter value is less. These timers and counters are not described in 3GPP
standards.
Usually there are 10 times more ‘no answer’ failures measured in the case of RRC Con-
nection Request establishment cause ‘interRAT cell reselection’. A typical network scenario
shows approximately a 10% RRC Connection ‘no answer’ rate for this particular establish-
ment cause, while the same failure rate for all other establishment causes is typically
measured in a range from 0.5 to 1% depending on the RNC manufacturer. Root causes are
different Ec/N0 thresholds defined for the inter-RAT cell reselection procedure.
Figure 2.42 UE does not answer RRC Connection Setup
154 UMTS Performance Measurement
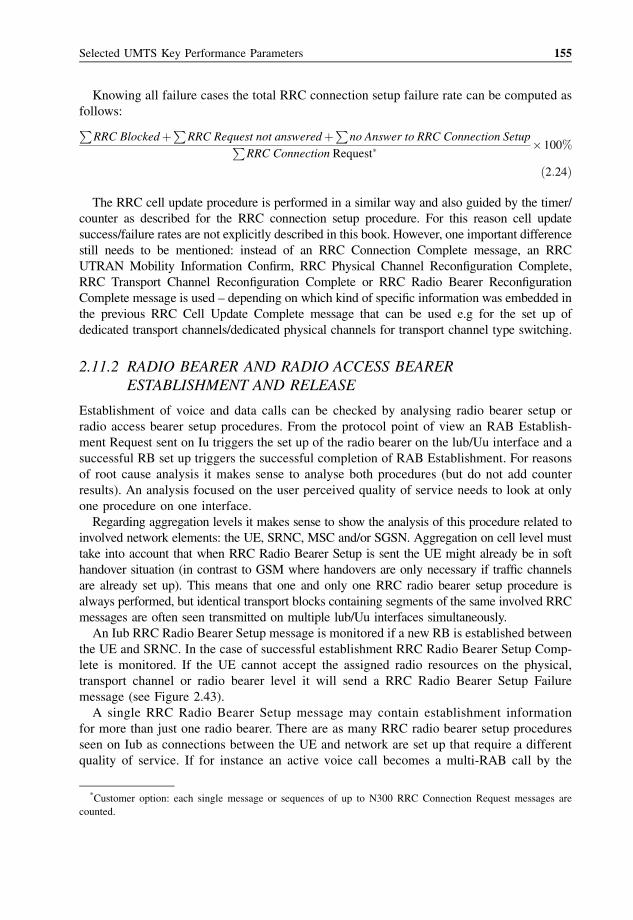
Knowing all failure cases the total RRC connection setup failure rate can be computed as
follows:
PRRC Blockedþ
PRRC Request not answeredþ
Pno Answer to RRC Connection SetupP
RRC Connection Request��100%
ð2:24Þ
The RRC cell update procedure is performed in a similar way and also guided by the timer/
counter as described for the RRC connection setup procedure. For this reason cell update
success/failure rates are not explicitly described in this book. However, one important difference
still needs to be mentioned: instead of an RRC Connection Complete message, an RRC
UTRAN Mobility Information Confirm, RRC Physical Channel Reconfiguration Complete,
RRC Transport Channel Reconfiguration Complete or RRC Radio Bearer Reconfiguration
Complete message is used – depending on which kind of specific information was embedded in
the previous RRC Cell Update Complete message that can be used e.g for the set up of
dedicated transport channels/dedicated physical channels for transport channel type switching.
2.11.2 RADIO BEARER AND RADIO ACCESS BEARERESTABLISHMENT AND RELEASE
Establishment of voice and data calls can be checked by analysing radio bearer setup or
radio access bearer setup procedures. From the protocol point of view an RAB Establish-
ment Request sent on Iu triggers the set up of the radio bearer on the lub/Uu interface and a
successful RB set up triggers the successful completion of RAB Establishment. For reasons
of root cause analysis it makes sense to analyse both procedures (but do not add counter
results). An analysis focused on the user perceived quality of service needs to look at only
one procedure on one interface.
Regarding aggregation levels it makes sense to show the analysis of this procedure related to
involved network elements: the UE, SRNC, MSC and/or SGSN. Aggregation on cell level must
take into account that when RRC Radio Bearer Setup is sent the UE might already be in soft
handover situation (in contrast to GSM where handovers are only necessary if traffic channels
are already set up). This means that one and only one RRC radio bearer setup procedure is
always performed, but identical transport blocks containing segments of the same involved RRC
messages are often seen transmitted on multiple lub/Uu interfaces simultaneously.
An Iub RRC Radio Bearer Setup message is monitored if a new RB is established between
the UE and SRNC. In the case of successful establishment RRC Radio Bearer Setup Comp-
lete is monitored. If the UE cannot accept the assigned radio resources on the physical,
transport channel or radio bearer level it will send a RRC Radio Bearer Setup Failure
message (see Figure 2.43).
A single RRC Radio Bearer Setup message may contain establishment information
for more than just one radio bearer. There are as many RRC radio bearer setup procedures
seen on Iub as connections between the UE and network are set up that require a different
quality of service. If for instance an active voice call becomes a multi-RAB call by the
*Customer option: each single message or sequences of up to N300 RRC Connection Request messages are
counted.
Selected UMTS Key Performance Parameters 155
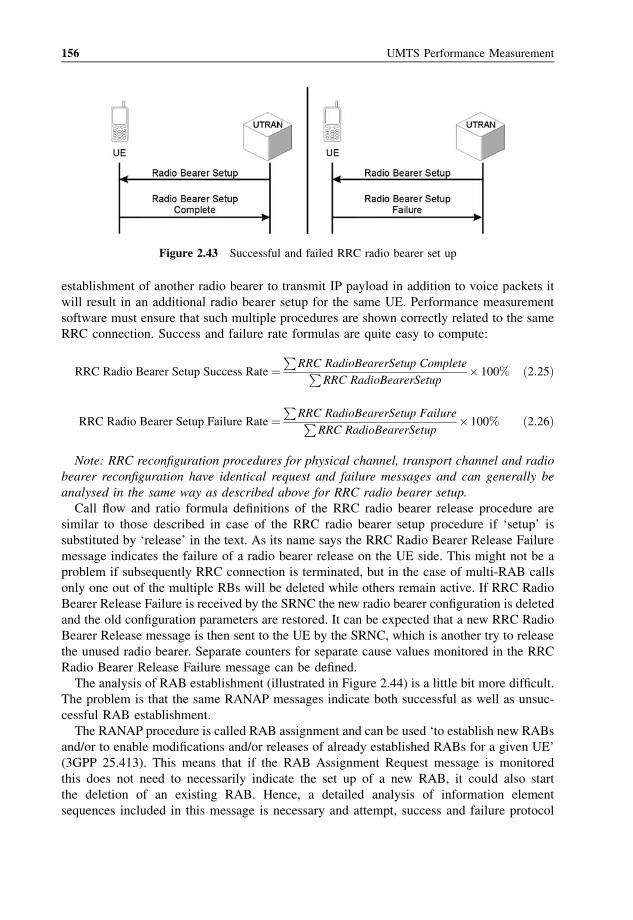
establishment of another radio bearer to transmit IP payload in addition to voice packets it
will result in an additional radio bearer setup for the same UE. Performance measurement
software must ensure that such multiple procedures are shown correctly related to the same
RRC connection. Success and failure rate formulas are quite easy to compute:
RRC Radio Bearer Setup Success Rate¼P
RRC RadioBearerSetup CompletePRRC RadioBearerSetup
� 100% ð2:25Þ
RRC Radio Bearer Setup Failure Rate¼P
RRC RadioBearerSetup FailurePRRC RadioBearerSetup
� 100% ð2:26Þ
Note: RRC reconfiguration procedures for physical channel, transport channel and radio
bearer reconfiguration have identical request and failure messages and can generally be
analysed in the same way as described above for RRC radio bearer setup.
Call flow and ratio formula definitions of the RRC radio bearer release procedure are
similar to those described in case of the RRC radio bearer setup procedure if ‘setup’ is
substituted by ‘release’ in the text. As its name says the RRC Radio Bearer Release Failure
message indicates the failure of a radio bearer release on the UE side. This might not be a
problem if subsequently RRC connection is terminated, but in the case of multi-RAB calls
only one out of the multiple RBs will be deleted while others remain active. If RRC Radio
Bearer Release Failure is received by the SRNC the new radio bearer configuration is deleted
and the old configuration parameters are restored. It can be expected that a new RRC Radio
Bearer Release message is then sent to the UE by the SRNC, which is another try to release
the unused radio bearer. Separate counters for separate cause values monitored in the RRC
Radio Bearer Release Failure message can be defined.
The analysis of RAB establishment (illustrated in Figure 2.44) is a little bit more difficult.
The problem is that the same RANAP messages indicate both successful as well as unsuc-
cessful RAB establishment.
The RANAP procedure is called RAB assignment and can be used ‘to establish new RABs
and/or to enable modifications and/or releases of already established RABs for a given UE’
(3GPP 25.413). This means that if the RAB Assignment Request message is monitored
this does not need to necessarily indicate the set up of a new RAB, it could also start
the deletion of an existing RAB. Hence, a detailed analysis of information element
sequences included in this message is necessary and attempt, success and failure protocol
Figure 2.43 Successful and failed RRC radio bearer set up
156 UMTS Performance Measurement
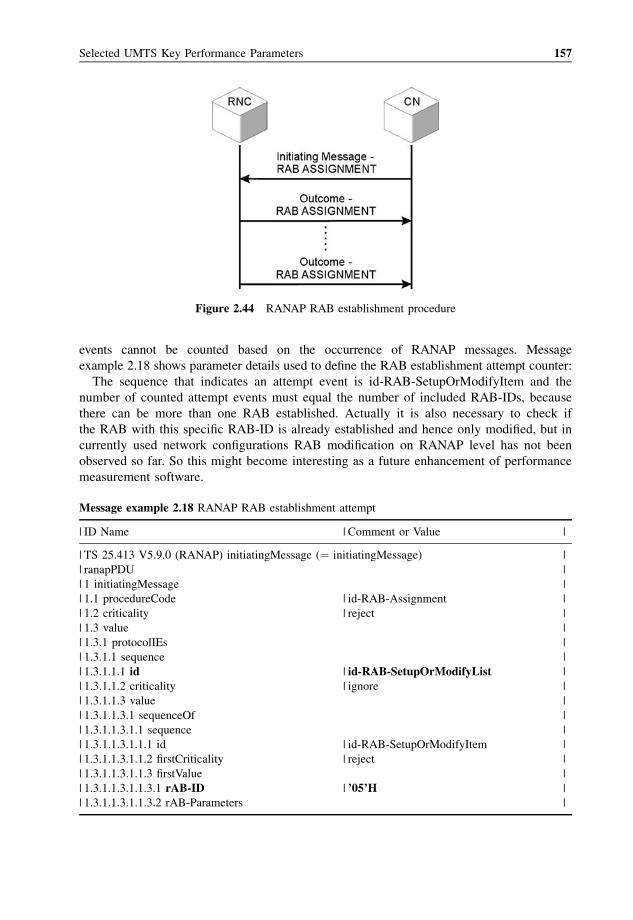
events cannot be counted based on the occurrence of RANAP messages. Message
example 2.18 shows parameter details used to define the RAB establishment attempt counter:
The sequence that indicates an attempt event is id-RAB-SetupOrModifyItem and the
number of counted attempt events must equal the number of included RAB-IDs, because
there can be more than one RAB established. Actually it is also necessary to check if
the RAB with this specific RAB-ID is already established and hence only modified, but in
currently used network configurations RAB modification on RANAP level has not been
observed so far. So this might become interesting as a future enhancement of performance
measurement software.
Figure 2.44 RANAP RAB establishment procedure
Message example 2.18 RANAP RAB establishment attempt
| ID Name | Comment or Value |
| TS 25.413 V5.9.0 (RANAP) initiatingMessage (¼ initiatingMessage) |
| ranapPDU |
| 1 initiatingMessage |
| 1.1 procedureCode | id-RAB-Assignment |
| 1.2 criticality | reject |
| 1.3 value |
| 1.3.1 protocolIEs |
| 1.3.1.1 sequence |
| 1.3.1.1.1 id | id-RAB-SetupOrModifyList |
| 1.3.1.1.2 criticality | ignore |
| 1.3.1.1.3 value |
| 1.3.1.1.3.1 sequenceOf |
| 1.3.1.1.3.1.1 sequence |
| 1.3.1.1.3.1.1.1 id | id-RAB-SetupOrModifyItem |
| 1.3.1.1.3.1.1.2 firstCriticality | reject |
| 1.3.1.1.3.1.1.3 firstValue |
| 1.3.1.1.3.1.1.3.1 rAB-ID | ’05’H |
| 1.3.1.1.3.1.1.3.2 rAB-Parameters |
Selected UMTS Key Performance Parameters 157
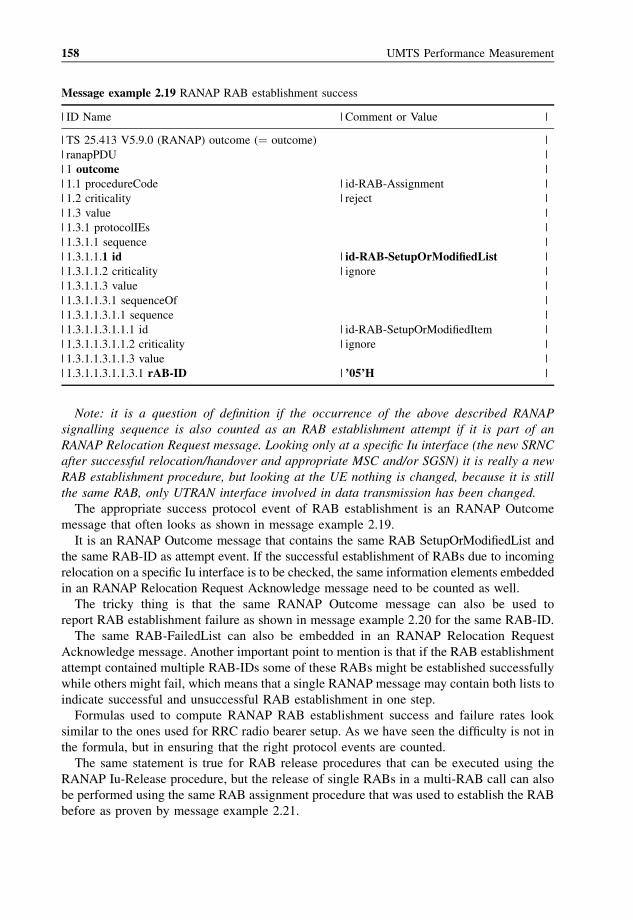
Note: it is a question of definition if the occurrence of the above described RANAP
signalling sequence is also counted as an RAB establishment attempt if it is part of an
RANAP Relocation Request message. Looking only at a specific Iu interface (the new SRNC
after successful relocation/handover and appropriate MSC and/or SGSN) it is really a new
RAB establishment procedure, but looking at the UE nothing is changed, because it is still
the same RAB, only UTRAN interface involved in data transmission has been changed.
The appropriate success protocol event of RAB establishment is an RANAP Outcome
message that often looks as shown in message example 2.19.
It is an RANAP Outcome message that contains the same RAB SetupOrModifiedList and
the same RAB-ID as attempt event. If the successful establishment of RABs due to incoming
relocation on a specific Iu interface is to be checked, the same information elements embedded
in an RANAP Relocation Request Acknowledge message need to be counted as well.
The tricky thing is that the same RANAP Outcome message can also be used to
report RAB establishment failure as shown in message example 2.20 for the same RAB-ID.
The same RAB-FailedList can also be embedded in an RANAP Relocation Request
Acknowledge message. Another important point to mention is that if the RAB establishment
attempt contained multiple RAB-IDs some of these RABs might be established successfully
while others might fail, which means that a single RANAP message may contain both lists to
indicate successful and unsuccessful RAB establishment in one step.
Formulas used to compute RANAP RAB establishment success and failure rates look
similar to the ones used for RRC radio bearer setup. As we have seen the difficulty is not in
the formula, but in ensuring that the right protocol events are counted.
The same statement is true for RAB release procedures that can be executed using the
RANAP Iu-Release procedure, but the release of single RABs in a multi-RAB call can also
be performed using the same RAB assignment procedure that was used to establish the RAB
before as proven by message example 2.21.
Message example 2.19 RANAP RAB establishment success
| ID Name | Comment or Value |
| TS 25.413 V5.9.0 (RANAP) outcome (¼ outcome) |
| ranapPDU |
| 1 outcome |
| 1.1 procedureCode | id-RAB-Assignment |
| 1.2 criticality | reject |
| 1.3 value |
| 1.3.1 protocolIEs |
| 1.3.1.1 sequence |
| 1.3.1.1.1 id | id-RAB-SetupOrModifiedList |
| 1.3.1.1.2 criticality | ignore |
| 1.3.1.1.3 value |
| 1.3.1.1.3.1 sequenceOf |
| 1.3.1.1.3.1.1 sequence |
| 1.3.1.1.3.1.1.1 id | id-RAB-SetupOrModifiedItem |
| 1.3.1.1.3.1.1.2 criticality | ignore |
| 1.3.1.1.3.1.1.3 value |
| 1.3.1.1.3.1.1.3.1 rAB-ID | ’05’H |
158 UMTS Performance Measurement
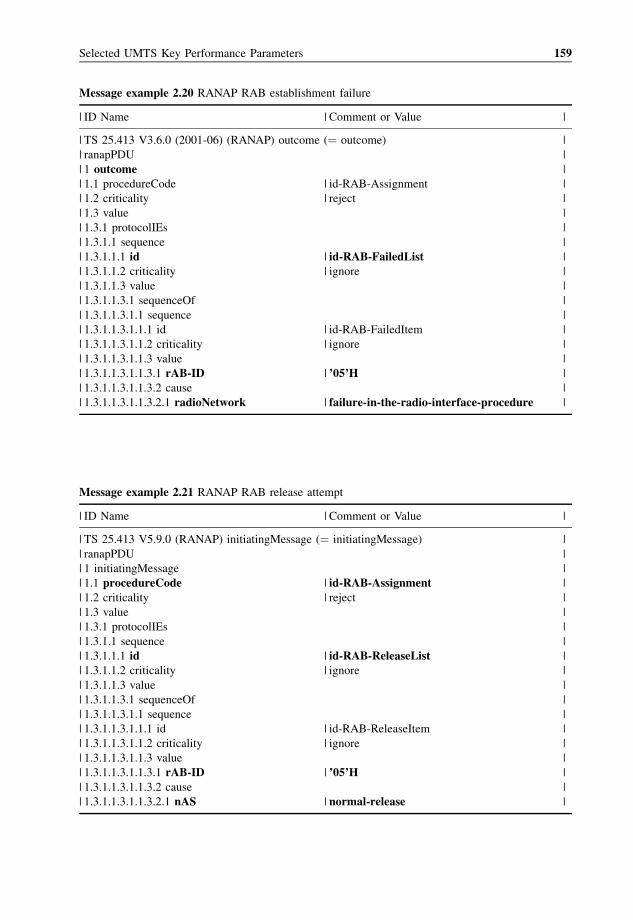
Message example 2.20 RANAP RAB establishment failure
| ID Name | Comment or Value |
| TS 25.413 V3.6.0 (2001-06) (RANAP) outcome (¼ outcome) |
| ranapPDU |
| 1 outcome |
| 1.1 procedureCode | id-RAB-Assignment |
| 1.2 criticality | reject |
| 1.3 value |
| 1.3.1 protocolIEs |
| 1.3.1.1 sequence |
| 1.3.1.1.1 id | id-RAB-FailedList |
| 1.3.1.1.2 criticality | ignore |
| 1.3.1.1.3 value |
| 1.3.1.1.3.1 sequenceOf |
| 1.3.1.1.3.1.1 sequence |
| 1.3.1.1.3.1.1.1 id | id-RAB-FailedItem |
| 1.3.1.1.3.1.1.2 criticality | ignore |
| 1.3.1.1.3.1.1.3 value |
| 1.3.1.1.3.1.1.3.1 rAB-ID | ’05’H |
| 1.3.1.1.3.1.1.3.2 cause |
| 1.3.1.1.3.1.1.3.2.1 radioNetwork | failure-in-the-radio-interface-procedure |
Message example 2.21 RANAP RAB release attempt
| ID Name | Comment or Value |
| TS 25.413 V5.9.0 (RANAP) initiatingMessage (¼ initiatingMessage) |
| ranapPDU |
| 1 initiatingMessage |
| 1.1 procedureCode | id-RAB-Assignment |
| 1.2 criticality | reject |
| 1.3 value |
| 1.3.1 protocolIEs |
| 1.3.1.1 sequence |
| 1.3.1.1.1 id | id-RAB-ReleaseList |
| 1.3.1.1.2 criticality | ignore |
| 1.3.1.1.3 value |
| 1.3.1.1.3.1 sequenceOf |
| 1.3.1.1.3.1.1 sequence |
| 1.3.1.1.3.1.1.1 id | id-RAB-ReleaseItem |
| 1.3.1.1.3.1.1.2 criticality | ignore |
| 1.3.1.1.3.1.1.3 value |
| 1.3.1.1.3.1.1.3.1 rAB-ID | ’05’H |
| 1.3.1.1.3.1.1.3.2 cause |
| 1.3.1.1.3.1.1.3.2.1 nAS | normal-release |
Selected UMTS Key Performance Parameters 159
The protocol sequence that indicates RAB Release is RAB-ReleaseList containing one or
multiple RAB-IDs. Separate counters for different cause values found in RAB Release
Attempt can be defined. As in the case of RAB establishment, the RAB release success event
contains the same protocol sequence and RAB-ID as attempt. RAB release failure is
indicated by the occurrence of RAB-ReleaseFailedList.
2.12 CALL DROP RATES
The definition of call drop rates also seems to be a philosophical discussion due to different
definitions of ‘call’. If a call is defined (as used in this book) as an active connection used to
exchange user data (e.g. voice or IP packets) between the UE and the network, the existence
of a call is bound to the existence of an RAB that consists of an RB and an Iu bearer. If either
radio bearer or Iu bearer is dropped, RAB drops subsequently.
Radio bearers use radio links (physical radio channels). If a radio bearer is mapped onto a
single radio link and this radio link goes out of order, e.g. due to synchronisation problems,
the radio bearer and the call will be seen as dropped. However, there is a chance to reinstall
radio links either if the UE and cell resynchronise themselves on the radio interface or if the
UE performs a successful RRC re-establishment procedure as already explained in chapter 1.
Due to this special nature of radio interface failures and channel re-establishment a special
analysis is recommended as explained in more detailed in section 2.13. Thus a dropped call
is defined as follows:
A dropped call is a dropped RAB:
This definition leads to the definition that a multi-RAB connection actually consists of
two or more single calls. If the radio connection to the UE is dropped all RABs are dropped
and the number of dropped calls for a particular UE rises by two or more. All in all such a
definition reflects the user perceived experience rather than problems seen in the network.
At first sight it looks as if the biggest advantage of this definition is that call drop events
can be detected relatively easily. An analysis of RAB release is enough. If release cause
indicates an abnormal reason the call has been dropped. The drop can be originated either by
UTRAN (including the SRNC) or by the core network (including foreign networks that
might be involved in calls). If UTRAN has caused the problem the drop will be started by
sending an RANAP Iu-Release Request or RAB-Release Request message, which triggers a
subsequent RANAP Iu-release procedure or RAB-release. RAB release is executed using the
same RAB assignment procedure used to establish RABs (compare message examples in
the previous section). The difference between both procedures is that in the case of
Iu-release the RANAP connection will be terminated and hence no RAB can remain active
while in the case of RAB release only the RAB is terminated, not the Iu signalling con-
nection between the SRNC and the core network element.
Note: it may happen that release causes in RANAP Iu-Release Request and the subsequent
RANAP Iu-release procedure are different (as shown in Figure 2.45). Also if Iu-Release
Request clearly indicates a failure on radio interface Iu-release may include cause value
‘normal release’, because this cause value refers to the release of RANAP dialogue only, not
to the release of RABs.
160 UMTS Performance Measurement
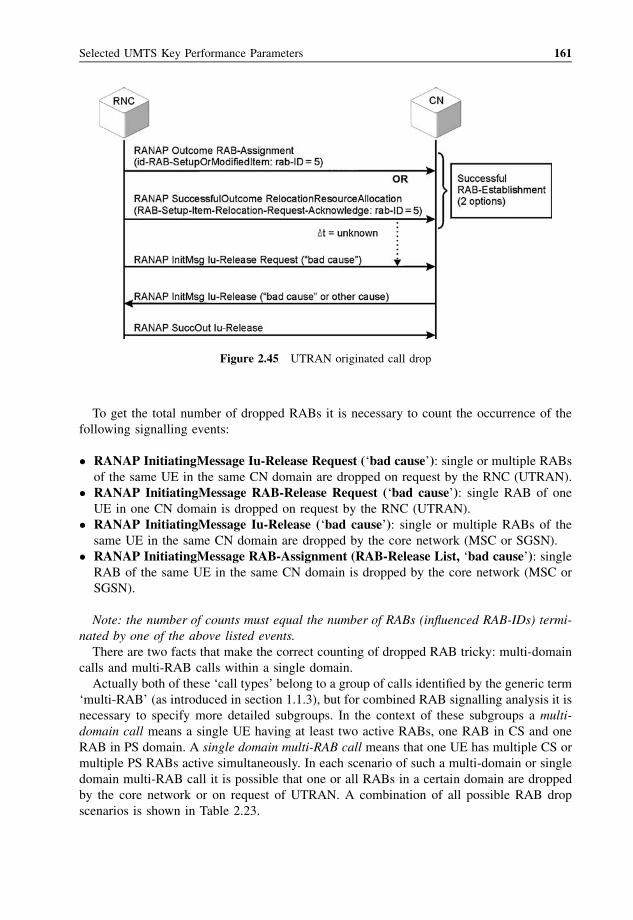
To get the total number of dropped RABs it is necessary to count the occurrence of the
following signalling events:
� RANAP InitiatingMessage Iu-Release Request (‘bad cause’): single or multiple RABs
of the same UE in the same CN domain are dropped on request by the RNC (UTRAN).
� RANAP InitiatingMessage RAB-Release Request (‘bad cause’): single RAB of one
UE in one CN domain is dropped on request by the RNC (UTRAN).
� RANAP InitiatingMessage Iu-Release (‘bad cause’): single or multiple RABs of the
same UE in the same CN domain are dropped by the core network (MSC or SGSN).
� RANAP InitiatingMessage RAB-Assignment (RAB-Release List, ‘bad cause’): singleRAB of the same UE in the same CN domain is dropped by the core network (MSC or
SGSN).
Note: the number of counts must equal the number of RABs (influenced RAB-IDs) termi-
nated by one of the above listed events.
There are two facts that make the correct counting of dropped RAB tricky: multi-domain
calls and multi-RAB calls within a single domain.
Actually both of these ‘call types’ belong to a group of calls identified by the generic term
‘multi-RAB’ (as introduced in section 1.1.3), but for combined RAB signalling analysis it is
necessary to specify more detailed subgroups. In the context of these subgroups a multi-
domain call means a single UE having at least two active RABs, one RAB in CS and one
RAB in PS domain. A single domain multi-RAB call means that one UE has multiple CS or
multiple PS RABs active simultaneously. In each scenario of such a multi-domain or single
domain multi-RAB call it is possible that one or all RABs in a certain domain are dropped
by the core network or on request of UTRAN. A combination of all possible RAB drop
scenarios is shown in Table 2.23.
Figure 2.45 UTRAN originated call drop
Selected UMTS Key Performance Parameters 161
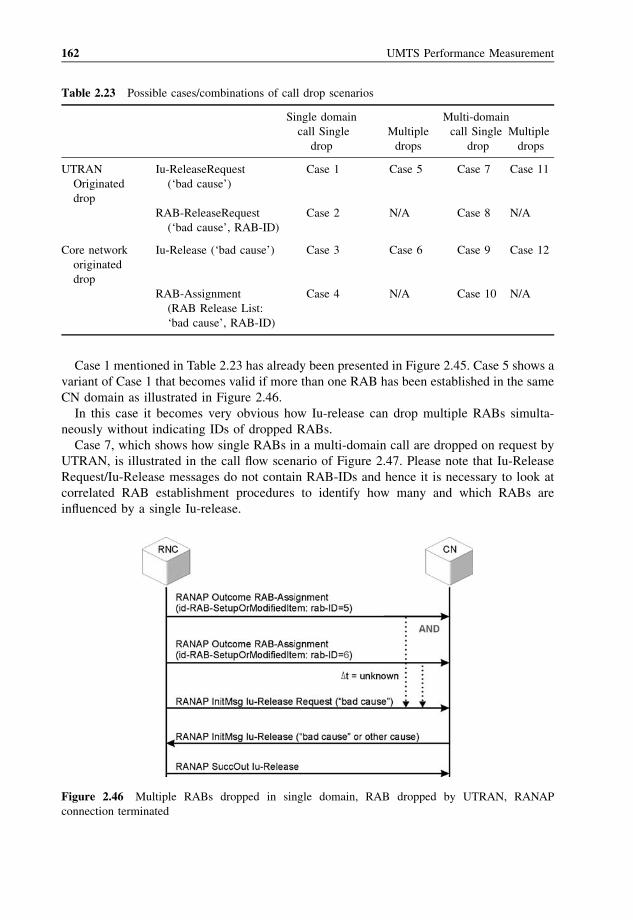
Case 1 mentioned in Table 2.23 has already been presented in Figure 2.45. Case 5 shows a
variant of Case 1 that becomes valid if more than one RAB has been established in the same
CN domain as illustrated in Figure 2.46.
In this case it becomes very obvious how Iu-release can drop multiple RABs simulta-
neously without indicating IDs of dropped RABs.
Case 7, which shows how single RABs in a multi-domain call are dropped on request by
UTRAN, is illustrated in the call flow scenario of Figure 2.47. Please note that Iu-Release
Request/Iu-Release messages do not contain RAB-IDs and hence it is necessary to look at
correlated RAB establishment procedures to identify how many and which RABs are
influenced by a single Iu-release.
Table 2.23 Possible cases/combinations of call drop scenarios
Single domain Multi-domain
call Single Multiple call Single Multiple
drop drops drop drops
UTRAN Iu-ReleaseRequest Case 1 Case 5 Case 7 Case 11
Originated (‘bad cause’)
drop
RAB-ReleaseRequest Case 2 N/A Case 8 N/A
(‘bad cause’, RAB-ID)
Core network Iu-Release (‘bad cause’) Case 3 Case 6 Case 9 Case 12
originated
drop
RAB-Assignment Case 4 N/A Case 10 N/A
(RAB Release List:
‘bad cause’, RAB-ID)
Figure 2.46 Multiple RABs dropped in single domain, RAB dropped by UTRAN, RANAP
connection terminated
162 UMTS Performance Measurement
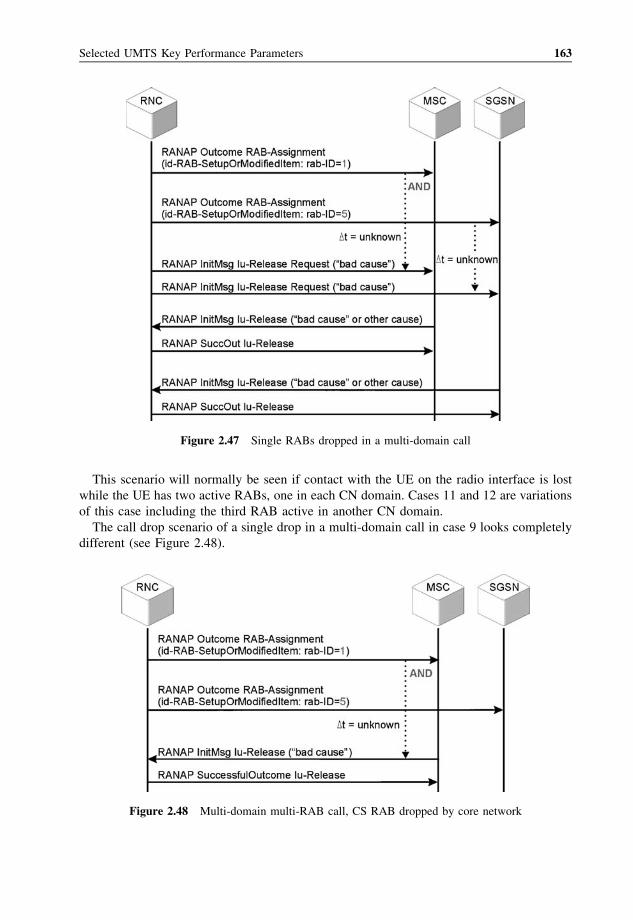
This scenario will normally be seen if contact with the UE on the radio interface is lost
while the UE has two active RABs, one in each CN domain. Cases 11 and 12 are variations
of this case including the third RAB active in another CN domain.
The call drop scenario of a single drop in a multi-domain call in case 9 looks completely
different (see Figure 2.48).
Figure 2.47 Single RABs dropped in a multi-domain call
Figure 2.48 Multi-domain multi-RAB call, CS RAB dropped by core network
Selected UMTS Key Performance Parameters 163
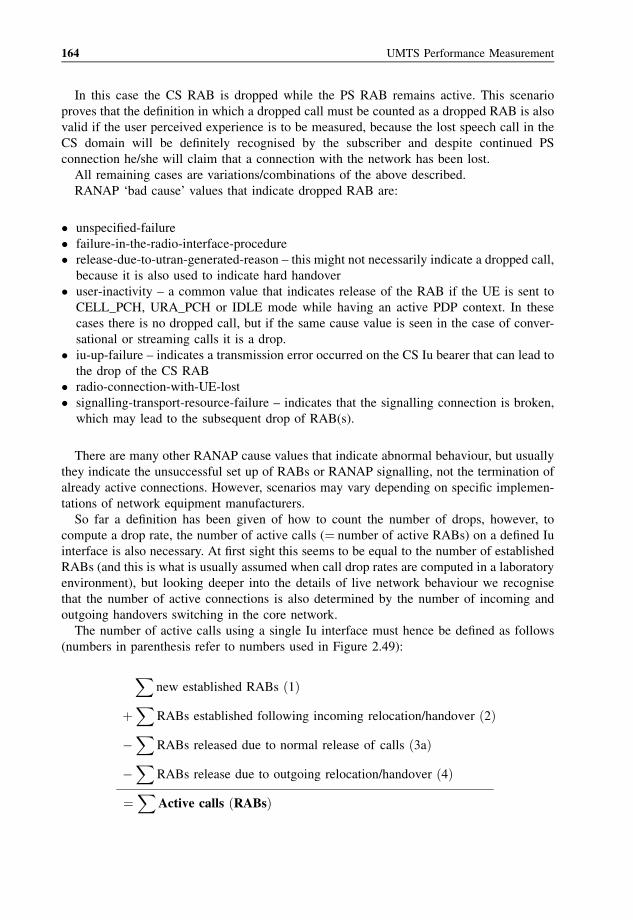
In this case the CS RAB is dropped while the PS RAB remains active. This scenario
proves that the definition in which a dropped call must be counted as a dropped RAB is also
valid if the user perceived experience is to be measured, because the lost speech call in the
CS domain will be definitely recognised by the subscriber and despite continued PS
connection he/she will claim that a connection with the network has been lost.
All remaining cases are variations/combinations of the above described.
RANAP ‘bad cause’ values that indicate dropped RAB are:
� unspecified-failure
� failure-in-the-radio-interface-procedure
� release-due-to-utran-generated-reason – this might not necessarily indicate a dropped call,
because it is also used to indicate hard handover
� user-inactivity – a common value that indicates release of the RAB if the UE is sent to
CELL_PCH, URA_PCH or IDLE mode while having an active PDP context. In these
cases there is no dropped call, but if the same cause value is seen in the case of conver-
sational or streaming calls it is a drop.
� iu-up-failure – indicates a transmission error occurred on the CS Iu bearer that can lead to
the drop of the CS RAB
� radio-connection-with-UE-lost
� signalling-transport-resource-failure – indicates that the signalling connection is broken,
which may lead to the subsequent drop of RAB(s).
There are many other RANAP cause values that indicate abnormal behaviour, but usually
they indicate the unsuccessful set up of RABs or RANAP signalling, not the termination of
already active connections. However, scenarios may vary depending on specific implemen-
tations of network equipment manufacturers.
So far a definition has been given of how to count the number of drops, however, to
compute a drop rate, the number of active calls (¼ number of active RABs) on a defined Iu
interface is also necessary. At first sight this seems to be equal to the number of established
RABs (and this is what is usually assumed when call drop rates are computed in a laboratory
environment), but looking deeper into the details of live network behaviour we recognise
that the number of active connections is also determined by the number of incoming and
outgoing handovers switching in the core network.
The number of active calls using a single Iu interface must hence be defined as follows
(numbers in parenthesis refer to numbers used in Figure 2.49):
Xnew established RABs ð1Þ
þX
RABs established following incoming relocation/handover ð2Þ
�X
RABs released due to normal release of calls ð3aÞ
�X
RABs release due to outgoing relocation/handover ð4Þ
¼X
Active calls ðRABsÞ
164 UMTS Performance Measurement
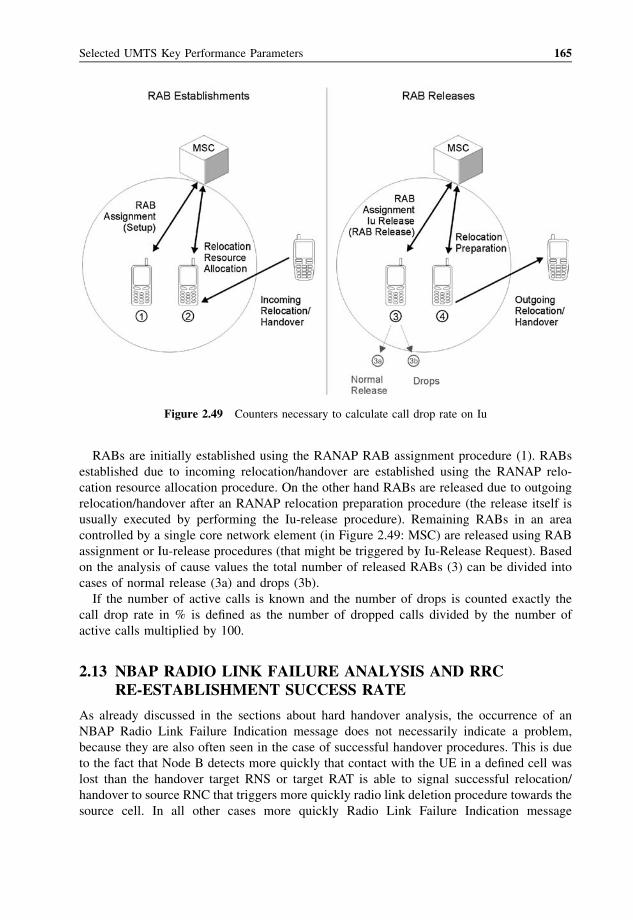
RABs are initially established using the RANAP RAB assignment procedure (1). RABs
established due to incoming relocation/handover are established using the RANAP relo-
cation resource allocation procedure. On the other hand RABs are released due to outgoing
relocation/handover after an RANAP relocation preparation procedure (the release itself is
usually executed by performing the Iu-release procedure). Remaining RABs in an area
controlled by a single core network element (in Figure 2.49: MSC) are released using RAB
assignment or Iu-release procedures (that might be triggered by Iu-Release Request). Based
on the analysis of cause values the total number of released RABs (3) can be divided into
cases of normal release (3a) and drops (3b).
If the number of active calls is known and the number of drops is counted exactly the
call drop rate in % is defined as the number of dropped calls divided by the number of
active calls multiplied by 100.
2.13 NBAP RADIO LINK FAILURE ANALYSIS AND RRCRE-ESTABLISHMENT SUCCESS RATE
As already discussed in the sections about hard handover analysis, the occurrence of an
NBAP Radio Link Failure Indication message does not necessarily indicate a problem,
because they are also often seen in the case of successful handover procedures. This is due
to the fact that Node B detects more quickly that contact with the UE in a defined cell was
lost than the handover target RNS or target RAT is able to signal successful relocation/
handover to source RNC that triggers more quickly radio link deletion procedure towards the
source cell. In all other cases more quickly Radio Link Failure Indication message
Figure 2.49 Counters necessary to calculate call drop rate on Iu
Selected UMTS Key Performance Parameters 165
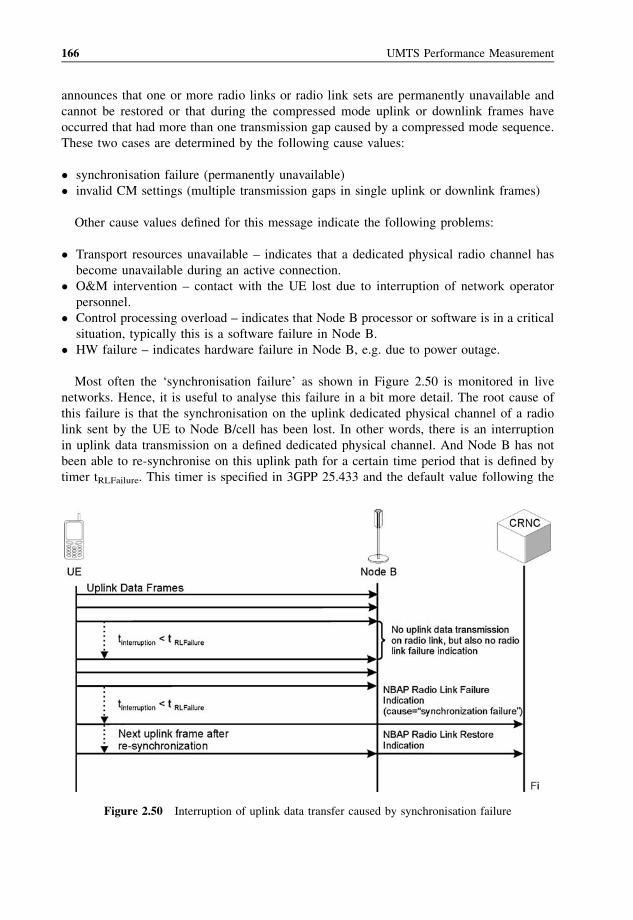
announces that one or more radio links or radio link sets are permanently unavailable and
cannot be restored or that during the compressed mode uplink or downlink frames have
occurred that had more than one transmission gap caused by a compressed mode sequence.
These two cases are determined by the following cause values:
� synchronisation failure (permanently unavailable)
� invalid CM settings (multiple transmission gaps in single uplink or downlink frames)
Other cause values defined for this message indicate the following problems:
� Transport resources unavailable – indicates that a dedicated physical radio channel has
become unavailable during an active connection.
� O&M intervention – contact with the UE lost due to interruption of network operator
personnel.
� Control processing overload – indicates that Node B processor or software is in a critical
situation, typically this is a software failure in Node B.
� HW failure – indicates hardware failure in Node B, e.g. due to power outage.
Most often the ‘synchronisation failure’ as shown in Figure 2.50 is monitored in live
networks. Hence, it is useful to analyse this failure in a bit more detail. The root cause of
this failure is that the synchronisation on the uplink dedicated physical channel of a radio
link sent by the UE to Node B/cell has been lost. In other words, there is an interruption
in uplink data transmission on a defined dedicated physical channel. And Node B has not
been able to re-synchronise on this uplink path for a certain time period that is defined by
timer tRLFailure. This timer is specified in 3GPP 25.433 and the default value following the
Figure 2.50 Interruption of uplink data transfer caused by synchronisation failure
166 UMTS Performance Measurement
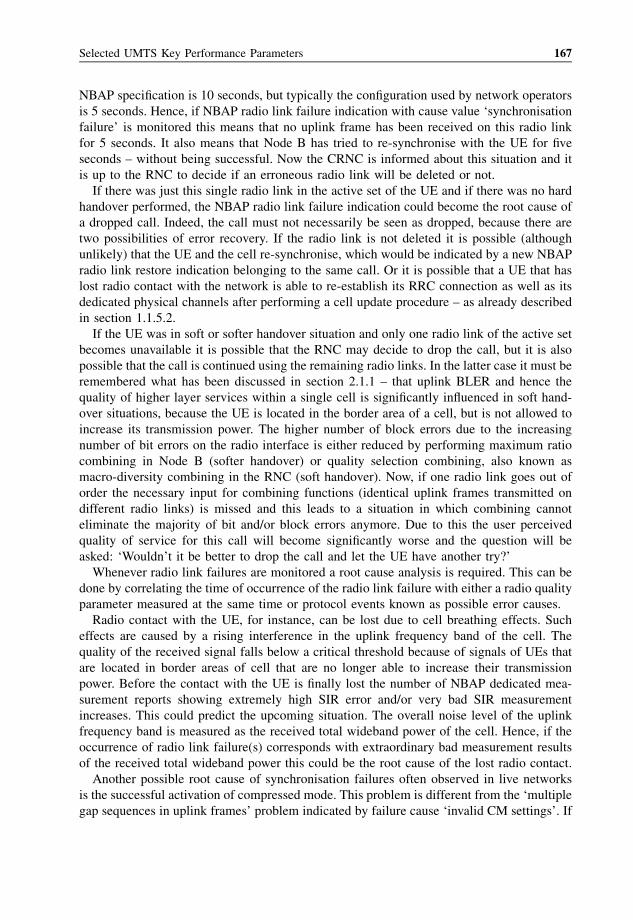
NBAP specification is 10 seconds, but typically the configuration used by network operators
is 5 seconds. Hence, if NBAP radio link failure indication with cause value ‘synchronisation
failure’ is monitored this means that no uplink frame has been received on this radio link
for 5 seconds. It also means that Node B has tried to re-synchronise with the UE for five
seconds – without being successful. Now the CRNC is informed about this situation and it
is up to the RNC to decide if an erroneous radio link will be deleted or not.
If there was just this single radio link in the active set of the UE and if there was no hard
handover performed, the NBAP radio link failure indication could become the root cause of
a dropped call. Indeed, the call must not necessarily be seen as dropped, because there are
two possibilities of error recovery. If the radio link is not deleted it is possible (although
unlikely) that the UE and the cell re-synchronise, which would be indicated by a new NBAP
radio link restore indication belonging to the same call. Or it is possible that a UE that has
lost radio contact with the network is able to re-establish its RRC connection as well as its
dedicated physical channels after performing a cell update procedure – as already described
in section 1.1.5.2.
If the UE was in soft or softer handover situation and only one radio link of the active set
becomes unavailable it is possible that the RNC may decide to drop the call, but it is also
possible that the call is continued using the remaining radio links. In the latter case it must be
remembered what has been discussed in section 2.1.1 – that uplink BLER and hence the
quality of higher layer services within a single cell is significantly influenced in soft hand-
over situations, because the UE is located in the border area of a cell, but is not allowed to
increase its transmission power. The higher number of block errors due to the increasing
number of bit errors on the radio interface is either reduced by performing maximum ratio
combining in Node B (softer handover) or quality selection combining, also known as
macro-diversity combining in the RNC (soft handover). Now, if one radio link goes out of
order the necessary input for combining functions (identical uplink frames transmitted on
different radio links) is missed and this leads to a situation in which combining cannot
eliminate the majority of bit and/or block errors anymore. Due to this the user perceived
quality of service for this call will become significantly worse and the question will be
asked: ‘Wouldn’t it be better to drop the call and let the UE have another try?’
Whenever radio link failures are monitored a root cause analysis is required. This can be
done by correlating the time of occurrence of the radio link failure with either a radio quality
parameter measured at the same time or protocol events known as possible error causes.
Radio contact with the UE, for instance, can be lost due to cell breathing effects. Such
effects are caused by a rising interference in the uplink frequency band of the cell. The
quality of the received signal falls below a critical threshold because of signals of UEs that
are located in border areas of cell that are no longer able to increase their transmission
power. Before the contact with the UE is finally lost the number of NBAP dedicated mea-
surement reports showing extremely high SIR error and/or very bad SIR measurement
increases. This could predict the upcoming situation. The overall noise level of the uplink
frequency band is measured as the received total wideband power of the cell. Hence, if the
occurrence of radio link failure(s) corresponds with extraordinary bad measurement results
of the received total wideband power this could be the root cause of the lost radio contact.
Another possible root cause of synchronisation failures often observed in live networks
is the successful activation of compressed mode. This problem is different from the ‘multiple
gap sequences in uplink frames’ problem indicated by failure cause ‘invalid CM settings’. If
Selected UMTS Key Performance Parameters 167
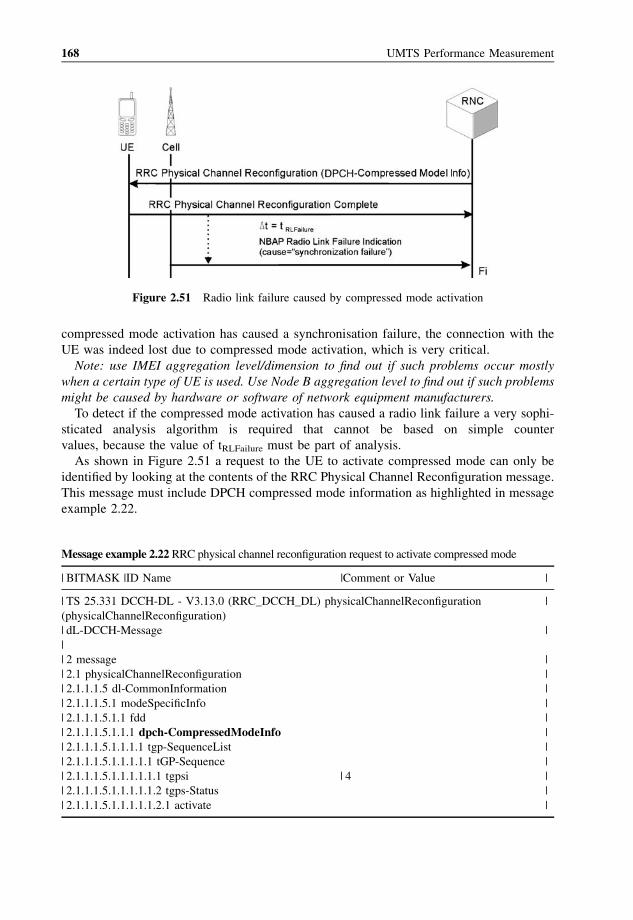
compressed mode activation has caused a synchronisation failure, the connection with the
UE was indeed lost due to compressed mode activation, which is very critical.
Note: use IMEI aggregation level/dimension to find out if such problems occur mostly
when a certain type of UE is used. Use Node B aggregation level to find out if such problems
might be caused by hardware or software of network equipment manufacturers.
To detect if the compressed mode activation has caused a radio link failure a very sophi-
sticated analysis algorithm is required that cannot be based on simple counter
values, because the value of tRLFailure must be part of analysis.
As shown in Figure 2.51 a request to the UE to activate compressed mode can only be
identified by looking at the contents of the RRC Physical Channel Reconfiguration message.
This message must include DPCH compressed mode information as highlighted in message
example 2.22.
Figure 2.51 Radio link failure caused by compressed mode activation
Message example 2.22 RRC physical channel reconfiguration request to activate compressed mode
| BITMASK |ID Name |Comment or Value |
| TS 25.331 DCCH-DL - V3.13.0 (RRC_DCCH_DL) physicalChannelReconfiguration |
(physicalChannelReconfiguration)
| dL-DCCH-Message |
|
| 2 message |
| 2.1 physicalChannelReconfiguration |
| 2.1.1.1.5 dl-CommonInformation |
| 2.1.1.1.5.1 modeSpecificInfo |
| 2.1.1.1.5.1.1 fdd |
| 2.1.1.1.5.1.1.1 dpch-CompressedModeInfo |
| 2.1.1.1.5.1.1.1.1 tgp-SequenceList |
| 2.1.1.1.5.1.1.1.1.1 tGP-Sequence |
| 2.1.1.1.5.1.1.1.1.1.1 tgpsi | 4 |
| 2.1.1.1.5.1.1.1.1.1.2 tgps-Status |
| 2.1.1.1.5.1.1.1.1.1.2.1 activate |
168 UMTS Performance Measurement
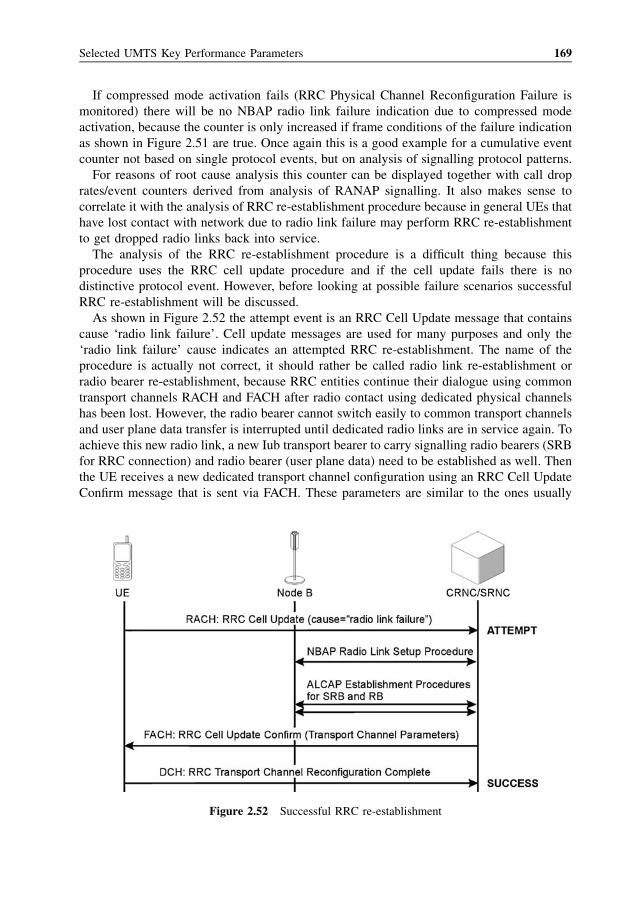
If compressed mode activation fails (RRC Physical Channel Reconfiguration Failure is
monitored) there will be no NBAP radio link failure indication due to compressed mode
activation, because the counter is only increased if frame conditions of the failure indication
as shown in Figure 2.51 are true. Once again this is a good example for a cumulative event
counter not based on single protocol events, but on analysis of signalling protocol patterns.
For reasons of root cause analysis this counter can be displayed together with call drop
rates/event counters derived from analysis of RANAP signalling. It also makes sense to
correlate it with the analysis of RRC re-establishment procedure because in general UEs that
have lost contact with network due to radio link failure may perform RRC re-establishment
to get dropped radio links back into service.
The analysis of the RRC re-establishment procedure is a difficult thing because this
procedure uses the RRC cell update procedure and if the cell update fails there is no
distinctive protocol event. However, before looking at possible failure scenarios successful
RRC re-establishment will be discussed.
As shown in Figure 2.52 the attempt event is an RRC Cell Update message that contains
cause ‘radio link failure’. Cell update messages are used for many purposes and only the
‘radio link failure’ cause indicates an attempted RRC re-establishment. The name of the
procedure is actually not correct, it should rather be called radio link re-establishment or
radio bearer re-establishment, because RRC entities continue their dialogue using common
transport channels RACH and FACH after radio contact using dedicated physical channels
has been lost. However, the radio bearer cannot switch easily to common transport channels
and user plane data transfer is interrupted until dedicated radio links are in service again. To
achieve this new radio link, a new Iub transport bearer to carry signalling radio bearers (SRB
for RRC connection) and radio bearer (user plane data) need to be established as well. Then
the UE receives a new dedicated transport channel configuration using an RRC Cell Update
Confirm message that is sent via FACH. These parameters are similar to the ones usually
Figure 2.52 Successful RRC re-establishment
Selected UMTS Key Performance Parameters 169
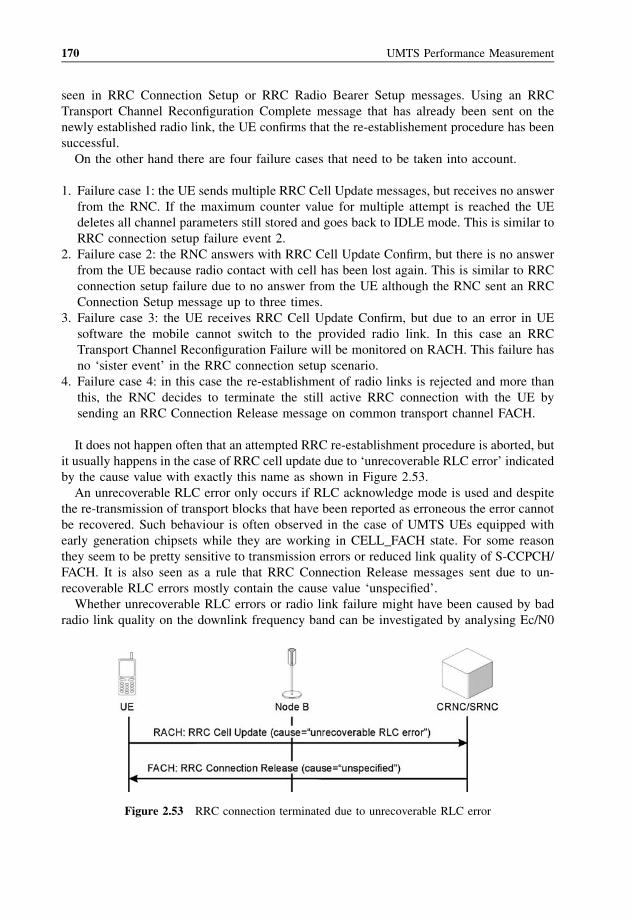
seen in RRC Connection Setup or RRC Radio Bearer Setup messages. Using an RRC
Transport Channel Reconfiguration Complete message that has already been sent on the
newly established radio link, the UE confirms that the re-establishement procedure has been
successful.
On the other hand there are four failure cases that need to be taken into account.
1. Failure case 1: the UE sends multiple RRC Cell Update messages, but receives no answer
from the RNC. If the maximum counter value for multiple attempt is reached the UE
deletes all channel parameters still stored and goes back to IDLE mode. This is similar to
RRC connection setup failure event 2.
2. Failure case 2: the RNC answers with RRC Cell Update Confirm, but there is no answer
from the UE because radio contact with cell has been lost again. This is similar to RRC
connection setup failure due to no answer from the UE although the RNC sent an RRC
Connection Setup message up to three times.
3. Failure case 3: the UE receives RRC Cell Update Confirm, but due to an error in UE
software the mobile cannot switch to the provided radio link. In this case an RRC
Transport Channel Reconfiguration Failure will be monitored on RACH. This failure has
no ‘sister event’ in the RRC connection setup scenario.
4. Failure case 4: in this case the re-establishment of radio links is rejected and more than
this, the RNC decides to terminate the still active RRC connection with the UE by
sending an RRC Connection Release message on common transport channel FACH.
It does not happen often that an attempted RRC re-establishment procedure is aborted, but
it usually happens in the case of RRC cell update due to ‘unrecoverable RLC error’ indicated
by the cause value with exactly this name as shown in Figure 2.53.
An unrecoverable RLC error only occurs if RLC acknowledge mode is used and despite
the re-transmission of transport blocks that have been reported as erroneous the error cannot
be recovered. Such behaviour is often observed in the case of UMTS UEs equipped with
early generation chipsets while they are working in CELL_FACH state. For some reason
they seem to be pretty sensitive to transmission errors or reduced link quality of S-CCPCH/
FACH. It is also seen as a rule that RRC Connection Release messages sent due to un-
recoverable RLC errors mostly contain the cause value ‘unspecified’.
Whether unrecoverable RLC errors or radio link failure might have been caused by bad
radio link quality on the downlink frequency band can be investigated by analysing Ec/N0
Figure 2.53 RRC connection terminated due to unrecoverable RLC error
170 UMTS Performance Measurement
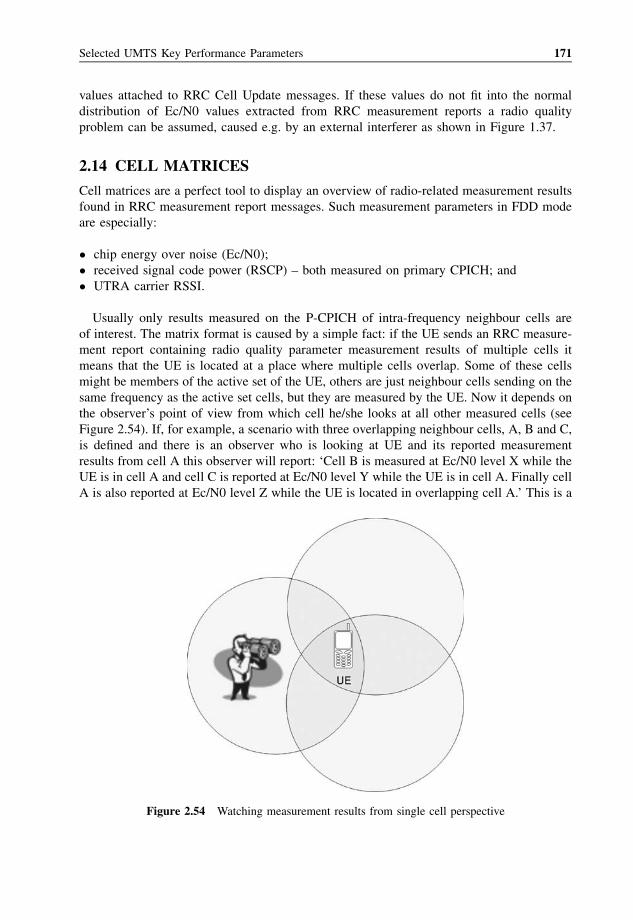
values attached to RRC Cell Update messages. If these values do not fit into the normal
distribution of Ec/N0 values extracted from RRC measurement reports a radio quality
problem can be assumed, caused e.g. by an external interferer as shown in Figure 1.37.
2.14 CELL MATRICES
Cell matrices are a perfect tool to display an overview of radio-related measurement results
found in RRC measurement report messages. Such measurement parameters in FDD mode
are especially:
� chip energy over noise (Ec/N0);
� received signal code power (RSCP) – both measured on primary CPICH; and
� UTRA carrier RSSI.
Usually only results measured on the P-CPICH of intra-frequency neighbour cells are
of interest. The matrix format is caused by a simple fact: if the UE sends an RRC measure-
ment report containing radio quality parameter measurement results of multiple cells it
means that the UE is located at a place where multiple cells overlap. Some of these cells
might be members of the active set of the UE, others are just neighbour cells sending on the
same frequency as the active set cells, but they are measured by the UE. Now it depends on
the observer’s point of view from which cell he/she looks at all other measured cells (see
Figure 2.54). If, for example, a scenario with three overlapping neighbour cells, A, B and C,
is defined and there is an observer who is looking at UE and its reported measurement
results from cell A this observer will report: ‘Cell B is measured at Ec/N0 level X while the
UE is in cell A and cell C is reported at Ec/N0 level Y while the UE is in cell A. Finally cell
A is also reported at Ec/N0 level Z while the UE is located in overlapping cell A.’ This is a
Figure 2.54 Watching measurement results from single cell perspective
Selected UMTS Key Performance Parameters 171
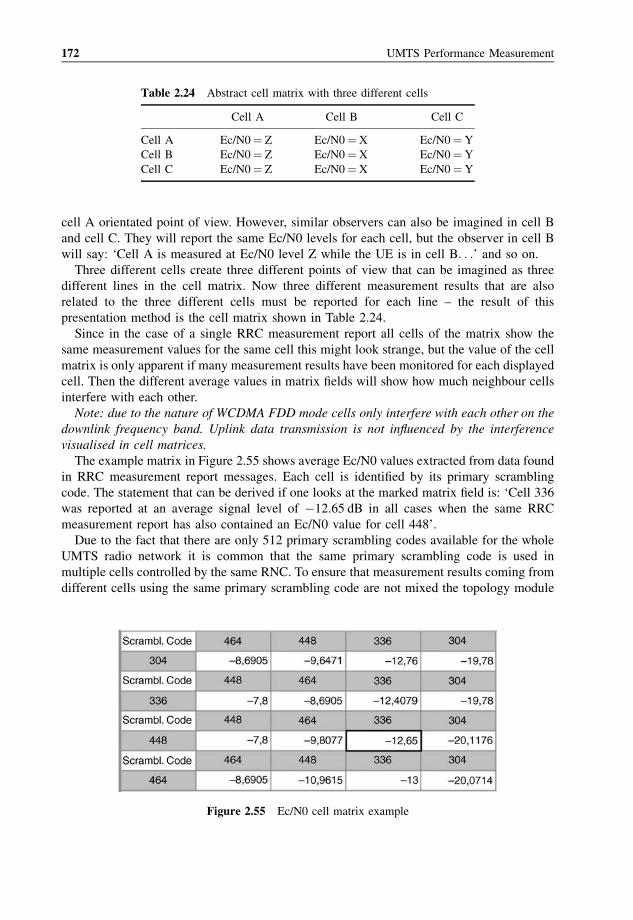
cell A orientated point of view. However, similar observers can also be imagined in cell B
and cell C. They will report the same Ec/N0 levels for each cell, but the observer in cell B
will say: ‘Cell A is measured at Ec/N0 level Z while the UE is in cell B. . .’ and so on.
Three different cells create three different points of view that can be imagined as three
different lines in the cell matrix. Now three different measurement results that are also
related to the three different cells must be reported for each line – the result of this
presentation method is the cell matrix shown in Table 2.24.
Since in the case of a single RRC measurement report all cells of the matrix show the
same measurement values for the same cell this might look strange, but the value of the cell
matrix is only apparent if many measurement results have been monitored for each displayed
cell. Then the different average values in matrix fields will show how much neighbour cells
interfere with each other.
Note: due to the nature of WCDMA FDD mode cells only interfere with each other on the
downlink frequency band. Uplink data transmission is not influenced by the interference
visualised in cell matrices.
The example matrix in Figure 2.55 shows average Ec/N0 values extracted from data found
in RRC measurement report messages. Each cell is identified by its primary scrambling
code. The statement that can be derived if one looks at the marked matrix field is: ‘Cell 336
was reported at an average signal level of �12.65 dB in all cases when the same RRC
measurement report has also contained an Ec/N0 value for cell 448’.
Due to the fact that there are only 512 primary scrambling codes available for the whole
UMTS radio network it is common that the same primary scrambling code is used in
multiple cells controlled by the same RNC. To ensure that measurement results coming from
different cells using the same primary scrambling code are not mixed the topology module
Table 2.24 Abstract cell matrix with three different cells
Cell A Cell B Cell C
Cell A Ec/N0¼ Z Ec/N0¼X Ec/N0¼Y
Cell B Ec/N0¼ Z Ec/N0¼X Ec/N0¼Y
Cell C Ec/N0¼ Z Ec/N0¼X Ec/N0¼Y
Figure 2.55 Ec/N0 cell matrix example
172 UMTS Performance Measurement
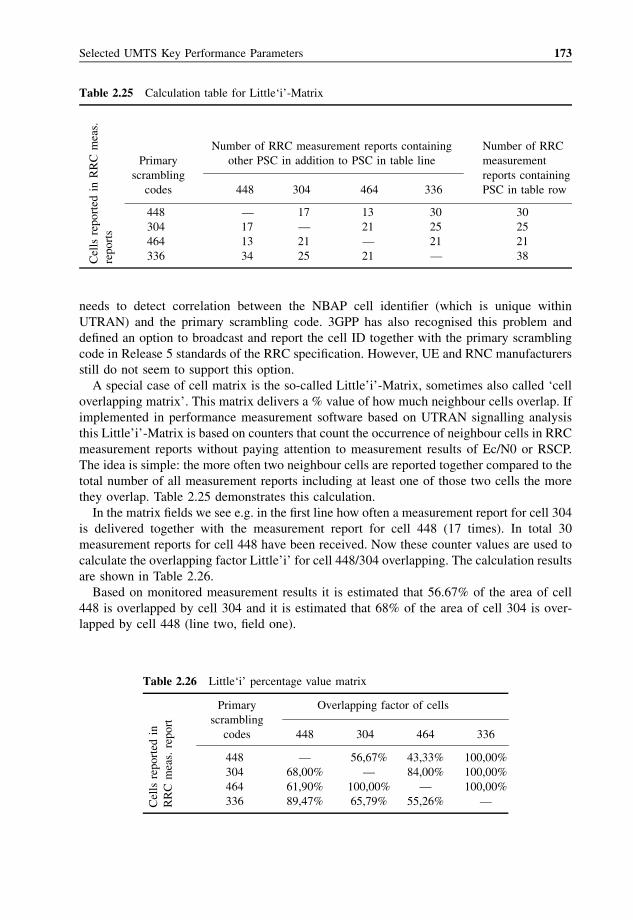
needs to detect correlation between the NBAP cell identifier (which is unique within
UTRAN) and the primary scrambling code. 3GPP has also recognised this problem and
defined an option to broadcast and report the cell ID together with the primary scrambling
code in Release 5 standards of the RRC specification. However, UE and RNC manufacturers
still do not seem to support this option.
A special case of cell matrix is the so-called Little’i’-Matrix, sometimes also called ‘cell
overlapping matrix’. This matrix delivers a % value of how much neighbour cells overlap. If
implemented in performance measurement software based on UTRAN signalling analysis
this Little’i’-Matrix is based on counters that count the occurrence of neighbour cells in RRC
measurement reports without paying attention to measurement results of Ec/N0 or RSCP.
The idea is simple: the more often two neighbour cells are reported together compared to the
total number of all measurement reports including at least one of those two cells the more
they overlap. Table 2.25 demonstrates this calculation.
In the matrix fields we see e.g. in the first line how often a measurement report for cell 304
is delivered together with the measurement report for cell 448 (17 times). In total 30
measurement reports for cell 448 have been received. Now these counter values are used to
calculate the overlapping factor Little’i’ for cell 448/304 overlapping. The calculation results
are shown in Table 2.26.
Based on monitored measurement results it is estimated that 56.67% of the area of cell
448 is overlapped by cell 304 and it is estimated that 68% of the area of cell 304 is over-
lapped by cell 448 (line two, field one).
Table 2.25 Calculation table for Little‘i’-Matrix
Number of RRC measurement reports containing Number of RRC
Primary other PSC in addition to PSC in table line measurement
scrambling reports containing
codes 448 304 464 336 PSC in table row
448 — 17 13 30 30
304 17 — 21 25 25
464 13 21 — 21 21
336 34 25 21 — 38Cellsreported
inRRC
meas.
reports
Table 2.26 Little‘i’ percentage value matrix
Primary Overlapping factor of cells
scrambling
codes 448 304 464 336
448 — 56,67% 43,33% 100,00%
304 68,00% — 84,00% 100,00%
464 61,90% 100,00% — 100,00%
336 89,47% 65,79% 55,26% —Cellsreported
in
RRC
meas.report
Selected UMTS Key Performance Parameters 173
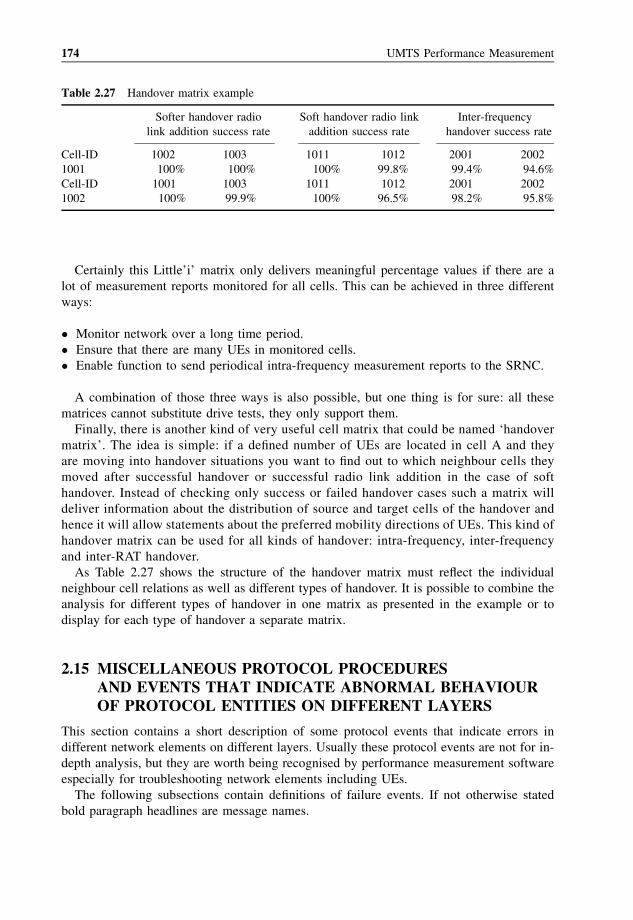
Certainly this Little’i’ matrix only delivers meaningful percentage values if there are a
lot of measurement reports monitored for all cells. This can be achieved in three different
ways:
� Monitor network over a long time period.
� Ensure that there are many UEs in monitored cells.
� Enable function to send periodical intra-frequency measurement reports to the SRNC.
A combination of those three ways is also possible, but one thing is for sure: all these
matrices cannot substitute drive tests, they only support them.
Finally, there is another kind of very useful cell matrix that could be named ‘handover
matrix’. The idea is simple: if a defined number of UEs are located in cell A and they
are moving into handover situations you want to find out to which neighbour cells they
moved after successful handover or successful radio link addition in the case of soft
handover. Instead of checking only success or failed handover cases such a matrix will
deliver information about the distribution of source and target cells of the handover and
hence it will allow statements about the preferred mobility directions of UEs. This kind of
handover matrix can be used for all kinds of handover: intra-frequency, inter-frequency
and inter-RAT handover.
As Table 2.27 shows the structure of the handover matrix must reflect the individual
neighbour cell relations as well as different types of handover. It is possible to combine the
analysis for different types of handover in one matrix as presented in the example or to
display for each type of handover a separate matrix.
2.15 MISCELLANEOUS PROTOCOL PROCEDURESAND EVENTS THAT INDICATE ABNORMAL BEHAVIOUROF PROTOCOL ENTITIES ON DIFFERENT LAYERS
This section contains a short description of some protocol events that indicate errors in
different network elements on different layers. Usually these protocol events are not for in-
depth analysis, but they are worth being recognised by performance measurement software
especially for troubleshooting network elements including UEs.
The following subsections contain definitions of failure events. If not otherwise stated
bold paragraph headlines are message names.
Table 2.27 Handover matrix example
Softer handover radio Soft handover radio link Inter-frequency
link addition success rate addition success rate handover success rate
Cell-ID 1002 1003 1011 1012 2001 2002
1001 100% 100% 100% 99.8% 99.4% 94.6%
Cell-ID 1001 1003 1011 1012 2001 2002
1002 100% 99.9% 100% 96.5% 98.2% 95.8%
174 UMTS Performance Measurement
2.15.1 MISCELLANEOUS RRC FAILURE INDICATIONS AND RATIO KPIS
2.15.1.1 RRC UTRAN Mobility Information Failure
This message indicates that the UE cannot react to the previously received RRC UTRAN
mobility command sent by the SRNC to allocate a new RNTI or to convey other mobility-
related information. A failure message will include a cause value. Separate counters can be
defined for separate cause values in this message. A failure ratio can be computed if the
number of UTRAN mobility information failures is set in relation to monitored UTRAN
mobility information. A success ratio can be computed as a ratio of UTRAN mobility inform-
ation confirm messages divided by the number of UTRAN mobility information messages.
Note: it must be kept in mind that UTRAN mobility information confirm can also be sent
by the UE after successful hard handover. In such cases the procedure code UTRAN mobility
information is not used for an attempt protocol event. Instead any RRC Reconfiguration
Complete or Cell Update Complete message must be counted as an attempt.
RRC UTRAN mobility information success rate¼P
RRC UTRAN Mobility Information ConfirmPRRC UTRAN Mobility Information
� 100% ð2:27Þ
RRC UTRAN mobility information failure rate¼PRRC UTRAN Mobility Information FailureP
RRC UTRAN Mobility Information� 100% ð2:28Þ
2.15.1.2 RRC Measurement Control Failure
This message indicates that the UE cannot initiate the RRC measurement procedure as
requested by the SRNC. The failure message will include a cause value. Separate counters
can be defined for separate cause values in this message. A failure ratio can be computed if
the number of UTRAN measurement control failures is set in relation to the number of
monitored RRC measurement control messages. It is not possible to compute a success ratio
because there is no protocol message defined if that measurement is activated successfully.
The only possible solution would be to look for the first RRC measurement report containing
the same measurement ID information element as used in RRC measurement control,
because if there are measurement results reported to the SRNC the initialisation of
measurement procedure must have been successful.
RRCMeasurement Initialization Failure Rate¼P
RRC Measurement Control FailurePRRC Measurement Control
�100%
ð2:29Þ
2.15.1.3 RRC Status
This message indicates a protocol error on the signalling connection between the UE and the
network. The result can be a dropped call. Separate counters for separate cause values in this
Selected UMTS Key Performance Parameters 175
message can be defined, but no ratio KPIs can be computed because this is a unidirectional
message.
2.15.1.4 RRC Security Mode Failure
This message indicates that the UE was not able to activate ciphering and/or integrity
protection as required by the network (SRNC) in the previously received RRC Security
Mode Control message. Separate counters for separate cause values in this message can be
defined. The successful activation of ciphering/integrity protection is indicated by the RRC
Security Mode Complete message. Hence, these protocol events can be used to compute
ratio KPIs as follows:
RRC Security Mode Success Rate ¼P
RRC Security Mode CompletePRRC Security Mode Control
� 100% ð2:30Þ
RRC Security Mode Failure Rate ¼P
RRC Security Mode FailurePRRC Security Mode Control
� 100% ð2:31Þ
2.15.1.5 RRC Transport Format Combination Control Failure
The transport format combination control procedure is used to restrict or enable generally
allowed uplink transport format combinations within the transport format combination set of
a single connection. In the case of the monitored RRC Transport Format Combination
Control Failure message the UE has not been able to accept settings required by the network
as sent in the RRC Transport Formation Combination message by the SRNC. Based on
protocol events a failure rate can be computed, but no success rate, because there is no
explicit success message defined in 3GPP 25.331 for this procedure.
RRC transport format combination control failure rate¼P
RRC Transport Format Combination Control FailurePRRC Transport Format Combination Control
� 100% ð2:32Þ
Note: changes of allowed transport format combinations may have an impact on the
maximum theoretical throughput of transport channels as used in the transport channel
usage ratio formula.
2.15.1.6 RRC Paging Response
This is not an error indication message, but the question often asked is how successful
paging on RRC level can be detected. RRC paging response is needed not only to calculate
a paging success rate, but also to measure the time difference between paging message and
paging response.
Depending on the RRC state of the UE there are two different paging responses possible.
If the UE is in IDLE mode it will answer using an RRC Connection Request. In this message
176 UMTS Performance Measurement
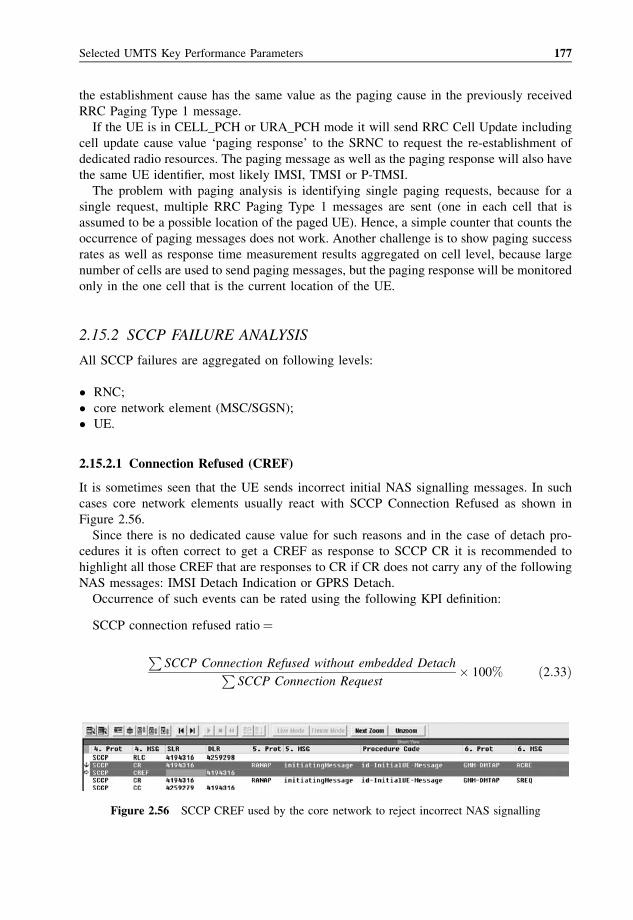
the establishment cause has the same value as the paging cause in the previously received
RRC Paging Type 1 message.
If the UE is in CELL_PCH or URA_PCH mode it will send RRC Cell Update including
cell update cause value ‘paging response’ to the SRNC to request the re-establishment of
dedicated radio resources. The paging message as well as the paging response will also have
the same UE identifier, most likely IMSI, TMSI or P-TMSI.
The problem with paging analysis is identifying single paging requests, because for a
single request, multiple RRC Paging Type 1 messages are sent (one in each cell that is
assumed to be a possible location of the paged UE). Hence, a simple counter that counts the
occurrence of paging messages does not work. Another challenge is to show paging success
rates as well as response time measurement results aggregated on cell level, because large
number of cells are used to send paging messages, but the paging response will be monitored
only in the one cell that is the current location of the UE.
2.15.2 SCCP FAILURE ANALYSIS
All SCCP failures are aggregated on following levels:
� RNC;
� core network element (MSC/SGSN);
� UE.
2.15.2.1 Connection Refused (CREF)
It is sometimes seen that the UE sends incorrect initial NAS signalling messages. In such
cases core network elements usually react with SCCP Connection Refused as shown in
Figure 2.56.
Since there is no dedicated cause value for such reasons and in the case of detach pro-
cedures it is often correct to get a CREF as response to SCCP CR it is recommended to
highlight all those CREF that are responses to CR if CR does not carry any of the following
NAS messages: IMSI Detach Indication or GPRS Detach.
Occurrence of such events can be rated using the following KPI definition:
SCCP connection refused ratio¼
PSCCP Connection Refused without embedded DetachP
SCCP Connection Request� 100% ð2:33Þ
Figure 2.56 SCCP CREF used by the core network to reject incorrect NAS signalling
Selected UMTS Key Performance Parameters 177
2.15.2.2 Inactivity Check Failure
If the inactivity timer expires before an answer from peer entity is received the SCCP
connection will be terminated by sending the SCCP RLSD (Released) message containing
release cause value ‘expiration of receive inactivity timer’. The occurrence of this error will
have fatal results for the existing RANAP connections and subsequently also for active
RABs, which are controlled by the RANAP.
It is expected that in such failure cases the RNC reacts by sending the RANAP Reset
Resource message that contains a cause value such as‘signalling transport resource failure’.
Further RANAP reset procedures may follow releasing active RABs that have been influ-
enced by losing the SCCP connection.
2.15.3 RANAP FAILURE ANALYSIS
2.15.3.1 RANAP Reset Resource
If this message is received by one of the RANAP entities the following 3GPP 25.413
‘resources and references (i.e. resources and Iu signalling connection identifiers) associated
to the Iu signalling connection identifiers indicated in the received message’ will be released
locally. The message is acknowledged by the peer entity by sending an RANAP Reset
Resource Acknowledge message. A distribution of counters per possible cause value is as
useful for root cause analysis as drill-down capability to the influenced/changed network
elements and single connections.
2.15.3.2 RANAP Reset
This message is used to release affected RABs and to erase all affected references for the
specific core network element or RNC node that has sent the RESET message. A distribution
of counters per possible cause value is as useful for root cause analysis as drill-down cap-
ability to the influenced/changed network elements and single connections.
2.15.3.3 RANAP Overload
Congestions on signalling connections can be reported by sending an RANAP Overload
message. The sender can be a core network node or RNC. It is expected that the receiving
entity starts activating signalling traffic reduction mechanisms to overcome the situation.
How such mechanisms work and how far they have been implemented in network nodes is
beyond the scope of this book.
2.15.4 NBAP FAILURE ANALYSIS
All NBAP Class 1 use the same signalling procedure that contain a:
� NBAP_Class1_Attempt: NBAP Initiating message
� NBAP_Class1_Success: NBAP Successful Outcome message
� NBAP_Class1_Failure: NBAP Unsuccessful Outcome message
178 UMTS Performance Measurement
Using these events, success and failure ratio KPI formulas can be defined as already
described in section 1.1.1. For each NBAP procedure separate counters/formulas will be
implemented. When aggregating NBAP counters/formulas on cell level, values of NBAP c-
ID will be used to display analysis results. In other words:
Often NBAP procedures prepare a subsequently executed handover to a target cell.
Ensure that all such NBAP events are shown at target cell aggregation level, but not related
to any cell (including the best cell) that is part of the active set when handover is attempted!
As recommended in the sections about handover analysis it is also useful to define subsets
of counters within the same NBAP procedure to determine if e.g. an NBAP radio link setup
procedure is used to establish dedicated transport resources for signalling radio bearers or to
prepare soft or hard handover. An advantage of such definitions is a faster root cause
analysis.
Some class 1 elementary procedures indicate availability and outage of network resources.
This is true for the following procedure codes:
� Reset
� Cell Deletion
� Common Transport Channel Deletion
� Block Resource
� Unblock Resource
Resource outage time can be measured as the time difference between the Block Resource
event and the Unblock Resource event. Cell outage time can be measured as the time dif-
ference between Cell Deletion event and the Cell Setup protocol event. In a similar way the
outage time of common transport channels can be computed.
If performance measurement software could link the occurrence of these events to influ-
enced connections (think about calls dropped due to a cell deletion procedure) it would be a
powerful feature for root cause analysis of network problems.
In addition, NBAP analysis needs counters for the following NBAP class 2 elementary
procedures. Since these are unidirectional messages without response no ratio KPI formulas
can be defined:
� Dedicated Measurement Failure Indication – indicates that a desired radio quality
parameter of a single UE connection will not be reported.
� Radio Link Failure Indication – as extensively discussed in section 2.13 and handover
analysis sections.
� Common Measurement Failure Indication – indicates that a desired radio quality
parameter of a single cell will not be reported.
� Resource Status Indication – does not necessarily indicate an error, but is always sent if
cells or physical channels go out of order or if a cell changes its capabilities, e.g. if
HSDPA support in a cell becomes unavailable. The included cause value must be analysed
to identify abnormal behaviour.
� Error Indication – used to report protocol errors (e.g. semantic errors) found in incoming
messages of connectionless NBAP class 2 elementary procedures back to the protocol
entity that has sent the NBAP class 2 message.
Selected UMTS Key Performance Parameters 179
2.15.5 RLC ACKNOWLEDGE MODE RETRANSMISSION RATE
Although this is not a protocol error the retransmission rate measured for RLC AM serviced
will be mentioned, because it is very important for root cause analysis in the case of
throughput problems. If transport channel throughput is high, but user perceived throughput
is low a high retransmission rate on the RLC could be the root cause.
Retransmitted RLC AM transport blocks can be detected using two different methods.
3GPP 32.403 recommends checking bitmasks of RLC Status messages and count blocks that
are marked in these bitmasks as not received. Manufacturers of performance measurement
software have a second and probably better approach. We may remember that the
architecture of this software requires an RLC reassember application. And to reassemble
correctly on RLC level it is mandatory to recognise all retransmissions and wait until the last
required transport block is received. This is the perfect opportunity to count the number of
retransmitted frames and provide this number using an internal interface to the performance
measurement module.
Root cause of high retransmission rates might not necessarily be located on the radio
interface. It has also already been observed in live networks that transmission problems in
ATM transport networks of UTRAN caused the most retransmissions on RLC level.
180 UMTS Performance Measurement
3
Call Establishmentand Handover Proceduresof PS Calls using HSDPA
The following chapter explains special performance measurement requirements for PS calls
that use HSDPA. Differences in performance measurement definitions and KPIs compared to
Release 99 network architecture/calls will also be discussed.
3.1 HSDPA CELL SET UP
The set up of HSDPA-capable Release 5 cells is differs from the set up of Release 99 cells in
that some additional signalling procedures can be monitored. The audit procedure performed
between Node B and CRNC as well as the set up of cells (see Figure 3.1) and common
transport channels RACH, FACH and PCH is identical to the procedures seen when a
Release 99 Node B or cell is taken into service. However, after a successful audit procedure
(that might have been caused by a Node B reset) the Node B indicates which of its local cells
are HSDPA capable using the NBAP Resource Status Indication message. Unfortunately,
this message cannot be monitored while the cell is in service and thus reliable topology status
information about which and how many cells of a network are HSDPA capable is only
available in the RNC operation and maintenance centre (OMC). Making this information
available to performance measurement software requires again sophisticated topology detec-
tion algorithms or a topology import/export interface between this software and the RNC.
After a successful NBAP cell set up and common transport channel set up for PCH,
RACH and FACH(s) for all HSDPA-capable cells, an NBAP shared physical channel
reconfiguration procedure is executed, which contains information about how many high-
speed physical downlink shared channel (HS-PDSCH) codes are available in each cell. This
means the maximum number of DL spreading codes with the fixed spreading factor 16 that
can be combined for radio transmission of HS-PDSCH. Based on this number of combined
spreading codes the maximum theoretical DL data transmission rate on the high-speed
physical shared channel can be calculated.
UMTS Performance Measurement: A Practical Guide to KPIs for the UTRAN Environment Ralf Kreher
# 2006 Ralf Kreher
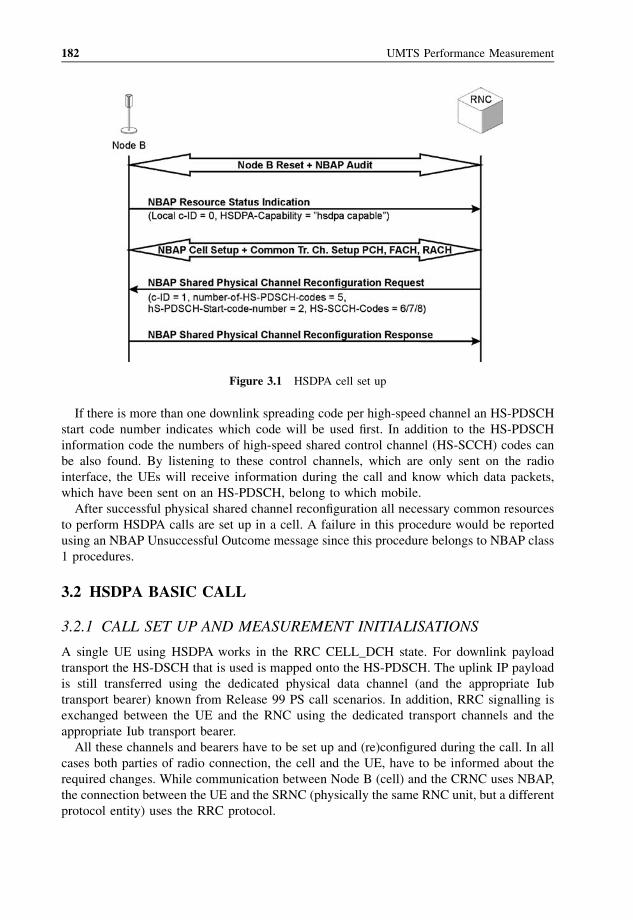
If there is more than one downlink spreading code per high-speed channel an HS-PDSCH
start code number indicates which code will be used first. In addition to the HS-PDSCH
information code the numbers of high-speed shared control channel (HS-SCCH) codes can
be also found. By listening to these control channels, which are only sent on the radio
interface, the UEs will receive information during the call and know which data packets,
which have been sent on an HS-PDSCH, belong to which mobile.
After successful physical shared channel reconfiguration all necessary common resources
to perform HSDPA calls are set up in a cell. A failure in this procedure would be reported
using an NBAP Unsuccessful Outcome message since this procedure belongs to NBAP class
1 procedures.
3.2 HSDPA BASIC CALL
3.2.1 CALL SET UP AND MEASUREMENT INITIALISATIONS
A single UE using HSDPA works in the RRC CELL_DCH state. For downlink payload
transport the HS-DSCH that is used is mapped onto the HS-PDSCH. The uplink IP payload
is still transferred using the dedicated physical data channel (and the appropriate Iub
transport bearer) known from Release 99 PS call scenarios. In addition, RRC signalling is
exchanged between the UE and the RNC using the dedicated transport channels and the
appropriate Iub transport bearer.
All these channels and bearers have to be set up and (re)configured during the call. In all
cases both parties of radio connection, the cell and the UE, have to be informed about the
required changes. While communication between Node B (cell) and the CRNC uses NBAP,
the connection between the UE and the SRNC (physically the same RNC unit, but a different
protocol entity) uses the RRC protocol.
Figure 3.1 HSDPA cell set up
182 UMTS Performance Measurement
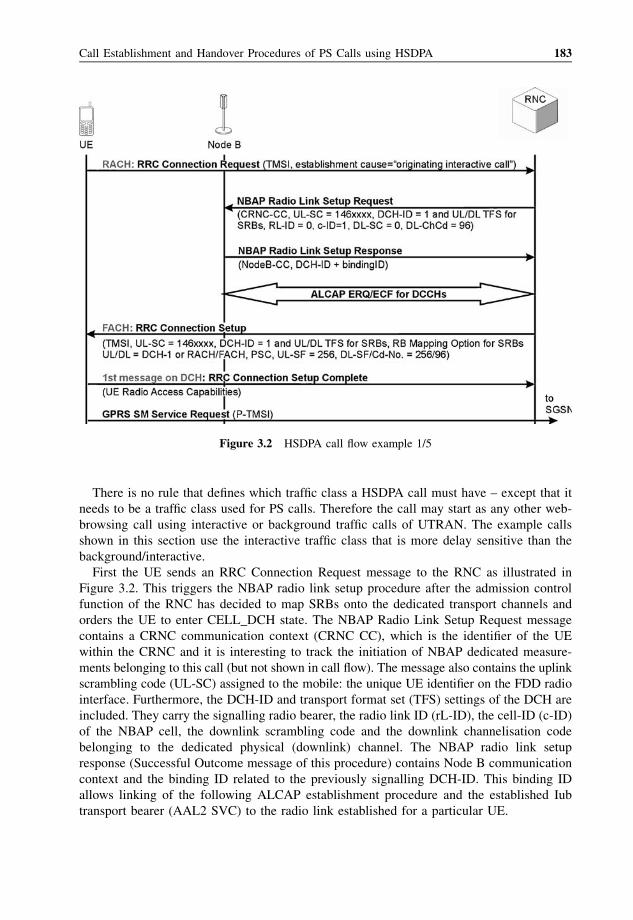
There is no rule that defines which traffic class a HSDPA call must have – except that it
needs to be a traffic class used for PS calls. Therefore the call may start as any other web-
browsing call using interactive or background traffic calls of UTRAN. The example calls
shown in this section use the interactive traffic class that is more delay sensitive than the
background/interactive.
First the UE sends an RRC Connection Request message to the RNC as illustrated in
Figure 3.2. This triggers the NBAP radio link setup procedure after the admission control
function of the RNC has decided to map SRBs onto the dedicated transport channels and
orders the UE to enter CELL_DCH state. The NBAP Radio Link Setup Request message
contains a CRNC communication context (CRNC CC), which is the identifier of the UE
within the CRNC and it is interesting to track the initiation of NBAP dedicated measure-
ments belonging to this call (but not shown in call flow). The message also contains the uplink
scrambling code (UL-SC) assigned to the mobile: the unique UE identifier on the FDD radio
interface. Furthermore, the DCH-ID and transport format set (TFS) settings of the DCH are
included. They carry the signalling radio bearer, the radio link ID (rL-ID), the cell-ID (c-ID)
of the NBAP cell, the downlink scrambling code and the downlink channelisation code
belonging to the dedicated physical (downlink) channel. The NBAP radio link setup
response (Successful Outcome message of this procedure) contains Node B communication
context and the binding ID related to the previously signalling DCH-ID. This binding ID
allows linking of the following ALCAP establishment procedure and the established Iub
transport bearer (AAL2 SVC) to the radio link established for a particular UE.
Figure 3.2 HSDPA call flow example 1/5
Call Establishment and Handover Procedures of PS Calls using HSDPA 183
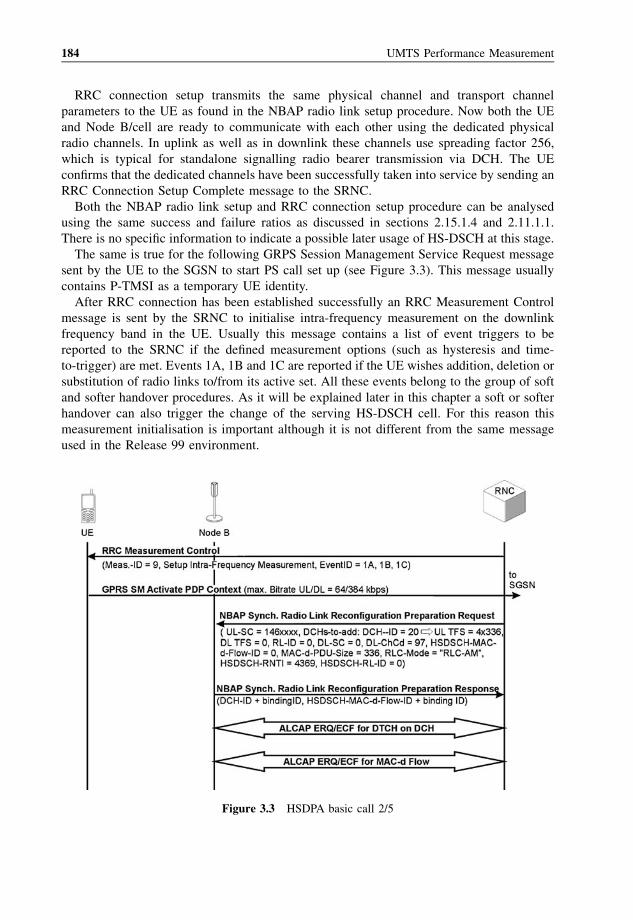
RRC connection setup transmits the same physical channel and transport channel
parameters to the UE as found in the NBAP radio link setup procedure. Now both the UE
and Node B/cell are ready to communicate with each other using the dedicated physical
radio channels. In uplink as well as in downlink these channels use spreading factor 256,
which is typical for standalone signalling radio bearer transmission via DCH. The UE
confirms that the dedicated channels have been successfully taken into service by sending an
RRC Connection Setup Complete message to the SRNC.
Both the NBAP radio link setup and RRC connection setup procedure can be analysed
using the same success and failure ratios as discussed in sections 2.15.1.4 and 2.11.1.1.
There is no specific information to indicate a possible later usage of HS-DSCH at this stage.
The same is true for the following GRPS Session Management Service Request message
sent by the UE to the SGSN to start PS call set up (see Figure 3.3). This message usually
contains P-TMSI as a temporary UE identity.
After RRC connection has been established successfully an RRC Measurement Control
message is sent by the SRNC to initialise intra-frequency measurement on the downlink
frequency band in the UE. Usually this message contains a list of event triggers to be
reported to the SRNC if the defined measurement options (such as hysteresis and time-
to-trigger) are met. Events 1A, 1B and 1C are reported if the UE wishes addition, deletion or
substitution of radio links to/from its active set. All these events belong to the group of soft
and softer handover procedures. As it will be explained later in this chapter a soft or softer
handover can also trigger the change of the serving HS-DSCH cell. For this reason this
measurement initialisation is important although it is not different from the same message
used in the Release 99 environment.
Figure 3.3 HSDPA basic call 2/5
184 UMTS Performance Measurement
While RRC measurements are initiated the UE continues the NAS signalling dialogue
with the SGSN and requests the activation of a PDP context. The appropriate GPRS session
management message also contains the desired maximum bit rates for uplink and downlink
radio transmission. The 384 kbps downlink transmission rate shown in the call flow example
does not necessarily need to trigger the assignment of HS-DSCH resources to this call. This
decision is up to RNC’s admission control function, because identical bit rates are found in
the RANAP RAB Assignment Request message that triggers the subsequently monitored
NBAP synchronised radio link reconfiguration preparation procedure on Iub. The request
message of this NBAP procedure contains a list of DCH-IDs and the appropriate transport
format set (TFS) parameters to be added. The DCH with DCH-ID¼ 20 shown in the
example call trace (Figures 3.2 to 3.6) will be used to transmit the uplink IP payload while its
downlink TFS is 0. This means that no downlink data transfer is possible on this DCH. Radio
link ID (RL-ID), downlink scrambling code (DL-SC) and downlink channelisation code
(DL-ChCd) are further parameters which are necessary to identify this dedicated radio link
on Uu. The parameter definition to MAC-d flow follows. A MAC-d flow is a physical Iub
transport bearer used to transport all downlink IP payload to be sent from the SRNC via HS-
DSCH to Node B. Packet scheduling and multiplexing is done in Node B as well as hybrid
ARQ error detection and correction. The throughput of a single or all MAC-d flows towards
a defined cell can be measured in a similar way as described for the transport channel
throughput measurement in Chapter 2, but transport channel throughput of the HS-DSCH
cannot be measured by monitoring MAC-d flows, only on the radio interface directly. For
this reason the reporting of the HS-DSCH provided bit rate using NBAP common
measurement reports has been defined in Release 5.
If the HS-DSCH-provided bit rate shows a high value, but downlink throughput measured
on all MAC-d flows to a defined cell seems to be too low it is recommended to look at the
RLC AM retransmission rate. If the RLC AM retransmission rate also does not show critical
values, the root cause of problems must be assumed to be located on the radio interface.
Unfortunately the retransmission rate of HARQ is not reported by Node B.
An important parameter of the UE is HS-DSCH-RNTI (often called, H-RNTI). Using this
ID, the UE is able to select its transport blocks from the HS-DSCH that is used by several
UEs simultaneously. The HS-DSCH RL-ID (radio link ID) becomes important if more than
one HS-DSCH is bundled in a HS-DSCH radio link set. A cell can have more than one HS-
PDSCH and hence multiple HS-DSCHs per UE are possible.
In the NBAP Synchronized Radio Link Reconfiguration Response message some binding
IDs can be seen that are used to tie appropriate Iub transport bearers (VPI/VCI/CID) to the
DCH used for UL IP payload transmission and to MAC-d flow. These transport bearers are
established using the well-known ALCAP procedures.
In the RRC Radio Bearer Setup message (see Figure 3.4) H-RNTI is found again in addition
to the RRC state indicator that orders the UE to remain in CELL_DCH state (ASN.1 encoded:
‘cell-DCH’). In the example call trace RAB, identified by RAB-ID=5, is represented by the
radio bearer with RB-ID¼ 6 and this radio bearer has a number of mapping options.
Note: it is interesting that some network equipment manufacturers have defined that a call
is in (virtual) ‘HSDPA Active’ state as long as the last mapping option DL transport
channel¼HS-DSCH is valid. This is true as long as the UE is located in HSDPA-capable
cells, no matter if the HS-DSCH is used for downlink payload transmission or not. Only if
the UE is handed over to a Release 99 cell (no HSDPA possible) this mapping option is
Call Establishment and Handover Procedures of PS Calls using HSDPA 185
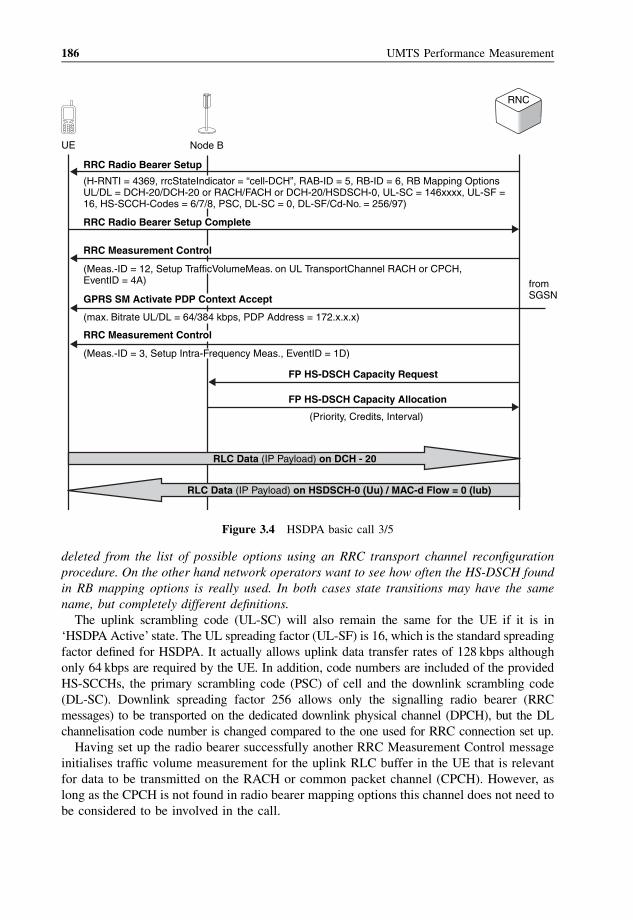
deleted from the list of possible options using an RRC transport channel reconfiguration
procedure. On the other hand network operators want to see how often the HS-DSCH found
in RB mapping options is really used. In both cases state transitions may have the same
name, but completely different definitions.
The uplink scrambling code (UL-SC) will also remain the same for the UE if it is in
‘HSDPA Active’ state. The UL spreading factor (UL-SF) is 16, which is the standard spreading
factor defined for HSDPA. It actually allows uplink data transfer rates of 128 kbps although
only 64 kbps are required by the UE. In addition, code numbers are included of the provided
HS-SCCHs, the primary scrambling code (PSC) of cell and the downlink scrambling code
(DL-SC). Downlink spreading factor 256 allows only the signalling radio bearer (RRC
messages) to be transported on the dedicated downlink physical channel (DPCH), but the DL
channelisation code number is changed compared to the one used for RRC connection set up.
Having set up the radio bearer successfully another RRC Measurement Control message
initialises traffic volume measurement for the uplink RLC buffer in the UE that is relevant
for data to be transmitted on the RACH or common packet channel (CPCH). However, as
long as the CPCH is not found in radio bearer mapping options this channel does not need to
be considered to be involved in the call.
UE Node B
RNC
(H-RNTI = 4369, rrcStateIndicator = “cell-DCH”, RAB-ID = 5, RB-ID = 6, RB Mapping OptionsUL/DL = DCH-20/DCH-20 or RACH/FACH or DCH-20/HSDSCH-0, UL-SC = 146xxxx, UL-SF =16, HS-SCCH-Codes = 6/7/8, PSC, DL-SC = 0, DL-SF/Cd-No. = 256/97)
(Meas.-ID = 12, Setup TrafficVolumeMeas. on UL TransportChannel RACH or CPCH,EventID = 4A) from
SGSN
(max. Bitrate UL/DL = 64/384 kbps, PDP Address = 172.x.x.x)
(Meas.-ID = 3, Setup Intra-Frequency Meas., EventID = 1D)
RRC Radio Bearer Setup
RRC Radio Bearer Setup Complete
RRC Measurement Control
RRC Measurement Control
FP HS-DSCH Capacity Request
FP HS-DSCH Capacity Allocation
RLC Data (IP Payload) on DCH - 20
RLC Data (IP Payload) on HSDSCH-0 (Uu) / MAC-d Flow = 0 (lub)
(Priority, Credits, Interval)
GPRS SM Activate PDP Context Accept
Figure 3.4 HSDPA basic call 3/5
186 UMTS Performance Measurement
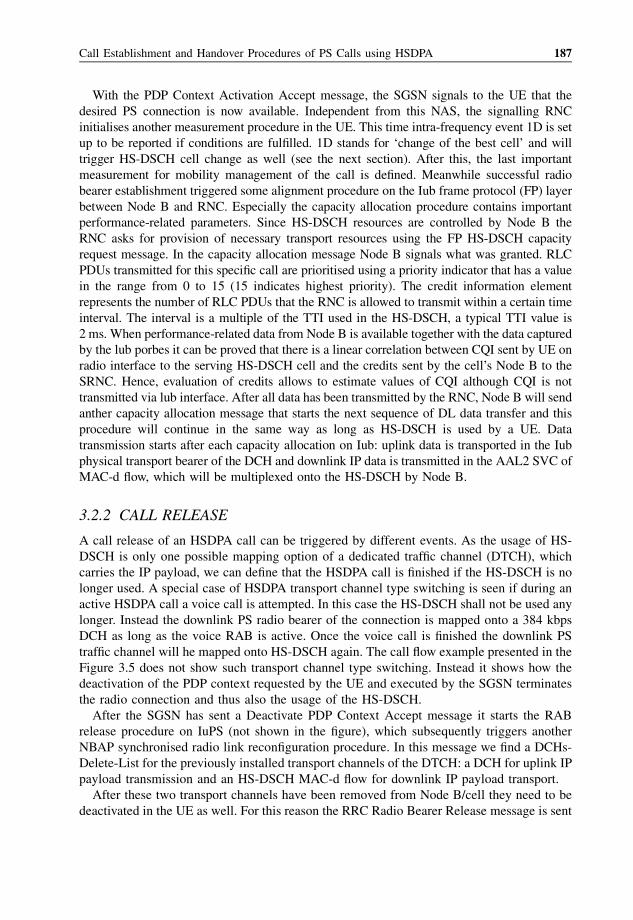
With the PDP Context Activation Accept message, the SGSN signals to the UE that the
desired PS connection is now available. Independent from this NAS, the signalling RNC
initialises another measurement procedure in the UE. This time intra-frequency event 1D is set
up to be reported if conditions are fulfilled. 1D stands for ‘change of the best cell’ and will
trigger HS-DSCH cell change as well (see the next section). After this, the last important
measurement for mobility management of the call is defined. Meanwhile successful radio
bearer establishment triggered some alignment procedure on the Iub frame protocol (FP) layer
between Node B and RNC. Especially the capacity allocation procedure contains important
performance-related parameters. Since HS-DSCH resources are controlled by Node B the
RNC asks for provision of necessary transport resources using the FP HS-DSCH capacity
request message. In the capacity allocation message Node B signals what was granted. RLC
PDUs transmitted for this specific call are prioritised using a priority indicator that has a value
in the range from 0 to 15 (15 indicates highest priority). The credit information element
represents the number of RLC PDUs that the RNC is allowed to transmit within a certain time
interval. The interval is a multiple of the TTI used in the HS-DSCH, a typical TTI value is
2 ms. When performance-related data from Node B is available together with the data captured
by the lub porbes it can be proved that there is a linear correlation between CQI sent by UE on
radio interface to the serving HS-DSCH cell and the credits sent by the cell’s Node B to the
SRNC. Hence, evaluation of credits allows to estimate values of CQI although CQI is not
transmitted via lub interface. After all data has been transmitted by the RNC, Node B will send
anther capacity allocation message that starts the next sequence of DL data transfer and this
procedure will continue in the same way as long as HS-DSCH is used by a UE. Data
transmission starts after each capacity allocation on Iub: uplink data is transported in the Iub
physical transport bearer of the DCH and downlink IP data is transmitted in the AAL2 SVC of
MAC-d flow, which will be multiplexed onto the HS-DSCH by Node B.
3.2.2 CALL RELEASE
A call release of an HSDPA call can be triggered by different events. As the usage of HS-
DSCH is only one possible mapping option of a dedicated traffic channel (DTCH), which
carries the IP payload, we can define that the HSDPA call is finished if the HS-DSCH is no
longer used. A special case of HSDPA transport channel type switching is seen if during an
active HSDPA call a voice call is attempted. In this case the HS-DSCH shall not be used any
longer. Instead the downlink PS radio bearer of the connection is mapped onto a 384 kbps
DCH as long as the voice RAB is active. Once the voice call is finished the downlink PS
traffic channel will he mapped onto HS-DSCH again. The call flow example presented in the
Figure 3.5 does not show such transport channel type switching. Instead it shows how the
deactivation of the PDP context requested by the UE and executed by the SGSN terminates
the radio connection and thus also the usage of the HS-DSCH.
After the SGSN has sent a Deactivate PDP Context Accept message it starts the RAB
release procedure on IuPS (not shown in the figure), which subsequently triggers another
NBAP synchronised radio link reconfiguration procedure. In this message we find a DCHs-
Delete-List for the previously installed transport channels of the DTCH: a DCH for uplink IP
payload transmission and an HS-DSCH MAC-d flow for downlink IP payload transport.
After these two transport channels have been removed from Node B/cell they need to be
deactivated in the UE as well. For this reason the RRC Radio Bearer Release message is sent
Call Establishment and Handover Procedures of PS Calls using HSDPA 187
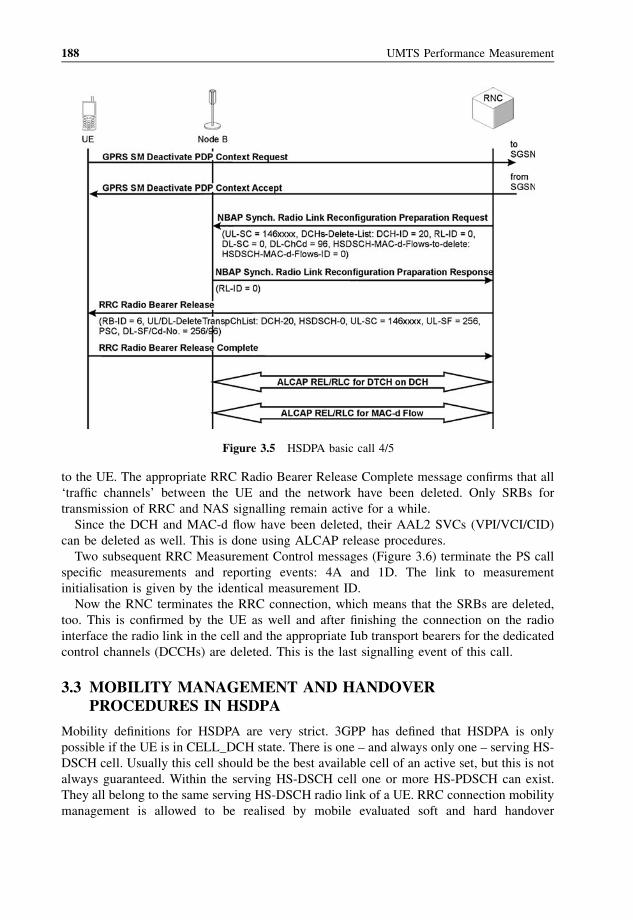
to the UE. The appropriate RRC Radio Bearer Release Complete message confirms that all
‘traffic channels’ between the UE and the network have been deleted. Only SRBs for
transmission of RRC and NAS signalling remain active for a while.
Since the DCH and MAC-d flow have been deleted, their AAL2 SVCs (VPI/VCI/CID)
can be deleted as well. This is done using ALCAP release procedures.
Two subsequent RRC Measurement Control messages (Figure 3.6) terminate the PS call
specific measurements and reporting events: 4A and 1D. The link to measurement
initialisation is given by the identical measurement ID.
Now the RNC terminates the RRC connection, which means that the SRBs are deleted,
too. This is confirmed by the UE as well and after finishing the connection on the radio
interface the radio link in the cell and the appropriate Iub transport bearers for the dedicated
control channels (DCCHs) are deleted. This is the last signalling event of this call.
3.3 MOBILITY MANAGEMENT AND HANDOVERPROCEDURES IN HSDPA
Mobility definitions for HSDPA are very strict. 3GPP has defined that HSDPA is only
possible if the UE is in CELL_DCH state. There is one – and always only one – serving HS-
DSCH cell. Usually this cell should be the best available cell of an active set, but this is not
always guaranteed. Within the serving HS-DSCH cell one or more HS-PDSCH can exist.
They all belong to the same serving HS-DSCH radio link of a UE. RRC connection mobility
management is allowed to be realised by mobile evaluated soft and hard handover
Figure 3.5 HSDPA basic call 4/5
188 UMTS Performance Measurement
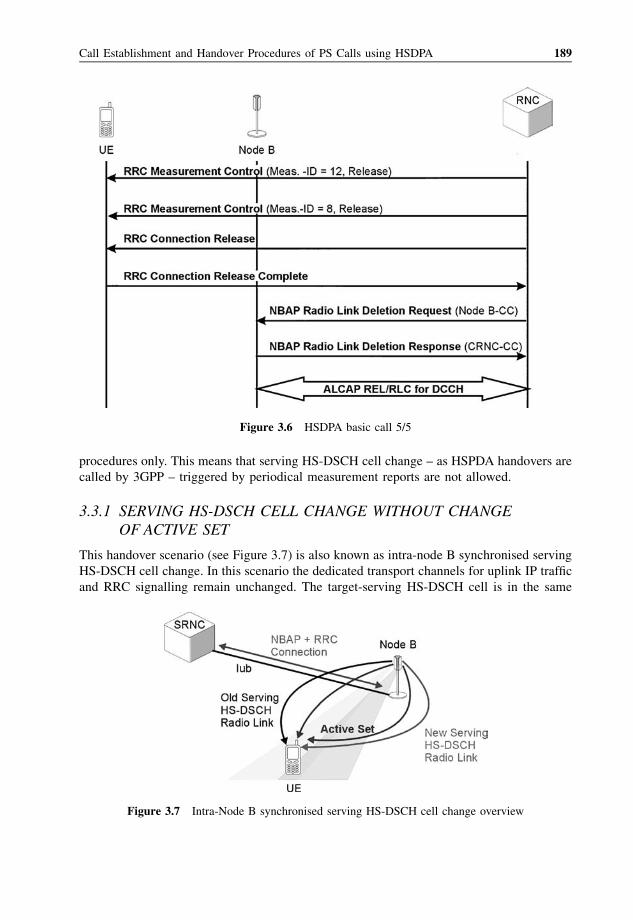
procedures only. This means that serving HS-DSCH cell change – as HSPDA handovers are
called by 3GPP – triggered by periodical measurement reports are not allowed.
3.3.1 SERVING HS-DSCH CELL CHANGE WITHOUT CHANGEOF ACTIVE SET
This handover scenario (see Figure 3.7) is also known as intra-node B synchronised serving
HS-DSCH cell change. In this scenario the dedicated transport channels for uplink IP traffic
and RRC signalling remain unchanged. The target-serving HS-DSCH cell is in the same
Figure 3.7 Intra-Node B synchronised serving HS-DSCH cell change overview
Figure 3.6 HSDPA basic call 5/5
Call Establishment and Handover Procedures of PS Calls using HSDPA 189
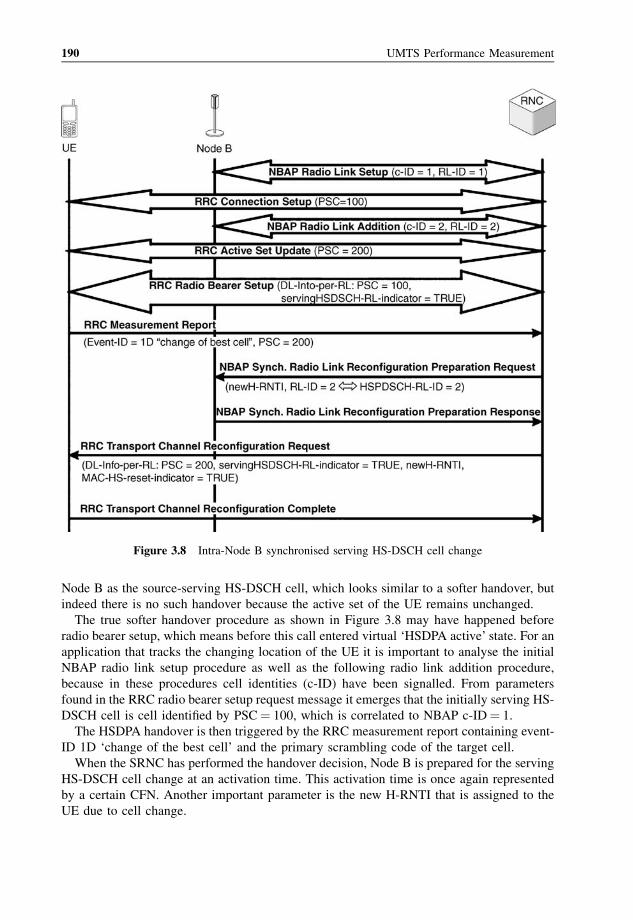
Node B as the source-serving HS-DSCH cell, which looks similar to a softer handover, but
indeed there is no such handover because the active set of the UE remains unchanged.
The true softer handover procedure as shown in Figure 3.8 may have happened before
radio bearer setup, which means before this call entered virtual ‘HSDPA active’ state. For an
application that tracks the changing location of the UE it is important to analyse the initial
NBAP radio link setup procedure as well as the following radio link addition procedure,
because in these procedures cell identities (c-ID) have been signalled. From parameters
found in the RRC radio bearer setup request message it emerges that the initially serving HS-
DSCH cell is cell identified by PSC¼ 100, which is correlated to NBAP c-ID¼ 1.
The HSDPA handover is then triggered by the RRC measurement report containing event-
ID 1D ‘change of the best cell’ and the primary scrambling code of the target cell.
When the SRNC has performed the handover decision, Node B is prepared for the serving
HS-DSCH cell change at an activation time. This activation time is once again represented
by a certain CFN. Another important parameter is the new H-RNTI that is assigned to the
UE due to cell change.
Figure 3.8 Intra-Node B synchronised serving HS-DSCH cell change
190 UMTS Performance Measurement
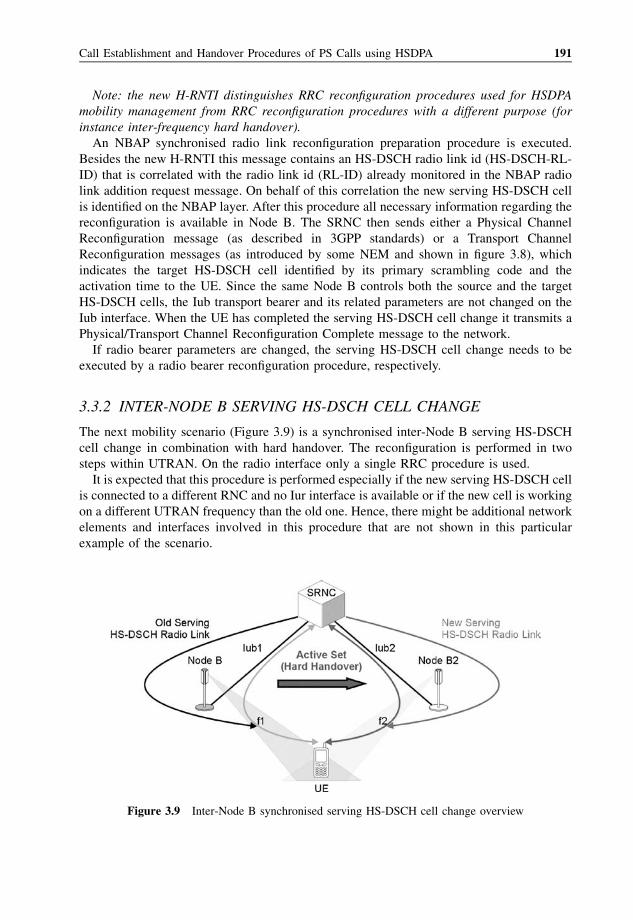
Note: the new H-RNTI distinguishes RRC reconfiguration procedures used for HSDPA
mobility management from RRC reconfiguration procedures with a different purpose (for
instance inter-frequency hard handover).
An NBAP synchronised radio link reconfiguration preparation procedure is executed.
Besides the new H-RNTI this message contains an HS-DSCH radio link id (HS-DSCH-RL-
ID) that is correlated with the radio link id (RL-ID) already monitored in the NBAP radio
link addition request message. On behalf of this correlation the new serving HS-DSCH cell
is identified on the NBAP layer. After this procedure all necessary information regarding the
reconfiguration is available in Node B. The SRNC then sends either a Physical Channel
Reconfiguration message (as described in 3GPP standards) or a Transport Channel
Reconfiguration messages (as introduced by some NEM and shown in figure 3.8), which
indicates the target HS-DSCH cell identified by its primary scrambling code and the
activation time to the UE. Since the same Node B controls both the source and the target
HS-DSCH cells, the Iub transport bearer and its related parameters are not changed on the
Iub interface. When the UE has completed the serving HS-DSCH cell change it transmits a
Physical/Transport Channel Reconfiguration Complete message to the network.
If radio bearer parameters are changed, the serving HS-DSCH cell change needs to be
executed by a radio bearer reconfiguration procedure, respectively.
3.3.2 INTER-NODE B SERVING HS-DSCH CELL CHANGE
The next mobility scenario (Figure 3.9) is a synchronised inter-Node B serving HS-DSCH
cell change in combination with hard handover. The reconfiguration is performed in two
steps within UTRAN. On the radio interface only a single RRC procedure is used.
It is expected that this procedure is performed especially if the new serving HS-DSCH cell
is connected to a different RNC and no Iur interface is available or if the new cell is working
on a different UTRAN frequency than the old one. Hence, there might be additional network
elements and interfaces involved in this procedure that are not shown in this particular
example of the scenario.
Figure 3.9 Inter-Node B synchronised serving HS-DSCH cell change overview
Call Establishment and Handover Procedures of PS Calls using HSDPA 191
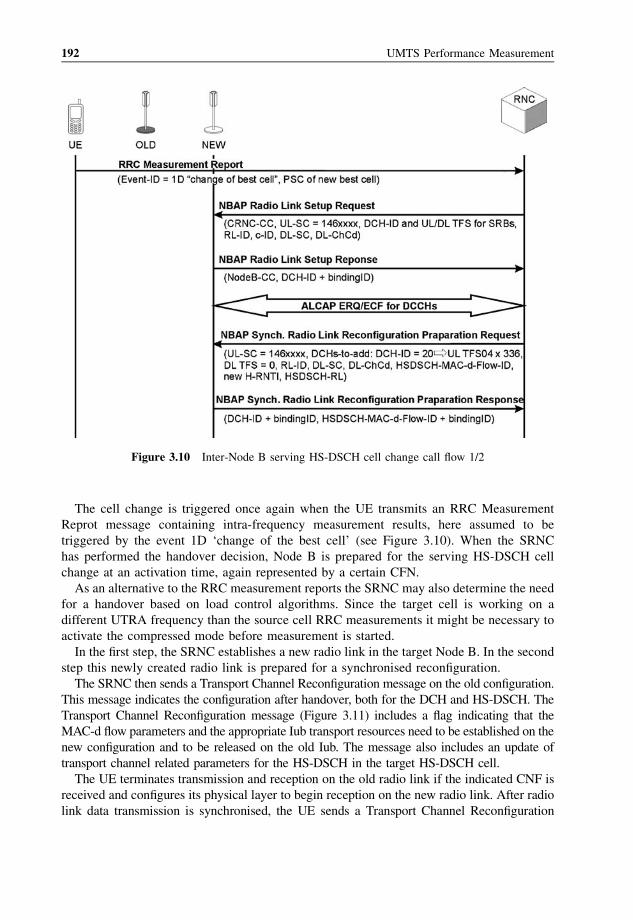
The cell change is triggered once again when the UE transmits an RRC Measurement
Reprot message containing intra-frequency measurement results, here assumed to be
triggered by the event 1D ‘change of the best cell’ (see Figure 3.10). When the SRNC
has performed the handover decision, Node B is prepared for the serving HS-DSCH cell
change at an activation time, again represented by a certain CFN.
As an alternative to the RRC measurement reports the SRNC may also determine the need
for a handover based on load control algorithms. Since the target cell is working on a
different UTRA frequency than the source cell RRC measurements it might be necessary to
activate the compressed mode before measurement is started.
In the first step, the SRNC establishes a new radio link in the target Node B. In the second
step this newly created radio link is prepared for a synchronised reconfiguration.
The SRNC then sends a Transport Channel Reconfiguration message on the old configuration.
This message indicates the configuration after handover, both for the DCH and HS-DSCH. The
Transport Channel Reconfiguration message (Figure 3.11) includes a flag indicating that the
MAC-d flow parameters and the appropriate Iub transport resources need to be established on the
new configuration and to be released on the old Iub. The message also includes an update of
transport channel related parameters for the HS-DSCH in the target HS-DSCH cell.
The UE terminates transmission and reception on the old radio link if the indicated CNF is
received and configures its physical layer to begin reception on the new radio link. After radio
link data transmission is synchronised, the UE sends a Transport Channel Reconfiguration
Figure 3.10 Inter-Node B serving HS-DSCH cell change call flow 1/2
192 UMTS Performance Measurement
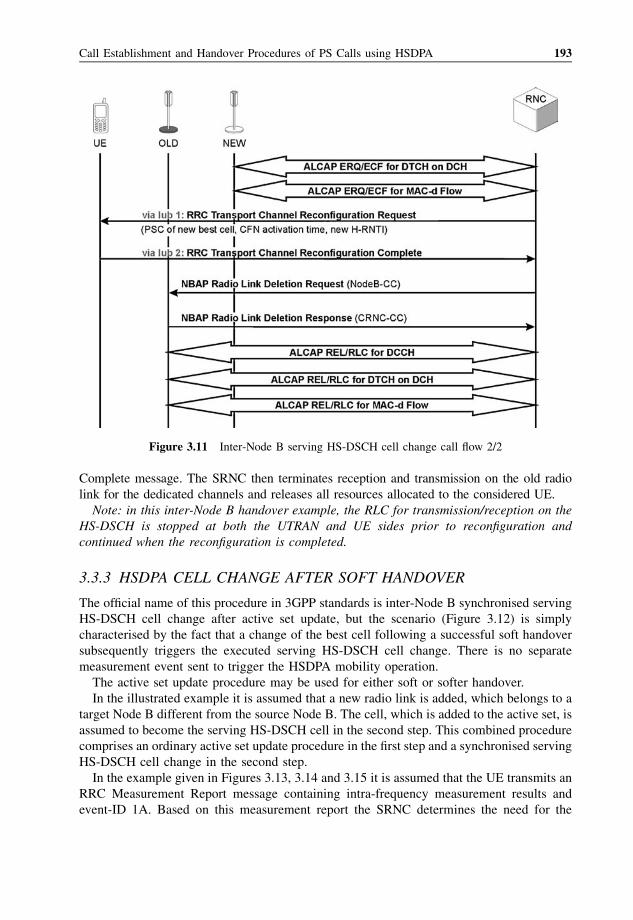
Complete message. The SRNC then terminates reception and transmission on the old radio
link for the dedicated channels and releases all resources allocated to the considered UE.
Note: in this inter-Node B handover example, the RLC for transmission/reception on the
HS-DSCH is stopped at both the UTRAN and UE sides prior to reconfiguration and
continued when the reconfiguration is completed.
3.3.3 HSDPA CELL CHANGE AFTER SOFT HANDOVER
The official name of this procedure in 3GPP standards is inter-Node B synchronised serving
HS-DSCH cell change after active set update, but the scenario (Figure 3.12) is simply
characterised by the fact that a change of the best cell following a successful soft handover
subsequently triggers the executed serving HS-DSCH cell change. There is no separate
measurement event sent to trigger the HSDPA mobility operation.
The active set update procedure may be used for either soft or softer handover.
In the illustrated example it is assumed that a new radio link is added, which belongs to a
target Node B different from the source Node B. The cell, which is added to the active set, is
assumed to become the serving HS-DSCH cell in the second step. This combined procedure
comprises an ordinary active set update procedure in the first step and a synchronised serving
HS-DSCH cell change in the second step.
In the example given in Figures 3.13, 3.14 and 3.15 it is assumed that the UE transmits an
RRC Measurement Report message containing intra-frequency measurement results and
event-ID 1A. Based on this measurement report the SRNC determines the need for the
Figure 3.11 Inter-Node B serving HS-DSCH cell change call flow 2/2
Call Establishment and Handover Procedures of PS Calls using HSDPA 193
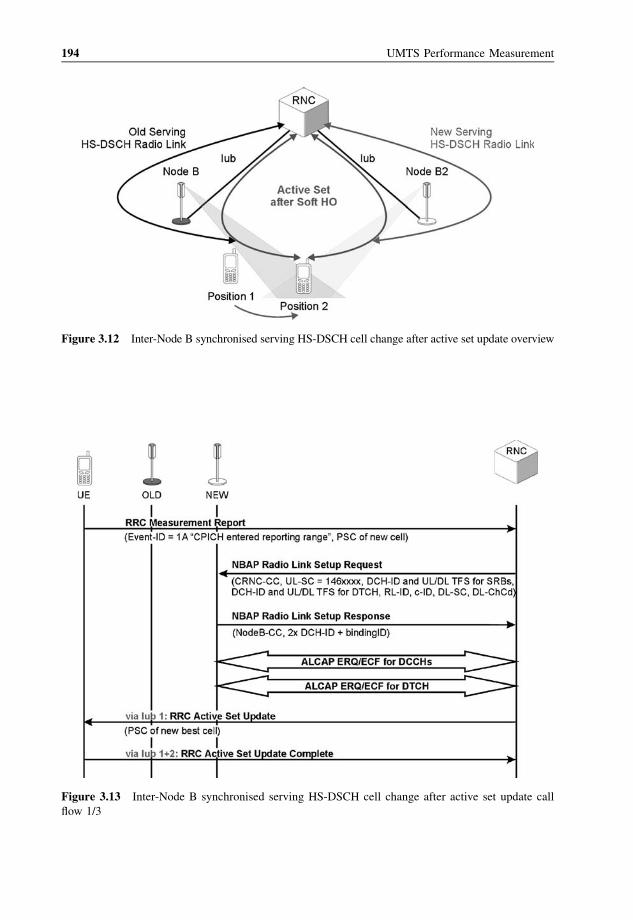
Figure 3.13 Inter-Node B synchronised serving HS-DSCH cell change after active set update call
flow 1/3
Figure 3.12 Inter-Node B synchronised serving HS-DSCH cell change after active set update overview
194 UMTS Performance Measurement
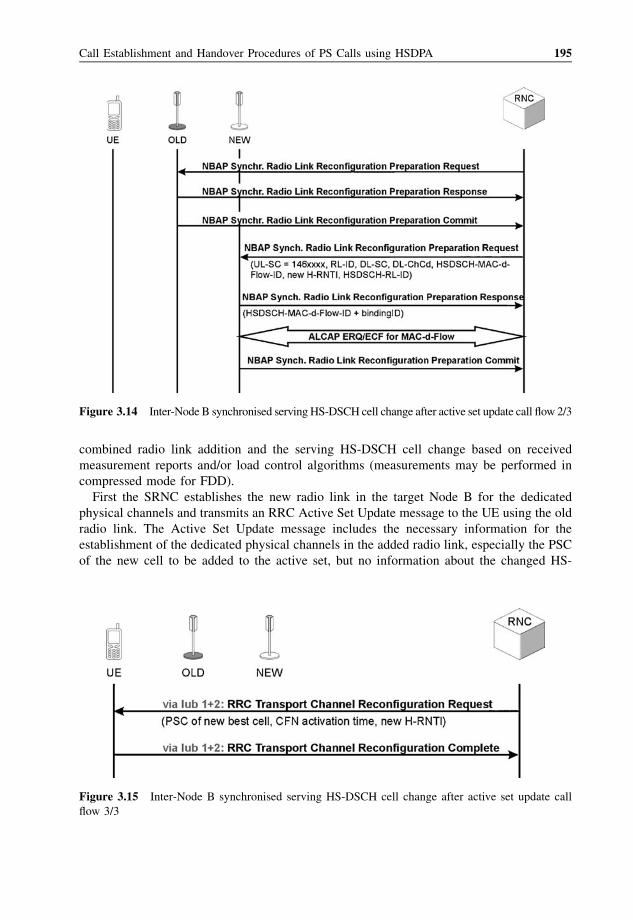
combined radio link addition and the serving HS-DSCH cell change based on received
measurement reports and/or load control algorithms (measurements may be performed in
compressed mode for FDD).
First the SRNC establishes the new radio link in the target Node B for the dedicated
physical channels and transmits an RRC Active Set Update message to the UE using the old
radio link. The Active Set Update message includes the necessary information for the
establishment of the dedicated physical channels in the added radio link, especially the PSC
of the new cell to be added to the active set, but no information about the changed HS-
Figure 3.15 Inter-Node B synchronised serving HS-DSCH cell change after active set update call
flow 3/3
Figure 3.14 Inter-Node B synchronised servingHS-DSCH cell change after active set update call flow 2/3
Call Establishment and Handover Procedures of PS Calls using HSDPA 195
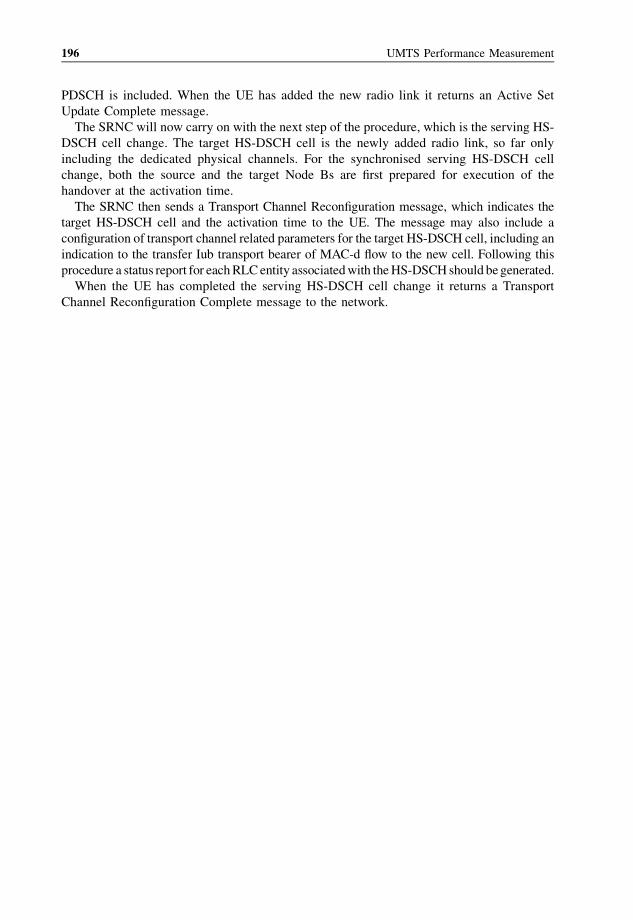
PDSCH is included. When the UE has added the new radio link it returns an Active Set
Update Complete message.
The SRNC will now carry on with the next step of the procedure, which is the serving HS-
DSCH cell change. The target HS-DSCH cell is the newly added radio link, so far only
including the dedicated physical channels. For the synchronised serving HS-DSCH cell
change, both the source and the target Node Bs are first prepared for execution of the
handover at the activation time.
The SRNC then sends a Transport Channel Reconfiguration message, which indicates the
target HS-DSCH cell and the activation time to the UE. The message may also include a
configuration of transport channel related parameters for the target HS-DSCH cell, including an
indication to the transfer Iub transport bearer of MAC-d flow to the new cell. Following this
procedure a status report for eachRLCentity associatedwith theHS-DSCH should begenerated.
When the UE has completed the serving HS-DSCH cell change it returns a Transport
Channel Reconfiguration Complete message to the network.
196 UMTS Performance Measurement
Glossary
2G second generation (synonym for GSM)
3G third generation (synonym for UMTS)
3GPP Third Generation Partnership Project
AAL ATM adaptive layer
AAL2 ATM adaptation layer type 2
AAL5 ATM adaptation layer type 5
Abis interface between BSC and BTS in GSM networks
AC admission control; authentication centre
ACK acknowledge
ACOM Attach Complete (message)
AICH acquisition indication channel
ALCAP access link control application part
AM acknowledge mode in RLC
AMR adaptive multi rate
ANSI American National Standards Institute
AP application part
APCA Activate PDP Context Accept (message)
APCR Activate PDP Context Request (message)
APN access point Name
ARFCN absolute radio frequency channel number
ASN.1 abstract syntax notation one
ATM asynchronous transfer mode
ATRJ Attach Reject (message)
ATRQ Attach Request (message)
BCC base station colour code
BCCH broadcast control channel
BCH broadcast channel
BCSM basic call state model
BER bit error rate
UMTS Performance Measurement: A Practical Guide to KPIs for the UTRAN Environment Ralf Kreher
# 2006 Ralf Kreher
BLER block error rate
BSC base station controller
BSIC base station identification code
BSS base station subsystem
BSSMAP base station subsystem management application part
BTS base transceiver station
CAMEL customised application for mobile network enhanced logic
CAP CAMEL application part
CC call control
CC convolutional coding (coding type)
CCCH common control channel
CDF continuous distribution function
CCPCH common control physical channel
CCTrCH coded composite transport channel
CDMA code division multiple access
CDMA2000 3rd generation code division multiple access
CDR call detail record
CFN connection frame number
CGI cell global identity
CGN charging gateway node
c-ID cell identity (NBAP ASN.1)
C-ID cell identity
CID connection identifier (AAL2)
ChCd channelisation code
CN core network
CORBA common object request broker architecture
CPCH common packet channel
CPICH common pilot channel
CRC cyclic redundancy check
CREF connection refused (SCCP)
CRNC controlling radio network controller
CS circuit switched
CS-1/2 capability set 1/2 (INAP)
CS-iRAT-HO circuit switched inter-RAT handover
CTCH common traffic channel
CT/Fi call trace/filter (application)
CTrCH common transport channel
dB decibel
dBm decibel referenced to 1 milliwatt
DCCH dedicated control channel
DCH dedicated channel
DECT digital enhanced cordless telephone
DL downlink
DL BLER downlink block error rate
198 UMTS Performance Measurement
DLR destination local reference number (SCCP)
DPCH dedicated physical channel
DPCCH dedicated physical control channel
DPDCH dedicated physical data channel
DRNC drift radio network controller
DRNS drift radio network subsystem
DSCH downlink shared channel
DTAP direct transfer application part
DTCH dedicated traffic channel
Ec/N0 chip energy over noise (measured on CPICH)
EDGE enhanced data rates for GSM evolution
E-GPRS enhanced GPRS
ETSI European Telecommunication Standards Institute
FACH forward access channel
FBI feedback information
FDD frequency division duplex
FER frame error rate
FP frame protocol
FTP file transfer protocol
Gb GPRS interface between SGSN and GSM BSS
GERAN GSM/EDGE radio access network
GGSN gateway GPRS support node
Gi interface between GGSN and external network
GMM GPRS mobility management
GMSC gateway MSC
Gn interface between two GSNs
Gp interface between two GGSNs
GPRS general packet radio service
Gr interface between SGSN and HLR/AuC
Gs interface between SGSN and serving MSC/VLR
GSM Global System for Mobile Communication
GSN GPRS support nodes
GTP GPRS tunnelling protocol
GTP-C GTP control
GTP-U GTP user
GUI graphic user interface
H.323 an ITU-T protocol suite for video-telephony over IP
H.263 an ITU-T video codec
HARQ hybrid automatic repeat request
HLR home location register
HO handover
H-RNTI high speed downlink shared channel radio network
temporary identity
Glossary 199
HSDPA high speed downlink packet access
HS-DSCH high speed downlink shared channel
HSPA high speed packet access
HS-PDSCH high speed physical downlink shared channel
HS-SCCH high speed shared control channel
HTTP hyper text transfer protocol
HW hardware
Hz hertz, cycles per second
ID identifier
IFHO inter-frequency (hard) handover
IMEI international mobile equipment identity
IMS IP multimedia subsystem
IMSI international mobile subscriber identity
IN intelligent network
INAP intelligent network application part
InFHHO intra-frequency hard handover
InitMsg Initiating Message
IP Internet protocol
IP/ST Internet protocol in ST datagram mode
IPv4 Internet protocol version 4
IPv6 Internet protocol version 6
ISCP interference signal code power
ISDN integrated services digital network
ISO International Organization for Standardization
ISP Internet service provider
ITU International Telecommunication Union
Iu UMTS interface between 3G-MSC/SGSN and RNC
Iub UMTS interface between RNC and Node B
IuCS UTRAN interface between RNC and the circuit-switched
domain of the CN
IuPS UTRAN interface between RNC and the packet-switched
domain of the CN
Iur UMTS interface between RNCs
kbps kilobits per second
kHz kilohertz
KPI key performance indicator
KQI key quality indicator
LA location area
LAC location area code
LAI location area identity
LAN local area network
LDC long distance carrier
LI length indicator
200 UMTS Performance Measurement
MAC medium access control; message authentication code
MAP mobile application part
Mbps megabits per second
MCC mobile country code
Mcps megachips per second
Meas-ID measurement ID (NBAP)
MEHO mobile evaluated handover
MGW media gateway
MHz megahertz
MM mobility management
MMS multimedia messaging service
MNC mobile network code
MOC mobile originated call
MPEG Moving Pictures Expert Group
MS mobile station
MSC mobile switching centre
MSISDN mobile subscriber ISDN number
MSN mobile subscriber number
MTC mobile terminated call
N/A not assigned
NAS non access stratum
NBAP Node B application part
NCC network colour code
NE network elements
NEM network equipment Manufacturer
NMS network management subsystem
Node B UMTS base station
OMC operation and maintenance centre
OSI open system interconnection
O&M operation and maintenance
PCCH paging control channel
P-CCPCH primary common control physical channel
PCH paging channel
PDF probability density function; probability distribution function
PDP packet data protocol (e.g. PPP, IP, X.25)
PDSCH physical downlink shared channel
PDU packet data unit
PER packed encoding rules (ASN.1)
PhCh physical channel
PIP ‘P’ Internet protocol
PLMN public land mobile network
PM performance Management; performance measurement
PO power offset
Glossary 201
PPP point-to-point protocol
PRACH physical random access channel
PS packet switched
PSC primary scrambling code
PS-iRAT-HO packet switched inter-RAT handover
P-TMSI packet TMSI
QAM quadrature amplitude modulation
QE quality estimate
QoS quality of service
QoE quality of experience
QPSK quadrature phase shift keying
R4 Release 4 of 3GPP UMTS standard
R5 Release 5 of 3GPP UMTS standard
R99 Release 1999 of 3GPP UMTS standard, sometimes
called Release 3 (R3)
RA routing area
RAB radio access bearer
RAB-ID radio access bearer Identity
RACH random access channel
RAI routing area identity
RAN radio access network
RANAP radio access network application part
RAT radio access technology
RAU routing area update
RB radio bearer
RF radio frequency
RL radio link
RL-ID radio link identity
RLC radio link control; release complete message
RLS radio link set
RNC radio network controller
RNS radio network subsystem
RNSAP radio network subsystem application part
RNTI radio network temporary identity
RRC radio resource control
RSCP received signal code power
RSSI received signal strength indicator
RTWP received total wideband power
RTT round trip time
SAC service area code
SAI service area identity
SAP service access point
SCCP signalling connection control part
202 UMTS Performance Measurement
S-CCPCH secondary common control physical channel
SCH synchronisation channel
SDU service data unit
SF spreading factor
SFN system frame number
SGSN serving GPRS support node
SIB system information block
SIM subscriber identity module
SIR signal-to-interference ratio
SLA service level agreement
SLR source local reference number (SCCP)
SM session management
SMS short message service
SPC signalling point code
SRB signalling radio bearer
SRNC serving radio network controller
SRNS serving radio network subsystem
SSCOP service specific connection oriented protocol
SSDT site selection diversity transmission
STM synchronous transfer module
STM1 synchronous transport module – level 1
SuccOut Successful Outcome (message)
SVC switched virtual connection
SW software
TB transport block
TBS transport block set
TC turbo coding (coding type)
TCP transmission control protocol
TDD time division duplex
TDMA time division multiple access
TD-SCDMA time division – synchronised code division multiple access
TEID tunnel endpoint identifier
TF transport format
TFC transport format combination
TFCI transport format combination indicator
TFS transport format set
TMF Tele Management Forum
TMSI temporary mobile subscriber identity
TPC transmission power control; transmit power command
TP/IX the ‘next’ Internet protocol
TR technical report (3GPP, ETSI)
TrCH transport channel
TRX transceiver
TS technical specification (3GPP, ETSI)
TTI time transmission interval
Glossary 203
TUBA TCP/UDP over connectionless-mode network layer
protocol (CLNP)
TV television
Tx transmission
uARFCN UMTS absolute radio frequency channel number
UDP user datagram protocol
UE user equipment
UL uplink
UL BLER uplink block error rate
UL-SC uplink scrambling code
UL-SF uplink spreading factor
Um GSM air interface
UM unacknowledged mode in RLC
UMTS Universal Mobile Telecommunication System
UP user plane
URA UMTS registration area
USIM UMTS subscriber identity module
UTRA UMTS terrestrial radio access
UTRAN UMTS terrestrial radio access network
Uu UMTS air interface
VCI virtual channel identifier
VLR visitor location register
VoIP voice over IP
VPI virtual path identifier
WAP wireless application protocol
WCDMA, W-CDMA wideband code division multiple access
WiFi wireless fidelity
WLAN wireless local area network
WWW World Wide Web
204 UMTS Performance Measurement
References
TECHNICAL SPECIFICATIONS
3GPP Technical Specifications; http://www.3gpp.org
The 3GPP specifications referred to in this book are from the release 99 and release 5 set of
specifications.
European Telecommunication Standards Institute; http://www.etsi.orgInternet Engineering Taskforce Specifications; http://www.ietf.orgInternational Telecommunication Union; http://www.itu.int
EXTRACT OF UMTS-RELATED SPECIFICATIONS
3GPP 23.107 Quality of Service (QoS) Concept and Architecture
3GPP 23.110 UMTS Access Stratum Services and Functions
3GPP 25.133 Requirements for Support of Radio Resource Management (FDD)
3GPP 25.211 Physical Channels and Mapping of Transport Channels onto Physical Channels (FDD)
3GPP 25.212 Technical Specification Group Radio Access Network: Multiplexing and Channel Coding (FDD)
3GPP 25.213 Technical Specification Group Radio Access Network: Spreading and Modulation (FDD)
3GPP 25.214 Technical Specification Group Radio Access Network: Physical Layer Procedures (FDD)
3GPP 25.215 Physical Layer – Measurements (FDD)
3GPP 25.301 Radio Interface Protocol Architecture
3GPP 25.308 High Speed Downlink Packet Access (HSDPA): Overall description: Stage 2
3GPP 25.321 Medium Access Control (MAC) Protocol Specification
3GPP 25.322 Radio Link Control (RLC) Protocol Specification
3GPP 25.323 Packet Data Convergence Protocol (PDCP) protocol
3GPP 25.324 Radio Interface for Broadcast/Multicast Services
3GPP 25.331 Radio Resource Control (RRC) Protocol Specification
3GPP 25.401 UTRAN Overall Description
3GPP 25.410 UTRAN Iu Interface: General Aspects and Principles
3GPP 25.411 UTRAN Iu Interface Layer 1
3GPP 25.413 UTRAN Iu Interface: RANAP Signalling
3GPP 25.420 UTRAN Iur Interface: General Aspects and Principles
3GPP 25.423 UTRAN Iur Interface RNSAP Signalling
3GPP 25.427 UTRAN Iub/Iur Interface User Plane Protocol for DCH Data Streams
UMTS Performance Measurement: A Practical Guide to KPIs for the UTRAN Environment Ralf Kreher
# 2006 Ralf Kreher
3GPP 25.430 UTRAN Iub Interface: General Aspects and Principles
3GPP 25.433 UTRAN Iub Interface NBAP Signalling
3GPP 25.858 High Speed Downlink Packet Access: Physical Layer Aspects
3GPP 25.877 High Speed Downlink Packet Access: Iub/Iur Protocol Aspects
3GPP 26.101 Mandatory Speech Codec Speech Processing Functions: Adaptive Multi-Rate (AMR) Speech
Codec Frame Structure
3GPP 26.091 Mandatory Speech Codec Speech Processing Functions: Adaptive Multi-Rate (AMR) Speech
Codec: Error Concealment of Lost Frames
3GPP 29.061 GPRS Tunnelling Protocol (GPT) across the Gn and Gp Interface CCITT Rec. E.880
Field Data Collection and Evaluation on the Performance of Equipment, Network,
and Services
3GPP 32.101 Telecommunication Management: Principles and High-Level Requirements
3GPP 32.403 Telecommunication Management; Performance Management (PM): Performance
Measurements – UMTS and Combined UMTS/GSM
3GPP 34.108 Common Test Environments for User Equipment (UE): Conformance Testing
ETSI GSM 12.04 Digital Cellular Telecommunication System (Phase 2): Performance Data Measurements
IETF RFC 791 Internet Protocol
IETF RFC 768 User Datagram Protocol
IETF RFC 2225 Classical IP and ARP over ATM
IETF RFC 2460 Internet Protocol, Version 6 (IPv6) Specification
ITU-T I.361 B-ISDN ATM Layer Specification
ITU-T I.363.2 B-ISDN ATM Adaptation Layer Type 2
ITU-T I.363.5 B-ISDN ATM Adaptation Layer Type 5
ITU-T Q.711 Functional Description of the Signalling Connection Control Part
ITU-T Q.712 Definition and Function of Signalling Connection Control Part Messages
ITU-T Q.713 Signalling Connection Control Part Formats and Codes
ITU-T Q.714 Signalling Connection Control Part Procedures
ITU-T Q.715 Signalling Connection Control Part User Guide
ITU-T Q.716 Signalling Connection Control Part (SCCP) Performance
ITU-T Q.2100 B-ISDN Signalling ATM Adaptation Layer (SAAL) – Overview Description
ITU-T Q.2110 B-ISDN ATM Adaptation Layer – Service Specific Connection Oriented Protocol (SSCOP)
ITU-T Q.2150.1 B-ISDN ATM Adaptation Layer-Signalling Transport Converter for the MTP3b
ITU-T Q.2150.2 AAL Type 2 Signalling Transport Converter on SSCOP (Draft)
ITU-T Q.2630.1 AAL type 2 Signalling Protocol (Capability Set 1)
LITERATURE
Holma, Toskala, WCDMA for UMTS, John Wiley & Sons, Ltd, UK, 2001.
Kaaranen, Naghian, Laitinen, Ahtiainen, Niemi, UMTS Networks, John Wiley & Sons, Ltd, UK, 2001.
Kreher, Ruedebusch, UMTS Signaling, John Wiley & Sons, Ltd, UK, 2005.
Laiho, Wacker, Novosad, Radio Network Planning and Optimisation for UMTS, John Wiley & Sons, Ltd, UK 2002
OTHER WWW SOURCES
Vallent: Leader in Service Assurance – www.watchmark.com
NIST/SEMATECH e-Handbook of Statistical Methods – http://www.itl.nist.gov/div898/handbook/, January 2006.
Rysavy Research – Wireless Technology: Assessment and Integration – www.rysavy.com
3G Americas: Unifying the Americas through Wireless Technology – www.3gamericas.org
206 UMTS Performance Measurement
Index
1–92G-3G Inter-RAT Handover 146–147
3G-2G Inter-RAT Handover 143–146
3G-3G Intra-frequency Hard Handover 138–143
95th percentile 57, 58
AAL2 6, 14, 30, 36, 39, 41, 48, 49, 62, 74,
101, 111, 118, 120, 131, 135, 183, 187
AAL2 SVC 6, 14, 30, 39, 41, 48, 49, 62, 74,
101, 111, 118, 120, 131, 135, 183, 187
AAL2L3 39, 131
AAL5 36
Abis 144, 146
Absolute Radio Frequency Channel Number.
See ARFCN
acknowledged PRACH preambles 80
Activate Secondary PDP Context 10
active set 12, 19, 39, 41–43, 49–51, 63, 69,
74, 85, 91, 92, 109, 114, 118, 120–128, 130,
131, 133, 134, 137, 142, 167, 171, 179,
184, 189, 192–194
Active Set Size Distribution 122–124, 126
Active Set Update 69, 127, 128, 130, 131,
192–194
aggregation level 6, 37, 47–51, 74, 82, 110,
111, 116, 120, 121, 125, 137, 155, 168, 179
ALCAP 14, 39, 48, 49, 118, 128, 131, 183,
185, 187
AMR 6, 7, 21, 25, 26, 28, 62, 65, 68, 69, 102
Application Throughput 21, 22, 100, 114
ARFCN 95
ASN.1 30, 36, 140, 141, 145, 185
Attach Success Rate 18
Base Station Colour Code (BCC)
Base Station Identification Code (BSIC)
Basic Call State Model 45
broadcast channel. See BCH
BCH 65, 101, 102
beam forming
bearer 6, 8–10, 14, 26, 28–31, 34, 41, 45,
51–54, 58, 68, 69, 88, 89, 93, 97, 100, 106,
107, 109, 111, 116–118, 120, 121, 131–133,
135, 147–149, 155, 156, 158, 160, 164,
169, 170, 182–187, 189, 191, 195
bearer capability 8, 9, 26
BER. See bit error rate
best cell 50, 58, 82, 88, 92, 109, 110, 118,
122, 130, 137, 179, 187, 190, 191, 193
bin 56, 58, 67, 68, 71, 77, 80, 83, 86, 89, 109
bit error rate 19, 41–43, 49, 63, 71, 72
BLER. See block error rate
block error rate 19, 50, 61, 62, 65, 71, 125
blocking 17, 80, 153
call 1, 7–12, 14, 17–28, 31–34, 36–39, 41,
44–46, 48, 49, 51, 52, 55, 56, 58, 62, 63,
65, 68, 69, 78, 80, 82, 85, 89, 93, 100–102,
109, 111, 112, 114, 116, 120, 125, 128, 131,
135–137, 140–142, 146, 147, 149, 151–153,
155, 156, 158, 160–165, 167, 169, 175,
181–187, 189, 191, 193, 195
call drop rate 52, 80, 151, 160, 164, 165, 169
call setup 17
call trace 7, 18, 36, 37, 39, 89, 101, 111,
112, 128, 136, 146, 151, 185
call type 9–11, 65, 68, 161
CDF. See cumulative distribution function
cell 6–8, 10–12, 15–17, 19–24, 28, 29, 31–34,
36, 37, 39, 41, 43–51, 58, 62, 63, 65, 69,
74–82, 87–89, 91–95, 97, 100–102, 109–112,
114, 116–118, 120–128, 130, 132–139,
141–151, 153–155, 160, 164–167, 169–175,
177, 179, 181–187, 189–195
cell ID 11, 12, 48, 49, 75, 76, 93, 134, 138,
173, 189, 191
cell neighbour matrix 51
Cell Setup procedure 11, 75
UMTS Performance Measurement: A Practical Guide to KPIs for the UTRAN Environment Ralf Kreher
# 2006 Ralf Kreher
Cell Update 11, 12, 20, 23, 32, 44, 92, 93,
150, 151, 155, 167, 169–171, 175, 177
CELL_DCH 17, 23, 29, 31, 33, 34, 39, 44–46,
81, 97, 147–151, 182, 183, 185, 189
CELL_FACH 17, 20, 31, 34, 44, 45, 50, 80,
97, 116, 123, 147, 148, 150, 151, 170
CELL_PCH 23, 28, 31, 32, 149–151, 164, 177
channel mapping 28, 30, 33, 34, 38, 148, 149
channel type switching. See transport channel
type switching.
channelisation code 28, 32, 45, 46, 116, 120,
130, 183, 185, 186
churn rate 2
class 1 NBAP procedures 5
class 2 NBAP procedures 5
Codec CRC (AMR) 25
Common Measurement Reports 49, 185
Common Packet Channel. See CPCH
common transport channels 7, 23, 28, 30, 45,
48, 49, 73, 123, 147, 148, 152, 169, 179, 181
compressed mode 84, 88, 94, 95, 135,
166–169, 191, 194
continuous distribution function 58, 60
control plane 20, 21, 38, 65, 100
Controlling Radio Network Controller.
See CRNC
convolutional coding 71, 72
CORBA 3
core network 1, 7, 9, 10, 26, 29, 38, 48, 51–53,
63, 137, 141, 142, 160, 161, 164, 165, 177, 178
Core Network Bearer 29
correlation 4, 6, 8, 11, 18, 24, 25, 34, 36, 43,
47–49, 51, 69, 75, 76, 80, 100, 113, 114,
121, 125, 173, 190
corrupted data 25
counter subsets 7
coverage 19, 21
CPCH 73, 74, 97, 101, 186
CPICH Ec/N0 50, 91, 128
CRC 26, 42, 61–65, 67–69, 71, 73, 74, 85,
89, 95, 100
CRNC 5, 11, 20, 36, 48, 49, 51, 78, 85, 101,
167, 181–183
CS domain 10, 12, 17, 164
cumulative counters 3, 13
cumulative distribution function 60
cyclic redundancy check. See CRC
data calls 7, 8, 17, 147, 155
database 12, 34, 37, 45, 55
dB 55, 69, 73, 80, 83, 84, 86, 100, 130, 172
dBm 55, 56, 80, 86
DCCH 62, 88
DCH 17, 21, 23, 24, 29, 31, 33, 34, 38, 39,
44–46, 49, 53, 62, 73, 81, 86, 97, 100–102,
105, 108, 111, 116–118, 131, 132, 147–152,
182–185, 187, 189, 192
deciphering 36
Dedicated Control Channel. See DCCH
dedicated measurements 15, 49, 78, 81, 82, 183
Dedicated Physical Channel. See DPCH
Dedicated Physical Control Channel.
See DPCCH
dedicated traffic channel. See DTCH
dedicated transport channel. See DCH
delay 10, 58, 73, 113, 122, 183
dimension 47, 49, 75, 106, 125, 168
discrete distribution function 58
DL BLER. See downlink BLER
downlink BLER 100
DPCCH 43, 72, 82, 109, 116
DPCH 16, 74, 86, 91, 130, 168, 186
DPDCH 72, 116, 130
Drift RNC. See DRNC
DRNC 5, 42, 48, 51
dropped call 19, 20, 132, 160, 164, 165,
167, 175
dropped RAB 160–162, 164
drops 48, 80, 160, 164, 165
DTCH 132, 148, 149, 187
Ec/N0, 92, 158
event-ID 16, 19, 94, 97, 100, 130, 134,
135, 138, 139, 142, 144, 146, 190, 194
error concealment (AMR) 25
error correction 38, 71, 101
error detection 26, 38, 71, 117, 185
error protection 72
extension bits 108
FACH 12, 17, 20, 23, 28, 30, 31, 34, 38, 44,
45, 48–50, 73, 74, 80, 89, 97, 101, 102,
116, 123, 147–152, 169, 170, 181
FDD 12, 15, 16, 30, 39, 49, 50, 62, 71, 80, 82,
85, 87, 91, 105, 118, 133, 134, 171, 172,
183, 194
FER. See frame error rate
file download 22, 33
file transfer 8, 17, 21–23, 100, 116
File Transfer Protocol. See FTP
208 Index
Forward Access Channel. See FACH
FP. See frame protocol
Frame Error Rate 26
frame protocol 36, 38, 62, 65, 71, 74,
105, 121, 187
frame protocol trailer
Frame Quality Error Rate 25
Frame Quality Indicator 25, 26
FTP 8, 21, 114
gauges 13, 37, 47, 58
GERAN 14, 88, 145, 146
GPRS Attach 18
GPRS Support Node 3
granularity 13, 55, 73, 110, 123
granularity period 55
Graphic user interface. See GUI.
GSM 1, 8, 12, 14, 22, 52, 88, 95, 134,
137, 143, 144, 146, 153, 155
GTP-tunnel 29–32
GUI 34, 125
handovers 12, 16, 19, 48, 50, 88, 132, 138,
141, 155, 164, 189
hard handover 12, 14, 50, 51, 69, 88, 89,
114, 131, 132, 137–139, 141, 142, 144,
164, 165, 167, 175, 179, 189–191
hierarchy of protocol versions 39
High Speed Downlink Packet Access.
See HSDPA
High Speed Downlink Shared Channel.
See HS-DSCH
High Speed Packet Downlink Access 22
High Speed Uplink Packet Access 27
higher layer signalling 38
histogram 58, 65, 93, 122, 124, 126,
127
HLR 18
H-RNTI 34, 185, 190
HSDPA 22, 27, 28, 33, 34, 74, 77, 88, 111,
116, 117, 147, 149, 179, 181–183, 185–187,
189–193, 195
HS-DSCH 22, 23, 28, 33, 34, 38, 49, 74, 77,
88, 101, 111, 117, 147, 149, 182,
184–187, 189–195
HS-DSCH Capacity Allocation 74
HS-DSCH Provided Bit Rate 77, 185
HS-DSCH Required Power 77
HSPDA handovers 189
HSUPA 27
HTTP 8, 59
human behaviour 20
IDLE state 32
IMEI 51, 52, 93, 168
IMSI 47, 48, 51, 177
in-band signalling 10, 26
Inner Loop Power Control 73
interfaces 4, 7, 10, 11, 26, 34, 36,
39, 41, 43, 63, 109, 113, 120,
121, 131, 137, 140, 141, 144, 146,
155, 191
interference 7, 15, 21, 24, 28, 42, 50, 63, 78,
82, 83, 87, 91, 128, 167, 172
inter-frequency handover 132, 133, 135,
141, 142, 147
Inter-MSC handover 12, 138–140
internet protocol. See IP
Inter-RAT handover 48, 52, 137, 142–144,
146, 174
Inter-RNC soft handover 14, 48, 128, 131
Intra-frequency hard handover 89, 137–139,
141
Intra-RNC Soft Handover 14, 128
IP 8, 9, 21, 27–34, 36, 38, 52, 57, 69, 88,
100, 102, 112–114, 146, 148, 156, 160,
182, 185, 187, 189
IP header 113, 114
ISDN 8
Iu bearer 29, 47, 52, 160, 164
Iub 5–7, 10, 11, 30, 31, 34, 36–39, 41, 43,
44, 49, 62, 63, 65, 71, 78, 85, 101, 105,
109, 111, 113, 114, 117, 120, 130, 131,
135, 137, 138, 140, 141, 146, 151, 155,
169, 182, 183, 185, 187, 189, 191, 192,
195
IuCS 7, 34, 36, 48, 63, 140, 141, 144
IuPS 7, 29, 31, 32, 34, 47, 113, 114, 187
Iur 7, 34, 36, 48, 89, 113, 118, 120, 121, 128,
131, 137–139, 191
Iu-Release 19, 141, 142, 144, 146, 158,
160–162, 165
Iu-Release Request 19, 160–162, 165
key performance indicator 2–4, 13
key quality indicators 3
KPI 2–7, 13, 16, 18, 37, 41, 54–56, 61, 117,
120, 142, 154, 177, 179
KPI formula 4, 18, 142, 179
KPI targets 2
KQI See key quality indicators
Index 209
length indicator 108
Little‘‘i’’ 173
Little‘‘i’’-Matrix 173
Location Update 12, 17
MAC 38, 100, 111, 117, 185, 187, 192,
195
MAC-d flow 111, 185, 187, 192, 195
macro-diversity 42, 44, 62, 63, 69, 71, 109,
112, 130, 151, 167
maximum bit rate 10, 26, 52, 53, 116, 185
maximum cell range 21
maximum ratio combining 42, 43, 109, 167
measurement ID 49, 75, 76, 175, 187
measurement jobs 13
measurement type 13
Medium Access Control. See MAC
micro-diversity 43, 44, 49
Mobile Switching Centre. See MSC.
mobility management 8, 12, 14, 16, 17, 32,
38, 47, 48, 187, 189, 190
MPEG-4 26
MSC 12, 17, 18, 25, 26, 38, 48, 52, 137–142,
144, 145, 155, 158, 161, 165, 177
multi-interface perspective 14
multi-layer perspective 14
Multi-RAB 10, 31, 65, 69, 155, 156, 158,
160, 161
NAS message 10, 17, 29, 177
NAS signalling 9, 29, 36, 47, 48, 51, 53, 147,
177, 185, 187
NBAP 4–6, 14, 15, 19, 36–39, 42, 43, 48–51,
53, 56, 63–65, 67, 69, 71, 72, 74–78,
80–82, 85–87, 89, 94, 100, 101, 103, 105,
106, 122, 128, 130–133, 135, 136, 138,
139, 141, 142, 146, 147, 149, 165, 167,
169, 173, 178, 179, 181–185, 187, 189, 190
NBAP Common Measurement Report
49, 56, 185
NBAP Dedicated Measurement procedures 51
NBAP Dedicated Measurement Report
50, 51, 167
NBAP dedicated measurements 49, 78, 81,
82, 183
NBAP measurement reports 15, 78, 89
NBAP Radio Link Restore Indication 128,
130, 136, 167
NBAP Radio Link Setup Request 183
NBAP Resource Status Indication 181
NBAP Shared Physical Channel
Reconfiguration 181
NBAP Success Rate 4–6
NCC 95
Network Colour Code. See NCC
network failure 17, 24
network topology 6, 153
Node B 5, 7, 15, 16, 19, 30, 36, 38, 41–43,
48, 49, 51, 54, 62–64, 69, 71, 73–76, 82,
85–87, 95, 101, 111, 120, 131, 136,
165–168, 181–185, 187, 189–192, 194, 195
Node B Application Part. See NBAP
Node B communication context 49, 183
Northbound interface 3
number of active calls 7, 164, 165
number of connections 12
number of dropped calls 160, 165
OMC 49, 76, 181
Outer Loop Power Control 73, 74
padding 100, 107, 112, 117
Paging 11, 32, 101, 151, 176, 177
Paging channel. See PCH.
paging response 32, 101, 151, 176, 177
path loss 27
payload 8, 9, 23, 28–31, 33, 34, 36, 38, 42, 49,
52, 53, 88, 97, 100, 102, 105–109,
112–114, 117, 121, 146, 156, 182, 185, 187
PCH 23, 28, 31, 32, 101, 149–151, 164, 177,
181
PDF 59, 60
PDP context 9, 10, 28–30, 32, 33, 45,
48, 151, 164, 185–187
PDU 36, 113
performance related data
physical channel BER 71, 72
Physical Channel Reconfiguration 14, 23, 31,
89, 132, 133, 135, 136, 141, 147, 148,
155, 168, 169, 181, 191
poor transmission speed 20
Preambles of PRACH 15
primary scrambling code. See PSC
primary traffic 118, 120
probability density function. See PDF
probe 7, 34
propagation conditions 21
propagation delay 73
210 Index
protocol event counters 13, 137, 142
protocol stacks 7, 36, 37, 114
PS call 9, 10, 22, 27, 28, 38, 45, 55, 69, 102,
181–185, 187, 189, 191, 193, 195
PS domain 12, 161
PSC 134, 135, 138, 139, 186, 189, 194
P-TMSI 177, 184
QE. See Quality Estimate
QE-Selector 72
QoE 16
QoS 29, 53
Quality Estimate 41–43, 49, 63, 71, 85
quality of experience 16, 17, 19
quality of service. See QoS
RAB 9, 10, 19, 26, 29, 31, 47, 48, 52, 53, 56,
65, 69, 107, 109–111, 113, 141, 142, 151,
155–165, 185, 187
RAB Assignment Request 29, 156, 185
RACH 11, 12, 20, 23, 28, 30, 31,
38, 44, 45, 48, 49, 65, 73, 88, 93,
97, 101, 102, 123, 147–152, 169,
170, 181, 186
radio access bearer. See RAB
radio bearer 10, 14, 17, 19, 28–31, 45, 48,
51–54, 58, 68, 69, 88, 89, 93, 97, 100, 102,
106, 109, 111, 116, 117, 132–134, 147–149,
152, 153, 155, 156, 158, 160, 169, 170, 179,
183–187, 189, 191
Radio Bearer Deletion 14, 132
Radio Bearer Establishment 14, 187
Radio Bearer Reconfiguration 14, 53, 93,
132, 133, 148, 155, 156, 191
radio interface 4, 7, 9, 12, 15, 17, 19, 21, 23,
25–32, 36–39, 41, 43, 55, 61, 64, 71–74,
87, 89, 101, 102, 105, 109, 111, 114,
116–118, 120, 132, 134, 160, 163, 167,
180, 182, 183, 185, 191
radio link 6, 12, 14–16, 19–21, 23, 24, 36, 39,
41–43, 49–51, 53, 58, 61–64, 67, 69, 71,
72, 75, 76, 79, 82, 85, 86, 88, 89, 94, 95,
105, 109, 118, 120–123, 125–128, 130–133,
135, 136, 138, 139, 141, 142, 146, 147,
160, 165–170, 174, 179, 183–185, 187,
189, 190, 192, 194
radio link addition 12, 14, 19, 50, 51, 69, 75,
76, 88, 89, 109, 122, 123, 125, 127, 128,
130, 131, 138, 139, 174, 189, 190, 194
radio link deletion 19, 23, 51, 88, 123, 125,
127, 130, 141, 165
radio link failure 14, 19, 20, 23, 24
Radio Link Reconfiguration Preparation 53, 63,
67, 185, 190
Radio Link Setup 14, 19, 43, 63, 64, 67, 72,
75, 76, 122, 128, 131–133, 135, 138, 141,
179, 183, 184, 189
Radio Network Controller 3, 5, 28, 42, 62
radio resources 24, 27, 28, 48, 80, 118, 138,
142, 155, 177
rake receiver 42, 87
RANAP 10, 17, 19, 29, 39, 47, 48, 52, 53,
113, 139–142, 144–146, 156–158, 160,
161, 164, 165, 169, 178, 185
Random Access Channel. See RACH
RB. See radio bearer
reassembly 34, 36, 39, 42, 43, 114
received total wideband power 15, 56, 74,
75, 78, 91, 167
registration 17, 18, 93, 150
releases of UMTS standards 39
relocation 52, 139–146, 158, 164, 165
Report Characteristics Settings
response time 13, 18, 58, 154, 177
retransmission 69, 180, 185
RLC 8, 16, 20, 21, 26, 28, 30, 31, 36, 38, 39,
41–44, 51, 53, 61, 69, 71, 72, 74, 88, 100–102,
105–107, 109, 111–114, 116–118, 120, 121,
132, 150, 170, 180, 185–187, 192, 195
RLC AM 16, 21, 116, 150, 180, 185
RLC AM retransmission rate 185
RLC header 106, 107, 117
RLC signalling 21, 107, 117
RLC throughput 20, 51, 100–102, 111, 120
RLC transport block 38, 41, 44, 61, 71, 74,
100, 107, 109, 113, 117, 118
RNC 3, 4, 7, 12, 14, 17, 18, 20, 28, 29,
31, 32, 34, 36, 38, 39, 47–49, 52, 54,
55, 62, 69, 76, 82, 84, 86, 89, 110,
117, 120, 128, 130, 131, 133, 135,
136, 138–142, 144, 147, 150–154,
161, 165, 167, 170, 172, 173,
177, 178, 181–183, 185–187, 191
RNSAP 14, 39, 48, 131, 138, 139, 141
roaming 3, 18, 47
root cause analysis 17, 25, 53, 132, 145, 155,
167, 169, 178–180
Round trip time 16, 87
Index 211
Routing Area Update 12
RRC 10–12, 14–17, 19, 20, 29–34, 36–39, 41–45,
48–53, 58, 62, 65, 67–69, 71, 79–83, 85–89,
92–94, 97, 100–102, 105, 106, 109, 127, 128,
130–142, 144, 146–156, 158, 160, 165,
167–173, 175–177, 182–187, 189–191, 194
RRC Active Set Update 69, 127, 128, 130,
131, 194
RRC Active Set Update Complete 127, 128, 130
RRC Active Set Update Failure 128
RRC Blocking Rate 80, 153
RRC Cell Update 11, 12, 20, 32, 44, 92, 93,
150, 151, 155, 169–171, 177
RRC Connected Mode 29
RRC connection 11, 12, 16, 17, 29–32, 45, 49,
79, 81, 88, 92, 93, 133, 134, 147, 150,
152–156, 167, 169, 170, 176, 183, 184,
186, 187, 189
RRC Connection Request 11, 12, 88, 92, 93,
133, 153–155, 176, 183
RRC Connection Setup Failure Rate 153
RRC Connection Setup Success Rate 152
RRC Measurement Control 86, 97, 134, 135,
175, 184, 186, 187
RRC Measurement Report 16, 19, 30, 31, 41, 45,
50, 82, 92, 97, 100, 128, 130, 135, 136,
138–140, 142, 171–173, 175, 190, 191, 194
RRC paging response 176
RRC Radio Bearer Setup 10, 53, 58, 132,
147, 155, 156, 158, 170, 185, 189
RRC Redirection 153
RRC Re-Establishment 19, 160, 165, 169,
170
RRC Status
RRC Transport Format Combination
Control Failure
RRC UTRAN Mobility Information
Success Rate 175
RSCP. See Received Signal Code Power
RTWP. See Received Total Wideband Power
SAC. See Service Area Code
SAI. See Service Area Identity 14
sampling period 54–56, 58, 83, 84, 108–112,
114, 122, 123, 125
SCCP 36, 144, 177, 178
SCCP Connection Refused Ratio 177
SCCP failures
S-CCPCH 31, 65, 73, 97, 170
SDU 107, 113, 114, 121
Secondary Common Control Physical
Channel. See S-CCPCH
secondary CPICH 93, 94
secondary PDP context 10
secondary traffic 21, 118, 120, 121, 124
selection combining 42, 167
service 3, 4, 7–11, 14, 16, 20, 21, 27, 29, 48,
51, 52, 57, 68, 80, 88, 102, 107, 116, 122,
125, 132, 152, 153, 155, 167, 169, 181, 184
Service Area Code 11
Service Area Identity 11, 48
service level agreement 4, 14
Service Request message 9, 10, 184
serving HS-DSCH cell 34, 49, 88, 184, 189–195
serving HS-DSCH radio link 189
serving RNC. See SRNC.
Setup message 8, 9, 26, 100, 133, 134, 147,
155, 170, 185
SGSN 9, 10, 18, 29, 30, 32, 38, 47, 48, 52, 53,
113, 137, 155, 158, 161, 177, 184–187
Short Message Service 8
signal-interference-ratio 83–85
Signalling Connection Control Part. See SCCP
Signalling Radio Bearer 17, 29, 68, 100, 152,
153, 169, 179, 183, 184, 186
signal-to-noise-ratio
SIR. See signal-interference-ratio
SIR error 16, 69, 74, 84, 167
SIR target 16, 69, 73, 74, 83–85
site selection diversity transmission. See SSDT
SMS. See Short Message Service
soft handover 12, 14, 19, 21, 23, 39, 41–43,
48, 49, 51, 58, 62, 63, 69, 74, 89, 110,
118, 120–128, 130–132, 137, 138, 155,
167, 174, 192, 193
softer handover 6, 42, 43, 49, 51, 88, 89,
110, 120, 128, 131, 167, 184, 189, 193
spreading codes 22, 28, 29, 116, 181
spreading factor 23, 28, 29, 31, 45, 46, 82,
116, 117, 148, 181, 184, 186
SRB. See signalling radio bearer
SRNC 5, 16, 17, 19, 23, 28–32, 39, 41, 42,
44, 47–51, 53, 62, 63, 65, 68, 69, 71, 73,
74, 78–80, 82, 85, 88, 89, 109, 113, 116,
117, 120, 128, 130, 131, 134, 135,
138–142, 144–147, 149–152, 155, 156,
158, 160, 174–177, 182, 184, 185,
190–192, 194, 195
SSCOP 36
SSDT 43, 109, 112
212 Index
state machine 29, 44–46, 147, 150, 151
state transition 34, 44, 45, 147, 150, 151, 186
synchronization failure 166
Synchronized Radio Link Reconfiguration
Preparation 184–195
target cell 12, 19, 50, 51, 95, 114, 132, 135,
137–139, 141, 142, 144, 145, 174, 179,
190, 191
TCP 8, 21, 27, 100, 112, 114, 116
TCP/IP 8, 21, 27, 100, 114
TDD 15
TEID. See tunnel endpoint identifier
Tele Management Forum 3
TFS. See transport format set
Throughput 6, 20–27, 29, 31, 34, 37, 45, 46,
50–52, 55–57, 69, 74, 77, 100–103,
105–115, 117, 120, 121, 176, 180, 185
time transmission interval. See TTI
TMSI 51, 177, 184
topology module 12, 36, 48, 49, 75, 92, 101
traffic class 10, 48, 51, 183
transmitted carrier power 15, 74, 76, 77
Transmitted carrier power of all codes not used
for HS-PDSCH or HS-SCCH transmission 77
Transmitted code power 16, 86, 100
transmitted power 12, 16, 100
transport block set 8, 42, 53, 71, 74, 121
transport blocks 8, 36, 38, 39, 41–44, 53, 61,
62, 65, 73, 89, 100, 105–109, 112, 114, 117,
118, 120, 121, 130, 150, 155, 170, 180, 185
transport channel bit error rate
transport channel BLER 62, 65, 67, 97
Transport Channel Reconfiguration 14, 132,
133, 155, 170, 186, 191, 192, 195
transport channel throughput 21, 24, 26, 69,
77, 102, 106–109, 111, 117, 120, 121,
180, 185
transport channel type switching 39, 155, 187
Transport Channel Usage Ratio 102,
115–117, 176
Transport Format Set 21, 28, 51, 53, 63, 67,
69, 100, 105, 106, 116, 132, 148, 183, 185
troubleshooting 10, 17, 76, 174
TTI 38, 53, 105, 109, 110, 187
tunnel endpoint identifier 31, 113
turn-on-period 55
type of service 8, 20, 21, 51
uARFCN 133–135, 142
UE 7–12, 15–17, 19–26, 28–34, 38, 39, 41, 42,
44–46, 48–54, 62, 63, 65, 67–69, 71, 73, 74,
78, 81–83, 85–89, 91–95, 97, 100–102, 105,
106, 109, 111, 114, 118, 120, 122, 123,
125–128, 130–138, 141–144, 146, 147,
149–156, 158, 160, 161, 163–173, 175–177,
179, 182–187, 189–192, 194, 195
UE measurement abilities 71, 87
UE Tx Power 85, 100
UL BLER. See uplink BLER
UMTS Absolute Radio Frequency Channel
Number. See uARFCN
UMTS bearer services 9
UMTS Registration Area. See URA
unrecoverable RLC error 170
uplink BLER 62, 125, 167
URA 28, 31, 32, 150, 151, 164, 177
URA_PCH 28, 31, 32, 150, 151, 164, 177
user behaviour 23, 24, 27
user identifier 10
user perceived throughput 21, 50, 112, 180
user plane 19–21, 38, 46, 48, 49, 51, 65, 100,
102, 112–114, 118, 149, 169
UTRA Carrier RSSI 92, 171
UTRAN 1, 4, 6–10, 12–16, 20, 22, 24, 26–28,
34, 36, 37, 39, 50, 52, 62, 69, 71, 72,
78–80, 82, 87–89, 93, 94, 100, 102, 105, 112,
121, 128, 131, 132, 134, 137, 141–144, 146,
147, 151–153, 155, 158, 160–162, 164,
173, 175, 180, 183, 191, 192
video-telephony 8, 9, 17, 24, 26, 27, 65
voice call 6, 8, 9, 17, 28, 31, 62, 65, 68, 135,
151, 155
VPI/VCI/CID 6, 30, 31, 44, 121, 185, 187
WCDMA 51, 172
web browsing 8, 21–23
XML 3
Index 213


