Embed Size (px)
Citation preview

Umweltforschungsplan
des Bundesministeriums für Umwelt,
Naturschutz und Reaktorsicherheit
Umwelt und Gesundheit
Förderkennzeichen (UFOPLAN) 298 61 503
Epidemiological Determination of Disease Risks from Bathing
Epidemiologische Erfassung des Erkrankungsrisikos beim Baden
von
Dr. Albrecht Wiedenmann 1,
Dr. Petra Krüger 1, Silke Gommel 1, Marion Eissler 1, Monika Hirlinger 1,
Angela Paul 1, Dr. Karl Jüngst 1, Elena Sieben 1
und
Prof. Dr. Klaus Dietz 2
1 Institut für Allgemeine Hygiene und Umwelthygiene
Eberhard Karls Universität Tübingen
Direktor: Prof. Dr. Konrad Botzenhart
2 Institut für Medizinische Biometrie
Universitätsklinikum Tübingen
Direktor: Prof. Dr. Klaus Dietz
IM AUFTRAG
DES UMWELTBUNDESAMTES
Dezember 2004

- 2 -
CORRESPONDING AUTHOR:
Dr. med. Albrecht Wiedenmann
District Government Stuttgart (Regierungspräsidium Stuttgart)
State Health Agency (Landesgesundheitsamt)
Wiederholdstr. 16
70174 Stuttgart
GERMANY
Tel.: +49-(0)711-1849-343
Fax.: +49-(0)711-1849-242
E-mail: [email protected]
www.badegewaesserstudie.de

- 3 -
DAS WASSER FINDET SEINEN WEG
( K. Hoffmann )
Dedicated to Konrad Botzenhart,
Director of the Institute of General and Environmental Hygiene
of the University of Tübingen,
on the occasion of his 65th birthday,
with gratitude for his supreme scientific support,
his lasting personal engagement,
and the outstanding working conditions he has provided to us.

- 4 -
Contents
1 Executive Summary................................................................................10
1.1 Aim:...................................................................................................................10
1.2 Materials and Methods: .....................................................................................10
1.3 Results: ..............................................................................................................11
1.4 Policy Implications:...........................................................................................12
2 Zusammenfassung und Empfehlungen ................................................14
2.1 Ziel: ...................................................................................................................14
2.2 Material und Methoden: ....................................................................................14
2.3 Ergebnisse: ........................................................................................................15
2.4 Handlungsempfehlungen:..................................................................................17
3 Introduction.............................................................................................19
3.1 Aim of the study................................................................................................19
4 Materials and Methods ..........................................................................19
4.1 Study sites and potential sources of contamination...........................................19
4.2 Weather conditions............................................................................................20
4.3 Recruitment of volunteers and inclusion and exclusion criteria .......................20
4.4 Environmental exposure....................................................................................21
4.5 Monitoring of the microbiological water quality ..............................................22
4.6 Quality control for the microbiological procedures ..........................................23
4.7 Retrospective molecular analysis of frozen samples.........................................24
4.8 Follow-up procedures........................................................................................24
4.9 Data entry and verification ................................................................................24
4.10 Calculation of individual exposure concentrations ...........................................25

- 5 -
4.11 Exposure definitions..........................................................................................26
4.12 Disease definitions ............................................................................................26
4.13 Evaluation interval ............................................................................................28
4.14 Formation of disease-specific and parameter-specific cohorts .........................29
4.15 Calculation of crude relative risks.....................................................................30
4.16 Estimation of threshold concentrations and bathers' excess risks by
application of a simplified dose-response model ("step-model") using a
"minimal p procedure". .....................................................................................30
4.17 Control for bias..................................................................................................32
4.18 Incidence rates in quartile and quintile categories and in arithmetic
concentration classes .........................................................................................38
4.19 Combined effect of exposure concentrations and swallowing water ...............39
5 Results .................................................................................................39
5.1 Follow-up rate, randomisation result, and study population
characteristics ....................................................................................................39
5.2 Microbial concentrations in the water samples .................................................40
5.3 External and internal quality control .................................................................43
5.4 Compliance with current EU standards.............................................................43
5.5 Crude incidence rates, bathers' excess rates and relative risks..........................44
5.6 Threshold concentrations and specific relative risks.........................................45
5.7 Incidence rates in quartile and quintile categories and in arithmetic
concentration classes .........................................................................................48
5.8 Combined effect of exposure concentrations and swallowing water ................49
5.9 Results of the analyses of stool specimens........................................................50
5.10 Derivation of parameters necessary for the estimation of cost-benefit
effects ................................................................................................................50

- 6 -
6 Conclusions and Recommendations .....................................................52
7 Acknowledgements .................................................................................58
8 Literature.................................................................................................61
Annex 1. Classification of the five study sites according to the European
Bathing water directive 76/160/EWG in the year of the study and in
the years before ........................................................................................64
Annex 2. Schematic site map with study arrangements at one of the five study
sites ("Lerchenauer See" in Munich) .......................................................65
Annex 3. Follow-up rate, medical exclusions, randomisation result, exclusions
due to unacceptable exposure status, and final cohort size.....................69
Annex 4. Disease-specific cohorts...........................................................................70
Annex 5. Parameter-specific cohorts .......................................................................72
Annex 6. Quality control of the enumeration procedure for Escherichia coli
and intestinal enterococci using quantitative external reference
materials...................................................................................................73
Annex 7. Concentration ranges and median concentrations of the
microbiological parameters at the five study sites ...................................76
Annex 8. Correlation of microbiological parameters: Orthogonal fits of log10
transformed data after censoring values below detection limit ...............79
Annex 9. Relationship of E. coli and intestinal enterococci counts in
comparison with data from the UK..........................................................86
Annex 10. Temporal and spatial variability of the microbiological water quality
at the five study sites: Concentrations of Escherichia coli and
intestinal enterococci ...............................................................................89
Annex 11. Principles of the calculation of individual exposure concentrations:
interpolation between sample results and extrapolation of sample
results .......................................................................................................95
Annex 12. Principles of the calculation of individual exposure concentrations:
interpolation between swimmers and non-swimmers areas.....................96

- 7 -
Annex 13. Principles of the calculation of individual exposure concentrations:
example for the assignment of calculated concentrations to an
individual bather ......................................................................................97
Annex 14. Principles of the calculation of individual exposure concentrations:
examples for inclusions and exclusions...................................................98
Annex 15. Influence of the exposure definition on the calculated exposure
concentration for the four faecal indicator organisms .............................99
Annex 16. Intensity of exposure: Number of head immersions .............................100
Annex 17. Intensity of exposure: Percentage of participants reporting to have
swallowed water.....................................................................................101
Annex 18. Crude incidence rates, excess risks (attributable risks) and relative
risks of bathers vs. non-bathers 1 week and 3 weeks after exposure:....102
Annex 19. Dose response model assumptions and control of bias ..........................108
Annex 20. Step models for dose response relationships: Estimates for
thresholds of effect (NOAEL's); incidence rates below and above
threshold concentrations; relative risks and attributable risks ...............117
Annex 21. Plots of exposure concentrations (X) by Chi square p values (Y)
("minimal p procedure") ........................................................................123
Annex 22. Control of bias: Univariate screening for potential confounding
variables .................................................................................................132
Annex 23. Control of bias: Analysis of potential threshold concentrations and
potential confounding variables by multiple logistic regression
(Effect Likelihood Ratio Tests) .............................................................151
Annex 24. "Which indicator is the best?": Comparison of the indicator
organisms by multiple logistic regression (Effect Likelihood Ratio
Tests)......................................................................................................161
Annex 25. Dependence of threshold concentrations and incidence rates of
gastroenteritis below and above threshold concentrations on disease
definition, exposure definition and faecal indicator ..............................163
Annex 26. Incidence rates of gastroenteritis in quartile categories .........................169

- 8 -
Annex 27. Incidence rates of gastroenteritis in quintile categories .........................178
Annex 28. Incidence rates of gastroenteritis in arithmetic concentration
categories and in categories according to Kay et al., 1994....................187
Annex 29. Incidence rates of skin infections/cutireactions in quartile and
quintile categories ..................................................................................192
Annex 30. Disease incidences by quartiles, quintiles and arithmetic
concentration classes: Comparison with the predicted step models
for dose-response relationships..............................................................194
Annex 31. Effect of water ingestion: Incidence rates of gastroenteritis in non-
bathers vs. bathers reporting to have swallowed water or not to have
swallowed water below and above threshold concentrations ................207
Annex 32. Effect of water ingestion: Risk of gastroenteritis attributable to
swallowing water below and above threshold concentrations..............217
Annex 33. Excess risk of gastroenteritis by 95th percentiles of Escherichia coli
and intestinal enterococci concentrations ..............................................220
Annex 34. Bases for a risk-related interpretation of monitoring results: Area-
integrated sampling according to ISO 5667-4 .......................................225
Annex 35. Bases for a risk-related interpretation of monitoring results:
Calculation of the percentage of concentrations exceeding the
threshold of effect (NOAEL) .................................................................228
Annex 36. Bases for a risk-related interpretation of monitoring results:
Calculation of time-integrated quality scores ........................................235
Annex 37. Materials used for study organisation: Press release..............................245
Annex 38. Examples for press reports before and after the bathing trials at the
five study sites........................................................................................250
Annex 39. Information flyer used for recruitment of participants...........................255
Annex 40. Information leaflet for participants and declaration of participation .....256
Annex 41. Memorandum with time-table for participants.......................................268

- 9 -
Annex 42. Questionnaire No. 1: two or three days before exposure ......................269
Annex 43. Questionnaire No. 2: Exposure day interview ......................................286
Annex 44. Questionnaire No. 3: Interview one week after exposure .....................293
Annex 45. Questionnaire No. 4: Interview three weeks after exposure .................300
Annex 46. Retrospective molecular analysis of frozen samples for Escherichia
coli and intestinal enterococci by quantitative real time PCR ...............317

- 10 -
1 Executive Summary
1.1 Aim:
Five epidemiological studies were performed following a randomised, controlled
study design in order to evaluate the risk of contracting infectious diseases from bathing
in fresh water.
1.2 Materials and Methods:
Study locations were situated in the north, east, southwest and southeast of
Germany: four sites on lakes and one site on a river. All sites had complied with current
EU regulations for at least the three previous years. The sources of faecal contamination
included raw and treated municipal sewage, agricultural and municipal run-off after
rainfall and contamination by water fowl.
A total of 2196 participants were recruited from the local population. Two to
three days before exposure the participants were interviewed in person, and all
participants underwent a short medical examination. On the exposure day participants
had to register at the beach, where they were randomised into equal-sized groups of
bathers and non-bathers. They received a lunch package and were interviewed a second
time. Non-bathers stayed within roped-off areas on the beach but away from water.
Bathers were exposed under individual supervision in four roped-off areas each divided
into a swimmers' and a non-swimmers' zone. They were instructed to stay in the water
for exactly ten minutes and to immerse their head at least three times. After exposure
they were asked whether they had swallowed water.
For the entire time the participants were being exposed water samples were
collected every twenty minutes from the centres of the swimmers' and non-swimmers'
zones in all four areas. These samples were analysed in a nearby mobile laboratory for
six microbiological parameters: Escherichia coli (EC), intestinal enterococci (IE),
Clostridium perfringens (CP), somatic coliphages (SOMCP), aeromonads (AE) and
Pseudomonas aeruginosa (PA).

- 11 -
One week after exposure all the participants were interviewed again in person
and underwent a medical examination. Individual exposure concentrations for all
microbiological parameters were assigned to each bather by minute-wise interpolation
between the monitoring results and by calculation of the arithmetic mean concentration
of the ten individual exposure minutes. Threshold-of-effect concentrations (NOAEL's)
were defined as the exposure concentrations which revealed the most significant
difference between the incidence rates among bathers below and above these
concentrations in a Pearson's Chi Square test, provided that the incidence rates of
bathers below the threshold concentration were not significantly lower than the
incidence rates of non-bathers, and provided that no expected cell value was less than
five. Potential threshold concentrations were tested against a variety of possible
confounding variables including age, gender, study location, weather conditions,
previous diseases, diseases in household members, consumption of prescription drugs,
nutritional factors, travel history, socio-economic status, risk perception and additional
water contact, using a multiple logistic regression procedure (Effect Likelihood Ratio
Test).
1.3 Results:
The follow-up rate was 91.9%. Statistically significant and unbiased dose-
response effects (p<0.05) could be demonstrated for three different definitions of
gastroenteritis (GE) and all four faecal indicator parameters (EC, IE, CP and SOMCP).
Skin ailments were partially associated with the concentration of aeromonads. No other
significant and unbiased association could be observed between any of the six
microbiological parameters and any of the other evaluated disease definitions (acute
febrile respiratory infections, common cold, ear infections, eye infections, urinary tract
infections).
The relative GE risks of bathers above threshold concentrations of EC or IE
compared to non-bathers ranged between 1.9 [95% CI: 1.3; 2.8] and 3.6 [95% CI: 1.8;
7.0], depending on the definition of GE. Higher relative risks were detected with the
more stringent definitions of GE (e.g. GE = vomiting or diarrhoea with three or more

- 12 -
bowel movements per day), which indicates that the majority of bathing-associated
cases of GE were not only mild forms. Bathers who reported having swallowed water
were at a higher risk of acquiring GE, particularly when they were exposed to above-
threshold concentrations.
Taking into consideration the results from all combinations of indicator
organisms and disease definitions, as well as the results from classifying participants
into concentration classes defined by quartiles and quintiles and by equal arithmetic
concentration ranges, the following threshold concentrations for increased risk of GE
from 10 minutes of bathing and three or more head immersions are proposed: 100
EC/100ml, 25 IE/100ml, 10 CP/100ml and 10 SOMCP/100ml.
The excess risks of GE among bathers above threshold concentrations in this
cohort never exceeded 5%, even though exposure concentrations reached maximum
levels of up to 4600 EC/100ml and up to 1200 IE/100ml. The concept of deriving
standards by limiting the maximum acceptable excess risk to 5%, as suggested in the
current draft version for the revision of the European bathing water directive
(Commission 2002) and in WHO publications (Havelaar et al., 2001; WHO 2003) is
thus shown to be inappropriate. If this concept were applied, it would be impossible to
derive standards for fresh water in Germany or other parts of the world, because in
practice the maximum detectable excess risk rate never exceeded 5%.
1.4 Policy Implications:
(1) Introduce regulations to make the monitoring of Escherichia coli and intestinal
enterococci in European bathing waters mandatory at two-week intervals by
application of methods ISO 9308-3 and ISO 7899-1 for three years.
(2) Introduce a mandatory European external quality assessment scheme for these
methods.
(3) Introduce an area-integrated sampling technique according to ISO 5667-4 to
provide better estimates of the mean water quality on the sampling day.

- 13 -
(4) Collect all raw monitoring data (concentrations and sampling dates) from all
member states for three years.
(5) Introduce a risk-related and time-integrated interpretation system for the
monitoring results based on the estimation of the percentage of indicator
concentrations exceeding the threshold-of-effect levels (NOAEL's) determined in
the European randomised controlled trials in sea and fresh water.
(6) Introduce a risk-related classification system for bathing waters based on rates of
compliance with the thresholds of effect (e.g "Time-integrated Quality Scores")
rather than on disease burden estimates, since disease burden estimates are more
variable and depend on the susceptibility of cohorts (ca. 20% excess risk in the
UK studies, vs. <5% in the German studies and in studies in other parts of the
world).
(7) Set guidelines and imperative values based on a political decision on the desirable
and feasible levels of health protection.

- 14 -
2 Zusammenfassung und Empfehlungen
2.1 Ziel:
Um Infektionsrisiken beim Baden in natürlichen Binnengewässern zu erfassen,
wurde eine epidemiologische Untersuchung mit fünf Teilprojekten nach dem Prinzip
einer randomisierten kontrollierten Studie durchgeführt.
2.2 Material und Methoden:
Die fünf Studienorte lagen im Norden, Osten, Südwesten und Südosten
Deutschlands. Vier Badestellen lagen an Seen, eine an einem Fluss. Alle Badestellen
hatten mindestens in den drei Jahren vor Durchführung der Studie die Anforderungen
der EU-Badegewässerrichtlinie erfüllt. Quellen fäkaler Verunreinigungen waren
geklärte und ungeklärte kommunale Abwässer, Abschwemmungen aus Siedlungs-
gebieten und landwirtschaftlichen Nutzflächen oder Einträge durch Wasservögel.
Insgesamt 2196 Studienteilnehmer wurden aus der örtlichen Bevölkerung ange-
worben. Zwei bis drei Tage vor der Exposition wurden persönliche Interviews
durchgeführt, und alle Teilnehmer wurden einer kurzen ärztlichen Untersuchung
unterzogen. Am Expositionstag wurden alle Teilnehmer am Strand registriert und nach
dem Zufallsprinzip in jeweils gleich große Gruppen von Badenden und Nicht-Badenden
eingeteilt. Alle erhielten ein einheitliches Lunch-Paket und wurden ein zweites Mal
interviewt. Die Nicht-Badenden hielten sich in abgegrenzten Strandarealen auf, wo sie
nicht mit dem Wasser in Berührung kamen. Die Badenden wurden unter individueller
Beobachtung in vier abgegrenzten Wasserarealen exponiert. Jedes der Areale war
zusätzlich in einen Schwimmer- und einen Nicht-Schwimmerbereich unterteilt. Die
Badenden wurden angewiesen, genau zehn Minuten im Wasser zu bleiben und dabei
mindestens dreimal den Kopf unter Wasser zu tauchen. Nach Ablauf der Expositionszeit
wurden sie gefragt, ob sie beim Baden Wasser geschluckt hatten.
Parallel zu den Badeaktivitäten wurden in der Mitte der Schwimmer- und Nicht-
Schwimmerbereiche der vier Badeareale alle 20 Minuten Wasserproben gezogen, die in

- 15 -
einem nahe gelegenen mobilen Laboratorium auf insgesamt sechs verschiedene mikro-
biologische Parameter hin untersucht wurden: Escherichia coli (EC), intestinale Entero-
kokken (IE, syn.: Darmenterokokken), Clostridium perfringens (CP), somatische Coli-
phagen (SOMCP), Aeromonaden (AE) and Pseudomonas aeruginosa (PA).
Eine Woche nach Exposition wurden alle Teilnehmer erneut persönlich
interviewt und anschließend einer kurzen ärztlichen Untersuchung unterzogen. Jedem
Badenden wurde seine individuelle Expositionskonzentration für alle sechs
mikrobiologischen Parameter zugeordnet, indem zwischen den einzelnen Messwerten
minutenweise interpoliert und das arithmetische Mittel der Konzentrationen in den zehn
individuellen Expositionsminuten berechnet wurde. Als Schwellenkonzentration für ein
erhöhtes Erkrankungsrisiko (engl.: threshold of effect, NOAEL) wurden diejenigen
Konzentrationen gewertet, die im Pearson's Chi Quadrat Test den signifikantesten
Unterschied zwischen der Inzidenzrate der Badenden unterhalb und oberhalb der
jeweiligen Konzentration ergaben, vorausgesetzt die Inzidenzrate unterhalb des
Schwellenwerts war nicht signifikant niedriger als die Inzidenzrate der Nicht-Badenden
und vorausgesetzt, dass sich im Vier-Felder-Test in keinem der Felder ein
Erwartungswert von kleiner fünf ergab. Potentielle Schwellenwerte wurden mit Hilfe
eines Verfahrens der multiplen logistischen Regression (Effect Likelihood Ratio Test)
gegen eine Vielzahl möglicher Störfaktoren getestet, darunter Alter und Geschlecht,
Studienort, Witterungsbedingungen, vorausgegangene Erkrankungen, Erkrankungen
von Haushaltsmitgliedern, Medikamenteneinnahme, Ernährungsfaktoren, Reise-
anamnese, sozio-ökonomische Bedingungen, Risikowahrnehmung und zusätzlicher
Wasserkontakt.
2.3 Ergebnisse:
Die follow-up Rate betrug 91.9%. Statistisch signifikante und nicht durch
Störfaktoren verfälschte Dosis-Wirkungs-Effekte (p<0.05) ergaben sich für alle drei
getesteten Definitionen der Gastroenteritis (GE) und alle vier Fäkalindikator-Parameter
(EC, IE, CP und SOMCP). Hautbeschwerden waren partiell mit der Konzentration von
Aeromonaden assoziiert. Weitere signifikante und nicht durch Störfaktoren verfälschte

- 16 -
Assoziationen zwischen den mikrobiologischen Parametern und anderen untersuchten
Krankheitsbildern (akute fieberhafte Atemwegsinfekte, Erkältungskrankheiten, Ohr-
infektionen, Augeninfektionen, Harnwegsinfekte) konnten in dieser Studie nicht
festgestellt werden.
Das relative GE-Risiko von Badenden, die oberhalb der berechneten
Schwellenwerte für EC bzw. IE exponiert waren, betrug im Vergleich zu den Nicht-
Badenden in Abhängigkeit von der GE-Definition zwischen 1.9 [95% KI: 1.3; 2.8] und
3.6 [95% KI: 1.8; 7.0]. Die höheren relativen Risiken ergaben sich für die stringenteren
GE-Definitionen (z. B. GE = Erbrechen oder Durchfall mit mindestens drei Stuhlgängen
pro Tag). Dies deutet darauf hin, dass die Mehrzahl der badebedingten Gastroenteritiden
nicht nur milde Verlaufsformen waren. Badende, die angaben, Wasser geschluckt zu
haben, hatten ein höheres GE-Risiko als Badende, die angaben, kein Wasser geschluckt
zu haben. Dieser Effekt zeigte sich besonders deutlich bei Badenden, die oberhalb der
Schwellenwerte exponiert waren.
Unter Berücksichtigung der Ergebnisse aller Kombinationen der
unterschiedlichen GE-Definitionen und der vier Fäkalindikator-Parameter, und unter
Berücksichtigung der Ergebnisse der Einteilung der Badenden entsprechend ihrer
Expositionskonzentration in Quartilen, Quintilen und in gleich große
Konzentrationsbereiche können folgende Schwellenwerte für ein erhöhtes GE-Risiko
bei zehnminütigem Baden mit mindestens dreimaligem Kopf-Untertauchen
angenommen werden: 100 EC/100ml, 25 IE/100ml, 10 CP/100ml and 10
SOMCP/100ml.
Das attributierbare GE-Risiko (Zusatzrisiko) der Badenden oberhalb der
Schwellenwerte überstieg in der untersuchten Kohorte nie die 5%-Marke, obwohl z. T.
hohe Expositionskonzentrationen von bis zu 4600 EC/100ml und bis zu 1200 IE/100ml
aufgetreten waren. Das im derzeitigen Entwurf der Novelle der EU-
Badegewässerrichtlinie (Commission 2002) und in WHO-Veröffentlichungen (Havelaar
et al. 2001; WHO 2003) zur Ableitung des Grenzwerts für IE angewandte Konzept, den
Grenzwert so festzulegen, dass das maximal tolerierte Zusatzrisiko beim Baden auf 5%
beschränkt wird, ist daher unzulänglich. Bei Anwendung dieses Konzepts könnten für
deutsche Binnengewässer und für andere Regionen der Welt, in denen bei

- 17 -
epidemiologischen Untersuchungen die maximalen Zusatzrisiken ebenfalls unterhalb
der 5%-Marke blieben, überhaupt keine Standards erlassen werden.
2.4 Handlungsempfehlungen:
(1) Einführung einer Untersuchungspflicht für die beiden Parameter Escherichia coli
und intestinale Enterokokken (Darmenterokokken) in europäischen
Badegewässern in 14-tägigen Abständen unter einheitlicher Anwendung der
Methoden ISO 9308-3 und ISO 7899-1 für einen Zeitraum von drei Jahren.
(2) Einführung eines für alle Prüflaboratorien obligatorischen europäischen externen
Qualitätskontrollsystems für diese Methoden.
(3) Einführung einer flächenintegrierten Probenahme-Technik nach ISO 5667-4 um
präzisere Schätzwerte für die mittlere Wasserqualität einer Badestelle am Tag der
Probenahme zu erhalten.
(4) Einführung einer Meldepflicht an die EU für die Rohdaten (Messwerte incl.
Probenahmedatum).
(5) Einführung eines risiko-orientierten Interpretationssystems für die Ergebnisse des
Untersuchungsprogramms mit zeitlicher Gewichtung der Einzelergebnisse
("Time-integrated Quality Score"). Dieses System sollte auf der Schätzung des
Anteils mikrobieller Konzentrationen beruhen, die an einer Badestelle über den
Schwellenwerten (NOAEL's) liegen, die in den beiden europäischen
randomisierten und kontrollierten Studien ermittelt wurden.
(6) Einführung eines risiko-orientierten Klassifizierungssystems für Badestellen.
Dieses System sollte eher auf dem Ausmaß der Überschreitung der
epidemiologisch begründbaren Schwellenwerte basieren und weniger auf der
Abschätzung der badebedingten Erkrankungszahlen, da diese sehr viel variabler
sind und von der Immunität der untersuchten Kohorte abhängen (ca. 20%
Zusatzrisiko in den britischen Studien, <5% in den deutschen Studien und in
anderen Teilen der Welt).

- 18 -
(7) Entscheidung über Grenz- und Richtwerte, sobald eine politische Entscheidung
darüber vorliegt, welches Ausmaß an Gesundheitsschutz an den Badestellen
wünschenswert und zu verwirklichen ist.

- 19 -
3 Introduction
3.1 Aim of the study
In order to evaluate the infectious disease risks from bathing in fresh water, five
epidemiological studies were carried out following the same "randomised controlled
study" design which had already been applied at Northern European coastal bathing
sites according to WHO recommendations (Kay et al., 1994).
4 Materials and Methods
4.1 Study sites and potential sources of contamination
Two of the five study sites were located in the southwest, one in the southeast,
one in the east and one in the north of Germany. All study sites had been officially
registered and monitored according to European law for many years and had complied
with European standards for at least the three previous bathing seasons (Annex 1).
Three lakes were primarily ground water lakes with little or no surface water input, one
of them located in a rural environment with adjacent conservation areas and sparse
natural populations of water fowl, and the remaining two in an urban environment with
moderate to high overpopulation with ducks, geese and gulls. One site was located on
Germany's biggest natural inland lake with the Rhine River running through and
hundreds of smaller rivers and streams running into it. These carry discharge from
tertiary treated sewage as well as from sporadic sewage treatment plant and combined
sewer overflows and from agricultural run-off. The lake could also be influenced by
illegal discharge from boats and by faecal deposits from urban and natural populations
of water fowl with varying densities. One bathing site was located at the shore of a blind
arm of a stream running through a major town with sporadic contamination from
combined sewer overflows and urban run-off after heavy rain falls and with permanent
but spatially scattered contamination, mainly from gulls, ducks and swans.

- 20 -
4.2 Weather conditions
Weather conditions which may have contributed to elevated concentrations of
faecal indicators during the studies did in fact occur shortly before two of the studies.
The weather conditions during the trials were rainy and cool in one case, cool and
windy in two other cases, and warm and sunny in the remaining ones.
4.3 Recruitment of volunteers and inclusion and exclusion criteria
With support from the local media (Annex 37, Annex 38), study volunteers were
recruited from the local population in the three weeks before each trial (Annex 39,
Annex 41). For the pilot trial only volunteers above 18 years of age were accepted for
participation. After additional ethical clearance with the ethics commission of the
University of Tübingen the lower age limit was set to 4 years for the remaining four
trials. Children below the age of fourteen had to be accompanied by one of their parents.
Teenagers between 14 and 18 were accepted with the written, signed consent of their
parents (Annex 40). Children below the age of four were excluded because they were
considered to be a potential source of faecal accidents during the trials which might
have biased the results. No upper age limit was set, as bathing was considered to be a
recreational activity with no such generally accepted limit. Two or three days before the
trials the volunteers were invited for a structured interview on their personal details and
their health conditions which was carried out by specially instructed interviewers. The
questionnaires (Annex 42) were subsequently checked by professional physicians. After
an additional inspection of the volunteers' throat, ears and eyes and electronic
temperature measurement in the ear the physicians decided whether the volunteers
appeared to be physically fit for participation in the study trials. Reasons for exclusion
were serious acute infectious diseases or fever or health conditions where bathing might
have presented a serious or life-threatening risk.

- 21 -
4.4 Environmental exposure
Two or three days after the first interview, the participants came to the beach at a
designated time and registered at an information desk, where they were randomised into
equally sized groups of bathers and non-bathers using a block-randomisation procedure
with blocks of ten. Children who were accompanied by their parents were asked
whether they would like to stay with their father or their mother or be on their own
before their parents received their randomisation result. Each participant received a
standardised lunch package consisting of two fresh rolls, sterilised cheese, canned
sausage, a banana, a package of wheat biscuits and a bottle of mineral water suitable for
baby food preparation, i .e. with guaranteed heterotrophic plate counts of less than 5/ml.
Five percent but no more than 20 of the lunch packages per trial were microbiologically
analysed and monitored for food pathogens in a state food safety laboratory. The bathers
were assigned to one of four roped-off bathing areas of approximately 10m width and
20m length which were distributed across the beach and each divided into a non-
swimmers' and a swimmers' zone. The non-bathers were directed to a roped-off area of
the beach with lawn or sand grounds where they could not come into contact with the
water (Annex 2). When the participants arrived at their destination they were
interviewed again by one of the project helpers. In this second interview (Annex 43) the
questions focused on symptoms having occurred after the first interview and on
nutritional details of the past two or three days. Participants who reported any new
symptoms were sent to one of the physicians on site, who decided whether these
symptoms were a reason for exclusion or not. After the interview the participants were
free to have their lunch and non-bathers were free to stay in the non-bathers' area for
normal beach activities like sun-bathing or playing, depending on the weather
conditions. Party-style facilities (tables, benches and tents) were available on the beach
both in the bathing and the non-bathing areas to provide an opportunity for eating and to
protect participants and interviewers from sunshine or rain if required. Non-bathers
were not urged to put on bathing clothes if the weather conditions were inappropriate.

- 22 -
Participants who had been randomised for bathing entered the water under the
individual supervision of their interviewers. Bathing duration was limited to exactly 10
minutes, and participants were asked to stay inside the roped-off areas and to stay or
swim around balloons which had been placed like buoys in the centre of the areas. They
were also instructed to completely immerse their heads at least three times during the 10
minutes. The supervisors individually recorded the start time and the end of the bathing
period and the number of head immersions performed in each of the ten minutes. After
leaving the water the participants were asked whether they had swallowed water
(http://www.badegewaesserstudie.de).
4.5 Monitoring of the microbiological water quality
For the duration of the trials water samples were collected from the centre of the
swimmers' and non-swimmers' zones of all of the four bathing areas at twenty-minute
intervals. They were delivered to a nearby mobile lab within 30 minutes in thermo-
insulated boxes with cooling elements. After arrival at the lab the samples were
immediately analysed by a team of professional technicians or stored in a refrigerator
for no longer than eight hours before the beginning of the analyses. All samples were
analysed for the following microbiological parameters according to international or
national standards or national recommendations (methods and specifications or
modifications in brackets): Escherichia coli (ISO 9308-3, MUG hydrolysis, microtiter
plate method, 3 plates per sample, 192 wells with a 1:2 dilution, 96 wells with a 1:10
dilution), intestinal enterococci (ISO 7899-1, MUD hydrolysis and formazan formation,
3 plates per sample, 288 wells with a 1:2 dilution), Clostridium perfringens (Council of
the European Union, 1998: membrane filtration, 100 and 10 ml on m-CP agar), somatic
coliphages (ISO 10705-2, 10 x 1 ml, sample pre-filtration with beef-extract-saturated
0.45 µm membrane filters, double agar layer method), aeromonads (Schulze 1996,
membrane filtration, 100 and 10 ml on ampicillin-dextrine-agar) and Pseudomonas
aeruginosa (ISO 12780, membrane filtration, 10 and 1 ml on cetrimide agar; only
pyocyanine-positive strains were counted). The values of the method-specific lower

- 23 -
detection limits were assigned to samples with analytical results below the detection
limit. Upper detection limits were not reached in any of the samples.
In addition to the parameters, which were monitored every 20 minutes, grab
samples were collected once per study location in each of the four exposure areas.
These samples were analysed for F-specific coliphages (10 x 1 ml Double Agar Layer
Method according to amended ISO 10705-1, February 1997, host strain Salmonella
typhimurium WG49), Bacteroides fragilis phages (10 x 1ml, Double Agar Layer
Method according to ISO/CD 10705-4, January 1999, host strain Bacteroides fragilis
RYC2056), enterovirus (10 litre grab sample, AlCl3 flocculation, glass-wool filtration,
elution with skim-milk buffer, precipitation at pH 4.5, resolution in Na2HPO4 at pH
7.5, membrane filtration 0.2µm, BGM-Flow monolayer plaque assay), EHEC
(membrane filtration of 100 ml, incubation on Endo-Agar, PCR detection of the stx1
and stx2 genes; performed by Landesuntersuchungsamt für das Gesundheitswesen
Südbayern), and for Cryptosporidium oocysts and Giardia cysts (20 litre grab sample,
compressed foam filtration, immunomagnetic separation, DAPI staining, direct
immunofluorescent assay with FITC-MAB).
4.6 Quality control for the microbiological procedures
Quality control procedures included positive and negative media controls for
target organisms. For E. coli and intestinal enterococci quantitative reference materials
were also applied which had been evaluated in earlier international round robin trials
funded by European Union research projects ("reference lenticules K", donated by
Institute Pasteur de Lille, European Community Contract SMT4-CT95-1603; DG12-
RSMT). In addition the organisers' main lab provided many years of professional
experience in microbiological water analysis (routine and research) with continued
participation in national and international external quality assessment schemes
(Niedersächsisches Landesgesundheitsamt, Außenstelle Aurich, Germany, for E. coli
and total coliforms; PHLS, UK, external quality assessment schemes for

- 24 -
Cryptosporidium, Giardia and viruses in water). ΦX174 and MS-2 coliphages and B56-
1 Bacteroides fragilis phages were used as internal quality controls.
4.7 Retrospective molecular analysis of frozen samples
Aliquots of all water samples were frozen at -20°C on the sampling day.
Glycerol was used as a preservative. These samples were retrospectively analysed for
Escherichia coli and intestinal enterococci by quantitative real time PCR
(LightCyclerTM-PCR). Details of the methods are described in Annex 46.
4.8 Follow-up procedures
One week after the trials all participants were invited again for a third interview
(Annex 44) and a subsequent inspection of the throat, eyes and ears. Interviewers and
doctors were unaware of the exposure status of the participants, and had been instructed
not to ask the participants about their exposure status. Participants who reported
symptoms of gastroenteritis were asked to collect a stool sample as soon as possible and
to send it to the Baden-Württemberg State Health Office in Stuttgart, where the samples
were examined for the following parameters: Salmonella, Shigella, Yersinia
enterocolitica, Campylobacter, EHEC, rotavirus, adenovirus, enteroviruses,
norwalkvirus, Cryptosporidium parvum and Giardia lamblia. 32 participants made use
of this opportunity.
Three weeks after the trials the participants received a last questionnaire by mail
(Annex 45), which they had to fill in at home and send back to the organisers of the
study. After receipt of this fourth questionnaire, each participant received a
compensation of 50 DM (25 Euro) to cover personal expenses.
4.9 Data entry and verification
Questionnaire data were entered into an electronic data base using electronic
questionnaires created in Epi Info Version 6.2 (CDC, USA and WHO, Switzerland). All

- 25 -
data were entered a second time by a different person and compared during entry by
application of the data verification module supplied with the Epi Info software. If data
were inconsistent a menu popped up showing both entries, providing an opportunity to
decide which of the choices was the correct one. For further statistical analyses the
complete data set was exported and subsequently imported into JMP version 5.0
Statistical Discovery Software TM (SAS Institute Inc., USA). All statistical analyses
were performed in JMP TM with the exception of the calculation of confidence limits for
relative risks, which were calculated in STATCALC (Epi Info) and some of the
Pearson's Chi Square Tests, which were calculated in MS Excel 97 TM.
4.10 Calculation of individual exposure concentrations
For each minute of trial duration microbial concentrations in the water were
calculated by arithmetic interpolation between the results obtained by analysing the
water samples. This was done for all bathing areas and in both the swimmers' and the
non-swimmers' zones (Annex 11). In addition, the arithmetic means between the
concentrations in the swimmers' and in the non-swimmers' zones were calculated
(Annex 12). First values were carried back and last values were carried forward for ten
minutes. This procedure was also applied for missing sample results, which
occasionally occurred due to rapid growth of contaminating bacterial or fungal flora on
the membrane filters, especially on cetrimide agar or in one case due to oversight of a
sample for E. coli and enterococci analysis. The microbial concentrations of each of the
ten minutes of water contact were individually assigned to each of the bathers. The
values from the non-swimmers' or the swimmers' zones were used, depending on where
the participant was staying. If during any given minute a participant switched between
the non-swimmers' and the the swimmers' areas, the arithmetic mean between both
concentrations was assigned for that minute (Annex 13). Individuals for whom one or
more of the ten minute-specific concentrations were not available, e.g. because they had
entered the water too early or too late or due to the lack of analytical results, were
excluded from further analysis (Annex 14). This procedure was performed separately
for each of the six microbiological parameters.

- 26 -
4.11 Exposure definitions
Exposure was defined in two different ways. The first definition was "10
minutes bathing with at least three head immersions", which is equivalent to the
instructions that the participants had received from the study organisers in the written
participation agreement and from their supervisors before entering the water. For this
definition the arithmetic mean of the ten concentrations which had been calculated and
assigned as described above was used as the mean exposure concentration of every
individual bather. The second definition takes into account the fact that the participants
followed the instructions to immerse their heads at least three times to a very varying
extent (Annex 16). As each immersion of the head might be looked upon as an
equivalent for the uptake of a certain small amount of water via the eyes and the
lacrimal duct, the nose and throat, and the mouth, the minute-specific concentrations of
all minutes during which the head was immersed were multiplied with the number of
head immersions during each of these minutes and added up. The result can be
considered to be equivalent to a single head immersion at that concentration. This
definition of exposure is therefore called "single head immersion" (Annex 15).
4.12 Disease definitions
To evaluate health effects the following diseases were defined by Boolean
combination of symptom variables from the questionnaires (Boolean operators in
capital letters; terms separated by commas belong to the same variable):
Abbreviation Definition
AFRI Acute Febrile Respiratory Infections:
( fever AND sore throat, sphagitis )
OR ( fever AND pain in the chest )
OR ( fever AND dry cough )

- 27 -
OR ( fever AND productive cough )
OR ( fever AND breathing difficulties )
OR ( fever AND runny nose, coryza )
CC Common Cold:
sore throat, sphagitis
OR dry cough
OR productive cough
OR runny nose, coryza
EAR Ear inflammation:
inflammation, suppuration, pain in the ears
EYE Eye inflammation:
inflammation, suppuration of the eyes, red painful eyes
GE_UK-wf Gastroenteritis, UK definition according to Kay et al. 1994, without
consideration of stool frequency:
diarrhoea
OR vomiting
OR ( nausea AND fever )
OR ( indigestion AND fever)
GE_UK Gastroenteritis, UK definition according to Kay et al., 1994:
(diarrhoea AND 3 or more bowel movements per day )
OR vomiting

- 28 -
OR ( nausea AND fever )
OR ( indigestion AND fever )
GE_NL-2 Gastroenteritis, Netherlands-2 definition according to van Asperen et al.,
1998:
diarrhoea
OR vomiting
OR nausea
OR stomach pains
SKIN Skin infections, cutireactions:
exanthema, skin eruption
OR skin irritation, itching
UTI Urinary Tract Infections:
inflammation of the urinary bladder, urinary tract
4.13 Evaluation interval
Similar research work performed at British sea water beaches (Kay et al., 1994)
has been heavily criticised because it only evaluated data collected after a three-week
interval (Mugglestone et al., 2000). There were two main points of criticism. First, the
incubation periods for the diseases under evaluation are hardly longer than one week.
Second, by extending the evaluation time to three weeks there is an increased risk for
introduction of bias from other sources of infection and from compliance problems due
to additional bathing. We therefore initially compared the crude incidence rates of
disease among bathers and non-bathers after the one-week interval with the incidence
rates after the three-week interval. After it became obvious from that comparison that

- 29 -
there was in fact no additional scientific benefit from using the three-week interval, all
subsequent analyses concentrated on the results obtained after one week. Nevertheless,
some evaluations of the data obtained after the three-week interval were performed for
the purpose of direct comparison with the results from the UK studies.
4.14 Formation of disease-specific and parameter-specific cohorts
Of the 2196 volunteers who participated in the 1st interview, 139 (6.3%) were
excluded because of incomplete follow-up, 39 (1.8%) were excluded because of
medical reasons, and 37 (1.7%) were excluded because of unacceptable exposure data.
Exposure data were considered unacceptable if participants did not comply with their
randomisation status, if they entered the water too early or too late, or if the total
exposure time was less or more than 10 minutes. From the final cohort consisting of
1981 participants, disease-specific cohorts were formed by additional exclusion of
participants who reported in the exposure-day interview (2nd interview) any symptom
that was part of the disease definition under evaluation or any symptom considered to
be a possible precursor of the disease under evaluation. Such symptoms were: fever,
sore throat, runny nose, dry cough, productive cough, pain in the chest or breathing
difficulties for the AFRI-cohort and for the CC-cohort; ear inflammation (inflammation,
suppuration, pain in the ears) for the EAR-cohort; eye inflammation (inflammation,
suppuration of the eyes, red painful eyes) for the EYE-cohort; fever, loss of appetite,
nausea, vomiting, stomach pains or cramps, indigestion, loose bowel motions or
diarrhoea for the GE-cohort; exanthema, skin eruption, skin irritation, itching, skin ulcer
for the SKIN-cohort and fever or inflammation of the urinary bladder or urinary tract for
the UTI-cohort. Participants were also excluded if no clear decision could be made on
whether the disease definition was fulfilled or not fulfilled. This could happen if
participants were not sure whether one or more of the essential symptoms used in the
disease definition had occurred, or if the information in the questionnaires was
incomplete.
- 30 -
Additional reductions of the disease-specific cohort sizes were necessary for the
group of bathers when statistical calculations were based on concentrations of specific
microorganisms, and information on these concentrations was partially missing because
laboratory results were not available for certain parameters in certain water samples.
These cohorts were called parameter-specific cohorts.
4.15 Calculation of crude relative risks
Crude relative risks were calculated for each of the nine disease definitions in
the disease-specific cohorts. If a crude relative risk was < 1, no further analyses were
performed for this disease definition. If a crude relative risk was > 1, further analyses
were performed to determine threshold concentrations as explained below, irrespective
of whether the crude relative risk was significantly > 1 or not. This was done because an
existing significant effect within the group of bathers can be masked by a subgroup with
no elevated risk due to low microbial exposure (exposure below a threshold).
4.16 Estimation of threshold concentrations and bathers' excess risks by
application of a simplified dose-response model ("step-model") using a
"minimal p procedure".
The model assumptions which were the basis of the statistical procedures used to
estimate microbial threshold concentrations for increased risk within the group of
bathers and to estimate bathers' excess risks compared to non-bathers were derived from
the dose-response model explained in WHO's "Guidelines for safe recreational water
environments" (WHO, 1998; 2003). These assumptions were:
(1) that a baseline risk for the bathers exists which is not significantly lower than the
non-bathers' risk (bathing is not protective for any of the specified diseases).
(2) that there is a maximum risk level (ceiling) which is less than 100%, as a certain
portion of the exposed population can be expected either to be immune or to
become infected without developing any symptoms ("silent infections").

- 31 -
(3) that there is a concentration range within which the risk increases from baseline
level towards the ceiling.
(4) that above and below this concentration range there is no trend or correlation
between concentration and risk.
Based on these model assumptions (especially point 4) it was concluded that the
application of statistical procedures to analyse the data for overall trends or overall
correlations over the whole range of concentrations may be inappropriate and
misleading. It was also recognised that if only few data (few cases) are available in the
concentration range where the risk increases (point 3), it may be impossible to derive a
perfect sigmoid-shaped function or even the exact concentration range and the slope of
the risk increase between baseline and ceiling. To avoid over-interpreting the data as
well as losing information due to overly complex model assumptions, the dose-response
model used for data analysis was therefore further reduced to a simple step function,
which can be described by only three parameters: the baseline risk, a threshold
concentration and the maximum risk. In this "step model" the disease incidence in the
group of non-bathers represents an estimate for the baseline, the threshold is an estimate
of the microbial exposure concentration above which there is increased risk from
bathing, and the disease incidence in the bathers exposed above the threshold
concentration is an estimate for the ceiling of the dose response curve (maximum risk).
To find the most probable value for the threshold concentration in the group of bathers,
the participants were sorted by their individual exposure concentration in ascending
order. For every actually occurring concentration a Pearson's Chi-square Test was
performed, comparing the incidence rate of a disease in the group of bathers exposed at
or below that concentration with the incidence rate in the group of bathers exposed
above that concentration. For each of these Chi-square tests the p value (probability of a
Chi-square value at least as large as the value observed under the null-hypothesis of no
threshold effect) was calculated. The concentration with the minimal p value below 0.05
and a test result which was not suspect due to expected cell values of less than five, was
considered to be the most reasonable estimate of the potential threshold. If all Pearson's
p values below 0.05 were suspect, Fisher's exact test was performed for the

- 32 -
concentration with the minimal Pearson's p, and the result was documented but not
analysed any further. A threshold concentration was considered to be potentially valid if
three additional conditions were fulfilled: 1st, the incidence rate in the group of bathers
exposed at or below this concentration was lower than the incidence rate above that
concentration (exclusion of paradox effects); 2nd, the incidence rate in the group of
bathers exposed at or below that concentration was not significantly lower (p<0.05) than
the incidence rate in the group of non-bathers (exclusion of pseudo-effects due to
accidental imbalance of cases within the group of bathers), and 3rd, the incidence rate in
the group of bathers exposed above that concentration was significantly higher than in
the group of non-bathers (p<0.05). If the incidence rate in the group of bathers exposed
at or below the threshold concentration was significantly higher than in the group of
non-bathers, it was concluded that the microbial indicator concentration could explain
(or indicate) the effect only partially. In this case the proposed dose-response model was
modified from a one-step model to a two-step model with the non-bathers' incidence
rate as the baseline risk, the incidence rate below the threshold as bathing-associated
baseline risk attributable to other independent risk factors, and the incidence rate above
the threshold as indicator-associated risk.
Thresholds which were potentially valid were further analysed as described
below to control for possible confounding effects from other risk factors or from
protective factors. Thresholds were finally accepted if there was no statistical evidence
that they were confounded by any other variable (Annex 19).
4.17 Control for bias
To control for bias a variety of potential confounding factors (variables) were
analysed. Initially all variables were univariately screened for possible effects in the
total final cohort of bathers and non-bathers (Pearson's Chi square tests). Variables
showing significant univariate effects (p<0.05) were considered to be potential
confounders of the threshold concentrations (Annex 22), and were further analysed
using a multivariate nominal logistic regression procedure (effect likelihood ratio tests).

- 33 -
If microbiological threshold concentrations remained significant effects (p<0.05) in a
model consisting of the disease as response variable and the threshold and the potential
confounder as model effects, thresholds were considered to be unbiased, and the
potential confounder was considered to be an independent predictor of disease. In
addition all models were analysed for possible interaction effects between threshold
values and potential confounding variables by crossing both effects in separate effect
likelihood ratio tests. Significant interaction effects (p<0.05) were recorded but the
thresholds were not rejected (Annex 23).
Factors considered to be potential confounders for all disease definitions were:
Ambient conditions:
study location (Kirchentellinsfurt, Uhldingen-Mühlhofen, Berlin, Lübeck,
München), weather conditions (cool or warm)
Interviewer effect:
number of the interviewer in the 3rd interview
Age: age grouped by 10-year intervals, age grouped by 10-year intervals and 60+
Gender: male or female
Socio-economic status:
degree (none, primary school, non-classical secondary school, secondary
school, university), occupation (unemployed, child or pupil, student,
homemaker, practicing a profession)
Household:
number of household members (1, 2, 3, 4, 5, >5), number of children < 5 years
of age living in household (none, 1, >1), children < 5 years living in household
(yes, no), other household members participating in the study (yes, no)
Chronic symptoms or diseases:
any severe illness in 6 months before 1st interview (yes, no), stay in hospital in
the 6 months before 1st interview (yes, no)

- 34 -
Medicines:
consumption of prescription drugs in the 4 weeks before 1st interview (yes,
no), antibiotics (yes, no), steroids (yes, no)
Consumption of alcohol or tobacco:
consumption of alcohol (yes, no), amount of alcohol consumed in the week
before 1st interview (0, 1-5, 6-10, >10 units (1 unit = 0.5 l beer, 0.25 l wine,
0.02 l spirits)), was this the normal amount of alcohol (yes, no), smoking (yes,
no), number of cigarettes per day (0, 1-5, 6-20, >20)
Risk factors related to additional water contact:
additional swimming or bathing in the week after the trial day (yes, no), normal
frequency of bathing in natural recreational waters (fresh or sea water) per
month during summer (never; sometimes: 1-3; often: >3), frequency of bathing
in 4 weeks before 1st interview (0, 1-5, >5), maximal swimming distance (-50,
-500, -5000 m), maximal swimming duration (10 min, 20 min, 30 min, 1 h, 2
h), normal frequency of going to a beach without entering the water per month
(never, sometimes: 1-3, often: >3), number of visits to a beach without entering
the water in 4 weeks before 1st interview (0, 1-5, >5), normal frequency of
using a public pool per month (never, sometimes: 1-3, often: >3), utilisation of
private pools (yes, no), visit to a leisure park with water activities in 4 weeks
before 1st interview (yes, no), normal frequency of each of the following water
sports activities per month during summer: canoeing, motor-boating, paddling,
surfing, diving, fishing (never, sometimes: 1-3, often: >3)
Leisure activities:
normal frequency of pub visits per month (never, sometimes: 1-3, often: >3),
normal frequency of party or disco visits per month (never, sometimes: 1-3,
often: >3), normal frequency of sports activities per month (never, sometimes:
1-3, often: >3)
Travel history:
overnight stays outside household in the 4 weeks before 1st interview (yes, no),
travel abroad in the 4 weeks before 1st interview (yes, no)
- 35 -
Information about the study and about environmental subjects:
initial source of information about this study (partner, recruitment team,
television, newspaper, other), having seen or heard news about this study (yes,
no), regular reading of a newspaper (yes, no), member of an environmental
organisation (yes, no), informed about the monitoring of beaches in Germany
(yes, no), quality of that information (positive or negative), worried about that
information (no, a bit, very much), information on the cleanliness of
recreational waters in Germany (yes, no), quality of that information (positive
or negative)
Risk perception:
are water-related activities considered to be dangerous (yes, no), ever gone to a
beach while feeling ill (yes, no), did feeling ill prevent from entering the water
(yes, no), ever refused to go bathing because beach was too dirty (yes, no), ever
refused to go bathing because water was too dirty (yes, no), ever refused to go
bathing because waves were too rough (yes, no), ever refused to go bathing
because of fear of becoming ill (yes, no)
Factors considered to be potential confounders only for specific disease definitions
were:
Disease definition CC:
Household:
household member with one of the following symptoms or diseases in the 2
weeks before 1st interview: common cold, sore throat, lung infection, fever
(yes, no)
Acute symptoms or ailments:
one or more of the following symptoms or ailments in the three weeks before
1st interview: fever, headache, runny nose, ear infection, dry cough, productive
cough, sore throat, pain in the chest, breathing problems, pain in the joints, loss
of appetite (yes, no)

- 36 -
Chronic symptoms or diseases:
ear ailments, chest ailments, hay fever, diabetes (yes, no)
Leisure activities:
normal frequency of cinema visits per month (never, sometimes: 1-3, often:
>3), normal frequency of other activities involving contact to large groups of
people (never, sometimes: 1-3, often: >3)
Risk factors related to additional water ingestion during the trial:
exposed and swallowed water during trial (no, teaspoon, tablespoon, cup),
exposed and swallowed water during trial (yes, no), swallowed water during
trial (unexposed or exposed and no, teaspoon, tablespoon, cup), swallowed
water during trial (unexposed or exposed and no, exposed and yes)
Disease definition EAR:
Household:
household member with one of the following symptoms or diseases in the 2
weeks before 1st interview: ear infection (yes, no)
Acute symptoms or ailments:
one or more of the following symptoms or ailments in the three weeks before
1st interview, in the two or three days between the 1st and the 2nd interview
and in the week after exposure: fever, headache, runny nose, dry cough,
productive cough, sore throat, pain in the chest, breathing difficulties (yes, no)
Chronic symptoms or diseases:
Ear ailments (yes, no)
Disease definition EYE:
Acute symptoms or ailments:
one or more of the following symptoms or ailments in the three weeks before
1st interview: eye infection or inflammation (yes, no), vision disorders (yes,
no)
Chronic symptoms or diseases:
chronic eye inflammation (yes, no), chronic hay fever (yes, no)

- 37 -
Disease definition GE:
Household:
household member with one of the following symptoms or diseases in the 2
weeks before 1st interview: common cold, fever, nausea, vomiting, diarrhoea
(yes, no)
Acute symptoms or ailments:
one or more of the following symptoms or ailments in the three weeks before
1st interview: fever, loss of appetite, nausea, vomiting, loose bowel motions,
diarrhoea, stomach pains, any of these symptoms (yes, no)
Chronic symptoms or diseases:
chronic stomach, gut, and liver ailments, diabetes (yes, no), normal frequency
of diarrhoea (never, hardly ever: 1-2 per year, often: 1-2 per month), proneness
to motion sickness (always, often, hardly ever, never)
Medicines:
consumption of the following prescription drugs in the 4 weeks before 1st
interview: laxatives (yes, no), stomach remedies (yes, no)
Dietary factors:
consumption of the following foods in the two or three days before exposure
(2nd interview) and in the week after exposure (3rd interview): ice cream,
bought sandwiches, chicken, chicken meat, eggs, scrambled eggs, omelettes,
tiramisu, home-made mayonnaise, hot dogs or grilled sausages, hamburgers,
salads, raw milk, raw cheese, raw meat, sausages, fast food, sea food (yes, no),
participation in a barbecue party in the week after exposure (yes, no)
Risk factors related to additional water ingestion during the trial:
exposed and swallowed water during trial (no, teaspoon, tablespoon, cup),
exposed and swallowed water during trial (yes, no), swallowed water during
trial (unexposed or exposed and no, teaspoon, tablespoon, cup), swallowed
water during trial (unexposed or exposed and no, exposed and yes)

- 38 -
Disease definition SKIN:
Household:
household member with one of the following symptoms or diseases in the 2
weeks before 1st interview: fever, skin ailments (yes, no)
Acute symptoms or ailments:
one or more of the following symptoms or ailments in the three weeks before
1st interview: fever, exanthema or skin eruption, itching, tingling, skin ulcer
(yes, no), fever in two or three days before 2nd interview (yes, no)
Chronic symptoms or diseases:
chronic skin, renal, neural and liver ailments, diabetes, hay fever (yes, no),
normal frequency of diarrhoea (never, hardly ever: 1-2 per year, often: 1-2 per
month), proneness to motion sickness (yes, no)
Risk perception:
frequency of sunburns after beach visits (always, often, hardly ever, never), are
sunburns treated (always, often, hardly ever, never)
4.18 Incidence rates in quartile and quintile categories and in arithmetic
concentration classes
To provide additional evidence for existing dose-response relationships between
microbial concentrations and disease risk, the microbiological parameters for which
unbiased threshold values could be established were analysed by classifying the data
into quartiles and quintiles and into arithmetic concentration classes with equal
concentration ranges. The disease incidences within the various classes were compared
to the disease incidence in the unexposed group of non-bathers, and significant
differences (Pearson's Chi-square test, p<0.05) were recorded.
For direct comparison between the results of previous studies performed in sea
water with the results obtained in fresh water, gastroenteritis data were also classified
using the quantile boundaries of the sea water studies published by Kay et al., 1994.

- 39 -
4.19 Combined effect of exposure concentrations and swallowing water
For the outcome variable "gastroenteritis" the term "dose response", which is
often used to describe the relationship between concentrations of microorganisms in the
water and disease risk, is misleading for at least two reasons. First of all, the
microbiological parameters measured in the water samples are indicator organisms, not
the causative agents themselves, and the pathogen-indicator ratio is variable. Second, a
concentration of organisms is not really a dose if the outcome (ill or not ill) depends on
the number of incorporated organisms. A dose could only be calculated by
multiplication of a specific exposure concentration with the volume of water which was
incorporated. With the applied study design this volume cannot be quantified exactly.
However, one can assume that it depends on both the number of head immersions and
the amount of water swallowed during exposure. The effect of the number of head
immersions was assessed by including this number in the exposure definition as
explained before. The effect of swallowing water was assessed by stratifying the
exposure classes defined by the thresholds (below threshold or above threshold) into
additional classes of participants who reported to have swallowed water and participants
who reported not to have swallowed water (Annex 17). The resulting four classes
(exposure below threshold and no water swallowed, exposure below threshold and
water swallowed, exposure above threshold and no water swallowed, exposure above
threshold and water swallowed) were considered to be the best possible estimate for the
relative amount of incorporated microbial agents capable of causing gastroenteritis.
5 Results
5.1 Follow-up rate, randomisation result, and study population characteristics
Starting off with a total of 2196 participants in the 1st interview and ending up
after exclusions and drop-out with 2018 participants who returned the 4th questionnaire,
the follow-up rate was 91.9%. After exclusion of an additional 37 participants whose

- 40 -
exposure data were unacceptable or incomplete the final cohort size was 1981. The
2067 volunteers who participated in the 2nd interview were randomised into groups of
1033 bathers (50.0%) and 1034 non-bathers (50.0%), which demonstrates the success of
the randomisation procedure. After disease specific exclusions the disease-specific
cohort sizes one week and three weeks after exposure were (disease definition in
brackets): 1569 and 1549 (AFRI), 1558 and 1534 (CC), 1953 and 1943 (EAR), 1943
and 1935 (EYE), 1757 and 1720 (GE_UK), 1768 and 1738 (GE_UK-wf), 1767 and
1731 (GE_NL-2), 1837 and 1816 (SKIN) 1946 and 1938 (UTI). For the parameters
aeromonads (AE), E. coli (EC), intestinal enterococci (IE) and somatic coliphages
(SOMCP) the parameter-specific cohorts were smaller than the disease-specific cohorts
by approximately 10 participants; for the parameter Pseudomonas aeruginosa (PA) the
cohort size was smaller by approximately 100 participants; no reduction was necessary
for the parameter Clostridium perfringens (CP) because there were no missing
laboratory data for this parameter. Tables with exact figures are in the annex (Annex 3,
Annex 4, Annex 5).
The age distribution among bathers and non-bathers in the final cohort was
almost identical. Minimum, 25th percentile, median, 75th percentile and maximum in
the group of bathers were 4, 14, 23, 39 and 79 years vs. 4, 15, 25, 39 and 89 years in the
group of non-bathers. The ratio of male to female participants in the group of bathers
was 489/473 (50.8%/49.2%), and 474/545 (46.5%/53.5%) in the group of non-bathers.
33 participants (1.7%) were pre-school children, 661 (33.4%) were schoolchildren, 235
(11.9%) were students, 711 (35.9%) were practising a profession, 151 (7.6%) were
homemakers or retired, 104 (5.2%) were unemployed, and 86 (4.3%) did not disclose
their employment status. 140 (7.1%) of the 1981 participants were members of an
environmental organisation, 1812 (91.5%) were not, and 29 (1.5%) did not answer the
question.
5.2 Microbial concentrations in the water samples

- 41 -
The total number of available sample results per parameter from all five study
locations was 421 for EC, 421 for IE, 423 for CP, 420 for SOMCP, 420 for AE and 385
for PA. The median concentrations and the concentration ranges were 136 EC /100ml
[4.7;5344], 37 IE /100ml [3.0; 1504], 1.8 CP /10ml [0.9, 26], 20 SOMCP /100ml [10,
3780], 8200 AE /100ml [600; 31400] and 1 PA /10ml [1; 10]. With the exception of AE
the lower range limit is equivalent to the lower detection limit. Median concentrations
and concentration ranges at each of the five study sites are in the annex (Annex 7,
Annex 10).
All faecal indicators correlated fairly well with each other, with correlation
coefficients of the log10-transformed concentrations between 0.79 and 0.41 (orthogonal
regression, univariate variances, after censoring values below detection limits), while all
coefficients for correlations with aeromonads or Pseudomonas aeruginosa were
between 0.31 and 0.07. The closest associations were between E. coli and intestinal
enterococci, and between E. coli and somatic coliphages. Correlation coefficients for all
15 combinations of parameters in descending order were: 0.79 (EC-IE), 0.78 (EC-
SOMCP), 0.57 (EC-CP), 0.51 (IE-CP), 0.50 (CP-SOMCP), 0.41 (IE-SOMCP), 0.31
(IE-PA), 0.29 (EC-PA), 0.28 (SOMCP-PA), 0.27 (EC-AE), 0.24 (SOMCP-AE), 0.23
(CP-AE), 0.17 (CP-PA), 0.11 (IE-AE) and 0.07 (AE-PA) (Annex 8).
The relationship between EC and IE which was found in this study is similar to
the. relationship between faecal coliform and faecal streptococcal counts in United
Kingdom bathing waters as published in Figure 4.7 of the WHO publication known as
the "Farnham Protocol" (Bathing Water Quality and Human Health: Faecal Pollution.
Outcome of an Expert Consultation, Farnham, UK, 2001). A reproduction of this figure
overlaid with the EC-IE-relationship found in this study is in the annex. However, the
formula of the linear regression function and the example calculations which are
provided in the WHO publication together with Figure 4.7 are probably erroneous. They
do not correspond to the graph and the example results are not plausible from an
empirical point of view. It is therefore not surprising that the linear regression function
revealed in this study differs from the function published by WHO:

- 42 -
UK (WHO, 2001): log faecal coliform count = 1.028 + 0.601 * log faecal strep. count
D (this study): log EC count = 0.728 + 0.940 * log IE count
In an orthogonal regression analysis revealing a variance ratio of 1.431 for EC/IE the
regression function after censoring values below the detection limit was:
D (this study): log EC count = 0.323 + 1.196 * log IE count (Annex 9)
Enteroviruses in 10 litres could not be detected at any of the five study sites.
Bacteroides fragilis phages in 10 ml could not be detected at four sites. At one site, the
method did not work due to problems with a clumping agar batch. F-specific
coliphages, Cryptosporidium oocyts and Giardia cysts could not be detected at four
study sites. Only at one study site were F-specific coliphages detected at a concentration
of 1 plaque forming particle/10ml in one of the four exposure areas. At this site
Cryptosporidium oocyts could be detected in two of the four areas at a concentration of
1 oocyst/20 litres, and Giardia cysts could be detected in all four areas, three times at a
concentration of 1 cyst/20 litres and once at a concentration of 3 cysts/20 litres. At this
site the minimum concentration of EC was 146/100ml, the minimum concentration of
IE was 110/100ml. EHEC (PCR detection of stx1 or stx2) could not be detected at any
of the five sites.
The results of the retrospective analyses of frozen sample aliquots by
quantitative real time PCR for Escherichia coli and intestinal enterococci were
disapppointing. While nearly perfect standard curves could be achieved for given
concentrations of target DNA, the quantitative results of the sample analyses did not
correlate with the culture results. Moreover, the samples from certain locations seemed
to contain inhibitory substances which could not be effectively removed by the applied
DNA extraction procedure, and obviously caused large numbers of false negative
results. Therefore, the PCR-based quantitative molecular detection methods which were
evaluated in this project cannot be considered to be a promising alternative to culture

- 43 -
methods. The molecular analyses may have also been hampered by the storage
conditions and by the lower sample volumes which were applied in the PCRs (effective
volumes: 1.8 ml for Escherichia coli; 9 ml for intestinal enterococci). Details of the
results are described in Annex 46.
5.3 External and internal quality control
The results obtained from the quantitative external quality control tests for EC
and IE using 'lenticules K' were well within the range of results that could be calculated
in a round robin trial performed by nine European expert labs in a EU research project
under the supervision of the Institute Pasteur de Lille, France. The means and the
standard deviations of the log10 transformed results obtained during the study trials
were 2.76 ±0.08 EC/100ml and 2.47±0.09 IE/100ml (n=38) compared to 2.77±0.18
EC/100ml and 2.49±0.30 IE/100ml (n=43) obtained in the round robin trial (Annex 6).
Internal quality control procedures for culture media and incubators did not reveal any
results which would have justified doubts about the analytical quality of the sample
results.
5.4 Compliance with current EU standards
According to the official report of the EU all five bathing sites complied with the
standards of the European bathing water guideline of 1976 at the end of the season in
which the studies were performed (Annex 1). This evaluation is based on the test results
of the official monitoring programs, which were performed independently by the
responsible local authorities throughout the bathing seasons, and excludes all test results
obtained during the study trials.
In 95.2% (401/421) of the samples collected during the five trial days EC
concentrations were below the imperative value of 2000/100ml. Thus, in the time
periods during which the trials were performed the total water quality of all five study
locations would have just passed the current European standard (95% of sample results
below 2000/100ml). If the study sites are considered separately, only one site would

- 44 -
have failed to comply with the current standard during the trial with a compliance rate
of only 80.0% (64/80) of the samples. The compliance rates of the other four sites in
ascending order were 97.7% (85/87), 97.7% (86/88), 100% (78/78) and 100% (88/88).
5.5 Crude incidence rates, bathers' excess rates and relative risks
The crude incidence rates of bathers vs. non-bathers one week after exposure
were AFRI: 0.9 % vs. 1.1 % (p=0.7098); CC: 15.4 % vs. 13.6 % (p=0.3051); EAR: 1.6
% vs. 0.7 % (p=0.0652); EYE: 1.7 % vs. 1.6 % (p=0.8717); GE_UK: 3.3 % vs. 1.4 %
(p=0.0074); GE_UK-wf: 5.4 % vs. 2.8 % (p=0.0056); GE_NL-2: 7.4 % vs. 5.2 %
(p=0.0531); SKIN: 9.3 % vs. 2.8 % (p=0.0000); UTI: 0.2 % vs. 0.4 % (p Pearson's Chi
square test = suspect, p Fisher's exact test =0.8764). The crude relative risks with lower
and upper 95% confidence limits were AFRI: 0.83 [0.31; 2.22]; CC: 1.13 [0.89; 1.45];
EAR: 2.26 [0.93; 5.52]; EYE: 1.06 [0.53; 2.10]; GE_UK: 2.37 [1.23; 4.54]; GE_UK-wf:
1.92 [1.20; 3.08]; GE_NL-2: 1.43 [0.99; 2.06]; SKIN: 3.30 [2.16; 5.05]; UTI: 0.53
[0.10; 2.89].
The comparison of crude incidence rates, bathers' excess risks and relative risks
calculated after the one-week interval and after the three-week interval revealed that the
evaluation of the data after the three-week interval yielded no advantage. All significant
differences between the crude incidence rates of bathers vs. non-bathers after one week
were less significant or no more significant after three weeks, and none of the
differences which were insignificant after one week became significant or nearly
significant after three weeks. The corresponding significant relative risks, especially
those for gastroenteritis, declined and the excess risks stayed more or less the same,
indicating that the majority of symptoms which were attributable to bathing occurred
within incubation periods of less than one week. It was therefore concluded that data
evaluation after an observation period of three weeks would only increase the risk of
bias, e. g. due to additional exposure or underreporting, as symptoms which are not very
severe are less likely to be remembered for a time period of three weeks than for a
period of one week. Further data evaluation therefore focused on the results obtained

- 45 -
after one week. Detailed data and figures of the comparison between results obtained
after one week and after three weeks may be found in the annex (Annex 18).
5.6 Threshold concentrations and specific relative risks
Disease definitions revealing crude relative risks >1 (bathers vs. non-bathers)
were further analysed according to the procedures described in the materials and
methods section to determine threshold concentrations for increased risk and upper
limits of the disease incidence rates above threshold concentrations ("ceilings" of dose-
response relationships). Threshold concentrations fulfilling the validity criteria
(incidence rate above threshold significantly higher than incidence rate below threshold
within the group of bathers; no suspect p in Pearson's Chi square test; incidence rate
among bathers above threshold significantly higher than incidence rate among non-
bathers; incidence rate among bathers below threshold not significantly lower than
incidence rate among non-bathers; threshold unbiased by any of the potential
confounding variables) could be established with exposure definition 1 ("10 min
bathing; ≥ 3 head immersions") for all three definitions of gastroenteritis (GE_UK,
GE_UK-wf and GE_NL-2) and all faecal indicators (EC, IE, CP and SOMCP), as well
as for skin ailments (SKIN) and aeromonads. With exposure definition 2 ("1 head
immersion") threshold concentrations fulfilling the validity criteria could be established
for all three definitions of gastroenteritis (GE_UK, GE_UK-wf and GE_NL-2) and all
faecal indicators (EC, IE, CP and SOMCP) with the exception of GE_UK-wf and EC.
The differences between the incidence rates of gastroenteritis among bathers exposed up
to threshold concentrations and the incidence rates of bathers above threshold
concentrations were highly significant, with minimal p values (Pearson's Chi square
test) between 0.0005 and 0.022. Due to the larger number of non-bathers than of bathers
up to threshold concentrations, the differences between the incidence rates of non-
bathers and the incidence rates of bathers above threshold concentrations were even
more significant, with p values ranging from <0.0001 to 0.0055. The potential threshold
concentration for exposure definition 2, GE_UK-wf and EC determined by the
"minimal p method" was not considered to be valid because the incidence rate of
- 46 -
bathers below the threshold was significantly lower than the non-bathers' rate (p<0.05).
Threshold concentrations for acute febrile respiratory infections (AFRI), common cold
(CC), ear infections (EAR), eye infections (EYE) and urinary tract infections (UTI)
were either non-existent or non-detectable with the available cohort size or within the
range of microbial concentrations encountered during this study, or they were
unacceptable because they did not fulfil the validity criteria.
The bathers' excess risk of gastroenteritis could entirely be attributed to the
concentration of any of the four faecal indicator organisms as there was no significant
difference between the incidence rates of bathers below threshold concentrations and
that of non-bathers (p values ranging from 0.12 to 1.0). Hence, the data derived from
this study do not provide any evidence for the existence of a "water-related risk of
gastroenteritis" which is independent of the extent of faecal contamination of the water.
A one-step model consisting of the incidence rate of non-bathers, the threshold
concentration and the incidence rate of bathers above the threshold concentration can
therefore be considered to be an acceptable simplification of the true dose-response
relationship. In contrast, the incidence rate for skin ailments among bathers below the
threshold concentration of aeromonads was significantly higher than the incidence rate
of non-bathers (p=0.028). It can therefore be concluded that the concentration of
aeromonads can only predict part of the water-related skin ailments, and the dose-
response relationship has to be described by a two-step model consisting of the
incidence rate of non-bathers, the incidence rate of bathers exposed up to threshold
concentration, and the incidence rate of bathers exposed above threshold concentration.
The incidence rates of gastroenteritis in the non-bathers group ("base-line risks")
corresponded well with the three different definitions of gastroenteritis, the most
stringent definition (GE_UK) revealing the lowest rate of 1.4% (95% CI: 0.8; 2.4), the
less stringent definitions (GE_UK-wf and GE_NL-2) revealing higher rates of 2.8%
(95% CI: 1.9; 4.1) and 5.2% (95% CI: 3.9; 6.9). Threshold concentrations depended
mainly on the microbial parameters and on the definition of exposure, and were
astonishingly constant for all three definitions of gastroenteritis, especially for the

- 47 -
parameters IE and CP. For exposure definition 1 ("10 min bathing; ≥ 3 head
immersions") the determined threshold concentrations were 180, 78 and 167 EC/100ml
( for GE_UK, GE_UK-wf, and GE-NL-2 respectively); 24, 21 and 24 IE/100ml; 13, 13
and 13 CP/100ml; and 150, 10 and 10 SOMCP/100ml. For exposure definition 2 ("1
head immersion") they were 1453 and 2163 EC/100ml (only GE_UK and GE_NL-2);
123, 123 and 145 IE/100ml; 38, 38 and 36 CP/100ml; and 330, 50 and 119
SOMCP/100ml.
The threshold concentrations depended mainly on the definition of exposure
("10 min. bathing; ≥ 3 head immersions" or "1 head immersion"), with, as expected,
significantly higher concentrations for exposure definition 2 (p=0.0088; ANOVA; log10
transformed data). They also depended on the microbiological parameter, with a
significant difference between the log10 transformed threshold concentrations of EC,
IE, CP and SOMCP (p=0.0061; ANOVA). They did not, however, depend on the
definition of gastroenteritis (p=0.32; ANOVA).
Like the incidence rates of non-bathers and the incidence rates of bathers ≤
threshold concentrations, the incidence rates of bathers above threshold concentrations
mainly depended on the definition of gastroenteritis, with a highly significant difference
between the incidence rates of GE_UK, GE_UK-wf and GE_NL-2 (p<0.0001;
ANOVA), and no significant difference between the two exposure definitions
(p=0.8997) and between the four faecal indicator parameters (p=0.8772). The mean
incidence rate of gastroenteritis among bathers above threshold concentrations was
5.2% for GE_UK (range: 4.4;6.5), 7.2% for GE_UK-wf (range: 6.9; 7.8), and 9.9% for
GE_NL-2 (range: 8.9;12.1).
Mean relative risks of bathers above threshold vs. non-bathers were 3.7 (range:
3.12; 4.61) for GE_UK, 2.6 (range: 2.43; 2.78) for GE_UK-wf and 1.9 (range: 1.71;
2.33) for GE_NL-2. Bathers' excess risks were 3.8% (range: 3.1; 5.2), 4.4% (range: 4.2;
5.7) and 4.7% (range: 4.0; 8.6), respectively. This demonstrates that the majority of
gastroenteritis cases attributable to bathing were cases meeting the most stringent

- 48 -
definition of gastroenteritis (vomiting or diarrhoea with three or more bowel
movements), i.e. they were not simply mild forms of gastroenteritis.
Detailed raw numbers, p values and 95% confidence intervals for incidence rates
and relative risks for all combinations of the two exposure definitions, the three
definitions of gastroenteritis and the four faecal indicator organisms, and for skin
ailments and aeromonads are listed in the annex (Annex 20, Annex 21, Annex 25).
5.7 Incidence rates in quartile and quintile categories and in arithmetic
concentration classes
The results from classifying bathers into quartiles and quintiles of the exposure
concentrations corresponded well with the predicted step models. The incidence rates of
gastroenteritis in the first quartile and in the first quintile were below the upper limit of
the 95% confidence interval of the incidence rate of non-bathers for all 24 combinations
of exposure definition, definition of gastroenteritis and faecal indicator organism.
Pearson's Chi square tests did not reveal a significant difference between the incidence
rates of non-bathers and the incidence rates in the first quartile or quintile in any of the
24 combinations. On the other hand, all incidence rates within the fourth quartile and,
with only one exception, all incidence rates within the fifth quintile were within the
95% confidence limits of the incidence rate ceilings of the predicted step models, i. e.
the incidence rates of bathers above threshold concentration. For the majority of
quartiles and quintiles with concentration ranges above threshold Pearson's Chi square
tests revealed significant differences between the incidence rates within the quantiles
and the incidence rate among non-bathers (Annex 26, Annex 27, Annex 29, Annex 30).
The classification of bathers into exposure classes of up to 20, >20 to 40, >40 to
60, >60 to 80, 80 to 158 and >158 IE/100 ml, which was done for the sake of direct
comparison with the results from sea water exposure, provided no evidence for a dose-
response relationship which could not be characterised by the proposed step model. For

- 49 -
all three definitions of gastroenteritis the incidence rate in the lowest exposure group
was below the upper 95% confidence limit of the incidence rate of non-bathers, and 14
of the 15 incidence rates of quantiles with geometric quantile means above threshold
concentrations were within the 95% confidence limits of the incidence rate ceilings of
the corresponding step models. 10 of them were significantly higher than the incidence
rates of non-bathers. Similar results could be observed for E. coli classes of 100 units
(Annex 28).
5.8 Combined effect of exposure concentrations and swallowing water
The most convincing evidence for the existence of a true-dose response
relationship for gastroenteritis attributable to bathing in faecally contaminated water
comes from the analysis of the combined effect of bathing below or above threshold
concentrations and swallowing water. Among bathers exposed below threshold
concentrations swallowing water caused an increase in the incidence rate of
gastroenteritis in 21 of the 23 combinations of exposure definitions, definitions of
gastroenteritis and faecal indicator organisms for which threshold concentrations could
be established. In one case the incidence rates were equal. In one case the incidence rate
of bathers who had swallowed water was lower. Among bathers exposed above
threshold concentrations the incidence rates of gastroenteritis were always higher for
those who reported to have swallowed water (Annex 31). The mean risk attributable to
swallowing water above threshold concentrations was significantly higher (p<0.0001;
ANOVA) than the attributable risk below threshold concentrations (3.6% (95% CI: 3.1;
4.2) vs. 1.3% (95% CI: 0.7;1.8)). There was no significant difference, however, between
the two exposure definitions ( 2.4% for definition 1 (95% CI: 1.7; 3.1) vs. 2.5% for
definition 2 (95% CI: 1.8; 3.2); p=0.86, ANOVA) or between the three definitions of
gastroenteritis (2.7% for GE_UK (95% CI: 1.8; 3.7) vs. 2.2% for GE_UK-wf (95% CI:
1.2; 3.1) and 2.5% for GE_NL-2 (95% CI: 1.6; 3.3); p=0.72, ANOVA) or between the
four faecal indicator parameters (2.0% for CP (95% CI: 1.0; 3.0), 3.0% for EC (95% CI:
1.9; 4.1), 2.5% for IE (95% CI: 1.4; 3.5), and 2.5% for SOMCP (95% CI: 1.4; 3.5);
p=0.62, ANOVA) (Annex 32). The fact that swallowing water containing a high

- 50 -
concentration of microbes (high dose) causes relatively more cases of illness in a
defined population than swallowing water containing a low concentration of microbes
(low dose) is plausible, and indicative for the existence of a true dose-response
relationship. However, it also suggests that the determined threshold concentrations are
not absolute values, as a slight effect of swallowing water was also detectable below
threshold concentrations. As already demonstrated by the effect of exposure definition
("10 min bathing; 3 head immersions" or "1 head immersion"), the concentrations above
which a significant increase in the incidence rates of disease is measurable depend on
the intensity of activities which are associated with the contact of waterborne
microorganisms with the mucosa of the lacrimal duct, the nasopharynx, the oral cavity
or the gastrointestinal tract, i. e. the number of head immersions and the amount of
water swallowed. They probably also depend on the size of the available cohort.
5.9 Results of the analyses of stool specimens
Four cases of gastroenteritis were laboratory-confirmed by identification of
Salmonella sp. in stool specimens. Two of these cases occurred among non-bathers, two
among bathers. It was concluded that the latter two cases were probably not bathing-
associated, but were rather due to risk factors which were independent of this study.
Other pathogens like Shigella, Yersinia enterocolitica, Campylobacter, EHEC,
rotavirus, adenovirus, enteroviruses, norwalkvirus, Cryptosporidium parvum and
Giardia lamblia could not be detected in any of the analysed specimens.
5.10 Derivation of parameters necessary for the estimation of cost-benefit effects
The socio-economic costs of bathing-acquired gastroenteritis on the one hand
and the benefit from prevention of bathing-associated gastroenteritis by setting or
tightening standards for faecal indicator organisms on the other hand depend to a great
extent on the severity of symptoms. If subjective symptoms are so severe that the
diseased person will seek professional medical advice or treatment or stay away from

- 51 -
work or cause other people (e. g. parents) to stay away from work, the disease will
cause measurable costs.
In this study a total of five participants, four male and one female, reported
having consulted a doctor in the week after exposure, and having been diagnosed with
gastroenteritis. Two of them belonged to the group of non-bathers, three to the group of
bathers. The two non-bathers were 8 and 21 years old, the bathers were 10, 28 and 53
years old. All five cases met the definition of GE_NL-2 and GE_UK-wf. One of the
bathers did not meet the definition of GE_UK. The exposure concentrations of the three
bathers were 4.1, 3.5 and 2.7 CP/10ml, 500, 392 and 371 EC/100ml, 49, 130 and 140
IE/100ml and 389, 172 and 112 SOMCP /100ml, i. e. all of them had been bathing
clearly above threshold concentrations. Of course it is impossible to decide for
individual cases whether they are attributable to bathing or not. The fact that all of them
had been bathing above threshold, however, is not contradictory to the assumption that
these cases might have been bathing-associated. Other risk factors for gastroenteritis
were reported by all three bathers (e.g. history of travelling abroad and gastroenteritis of
a household member in one case, consumption of raw milk and raw milk cheese in the
other two cases) and might have been alternative sources of infection.
In summary, 2 of 26 non-bathers (7.7%; 95% CI: 0.9; 25.1) who developed
gastroenteritis (Definition: GE_UK-wf; i. e. diarrhoea or vomiting) within one week
after the trial day consulted a doctor vs. 3 of 40 bathers with gastroenteritis (7.6%; 95%
CI: 1.6; 20.4) who were exposed above threshold concentrations for faecal indicators
(p=0.66; Fisher's exact test).
Taking into consideration the fact that the majority of gastroenteritis cases
attributable to bathing were cases meeting the most stringent definition of gastroenteritis
(3.4% GE_UK vs. 4.4% GE_UK-wf and 4.7% GE_NL-2), these results do not justify
the assumption that gastroenteritis acquired by bathing in faecally contaminated fresh
water is less or more severe or causes less or more socio-economic costs than
gastroenteritis acquired through other sources of infection. Standard estimates for the

- 52 -
socio-economic costs of gastroenteritis may therefore be used to analyse cost-benefit
effects of setting or altering standards for faecal indicator organisms in fresh water
bathing sites.
To estimate the costs of bathing-acquired gastroenteritis in Germany it must be
determined how many people per year are bathing above threshold concentrations. It
should also be evaluated whether a bathing duration of 10 minutes and four head
immersions (the median number of head immersions in this study) are a reasonable
estimate for typical bathing intensity. This, however, is beyond the scope of this study
and should be determined in additional research projects.
6 Conclusions and Recommendations
The results of this study show that bathing in faecally contaminated German
fresh water bathing sites which pass the current microbiological standards of the
European bathing water directive of 1976 can increase the risk of acquiring
gastroenteritis compared to the risk of non-bathers by a factor of two to four within one
week after exposure. A significant increase in the risk of bathing vs. non-bathing
became detectable when the extent of faecal contamination of the water exceeded
certain threshold concentrations. Such threshold concentrations could be established for
each of the four faecal indicator organisms, Clostridium perfringens, intestinal
enterococci, Escherichia coli and somatic coliphages, which were monitored during
exposure of the study participants.
Threshold concentrations for increased risk are not absolute. They depend on the
intensity of bathing activities which allow the microorganisms present in the water to
come into contact with the mucous membranes of the lacrimal duct, the nasopharynx,
the oral cavity or the gastrointestinal tract. A bather who immerses his head only once
encounters the same risk at a higher exposure concentration as a bather who immerses
his head three or more times at a lower exposure concentration; and swallowing water
with a high concentration of faecal indicators will result in a greater increase of risk

- 53 -
than swallowing water with a low concentration. Any threshold and any dose-response
relationship which is derived from exposure studies with standardised bathing activities
is therefore only valid for the type of exposure which has been applied in the
corresponding trials, i. e. for bathing activities which are similar to those of the study
participants.
Ultimately, the type of exposure which was chosen in this study (10 minutes of
bathing and at least three head immersions) is probably an underestimation of the actual
mean exposure intensity in "real life". Only 9% of the participants immersed their heads
less often than required, while 53% voluntarily did it more often (median = 4; mean =
5.5; range = 0-87 head immersions).
Considering both the results of fitting step models for dose-response
relationships between the concentration of indicator organisms and gastroenteritis and
the results of the calculation of incidence rates within classes of concentration ranges
defined by quartiles and quintiles, and with respect to the threshold of 32 faecal
streptococci / 100ml which could be derived from similar studies in sea water, the
following threshold concentrations for an increased risk of gastroenteritis from 10
minutes of bathing and at least three head immersions are recommended: 10/100ml for
Clostridium perfringens, 25/100ml for intestinal enterococci, 100/100ml for
Escherichia coli, and 10/100ml for somatic coliphages.
Using step models as an approximation for dose-response relationships has three
main advantages. First, they are easy to compute because they can be described by only
three parameters: the baseline risk, the threshold concentration and the maximum risk.
Second, they provide conservative estimates for the maximum risk, since extrapolation
into higher concentration ranges do not produce results which are beyond what is
verifiable by experimental data. Third, they are easy to communicate to the public. The
models, however, overestimate the risk for concentrations slightly above the threshold,
and for the same reasons they slightly underestimate the maximum risk. The assumption
that there is no further risk increase at higher concentrations than those which were

- 54 -
encountered during this study is strongly supported by the results of the studies reported
by Cabelli et al. 1982/83 on bathing-associated gastroenteritis at Egyptian beaches.
According to an analysis performed for the WHO (Prüss, 1998) these are the only
studies which provide experimental data for higher exposure concentrations. In these
studies no increase in the incidence rates of gastroenteritis could be detected for bathers
exposed to 9160 enterococci /100ml (geometric mean concentration) vs. bathers
exposed to 954 enterococci /100ml. The incidence rates among bathers exposed to the
roughly tenfold concentrations were even slightly lower: 4.5% vs. 4.8% for visitors
from Cairo, and 1.9% vs. 2.1% for local residents. Van Asperen et al., 1998, report
similar results for triathletes exposed in Dutch fresh waters. The incidence rate for
exposure concentrations of ca. 1200 E. coli / 100 ml was 6.7% vs. 10.9% for exposure
concentrations of 500/100ml.
The incidence rate of gastroenteritis clearly depends on the definition of the
disease. More stringent definitions result in lower incidence rates and in higher relative
risks for bathers above threshold concentrations than less stringent definitions. Excess
risks for bathers above threshold concentrations are higher for less stringent definitions.
Threshold concentrations, however, were independent of the definition of
gastroenteritis. They are probably also independent of the portion of susceptible
individuals in different cohorts, e. g. cohorts of tourists. Standards for faecal indicator
organisms should therefore be based on a threshold concept rather than on estimates of
how many bathers will become ill ("disease burden"). The percentage of bathers who
become ill may differ dramatically depending on the cohort that is used as the basis for
the estimate. According to Prüss, 1998, maximum excess risks range between 0.4%
(Dufur et al., 1984) and 27.7% (Fewtrell et al., 1992) in studies involving fresh water
exposure and between 0.53% (Cheung et al., 1989) and 19.5% (Kay et al., 1994) in
studies involving sea water exposure. To base regulatory standards on maximal
acceptable excess risks, e. g. 5%, as it is has been done in the current proposal for a
revised European bathing water directive (Commission, 2002) and in WHO publications
(Havelaar et al. 2001; WHO 1998 and 2003), is therefore inappropriate. If this concept
were applied to the results of this study or the results of the Cabelli studies in Egypt, no

- 55 -
imperative or guide values would be necessary at all for German fresh waters or
Egyptian beaches or bathing areas in any other part of the world where the maximal
excess risks were below 5% (Annex 33).
In contrast, a threshold concept would consist of calculating the percentage of
microbial concentrations exceeding the threshold during the bathing season. This
percentage is identical with the percentage of bathers exposed above threshold, i. e. the
percentage of bathers who are at increased risk, under the assumption that bathing
activities are randomly distributed over the season. A threshold concept would therefore
provide a classification of beaches according to their overall health risk from faecal
contamination and should consist of the following components:
(1) The threshold concentrations; e. g. 25 IE/100ml and 100 EC/100ml.
(2) Estimates for the mean water quality on the days of sampling; e. g. the
concentrations determined by area-integrated sampling (one pooled sample) from
four representative sampling points on a beach.
(3) A standardised (constant) estimate for the standard deviation of lognormal
distributed microbiological concentrations on the day of sampling; e.g. 0.4 for
log10 transformed concentrations of IE or EC.
(4) The calculation of the most probable percentage of microbial concentrations
above threshold on the day of sampling. This percentage can be easily computed
with any standard spread sheet calculation program like Excel(TM) or can be read
from a prepared table (s. Annex).
(5) A time weight for the monitoring results to ensure that more frequent sampling
apart from the regular sampling intervals, e. g. after incidences of high
contamination, is not discouraged (or "punished") by a disproportionate influence
of these sample results on the final result for the complete season. The sample
results should therefore be weighted by the number of days for which they are
assumed to be valid, i.e. the number of days until the next sample is collected.

- 56 -
(6) The calculation of the mean percentage of indicator concentrations exceeding the
thresholds during the bathing season, as an estimate for the percentage of bathers
at increased risk.
(7) A political decision on which percentages are acceptable in different quality
categories.
Examples and illustrations to explain this concept may be found in the annex (Annex
24, Annex 34, Annex 35, Annex 36).
The current European standard for Escherichia coli in bathing water requires a
compliance rate of 95% of the samples with an imperative value of 2000 faecal
coliforms /100ml. In the proposal for a revision of this standard a 95th percentile
approach is favoured, and the imperative value is reduced to 500 E. coli /100ml. This
value was proposed by the German Federal Environmental Agency using preliminary
data (four of five data sets) from this study and a tentative dose-response model (López-
Pila, 2002). It was argued that the proposed reduction of the imperative value would
result in a 50% reduction of the disease burden of bathing sites which just comply with
the standard, assuming lognormal distributed concentrations with a SD of 0.75 during
the bathing season. A repetition of this analysis using the complete data set and the step
model approach revealed almost the same results (ca. 55% reduction) for all three
definitions of gastroenteritis. The 95th percentiles for IE concentrations which would
correspond to the risk levels associated with 95th percentile concentrations of 500 and
250 EC/100ml (the proposed imperative and guide value in the current EU proposal)
would be ca. 120 and 60 IE/100ml. These values are considerably lower than those
being proposed (200 and 100 IE/100ml), indicating that the proposed standards for E.
coli would provide a higher degree of health protection than the standards for intestinal
enterococci. The relation between the proposed standards for these two indicator
parameters should therefore be reconsidered.
The risk for bathing-associated skin ailments (disease definition "SKIN") in this
study was not correlated to the concentration of any of the four faecal indicators. It

- 57 -
could, however, be partially predicted by the concentration of aeromonads. The
incidence rates among non-bathers, bathers below threshold concentration (ca. 5600
aeromonads /100ml) and bathers above the threshold concentration were 2.8%, 5.3%
and 12.2% respectively, i.e. ca. 75% of the maximum excess risk occurred above the
threshold concentration, while ca. 25% were obviously due to other independent
bathing-associated factors, for example the presence of parasites of the Trichobilharzia
genus. As the possible association between aeromonads and skin ailments has not yet
been widely studied, it is recommended that this parameter be included in future studies
to find out whether these results are reproducible.
No other significant and unbiased association between any of the six
microbiological parameters and any of the other disease definitions (AFRI, CC, EAR,
EYE, UTI) could be observed in this study.

- 58 -
7 Acknowledgements
We thank our international consultants D Kay (CREH, Centre for Research into
Environment and Health, University of Wales, UK), J Fleisher (formerly at SUNY
Health Science Center at Brooklyn, USA), and I Leenen (formerly at RIVM,
Rijksinstituut voor Volksgezondheid en Milieu, National Institute for Public Health and
the Environment, NL) for their invaluable advice on planning and evaluating the study.
We thank our co-operation partners at the five study locations for their efforts
and support, especially S Brockmann, C Sacré and colleagues (Landesgesundheitsamt
Stuttgart), R Waidmann, S Zimmermann, G Möller (Gesundheitsamt im Landratsamt
Tübingen), H Gabler (Institut für Sportwissenschaft Universität Tübingen), R von
Butler (Universitätsklinikum Tübingen) Gemeindeverwaltung and Freiwillige
Feuerwehr (Kirchentellinsfurt), B Kiß and colleagues (Gesundheitsamt im Landratsamt
Bodenseekreis), Gemeindeverwaltung and Freiwillige Feuerwehr (Uhldingen-
Mühlhofen), J López-Pila, R Szewzyk and Colleagues (Federal Environmental Agency,
Umweltbundesamt, Berlin), Gesundheitsamt Wedding and Berliner Bäderbetriebe
(Berlin), C Höller and colleagues (Institut für Umwelttoxikologie, Umweltmedizin und
Hygiene der Christian-Albrechts-Universität Kiel), B Majeran and colleagues (Bereich
Umweltschutz der Hansestadt Lübeck), Feuerwehr der Hansestadt Lübeck and Lübecker
Schwimmbäder GmbH (Lübeck), P Schindler and colleagues (Landesuntersuchungsamt
für das Gesundheitswesen Südbayern), S Schweitzer and colleagues (Referat für
Gesundheit und Umwelt/Stadthygiene der Landeshauptstadt München)
We are especially indebted to the 202 project helpers who supported us at the
five study sites with the recruitment, administration, interviewing and medical
examination of the participants, with building up and maintaining the study
infrastructure at the beaches, with monitoring the bathing activities, with collecting,
transporting and analysing the water samples. With their unique team-spirit, their
enthusiasm and wealth of invention they created an incredible working-atmosphere, and
made it possible to perform this study:

- 59 -
W Albers, M Albl, T Albrecht, D Alexander, A Amefia, C Angermayer, A Baldus, R
Bartocha, T Bartocha, A Bartocha, K Becker, F Beggel, E Behnk, N Bender, D Binder,
T Bisinger, K Block, H Bode , R Böhme, H Bohn, J Bohnert, T Braker, G Braun, A
Braun, K Breithecker, B Breitinger, A Breuninger, S Brockmann, N Brunner, H
Büchler, M Büchler, J Buntscherer , K Dibbern, E Diehl, V Djudja Fokam, C Dolana, N
Doll, M Dose, Dürkop, A Eissler, C Enzensberger, T Erb, D Fechler, C Feder, R
Filkorn-Kaiser, T Fischer, E Freier, B Friedrich, A Friedrich, B Fritz, H Füger, U
Gänsbauer, B Geerdts, J Gertz, K Glück, C Goerke, S Gommel, Z Gülmez, V Gutofski,
E Haack, A Hahn, H Hannemann, C Häring, S Hauf, B Heim, A Heininger, M Henkel,
P Henneberg, M Hirlinger, C Hock, B Höhlich, C Höller, U Höppner, K Höppner, S
Hornung, B Hübner, S Hülpüsch, B Jenzen-Blunck, M Jung, D Kahlert, N Kaiser, B
Kempgens, K Kifferle, A King, J Kirchner, B Kiß, V Kley, A Kopp, H Krüger, D
Krüger, A Landau, H Lang , P Langer, W Leuthner-Seufert, J López-Pila, B Lütgens, U
Luther-Kliegl, F Mädler, R Majeran, A Malak, G Massmann, J Mayer, A Mielke, S
Mohr, G Möller, W Müller, J Müller, D Münchhow, U Naumann, R Nerger, M Noftz, S
Nußbäumer, A Ostertag, Ott, M Paap, U Patan, C Patzelt, A Paul, R Pawelczyk, E
Pawlitzky, Pellnitz-Bassing, F Perssen, M Peters, M Pfeiffer, H Picklaps, F Pohle, U
Polten, R Quazbir, M Rahn, A Randers, N Rapior, S Rasch, G Rechtsteiner, P Reinhard,
T Riedt, F Robens, J Rück, H Rück, D Rupp, A Salzmann, A Sassmann, S Sauer, U
Sauter, J Schadt, B Schappert, I Scharf, K Scherer, Schimmelpfennig, K Schoger, H
Schröpfer, U Schulz, A Schulz, M Schulz, H Schweizer, A Schwekendiek, T Schwenke,
A Seeger, D Siegfried, J Sievers, C Silberhorn-Wiedenmann, T Sinnberg, D Skodacek,
K Sop Mahadjou, D Stabenow, R Stadler, I Stadler, S Stahl, D Stamer, A Steibli, A
Steinhuber, I Straub, B Suletzki, L Sydel, Szagun, R Szewzyk, H Taylor, M Tedesco, I
Tedesco, C Temür, N Tetsch, G Thielert, C Thielert, U Thiemann, F Thorsteinsson, F
Trauner, G Ungericht, W Vogl, C Vöhringer, A Voigt, R von Butler, B von Vacano, J
Wafo, C Waibel, R Waidmann, D Walz, C Weiß, M Weiss, V Weiß, A Wiech, S
Zimmermann, I Zimmermann, S zur Oven-Krockhaus.
- 60 -
We thank all those working in the background or supporting us with their
stimulating ideas, among others H Rausch, W Dohl and R Has at the media lab of the
Institute for Medical Microbiology of the University of Tübingen, I and W
Langhammer, C Führer, E Hauschulz, G Kern and M Todorowitsch at the Institute of
General and Environmental Hygiene, I Karl at the legal branch of the University Clinics
of Tübingen, and W Dettinger at the construction office of the University of Tübingen;
and we apologise to all who have not been named or whom we may have forgotten to
mention.
We thank all the press agencies, newspapers, radio and television stations who
have helped us with their reports to recruit the study participants and to inform the
public about the aims of this study.
We thank our friends, spouses and children who had to do without us when we
were away from home for weeks during the summer months of 2000 and 2001 when the
studies were performed, and later on during many weekends spent with the preparation
of lectures, reports and publications.
We thank Diane Blaurock, Tübingen, for the linguistic revision of this
manuscript.
... and last not least we are indebted to the 2196 volunteers who participated in
the randomised controlled trials, especially to those who undertook disease or injuries as
a consequence of their participation. Thank you very much to all of you!
- 61 -
8 Literature
(1) Commission of the European Communities: Proposal for a directive of the
European Parliament and of the Council concerning the quality of bathing water,
Brussels, 24.10.2002 (2002).
(2) Council of the European Communities: Council Directive 76/160/EEC of 8
December 1975 concerning the quality of bathing water. Official Journal of the
European Communities L 031 (1976) 1-7.
(3) Council of the European Union: Council Directive 98/83/EC of 3 November 1998
on the quality of water intended for human consumption. Official Journal of the
European Communities L 330 (1998) 32-54.
(4) Havelaar A, Blumenthal UJ, Strauss M, Kay D, Bartram J: Guidelines: the
current position. In: Fewtrell L, Bartram J (eds.): Water Quality: Guidelines,
Standards & Health (WHO Water Series) ISBN: 1900222280, IWA Publishing,
London (2001)
(5) Kay D, Fleisher JM, Salmon RL, Wyer MD, Godfree AF, Zelenauch-Jacquotte Z,
Shore R: Predicting likelihood of gastroenteritis from sea bathing: results from
randomised exposure. Lancet 344 (1994) 905-910.
(6) López-Pila J, Höller C, Wiedenmann A: Recommendations of The Ministry of
Health Scientific Advisory Board on Bathing Waters concerning consequences of
the study: “A randomised epidemiological study on health risks from bathing in
German fresh water bathing sites” by A. Wiedenmann et al. for the derivation of
health-related standards for fresh bathing waters. EU expert consultation, Brussels
(2002) extended abstract.
(7) Mugglestone MA, Stutt ED, Rushton L: A Review of the Health Effects of Sea
Bathing Water (Web Report W2), IEH Institute for Environment and Health,
Leicester, UK, (2000) http://www.le.ac.uk/ieh/webpub/webpub.html
(8) Prüss A.: Review of epidemiological studies on health effects from exposure to
recreational water. Int. J. Epidemiol. 27 (1998) 1-9.

- 62 -
(9) Schulze E (ed.): Methoden der biologischen Wasseruntersuchung, Bd.1,
Hygienisch-mikrobiologische Wasseruntersuchungen. ISBN 3827408741,
Elsevier Urban und Fischer, Jena (1996)
(10) van Asperen IA, Medema G, Borgdorff MW, Sprenger MJ, Havelaar AH Risk of
gastroenteritis among triathletes in relation to faecal pollution of fresh waters.
International journal of epidemiology, 27 (1998) 309–315.
(11) Wiedenmann A: http://www.badegewaesserstudie.de (2000)
(12) Wiedenmann A, Botzenhart K: Area-integrated sampling and calculation of time-
integrated quality scores: proposal for a new way of monitoring and classifying
fresh and sea water bathing sites based on epidemiological evidence. Meeting of
the Specialist Group on Health Related Water Microbiology of the International
Water Association, Cape Town, Sept. 2003.
(13) World Health Organisation: Guidelines for Safe Recreational-water
Environments. Vol 1: Coastal and Fresh-waters. Draft for Consultation.
EOS/DRAFT/98.14 October (1998)
(14) World Health Organisation: Bathing Water Quality and Human Health: Faecal
Pollution. Outcome of an Expert Consultation, Farnham, UK (2001)
(15) World Health Organisation: Guidelines for Safe Recreational-water
Environments. Vol 1: Coastal and fresh waters. ISBN 92 4 154580 1, WHO
Geneva (2003)

- 63 -
Umweltforschungsplan
des Bundesministeriums für Umwelt,
Naturschutz und Reaktorsicherheit
Umwelt und Gesundheit
Förderkennzeichen (UFOPLAN) 298 61 503
Epidemiological Determination of Disease Risks from Bathing
Epidemiologische Erfassung des Erkrankungsrisikos beim Baden
- Annex -
von
Dr. Albrecht Wiedenmann 1,
Dr. Petra Krüger 1, Silke Gommel 1, Marion Eissler 1, Monika Hirlinger 1,
Angela Paul 1, Dr. Karl Jüngst 1, Elena Sieben 1
und
Prof. Dr. Klaus Dietz 2
1 Institut für Allgemeine Hygiene und Umwelthygiene
Eberhard Karls Universität Tübingen
Direktor: Prof. Dr. Konrad Botzenhart
2 Institut für Medizinische Biometrie
Universitätsklinikum Tübingen
Direktor: Prof. Dr. Klaus Dietz
IM AUFTRAG
DES UMWELTBUNDESAMTES
Dezember 2004
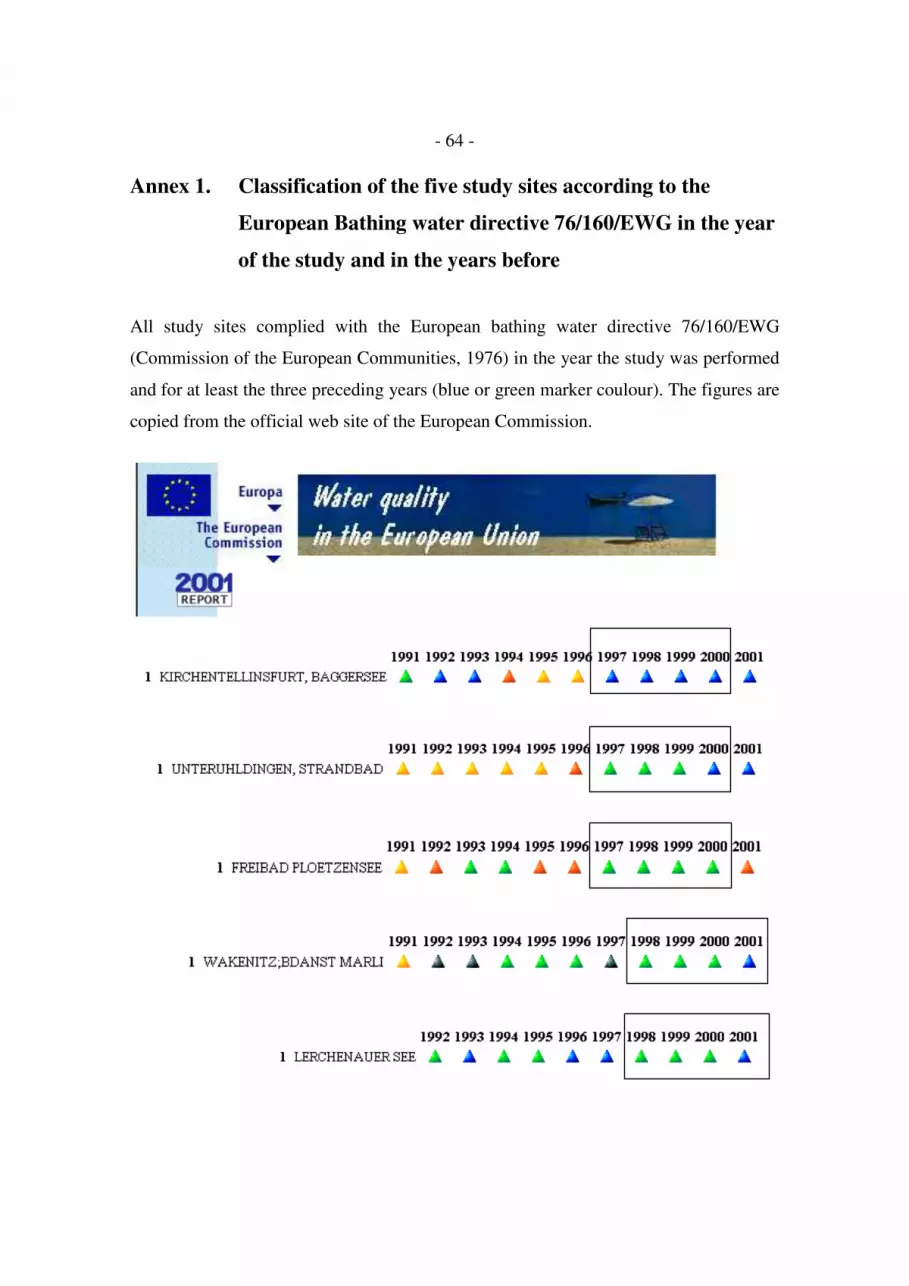
- 64 -
Annex 1. Classification of the five study sites according to the
European Bathing water directive 76/160/EWG in the year
of the study and in the years before
All study sites complied with the European bathing water directive 76/160/EWG
(Commission of the European Communities, 1976) in the year the study was performed
and for at least the three preceding years (blue or green marker coulour). The figures are
copied from the official web site of the European Commission.

- 65 -
Annex 2. Schematic site map with study arrangements at one of the
five study sites ("Lerchenauer See" in Munich)
The graphic representation on the following page is an example for the study
arrangements on the beach. At all sites participants received maps like this at the
registration desk to assist them in finding their way to their individual bathing area or to
the non-bathers area and to one of the supervisors (project helpers). Supervisors were
numbered and uniformly dressed with caps and t-shirts: blue ones for bathers, and red
ones for non-bathers.


- 67 -
Areas reserved to
the research project
Tents (Shelter, change clothes etc. )
BATHERS:
NON-BATHERS:
Helper:
No.
17
18
19
20
21
22
23
24
Boat
Boat
Boat
Helper:
No. 1 - 2 - 3 - 4
A
Helper:
No. 5 - 6 - 7 - 8
B
Helperr:
Nr. 9 - 10 - 11 - 12
CHelper:
No.
13
14
15
16
D
Registration
Lunch
2. Interview
Doctor
Terrace 2.Interview
Doctor
WC
Boat
Mobile laboratory
to be reached within < 30 min.


- 69 -
Annex 3. Follow-up rate, medical exclusions, randomisation result,
exclusions due to unacceptable exposure status,
and final cohort size
1. In
terv
iew
Exclu
ded
Dro
p-off
2. In
terv
iew
Exclu
ded
Dro
p-off
3. In
terv
iew
Dro
p-off
4. Q
uestio
nnaire
Unac
epta
ble e
xposu
re
Final
cohort
Bathers
Non-bathers
Total
2196
20672034
20181981
0
500
1000
1500
2000
2500
Bathers
Non-bathers
Total
Total Follow-up rate Bathers Non-bathers
n (%) n (%) n (%)
1. Interview 2196 (100.0) Medical Exclusions 17
Drop-off 112
2. Interview 2067 (94.1) 1033 (50.0) 1034 (50.0)
Medical Exclusions 22 15 7
Drop-off 11 6 5
3. Interview 2034 (92.6) 1012 (49.8) 1022 (50.2)
Drop-off 16 13 3
4. Postal Questionnaire 2018 (91.9) 999 (49.5) 1019 (50.5)
Unaceptable exposure data 37 37
Final cohort 1981 962 (48.6) 1019 (51.4)
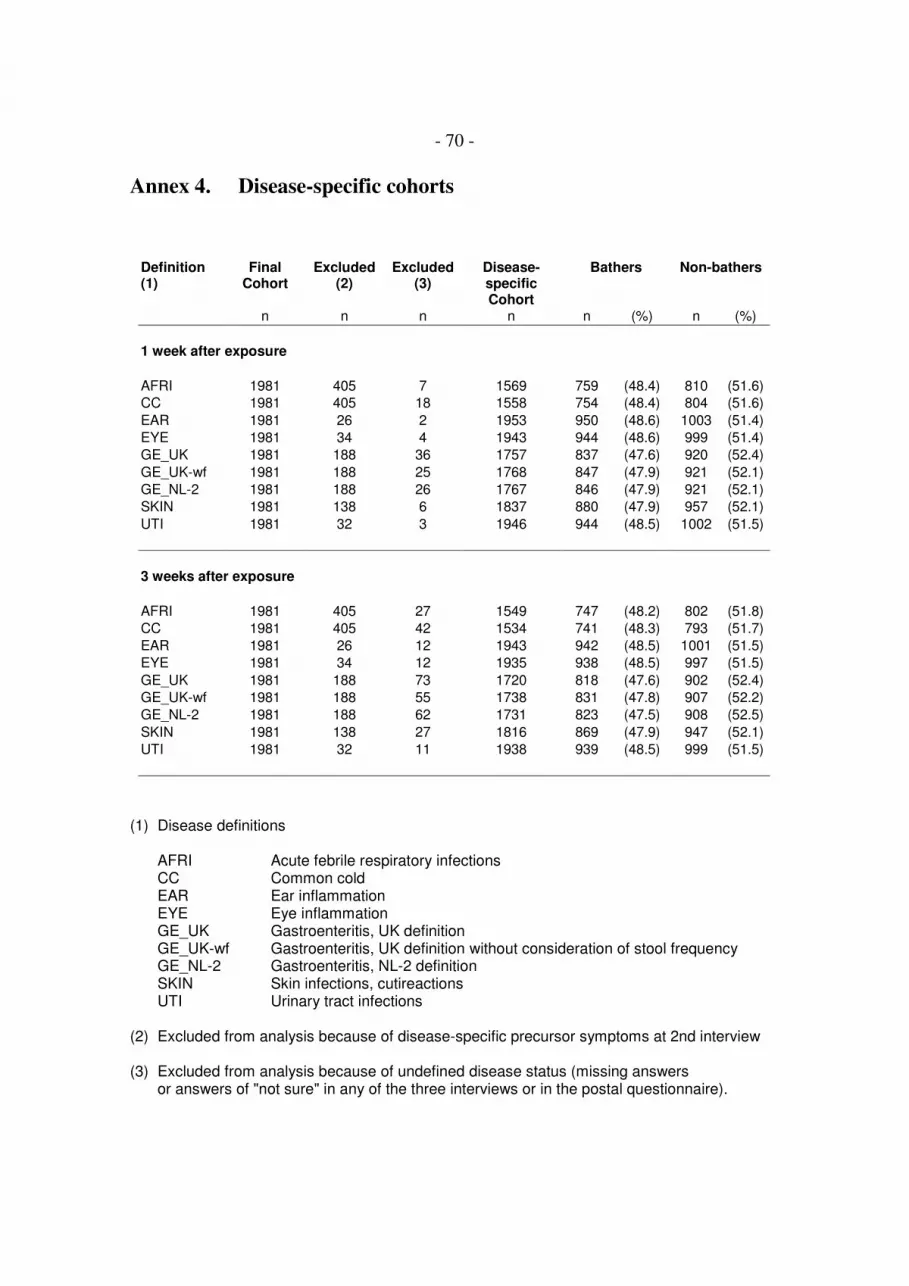
- 70 -
Annex 4. Disease-specific cohorts
Definition(1)
FinalCohort
Excluded(2)
Excluded(3)
Disease-specificCohort
Bathers Non-bathers
n n n n n (%) n (%)
1 week after exposure
AFRI 1981 405 7 1569 759 (48.4) 810 (51.6)
CC 1981 405 18 1558 754 (48.4) 804 (51.6)
EAR 1981 26 2 1953 950 (48.6) 1003 (51.4)
EYE 1981 34 4 1943 944 (48.6) 999 (51.4)
GE_UK 1981 188 36 1757 837 (47.6) 920 (52.4)
GE_UK-wf 1981 188 25 1768 847 (47.9) 921 (52.1)
GE_NL-2 1981 188 26 1767 846 (47.9) 921 (52.1)
SKIN 1981 138 6 1837 880 (47.9) 957 (52.1)
UTI 1981 32 3 1946 944 (48.5) 1002 (51.5)
3 weeks after exposure
AFRI 1981 405 27 1549 747 (48.2) 802 (51.8)
CC 1981 405 42 1534 741 (48.3) 793 (51.7)
EAR 1981 26 12 1943 942 (48.5) 1001 (51.5)
EYE 1981 34 12 1935 938 (48.5) 997 (51.5)
GE_UK 1981 188 73 1720 818 (47.6) 902 (52.4)
GE_UK-wf 1981 188 55 1738 831 (47.8) 907 (52.2)
GE_NL-2 1981 188 62 1731 823 (47.5) 908 (52.5)
SKIN 1981 138 27 1816 869 (47.9) 947 (52.1)
UTI 1981 32 11 1938 939 (48.5) 999 (51.5)
(1) Disease definitions
AFRI Acute febrile respiratory infectionsCC Common coldEAR Ear inflammationEYE Eye inflammationGE_UK Gastroenteritis, UK definitionGE_UK-wf Gastroenteritis, UK definition without consideration of stool frequencyGE_NL-2 Gastroenteritis, NL-2 definitionSKIN Skin infections, cutireactionsUTI Urinary tract infections
(2) Excluded from analysis because of disease-specific precursor symptoms at 2nd interview
(3) Excluded from analysis because of undefined disease status (missing answersor answers of "not sure" in any of the three interviews or in the postal questionnaire).

- 71 -
Disease-specific cohorts 1 week after exposure
0
500
1000
1500
2000
2500
AFR
ICC
EAR
EYE
GE_U
K
GE_U
K-w
f
GE_N
L-2
SKIN U
TI
Nu
mb
er
of
pa
rtic
ipa
nts
Final cohort
Disease specific cohort
Disease-specific cohorts 3 weeks after exposure
0
500
1000
1500
2000
2500
AFR
ICC
EAR
EYE
GE_U
K
GE_U
K-w
f
GE_N
L-2
SKIN U
TI
Nu
mb
er
of
pa
rtic
ipa
nts
Final cohort
Disease specific cohort

- 72 -
Annex 5. Parameter-specific cohortsD
isea
se d
efi
nit
ion
(1)
Dis
ea
se-s
pe
cif
ic c
oh
ort
AE
resu
lt m
issin
g (
2)
AE
co
ho
rt
CP
resu
lt m
issin
g
CP
co
ho
rt
EC
resu
lt m
issin
g
EC
co
ho
rt
IE r
esu
lt m
issin
g
IE c
oh
ort
PA
resu
lt m
issin
g
PA
co
ho
rt
SO
MC
P r
esult m
issin
g
SO
MC
P c
oh
ort
1 week after exposure
AFRI 1569 9 1560 0 1569 9 1560 9 1560 107 1462 7 1562
CC 1558 9 1549 0 1558 8 1550 8 1550 107 1451 7 1551
EAR 1953 17 1936 0 1953 10 1943 10 1943 121 1832 13 1940
EYE 1943 17 1926 0 1943 10 1933 10 1933 117 1826 13 1930
GE_UK 1757 12 1745 0 1757 9 1748 9 1748 108 1649 12 1745
GE_UK-wf 1768 12 1756 0 1768 9 1759 9 1759 110 1658 12 1756
GE_NL-2 1767 12 1755 0 1767 9 1758 9 1758 110 1657 12 1755
SKIN 1837 15 1822 0 1837 10 1827 10 1827 107 1730 11 1826
UTI 1946 15 1931 0 1946 10 1936 10 1936 120 1826 12 1934
3 weeks after exposure
GE_UK 1720 12 1708 0 1720 8 1712 8 1712 108 1612 12 1708
(1) Disease definitions
AFRI Acute febrile respiratory infectionsCC Common coldEAR Ear inflammationEYE Eye inflammationGE_UK Gastroenteritis, UK definitionGE_UK-wf Gastroenteritis, UK definition without consideration of stool frequencyGE_NL-2 Gastroenteritis, NL-2 definitionSKIN Skin infections, cutireactionsUTI Urinary tract infections
(2) Microbiological parameters
AE AeromonadsCP Clostridium perfringensEC Escherichia coliIE Intestinal enterococciPA Pseudomonas aeruginosaSOMCP Somatic coliphages

- 73 -
Annex 6. Quality control of the enumeration procedure for
Escherichia coli and intestinal enterococci using
quantitative external reference materials
Quality control procedures included positive and negative media controls for target
organisms, or in the case of E. coli and intestinal enterococci the application of
quantitative reference materials which had been evaluated in an earlier international
round robin trial funded by a European Union research project ("reference lenticules K",
donated by Institute Pasteur de Lille, European Community Contract SMT4-CT95-
1603; DG12-RSMT).
The figures in this annex show the results achieved with these reference materials
during the five epidemiological studies in comparison with the results obtained by 9 EU
expert labs in a round robin trial performed in the EU project mentioned above.
Geometric means ± 2 or 3 standard deviations are shown for the results of the European
round robin trial and for the results achieved during the five epidemiological studies.

- 74 -
Quality Control Escherichia coli
Reference Lenticules IPL-K
10
100
1000
10000
2 4 6 8
10
12
14
16
18
20
22
24
26
28
30
32
34
36
38
40
42
number of experiment
MP
N / 1
00
ml
9 EU expert labs
GM+3s
GM+2s
GM
GM-2s
GM+2s
5 epi-studies
Quality Control Escherichia coli
Reference Lenticules IPL-K
10
100
1000
10000
2 4 6 8
10
12
14
16
18
20
22
24
26
28
30
32
34
36
38
40
42
number of experiment
MP
N / 1
00
ml
9 EU expert labs
5 epi-studies
GM+3s
GM+2s
GM
GM-2s
GM+2s
MPN /100 ml Most Probable Number per 100 mlGM + 3s Geometric mean + 3 x standard deviationGM + 2s Geometric mean + 2 x standard deviationGM Geometric meanGM - 2s Geometric mean - 2 x standard deviationGM - 3s Geometric mean - 3 x standard deviation

- 75 -
Quality Control Intestinal Enterococci
Reference Lenticules IPL-K
10
100
1000
10000
1 3 5 7 9
11
13
15
17
19
21
23
25
27
29
31
33
35
37
39
41
43
number of experiment
MP
N / 1
00
ml
9 EU expert labs
GM+3s
GM+2s
GM
GM-2s
GM-3s
5 epi-studies
Quality Control Intestinal Enterococci
Reference Lenticules IPL-K
10
100
1000
10000
1 3 5 7 9
11
13
15
17
19
21
23
25
27
29
31
33
35
37
39
41
43
number of experiment
MP
N / 1
00
ml
9 EU expert labs
5 epi-studies
GM+3s
GM+2s
GM
GM-2s
GM-3s
MPN /100 ml Most Probable Number per 100 mlGM + 3s Geometric mean + 3 x standard deviationGM + 2s Geometric mean + 2 x standard deviationGM Geometric meanGM - 2s Geometric mean - 2 x standard deviationGM - 3s Geometric mean - 3 x standard deviation

- 76 -
Annex 7. Concentration ranges and median concentrations
of the microbiological parameters at the five study sites
The figures in this annex show the concentration ranges and median concentrations of
the six microbiological parameters at the five study sites. Lower detection limits are
marked by a horizontal line in orange. The sites are sorted from left to right in
ascending order according to the median concentration of intestinal enterococci.
Legend
Parameters:
IE Intestinal enterococciEC Escherichia coliCP Clostridium perfringensSOMCP Somatic coliphagesAE AeromonadsPA Pseudomonas aeruginosa
orange line lower detection limit
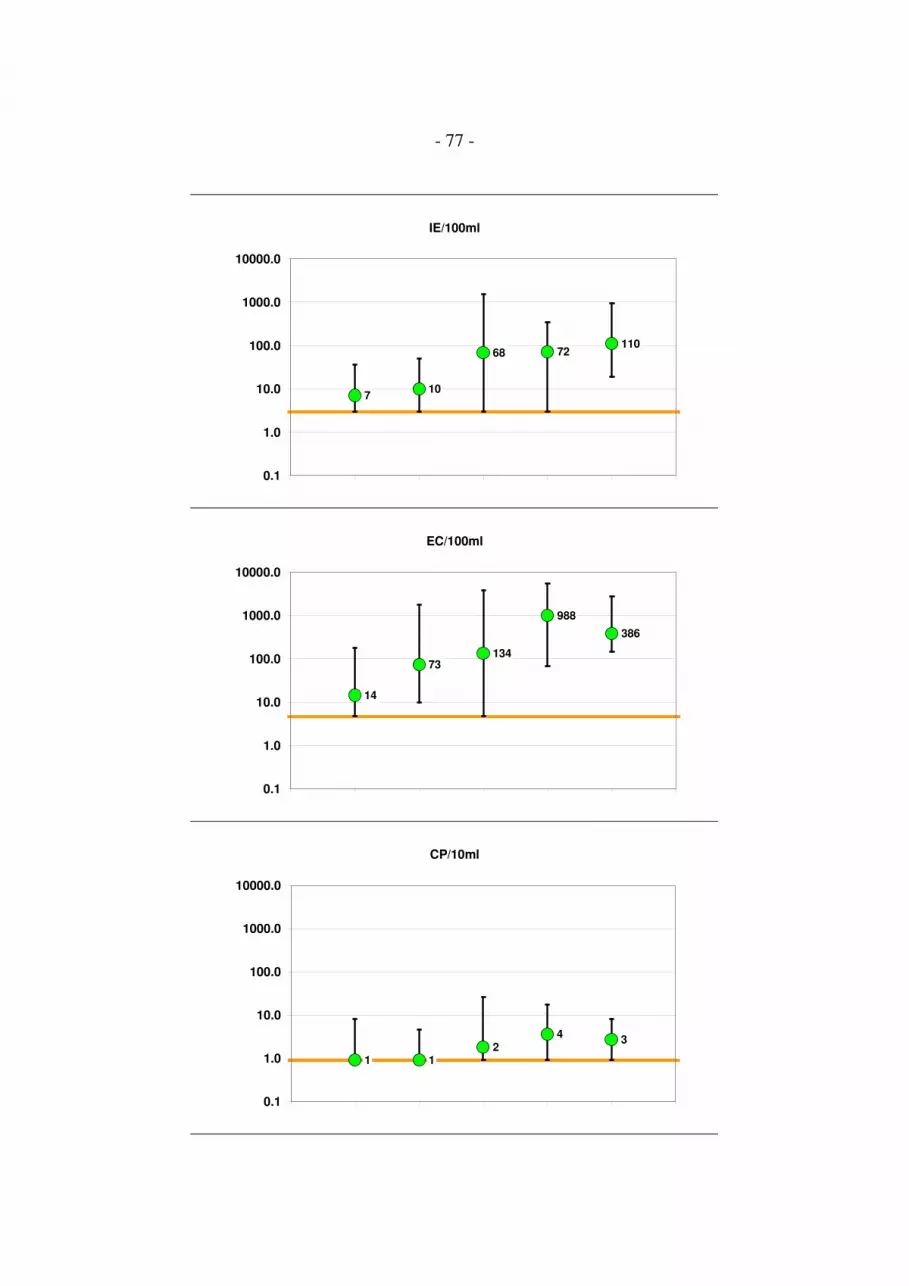
- 77 -
IE/100ml
710
68 72110
0.1
1.0
10.0
100.0
1000.0
10000.0
EC/100ml
14
73134
988
386
0.1
1.0
10.0
100.0
1000.0
10000.0
CP/10ml
1 12
43
0.1
1.0
10.0
100.0
1000.0
10000.0

- 78 -
SOMCP/100ml
10 10 10
600
120
0.1
1.0
10.0
100.0
1000.0
10000.0
AE/100ml
4250
10600 10450 13800
3100
1
10
100
1000
10000
100000
PA/10ml
1 1 1 1 1
0.1
1.0
10.0
100.0
1000.0
10000.0

- 79 -
Annex 8. Correlation of microbiological parameters:
Orthogonal fits of log10 transformed data after censoring
values below detection limit
The correlation between each of the six microbiological parameters was analysed by
orthogonal regression. ANOVA test results revealed significant differences between the
parameter variances for all 15 possible combinations. Orthogonal regression was
therefore based on the specific variance ratio of each of the 15 combinations. Intercepts,
slopes and correlation coefficients of the resulting orthogonal fit lines are listed in the
table below. Results are sorted in descending order according to the correlation
coefficient. The graphs on the following pages display the data points in different
colours according to the study site. The tables next to the graphs list the number of
samples which were censored ("1") or not censored ("0"). The variance ratios for the
various combinations of parameters are displayed as well. Orthogonal fit lines can be
calculated using the following formula:
log10(parameter Y) = intercept + slope * log10(parameter X)
Parameter X Parameter Y N Samples Intercept Slope Correlation
EC EN 391 -0.270 0.836 0.79
EC SOMCP 243 -1.112 1.243 0.78
EC CP 285 -0.907 0.537 0.57
EN CP 278 -0.714 0.631 0.51
CP SOMCP 209 1.137 2.115 0.50
EN SOMCP 241 -0.802 1.525 0.41
EN PA 50 -1.370 0.841 0.31
EC PA 50 -1.685 0.640 0.29
SOMCP PA 49 -1.099 0.483 0.28
EC AE 405 2.779 0.492 0.27
SOMCP AE 242 2.760 0.529 0.24
CP AE 285 3.473 1.030 0.23
CP PA 47 -0.252 0.795 0.17
EN AE 399 2.871 0.617 0.11
AE PA 48 -4.789 1.211 0.07

- 80 -
0
1
2
3
4
5
IE_
10
0m
l_lo
g1
0_
Co
nc
0 1 2 3 4 5
EC_100ml_log10_Conc
EC IE N Samples
- - 3
0 0 391
0 1 18
1 0 12
Orthogonal Fit Ratio=0.699
Legend
Parameters:
EC Escherichia coliIE Intestinal enterococciSOMCP Somatic coliphagesCP Clostridium perfringensPA Pseudomonas aeruginosaAE Aeromonads
Censoring:
0 uncensored result (result within the detection limits)1 censored (result below detection limit)- no result available (analytical failure)

- 81 -
0
1
2
3
4
5
CP
_1
0m
l_lo
g1
0_
Co
nc
0 1 2 3 4 5
EC_100ml_log10_Conc
EC CP N Samples
- 0 1
- 1 2
0 - 1
0 0 285
0 1 123
1 0 2
1 1 10
Orthogonal Fit Ratio=0.289
0
1
2
3
4
5
SO
MC
P_
10
0m
l_lo
g1
0_
Co
nc
0 1 2 3 4 5
EC_100ml_log10_Conc
EC SOMCP N Samples
- 0 2
- 1 1
0 - 4
0 0 243
0 1 162
1 0 1
1 1 11
Orthogonal Fit Ratio=1.544
0
1
2
3
4
5
AE
_1
00
ml_
log
10
_ C
on
c
0 1 2 3 4 5
EC_100ml_log10_Conc
EC AE N Samples
- 0 3
0 - 4
0 0 405
1 0 12
Orthogonal Fit Ratio=0.242

- 82 -
0
1
2
3
4
5
PA
_1
0m
l_lo
g1
0_
Co
nc
0 1 2 3 4 5
EC_100ml_log10_Conc
EC PA N Samples
- 1 3
0 - 39
0 0 50
0 1 320
1 1 12
Orthogonal Fit Ratio=0.409
0
1
2
3
4
5
CP
_1
0m
l_lo
g1
0_
Co
nc
0 1 2 3 4 5
IE_100ml_log10_ Conc
IE CP N Samples
- 0 1
- 1 2
0 - 1
0 0 278
0 1 124
1 0 9
1 1 9
Orthogonal Fit Ratio=0.399
0
1
2
3
4
5
SO
MC
P_
10
0m
l_lo
g1
0_
Co
nc
0 1 2 3 4 5
IE_100ml_log10_ Conc
IE SOMCP N Samples
- 0 2
- 1 1
0 - 4
0 0 241
0 1 158
1 0 3
1 1 15
Orthogonal Fit Ratio=2.326

- 83 -
0
1
2
3
4
5
AE
_1
00
ml_
log
10
_ C
on
c
0 1 2 3 4 5
IE_100ml_log10_ Conc
IE AE N Samples
- 0 3
0 - 4
0 0 399
1 0 18
Orthogonal Fit Ratio=0.381
0
1
2
3
4
5
PA
_1
0m
l_lo
g1
0_
Co
nc
0 1 2 3 4 5
IE_100ml_log10_ Conc
IE PA N Samples
- 1 3
0 - 39
0 0 50
0 1 314
1 1 18
Orthogonal Fit Ratio=0.707
0
1
2
3
4
5
SO
MC
P_
10
0m
l_lo
g1
0_
Co
nc
0 1 2 3 4 5
CP_10ml_log10_ Conc
CP SOMCP N Samples
- 0 1
0 - 2
0 0 209
0 1 77
1 - 2
1 0 36
1 1 97
Orthogonal Fit Ratio=4.473

- 84 -
0
1
2
3
4
5
AE
_1
00
ml_
log
10
_ C
on
c
0 1 2 3 4 5
CP_10ml_log10_ Conc
CP AE N Samples
- - 1
0 - 3
0 0 285
1 0 135
Orthogonal Fit Ratio=1.061
0
1
2
3
4
5
PA
_1
0m
l_lo
g1
0_
Co
nc
0 1 2 3 4 5
CP_10ml_log10_ Conc
CP PA N Samples
- - 1
0 - 27
0 0 47
0 1 214
1 - 11
1 0 3
1 1 121
Orthogonal Fit Ratio=0.631
0
1
2
3
4
5
AE
_1
00
ml_
log
10
_ C
on
c
0 1 2 3 4 5
SOMCP_100ml_log10_Conc
SOMCP AE N Samples
- 0 4
0 - 4
0 0 242
1 0 174
Orthogonal Fit Ratio=0.279

- 85 -
0
1
2
3
4
5
PA
_1
0m
l_lo
g1
0_
Co
nc
0 1 2 3 4 5
SOMCP_100ml_log10_Conc
SOMCP PA N Samples
- 1 4
0 - 29
0 0 49
0 1 168
1 - 10
1 0 1
1 1 163
Orthogonal Fit Ratio=0.233
0
1
2
3
4
5
PA
_1
0m
l_lo
g1
0_
Co
nc
0 1 2 3 4 5
AE_100ml_log10_ Conc
AE PA N Samples
- - 1
- 0 2
- 1 1
0 - 38
0 0 48
0 1 334
Orthogonal Fit Ratio=1.467

- 86 -
Annex 9. Relationship of E. coli and intestinal enterococci counts
in comparison with data from the UK
1
10
100
1,000
10,000
100,000
1 10 100 1,000 10,000 100,000
Faecal coliformsConcentration / 100 ml
Faecal
str
ep
toco
cci
Relationship between faecal coliform and faecal streptococcal counts
in United Kingdom bathing waters after censoring zero values
(reprod. from WHO, 2001, Figure 4.7., p. 38),
overlaid by the regression function given in the text quoted below (red line)
The regression function does not seem to correspond well with the dot plot, and the
results of the sample calculations in the text quoted below do not correspond with the
empirical observation that faecal coliform concentrations tend to be higher than faecal
streptococci concentrations. The formula for the regression function is therefore
probably erroneous. WHO, 2001, p. 38-39 ("Farnham protocol"): "There is no exact
relationship between faecal streptococci and E. coli counts (Figure 4.7). Nevertheless, a
relationship can be expressed by the equation below, which may help in interpreting
historical data:
log faecal coliform count = 1.028 + 0.601 * log faecal streptococcal count.
Consequently, counts of =100 faecal coliforms/100 ml can be equated to =40 faecal
streptococci/100 ml, =250 faecal coliforms/100 ml to =200 faecal streptococci/100 ml
and =450 faecal coliforms/100 ml to =500 faecal streptococci/100 ml."
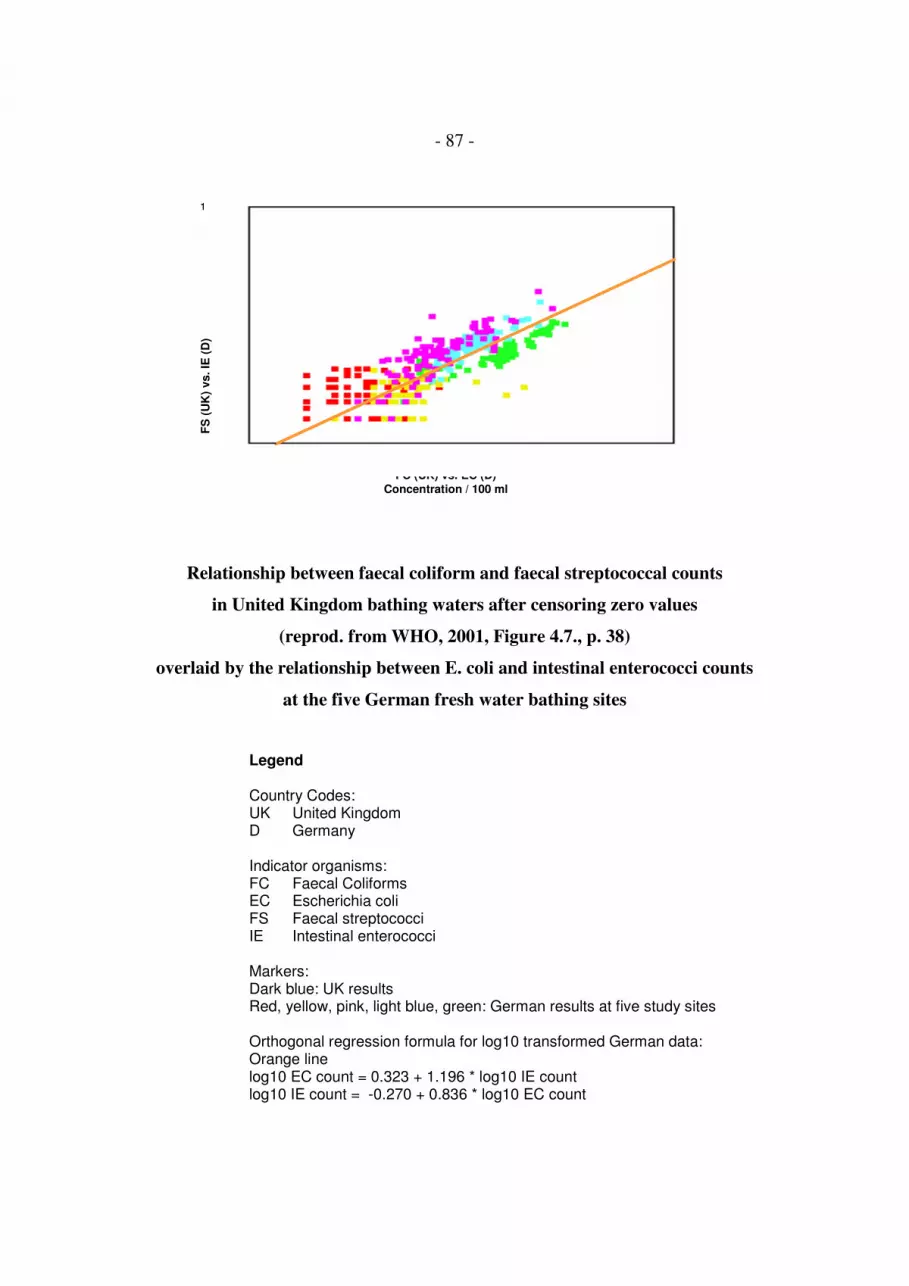
- 87 -
1
10
100
1,000
10,000
100,000
1 10 100 1,000 10,000 100,000
FC (UK) vs. EC (D)Concentration / 100 ml
FS
(U
K)
vs. IE
(D
)
Relationship between faecal coliform and faecal streptococcal counts
in United Kingdom bathing waters after censoring zero values
(reprod. from WHO, 2001, Figure 4.7., p. 38)
overlaid by the relationship between E. coli and intestinal enterococci counts
at the five German fresh water bathing sites
Legend
Country Codes:UK United KingdomD Germany
Indicator organisms:FC Faecal ColiformsEC Escherichia coliFS Faecal streptococciIE Intestinal enterococci
Markers:Dark blue: UK resultsRed, yellow, pink, light blue, green: German results at five study sites
Orthogonal regression formula for log10 transformed German data:Orange linelog10 EC count = 0.323 + 1.196 * log10 IE countlog10 IE count = -0.270 + 0.836 * log10 EC count

- 88 -
1
10
100
1,000
10,000
100,000
1 10 100 1,000 10,000 100,000
FC (UK) vs. EC (D)Concentration / 100 ml
FS
(U
K)
vs. IE
(D
)
Relationship between faecal coliform and faecal streptococcal counts
in United Kingdom bathing waters after censoring zero values
(reprod. from WHO, 2001, Figure 4.7., p. 38)
overlaid by the relationship between E. coli and intestinal enterococci counts
at four of the five German fresh water bathing sites
Results from the site which was probably influenced by tertiary treated sewage effluent
(green dots; see page before) are omitted.
Legend
Country Codes:UK United KingdomD Germany
Indicator organisms:FC Faecal ColiformsEC Escherichia coliFS Faecal streptococciIE Intestinal enterococci
Markers:Dark blue: UK resultsRed, yellow, pink, light blue: German results at four study sites
Orthogonal regression formula for log10 transformed German data (orange line)log10 EC count = 0.485 + 1.028 * log10 IE countlog10 IE count = -0.472 + 0.973 * log10 EC count

- 89 -
Annex 10. Temporal and spatial variability of the microbiological
water quality at the five study sites:
Concentrations of Escherichia coli and intestinal
enterococci
Water samples were collected every 20 minutes in the centres of the swimmers' and
non-swimmers' zones of four roped-off areas at each of the five study sites. The figures
in this annex demonstrate the temporal and spatial variability of the test parameters
Escherichia coli and intestinal enterococci at the five sites. Sites were sorted according
to the level of faecal contamination in ascending order.
Legend:
A, B, C, D The four roped-off bathing areas on the beach
S Swimmers' zone within bathing area (approx. 10 x 10 m)
NS Non-swimmers' zone within bathing area (approx. 10 x 10 m)

- 90 -
1 2 3 4 5 6 7 8 9 10
A-NS
A-S
B-NS
B-S
C-NS
C-S
D-NSD-S
0
100
200
300
400
500
600
700
800
900
1000
EN
/10
0m
l
time ( 20-min intervals )
ENTEROCOCCI (EN)
A-NS
A-S
B-NS
B-S
C-NS
C-S
D-NS
D-S
1 2 3 4 5 6 7 8 9 10
A-NS
A-S
B-NS
B-S
C-NS
C-SD-NS
D-S
0
1000
2000
3000
4000
5000
6000
EC
/10
0m
l
time ( 20-min intervals )
ESCHERICHIA COLI (EC)
A-NS
A-S
B-NS
B-S
C-NS
C-S
D-NS
D-S

- 91 -
1 2 3 4 5 6 7 8 9 10 11
A-NS
A-S
B-NS
B-S
C-NS
C-SD-NS
D-S
0
100
200
300
400
500
600
700
800
900
1000
EN
/10
0m
l
time ( 20-min intervals )
ENTEROCOCCI (EN)
A-NS
A-S
B-NS
B-S
C-NS
C-S
D-NS
D-S
1 2 3 4 5 6 7 8 9 10 11
A-NS
A-S
B-NS
B-S
C-NS
C-SD-NS
D-S
0
1000
2000
3000
4000
5000
6000
EC
/10
0m
l
time ( 20-min intervals )
ESCHERICHIA COLI (EC)
A-NS
A-S
B-NS
B-S
C-NS
C-S
D-NS
D-S
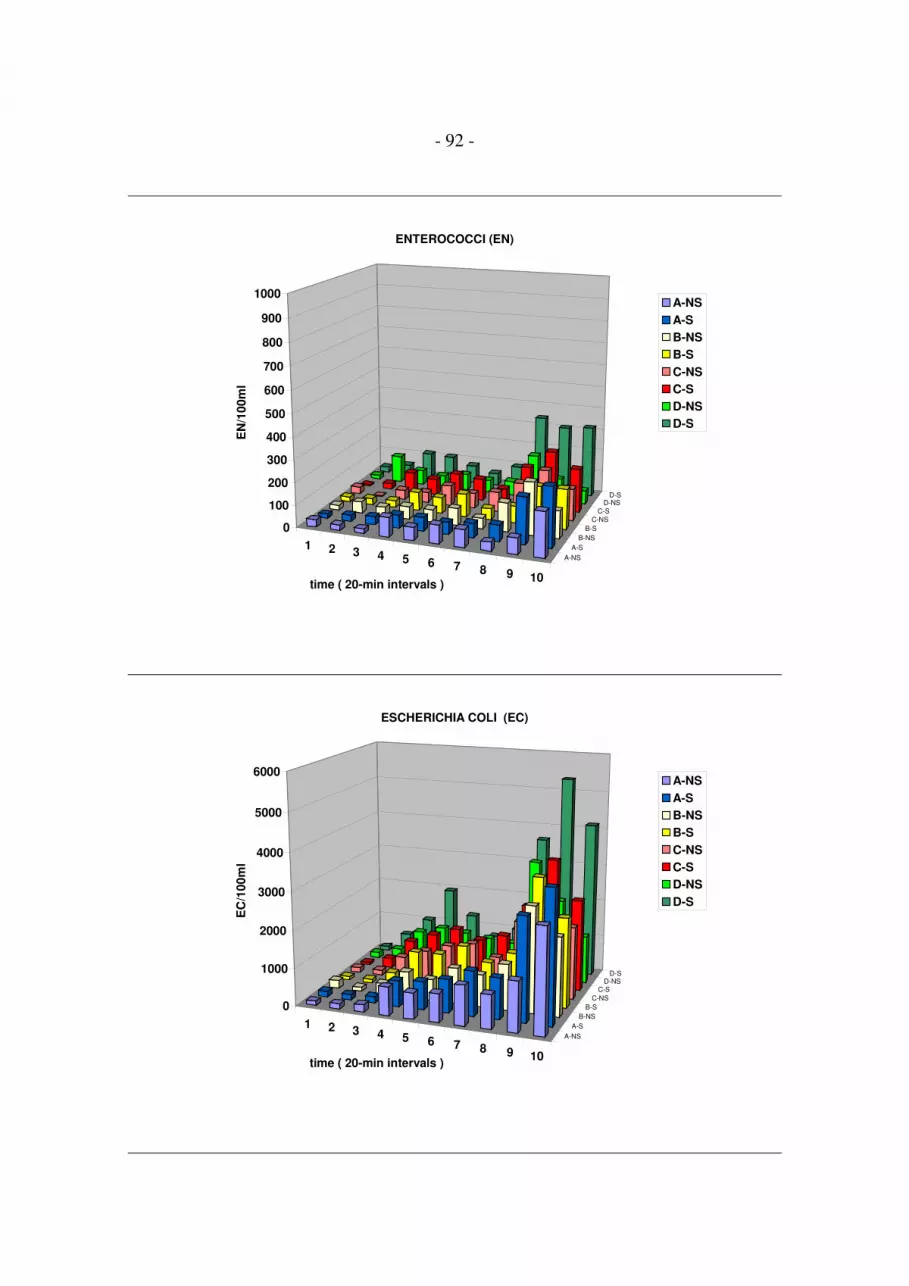
- 92 -
1 2 3 4 5 6 7 8 9 10
A-NS
A-S
B-NS
B-S
C-NS
C-S
D-NSD-S
0
100
200
300
400
500
600
700
800
900
1000
EN
/10
0m
l
time ( 20-min intervals )
ENTEROCOCCI (EN)
A-NS
A-S
B-NS
B-S
C-NS
C-S
D-NS
D-S
1 2 3 4 5 6 7 8 9 10
A-NS
A-S
B-NS
B-S
C-NS
C-SD-NS
D-S
0
1000
2000
3000
4000
5000
6000
EC
/10
0m
l
time ( 20-min intervals )
ESCHERICHIA COLI (EC)
A-NS
A-S
B-NS
B-S
C-NS
C-S
D-NS
D-S

- 93 -
1 2 3 4 5 6 7 8 9 10 11
A-NS
A-S
B-NS
B-S
C-NS
C-SD-NS
D-S
0
100
200
300
400
500
600
700
800
900
1000
EN
/10
0m
l
time ( 20-min intervals )
ENTEROCOCCI (EN)
A-NS
A-S
B-NS
B-S
C-NS
C-S
D-NS
D-S
1 2 3 4 5 6 7 8 9 10 11
A-NS
A-S
B-NS
B-S
C-NS
C-SD-NS
D-S
0
1000
2000
3000
4000
5000
6000
EC
/10
0m
l
time ( 20-min intervals )
ESCHERICHIA COLI (EC)
A-NS
A-S
B-NS
B-S
C-NS
C-S
D-NS
D-S

- 94 -
1 2 3 4 5 6 7 8 9 10 11
A-NS
A-S
B-NS
B-S
C-NS
C-SD-NS
D-S
0
100
200
300
400
500
600
700
800
900
1000
EN
/10
0m
l
time ( 20-min intervals )
ENTEROCOCCI (EN)
A-NS
A-S
B-NS
B-S
C-NS
C-S
D-NS
D-S
1 2 3 4 5 6 7 8 9 10 11
A-NS
A-S
B-NS
B-S
C-NS
C-SD-NS
D-S
0
1000
2000
3000
4000
5000
6000
EC
/10
0m
l
time ( 20-min intervals )
ESCHERICHIA COLI (EC)
A-NS
A-S
B-NS
B-S
C-NS
C-S
D-NS
D-S

- 95 -
Annex 11. Principles of the calculation of individual exposure
concentrations: interpolation between sample results and
extrapolation of sample results
88
45
32
65
20
0
10
20
30
40
50
60
70
80
90
100
0 20 40 60 80 100 120 140 160
trial-time (minutes)
co
ncen
trati
on
(mic
ro-o
rgan
ism
s p
er
vo
lum
e)
Calculation of individual exposure
missing value
?
linear
interpolation
first value
carried back
last valuecarried forward
real values
Legend
Green dots Concentrations in the water samples collected at twenty-minute intervals
Blue dots Concentrations calculated for the minutes before, after and between thesampling moments
First values were carried back, and last values were carried forward for a maximum of
ten minutes. The same procedure was applied if sample results were missing due to
analytical failures. Values between regular results were calculated by linear
interpolation

- 96 -
Annex 12. Principles of the calculation of individual exposure
concentrations: interpolation between swimmers and non-
swimmers areas
0
10
20
30
40
50
60
70
80
90
100
0 20 40 60 80 100 120 140 160
trial-time (minutes)
co
ncen
trati
on
(mic
ro-o
rgan
ism
s p
er
vo
lum
e)
S
(S+NS)/2
NS
Calculation of individual exposure
Data from swimmers area
arithmetic mean
Data from non-swimmers area
Legend
Green dots Concentrations in the water samples collected at twenty-minute intervals inthe swimmers' area
Green triangels Concentrations in the water samples collected at twenty-minute intervals inthe non-swimmers' area
Purple dashes Arithmetic means between the concentrations in the swimmers' and in thenon-swimmers' area after minute-wise interpolation between the sampleresults in both areas

- 97 -
Annex 13. Principles of the calculation of individual exposure
concentrations: example for the assignment of calculated
concentrations to an individual bather
minute
33-37
0
10
20
30
40
50
60
70
80
90
100
0 20 40 60 80 100 120 140 160
trial-time (minutes)
co
ncen
trati
on
(mic
ro-o
rgan
ism
s p
er
vo
lum
e)
S
(S+NS)/2
NS
Calculation of individual exposure
minute
28-31
minute 32
Exposure = arithmetic mean
The bather stayed in the non-swimmers' area for four minutes. In the fifth minute the
bather stayed in the non-swimmers' area as well as in the swimmers' area. In the
following five minutes the bather stayed in the swimmers' area. The exposure
concentration was calculated as the arithmetic mean of the concentrations in these ten
minutes (concentrations marked in pink).

- 98 -
Annex 14. Principles of the calculation of individual exposure
concentrations: examples for inclusions and exclusions
minute
48-57
minute
35-44
88
45
32
65
20
0
10
20
30
40
50
60
70
80
90
100
0 20 40 60 80 100 120 140 160
trial-time (minutes)
co
ncen
trati
on
(mic
ro-o
rgan
ism
s p
er
vo
lum
e)
excluded
excluded
excluded
Calculation of individual exposure
Exposure =
arithmetic mean
Only bathers for whom concentrations for each of the ten exposure minutes were
available were included. If concentrations for any of the ten exposure minutes were
missing either because the bathers entered the water too early or too late or because
sample results were missing due to analytical failures, the bathers were excluded from
the analysis.

- 99 -
Annex 15. Influence of the exposure definition on the calculated
exposure concentration for the four faecal indicator
organisms
1
10
100
1000
10000
100000
Y
1 10 100 1000 10000
EC / 100 ml at 5th exposure minute
1
10
100
1000
10000
100000
Y
1 10 100 1000 10000
IE / 100 ml at 5th exposure minute
0.1
1
10
100
1000
Y
.1 1 10 100
CP / 10 ml at 5th exposure minute
1
10
100
1000
10000
100000
Y
1 10 100 1000 10000
SOMCP / 100 ml at 5th exp. minute
Legend:
X Concentration of the microbiological parametersat the 5th exposure minute of each bather
Y, black dots Arithmetic mean of the 10 concentrations at the 10 individualexposure minutes of each bather (Exposure definition: "10 minbathing, 3 head immersions").
Y, colour dots Sum of all concentrations at which the head was immersed, perbather (Exposure definition: "1 head immersion").
EC Escherichia coliIE Intestinal EnterococciCP Clostridium perfringensSOMCP Somatic coliphages

- 100 -
Annex 16. Intensity of exposure:
Number of head immersions
Head Immersions in the GE Cohort (Def. "UK-wf")( n = 847 )
0
50
100
150
200
250
300
350
0 2 4 6 8 10 12 14 16 19 21 23 25 27 33 36 43 79 87
number of head immersions
nu
mb
er
of
part
icip
an
ts
Min.: 0
Max.: 87
Median: 4
Mean: 5.5
Participants were asked to immerse their head at least three times during the 10 minutes
of bathing. Only 9% of the participants immersed their heads less often than required,
while 53% voluntarily did it more often (median = 4; mean = 5.5; range = 0-87 head
immersions). The type of exposure which was chosen in this study (10 minutes of
bathing and at least three head immersions) is therefore probably rather an
underestimation of the mean exposure intensity in "real life".

- 101 -
Annex 17. Intensity of exposure:
Percentage of participants reporting to have swallowed
water
"Did you swallow water?"n = 847 ( GE Cohort; Def. UK-wf; Parameter EC )
1.5%
45.2%
53.2%
0.0%
10.0%
20.0%
30.0%
40.0%
50.0%
60.0%
70.0%
80.0%
90.0%
100.0%
"no" "yes" "not sure"
For the outcome "gastroenteritis" in particular, the exposure dose, i. e. the number of
microorganisms which were incorporated, depends not only on the concentration of the
microorganisms in the water, but also on the incorporated volume of water. Besides the
number of head immersions, swallowing water can therefore be considered a main
influence factor. The role of swallowing water as a risk factor was studied by using it as
an additional classification criterion for participants who were exposed at high or at low
concentrations.

- 102 -
Annex 18. Crude incidence rates, excess risks (attributable risks)
and relative risks of bathers vs. non-bathers
1 week and 3 weeks after exposure:
Disease Bathers Non-bathers
definition Cases Participants Cases Participants
1 week 3 weeks 1 w 3 w 1 week 3 weeks 1 w 3 w
n (%) n (%) n n n (%) n (%) n n
AFRI 7 (0.9) 13 (1.7) 759 747 9 (1.1) 18 (2.2) 810 802
CC 116 (15.4) 171 (23.1) 754 741 109 (13.6) 162 (20.4) 804 793
EAR 15 (1.6) 21 (2.2) 950 942 7 (0.7) 13 (1.3) 1003 1001
EYE 16 (1.7) 25 (2.7) 944 938 16 (1.6) 25 (2.5) 999 997
GE_UK 28 (3.3) 54 (6.6) 837 818 13 (1.4) 43 (4.8) 920 902
GE_UK-wf 46 (5.4) 75 (9) 847 831 26 (2.8) 64 (7.1) 921 907
GE_NL-2 63 (7.4) 107 (13) 846 823 48 (5.2) 101 (11.1) 921 908
SKIN 82 (9.3) 113 (13) 880 869 27 (2.8) 41 (4.3) 957 947
UTI 2 (0.2) 4 (0.4) 944 939 4 (0.4) 11 (1.1) 1002 999
Disease Excess cases Excess risk RR p (Pearson's Chi sq. Test)
definition 1 week 3 weeks 1 week 3 weeks 1 week 3 weeks 1 week 3 weeks
n n (%) (%)
AFRI -2 -5 -0.2 -0.5 0.83 0.78 0.7098 0.4790
CC 7 9 1.8 2.6 1.13 1.13 0.3051 0.2087
EAR 8 8 0.9 0.9 2.26 1.72 0.0652 0.1179
EYE 0 0 0.1 0.2 1.06 1.06 0.8717 0.8270
GE_UK 15 11 1.9 1.8 2.37 1.38 0.0074 ** 0.0996
GE_UK-wf 20 11 2.6 2.0 1.92 1.28 0.0056 ** 0.1306
GE_NL-2 15 6 2.2 1.9 1.43 1.17 0.0531 (*) 0.2301
SKIN 55 72 6.5 8.7 3.30 3.00 <.0001 *** <.0001 ***
UTI -2 -7 -0.2 -0.7 0.53 0.39 0.4563 0.0901
Significance: (*) border line
* < 0.05
** < 0.01
*** < 0.001
Disease definitions
AFRI Acute febrile respiratory infectionsCC Common coldEAR Ear inflammationEYE Eye inflammationGE_UK Gastroenteritis, UK definitionGE_UK-wf Gastroenteritis, UK definition without consideration of stool frequencyGE_NL-2 Gastroenteritis, NL-2 definitionSKIN Skin infections, cutireactionsUTI Urinary tract infections

- 103 -
Crude incidence rates of AFRI (Acute febrile respiratory infections)Bathers vs. non-bathers
1 week vs. 3 weeks after exposure
0.92 1.111.74 2.24
0.00
5.00
10.00
15.00
20.00
25.00
30.00
35.00
40.00
AFRI 1 week AFRI 3 weeks
% B
NB
Crude incidence rates of CC (Common cold)Bathers vs. non-bathers
1 week vs. 3 weeks after exposure
15.38
23.08
13.56
20.43
0.00
5.00
10.00
15.00
20.00
25.00
30.00
35.00
40.00
CC 1 week CC 3 weeks
% B
NB
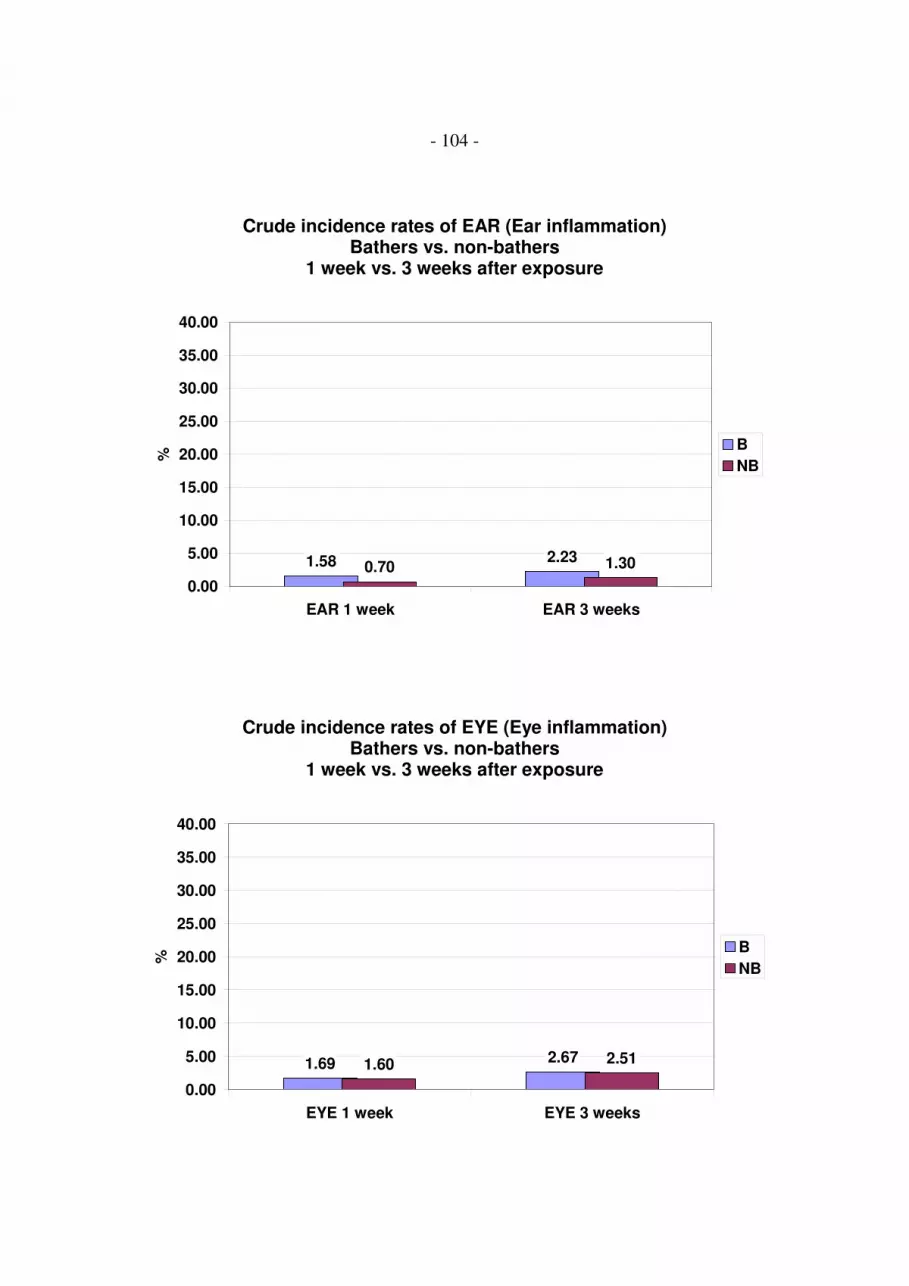
- 104 -
Crude incidence rates of EAR (Ear inflammation)Bathers vs. non-bathers
1 week vs. 3 weeks after exposure
1.58 2.230.70 1.30
0.00
5.00
10.00
15.00
20.00
25.00
30.00
35.00
40.00
EAR 1 week EAR 3 weeks
% B
NB
Crude incidence rates of EYE (Eye inflammation)Bathers vs. non-bathers
1 week vs. 3 weeks after exposure
1.69 2.671.60 2.51
0.00
5.00
10.00
15.00
20.00
25.00
30.00
35.00
40.00
EYE 1 week EYE 3 weeks
% B
NB

- 105 -
Crude incidence rates of GE_UK (Gastroenteritis, UK definition )Bathers vs. non-bathers
1 week vs. 3 weeks after exposure
3.35
6.60
1.41
4.77
0.00
5.00
10.00
15.00
20.00
25.00
30.00
35.00
40.00
GE_UK 1 week GE_UK 3 weeks
% B
NB
**
Crude incidence rates of GE_UK-wf(Gastroenteritis, UK definition without consideration of stool frequency)
Bathers vs. non-bathers1 week vs. 3 weeks after exposure
5.43
9.03
2.82
7.06
0.00
5.00
10.00
15.00
20.00
25.00
30.00
35.00
40.00
GE_UK-wf 1 week GE_UK-wf 3 weeks
% B
NB
**
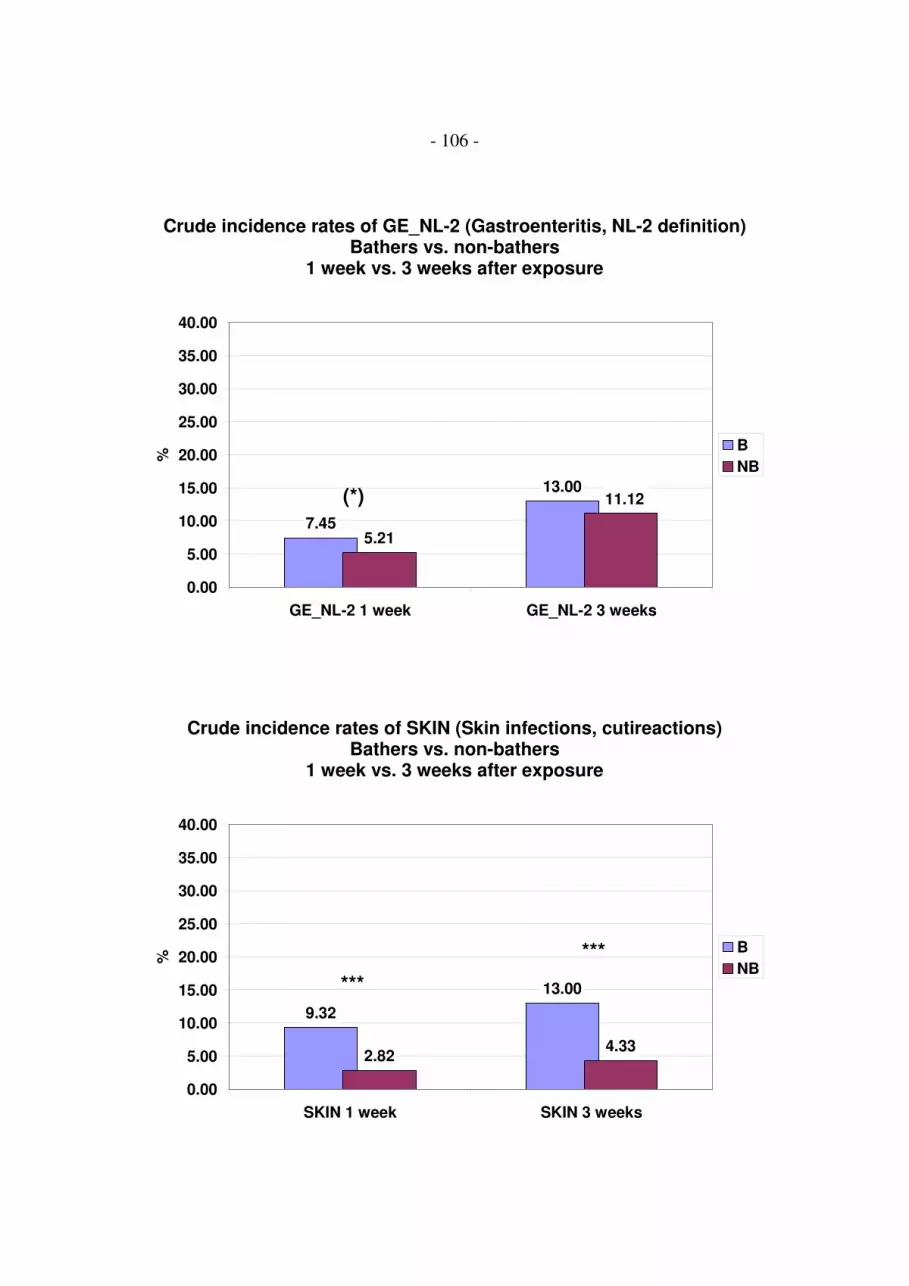
- 106 -
Crude incidence rates of GE_NL-2 (Gastroenteritis, NL-2 definition)Bathers vs. non-bathers
1 week vs. 3 weeks after exposure
7.45
13.00
5.21
11.12
0.00
5.00
10.00
15.00
20.00
25.00
30.00
35.00
40.00
GE_NL-2 1 week GE_NL-2 3 weeks
% B
NB
(*)
Crude incidence rates of SKIN (Skin infections, cutireactions)Bathers vs. non-bathers
1 week vs. 3 weeks after exposure
9.32
13.00
2.824.33
0.00
5.00
10.00
15.00
20.00
25.00
30.00
35.00
40.00
SKIN 1 week SKIN 3 weeks
% B
NB***
***

- 107 -
Crude incidence rates of UTI (Urinary tract infections)Bathers vs. non-bathers
1 week vs. 3 weeks after exposure
0.21 0.430.40 1.10
0.00
5.00
10.00
15.00
20.00
25.00
30.00
35.00
40.00
UTI 1 week UTI 3 weeks
% B
NB

- 108 -
Annex 19. Dose response model assumptions and control of bias
The figures in this annex illustrate the dose-response model assumptions on which the
data analysis was based.
Dose response model
Susceptible
Background illness
Immuneor infectedbut not ill
Exposure concentration = Log10 ( MO/100 ml )
Dis
ea
se
ra
te (
%)
Th
0
100
Legend:
Disease rate (%) Incidence rate of disease (e. g. gastroenteritis) reported by studyparticipants within one week or three weeks after exposure
Log10 (MO/100ml) Concentration of microorganisms assigned to a batherTh Threshold of effect; NOAEL = no observed adverse effect levelImmune or infected Part of exposed participants who had no symptoms eitherbut not ill because they are immune or because the infection is asymptomaticSusceptible Part of exposed participants who are susceptible to symptomatic
infectionsBackground illness Part of exposed participants who have symptomatic infections due to
independent other sources of infection, e. g. household contact,contaminated meals, etc.

- 109 -
The model assumptions were:
1. There is a baseline risk ("background rate of illness") for bathers which is due to
other risk factors independent of bathing, and which is not significantly lower than
the incidence rate of disease among non-bathers, i. e. it was assumed that a bathing
duration of 10 minutes is not protective for any of the evaluated infectious diseases.
2. There is a maximum risk level (ceiling) which is less than 100%, as a certain part of
the exposed population can be expected to be either immune or to become infected
without developing any symptoms ("silent infections").
3. There is a certain concentration range within which the risk increases from baseline
level towards the ceiling. When the exposure concentration of microorganisms is
plotted on a log10 transformed scale on the x-axis this part of the curve is ideally
sigmoid shaped.
4. The slope of the sigmoid part of the curve depends on the virulence of the pathogens
which are present in the water.
5. Below and above that concentration range there is no trend or correlation between
the concentration of monitored microorganisms and risk, because risk remains at a
constant level.
6. For standardised exposure activities there is a threshold of effect (NOAEL = no
observed adverse effect level), i. e. a concentration below which there is no
detectable difference between the incidence rate among bathers and the incidence
rate among non-bathers.
7. When a concentration of organisms (MO/100ml) is modelled as the x-variable
instead of a dose (i.e. the number of organisms which are incorporated or which
come into contact e.g. with the skin, the eyes etc.) the NOAEL depends on the
intensity of exposure. A low exposure intensity (e.g. 1 head immersion) will result
in a higher NOAEL than a high exposure intensity (e. g. 3 or more head
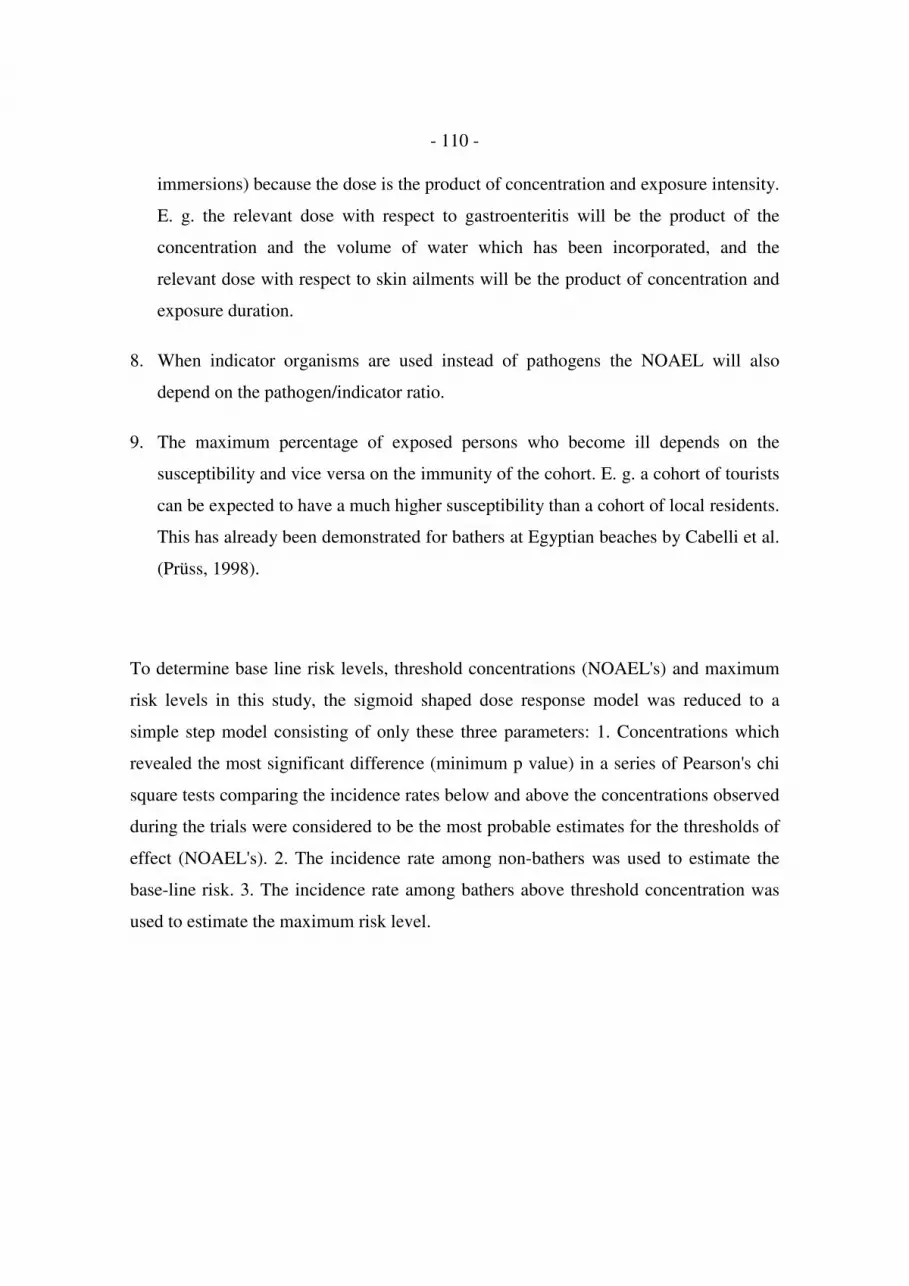
- 110 -
immersions) because the dose is the product of concentration and exposure intensity.
E. g. the relevant dose with respect to gastroenteritis will be the product of the
concentration and the volume of water which has been incorporated, and the
relevant dose with respect to skin ailments will be the product of concentration and
exposure duration.
8. When indicator organisms are used instead of pathogens the NOAEL will also
depend on the pathogen/indicator ratio.
9. The maximum percentage of exposed persons who become ill depends on the
susceptibility and vice versa on the immunity of the cohort. E. g. a cohort of tourists
can be expected to have a much higher susceptibility than a cohort of local residents.
This has already been demonstrated for bathers at Egyptian beaches by Cabelli et al.
(Prüss, 1998).
To determine base line risk levels, threshold concentrations (NOAEL's) and maximum
risk levels in this study, the sigmoid shaped dose response model was reduced to a
simple step model consisting of only these three parameters: 1. Concentrations which
revealed the most significant difference (minimum p value) in a series of Pearson's chi
square tests comparing the incidence rates below and above the concentrations observed
during the trials were considered to be the most probable estimates for the thresholds of
effect (NOAEL's). 2. The incidence rate among non-bathers was used to estimate the
base-line risk. 3. The incidence rate among bathers above threshold concentration was
used to estimate the maximum risk level.

- 111 -
Simplified dose response model:Step model
Susceptible
Background illness
Immuneor infectedbut not ill
Exposure concentration = Log10 ( MO/100 ml )
Dis
ea
se
ra
te (
%)
Th
0
100
Legend:
Disease rate (%) Incidence rate of disease (e. g. gastroenteritis) reported by studyparticipants within one week or three weeks after exposure
Log10 (MO/100ml) Concentration of microorganisms assigned to a batherTh Threshold of effect; NOAEL = no observed adverse effect levelImmune or infected Part of exposed participants who show no symptoms eitherbut not ill because they are immune or because the infection is asymptomaticSusceptible Part of exposed participants who are susceptible to symptomatic
infectionsBackground illness Part of exposed participants who have symptomatic infections due to
independent other sources of infection, e. g. household contact,contaminated meals etc.

- 112 -
Different susceptibility of exposed cohort
Susceptible
Background illness
Immuneor infected
but not ill
Exposure concentration = Log10 ( MO/100 ml )
Dis
ease r
ate
(%
)
Th
0
100
Susceptible
Background illness
Immuneor infected
but not ill
Exposure concentration = Log10 ( MO/100 ml )
Dis
ease
rate
(%
)
Th
0
100
Legend
Disease rate (%) Incidence rate of disease (e. g. gastroenteritis) reported by studyparticipants within one week or three weeks after exposure
Log10 (MO/100ml) Concentration of microorganisms assigned to a batherTh Threshold of effect; NOAEL = no observed adverse effect levelImmune or infected Part of exposed participants who show no symptoms eitherbut not ill because they are immune or because the infection is asymptomaticSusceptible Part of exposed participants who are susceptible to symptomatic
infectionsBackground illness Part of exposed participants who have symptomatic infections due to
independent other sources of infection, e. g. household contact,contaminated meals etc.

- 113 -
Different exposure intensity
Susceptible
Background illness
Immuneor infectedbut not ill
Exposure concentration = Log10 ( MO/100 ml )
Dis
ease
ra
te (
%)
Th
0
100
Susceptible
Background illness
Immuneor infectedbut not ill
Exposure concentration = Log10 ( MO/100 ml )
Dis
ease
ra
te (
%)
0
100
Th
Legend
Disease rate (%) Incidence rate of disease (e. g. gastroenteritis) reported by studyparticipants within one week or three weeks after exposure
Log10 (MO/100ml) Concentration of microorganisms assigned to a batherTh Threshold of effect; NOAEL = no observed adverse effect levelImmune or infected Part of exposed participants who show no symptoms eitherbut not ill because they are immune or because the infection is asymptomaticSusceptible Part of exposed participants who are susceptible to symptomatic
infectionsBackground illness Part of exposed participants who have symptomatic infections due to
independent other sources of infection, e. g. household contact,contaminated meals etc.
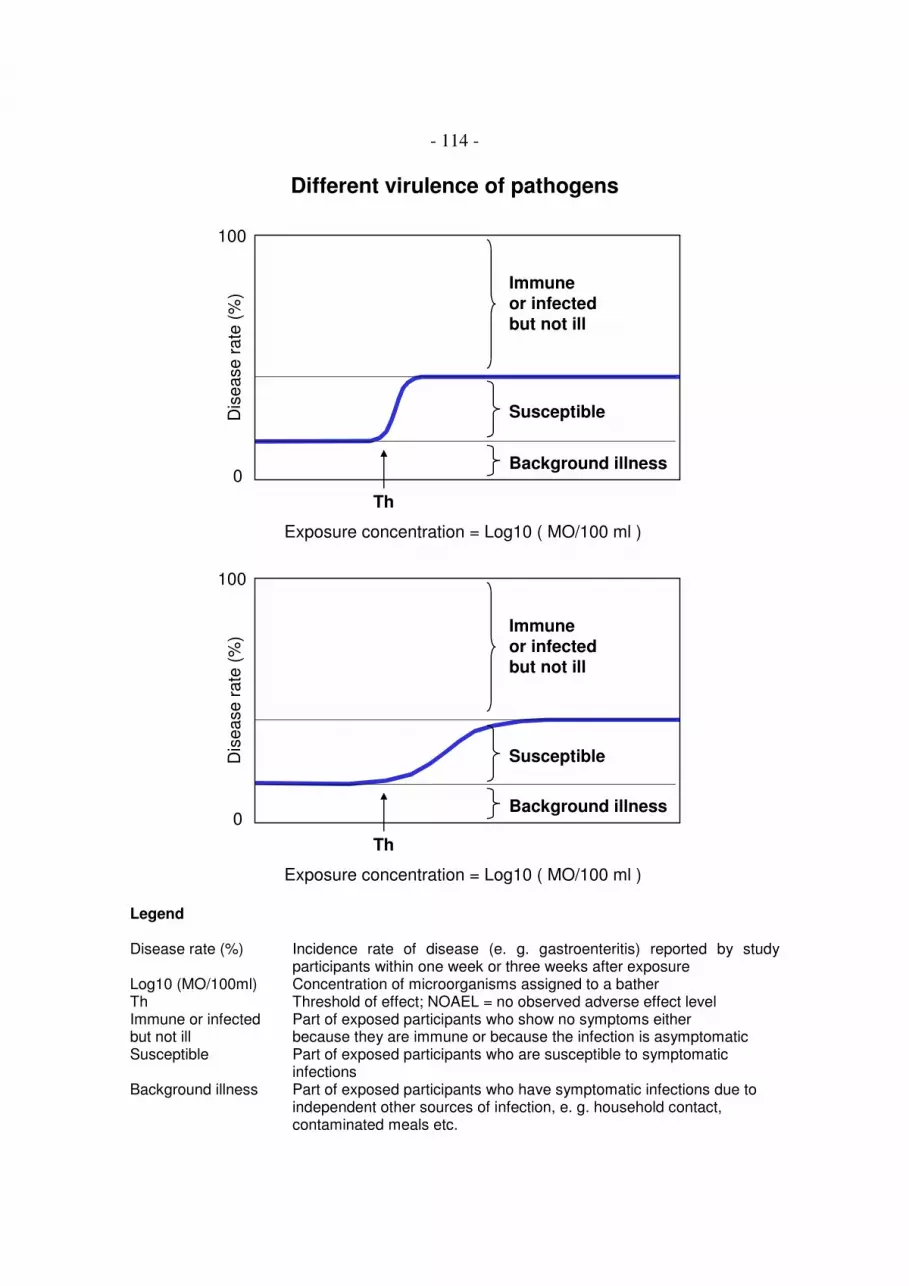
- 114 -
Different virulence of pathogens
Susceptible
Background illness
Immuneor infectedbut not ill
Exposure concentration = Log10 ( MO/100 ml )
Dis
ease r
ate
(%
)
Th
0
100
Susceptible
Background illness
Immuneor infectedbut not ill
Exposure concentration = Log10 ( MO/100 ml )
Dis
ease r
ate
(%
)
Th
0
100
Legend
Disease rate (%) Incidence rate of disease (e. g. gastroenteritis) reported by studyparticipants within one week or three weeks after exposure
Log10 (MO/100ml) Concentration of microorganisms assigned to a batherTh Threshold of effect; NOAEL = no observed adverse effect levelImmune or infected Part of exposed participants who show no symptoms eitherbut not ill because they are immune or because the infection is asymptomaticSusceptible Part of exposed participants who are susceptible to symptomatic
infectionsBackground illness Part of exposed participants who have symptomatic infections due to
independent other sources of infection, e. g. household contact,contaminated meals etc.

- 115 -
The described dose-response relationships (better: concentration response relationships)
may be influenced mainly by four different forms of bias: misclassification bias, recall
bias, confounding and effect modification.
1. Misclassification bias would result from an imprecise assignment of exposure
concentrations to individual bathers. It would produce false low NOAEL's and false
shallow slopes of the dose-response curves. It would not, however, affect the base-
line risk and the maximum risk level. Misclassification in this study was reduced to
a minimum by monitoring the water quality at very short time intervals (20 minutes)
at exactly the place where the bathers were exposed, and by applying very precise
microbiological methods and strict quality control procedures, especially for the two
parameters Escherichia coli and intestinal enterococci (three 96 well microtiter
plates instead of one per sample; short transportation and storage times; application
of external quality control materials).
2. Recall bias would result in higher incidence rates of disease among exposed
individuals than among unexposed individuals because exposed individuals might
tend to remember symptoms better than unexposed individuals. This effect could
not be totally excluded as, of course, the participants knew whether they had been
bathing or not. However, they were not aware of the water quality at the time of
their exposure, nor were the organisers of the study. Recall bias would therefore
most probably not affect the NOAEL. It might result in a higher base-line risk level
among bathers and in a false high maximum risk level. For the outcome variable
"gastroenteritis" such an effect could not be observed for the base-line risk level. It
is therefore considered improbable that there was a recall bias effect solely
influencing the maximum risk level.
3. Confounding would result from an imbalance of independent other risk factors
among bathers and non-bathers, or within the group of bathers from an imbalance of
such risk factors among those who were exposed at high or low concentrations.
Confounding would mean that an effect is erroneously attributed to bathing or to

- 116 -
bathing at high concentrations of microorganisms. It could affect the base-line risk,
the threshold concentration (NOAEL), the slope and the maximum risk level. In an
extreme situation confounding could simulate a dose-response relationship which
does not really exist at all. Confounding was therefore controlled by a multiple
logistic regression procedure (effect likelihood ratio tests) which included non-
bathers as well as bathers, and in which the threshold concentration and a variety of
other identified risk factors were modelled as effect variables with the disease as
outcome variable. Dose-response models were not considered to be valid when the
determined threshold concentration (NOAEL) did not remain a significant effect
(p<0,05) in these tests.
4. Effect modification would result from factors which are homogeneously distributed
over the group of bathers and non-bathers, but affect (modify) the intensity of the
outcome variable, i. e. the incidence rate of disease, when they occur in combination
with other effect variables e. g. a high or low exposure concentration. Effect
modification would also affect the NOAEL. however, as the cohort was recruited
from the normal population, effect modification can be assumed to occur in "real
life" to an extent similar to which it may have occurred in this study. It was
therefore not considered to be a form of bias which has to be controlled for. If other
risk factors revealed significant interaction effects in the effect likelihood ratio tests
mentioned above, this was recorded but was not analysed further.
The model assumptions described in this annex in combination with the possible effects
of bias are sufficient to explain the high degree of variability in the results from a
variety of epidemiological studies investigating health effects from bathing in sea or
fresh water (Prüss, 1998). They can also explain the differences and similarities between
the results of this study and the results of studies with similar design performed at UK
coastal bathing sites (Kay et al., 1994).

- 117 -
Annex 20. Step models for dose response relationships:
Estimates for thresholds of effect (NOAEL's);
incidence rates below and above threshold concentrations;
relative risks and attributable risks
For all exposure concentrations which occurred in this study incidence rates of disease
were calculated among bathers exposed up to this concentration and among bathers
exposed above this concentration, and a Pearson's chi square test was performed at each
concentration level. The concentration level which revealed a minimum p value was
considered to be the most probable estimate for the threshold of effect (i. e. the
NOAEL; no observed adverse effect level). Threshold concentrations were considered
to be valid only when the following conditions were fulfilled: minimum p < 0.05; no
suspect test result (no expected cell value < 5); incidence rate below threshold not
significantly lower than incidence rate of non-bathers; incidence rate above threshold
significantly higher than incidence rate of non-bathers; threshold concentration not
confounded by any of the potential confounding variables which were evaluated in this
study (evaluation by multiple logistic regression; effect likelihood ratio tests). The
tables in this annex also list the corresponding relative risks and attributable risks.

- 118 -
Legend
Disease definitions:
GE_UK Gastroenteritis, UK definitionGE_UK-wf Gastroenteritis, UK definition without consideration of stool frequencyGE_NL-2 Gastroenteritis, NL-2 definitionSKIN Skin infections, cutireaction
Microbiological parameters:
CP Clostridium perfringensEC Escherichia coliIE Intestinal enterococciSOMCP Somatic coliphagesAE Aeromonads
Parameter units:
MPN Most probable numberCFP Colony forming particlesPFP Plaque forming particles
Miscellaneous:
Threshold Threshold of effect (estimate for the NOAEL)conc. Concentrationp Pearson's Chi square p value (bathers vs. non-bathers)n total number of participants per category95% CI 95% confidence intervalRR Relative risk (incidence rate of bathers / incidence rate of non-bathers)aR attributable risk (incidence rate of bathers - incidence rate of non-bathers);
synonymous: "excess risk"not applicable Compared to bathing duration the number of head immersions cannot be
assumed to relevantly effect the incidence rate of skin infections orcutireactions. It was therefore considered inappropriate to apply exposuredefinition 2 ("1 head immersion") to skin ailments.

- 119 -
Table 1: Incidence rates among non-bathers, bathers below threshold concentrationsand bathers above threshold concentrations for exposure definition 1
Exposure definition 1:( "10 min bathing; 3 head immersions" )
Disease Parameter Non-bathers Bathers <= Threshold Threshold Bathers > Threshold
definition cases n (%) [ 95% CI ] cases n (%) [ 95% CI ] p conc. cases n (%) [ 95% CI ] p
GE_UK EC /100 ml 13 920 (1.4) [ 0.8; 2.4 ] 7 409 (1.7) [ 0.7; 3.5 ] 0.6800 180 21 419 (5.0) [ 3.1; 7.6 ] 0.0001
GE_UK-wf EC /100 ml 26 921 (2.8) [ 1.9; 4.1 ] 5 259 (1.9) [ 0.6; 4.4 ] 0.4275 78 41 579 (7.1) [ 5.1; 9.5 ] 0.0001
GE_NL-2 EC /100 ml 48 921 (5.2) [ 3.9; 6.9 ] 18 396 (4.5) [ 2.7; 7.1 ] 0.6113 167 45 441 (10.2) [ 7.5; 13.4 ] 0.0006
GE_UK IE /100 ml 13 920 (1.4) [ 0.8; 2.4 ] 5 320 (1.6) [ 0.5; 3.6 ] 0.7905 24 23 508 (4.5) [ 2.9; 6.7 ] 0.0003
GE_UK-wf IE /100 ml 26 921 (2.8) [ 1.9; 4.1 ] 6 307 (2.0) [ 0.7; 4.2 ] 0.4080 21 40 531 (7.5) [ 5.4; 10.1 ] 0.0000
GE_NL-2 IE /100 ml 48 921 (5.2) [ 3.9; 6.9 ] 12 321 (3.7) [ 1.9; 6.4 ] 0.2983 24 51 516 (9.9) [ 7.4; 12.8 ] 0.0008
GE_UK CP /10 ml 13 920 (1.4) [ 0.8; 2.4 ] 4 329 (1.2) [ 0.3; 3.1 ] 1.0000 1.3 24 508 (4.7) [ 3.1; 6.9 ] 0.0002
GE_UK-wf CP /10 ml 26 921 (2.8) [ 1.9; 4.1 ] 8 331 (2.4) [ 1.0; 4.7 ] 0.7079 1.3 38 516 (7.4) [ 5.3; 10.0 ] 0.0001
GE_NL-2 CP /10 ml 48 921 (5.2) [ 3.9; 6.9 ] 13 331 (3.9) [ 2.1; 6.6 ] 0.3624 1.3 50 515 (9.7) [ 7.3; 12.6 ] 0.0012
GE_UK SOMCP /100 ml 13 920 (1.4) [ 0.8; 2.4 ] 16 656 (2.4) [ 1.4; 3.9 ] 0.1352 150 # 11 169 (6.5) [ 3.3; 11.3 ] 0.0004
GE_UK-wf SOMCP /100 ml 26 921 (2.8) [ 1.9; 4.1 ] 7 305 (2.3) [ 0.9; 4.7 ] 0.6326 10 37 530 (7.0) [ 5.0; 9.5 ] 0.0002
GE_NL-2 SOMCP /100 ml 48 921 (5.2) [ 3.9; 6.9 ] 11 304 (3.6) [ 1.8; 6.4 ] 0.2694 10 49 530 (9.2) [ 6.9; 12 ] 0.0031
SKIN * AE /100 ml 27 957 (2.8) [ 1.9; 4.1 ] 19 357 (5.3) [ 3.2; 8.2 ] 0.0282 5622 62 508 (12.2) [ 9.5; 15.4 ] 0.0000
* Incidence rate of bathers exposed <= threshold significantly higher than incidence rate of non-bathers (two-step dose response model)
# threshold estimate probably too high, due to a second local minimum of Chi square p values

- 120 -
Table 2: Incidence rates among non-bathers, bathers below threshold concentrationsand bathers above threshold concentrations for exposure definition 2
Exposure definition 2:( "1 head immersion" )
Disease Parameter Non-bathers Bathers <= Threshold Threshold Bathers > Threshold
definition cases n (%) [ 95% CI ] cases n (%) [ 95% CI ] p conc. cases n (%) [ 95% CI ] p
GE_UK EC /100 ml 13 920 (1.4) [ 0.8; 2.4 ] 11 555 (2.0) [ 1.0; 3.5 ] 0.4028 1453 17 273 (6.2) [ 3.7; 9.8 ] 0.0000
GE_UK-wf EC /100 ml 26 921 (2.8) [ 1.9; 4.1 ] --- --- --- --- --- ---
GE_NL-2 EC /100 ml 48 921 (5.2) [ 3.9; 6.9 ] 37 623 (5.9) [ 4.2; 8.1 ] 0.5388 2163 26 214 (12.1) [ 8.1; 17.3 ] 0.0002
GE_UK IE /100 ml 13 920 (1.4) [ 0.8; 2.4 ] 5 351 (1.4) [ 0.5; 3.3 ] 1.0000 123 23 477 (4.8) [ 3.1; 7.1 ] 0.0001
GE_UK-wf IE /100 ml 26 921 (2.8) [ 1.9; 4.1 ] 8 353 (2.3) [ 1.0; 4.4 ] 0.5811 123 38 485 (7.8) [ 5.6; 10.6 ] 0.0000
GE_NL-2 IE /100 ml 48 921 (5.2) [ 3.9; 6.9 ] 16 370 (4.3) [ 2.5; 6.9 ] 0.5066 145 47 467 (10.1) [ 7.5; 13.2 ] 0.0007
GE_UK CP /10 ml 13 920 (1.4) [ 0.8; 2.4 ] 2 248 (0.8) [ 0.1; 2.9 ] 1.0000 3.8 26 589 (4.4) [ 2.9; 6.4 ] 0.0003
GE_UK-wf CP /10 ml 26 921 (2.8) [ 1.9; 4.1 ] 5 250 (2.0) [ 0.7; 4.6 ] 0.4722 3.8 41 597 (6.9) [ 5.0; 9.2 ] 0.0002
GE_NL-2 CP /10 ml 48 921 (5.2) [ 3.9; 6.9 ] 5 194 (2.6) [ 0.8; 5.9 ] 0.1170 3.6 58 652 (8.9) [ 6.8; 11.3 ] 0.0041
GE_UK SOMCP /100 ml 13 920 (1.4) [ 0.8; 2.4 ] 9 487 (1.8) [ 0.8; 3.5 ] 0.5315 330 18 338 (5.3) [ 3.2; 8.3 ] 0.0001
GE_UK-wf SOMCP /100 ml 26 921 (2.8) [ 1.9; 4.1 ] 7 298 (2.3) [ 0.9; 4.8 ] 0.6612 50 37 537 (6.9) [ 4.9; 9.4 ] 0.0002
GE_NL-2 SOMCP /100 ml 48 921 (5.2) [ 3.9; 6.9 ] 19 386 (4.9) [ 3.0; 7.6 ] 0.8286 119 41 448 (9.2) [ 6.6; 12.2 ] 0.0055
SKIN AE /100 ml not applicable
--- potential threshold concentration not accepted because incidence rate below threshold is significantly lower than incidence rate of non-bathers

- 121 -
Table 3: Relative risks and attributable risksof bathers exposed above threshold concentrations vs. non-bathers
Exposure definition 1:( "10 min bathing; 3 head immersions" )
Exposure definition 2:( "1 head immersion" )
Disease Parameter Non-bathers Bathers > Threshold Bathers > Threshold
definition cases n cases n RR [ 95% CI ] aR cases n RR [ 95% CI ] aR
GE_UK EC 13 920 21 419 3.55 [ 1.79; 7.02 ] 3.6% 17 273 4.41 [ 2.17; 8.96 ] 5.2%
GE_UK-wf EC 26 921 41 579 2.51 [ 1.55; 4.05 ] 4.3% --- --- --- --- ---
GE_NL-2 EC 48 921 45 441 1.96 [ 1.32; 2.89 ] 5.0% 26 214 2.33 [ 1.48; 3.67 ] 8.6%
GE_UK IE 13 920 23 508 3.2 [ 1.64; 6.27 ] 3.1% 23 477 3.41 [ 1.74; 6.68 ] 3.7%
GE_UK-wf IE 26 921 40 531 2.67 [ 1.65; 4.32 ] 4.7% 38 485 2.78 [ 1.71; 4.51 ] 5.7%
GE_NL-2 IE 48 921 51 516 1.9 [ 1.3; 2.77 ] 4.7% 47 467 1.93 [ 1.31; 2.84 ] 6.0%
GE_UK CP 13 920 24 508 3.34 [ 1.72; 6.51 ] 3.3% 26 589 3.12 [ 1.62; 6.03 ] 3.2%
GE_UK-wf CP 26 921 38 516 2.61 [ 1.6; 4.25 ] 4.5% 41 597 2.43 [ 1.5; 3.93 ] 4.6%
GE_NL-2 CP 48 921 50 515 1.86 [ 1.27; 2.73 ] 4.5% 58 652 1.71 [ 1.18; 2.47 ] 4.6%
GE_UK SOMCP 13 920 11 169 4.61 [ 2.1; 10.11 ] 5.1% 18 338 3.77 [ 1.87; 7.61 ] 4.2%
GE_UK-wf SOMCP 26 921 37 530 2.47 [ 1.51; 4.04 ] 4.2% 37 537 2.44 [ 1.49; 3.98 ] 4.6%
GE_NL-2 SOMCP 48 921 49 530 1.77 [ 1.21; 2.6 ] 4.0% 41 448 1.76 [ 1.18; 2.62 ] 4.9%
SKIN AE 27 957 62 508 4.33 [ 2.79; 6.71 ] 9.4% not applicable
SKIN * AE 19 * 357 * 62 508 2.29 [ 1.40; 3.77 ] 6.9% not applicable
* bathers exposed <= threshold (two-step dose response model)
--- potential threshold concentration not accepted because incidence rate below threshold is significantly lower than incidence rate of non-bathers


Annex 21. Plots of exposure concentrations (X) by Chi square p
values (Y) ("minimal p procedure")
For all exposure concentrations "K" which were calculated using exposure definition 1
("10 minutes bathing; ≥ 3 head immersions") or exposure definition 2 ("1 head
immersion") Pearson's Chi-square Tests were performed to compare the incidence
rates of disease in the group of bathers exposed at or below a certain concentration "K"
with the incidence rate in the group of bathers exposed above that concentration. The
concentration with the minimum p value below 0.05 and a test result which was not
suspect due to expected cell values of less than five was considered to be the most
probable estimate for a potential threshold of effect. The figures on the following pages
show the "K" by p plots for all combinations of faecal indicator organisms (IE, EC, CP,
SOMCP) with the three definitions of gastroenteritis (GE_UK, GE_UK-wf and
GE_NL-2). Combinations with AE or PA which did not reveal any valid results are
shown for comparison. The last figure shows the plot for AE and SKIN (skin infections,
cutireactions). All other combinations of microorganisms and disease definitions either
did not reveal any potentially valid threshold concentrations according to the criteria
defined in the materials and methods section or they were confounded by other
predictors of disease.

- 124 -
Legend
Indicator organisms:
IE Intestinal enterococciEC Escherichia coliCP Clostridium perfringensSOMCP Somatic coliphagesAE AeromonadsPA Pseudomonas aeruginosa
Disease definitions:
GE_UK Gastroenteritis, UK definitionGE_UK-wf Gastroenteritis, UK definition without consideration of stool frequencyGE_NL-2 Gastroenteritis, NL-2 definition (van Asperen et al., 1998)SKIN Skin infections, cutireactions
X- and Y-axis:
K Exposure concentration.Concentrations of indicator organisms assigned to the participants usingexposure definition 1 ("10 minutes bathing; ≥ 3 head immersions") or exposuredefinition 2 ("1 head immersion").
p Probability of error in Chi square tests.Null-hypothesis: No difference between the incidence rate of disease (GE,SKIN) in participants exposed at concentrations ≤ K and incidence rate ofdisease in participants exposed at concentrations > K.
Markers:
Red dots suspect p values (expected cell value < 5)Black dots p value not suspect
Horizontal lines:
Black line alpha level (level of significance) = 0.05 (5%)Red line alpha level (level of significance) = 0.01 (1%)
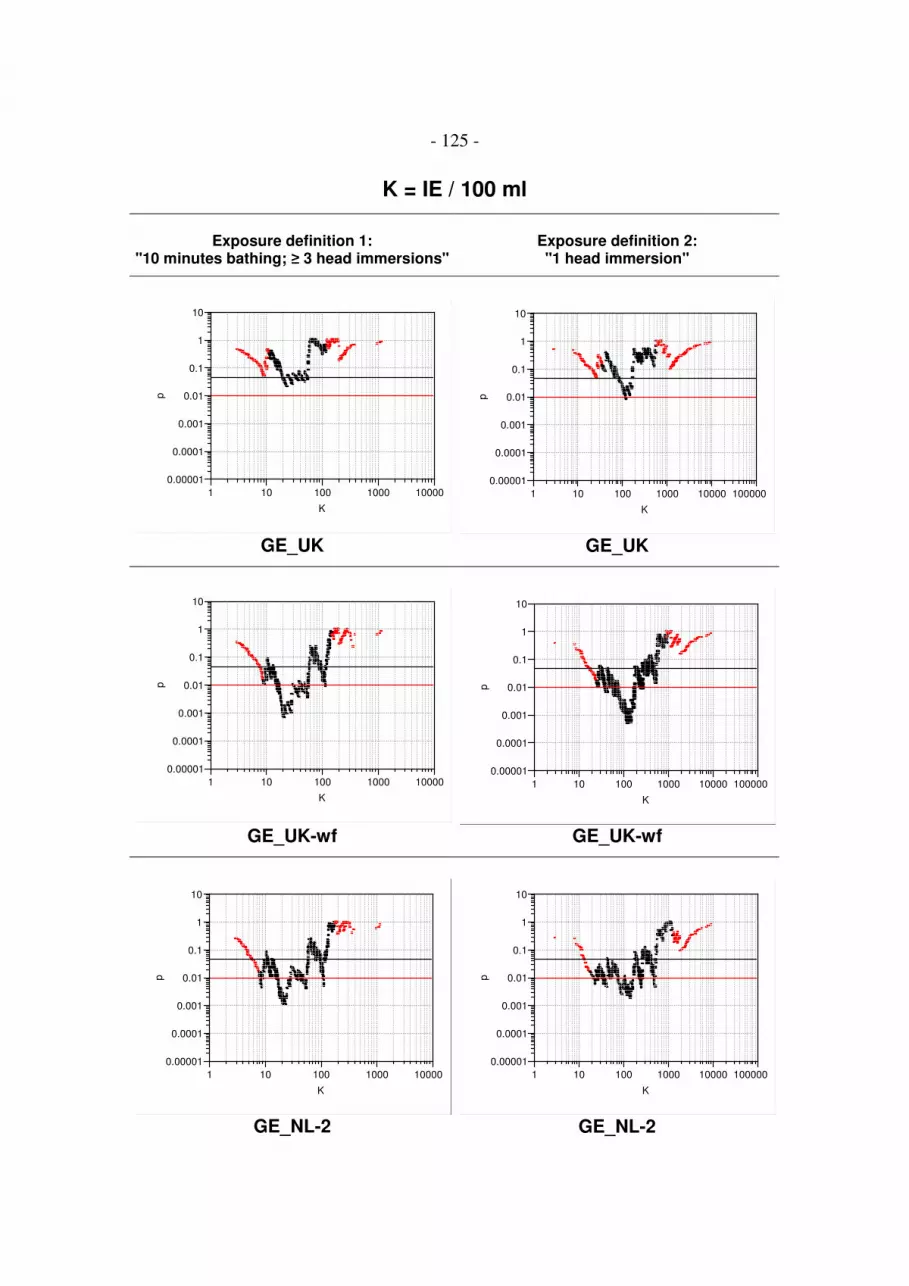
- 125 -
K = IE / 100 ml
Exposure definition 1:"10 minutes bathing; ≥ 3 head immersions"
Exposure definition 2:"1 head immersion"
0.00001
0.0001
0.001
0.01
0.1
1
10
p
1 10 100 1000 10000
K
0.00001
0.0001
0.001
0.01
0.1
1
10
p1 10 100 1000 10000 100000
K
GE_UK GE_UK
0.00001
0.0001
0.001
0.01
0.1
1
10
p
1 10 100 1000 10000
K
0.00001
0.0001
0.001
0.01
0.1
1
10
p
1 10 100 1000 10000 100000
K
GE_UK-wf GE_UK-wf
0.00001
0.0001
0.001
0.01
0.1
1
10
p
1 10 100 1000 10000
K
0.00001
0.0001
0.001
0.01
0.1
1
10
p
1 10 100 1000 10000 100000
K
GE_NL-2 GE_NL-2

- 126 -
K = EC / 100 ml
Exposure definition 1:"10 minutes bathing; ≥ 3 head immersions"
Exposure definition 2:"1 head immersion"
0.00001
0.0001
0.001
0.01
0.1
1
10
p
1 10 100 1000 10000
K
0.00001
0.0001
0.001
0.01
0.1
1
10
p1 10 100 1000 10000 100000
K
GE_UK GE_UK
0.00001
0.0001
0.001
0.01
0.1
1
10
p
1 10 100 1000 10000
K
0.00001
0.0001
0.001
0.01
0.1
1
10
p
1 10 100 1000 10000 100000
K
GE_UK-wf GE_UK-wf
0.00001
0.0001
0.001
0.01
0.1
1
10
p
1 10 100 1000 10000
K
0.00001
0.0001
0.001
0.01
0.1
1
10
p
1 10 100 1000 10000 100000
K
GE_NL-2 GE_NL-2

- 127 -
K = CP / 10 ml
Exposure definition 1:"10 minutes bathing; ≥ 3 head immersions"
Exposure definition 2:"1 head immersion"
0.00001
0.0001
0.001
0.01
0.1
1
10
p
.1 1 10 100
K
0.00001
0.0001
0.001
0.01
0.1
1
10
p.1 1 10 100 1000
K
GE_UK GE_UK
0.00001
0.0001
0.001
0.01
0.1
1
10
p
.1 1 10 100
K
0.00001
0.0001
0.001
0.01
0.1
1
10
p
.1 1 10 100 1000
K
GE_UK-wf GE_UK-wf
0.00001
0.0001
0.001
0.01
0.1
1
10
p
.1 1 10 100
K
0.00001
0.0001
0.001
0.01
0.1
1
10
p
.1 1 10 100 1000
K
GE_NL-2 GE_NL-2

- 128 -
K = SOMCP / 100 ml
Exposure definition 1:"10 minutes bathing; ≥ 3 head immersions"
Exposure definition 2:"1 head immersion"
0.00001
0.0001
0.001
0.01
0.1
1
10
p
1 10 100 1000 10000
K
0.00001
0.0001
0.001
0.01
0.1
1
10
p1 10 100 1000 10000 100000
K
GE_UK GE_UK
0.00001
0.0001
0.001
0.01
0.1
1
10
p
1 10 100 1000 10000
K
0.00001
0.0001
0.001
0.01
0.1
1
10
p
1 10 100 1000 10000 100000
K
GE_UK-wf GE_UK-wf
0.00001
0.0001
0.001
0.01
0.1
1
10
p
1 10 100 1000 10000
K
0.00001
0.0001
0.001
0.01
0.1
1
10
p
1 10 100 1000 10000 100000
K
GE_NL-2 GE_NL-2

- 129 -
K = AE / 100 ml
Exposure definition 1:"10 minutes bathing; ≥ 3 head immersions"
Exposure definition 2:"1 head immersion"
0.00001
0.0001
0.001
0.01
0.1
1
10
p
100 1000 10000 100000
K
0.00001
0.0001
0.001
0.01
0.1
1
10
p100 1000 10000 100000 1000000
K
GE_UK GE_UK
0.00001
0.0001
0.001
0.01
0.1
1
10
p
100 1000 10000 100000
K
0.00001
0.0001
0.001
0.01
0.1
1
10
p
100 1000 10000 100000 1000000
K
GE_UK-wf GE_UK-wf
0.00001
0.0001
0.001
0.01
0.1
1
10
p
100 1000 10000 100000
K
0.00001
0.0001
0.001
0.01
0.1
1
10
p
100 1000 10000 100000 1000000
K
GE_NL-2 GE_NL-2

- 130 -
K = PA / 10 ml
Exposure definition 1:"10 minutes bathing; ≥ 3 head immersions"
Exposure definition 2:"1 head immersion"
0.00001
0.0001
0.001
0.01
0.1
1
10
p
.1 1 10 100 1000
K
0.00001
0.0001
0.001
0.01
0.1
1
10
p.1 1 10
K
GE_UK GE_UK
0.00001
0.0001
0.001
0.01
0.1
1
10
p
.1 1 10
K
0.00001
0.0001
0.001
0.01
0.1
1
10
p
.1 1 10 100 1000
K
GE_UK-wf GE_UK-wf
0.00001
0.0001
0.001
0.01
0.1
1
10
p
.1 1 10
K
0.00001
0.0001
0.001
0.01
0.1
1
10
p
.1 1 10 100 1000
K
GE_NL-2 GE_NL-2

- 131 -
K = AE / 100 ml
Exposure definition 1:"10 minutes bathing; ≥ 3 head immersions"
Exposure definition 2:"1 head immersion"
0.00001
0.0001
0.001
0.01
0.1
1
10
p
100 1000 10000 100000
K
SKIN not applicable

- 132 -
Annex 22. Control of bias:
Univariate screening for potential confounding variables
To control for bias a variety of potential confounding factors (variables) were analysed.
Initially all variables were univariately screened for possible effects in the total final
cohort of bathers and non-bathers (Pearson's Chi square tests). Variables showing
significant univariate effects (p<0.05) were considered to be potential confounders of
the threshold concentrations, and were further analysed using a multivariate nominal
logistic regression procedure (effect likelihood ratio tests).
Table legend:
Category Category of potential confounding variables
Variable Variable name in computer data base
Explanation Explanation of variable
Tested * if one of the following disease definitions was included in the test:
AFRI = Acute febrile respiratory infectionsCC = common coldEAR = Ear inflammationEYE = Eye inflammationGE = GastroenteritisSKIN = Skin infection or cutireactionUTI = Urinary tract infection
Effect * if the variable revealed a significant effect on the outcome of one of the following diseases in Pearson's Chi square test (p < 0.05):
AFRI = Acute febrile respiratory infectionsCC = common coldEAR = Ear inflammationEYE = Eye inflammationGE_UK = Gastroenteritis UK definitionGE_UK-wf = GE UK definition without consideration of stool frequencyGE_NL-2 = Gastroenteritis NL-2 definitionSKIN = Skin infection or cutireactionUTI = Urinary tract infection

- 133 -
Category Variable name Explanation Tested Effect
CC
EA
R
EY
E
GE
SK
IN
CC
EA
R
EY
E
GE
_U
K-w
f
GE
_U
K
GE
_U
K-3
w
GE
_N
L-2
SK
IN
Ambient conditions LOCATION study location(Kirchentellinsfurt, Uhldingen-Mühlhofen,Berlin, Lübeck, München)
* * * * * * * * *
WEATHER_TEMP weather conditions (cool or warm) * * * * * * *
Interviewer effect INR3 number of the interviewer in the 3rdinterview
* * * * *
Age AGE age in years * * * * *
AGE-GROUP age grouped by 10-years intervals * * * * * *
AGE-GROUP_2 age grouped by 10-year intervals and 60+ * * * * * *
Gender SEX1 male or female * * * * * *
Socio-economic status DEGREE1 degree(none, primary school, non-classicalsecondary school, secondary scool 12thclass, secondary school 13th class, non-classical university, classical university,other)
* * * * * *
DEGREE1_2 degree (none, primary school, non-classicalsecondary school, secondary scool,university)
* * * * * * *

- 134 -
Category Variable name Explanation Tested Effect
CC
EA
R
EY
E
GE
SK
IN
CC
EA
R
EY
E
GE
_U
K-w
f
GE
_U
K
GE
_U
K-3
w
GE
_N
L-2
SK
IN
Socio-economic status OCCUP1 occupation(unemployed, child or pupil, student,household, practicing a profession, retired)
* * * * * *
OCCUP1_2 occupation(unemployed, child or pupil, student,household, practicing a profession)
* * * * * *
Household HHMEMB1 number of household members * * * * *
HHMEMB1_2 number of household members (1, 2, 3, 4,5, >5)
* * * * * *
HHCHILD1 number of children < 5 years of age living inhousehold
* * * * *
HHCHILD1_2 number of children < 5 years of age living inhousehold (none, 1, >1)
* * * * * * * *
HHCHILD1_3 children < 5 years living in household (yes,no)
* * * * * *
HHVOL2 other household members participating inthe study (yes, no)
* * * * * *
HHCOLD1 household member with common cold in 2weeks before 1st interview (yes, no)
* * *
HHTHRO1 household member with sore throat in 2weeks before 1st interview (yes, no)
*
HHLUNG1 household member with lung infection in 2weeks before 1st interview (yes, no)
*

- 135 -
Category Variable name Explanation Tested Effect
CC
EA
R
EY
E
GE
SK
IN
CC
EA
R
EY
E
GE
_U
K-w
f
GE
_U
K
GE
_U
K-3
w
GE
_N
L-2
SK
IN
Household HHFEV1 household member with fever in 2 weeksbefore 1st interview (yes, no)
* * * *
HHEAR1 household member with ear infection in 2weeks before 1st interview (yes, no)
*
HHEYE1 household member with eye infection in 2weeks before 1st interview (yes, no)
*
HHNAUS1 household member with nausea in 2 weeksbefore 1st interview (yes, no)
*
HHVOM1 household member with vomiting in 2weeks before 1st interview (yes, no)
*
HHDIAR1 household member with diarrhoea in 2weeks before 1st interview (yes, no)
* *
HHSKIN1 household member with skin ailments in 2weeks before 1st interview (yes, no)
*
Chronic symptoms CCHEST1 chronic chest ailments *
CEAR1 chronic ear ailments * *
CEYE1 chronic eye ailments *
CHAY1 chronic hay fever * * * * *
CSTOM1 chronic stomach ailments * * * *
CGUT1 chronic gut ailments *
ILLDIARFR1 normal frequency of diarrhoea (never,hardly ever: 1-2 per year, often: 1-2 permonth)
* * * * *

- 136 -
Category Variable name Explanation Tested Effect
CC
EA
R
EY
E
GE
SK
IN
CC
EA
R
EY
E
GE
_U
K-w
f
GE
_U
K
GE
_U
K-3
w
GE
_N
L-2
SK
IN
Chronic symptoms TRAVSICK4 proneness to motion sickness (always,often, hardly ever, never)
* * *
CLIV1 chronic liver ailments * *
CSKIN1 chronic skin ailments * *
CREN1 chronic renal ailments *
CNEUR1 chronic neural ailments *
CDIAB1 chronic diabetes * * *
ILL6MON1 any severe illness in 6 months before 1stinterview (yes, no)
* * * * *
ILLHOSP1 stay in hospital in 6 months before 1stinterview (yes, no)
* * * * *
Symptoms or ailments SYFEV1 fever in three weeks before 1st interview * * * * *
SYFEV2 fever between 1st and 2nd interview * *
SYFEV3 fever in the week after exposure *
SYHEAD1 headache in three weeks before 1stinterview
* * *
SYHEAD2 headache between 1st and 2nd interview *
SYHEAD3 headache in the week after exposure * *
SYNOSE1 runny nose in three weeks before 1stinterview
* *
SYNOSE2 runny nose between 1st and 2nd interview *
SYNOSE3 runny nose in the week after exposure *

- 137 -
Category Variable name Explanation Tested Effect
CC
EA
R
EY
E
GE
SK
IN
CC
EA
R
EY
E
GE
_U
K-w
f
GE
_U
K
GE
_U
K-3
w
GE
_N
L-2
SK
IN
Symptoms or ailments SYDCOUGH1 dry cough in three weeks before 1stinterview
* *
SYDCOUGH2 dry cough between 1st and 2nd interview *
SYDCOUGH3 dry cough in the week after exposure * *
SYPCOUGH1 productive cough in three weeks before 1stinterview
* *
SYPCOUGH2 productive cough between 1st and 2ndinterview
*
SYPCOUGH3 productive cough in the week afterexposure
*
SYTHRO1 sore throat in three weeks before 1stinterview
* *
SYTHRO2 sore throat between 1st and 2nd interview *
SYTHRO3 sore throat in the week after exposure *
SYBREATH1 breathing problems in three weeks before1st interview
* *
SYBREATH2 breathing problems between 1st and 2ndinterview
*
SYBREATH3 breathing problems in the week afterexposure
*
SYCHEST1 pain in the chest in three weeks before 1stinterview
*
SYJOINT1 pain in the joints in three weeks before 1stinterview
*
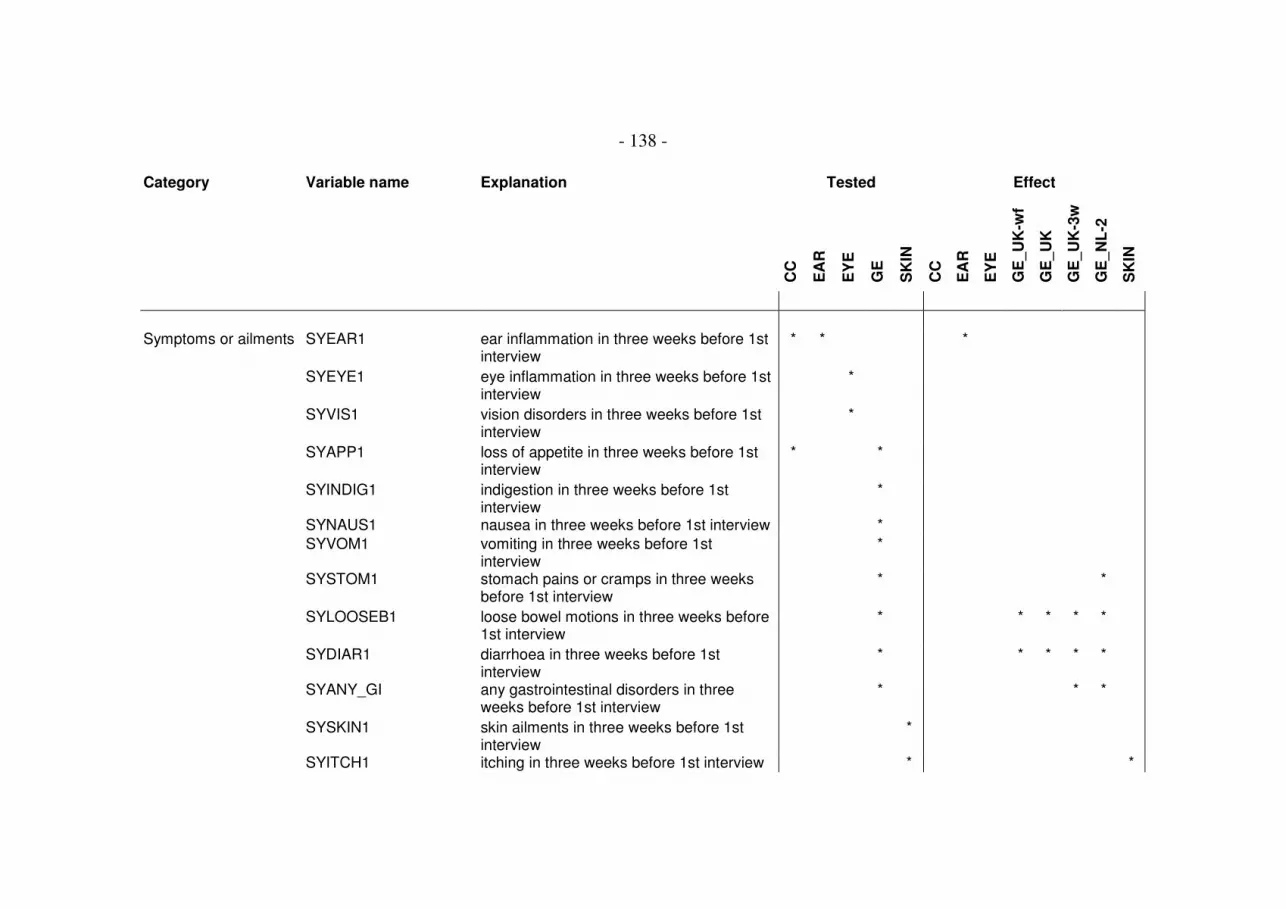
- 138 -
Category Variable name Explanation Tested Effect
CC
EA
R
EY
E
GE
SK
IN
CC
EA
R
EY
E
GE
_U
K-w
f
GE
_U
K
GE
_U
K-3
w
GE
_N
L-2
SK
IN
Symptoms or ailments SYEAR1 ear inflammation in three weeks before 1stinterview
* * *
SYEYE1 eye inflammation in three weeks before 1stinterview
*
SYVIS1 vision disorders in three weeks before 1stinterview
*
SYAPP1 loss of appetite in three weeks before 1stinterview
* *
SYINDIG1 indigestion in three weeks before 1stinterview
*
SYNAUS1 nausea in three weeks before 1st interview *
SYVOM1 vomiting in three weeks before 1stinterview
*
SYSTOM1 stomach pains or cramps in three weeksbefore 1st interview
* *
SYLOOSEB1 loose bowel motions in three weeks before1st interview
* * * * *
SYDIAR1 diarrhoea in three weeks before 1stinterview
* * * * *
SYANY_GI any gastrointestinal disorders in threeweeks before 1st interview
* * *
SYSKIN1 skin ailments in three weeks before 1stinterview
*
SYITCH1 itching in three weeks before 1st interview * *

- 139 -
Category Variable name Explanation Tested Effect
CC
EA
R
EY
E
GE
SK
IN
CC
EA
R
EY
E
GE
_U
K-w
f
GE
_U
K
GE
_U
K-3
w
GE
_N
L-2
SK
IN
Symptoms or ailments SYPIN1 needles and pins in three weeks before 1stinterview
*
SYSKINUL1 skin ulcer in three weeks before 1stinterview
*
Medicines MED1 consumption of prescription drugs in 4weeks before 1st interview (yes, no)
* * * * *
MEDANTI1 antibiotics in 4 weeks before 1st interview(yes, no)
* * * * *
MEDCORT1 steroids in 4 weeks before 1st interview(yes, no)
* * * * *
MEDLAX1 laxatives in 4 weeks before 1st interview(yes, no)
*
Medicines MEDSTOM1 stomach remedies in 4 weeks before 1stinterview (yes, no)
* *
Food FRMEAT2 consumption of raw meat in two or threedays before exposure
*
FRMEAT3 consumption of raw meat in the week afterexposure
*
FRMILK2 consumption of raw milk in two or threedays before exposure
* *

- 140 -
Category Variable name Explanation Tested Effect
CC
EA
R
EY
E
GE
SK
IN
CC
EA
R
EY
E
GE
_U
K-w
f
GE
_U
K
GE
_U
K-3
w
GE
_N
L-2
SK
IN
Food FRMILK3 consumption of raw milk in the week afterexposure
*
FRCHEESE2 consumption of raw milk cheese in two orthree days before exposure
*
FRCHEESE3 consumption of raw milk cheese in theweek after exposure
*
FEGG2 consumption of scambled eggs, omlettes intwo or three days before exposure
*
FEGG3 consumption of scrambled eggs, omelettesin the week after exposure
*
FMAYO2 consumption of selfmade mayonnaise intwo or three days before exposure
*
FMAYO3 consumption of selfmade mayonnaise inthe week after exposure
*
FTIRA2 consumption of tiramisu in two or threedays before exposure
*
FTIRA3 consumption of tiramisu in the week afterexposure
*
FICE2 consumption of icecream in two or threedays before exposure
*
FICE3 consumption of icecream in the week afterexposure
* *

- 141 -
Category Variable name Explanation Tested Effect
CC
EA
R
EY
E
GE
SK
IN
CC
EA
R
EY
E
GE
_U
K-w
f
GE
_U
K
GE
_U
K-3
w
GE
_N
L-2
SK
IN
Food FCHICK2 consumption of chicken meat or poultry intwo or three days before exposure
*
FCHICK3 consumption of chicken meat or poultry inthe week after exposure
*
FFASTF2 consumption of fast-food in two or threedays before exposure
*
FFASTF3 consumption of fast-food in the week afterexposure
*
FBURGER2 consumption of hamburgers in two or threedays before exposure
*
FBURGER3 consumption of hamburgers in the weekafter exposure
*
FHOTDOG2 consumption of hot digs in two or threedays before exposure
* *
FHOTDOG3 consumption of hot dogs in the week afterexposure
*
FSAUSAGE2 consumption of grilled sausages in two orthree days before exposure
*
FSAUSAGE3 consumption of grilled sausages in theweek after exposure
*
FSANDW2 consumption of bought sandwiches in twoor three days before exposure
*

- 142 -
Category Variable name Explanation Tested Effect
CC
EA
R
EY
E
GE
SK
IN
CC
EA
R
EY
E
GE
_U
K-w
f
GE
_U
K
GE
_U
K-3
w
GE
_N
L-2
SK
IN
Food FSANDW3 consumption of bought sandwiches in theweek after exposure
* * * *
FSALAD2 consumption of salads in two or three daysbefore exposure
*
FSALAD3 consumption of salads in the week afterexposure
*
FSEAF2 consumption of sea food in two or threedays before exposure
*
FSEAF3 consumption of sea food in the week afterexposure
*
FBBQ2 consumption of blablab in two or three daysbefore exposure
*
FBBQ3 participation in a barbecuing party in theweek after exposure (yes, no)
*
Alcohol ALC1 consumption of alcohol (yes, no) * * * * * *
ALC7D1 amount of alcohol consumed in the weekbefore 1st interview(number of units (1 unit = 0.5 l beer, 0.25 lwine, 0.02 l spirits))
* * * * *

- 143 -
Category Variable name Explanation Tested Effect
CC
EA
R
EY
E
GE
SK
IN
CC
EA
R
EY
E
GE
_U
K-w
f
GE
_U
K
GE
_U
K-3
w
GE
_N
L-2
SK
IN
Alcohol ALC7D1_2 amount of alcohol consumed in the weekbefore 1st interview(0, 1-5, 6-10, >10 units (1 unit = 0.5 l beer,0.25 l wine, 0.02 l spirits))
* * * * * *
ALC7D1_3 amount of alcohol consumed in the weekbefore 1st interview(0, 1-5, >5 units (1 unit = 0.5 l beer, 0.25 lwine, 0.02 l spirits))
* *
ALC7D1_4 amount of alcohol consumed in the weekbefore 1st interview(0 units, >0 units (1 unit = 0.5 l beer, 0.25 lwine, 0.02 l spirits))
*
ALCUS1 was this the normal amount of alcohol (yes,no)
* * * * *
Tobacco SMOKE1 smoking (yes, yes only pipe, no) * * * * *
SMOKE1_2 smoking (yes, no) * * * * *
SMOKENR1 number of cigarettes per day * * * * *
SMOKENR1_2 number of cigarettes per day (0, 1-5, 6-20,>20)
* * * * *
Leisure activities LEPARTY1 normal frequency of party or disco visits permonth(never, sometimes: 1-3, often: >3)
* * * * * *

- 144 -
Category Variable name Explanation Tested Effect
CC
EA
R
EY
E
GE
SK
IN
CC
EA
R
EY
E
GE
_U
K-w
f
GE
_U
K
GE
_U
K-3
w
GE
_N
L-2
SK
IN
Leisure activities LEPUB1 normal frequency of pub visits per month(never, sometimes: 1-3, often: >3)
* * * * * * * *
LESPORT1 normal frequency of sports activities permonth(never, sometimes: 1-3, often: >3)
* * * * * * *
LECIN1 normal frequency of cinema visits permonth (never, sometimes: 1-3, often: >3)
*
LEOTHER1 normal frequency of other activitiesinvolving contact to large groups of people(never, sometimes: 1-3, often: >3)
*
Travel history TRAVEL1 overnight stays outside household in 4weeks before 1st interview (yes, no)
* * * * * *
TRAVPL1 travelling abroad in 4 weeks before 1stinterview (yes, no)
* * * * *
Water related BP_WATER exposed and swallowed water during trial(no, tea-spoon, table-spoon, cup)
* *
BP_Water_B-nein_B-ja exposed and swallowed water during trial(yes, no)
* * *
BP_Water_NB=0_B=1-4 swallowed water during trial (unexposed orexposed and no, tea-spoon, table-spoon,cup)
* * * *

- 145 -
Category Variable name Explanation Tested Effect
CC
EA
R
EY
E
GE
SK
IN
CC
EA
R
EY
E
GE
_U
K-w
f
GE
_U
K
GE
_U
K-3
w
GE
_N
L-2
SK
IN
Water related BP_Water_NB_B-nein_B-ja
swallowed water during trial (unexposed orexposed and no, exposed and yes)
* * * * *
BATH1 normal frequency of bathing in naturalrecreational waters (fresh or sea water) permonth during summer (never; sometimes:1-3; often: >3)
* * * * *
BATH2 swimming or bathing in the two or threedays between 1st and 2nd interview (yes,no)
* * * * *
BATH3 additional swimming or bathing in the weekafter the trial day (yes, no)
* * * * * *
BATHFR1 frequency of bathing in 4 weeks before 1stinterview
* * * * *
BATHFR1_2 frequency of bathing in 4 weeks before 1stinterview (0, 1-5, >5)
* * * * *
HBEACH1 normal frequency of going to a beachwithout entering the water per month(never, sometimes: 1-3, often: >3)
* * * * * *
HBEACHFR1 number of beach visits without entering thewater in the 4 weeks before 1st interview
* * * * *
HBEACHFR1_2 number of beach visits without entering thewater in 4 weeks before 1st interview (0, 1-5, >5)
* * * * *

- 146 -
Category Variable name Explanation Tested Effect
CC
EA
R
EY
E
GE
SK
IN
CC
EA
R
EY
E
GE
_U
K-w
f
GE
_U
K
GE
_U
K-3
w
GE
_N
L-2
SK
IN
Water related HBEACHFR1_3 beach visits without entering the water in 4weeks before 1st interview (yes, no)
* * * *
HPUPOOL1 normal frequency of using a public pool permonth(never, sometimes: 1-3, often: >3)
* * * * * *
HPRPOOL1 normal frequency of using a private poolper month during sumer(never; sometimes: 1-3; often: >3)
* * * * *
HPRPOOL1_2 utilisation of private pools (yes, no) * * * * * *
HLEPARK1 visit to a leasure park with water activitiesin 4 weeks before 1st interview(yes, no)
* * * * * *
BASWIMDIS1 maximal swimming distance (number ofmeters)
* * * * *
BASWIMDIS1_2 maximal swimming distance (-50, >50 m) * * * * *
BASWIMDIS1_3 maximal swimming distance (-50, -500, -5000 m)
* *
BASWIMDUR1 maximal swimming duration (number ofminutes)
* * * * *
BASWIMDUR1_2 maximal swimming duration (10 min, 20min, 30 min, 1 h, 2 h)
* * * * *
BASWIMDUR1_3 maximal swimming duration (10 min, >10min)
*

- 147 -
Category Variable name Explanation Tested Effect
CC
EA
R
EY
E
GE
SK
IN
CC
EA
R
EY
E
GE
_U
K-w
f
GE
_U
K
GE
_U
K-3
w
GE
_N
L-2
SK
IN
Water related WASURF1 normal frequency of surfing during summer(never, sometimes: 1-3, often: >3)
* * * * * *
WASURF1_2 normal frequency of surfing during summer(never, once or more)
* *
WAPAD1 normal frequency of paddling duringsummer (never, sometimes: 1-3, often: >3)
* * * * *
WAPAD1_2 normal frequency of paddling duringsummer (never, once or more)
* *
WACANOE1 normal frequency of canoeing duringsummer(never, sometimes: 1-3, often: >3)
* * * * * * *
WACANOE1_2 normal frequency of canoeing duringsummer (never, once or more)
* *
WAMOTOR1 normal frequency of motorboating duringsummer (never, once or more)
* * * * * *
WAMOTOR1_2 normal frequency of motorboating duringsummer(never, sometimes: 1-3, often: >3)
* *
WADIV1 normal frequency of diving during summer(never, once or more)
* * * * * *
WADIV1_2 normal frequency of diving during summer(never, sometimes: 1-3, often: >3)
* *
WAFISH1 normal frequency of fishing during summer(never, once or more)
* * * * *

- 148 -
Category Variable name Explanation Tested Effect
CC
EA
R
EY
E
GE
SK
IN
CC
EA
R
EY
E
GE
_U
K-w
f
GE
_U
K
GE
_U
K-3
w
GE
_N
L-2
SK
IN
WAFISH1_2 normal frequency of fishing during summer(never, once or more)
* *
Risk perception WADA4 are water related activities considered to bedangerous (yes, no)
* * * * *
BBILL4 ever gone to a beach while feeling ill (yes,no)
* * * * * * *
BBILLWAT4 did feeling ill prevent from entering thewater (yes, no)
* * * * *
WQNBBEACH4 ever refused to go bathing because beachwas too dirty (yes, no)
* * * * * * * *
WQNBWATER4 ever refused to go bathing because waterwas too dirty (yes, no)
* * * * * *
WQNBWAVES4 ever refused to go bathing because waveswere too rough (yes, no)
* * * * *
WQNBHRISK4 ever refused to go bathing because of fearto become ill (yes, no)
* * * * * *
SUNBFR4 frequency of sunburns after beach visits(always, often, hardly ever, never)
*
SUNBMED4 are sunburns treated (always, often, hardlyever, never)
*

- 149 -
Category Variable name Explanation Tested Effect
CC
EA
R
EY
E
GE
SK
IN
CC
EA
R
EY
E
GE
_U
K-w
f
GE
_U
K
GE
_U
K-3
w
GE
_N
L-2
SK
IN
Information IRECRUIT4 initial source of information about this study(partner, recruitment team, television,newspaper, other)
* * * * * *
IMEDIA4 having seen or heard news about this study(yes, no)
* * * * *
INEWSPAP4 regular reading of a newspaper (yes, no) * * * * *
IENVORG4 member of an environmental organisation(yes, no)
* * * * * *
WQCONTR4 informed about the control of beaches inGermany (yes, no)
* * * * * *
WQCONTRPN4 quality of information on control of beachesin Germany (positive or negative)
* * * * * * *
WQCONTRWO4 worried about information on the control ofbeaches in Germanyno, a bit, very much)
* * * * *
WQCONTRWO4_2 worried about information on the control ofbeaches in Germany (yes, no)
* * *
WQCLEAN4 information on the cleanliness ofrecreational waters in Germany (yes, no)
* * * * * * * *
WQCLEANPN4 quality of information on cleanliness ofGerman recreational waters(positive or negative)
* * * * * *


- 151 -
Annex 23. Control of bias:
Analysis of potential threshold concentrations and
potential confounding variables by multiple logistic
regression (Effect Likelihood Ratio Tests)
To control for bias a variety of potential confounding factors (variables) were analysed.
Initially all variables were univariately screened for possible effects in the total final
cohort of bathers and non-bathers (Pearson's Chi square tests). Variables showing
significant univariate effects (p<0.05) were considered to be potential confounders of
the threshold concentrations, and were further analysed using a multivariate nominal
logistic regression procedure (effect likelihood ratio tests). If microbiological threshold
concentrations remained significant effects (p<0.05) in a model consisting of the disease
as response variable and the threshold and the potential confounder as model effects,
thresholds were considered to be unbiased and were accepted, and the potential
confounder was considered to be an independent predictor of disease. In addition all
models were analysed for possible interaction effects between threshold values and
potential confounding variables by crossing both effects in separate effect likelihood
ratio tests. Significant interaction effects (p<0.05) were recorded but the thresholds were
not rejected.
Table legend:
Parameter Microorganism:CP = Clostridium perfringensEC = Escherichia coliIE = Intestinal enterococciSOMCP = Somatic coliphagesAE = AeromonadsPA = Pseudomonas aeruginosa
Unit MPN = Most Probable NumberCFP = Colony Forming Particle

- 152 -
Table legend, continued
Disease AFRI = Acute febrile respiratory infectionsCC = common coldEAR = Ear inflammationEYE = Eye inflammationGE_UK = Gastroenteritis UK definitionGE_UK-wf = GE UK definition without consideration of stool frequencyGE_NL-2 = Gastroenteritis NL-2 definitionSKIN = Skin infection or cutireactionUTI = Urinary tract infection
Threshold Potential threshold concentration--- no concentration fulfilling the criteria for a potential threshold yellow = Chi square test result not suspect and threshold unbiased
p ChiSq Pearson's Chi square p value in a comparison of the incidence rates above andbelow the threshold concentrationsuspect = suspect p value due to an expected cell value of less than 5 inPearson's Chi square test
p Fisher p value in Fisher's Exact Test
Status o.k. no confounding and no interaction with any of the tested potentialconfounding variables
o.k. (i) no confounding but interaction with at least one other independentpredictor of disease
biased potential threshold confounded by at least one other predictorof disease
fn footnote number
sign. better microbiological parameters which are significantly better predictorsof the outcome (disease)
Table footnotes:
No. Number of footnote
Parameter Microorganism:CP = Clostridium perfringensEC = Escherichia coliIE = Intestinal enterococciSOMCP = Somatic coliphagesAE = AeromonadsPA = Pseudomonas aeruginosa
Variable Variable name in computer data base
p Chi Square p value in Effect Likely Ratio Test
Effect b = biasi = significant interaction between "variable" and "threshold"
Explanation Explanation of variable

- 153 -
Parameter Unit Disease Exposure Definition 1 Exposure Definition 2
"10 minutes bathing; ≥ 3 head immersions" "1 head immersion"
Threshold p ChiSq p Fisher status fn sign. better Threshold p ChiSq p Fisher status fn sign. better
EC MPN/100ml AFRI --- ---
IE MPN/100ml AFRI --- ---
CP CFP/10ml AFRI --- ---
SOMCP PFP/100ml AFRI --- ---
AE CFP/100ml AFRI --- ---
PA CFP/10ml AFRI --- ---
EC MPN/100ml CC 261 0.0007 biased 1 936.3 0.0130 biased 16
IE MPN/100ml CC 132 0.0010 biased 2 ---
CP CFP/10ml CC 3 0.0220 biased 3 ---
SOMCP PFP/100ml CC 128 0.0012 biased 4 247.5 0.0052 biased 17
AE CFP/100ml CC 25580 suspect 0.0230 biased 5 ---
PA CFP/10ml CC --- 4 0.0500 biased 18
EC MPN/100ml EAR --- ---
IE MPN/100ml EAR --- 9467 suspect 0.0160 biased 19
CP CFP/10ml EAR --- ---
SOMCP PFP/100ml EAR --- ---
AE CFP/100ml EAR --- 542835 suspect 0.0480 biased 20
PA CFP/10ml EAR --- ---
EC MPN/100ml EYE --- 18112 suspect 0.0160 biased 21
IE MPN/100ml EYE --- 9467 suspect 0.0170 biased 22
CP CFP/10ml EYE --- 136 suspect 0.0026 biased 23
SOMCP PFP/100ml EYE --- ---
AE CFP/100ml EYE 16612 suspect 0.0320 biased 6 542835 suspect 0.0008 o.k. (i) 24
PA CFP/10ml EYE --- ---

- 154 -
Parameter Unit Disease Exposure Definition 1 Exposure Definition 2
"10 minutes bathing; ≥ 3 head immersions" "1 head immersion"
Threshold p ChiSq p Fisher status fn sign. better Threshold p ChiSq p Fisher status fn sign. better
EC MPN/100ml GE_UK 180 0.0086 o.k. 1453 0.0015 o.k.
GE_UK-wf 78 0.0025 o.k. ---
GE_NL-2 167 0.0019 o.k. 2163 0.0030 o.k. CP, EN
IE MPN/100ml GE_UK 24 0.0220 o.k. 123 0.0075 o.k.
GE_UK-wf 21 0.0006 o.k. 123 0.0005 o.k.
GE_NL-2 24 0.0010 o.k. (i) 7 145 0.0018 o.k. (i) 25
CP CFP/10ml GE_UK 1 0.0058 o.k. 4 0.0080 o.k. (i) 26 EC
GE_UK-wf 1 0.0019 o.k. EN 4 0.0043 o.k. EC, EN
GE_NL-2 1 0.0018 o.k. (i) 8 4 0.0032 o.k. (i) 27
SOMCP PFP/100ml GE_UK 150 0.0080 o.k. (i) 9 CP, EC, EN 330 0.0058 o.k. EC
GE_UK-wf 10 0.0035 o.k. (i) 10 50 0.0049 o.k. (i) 28
GE_NL-2 10 0.0025 o.k. (i) 11 119 0.0180 o.k. (i) 29
AE CFP/100ml GE_UK --- ---
GE_UK-wf --- 13600 0.0370 o.k. CP, EC, EN
GE_NL-2 --- 5950 suspect 0.0170 biased 30
PA CFP/10ml GE_UK 1 suspect 0.0310 biased 12 ---
GE_UK-wf --- ---
GE_NL-2 --- ---

- 155 -
Parameter Unit Disease Exposure Definition 1 Exposure Definition 2
"10 minutes bathing; ≥ 3 head immersions" "1 head immersion"
Threshold p ChiSq p Fisher status fn sign. better Threshold p ChiSq p Fisher status fn sign. better
EC MPN/100ml SKIN ---
IE MPN/100ml SKIN 356 suspect 0.0070 o.k. (i) 13 not applicable
CP CFP/10ml SKIN 5 suspect 0.0440 biased 14
SOMCP PFP/100ml SKIN ---
AE CFP/100ml SKIN 5622 0.0006 o.k. (i) 15
PA CFP/10ml SKIN ---
EC MPN/100ml UTI ---
IE MPN/100ml UTI --- not applicable
CP CFP/10ml UTI ---
SOMCP PFP/100ml UTI ---
AE CFP/100ml UTI ---
PA CFP/10ml UTI ---
--- no concentration fulfilling the criteria for a potential threshold
threshold concentration fulfilling all criteria of validity

- 156 -
Footnotes:
No. Parameter Disease Variable p Effect Explanation
Exposure Definition 1
1 EC CC WQCONTRPN4 0.0067 b quality of information on control of beaches in Germany (positive or negative)
WQCLEANPN4 0.0184 b quality of information on cleanliness of German recreational waters (positive or negative)
2 IE CC WQCONTRPN4 0.0073 b quality of information on control of beaches in Germany (positive or negative)
SYHEAD1 0.0100 i headache in three weeks before 1st interview
BBILL4 0.0417 i ever gone to a beach while feeling ill (yes, no)
3 CP CC LOCATION 0.0014 b study location (Kirchentellinsfurt, Uhldingen-Mühlhofen, Berlin, Lübeck, München)
WEATHER_TEMP 0.0001 b weather conditions (cool or warm)
AGE-GROUP 0.0000 b age grouped by 10-years intervals
AGE-GROUP_2 0.0000 b age grouped by 10-year intervals and 60+
DEGREE1 0.0037 b degree (none, primary school, non-classical secondary school, secondary scool 12th class,secondary school 13th class, non-classical university, classical university, other)
DEGREE1_2 0.0013 b degree (none, primary school, non-classical secondary school, secondary scool, university)
OCCUP1 0.0005 b occupation (unemployed, child or pupil, student, household, practicing a profession, retired)
OCCUP1_2 0.0002 b occupation (unemployed, child or pupil, student, household, practicing a profession)
WQCONTRPN4 0.0114 b quality of information on control of beaches in Germany (positive or negative)
WQCLEANPN4 0.0190 b quality of information on control of beaches in Germany (positive or negative)
BBILL4 0.0006 i ever gone to a beach while feeling ill (yes, no)
4 SOMCP CC LOCATION 0.0125 b study location (Kirchentellinsfurt, Uhldingen-Mühlhofen, Berlin, Lübeck, München)
WEATHER_TEMP 0.0007 b weather conditions (cool or warm)
WQCONTRPN4 0.0082 b quality of information on control of beaches in Germany (positive or negative)
WQCLEANPN4 0.0195 b quality of information on control of beaches in Germany (positive or negative)
TRAVEL1 0.0014 i overnight stays outside household in 4 weeks before 1st interview (yes, no)
5 AE CC AGE-GROUP 0.0000 b age grouped by 10-years intervals
AGE-GROUP_2 0.0000 b age grouped by 10-year intervals and 60+

- 157 -
No. Parameter Disease Variable p Effect Explanation
DEGREE1 0.0019 b degree (none, primary school, non-classical secondary school, secondary scool 12th class,secondary school 13th class, non-classical university, classical university, other)
DEGREE1_2 0.0006 b degree (none, primary school, non-classical secondary school, secondary scool, university)
OCCUP1 0.0006 b occupation (unemployed, child or pupil, student, household, practicing a profession, retired)
OCCUP1_2 0.0003 b occupation (unemployed, child or pupil, student, household, practicing a profession)
6 AE EYE CHAY1 0.0423 b chronic hay fever
WACANOE1 0.0166 b normal frequency of canoeing during summer (never, sometimes: 1-3, often: >3)
WACANOE1_2 0.0062 b normal frequency of canoeing during summer (never, once or more)
HBEACHFR1_3 0.0301 b beach visits without entering the water in 4 weeks before 1st interview (yes, no)
BBILL4 0.0067 b ever gone to a beach while feeling ill (yes, no)
7 IE GE_NL-2 SYSTOM1 0.0081 i stomach pains or cramps in three weeks before 1st interview
SYANY_GI 0.0446 i any gastrointestinal disorders in three weeks before 1st interview
8 CP GE_NL-3 SYSTOM1 0.0089 i stomach pains or cramps in three weeks before 1st interview
9 SOMCP GE_UK SYLOOSEB1 0.0354 i loose bowel motions in three weeks before 1st interview
10 SOMCP GE_UK-wf SYLOOSEB1 0.0173 i loose bowel motions in three weeks before 1st interview
11 SOMCP GE_NL-2 SYSTOM1 0.0104 i stomach pains or cramps in three weeks before 1st interview
SYANY_GI 0.0172 i any gastrointestinal disorders in three weeks before 1st interview
12 PA GE_UK HHCHILD1_3 0.0076 b children < 5 years living in household (yes, no)
SYLOOSEB1 0.0000 i loose bowel motions in three weeks before 1st interview
FHOTDOG2 0.0161 i consumption of hot digs in two or three days before exposure
13 IE SKIN LOCATION 0.0000 i study location (Kirchentellinsfurt, Uhldingen-Mühlhofen, Berlin, Lübeck, München)
WEATHER_TEMP 0.0000 i weather conditions (cool or warm)
CSKIN1 0.0000 i chronic skin ailments
SYITCH1 0.0000 i itching in three weeks before 1st interview

- 158 -
No. Parameter Disease Variable p Effect Explanation
HLEPARK1 0.0000 i visit to a leisure park with water activities in 4 weeks before 1st interview (yes, no)
WQNBHRISK4 0.0000 i ever refused to go bathing because of fear to become ill (yes, no)
14 CP SKIN WQNBHRISK4 0.0375 b ever refused to go bathing because of fear to become ill (yes, no)
WEATHER_TEMP 0.0159 i weather conditions (cool or warm)
15 AE SKIN WEATHER_TEMP 0.0022 i weather conditions (cool or warm)
CSKIN1 0.0000 i chronic skin ailments
SYITCH1 0.0012 i itching in three weeks before 1st interview
ALC1 0.0031 i consumption of alcohol (yes, no)
Exposure Definition 2
16 EC CC LOCATION 0.0019 b study location (Kirchentellinsfurt, Uhldingen-Mühlhofen, Berlin, Lübeck, München)
WEATHER_TEMP 0.0001 b weather conditions (cool or warm)
AGE-GROUP 0.0000 b age grouped by 10-years intervals
AGE-GROUP_2 0.0000 b age grouped by 10-year intervals and 60+
DEGREE1 0.0058 b degree (none, primary school, non-classical secondary school, secondary scool 12th class,secondary school 13th class, non-classical university, classical university, other)
DEGREE1_2 0.0023 b degree (none, primary school, non-classical secondary school, secondary scool, university)
OCCUP1 0.0011 b occupation (unemployed, child or pupil, student, household, practicing a profession, retired)
LESPORT1 0.0174 b normal frequency of sports activities per month (never, sometimes: 1-3, often: >3)
WQCONTRPN4 0.0079 b quality of information on control of beaches in Germany (positive or negative)
WQCLEANPN4 0.0211 b quality of information on control of beaches in Germany (positive or negative)
BBILL4 0.0091 i ever gone to a beach while feeling ill (yes, no)
17 SOMCP CC LOCATION 0.0068 b study location (Kirchentellinsfurt, Uhldingen-Mühlhofen, Berlin, Lübeck, München)
WEATHER_TEMP 0.0005 b weather conditions (cool or warm)
DEGREE1 0.0054 b degree (none, primary school, non-classical secondary school, secondary scool 12th class,secondary school 13th class, non-classical university, classical university, other)
DEGREE1_2 0.0021 b degree (none, primary school, non-classical secondary school, secondary scool, university)

- 159 -
No. Parameter Disease Variable p Effect Explanation
WQCONTRPN4 0.0076 b quality of information on control of beaches in Germany (positive or negative)
WQCLEANPN4 0.0226 b quality of information on control of beaches in Germany (positive or negative)
TRAVEL1 0.0188 i overnight stays outside household in 4 weeks before 1st interview (yes, no)
WADIV1 0.0208 i normal frequency of diving during summer (never, once or more)
18 PA CC LOCATION 0.0012 b study location (Kirchentellinsfurt, Uhldingen-Mühlhofen, Berlin, Lübeck, München)
WEATHER_TEMP 0.0001 b weather conditions (cool or warm)
AGE-GROUP 0.0000 b age grouped by 10-years intervals
AGE-GROUP_2 0.0000 b age grouped by 10-year intervals and 60+
OCCUP1 0.0005 b occupation (unemployed, child or pupil, student, household, practicing a profession, retired)
OCCUP1_2 0.0002 b occupation (unemployed, child or pupil, student, household, practicing a profession)
HHCOLD1 0.0170 b household member with common cold in 2 weeks before 1st interview (yes, no)
WACANOE1 0.0237 b normal frequency of canoeing during summer (never, sometimes: 1-3, often: >3)
HPUPOOL1 0.0132 b normal frequency of using a private pool per month during sumer: never; sometimes: 1-3; often: >3)
WQCONTRPN4 0.0099 b quality of information on control of beaches in Germany (positive or negative)
WQCLEANPN4 0.0136 b quality of information on control of beaches in Germany (positive or negative)
DEGREE1 0.0441 i degree (none, primary school, non-classical secondary school, secondary scool 12th class,secondary school 13th class, non-classical university, classical university, other)
DEGREE1_2 0.0003 i degree (none, primary school, non-classical secondary school, secondary scool, university)
BBILL4 0.0084 i ever gone to a beach while feeling ill (yes, no)
WASURF1 0.0076 i normal frequency of surfing during summer (never, sometimes: 1-3, often: >3)
19 IE EAR SYEAR1 0.0031 b ear inflammation in three weeks before 1st interview
SYHEAD1 0.0000 i headache in three weeks before 1st interview
SYDCOUGH3 0.0000 i dry cough in the week after exposure
20 AE EAR SYEAR1 0.0044 b ear inflammation in three weeks before 1st interview
SYHEAD1 0.0000 i headache in three weeks before 1st interview
SYDCOUGH3 0.0000 i dry cough in the week after exposure
21 EC EYE CHAY1 0.0418 b chronic hay fever
HBEACHFR1_3 0.0267 b beach visits without entering the water in 4 weeks before 1st interview (yes, no)

- 160 -
No. Parameter Disease Variable p Effect Explanation
HHMEMB1_2 0.0201 i number of household members (1, 2, 3, 4, 5, >5)
BBILL4 0.0353 i ever gone to a beach while feeling ill (yes, no)
22 IE EYE CHAY1 0.0453 b chronic hay fever
HHMEMB1_2 0.0000 i number of household members (1, 2, 3, 4, 5, >5)
WACANOE1 0.0000 i normal frequency of canoeing during summer (never, sometimes: 1-3, often: >3)
WACANOE1_2 0.0000 i normal frequency of canoeing during summer (never, once or more)
WAPAD1_2 0.0000 i normal frequency of paddling during summer (never, once or more)
HBEACHFR1_3 0.0000 i beach visits without entering the water in 4 weeks before 1st interview (yes, no)
23 CP EYE CHAY1 0.0458 b chronic hay fever
HBEACHFR1_3 0.0280 b beach visits without entering the water in 4 weeks before 1st interview (yes, no)
BBILL4 0.0104 i ever gone to a beach while feeling ill (yes, no)
24 AE EYE CHAY1 0.0000 i chronic hay fever
HBEACHFR1_3 0.0000 i beach visits without entering the water in 4 weeks before 1st interview (yes, no)
25 IE GE_NL-2 SYSTOM1 0.0084 i stomach pains or cramps in three weeks before 1st interview
TRAVSICK4 0.0152 i proneness to motion sickness (always, often, hardly ever, never)
26 CP GE_UK SYLOOSEB1 0.0354 i loose bowel motions in three weeks before 1st interview
27 CP GE_NL-2 SYSTOM1 0.0234 i stomach pains or cramps in three weeks before 1st interview
28 SOMCP GE_UK-wf SYLOOSEB1 0.0189 i loose bowel motions in three weeks before 1st interview
29 SOMCP GE_NL-2 SYSTOM1 0.0319 i stomach pains or cramps in three weeks before 1st interview
30 AE GE_NL-2 HHCHILD1_2 0.0865 b number of children < 5 years of age living in household (none, 1, >1)
HHCHILD1_3 0.0722 b children < 5 years living in household (yes, no)
CSTOM1 0.0042 i chronic stomach ailments

- 161 -
Annex 24. "Which indicator is the best?":
Comparison of the indicator organisms by multiple logistic
regression (Effect Likelihood Ratio Tests)
To evaluate differences in the power of the various groups of microorganisms to
indicate the risk of acquiring gastroenteritis, effect likelihood ratio tests were performed
for all combinations of indicator organisms, exposure definitions and definitions of
gastroenteritis one by one. Threshold concentrations determined for the various
combinations of indicator organisms, exposure definitions and definitions of
gastroenteritis were modelled as effect source variables, and gastroenteritis was
modelled as outcome variable. The likelihood-ratio Chi square tests were calculated as
twice the difference of the log-likelihoods between the full model and the model
constrained by the hypothesis to be tested (the model without the effect). Chi square p
values were used to decide which of the two indicator organisms in the model was
superior. The results demonstrated that intestinal enterococci and Escherichia coli are
the two indicators which worked well in most cases. Clostridium perfringens and
somatic coliphages would also work but would probably be less effective. Compared to
the faecal indicator organisms aeromonads are of no use as potential predictors for the
risk of acquiring gastroenteritis.
LegendParameter:CP Clostridium perfringensEC Escherichia coliIE Intestinal enterococciSOMCP Somatic coliphagesAE Aeromonads
Disease definition:GE_UK Gastroenteritis, UK definitionGE_UK-wf Gastroenteritis, UK definition without consideration of stool frequencyGE_NL-2 Gastroenteritis, NL-2 definition
Miscellaneous:(b) number of tests in which the parameter was superior;
i. e. a better predictor of the diseasep Chi square p value in effect likelihood ratio tests significant difference
* if p < 0.05

- 162 -
Exposure definition 1:( "10 min bathing; 3 head immersions" )
Exposure definition 2:( "1 head immersion" )
Parameter (b) GE_UK GE_UK-wf GE_NL-2 GE_UK GE_UK-wf GE_NL-2
p s p s p s p s p s p s
CP 2 0.0896 0.1058 0.1869 0.1443 0.0469 *
EC 3 0.1983 0.0926 0.1362 0.0242 * 0.0509
CP 1 0.0778 0.3041 0.3279 0.3757 0.7288 0.3430
EN 5 0.4363 0.0497 * 0.1339 0.0878 0.0120 * 0.0783
CP 3 0.0085 * 0.1235 0.2311 0.1637 0.4922 0.1254
SOMCP 3 0.1110 0.1476 0.1868 0.0645 0.1078 0.3211
EC 2 0.1770 0.5314 0.3824 0.0794 0.1673
EN 3 0.4602 0.0846 0.2097 0.1328 0.0394 *
EC 4 0.0244 * 0.2061 0.3254 0.0352 * 0.1012
SOMCP 1 0.1499 0.2591 0.2584 0.3743 0.1872
EN 6 0.0336 * 0.0974 0.3680 0.1384 0.0561 0.0750
SOMCP 0 0.1006 0.9567 0.6749 0.2075 0.7867 0.9470
AE 0 0.7416
CP 1 0.0241 *
AE 0 0.2091
EC 1 0.0114 *
AE 0 0.8223
EN 1 0.0078 *
AE 0 0.4924
SOMCP 1 0.0584
Total
EN 15
EC 10
CP 7
SOMCP 5
AE 0

- 163 -
Annex 25. Dependence of threshold concentrations and incidence
rates of gastroenteritis below and above threshold
concentrations on disease definition, exposure definition
and faecal indicator
Threshold concentrations for increased risk of gastroenteritis from bathing in faecally
contaminated water could be determined using a step model approach for 23 of the 24
possible combinations of four faecal indicator parameters (EC, IE, CP, SOMCP), three
definitions of gastroenteritis (GE_UK, GE_UK-wf, GE_NL-2) and two exposure
definitions ("10 minutes bathing, ≥ 3 head immersions", "1 head immersion"). ANOVA
tests were used to examine the dependence of threshold concentrations and incidence
rates of gastroenteritis below and above threshold concentrations on disease definition,
exposure definition and faecal indicator parameters.
The analyses suggest that:
• Threshold concentrations depend on the definition of exposure (high exposure
intensities yielding lower threshold levels than low exposure intensities), and on the
choice of the faecal indicator parameters (faecal indicator parameters which are
generally less abundant in faecal material, e. g. CP, yielding lower threshold levels
than parameters which are generally more abundant, e. g. EC). Threshold
concentrations, however, are independent of the definition of gastroenteritis, i. e. is
makes no difference whether gastroenteritis is defined in a more or less stringent
way.
• The incidence rate of gastroenteritis below threshold concentrations depends only
on the definition of gastroenteritis, the more stringent definitions yielding lower
incidence rates than the less stringent definitions. It is, however, independent of the
choice of the faecal indicator parameter (EC, IE, CP or SOMCP). It is also
independent of the definition of exposure.

- 164 -
• The incidence rate of gastroenteritis above threshold concentrations (maximum
incidence rate or "ceiling" of the dose response relationship) depends only on the
definition of gastroenteritis as well, the more stringent definitions yielding lower
maximum levels than the less stringent definitions. Like the incidence rate below
threshold concentrations it is independent of the choice of the faecal indicator
parameter and independent of the definition of exposure.
Legend
GE_UK Gastroenteritis, UK definitionGE_UK-wf Gastroenteritis, UK definition without consideration of stool frequencyGE_NL-2 Gastroenteritis, NL-2 definition
CP Clostridium perfringensEC Escherichia coliIE Intestinal enterococciSOMCP Somatic coliphages
Exposure Def. 1 "10 minutes bathing, ≥ 3 head immersions"Exposure Def. 2 "1 head immersion"
Th Threshold concentration

- 165 -
Incid
ence r
ate
<=
Th
0
1
2
3
4
5
6
7
Exposure Def. 1 Exposure Def. 2
Exposure Definition ANOVA p = 0.5741
Incid
ence r
ate
<=
Th
0
1
2
3
4
5
6
7
CP EC EN SOMCP
Parameter ANOVA p = 0.6050
Incid
ence r
ate
<=
Th
0
1
2
3
4
5
6
7
1) GE_UK 2) GE_UK-wf 3) GE_NL-2
GE-Definition ANOVA p < 0.0001

- 166 -
log10 T
hre
shold
Conc./100m
l
0.5
1.0
1.5
2.0
2.5
3.0
3.5
Exposure Def. 1 Exposure Def. 2
Exposure Definition ANOVA p = 0.0088
log
10
Th
resh
old
Co
nc./
10
0m
l
0.5
1.0
1.5
2.0
2.5
3.0
3.5
CP EC EN SOMCP
Parameter ANOVA p = 0.0061
log
10
Th
resh
old
Co
nc./
10
0m
l
0.5
1.0
1.5
2.0
2.5
3.0
3.5
1) GE_UK 2) GE_UK-wf 3) GE_NL-2
GE-Definition ANOVA p = 0.3209

- 167 -
Incid
ence r
ate
>T
h
0
2
4
6
8
10
12
14
16
Exposure Def. 1 Exposure Def. 2
Exposure Definition ANOVA p = 0.8997
Incid
ence r
ate
>T
h
0
2
4
6
8
10
12
14
16
CP EC IE SOMCP
Parameter ANOVA p = 0.8772
Incid
ence r
ate
>T
h
0
2
4
6
8
10
12
14
16
1) GE_UK 2) GE_UK-wf 3) GE_NL-2
GE-Definition ANOVA p < 0.0001

- 168 -
0
2
4
6
8
10
12
14
16
18
EC IE CP
SO
MC
P
EC IE CP
SO
MC
P
gro
up
mean
EC IE CP
SO
MC
P
EC IE CP
SO
MC
P
gro
up
mean
EC IE CP
SO
MC
P
EC IE CP
SO
MC
P
gro
up
mean
5.2%
7.2%
9.9%GE_UK
GE_UK-wf
GE_NL-2
Incidence rate of gastroenteritis in bathers above threshold
"10 min bathing; 3 head immersions"
"1 head immersion"
no
t vali
d
I = 95% Confidence interval
Legend
GE_UK Gastroenteritis, UK definitionGE_UK-wf Gastroenteritis, UK definition without consideration of stool frequencyGE_NL-2 Gastroenteritis, NL-2 definition
CP Clostridium perfringensEC Escherichia coliIE Intestinal enterococciSOMCP Somatic coliphages
- 169 -
Annex 26. Incidence rates of gastroenteritis in quartile categories
In the tables and figures in this annex the incidence rates among non-bathers were
compared to the incidence rates among bathers exposed in quartile categories of
microbiological exposure concentrations. Pearson's Chi square tests were separately
performed for each of the four categories. Significant differences between bathers and
non-bathers (p<0.05) were marked by an asterisk.
Legend
Disease definitions:
GE_UK Gastroenteritis, UK definitionGE_UK-3-weeks Gastroenteritis, UK definition, 3 weeks after exposureGE_UK-wf Gastroenteritis, UK definition without consideration of stool frequencyGE_NL-2 Gastroenteritis, NL-2 definition
Faecal indicator parameters:
CP Clostridium perfringens (concentration per 10 ml)EC Escherichia coli (concentration per 100 ml)IE Intestinal enterococci (concentration per 100 ml)SOMCP Somatic coliphages (concentration per 100 ml)
Exposure definitions:
Exposure Def. 1 "10 minutes bathing, ≥ 3 head immersions"Exposure Def. 2 "1 head immersion"
Exposure:
0 Non-bathersxy quartile cut points
Disease:
0 Participants without gastroenteritis according to specified definition1 Participants with gastroenteritis according to specified definition
Miscellaneous:
n Total number of participants in this analysisp Chi² Probability of error in Pearson's Chi Square test* p Chi² < 0.05s "suspect"; if an expected cell value was less than 5

- 170 -
Contingency Table
Quartiles_Exposure Def. 1_CP By GE_UK
Disease
Exposure 0 1 n % p Chi² * s
0 907 13 920 1.4
0.9 218 4 222 1.8 0.6677 s
1.8 195 4 199 2.0 0.5324 s
3.3 198 11 209 5.3 0.0005 * s
14.8 198 9 207 4.3 0.0058 * s
1716 41 1757
0.00
0.25
0.50
0.75
1.00
0.0 0.9 1.8 3.3 14.8
0
1
Contingency Table
Quartiles_Exposure Def. 1_CP By GE_UK-3-weeks
Disease
Exposure 0 1 n % p Chi² * s
0 859 43 902 4.8
0.9 210 8 218 3.7 0.4855
1.8 183 13 196 6.6 0.2819
3.3 183 22 205 10.7 0.0010 *
14.8 188 11 199 5.5 0.6530
1623 97 1720
0.00
0.25
0.50
0.75
1.00
0.0 0.9 1.8 3.3 14.8
0
1
Contingency Table
Quartiles_Exposure Def. 1_CP By GE_UK-wf
Disease
Exposure 0 1 n % p Chi² * s
0 895 26 921 2.8
0.9 218 6 224 2.7 0.9064
1.8 193 9 202 4.5 0.2266
3.3 193 18 211 8.5 0.0001 *
14.8 197 13 210 6.2 0.0158 *
1696 72 1768
GE
-Ka
y3
oh
ne
F
0.00
0.25
0.50
0.75
1.00
0.0 0.9 1.8 3.3 14.8
0
1
Quartiles_Exposure Def. 1_CP By GE_NL-2
Disease
Exposure 0 1 n % p Chi² * s
0 873 48 921 5.2
0.9 213 11 224 4.9 0.8550
1.8 190 12 202 5.9 0.6766
3.3 188 23 211 10.9 0.0021 *
14.8 192 17 209 8.1 0.1014
1656 111 1767
0.00
0.25
0.50
0.75
1.00
0.0 0.9 1.8 3.3 14.8
0
1

- 171 -
Contingency Table
Quartiles_Exposure Def. 1_EC By GE_UK
Disease
Exposure 0 1 n % p Chi² * s
0 907 13 920 1.4
71.5 203 2 205 1.0 0.6214 s
180.8 203 6 209 2.9 0.1391 s
379.1 199 8 207 3.9 0.0184 * s
4599.5 195 12 207 5.8 0.0001 * s
1707 41 1748
0.00
0.25
0.50
0.75
1.00
0.0 71.5 180.8379.1
4599.5
0
1
Contingency Table
Quartiles_Exposure Def. 1_EC By GE_UK-3-weeks
Disease
Exposure 0 1 n % p Chi² * s
0 859 43 902 4.8
71.5 194 9 203 4.4 0.8393
180.8 195 13 208 6.3 0.3784
379.1 186 13 199 6.5 0.3049
4599.5 181 19 200 9.5 0.0086 *
1615 97 1712
0.00
0.25
0.50
0.75
1.00
0.0 71.5 180.8 379.1
4599.5
Quartiles_MeanK_EC
0
1
Contingency Table
Quartiles_Exposure Def. 1_EC By GE_UK-wf
Disease
Exposure 0 1 n % p Chi² * s
0 895 26 921 2.8
71.5 203 4 207 1.9 0.4717
180.8 201 11 212 5.2 0.0806
379.1 197 14 211 6.6 0.0068 *
4599.5 191 17 208 8.2 0.0003 *
1687 72 1759
0.00
0.25
0.50
0.75
1.00
0.0 71.5 180.8 379.1 4599.5
0
1
Contingency Table
Quartiles_Exposure Def. 1_EC By GE_NL-2
Disease
Exposure 0 1 n % p Chi² * s
0 873 48 921 5.2
71.5 200 7 207 3.4 0.2693
180.8 197 14 211 6.6 0.4124
379.1 189 22 211 10.4 0.0046 *
4599.5 188 20 208 9.6 0.0159 *
1647 111 1758
GE
-NL
3
0.00
0.25
0.50
0.75
1.00
0.0 71.5 180.8 379.14599.5
0
1

- 172 -
Contingency Table
Quartiles_Exposure Def. 1_EN By GE_UK
Disease
Exposure 0 1 n % p Chi² * s
0 907 13 920 1.4
14.3 203 4 207 1.9 0.5797 s
52.8 205 5 210 2.4 0.3121 s
100.7 197 10 207 4.8 0.0017 * s
1189.5 195 9 204 4.4 0.0052 * s
1707 41 1748
0.00
0.25
0.50
0.75
1.00
0.0 14.3 52.8 100.7
1189.5
0
1
Contingency Table
Quartiles_Exposure Def. 1_EN By GE_UK-3-weeks
Disease
Exposure 0 1 n % p Chi² * s
0 859 43 902 4.8
14.3 195 9 204 4.4 0.8285
52.8 197 12 209 5.7 0.5584
100.7 185 16 201 8.0 0.0689
1189.5 179 17 196 8.7 0.0292 *
1615 97 1712
0.00
0.25
0.50
0.75
1.00
0.0 14.3 52.8 100.7
1189.5
0
1
Contingency Table
Quartiles_Exposure Def. 1_EN By GE_UK-wf
Disease
Exposure 0 1 n % p Chi² * s
0 895 26 921 2.8
14.3 203 5 208 2.4 0.7383
52.8 203 9 212 4.2 0.2805
100.7 196 14 210 6.7 0.0065 *
1189.5 190 18 208 8.7 0.0001 *
1687 72 1759
0.00
0.25
0.50
0.75
1.00
0.0 14.3 52.8 100.7 1189.5
0
1
Contingency Table
Quartiles_Exposure Def. 1_EN By GE_NL-2
Disease
Exposure 0 1 n % p Chi² * s
0 873 48 921 5.2
14.3 200 8 208 3.8 0.4126
52.8 198 13 211 6.2 0.5817
100.7 191 19 210 9.0 0.0336 *
1189.5 185 23 208 11.1 0.0017 *
1647 111 1758
GE
-NL
3
0.00
0.25
0.50
0.75
1.00
0.0 14.3 52.8 100.71189.5
0
1

- 173 -
Contingency Table
Quartiles_Exposure Def. 1_SOMCP By GE_UK
Disease
Exposure 0 1 n % p Chi² * s
0 907 13 920 1.4
10 295 5 300 1.7 0.7517 s
34.5 107 4 111 3.6 0.0869 s
141.6 202 7 209 3.3 0.0554 s
3597.5 194 11 205 5.4 0.0004 * s
1705 40 1745
GE
-Ka
y3
0.00
0.25
0.50
0.75
1.00
0.0 10.0 34.5
141.6
3597.5
Quartiles_MeanK_SOMCP
0
1
Contingency Table
Quartiles_Exposure Def. 1_SOMCP By GE_UK-3-weeks
Disease
Exposure 0 1 n % p Chi² * s
0 859 43 902 4.8
10 286 11 297 3.7 0.4434
34.5 100 10 110 9.1 0.0546
141.6 191 13 204 6.4 0.3449
3597.5 177 18 195 9.2 0.0136 *
1613 95 1708
GE
-Ka
y3
4
0.00
0.25
0.50
0.75
1.00
0.0 10.0 34.5
141.6
3597.5
Quartiles_MeanK_SOMCP
0
1
Contingency Table
Quartiles_Exposure Def. 1_SOMCP By GE_UK-wf
Disease
Count 0 1 % p Chi² * s
0 895 26 921 2.8
10 295 7 302 2.3 0.6383
34.5 106 9 115 7.8 0.0051 * s
141.6 200 12 212 5.7 0.0386 *
3597.5 190 16 206 7.8 0.0007 *
1686 70 1756
GE
-Ka
y3
oh
ne
F
0.00
0.25
0.50
0.75
1.00
0.0 10.0 34.5
141.6
3597.5
0
1
Contingency Table
Quartiles_Exposure Def. 1_SOMCP By GE_NL-2
Disease
Exposure 0 1 n % p Chi² * s
0 873 48 921 5.2
10 290 11 301 3.7 0.2739
34.5 103 12 115 10.4 0.0238 *
141.6 195 17 212 8.0 0.1130
3597.5 186 20 206 9.7 0.0143 *
1647 108 1755
GE
-NL
3
0.00
0.25
0.50
0.75
1.00
0.0 10.0 34.5
141.6
3597.5
0
1

- 174 -
Contingency Table
Quartiles_Exposure Def. 2_CP By GE_UK
Disease
Exposure 0 1 n % p Chi² * s
0 907 13 920 1.4
3.6 240 2 242 0.8 0.4719 s
7.3 177 8 185 4.3 0.0081 * s
14.6 192 9 201 4.5 0.0045 * s
360 200 9 209 4.3 0.0063 * s
1716 41 1757
0.00
0.25
0.50
0.75
1.00
0.0 3.6 7.3 14.6 360.0
0
1
Contingency Table
Quartiles_Exposure Def. 2_CP By GE_UK-3-weeks
Disease
Exposure 0 1 n % p Chi² * s
0 859 43 902 4.8
3.6 230 10 240 4.2 0.6943
7.3 166 16 182 8.8 0.0290 *
14.6 180 15 195 7.7 0.0979
360 188 13 201 6.5 0.3207
1623 97 1720
GE
-Ka
y3
4
0.00
0.25
0.50
0.75
1.00
0.0 3.6 7.3 14.6 360.0
0
1
Contingency Table
Quartiles_Exposure Def. 2_CP By GE_UK-wf
Disease
Exposure 0 1 n % p Chi² * s
0 895 26 921 2.8
3.6 239 5 244 2.0 0.5043
7.3 175 11 186 5.9 0.0324 *
14.6 188 17 205 8.3 0.0002 *
360 199 13 212 6.1 0.0172 *
1696 72 1768
0.00
0.25
0.50
0.75
1.00
0.0 3.6 7.3 14.6 360.0
0
1
Contingency Table
Quartiles_Exposure Def. 2_CP By GE_NL-2
Disease
Exposure 0 1 n % p Chi² * s
0 873 48 921 5.2
3.6 234 10 244 4.1 0.4771
7.3 171 15 186 8.1 0.1256
14.6 183 22 205 10.7 0.0031 *
360 195 16 211 7.6 0.1786
1656 111 1767
GE
-NL
3
0.00
0.25
0.50
0.75
1.00
0.0 3.6 7.3 14.6 360.0
0
1

- 175 -
Contingency Table
Quartiles_Exposure Def. 2_EC By GE_UK
Disease
Exposure 0 1 n % p Chi² * s
0 907 13 920 1.4
232.5 202 3 205 1.5 0.9561 s
739 205 4 209 1.9 0.5915 s
2203.6 198 10 208 4.8 0.0018 * s
32811.8 195 11 206 5.3 0.0004 * s
1707 41 1748
0.00
0.25
0.50
0.75
1.00
0.0 232.5
739.0
2203.6
32811.8
0
1
Contingency Table
Quartiles_Exposure Def. 2_EC By GE_UK-3-weeks
Disease
Exposure 0 1 n % p Chi² * s
0 859 43 902 4.8
232.5 194 9 203 4.4 0.8393
739 194 14 208 6.7 0.2474
2203.6 189 14 203 6.9 0.2152
32811.8 179 17 196 8.7 0.0292 *
1615 97 1712
0.00
0.25
0.50
0.75
1.00
0.0 232.5
739.0
2203.6
32811.8
0
1
Contingency Table
Quartiles_Exposure Def. 2_EC By GE_UK-wf
Disease
Exposure 0 1 n % p Chi² * s
0 895 26 921 2.8
232.5 202 4 206 1.9 0.4775
739 202 11 213 5.2 0.0830
2203.6 197 13 210 6.2 0.0158 *
32811.8 191 18 209 8.6 0.0001 *
1687 72 1759
GE
-Ka
y3
oh
ne
F
0.00
0.25
0.50
0.75
1.00
0.0 232.5
739.0
2203.6
32811.8
0
1
Contingency Table
Quartiles_Exposure Def. 2_EC By GE_NL-2
Disease
Exposure 0 1 n % p Chi² * s
0 873 48 921 5.2
232.5 198 8 206 3.9 0.4277
739 196 16 212 7.5 0.1842
2203.6 195 15 210 7.1 0.2709
32811.8 185 24 209 11.5 0.0008 *
1647 111 1758
GE
-NL
3
0.00
0.25
0.50
0.75
1.00
0.0 232.5
739.0
2203.6
32811.8
0
1

- 176 -
Contingency Table
Quartiles_Exposure Def. 2_EN By GE_UK
Disease
Exposure 0 1 n % p Chi² * s
0 907 13 920 1.4
52.5 204 4 208 1.9 0.5856 s
191.8 199 8 207 3.9 0.0184 * s
426.5 202 7 209 3.3 0.0554 s
11816.4 195 9 204 4.4 0.0052 * s
1707 41 1748
0.00
0.25
0.50
0.75
1.00
0.0 52.5 191.8426.5
11816.4
0
1
Contingency Table
Quartiles_Exposure Def. 2_EN By GE_UK-3-weeks
Disease
Exposure 0 1 n % p Chi² * s
0 859 43 902 4.8
52.5 196 9 205 4.4 0.8179
191.8 192 15 207 7.2 0.1485
426.5 192 12 204 5.9 0.5082
11816.4 176 18 194 9.3 0.0129 *
1615 97 1712
0.00
0.25
0.50
0.75
1.00
0.0 52.5 191.8 426.5
11816.4
Quartiles_SAKK_EN
0
1
Contingency Table
Quartiles_Exposure Def. 2_EN By GE_UK-wf
Disease
Exposure 0 1 n % p Chi² * s
0 895 26 921 2.8
52.5 204 4 208 1.9 0.4661
191.8 198 12 210 5.7 0.0359 *
426.5 199 13 212 6.1 0.0172 *
11816.4 191 17 208 8.2 0.0003 *
1687 72 1759
0.00
0.25
0.50
0.75
1.00
0.0 52.5 191.8
426.5
11816.4
Quartiles_SAKK_EN
0
1
Contingency Table
Quartiles_Exposure Def. 2_EN By GE_NL-2
Disease
Exposure 0 1 n % p Chi² * s
0 873 48 921 5.2
52.5 201 7 208 3.4 0.2639
191.8 192 17 209 8.1 0.1014
426.5 196 16 212 7.5 0.1842
11816.4 185 23 208 11.1 0.0017 *
1647 111 1758
GE
-NL
3
0.00
0.25
0.50
0.75
1.00
0.0 52.5 191.8
426.5
11816.4
0
1

- 177 -
Contingency Table
Quartiles_Exposure Def. 2_SOMCP By GE_UK
Disease
Exposure 0 1 n % p Chi² * s
0 907 13 920 1.4
40 247 5 252 2.0 0.5137 s
184.3 155 4 159 2.5 0.3025 s
673.5 198 8 206 3.9 0.0178 * s
28615 198 10 208 4.8 0.0018 * s
1705 40 1745
GE
-Ka
y3
0.00
0.25
0.50
0.75
1.00
0.0 40.0 184.3
673.5
28615.0
0
1
Contingency Table
Quartiles_Exposure Def. 2_SOMCP By GE_UK-3-weeks
Disease
Exposure 0 1 n % p Chi² * s
0 859 43 902 4.8
40 239 12 251 4.8 0.9928
184.3 147 10 157 6.4 0.3955
673.5 185 16 201 8.0 0.0689
28615 183 14 197 7.1 0.1798
1613 95 1708
GE
-Ka
y3
4
0.00
0.25
0.50
0.75
1.00
0.0 40.0 184.3
673.5
28615.0
Quartiles_SAKK_SOMCP
0
1
Contingency Table
Quartiles_Exposure Def. 2_SOMCP By GE_UK-wf
Disease
Exposure 0 1 n % p Chi² * s
0 895 26 921 2.8
40 247 7 254 2.8 0.9543
184.3 153 9 162 5.6 0.0697
673.5 195 15 210 7.1 0.0025 *
28615 196 13 209 6.2 0.0151 *
1686 70 1756
0.00
0.25
0.50
0.75
1.00
0.0 3.6 7.3 14.6 360.0
0
1
Contingency Table
Quartiles_Exposure Def. 2_SOMCP By GE_NL-2
Disease
Exposure 0 1 n % p Chi² * s
0 873 48 921 5.2
40 242 12 254 4.7 0.7548
184.3 150 11 161 6.8 0.4034
673.5 190 20 210 9.5 0.0177 *
28615 192 17 209 8.1 0.1014
1647 108 1755
GE
-NL
3
0.00
0.25
0.50
0.75
1.00
0.0 40.0 184.3
673.5
28615.0
0
1

- 178 -
Annex 27. Incidence rates of gastroenteritis in quintile categories
In the tables and figures in this annex the incidence rates among non-bathers were
compared to the incidence rates among bathers exposed in quintile categories of
microbiological exposure concentrations. Pearson's Chi square tests were separately
performed for each of the five categories. Significant differences between bathers and
non-bathers (p<0.05) were marked by an asterisk.
Legend
Disease definitions:
GE_UK Gastroenteritis, UK definitionGE_UK-3-weeks Gastroenteritis, UK definition, 3 weeks after exposureGE_UK-wf Gastroenteritis, UK definition without consideration of stool frequencyGE_NL-2 Gastroenteritis, NL-2 definition
Faecal indicator parameters:
CP Clostridium perfringens (concentration per 10 ml)EC Escherichia coli (concentration per 100 ml)IE Intestinal enterococci (concentration per 100 ml)SOMCP Somatic coliphages (concentration per 100 ml)
Exposure definitions:
Exposure Def. 1 "10 minutes bathing, ≥ 3 head immersions"Exposure Def. 2 "1 head immersion"
Exposure:
0 Non-bathersxy quintile cut points
Disease:
0 Participants without gastroenteritis according to specified definition1 Participants with gastroenteritis according to specified definition
Miscellaneous:
n Total number of participants in this analysisp Chi² Probability of error in Pearson's Chi Square test* p Chi² < 0.05s "suspect"; if an expected cell value was less than 5

- 179 -
Contingency Table
Quintiles_Exposure Def. 1_CP By GE_UK
Disease
Exposure 0 1 n % p Chi² * s
0 907 13 920 1.4
0.9 218 4 222 1.8 0.6677 s
1.3 113 2 115 1.7 0.7826 s
2.2 162 7 169 4.1 0.0152 * s
3.6 155 9 164 5.5 0.0007 * s
14.8 161 6 167 3.6 0.0480 * s
1716 41 1757
0.00
0.25
0.50
0.75
1.00
0.0 0.9 1.3 2.2 3.6 14.8
0
1
Contingency Table
Quintiles_Exposure Def. 1_CP By GE_UK-3-weeks
Disease
Exposure 0 1 n % p Chi² * s
0 859 43 902 4.8
0.9 210 8 218 3.7 0.4855
1.3 104 9 113 8.0 0.1461
2.2 154 14 168 8.3 0.0588
3.6 141 16 157 10.2 0.0062 *
14.8 155 7 162 4.3 0.8048
1623 97 1720
0.00
0.25
0.50
0.75
1.00
0.0 0.9 1.3 2.2 3.6 14.8
0
1
Contingency Table
Quintiles_Exposure Def. 1_CP By GE_UK-wf
Disease
Exposure 0 1 n % p Chi² * s
0 895 26 921 2.8
0.9 218 6 224 2.7 0.9064
1.3 111 4 115 3.5 0.6928 s
2.2 160 12 172 7.0 0.0063 *
3.6 152 14 166 8.4 0.0004 *
14.8 160 10 170 5.9 0.0402 *
1696 72 1768
GE
-Ka
y3
oh
ne
F
0.00
0.25
0.50
0.75
1.00
0.0 0.9 1.3 2.2 3.6 14.8
0
1
C
Quintiles_Exposure Def. 1_CP By GE_NL-2
Disease
Exposure 0 1 n % p Chi² * s
0 873 48 921 5.2
0.9 213 11 224 4.9 0.8550
1.3 111 4 115 3.5 0.4221
2.2 155 17 172 9.9 0.0174 *
3.6 146 19 165 11.5 0.0019 *
14.8 158 12 170 7.1 0.3317
1656 111 1767
GE
-NL
3
0.00
0.25
0.50
0.75
1.00
0.0 0.9 1.3 2.2 3.6 14.8
0
1

- 180 -
Contingency Table
Quintiles_Exposure Def. 1_EC By GE_UK
Disease
Exposure 0 1 n % p Chi² * s
0 907 13 920 1.4
61.1 163 1 164 0.6 0.4013 s
115.9 162 5 167 3.0 0.1408 s
244.9 162 5 167 3.0 0.1408 s
445.2 156 7 163 4.3 0.0118 * s
4599.5 157 10 167 6.0 0.0002 * s
1707 41 1748
GE
-Ka
y3
0.00
0.25
0.50
0.75
1.00
0.0 61.1
115.9
244.9
445.2
4599.5
0
1
Contingency Table
Quintiles_Exposure Def. 1_EC By GE_UK-3-weeks
Exposure 0 1 n % p Chi² * s
0 859 43 902 4.8
61.1 156 7 163 4.3 0.7929
115.9 156 9 165 5.5 0.7062
244.9 153 12 165 7.3 0.1808
445.2 147 10 157 6.4 0.3955
4599.5 144 16 160 10.0 0.0077 *
1615 97 1712
0.00
0.25
0.50
0.75
1.00
0.0 61.1 115.9
244.9
445.2
4599.5
0
1
Contingency Table
Quintiles_Exposure Def. 1_EC By GE_UK-wf
Exposure 0 1 n % p Chi² * s
0 895 26 921 2.8
61.1 163 3 166 1.8 0.4547 s
115.9 162 6 168 3.6 0.5973 s
244.9 160 10 170 5.9 0.0402 *
445.2 154 12 166 7.2 0.0044 *
4599.5 153 15 168 8.9 0.0001 *
1687 72 1759
0.00
0.25
0.50
0.75
1.00
0.0 61.1 115.9
244.9
445.2
4599.5
0
1
Contingency Table
Quintiles_Exposure Def. 1_EC By GE_NL-2
Exposure 0 1 n % p Chi² * s
0 873 48 921 5.2
61.1 160 6 166 3.6 0.3833
115.9 158 9 167 5.4 0.9245
244.9 155 15 170 8.8 0.0636
445.2 150 16 166 9.6 0.0257 *
4599.5 151 17 168 10.1 0.0135 *
1647 111 1758
GE
-NL
3
0.00
0.25
0.50
0.75
1.00
0.0 61.1 115.9
244.9
445.2
4599.5
0
1

- 181 -
Contingency Table
Quintiles_Exposure Def. 1_EN By GE_UK
Disease
Exposure 0 1 n % p Chi² * s
0 907 13 920 1.4
12.2 164 3 167 1.8 0.7051 s
26.5 162 3 165 1.8 0.6910 s
68 156 11 167 6.6 0.0000 * s
114 162 4 166 2.4 0.3411 s
1189.5 156 7 163 4.3 0.0118 * s
1707 41 1748
0.00
0.25
0.50
0.75
1.00
0.0 12.2 26.5
68.0
114.0
1189.5
Quintiles_MeanK_EN
0
1
Contingency Table
Quintiles_Exposure Def. 1_EN By GE_UK-3-weeks
Disease
Exposure 0 1 n % p Chi² * s
0 859 43 902 4.8
12.2 158 6 164 3.7 0.5329
26.5 156 9 165 5.5 0.7062
68 148 16 164 9.8 0.0102 *
114 152 9 161 5.6 0.6557
1189.5 142 14 156 9.0 0.0316 *
1615 97 1712
GE
-Ka
y3
4
0.00
0.25
0.50
0.75
1.00
0.0 12.2 26.5 68.0 114.0
1189.5
Quintiles_MeanK_EN
0
1
Contingency Table
Quintiles_Exposure Def. 1_EN By GE_UK-wf
Disease
Exposure 0 1 n % p Chi² * s
0 895 26 921 2.8
12.2 164 3 167 1.8 0.4486 s
26.5 162 5 167 3.0 0.9027 s
68 154 15 169 8.9 0.0001 *
114 161 7 168 4.2 0.3501
1189.5 151 16 167 9.6 0.0000 *
1687 72 1759
GE
-Ka
y3
oh
ne
F
0.00
0.25
0.50
0.75
1.00
0.0 12.2 26.5 68.0 114.0
1189.5
0
1
Contingency Table
Quintiles_Exposure Def. 1_EN By GE_NL-2
Disease
Exposure 0 1 n % p Chi² * s
0 873 48 921 5.2
12.2 162 5 167 3.0 0.2206
26.5 156 10 166 6.0 0.6682
68 151 18 169 10.7 0.0064 *
114 159 9 168 5.4 0.9380
1189.5 146 21 167 12.6 0.0003 *
1647 111 1758
GE
-NL
3
0.00
0.25
0.50
0.75
1.00
0.0 12.2 26.5 68.0 114.0
1189.5
0
1
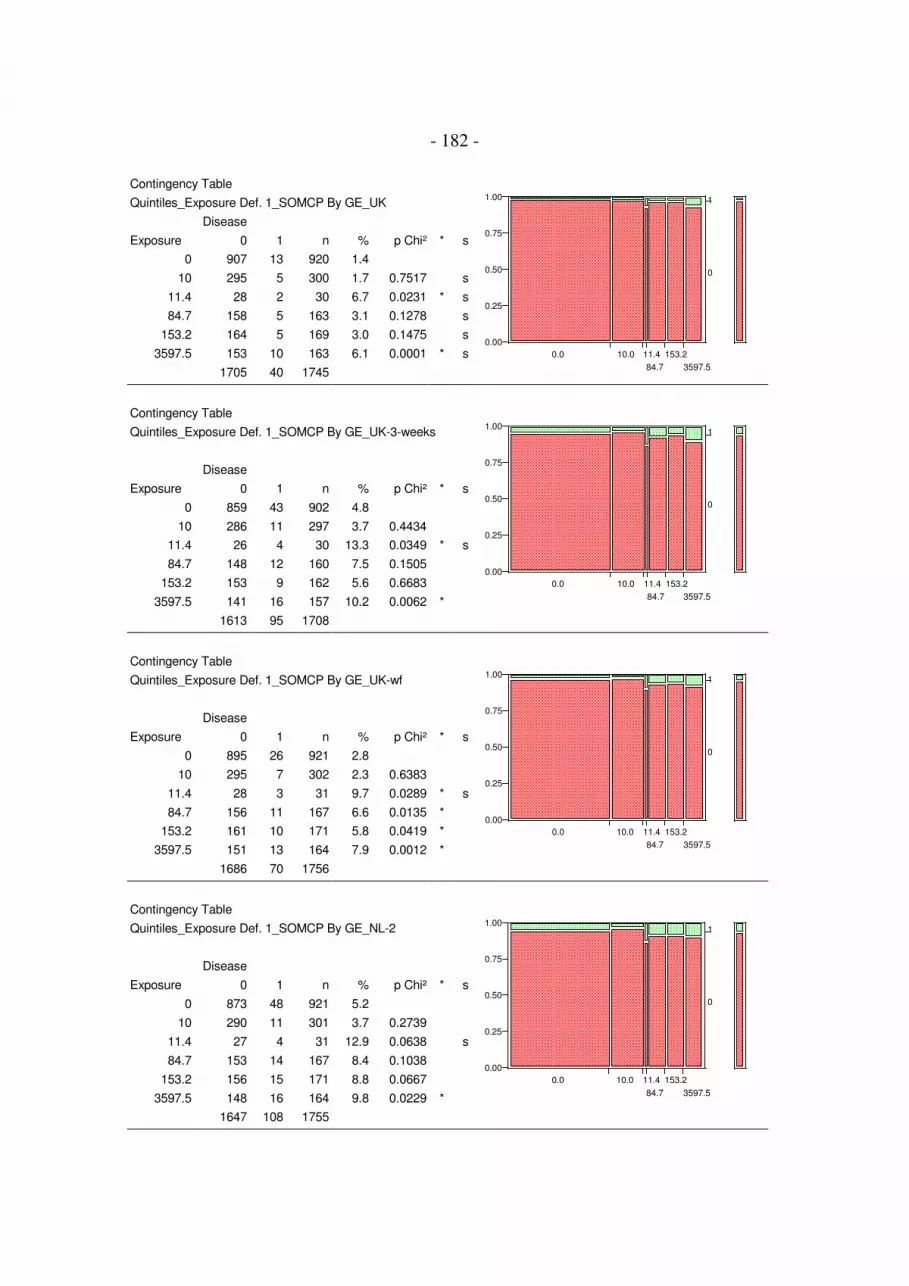
- 182 -
Contingency Table
Quintiles_Exposure Def. 1_SOMCP By GE_UK
Disease
Exposure 0 1 n % p Chi² * s
0 907 13 920 1.4
10 295 5 300 1.7 0.7517 s
11.4 28 2 30 6.7 0.0231 * s
84.7 158 5 163 3.1 0.1278 s
153.2 164 5 169 3.0 0.1475 s
3597.5 153 10 163 6.1 0.0001 * s
1705 40 1745
GE
-Ka
y3
0.00
0.25
0.50
0.75
1.00
0.0 10.0 11.4
84.7
153.2
3597.5
0
1
Contingency Table
Quintiles_Exposure Def. 1_SOMCP By GE_UK-3-weeks
Disease
Exposure 0 1 n % p Chi² * s
0 859 43 902 4.8
10 286 11 297 3.7 0.4434
11.4 26 4 30 13.3 0.0349 * s
84.7 148 12 160 7.5 0.1505
153.2 153 9 162 5.6 0.6683
3597.5 141 16 157 10.2 0.0062 *
1613 95 1708
GE
-Ka
y3
4
0.00
0.25
0.50
0.75
1.00
0.0 10.0 11.4
84.7
153.2
3597.5
0
1
Contingency Table
Quintiles_Exposure Def. 1_SOMCP By GE_UK-wf
Disease
Exposure 0 1 n % p Chi² * s
0 895 26 921 2.8
10 295 7 302 2.3 0.6383
11.4 28 3 31 9.7 0.0289 * s
84.7 156 11 167 6.6 0.0135 *
153.2 161 10 171 5.8 0.0419 *
3597.5 151 13 164 7.9 0.0012 *
1686 70 1756
0.00
0.25
0.50
0.75
1.00
0.0 10.0 11.4
84.7
153.2
3597.5
0
1
Contingency Table
Quintiles_Exposure Def. 1_SOMCP By GE_NL-2
Disease
Exposure 0 1 n % p Chi² * s
0 873 48 921 5.2
10 290 11 301 3.7 0.2739
11.4 27 4 31 12.9 0.0638 s
84.7 153 14 167 8.4 0.1038
153.2 156 15 171 8.8 0.0667
3597.5 148 16 164 9.8 0.0229 *
1647 108 1755
GE
-NL
3
0.00
0.25
0.50
0.75
1.00
0.0 10.0 11.4
84.7
153.2
3597.5
0
1

- 183 -
Contingency Table
Quintiles_Exposure Def. 2_CP By GE_UK
Disease
Exposure 0 1 n % p Chi² * s
0 907 13 920 1.4
2.7 167 1 168 0.6 0.3871 s
5.5 169 5 174 2.9 0.1649 s
9.9 156 5 161 3.1 0.1215 s
17.5 158 10 168 6.0 0.0002 * s
360 159 7 166 4.2 0.0134 * s
1716 41 1757
0.00
0.25
0.50
0.75
1.00
0.0 2.7 5.5 9.9 17.5 360.0
0
1
Contingency Table
Quintiles_Exposure Def. 2_CP By GE_UK-3-weeks
Disease
Exposure 0 1 n % p Chi² * s
0 859 43 902 4.8
2.7 161 5 166 3.0 0.3158
5.5 159 15 174 8.6 0.0393 *
9.9 147 9 156 5.8 0.5930
17.5 146 16 162 9.9 0.0089 *
360 151 9 160 5.6 0.6431
1623 97 1720
GE
-Ka
y3
4
0.00
0.25
0.50
0.75
1.00
0.0 2.7 5.5 9.9 17.5
360.0
Quintiles_SAKK_CP
0
1
Contingency Table
Quintiles_Exposure Def. 2_CP By GE_UK-wf
Disease
Exposure 0 1 n % p Chi² * s
0 895 26 921 2.8
2.7 166 3 169 1.8 0.4365 s
5.5 167 9 176 5.1 0.1131
9.9 155 7 162 4.3 0.3063 s
17.5 155 16 171 9.4 0.0000 *
360 158 11 169 6.5 0.0150 *
1696 72 1768
GE
-Ka
y3
oh
ne
F
0.00
0.25
0.50
0.75
1.00
0.0 2.7 5.5 9.9 17.5 360.0
0
1
Contingency Table
Quintiles_Exposure Def. 2_CP By GE_NL-2
Disease
Exposure 0 1 n % p Chi² * s
0 873 48 921 5.2
2.7 164 5 169 3.0 0.2106
5.5 161 15 176 8.5 0.0837
9.9 154 8 162 4.9 0.8848
17.5 148 22 170 12.9 0.0002 *
360 156 13 169 7.7 0.1972
1656 111 1767
GE
-NL
3
0.00
0.25
0.50
0.75
1.00
0.0 2.7 5.5 9.9 17.5 360.0
0
1

- 184 -
Contingency Table
Quintiles_Exposure Def. 2_EC By GE_UK
Disease
Exposure 0 1 n % p Chi² * s
0 907 13 920 1.4
206 164 0 164 0.0 0.1256 s
471.4 159 7 166 4.2 0.0134 * s
1085.6 163 2 165 1.2 0.8387 s
2749.4 155 12 167 7.2 0.0000 * s
32811.8 159 7 166 4.2 0.0134 * s
1707 41 1748
0.00
0.25
0.50
0.75
1.00
0.0 206.0
471.4
1085.6
2749.4
32811.8
0
1
Contingency Table
Quintiles_Exposure Def. 2_EC By GE_UK-3-weeks
Disease
Exposure 0 1 n % p Chi² * s
0 859 43 902 4.8
206 156 6 162 3.7 0.5521
471.4 154 13 167 7.8 0.1079
1085.6 154 7 161 4.3 0.8169
2749.4 145 17 162 10.5 0.0036 *
32811.8 147 11 158 7.0 0.2471
1615 97 1712
0.00
0.25
0.50
0.75
1.00
0.0 206.0
471.4
1085.6
2749.4
32811.8
Quintiles_SAKK_EC
0
1
Contingency Table
Quintiles_Exposure Def. 2_EC By GE_UK-wf
Disease
Exposure 0 1 n % p Chi² * s
0 895 26 921 2.8
206 164 1 165 0.6 0.0921 s
471.4 159 10 169 5.9 0.0385 *
1085.6 160 8 168 4.8 0.1839
2749.4 153 16 169 9.5 0.0000 *
32811.8 156 11 167 6.6 0.0135 *
1687 72 1759
0.00
0.25
0.50
0.75
1.00
0.0 206.0
471.4
1085.6
2749.4
32811.8
Quintiles_SAKK_EC
0
1
Contingency Table
Quintiles_Exposure Def. 2_EC By GE_NL-2
Disease
Exposure 0 1 n % p Chi² * s
0 873 48 921 5.2
206 161 4 165 2.4 0.1225
471.4 155 13 168 7.7 0.1903
1085.6 155 13 168 7.7 0.1903
2749.4 150 19 169 11.2 0.0027 *
32811.8 153 14 167 8.4 0.1038
1647 111 1758
GE
-NL
3
0.00
0.25
0.50
0.75
1.00
0.0 206.0
471.4
1085.6
2749.4
32811.8
Quintiles_SAKK_EC
0
1

- 185 -
Contingency Table
Quintiles_Exposure Def. 2_EN By GE_UK
Disease
Exposure 0 1 n % p Chi² * s
0 907 13 920 1.4
42 166 2 168 1.2 0.8200 s
111.9 161 3 164 1.8 0.6839 s
256.3 158 9 167 5.4 0.0008 * s
544.5 160 6 166 3.6 0.0465 * s
11816.4 155 8 163 4.9 0.0029 * s
1707 41 1748
GE
-Ka
y3
0.00
0.25
0.50
0.75
1.00
0.0 42.0 111.9
256.3
544.5
11816.4
Quintiles_SAKK_EN
0
1
Contingency Table
Quintiles_Exposure Def. 2_EN By GE_UK-3-weeks
Disease
Exposure 0 1 n % p Chi² * s
0 859 43 902 4.8
42 160 6 166 3.6 0.5142
111.9 155 9 164 5.5 0.6935
256.3 149 14 163 8.6 0.0460 *
544.5 152 10 162 6.2 0.4489
11816.4 140 15 155 9.7 0.0131 *
1615 97 1712
0.00
0.25
0.50
0.75
1.00
0.0 42.0 111.9
256.3
544.5
11816.4
0
1
Contingency Table
Quintiles_Exposure Def. 2_EN By GE_UK-wf
Disease
Exposure 0 1 n % p Chi² * s
0 895 26 921 2.8
42 166 2 168 1.2 0.2189 s
111.9 160 6 166 3.6 0.5787 s
256.3 157 11 168 6.5 0.0143 *
544.5 158 12 170 7.1 0.0056 *
11816.4 151 15 166 9.0 0.0001 *
1687 72 1759
0.00
0.25
0.50
0.75
1.00
0.0 42.0 111.9
256.3
544.5
11816.4
0
1
Contingency Table
Quintiles_Exposure Def. 2_EN By GE_NL-2
Disease
Exposure 0 1 n % p Chi² * s
0 873 48 921 5.2
42 164 4 168 2.4 0.1136
111.9 154 11 165 6.7 0.4477
256.3 156 12 168 7.1 0.3130
544.5 153 17 170 10.0 0.0154 *
11816.4 147 19 166 11.4 0.0021 *
1647 111 1758
GE
-NL
3
0.00
0.25
0.50
0.75
1.00
0.0 42.0 111.9
256.3
544.5
11816.4
0
1

- 186 -
Contingency Table
Quintiles_Exposure Def. 2_SOMCP By GE_UK
Disease
Exposure 0 1 n % p Chi² * s
0 907 13 920 1.4
30 173 4 177 2.3 0.4035 s
65.8 149 2 151 1.3 0.9316 s
349.8 160 5 165 3.0 0.1342 s
958.8 159 7 166 4.2 0.0134 * s
28615 157 9 166 5.4 0.0007 * s
1705 40 1745
0.00
0.25
0.50
0.75
1.00
0.0 30.0 65.8
349.8
958.8
28615.0
0
1
Contingency Table
Quintiles_Exposure Def. 2_SOMCP By GE_UK-3-weeks
Disease
Exposure 0 1 n % p Chi² * s
0 859 43 902 4.8
30 165 10 175 5.7 0.5961
65.8 145 6 151 4.0 0.6683
349.8 148 12 160 7.5 0.1505
958.8 150 13 163 8.0 0.0912
28615 146 11 157 7.0 0.2392
1613 95 1708
GE
-Ka
y3
4
0.00
0.25
0.50
0.75
1.00
0.0 30.0 65.8
349.8
958.8
28615.0
0
1
Contingency Table
Quintiles_Exposure Def. 2_SOMCP By GE_UK-wf
Disease
Exposure 0 1 n % p Chi² * s
0 895 26 921 2.8
30 173 5 178 2.8 0.9917
65.8 149 6 155 3.9 0.4773 s
349.8 157 10 167 6.0 0.0354 *
958.8 157 11 168 6.5 0.0143 *
28615 155 12 167 7.2 0.0047 *
1686 70 1756
GE
-Ka
y3
oh
ne
F
0.00
0.25
0.50
0.75
1.00
0.0 30.0 65.8
349.8
958.8
28615.0
Quintiles_SAKK_SOMCP
0
1
Contingency Table
Quintiles_Exposure Def. 2_SOMCP By GE_NL-2
Disease
Exposure 0 1 n % p Chi² * s
0 873 48 921 5.2
30 170 8 178 4.5 0.6903
65.8 145 9 154 5.8 0.7458
349.8 154 13 167 7.8 0.1836
958.8 153 15 168 8.9 0.0577
28615 152 15 167 9.0 0.0549
1647 108 1755
GE
-NL
3
0.00
0.25
0.50
0.75
1.00
0.0 30.0 65.8
349.8
958.8
28615.0
0
1

- 187 -
Annex 28. Incidence rates of gastroenteritis in arithmetic
concentration categories and in categories according to
Kay et al., 1994
In the tables and figures in this annex the incidence rates among non-bathers were
compared to the incidence rates among bathers exposed in arithmetic categories of
microbiological exposure concentrations. 20 unit intervals were chosen for IE exposure,
and 100 unit intervals were chosen for EC exposure. For the purpose of direct
comparability to the results reported for sea water exposure (Kay et al., 1994) a category
"80 to 158" was formed for IE exposure, as 158 IE/100ml was the maximum
concentration found in these studies. In addition data were evaluated using the quartile
cut points of IE exposure in the sea water studies. Pearson's Chi square test were
performed separately for each of the categories. Significant differences between bathers
and non-bathers (p<0.05) were marked by an asterisk. The results from sea water
exposure were reported as incidence rates of gastroenteritis (definition GE_UK) within
a time period of 3 weeks after exposure. The results from fresh water exposure are
therefore also displayed for the 3-week evaluation period (definition GE_UK-3-weeks),
although an evaluation interval of 3 weeks was found to be less appropriate in this study
(see results section).
- 188 -
Legend
Disease definitions:
GE_UK Gastroenteritis, UK definitionGE_UK-3-weeks Gastroenteritis, UK definition, 3 weeks after exposureGE_UK-wf Gastroenteritis, UK definition without consideration of stool frequencyGE_NL-2 Gastroenteritis, NL-2 definition
Faecal indicator parameters:
CP Clostridium perfringensEC Escherichia coliIE Intestinal enterococciSOMCP Somatic coliphages
Exposure definitions:
Exposure Def. 1 "10 minutes bathing, ≥ 3 head immersions"Exposure Def. 2 "1 head immersion"
Exposure:
0 Non-bathersxy cut points of exposure concentration categories:
Kay_quantiles (20 unit intervals from 0 to 80; 80 to 158, and >158)Kay_quartiles (quartile cut points in the sea water studies, Kay et al. 1994)100 (100 unit intervals from 0 to 500, and >500)
Disease:
0 Participants without gastroenteritis according to specified definition1 Participants with gastroenteritis according to specified definition
Miscellaneous:
n Total number of participants in this analysisp Chi² Probability of error in Pearson's Chi Square test* p Chi² < 0.05s "suspect"; if an expected cell value was less than 5

- 189 -
IE_Kay_Quantiles By GE_UK
Disease
Exposure 0 1 n % p Chi² * s
0 907 13 920 1.4
20 292 5 297 1.7 0.7371 s
40 86 3 89 3.4 0.1580 s
60 69 6 75 8.0 0.0001 * s
80 90 4 94 4.3 0.0409 * s
158 180 7 187 3.7 0.0292 * s
1190 83 3 86 3.5 0.1413 s
1707 41 1748
GE
-Kay3
0.00
0.25
0.50
0.75
1.00
0
20
40
60
80
158
1190
Kay_Quantiles
0
1
IE_Kay_Quantiles By GE_UK_3-weeks
Disease
Exposure 0 1 n % p Chi² * s
0 859 43 902 4.8
20 281 13 294 4.4 0.8076
40 83 6 89 6.7 0.4124 s
60 63 9 72 12.5 0.0050 * s
80 88 5 93 5.4 0.7941 s
158 166 13 179 7.3 0.1688
1190 75 8 83 9.6 0.0553 s
1615 97 1712
GE
-Ka
y3
4
0.00
0.25
0.50
0.75
1.00
0
20
40
60
80
15
8
11
90
Kay_Quantiles
0
1
IE_Kay_Quantiles By GE_UK-wf
Disease
Exposure 0 1 n % p Chi² * s
0 895 26 921 2.8
20 292 6 298 2.0 0.4474
40 84 7 91 7.7 0.0126 * s
60 69 6 75 8.0 0.0145 * s
80 90 7 97 7.2 0.0201 * s
158 176 14 190 7.4 0.0022 *
1190 81 6 87 6.9 0.0383 * s
1687 72 1759
0.00
0.25
0.50
0.75
1.00
0
20
40
60
80
158
1190
Kay_Quantiles
0
1
IE_Kay_Quantiles By GE_NL-2
Disease
Exposure 0 1 n % p Chi² * s
0 873 48 921 5.2
20 286 11 297 3.7 0.2925
40 82 9 91 9.9 0.0648
60 67 8 75 10.7 0.0486 * s
80 89 8 97 8.3 0.2123
158 171 19 190 10.0 0.0116 *
1190 79 8 87 9.2 0.1210 s
1647 111 1758
GE
-NL3
0.00
0.25
0.50
0.75
1.00
0
20
40
60
80
158
1190
Kay_Quantiles
0
1

- 190 -
Contingency Table
IE_Kay_Quartiles By GE_UK
Disease
Exposure 0 1 n % p Chi² * s
0 907 13 920 1.4
14 192 4 196 2.0 0.5147 s
27 136 2 138 1.4 0.9732 s
50 74 3 77 3.9 0.0958 s
158 315 16 331 4.8 0.0004 *
1190 83 3 86 3.5 0.1413 s
1707 41 1748
GE
-Kay3
0.00
0.25
0.50
0.75
1.00
0
14
27
50
158
1190
Kay_Quartiles
0
1
Contingency Table
IE_Kay_Quartiles By GE_UK_3-weeks
Disease
Exposure 0 1 n % p Chi² * s
0 859 43 902 4.8
14 184 9 193 4.7 0.9508
27 132 6 138 4.3 0.8286
50 70 6 76 7.9 0.2300 s
158 295 25 320 7.8 0.0412 *
1190 75 8 83 9.6 0.0553 s
1615 97 1712
GE
-Ka
y3
4
0.00
0.25
0.50
0.75
1.00
0
14
27
50
15
8
11
90
Kay_Quartiles
0
1
Contingency Table
IE_Kay_Quartiles By GE_UK-wf
Disease
Exposure 0 1 n % p Chi² * s
0 895 26 921 2.8
14 192 5 197 2.5 0.8250
27 136 3 139 2.2 0.6543 s
50 72 6 78 7.7 0.0190 * s
158 311 26 337 7.7 0.0001 *
1190 81 6 87 6.9 0.0383 * s
1687 72 1759
0.00
0.25
0.50
0.75
1.00
0
14
27
50
158
1190
Kay_Quartiles
0
1
Contingency Table
IE_Kay_Quartiles By GE_NL-2
Disease
Exposure 0 1 n % p Chi² * s
0 873 48 921 5.2
14 189 8 197 4.1 0.5015
27 131 7 138 5.1 0.9452
50 72 6 78 7.7 0.3522 s
158 303 34 337 10.1 0.0019 *
1190 79 8 87 9.2 0.1210 s
1647 111 1758
GE
-NL3
0.00
0.25
0.50
0.75
1.00
0
14
27
50
158
1190
Kay_Quartiles
0
1

- 191 -
EC_100_quantiles By GE_UK
Disease
Exposure 0 1 n % p Chi² * s
0 907 13 920 1.4
100 301 5 306 1.6 0.7807 s
200 133 6 139 4.3 0.0162 * s
300 99 2 101 2.0 0.6529 s
400 87 4 91 4.4 0.0348 * s
500 39 2 41 4.9 0.0799 s
4600 141 9 150 6.0 0.0002 * s
1707 41 1748
GE
-Kay3
0.00
0.25
0.50
0.75
1.00
0
100
200
300
400
500
4600
EC_100_quantiles
0
1
EC_100_quantiles By GE_UK_3-weeks
Disease
Exposure 0 1 n % p Chi² * s
0 859 43 902 4.8
100 289 14 303 4.6 0.9171
200 128 11 139 7.9 0.1195
300 92 5 97 5.2 0.8654 s
400 81 6 87 6.9 0.3821 s
500 37 3 40 7.5 0.4326 s
4600 129 15 144 10.4 0.0059 *
1615 97 1712
GE
-Kay34
0.00
0.25
0.50
0.75
1.00
0
100
200
300
400
500
4600
EC_100_quantiles
0
1
EC_100_quantiles By GE_UK-wf
Disease
Exposure 0 1 n % p Chi² * s
0 895 26 921 2.8
100 301 8 309 2.6 0.8281
200 131 10 141 7.1 0.0091 * s
300 99 5 104 4.8 0.2626 s
400 85 7 92 7.6 0.0137 * s
500 38 3 41 7.3 0.0996 s
4600 138 13 151 8.6 0.0004 *
1687 72 1759
GE
-Kay3 o
hne F
0.00
0.25
0.50
0.75
1.00
0
100
200
300
400
500
4600
EC_100_quantiles
0
1
EC_100_quantiles By GE_NL-2
Disease
Exposure 0 1 n % p Chi² * s
0 873 48 921 5.2
100 295 13 308 4.2 0.4882
200 129 12 141 8.5 0.1141
300 93 11 104 10.6 0.0260 *
400 83 9 92 9.8 0.0697
500 38 3 41 7.3 0.5561 s
4600 136 15 151 9.9 0.0222 *
1647 111 1758
GE
-NL3
0.00
0.25
0.50
0.75
1.00
0
100
200
300
400
500
4600
EC_100_quantiles
0
1

- 192 -
Annex 29. Incidence rates of skin infections/cutireactions
in quartile and quintile categories
In the tables and figures in this annex the incidence rates skin infections/cutireactions
among non-bathers were compared to the incidence rates among bathers exposed in
quartile and quintile categories of microbiological exposure concentrations. Pearson's
Chi square tests were performed separately for each of the categories. Significant
differences between bathers and non-bathers (p<0.05) were marked by an asterisk.
Legend
Disease definitions:
SKIN Skin infections, cutireactions
Indicator parameter:
AE Aeromonads (concentration per 100 ml)
Exposure definition:
Exposure Def. 1 "10 minutes bathing, ≥ 3 head immersions"
Exposure:
0 Non-bathersxy quartile or quintile cut points
Disease:
0 Participants without gastroenteritis according to specified definition1 Participants with gastroenteritis according to specified definition
Miscellaneous:
n Total number of participants in this analysisp Chi² Probability of error in Pearson's Chi Square test* p Chi² < 0.05s "suspect"; if an expected cell value was less than 5

- 193 -
Contingency Table
Quartiles_Exposure Def. 1_AE By SKIN
Disease
Exposure 0 1 n % p Chi² * s
0 930 27 957 2.8
3339.875 202 14 216 6.5 0.0082 *
7331.25 201 16 217 7.4 0.0013 *
11203.5 187 29 216 13.4 0.0000 *
26930 194 22 216 10.2 0.0000 *
1714 108 1822
SK
IN3
0.00
0.25
0.50
0.75
1.00
0 3339.875
7331.25
11203.5
26930
0
1
Contingency Table
Quintiles_Exposure Def. 1_AE By SKIN
Disease
Exposure 0 1 n % p Chi² * s
0 930 27 957 2.8
3034.3 161 12 173 6.9 0.0064 *
4996.4 167 7 174 4.0 0.3932
8943 146 26 172 15.1 0.0000 *
11855.3 155 18 173 10.4 0.0000 *
26930 155 18 173 10.4 0.0000 *
1714 108 1822
SK
IN3
0.00
0.25
0.50
0.75
1.00
0 3034.3
4996.4
8943
11855.3
26930
0
1

- 194 -
Annex 30. Disease incidences by quartiles, quintiles and arithmetic
concentration classes: Comparison with the predicted step
models for dose-response relationships
The figures in this annex display the dose-response models (step-models) consisting of :
1. the incidence rate among non-bathers with 95% confidence intervals,
2. the threshold concentrations which are defined as the exposure concentrations with
the most significant difference between the incidence rates among bathers exposed
below and above that concentration (concentration with minimal Chi square p), and
3. the incidence rates among bathers exposed above threshold concentrations with 95%
confidence intervals.
The incidence rates among bathers exposed in quartile and quintile categories of micro-
biological exposure concentrations are displayed as horizontal lines indicating the
quantile ranges. The geometric means of the quantile ranges are marked by a dot.
Incidence rates which are significantly different from the non-bathers rate (Pearson's
Chi square test, p < 0.05) are marked by an asterisk.
To enable a direct comparison between the results of previous studies performed in sea
water and the results obtained in fresh water, gastroenteritis data were also classified
using the quantile borders of the sea water studies published by Kay et al., 1994. In
addition, data were classified by splitting them into 20 unit intervals of intestinal
enterococci exposure and into 100 unit intervals of E. coli exposure. For enterococci
split into 20 unit intervals the two upper classes are "80 to 158" and "158 to maximum".
The class "80 to 158" was calculated for direct comparison with the sea water results
again, as 158 was the maximum concentration found in the sea water studies.
From the comparison of the step models with the results of classification of the
gastroenteritis data into quantile categories and into intervals with fixed arithmetic

- 195 -
ranges it was intuitively concluded that the following concentrations would be
reasonable estimates for thresholds of effect (NOAEL's; no observed adverse effect
levels) for the condition “bathing duration of 10 minutes including three or more head
immersions”:
ca. 100 EC/100 ml
ca. 25 IE/100 ml
ca. 10 CP/100 ml (1 CP/10 ml)
ca. 10 SOMCP/100 ml
The relation of 100 EC/100 ml to 25 IE/100 ml also corresponds very well with the
result of the orthogonal regression analysis for these two parameters in the original
water samples, which revealed a regression function of log10(IE) = -0.270 + 0.836 *
log10(EC). From this equation it can be calculated that 100 EC/100 ml would
correspond to 25.23 IE/100 ml.
For skin infections or cutireactions concentrations of aeromonads above ca. 6000/100ml
can explain part of the effect while a remaining part has to be attributed to other water-
related factors which did not correspond with any of the microorganisms monitored in
this study (two-step model).

- 196 -
Escherichia coli by Gastroenteritis (Definition UK)
Exposure definition: "10 min bathing; 3 head immersions"
0
2
4
6
8
10
12
14
1 10 100 1000 10000
Concentration / 100 ml
Inc
ide
nc
e r
ate
(%
) Step model
95% CI (UL)
95% CI (LL)
Quintiles
Range mean
Quartiles
Range mean
**
**
Fig. 1
Escherichia coli by Gastroenteritis (Definition UK-wf)
Exposure definition: "10 min bathing; 3 head immersions"
0
2
4
6
8
10
12
14
1 10 100 1000 10000
Concentration / 100 ml
Inc
ide
nc
e r
ate
(%
) Step model
95% CI (UL)
95% CI (LL)
Quartiles
Range mean
Quintiles
Range mean
**
***
Fig. 2
Escherichia coli by Gastroenteritis (Definition NL-2)
Exposure definition: "10 min bathing; 3 head immersions"
0.0
2.0
4.0
6.0
8.0
10.0
12.0
14.0
1 10 100 1000 10000
Concentration / 100 ml
Inc
ide
nc
e r
ate
(%
) Step model
95% CI (UL)
95% CI (LL)
Quartiles
Range mean
Quintiles
Range mean
****
Fig. 3
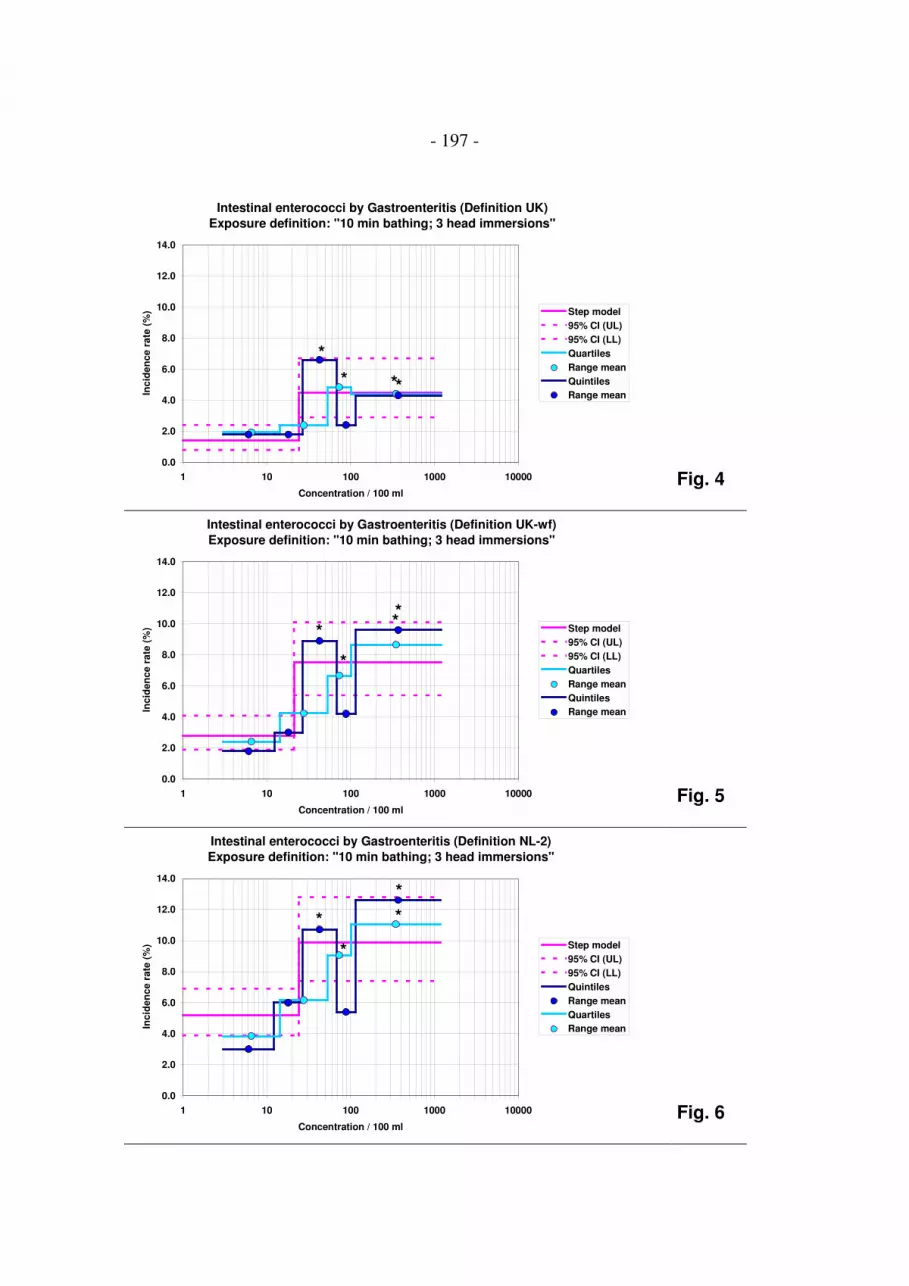
- 197 -
Intestinal enterococci by Gastroenteritis (Definition UK)
Exposure definition: "10 min bathing; 3 head immersions"
0.0
2.0
4.0
6.0
8.0
10.0
12.0
14.0
1 10 100 1000 10000
Concentration / 100 ml
Inc
ide
nc
e r
ate
(%
) Step model
95% CI (UL)
95% CI (LL)
Quartiles
Range mean
Quintiles
Range mean**
*
*
Fig. 4
Intestinal enterococci by Gastroenteritis (Definition UK-wf)
Exposure definition: "10 min bathing; 3 head immersions"
0.0
2.0
4.0
6.0
8.0
10.0
12.0
14.0
1 10 100 1000 10000
Concentration / 100 ml
Inc
ide
nc
e r
ate
(%
) Step model
95% CI (UL)
95% CI (LL)
Quartiles
Range mean
Quintiles
Range mean
**
*
*
Fig. 5
Intestinal enterococci by Gastroenteritis (Definition NL-2)
Exposure definition: "10 min bathing; 3 head immersions"
0.0
2.0
4.0
6.0
8.0
10.0
12.0
14.0
1 10 100 1000 10000
Concentration / 100 ml
Inc
ide
nc
e r
ate
(%
) Step model
95% CI (UL)
95% CI (LL)
Quintiles
Range mean
Quartiles
Range mean
*
**
*
Fig. 6

- 198 -
Clostridium perfringens by Gastroenteritis (Definition UK)
Exposure definition: "10 min bathing; 3 head immersions"
0.0
2.0
4.0
6.0
8.0
10.0
12.0
14.0
0.1 1 10 100
Concentration / 10 ml
Inc
ide
nc
e r
ate
(%
) Step model
95% CI (UL)
95% CI (LL)
Quintiles
Range mean
Quartiles
Range mean
**
***
Fig. 7
Clostridium perfringens by Gastroenteritis (Definition UK-wf)
Exposure definition: "10 min bathing; 3 head immersions"
0.0
2.0
4.0
6.0
8.0
10.0
12.0
14.0
0.1 1 10 100
Concentration / 10 ml
Inc
ide
nc
e r
ate
(%
) Step model
95% CI (UL)
95% CI (LL)
Quintiles
Range mean
Quartiles
Range mean
*
**
**
Fig. 8
Clostridium perfringens by Gastroenteritis (Definition NL-2)
Exposure definition: "10 min bathing; 3 head immersions"
0.0
2.0
4.0
6.0
8.0
10.0
12.0
14.0
0.1 1 10 100
Concentration / 10 ml
Inc
ide
nc
e r
ate
(%
) Step model
95% CI (UL)
95% CI (LL)
Quintiles
Range mean
Quartiles
Range mean
* *
*
Fig. 9

- 199 -
Somatic coliphages by Gastroenteritis (Definition UK)
Exposure definition: "10 min bathing; 3 head immersions"
0.0
2.0
4.0
6.0
8.0
10.0
12.0
14.0
1 10 100 1000 10000
Concentration / 100 ml
Inc
ide
nc
e r
ate
(%
) Step model
95% CI (UL)
95% CI (LL)
Quintiles
Range mean
Quartiles
Range mean
***
Fig. 10
Somatic coliphages by Gastroenteritis (Definition UK-wf)
Exposure definition: "10 min bathing; 3 head immersions"
0.0
2.0
4.0
6.0
8.0
10.0
12.0
14.0
1 10 100 1000 10000
Concentration / 100 ml
Inc
ide
nc
e r
ate
(%
) Step model
95% CI (UL)
95% CI (LL)
Quintiles
Range mean
Quartiles
Range mean
*
**
* ***
Fig. 11
Somatic coliphages by Gastroenteritis (Definition NL-2)
Exposure definition: "10 min bathing; 3 head immersions"
0.0
2.0
4.0
6.0
8.0
10.0
12.0
14.0
1 10 100 1000 10000
Concentration / 100 ml
Inc
ide
nc
e r
ate
(%
) Step model
95% CI (UL)
95% CI (LL)
Quintiles
Range mean
Quartiles
Range mean
***
Fig. 12

- 200 -
Escherichia coli by Gastroenteritis (Definition UK)
Exposure definition: "1 head immersion"
0.0
2.0
4.0
6.0
8.0
10.0
12.0
14.0
1 10 100 1000 10000 100000
Concentration / 100 ml
Inc
ide
nc
e r
ate
(%
) Step model
95% CI (UL)
95% CI (LL)
Quintiles
Range mean
Quartiles
Range mean*
*
*
**
Fig. 13
Escherichia coli by Gastroenteritis (Definition UK-wf)
Exposure definition: "1 head immersion"
0.0
2.0
4.0
6.0
8.0
10.0
12.0
14.0
1 10 100 1000 10000 100000
Concentration / 100 ml
Inc
ide
nc
e r
ate
(%
) non-bathers
95% CI (UL)
95% CI (LL)
Quintiles
Range mean
Quartiles
Range mean
*
*
*
* *
Fig. 14
Escherichia coli by Gastroenteritis (Definition NL-2)
Exposure definition: "1 head immersion"
0.0
2.0
4.0
6.0
8.0
10.0
12.0
14.0
1 10 100 1000 10000 100000
Concentration / 100 ml
Inc
ide
nc
e r
ate
(%
) Step model
95% CI (UL)
95% CI (LL)
Quintiles
Range mean
Quartiles
Range mean
* *
Fig. 15

- 201 -
Intestinal enterococci by Gastroenteritis (Definition UK)
Exposure definition: "1 head immersion"
0.0
2.0
4.0
6.0
8.0
10.0
12.0
14.0
1 10 100 1000 10000 100000
Concentration / 100 ml
Inc
ide
nc
e r
ate
(%
) Step model
95% CI (UL)
95% CI (LL)
Quintiles
Range mean
Quartiles
Range mean
* **
**
Fig. 16
Intestinal enterococci by Gastroenteritis (Definition UK-wf)
Exposure definition: "1 head immersion"
0.0
2.0
4.0
6.0
8.0
10.0
12.0
14.0
1 10 100 1000 10000 100000
Concentration / 100 ml
Inc
ide
nc
e r
ate
(%
) Step model
95% CI (UL)
95% CI (LL)
Quintiles
Range mean
Quartiles
Range mean
**
***
*
Fig. 17
Intestinal enterococci by Gastroenteritis (Definition NL-2)
Exposure definition: "1 head immersion"
0.0
2.0
4.0
6.0
8.0
10.0
12.0
14.0
1 10 100 1000 10000 100000
Concentration / 100 ml
Inc
ide
nc
e r
ate
(%
) Step model
95% CI (UL)
95% CI (LL)
Quintiles
Range mean
Quartiles
Range mean
***
Fig. 18

- 202 -
Clostridium perfringens by Gastroenteritis (Definition UK)
Exposure definition: "1 head immersion"
0.0
2.0
4.0
6.0
8.0
10.0
12.0
14.0
0.1 1 10 100 1000
Concentration / 10 ml
Inc
ide
nc
e r
ate
(%
) Step model
95% CI (UL)
95% CI (LL)
Quintiles
Range mean
Quartiles
Range mean**
*
**
Fig. 19
Clostridium perfringens by Gastroenteritis (Definition UK-wf)
Exposure definition: "1 head immersion"
0.0
2.0
4.0
6.0
8.0
10.0
12.0
14.0
0.1 1 10 100 1000
Concentration / 10 ml
Inc
ide
nc
e r
ate
(%
) Step model
95% CI (UL)
95% CI (LL)
Quintiles
Range mean
Quartiles
Range mean
**
**
*
Fig. 20
Clostridium perfringens by Gastroenteritis (Definition NL-2)
Exposure definition: "1 head immersion"
0.0
2.0
4.0
6.0
8.0
10.0
12.0
14.0
0.1 1 10 100 1000
Concentration / 10 ml
Inc
ide
nc
e r
ate
(%
) Quintiles
95% CI (UL)
95% CI (LL)
Step model
Range mean
Quartiles
Range mean
*
*
Fig. 21

- 203 -
Somatic coliphages by Gastroenteritis (Definition UK)
Exposure definition: "1 head immersion"
0.0
2.0
4.0
6.0
8.0
10.0
12.0
14.0
1 10 100 1000 10000 100000
Concentration / 100 ml
Inc
ide
nc
e r
ate
(%
) Step model
95% CI (UL)
95% CI (LL)
Quintiles
Range mean
Quartiles
Range mean
****
Fig. 22
Somatic coliphages by Gastroenteritis (Definition UK-wf)
Exposure definition: "1 head immersion"
0.0
2.0
4.0
6.0
8.0
10.0
12.0
14.0
1 10 100 1000 10000 100000
Concentration / 100 ml
Inc
ide
nc
e r
ate
(%
) Step model
95% CI (UL)
95% CI (LL)
Quintiles
Range mean
Quartiles
Range mean
***
**
Fig. 23
Somatic coliphages by Gastroenteritis (Definition NL-2)
Exposure definition: "1 head immersion"
0.0
2.0
4.0
6.0
8.0
10.0
12.0
14.0
1 10 100 1000 10000 100000
Concentration / 100 ml
Inc
ide
nc
e r
ate
(%
) Step model
95% CI (UL)
95% CI (LL)
Quintiles
Range mean
Quartiles
Range mean
* (*) (*)
Fig. 24

- 204 -
Escherichia coli by Gastroenteritis (Definition UK)
Exposure definition: "10 min bathing; 3 head immersions"
0
2
4
6
8
10
12
14
1 10 100 1000 10000
Concentration / 100 ml
Inc
ide
nc
e r
ate
(%
)
Step model
95% CI (UL)
95% CI (LL)
Quantiles
Range mean
*
* *
Fig. 25
Escherichia coli by Gastroenteritis (Definition UK-wf)
Exposure definition: "10 min bathing; 3 head immersions"
0
2
4
6
8
10
12
14
1 10 100 1000 10000
Concentration / 100 ml
Inc
ide
nc
e r
ate
(%
)
Step model
95% CI (UL)
95% CI (LL)
Quantiles
Range mean
**
*
Fig. 26
Escherichia coli by Gastroenteritis (Definition NL-2)
Exposure definition: "10 min bathing; 3 head immersions"
0.0
2.0
4.0
6.0
8.0
10.0
12.0
14.0
1 10 100 1000 10000
Concentration / 100 ml
Inc
ide
nc
e r
ate
(%
)
Step model
95% CI (UL)
95% CI (LL)
Quantiles
Range mean
**
Fig. 27

- 205 -
Intestinal enterococci by Gastroenteritis (Definition UK)
Exposure definition: "10 min bathing; 3 head immersions"
0.0
2.0
4.0
6.0
8.0
10.0
12.0
14.0
1 10 100 1000 10000
Concentration / 100 ml
Inc
ide
nc
e r
ate
(%
)
Step model
95% CI (UL)
95% CI (LL)
Quantiles
Range mean
*
*
*
Fig. 28
Intestinal enterococci by Gastroenteritis (Definition UK-wf)
Exposure definition: "10 min bathing; 3 head immersions"
0.0
2.0
4.0
6.0
8.0
10.0
12.0
14.0
1 10 100 1000 10000
Concentration / 100 ml
Inc
ide
nc
e r
ate
(%
)
Step model
95% CI (UL)
95% CI (LL)
Quantiles
Range mean
* ** *
*
Fig. 29
Intestinal enterococci by Gastroenteritis (Definition NL-2)
Exposure definition: "10 min bathing; 3 head immersions"
0.0
2.0
4.0
6.0
8.0
10.0
12.0
14.0
1 10 100 1000 10000
Concentration / 100 ml
Inc
ide
nc
e r
ate
(%
)
Step model
95% CI (UL)
95% CI (LL)
Quantiles
Range mean
**
Fig. 30

- 206 -
Aeromonads by Skin ailments
Exposure definition: "10 min bathing; at least 3 head immersions"
0.0
2.0
4.0
6.0
8.0
10.0
12.0
14.0
16.0
100 1000 10000 100000
Concentration / 10 ml
Incid
en
ce r
ate
(%
) Step model
95% CI (UL)
95% CI (LL)
Quintiles
Range mean
Quartiles
Range mean
**
*
*
*
*
* *
Fig. 31

- 207 -
Annex 31. Effect of water ingestion:
Incidence rates of gastroenteritis in non-bathers
vs. bathers reporting to have swallowed water or not to
have swallowed water below and above threshold
concentrations
After 10 minutes of bathing participants were asked whether they had swallowed water.
Incidence rates of gastroenteritis were calculated for bathers exposed below or above
threshold concentrations of four faecal indicator parameters (EC, IE, CP, SOMCP)
using three different definitions of gastroenteritis (GE_UK, GE_UK-wf, GE_NL-2) and
two exposure definitions ("10 minutes bathing, ≥ 3 head immersions", "1 head
immersion"). Bathers exposed below and above threshold concentrations were
additionally sub-classified according to their response to the question "Did you swallow
water?" Bathers who were not sure whether they had swallowed water were excluded
from this analysis. Pearson's Chi Square tests were performed to compare the incidence
rates of gastroenteritis in the four resulting categories of bathers to the incidence rate of
gastroenteritis in the group of non-bathers. The tables and figures in this annex
demonstrate the results of these analyses.
- 208 -
Legend
Disease definitions:
GE_UK Gastroenteritis, UK definitionGE_UK-wf Gastroenteritis, UK definition without consideration of stool frequencyGE_NL-2 Gastroenteritis, NL-2 definition
Faecal indicator parameters:
CP Clostridium perfringensEC Escherichia coliIE Intestinal enterococciSOMCP Somatic coliphages
Exposure definitions:
Exposure Def. 1 "10 minutes bathing, ≥ 3 head immersions"Exposure Def. 2 "1 head immersion"
Exposure:
0 Non-bathers1 Bathers below threshold concentration who did not swallow water2 Bathers below threshold concentration who swallowed water3 Bathers above threshold concentration who did not swallow water4 Bathers above threshold concentration who swallowed water
Disease:
0 Participants without gastroenteritis according to specified definition1 Participants with gastroenteritis according to specified definition
Miscellaneous:
n Total number of participants in this analysisp Chi² Probability of error in Pearson's Chi Square test* p Chi² < 0.05s "suspect"; if an expected cell value was less than 5

- 209 -
Exposure Def. 1_ CP By GE-NL-2
Disease
Exposure 0 1 n % p Chi² * s
0 873 48 921 5.2
1 186 7 193 3.6 0.3555
2 130 6 136 4.4 0.6925
3 240 21 261 8.0 0.0847
4 223 29 252 11.5 0.0003 *
1652 111 1763
0.00
0.25
0.50
0.75
1.00
0 1 2 3 4
0
1
Exposure Def. 1_ EC By GE-NL-2
Disease
Exposure 0 1 n % p Chi² * s
0 873 48 921 5.2
1 231 10 241 4.1 0.5002
2 147 8 155 5.2 0.9791
3 192 18 210 8.6 0.0609
4 200 27 227 11.9 0.0003 *
1643 111 1754
0.00
0.25
0.50
0.75
1.00
0 1 2 3 4
0
1
Exposure Def. 1_ IE By GE-NL-2
Disease
Exposure 0 1 n % p Chi² * s
0 873 48 921 5.2
1 185 5 190 2.6 0.1287
2 122 7 129 5.4 0.9184
3 238 23 261 8.8 0.0307 *
4 225 28 253 11.1 0.0008 *
1643 111 1754
GE
-NL3
0.00
0.25
0.50
0.75
1.00
0 1 2 3 4
0
1
Exposure Def. 1_ SOMCP By GE-NL-2
Disease
Exposure 0 1 n % p Chi² * s
0 873 48 921 5.2
1 175 5 180 2.8 0.1629
2 116 6 122 4.9 0.8906
3 245 22 267 8.2 0.0643
4 234 27 261 10.3 0.0027 *
1643 108 1751
GE
-NL3
0.00
0.25
0.50
0.75
1.00
0 1 2 3 4
0
1

- 210 -
Exposure Def. 2_ CP By GE-NL-2
Disease
Exposure 0 1 n % p Chi² * s
0 873 48 921 5.2
1 114 3 117 2.6 0.2120
2 75 2 77 2.6 0.3124 s
3 312 25 337 7.4 0.1382
4 278 33 311 10.6 0.0009 *
1652 111 1763
GE
-NL
3
0.00
0.25
0.50
0.75
1.00
0 1 2 3 4
0
1
Exposure Def. 2_ EC By GE-NL-2
Disease
Exposure 0 1 n % p Chi² * s
0 873 48 921 5.2
1 328 20 348 5.8 0.7056
2 255 17 272 6.3 0.5074
3 95 8 103 7.8 0.2794
4 92 18 110 16.4 6E-06 *
1643 111 1754
GE
-NL3
0.00
0.25
0.50
0.75
1.00
0 1 2 3 4
0
1
Exposure Def. 2_ IE By GE-NL-2
Disease
Exposure 0 1 n % p Chi² * s
0 873 48 921 5.2
1 210 6 216 2.8 0.1301
2 143 10 153 6.5 0.5022
3 213 22 235 9.4 0.0173 *
4 204 25 229 10.9 0.0015 *
1643 111 1754
GE
-NL
3
0.00
0.25
0.50
0.75
1.00
0 1 2 3 4
0
1
Exposure Def. 2_ SOMCP By GE-NL-2
Disease
Exposure 0 1 n % p Chi² * s
0 873 48 921 5.2
1 225 11 236 4.7 0.7315
2 141 8 149 5.4 0.9362
3 195 16 211 7.6 0.1786
4 209 25 234 10.7 0.0021 *
1643 108 1751
GE
-NL
3
0.00
0.25
0.50
0.75
1.00
0 1 2 3 4
0
1

- 211 -
Exposure Def. 1_ CP By GE-UK-wf
Disease
Exposure 0 1 n % p Chi² * s
0 895 26 921 2.8
1 189 4 193 2.1 0.5581
2 132 4 136 2.9 0.9383 s
3 246 15 261 5.8 0.0227 *
4 230 23 253 9.1 1E-05 *
1692 72 1764
GE
-Ka
y3
oh
ne
F
0.00
0.25
0.50
0.75
1.00
0 1 2 3 4
0
1
Exposure Def. 1_ EC By GE-UK-wf
Disease
Exposure 0 1 n % p Chi² * s
0 895 26 921 2.8
1 153 2 155 1.3 0.2675 s
2 101 3 104 2.9 0.9714 s
3 279 17 296 5.7 0.0179 *
4 255 24 279 8.6 2E-05 *
1683 72 1755
GE
-Ka
y3
oh
ne
F
0.00
0.25
0.50
0.75
1.00
0 1 2 3 4
0
1
Exposure Def. 1_ IE By GE-UK-wf
Disease
Exposure 0 1 n % p Chi² * s
0 895 26 921 2.8
1 178 3 181 1.7 0.3705 s
2 123 3 126 2.4 0.7767 s
3 254 16 270 5.9 0.0151 *
4 233 24 257 9.3 5E-06 *
1683 72 1755
GE
-Kay3 o
hne F
0.00
0.25
0.50
0.75
1.00
0 1 2 3 4
0
1
Exposure Def. 1_ SOMCP By GE-UK-wf
Disease
Exposure 0 1 n % p Chi² * s
0 895 26 921 2.8
1 177 3 180 1.7 0.3756 s
2 119 4 123 3.3 0.7891 s
3 252 15 267 5.6 0.0276 *
4 239 22 261 8.4 5E-05 *
1682 70 1752
GE
-Kay3 o
hne F
0.00
0.25
0.50
0.75
1.00
0 1 2 3 4
0
1

- 212 -
Exposure Def. 2_ CP By GE-UK-wf
Disease
Exposure 0 1 n % p Chi² * s
0 895 26 921 2.8
1 143 3 146 2.1 0.5959 s
2 102 3 105 2.9 0.9841 s
3 292 16 308 5.2 0.0473 *
4 260 24 284 8.5 3E-05 *
1692 72 1764
GE
-Kay3 o
hne F
0.00
0.25
0.50
0.75
1.00
0 1 2 3 4
0
1
Exposure Def. 2_ EC By GE-UK-wf
Threshold not valid
Exposure Def. 2_ IE By GE-UK-wf
Disease
Exposure 0 1 n % p Chi² * s
0 895 26 921 2.8
1 201 3 204 1.5 0.2701
2 142 5 147 3.4 0.6981 s
3 231 16 247 6.5 0.0062 *
4 214 22 236 9.3 0.0000 *
1683 72 1755
GE
-Kay3 o
hne F
0.00
0.25
0.50
0.75
1.00
0 1 2 3 4
0
1
Exposure Def. 2_ SOMCP By GE-UK-wf
Disease
Exposure 0 1 n % p Chi² * s
0 895 26 921 2.8
1 176 3 179 1.7 0.3808 s
2 114 4 118 3.4 0.7292 s
3 253 15 268 5.6 0.0285 *
4 244 22 266 8.3 0.0001 *
1682 70 1752
GE
-Ka
y3
oh
ne
F
0.00
0.25
0.50
0.75
1.00
0 1 2 3 4
0
1

- 213 -
Exposure Def. 1_ CP By GE-UK
Disease
Exposure 0 1 n % p Chi² * s
0 907 13 920 1.4
1 190 2 192 1.0 0.6849 s
2 133 2 135 1.5 0.9500 s
3 249 7 256 2.7 0.1481 s
4 233 17 250 6.8 0.0000 *
1712 41 1753
GE
-Kay3
0.00
0.25
0.50
0.75
1.00
0 1 2 3 4
0
1
Exposure Def. 1_ EC By GE-UK
Disease
Exposure 0 1 n % p Chi² * s
0 907 13 920 1.4
1 244 3 247 1.2 0.8118 s
2 158 4 162 2.5 0.3189 s
3 192 6 198 3.0 0.1102 s
4 202 15 217 6.9 0.0000 *
1703 41 1744
GE
-Kay3
0.00
0.25
0.50
0.75
1.00
0 1 2 3 4
0
1
Exposure Def. 1_ IE By GE-UK
Disease
Exposure 0 1 n % p Chi² * s
0 907 13 920 1.4
1 187 2 189 1.1 0.7005 s
2 126 3 129 2.3 0.4284 s
3 249 7 256 2.7 0.1481 s
4 234 16 250 6.4 0.0000 *
1703 41 1744
GE
-Kay3
0.00
0.25
0.50
0.75
1.00
0 1 2 3 4
0
1
Exposure Def. 1_ SOMCP By GE-UK
Disease
Exposure 0 1 n % p Chi² * s
0 907 13 920 1.4
1 362 7 369 1.9 0.5251
2 276 9 285 3.2 0.0545
3 70 2 72 2.8 0.3608 s
4 86 9 95 9.5 0.0000 * s
1701 40 1741
GE
-Kay3
0.00
0.25
0.50
0.75
1.00
0 1 2 3 4
0
1

- 214 -
Exposure Def. 2_ CP By GE-UK
Disease
Exposure 0 1 n % p Chi² * s
0 907 13 920 1.4
1 143 2 145 1.4 0.9744 s
2 103 1 104 1.0 0.7070 s
3 296 7 303 2.3 0.2855 s
4 263 18 281 6.4 4E-06 *
1712 41 1753
GE
-Kay3
0.00
0.25
0.50
0.75
1.00
0 1 2 3 4
0
1
Exposure Def. 2_ EC By GE-UK
Disease
Exposure 0 1 n % p Chi² * s
0 907 13 920 1.4
1 304 4 308 1.3 0.8818 s
2 238 7 245 2.9 0.1220 s
3 132 5 137 3.7 0.0591 s
4 122 12 134 9.0 8E-08 * s
1703 41 1744
GE
-Ka
y3
0.00
0.25
0.50
0.75
1.00
0 1 2 3 4
0
1
Exposure Def. 2_ IE By GE-UK
Disease
Exposure 0 1 n % p Chi² * s
0 907 13 920 1.4
1 201 2 203 1.0 0.6308 s
2 143 3 146 2.1 0.5535 s
3 235 7 242 2.9 0.1153 s
4 217 16 233 6.9 2E-06 *
1703 41 1744
GE
-Kay3
0.00
0.25
0.50
0.75
1.00
0 1 2 3 4
0
1
Exposure Def. 2_ SOMCP By GE-UK
Disease
Exposure 0 1 n % p Chi² * s
0 907 13 920 1.4
1 295 4 299 1.3 0.9232 s
2 181 5 186 2.7 0.21 s
3 137 5 142 3.5 0.0701 s
4 181 13 194 6.7 9E-06 * s
1701 40 1741
GE
-Ka
y3
0.00
0.25
0.50
0.75
1.00
0 1 2 3 4
0
1

- 215 -
GE-Risk by IE Exposure and Water Ingestion
( Th = 21 IE / 100 ml )
9.3 %
5.9 %
2.4 %1.7 %
2.8 %
0.0
1.0
2.0
3.0
4.0
5.0
6.0
7.0
8.0
9.0
10.0
unexposed < Th < Th + W > Th > Th + W
GE
-UK
-wf
( %
)
26/921 3/126 24/2573/181 16/270
***
*
Legend
Disease definition:
GE_UK-wf Gastroenteritis, UK definition without consideration of stool frequency
Faecal indicator parameter:
IE Intestinal enterococci
Exposure definition:
Exposure Def. 1 "10 minutes bathing, ≥ 3 head immersions"
Exposure:
unexposed Non-bathers< Th Bathers below threshold concentration who did not swallow water< Th + W Bathers below threshold concentration who swallowed water> Th Bathers above threshold concentration who did not swallow water> Th + W Bathers above threshold concentration who swallowed water
Significance:
* Pearson's Chi Square p exposed vs. unexposed < 0.05*** Pearson's Chi Square p exposed vs. unexposed < 0.001

- 216 -
GE-Risk by EC Exposure and Water Ingestion
( Th = 78 EC / 100 ml )
8.6 %
5.7 %
2.9 %
1.3 %
2.8 %
0.0
1.0
2.0
3.0
4.0
5.0
6.0
7.0
8.0
9.0
10.0
unexposed < Th < Th + W > Th > Th + W
GE
-UK
-wf
( %
)
26/921 3/104 24/2792/155 17/296
***
*
Legend
Disease definition:
GE_UK-wf Gastroenteritis, UK definition without consideration of stool frequency
Faecal indicator parameter:
EC Escherichia coli
Exposure definition:
Exposure Def. 1 "10 minutes bathing, ≥ 3 head immersions"
Exposure:
unexposed Non-bathers< Th Bathers below threshold concentration who did not swallow water< Th + W Bathers below threshold concentration who swallowed water> Th Bathers above threshold concentration who did not swallow water> Th + W Bathers above threshold concentration who swallowed water
Significance:
* Pearson's Chi Square p exposed vs. unexposed < 0.05*** Pearson's Chi Square p exposed vs. unexposed < 0.001

- 217 -
Annex 32. Effect of water ingestion:
Risk of gastroenteritis attributable to swallowing water
below and above threshold concentrations
Swallowing water above threshold concentrations for faecal indicator organisms (higher
degree of faecal contamination) resulted in higher attributable risks than swallowing
water below threshold concentrations (lower degree of faecal contamination). This
effect was independent of the definition of exposure, the choice of the indicator
organism and the definition of gastroenteritis.
Legend
Disease definition:
GE_UK Gastroenteritis, UK definitionGE_UK-wf Gastroenteritis, UK definition without consideration of stool frequencyGE_NL-2 Gastroenteritis, NL-2 definition
Faecal indicator parameter:
CP Clostridium perfringensEC Escherichia coliIE Intestinal enterococciSOMCP Somatic coliphages
Exposure definition:
Exposure Def. 1 "10 minutes bathing, ≥ 3 head immersions"Exposure Def. 2 "1 head immersion"
Miscellaneous:
aR risk attributable to swallowing water

- 218 -
ExposureDefinition
IndicatorParameter
Definition ofGastroenteritis
aR ≤ Threshold( % )
aR > Threshold( % )
Def. 1 CP GE_UK 0.4 4.1
Def. 1 EC GE_UK 1.3 3.9
Def. 1 EN GE_UK 1.3 3.7
Def. 1 SOMCP GE_UK 1.3 6.7
Def. 2 CP GE_UK -0.4 4.1
Def. 2 EC GE_UK 1.6 5.3
Def. 2 EN GE_UK 1.1 4.0
Def. 2 SOMCP GE_UK 1.4 3.2
Def. 1 CP GE_UK-wf 0.9 3.3
Def. 1 EC GE_UK-wf 1.6 2.9
Def. 1 EN GE_UK-wf 0.7 3.4
Def. 1 SOMCP GE_UK-wf 1.6 2.8
Def. 2 CP GE_UK-wf 0.8 3.3
Def. 2 EC GE_UK-wf not defined not defined
Def. 2 EN GE_UK-wf 1.9 2.8
Def. 2 SOMCP GE_UK-wf 1.7 2.7
Def. 1 CP GE_NL-2 0.8 3.5
Def. 1 EC GE_NL-2 1.0 3.3
Def. 1 EN GE_NL-2 2.8 2.3
Def. 1 SOMCP GE_NL-2 2.1 2.1
Def. 2 CP GE_NL-2 0.0 3.2
Def. 2 EC GE_NL-2 0.5 8.6
Def. 2 EN GE_NL-2 3.8 1.6
Def. 2 SOMCP GE_NL-2 0.7 3.1
Mean 1.3 3.6
Attributa
ble
ris
k o
f w
ate
r in
gestion
-1
0
1
2
3
4
5
6
7
8
9
<=Th >Th
Exposure concentration ANOVA: p < 0.0001

- 219 -
Attributa
ble
ris
k o
f w
ate
r in
gestion
-1
0
1
2
3
4
5
6
7
8
9
Def. 1 Def. 2
Exposure definitionANOVA: p = 0.86
Attributa
ble
ris
k o
f w
ate
r in
gestion
-1
0
1
2
3
4
5
6
7
8
9
1) GE_UK 2) GE_UK-wf 3) GE_NL-2
Definition of gastroenteritisANOVA: p = 0.72
Attributa
ble
ris
k o
f w
ate
r in
gestion
-1
0
1
2
3
4
5
6
7
8
9
CP EC EN SOMCP
ParameterANOVA: p = 0.62

- 220 -
Annex 33. Excess risk of gastroenteritis by 95th percentiles
of Escherichia coli and intestinal enterococci
concentrations
Estimates of the disease burden from bathing in recreational waters with lognormal
distributed concentrations of microbiological indicator organisms have been made by
WHO (1998, 2003) and by the European Commission in order to derive health
standards. The dose-response relationships of intestinal enterococci with gastroenteritis
(UK-definition) and acute febrile respiratory infections which were found in randomised
controlled trials performed at coastal bathing sites in the UK (Kay et al, 1994) were
used to calculate bathers' excess rates of disease at the 95th percentiles of lognormal
distributions of faecal indicator densities (Commission, 2002). The figures in this annex
display the estimated excess rates of gastroenteritis on the y-axis by 95th percentile
concentrations of lognormal distributed concentrations of Escherichia coli and intestinal
enterococci on the x-axis. The standard deviation of the distributions was uniformly set
to 0.75. The dose response relationships used in these calculations were the step models
for the gastroenteritis definitions GE_UK; GE_UK-wf and GE_NL-2. The maximum
risk levels for these three definitions were harmonised for the two indicator organisms
by calculating the arithmetic mean of the estimated maximum risk levels of both
indicators for each of the three definitions. The threshold concentrations were
harmonised as well: 25 IE/100 ml and 100 EC/100ml were used as threshold concen-
trations for all three definitions of GE. A step model was also adapted to the incidence
rates of gastroenteritis in quartile categories of faecal streptococci published by Kay et
al. 1994. The cut-point between the second and third quartile was modelled as threshold
concentration. The model parameters for the three definitions of gastroenteritis are listed
in the table below:

- 221 -
GE definition Indicator Original models Harmonised models
Th BLR MRL aR Th BLR MRL aR
(MPN) (%) (%) (%) (MPN) (%) (%) (%)
GE_UK EC /100 ml 180 1.4 5.0 3.6 100 1.4 4.75 3.35
GE_UK-wf EC /100 ml 78 2.8 7.1 4.3 100 2.8 7.3 4.5
GE_NL-2 EC /100 ml 167 5.2 10.2 5.0 100 5.2 10.05 4.85
GE_UK IE /100 ml 24 1.4 4.5 3.1 25 1.4 4.75 3.35
GE_UK-wf IE /100 ml 21 2.8 7.5 4.7 25 2.8 7.3 4.5
GE_NL-2 IE /100 ml 24 5.2 9.9 4.7 25 5.2 10.05 4.85
GE_UK (*) FS/100 ml 26 9.7 19.2 9.5 25 9.7 19.2 9.5
Legend
Th Threshold of effect (NOAEL)BLR Base line risk (incidence rate among non-bathers)MRL Maximum risk level; incidence rate above threshold concentrationaR attributable risk (excess risk); = MRL-BLRMPN Most probable numberGE_UK Gastroenteritis; UK definition according to Kay et al., 1994GE_UK-wf Gastroenteritis; UK definition without consideration of stool frequencyGE_NL-2 Gastroenteritis; NL-2 definition according to van Asperen et al.; 1998EC Escherichia coliIE; FS Intestinal enterococci; faecal streptococci(*) results from sea water exposure
The curves in the figures displayed in this annex were calculated in MS ExcelTM using
the following formulae:
GE_UK (%) =(1-NORMDIST(LOG10(25);LOG10(IE);0.75;TRUE))*100*0.0335
=(1-NORMDIST(LOG10(100);LOG10(EC);0.75;TRUE))*100*0.0335
GE_UK-wf (%) =(1-NORMDIST(LOG10(25); LOG10(IE);0.75;TRUE))*100*0.045
=(1-NORMDIST(LOG10(100); LOG10(EC);0.75;TRUE))*100*0.045
GE_NL-2 (%) =(1-NORMDIST(LOG10(25); LOG10(IE);0.75;TRUE))*100*0.0485
=(1-NORMDIST(LOG10(100); LOG10(EC);0.75;TRUE))*100*0.0485
GE_UK (*) (%) =(1-NORMDIST(LOG10(25); LOG10(IE);0.75;TRUE))*100*0.095
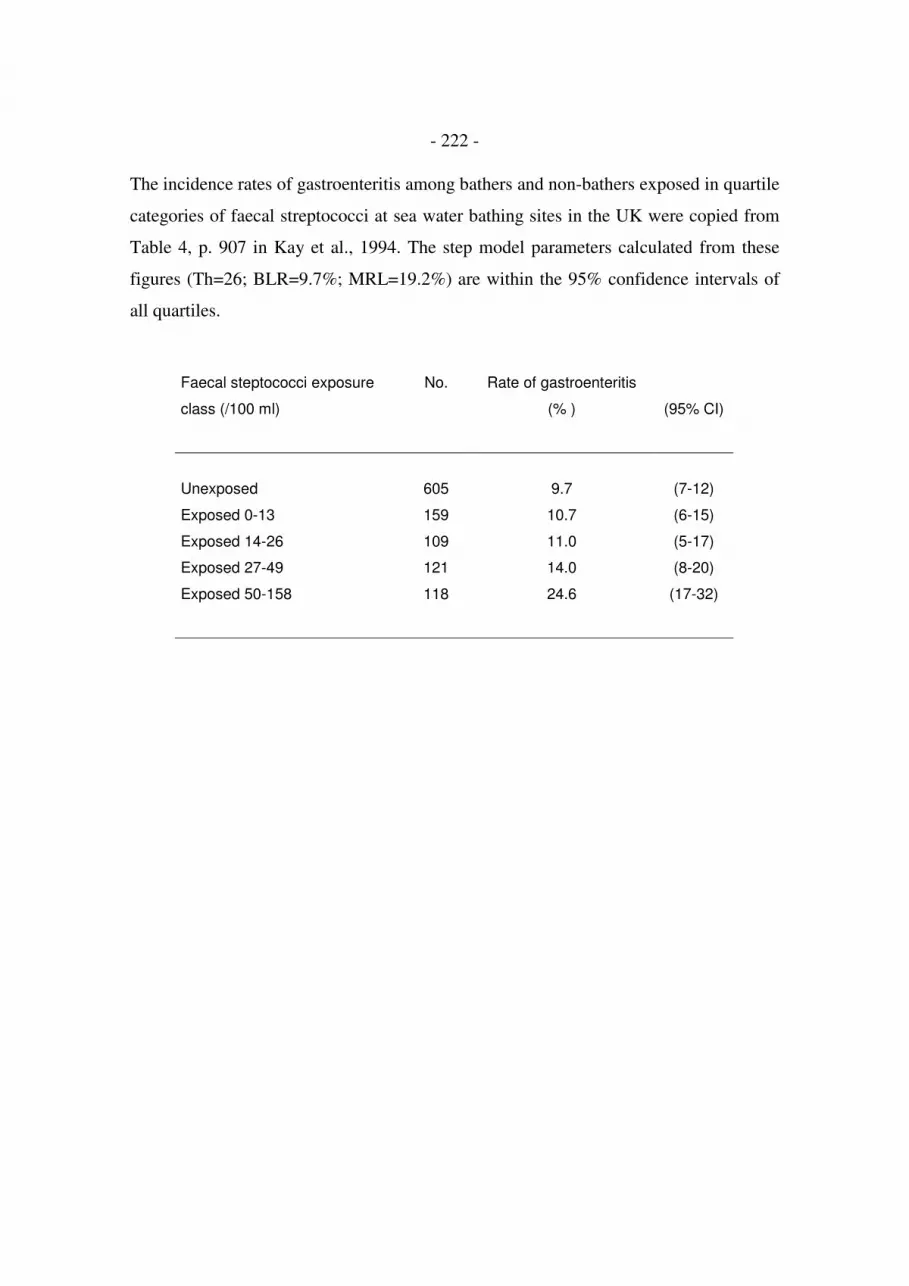
- 222 -
The incidence rates of gastroenteritis among bathers and non-bathers exposed in quartile
categories of faecal streptococci at sea water bathing sites in the UK were copied from
Table 4, p. 907 in Kay et al., 1994. The step model parameters calculated from these
figures (Th=26; BLR=9.7%; MRL=19.2%) are within the 95% confidence intervals of
all quartiles.
Faecal steptococci exposure
class (/100 ml)
No. Rate of gastroenteritis
(% ) (95% CI)
Unexposed 605 9.7 (7-12)
Exposed 0-13 159 10.7 (6-15)
Exposed 14-26 109 11.0 (5-17)
Exposed 27-49 121 14.0 (8-20)
Exposed 50-158 118 24.6 (17-32)

- 223 -
Attributable risk (excess risk) of gastroenteritisby 95th percentiles of EC or IE exposure
at German fresh water bathing sites(SD of log10 transformed concentration data = 0.75)
Gastroenteritis definition: UK
0.0
0.5
1.0
1.5
2.0
2.5
3.0
3.5
4.0
4.5
5.0
1 10 100 1000 10000 100000
95. Percentile of EC or IE / 100 ml
att
rib
uta
ble
ris
k (
% )
EC Def. UK
IE Def. UK
Gastroenteritis definition: UK-wf
0.0
0.5
1.0
1.5
2.0
2.5
3.0
3.5
4.0
4.5
5.0
1 10 100 1000 10000 100000
95. Percentile of EC or IE / 100 ml
( %
)
EC Def. UK-wf
IE Def. UK-wf

- 224 -
Attributable risk (excess risk) of gastroenteritisby 95th percentiles of EC or IE exposure
at German fresh water bathing sites(SD of log10 transformed concentration data = 0.75)
Gastroenteritis definition: NL-2
0.0
0.5
1.0
1.5
2.0
2.5
3.0
3.5
4.0
4.5
5.0
1 10 100 1000 10000 100000
95. Percentile of EC or IE / 100 ml
( %
)
EC Def. NL-2
IE Def. NL-2
All definitions: Comparison with results from sea water exposure
0.0
1.0
2.0
3.0
4.0
5.0
6.0
7.0
8.0
9.0
10.0
1 10 100 1000 10000 100000
95. Percentile of IE / 100 ml
( %
)
IE Def. NL-2
IE Def. UK-wf
IE Def. UK
FS Def. UK ( Sea water )

- 225 -
Annex 34. Bases for a risk-related interpretation of monitoring
results: Area-integrated sampling according to ISO 5667-4
Assuming that microbiological concentrations in a water body of a certain bathing site
are lognormal distributed on the day of sampling, it is essential to increase the
probability that the sample result is close to the true median concentration if the health
risk from bathing at this site on the sampling day is to be estimated. The better the
estimate for the mean water quality is, the more reliable the estimate for the potential
health risk will be.
The best way to estimate the mean water quality would be to take multiple samples,
analyse them separately and calculate the geometric mean. However, this would also
multiply the costs of the analysis. ISO 5667-4 “Guidance on sampling from lakes,
natural and man-made” defines in chapter 3.4.2. an area-integrated sample as a "Water
sample obtained after combining a series of samples taken at various locations of a body
of water from a particular depth". This technique would only increase the time for
sampling but would not increase the costs of laboratory analysis.
The graphs in this annex illustrate the gain in precision when two-fold, three-fold or
four-fold area-integrated samples are collected from a water matrix with lognormal
distributed concentrations and a standard deviation of 0.4. The dot plots were generated
by combining 1000 random numbers from lognormal distributions with a median of 250
indicator organisms per 100 ml or a median concentration with 10,000 indicator
organisms per 100 ml on the x-axis with another set of 1000 random numbers from the
same distribution on the y-axis. The present mandatory value for E. coli in the EU (2000
EC/100 ml) is marked as a red line. The graphs demonstrate that the area-integrated
sampling technique would not only decrease the risk of false high estimates when the
water quality is good; it would also decrease the risk of misinterpreting the true
situation when the water quality is bad.

- 226 -
Legend:
left column: geometric mean = 250/100 mlright column: geometric mean = 10,000/100 ml
x random number from lognormal distribution (x-value)x_ random number from lognormal distribution (y-value)
2x/2 sum of 2 random numbers from lognormal distribution divided by 2 (x-value)2x/2_ sum of 2 random numbers from lognormal distribution divided by 2 (y-value)
3x/3 sum of 3 random numbers from lognormal distribution divided by 3 (x-value)3x/3_ sum of 3 random numbers from lognormal distribution divided by 3 (y-value)
4x/4 sum of 4 random numbers from lognormal distribution divided by 4 (x-value)4x/4_ sum of 4 random numbers from lognormal distribution divided by 4 (y-value)

- 227 -
geometric mean = 250 geometric mean = 10,000

- 228 -
Annex 35. Bases for a risk-related interpretation of monitoring
results: Calculation of the percentage of concentrations
exceeding the threshold of effect (NOAEL)
If a monitoring result is considered to be the most probable estimate for the mean water
quality on the sampling day, the percentage of concentrations probably exceeding the
threshold of effect (%>Th) can be calculated according to the following equation:
%>Th = (1 - p, normal (x = log10(Th);µ = log10(monitoring result); σ = 0.4))*100
When the bathers are randomly distributed over the beach it can be assumed that this is
also the percentage of bathers who are exposed above the threshold concentration, i. e.
the percentage of bathers who are at risk of acquiring e.g. gastroenteritis from 10
minutes of bathing and at least three head immersions. The percentage of bathers who
become ill (disease burden) can then be estimated by combining this figure with a dose
response model. When a step model is used the percentage of bathers who will probably
suffer from bathing-associated disease is simply the product of the percentage of bathers
exposed above threshold (%>Th) and the expected percentage of susceptible people in
the cohort (maximum incidence rate - base line risk).
The figures in this annex illustrate how estimates for different mean water qualities
(monitoring results) correspond with %>Th for lognormal distributed densities of
Escherichia coli with a standard deviation of 0.4. If other standard deviations are found
for certain bathing sites, these may of course replace the 0.4.
The formula for calculating %>Th values can easily be programmed in any standard
spread sheet calculation program. In MS Excel, for example, the formula for E. coli
concentrations (EC) and a threshold of 100 EC/100 ml would be:
%>Th = (1-NORMDIST(LOG10(100);LOG10(EC);0.4;TRUE))*100

- 229 -
However, the %>Th values for all possible concentrations of E. coli and intestinal
enterococci can also be listed in tables. Examples with standard deviations of 0.4 and
threshold levels for gastroenteritis of 100 EC/100 ml and 25 IE/100 ml are also
provided in this annex.
In this way concentrations of indicator organisms, which in and of themselves cannot be
interpreted, can be transformed into meaningful figures.
Legend:
Th Threshold of effect (NOAEL)%>Th percent concentrations exceeding the thresholdEC Escherichia coliIE Intestinal enterococci

- 230 -
0.0
0.1
0.2
0.3
0.4
0.5
0.6
0.7
0.8
0.9
1.0
0.01 0.10 1.00 10.00 100.00 1000.00 10000.00 100000.00
EC / 100 ml
pro
ba
bilit
y d
en
sit
y
0.0
0.1
0.2
0.3
0.4
0.5
0.6
0.7
0.8
0.9
1.0
above theshold
below threshold
Th = 100 EC / 100 ml
1 / 100 ml
0.4
0 % > Th
0.0
0.1
0.2
0.3
0.4
0.5
0.6
0.7
0.8
0.9
1.0
0.01 0.10 1.00 10.00 100.00 1,000.00 10,000.00 100,000.00
EC / 100 ml
pro
ba
bilit
y d
en
sit
y
0.0
0.1
0.2
0.3
0.4
0.5
0.6
0.7
0.8
0.9
1.0
above threshold
below threshold
Th = 100 EC / 100 ml
10 / 100 ml
1 % > Th
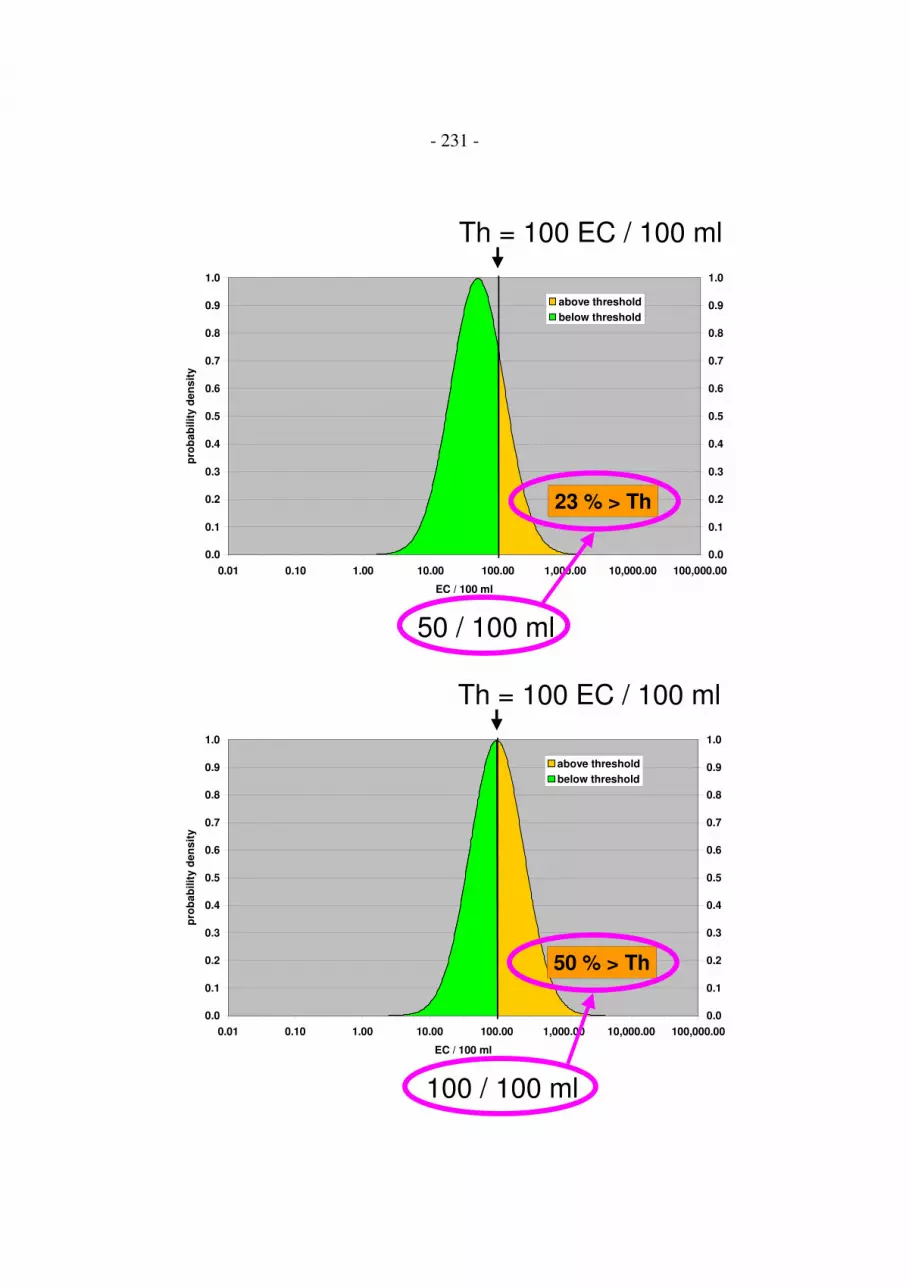
- 231 -
0.0
0.1
0.2
0.3
0.4
0.5
0.6
0.7
0.8
0.9
1.0
0.01 0.10 1.00 10.00 100.00 1,000.00 10,000.00 100,000.00
EC / 100 ml
pro
ba
bilit
y d
en
sit
y
0.0
0.1
0.2
0.3
0.4
0.5
0.6
0.7
0.8
0.9
1.0
above threshold
below threshold
Th = 100 EC / 100 ml
50 / 100 ml
23 % > Th
0.0
0.1
0.2
0.3
0.4
0.5
0.6
0.7
0.8
0.9
1.0
0.01 0.10 1.00 10.00 100.00 1,000.00 10,000.00 100,000.00
EC / 100 ml
pro
ba
bilit
y d
en
sit
y
0.0
0.1
0.2
0.3
0.4
0.5
0.6
0.7
0.8
0.9
1.0
above threshold
below threshold
Th = 100 EC / 100 ml
100 / 100 ml
50 % > Th

- 232 -
0.0
0.1
0.2
0.3
0.4
0.5
0.6
0.7
0.8
0.9
1.0
0.01 0.10 1.00 10.00 100.00 1,000.00 10,000.00 100,000.00
EC / 100 ml
pro
ba
bilit
y d
en
sit
y
0.0
0.1
0.2
0.3
0.4
0.5
0.6
0.7
0.8
0.9
1.0
above threshold
below threshold
Th = 100 EC / 100 ml
500 / 100 ml
96 % > Th
0.0
0.1
0.2
0.3
0.4
0.5
0.6
0.7
0.8
0.9
1.0
0.01 0.10 1.00 10.00 100.00 1,000.00 10,000.00 100,000.00
EC / 100 ml
pro
bab
ilit
y d
en
sit
y
0.0
0.1
0.2
0.3
0.4
0.5
0.6
0.7
0.8
0.9
1.0
above threshold
below threshold
Th = 100 EC / 100 ml
>1073 / 100 ml
100 % > Th

- 233 -
Table: % >Th for Escherichia coli ConcentrationsSD=0.4; Th = 100 EC/100 ml
EC / 100 ml >Th %
0 - 9 = 0 %
10 - 13 = 1 %
14 - 16 = 2 %
17 - 18 = 3 %
19 - 20 = 4 %
21 - 22 = 5 %
23 - 24 = 6 %
25 - 26 = 7 %
27 - 28 = 8 %
29 = 9 %
30 - 31 = 10 %
32 - 33 = 11 %
34 = 12 %
35 - 36 = 13 %
37 = 14 %
38 - 39 = 15 %
40 = 16 %
41 - 42 = 17 %
43 = 18 %
44 - 45 = 19 %
46 = 20 %
47 - 48 = 21 %
49 = 22 %
50 - 51 = 23 %
52 = 24 %
53 - 54 = 25 %
55 - 56 = 26 %
57 = 27 %
58 - 59 = 28 %
60 = 29 %
61 - 62 = 30 %
63 - 64 = 31 %
65 = 32 %
66 - 67 = 33 %
68 - 69 = 34 %
70 = 35 %
71 - 72 = 36 %
73 - 74 = 37 %
75 - 76 = 38 %
77 - 78 = 39 %
79 - 80 = 40 %
81 - 82 = 41 %
83 - 84 = 42 %
85 - 86 = 43 %
87 - 88 = 44 %
89 - 90 = 45 %
91 - 92 = 46 %
93 - 94 = 47 %
95 - 96 = 48 %
97 - 98 = 49 %
99 - 101 = 50 %
102 - 103 = 51 %
104 - 105 = 52 %
106 - 108 = 53 %
109 - 110 = 54 %
111 - 113 = 55 %
114 - 117 = 56 %
118 - 119 = 57 %
EC / 100 ml >Th %
120 - 121 = 58 %
122 - 124 = 59 %
125 - 127 = 60 %
128 - 130 = 61 %
131 - 134 = 62 %
135 - 137 = 63 %
138 - 140 = 64 %
141 - 144 = 65 %
145 - 148 = 66 %
149 - 151 = 67 %
152 - 155 = 68 %
156 - 159 = 69 %
160 - 164 = 70 %
165 - 168 = 71 %
169 - 173 = 72 %
174 - 178 = 73 %
179 - 183 = 74 %
184 - 188 = 75 %
189 - 194 = 76 %
195 - 200 = 77 %
201 - 206 = 78 %
207 - 213 = 79 %
214 - 220 = 80 %
221 - 228 = 81 %
229 - 236 = 82 %
237 - 245 = 83 %
246 - 254 = 84 %
255 - 265 = 85 %
266 - 276 = 86 %
277 - 288 = 87 %
289 - 302 = 88 %
303 - 317 = 89 %
318 - 334 = 90 %
335 - 353 = 91 %
354 - 376 = 92 %
377 - 403 = 93 %
404 - 435 = 94 %
436 - 476 = 95 %
477 - 530 = 96 %
531 - 608 = 97 %
609 - 737 = 98 %
738 - 1072 = 99 %
1073 - > 1073 = 100 %

- 234 -
Table: %>Th for Intestinal Enterococci ConcentrationsSD=0.4; Th = 25 IE/100 ml
IE / 100 ml > Th %
0 - 2 = 0 %
3 = 1 %
4 = 2 %
5 = 4 %
6 = 6 %
7 = 8 %
8 = 11 %
9 = 13 %
10 = 16 %
11 = 19 %
12 = 21 %
13 = 24 %
14 = 26 %
15 = 29 %
16 = 31 %
17 = 34 %
18 = 36 %
19 = 38 %
20 = 40 %
21 = 42 %
22 = 44 %
23 = 46 %
24 = 48 %
25 = 50 %
26 = 52 %
27 = 53 %
28 = 55 %
29 = 56 %
30 = 58 %
31 = 59 %
32 = 61 %
33 = 62 %
34 = 63 %
35 = 64 %
36 = 65 %
37 = 66 %
38 = 68 %
39 = 69 %
40 - 41 = 70 %
42 = 71 %
43 = 72 %
44 = 73 %
45 = 74 %
46 - 47 = 75 %
48 = 76 %
49 - 50 = 77 %
51 = 78 %
52 - 53 = 79 %
IE / 100 ml > Th %
54 - 55 = 80 %
56 - 57 = 81 %
58 - 59 = 82 %
60 - 61 = 83 %
62 - 63 = 84 %
64 - 66 = 85 %
67 - 69 = 86 %
70 - 72 = 87 %
73 - 75 = 88 %
76 - 79 = 89 %
80 - 83 = 90 %
84 - 88 = 91 %
89 - 94 = 92 %
95 - 100 = 93 %
101 - 108 = 94 %
109 - 119 = 95 %
120 - 132 = 96 %
133 - 152 = 97 %
153 - 184 = 98 %
185 - 268 = 99 %
269 - > 269 = 100 %

Annex 36. Bases for a risk-related interpretation of monitoring
results: Calculation of time-integrated quality scores
The principle aim of monitoring recreational waters for faecal indicator organisms is to
protect the health of bathers from infectious agents which can be spread with human or
animal faeces. If at the end of a monitoring period beaches are classified into different
quality categories according to the results of monitoring for faecal indicator organisms,
the quality categories should reflect the mean health risk at the various sites in the most
objective way possible. It is a nuisance when bathing sites with lower health risks are
classified into lower quality categories than bathing sites with high health risks, as
happens with the current classification system in the EU. Misclassifications detract from
the confidence in a monitoring and classification system, and encourage counter-
productive strategies to "outsmart" the system. An example: with the current monitoring
system in the EU it is beneficial to collect additional samples in between the routine
monitoring intervals when the water quality can be expected to be good, while it is
disadvantageous to collect additional samples when the water quality is bad. This runs
contrary to what a good HACCP concept should result in. Health authorities would
often like to take additional samples when the water quality is bad, and they would also
like to take multiple samples at various sampling points to look for spot contamination.
However, if additional sampling results during short periods of low water quality have
an over-proportional influence on the final classification result, health authorities can
hardly justify their activities, especially when superior authorities also protect the
touristic and financial interests of the municipality which is managing a beach. This
problem would not be solved with any of the other monitoring and classification
systems which have been proposed either by the WHO (1998, 2003) or by the
Commission of the European Union (2002).
Therefore it has been proposed that bathing sites be classified according to a time-
integrated quality score (Wiedenmann et al., 2003). The score is based on estimates for
the percentage of indicator concentrations which exceed the thresholds of effect

- 236 -
(NOAEL's) for gastroenteritis ("%>Th") as explained in the corresponding Annex
("Bases for a risk-related interpretation of monitoring results: Calculation of the
percentage of concentrations exceeding the threshold of effect (NOAEL)").
The score is expressed in a figure between 0 and 100%, and can be calculated according
to a simple equation:
Time-integrated Quality Score = sum((%>Th)*days))/total days
“%>Th” is the estimated percentage of concentrations exceeding the threshold of effect
(NOAEL) on the day of sampling, “days” is the number of days until the next sampling
date, and “total days” is the total number of days of the bathing season. If two or more
indicator organisms with different thresholds of effect are monitored simultaneously,
the higher "%>Th"-value is used for the calculation in each case.
If it is assumed that bathing activities are randomly distributed over the bathing season,
the score can be interpreted as an estimate for the percentage of bathers who were
exposed above threshold of effect concentrations during that season. Thus, the score is
easy to interpret, and its meaning can be easily explained to the public. It would then be
a political decision to define score ranges which are considered to be "excellent",
"good", "acceptable" or "poor."

- 237 -
Classification of bathing sites according to the time-integrated quality score would have
the following advantages:
1. The classification would be strictly risk-related, i. e. based on estimates for the
mean health risk from faecal water pollution at the various bathing sites.
2. These risk estimates are essentially based on epidemiological evidence from
studies with a randomised, controlled trial design.
3. The quality score is independent of the variable susceptibility of different cohorts
to infectious agents (e. g. tourists vs. local residents; UK cohort vs. German
cohort, etc.).
4. The score accounts for the fact that the risk of infectious disease from bathing in
faecally contaminated water does not increase with increasing indicator densities
after having reached a maximum risk level. It also accounts for the fact that the
risk from bathing cannot be less than zero. It is therefore less affected by
statistical outliers (low or high) than other methods.
5. The score does not depend on any distribution assumptions for the changes in the
mean microbiological water quality which occur during the bathing season; i. e. it
doesn't matter whether these changes are e. g. lognormal distributed or whether
they have a "messy" multiple-peak or chaotic distribution.
6. The score is free of any of the possible paradox reactions which can be
encountered with classification according to the percentile approach, where, for
example, a 95th percentile can increase when the water quality tends to become
better or when a low value is added to a group of higher values. It is also
impossible that the score has a higher value than any of the values which are used
to calculate the score.

- 238 -
7. It would be advantageous to control a high value as soon as possible, to keep the
time period short for which it counts; i. e. health authorities would not come into
conflict with other interests (touristic, financial) for intensifying their control
measures when the water quality has deteriorated.
8. If more than one sample is collected at a certain beach on a single day, e. g. due to
complaints of bathers, the geometric mean of these sample results could be used
in the score calculation.
9. The system would be open for supplementary monitoring schemes which may be
performed by licensed laboratories e. g. on behalf of environmental organisations,
tourist associations, etc.
10. If the number of bathers at a beach is recorded during the bathing season, it is
very easy to compute e. g. the expected number of gastroenteritis cases that have
probably occurred during that season ("disease burden"). This calculation can be
done for different susceptibilities of cohorts. Thus, health authorities could
calculate where infra-structural measures to improve the water quality would be
most efficient.
One potential argument against this concept could be that a microbiological water
quality detected on a certain day will almost never stay the same for the number of days
until the next sample is collected. However, to carry a value forward until the next result
is available is the most reasonable thing to do. All other assumptions would be even
more speculative, and in fact health authorities as well as bathers "behave" accordingly
during the time interval between two consecutive measurements. They assume that the
latest result is the one which is valid for the moment, because no other information is
available.
Another concern was that the final result could be skewed, if only the bad results are
controlled by additional measurements but the good results are accepted as is. However,

- 239 -
classification results with conventional methods (e. g. calculation of 95% compliance
rates with mandatory values or the calculation of 95th percentiles) are already skewed
towards the "worse" side by the random error which is due to the limited number of
samples which can be used in these calculations (Wiedenmann, 2003). In addition, it is
a common experience of health authorities that unexpectedly high monitoring results
often cannot be reproduced by control measurements nor can they be explained by any
systematic contamination e. g. from agricultural run-off or sewage discharge. They may
be due to faecal accidents of human or animal origin, especially water fowl, and have
little significance for the classification of a bathing site as no water quality directive
whatsoever can prevent such accidents. A mechanism that partially compensates for
these sources of error is therefore reasonable as well.
The table and the figures in this annex illustrate how a time-integrated quality score is
calculated using sampling dates and monitoring results for Escherichia coli, how the
results can be transformed into estimates for disease burden of a bathing site, how the
results can be plotted in quality control charts for the bathing season, and how the score
correlates with other methods of classification of recreational water quality.

- 240 -
SampleNo.
SamplingDate
No. ofDays
EC/100ml %>Th (%>Th)*days % GE (%GE)*days
1 27.04.00 14 41 17 233 0.8 11.0
2 11.05.00 12 49 22 263 1.0 12.4
3 23.05.00 14 60 29 405 1.4 19.1
4 06.06.00 22 17 3 60 0.1 2.8
5 28.06.00 17 30 10 162 0.4 7.6
6 15.07.00 19 30 10 182 0.4 8.5
7 03.08.00 12 320 90 1076 4.2 50.6
8 15.08.00 7 1500 100 699 4.7 32.8
9 22.08.00 7 410 94 656 4.4 30.8
10 29.08.00 8 38 15 117 0.7 5.5
11 06.09.00 24 142 65 1556 3.0 73.1
End 30.09.00
Total days 156 Sum 5410 Sum 254.3
TIQS 35 % DB 1.6 %
Table 1: Example for the calculation of a Time-integrated Quality Score
LegendSample No. Sample numberSampling Date Date when the sample was collectedNo. of Days Number of days between two consecutive sampling daysEC/100ml Concentration of Escherichia coli / 100ml%>Th Estimated percentage of concentrations above threshold concentration
(NOAEL) on the sampling day. It is assumed that EC/100ml is the median oflognormal distributed concentrations with a standard deviation of 0.4 on thesampling day.
(%>Th)*days Product of (%>Th) and (No. of Days)Total days Total number of days between first sampling day and end of the bathing
seasonTIQS Time-integrated Quality Score (Estimated percentage of bathers exposed
above threshold of effect during the monitoring period)Calculation: Sum((%>Th)*days)/total days
%GE Estimated percentage of bathers who would acquire gastroenteritis (GE-Definition: UK-wf) from 10 minutes bathing and at least three headimmersions at a German fresh water bathing site in a cohort of localresidents with 4.7% susceptible individuals.Calculation: (%>Th)*0.047.Step model parameters of dose response relationship:baseline incidence rate = 2.8%; Threshold of effect = 100EC/100ml;maximum incidence rate = 7.5%
(%GE)*days Product of (%GE) and (No. of Days)DB Disease burden (estimated percentage of bathers acquiring gastroenteritis
from 10 minitues bathing and at least three head immersions during themonitoring period).Calculation: sum((%GE)*days)/total days

- 241 -
Quality Control Chartbased on the monitoring data listed in Table 1 of this annex.
0
10
20
30
40
50
60
70
80
90
100
27.0
4.00
04.0
5.00
11.0
5.00
18.0
5.00
25.0
5.00
01.0
6.00
08.0
6.00
15.0
6.00
22.0
6.00
29.0
6.00
06.0
7.00
13.0
7.00
20.0
7.00
27.0
7.00
03.0
8.00
10.0
8.00
17.0
8.00
24.0
8.00
31.0
8.00
07.0
9.00
14.0
9.00
21.0
9.00
28.0
9.00
( %
)
% bathers exposed abovethreshold ( EC or IE )
expected excess risk (GE)
60
1730
3201073
410
38
142
Monitoring period (time scale)
100
90
80
70
60
50
40
30
20
10
0
(%> Th)
3041
Time-integrated Quality Score = 35 %
EC/100ml
49
30.Sep.27.Apr.
0
10
20
30
40
50
60
70
80
90
100
27.0
4.00
04.0
5.00
11.0
5.00
18.0
5.00
25.0
5.00
01.0
6.00
08.0
6.00
15.0
6.00
22.0
6.00
29.0
6.00
06.0
7.00
13.0
7.00
20.0
7.00
27.0
7.00
03.0
8.00
10.0
8.00
17.0
8.00
24.0
8.00
31.0
8.00
07.0
9.00
14.0
9.00
21.0
9.00
28.0
9.00
( %
)
% bathers exposed abovethreshold ( EC or IE )
expected excess risk (GE)
60
1730
3201500
410
38
142
Monitoring period (time scale)
1009080
7060
504030
2010
0
(%> Th)
3041
EC/100ml
49
30.Sep.27.Apr.
Disease burden = 1.6 %
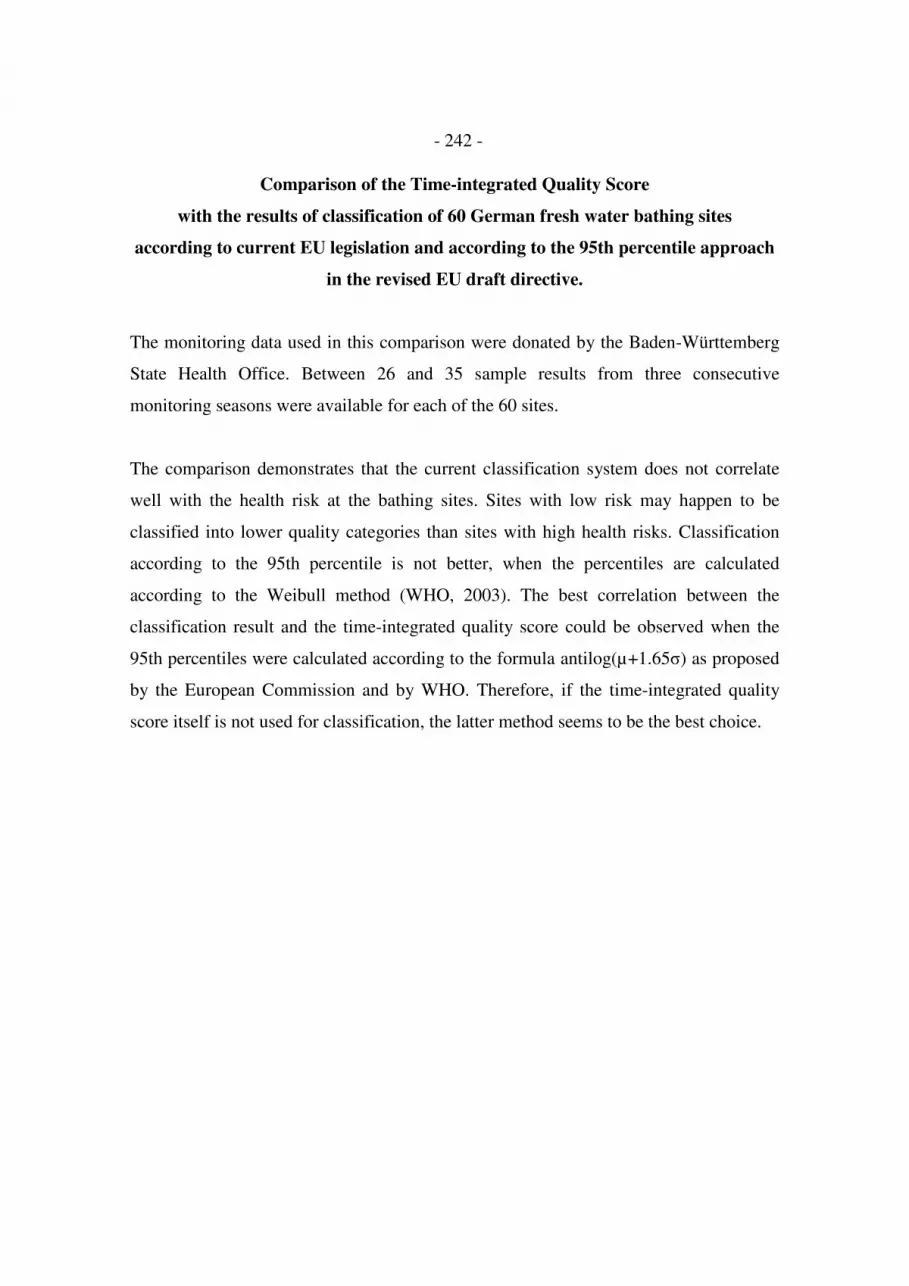
- 242 -
Comparison of the Time-integrated Quality Score
with the results of classification of 60 German fresh water bathing sites
according to current EU legislation and according to the 95th percentile approach
in the revised EU draft directive.
The monitoring data used in this comparison were donated by the Baden-Württemberg
State Health Office. Between 26 and 35 sample results from three consecutive
monitoring seasons were available for each of the 60 sites.
The comparison demonstrates that the current classification system does not correlate
well with the health risk at the bathing sites. Sites with low risk may happen to be
classified into lower quality categories than sites with high health risks. Classification
according to the 95th percentile is not better, when the percentiles are calculated
according to the Weibull method (WHO, 2003). The best correlation between the
classification result and the time-integrated quality score could be observed when the
95th percentiles were calculated according to the formula antilog(µ+1.65σ) as proposed
by the European Commission and by WHO. Therefore, if the time-integrated quality
score itself is not used for classification, the latter method seems to be the best choice.

- 243 -
Sais
on>
Th_E
CF
S (
%)
2000-2
002
0
10
20
30
40
50
60
70
blau grün rot
Beurteilung alt_GCEC 2000-2002 sB
blue green red
“old” classification: percentage-method
n = 60 beaches
T
ime-i
nte
gra
ted
Qu
ality
Sco
re (
%)
Legend
blue site complied with guide values for total coliforms and faecal coliforms in at least80%, and with mandatory values in at least 95% of the samples in each of thethree years
green site complied with mandatory values for total coliforms and faecal coliforms in atleast 95% of the samples in each of the three years
red site did not comply with mandatory values for total coliforms or faecal coliforms inmore than 5% of the samples of at least one of the three years

- 244 -
Sa
iso
n>
Th
_E
CF
S (
%)
0
10
20
30
40
50
60
ausgezeichnet gut mangelhaft
Beurteilung neu_ECFS_q
n = 60 beaches
excellent good poor
“new” classification: Weibull-method
T
ime-i
nte
gra
ted
Qu
ality
Sco
re (
%)
Sa
iso
n>
Th
_E
CF
S (
%)
20
00
-20
02
0
10
20
30
40
50
60
70
ausgezeichnet gut mangelhaft
Beurteilung neu_ECFS 2000-2002
excellent good poor
“new” classification: percentile-method
T
ime-i
nte
gra
ted
Qu
ality
Sco
re (
%)
n = 60 beaches
Legend:
excellent 95th percentile for Escherichia coli ≤ 250/100ml,and for faecal streptococci ≤ 100/100ml
good 95th percentile for Escherichia coli ≤ 500/100ml,and for faecal streptococci ≤ 200/100ml
poor 95th percentile for Escherichia coli >250/100ml,and for faecal streptococci >200/100ml

- 245 -
Annex 37. Materials used for study organisation:
Press release
To inform public media a press release was launched by the University of Tübingen
three to four weeks ahead of each of the trials. The release explained the scientific
background and aims of the study and included information on the location of the study
site, the time-table, and phone numbers of the project managment team, an e-mail
address and the URL of the study web site for more detailed information. An example
in German language is given in this annex.

- 246 -
Pressemitteilung
Tübingen, 21. Mai 2000
"Planschen für die Wissenschaft"
Teil 4 der umweltmedizinischen Studie findet am 16. Juni im Strandbad Marli
in Lübeck statt – 500 Badefans gesucht – Teilnehmer können sich ab sofort anmelden.
"Planschen für die Wissenschaft" - Unter diesem Motto findet am Samstag, 16. Juni,
im Strandbad Marli in Lübeck in Zusammenarbeit mit dem Bereich Umweltschutz der
Hansestadt Lübeck, der Lübecker Schwimmbäder GmbH und dem Institut für Hygiene
und Umweltmedizin der Universität Kiel ein Forschungsprojekt des
Umweltbundesamts und des Instituts für Allgemeine Hygiene und Umwelthygiene der
Universität Tübingen statt. Dabei sollen die 1976 von der Europäischen Union
festgelegten Richtlinien und Grenzwerte zur mikrobiologischen Qualität von
Süßwasser-Badestellen unter der Leitung des Facharztes für Hygiene und
Umweltmedizin Dr. Albrecht Wiedenmann überprüft werden. Für die groß angelegte
Studie werden 500 Versuchsteilnehmer aus Lübeck gesucht, die unter dem Motto
"Planschen für die Wissenschaft" für zehn Minuten Baden gehen.
• Hintergrund:
Das Umweltbundesamt lässt dieses Forschungsprojekt in der Badesaison 2000 und 2001
stellvertretend für die deutschen Süßwasser-Badestellen an insgesamt fünf
verschiedenen Binnengewässern in Deutschland durchführen, die nach der

- 247 -
Badegewässerrichtlinie der Europäischen Union laufend kontrolliert werden und im
Hinblick auf die Wasserqualität den Bestimmungen entsprechen: die ersten drei Studien
fanden bereits im vergangenen Jahr am Baggersee Kirchentellinsfurt bei Tübingen, in
Unteruhldingen am Bodensee und im Strandbad Plötzensee in Berlin statt. das fünfte
Projekt ist im August in Bayern geplant. Obwohl die Badegewässerrichtlinie bereits seit
1976 besteht, wurden in Deutschland bisher noch nie Gesundheitsdaten im
Zusammenhang mit dem Baden in Naturgewässern auf diese systematische Weise
erhoben.
Mit den fünf Studien soll festgestellt werden, ob durch die Badegewässerrichtlinie
sichergestellt wird, dass es beim Baden in unseren heimischen Gewässern nicht zu
gesundheitlichen Beeinträchtigungen durch Mikroorganismen kommt. Dabei sollen
hauptsächlich leichtere Beschwerden erfasst werden, mit denen die Menschen
normalerweise nicht zum Arzt gehen und die deshalb in der Regel unbekannt bleiben: z.
B. leichte Augen-, Ohren- und Rachenentzündungen oder leichte Magen-Darm-Infekte.
Da solche Beschwerden auch völlig unabhängig vom Baden auftreten können, werden
die 500 Badewilligen erst im Strandbad nach dem Zufallsprinzip entweder der
"Badegruppe" oder einer gleich großen "Nichtbadegruppe" zugeteilt, die dann als
Vergleichsgruppe dient. Parallel zu der Badeaktion werden in kurzen Abständen
Wasserproben gezogen und in einem mobilen Laboratorium gleich vor Ort
mikrobiologisch untersucht. So können die Wissenschaftler überprüfen, ob evtl.
auftretende gesundheitliche Beschwerden auch unterhalb der Grenzwerte der
Badegewässerrichtlinie in einem Zusammenhang mit der im Wasser gemessenen
Konzentration an Mikroorganismen stehen.
Mit der Untersuchung sollen keinerlei Aussagen zur Wasserqualität eines einzelnen
Gewässers gemacht werden. Die Ergebnisse sollen möglichst allgemein gültig und
auf andere Binnengewässer übertragbar sein. Daher werden die Daten aller fünf
Erhebungen erst Ende des Jahres 2001 in anonymisierter Form zusammen gerechnet
und gemeinsam ausgewertet.

- 248 -
Was genau erwartet die Teilnehmer aus Lübeck? Sie erhalten bei der Anmeldung
zur Studie ein Informationsblatt und unterschreiben eine Teilnahmeerklärung. Ein erstes
Interview zum allgemeinen Gesundheitszustand, zu den Ernährungsgewohnheiten etc.,
sowie eine kurze ärztliche Untersuchung (Augen-, Ohren- und Rachen-Inspektion)
findet nach Terminabsprache am Mittwoch, dem 13. Juni, oder Donnerstag, dem 14.
Juni, im Rathaus in Lübeck statt. Dabei wird der erste von insgesamt vier Fragebögen
ausgefüllt. Der zweite folgt am Badetag selbst, der dritte eine Woche später (wieder im
Rahmen eines Interviews mit kurzer Untersuchung) und der vierte wird drei Wochen
nach dem Badetag zuhause ausgefüllt. Für den Badetag, Samstag, den 16. Juni, erhalten
die Teilnehmer einen Termin für den Strandbadbesuch zwischen 11:30 Uhr und 14:30
Uhr. Eine Woche vor und eine Woche nach diesem Badetermin sollten die
Studienteilnehmer nicht in Naturgewässern baden.
Am Badetag werden die "Bade-Gruppe" und "Nichtbade-Gruppe" gebildet. Wer baden
geht, sollte zehn Minuten im Wasser bleiben und in dieser Zeit drei Mal den Kopf kurz
unter Wasser tauchen. Sog. Badebetreuer protokollieren dabei genau, wann wer wo im
Wasser war, damit die einzelnen Teilnehmer später den Messwerten der Wasserqualität
exakt zugeordnet werden können. Wegen des großen Organisationsaufwandes läuft die
Studie auch bei schlechtem Wetter. Allerdings kann dann am Strand in den ca. 30
Zeltpavillons Zuflucht gesucht werden. Für die Teilnehmer ist der Besuch des
Strandbads an diesem Tag übrigens kostenlos. Damit alle Teilnehmer auch hinsichtlich
der Ernährung ähnlichen Bedingungen ausgesetzt sind, wird außerdem für ein
kostenloses Lunchpaket gesorgt.
• Wer kann teilnehmen ?
Teilnehmen kann, wer gesund und volljährig ist. Jugendliche zwischen 14 und 18
Jahren können mit einer Einverständniserklärung beider Eltern oder Erziehungs-
berechtigten selbständig teilnehmen. Kinder zwischen 4 und 14 Jahren benötigen
ebenfalls die Einverständniserklärung beider Eltern oder Erziehungsberechtigten und
können in Begleitung mindestens eines Elternteils oder eines Erziehungsberechtigten
teilnehmen.

- 249 -
• Wie kann man sich anmelden ?
Anmelden kann man sich telefonisch unter unter 0177-300-1432 bzw. -1434 oder per e-
mail unter [email protected]. Man bekommt dann eine
Teilnahmeerklärung zugeschickt, die zum 1. Interview mitgebracht werden muss.
Nähere Informationen gibt's auch unter http://www.badegewaesserstudie.de im Internet.
Hier kann auch das Merkblatt und die Teilnahmeerklärung abgerufen und ausgedruckt
werden.
• Was bekommt man dafür ?
Wer die Studie bis zum letzten Fragebogen am 7. Juli mitmacht, erhält eine
Aufwandsentschädigung von 50 Mark. Da 500 Personen, die genügend Zeit und
Begeisterung für ein solches Forschungsprojekt mitbringen, nicht leicht zu finden sind,
werden die Teilnehmer gebeten, auch Familienangehörige, Freunde, Bekannte,
Kollegen etc. auf das Projekt aufmerksam zu machen. Nach dem Prinzip "Teilnehmer
werben Teilnehmer" erhält man für jeden weiteren angeworbenen Teilnehmer, der bis
zum letzten Fragebogen mit dabei bleibt, zusätzlich 10,- DM.
Nähere Informationen für die Medien:
Dr. Albrecht Wiedenmann
Eberhard-Karls-Universität Tübingen
Institut für Allgemeine Hygiene und Umwelthygiene
Wilhelmstraße 31; D-72074 Tübingen
Tel. 0177-300-1431 / Fax. 0177-99-300-1431
Internet: http://www.badegewaesserstudie.de,
E-mail: [email protected]

- 250 -
Annex 38. Examples for press reports before and after the bathing
trials at the five study sites
Reutlinger_Generalanzeiger_2000-05-23:
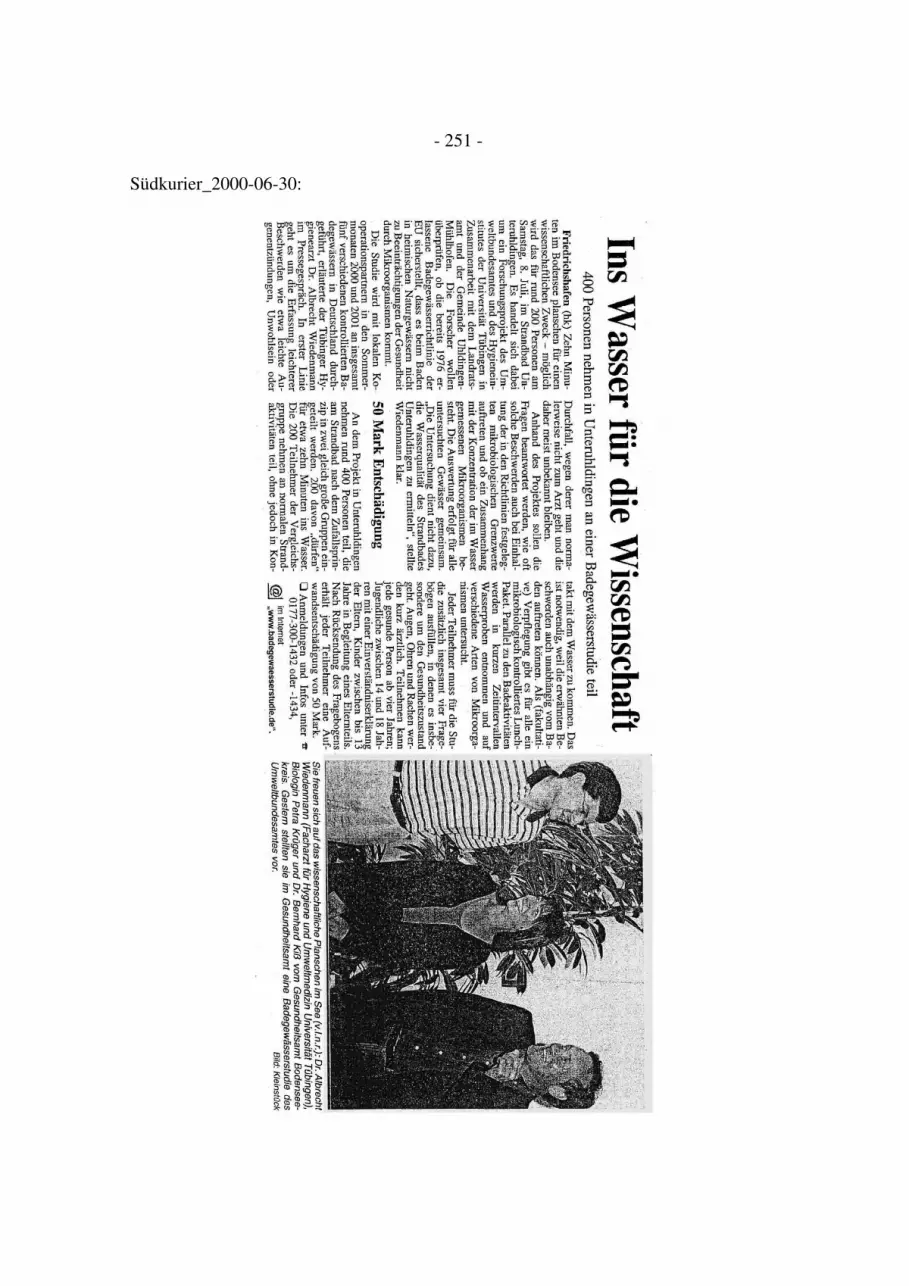
- 251 -
Südkurier_2000-06-30:

- 252 -
BILD_Berlin-Brandenburg_2000-08-02:
Neues_Deutschland_2000-08-03:

- 253 -
Lübecker_Nachrichten_2001-06-17:

- 254 -
AZ_München_2001-08-06:

- 255 -
Annex 39. Information flyer used for recruitment of participants

- 256 -
Annex 40. Information leaflet for participants and declaration of
participation
An information leaflet with a declaration of participation was handed out or sent by
mail or e-mail to people who took an interest in participation. The signed declaration of
participation was collected on registration before the first interview, and was kept in the
files together with the questionnaires.
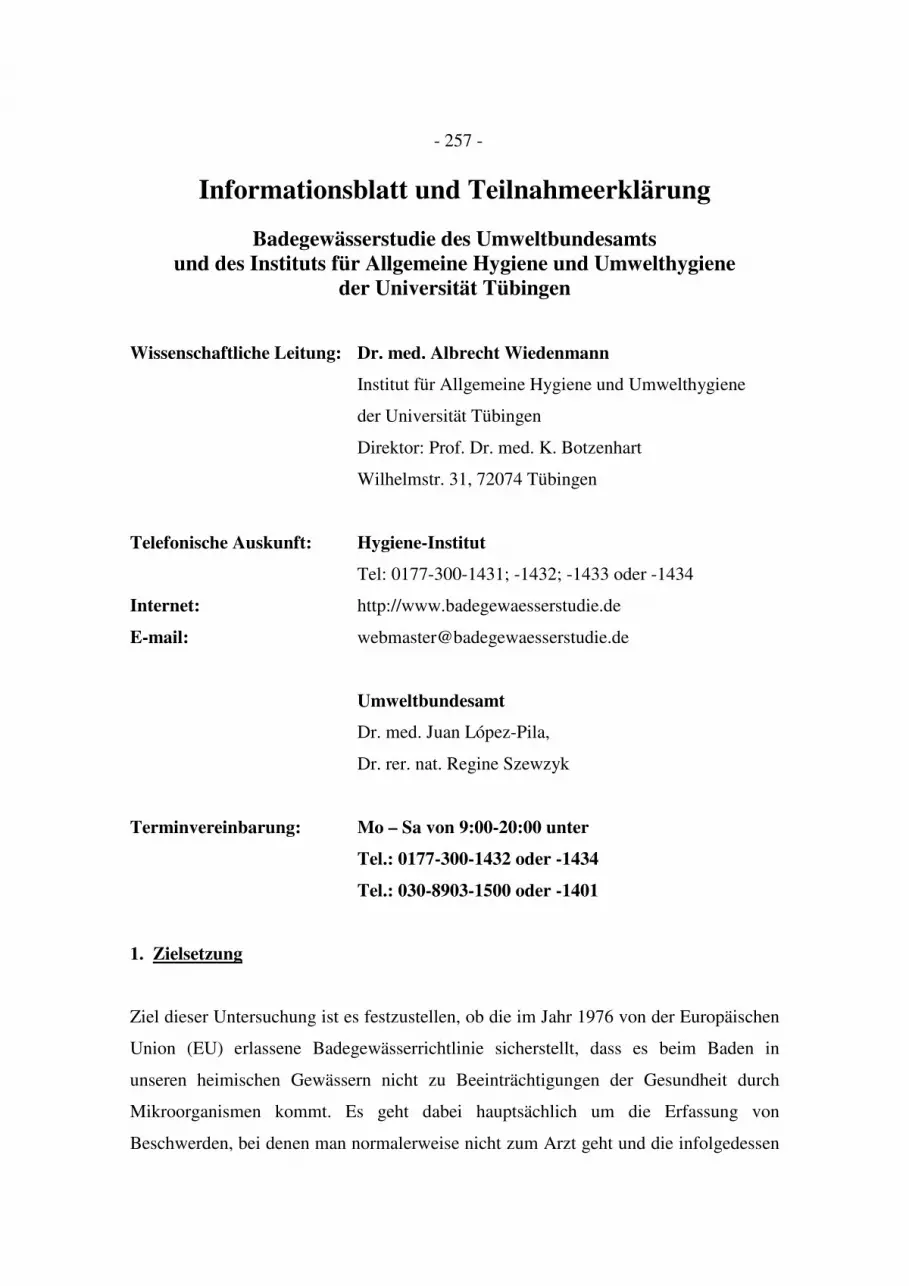
- 257 -
Informationsblatt und Teilnahmeerklärung
Badegewässerstudie des Umweltbundesamtsund des Instituts für Allgemeine Hygiene und Umwelthygiene
der Universität Tübingen
Wissenschaftliche Leitung: Dr. med. Albrecht Wiedenmann
Institut für Allgemeine Hygiene und Umwelthygiene
der Universität Tübingen
Direktor: Prof. Dr. med. K. Botzenhart
Wilhelmstr. 31, 72074 Tübingen
Telefonische Auskunft: Hygiene-Institut
Tel: 0177-300-1431; -1432; -1433 oder -1434
Internet: http://www.badegewaesserstudie.de
E-mail: [email protected]
Umweltbundesamt
Dr. med. Juan López-Pila,
Dr. rer. nat. Regine Szewzyk
Terminvereinbarung: Mo – Sa von 9:00-20:00 unter
Tel.: 0177-300-1432 oder -1434
Tel.: 030-8903-1500 oder -1401
1. Zielsetzung
Ziel dieser Untersuchung ist es festzustellen, ob die im Jahr 1976 von der Europäischen
Union (EU) erlassene Badegewässerrichtlinie sicherstellt, dass es beim Baden in
unseren heimischen Gewässern nicht zu Beeinträchtigungen der Gesundheit durch
Mikroorganismen kommt. Es geht dabei hauptsächlich um die Erfassung von
Beschwerden, bei denen man normalerweise nicht zum Arzt geht und die infolgedessen

- 258 -
in der Regel unbekannt bleiben: z. B. leichte Augen-, Ohren- und Rachenentzündungen,
Unwohlsein, Erbrechen, leichte Durchfallerkrankungen und Ähnliches.
Durch die Studie sollen folgende Fragen beantwortet werden:
1.) wie häufig treten solche Beschwerden auch bei Einhaltung der in der
Badegewässerrichtlinie festgelegten mikrobiologischen Grenzwerte auf ?
2.) besteht hierbei ein Zusammenhang mit der Konzentration der im Wasser
gemessenen Mikroorganismen ?
Hierzu werden insgesamt ca. 2000 Teilnehmer benötigt, die bereit sind, an einem
Wochenende an ein ganz normales öffentliches Badegewässer zu kommen, und in
einem mit Markierungsseilen abgegrenzten Bereich für 10 Minuten baden zu gehen.
Gleichzeitig werden in diesem Bereich in kurzen Abständen Wasserproben entnommen
und mikrobiologisch untersucht. Vor und einige Tage nach dem Baden werden die
Teilnehmer über ihren Gesundheitszustand befragt.
Die o. g. Beschwerden können natürlich auch völlig unabhängig vom Baden aus ganz
verschiedenen Ursachen auftreten. Es ist deshalb notwendig, die Häufigkeit dieser
Beschwerden auch bei einer Gruppe von Personen zu bestimmen, die nicht gebadet hat.
Die Gruppe der Nicht-Badenden sollte sich ansonsten aber möglichst wenig von der
Gruppe der Badenden unterscheiden. Die Teilnehmer an dieser Studie werden daher
nach dem Zufallsprinzip eingeteilt und erfahren erst am Strand, ob sie zur Gruppe der
Badenden oder Nicht-Badenden gehören. Da die mikrobiologische Untersuchung der
Wasserproben im Labor mindestens 1-2 Tage dauert bis die Ergebnisse vorliegen,
können weder die Studienteilnehmer noch die Organisatoren schon am Badetag wissen,
wie hoch oder niedrig die Konzentration von Mikroorganismen innerhalb der einzelnen
Badebereiche ist. Sie wissen lediglich, dass die mikrobiologischen Grenzwerte in
diesem Badegewässer eingehalten werden.

- 259 -
Da die gewonnenen Ergebnisse möglichst allgemein gültig sein sollen, wird die
Untersuchung an fünf verschiedenen Badegewässern innerhalb Deutschlands
durchgeführt. Die Auswertung erfolgt für alle untersuchten Gewässer gemeinsam. Es
geht also nicht darum, die Qualität eines bestimmten Badesees oder Badestrands zu
ermitteln. Es erfolgt aus diesem Grund auch keine Mitteilung von Messwerten an die
einzelnen Teilnehmer. Die Studie beschäftigt sich auch nicht mit ökologischen
Fragestellungen, z. B. mit Belangen des Naturschutzes oder Problemen wie
Gewässerüberdüngung, Algenwachstum, Verlandung usw.. Solche Probleme können an
manchen Badegewässern völlig unabhängig von der nach Badegewässerrichtlinie
ermittelten mikrobiologischen Wasserqualität vorhanden sein.
2. Beschreibung des Studienablaufs
Die Studie wird ausschließlich an Badegewässern durchgeführt, die laufend nach EU-
Richtlinie kontrolliert werden und von den Gesundheitsbehörden offiziell zum Baden
zugelassenen sind. Die Vorgaben der Badegewässerrichtlinie im Hinblick auf die
mikrobiologische Wasserqualität wurden an diesen Gewässern in den vergangenen
Jahren eingehalten.
Für die Studie werden pro Badestelle 400 Teilnehmer benötigt. Die Teilnehmer sollten
gesund und mindestens 4 Jahre alt sein. Jugendliche zwischen 14 und 18 Jahren können
mit einer Einverständniserklärung beider Eltern oder Erziehungsberechtigten
selbständig teilnehmen. Kinder zwischen 4 und 14 Jahren benötigen ebenfalls die
Einverständniserklärung beider Eltern oder Erziehungsberechtigten und können in
Begleitung mindestens eines Elternteils oder eines Erziehungsberechtigten teilnehmen.
Die Teilnehmer werden gebeten, sich 2-3 Tage vor dem Badetag zu einem telefonisch
vereinbarten Termin an einem zentral gelegenen Ort zu einem ersten Interview
(Befragung) einzufinden. Nach Vorlage der unterschriebenen Teilnahme-Erklärung
(nicht vergessen!) füllen Mitarbeiter des Projekts gemeinsam mit dem Teilnehmer einen
Fragebogen aus, in dem hauptsächlich Angaben zum Gesundheitszustand, zu den
Ernährungsgewohnheiten und den persönlichen Lebensverhältnissen gemacht werden

- 260 -
(Fragebogen Nr.1). Im Anschluß an das Interview prüft ein ebenfalls anwesender Arzt
die Angaben im medizinischen Teil des Fragebogens und bespricht sie mit dem
Teilnehmer. Der Arzt misst mit einem Infrarot-Thermometer im äußeren Gehörgang die
Körpertemperatur und schaut sich Augen, Ohren und Rachen an, um sicherzustellen,
dass keine Infektionskrankheit in diesem Bereich besteht. Er entscheidet dann, ob die
Person aus seiner Sicht an der Studie teilnehmen kann. Anschließend erhält der
Teilnehmer einen Termin für den Badetag (11:30; 12:00; 12:30; 13:00; 13:30 oder
14:00 Uhr) zu dem er sich am Badestrand einfinden soll.
Am Badetag melden sich die Teilnehmer zum vereinbarten Zeitpunkt am
Informationsstand. Sie erfahren erst jetzt, ob sie in die Gruppe der Badenden oder
Nicht-Badenden eingeteilt worden sind. Es besteht hierbei also keine Wahlmöglichkeit.
Auch ein Tausch mit anderen Teilnehmern, z. B. Freunden oder Verwandten, ist nicht
möglich. Wir empfehlen aus diesem Grund auch, dass jeder Teilnehmer seine eigenen
Strandutensilien (eigenes Handtuch, eigene Bastmatte etc.) mitbringt. Kinder, die nicht
selbständig baden können, werden zusammen mit mindestens einem Elternteil zum
Baden oder Nicht-Baden eingeteilt.
Um für alle Teilnehmer während des Aufenthalts am Strand möglichst gleiche
Ernährungsbedingungen zu schaffen, sollten am Badetag keine Lebensmittel am Strand
eingekauft oder mitgebracht werden, auch kein Eis, keine belegten Brote, Currywurst
etc.. Die Teilnehmer erhalten statt dessen ein einheitliches kostenloses Lunchpaket mit
Getränk.
Sie erfahren jetzt auch die Nummer ihres Betreuers am Strand, bei dem sie sich
anschließend melden sollen. Der Strand ist in vier jeweils 15-20 Meter breite Streifen
eingeteilt, die mit A bis D gekennzeichnet sind. Dorthin wenden sich die Badenden. Die
Nicht-Badenden sind in einem separaten Strandabschnitt untergebracht wo sie nicht in
Kontakt mit dem Wasser kommen, ansonsten aber die üblichen Aktivitäten ausüben
können (Sonnenbaden, Ballspielen etc.). Alle Projekthelfer tragen eine deutlich
sichtbare Nummer auf dem T-Shirt. Die Betreuer der Badenden haben ein blaues T-

- 261 -
Shirt und blaue Schirmmütze, die Betreuer der Nicht-Badenden tragen rote T-Shirts.
Andere Projekthelfer z. B. an den Info-Tischen sind an den grünen T-Shirts zu
erkennen. Der Betreuer führt gemeinsam mit den Teilnehmern, die sich bei ihm
gemeldet haben, das Badetag-Interview durch (Fragebogen Nr.2). Auch am Badetag
sind wieder Ärzte vor Ort, die bei Gesundheitsproblemen, die seit dem ersten Interview
neu aufgetreten sind, zu Rate gezogen werden. Nach dem Interview gehen die
Teilnehmer, die zum Baden eingeteilt sind, für 10 Minuten ins Wasser. Der Betreuer
protokolliert in diesen 10 Minuten alle Aktivitäten im Wasser (Schwimmen, Planschen
etc.). Die Teilnehmer werden gebeten, sich während dieser 10 Minuten möglichst dicht
bei einer der beiden Probenahmestellen im Wasser aufzuhalten. Diese sind mit einem
weißen oder blauen Luftballon gekennzeichnet. Zusätzlich sollten die Teilnehmer
mindestens 3-mal kurz den Kopf unter Wasser tauchen (Kinder natürlich nur, wenn sie
selbst Lust dazu haben!). Es werden auch genügend Schwimmhilfen (Schwimmbretter,
Wasserbälle etc.) zur Verfügung stehen, so dass man sich während der 10 Minuten
Badezeit im Wasser auch ausruhen kann. Nach dem Baden können die Teilnehmer
wieder nach Hause gehen oder noch weiter am Strand bleiben. Sie sollten jedoch nicht
erneut ins Wasser gehen. Alle Teilnehmer, auch die Nicht-Badenden, sollten unbedingt
versuchen, 1 Woche vor bis 1 Woche nach dem Badetag den Kontakt zu
Naturgewässern zu meiden.
Wegen des großen Organisationsaufwandes kann die Durchführung der Studie nicht
vom Wetter abhängig gemacht werden. Die Teilnehmer sollten daher bereit sein, auch
bei relativ schlechtem Wetter an die Badestelle zu kommen. Es ist in jedem Fall für
ausreichenden Regenschutz in Zelten gesorgt. Auch im umgekehrten Fall, bei zu starker
Sonneneinstrahlung, besteht die Möglichkeit, sich im Schatten der Zelte aufzuhalten.
Wie alle Badegäste sind auch die Teilnehmer dieser Studie gehalten, am Strand ist
jeweils gültige Strandordnung zu beachten.
1 Woche nach dem Badetag findet das 3. Interview statt, zu dem sich die Teilnehmer
erneut einen Termin geben lassen. Das Interview verläuft wieder wie das 1. Interview,

- 262 -
d.h. es wird ein Fragebogen ausgefüllt (Fragebogen Nr. 3), und es findet wieder eine
kurze ärztliche Untersuchung statt.
3 Wochen nach dem Badetag füllen die Teilnehmer den letzten Fragebogen aus
(Fragebogen Nr.4). Sie bekommen diesen Fragebogen zwei Tage vorher zugeschickt
und können ihn gleich nach dem Ausfüllen in einem mitgelieferten vorfrankierten
Umschlag an das Hygiene-Institut der Universität Tübingen zurückschicken.
3. Gesundheitsrisiko
Da die Studie an einem nach EU-Richtlinie kontrollierten und offiziell zugelassenen
Badegewässer durchgeführt wird, besteht für die Teilnehmer kein größeres
Gesundheitsrisiko, als für viele Millionen Menschen, die ebenfalls jedes Jahr an den
nach EU-Richtlinie kontrollierten Stränden Europas baden. Am Badetag werden
zusätzliche Gesundheitsschutzmaßnahmen getroffen, z. B. durch Anwesenheit von
Mitarbeitern des DRK, der DLRG o. Ä.. Jeder Badende wird außerdem von einem
Projekthelfer ständig beobachtet. Das allgemeine Baderisiko ist für die Studienteil-
nehmer daher erheblich geringer als normalerweise.
Wie bei anderen alltäglichen Freizeitaktivitäten in der freien Natur, z. B. Joggen im
Wald, bestehen auch beim Baden bestimmte Risiken, die nicht hundertprozentig
ausgeschlossen werden können. Hierunter fallen Verletzungen, z. B. durch
Glasscherben, oder durch Sturz nach Ausrutschen oder Abgleiten von der Ufer-
böschung. Im Extremfall droht beim Baden das Risiko des Ertrinkens, z. B. beim
Auftreten von Muskelkrämpfen oder Bewußtseinsverlust. In äußerst seltenen Fällen
können Erreger, die über wildlebende Nagetiere ins Wasser oder in den Boden
gelangen, durch die Haut oder durch Verschlucken von Wasser in den Körper
eindringen und zu hochfieberhaften Erkrankungen oder schweren Magen-Darm-
Infekten führen. Durch Ausscheidungen von Wasservögeln kann es zu Hautausschlägen
mit heftigem Juckreiz kommen. Ähnliche Symptome können von kleinen Parasiten
verursacht werden, die sich im Gras auf den Liegewiesen aufhalten. Auch nach

- 263 -
Zeckenstichen sind Hautausschläge oder schwere fieberhafte Erkrankungen möglich.
Wir empfehlen daher allen Teilnehmern, den behandelnden Arzt/Ärztin in solchen
Fällen auf den erfolgten Besuch eines Badesees oder einen erfolgten Zeckenstich
hinzuweisen. Alle diese Erkrankungen sind nicht Gegenstand dieses Forschungs-
projekts. Sie stehen in keinem Zusammenhang mit der nach Badegewässerrichtlinie
ermittelten Wasserqualität oder sind so selten, dass keine Chance bestünde, sie im
Rahmen einer Studie mit 2000 Teilnehmer überhaupt zu erfassen.
4. Versicherungsschutz
Für alle mit der Studie in Zusammenhang stehende Aktivitäten besteht ein zusätzlicher
Unfallversicherungsschutz mit einer Deckungssumme von 50.000/100.000 DM
(Ecclesia Versicherungsdienst GmbH). Für Schäden, die durch Projekthelfer oder
Projektmitarbeiter verursacht werden, tritt die Haftpflichtversicherung des Universitäts-
klinikums Tübingen ein. Im Falle von Erkrankungen ist die normale Kranken-
versicherung oder der Sozialversichungsträger erstattungspflichtig.
5. Datenschutz
Die personenbezogenen Daten der Teilnehmer werden streng vertraulich behandelt.
Eine Weitergabe an unbeteiligte Dritte erfolgt nicht. Zum Zwecke der wissen-
schaftlichen Auswertung werden die Daten anonymisiert. D. h. jeder Teilnehmer wird
nur noch anhand einer Nummer identifiziert. Alle Helfer und Projektmitarbeiter stehen
entweder selbst unter ärztlicher Schweigepflicht oder sie haben eine Schweigepflichts-
erklärung unterschrieben, wie sie von der Ärztekammer für Mitarbeiter eines Arztes
vorgesehen ist.

- 264 -
6. Spesen / Auslagen
Als Aufwandsentschädigung für die Teilnahme an der Studie erhalten alle Teilnehmer
am Ende 50,- DM. Voraussetzung für die Auszahlung der Aufwandsentschädigung ist
die Teilnahme an allen Interviews und am Badetag und die Rücksendung des
vollständig ausgefüllten 4. Fragebogens drei Wochen nach dem Badetag.
7. Zeitplan
Datum Uhrzeit Ort Anlass
Mi16.08.00
oderDo
17.08.00
15:00bis 21:00
Technischen Universität,Mathematikgebäude, Raum 301,
Straße des 17. Juni 135, gegenüberHauptgebäude, U-Bahnhof Ernst
Reuter Platz
1. Interview
Samstag19.08.00
ab 11:30bis 5:00
Strandbad Plötzensee Badetag2. Interview
Samstag26.08.00 10:00
bis 18:00
Technischen Universität,Mathematikgebäude, Raum 301,
Straße des 17. Juni 135, gegenüberHauptgebäude, U-Bahnhof Ernst
Reuter Platz
3. Interview
Samstag09.09.00
----- ------ 4. Fragebogenper Post
8. Zeitbedarf
• 1. Interview mit kurzer ärztlicher Untersuchung: ca. 30 min
• Badetag incl. 2. Interview: ca. 1-1,5 Std., nach Belieben auch länger
• 3. Interview mit kurzer ärztlicher Untersuchung: ca. 20 min
• 4. Fragebogen zu hause: ca. 20 min

- 265 -
9. Terminvereinbarung für das 1. Interview:
(((( Tel.: 0177-300-1432 bzw. -1434, Sprechzeiten: Mo - Sa 9:00-20:00
oder
(((( Tel.: 030-8903-1500 oder -1401, Sprechzeiten: Mo - Do 8:00-16:00
Termin vergessen / ändern / absagen? àààà ( Telefon wie oben
Bitte 1 Woche vor und 1 Woche nach dem Badetag
nicht mehr in einem Naturgewässer ( Strandbad, See, Baggersee, Fluss, Meer)
baden !
Zustimmung zur Badegewässerstudie des Umweltbundesamts und des Instituts für
Allgemeine Hygiene und Umwelthygiene der Universität Tübingen
• Ich habe Abschnitt 1-9 der Teilnehmerinformation gelesen und verstanden.
Eventuelle zusätzliche Fragen wurden mir ausreichend beantwortet
• Ich werde am Badetag nur teilnehmen, wenn ich mich gesund fühle und keine
Erkrankungen habe, bei denen Baden ein ernsthaftes Risiko für mich bedeuten
würde (z. B. frische Operationswunden, Herzbeschwerden, Kollapsneigung, offene
Hautausschläge, Immundefekt). Im Zweifelsfall werde ich ärztlichen Rat einholen.
Ich werde auch nicht kommen, wenn ich unter akuten Infektionskrankheiten leide,
die auf andere Teilnehmer übertragbar sind. z. B. Durchfall, Fieber, Erbrechen,
ansteckende Hautausschläge)
• Ich weiß, dass ich, ggf. zusammen mit meinen Kindern, am Badetag nach dem
Zufallsprinzip in die Gruppe der Badenden oder der Nicht-Badenden eingeteilt
werde und keine Wahl- oder Tauschmöglichkeit habe.

- 266 -
• Ich habe zur Kenntnis genommen, dass am Badetag ein zusätzlicher
Unfallversicherungsschutz besteht und dass ich Unfälle unverzüglich der
Projektleitung melden muss, um den Versicherungsschutz nicht zu verlieren.
• Ich weiß, dass ich jederzeit und ohne jede Begründung die Teilnahme an dieser
Studie beenden kann. Ich versichere aber, in diesem Fall das Projektteam umgehend
hierüber zu informieren.
• Ich erkläre mich bereit, an dieser Studie und an den damit verbundenen
Befragungen teilzunehmen.
• Es wurde mir zugesichert, dass alle Informationen über meine Person streng
vertraulich behandelt und keine personenbezogenen Daten an unbeteiligte Dritte
weitergegeben werden.
• Ich willige ein, dass für die wissenschaftliche Auswertung meine Angaben auf
elektronischen Datenträgern gespeichert werden.
Teilnehmer:
Name, Vorname: ______________________________________________________
(bitte in Druckbuchstaben)
Alter : (zutreffendes ankreuzen)
□ 4-6 □ 7-13 □ 14-17 □ 18 oder älter
Teilnehmer ist
□ Schwimmer □ Nicht-Schwimmer
Datum: _____________
_____________________________________________________________
Unterschrift des Teilnehmers

- 267 -
Einverständniserklärung beider Eltern od. Erziehungsberechtigten (für alle
Teilnehmer unter 18 Jahren):
Ich willige ein, dass mein o. g. Sohn / meine o. g. Tochter an der Badegewässerstudie
teilnimmt. 4-13-Jährige können nur in Begleitung eines
Elternteils/Erziehungsberechtigten teilnehmen.
_________________________________________
Unterschrift der Mutter / 1. Erzeihungsberechtigter
_________________________________________
Unterschrift des Vaters / 2. Erziehungsberechtigter
Bei nur einer Unterschrift: □ Ich bin der/die alleinige Erziehungsberechtigte
Anschrift des Teilnehmers:
Straße: _____________________________________________________________
PLZ / Ort: __________________________________________________________
Telefon:____________ Fax: ______________ e-mail: _______________________
Bankverbindung für die Überweisung der Aufwandsentschädigung:
Name des Kontoinhabers: ______________________________________________
Name des Bankinstituts: ______________________________________________
Bankleitzahl: _____________________ Kontonummer: ____________________
Meine Teilnahme wurde vermittelt durch::
__________________________________________________________________ (Name, Vorname in Druckbuchstaben)

- 268 -
Annex 41. Memorandum with time-table for participants

- 269 -
Annex 42. Questionnaire No. 1:
two or three days before exposure
Interview Nr.1
Badegewässerstudie des Umweltbundesamtes und desHygiene-Instituts der Universität Tübingen
Datum: _____________________
Name, Vorname des Interviewers:_______________________________________
1. TEIL – PERSÖNLICHE DATEN
1. Name, Vorname des Teilnehmers:
______________________________________________________________
2. Geburtsdatum: ____/_____/_______
3. Geschlecht: männl. � weibl. �4. Adresse unter der Sie die nächsten 3 Monate erreichbar sind:
Straße:_______________________________________________
PLZ/Ort:_____________________________________________
Telefon (privat):_______________________________________
5. Telefon an Arbeitsplatz:
______________________________________________________________

- 270 -
6. Welchen Abschluß haben Sie?
Hauptschule � Realschule � Fachhochschulreife �Hochschulreife � Fachhochschule � Universität �Anderer* � Keinen � Keine Angabe �
*bitte genauere Angaben:_________________________________________
______________________________________________________________
7. Welcher beruflichen Beschäftigung gehen Sie zur Zeit nach? Oder sind Sie nochSchüler?______________________________________________________________
______________________________________________________________
8. Wieviel Personen leben in Ihrem Haushalt?(Unter Haushalt ist gemeint, wenn Einrichtungen wie Küche, Bad und Toilette gemeinsam genutzt werden.)
Anzahl: ______
Keine Angabe �Wieviel sind davon unter 5 Jahre? ______
Keine Angabe �

- 271 -
9. Hatte jemand in Ihren Haushalt innerhalb der letzten 2 Wochen eines derfolgenden Symptome?(es sind nur die Haushaltsmitglieder gemeint, nicht der Teilnehmer)
Ja Nein Nicht sicher
(1) Durchfall � � �(2) Übelkeit � � �(3) Erbrechen � � �(4) Erkältung (Husten, Schnupfen) � � �(5) Fieber � � �(6) Ohrinfektion � � �(7) Lungeninfektion / Bronchitis � � �(8) Halsschmerzen / Rachenentzündung � � �(9) Augeninfektion � � �(10) Akuter Hautausschlag � � �
10. Nehmen noch weitere Personen Ihres Haushalts an dieser Studie teil?
Ja � Nein � Nicht sicher �Falls ja, notieren Sie bitte die Namen:
1: ________________________________________________________
2: ________________________________________________________
3: ________________________________________________________
4: ________________________________________________________

- 272 -
2.TEIL – ALLGEMEINER GESUNDHEITSZUSTAND
11. Leiden Sie an einer der folgenden chronischen Krankheiten?
Ja Nein Nicht sicher
(1) RÜCKENSCHMERZEN � � �(z.B. Hexenschuß/Bandscheiben-Probleme)
(2) Erhöhter BLUTDRUCK � � �
(3) ATEMWEGSBESCHWERDEN � � �(z.B. Asthma/Bronchitis)
(4) DIABETES � � �(Zuckerkrankheit)
(5) MAGENPROBLEME � � �(z.B. Magengeschwür)genauere Beschr.:_______________________________________________
(6) DARM PROBLEME � � �(z.B. Verstopfung, Durchfall, Reizdarm )
genauere Beschr.:_______________________________________________
(7) OHREN PROBLEME / GEHÖRSCHÄDEN � � �Genauere Beschr.:______________________________________________
(8) HERZKRANKHEITEN � � �(z.B. Angina pectoris)
genauere Beschr.:_______________________________________________

- 273 -
Fortsetzung: ALLGEMEINER GESUNDHEITSZUSTAND Ja Nein
Nicht sicher
(9) LEBERLEIDEN (z. B. Hepatitis) � � �GenauereBeschr.:_____________________________________________________
Falls Hepatitis, welcher Typ?
Hepatitis A � � �Hepatitis B � � �Andere Typen � � �
(10) HABEN SIE EINE NICHT VERHEILTE � � �VERLETZUNG?genauere Beschr.:______________________________________________
(11) NIEREN- ODER BLASEN-PROBLEME � � �genauere Beschr.:_______________________________________________
(12) NEUROLOGISCHE STÖRUNGEN � � �(z.B. Epilepsie/Migräne/Schlaganfall/Lähmung)
genauere Beschr.:_______________________________________________
(13) HEUSCHNUPFEN � � �
(14) HAUTKRANKHEITEN � � �(z.B. Ekzem, Schuppenflechten, Neurodermitis)
genauere Beschr.:______________________________________________

- 274 -
(15) AUGENLEIDEN � � �häufige Entzündungen (rote Augen)
genauere Beschr.:______________________________________________
(16) ANDERE GESUNDHEITLICHE PROBLEME � � �Bitte beschreiben Sie kurz: _______________________________________
_____________________________________________________________
_____________________________________________________________
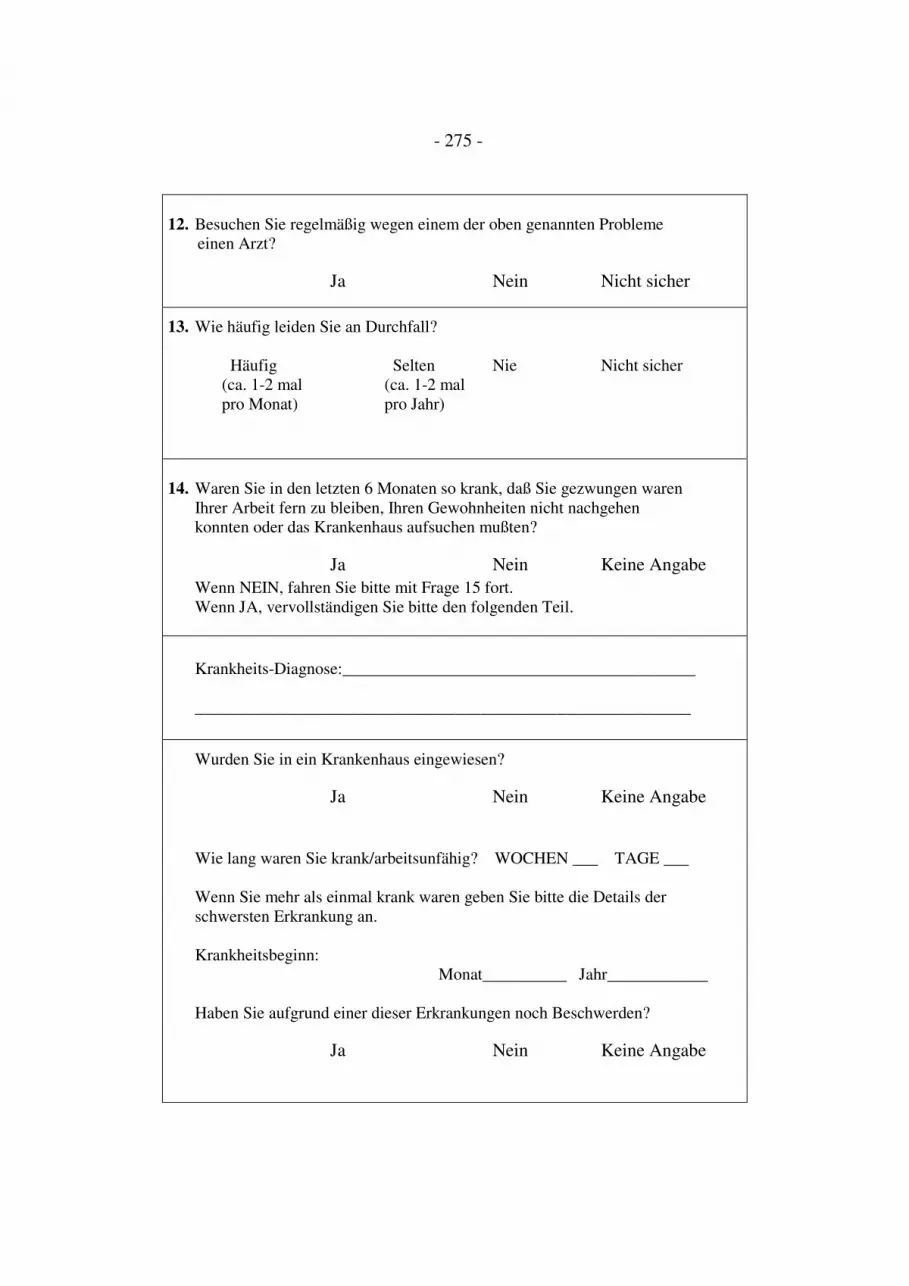
- 275 -
12. Besuchen Sie regelmäßig wegen einem der oben genannten Problemeeinen Arzt?
Ja � Nein � Nicht sicher �13. Wie häufig leiden Sie an Durchfall?
Häufig Selten Nie Nicht sicher(ca. 1-2 mal (ca. 1-2 malpro Monat) pro Jahr)
� � � �14. Waren Sie in den letzten 6 Monaten so krank, daß Sie gezwungen waren
Ihrer Arbeit fern zu bleiben, Ihren Gewohnheiten nicht nachgehenkonnten oder das Krankenhaus aufsuchen mußten?
Ja � Nein � Keine Angabe �Wenn NEIN, fahren Sie bitte mit Frage 15 fort.Wenn JA, vervollständigen Sie bitte den folgenden Teil.
Krankheits-Diagnose:__________________________________________
___________________________________________________________
Wurden Sie in ein Krankenhaus eingewiesen?
Ja � Nein � Keine Angabe �
Wie lang waren Sie krank/arbeitsunfähig? WOCHEN ___ TAGE ___
Wenn Sie mehr als einmal krank waren geben Sie bitte die Details derschwersten Erkrankung an.
Krankheitsbeginn:Monat__________ Jahr____________
Haben Sie aufgrund einer dieser Erkrankungen noch Beschwerden?
Ja � Nein � Keine Angabe �

- 276 -
15. Hatten Sie innerhalb der letzten 3 Wochen eines der unten aufgeführtenSymptome länger als 24 Stunden?Bitte jede Frage mit JA, NEIN oder NICHT SICHER beantworten
Grippe / Erkältungssymptome (über 24 Std.)
Ja NeinNichtsicher
BeginnDatum
Dauer inTagen
(1) Fieber (heiß u. kalt,Schüttelfrost) � � � ____/____ _______
(2) Kopfschmerzen � � � ____/____ _______(3) Schmerzende Beine, Arme,
Gelenke � � � ____/____ _______(4) Rachenentzündung /
Halsschmerzen � � � ____/____ _______
Atemwegssymptome (über 24 Std.)
Ja NeinNichtsicher
BeginnDatum
Dauer inTagen
(5) Beschwerden im Brustkorb � � � ____/____ _______
(6) Trockener Husten � � � ____/____ _______(7) Husten (Abhusten von
Schleim) � � � ____/____ _______
(8) Keuchen / Kurzatmigkeit � � � ____/____ _______
(9) Schnupfen � � � ____/____ _______
Ohren /Augensymptome (über 24 Std.)
Ja NeinNichtsicher
BeginnDatum
Dauer inTagen
(10) Ohreninfektion(Entzündung, Vereiterung)
� � � ____/____ _______
(11) Augeninfektion(rote, entzündete Augen) � � � ____/____ _______
(12) Sehstörungen � � � ____/____ _______
Magen-, Bauch- und Darmsymptome (über 24 Std.)
Ja NeinNichtsicher
BeginnDatum
Dauer inTagen
(13) Appetitlosigkeit � � � ____/____ _______

- 277 -
Ja NeinNichtsicher
BeginnDatum
Dauer inTagen
(14) Verdauungsstörung � � � ____/____ _______(15) Magenschmerzen
(Koliken, Krämpfe,Bauchschmerzen)
� � � ____/____ _______
(16) Lockerer Stuhlgang (weicher als normal) � � � ____/____ _______
(17) Durchfall � � � ____/____ _______
Wenn ja, waren dieDurchfälle
breiartig � � � ____/____ _______
flüssig braun - gelb � � � ____/____ _______
wässerig klar � � � ____/____ _______
blutig � � � ____/____ _______
Wieviel Stuhlgänge traten pro Tag maximal auf? _________ pro Tag
Ja NeinNichtsicher
BeginnDatum
Dauer inTagen
(18) Brechreiz (Übelkeit / Unwohlsein) � � � ____/____ _______
(19) Erbrechen � � � ____/____ _______
Wie häufig mußten Sie erbrechen? _________ pro Tag
Hautsymptome (über 24 Std.)
Ja NeinNichtsicher
BeginnDatum
Dauer inTagen
(20) Hautausschläge � � � ____/____ _______
(21) Hautgeschwüre /offene Stellen � � � ____/____ _______
(22) Jucken (Hautreizung) � � � ____/____ _______

- 278 -
Andere Symptome (über 24 Std.)
Ja NeinNichtsicher
BeginnDatum
Dauer inTagen
(23) Ausgeprägte Müdigkeit (unübliche Müdigkeit, Mattigkeit)
� � � ____/____ _______
(24) Benommenheit /Schwindelgefühl � � � ____/____ _______
(25) Stechen / Kribbeln � � � ____/____ _______
(26) Muskelkrämpfe (in Armen und Beinen) � � � ____/____ _______
(27) Harnwegsinfektion / Blasenentzündung � � � ____/____
_______

- 279 -
(28) Wenn Sie irgendein anderes Symptom über 24h hatten, das nichtauf dieser Liste steht, so nennen Sie es bitte mit Datum und Krankheitsdauer:
Datum Dauer in Tagen
1.________________________________ ____ /____ _______
2.________________________________ ____ /____ _______
16. Rauchen Sie, Pfeife bitte extra ankreuzen ?
Ja � Pfeife � Nein � Keine Angabe �Wenn Sie nie geraucht haben fahren Sie bitte mit Frage 18 fort.
Wenn Sie rauchen, wie viele Zigaretten rauchen Sie am Tag ___(Zigarren und „Selbstgedrehte“ zählen wie eine Zigarette)
17. Wenn Sie ein Ex-Raucher sind, wie lange rauchen Sie schon nicht mehr?
_____ JAHRE ______MONATE _____TAGE
18. Wie oft, falls überhaupt, trinken Sie Alkohol?
NiemalsWeniger als
einmal pro WocheMind. einmal pro
Wochenicht sicher
� � � �Wenn die Antwort auf Frage 18 niemals lautet fahren Sie bitte mit Frage 21 fort.
19. Wie viele Einheiten Alkohol haben Sie ungefähr in den letzten 7 Tagengetrunken?_________________________________________________________
Eine Einheit = eine halbe Bier, ¼ l Wein, 1/8l Portwein/Sherry/Martini,3 x 0,2 cl Schnaps/Whisky/Cognac/Likör etc.

- 280 -
20. Würden Sie sagen, daß Sie in der letzten Woche ein übliches Trinkverhaltenhatten?
JA
NEIN-Ich trinke
normalerweiseweniger Alkohol-
NEIN-Ich trinke
normalerweise mehrAlkohol-
KEINEANBGABE
� � � �21. Haben Sie in den letzten 4 Wochen irgendwelche Tabletten oder
Medikamente genommen?
Ja � Nein � Keine Angabe �wenn ja, waren es:
Ja Nein Nicht sicher Name der Tabletten / Medizin
Antibiotika(z.B. Penicillin) � � � ________________________________Immunsuppressiva(z. B. Kortison) � � � ________________________________Abführmittel � � � ________________________________Magenmittel � � � ________________________________Andere � � � ________________________________

- 281 -
3.TEIL – Aufenthalte im In- und Ausland
22. Haben Sie in den letzten 4 Wochen außerhalb Ihres Haushaltesübernachtet(z.B. Ferien/Dienstreisen/Besuche bei Verwandte)
Ja � Nein � Nicht sicher �
Wenn JA, war der Aufenthalt in Deutschland oder im Ausland?
DEUTSCHLAND AUSLAND BEIDES
� � �Bitte geben Sie das Datum und die besuchten Orte -möglichst mit Postleitzahl- an, die Sie in den letzten 4 Wochen besucht haben
Orte DatumDauer des
Aufenthaltes

- 282 -
TEIL 4 – Aktivitäten in der Freizeit
23. Wie oft nehmen Sie durchschnittlich in einem Monat in dieser Jahreszeitan den unten aufgeführten Aktivitäten teil?
öfters>3 mal
manchmal1-3 mal
überhauptnicht
Nichtsicher
wie oft imletzten Monat
(1) Kneipenbesuche � � � � ____(2) Party-/Disco-
besuche � � � � ____(3) Sportverein � � � � ____(4) Kino/Theater � � � � ____(5) Andere* � � � � ____Genauere Angaben: ______________________________________________
24. Wie oft üben Sie durchschnittlich in einem Sommermonat mit normalenWitterungsverhältnissen die folgenden Wassersportarten in Naturgewässern aus?
oft>3mal
manchmal1-3 mal
überhauptnicht
nichtsicher
wie oft imletztenMonat
(1) Kanufahren,Schlauchboot, Rudern � � � � ____
(2) Motor- oderSchnellbootfahren � � � � ____
(3) Tauchen/ Schnorcheln � � � � ____
(4) Surfen/ Wasserski/ Jetski/Segeln � � � � ____
(5) Angeln � � � � ____(6) Planschen/
Wassertreten � � � � ____(7) Anderes* � � � � ____*Genauere
Beschreibung:___________________________________________________
____________________________________________________________________

- 283 -
25. Wie oft gehen Sie in Naturgewässern schwimmen oder baden? (Bitte geben Sie die durchschnittliche / typische Häufigkeit pro Monat
-während des Sommers- an)
oft>3 mal
manchmal1-3 mal
überhauptnicht
nicht sicherwie oft im letzten
Monat
� � � � ____
Wenn JA, wie weit und/oder wie lange schwimmen Sie normalerweise?
(Die Länge eines Pools = 25m) ____ Meter ________ Minuten
Bitte geben Sie genau an wo Sie in den letzten 3 Wochen gebadet haben-möglichst mit Postleitzahl-
Ort Deutschland Ausland wie oft?
1.
2.
3.
4.
5.
26. Wie oft gehen Sie an einen Strand (Meer, See oder Fluß) ohne in das Wasser zugehen?
oft>3 mal
manchmal1-3 mal
überhauptnicht
nicht sicherwie oft im letzten
Monat
� � � � ____
27. Wie oft benutzen Sie in einem Sommermonat mit normalenWitterungsverhältnissen ein Schwimmbecken (Freibad / Hallenbad)?
1: Öffentliches Schwimmbecken
oft>3 mal
manchmal1-3 mal
überhauptnicht
nicht sicherwie oft im letzten
Monat
� � � � ____

- 284 -
2. Andere Schwimmbecken (z.B. priv. Pool)
oft>3 mal
manchmal1-3 mal
überhauptnicht
nicht sicherwie oft im letzten
Monat
� � � � ____28. Waren Sie in den letzten Monaten in einem Freizeitpark und haben dort
irgendwelche Vergnügungsangebote im oder auf dem Wasser genutzt?(z.B. Wasserrutschen / Rafting / Floßfahrten)
Ja � Nein � Nicht sicher �
Wenn JA war der Park im Inland oder im Ausland?
Inland � Ausland � Nicht sicher �Bitte geben Sie den Namen des Parks an:
___________________________________________________________
29. Können Sie gut schwimmen?(Können Sie mind. 2 Beckenlängen durchschwimmen)
Ja � Nein � Keine Angabe �
30. Haben Sie noch irgendwelche ergänzende Hinweise oder Kommentare, die unsin diesem Zusammenhang helfen könnten?(z.B. Informationen über allg. Gesundheit, Reisen / Arbeit im Ausland undFreizeitbeschäftigungen im Zusammenhang mit Wasser.)

- 285 -
Arztbogen - vom untersuchenden Arzt auszufüllen -
Name des Arztes:_________________________________________________________
Normal Gerötet BelegtRachen und Tonsillen � � �
ja Nein
Anhalt auf einen Ohreninfekt ? � �Anhalt auf einen Augeninfekt? � �Anhalt auf einen sonstigen Infekt? � �Temperatur >38°C � �Wenn Ja, bitte kurze schriftliche Angaben machen (Verdachtsdiagnose):
______________________________________________________________
______________________________________________________________
______________________________________________________________
Wurde der medizinische Teil des Fragebogens geprüft? Ja � Nein �
Empfohlen Hausarzt aufzusuchen? Ja � Nein �
Sind Sie für einen Ausschluß des Probanden? Ja � Nein �

- 286 -
Annex 43. Questionnaire No. 2:
Exposure day interview
Badegewässer-Studie des Umweltbundesamtesund des Hygiene-Instituts der Universität Tübingen
Interview am Badetag Datum: _________________
Name, Vorname des Interviewers:
___________________________________________________________
ABSCHNITT 1 KONSUMIERTE LEBENSMITTEL
1. Name, Vorname des Teilnehmers:
__________________________________________________________
2. Haben Sie innerhalb der letzten 3 Tage eines der folgenden Lebensmittel zu sichgenommen? Wenn Ja vermerken Sie bitte ob es sich um selbst zubereitete oderfertig gekaufte Lebensmittel handelte.
Ja Nein Nichtsicher
selbstzubereitet
gekauft
(1) Speiseeis � � � � �(2) Belegte Brote / Brötchen � � � � �(3) Hähnchen / Hühnerfleisch � � � � �(4) Eier / Eierspeisen (Omelett,
Rührei, Pfannkuchen, frische Waffeln)
� � � � �
(5) Mousse au Chocolat, Tiramisu
� � � � �(6) Mayonnaise
(selbst zubereitet)� � � � �
(7) Brat- oder Grillwürste(Hot dogs etc. )
� � � � �(8) Hamburger
( Hacksteak etc.)� � � � �

- 287 -
Ja Nein Nichtsicher
Selbstzubereitet
gekauft
(9) Salate � � � � �(10) Rohmilch, Vorzugsmilch
(nicht pasteurisiert )� � � � �
(11) Andere Rohmilchprodukte (z. B. Rohmilchkäse)
� � � � �(12) Rohes Fleisch
( z.B. Tatar, Mettwurst )� � � � �
Ja Nein Nichtsicher
Selbstzubereitet
gekauft
(13) Wurstwaren � � � � �(14) Imbiß aus Straßenverkauf
( Fast food )� � � � �
(15) Meeresfrüchte ∗
( Muscheln, Schneckenetc.)
� � � � �∗nähere Bezeichnung: ________________________________________________
__________________________________________________________________
3. Haben Sie in den letzten 3 Tagen an einem Grillfest oder Buffet teilgenommen?
Ja � Nein � Nicht sicher �

- 288 -
ABSCHNITT 2 ALLGEMEINER GESUNDHEITSZUSTAND
4. Haben Sie heute oder in den letzten 3 Tagen irgendeines der folgendenSymptome gehabt? Antworten Sie bitte auf alle Fragen mit Ja, Nein oder Nichtsicher
Lesen Sie bitte die Abschnittsüberschriften vor und fragen Sie, ob der Teilnehmer irgendeines dieser Symptome hatte.
Grippe / Erkältungssymptome
Ja NeinNichtsicher
(1) Fieber (heiß- und kalt,Schüttelfrost )
� � �(2) Kopfschmerzen � � �(3) Schmerzende
Beine, Arme, Gelenke� � �
(4) Rachenentzündung / Halsschmerzen � � �Atemwegssymptome
(5) Beschwerden im Brustkorb � � �(6) Trockener Husten � � �(7) Husten ( Abhusten von Schleim ) � � �(8) Keuchen / Kurzatmigkeit � � �(9) Schnupfen � � �

- 289 -
Ohren- / AugensymptomeJa Nein Nicht
sicher
(10) Ohrinfektionen(Entzündung, Vereiterung )
� � �(11) Augeninfektionen
(rote, entzündete Augen )� � �
(12) Sehstörungen � � �Magen- und Darmsymptome
Ja Nein Nichtsicher
(13) Appetitlosigkeit � � �(14) Verdauungsstörungen � � �(15) Magenschmerzen
(Koliken ,Krämpfe, Bauchschmerzen)� � �
(16) Lockerer Stuhlgang (weicher als normal)
� � �(17) Durchfall � � �
Wenn ja, waren die Durchfälle
breiartig � � �flüssig braun - gelb � � �wässerig klar � � �blutig � � �Wieviel Stuhlgänge traten pro Tag maximal auf? _______ pro Tag
(18) Brechreiz ( Übelkeit / Unwohlsein)
� � �(19) Erbrechen � � �
Wie häufig mußten Sie erbrechen? ________ pro Tag

- 290 -
HautsymptomeJa Nein Nicht
sicher
(20) Hautausschläge � � �(21) Hautgeschwüre / offene Stellen � � �(22) Jucken
(Hautreizung)� � �
Andere SymptomeJa Nein Nicht
sicher
(23) Ausgeprägte Müdigkeit(unübliche Müdigkeit, Mattigkeit)
� � �(24) Benommenheit /Schwindelgefühl
� � �(25) Stechen / Kribbeln � � �(26) Muskelkrämpfe
(in Armen-u.Beinen)� � �
(27) Harnwegsinfektion / Blasenentzündung
� � �
Hatten Sie irgendein anderes Krankheitssymptom?wenn ja, welches___________________________________________________________
___________________________________________________________
Keine Symptome in den letzten 3 Tagen �
Wenn keine Krankheit vorliegt, so gehen Sie bitte zu Frage 8, sonst fahrenSie bitte mit Frage 5 fort

- 291 -
5. Wann begann die Krankheit, wann hörte sie auf und wie lange dauerte sie ?Bitte auf dem Kalender alle Tage einkreisen, an denen irgendeines dieserSymptome aufgetreten ist.
Monat:___________ Jahr:__________
Mo Di Mi Do Fr Sa
6. Welches war das erste Symptom ? ____________________________� �[Tragen Sie bitte die Symptom-Nummer aus Seite 2, 3 und 4 ein.]
7. Haben Sie Ihren Arzt wegen dieser Symptome aufgesucht ?
Ja � Nein � Nicht sicher �Wenn ja, wurde eine Krankheit diagnostiziert ?
Diagnose: _______________________________________________________
8. Waren Sie seit dem 1. Interview dieser Studie wieder schwimmen oder baden,bzw. haben Sie Wassersport betrieben?
Ja � Nein � Nicht sicher �wenn ja, war dies
im Schwimmbad (Beckenbad) �im Naturgewässer (Meer, Fluß, See, Baggersee etc.) �bitte genauere Angaben (z.B. Baden, Bootfahren,... Datum und Ort)
____________________________________________________________
9. Nehmen noch weitere Personen Ihres Haushalts an dieser Studie teil?
Wenn ja, notieren Sie bitte die Namen:
1: __________________________________________________________
2: __________________________________________________________
3: __________________________________________________________
10. Möchten Sie noch weitere Informationen anfügen?
________________________________________________________________

- 292 -
Arztbogen - vom untersuchenden Arzt auszufüllen -
Name des Arztes:_____________________________________________________________
Normal Gerötet BelegtRachen und Tonsillen � � �
ja Nein
Anhalt auf einen Ohreninfekt ? � �Anhalt auf einen Augeninfekt? � �Anhalt auf einen sonstigen Infekt? � �Temperatur >38°C � �Wenn Ja, bitte kurze schriftliche Angaben machen (Verdachtsdiagnose):
______________________________________________________________
______________________________________________________________
______________________________________________________________
Wurde der medizinische Teil des Fragebogens geprüft? Ja � Nein �
Empfohlen Hausarzt aufzusuchen? Ja � Nein �
Sind Sie für einen Ausschluß des Probanden? Ja �Nein �

- 293 -
Annex 44. Questionnaire No. 3:
Interview one week after exposure
Badegewässerstudie des Umweltbundesamtes unddes Hygiene-Instituts der Universität Tübingen
anschließende Befragung Datum:_____________(1 Woche nach dem Baden)
Name, Vorname des Interviewers:
ABSCHNITT 1 KONSUMIERTE LEBENSMITTEL
1. Name, Vorname des Teilnehmers:
2. Haben Sie seit dem Badetag eines der folgenden Lebensmittelzu sich genommen?
Ja NeinNichtsicher
(1) Speiseeis � � �(2) Belegte Brote / Brötchen
(fertig gekauft)� � �
(3) Hähnchen / Hühnerfleisch � � �(4) Eier / Eierspeisen (Omelett,
Rührei, Pfannkuchen, frischeWaffeln)
� � �
(5) Mousse au Chocolat, Tiramisu � � �(6) Mayonnaise
(selbst zubereitet)� � �
(7) Brat- oder Grillwürste(Hot dogs etc.)
� � �(8) Hamburger
(Hacksteak etc.)� � �
(9) Salate � � �(10) Rohmilch / Vorzugsmilch
(nicht pasteurisiert)� � �

- 294 -
Ja Nein Nichtsicher
(11) Andere Rohmilchprodukte (z. B. Rohmilchkäse)
� � �(12) Rohes Fleisch
(z.B. Tatar, Mettwurst)� � �
(13) Wurstwaren � � �(12) Imbiß aus Straßenverkauf
(Fast food)� � �
(13) Meeresfrüchte∗
(z.B. Muscheln, Schnecken etc..)� � �
∗nähere Bezeichnung: _____________________________________________
Haben Sie seit dem Badetag an einem Grillfest oder Buffet teilgenommen?
Ja � Nein � Nicht sicher �

- 295 -
ABSCHNITT 2 ALLGEMEINER GESUNDHEITSZUSTAND
4. Überlegen Sie bitte, ob seit dem Badetag eines der folgenden Symptome beiIhnen aufgetreten ist? Antworten Sie bitte auf alle Fragen bitte mit JA, NEINoder NICHT SICHER
Lesen Sie bitte die Abschnittsüberschriften vor und fragen Sie, ob irgendeines dieserSymptome aufgetreten ist. Zeigen Sie bitte den mitgelieferten Kalender, um dasAnfangsdatum und die Dauer jeder einzelnen Beschwerde festzustellen.
Grippe / ErkältungssymptomeJa Nein Nicht
sicherBeginnDatum
Dauer inTagen
Fieber(heiß und kalt, Schüttelfrost)
� � � ___/___ ___Kopfschmerzen � � � ___/___ ___Schmerzende Beine, Arme,Gelenke
� � � ___/___ ___Rachenentzündung /Halsschmerzen
� � � ___/___ ___
Atemwegssymptome
Beschwerden im Brustkorb � � � ___/___ ___Trockener Husten � � � ___/___ ___Husten (Abhusten von Schleim) � � � ___/___ ___Keuchen /Kurzatmigkeit � � � ___/___ ___Schnupfen � � � ___/___ ___
Ohren- / AugensymptomeJa Nein Nicht
sicherBeginnDatum
Dauer inTagen
Ohrinfektionen(Entzündung, Vereiterung)
� � � ___/___ ___Augeninfektionenrote, entzündete Augen
� � � ___/___ ___Sehstörungen � � � ___/___ ___

- 296 -
DarmsymptomeJa Nein Nicht
sicherBeginnDatum
Dauer inTagen
Appetitlosigkeit � � � ___/___ ___Verdauungsstörungen � � � ___/___ ___Magenschmerzen (Koliken,Krämpfe, Bauchschmerzen)
� � � ___/___ ___Lockerer Stuhlgang (weicher als normal)
� � � ___/___ ___Durchfall � � � ___/___ ___
Wenn ja, waren die Durchfälle
breiartig � � � ___/___ ___flüssig braun - gelb � � � ___/___ ___wässerig klar � � � ___/___ ___blutig � � � ___/___ ___
Wieviel Stuhlgänge traten pro Tag maximal auf? ________ pro Tag
Brechreiz(Übelkeit, Unwohlsein)
� � � ___/___ ___Erbrechen � � � ___/___ ___
Wie häufig mußten Sie erbrechen? ________ pro Tag

- 297 -
HautsymptomeJa Nein Nicht
sicherBeginnDatum
Dauer inTagen
Hautausschläge � � � ___/___ ___Hautgeschwüre / offene
Stellen� � � ___/___ ___
Jucken(Hautreizung)
� � � ___/___ ___
Andere Symptome
Ausgeprägte Müdigkeit(unübliche Müdigkeit, Mattigkeit)
� � � ___/___ ___
Benommenheit / Schwindelgefühl
� � � ___/___ ___Stechen / Kribbeln � � � ___/___ ___Muskelkrämpfe
(in Armen u. Beinen)� � � ___/___ ___
Harnwegsinfektion / Blasenentzüdung
� � � ___/___ ___Ist irgendein Symptom aufgetreten, das nicht auf der Liste steht? Wenn ja,
welches:
______________________________________________________________
______________________________________________________________
______________________________________________________________
Wann haben die Symptome angefangen? ________
Wie viele Tage dauerten sie ? ________
Keine Symptome seit dem Badetag festgestellt �
Wenn keine Krankheit vorliegt, so gehen sie bitte weiter zu Frage 7, sonst fahren Siebitte mit Frage 5 fort.

- 298 -
5. Haben Sie Ihren Arzt wegen dieser Symptome aufgesucht ?
Ja � Nein � Nicht sicher �Wenn Ja, wurde eine Krankheit diagnostiziert
Ja � Nein � Keine Angabe �Diagnose _______________________________________________________
6. An wie vielen Tagen konnten Sie wegen dieser Symptome nicht Ihre normaleArbeit / Tätigkeit ausüben?
______________Anzahl der Tage
Wurden Sie deshalb in ein Krankenhaus eingewiesen ?
Ja � Nein � Keine Angabe �
Wenn Ja, in welches Krankenhaus?___________________________________
_______________________________________________________________
Kontakt mit Naturgewässern ?
7. Waren Sie seit dem Badetag dieser Studie wieder schwimmen oder baden, bzw. haben Sie Wassersport betrieben?
Ja � Nein � Nicht sicher �wenn ja, war dies
im Schwimmbad (Beckenbad) �im Naturgewässer (Meer, Fluß, See, Baggersee etc.) �bitte genauere Angaben (z. B. Baden, Bootfahren,... Datum, Ort, Name des Freibads, des Hallenbads, des Strandbads, des Sees, etc.):
________________________________________________________________
________________________________________________________________

- 299 -
Arztbogen - vom untersuchenden Arzt auszufüllen -
Name des Arztes:_____________________________________________________________
Normal Gerötet BelegtRachen und Tonsillen � � �
ja Nein
Anhalt auf einen Ohreninfekt ? � �Anhalt auf einen Augeninfekt? � �Anhalt auf einen sonstigen Infekt? � �Temperatur >38°C � �Wenn Ja, bitte kurze schriftliche Angaben machen (Verdachtsdiagnose):
______________________________________________________________
______________________________________________________________
______________________________________________________________
Empfohlen Hausarzt aufzusuchen? Ja � Nein �

- 300 -
Annex 45. Questionnaire No. 4:
Interview three weeks after exposure
Badegewässerstudie des Umweltbundesamtes unddes Hygiene-Instituts der Universität Tübingen
Fragebogen 3 Wochen nach dem Badetag
Bitte lesen Sie diesen Fragebogen durch und beantworten Sie sorgfältig die Fragen.Bitte beantworten Sie jede Frage entweder durch einkreisen der Antwort oderdurch ankreuzen eines Kästchens, oder beantworten Sie die Frage schriftlich.Beispiele:
MONAT: August/September Jahr: 2001
Mo Di Mi Do Fr Sa So JA NEIN
18 19 � �20 21 22 23 24 25 2627 28 29 30 31 1 2 Beginn Dauer
3 4 5 6 7 8 9 01/09 5 Tage10 11 12
Angaben zur Person:1. Name:
_____________________________________________________________2. Geburtsdatum:
______________/______________/____________Tag Monat Jahr
3. Geschlecht: � � männl. weibl.
4. Anschrift:
Straße: ______________________________________________________
PLZ /Ort: ______________________________________________________
Telefon: ______________________________________________________
5. Telefon am Arbeitsplatz:________________________________________________________________
6. In der nächsten Zeit zu erreichen unter (Adresse in den nächsten 3 Monaten)
________________________________________________________________
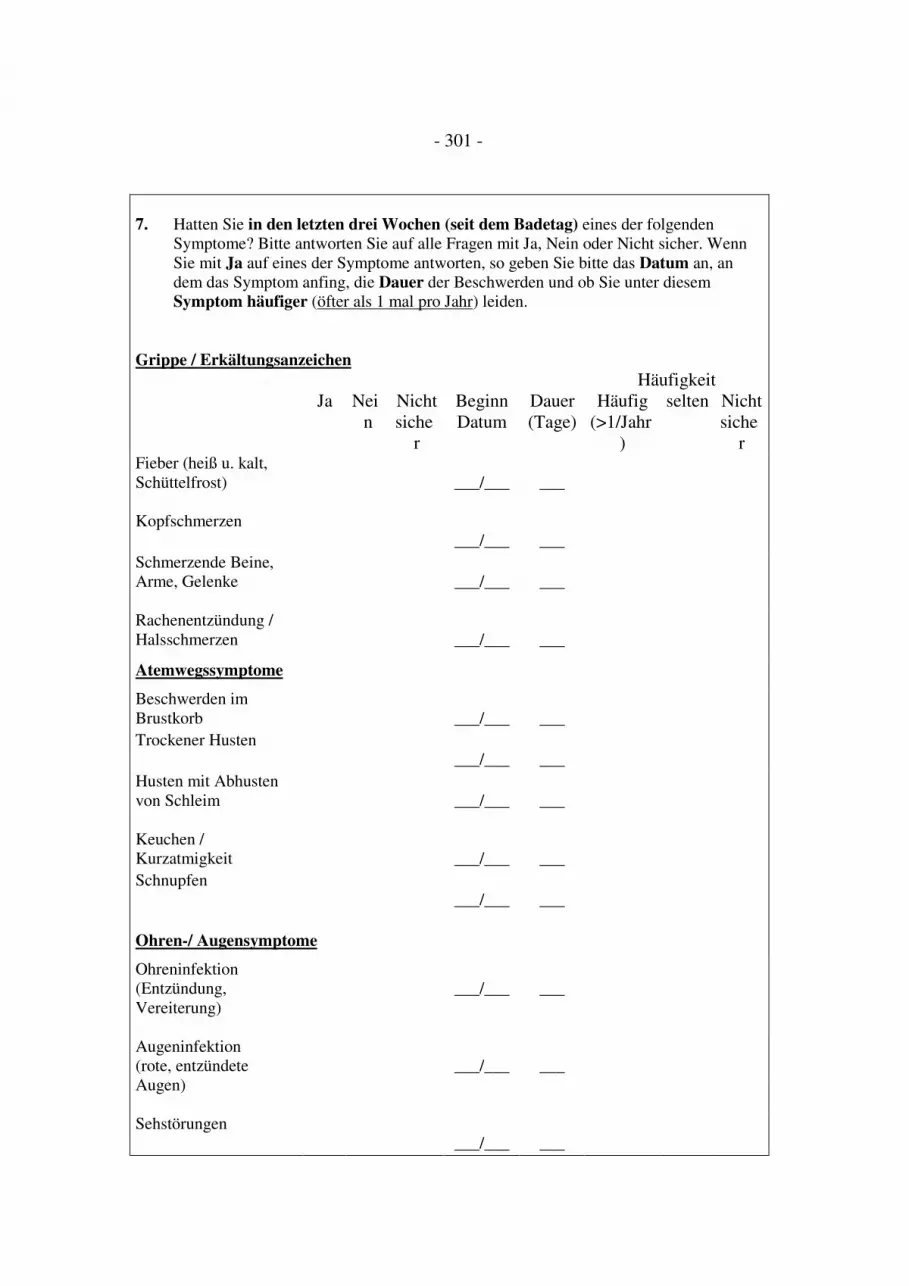
- 301 -
7. Hatten Sie in den letzten drei Wochen (seit dem Badetag) eines der folgendenSymptome? Bitte antworten Sie auf alle Fragen mit Ja, Nein oder Nicht sicher. WennSie mit Ja auf eines der Symptome antworten, so geben Sie bitte das Datum an, andem das Symptom anfing, die Dauer der Beschwerden und ob Sie unter diesemSymptom häufiger (öfter als 1 mal pro Jahr) leiden.
Grippe / ErkältungsanzeichenHäufigkeit
Ja Nein
Nichtsiche
r
BeginnDatum
Dauer(Tage)
Häufig(>1/Jahr
)
selten Nichtsiche
rFieber (heiß u. kalt,Schüttelfrost) � � � ___/___ ___ � � �Kopfschmerzen � � � ___/___ ___ � � �Schmerzende Beine,Arme, Gelenke � � � ___/___ ___ � � �Rachenentzündung /Halsschmerzen � � � ___/___ ___ � � �Atemwegssymptome
Beschwerden imBrustkorb � � � ___/___ ___ � � �Trockener Husten � � � ___/___ ___ � � �Husten mit Abhustenvon Schleim � � � ___/___ ___ � � �Keuchen /Kurzatmigkeit � � � ___/___ ___ � � �Schnupfen � � � ___/___ ___ � � �Ohren-/ Augensymptome
Ohreninfektion(Entzündung,Vereiterung)
� � � ___/___ ___ � � �
Augeninfektion(rote, entzündeteAugen)
� � � ___/___ ___ � � �
Sehstörungen � � � ___/___ ___ � � �
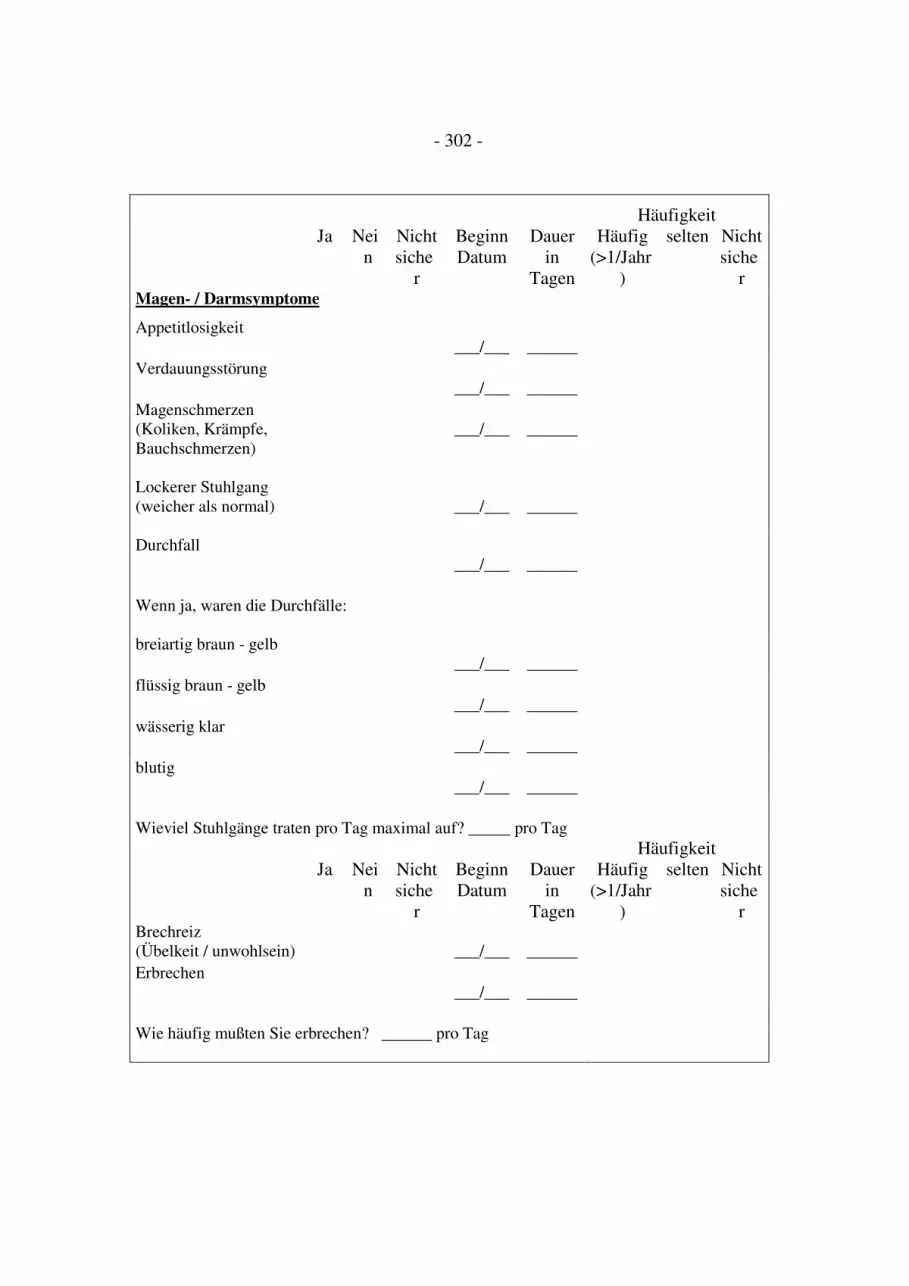
- 302 -
HäufigkeitJa Nei
nNichtsiche
r
BeginnDatum
Dauerin
Tagen
Häufig(>1/Jahr
)
selten Nichtsiche
rMagen- / Darmsymptome
Appetitlosigkeit � � � ___/___ ______ � � �Verdauungsstörung � � � ___/___ ______ � � �Magenschmerzen(Koliken, Krämpfe,Bauchschmerzen)
� � � ___/___ ______ � � �
Lockerer Stuhlgang(weicher als normal) � � � ___/___ ______ � � �Durchfall � � � ___/___ ______ � � �Wenn ja, waren die Durchfälle:
breiartig braun - gelb � � � ___/___ ______flüssig braun - gelb � � � ___/___ ______wässerig klar � � � ___/___ ______blutig � � � ___/___ ______
Wieviel Stuhlgänge traten pro Tag maximal auf? _____ pro TagHäufigkeit
Ja Nein
Nichtsiche
r
BeginnDatum
Dauerin
Tagen
Häufig(>1/Jahr
)
selten Nichtsiche
rBrechreiz(Übelkeit / unwohlsein) � � � ___/___ ______ � � �Erbrechen � � � ___/___ ______ � � �Wie häufig mußten Sie erbrechen? ______ pro Tag

- 303 -
HäufigkeitJa Nei
nNichtsiche
r
BeginnDatum
Dauerin
Tagen
Häufig(>1/Jahr
)
selten Nichtsiche
rHautsymptomeHautausschläge � � � ___/___ ______ � � �Hautgeschwüre /offeneStellen � � � ___/___ ______ � � �Jucken (Hautreizung) � � � ___/___ ______ � � �Andere Symptome
HäufigkeitJa Nei
nNichtsiche
r
BeginnDatum
Dauer(Tage)
Häufig(>1/Jahr
)
selten Nichtsiche
rAusgeprägte Müdigkeit(unübliche Müdigkeit,Mattigkeit)
� � � ___/___ ______ � � �Benommenheit/Schwindelgefühl � � � ___/___ ______ � � �Stechen / Kribbeln � � � ___/___ ______ � � �Muskelkrämpfe (inArmen und Beinen) � � � ___/___ ______ � � �Harnwegsinfektion /Blasenentzündung � � � ___/___ ______ � � �Pilzinfektion � � � ___/___ ______ � � �Wenn Sie irgendein Symptom haben, das nicht auf der Liste steht, so schreiben Sie es bittein der nachfolgenden Spalte auf.
HäufigkeitBeginnDatum
Dauer(Tage)
Häufig(>1/Jahr
)
selten Nichtsiche
r
_________________________________ ___/___ ______ � � �_________________________________ ___/___ ______ � � �_________________________________ ___/___ ______ � � �_________________________________ ___/___ ______ � � �

- 304 -
Wenn Sie auf eines der Symptome mit Ja geantwortet haben,so fahren Sie bitte mit Frage 8 fort.
Wenn Sie keines dieser Symptome hatten, so gehen Sie bitte zu Frage 16..
8. Waren diese Symptome Teil einer einzigen Erkrankung ?
Ja (einzige Erkrankung) �Nein (ich hatte mehrere Erkrankungen gleichzeitig) �Keine wirkliche Erkrankung (ich fühlte mich nicht krank) �Unsicher �
9. Kreisen Sie bitte auf dem unteren Kalender alle Tage ein, an denen Sie sich unwohlfühlten oder irgendeines dieser Symptome hatten.
August/September 2001
Mo Di Mi Do Fr Sa So18 19
20 21 22 23 24 25 2627 28 29 30 31
1 2 3 4 5 6 78
10. Welches war das erste Symptom ?
__________________________________________________________________
11. Wenn Sie mehrere Erkrankungen gleichzeitig hatten, so machen Sie bitte untengenauere Angaben dazu, besonders wichtig ist das Anfangsdatum der Krankheit.
___________________________________________________________________
___________________________________________________________________
___________________________________________________________________
___________________________________________________________________

- 305 -
12. Wurde die Erkrankung von Ihrem Arzt festgestellt ?
Ja � Nein � Nicht sicher �Wenn JA , wie lautete die Diagnose ?
_____________________________________________________________________
Bitte kreuzen Sie an, ob wir Ihren Arzt, falls wir mehr Informationen benötigen,fragen können. Falls ja, geben Sie bitte Name und Adresse an.
Ja � Nein � Keine Angabe �Name und Adresse des Arztes: __________________________________________________________________
__________________________________________________________________
Hiermit entbinde ich meinen oben genannten Arzt bezüglich der oben genanntenErkrankungen von der Schweigepflicht gegenüber dem Projektleiter derBadegewässerstudie (Herr Dr. med. A. Wiedenmann).
Datum:____________
Unterschrift:___________________________________________________
13. Wurden Ihnen auf Grund der Erkrankung Medikamente verschrieben?
Ja � Nein � Keine Angabe �Wenn JA welche, bitte notieren:
1.___________________________________________
2. __________________________________________
3. __________________________________________

- 306 -
14. Mußten Sie wegen einer der Erkrankungen seit dem Badetag ins Krankenhaus ?
Ja � Nein � Keine Angabe �Wenn JA, wegen welcher Erkrankung und in welches Krankenhaus ?
___________________________________________________________________
___________________________________________________________________
15. Wie viele Tage konnten Sie wegen dieser Erkrankung Ihre Arbeit oder eine andereTätigkeit nicht ausüben ?
Keinen Nur einenTag
2 - 7 Tage 8 - 14 Tage Mehr als 14 Tage Keine Angabe
� � � � � �16. Sind Sie jemals nach dem Baden in einem Gewässer in Deutschland krank geworden. ?
Ja � Nein � Nicht sicher �Wenn JA, welche der nachfolgenden Krankheiten waren es ?(Sie können mehrere ankreuzen)
� Kopfschmerzen � Zahnschmerzen � Ohrenschmerzen
� Durchfall � Erbrechen � Fieber
� Erkältungen � Rachenentzündung � Augenbeschwerden
� Anderes* � Keine Angabe*Bitte genauere Angaben
_____________________________________________________________________

- 307 -
17. Sind Sie jemals an einen Badestrand gegangen, obwohl Sie sich schon krank gefühlthaben ?
Ja � Nein � Nicht sicher �
Wenn JA, welche der nachfolgenden Krankheiten waren es ?(Sie können mehrere ankreuzen)Wenn NEIN, fahren Sie bitte mit Frage 18 fort
� Kopfschmerzen � Zahnschmerzen � Ohrenschmerzen
� Durchfall � Erbrechen � Fieber
� Erkältungen � Rachenentzündung � Augenbeschwerden
� Anderes* � Keine Angabe
*Bitte genauere Angaben
______________________________________________________________
Hat Sie das davon abgehalten, ins Wasser zu gehen ?
Ja � Nein � Nicht sicher �
18. Wie oft bekommen Sie beim Baden einen Sonnenbrand?
Immer � Häufig � Selten � Nie � Nicht sicher �
19. Wie oft behandeln Sie Ihren Sonnenbrand anschließend (Cremes, Hausmittel etc.) ?
Immer � Häufig � Selten � Nie � Nicht sicher �20. Wird Ihnen vom Autofahren, Busfahren oder Bahnfahren leicht übel ?
Immer � Häufig � Selten � Nie � Nicht sicher �

- 308 -
21. Hat sich eine Person, die mit Ihnen in Ihrem Haushalt lebt, während der letzten 3Wochen unwohl gefühlt oder war eine Person in Ihrem Haushalt krank?(Der Haushalt schließt nur Personen ein, mit denen Sie zusammenleben und mitdenen Sie Einrichtungen wie z.B. Küche, Bad und Toilette teilen.)
Ja � Nein � Nicht sicher �Wenn NEIN (keine neu aufgetretene Erkrankung in den letzten 3Wochen in Ihrem Haushalt), fahren Sie bitte mit Frage 24 fort.
22. Wenn JA, hat diese Erkrankung vor Ihrer eigenen Erkrankung begonnen?
Ja � Nein � Nicht zutreffend �23. Bitte machen Sie nachfolgend genaue Angaben zu den Erkrankungen Ihrer
Haushalts-Mitglieder:Je nach Erkrankung schreiben Sie:
D für DurchfallÜ für ÜbelkeitE für ErbrechenO für Ohreninfektion (z.B. Ohrenschmerzen)A für Augeninfektion (z.B. entzündete, rote Augen)F für Fieber oder erhöhte TemperaturR für RachenentzündungS für sonstige Symptome
z.B.: wenn ein Kind Durchfall, Erbrechen und Fieber hatte,müssen Sie als Krankheitsbeschreibung folgendes schreiben: D, E, F
Initialen desErkrankten
Alter Krankheits-bezeichnung
Krankheits-beginn
Nahm diese Personebenfalls an der Studie
teil?
Ja � Nein �Ja � Nein �Ja � Nein �Ja � Nein �Ja � Nein �

- 309 -
Fortsetzung der Frage 23Bitte notieren Sie alle Details, wie zum Beispiel die vermuteteKrankheitsursache, Besonderheiten oder andere Informationen zur Krankheitbzw. den Symptomen:
____________________________________________________________________
____________________________________________________________________
24. Haben Sie seit dem Badetag außerhalb Ihres Haushaltes übernachtet ? (z.B. in denFerien / Dienstreisen / Besuche von Verwandten und Bekannten)
Ja � Nein � Nicht sicher �Wenn JA, war es in Deutschland oder im Ausland?
Deutschland � Ausland � Beides �Bitte geben Sie unten das Datum und die Orte –möglichst mit Postleitzahl- an,die Sie besucht haben:
Ort Datum Dauer
1.)
2.)
3.)
25. Waren Sie seit dem Badetag wieder Schwimmen?(Nur Beckenbäder mit gechlortem Wasser)
Ja � Nein � Nicht sicher �Wenn NEIN, gehen Sie bitte zu Frage 26 weiter.
Wenn JA beantworten Sie bitte die nachfolgenden Fragen durch Ankreuzen derentsprechenden Kästchen.
Ja Nein Nichtsicher
Wie oft, seit demBadetag
In öffentliche Schwimmbädern? � � � _____In anderen Schwimmbädern? � � � _____

- 310 -
26. Waren Sie seit dem Badetag im Meer, in einem See oder in einem Fluß schwimmen?
Ja Nein Nicht sicher wie oft?
� � � ____
Wenn JA, notieren Sie bitte wo genau Sie schwimmen waren (z.B. auch welchesStandbad), kreuzen Sie an, ob in Deutschland oder im Ausland und geben Sie möglichstdas genaue Datum an.
Ort -möglichst mit Postleitzahl- Deutschland Ausland Datum
1.
2.
3.
4.
27. Haben Sie seit dem Badetag Strände besucht, ohne ins Wasser zu gehen ?
Ja Nein Nicht sicher wie oft?
� � � ____
Wenn JA, schreiben Sie bitte jeden Strand auf den Sie besucht haben, kreuzen Sie an, ob inDeutschland oder im Ausland, und geben Sie möglichst das genaue Datum an.
Ort –möglichst mit Postleitzahl- Deutschland Ausland Datum
1.
2.
3.
4.

- 311 -
28. Wenn Sie einen Badestrand besuchen, gehen Sie dann auch ins Wasser ?
Meistens Manchmal Selten Nie Nicht sicher
� � � � �29. Wie oft tauchen Sie Ihren Kopf beim Baden unter Wasser ?
Meistens Manchmal Selten Nie Nicht sicher
� � � � �
30. Haben Sie seit dem Badetag irgendeinen Wassersport betrieben?Kreuzen Sie bitte bei jeder der nachfolgenden WassersportartenJA, NEIN oder NICHT SICHER an.
Ja Nein Nicht sicher(1) Schlauchboot / Ruderboot / Kajakfahren � � �(2) Schnellboot- / Motorbootfahren � � �(3) Tauchen / Schnorcheln � � �(4) Surfen / Wasserski / Jetski / Segeln usw. � � �(5) Angeln � � �(6) Planschen / Wassertreten � � �(7) Anderes * � � �
*Genauere Angaben anderer Wassersportarten
_____________________________________________________________________
_____________________________________________________________________

- 312 -
31. Betrachten Sie Wassersport (bzw. Sportliche Aktivitäten im Wasser) als gefährlich ?
Ja � Nein � Nicht sicher �Wenn JA, welche der folgenden Aktivitäten betrachten Sie als gefährlich?(Sie können mehr als eine ankreuzen)
Schlauchbootfahren
Kajak fahren
Windsurfen /Segeln
Tauchen /Schnorcheln
Wasserski
� � � � �Surfen Schwimmen /
BadenAnderes * Nicht sicher
� � � �*Bitte genaue Angaben
_________________________________________________________________
_________
32. Waren Sie seit dem Badetag in einem Vergnügungs- / Freizeitpark und haben Siedort irgendwelche Wasseranlagen benutzt? (z.B. Wasserrutschen, Wasserfontänen,Rafting)
Ja � Nein � Nicht sicher �Wenn JA, war die Anlage im Inland oder im Ausland?
Inland � Ausland �Bitte geben Sie den Namen der Anlage an: ______________________________________________________________
33. Haben Sie schon mal etwas darüber gehört wie die Badegewässer und Badestrände inDeutschland gepflegt und kontrolliert werden ?
Ja � Nein � Nicht sicher �Wenn NEIN gehen Sie bitte zu Frage 34 weiter.

- 313 -
Wenn JA, war diese Information eher positiv oder negativ ?
Positiv � Negativ � Nicht sicher �
Wenn NEGATIV, hat Sie das beunruhigt ?
gar nicht etwas sehr nicht sicher
� � � �34. Haben Sie schon irgend etwas bezüglich der Sauberkeit von Badegewässern in
Deutschland gehört ?
Ja � Nein � Nicht sicher �Wenn NEIN, gehen Sie bitte zu Frage 35
Wenn JA, war diese Information positiv oder negativ?
Positiv � Negativ �Wenn NEGATIV, von welchen speziellen Problemen haben Sie gehört ?(Sie können auch mehrere Kästchen ankreuzen)
Öl-Lache Treibgut Gesundheitsrisiko
� � �Verschmutzung
durch ChemikalienVerschmutzungdurch Abwasser Anderes * Nicht sicher
� � � �* Bitte genauere Angaben:
35. Haben Sie es jemals abgelehnt aus einem der folgenden Gründe an einer öffentlichenBadestelle baden zu gehen?
Strand zudreckig
Wasser zudreckig
zu starke Brandung /zu hoher Wellengang
Furcht vorKrankheiten
Nicht sicher
ja nein ja nein ja nein ja nein
� � � � � � � � �36. Wodurch haben Sie zum ersten Mal von dieser Studie gehört?
(Bitte nur ein Kästchen ankreuzen).
Durch den PartnerFreunde/ Bekannte
durch einenAnwerber
aus demFernsehen
aus einerZeitung
Anderes* Nicht sicher

- 314 -
� � � � � �*Bitte genauere Angaben:__________________________________________________________________

- 315 -
37. Haben Sie in den Medien irgendwelche Nachrichten und / oder Berichterstattungenüber diese Studie gesehen?
Ja � Nein � Nicht sicher �
38. Sind Sie Mitglied einer Umweltorganisation?
Ja � Nein � Keine Angabe �
39. Welche Tageszeitung lesen Sie ? Wenn keine, schreiben Sie bitte KEINE
_____________________________________________________________________
40. Kommentare: Bitte schreiben Sie hier alles, wovon Sie denken, daß es fürunsere Studie nützlich sein könnte __________________________________________________________________
__________________________________________________________________
Unterschrift:______________________________________________________________
Ausgefüllt am Datum: ___________/___________/___________/_
Vielen Dank, daß Sie sich die Zeit genommen haben, diesen Fragebogen auszufüllen.Und vielen Dank für Ihre Teilnahme an der Badegewässerstudie!Bitte schicken Sie den vollständig ausgefüllten Fragebogen so bald wie möglich in dembeigefügten Briefumschlag zurück.
Adresse:
Dr. med. A. WiedenmannInstitut für Allgemeine Hygiene und Umwelthygiene der Universität TübingenWilhelmstr. 3172074 TübingenTel.: 0177 –3001431, -3001432, -3001433, -3001434

- 316 -

- 317 -
Annex 46. Retrospective molecular analysis of frozen samples
for Escherichia coli and intestinal enterococci by
quantitative real time PCR
Materials and methods
Sample preservation and storage
Four 45 ml aliquots of all water samples collected during the epidemiological trials
were mixed each with 5 ml of glycerol and frozen at -20°C on the sampling day. These
50 ml samples were retrospectively analysed for Escherichia coli and intestinal
enterococci by quantitative real time PCR (LightCyclerTM-PCR). Samples were stored
at -20°C for a maximum of 31 months before DNA extraction. Extracted DNA was
stored at -72°C for a maximum of 8 months before amplification.
Separation of bacterial cells from water samples
Two 45 ml aliquots of each of the original water samples were thawed and filtered
through a 0.4 µm membrane filter (Type GTTP, Millipore).
Cell lysis and DNA extraction
The membrane was folded up and placed into a 1.5 ml micro-centrifuge tube. 300 ml of
0,2 M EDTA, pH 8.0, were added; the tube was vortexed, frozen in liquid nitrogen and
subsequently thawed and boiled in a dry-block. The freeze-boil procedure was repeated
five times. 300 ml binding buffer und 40 µl proteinase K were added to give a total
volume of 600 µl. The reaction mix was incubated at 72°C for 10 minutes. The filter
membrane and the 600 µl of reaction mix were placed onto the membrane of the filter
unit of a Spin-XTM micro-centrifuge tube filter (Costar). The tube was centrifuged for
one minute at 5000g. DNA was extracted from the 600 µl of filtrate using a
commecially available DNA extraction kit (High Pure PCR Template Kit; Roche). The
final extraction volume was 50 µl, which is equivalent to 90 ml of the original water
sample.

- 318 -
Sample volume equivalents used for PCR detection
Aliquots of 1 µl, equivalent to 1.8 ml of the original water samples, were used in the
PCRs to detect Eschericha coli (EC), and aliquots of 5 µl, equivalent to 9 ml of the
original water samples, were used in the PCRs to detect intestinal enterococci (IE). Thus
the theoretical PCR detection limits were 56 EC/100ml and 11 IE/100ml, and 2
bacterial cells in a reaction mix would approximately correspond with the NOAELs of
ca. 100 EC/100ml and 25 IE/100ml. It was considered that if quantification by PCR
would fail, this might open up the chance to compare qualitative PCR results with
NOAELs so that concentrations below NOAELs would correspond to negative PCR
results and concentrations above NOAELs would correspond to positive PCR results.
PCR for Escherichia coli
Primer sequences (P1 = 5'-ATC ACC GTG GTG ACG CAT GTC GC-3' and P2= 5'-
CAC CAC GAT GCC ATG TTC ATC TGC-3') were derived from the uidA gene of E.
coli, encoding beta-glucuronidase, and were used to amplify a 486-bp fragment (Juck et
al., 1996). Hybridization probes (EC1FL = 5'-CAT CCG GTC AGT GGC AGT--FL-3'
and EC1LC = 5'-LC Red640--AAG GGC GAA CAG TTC CTG A--PH-3') were
synthesised by TIB MOLBIOL, Berlin. The lightCycler protocol consisted of 4
programs. Program 1 (denaturation): Segment 1 (Temperature Target 95°C, Hold Time
600 sec, Slope 20°C/sec, Acquisition Mode: None). Program 2 (amplification): Segment
1 (Temperature Target 95°C, Hold Time 1 sec, Slope 20°C/sec, Acquisition Mode:
None); Segment 2 (Temperature Target 55°C, Hold Time 10 sec, Slope 20°C/sec,
Acquisition Mode: Single); Segment 3 (Temperature Target 72°C, Hold Time 12 sec,
Slope 20°C/sec, Acquisition Mode: None). Program 3 (melting curve): Segment 1
(Temperature Target 95°C, Hold Time 0 sec, Slope 20°C/sec, Acquisition Mode:
None); Segment 2 (Temperature Target 45°C, Hold Time 15 sec, Slope 20°C/sec,
Acquisition Mode: None); Segment 3 (Temperature Target 90°C, Hold Time 0 sec,
Slope 0.1°C/sec, Acquisition Mode: Continuous). Program 4 (cooling): Segment 1
(Temperature Target 40°C, Hold Time 30 sec, Slope 20°C/sec, Acquisition Mode:
None). Quantification settings: F2/F1; Baseline Adjustment: Arithmetic; Analysis:
Second Derivative Maximum. LightCycler capillaries containing 1, 10, 50, 100, 200,
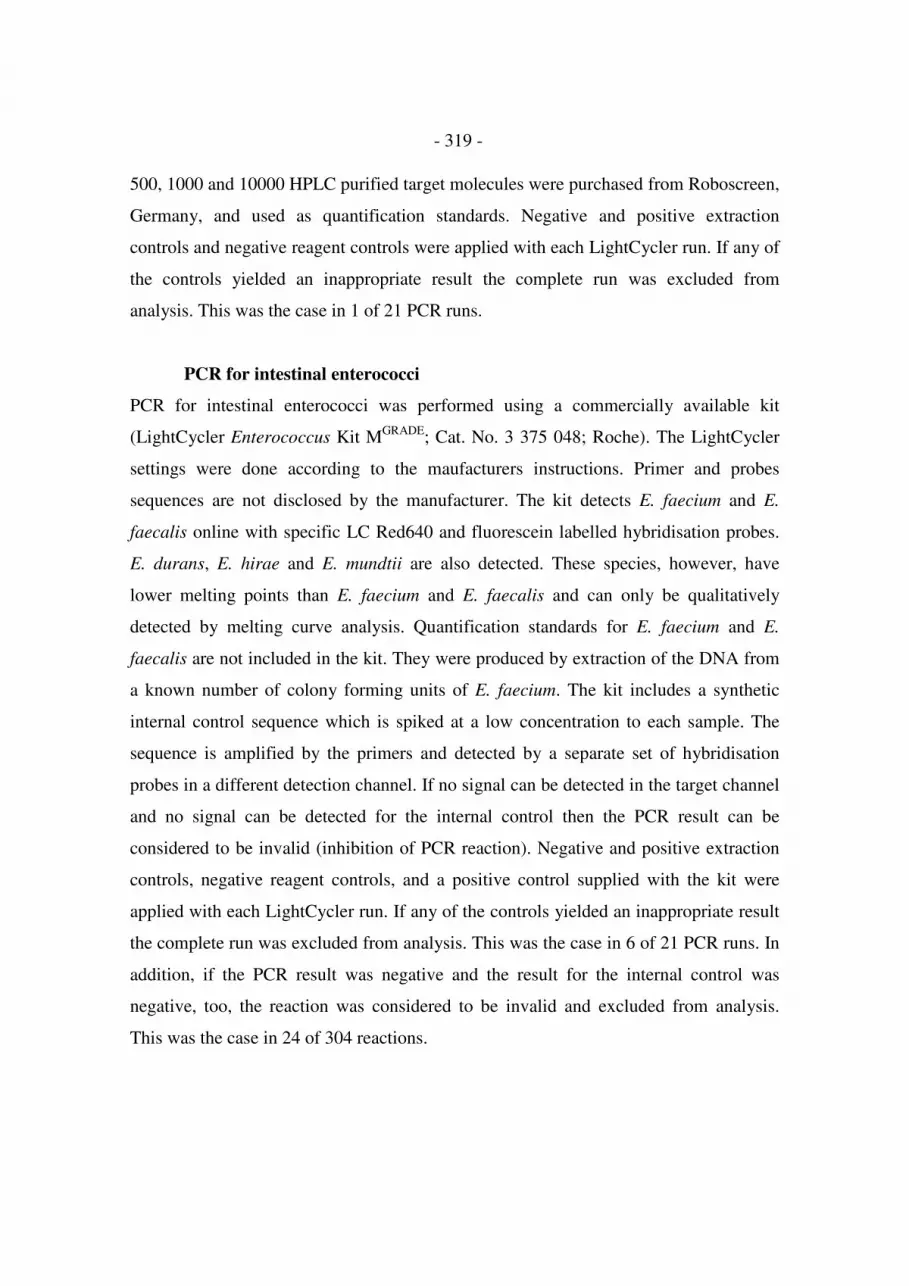
- 319 -
500, 1000 and 10000 HPLC purified target molecules were purchased from Roboscreen,
Germany, and used as quantification standards. Negative and positive extraction
controls and negative reagent controls were applied with each LightCycler run. If any of
the controls yielded an inappropriate result the complete run was excluded from
analysis. This was the case in 1 of 21 PCR runs.
PCR for intestinal enterococci
PCR for intestinal enterococci was performed using a commercially available kit
(LightCycler Enterococcus Kit MGRADE; Cat. No. 3 375 048; Roche). The LightCycler
settings were done according to the maufacturers instructions. Primer and probes
sequences are not disclosed by the manufacturer. The kit detects E. faecium and E.
faecalis online with specific LC Red640 and fluorescein labelled hybridisation probes.
E. durans, E. hirae and E. mundtii are also detected. These species, however, have
lower melting points than E. faecium and E. faecalis and can only be qualitatively
detected by melting curve analysis. Quantification standards for E. faecium and E.
faecalis are not included in the kit. They were produced by extraction of the DNA from
a known number of colony forming units of E. faecium. The kit includes a synthetic
internal control sequence which is spiked at a low concentration to each sample. The
sequence is amplified by the primers and detected by a separate set of hybridisation
probes in a different detection channel. If no signal can be detected in the target channel
and no signal can be detected for the internal control then the PCR result can be
considered to be invalid (inhibition of PCR reaction). Negative and positive extraction
controls, negative reagent controls, and a positive control supplied with the kit were
applied with each LightCycler run. If any of the controls yielded an inappropriate result
the complete run was excluded from analysis. This was the case in 6 of 21 PCR runs. In
addition, if the PCR result was negative and the result for the internal control was
negative, too, the reaction was considered to be invalid and excluded from analysis.
This was the case in 24 of 304 reactions.

- 320 -
Results
The results of the retrospective analyses of frozen sample aliquots by
quantitative real time PCR for Escherichia coli and intestinal enterococci were
disappointing. While nearly perfect standard curves could be achieved for given
concentrations of target DNA, the quantitative results of the sample analyses did not
correlate with the culture results. Moreover, the samples from certain locations seemed
to contain inhibitory substances which could not be effectively removed by the applied
DNA extraction procedure, and obviously caused large numbers of false negative
results, although the internal control in the Enterococcus Kit indicated a failure of
amplification in only 8% (24/304) of the samples.
Conclusions
The PCR-based quantitative molecular detection methods which were evaluated
in this project cannot be considered to be a promising alternative to culture methods.
However, the molecular analyses may have been hampered by the storage conditions
(up to 31 months at -20°C for water samples and up to 10 months at -72°C for extracted
DNA) and by the lower sample volumes which were applied in the PCRs (effective
volumes: 1.8 ml for Escherichia coli; and 9 ml for intestinal enterococci).
In addition, PCR for intestinal enterococci did not detect the same species as the
culture method. Quantification was restricted to E. faecium and E. faecalis, and
qualitative results were restricted to E. faecium, E. faecalis, E. durans, E. mundtii and E.
hirae.
In contrast to the standards used for E. coli detection, which were quantified by
HPLC, the standards for intestinal enterococci were not absolute; they incorporated the
potential losses of DNA which may occur during the extraction procedure. This may be
an explanation for the lower detection limit for intestinal enterococci than for E. coli
which was observed in comparison with the culture results.

- 321 -
For future epidemiological studies it is recommended to extract DNA from
larger water sample volumes immediately after sample collection and to store extracted
DNA at -70°C or in liquid nitrogen instead of storing water aliquots.
Literature
Juck, D., J. Ingram, M. Prevost, J. Coallier, and C. Greer. 1996. Nested PCR protocol
for the rapid detection of Escherichia coli in potable water. Can. J. Microbiol. 42:862-
866.
Acknowledgements
We thank D Tougianidou, 4 base Lab, Reutlingen, and C Hock for their technical
support and co-operation.

- 322 -
0
1
2
3
4
5
6P
CR
log10(C
alc
ula
ted U
nits)
0 1 2 3 4 5 6
Standard log10(CFP)
Linear Fit (x to y) and 95% Confidence Curves
R² = 0.97
n = 83
Combined results for the quantification standards in 15 runs of quantitative real
time PCR for intestinal enterococci (IE)
Note: All individual R² values were >0.90.
Negative PCR results were excluded.
The standard was extracted from an equivalent number
of colony forming particles (CFP) of Enterococcus faecium.

- 323 -
0
1
2
3
4
5
6P
CR
log10(C
alc
ula
ted U
nits)
0 1 2 3
IE Culture Result log10(MPN/9ml)
Linear Fit (x to y) and 95% Confidence Curves
R² = 0.06
n = 23
NOAEL for culture results (ca. 25 IE/100ml)
Comparison of culture results (ISO 7899-1; MUD-hydrolysis) and
quantitative real time PCR for intestinal enterococci (IE)
in 23 bathing water samples
Note: PCR only detects E. faecium and E. faecalis
Negative PCR results were excluded.

- 324 -
0
1
2
3
4
PC
R log10(c
alc
ula
ted u
nits)
0 1 2 3 4
Standard log10(molecules)
Linear Fit (x to y) and 95% Confidence Curves
R² = 0.98
n = 115
Combined results for the quantification standards in 20 runs of quantitative real
time PCR for Escherichia coli (MUG gene)
Note: All individual R² values were >0.90.
Negative PCR results were excluded.
Molecules were quantified by HPLC (Roboscreen, Germany).

- 325 -
0
1
2
3
4
5
6P
CR
lo
g1
0(c
alc
ula
ted
un
its)
0 1 2 3
EC log10 (MPN/1.8 ml)
Linear Fit (x to y) and 95% Confidence Curves
R² = 0.07
n = 41
NOAEL for culture results (ca. 100 IE/100ml)
Comparison of culture results (ISO 9308-3; MUG-hydrolysis) and quantitative real
time PCR (MUG-gene) for Escherichia coli (EC)
in 41 bathing water samples
Note: Negative PCR results were excluded.

- 326 -
0
1
2
3
4
PC
R log10(c
alc
ula
ted u
nits)
0 1 2 3 4
EC log10(molecules or MPN/1.8ml)
0
1
2
3
4
5
6
PC
R log10(C
alc
ula
ted U
nits)
0 1 2 3 4 5 6
IE log10(CFP or MPN/9ml)
Comparison of quantitative real time PCR results and culture results
for Escherichia coli (EC) and intestinal enterococci (IE)
o = water samples : = quantification standards
red line = linear fit for quantification standards (x to y)
green lines = NOAELs for culture results (ca. 100 EC/100 ml and ca. 25 IE/100ml)

- 327 -
F2
+F
3
0.00
0.25
0.50
0.75
1.00
0 1
IE > 1 MPN/9ml
neg
positiv
Culture result PCR negative PCR positive Total
< 1MPN/9ml 36 13 49
> 1 MPN/9ml 138 78 216
Total 174 91 265
Comparison of culture results (ISO 7899-1; MUD-hydrolysis)
and qualitative real time PCR results for intestinal enterococci (IE)
at a cut-off level of 1 MPN/9ml
(= theoretical PCR detection limit; = ca. 11 MPN/100ml)
Note: PCR detects E. faecium, E. faecalis, E. durans, E. mundtii and E. hirae.
Discrepant results are underlined.

- 328 -
F2
+F
3
0.00
0.25
0.50
0.75
1.00
0 1
IE > 2.25 MPN/9ml
neg
positiv
Culture result PCR negative PCR positive Total
< 2.25 MPN/9ml 81 23 104
> 2.25 MPN/9ml 93 68 161
Total 174 91 265
Comparison of culture results (ISO 7899-1; MUD-hydrolysis)
and qualitative real time PCR results for intestinal enterococci (IE)
at a cut-off level of 2.25 MPN/9ml
(= NOAEL; = 25 MPN/100ml)
Note: PCR detects E. faecium, E. faecalis, E. durans, E. mundtii and E. hirae.
Discrepant results are underlined.

- 329 -
F2+
F3
0.00
0.25
0.50
0.75
1.00
0 1
IE >6.75 MPN/9ml
neg
positiv
Culture result PCR negative PCR positive Total
< 6.75 MPN/9ml 129 44 173
> 6.75 MPN/9ml 45 47 92
Total 174 91 265
Comparison of culture results (ISO 7899-1; MUD-hydrolysis)
and qualitative real time PCR results for intestinal enterococci (IE)
at a cut-off level of 6.75 MPN/9ml
(= level with equal numbers of discrepant results; = 75 MPN/100ml)
Note: PCR detects E. faecium, E. faecalis, E. durans, E. mundtii and E. hirae.
Discrepant results are underlined.

- 330 -
PC
R r
esu
lt
0.00
0.25
0.50
0.75
1.00
0 1
EC > 1 MPN/1.8 ml
negative
positive
Culture result PCR negative PCR positive Total
< 1 MPN/1.8ml 113 1 114
> 1 MPN/1.8ml 245 41 286
Total 358 42 400
Comparison of culture results (ISO 9308-3; MUG-hydrolysis) and
qualitative real time PCR results for Escherichia coli (EC)
at a cut-off level of 1 MPN/1.8ml
(= theoretical PCR detection limit; = ca. 56 MPN/100ml)
Note: PCR detects MUG gene
Discrepant results are underlined.

- 331 -
PC
R r
esu
lt
0.00
0.25
0.50
0.75
1.00
0 1
EC > 1.8 MPN/1.8 ml
negative
positive
Culture result PCR negative PCR positive Total
< 1.8 MPN/1.8ml 168 1 169
> 1.8 MPN/1.8ml 190 41 231
Total 358 42 400
Comparison of culture results (ISO 9308-3; MUG-hydrolysis) and
qualitative real time PCR results for Escherichia coli (EC)
at a cut-off level of 1.8 MPN/1.8ml
(= NOAEL; = 100 MPN/100ml)
Note: PCR detects MUG gene
Discrepant results are underlined.

- 332 -
PC
R r
esu
lt
0.00
0.25
0.50
0.75
1.00
0 1
EC > 20 MPN/1.8 ml
negative
positive
Culture result PCR negative PCR positive Total
< 20 MPN/1.8ml 342 16 358
> 20 MPN/1.8ml 16 26 42
Total 358 42 400
Comparison of culture results (ISO 9308-3; MUG-hydrolysis) and
qualitative real time PCR results for Escherichia coli (EC)
at a cut-off level of 20 MPN/1.8ml
(= level with equal numbers of discrepant results; = ca. 1100 MPN/100ml)
Note: PCR detects MUG gene
Discrepant results are underlined.