Embed Size (px)
Citation preview
Unclassified ECO/WKP(2007)45 Organisation de Coopération et de Développement Économiques Organisation for Economic Co-operation and Development 14-Mar-2008 ___________________________________________________________________________________________
English - Or. English ECONOMICS DEPARTMENT
PRIMARY AND SECONDARY EDUCATION IN THE UNITED STATES ECONOMICS DEPARTMENT WORKING PAPER No. 585 By Peter Tulip and Gregory Wurzburg
All Economics Department Working Papers are available through OECD's internet web site at www.oecd.org/eco/Working_Papers
JT03242325
Document complet disponible sur OLIS dans son format d'origine Complete document available on OLIS in its original format
EC
O/W
KP(2007)45
Unclassified
English - O
r. English
Cancels & replaces the same document of 06 December 2007
ECO/WKP(2007)45
2
ABSTRACT/RESUME
Primary and Secondary Education in the United States
The average educational attainment of US students is weak by international comparison. For example, mean results of PISA test scores are below the OECD average. This is despite substantial resources devoted to the schooling system. One partial explanation for this is that academic standards, curriculum and examinations are not sufficiently challenging in most US states. In 2001, Congress enacted the No Child Left Behind Act (NCLB) to raise achievement levels, especially of certain groups that perform badly. The Act requires states to establish clear content standards as to what students should know, to regularly assess performance and to set thresholds for adequate yearly progress; it also requires schools where students are failing to meet such thresholds to improve or close, while enhancing options for parents of children in such schools to place their children elsewhere. The law appears to be well conceived, addressing key problems in a sensible manner. Preliminary indications are consistent with it raising school performance and closing achievement gaps. The NCLB legislation should therefore be reauthorised. Moreover, the NCLB framework of standards, assessment and accountability should be extended through upper secondary education. That said, there are a number of areas in which improvements could be made. Though the federal government cannot set standards, it could strengthen incentives for more states to make their standards more challenging. As well, the federal government should help states and districts to better test student achievement and assess progress.
JEL classification codes: H52, I28
Key words: Education; schools, No Child Left Behind, PISA, United States
L'enseignement primaire et secondaire aux États-Unis
Le niveau d’instruction moyen des élèves aux États-Unis est faible par rapport à ce qu’il est dans d’autres pays. Les résultats moyens au test du PISA, par exemple, sont inférieurs à la moyenne de l’OCDE en dépit des ressources considérables consacrées au système scolaire. L’une des explications possibles est que les États pour la plupart ne se montrent pas assez ambitieux, qu’il s’agisse du niveau d’acquis exigé, des programmes d’enseignement ou des examens. En 2001, le Congrès a voté la loi baptisée No Child Left Behind (NCLB) afin de relever le niveau des acquis, en particulier parmi certains groupes de population dont les performances laissent à désirer. Cette loi exige des États qu’ils définissent clairement les connaissances que les élèves doivent acquérir, qu’ils évaluent les performances à intervalles réguliers et qu’ils fixent de façon appropriée des objectifs de progression annuelle ; elle exige par ailleurs des établissements scolaires dont les élèves n’atteignent pas ces objectifs, qu’ils s’améliorent ou ferment, et parallèlement elle donne aux parents dont les enfants fréquentent ces établissements plus de possibilités pour les scolariser ailleurs. Cette loi est, semble-t-il, bien conçue et traite raisonnablement des problèmes essentiels. D’après les premiers constats, elle a permis d’améliorer les performances des établissements scolaires et d’atténuer les écarts de résultats. Cette législation devrait donc être reconduite. De plus, ses dispositions concernant le niveau d’exigence, l’évaluation et l’obligation de rendre compte devraient être appliquées au deuxième cycle de l’enseignement secondaire. Cela dit, des améliorations pourraient être apportées dans un certain nombre de domaines. S’il est vrai que le gouvernement fédéral ne peut fixer de normes en la matière, il pourrait renforcer les mesures incitatives afin qu’un plus grand nombre d’États revoient à la hausse leur niveau d'exigence. De même, il pourrait aider les États et les districts scolaires à améliorer l’évaluation des acquis des élèves et des progrès accomplis.
JEL classification codes: H52; I28
Key words: Education; Ècoles; No Child Left Behind, PISA, États-Unis
Copyright OECD, 2007 Application for permission to reproduce or translate all, or part of, this material should be made to: Head of Publications Service, OECD, 2 rue andré-Pascal, 75775 Paris cedex 16, France
ECO/WKP(2007)45
3
TABLE OF CONTENTS
ABSTRACT/RESUME .................................................................................................................................. 2
Primary and Secondary Education in the United States ................................................................................. 2
PRIMARY AND SECONDARY EDUCATION IN THE UNITED STATES.............................................. 5
Dimensions of the problem ......................................................................................................................... 5 The United States should be among the world leaders ............................................................................ 8 Inequality ............................................................................................................................................... 10 Why do US school students perform below the international average? ................................................ 12 Centralisation and academic schooling standards ................................................................................. 15 Past attempts to improve schooling performance fell short ................................................................... 17 A stronger federal role to raise academic standards .............................................................................. 18 Early signs of progress .......................................................................................................................... 19
The urgent need for challenging standards ................................................................................................ 21 Conclusion ................................................................................................................................................. 25
BIBLIOGRAPHY ......................................................................................................................................... 26
ANNEX 1 FURTHER EVIDENCE ON SCHOOL PERFORMANCE ..................................................... 29
Tables 1. International comparisons of student performance ................................................................................ 7 2. Test scores: United States versus best-performers ................................................................................. 8 3. Dispersion of test results; PISA 2003................................................................................................... 10 4. Rank of US students in mathematics by parental occupation .............................................................. 12 5. Curriculum-based external exit exams, OECD, 1997 .......................................................................... 14 6. Changes in reading and math achievement, and gaps for selected groups during early years of NCLB,
as measured by NAEP ........................................................................................................................ 20 7. Trends in proportion of students at proficient level in reading and mathematics before and after
implementation of NCLB, as measured by NAEP ................................................................................ 21 8. Advanced placement - trends in coverage, overall enrolments and enrolments of key subgroups, 1995-
2005 ....................................................................................................................................................... 24 A1. Number of states showing an increase in the percentage of 4th grade students performing at or
above the state's proficient level from 2000/01 to 2002/03 ............................................................. 29 A2. Summary of results of selected surveys of achievement trends in states (per cent of states) ............ 30 A3. Trends in reading and mathematics results, during early years of NCLB, as measured by NAEP ... 30 A4. Changes in reading and math achievement gaps for selected groups during early years of NCLB, as
measured by NAEP .......................................................................................................................... 31 Figures
1. The US performance in international tests is unimpressive ................................................................... 6 2. US students should do better .................................................................................................................. 9 3. Distribution of students by proficiency ................................................................................................ 11
Boxes Box 1. Main provisions of the No Child Left Behind Act (NCLB) ......................................................... 18 Box 2. De facto national standards: the example of the Advanced Placement Program ......................... 23 Box 3. Recommendations on schools ...................................................................................................... 25

ECO/WKP(2007)45
4
ECO/WKP(2007)45
5
PRIMARY AND SECONDARY EDUCATION IN THE UNITED STATES
By Peter Tulip and Gregory Wurzburg1
1. A centrepiece of the Administration’s domestic policy agenda is the No Child Left Behind Act. Against a background of disappointing education performance, the Act aims to raise standards and hold schools accountable for results. Specifically, it calls for nationwide annual testing in grades 3 to 8, greater accountability requirements (while preserving local control), and increased parental choice if schools are failing. This paper discusses the background, implementation and effects of these measures, with a focus on standards. Given space limitations, important policy issues such as teacher quality and school choice are not discussed.
Dimensions of the problem
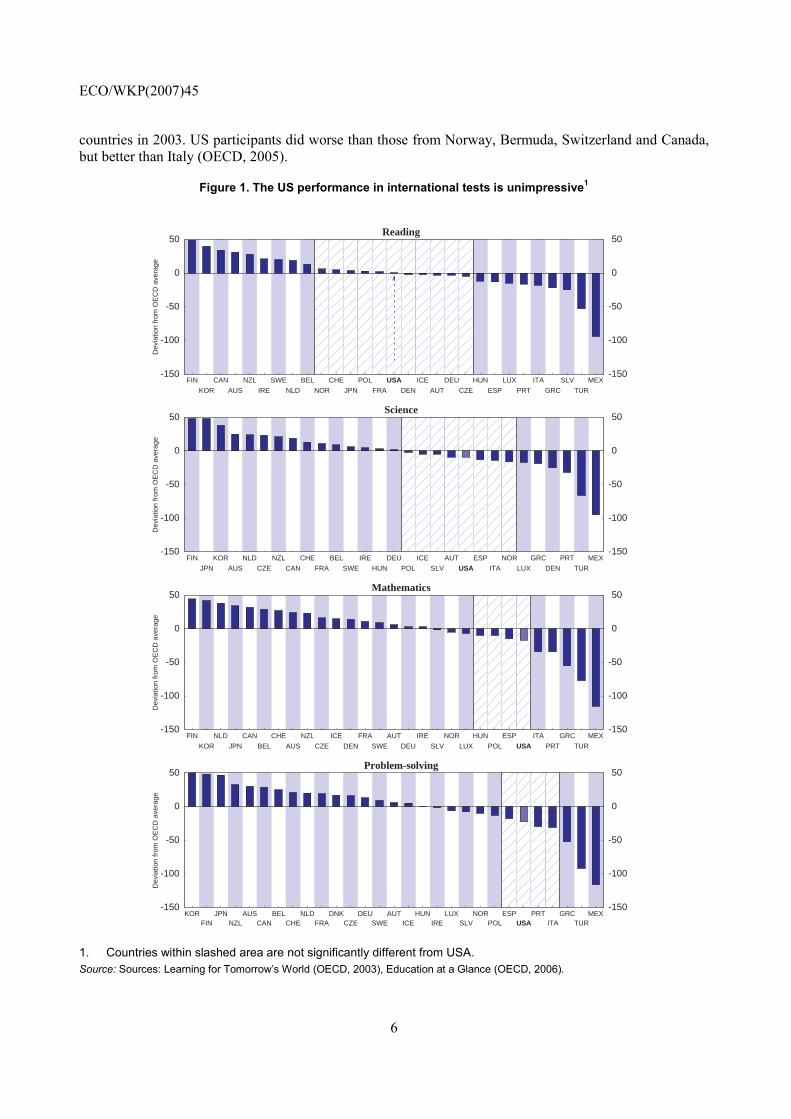
2. Determining what school students can and should learn is difficult. Accordingly, international comparisons provide a useful and interesting benchmark. Unfortunately, the performance of US students in international tests is not especially good. For example, the 2003 Programme for International Student Assessment (PISA) tested 15-year olds in four broad areas. (In the United States, most 15-year olds are in 10th Grade). As shown in Figure 1, US students performed near the OECD average in reading and below the average in science, mathematics, and problem solving. These results are disappointing given that many Americans expect their school students to outperform those of other countries. This expectation seems a reasonable one, considering the stellar performance of the United States in other educational fields and the many advantages US students enjoy (discussed below).
3. Other international comparisons show similar results. Table 1 reports the rank of US students relative to other OECD countries, as measured by PISA, the Progress in International Reading Literacy Study (PIRLS) and the Trends in International Mathematics and Science Study (TIMSS). For comparability and simplicity, the table restricts the sample to OECD countries. So the often-superior performance of the United States relative to many poor non-OECD countries is not reflected, but neither is the inferior performance relative to Singapore, Hong Kong and Chinese Taipei. The relative US performance is not as disappointing in TIMSS and PIRLS as in PISA, yet a common finding is that US students fall below international best-practice. In most studies, the US performance varies between middling and poor.2 These results are also in line with international comparisons of adults. The Adult Literacy and Lifeskills (ALL) Survey assessed the literacy and numeracy skills of 16-65 year olds in six
1. This paper is based on material from the OECD Economic Survey of the United States published in
May 2007 under the authority of the Economic and Development Review Committee (EDRC). The authors would like to thank Val Koromzay, Andrew Dean, Patrick Lenain, Hannes Suppanz, and John Cresswell for valuable comments on earlier drafts. The paper has also benefited from discussions with numerous American experts, including from the government. Special thanks go to Laure Meuro for technical assistance and to Chrystyna Harpluk and Deirdre Claassen for technical preparation. The authors can be contacted at [email protected] and [email protected].
2. A possible exception is TIMSS 4th grade science, where the United States came third out of 11 OECD members. In the full sample, the United States ranked 6th out of 25 economies, behind Singapore, Chinese Taipei, Japan, Hong Kong and England.
ECO/WKP(2007)45
6
countries in 2003. US participants did worse than those from Norway, Bermuda, Switzerland and Canada, but better than Italy (OECD, 2005).
Figure 1. The US performance in international tests is unimpressive1
-150
-100
-50
0
50
-150
-100
-50
0
50
FIN
KOR
CAN
AUS
NZL
IRE
SWE
NLD
BEL
NOR
CHE
JPN
POL
FRA
USADEN
ICE
AUT
DEU
CZE
HUN
ESP
LUX
PRT
ITA
GRC
SLV
TUR
MEX
Reading
Dev
iatio
n fr
om O
EC
D a
vera
ge
-150
-100
-50
0
50
-150
-100
-50
0
50
FIN
JPN
KOR
AUS
NLD
CZE
NZL
CAN
CHE
FRA
BEL
SWE
IRE
HUN
DEU
POL
ICE
SLV
AUT
USAESP
ITA
NOR
LUX
GRC
DEN
PRT
TUR
MEX
Science
Dev
iatio
n fr
om O
EC
D a
vera
ge
-150
-100
-50
0
50
-150
-100
-50
0
50
FIN
KOR
NLD
JPN
CAN
BEL
CHE
AUS
NZL
CZE
ICE
DEN
FRA
SWE
AUT
DEU
IRE
SLV
NOR
LUX
HUN
POL
ESP
USAITA
PRT
GRC
TUR
MEX
Mathematics
Dev
iatio
n fr
om O
EC
D a
vera
ge
-150
-100
-50
0
50
-150
-100
-50
0
50
KORFIN
JPNNZL
AUSCAN
BELCHE
NLDFRA
DNKCZE
DEUSWE
AUTICE
HUNIRE
LUXSLV
NORPOL
ESPUSA
PRTITA
GRCTUR
MEX
Problem-solving
Dev
iatio
n fr
om O
EC
D a
vera
ge
1. Countries within slashed area are not significantly different from USA. Source: Sources: Learning for Tomorrow’s World (OECD, 2003), Education at a Glance (OECD, 2006).
ECO/WKP(2007)45
7
Table 1. International comparisons of student performance
Rank of US students relative to other OECD countries
PISA PIRLS TIMSS TIMSS Reading 15th of 29 6th of 17 Science 18th of 29 3rd of 11 5th of 13 Mathematics 24th of 29 6th of 11 8th of 13 Problem solving 24th of 29 Memo items: Students tested 15-year-olds Grade 4 Grade 4 Grade 8 Date 2003 2001 2003 2003
Source: Adapted from Lemke and Gonzales (2006).
4. This unimpressive performance is not new. PISA results for 2000, TIMSS results for 1995 and 1999, as well as earlier, less representative, results from the International Assessment of Educational Progress also showed qualitatively similar results. Hanushek (1998, Chart 1) shows a series of international comparisons from 1963 to 1991. In five of the six tests the United States lies below the mean. What is new is that this underperformance in terms of quality is no longer being offset by the superior performance in terms of quantity. It used to be that far more Americans completed high school than did their counterparts in other countries. But other countries began to catch up with and overtake the US in the 1970s and 1980s. By 2004, among those aged 25-34 (who would have typically graduated between 1988 and 1997), the US rank in terms of high-school completion rates had fallen to 11th out of 30 OECD countries (OECD, 2006a, Table A1.2a; Hanushek, 1998).
5. Two other patterns in Table 1 might be noted. First, the US relative performance is somewhat stronger among younger students than among older students. This is clearest in the difference between TIMSS 4th graders and 8th graders. It also appears in the weaker performance in PISA (which mostly covers 10th graders) and in some other studies that are not shown. Second, the United States does worse in mathematics than in reading or science. Reasons for these differences are not clear, though they may be important to diagnosing why the United States disappoints.
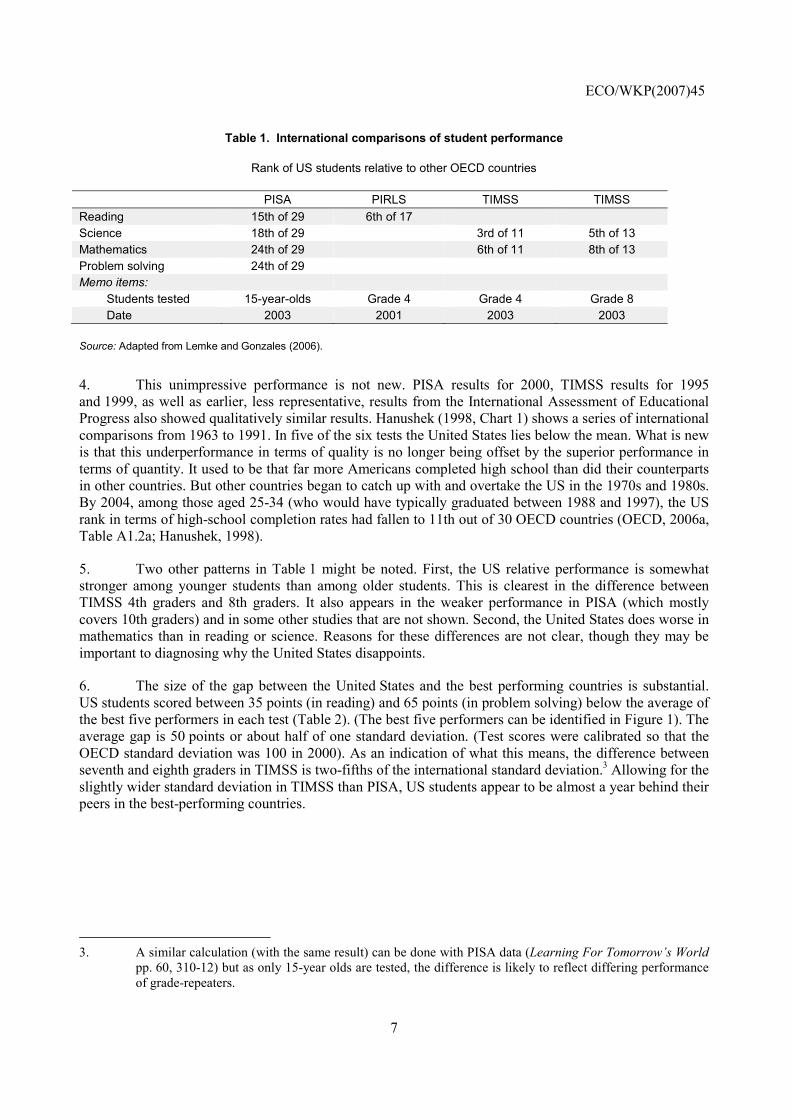
6. The size of the gap between the United States and the best performing countries is substantial. US students scored between 35 points (in reading) and 65 points (in problem solving) below the average of the best five performers in each test (Table 2). (The best five performers can be identified in Figure 1). The average gap is 50 points or about half of one standard deviation. (Test scores were calibrated so that the OECD standard deviation was 100 in 2000). As an indication of what this means, the difference between seventh and eighth graders in TIMSS is two-fifths of the international standard deviation.3 Allowing for the slightly wider standard deviation in TIMSS than PISA, US students appear to be almost a year behind their peers in the best-performing countries.
3. A similar calculation (with the same result) can be done with PISA data (Learning For Tomorrow’s World
pp. 60, 310-12) but as only 15-year olds are tested, the difference is likely to reflect differing performance of grade-repeaters.
ECO/WKP(2007)45
8
Table 2. Test scores: United States versus best-performers; PISA 2003
US mean OECD average Average of best 5 performers
Gap between US and best performers
Reading 495 494 530 35 Science 491 500 537 46 Mathematics 483 500 538 55 Problem Solving 477 500 542 65
Source: Learning for Tomorrow’s World (OECD, 2003), Education at a Glance (OECD, 2006).
The United States should be among the world leaders
7. These test results are surprising when compared to the impressive US performance on many other social and economic indicators. In particular, the performance of US universities, discussed in a companion paper (Tulip, 2007), suggests that education is something Americans can do exceptionally well. Consistent with this, the United States has a highly skilled workforce (whether measured by wages or credentials) and it leads the world in many technologically-advanced industries.
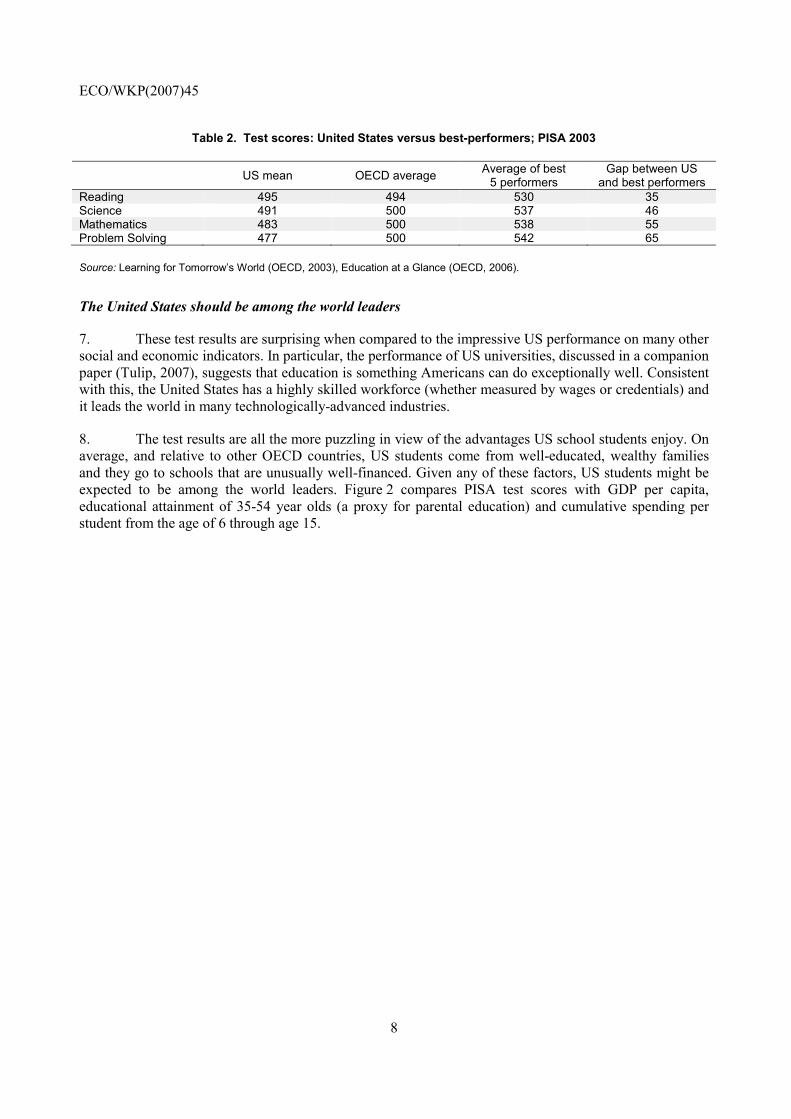
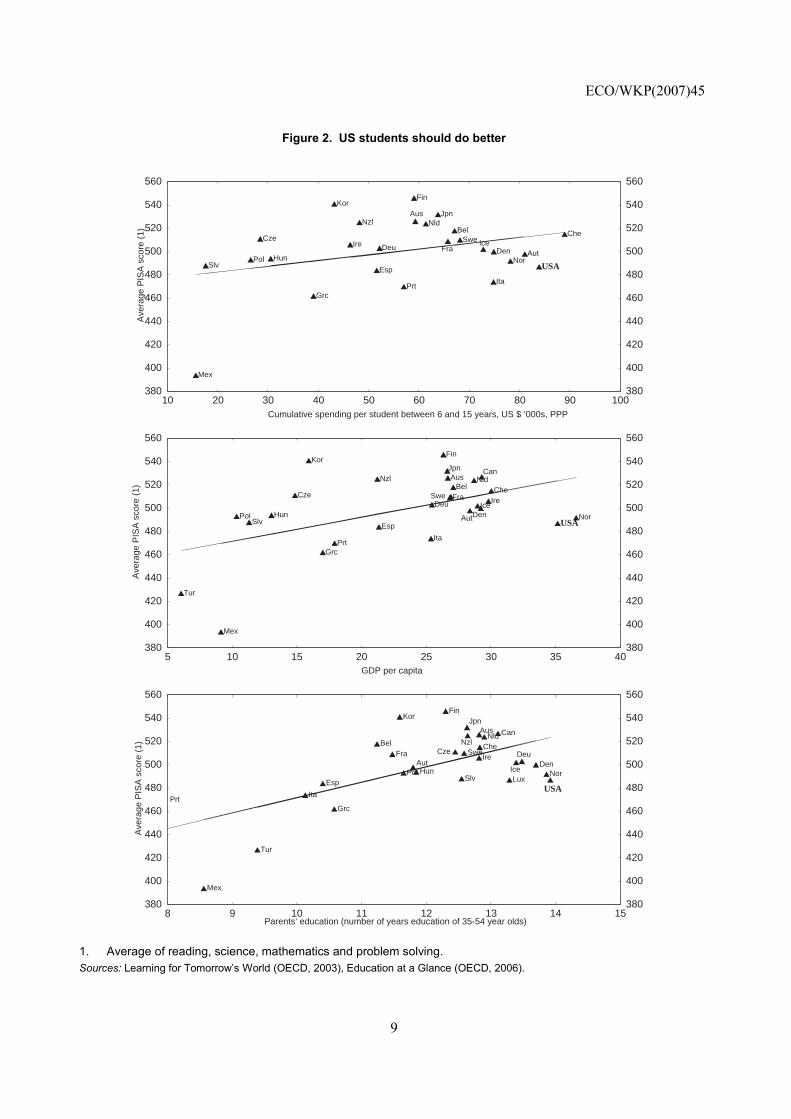
8. The test results are all the more puzzling in view of the advantages US school students enjoy. On average, and relative to other OECD countries, US students come from well-educated, wealthy families and they go to schools that are unusually well-financed. Given any of these factors, US students might be expected to be among the world leaders. Figure 2 compares PISA test scores with GDP per capita, educational attainment of 35-54 year olds (a proxy for parental education) and cumulative spending per student from the age of 6 through age 15.
ECO/WKP(2007)45
9
Figure 2. US students should do better
10 20 30 40 50 60 70 80 90 100380
400
420
440
460
480
500
520
540
560
380
400
420
440
460
480
500
520
540
560
Aut
BelCze
Den
Fin
Deu
Grc
Hun
Ire
Ita
JpnKor
Mex
NldNzl
NorPol
Prt
SlvEsp
SweChe
USA
Aus
FraIce
Cumulative spending per student between 6 and 15 years, US $ ’000s, PPP
Ave
rage
PIS
A s
core
(1)
5 10 15 20 25 30 35 40380
400
420
440
460
480
500
520
540
560
380
400
420
440
460
480
500
520
540
560
AusBel
Cze
Fin
FraDeu
Grc
HunIce
Ire
Ita
Kor
Mex
NldNzl
NorPol
Prt
SlvEsp
Che
Tur
USA
Jpn Can
Aut
Swe
Den
GDP per capita
Ave
rage
PIS
A s
core
(1)
8 9 10 11 12 13 14 15380
400
420
440
460
480
500
520
540
560
380
400
420
440
460
480
500
520
540
560
BelCan
Den
Fin
Fra
Grc
Hun
Ire
Ita
Kor
Lux
Mex
Nld
NorPol
Prt
SlvEsp
SweChe
Tur
USA
Deu
Nzl
Aut
Cze
AusJpn
Ice
Parents’ education (number of years education of 35-54 year olds)
Ave
rage
PIS
A s
core
(1)
1. Average of reading, science, mathematics and problem solving. Sources: Learning for Tomorrow’s World (OECD, 2003), Education at a Glance (OECD, 2006).
ECO/WKP(2007)45
10
9. The strength of these relationships has been the subject of substantial research. In general, this suggests that income and parental education are strongly correlated with educational performance, whereas spending is not. But for present purposes, the key point is how badly US students do, relative to their resources. In each of the three panels, the United States is one of the largest negative outliers. If one believes that inputs should bear some relationship to outputs, the US test results are a puzzle.
Inequality
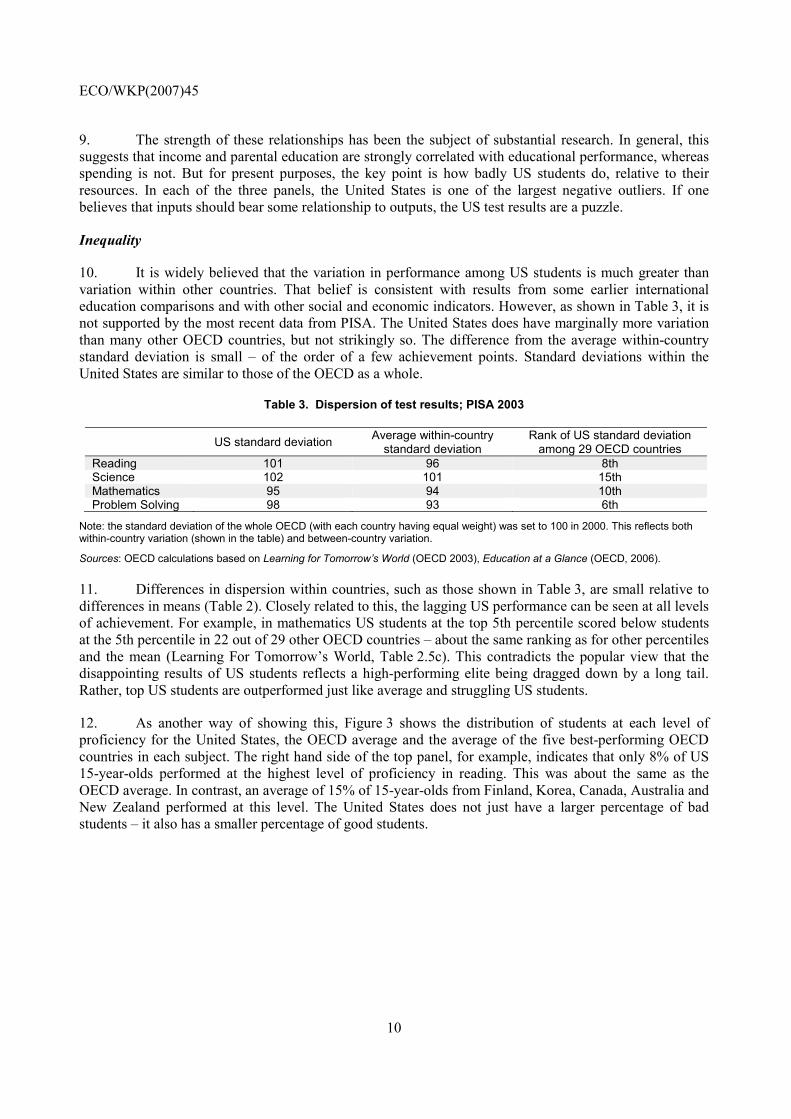
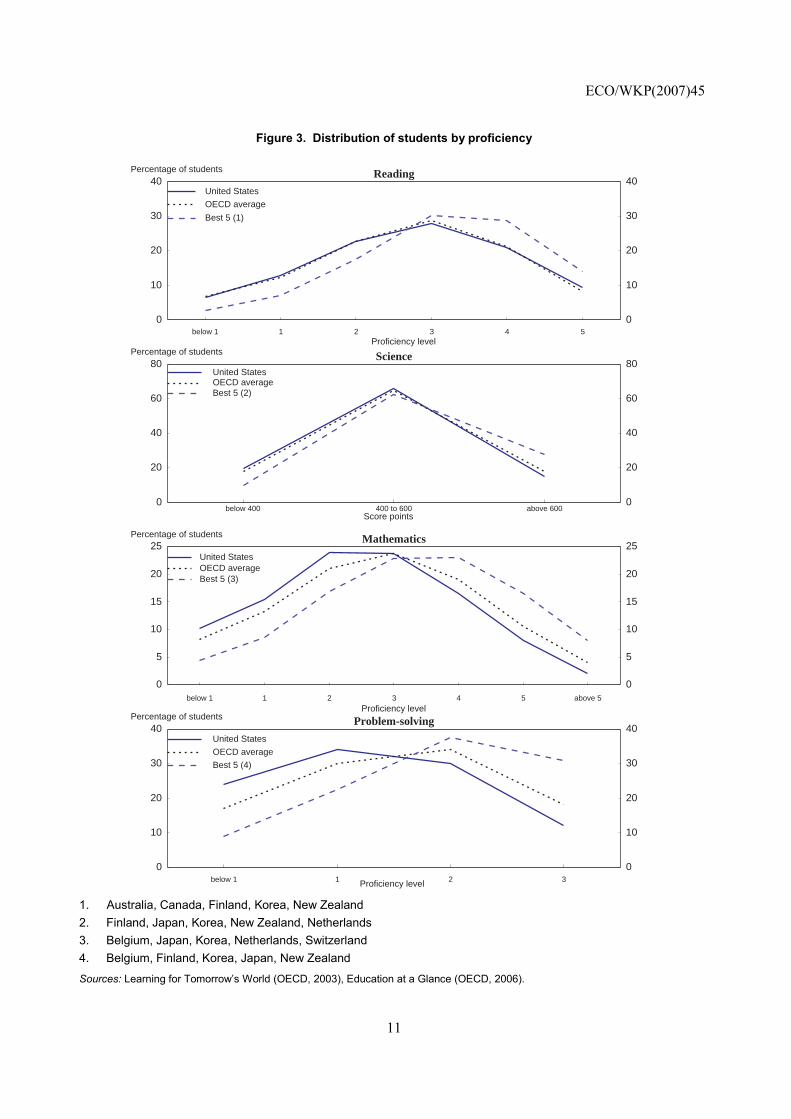
10. It is widely believed that the variation in performance among US students is much greater than variation within other countries. That belief is consistent with results from some earlier international education comparisons and with other social and economic indicators. However, as shown in Table 3, it is not supported by the most recent data from PISA. The United States does have marginally more variation than many other OECD countries, but not strikingly so. The difference from the average within-country standard deviation is small – of the order of a few achievement points. Standard deviations within the United States are similar to those of the OECD as a whole.
Table 3. Dispersion of test results; PISA 2003
US standard deviation Average within-country standard deviation
Rank of US standard deviation among 29 OECD countries
Reading 101 96 8th Science 102 101 15th Mathematics 95 94 10th Problem Solving 98 93 6th
Note: the standard deviation of the whole OECD (with each country having equal weight) was set to 100 in 2000. This reflects both within-country variation (shown in the table) and between-country variation.
Sources: OECD calculations based on Learning for Tomorrow’s World (OECD 2003), Education at a Glance (OECD, 2006).
11. Differences in dispersion within countries, such as those shown in Table 3, are small relative to differences in means (Table 2). Closely related to this, the lagging US performance can be seen at all levels of achievement. For example, in mathematics US students at the top 5th percentile scored below students at the 5th percentile in 22 out of 29 other OECD countries – about the same ranking as for other percentiles and the mean (Learning For Tomorrow’s World, Table 2.5c). This contradicts the popular view that the disappointing results of US students reflects a high-performing elite being dragged down by a long tail. Rather, top US students are outperformed just like average and struggling US students.
12. As another way of showing this, Figure 3 shows the distribution of students at each level of proficiency for the United States, the OECD average and the average of the five best-performing OECD countries in each subject. The right hand side of the top panel, for example, indicates that only 8% of US 15-year-olds performed at the highest level of proficiency in reading. This was about the same as the OECD average. In contrast, an average of 15% of 15-year-olds from Finland, Korea, Canada, Australia and New Zealand performed at this level. The United States does not just have a larger percentage of bad students – it also has a smaller percentage of good students.
ECO/WKP(2007)45
11
Figure 3. Distribution of students by proficiency
0
10
20
30
40Percentage of students
0
10
20
30
40Reading
below 1 1 2 3 4 5Proficiency level
United States
OECD average
Best 5 (1)
0
20
40
60
80Percentage of students
0
20
40
60
80Science
below 400 400 to 600 above 600Score points
United StatesOECD averageBest 5 (2)
0
5
10
15
20
25Percentage of students
0
5
10
15
20
25
below 1 1 2 3 4 5 above 5
Mathematics
Proficiency level
United StatesOECD averageBest 5 (3)
0
10
20
30
40Percentage of students
0
10
20
30
40
below 1 1 2 3
Problem-solving
Proficiency level
United States
OECD average
Best 5 (4)
1. Australia, Canada, Finland, Korea, New Zealand 2. Finland, Japan, Korea, New Zealand, Netherlands 3. Belgium, Japan, Korea, Netherlands, Switzerland 4. Belgium, Finland, Korea, Japan, New Zealand
Sources: Learning for Tomorrow’s World (OECD, 2003), Education at a Glance (OECD, 2006).
ECO/WKP(2007)45
12
13. It is sometimes suggested that the poor US performance reflects failings of disadvantaged inner-city schools, while more prosperous schools do relatively well. Again, this hypothesis does not seem consistent with the latest PISA results. The students tested in PISA are asked about their parents’ occupations, and these responses are mapped into an internationally comparable index of socioeconomic status. As shown in Table 4, when the mathematics performance of well-off US students is compared with that of well-off students in other countries, they lag in the same way as that of students from disadvantaged backgrounds. Measuring family background by parental education or number of books in the home gives essentially the same result (Hampden-Thompson and Johnston, 2006, Table 2). The relatively poor United States performance (for mathematics in PISA) is evident among all socio-economic groups.
Table 4. Rank of US students in mathematics by parental occupation
Socioeconomic background Rank of US among 29 OECD countries Bottom quarter 24 Second quarter 22 Third quarter 23 Top quarter 23 All 24
Source: Lemke (2004), p. 109.
Why do US school students perform below the international average?
14. It is not clear why US school outcomes are disappointing, relative to expectations. Part of the explanation is that academic standards in the United States appear to be lower than elsewhere. That is, less is asked of US students. Evidence on this comes from detailed comparisons of mathematics and science curricula as part of TIMSS (see for example, Schmidt et al. 1998, 2001, 2002). William Schmidt, the US TIMSS National Research Coordinator, summarizes differences in mathematics curricula:
By the middle grades the top achieving countries … begin the transition to the study of algebra, including linear equations and functions, geometry and even in some cases, basic trigonometry. By the end of eighth grade in these countries children have mostly completed US high school courses in algebra I and geometry. By contrast, most US students are destined to mostly continue the study of arithmetic. In fact, we estimate that at the end of eighth grade US students are some two or more years behind their counterparts around the world (Schmidt, 2003 p. 1).
Similarly, while US middle-school students are still focused on basics of elementary science that are strong on description (for example, earth sciences), students in other countries are shifting to beginning concepts in chemistry and physics that are more analytical (Schmidt, Houng and Cogan, 2002, p. 3).
15. Consistent with this, students who move between countries report that US schools are easier. Loveless (2002) surveyed high school students from other countries who had recently studied in the United States. Eighty-five percent reported that US classes were easier while 11% thought US classes were harder. US students who had studied abroad agreed, though less emphatically. Fifty-six per cent thought US classes were easier while 30% thought they were harder. Apart from being interesting in itself, this suggests that the correlation between standards and performance is less likely to reflect reverse causation. One reason why standards are low in the United States may be that they have been lowered to accommodate low performance. But if that were all, one would expect to find students having difficulty with the material. Instead, they find it easier – suggesting that standards have been lowered by more than student ability warranted.
16. The astonishing self-confidence of US students also suggests standards are lax. Although they rank 24th out of 29 OECD countries in mathematics performance, US students more strongly agree with
ECO/WKP(2007)45
13
the statement “I get good grades in mathematics” than students from any other country. Similar self-confidence is reflected in their responses to statements “In my mathematics class, I understand even the most difficult work”, “I learn mathematics quickly”, “I have always believed that mathematics is one of my best subjects”, and “I am just not good at mathematics”. Although cultural differences may underlie these responses, one interpretation is that US students are being commended for work that would not be acceptable in other countries.
17. This matters, but perhaps in a different way to what is often thought. Contrary to widespread hopes that promotion of self-esteem and confidence will encourage learning, grade inflation seems to lower performance. The PISA index of self-confidence in mathematics (on which the United States ranks highest) is negatively and significantly correlated with mathematics performance across countries.4 More persuasively, Figlio and Lucas (2004) track students through longitudinal data across different teachers. Their data set has observations on third, fourth and fifth graders in a large school district in Florida. Controlling for class-room composition and school and student fixed effects, they find that improvements in test results are about 20% greater in math and one-third greater in reading for students who are assigned to teachers who are tough graders.
18. In short, one reason why US students perform worse than their international counterparts seems to be that they are not being challenged. For teachers, principals, textbook authors and the like, some remedies for this are probably obvious. For policy makers, it is important to determine why standards are low.
19. The TIMSS research noted above (Schmidt et al. 1998, 2001, 2002) suggested that US students lag behind their peers overseas because of weaknesses in US curricula. Following detailed comparison of standards, textbooks, surveys of teachers and classroom observation in different countries, Schmidt and his colleagues concluded that US courses were “a mile wide and an inch deep”. For example, whereas eighth-grade mathematics textbooks in Japan cover 10 topics in depth, US eighth-grade textbooks cover 30 topics superficially. (The correlation between textbook coverage and what teachers teach is about 0.95). A lack of focus promotes memorization rather than depth of understanding. Either because of this, or because little sinks in, the content is reviewed in subsequent years. Whereas high-achieving countries often teach specific topics in mathematics in three consecutive years, they are typically taught over six years in the United States. Because of the time devoted to repetitive review, progress is slow.
20. These findings have been very influential. For example, the recently released guidelines by the National Council of Teachers of Mathematics (2006) propose clearer focus in mathematics curricula with more depth and less breadth. They emphasize the TIMSS research in motivating the changes. As a parallel development, many school districts have been adopting foreign curricula. For example, some 300 school systems in the United States have adopted “Singapore Math” (Hechinger, 2006) – Singapore being the highest ranked country in TIMSS. Educators have likewise been looking closely at how mathematics and science are taught in other high-performing countries, such as Finland and Taiwan.5
21. It may be that the problems of US curricula simply reflected poor information: educators may have been unaware that they could do better. If so, developments such as those noted in the previous paragraph are very encouraging. Or it may be that the problems are more fundamental. Schmidt et al.
4. Closely related to this, there is a strong negative correlation across countries between enjoyment of
mathematics and performance. As Whitehurst (2003) points out, this suggests that mathematics does not need to be made fun.
5. For an account of how one school district (Montgomery county, Maryland) adjusted its mathematics curriculum in response to the TIMSS research, see Larson (2001).
ECO/WKP(2007)45
14
(1998) for example, attributed the breadth and consequent lack of depth to the decentralised nature of educational planning in the United States, which leads to curricula that attempt to keep everyone happy. In that case the appropriate policy remedy would presumably be increased centralisation of standards.
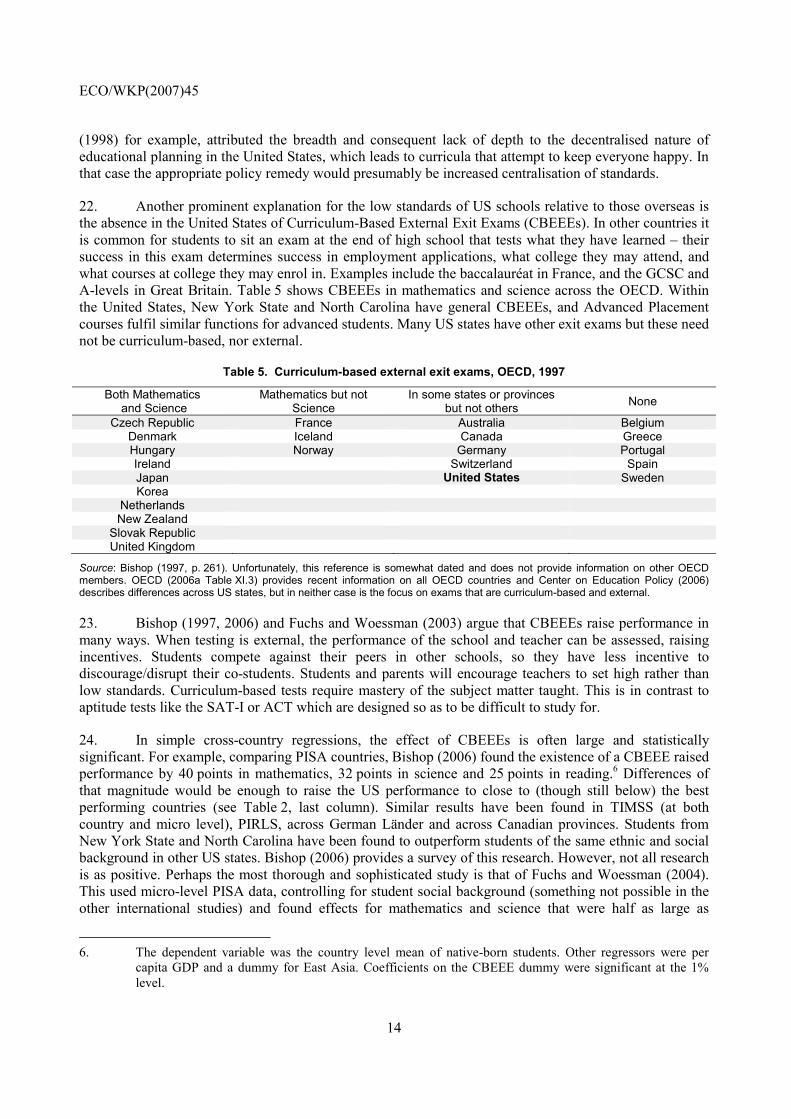
22. Another prominent explanation for the low standards of US schools relative to those overseas is the absence in the United States of Curriculum-Based External Exit Exams (CBEEEs). In other countries it is common for students to sit an exam at the end of high school that tests what they have learned – their success in this exam determines success in employment applications, what college they may attend, and what courses at college they may enrol in. Examples include the baccalauréat in France, and the GCSC and A-levels in Great Britain. Table 5 shows CBEEEs in mathematics and science across the OECD. Within the United States, New York State and North Carolina have general CBEEEs, and Advanced Placement courses fulfil similar functions for advanced students. Many US states have other exit exams but these need not be curriculum-based, nor external.
Table 5. Curriculum-based external exit exams, OECD, 1997
Both Mathematics and Science
Mathematics but not Science
In some states or provinces but not others None
Czech Republic France Australia Belgium Denmark Iceland Canada Greece Hungary Norway Germany Portugal Ireland Switzerland Spain Japan United States Sweden Korea
Netherlands New Zealand
Slovak Republic United Kingdom
Source: Bishop (1997, p. 261). Unfortunately, this reference is somewhat dated and does not provide information on other OECD members. OECD (2006a Table XI.3) provides recent information on all OECD countries and Center on Education Policy (2006) describes differences across US states, but in neither case is the focus on exams that are curriculum-based and external.
23. Bishop (1997, 2006) and Fuchs and Woessman (2003) argue that CBEEEs raise performance in many ways. When testing is external, the performance of the school and teacher can be assessed, raising incentives. Students compete against their peers in other schools, so they have less incentive to discourage/disrupt their co-students. Students and parents will encourage teachers to set high rather than low standards. Curriculum-based tests require mastery of the subject matter taught. This is in contrast to aptitude tests like the SAT-I or ACT which are designed so as to be difficult to study for.
24. In simple cross-country regressions, the effect of CBEEEs is often large and statistically significant. For example, comparing PISA countries, Bishop (2006) found the existence of a CBEEE raised performance by 40 points in mathematics, 32 points in science and 25 points in reading.6 Differences of that magnitude would be enough to raise the US performance to close to (though still below) the best performing countries (see Table 2, last column). Similar results have been found in TIMSS (at both country and micro level), PIRLS, across German Länder and across Canadian provinces. Students from New York State and North Carolina have been found to outperform students of the same ethnic and social background in other US states. Bishop (2006) provides a survey of this research. However, not all research is as positive. Perhaps the most thorough and sophisticated study is that of Fuchs and Woessman (2004). This used micro-level PISA data, controlling for student social background (something not possible in the other international studies) and found effects for mathematics and science that were half as large as
6. The dependent variable was the country level mean of native-born students. Other regressors were per
capita GDP and a dummy for East Asia. Coefficients on the CBEEE dummy were significant at the 1% level.
ECO/WKP(2007)45
15
Bishop’s estimates (and only marginally significant) and an effect on reading scores that was close to zero (albeit positive).
25. Within the United States, there is a debate over whether high-school graduates should be required to pass an exam. Empirical research (see, for example, Center on Education Policy, 2006) has not found this requirement, of itself, to be especially advantageous. The international literature, in contrast, has focused on exams that are curriculum-based and external, where the results are clearer. Overall, CBEEEs are strongly correlated with performance in a wide range of data sources. That said, there are still substantial uncertainties. For example, it is not clear that this effect is causal or robust to alternative specifications. Furthermore, some of the favourable effect of CBEEEs may come from their high stakes. In a decentralised economy like the United States, where the federal government cannot direct colleges or employers to use exam grades in their admission decisions, it is not clear that the success of CBEEEs could be easily transplanted.
26. In addition to the above references there have been many other assessments of international differences in education performance. For example, many policy advocates argue that international comparisons vindicate their particular policy positions, though formal evidence in support is typically weak. Multivariate analysis is at a stage that might be described as exploratory rather than conclusive. Three recent econometric investigations of PISA data (in addition to the research cited above on CBEEEs) include Learning for Tomorrow’s World (OECD, 2003); Carey and Ernst (2006) and Willms (2006). However, none of these include the factors discussed above (low expectations, curriculum design, CBEEEs, etc) in their specifications. Nor do they examine other topical policy issues, such as teacher quality or school choice. These studies, like the work cited above on CBEEEs, and many other less formal international comparisons, do not compare their conclusions with those of others. Although there is strong agreement that some background factors matter (for example, income or parental education), this does not extend to policy instruments. Consistent with this, many academics attribute much of the variation to “culture” (shorthand for factors that we cannot identify or measure). In particular, we have very limited information on why the United States does so poorly. International comparisons indicate there is considerable scope for doing better, but do not provide precise guidelines. Nevertheless, they do support calls to raise standards, give curricula more focus and coherence, and place greater emphasis on curriculum-based external exams. These issues are explored below.
Centralisation and academic schooling standards
27. As noted above, the comparative weakness of US academic standards may stem in part from the highly decentralised administration of the school system and from the absence of central steering (through central curriculum or external exams). Responsibility for schooling in the United States rests primarily with the states.7,8 The fifty state governments, territories and the District of Columbia establish the framework within which the approximately 13 000 local education authorities organise schooling from
7. Under the US Constitution those responsibilities that are not specifically assigned to the federal
government are left to the individual states. Australia, Austria, Canada, Germany, Spain, Switzerland, and the United Kingdom have similar federal systems or other governance arrangements under which states/province/regions have primary responsibility for schools.
8. Until recently the federal role in schooling has been limited to federal responsibilities, such as national defence (the National Defence Education Act of 1958 was enacted to strengthen mathematics and science instruction in schools), areas where the Federal constitution supersedes state law or federal law addresses gaps in state law (Federal constitutional guarantee of equal protection or federal legislation guaranteeing access of students with disabilities to quality education), and support of educational research.
ECO/WKP(2007)45
16
kindergarten through year 12.9 Within that decentralised structure, there is a high degree of variability across states in the extent to which states themselves provide central direction.
28. The degree of decentralisation in the governance and administration of schools and lesson planning found in the United States (that is, control over inputs) is not exceptional by international comparison. A 2003 OECD survey of decision making in lower secondary education found that in 11 of the 25 countries or sub-national regions covered, schools had control over half or more of the decisions related to the organisation of instruction. Schools have authority to choose textbooks in nearly all countries and, in nearly half of the countries covered, had a say in the definition of course content and the range of subjects taught. Moreover, there has been a clear trend internationally towards decentralisation of decision making. Between 1998 and 2003, the percentage of decisions taken at the school level increased in 13 of the 17 countries for which data were available; centralisation of decisions occurred only in 4 countries. These shifts towards decentralisation of decision making extend to administrative matters as well (e.g. budgeting and hiring of teachers).10 They have been motivated for similar reasons as those in the United States, particularly with regard to enhancing accountability. As school “league tables” have become more widely available, there have been stronger incentives for educators at the school level to exert more control over schooling. Classroom teachers and school administrators are in a good position to take stock of individual learning needs and they need the autonomy to adapt instruction accordingly. Decentralisation has occurred also as part of a continuing trend towards increasing parental say in local school affairs (Glenn and de Groof, 2005).
29. Whereas many countries have decentralised decision-making with regard to inputs, decisions over outcomes, such as the academic performance standards, are more centralised. In this regard, the US is unusual. The international trend towards decentralisation coincides with a stronger central role in the design of curricula, standards and testing. Thus, although schools in 19 out of 25 countries decide on textbooks, those decisions are typically guided by a framework established at a higher level (usually central government). In most countries overall academic programme design is either set or guided by the state or central level of government. Even in countries where schools define course content, this usually is done within a framework of learning objectives established by state or central government. Also, the use of external exit examinations in many countries should be seen as an integral element of comprehensive approaches to building quality into schooling systems. They are the last of a series of independent assessments for monitoring progress towards educational targets that are set at a higher (often central) level; educators decide – often with a high degree of autonomy – how to achieve those targets.
30. Decentralisation of decisions on outcomes is a worry because if individuals are able to evaluate their own performance, they will tend to assess it too favourably, particularly if doing so increases financial payments or reduces penalties. As educational decision-making is decentralised down to a district or town level, these incentives may not change, but the control that individuals (students, teachers and parents) have, and hence the distortions arising from subjective assessments, increases. Furthermore, decentralisation seems likely to lead to more dispersion of results. To prevent grade inflation, some central control over the “measuring rod” is needed.
9. Education in America is delivered in schools that run from Kindergarten for 5-year olds through
elementary schools (typically grades 1-6), middle schools (grades 7-9), and high schools (grades 10-12). A high school diploma is awarded at the end 12th grade. About half of US children participate in optional pre-school programmes; education is compulsory from age 5 through 15 or 16 (depending on the state); the upper secondary graduation rate in 2004 was 75% (the OECD average was 81%).
10. OECD, 2004, pp. 423-438. Also see OECD, 2006b for a discussion of changes in policy and practice to increase responsiveness of schools to parental and community preferences.
ECO/WKP(2007)45
17
31. Indeed, a state-by-state analysis of standards carried out by the Thomas B. Fordham Foundation provides direct evidence of shortcomings in state standards and the high degree of variability between states. Starting in the late 1990s the foundation organised teams of experts to review state standards, first in language, and later in US history, mathematics, science and world history. They judged standards according to their clarity and rigour and whether they were “right-headed about content”. Based on this, they graded states (on a scale from A to F – highest to lowest) and ranked them. The results of this analysis were published in 1997, 2003, and 2006 (Finn et al., 2006). By their assessment, they found in 2006 only 9 states to be doing very well (grade of B or better) and 26 states to be doing poorly or failing (grade of D or F). Testing practices reveal important differences as well. Until the end of the 1990s, a large majority of states did not have final examinations. By 2004, only 20 states had compulsory exit exams, with as few as 10 with exams based on standards (i.e. linked to a curriculum and course requirements guided from the state level).11 As a result, in many states there is considerable discretion at the local and school levels with regard to the number of courses that students are required to take, what it is that students are expected to know at different grade levels, and whether and how student performance is judged. The prevalence of low standards found by the Fordham Foundation implies that that discretion is often exercised poorly.
Past attempts to improve schooling performance fell short
32. The weaknesses in schooling discussed above are not new. In 1964, Congress enacted the Elementary and Secondary Education Act (ESEA) to strengthen what was perceived as weak performance in schools serving large numbers of disadvantaged children. It channelled federal money to support programmes aimed at improving education opportunities, quality and attainment. Yet by the early 1980s it was evident that schools were failing not only in hard-pressed inner cities and poor rural areas, but more generally. The National Commission on Excellence in Education concluded in 1983 that “… the educational foundations of our society are presently being eroded by a rising tide of mediocrity that threatens our very future as a Nation and a people. What was unimaginable a generation ago has begun to occur-others are matching and surpassing our educational attainments”. The Commission recommended higher and more challenging standards; proficiency in reading, mathematics, science, social studies, computer science, and foreign language; regular testing of achievement; and that students meet rigorous achievement standards to graduate (National Commission on Excellence in Education, 1983). The report drew attention to weaknesses in American education and raised their visibility and importance in national debate. Following publication of the report, some states launched initiatives to implement the Commission’s recommendations. In 1989, in an unprecedented “education summit”, the President and governors agreed to set national goals to be met by the year 2000. These were later spelt out to include raising high school graduation rates, and demonstrating mastery of “five core subjects”12 at the end of 4th, 8th and 12th grade. When the ESEA was reauthorised in 1994 it introduced a requirement that every state introduce a “standards-based education system that would apply to all students”. The law required states to specify standards for each year and to develop tests to measure progress; it required poor children (those covered by ESEA Title I) to be tested at least once in grades 3-5, 6-9, and 10-12.
33. However, as in the past, the federal government was able to play only a limited role in overseeing implementation and compliance (Hess et al. 2006, pp. 14-15). In 1996, following a second education summit it was noted that “[g]raduation rates are up, and the number of students taking a core of academic subjects increased from 13% to 47%. But there’s still cause for concern. In 1994, only a third of 12th grade students could master rigorous reading passages. Only 11% showed a strong grasp of history, and standards of US schools pale in comparison to those of other industrialised nations”. (Bracket 1996).
11. National Center for Education Statistics, 2005.
12. Among the following: English, mathematics, science, foreign languages, civics and government, economics, art, history, and geography.
ECO/WKP(2007)45
18
A stronger federal role to raise academic standards
34. In 2001, Congress enacted the No Child Left Behind Act13 (NCLB) because of the persistent ineffectiveness of state and school districts and earlier federal legislation to effectively address the problem of poor outcomes. NCLB aims to strike a balance between the federal interest in setting stronger standards, and the authority of states to define such standards, without impinging on autonomy of schools (Box 1). Specifically, the Act redefines the authority of the federal government in schooling matters by establishing a framework for strengthened accountability of school performance. It requires states to put in place assessment systems to increase the availability and quality of information on student and school performance; it requires states to establish content standards,14 as well as achievement standards15 that, when met, will ensure that by the end of the school year 2013/14 all pupils are functioning at or above the level each state determines to be proficient. It requires that such standards be met for all sub-groups in the population. The strengthened framework for accountability breaks with earlier federal legislation by extending coverage of such requirements from just those schools receiving ESEA funding, to all schools in any state receiving ESEA funding. In most important respects the goals of NCLB and instruments for achieving them are in line with the trend in federal education legislation, as well as with initiatives in several American states to improve education quality by strengthening standards and accountability for outcomes. They also parallel developments in other countries referred to above (see also OECD, 2006b).
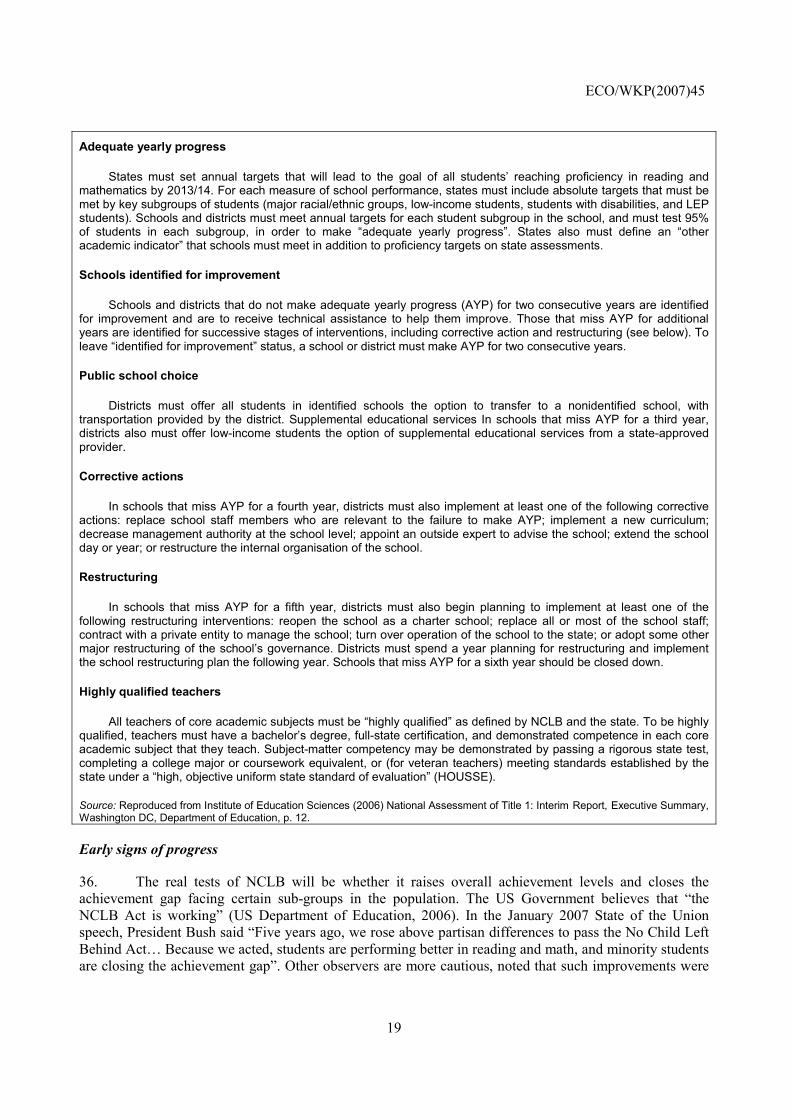
35. Five years after NCLB was signed into law, different aspects of the legislation are in different stages of implementation; some remedies and sanctions have not even been applied for the first time because of their phased escalated nature.16 So far, all states and the District of Columbia have put in place accountability plans and reading and mathematics assessments for all students in grades 3-8 and at least once in high school. The proportion of teachers who are classified as highly qualified has risen to 91%.
Box 1. Main provisions of the No Child Left Behind Act (NCLB)
State assessments
States must implement annual assessments in reading and mathematics in grades 3-8 and at least once in grades 10-12, and in science at least once in each of three grade spans: 3-5, 6-9 and 10-12. Assessments must be aligned with challenging state content and academic achievement standards. States must provide for participation of all students, including students with disabilities and limited English proficient (LEO) students. States must provide for the assessment of English language proficiency of all LEP students.
13. Signed into law in January 2002 by President Bush The No Child Left Behind Act of 2001 (Public Law
107-110) amends the Elementary and Secondary Education Act of 1964. ESEA was the original framework legislation for federal education law related to improving academic achievement of disadvantaged children (including pre-school education); improving instruction for limited English proficient and immigrant students; libraries; and Indian, Native Hawaiian, and Alaska native education.
14. What students are expected to know at each grade level in the main subject areas, including mathematics, reading and science.
15. These are targets defining levels of proficiency – basic, proficient and advanced – and the scores that students are expected to reach at each level.
16. Later this year there will be available results of a comprehensive evaluation of implementation, as well as results of the 2006 round of the National Assessment of Education Progress (NAEP) results. In the meantime there are available results of recent tests of student achievement, as well as interim assessments of various aspects of the legislation.
ECO/WKP(2007)45
19
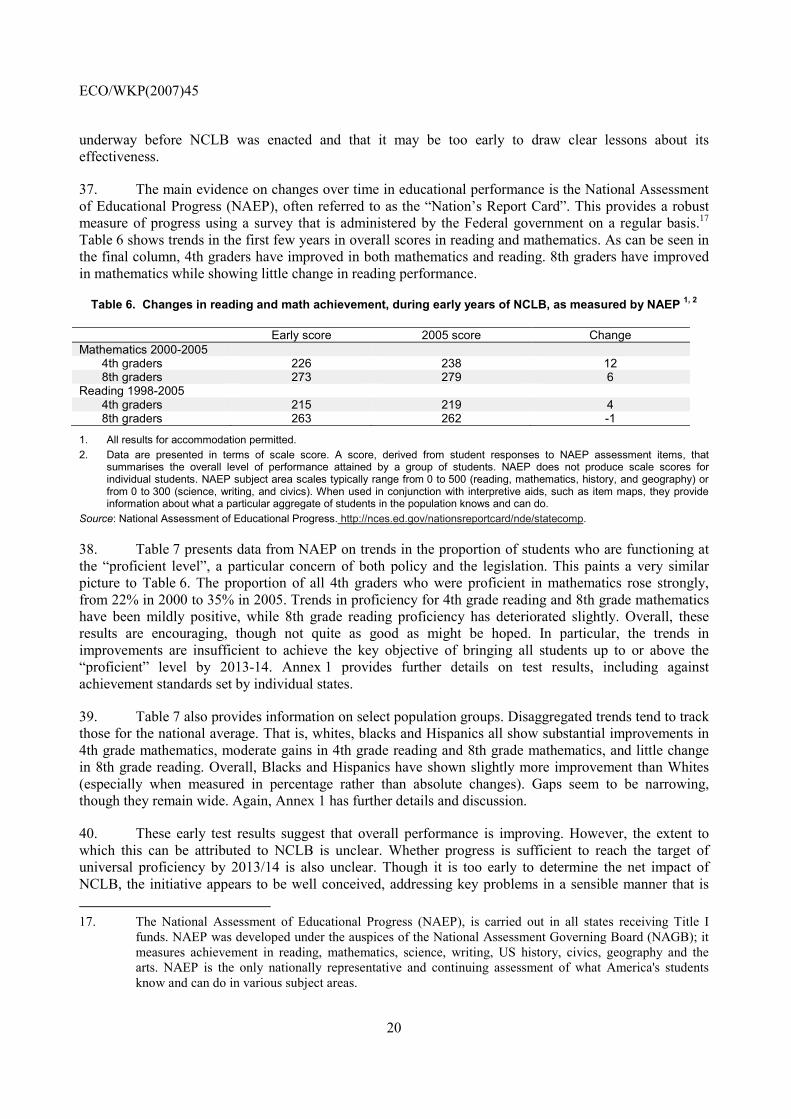
Adequate yearly progress
States must set annual targets that will lead to the goal of all students’ reaching proficiency in reading and mathematics by 2013/14. For each measure of school performance, states must include absolute targets that must be met by key subgroups of students (major racial/ethnic groups, low-income students, students with disabilities, and LEP students). Schools and districts must meet annual targets for each student subgroup in the school, and must test 95% of students in each subgroup, in order to make “adequate yearly progress”. States also must define an “other academic indicator” that schools must meet in addition to proficiency targets on state assessments.
Schools identified for improvement
Schools and districts that do not make adequate yearly progress (AYP) for two consecutive years are identified for improvement and are to receive technical assistance to help them improve. Those that miss AYP for additional years are identified for successive stages of interventions, including corrective action and restructuring (see below). To leave “identified for improvement” status, a school or district must make AYP for two consecutive years.
Public school choice
Districts must offer all students in identified schools the option to transfer to a nonidentified school, with transportation provided by the district. Supplemental educational services In schools that miss AYP for a third year, districts also must offer low-income students the option of supplemental educational services from a state-approved provider.
Corrective actions
In schools that miss AYP for a fourth year, districts must also implement at least one of the following corrective actions: replace school staff members who are relevant to the failure to make AYP; implement a new curriculum; decrease management authority at the school level; appoint an outside expert to advise the school; extend the school day or year; or restructure the internal organisation of the school.
Restructuring
In schools that miss AYP for a fifth year, districts must also begin planning to implement at least one of the following restructuring interventions: reopen the school as a charter school; replace all or most of the school staff; contract with a private entity to manage the school; turn over operation of the school to the state; or adopt some other major restructuring of the school’s governance. Districts must spend a year planning for restructuring and implement the school restructuring plan the following year. Schools that miss AYP for a sixth year should be closed down.
Highly qualified teachers
All teachers of core academic subjects must be “highly qualified” as defined by NCLB and the state. To be highly qualified, teachers must have a bachelor’s degree, full-state certification, and demonstrated competence in each core academic subject that they teach. Subject-matter competency may be demonstrated by passing a rigorous state test, completing a college major or coursework equivalent, or (for veteran teachers) meeting standards established by the state under a “high, objective uniform state standard of evaluation” (HOUSSE).
Source: Reproduced from Institute of Education Sciences (2006) National Assessment of Title 1: Interim Report, Executive Summary, Washington DC, Department of Education, p. 12.
Early signs of progress
36. The real tests of NCLB will be whether it raises overall achievement levels and closes the achievement gap facing certain sub-groups in the population. The US Government believes that “the NCLB Act is working” (US Department of Education, 2006). In the January 2007 State of the Union speech, President Bush said “Five years ago, we rose above partisan differences to pass the No Child Left Behind Act… Because we acted, students are performing better in reading and math, and minority students are closing the achievement gap”. Other observers are more cautious, noted that such improvements were
ECO/WKP(2007)45
20
underway before NCLB was enacted and that it may be too early to draw clear lessons about its effectiveness.
37. The main evidence on changes over time in educational performance is the National Assessment of Educational Progress (NAEP), often referred to as the “Nation’s Report Card”. This provides a robust measure of progress using a survey that is administered by the Federal government on a regular basis.17 Table 6 shows trends in the first few years in overall scores in reading and mathematics. As can be seen in the final column, 4th graders have improved in both mathematics and reading. 8th graders have improved in mathematics while showing little change in reading performance.
Table 6. Changes in reading and math achievement, during early years of NCLB, as measured by NAEP 1, 2
Early score 2005 score Change Mathematics 2000-2005 4th graders 226 238 12 8th graders 273 279 6 Reading 1998-2005 4th graders 215 219 4 8th graders 263 262 -1
1. All results for accommodation permitted. 2. Data are presented in terms of scale score. A score, derived from student responses to NAEP assessment items, that
summarises the overall level of performance attained by a group of students. NAEP does not produce scale scores for individual students. NAEP subject area scales typically range from 0 to 500 (reading, mathematics, history, and geography) or from 0 to 300 (science, writing, and civics). When used in conjunction with interpretive aids, such as item maps, they provide information about what a particular aggregate of students in the population knows and can do.
Source: National Assessment of Educational Progress. http://nces.ed.gov/nationsreportcard/nde/statecomp.
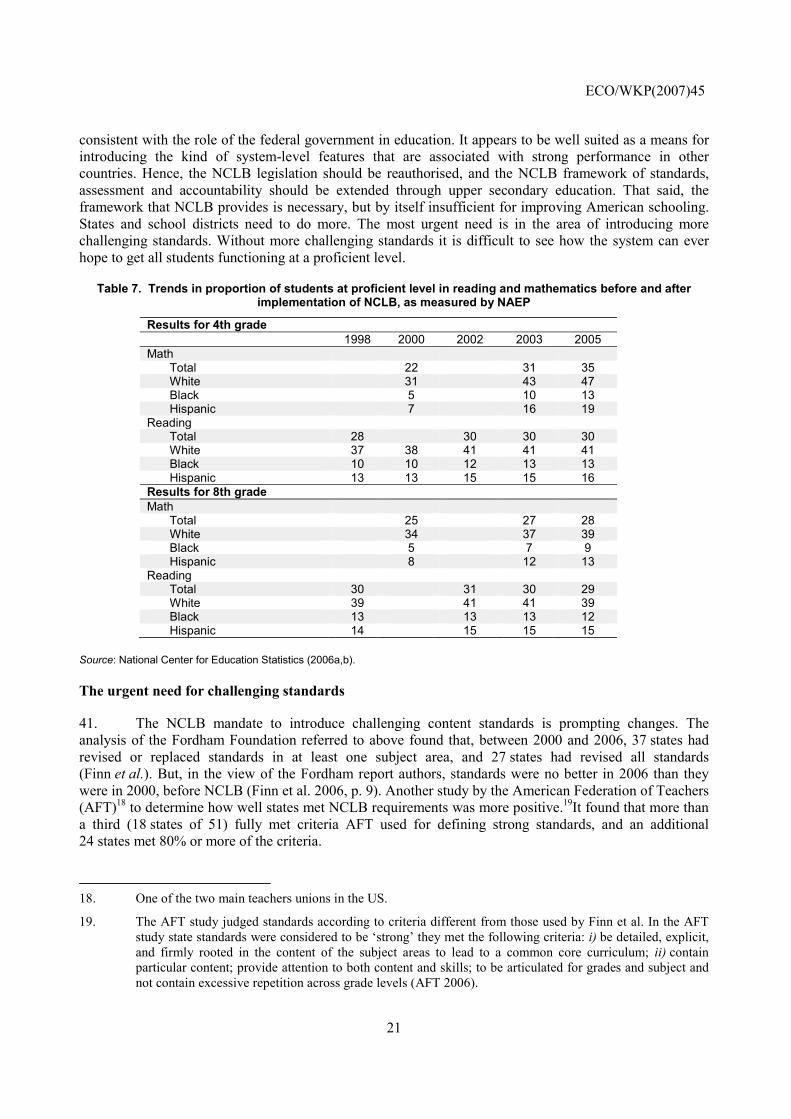
38. Table 7 presents data from NAEP on trends in the proportion of students who are functioning at the “proficient level”, a particular concern of both policy and the legislation. This paints a very similar picture to Table 6. The proportion of all 4th graders who were proficient in mathematics rose strongly, from 22% in 2000 to 35% in 2005. Trends in proficiency for 4th grade reading and 8th grade mathematics have been mildly positive, while 8th grade reading proficiency has deteriorated slightly. Overall, these results are encouraging, though not quite as good as might be hoped. In particular, the trends in improvements are insufficient to achieve the key objective of bringing all students up to or above the “proficient” level by 2013-14. Annex 1 provides further details on test results, including against achievement standards set by individual states.
39. Table 7 also provides information on select population groups. Disaggregated trends tend to track those for the national average. That is, whites, blacks and Hispanics all show substantial improvements in 4th grade mathematics, moderate gains in 4th grade reading and 8th grade mathematics, and little change in 8th grade reading. Overall, Blacks and Hispanics have shown slightly more improvement than Whites (especially when measured in percentage rather than absolute changes). Gaps seem to be narrowing, though they remain wide. Again, Annex 1 has further details and discussion.
40. These early test results suggest that overall performance is improving. However, the extent to which this can be attributed to NCLB is unclear. Whether progress is sufficient to reach the target of universal proficiency by 2013/14 is also unclear. Though it is too early to determine the net impact of NCLB, the initiative appears to be well conceived, addressing key problems in a sensible manner that is 17. The National Assessment of Educational Progress (NAEP), is carried out in all states receiving Title I
funds. NAEP was developed under the auspices of the National Assessment Governing Board (NAGB); it measures achievement in reading, mathematics, science, writing, US history, civics, geography and the arts. NAEP is the only nationally representative and continuing assessment of what America's students know and can do in various subject areas.
ECO/WKP(2007)45
21
consistent with the role of the federal government in education. It appears to be well suited as a means for introducing the kind of system-level features that are associated with strong performance in other countries. Hence, the NCLB legislation should be reauthorised, and the NCLB framework of standards, assessment and accountability should be extended through upper secondary education. That said, the framework that NCLB provides is necessary, but by itself insufficient for improving American schooling. States and school districts need to do more. The most urgent need is in the area of introducing more challenging standards. Without more challenging standards it is difficult to see how the system can ever hope to get all students functioning at a proficient level.
Table 7. Trends in proportion of students at proficient level in reading and mathematics before and after implementation of NCLB, as measured by NAEP
Results for 4th grade 1998 2000 2002 2003 2005
Math Total 22 31 35 White 31 43 47 Black 5 10 13 Hispanic 7 16 19 Reading Total 28 30 30 30 White 37 38 41 41 41 Black 10 10 12 13 13 Hispanic 13 13 15 15 16 Results for 8th grade Math Total 25 27 28 White 34 37 39 Black 5 7 9 Hispanic 8 12 13 Reading Total 30 31 30 29 White 39 41 41 39 Black 13 13 13 12 Hispanic 14 15 15 15
Source: National Center for Education Statistics (2006a,b).
The urgent need for challenging standards
41. The NCLB mandate to introduce challenging content standards is prompting changes. The analysis of the Fordham Foundation referred to above found that, between 2000 and 2006, 37 states had revised or replaced standards in at least one subject area, and 27 states had revised all standards (Finn et al.). But, in the view of the Fordham report authors, standards were no better in 2006 than they were in 2000, before NCLB (Finn et al. 2006, p. 9). Another study by the American Federation of Teachers (AFT)18 to determine how well states met NCLB requirements was more positive.19It found that more than a third (18 states of 51) fully met criteria AFT used for defining strong standards, and an additional 24 states met 80% or more of the criteria.
18. One of the two main teachers unions in the US.
19. The AFT study judged standards according to criteria different from those used by Finn et al. In the AFT study state standards were considered to be ‘strong’ they met the following criteria: i) be detailed, explicit, and firmly rooted in the content of the subject areas to lead to a common core curriculum; ii) contain particular content; provide attention to both content and skills; to be articulated for grades and subject and not contain excessive repetition across grade levels (AFT 2006).
ECO/WKP(2007)45
22
42. But if these changes are leading to results, the results seem intolerably modest and slow in coming. So far the federal pressure on states to raise content and achievement standards does not appear to have much effect on student performance. It was anticipated that regular publication of NAEP results would make it possible to “name” states that performed badly against that nation-wide benchmark. In cases where student performance as measured by state assessment systems was inflated in comparison to NAEP because of lax state standards, it also was anticipated that the publication of NAEP results would “shame” states into improving content standards and raising the NCLB-mandated “cut-off point” – the minimum score required for satisfactory performance. In fact states do not appear to be raising the cut-off points in their state assessments to reflect the changes. This blunts the impact of NCLB as a tool for identifying under-performing schools.20 Progress towards wider adoption of challenging content standards is slow at best. The discrepancies discussed in Annex 1 between limited improvement according to NAEP, and marked improvement according to state assessment programmes are a troubling sign that, at a minimum, states hold divergent views as to what constitutes satisfactory levels of proficiency. A number of observers have suggested that the differences between NAEP and state assessment measures in the proportion of students found to have low levels of achievement provides further evidence that some states have adopted cut-off points21 that are too low to be challenging.
Because states have considerable leeway to decide how aggressively to raise the AYP (adequate yearly progress) bar… NCLB may invite gaming of the system by states that wish to minimise the number of schools that fail to make AYP … [B]y 2005, some states had virtually no schools identified as needing improvement while other states identified more than 70% of theirs as failing to clear the bar … “universal proficiency” will have very different meanings in different states (Hess et al., 2006, p. 35).
43. Recent developments regarding exams at the exit of high school are a symptom of the problem of unevenness between states in the strictness of standards. For years, the US high school diploma has been criticised for being little more than an attendance certificate, as states rarely required students to pass a central exam as a condition of graduation (Achieve, 2006). Minimum competency exams introduced in the 1970s and 1980s did little except to establish (low) thresholds for minimum accepted performance; few states required students to pass them to graduate. NCLB requirements22 have pushed many states to introduce exit exams that high school students must pass in order to graduate. In 2006, it was reported that 26 states had put in place exit exams or planned to have them in place by 2012. But only 11 of them plan to use the same cut-off points that are required by NCLB. Most of the rest, plan to use lower scores; some plan to use an entirely different test. As a result, only a small majority of states will be able to ensure that high school graduates reach or exceed “proficient” levels of achievement (CEP 2006). An earlier study of exit exams in six states (Florida, Maryland, Massachusetts, New Jersey, Ohio and Texas) found that the level of proficiency required to pass exit exams was low by international standards. The threshold for passing maths tests was found to correspond to what students in other countries typically learn in 7th or 8th grade and that for passing English language to what 8th and 9th graders should know. The subjects covered by such exams, though essential, were a relatively small slice of the areas in which students should be proficient (Achieve, 2004).
20. NAEP cannot be used to evaluate the performance of individual schools. That can be done only through the
state assessment programmes, mandated by NCLB, that specify, among other things, the cut-off point below which student performance is considered to be unsatisfactory. But states have an incentive to not raise the cut-point in order to minimize the number of schools liable to be found to be under-performing.
21. That is, the achievement standards that states are supposed to set to indicate the scores that correspond to the basic, proficient, and advanced level of achievement.
22. In particular the requirement that by 2014 all students be performing at a level of proficient or better, and that students be tested at least once between years 10 and 12.
ECO/WKP(2007)45
23
44. More challenging exit exams are not enough, however. If curriculum and schooling experience of students do not prepare students adequately, exit exams simply “inspect in quality” by identifying students who perform badly, rather than “building in quality” by providing a solid schooling experience. States should be implementing curriculum-based external exit exams that meet or exceed NCLB standards. They should be guided by the experience that states such as New York and Texas have had with exit exams.
45. It is not feasible for the federal government to prescribe common standards and curriculum, and central testing. However, it can strengthen incentives for states and districts to adopt proven standards-driven programmes. There is long history of de facto national schooling programmes such as the Advanced Placement Program and International Baccalaureate. These are programmes that match high standards for required level of performance with fully developed curricula and centralised examinations; they also have their own requirements for teacher preparation (independent of state requirements). Though far from universal, they are national in character and widely available in school districts throughout the United States. They have demonstrated capacity for addressing an increasingly broad spectrum of learning needs, with the result that total enrolments in these programmes have grown and are increasingly representative of the US student population. Moreover, because of the success of the Advanced Placement program in upper secondary education (years 10-12), it is being used increasingly to guide the restructuring of standards, curriculum and testing at lower grades (Box 2). States and districts need to implement more challenging curricula and levels of performance. Advanced Placement and the International Baccalaureate provide models of standards that could be adopted more widely.
Box 2. De facto national standards: the example of the Advanced Placement Program
For legal and political reasons the federal government steers clear of establishing anything that could be interpreted as a national content standard, curriculum or examination. In the 1990s the Department of Education laid the groundwork for a discussion involving employers, trade unions and educators to discuss national targets for learning outcomes, but little came of that. However, de facto national standards do exist. One of the most successful is the Advanced Placement Program (AP)1. Established in 1955 it consists of an intensive, high quality curriculum in 35 subject areas starting at the 10th year and geared to the entrance standards of selective higher education institutions. The AP curriculum is taught by teachers who are specially trained for the program. Students must get a passing grade to receive credit. AP exam results are used by higher education institutions in the US and more than 30 countries for purposes of admission decisions, award of higher education credit, and placement in higher-level studies (College Board 2006, Advanced Placement: Report to the Nation, apcentral.collegeboard.com, p. 1).
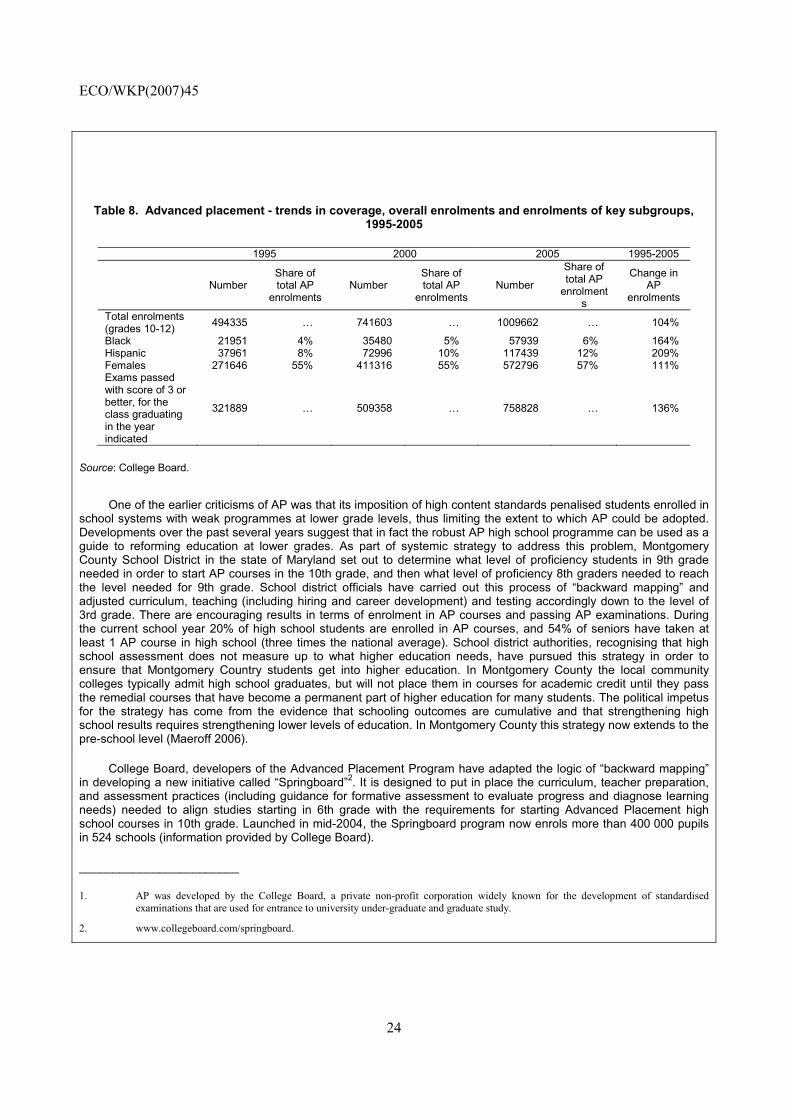
The AP program was designed to ensure that the last years of high school prepared students adequately for higher education. Originally developed with the standards of highly selective schools in mind, AP started out as a program targeted on students with strong academic records and demonstrated proficiency. As such it was an attempt to fill gaps in school standards that higher education admission offices found to vary greatly between and within states in terms of how challenging they were and how strictly they were applied in evaluating student performance. Its use has expanded as participation in higher education – and the need for remedial education for higher education students – has risen. Over time AP has evolved into a de facto national (though by no means universal) standard. It is found in schools in all states of the US, territories, and in overseas education facilities such as those operated by the Department of Defence for military dependents. Although AP emerged as a programme that heavily benefited students from the best high schools going to elite higher education institutions, it has evolved into a programme for any student going on to higher education, which comprises a large and growing share of high school graduates. Enrolment trends (see Table 8) reveal remarkable growth in the proportion of students enrolled in AP courses and scoring well on AP exams. Overall enrolments more than doubled during that time, with particularly large rises among Blacks (up 164%) and Hispanics (209%). During this time the number of examinations that were passed by graduating classes rose by 135%. Expansion of participation has increased to such an extent that for the high school class of 2005, 14.1% of graduating seniors had scored well on at least one AP examination during high school.
ECO/WKP(2007)45
24
Table 8. Advanced placement - trends in coverage, overall enrolments and enrolments of key subgroups, 1995-2005
1995 2000 2005 1995-2005
Number Share of total AP
enrolments Number
Share of total AP
enrolments Number
Share of total AP
enrolments
Change in AP
enrolments
Total enrolments (grades 10-12) 494335 … 741603 … 1009662 … 104%
Black 21951 4% 35480 5% 57939 6% 164% Hispanic 37961 8% 72996 10% 117439 12% 209% Females 271646 55% 411316 55% 572796 57% 111% Exams passed with score of 3 or better, for the class graduating in the year indicated
321889 … 509358 … 758828 … 136%
Source: College Board.
One of the earlier criticisms of AP was that its imposition of high content standards penalised students enrolled in school systems with weak programmes at lower grade levels, thus limiting the extent to which AP could be adopted. Developments over the past several years suggest that in fact the robust AP high school programme can be used as a guide to reforming education at lower grades. As part of systemic strategy to address this problem, Montgomery County School District in the state of Maryland set out to determine what level of proficiency students in 9th grade needed in order to start AP courses in the 10th grade, and then what level of proficiency 8th graders needed to reach the level needed for 9th grade. School district officials have carried out this process of “backward mapping” and adjusted curriculum, teaching (including hiring and career development) and testing accordingly down to the level of 3rd grade. There are encouraging results in terms of enrolment in AP courses and passing AP examinations. During the current school year 20% of high school students are enrolled in AP courses, and 54% of seniors have taken at least 1 AP course in high school (three times the national average). School district authorities, recognising that high school assessment does not measure up to what higher education needs, have pursued this strategy in order to ensure that Montgomery Country students get into higher education. In Montgomery County the local community colleges typically admit high school graduates, but will not place them in courses for academic credit until they pass the remedial courses that have become a permanent part of higher education for many students. The political impetus for the strategy has come from the evidence that schooling outcomes are cumulative and that strengthening high school results requires strengthening lower levels of education. In Montgomery County this strategy now extends to the pre-school level (Maeroff 2006).
College Board, developers of the Advanced Placement Program have adapted the logic of “backward mapping” in developing a new initiative called “Springboard”2. It is designed to put in place the curriculum, teacher preparation, and assessment practices (including guidance for formative assessment to evaluate progress and diagnose learning needs) needed to align studies starting in 6th grade with the requirements for starting Advanced Placement high school courses in 10th grade. Launched in mid-2004, the Springboard program now enrols more than 400 000 pupils in 524 schools (information provided by College Board).
________________________
1. AP was developed by the College Board, a private non-profit corporation widely known for the development of standardised examinations that are used for entrance to university under-graduate and graduate study.
2. www.collegeboard.com/springboard.
ECO/WKP(2007)45
25
Conclusion
46. United States education performance has slipped comparatively. As the international edge in high-school completion rates has disappeared, the weaknesses in quality of schooling have become particularly apparent. Lagging performance is evident across the board, including among affluent and academically successful students. The United States does not just have more students performing badly – it also has many fewer students performing well. The weak performance appears to be due in large part to system-level weaknesses. Resources do not appear to be at the root of the problem because the system is comparatively well-financed at an aggregate level, though how those resources are allocated between and within schools probably does matter. There is strong evidence that teacher quality and performance also matter. However this paper has focused on the prior fundamental question of what is expected of primary and secondary education in the United States. Academic standards, curricula and testing are insufficiently challenging, in part because they are set at a de-centralised level.
47. Concerns about these weaknesses in the system are not new and many reforms at the state and federal level have aimed to address them. But results of regular nation-wide assessments carried out by the federal government indicate that the earlier reforms have not been especially effective: overall achievement levels remain low and the performance gaps facing some groups remain large. The No Child Left Behind Act of 2002 is the most recent federal initiative to strengthen schooling. It combines measures to prod states to raise standards and set performance targets, with requirements for better and more freely available information on school performance and remedies where schools under-perform. It appears to be a sound approach to improving schooling, but, because of the pivotal role of states and localities, is not enough by itself. Challenging education programmes do exist in the United States, but their take-up is far from universal. Recommendations for building on the No Child Left Behind Act are outlined in Box 3.
Box 3. Recommendations on schools
Although there are considerable uncertainties regarding policy for schools, the Federal government’s No Child Left Behind (NCLB) initiative appears to be well conceived, addressing key problems in a sensible manner. Preliminary indications are consistent with it raising school performance and narrowing achievement gaps. Hence:
• The NCLB legislation should be reauthorized.
• The NCLB framework of standards, assessment and accountability should be extended through upper secondary education.
That said, there are a number of areas in which improvements could be made. Educational content standards and curricula in the US appear to be less challenging than those found in other countries. No Child Left Behind requires states to formulate challenging content standards, but they vary and show no signs of reaching the levels needed. Tests are often testing the wrong things and failing to provide relevant information. Hence:
• States and districts need to implement more challenging curricula and levels of performance. For example, Advanced Placement and the International Baccalaureate provide models of standards that could be adopted more widely.
• The objective of bringing all pupils to high levels of proficiency should not be watered down.
• States should consider implementing curriculum-based external exit exams, like those in New York or North Carolina. NCLB should require curriculum-based external exit exams.
ECO/WKP(2007)45
26
BIBLIOGRAPHY
Achieve, Inc. (2004), Do Graduation Tests Measure up? A Closer Look at State High School Exams, Washington DC, Achieve, Inc., www.achieve.org.
Achieve, Inc. (2006), Closing the Expectations Gap 2006 (American Diploma Project), Washington DC: Achieve, Inc., www.achieve.org.
AFT Teachers (2006), “Smart Testing: Let’s Get it Right”, Policy Brief, No. 19, July.
Bishop, J. (1997), “The Effect of National Standards and Curriculum-Based Exams on Achievement”, AEA Papers and Proceedings, Vol. 87, No. 2, May, pp. 206-264.
Bishop, J. (2006), “Drinking from the Foundation of Knowledge: Student Incentives to Study and Learn” Chapter 15 in Handbook of the Economics of Education Vol. 2, in E.A. Hanushek and F. Welch (eds.), North-Holland Publication, Netherlands.
Brackett, E. (1996), Ready for Work: National Education Summit, On-line Backgrounders, transcript, 27 March, Public Broadcasting System, www.pbs.org/newshour/bb/education/summit_3-27a.html.
Carey, D. and E. Ernst (2006), “Improving Education Achievement and Attainment in Luxembourg”, OECD Economics Department Working Papers, No. 508, OECD Economics Department.
Center on Education Policy (2006), From the Capital to the Classroom: Year 4 of the No Child Left Behind Act, Washington, Center on Education Policy.
Figlio, D.N. and L. Kenny (2006), “Individual Teacher Incentives and Student Performance”, NBER Working Paper, No. 12627, Cambridge, National Bureau of Economic Research, October.
Figlio, D.N. and M. Lucas (2004), “Do High Grading Standards Affect Student Performance?”, Journal of Public Economics 88.
Finn, C. Jr., L.J. and M.J. Petrilli (2006), The State of State Standards, Washington DC, Thomas B. Fordham Foundation.
Fuchs, T. and L. Woessman (2004), “What Accounts for International Differences in Student Performance? A re-examination using PISA data”, CESifo Working Paper, No. 1235, July.
Glenn, C. and J. de Groof (2005), Balancing Freedom, Autonomy and Accountability in Education, Nijmegen: Wolf Legal Publishers.
Hampden-Thompson, G. and J.S. Johnston (2006) “Variation in the Relationship Between Nonschool Factors and Student Achievement on International Assessments”, National Center for Education Statistics, Institute of Education Sciences Statistics in Brief, NCES 2006-014.
ECO/WKP(2007)45
27
Hanushek, E. (1998), “Conclusions and Controversies About Effectiveness of School Resources”, FRBNY Economic Policy Review, March.
Hechinger, J. (2006), “New Report Urges Return to Basics in teaching Math”, Wall Street Journal, 12 September, p. A1.
Hess, F.M. and M.J. Petrilli (2006), No Child Left Behind: Primer, New York, Peter Lang.
Hoxby, C.M. (2006), School Choice: The Three Essential Elements and Several Policy Options, Keynote speech, New Zealand Association of Economists, 46th Annual Conference 2005, Christchurch.
Institute of Education Sciences, (2006), National Assessment of Title I: Interim Report – Executive Summary, NCEE 2006-4000, Washington DC, US Department of Education, February.
Larson, J. (2001), “International Performance Standards in Montgomery County Public Schools” Montgomery County Public Schools office of Shared Sccountabiltiy, April.
Lemke, M. (2004), International Outcomes Of Learning in Mathematics Literacy and Problem Solving: PISA 2003 Results from the US Perspective, National Center for Education Statistics.
Lemke, M. and P Gonzales (2006) US Student and Adult Performance on International Assessments of Educational Achievement; Findings from the Condition of Education 2006, National Center for Education Statistics.
Loveless, T (2002), The Brown Center Report on American Education, 2002, The Brookings Institution.
Maeroff, G.I. (2006), Building Blocks: Making Children Successful in the Early Years of School, New York, Palgrave Macmillan.
Montgomery, L.and J. Mathews (2006), “The Future of D.C. Public Schools: Traditional or Charter Education”, in Washington Post, 22 August, www.washingtonpost.com/wpdyn/content/article/2006/08/21/AR2006082101758_5.html.
Murnane, R. (1996), “Staffing the Nation’s Schools with Skilled Teachers”, in E. Hanushek and D. Jorgenson (eds.), Improving America’s, Schools: The Role of Incentives, Washington DC, National Academy Press.
National Center for Education Statistics (2006a), The Nation’s Report Card: Mathematics 2005, Washington DC, http://nces.ed.gov/nationsreportcard/pdf/main2005/2006453.pdf.
National Center for Education Statistics (2006b), The Nation’s Report Card: Reading 2005, Washington DC, http://nces.ed.gov/nationsreportcard/pdf/main2005/2006451.pdf.
National Council of Teachers of Mathematics, (2006), “Curriculum Focal Points for Prekindergarten through Grade 8 Mathematics: A Quest for Coherence”.
National Science Board (2004) “Science and Engineering Indicators 2004”, May, www.nsf.gov/statistics/seind04/start.htm.
OECD (2003), Learning for Tomorrow’s World, Paris.
OECD (2004), Education at a Glance, Paris.
ECO/WKP(2007)45
28
OECD (2005) Learning a Living: First Results of the Adult Literacy and Lifeskills Survey, Paris, OECD.
OECD (2006a), Education at a Glance, Paris.
OECD (2006b), Demand-Sensitive Schooling: Evidence and Issues, Paris.
Schmidt, W., R. Houang and L. Cogan (2002), “A Coherent Curriculum: The Case of Mathematics”, American Educator, Summer 2002.
Schmidt, W. (2003), “Presentation to Mathematics and Science Initiative”, 4 February, www.ed.gov/print/rschstat/research/progs/mathscience/schmidt.html.
Schmidt, W.H., C.C. McKnight, P.M. Jakwerth, L.S. Cogan, S.A. Raizen, R.T. Houang, G.A. Valverde, D.E. Wiley, R.G. Wolfe, L.J. Bianchi, W.-L. Yang, S.-H. Kang and E.D. Britton (1998), Facing the Consequences: Using TIMSS for a Closer Look at United States Mathematics and Science Education, Kluwer Academic Publishers.
Schmidt, W.H., C.C. McKnight, R.T. Houang, H.C. Wang, D.E.Wiley, L.S. Cogan and R.G.Wolfe (2001), Why Schools Matter: A Cross-national Comparison of Curriculum and Learning, Jossey-Bass, Indianapolis IN.
Tulip, P. (2007) “Financing Higher Education in the United States” OECD Economics Department Working Paper (forthcoming)
US Department of Education (2006) No Child Left Behind Act Is Working, www.ed.gov/nclb/overview/importance/nclbworking.html, December 2006.
Whitehurst, G. (2003), “Research on Mathematics Education” Presentation to Mathematics and Science Initiative, 6 February, at www.ed.gov/print/rschstat/research/progs/mathscience/whitehurst.html.
Willms, J.D. (2006), “Learning divides: ten policy questions about the performance and equity of schools and schooling systems”, UNESCO Institute for statistics, Working Paper, No. 5.
Woessmann, L. (2006), “Public-Private Partnership and Schooling Outcomes across Countries”, CESifo Working Paper No. 1662, February.
Woessmann, L.R. (2005), “The Effect Heterogeneity of Central Examinations: Evidence from TIMSS, TIMSS-Repeat and PISA”, Education Economics, Vol. 13, No. 2, pp. 143-169, June.
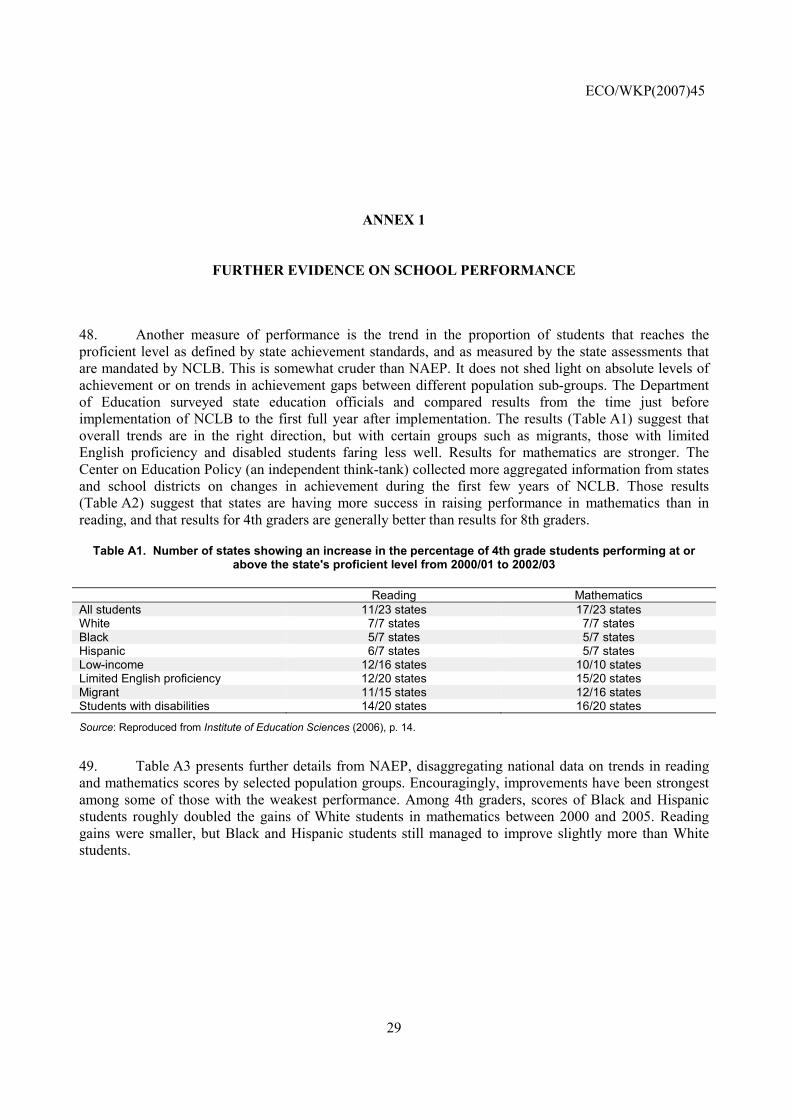
ECO/WKP(2007)45
29
ANNEX 1
FURTHER EVIDENCE ON SCHOOL PERFORMANCE
48. Another measure of performance is the trend in the proportion of students that reaches the proficient level as defined by state achievement standards, and as measured by the state assessments that are mandated by NCLB. This is somewhat cruder than NAEP. It does not shed light on absolute levels of achievement or on trends in achievement gaps between different population sub-groups. The Department of Education surveyed state education officials and compared results from the time just before implementation of NCLB to the first full year after implementation. The results (Table A1) suggest that overall trends are in the right direction, but with certain groups such as migrants, those with limited English proficiency and disabled students faring less well. Results for mathematics are stronger. The Center on Education Policy (an independent think-tank) collected more aggregated information from states and school districts on changes in achievement during the first few years of NCLB. Those results (Table A2) suggest that states are having more success in raising performance in mathematics than in reading, and that results for 4th graders are generally better than results for 8th graders.
Table A1. Number of states showing an increase in the percentage of 4th grade students performing at or above the state's proficient level from 2000/01 to 2002/03
Reading Mathematics All students 11/23 states 17/23 states White 7/7 states 7/7 states Black 5/7 states 5/7 states Hispanic 6/7 states 5/7 states Low-income 12/16 states 10/10 states Limited English proficiency 12/20 states 15/20 states Migrant 11/15 states 12/16 states Students with disabilities 14/20 states 16/20 states
Source: Reproduced from Institute of Education Sciences (2006), p. 14.
49. Table A3 presents further details from NAEP, disaggregating national data on trends in reading and mathematics scores by selected population groups. Encouragingly, improvements have been strongest among some of those with the weakest performance. Among 4th graders, scores of Black and Hispanic students roughly doubled the gains of White students in mathematics between 2000 and 2005. Reading gains were smaller, but Black and Hispanic students still managed to improve slightly more than White students.
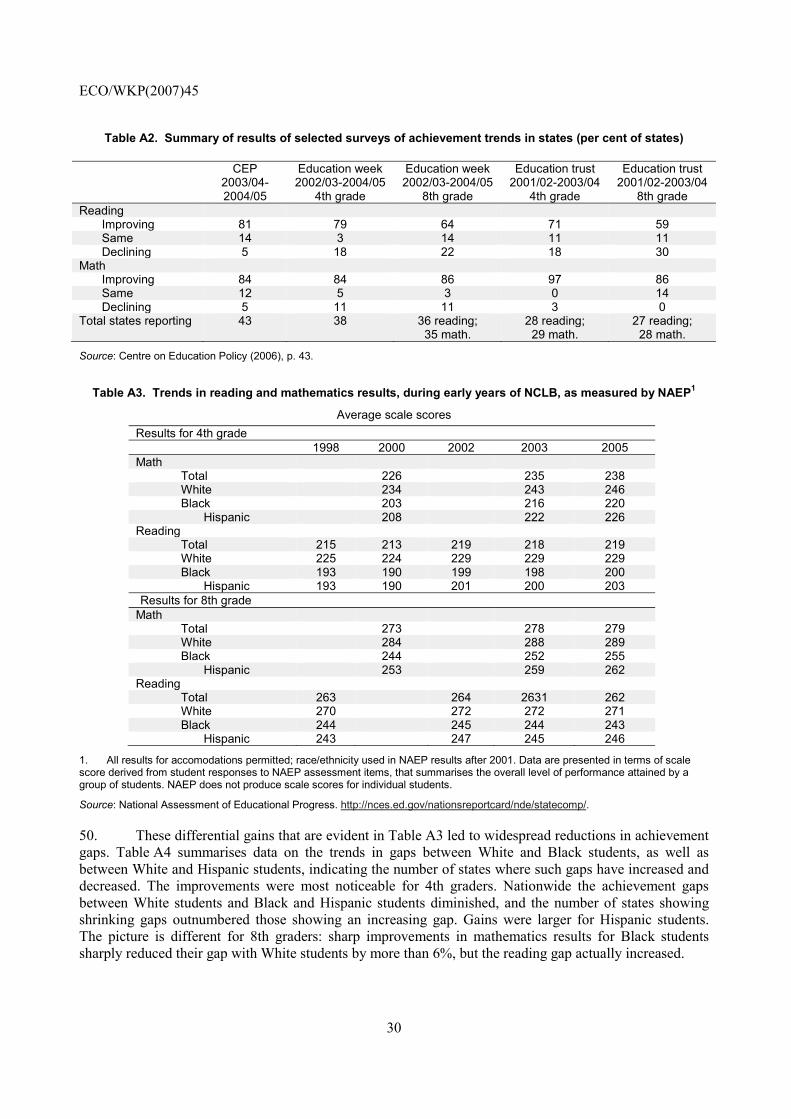
ECO/WKP(2007)45
30
Table A2. Summary of results of selected surveys of achievement trends in states (per cent of states)
CEP 2003/04-2004/05
Education week 2002/03-2004/05
4th grade
Education week 2002/03-2004/05
8th grade
Education trust 2001/02-2003/04
4th grade
Education trust 2001/02-2003/04
8th grade Reading Improving 81 79 64 71 59 Same 14 3 14 11 11 Declining 5 18 22 18 30 Math Improving 84 84 86 97 86 Same 12 5 3 0 14 Declining 5 11 11 3 0 Total states reporting 43 38 36 reading;
35 math. 28 reading;
29 math. 27 reading;
28 math.
Source: Centre on Education Policy (2006), p. 43.
Table A3. Trends in reading and mathematics results, during early years of NCLB, as measured by NAEP1
Average scale scores Results for 4th grade
1998 2000 2002 2003 2005 Math Total 226 235 238 White 234 243 246 Black 203 216 220
Hispanic 208 222 226 Reading Total 215 213 219 218 219 White 225 224 229 229 229 Black 193 190 199 198 200
Hispanic 193 190 201 200 203 Results for 8th grade
Math Total 273 278 279 White 284 288 289 Black 244 252 255
Hispanic 253 259 262 Reading Total 263 264 2631 262 White 270 272 272 271 Black 244 245 244 243
Hispanic 243 247 245 246
1. All results for accomodations permitted; race/ethnicity used in NAEP results after 2001. Data are presented in terms of scale score derived from student responses to NAEP assessment items, that summarises the overall level of performance attained by a group of students. NAEP does not produce scale scores for individual students.
Source: National Assessment of Educational Progress. http://nces.ed.gov/nationsreportcard/nde/statecomp/.
50. These differential gains that are evident in Table A3 led to widespread reductions in achievement gaps. Table A4 summarises data on the trends in gaps between White and Black students, as well as between White and Hispanic students, indicating the number of states where such gaps have increased and decreased. The improvements were most noticeable for 4th graders. Nationwide the achievement gaps between White students and Black and Hispanic students diminished, and the number of states showing shrinking gaps outnumbered those showing an increasing gap. Gains were larger for Hispanic students. The picture is different for 8th graders: sharp improvements in mathematics results for Black students sharply reduced their gap with White students by more than 6%, but the reading gap actually increased.
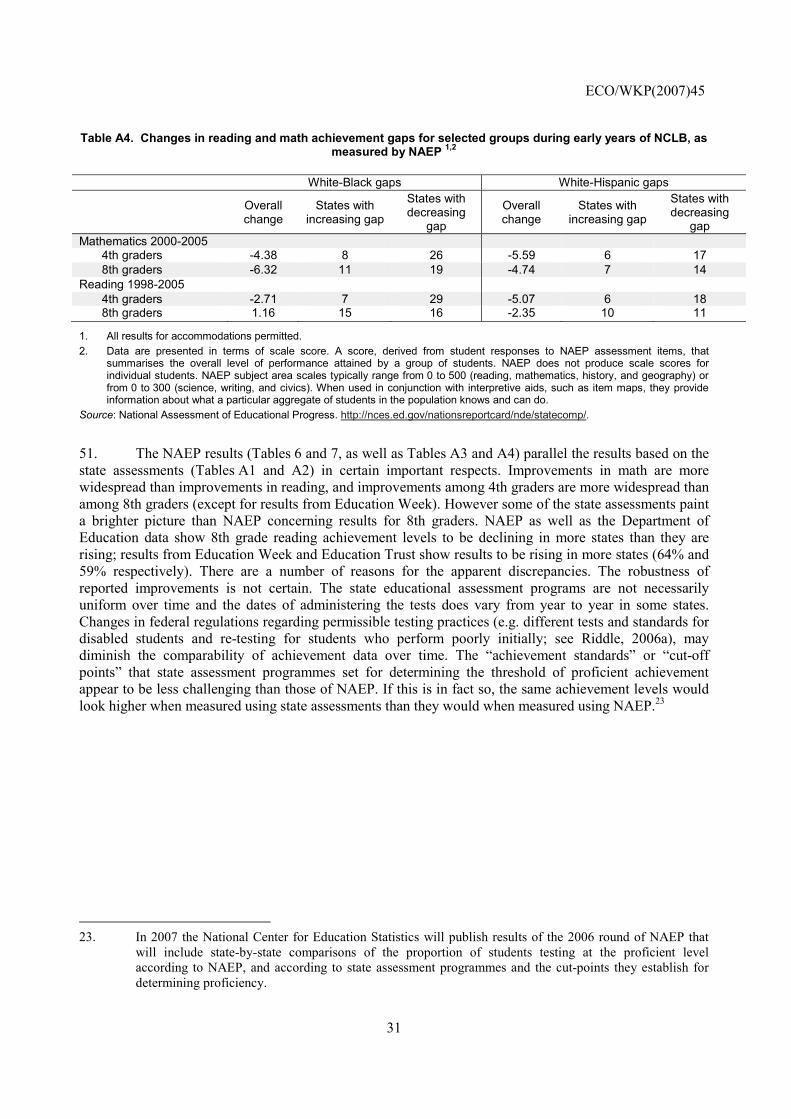
ECO/WKP(2007)45
31
Table A4. Changes in reading and math achievement gaps for selected groups during early years of NCLB, as measured by NAEP 1,2
White-Black gaps White-Hispanic gaps
Overall change
States with increasing gap
States with decreasing
gap
Overall change
States with increasing gap
States with decreasing
gap Mathematics 2000-2005 4th graders -4.38 8 26 -5.59 6 17 8th graders -6.32 11 19 -4.74 7 14 Reading 1998-2005 4th graders -2.71 7 29 -5.07 6 18 8th graders 1.16 15 16 -2.35 10 11
1. All results for accommodations permitted. 2. Data are presented in terms of scale score. A score, derived from student responses to NAEP assessment items, that
summarises the overall level of performance attained by a group of students. NAEP does not produce scale scores for individual students. NAEP subject area scales typically range from 0 to 500 (reading, mathematics, history, and geography) or from 0 to 300 (science, writing, and civics). When used in conjunction with interpretive aids, such as item maps, they provide information about what a particular aggregate of students in the population knows and can do.
Source: National Assessment of Educational Progress. http://nces.ed.gov/nationsreportcard/nde/statecomp/.
51. The NAEP results (Tables 6 and 7, as well as Tables A3 and A4) parallel the results based on the state assessments (Tables A1 and A2) in certain important respects. Improvements in math are more widespread than improvements in reading, and improvements among 4th graders are more widespread than among 8th graders (except for results from Education Week). However some of the state assessments paint a brighter picture than NAEP concerning results for 8th graders. NAEP as well as the Department of Education data show 8th grade reading achievement levels to be declining in more states than they are rising; results from Education Week and Education Trust show results to be rising in more states (64% and 59% respectively). There are a number of reasons for the apparent discrepancies. The robustness of reported improvements is not certain. The state educational assessment programs are not necessarily uniform over time and the dates of administering the tests does vary from year to year in some states. Changes in federal regulations regarding permissible testing practices (e.g. different tests and standards for disabled students and re-testing for students who perform poorly initially; see Riddle, 2006a), may diminish the comparability of achievement data over time. The “achievement standards” or “cut-off points” that state assessment programmes set for determining the threshold of proficient achievement appear to be less challenging than those of NAEP. If this is in fact so, the same achievement levels would look higher when measured using state assessments than they would when measured using NAEP.23
23. In 2007 the National Center for Education Statistics will publish results of the 2006 round of NAEP that
will include state-by-state comparisons of the proportion of students testing at the proficient level according to NAEP, and according to state assessment programmes and the cut-points they establish for determining proficiency.
ECO/WKP(2007)45
32
WORKING PAPERS
The full series of Economics Department Working Papers can be consulted at www.oecd.org/eco/Working_Papers/
584. Financing higher education in the United States (November 2007) Peter Tulip 583. Corporate net lending: a review of recent trends (November 2007) Christophe André, Stéphanie Guichard, Mike Kennedy and David Turner 581. Local government finances: The link between intergovernmental transfers and net worth (September 2007) Luiz de Mello 580. Boosting Austria's innovation performance improving innovation (September 2007) Willi Leibfritz and Jürgen Janger 579. Improving employment prospects in the Slovak Republic: Building on past reforms (September 2007) Andres Fuentes 578. Improving education outcomes in the Slovak Republic (September 2007) David Carey 577. Regulatory reforms in Sweden have boosted productivity (September 2007) Espen Erlandsen and Jens Lundsgaard 576. The policy determinants of investment in tertiary education (September 2007) Joaquim Oliveira Martins, Romina Boarini, Hubert Strauss,
Christine de la Maisonneuve and Clarice Saadi 575. Product market competition in the OECD countries: taking stock and moving forward (September 2007) Jens Høj, Miguel Jimenez, Maria Maher, Giuseppe Nicoletti
and Michael Wise 574. Too little destruction too little creation: A Schumpeterian diagnosis of barriers to sustained growth
in Ukraine (September 2007) Christian Gianella and William Tompson 573. How do the OECD Growth Projections for the G7 Economies Perform? A post-mortem
(September 2007) Lukas Vogel 572. Austria’s deepening economic integration with Central and Eastern Europe (August 2007) Rina Bhattacharya 571. Meeting the challenges of decentralization in France (July 2007) Stéphanie Jamet Faire face aux défis de la décentralisation en France (juillet 2007) Stéphanie Jamet
ECO/WKP(2007)45
33
570. Enhancing incentives to improve performance in the education system in France (July 2007) Paul O’Brien Renforcer les incitations à une meilleure performance du système éducatif en France (juillet 2007) Paul O’Brien 569. Combating poverty and social exclusion in France (July 2007) Stéphanie Jamet Lutter contre la pauvreté et l’exclusion social en France (juillet 2007) Stéphanie Jamet 568. The competition law and policy indicator (July 2007) Jens Hoj 567. Structural policies and economic resilience to shocks (July 2007) Romain Duval, Jørgen Elmeskov and Lukas Vogel 566. Family policy in Hungary: how to improve the reconciliation between work and family? (July 2007) Philip Hemmings 565. Encouraging sub-national government efficiency in Hungary (July 2007) Alessandro Goglio 564. Integration of immigrants in OECD countries: do policies matter? (July 2007) Orsetta Causa and Sébastien Jean 563. The unemployment impact of immigration in OECD countries (July 2007) Sébastien Jean and Miguel Jiménez 562. Migration in OECD countries: labour market impact and integration issues (July 2007) Sébastien Jean, Orsetta Causa, Miguel Jiminez and Isabelle Wanner 561. The internationalisation of production, international outsourcing and employment in the OECD (June 2007) Margit Molnar, Nigel Pain and Daria Taglioni 560. Why has Swedish inflation been persistently low? (June 2007) Felix Hüefner 559. The Swedish housing market – better allocation via less regulation (June 2007) Felix Hüefner and Jens Lundsgaard 558 Linkages between performance and institutions in the primary and secondary education sector (June 2007) Douglas Sutherland and Robert Price 557. Toward a more efficient taxation system in New Zealand (June 2007) Annabelle Mourougane 556. Income inequality, poverty and social spending in Japan (June 2007) Randall Jones 555. Improving the efficiency of health care spending: selected evidence on hospital performance (May 2007) Espen Erlandsen


