Embed Size (px)
Citation preview

Advances in Colloid and Interface Science 199–200 (2013) 66–77
Contents lists available at ScienceDirect
Advances in Colloid and Interface Science
j ourna l homepage: www.e lsev ie r .com/ locate /c is
Understanding glycoprotein behaviours using Raman and Ramanoptical activity spectroscopies: Characterising the entanglementinduced conformational changes in oligosaccharide chains of mucin
L. Ashton a,e, P.D.A. Pudney c,⁎, E.W. Blanch a,b, G.E. Yakubov c,d,⁎⁎a Manchester Institute of Biotechnology (MIB), The University of Manchester, 131 Princess Street, Manchester M1 7DN, United Kingdomb Faculty of Life Sciences, The University of Manchester, 131 Princess Street, Manchester M1 7DN, United Kingdomc Unilever Discover, Colworth Science Park, Sharnbrook, Bedford, MK44 1LQ, United Kingdomd Australian Research Council Centre of Excellence in Plant Cell Walls, School of Chemical Engineering, The University of Queensland, Queensland 4072, Australiae School of Chemistry, The University of Manchester, 131 Princess Street, Manchester, M1 7DN, United Kingdom
⁎ Corresponding author.⁎⁎ Corresponding author at: Australian Research CouncCell Walls, School of Chemical Engineering, The Univers4072, Australia.
E-mail address: [email protected] (G.E. Yakub
0001-8686/$ – see front matter © 2013 Elsevier B.V. Allhttp://dx.doi.org/10.1016/j.cis.2013.06.005
a b s t r a c t
a r t i c l e i n f oAvailable online 18 June 2013
Keywords:Raman optical activityRaman spectroscopyGlycoproteinMucinPolymer entanglement2D correlation analysis
We illustrate the great potential of Raman and ROA spectroscopies for investigating the structure and organisationof glycoproteins and the complex matrices they can form. In combination these spectroscopic techniques are sen-sitive to changes in conformation revealing details of secondary and tertiary structures, probing hydrogen bondinginteractions, as well as resolving side chain orientation and the absolute configuration of chiral substructures. Todemonstrate this potential we have characterised the structural changes in a complex glycoprotein, mucin. Spec-tral changes were observed during the entanglement transition as the mucin concentration was increased. By ap-plying two-dimensional correlation analysis (2DCos) to the ROA and Raman concentration-dependent spectralsets delicate transitions in mucin conformation could also be determined. From ~20–40 mg/ml conformationaltransitions assigned mainly to the sugar N-acetyl-D-galactosamine (GalNAc), which is the linking saccha-ride unit to the protein backbone, were monitored. Further changes in local oligosaccharide conformationabove 40 mg/ml were also monitored, together with other structural transitions observed in the proteincore, particularly β-structure formation. Consequently, these spectral techniques were shown to monitorthe formation of transient entanglements formed by brush–brush interactions between oligosaccharidecombs of mucin molecules identifying changes in both carbohydrate and protein moieties. This work clear-ly shows how these methods can be used to elucidate fresh insights into the complex behaviour of theselarge complex molecules.
© 2013 Elsevier B.V. All rights reserved.
Contents
1. Introduction . . . . . . . . . . . . . . . . . . . . . . . . . . . . . . . . . . . . . . . . . . . . . . . . . . . . . . . . . . . . . . . 662. Experimental . . . . . . . . . . . . . . . . . . . . . . . . . . . . . . . . . . . . . . . . . . . . . . . . . . . . . . . . . . . . . . 70
2.1. Mucin solution preparation . . . . . . . . . . . . . . . . . . . . . . . . . . . . . . . . . . . . . . . . . . . . . . . . . . . . 702.2. Raman spectroscopy and Raman optical activity measurements and data analysis . . . . . . . . . . . . . . . . . . . . . . . . . . . 702.3. Data preprocessing . . . . . . . . . . . . . . . . . . . . . . . . . . . . . . . . . . . . . . . . . . . . . . . . . . . . . . . . 70
3. Results and discussion . . . . . . . . . . . . . . . . . . . . . . . . . . . . . . . . . . . . . . . . . . . . . . . . . . . . . . . . . . 704. Conclusion . . . . . . . . . . . . . . . . . . . . . . . . . . . . . . . . . . . . . . . . . . . . . . . . . . . . . . . . . . . . . . . 75Acknowledgements . . . . . . . . . . . . . . . . . . . . . . . . . . . . . . . . . . . . . . . . . . . . . . . . . . . . . . . . . . . . . . 75References . . . . . . . . . . . . . . . . . . . . . . . . . . . . . . . . . . . . . . . . . . . . . . . . . . . . . . . . . . . . . . . . . . 75
il Centre of Excellence in Plantity of Queensland, Queensland
ov).
rights reserved.
1. Introduction
Mucins are a class of high molecular weight glycoproteins ubiqui-tously found in metazoans [1,2]. The roles of mucins are diverse, andinclude antimicrobial and antiviral properties as well as a number ofphysical functions such as structuring of themucosal gel and lubrication
67L. Ashton et al. / Advances in Colloid and Interface Science 199–200 (2013) 66–77
[3–5]. This diversity is due to their ability to self-assemble and formmu-cosal linings of different kinds, which in the gastrointestinal tract canrange from a few up to 200 μm in some parts of the colon and stomach[6–8]. This mucosal gel not only provides lubrication but also forms amesh-like, size and charge exclusion barrier that when compromisedmay lead to serious disorders such as in the case of cystic fibrosis pa-tients [9,10]. Integrity of the thickmucosal layer stems from the assem-bly of mucins into a viscoelastic hydrogel.
The genetically encoded block-copolymer structure of mucins isthe key prerequisite for their ability to self-assemble and form muco-sal linings of different kinds. The majority of gel-forming mucins havenaked protein globules at both termini, separated by a hydrophilicheavily glycosylated block. This block may be continuous (e.g. MUC2mucin [1]) or can be interrupted by naked domains (e.g. MUC5B [1]).The glycosylated domain is particularly rich in serine, threonineand proline. The former two amino acid residues act as anchoringpoints for O-link glycosylation. This is done by conjugation withN-acetylgalactosamine (GalNAc) via the hydroxyl group of serine orthreonine. In typical cases, the biosynthesis of O-glycans is facilitatedby an enzyme complex and growth of the oligosaccharide chain is by se-quential addition of sugar moieties. Essentially the O-glycan brush isformed via a ‘grafting from’ route analogous to that developed for syn-thetic polymer brushes [11]. This is opposite to the case of N-glycansthat are typical for membrane-bound mucins [1,4] and many glyco-proteins [12]. For N-glycosylation, the full oligosaccharide block issynthesised first and then attached as a whole to the asparagine res-idue and hence can be considered as a ‘grafting to’ method of brushassembly. ‘Grafting from’ growth of O-glycans enables the formationof much denser brushes as compared to the ‘grafting to’ route [11].The dense glycosylated brush region has sufficient structural stabil-ity, yet enough flexibility, to allow for mucins to adopt an essentiallyunfolded conformation under a variety of conditions [5,10]. A moredetailed analysis of mucin structure showed a dumb-bell conformationwith the whole molecule resembling a swollen coil [13–17]. Despitebeing flexible, the glycosylated region has structural stability strongenough to keep mucin molecules in essentially unfolded conformationunder a variety of conditions [18]. Due to extensive hydration of theglycosylated region, the primary topology of mucin assembly is viaend-to-end aggregation of the naked protein domains (e.g. cysteineknots) located at both termini of gel forming mucins. This enables theformation of stable mucin oligomers with total molecular weightsreaching tens of megadaltons. This oligomerisation results in slow re-laxation times inmucin systems and effectively drives gelation andmu-cosal assembly. The second key factor in building up a 3Dmucosal gel isbrush–brush or ‘zip’ interactions that result from lateral links [19,20].The synergistic interplay between ‘end-to-end’ and ‘zip’ interactionscan also lead to the emergence of different types of microstructures inmucin solutions and gels, as well as nematic ordering in concentratedmucin solutions [20,21]. Another key property of mucus is the polyelec-trolyte swelling of concentratedmucin solutions. Although the swellingas such is driven by Donnan equilibrium the rapid kinetics requirespre-existence of a network topology associated with ‘end-to-end’ and‘brush–brush’ links.
Although the whole complex of assembly is unique for mucins andmucin-like molecules, the individual elements of assembly can be repli-cated in model synthetic systems. For example, solutions of comb-brushpolyelectrolytes such as polystyrene sulphonate [22] can model rhe-ological and scattering behaviour of non-gelling or weakly gellingmucins. Gel properties can find analogy in micro-phase separated sys-tems such as carbopol [23,24], in which dense domains are separatedby water-rich loose domains or liquid cages [19].
In order to elucidate the formation of brush–brush entanglementswehave taken a non-aggregating mucin at high concentrations to achievethe formation of non-gelled entangled solution, in which movement ofmolecules remains diffusive [13]. This condition enables us to studystatistically independent cross-links unattainable in gelling systems.
Previously it has been established that for a non-charged heavilyglycosylated porcine stomach MUC 6 mucin a dynamic transitionbetween semidilute (ηspec1
�2) and entangled (ηspec3
�2) rheological
regimes occurs at bulk concentration of 24 mg/ml. No aggregationor gel formation was observed or implied from rheological, dynamiclight scattering or small angle X-ray scattering measurements [14,15].In addition, molecular conformations of this mucin were probed usingoptical waveguide lightmode spectroscopy [25–27], which is one ofthe optical surface characterisation techniques commonly used instudying mucins and glycoproteins. For example, other mucins suchas gastric MUC5AC and salivary MUC5B were studied previously usingellipsometry [28,29], surface plasmon resonance spectroscopy [30],and dual polarisation interferometry (DPI) [31,32]. Quartz Crystal Mi-crobalancewith dissipationwas also employed tomonitoring hydrationof adsorbed mucosal layers, and provided structural information forfully hydrated polymeric moieties [33]. A combination of optical andmicrobalance techniques was proven to be a powerful tool to investi-gate molecular conformations as it enables independent quantificationof the adsorbed amount and layer hydration [33,34]. However thesemethods rely on the material being adsorbed on a substrate and arenot suitable for characterising bulk properties. The molecular forcesmeasuring techniques such as Atomic Force Microscopy (AFM) or Sur-face Force Balance (or Surface Force Apparatus) enable elucidatingforce-stretching profile and persistence length of polymeric species, al-though they do also rely on thematerial being adsorbed. Both, AFM andSFB have been applied to probe the behaviour of adsorbed layers of thevery sameMUC 6 mucin sample [26,35]. In a typical force spectroscopyexperiment, the interaction was measured between two adsorbedlayers of mucin. The result of the experiment is a force versus distancecurve recorded during approach and retraction of surfaces. The approachpart of the curve is governed by the electrostatic and steric interactions,while on retraction the pull-off process was characterised by events thatin theory could provide the basis for calculating persistence/Kuhn length,chain stiffness, and macromolecular contour length typically usingWorm Like Chain (WLC) or Freely Jointed Chain (FJC) models. Bothforce balance and surface techniques demonstrated the presence ofentangled network in adsorbed mucin layers, but due to complexcollective dynamic of mucin chains failed to produce reliable enoughresult for WLC or FJC models to be applicable. Thus despite a profuseeffort the molecular details of the structure of the entangled networkremained concealed. This is largely due to the fact that investigating thestructuring element in the weak entangled network of mucin concen-trated solutions requires a method sensitive to overall molecular con-formation. Furthermore, this method should enable probing of smallerelements within the structure of a large macromolecule, especially inthe case of complex mucins that are notoriously difficult to study [5].Two suchmethods are Raman spectroscopy, whichmeasuresmolecularvibrations, and Raman optical activity (ROA), which measures a smalldifference in intensity in Raman scattering from chiral molecules inright- and left-circularly polarised light [36,37].
These two related vibrational spectroscopic techniques possessmany advantages for studying biological molecules, including havingnomolecular size limitations, their being label-free, wide applicabilityto different sample conditions and types, the ability to measure bothRaman and ROA simultaneously on the same sample from a single in-strument, and the high information content of the spectra. In addi-tion, the combination of Raman with ROA provides highly detailedinsight into the structure and conformational dynamics of biomole-cules and their assemblies. Here, we illustrate the great potential ofRaman and ROA spectroscopies for investigating the structure and or-ganisation of glycoproteins and the complex matrices they can form.We direct the interested reader to a number of other references fordiscussions of the underlying theories of Raman [38,39] and ROA scat-tering [36].
There are 3N-6 vibrational modes for a nonlinear molecule withN atoms, providing a unique fingerprint of biomolecular identity and

Fig. 1. Backscattered Raman (IR + IL) and ROA (IR − IL) spectra of A) HSA [43,45],B) concanavalin A [45], and C) hen lysozyme [43,45] at ~pH 5.4 and 20 °C.
68 L. Ashton et al. / Advances in Colloid and Interface Science 199–200 (2013) 66–77
environment. For proteins, these vibrational modes generate a numberof useful Raman and ROA features. These include: the amide I regionfrom ~1630 to 1700 cm−1 arising mainly from C_O stretches; thebackbone skeletal stretch region ~870–1150 cm−1 originating predom-inantly from Cα\C, Cα\Cβ and Cα\N stretch coordinates; and the ex-tended amide III region from ~1230 to 1340 cm−1 which is generatedmainly from the in-phase combination of the in-plane N–H defor-mation with the C\N stretch along with mixing of the N–H andCα–H deformations [40–42]. Amide II vibrations, found in the region~1510–1570 cm−1 and arising from the out-of-phase combination ofin-plane N–H deformations with C\N stretches, are usually weak inRaman spectra but can present large ROA bands. Therefore, the normalmodes of biomolecules are complex and they contain contributionsfrom local vibrational coordinates within both the backbone and sidechains, whether amino acids in proteins or sugars in glycans. Ramanspectra of proteins contain a number of bands sensitive to secondarystructure but these are often obscured by bands arising from the sidechains of residues. Although these overlapping side chain bands arevery informative they can also make analysis of the protein's structuredifficult. ROA cuts through the complexity of vibrational spectra asthe largest ROA signals are usually associated with vibrational modesthat sample the most chiral and rigid elements of the molecule. Thesemodes are mainly located within the backbone and generate ROAband patterns characteristic of the backbone conformation.
The timescales of Raman scattering events are much quicker thanthe fastest fluctuations in the conformations of biological molecules,typically being on the order of femtoseconds. As a result of this, theROA spectra of biomolecules are a superposition of ‘snapshots’ fromall conformations adopted by the molecule at equilibrium [43]. AsROA intensities are dependent on absolute chirality, the contributionsfrom enantiomeric structures that are generated as the moleculeexplores all accessible conformations will tend to cancel each otherout. In this respect, ROA possesses an enhanced sensitivity to the dy-namics of biological molecules. Conventional Raman band intensitiesare “blind” to chirality and are therefore less sensitive to conforma-tional mobility.
In combination these spectroscopic techniques are sensitive tochanges in conformation revealing details of secondary and tertiarystructures, probing hydrogen bonding interactions, as well as resolvingside chain orientation and the absolute configuration of chiral substruc-tures. Raman and ROA have been applied to a diverse range of proteins.Fig. 1 illustrates the sensitivity of protein Raman and ROA spectra tostructure. Fig. 1A presents Raman and ROA spectra for an α-helicalprotein, human serum albumin (HSA) [43]. The SCOP analysis of theProtein Data Bank (PDB) X-ray crystal structure 1ao6 of HSA reports69.2% α-helix, 1.7% 310-helix and the remainder being loops andturns. We can observe in the Raman spectrum of HSA that this second-ary structure distribution is reflected in the amide I region with theamide I peak at ~1652 cm−1 being typical of α-helix, while the amideIII region containing strong signals from ~1300 to 1340 cm−1 withmuch lower intensity in the region ~1200–1280 cm−1 suggests a highhelix content. However, this assessment is complicated by the knowncontributions from Trp vibrations ~1345 and 1365 cm−1, making sepa-ration of the backbone and side-chain bands difficult. The details ofHSA's secondary structure are more easily discernible in the ROA spec-trum. The strong sharp positive ROA band at ~1340 cm−1 and smallerpositive band at ~1300 cm−1 have been shown to originate fromα-helix in hydrated and hydrophobic local environments, respec-tively. The amide I couplet is negative at ~1640 cm−1 and positiveat ~1665 cm−1 which is also characteristic of α-helix [43,44], as isthe positive ROA intensity in the range ~870–950 cm−1.
Fig. 1B presents the Raman and ROA spectra of the β-sheet proteinjack bean concanavalin A [45] which has 43.5% β-strand, 1.7% α-helixand 1.3% 310-helix in a jelly roll β-barrel with the remainder beinghairpin bends and long loops, according to PDB X-ray crystal structure2cna. In the Raman spectrum of concanavalin A, the amide I couplet
now appears at ~1670 cm−1, in agreement with the presence ofβ-sheet, though there are also overlapping bands from tyrosine residuesfrom ~1600 to 1620 cm−1. This analysis is corroborated by the increasedRaman intensity in the amide III region from 1200 to1250 cm−1, thoughit is difficult to distinguish between the contributions from strands, turnsand disordered structures. As for HSA, the structural features of conca-navalin A are easier to distinguish in its ROA spectrum. There is a sharpROA couplet with a negative band at ~1241 cm−1 and positive compo-nent at ~1295 cm−1 which is diagnostic of β-sheet. The negative peakof the β-sheet couplet is typically constrained either to the region~1220 cm−1 or ~1240 cm−1, while the positive peak for this couplet ismore variable depending on the specifics of β-sheet composition andtopology and can appear from ~1260 to 1295 cm−1. The amide I ROAcouplet, negative at ~1658 cm−1 and positive at ~1677 cm−1, aswell as bands in the backbone skeletal stretch region from ~950to1020 cm−1 are consistent with β-sheet [43,46]. Negative ROA bandsin the range ~1340–1380 cm−1 denote the presence of β-hairpinbends, such as that at ~1345 cm−1 observed here. This feature allowsROA to differentiate between parallel and antiparallel β-sheet as only an-tiparallel sheet usually contains hairpin bends. β-sheet proteins also typ-ically display a strong positive ROA band from ~1314 to1325 cm−1, and

69L. Ashton et al. / Advances in Colloid and Interface Science 199–200 (2013) 66–77
is observed here at ~1316 cm−1, that arises from residues that supportthe polyproline II helical (PPII) conformation. These correspond to thePPII helical elements that are often found in longer loops between ele-ments of secondary structure [47,48].
Fig. 1C shows the Raman and ROA spectra of hen lysozyme [43,45],which contains 28.7% α-helix, 10.9% 310-helix and 6.2% β-sheet ac-cording to PDB X-ray crystal structure 1lse. The amide I and II regionsof the Raman spectrum of hen lysozyme show some similarities tothose already discussed for HSA and concanavalin A, reflecting thepresence of both α-helix and β-sheet. However, the amide I and IIIRaman profiles contain many overlapping bands; the ROA spectrumagain more clearly reveals the main structural features. These includethe positive amide III ROA bands assigned to hydrophobic and hydratedα-helix at ~1299 and 1342 cm−1, respectively, aswell as the sharp neg-ative band at ~1240 cm−1 from the β-sheet domain. The amide I ROAcouplet, negative at ~1641 and positive at 1665 cm−1 with a small pos-itive shoulder at ~1683 cm−1, also indicates the presence of α-helixwith a lesser amount of β-sheet. The positive bands in the backboneskeletal stretch region from 900 to 950 and 950 to1020 cm−1 confirmthe presence of both α-helix and β-sheet, respectively.
Within the Raman spectra for proteins can be found bands fromdifferent amino acid side chains, with aromatic residues (Trp, Phe andTyr) being particularly prominent. Protein ROA spectra also present fea-tures arising from side chains, though these are generally weak otherthan for those arising from the W3 vibrational mode of Trp residues at~1550 cm−1 [49]. Several of the Raman signatures of aromatic sidechains are useful diagnostics of hydrogen bonding interactions [50–54],while the ROA signature for Trp residues has proven to be sensitive tochanges in local stereochemistry of the indole ring [55].
Raman and, to a lesser extent, ROA have been used to study manyaspects of protein structure including the monitoring of protein disor-der [56–58], formation of amyloid fibrils [59] and protein unfolding[55] including under shear [60].
Less work has been done on carbohydrates and glycoproteins, buta number of studies using both Raman and, in particular, ROA havesuccessfully characterised carbohydrates [61–68]. The first reportedROA study on carbohydrate polymers was conducted on cyclodextrinsof different sizes (α-, β- and γ-D-forms) and proposed an intense andcharacteristic marker band for the glycosidic linkage, specifically fromC\O stretches coupled to C1–H deformations [69]. ROA studies on anumber of mono- and di-saccharides then began to explore the sensi-tivity of ROA spectral features to the identity of the sugar and the natureof the glycosidic linkage. In a more extensive investigation [61], theBarron group shortly thereafter presented ROA spectra of 15 differentmonosaccharides that verified several key findings; first, the ability ofROA to determine the absolute configuration about each chiral centrein a carbohydrate; second, the potential ability to differentiate betweenα- and β-anomeric linkages; third, that large ROA spectral differencesare apparent between epimers; fourth, that ROA spectra can also dis-criminate between homomorphic sugars, which have the same stereo-chemistry around each asymmetrically substituted carbon but differentsubstituents, though the spectral differences are weaker than for epi-mers; and fifth, the relative conformations of CH2OH groups, whichare important for intramolecular hydrogen bonding and for stabilisingbackbone conformations, can be inferred from ROA band patterns.
Bell et al. [70] in their study of glucose-derived disaccharidessubsequently clarified the origin of the earlier assignment of the gly-cosidic linkage marker band to being from the linkage's C\O\Cstretch coordinates coupling with ring stretching and C–O–H defor-mations. These authors also proposed that a number of other bandswere also associated with the glycosidic linkage and that ROA bandpatterns could be particularly useful for investigating the solutionstructures of oligo- and poly-saccharides, which will be present asan ensemble of multiple conformations, so complicating analysis byother methods. As discussed above, it was becoming apparent evenin these early studies that ROA had the potential to reveal the details
of conformational dynamics of complex carbohydrates in solution [63].Bell et al. also showed that ROA can inform about extended structure inD-glucose-derived polysaccharides [64].
The first reported ROA spectrum of a glycoprotein was fororosomucoid [71], also known as α1-acid glycoprotein, which hasa carbohydrate content of ~40% by weight. Although little analysisof the structure was possible at the time and the S/N level was low, thisstudy did clarify that ROA spectra of glycoproteins contain informationabout both the protein and carbohydrate components. The sensitivity ofROA to the conformational dynamics of carbohydrates was also exploredby the Barron group [72], following on from their earlierwork,when theyinvestigated spectral features generated by β-cyclodextrin and twomethylated derivatives and a linear equivalent, maltoheptaose. Uponcomparison of the spectra collected for the different cyclodextrins andupon binding to sodium benzoate the authors showed that the alreadymentioned ROA marker band near 915 cm−1 for the glycosidic linkagein polysaccharides is also sensitive to conformational flexibility. As partof a study on proteins with irregular folds, Smyth et al. [56] also reportedthe ROA spectrum of yeast invertase, which contains nine high-mannoseoligosaccharide chains contributing ~50% of the glycoprotein's mass.
Hydration interactions are likely to be important for the conforma-tional dynamics and stability of carbohydrates in general, and ROAwas used in conjunction with quantum chemical calculations for glu-cose, galactose and lactose in order to investigate this [73]. Densityfunctional theory (DFT) calculations found that explicit hydration by asingle water molecule was important for regulating the conformationsof the two monosaccharides and that these energetically favouredstructures were also preserved in solution. Interestingly, the conforma-tional preference of the β(1 → 4)-glycosidic linkage of lactose did notchange upon explicit hydration by a single water molecule, but didchange in solution, indicating that entropic effects are responsible forregulating the glycosidic conformation.
Particularly noteworthy was the study by Zhu et al. [65] who usedROA to both confirm the previously suggested β-sheet rich lipocalinfold of the polypeptide backbone of bovine α1-acid glycoproteinand identified glycosidic linkage types within the pentasaccharideglycan core. Kopecky et al. [74] had earlier investigated the conforma-tional stability of the human blood variant of the same protein usingRaman. The ability of Raman to detect intermolecular interactions bythe glycan moiety of fish antifreeze glycoproteins, in this case specificinteractions between the proteins and an ordered pyrolitic graphitesurface, has been shown by Cui et al. [75]. Recently, the analytical ca-pabilities of combining Raman with chemometrics for characterisingglycosylation were established by Brewster et al. [76]. In a computa-tional study, Luber and Reiher [77] found that ROA spectra are sensi-tive to changes from the chair to boat conformation of the pyranosering, and also confirmed that solvation of carbohydrates has a signif-icant effect on the spectral features.
Recently, Yaffe et al. used ROA to investigate the details of higherorder structure in the glycosaminoglycan hyaluronan [66], whileRudd et al. [78] reported ROA spectra of several other glycosamino-glycans. The sensitivity of ROA spectra to glycan conformation wasexplored in greater detail in a study of the high-mannose glycopro-tein yeast invertase from Saccharomyces cerevisiae [67]. Furthermore,the same paper also presented an ROA spectrum of a commercialsample of bovine submaxillary mucin that indicated that even thoughthe polypeptide backbone may be largely disordered it did not appearto adopt any PPII structure. These studies have clearly demonstratedthat Raman and ROA spectra are highly informative about carbohy-drate composition and conformation. As discussed above, one of thekey advantages of applying vibrational spectroscopy to the study ofglycoprotein structure is that the spectrum is composed of bands aris-ing from both the carbohydrate and protein components, allowing si-multaneous analysis of both in an intact glycoprotein, and so showsgreat promise for contributing strongly in this challenging researchfield. Here we use Raman and ROA to elucidate mucin behaviour in

Carbohydrateside-chains
Peptidebackbone
Hydrophobicglobule
~2.5 nm
~20 nm nm
Fig. 2. Schematic diagram of porcine gastric mucin with a monomeric dumbbell-likestructure with typically 2 globular domains linked by a heavily glycosylated spacerextending ~40–50 nm in a hydrated state (ionic strength 10−5 M) [13].
70 L. Ashton et al. / Advances in Colloid and Interface Science 199–200 (2013) 66–77
solution with changes in concentration. This work shows how thesemethods give new information on the mucin conformation in solu-tion, both at the general structural level and how particular parts ofthe molecule are changing; thus providing key insights into mucinphysico-chemical properties.
2. Experimental
2.1. Mucin solution preparation
Pharmaceutical grade porcine gastric mucin with a meanmolecularweight estimated as 546.4 kDa [13,14] (A/S Orthana Kemisk FabrikKastrup, Denmark), was extensively dialyzed using a 16 kDa cellulosemembrane against ultrapure water (Elga, Marlow, U.K.) to remove allsalts and other low-molecular-weight additives, and then lyophilizedand stored at ≤−10 °C until use. A short summary of characterisationwork on this mucin [13–15,25–27,79] is as follows: processed andused as described, the sample is a 93–97% pure porcine gastric mucingenetically similar to human MUC6 [14] Chemical hydrolysis followedby chromatography established that sialic acid is only present in tracequantities. The main sample impurity is most likely bound water thatremained despite freeze-drying. UV-spectroscopic analysis of gel filtra-tion samples, and conductivity measurements revealed traces of lipids,free peptides, and free sugars at trace concentrations (too low to quan-tify) and salt impurities ~0.01 mM for a 1 mg/ml mucin solution. PAGEanalysis showed that small molecules (>1 kDa)were absent, for exam-ple, serum albumins, which have been suspected to be contaminants inothermucin samples [31] Themucin is heavily glycosylatedwith carbo-hydrate side-chains accounting for 71–76% of molecular mass [13] Themolecular structure is a monomeric dumbbell [13,15,16] (Fig. 2) withthe radius of gyration, Rg, ~55 nm at ionic strength ~10−5 M. The spac-er that connects the two protein-rich globules is heavily O-glycosylatedwith predominantly neutral di- and trisaccharides. The mucin has noisoelectric point [14] but remains weakly net negative throughout thepH range 2–11.
Solutions were prepared with concentrations between 20 and80 mg/ml by dissolving the lyophilized mucin in distilled deionisedwater. A small amount of activated charcoal was added to each sample,which was then centrifuged and filtered through a 0.22 μm Duraporemembrane to remove fluorescent impurities and used immediately[55]. The samples of galactose, N-acetyl-D-galactosamine (GalNAc),N-acetyl-D-glucosamine (GlcNAc), D-fucose, L-threonine (Thr) andL-serine (Ser) (Sigma) were used without further purification by dis-solving in deionised water.
2.2. Raman spectroscopy and Raman optical activity measurements anddata analysis
All Raman and ROA experiments were performed using aChiralRAMAN instrument (Biotools Inc., Jupiter FL) [80] with the follow-ing experimental conditions: laser wavelength 532.5 nm, laser power atsample ~600 mW, spectral resolution ~7 cm−1 and total acquisitiontimes of ~6–10 h (34,000–48,000 scans per spectrum). For each solution~100 μl was pipetted into individual quartz cells and positioned for opti-mum spectral collection in the ChiralRAMAN instrument. Several repeatexperiments were performed at each concentration, with ROA andRaman spectra being collected simultaneously. The final spectra at con-centrations of 20, 30 and 50 mg/ml combined two separate collectionsin order to acquire acceptable ROA signal-to-noise ratios.
We have previously used analytical methods, referred to as 2DRaman and 2D ROA correlation analysis [81], to probe the complexityof conformational transitions in biomolecules [82–84]. 2D correlationanalysis (2DCos) is a cross-correlation technique that is applied to apreviously measured set of perturbation-induced spectra as a func-tion of two independent wavenumber positions [81]. This results insynchronous and asynchronous plots, which identify similarities and
differences, respectively, in behaviour between bands occurring at twoindependent wavenumbers. The further technique of 2D perturbation–correlation moving windows (PCMW), which plots the synchronousand asynchronous data on a plane between a spectral variable axis anda perturbation axis, directly relates the perturbation to spectral variations[85]. For the PCMW calculation the spectral sets were grouped into sub-sets of three spectra, e.g. the first set consisted of 20, 30 and 40 mg/mlspectra, the second set 30, 40 and 50 mg/ml spectra and so forth untilall spectra in the set were included and 2DCos calculations carried outfor each set, thus creating a moving window of data. From PCMW plotsdistinct phases and directions of change in the conformational transitioncan be identified. 2DCos and PCMW calculations were performed using2Dshige freeware [http://science.kwansei.ac.jp/~ozaki/index_e.html].
2.3. Data preprocessing
As has been extensively discussed in previous papers [83,86,87],and therefore is only briefly dealt with here, data preprocessing isnecessary to calculate reliable 2DCos particularly with biological sam-ples. At each stage of data preprocessing, 2D contour plots were pro-duced and compared to ensure the generation of consistent andunambiguous plots.
For the data presented here all spectra were standardised to a totalof 40,000 scans. In order to ensure that the analysed spectral varia-tions were purely due to structural changes and not as a result ofthe increased amount of mucin, normalisation to a concentration of50 mg/ml was also applied. To remove baseline drift resulting frominstrumental imperfections and instabilities and to improve clarityof the 2DCos plots baseline correction was applied individually toeach spectrum, across the complete spectral range. ROA spectra werealso smoothed using Fast Fourier Transform filtering to 5 FFT points.Baseline correction and smoothing were applied with Origin 7.5.
3. Results and discussion
Fig. 3A displays the Raman spectra of mucin from 20 to 80 mg/mlin 10 mg/ml steps where several changes can be observed across thespectrum with increasing concentration. Also depicted in Fig. 3B arethe spectra of the main sugars that decorate the mucin backbone;GlcNAc (23.5%) galactose (20.6%), GalNAc (19.4%) and fucose (6.6%)[14]. Furthermore, as the mucin backbone has a high proportion ofserine (Ser) and threonine (Thr), between 30 and 45% of the proteincontent (9% of total content of the glycoprotein), their Raman spectra

Fig. 3. (A) Raman spectra of mucin concentration series 20 mg/ml to 80 mg/ml in10 mg/ml steps, normalised to 40,000 scans and then to 50 mg/ml mucin concentra-tion to allow band comparisons (B) Raman spectra of mucin at concentrations 20and 80 mg/ml, as well as Raman spectra of the sugars; GlcNAc, galactose, GalNAc andfucose and the amino acids serine and threonine.
Table 1Proposed assignments of Raman bands of mucin based on the dominating spectralfeatures in sugar and amino acid spectra shown in Fig. 3B.
Band (cm−1) Proposed assignment
795 GalNAc825 GlcNAc, galactose, fucose, serine884 Galactose, GlcNAc1070 Galactose1090 GalNAc, GlcNAc1130 GalNAc1160 GalNAc, threonine1273 GlcNAc1332 GalNAc, GlcNAc1384 GalNAc, GlcNAc1464 GalNAc, GlcNAc, fucose, galactose
71L. Ashton et al. / Advances in Colloid and Interface Science 199–200 (2013) 66–77
are also shown for comparison. From the proposed band assignments(listed in Table 1) it can be observed that the majority of the Ramanmucin spectral features arise from the carbohydrate component.Although some bands associated with the backbone apo-protein arealso observed, mainly from Ser and Thr residues, there is little indica-tion in the Raman spectra of any ordered structure in the backbone.
So, despite Raman's sensitivity to protein conformation, in theRaman mucin spectra where features are dominated by carbohydrateassigned bands no secondary structural information can be observed.As previously discussed, the mucin is heavily glycosylated (~80%) andthis is most likely why the sugars surrounding the protein backbone
dominate in the Raman spectra. However, there is also the furthercomplication that protein structure in mucin is reported as largelybeing unfolded in nature [18]. ROA has been shown to be exquisitely sen-sitive to less-ordered structure. It is well documented that polyproline IIand β-like conformations are common motifs for unfolded proteins[88], structures that ROA is particularly strong at characterising [46,76].Therefore the ROA spectra are examined first.
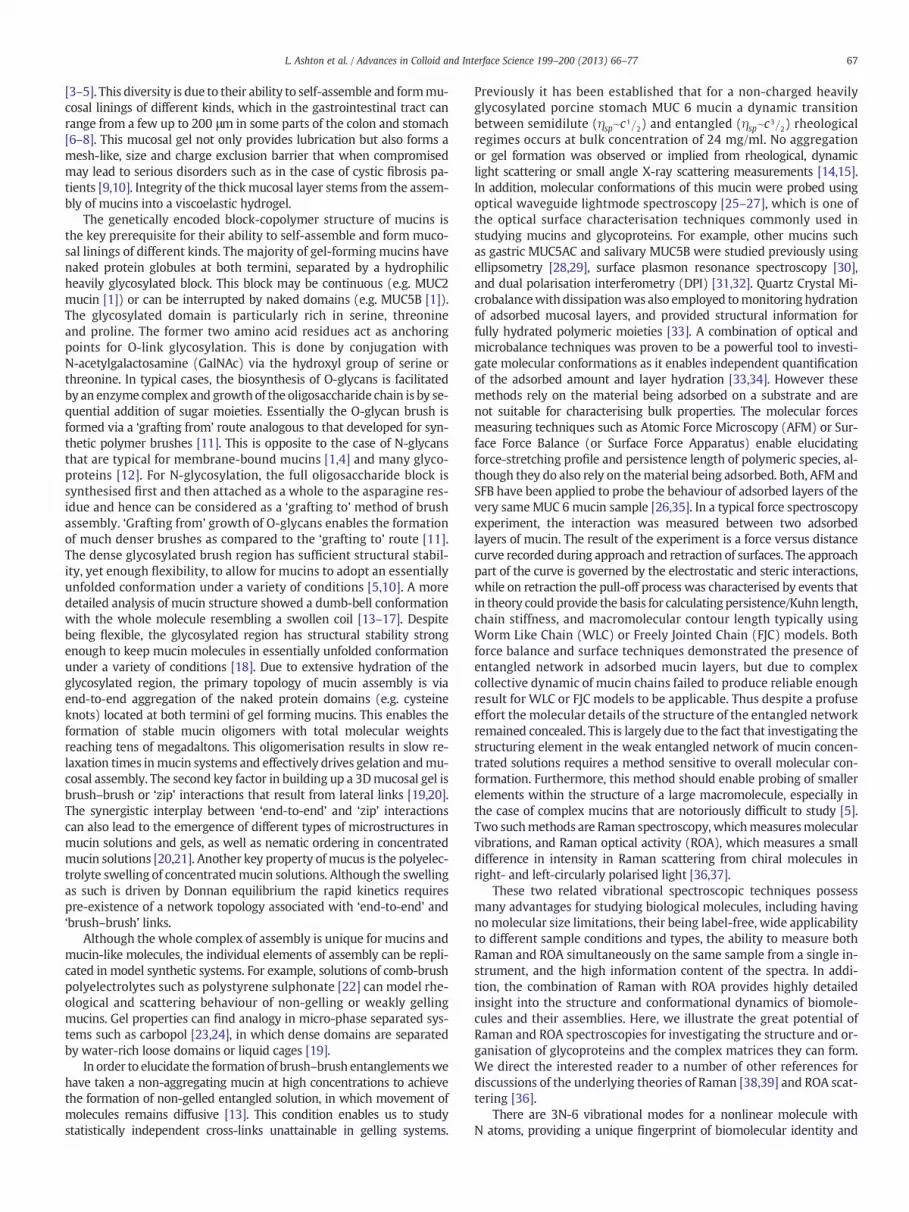
The concentration series of mucin ROA spectra from 20 to 80 mg/mlin 10 mg/ml steps are shown in Fig. 4A. The ROA spectra of the mainsugars that decorate the backbone of this mucin, the ROA spectra ofSer and Thr, and a typical β-sheet protein spectrum are plotted alongwith those of mucin at 20 and 80 mg/ml concentrations in Fig. 5 to fur-ther aid with band assignments, and a list of proposed assignments isgiven in Table 2. The ROA spectra show distinctly different featuresupon increasing mucin concentration with a number of changes inboth band position and intensity. Although intense sugar associatedbands can be observed to dominate the ROA spectra, spectral variationsalso occur in wavenumber regions associated with β-structure, identi-fied in Fig. 4B–E. However, due to the complex nature of these changingROA features, it is difficult through visual inspection alone to relatethese spectral variations directly to mucin concentration, thereforethis data set has been analysed by 2DCos.
The principal aim of perturbation-based 2DCos is to improve visu-alization of complex spectra by applying a simple cross-correlationanalysis to previously measured spectra as a function of two indepen-dent wavenumber positions, thereby spreading the spectra over anadditional dimension. Conventionally, 2DCos analysis has been usedto calculate both a synchronous and an asynchronous matrix fromthe experimental data that depict similarities and differences, respec-tively, in behavioural trends of spectral variation across the completedata set [81]. These matrices may be displayed in a variety of ways in-cluding contour maps, stacked traces or fishnet structures. Althoughthe best overall view of the intensity profile of a correlation spectrummay be provided by stacked traces or pseudo-3-dimensional figures,they may be difficult to interpret, and for the majority of 2DCos stud-ies contour plots are favoured, as detailed peak shapes and positionsmay be easily identified. One advantage of using 2DCos techniquesis that significant spectral variations can be identified and directlycompared without having to examine numerous plots of single inten-sities as a function of concentration, which is particularly useful withbroader and overlapping bands. Fig. 6A displays the 2DCos synchro-nous plot generated from the concentration-dependent mucin ROAspectral set.
Synchronous contour maps consist of two types of contours posi-tioned at general coordinates (ν1,ν2): autopeaks, which occur alongthe diagonal of the plot (ν1 = ν2) and identify bands of dynamicintensity change; and cross peaks, which indicate the existence ofrelative similarities in behaviour between two independent bandspositioned above or below the diagonal (ν1 ≠ ν2). By definition,autopeaks are always positive, whereas cross peaks may be positive(e.g. when spectral peaks are changing in the same direction),

Fig. 4. (A) ROA spectra of mucin concentration series 20 mg/ml to 80 mg/ml in 10 mg/ml steps, with close up of bands at (B) ~1046 cm−1, (C) ~1160 cm−1, (D) ~1220 and1260 cm−1 and (E) ~1328 and 1363 cm−1.
72 L. Ashton et al. / Advances in Colloid and Interface Science 199–200 (2013) 66–77
represented in this paper by unshaded contours, or negative (e.g. whenspectral peaks are changing in the opposite direction), denoted by con-tours shaded grey. Fig. 6B displays the diagonal values, or autopeaks,plotted as a function of intensity (arbitrary units) versus wavenumberreferred to as the autocorrelation, in this way bands of most dynamicspectral variance can be easily observed relative to each other.
In Fig. 6A and B, depicting the 2DCos synchronous plot and autocor-relation plot, respectively, calculated from the ROA concentration-dependent spectral set, a large spectral variation occurring at~1046 cm−1 can be observed to dominate both plots. The ROA con-tours are relatively small (c.f. Fig. 7 for Raman), reflecting the sharpROA bands observed in Fig. 4.
Although 2DCos methods can be used to determine both correlated(synchronous) and out of phase (asynchronous) trends in behaviourthey fail to unequivocally relate band intensity changes to the perturba-tion, in this case the increase in concentration.Moreover, in investigationsof complex biological systems interpretation of asynchronous plotscan be difficult and in some specific circumstances may be unreliable[89–91]. A further more reliable and easier way to interpret 2DCostechnique, perturbation correlation moving windows (PCMW) [85],has been developed to take advantage of both the synchronous andasynchronous information by plotting both data on a plane betweenthe spectral variable axis and a perturbation axis, as shown in Fig. 6C.From PCMW plots distinct phases and directions of change in the con-formational transition can be identified for specific wavenumbers anddirectly compared across all wavenumber regions. The large change oc-curring in the positive ROA band at ~1046 cm−1 can also be observed in
the PCMW plot of the ROA data (Fig. 6C) along with a complex numberof other variations due to the sensitivity of the PCMW to all changes.When examined closely, the strongest changes, identified by the closestpacked numbers of contours, can be observed between 30 and 50 mg/mlwith a possible second set of changes occurring at 70 mg/ml. This divi-sion of the concentration-induced changes into two transitions is moreclearly observed in the PCMW plot of the Raman data set (Fig. 7C) spe-cifically in the region 1200–1450 cm−1 where an initial increase in in-tensity is observed from 30 to 50 mg/ml (indicated by the unshadedcontours) before a decrease in intensity at 60 mg/ml (indicated by theshaded contours) and a further increase at 70 mg/ml. In Fig. 6C a similarprofile of contours can be observed at ~1046 cm−1.
In the ROA spectra (Fig. 4) at 20–30 mg/ml two distinct peaks at~1040 and 1062 cm−1 can be observed, both bands assigned to GalNAcand GlcNAc, respectively (Table 2). As concentration increases there is achange from two bands to one slightly broader band at ~1046 cm−1
with a large increase in intensity, as highlighted in the 2DCos plots.As observed from Fig. 5B, although dominated by sugar assignedbands, bands in this region in proteins have also been associated withβ-structure [46]. The changing ROA bands at ~1160 and 1260 cm−1,likewise have been assigned to both β-structure and sugars, however,a further, ROA band at ~1220 cm−1 has been definitively assigned toβ-structure [43,56,82]. Although spectral variation at ~1220 cm−1 canbe observed in Fig. 4 it is difficult to relate these changes to the twoconcentration-induced transitions due to variation in profile and intensi-ty. By using the alternative approach of PCMW (Fig. 6C) shaded contourscan be observed from 30 to 50 mg/ml for the band at ~1220 cm−1
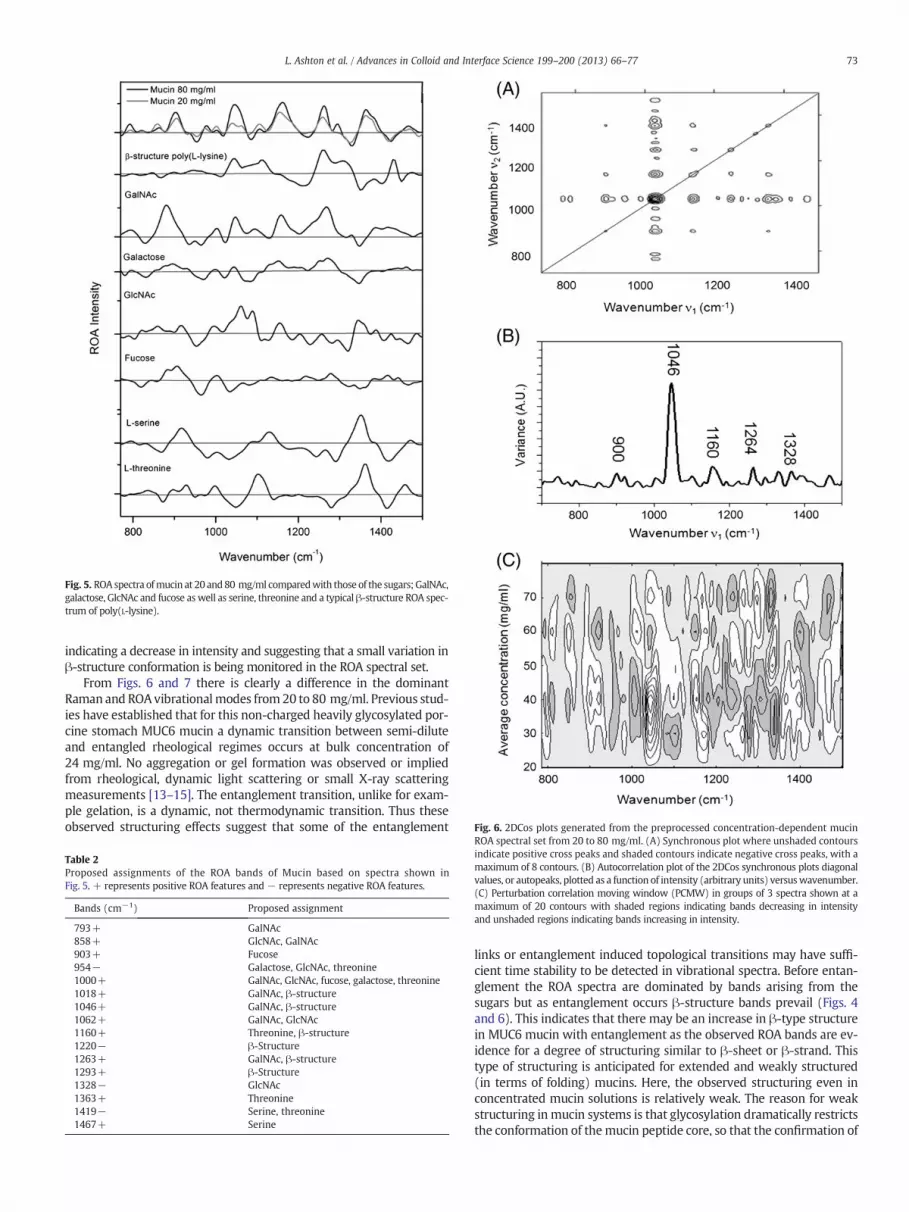
Fig. 5. ROA spectra ofmucin at 20 and80 mg/ml comparedwith those of the sugars;GalNAc,galactose, GlcNAc and fucose as well as serine, threonine and a typical β-structure ROA spec-trum of poly(L-lysine).
Fig. 6. 2DCos plots generated from the preprocessed concentration-dependent mucin
73L. Ashton et al. / Advances in Colloid and Interface Science 199–200 (2013) 66–77
indicating a decrease in intensity and suggesting that a small variation inβ-structure conformation is being monitored in the ROA spectral set.
From Figs. 6 and 7 there is clearly a difference in the dominantRaman and ROA vibrationalmodes from 20 to 80 mg/ml. Previous stud-ies have established that for this non-charged heavily glycosylated por-cine stomach MUC6 mucin a dynamic transition between semi-diluteand entangled rheological regimes occurs at bulk concentration of24 mg/ml. No aggregation or gel formation was observed or impliedfrom rheological, dynamic light scattering or small X-ray scatteringmeasurements [13–15]. The entanglement transition, unlike for exam-ple gelation, is a dynamic, not thermodynamic transition. Thus theseobserved structuring effects suggest that some of the entanglement
Table 2Proposed assignments of the ROA bands of Mucin based on spectra shown inFig. 5. + represents positive ROA features and − represents negative ROA features.
Bands (cm−1) Proposed assignment
793+ GalNAc858+ GlcNAc, GalNAc903+ Fucose954− Galactose, GlcNAc, threonine1000+ GalNAc, GlcNAc, fucose, galactose, threonine1018+ GalNAc, β-structure1046+ GalNAc, β-structure1062+ GalNAc, GlcNAc1160+ Threonine, β-structure1220− β-Structure1263+ GalNAc, β-structure1293+ β-Structure1328− GlcNAc1363+ Threonine1419− Serine, threonine1467+ Serine
ROA spectral set from 20 to 80 mg/ml. (A) Synchronous plot where unshaded contoursindicate positive cross peaks and shaded contours indicate negative cross peaks, with amaximum of 8 contours. (B) Autocorrelation plot of the 2DCos synchronous plots diagonalvalues, or autopeaks, plotted as a function of intensity (arbitrary units) versuswavenumber.(C) Perturbation correlation moving window (PCMW) in groups of 3 spectra shown at amaximum of 20 contours with shaded regions indicating bands decreasing in intensityand unshaded regions indicating bands increasing in intensity.
links or entanglement induced topological transitions may have suffi-cient time stability to be detected in vibrational spectra. Before entan-glement the ROA spectra are dominated by bands arising from thesugars but as entanglement occurs β-structure bands prevail (Figs. 4and 6). This indicates that there may be an increase in β-type structurein MUC6 mucin with entanglement as the observed ROA bands are ev-idence for a degree of structuring similar to β-sheet or β-strand. Thistype of structuring is anticipated for extended and weakly structured(in terms of folding) mucins. Here, the observed structuring even inconcentrated mucin solutions is relatively weak. The reason for weakstructuring in mucin systems is that glycosylation dramatically restrictsthe conformation of themucin peptide core, so that the confirmation of

Fig. 7. 2DCos plots generated from the preprocessed concentration-dependent mucinRaman spectral set from 20 to 80 mg/ml. (A) Synchronous plot where unshaded contoursindicate positive cross peaks and shaded contours indicate negative cross peaks, with amaximum of 8 contours. (B) Autocorrelation plot of the 2DCos synchronous plots diagonalvalues, or autopeaks, plotted as a function of intensity (arbitrary units) versuswavenumber.(C) Perturbation correlation moving window (PCMW) in groups of 3 spectra shown at amaximum of 20 contours with shaded regions indicating bands decreasing in intensityand unshaded regions indicating bands increasing in intensity.
74 L. Ashton et al. / Advances in Colloid and Interface Science 199–200 (2013) 66–77
the polypeptide coremay lie onlywithin a relatively narrow range of di-hedral angles [92] which is insufficient for developing helical structure.
Increases in band intensity can also be observed for othersugar assigned bands including the fucose associated +ve ROA peakat ~903 cm−1, and the galactose and GlcNAc associated band at~954 cm−1 and the GlcNAc band at ~1328 cm−1. These changessuggest that with increasing mucin concentration the ROA responseto the stereochemistry of the outer residues of oligosaccharidechains also becomes stronger.
Furthermore, the same analysis has been applied to the Ramandata, see Fig. 7. It can be easily observed from Fig. 7B, the autocorre-lation plot of intensity versus wavelength, that the largest changesin the concentration-dependent mucin Raman spectral set occur at~1130, 1332 and 1384 cm−1 with further weaker changes at ~805,
1273 and 1464 cm−1. The changes centred at ~805 cm−1 reflect var-iations in the two bands measured at ~795 and 825 cm−1. The posi-tive cross peaks in Fig. 7A indicate that the majority of bands arechanging in intensity in the same direction that is they are increasingin intensity with increasing mucin concentration. Negative cross peaksobserved at coordinates between ~795 and 825 cm−1 and other signif-icantly varying bands indicate a change in intensity in opposite direc-tions, determining that the bands at ~795 and 825 cm−1 decrease inintensity as mucin concentration increases. As previously stated, themajority of the Ramanmucin spectral features are assigned to carbohy-drate vibrations. Raman carbohydrate bands above ~950 cm−1 are gen-erally assigned to the sugar ring structure, arising from CH2, COH andCH2OH groups, while bands between ~750 and 930 cm−1 have beensuggested to monitor anomeric conformations [61,62]. Arboleda andLoppnow [62] demonstrated how the spectra of α and β anomers ofglucose, galactose andmannose differed significantlywith distinct spec-tral variations observed at lower wavenumbers. In particular, galactoseexhibited a clear loss of bands occurring at ~790 and 825 cm−1 in the1-O-methyl-β-D-galactose compared to the 1-O-methyl-α-D-galactose.Based on previous assignments, the increase in intensity of bands from~1130 to 1464 cm−1 ismost likely a result of changes in sugar ring vibra-tions from intermolecular interactions while the loss of intensity occur-ring at ~795 and 825 cm−1 may be monitoring more subtle changesrelated to anomeric conformation.
As previously stated, the Raman PCMW plot is shown in Fig. 7Cwith overall grouping of contours suggests that spectral variancefrom 20 to 80 mg/ml occurs in two separate transition phases, initiallyfrom30 to 40 mg/mlwith secondary,weaker changes occurring around70 mg/ml. This is similar to the ROA data with the secondweaker set ofchanges at 70 mg/ml being more strongly observed here.
If examined closely the decrease in intensity of the bands at ~795and 825 cm−1 are determined in Fig. 7C (by the central points of thesmallest of this group of contours) to be at its maximum at ~30 mg/ml.Further changes in other increasing bands at ~1130, 1273, 1332, 1384and 1464 cm−1 can be determined in the PCMW plot to be centred at~40 mg/ml, suggesting that the initial transition may be a more com-plex process than previously reported.
If, as suggested above, the bands at ~795 and 825 cm−1 are mon-itoring a change in vibrations related to anomeric conformation thePCMW indicates that this change occurs first, centred at a concentrationof ~30 mg/ml. In particular, the contour shape (complete contours) andthe larger number of contours observed at ~795 cm−1 suggest thatchanges in this region are dominated by this lower wavenumber bandassigned to GalNAc. This observation is significant as GalNAc is thesugar attached through Ser or Thr to the protein backbone in theO-linked structure of mucin. Indeed, the strong conformational effectof GalNAc residues in mucins has been reported elsewhere [93,94].Coltart et al. [93] reported that in the molecular organisation withina shorter model mucin-like glycopeptide the initial GalNAc residue ef-fectively dominates structure. Experimental CD data and simulationsreported by Liu et al. [94] further established the particular role ofGalNAc in affecting the conformation of the protein backbone inmucin-like glycoproteins. The most likely reason for this particular ef-fect of GalNAc on conjugated proteins is the existence of hydrogenbonds that stabilise the GalNAc–Ser/Thr link [95]. Initial studies of thislink [93,95] favoured the view that anH-bond is formeddirectly betweenthe amide nitrogen of each GalNAc residue and the carbonyl oxygen ofthe adjacent peptide. Recent simulations, however, demonstrated thatthis hydrogen bond must be very weak [96,97] and further suggestedthat experimentally observed conformations of the oligosaccharidechains were stabilised by a water molecule forming a linker betweenSer/Thr and GalNAc. The presence of water molecules can explain thehigh level of flexibility of glycosylated domains due to the high mobilityof water molecules, which can provide intramolecular lubrication. Thismechanism can be analogous to that observed between ions confinedwithin a rubbing contact [98]. This lubrication can facilitate the chain
75L. Ashton et al. / Advances in Colloid and Interface Science 199–200 (2013) 66–77
motion and thus supportflexibility of themucin hydrophilic oligosaccha-ride comb-brush domain. At the same time, the water molecules associ-ated via hydrogen bonds with GalNAc-Ser/Thr may prohibit folding ofglycosylated domains into compact structure, keeping the whole struc-ture extended [99]. The initial loss of intensity in the GalNAc assignedband at ~795 cm−1 may be monitoring a change in hydrogen bondingassociated with the GalNAc–Ser/Thr link. This flexibility of the GalNAc–Ser/Thr link may be sufficient to allow the entanglement-inducedchanges in hydrogen bonding to occur thatwe can associatewith the ob-served loss of intensity in the GalNAc assigned band at ~795 cm−1,which is a characteristic spectral feature of anomeric transitions inO-linkages. The increase in intensity of the sugar assigned bands ob-served from ~1130 to 1464 cm−1 shown in Fig. 7C to be centred at40 mg/ml, may arise from changes to the sugar rings in the short oligo-saccharide chains occurring with continuing changes in the hydrationshell. The weaker spectral variations depicted at ~70 mg/ml are mostlikely monitoring the start of extensive brush overlap formation whichhas been reported to occur at ~88 mg/ml [20].
The changes in the vibrational spectra and β-structuring may lead toa hypothesis that the entanglement in the mucin system is achievedthrough brush–brush interaction between oligosaccharide side chainsof neighbouringmucinmolecules, amechanism thatwas postulated pre-viously [19]. Although for general polymer brushes the brush–brush in-terdigitation is energetically unfavourable, this could be the opposite inmucin systems. Corzana et al. [97] suggest that not only a bridgingwater molecule but also water molecules surrounding oligosaccharidesare important for the stabilisation of the extended conformation of thebackbone. Water molecules trapped in the pocket of GalNAc–Ser/Thrlinks and those of surrounding oligosaccharide chains have lower mo-bility [100], and hence lower entropy. Upon entanglement it could befavourable to form an entangled brush–brush link and liberate somewater that then stabilises mucin structure. This liberation of waterfrom hydration shells will result in the increase of entropy and hencedrive this process from energetic considerations. The Raman featuresin the mucin spectra (Fig. 3) associated with GalNAc and Ser may beassociated with partial loss or transformation of such a hydrated shelland possibly with re-arrangement of the water pocket between eachGalNAc and its peptide unit. The brush–brush orientation should bringthe protein domains nearer to each other, and hence facilitate β-typestructuring observed in ROA spectra.
4. Conclusion
Here we report the structural characterisation of a complex andextensively post-translationally modified biological molecule utilizing acombination of Raman and ROA techniques. The spectroscopic methodsused in combinationwith advanced chemometric 2DCos approaches en-able the analysis of whole large complex glycoprotein molecules such asmucin. The capacity of this method makes it useful in the analysis ofstructural changes and interactions for such largemolecules, the tacklingof which using other techniques is challenging.
We ascertain that in mucin aqueous solutions of various concentra-tions there are ‘delicate’ structural changes associatedwith the entangle-ment transition. The band assignments point towards oligosaccharidesand GalNAc–Ser/Thr linkages as key molecular groups affected by thetransition. Such structured elements are potentially crucial for the struc-turing of mucin in mucosal secretions as well as in interactions with bio-active molecules like e.g. drugs or food constituents.
A unique property of mucins is their ability to form very differenttypes of mucosal secretions depending on the type of mucin and itsconcentration. These can span from very watery tear fluids [101], toviscoelastic liquids like saliva [102] and finally elastic gels [103] thatalso can assemble into macroscopically stratified structures as thoseobserved in the colon and intestine. We hypothesize that observedstructural elements can be important contributors to the formation
of such a broad range of molecular organisations found in mucosalfluids.
Acknowledgements
The authors would like to thank Ann-Marie Williamson for inputand support of this work. G.Y. acknowledges the funding supportfrom the Australian Research Council Centre of Excellence in PlantCell Walls received at later stages of this work.
References
[1] Roussel P, Delmotte P. The diversity of epithelial secreted mucins. Curr OrgChem 2004;8:413–37.
[2] Lang TA, Hansson GC, Samuelsson T. Gel-forming mucins appeared early inmetazoan evolution. Proc Natl Acad Sci U S A 2007;104:16209–14.
[3] Tabak LA, LevineMJ, Mandel ID, Ellison SA. Role of salivarymucins in the protectionof the oral cavity. J Oral Pathol Med 1982;11:1–17.
[4] Bansil R, Stanley E, Lamont JT. Mucin biophysics. Annu Rev Physiol 1995;57:635–57.
[5] Bansil R, Turner BS. Mucin structure, aggregation, physiological functions andbiomedical applications. Curr Opin Colloid Interface Sci 2006;11:164–70.
[6] Matsuo K, Ota H, Akamatsu T, Sugiyama A, Katsuyama T. Histochemistry of thesurface mucous gel layer of the human colon. Gut 1997;40:782–9.
[7] Brownlee IA, Havler ME, Dettmar PW, Adrian A, Pearson JP. Colonic mucus: se-cretion and turnover in relation to dietary fibre intake. Proc Nutr Soc 2003;62:245–9.
[8] Johansson MEV, Thomsson KA, Hansson GC. Proteomic analyses of the twomucus layers of the colon barrier reveal that their main component, the Muc2mucin, Is strongly bound to the Fcgbp protein. J Proteome Res 2009;8:3549–57.
[9] Rose MC, Voynow JA. Respiratory tract mucin genes and mucin glycoproteins inhealth and disease. Physiol Rev 2006;86:245–78.
[10] Thornton DJ, Rousseau K, McGuckin MA. Structure and function of the polymericmucins in airways mucus. Annu Rev Physiol 2008;70:459–86.
[11] Prucker O, Ruhe J. Synthesis of poly(styrene) monolayers attached to high sur-face area silica gels through self-assembled monolayers of azo initiators. Macro-molecules 1998;31:592–601.
[12] Sarni-Manchado P, Canals-Bosch J-M, Mazerolles G, Cheynier V. Influence of theglycosylation of human salivary proline-rich proteins on their interactions withcondensed tannins. J Agric Food Chem 2008;56:9563–9.
[13] Yakubov GE, Papagiannopoulos A, Rat E, Easton RL, Waigh TA. Molecular struc-ture and rheological properties of short-side-chain heavily glycosylated porcinestomach mucin. Biomacromolecules 2007;8:3467–77.
[14] YakubovGE, PapagiannopoulosA, Rat E,Waigh TA. Charge and interfacial behavior ofshort side-chain heavily glycosylated porcine stomach mucin. Biomacromolecules2007;8:3791–9.
[15] Di Cola E, Yakubov GE, Waigh TA. Double globular structure of porcine stomachmucin: a small-angle x-ray scattering study. Biomacromolecules 2008;9:3216–22.
[16] Griffiths PC, Occhipinti P, Morris C, Heenan RK, King SM, Gumbleton M.PGSE-NMR and SANS studies of the interaction of model polymer therapeuticswith mucin. Biomacromolecules 2010;11:120–5.
[17] Znamenskaya Y, Sotres J, Engblom J, Arnebrant T, Kocherbitov V. Effect of hydra-tion on structural and thermodynamic properties of pig gastric and bovine sub-maxillary gland mucins. J Phys Chem B 2012;116:5047–55.
[18] Lafitte G, Soderman O, Thuresson K, Davies J. PFG-NMR diffusometry: a tool forinvestigating the structure and dynamics of noncommercial purified pig gastricmucin in a wide range of concentrations. Biopolymers 2007;86:165–75.
[19] Bromberg LE, Barr DP. Self-association of mucin. Biomacromolecules 2000;1:325–34.
[20] Waigh TA, Papagiannopoulos A, Voice A, Bansil R, Unwin AP, Dewhurst CD, et al.Entanglement coupling in porcine stomach mucin. Langmuir 2002;18:7188–95.
[21] Viney C, Huber AE, Verdugo P. Liquid-crystalline order in mucus. Macromole-cules 1993;26:852–5.
[22] Papagiannopoulos A, Fernyhough CM, Waigh TA, Radulescu A. Scattering studyof the structure of polystyrene sulfonate comb polyelectrolytes in solution.Macromol Chem Phys 2008;209:2475–86.
[23] Kim JY, Song JY, Lee EJ, Park SK. Rheological properties and microstructures ofCarbopol gel network system. Colloid Polym Sci 2003;281:614–23.
[24] Oppong FK, Rubatat L, Frisken BJ, Bailey AE, de Bruyn JR. Microrheology andstructure of a yield-stress polymer gel. Phys Rev 2006;73.
[25] Horvath R, McColl J, Yakubov GE, Ramsden JJ. Structural hysteresis and hierarchyin adsorbed glycoproteins. J Chem Phys 2008;129.
[26] McColl J, Yakubov GE, Ramsden JJ. Complex desorption of mucin from silica.Langmuir 2007;23:7096–100.
[27] McColl J, Yakubov GE, Ramsden JJ. Temperature dependence of mucin adsorption.Langmuir 2008;24:902–5.
[28] Lindh L, Glantz PO, Carlstedt I,Wickstrom C, Arnebrant T. Adsorption ofMUC5B andthe role of mucins in early salivary film formation. Colloids Surf B Biointerfaces2002;25:139–46.
[29] Svensson O, Arnebrant T. Mucin layers and multilayers — physicochemical prop-erties and applications. Curr Opin Colloid Interface Sci 2010;15:395–405.

76 L. Ashton et al. / Advances in Colloid and Interface Science 199–200 (2013) 66–77
[30] Efremova NV, Huang Y, Peppas NA, Leckband DE. Direct measurement of interac-tions between tethered poly(ethylene glycol) chains and adsorbed mucin layers.Langmuir 2002;18:836–45.
[31] Lundin M, Sandberg T, Caldwell KD, Blomberg E. Comparison of the adsorptionkinetics and surface arrangement of “as received” and purified bovine submaxillarygland mucin (BSM) on hydrophilic surfaces. J Colloid Interface Sci 2009;336:30–9.
[32] Lane TJ, Fletcher WR, Gormally MV, Johal MS. Dual-beam polarization interfer-ometry resolves mechanistic aspects of polyelectrolyte adsorption. Langmuir2008;24:10633–6.
[33] Macakova L, Yakubov GE, Plunkett MA, Stokes JR. Influence of ionic strengthchanges on the structure of pre-adsorbed salivary films. A response of a naturalmulti-component layer. Colloids Surf B Biointerfaces 2010;77:31–9.
[34] Halthur TJ, Arnebrant T, Macakova L, Feiler A. Sequential adsorption of bovinemucin and lactoperoxidase to various substrates studied with quartz crystal mi-crobalance with dissipation. Langmuir 2010;26:4901–8.
[35] Harvey NM, Yakubov GE, Stokes JR, Klein J. Normal and shear forces betweensurfaces bearing porcine gastric mucin, a high-molecular-weight glycoprotein.Biomacromolecules 2011;12:1041–50.
[36] Barron LD. Molecular light scattering and optical activity. 2nd ed. Cambridge:Cambridge University Press; 2004 .
[37] Barron LD, Hecht L, Mccoll IH, Blanch EW. Raman optical activity comes of age.Mol Phys 2004;102:731–44.
[38] TumaR. Raman spectroscopy of proteins: frompeptides to large assemblies. J RamanSpectrosc 2005;36:307–19.
[39] Smith E, Dent G. Modern Raman spectroscopy: a practical approach; 2005 .[40] Diem M. Introduction to modern vibrational spectroscopy. New York: Wiley;
1993 .[41] Schweitzer-Stenner R. Visible and UV-resonance Raman spectroscopy of model
peptides. J Raman Spectrosc 2001;32:711–32.[42] Schweitzer-Stenner R, Eker F, Huang Q, Griebenow K, Mroz PA, Kozlowski PM.
Structure analysis of dipeptides in water by exploring and utilizing the structuralsensitivity of amide III by polarized visible Raman, FTIR-spectroscopy and DFTbased normal coordinate analysis. J Phys Chem B 2002;106:4294–304.
[43] Barron LD, Hecht L, Blanch EW, Bell AF. Solution structure and dynamics of bio-molecules from Raman optical activity. Prog Biophys Mol Biol 2000;73:1–49.
[44] Blanch EW, Hecht L, Barron LD. Vibrational Raman optical activity of proteins,nucleic acids, and viruses. Methods 2003;29:196–209.
[45] Barron LD, Blanch EW, Mccoll IH, Syme CD, Hecht L, Nielsen K. Structure and be-haviour of proteins, nucleic acids and viruses from vibrational Raman optical ac-tivity. Spectrosc Int J 2003;17:101–26.
[46] Mccoll LH, Blanch EW, Gill AC, Rhie AGO, Ritchie MA, Hecht L, et al. A new per-spective on beta-sheet structures using vibrational Raman optical activity:from poly(L-lysine) to the prion protein. J Am Chem Soc 2003;125:10019–26.
[47] Adzhubei AA, Sternberg MJE. Left-handed polyproline-II helices commonly occurin globular-proteins. J Mol Biol 1993;229:472–93.
[48] Stapley BJ, Creamer TP. A survey of left-handed polyproline II helices. Protein Sci1999;8:587–95.
[49] Blanch EW, Hecht L, Day LA, Pederson DM, Barron LD. Tryptophan absolute ste-reochemistry in viral coat proteins from Raman optical activity. J Am Chem Soc2001;123:4863–4.
[50] Miura T, Takeuchi H, Harada I. Tryptophan Raman bands sensitive to hydrogen-bonding and side-chain conformation. J Raman Spectrosc 1989;20:667–71.
[51] Maiti NC, Apetri MM, Zagorski MG, Carey PR, Anderson VE. Raman spectroscopiccharacterization of secondary structure in natively unfolded proteins: alpha-synuclein. J Am Chem Soc 2004;126:2399–408.
[52] Prevelige PE, Thomas D, Aubrey KL, Towse SA, Thomas GJ. Studies of virus struc-ture by Raman-spectroscopy .37. Subunit conformational-changes accompany-ing bacteriophage-P22 capsid maturation. Biochemistry 1993;32:537–43.
[53] Siamwiza MN, Lord RC, Chen MC, Takamatsu T, Harada I, Matsuura H, et al. Inter-pretation of doublet at 850 And 830 cm−1 in Raman-spectra of tyrosyl residuesin proteins and certain model compounds. Biochemistry 1975;14:4870–6.
[54] Arp Z, Autrey D, Laane J, Overman SA, Thomas GJ. Structural studies of viruses byRaman spectroscopy part LXXI — tyrosine Raman signatures of the filamentousvirus Ff are diagnostic of non-hydrogen-bonded phenoxyls: demonstration byRaman and infrared spectroscopy of p-cresol vapor. Biochemistry 2001;40:2522–9.
[55] Blanch EW, Morozova-Roche LA, Hecht L, Noppe W, Barron LD. Raman opticalactivity characterization of native and molten globule states of equine lysozyme:comparison with hen lysozyme and bovine alpha-lactalbumin. Biopolymers2000;57:235–48.
[56] Smyth E, Syme CD, Blanch EW, Hecht L, Vasak M, Barron LD. Solution structure ofnative proteins with irregular folds from Raman optical activity. Biopolymers2001;58:138–51.
[57] Barron LD, Blanch EW, Hecht L. Unfolded proteins studied by Raman optical ac-tivity. Unfolded Proteins 2002;62:51–90.
[58] Blanch EW, Kasarda DD, Hecht L, Nielsen K, Barron LD. New insight into the so-lution structures of wheat gluten proteins from Raman optical activity. Biochem-istry 2003;42:5665–73.
[59] Blanch EW, Morozova-Roche LA, Cochran DAE, Doig AJ, Hecht L, Barron LD. Ispolyproline II helix the killer conformation? A Raman optical activity study ofthe amyloidogenic prefibrillar intermediate of human lysozyme. J Mol Biol2000;301:553–63.
[60] Ashton L, Dusting J, Imomoh E, Balabani S, Blanch EW. Shear-induced unfoldingof lysozyme monitored in situ. Biophys J 2009;96:4231–6.
[61] Wen ZQ, Barron LD, Hecht L. Vibrational Raman optical-activity of monosaccha-rides. J Am Chem Soc 1993;115:285–92.
[62] Arboleda PH, Loppnow GR. Raman spectroscopy as a discovery tool in carbohy-drate chemistry. Anal Chem 2000;72:2093–8.
[63] Bell AF, Barron LD, Hecht L. Vibrational Raman optical-activity study of D-glucose.Carbohydr Res 1994;257:11–24.
[64] Bell AF, Hecht L, Barron LD. Polysaccharide vibrational Raman optical activity:laminarin and pullulan. J Raman Spectrosc 1995;26:1071–4.
[65] Zhu FJ, Isaacs NW, Hecht L, Barron LD. Polypeptide and carbohydrate structure ofan intact glycoprotein from Raman optical activity. J Am Chem Soc 2005;127:6142–3.
[66] Yaffe NR, Almond A, Blanch EW. A new route to carbohydrate secondary and ter-tiary structure using Raman spectroscopy and Raman optical activity. J Am ChemSoc 2010;132:10654–5.
[67] Johannessen C, Pendrill R, Widmalm G, Hecht L, Barron LD. Glycan structure of ahigh-mannose glycoprotein from Raman optical activity. Angew Chem Int Ed2011;50:5349–51.
[68] Cheeseman JR, Shaik MS, Popelier PLA, Blanch EW. Calculation of Raman opticalactivity spectra of methyl-beta-D-glucose incorporating a full molecular dynam-ics simulation of hydration effects. J Am Chem Soc 2011;133:4991–7.
[69] Barron LD, Gargaro AR, Wen ZQ, Macnicol DD, Butters C. Vibrational Ramanoptical-activity of cyclodextrins. Tetrahedron Asymmetry 1990;1:513–6.
[70] Bell AF, Hecht L, Barron LD. Disaccharide solution stereochemistry from vibra-tional Raman optical-activity. J Am Chem Soc 1994;116:5155–61.
[71] Bell AF, Ford SJ, Hecht L, Wilson G, Barron LD. Vibrational Raman optical-activityof glycoproteins. Int J Biol Macromol 1994;16:277–8.
[72] Bell AF, Hecht L, Barron LD. New evidence for conformational flexibility in cyclo-dextrins from vibrational Raman optical activity. Chem Eur J 1997;3:1292–8.
[73] Macleod NA, Johannessen C, Hecht L, Barron LD, Simons JP. From the gas phaseto aqueous solution: vibrational spectroscopy, Raman optical activity andconformational structure of carbohydrates. Int J Mass Spectrom 2006;253:193–200.
[74] Kopecky V, Ettrich R, Hofbauerova K, Baumruk V. Structure of human alpha(1)-acidglycoprotein and its high-affinity binding site. Biochem Biophys Res Commun2003;300:41–6.
[75] Cui Y, Turner G, Roy UN, Guo M, Pan Z, Morgan S, et al. Raman spectroscopyshows antifreeze glycoproteins interact with highly oriented pyrolytic graphite.J Raman Spectrosc 2005;36:1113–7.
[76] Brewster VL, Ashton L, Goodacre R. Monitoring the glycosylation status of pro-teins using Raman spectroscopy. Anal Chem 2011;83:6074–81.
[77] Luber S, Reiher M. Calculated Raman optical activity spectra of 1,6-anhydro-beta-D-glucopyranose. J Phys Chem A 2009;113:8268–77.
[78] Rudd TR, Hussain R, Siligardi G, Yates EA. Raman and Raman optical activity ofglycosaminoglycans. Chem Commun 2010;46:4124–6.
[79] Yakubov GE, McColl J, Bongaerts JHH, Ramsden JJ. Viscous boundary lubricationof hydrophobic surfaces by mucin. Langmuir 2009;25:2313–21.
[80] Hug W, Hangartner G. A novel high-throughput Raman spectrometer for polar-ization difference measurements. J Raman Spectrosc 1999;30:841–52.
[81] Noda I, Ozaki Y. Two-dimensional correlation spectroscopy. Chichester: JohnWiley and Sons; 2004 .
[82] Ashton L, Barronz LD, Czarnik-Matusewicz B, Hecht L, Hyde J, Blanch EW.Two-dimensional correlation analysis of Raman optical activity data on thealpha-helix-to-beta-sheet transition in poly(L-lysine). Mol Phys 2006;104:1429–45.
[83] Ashton L, Barron LD, Hecht L, Hyde J, Blanch EW. Two-dimensional Raman andRaman optical activity correlation analysis of the alpha-helix-to-disordered transi-tion in poly(L-glutamic acid). Analyst 2007;132:468–79.
[84] Ashton L, Blanch EW. Investigation of polypeptide conformational transitionswith two-dimensional Raman optical activity correlation analysis, applyingautocorrelation and moving window approaches. Appl Spectrosc 2008;62:469–75.
[85] Morita S, Shinzawa H, Noda I, Ozaki Y. Perturbation–correlation moving-windowtwo-dimensional correlation spectroscopy. Appl Spectrosc 2006;60:398–406.
[86] Czarnecki MA. Some comments on the application of two-dimensional correla-tion spectroscopy and normalization of the dynamic spectra. Appl Spectrosc2003;57:107–9.
[87] Ashton L, Czarnik-Matusewiez B, Blanch EW. Application of two-dimensionalcorrelation analysis to Raman optical activity. J Mol Struct 2006;799:61–71.
[88] Shi ZS, Chen K, Liu ZG, Kallenbach NR. Conformation of the backbone in unfoldedproteins. Chem Rev 2006;106:1877–97.
[89] Huang H. “Sequential order” rules in generalized two-dimensional correlationspectroscopy. Anal Chem 2007;79:8281–92.
[90] Shashilov VA, Lednev IK. 2D correlation deep UV resonance Raman spectroscopyof early events of lysozyme fibrillation: kinetic mechanism and potential inter-pretation pitfalls. J Am Chem Soc 2008;130:309–17.
[91] Jia Q, Wang N-N, Yu Z-W. An insight into sequential order in two-dimensionalcorrelation spectroscopy. Appl Spectrosc 2009;63:344–53.
[92] Shogren R, Gerken TA, Jentoft N. Role of glycosylation on the conformation andchain dimensions of O-linked glycoproteins — light-scattering-studies of ovinesubmaxillary mucin. Biochemistry 1989;28:5525–36.
[93] Coltart DM, Royyuru AK, Williams LJ, Glunz PW, Sames D, Kuduk SD, et al. Prin-ciples of mucin architecture: structural studies on synthetic glycopeptides bear-ing clustered mono-, di-, tri-, and hexasaccharide glycodomains. J Am Chem Soc2002;124:9833–44.
[94] Liu MA, Borgert A, Barany G, Live D. Conformational consequences of proteinglycosylation: preparation of O-mannosyl serine and threonine building blocks,and their incorporation into glycopeptide sequencesderived fromalpha-dystroglycan.Biopolymers 2008;90:358–68.

77L. Ashton et al. / Advances in Colloid and Interface Science 199–200 (2013) 66–77
[95] Butenhof KJ, Gerken TA. Structure and dynamics of mucin-like glycopeptides —
examination of peptide-chain expansion and peptide carbohydrate interactionsby stochastic dynamics simulations. Biochemistry 1993;32:2650–63.
[96] Corzana F, Busto JH, Jimenez-Oses G, Asensio JL, Jimenez-Barbero J, Peregrina JM,et al. New insights into alpha-GalNAc-Ser motif: influence of hydrogen bondingversus solvent interactions on the preferred conformation. J Am Chem Soc2006;128:14640–8.
[97] Corzana F, Busto JH, Jimenez-Oses G, de Luis MG, Asensio JL, Jimenez-Barbero J,et al. Serine versus threonine glycosylation: the methyl group causes a drastic al-teration on the carbohydrate orientation and on the surrounding water shell. JAm Chem Soc 2007;129:9458–67.
[98] Raviv U, Giasson S, Kampf N, Gohy JF, Jerome R, Klein J. Lubrication by chargedpolymers. Nature 2003;425:163–5.
[99] Stokke BT, Talashek TA, Brant DA. Influence of aqueous solvation on side-chainbackbone interaction in comb-like branched bacterial polysaccharides. Macro-molecules 1994;27:1124–35.
[100] Ramadugu SK, Chung YH, Xia JC, Margulis CJ. When sugars get wet. A comprehen-sive study of the behavior ofwater on the surface of oligosaccharides. J Phys ChemB2009;113:11003–15.
[101] McMaster TJ, Berry M, Corfield AP, Miles MJ. Atomic force microscopy of thesubmolecular architecture of hydrated ocular mucins. Biophys J 1999;77:533–41.
[102] Stokes JR, Davies GA. Viscoelasticity of human whole saliva collected after acidand mechanical stimulation. Biorheology 2007;44:141–60.
[103] Taylor C, Allen A, Dettmar PW, Pearson JP. The gel matrix of gastric mucus ismaintained by a complex interplay of transient and nontransient associations.Biomacromolecules 2003;4:922–7.


![Dynamics of the [4Fe-4S] Cluster in Pyrococcus furiosus D14C Ferredoxin via Nuclear Resonance Vibrational and Resonance Raman Spectroscopies, Force Field Simulations, and Density Functional](https://img.pdfslide.net/doc/110x75/6339a815908ccdf2c60c38ac/dynamics-of-the-4fe-4s-cluster-in-pyrococcus-furiosus-d14c-ferredoxin-via-nuclear.jpg)


