Embed Size (px)
Citation preview
This is a repository copy of Widening Access to Postgraduate Study and the Professions: :Understanding the Student Consortium strand report.
White Rose Research Online URL for this paper:https://eprints.whiterose.ac.uk/103360/
Version: Published Version
Monograph:Wakeling, Paul orcid.org/0000-0001-7387-4145, Hancock, Sally orcid.org/0000-0001-8488-2765 and Hampden-Thompson, Gillian orcid.org/0000-0002-4882-4565 (2015) Widening Access to Postgraduate Study and the Professions: : Understanding the StudentConsortium strand report. Research Report. University of York, Department of Education
[email protected]://eprints.whiterose.ac.uk/
Reuse This article is distributed under the terms of the Creative Commons Attribution-NonCommercial-NoDerivs (CC BY-NC-ND) licence. This licence only allows you to download this work and share it with others as long as you credit the authors, but you can’t change the article in any way or use it commercially. More information and the full terms of the licence here: https://creativecommons.org/licenses/
Takedown If you consider content in White Rose Research Online to be in breach of UK law, please notify us by emailing [email protected] including the URL of the record and the reason for the withdrawal request.
Understanding the Student
Consortium Strand ReportPaul Wakeling, Sally Hancock, Gillian Hampden-Thompson
Widening Access to PostgraduateStudy and the Professions
SEPTEMBER 2015
Acknowledgements This research project, funded by the Higher Education Funding Council for England (HEFCE), is a collaboration across six institutions. The research team would like to thank the various institutional staff across the consortium that made this research possible; particularly the project managers in each institution: Helen Sykes (University of Leeds); Jane Hardman (University of Manchester); Betty Anyika (University of Sheffield); Cherryl Jones (University of Warwick) and Duncan Lean (University of York). Special thanks are due to Clare McKeague (project manager, Newcastle University) who coordinated the collection of survey and application data across the consortium, and to Courtney Lawrence (University of York) who collated and cleaned application data.
This report should be cited as: Wakeling, P., Hancock, S., and Hampden-Thompson, G. (2015) Widening Access to Postgraduate Study and the Professions. Understanding the Student - Consortium strand report. University of York, Department of Education. © Copyright The University of York, UK, and the authors of the report hold the copyright for the text of the report. The authors give permission for users of the report to display and print the contents of the report for their own non-commercial use, providing that the materials are not modified, copyright and other proprietary notices contained in the materials are retained, and the source of the material is cited clearly following the citation details provided. Otherwise users are not permitted to duplicate, reproduce, re-publish, distribute or store material from the report without express written permission.
1
Contents
List of tables 2 List of figures 3 Executive summary 4 1. Introduction 7 2. Method 10 3. Basic description of datasets 13 4. Post-graduation activities of alumni 22 5. Applications to postgraduate study 28 6. Transition to postgraduate study 39 7. Characteristics of postgraduate students 54
8. Barriers to progression 71 9. Future plans of alumni and postgraduate students 82
10. Conclusion and recommendations 87 References 91
2
List of tables Table 2.1. Response rates and numbers by dataset 11 Table 3.1. Overall descriptive statistics for all datasets 14 Table 4.1. Characteristics of respondents’ most recent job 24 Table 5.1. Applications, offers and enrolments for taught postgraduate 29
programmes by selected characteristics Table 6.1. Progression to all postgraduate courses 42 Table 6.2. Progression to taught Masters courses 45 Table 6.3. Progression to Research degrees 48 Table 6.4. Progression to Postgraduate Certificate in Education courses 51 Table 7.1. Most frequent undergraduate institution of postgraduates 54 Table 7.2. Academic characteristics of postgraduate students 55 Table 7.3. Postgraduate subject choice by undergraduate subject 56 Table 7.4. Postgraduate subject choice by undergraduate subject and
undergraduate attainment 56 Table 7.5. Means of funding postgraduate tuition fees and living costs 60 Table 7.6. Motivations of postgraduates 68 Table 8.1. Would you apply to postgraduate study in the future? 71 Table 8.2. Intention to apply to postgraduate study in the future: reasons why 73 Table 8.3. No intention to apply to postgraduate study in the future: reasons why 77 Table 9.1. Primary future plans of alumni 83 Table 9.2. Secondary future plans of alumni 84 Table 9.3. Primary future plans of postgraduates 85 Table 9.4. Secondary future plans of postgraduates 86
3
List of figures Figure 4.1. Main activity since graduation reported by first-degree alumni by year of graduation 23 Figure 4.2. Median salary by year of graduate, gender and postgraduate study status 26 Figure 5.1. Ratio of applications to offers to enrolments 34 Figure 5.2. Offer and enrolments by type of postgraduate programme 36 Figure 5.3. Offer and enrolments by postgraduate subject area 37 Figure 5.4. Offer and enrolments by socio-economic background measure 38 Figure 6.1. Progression to postgraduate study by graduating cohort 39 Figure 6.2. Progression to postgraduate study by type of postgraduate programme and graduating cohort 40 Figure 6.3. Progression to postgraduate study by undergraduate degree attainment and graduating cohort 41 Figure 6.4. Progression by ethnicity (all postgraduate courses) 44 Figure 6.5. Progression by ethnicity (Taught Masters only) 47 Figure 6.6. Progression by ethnicity (Research degrees only) 50 Figure 6.7. Progression by ethnicity (PGCE only) 53 Figure 7.1. Repayable debt from undergraduate degree, reported by Postgraduates 59 Figure 7.2. Source of tuition fee and living cost funding by undergraduate
attainment 62 Figure 7.3. Source of tuition fee and living cost funding by postgraduate subject area 63 Figure 7.4. Source of postgraduate tuition fee and living cost funding by type of postgraduate course 64 Figure 7.5. Source of postgraduate tuition fee and living cost funding by mode of study 65 Figure 7.6. Source of postgraduate tuition fee and living cost funding by parental NSS-SEC 66 Figure 7.7. Motivations of postgraduates by postgraduate subject area 69 Figure 7.8. Motivations of postgraduates by parental NS-SEC 70 Figure 8.1. Intention to apply to postgraduate study in the future: reasons why by undergraduate subject area 74 Figure 8.2. Intention to apply to postgraduate study in the future: reasons why by parental NS-SEC 75 Figure 8.3. No intention to apply to postgraduate study in the future: reasons why by undergraduate subject area 78 Figure 8.4. No intention to apply to postgraduate study in the future: reasons why by parental NS-SEC 79 Figure 8.5. No intention to apply to postgraduate study in the future: reasons why by undergraduate degree attainment 80 Figure 8.6. No intention to apply to postgraduate study in the future: reasons why by gender 81
4
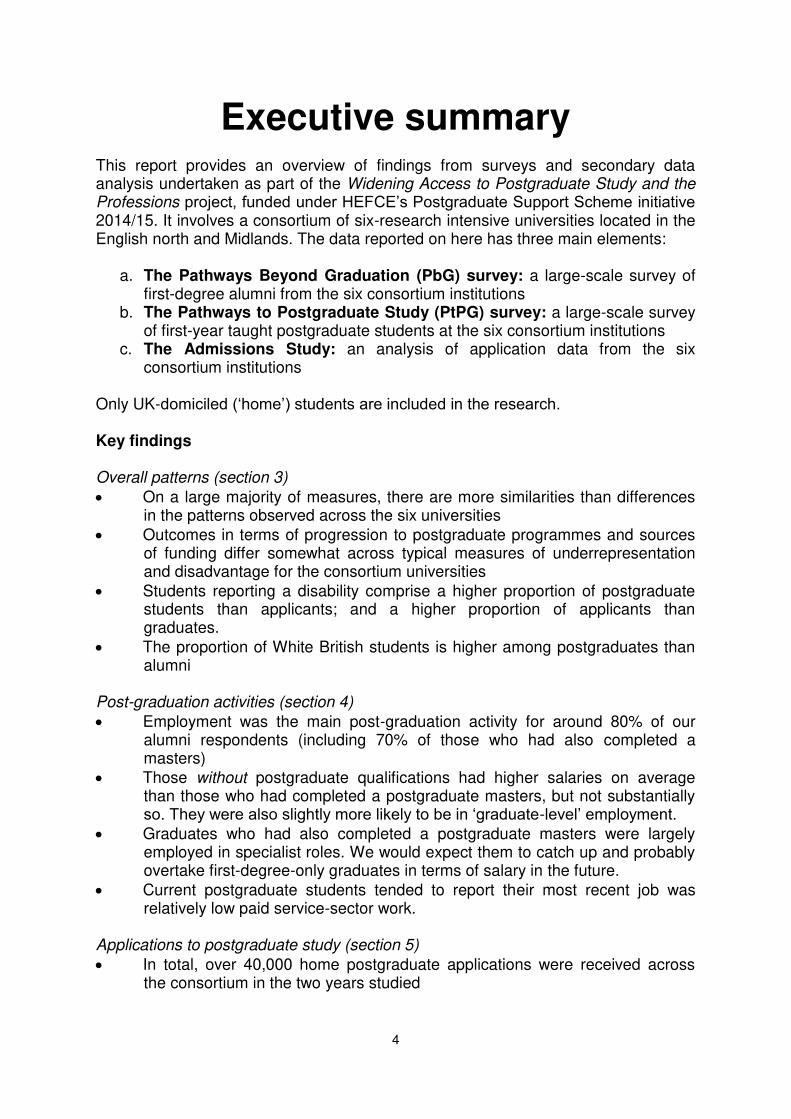
Executive summary This report provides an overview of findings from surveys and secondary data analysis undertaken as part of the Widening Access to Postgraduate Study and the Professions project, funded under HEFCE’s Postgraduate Support Scheme initiative 2014/15. It involves a consortium of six-research intensive universities located in the English north and Midlands. The data reported on here has three main elements:
a. The Pathways Beyond Graduation (PbG) survey: a large-scale survey of first-degree alumni from the six consortium institutions
b. The Pathways to Postgraduate Study (PtPG) survey: a large-scale survey of first-year taught postgraduate students at the six consortium institutions
c. The Admissions Study: an analysis of application data from the six consortium institutions
Only UK-domiciled (‘home’) students are included in the research. Key findings Overall patterns (section 3)
On a large majority of measures, there are more similarities than differences in the patterns observed across the six universities
Outcomes in terms of progression to postgraduate programmes and sources of funding differ somewhat across typical measures of underrepresentation and disadvantage for the consortium universities
Students reporting a disability comprise a higher proportion of postgraduate students than applicants; and a higher proportion of applicants than graduates.
The proportion of White British students is higher among postgraduates than alumni
Post-graduation activities (section 4)
Employment was the main post-graduation activity for around 80% of our alumni respondents (including 70% of those who had also completed a masters)
Those without postgraduate qualifications had higher salaries on average than those who had completed a postgraduate masters, but not substantially so. They were also slightly more likely to be in ‘graduate-level’ employment.
Graduates who had also completed a postgraduate masters were largely employed in specialist roles. We would expect them to catch up and probably overtake first-degree-only graduates in terms of salary in the future.
Current postgraduate students tended to report their most recent job was relatively low paid service-sector work.
Applications to postgraduate study (section 5)
In total, over 40,000 home postgraduate applications were received across the consortium in the two years studied
5
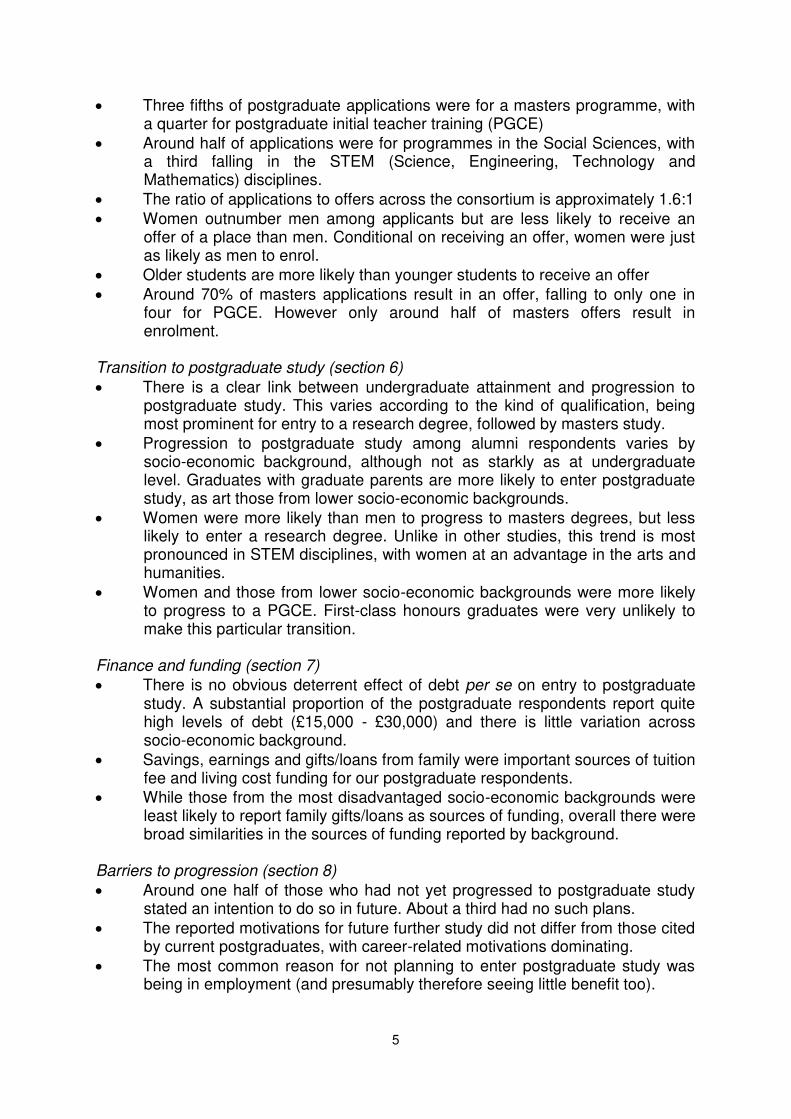
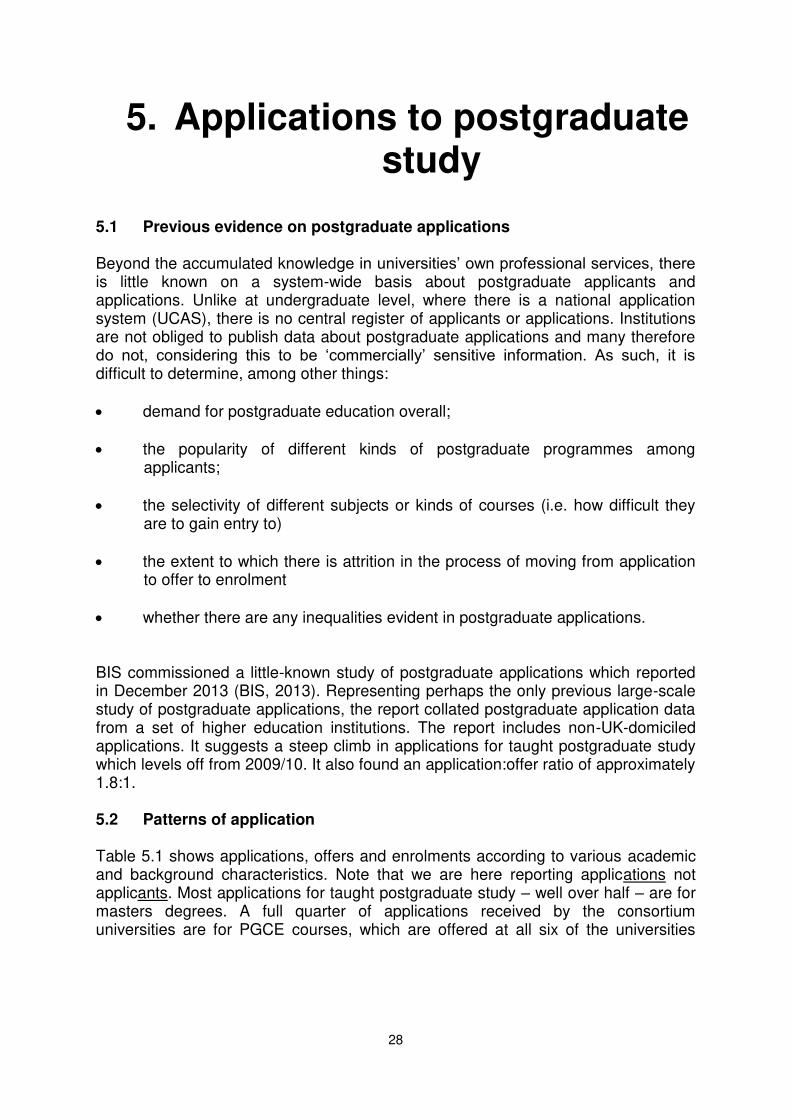
Three fifths of postgraduate applications were for a masters programme, with a quarter for postgraduate initial teacher training (PGCE)
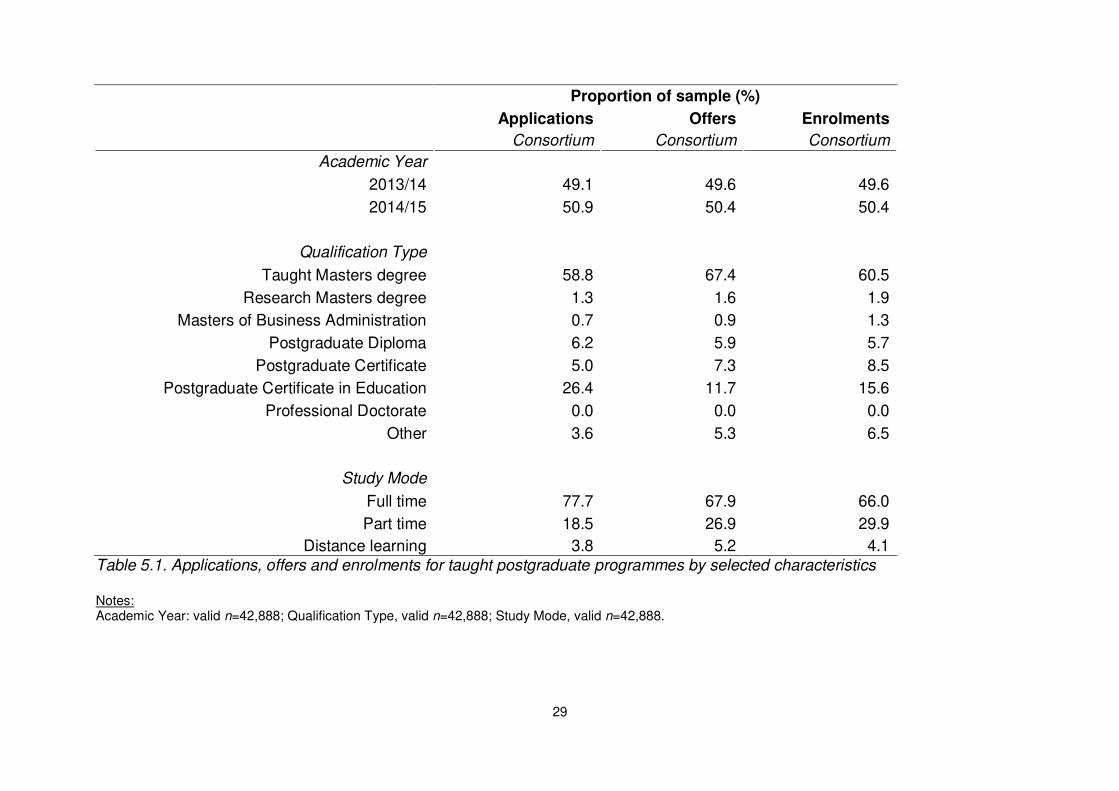
Around half of applications were for programmes in the Social Sciences, with a third falling in the STEM (Science, Engineering, Technology and Mathematics) disciplines.
The ratio of applications to offers across the consortium is approximately 1.6:1
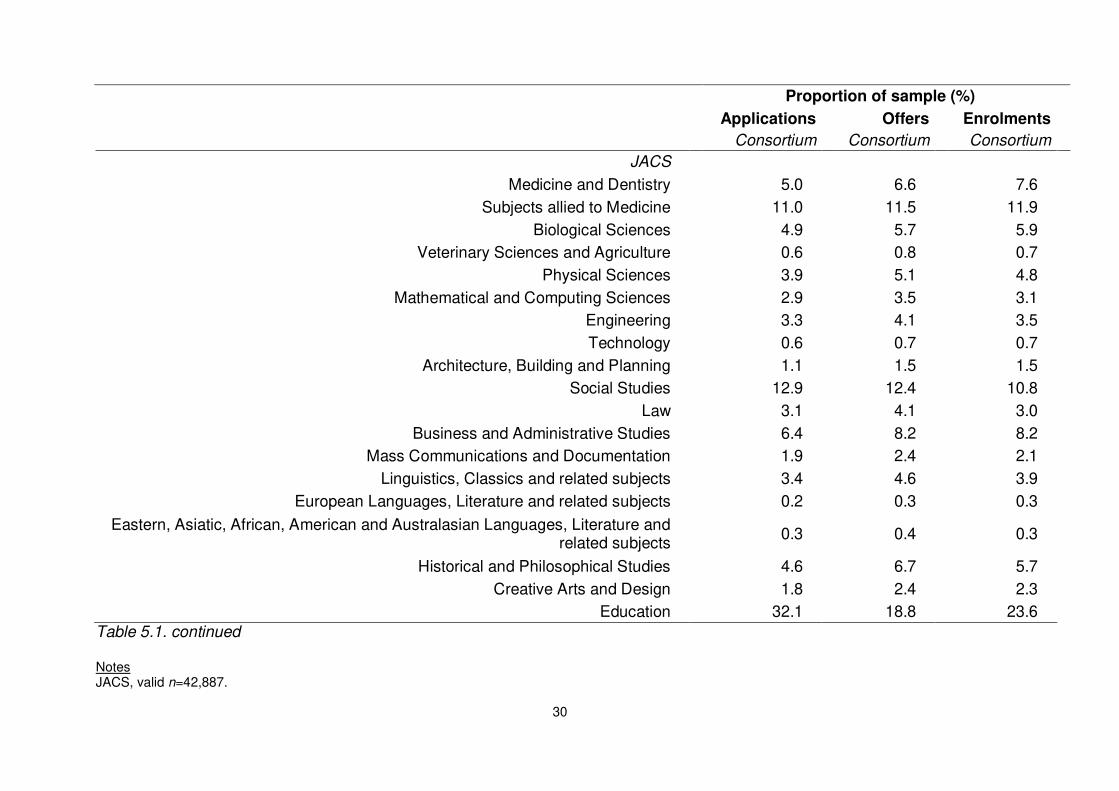
Women outnumber men among applicants but are less likely to receive an offer of a place than men. Conditional on receiving an offer, women were just as likely as men to enrol.
Older students are more likely than younger students to receive an offer
Around 70% of masters applications result in an offer, falling to only one in four for PGCE. However only around half of masters offers result in enrolment.
Transition to postgraduate study (section 6)
There is a clear link between undergraduate attainment and progression to postgraduate study. This varies according to the kind of qualification, being most prominent for entry to a research degree, followed by masters study.
Progression to postgraduate study among alumni respondents varies by socio-economic background, although not as starkly as at undergraduate level. Graduates with graduate parents are more likely to enter postgraduate study, as art those from lower socio-economic backgrounds.
Women were more likely than men to progress to masters degrees, but less likely to enter a research degree. Unlike in other studies, this trend is most pronounced in STEM disciplines, with women at an advantage in the arts and humanities.
Women and those from lower socio-economic backgrounds were more likely to progress to a PGCE. First-class honours graduates were very unlikely to make this particular transition.
Finance and funding (section 7)
There is no obvious deterrent effect of debt per se on entry to postgraduate study. A substantial proportion of the postgraduate respondents report quite high levels of debt (£15,000 - £30,000) and there is little variation across socio-economic background.
Savings, earnings and gifts/loans from family were important sources of tuition fee and living cost funding for our postgraduate respondents.
While those from the most disadvantaged socio-economic backgrounds were least likely to report family gifts/loans as sources of funding, overall there were broad similarities in the sources of funding reported by background.
Barriers to progression (section 8)
Around one half of those who had not yet progressed to postgraduate study stated an intention to do so in future. About a third had no such plans.
The reported motivations for future further study did not differ from those cited by current postgraduates, with career-related motivations dominating.
The most common reason for not planning to enter postgraduate study was being in employment (and presumably therefore seeing little benefit too).
6
Over half were discouraged by the cost of postgraduate study; that this is higher than the one third citing the absence of finance suggests some students are able to afford further study but decide it is not worth it.
Many graduates, however, felt they were unsuited to further study or were ‘fed up’ with studying. This suggests there may be important information and attitudinal barriers for institutions to overcome.
Future plans (section 9)
Alumni respondents’ reported future plans were overwhelmingly career focused. The most common aspirations were to progress in their current role, find/maintain employment, and for about one fifth of 2012 graduates to undertake postgraduate study.
Where secondary aspirations were mentioned, postgraduate study was the most popular intention. Family formation and living abroad also featured in a minority of cases.
Among the current postgraduates, career aspirations also featured prominently. There were also ambitions for further postgraduate study (e.g. PhD for masters students, masters for PGCE students).
Current postgraduates were more concerned than the alumni sample to secure their current financial position. This reflects perhaps the precarious previous employment position that many mentioned (see section 5)
Conclusions and recommendations (section 10)
Four background measures are associated with disadvantage in transition to postgraduate study for consortium alumni: parental socio-economic class, parental higher education, school type and financial means. Postcode measures and disability were not found to be useful.
We recommend institutions consider four areas for action. These range across the student lifecycle and are not limited to conversion of postgraduate applicants to entrants. The four areas are: improving attainment; extending and improving information, advice and guidance; investigating postgraduate admissions policies and practices; and targeting support affordability (e.g. through scholarships).
Finally we make suggestions for further research, including repeating the surveys and Admissions Study for other years and other universities.
7
1. Introduction 1.1 This report This report provides an overview of findings from surveys and secondary data analysis undertaken by a research team at the University of York and the University of Sussex as part of the ‘Understanding the Student’ strand of the Widening Access to Postgraduate Study and the Professions project. This project, which is funded under HEFCE’s Postgraduate Support Scheme initiative 2014/15, involves a consortium of six-research intensive universities located in the English north and Midlands:
University of Leeds
University of Manchester
Newcastle University
University of Sheffield
University of Warwick
University of York The consortium is led by the University of Sheffield, with consortium partners taking responsibility for different aspects of the project activity. While a substantial part of the consortium’s activity and expenditure has been the creation and award of scholarships for postgraduate students from underrepresented backgrounds, a programme of research into the barriers to and motivations for postgraduate study has been embedded in the project from the outset. Further details of the project are given in Strike (2014). The Understanding the Student (UtS) strand of activity is led by Newcastle University, with support from the University of York. The research reported here forms one element of the overall UtS strand, which also includes research procured from third parties covering:
Re-analysis of national cohort data on transition to postgraduate study using the ‘Futuretrack’ dataset (Institute for Employment Research, University of Warwick)
Qualitative study of the career and further study trajectories of first-degree graduates from the consortium universities (undertaken by CRAC)
An evaluation of the project, including analysis of the effectiveness of the scholarships offered (undertaken by CFE).
Each of these sub-projects has generated a report. The CRAC and Futuretrack reports are available via the project website, www.postgradsupport.co.uk The current report is the final consortium report for research undertaken by the York/Sussex research team. It does not identify any of the participating universities in the analysis. We have also producedinstitutional versions of the report for each consortium partner which identifies only the institution receiving that report anda technical supplement (Hancock et al., 2015) explaining the research designs,
8
sampling and analytical approaches adopted and providing copies of research instruments.Furthermore, the overall consortium report includes a chapter on the UtS strand as a whole, incorporating findings from across the various elements of research mentioned above. 1.2 Background to the study The growing consensus over the economic, social and cultural benefits of postgraduate study has not been matched by a detailed understanding of who progresses to postgraduate study, and why. Similarly limited is our understanding of the barriers to postgraduate study. The lack of robust empirical data on these issues is particularly concerning in the context of a reported decline in UK postgraduate student numbers in recent years (see, for example Times Higher Education 10 January 2013), and has led to calls for more research on postgraduate education by a number of organisations (1994 Group, 2012; British Academy, 2012; HEC, 2012; Lindley and Machin, 2013; Milburn, 2012; NUS, 2012). Existing research into postgraduate education in the UK shows that only a minority of postgraduate students enter their course immediately following their undergraduate degree (House 2010; Wakeling and Hampden-Thompson 2013; HEFCE 2013a, 2013b). This finding calls into question the validity of many commonly cited surveys of graduates, which report graduate activity soon after the completion of an undergraduate degree (e.g. the Destinations of Leavers from Higher Education survey [DLHE], which takes place six months after graduation). As a result, we know relatively little about graduates’ activities over later years, and universities remain largely uninformed as to the prior activities of returning postgraduates. The deficiency of data on both graduate pathways and entrants to postgraduate study presents a significant hindrance to the development of meaningful policies aimed at widening participation to postgraduate study. It is clear that inequalities exist in the transition to postgraduate study. Recent research conducted by Wakeling and Hampden-Thompson (2013) noted that even after academic attainment is controlled for:
men are more likely than women to progress to both postgraduate taught and research courses;
certain ethnic groups are less likely to progress (notably Black Caribbean and Bangladeshi groups);
graduates of more selective universities typically have higher rates of progression;
graduates from lower socio-economic backgrounds remain underrepresented in the postgraduate population
In order to provide rigorous new evidence on the factors associated with both progression and non-progression to postgraduate study, the UtS strand sought to develop three large quantitative datasets. In what follows, a broad overview of the research process is presented. Fuller details will be made available in the forthcoming technical report.
9
1.3 The contribution of UtS to understanding taught postgraduate study The research conducted under the auspices of the project provides new insight into the background characteristics of graduates progressing to postgraduate study, those currently engaged in taught postgraduate study and those making taught postgraduate applications. Many of the variables captured are not available in other existing datasets or if they are, have not previously been investigated. In particular, there has been almost no investigation of postgraduate applications and certainly none of the kind we are able to undertake here. We will also examine the motivations for and barriers to postgraduate study as reported by graduates, capturing both the broad range of responses through a survey and also in-depth exploration through individual graduates’ biographies. The overarching design of the package of research moves from broad national patterns (Futuretrack) through institution-level patterns (this report) down to the individual level (CRAC). With this research we will be able to provide intelligence on the respective association of socio-demographic and academic background characteristics, and finance and funding with the take-up of taught postgraduate education by home students.
10
2. Method 2.1 Overview of datasets The data collected and analysed by the York/Sussex research team comprises three main elements:
a. The Pathways Beyond Graduation (PbG) survey: a large-scale survey of first-degree alumni from the six consortium institutions who graduated in 2009 or 2012 (May 2014)
b. The Pathways to Postgraduate Study (PtPG) survey: a large-scale survey of first-year taught postgraduates students at the six consortium institutions in each of the academic years 2013/14 and 2014/15 (June – July 2014; and October – November 2014)
c. The Admissions Study: an analysis of application data from the six consortium institutions, including an analysis of both applicant characteristics and course applications for applications received during 2012/13 and 2013/14 (data collated in December 2014).
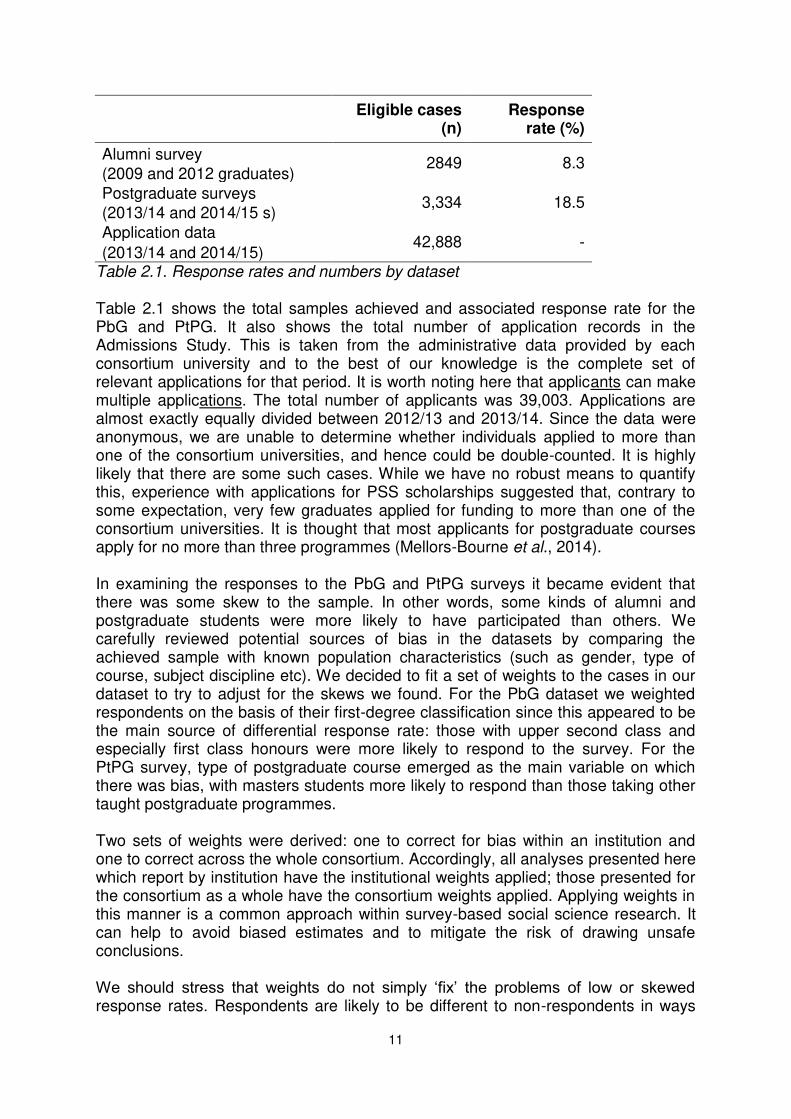
In each dataset we selected only those students who were classified as UK-domiciled (i.e. ‘home’ students). The PbG and PtPG surveys were conducted online using ‘Qualtrics’ software. They were closed surveys, in that they could only be completed by individuals in the target population, contact details for whom were provided by the consortium universities. For the Admissions Study, all relevant application records were provided to a common specification of format and content. All data were held anonymously and subject to appropriate consent protocols as stipulated in the ethical approval granted by the University of York’s Education Ethics Committee and in data sharing agreements within the consortium. Incentives were offered to encourage survey participation in the form of ‘star prize’ vouchers for randomly-chosen respondents and token incentives (£5 voucher) for early responders. 2.2 Response rates/total numbers Overall response rates to the surveys are given in Table 3.1. Response rates were higher for the PtPG surveys than for PbG, although they were higher for 2014/15 than 2013/14. Response rates also differ considerably between institutions, especially in the 2013/14 PtPG survey. While the response rates are disappointing, they are not out-of-line with comparable research. Lessons learned during implementation of UtS, together with the action of consortium project managers helped to improve response rates for the 2014/15 PtPG survey. In some institutions response to the 2014/15 PtPG survey exceeded those achieved by the Higher Education Academy’s PTES survey, which enjoys considerably more prominence and resource.
11
Eligible cases (n)
Response rate (%)
Alumni survey 2849 8.3
(2009 and 2012 graduates)
Postgraduate surveys 3,334 18.5
(2013/14 and 2014/15 s)
Application data 42,888 -
(2013/14 and 2014/15) Table 2.1. Response rates and numbers by dataset Table 2.1 shows the total samples achieved and associated response rate for the PbG and PtPG. It also shows the total number of application records in the Admissions Study. This is taken from the administrative data provided by each consortium university and to the best of our knowledge is the complete set of relevant applications for that period. It is worth noting here that applicants can make multiple applications. The total number of applicants was 39,003. Applications are almost exactly equally divided between 2012/13 and 2013/14. Since the data were anonymous, we are unable to determine whether individuals applied to more than one of the consortium universities, and hence could be double-counted. It is highly likely that there are some such cases. While we have no robust means to quantify this, experience with applications for PSS scholarships suggested that, contrary to some expectation, very few graduates applied for funding to more than one of the consortium universities. It is thought that most applicants for postgraduate courses apply for no more than three programmes (Mellors-Bourne et al., 2014). In examining the responses to the PbG and PtPG surveys it became evident that there was some skew to the sample. In other words, some kinds of alumni and postgraduate students were more likely to have participated than others. We carefully reviewed potential sources of bias in the datasets by comparing the achieved sample with known population characteristics (such as gender, type of course, subject discipline etc). We decided to fit a set of weights to the cases in our dataset to try to adjust for the skews we found. For the PbG dataset we weighted respondents on the basis of their first-degree classification since this appeared to be the main source of differential response rate: those with upper second class and especially first class honours were more likely to respond to the survey. For the PtPG survey, type of postgraduate course emerged as the main variable on which there was bias, with masters students more likely to respond than those taking other taught postgraduate programmes. Two sets of weights were derived: one to correct for bias within an institution and one to correct across the whole consortium. Accordingly, all analyses presented here which report by institution have the institutional weights applied; those presented for the consortium as a whole have the consortium weights applied. Applying weights in this manner is a common approach within survey-based social science research. It can help to avoid biased estimates and to mitigate the risk of drawing unsafe conclusions. We should stress that weights do not simply ‘fix’ the problems of low or skewed response rates. Respondents are likely to be different to non-respondents in ways

12
that we have not and sometimes cannot measure. Caution is therefore needed interpreting the results presented in this report. For a more detailed account of the research design and analysis of data, please see the Technical Supplement to this report (Hancock et al., 2015).
13
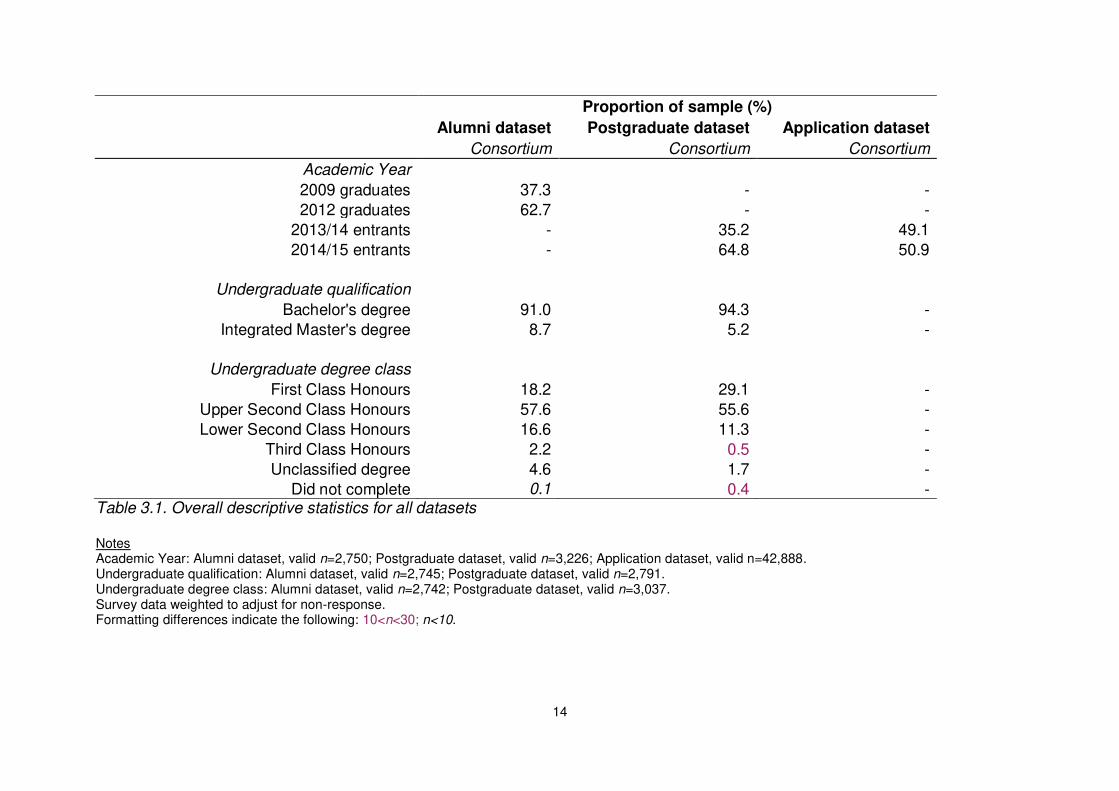
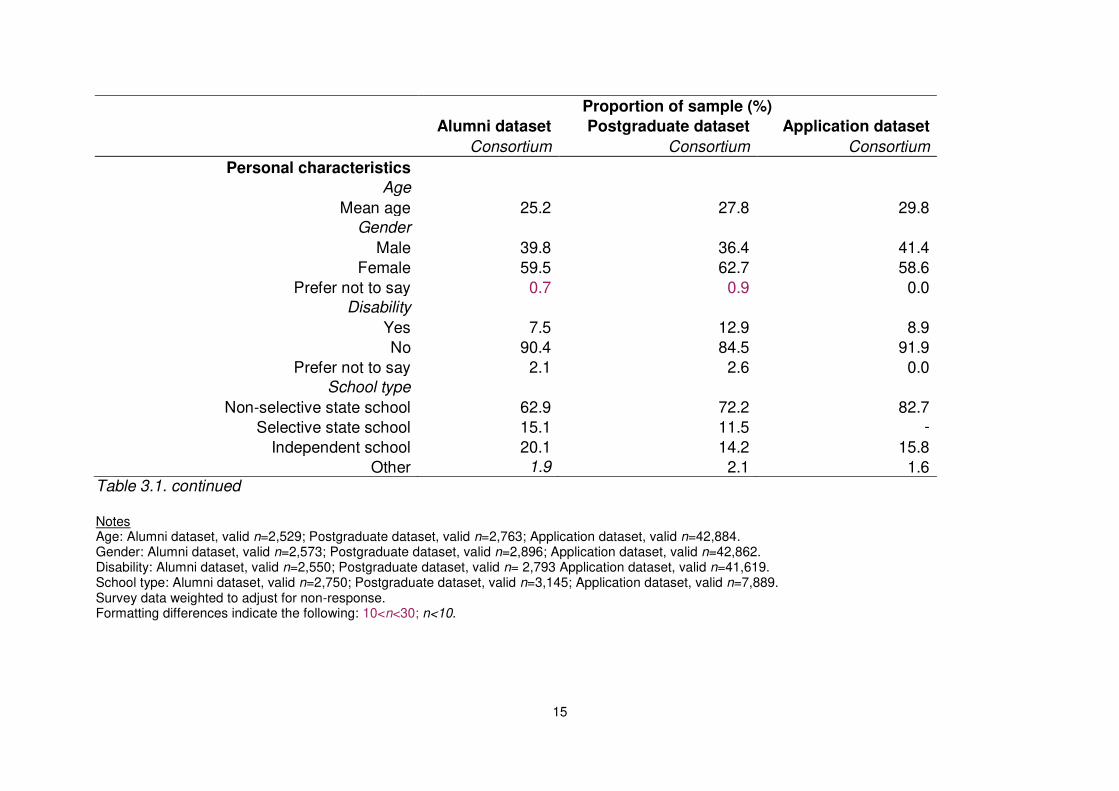
3. Basic description of datasets 3.1 Overall impressions Simple descriptive statistics for the consortium are presented in Table 3.1, which covers the three different data sources. Immediately we can see one of the non-response issues which is not readily addressed by applying weights on first-degree classification (PbG) or type of postgraduate programme (PtPG): response rates. In both datasets there is a time-related bias, with 2012 alumni more likely to respond than 2009 graduates; and new postgraduates in 2014/15 responding at a higher rate than those entering in 2013/14. This skew does not affect the virtually complete Admissions Study. Before looking at the detailed statistics, it is worth making an over-arching point which has emerged from the research team’s various analyses and previous presentations of the data. Our overall judgement is that there are more similarities than differences in the patterns observed across the six universities. There are very few trends noted in respect of access to postgraduate study which differ markedly between consortium universities. While each university will of course want to understand its own position in relation to the overall outcomes we report here, the results for the consortium as whole should be equally, if not more closely scrutinised. We anticipated some similarity across all the institutions given their overall profiles (northern, research-intensive, selective, members of the Russell Group, broadly comprehensive in disciplinary coverage etc), but we also anticipated some key differences related to size and location. Such differences have emerged as rather muted. Similarly, as we will show below, the outcomes in terms of progression to postgraduate programmes and sources of funding differ relatively little across typical measures of underrepresentation and disadvantage for the consortium universities. We find, for instance, that rates of progression to postgraduate study for our alumni respondents differ little according to the socio-economic class of their parents; and that there are likewise not marked differences in source of funding. (There are some important exceptions, which we will discuss below). These observations have implications for how we conceive of disadvantage at postgraduate level and how we might act to address it. They chime with national data whereby clear differences emerge in rates of transition to postgraduate study across different types of institution (Wakeling and Hampden-Thompson, 2013). 3.2 Academic characteristics Looking first at the academic profile of our respondents, we see that around one in ten alumni report holding an integrated masters degree, whereas the equivalent figure in PtPG is one in twenty. This reflects a well-known tendency for integrated masters graduates to progress to taught postgraduate programmes at lower rates than those with a bachelors degree (Wakeling and Hampden-Thompson, 2013).1
1 This is inverted for entry to doctoral study.
14
Proportion of sample (%)
Alumni dataset Postgraduate dataset Application dataset
Consortium Consortium Consortium
Academic Year
2009 graduates 37.3 - -
2012 graduates 62.7 - -
2013/14 entrants - 35.2 49.1
2014/15 entrants - 64.8 50.9
Undergraduate qualification
Bachelor's degree 91.0 94.3 -
Integrated Master's degree 8.7 5.2 -
Undergraduate degree class
First Class Honours 18.2 29.1 -
Upper Second Class Honours 57.6 55.6 -
Lower Second Class Honours 16.6 11.3 -
Third Class Honours 2.2 0.5 -
Unclassified degree 4.6 1.7 -
Did not complete 0.1 0.4 - Table 3.1. Overall descriptive statistics for all datasets Notes Academic Year: Alumni dataset, valid n=2,750; Postgraduate dataset, valid n=3,226; Application dataset, valid n=42,888. Undergraduate qualification: Alumni dataset, valid n=2,745; Postgraduate dataset, valid n=2,791. Undergraduate degree class: Alumni dataset, valid n=2,742; Postgraduate dataset, valid n=3,037. Survey data weighted to adjust for non-response. Formatting differences indicate the following: 10<n<30; n<10.
15
Proportion of sample (%)
Alumni dataset Postgraduate dataset Application dataset
Consortium Consortium Consortium
Personal characteristics
Age
Mean age 25.2 27.8 29.8
Gender
Male 39.8 36.4 41.4
Female 59.5 62.7 58.6
Prefer not to say 0.7 0.9 0.0
Disability
Yes 7.5 12.9 8.9
No 90.4 84.5 91.9
Prefer not to say 2.1 2.6 0.0
School type
Non-selective state school 62.9 72.2 82.7
Selective state school 15.1 11.5 -
Independent school 20.1 14.2 15.8
Other 1.9 2.1 1.6 Table 3.1. continued Notes Age: Alumni dataset, valid n=2,529; Postgraduate dataset, valid n=2,763; Application dataset, valid n=42,884. Gender: Alumni dataset, valid n=2,573; Postgraduate dataset, valid n=2,896; Application dataset, valid n=42,862. Disability: Alumni dataset, valid n=2,550; Postgraduate dataset, valid n= 2,793 Application dataset, valid n=41,619. School type: Alumni dataset, valid n=2,750; Postgraduate dataset, valid n=3,145; Application dataset, valid n=7,889. Survey data weighted to adjust for non-response. Formatting differences indicate the following: 10<n<30; n<10.
16
Proportion of sample (%)
Alumni dataset Postgraduate dataset Application dataset
Consortium Consortium Consortium
Ethnicity
White British 85.3 83.1 -
Other White background 2.0 2.7 -
Black - Caribbean 0.3 0.3 -
Black - African 0.5 1.5 -
Black British 0.7 0.9 -
Other Black background 0.0 0.0 -
Mixed - White and Black Caribbean 0.7 0.7 -
Mixed - White and Black African 0.4 0.2 -
Mixed - White and Asian 0.9 1.2 -
Asian or Asian British - Indian 2.1 2.5 -
Asian or Asian British - Pakistani 1.2 1.8 -
Asian or Asian British - Bangladeshi 0.4 0.5 -
Chinese 1.6 0.7 -
Other Asian background 0.5 0.5 -
Other Mixed background 1.6 1.1 -
Gypsy or Traveller 0.1 0.0 -
Irish Traveller 0.0 0.0 -
Other Ethnic background 0.2 0.7 -
Not known 0.0 0.1 -
Prefer not to say 1.6 1.6 - Table 3.1. continued Notes Ethnicity: Alumni dataset, valid n=2,571; Postgraduate dataset, valid n=2,809. Survey data weighted to adjust for non-response. Formatting differences indicate the following: 10<n<30; n<10.
17
Proportion of sample (%)
Alumni dataset Postgraduate dataset Application dataset
Consortium Consortium Consortium
Parental higher education
2+ parents attended HE 42.7 42.6 -
1 parent attended HE 25.5 21.5 -
No parent attended HE 31.8 36.0 -
POLAR3 quintile
1. Mean young participation rate – 16.1% 9.2 11.8 12.2
2. Mean young participation rate – 25.0% 13.4 15.8 17.7
3. Mean young participation rate – 32.8% 18.5 17.7 18.4
4. Mean young participation rate – 41.8% 25.8 22.7 21.8
5. Mean young participation rate – 57.6% 33.1 32.0 30.0 Table 3.1. continued Notes Parental higher education: Alumni dataset, valid n=2,750; Postgraduate dataset, valid n=3,226. POLAR3 quintile: Alumni dataset, valid n=2,369; Postgraduate dataset, valid n=2,351; Application dataset, valid n= 41,663. Survey data weighted to adjust for non-response. Formatting differences indicate the following: 10<n<30; n<10.
18
Proportion of sample (%)
Alumni dataset Postgraduate dataset Application dataset
Consortium Consortium Consortium
Parental NS-SEC
Higher managerial and professional 30.7 24.9 27.4
Lower managerial and professional 36.8 35.0 35.1
Intermediate occupations 11.6 11.3 14.0
Small employers and own account workers 4.6 14.0 6.3 Lower supervisory and technical
occupations 2.4 0.0 6.8
Semi-routine occupations 2.9 3.9 7.5
Routine occupations 1.8 2.8 2.8
Never worked and long-term unemployed 9.2 8.2 0.0 Table 3.1. continued Notes Parental NS-SEC: Alumni dataset, valid n=2,167; Postgraduate dataset, valid n=2,507; Application dataset, valid n=6,001. Survey data weighted to adjust for non-response. Formatting differences indicate the following: 10<n<30; n<10.
19
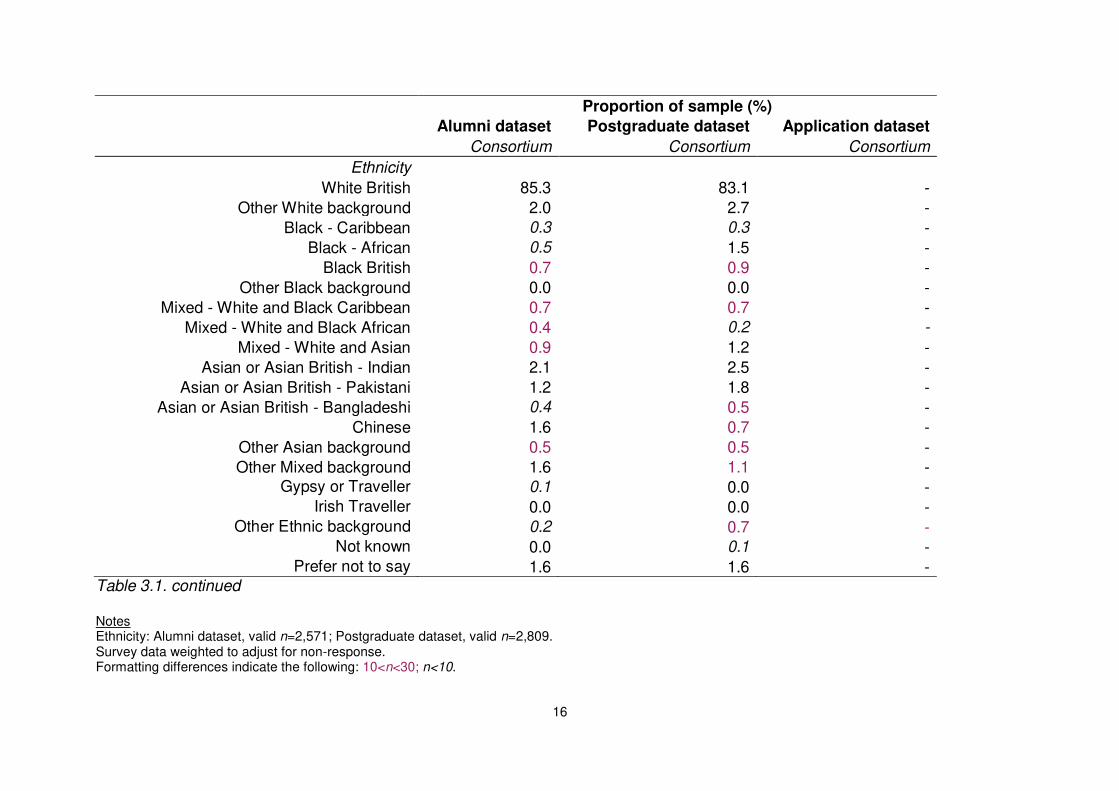
As we also might expect, even with weights applied the proportion with undergraduate first-class honours is higher in the PtPG survey, no doubt as a result of self-selection and through the application of universities’ postgraduate entry requirements (and possibly funders’ selectivity too). Postgraduates in the PtPG survey and the Admissions Study are slightly older than those in the PbG survey – inevitable given the characteristics of the consortium universities’ undergraduate populations and the set time since graduation for this population. 3.3 Personal characteristics: age, disability, ethnicity We turn now to the personal characteristics of our respondents and applicants. It is difficult to find national comparative data on the mean age of postgraduate students, although HEFCE (2013b) statistics provide median (aged 26 – 30) and mode (21 – 25), although noting that 40 per cent of new taught postgraduate entrants are aged over 30. Wakeling (2009, p. 102) reports a mean age of 34 for all UK-domiciled postgraduates in 2003/04 - 2004/05. Consortium postgraduates (and applicants) therefore appear as a group to be younger than average. This may reflect the character of the taught postgraduate provision in the six universities, which is focused on full-time masters study. Judging by overall proportions, those reporting a disability represent a higher proportion of postgraduate students than postgraduate applicants, where their proportion is in turn higher than among alumni in the PbG survey. Taken at face value, this might cause us to call into question the use of disability status as a criterion for the award of PSS scholarships by some of the consortium partners. Further analysis is required however to validate such a conclusion. In particular we should be cautious about drawing inferences across the datasets given the probable influences of compositional effects between levels (e.g. different subject mix). We should also note that no applicants are coded as “prefer not to answer” in relation to disability – such individuals likely appear as “no disability”. As we would expect from previous research, ethnicity presents a complex picture. Social scientists tend to eschew approaches that treat ethnicity in the UK as binary (white/non-white). This is especially pertinent in analyses of educational attainment and progression where there are wide varieties in the fortunes of different minority ethnic groups. Some have higher attainment than the White British group; and almost all have higher rates of undergraduate participation than White British young people (although see Boliver (2015) for discussion of ethnic inequalities in admission). This is reflected to some extent in our data: the Black African and Asian or Asian British – Indian groups both have higher proportional representation among the PtPG respondents than PbG.2 Other groups such as Other Mixed and Chinese3 see their representation fall. In many groups the cell sizes are such that only a small number of individuals are represented, making any firm conclusions particularly
2 We did not collect ethnicity data in the Admissions Study. Institutions hold this data, but it is
classified as ‘sensitive data’ in the terms of the Data Protection Act 1998. It was agreed that including this data would have delayed or perhaps even prevented the sharing of admissions data necessary for the Admissions Study to proceed and for this reason it was decided to exclude ethnicity data from the Study. 3 This is a little surprising given national patterns. However we may have seen different results if
looking at doctoral students.
20
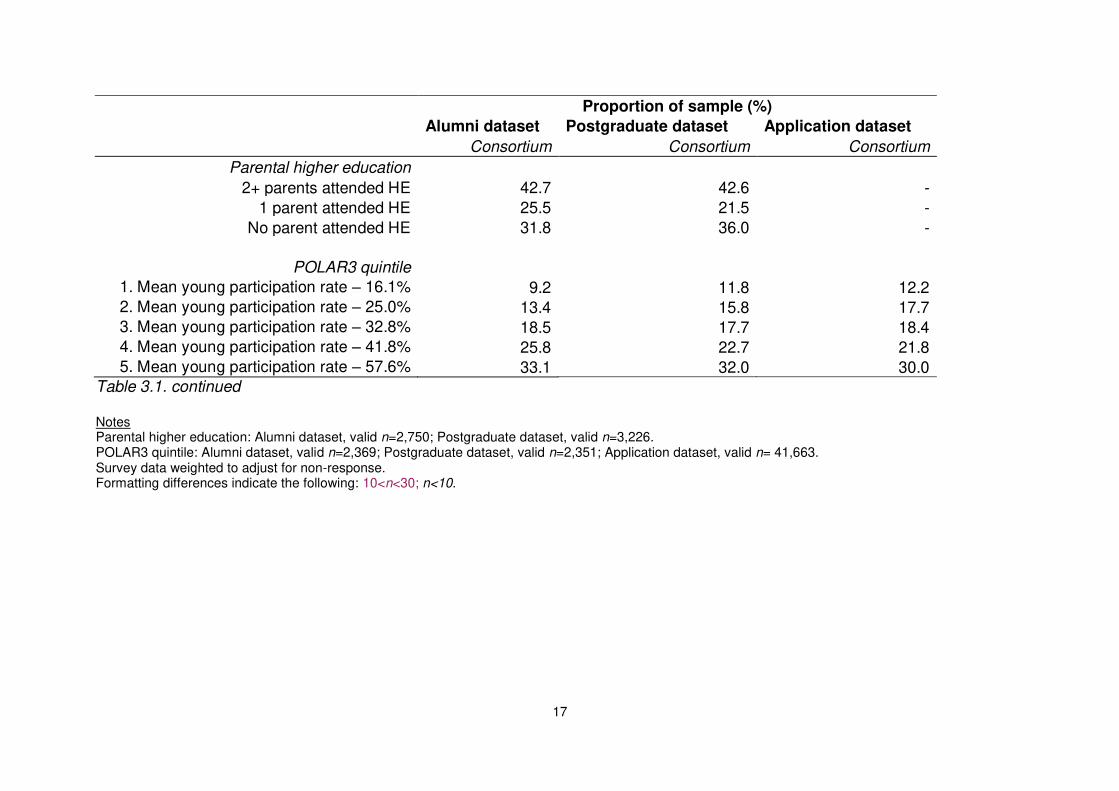
unsafe. We can be more confident in noting that the proportion of White British individuals is higher among the postgraduate students than the alumni. 3.4 Socio-economic background Finally in this section, Table 3.1 also provides an overview of various socio-economic background measures, including socio-economic class, type of secondary school attended, parental education and geo-demographic measures (‘POLAR3’). These have been the focus of considerable attention at undergraduate level, with three of the four being included in the set of widening participation performance indicators provided by HESA on an annual basis. Note here that the statistics reported for the Admissions Study relate only to those applicants who were undergraduates in the same university. This is because data is not routinely collected on these characteristics for postgraduate applicants and has instead been sourced from institutions’ student records via data linkage. These statistics in particular should therefore be treated with caution. It is well known that former independent school pupils are overrepresented at undergraduate level. Around 6 – 7% of English school pupils are in independent schools, but they represent some 11% of young first-degree entrants in England. In the consortium universities, the representation of former independent pupils among new entrants ranged from 14% to 26% in 2013/14 (source: HESA Performance Indicators). Official figures do not distinguish between types of state school; however we have been able to separate selective and non-selective state schools (the former being grammar schools in those areas of the country still operating an eleven-plus examination). The PbG survey looks broadly representative of the consortium universities, with one-fifth of respondents being former independent pupils. A further 15% reported attending a selective state school. Among the PtPG respondents there is a lower representation of both independent and selective state school former pupils. On the face of it, this suggests a greater probability of state-educated graduates in the consortium universities progressing to taught postgraduate study. We will investigate this further below. Within the research literature on educational attainment and transitions one of, if not the strongest predictor of a child’s educational outcomes is their parents’ level of education. Data on parental education is now collected via UCAS and HESA for full-time undergraduate entrants, although it has been somewhat under-analysed for postgraduates. Wakeling (2009) found those with highly educated parents to be overrepresented among postgraduates and Wakeling and Hampden-Thompson (2013) found those with at least one parent with a higher educational qualification to be five percentage points more likely to progress to progress to taught postgraduate study than those whose parents did not have a higher education qualification. In contrast to the UCAS/HESA measure which simply asks whether any parent holds a higher education qualification, we asked this about each parent. We were thus able to identify students with none, one or two parents with a higher education qualification.4 The largest group, with similar representation across the PbG and PtPG surveys, is those with two graduate parents. More respondents had no parents
4 We should note here that respondents might not be in touch with all their parents – some from single
parent families may only be able to report on one parent, for instance.
21
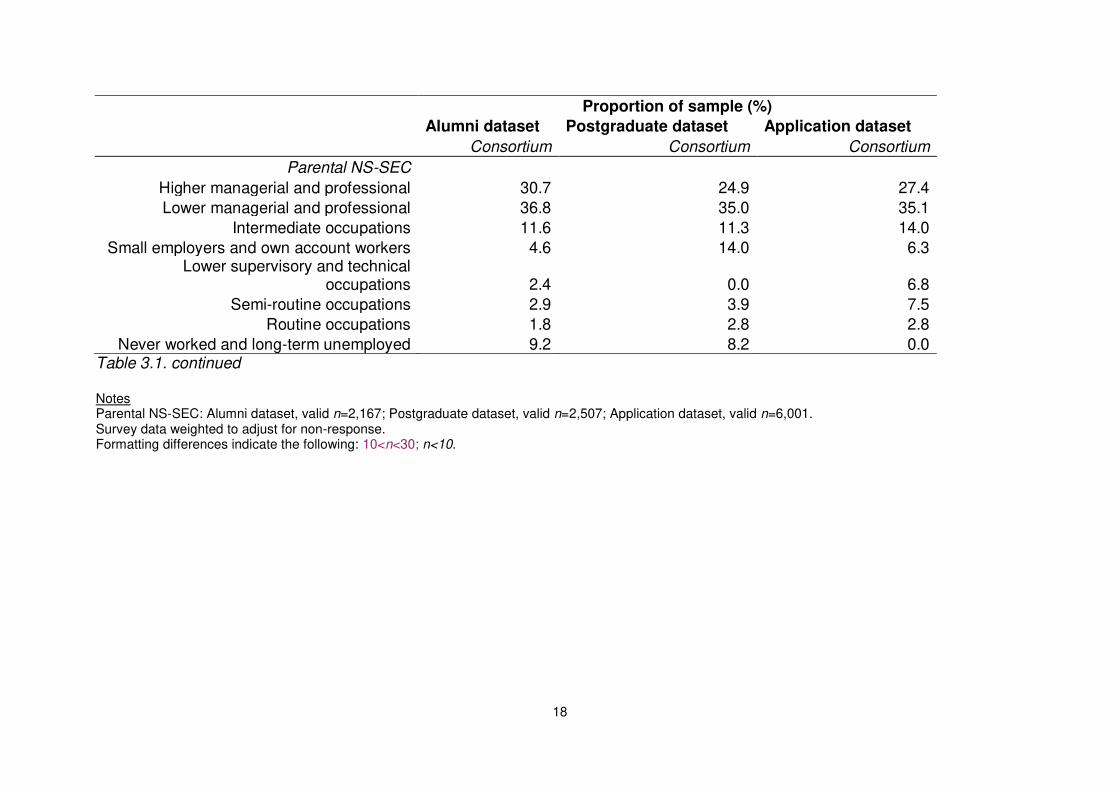
with a higher education qualification than had a sole parent so qualified in both surveys. While the proportions shift little across the surveys, we shall see in our analysis of the PbG survey that there appears to be a strong association between parental education and transition to postgraduate study. Parental socio-economic class was captured for PbG and PtPG respondents through a question asking about their parents’ occupation (including job title) at age 16. Using the CASCOT system developed in the Futuretrack study we were able to derive parental socio-economic class using the National Statistics Socio-economic Classification (NS-SEC) for about three-quarters of the respondents in both the PbG and PtPG datasets. Cell sizes are on the small side for NS-SEC categories 5 – 8. HESA provides benchmarking data on new undergraduate entrants from NS-SEC classes 4 – 7. About one third of entrants to English higher education institutions were from this group in 2013/14, with the range being 19% - 25% in the six consortium universities. There is a drop in the proportional representation of graduates in the Higher Managerial and Professional class between the PbG and PtPG surveys, and a growth in the proportion in Small Employers and Own Account Workers group. Otherwise, the distribution across social classes does not look markedly different. Although parental socio-economic class was collected by some of the institutions as part of their PSS scholarship application process, it did not form one of the criteria for award. Instead, some of the consortium partners used a neighbourhood-based measure as a qualifying characteristic in making scholarship awards. This was typically based on the postcode of a graduate’s residence at the point they applied for entry to undergraduate study. The ‘POLAR’ system classifies postcodes into micro-areas based on the rate of higher education participation in those areas and then divides the set of micro-neighbourhoods into quintiles. The neighbourhoods with the lowest rates of participation on this basis – conventionally those in Quintile 1 and sometimes Quintile 1-2 – are classified as ‘Low Participation Neighbourhoods’ (LPN). Again, HESA provides comparative data which shows 11% of new undergraduates came from Quintile 1. In our surveys, we saw a slightly lower proportion of LPN respondents than the national average, but higher than that reported for our institutions by HESA (two at 5-6%, the remainder at 8%). There is a subtle but perceptible shift towards LPN graduates in the PtPG survey.
22
4. Post-graduation activities of alumni
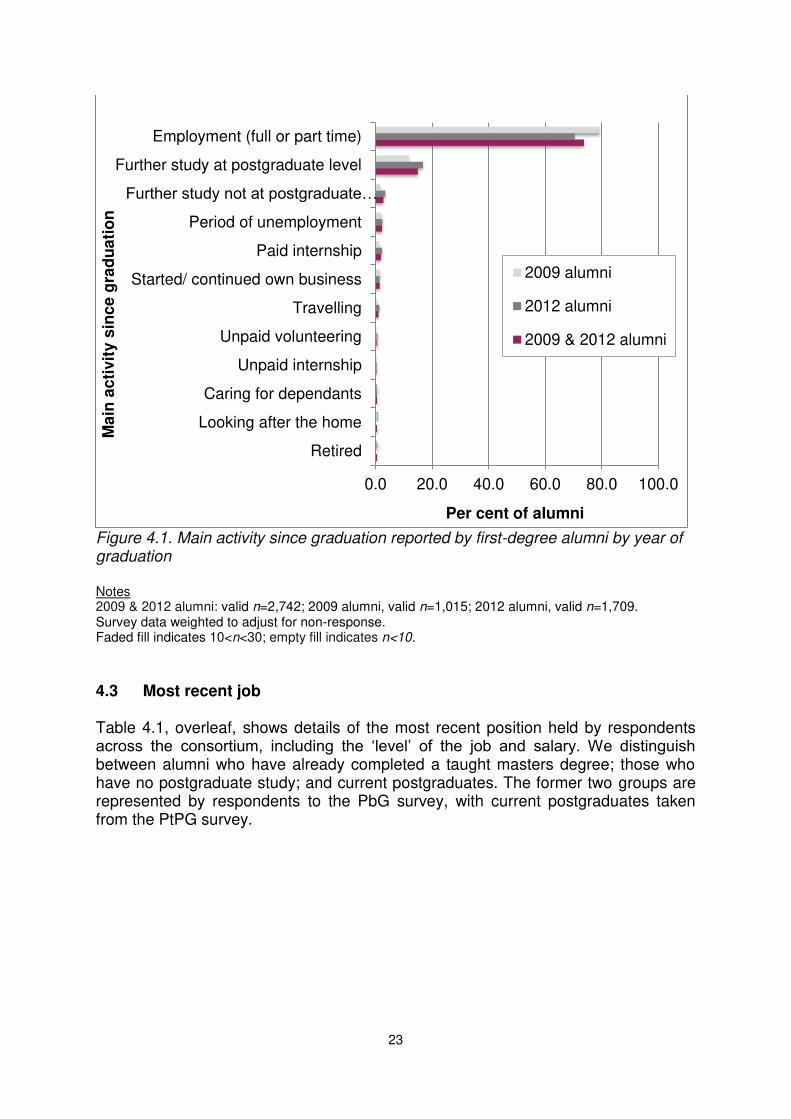
4.1 Introduction We can use the PbG survey, and to some extent the PtPG survey, to investigate the post-graduation activities of first-degree alumni from the six consortium universities. While data on post-graduation activities is available through HESA’s DLHE survey, this captures only the very early activities of alumni in the year following their graduation. HESA runs a biennial longitudinal version of DLHE with a much smaller sample. Our survey focused on alumni graduating in 2009 and 2012. As it was conducted in 2014, this means the alumni were either five or two years post-first-degree graduation. We are thus able to get an arguably more stable picture of their graduate trajectories and also to see for some graduates what impact taking a masters degree may have had on their career. Examining the alumni data is also important to put taught postgraduate study in particular into context. Enrolling on a postgraduate qualification is one among many options open to graduates. Of course some may face barriers to enrolling and thus find their postgraduate ambitions thwarted. Others may positively choose not to take postgraduate qualifications because they are not interested or because there are more attractive and/or lucrative options open to them. A third group may enrol in a postgraduate course if faced with un- or underemployment as a means of improving their attractiveness to employers or simply ‘riding out’ tough macroeconomic conditions. We investigate some of these possibilities further later in this report. In this section, we look at overall destinations, before drilling down into employment outcomes for our respondents. 4.2 Overall outcomes Figure 4.1 shows the main post-graduation activity reported by alumni for 2009 and 2012. The broad pattern confirms what we already know from existing sources such as HESA’s DLHE. Just under one-sixth of consortium alumni report further study at postgraduate level as their main activity. The figure is slightly higher for the more recent graduates, which also matches known trends. The figure for postgraduate study is a little lower than the consortium average in DLHE, but that is very likely to be because graduates who have completed a masters and also worked will report their main activity as employment (this was the case for over 70% of our respondents who had completed a masters degree). Employment is by far the most common activity reported by graduates, with four-fifths of 2009 graduates citing this. Other activities, including unemployment, starting a business, travelling and homemaking were reported by very small numbers of respondents.
23
Figure 4.1. Main activity since graduation reported by first-degree alumni by year of graduation
Notes 2009 & 2012 alumni: valid n=2,742; 2009 alumni, valid n=1,015; 2012 alumni, valid n=1,709. Survey data weighted to adjust for non-response. Faded fill indicates 10<n<30; empty fill indicates n<10.
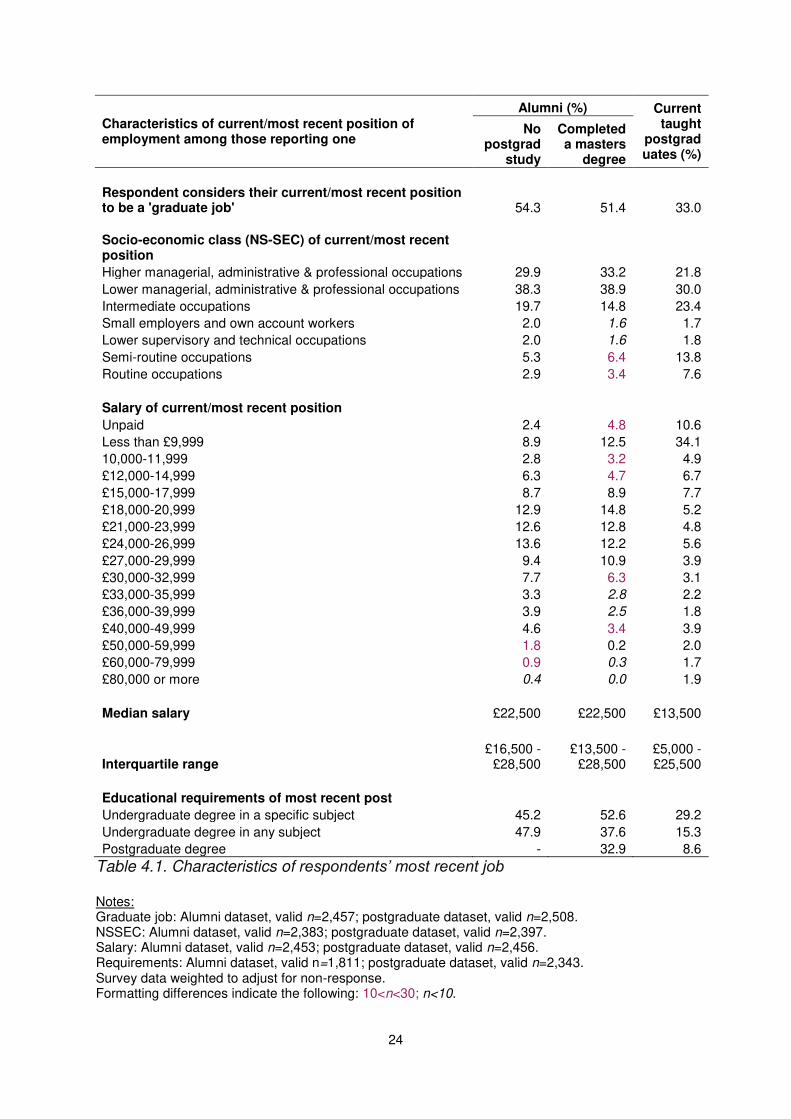
4.3 Most recent job Table 4.1, overleaf, shows details of the most recent position held by respondents across the consortium, including the ‘level’ of the job and salary. We distinguish between alumni who have already completed a taught masters degree; those who have no postgraduate study; and current postgraduates. The former two groups are represented by respondents to the PbG survey, with current postgraduates taken from the PtPG survey.
0.0 20.0 40.0 60.0 80.0 100.0
Retired
Looking after the home
Caring for dependants
Unpaid internship
Unpaid volunteering
Travelling
Started/ continued own business
Paid internship
Period of unemployment
Further study not at postgraduate…
Further study at postgraduate level
Employment (full or part time)
Per cent of alumni
Ma
in a
cti
vit
y s
inc
e g
rad
uati
on
2009 alumni
2012 alumni
2009 & 2012 alumni
24
Characteristics of current/most recent position of employment among those reporting one
Alumni (%) Current taught
postgraduates (%)
No postgrad
study
Completed a masters
degree
Respondent considers their current/most recent position to be a 'graduate job' 54.3 51.4 33.0
Socio-economic class (NS-SEC) of current/most recent position
Higher managerial, administrative & professional occupations 29.9 33.2 21.8
Lower managerial, administrative & professional occupations 38.3 38.9 30.0
Intermediate occupations 19.7 14.8 23.4
Small employers and own account workers 2.0 1.6 1.7
Lower supervisory and technical occupations 2.0 1.6 1.8
Semi-routine occupations 5.3 6.4 13.8
Routine occupations 2.9 3.4 7.6
Salary of current/most recent position
Unpaid 2.4 4.8 10.6
Less than £9,999 8.9 12.5 34.1
10,000-11,999 2.8 3.2 4.9
£12,000-14,999 6.3 4.7 6.7
£15,000-17,999 8.7 8.9 7.7
£18,000-20,999 12.9 14.8 5.2
£21,000-23,999 12.6 12.8 4.8
£24,000-26,999 13.6 12.2 5.6
£27,000-29,999 9.4 10.9 3.9
£30,000-32,999 7.7 6.3 3.1
£33,000-35,999 3.3 2.8 2.2
£36,000-39,999 3.9 2.5 1.8
£40,000-49,999 4.6 3.4 3.9
£50,000-59,999 1.8 0.2 2.0
£60,000-79,999 0.9 0.3 1.7
£80,000 or more 0.4 0.0 1.9
Median salary £22,500 £22,500 £13,500
Interquartile range £16,500 -
£28,500 £13,500 -
£28,500 £5,000 - £25,500
Educational requirements of most recent post
Undergraduate degree in a specific subject 45.2 52.6 29.2
Undergraduate degree in any subject 47.9 37.6 15.3
Postgraduate degree - 32.9 8.6
Table 4.1. Characteristics of respondents’ most recent job Notes: Graduate job: Alumni dataset, valid n=2,457; postgraduate dataset, valid n=2,508. NSSEC: Alumni dataset, valid n=2,383; postgraduate dataset, valid n=2,397. Salary: Alumni dataset, valid n=2,453; postgraduate dataset, valid n=2,456. Requirements: Alumni dataset, valid n=1,811; postgraduate dataset, valid n=2,343. Survey data weighted to adjust for non-response. Formatting differences indicate the following: 10<n<30; n<10.
25
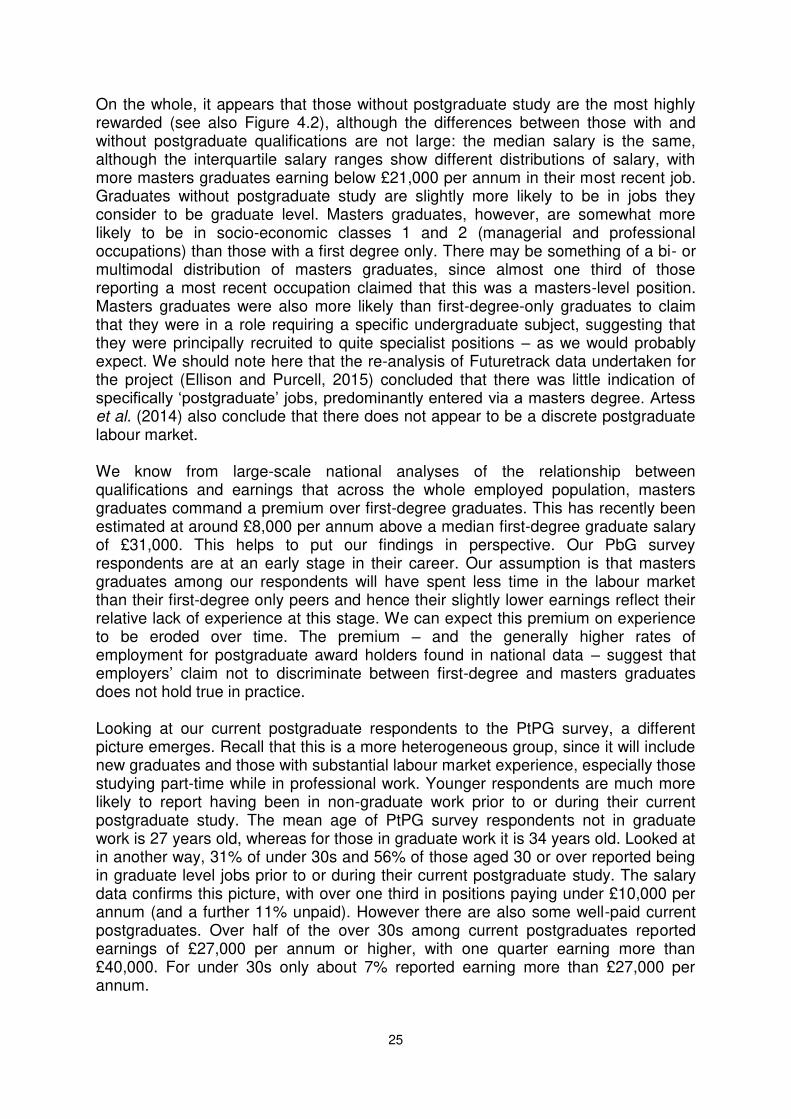
On the whole, it appears that those without postgraduate study are the most highly rewarded (see also Figure 4.2), although the differences between those with and without postgraduate qualifications are not large: the median salary is the same, although the interquartile salary ranges show different distributions of salary, with more masters graduates earning below £21,000 per annum in their most recent job. Graduates without postgraduate study are slightly more likely to be in jobs they consider to be graduate level. Masters graduates, however, are somewhat more likely to be in socio-economic classes 1 and 2 (managerial and professional occupations) than those with a first degree only. There may be something of a bi- or multimodal distribution of masters graduates, since almost one third of those reporting a most recent occupation claimed that this was a masters-level position. Masters graduates were also more likely than first-degree-only graduates to claim that they were in a role requiring a specific undergraduate subject, suggesting that they were principally recruited to quite specialist positions – as we would probably expect. We should note here that the re-analysis of Futuretrack data undertaken for the project (Ellison and Purcell, 2015) concluded that there was little indication of specifically ‘postgraduate’ jobs, predominantly entered via a masters degree. Artess et al. (2014) also conclude that there does not appear to be a discrete postgraduate labour market. We know from large-scale national analyses of the relationship between qualifications and earnings that across the whole employed population, masters graduates command a premium over first-degree graduates. This has recently been estimated at around £8,000 per annum above a median first-degree graduate salary of £31,000. This helps to put our findings in perspective. Our PbG survey respondents are at an early stage in their career. Our assumption is that masters graduates among our respondents will have spent less time in the labour market than their first-degree only peers and hence their slightly lower earnings reflect their relative lack of experience at this stage. We can expect this premium on experience to be eroded over time. The premium – and the generally higher rates of employment for postgraduate award holders found in national data – suggest that employers’ claim not to discriminate between first-degree and masters graduates does not hold true in practice. Looking at our current postgraduate respondents to the PtPG survey, a different picture emerges. Recall that this is a more heterogeneous group, since it will include new graduates and those with substantial labour market experience, especially those studying part-time while in professional work. Younger respondents are much more likely to report having been in non-graduate work prior to or during their current postgraduate study. The mean age of PtPG survey respondents not in graduate work is 27 years old, whereas for those in graduate work it is 34 years old. Looked at in another way, 31% of under 30s and 56% of those aged 30 or over reported being in graduate level jobs prior to or during their current postgraduate study. The salary data confirms this picture, with over one third in positions paying under £10,000 per annum (and a further 11% unpaid). However there are also some well-paid current postgraduates. Over half of the over 30s among current postgraduates reported earnings of £27,000 per annum or higher, with one quarter earning more than £40,000. For under 30s only about 7% reported earning more than £27,000 per annum.
26
The job titles reported by current postgraduates under 30 years of age tend to be clustered in distinct areas. Many are lower level jobs in retail, catering and other service sector work, including customer-oriented work. There is also a group working in ancillary roles in educational institutions: teaching assistants, tutors, student support and so on. Superficially at least, this group has some similarities to the class of ‘Emergent Service Workers’ identified by Savage et al. (2013) in their analysis of the BBC’s Great British Class Survey: an urban, relatively young, highly-educated but not especially well-paid group.
Figure 4.2. Median salary by year of graduate, gender and postgraduate study status Notes: Salary if no postgraduate study: 2009, valid n=500; 2012, valid n=1,048. Salary with postgraduate masters: 2009, valid n=183; 2012, valid n=176. Survey data weighted to adjust for non-response.
We also looked at the job titles reported by masters graduates in the PbG survey where they indicated that a postgraduate qualification was required for their current or most recent position. The modal job in such cases was some form of schoolteaching. There was also a substantial group of respondents working in a research post, either university based (e.g. ‘postdoctoral’ researcher) or in another sector. Nearly all of the remainder reported job titles which represented specialist roles in a particular sector, such as environmental work, architecture, the legal profession and healthcare. We would anticipate that these roles being classified as ‘Expert’ using the typology developed in the Futuretrack study (Elias and Purcell, 2013). Across the consortium, just over 60 of the nearly 400 respondents who had already completed a masters degree reported that neither undergraduate nor
0
5000
10000
15000
20000
25000
30000
� Men � Women � Men � Women
� 2009 � 2012
Me
dia
n s
ala
ry
Year/Gender
No postgraduate study
Completed postgraduate masters

27
postgraduate qualifications were required for their job.5 Looking at the job titles for this group, however, the range of jobs cited differs considerably from that reported by the current postgraduates in the PtPG survey. There are only a handful working in semi-routine service sector work, with many others engaged in work which might be classed by Futuretrack as ‘orchestrator’ or ‘communicator’ roles (although tending to the junior level of such positions).
5 There is some inconsistency in individuals’ responses between questions asking about qualifications
required and the question which asks whether the job in question was in their view a ‘graduate job’. Some of the jobs listed as non-graduate included “medical doctor”, “graduate teaching assistant”, “trainee solicitor” and so on.
28
5. Applications to postgraduate study
5.1 Previous evidence on postgraduate applications Beyond the accumulated knowledge in universities’ own professional services, there is little known on a system-wide basis about postgraduate applicants and applications. Unlike at undergraduate level, where there is a national application system (UCAS), there is no central register of applicants or applications. Institutions are not obliged to publish data about postgraduate applications and many therefore do not, considering this to be ‘commercially’ sensitive information. As such, it is difficult to determine, among other things:
demand for postgraduate education overall;
the popularity of different kinds of postgraduate programmes among applicants;
the selectivity of different subjects or kinds of courses (i.e. how difficult they are to gain entry to)
the extent to which there is attrition in the process of moving from application to offer to enrolment
whether there are any inequalities evident in postgraduate applications.
BIS commissioned a little-known study of postgraduate applications which reported in December 2013 (BIS, 2013). Representing perhaps the only previous large-scale study of postgraduate applications, the report collated postgraduate application data from a set of higher education institutions. The report includes non-UK-domiciled applications. It suggests a steep climb in applications for taught postgraduate study which levels off from 2009/10. It also found an application:offer ratio of approximately 1.8:1. 5.2 Patterns of application Table 5.1 shows applications, offers and enrolments according to various academic and background characteristics. Note that we are here reporting applications not applicants. Most applications for taught postgraduate study – well over half – are for masters degrees. A full quarter of applications received by the consortium universities are for PGCE courses, which are offered at all six of the universities
29
Proportion of sample (%)
Applications Offers Enrolments
Consortium Consortium Consortium
Academic Year
2013/14 49.1 49.6 49.6
2014/15 50.9 50.4 50.4
Qualification Type
Taught Masters degree 58.8 67.4 60.5
Research Masters degree 1.3 1.6 1.9
Masters of Business Administration 0.7 0.9 1.3
Postgraduate Diploma 6.2 5.9 5.7
Postgraduate Certificate 5.0 7.3 8.5
Postgraduate Certificate in Education 26.4 11.7 15.6
Professional Doctorate 0.0 0.0 0.0
Other 3.6 5.3 6.5
Study Mode
Full time 77.7 67.9 66.0
Part time 18.5 26.9 29.9
Distance learning 3.8 5.2 4.1
Table 5.1. Applications, offers and enrolments for taught postgraduate programmes by selected characteristics Notes: Academic Year: valid n=42,888; Qualification Type, valid n=42,888; Study Mode, valid n=42,888.
30
Proportion of sample (%)
Applications Offers Enrolments
Consortium Consortium Consortium
JACS
Medicine and Dentistry 5.0 6.6 7.6
Subjects allied to Medicine 11.0 11.5 11.9
Biological Sciences 4.9 5.7 5.9
Veterinary Sciences and Agriculture 0.6 0.8 0.7
Physical Sciences 3.9 5.1 4.8
Mathematical and Computing Sciences 2.9 3.5 3.1
Engineering 3.3 4.1 3.5
Technology 0.6 0.7 0.7
Architecture, Building and Planning 1.1 1.5 1.5
Social Studies 12.9 12.4 10.8
Law 3.1 4.1 3.0
Business and Administrative Studies 6.4 8.2 8.2
Mass Communications and Documentation 1.9 2.4 2.1
Linguistics, Classics and related subjects 3.4 4.6 3.9
European Languages, Literature and related subjects 0.2 0.3 0.3
Eastern, Asiatic, African, American and Australasian Languages, Literature and related subjects
0.3 0.4 0.3
Historical and Philosophical Studies 4.6 6.7 5.7
Creative Arts and Design 1.8 2.4 2.3
Education 32.1 18.8 23.6
Table 5.1. continued Notes JACS, valid n=42,887.
31
Proportion of sample (%)
Applications Offers Enrolments
Consortium Consortium Consortium
Subject Area
STEM 33.3 39.5 39.7
Social Sciences 56.4 46.0 47.8
Arts and Humanities 10.4 14.5 12.5
Gender
Male 41.4 43.8 43.0
Female 58.6 62.2 57.0
Age Group
21 or under 0.0 0.0 0.0
22-29 71.8 70.7 69.3
30-39 15.6 15.9 16.4
40 or over 12.5 13.4 14.3
Mean age 29.8 29.6 29.3
Disability
No 91.1 90.6 90.8
Yes 8.9 9.5 9.2
Table 5.1. continued Notes: Subject area: valid n=42,887; Gender, valid n=42,861; Age group, valid n=42,884; Disability, valid n=41,619.
32
Proportion of sample (%)
Applications Offers Enrolments
Consortium Consortium Consortium
POLAR3 quintile
1. Mean young participation rate – 16.1% 12.2 10.4 10.3
2. Mean young participation rate – 25.0% 17.7 16.5 16.7
3. Mean young participation rate – 32.8% 18.4 17.2 17.1
4. Mean young participation rate – 41.8% 21.8 22.9 23.4
5. Mean young participation rate – 57.6% 30.0 33.0 32.6
School type
State 82.7 80.2 80.5
Independent 15.8 18.1 17.8
Other 1.6 1.7 1.8
Table 5.1. continued Notes: POLAR3: valid n=41,663; School type, valid n=7,889.
33
Proportion of sample (%)
Applications Offers Enrolments
Consortium Consortium Consortium
Parental NS-SEC
Higher managerial and professional 27.4 29.5 29.5
Lower managerial and professional 35.1 35.2 35.4
Intermediate occupations 14.0 14.0 13.4
Small employers and own account workers 6.3 6.4 6.7
Lower supervisory and technical occupations 6.8 5.7 5.5
Semi-routine occupations 7.5 6.8 7.0
Routine occupations 2.8 2.3 2.3
Never worked and long-term unemployed 0.0 0.0 0.0
Application to PSS
No 95.8 93.6 92.9
Yes 4.3 6.4 7.1
Table 5.1. continued Notes: Parental NS-SEC, valid n=6,001; Application to PSS, valid n=42,888.
34
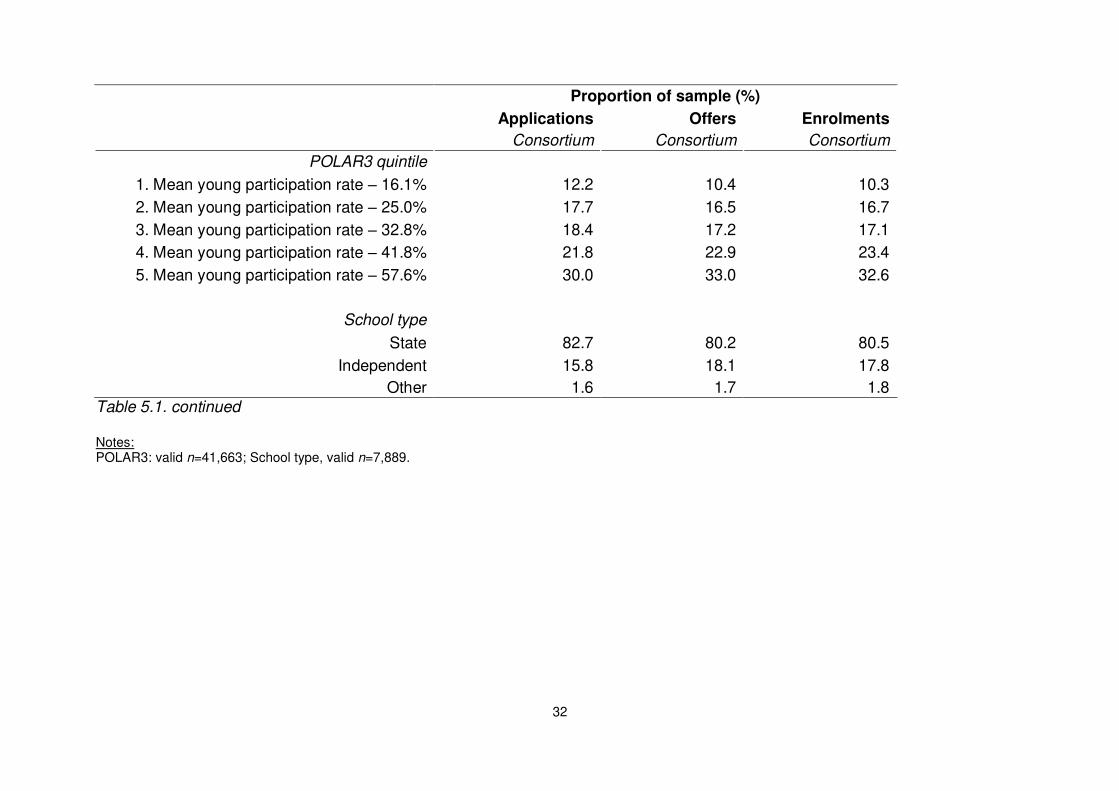
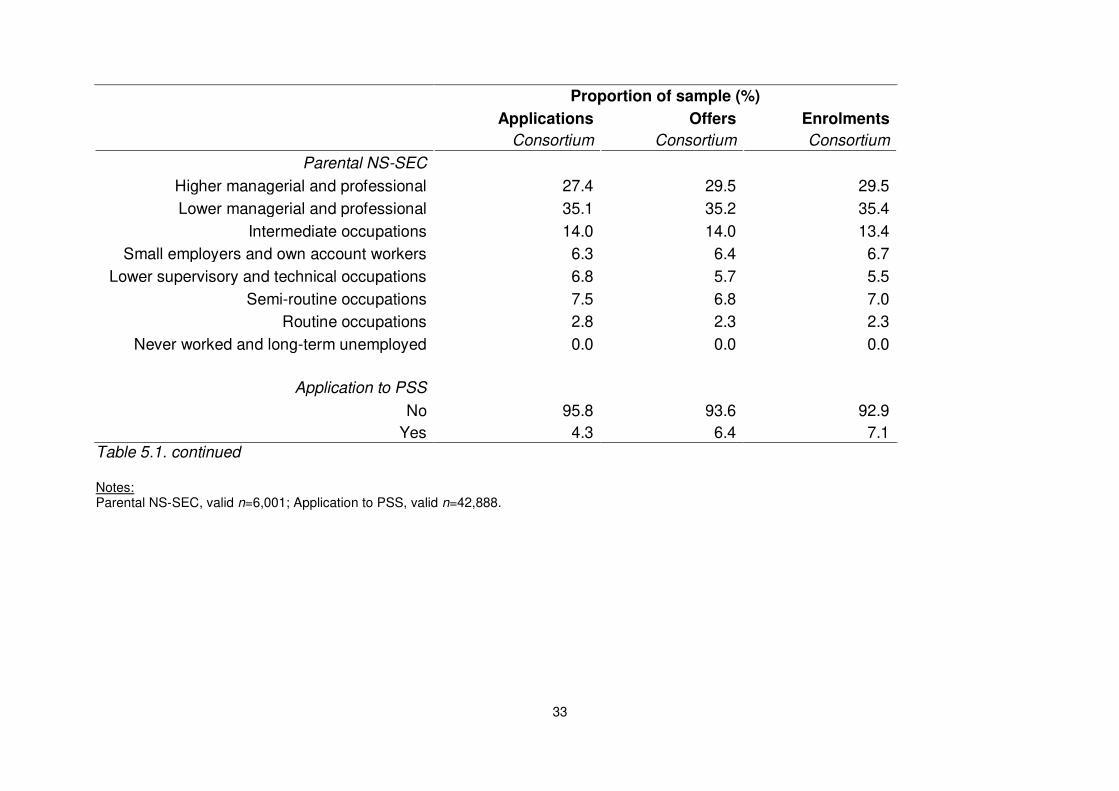
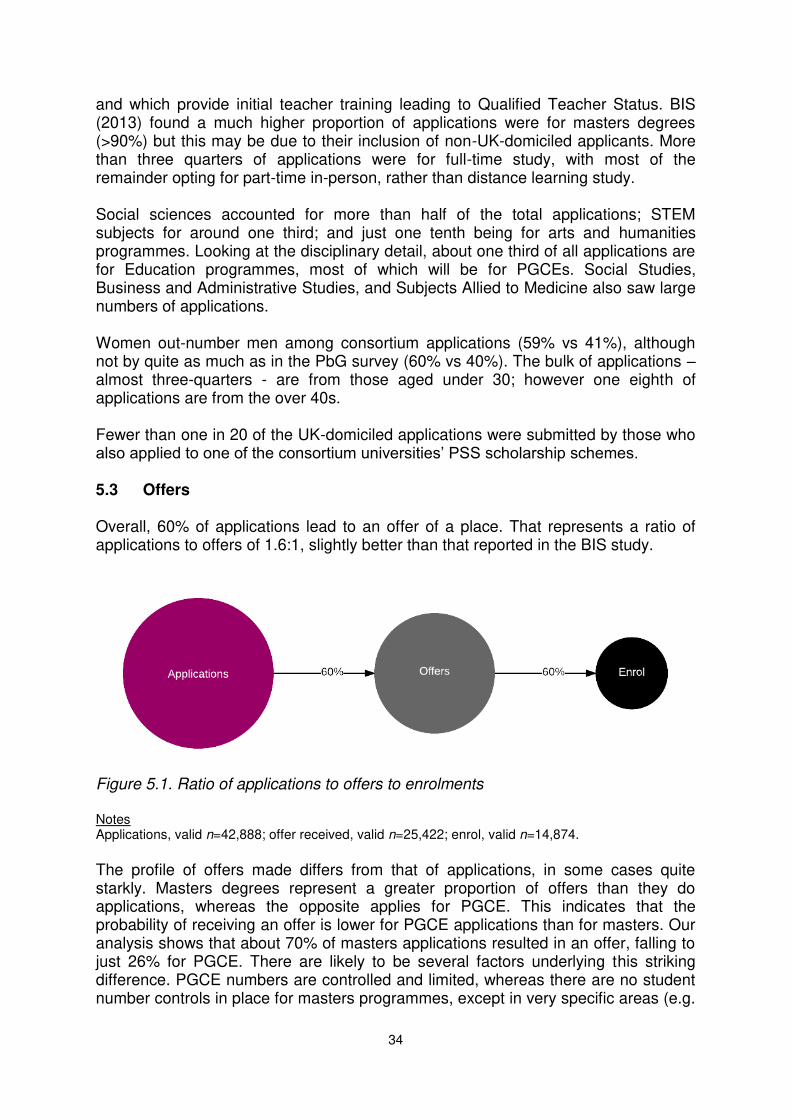
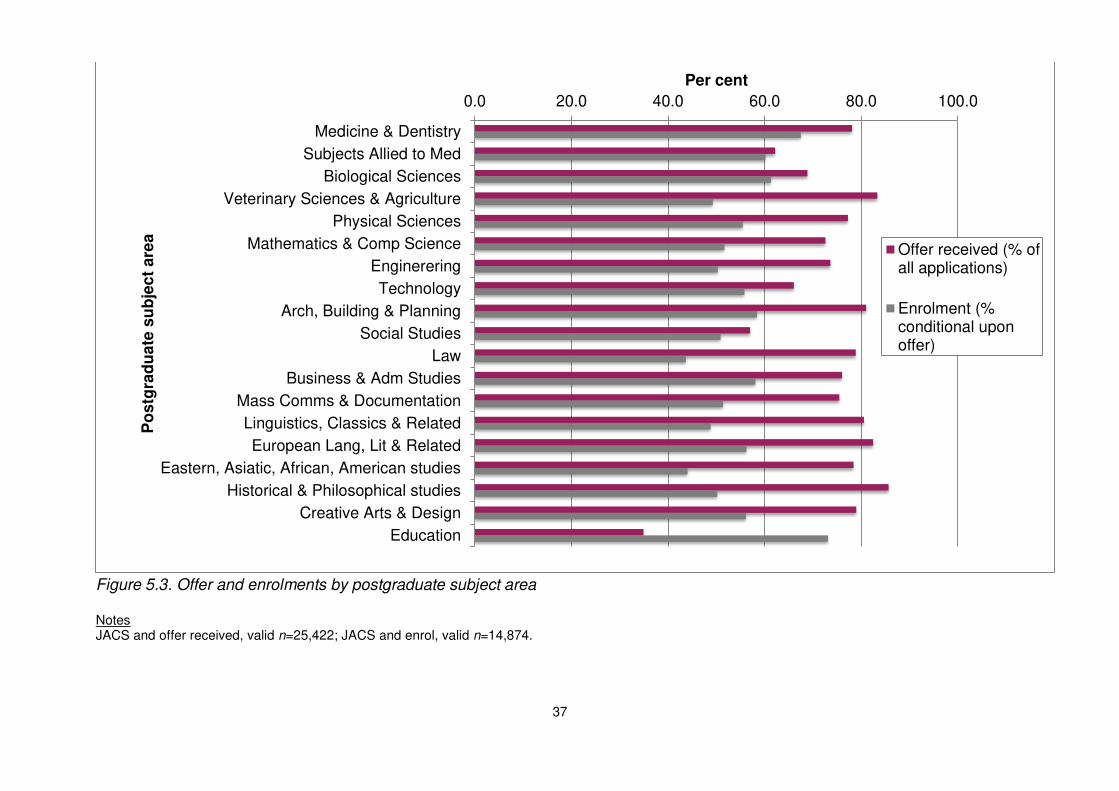
and which provide initial teacher training leading to Qualified Teacher Status. BIS (2013) found a much higher proportion of applications were for masters degrees (>90%) but this may be due to their inclusion of non-UK-domiciled applicants. More than three quarters of applications were for full-time study, with most of the remainder opting for part-time in-person, rather than distance learning study. Social sciences accounted for more than half of the total applications; STEM subjects for around one third; and just one tenth being for arts and humanities programmes. Looking at the disciplinary detail, about one third of all applications are for Education programmes, most of which will be for PGCEs. Social Studies, Business and Administrative Studies, and Subjects Allied to Medicine also saw large numbers of applications. Women out-number men among consortium applications (59% vs 41%), although not by quite as much as in the PbG survey (60% vs 40%). The bulk of applications – almost three-quarters - are from those aged under 30; however one eighth of applications are from the over 40s. Fewer than one in 20 of the UK-domiciled applications were submitted by those who also applied to one of the consortium universities’ PSS scholarship schemes. 5.3 Offers Overall, 60% of applications lead to an offer of a place. That represents a ratio of applications to offers of 1.6:1, slightly better than that reported in the BIS study.
Figure 5.1. Ratio of applications to offers to enrolments Notes Applications, valid n=42,888; offer received, valid n=25,422; enrol, valid n=14,874.
The profile of offers made differs from that of applications, in some cases quite starkly. Masters degrees represent a greater proportion of offers than they do applications, whereas the opposite applies for PGCE. This indicates that the probability of receiving an offer is lower for PGCE applications than for masters. Our analysis shows that about 70% of masters applications resulted in an offer, falling to just 26% for PGCE. There are likely to be several factors underlying this striking difference. PGCE numbers are controlled and limited, whereas there are no student number controls in place for masters programmes, except in very specific areas (e.g.
35
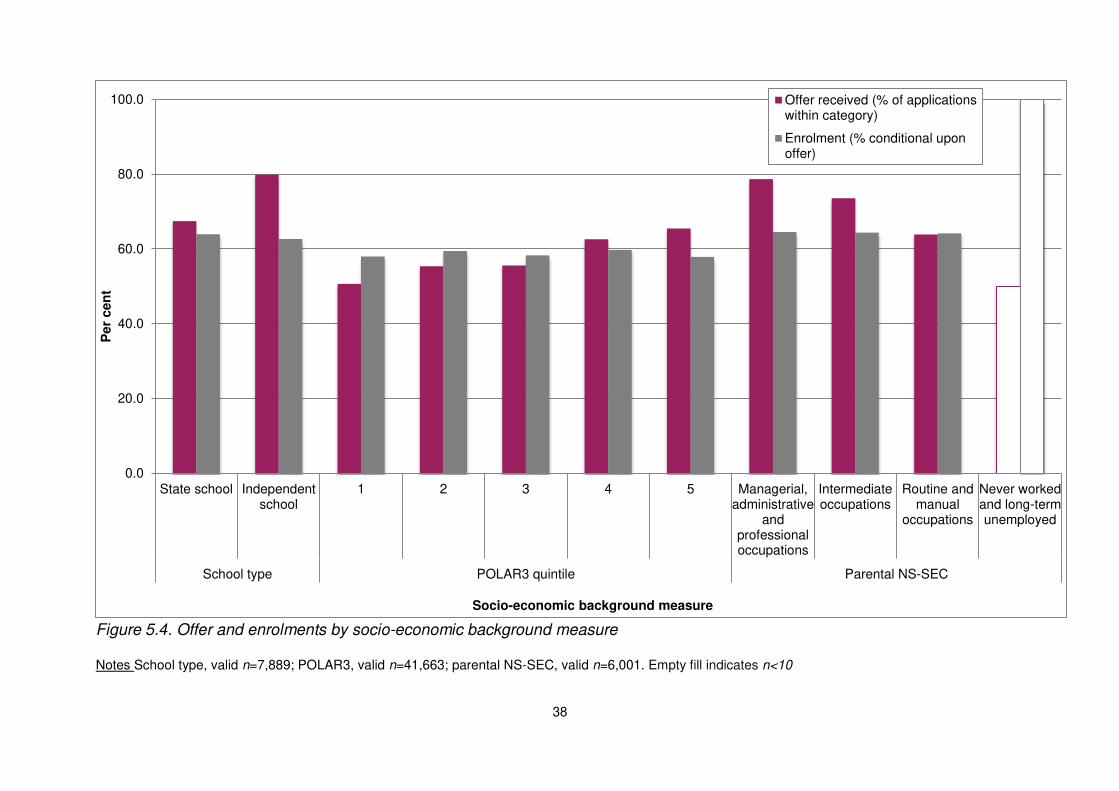
social work). Furthermore, selection for PGCE programmes involves a judgement of potential for teaching and not simply ability to cope with the academic aspects of the course. Postgraduate Certificates other than PGCE had the highest offer rate, at 86%. The likelihood of obtaining an offer increased with age: those over 40 were slightly more likely to obtain an offer than those between 30 and 39, who in turn were more likely to receive an offer than the under 30s. Applications from those declaring a disability, men, and those applying for PSS support were all more likely to receive an offer. While men’s apparent advantage in receiving an offer is likely partly due to their underrepresentation among applications to the highly selective PGCE, women (68%) are at a disadvantage in receiving an offer for taught masters degrees compared to men (73%). Unfortunately we lack data on applicants’ prior attainment, which might explain some of this variation. 5.4 Enrolments Overall, one third of applications results in an enrolment. Some 58% of those with an offer subsequently enrol. There are further changes in application profile between offer and enrolment stage. We see here, for instance, that the proportion of PGCE applications bounces back in comparison to masters. Examining this in more detail shows 78% of PGCE applications which resulted in an offer leading subsequently to enrolment. The equivalent figure for a taught masters degree is 53%. There are two candidate explanations here, both of which may operate in parallel. The application system for PGCE in place at the time this data was collected required applicants to apply serially, meaning they would apply first to their first choice, and then to a second choice only if unsuccessful. Masters applicants, in contrast, can apply to as many institutions as they choose and so may be taking up an offer elsewhere. There is also funding available to PGCE students through the SLC in roughly the same manner as for undergraduate study. At present, no such arrangement exists for masters study, meaning masters students have more of a challenge in securing funding. 5.5 Offers and enrolments by selected academic and background characteristics Offer and enrolment rates vary when broken out by various academic and background characteristics (see Figures 5.2-5.4). Applications to postgraduate certificates are most likely to lead to an offer, whereas applicants to MBA courses are most likely to enrol, conditional upon receiving an offer. Turning to background characteristics, we observed that higher proportions of independently-educated applicants received an offer, as did those from high participation neighbourhoods and NSSEC class 1 and 2. Women were less likely than men to receive an offer for a taught Masters degree; but, conditional on receiving an offer, were were just as likely as men to enrol. This suggests that there may be inequalities in access to postgraduate study in terms of these background characteristics.
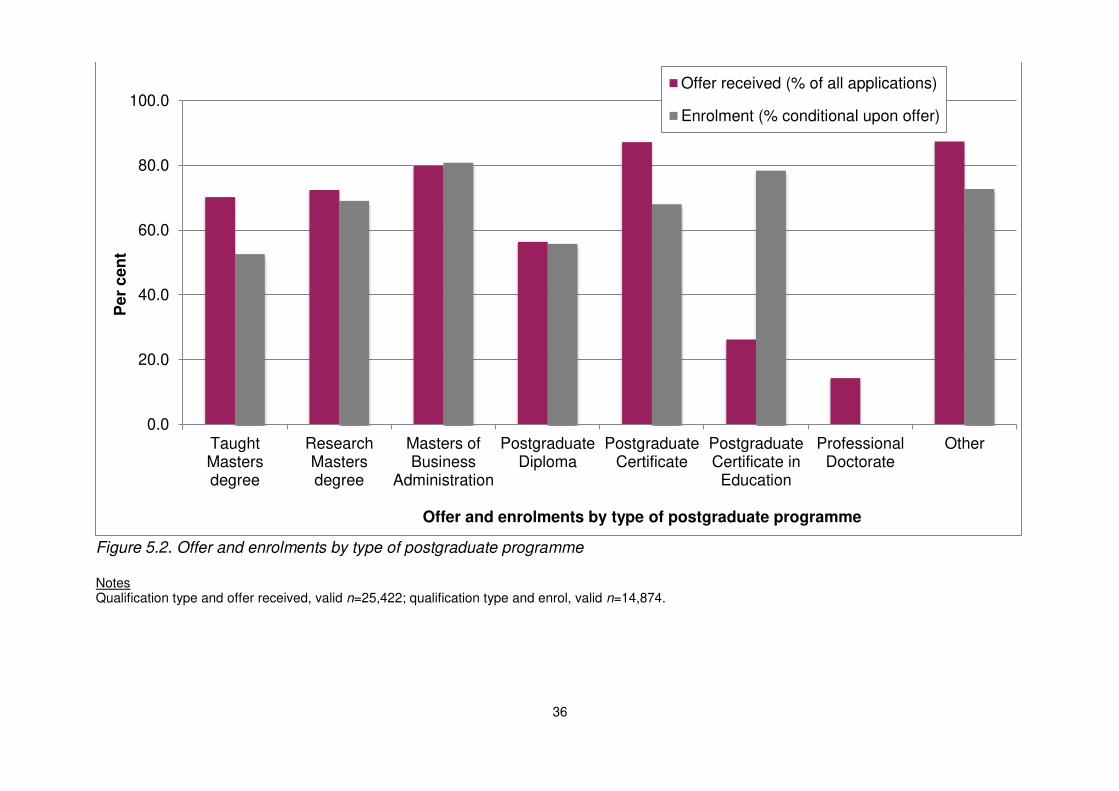
36
Figure 5.2. Offer and enrolments by type of postgraduate programme Notes Qualification type and offer received, valid n=25,422; qualification type and enrol, valid n=14,874.
0.0
20.0
40.0
60.0
80.0
100.0
TaughtMastersdegree
ResearchMastersdegree
Masters ofBusiness
Administration
PostgraduateDiploma
PostgraduateCertificate
PostgraduateCertificate inEducation
ProfessionalDoctorate
Other
Pe
r c
en
t
Offer and enrolments by type of postgraduate programme
Offer received (% of all applications)
Enrolment (% conditional upon offer)
37
Figure 5.3. Offer and enrolments by postgraduate subject area Notes JACS and offer received, valid n=25,422; JACS and enrol, valid n=14,874.
0.0 20.0 40.0 60.0 80.0 100.0
Medicine & Dentistry
Subjects Allied to Med
Biological Sciences
Veterinary Sciences & Agriculture
Physical Sciences
Mathematics & Comp Science
Enginerering
Technology
Arch, Building & Planning
Social Studies
Law
Business & Adm Studies
Mass Comms & Documentation
Linguistics, Classics & Related
European Lang, Lit & Related
Eastern, Asiatic, African, American studies
Historical & Philosophical studies
Creative Arts & Design
Education
Per cent
Po
stg
rad
uate
su
bje
ct
are
a
Offer received (% ofall applications)
Enrolment (%conditional uponoffer)
38
Figure 5.4. Offer and enrolments by socio-economic background measure Notes School type, valid n=7,889; POLAR3, valid n=41,663; parental NS-SEC, valid n=6,001. Empty fill indicates n<10
0.0
20.0
40.0
60.0
80.0
100.0
State school Independentschool
1 2 3 4 5 Managerial,administrative
andprofessionaloccupations
Intermediateoccupations
Routine andmanual
occupations
Never workedand long-termunemployed
School type POLAR3 quintile Parental NS-SEC
Per
cen
t
Socio-economic background measure
Offer received (% of applicationswithin category)
Enrolment (% conditional uponoffer)
39
6. Transition to postgraduate study
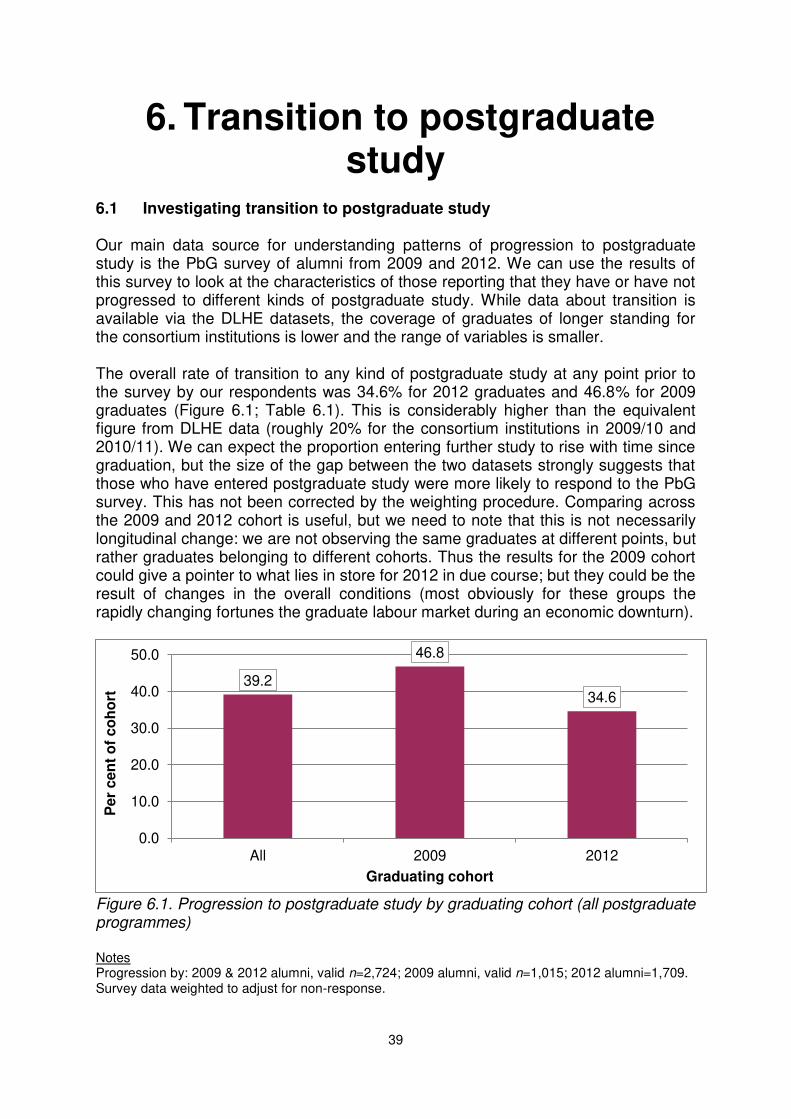
6.1 Investigating transition to postgraduate study Our main data source for understanding patterns of progression to postgraduate study is the PbG survey of alumni from 2009 and 2012. We can use the results of this survey to look at the characteristics of those reporting that they have or have not progressed to different kinds of postgraduate study. While data about transition is available via the DLHE datasets, the coverage of graduates of longer standing for the consortium institutions is lower and the range of variables is smaller. The overall rate of transition to any kind of postgraduate study at any point prior to the survey by our respondents was 34.6% for 2012 graduates and 46.8% for 2009 graduates (Figure 6.1; Table 6.1). This is considerably higher than the equivalent figure from DLHE data (roughly 20% for the consortium institutions in 2009/10 and 2010/11). We can expect the proportion entering further study to rise with time since graduation, but the size of the gap between the two datasets strongly suggests that those who have entered postgraduate study were more likely to respond to the PbG survey. This has not been corrected by the weighting procedure. Comparing across the 2009 and 2012 cohort is useful, but we need to note that this is not necessarily longitudinal change: we are not observing the same graduates at different points, but rather graduates belonging to different cohorts. Thus the results for the 2009 cohort could give a pointer to what lies in store for 2012 in due course; but they could be the result of changes in the overall conditions (most obviously for these groups the rapidly changing fortunes the graduate labour market during an economic downturn).
Figure 6.1. Progression to postgraduate study by graduating cohort (all postgraduate programmes) Notes Progression by: 2009 & 2012 alumni, valid n=2,724; 2009 alumni, valid n=1,015; 2012 alumni=1,709. Survey data weighted to adjust for non-response.
39.2
46.8
34.6
0.0
10.0
20.0
30.0
40.0
50.0
All 2009 2012
Pe
r c
en
t o
f c
oh
ort
Graduating cohort
40
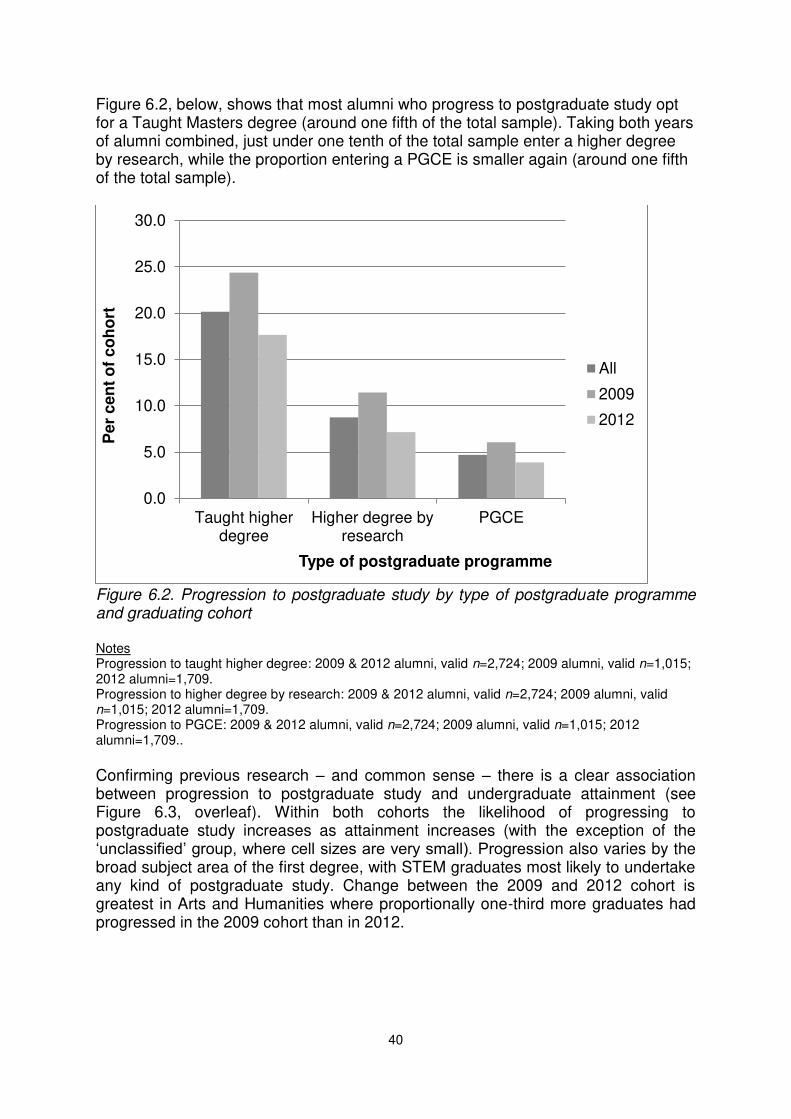
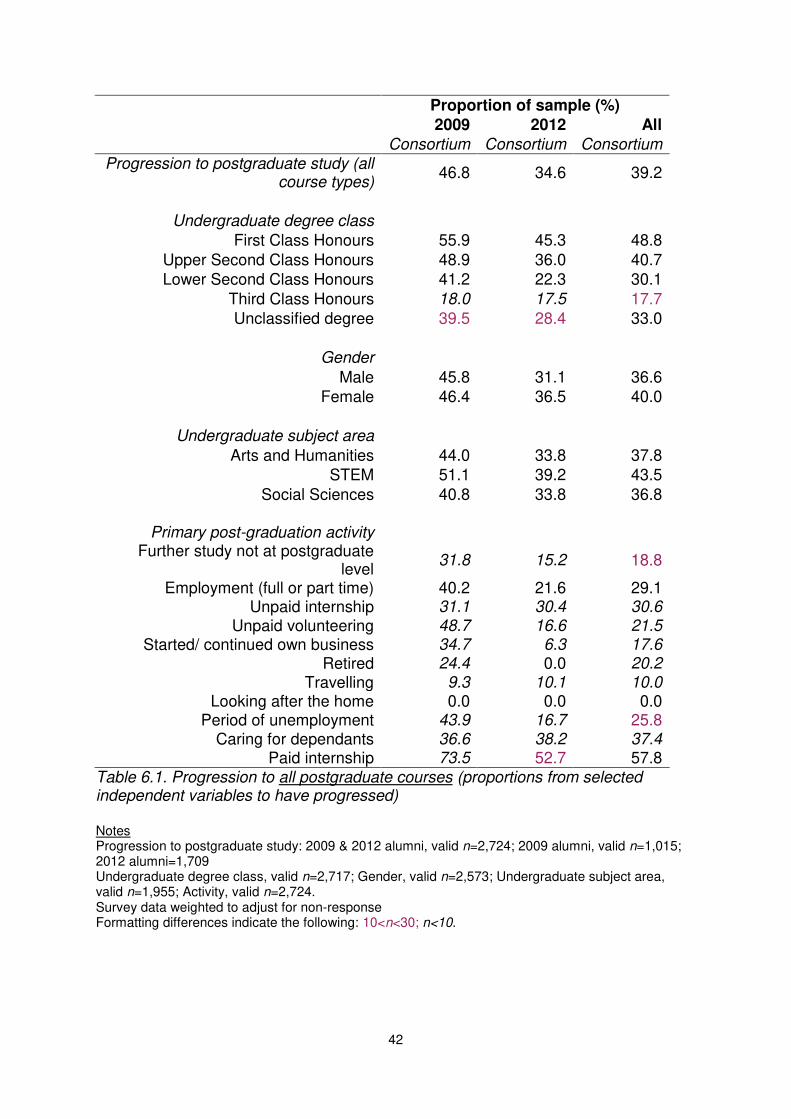
Figure 6.2, below, shows that most alumni who progress to postgraduate study opt for a Taught Masters degree (around one fifth of the total sample). Taking both years of alumni combined, just under one tenth of the total sample enter a higher degree by research, while the proportion entering a PGCE is smaller again (around one fifth of the total sample).
Figure 6.2. Progression to postgraduate study by type of postgraduate programme and graduating cohort Notes Progression to taught higher degree: 2009 & 2012 alumni, valid n=2,724; 2009 alumni, valid n=1,015; 2012 alumni=1,709. Progression to higher degree by research: 2009 & 2012 alumni, valid n=2,724; 2009 alumni, valid n=1,015; 2012 alumni=1,709. Progression to PGCE: 2009 & 2012 alumni, valid n=2,724; 2009 alumni, valid n=1,015; 2012 alumni=1,709..
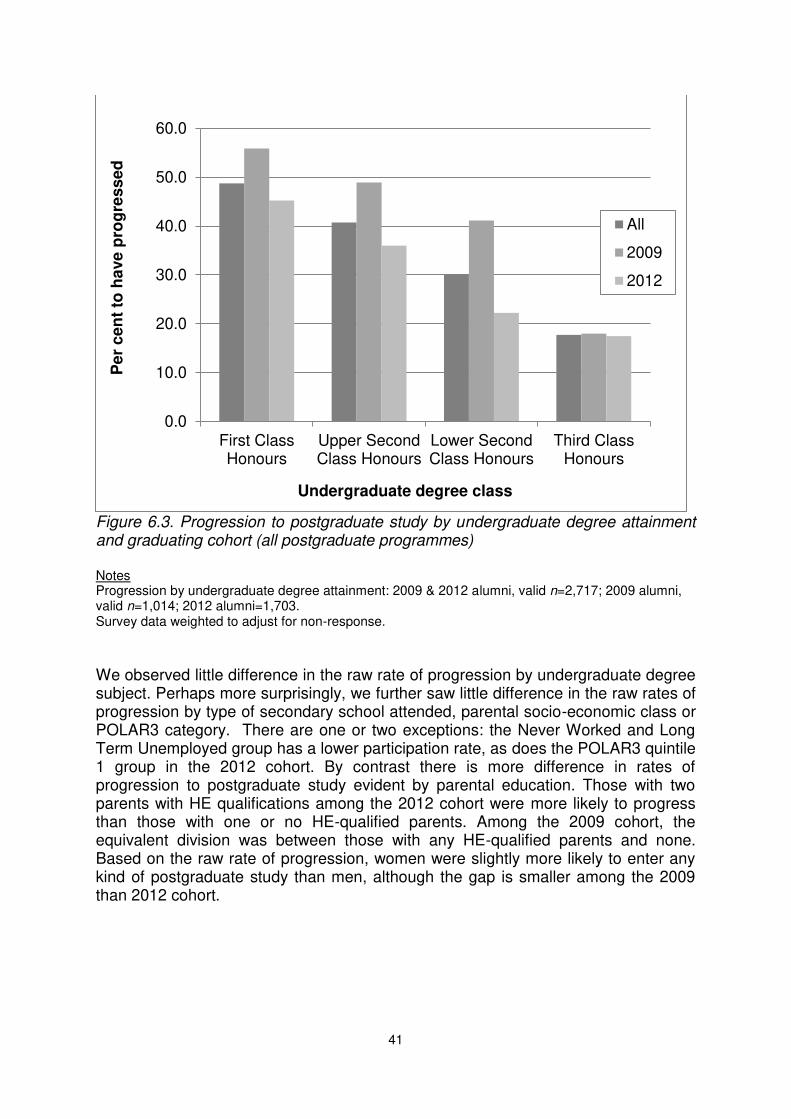
Confirming previous research – and common sense – there is a clear association between progression to postgraduate study and undergraduate attainment (see Figure 6.3, overleaf). Within both cohorts the likelihood of progressing to postgraduate study increases as attainment increases (with the exception of the ‘unclassified’ group, where cell sizes are very small). Progression also varies by the broad subject area of the first degree, with STEM graduates most likely to undertake any kind of postgraduate study. Change between the 2009 and 2012 cohort is greatest in Arts and Humanities where proportionally one-third more graduates had progressed in the 2009 cohort than in 2012.
0.0
5.0
10.0
15.0
20.0
25.0
30.0
Taught higherdegree
Higher degree byresearch
PGCE
Pe
r c
en
t o
f c
oh
ort
Type of postgraduate programme
All
2009
2012
41
Figure 6.3. Progression to postgraduate study by undergraduate degree attainment and graduating cohort (all postgraduate programmes) Notes Progression by undergraduate degree attainment: 2009 & 2012 alumni, valid n=2,717; 2009 alumni, valid n=1,014; 2012 alumni=1,703. Survey data weighted to adjust for non-response.
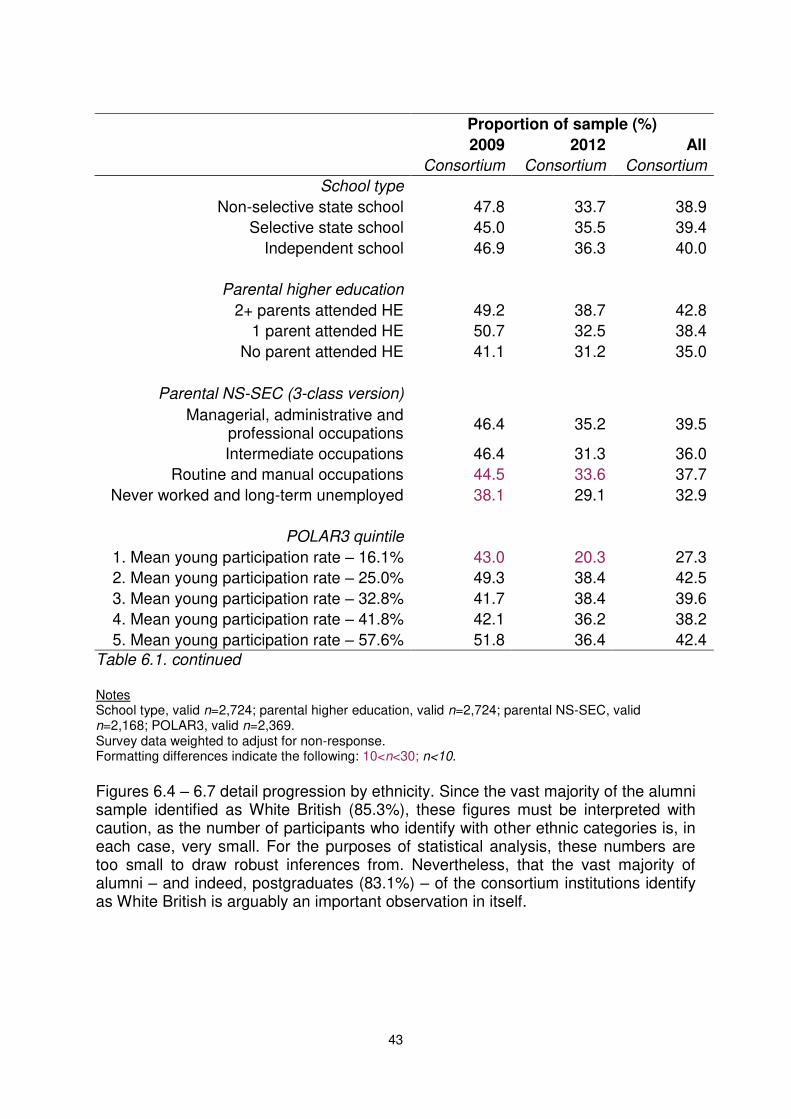
We observed little difference in the raw rate of progression by undergraduate degree subject. Perhaps more surprisingly, we further saw little difference in the raw rates of progression by type of secondary school attended, parental socio-economic class or POLAR3 category. There are one or two exceptions: the Never Worked and Long Term Unemployed group has a lower participation rate, as does the POLAR3 quintile 1 group in the 2012 cohort. By contrast there is more difference in rates of progression to postgraduate study evident by parental education. Those with two parents with HE qualifications among the 2012 cohort were more likely to progress than those with one or no HE-qualified parents. Among the 2009 cohort, the equivalent division was between those with any HE-qualified parents and none. Based on the raw rate of progression, women were slightly more likely to enter any kind of postgraduate study than men, although the gap is smaller among the 2009 than 2012 cohort.
0.0
10.0
20.0
30.0
40.0
50.0
60.0
First ClassHonours
Upper SecondClass Honours
Lower SecondClass Honours
Third ClassHonours
Pe
r c
en
t to
have
pro
gre
ss
ed
Undergraduate degree class
All
2009
2012
42
Proportion of sample (%)
2009 2012 All
Consortium Consortium Consortium
Progression to postgraduate study (all course types)
46.8 34.6 39.2
Undergraduate degree class
First Class Honours 55.9 45.3 48.8
Upper Second Class Honours 48.9 36.0 40.7
Lower Second Class Honours 41.2 22.3 30.1
Third Class Honours 18.0 17.5 17.7
Unclassified degree 39.5 28.4 33.0
Gender
Male 45.8 31.1 36.6
Female 46.4 36.5 40.0
Undergraduate subject area
Arts and Humanities 44.0 33.8 37.8
STEM 51.1 39.2 43.5
Social Sciences 40.8 33.8 36.8
Primary post-graduation activity Further study not at postgraduate
level 31.8 15.2 18.8
Employment (full or part time) 40.2 21.6 29.1 Unpaid internship 31.1 30.4 30.6
Unpaid volunteering 48.7 16.6 21.5 Started/ continued own business 34.7 6.3 17.6
Retired 24.4 0.0 20.2
Travelling 9.3 10.1 10.0 Looking after the home 0.0 0.0 0.0
Period of unemployment 43.9 16.7 25.8 Caring for dependants 36.6 38.2 37.4
Paid internship 73.5 52.7 57.8
Table 6.1. Progression to all postgraduate courses (proportions from selected independent variables to have progressed) Notes Progression to postgraduate study: 2009 & 2012 alumni, valid n=2,724; 2009 alumni, valid n=1,015; 2012 alumni=1,709 Undergraduate degree class, valid n=2,717; Gender, valid n=2,573; Undergraduate subject area, valid n=1,955; Activity, valid n=2,724. Survey data weighted to adjust for non-response Formatting differences indicate the following: 10<n<30; n<10.
43
Proportion of sample (%)
2009 2012 All
Consortium Consortium Consortium
School type
Non-selective state school 47.8 33.7 38.9
Selective state school 45.0 35.5 39.4
Independent school 46.9 36.3 40.0
Parental higher education
2+ parents attended HE 49.2 38.7 42.8
1 parent attended HE 50.7 32.5 38.4
No parent attended HE 41.1 31.2 35.0
Parental NS-SEC (3-class version)
Managerial, administrative and professional occupations
46.4 35.2 39.5
Intermediate occupations 46.4 31.3 36.0
Routine and manual occupations 44.5 33.6 37.7
Never worked and long-term unemployed 38.1 29.1 32.9
POLAR3 quintile
1. Mean young participation rate – 16.1% 43.0 20.3 27.3
2. Mean young participation rate – 25.0% 49.3 38.4 42.5
3. Mean young participation rate – 32.8% 41.7 38.4 39.6
4. Mean young participation rate – 41.8% 42.1 36.2 38.2
5. Mean young participation rate – 57.6% 51.8 36.4 42.4
Table 6.1. continued Notes School type, valid n=2,724; parental higher education, valid n=2,724; parental NS-SEC, valid n=2,168; POLAR3, valid n=2,369. Survey data weighted to adjust for non-response. Formatting differences indicate the following: 10<n<30; n<10.
Figures 6.4 – 6.7 detail progression by ethnicity. Since the vast majority of the alumni sample identified as White British (85.3%), these figures must be interpreted with caution, as the number of participants who identify with other ethnic categories is, in each case, very small. For the purposes of statistical analysis, these numbers are too small to draw robust inferences from. Nevertheless, that the vast majority of alumni – and indeed, postgraduates (83.1%) – of the consortium institutions identify as White British is arguably an important observation in itself.
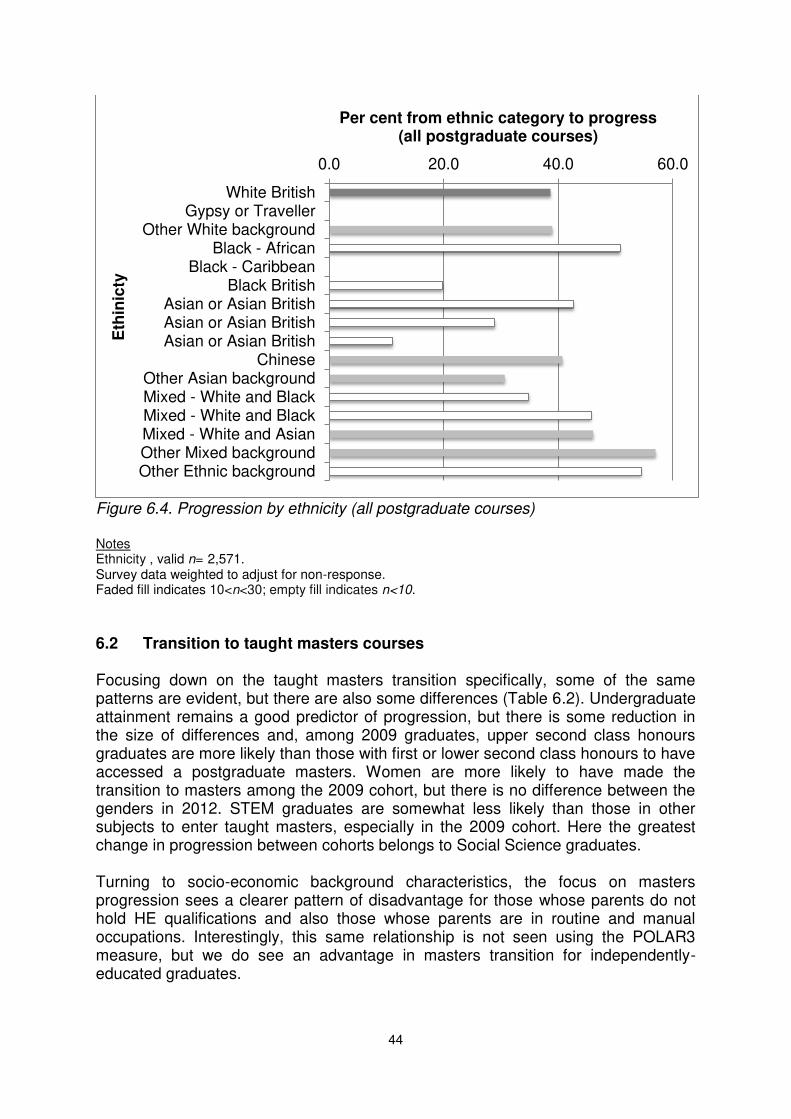
44
Figure 6.4. Progression by ethnicity (all postgraduate courses) Notes Ethnicity , valid n= 2,571. Survey data weighted to adjust for non-response. Faded fill indicates 10<n<30; empty fill indicates n<10.
6.2 Transition to taught masters courses Focusing down on the taught masters transition specifically, some of the same patterns are evident, but there are also some differences (Table 6.2). Undergraduate attainment remains a good predictor of progression, but there is some reduction in the size of differences and, among 2009 graduates, upper second class honours graduates are more likely than those with first or lower second class honours to have accessed a postgraduate masters. Women are more likely to have made the transition to masters among the 2009 cohort, but there is no difference between the genders in 2012. STEM graduates are somewhat less likely than those in other subjects to enter taught masters, especially in the 2009 cohort. Here the greatest change in progression between cohorts belongs to Social Science graduates. Turning to socio-economic background characteristics, the focus on masters progression sees a clearer pattern of disadvantage for those whose parents do not hold HE qualifications and also those whose parents are in routine and manual occupations. Interestingly, this same relationship is not seen using the POLAR3 measure, but we do see an advantage in masters transition for independently-educated graduates.
0.0 20.0 40.0 60.0
White BritishGypsy or Traveller
Other White backgroundBlack - African
Black - CaribbeanBlack British
Asian or Asian BritishAsian or Asian BritishAsian or Asian British
ChineseOther Asian backgroundMixed - White and BlackMixed - White and BlackMixed - White and AsianOther Mixed backgroundOther Ethnic background
Per cent from ethnic category to progress (all postgraduate courses)
Eth
inic
ty
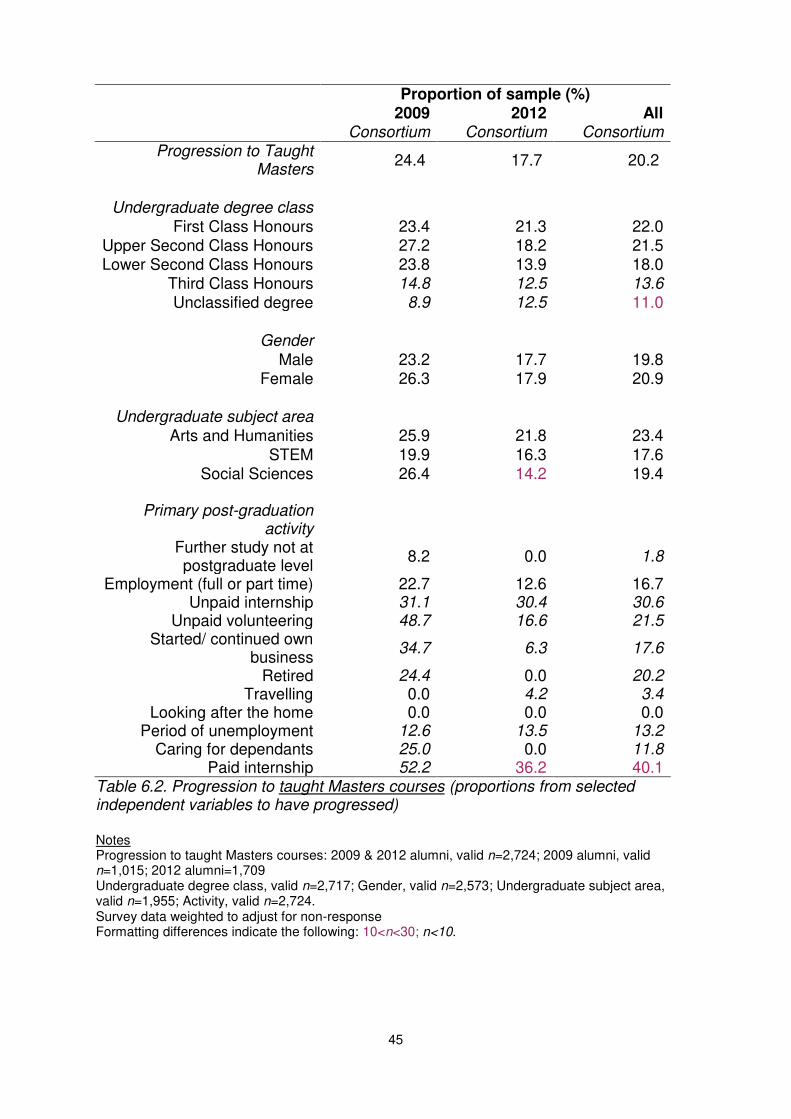
45
Proportion of sample (%) 2009 2012 All Consortium Consortium Consortium
Progression to Taught Masters
24.4 17.7 20.2
Undergraduate degree class
First Class Honours 23.4 21.3 22.0 Upper Second Class Honours 27.2 18.2 21.5 Lower Second Class Honours 23.8 13.9 18.0
Third Class Honours 14.8 12.5 13.6
Unclassified degree 8.9 12.5 11.0
Gender
Male 23.2 17.7 19.8 Female 26.3 17.9 20.9
Undergraduate subject area
Arts and Humanities 25.9 21.8 23.4
STEM 19.9 16.3 17.6 Social Sciences 26.4 14.2 19.4
Primary post-graduation
activity
Further study not at postgraduate level
8.2 0.0 1.8
Employment (full or part time) 22.7 12.6 16.7 Unpaid internship 31.1 30.4 30.6
Unpaid volunteering 48.7 16.6 21.5 Started/ continued own
business 34.7 6.3 17.6
Retired 24.4 0.0 20.2 Travelling 0.0 4.2 3.4
Looking after the home 0.0 0.0 0.0 Period of unemployment 12.6 13.5 13.2
Caring for dependants 25.0 0.0 11.8 Paid internship 52.2 36.2 40.1
Table 6.2. Progression to taught Masters courses (proportions from selected independent variables to have progressed) Notes Progression to taught Masters courses: 2009 & 2012 alumni, valid n=2,724; 2009 alumni, valid n=1,015; 2012 alumni=1,709 Undergraduate degree class, valid n=2,717; Gender, valid n=2,573; Undergraduate subject area, valid n=1,955; Activity, valid n=2,724. Survey data weighted to adjust for non-response Formatting differences indicate the following: 10<n<30; n<10.
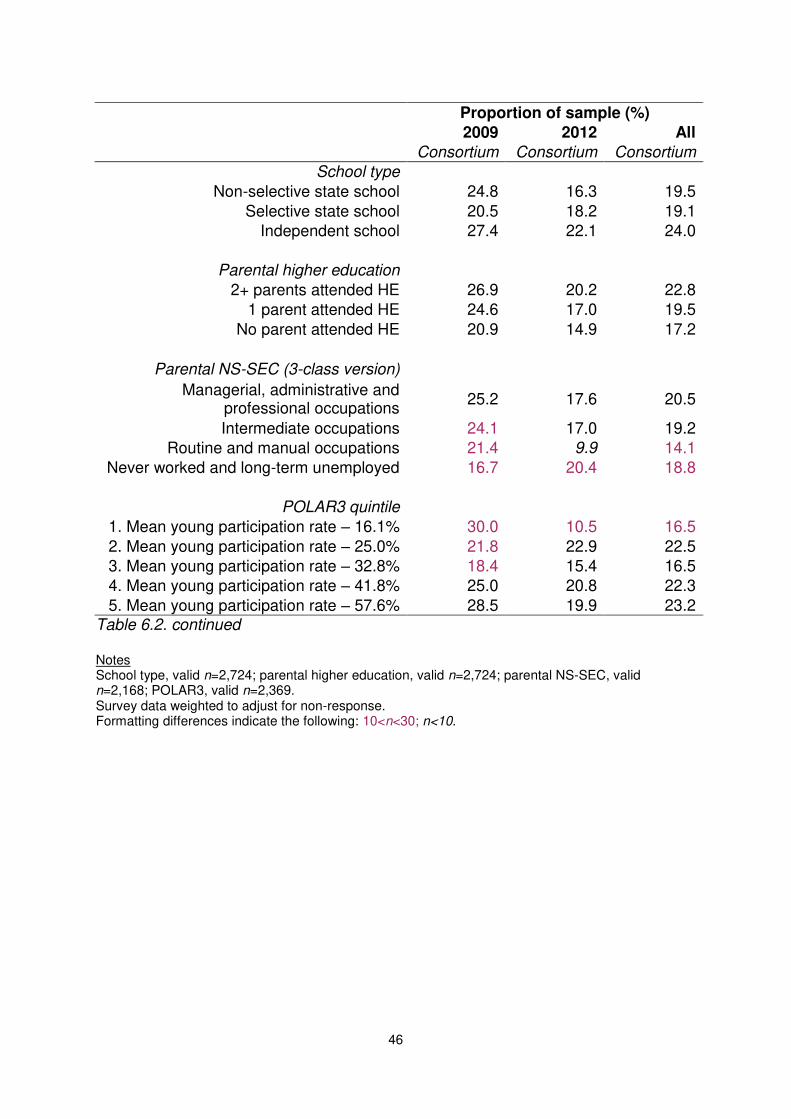
46
Proportion of sample (%)
2009 2012 All
Consortium Consortium Consortium
School type
Non-selective state school 24.8 16.3 19.5
Selective state school 20.5 18.2 19.1
Independent school 27.4 22.1 24.0
Parental higher education
2+ parents attended HE 26.9 20.2 22.8
1 parent attended HE 24.6 17.0 19.5
No parent attended HE 20.9 14.9 17.2
Parental NS-SEC (3-class version)
Managerial, administrative and professional occupations
25.2 17.6 20.5
Intermediate occupations 24.1 17.0 19.2
Routine and manual occupations 21.4 9.9 14.1
Never worked and long-term unemployed 16.7 20.4 18.8
POLAR3 quintile
1. Mean young participation rate – 16.1% 30.0 10.5 16.5
2. Mean young participation rate – 25.0% 21.8 22.9 22.5
3. Mean young participation rate – 32.8% 18.4 15.4 16.5
4. Mean young participation rate – 41.8% 25.0 20.8 22.3
5. Mean young participation rate – 57.6% 28.5 19.9 23.2
Table 6.2. continued Notes School type, valid n=2,724; parental higher education, valid n=2,724; parental NS-SEC, valid n=2,168; POLAR3, valid n=2,369. Survey data weighted to adjust for non-response. Formatting differences indicate the following: 10<n<30; n<10.
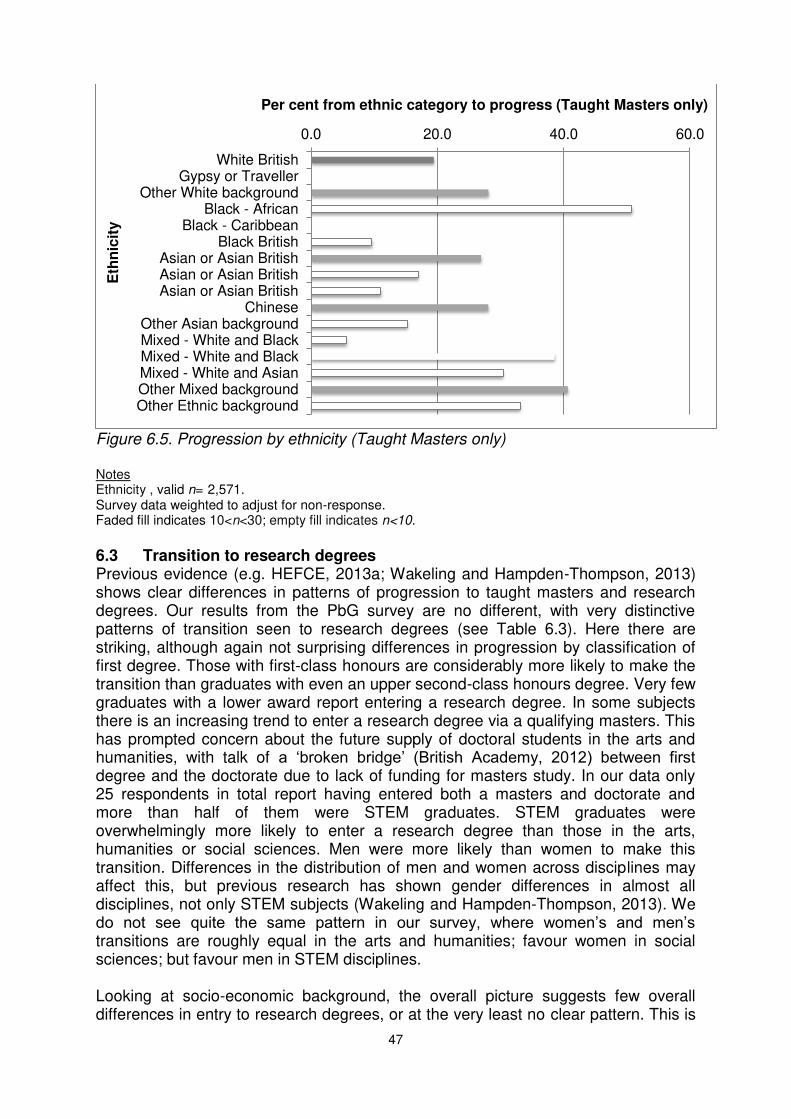
47
Figure 6.5. Progression by ethnicity (Taught Masters only) Notes Ethnicity , valid n= 2,571. Survey data weighted to adjust for non-response. Faded fill indicates 10<n<30; empty fill indicates n<10.
6.3 Transition to research degrees Previous evidence (e.g. HEFCE, 2013a; Wakeling and Hampden-Thompson, 2013) shows clear differences in patterns of progression to taught masters and research degrees. Our results from the PbG survey are no different, with very distinctive patterns of transition seen to research degrees (see Table 6.3). Here there are striking, although again not surprising differences in progression by classification of first degree. Those with first-class honours are considerably more likely to make the transition than graduates with even an upper second-class honours degree. Very few graduates with a lower award report entering a research degree. In some subjects there is an increasing trend to enter a research degree via a qualifying masters. This has prompted concern about the future supply of doctoral students in the arts and humanities, with talk of a ‘broken bridge’ (British Academy, 2012) between first degree and the doctorate due to lack of funding for masters study. In our data only 25 respondents in total report having entered both a masters and doctorate and more than half of them were STEM graduates. STEM graduates were overwhelmingly more likely to enter a research degree than those in the arts, humanities or social sciences. Men were more likely than women to make this transition. Differences in the distribution of men and women across disciplines may affect this, but previous research has shown gender differences in almost all disciplines, not only STEM subjects (Wakeling and Hampden-Thompson, 2013). We do not see quite the same pattern in our survey, where women’s and men’s transitions are roughly equal in the arts and humanities; favour women in social sciences; but favour men in STEM disciplines. Looking at socio-economic background, the overall picture suggests few overall differences in entry to research degrees, or at the very least no clear pattern. This is
0.0 20.0 40.0 60.0
White BritishGypsy or Traveller
Other White backgroundBlack - African
Black - CaribbeanBlack British
Asian or Asian BritishAsian or Asian BritishAsian or Asian British
ChineseOther Asian backgroundMixed - White and BlackMixed - White and BlackMixed - White and AsianOther Mixed backgroundOther Ethnic background
Per cent from ethnic category to progress (Taught Masters only) E
thn
icit
y
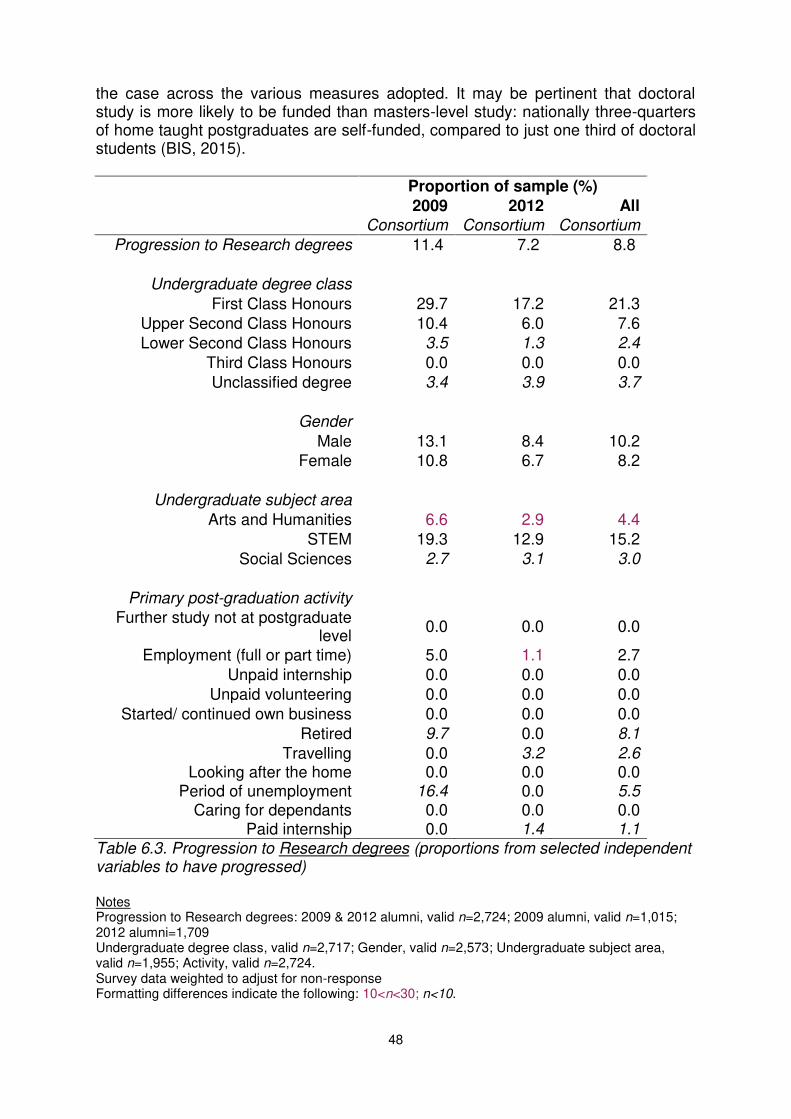
48
the case across the various measures adopted. It may be pertinent that doctoral study is more likely to be funded than masters-level study: nationally three-quarters of home taught postgraduates are self-funded, compared to just one third of doctoral students (BIS, 2015).
Proportion of sample (%)
2009 2012 All
Consortium Consortium Consortium
Progression to Research degrees 11.4 7.2 8.8
Undergraduate degree class
First Class Honours 29.7 17.2 21.3
Upper Second Class Honours 10.4 6.0 7.6
Lower Second Class Honours 3.5 1.3 2.4
Third Class Honours 0.0 0.0 0.0
Unclassified degree 3.4 3.9 3.7
Gender
Male 13.1 8.4 10.2
Female 10.8 6.7 8.2
Undergraduate subject area
Arts and Humanities 6.6 2.9 4.4
STEM 19.3 12.9 15.2
Social Sciences 2.7 3.1 3.0
Primary post-graduation activity
Further study not at postgraduate level
0.0 0.0 0.0
Employment (full or part time) 5.0 1.1 2.7
Unpaid internship 0.0 0.0 0.0
Unpaid volunteering 0.0 0.0 0.0
Started/ continued own business 0.0 0.0 0.0
Retired 9.7 0.0 8.1
Travelling 0.0 3.2 2.6 Looking after the home 0.0 0.0 0.0
Period of unemployment 16.4 0.0 5.5
Caring for dependants 0.0 0.0 0.0 Paid internship 0.0 1.4 1.1
Table 6.3. Progression to Research degrees (proportions from selected independent variables to have progressed) Notes Progression to Research degrees: 2009 & 2012 alumni, valid n=2,724; 2009 alumni, valid n=1,015; 2012 alumni=1,709 Undergraduate degree class, valid n=2,717; Gender, valid n=2,573; Undergraduate subject area, valid n=1,955; Activity, valid n=2,724. Survey data weighted to adjust for non-response Formatting differences indicate the following: 10<n<30; n<10.
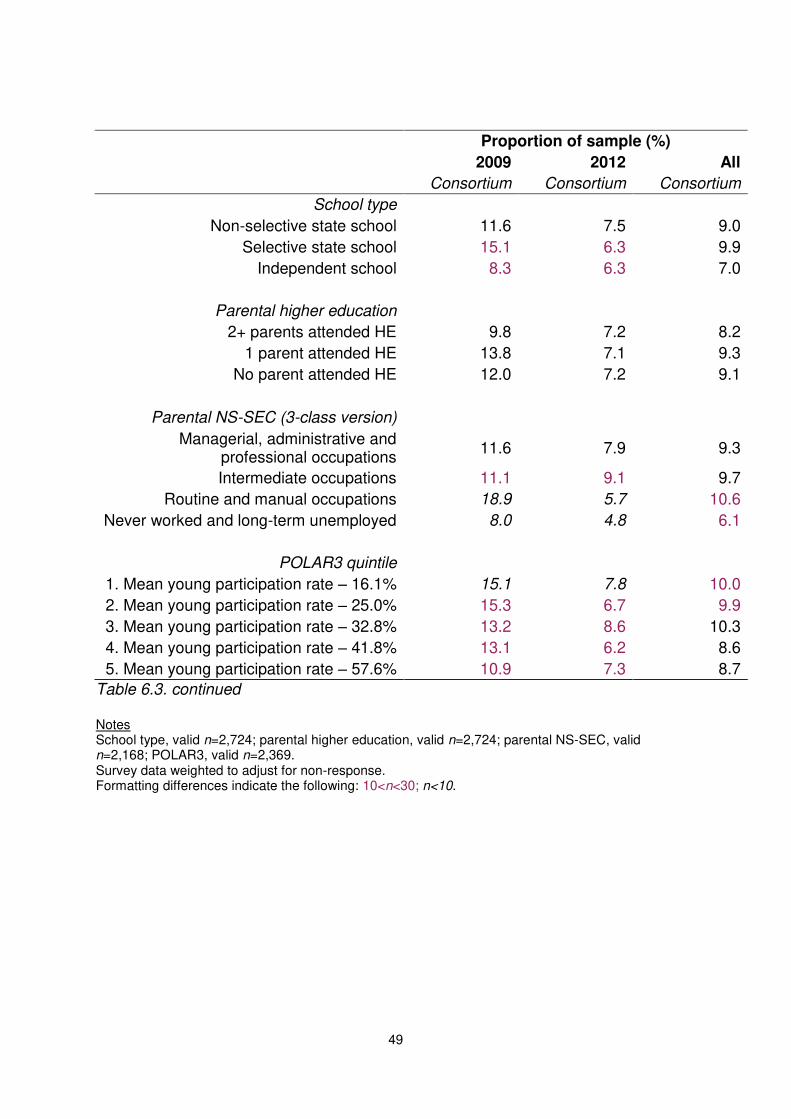
49
Proportion of sample (%)
2009 2012 All
Consortium Consortium Consortium
School type
Non-selective state school 11.6 7.5 9.0
Selective state school 15.1 6.3 9.9
Independent school 8.3 6.3 7.0
Parental higher education
2+ parents attended HE 9.8 7.2 8.2
1 parent attended HE 13.8 7.1 9.3
No parent attended HE 12.0 7.2 9.1
Parental NS-SEC (3-class version)
Managerial, administrative and professional occupations
11.6 7.9 9.3
Intermediate occupations 11.1 9.1 9.7
Routine and manual occupations 18.9 5.7 10.6
Never worked and long-term unemployed 8.0 4.8 6.1
POLAR3 quintile
1. Mean young participation rate – 16.1% 15.1 7.8 10.0
2. Mean young participation rate – 25.0% 15.3 6.7 9.9
3. Mean young participation rate – 32.8% 13.2 8.6 10.3
4. Mean young participation rate – 41.8% 13.1 6.2 8.6
5. Mean young participation rate – 57.6% 10.9 7.3 8.7
Table 6.3. continued Notes School type, valid n=2,724; parental higher education, valid n=2,724; parental NS-SEC, valid n=2,168; POLAR3, valid n=2,369. Survey data weighted to adjust for non-response. Formatting differences indicate the following: 10<n<30; n<10.
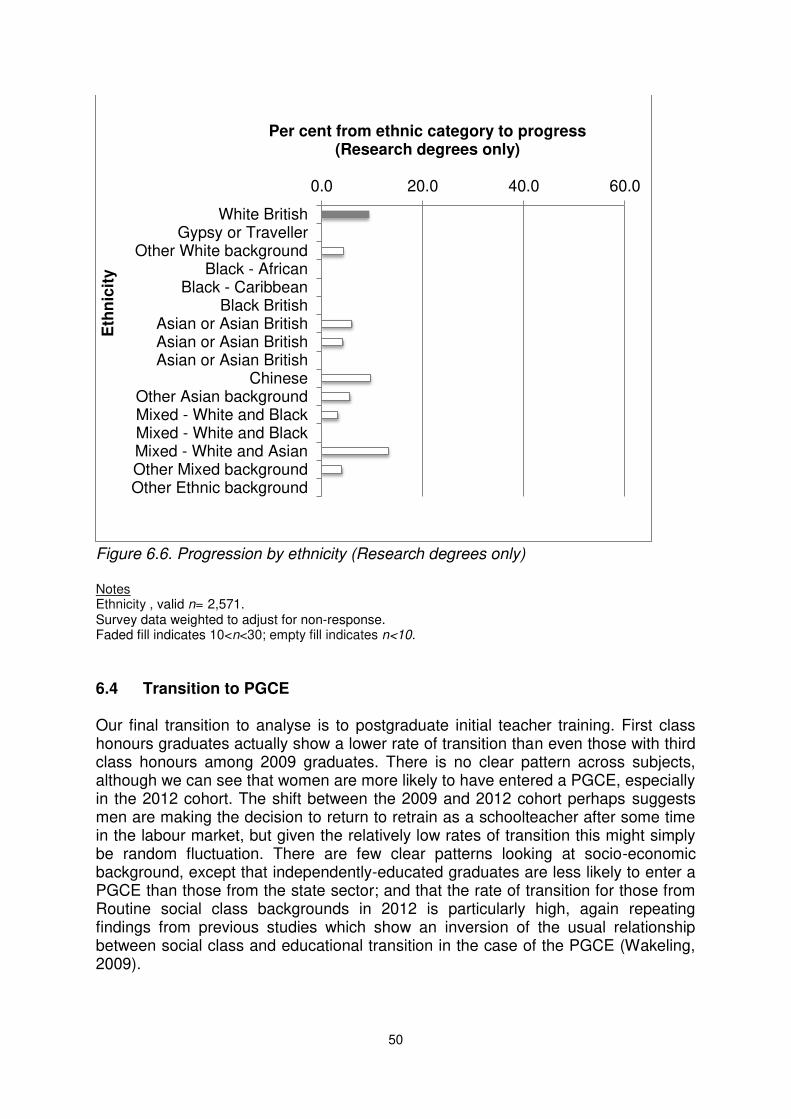
50
Figure 6.6. Progression by ethnicity (Research degrees only) Notes Ethnicity , valid n= 2,571. Survey data weighted to adjust for non-response. Faded fill indicates 10<n<30; empty fill indicates n<10.
6.4 Transition to PGCE Our final transition to analyse is to postgraduate initial teacher training. First class honours graduates actually show a lower rate of transition than even those with third class honours among 2009 graduates. There is no clear pattern across subjects, although we can see that women are more likely to have entered a PGCE, especially in the 2012 cohort. The shift between the 2009 and 2012 cohort perhaps suggests men are making the decision to return to retrain as a schoolteacher after some time in the labour market, but given the relatively low rates of transition this might simply be random fluctuation. There are few clear patterns looking at socio-economic background, except that independently-educated graduates are less likely to enter a PGCE than those from the state sector; and that the rate of transition for those from Routine social class backgrounds in 2012 is particularly high, again repeating findings from previous studies which show an inversion of the usual relationship between social class and educational transition in the case of the PGCE (Wakeling, 2009).
0.0 20.0 40.0 60.0
White BritishGypsy or Traveller
Other White backgroundBlack - African
Black - CaribbeanBlack British
Asian or Asian BritishAsian or Asian BritishAsian or Asian British
ChineseOther Asian backgroundMixed - White and BlackMixed - White and BlackMixed - White and AsianOther Mixed backgroundOther Ethnic background
Per cent from ethnic category to progress (Research degrees only)
Eth
nic
ity
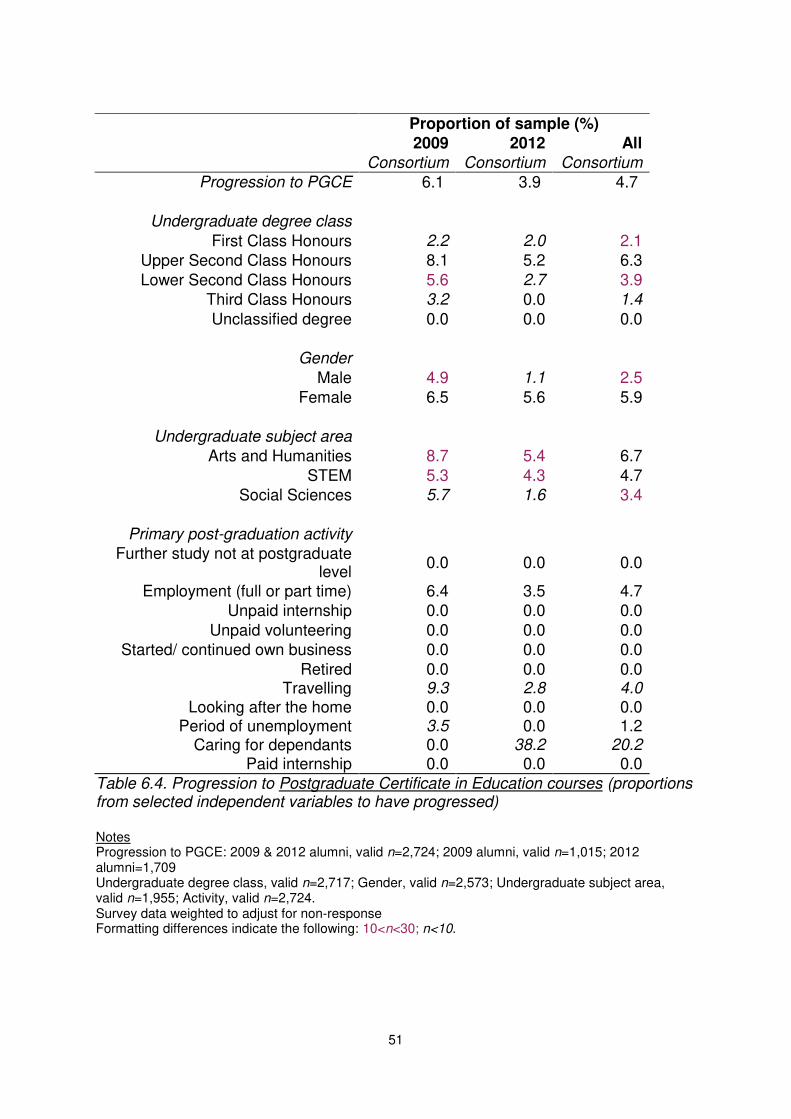
51
Proportion of sample (%)
2009 2012 All
Consortium Consortium Consortium
Progression to PGCE 6.1 3.9 4.7
Undergraduate degree class
First Class Honours 2.2 2.0 2.1
Upper Second Class Honours 8.1 5.2 6.3
Lower Second Class Honours 5.6 2.7 3.9
Third Class Honours 3.2 0.0 1.4
Unclassified degree 0.0 0.0 0.0
Gender
Male 4.9 1.1 2.5
Female 6.5 5.6 5.9
Undergraduate subject area
Arts and Humanities 8.7 5.4 6.7
STEM 5.3 4.3 4.7
Social Sciences 5.7 1.6 3.4
Primary post-graduation activity
Further study not at postgraduate level
0.0 0.0 0.0
Employment (full or part time) 6.4 3.5 4.7
Unpaid internship 0.0 0.0 0.0
Unpaid volunteering 0.0 0.0 0.0
Started/ continued own business 0.0 0.0 0.0
Retired 0.0 0.0 0.0 Travelling 9.3 2.8 4.0
Looking after the home 0.0 0.0 0.0 Period of unemployment 3.5 0.0 1.2
Caring for dependants 0.0 38.2 20.2
Paid internship 0.0 0.0 0.0
Table 6.4. Progression to Postgraduate Certificate in Education courses (proportions from selected independent variables to have progressed) Notes Progression to PGCE: 2009 & 2012 alumni, valid n=2,724; 2009 alumni, valid n=1,015; 2012 alumni=1,709 Undergraduate degree class, valid n=2,717; Gender, valid n=2,573; Undergraduate subject area, valid n=1,955; Activity, valid n=2,724. Survey data weighted to adjust for non-response Formatting differences indicate the following: 10<n<30; n<10.
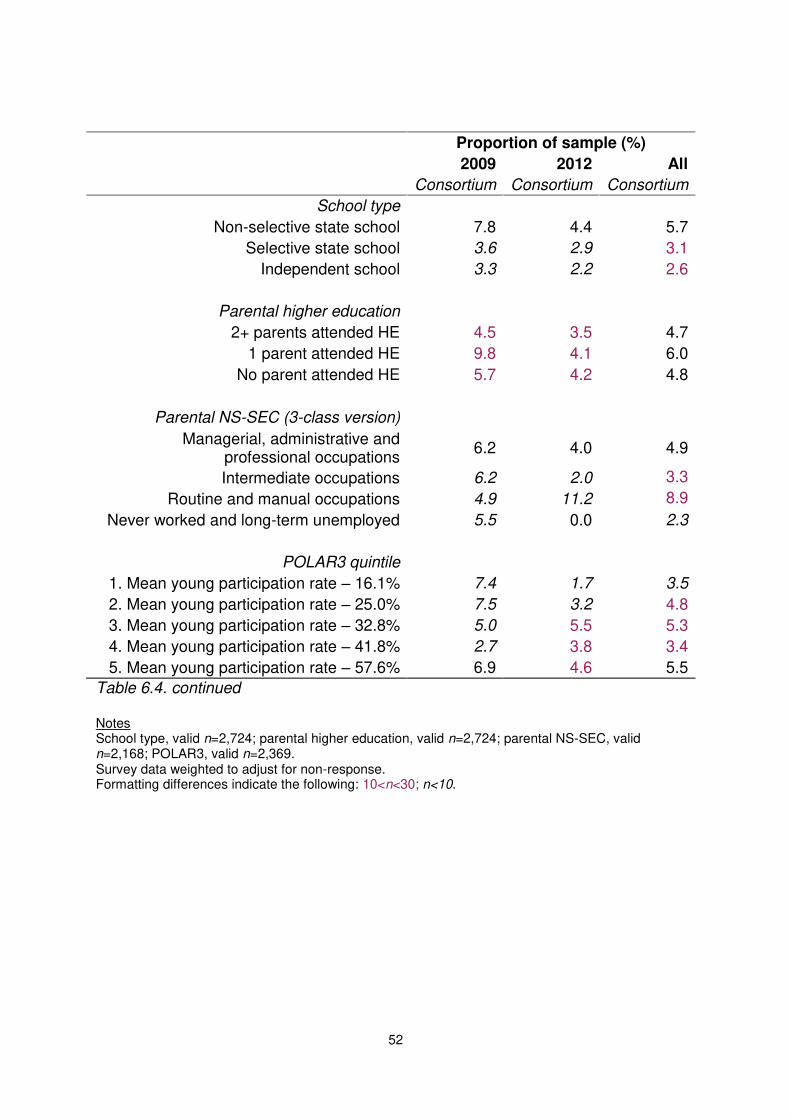
52
Proportion of sample (%)
2009 2012 All
Consortium Consortium Consortium
School type
Non-selective state school 7.8 4.4 5.7
Selective state school 3.6 2.9 3.1
Independent school 3.3 2.2 2.6
Parental higher education
2+ parents attended HE 4.5 3.5 4.7
1 parent attended HE 9.8 4.1 6.0
No parent attended HE 5.7 4.2 4.8
Parental NS-SEC (3-class version)
Managerial, administrative and professional occupations
6.2 4.0 4.9
Intermediate occupations 6.2 2.0 3.3
Routine and manual occupations 4.9 11.2 8.9
Never worked and long-term unemployed 5.5 0.0 2.3
POLAR3 quintile
1. Mean young participation rate – 16.1% 7.4 1.7 3.5
2. Mean young participation rate – 25.0% 7.5 3.2 4.8
3. Mean young participation rate – 32.8% 5.0 5.5 5.3
4. Mean young participation rate – 41.8% 2.7 3.8 3.4
5. Mean young participation rate – 57.6% 6.9 4.6 5.5
Table 6.4. continued Notes School type, valid n=2,724; parental higher education, valid n=2,724; parental NS-SEC, valid n=2,168; POLAR3, valid n=2,369. Survey data weighted to adjust for non-response. Formatting differences indicate the following: 10<n<30; n<10.
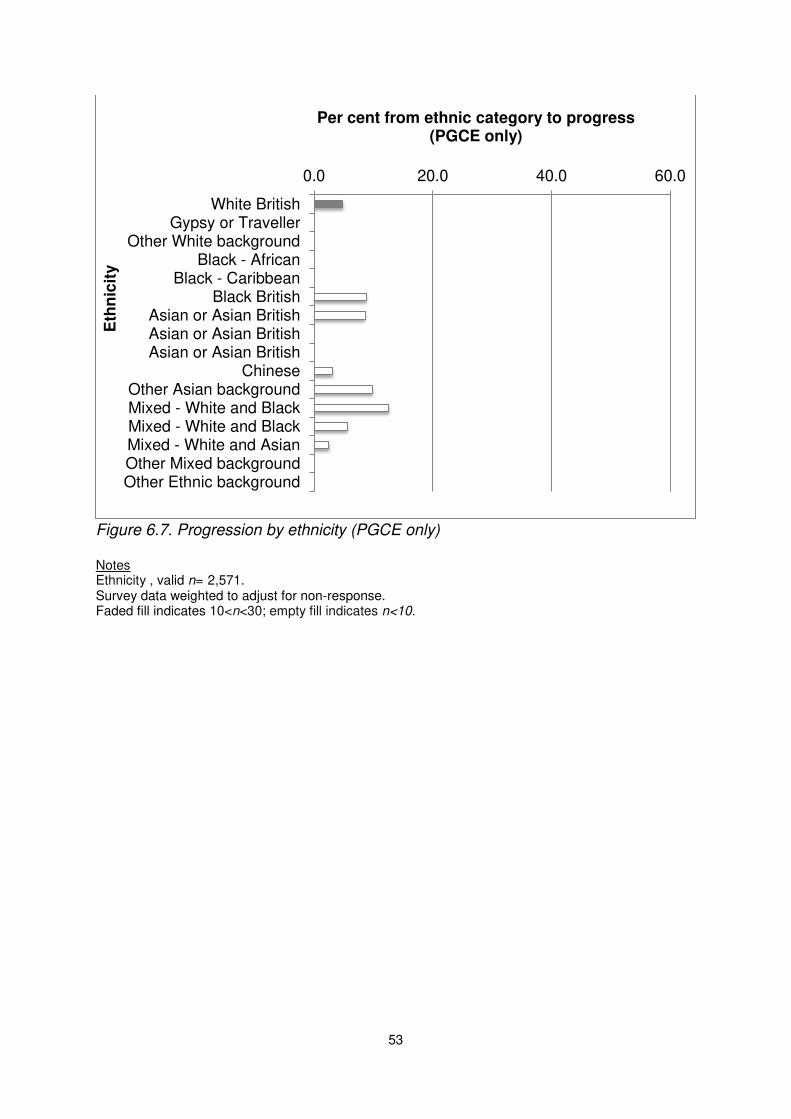
53
Figure 6.7. Progression by ethnicity (PGCE only) Notes Ethnicity , valid n= 2,571. Survey data weighted to adjust for non-response. Faded fill indicates 10<n<30; empty fill indicates n<10.
0.0 20.0 40.0 60.0
White BritishGypsy or Traveller
Other White backgroundBlack - African
Black - CaribbeanBlack British
Asian or Asian BritishAsian or Asian BritishAsian or Asian British
ChineseOther Asian backgroundMixed - White and BlackMixed - White and BlackMixed - White and AsianOther Mixed backgroundOther Ethnic background
Per cent from ethnic category to progress (PGCE only)
Eth
nic
ity
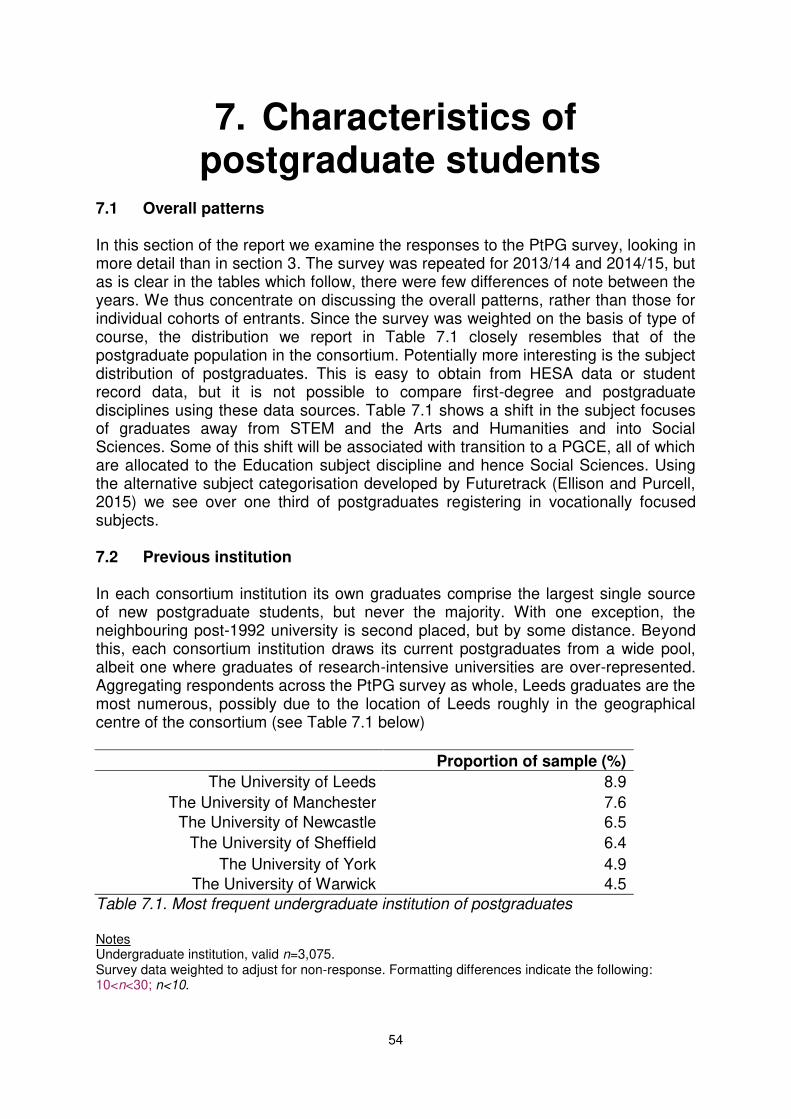
54
7. Characteristics of postgraduate students
7.1 Overall patterns In this section of the report we examine the responses to the PtPG survey, looking in more detail than in section 3. The survey was repeated for 2013/14 and 2014/15, but as is clear in the tables which follow, there were few differences of note between the years. We thus concentrate on discussing the overall patterns, rather than those for individual cohorts of entrants. Since the survey was weighted on the basis of type of course, the distribution we report in Table 7.1 closely resembles that of the postgraduate population in the consortium. Potentially more interesting is the subject distribution of postgraduates. This is easy to obtain from HESA data or student record data, but it is not possible to compare first-degree and postgraduate disciplines using these data sources. Table 7.1 shows a shift in the subject focuses of graduates away from STEM and the Arts and Humanities and into Social Sciences. Some of this shift will be associated with transition to a PGCE, all of which are allocated to the Education subject discipline and hence Social Sciences. Using the alternative subject categorisation developed by Futuretrack (Ellison and Purcell, 2015) we see over one third of postgraduates registering in vocationally focused subjects. 7.2 Previous institution In each consortium institution its own graduates comprise the largest single source of new postgraduate students, but never the majority. With one exception, the neighbouring post-1992 university is second placed, but by some distance. Beyond this, each consortium institution draws its current postgraduates from a wide pool, albeit one where graduates of research-intensive universities are over-represented. Aggregating respondents across the PtPG survey as whole, Leeds graduates are the most numerous, possibly due to the location of Leeds roughly in the geographical centre of the consortium (see Table 7.1 below)
Proportion of sample (%)
The University of Leeds 8.9
The University of Manchester 7.6
The University of Newcastle 6.5
The University of Sheffield 6.4
The University of York 4.9
The University of Warwick 4.5
Table 7.1. Most frequent undergraduate institution of postgraduates Notes Undergraduate institution, valid n=3,075. Survey data weighted to adjust for non-response. Formatting differences indicate the following: 10<n<30; n<10.
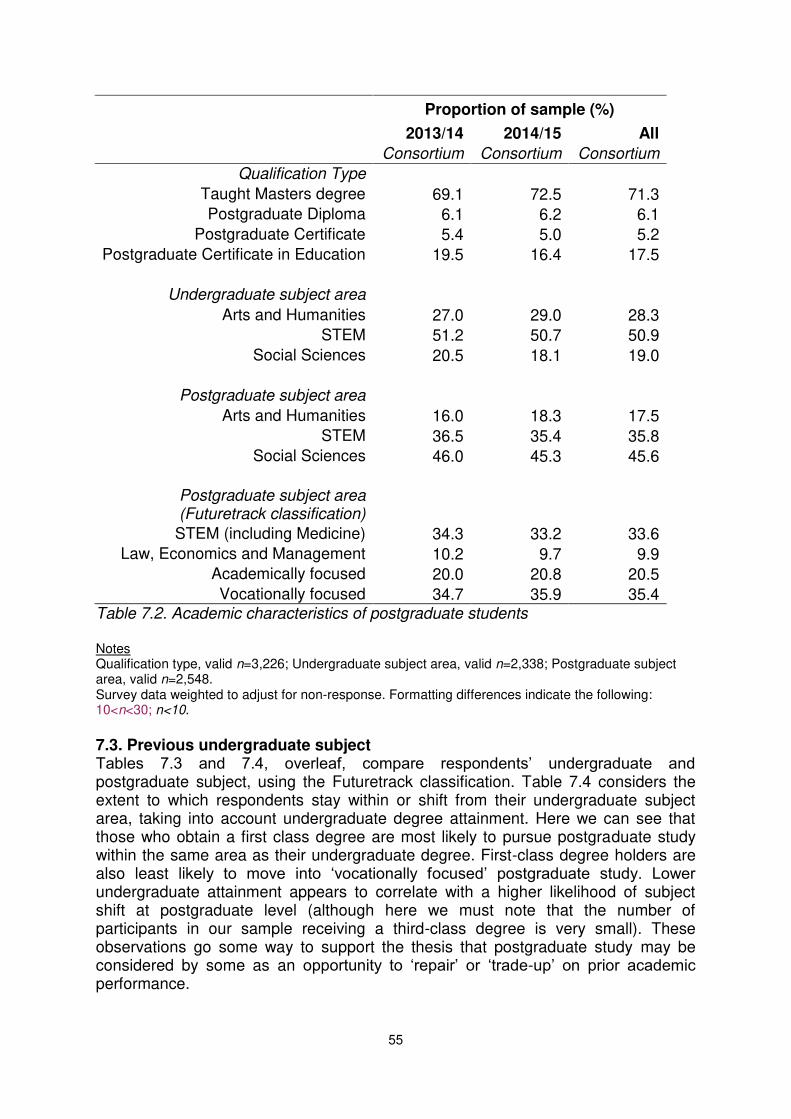
55
Proportion of sample (%)
2013/14 2014/15 All
Consortium Consortium Consortium
Qualification Type
Taught Masters degree 69.1 72.5 71.3
Postgraduate Diploma 6.1 6.2 6.1
Postgraduate Certificate 5.4 5.0 5.2
Postgraduate Certificate in Education 19.5 16.4 17.5
Undergraduate subject area
Arts and Humanities 27.0 29.0 28.3
STEM 51.2 50.7 50.9
Social Sciences 20.5 18.1 19.0
Postgraduate subject area
Arts and Humanities 16.0 18.3 17.5
STEM 36.5 35.4 35.8
Social Sciences 46.0 45.3 45.6
Postgraduate subject area (Futuretrack classification)
STEM (including Medicine) 34.3 33.2 33.6
Law, Economics and Management 10.2 9.7 9.9
Academically focused 20.0 20.8 20.5
Vocationally focused 34.7 35.9 35.4 Table 7.2. Academic characteristics of postgraduate students Notes Qualification type, valid n=3,226; Undergraduate subject area, valid n=2,338; Postgraduate subject area, valid n=2,548. Survey data weighted to adjust for non-response. Formatting differences indicate the following: 10<n<30; n<10.
7.3. Previous undergraduate subject Tables 7.3 and 7.4, overleaf, compare respondents’ undergraduate and postgraduate subject, using the Futuretrack classification. Table 7.4 considers the extent to which respondents stay within or shift from their undergraduate subject area, taking into account undergraduate degree attainment. Here we can see that those who obtain a first class degree are most likely to pursue postgraduate study within the same area as their undergraduate degree. First-class degree holders are also least likely to move into ‘vocationally focused’ postgraduate study. Lower undergraduate attainment appears to correlate with a higher likelihood of subject shift at postgraduate level (although here we must note that the number of participants in our sample receiving a third-class degree is very small). These observations go some way to support the thesis that postgraduate study may be considered by some as an opportunity to ‘repair’ or ‘trade-up’ on prior academic performance.
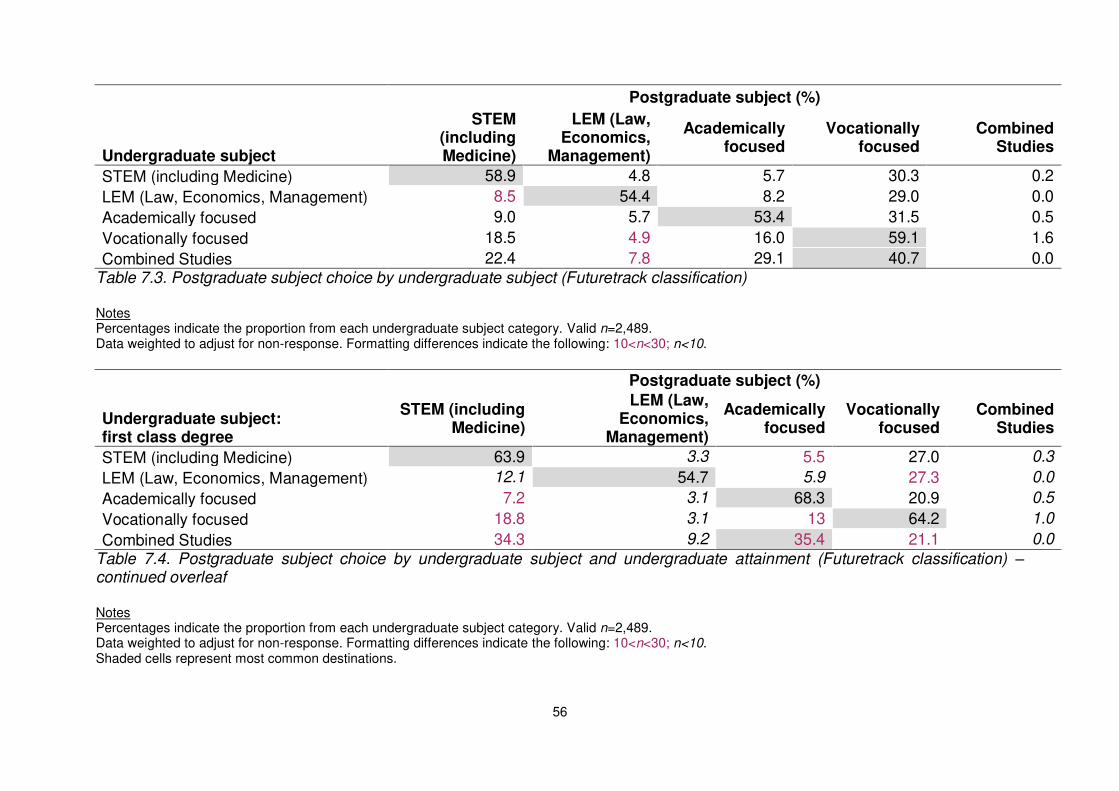
56
Postgraduate subject (%)
Undergraduate subject
STEM (including Medicine)
LEM (Law, Economics,
Management)
Academically focused
Vocationally focused
Combined Studies
STEM (including Medicine) 58.9 4.8 5.7 30.3 0.2
LEM (Law, Economics, Management) 8.5 54.4 8.2 29.0 0.0
Academically focused 9.0 5.7 53.4 31.5 0.5
Vocationally focused 18.5 4.9 16.0 59.1 1.6
Combined Studies 22.4 7.8 29.1 40.7 0.0
Table 7.3. Postgraduate subject choice by undergraduate subject (Futuretrack classification) Notes Percentages indicate the proportion from each undergraduate subject category. Valid n=2,489. Data weighted to adjust for non-response. Formatting differences indicate the following: 10<n<30; n<10.
Postgraduate subject (%)
Undergraduate subject: first class degree
STEM (including Medicine)
LEM (Law, Economics,
Management)
Academically focused
Vocationally focused
Combined Studies
STEM (including Medicine) 63.9 3.3 5.5 27.0 0.3
LEM (Law, Economics, Management) 12.1 54.7 5.9 27.3 0.0
Academically focused 7.2 3.1 68.3 20.9 0.5
Vocationally focused 18.8 3.1 13 64.2 1.0
Combined Studies 34.3 9.2 35.4 21.1 0.0
Table 7.4. Postgraduate subject choice by undergraduate subject and undergraduate attainment (Futuretrack classification) – continued overleaf Notes Percentages indicate the proportion from each undergraduate subject category. Valid n=2,489. Data weighted to adjust for non-response. Formatting differences indicate the following: 10<n<30; n<10. Shaded cells represent most common destinations.
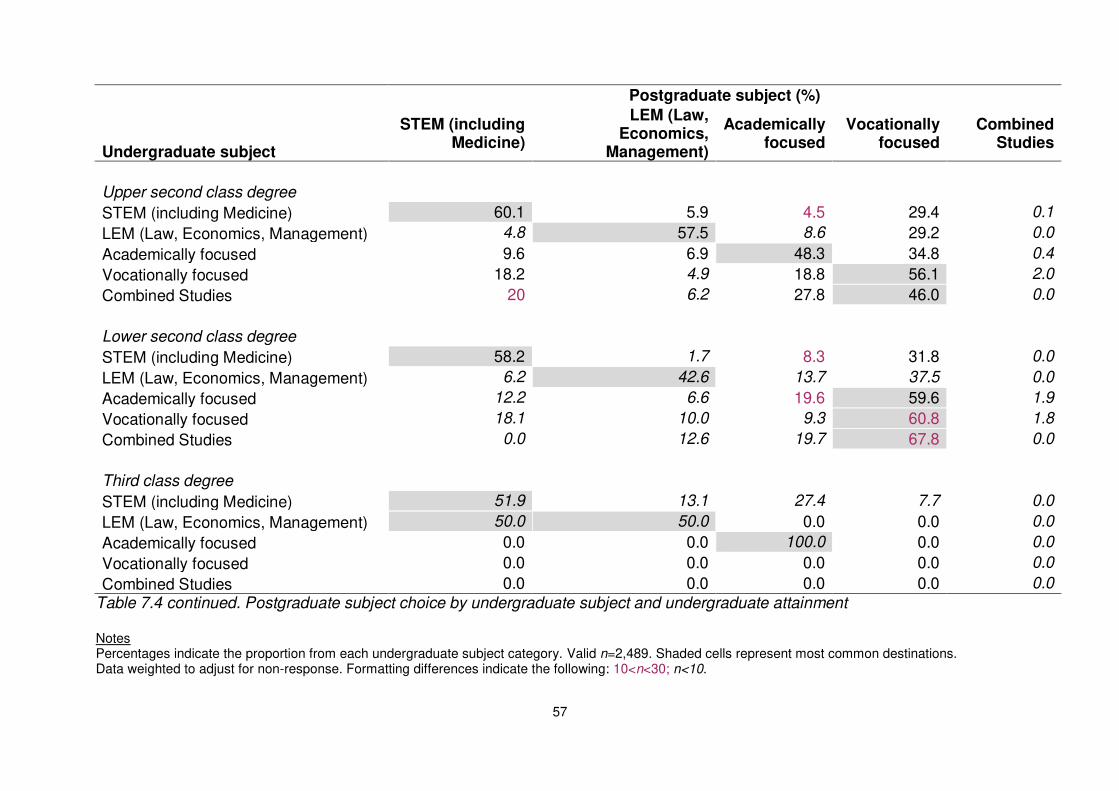
57
Postgraduate subject (%)
Undergraduate subject
STEM (including Medicine)
LEM (Law, Economics,
Management)
Academically focused
Vocationally focused
Combined Studies
Upper second class degree
STEM (including Medicine) 60.1 5.9 4.5 29.4 0.1
LEM (Law, Economics, Management) 4.8 57.5 8.6 29.2 0.0
Academically focused 9.6 6.9 48.3 34.8 0.4
Vocationally focused 18.2 4.9 18.8 56.1 2.0
Combined Studies 20 6.2 27.8 46.0 0.0
Lower second class degree
STEM (including Medicine) 58.2 1.7 8.3 31.8 0.0
LEM (Law, Economics, Management) 6.2 42.6 13.7 37.5 0.0
Academically focused 12.2 6.6 19.6 59.6 1.9
Vocationally focused 18.1 10.0 9.3 60.8 1.8
Combined Studies 0.0 12.6 19.7 67.8 0.0
Third class degree
STEM (including Medicine) 51.9 13.1 27.4 7.7 0.0
LEM (Law, Economics, Management) 50.0 50.0 0.0 0.0 0.0
Academically focused 0.0 0.0 100.0 0.0 0.0
Vocationally focused 0.0 0.0 0.0 0.0 0.0
Combined Studies 0.0 0.0 0.0 0.0 0.0
Table 7.4 continued. Postgraduate subject choice by undergraduate subject and undergraduate attainment Notes Percentages indicate the proportion from each undergraduate subject category. Valid n=2,489. Shaded cells represent most common destinations. Data weighted to adjust for non-response. Formatting differences indicate the following: 10<n<30; n<10.
58
7.3 Finance and funding Within the PtPG survey we were able to collect data about postgraduate finances and funding which is not readily available from other sources. Specifically, we asked current postgraduates about their debt levels both upon graduating and as they stood now. We also asked about sources of tuition fee and maintenance funding in a way much more detailed than is collected by HESA, for instance. Our results are shown in Table 7.5. The distribution of both original and repayable student debt is bimodal. Some current postgraduates report no debt at all, with the proportion almost doubling between graduating and the point of responding to the survey. This indicates that some students have cleared their debts prior to entering postgraduate study. Those with no repayable debt are on average 12 years older than those who retain some debts. Older graduates will have had longer in which to pay off debts but will also likely have had lower debts in the first place since the amount which the average undergraduate needs to borrow has grown considerably in recent years. 6 There is also a concentration of debt levels for current postgraduates in the range £15,000 to £30,000. These are, on the face of it, really quite substantial debts, yet they have evidently not prevented these respondents from enrolling. A sizeable group report not actually knowing what their level of debt is. This is not definitive evidence that debt is no deterrent to postgraduate enrolment; but it does show that there is not a straightforward linear relationship between debt levels and postgraduate enrolment. Our data here needs to be viewed alongside evidence from the other studies procured as part of the UtS strand. Among our PtPG respondents at least, debt levels do not vary markedly across parental socio-economic class or POLAR3 classification. In our PtPG survey we asked respondents in detail about their sources of funding for tuition fees and for their living costs (see Table 7.5). Data collected via HESA does not ask about funding of living costs, nor does it distinguish, for tuition fee support, between different kinds of self-funding. We were able to ascertain whether students were paying for their own fees and living costs using their own savings, a gift or loan from family, private loan finance or from employment income. Note that students could select more than one source of finance. The single most common source of tuition fees finance was ‘My own savings’, which was reported by more than one third of respondents. Own savings were also common as a source of living costs, although here they were second to income from employment. Among full-time students, almost half were using savings to support living costs – more than half among full-time masters students.
6 Note of course that all the PtPG survey respondents graduated before the latest increase in
undergraduate tuition fees in England to a maximum of £9,000 per annum.
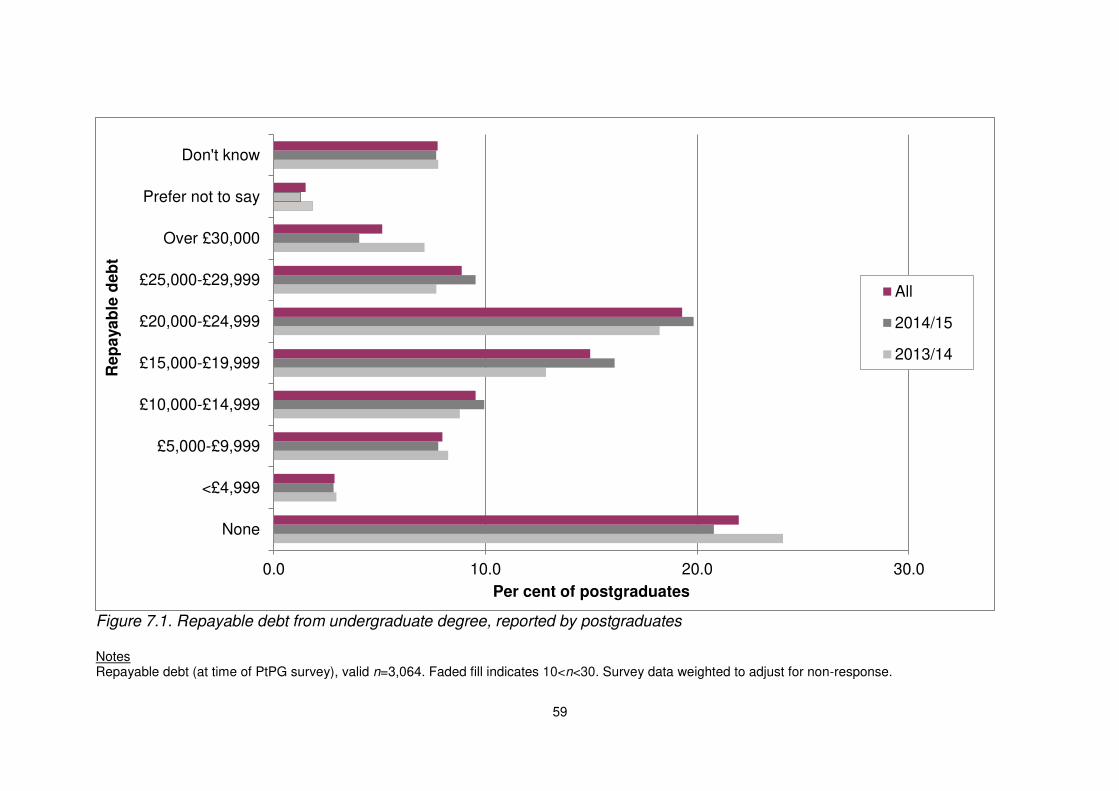
59
Figure 7.1. Repayable debt from undergraduate degree, reported by postgraduates Notes Repayable debt (at time of PtPG survey), valid n=3,064. Faded fill indicates 10<n<30. Survey data weighted to adjust for non-response.
0.0 10.0 20.0 30.0
None
<£4,999
£5,000-£9,999
£10,000-£14,999
£15,000-£19,999
£20,000-£24,999
£25,000-£29,999
Over £30,000
Prefer not to say
Don't know
Per cent of postgraduates
Rep
aya
ble
deb
t
All
2014/15
2013/14
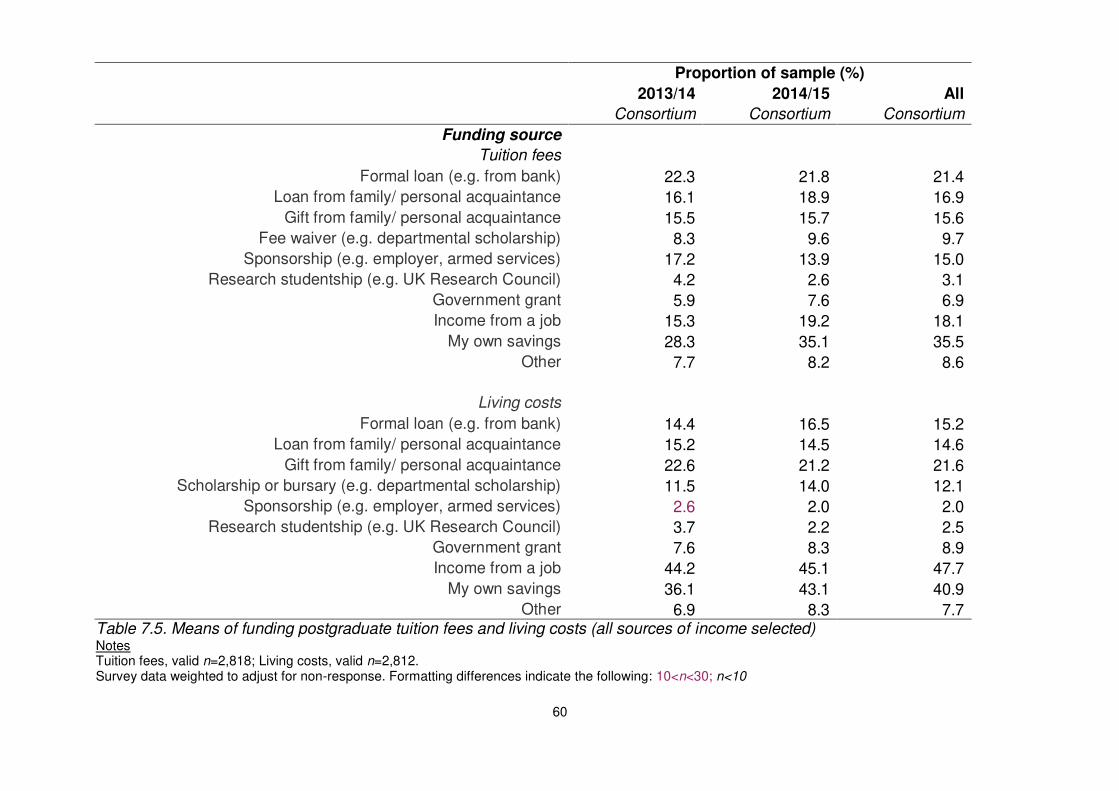
60
Proportion of sample (%)
2013/14 2014/15 All
Consortium Consortium Consortium
Funding source
Tuition fees
Formal loan (e.g. from bank) 22.3 21.8 21.4
Loan from family/ personal acquaintance 16.1 18.9 16.9
Gift from family/ personal acquaintance 15.5 15.7 15.6
Fee waiver (e.g. departmental scholarship) 8.3 9.6 9.7
Sponsorship (e.g. employer, armed services) 17.2 13.9 15.0
Research studentship (e.g. UK Research Council) 4.2 2.6 3.1
Government grant 5.9 7.6 6.9
Income from a job 15.3 19.2 18.1
My own savings 28.3 35.1 35.5
Other 7.7 8.2 8.6
Living costs
Formal loan (e.g. from bank) 14.4 16.5 15.2
Loan from family/ personal acquaintance 15.2 14.5 14.6
Gift from family/ personal acquaintance 22.6 21.2 21.6
Scholarship or bursary (e.g. departmental scholarship) 11.5 14.0 12.1
Sponsorship (e.g. employer, armed services) 2.6 2.0 2.0
Research studentship (e.g. UK Research Council) 3.7 2.2 2.5
Government grant 7.6 8.3 8.9
Income from a job 44.2 45.1 47.7
My own savings 36.1 43.1 40.9
Other 6.9 8.3 7.7 Table 7.5. Means of funding postgraduate tuition fees and living costs (all sources of income selected) Notes Tuition fees, valid n=2,818; Living costs, valid n=2,812. Survey data weighted to adjust for non-response. Formatting differences indicate the following: 10<n<30; n<10
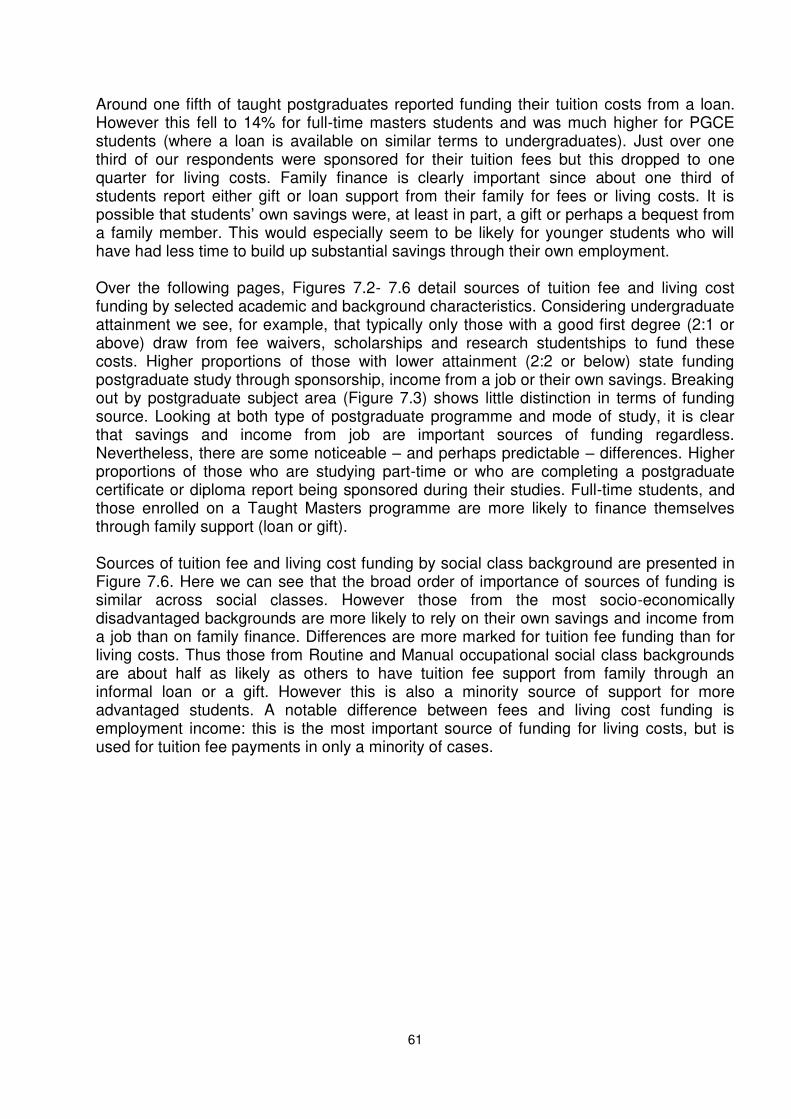
61
Around one fifth of taught postgraduates reported funding their tuition costs from a loan. However this fell to 14% for full-time masters students and was much higher for PGCE students (where a loan is available on similar terms to undergraduates). Just over one third of our respondents were sponsored for their tuition fees but this dropped to one quarter for living costs. Family finance is clearly important since about one third of students report either gift or loan support from their family for fees or living costs. It is possible that students’ own savings were, at least in part, a gift or perhaps a bequest from a family member. This would especially seem to be likely for younger students who will have had less time to build up substantial savings through their own employment. Over the following pages, Figures 7.2- 7.6 detail sources of tuition fee and living cost funding by selected academic and background characteristics. Considering undergraduate attainment we see, for example, that typically only those with a good first degree (2:1 or above) draw from fee waivers, scholarships and research studentships to fund these costs. Higher proportions of those with lower attainment (2:2 or below) state funding postgraduate study through sponsorship, income from a job or their own savings. Breaking out by postgraduate subject area (Figure 7.3) shows little distinction in terms of funding source. Looking at both type of postgraduate programme and mode of study, it is clear that savings and income from job are important sources of funding regardless. Nevertheless, there are some noticeable – and perhaps predictable – differences. Higher proportions of those who are studying part-time or who are completing a postgraduate certificate or diploma report being sponsored during their studies. Full-time students, and those enrolled on a Taught Masters programme are more likely to finance themselves through family support (loan or gift). Sources of tuition fee and living cost funding by social class background are presented in Figure 7.6. Here we can see that the broad order of importance of sources of funding is similar across social classes. However those from the most socio-economically disadvantaged backgrounds are more likely to rely on their own savings and income from a job than on family finance. Differences are more marked for tuition fee funding than for living costs. Thus those from Routine and Manual occupational social class backgrounds are about half as likely as others to have tuition fee support from family through an informal loan or a gift. However this is also a minority source of support for more advantaged students. A notable difference between fees and living cost funding is employment income: this is the most important source of funding for living costs, but is used for tuition fee payments in only a minority of cases.
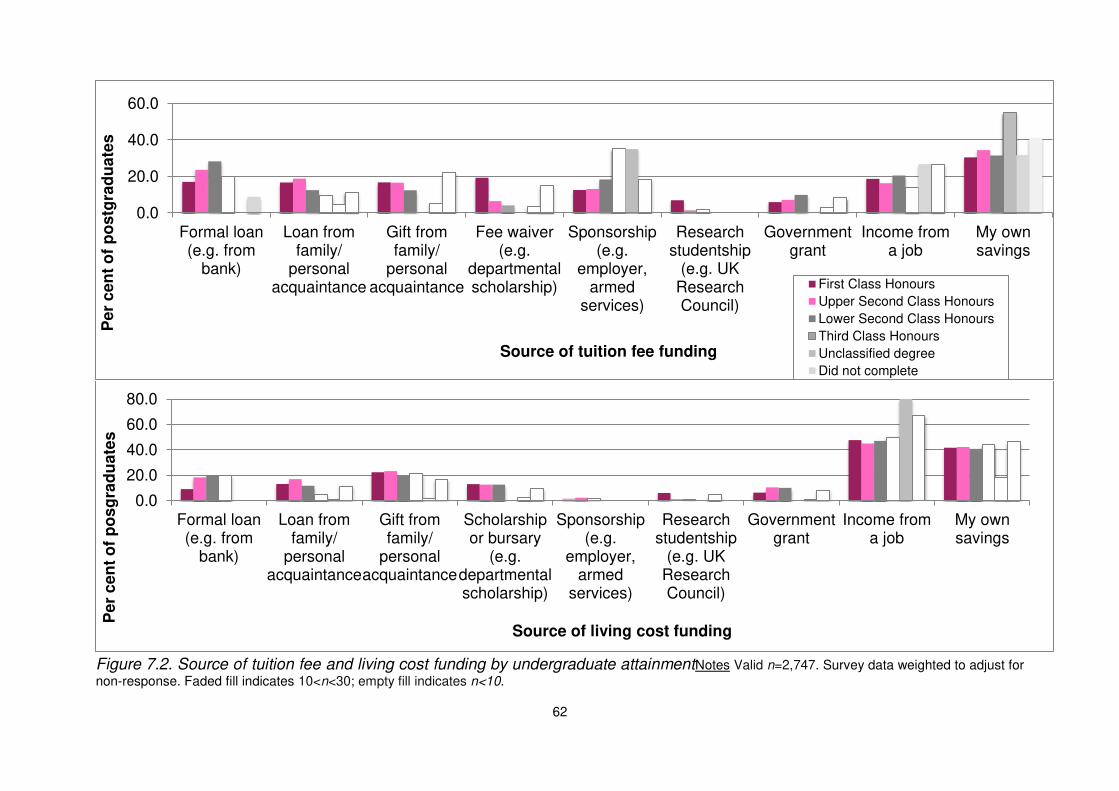
62
Figure 7.2. Source of tuition fee and living cost funding by undergraduate attainmentNotes Valid n=2,747. Survey data weighted to adjust for
non-response. Faded fill indicates 10<n<30; empty fill indicates n<10.
0.0
20.0
40.0
60.0
Formal loan(e.g. from
bank)
Loan fromfamily/
personalacquaintance
Gift fromfamily/
personalacquaintance
Fee waiver(e.g.
departmentalscholarship)
Sponsorship(e.g.
employer,armed
services)
Researchstudentship
(e.g. UKResearchCouncil)
Governmentgrant
Income froma job
My ownsavings
Pe
r c
en
t o
f p
ostg
rad
ua
tes
Source of tuition fee funding
First Class Honours
Upper Second Class Honours
Lower Second Class Honours
Third Class Honours
Unclassified degree
Did not complete
0.0
20.0
40.0
60.0
80.0
Formal loan(e.g. from
bank)
Loan fromfamily/
personalacquaintance
Gift fromfamily/
personalacquaintance
Scholarshipor bursary
(e.g.departmentalscholarship)
Sponsorship(e.g.
employer,armed
services)
Researchstudentship
(e.g. UKResearchCouncil)
Governmentgrant
Income froma job
My ownsavings
Pe
r c
en
t o
f p
osg
rad
uate
s
Source of living cost funding
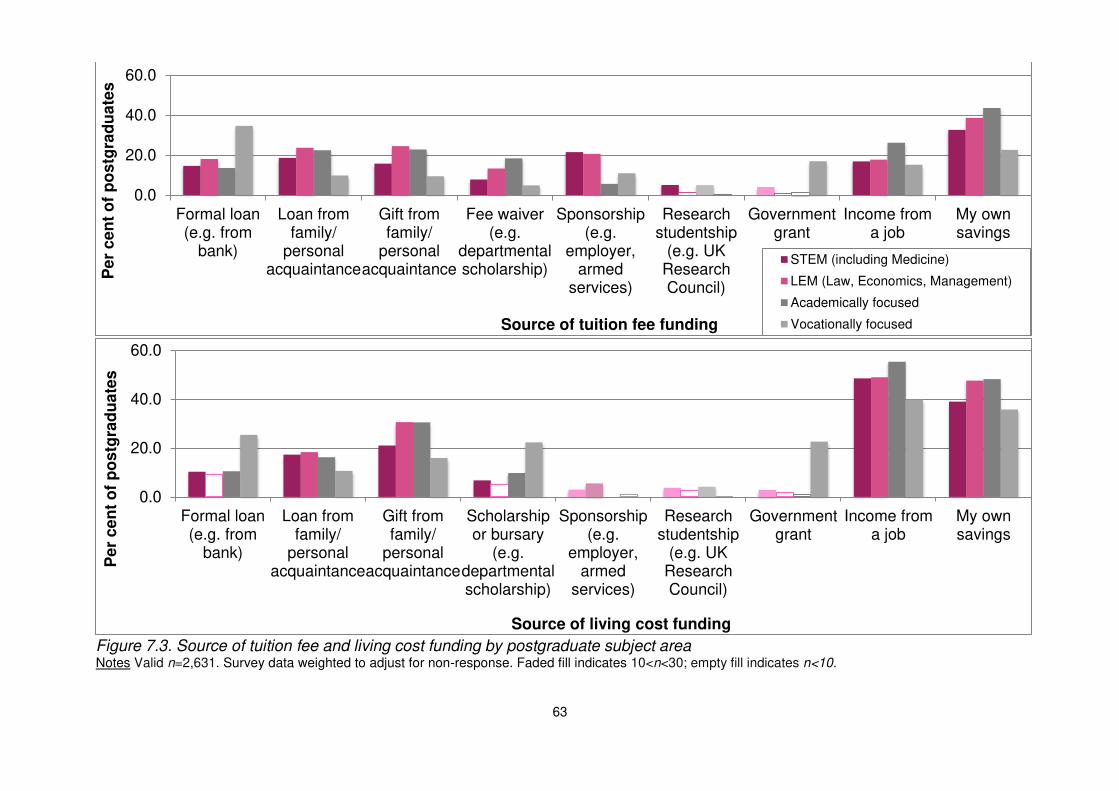
63
Figure 7.3. Source of tuition fee and living cost funding by postgraduate subject area Notes Valid n=2,631. Survey data weighted to adjust for non-response. Faded fill indicates 10<n<30; empty fill indicates n<10.
0.0
20.0
40.0
60.0
Formal loan(e.g. from
bank)
Loan fromfamily/
personalacquaintance
Gift fromfamily/
personalacquaintance
Fee waiver(e.g.
departmentalscholarship)
Sponsorship(e.g.
employer,armed
services)
Researchstudentship
(e.g. UKResearchCouncil)
Governmentgrant
Income froma job
My ownsavings
Pe
r c
en
t o
f p
ostg
rad
ua
tes
Source of tuition fee funding
STEM (including Medicine)
LEM (Law, Economics, Management)
Academically focused
Vocationally focused
0.0
20.0
40.0
60.0
Formal loan(e.g. from
bank)
Loan fromfamily/
personalacquaintance
Gift fromfamily/
personalacquaintance
Scholarshipor bursary
(e.g.departmentalscholarship)
Sponsorship(e.g.
employer,armed
services)
Researchstudentship
(e.g. UKResearchCouncil)
Governmentgrant
Income froma job
My ownsavings
Pe
r c
en
t o
f p
ostg
rad
ua
tes
Source of living cost funding
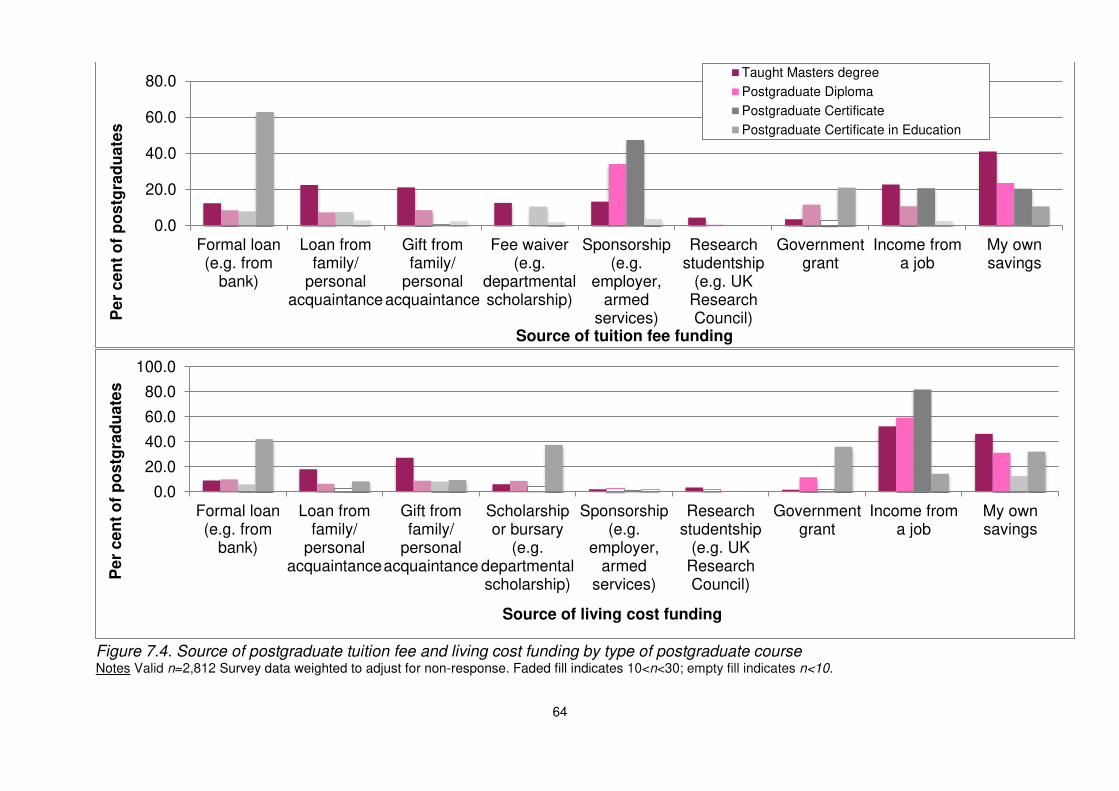
64
Figure 7.4. Source of postgraduate tuition fee and living cost funding by type of postgraduate course Notes Valid n=2,812 Survey data weighted to adjust for non-response. Faded fill indicates 10<n<30; empty fill indicates n<10.
0.0
20.0
40.0
60.0
80.0
Formal loan(e.g. from
bank)
Loan fromfamily/
personalacquaintance
Gift fromfamily/
personalacquaintance
Fee waiver(e.g.
departmentalscholarship)
Sponsorship(e.g.
employer,armed
services)
Researchstudentship
(e.g. UKResearchCouncil)
Governmentgrant
Income froma job
My ownsavings
Pe
r c
en
t o
f p
ostg
rad
ua
tes
Source of tuition fee funding
Taught Masters degree
Postgraduate Diploma
Postgraduate Certificate
Postgraduate Certificate in Education
0.0
20.0
40.0
60.0
80.0
100.0
Formal loan(e.g. from
bank)
Loan fromfamily/
personalacquaintance
Gift fromfamily/
personalacquaintance
Scholarshipor bursary
(e.g.departmentalscholarship)
Sponsorship(e.g.
employer,armed
services)
Researchstudentship
(e.g. UKResearchCouncil)
Governmentgrant
Income froma job
My ownsavings
Pe
r c
en
t o
f p
ostg
rad
ua
tes
Source of living cost funding
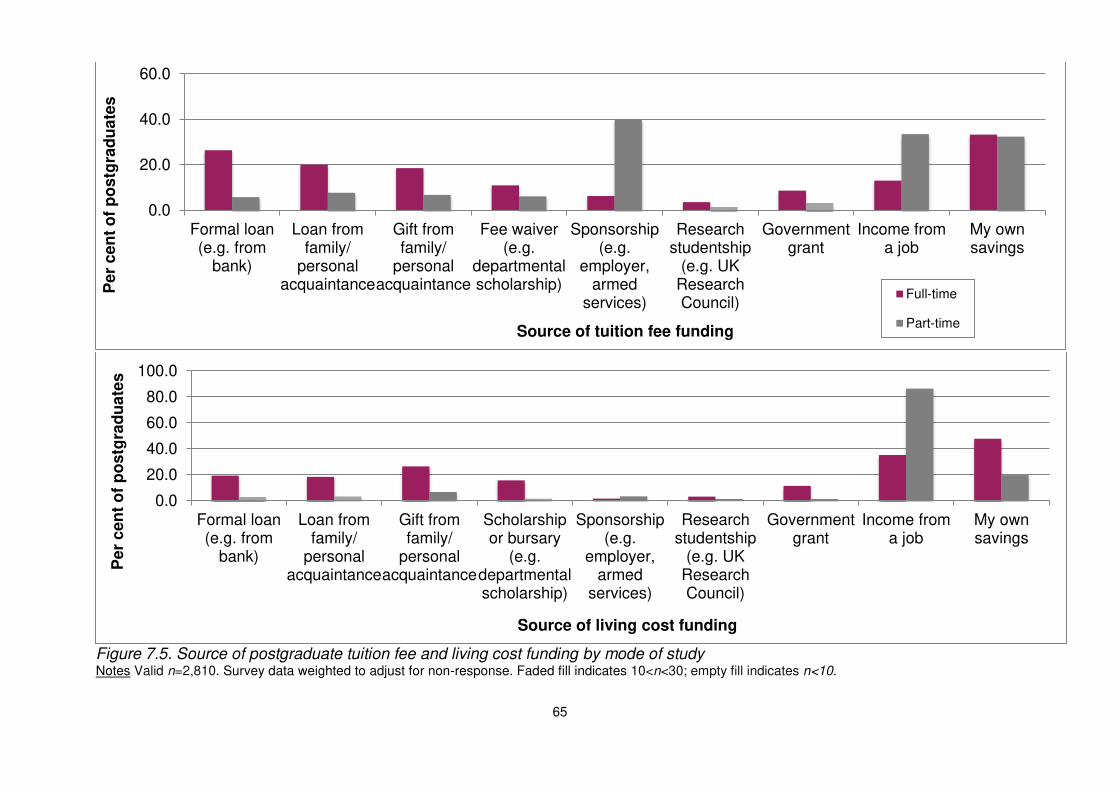
65
Figure 7.5. Source of postgraduate tuition fee and living cost funding by mode of study Notes Valid n=2,810. Survey data weighted to adjust for non-response. Faded fill indicates 10<n<30; empty fill indicates n<10.
0.0
20.0
40.0
60.0
Formal loan(e.g. from
bank)
Loan fromfamily/
personalacquaintance
Gift fromfamily/
personalacquaintance
Fee waiver(e.g.
departmentalscholarship)
Sponsorship(e.g.
employer,armed
services)
Researchstudentship
(e.g. UKResearchCouncil)
Governmentgrant
Income froma job
My ownsavings
Pe
r c
en
t o
f p
ostg
rad
ua
tes
Source of tuition fee funding
Full-time
Part-time
0.0
20.0
40.0
60.0
80.0
100.0
Formal loan(e.g. from
bank)
Loan fromfamily/
personalacquaintance
Gift fromfamily/
personalacquaintance
Scholarshipor bursary
(e.g.departmentalscholarship)
Sponsorship(e.g.
employer,armed
services)
Researchstudentship
(e.g. UKResearchCouncil)
Governmentgrant
Income froma job
My ownsavings
Pe
r c
en
t o
f p
ostg
rad
ua
tes
Source of living cost funding
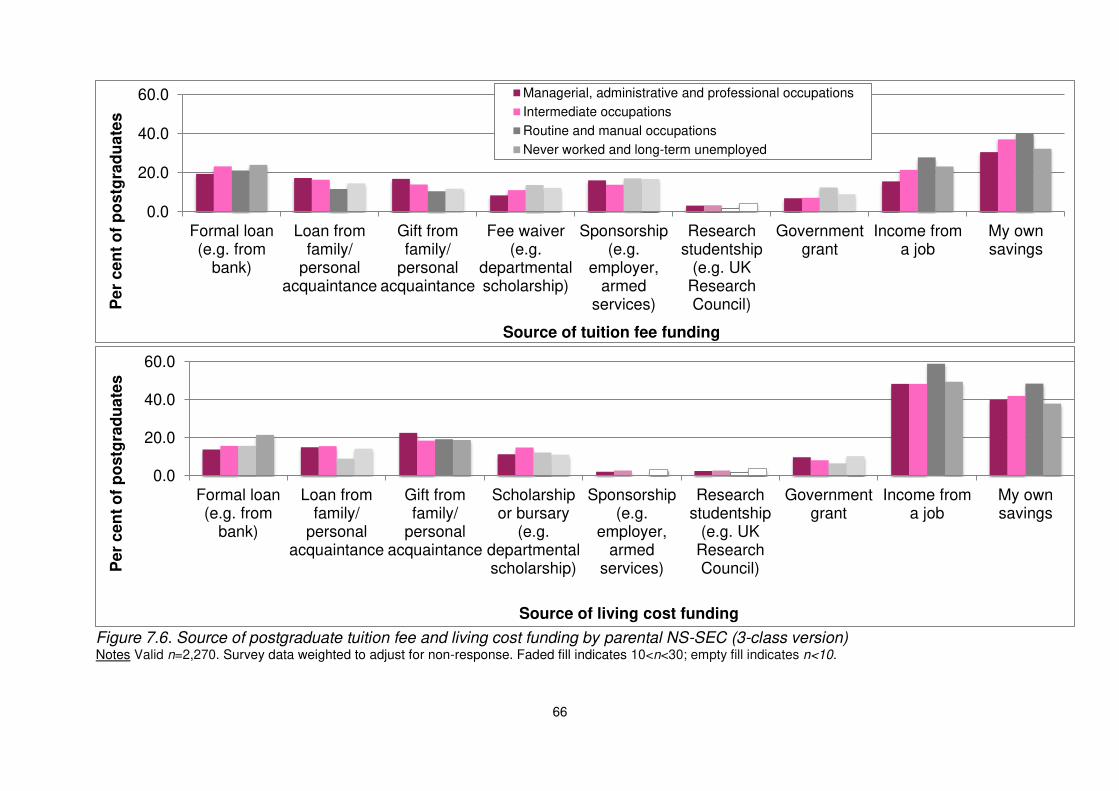
66
Figure 7.6. Source of postgraduate tuition fee and living cost funding by parental NS-SEC (3-class version) Notes Valid n=2,270. Survey data weighted to adjust for non-response. Faded fill indicates 10<n<30; empty fill indicates n<10.
0.0
20.0
40.0
60.0
Formal loan(e.g. from
bank)
Loan fromfamily/
personalacquaintance
Gift fromfamily/
personalacquaintance
Fee waiver(e.g.
departmentalscholarship)
Sponsorship(e.g.
employer,armed
services)
Researchstudentship
(e.g. UKResearchCouncil)
Governmentgrant
Income froma job
My ownsavings
Pe
r c
en
t o
f p
ostg
rad
ua
tes
Source of tuition fee funding
Managerial, administrative and professional occupations
Intermediate occupations
Routine and manual occupations
Never worked and long-term unemployed
0.0
20.0
40.0
60.0
Formal loan(e.g. from
bank)
Loan fromfamily/
personalacquaintance
Gift fromfamily/
personalacquaintance
Scholarshipor bursary
(e.g.departmentalscholarship)
Sponsorship(e.g.
employer,armed
services)
Researchstudentship
(e.g. UKResearchCouncil)
Governmentgrant
Income froma job
My ownsavings
Pe
r c
en
t o
f p
ostg
rad
ua
tes
Source of living cost funding
67
7.4 Motivations for postgraduate study We asked postgraduates for their top three reasons for choosing to pursue a postgraduate course. Table 7.6 sets these out. We might usefully divide these into major and minor motivations. There appear to be two sets of major motivations: one relates to career progression, with roughly half of respondents stating their motivation was ‘to progress my career’ or ‘to enter a profession which favours this qualification’. A second, slightly less popular set of motivations was intrinsic: ‘to pursue an intellectual interest’ or ‘to expand my knowledge of a chosen subject’. Around one fifth were motivated by potential increased earnings or a career change, with about a third seeing their current programme as a step to further qualifications (e.g. a PhD). More negative reasons were cited by a small minority, including lack of other opportunities or simply to delay getting a job. Further analysis of the statistics presented in Table 8.5 by certain background characteristics, including parental socio-economic class and parental education, showed very little difference across categories. We did, however, find that PSS scholars were about twice as likely as other students to cite progression to a PhD as a motivation. Around half of the PSS scholars responding to our survey stated this. Figures 7.7 and 7.8, over the following pages, consider postgraduates’ motivations by postgraduate subject area and parental NS-SEC. Of the two charts, we see greater diversity in terms of subject studied. Interesting among these, a notably higher proportion of STEM postgraduates state the motivation of changing career. Higher proportions of those enrolled on academically-focused postgraduate courses stated intellectual interest and to enable progression to a higher degree as motivating reasons. Considering postgraduates’ motivations by parental NS-SEC, we see less evidence of difference between the class categories. Of note, however, are the relatively higher proportions of students from routine and manual or never worked and long-term unemployed classes to cite intellectual interest, progression to a higher degree and contribution to society as motivating reasons for undertaking postgraduate study. Higher proportions of students from these classes also selected available funding as a motivating reason.
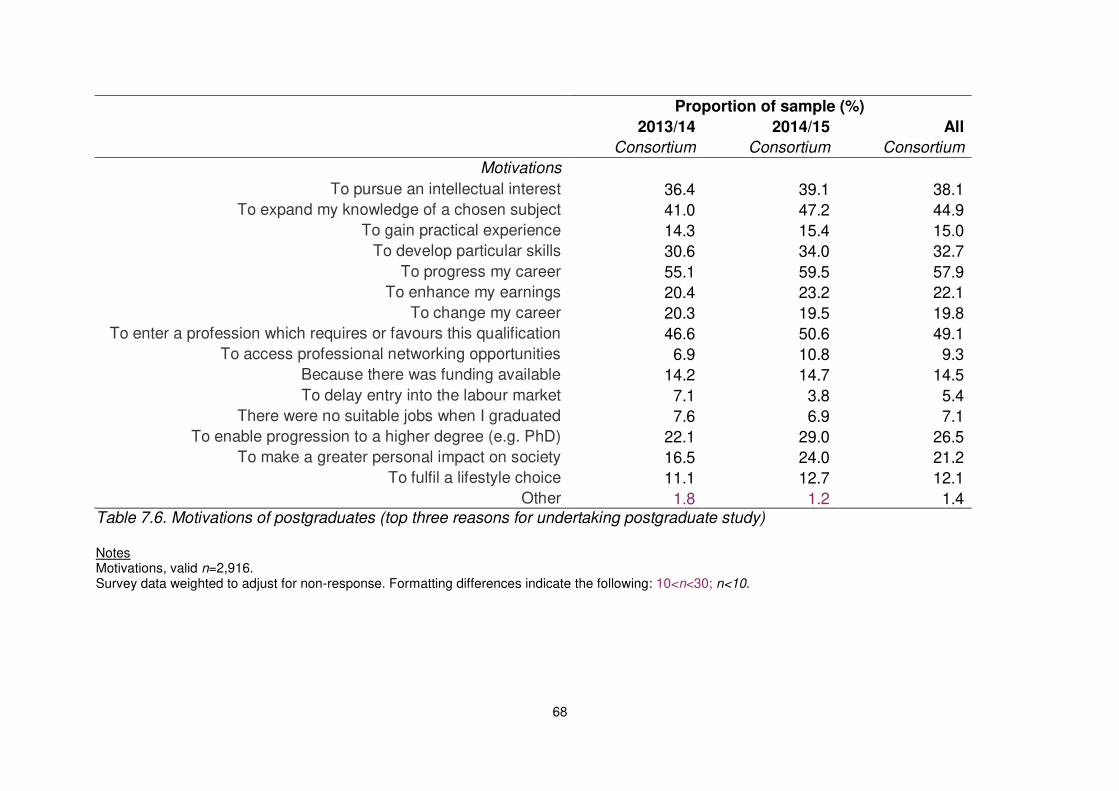
68
Proportion of sample (%)
2013/14 2014/15 All
Consortium Consortium Consortium
Motivations
To pursue an intellectual interest 36.4 39.1 38.1
To expand my knowledge of a chosen subject 41.0 47.2 44.9
To gain practical experience 14.3 15.4 15.0
To develop particular skills 30.6 34.0 32.7
To progress my career 55.1 59.5 57.9
To enhance my earnings 20.4 23.2 22.1
To change my career 20.3 19.5 19.8
To enter a profession which requires or favours this qualification 46.6 50.6 49.1
To access professional networking opportunities 6.9 10.8 9.3
Because there was funding available 14.2 14.7 14.5
To delay entry into the labour market 7.1 3.8 5.4
There were no suitable jobs when I graduated 7.6 6.9 7.1
To enable progression to a higher degree (e.g. PhD) 22.1 29.0 26.5
To make a greater personal impact on society 16.5 24.0 21.2
To fulfil a lifestyle choice 11.1 12.7 12.1
Other 1.8 1.2 1.4 Table 7.6. Motivations of postgraduates (top three reasons for undertaking postgraduate study) Notes Motivations, valid n=2,916. Survey data weighted to adjust for non-response. Formatting differences indicate the following: 10<n<30; n<10.
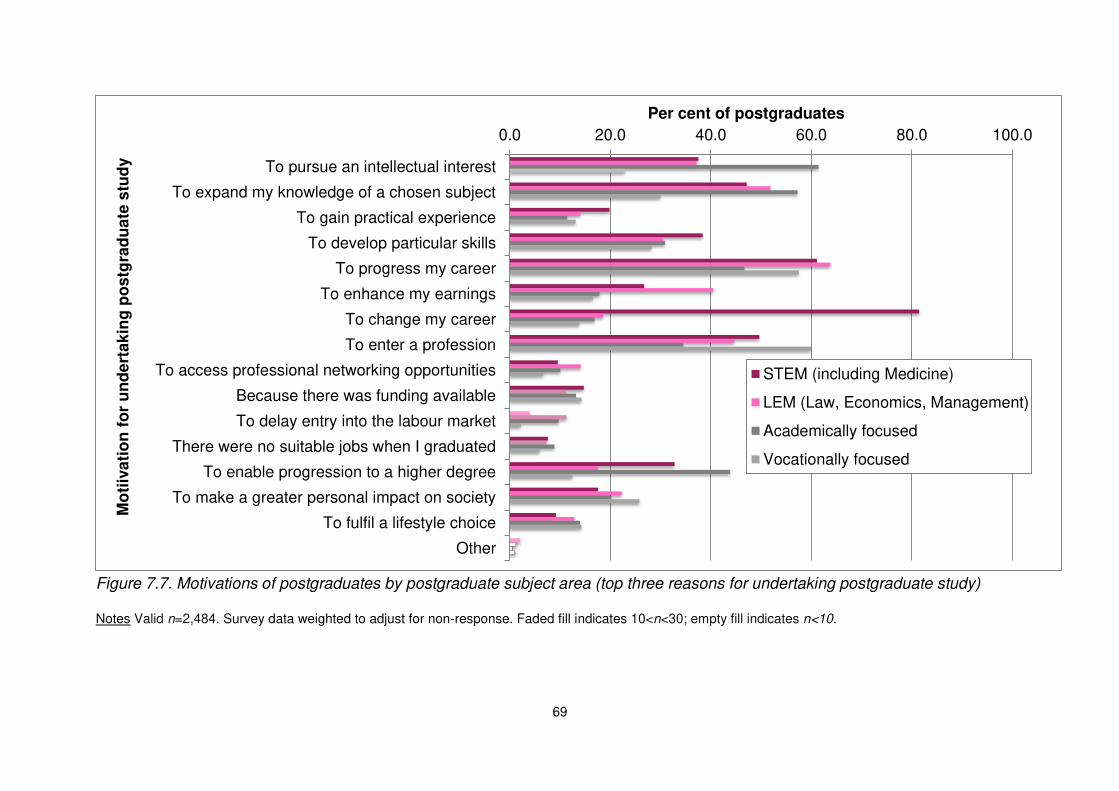
69
Figure 7.7. Motivations of postgraduates by postgraduate subject area (top three reasons for undertaking postgraduate study) Notes Valid n=2,484. Survey data weighted to adjust for non-response. Faded fill indicates 10<n<30; empty fill indicates n<10.
0.0 20.0 40.0 60.0 80.0 100.0
To pursue an intellectual interest
To expand my knowledge of a chosen subject
To gain practical experience
To develop particular skills
To progress my career
To enhance my earnings
To change my career
To enter a profession
To access professional networking opportunities
Because there was funding available
To delay entry into the labour market
There were no suitable jobs when I graduated
To enable progression to a higher degree
To make a greater personal impact on society
To fulfil a lifestyle choice
Other
Per cent of postgraduates M
oti
iva
tio
n f
or
un
de
rtak
ing
po
stg
rad
ua
te s
tud
y
STEM (including Medicine)
LEM (Law, Economics, Management)
Academically focused
Vocationally focused
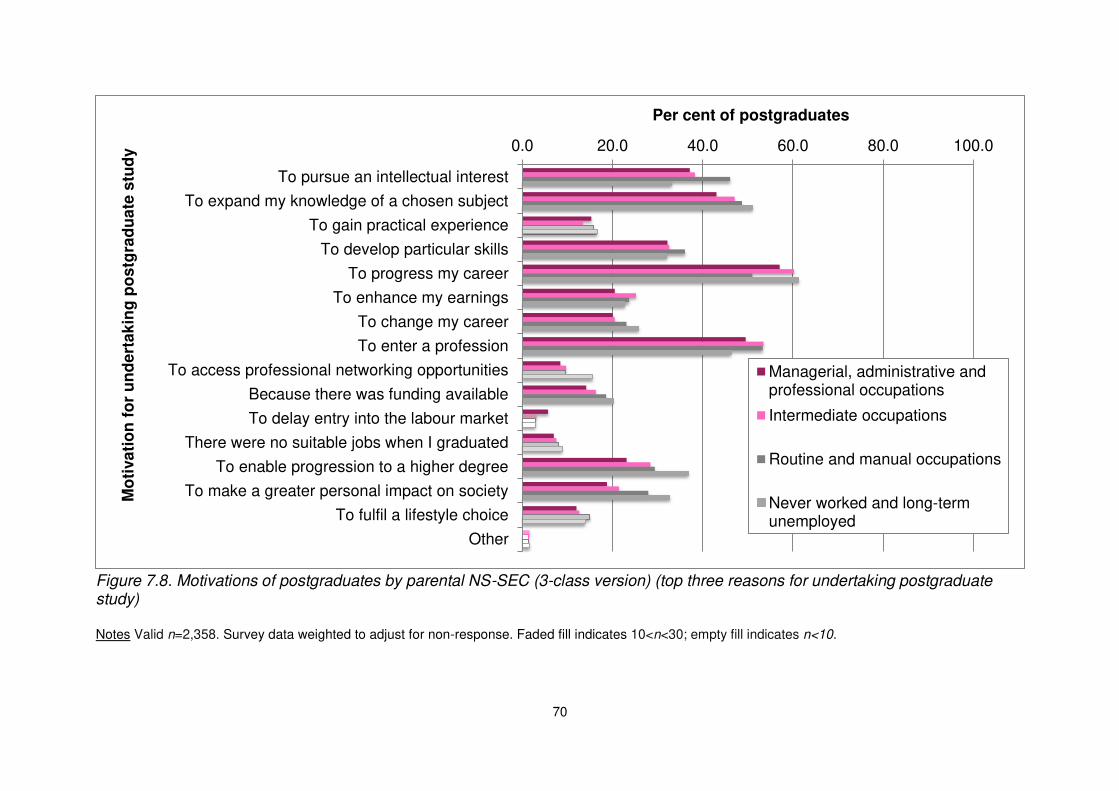
70
Figure 7.8. Motivations of postgraduates by parental NS-SEC (3-class version) (top three reasons for undertaking postgraduate study) Notes Valid n=2,358. Survey data weighted to adjust for non-response. Faded fill indicates 10<n<30; empty fill indicates n<10.
0.0 20.0 40.0 60.0 80.0 100.0
To pursue an intellectual interest
To expand my knowledge of a chosen subject
To gain practical experience
To develop particular skills
To progress my career
To enhance my earnings
To change my career
To enter a profession
To access professional networking opportunities
Because there was funding available
To delay entry into the labour market
There were no suitable jobs when I graduated
To enable progression to a higher degree
To make a greater personal impact on society
To fulfil a lifestyle choice
Other
Per cent of postgraduates M
oti
va
tio
n f
or
un
de
rtak
ing
po
stg
rad
ua
te s
tud
y
Managerial, administrative andprofessional occupations
Intermediate occupations
Routine and manual occupations
Never worked and long-termunemployed
71
8. Barriers to progression 8.1 Introduction In order to enhance our understanding of progression to postgraduate study, the research team considered it essential to explore the characteristics and situations of those who do not progress. The PbG survey provided access to this group, and recorded their attitudes and reasoning towards future postgraduate study. In this sector, results are presented to the question: Would you apply to postgraduate study in the future? and the subsequent question which asked respondents to explain the reasoning behind their decision. The latter question was presented in a multiple choice format, where respondents could select the three statements that they most agreed with. 8.2 Attitudes to postgraduate study Of those who have not yet progressed to postgraduate study, around one half stated that they would apply in the future (see Table 8.1). We can see that the intention for more recent graduates is slightly higher, which is unsurprising given the relatively lower rate of progression for this group.
Proportion of sample (%)
2009 2012
Consortium Consortium
Yes 45.0 50.2
No 31.2 27.6
Don't know 23.7 22.0
Prefer not to answer 0.0 0.2
Table 8.1. Would you apply to postgraduate study in the future? Notes Alumni sample (those who have not progressed only): valid n=1,330 Survey data weighted to adjust for non-response. Formatting differences indicate the following: 10<n<30; n<10.
Around one third of respondents do not envisage applying for postgraduate study in the future. A slightly higher proportion of 2009 alumni do not expect to apply to postgraduate study in the future. Across the consortium, just over one-fifth of those who have not yet progressed are undecided as to whether they will apply for postgraduate study. 8.3 Intention to apply to postgraduate study in the future Alumni who intend to apply to postgraduate study in the future tended to state similar motivating reasons as the sample of postgraduates, noted in the previous chapter. Career-related motivations are important: around two-third of alumni cited career progression as a motivating reason, while around half expressed a wish to develop particular skills, which we might infer are likely related to a specific profession (see
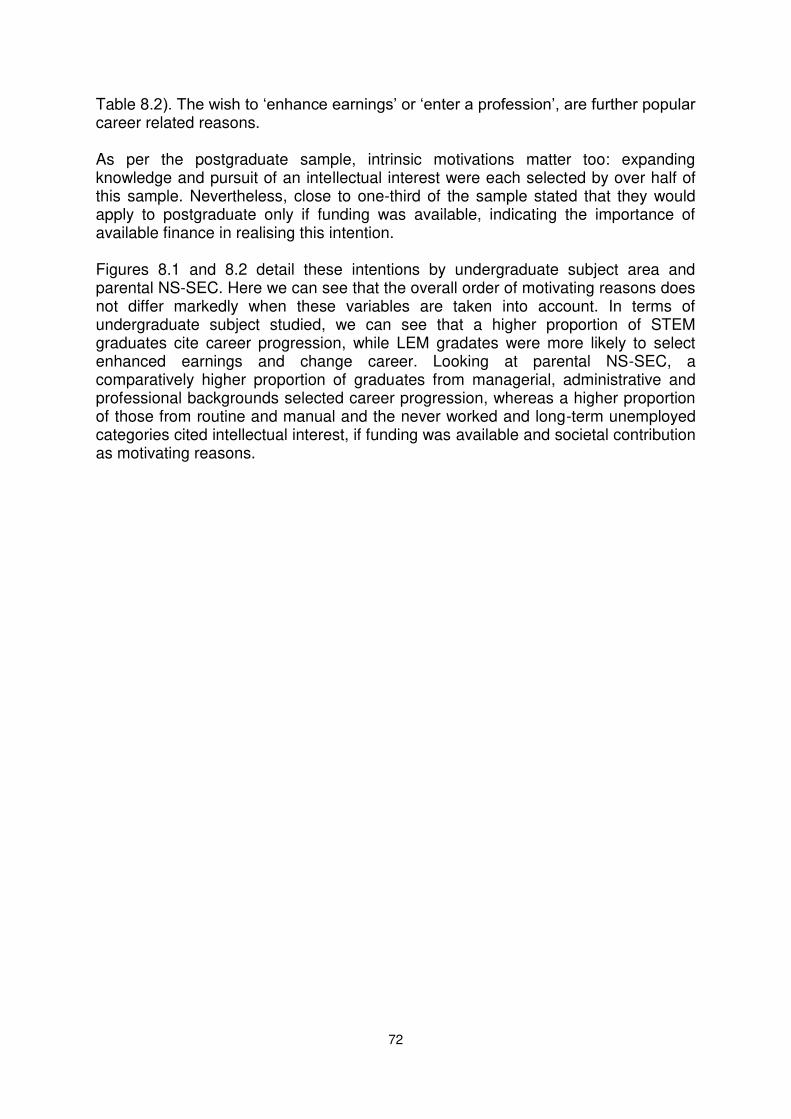
72
Table 8.2). The wish to ‘enhance earnings’ or ‘enter a profession’, are further popular career related reasons. As per the postgraduate sample, intrinsic motivations matter too: expanding knowledge and pursuit of an intellectual interest were each selected by over half of this sample. Nevertheless, close to one-third of the sample stated that they would apply to postgraduate only if funding was available, indicating the importance of available finance in realising this intention. Figures 8.1 and 8.2 detail these intentions by undergraduate subject area and parental NS-SEC. Here we can see that the overall order of motivating reasons does not differ markedly when these variables are taken into account. In terms of undergraduate subject studied, we can see that a higher proportion of STEM graduates cite career progression, while LEM gradates were more likely to select enhanced earnings and change career. Looking at parental NS-SEC, a comparatively higher proportion of graduates from managerial, administrative and professional backgrounds selected career progression, whereas a higher proportion of those from routine and manual and the never worked and long-term unemployed categories cited intellectual interest, if funding was available and societal contribution as motivating reasons.
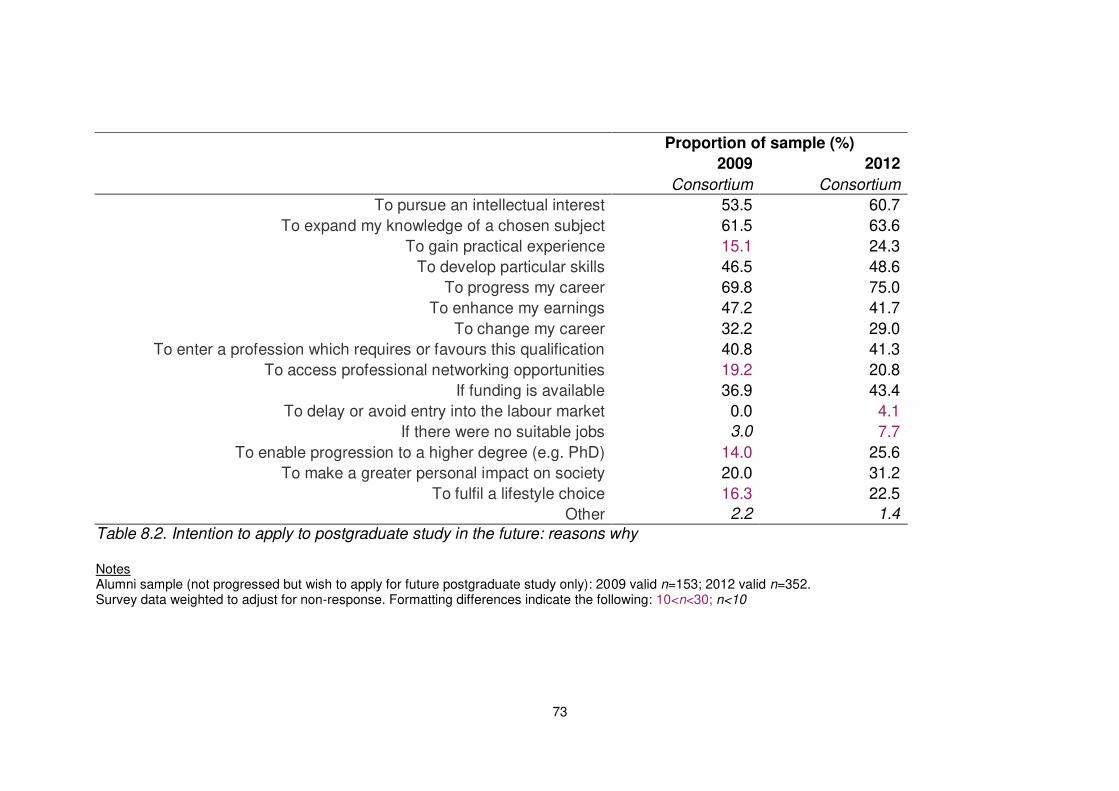
73
Proportion of sample (%)
2009 2012
Consortium Consortium
To pursue an intellectual interest 53.5 60.7
To expand my knowledge of a chosen subject 61.5 63.6
To gain practical experience 15.1 24.3
To develop particular skills 46.5 48.6
To progress my career 69.8 75.0
To enhance my earnings 47.2 41.7
To change my career 32.2 29.0
To enter a profession which requires or favours this qualification 40.8 41.3
To access professional networking opportunities 19.2 20.8
If funding is available 36.9 43.4
To delay or avoid entry into the labour market 0.0 4.1
If there were no suitable jobs 3.0 7.7
To enable progression to a higher degree (e.g. PhD) 14.0 25.6
To make a greater personal impact on society 20.0 31.2
To fulfil a lifestyle choice 16.3 22.5
Other 2.2 1.4
Table 8.2. Intention to apply to postgraduate study in the future: reasons why Notes Alumni sample (not progressed but wish to apply for future postgraduate study only): 2009 valid n=153; 2012 valid n=352. Survey data weighted to adjust for non-response. Formatting differences indicate the following: 10<n<30; n<10
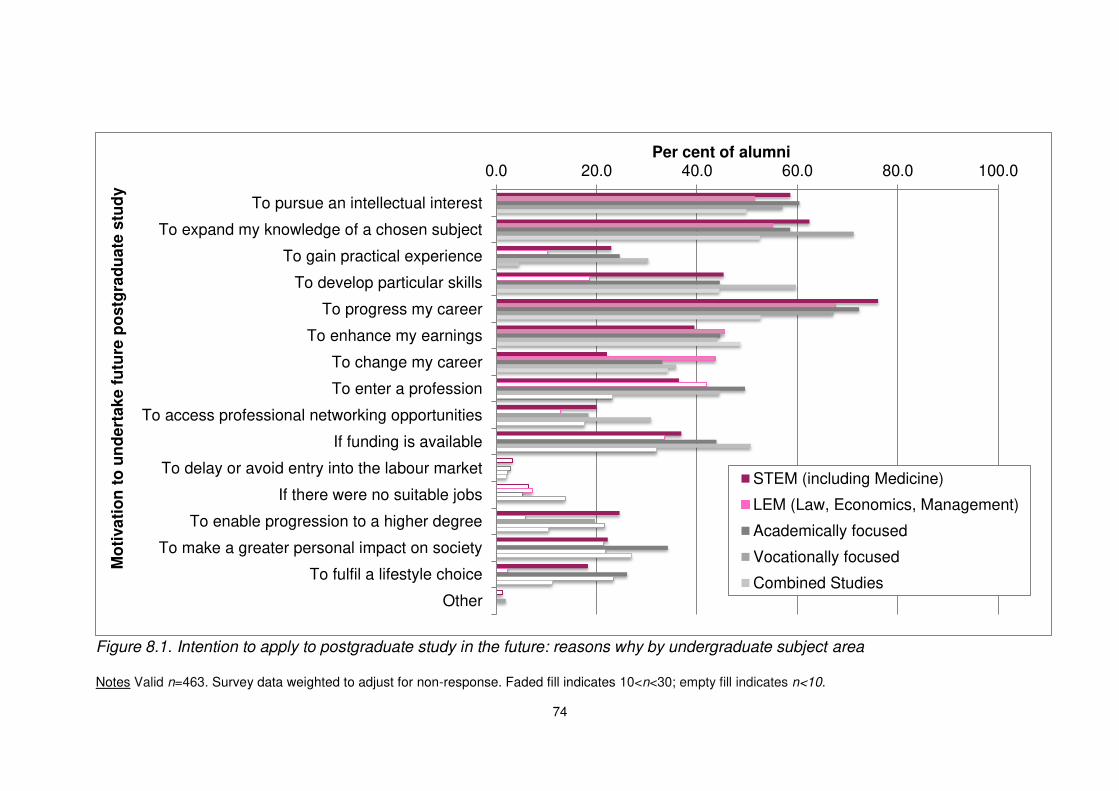
74
Figure 8.1. Intention to apply to postgraduate study in the future: reasons why by undergraduate subject area Notes Valid n=463. Survey data weighted to adjust for non-response. Faded fill indicates 10<n<30; empty fill indicates n<10.
0.0 20.0 40.0 60.0 80.0 100.0
To pursue an intellectual interest
To expand my knowledge of a chosen subject
To gain practical experience
To develop particular skills
To progress my career
To enhance my earnings
To change my career
To enter a profession
To access professional networking opportunities
If funding is available
To delay or avoid entry into the labour market
If there were no suitable jobs
To enable progression to a higher degree
To make a greater personal impact on society
To fulfil a lifestyle choice
Other
Per cent of alumni
Mo
tiva
tio
n t
o u
nd
ert
ak
e f
utu
re p
os
tgra
du
ate
stu
dy
STEM (including Medicine)
LEM (Law, Economics, Management)
Academically focused
Vocationally focused
Combined Studies
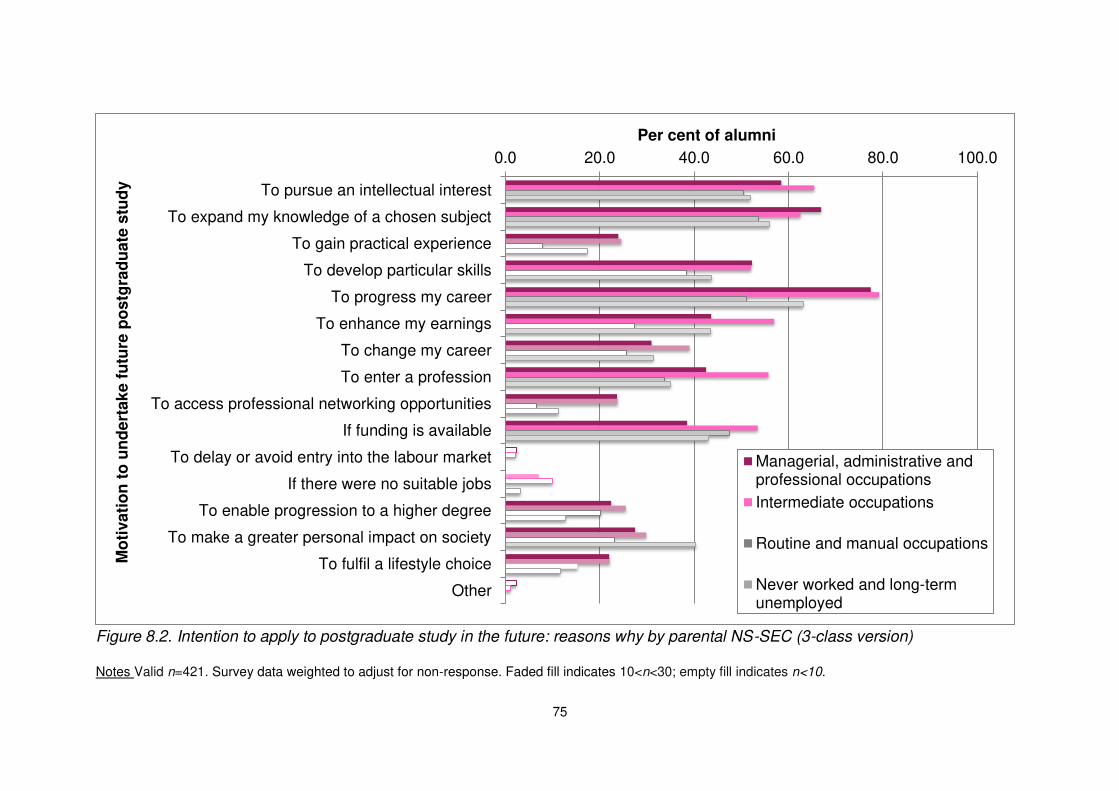
75
Figure 8.2. Intention to apply to postgraduate study in the future: reasons why by parental NS-SEC (3-class version) Notes Valid n=421. Survey data weighted to adjust for non-response. Faded fill indicates 10<n<30; empty fill indicates n<10.
0.0 20.0 40.0 60.0 80.0 100.0
To pursue an intellectual interest
To expand my knowledge of a chosen subject
To gain practical experience
To develop particular skills
To progress my career
To enhance my earnings
To change my career
To enter a profession
To access professional networking opportunities
If funding is available
To delay or avoid entry into the labour market
If there were no suitable jobs
To enable progression to a higher degree
To make a greater personal impact on society
To fulfil a lifestyle choice
Other
Per cent of alumni M
oti
va
tio
n t
o u
nd
ert
ak
e f
utu
re p
os
tgra
du
ate
stu
dy
Managerial, administrative andprofessional occupations
Intermediate occupations
Routine and manual occupations
Never worked and long-termunemployed
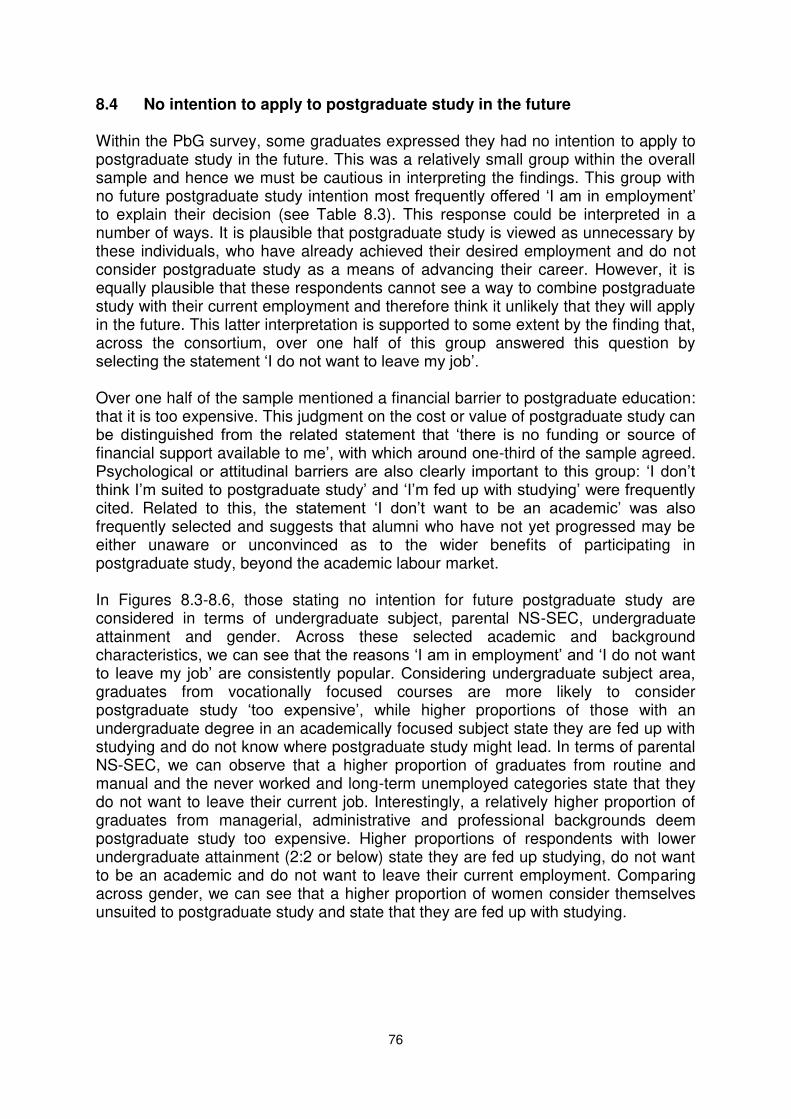
76
8.4 No intention to apply to postgraduate study in the future Within the PbG survey, some graduates expressed they had no intention to apply to postgraduate study in the future. This was a relatively small group within the overall sample and hence we must be cautious in interpreting the findings. This group with no future postgraduate study intention most frequently offered ‘I am in employment’ to explain their decision (see Table 8.3). This response could be interpreted in a number of ways. It is plausible that postgraduate study is viewed as unnecessary by these individuals, who have already achieved their desired employment and do not consider postgraduate study as a means of advancing their career. However, it is equally plausible that these respondents cannot see a way to combine postgraduate study with their current employment and therefore think it unlikely that they will apply in the future. This latter interpretation is supported to some extent by the finding that, across the consortium, over one half of this group answered this question by selecting the statement ‘I do not want to leave my job’. Over one half of the sample mentioned a financial barrier to postgraduate education: that it is too expensive. This judgment on the cost or value of postgraduate study can be distinguished from the related statement that ‘there is no funding or source of financial support available to me’, with which around one-third of the sample agreed. Psychological or attitudinal barriers are also clearly important to this group: ‘I don’t think I’m suited to postgraduate study’ and ‘I’m fed up with studying’ were frequently cited. Related to this, the statement ‘I don’t want to be an academic’ was also frequently selected and suggests that alumni who have not yet progressed may be either unaware or unconvinced as to the wider benefits of participating in postgraduate study, beyond the academic labour market.
In Figures 8.3-8.6, those stating no intention for future postgraduate study are considered in terms of undergraduate subject, parental NS-SEC, undergraduate attainment and gender. Across these selected academic and background characteristics, we can see that the reasons ‘I am in employment’ and ‘I do not want to leave my job’ are consistently popular. Considering undergraduate subject area, graduates from vocationally focused courses are more likely to consider postgraduate study ‘too expensive’, while higher proportions of those with an undergraduate degree in an academically focused subject state they are fed up with studying and do not know where postgraduate study might lead. In terms of parental NS-SEC, we can observe that a higher proportion of graduates from routine and manual and the never worked and long-term unemployed categories state that they do not want to leave their current job. Interestingly, a relatively higher proportion of graduates from managerial, administrative and professional backgrounds deem postgraduate study too expensive. Higher proportions of respondents with lower undergraduate attainment (2:2 or below) state they are fed up studying, do not want to be an academic and do not want to leave their current employment. Comparing across gender, we can see that a higher proportion of women consider themselves unsuited to postgraduate study and state that they are fed up with studying.
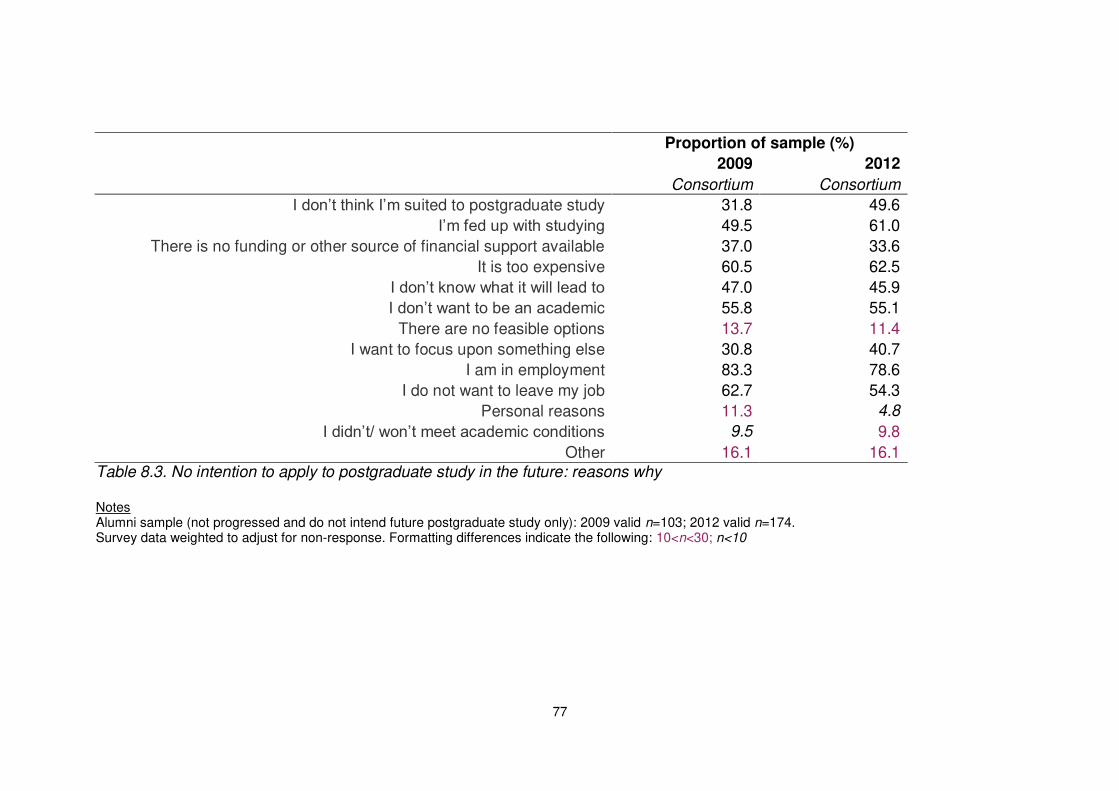
77
Proportion of sample (%)
2009 2012
Consortium Consortium
I don’t think I’m suited to postgraduate study 31.8 49.6
I’m fed up with studying 49.5 61.0
There is no funding or other source of financial support available 37.0 33.6
It is too expensive 60.5 62.5
I don’t know what it will lead to 47.0 45.9
I don’t want to be an academic 55.8 55.1
There are no feasible options 13.7 11.4
I want to focus upon something else 30.8 40.7
I am in employment 83.3 78.6
I do not want to leave my job 62.7 54.3
Personal reasons 11.3 4.8
I didn’t/ won’t meet academic conditions 9.5 9.8
Other 16.1 16.1
Table 8.3. No intention to apply to postgraduate study in the future: reasons why Notes Alumni sample (not progressed and do not intend future postgraduate study only): 2009 valid n=103; 2012 valid n=174. Survey data weighted to adjust for non-response. Formatting differences indicate the following: 10<n<30; n<10
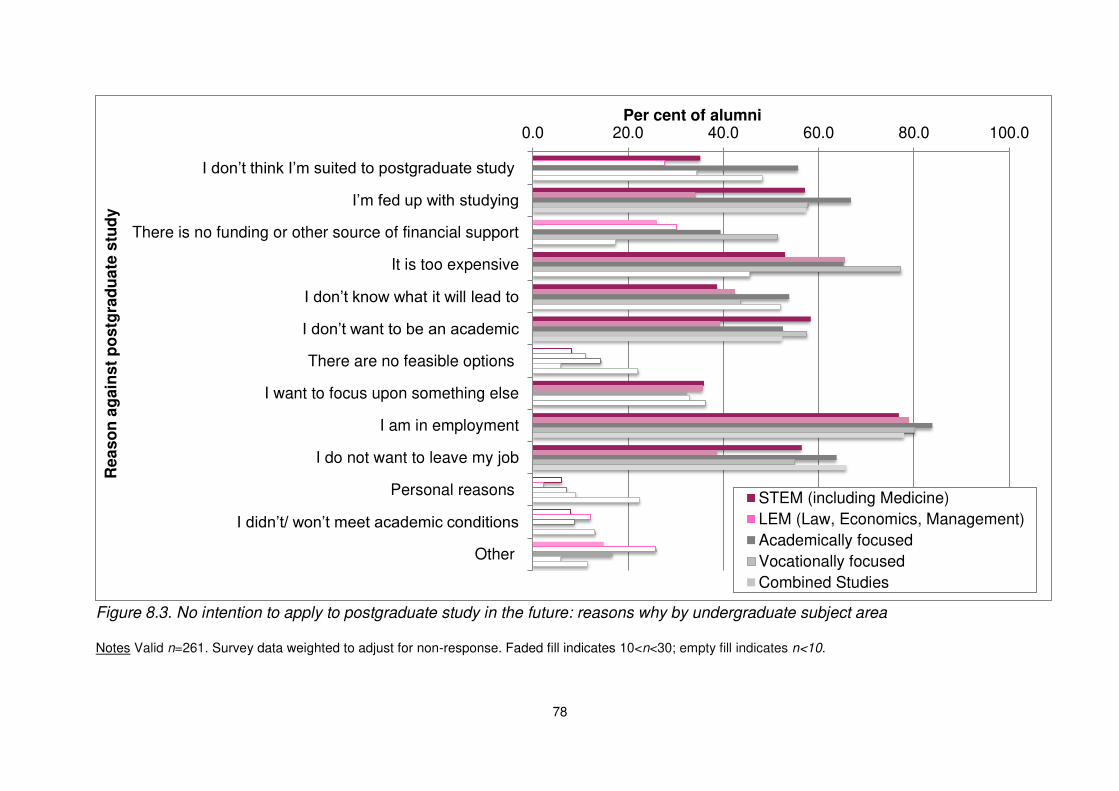
78
Figure 8.3. No intention to apply to postgraduate study in the future: reasons why by undergraduate subject area Notes Valid n=261. Survey data weighted to adjust for non-response. Faded fill indicates 10<n<30; empty fill indicates n<10.
0.0 20.0 40.0 60.0 80.0 100.0
I don’t think I’m suited to postgraduate study
I’m fed up with studying
There is no funding or other source of financial support
It is too expensive
I don’t know what it will lead to
I don’t want to be an academic
There are no feasible options
I want to focus upon something else
I am in employment
I do not want to leave my job
Personal reasons
I didn’t/ won’t meet academic conditions
Other
Per cent of alumni R
ea
so
n a
gain
st
po
stg
rad
ua
te s
tud
y
STEM (including Medicine)
LEM (Law, Economics, Management)
Academically focused
Vocationally focused
Combined Studies
79
Figure 8.4. No intention to apply to postgraduate study in the future: reasons why by parental NS-SEC (3-class version) Notes Valid n=238. Survey data weighted to adjust for non-response. Faded fill indicates 10<n<30; empty fill indicates n<10.
0.0 20.0 40.0 60.0 80.0 100.0
I don’t think I’m suited to postgraduate study
I’m fed up with studying
There is no funding or other source of financial support
It is too expensive
I don’t know what it will lead to
I don’t want to be an academic
There are no feasible options
I want to focus upon something else
I am in employment
I do not want to leave my job
Personal reasons
I didn’t/ won’t meet academic conditions
Other
Per cent of alumni R
ea
so
n a
gain
st
futu
re p
os
tgra
du
ate
stu
dy
Managerial, administrative and professional occupations
Intermediate occupations
Routine and manual occupations
Never worked and long-term unemployed
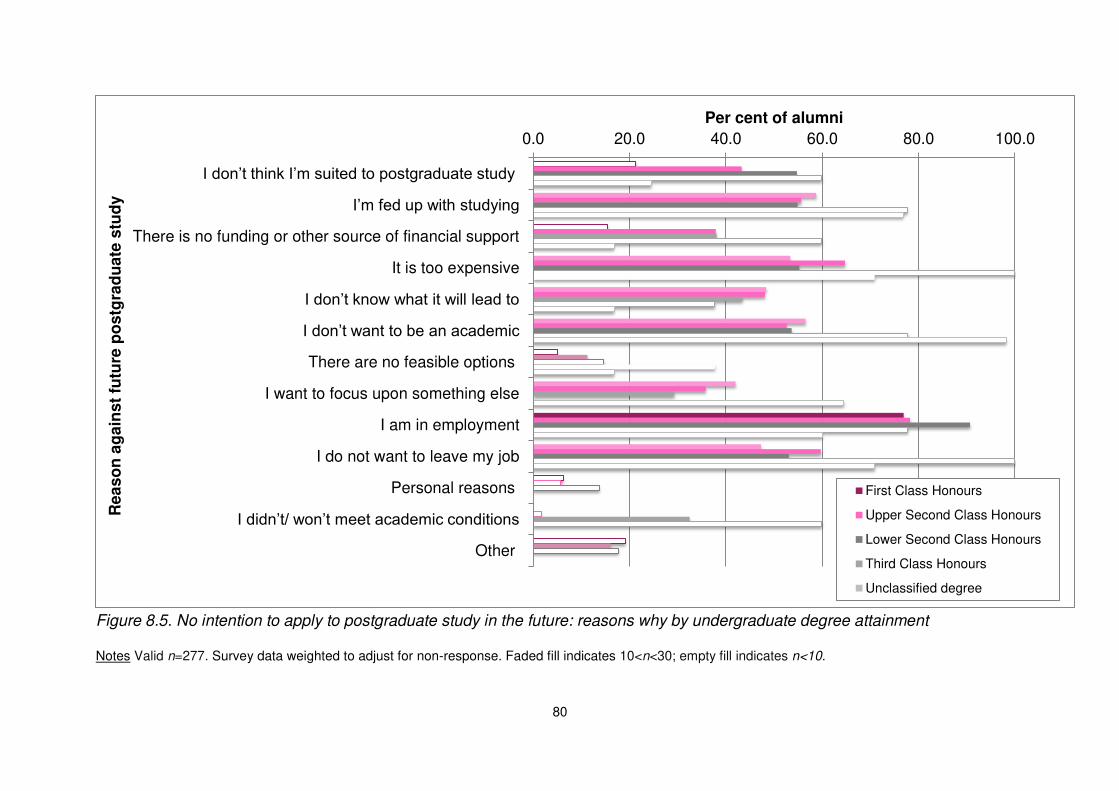
80
Figure 8.5. No intention to apply to postgraduate study in the future: reasons why by undergraduate degree attainment Notes Valid n=277. Survey data weighted to adjust for non-response. Faded fill indicates 10<n<30; empty fill indicates n<10.
0.0 20.0 40.0 60.0 80.0 100.0
I don’t think I’m suited to postgraduate study
I’m fed up with studying
There is no funding or other source of financial support
It is too expensive
I don’t know what it will lead to
I don’t want to be an academic
There are no feasible options
I want to focus upon something else
I am in employment
I do not want to leave my job
Personal reasons
I didn’t/ won’t meet academic conditions
Other
Per cent of alumni R
ea
so
n a
ga
ins
t fu
ture
po
stg
rad
ua
te s
tud
y
First Class Honours
Upper Second Class Honours
Lower Second Class Honours
Third Class Honours
Unclassified degree
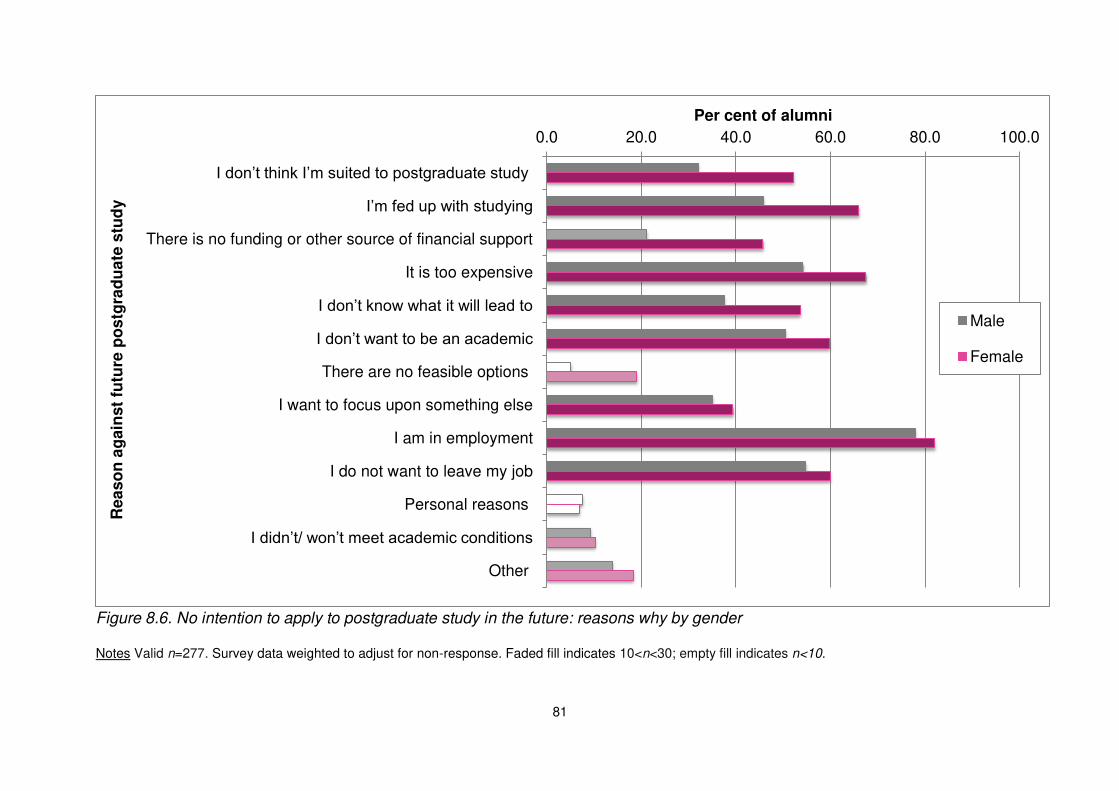
81
Figure 8.6. No intention to apply to postgraduate study in the future: reasons why by gender Notes Valid n=277. Survey data weighted to adjust for non-response. Faded fill indicates 10<n<30; empty fill indicates n<10.
0.0 20.0 40.0 60.0 80.0 100.0
I don’t think I’m suited to postgraduate study
I’m fed up with studying
There is no funding or other source of financial support
It is too expensive
I don’t know what it will lead to
I don’t want to be an academic
There are no feasible options
I want to focus upon something else
I am in employment
I do not want to leave my job
Personal reasons
I didn’t/ won’t meet academic conditions
Other
Per cent of alumni R
ea
so
n a
gain
st
futu
re p
os
tgra
du
ate
stu
dy
Male
Female
82
9. Future plans of alumni and postgraduate students
9.1 Introduction In this section, we present the future plans of both alumni and postgraduates, recorded through the PbG and PtPG surveys. This information was captured by the open question: What are your plans and aspirations for the longer-term future? You may comment on professional and personal ambitions. Survey respondents entered their responses into a text box, meaning that this question was one of the few sources of qualitative data in each survey. The research team considered it important to afford respondents relative freedom in responding to this question, and therefore wished to avoid the use of a predefined set of ‘closed’ answers. The qualitative data were coded thematically and inductively (so to say, thematic codes emerged from analysis of the dataset and were not devised in advance of conducting the analysis). Nevertheless, it is noteworthy that the resultant thematic codes largely mirror those employed elsewhere in the survey (for example, the list of answer options for the question inquiring about the additional activities of alumni and postgraduates). Simply put, the future plans expressed by alumni and postgraduates fall within the range of options we would expect these groups to pursue. Perhaps unsurprisingly, securing or advancing a career is the dominant concern for both alumni and postgraduate students across the consortium. In what follows, there are two tables presented for each group, alumni and postgraduates. In each case, the first table refers to ‘primary plans’; in other words, the prioritised and most important plans expressed by a respondent. For both the PbG and PtPG surveys, the majority of respondents offered only one intention when responding to this question. However, a sizeable minority also offered an additional or ‘secondary’ future intention. These responses were also coded and are presented for each group. 9.2 Future plans of alumni Primary future plans of alumni Across the consortium, the most frequently cited ‘primary’ future plan for both 2009 and 2012 alumni was ‘progress in current career’ (see Table 9.1). As we might expect, the percentage stating such an intention is higher for 2009 graduates, who we could reasonably hypothesise are more likely than the recent graduates to be employed in a job that they envisage continuing in for the longer-term. Related to this, and perhaps reflecting a slightly less settled employment status, a higher proportion of 2012 graduates stated the more general aspiration of finding and maintaining employment. Further study at postgraduate level appears to be a more popular aspiration for the recent graduates (2012 alumni) than it does for 2009 alumni. This is likely related to the difference in time since graduation between each group, and the observation
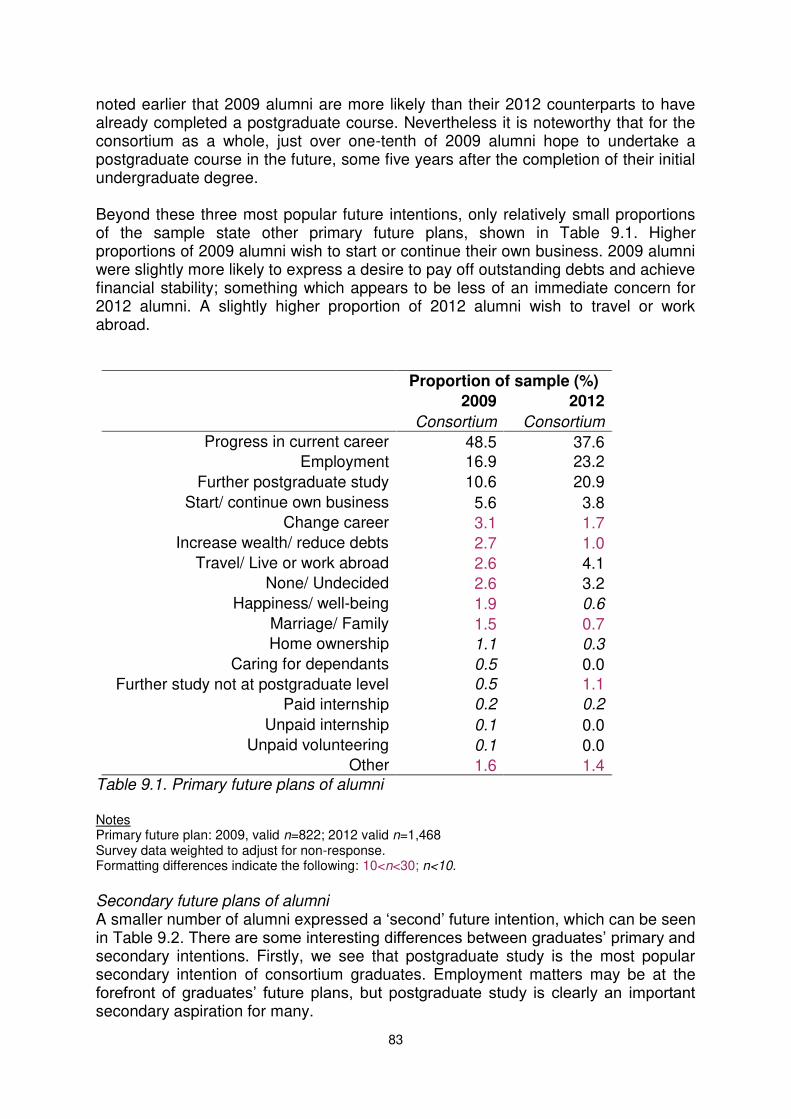
83
noted earlier that 2009 alumni are more likely than their 2012 counterparts to have already completed a postgraduate course. Nevertheless it is noteworthy that for the consortium as a whole, just over one-tenth of 2009 alumni hope to undertake a postgraduate course in the future, some five years after the completion of their initial undergraduate degree. Beyond these three most popular future intentions, only relatively small proportions of the sample state other primary future plans, shown in Table 9.1. Higher proportions of 2009 alumni wish to start or continue their own business. 2009 alumni were slightly more likely to express a desire to pay off outstanding debts and achieve financial stability; something which appears to be less of an immediate concern for 2012 alumni. A slightly higher proportion of 2012 alumni wish to travel or work abroad.
Proportion of sample (%)
2009 2012
Consortium Consortium
Progress in current career 48.5 37.6
Employment 16.9 23.2
Further postgraduate study 10.6 20.9
Start/ continue own business 5.6 3.8
Change career 3.1 1.7
Increase wealth/ reduce debts 2.7 1.0
Travel/ Live or work abroad 2.6 4.1
None/ Undecided 2.6 3.2
Happiness/ well-being 1.9 0.6
Marriage/ Family 1.5 0.7
Home ownership 1.1 0.3
Caring for dependants 0.5 0.0
Further study not at postgraduate level 0.5 1.1
Paid internship 0.2 0.2
Unpaid internship 0.1 0.0
Unpaid volunteering 0.1 0.0
Other 1.6 1.4 Table 9.1. Primary future plans of alumni Notes Primary future plan: 2009, valid n=822; 2012 valid n=1,468 Survey data weighted to adjust for non-response. Formatting differences indicate the following: 10<n<30; n<10.
Secondary future plans of alumni A smaller number of alumni expressed a ‘second’ future intention, which can be seen in Table 9.2. There are some interesting differences between graduates’ primary and secondary intentions. Firstly, we see that postgraduate study is the most popular secondary intention of consortium graduates. Employment matters may be at the forefront of graduates’ future plans, but postgraduate study is clearly an important secondary aspiration for many.
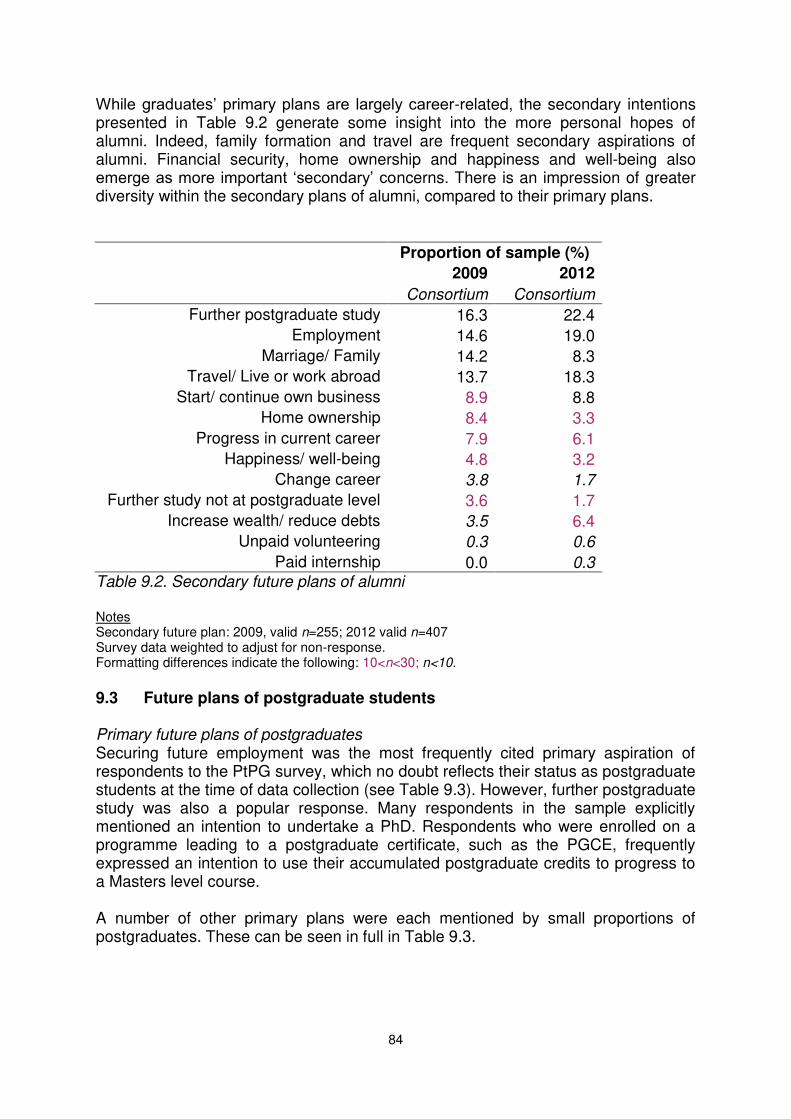
84
While graduates’ primary plans are largely career-related, the secondary intentions presented in Table 9.2 generate some insight into the more personal hopes of alumni. Indeed, family formation and travel are frequent secondary aspirations of alumni. Financial security, home ownership and happiness and well-being also emerge as more important ‘secondary’ concerns. There is an impression of greater diversity within the secondary plans of alumni, compared to their primary plans.
Proportion of sample (%)
2009 2012
Consortium Consortium
Further postgraduate study 16.3 22.4
Employment 14.6 19.0
Marriage/ Family 14.2 8.3
Travel/ Live or work abroad 13.7 18.3
Start/ continue own business 8.9 8.8
Home ownership 8.4 3.3
Progress in current career 7.9 6.1
Happiness/ well-being 4.8 3.2
Change career 3.8 1.7
Further study not at postgraduate level 3.6 1.7
Increase wealth/ reduce debts 3.5 6.4
Unpaid volunteering 0.3 0.6
Paid internship 0.0 0.3 Table 9.2. Secondary future plans of alumni Notes Secondary future plan: 2009, valid n=255; 2012 valid n=407 Survey data weighted to adjust for non-response. Formatting differences indicate the following: 10<n<30; n<10.
9.3 Future plans of postgraduate students
Primary future plans of postgraduates Securing future employment was the most frequently cited primary aspiration of respondents to the PtPG survey, which no doubt reflects their status as postgraduate students at the time of data collection (see Table 9.3). However, further postgraduate study was also a popular response. Many respondents in the sample explicitly mentioned an intention to undertake a PhD. Respondents who were enrolled on a programme leading to a postgraduate certificate, such as the PGCE, frequently expressed an intention to use their accumulated postgraduate credits to progress to a Masters level course. A number of other primary plans were each mentioned by small proportions of postgraduates. These can be seen in full in Table 9.3.
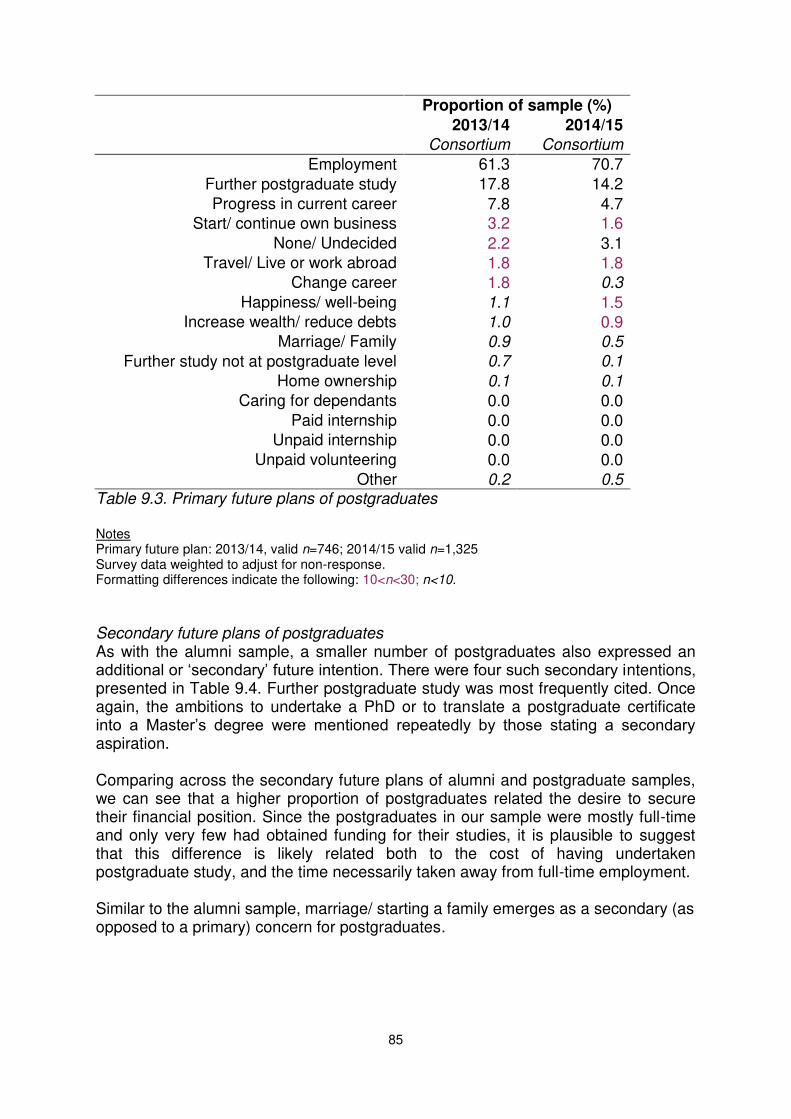
85
Proportion of sample (%)
2013/14 2014/15
Consortium Consortium
Employment 61.3 70.7
Further postgraduate study 17.8 14.2
Progress in current career 7.8 4.7
Start/ continue own business 3.2 1.6
None/ Undecided 2.2 3.1
Travel/ Live or work abroad 1.8 1.8
Change career 1.8 0.3
Happiness/ well-being 1.1 1.5
Increase wealth/ reduce debts 1.0 0.9
Marriage/ Family 0.9 0.5
Further study not at postgraduate level 0.7 0.1
Home ownership 0.1 0.1
Caring for dependants 0.0 0.0
Paid internship 0.0 0.0
Unpaid internship 0.0 0.0
Unpaid volunteering 0.0 0.0
Other 0.2 0.5 Table 9.3. Primary future plans of postgraduates Notes Primary future plan: 2013/14, valid n=746; 2014/15 valid n=1,325 Survey data weighted to adjust for non-response. Formatting differences indicate the following: 10<n<30; n<10.
Secondary future plans of postgraduates As with the alumni sample, a smaller number of postgraduates also expressed an additional or ‘secondary’ future intention. There were four such secondary intentions, presented in Table 9.4. Further postgraduate study was most frequently cited. Once again, the ambitions to undertake a PhD or to translate a postgraduate certificate into a Master’s degree were mentioned repeatedly by those stating a secondary aspiration. Comparing across the secondary future plans of alumni and postgraduate samples, we can see that a higher proportion of postgraduates related the desire to secure their financial position. Since the postgraduates in our sample were mostly full-time and only very few had obtained funding for their studies, it is plausible to suggest that this difference is likely related both to the cost of having undertaken postgraduate study, and the time necessarily taken away from full-time employment. Similar to the alumni sample, marriage/ starting a family emerges as a secondary (as opposed to a primary) concern for postgraduates.
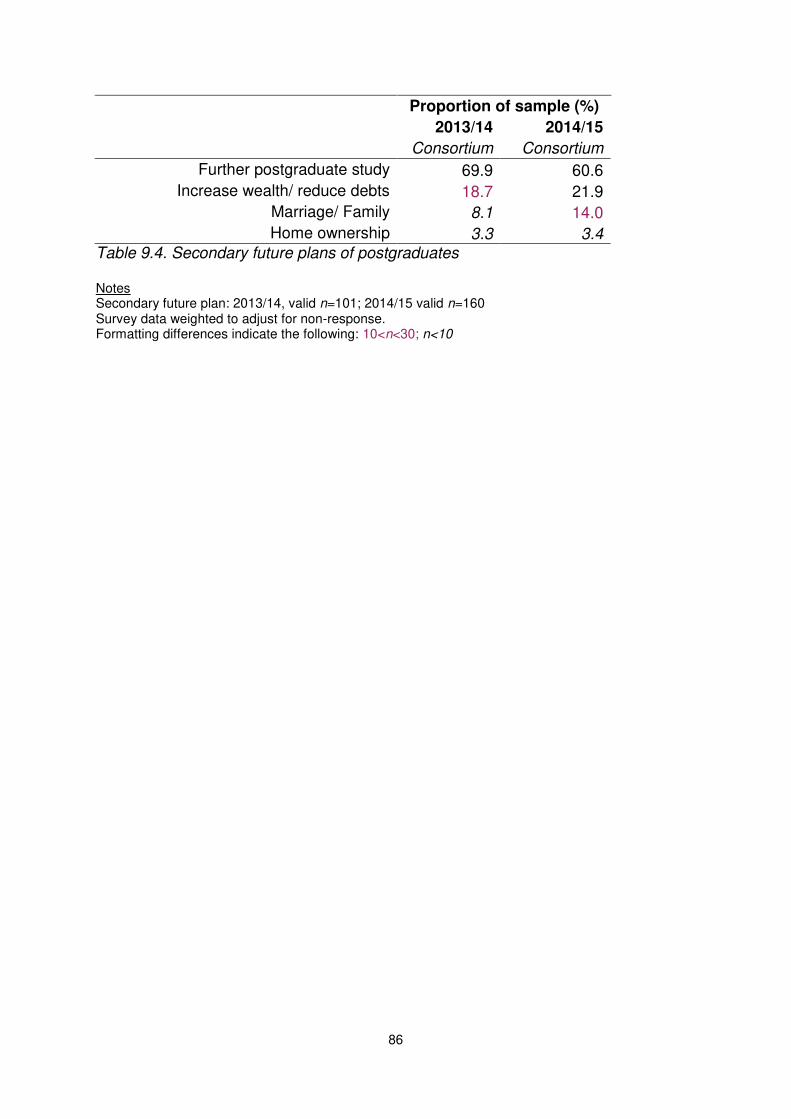
86
Proportion of sample (%)
2013/14 2014/15
Consortium Consortium
Further postgraduate study 69.9 60.6
Increase wealth/ reduce debts 18.7 21.9
Marriage/ Family 8.1 14.0
Home ownership 3.3 3.4 Table 9.4. Secondary future plans of postgraduates Notes Secondary future plan: 2013/14, valid n=101; 2014/15 valid n=160 Survey data weighted to adjust for non-response. Formatting differences indicate the following: 10<n<30; n<10
87
10. Conclusion and recommendations
10.1 Key patterns Some overall findings emerge from the UtS surveys and analysis of admissions data. First, we saw broad similarity in the patterns observed across the six consortium universities, supporting the conclusion by Wakeling and Hampden-Thompson (2013) that first-degree university type strongly structures transition to postgraduate study. Our findings extend this observation to cover current postgraduate students within the institutions, where we see broad similarity in student characteristics. Attainment The survey research also confirms the importance of first-degree attainment in postgraduate transitions. Students with first-class or upper-second-class honours degrees were substantially overrepresented among postgraduate respondents and were also much more likely to enter postgraduate study, especially to higher degree study. Complexity In contrast to these two straightforward conclusions, in other areas there is substantial complexity present in the research findings. Patterns vary across subject discipline and the type of postgraduate qualification considered. The profile of entrants to PGCE programmes, for example, differs in many respects to that of masters students in terms of socio-economic background, attainment, gender and prior discipline. PGCE programmes are also much more selective than masters programmes, having much lower proportion of offers made. Finance and funding While respondents reported different sources of fees and maintenance funding, these did not differ substantially across a range of different background and academic characteristics. Savings and income from a job were the most frequently cited sources of finance. That is not to say that there was no variation: those from the most socio-economically disadvantaged group were less likely to draw on family support, for instance. Also, sources of funding differed somewhat according to first-degree classification, mode of study and type of course. We should note here that those who are unable or unwilling to fund a postgraduate course are missing from the PtPG survey. Debt was not obviously a deterrent, at least for the majority. We saw little evidence, on the face of it, that debt levels predict progression to postgraduate study for the alumni. In the PtPG survey there were many students with quite high levels of debt. Cost emerges as a stronger deterrent. For some respondents, this meant lack of funding, but greater numbers of respondents stated that postgraduate was too expensive, suggesting a relative, rather than absolute aversion.
88
Motivations If cost is a deterrent, then perhaps so is knowledge of the benefits of postgraduate qualifications. Our respondents are largely young and at an early stage of their graduate career, hence we should not read too much into the lack of a salary premium for those with a postgraduate qualification in the PbG survey when compared to their first-degree-only peers (especially as much larger studies do show a premium). However there are more promising indicators, with our postgraduate-qualified respondents being more likely to be in specialist jobs. Our respondents generally reported career-related motivations, involving getting certain kinds of employment and improving earnings. However they also cited for intrinsic motivations related to the subject studied. Many reported not wanting to study at postgraduate level and of course postgraduate study is not for everyone. However we need to be careful to avoid a situation where the disadvantaged self-select out of further study as “not for the likes of me”, especially if this is based on partial or poor information, advice and guidance. This points to the importance of the work carried out in the Information, Advice and Guidance strand of the consortium’s project. Disadvantage We have investigated whether characteristics associated with inequalities in access at undergraduate level remain important in predicting transition to postgraduate study. Our evidence suggests the following factors remain important for consortium alumni: • Parental socio-economic class. NS-SEC groups 4 – 8 see lower rates of
transition to postgraduate programmes • Parental education. First-generation students – those whose parents did not
enter higher education – have lower rates of transition than those with a graduate parent.
• School type. Former independent school pupils are more likely than state school pupils to progress.
• Financial means. While we do not have direct evidence of graduates’ financial means, many report cost as a disincentive. The high proportion of those reporting funding their postgraduate study from their own/their families’ resources suggest that graduates without such support could not enrol.
Other factors did not emerge as important barriers: • Postcode measures. The patterns of transition by POLAR3 category were
inconclusive. • Disability. In many instances, respondents reporting a disability were more,
not less likely to enter postgraduate study. 10.2 Recommendations for action Based on our findings, we suggest there are four areas in which institutions could take action to address the inequalities in access to taught postgraduate study observed. We have presented these in a deliberate order, which reflects the stage in the student lifecycle at which interventions could be implemented. We contend that
89
the measures of socio-economic disadvantage associated with transition to postgraduate study are partly indicative of differences in attainment and decision-making, and partly proxies for familial financial resources. Their use is relatively low-risk in ‘soft’ interventions focused on attainment and advice. They can be used as monitoring measures at all levels. However there are some reliability issues in using them for awarding scholarships in the longer term. Improving attainment Since attainment is strongly predictive of transition to postgraduate study, reducing inequalities in attainment across student background characteristics should also reduce inequalities in postgraduate access. The current turn within higher education policy to focus on outcomes is already looking at these issues in relation to employability and social mobility. Our evidence gives further justification to this attention. This is a difficult and complex set of issues to address, covering ethnicity, social class and gender. Nevertheless there has been success in compulsory education in these areas which has begun to translate into improvements in first-degree entry rates. Extend and improve information, advice and guidance Results from the PbG survey suggest some misunderstandings of the purpose and benefits of postgraduate study. The fact that those with two graduate parents are most likely to make the transition to this level underlines the influence of prior familial knowledge of the system. Our findings support the evidence emerging from the consortium’s Information, Advice and Guidance activities that much more extensive support is required in this area. Making sure this is provided to current undergraduate students is an obvious first step. Admissions practices/policies Our evidence shows some differences in offer rates for different kinds of students. While we lacked data on prior attainment, there are some worrying indications that women and those from disadvantaged backgrounds were less likely to receive an offer of a place. There has been extensive work on professionalism and fair admissions at undergraduate level. We are unsure as to how much this has carried over to the postgraduate level; however our suspicion is that postgraduate selection remains something of a ‘secret garden’, with wide variation in practice and without the scrutiny on selectors’ assumptions which has paid dividends for equality at undergraduate level. Targetting support for affordability Affordability of postgraduate study emerges as a clear barrier for those without independent financial means. The consortium’s scholarships offered through PSS have helped to mitigate this for over 400 students in 2014/15. Our findings suggest that targeting on the basis of financial means will be the most effective means of addressing affordability. This is because financial support applies at the very end of a longer process of deciding on postgraduate study. Here we believe finance can be critical; but it seems to be less critical in the lead up to this point (see also Mellors-Bourne et al., 2014). Finance is also a verifiable measure. Using other measures, such as parental occupation, education and postcode measures relies on honesty on
90
the part of the applicant and is likely to suffer from error as children often do not know or misremember parental information. 10.3 Suggestions for further research Finally, we suggest some ways in which the research here could be extended and enhanced. As a research team we will be extending and deepening our analysis of the three datasets in subsequent analysis, employing more sophisticated statistical techniques and investigating other aspects of the data. An obvious way to extend the research is simply to repeat the two surveys and Admissions Study for different academic years. For comparable results, the 2010 and 2013 cohorts could be surveyed and the Admissions Study repeated with 2015/16 cycle data. It might also be instructive to survey older cohorts (e.g. 2005 graduates). Similarly, the surveys could be repeated with the inclusion of additional institutions, perhaps from different kinds of institution (such as other universities in the consortium universities’ home cities). Additional items of data could be collected in subsequent research. Key omissions from the Admissions Study were ethnicity and first-degree attainment. The former is collected, but sensitive; the latter is usually collected at the application stage, but is not routinely held electronically across the six consortium universities. There is scope for institutions which do not currently collect this information to do so in future; indeed a number of additional fields could usefully be collected, covering (for instance) parental occupation and postcode on entry to undergraduate study, first degree year, institution and discipline and so on. A final suggestion would be to look in detail at available financial measures as predictive of progression to postgraduate study. This might require data linkage using institutions’ records about the SLC assessments of their undergraduates’ ‘household residual income’.
91
References 1994 Group (2012) The Postgraduate Crisis. London: 1994 Group. Artess, J., Ball, C., Forbes, P. and Hughes, T. (2014) Taught Postgraduate Employability and Employer Engagement: Masters with a purpose. Manchester: HECSU. Boliver, V. (2015) Exploring ethnic inequalities in admission to Russell Group universities. Sociology. doi: 10.1177/0038038515575859. The British Academy (2012). Postgraduate Funding: the Neglected Dimension. London: The British Academy. Department for Business, Innovation and Skills (BIS) (2013) Exploring Student Demand for Postgraduate Study (BIS Research Paper no. 154). London: BIS. Department for Business, Innovation and Skills (BIS) (2015) Consultation on Support for Postgraduate Study. London: BIS. Elias, P. and Purcell, K. (2013) Classifying graduate occupations for the knowledge society (Futuretrack Working Paper 5). Coventry: Institute for Employment Research, University of Warwick. Ellison, R. and Purcell, K. (2015) Addressing the research questions via Futuretrack data analysis: Final Report. Coventry: Institute for Employment Research, University of Warwick. Hancock, S., Wakeling, P. and Hampden-Thompson, G. (2015) Technical Supplement to the Understanding the Student strand report. University of York, Department of Education. HEFCE (2013a) Trends in transition from first-degree to postgraduate study: qualifiers between 2002-03 and 2010-11. Bristol: HEFCE. HEFCE (2013b) Postgraduate education in England and Northern Ireland: Overview Report 2013. Bristol: HEFCE. Higher Education Commission (HEC) (2012). Postgraduate Education: an Independent Inquiry by the Higher Education Commission. London: Higher Education Commission. House, G. (2010) Postgraduate Education in the United Kingdom. Oxford: Higher Education Policy Institute and The British Library. Lindley, J. and Machin, S. (2013) The Postgraduate Premium: Revisiting Trends in Social Mobility and Educational Inequalities in Britain and America. London: The Sutton Trust.
92
Mellors-Bourne, R., Hooley, T. and Marriott, J. (2014) Understanding how people choose to pursue taught postgraduate study. Cambridge: CRAC. Milburn, A. (2012). University Challenge: How Higher Education Can Advance Social Mobility: a progress report by the Independent Reviewer on Social Mobility and Child Poverty. London: The Cabinet Office. National Union of Students (NUS) (2012). Steps Towards a Fairer System of Postgraduate Funding in England. London: NUS. Savage, M., Devine, F., Cunningham, N., Taylor, M., Li, Y., Hjellbrekke, J., Le Roux, B., Friedman, S. and Miles, A., (2013)‘A new model of social class: findings from the BBC’s Great British Class Survey experiment. Sociology, 48 (1): 219–250. Strike, T. (2014) Postgraduate Taught Scholarship Scheme: Widening access to postgraduate study and the professions. Sheffield: University of Sheffield. Wakeling, P. (2009) Social Class and Access to Postgraduate Education in the UK: a Sociological Analysis. PhD thesis, Faculty of Humanities, University of Manchester. Wakeling, P. and Hampden-Thompson, G. (2013). Transition to higher degrees across the UK: an analysis of regional, institutional and individual differences. York: Higher Education Academy.