Embed Size (px)
Citation preview

Wolfgang Lutz (Editor)
Population Development EnvironmentUnderstanding their Interactionsin Mauritius
Associate Editors:
lawaharlaal Baguant, Christopher Prinz,Ferenc L. Toth, Anne Babette Wils
With 52 Figures
Springer-VerlagBerlin Heidelberg New YarkLondon Paris TokyoHong Kong BarcelonaBudapest
Wolfgang LutzInternational Institutefor Applied Systems Analysis (I1ASA)236I Laxenburg / Austria
The project on which this book is based was conducted with financial support from the UnitedNations Population Fund (UNFPA).
The designations employed and the presentation of material in this publication do notimply the expression of any opinion whatsoever on the part of the United Nations PopulationFund concerning the legal status or authority of any country, territory, city or area or thedetermination of its frontiers or boundaries. Views expressed are the authors' own and do notnecessarily reflect the opinions or policy of the Fund.
ISBN 3-540-58301-7 Springer-Verlag Berlin Heidelberg New York TokyoISBN 0-387-58301-7 Springer-Verlag New York Berlin Heidelberg Tokyo
This work is subject to copyright. All rights are reserved, whether the whole or part of thematerial is concerned, specifically the rights oftranslation, reprinting, reuse of illustration, recitation, broadcasting, reproduction on microfilms or in other ways, and storage in data banks.Duplication of this publication or parts thereof is only permitted under the provisions of theGerman Copyright LawofSeptember9.1965, in its version ofJune 24,1985, and a copyright feemust always be paid. Violations fall under the prosecution act of the German Copyright Law.
© 1994 International Institute for Applied Systems Analysis, Laxenburg, Austria, and UnitedNations Population Fund (UNFPA), New York, USAPrinted in Germany
The use of registered names, trademarks, etc. in this publication does not imply. even in the absence ofa specific statement, that such names are exempt from the relevant protective laws andregulations and therefore free for general use.
42/2202-543210- Printed on acid-free paper
Foreword
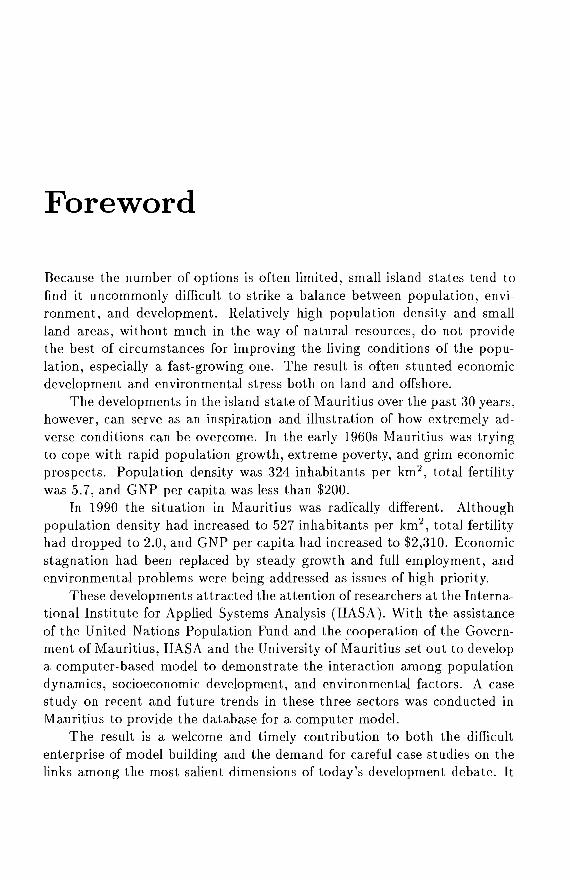
Because the number of options is often limited, small island states tend tofind it uncommonly difficult to strike a balance between population, environment, and development. Relatively high population density and smallland areas, without much in the way of natural resources, do not providethe best of circumstances for improving the living conditions of the population, especially a fast-growing one. The result is often stunted economicdevelopment and environmental stress both on land and offshore.
The developments in the island state of Mauritius over the past 30 years,however, can serve as an inspiration and illustration of how extremely adverse conditions can be overcome. In the early 1960s Mauritius was tryingto cope with rapid population growth, extreme poverty, and grim economicprospects. Population density was 324 inhabitants per km 2 , total fertilitywas 5.7, and GNP per capita was less than $200.
In 1990 the situation in Mauritius was radically different. Althoughpopulation density had increased to 527 inhabitants per km 2 , total fertilityhad dropped to 2.0, and GNP per capita had increased to $2,310. Economicstagnation had been replaced by steady growth and full employment, andenvironmental problems were being addressed as issues of high priority.
These developments at tracted the attention of researchers at the International Institute for Applied Systems Analysis (IIASA). With the assistanceof the United Nations Population Fund and the cooperation of the Government of Mauritius, IIASA and the University of Mauritius set out to developa computer-based model to demonstrate the interaction among populationdynamics, socioeconomic development, and environmental factors. A casestudy on recent and future trends in these three sectors was conducted inMauritius to provide the database for a computer model.
The result is a welcome and timely contribution to both the difficultenterprise of model building and the demand for careful case studies on thelinks among the most salient dimensions of today's development debate. It

VI Foreword
is hoped that the Mauritius endeavor provides a useful example for governments in their efforts to design and implement strategies and programs tomeet the challenges of population growth and distribution, socioeconomicdevelopment, and environmental protection.
Dr. Nafis SadikExecutive Director
United Nations Population Fund (UNFPA)March 1994
Preface
It gives me great pleasure to write this Preface in the double capacity asformer Head of the School of Agriculture, University of Mauritius, and asthe current Minister of Economic Planning and Development. As part of thestudy "Mauritius 2000," which was initiated by the University of Mauritiusin the early 1980s to address national problems through the then novel approach of multidisciplinary research, biotechnology and population studieswere given prominent importance. The latter developed into the presentcollaborative study, Population-Development-Environment: Understandingtheir Interactions in Mauritius. This project was made possible through theinvaluable inputs of the International Institute for Applied Systems Analysis(IIASA).
Human activities and population dynamics are inextricably linked toenvironmental problems in all countries. The IIASA Mauritius model, whichis also called the population-development-environment (PD E) model, is anexcellent attempt to integrate the dynamics of key developmental parameterswithin the constraints imposed by resource allocation and environmentaldegradation. I am confident that this long-term physical-planning tool willnot only be useful to complement the tasks of planners in Mauritius, butwill also serve as a methodology for training planners of the developingworld at large. This approach allows for identification of required measuresfor the desired outcomes while pointing out the dangers and opportunitiesfacing the economy. It also provides an opportunity for developing a moredetached and long-term view than usually presented in a five-year plan and,more importantly, allows policy makers a chance to view trends without thedistortion of the immediate short-run pressure that they face in day-to-daydecision making.
Our preoccupation in the concluding years of this century will be todevelop a better understanding of the nexus of interrelated issues of environmental sustainability and economic growth. Environmental degradation,
Vlll Preface
agricultural exploitation, natural resources depletion, population explosion,and poverty alleviation - to name but a few - fall within this wide ambit.
Fortunately for humankind, ongoing studies are proving to be optimistic.There are many "win-win" opportunities. Policy options exist which couldensure that measures for efficient income growth complement environmentalprotection measures. For Mauritius, the demographic watershed was reachedin the 1970s when the main dip in population growth rates occurred. Today,we are positioning ourselves for other challenges: to upgrade our productiontechnology within the context of sustainable development.
This study, which brings together several critical parameters, shouldassist Mauritian planners, industrialists, and educators in taking wellconsidered decisions on the future policy options for the country. The Ministry of Economic Planning and Development has provided much of the socioeconomic data on Mauritius and has contributed to the formulation ofthe population-Iabor-market-educational model.
On behalf of the government of Mauritius, I would like to express mythanks to the United Nations Population Fund (UNFPA) office in New Yorkfor providing the funds to enable this project to be carried out by the University of Mauritius and the International Institute for Applied Systems Analysis. My thanks also go to the local United Nations Development Program(UNDP) office and UNFPA office for providing the local support.
Professor A.S. KasenallyMinister of Economic Planning and Development
MauritiusMarch 1994
Contents
Foreword
Preface
Contributors
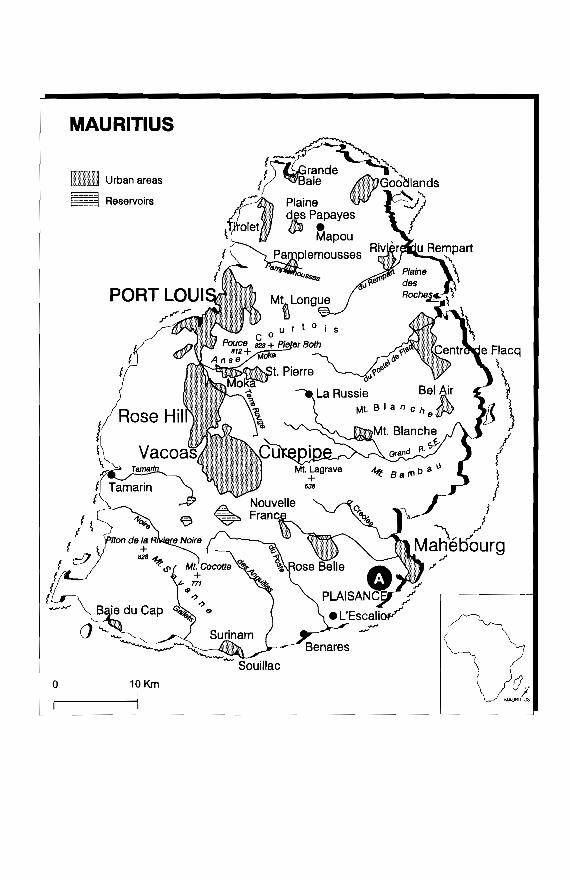
Map of Mauritius
1 IntroductionWolfgang Lutz
Part I: What Do We Want To Understand?
2 Background: People and DevelopmentNathan Keyfitz
3 Simulation Models of Demographic, Economic,and Environmental InteractionsWarren C. Sanderson
Part II: Understanding Through History
4 People on Mauritius: 1638-1991Wolfgang Lutz and Anne Babette Wils
5 From No-Man's-Land to a Congested Paradise:An Environmental History of MauritiusFerenc L. Toth
6 Water Resources and Water ManagementToolseeram Ramjeawon
7 Sugar Cane and Other AgricultureJairaj Ramkissoon
v
Vll
Xl
XIV
1
11
33
75
99
121
139
x
8 Industrial Development and the Labor ForceEsther Hanoomanjee
9 Sustainable TourismM. Sen Ramsamy
10 EnergyJaishree Beedasy and Revin Panmy BeehaT'T'Y
Part III: Understanding Through Modeling
11 Philosophy of the PDE ApproachWolfgang Lutz
12 The Population ModuleWolfgang Lutz and Christopher Prinz
13 The Economic ModuleA nne Babette Wils
14 Land Use and Regional DistributionEinar Holm
15 Modeling the Water SystemsFerenc L. Toth
16 Scenarios for Mauritius, 1990-2050Christopher Prinz and A nne Babette Wils
17 Alternative Histories Since 1962Christopher Prinz
Part IV: Our Present Understanding:What Have We Learned?
18 Lessons From Mauritius in the Global ContextWolfgang Lutz
19 Epilogue: How Useful is the Mauritius Study forOther Parts of the World?Wolfgang Lutz
References
Contents
157
175
191
209
221
233
249
265
293
333
361
387
391
Contributors
Jawaharlall Baguant is head of the school of engineering at the University of Mauritius. He received his Ph.D. in chemical engineering from theUniversity of Tennessee. His main research areas include energy planning,biomass resources, ethanol production, and use of cane tops and leaves.
Jaishree Beedasy is a lecturer in engineering at the University of Mauritius. She received her M.Sc. in information technology from the University ofYork. Her main research interests include GIS modeling information systemsand physical resource management.
Revin Panray Beeharry is a lecturer in engineering at the University ofMauritius. He received his M.Sc. in chemical engineering from the IllinoisInstitute of Technology. His main research interests include energy systemsmodeling.
Esther Hanoomanjee is a principal economist for the Ministry of Economic Planning and Development in Mauritius. She received her M.A. ineconomics from Madras University. Her main research interests include social development planning related to population, the labor market, education, and human resources.
Einar Holm is head of the department of geography at the University ofUmea. He received his Ph.D. in social and economic geography from the University of Umea. His main research interests include development methodsbased on time geography, actor-driven simulation, geographical informationsystems, and models on population and environmental systems.
Nathan Keyfitz is an Institute Scholar at UASA. He is Andelot Professorof Sociology Emeritus at Harvard University and Lazarus Professor of SocialDemography Emeritus at Ohio State University. He received his Ph.D. in
Xll Contributors
sociology from the University of Chicago. His main research interests includepopulation change and social policy, mathematical demography, populationforecasting, and the relation of population to environment and development.
Wolfgang Lutz is leader of the Population Project at IIASA and adjunctprofessor at the University of Vienna. He received his Ph.D. in demographyfrom the University of Pennsylvania. His main research interests includeinteractions between the population variable, socioeconomic development,and the natural environment.
Christopher Prinz is a research scholar in IIASA's Population Project.He received his M.Sc. in social and economic science from the Universityof Vienna. His main research interests include population and householdprojections, family demography, and the impact of demographic changes onsocial and economic development.
Toolseeram Ramjeawon is a lecturer in environmental studies at the University of Mauritius. He received his M.Sc. in the field of water technologyfrom the University in Montpelier. His main research interests are modelingpopulation-development-water interactions on small island states and treatment of industrial wastewaters by high-rate anaerobic treatment processes.
Jairaj Ramkissoon is a senior lecturer in animal science and production atthe University of Mauritius. He received his M.Sc. in physics and biochemistry from the University of Reading. His main research interests includeagricultural/food and livestock strategic and policy studies and land-useevaluations.
M. Sen Ramsamy is a tourist officer at the Ministry of Tourism in Mauritius. His research interests include the social, economic, and environmentalimpacts of tourism.
Warren C. Sanderson is a professor of economics at the State Universityof New York at Stony Brook. He received his Ph.D. in economics fromStanford University. His main research interests include modeling economic,demographic, and environmental interactions in Third World countries andpopulation forecasts after an environmental catastrophe.
Ferenc L. Toth is a research scholar in IIASA's project on EnvironmentallyCompatible Energy Strategies. He received his Ph.D. in economics from the

Contributors Xlll
Karl Marx University of Economics. His main research interests includepopulation, economy, and environmental interactions.
Anne Babette Wils is a research scholar in IIASA's Population Project.She received her M.Sc. in economics from the University of Vienna. Her mainresearch interests include migration trends and future scenarios in populationand development.
MAURITIUS
10 Km
Urban areas
1====8 Reservoirs
o
~-------------------------'--------
Chapter 1
Introduction
Wolfgang Lutz
Is the rapid increase in the number of people on our planet the main reasonfor growing environmental stress, or is it due to consumption patterns together with wrong policies? This has become a very controversial questiondividing not only scientists but also political, diplomatic, and even religiouscircles in different parts of the world. The disruptive force of this questionstems from the fact that the Northern Hemisphere can largely be blamed fortoday's consumption and emission patterns, whereas present (and future)population growth is concentrated in the South.
This controversy was an important underlying issue at the 1992 EarthSummit (United Nations Conference on Environment and Development) inRio de Janeiro and figures prominently in the planning of the 1994 WorldPopulation Conference in Cairo. Shortly before UNCED '92, the Archbishop of Canterbury wrote to the pope in Rome that the Catholic viewon contraception needs to be reconsidered because rapid population growthis threatening our global commons. Rome answered that the reasons forthe world's environment and development crisis were other than populationgrowth. This political and religious controversy essentially goes back to apurely scientific question, admittedly not a very easy one, requiring interdisciplinary analysis. Nevertheless, it is astonishing to see how little empiricaland solid scientific analysis on the issue has been conducted so far. This isthe area in which this book hopes to make a contribution.
2 Wolfgang Lutz
When the distinguished British economist J .E. Meade and the equallydistinguished sociologist Richard Titmuss visited the small Indian Oceanisland of Mauritius in 1960 to assess the development potentials of thissugar island, they found a desperate and crowded place; the populationwas trapped in extreme poverty and had one of the highest growth rateson Earth and no prospects for economic improvement. Both scientists concluded that population growth was the main problem and a fertility declinethe prerequisite for improvement. A few years later Mauritius experiencedwhat was probably the most rapid (strictly voluntary) fertility decline inhuman history.
Today, 30 years after the Titmuss and Meade visits, Mauritius has abooming economy with no unemployment, its fertility is around replacementlevel, and life expectancy on the island is almost as high as in Europe.Economically sometimes characterized as a newly industrializing country,the government is now seriously trying to control pollution and preserve thefragile environment of this beautiful and very densely populated island.
What are the factors behind this stunning success? How did fertilitydecline in the absence of any economic growth? Where did the followingeconomic boom originate? What were the environmental constraints forMauritius in the past, and what will they be in the future? How can the government design robust policies for sustainable development in Mauritius? Toanswer some of these questions, a multi-sectoral computer simulation modelwas developed, the essence of which is described in Part III of this book.
But what can Mauritius, with only 0.00125 percent of the world's landsurface and 0.020 percent of its present population, contribute to the globalpopulation-environment debate? The authors of this study believe that wecan learn a number of very important lessons from Mauritius and that thiscase study can strengthen our understanding of the highly complex interactions between population, development, and the environment. We believethat only concrete empirical evidence, presented in a broad and unambiguous framework that both the social and the natural scientists can accept,will prepare the grounds for a common understanding across disciplines. Togain such common grounds in the global population-environment debate, itis essential to have well-studied cases to refer to. Especially when the globaldebate is as confusing and ideological as the present one, an analytical approach developed for a specific case study (such as the model presented inthis book) may well help to serve as a guideline for the global discussion.
Introduction
Are There Analytical Approaches to Resolvethe Population-Environment Debate?
3
The number of scientific conferences as well as books and articles, on thepopulation and environment issue has been growing exponentially over thepast five years. A glance in the Social Science Citation Index shows veryfew titles with combinations of the keywords population and environment(or sustainable) before 1988. Since then, there has been an upsurge in suchtitles and many more are in the process of being published. At the momentthere is at least a dozen books on the topic under production. Many ofthem are conference proceedings with very diverse sets of papers approaching the broad issue from different angles and different levels (global, regional,individual). So far the scientific community seems to be a long way froma general analytical framework to analyze the issue. Even the demographicand environmental variables chosen for analysis (not to mention the assumedmechanisms of causation) tend to vary greatly. The number of comprehensive quantitative models on population and environment is very small so far.
One equation that has gained prominence in the debate and has becomea kind of common point of reference is the I=PAT equation described inEhrlich and Ehrlich (1990). This identity equation describes environmentalimpact (I) as being composed of three factors: population (P), affluence (A),and technology (T). Since A is defined as per capita consumption (CI P)and T as environmental impact per consumption unit (IIC), the Cs and Pscancel and the equation becomes 1=1. Hence I=PAT gives a decompositionof environmental impact into the three presumably independent and relevantcomponents - population size, affluence, and technology. This decompositionserves the useful purpose oftelling people that it is not one factor alone thatcauses environmental problems but some combination of several factors.
Beyond this the I=PAT equation proves to be problematic as a pointof departure for analytical studies. First, the given decomposition into thethree factors is just one of many possible decompositions that also may include a larger number of components. Before its application as an analyticaltool, it is necessary to justify the choice of components. This depends crucially on what is meant by environmental impact: the factors consideredrelevant for the depletion of the ozone layer will be very different from thoseassumed to cause deforestation or decreasing biodiversity. Second, this formof the equation suggests the independence of the factors considered. Yet a
4 Wolfgang Lutz
major discussion on the population-environment issue concerns interactionsbetween the factors; one side stresses that higher population will increasetechnology, while another side assumes that population growth decreases affluence, and still others stress that increasing affluence reduces populationgrowth.
Is there any analytical tool that can help to resolve the dispute? Thisquestion needs to remain open until the scientific discussion evolves further.The analytical tool proposed in this volume is intended as a step towarda more comprehensive formalization of this question. It is an attempt toset some basic parameters for a structured and scholarly discussion on theinteractions between population change, economic development, and environmental degradation.
In addition to the difficulty arising from the fact that different scientificdisciplines have different paradigms and different languages for approachingthe question, there is one very serious problem for any empirical analysis namely, the strong heterogeneity that makes every result highly dependenton the level of aggregation. For instance, the estimated effect of populationgrowth on future CO2 emissions differs greatly depending on whether onecalculates it at a global, regional, or even su bnational level. It has beenshown (e.g., Lutz, forthcoming) that identical assumptions of constant fertility and mortality rates together with constant per capita CO2 emissionsmay result in 16, 10, or 8 gigatons of global carbon emissions in the year2050 depending on the aggregation level at which the calculations are being performed (global, South and North separately, poor and rich separatelyacross boundaries). The reason for this huge discrepancy is that those population groups with the highest birth rates also have the lowest per capitaemlSSlOns.
This example illustrates a heterogeneity effect that seriously distorts allkinds of associations in the population-environment fields which are conducted at a higher level of aggregation. This is a powerful argument in favorof giving priority to the analysis of case studies. Environmental, economic,political, and cultural conditions are globally very diverse and yet cruciallyimportant for understanding the mechanisms in which population, development, and environment interact. As a consequence, statements on thepopulation-environment issue that should have universal validity need to beso general that their information content is limited.
Case studies may be both qualitative and quantitative, and these approaches may complement each other. The quantitative model suggested
Introduction 5
in this book provides a methodology for organizing and analyzing complexdata so that interrelationships can be more easily understood and intellectually managed - thereby facilitating policy making, planning, training, andawareness-creation on population-development-environment interactions.
For many different reasons, the island of Mauritius was chosen as thecase study for the first application of the analytical framework developedhere. Among the most important reasons are the environmental isolationof this mid-Indian Ocean island, the extremely high population density, andespecially the broad availability and generally very high quality of statistical information on most demographic, economic, and environmental aspects.Another important reason for choosing Mauritius was the presence of a competent local team of scientists at the University of Mauritius that was willingto collaborate closely with IIASA on the project. Seven of the fourteen authors contributing to this volume are Mauritian.
Structure of the Volume
This volume is structured around the notion of understanding. Understanding is a process which always remains incomplete. But understanding impliesalso the progression to a clearer and more complete picture of how the systemworks. Understanding also has the connotation of a holistic perception of thesystem that does not take specific questions out of context. All three a8pectsof understanding are meant when the notion is being used in this volume.
The first section of the book, "What Do We Want To Understand? ," triesto define the question. It gives a background paper by Nathan Keyfitz thatputs the present volume into the broader perspective of global developmenttrends over recent decades and presents concerns about the role of populationin future development considering environmental constraints. The chapteralso looks at the role of nation-states in development policies and scientific approa.ches to the global issue at a case study level. Chapter 3 gives amore technical survey of simulation models in the population-developmentenvironment field. Warren Sanderson, who published a systematic and comprehensive survey of economic-demographic simulation models in 1980, wasinvited to write this chapter expanding the analysis to models that explicitlyconsider environmental aspects.
There are different ways of understanding and different tools to helpadvance our understanding. This book takes a dual approach. The sections"Understanding Through History" and "Understanding Through Modeling"
6 Wolfgang Lutz
complement each other. Part II, "Understanding Through History," is anattempt to write an integrated history of the population, the economy, andthe environment in Mauritius up to the present. Despite all efforts to havean interdisciplinary approach to the issue, the section is still structured according to specific relevant topics. This was necessary because individualexpertise still exists largely by scientific disciplines. The section provides ahighly condensed and greatly revised version of the conference proceedingsentitled Population, Economy, and Environment in Mauritius (Lutz andToth, 1991). The authors of this section are mostly Mauritian.
Part III describes our efforts for an "Understanding Through Modeling."It gives the design and many applications of the population-developmentenvironment model which was carried out at IIASA in close contact withthe University of Mauritius. This model, which is built for the simultaneousconsideration of the various aspects discussed in this section, allows a higherdegree of integration than the approach taken in Part II, "UnderstandingThrough History." If Part II is labeled multidisciplinary, Part III may becalled interdisciplinary.
Part II consists of a set of seven papers which are devoted to some keyissues for understanding the evolution of the Mauritian social, economic,and physical systems. Chapter 4 by Wolfgang Lutz and Anne Babette Wilsgives the population history of Mauritius emphasizing its most prominentfeature, namely, the extremely rapid fertility decline during the 1960s andearly 1970s; but it also describes the social and political structures of thecountry. Stepping back from this socio-demographic perspective and lookingat the life-support system in a broader sense, Chapter 5 by Ferenc Toth givesan environmental history of Mauritius. It stretches from the early colonialdays to the time of independence.
Chapter 6 by Toolseeram Ramjeawon gives a compact survey of Mauritian water resources and water management, issues that are crucial forsustainable development in Mauritius. Chapter 7 by J airaj Ramkissoonaddresses the traditional backbone of the Mauritian economy, sugar cane,and puts it into the perspective of general agricultural development. Special emphasis is given to the question of food supply. Chapter 8 by Esther Hanoomanjee studies non-sugar manufacturing and the recent boom ofexport-oriented industry. The chapter also outlines the role of governmental development policies and pays special attention to changes in the laborforce. Chapter 9 by M. Sen Ramsamy works out the special role of tourism
Introduction 7
in Mauritius, which represents a rather strong and immediate linkage between environmental preservation and economic profit in an internationalcompetitive market. Chapter 10 by Jaishree Beedasy and Revin PanrayBeeharry studies another important area that relates to economic as well asenvironmental issues, namely, energy systems in Mauritius.
Part III, "Understanding Through Modeling," consists of five chaptersthat describe the structure of the PDE Mauritius model and two chaptersthat present applications of the model to the future and to hypothetical alternative past trends. The design and implementation of the model resultedfrom the work of an interdisciplinary and international team over more thantwo years. The authors of the chapters describing the different modules ofthe model are also primarily responsible for those parts of the model. Atthis point the absolutely essential contribution of our programmer, FrantisekGyarfas, is gratefully acknowledged.
Chapter 11 by Lutz gives a short introduction to Part III by describing the basic reasoning behind the modeling approach chosen. Chapter 12by Lutz and Christopher Prinz summarizes the population module, whichconsiders the composition of the population by age, gender, education, andlabor-force participation in the form of a multistate model. Chapter 13 byWils gives an outline of the economic module that essentially consists of aninput-output model with certain additions and modifications. Chapter 14by Einar Holm outlines the structure and the basic assumptions made in theland-use module. Chapter 15 by Toth gives an account of the water module that considers the lagoon as well as quantity and quality aspects of thestream flow. More detailed descriptions of all modules have been publishedas IIASA Working Papers and are available to the interested reader.
Chapter 16 is, in a way, the culmination of the whole project. Written byPrinz and Wils, it presents a summary of findings from extensive scenariocalculations up to the year 2050. The chapter shows the baseline scenarios chosen for the different sectors of the model and then gives aggregatescenarios first in a raw and unadjusted form and then in an adjusted formthat makes all sectors of the model more consistent and plausible. Againstthis background several special policy options are calculated and discussed.Chapter 17 by Prinz gives alternative scenario calculations along the sameline, but uses 1962 instead of 1990 as the starting year. Comparing thesecalculations to the actual path of development, the chapter describes whatwould have happened if, e.g., fertility had not declined the way it did.

8 Wolfgang Lutz
Part IV is entitled "Our Present Understanding: What Have WeLearned?" In Chapter 18, Lutz attempts to pull together the many different findings at various levels reached by differing methods and approaches.It is structured around five basic questions that figure prominently in thepresent population-environment debate and to which we believe the Mauritius case study could make a contribution. In the Epilogue, Lutz discussesthe transferability of the study's findings to other countries.

Part I
What Do We Want To Understand?

Chapter 2
Background: People andDevelopment
Nathan [(eyfitz
2.1 Stalled on the Road to Development*
Future historians will see the present world society as frozen. Not that eventsto occupy the media are lacking, between petty civil wars and terrorism, butin the most important field of all - development that would remove grossinequality, and at the same time adapt to the constraints of our planet - wefind hesitation and uncertainty; after exhilarating progress in the 1960s wesee now a discouraged halt. Nearly three-quarters of the 5.4 billion worldpopulation are suspended in an intermediate, transitional, condition - theyare far from primitive, but not yet fully modern. These people, living in thenational units of the developing countries, have been touched by modernity,in a process that should have continued on to complete development, butthat is now stalled.
The stalled condition is a frustrating one, full of imbalances and contradictions for the 4 billion people that it affects. The majority are by nowliterate, and many are educated well beyond literacy, but the jobs in which
*Seetion 2.1 is the author's contribution to UNCED in Rio de Janeiro, and appeared as aneditorial commentary, "Stalled on the road to development," in the Earth Summit Times,Tuesday, June 2, 1992, p. 6.
12 Nathan Keyfitz
they can apply their education are too few, and available jobs have littlerelation to those their education led them to expect. They have graphicaccess through television and otherwise to the way of life of developed countries, but its luxury is withheld from them; they are invited to watch a feastbut excluded from partaking. They have a large measure of death control,including mass inoculation against the most common diseases, but lack theindispensable birth control that has to go with it. Their condition of partial development manifests such abnormalities as corruption, unemployment,civil war with modern deadly equipment, internal inequality of income exceeding even that of the rich countries, all problems more serious for thepartially developed than they are for either primitive or modern peoples.
The stalled condition comes as a surprise to national and internationalplanners of development. When the United Nations announced the firstDevelopment Decade in 1960 it expected that development would occur witha big push over a decade or two. Progress was made toward this goal in the1960s and to some extent in the 1970s, but in the 1980s retrogression set in.We see many signs of this retrogression. Birth control effort slowed, and theUnited Nations has had to raise its estimate of future population. The netflow of capital from the rich countries to the poor reversed, so that the poorhave become net providers of capital to the rich. Inequality both withincountries and among them has increased.
Some Third World countries report economic growth of impressiveamount but it turns out that as much as half of their apparent increaseof income is just bad accounting, the drawing down of capital by selling offnatural resources and calling the receipts income. Extracting oil from theground and burning it in internal-combustion motors is called productionin conventional accounting; from the ecological point of view the identicalactivity is destruction. That the economist can call production what theecologist calls destruction is a striking but by no means unique example ofthe importance of interpretation in human affairs.
If higher apparent income leaves deteriorating soil, damaged forests, andpolluted atmosphere then it comes at the expense of later generations. Badlyneeded is a proper set of accounts on the development progress, say up tothe standards applied in running even a small business.
But the difficulty goes deeper than merely getting the numbers right.Poor countries are placed in a position where they cannot protect their natural heritage of forest and soil. They are fiercely proud of their politicalindependence, vigorously protect their autonomy in a defined territory, but
Background: People and Development 13
they do not equally protect their patrimony of natural resources; remorselessexternal markets will not let them. As their population grows the pressureon their soil and their forests increases year by year. Traditional peasantsevolved practices that preserve their land for their children; they want stability more than higher current income. Their ancient stabilizing practicesare abandoned as development gets under way, but the stability that richcountries can contrive is not yet in reach. In the face of growing populations and specialized production for export they are forced to neglect theirenvironments, even though it is above all poor countries that in the end willsuffer from a crippled environment.
As long as it lasts this condition is a danger for those concerned andfor the world. Not many years ago it was thought that the answer was forthe rich countries to supply massive financial aid. We now know that theproblem is not so easily disposed of as appeared in the simpler world of the1950s and 1960s.
A solution more imaginative than just handing over money has to besought. After all, the money in amounts that would make a difference issimply not there. Germany is suffering from the costs of unification plus aidto ex-socialist countries to its east; the United States has become a majorborrower, a competitor ofthe less developed countries for scarce internationalcapital; after years of brilliant success, Japan is in the midst of a recessionin which its stock markets have lost half their value.
This introduction presents some background to a case study concentrated on one country, Mauritius, with just 1 million population out of theworld's 5.4 billion. What has made its study instructive is that it is in important respects a success story. Its prospects 30 years ago were dreary;today it is industrializing, educating its population, controlling its births.If the work of observation and analysis here reported has been done well itshould provide some pointers to what might be possible elsewhere. That itis small and an island distant from the mainland, with a relatively simpleeconomy, has made study feasible in a short period of time, and with limitedresources.
But before embarking on a comparison of the Mauritian condition beforeand after the development effort of the past 30 years, with analysis of whatit was that has made Mauritius different from most of the other developingcountries, it will be useful to review the situation of the Third World ingeneral, and the way that it has fared in the short but eventful years followingdecolonization.
14 Nathan Keyfitz
2.2 The Initial Path: ShortsightedPopulationism and Isolationism
The sense of nationalism that moved through the colonies of Britain, France,and Holland after World War II was both the cause and the result of theirstruggle for independence. To mobilize whole populations into an irresistibleforce that would expel the foreign rulers required the construction of symbolsin which the intellectuals took a major part, but the messages had to reachbroad layers of city people as well as to a lesser extent of peasants. In someinstances - Indonesia was an instance - violence was necessary; in others theseparation from the colonial power was accomplished by peaceful negotiation.The more protracted and the more violent the struggle the more deeply thenew set of national symbols was imprinted on citizens.
Once they attained independence after World War II the new nations setthemselves a sequence of objectives: increased population that was thoughtto give the state more weight in its region and in the world, developmentunder the aegis of the state, nationalization of foreign-owned enterprisesin any industry considered nationally important; official encouragement ofimport substitution regardless of the interest of consumers. Foreign investment was regarded with suspicion when it was permitted at all. Sacrosanctnational territory and absolute sovereignty went along with carelessness onthe preservation of the qualities of that territory, so that some of the mostnationalistic states were the ones that wreaked the greatest destruction ontheir forests and soils in pursuit of very short-run economic goals. That wasthe era of one-party constitutions in the new countries, the era of Mao Zedong in China, Sukarno in Indonesia, Idi Amin in Uganda. Looking back onthe history in the light of subsequent experience we find it hard to estimatehow far these recklessly wrong policies set back development; the least wecan say is that it was a very expensive learning experience.
Perhaps that third of a century of misguided effort was not whollywasted; it could have been necessary to go through it to find out thatmerely declaring national sovereignty, making the autonomy of the nation thesupreme and absolute morality, overriding democracy and human rights, encouraging irresponsible reproduction, would not bring the results hoped for.
So fast have all of us learned that it is hard now to understand the twofeatures of early postwar nationalism: population seen as a symbol of national power, and the governmentally controlled economy as a self-contained
Background: People and Development 15
instrument for national prosperity. Appropriating what the colonial powerhad left behind did not deliver much wealth to the average citizen; the countries were admittedly poor in goods, and if they had any wealth it consistedof their own people. On a distorted interpretation of this clearly correctproposition, President Sukarno in Indonesia insistently expounded the needfor more people; his attitude and that of self-proclaimed patriots everywhereresembled that of the mercantilists writing at the dawn of modern nationalism in Europe.
The new nationalism of the second half of the 20th century did not trustforeigners or even indigenous private enterprisers with the economy. All ofthe important elements, the "commanding heights" of the economy wouldhave to be placed under national, and governmental, control. Nehru, influenced by Professor Mahalanobis, a brilliant man in other fields who set outto invent economics, sought the physical control of the investment processthat would modernize India; that meant among other things a state-runsteel industry to provide materials for the capital goods that would producethe multitude of badly needed goods for consumption. Everything basicand therefore important - electric power, transport, telephone, and othercommunication - had to be run by the state. The development sequence,starting with these, had to be guided by a national plan written out in advance. Marxist theory, and the Soviet practice of the time, seemed to givesanction to all this, but Western donor countries lacked the courage and vision to describe it for what all now know it to have been. The less developedcountries had to learn for themselves.
2.3 Planning Holds Up Progress
It took two or three decades of experience with increasing population andgovernment control of investment to destroy the faith in this approach. Morepeople were found to be an increased load on the whole national system;excessive guidance of the economy builds up and then preserves sectors like steel - long after they have ceased to be the leading edge. In respect ofconsumer goods central planning produces the wrong things, and producesthem inefficiently. A housewife going to market can write out a shopping listthat is her plan for the morning; securing the welfare of the nation is not assimple as a shopping list. No government can have as clear an understandingof its citizens' needs as the housewife has of her family's.
16 Nathan Keyfitz
Worse than that: in the form that planning came to take in a numberof countries the plan documents aroused the expectations of the citizenrywithout providing realistic means to the fulfillment of those expectations.The divergence between the promise of the plans and their meager resultsbecame more and more conspicuous, everywhere from Malaysia to the USSR.
2.4 Nationalism Turns Positive
Minimal national planning in the form of a budget for government expenditures on social overhead is indispensable, but nearly every country is nowmoving to give general planning no more than its due place. Nigeria recentlypassed a law that allows all investments of more than $2 million to be entirely controlled by their foreign owners, who do not have to take in Nigerianpartners as before, and who have entire liberty to repatriate profits. Onlysmall shops and service establishments are reserved for Nigerians. Permission to invest is provided by a single agency, rather than being controlled bydozens; that saves time for the investor, reduces cost to the country, narrowsthe scope for corruption.
China has relaxed the many restrictions that it once had on foreigninvestment. Among other items, foreign consumer products factories thatwere formally required to export the bulk of their output are now allowed totarget 1.16 billion consumers. Foreign banks and law firms are getting moreleeway to operate while foreign property developers are encouraged to buildapartments, hotels, office towers, and shopping malls (Wall Street Journal,November 25, 1992, p. 9).
Virtually everyone of the developing countries has similarly turnedaround. Now instead of expelling the old multinationals and fighting off newones, countries are competing to attract foreign industry, especially branchplants. Sometimes indeed they go too far with tax holidays and other expensive inducements. This competition for the attention of investors arisesbecause developed country corporations with spare cash to place abroad arefewer; LDC policies that would have brought a good deal of investment adecade or two back are now not attractive enough. The turnaround in policyhas come late, in an era when heavy demands encounter declining funds in allcapital markets. We shall see in a moment that this has deadly consequencesfor rapidly growing populations.
Background: People and Development 17
2.5 The Nation is Identified With a Territory ButNot With its Share of the Biosphere
Alongside more emphasis on population control and a market economy onefeature of the national spirit has been constant: its identification with thecertain geographical area. No government could think of giving away orselling a square meter of the national territory. Trading pieces of land withother countries is repugnant, even where there would be a common advantageto the two parties. Renting out land for foreign military bases is suspect evenwhere the state exchequer badly needs the money, and in addition the basewould provide a welcome defense. In short the national soil is sacred, tobe handed down intact to all the following generations; it is not subjectto negotiation, to truck or trade, for any purpose whatever, economic orpolitical.
An outsider therefore finds it strange that there is no such nationalidentification with what lies on, over, or under the soil. It is regarded asperfectly proper to sell the oil, the copper, and other subsoil wealth; to rundown the soil itself by producing more peanuts than the world needs ~ as inSenegal- and so lower the water table and promote the spread of the desert;to sell the forests in the form of plywood or furniture, or to cut them downto produce beef for a few years as in Brazil's Amazon.
In short, holding intact a defined territory, i.e., a piece of land, has beena constant feature of the spirit of nationalism, that on other dimensionshas changed substantially; it has moved from encouraging larger populationto having a healthy and prosperous population no longer in rapid increase;from the state conducting all investment to the state standing back andencouraging private capital, domestic and foreign. Can we now hope fora move to identify with the ecological content of the national territory aswell as with its geographical boundaries? The purpose would be a durableeconomy, in which development will make a better life for each succeedinggeneration, rather than a quick sell-off of natural resources for the passingbenefit of the generation now on the scene.
So far we still hear that preserving the forests of the Amazon has toyield to more urgent matters, like investment in factories and paying interest on the debt and so maintaining the nation's credit standing. These areindeed of immediate importance for development. But it is in the nature of
18 Nathan Keyfitz
development that it requires harder work and more saving than would beneeded if there was no development, a fact temporarily obscured during the1980s by the seemingly unlimited funds that could be borrowed in international markets. Development means that the present generation labors andabstains in order to accumulate capital that will make for the ease of futuregenerations. One hopes that the process will be assisted by the nations thatare already developed, but ultimately the crucial element is the effort andsaving of the poor country's own citizens.
Herein is the paradox that resides in carelessness on ecological matters.Development is promoted with many sacrifices and the increased incomethat is going to result will mostly benefit children and grandchildren. Andto accomplish this economic goal by sacrificing ecological considerations willnot leave the means for a prosperous existence to later generations. Sellingoff those forests to serve developmental purposes makes little sense if thesupposedly wealthy descendants will inherit only a barren wilderness. Thelabor and the abstention of the present generation will be worthwhile if alongwith a prospering economy the children and grandchildren of those now alivecan have a territory as naturally rich as the one that exists today.
The point has often been made in international meetings that industryis what does the major damage to the environment, that fossil fuel emissionsand CFCs from refrigerators do far more damage in total than poor peoplecutting trees for firewood. True of course; the poor and the rich each dodamage in their own way, but since the rich command more powerful instruments they do more damage. Insofar as population increase is mostlyof the poor it is not the cause of the trouble. That is certainly true of thepast, but what of the future? We hope that the poor will become middleclass, if not rich, and when that happens their numbers will greatly affectthe environment. Facing the future it cannot be true at one and the sametime that the numbers of the poor do not matter and that development toraise the level of the poor must go ahead. The poor do less damage than therich, but if the poor are the rich of the next generation, then their numbersmatter greatly.
Put briefly, the one who argues with evidence from the past that it isthe rich who do the damage, and therefore the numbers of poor do notmatter, cannot carry the argument into the future without saying also thatthe poor will remain poor. One who expects that the poor will become richhas to accept that the numbers of the poor are going to make a great dealof difference to the world of the future.
Background: People and Development 19
In accord with this will the world go on to a new phase, in which thenational state would be the custodian of its ecosystem as well as of its territory? Everyone surely wants to avoid the contradiction discussed above:that development requires sacrifice of this generation to serve later generations; economic activities that destroy the environment will nullify the gainsof development and leave the following generations empty handed. And development will sooner and more innocuously raise the level of the poor if thepoor do not rapidly increase.
2.6 MDCS Versus LDCS
While errors have certainly been made and are being made by the countries of the Third World, the First World has had a relation to the formercolonies not entirely innocent. The colonial period itself was initiated because raw materials were needed for the beginning industry of Western Europe, and securing these distorted the precolonial economies, that before hadattained some degree of balance over the course of centuries. Having turnedtheir overseas territories into producers of spices, cotton, jute, coffee, sugar,sisal, kapok, rubber, and other tropical products, those Western overlordsdeparted.
They were in some degree pushed out, but from their side the colonieswere no longer necessary. Artificial aniline dyes were the forerunners of aprocess of substitution that went through silk, rubber, beverages, nylon, andother fibers. The invention of substitutes accelerated with decolonization,that gave the strongest economic incentive to the independence of the mostadvanced countries, independence of their former colonies. After the DutchEast Indies won their freedom from Holland it was the latter that progressedmore rapidly.
Part of the reason for the slow progress, for instance of Indonesia, wasthe fall in prices of rubber, sisal, edible oils, and virtually every other colonialproduct except petroleum. What was to be the source of capital for development turned out to be grossly inadequate even to maintain the previouslevel of living.
What seemed like good fortune was the presence of large amounts ofpetrodollars in United States and other banks, and these were borrowedby the LDCs at rather low rates of interest. Once the loans were made awholly unplanned shortage of capital appeared, and interest rates - especially long-term rates - rose accordingly. The borrowing countries had no
20 Nathan Keyfitz
way of repaying the loans when they came due, and they had to roll theseover at the new high rates prevailing. As a result the flow of funds thattraditionally went from the more developed to the less developed countries(for instance, from Britain to the United States at the turn of the century)is currently from the LDCs to the MDCs.
This aspect of the history is worth repeating for the benefit of those whoconsider that the predicament of the LDCs was wholly the result of their ownerrors. One can see a nice balance between those errors, on the one side, andthe movement of postwar economics and technology that undercut prices oftropical raw materials and tempted into the trap of excessive borrowing.
2.7 People as Consumers
Abstracting from both external relations and internal environment for amoment, one way to think about population is to consider its individualmembers in their role as producers and consumers. People are both the activeelement making countries develop and the beneficiaries of development. Letus briefly look at the changes now going forward in the LDCs from a peoplepoint of view.
In the present LDCs, as in Europe over 200 years, the motor of development is people's wish to rise financially and socially. The unlimited desirefor goods on which economic progress hinges is by no means "natural"; theDutch found this when they failed to attract labor with wages that wouldhave been high for the time and place. Accordingly they introduced forcedlabor in the growing of sugar, and each peasant in the designated areas wasrequired to contribute as a tax in kind one-fifth of his land and one-fifthof his time. The British preferred a "free" economy, and finding that theircolonial subjects had little use for money, and hence saw no point in workingto earn it, they made laws that gave their subjects a use for money: to paya specially instituted poll tax.
But that phase is now over. With the exception of a few isolated andbackward parts of countries that have not yet been touched by the urgeto social mobility and desire for consumer goods the whole world is nowsufficiently advanced that the desire for goods is no longer a problem. Infact economics has spoken of a "demonstration effect," the desire for goodsstimulated by the media and then by exhibition of their local use in the
Background: People and Development 21
possession of friends and neighbors. That desire, for example as expressedin a "cargo cult" in the South Pacific, was in some instances so strong thatit distracted from the realization that one had to work and sacrifice in orderto satisfy it.
Such discussion has largely disappeared from economics and social science generally; progress is no longer held up either by inadequate or byexcessive desire for goods. The spread of education and the developmentmovement of the postwar period has achieved this if it did nothing more.
2.8 Motivations to Produce and ConsumeReconciled by the Market
Once both too little and too much desire for goods are overcome, the problemcomes to center on the skilled labor force and the purposeful enterprisethat will produce the goods. We have to reckon with the fact that whatpeople would like to do in their capacity of producers does not necessarilyaccord with what they want to obtain in their capacity of consumers. Forthe community as a whole, if not for individuals, there has to be an exactcorrespondence, in fact an identity, between these: the community can onlyconsume what it produces - or what it can obtain by trading its productionand services. If people want to work at a desk job in a major city, preferablythe national capital, and they want to consume rice, automobiles, televisionsets, that are not produced by people who sit at desks, then something willhave to give. In no conceivable economic system can everybody have justwhat he or she wants, either what they want to work at as producers or whatthey want to possess as consumers. The economic problem is to find theminimum departure from what they want that will satisfy the unavoidableconstraints.
The congruence between what people want to produce and what theywant to consume is readily attained in free exchange. A group of people aremaking some commodity, say pottery, and the highest price at which theycan manage to sell the product determines the wages they will have. If theproduct is not saleable they will have to find something else to produce, orelse so improve the product so that it can be sold. The discipline of themarket minimizes the incongruence between what people collectively wantto produce and what they want to consume.
22 Nathan Keyfitz
2.9 Model Dependence is Inevitable
The growth of population is central to the work reported in this volume.That growth has been rapid over the postwar period, and to it can be attributed many of the difficulties and inefficiencies of the developing countries.
To think about population one sets up a model, and different modelsproduce very different outcomes. As for any other important subject, avariety of models are current, all competing for attention. One can see whatdifference the model makes by considering two or three very simple ones.
Suppose that production depends only on people, and in particular ontheir skills and effort. It is people who initially create the inert factors ofproduction -land and capital in classical economics - and hence people andtheir training are the fundamental factor of production - the sole factor insome extreme formulations. It requires no argument to show that with thismodel overpopulation simply cannot occur.
Contrast that with a model in which people do not enter abstractly asproducers, but require slots, that we call jobs, into which they can fit, andthese jobs are created by enterprise and capital. With this model the personcannot be a producer at all without the capital and enterprise that will offerhim or her a job. That part of the population in excess of the jobs offeredwill be a drag on welfare; the model easily recognizes overpopulation oncepopulations have become large.
The above applies to land as well as to capital where the person cannotproduce without a suitable plot to till, and when it is so applied we havethe economics of Malthus, whose name has become identified with overpopulation.
Not directly related to any of the above three models is one in whichproduction is considered within the environment, the setting in the biospherethat provides the materials we need to keep alive. A simple way of takingthis into account makes the drain on the environment proportional to thenumber of people. On this static view twice as many people will cut twiceas many trees for firewood, consume twice as many fish, burn twice as muchfossil fuel, all assuming that other factors remain constant.
The four models sketched in rough form above are by no means exhaustive, and to show the richness of the subject we proceed to sketch one more.If it is not entirely novel or surprising, at least it is not in the literature inthe form presented.
Background: People and Development 23
2.10 Population Growth: A PoliticallyDisturbing Element
Here we consider a causal path starting with the fact that lower death ratesand especially lower infant mortality with little change in birth rates leadsto much larger cohorts than before, and after a very few years the newcohorts come to working age. Because they are more numerous, at the sametime as productivity in the countryside where most of them are born hasincreased rapidly, there is inadequate land for them to follow the ancestraloccupations. How far population growth alone drives people off the landand into cities is debated, with evidence for and against, but there is littledoubt that combined with shortage of rural opportunities it adds to thecityward migration. Beyond that, formal education, stimulated by the desirefor upward mobility, and eagerly demanded by a population that is ambitiousfor personal advance, has expanded enormously, and even if the land wasavailable they would not be willing to engage in the traditional way of life oftheir ancestors. All this leads to a flight to the cities, and one sees everywhereunprecedented expansion of the cities of the poor countries. No longer arecities places where manufacturing draws workers from the countryside to newjobs that its enterprise capital creates, as in 19th-century Europe; they areplaces where population for which the countryside has no use takes refuge,hoping something will turn up.
The one thing that looks superficially like a solution is to expand government services and establish state enterprises. The pressure to do thatbecomes enormous, under the impulse of electoral politics where there isdemocratically elected government, and under the threat of social disorderwhere there is one-party government. The effect is the same; overstaffed government offices turning over paper, and state factories inefficiently makingobsolete products.
Throughout Asia, Africa, and Latin America, it was the rapid growth ofpopulation that helped to initiate the process above traced. The new largecohorts of young people wanted jobs; they were far better educated than theirpeasant parents, and so they were less subservient and less easily put off withexcuses for delay; large proportions had migrated to the capital and othercities, where they were a visible threat to governments; if communism hasgone out of style as an ideology of protest fundamentalist religion remainsand is equally capable of resorting to violence in a cause that it deemsjust. The rapid increase of population, and especially the increase of young,
24 Nathan Keyfitz
educated, and ambitious young people, is a powerful source of pressure ongovernments. Offering jobs to as many of its members as possible contributesto civil order, at least in the short run, but it also contributes to debt, internaland external.
It did not take many years of living through such pressure for governments to reverse their view of birth control. Far from seeing each additionalbirth as a source of strength to the state, they came to see a birth as 20 yearslater a young adult with a high school diploma looking for a job. Trying tomake one for him would distort the development process. The turnaroundin attitudes of developing country officials seems to have occurred especiallyduring the 1970s, and was observed by the world between the BucharestConference of 1974 and the Mexico City Conference of 1984.
And yet a theoretical case has been presented for paying less attentionto population in development planning; that the slowing of progress due topopulation growth is not as serious as previously thought and could evenbe favorable. That case rests on a reversal of the argument above. Startingfrom the fact that increased population destabilizes the preexisting situation,stressing the same pressure on institutions described above, it takes it thatthis pressure will be exerted in an entirely constructive direction: it will forcethe abandonment of a directed economy, whose visible inefficiency cannotcope with the larger population. There have indeed been some cases wherethis occurred, whose description we owe to Ester Boserup (1981, 1990), butits generalization to a general principle has little support; there are equallycases where population density has led to the opposite.
One does not need to go as far as Karl Wittfogel (1957), whose OrientalDespotism created a stir a few years back, but we should remind ourselvesof the learned case he built up, found convincing by many in the 1940s and1950s, that was exactly the opposite of the populationist argument. In hishistorical-anthropological analysis large irrigation works were necessary toprovide food to dense populations, and once such a piece of construction wasin place population would increase further on the foodstuffs grown with thewater that it stored. This dependence of large populations on the dams andstorage reservoirs permitted - indeed required - absolute rulers. With densepopulations dependent on the dams, freedom would have been too dangerous.People realized the danger to themselves if the dam was not protected, andthey submitted to subservience because that made their livelihood moresecure. Many such "hydraulic civilizations" were listed by Wittfogel (1957),from ancient Babylon to Stalin's USSR.
Background: People and Development 25
2.11 Technology's Two Faces
Poor people spend the larger part of their incomes on food. For AdamSmith capital meant the pile of wheat that would pay the workers whilethey built roads and factories. In modern times, however, such homegrowncapital is subordinate to capital as the means by which modern technologyis carried, and hence in considerable part only available by import fromabroad. For the developing country capital is not mere local productionand abstention from consumption, as it was for Smith, but the assemblyof funds with which equipment can be purchased abroad. Technology, onthe one side, substitutes plentiful materials for scarce ones, and so increasesthe population that can live on given natural resources. But advancingtechnology makes capital more indispensable if labor is to support itself.As automated factories reduce prices of many goods it becomes harder forunequipped labor to be competitive. The two faces of technology need to bekept in mind - its capacity to substitute common materials for scarce ones,and its being available to the LDC only by purchase from abroad. The firstincreases the population that can survive and prosper in a given territory,and the second limits the number of people who can have productive jobsby virtue of limits of capital. Both need to be kept in mind.
When technology is primitive people can make the instruments of production for themselves. Starting only from local trees, a village carpentermakes handlooms, and these are then operated by village girls, the wholeprocess from yarn to cloth, even to clothing, being self-contained. There arevillages in Indonesia where this still goes on. Insofar as production takes thisartisanal form, using only homemade physical capital for clothing, furniture,houses, tools, any number of people can be accommodated with jobs, andwe are back to the limits set by food and fibers. But such local autonomyis more and more undercut by machine-produced goods. The value of itstradeable output is reduced, and if its population has gone beyond what canbe supported by cereals from its own fields, it has less and less chance ofbuying its subsistence from abroad. True that there is a worldwide surplusof food, but that is no comfort to those whose production of tradeables doesnot suffice to give them access to the markets where foodstuffs are traded.
If the people of tropical Africa have no means to pay for foreign food,and can hardly hope for charitable contributions to keep them going forvery long, they might be able to survive in a different way. Could they notprovide a labor force that would draw capital and enterprise from abroad?As unskilled labor becomes a smaller and smaller input to currently efficient
26 Nathan Keyfitz
production they would have to educate themselves as a prerequisite to this.In principle this is possible, but educated populations are increasing in manyplaces, and the LDCs are running out of strategies for attracting the capitalthat would employ the numbers now entering the labor force.
2.12 Present Shortage of Capital in the World
All this is rather thoroughly understood in the developing countries. If thatindispensable capital is to come from abroad it has to be paid for, andin the circumstances of most of the LDCs the means of payment do notincrease with population. More people in Indonesia do not result in moreoil to export - indeed the additional population uses oil and so diminishesexports. Borrowing has been extensively tried, but the developing countriesas a whole have now reached the limits of borrowing. More people do notincrease creditworthiness in the judgment of foreign banks and governments.There are still gifts - foreign aid - but the volume ofthese will never be great,and in real terms it has been declining.
Once the central importance of foreign-made capital goods for development is recognized, along with the obvious limits on securing enough ofthem on credit, as gifts, or in exchange for natural resources, then we haveto think of additional population as contributing to development only in themeasure that it can produce exportable goods or services with little or nocapital. One service that countries can provide is tourism, in a sense thesale of its scenery, and it is important to push this further, but again thisrequires construction of hotels and other facilities (i.e., capital), and evenwith capital the number of people who can usefully be employed in hotelsand museums is not great in relation to burgeoning populations.
When Stalin faced exactly this problem of backwardness in respect ofproductive equipment in the 1930s he calculated that he needed capital fromabroad more than he needed people, so he collected and exported wheat indisregard of the low world price, and allowed his own peasants to starve.The policy had its own brutal logic and a gruesome kind of effectiveness.Contemporary governments are fortunately too humane to adopt it.
To summarize all this in two sentences. The power of technology toget around the limits of resources is great, and if this was all that was tobe said there would be no limit to the population that could be sustained.
Background: People and Development 27
But technology also makes large volumes oflabor unnecessary in production,and so deprives growing populations of access to the technology that wouldsupport them. The outcome is what we see - productivity never greater,including in the production of foodstuffs, hunger widespread.
2.13 Let the Facts Decide?
Those concerned with empirical social science would like to be able to saythat facts are adequate to decide among models. Facts do provide someevidence. Writers who claim to show that population does not matter muchfor development justify their departure from the emphasis that classical economics placed on land by showing how prices of natural, which is to sayunprocessed, goods have tended to fall in the recent past just as manufactured goods have done. (This can be expressed in terms of the labor timerequired for production or extraction.) Not only foodstuffs but copper, tin,iron ore, all out of the ground and nonrenewable, are available in abundanceat prices that in relation to the general price level, which is to say their realprices, have never been lower.
Such renewable resources as rice, rubber, palm oil, and sisal have likewiseshown real price declines. Greatly increased agricultural productivity hasdeferred any genera' shortage of foodstuffs, and real prices have not risen asthe more static classic economics said they would. Price declines in the faceof increasing population are enough to show that the goods in question arebecoming more abundant, not scarcer. Oil is the only important exception,and even it has not risen in price nearly as much as threatened.
The argument is valid, but partial. It takes no account of the threatenedexhaustion of fisheries, forests, and soils, or the possibility of global warmingwith the increased use of fossil fuels that pour carbon dioxide, methane, andother greenhouse gases into the atmosphere. Everyone of these resources,from the fisheries harvest to the amount of emissions that the atmosphere canabsorb with only tolerable warming, can be harvested up to a certain amountwithout damage. Each is like a piece of financial capital that furnishes anincome to the rentier who owns it, and lasts forever if drawing is less than orequal to the annual interest, but is quickly exhausted once the owner startsto borrow on his capital. It is in these environmental elements - and notin copper, tin, or iron ore - that the strongest case for population control
28 Nathan Keyfitz
now consists. Paradoxically, it is the so-called renewable resources that willbe exhausted long before the nonrenewable, and that due to two elements:increase of population and of income per head.
This is not the place to pursue the matter further. Evidence of theharm done by population growth is offered from many points of view notonly by the classical economists, but also by Gunnar Myrdal (1968), W.Arthur Lewis (1955), Coale and Hoover (1958), Herman Daly (1986), GideonRosenbluth (1976), the World Bank Report of 1984, various NAS reports,Barney's Global 2000: Report to the President (1980), the Meadows's Limits to Growth (1972, 1992a), as well as other recent writings by biologistsPaul Ehrlich (1970), E.O. Wilson (1988), Garret Hardin (1993), and manyothers who point to the spread of deserts, extinction of species, ecologicaltenuousness. Shortage of the capital that would permit useful employmentfor a fast-growing population was the chief reason why population was seenas a problem in the 1960s; while that still applies, the absorptive limits ofthe environment - including renewable resources of all kinds - seem todaymore immediate and pressing.
2.14 Perhaps No General Relation Exists:The General Question May Be Meaningless
Is it possible that to seek a general relation between population and development is to look for something that is not there? We know that there arecountries that would have higher incomes per head with fewer people; wealso know that there are countries that would have a higher income per headwith more people. In the face of this any claimed universal relation couldbe said to be sophistry.
Thus an extreme anti-natalist might argue that marginal income isbound to be less than average income, so removing everyone down to thelast person would raise the average. This conclusion cannot be right, for itproves too much: it proves, as Marx said in his criticism of Malthus, thatthe world was already overpopulated when it contained just two persons.
The preceding Malthusian (or classical) and opposed neoclassical modelsare not infrequently put forth as though they could prescribe a populationpolicy for a particular country. Since both can be argued with equal generality it is clear that we cannot trust either, and we cannot in fact trust anystatement put forth with the degree of generality that these claim.
Background: People and Development 29
2.15 If Overall Growth is not Sustainable
Up to the 1960s those who speculated that the growth path of the nationscould be blocked by limits of the environment were far enough from themainstream of social science that they could be disregarded. In the 19thcentury the worst that was contemplated was some country running out ofsome essential material - as Jevons's fear that England would exhaust itscoal resources, and so no longer be financially able to import vital suppliesof grain (Jevons, 1909).
A series of books that appeared around 1970 have deprived us of ourinnocence. Meadows et at. (1972), Paul Ehrlich (1968), Barry Commoner(1971), and others launched the ecological movement that has much affectedthe intellectual and even the political world. Since its appearance the neutrality of the biosphere toward our activities, its capacity to accept whateverwe put into it, to adapt to any changes we make and whatever we do to it,can never again be taken for granted. Whatever we think of the science inthe writings of those who aroused us - and judgments on this are varied - wehave to concede that they brought about a change in human consciousness.
Whether the change in thinking is justified by a change in the physical condition of the biosphere that became apparent around 1970 will bedebated. Perhaps the new thinking was merely due to a number of giftedwriters seizing on an anti-development anti-natalist theme and giving it popular currency. Perhaps it was due to incipient deterioration of the environment that was becoming sufficiently visible that people would buy books onthe subject.
Perhaps it was opposition to economic progress that paradoxically seemsto be aroused by progress itself in the minds of some of those who mostbenefit from it. Daniel Bell (1990) speaks of the spread of rationality, thatfor 200 years has given a direction to history, enabled us to know what was"progressive" and what was "reactionary," and produced the radical changein living conditions from which we benefit. Now, he says, "Technology, asan engine of progress, has become demonized by the fears of those whoemphasize its spillover effects."
Whatever its cause, we are now aroused to the possibility that the biosphere in which all economies are unavoidably seated - there is no otherplace for them - is limited in the amount of progress that it can stand.Progress is now called development but the entity has not changed; it wasnot an invention of the United Nations about 1950, but was an invention ofthe 18th century (Bury, 1982). Prior to that the dominant view was that
30 Nathan Keyfitz
history was forever proceeding downhill, from an original paradise to classical times, that were still high civilization, to an 18th century that could dono better than repeat the classics.
In two centuries the size of population participating in progress, whereprogress is measured by consumption, has enormously increased. Not onlyhas the planetary population risen to the point where today it numbers fullyfive times as many as in 1798 when Malthus (1967) wrote his first Essay in1798, but the fraction of that larger population that aspires to participate inprogress has gone up far faster. From a few lavishly consuming aristocratsand merchants to the billion or more who drive the half billion motor carsregistered in the world by 1990, and on to the remainder of the five billionon the planet who aspire to the same luxury, is an awesome progression.The consumers present and prospective have multiplied since Malthus's daynot in the ratio of 5 to 1 as the population did, but in a ratio that could be1000 to l.
To the ecological movement among the beneficiaries of progress onlyso much development of the kind we have had up to now is possible, andfurther development is going to depend on research that will change its form.Thus Gro Harlem Brundtland (1989) referring to the Commission [1987] shechaired,
The Commission found no absolute limits to growth. Limits are indeedimposed by the impact of present technologies and social organization onthe biosphere, but we have the ingenuity to change. And change we must.
If that requires waiting until new technologies can be invented it willnot be accepted in countries that are below Scandinavian levels of opulence.The notion that the form of technology will have to change is not vividlypresent in the minds of those less well-off. "Let us get on with today's style ofdevelopment and then we too can comfortably contemplate its evils," is whatthey seem to say. For them the insistence on anything that draws attentionaway from development is seen as an only partially relevant diversion. Theydo not deny that the obstacle exists; it is indeed there, but it has beenbrought about by the countries that have been developing for a century ortwo, and it is up to them to worry about it.
What all this comes down to is that if only so much development istolerable, then the entire character of the development movement of thepresent half century is altered. It becomes a zero-sum game, in which all theadvantages go to the first arrivals. If the latecomers push the game further,
Background: People and Development 31
by industrializing at whatever cost to the ecosphere, they will be punishingthose already rich for their greed.
The novel feature ofthe conflict here engendered is that it is not betweencontemporaries. The present inhabitants of the First World will not suffermuch from the threatened global change. It is the Third World versus thedescendants of the present First World. We who live now are the onlypossible advocates of our grandchildren not yet born, and we are half-heartedadvocates. If our personal and immediate level of living was threatened wewould be trying harder than we are to resolve the conflict.
2.16 A Concrete Approach in Terms ofWhat Would Happen If ...
To formulate a population policy one must ask what any increment to thepopulation will be doing. Supposing that the existing population will takecare of itself as it has been doing up to now, we would ask about the economicopportunities for the 26 million gross now being added each year in Indiaor the 4.5 million in Indonesia. We know that in the best of circumstancesmuch of the increment will be on the land, either as landless laborers orfurther dividing postage-stamp-sized holdings. In Indonesia some will betransmigrants transported out of crowded Java in the hope of making betteruse of the land resources of the republic, but the number of these will besmall compared with the natural increase. A high proportion of the villagechildren who have gone to secondary school will migrate to the cities. Theamount of capital needed to put an educated member of the labor force tosuitable work is much greater than that required to employ a maker of spicecigarettes, a gardener, or a landless laborer in the sawah.
To repeat once again the message of this chapter. Every attemptedgeneral relation is unacceptable in logic and is contradicted by data. Manyof the early arguments for population control rested on decreasing marginalreturns to population; it was not noticed by those putting them forwardthat this implies that the first person on the planet would be better off ifno second person appeared. On the other side, if human capital is all thatis needed for production then population need not stop growing even whenwe are standing elbow to elbow on the land surface of the planet. Suchabsurdities are implicit in the common generalizations whenever they arestated without recognition of the range of densities over which they apply.
32 Nathan Keyfitz
But a bound or limit that would apply under all circumstances does notexist. That is why it is so easy for either side to confute its opponents withempirical counterexamples.
Useful policy advice is only to be obtained for concrete cases, individualcountries or parts of countries, in which the particular environment - biological, political, economic, social - enables one to make explicit judgments onhow the welfare of the community will be affected if the proposed incrementto population is born or not born. If it is too difficult to make such judgments we had better forget policy and let Nature take its course. We havetoday vivid examples to show how disastrous the natural course can be.
Chapter 3
Simulation Models ofDemographic, Economic,and EnvironmentalInteractions
Warren C. Sande1"SOn
Economic development and sound environmental management arecomplementary. Development can contribute to improved environmentalmanagement, and a healthy environment is essential for sustaining development. [World Bank, 1992b]
The idea that the two pursuits - economic development that looks after thewelfare of people, their needs and wants, and environmental conservationthat attends to the welfare of the world - can go along merrily hand in handas equals is false. The first priority has to be the welfare of surroundingecosystems, for without their healthy functioning no economic system canlast. [Rowe, 1990]
At this stage, there are major uncertainties about greenhouse theory, aboutthe effects of a possible warming, and about the economic and politicalimpacts of hasty, ill-considered policies. Does it make sense to waste $100billion a year on what is still a phantom threat when there are so manypressing - and real - problems in need of resources? [Singer, 1992]
34 Warren C. Sanderson
3.1 Introduction
This volume aims to deepen our understanding of the interrelations betweenpopulation, development, and the environment through history and throughmodeling. This chapter provides an introduction to what we currently knowabout the modeling of those interactions.
3.1.1 The challenges
It now appears that one ofthe most important challenges facing people in the21st century will be sustainable development. It is a challenge because it isnot clear that the progressive alleviation of poverty in the Third World, evenat the current less than desirable rates, and the continuation of economicgrowth in the First and Second Worlds over the next century is feasible, giventhe Earth's environmental and ecological constraints. It is an importantchallenge because the human, environmental, and economic costs of a crashwould be stupendous.
The challenge facing people interested in sustainable development is howto make progress in an area full of contradictory analyses. This book andthe simulation model of sustainable development in Mauritius, which is itscenterpiece, are responses to this challenge. The purpose of this chapter isto put that response into perspective.
3.1.2 Simulation models
Simulation models come in many forms and serve many purposes. Perhapsthe best-known simulation models today are the simulators used by pilots tolearn how to fly their aircraft in a variety of unusual circumstances. Nowadays some of these simulators are so good that the experience of "flying"them is very close to the real thing. On the other hand, simulation models used for predicting the weather one or two days into the future are notnearly that precise. Still these imperfect models turn out to be very usefulin practice; millions of people check their results every day. Thus, simulation models are not something far outside our everyday experience. We relyon their results whenever we fly in a commercial jet aircraft or listen to aweather forecast. In this chapter, we rely on their results to teach us aboutsustainable development.
What simulation models have in common is that they are all simplifiedrepresentations of complex systems. To the extent that the representation
Models of Demographic, Economic, and Environmental Interactions 35
is a useful one, we can learn about the behavior of the complex system byexperiencing or studying the behavior of a less complicated model. Typically, simulation models are not "solved" just once, but are run many timesto get a "feel" for how they function in a variety of circumstances. Peopleturn to simulation models because for one reason or another it is infeasibleto test the system directly. It is not possible to teach pilots about the consequences of engine explosions through direct experience nor is it desirable toteach policy makers about the consequences of their actions by making themexperience real environmental catastrophes. Crashes are much cheaper in aflight simulator or in a model of sustainable development than they are inreality.
3.1.3 Outline
Models of sustainable development are complex. To explain them better wehave constructed a simple model of a place that we call Wonderland. InSection 3.2, we explore the Wonderland model in detail and use it as anexample for discussing the basic concepts of sustainable development modeling. We show how it is possible to get Wonderland to experience dreadfulenvironmental crashes and how to get it to experience sustainable prosperity. Armed with models of crashes and prosperity, we address the debatebetween economists and ecologists on environmental issues. In Wonderland,the nature of their disagreement becomes quite clear.
Once we have been through Wonderland, other models of sustainabledevelopment will seem less curious. In Section 3.3, we discuss the World3model, a sustainable development model for the world, made famous in TheLimits to Growth (Meadows et al., 1972) and Beyond the Limits (Meadowset al., 1992b). World3 is best known for its suggestion that the world is noton a sustainable course, and that without a significant change in orientation,we will almost surely crash.
The first, and to our knowledge only, model of an observed environmental collapse was produced by Anthony Picardi in 1974 in a study of theSahel. His model provides a convincing and detailed account of what causedthe crash and what the future of the Sahel would be like under a broadrange of policies. We devote Section 3.4 to considering the sustainability ofdevelopment in the Sahel through the prism of the Picardi model. It turnsout to have a great deal to teach us.
One of the oldest continuing modeling traditions belongs to the UnitedStates Agency for International Development (USAID), through its funding
36 Warren C. Sanderson
of three RAPID projects over the last two decades. RAPID stands for Resources for the Awareness of Population Impacts on Development, and themodels produced under these projects are designed for presentation ratherthan study. Recently, RAPID III models have developed more elaborateenvironmental structures. In Section 3.5, we discuss the most recent RAPIDmodel for Costa Rica and show what it teaches us about the interactionsbetween population growth and the environment.
The Mauritius model is presented in broad terms in Section 3.6. Wedescribe its structure and show how it provides a badly needed new perspective. We briefly discuss other related models in Section 3.7 and concludewith some thoughts on the development of sustainable models.
3.2 Simulation Modeling of Development Paths:In Theory
3.2.1 Introduction
Simulations of development paths are, generally, produced within a framework composed of three basic components: a set of equations, called themodel, that specifies how variables are related to one another; a set of numbers, called parameters, that gives specific form to the model's equations;and a development scenario that specifies the model's initial conditions andthe time profiles of all its exogenous variables (exogenous variables influencethe other variables in the model, but are not themselves influenced by any ofthem). The World Commission on Environment and Development (1987),also known as the Brundtland Commission, defined sustainable developmentas "development that meets the needs of the present without compromisingthe ability of future generations to meet their own needs" (Brundtland, 1987,p. 43). If the resulting simulations are to address questions of sustainabledevelopment, a fourth component must be added, one that we call sustainability considerations.
For those without a technical background, these models often seem likeblack boxes. Certain things go in, certain things come out; but what happensinside is shrouded in mystery. In this section, we open one particular blackbox and allow the readers to look inside. The box contains a model thatincorporates economic, demographic, and environmental interactions. It haseight equations, thirteen parameters, four initial conditions, and one timepath of an exogenous variable (see Table 3.1). Because of its small size, it is
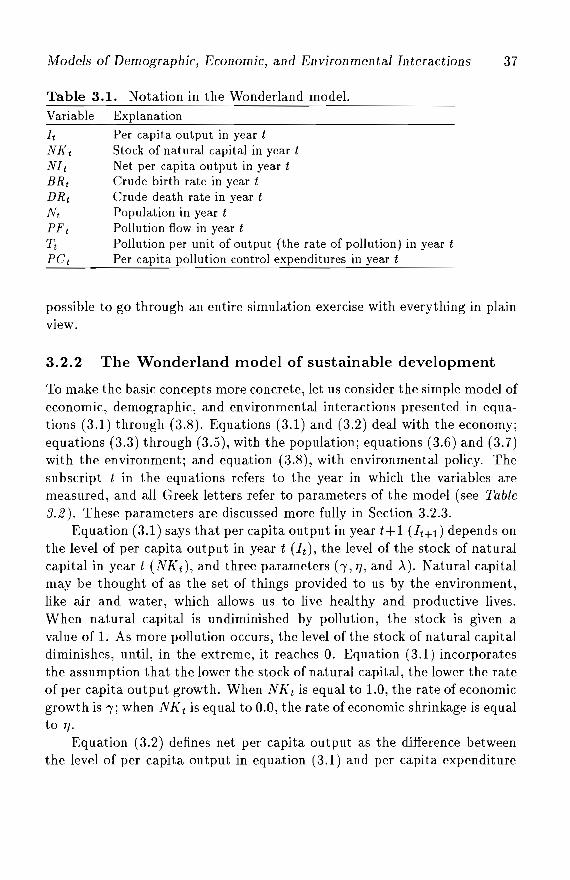
Models of Demographic, Economic, and Environmental Interactions 37
Table 3.1. Notation in the Wonderland model.
Variable Explanation
It Per capita output in year tNf( t Stock of natural capital in year tNIt Net per capita output in year tBRt Crude birth rate in year tDR t Crude death rate in year tNt Population in year tPF t Pollution flow in year tTt Pollution per unit of output (the rate of pollution) in year tpet Per capita pollution control expenditures in year t
possible to go through an entire simulation exercise with everything in plainview.
3.2.2 The Wonderland model of sustainable development
To make the basic concepts more concrete, let us consider the simple model ofeconomic, demographic, and environmental interactions presented in equations (3.1) through (3.8). Equations (3.1) and (3.2) deal with the economy;equations (3.3) through (3.5), with the population; equations (3.6) and (3.7)with the environment; and equation (3.8), with environmental policy. Thesubscript t in the equations refers to the year in which the variables aremeasured, and all Greek letters refer to parameters of the model (see Table3.2). These parameters are discussed more fully in Section 3.2.3.
Equation (3.1) says that per capita output in year t+1 (It+d depends onthe level of per capita output in year t (It), the level of the stock of naturalcapital in year t (NK t ), and three parameters b, TJ, and >.). Natural capitalmay be thought of as the set of things provided to us by the environment,like air and water, which allows us to live healthy and productive lives.When natural capital is undiminished by pollution, the stock is given avalue of 1. As more pollution occurs, the level of the stock of natural capitaldiminishes, until, in the extreme, it reaches 0. Equation (3.1) incorporatesthe assumption that the lower the stock of natural capital, the lower the rateof per capita output growth. When NK t is equal to 1.0, the rate of economicgrowth is /; when NK t is equal to 0.0, the rate of economic shrinkage is equalto TJ.
Equation (3.2) defines net per capita output as the difference betweenthe level of per capita output in equation (3.1) and per capita expenditure
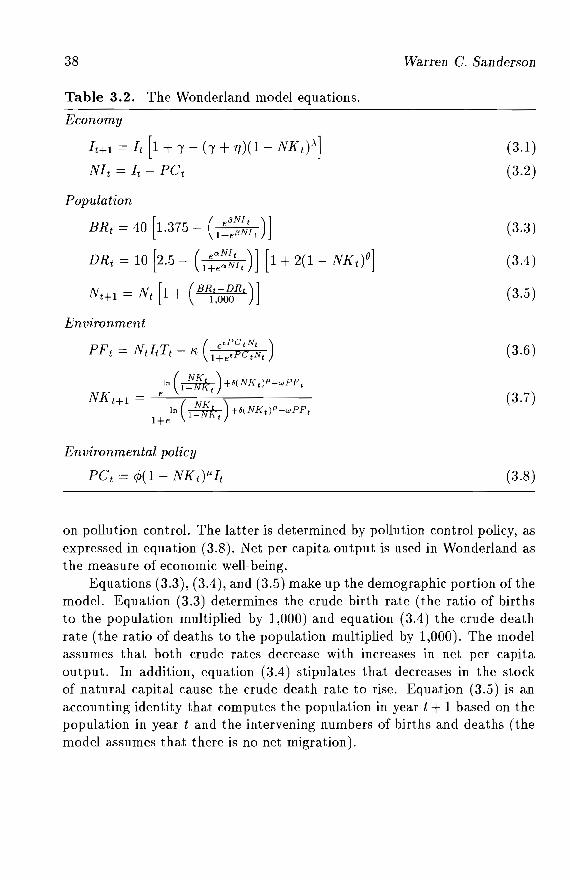
38
Table 3.2. The Wonderland model equations.
Economy
It +l = It [1 + I - h + 1]) (1 - NK t),\ ]
NIt = It - PCt
Population
BR =40 [1.375- ( e13N1t
)]t l+e13N1t
DR = 10 [2.5 - ( eaN1t
)] [1 + 2(1 - NK )0]t l+eaN1 t t
N N [1+ (BRt-DRt)]t+l = t 1,000
Environment
Environmental policy
pet = 4>(1 - NKt)Ji-It
Warren C. Sanderson
(3.1 )
(3.2)
(3.3)
(3.4 )
(3.5)
(3.6)
(3.7)
(3.8)
on pollution control. The latter is determined by pollution control policy, asexpressed in equation (3.8). Net per capita output is used in Wonderland asthe measure of economic well-being.
Equations (3.3), (3.4), and (3.5) make up the demographic portion ofthemodel. Equation (3.3) determines the crude birth rate (the ratio of birthsto the population multiplied by 1,000) and equation (3.4) the crude deathrate (the ratio of deaths to the population multiplied by 1,000). The modelassumes that both crude rates decrease with increases in net per capitaoutput. In addition, equation (3.4) stipulates that decreases in the stockof natural capital cause the crude death rate to rise. Equation (3.5) is anaccounting identity that computes the population in year t + 1 based on thepopulation in year t and the intervening numbers of births and deaths (themodel assumes that there is no net migration).
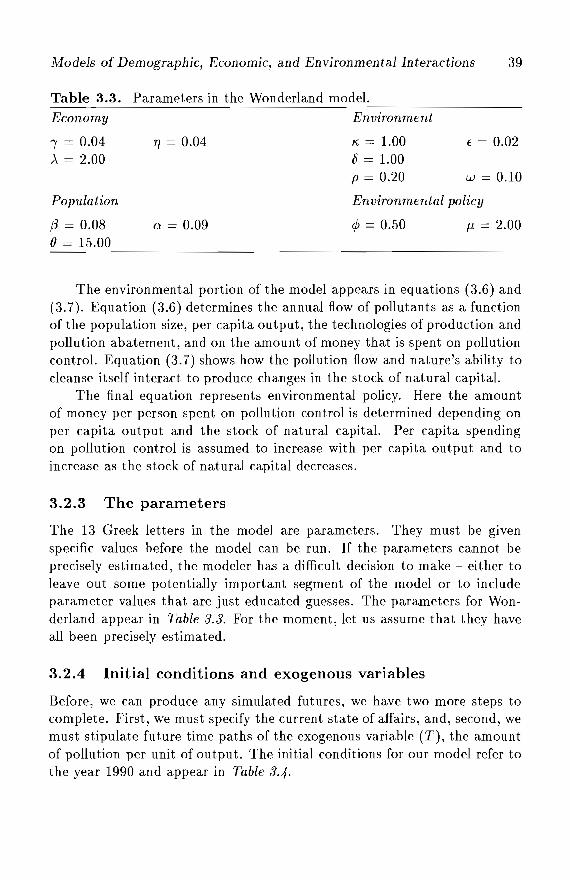
Models of Demographic, Economic, and Environmental Interactions 39
Table 3.3. Parameters in the Wonderland model.
Economy
1=0.04>. = 2.00
7/ = 0.04
Environment
K = 1.00b = 1.00p = 0.20
E = 0.02
w = 0.10
Population Environmental policy
{3 = 0.088 = 15.00
a = 0.09 ¢ = 0.50 f1 = 2.00
The environmental portion of the model appears in equations (3.6) and(3.7). Equation (3.6) determines the annual flow of pollutants as a functionof the population size, per capita output, the technologies of production andpollution abatement, and on the amount of money that is spent on pollutioncontrol. Equation (3.7) shows how the pollution flow and nature's ability tocleanse itself interact to produce changes in the stock of natural capital.
The final equation represents environmental policy. Here the amountof money per person spent on pollution control is determined depending onper capita output and the stock of natural capital. Per capita spendingon pollution control is assumed to increase with per capita output and toincrease as the stock of natural capital decreases.
3.2.3 The parameters
The 13 Greek letters in the model are parameters. They must be givenspecific values before the model can be run. If the parameters cannot beprecisely estimated, the modeler has a difficult decision to make - either toleave out some potentially important segment of the model or to includeparameter values that are just educated guesses. The parameters for Wonderland appear in Table 3.3. For the moment, let us assume that they haveall been precisely estimated.
3.2.4 Initial conditions and exogenous variables
Before, we can produce any simulated futures, we have two more steps tocomplete. First, we must specify the current state of affairs, and, second, wemust stipulate future time paths of the exogenous variable (T), the amountof pollution per unit of output. The initial conditions for our model refer tothe year 1990 and appear in Table 3.4.
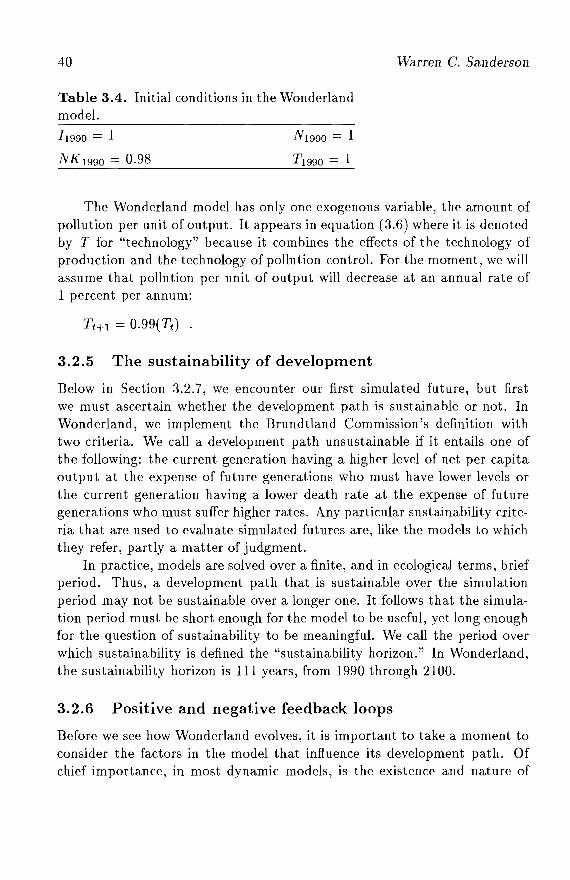
40 Warren C. Sanderson
Table 3.4. Initial conditions in the Wonderlandmodel.
[1990 = 1 N1990 = 1
NK 1990 = 0.98 T1990 = 1
The Wonderland model has only one exogenous variable, the amount ofpollution per unit of output. It appears in equation (3.6) where it is denotedby T for "technology" because it combines the effects of the technology ofproduction and the technology of pollution control. For the moment, we willassume that pollution per unit of output will decrease at an annual rate of1 percent per annum:
3.2.5 The sustainability of development
Below in Section 3.2.7, we encounter our first simulated future, but firstwe must ascertain whether the development path is sustainable or not. InWonderland, we implement the Brundtland Commission's definition withtwo criteria. We call a development path unsustainable if it entails one ofthe following: the current generation having a higher level of net per capitaoutput at the expense of future generations who must have lower levels orthe current generation having a lower death rate at the expense of futuregenerations who must suffer higher rates. Any particular sustainability criteria that are used to evaluate simulated futures are, like the models to whichthey refer, partly a matter of judgment.
In practice, models are solved over a finite, and in ecological terms, briefperiod. Thus, a development path that is sustainable over the simulationperiod may not be sustainable over a longer one. It follows that the simulation period must be short enough for the model to be useful, yet long enoughfor the question of sustainability to be meaningful. We call the period overwhich sustainability is defined the "sustainability horizon." In Wonderland,the sustainability horizon is 111 years, from 1990 through 2100.
3.2.6 Positive and negative feedback loops
Before we see how Wonderland evolves, it is important to take a moment toconsider the factors in the model that influence its development path. Ofchief importance, in most dynamic models, is the existence and nature of
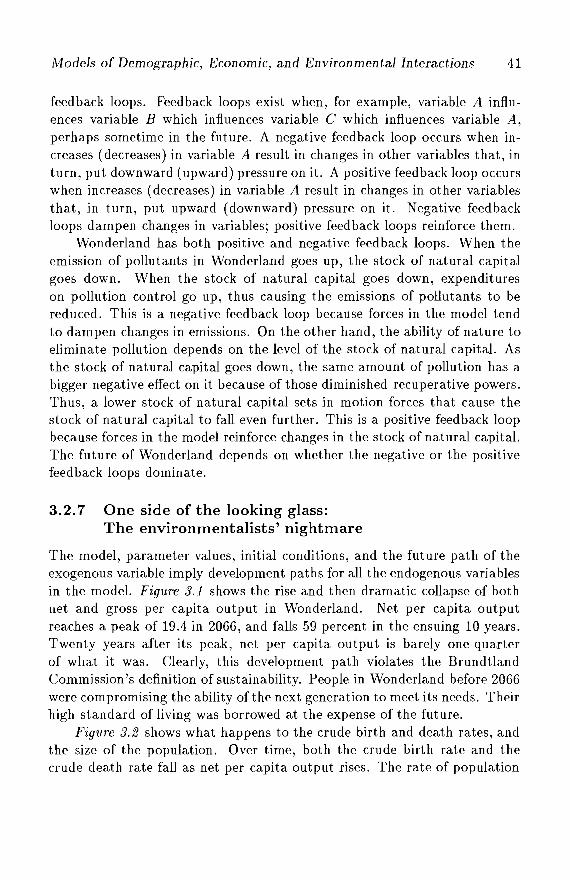
Models of Demographic, Economic, and Environmental Interactions 41
feedback loops. Feedback loops exist when, for example, variable A influences variable B which influences variable C which influences variable A,perhaps sometime in the future. A negative feedback loop occurs when increases (decreases) in variable A result in changes in other variables that, inturn, put downward (upward) pressure on it. A positive feedback loop occurswhen increases (decreases) in variable A result in changes in other variablesthat, in turn, put upward (downward) pressure on it. Negative feedbackloops dampen changes in variables; positive feedback loops reinforce them.
Wonderland has both positive and negative feedback loops. When theemission of pollutants in Wonderland goes up, the stock of natural capitalgoes down. When the stock of natural capital goes down, expenditureson pollution control go up, thus causing the emissions of pollutants to bereduced. This is a negative feedback loop because forces in the model tendto dampen changes in emissions. On the other hand, the ability of nature toeliminate pollution depends on the level of the stock of natural capital. Asthe stock of natural capital goes down, the same amount of pollution has abigger negative effect on it because of those diminished recuperative powers.Thus, a lower stock of natural capital sets in motion forces that cause thestock of natural capital to fall even further. This is a positive feedback loopbecause forces in the model reinforce changes in the stock of natural capital.The future of Wonderland depends on whether the negative or the positivefeedback loops dominate.
3.2.7 One side of the looking glass:The environmentalists' nightmare
The model, parameter values, initial conditions, and the future path of theexogenous variable imply development paths for all the endogenous variablesin the model. Figure 3.1 shows the rise and then dramatic collapse of bothllet and gross per capita output in Wonderland. Net per capita outputreaches a peak of 19.4 in 2066, and falls 59 percent in the ensuing 10 years.Twenty years after its peak, net per capita output is barely one-quarterof what it was. Clearly, this development path violates the BrundtlandCommission's definition of sustainability. People in Wonderland before 2066were compromising the ability ofthe next generation to meet its needs. Theirhigh standard of living was borrowed at the expense of the future.
Figure 3.2 shows what happens to the crude birth and death rates, andthe size of the population. Over time, both the crude birth rate and thecrude death rate fall as net per capita output rises. The rate of population
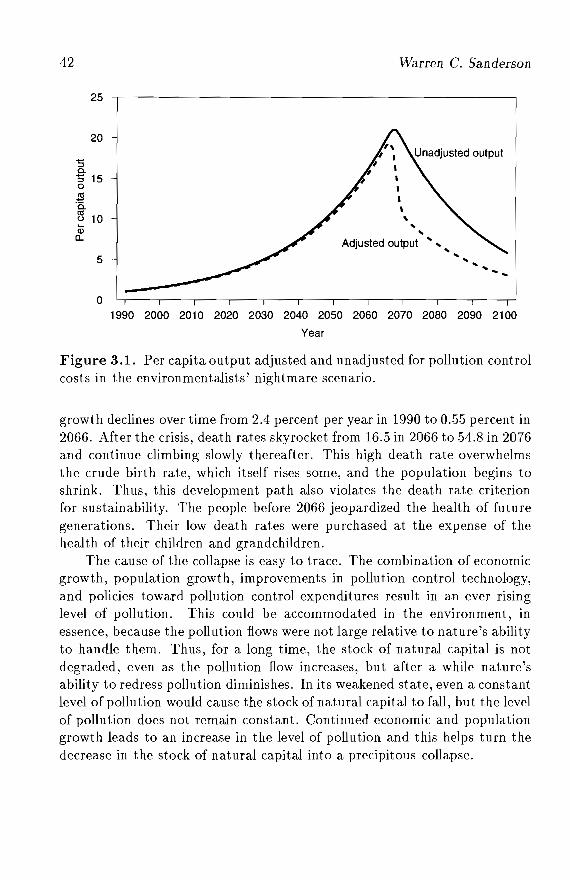
42
25
20
"5c."5 15og.6.ellu 10Qja.
5
o
Warren C. Sanderson
Adjusted output .. .. ......
1990 2000 2010 2020 2030 2040 2050 2060 2070 2080 2090 2100
Year
Figure 3.1. Per capita output adjusted and unadjusted for pollution controlcosts in the environmentalists' nightmare scenario.
growth declines over time from 2.4 percent per year in 1990 to 0.55 percent in2066. After the crisis, death rates skyrocket from 16.5 in 2066 to 54.8 in 2076and continue climbing slowly thereafter. This high death rate overwhelmsthe crude birth rate, which itself rises some, and the population begins toshrink. Thus, this development path also violates the death rate criterionfor sustainability. The people before 2066 jeopardized the health of futuregenerations. Their low death rates were purchased at the expense of thehealth of their children and grandchildren.
The cause of the collapse is easy to trace. The combination of economicgrowth, population growth, improvements in pollution control technology,and policies toward pollution control expenditures result in an ever risinglevel of pollution. This could be accommodated in the environment, inessence, because the pollution flows were not large relative to nature's abilityto handle them. Thus, for a long time, the stock of natural capital is notdegraded, even as the pollution flow increases, but after a while nature'sability to redress pollution diminishes. In its weakened state, even a constantlevel of pollution would cause the stock of natural capital to fall, but the levelof pollution does not remain constant. Continued economic and populationgrowth leads to an increase in the level of pollution and this helps turn thedecrease in the stock of natural capital into a precipitous collapse.
Models of Demographic, Economic, and Environmental Interactions 43
50
~40 ~
Q)"0"0
30 ~.I::.t::
20 :0Q)"0::J
10 0
Crude birth rate
Jo ••-.. .. ........
- ........ 1._------------ .Crude death rate O_O_O_O_oJ
2.5
3.0 60------_.ro-o
0.5
~ 2.0'(i)
c21.5«l'Sc.d: 1.0
o 01990 2000 2010 2020 2030 2040 2050 2060 2070 2080 2090 2100
Year
Figure 3.2. Population size, crude death rate, and crude birth rate in theenvironmentalists' nightmare scenario.
The rate of pollution declines steadily throughout the simulation period.In other words, people are producing less and less pollution per unit outputas time goes on. The collapse has nothing to do with a change in the rate ofpollution reduction. Even with increasing expenditures on pollution control,a declining rate of pollution, and a falling rate of population growth, thecollapse still occurs. What makes this simulated future so nightmarish isthat the calamity occurs so quickly and with so little warning.
Imagine two people in Wonderland dressed in T-shirts and shorts arguingloudly in front of a crowd of people. The time is 2050. His T-shirt reads"ECOLOGIST"; hers reads "ECONOMIST."
"Look," he said, "we've been polluting the country for 60 years now.Sooner or later it is just going to be too much for the environment to handle.We need to cut back on our pollution now!"
"We've been growing very nicely for 60 years now," she replied. "Povertyhas been substantially reduced, birth rates are going down, death rates aregoing down, and the population growth rate is falling. We're doing just fine,no thanks to you. If we listened to you years ago, we would have cut backand had more poverty now."
"Nonsense," he said, "the environment is not like an economic system, itis subject to all sorts of discontinuities. Things can look like they're OK for
44 Warren C. Sanderson
a long time while environmental stresses build up and then, all of a sudden,there's a discontinuous change."
"Yeah," she said, "show me a discontinuous change over the last 60years."
The crowd doesn't know what to conclude from these mutually contradictory arguments. We now understand that business went on as usual andthat 17 years later a dreadful crash occurred, destroying the economy andcausing a horrible rise in death rates. But in 2050, without the Wonderland model, they couldn't have known that. ECOLOGIST would have beenawarded the Nobel Prize in biology for his work on discontinuities in polluted ecological systems, except that, after the crash, money was short andthe prizes were discontinued.
Look, the two are wandering over toward that mirror and the crowd isfollowing. Let's follow too.
3.2.8 On the other side of the looking glass:The economists' dream
On this side of the looking glass, Wonderland looks very familiar. The eightequations, the thirteen parameters, and the four initial conditions are allidentical. The only thing that is different is the time path of the exogenousvariable T (pollution per unit of output). Where we came from, pollutionper unit of output fell by 1 percent per year; on this side of the looking glassit falls by 4 percent per year. Figures 3.3 and 3.4 indicate the future ofWonderland on this side of the looking glass.
Figure 3.3 shows that per capita output and per capita output afteradjustment for pollution control costs grow steadily. Now there is sustainableprosperity in Wonderland not an environmental catastrophe. Figure 3.4shows that, over time, the birth rate converges to the death rate and that,by the end of the 21st century, population growth stops. There is never atime when the crude death rate rises precipitously. We call this simulatedfuture, the economists' dream. Clearly, the economists' dream future issustainable according to the definition that we gave above. Each generationleaves to the future the means to live longer and more prosperous lives.
Population growth and economic growth do cause an increase in theflow of pollution, but the increase is not large enough to degrade the stockof natural capital. Indeed, the pollution flow itself reaches a peak in 2083 andfalls continuously thereafter. Thus, by the end of 21st century, population
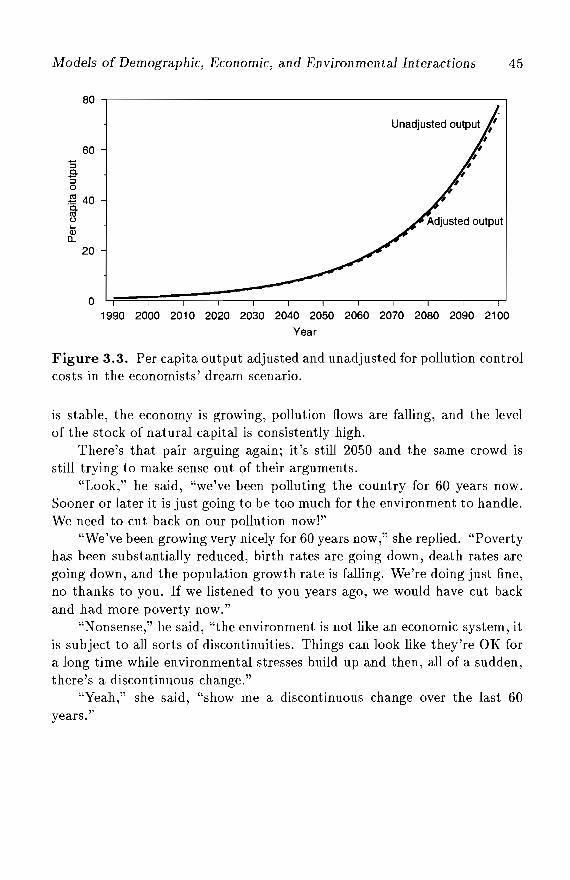
1'vlodels of Demographic, Economic, and Environmental Interactions 45
80 -,------------------------------,
60"Sa."So.~ 40a.ClloQ:;a.
20
o1990 2000 2010 2020 2030 2040 2050 2060 2070 2080 2090 2100
Year
Figure 3.3. Per capita output adjusted and unadjusted for pollution controlcosts in the economists' dream scenario.
is stable, the economy is growing, pollution flows are falling, and the levelof the stock of natural capital is consistently high.
There's that pair arguing again; it's still 2050 and the same crowd isstill trying to make sense out of their arguments.
"Look," he said, "we've been polluting the country for 60 years now.Sooner or later it is just going to be too much for the environment to handle.We need to cut back on our pollution now!"
"We've been growing very nicely for 60 years now," she replied. "Povertyhas been substantially reduced, birth rates are going down, death rates aregoing down, and the population growth rate is falling. We're doing just fine,no thanks to you. If we listened to you years ago, we would have cut backand had more poverty now."
"Nonsense," he said, "the environment is not like an economic system, itis subject to all sorts of discontinuities. Things can look like they're OK fora long time while environmental stresses build up and then, all of a sudden,there's a discontinuous change."
"Yeah," she said, "show me a discontinuous change over the last 60years."
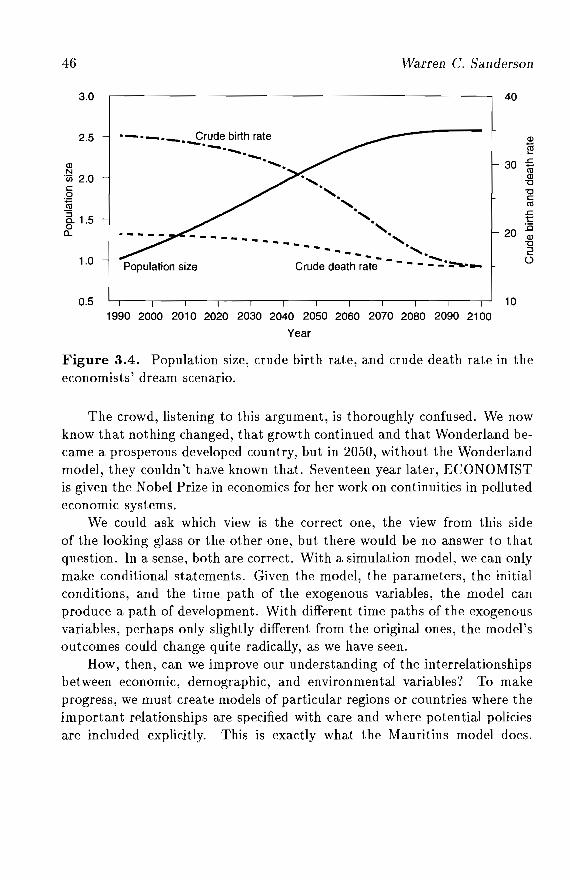
46
3.0
Warren C. Sanderson
40
2.5
Q)N'iIi 2.0co~"S~ 1.5a..
1.0
0.5
.-._._ Crude birth rate...................................'.
,.,.,.--- '.------ ,.-.......-
Population size Crude death rate - - - - - _.=---
1990 2000 2010 2020 2030 2040 2050 2060 2070 2080 2090 2100
Year
Q)
~
30 ~Q)"0"0cctl
..c1::
20 :isQ)"02o
10
Figure 3.4. Population size, crude birth rate, and crude death rate in theeconomists' dream scenario.
The crowd, listening to this argument, is thoroughly confused. We nowknow that nothing changed, that growth continued and that Wonderland became a prosperous developed country, but in 2050, without the Wonderlandmodel, they couldn't have known that. Seventeen year later, ECONOMISTis given the Nobel Prize in economics for her work on continuities in pollutedeconomic systems.
We could ask which view is the correct one, the view from this sideof the looking glass or the other one, but there would be no answer to thatquestion. In a sense, both are correct. With a simulation model, we can onlymake conditional statements. Given the model, the parameters, the initialconditions, and the time path of the exogenous variables, the model canproduce a path of development. With different time paths of the exogenousvariables, perhaps only slightly different from the original ones, the model'soutcomes could change quite radically, as we have seen.
How, then, can we improve our understanding of the interrelationshipsbetween economic, demographic, and environmental variables? To makeprogress, we must create models of particular regions or countries where theimportant relationships are specified with care and where potential policiesare included explicitly. This is exactly what the Mauritius model does.
Models of Demographic, Economic, and Environmental Interactions 47
Before, we get to Mauritius, though, we have to go through three othermodels, three other lands. Each has a lesson to teach.
ECOLOGIST and ECONOMIST are walking toward a little bridge. Thesign next to it says "World." Let's see what's on the other side.
3.3 The World3 Model
Advocates of a world view that is different from the one presented herewould enhance future discussions if they would express their theory as aformal model, so that persons in various fields could personally scrutinizeits assumptions and independently determine its implications. . .. Thosewho agree with the basic ideas expressed in World3 can go on to test,improve, and disaggregate the model and to use it where appropriate asa basis for policy in local, regional, or national systems. [Meadows et ai.,1974, p. 563]
3.3.1 Introduction
The World3 model is an economic, demographic, and environmental model ofthe world taken as a whole. It is the outcome of a rapid evolutionary processthat took place between 1970 and 1972, culminating in the publication of thebest-selling book, The Limits to Growth (see Meadows et al., 1982, pp. 2223 for more details on the origins of World3). By the early 1980s, this bookhad already sold over three million copies and World3 easily became themost famous model of sustainable development ever produced. Today, itcomfortably maintains this distinction.
Along with its popularity came a substantial amount of notoriety. Meadows et at. (1982, p. 23) called World3 "one of the most criticized models ofall time." Criticisms bring with them the opportunity for improvement, and,with so many suggestions and so many interested parties, it seems naturalthat World3 should have evolved into something better - that by now therewould be World4, WorldS, and World6 models. Nevertheless, this evolutionhas not occurred. Understanding why World3 has turned out to be an evolutionary dead-end, even for its creators (the World3 model in Meadows et at.,1992b, is almost identical to the one used in Meadows et al., 1972), providesimportant background for understanding the role of the Mauritius model,which traces its roots to an entirely different stock.
48 Warren C. Sanderson
3.3.2 The structure of the World3 model
World3 is a medium-sized model consisting of 149 equations and tables.The population segment of the model includes 48 equations; the economicsegment, 81 equations; and the natural resources and pollution segment, 18equations. The detailed structure of the World3 model appears in Meadowset al. (1974, pp. 567-586).
Population
The World3 model keeps track of the population in four broad age groups,0-14, 15-44, 45-64, and 65 and above. Population growth is determinedby the difference between the crude birth rate and the crude death rate asin the Wonderland model, but the determinants of those rates are muchmore elaborate than in the earlier model. Let us consider the crude deathrate, for example. An increase in industrial output, holding populationsize and age structure fixed, brings with it an increase in pollution thatincreases the crude death rate. An increase in industrial output also entailsmore crowding, which also causes an increase in death rates. Thus, anincrease in industrial output has an unambiguously negative effect on thecrude death rate. An increase in service output per capita causes an increasein pollution and an increase in medical services per capita; therefore, it hasan ambiguous effect on death rates. Similarly, an increase in agriculturalproduction increases pollution and increases food availability per capita,making its effect on death rates also ambiguous.
Education is not included in the World3 model. There can be no doubtthat this is a serious omission, especially since of the effects of education onmortality, fertility, as well as on labor productivity, are substantial.
Economy
The economy comprises three sectors: industry, services, and agriculture.
Industry and services. Industrial output and service output depend on theamounts of capital in those two sectors multiplied by sector-specific outputcapital ratios. Only in extreme conditions of rapid population decline doesthe size of the labor force constrain output. In usual times, the modelassumes that there is chronic unemployment and that neither the size of thelabor force nor its training and education have any bearing on output.
Models of Demographic, Economic, and Environmental Interactions 49
To understand how the model functions, imagine that we begin this yearwith the industrial and service capital stocks we inherited from the past.Industrial and service output levels are determined simply by multiplyingthose stocks by the respective output-capital ratios. Most service output isconsumed and vanishes from the model. Some service output goes into healthservices that influence the crude death rate and family-planning services thatinfluence the crude birth rate. Services do not use natural resources or causepollution, and essentially playa very minor role in the model.
Industrial output is far more central to the model than are services. Thefirst claimant on industrial capital is the amount needed to obtain naturalresources. What industrial capital remains is then used to produce industrialoutput. The amount of industrial output is the amount of industrial capitalnot used to obtain natural resources, multiplied by the industrial outputcapital ratio. A fixed fraction of industrial output is consumed and vanishesfrom the model. Other fractions allocate the remainder to investments inagriculture, services, and industry.
Each year agricultural, service, and industrial capital stocks are assumedto be diminished by depreciation and augmented by investments. The newcapital stocks at the beginning of the next period are determined by addingnet investments to the stocks at the beginning of this period. From this point,we return to the beginning of our discussion, determine the output of servicesfrom the new service capital stock, and compute the output of industry, aftersubtracting the capital required for obtaining natural resources from the newindustrial capital stock.
Industrial output is central to another area of the model as well. Industrial output requires nonrenewable resources. The use of these nonrenewable resources causes persistent pollution (all pollution except air pollution), which decreases the fertility of agricultural land and increases thecrude death rate. In addition, industrial output has a direct negative impacton agricultural yields because of air pollution. Persistent pollution and airpollution have no direct effect on industrial output or service output.
Agriculture. The agricultural sector is the most complex in the model. Foodis produced on arable land according to a particular yield (in World3, allarable land is assumed to be used for crop production). The amount ofarable land and the agricultural yield in any period is predetermined bypast circumstances. Next period's amount of arable land and yield will be
50 Warren C. Sanderson
influenced by investment decisions made in this period and by the laggedeffects of previous decisions.
The fraction of total available capital that gets invested in agriculturedepends on the relationship between the amount of food produced per capitaand the amount of food desired per capita. The amount of food desiredincreases with the amount of industrial output and population size. Theamount of food produced depends on the product of the amount of landand the yield. In general, as the ratio of food produced to food desired goesdown, an ever larger share of available capital is devoted to agriculture. Thisfollows from an assumption that agricultural production is given priority inthe model. The industrial sector is the residual claimant on capital.
Increases in agricultural production set into playa substantial set ofcountervailing forces that ultimately reduce it. The amount of land erosionthat takes place in the model depends positively both on the amount ofarable land and on the yield. Thus, investments that increase the amount ofarable land and the yield produce additional erosion. Erosion permanentlyremoves land from the model. Persistent pollution increases with both theamount of arable land and the amount of investment per hectare. Persistentpollution lowers yields, causing more investment to be used to produce thesame amount of food, which in turn produces additional persistent pollutionthat lowers yields even more. This is a powerful positive feedback loop andwe return to it when we look at the results of the model.
Natural Capital and Pollution
Despite its importance to the goals of the model, the treatment of nonrenewable resources and pollution in World3 is cursory at best. The model beginswith a fixed stock of a single nonrenewable resource. Industrial output usessome of this output, and so every year the remaining stock of the nonrenewable resource falls, causing extraction costs to increase. In the model thisis represented by making the fraction of capital that has to be devoted toobtaining resources increase as the stock of the resource decreases.[l] Since,capital needed to obtain resources has priority over everything else in themodel, the share of capital that can be devoted to the other sectors of theeconomy must decline. In addition, rising population and per capita industrial production require still greater investments in agriculture, taking evenmore from the industrial sector. Since there is no ongoing technologicalchange in the nonrenewable resource sector, nor any su bstitution betweenresources, this process causes output to collapse.
Models of Demographic, Economic, and Environmental Interactions 51
There are two types of pollution in the model, persistent pollution andair pollution. Persistent pollution is generated from the use of nonrenewableresources by the industrial and agricultural sectors. Air pollution is producedonly by industrial output. Persistent pollution appears in the environmentsome years after it was generated. Nature removes some amount of persistentpollution each year, but, like in Wonderland, nature's ability to renew itself isassumed to diminish as the amount of persistent pollution grows. This formsan important positive feedback loop that also leads to collapse. Pollutionhas two effects in the model. It reduces the agriculture yield per hectare,and it reduces life expectancy.
3.3.3 The results of the World3 model
The most widely remembered results of the World3 model are the mass ofgraphs showing global collapse. These graphs were coupled with statementslike: "even the most optimistic estimates of the benefits of technology in themodel did not prevent the ultimate decline of population and industry or infact did not in any case postpone the collapse beyond the year 2100." TheLimits to Growth left readers with three basic conclusions, but it is the firstthat most people remember.
If the present growth trends in world population, industrialization, pollution, food production, and resource depletion continue unchanged, thelimits to growth on this planet will be reached sometime within the nextone hundred years. The most probable result will be a rather sudden anduncontrollable decline in both population and industrial capacity. [Meadows et at., 1972, p. 29][2]
It has now been more than 20 years since those words have been writtenand, according to Beyond the Limits (Meadows et at., 1992b), we have continued on the wrong course. Without change, collapse is now even closer,within the next 80 years. Imagine a couple who had a child in 1992 in adeveloped country. Given projected life expectancies, that child probablywould be alive at the time of the horrible economic, demographic, and environmental crash. If World3 is an appropriate representation of reality,and we continue to grow as we have been doing, then, clearly, our currentstandard of living will have been purchased at our children's expense.
Economics got the title "the dismal science" because Malthusian modelspredicted that population growth would wipe out all productivity gains andkeep people at a subsistence standard ofliving. World3 goes one step beyond
52 vVarren C. Sanderson
Malthus, bringing us face to face with the nightmare of impending "suddenand uncontrollable decline."
3.3.4 Comments on World3
World3 is one of the most criticized models ever produced. This body ofwork is suddenly relevant again with the publication in 1992 of Beyondthe Limits, which uses World3 in virtually unchanged form. Perhaps thosecritiques should be republished as well. Summarizing them would take fartoo long here. Instead, we concentrate on understanding the unproductivityof the World3 approach.
It could be argued that World3 has been fruitful as a tool for persuasion, rather than as a base for further sustainable development modeling.Certainly, there is an element of truth to this statement. World3 was definitely designed to be an effective vehicle for communicating a vision of thefuture to people, but, as the quotation from Dynamics of Growth in a FiniteWorld at the beginning of this section indicates, the creators of World3 alsohad a vision of how the scientific dialogue would unfold. Critics of World3would present alternative simulations; the authors of World3, or perhapsothers, would respond and then, round after round, ever better world andlocal models would result. But this vision never materialized.
We have already encountered the key to understanding the barrennessof World3 in Wonderland. In Wonderland, it was not always so easy to knowon which side of the looking glass we stood. A slight change of a numberhere or there and the model could easily go from collapse to prosperity andback again. It turns out that World3, just like Wonderland, is extremelysensitive to its parameters and particularly its assumptions about the natureof technical change. Gently nudge a parameter here or tweak one over thereand collapses give way to continued growth. Thus World3 contains manyvisions, some gruesome and some gentle, depending on figures no one canknow with assurance.
By 1973, the community of modelers had already learned the basic storyline (see Cole et al., 1973, for example). World3 and models like it couldbe made to produce continued growth or collapse depending on assumptionsabout unknown and, possibly, unknowable parameters. Without substantialimprovement in our knowledge of the underlying relationships needed tobuild a global model of sustainable development, further development ofWorld3 was, in 1973, and still remains a fruitless exercise. This is whymodelers never built on the World3 foundation.
Models of Demographic, Economic, and Environmental Interactions 53
The collapse of World3 in 1973 was disruptive to the process of environmental modeling. It did teach us, though, that what was neededwas not another model with uncertain parameters and stylized equations,but, instead, models of particular places or regions where the equationscould be specified with more confidence and made more robust to uncertainparameters.
There's that couple arguing again. The crowd's gone. Let's walk overand listen.
ECOLOGIST: "I admit that you are right about the flaws in the model,but it still shows how a system can collapse. Systems can collapse and thesooner people learn that the better; then perhaps they would do somethingabout it."
ECONOMIST: "Systems don't just collapse, particularly the entireEarth. If there are problems they would show up in some place first. Ifthe price of some raw material rises, people will conserve on its use andsubstitute some cheaper material. If farm land becomes degraded, it won'tbecome degraded everywhere in the world all at once. The first signs ofa problem will gives us time to work up a solution. Anyway, show me aconcrete example of a collapse."
He points to a little bridge and they go off. The sign by the bridge says"The Sahel." Let's follow them.
3.4 The SOCIOMAD Model
"This study is the first time the tragedy-of-the-commons syndrome has beentreated in an explicit interacting ecological-social-economic framework" (Picardi, 1974, p. 16).
3.4.1 Introduction
[n 1974, Anthony Picardi, then a graduate student in the Department ofCivil Engineering at the Massachusetts Institute of Technology (MIT), wrotea dissertation that included, to our knowledge, the first simulation model ofsustainable development applied on a less than global scale. It was devotedto a study of the portion of the Sahel found in the Tahoua region of Nigerand was funded by the United States Agency for International Developmentfor the United Nations, as part of a larger project. Unfortunately, Picardi'sthesis was never published.[3] Picardi remembers the response it received:
54 Warren C. Sanderson
USAID didn't want our study published. They gave us money to printonly a half dozen copies. They forbid [sic] MIT to publish it with Institutefunds and refused to send it to the USAID field offices in Africa.
There were several reasons given, some obviously false. My personalopinion is that they wanted a study that recommended a quick fix. Preferably something high-tech that US businesses could supply. Cattle breedingtechnology or the use of satellites, maybe.
The message of SAHEL is that there is no quick, technical fix. Theproblems in the Sahel are all interconnected in a complex socio-politicalecological system. The only solutions are long-term.... That wasn't whatUSAID or the UN wanted to hear. [As quoted in Barney et al., 1991,p. 193]
Although it was never published, Picardi's thesis deserves recognition asone of the best simulation studies of sustainable development ever written,and certainly as a fundamental piece of work in the area. One of the mostcompelling (and chilling) aspects of Picardi's work is its focus on a realeconomic and environmental crash. During the drought of the early 1970s,thousands of people died, further thousands were turned into environmentalrefugees, and the loss of grazing animals - the main form of productivecapital in the area - to dehydration and starvation was substantial.
The study area lies in the western portion of Niger on the border withMali. This region, which is about the size of Kentucky in the USA, waschosen because of the availability of data and because there was a singledominant form of economic activity, livestock raising. The dominant lifestylethere is nomadic.
The nomads of the Sahel live a precarious existence. They raise animalsfor food, milk, transport, and sale. Rain is often scare and usually veryunevenly distributed. Herds are moved from place to place depending onthe rainfall and vegetation growth. Most of the area is a gigantic commongrazing field without clearly defined property rights. During periods of goodrainfall, populations of people and animals build up, the animals overgrazethe land, the land deteriorates and this produces a situation ripe for the nextcollapse.
3.4.2 The SOCIOMAD model of the Sahel
Picardi's thesis contains three successively more complex models called,from the simplest to the most inclusive, SAHEL2, ECNOMAD3, andSOCIOMAD. SAHEL2, the underlying ecological model, deals with the
Models of Demographic, Economic, and Environmental Interactions .5.5
relationship between the quality of rangeland, the size of herds, and thelength of periods of migration into the Sahel from areas outside the region,among other things. Rainfall, the quality of rangeland, and governmentpolicies constrain what the nomads can do. What they will do, in terms ofvariables such as their number of children ever born, the animal slaughterrate, and amount of capital held in nonanimal form, depends not only onwhat nature and the government will allow them to do, but on their preferences as well. ECNOMAD3 adds these preferences to the SAHEL2 model.The result is a framework in which the behavior of the nomads is responsiveto their environment and to government policies. As in most economic models, preferences in ECNOMAD3 are assumed to be fixed. SOCIOMAD goesone step further and explicitly specifies the process by which preferenceschange with experience and because of various government programs.
The Economic Segment
In the Sahel, the main resources are water and rangeland. Rainfall is exogenous in the model, and the quality of the rangeland in any period dependson the amount of rainfall, on the forage utilization intensity during that period, and on the quality of the rangeland in the previous period. The forageutilization intensity depends on the number of animals grazed on the land,the amount of land available for grazing, and the duration of migratory periods, among other things. Once the sustainable level of forage utilizationis exceeded, the soil begins to deteriorate. The sustainable level of forageutilization of degraded soils is even less, so a constant high level of forageutilization causes an accelerating decline in soil quality, ending either in desertification of the land or in massive livestock die off. This is the dominantpositive feedback loop in the model. Land regeneration is included in themodel, but it happens at a much slower rate than does degeneration.
There are two populations in the model, the population of livestockand the population of people. The population of animals is given quite asophisticated treatment. There are birth rates and death rates that dependon the amount of forage available. Besides the factors mentioned above, theamount of forage depends on the extent that water is available from wells.Improvements in veterinary services reduce the livestock death rate, but, ofcourse, the more crucial determinant of that rate is the size of the humanpopulation.
In the model, humans use the livestock for four different purposes: formeat, for milk, for sale (so that other goods can be purchased), and for what
56 Warren C. Sanderson
Picardi calls "social infrastructure." This last category includes the use ofanimals for gifts, dowries, establishing social ties, transport, and droughtand disease insurance.
The allocation of the herd for these four purposes is computed using theprices of animals, millet, and milk and a set of desired allocations, whichcan change slowly over time with experience and government policy. Thenomads also determine the length of migratory periods in the Sahel and theherd slaughter rate. If the herd grows too large and degrades the rangeland,less forage will grow and both the human and animal populations will suffer.
The Demographic Sector
In the SOCIOMAD model, people are born, die, and migrate. The agestructure of the population does not explicitly appear, but approximate agestructure effects are included in some demographic equations. For example,the crude birth rate is assumed to depend on the fraction of women in thereproductive ages (an age-structure variable), per capita wealth, and a laggedvalue of life expectancy. The fraction of women in the reproductive age in agiven period is approximated using that period's value of life expectancy.
Natural Capital and Pollution
Pollution, per se, does not exist in the SOCIOMAD model, and there areno nonrenewable resources. Natural capital is represented by the quality ofthe rangeland. Like in Wonderland and World3, nature in the SOCIOMADmodel has the power to undo some or all the damage done by human oranimal sources, and this power is assumed to wane as the damage increases.
Policy Variables
SOCIOMAD is rich in its array of policy variables. This is one strengthof the model. Among the policy variables are: well-digging to increase theamount of land over which the nomads can graze, veterinary interventionsto reduce livestock death rates, food relief for people in bad times, changesin the prices of animals due to government policies, supplemental livestockfeeding programs, taxes based on herd size, and a set of range-managementpolicies.
Models of Demographic, Economic, and Environmental Interactions 57
3.4.3 Results of the SOCIOMAD model
Picardi's discussions of the effects of past and potential future policy interventions are extensive and rich in detail. In the space available, we canprovide only a brief glimpse of them. Picardi used the SAHEL2 model torun historical experiments with a starting date of 1920. One question addressed was whether the severity of the crash of the early 1970s was due tothe severity of the drought. The answer is that it was not. The severity ofthe drought of the 1970s was not unprecedented.[4] The simulations showedthat the drought determined the timing of the crash, but not whether therewould be one. If the crash did not occur in the early 1970s, it would haveoccurred later when the next drought came. The root cause of the severityof the crash was not the severity of the drought, but the cumulative effectsof excess grazing brought about by a prior period of unusually good rainfalland other factors.
A simulation was also used to assess the impacts of three historically significant interventions: well-digging, improved veterinary care, and improvedpublic-health conditions. The outcome of this experiment is striking. Theinterventions worsened the effects of the drought and increased the loss ofhuman life. In the period after the drought, population size is higher in theSahel in the no intervention scenario than in the case observed because, inthe former, the population approached the carrying capacity of the land ata slower rate of growth, leading to less overshooting, less land deterioration,and a higher long-run soil quality.
In a forward-looking analysis, Picardi goes one step further and usesthe SOCIOMAD model to ask what would happen if the three interventionslisted above, after having occurred, were slowly reversed, so that by 2020 theSahel returned to the conditions observed in the 1920s. The answer is that, inthis "complete neglect" scenario, human and animal populations were higherin 2020 than in the case where the interventions were maintained. Thoseparticular interventions appear to be counterproductive in the long run.
Picardi considers other polices, including raising the real price of cattle,increasing the preference for nonanimal wealth holding, increasing taxes onanimals, and limiting the amount of time nomads spend in the Sahel. Theresults of all of these are dismaying - land degradation, starvation, and outmigration. The reason is that the land remains a common property, whoseservices are free to the nomads. Picardi finds that the only policies that havea possibility of succeeding are those that regulate the numbers of animalsmaintained on the land according to the condition of the soil. He argues
58 Warren C. Sanderson
that this sort of regulation would not likely be obtained voluntarily from thenomads and probably would require the imposition of some kind of outsideauthority.
To simulate what this outside authority might do, an experiment wascreated in which the herd size is varied year by year so that the size of theherd to be carried over the dry season plus expected additions to the herdwould not exceed the prior season's sustained carrying capacity. This scenario was much more optimistic for land quality, but the annual requiredslaughter rates varied enormously, sometimes leading to massive herd reductions followed by human starvation and waves of out-migration. Thesefluctuations could be eliminated through a supplemental feeding program,where herd sizes were related to the long-run state of land quality, but othersimulations show that these programs could, sometimes, be more costly thanthe value of all the stock slaughtered.
A combination of policies that include direct stock control, supplementary feeding, veterinary interventions to reduce stock death rates, and education that increases material aspirations would have the effect of increasingincomes and decreasing desertification over the long run.
When health, nutrition, and family-planning interventions are added asa package to this optimistic simulation, matters get worse. The range stillimproves in quality, but incomes per capita are not nearly as high becauseof the increased population size. The increased population size is due, inpart, to an assessment that family planning can play only a limited role inreducing fertility among the nomadic people of the Sahel. In the simulations,the introduction of a family-planning program only reduces the prior fertilitylevel by 10 percent, a very modest amount.
3.4.4 Comments
The sorts of economic and demographic crashes feared by ecologists do occurand the history of the Sahel region provides us with dramatic case studies.Picardi's choice of the Sahel as the setting for his sustainable developmentsimulation models was inspired. The results show the power of systemsdynamics methodology - as it was in the early 1970s - for understandingthe interrelationships between economic, demographic, and environmentalconcerns. In retrospect, it is a great shame that Picardi's thesis was neverpu blished and that it has not served as a point of departure for other models.
The Sahel is the vision of the early Malthus manifested on Earth, butwith an additional dismal twist. In the Sahel, when there is a period of good
Models of Demographic, Economic, and Environmental Interactions .59
rains or when there is progress in keeping livestock or humans alive, thepopulation begins to grow and this growth builds up a certain momentum.In this situation, a drought could trigger a collapse that does not return thesystem to some stable equilibrium point. The overshooting that happens,when the drought comes and people try desperately to maintain their herdsand themselves, can cause damage to the environment that can only be repaired over a long period. Thus the collapse of a rapidly growing populationdoes not return the system to the same equilibrium that is reached when amore slowly growing population crashes, as we saw from Picardi's historicalsimulations. The collapse of a more rapidly growing population leads to aworse situation. Interventions to help the nomads after the 1930s left themworse off after the drought of the early 1970s than they would have beenwithout those interventions.
The extra dismal element that Malthus did not foresee was that there is arelationship between economic and demographic growth paths and the localequilibrium that the system can attain. If population and economic growthrates slow down gradually as the system's limits are approached, there maynot be a crash. If those growth rates do not decline, as in SOCIOMAD,World3, and Wonderland, there is the possibility of a crash, bringing withit more damage and a lower local equilibrium.
In arguing in favor of lowering population growth rates, many peoplecite the role of slower population growth in postponing crises. Picardi'swork emphasizes another advantage. If a crisis does occur, less damage islikely to result if the system as a whole has less momentum.
In the Sahel, the environmental crisis was caused by the existence ofa crucial common property resource, grazing land. In theory, there areseveral ways of dealing with such situations. One is to privatize the commonproperty, but this is impossible in the Sahel. Although it is possible to sellparts of the land, this would not be a solution to the nomads' economicproblems. Rains are very spotty. Any given fixed parcel of land mayormay not get rainfall. The advantage of nomadism is that people and herdscan move to those random places where rainfall has occurred. Governmentmanagement of the common property is another approach. This requires agovernment that has a strong preference for the future over the present, isrelatively free of corruption, understands the long-run relationship between aset of characteristics of soil condition and the appropriate aggregate numberof animals that should be allowed to graze, has the monetary resourcesto fund a supplementary livestock-feeding program, and has the means to
60 Warren C. Sanderson
enforce its decisions. Such a set of characteristics is difficult to find in anyof the region's governments.
The difficulty of finding an easy solution to the problems of the Sahelis one of the chief conclusions of the Picardi models. Perhaps the nextgeneration of models needs to broaden the system boundaries. Could theproblems be addressed more appropriately in a model that also includedthe greener areas farther to the south?[5] Then, policies might be able tobe designed that allow for continuous migration out of a small Sahelianpopulation.
For sustainable development modeling, common property problems areespecially crucial because they can produce strong positive feedback loopsthat can cause crashes. In Mauritius, the main common property problemsrelate to water use. When we get there, we will see that they have beentreated in great detail.
Directly in front of us now, stands that couple again, arguing as usual,and looking somewhat bedraggled for having spent so long in this dry anddusty part of the world.
ECONOMIST: "Don't you owe me some money?"ECOLOGIST: "What are you talking about?""Don't you remember the bet we made about the prices of nonrenewable
resources? You said that nonrenewable resources were finite and therefore,as we ran out of them, they would cost more and we bet on it."
"Yes, I remember," he said glumly, writing her a check for $10,000. "Butthat doesn't mean that economic and ecological structures can't collapse.Look around you. Here is a terrible crash. People are suffering and dyingand you keep saying that economies can't crash. Why don't you open youreyes to reality'?"
"Of course, the economy collapsed," she said. "What did you expect?It's a one-sector economy based on a common resource that is unpriced anduncontrolled. There is no possibility of substituting land for anything else,and no technological progress in the number of these shrubs the land canproduce. I answered a question about this sort of situation in a prelim Itook in grad school."
"You knew all about crashes?" he asked with astonishment. "You knewall a.bout crashes from graduate school and you've argued with me all thistime that crashes can't happen. I can't believe it!" he added looking at theheavens. "What's going on here?"
Models of Demographic, Economic, and Environmental Interactions 61
"It's not so difficult," she said. "In a complex economy, where pricesplay their role in allocating resources, where substitution is possible, andtechnological progress accumulates from small changes in a wide varietyof processes, negative feedback loops dominate and, in the aggregate, thebehavior of the system is smooth and reasonably predictable. This is how Iwon the bet with you. The Sahel is a case of a single-sector economy basedon a common resource with no prices and few substitution possibilities."
"All right," he said, "where markets function well we do not have to beso worried about collapse, but look around you; the market doesn't alwaysfunction well and can't always be made to function well. What do we do inthese cases? Say that the Sahel does not fit our textbook models and walkaway."
"Give me another example of a case of a complex economy where anunpriced common resource plays a crucial role," she asked.
"That's easy," he replied, "the place is the Earth, and the unpricedcommon resource is the air."
"Speaking of air," she said, "isn't it awfully hot here? What's overthere?"
It's a small bridge and a sign that reads "Costa Rica." Immediatelythey begin walking in that direction. Let's follow them.
3.5 POMA: Interactive Model of Populationand Environment in Costa Rica, 1990
3.5.1 Introduction
The POMA (Poblacion y Medio Ambiente) model is devoted to the consideration of the relationship between population and the environment withspecial emphasis on Costa Rica's central valley (see Arcia et al., 1991). It isthe result of a collaboration between the Asociaci6n Demografica Costarricense and the RAPID III project, funded by the United States Agency forInternational Development. Three RAPID projects funded by US AID havebeen producing models of the effects of population growth on developmentsince the early 1970s. Thus, in contrast with World3 and SOCIOMAD,the RAPID models have been developing over a period of two decades. Toour knowledge, there does not exist any other continuous program of modeldevelopment in the population area with a longer history.
62 Warren C. Sanderson
Since the beginning of the RAPID program, the objective of the modelshas been presentational. The models were designed to demonstrate negativeeffects of population growth to policy makers, to motivate them to spendmore resources on programs to reduce fertility. Because of this objective,RAPID models tend to be highly simplified in comparison with more scientifically oriented ones. The POMA model is no exception. Although itcontains economic, demographic, and environmental variables, it is not amodel of sustainable development, because it does not permit intergenerational welfare or income comparisons.
3.5.2 The POMA model
The Economic Segment
Real income per capita is assumed to grow at a fixed percentage rate per yearover the projection period, which is from 1985 to 2025 for both Costa Rica asa whole and the central valley and is from 1975 to 2025 for the metropolitanarea of San Jose. The fixed percentage rate of growth is assumed not tovary over time or over region or to be influenced by the rate of populationgrowth or by the effects of any sort of pollution. Thus, the model cannotanswer questions about the effects of population growth or environmentaldegradation on per capita income growth. This is extremely unfortunatein the Costa Rican case, because there is evidence that these feedbacks aresignificant (see Repetto, 1992).
The Demographic Segment
The POMA model has at its core a standard (cohort components) populationprojection module. Populations are projected for Costa Rica as a whole, thecentral valley of Costa Rica, and the San Jose metropolitan area (San Joselies within the central valley). The projections take as inputs the time pathsof two sorts of variables, life expectancies at birth by sex and total fertilityrates.[6] Life expectancy improvements are assumed to be exogenous, andtherefore unaffected by pollution or income changes. Two paths of totalfertility rate have been chosen. One maintains the total fertility rate at the1980-198.5 level, and the other allows the total fertility rate to fall slowly to2.21 in the 2020-2025 period.
The authors of the POMA model did not have any life expectancy ortotal fertility rate data except for the country as a whole, so, in lieu of amore convincing idea, they assumed that the levels and time paths of life
Models of Demographic, Economic, and Environmental Interactions 63
expectancies and total fertility rates would be the same in all three regions.In addition, the POMA model assumes that there is no net migration between San Jose and any other part of the country, and between the centralvalley and any other part of the country. All these assumptions are highlyquestionable and their correspondence to the reality that they are supposedto represent is dubious.
Under the low fertility assumption Costa Rica's population would growby 97 percent in the 40-year period from 198.5 to 2025, or at an average annual rate of 1.7 percent. Under the high fertility assumption, the populationwould grow by 152 percent in the 40-year period, or at an average annualrate of 2.3 percent. If pollution per person were constant, going from thehigh scenario to the low one would reduce the increase in pollution from152 percent to92 percent. Of course, if Costa Rica wanted to reduce pollution rather than accept a large increase, other steps in addition to reducingfertility would be required.
The Natural Capital and Pollution Segment
Most of the POMA model is designed to look at the effects of populationgrowth on various forms of environmental degradation. These are: airquality reductions due to automotive emissions, increases in the productionof solid wastes, deforestation, and the encroachment of urban areas on theuse of land for agriculture and forests.
Air quality is considered in terms of amounts of sulfur dioxide, carbonmonoxide, nitrogen oxides, suspended particulates, and hydrocarbons contributed by vehicles to the air of San Jose. From the population projection,we know the future population of San Jose at five-year intervals from 1985through 2025. Three time paths are given for the ratio of people to vehicles.In the first, it remains constant at 7.1. In the second, it falls to 5.0 in 2025,and, in the third, it falls more rapidly to 4.2 in 2025. Roughly speaking,we can think of each path referring to a different rate of per capita incomegrowth, in San Jose. The faster the rate of economic growth, the faster theratio of people to vehicles is expected to fall.
For each fertility path, there are three paths of the ratio of people tovehicles, making for six possible combinations. For any given combination,the number of vehicles in each year in San Jose can be easily computed.Since each vehicle is assumed to produce a fixed amount of each of the fivepollutants, the amount of each pollutant contributed by the vehicles alsomay be easily calculated. The implicit assumption is that vehicles will not
64 Warren C. Sanderson
become less polluting over time and that less polluting fuels will not beformulated or, at least, that if there are less polluting vehicles and fuels theywill not be used in Costa Rica. All possible policies with regard to vehicularemissions are ignored.
Analogously, three exogenous time paths of the amount of solid wasteper person-day are given. One remains constant at 0.677 kilograms perperson-day. The second rises from 0.677 kilograms per person-day in 1990to 0.900 in 2025; and the third, from 0.677 to 1.200. When we multiply theamount of solid waste per person-day by the number of person-days fromthe population projection, we obtain the amount of solid waste. Given thetime path of solid waste per person-day, the more people, the more waste.All possible policies with respect to recycling and other ways of dealing withsolid waste production are ignored.
Deforestation is studied in two ways: directly, using a three-step process; and indirectly, under the rubric of land use. The first step in the directprocedure is to determine per capita demand for processed wood. An ordinary least squares (OLS) regression was run on data from 1970 to 1989 withthe per capita consumption of wood as the dependent variable and population size and the price of wood as the independent variables. Per capitaincome and government foreign-trade polices were assumed to have no effect on the demand for wood. Based on this equation, an assumption aboutwhat the future price of wood might be, and other adjustments, two timeprofiles of wood consumption per capita were produced: one for the higherfertility scenario and one for the lower fertility scenario. Multiplying woodconsumption per capita by the number of people produces the total amountof wood consumed.
The second step is to translate cubic meters of wood consumed tohectares of forest cut down. Two possibilities are considered: a more efficient one, where fewer hectares of forest are harvested per cubic meter ofwood produced; and a less efficient one, where more hectares are used. Multiplying the number of hectares harvested per cubic meter of wood producedby the number of cubic meters demanded, the authors obtain the number ofhectares that must be cut down to meet that demand.
In the third step, the amount of commercial forest remaining is computed. Since it is assumed that there is no replanting of commercial forests,the number of hectares of commercial forest at time t + 1 is just the numberof hectares at time t minus the number of hectares harvested. If the inefficient technology is used, the commercial forests of Costa Rica are wiped
Models of Demographic, Economic, and Environmental Interactions 65
out by 2003 in the high fertility case and by 2004, in the low fertility case.Given the more efficient technology, the entire commercial forests of CostaRica are wiped out by the year 2013, no matter which fertility assumption isused. Apparently, better governmental policies toward commercial forestryare urgently needed.
Land use in the central valley is determined using a set of four equations.In the first, the amount of urban land used in a given year is assumed todepend on the population of the central valley in that year and on past values of income per capita and municipal infrastructure costs. In the second,municipal infrastructure costs in a given year depend on the current population and the past amount of urban land used. In the third, agriculturalland is assumed to decrease as urban land grows, and, in the last equation,forestland is assumed to decrease as agricultural land shrinks.
This analysis predicts a substantial decline in the remaining forestlandin the central valley by the year 2025. If these computations are consistentwith the ones on deforestation, we must assume that the remaining forestsare not commercial ones.
3.5.3 Comments
As expected, increases in population size always cause increases in pollution.This conclusion is built into the model.
An important problem with RAPID models, like this one, is that theytend to avoid consideration of all possible governmental policy responses to agrowing population. This is, of course, their nature. The models are designedto spread awareness of problems associated with population growth, and tosuggest that slowing fertility is the only solution to them. A presentation ofalternative policies would be contrary to the mission of the RAPID project.
There's a RAPID presentation of the POMA model just ending overthere. ECOLOGIST and ECONOMIST get up and start discussing whatthey have just seen.
"Wasn't that fun," he said. "I hope that really gets their attention. Ilike the color graphics on the screen."
"Fun," she said. "That wasn't fun; that was dreadful. How could theytreat population policy as the only policy in the entire world that can beused against pollution? Even their own figures show how ridiculous that is.There is no population policy that can save their commercial forests. Savingtheir commercial forests will require other sorts of policies. Probably each ofthe effects they showed could be completely eliminated by using up-to-date
66 Warren C. Sanderson
technology already in use in a dozen countries. Why do you support suchbiased work?"
"Because," he replied, "it gets people's attention. Then maybe they'lldo something about pollution and about population growth."
"Look," she said, "we've agreed that in some parts of the economicsystem markets work ..."
"Yes," he interrupted, "that little bit of wisdom cost me $10,000. Andwe've also agreed that crashes can happen and have really happened."
"Yes," she said, "but mainly in cases with important unpriced and uncontrolled common property resources. But then shouldn't you also agreeto stop supporting this one-sided form of modeling where only one set ofpolicies is explored. Wouldn't it be better if we got people's attention bygiving them the whole story and telling them about population options, environmental options, and technological options instead of pretending thatone or another set didn't exist?"
"Of course, for scientific work it's better to have models that include allthe options," he said, "but I've never seen a model that did that."
"What's over there," she asked as she pointed to her right."It looks like another bridge," he said. "The sign says'Mauritius'. Do
you want to try it?"They're walking toward the bridge. Let's follow them.
3.6 The Mauritius Model
3.6.1 Introduction
While the past two decades produced a lively and rapidly growing literatureon the interrelationships between economic, demographic, and environmental variables,[7] the development of simulation models that included thesethree factors almost came to a complete halt, after the burst of activity in theearly 1970s. In the early 1990s, some people at IIASA grew uncomfortablewith this state of affairs. They believed that researchers could learn a greatdeal about the relationship between the environment and development, ingeneral, by studying it in specific settings. It is that belief that motivatedthe creation of the Mauritius model.
From the beginning, the Mauritius modeling project had three goals: tohelp Mauritian decision makers formulate sustainable development policies;to address specific questions in the literature and to show how they could be
Models of Demographic, Economic, and Environmental Interactions 67
answered in the context of Mauritius; and to provide a first step in the process of reinvigorating the subject of sustainable development modeling. TheMauritius model does not, by itself, provide answers to general questions,but it does provide answers to particular questions.
In order meet its objectives the Mauritius modeling team avoided thenebulous relationships found in World3; put substantial emphasis on common property problems, as suggested by the SOCIOMAD model of the Sahel (in the Mauritius case, this common property resource is water); andincluded specific economic, demographic, and environmental policies, in contrast to the POMA model. A strength of the Mauritius model is the detailwith which those policy alternatives are articulated.
3.6.2 The Mauritius model in brief
The Mauritius model is described in detail in Part III of this book, so herewe only present highlights of its structure. The model has four modules:population, economy, land use, and water resources. The population module produces projections of the population of Mauritius by age, sex, studentstatus, and educational attainment. The Mauritius model is the only oneconsidered here to incorporate education explicitly. Education is allowed toincrease the productivity of labor, but costs money to produce. This treatment of education is of crucial importance to the model. If people werenot allowed to become more productive with education, the effect of population growth on per capita income growth and pollution would essentiallybe predetermined. The population module is linked to the land-use modulethrough the demand for urban land and to the water module through thewater needs of the population and the consequent water pollution.
The economic module is based on a IS-sector input-output frameworkwith fixed relative prices. It is linked to the demographic sector throughlabor supply and labor productivity. It is connected to the land-use modulethrough the demand for land for agricultural purposes. Because agriculturalactivities compete for land with urban development, population growth canreduce economic growth through the reduction of land available for farming.The economic module and the water module are interconnected; economicactivities cause various sorts of water pollution, and water pollution causesa diminution of the amount of water available for irrigation and a resultingdecline in crop yields.
68 Warren C. Sanderson
Like the economic module, the land-use module is connected to all theothers. Land can be used for sugar-cane growing, other agriculture, recreation, urban commercial purposes, and urban residential purposes. Landquality cannot degrade in the model, and there is no provision for erosion.
The water module is the model's key component for shedding light onquestions of sustainable development. People use water, and their wastescause water pollution. Economic activity also uses water and causes pollution. When water gets too polluted, labor productivity falls, as the everydayactivities of people get disrupted, and agricultural output decreases becauseof limitations on irrigation. On the other hand, though water is treated as anunpriced common property resource, it is not uncontrolled. The governmentcan spend money on building reservoirs and on water treatment facilities ofvarious sorts.
An unusual and very desirable feature of the Mauritius model is the greatdetail with which policy options in the water module are treated. For example, the module contains a list of possible reservoir sites being considered bythe Mauritius water authorities, their costs, and their capacities. The usercan specify which particular reservoirs get built in each period. Still, goodreservoir sites are limited and water purification systems can only eliminatea. certain amount of pollution from the water. We will not spoil the enjoyment of reading this book by giving away its ending here. The reader willhave to wait to see how water provides limits to Mauritian growth.
The Mauritius model is extraordinarily open. There are over 1,000 parameters that can be set by the user. The disadvantage of this is that theuse of the model can be daunting at first. On the other hand, experiencedusers have at their disposal a flexible tool for the study of both the Mauritiuseconomy and the nature of sustainable development from which much morecan be learned than can be presented in this volume.
3.7 Other Models
Space and time have severely limited the number of models that could bereviewed here. The first model we sought for this review was the ECCO (Enhancement of Carrying Capacity Options) model.[8] The ECCO frameworkis a recent modeling approach explicitly devoted to the study of sustainabledevelopment. What made it particularly attractive to us was the existenceof a Mauritian application (MECCa).
Models of Demographic, Economic, and Environmental Interactions 69
In ECCO models, the equations are written in terms of energy use andso are very different from those of the IIASA Mauritius model. With some700 equations, the MECCa model is a large one and the task of comparingit with the IIASA model would have been both challenging and interesting.Because the equations of the ECCO and MECCa models have never beenpublished, a comparative study of the two approaches must be left on theagenda for future work.
This chapter neglects a whole set of models oriented toward energy useand the consequent atmospheric pollution.[9] One of these, the EdmondsReilly model (Edmonds and Reilly, 1983, 1985), is evolving into a modelthat seems like it could be used for the study of sustainable development(Edmonds et az', 1991), but the new "second generation" model was not yetrunning when this chapter was written. Reviewing these models would haveled us much too far from our main themes.
Other interesting models have been left out as well (see Barney et aZ.,1991). There were severe limits to the length of this chapter and overshootingthem would have led to a painfully persona] crash.
3.8 Toward the Development of SustainableModels
If the discussion among biologists, demographers, ecologists, economists, andothers is to become more productive in the future, it has to move beyondthe current cycle of scare-and-soothe studies. On the one hand, we aretold that our economy will crash and our children and grandchildren willbe devastated by famine and disease, and, on the other hand, we are toldthat everything will be fine forever. To break this cycle, requires that webecome more committed to science and less to causes. It requires that wedo not first decide what is most important and then try to convince othersby presenting only the pieces of information that fit our preconceptions. Itrequires a dedication to the quantification of the results of different policesand, above all, it requires that biologists, demographers, ecologists, andeconomists listen to one another, and take one another seriously.
The Mauritius model project is an attempt to break out of this cycle bytreating a variety of concerns in an evenhanded manner. More than anythingelse, this is its greatest strength.
But are modeling schools that focus on science sustainable? Science canbe messy. One kind of effect can dominate in some countries, but not in

70 Warren C. Sanderson
others. Will agencies fund projects that show that sometimes their favoriteinterventions are very useful and that sometimes they have a marginal impact? If not, the public will be left wandering in a land filled with alternatingvisions of havoc and prosperity, until perhaps one of them came true. Theremust be a better way to find out on which side of the looking glass our pathlies.
ECONOMIST: "What do you think of Mauritius so far?"ECOLOGIST: "It seems pleasant enough. But then again, we haven't
gotten very far. There seems to be concern about pollution and environmenthere. I like that."
"And a variety of options for improving the environment are considered.I like that," she said. Just as she finished, she glanced down and saw a groupof strange looking birds walking in front of her. She picked one up. "Look,"she said, "they don't have any wings; none of them have any wings."
"That's impossible," he said, picking up another one of them."What is it?" she asked."I don't know," he replied as he looked through its feathers. "It's got
small vestigial wings hidden under its feathers. It obviously can't fly. I'venever seen anything like it in my life. They certainly seem to like this forest,"he continued. "They're all over the place."
They were standing in a forest of large trees. She looked around andsaid, "What kind of trees are these, anyway?"
He looked at the trees and then at a branch that had fallen to the ground.The wood was jet black. "These look like..." He caught himself before hefinished his sentence. "And we're on Mauritius, right?"
"Yes," she said."Then," pointing at one of the birds, he went on, "these must be ... oh,
for heaven's sake, I think I know exactly what these are. These birds aredodo birds, and those trees are ebony trees."
"But dodo birds are extinct," she said."And there are no more ebony trees on Mauritius," he said continu
ing her thought. "They were unpriced and uncontrolled common propertyresources caught in positive feedback loops," he said and they both laughed.
"Do you think there are any positive feedback loops on Mauritius today,"she asked.
"Of course," he answered."How about betting on that," she said, "double or nothing.""You're on," he replied. "Let's go see."
Models of Demographic, Economic, and Environmental Interactions 71
Notes
[1] If natural resources really grew scarcer over time, we would expect to see a longrun upward trend in their prices. Unfortunately for the World3 modelers, thisis diametrically opposed to the historical record, which shows generally fallingprices during the last century. See Simon (1981) for a discussion of this issue.
[2] The page numbers for The Limits to Growth refer to the Signet (New York)paperback edition.
[3] We obtained a copy of his thesis by writing to Dr. Anthony C. Picardi, 58Washburn Avenue, Wellesley, Massachusetts, 02181, USA. We obtained thisaddress from Barney et al., 1991.
[4] The drought in the early 1970s was not exceptionally severe by historical standards. Picardi presents evidence suggesting that a similar period of droughtoccurred twice before in the 20th century, roughly at 30-year intervals.
[5] An excellent choice of settings for future work in this area would be the Sudan.In northern Sudan, the pressures of increasing human and animal populationshave been causing increased desertification. As a consequence, nomadic peoplehave been pushed southward causing intertribal warfare. A model of the Sudan,then, could weigh the costs of such environmentally caused conflicts against thecosts of policies which could avoid them.
[6] The total fertility rate is the average number of live births a woman would haveover her lifetime, given the observed fertility behavior of a given period.
[7] There are nearly 400 references in the bibliography of the World DevelopmentReport 1992: Development and the Environment (World Bank, 1992b). Thevast majority of these were written in the past two decades. Even this bibliography is hardly complete. For example, no work done by Julian Simon or hiscollaborators appears there.
[8] See Gilbert and Braat (1991) for a general description of the model and for somecase studies. The ECCO framework was first described in an unpublished paperby Slesser in 1984 (see Slesser, 1991) and subsequently elaborated in Slesser andKing (1988).
[9] A good starting point for studying these models is The Energy Journal SpecialIssue on Global Warming 12(1),1991. It contains applications of some currentlyactive models and references to many others.


Part II
Understanding Through History

Chapter 4
People on Mauritius:1638-1991
Wolfgang Lutz and Anne Babette Wils
4.1 Introduction
This chapter approaches a better understanding of population-developmentenvironment interactions by providing a short multidisciplinary history ofMauritius which focuses on the primary agents of change over the last century - the human population (a more detailed account of population changein Mauritius is given in Lutz and Wils, 1991). Chapters 5 through 10 describe the environmental and economic spheres that form the context ofhuman life on Mauritius influencing the population and being influenced bythe population.
Mauritius - situated in the Indian Ocean about 800 km east of Madagascar and with a land surface of about 1,860 km2
- has been known tocivilization much longer than it has been settled. Arab merchants had itmarked on their maps 1,000 years ago and called it Dina Mozare, but theydid not live on it. The population history of the island of Mauritius startedin 1638 when the Dutch East India Company sent a group of settlers to thepreviously uninhabited island. A major interest of the Dutch was in cuttingand selling the valuable ebony trees. The island also served as a haven formerchant ships to Asia. The large populations of turtles became a welcomesupplement to the sailors' diet, while the famous flightless dodo birds were
76 Wolfqang Lutz and Anne Babette Wils
quickly exterminated. It is estimated that by the end of the 17th century,about 200 Dutch colonists and 500-1,000 slaves lived on Mauritius. But in1710 the Dutch abandoned Mauritius in favor of their new stronghold, theCape of Africa.
In 1721 a small French party landed on Mauritius, which was then calledHe de France. Soon the French East India Company brought more settlersto Mauritius. It is reported that during the influential governorship of Mahede Labourdonnais (1735-1746), the population of the island increased fromunder 1,000 to over 3,000. During this time sugar cultivation was introduced,and increasing numbers of slaves were brought from Madagascar and WestAfrica to work on the sugar estates. By 1817 the population of the islandhad increased to almost 100,000, consisting of more than 80 percent slaves,11 percent free colored inhabitants, and 8 percent Europeans or descendantsof Europeans.
In 1810 Mauritius was conquered by the British. Initially, this madelittle difference to life on the island and its people because the French wereguaranteed the rights to keep their properties, to use their language, to followtheir laws, and to practice their religion. The biggest change came with theabolition of slavery between 1834 and 1839. Large numbers of indenturedlaborers were brought in from India to replace the freed slaves. Between1851 and 1861 more than 100,000 Indians arrived in Mauritius. Since thattime the majority of the Mauritian population has been of Indian origin.
In 1968 political power was passed to the Mauritians themselves after long, but nonviolent negotiations with the UK. In terms of population trends, this had little immediate impact. In the late 1940s and early1950s, mortality had already declined considerably due to the eradicationof malaria and other health improvements. Simultaneously, fertility ratesincreased, thus resulting in a steep increase of population growth rates tolevels of more than 3 percent per year. This demographic discontinuitywhich dominates the picture of any kind of visual or quantitative description of Mauritian population trends resulted in a large number of youngMauritians born in the 1950s. This phenomenon, together with a secondremarkable discontinuity of past trends, namely, a steep decline of fertilityduring the late 1960s and 1970s, resulted in an unusually large cohort ofyoung people - the youth cohort - that will characterize the Mauritian agestructure for decades to come.
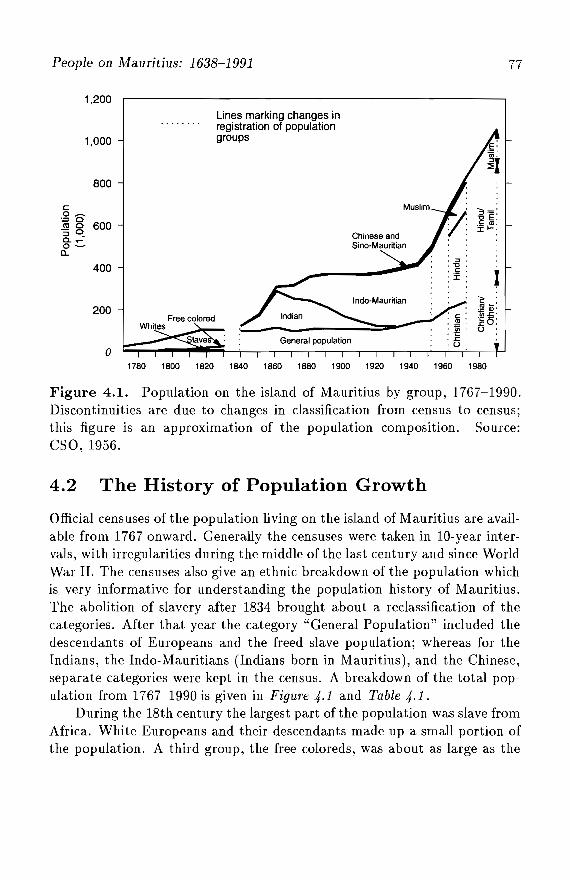
People on Mauritius: 1638-1991
1,200
77
1,000
800
co ~.~ 0--'l! g 600::J •c. .....o ~a.
400
200
o
Lines marking changes inregistration of populationgroups
, :J ', "C ,
,.6 ' l::I: :
Indo-Mauritian
General population
1780 1800 1820 1840 1860 1880 1900 1920 1940 1960 1980
Figure 4.1. Population on the island of Mauritius by group, 1767-1990.Discontinuities are due to changes in classification from census to census;this figure is an approximation of the population composition. Source:CSO, 1956.
4.2 The History of Population Growth
Official censuses of the population living on the island of Mauritius are available from 1767 onward. Generally the censuses were taken in 10-year intervals, with irregularities during the middle of the last century and since WorldWar II. The censuses also give an ethnic breakdown of the population whichis very informative for understanding the population history of Mauritius.The abolition of slavery after 1834 brought about a reclassification of thecategories. After that year the category "General Population" included thedescendants of Europeans and the freed slave population; whereas for theIndians, the Indo-Mauritians (Indians born in Mauritius), and the Chinese,separate categories were kept in the census. A breakdown of the total population from 1767-1990 is given in Figure 4.1 and Table 4.1.
During the 18th century the largest part of the population was slave fromAfrica. White Europeans and their descendants made up a small portion ofthe population. A third group, the free coloreds, was about as large as the
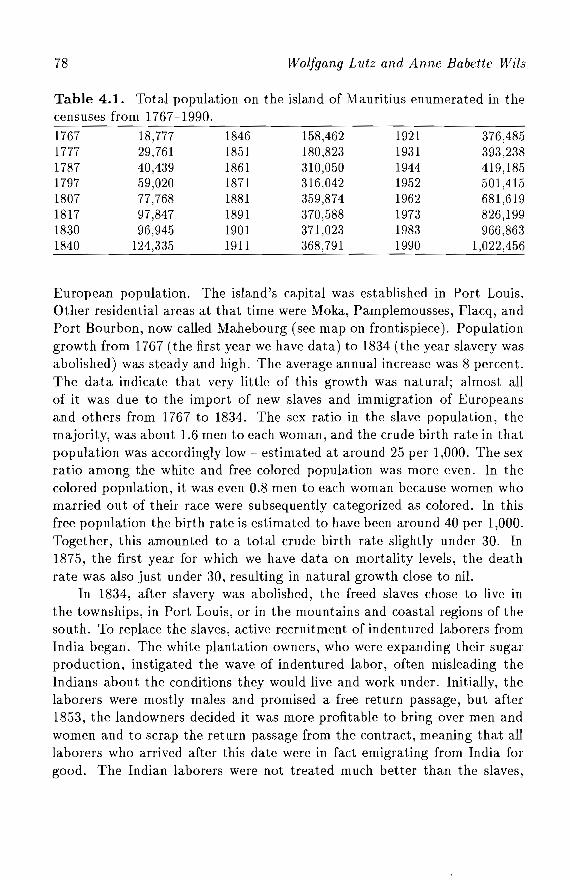
78 Wolfgang Lutz and Anne Babette Wils
Table 4.1. Total population on the island of Mauritius enumerated in thecensuses from 1767-1990.
17671777178717971807181718301840
18,77729,76140,43959,02077,76897,84796,945
L24,335
18461851186118711881189119011911
158,462180,823310,050316,042359,874370,588371,023368,791
19211931194419521962197319831990
376,485393,238419,185501,415681,619826,199966,863
L,022,456
European population. The island's capital was established in Port Louis.Other residential areas at that time were Moka, Pamplemousses, Flacq, andPort Bourbon, now called Mahebourg (see map on frontispiece). Populationgrowth from 1767 (the first year we have data) to 1834 (the year slavery wasabolished) was steady and high. The average annual increase was 8 percent.The data indicate that very little of this growth was natural; almost allof it was due to the import of new slaves and immigration of Europeansand others from 1767 to 1834. The sex ratio in the slave population, themajority, was about 1.6 men to each woman, and the crude birth rate in thatpopulation was accordingly low - estimated at around 25 per 1,000. The sexratio among the white and free colored population was more even. In thecolored population, it was even 0.8 men to each woman because women whomarried out of their race were subsequently categorized as colored. In thisfree population the birth rate is estimated to have been around 40 per 1,000.Together, this amounted to a total crude birth rate slightly under 30. In1875, the first year for which we have data on mortality levels, the deathrate was also just under 30, resulting in natural growth close to nil.
In 1834, after slavery was abolished, the freed slaves chose to live inthe townships, in Port Louis, or in the mountains and coastal regions of thesouth. To replace the slaves, active recruitment of indentured laborers fromIndia began. The white plantation owners, who were expanding their sugarproduction, instigated the wave of indentured labor, often misleading theIndians about the conditions they would live and work under. Initially, thelaborers were mostly males and promised a free return passage, but after1853, the landowners decided it was more profitable to bring over men andwomen and to scrap the return passage from the contract, meaning that alllaborers who arrived after this date were in fact emigrating from India forgood. The Indian laborers were not treated much better than the slaves,
People on Mauritius: 1638-1991 79
the sanitary conditions were terrible (Parahoo, 1986), and death rates wereextremely high.
The rate of immigration was enormous, and the population of Mauritiustripled during this time from around 100,000 in 1834 to 310,000 by thecensus of 1861. The strongest intercensal immigration decade was 18511861, with a total of over 100,000 immigrants. As women began to arrivefrom India soon after the men, the sex ratio normalized, and the native IndoMauritian population was born. By the end of the century immigration hadvirtually ceased.
During the period of Indian immigration and the birth of the IndoMauritian population, other ethnic groups in the population - previously thewhite, free colored, and slave populations, classified as "General Population"after the census of 1846 - barely grew. There were 101,000 classified asgeneral population in the 1846 census; 100 years later, there were 143,000.The general population includes those of mixed origin, for example, whiteand Indian origin. The almost zero growth rate of the general populationmay indicate that intermarriage was not common: descendants of mixedmarriages were classified as general, and if there had been intermarriage,the group of mixed descendants would have increased.
Figure 4.2, which shows the crude birth and death rates in Mauritiusbetween 1875 and 1991, depicts the low population growth in the half centuryafter immigration ended. Crude birth and death rates in the 19th centuryup to the early 20th century were roughly at the same level but showedenormous annual variations that are typical for premodern conditions. Thisresulted in very little if no natural growth. From 1875 to about 1893, thecrude birth rate was slightly higher than the death rate. Death rates wereunstable, ranging between 30 and 35. The peaks were caused by variousepidemics - cholera, smallpox, the Bubonic plague in 1899 - and particularlystrong hurricanes. Prior to 1862 malaria, a major killer in subsequent years,was not endemic to Mauritius. Malaria was worse in the coastal areas,and many people moved to the higher, central plateau of the island wherethe towns of Curepipe, Vacoas, and Quatre Bornes are now located. ManyIndians acquired the land in the low areas during this period.
In 1919 there was a mortality peak of more than 60 per 1,000, caused byan out break ofthe Spanish flu which killed thousands of Mauritians (Titmussand Abel-Smith, 1968, p. 49). In the early 1920s, mortality rates declinedmore consistently for the first time. During this period the water supplywas chlorinated and there were campaigns against malaria and hookworm
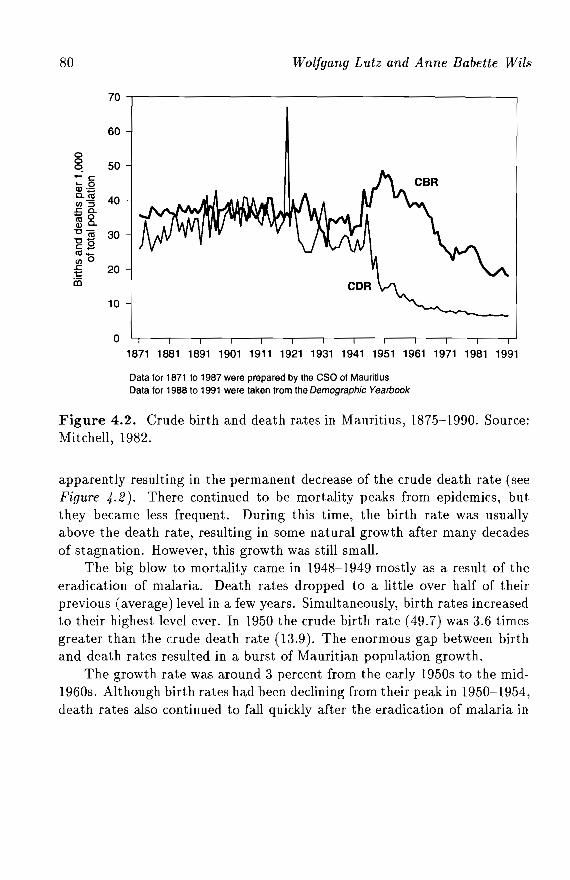
80
70
60
00 50q.... c:... aQ)~
0. <a 40rn"S.co.-a:go."Clij 30"Coc:_<a_rna.c 20t::iii
10
o
Wolfgang Lutz and Anne Babette Wils
1871 1881 1891 1901 1911 1921 1931 1941 1951 1961 1971 1981 1991
Data for 1871 to 1987 were prepared by the csa of MauritiusData for 1988 to 1991 were taken from the Demographic Yearbook
Figure 4.2. Crude birth and death rates in Mauritius, 1875-1990. Source:Mitchell, 1982.
apparently resulting in the permanent decrease of the crude death rate (seeFigure 4.2). There continued to be mortality peaks from epidemics, butthey became less frequent. During this time, the birth rate was usuallyabove the death rate, resulting in some natural growth after many decadesof stagnation. However, this growth was still small.
The big blow to mortality came in 1948-1949 mostly as a result of theeradication of malaria. Death rates dropped to a little over half of theirprevious (average) level in a few years. Simultaneously, birth rates increasedto their highest level ever. In 1950 the crude birth rate (49.7) was 3.6 timesgreater than the crude death rate (13.9). The enormous gap between birthand death rates resulted in a burst of Mauritian population growth.
The growth rate was around 3 percent from the early 1950s to the mid1960s. Although birth rates had been declining from their peak in 1950-1954,death rates also continued to fall quickly after the eradication of malaria in
People on Mauritius: 1638-1991 81
1948-1949. In the 1960s and 1970s, the death rate stabilized while the birthrates plummeted. Together this brought the current growth rate down tojust over 1 percent annually. The current observed growth is only due tothe young age structure of the population; the net reproduction rate hasremained around 1.0 since 1984, indicating that one generation will justreplace itself and the population size will stop growing in the long run if thisfertility level stays constant.
The increase of the crude birth rate in Mauritius right after World WarII is an example of a fertility increase in response to, among other things,better health of mothers which is often observed at the beginning of thedemographic transition. The precipitous decline in the birth rate that startedin the 1950s is attributable to delayed marriage followed by the maritalfertility transition. The fertility decline was more rapid in Mauritius thanin any other country with accessible data.
The total fertility rate (TFR) - an indicator free of effects from the agestructure - hovered around five children per woman in the first half of thecentury. By 1952 the TFR had increased to a high level of 6.74, and 10 yearslater in 1962 was still high at 5.86. Over the following 10 years it then fellprecipitously to 3.42 in 1972, a phenomenon that will be discussed in moredetail below. In the mid-1980s the Mauritian TFR was even below 2.0, aWestern European level. Since then it has slightly increased to around 2.4in 1992.
During the past three decades total population grew very rapidly from681,619 in 1962 to 826,199 in 1972 and 966,863 in 1983. Figures from themost recent census in 1990 show that after 1983 the population grew byanother 100,000 people to 1,056,660.
Figure 4-3 shows the population density of the island in 1990. Theheight of the peaks in the map show the level of population density - highpeaks mean high density. The highest density is in Port Louis, and continuesalong the urban corridor - Quatre Bornes, Vacoas, and Curepipe. There area few other small urban centers, but otherwise there is a fairly even lowdensity in rural areas. The lowest densities (not easily discernible on themap) are in the mountainous south. In 1990, a little over 40 percent of thepopulation lived in areas classified as urban, and this proportion had beenstable since 1970 (Keyfitz and Flieger, 1990).
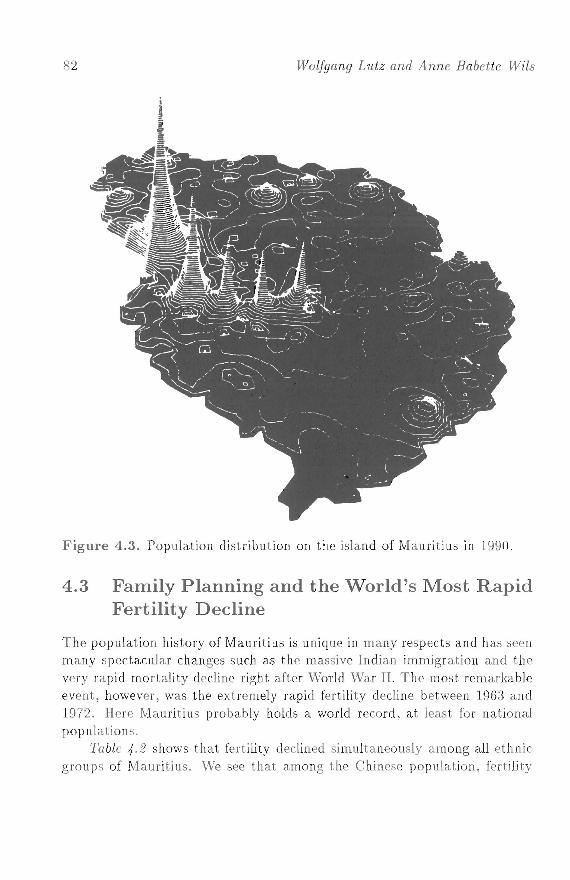
82 Wolfgang Lutz and Anne Babette Wils
Figure 4.3. Population distribution on the island of Mauritius in 1990.
4.3 Family Planning and the World '8 Most RapidFertility Decline
The population history of Mauritius is unique in many respects and has seenmany spectacular changes such as the massive Indian immigration and thevery rapid mortality decline right after World War II. The most remarkableevent, however, was the extremely rapid fertility decline between 1963 and1972. Here tvlauritius probably holds a world record, at least for nationalpop ulations.
Table 4.2 shows that fertility declined simultaneously among all ethnicgroups of Mauritius. We see that among the Chinese population, fertility
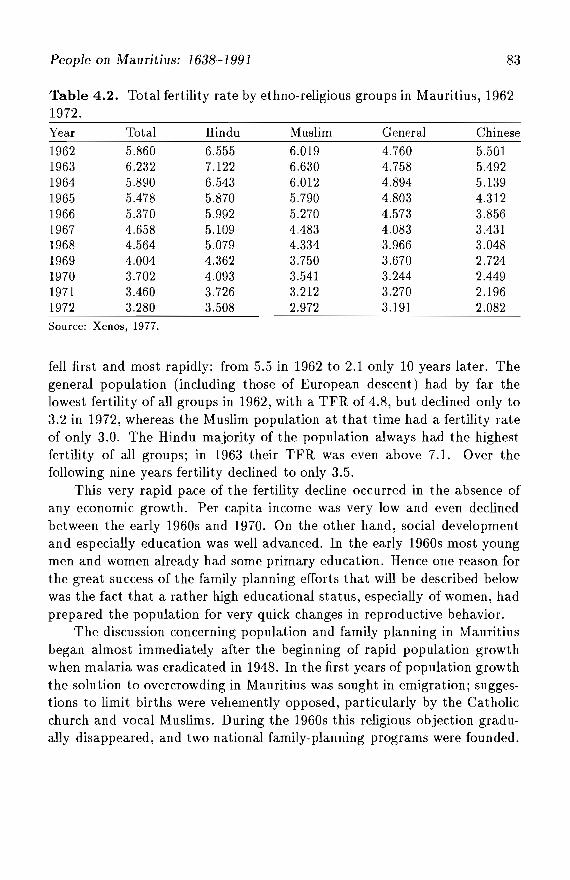
People on Mauritius: 16.'18-1991 83
Table 4.2. Total fertility rate by ethno-religious groups in Mauritius, 1962-1972.Year Total Hindu Muslim General Chinese1962 5.860 6.555 6.019 4.760 5.5011963 6.232 7.122 6.630 4.758 5.4921964 5.890 6.543 6.012 4.894 5.1391965 5.478 5.870 5.790 4.803 4.3121966 5.370 5.992 5.270 4.573 3.8561967 4.658 5.109 4.483 4.083 3.4311968 4.564 5.079 4.334 3.966 3.0481969 4.004 4.362 3.750 3.670 2.7241970 3.702 4.093 3.541 3.244 2.4491971 3.460 3.726 3.212 3.270 2.1961972 3.280 3.508 2.972 3.191 2.082
Source: Xenos, 1977.
fell first and most rapidly: from 5.5 in 1962 to 2.1 only 10 years later. Thegeneral population (including those of European descent) had by far thelowest fertility of all groups in 1962, with a TFR of 4.8, but declined only to3.2 in 1972, whereas the Muslim population at that time had a fertility rateof only 3.0. The Hindu majority of the population always had the highestfertility of all groups; in 1963 their TFR was even above 7.1. Over thefollowing nine years fertility declined to only 3.5.
This very rapid pace of the fertility decline occurred in the absence ofany economic growth. Per capita income was very low and even declinedbetween the early 1960s and 1970. On the other hand, social developmentand especially education was well advanced. In the early 1960s most youngmen and women already had some primary education. Hence one reason forthe great success of the family-planning efforts that will be described belowwas the fact that a rather high educational status, especially of women, hadprepared the population for very quick changes in reproductive behavior.
The discussion concerning population and family planning in Mauritiusbegan almost immediately after the beginning of rapid population growthwhen malaria was eradicated in 1948. In the first years of population growththe solution to overcrowding in Mauritius was sought in emigration; suggestions to limit births were vehemently opposed, particularly by the Catholicchurch and vocal Muslims. During the 1960s this religious objection gradually disappeared, and two national family-planning programs were founded.
84 Wolfgang Lutz and Anne Babette Wils
By the mid-1980s the majority of the women in union in childbearing ageswere using contraception and almost all of them had done so at some point.
Without doubt the efficiently conducted family-planning programsplayed a key role in the spectacular decline of fertility in Mauritius. Forthis reason we take a closer look at the conditions that led to the successfulimplementation offamily planning despite the influential religious oppositionwhen the programs first began.
Until 1949, concern about overpopulation was not great, if it existed atall. A report by the Labor Commissioner was presented to the governmentsuggesting emigration to Borneo and Madagascar when the numbers of people become too great. Soon thereafter, in 1950, the first suggestion was madein Parliament that present birth rates needed to be curbed by populationcontrol. Reaction was hostile from all sides. Members of all three large religious communities objected vehemently, stating that family planning wascontrary to their faith. Extensive, vehement opposition to that proposalfollowed in the Mauritian newspapers.
Despite this objection it was clear that continued population growthpresented a problem, and the government elected a committee to investigate.In 1953, this committee, consisting of at least one Protestant, one Muslim,one Hindu, one Chinese descendant, and five Catholics, recommended thatthe government should initiate a social-services system including familyplanning support. Although the report was never discussed in Parliament,it was presented in the press. This time, reactions were mixed rather thancompletely negative. The Catholics conceded that married couples were notobliged to produce as many children as possible, but stressed that abstentionwas the only acceptable means of avoiding pregnancy.
This change of attitude culminated in the foundation of their own familyplanning organization, the Action Familiale (AF), in 1962, five years afterthe independent Mauritius Family Planning Association (MFPA) had beenfounded. What caused this change of attitude, especially within the veryinfluential Catholic church which reluctantly not only accepted abstentionbut, during the early 1960s, also explicitly supported family planning byallowing the natural rhythm method?
The Catholic church's willingness to think about family planning usingthe rhythm method was critically influenced by a French Jesuit, ProfessorLestapis. His view was that the Catholic doctrine was not against the freedecision of couples to have a limited number of children, but rather against
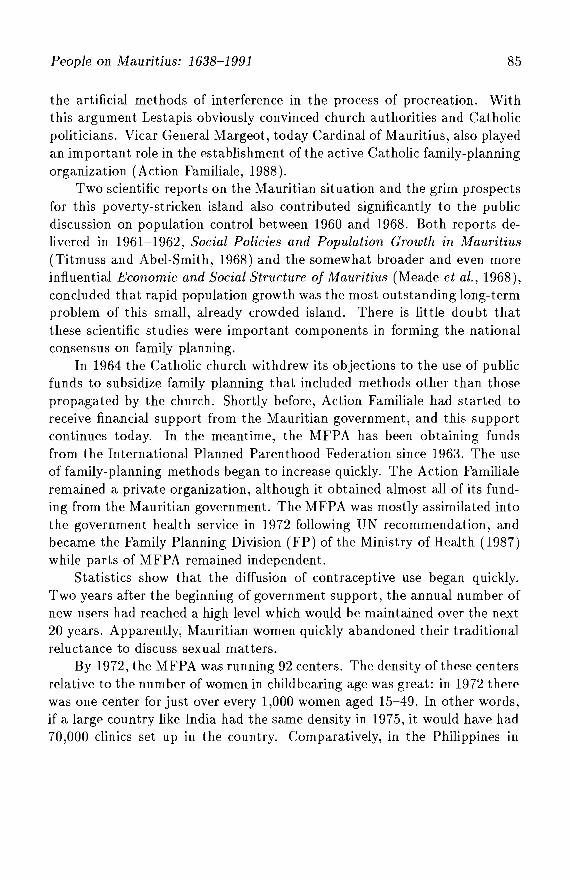
People on Mauritius: 1638-1991 85
the artificial methods of interference in the process of procreation. Withthis argument Lestapis obviously convinced church authorities and Catholicpoliticians. Vicar General Margeot, today Cardinal of Mauritius, also playedan important role in the establishment of the active Catholic family-planningorganization (Action Familiale, 1988).
Two scientific reports on the Mauritian situation and the grim prospectsfor this poverty-stricken island also contributed significantly to the publicdiscussion on population control between 1960 and 1968. Both reports delivered in 1961-1962, Social Policies and Population Growth in Mauritius(Titmuss and Abel-Smith, 1968) and the somewhat broader and even moreinfluential Economic and Social Structure of Mauritius (Meade et al., 1968),concluded that rapid population growth was the most outstanding long-termproblem of this small, already crowded island. There is little doubt thatthese scientific studies were important components in forming the nationalconsensus on family planning.
In 1964 the Catholic church withdrew its objections to the use of publicfunds to subsidize family planning that included methods other than thosepropagated by the church. Shortly before, Action Familiale had started toreceive financial support from the Mauritian government, and this supportcontinues today. In the meantime, the MFPA has been obtaining fundsfrom the International Planned Parenthood Federation since 1963. The useof family-planning methods began to increase quickly. The Action Familialeremained a private organization, although it obtained almost all of its funding from the Mauritian government. The MFPA was mostly assimilated intothe government health service in 1972 following UN recommendation, andbecame the Family Planning Division (FP) of the Ministry of Health (1987)while parts of MFPA remained independent.
Statistics show that the diffusion of contraceptive use began quickly.Two years after the beginning of government support, the annual number ofnew users had reached a high level which would be maintained over the next20 years. Apparently, Mauritian women quickly abandoned their traditionalreluctance to discuss sexual matters.
By 1972, the MFPA was running 92 centers. The density ofthese centersrelative to the number of women in childbearing age was great: in 1972 therewas one center for just over every 1,000 women aged 15-49. In other words,if a large country like India had the same density in 1975, it would have had70,000 clinics set up in the country. Comparatively, in the Philippines in
86 Wolfgang Lutz and Anne Babette Wils
1972, there were 1,800 clinics registered at the end of the year, or one clinicfor every 2,800 women aged 15-49, only one-third the Mauritian density.
Reflecting the density of the two family-planning organizations relativeto population, a survey in 1975 - only ten years after family planning wasintensified in Mauritius - found that almost all married women under age50 had knowledge of family-planning methods, and most knew of more thanone method. The pill was the most familiar method. The survey also showedthat almost half of the women in union under age 50 were current users ofcontraception. There were twice as many users of supplied methods (predominately the pill) as of natural methods.
In 1985 a second survey was undertaken by the government because thevery low fertility rate indicated that more women were using contraceptivesthan were officially registered. The results showed that almost 75 percentof the married women 15-49 were using some form of contraception. Themost common method was still the pill, although the percentage of womenusing the pill had not increased since 1975. Condoms and spermicide were inuse more often in 1985 than in 1975, and sterilization, not available in 1975,was the contraceptive method used by 5 percent of the women. Naturalmethods were also more widely used; almost all of this increase was due tomore couples practicing withdrawal. Since withdrawal was not propagatedby any of the family-planning organizations, the increase is remarkable. Onecan observe a small increase in the total percentage using the three rhythmmethods instructed by the Action Familiale, and a considerable shift withinthe methods.
The survey did not ask about abortion, which is illegal in Mauritius.The 1983 Census Report on health, morbidity, and mortality reports that in1975,2,479 women were released from hospitals after abortions, and in 1983,2,815 women had been admitted because of complications from abortions.Compared to the 20,000 or so annual births, this is a high number. One cantheorize that some women who have had abortions would not want to admitthis, and they may say they are using withdrawal to avoid pregnancy.
Today the rate of contraceptive use in Mauritius is comparable to thatin Europe and North America. In the 30 years between 1950 and 1980,Mauritius moved from complete absence of and opposition to family planningto, 15 years later, the beginning of an intense effort to spread family planningto, again 15 years later, 75 percent contraceptive use among women in unionaged 15~45, which is about what is needed for replacement fertility.
People on Mauritius: 1638-1991 87
But contraception is only part of the story. Parallel to the increase incontraceptive use, marriage patterns in Mauritius changed significantly todelayed marriage. This shift began in the 1950s, and already depressed thebirth rate slightly. It gained momentum in the 1960s and by the early 1970sa new marriage pattern at later age was established. Xenos (1977) calculatesthat between 1962 and 1972 half of the birth rate decrease was due to delayedmarriage. This fundamental change in reproductive behavior in Mauritius isalso mirrored in the age patterns of fertility. Age-specific fertility rates forMauritius are available on an annual basis from 1962 onward. This makesit possible to closely follow the changes in the age pattern during the rapidfertility decline described above.
Figure 4.4 gives the age profiles of fertility for 1962, 1972, and 1987.From this figure we can clearly see that the fertility decline was relativelystronger at the ages above 35 than in the prime childbearing ages. The curvefor 1962 is slightly convex after its peak, that for 1972 is almost a straightline, and the one for 1987 is even concave. This is a typical change over thecourse of fertility transition from the convex curve of "natural" fertility tothe concave curve of controlled fertility.
4.4 The Youth Cohort in Mauritius
Figure 4.5 gives a three-dimensional representation of the changing agestructure of the male population on the island of Mauritius since the 1851census. The right-hand axis gives the year of observation. Censuses wereusually taken in the first two years of a decade. For irregular intervals datawere interpolated. The left-hand side gives the age distribution of the population in five-year age groups starting with the age indicated in the label.The height of the "mountain" gives the number of men in the specific yearof the specific age group. The figure shows two pronounced peaks. The firstis in 1861 in the age range 25-39. This peak represents the Indian indentured laborers who arrived in large numbers after 1851. Historical statisticsshow that during the 1850s and 1860s about 138,000 men and 50,000 womenwere brought to Mauritius. Since these were mostly young adults, the agestructure of Mauritius became very peculiar. The graph also shows that theIndian immigrants must have had extremely high mortality because they donot show up in large numbers in later censuses at higher ages, and statisticsshow that only less than one-third of the immigrants left Mauritius again.
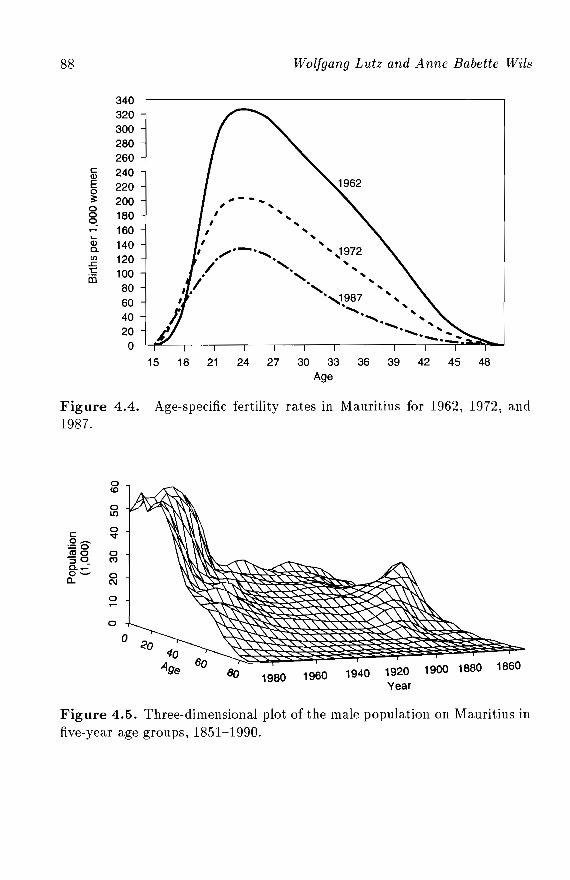
88
C<D
!5:i:aaa.
Qja.00.ctiii
34032030028026024022020018016014012010080604020o
Wolfgang Lutz and Anne Babette Wils
... -- .... .. .. .. .. .. .. ........ -........ .. ..1972. ., "/ . ..
/
0 , ...., ., .., 0 .,1987 ............ ..., "...... ..
.......... " ............._.......
15 18 21 24 27 30 33 36 39 42 45 48Age
Figure 4.4. Age-specific fertility rates in Mauritius for 1962, 1972, and1987.
aco
aLtl
c ao~
"t:;::0ClIO a"S O_ Ma.~o~ a
0- N
a
a
6080 1980 1960 1940 1920 1900 1880
Year
1860
Figure 4.5. Three-dimensional plot of the male population on Mauritius infive-year age groups, 1851-1990.
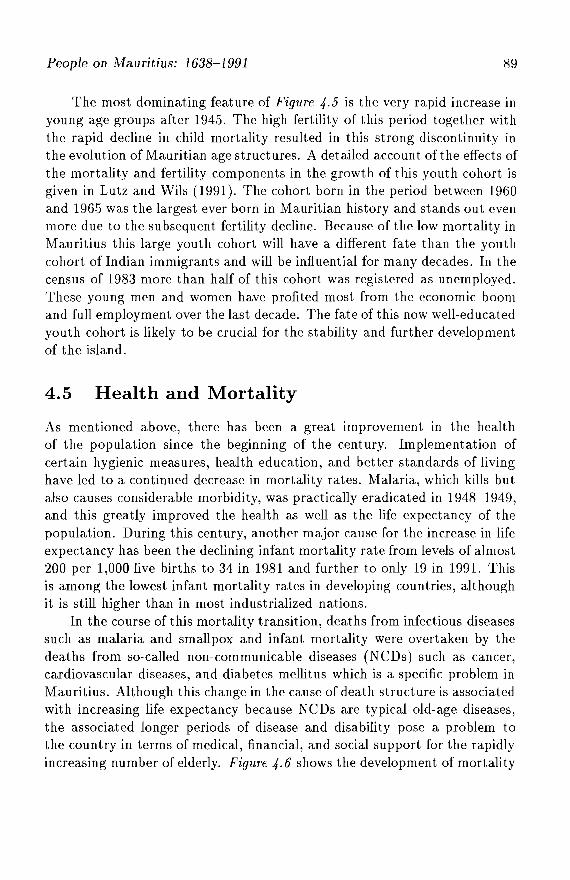
People on Mauritius: 1638-1991 89
The most dominating feat ure of Figure 4- 5 is the very rapid increase inyoung age groups after 1945. The high fertility of this period together withthe rapid decline in child mortality resulted in this strong discontinuity inthe evolution of Mauritian age structures. A detailed account of the effects ofthe mortality and fertility components in the growth of this youth cohort isgiven in Lutz and Wils (1991). The cohort born in the period between 1960and 1965 was the largest ever born in Mauritian history and stands out evenmore due to the subsequent fertility decline. Because of the low mortality inMauritius this large youth cohort will have a different fate than the youthcohort of Indian immigrants and will be influential for many decades. In thecensus of 1983 more than half of this cohort was registered as unemployed.These young men and women have profited most from the economic boomand full employment over the last decade. The fate of this now well-educatedyouth cohort is likely to be crucial for the stability and further developmentof the island.
4.5 Health and Mortality
As mentioned above, there has been a great improvement in the healthof the population since the beginning of the century. Implementation ofcertain hygienic measures, health education, and better standards of livinghave led to a continued decrease in mortality rates. Malaria, which kills butalso causes considerable morbidity, was practically eradicated in 1948-1949,and this greatly improved the health as well as the life expectancy of thepopulation. During this century, another major cause for the increase in lifeexpectancy has been the declining infant mortality rate from levels of almost200 per 1,000 live births to 34 in 1981 and further to only 19 in 1991. Thisis among the lowest infant mortality rates in developing countries, althoughit is still higher than in most industrialized nations.
In the course of this mortality transition, deaths from infectious diseasessuch as malaria and smallpox and infant mortality were overtaken by thedeaths from so-called non-communicable diseases (NCDs) such as cancer,cardiovascular diseases, and diabetes mellitus which is a specific problem inMauritius. Although this change in the cause of death structure is associatedwith increasing life expectancy because NCDs are typical old-age diseases,the associated longer periods of disease and disability pose a problem tothe country in terms of medical, financial, and social support for the rapidlyincreasing number of elderly. Figure 4.6 shows the development of mortality
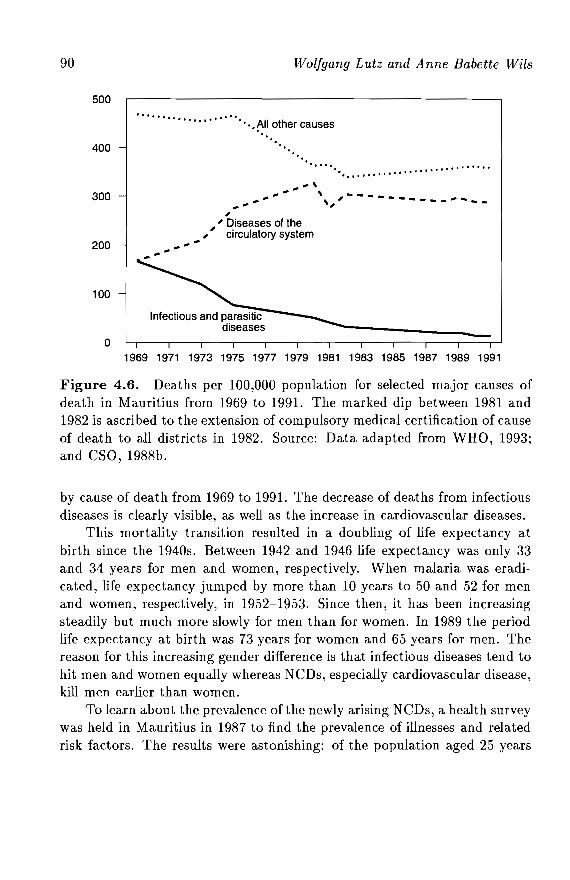
90
500
400
Wolfgang Lutz and Anne Babette Wils
I ••••••••••••••••••••
". ~II other causes
' ...... •• I • I •• I ••••••• I •• I I ••••••••
300
200
100
o
.... ,... --- ',,---------_ ........... ,,
, , Diseases of the, circulatory system......
1969 1971 1973 1975 1977 1979 1981 1983 1985 1987 1989 1991
Figure 4.6. Deaths per 100,000 population for selected major causes ofdeath in Mauritius from 1969 to 1991. The marked dip between 1981 and1982 is ascribed to the extension of compulsory medical certification of causeof death to all districts in 1982. Source: Data adapted from WHO, 1993;and CSO, 1988b.
by cause of death from 1969 to 1991. The decrease of deaths from infectiousdiseases is clearly visible, as well as the increase in cardiovascular diseases.
This mortality transition resulted in a doubling of life expectancy atbirth since the 1940s. Between 1942 and 1946 life expectancy was only 33and 34 years for men and women, respectively. When malaria was eradicated, life expectancy jumped by more than 10 years to 50 and 52 for menand women, respectively, in 1952-1953. Since then, it has been increasingsteadily but much more slowly for men than for women. In 1989 the periodlife expectancy at birth was 73 years for women and 65 years for men. Thereason for this increasing gender difference is that infectious diseases tend tohit men and women equally whereas NCDs, especially cardiovascular disease,kill men earlier than women.
To learn about the prevalence of the newly arising NCDs, a health surveywas held in Mauritius in 1987 to find the prevalence of illnesses and relatedrisk factors. The results were astonishing: of the population aged 25 years
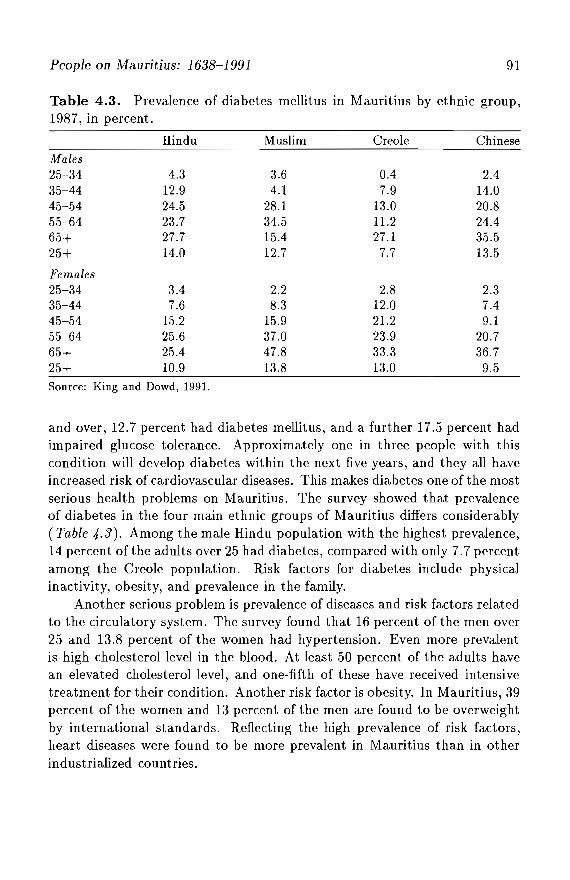
People on Mauritius: 1638-1991 91
Table 4.3. Prevalence of diabetes mellitus in Mauritius by ethnic group,1987, in percent.
Hindu Muslim Creole Chinese
Males25-34 4.3 3.6 0.4 2.435-44 12.9 4.1 7.9 14.045-54 24.5 28.1 13.0 20.855-64 23.7 34.5 11.2 24.465+ 27.7 15.4 27.1 35.525+ 14.0 12.7 7.7 13.5
Females25-34 3.4 2.2 2.8 2.335-44 7.6 8.3 12.0 7.445-54 15.2 15.9 21.2 9.155-64 25.6 37.0 23.9 20.765+ 25.4 47.8 33.3 36.725+ 10.9 13.8 13.0 9.5
Source: King and Dowd, 1991.
and over, 12.7 percent had diabetes mellitus, and a further 17.5 percent hadimpaired glucose tolerance. Approximately one in three people with thiscondition will develop diabetes within the next five years, and they all haveincreased risk of cardiovascular diseases. This makes diabetes one of the mostserious health problems on Mauritius. The survey showed that prevalenceof diabetes in the four main ethnic groups of Mauritius differs considerably(Table 4.3). Among the male Hindu population with the highest prevalence,14 percent of the adults over 25 had diabetes, compared with only 7.7 percentamong the Creole population. Risk factors for diabetes include physicalinactivity, obesity, and prevalence in the family.
Another serious problem is prevalence of diseases and risk factors relatedto the circulatory system. The survey found that 16 percent of the men over25 and 13.8 percent of the women had hypertension. Even more prevalentis high cholesterol level in the blood. At least 50 percent of the adults havean elevated cholesterol level, and one-fifth of these have received intensivetreatment for their condition. Another risk factor is obesity. In Mauritius, 39percent of the women and 13 percent of the men are found to be overweightby international standards. Reflecting the high prevalence of risk factors,heart diseases were found to be more prevalent in Mauritius than in otherindustrialized countries.
92 Wolfgang Lutz and Anne Babette Wils
Mauritius is one of the few countries in the African region which providesgood public-health services to its population, which are free to all. Most ofthe hospital beds are public, and more than half of the doctors and dentistsare in public service.
Health services in Mauritius were developed relatively early. In 1967there were 3,112 hospital beds in Mauritius, about 4.5 beds for every 1,000persons. By 1988 the situation had actually worsened. There were 3,071hospital beds, or about 3 per 1,000 persons, but perhaps this has been compensated by better quality or more ambulatory treatment. The Mauritiushealth-care system comprises many small medical centers. In 1967 therewere 94 such small centers on the island. By 1988 the number had decreasedto 67. These centers, in existence before the family-planning activities beganin Mauritius, also distribute contraceptive materials and information. Theirexistence and relatively dense distribution no doubt aided the success of thefamily-planning exercise.
In 1969 there was one doctor for every ,5,000 people; in 1975 there wasone for 3,000; in 1983, one for 1,500; and in 1991, fewer than 1,000 peoplehad to share one doctor. This increase in medical personnel over the past20 years is also reflected in the number of dentists and nurses.
Parallel to the official medical circuit, there are many alternative medicalpractices. Particularly, traditional spiritual healers remain to this day thepreferred method or at least the method of last resort, with considerablemedical success, according to many Mauritians.
The costs of official care, especially for the government, have increasedenormously over the past decade. We mentioned above that the treatment ofchronic diseases like heart diseases and diabetes is very costly. Health expenditures doubled from 1980 to 1986 and almost doubled again by 1991. A largepart of this increase probably arises from improved treatment. But there isalso a large increase in the elderly population in Mauritius, who typicallyrequires more treatment, and this group will continue to grow considerablyin the next decades. Thus, Mauritius can expect that health expenditureswill rise greatly in the future.
4.6 Education, Social Welfare, and Politics
4.6.1 Education
As early as 1878 a Royal Commission inquiry into the conditions of the Indian laborers recommended compulsory education for all. Not much of this
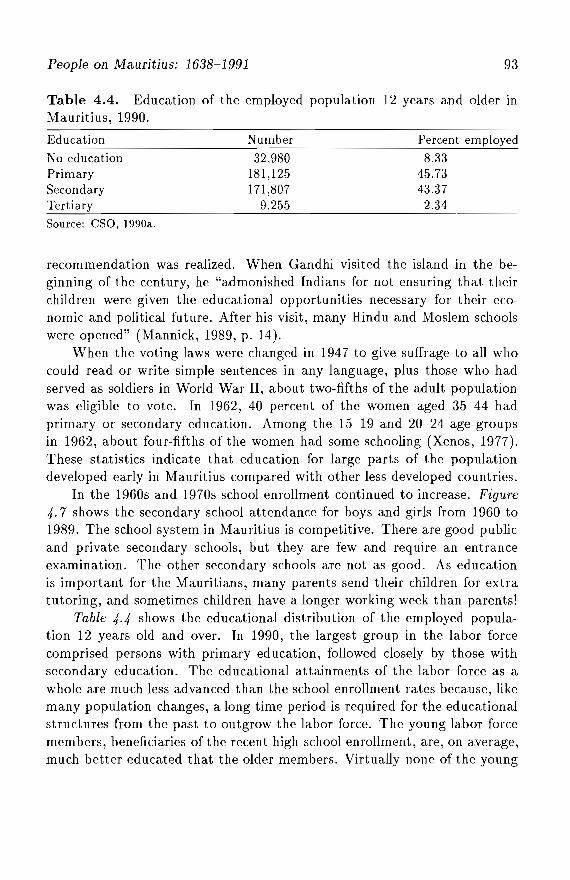
People on Mauritius: 1638-1991 93
Table 4.4. Education of the employed population 12 years and older inMauritius, 1990.
Education
No educationPrimarySecondaryTertiary
Source: csa, 1990a.
Number
32,980181,125171,807
9,255
Percent employed
8.3345.7343.372.34
recommendation was realized. When Gandhi visited the island in the beginning of the century, he "admonished Indians for not ensuring that theirchildren were given the educational opportunities necessary for their economic and political future. After his visit, many Hindu and Moslem schoolswere opened" (Mannick, 1989, p. 14).
When the voting laws were changed in 1947 to give suffrage to all whocould read or write simple sentences in any language, plus those who hadserved as soldiers in World War II, about two-fifths of the adult populationwas eligible to vote. In 1962, 40 percent of the women aged 35-44 hadprimary or secondary education. Among the 15-19 and 20-24 age groupsin 1962, about four-fifths of the women had some schooling (Xenos, 1977).These statistics indicate that education for large parts of the populationdeveloped early in Mauritius compared with other less developed countries.
In the 1960s and 1970s school enrollment continued to increase. Figure4.7 shows the secondary school attendance for boys and girls from 1960 to1989. The school system in Mauritius is competitive. There are good publicand private secondary schools, but they are few and require an entranceexamination. The other secondary schools are not as good. As educationis important for the Mauritians, many parents send their children for extratutoring, and sometimes children have a longer working week than parents!
Table 4.4 shows the educational distribution of the employed population 12 years old and over. In 1990, the largest group in the labor forcecomprised persons with primary education, followed closely by those withsecondary education. The educational attainments of the labor force as awhole are much less advanced than the school enrollment rates because, likemany population changes, a long time period is required for the educationalstructures from the past to outgrow the labor force. The young labor forcemembers, beneficiaries of the recent high school enrollment, are, on average,much better educated that the older members. Virtually none of the young
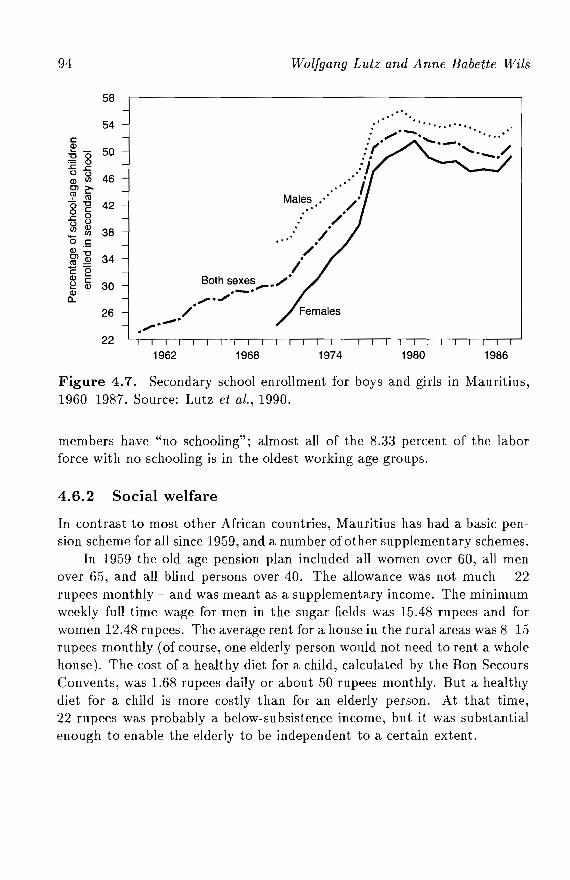
94
58
54cQ)
50... -"0 0= 0.r::..r::.u u 46Q) (J)
Cl~"? ctlo"g 42o 0
.r::. uU Q)
38:::. (J)
0 cQ):(;ClQ) 34ctl-ceQ) cl::? Q) 30Q)c..
26
22
Wolfgang Lutz and Anne Babette Wils
.'.".
..... ,-----. .. ..:(- "- .
:', ........-./.: I....... i
Males •• ' /'
/: /'
",/'
iBoth sexes /'.--.."""...~../
/.~.-.
1962 1968 1974 1980 1986
Figure 4.7. Secondary school enrollment for boys and girls in Mauritius,1960-1987. Source: Lutz et al., 1990.
members have "no schooling"; almost all of the 8.33 percent of the laborforce with no schooling is in the oldest working age groups.
4.6.2 Social welfare
In contrast to most other African countries, Mauritius has had a basic pension scheme for all since 1959, and a number of other supplementary schemes.
In 1959 the old age pension plan included all women over 60, all menover 65, and all blind persons over 40. The allowance was not much - 22rupees monthly - and was meant as a supplementary income. The minimumweekly fu11- time wage for men in the sugar fields was 15.48 rupees and forwomen 12.48 rupees. The average rent for a house in the rural areas was 8-15rupees monthly (of course, one elderly person would not need to rent a wholehouse). The cost of a healthy diet for a child, calculated by the Bon SecoursConvents, was 1.68 rupees daily or about 50 rupees monthly. But a healthydiet for a child is more costly than for an elderly person. At that time,22 rupees was probably a below-subsistence income, but it was substantialenough to enable the elderly to be independent to a certain extent.
People on Mauritius: 1638-1991 95
In addition to the basic pension, there were other employment-relatedschemes: 10,000 clerical and higher civil servants in 1959 - out of under200,000 active population - were covered by a comfortable pension schemeproviding them with up to two-thirds of their final salary. An additional11,000 nonwhite-collar government employees were covered by a less generouspension scheme. Another source of pensions was the Sugar Industry PensionFund, which had 8,377 contributing members in 1959 consisting of staff,artisans, and monthly paid laborers. Other organizations appear to havebeen either much smaller or less formal. The three big funds provided 15 to20 percent of the employed with a comfortable pension scheme.
In 1976 the government introduced a far-reaching social program. Thescheme provided "for a combination of earnings-related, inflation-proof contributory pensions" (Mannick, 1989, p. 127). The scheme comprises threeparts: universal basic benefits for pensioners, widowers, children under 10,inmates in institutions, and invalids (beneficiaries do not need to be contributors); contributory benefits for everyone who contributes; and industrialinjury benefits.
4.6.3 Politics
The development of education, health facilities, and social and economicpolicies shows that Mauritius has had responsible governments who havecared for the population of the island. On several vital issues, including thefamily-planning policies of the 1960s, the economic policies of the 1980s, andrecent environmental policies, the Mauritian political system has proved tobe capable of setting priorities with a long time horizon and finding politicalconsensus beyond day- to-day quarrels.
The island was ruled by the British until 1967, when it became independent. Complete independence was preceded by decades of political activityin the population of the island and shared political responsibility with theBritish. The transition to independence was negotiated and nonviolent; thepeople of Mauritius voted for it in an election in 1967. Since then, althoughnot without periods of trouble, and even some riots, each government hasbeen elected democratically, all political parties have been allowed (fromfar-right to Trotskyites), and there have been continual shifts of power fromone political party to another, as in any other mature democracy.
Mauritius has a strong socialist or labor tradition. The winning partiesin elections have been of the social left - the Labor Party, the Mouvement
96 Wolfgang Lutz and Anne Babette Wils
Militant Mauricien (MMM), the Mouvement Socialiste Mauricien (MSM).A constant conservative player on the political field is the Parti MauricienSocial Democrate (PMSD). However, in all governments, except one briefinterlude in 1982-1983, the socialist or labor parties have formed coalitiongovernments with the PMSD. Thus, in spite of the usual political squabbles,the country seems to have been ruled by consensus rather than by opposition.
The government of Mauritius has been troubled by intermittent attempts to suppress riots and strikes with repressive methods such as callinga state of emergency, enacting strict laws on political activity, and arrestingpolitical leaders. In fact, in some years - e.g., in 1971-1972 a state of emergency was called; in 1979 strikes occurred; in 1985 the government tried tocurtail press freedom - the country appeared to be heading for a coup anda dictatorship, but it never happened. Why not?
In short, to an external observer, there seem to be three pillars to thedemocracy of Mauritius. The most important is the empowerment of thepeople themselves. The people of Mauritius can read; they are informed.In times of trouble, they have reacted with solidarity, have gone on strike(paralyzing the economy), have rallied, and have vocalized their discontent.These activities were organized; the people were informed and knew aboutthe issue at hand. This homeostatic element in the political system of Mauritius cannot be underestimated.
A second important element is the tradition of ruling by consensus whichwas explicitly started by Sir Ramgoolam, the first prime minister after independence. In 1967 his alliance of parties grouped together to form theIndependence Party and gained 39 seats in Parliament with 55 percent ofthe vote, while the PMSD received 23 seats with 44 percent of the vote.Rather than proceeding on his own, Sir Ramgoolam invited the PMSD, theparty which represented the interests of those with money on Mauritius likethe sugar barons, to join him in a coalition. This stroke of genius keptmuch-needed capital and entrepreneurial skills in the country, and later alsoturned out to be important for forging the connection with the EEC.
The third important element is that the group of Mauritians who havetraditionally owned most of the wealth in the country, the Franco-Mauritiansugar landowners, has long been separated from the group with politicalpower. When the British took over the island in 1810, the Franco-Mauritiansstayed, and were allowed to keep their land, language, and traditions. Theyare accustomed to owning the wealth but not the government, and they knowhow to make this situation work for them. Thus, now that political power
People on Mauritius: 1638-1991 97
lies with the Indo-Mauritian majority of the population, no life-threateningchange has occurred for them.
4.7 Conclusion
This chapter has given a brief overview of the population developmentin Mauritius from the time of the first settlements in the 17th century.Throughout its history, different peoples have come to Mauritius - Frenchsettlers, Malagasy slaves, Indian workers and traders, Chinese businessmen- and have formed a unique collage of cultures. In the 18th and 19th centuries, life was hard on the island. Social and health conditions were bad,and frequent epidemics of malaria, cholera, and other diseases kept mortalityrates high. The situation started improving in the early 20th century. Deathrates decreased, especially after the eradication of malaria. This resulted ina population explosion. In a remarkable effort over only two decades, theMauritians curtailed their fertility to replacement levels and thus avertedfurther excessive population growth on their already very densely populatedisland. The country has enjoyed high education levels from the 1930s onward, and very high levels since the 1960s and 1970s. The political system ofMauritius is an example of a functioning democracy in the developing worldthat is capable of effective long-term planning.

Chapter 5
From No-Man's-Land to aCongested Paradise: AnEnvironmental History ofMauritius
Ferenc L. Toth
5.1 Introduction
The fascinating social, political, and economic history of Mauritius has beentold by many (e.g., Barnwell and Toussaint, 1949; Bissoondoyal, 1963; Mannick, 1979; Addison and Hazareesingh, 1984). This chapter takes a different perspective. It attempts to describe and explain sudden changes andlong-term evolutionary processes that, over the centuries, shaped naturalresources and various ecological systems of the island resulting in what contemporary inhabitants and visitors experience. The environmental historyof Mauritius is by no means less fascinating than its social history. Human intervention, in many cases inadvertently, profoundly transferred thelandscape, fauna, and flora over the centuries. The balance between direct,local causes behind these interventions and remote and often indirect drivingforces has changed over time, but this chapter shows the overall dominanceof the latter group. Even in the position of full political sovereignty, the
100 Ferenc L. Toth
remote economic, political, and increasingly environmental processes andforces tend to shape local structures. This is the main reason behind ourconfidence that the island's environmental history has useful lessons for thefuture of Mauritius and perhaps many other small islands.
Over the past three hundred years, the most dominant and persistentlong-term trend in the history of global environment was the expansion ofagricultural land, mostly at the expense of prime forests. Land conversionproceeded at an increasing speed in Eastern Europe, the Americas, Southand East Asia, and Australia as European settlers gradually moved to theseregions. Richards (1986, p. 56) gives a concise summary of driving forces:
[T]he driving impetus behind this spread of agricultural land is not duedirectly to pressures of population growth. . .. Most land clearance andplowing has been undertaken ... responding to market forces .... Cash saleand profits were the motor propelling this trend ....
These opportunities opened up as one after another peripheral regionsof the 'globe became increasingly involved in the world economy centeredon Western Europe (Wallerstein, 1974, 1980). The environmental history ofMauritius is a unique blend of general patterns and special, local variationsof processes of frontier development. Shifts in the relative importance ofthe island's linkages to regional centers and to the European core of theworld economy triggered profoundly different motivations for and processesof economic development in Mauritius over the centuries. The implicationsfor managing the island's natural resources clearly reflect these changes asmany of them left long-term, if not permanent, marks on the environment.
5.2 Extreme Forms of Exploitive Development:Early Days and the Dutch
The preamble to the emergence of the modern world economy, the great seaborne extension of the European core, was marked by the Age of Discovery.Ships sailed across the oceans in search for new trading partners and fornew trading routes to old ones. Large continents and small islands werediscovered in these travels. In the region of our interest, the Indian Ocean,results were fascinating. Sailing around the Cape of Good Hope in Africaand then northeast through the Mozambique Channel opened the sea linkto India. The next step was the establishment of trade linkages to SoutheastAsia. Throughout the 16th century, the majority of the trading ships used
From No-Man's-Land to a Congested Paradise 101
this so-called inner route and only a few of them passed east of Madagascarto have a stopover at the Mascarene Islands.
Human intervention and destruction of the native fauna and flora onMauritius began more than a century before the establishment of even a temporary human settlement on the island. The Portuguese ship commandedby Domingos Fernandez (considered to be the European explorer of Mauritius) left pigs, goats, and cattle from Madagascar on the island as earlyas 1510. These alien species were soon followed by monkeys and rats. Allthese animals apparently found their niche among the local species of theisland because ships stopping over on the island over the next few decadeswere able to replenish their food supplies not only with exotic but also withdomestic animals.
Nonetheless, the aliens took a heavy toll on natives. Except for twosmall birds, predators were missing from the fauna. This made possible theevolution of flightless birds and large but defenseless reptiles. The rich andversatile bird population was the worst affected by the newcomers. Monkeysdestroyed nests and killed the young of endemic birds, rats robbed theirnests, while pigs mainly affected ground-nesting birds. Other species suffered, too. Rats practically eliminated snakes and large lizards. But almostall endemic species were affected, at least indirectly, by the interventionand impacts of aliens on their habitats. Monkeys destroyed flowers, smallbranches, and fruit trees in the canopy; pigs and grazing animals trampledand uprooted seedlings on the ground.
During this period of more than a century between the European discovery of Mauritius and the first Dutch settlement on the island, it was anopen-access common property resource. Whoever cast anchor on the islandcould freely take as much as was needed. But the limited number of usersand their limited capacity to take things with them prevented the depletionof the island's resources.
By the early 17th century, improvements in vessels and navigation permit ted sailing across the Indian Ocean between the southern tip of Africaand South and Southeast Asia. As a result, the number of ships using theMascarene Islands, mainly Mauritius as a stopover to stock up on freshwater, food, and wood for ship repair, increased. The strategic importance ofMauritius was increasing, and it was merely a question of time before somenation would claim exclusive rights over the island.
Given the Dutch supremacy in the early 17th century in Southeast Asiaand on the trading routes leading there, it was the Dutch who first claimed
102 Ferenc L. Tath
it. They already had a well-established settlement at their final destinationin Batavia, on the island of Java, since 1619. The primary interest of theDutch East India Company was trade and an uninhabited island had nothingto offer toward this end. A major motivation for the Dutch to take Mauritiuswas strategic: to prevent the French and English from using Mauritius astheir stopover base. So the primary source of attraction for the Dutch tosettle in Mauritius was its location. The typical motivations for establishingand expanding frontiers were access to arable land and cash crop production,but Mauritius had to wait 200 years - for its third owner - until these goalswere established and developed.
In the emerging network of colonies controlled from the sea, securing asafe port to provide supplies and refuge for ship repair was extremely important.[l] All other resources and services provided by the island of Mauritiusemerged only as by-products of this preventive use. The Dutch kept Mauritius even after they established another settlement at the Cape of GoodHope. Although they returned to the island after a few years of temporaryabandonment, with the well-established settlement at the Cape, the strategicimportance of Mauritius for them became much smaller by then.
The above order of priorities was also reflected by the Dutch attitudetoward the island's resource base and their resource management practices.The first Dutch period in Mauritius (1638-1653) represented an extremeform of exploitive development: maximize output with the lowest possibleamount of investments regardless of the short- and long-term consequences.Investments were limited to building a few roads for transporting timber tothe port and to constructing shelters for the small number of inhabitants. Inthe history of Mauritius, this period was the heaviest and most destructivehuman intervention in the natural environment per unit of time. In just twodecades, the Dutch cleared huge tracts of the ebony forests, exterminated thedodo, and continued the introduction of alien plant and animal species. Eventhe single forest conservation measure of this period had purely economicreasons. The market for ebony in Europe became saturated and falling pricesdid not justify the relatively high transport costs. As a pure market-controlmeasure, ebony felling was restricted to 400 trees per year.
The small investment made by the Dutch from the proceeds of the island's resources was completely destroyed when they abandoned the islandin 1653. Mauritius was left much poorer than it had been two decades earliernot only ecologically but also economically. Had the ebony forests been leftuncut, the income from selling the timber later could have been an enormous
From No-Man's-Land to a Congested Paradise 103
investment potential for the local economy to take off. Instead, the proceedsbecame just a small fraction of the tremendous wealth accumulated by theDutch empire in those decades.
The second Dutch period (1664-1710) did not bring better managementor development of the island's abundant resources. The number of people onthe island never exceeded 400 throughout the Dutch period. This was simplybelow the critical mass necessary to establish a developing community, letalone start the various accumulation processes (capital, land, labor). Nei therthe Dutch East Indian Company nor its governors and employees stationedin Mauritius had the slightest short-term interest in doing anything in thisdirection. Apparently, the natural resources of the island were so abundantrelative to the number of people on the island that they provided sufficientsupply despite very poor management. Failure to build up sufficient reserves,however, left early settlers at the mercy of external sources when their cropswere destroyed by natural calamities.
The tremendous intensity of destruction, so typical of the first Dutchperiod, decreased somewhat in the second phase. Woodcutting continued,but the motivation changed: there was an increasing need for agriculturalland. Thus the typical pattern of land conversion, which can be observed inmany regions of the world over the centuries, can be identified in the earlyhistory of Mauritius. The first step of the sequences is forest degradationfollowed by total land clearing. "Frequently, forest cutting and consequentdegrading has been a prelude to clearance and conversion of land to sedentary agriculture" (Richards, 1986, p. 59). In Mauritius, selective cutting ofthe ebony tree deprived the forest of its most voluminous tree, disrupted thespatial and temporal balance of forest succession, and opened large gaps forunprecedented competition in regrowth. Fast-growing and, in many cases,alien species, usually not the economically most valuable, were able to increase their share significantly. The result is that even in regions wherethere would have been sufficient time for the forest to regrow, the speciescomposition, and thus the economic value, was much lower than those ofthe original forests. Thus they could easily be cleared for agriculture in thesecond Dutch period or later.
The seven-decade Dutch period in Mauritius shows a reverse populationdevelopment relationship compared to the typical pattern of recent decadesin many parts of the developing world. In the developing world, high population density and fast population growth absorb resources that would berequired to initiate and accelerate economic development (see, for example,
104 Ferenc L. Toth
Keyfitz, 1991). In 17th-century Mauritius, in addition to the lack of motivation, the small size of the population prevented economic developmentdespite external trade and economic linkages. This is not an unusual situation on small, island-based economies. Even in the late 20th century, withall the blessings of modern transport and communication technologies, development processes are suppressed by low population densities and by thesmall size of local markets. The result is emigration of mainly the youngand able, thus closing the loop in a downward spiral. These processes areneatly documented by Brookfield (1981) for the outer islands of Fiji.
The problem of low population density was further aggravated by theunbalanced sex ratio. The settler community was predominantly made upof males, for whom the island was a temporary station. For these settlers,there was simply no reason to worry about the future of the state of theresources. There was a complete lack of concern to leave something usefulfor their descendants. On the contrary, they wanted to maximize what theycould take with them.
In summary, the political and strategic interests (not to be used byothers) and the resources extracted from the island (timber, food, freshwater)justified the not very high transaction costs of ensuring exclusivity for theDutch. The Dutch era was also the transition period: Mauritius was not acommon property resource anymore, but the owner, the Dutch East IndiaCompany, did not consider it a high-value property either. When its valuerelative to their other assets and to their management capacity became toolow, the company simply gave it up, probably based on the principle of "easycome, easy go."
5.3 Establishing an Agricultural Frontier:French and Early British Colonial Times
The French were latecomers among the West European trading nations in thelndian Ocean. In their effort to secure strategic naval ports, they had to takewhatever was left by others. In the region of our interest, they establishedtwo bases: one on Madagascar and another on the small island of Bourbon(today known as Reunion). Neither was appropriate, however. The hostilityof and regular attacks by the local population on Madagascar and the lackof a good port on Bourbon made the French East India Company eager tocapture Mauritius when it became evident that the Dutch had abandonedthe island.
From No-Man's-Land to a Congested Paradise 105
The role intended for Mauritius in the early French period was similarto that under the earlier Dutch rule. With a prospering coffee-based agricultural settlement on Bourbon, Mauritius was supposed to become a commercial port and strategic naval base. A necessary condition for this role,however, was a considerable improvement in the level of food self-sufficiency.High-yield, cyclone-resistant food crops were needed, and manioc and cassava were successfully introduced. Maize and vegetables were also grown forhuman consumption and for animal feed. As a result of these efforts, the3,000 or so population on the island in 1739 became food self-sufficient injust a few years.
This period of agricultural expansion marked the first attempt in biological pest control in Mauritius. Grasshoppers caused major damage toagricultural crops therefore myna birds were brought from India to control them. Mynas virtually wiped out the grasshopper population, but alsocaused a lot of damage to the exotic and native fauna and flora.
Sugar-cane growing was spreading slowly during this period, nonethelessthe first sugar factory was built in the early 1740s. Some considered sugarthe main industry in the future of the island despite the fact that signs werenot very promising. Even two decades later, the quality of locally producedsugar was so poor that it was used as cement in the construction industryand sugar for human consumption had to be imported.
Shifting the naval base and main port from Port Bourbon on the southeast coast of the island to Port Louis in the northwest had several implications. Large construction projects required huge quantities of wood. Thefirst river diversion was constructed to deliver water from Grand River NorthWest in order to secure the freshwater supply for Port Louis.
The program to increase food production was so successful that by 1756,the outbreak of the Seven Years' War between France and Great Britain,Mauritius was able to provide significant food supplies to the French Navy onthe Indian Ocean. This period also marked the origins of "export-oriented"industrial production: Mauritius provided arms and gun-powder for theFrench troops. But this period also showed the limitations and vulnerability of a small economy on a small island. Stocks and reserves were soondepleted leaving the islanders totally dependent on fluctuating current production. When crops were destroyed by a cyclone in 1760, the situationbecame hopeless. After the breakdown of trade links to India, where Britaintook over all French trading posts, clothes and other imported manufactured goods became scarce. The island with its 19,000 desperate inhabitants
106 Ferenc L. Toth
was transferred from the bankrupt French East India Company and becameproperty of the French crown in 1766.
The first 15 years of French crown rule was a period of improvementsand prosperity. The balance of agricultural production shifted again towardcommercial products, especially spices, that provided higher profits. Lessattention was devoted to food self-sufficiency, and, once again, an increasingfraction of food supplies was imported from Madagascar. Sugar cane keptits relative share, but it was produced to satisfy domestic needs only, as theEuropean demand was largely satisfied from Caribbean sources. The bulkof the production from the sugar mills was used to produce spirits for localconsumption.
Increasing population and expanding agriculture apparently led to massive deforestation. As early as 1761 a law was passed to stop cutting downthe forests. As it was not observed, it had to be reinforced a few years later.Interestingly, the reasons behind these laws did not include the prime consequence, namely, erosion of the fertile top soil, but rather the secondaryimpacts: damage to the harbor of Port Louis due to siltation and drying upof the land surface in the absence of trees that prevents plant development.Obviously, the first victims of demand for wood for construction and fuelwere the forests near the larger settlements. As a sharp contrast to the reports by early travelers who described the animals and the vegetation coverof the island so glowingly 200 years earlier, Bernadin de Saint-Pierre's visionof the environs of Port Louis in the late 1770s is rather unattractive: the city"was surrounded by rocky hills without trees or bushes, ... the mountainsides were covered with burnt grass for six months of every year" (Mannick,1979, p. 28).
The slowly but steadily increasing economic power of Mauritius wasclearly demonstrated by the role it played in the next war between the Frenchand the British between 1778 and 1783. The island was able to support hugefleets of the French Navy with food, arms, and ammunition.
The increasing appreciation of the value and environmental services offorests was demonstrated in the next cycle of agricultural expansion. In the1780s a large number of new farmers settled on the island. They were allowed to clear land for agriculture in the southern region, but new forestswere planted in other parts of the island where soils and terrain were deemedless suitable for agriculture. This was also the time of the first large-scaleenvironmental redevelopment program in Mauritius. The reforestation program initiated in 1781 resulted in more than 100,000 trees planted along the
From No-Man's-Land to a Congested Paradise 107
coast where ebony forests were cut by the Dutch and early French settlers.Yet again, the program involved new tree species (ravanala and casuarina)brought to the island from East India, thus the newly planted forests furtherincreased the share of alien vegetation.
The 1780s was not only a period of economic expansion and prosperity, but also one of fraud (use of public funds for personal benefits), powerabuses (speculations with real estate), macroeconomic mismanagement (uncontrolled printing of paper money leading to inflation), and scandals. Ason many occasions before and after in the history of natural resources, scandals also involved the forests. Ignoring the reinforced 1761 law against forestcutting, a friend of the then governor, for example, cleared huge tracts ofgovernment-owned forests and sold the wood back to the government.
The historical changes in Europe, and especially in France, and the repeated wars between France and Great Britain made little impact on Mauritius. Even the transfer of political power over the island from the Frenchto the British in 1810 was relatively smooth. The ownership of private property, including those of agricultural land and plantations was left untouched.Inhabitants were allowed to preserve their languages, laws, customs, and religions. Even outlawed conditions survived several decades of British rule,the most prominent example being slavery and slave trade. As early as 1794the French government passed a law to abolish slavery and ordered slavesto be freed without compensation to their owners. Nothing happened inMauritius except that the two officers who came to enforce the law were expelled. Slave trading had been abolished in all British colonies years beforeMauritius came under British rule. Yet, some 25,000 slaves were broughtto Mauritius between 1810 and 1835, almost half of them just in the lasteight years.
The early 19th century was still characterized by patterns of exploitivedevelopment in Mauritius. Most plantation owners and farmers strove forquick profits in order to accumulate some wealth to establish their newlife back in Europe. Successful landowners returned to Europe with theiraccumulated capital rather than investing it in Mauritius. This attituderesulted in a series of negative impacts on the natural resource base, socialmorale, and general economic conditions. In an attempt to reduce costs andincrease profits, no fertilizers were applied to the plantations. Instead, theresponse to declining yields from depleted soil fertility was to open up newlands for agriculture. Land clearing took the most destructive form of landconversion. Trees, bushes, and other vegetation were simply burned down,
108 Ferenc L. Toth
the area was cultivated for a few years, and then abandoned. The sugar-canearea declined (total area around 4,000 hectares in 1810) at the expense ofcoffee and tea plantations and fruit and vegetable cultivations.
Despite the general patterns of exploitive development, there were several attempts in these decades to improve local conditions. At least part ofthe government revenue raised in Mauritius was invested locally. New roadswere built and the old ones upgraded, and bridges were constructed as partof the effort to improve access to the newly opened agricultural areas inland.The coastal defense system was fortified and institutions to provide primaryeducation were established. But the vigor and success of these efforts largelydepended on the talent, vision, and determination of individual governors.
As the island became more densely populated, it ceased to be as healthya place as it used to be. Less than two centuries before, the Dutch broughtsick people to Mauritius to recover because it had a pleasant climate andwas free of diseases. The smallpox epidemic of 1792 apparently failed tocreate sufficient concerns about public health. By the early 19th centurythe large population of mixed origin, the increasing number of visiting ships,and poor hygienic conditions led to a series of disease outbreaks: smallpoxin 1811, rabies two years later, and cholera in 1819. The last disease killedalmost one-fifth of the population.
In the early 18th century, the primary importance of Mauritius for itsowner was still its strategic location. The island's involvement in the worldeconomy had begun, but it was in the early phase of the process. Politicalcontrol over Mauritius was exercised from Europe, but many important economic linkages were restricted to the South Asian and East African regions.Slave labor required to extend agricultural production was imported fromMadagascar. The island was more or less self-reliant in agricultural products,but imported most manufactures. The rate of population increase was low,mainly driven by the labor need of the slowly increasing European settlers.The white to slave ratio of one to six was roughly maintained throughoutthe whole period.
5.4 Closing the Agricultural Frontier:1830s to World War II
Similar to the Dutch motivations to conquer Mauritius, the original objectiveof the British to take the island was to wipe out the nuisance of corsairs attacking and robbing their merchant ships from Mauritius as their base. They
From No-Man's-Land to a Congested Paradise 109
simply wanted to secure their rule in and trade routes to India. Yet, a seriesof developments in the 1820s and 1830s led to the increasing involvementof Mauritius in the British Colonial Empire and thus in the world economy.Without them, the island could have become a forgotten land by the second half of the century when the proliferation of steam vessels and openingof the Suez Canal robbed Mauritius of its original strategic and geographicimportance on a major trading route of the expanding world economy.
Some of these developments were rooted in the internal biophysical andsocioeconomic conditions of Mauritius, but a variety of significant ones originated from outside. Probably the most important factor was the increasingimportance of sugar in the European diet. Sold as a luxury good first andas medicine later, it gradually became a commodity in the 18th century.Between 1700 and 1800, sugar consumption in England increased IS-fold.Per capita consumption in Paris was estimated at five kilograms, but thisseems to be high in view of another estimate of one kilogram per capitafor France as a whole. Braudel's (1979) warning is fully justified: althoughsugar was increasingly popular, it still counted as a luxury good. In manyFrench peasant households, a cone of sugar was hanging above the table.Instructions for use: lift your cup for a second so that the melting sugar cansweeten its content.
By 1750 the world economy emerged from the relative recession thatbegan around 1620. The first target for new geographical expansion wasthe Caribbean region. Here one of the most profitable activities was sugarcane growing based on slave labor. No wonder the French government paidspecial premium for slave-trading ships transporting slaves to the FrenchWest Indies (French Antilles) in order to promote sugar production (Hopkins, 1973). In the 18th century, sugar was the most important importcommodity from overseas to France. It was also the biggest import itemto England. Sugar-cane growing and sugar production conquered SoutheastBrazil and the Caribbean: Martinique, Guadeloupe, Curac;ao, Jamaica, andSan Domingo. While on most of these islands, sugar was the prime reasonbehind land conversion and it remained the main crop for centuries, in otherregions it was only a transient factor in the long-term environmental transformation process. In the subtropical coastal provinces of Southeast Brazil,for example, aboriginal swidden cultivation was intensified in the first phaseof European expansion that left a greater effect on the forests of the region than sugar later (Dean, 1983). Gold and diamond mining pushed landconversion one step further when demand for local food production (manioc,
110 Ferenc L. Toth
corn, rice, and ranching) significantly increased (Williams, 1990). Plantationsugar as an export crop was the main driving force behind the deforestationof the region only between 1750 and 1830 (Richards, 1986). By 1830, coffeebecame the main export commodity.
In Mauritius, following a devastating cyclone in 1818, a thorough reconsideration of agricultural policy was initiated by the governor. The conclusion was that sugar cane proved to be the most resistant crop to cyclones,and once again the hundred-year-oJd vision of sugar cane as the main agricultural crop of Mauritius had been revived. Sugar cane in fact became thedominant crop, followed by beans, manioc, and barley which were grownfor local consumption. The area of sugar plantations doubled in less than adecade, reaching 20,000 hectares by 1830.
At about the same time, a technological innovation further energizedthe sugar industry. The first modern sugar factory was built. In addition toreducing labor requirement, it provided higher rates of juice extraction. Theresult was a dramatic improvement in the profitability of sugar production.Higher extraction ratios also made less fertile soils profitable to cultivate.
Probably the most significant impulse for the expansion of sugar industrywas a change in British economic policy. Mauritius enjoyed a special statusamong the British colonies. It was allowed to trade freely with all countries ofthe world, but its sugar export to Britain was subject to a speciaJ duty whichmade it Jess competitive compared to sugar from the West Indies. Afterfierce negotiations with the British government, the discriminative duty wasabolished in 1825 but the free-trading right was retained. These eventsgenerated profound changes in the social structure, economic conditions,and natural-resource use over the next decades.
Owners of sugar plantations in the West Indies, where slavery was infact abolished, feared that Mauritius could gain a competitive edge by producing sugar cheaper with its still existing slaves. The primary concernbehind these protests was in fact not Mauritius. Plantation owners in theWest Indies wanted protection against competition with slavery-based production in Brazil and Cuba (Williams, 1964). External political pressure toabolish slavery in Mauritius mounted, and in 1835 slaves were finally freedin a complex compensation and transition arrangement. Slave owners werehandsomely compensated for their losses in property. Slaves were orderedto continue working on the plantation as wage laborers for some period oftime in order to prevent economic disruptions due to a sudden drop in labor
From N0- Man 's-Land to a Congested Paradise 111
supply. These arrangements provided sufficient capital for plantation ownersto experiment with different sugar-cane varieties and cultivation methods.As a result, both yields and quality of the sugar were improving.
The abolishment of slavery not only brought major transformation to thesocial structure in Mauritius. It also induced major changes in the numberand demographic composition of the population over the next few decades(see Chapter 4). Already in the first few years after slavery was outlawed,some 24,000 indentured laborers arrived from India to replace slaves on thesugar plantations. In just a decade their number doubled and by 1870 over70 percent of the island's 316,000 population was Indian or an Indian descendant.[2] It took more than a century for the population to slowly increasefrom virtually zero to 100,000. As a response to a political institutionalchange and a series of external economic changes, the population tripled inless than 30 years. It took almost another century to add the next 100,000people to the island's population.[3]
The vacuum of increasing market opportunities and the feared laborshortage in a period of rapid expansion of the agricultural frontier pulledhuge crowds to Mauritius. (This lies in contrast to land conversion due toincreasing population pressures in many regions of the developing world acentury later.) A continuous flow of indentured laborers was necessary tokeep labor prices low. Securing cheap and reliable labor was the top priorityof old plantation owners and new European settlers. The historical significance and root causes of these processes can be compared to what happenedin Eastern Europe in the early phase of the European agricultural expansionin the 16th and 17th centuries. Responding to the rapidly increasing grainmarket in Western Europe, cultivation areas in the East were extended andrequired labor. "Only a harshly repressive system could hold peasants in alabor-scarce economy" (Richards, 1990, p. 168) leading to a revived manorialsystem (zweite Leibeigenschaft) east of the Elba. The Mauritian equivalentwas the requirement to save the return fare to India, an efficient way to keeplaborers on the plantations for an extended period of time.
The order and causal relationships of population growth and land conversion were opposite in most regions that had indigenous populations priorto the frontier expansion. Newly established market relationships relaxedthe constraints on local land use and the need for self-sufficiency in foodproduction which kept local population numbers at the endogenously sustainable level for centuries. Once it was possible to obtain food from outside
112 Ferenc L. Toth
in exchange for cash crops, the population started to grow even in the absence of any change in lifestyles, sanitary conditions, or modern medicine(Roth, 1983).
The population boom in Mauritius gave rise to severe problems becausewith new people came new diseases. A series of cholera out breaks in the1850s and a major malaria epidemic in 1865 killed almost 100,000 people.In these days, Mauritius was obviously one of the most unhealthy colonies ofthe British Empire. Sanitary conditions were below any standard, and healthprecautions virtually nonexistent. Domestic wastes were dumped in nearbystreams and rivers, making the outbreak and spread of waterborne diseaseseasy. These practices existed for many decades and did not cause majorproblems, but, with the dramatically increasing population density, wasteloads soon exceeded the absorptive capacities of the freshwater systems.The British governor of the time found all streams and rivers on the islandseverely polluted. Yet, the first clean drinking-water supply was put intouse only in 1895.
The change in the mode of production from slave labor to free indentured laborers was yet another component of productivity and profitabilityimprovements in sugar production. Although working and living conditionsof the two groups did not significantly differ, their incentives and attitudeswere quite different. Indians were considered to be good and reliable workers,and this soon resulted in higher yields and better-quality crops.
Expanding market opportunities induced an extension of sugar-canelands and required even more labor. As yields and profitability of sugar production were improving, the attitude of plantation owners began to change.Instead of running away with their profits, they invested their money locally. After a long period of exploitive development and permanent landdegradation, investments were made to improve land productivity. The firstcanals were built to support small-scale irrigation schemes. Soil fertilizationalso began in this period using guano imported from the nearby Seychellesand the distant Peru. As labor was no longer cheap, better machines wereused on the plantations. After 1850 a railway network was built to transportprocessed sugar to Port Louis.
By 1853, in less than two decades, the sugar-cane area grew to over50,000 hectares (almost one-third of the island's total area) and remained atthat level for a few decades. Annual sugar production was around 115,000tons. Starting in this period sugar determined the fate of the island, especially after 1869 when opening of the Suez Canal stripped its income from
From No-Man's-Land to a Congested Paradise 113
trade, ship repair, and other services related to long-distance trade betweenEurope and South Asia.
Given the general climatic conditions in Mauritius, sugar proved to beby far the most profitable crop. Yet, its overwhelming dominance made theisland totally vulnerable to local weather variabilities and global economicfluctuations. When yields were high and prices were favorable, Mauritiusprospered. When cyclones destroyed the crop or world market prices forsugar were depressed, it often needed external assistance to survive. Thevulnerability of this practically single-crop economy is illustrated by mentioning just a few events in the history of Mauritius: the worst cyclonein history destroyed sugar-cane plantations and damaged sugar factories in1892; the first decade of the 20th century brought depressed sugar pricesand economic downturn. Starting with the First World War, the next 15years were a period of economic boom until sugar prices fell again in 1927and many mills had to be closed. The Great Depression of the world economy and another big cyclone in 1931 resulted again in hard times with noeconomic revival until 1937.
We recall that common driving forces for both processes, populationgrowth and expansion of the agricultural frontier, originated with the outside. External market opportunities for sugar were grabbed up by localentrepreneurs, and a large number of people were brought to the island tomake these opportunities feasible. The two decades in the history of Mauritius between 1835 and 1855 is a clear example of how geographically remotecauses and forces of the world economy were shaping local structures, created and intensified or suppressed local social, demographic, economic, andecological processes. The magnitude of local impacts is especially astounding if we consider that the role of Mauritius in world trade, in both valueand tonnage terms, was practically negligible.
Sugar is a forest killer in two respects. First, huge tract of forests had tobe cleared to increase plantation area. Second, sugar processing is an energyintensive process. Efficiency was low and the process required enormousquantities of wood. Before the arrival of steam-powered vacuum-pans in themodern mills of the late 19th century, crystallization of cane juice was verywasteful of fuel. In the sugar-cane growing regions of the Philippines, forexample, wood had become so scarce around 1850 that planters had to usethe pulp of pressed sugar cane as fuel (Roth, 1983).
By 1882 less than 3 percent of the original 1,800 km2 of virgin forestssurvived, almost entirely in the least accessible high-altitude regions. In
114 Ferenc L. Toth
a new wave of environmental rehabilitation efforts, the government beganto buy back land, planted trees, and introduced a series of reafforestationlaws. These ecosystem redevelopment efforts were partly oriented towardprotection of water resources as new forests stands were mainly plantedalong streams and rivers.
External linkages of Mauritius in the late 19th century were rather atypical compared with other parts of the British colonial system. In Southand Southeast Asia a nested hierarchy of economic relations and politicaladministration emerged in which regional centers and their subcenters directed resource extraction and agricultural frontier expansion in their subregions and hinterlands (Richards, 1990, p. 165). In contrast, Mauritiuswas directly governed from London and major economic policies affectingthe island (abolishment of slavery, foreign trade rights, export duties) werealso drafted in the European core. Although trade linkages with Englandwere apparently important and significant (witness the debate about special tariffs on sugar exports and the concern of Caribbean sugar producersabout the competitiveness of Mauritian sugar due to slave labor), they werecomplemented by a series of export-import relationships with other regionsin the Indian Ocean. For example, a significant portion of sugar exportswent to India in exchange for rice imports to feed the Mauritian populationof Indian origin. Madagascar was also an important absorber of Mauritiansugar and rum exports until 1895 when it was conquered by the French andtrade links broke down.
Wallerstein's (1976) analysis about the three zones of African production is valid to some extent for Mauritius in a special form. In Wallerstein'sscheme, the first zone produces for the world market directly (sugar production in Mauritius); the second zone produces food for workers in the first zone(rice imports from India). The third zone provides labor for the first and, tosome extent, for the second zones (import of indentured laborers from Indiato Mauritius). The form of social organization of production in the first zoneinvolves either white settlers/farmers and/or companies/concessions. Laborin the first zone consists mainly of indentured laborers. This form keeps labor costs worldwide at a low level. The slow increase of the economic powerof indentured laborers and their descendants results in their "peasantization": an increasing number of them are able to purchase and work on theirown land.
From No-Man's-Land to a Congested Paradise 115
In Mauritius this process, however, was combined with a series of otherforces at work. They included fluctuations in prices and market opportunities, technological changes in growing and milling sugar cane. The netoutcome in Mauritius involved major shifts in the number and average sizeof sugar-cane plantations and sugar factories. A delayed and long-lastingeffect of the primary social and technological changes was a concentrationof landed properties in the hands of those who adapted fastest to changingconditions and grabbed emerging new opportunities. The number of plantation owners decreased from 4,000 in 1846 to 1,600 by 1871, although theplantation area increased five-fold in about the same period. Beginning inthe 1880s, the tendency reversed as large estates were subdivided and soldto Indians who accumulated sufficient capital to start their own small-scaleplantations.
Given the technologies and land-management practices ofthe time, therewas hardly any increasing return-to-scale in sugar-cane growing. Yet, landuse on small-scale plantations was probably more intensive than on large estates. In the absence of any reserve capital and appropriate credit schemes,however, investments in increasing soil fertility were more or less a directfunction of fluctuating income. The concentration trend was more apparent in the sugar-milling sector. Largely due to the economic slump of the1880s, four out of five sugar mills closed down, but the surviving ones weremodernized. The result was higher sugar extraction rates from the cane andimproving profitability of sugar production and milling.
Land-management practices generally improved in the early 20th century. Unused parts of the cane were increasingly returned to the fields asfertilizers. As sugar-cane plantations were extended to drier areas, expansionof the irrigation network became necessary to reduce losses from droughtsand to increase yields in these areas. This involved large-scale hydrologicalprojects, at least under Mauritian conditions. The La Ferme Reservoir constructed in 1914 for irrigation with 11.8 million m3 useful capacity is stillthe second largest reservoir on the island.
In another attempt to control agriculture, the mongoose from India wasintroduced in the early 1900s to reduce rats in the sugar-cane fields. Theeffort brought mixed results in terms of its original objective, but, yet again,the side effects were clearly unfavorable. The mongoose completed the elimination of native ground-nesting birds that began centuries ago by pigs.
116 Ferenc L. Toth
5.5 High Population Density:World War II to Independence
Following the economically prosperous years of the Second World War, a newperiod started in the environmental history of Mauritius. It was dominatedby changing population-environment relations largely due to high rates ofpopulation growth. As a result of sustained high birth rates and a suddenfall in mortality following the eradication of malaria, the average annualrate of natural population increase between 1948 and 1958 was about 3percent (see Chapter 4). Total population increased by 36 percent in thisdecade, adding 158,000 people to the population (see Brookfield, 1957, fora thorough analysis of the demographic situation of the early 1950s). Thegrowth rates themselves were not alarming, since many other countries atthat time and many more in subsequent decades experienced this kind ofpopulation explosion, but none of these other countries started from thealready high population-density level in Mauritius (269 persons for eachkm2 in 1952) in relation to land and other natural resources.
The prospects and disastrous consequences of continued fast populationgrowth alerted the British Colonial administrators and the local government.A series of committees were set up and reports commissioned to evaluate thesituation and propose action. They all pointed to the poor natural resourceendowments of the island as a severe constraint in its future development,but their major focus was on the combination of potential economic, social,and political disasters as a result of overpopulation. None of them addressedenvironmental issues directly. This is not surprising because environmentalquality does not really matter when there are other threats such as a disintegrating economy, a complete breakdown of social services, and potentialsocial unrest.[4]
One would expect that the combination of a rapidly increasing population from an already high density level and finite land and natural resourcescould have made Mauritius a showcase of Malthusian collapse in the 1950s.On the contrary, analysts of the situation (see, for example, Brookfield,1957; Meade, 1967) deny the relevance of the Malthusian scheme in thecase of Mauritius. A superficial observer could easily draw false conclusionsrelated to population-environment interactions from some of the developments in Mauritius in the period of fast population growth. Real nationalincome per capita declined by more than 10 percent between 1953 and 1958;
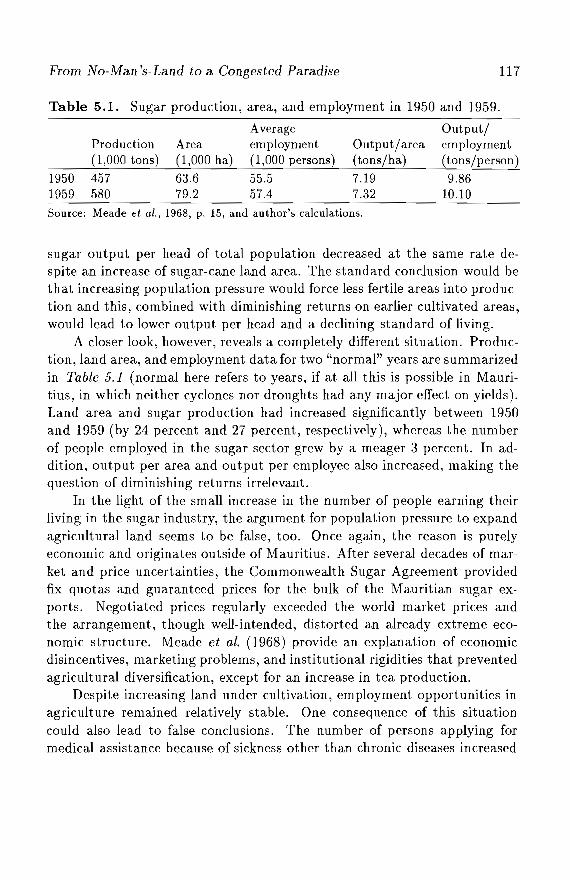
From No-Man's-Land to a Congested Paradise 117
Area(1,000 ha)
Production(1,000 tons)
Table 5.1. Sugar production, area, and employment in 1950 and 1959.
Average Output/employment Output/area employment(1,000 persons) (tons/ha) (tons/person)
19501959
457580
63.679.2
55.5 7.19 9.8657.4 7.32 10.10
Source: Meade et al., 1968, p. 15, and author's calculations.
sugar output per head of total population decreased at the same rate despite an increase of sugar-cane land area. The standard conclusion would bethat increasing population pressure would force less fertile areas into production and this, combined with diminishing returns on earlier cultivated areas,would lead to lower output per head and a declining standard of living.
A closer look, however, reveals a completely different situation. Production, land area, and employment data for two "normal" years are summarizedin Table 5.1 (normal here refers to years, if at all this is possible in Mauritius, in which neither cyclones nor droughts had any major effect on yields).Land area and sugar production had increased significantly between 1950and 1959 (by 24 percent and 27 percent, respectively), whereas the numberof people employed in the sugar sector grew by a meager 3 percent. In addition, output per area and output per employee also increased, making thequestion of diminishing returns irrelevant.
In the light of the small increase in the number of people earning theirliving in the sugar industry, the argument for population pressure to expandagricultural land seems to be false, too. Once again, the reason is purelyeconomic and originates outside of Mauritius. After several decades of market and price uncertainties, the Commonwealth Sugar Agreement providedfix quotas and guaranteed prices for the bulk of the Mauritian sugar exports. Negotiated prices regularly exceeded the world market prices andthe arrangement, though well-intended, distorted an already extreme economic structure. Meade et al. (1968) provide an explanation of economicdisincentives, marketing problems, and institutional rigidities that preventedagricultural diversification, except for an increase in tea production.
Despite increasing land under cultivation, employment opportunities inagriculture remained relatively stable. One consequence of this situationcould also lead to false conclusions. The number of persons applying formedical assistance because of sickness other than chronic diseases increased
118 Ferenc 1. Toth
over six times between 19.53 and 19.59 (Titmuss and Abel-Smith, 1968, p. 11).With a view to the fast rate of population growth, one would assume thatthis was a result of increasing congestion, declining living standards, anddeteriorating public hygiene. In fact, the reason is economic rather thanenvironmental. The majority of the applicants for medical treatment simplyfailed to find employment and used the medical system to get financial assistance. In the 19.50s public-health conditions were improving: malaria hadalready been wiped out, and tuberculosis was getting under control resultingin sharply declining mortality rates.
As a result of a fast increase in sugar-cane area in the 19.50s, virtually noother land was left that could be reclaimed for further agricultural expansion.The only way to increase output was more intensive land use. An importantpart of this effort was a major soil survey and land classification projectcompleted by 1962. The survey suggested most suitable crops for varioussoil types in different regions, together with cultivation practices includingirrigation and fertilizer use. Soil conservation was an important part of theproject as it identified areas where cultivation should be abandoned becauseof high rates of soil erosion.
Some of the new areas brought under sugar-cane cultivation in the 19.50swere located in the relatively drier regions of the island. Droughts had always been a problem in Mauritius. An obvious solution to both problems wasto improve the utilization of water resources. No reservoirs had been builtbetween 1929, when La Nicoliere was constructed, and the early 19.50s. In19.53-19.54, three reservoirs were completed (Piton du Milieu, Mare Longue,and Tamarind Falls) two of which were built for a combined purpose of irrigation and hydroelectricity generation with a total useful capacity of 7.7million m3 . They both supported current production and encouraged agricultural expansion in the dry areas.
These efforts of the Mauritian government were reconfirmed by theMeade report: "Much capital has already been invested in schemes to provide water for agriculture and further schemes are under investigation, andwe can think of no safer or more profitable form of investment" (Meade etal., 1968). It is highly unlikely that it was the direct result of this report, butthe largest reservoir in Mauritius was completed in 1961 (Mare aux Vacoas,22 million m3 useful capacity), and another smaller one was constructed in1962 (Eau Bleue, 6 million m3 useful capacity).
From No-Man's-Land to a Congested Paradise 119
Another convenient method to increase sugar output, especially whenprices were high and guaranteed, was increasing the input of chemical pesticides and fertilizers. Despite abundant labor and high rates of unemployment, the application of herbicides began in the early 1950s and has gainedin increasing popularity ever since. The use of chemical fertilizers shows asimilar pattern making Mauritius one of the heaviest users per unit of areain the world (for details, see Chapter 7).
5.6 Summary and Conclusions
The preceding analysis shows that during the 400-year history of Mauritius,various forms of natural resource exploitation and environmental transformation were to a large extent the results of fluctuating opportunities ininternational trade (fluctuations of the sugar price, availability of food forimports), changes in economic policies of the colonial power and other important trading partners (reduction of sugar-export tax to Britain in the 1830s,setting up a tariff and quota system after World War II), various forms oftechnological change (diffusion of more efficient sugar-milling technologies,construction of railways, improving agrotechniques), institutional changes(abolition of slavery), and political changes (shift of colonial power fromFrance to Britain, changes in policies of consecutive governors and other local political authorities). The combination of these factors conditioned theaspirations and behaviors of various economic and social actors in Mauritiusover the centuries. It is possible to tell the story of the dodo without considering the external factors, but it is impossible to understand it. It is hopedthat this chapter has been able to provide some of the missing explanations.
Notes
[1] It is worth noting that the first, modern stock exchange in Amsterdam waslargely based on shares of trading companies (Kostolany, 1987). Besides thestandard prompt deals, the Amsterdam Stock Exchange handled options andforward deals, compensation courses, and report and deport deals. Because ofdangers and uncertainties involved in the long sailing trips across the IndianOcean and on the Atlantic, real and, in many cases, manufactured news aboutthe fate of the ships provided on excellent base for speculations on the stockexchange.
120 Ferenc L. Toth
[2] In addition to the strong "pull" factor in Mauritius, severe "push" forces wereat work in India as well, such as a series of famines in the early 18th century.
[3] The prospect for a boom of the sugar industry was already in the air in the1830s. When Charles Darwin visited Mauritius in 1836 he was impressed withthe landscape and the mixed population of various races. He noted in his diary:"the country on this side of the island appears pretty well cultivated, the wholebeing divided into fields & studded with farmhouses. I am, however, assuredthat of the whole land not more than half is yet in a productive state; if such isthe case & considering the present great export of sugar, at some future periodthis island when thickly peopled, will be of great value" (Darwin, 1934).
[4] Meier (1959) suggested that fast population growth could lead to martial law oreven to establishing concentration camps as a way of handling the large numberof unemployed people.
CI'lapter 6
Water Resources andWater Management
Tooiseeram Ramjeawon
6.1 Introduction
Water is an extremely complex resource. It is closely involved in a numberof basic natural constraints to societal development (soil productivity, industrial production, energy resources, health promotion, etc.), and is activein generating side effects of human intervention in natural systems by itsmobility and erosive and chemical properties.
Mauritius has a specialized environment: it is open to wave action fromall sides; it has small catchment areas so that a high proportion of erodedmaterial is lost into the sea; and the limited water-retaining capacity makesit sensitive to drought conditions. River basins are large in number but smallin size, with limited regulation capacity. The turnover time of groundwatersystems tends to be short - a few years at most. Seawater intrusion is aproblem in coastal areas, especially where overexploitation occurs due to increasing populations, industrial production, and agricultural developments.
Environmentally, even more than economically, Mauritius is exposed toexternal forces. This vulnerability is directly correlated to its small size. Thefollowing discussion synthesizes the most important aspects of the watermanagement situation on the island, and analyzes the complexity of waterin relation to sustainable development.
122 Toolseeram Ramjeawon
6.2 Geology and Climatology
Except for the beaches and the coral reefs, Mauritius is entirely of volcanicorigin, with altitudes varying from sea level to a central plateau with amaximum height of 600 m. The landscape of Mauritius owes its origin tothe superposition of volcanic activity at different periods and the differentialrates of erosion. Four major periods can be distinguished:
• Emerging period of the island (between 10 and 6.7 million years).• The old series: during this period of activity (6.2 to 5 million years)
the island acquired its circular shield shape. The basaltic masses makeup the island's skeleton and cover nearly 20 percent of its area as highmountain masses and a few hills scattered on the center of the island.
• The intermediate series: after a relatively calm period (1.5 million years)during which heavy erosion took place, depressions were filled by volcanicflows between 3.5 and 1.7 million years. This was followed by a calmperiod of about 1.2 million years.
• The late volcanic series: during this period (700,000-25,000 years) flowssprang from volcanoes situated in the core of the original volcano andspilled through gaps toward the sea.
Only the late volcanic series gave rise to good aquifers in view of theirthickness and permeabilities. Groundwater is abstracted from the doleriticbasalts of the younger volcanic series which overlie the hard compacted impermeable rocks of the older volcanics. The younger series are characterizedby medium to high permeability, due mostly to fissures and cavities.
The coastline is some 200 km long and is surrounded by fringing coralreefs which enclose a lagoon area of 243 km2
• Living coral reef formations resist destruction from sea action by continuously growing, due to a preferencefor light and sediment-free waters. Growth rate is of the order of 2 mm peryear. The island has no continental shelf proper; the water reaches a depthof 3,000 meters within 20 km of its coastline. The volcanic nature of theisland's origin, the existence of coral reefs, and the access to the lagoons ofabout 50 rivers and rivulets determine the diversity of the coastal habitats.
Climatic conditions prevailing in Mauritius determine not only the waterresources of the island but also land use and irrigation needs. Mauritiusenjoys a moderate tropical climate. Two seasons are observed:
• Summer from November to April. This is the warmer and rainier season,during which tropical cyclones may occur. February and March are thewettest months.
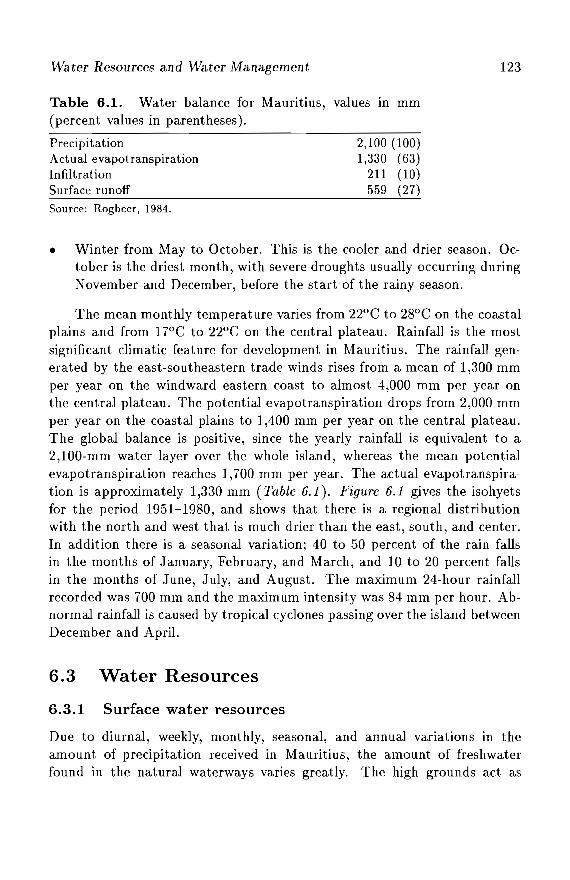
Water Resources and Water Management
Table 6.1. Water balance for Mauritius, values in mm(percent values in parentheses).
123
PrecipitationActual evapotranspirationIntiltrationSurface runoffSource: Rogbeer, 1984.
2,100 (100)1,330 (63)
211 (10)559 (27)
• Winter from May to October. This is the cooler and drier season. October is the driest month, with severe droughts usually occurring duringNovember and December, before the start of the rainy season.
The mean monthly temperature varies from 22°C to 28°C on the coastalplains and from 17°C to 22°C on the central plateau. Rainfall is the mostsignificant climatic feature for development in Mauritius. The rainfall generated by the east-southeastern trade winds rises from a mean of 1,300 mmper year on the windward eastern coast to almost 4,000 mm per year onthe central plateau. The potential evapotranspiration drops from 2,000 mmper year on the coastal plains to 1,400 mm per year on the central plateau.The global balance is positive, since the yearly rainfall is equivalent to a2,100-mm water layer over the whole island, whereas the mean potentialevapotranspiration reaches 1,700 mm per year. The actual evapotranspiration is approximately 1,330 mm (Table 6.1). Figure 6.1 gives the isohyetsfor the period 1951-1980, and shows that there is a regional distributionwith the north and west that is much drier than the east, south, and center.In addition there is a seasonal variation; 40 to 50 percent of the rain fallsin the months of January, February, and March, and 10 to 20 percent fallsin the months of June, July, and August. The maximum 24-hour rainfallrecorded was 700 mm and the maximum intensity was 84 mm per hour. Abnormal rainfall is caused by tropical cyclones passing over the island betweenDecember and April.
6.3 Water Resources
6.3.1 Surface water resources
Due to diurnal, weekly, monthly, seasonal, and annual variations in theamount of precipitation received in Mauritius, the amount of freshwaterfound in the natural waterways varies greatly. The high grounds act as
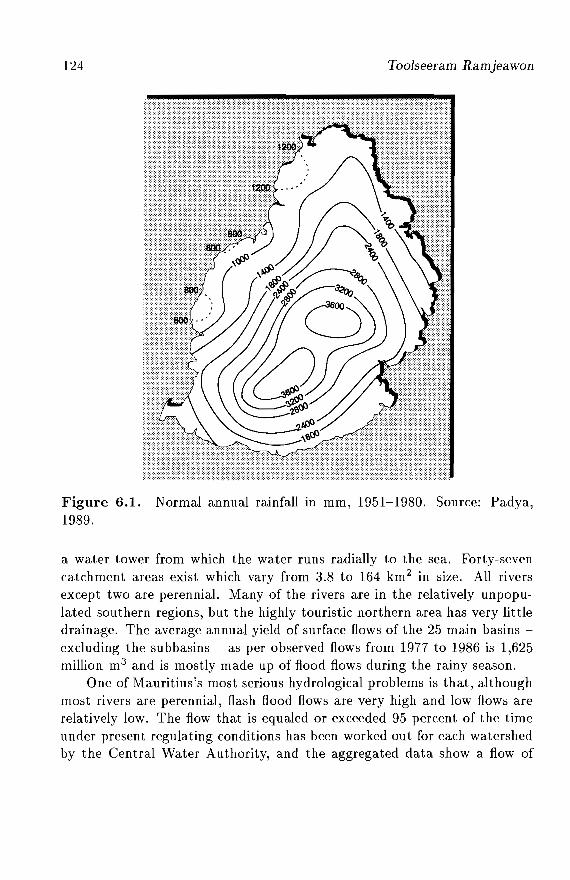
124 Toolseeram Ramjeawon
Figure 6.1. Normal annual rainfall In mm, 1951-1980. Source: Padya,1989.
a water tower from which the water runs radially to the sea. Forty-sevencatchment areas exist which vary from 3.8 to 164 km 2 in size. All riversexcept two are perennial. Many of the rivers are in the relatively unpopulated southern regions, but the highly touristic northern area has very littledrainage. The average annual yield of surface flows of the 25 main basins excluding the subbasins - as per observed flows from 1977 to 1986 is 1,625million m3 and is mostly made up of flood flows during the rainy season.
One of Mauritius's most serious hydrological problems is that, althoughmost rivers are perennial, flash flood flows are very high and low flows arerelatively low. The flow that is equaled or exceeded 95 percent of the timeunder present regulating conditions has been worked out for each watershedby the Central Water Authority, and the aggregated data show a flow of
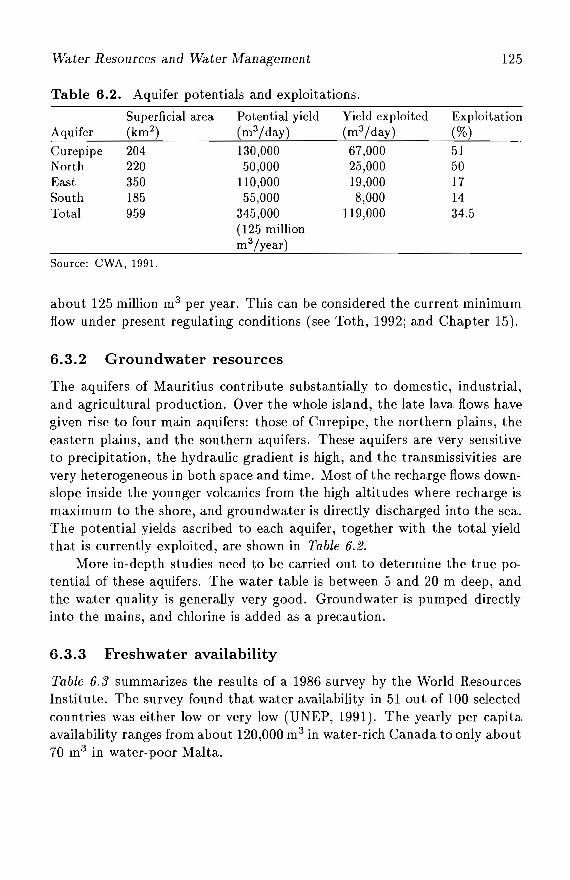
Water Resources and Water Management
Table 6.2. Aquifer potentials and exploitations.
125
Aquifer
CurepipeNorthEastSouthTotal
Superficial area Potential yield Yield exploited(km 2) (m3(day) (m3(day)
204 130,000 67,000220 50,000 25,000350 110,000 19,000185 55,000 8,000959 345,000 119,000
(125 millionm3(year)
Exploitation(%)
5150171434.5
Source: CWA, 1991.
about 125 million m3 per year. This can be considered the current minimumflow under present regulating conditions (see Toth, 1992; and Chapter 15).
6.3.2 Groundwater resources
The aquifers of Mauritius contribute substantially to domestic, industrial,and agricultural production. Over the whole island, the late lava flows havegiven rise to four main aquifers: those of Curepipe, the northern plains, theeastern plains, and the southern aquifers. These aquifers are very sensitiveto precipitation, the hydraulic gradient is high, and the transmissivities arevery heterogeneous in both space and time. Most of the recharge flows downslope inside the younger volcanics from the high altitudes where recharge ismaximum to the shore, and groundwater is directly discharged into the sea.The potential yields ascribed to each aquifer, together with the total yieldthat is currently exploited, are shown in Table 6.2.
More in-depth studies need to be carried out to determine the true potential of these aquifers. The water table is between 5 and 20 m deep, andthe water quality is generally very good. Groundwater is pumped directlyinto the mains, and chlorine is added as a precaution.
6.3.3 Freshwater availability
Table 6.3 summarizes the results of a 1986 survey by the World ResourcesInstitute. The survey found that water availability in 51 out of 100 selectedcountries was either low or very low (UNEP, 1991). The yearly per capitaavailability ranges from about 120,000 m3 in water-rich Canada to only about70 m3 in water-poor Malta.
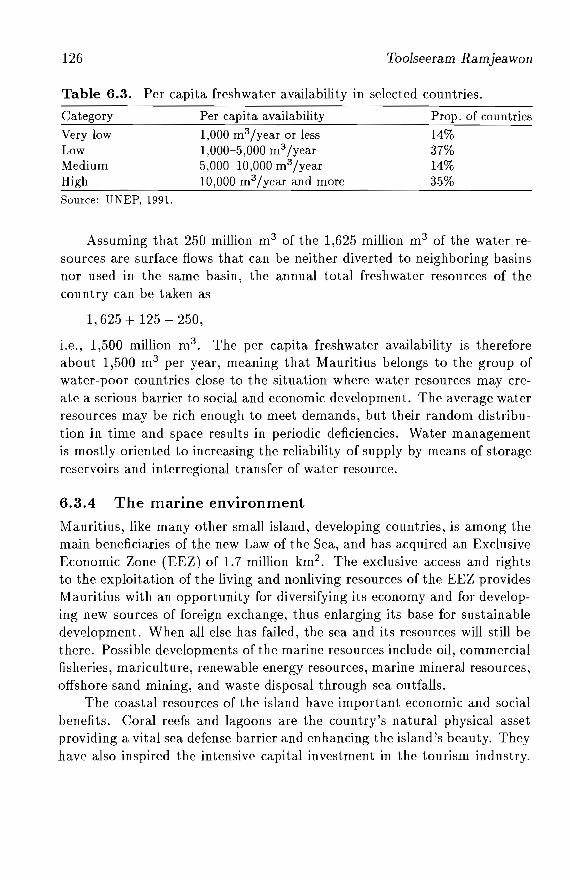
126 Toolseeram Ramjeawon
Table 6.3. Per capita freshwater availability in selected countries.
Category
Very lowLowMediumHighSource: UNEP, 1991.
Per capita availability
1,000 m3 /year or less1,000-5,000 m3 /year5,000-10,000 m3 /year10,000 m3/year and more
Prop. of countries
14%37%14%35%
Assuming that 250 million m3 of the 1,625 million m3 of the water resources are surface flows that can be neither diverted to neighboring basinsnor used in the same basin, the annual total freshwater resources of thecountry can be taken as
1,625 + 125 - 250,
i.e., 1,500 million m3 . The per capita freshwater availability is thereforeabout 1,500 m3 per year, meaning that Mauritius belongs to the group ofwater-poor countries close to the situation where water resources may create a serious barrier to social and economic development. The average waterresources may be rich enough to meet demands, but their random distribution in time and space results in periodic deficiencies. Water managementis mostly oriented to increasing the reliability of supply by means of storagereservoirs and interregional transfer of water resource.
6.3.4 The marine environment
Mauritius, like many other small island, developing countries, is among themain beneficiaries of the new Law of the Sea, and has acquired an ExclusiveEconomic Zone (EEZ) of 1.7 million km2
• The exclusive access and rightsto the exploitation of the living and nonliving resources of the EEZ providesMauritius with an opportunity for diversifying its economy and for developing new sources of foreign exchange, thus enlarging its base for sustainabledevelopment. When all else has failed, the sea and its resources will still bethere. Possible developments of the marine resources include oil, commercialfisheries, mariculture, renewable energy resources, marine mineral resources,offshore sand mining, and waste disposal through sea outfalls.
The coastal resources of the island have important economic and socialbenefits. Coral reefs and lagoons are the country's natural physical assetproviding a vital sea defense barrier and enhancing the island's beauty. Theyhave also inspired the intensive capital investment in the tourism industry.
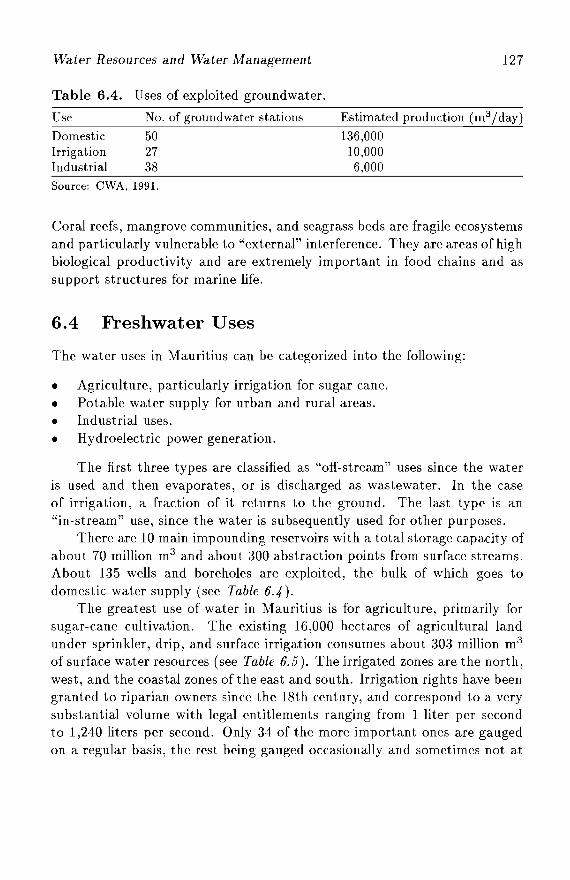
Water Resources and Water Management
Table 6.4. Uses of exploited groundwater.
127
Use
DomesticIrrigationIndustrial
No. of groundwater stations
502738
Estimated production (m3 jday)
136,00010,000
6,000
Source: CWA, 1991.
Coral reefs, mangrove communities, and seagrass beds are fragile ecosystemsand particularly vulnerable to "external" interference. They are areas of highbiological productivity and are extremely important in food chains and assupport structures for marine life.
6.4 Freshwater Uses
The water uses in Mauritius can be categorized into the following:
• Agriculture, particularly irrigation for sugar cane.• Potable water supply for urban and rural areas.• Industrial uses.• Hydroelectric power generation.
The first three types are classified as "off-stream" uses since the wateris used and then evaporates, or is discharged as wastewater. In the caseof irrigation, a fraction of it returns to the ground. The last type is an"in-stream" use, since the water is subsequently used for other purposes.
There are 10 main impounding reservoirs with a total storage capacity ofabout 70 million m3 and about 300 abstraction points from surface streams.About 135 wells and boreholes are exploited, the bulk of which goes todomestic water supply (see Table 6.4).
The greatest use of water in Mauritius is for agriculture, primarily forsugar-cane cultivation. The existing 16,000 hectares of agricultural landunder sprinkler, drip, and surface irrigation consumes about 303 million m3
of surface water resources (see Table 6.5). The irrigated zones are the north,west, and the coastal zones ofthe east and south. Irrigation rights have beengranted to riparian owners since the 18th century, and correspond to a verysubstantial volume with legal entitlements ranging from 1 liter per secondto 1,240 liters per second. Only 34 of the more important ones are gaugedon a regular basis, the rest being gauged occasionally and sometimes not at
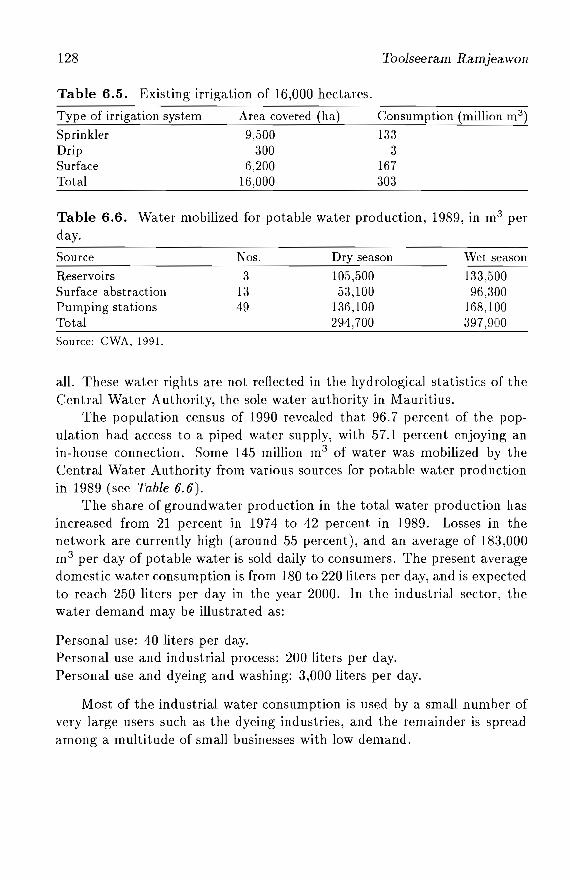
128
Table 6.5. Existing irrigation of 16,000 hectares.
Toolseeram Ramjeawon
Type of irrigation system Area covered (ha) Consumption (million m3 )
Sprinkler 9,500 133Drip 300 3Surface 6,200 167Total 16,000 303
Table 6.6. Water mobilized for potable water production, 1989, in m3 perday.
Source
ReservoirsSurface abstractionPumping stationsTotal
Nos. Dry season Wet season
3 105,500 133,50013 53,100 96,30049 136,100 168,100
294,700 397,900
Source: CWA, 1991.
all. These water rights are not reflected in the hydrological statistics of theCentral Water Authority, the sole water authority in Mauritius.
The population census of 1990 revealed that 96.7 percent of the population had access to a piped water supply, with 57.1 percent enjoying anin-house connection. Some 145 million m3 of water was mobilized by theCentral Water Authority from various sources for potable water productionin 1989 (see Table 6.6).
The share of groundwater production in the total water production hasincreased from 21 percent in 1974 to 42 percent in 1989. Losses in thenetwork are currently high (around 55 percent), and an average of 183,000m 3 per day of potable water is sold daily to consumers. The present averagedomestic water consumption is from 180 to 220 liters per day, and is expectedto reach 250 liters per day in the year 2000. In the industrial sector, thewater demand may be illustrated as:
Personal use: 40 liters per day.Personal use and industrial process: 200 liters per day.Personal use and dyeing and washing: 3,000 liters per day.
Most of the industrial water consumption is used by a small number ofvery large users such as the dyeing industries, and the remainder is spreadamong a multitude of small businesses with low demand.
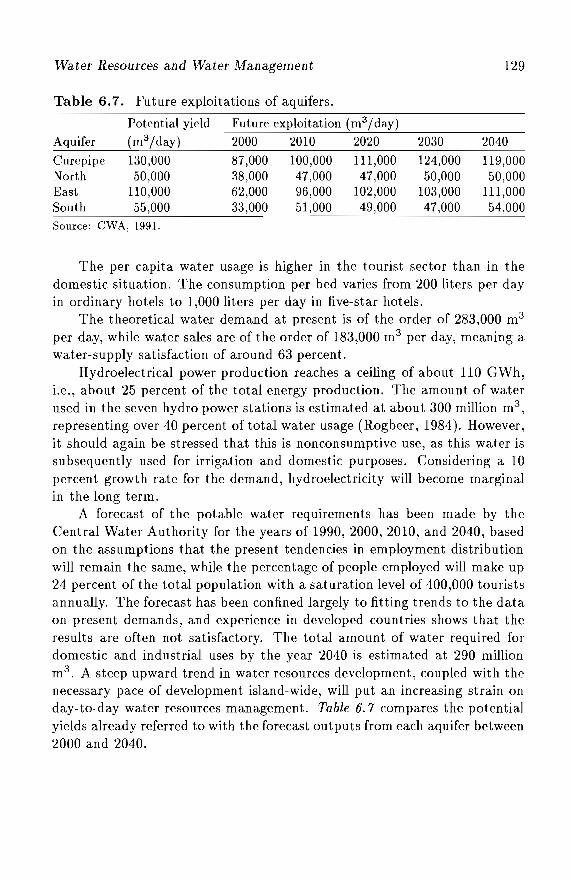
Water Resources and Water Management
Table 6.7. Future exploitations of aquifers.
129
AquiferCurepipeNorthEastSouth
Potential yield Future exploitation (rn3 / day)(rn3 /day) 2000 2010 2020
130,000 87,000 100,000 111,00050,000 38,000 47,000 47,000
110,000 62,000 96,000 102,00055,000 33,000 51,000 49,000
2030
124,00050,000
103,00047,000
2040
119,00050,000
111,00054,000
Source: CWA, 1991.
The per capita water usage is higher in the tourist sector than in thedomestic situation. The consumption per bed varies from 200 liters per dayin ordinary hotels to 1,000 liters per day in five-star hotels.
The theoretical water demand at present is of the order of 283,000 m3
per day, while water sales are of the order of 183,000 m3 per day, meaning awater-supply satisfaction of around 63 percent.
Hydroelectrical power production reaches a ceiling of about 110 GWh,i.e., about 25 percent of the total energy production. The amount of waterused in the seven hydro power stations is estimated at about 300 million m3 ,
representing over 40 percent of total water usage (Rogbeer, 1984). However,it should again be stressed that this is nonconsumptive use, as this water issubsequently used for irrigation and domestic purposes. Considering a 10percent growth rate for the demand, hydroelectricity will become marginalin the long term.
A forecast of the potable water requirements has been made by theCentral Water Authority for the years of 1990, 2000, 2010, and 2040, basedon the assumptions that the present tendencies in employment distributionwill remain the same, while the percentage of people employed will make up24 percent of the total population with a saturation level of 400,000 touristsannually. The forecast has been confined largely to fitting trends to the dataon present demands, and experience in developed countries shows that theresults are often not satisfactory. The total amount of water required fordomestic and industrial uses by the year 2040 is estimated at 290 millionm3 . A steep upward trend in water resources development, coupled with thenecessary pace of development island-wide, will put an increasing strain onday-to-day water resources management. Table 6.7 compares the potentialyields already referred to with the forecast outputs from each aquifer between2000 and 2040.
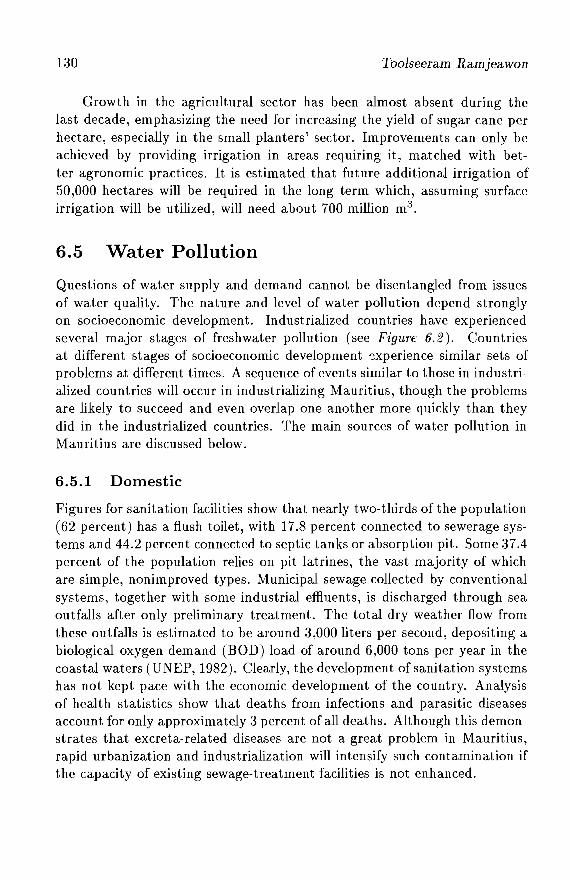
130 Toolseeram Ramjeawon
Growth in the agricultural sector has been almost absent during thelast decade, emphasizing the need for increasing the yield of sugar cane perhectare, especially in the small planters' sector. Improvements can only beachieved by providing irrigation in areas requiring it, matched with better agronomic practices. It is estimated that future additional irrigation of50,000 hectares will be required in the long term which, assuming surfaceirrigation will be utilized, will need about 700 million m3 .
6.5 Water Pollution
Questions of water supply and demand cannot be disentangled from issuesof water quality. The nature and level of water pollution depend stronglyon socioeconomic development. Industrialized countries have experiencedseveral major stages of freshwater pollution (see Figure 6.2). Countriesat different stages of socioeconomic development ~xperience similar sets ofproblems at different times. A sequence of events similar to those in industrialized countries will occur in industrializing Mauritius, though the problemsare likely to succeed and even overlap one another more quickly than theydid in the industrialized countries. The main sources of water pollution inMauritius are discussed below.
6.5.1 Domestic
Figures for sanitation facilities show that nearly two-thirds of the population(62 percent) has a flush toilet, with 17.8 percent connected to sewerage systems and 44.2 percent connected to septic tanks or absorption pit. Some 37.4percent of the population relies on pit latrines, the vast majority of whichare simple, nonimproved types. Municipal sewage collected by conventionalsystems, together with some industrial effluents, is discharged through seaoutfalls after only preliminary treatment. The total dry weather flow fromthese outfalls is estimated to be around 3,000 liters per second, depositing abiological oxygen demand (BOD) load of around 6,000 tons per year in thecoastal waters (UNEP, 1982). Clearly, the development of sanitation systemshas not kept pace with the economic development of the country. Analysisof health statistics show that deaths from infections and parasitic diseasesaccount for only approximately 3 percent of all deaths. Although this demonstrates that excreta-related diseases are not a great problem in Mauritius,rapid urbanization and industrialization will intensify such contamination ifthe capacity of existing sewage-treatment facilities is not enhanced.
Water Resources and Water Management 131
1. Oxygen balance2. Eutrophication3. Heavy metals4. Acidification
5. Organic micropollutants6. Nitrates7. Groundwater contamination
2 3 45 6 7
co
~oc-oQi>.3
1950 1960 1970 1980 1990
Figure 6.2. Onset of major water pollution problems in Europe. Source:UNEP, 1991.
6.5.2 Industrial
There were some 615 manufacturing industries in 1989, with a predominanceof food-processing and textile industries. During the boom in developmentof EPZ industries, several of the new factories were encouraged to locate inrural areas in order to alleviate unemployment problems. This was effectedwith little or no regard to wastewater problems. The absence of legislationregulating the discharge of effluents into the environment was a further incentive to those industries which responded to the call by the governmentto develop employment opportunities in rural areas (in addition to financial, energy, and other incentives). This has resulted in a rather haphazarddisposal of effluents into the environment, through water courses and soakaways. Particular attention has been focused on dyehouse effluents becauseof the aesthetic problems that resulted with their colored, hot, and foamyeffluents. Of the 48 dyeing industries operating in 1990, 36 discharged theireffluents to the public sewer, 8 to the ground through soakaways, and the
132 Toolseeram Ramjeawon
remammg 4 to water courses. The sewer network is limited to urban areas and only 14 percent of all industries in Mauritius are connected to it.These industries are receiving a cheap and easy disposal option, since theireffluents are not treated and are being discharged together with municipalsewage through sea outfalls. Strong public pressure and the need to protectwater resources have forced the Central Water Authority to adopt dischargestandards to all water sinks (surface, ground, and lagoon waters).
These standards are viewed as very strict and difficult to meet at reasonable cost. Industries not connected to the sewer network feel that they arebeing penalized for answering the call in the mid-1980s to locate quickly inrural areas in order to decrease unemployment. Treatment facilities installedfor dyehouse effluents are limited in effectiveness, and the authorities cannotrealistically enforce the standards as the economy is, at present, too dependent on this sector. The result is a waste of resources for all those concerned.The 19 sugar mills in operation, mostly in the rural areas, represent an important source of organic pollution. These industries are close to rivers forobvious water requirements and produce organic wastes on a seasonal basis.Treatment has, up to now, been limited to preliminary processes only. Thesugar industry is much more well established in Mauritius, and, because itdoes not produce colored effluents, the pollution problems of this industryhave not been pursued to the same extent as textile factories.
6.5.3 Agrochemical
Agriculture is intensive over half the island's area, and constitutes an important non-point source of pollution. Some 93 percent of the cultivated areais under sugar cane, 2 percent under tea, 0.5 percent under tobacco, andthe rest supports miscellaneous vegetables, fruits, and horticultural production. The use of agrochemicals is therefore largely conditioned by sugar-caneagriculture. About 25 percent of the sugar-cane land is administered by theagricultural diversification program.
From 120 to 150 kg of nitrogen is applied per hectare of sugar-cane fields.Interlining with maize would bring another 40 to 62 kg of N; potatoes, some80 kg; groundnut, 20 kg; and beans, around 29 kg of N per hectare for eachcrop cycle. The intensive use of fertilizers is explained by the scarcity ofprime agricultural land. It is estimated that only about 20 percent of thenitrogen applied is recovered at harvest, while 30 percent is immobilizedin soil organic matter. According to Deville and Ng (1984), there is verylittle direct leaching (less than 5 percent of the fertilizer applied) during the
Water Resources and Water Management 133
year of application. However, the soil organic nitrogen may be graduallyreleased over time, and may create problems in the future. Nitrate levelsin groundwater need a more in-depth investigation in order to determine ageneral trend.
Sugar-cane fields annually receive between 3.0 and 7.0 kg of active ingredients per hectare of pesticides - almost exclusively herbicides. Whenintercropped, the sugar-cane lands additionally obtain some 2.0 to 5.0 kg ofactive ingredients per ton of herbicides. It is to be noted that the secondapplication of herbicides in Mauritius occurs at the same time as the summerrains. Up to 6.0 kg of active ingredient per hectare may be used per cropcycle for leafy vegetables on non-sugar-cane land. Given that multicroppingand mixed-cropping are intensive on non-sugar land, and that the methodof spraying allows over 90 percent of the pesticides applied to spill on theground, the resulting chemical contamination of soil and groundwater canbe regarded as a chemical time bomb that will eventually explode. It isobvious in Mauritius that the main environmental impact of agrochemicalusage is regulated by sugar-cane agriculture and usage of sugar-cane lands.It is necessary for the sugar industry to investigate the marginal costs ofevery extra ton of food or sugar it produces.
6.5.4 Lagoon
The lagoon around Mauritius is the ultimate sink for all the land-basedsources of pollution. It is bound by coral reefs and is more or less a semienclosed system. At least 50 percent of the lagoon water is estimated to berenewed daily by water exchange with the ocean through passes and deepchannels cut across the reefs.
Much concern has been expressed over the quality of the reefs and thecoastal waters along the shores of Mauritius. Three main reasons are givenfor this degradation:
1. Effect of pollutant discharges into the lagoons directly or through watercourses.
2. Effect of cyclone damage.3. Effect of coral blasting with dynamite for fishing.
The last source has now virtually stopped due to strict legislation andenforcement, whereas the second source is a natural phenomenon which cannot be altered. The list of land-based activities that can greatly reduce theproductivity or even destroy coral reefs, mangrove communities, and seagrass
134 Toolseeram Ramjeawon
beds is very long, but can generally be summarized under two main headings: silt and pollution. The healthiest reefs are always found in the clearestwaters. Typical causes of siltation are land reclamation, soil erosion, anddredging. It is estimated that between 500,000 and 600,000 metric tons ofcoral sand are removed from the coastal and marine environment annually.
The types of pollution that have damaging effects include agriculturalrunoff (containing residues of pesticides and fertilizers), industrial pollution(especially through sea outfall discharges), sewage pollution (through seaoutfalls and coastal tourism development), and solid waste disposal near thecoast. These forms of pollution affect mainly the nutrient balance, eitherdestroying the processes through which nutrients are created and recycledor "fertilizing" the water, causing entrophication problems. Coral mining,commercial shell and coral collection, spear fishing, and anchor damage mustalso be added to the list of factors destroying the coral reefs.
6.6 Water-Resources Development andManagement
Water resources management will never be easy in Mauritius given the uncertainties and extremes of annual and seasonal distribution of rainfall. Compounding the present problems will be the rate at which demands are likelyto increase over the next 50 years and the speed at which additional waterresources will be mobilized. Based on historical observations and an analysisof current trends, the main objectives of water-resources management in awater-poor country like Mauritius may be summarized as follows:
1. To increase the reliability of water resources by constructing storagesystems and by protecting water resources against pollution.
2. To increase the efficiency of water use through a good distribution network, reuse and recycling, efficient irrigation systems, and economicincentives.
3. To satisfy the needs of the population, tourism, agriculture, and industryaccording to socially justified priorities.
It is increasingly evident that the present level of production cannotbe sustained in severely dry periods. Existing surface resources are unableto relieve pressures in groundwater during droughts, due to lack of reservoir storage. Groundwater extraction is currently less than the recharge,
Water Resources and Water Management 135
but, when discharge into the sea (diffuse along the coasts) is added, a greatdeficit appears that is compensated by a marked reduction in groundwater storage during non-rainy periods. Over the 20-year period from 1990 to2010, output from surface resources for domestic, industrial, and commercialuses is projected to increase from 187,000 to 342,000 m3 per day (83 percentincrease) and groundwater from 125,000 to 294,000 m3 per day (135 percent). The long-term future use of water resources implies a full utilizationof aquifer potentials island-wide. Future water-resource development may beclose to the safe or sustainable yield. The different types of water-resourcesdevelopment systems needed in the future are as follows:
1. Surface water: streamflows in Mauritius are highly variable, due to thesmall catchment sizes and steep channels. Unless seasonal balancingstorage is available, water use has to be sanctioned, monitored, andcontrolled under dry period flow conditions (i.e., those less than themean but higher than the minimum) to prevent waste of water at sea.There will be a need to increase the yield of sugar cane per hectare toa significant level, especially in the small planters' sector, and this canonly be done by providing irrigation for areas requiring it. To meet waterdemands in the dry areas that arise as a result of irrigation, flood waterhas to be stored in reservoirs and regulated flows given to the commandareas according to irrigation demands. One important aspect of futuredam construction is the need to prevent in-stream storages from rapidlysilting up. A novel reservoir construction technique ("reservoirs in thesea") has been used in Hong Kong to dam sea inlets, pump out the saltwater, and replace it with freshwater (Chan and Chan, 1981). The tworeservoirs constructed so far (capacity of 450 million m3
) have been aninnovative solution to Hong Kong's water supply problems.
2. Rainwater harvesting: this is not suitable as a primary source of waterfor public-water supplies for economic reasons. However, it is a goodprimary or supplementary source at the household or local level.
3. Groundwater: given the need to substantially increase groundwater development in the future, the knowledge of hydrogeology of the islandneeds to be increased in order to determine the true potential of aquifers.
4. Wastewater reuse: examples already exist for the use of wastewater ona small scale in Mauritius. For instance, tourist accommodations makeuse of treated wastewater from package treatment plants to irrigate gardens and lawns. However, the opportunity for wastewater reuse is much
136 Toolseeram Ramjeawon
higher in an agricultural country like Mauritius. For health and aesthetic reasons, reuse of treated sewage effluent could be primarily usedfor such non-potable applications as irrigated agriculture and industrialcooling. The main actual limitation of this option is the lack of a centralreticulated sewerage system from which the wastewater can be used,as well as the lack of a conventional treatment plant. Treated urbanstormwater runoff is used to supplement potable water supplies in Singapore (Bingham, 1985), but this demands extensive treatment of thewater to ensure that it satisfies drinking water standards. This can findapplications in urbanized areas of Mauritius, but whether it is an appropriate technology for use in Mauritius remains to be proved. In Israel, 65percent of the flow of water is reused, increasing the available quantity ofwater in agriculture by 20 percent. The feasibility of wastewater reuse inMauritius will depend on the cost relative to alternative supplies and onpublic acceptance. Costs presented by Ertuna (1988) show a variationbetween about $0.30 and $0.80 for four countries in the Middle East,and it is likely that the costs for small island applications will be higher.The unit cost of water production for Mauritius in 1985 was $0.29 perm3 (Worldwater/WHO, 1987).
Other nonconventional methods of producing freshwater such as desalination, importation, weather modification, and seawater intrusion barriersexist, but do not appear to be economically feasible options in Mauritius.They can only be considered if the conventional water sources are fully committed and more expensive to develop.
The piped systems in Mauritius very often suffer from problems causedby inadequate maintenance and repairs as well as the age of the materialsused. It is necessary to strike a balance between high investment costs tomobilize water resources and the costs involved in reducing water losses.Efficient use of water in irrigation schemes should be encouraged, such asthe use of drip (or trickle) irrigation methods rather than traditional floodirrigation in furrows. Proper irrigation scheduling, based on knowledge of thewater requirements of different crops, is also required. Non-potable sourcesof water such as brackish water and treated wastewater should be consideredfor agriculture if the freshwater resources of the island are under stress.
Water-quality management in Mauritius is faced with numerous obstacles. It has been a neglected subject for various reasons, including lack ofpolitical will, resource and labor constraints, institutional inertia, and publicapathy. Decision makers need to be convinced that investments in enhancing

Water Resources and Water Management 137
water quality will directly contribute to social and economic benefits, similarto investments in other sectors. Water and land use are closely related, anda coordinated plan of the land-use resources in each watershed is necessary.The policy adopted in the past, by which land-use-planning decisions werefirst made and the corrective measures to face the impacts of these decisionson the water resources were only taken afterward, must be abandoned.
The next important step is the determination of water-quality objectivesand criteria. These should consider the country's economic and climatic requirements, along with the work force, expertise, and institutions which arenecessary for their implementation. A comparison of the statistics for sanitation facilities in 1983 and 1990 shows that the proportion of the populationconnected to a sewer network has remained steady (18.4 percent). The failure of some of the preliminary treatment plants and the lack of operationalskills in others would suggest that reliance should only be placed on a fewconventional treatment plants.
One approach to the problem of disposal of effluents may be to havelong sea outfalls, where the large degree of dilution available may allowonly preliminary treatment. This will also eliminate the need for extensiveland facilities or sludge-handling problems. The outfalls need to be wellsituated and of adequate length. But this option, of course, precludes theuse of treated effluents for non-potable uses such as irrigation. The sewernetwork cannot realistically be expected to cover the whole island includingrural areas. A thorough investigation of the efficiency of septic tanks andsoakaways needs to be carried out, with particular regard to the impacton groundwater. If there are no adverse impacts, their use should not bediscouraged as they are likely to be the preferred option for many people, asthe increase in the figures for type of sanitation facility reveal.
The treatment of industrial wastes, particularly from dye houses, willalways pose technological problems. It would, then, be advisable to rely ona few common treatment plants so that problems and resources are shared.The importance of anaerobic digestion for environmental protection and recovery of renewable resources is now recognized. Anaerobic treatment, usingmodern high rate anaerobic processes, is feasible for a wide range of wastes,including very low strength effluents such as domestic sewage. Regardingthe technological simplicity of high rate systems like the Upflow AnaerobicSludge Blanket (UASB) process, the implementation of these systems canmake developing countries like Mauritius almost self-sufficient with respectto the protection of the environment.
138 Toolseeram Ramjeawon
The potential value of the living and nonliving resources of the marineenvironment should not be underestimated; but it would similarly be foolish to underestimate the enormous constraints that confront the country inthe exploitation of the potentials. The skills, information, technology, andfinancial resources required to translate potentials into tangible benefits arestill lacking.
In July 1971, the Central Water Authority was created by an act ofParliament. Its task is to control, develop, and conserve the country's waterresources; it is the sole water authority in the island. Nowadays, there isa need for an agency for water-resources assessment, monitoring, licensing,and control of water resources. This should be undertaken by a governmentdepartment or ministry that is not a user agency to ensure that there isno conflict of interest in allocating available water resources. A sole waterauthority may favor the use of water resources in its own sector at theexpense of other sectors such as agriculture. It may also lack the incentiveto make the most efficient use of water measures such as leak detection, andwaste prevention may be given low priority.
6.7 Conclusion
The availability of water is a key factor in the socioeconomic developmentof the island and its use is subject to severe competition. The complexity ofthe water resource system and the immutability of the water cycle will resultin expanding environmental problems for Mauritius as it rapidly develops inthe 21st century. Problems of aggravating water scarcity and deterioratingwater quality will increase, unless the sectoral approaches of the past arecomplemented by new approaches. The water demand in the long run willbe met only through an integrated approach, including legislative, economic,and technical measures aimed at the rational use of water resources. On theother hand, the country must learn to live on the terms of the water cycleon the island. It is essential that the new paradigm distinguishes betweenwhat the Mauritian society can change - i.e., its own behavior - and whatit cannot change - i.e., the laws of nature. Awareness of such distinctionsis necessary in seeking the new strategies that will carry Mauritius into thenext century.
Chapter 7
Sugar Cane and OtherAgriculture
Jairaj Ramkissoon
7.1 Introduction
Mauritius has long been characterized as a sugar island. "Sugar is King inMauritius," said J.E. Meade in 1966 in his presidential address to the RoyalEconomic Society (Meade, 1967, p. 244). This was before recent industrialization. But still today sugar-cane fields completely dominate the landscapeof Mauritius and the attachment of the population to sugar cane is morethan just economic. This chapter describes the interaction between manand nature as it has evolved around sugar production and other agriculturalproduction on Mauritius.
7.2 History
The island of Mauritius, as humans first encountered it, was completelycovered with lush tropical forests and was the habitat of many small speciesof birds and reptiles, many unique to the island.
The Dutch made two attempts at settlement in the 17th century, mainlyfor strategic reasons. They introduced sugar cane from Batavia (Indonesia)in 1639, as well as deer, rabbits, and cattle. They also introduced severalother crops including rice, wheat, maize, sweet potato, coconut, pineapple,
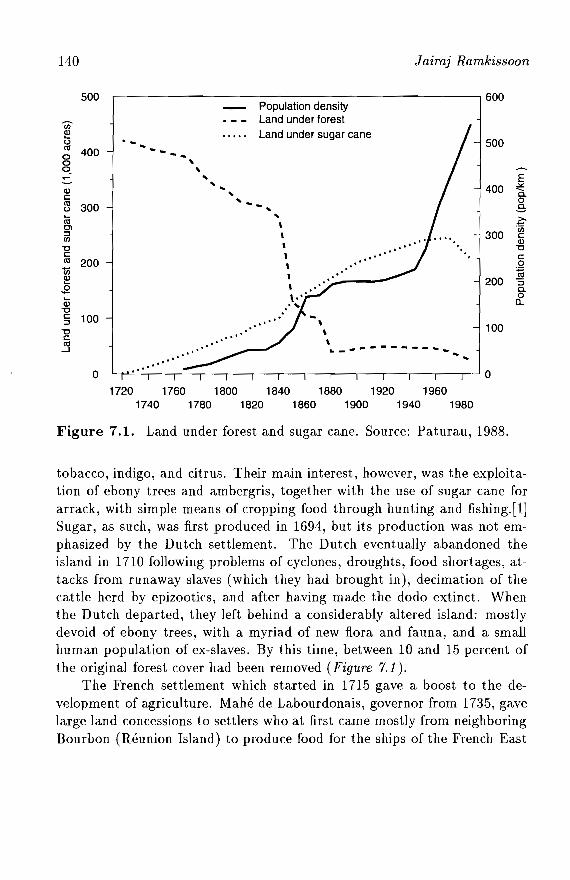
140 Jaimj Ramkissoon
500 600Population density
en Land under forest
~ Land under sugar cane() .- 500eu 400 ---0 -0 "o. "" E~
" 400 ~Q) ..c:: " 0-eu "-- 0() 300 " .e~ " ~0'1
,·00
::::J , 300 c::en Q)
"C,
"Cc:: , ", c::eu 200 " .Q,U5 , cu~ , 200 "S.E 0-.... \' " 0Q)
" ... a.."Cc:: 100 ",::::J ", 100"C ,c:
"....
eu ",...J
o1720 1760 1800 1840 1880 1920 1960
1740 1780 1820 1860 1900 1940 1980
Figure 7.1. Land under forest and sugar cane. Source: Paturau, 1988.
tobacco, indigo, and citrus. Their main interest, however, was the exploitation of ebony trees and ambergris, together with the use of sugar cane forarrack, with simple means of cropping food through hunting and fishing.[l]Sugar, as such, was first produced in 1694, but its production was not emphasized by the Dutch settlement. The Dutch eventually abandoned theisland in 1710 following problems of cyclones, droughts, food shortages, attacks from runaway slaves (which they had brought in), decimation of thecattle herd by epizootics, and after having made the dodo extinct. Whenthe Dutch departed, they left behind a considerably altered island: mostlydevoid of ebony trees, with a myriad of new flora and fauna, and a smallhuman population of ex-slaves. By this time, between 10 and 15 percent ofthe original forest cover had been removed (Figure 7.1).
The French settlement which started in 1715 gave a boost to the development of agriculture. Mahe de Labourdonais, governor from 1735, gavelarge land concessions to settlers who at first came mostly from neighboringBourbon (Reunion Island) to produce food for the ships of the French East
Sugar Cane and Other Agriculture 141
India Company (De Sornay, 1950). The population settled mostly alongthe warm coastal areas, and by 1742 about 16 percent of the island hadbeen cleared for cultivation. Maize was an important crop, and cassavafrom Brazil was introduced in 1740 to constitute the main staple diet ofthe slaves. Magon, governor from 1755 to 1759, further fostered sugar caneand animal husbandry by removing all previous restrictions on deforestationin 1755.
Many crops were introduced with varying success. The crops were notresistant to the periodic cyclones and droughts. Wheat production variedfrom 500 metric tons in 1773 to 330 metric tons in 1787 (De Sornay, 1950).Coffee was planted on an industrial scale in 1765, but was virtually wiped outin 1776, although it recovered by the early 19th century. Poivre, the islandintendant, first introduced spices, mainly doves and nutmeg (and other foodcrops), in the early 1770s. His intention was the establishment of a nurseryto supply seeds to other French colonies. This attempt eventually provedsuccessful and spice seeds were sent, for example, to Cayenne in the WestIndies and Zanzibar (Ly-Tio-Fane, 1958).
The sugar component was still of marginal significance, being fraughtwith marketing problems. The French crown, which took possession of theisland from 1767, made re-allotments of lands with conditions relating toslave and animal labor inputs per unit area of land offered. The primaryobjective of French policy was expansion of food production. The strategicimportance of the island, especially in the context of the war between Franceand England for India, led to all efforts and resources being diverted toservice the war, particularly by way of food production (Coombes, 1963).Internal food security considerations also became prominent as a result offamine which occurred in 1793 and 1794 (Paturau, 1988).
When the British conquered the island in 1810 (Treaty of Reims 1814),18 percent of the island was involved in agricultural production, mainly alongthe coastal areas, but sugar cane covered only 14 percent of the agriculturallands (Coombes, 1963).
The period of peace that followed British takeover was conducive to thedevelopment of the island, particularly the sugar industry. The instrumentalfactor was the opening of the British market to sugar. The British wereinterested in producing cash crops in Mauritius rather than food, whichcould easily be supplied from other colonies, mainly India and Australia (DeSornay, 1950). Several factors led to the choice of sugar cane, not the leastbeing the cyclones of 1818, 1819, and 1824 which removed all interest in
142 Jaimj Ramkissoon
coffee and other tree crop plantations. The next few decades were times ofgreat change in Mauritius.
Slavery was abolished in 1833. The ex-slaves, after leaving the plantations, collected mainly along the coastal areas. There they started with subsistence agriculture and fishing (Walter, 1910), without much effect on forestand environment. Meanwhile, due to massive Indian immigration, agricultural activities increased. Sugar plantations were mainly in the northern andeastern plains. The introduction of the natural fertilizer guano from Peru in1843 further enhanced sugar-cane yields and acreage, as is apparent in theincrease of sugar-cane production in the years 1843-1947 (see Figure 7.1).
Sugar-cane production became better regulated and organized throughthe creation of the Chamber of Agriculture in 1853. This institution, whosepurpose was "to defend the interests of the planter community," becameextremely valuable to subsequent agricultural development, particularly forthe sugar industry. By the mid-19th century, 259 sugar factories were inoperation, while 50,000 hectares (almost one-third of the island) had beenput under sugar cane.
To support the initial expansion of the sugar plantations, forestland wascleared. Also, private forests, mostly in the central plateau leased out totimber merchants and fuel makers, were being indiscriminately cut down.Another factor led to further diminution of forests as well as major socioeconomic changes: the outbreak of malaria in 1868 along the coastal areasof the island. This led to a mass movement of the population to the heretofore forested central areas, which subsequently became deforested. By now,almost all of the indigenous forests had disappeared: the area under primary forests, 121,000 hectares (65 percent of the total island area) in 1835,was reduced to only 6,800 hectares (4 percent of the island) in 1872 (seeFigure 7.1).
The spread of malaria seriously curtailed labor availability to the sugarindustry, but there also were a series of other setbacks: the sugar crisis ofLondon in 1847; reduced production as a result of pest and disease proliferation, e.g., the borer pest in 1850 and sugar-cane diseases (1866 to 1875)(Rouillard, 1990); sugar-price slumps in the 1870s; and increasing competition of "bounty-fed" beet sugars (Mauritius Chamber of Agriculture, 1953).
As a result, the sugar industry went through a restructuring processaimed at improving technical efficiency through centralization and the formation of sugar companies, along with factory modernization. Many smallfactories were closed. The coastal lands, deserted by the large estate owners,
Sugar Cane and Other Agriculture 143
were sold at relatively low prices mostly to the Indian population (Walter,1910). This was the beginning of the redistribution of wealth and the rise ofprosperity of a segment of the Indo-Mauritian population.
Another significant development took place in the 1880s. The government, after several enactments in 1874 and 1875 to check uncontrolled landclearances, commissioned an investigation on forestry and the environmental state of the island. The ensuing report submitted in 1881 by Thomson,Deputy Conservator of Forests for India, concluded that "the whole of thecentral ridge of the table land ... the great watershed in which all the largerrivers take their rise, requires to be permanently retained under forests"(Thomson, 1881). His recommendation, which was repeated later (Gleadow,1904), started the reacquisition by the government of private forests and theinitiation of a reforestation program.
The year 1881 thus marked an end to ruthless land use and deforestation, as the colonial government immediately launched a vast land acquisition program. All previous legislation was repealed and new regulationscontained stricter provisions for the conservation, restoration, and management of woods and forests. A number of boards and a fund were set up toadminister the acquisition and enforce the legislation. From 1881 to 1930the government purchased some 21,000 hectares of forestlands in the centralplateau region (Ministry of Economic Planning and Development, 1986).
The sugar industry was subjected to a Royal Commission Inquiry in1909. Its important recommendations included the evaluation of irrigationpossibilities and the creation of cooperative credit societies to help improvethe poor cane productivity of the small planters. The cooperative movementwas launched in 1913 to provide loans to the small planter community. Theirrigation expert, Harriet, in turn recommended the creation of reservoirs.La Ferme was one of them, and began providing water to the sugar estatesin June 1916.
The period of prosperity and development that culminated during theFirst World War (1914-1918) crashed again in the 1930s during the worldrecession. Mauritius was hit hard by the slump in sugar prices. In reaction,the UK, which had already reestablished the system of Imperial Preferencesfor sugar in 1919, undertook to import the bulk of all colonial and dominionsugar in 1937. It maintained this venture during World War II in order toguarantee its own supply.
The onset of World War II called for exceptional measures, particularlyregarding food supply in terms of production of selected foodcrops such as
144 Jairaj Ramkissoon
maize, cassava, sweet potatoes, and rice. The government imposed on thesugar estates and large planters (those having more than 20 arpents of land)the conversion of 22.5 percent of the acreage, later increased to 27.5 percent, to the exclusive cultivation of foodcrops. Thus, by 1943, foodcropacreage rose to 14,350 hectares, although the production targets could neverbe reached. The program had to be scrapped in 1945 and all the lands reverted to sugar cane, despite the continuing food crisis (Ministry of EconomicPlanning and Development, 1986).
The Food Production Board was created in 1947 and took control ofsome crown lands. The Board offered subsidies and price guarantees forselected crops, and imposed the exclusive use of newly cleared lands forfoodcrops for at least a year. The foodcrop area again rose to around 10,370hectares during the period 1947-1950, with significant increases in food production. However, the success was short-lived as a result of the removal ofthe subsidies and price guarantees by 1950. The Board published a "Memorandum on Food Policy" in 1950, defining "normal time" and "emergency"policy guidelines. Later, that policy became a more generalized statementin terms of land-use optimization, the maintenance of the sugar industry,and diversification into tea and food production.
The postwar period also witnessed another dramatic development ofthe sugar sector, arising from a combination of favorable bioclimatic andmarketing conditions, and generating a period of socioeconomic stability onthe island. Malaria was virtually eradicated and cyclones were rare in theperiod from 1946 to 1960. A high-yielding sugar-cane variety (the M134/32)released in 1937, together with enormous increases in the use of fertilizers,doubled sugar production within a short period (Rouillard, 1990). Infrastructure and irrigation were also developed.
The Mauritius Sugar Industry Research Institute (MSIRI) was created in1953 and took over all sugar-related research. The sugar industry extendedthe use of land-clearing machinery and lorry transportation. The security ofthe sugar sector was further enhanced by the setting up of the Cyclone andDrought Insurance Scheme in 1946. The Commonwealth Sugar Agreement(CSA) was signed in 1953 and maintained the marketing guarantees of thefirst agreement signed in 1937.
Sugar-cane acreage expanded by 63 percent during the period from 1945to 1966, from 53,800 hectares to 87,600 hectares (the highest ever attained)in 1966. These two postwar decades were a real discontinuity with the past.After these changes had taken place, the sugar industry stabilized. Yields
Sugar Cane and Other Agriculture 145
were about 60 metric tons per hectare, fertilizer use was about 120 kg perhectare, and some 70,000 to 90,000 hectares were under cultivation. TheCommonwealth Sugar Agreement remained in effect until 1974.
The agricultural sector, the main industry of the island since Britishrule, has been experiencing a gradual erosion of its socioeconomic importanceover the short span of the last decade. Its share in GDP has depreciatedfrom 22 percent in 1976 to 15 percent during 1984-1987, and further to anestimated low of 12.7 percent for the period between 1988 and 1990. Thecontribution of the export duty levied on sugar to total government revenuehas substantially decreased recently, from 9.8 percent in 1987 to 4.4 percentin 1989.
A decline is also noted in the share of agriculture in total export earnings,from 88 percent in the mid-1970s to about 40 percent in the late 1980s. Also,agriculture was surpassed by the Export Processing Zone (EPZ, see Chapter8 for det ails) sector even in terms of net foreign exchange earnings in 1991. Asimilar phenomenon is noted with respect to agricultural employment whichappears to have leveled off over the past few years to some 75,000. In fact, adifferent problem has surfaced recently. The increasing competition from thenonagricultural sector is causing a seasonal lack of labor which has turnedout to be a serious constraint to agricultural development.
7.3 The Sugar Sector
7.3.1 Ownership
The sugar sector consists of miller-planters and associated large estates(about 30 in all), along with other small sugar planters constituting independent holdings (approximately 35,000). There are 19 sugar mills, of which3 are foreign-owned and 1 has been government property since 1973. Themiller-planters accounted for 52.6 percent of the total cultivated area undersugar cane and 60.3 percent of the total sugar production in 1990 (MauritiusChamber of Agriculture, 1991). More than half of the small planters haveholdings of less than half a hectare. The number of small holdings has beenon the increase over time, particularly as a result of fragmentation arisingfrom inheritance or tax and labor laws (World Bank, 1986). This has beena cause for concern in view of the lower productivity of such small holdings:small planters' yields average out to 6.7 metric tons of sugar per hectarecompared with 9.6 metric tons for each hectare for the large estates (1990data) although considerable regional and holding size differences exist.
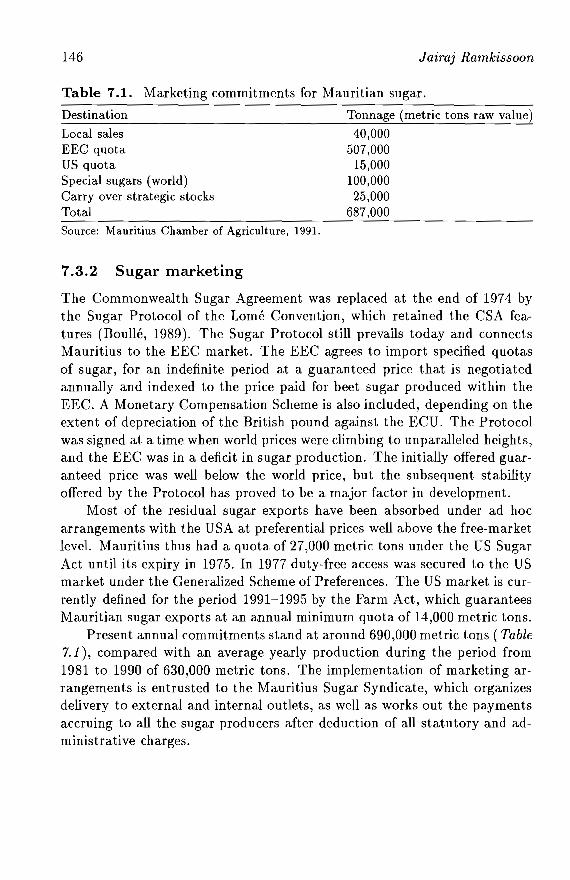
146
Table 7.1.
Destination
Jairaj Ramkissoon
Marketing commitments for Mauritian sugar.
Tonnage (metric tons raw value)
Local salesEEC quotaUS quotaSpecial sugars (world)Carryover strategic stocksTotalSource: Mauritius Chamber of Agriculture, 1991.
40,000507,000
15,000100,00025,000
687,000
7.3.2 Sugar marketing
The Commonwealth Sugar Agreement was replaced at the end of 1974 bythe Sugar Protocol of the Lome Convention, which retained the CSA features (Boulle, 1989). The Sugar Protocol still prevails today and connectsMauritius to the EEC market. The EEC agrees to import specified quotasof sugar, for an indefinite period at a guaranteed price that is negotiatedannually and indexed to the price paid for beet sugar produced within theEEC. A Monetary Compensation Scheme is also included, depending on theextent of depreciation of the British pound against the ECU. The Protocolwas signed at a time when world prices were climbing to unparalleled heights,and the EEC was in a deficit in sugar production. The initially offered guaranteed price was well below the world price, but the subsequent stabilityoffered by the Protocol has proved to be a major factor in development.
Most of the residual sugar exports have been absorbed under ad hocarrangements with the USA at preferential prices well above the free-marketlevel. Mauritius thus had a quota of 27,000 metric tons under the US SugarAct until its expiry in 1975. In 1977 duty-free access was secured to the USmarket under the Generalized Scheme of Preferences. The US market is currently defined for the period 1991-1995 by the Farm Act, which guaranteesMauritian sugar exports at an annual minimum quota of 14,000 metric tons.
Present annual commitments stand at around 690,000 metric tons (Table7.1), compared with an average yearly production during the period from1981 to 1990 of 630,000 metric tons. The implementation of marketing arrangements is entrusted to the Mauritius Sugar Syndicate, which organizesdelivery to external and internal outlets, as well as works out the paymentsaccruing to all the sugar producers after deduction of all statutory and administrative charges.
Sugar Cane and Other Agriculture
7.3.3 Fiscal policy and profitability
147
A tax on sugar was introduced in 1961 at a uniform rate of 5 percent of thegross value of exports, and increased to 6 percent in the early 1970s. Theinitial rationale was purely fiscal. Later, the tax served as a disincentive forsugar and an incentive for diversification toward other crops. In 1975 thesmall planters (producing less than 20 metric tons of sugar) were exempted,while a progressive rate was introduced. Thus, the tax policy also acquireda redistributive function. A surcharge of 75 percent on the basic tax waslevied in 1979 to mop up windfall gains, while the industry was also liableto corporate tax (after payment of dividends). In this period, sugar taxeswere a major source of government revenue. Simultaneously, the enhancedproduction and high sugar prices in the mid-1970s led to increased profitswhich were partly invested in non-sugar sectors such as the new ExportProcessing Zone and tourism, to a large extent spurring the economic growthof this period. Investments within the sugar sector also increased.
Profitability, however, was greatly reduced by the early 1980s during theworld recession, and further aggravated by cyclones and droughts. The financial burden of labor laws also became critical. Large estates were required tomaintain a regular work force all year round. The main consequences werethe fragmentation of estates with 100 to 500 arpents and decreasing capitalinvestments.
7.3.4 Other problems and measures
The sugar sector went through a major reform period starting from the early1980s. The government provided some relief by decreasing the surcharge to50 percent in 1982. Following the recommendations of the Commission ofInquiry on the Sugar Industry, a Sugar Authority was established in July1984 and a Sugar Action Plan published in February 1985. Support fromthe World Bank, in terms of a Sugar Industry Project, became available inSeptember 1985. The sugar export duty was further relaxed by broadeningthe exemption and applying progressive rates, and standardized accountingformats were established. Two mills were allowed to close in 1985, andsupport services for the small planters were to be provided by the creationof Farmers' Service Centers. Following the Sugar Industry Efficiency Study(1988) and the positive measures in the Sugar Industry Efficiency Act of1989, declining profit margins have been offset to some extent.
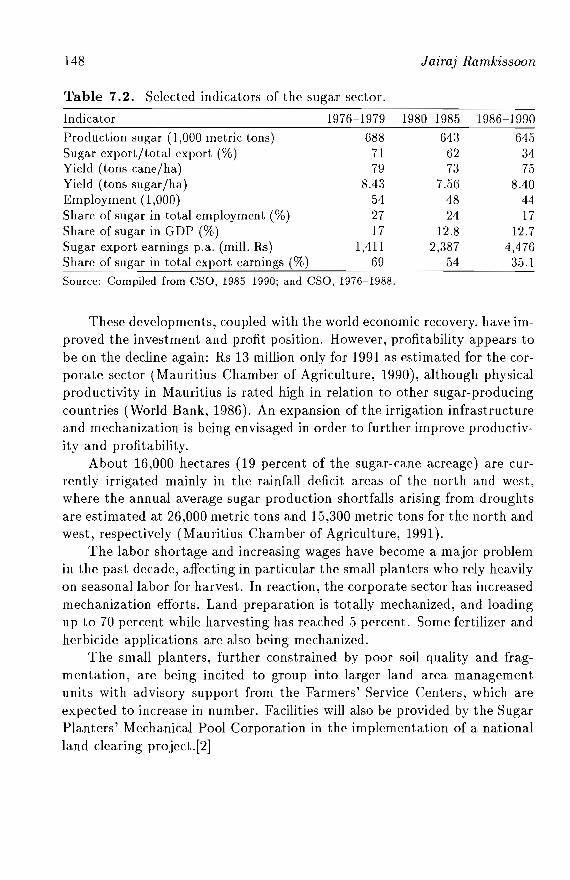
148
Table 7.2. Selected indicators of the sugar sector.
Jairaj Ramkissoon
Indicator 1976-1979
Production sugar (1,000 metric tons) 688Sugar export/total export (%) 71Yield (tons cane/ha) 79Yield (tons sugar/ha) 8.43Employment (1,000) 54Share of sugar in total employment (%) 27Share of sugar in GDP (%) 17Sugar export earnings p.a. (mill. Rs) 1,411Share of sugar in total export earnings (%) 69
Source: Compiled from CSO, 1985-1990; and CSO, 1976-1988.
1980-1985
6436273
7.564824
12.82,387
Ei4
1986-1990
6453475
8.404417
12.74,47635.1
These developments, coupled with the world economic recovery, have improved the investment and profit position. However, profitability appears tobe on the decline again: Rs 13 million only for 1991 as estimated for the corporate sector (Mauritius Chamber of Agriculture, 1990), although physicalproductivity in Mauritius is rated high in relation to other sugar-producingcountries (World Bank, 1986). An expansion of the irrigation infrastructureand mechanization is being envisaged in order to further improve productivity and profitability.
About 16,000 hectares (19 percent of the sugar-cane acreage) are currently irrigated mainly in the rainfall deficit areas of the north and west,where the annual average sugar production shortfalls arising from droughtsare estimated at 26,000 metric tons and 15,300 metric tons for the north andwest, respectively (Mauritius Chamber of Agriculture, 1991).
The labor shortage and increasing wages have become a major problemin the past decade, affecting in particular the small planters who rely heavilyon seasonal labor for harvest. In reaction, the corporate sector has increasedmechanization efforts. Land preparation is totally mechanized, and loadingup to 70 percent while harvesting has reached 5 percent. Some fertilizer andherbicide applications are also being mechanized.
The small planters, further constrained by poor soil quality and fragmentation, are being incited to group into larger land area managementunits with advisory support from the Farmers' Service Centers, which areexpected to increase in number. Facilities will also be provided by the SugarPlanters' Mechanical Pool Corporation in the implementation of a nationalland-clearing project.[2]
Sugar Cane and Other Agriculture 149
Table 7.2 gives selected indicators of the sugar industry in the economicand social development of Mauritius.
7.4 Other Agriculture
7.4.1 Food for local consumption
Improvements in food self-sufficiency have been tried repeatedly, for example, in the 1970s as part of the then reigning strategy of import substitutionand food security. At the same time, subsidies on imported rice and flourhave been maintained. Some measure of success has been achieved withfoodcrops, particularly potatoes, but the profitability of most of these diversification programs is still difficult to assess.
The producers are again segmented into the large sugar estates thatfocus on the utilization of sugar-cane interline and rotation lands for theproduction of potatoes, maize, and groundnuts mainly and small planterswho produce a variety of foodcrops and vegetables on small plots (less thana hectare).
A major effort was started in the 1980s to review agricultural pricingissues. A scheme of guaranteed prices was initiated for selected crops (potatoes, maize, onions, and garlic) by the Agricultural Marketing Board (AMB),which maintains a monopoly over the imports of these (and some other) fooditems and has recourse to imports only when local production faces shortfalls.
Similar incentives have been given to the livestock, milk, and meat sectors, but production, except for poultry, has always lagged behind set targets. The same impediments continue to prevail and hamper diversification efforts: cyclones and droughts; lack of irrigation facilities; rocky soil;marketing constraints for most food items outside the control of the AMB,which are subject to extreme volatility in prices; problems of land and laborscarcity; and, not least, the seemingly traditional and customarily accepteddependence on external supplies for foodstuffs which have been dramaticallyincreasing over the years.
Table 7.3, which indicates the structure offood production and importsfor the period 1988-1990, gives the continuing high dependence of Mauritiuson food imports, which amounted to Rs 2.65 billion in cost, insurance, andfreight (elF) in 1990, i.e., 11 percent oftotal imports and 47 percent of totalagricultural and food export earnings. Table 7.4 gives a summary pictureof land allocations to various agricultural activities since the mid-1940s.
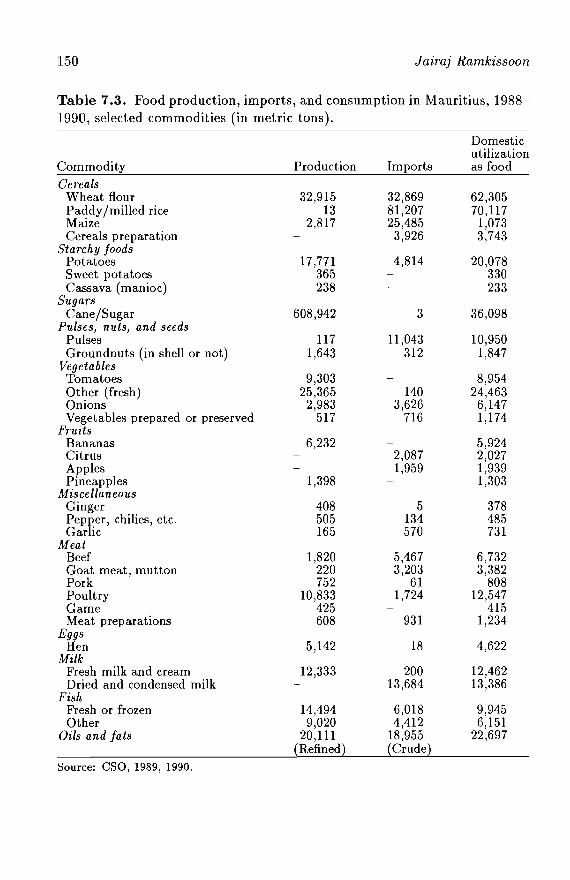
150 Jairaj Ramkissoon
Table 7.3. Food production, imports, and consumption in Mauritius, 1988-1990, selected commodities (in metric tons).
Domesticutilization
Commodity Production Imports as foodCereals
Wheat flour 32,915 32,869 62,305Paddy/milled rice 13 81,207 70,117Maize 2,817 25,485 1,073Cereals preparation 3,926 3,743
Starchy foodsPotatoes 17,771 4,814 20,078Sweet potatoes 365 330Cassava (manioc) 238 233
SugarsCane/Sugar 608,942 3 36,098
Pulses, nuts, and seedsPulses 117 11 ,043 10,950Groundnuts (in shell or not) 1,643 312 1,847
VegetablesTomatoes 9,303 8,954Other (fresh) 25,365 140 24,463Onions 2,983 3,626 6,147Vegetables prepared or preserved 517 716 1,174
FruitsBananas 6,232 5,924Citrus 2,087 2,027Apples 1,959 1,939Pineapples 1,398 1,303
MiscellaneousGinger 408 5 378Pepper, chilies, etc. 505 134 485Garlic 165 570 731
MeatBeef 1,820 5,467 6,732Goat meat, mutton 220 3,203 3,382Pork 752 61 808Poultry 10,833 1,724 12,547Game 425 415Meat preparations 608 931 1,234
EggsHen 5,142 18 4,622
MilkFresh milk and cream 12,333 200 12,462Dried and condensed milk 13,684 13,386
FishFresh or frozen 14,494 6,018 9,945Other 9,020 4,412 6,151
Oils and fats 20,111 18,955 22,697(Refined) (Crude)
Source: csa, 1989, 1990.
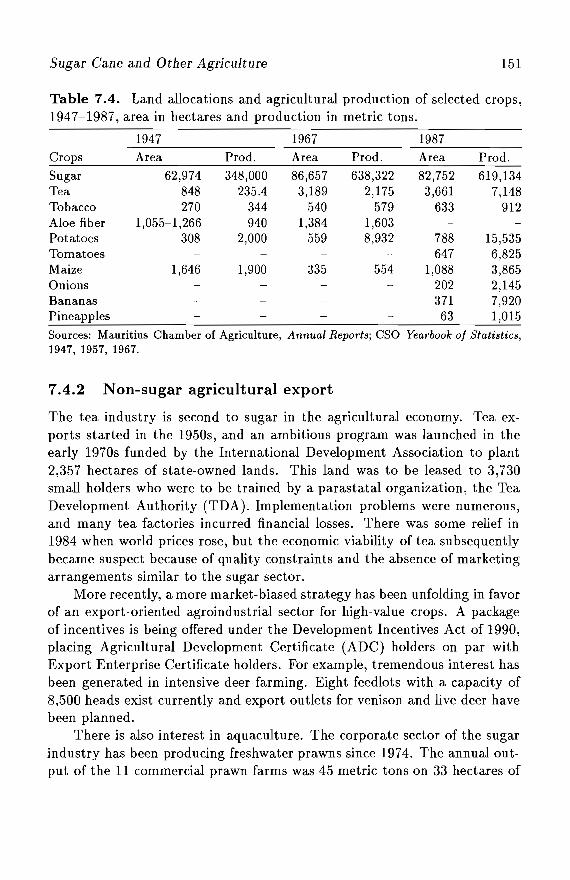
Sugar Cane and Other Agriculture 151
Table 7.4. Land allocations and agricultural production of selected crops,1947-1987, area in hectares and production in metric tons.
1947 1967 1987Crops Area Prod. Area Prod. Area Prod.
619,1347,148
912
82,7523,661
633
Sugar 62,974 348,000 86,657 638,322Tea 848 235.4 3,189 2,175Tobacco 270 344 540 579Aloe fiber 1,055-1,266 940 1,384 1,603Potatoes 308 2,000 559 8,932 788 15,535Tomatoes 647 6,825Maize 1,646 1,900 335 554 1,088 3,865Onions 202 2,145Bananas 371 7,920Pineapples 63 1,015
Sources: Mauritius Chamber of Agriculture, Annual Reports; csa Yearbook of Statistics,1947,1957,1967.
7.4.2 Non-sugar agricultural export
The tea industry is second to sugar in the agricultural economy. Tea exports started in the 1950s, and an ambitious program was launched in theearly 1970s funded by the International Development Association to plant2,357 hectares of state-owned lands. This land was to be leased to 3,730small holders who were to be trained by a parastatal organization, the TeaDevelopment Authority (TDA). Implementation problems were numerous,and many tea factories incurred financial losses. There was some relief in1984 when world prices rose, but the economic viability of tea subsequentlybecame suspect because of quality constraints and the absence of marketingarrangements similar to the sugar sector.
More recently, a more market-biased strategy has been unfolding in favorof an export-oriented agroindustrial sector for high-value crops. A packageof incentives is being offered under the Development Incentives Act of 1990,placing Agricultural Development Certificate (ADC) holders on par withExport Enterprise Certificate holders. For example, tremendous interest hasbeen generated in intensive deer farming. Eight feedlots with a capacity of8,500 heads exist currently and export outlets for venison and live deer havebeen planned.
There is also interest in aquaculture. The corporate sector of the sugarindustry has been producing freshwater prawns since 1974. The annual output of the 11 commercial prawn farms was 45 metric tons on 33 hectares of
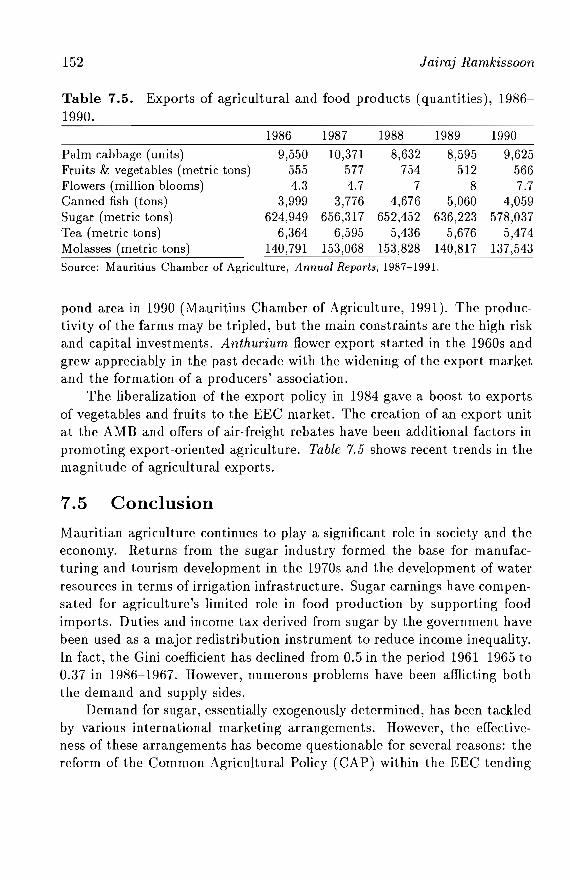
152 Jaimj Ramkissoon
Table 7.5. Exports of agricultural and food products (quantities), 19861990.
1986 1987 1988 1989Palm cabbage (units) 9,550 10,371 8,632 8,595Fruits & vegetables (metric tons) 555 577 754 512Flowers (million blooms) 4.3 4.7 7 8Canned fish (tons) 3,999 3,776 4,676 5,060Sugar (metric tons) 624,949 656,317 652,452 636,223Tea (metric tons) 6,364 6,595 5,436 5,676Molasses (metric tons) 140,791 153,068 153,828 140,817Source: Mauritius Chamber of Agriculture, Annual Reports, 1987-1991.
19909,625
5667.7
4,059578,037
5,474137,543
pond area in 1990 (Mauritius Chamber of Agriculture, 1991). The productivity of the farms may be tripled, but the main constraints are the high riskand capital investments. Anthurium flower export started in the 1960s andgrew appreciably in the past decade with the widening of the export marketand the formation of a producers' association.
The liberalization of the export policy in 1984 gave a boost to exportsof vegetables and fruits to the EEC market. The creation of an export unitat the AMB and offers of air-freight rebates have been additional factors inpromoting export-oriented agriculture. Table 7.5 shows recent trends in themagnitude of agricultural exports.
7.5 Conclusion
Mauritian agriculture continues to playa significant role in society and theeconomy. Returns from the sugar industry formed the base for manufacturing and tourism development in the 1970s and the development of waterresources in terms of irrigation infrastructure. Sugar earnings have compensated for agriculture's limited role in food production by supporting foodimports. Duties and income tax derived from sugar by the government havebeen used as a major redistribution instrument to reduce income inequality.In fact, the Gini coefficient has declined from 0.5 in the period 1961-1965 to0.:37 in 1986-1967. However, numerous problems have been afflicting boththe demand and supply sides.
Demand for sugar, essentially exogenously determined, has been tackledby various international marketing arrangements. However, the effectiveness of these arrangements has become questionable for several reasons: thereform of the Common Agricultural Policy (CAP) within the EEC tending
Sugar Cane and Other Agriculture 153
toward decreased agricultural support; the uncertainties of the GATT outcome favoring trade liberalization; and the formation of other trade blockssuch as the North American Free Trade Association. The world sugar market has been in chronic surplus since 1981, and the EEC is in a sugar surplusposition now, contributing about 25 percent to the residual world market forsugar. The US market has been dwindling over the past decade: it represented 16.6 percent of total sugar exports in 1979-1980 but only 4.4 percentin 1990-1991. Sugar prices on the world market have been stumbling whilethe EEC-offered prices have remained frozen since the mid-1980s, with theprospect of prices becoming even more depressed in real terms in comingyears. The increase in sugar earnings in terms of Mauritian rupees in thepast decade, in fact, has derived essentially from the adoption of a flexibleexchange rate system since 1983, the net effect of which has been a continually depreciating rupee against the most important international currencies. Boom prospects appear elusive, particularly considering the increasedutilization of sugar substitutes since 1974. Tea prices also have been lowsince 1984. However, the internal demand for food has been increasing andthe pattern of food consumption has been changing toward more expensiveitems, as a result of economic growth.
The supply side has also been experiencing several constraints. Laborshortage and low productivity have become acute. The land resource baseis still greatly limited by the rocky terrain. Agriculture land is being lostto nonagricultural use at an annual rate of 300 hectares (Mauritius Chamber of Agriculture, 1991). There has been a reduction of 16,000 hectares ofagricultural lands - a decrease of 15 percent between 1965 and 1986 (Ministry of Housing, Lands, and the Environment, 1990). The profitability ofagricultural enterprises is eroding. Agricultural diversification has had limited success except for poultry and potato production, and to some extentfresh vegetable production. This effort, furthermore, has been essentiallyrestricted within the boundary of the sugar system, necessarily subservientto sugar production, although it constitutes an efficient use of the sugarind ustry resources.
There are also more specific social implications in terms of agriculturaland food policy. Who is going to produce the food that could and should beproduced? And who in the population is actually going to adapt consumption patterns to the production potential of the agricultural sector and thenatural-resource endowments of the country? Could the "cash-crop/ cheapfood" policy be indefinitely sustained with the likely substantial expansion
154 Jaimj Ramkissoon
in food imports and a heavier burden of food subsidies? And could nutritional/health interactions be forceful enough toward a gradual shift indietary patterns? Little success has been achieved so far in these areas.The classic producer-consumer conflict can only partially explain the lackof achievement. In fact, it derives more from the socioeconomic complexityof the Mauritian society, which makes the whole issue a sensitive one withsignificant political overtones.
Environmental considerations are also receiving increasing interest. Sustainable agriculture has become an issue. Concern has been expressed aboutnitrate and pesticide effects (Ministry of Environment and Quality of Life,1991). Preliminary studies undertaken by the Central Water Authority inthe late 1980s indicate that nitrate levels in groundwater were approachingrecommended tolerance limits (50 mg per liter) in some areas during certain periods of the year. MSIRI investigations, however, show that nitrateleaching is not significant in the year of application. The method of sprayingpesticides results in over 90 percent of the pesticides falling on the ground insome places, and application rates are suspected to be high, particularly insugar-cane fields with crop interlining or in rotation with foodcrops. Residual tests on some foodcrops do not appear to be alarming at this point.Residual effects of triazine herbicides (commonly used in Mauritius) havebeen detected in Western Europe and the USA, but to date no studies onthis pesticide have been undertaken in Mauritius.
However, efforts are continuing on several fronts to address these issues. Political diplomacy and foreign policy, which are increasingly viewedas instruments of support to economic development, are extensively gearedto the preservation of the Sugar Protocol and other marketing contracts.The only strategy appears to be long-term arrangements, which so far havebeen powerful instruments of socioeconomic stability and the best example of North-South cooperation. The so-called "EEC dividends" in favor ofAfrican, Caribbean, and Pacific (ACP) countries should be viewed in thecontext of the long history of sugar marketing - itself deriving from a colonial legacy of sugar plantation economies - where there have been manyinstances of "colonial dividends," as well as in favor of the colonial powers.
On the domestic front, consumer subsidies particularly on rice and flourare still maintained, while food prices of other foodstuffs are either fixed orcontrolled and import tariffs removed from almost all food items. Furthermore, provisions for rice and flour are secured by the government.
Sugar Cane and Other Agriculture 155
Additionally, there is stricter control on agricultural land use, althoughreallocation of land resources have to be faced in the long term not onlywithin the agricultural sector, but also between it and the rest of the economy. The current exercise of the National Physical Development Plan isextremely important in the creation of agricultural and land-resource policies favorable to sustainable development. Various studies designed to lookat environmental impacts are under way. The government, with the supportof the World Bank, has also presented an Indicative Investment Program(containing a comprehensive list of agricultural development projects including environmental activities and R&D) to the International Aid Donorsmeeting in 1990. Recently, the government has even started to incorporatenutritional considerations in its policy-making process.
The potential to improve land and labor productivity in agriculture doesseem considerable, but massive capital and technological inputs, plus a package of socioeconomic measures and incentives to offset the relatively disadvantaged position of agriculture in comparison to the EPZ and the servicessectors are needed. Past experience of dealing with crises ought to help.Nevertheless, there may still be prospective situations that should be lookedinto more carefully, such as the presumed effects of world climate changeand more effective development and/or application of emerging technologies, in addition to more effective exploitation of existing low-technologypossibilities.
Clearly, the issues are complex. The interconnectedness of the agricultural system with the rest of the economy and the environmental implicationsincrease the complexity. A systematic and integrated approach to planning,not only with a short-term view but perhaps more so within a long-termperspective horizon, is needed.
Notes
[1] Ambergris is a waxy substance found floating in or around the shores of tropicalwaters, believed to originate in the intestines of the sperm whale, and used inperfumery. Arrack is a spirit manufactured from sugar-cane juice.
[2] This project aims at removing heavy volcanic rocks, which can be found practically everywhere, from the sugar fields.

Chapter 8
Industrial Development andthe Labor Force
Esther Hanoomanjee
8.1 Introduction
In 1990 Mauritius had a per capita GNP of $2,250 which is about equalto that of Bulgaria, Algeria, Malaysia, and Argentina. The average growthrate in total GNP was 5.2 percent between 1965 and 1980 and 6.0 percentover the last decade. Growth rates in manufacturing were more than 10percent (World Bank, 1992b). This very rapid growth was mostly due tothe development of the Export Processing Zone (EPZ) in the 1980s. Thischapter traces the industrial development of the Mauritius economy sincethe colonial period. The chapter then focuses on the conditions under whichEPZ grew, giving special emphasis to the role of labor and in particularfemale labor.
8.2 The Role of Non-sugar ManufacturingBefore 1968
8.2.1 Non-sugar production: A historical perspective
Industries were started in Mauritius in the Dutch period. The introductionof sugar in the late 16th century led to the emergence of several supportive
158 Esther Hanoomanjee
manufacturing activities. These included shipbuilding, iron foundries, distilleries for rum and alcohol, salt pans, and limekilns. The earliest records onthe Mauritius economy - the Administrative Report 1879 of the Colony ofMauritius- indicates that, apart from sugar, other manufactured producefor export, including vanilla, aloe fiber, coconut oil, and rum, was negligible(Ministry of Industry and Industrial Technology, 1990).
There was little development over the next century, and in 1961 it wasobserved that, "For the most part, manufacturing in Mauritius was at arather primitive stage of development, carried out on a small scale and oftenstruggling to keep alive against many difficulties and obstacles" (Meade et al.,1968). In sharp contrast, the production of sugar from sugar cane was highlyorganized and undertaken in an efficient manner with up-to-date equipmentand technology. Thus, there was a dichotomy between the production of themain export - sugar - and manufacturing in the rest of the economy.
The industries serving the sugar sector, such as timber, engineering, andaloes, were better organized than the rest of the manufacturing sector. Thus,of the several engineering workshops which had developed for the maintenance of the equipment used by the sugar industry, two or three of themcould produce some of the smaller tools required by the sugar and the otherindustries. However, the small size of the total market for such equipmentdid not render the production of this equipment viable on a commercial basis. This was also true of the by-products of the sugar industry - namely,molasses and bagasse. Some 50 percent of the molasses was exported, about10 percent used in the local distilleries for the production of rum, and therest used as fertilizers. The possibility of setting up a distillery for the production of alcohol for export was proposed in 1969, but was not retainedbecause of the lack of initiative of local entrepreneurs.
By 1948, several small establishments were producing a variety of itemsfor domestic consumption. A summary of industrial production is given inTable 8.1.
8.2.2 Employment in non-sugar manufactures
In 1948, there were some 370 persons licensed to manufacture oil, lime,salt, gold, and silverware, etc. Employment in the non-sugar manufacturing sector continued to grow slowly over the century. By 1951, the number of persons employed in non-sugar manufacturing industries was 11,000,
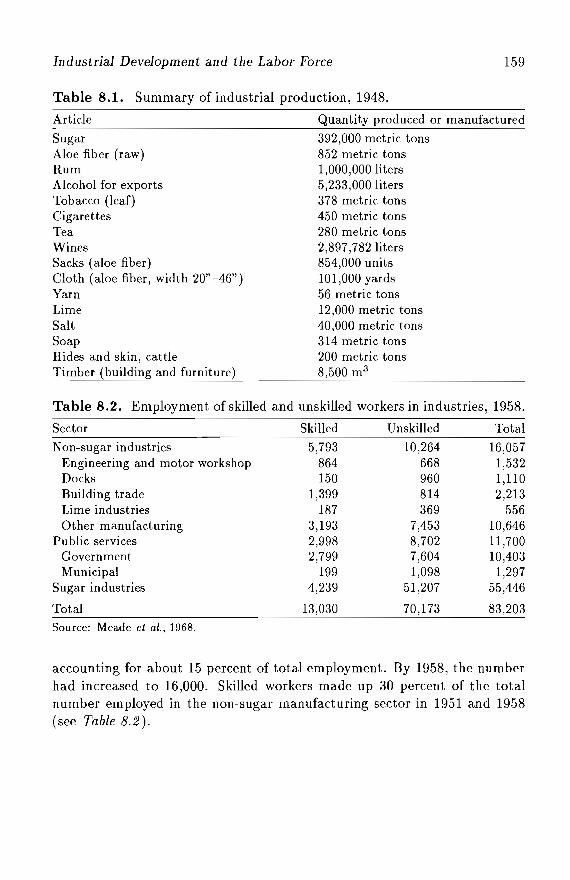
Industrial Development and the Labor Force
Table 8.1. Summary of industrial production, 1948.
159
Article
SugarAloe fiber (raw)RumAlcohol for exportsTobacco (leaf)CigarettesTeaWinesSacks (aloe fiber)Cloth (aloe fiber, width 20" -46")YarnLimeSaltSoapHides and skin, cattleTimber (building and furniture)
Quantity produced or manufactured
392,000 metric tons852 metric tons1,000,000 liters5,233,000 liters378 metric tons450 metric tons280 metric tons2,897,782 liters854,000 units101,000 yards56 metric tons12,000 metric tons40,000 metric tons314 metric tons200 metric tons8,500 m 3
Table 8.2. Employment of skilled and unskilled workers in industries, 1958.
Sector Skilled Unskilled Total
Non-sugar industries 5,793 10,264 16,057Engineering and motor workshop 864 668 1,532Docks 150 960 1,110Building trade 1,399 814 2,213Lime industries 187 369 556Other manufacturing 3,193 7,453 10,646
Public services 2,998 8,702 11,700Government 2,799 7,604 10,403Municipal 199 1,098 1,297
Sugar industries 4,239 51,207 55,446
Total 13,030 70,173 83,203
Source: Meade et al., 1968.
accounting for about 15 percent of total employment. By 1958, the numberhad increased to 16,000. Skilled workers made up 30 percent of the totalnumber employed in the non-sugar manufacturing sector in 1951 and 1958(see Table 8.2).
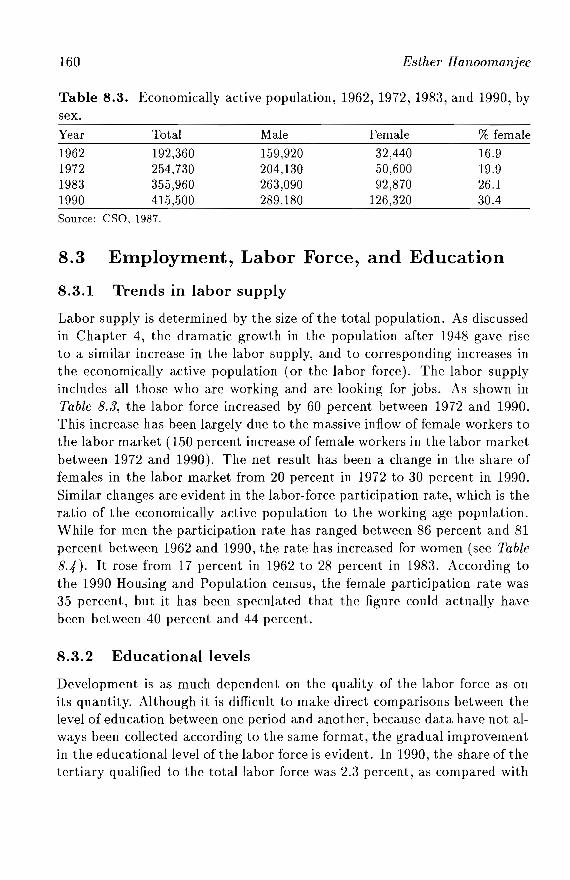
160 Esther Hanoomanjee
Table 8.3. Economically active population, 1962, 1972, 1983, and 1990, bysex.
Year
1962197219831990Source:
Total192,360254,730355,960415,500
csa,1987.
Male Female % female
159,920 32,440 16.9204,130 50,600 19.9263,090 92,870 26.1289,180 126,320 30.4
8.3
8.3.1
Employment, Labor Force, and Education
Trends in labor supply
Labor supply is determined by the size of the total population. As discussedin Chapter 4, the dramatic growth in the population after 1948 gave riseto a similar increase in the labor supply, and to corresponding increases inthe economically active population (or the labor force). The labor supplyincludes all those who are working and are looking for jobs. As shown inTable 8.3, the lahar force increased by 60 percent between 1972 and 1990.This increase has been largely due to the massive inflow of female workers tothe labor market (1.50 percent increase offemale workers in the labor marketbetween 1972 and 1990). The net result has been a change in the share offemales in the labor market from 20 percent in 1972 to 30 percent in 1990.Similar changes are evident in the lahar-force participation rate, which is theratio of the economically active population to the working-age population.While for men the participation rate has ranged between 86 percent and 81percent between 1962 and 1990, the rate has increased for women (see Table8.4). It rose from 17 percent in 1962 to 28 percent in 1983. According tothe 1990 Housing and Population census, the female participation rate was35 percent, but it has been speculated that the figure could actually haveheen between 40 percent and 44 percent.
8.3.2 Educational levels
Development is as much dependent on the quality of the labor force as onits quantity. Although it is difficult to make direct comparisons between thelevel of education between one period and another, because data have not always been collected according to the same format, the gradual improvementin the educational level of the labor force is evident. In 1990, the share of thetertiary qualified to the total labor force was 2.3 percent, as compared with
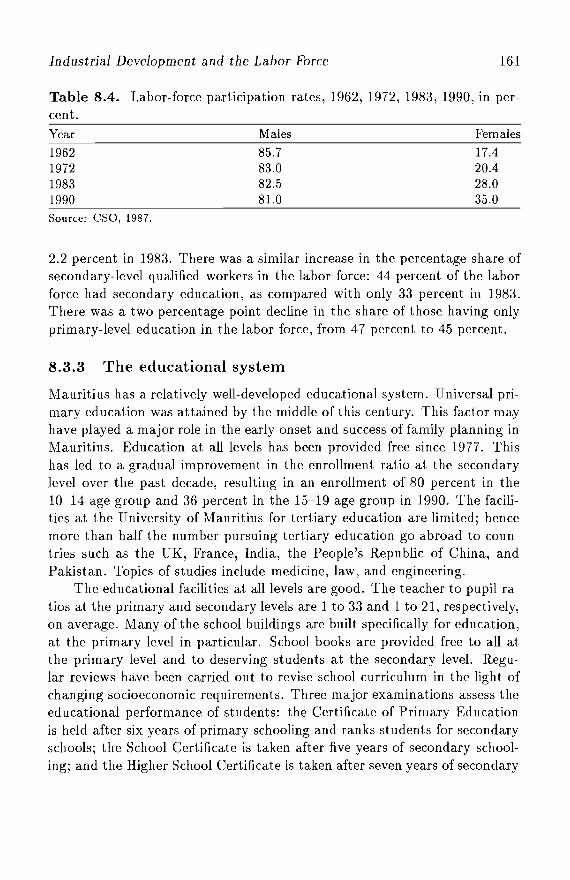
Industrial Development and the Labor Force 161
Table 8.4. Labor-force participation rates, 1962, 1972, 1983, 1990, in percent.
Year Males Females
1962 85.7 17.41972 83.0 20.41983 82.5 28.01990 81.0 35.0
Source: csa, 1987.
2.2 percent in 1983. There was a similar increase in the percentage share ofsecondary-level qualified workers in the labor force: 44 percent of the laborforce had secondary education, as compared with only 33 percent in 1983.There was a two percentage point decline in the share of those having onlyprimary-level education in the labor force, from 47 percent to 45 percent.
8.3.3 The educational system
Mauritius has a relatively well-developed educational system. Universal primary ed ucation was attained by the middle of this century. This factor mayhave played a major role in the early onset and success of family planning inMauritius. Education at all levels has been provided free since 1977. Thishas led to a gradual improvement in the enrollment ratio at the secondarylevel over the past decade, resulting in an enrollment of 80 percent in the10-14 age group and 36 percent in the 15-19 age group in 1990. The facilities at the University of Mauritius for tertiary education are limited; hencemore than half the number pursuing tertiary education go abroad to countries such as the UK, France, India, the People's Republic of China, andPakistan. Topics of studies include medicine, law, and engineering.
The educational facilities at all levels are good. The teacher to pupil ratios at the primary and secondary levels are 1 to 33 and 1 to 21, respectively,on average. Many of the school buildings are built specifically for education,at the primary level in particular. School books are provided free to all atthe primary level and to deserving students at the secondary level. Regular reviews have been carried out to revise school curriculum in the light ofchanging socioeconomic requirements. Three major examinations assess theeducational performance of students: the Certificate of Primary Educationis held after six years of primary schooling and ranks students for secondaryschools; the School Certificate is taken after five years of secondary schooling; and the Higher School Certificate is taken after seven years of secondary
162 Esther Hanoomanjee
schooling. The last two exams are moderated externally by Cambridge University for most subjects, and are thus internationally accepted.
The weakness of the existing system is the nonuniformity of schools atthe secondary level. There is a wide disparity between the 16,600 seatsavailable in the "quality" schools and the remaining 62,600 seats. The competition to enter the former is extremely intense, and students and parentsare under heavy pressure during most of the primary cycle.
The Master Plan for Education (Ministry of Education and Science,1991), which was prepared in 1991 with much public support, attempts toresolve the weakness in the system by introducing nine years of basic education. The plan proposes that facilities of different academic and technical/vocational combinations be built gradually in order to provide appropriate education to all students who complete the primary cycle. The objectiveis to phase out the Certificate of Primary Education at the end of the primary cycle, thus enabling all students to move on to an educational programwhich is in line with their own potential and aptitude.
Recurrent expenditure on education currently stands at 13 percent ofthe total national budget, thus making education one of the largest users ofgovernment funds. Salaries and wages account for the largest share of thisexpenditure, and some trimming could be made through the introduction ofvarious measures, including the grouping of subjects taught at the variousschools. More than 70 different subjects are taught at the secondary level.In line with government policy to promote local languages, five languages(apart from English and French) are taught at the primary level. At most ofthe schools, physical improvements have been made regularly to educationalinfrastructure. The Master Plan envisages a major investment of $65 million over the next decade. Facilities will be expanded for teaching science,computer skills, and technical subjects at the secondary level, for buildingand improving laboratories and teaching halls at the tertiary level, and forintensifying the use of correspondence courses at all levels.
8.4 Rationale for the Export Processing Zone
Sugar remained the main crop of the Mauritian economy till the 1950s,when the need to diversify the economic base was first felt. The pressureof rapid population growth on the stagnant sugar sector ~ the predominanteconomic activity - left little room for improving the living standards ofthe population. Unemployment had skyrocketed to about 20 percent of
Industrial Development and the Labor Force 163
the labor force, and all signs indicated that the country was caught in a"poverty trap." Based on the then available technology, the land-use limitsto increasing sugar production had already been reached, with a productionof some 700,000 metric tons. The situation as regards labor was paradoxical.Even though unemployment was raging at 20 percent, it was difficult to getworkers, in particular youth, to enter into any agricultural occupation, be itsugar or tea.
The policy to industrialize the economy was adopted as a means to liftthe economy out of the doldrums. In the first round, with the setting upof the Development Certificate (DC) scheme in the 1960s, a whole range ofimport substitution industries was set up to meet local requirements. By1970 the limit to produce certain goods had been reached; it was evidentthat in some cases, production of certain items was no longer profitable. Inaddition, many of the initial problems of unemployment and lack of growthpersisted, despite the DC scheme. It became evident that the scheme haddone little to resolve the unemployment problem. Most of the industriesthat had been set up were capital intensive, employing only a handful ofworkers each.
Nevertheless, the DC scheme had an important positive impact. Ittaught a nucleus of entrepreneurs the necessary managerial expertise forundertaking large-scale (in Mauritian terms) production and helped theseentrepreneurs develop the skills for taking risks. Equipped with these skills,Mauritian entrepreneurs felt quite confident to enter into export-market production when they were given the incentives to do so. For government planners, the continuing problems faced by the country left no choice but to turnto another scheme - this time, export-market production - to resolve them.Hence, by the 1970s, the country was ready to move into export-marketproduction.
Thus Mauritius, like many resource-poor countries of the Far Eastadopted a strategy of export-market production in 1970. Unlike many ofthe others in the field at that time, Mauritius had no particular raw materials, had little knowledge of the export market, and knew even less aboutpossible production technologies. In most of the initial Export ProductionZone industries (henceforth referred to as EPZ industries), the Mauritianentrepreneur was, therefore, confined to providing the capital - either fromhis own resources or from loans from the Development Bank of Mauritius- and management; and the other inputs - namely, market information,technology, and so on - were provided by the foreign partner.
164 Esther Hanoomanjee
8.4.1 Local factors favoring EPZ development
Despite the handicaps with which Mauritius entered into export-market production, Mauritius had three basic assets which proved to be critical for itsinitial success. First, it had a large pool of fairly well-educated, bilingual,intelligent, and easily trainable workers. As stated in the first NationalDevelopment Plan, "Our people are our only asset." While most youthsshunned agricultural employment, they willingly allowed themselves to besu bjected to the harsh industrial discipline.
Employment in the newly opened industries was eagerly sought by boththe male and female unemployed. In the initial years (till 1977), when thewage rates for females were lower than for males, there was a bias towardemploying females who, in addition to being fairly docile, had almost thesame educational qualifications as males.
Second, Mauritius had a stable political environment. As examined byBheenick and Schapiro (1989), there were several features of the domesticenvironment which were favorable to the industrialization efforts in Mauritius. The constitution of Mauritius, which was based on the Westminstermodel, provided "the right of the individual to protection for the privacyof his home and other property and from deprivation of property withoutcompensation." In order to further win the confidence of prospective investors, Mauritius joined two important international investment guaranteemechanisms. These were the International Convention for the Settlementof Investment Disputes (ICSID) and the Multilateral Investment Guarantee Agency (MIGA). Unlike some countries which have adopted a policy ofdiscrimination to foster the development of some specific groups in society,Mauritius adopted a policy of equal rights for all segments of its society,irrespective of religion, race, or creed.
Finally, Mauritius had a well-developed social and economic infrastructure network. It had a central bank, a stock exchange, a development bank,and a leasing company. The internal and external communications networkwas relatively good, and facilities for schooling, health, and social securitywere available for all on a country-wide basis.
As pointed out by Bheenick and Hanoomanjee (1988), given that mostfacilities were comparatively well spread out between the rural and urbanareas and all Mauritians enjoyed free health services and education, therewere few signs of overt social disruption even when unemployment was highand living standards poor.
Industrial Development and the Labor Force
8.4.2 External factors favoring EPZ development
165
The external factors have also been important to setting up the MauritiusEPZ; in some cases they may be even more important than the local factors.The most important external factors have been the access to the Europeanmarket for Mauritian goods through the Lome Convention. Mauritian goodsare subject to the rules of origin condition of the European Common Market.The European Economic Community also had specific agencies, such as theCenter for Industrial Investment (CID) and the European Investment Bank,which were responsible for bringing EC investors to the African, Caribbean,and Pacific (ACP) countries, including Mauritius. The European InvestmentBank invested in several private sector initiatives in Mauritius.
Mauritian goods enjoyed preferential entry to the US market throughthe General System of Preferences (GSP). These two factors were criticalfor enticing Asian investors to Mauritius. In addition, the inflow of HongKong capital has been very important for the success of the EPZ and thusthe recent industrialization in Mauritius. Hong Kong has accounted for morethan 50 percent of all capital invested in Mauritius during the period from1985 to 1989. Uncertainty over the merger with mainland China in 1997would appear to have shaken business confidence and caused an outflow ofcapital from Hong Kong. Mauritius has a large Sino-Mauritian communityand has been a fortunate recipient of some of this outflow. There are fewsigns of this source drying up. Since 1975, however, other countries such asFrance, the UK, Germany, and South Africa have also invested in Mauritius.
By 1970, when the EPZ legislation was formulated, the legislation forpromoting import substitution industries was already in place. Starting fromthe Income Tax (Amendment) Ordinance of 1961, which provided a range ofincentives to import substitution industries, the facilities for encouraging import substitution industries were extended, and customs drawback schemeswere introduced to encourage domestic firms to export goods. In 1970, thegovernment introduced the Export Processing Zone Act which incorporateda generous combination of incentives and facilities (Ministry of Industry andIndustrial Technology, 1990). These included:
• Duty-free imports of machinery, spare parts, and raw material.• Exemption from income tax on dividends during the first 10 years of op
eration from the start of production, and free repatriation of dividends.• Free repatriation of capital (without appreciation) after approved status
from the Bank of Mauritius has been obtained.
166 Esther Hanoomanjee
• Easy access to electric power, loans, investment, and export finance atpreferential rates.
• Export credit and export insurance facilities.• Capital depreciation allowances and investment credits.• Comparatively flexible labor legislation.• Exemption from payment of half the normal registration fee on land and
buildings purchased for new enterprises.• Issue of residence and work permits to shareholders and expatriate tech
nical and professional workers.• Accessibility to factories for lease or rent.• Guarantee against nationalization.
The corporate tax structure has been simplified since 1985. All new andold companies opting for the new option are charged a flat rate of only 15percent for the duration of their operations, compared with the standardrate of 35 percent (Ministry of Industry and Industrial Technology, 1990).In addition to the EPZ scheme, there are two other schemes to promote exports. The Export Service Zone Scheme was introduced in 1981 to stimulatethe export and re-export of manufactured goods and services by establishing specialized firms. It has also sought to encourage the development ofprofessional services in marketing, financial, and export services. The HotelManagement Incentives Act was introduced to provide incentives to companies to set up specialized managerial and marketing services in approvedhotel development, and has aimed at attracting tourists to Mauritius.
A major review of the EPZ strategy became necessary in the early 1980s,as part of the country's structural adjustment program. Steps were takento harmonize the facilities for the EPZ and the DC schemes. DC companiesthat exported part of their products were entitled to the same tax concessionsas EPZ companies for the amount exported. Double Taxation Conventionswere signed with France, the UK, and India to ensure that industrialistswould be entitled to deduct taxes paid on dividends earned in Mauritius.
Other institutional support arrangements included the privatization ofthe Development Bank of Mauritius in 1988. The objective was to "facilitate industrial, agricultural and economic development in Mauritius." Inorder to attract private capital to the industrial sector two organizations werelaunched: the Stock Exchange of Port Louis and the Unit Trust Scheme. Undoubtedly, the most important development in export promotion has beenthe Mauritius Export Development and Investment Authority (MEDIA) set
Industrial Development and the Labor Force 167
up in 1985. Since 1987 MEDIA has focused its campaigns on non-textilesectors. While MEDIA has been important in providing administrative support to meet the needs of industrialists, its ability to spearhead and finetune ind ustrial development is yet to be tested. Another organization whoseimportance is growing with industrialization is the Mauritius Standards Bureau. Being responsible for certification and quality improvement, its role inraising the status of the label "Made in Mauritius" to a mark of excellenceis strategic.
8.4.3 The growth of the EPZ
Two distinct phases in the development of EPZ can be discerned: the firstphase, 1970-1980; and the second phase, 1980-1990.
The first 10 years of EPZ industrialization were difficult. The totalnumber of EPZ companies remained below 100 for the first decade of itsdevelopment. In the early stages, the majority of investors came from HongKong, followed by France, with foreign joint ventures accounting for morethan half the companies which were set up in this period. Textiles and clothing were the main sectors into which investment flowed. Studies undertakenduring the period show that Mauritius was attractive as a base for subcontracting and export-market production in terms of the cost of productionand the basic facilities available (Bheenick and Hanoomanjee, 1988), but itssuccess was somewhat dissipated by time-consuming administrative procedures for obtaining EPZ certificates, as well as by other requirements whichwere - in theory - expected to attract investors to Mauritius.
Some 50 new industrial establishments were set up in Mauritius outsidethe EPZ during 1970 to 1980. Approximately 35,800 new jobs were createdduring this period in the industrial sector, of which 56 percent (20,300) werein EPZ industries. EPZ companies accounted for 17 percent of the valueadded in the industrial sector in 1976. By 1980, its share had escalated to28 percent, while import substitution industries (Development Certificatecompanies) accounted for 55 percent of industrial sector value added. Table8.5 presents the growth of the EPZ within the industrial sector.
Mauritius had not made much headway with industrialization by 1980.After 20 years of the Development Certificate scheme, the manufacturingsector accounted for about 15 percent of total GDP; in the early 1960s themanufacturing sector made up 16 percent of total GDP. The efforts to industrialize had some impact on employment creation; about a third of the
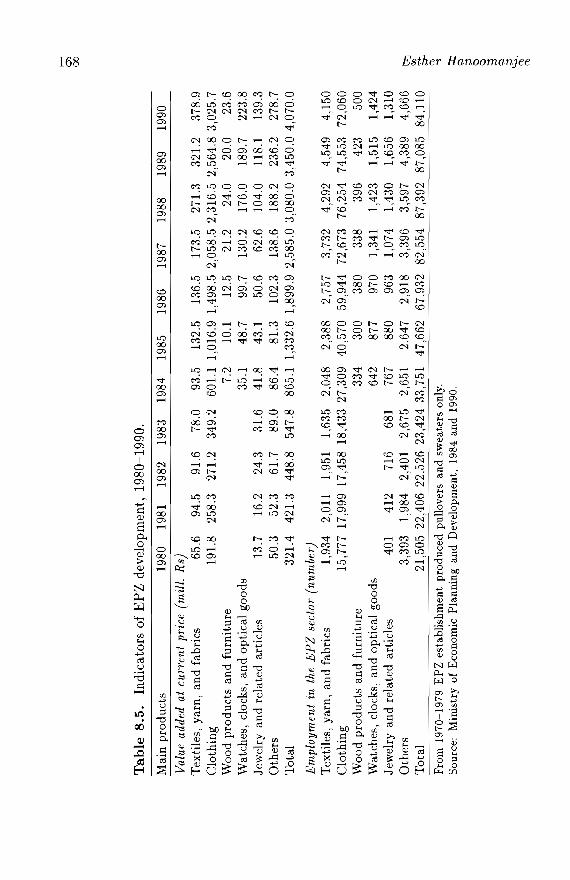
13.7
16.2
24.3
31.6
50.3
52.3
61.7
89.0
321.
442
1.3
448.
854
7.8
Ta
ble
8.5
.In
dica
tors
of
EP
Zde
velo
pmen
t,19
80-1
990.
Mai
npr
oduc
ts19
8019
8119
8219
83
Val
uead
ded
atcu
rren
tpr
ice
(mil
/.R
s)T
exti
les,
yarn
,an
dfa
bric
s65
.694
.591
.678
.0C
loth
ing
191.
825
8.3
271.
234
9.2
Woo
dpr
oduc
tsan
dfu
rnit
ure
Wat
ches
,cl
ocks
,an
dop
tica
lgo
ods
Jew
elry
and
rela
ted
arti
cles
Oth
ers
Tot
al
1984
1985
1986
1987
1988
1989
1990
93.5
132.
513
6.5
173.
527
1.3
321.
237
8.9
601.
11,
016.
91,
498.
52,
058.
52,
316.
52,
564.
83,
025.
77.
210
.112
.521
.224
.020
.023
.635
.148
.799
.713
0.2
176.
018
9.7
223.
841
.843
.150
.662
.610
4.0
118.
113
9.3
86.4
81.3
102.
313
8.6
188.
223
6.2
278.
786
5.1
1,33
2.6
1,89
9.9
2,58
5.0
3,08
0.0
3,45
0.0
4,07
0.0
......
O'l
00
Em
plo
ymen
tin
the
EP
Zse
cto
r(n
um
ber
)T
exti
les,
yarn
,an
dfa
bric
s1,
934
2,01
11,
951
1,63
52,
048
Clo
thin
g15
,777
17,9
9917
,458
18,4
3327
,309
Woo
dpr
oduc
tsan
dfu
rnit
ure
334
Wat
ches
,cl
ocks
,an
dop
tica
lgo
ods
642
Jew
elry
and
rela
ted
arti
cles
401
412
716
681
767
Oth
ers
3,39
31,
984
2,40
12,
675
2,65
1T
otal
21,5
0522
,406
22,5
2623
,424
33,7
51
Fro
m1970~1979
EP
Zes
tab
lish
men
tp
rod
uce
dpu
llov
ers
and
swea
ters
only
.S
ourc
e:M
inis
try
of
Eco
nom
icP
lan
nin
gan
dD
evel
opm
ent,
1984
and
1990
.
2,38
82,
757
3,73
24,
292
4,54
94,
150
40,5
7059
,944
72,6
7376
,254
74,5
5372
,060
300
380
338
396
423
500
877
970
1,34
11,
423
1,51
51,
424
880
963
1,07
41,
430
1,65
61,
310
2,64
72,
918
3,39
63,
597
4,38
94,
666
t:>:l
47,6
6267
,932
82,5
5487
,392
87,0
8584
,110
OJ) -;::J- t1> -; =:t1 Q ;:l
C C ;j Q 2 t1> t1>
Industrial Development and the Labor Force 169
new jobs that were created between 1960 and 1980 were in the manufacturing sector. There was also little change on the export performance of theeconomy, with agriculture still accounting for more than 70 percent of totalexports. In the early 1960s, nonagricultural exports were negligible.
Since the 1980s, there has been considerable development in the manufacturing sector. This sector accounted for some 15 percent of the GDP inthe period from 1970 to 1980. It began rising in 1984 (from 18.1 percent in1984 to 23.2 percent in 1991). The highest rate attained was 24.6 percent in1986. Much of the rise in the value added of the manufacturing sector sincethe mid-1980 has been due to the phenomenal growth of the EPZ sector.After accounting for less than 5 percent of the value added of the manufacturing sector up to 1982, its share escalated to a peak of 13.,5 percent in 1988and has since stabilized at around 12.8 percent.
In terms of employment, a similar trend is evident. The position ofthe agricultural sector as the main source of employment, accounting for 47percent of total employment in large establishments in 1970, had fallen to 29percent in 1980. The downward trend continued in the 1980s and reached 17percent in 1991. The achievements of the manufacturing sector in creatingnew jobs have outweighed its success in terms of value added. The impact ofthe industrialization policies, in particular, for export market production, oncreating new jobs was almost immediate, The manufacturing sector, whichaccounted for 6 percent of total employment (in large establishments) in1973, jumped to 12 percent by 1974; in 1988 it reached 39.4 percent. Sincethen it has fallen slightly; in 1991 it was 38.4 percent.
The encroachment of the manufacturing sector has been most significantin terms of export earnings. Given the monopoly position held by sugar inthe Mauritius economy until 1970, more than 80 percent of total exportearnings were made up of earnings from sugar. With the development ofthe EPZ sector, this figure fell to 60 percent in 1980 and to 28 percent in1991. EPZ exports, in turn, moved from accounting for less than 10 percentof total export earnings in 1975 to over 24 percent in 1980 and to 62 percentin 1991.
8.4.4 Sectoral development
The Mauritius EPZ has been dominated by clothing firms. There has beensome diversification away from this subsector: nonetheless, clothing continues to account for some 70 percent of total EPZ output. Next in importanceis textiles with a contribution of 10 percent to EPZ value added.
170 Esther Hanoomanjee
With the exception of the diamond-cutting industry, which benefitedfrom the EPZ even before the EPZ Act officially passed in the Legislative Assembly, activities outside the main sectors started only after the 1980s. Thenew areas were jewelry, wood furniture, leather and footwear, and electronics. The contributions of these sectors in terms of value added, employment,and export earnings have been limited.
8.4.5 EPZ markets
The main market for EPZ products is the European Economic Community,of which France is the most important outlet, followed by the United States ofAmerica. In recent years there has been some decline in exports to the USA,but it has remained the second most important market. The market patternreflects the ethnic characteristics of the EPZ firms. While many of thelarger French partnerships export to France, the US market is monopolizedby Hong Kong business concerns - operating alone or in partnerships withMauritians. The markets for the non-textile exports are mainly the USA,Germany, and East Asia.
8.4.6 EPZ imports
Notwithstanding the EC rules of origin which restrict the sources of rawmaterial to EC or ACP member countries, the EPZ imports come from avariety of sources. The most important ofthese sources are France, Germany,Hong Kong, and Japan. The main imports are textiles, yarn and fabrics,machinery and transport equipment, and wool and animal hair. An important feature of the EPZ goods is the high import content of their finishedproducts, which is estimated at almost 75 percent of the value of output.Some vertical linkages have been introduced in the wearing apparel sector.Among the textile factories, there are two important weaving mills, whichoffer a range of cotton and blended cotton fabrics. Considerable scope existsfor furthering the backward linkages.
8.5 Transition to a Newly IndustrializingCountry Status
The success of the EPZ has been due to the juxtaposition of several favorable factors. External resources and internal political stability were crucial.
Industrial Development and the Labor Force 171
Since the beginning of the 1990s, some of the leading subsectors have beendeclining. There has been a down turn in the overall growth rate of theindustrial sector. This sector, which had registered growth rates of 13 and16 percent in 1985 and 1986, has declined to less than 10 percent since1989. The share of the industrial sector in the overall economy is fluctuatingaround 31 percent. There has been feeble growth in employment and newindustries.
Much of the decline of the industrial sector stems from the marginalgrowth in the EPZ. Growth rates have declined from the heights of30 percentin 1985 and 34 percent in 1986 to less than 5 percent for the period after 1989.Employment and investments have declined slightly since 1988. Exports, onthe other hand, have fluctuated widely over the past five years. The growthrate between 1989 and 1990 was around 10 percent. The share of the EPZin the industrial sector has continued to increase.
Within the EPZ, the wearing apparel subsector retains its dominantposition, accounting for more than 70 percent of the total EPZ value added.In terms of employment, its position is even stronger and more than 80percent of EPZ workers are employed in this subsector. This su bsectoralso has one of the lowest ratio of value added to exports. This ratio hasfluctuated from 35 percent for wearing apparel to 80 percent for textile yarnand 25 percent for watches, clocks, and optical goods. A major weakness ofthe Mauritius EPZ is the low value added per worker.
On the positive side, there has been some improvement in the net exportsof the EPZ sector over the past five years. Net exports (total EPZ exportsminus total EPZ imports) increased from around Rs 750 million in 1985 toaround Rs 4.0 billion in 1990. This is indicative of the steady backwardlinkages that are slowly taking root in Mauritius. The opening up of twotextile mills has contributed to this improvement. Similarly, there has beenan improvement in the ratio of net exports to total exports. In percentageterms, it improved from 23 percent to 35 percent over the period from 1985to 1990. In addition, there has been some diversification in the EPZ base.Jewelry, software development, electronics, and leather products are some ofthe potential growth areas.
Continued success calls for a new set of rules, as the game of exportmarket production has changed for Mauritius. The achievement to datelargely stems from the utilization of available labor. From a situation of20 percent unemployment in the 1970s, Mauritius reached a position of fullemployment by the late 1980s. The labor force has increased from 254,700
172 Esther' Hanoomanjee
in 1972 to 415,500 in 1990. A total of 66,000 female workers entered thelabor force during this period. Labor has acted as the engine of growth(World Bank, 1992a). Further increases in output must, perforce, come {romimproved productivity. As a result of its success in attaining full employmentand as a consequence increasing labor costs, Mauritius can no longer competeinternationally on the basis of low cost.
In terms of productivity improvement, Mauritius has three options.First, in the case of knitwear, for example, the adoption of improved technology can bring about an increase in productivity. The replacement "ofhand-operated machines by numerically-controlled automatic machines willnot only result in higher output per hour ... [but also] allow more complexpatterns and higher flexibility since they can be directly connected withCAD-systems" (German Development Institute, 1992). Only a few of thelargest companies have installed automatic machines, and some form of government assistance will be necessary to encourage medium-size and smallfirms to follow. Productivity could also be improved by better managementtechniques, reorganization on the plant floor, and training programs.
With regard to garments, where there is comparatively less scope forimprovements in production technology, value added can be increased bymoving into the higher value range of garments. Entry into the higher market segment, however, requires a more aggressive marketing strategy thanis currently in practice. A survey of Mauritius garment firms undertakenrecently indicates that "the share of total sales to the three most importantcustomers varies between .50 and 80 percent for the majority of the enterprises visited" (German Development Institute, 1992). It appears that thetendency is for Mauritian entrepreneurs to cultivate a few customers withwhom they can develop long-term contracts. Local entrepreneurs are reluctant to venture into arrangements with new customers. In order to stay inbusiness, local garment manufacturers will need to move away from traditional customers, to develop the capacity to create original designs, and torespond swiftly to changes in fashions in the clients' markets.
Finally, in order to compete effectively with countries such as Turkeyand Tunisia which are newly emerging garment producers, as well as withEastern Europe which has a long tradition in garment manufacture, thegovernment has to adopt a macroeconomic policy stance which continuesto be conducive to export manufacturing that is essentially a "buyers' market." The international and local conditions are constantly changing; competition from other suppliers is intense; and the fashion industry is highly
Industrial Development and the Labor Force 173
volatile. Nevertheless, Mauritius must be able to capture orders due to itshigh-quality product, on-time delivery, original design capacity, and regularcontacts with the markets. In order to cope with these conditions a wholeprogram of improvements needs to be undertaken. The port and the localtransport system should be revamped and made more efficient. The bankingand financial sector needs to be reorganized to enable small and medium-sizefirms to have access to credit for increasing productivity and other improvements, and finally the education and training system should be geared toproviding the skills needed by industry. There is no place in "corporateMauritius" for the inefficient firm or the entrepreneur who only wishes tohold on to existing markets. Any attempt to perpetuate inefficiency, forexample, with the importation of cheap labor, will prove to be disastrous inthe long run and will run counter to the strategy of moving upmarket. Thesame philosophy of excellence is required if Mauritius is to move into newareas such as electronics and computer data entry, in which it has made afeeble attempt.

Chapter 9
Sustainable Tourism
M. Sen Ramsamy
You gather the idea that Mauritius wasmade first and then Heaven, and that
Heaven was copied after Mauritius.Mark Twain
9.1 Introduction
Tourism originates in an art of living which reflects economic well-being andhigh social status. Over the years, tourism has developed a solid reputationas one of the world's major economic activities with a high potential forfurther growth. The challenges of the late 20th century for the industry aretwofold: to ensure sustainable growth and to adopt a development strategythat will be economically viable, socially acceptable, and environmentallysound in the long term.
Admittedly, however, several cases of environmental damage have takenplace in various parts of the world as a result of tourism and tourism-relateddevelopment. Examples of these are the concrete developments along theCosta Bravaj in Acapulco; along the Adriatic coast north of Dubrovnik; andin Cancun, Mexico. These cases are unfortunately the direct consequencesof an unplanned development strategy and very often a mismanagement ofresources. Tourism in the Republic of Mauritius is essentially dependent
176 M. Sen Ramsamy
on natural resources. Conscious of the neces~ity for a judicious utilizationof the limited resources available, the government of Mauritius has established a policy for selective tourism development. The underlying principleof this policy is to maximize foreign exchange earnings while preserving thecountry's natural charm and elegance.
The quote from Mark Twain at the beginning of this chapter clearlyillustrates the quality of Mauritius as it was perceived by travelers in the1800s. Today, with its population of 1.1 million inhabitants and its rapidevolution from an agricultural economy to an industrialized one, Mauritius iscurrently propelling its way to become a leading economic force in the IndianOcean region. As a result of the recent accelerated pace of development,the natural panorama of the country has obviously undergone importantchanges.
9.2 History
Tourism in Mauritius began in 1952 with the creation, by the Mauritius Hotels, of the first hotel establishment (see Figure 9.1). It was called the ParkHotel and was situated at Curepipe on the central plateau of the island. Thechoice of the site, which is the wettest area of Mauritius, gives an indicationthat promoting tourism was not the prime factor for the development of theindustry at that time. In fact, the Park Hotel served mainly as accommodations for the crews of the few airlines which started to include Mauritiusin their flight schedules.
The first beach hotel was constructed by the Mauritius Hotels at LeMorne in the southwest of the country in 1954, and consisted of only sixbedrooms. That structure did not, however, attract many foreign visitorsexcept for a few tourists from nearby Reunion Island and Madagascar. Withthe opening, by the same group, of another beach hotel at Le Chalandnear the airport in 1961, the in-flow of tourists and airline crews becamemore regular. The late 1960s witnessed an uninterrupted growth in hoteldevelopment, especially in the wake of the independence celebrations in 1968.
Tourism as an economic activity in Mauritius started around 1971, whena 90-room hotel was built - again by the Mauritius Hotels - at Trou auxBiches in the northwest of the island. Following the boom of the early1970s, investment in self-contained bungalow projects was accelerated byother business groups. Association with foreign companies started with thesetting up of the Club Med and the St. Geran Hotel by the Southern Sun
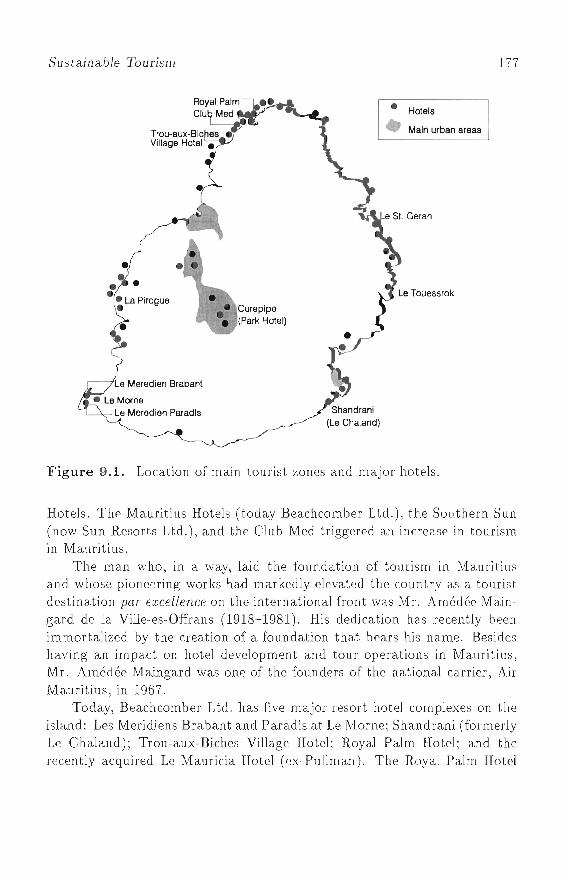
Sustainable Tourism 177
Main urban areas
Le Touessrok
• Hotels•
Curepipe(Park Hotel)•
Le Meredien Brabant
Figure 9.1. Location of main tourist zones and major hotels.
Hotels. Tltf' Mauritius Hotels (today Beachcomber Ud.), the Southern Sun(now Sun Resorts Ltd.), and the Club Med triggered an increase in tourismin Mauritius.
The man who, in a way, laid the foundation of tonrism in Mauritiusand whose pioneering works had markedly elevated the country as a touristdestina.tion par excellence on the international front was Ml'. Amedee Maingard de 130 Ville-es- Offrans (1918-1981). His dedication has recently beenimmortalized by the creation of a foundation that bears his name. Besideshaving an impa.ct on hotel development and tour operations in Mauritius,M1'. Amedee Maingard was one of the founders of the national carrier, AirMauritius, in 1967.
Today, Beachcomber Ltd. has five major resort hotel complexes on theisland: Les Meridjens Brabant and Paradis at I.e lVlorne; Shandrani (formerlyLe Cha-land); Trou-aux-Bjches Village Hotel; Royal Palm Hotel; and therecently acquired Le Mauricia Hotel (ex-Pullman). The Royal Palm Hotel
178 M. Sen Ramsamy
represents a master piece in the art of architectural creations. For its part,Sun Resorts Ltd. has created three famous deluxe resort hotels: St. GeranHotel in the east, Le Touessrok Hotel in the southeast, and La Pirogue Hotelin the west. Today Mauritius has a total capacity of approximately 5,000rooms in 80 hotel establishments scattered in the various tourist zones of theisland.
To shake off the severe recession that gripped the island's economy during the late 1970s and early 1980s, the then newly formed coalition government decided to attract a larger volume of foreign investment in the varioussectors of the economy. Beginning in 1982, tourism, like the manufacturingsector, was also called upon to playa more significant role in the economictakeoff of Mauritius. The consolidation of the existing markets and the cultivation of new tourist-generating sources were the priorities of the time. Thisboost in tourism was accompanied by considerable pressure for additionalroom capacity, which in turn stimulated further development in the hotelsector. The first phase of tourism development in Mauritius was thereforeset in motion.
Since 1982, the government has adopted a strategy of offering a packageof incentives for hotel development through the grant of the Hotel Development Certificate coupled with the provision of adequate state-financedinfrastructure services. As a result, a large inflow of foreign capital contributed to Mauritius's struggle to pull itself out of its dangerous economicstagnation of the late 1970s. The economic "miracle" thus took shape, butat a cost. The mushrooming of large resort hotels along the coast from1986 started, however, to show signs of decay on the physical environmentespecially along the coast.
The economic diversification programs adopted at that time had servedthe government in its endeavor to wipe out the unemployment problem whichseverely plagued the country. These programs, however, did not take intoaccount the need for sound long- term planning. Proper inter-ministerial coordination at the technical level was also lacking. This resulted in additionalstrain on the island's natural resources. Since 1988 a restrictive policy hasbeen applied on development in the hotel sector. New hotel projects arediscouraged, and approved projects have been frozen until market evolutionbecomes more promising. The present excess room capacity in Mauritiushas had a direct bearing on the average room occupancy rates registeredin the hotel industry during the past three years. On the other hand, the
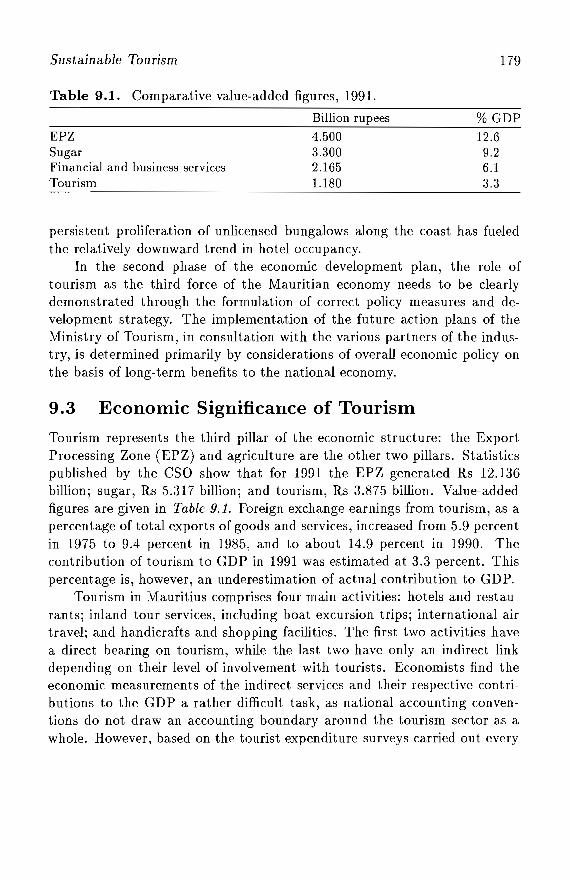
Sustainable Tourism
Table 9.1. Comparative value-added figures, 1991.
Billion rupees
179
%GDP
EPZSugarFinancial and business servicesTourism
4.5003.3002.1651.180
12.69.26.13.3
persistent proliferation of unlicensed bungalows along the coast has fueledthe relatively downward trend in hotel occupancy.
In the second phase of the economic development plan, the role oftourism as the third force of the Mauritian economy needs to be clearlydemonstrated through the formulation of correct policy measures and development strategy. The implementation of the future action plans of theMinistry of Tourism, in consultation with the various partners of the industry, is determined primarily by considerations of overall economic policy onthe basis of long-term benefits to the national economy.
9.3 Economic Significance of Tourism
Tourism represents the third pillar of the economic structure: the ExportProcessing Zone (EPZ) and agriculture are the other two pillars. Statisticspublished by the csa show that for 1991 the EPZ generated Rs 12.136billion; sugar, Rs 5.317 billion; and tourism, Rs 3.875 billion. Value-addedfigures are given in Table 9.1. Foreign exchange earnings from tourism, as apercentage of total exports of goods and services, increased from 5.9 percentin 1975 to 9.4 percent in 1985, and to about 14.9 percent in 1990. Thecontribution of tourism to GDP in 1991 was estimated at 3.3 percent. Thispercentage is, however, an underestimation of actual contribution to GDP.
Tourism in Mauritius comprises four main activities: hotels and restaurants; inland tour services, including boat excursion trips; international airtravel; and handicrafts and shopping facilities. The first two activities havea direct bearing on tourism, while the last two have only an indirect linkdepending on their level of involvement with tourists. Economists find theeconomic measurements of the indirect services and their respective contributions to the GDP a rather difficult task, as national accounting conventions do not draw an accounting boundary around the tourism sector as awhole. However, based on the tourist expenditure surveys carried out every
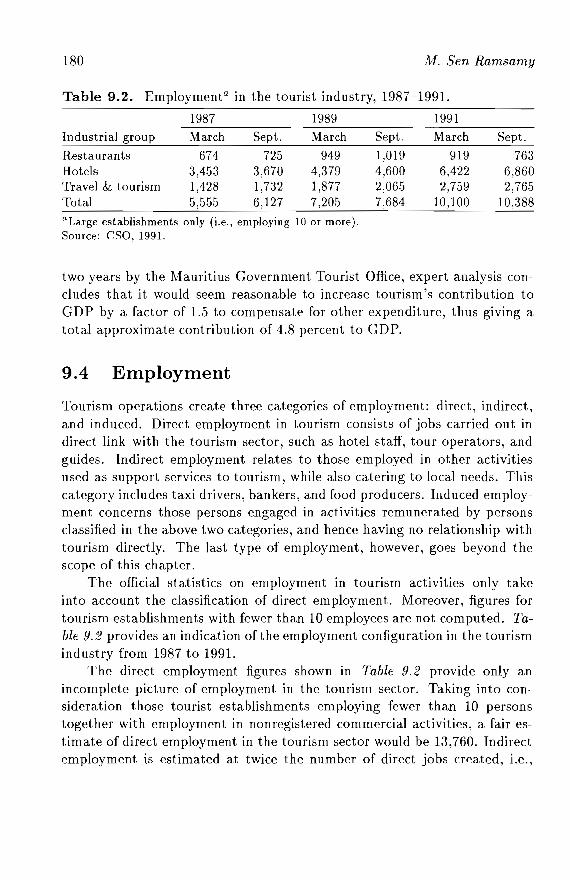
180 M. Sen Ramsamy
Table 9.2. Employmenta in the tourist industry, 1987-1991.
1987 1989 1991-------
Industrial group March Sept, March Sept. March Sept.
Restaurants 674 725 949 1,019 919 763Hotels 3,453 3,670 4,379 4,600 6,422 6,860Travel & tourism 1,428 1,732 1,877 2,065 2,759 2,765Total 5,555 6,127 7,205 7,684 10,100 10,388aLarge establishments only (i.e., employing 10 or more).Source: CSO, 1991.
two years by the Mauritius Government Tourist Office, expert analysis concludes that it would seem reasonable to increase tourism's contribution toGDP by a factor of 1.5 to compensate for other expenditure, thus giving atotal approximate contribution of 4.8 percent to GDP.
9.4 Employment
Tourism operations create three categories of employment: direct, indirect,and induced. Direct employment in tourism consists of jobs carried out indirect link with the tourism sector, such as hotel staff, tour operators, andguides. Indirect employment relates to those employed in other activitiesused as support services to tourism, while also catering to local needs. Thiscategory includes taxi drivers, bankers, and food producers. Induced employment concerns those persons engaged in activities remunerated by personsclassified in the above two categories, and hence having no relationship withtourism directly. The last type of employment, however, goes beyond thescope of this chapter.
The official statistics on employment in tourism activities only takeinto account the classification of direct employment. Moreover, figures fortourism establishments with fewer than 10 employees are not computed. Table 9.2 provides an indication of the employment configuration in the tourismindustry from 1987 to 1991.
The direct employment figures shown in Table 9.2 provide only anincomplete picture of employment in the tourism sector. Taking into consideration those tourist establishments employing fewer than 10 personstogether with employment in nonregistered commercial activities, a fair estimate of direct employment in the tourism sector would be 13,760. Indirectemployment is estimated at twice the number of direct jobs created, i.e.,
Sustainable Tourism 181
approximately 27,520. Consequently, total direct and indirect employmentin tourism would be equivalent to approximately 8.8 percent of a workingpopulation of 470,000.
9.5 Tourism Development Pattern
9.5.1 Policy and strategy
The space limitation of Mauritius, along with the fragile sociocultural fabricof this pluri-ethnic society, warrants a rational approach to tourism development on the basis of long-term vision and an application of sound planningtechniques. Consequently, the upmarket image of the destination is stronglysupported by policy measures and development strategies tailored to ensuresustainable growth.
The marketing strategy of the Ministry of Tourism, implemented by theMauritius Government Tourist Office, is to target the high-spending segmentof the long-haul affluent markets to help maximize foreign exchange earnings. The distaste for mass tourism is emphasized through the prohibition ofcharter flights to service the island. The consolidation of the existing marketsources constitutes a major task. Prudent penetration of new markets likeJapan, Australia, South Africa, India, and Scandinavia is being undertakento diversify the base of the island's tourist-generating sources. Market research and evaluation are therefore essential to be able to carry out fruitfuloperations on the highly competitive international market. The marketingoffice of the Ministry of Tourism has been promoting these potential markets for years to maintain a competitive edge with other holiday destinationsoffering similar attractions.
To offset the negative effects of urbanization in tourist zones and theresultant change in the coastal topography, the Ministry of Tourism hasimposed (besides a freeze in the hotel sector due to excess room capacity) aseries of regulatory measures with a view to preserving the scenic landscapeof these zones. Such measures include:
• A ban on high-rise complexes - the maximum height of buildings shouldbe restricted to one floor or to the height of a palm tree.
• Hotel projects now frozen should not exceed two hundred rooms.• Strict compliance must be made with all sanitary regulations.• Architectural designs must be appropriate for characteristics of the zone.• Marine environment must be carefully preserved.
182 M. Sen Ramsamy
• Plot coverage ratio must be maintained within 40 percent.• Sufficient space must be provided for proper landscaping.• Buildings must be set back from roads and/or the high water mark.
In addition, the quality of service offered to visitors ~ for which Mauritius is world famous - should be provided by a well-trained staff. Anincrease in rooms has currently resulted in a shortage of trained personnel in the hotel sector. Staff poaching has consequently become more orless common practice which requires immediate remedial measures. Besidesgovernment-funded training courses through the Industrial and VocationalTraining Board, in-house training courses are highly encouraged for the hotel sector. The launching of a certificate course in travel and tourism alsoforms part of the government's strategy to improve the quality of service atall levels of tourism operations in Mauritius (airlines, tour operators, guides,and travel agents).
9.5.2 Air access policy
Tourism development in Mauritius is closely linked with international airtravel. The air communication network of Mauritius is predominantly controlled by the national carrier Air Mauritius. Other scheduled internationalair services are also provided by Air France, British Airways, South AfricanAirways, Singapore Airlines, among others. Most major cities of the worldare connected through regular scheduled flights with stop-overs or nonstopservices, especially to and from Europe. A diversification of the route network is necessary in the light of major developments taking place on theinternational front. Obtaining landing rights for Air Mauritius in Australia,after years of negotiations, has been a step in this direction.
On the other hand, the government's policy for selective tourism development dictates an extremely cautious approach to charter flight operations.In an attempt to ward off the risk of opening up the destination to masstourism, charter flights are not allowed to service the country's air route.The operation of charter services to and from Reunion Island, a French territory close to Mauritius, by charter companies has prompted a large flow ofvisitors to Mauritius via that destination at cheaper rates. Island-hoppingfrom Reunion Island therefore constitutes a matter of concern for the wholeIndian Ocean area.
In spite of the constraints discussed above, government policy pertainingto air access remains essentially based on the consolidation of existing routesand on flexibility and reciprocity.
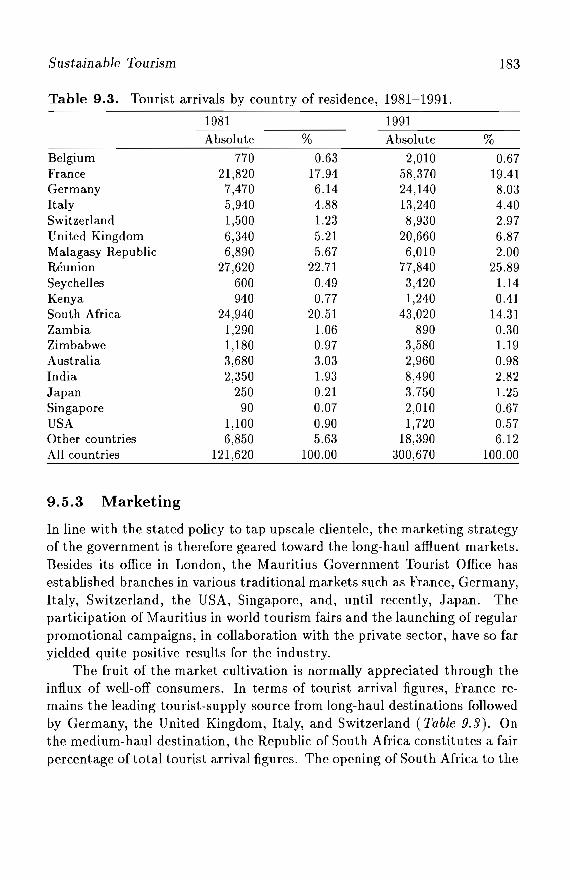
Sustainable Tourism
Table 9.3. Tourist arrivals by country of residence, 1981-1991.
1981 1991
Absolute % Absolute
Belgium 770 0.63 2,010France 21,820 17.94 58,370Germany 7,470 6.14 24,140Italy 5,940 4.88 13,240Switzerland 1,500 1.23 8,930United Kingdom 6,340 5.21 20,660Malagasy Republic 6,890 5.67 6,010Reunion 27,620 22.71 77,840Seychelles 600 0.49 3,420Kenya 940 0.77 1,240South Africa 24,940 20.51 43,020Zambia 1,290 1.06 890Zimbabwe 1,180 0.97 3,580Australia 3,680 3.03 2,960India 2,350 1.93 8,490Japan 250 0.21 3,750Singapore 90 0.07 2,010USA 1,100 0.90 1,720Other countries 6,850 5.63 18,390All countries 121,620 100.00 300,670
9.5.3 Marketing
183
%0.67
19.418.034.402.976.872.00
25.891.140.41
14.310.301.190.982.821.250.670.576.12
100.00
In line with the stated policy to tap upscale clientele, the marketing strategyof the government is therefore geared toward the long-haul affluent markets.Besides its office in London, the Mauritius Government Tourist Office hasestablished branches in various traditional markets such as France, Germany,Italy, SWitzerland, the USA, Singapore, and, until recently, Japan. Theparticipation of Mauritius in world tourism fairs and the launching of regularpromotional campaigns, in collaboration with the private sector, have so faryielded quite positive results for the industry.
The fruit of the market cultivation is normally appreciated through theinflux of well-off consumers. In terms of tourist arrival figures, France remains the leading tourist-supply source from long-haul destinations followedby Germany, the United Kingdom, Italy, and Switzerland (Table 9.3). Onthe medium-haul destination, the Republic of South Africa constitutes a fairpercentage of total tourist arrival figures. The opening of South Africa to the
184 M. Sen Ramsamy
external world represents a potential avenue for new market penetration bymany countries. Mauritius is geographically well placed to take advantageof that evolution.
9.5.4 Tourist zones
Mauritius is approximately 1,860 km2 with 1.1 million inhabitants and comprises three main tourist zones. The physical development of these zonesis subject to restrictive policy measures to discourage possible abuse of thesocial and environmental structures. The three zones are:
• The northern tourist zone, a vast expanse of coastal area from Balaclavato Grand Gaube.
• The eastern tourist zone, a coastal stretch from Roches Noires to Troud 'Eau Douce.
• The southwestern tourist zone, a coastal line stretching from Flic-en- Flacto Le Morne.
Increasing development pressure on the physical structure of the touristzones warrants the establishment of a strategic planning system for morerational land use, bearing in mind sensitivity to the protection of the surrounding seaboard. A study of the northern tourist zone by the PhysicalLand Development Plan will help trace the appropriate line of action forproper land zoning and utilization. The northern tourist zone covers approximately 20 km of coastline and consists of 26 beach hotels with a totalof 1,891 rooms. An estimate of 830 rooms are also available to visitors inthis area in the form of guest houses, flats, and bungalows.
The eastern tourist zone has 39 km of coastline and approximately 1,290rooms. The room configuration of this zone is expected to undergo changesin the coming years after the completion of new hotel projects which havebeen frozen for the time being.
The southwestern zone stretches over 37 km and comprises 16 beachhotels with 1,036 rooms. An addition of five hotel complexes, also placed inobeyance, will further extend room capacity when restrictions are relaxed.
9.5.5 Rodrigues
The island of Rodrigues, which is the tenth district of Mauritius, has recentlywitnessed an accelerated pace of tourism development with the opening of its
Sustainable Tourism 185
first deluxe hotel at Pointe Coton. It is worth emphasizing here that tourismdevelopment in Rodrigues should not follow the Mauritius tourism development model. The island of Rodrigues must, by all means, complement theMauritian tourism product by creating facilities that bring in positive valuesto the tourism circuit in general. Rodrigues should also be encouraged topreserve its rustic style and charm.
9.5.6 Tourist attractions
Mauritius is promoted and exclusively perceived as an upmarket tourist destination which attracts visitors with a high-spending pattern from the traditional tourist-generating markets, principally Europe. As an island destination, Mauritius is limited in terms of space and natural resources. The mainattractions of the island consist, obviously, of the white sandy beaches, theglittering seascapes, and the warm tropical sun of the Southern Hemisphere.These attractions are further embellished with a wide spectrum of relatedservices such as yachting, big game fishing, scuba diving, windsurfing, parasailing, and undersea walking.
Because of these attractions and facilities, the beach represents an important share in the development of tourism in Mauritius. Out of 321..5 kmof coastline, 9 percent has been allocated for hotel development; 16 percent,for villas; and 11 percent, for public beaches. The rest of the coastline iseither under vegetation or simply inaccessible. Beach availability thereforeconstitutes a rare resource to be exploited in a judicious and well-plannedmanner.
In an attempt to alleviate the pressure resulting from a concentrationof visitors along the coast, diversification of tourism has been encouragedthrough the creation of tourism-related facilities and attractions that arelocated inland. These attractions should, however, highlight the rich sociocultural texture of the Mauritian society, its historical background, itsculinary art, its rhythmic music (called the sega), and, above all, the legendary hospitality and warmth of this cosmopolitan nation.
Most of the existing inland attractions are environmentally oriented.The Pamplemousses Garden in the northern part of the island stands out asa rare botanical sanctuary. The Casela Bird Park, the Le Val Nature Park,and the Domaine du Chasseur are only a few examples of inland attractionscreated in line with the government's policy for a diversification of tourism.These parks provide a boost to eco-tourism.
186 M. Sen Ramsamy
Another recently opened major tourist attraction is the Domaine LesPailles near the capital city of Port Louis. Conforming with the new policyof development of tourism-related projects that are sensitive to the environment, the promoter of the Domaine has brought about a sort of revolutionin the art of creation that deserves special mention. The product comprisestwo high-class restaurants built on a vast portion of land cradled in a valley,where safaris and tours on horse-driven carriages constitute the principal attractions. Besides being an ideal venue for leisure, the Domaine Les Paillesprovides a rare opportunity for a thrilling journey into the past. The architectural structures of the past have been restored in minute detail.
For its part, the Mauritian hotels, most of which are situated on theseafront, ensure maximum comfort in luxurious settings. Altogether, thefacilities provided further enhance the intimate charm and elegance of Mauritius. Statistics on the hotels in Mauritius are given in Tables 9.4 to 9.6.
9.6 Proliferation of Unlicensed Bungalows
The restrictive policy on hotel development, in favor of tourism-relatedprojects, was designed to provide more space to tourism professionals. Thispolicy has been disturbed slightly by the proliferation of unlicensed bungalows in the coastal zones, to the detriment of hotel establishments. Theavailability of rooms at cheaper rates in the informal accommodation sectoris reflected in the relatively downward trend in room occupancy rates inrecent years.
Besides the 5,000 rooms available in the hotel sector, the present capacityof the nonregistered bungalows is approximately 2,000. In an attempt to curbthe ascending trend of tourist bungalow development such accommodationunits must be registered. This exercise will enable the government to keeprecords of the economic activities carried out in the informal sector, whilereaping returns from taxes. However, in line with the policy to increaseupmarket tourism, standards will need to be established and enforced for alllicensed accommodations.
If the performance of the large hotels can be termed as satisfactory,the slow rate of growth registered by the new entrants in the hotel sectorhas prompted considerable discounting, which inevitably means a squeezeon profit margins. This situation could be reversed should these new hotelproperties initiate new forms of overseas marketing and promotional activities to boost demand. Simultaneously, investment in training is a sine qua
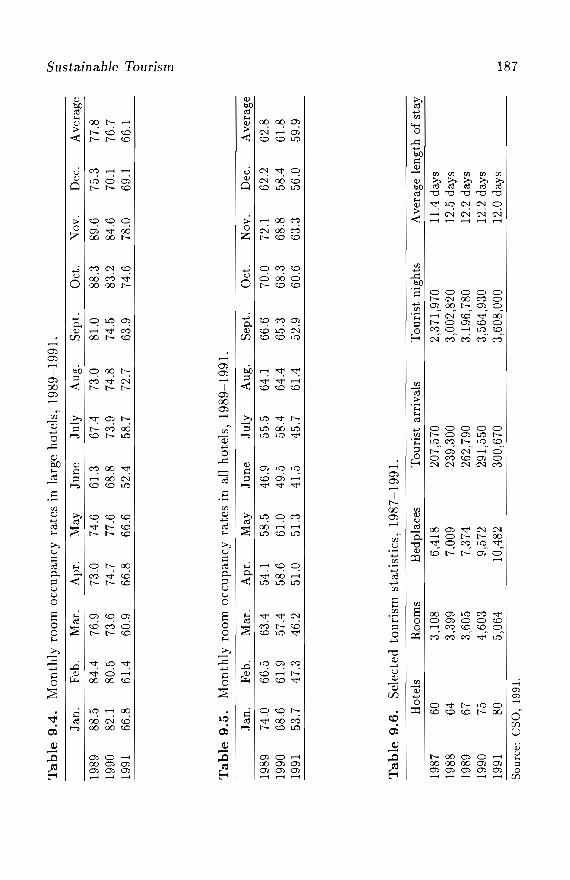
Ta
ble
9.4
.M
on
thly
roo
mo
ccu
pan
cyra
tes
inla
rge
ho
tels
,1
98
9-1
99
1.
en c (fl
Jan
.Fe
b.M
ar.
Apr
.M
ayJu
ne
July
Aug
.S
ept.
Oct
.N
ov.
Dec
.A
vera
ge.,... ~ -.
1989
88.5
84.4
76.9
73.0
74.6
61.3
67.4
73.0
81.0
88.3
89.6
75.3
77.8
::: ~
1990
82.1
80.5
73.6
74.7
77.6
68.8
73.9
74.8
74.5
83.2
84.6
70.1
76.7
0- m
1991
66.8
61.4
60.9
66.8
66.6
52.4
58.7
72.7
63.9
74.6
78.0
69.1
66.1
~ c .., Cij' i3
Ta
ble
9.5
.M
on
thly
roo
mo
ccu
pan
cyra
tes
inal
lh
ote
ls,
19
89
-19
91
.
Jan
.Fe
b.M
ar.
Apr
.M
ayJu
ne
July
Aug
.S
ept.
Oct
.N
ov.
Dec
.A
vera
ge
1989
74.0
66.5
63.4
.54.
158
.546
.955
.564
.166
.670
.072
.162
.262
.819
9068
.661
.957
.458
.661
.049
.558
.464
.465
.368
.368
.858
.461
.819
9153
.747
.346
.251
.051
.341
.545
.761
.452
.960
.663
.356
.059
.9
Ta
ble
9.6
.S
elec
ted
tou
rism
stat
isti
cs,
19
87
-19
91
.
Hot
els
Roo
ms
Bed
plac
esT
ouri
star
riva
lsT
ouri
stni
ghts
Ave
rage
leng
thof
stay
1987
603,
108
6,41
820
7,57
02,
371,
970
11.4
days
1988
643,
399
7,00
923
9,30
03,
002,
820
12.5
days
1989
673,
605
7,37
426
2,79
03,
196,
780
12.2
days
1990
754,
603
9,57
229
1,55
03,
564,
930
12.2
days
1991
805,
064
10,4
8230
0,67
03,
608,
000
12.0
days
>-'
00
Sour
ce:
csa,
1991
.-.j
188 M. Sen Ramsamy
non for survival in the industry as the success of tourism depends largely onthe quality of service offered.
9.7 Social Impact of Tourism
Mauritius, also known as the United Nations in miniature, contains all theingredients for a good social impact assessment. A recent survey carried outby an expert consultancy firm based in the UK, Cleverdon Steer, has revealedthat Mauritian attitudes toward tourists are quite favorable. However, opinions tend to differ on the planning model adopted for the development ofthe industry, especially with regard to hotel development near the beach.
The majority of the local population (69.5 percent) is favorable to thephysical presence of foreigners in the country. This behavior is still morepronounced when Mauritians strongly support the idea of more interactionbetween visitors and themselves. There is a general belief that tourismcontributes to a large extent to the national economy (70.1 percent); nevertheless, 32.3 percent perceive tourists as disease vectors. Concerns aboutthe relative scarcity of some food items due to tourist consumption (23.9percent) and crowded beaches (7.9 percent) have also been expressed. Theprovision of adequate amenities and facilities on public beaches for the general public by the local authorities may, however, modify the percentage forthe beach concern evaluated above. To encourage state investment in thecreation of leisure amenities, public opinion must become aware of the needto maintain hygienic conditions on the beach and for proper utilization ofthese facilities.
9.8 Sewage Disposal in Tourist Zones
The well-being of the economy in the recent years has resulted in a greatervolume of investments by the local population in residential and commercial projects, and an intensification of activities in the tourist zones. Consequently, specific environmental impact control has been exercised in anattempt to mitigate any eventual negative side effects of such developments.Several control mechanisms have been engineered to keep environmental pollution at a minimum. For sewage disposal, the following conditions are imposed prior to granting a Development Permit by the local authorities, andafter consultation with the relevant government bodies:
Sustainable Tourism 189
• The installation of a septic tank followed by an absorption pit for privateresidential bungalows.
• The installation of a septic tank together with absorption pits and akitchen grease trap for hotels with fewer than 75 rooms, restaurants,and similar establishments.
• The compulsory installation of a treatment plant for hotels having morethan 75 rooms.
The sanitary regulations in force in Mauritius compel hotel operators todischarge the treated effluent into the hinterland to avoid beach contamination. In practice, however, for residential units and commercial complexesthe system is found to contain a few deficiencies. Recent on-site inspectionshave revealed that the operations of sewage-treatment plants by the hotels donot give satisfactory results, as observed from the poor quality of the treatedeffluent. The lack of proper training facilities for maintenance personnel alsocontributes to the poor performance of these plants. Consequently, as oftenobserved, the re-use of the treated effluent for irrigation purposes is oftenquestioned.
9.9 Lagoon Pollution
Polluted lagoons can cause serious harm to tourism if remedial actions arenot taken. A proper system of monitoring and control must be establishedto prevent severe damage. With the intensification of commercial activities inland, and the rapid urbanization effects of tourism along the coast, ageneral deterioration of the lagoons is bound to occur, especially near thedeveloping areas.
The activities of motor boats and the lack of proper control of oil spillingin the lagoons have resulted in visible damage to the marine ecosystem. Thecontamination of seawater may also result from inland industrial effluentdischarged in rivers that generally also carry relatively large volumes of toxiccomponents. Fortunately though, such damage has not yet attained anyalarming proportions. Utmost caution is, however, warranted.
To reduce the damage caused to the marine ecosystem to an acceptablelevel, the extraction of corals and shells from the waters is forbidden. Thisprohibition, however, should be accompanied by more rigid control on thesale of imported shells, if not their prohibition.
190
9.10 Conclusions
M. Sen Ramsamy
The prerequisites for the orderly and successful development of tourism areproper planning and monitoring. Strategic planning enables objectives andguidelines to be established as a basis for policy formulation, while masterplanning translates these aims into a detailed action framework. Planningof any type is, however, not a goal in itself. The monitoring of developmentplans in coordination with the relevant bodies is an essential tool in the implementation and polishing of programs. Provision for adjustments in theseprograms is necessary to attain the objectives in the constantly evolvingmarket forces.
Taking into consideration the nature of tourism as an activity which issensitive to social pressures and psychological factors and changes in preferences and economic conditions, coupled with the changing profile of thetourists themselves, planners in tourism should make room for flexi bili tyin their approach to be able to adjust development strategies according tomarket forces and trends.
The raw material used for tourism development comprises basically natural and/or manufactured attractions, a mild climate, social tranquility, andpolitical stability. Fortunately, Mauritius is endowed with all the ingredientsnecessary for sustainable growth of its tourism industry. Any intensificationof activities in other sectors of the economy could, however, result in a partial or even a complete exhaustion of some of these factors, particularly themore vulnerable ones such as natural resources. The success of tourism veryoften gives way to temptations for further exploitation of resources whichcan, in the long term, prove detrimental to the fundamental interests oftourism itself. Tourism is therefore condemned to abide strictly by the rulesof nature conservation for its own survival.
The success story of tourism in Mauritius has been confirmed by therelatively satisfactory performance of the sector in adverse conditions markedby international conflicts such as the Gulf War. The task of intelligentlymanaging this success now constitutes a challenge for both the governmentand the private sector. To meet this challenge certain requirements mustbe met: acceptance of the policy and development strategies adopted, acautious and realistic approach to planning, and discipline in the executionof works.
Chapter 10
Energy
laishree Beedasy and Revin Panray Beeharry
10.1 Introduction
At any level of economic development, energy is an input to the productionand consumption systems. As a country's economy changes, the energy mixrequired to meet its total energy needs changes as well. To support economicdevelopment, to expand food production, and to halt environmental degradation, developing countries need to review their energy supply/demandpatterns. It is of prime importance, therefore, to obtain an insight into thecountry's energy flow. For this purpose, analyses of the past and presentproduction and consumption trends of commercial and noncommercial energy and the energy intensities of the various economic sectors of Mauritiusare undertaken in this chapter. An assessment of potential energy supplyalternatives is also presented.
10.2 History
In the early days, the Mauritian population met its energy needs from localresources; it depended on fuelwood and charcoal for cooking. Most of thefuelwood was obtained from the forests in the proximity of the settlements.The population density was low and fuelwood was in plentiful supply. Overthe course oftime, in addition to cutting the wood for fuel, scrub forests werebeing converted for agricultural and residential purposes. Consequently,
192 Jaishree Beedasy and Revin Panmy Beeharry
fuelwood became steadily less available. The pressure on the forests, tosome extent, was alleviated by the utilization of imported fuel and kerosene.
Transportation in Mauritius was limited to vehicles and carts drawnby horses and oxen. After a period of economic and population growth inthe mid-19th century, two changes took place in the local transport system.Some sugar factorie~ near the coast began to use small boats to transportsugar to the harbor. By 1862, the rapidly growing commerce and sugarindustry led to the introduction of trains. Railways were important formoving freight and passenger traffic until around 1920. From the 1920s untiljust after World War II, the railways faced increasing competition from roadtransport (buses and lorries) and became unprofitable. In 1962, during aperiod of rapid increase in the price costs of coal and an increase in thescarcity of firewood, the decision to close the railway system was taken.
Industrial production, until quite recently, was limited to sugar-canemilling. Originally, cane was crushed using animal power, and extractedjuice was evaporated in vats over open fires. The cane pulp was sun driedand used as fuel, but it had to be supplemented by firewood. The technology for sugar manufacturing developed significantly through the advent ofsteam for motive power generation and for process heating. By 1822, thevertical mills operated by oxen were replaced by mills generated by steamturbines. The evaporation station, however, was a big consumer of energy.The energy needs of factories were met only partly by burning the driedcane pulp-bagasse and had to be supplemented by firewood. There was adrastic change in the situation with the application of Rillieux's proposals ofmultiple utilization of steam in multi-effect evaporators. This developmentpermitted the sugar industry to achieve energy self-sufficiency by burningits own bagasse.
As the country developed, the energy requirements increased and therewas a change in demand for fuel types. Fossil fuels began to be imported togradually substitute for the scarce and less efficient local fuel sources (exceptfor the manufacture of raw sugar).
10.3 Energy Sources
Mauritius does not have any proven fossil fuel reserves. The country's localenergy sources meet only a limited part of the energy demand. Mauritius depends on imported fossil fuel for more than 80 percent of its needs (excludingsugar milling). The total primary energy consumption in 1990 was around
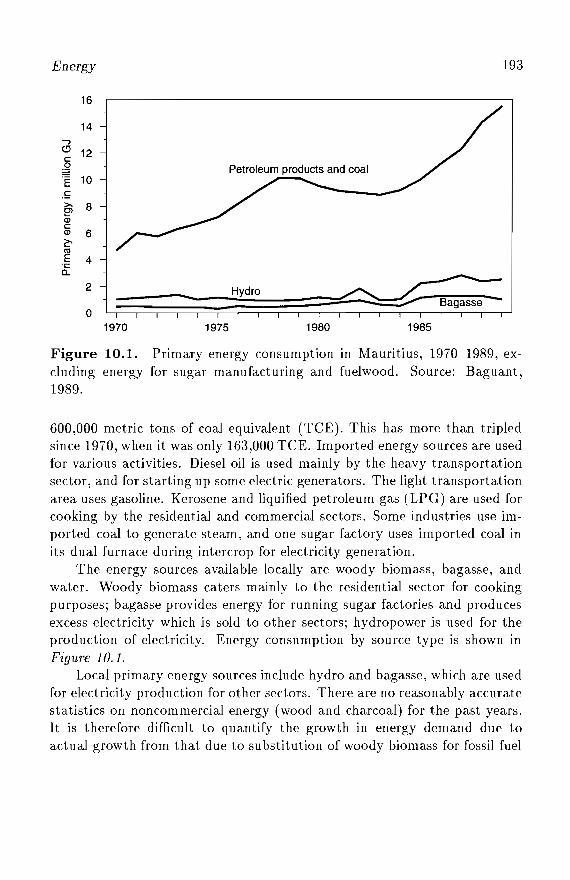
Energy 193
16
14...,G 12c~·E 10.s>- 8e'Q)cQ) 6~CIlE 4~
2
o
Petroleum products and coal
Hydro:
1970 1975 1980 1985
Figure 10.l.cluding energy1989.
Primary energy consumption in Mauritius, 1970-1989, exfor sugar manufacturing and fuelwood. Source: Baguant,
600,000 metric tons of coal equivalent (TCE). This has more than tripledsince 1970, when it was only 163,000 TCE. Imported energy sources are usedfor various activities. Diesel oil is used mainly by the heavy transportationsector, and for starting up some electric generators. The light transportationarea uses gasoline. Kerosene and liquified petroleum gas (LPG) are used forcooking by the residential and commercial sectors. Some industries use imported coal to generate steam, and one sugar factory uses imported coal inits dual furnace during intercrop for electricity generation.
The energy sources available locally are woody biomass, bagasse, andwater. Woody biomass caters mainly to the residential sector for cookingpurposes; bagasse provides energy for running sugar factories and producesexcess electricity which is sold to other sectors; hydropower is used for theproduction of electricity. Energy consumption by source type is shown inFigure 10.1.
Local primary energy sources include hydro and bagasse, which are usedfor electricity production for other sectors. There are no reasonably accuratestatistics OIl noncommercial energy (wood and charcoal) for the past years.It is therefore difficult to quantify the growth in energy demand due toactual growth from that due to substitution of woody biomass for fossil fuel
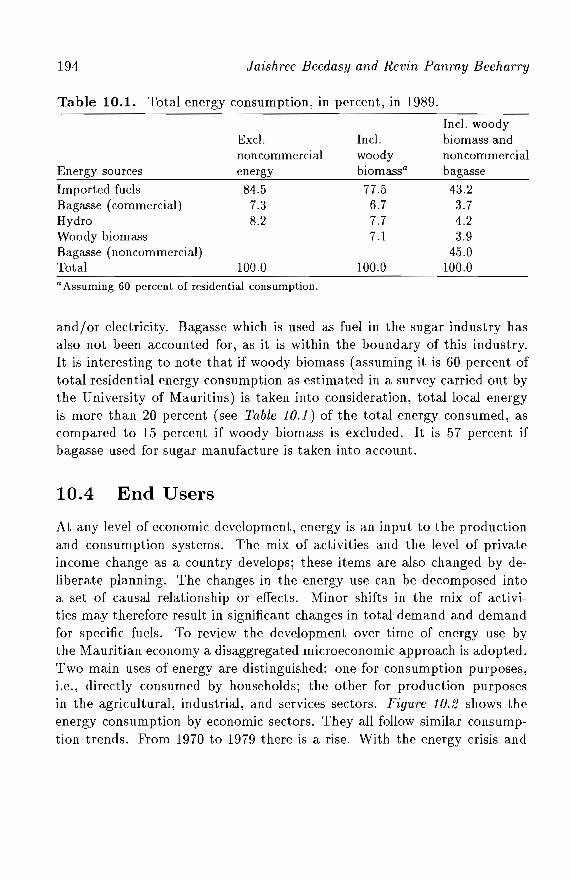
194
Table 10.1.
Jaishree Beedasy and Revin Panmy Beeharry
Total energy consumption, in percent, in 1989.
Energy sources
Imported fuelsBagasse (commercial)HydroWoody biomassBagasse (noncommercial)Total
Exc!.noncommercialenergy
84.57.38.2
100.0
Inc!.woodybiomassG
77.56.77.77.1
100.0
Incl. woodybiomass andnoncommercialbagasse
43.23.74.23.9
45.0100.0
G Assuming 60 percent of residential consumption.
and/or electricity. Bagasse which is used as fuel in the sugar industry hasalso not been accounted for, as it is within the boundary of this industry.It is interesting to note that if woody biomass (assuming it is 60 percent oftotal residential energy consumption as estimated in a survey carried out bythe University of Mauritius) is taken into consideration, total local energyis more than 20 percent (see Table 10.1) of the total energy consumed, ascompared to 15 percent if woody biomass is excluded. It is 57 percent ifbagasse used for sugar manufacture is taken into account.
IDA End Users
At any level of economic development, energy is an input to the productionand consumption systems. The mix of activities and the level of privateincome change as a country develops; these items are also changed by deliberate planning. The changes in the energy use can be decomposed intoa set of causal relationship or effects. Minor shifts in the mix of activities may therefore result in significant changes in total demand and demandfor specific fuels. To review the development over time of energy use bythe Mauritian economy a disaggregated microeconomic approach is adopted.Two main uses of energy are distinguished: one for consumption purposes,i.e., directly consumed by households; the other for production purposesin the agricultural, industrial, and services sectors. Figure 10.2 shows theenergy consumption by economic sectors. They all follow similar consumption trends. From 1970 to 1979 there is a rise. With the energy crisis and
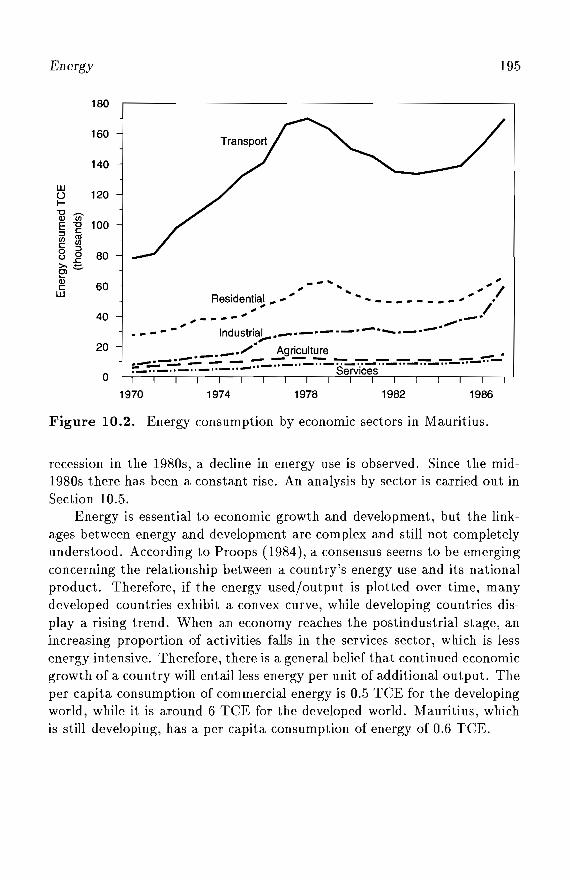
Energy
180
160
140
UJ() 120I-
-gooE -0 100::3 CrJJ ctlC rJJo ::3o 2 80e;~
:g 60UJ
40
20
o
195
--~ ~~., ".... .",.; IResidential .- .- .. .. ...",.; ------.- I
.",.;----.; ~.~.
- - - Industrial __._.-._.--........ _ •..-.-"_"""," Agriculture ".. --~-...=.--...:.-...:. - --_'77""_-::--~-:-;-...::-:--~_-:-:--~-:-:--~_-:-:--:""- .. - .. - .. - .• _ .• _.. Services
1970 1974 1978 1982 1986
Figure 10.2. Energy consumption by economic sectors in Mauritius.
recession in the 1980s, a decline in energy use is observed. Since the mid1980s there has been a constant rise. An analysis by sector is carried out inSection 10.5.
Energy is essential to economic growth and development, but the linkages between energy and development are complex and still not completelyunderstood. According to Proops (1984), a consensus seems to be emergingconcerning the relationship between a country's energy use and its nationalproduct. Therefore, if the energy used/output is plotted over time, manydeveloped countries exhibit a convex curve, while developing countries displaya rising trend. When an economy reaches the postindustrial stage, anincreasing proportion of activities falls in the services sector, which is lessenergy intensive. Therefore, there is a general belief that continued economicgrowth of a country will entail less energy per unit of additional output. Theper capita consumption of commercial energy is 0.5 TCE for the developingworld, while it is around 6 TCE for the developed world. Mauritius, whichis still developing, has a per capita consumption of energy of 0.6 TCE.
196
10.5
Jaishree Beedasy and Revin Panray Beeharry
Sectoral Energy Intensity
Two factors affect total energy consumption: the relative growth of sectors,such as transport versus services; and the energy intensity within each sector.
10.5.1 Transportation
The transportation sector has a special place in the energy demand. It is byfar the largest consumer of gasoline and diesel, the mix being in the ratioof 40 to 60. It accounted for 49 percent of primary energy consumption in1970 and 39 percent in 1989. This is the most energy-intensive sector of theMauritian economy; its energy intensity (EI) is some 4 kg coal equivalent(CE) per dollar (Baguant and Manrahhan, 1990, Table 2-1). The energyintensity increased for a few years after 1970, and has been decreasing sincethe energy crisis. In Mauritius, personal travel and vehicle ownership hasrisen with GDP and household income. There is a growing demand forgreater personal mobility and movement of goods. As transport is totallydependent on oil, and likely to remain so for some time to come, the sector'sshare in energy consumption is bound to continue growing in the future,together with the actual oil consumption growing at the rate of almost 15percent annually. But the growth in transport energy can be met by moreefficient vehicles and use of diesel fuel instead of gasoline. There has been agreat decrease in EI from 6.4 kgCE per dollar in 1970 to 3.9 kgCE per dollarin 1989. Three factors may be responsible for this decrease:
1. The replacement of inefficient vehicles by new and more efficient ones.2. The substitution of regular gasoline for premium which is more efficient.3. The rapidly growing output of "transport and communications" and
communications sectors which are not energy intensive.
10.5.2 Industrial
The industrial sector referred to here includes all the manufacturing industries of the Export Processing Zone: beverage industries, the textile industries, food processing, and construction. It excludes, however, the sugarfactories that use the sugar by-product (bagasse) for their energy requirements. Industry is the second largest energy consumer of all sectors. Itdepends mainly on electricity (35 percent) and fuel oil (46 percent), andto a small extent on LPG (1 percent). Since 1987 it has also depended oncoal (18 percent). The EI in industry has increased by a factor of 1.5 since
Energy 197
1970, i.e., from 74 to 125 kgCE per $1,000. With an expanding industrialsector, the EI has been increasing overall, even though the impact of theoil crises in the mid-1970s and early 1980s caused a decrease at the time.The stagnation and decrease of the EI in the mid-1980s were due to the increase in industrial output by mainly labor, not energy-consuming machines.In that period, unemployment in the country reached alarming proportionsand threatened its social and economic well-being. This led the Mauritiangovernment to promote the establishment of new industries to absorb thesurplus labor. Since 1987, however, EI has been increasing because severalnew industries, such as those in the textile sector, have been equipped withcoal-fired steam generation plants.
Given quasi-full employment and the scarcity of labor, industries in thefuture are likely to become more capital intensive. Mechanization, alongwith a growing EPZ sector, will lead to an increase in energy consumption.The extent of the increase will depend largely on the energy intensity of thenew industries. Most of the industries now belong to the textile or manufacturing sectors. Echiburu (1977) made a study of the labor/energy tradeofffor UK industries for the period between 1948 and 1975. Her results for themarginal energy requirements to substitute one man-hour were 1 kWh perman-hour for textile industries; 10 kWh for iron and steel industries; 2 kWhfor food, drink, and tobacco industries; and 2 kWh for all manufacturingindustries. According to Bheenick and Hanoomanjee (1989), the industrialfuture of Mauritius lies in the direction of such high-growth, high-technologyindustries as information, communication, and electronics. The energy requirements of information processing are relatively low; the greatest need ofsuch ind ustries is skilled workers.
10.5.3 Agricultural
The agricultural sector is dominated by sugar-cane plantations. The current policy of the government is to promote agricultural diversification byintensifying the growing of sugar cane and releasing land for other food cropcultivation. Energy carriers in this sector are diesel, fuel oil, and electricity.There is a lack of data available for this sector on the quantities of differenttypes of fuels; consequently estimates have been used. The sugar industry isvery energy intensive, but - as mentioned above - self-sufficient in its energyrequirements. Bagasse is used for electricity production for the sugar factories and for operating irrigation works during the growing season. Any excesselectricity produced by the sugar industry is sold to other sectors. During
198 Jaishree Beedasy and Revin Panray Beeharry
the off-season those sectors provide the electricity for maintenance purposesand for irrigation. Diesel is also used for pumping in water irrigation.
Although one might expect that agriculture is not a very energy-intensivesector, its EI has doubled from around 30 to 60 kgCE per $1,000 and nowmatches the industrial sector. In the early 1970s it was still labor intensiveand not mechanized, but mechanization has gradually increased in this sector. In addition, there are fluctuations in the EI whenever the price andproduction of sugar change. The trend in energy consumption has been increasing with the introduction of mechanical loaders for the sugar cane, andfurther use of machines for irrigation, transportation, and land preparation.More intensive mechanization will be required as a result of a scarcity oflabor and the policy to intensify sugar production per hectare in order torelease land for other crops. This will cause further increases in the EI inthe years to come. However, at present, there is much room for efficiencyimprovements in the use of equipment and vehicles in this sector.
10.5.4 Commercial and Services
This sector is made up of private and public services: commercial stores,hotels, restaurants, government buildings, and offices. It is the least energyintensive sector, but there has been an increase in EI between 1970 and1987 from 14 to 19 kgCE per $1,000. This is mainly due to the growthof tourism and improvements in the public infrastructure. The fuels usedare electricity (90 percent) and LPG (10 percent), the latter being used forcooking in hotels and restaurants.
10.5.5 Residential
This sector is different from the above sectors in that it uses energy forconsumption purposes and not for production purposes, and therefore cannotbe expressed as TCE per dollar. It is the main user of noncommercial energy,fuelwood, and charcoal. Commercial energy consumption time series arereadily available. The commercial fuel mix is electricity, kerosene, and LPGin the ratio 57:41:2 in 1970 and 62:20:18 in 1989. The substitution of keroseneis likely to continue with the lowering of tax on LPG in 1986-1987, improvedelectricity supply over the entire island, and improved standard of living. Asignificant percentage of household fuel is wood, which is purchased in localmarkets or gathered.
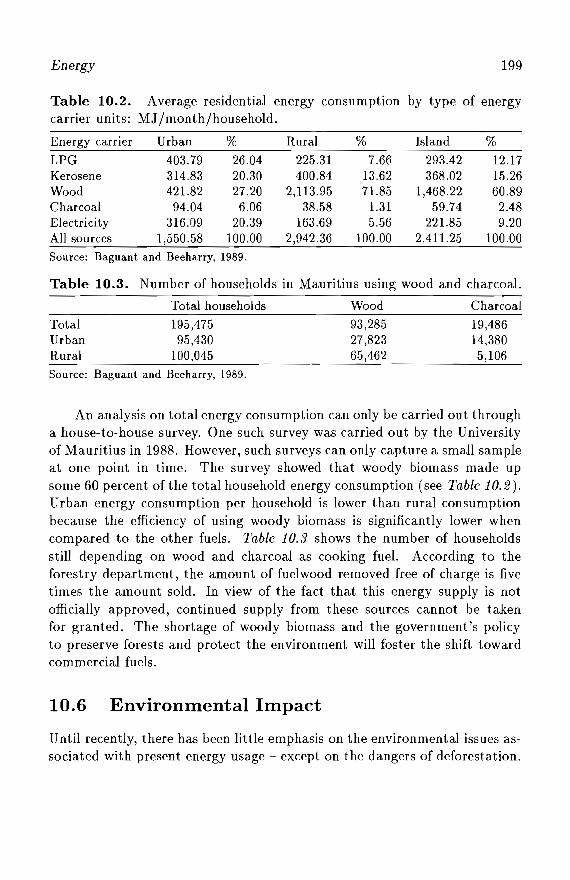
Energy 199
Table 10.2. Average residential energy consumption by type of energycarrier units: MJ/month/household.
Energy carrier Urban % Rural % Island %LPG 403.79 26.04 225.31 7.66 293.42 12.17Kerosene 314.83 20.30 400.84 13.62 368.02 15.26Wood 421.82 27.20 2,113.95 71.85 1,468.22 60.89Charcoal 94.04 6.06 38.58 1.31 59.74 2.48Electricity 316.09 20.39 163.69 5.56 221.85 9.20All sources 1,550.58 100.00 2,942.36 100.00 2,411.25 100.00
Source: Baguant and Beeharry, 1989.
Table 10.3. Number of households in Mauritius using wood and charcoal.
Total households Wood CharcoalTotalUrbanRural
195,47595,430
100,045
93,28527,82365,462
19,48614,3805,106
Source: Baguant and Beeharry, 1989.
An analysis on total energy consumption can only be carried out througha house-to-house survey. One such survey was carried out by the Universityof Mauritius in 1988. However, such surveys can only capture a small sampleat one point in time. The survey showed that woody biomass made upsome 60 percent of the total household energy consumption (see Table 10.2).Urban energy consumption per household is lower than rural consumptionbecause the efficiency of using woody biomass is significantly lower whencompared to the other fuels. Table 10.3 shows the number of householdsstill depending on wood and charcoal as cooking fuel. According to theforestry department, the amount of fuelwood removed free of charge is fivetimes the amount sold. In view of the fact that this energy supply is notofficially approved, continued supply from these sources cannot be takenfor granted. The shortage of woody biomass and the government's policyto preserve forests and protect the environment will foster the shift towardcommercial fuels.
10.6 Environmental Impact
Unti! recently, there has been little emphasis on the environmental issues associated with present energy usage - except on the dangers of deforestation.
200 Jaishree Beedasy and Revin Panray Beeharry
There is, nevertheless, a great need to control pollution due to emissionsfrom the combustion of fuels. The use of coal-fired boilers for generatingprocess steam in certain industries is also viewed with concern. The pollutants released are sulfur dioxide, carbon dioxide, and carboniferous particles.Some industries use diesel or oil-fired boilers which emit sulfur dioxide andcarbon dioxide. When combustion of any of these fuels is incomplete carbonmonoxide is also produced.
The thermal-generating power stations also pollute the air with gaseslike carbon dioxide and sulfur dioxide. The sugar factories produce fly ashwhen bagasse is combusted. Depending on the wind speed and direction,the fly ash can be carried quite far from the factories and deposited inresidential areas.
A slow deterioration in the quality of environment has been observedin the urban areas and along the main road networks. The recent increasein road traffic, together with the numerous old vehicles on the roads, isresponsible for this. Spills of fuel and engine oil deteriorate roads; usedoil is discarded into rivers, streams, or drains along the roads. Anothersource of pollution is the gaseous emission from the exhaust pipes of vehicles,including inorganic lead compounds, unburned fuel, carbon dioxide, carbonmonoxide, and nitrogen oxides. Mauritius still uses only leaded petrol witha lead content between 0.57 and 0.67 grams per liter of petrol. The presentdensity of vehicles per kilometer of road is 68, and it is expected that it willincrease to 115 by the year 2000. If this occurs, the environment will begreatly affected by the presence of lead. The lead content of petrol mustbe decreased or there must be a decrease in the number of vehicles on theroads. This could be achieved by introducing a mass transit system alongthe highly congested routes linking the urban areas of the district of PlainesWilhems to the capital, Port Louis. Another positive step would be thepromotion of bicycles. Cycling could become a healthy and "clean" fad inthe year 2000.
It is crucial to inform and educate Mauritians about the dangers of pollution and the ways to curb the deterioration of the environment. This latteraim is not easy to achieve without adequate pollution control legislation.The Ministry of Environment and Quality of Life is responsible for the formulation and implementation of environmental protection and conservationpolicies and programs.
Energy 201
10.7 Local Resources
The level of commercial energy consumption and production in Mauritius,if examined along the lines of Parikh (1980), is in a phase of developmentjust above the subsistence threshold. It is still on the steeply rising slope ofthe energy/output curve. For further development and progress, an adequatesupply of energy has to be maintained. In view of the pressure of the rapidlydeveloping industrial sector - increasing transport and the mechanization ofagriculture - this may pose quite a challenge. Simultaneously, with regard topossible worldwide agreements on the reduction of greenhouse gas emissions,as well as local pollution, alternatives should be considered. The optionswhich could be adopted to overcome these constraints include the use ofsome alternative energy sources, as discussed below.
10.7.1 Bio-Fuel
Bagasse
Bagasse is a major source of energy in the local context. From the pointof view of steam production, its most important property is its moisturecontent. The average heat content of bagasse at 50 percent moisture is 9.9GJ per metric ton. The production of bagasse is 280 kg per metric ton ofcane. Annually some 5.5 million metric tons of sugar cane are harvested,with an energy potential from bagasse of 15 million GJ per year.
Efficient sugar factories produce excess steam and/or bagasse, which isused for the production of electricity for sale to other sectors. Currently thisexport amounts to 10 kWh per metric ton of cane. If the Central ElectricityBoard were to offer a reasonable price per unit, the sugar factories could bemotivated to improve this figure to 20 kWh per metric ton of cane. This canbe achieved with some minor modifications to the existing infrastructure.If high pressure boilers and condensing turbines were to replace existingequipment, total electricity production could reach 60 kWh per metric tonof cane. This electricity, however, would only be available during the harvestseason. For a continuous supply another fuel could be combusted duringthe nongrowing season. Such a scheme is already in operation at one ofthe sugar factories (Flacq United States Limited), where a dual furnaceenables the combustion of coal during the off-season. This system has hadpositive results. If this measure were to be adopted, the total production
202 Jaishree Beedasy and Revin Panmy Beeharry
would provide some 990 GWh, i.e., an additional 660 GWh from the coal.According to Baguant and Manrahhan (1991) this would cover half the totalenergy needs for electricity in the year 2010.
Molasses
Molasses is a by-product of the sugar industry. Ethanol can be obtainedfrom molasses by fermentation and distillation, and low-grade ethanol canbe used as a cooking fuel substitute. This would reduce the quantity ofwoody biomass and kerosene utilized in the kitchen. It is technically feasibleto replace 1 liter of kerosene with 1.25 liters of 85° (low-grade) ethanol.The volume of ethanol required for complete replacement of kerosene canbe produced from locally available molasses. But, again, to encourage thisshift, appropriate policies need to be formulated.
Biogas
This is a cheap source of energy with a simple production process, and canbe worked by people with little training. The process uses animal wasteand kitchen waste to produce methane through fermentation. This can beused either directly for cooking or by further conversion into power for smallmachines.
Anaerobic Wastewater Treatment
Currently, a project is being carried out at the University of Mauritius forthe treatment of wastewater from the sugar industry. The wastewater is fedto a tank; during anaerobic treatment of the effluent, methane is producedat one end, while at the other clean water is obtained. No further energyis required for heating during the process, as the wastewater is already hot.This project seems to be very promising in terms of wastewater disposal andenergy production.
10.7.2 Solar energy
Mauritius receives between 8 and 10 hours of sunshine daily. The averageinsolation on a horizontal surface in Mauritius varies from about 6 kWh perm2 per day in the summer to 3.25 kWh per m2 per day in the winter.
In fact, Mauritian electricity needs could be met by solar cells coveringa few square kilometers of the country! Solar energy can be llsed directly for
Energy 203
crop drying and water heating. Power can also be derived from small-scaleconvertors of solar energy, e.g., for water pumping.
In Mauritius, solar water heaters have already been tried and proved tobe technically feasible; some hotels and households are already using suchheaters. A survey carried out by the University of Mauritius in 1989 foundthat 9 percent of the electricity consumed in the household was used solelyfor heating water for hygienic uses. It is also assumed that firewood forcooking heats a certain percentage of water. Therefore, if most of the energyfor heating water were obtained from solar heaters, electricity requirementscould be reduced by at least 10 percent. However, high costs deter the spreadof solar heaters.
10.7.3 Wind energy
Mauritius has a continual wind speed varying from four to eight meters persecond, representing a large energy potential. The harnessing of wind energyhas not progressed as far as other forms of energy; further studies need tobe carried out. Wind power can be applied to uses such as water pumpingand generation of electricity.
10.7.4 Hydropower
Hydro electricity contributes up to 30 percent of the total electricity supply.Currently, the total hydropower installed capacity is 51 MW, and it is believed that up to a capacity of 75 MW can be reached. In the future, a pumphydro scheme could be developed to provide power at peak periods. The useof a pump hydro system allows the conversion of excess base power into morevaluable peak power. A pump hydro scheme can allow an extension of thehydro capacity once the maximum of 7.5 MW is reached. An advantage ofthis scheme is that, being a closed circuit, once the water is in the system itwill be independent of climatic conditions, as opposed to hydropower plants.
10.8 Future Carbon Emissions
The environmental impact of energy use in Mauritius depends on the mixof energy carriers as well as the future economic development path. Carbonemissions are of special concern in this context. Mauritius's contributionto global CO 2 emissions is minimal, not only in absolute terms but alsoon a per capita basis (240 kg carbon per capita); it has approximately the
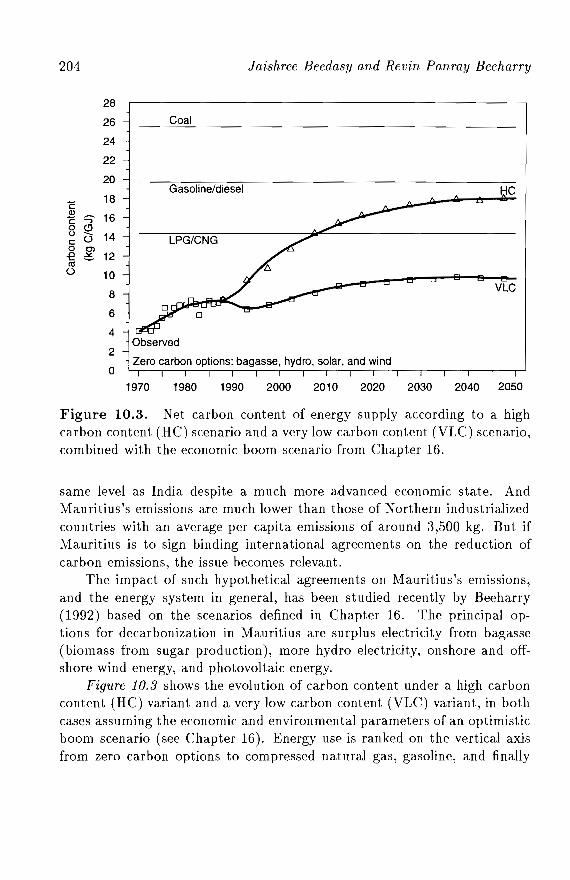
laishree Beedasy and Revin Panray Beeharry204
28
26
24
22
20
C18
Ql16C ::::;-
0 §0 14c0 OJ-e ~ 12<1l() 10
8
6
4
2
0
Coal
Gasoline/diesel
Observed
Zero carbon options: bagasse, hydro, solar, and wind
HC
VLC
1970 1980 1990 2000 2010 2020 2030 2040 2050
Figure 10.3. Net carbon content of energy supply according to a highcarbon content (HC) scenario and a very low carbon content (VLC) scenario,combined with the economic boom scenario from Chapter 16.
same level as India despite a much more advanced economic state. AndMauritius's emissions are much lower than those of Northern industrializedcountries with an average per capita emissions of around 3,500 kg. But ifMauritius is to sign binding international agreements on the reduction ofcarbon emissions, the issue becomes relevant.
The impact of such hypothetical agreements on Mauritius's emissions,and the energy system in general, has been studied recently by Beeharry(1992) based on the scenarios defined in Chapter 16. The principal options for decarbonization in Mauritius are surplus electricity from bagasse(biomass from sugar production), more hydro electricity, onshore and offshore wind energy, and photovoltaic energy.
Figure 10.3 shows the evolution of carbon content under a high carboncontent (HC) variant and a very low carbon content (VLC) variant, in bothcases assuming the economic and environmental parameters of an optimisticboom scenario (see Chapter 16). Energy use is ranked on the vertical axisfrom zero carbon options to compressed natural gas, gasoline, and finally
Energy 205
coal. Compared to the current 240 kg of carbon per capita, this figure impliesthat part of the reduction is possible through fuel substitution, achieved bythe transition from a high carbon energy supply mix to a very low carbonenergy supply mix. The remaining reduction could only be achieved by moreradical changes in the energy supply mix, such as electrifying transportationand providing required electricity from zero net carbon fuels.
In summary, the calculations show that despite further increases in energy use under the boom scenario, energy efficiency improvements combinedwith enhanced use of bagasse have the potential of reducing energy-relatedCO 2 emission to levels well below the assumed target of 420 kg of carbon percapita that could be part of an international agreement of equal per capitaemissions rights by 2050.
10.9 Conclusion
The capital investment for the implementation of some of the schemes forreducing carbon contents and dependence on imported energy will necessitate considerable funding which would have to come from local and foreignsources. It could be argued that if Mauritius can afford so many vehicles,electrical appliances for households, and sophisticated machinery for its industries, it could well afford to import fuel. The important issue is not onlywhether it could afford to buy fuel, but also whether it could be less dependent on imported energy sources while exploiting available local resources tothe fullest. There would be a net positive impact on the environment as thequantities of the more polluting fuels would decrease. The above-mentionedmeasures would undoubtedly reduce firewood consumption and help in forest preservation. For further development of the country, the demand forenergy will increase. It is crucial, therefore, to plan ahead and adopt energystrategies that are compatible with the environment.


Part III
Understanding Through Modeling

Chapter 11
Philosophy of the PDEApproach
Wolfgang Lutz
Formal models on computer are a tool to support the human brain. Inthe same way that a pencil can help the scientist remember his presentthoughts, a computer model can help the scientist consider simultaneouslymore variables and interdependencies than he could manage even with a welltrained mind. Because population-development-environment interactionsare highly complex, a nonformal, noncomputerized analysis such as thatpresented in the chapters in Part II can only describe relevant aspects andinteractions one after the other. This approach may be appropriate forunderstanding the history and describing the course of events that havealready taken place and that will not be altered by the model of the scientist,although its interpretation may well be altered.
When attempting to project possible future trends, on the other hand,the simultaneous consideration of all important interactions between thevariables is absolutely essential. Anyone-dimensional projection of a trendthat disregards likely influences of other variables is bound to be wrong in thesense that reality will be different. Hence, at least for the future, we need touse computer modeling to combine and evaluate complex sets of assumptionsabout individual variables and specific linkages. Despite its superiority inmany aspects to a purely mental model, a computer model will always be
210 Wolfgang Lutz
far short of an exact representation of reality. The best circumstance onecan hope for is to capture the most relevant aspects of the system.
Any design of a model includes difficult choices of variables and assumedmechanisms. The results of the model will crucially depend on those choices.The challenge for our attempt to design the PDE model was to be as comprehensive and flexible as possible. We chose to meet this challenge by designinga model with two levels: a "hard-wired" level and a soft level. In the basic(hard-wired) structure of the model we stick to unambiguous relationshipswhich can hardly be debated even by scientists with greatly conflicting views.In the "soft" part of the model, which is operationalized through the tools ofscenario setting, all the less straightforward and controversial linkages maybe defined. A comparison of the outcomes of alternative specifications inthe soft part then can help to better understand the alternative behavior ofthe system and put into perspective differences in opinion expressed in theliterature about interdependencies and feedbacks.
In short, the PDE model is a flexible and user friendly computer tool tocomprehend the relationships between population change (P), socioeconomicdevelopment (D), and environmental factors (E). It gives a broad accountingframework which quantitatively specifies the most important and immediateeffects of some sectors of the system on others. It is flexible in the sense thatthe user is free to choose different values for a large number of parameters,and to define any combination of possible trends and policies - as well asfeedback mechanisms - through the tools of time-dependent interactive scenario setting. The PDE model aims at enhancing scientific understandingand demonstrating the longer-term consequences of alternative policies orexternal developments. It has no immediate advocacy purpose.
When discussing the philosophy and basic structure of PDE models, it isimportant to distinguish between the general PDE approach, which could beapplied to other countries or regions, and the specific form of PDE Mauritius.The latter was made to fit specific Mauritian conditions ranging from theclimate to economic structure, data availability, and time constraints in thecompletion of the model. The Mauritius model should be seen as a firstattempt and a prototype of a PDE application.
The first letter in PDE refers to population; the second, to development;and the third, to environment. This sequence is not arbitrary; it expressesthe basic philosophy of the model. Population is taken as the point of departure as one of the basic driving forces that - together with many otherfactors - has an impact on development within environmental constraints.
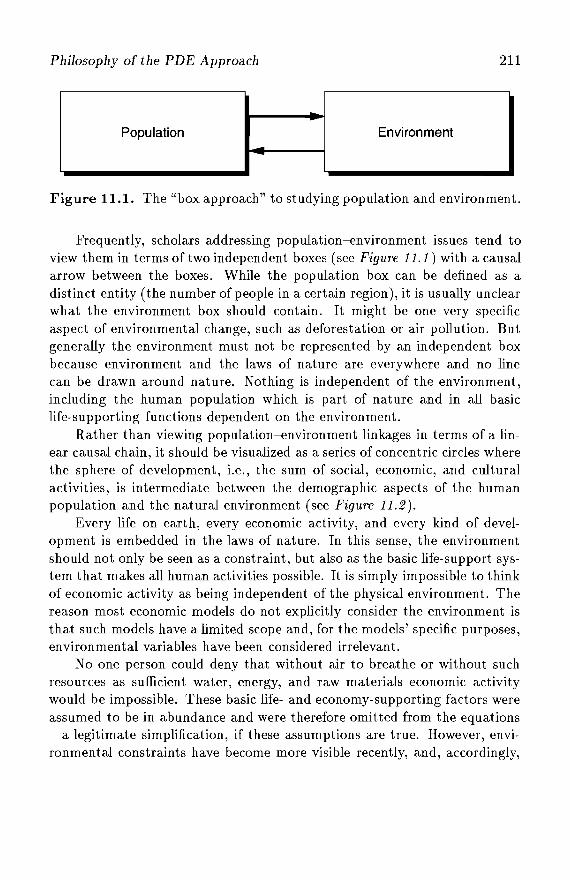
Philosophy of the PDE Approach 211
Population Environment-
Figure 11.1. The "box approach" to studying population and environment.
Frequently, scholars addressing population-environment issues tend toview them in terms of two independent boxes (see Figure 11.1) with a causalarrow between the boxes. While the population box can be defined as adistinct entity (the number of people in a certain region), it is usually unclearwhat the environment box should contain. It might be one very specificaspect of environmental change, such as deforestation or air pollution. Butgenerally the environment must not be represented by an independent boxbecause environment and the laws of nature are everywhere and no linecan be drawn around nature. Nothing is independent of the environment,including the human population which is part of nature and in all basiclife-supporting functions dependent on the environment.
Rather than viewing population-environment linkages in terms of a linear causal chain, it should be visualized as a series of concentric circles wherethe sphere of development, i.e., the sum of social, economic, and culturalactivities, is intermediate between the demographic aspects of the humanpopulation and the natural environment (see Figure 11.2).
Every life on earth, every economic activity, and every kind of development is embedded in the laws of nature. In this sense, the environmentshould not only be seen as a constraint, but also as the basic life-support system that makes all human activities possible. It is simply impossible to thinkof economic activity as being independent of the physical environment. Thereason most economic models do not explicitly consider the environment isthat such models have a limited scope and, for the models' specific purposes,environmental variables have been considered irrelevant.
No one person could deny that without air to breathe or without suchresources as sufficient water, energy, and raw materials economic activitywould be impossible. These basic life- and economy-supporting factors wereassumed to be in abundance and were therefore omitted from the equations- a legitimate simplification, if these assumptions are true. However, environmental constraints have become more visible recently, and, accordingly,
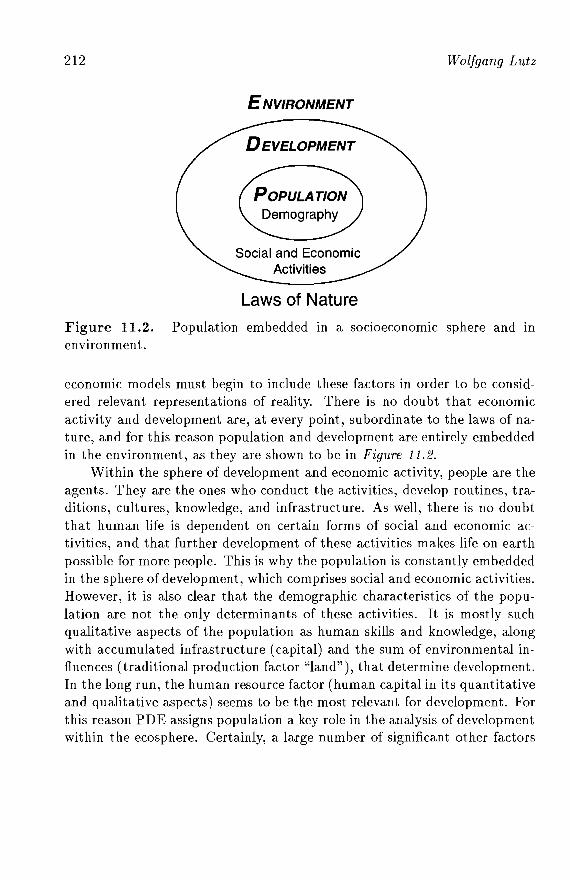
212
ENVIRONMENT
Social and EconomicActivities
Laws of Nature
Wolfgang Lutz
Figure 11.2. Population embedded in a socioeconomic sphere and III
environment.
economic models must begin to include these factors in order to be considered relevant representations of reality. There is no doubt that economicactivity and development are, at every point, subordinate to the laws of nature, and for this reason population and development are entirely embeddedin the environment, as they are shown to be in Figure 11.2.
Within the sphere of development and economic activity, people are theagents. They are the ones who conduct the activities, develop routines, traditions, cultures, knowledge, and infrastructure. As well, there is no doubtthat human life is dependent on certain forms of social and economic activities, and that further development of these activities makes life on earthpossible for more people. This is why the population is constantly embeddedin the sphere of development, which comprises social and economic activities.However, it is also clear that the demographic characteristics of the population are not the only determinants of these activities. It is mostly suchqualitative aspects of the population as human skills and knowledge, alongwith accumulated infrastructure (capital) and the sum of environmental influences (traditional production factor "land"), that determine development.In the long run, the human resource factor (human capital in its quantitativeand qualitative aspects) seems to be the most relevant for development. Forthis reason PDE assigns population a key role in the analysis of developmentwithin the ecosphere. Certainly, a large number of significant other factors
Philosophy of the PDE Approach 213
influence development, which are specified as exogenous and endogenousvariables in the economic module of PDE.
The environment is everywhere; but how should it be meaningfully captured in a quantitative model? Most of the analyses which claim to considerthe environment in the context of development select one or two very specificaspects of the environment, be it CO 2 emissions or rates of deforestation.These specific analyses can be useful as illustrations for certain impacts, butthey cannot claim to comprehensively capture development-environment interactions. Attention is currently being given to carbon emissions, becauseof the fear of climate warming, and to the level of CFCs and its impacton the ozone layer. Tomorrow, however, new environmental priorities mayarise, such as immediate problems of water supply, toxic waste, radiation,or possible new threats to human health. Because such a disjointed andfractional approach to environmental questions could turn out to be rathershort lived - hence missing some of the more important interactions - thePDE approach attempts to be as comprehensive as possible by, at least intheory, giving attention to all possible environmental aspects.
When thinking of how to find a meaningful differentiation of the environment as it relates to human life on earth, it can be instructive to go backto the very origins of Occidental thinking in ancient Miletas, around 600B.C. There Anaximander, who had supposedly drawn the first map of theworld, claimed that four elements - water, air, fire, and earth - made up theworld and were in some kind of balance. These early attempts to understandnature and the environment of people may also be useful in structuring ourthinking in how to identify relevant environmental aspects for the modelingof population-environment interactions. Water, air, and land can readily betaken as environmental subsystems that deserve special treatment and aredescribed by separate modules in the environmental segment of PDE. Firecan be interpreted as energy that is also worth separate treatment. Anotherenvironmental system, which is not mentioned by Anaximander, is the sumof living species on earth. For our purposes it is useful to distinguish betweenthe human species, the population, and other species with special attentionto the change in biodiversity. This philosophy is the basis for the generalPD E model as shown in Figure 11.3.
When attempting to translate these general ideas into an operationalquantitative model for the computer, in a specific case-study application, alarge number of specifications and definitions are required. In this we triedto follow three basic principles of modeling:
214 Wolfgang Lutz
1. The model should only include relevant aspects that could potentiallymake a difference in the case considered.
2. The model should be as simple and straightforward as possible, avoiding"magic" black boxes.
3. Only unambiguous and direct relationships should be hard-wired in themodel. All other aspects should be treated as part of the soft modelstructure, as expressed by scenario settings.
While there is little that is new about the first two principles, the thirdmay need some explanation. Our approach is based on one of the lessonswe have learned from global modeling of the 1970s and early 1980s. Thesystem should not become an artificial world in itself which, due to manypredefined feedback loops, develops its own life and takes off in directionsthat can hardly be followed by common sense and have little to do withreality. We wanted to avoid hard-wired unchangeable feedback loops thatare based only on ambiguous theory and scattered empirical evidence.
An example of this is whether fertility and mortality levels should bemade direct functions of any other demographic, economic, or environmental parameters in the model. Because the vast literature on socioeconomicfertility determinants does not suggest any clear and simple functional relationship between fertility and a set of non-demographic parameters, we decided not to specify such a relationship in the hard-wired part of the model.Instead, the user can decide when and how in the course ofrunning the modelthe fertility levels in the different population groups should be changed, basedeither on changing socioeconomic or environmental conditions or simply onassumptions about relevant cultural and behavioral changes. This possibility of user-defined feedback through scenario assumptions is called the softmodel. With respect to fertility, there are also several hard-wired aspectswhich work through the changing educational composition ofthe population:if the user assumes different fertility levels for different educational groups,a change in the educational composition of the population - which is alsoinfluenced by economic and government policy parameters - has a directimpact on the average fertility level in the population. This is a simple consequence of changing weights. Similar distinctions between hard and softparts of the model can be found for many different sectors.
Following these thoughts, Figure 11.3 gives the model proposed as ageneral guideline for the PDE approach. At the center one finds the population broken down - in the first instance - by age and sex. This gives thetraditional age pyramid with men (on the left) and women (on the right),
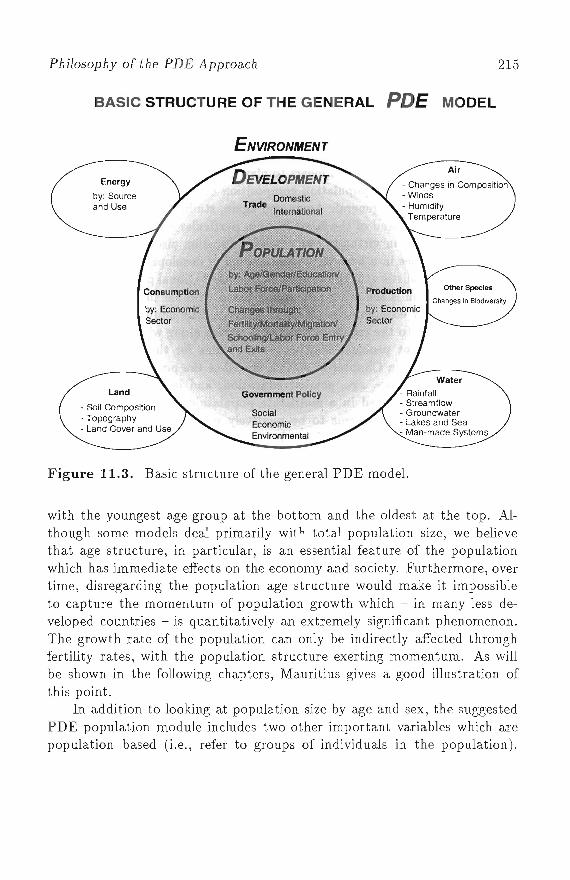
Philosophy of the PDE Approach 215
BASIC STRUCTURE OF THE GENERAL PDE MODEL
ENVIRONMENT
Energy
by: Sourceand Use
Land
- Soil Composition- Topography- Land Cover and Use
Air
- Ctlanges in Composition- Winds- Humidity
Temperature
Other Species
Changes In BIodiversity
Water
- Rainfall- Streamflow- Groundwater- Lakes and Sea- Man-made Systems
Figure 11.3. Basic structure of the general PDE model.
with the youngest age group at the bottom and the oldest at the top. Although some models deal primarily wit h total population size, we believethat age structure, in particular, is an essential feature of the populationwhich has immediate effects on the economy and society. Furthermore, overtime, disregarding the population age structure would make it impossibleto capture the momentum of population growth which - in many less developed countries - is quantitatively an extremely significant phenomenon.The growth rate of the population can only be indirectly affected throughfertility rates, with the population structure exerting momentum. As willbe shown in the following chapters, Mauritius gives a good illustration ofthis point.
In addition to looking at population size by age and sex, the suggestedPDE population module includes two other important variables which arepopulation based (i.e., refer to groups of individuals in the population).
216 Wolfgang Lutz
These also address certain aspects of social development, namely, educationand labor-force participation. With regard to education, there is an enormous amount of demographic literature indicating that education is one ofthe most important, if not the single most important, covariate of demographic behavior. Education appears to play an equally important role withregard to the effects of population composition on economic and socioeconomic development in general. Again and again, studies show that the skillsof the population - and of the labor force in particular - are a major determinant of progress in virtually every field. Education also seems to be oneof the key variables in a broader understanding of development as a changefrom a rather fatalistic attitude toward life to more rational planning. Laborforce participation is the other population- based variable that is consideredto be particularly economically relevant. There is little doubt that the laborforce contributes to the creation of national wealth along with advancementin the development process. Further justifications for the choice of thesevariables are given in Chapter 12, which describes the population module.
All these aspects - age, gender, education, and labor-force participation - are cross-classified in a multistate population model. This form ofthe population module seems to be relatively unambiguous, with respectto both substance and methodology. It is an attempt to summarize, in onecompact unit, the essentials of population dynamics that can be handed overto the rest of the model for economic, environmental, and policy considerations. Parameters of change in the population module are fertility, mortality,and migration in each subgroup, as well as schooling and labor-force entryand exit.
In Figure 11.3 the population parameters are embedded at every pointin the sphere of social and economic activities, including accumulated knowledge and infrastructure that may be summarized by the notion of development. This includes models of production and consumption by economicsectors as well as imports, exports, and domestic trade. Obviously savings,investments, and government expenditures also need to be considered. Finally government policies playa crucial role in all social, economic, and evenenvironmental aspects.
Unlike most other modeling attempts at addressing these issues, thePDE model does not want to be primarily an economic model. Its emphasisis on the population-environment relationship. But because population factors hardly ever directly interact with environmental factors, the economicmodule is intended to serve as a linkage between the two. In designing the
Philosophy of the PDE Approach 217
economic module, one is faced with a dilemma: on the one hand, the philosophy of the PDE approach asks for as simple a model as possible to servethe purpose of linking population to the environment, whereas, on the otherhand, one is in competition with a large number of very sophisticated economic models that do not attempt to provide this linkage. For the Mauritiusapplication, a form of the input-output table has been combined with certain features of general equilibrium models. The final product still reflectsthe evolution of thinking and development, and, although it is functional,it could well be improved for another application. In particular, it may benecessary to reconsider whether the advantages of an input-output table areworth its limitations. These aspects are discussed in Chapter 13.
But no matter which approach to economic modeling is chosen, certainfeatures should be retained. These are reflected in the Mauritius model, asdescribed below. With regard to the linkage of the economic module to thepopulation module, all of the selected basic population characteristics - sex,age, education, and labor-force participation - must be reflected in the economic input parameters and must make a difference in the results. In theMauritius application, age, gender, and labor-force participation determinethe size of the active population, as opposed to the dependent population(children, elderly, homemakers). Higher labor-force participation reducesthe size of the dependent population. The educational composition of thepopulation also has important independent effects on the economy. Firstly,higher education is assumed to increase economic productivity and, as aconsequence, the competitiveness on the world market, and lead to fastertechnological progress. Secondly, consumption patterns are assumed to depend on age and education. Because the population module can only providesuch information about individuals that cannot be directly translated intohousehold distributions, consumption is also defined for individuals by ageinstead of the usual household definition.
Another general criterion for the economic module is that it should consider the main components of the economy separately, in order to allow theanalysis of changes in the economic structure. But a model of the worldmarket for relevant export goods (such as sugar in Mauritius) is not beingattempted. It would be a very complex task in itself. Instead external factors- such as export demand - are treated through scenario-defined input parameters. The economic module should also produce some basic indicatorsof material well-being, quantify government expenditures and investment invarious important aspects of infrastructure, education, and social security,
218 Wolfgang Lutz
and provide unemployment figures. Finally, the economic module is expectedto produce - as output variables - the input parameters for the various environmental modules. These parameters include water-demand figures, waterpollution, solid waste, and changes in land use.
Figure 11.3 finds the environment broken down into four basic environmental sectors: air, water, land, and energy. The air module should beconcerned with the chemical composition of the air, along with air temperatures and humidity, and the direction, speed, and seasonality of winds. Thespecific aspects and models selected to describe relevant aspects of atmospheric change depend, to a great degree, on the country or region chosen.In urban and industrial areas in particular, emphasis would be placed on airpollution which displays immediate implications on human health and onthe health of the vegetation, especially forests. For more global considerations, attention would probably be directed to greenhouse gases along withthose gases responsible for ozone depletion. In the specific case of Mauritius, the fundamental modeling principle - of only including variables thatare assumed to have an effect on the outcome - resulted in the decision toomit the air module altogether. The almost permanent winds in the areaimmediately transport any kind of air pollution over the vast Indian Ocean.Some minor local air-pollution problems, located near sugar mills, did notjustify an extensive consideration of air-quality questions. The questions ofair temperature and humidity, relevant to the water balance of Mauritius,are extensively dealt with in the water module.
The water module is probably the most relevant of the environmentalaspects, due to its direct link to human life-support systems. Problems withwater supply can, in both the short and long term, lead directly to healthproblems such as those caused by lack of food production or by the consumption of contaminated water. Because most regions have different semiindependent water systems such as rivers, groundwater, lakes, and coastalwaters, the water module should consist of several sub-modules that describeand model the dynamics of the systems relevant for life in the specific regions. For each subsystem, two important and different aspects of waterneed to be considered: the quantity and the quality. Both aspects are important, and problems with either one may cause problems for the system.However, quantity and quality are not independent. The quality of a givenamount of polluted water can be improved by adding clean water. Hence,quantity can solve the quality problem.
Philosophy of the PDE Approach 219
Hydrological modeling is a large scientific field in itself. After a review ofthe relevant literature, the following approach was chosen: the surface freshwater model is basically concerned with the balance of water requirements(demand) and water availability (supply) at a given user-defined minimumwater-quality standard. Supply and demand for water are specified in termsof physical quantities. The water-quality standard chosen, together with theuser's decision about investments in wastewater treatment, determines thedilution flow component of water demand. In this way, water quantity andquality have been linked into a common system. The freshwater supply isbased on information about precipitation, evaporation, and historical flowdata. The water supply is measured in terms of aggregated minimum flowwhich the user can choose to increase by investing in storage capacities.
In the specific case of Mauritius, the approach described above was applied, taking the island as one more or less homogeneous region. In other,more heterogeneous, cases one would certainly have to specify a more complex multiregional model and account for the possibility of water being transported by rivers from one region to another. The model also includes aseparate module on water dynamics and sedimentation in the lagoons surrounding large parts of Mauritius. The Mauritius water module is describedin detail in Chapter 15.
Theoretically, the land module includes all aspects of surface structure,vegetation, and soil composition. In cases where soil degradation and erosionare serious problems, appropriate models which describe these phenomenain physical terms need to be chosen. In the case of Mauritius, the landmodule is mostly concerned with questions of land use and regional distribution, which are closely tied to economic changes and the values of differentcategories of land. This module distinguishes between four major types ofland use: urban use (including settlements and industries), sugar-cane fields,other agriculture, and beaches which, because of the tourist industry, haveby far the highest value per land unit. There are also protected lands (crownlands) and hardly usable areas on Mauritius. The land-use module reconciles competition from different users, and puts constraints on the economicmodule and on environmental aspects. This part of the model is discussedextensively in Chapter 14.
The influence of all nonhuman living things (other species), as includedin Figure 11.3, was not mentioned by Anaximander, but can certainly bevery relevant for the human-environment interaction. This aspect includesconsiderations of biodiversity as well as the changing distribution of species
220 Wolfgang Lutz
ranging from bacteria to whales. It is relevant not only for basic life-supportsystems but also for the disease environment that affects human mortalityand partly also fertility. In the case of Mauritius, however, these questionswere not considered in the quantitative model because of the first principlediscussed earlier, i.e., changes in other species are generally not considered tomake a big difference in Mauritius over the next six decades. Because of theirimpact on the lagoons, coral reefs are given special attention; vegetation isalso considered in the land-use module.
Energy, the fourth of the basic elements mentioned by Anaximander,could be treated either as a separate module or as part of the economicmodule. Because of its close relationship to the economy, it was decided toinitially treat energy considerations as part of the economic module (Chapter 13). If more sophisticated and independent energy modeling were to beconsidered desirable, a separate energy module would have the advantagethat energy could be treated on physical instead of monetary terms as isdone, for instance, by the ECCO models (King, 1991). The same is true foragriculture, which in PDE Mauritius is considered one of several economicsectors. In a predominantly agricultural country it might make sense, however, to create a separate agricultural module, possibly in conjunction withthe land module.
The specific form of the PDE approach chosen for PDE Mauritius consists of four semi-independent modules: population, economy, water, andland use. The population and water modules can also be used as fullyindependent models in themselves if scenarios are defined for parameters designed to be imported from other modules. In the specific Mauritian PDEapplication, the land-use module is so closely tied to the economic modulethat it seems pointless to run the two independently.
The full model has close to 1,000 parameters. The following chaptersgive comprehensive descriptions of the four modules and their interactionsin an intentionally informal manner to make it comprehensible to a broadaudience. Full descriptions of all model equations are given in a series ofseparate IIASA Working Papers (Prinz, 1992; Toth, 1992; Wils, 1993).
Chapter 12
The Population Module
Wolfgang Lutz and Christopher Prinz
12.1 The Model
12.1.1 Determinants and characteristics ofpopulation change
In this chapter we describe the specific structure of the multistate population model chosen for the population module of PDE Mauritius. Figure 12.1gives some general aspects of the relationship between input and output parameters in a population model for a case that considers age, sex, and placeof residence. It is important to distinguish between determinants and characteristics of population change. Only the characteristics of the populationhave an effect on the economy and the environment. The basic characteristics are total size, growth rate, density, age distribution (including mean ageand demographic dependency ratios), sex ratio, and regional distribution ofthe population. These supposedly relevant characteristics of the population,however, cannot be influenced directly but can only be affected by changesin one or more of the three basic determinants of population change, namely,fertility, mortality, and migration.
The effects of changes in fertility, mortality, and migration on populationcharacteristics are not always immediate, but they follow the laws of population dynamics. Even a severe famine or certain epidemics do not directlydiminish total population size but work through age- and sex-specific death
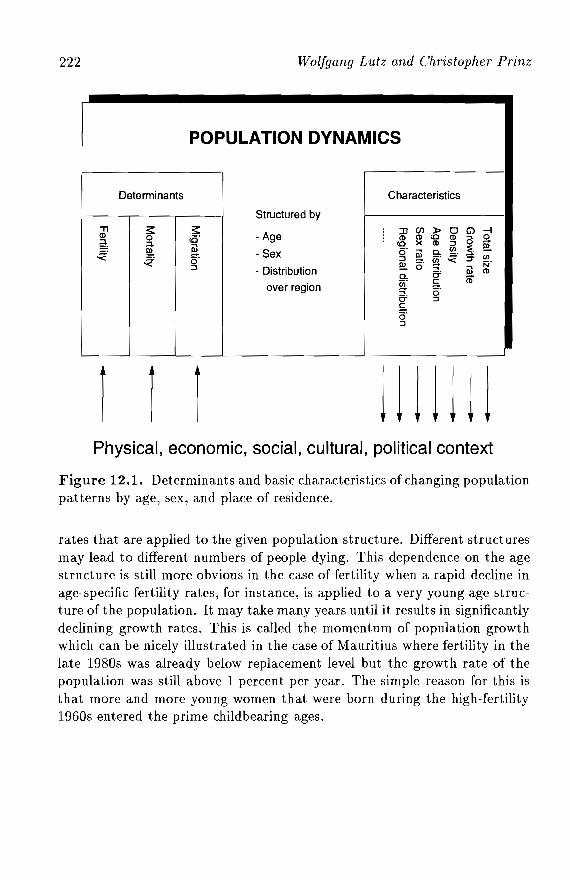
222 Wolfgang Lutz and Christopher Prinz
POPULATION DYNAMICS
Determinants Characteristics
Structured by"Tl ~ ~ :D en » 0 G) -lCD 0 cO' - Age CD CD co CD a Sl.§ ::l- §. co X CD :J
! ~~ - Sex o' §. a. ~.-< ~ o' :J @" -< ~ en
:J - Distribution ~ o' §.N'
C' CDa.~. ~ CD
over region o'C' :J~o':J
r r r 1111111Physical, economic, social, cultural, political context
Figure 12.1. Determinants and basic characteristics of changing populationpatterns by age, sex, and place of residence.
rates that are applied to the given population structure. Different structuresmay lead to different numbers of people dying. This dependence on the agestructure is still more obvious in the case of fertility when a rapid decline inage-specific fertility rates, for instance, is applied to a very young age structure of the population. It may take many years until it results in significantlydeclining growth rates. This is called the momentum of population growthwhich can be nicely illustrated in the case of Mauritius where fertility in thelate 1980s was already below replacement level but the growth rate of thepopulation was still above 1 percent per year. The simple reason for this isthat more and more young women that were born during the high-fertility1960s entered the prime childbearing ages.
The Population Module 223
The determinants of fertility, mortality, and migration are very complexincluding biological, economic, social, and cultural aspects. For the reasons discussed in Chapter 11 we do not predefine the way in which fertility,mortality, or migration change as a result of changes in the economic orenvironmental modules of the PDE model, but the user has the freedom tochoose the fertility, mortality, or migration response considered necessary bythe means of scenario setting.
12.1.2 Choice of demographic dimensions considered
The population module of PDE Mauritius can be used either independentlyto study population dynamics by age, sex, education, and labor-force participation or as an integral part of the PDE model. It represents a summary ofthe most important aspects of population dynamics with respect to the fourbasic dimensions of population structure (age, sex, education, and laborforce participation) that are considered relevant for any interaction betweenthe population and its environment.
Space limitation does not permit a summary of the huge demographicliterature on these four dimensions of demographic structure and change.Instead the population module is presented here as a proposed basic demographic model including the essentials that a demographer would considerappropriate. Certainly there are many other important demographic dimensions, most notably marital status, marital duration, parity, and householdcomposition, but we assume that few demographers would challenge thechoice of the four most relevant dimensions.
Age and sex are at the very base of demographic analysis and of immediate relevance for population growth. For example, the momentum ofpopulation growth can only be understood and modeled when the age structure of the population is considered. Sex composition by age is essentialfor determining the fertility level and also very relevant for mortality ratesbecause male and female mortality patterns tend to be quite different. Migration also tends to vary strongly with both age and sex. For these reasonsage and sex would be the absolute minimum any self-respecting demographer could accept in a population module. However, the (non-demographic)literature of demo-economic and other modeling is full of examples of modelsthat consider only total population size and the crude birth and death rates,i.e., the number of births and deaths per thousand persons in the population.
224 Wolfgang Lutz and Christopher Prinz
Because these models do not consider the effect of the age structure on thebirth rate (that is independent of the number of children per woman) theirfindings are sometimes greatly misleading.
Education is not a demographic variable in the strict sense but it is apopulation characteristic that is increasingly considered one of the most relevant aspects for not only fertility, mortality, and migration but also economicproductivity and technological change. The empirical evidence of the relevance of education on these variables is overwhelming both at the micro-leveland at the macro-level. Generally, better education leads to lower fertility,lower mortality, higher migration, and higher productivity. The measurement of education, however, is less straightforward than the measurement ofage and sex.
There are two main criteria for the distinction between educationalgroups: by reading and writing skills (literacy) or by years of formal education completed. The usefulness of the two approaches depends on thestatus of the specific population in the process of social development. In anindustrialized society where almost everybody can read and write the distinction by formal education is much more useful, whereas in a country withlarge proportions still illiterate reading and writing skills are the most important criteria. In the case of Mauritius, where already in the 1960s largeproportions of the population were literate, it was decided to distinguishbetween primary, secondary, and tertiary education.
Labor-force participation is probably the least self-suggestive of the fourdimensions considered. It is a dichotomous variable that indicates whethera person is part of the labor force or not. Generally this is defined as apopulation-based measure that is independent of the question of actual employment. Hence the labor force includes all people that are actually working(including those on sick or maternity leave) and the unemployed. Somewhatloosely one can say that the labor force consists of all people that want towork. Obviously the numerical measurement of this also depends on nationaldefinitions, which may differ from country to country. For example, a housewife who is theoretically willing to work but does not take any concrete stepstoward finding a job because she considers it hopeless and does not registeras unemployed because she is not entitled to benefits may be considered partof the labor force in some cases and outside the labor force in others. Despitethese problems of definition, major changes in labor-force participation ratesindicate major social changes that have significant impacts on the economyat various levels.
The Population Module 225
One prominent demographic variable that is omitted in this populationmodule is marital status. Because marriage is still closely related to fertilityin most countries of the world, changes in marriage patterns have immediate consequences on birth rates. This is also true for Mauritius where therapid fertility decline in the late 1960s and early 1970s was to a significantextent due to increases in the age at marriage (see Chapter 4). Regardlessof this importance of marriage it is of interest here only as an intermediatevariable influencing fertility. For this reason marital status as an independent variable has not been specified; nevertheless all scenario assumptionson fertility include the marital-status dimension.
Considerable attention has also been given to determining whetherhousehold size and structure should be explicitly treated in the model. Astrong argument in favor of this is that private consumption patterns areusually defined in terms of household consumption, not by individual consumption. There is, however, no feasible way to convert information basedon individuals (such as given in the form chosen for the population module)directly into information on households. Even if these two different aspectscould be matched for the starting year, there is no way to guarantee consistent changes in both when patterns are projected into the future. Forthis reason the population module sticks to the individual as the unit ofanalysis; in the economic part, consumption patterns are also defined on anindividual basis.
12.1.3 A multistate population model
The traditional cohort component method of population projection is designed to forecast populations only by age and sex. If we want to includethe two additional dimensions ~ education and labor-force participation -we must refer to the tools of multistate population projection. This methodwas originally developed to consider and forecast populations simultaneouslyin several regions that interact with each other, i.e., in addition to havinga child or dying, people can also migrate to another state at any age andat any time (see Rogers and Willekens, 1986; Keyfitz, 1985; among others).This methodology, however, is not limited to the analysis of geographicalregions. It can also be applied to different population groups (marital-statusgroups or educational groups) living in the same region or groups defined byany other criterion.
For the pu rpose of breaking down the population by ed ucation and laborforce participation, seven states have been defined as shown in Figure 12.2.
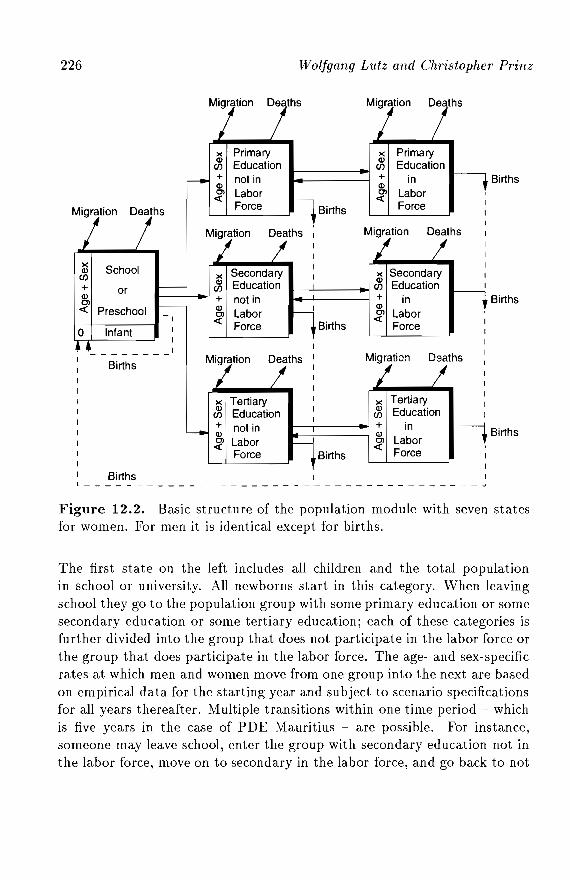
226 Wolfgang Lutz and Christopher Prinz
Births
Births
Migration Deaths
Births
)( Primary..._----., ~ Education
+ inQ)
;jf LaborForce
)( Primary~ Education+ not inQ)
;f LaborForce
Migration Deaths
Secondary )( Secondary~ Q)
(J) Education ..._---...J...------I~ (J) Education1------1~1 + not in + in
~ Labor ~ Labor« Force Births Force
)(SchoolQ)
(J)
+ orQ)Cl« Preschool
0 Infant
Migration Deaths
Births
Migration Deaths
Births
)( Tertiary~ Education
1----,-------1., + in...------.------1 ~ Labor
« Force
)( Tertiary~ Education~ not in;f Labor
Force
Migration DeathsBirths
Births IL . ~
Figure 12.2. Basic structure of the population module with seven statesfor women. For men it is identical except for births.
The first state on the left includes all children and the total populationin school or university. All newborns start in this category. When leavingschool they go to the population group with some primary education or somesecondary education or some tertiary education; each of these categories isfurther divided into the group that does not participate in the labor force orthe group that does participate in the labor force. The age- and sex-specificrates at which men and women move from one group into the next are basedon empirical data for the starting year and subject to scenario specificationsfor all years thereafter. Multiple transitions within one time period - whichis five years in the case of PDE Mauritius - are possible. For instance,someone may leave school, enter the group with secondary education not inthe labor force, move on to secondary in the labor force, and go back to not
The Population Module 227
in the labor force within a five-year period. Within each group women havechildren according to the schedule of age-specific fertility rates, which can bedefined separately for each group and which may change over time accordingto scenario specifications. Newborns do not enter the group of their motherbut start at age zero in the group of children and students.
In addition to the possible transition to another group - where the modelis semi-hierarchical because not all transitions go in both directions - peoplecan leave the states by either emigration from Mauritius or death. Peoplemay also enter the states by immigration. Age- and sex-specific death ratescan also be defined separately for each group. Because of the lack of empirical information on differentials in these rates, however, the default inthe program is identical mortality rates in all states. Migration is specified in terms of absolute numbers and assumed to differ substantially witheducational groups, with the most educated showing the highest mobility.
To what extent the resulting population characteristics (the output parameters of the population module) influence the economic and environmental modules is discussed in the description of the respective modules in laterchapters. In short, most of the effects of population size and structure onthe environment work via the economy: higher education directly increaseslabor-force participation; consumption is dependent on educational level andage; the supply of labor is given by educational groups; and government expenditures are directly dependent on the age structure (pension, health, andeducational expenditures). There are also direct effects of population sizeon the land-use module with respect to land demand for housing and on thewater module with respect to gross water intake by private households.
12.2 The Data
12.2.1 Population structure in the starting years
This section focuses on the information that was assembled and estimated togive the starting population structure according to the above-defined population states (see Chapter 4 for the population history of Mauritius). Thepopulation module uses two kinds of scenarios: one makes projections from1990 to 2050 and one looks at possible alternative histories from 1962 onward. These starting years have been chosen because they were census years.
The main source of information used for the model was the Mauritian1990 Population Census. In this census, 37 questions were asked, includingquestions about age, sex, marital status, citizenship, address, address five
228 Wolfgang Lutz and Christopher Prinz
years ago, age at marriage, number of children, religion, school attendance,educational qualification, occupation, activity status, employment status,and place of work. From the census results we derived (partly estimated)the population distribution across the seven states in our model. The 1962population distribution was estimated from several sources, such as the Digest of Educational Statistics (several issues), publications from previouspopulation censuses, and additional material from the Ministry of EconomicPlanning and Development.
Between 1962 and 1990, the Mauritian population increased from lessthan 700,000 people to more than 1 million. During that period, the proportion of children declined from 54.5 percent to 38.5 percent. This declinecorresponded to an increase in the proportion of people in working age (from40 percent in 1962 to 53 percent in 1990) as well as an increase in the proportion of people aged 60 years and over (from 5.4 percent to 8.4 percent).
In 1962, the proportions of women aged 15-24 and 25-44 in the laborforce were only 8 percent and 21 percent, respectively. By 1990, 37 percentand 44 percent of these female population groups were part of the laborforce. Together with the aging of the population and the higher educationalattainment of women, this increase was responsible for a very significantincrease in the overall percentage of women in the labor force: from 15percent in 1962 to 35 percent in 1990 (see Table 12.1). Due to the highnumber of young adults the respective figure for men increased also slightlyfrom 80 percent in 1962 to 82 percent in 1990, but the proportion of workingmen aged 45 years and over clearly declined.
The educational qualifications of the labor force also changed drastically. In 1962, the proportion of women with only primary education was 85percent in the age group 25-44 and 93 percent in the age group 45-64 (seeTable 12.1). By 1990, the proportions declined to 56 percent and 78 percent, respectively. Similarly, the proportion of men with at least secondaryeducation increased from 24 percent and 9 percent for age groups 25-44 and45-64, respectively, in 1962 to 51 percent and 26 percent by 1990. Thesechanges are explained by strong shifts in school enrollment ratios during theperiod. Enrollment among females aged 10-14 years increased from 50 to 80percent, and among females aged 15-19 years from 10 percent to 35 percent.Among males, the increase in school enrollment started some years earlierand thus was less marked during the observed period. Interestingly, by 1990school enrollment ratios no longer differed by sex.
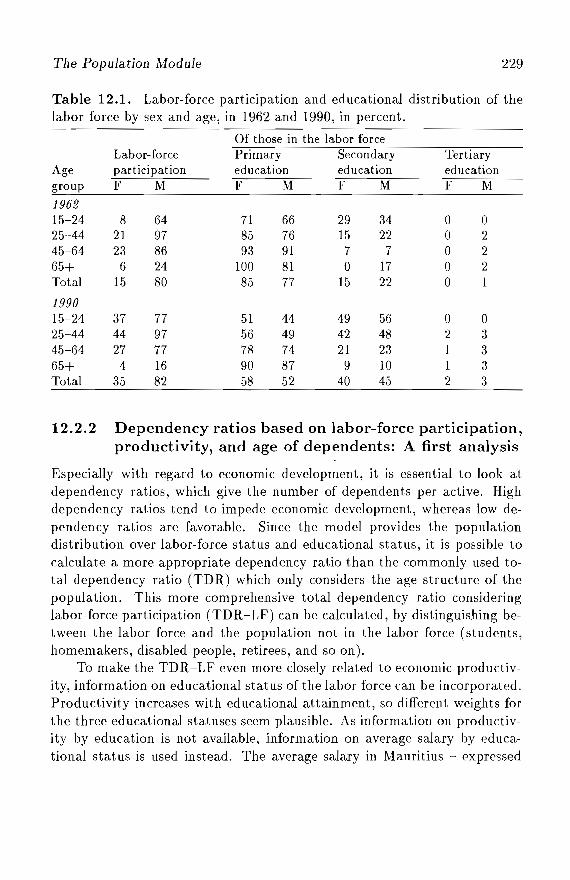
The Population Module 229
Table 12.l. Labor-force participation and educational distribution of thelabor force by sex and age, in 1962 and 1990, in percent.
Of those in the labor forceLabor-force Primary Secondary Tertiary
Age participation education education educationgroup F M F' M F M F M
196215-24 8 64 71 66 29 34 0 025-44 21 97 85 76 15 22 0 245-64 23 86 93 91 7 7 0 265+ 6 24 100 81 0 17 0 2Total 15 80 85 77 15 22 0 1
199015-24 37 77 51 44 49 56 0 025-44 44 97 56 49 42 48 2 345-64 27 77 78 74 21 23 1 365+ 4 16 90 87 9 10 1 3Total 35 82 58 52 40 45 2 3
12.2.2 Dependency ratios based on labor-force participation,productivity, and age of dependents: A first analysis
Especially with regard to economic development, it is essential to look atdependency ratios, which give the number of dependents per active. Highdependency ratios tend to impede economic development, whereas low dependency ratios are favorable. Since the model provides the populationdistribution over labor-force status and educational status, it is possible tocalculate a more appropriate dependency ratio than the commonly used total dependency ratio (TDR) which only considers the age structure of thepopulation. This more comprehensive total dependency ratio consideringlabor-force participation (TDR-LF) can be calculated, by distinguishing between the labor force and the population not in the labor force (students,homemakers, disabled people, retirees, and so on).
To make the TDR-LF even more closely related to economic productivity, information on educational status of the labor force can be incorporated.Productivity increases with educational attainment, so different weights forthe three educational statuses seem plausible. As information on productivity by education is not available, information on average salary by educational status is used instead. The average salary in Mauritius - expressed
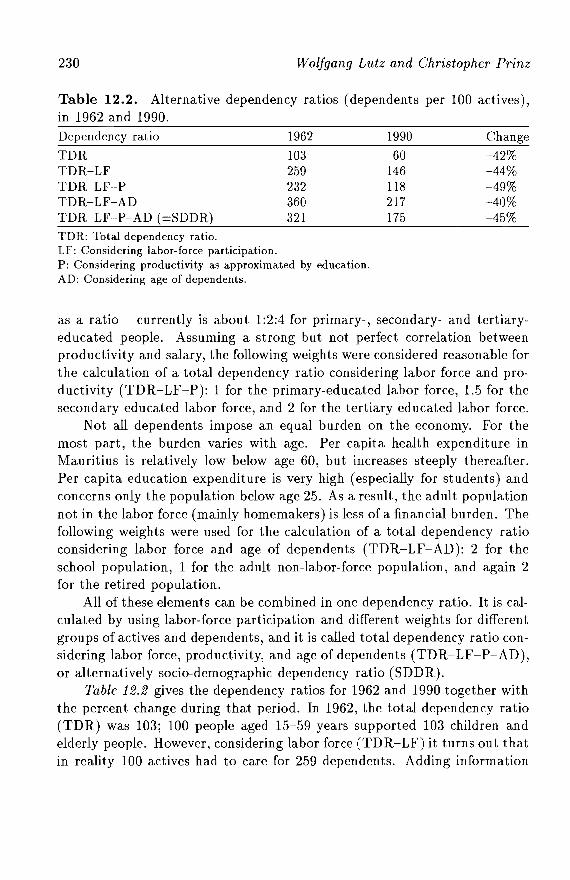
230 Wolfgang Lutz and Christopher Prinz
Table 12.2. Alternative dependency ratios (dependents per 100 actives),in 1962 and 1990.Dependency ratio
TDRTDR-LFTDR-LF-PTDR-LF-ADTDR-LF-P-AD (=SDDR)
1962103259232360321
199060
146118217175
Change-42%-44%-49%-40%-45%
TDR: Total dependency ratio.LF: Considering labor-force participation.P: Considering productivity as approximated by education.AD: Considering age of dependents.
as a ratio - currently is about 1:2:4 for primary-, secondary- and tertiaryeducated people. Assuming a strong but not perfect correlation betweenproductivity and salary, the following weights were considered reasonable forthe calculation of a total dependency ratio considering labor force and productivity (TDR-LF-P): 1 for the primary-educated labor force, 1.5 for thesecondary-educated labor force, and 2 for the tertiary-educated labor force.
Not all dependents impose an equal burden on the economy. For themost part, the burden varies with age. Per capita health expenditure inMauritius is relatively low below age 60, but increases steeply thereafter.Per capita education expenditure is very high (especially for students) andconcerns only the population below age 25. As a result, the adult populationnot in the labor force (mainly homemakers) is less of a financial burden. Thefollowing weights were used for the calculation of a total dependency ratioconsidering labor force and age of dependents (TDR-LF-AD): 2 for theschool population, 1 for the adult non-labar-force population, and again 2for the retired population.
All of these elements can be combined in one dependency ratio. It is calculated by using labor-force participation and different weights for differentgroups of actives and dependents, and it is called total dependency ratio considering labor force, productivity, and age of dependents (TDR-LF-P-AD),or alternatively socia-demographic dependency ratio (SDDR).
Table 12.2 gives the dependency ratios for 1962 and 1990 together withthe percent change during that period. In 1962, the total dependency ratio(TDR) was 103; 100 people aged 15-59 years supported 103 children andelderly people. However, considering labor force (TDR-LF) it turns out thatin reality 100 actives had to care for 259 dependents. Adding information
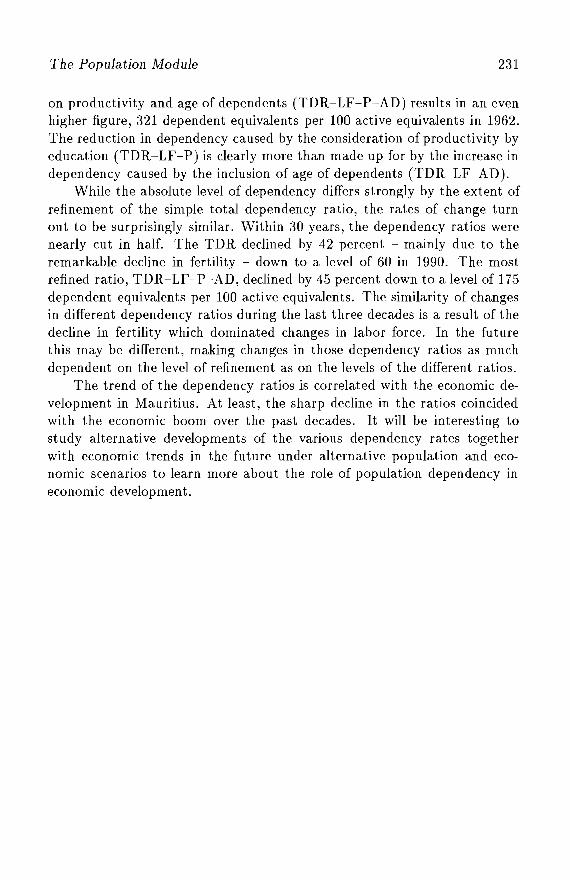
The Population Module 231
on productivity and age of dependents (TDR-LF-P-AD) results in an evenhigher figure, 321 dependent equivalents per 100 active equivalents in 1962.The reduction in dependency caused by the consideration of productivity byeducation (TDR-LF-P) is clearly more than made up for by the increase independency caused by the inclusion of age of dependents (TDR-LF-AD).
While the absolute level of dependency differs strongly by the extent ofrefinement of the simple total dependency ratio, the rates of change turnout to be surprisingly similar. Within 30 years, the dependency ratios werenearly cut in half. The TDR declined by 42 percent - mainly due to theremarkable decline in fertility - down to a level of 60 in 1990. The mostrefined ratio, TDR-LF-P-AD, declined by 45 percent down to a level of 175dependent equivalents per 100 active equivalents. The similarity of changesin different dependency ratios during the last three decades is a result of thedecline in fertility which dominated changes in labor force. In the futurethis may be different, making changes in those dependency ratios as muchdependent on the level of refinement as on the levels of the different ratios.
The trend of the dependency ratios is correlated with the economic development in Mauritius. At least, the sharp decline in the ratios coincidedwith the economic boom over the past decades. It will be interesting tost udy alternative developments of the various dependency rates togetherwith economic trends in the future under alternative population and economic scenarios to learn more about the role of population dependency ineconomic development.

Chapter 13
The Economic Module
Anne Babette Wils *
13.1 Introduction
The economic module developed for Mauritius is an input-output model fora small, open economy. The economy is seen as a mediator between thepopulation and the environment. The effect of a given or growing numberof people on the environment certainly differs depending on the activities ofthe people. By using resources of an environment in a prudent, or careless,manner a population can live well, or poorly, for a long period.
It matters to the environment whether the people are engaged in growingsugar, dyeing woolens, or international banking. Sugar production requireslarge amounts of land and water, and dumps organic waste into the rivers;dyeing woolens requires little land but a great deal of water, and dumpschemical waste into the rivers; international banking by itself, on the otherhand, refjuires almost no interaction with the environment (although theconsequences of international banking action on a country's economy mayaffect its environment). Our concern with the different effects of variouseconomic sectors led us to choose the input--olltput model structure.
The input-output model calculates the output of the economy by sectors. There can be, e.g., 100 or 200 sectors. This model has 15 sectors, whichmakes it a relatively aggregated input-output model. The model calculates
*1 acknowledge my indebtedness to Markus Amann, Warren Sanderson, Einar Holm, Wolfgang Lntz, and Esther Hanoomanjee for their substantial contributions.
234 A nne Babette Wils
total production by sector based on the final demand by sector. Final demand is consumption by end users of a product.
Each sector has population and environment coefficients. To produce amillion rupees worth of sugar requires different labor input than a millionrupees turnover at an international bank. For each sector, unit requirementsof labor by education are necessary input. Similarly, for each sector theunit requirements for land and water and the unit emissions of waste arealso needed. Depending on the structure of the economy by sector, theinteraction with the population and the environment is completely different.
The labor coefficients differ by the education of the labor force. A bettereducated labor force is assumed to be more productive than a less educatedlabor force, all else being equal.
In the complete model, in order to make consistent economic scenarios,adjustments are often required in the population or environment or policyvariables. For example, it is possible - and was often the case - that inscenario building the results show, e.g., more land, or more laborers withtertiary education, demanded than available. The calibration of the scenarios is a fascinating learning process described in Chapter 16.
13.2 General Model Structure
The model is one in which exports and education are the main driving forces.The size of the population is also important. Population influences government expenditure and the composition of private consumption demand.
Because of the way consumption and investment multipliers are specified, the structure of the model is such that it can be applied only toeconomies which are very open ~ where import and export value is a largeportion of the GDP ~ and which have relatively small domestic markets.
The main model assumptions are:
1. Export demand is exogenous, provided by the scenario maker. Government demand is a function of population and an exogenously providedper capita expenditure. Private consumption and investment demandare endogenous. Gross output is calculated from export demand, government demand, private consumption, and investment demand. GD Pand imports are calculated from gross output.
2. The labor coefficients - number of people needed to produce one unit ofoutput in each sector - are driven by the education of the labor force:the more educated the population, the fewer people needed to produce
The Economic Module 235
one unit of output. The labor coefficients are further influenced by anexogenous variable: technological change.
3. Private consumption is a function of per capita income and spendingdistribution. We allow spending on three main goods: housing, foodand "other." The model distinguishes three main income classes: low,with primary education; medium, with secondary education; and high,with tertiary education.
4. The environmental coefficients - land and water necessary per unit ofoutput and pollution emissions per unit of output - are exogenous tothe economic model and determined in the land and water models.
5. In each period, private consumption demand equals GDP minus taxesminus savings.
6. Investment demand is devoted to increasing or maintaining the desiredstock of capital. The desired capital stock depends on the level of (desired) gross output. A part of the desired capital stock exists in theform of vintage capital. Considerations such as interest and profit arenot included. Investments equal savings plus net borrowing from abroad.
7. The savings rate is an endogenous variable which is adjusted to satisfyassumptions 5 and 6 simultaneously. Maximum and minimum possiblesavings rates are provided by the scenario maker. Investments whichcannot be paid for when the maximum savings rate is reached are paid forby borrowing abroad. Interest is paid on loans, and loans are amortizedby raising the savings rate in the following period to payoff as muchof the debt as possible with that rate, and this continues until the debtis repaid.
8. The model is a series of single-period models with changes occurring between periods. The model calculates exactly what production is neededto fulfill final demand, and therefore, by definition, all goods producedare sold in the same year.
9. Prices are fixed.
13.2.1 The Mauritian input-output table
The main tool of input-output analysis is a matrix called the input-outputtable. Table 13.1 provides the 1987 Mauritius table as it was prepared bythe Central Bureau of Statistics and adapted for the project. As a proxyfor the 1990 table, Table 13.1 lists 1987 data. However, actual 1990 levelsof export demand by sector, published by the Central Bureau of Statistics,were used in the model.
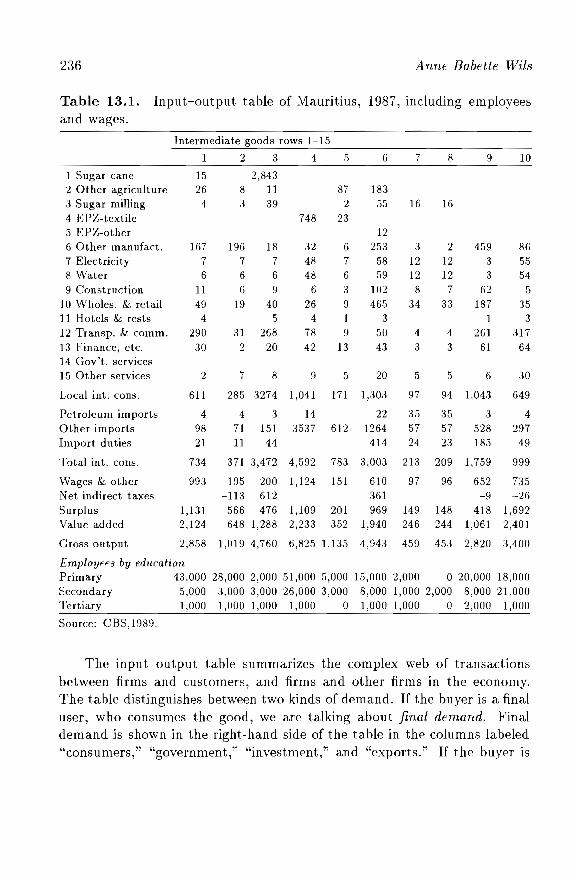
236 A nne Babette Wits
Table 13.1. Input-output table of Mauritius, 1987, including employeesand wages.
Intermediate goods rows 1-15
1 2 3 4 5 6 7 8 9 10
1 Sugar cane 15 2,8432 Other agricult ure 26 8 11 87 1833 Sugar milling 4 3 39 2 55 16 164 EPZ-textile 748 235 EPZ-other 126 Other manufact. 167 196 18 32 6 253 3 2 459 8G7 Electricity 7 7 7 48 7 58 12 12 3 5,58 Water 6 6 6 48 6 59 12 12 3 549 Construction 11 6 9 6 3 102 8 7 62 ,5
10 Wholes. & retail 49 19 40 26 9 465 34 33 187 3511 Hotels & rests 4 ,5 4 1 3 1 312 Transp. & comm. 290 31 268 78 9 50 4 4 261 31713 Finance, etc. 30 2 20 42 13 43 3 3 61 6414 Gov't. services15 Other services 2 7 8 9 5 20 ,5 ,5 6 30
Local int. cons. 611 285 3274 1,041 171 1,303 97 94 1,043 649
Petroleum imports 4 4 3 14 22 35 35 3 4Other im ports 98 71 151 3537 612 1264 57 57 528 297Import duties 21 11 44 414 24 23 185 49
Total into cons. 734 371 3,472 4,592 783 3,003 213 209 1,759 999
Wages & other 993 195 200 1,124 151 610 97 96 652 735Net indirect taxes -113 612 361 -9 -26Surplus 1,131 566 476 1,109 201 969 149 148 418 1,692Value added 2,124 648 1,288 2,233 352 1,940 246 244 1,061 2,401
Gross output 2,858 1,019 4,760 6,825 1,135 4,943 459 453 2,820 :3,400
Employees by educationPrimary 43,000 28,000 2,000 51,000 5,000 15,000 2,000 o 20,000 18,000Secondary 5,000 3,000 3,000 26,000 3,000 8,000 1,000 2,000 8,000 21,000Tertiary 1,000 1,000 1,000 1,000 a 1,000 1,000 a 2,000 1,000
Source: CBS,1989.
The input-output table summarizes the complex web of transactionsbetween firms and customers, and firms and other firms in the economy.The table distinguishes between two kinds of demand. If the buyer is a finaluser, who consumes the good, we are talking about final demand. Finaldemand is shown in the right-hand side of the table in the columns labeled"consumers," "government," "investment," and "exports." If the buyer is
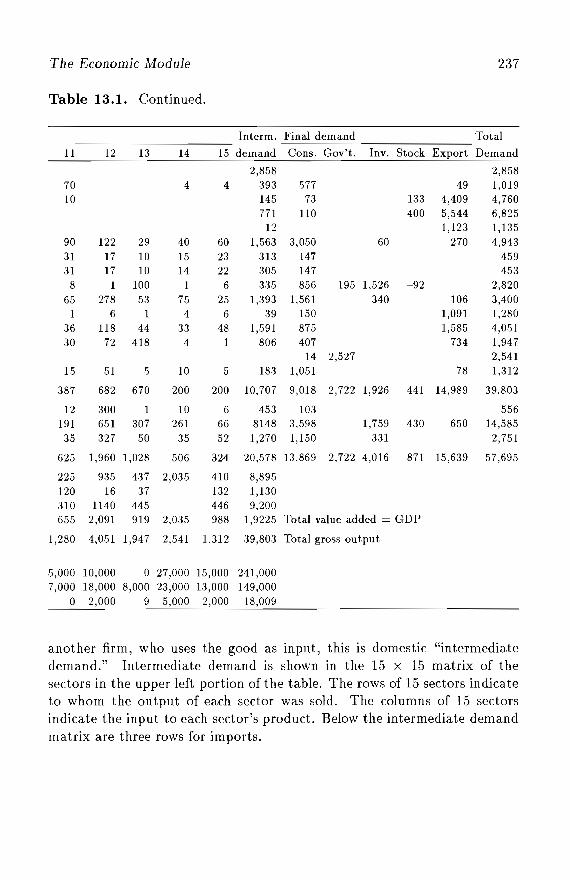
The Economic Module 237
Table 13.1. Continued.
Interm. Final demand Total
11 12 13 14 15 demand Cons. Gov't. Inv. Stock Export Demand
2,858 2,85870 4 4 393 577 49 1,01910 145 73 133 4,409 4,760
771 110 400 5,544 6,82512 1,123 1,135
90 122 29 40 60 1,563 3,050 60 270 4,94331 17 10 15 23 313 147 45931 17 10 14 22 305 147 453
8 1 100 I 6 335 856 195 1,526 -92 2,82065 278 53 75 25 1,393 1,561 340 106 3,400
1 6 1 4 6 39 150 1,091 1,28036 118 44 33 48 1,591 875 1,585 4,05130 72 418 4 1 806 407 734 1,947
14 2,527 2,54115 51 5 10 5 183 1,051 78 1,312
387 682 670 200 200 10,707 9,018 2,722 1,926 441 14,989 39,803
12 300 I 10 6 453 103 556191 651 307 261 66 8148 3,598 1,759 430 650 14,58535 327 50 35 52 1,270 1,150 331 2,751
625 1,960 1,028 506 324 20,578 13,869 2,722 4,016 871 15,639 57,695
225 935 437 2,035 410 8,895120 16 37 132 1,130310 1140 445 446 9,200655 2,091 919 2,035 988 1,9225 Total value added = GDP
1,280 4,051 1,947 2,541 1.312 39,803 Total gross output
5,000 10,000 0 27,000 15,000 241,0007,000 18,000 8,000 23,000 13,000 149,000
0 2,000 9 5,000 2,000 18,009
another firm, who uses the good as input, this is domestic "intermediatedemand." Intermediate demand is shown in the 15 X 15 matrix of thesectors in the upper left portion of the table. The rows of 15 sectors indicateto whom the output of each sector was sold. The columns of 15 sectorsindicate the input to each sector's product. Below the intermediate demandmatrix are three rows for imports.
238 Anne Babette Wils
Economic product is shown in the next three rows. It is the valueadded. Value added is divided among wages, indirect taxes (negative taxesare subsidies), and surplus. These are indicated separately in three rows.The sum of these three, value added, is shown in the row directly below.
The next row of the input-output table shows gross output value. This isthe sum of the value of the domestic intermediate goods, imports, and valueadded. The total gross output of each sector is exactly equal to the total finaland intermediate demand from that sector - compare the last row with thelast column. Goods that are not sold are accounted as increases in stocks.The total value added shown in the right-most cell of the row for value addedis equal to GDP. GDP is equal to total final demand from consumers plusgovernment consumption plus investments plus exports minus total imports.
The input-output table is a concise summary of the activities of a giveneconomy in a given year. For use in modeling, we use this table to make theunit matrix by setting gross output in each sector to 100, and dividing theintermediate goods and the value added appropriately. This adjusted table,called the coefficients matrix, indicates the state of technology in a country.
13.2.2 Technical coefficients matrix and technological change
With a given coefficients matrix and varied vectors of final demand, differentoutput scenarios can be calculated. In such scenarios there is no technological change. This inflexibility has often been used as an argument againstinput-output models. However, we do allow for technological change.
Labor productivity changes through an explicit scenario variable, whichis exogenous, and through endogenous change in labor productivity via education (see Section 13..5). The education profile of the labor force is a resultof the population module (see Chapter 12 and Prinz, 1992).
Capital productivity is changed through an exogenous capital ratio variable. There is no endogenous connection between labor and capital productivity, as would be provided in a Cobb-Douglas type of output calculation.Section 13.6 on capital productivity discusses how labor and capital productivity changes should be combined.
Emission treatment, costs oftreatment, and levels of emission are explicitly dealt with in the water module (see Chapter 1.5 and Toth, 1992). Energyefficiency has been studied by Beeharry (1992) using the Mauritius model.Changes in the land productivity are included in the land-use module (seeChapter 14).
The Economic Module 239
13.3 Calculation of Gross Output, Value Added,and Final Demand
The gross output in each of the 15 sectors, the vector G, can be written interms of final demand and the Leontief matrix derived from the technicalcoefficients matrix, A:
and
L = (I - A)-l
(13.1)
(13.2)
where E, C, and If are the vectors for exogenous final demand (exports andgovernment services), private consumption, and investment, respectively. Allthree vectors refer to domestic final demand. A is the technical coefficientsmatrix; and I, the identity matrix.
Through the introduction of a matrix multiplier derived in Wils (1993),gross output can be written wholly in terms of E only and the vintage capitalstock vector, V. The vectors for C and If are then derived from gross output.
13.3.1 Exogenous export and government demand
Export demand is an exogenous variable in the model. Scenario makers specify what they believe will be, or might be, the export demand for Mauritius.This does not mean that Mauritius has no influence over the kind of goodsit will export. As a matter of fact, the government policy of the past fewdecades undoubtedly helped the observed export expansion. In this case,the user can play with different export policies and the success or failurethereof. The exports are paid for in the same year as delivery. The exportsprovided by the scenario maker are the vector Ex.
Government final demand is a function of the population size and scenarios specified for the per capita expenditure on school education, universityeducation, public health, and general services. School education expenditureapplies only to the number of children in school; university education appliesto the calculated number of enrolled people aged 20 and over; public-healthexpenditure applies to the whole population but follows the age patternobserved in the late 1980s for hospital treatment; and general expenditureapplies to the whole population equally. This results in a vector Eg • Thesum of Ex and E g is the exogenous demand vector, E.
240 Anne Babette Wils
One could argue that public expenditure is budgeted in another way: thegovernment specifies how much it would like to spend and then, dependingon the size of the population, per capita expenditure goes up and down.However, we feel that the public budget is very much pushed and pulled bythe size of the population and by the changes in the age structure. Healthexpenditures soar as the elderly population increases because each elderlyperson has a "right" to a certain level of treatment, and, if there is notenough equipment or personnel, more is sought. Schools are opened andclosed depending on the size of the classes and the number of pupils.
Unlike exports, government expenditure is paid for domestically, and theincome for government is derived from taxes and import duties. The modeldoes not automatically require a balanced budget. The scenario maker mustincrease or decrease taxes or expenditure and rerun the model in order tobalance the budget. Through this, the scenario maker acquires a sense ofthe dynamics of the government budget.
13.3.2 Gross output with endogenous investments
To make investments endogenous, let us assume that investment spendingis devoted to increasing or maintaining the stock of capital, K, at the desired level. Let us further assume that desired capital stock depends on thelevel of (desired) gross output. Considerations such as interest rates andprofit are not included. The relationship between the vector of capital stockand the gross output, G, can then be written as the diagonal capital ratiomatrix, KR:
K = KR· G (13.3)
The relationship between investment and gross output is shown in Figure 13.1. For each level of gross output, there is a requirement for capitalaccording to this capital ratio. This K-line starts at the origin. There is alsovintage capital stock available to the economy, represented by the V-line. Atzero gross output, all capital stock is still available. Up until a certain levelof gross output, production is low, and vintage capital in all sectors suffices,and is used up at a rate equal to the capital ratio. There are no investments.
At gross output level A, one sector "runs out" of vintage capital, and,for increases in gross output, investments in this sector are needed. Theinvestment I -line departs from level A with a low curve (only one sector
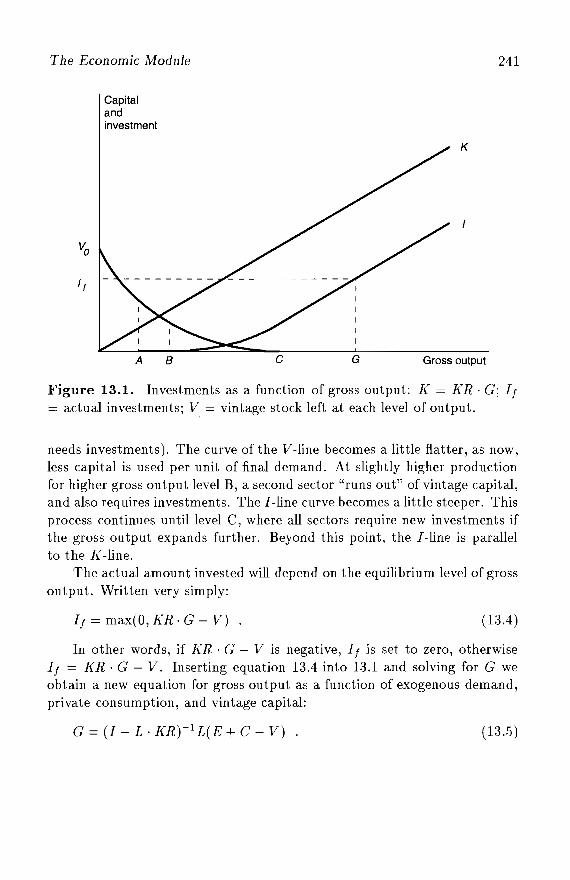
The Economic Module
Capitalandinvestment
241
If
A B C G
K
Gross output
Figure 13.1. Investments as a function of gross output: J( = KR . G; If= actual investments; V = vintage stock left at each level of output.
needs investments). The curve of the V-line becomes a little flatter, as now,less capital is used per unit of final demand. At slightly higher productionfor higher gross output level B, a second sector "runs out" of vintage capital,and also requires investments. The I-line curve becomes a little steeper. Thisprocess continues until level C, where all sectors require new investments ifthe gross output expands further. Beyond this point, the I-line is parallelto the J(-line.
The actual amount invested will depend on the equilibrium level of grossoutput. Written very simply:
If = max(O, KR· G - V) (13.4)
In other words, if KR . G - V is negative, If is set to zero, otherwiseIf = KR . G - V. Inserting equation 13.4 into 13.1 and solving for G weobtain a new equation for gross output as a function of exogenous demand,private consumption, and vintage capital:
G = (I - L . KR)-l L( E +C - V) . (13 ..5)
242 Anne Babette Wils
13.3.3 Gross output with endogenous private consumptionand investments
It now remains to write e in equation (13.5) in terms of E. Let us assumethat private consumption is equal to income minus tax, T, minus savings, S.Private consumption is equal to Ye , consumed income. Income is equal tothe value-added portion of gross output. For the moment, we assume thereis no external income from interest, transfers from abroad, or governmenttransfers. Then, consumed income Ye can be written:
Ye = VR· TS . G , (13.6)
where VR is the diagonal matrix whose ith element is the ratio of valueadded in sector i to gross output in that sector and TS is the diagonalmatrix where each element tSi is equal to (1- ti - s) where ti is the tax ratein sector i and S is the national savings rate.
The Ye vector provides the source of income used for private consumption, but not the final demand vector for private consumption (e.g., a personwhose source of income is in the construction sector spends the income inmany other sectors). To obtain the final demand vector for private consumption, Ye is pre-multiplied with the redistribution matrix R e . The R e matrixprovides the unit per capita consumption distribution. The i,jth elementof each column shows the proportion of income earned in sector j consumedprivately in sector i. The columns of the Re matrix sum to less than unitybecause a portion of private consumption demand goes to imports. Currently, about one-third of private demand is for imported goods. The Re
matrix in future scenario years depends on income distribution (see Section13.4). Private consumption of domestic goods can now be written as:
e = R e . TS . VR . G . (13.7)
The Re, TS, and VR matrices are known and exogenous, and can bereduced to one known output-to-consumption matrix, OTe. Then
e = OTe· G . (13.8)
Inserting this into the equation for gross output gives a new gross outputequation:
G = (I - L . KRr1 L(E + OTe . G - V) (13.9)
Separating out the expression with G on the right-hand side of the equation and solving for G gives:
The Economic Module
G = [I - (I - L· KR)-l L . OTC]-I(I - L . KR)-l L(E - V)
243
(13.10)
This is gross output written solely in terms of exogenous demand andknown vectors and matrices.
The inverse expressions indicate, for each unit of exogenous demand E,given the vintage capital stock V, how much more output is produced viamultipliers for private consumption and investments. The restrictions onthis expression are discussed in Wils (1993). The restrictions are such thatthe model can be applied to small, open economies.
13.3.4 Balanced savings and investments
It is also a model assumption that the savings rate is endogenous and suchthat it satisfies model assumptions .5 and 6. To do this, the module takesthe savings rate from the previous period as small s. It calculates GDP andprivate consumption, investments, and savings. It checks if savings are equalto investments. If not, then s is raised or lowered and the economy recalculated, until equality is reached. In the case that there are still insufficientfunds at the maximum savings rate, there is borrowing from abroad. In thecase that there is too much savings at the minimum savings rate relativeto desired investment, the unused amount is carried over to the next period(see Figure 13.2).
13.4 Private Consumption Demand andIncome Distribution by Education
It is evident that it is important to know the R c matrix, the redistributionmatrix for private consumption, as an exogenous variable. At the same time,it is empirically known that the distribution of private consumption over acollection of goods is dependent on the level of income and the distributionof income, both endogenous. The distribution of private consumer demandis one of the points where the size and the education distribution of thepopulation affects the total output of the economy.
Private consumer demand is, of course, mainly determined by the levelof income. It is known that as people become more wealthy, and moreeducated, they not only spend more income, but also spend it on differentgoods. Poor people spend a far greater proportion of their income on basicitems such as food, whereas the more wealthy spend a large proportion of
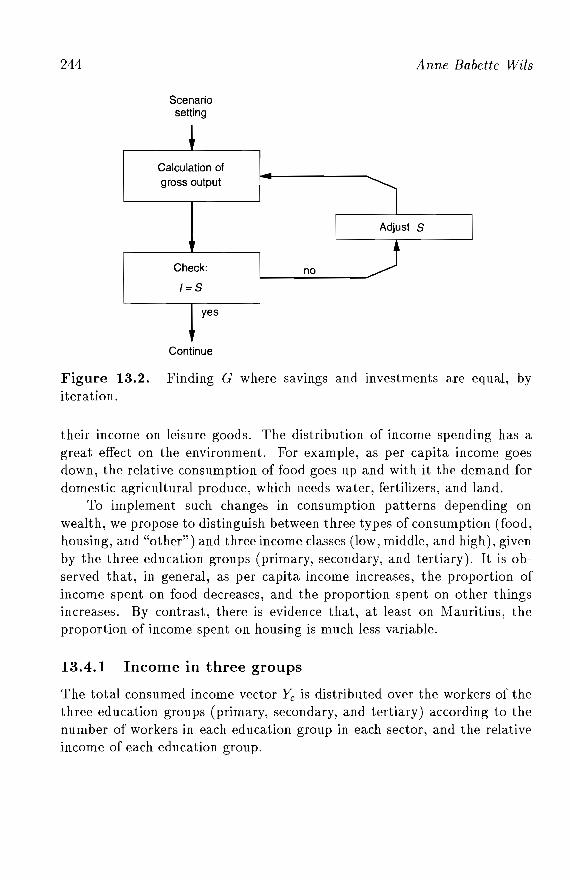
244
Scenariosetting
Calculation ofgross output
Check:
1= S
yes
Continue
no
Anne Babette Wits
Figure 13.2. Finding G where savings and investments are equal, byiteration.
their income on leisure goods. The distribution of income spending has agreat effect on the environment. For example, as per capita income goesdown, the relative consumption of food goes up and with it the demand fordomestic agricultural produce, which needs water, fertilizers, and land.
To implement such changes in consumption patterns depending onwealth, we propose to distinguish between three types of consumption (food,housing, and "other") and three income classes (low, middle, and high), givenby the three education groups (primary, secondary, and tertiary). It is observed that, in general, as per capita income increases, the proportion ofincome spent on food decreases, and the proportion spent on other thingsincreases. By contrast, there is evidence that, at least on Mauritius, theproportion of income spent on housing is much less variable.
13.4.1 Income in three groups
The total consumed income vector Yc is distributed over the workers of thethree education groups (primary, secondary, and tertiary) according to thenumber of workers in each education group in each sector, and the relativeincome of each education group.
The Economic Module 24.5
It is assumed that in all sectors workers with tertiary education earn themost, and workers with primary education the least. In all sectors j, workers with tertiary education earn four times as much as those with primaryeducation, and workers with secondary education earn twice as much. Thisestimate was confirmed in interviews with Mauritian experts.
13.4.2 Consumption in three broad groups
We aggregated the data in the Mauritian Household Survey into the threemain consumption categories. The observed proportion of income spent onhousing, h, in the household survey is only 0.1 when imputed rent is excluded.This is extremely low, but home ownership is very high on Mauritius - 98percent of households in the 1990 census - and expenditure includes almostonly relatively simple construction costs and very little rent.
The observed monthly per capita proportion of income spent on food,f, in the household survey for different per capita income is shown in Figure
13.3. A logarithmic regression through the observed points estimates therelationship between percentage of income spent on food and monthly percapita income. The proportion of income spent on food is a function of percapita income, y:
f = f( y) .
This f is estimated using the exogenous portion of gross output (it couldnot be solved analytically with the whole equation for G).
The proportion of income spent on "other," 0, is the residual:
o = 1 - h - f(y) .
The three income groups and the three consumption groups, plus thedistribution of consumption over 15 sectors within the three main consumption groups, are used to find the Rc matrix.
There are two ways in which population affects the Rc matrix. First,a larger population reduces per capita income (all else being equal) whichaffects f(y). On the other hand, a redistribution of f(y) in favor of foodcould result in a kind of consumption that increases output - for example,if there are large income multipliers associated with agricultural productionor food processing. In the scenarios, a larger absolute population did resultin a higher total GNP, at lower per capita levels, given the same exogenous demand and vintage capital. Second, the education distribution of theworkers affects the relative size of the three income groups.
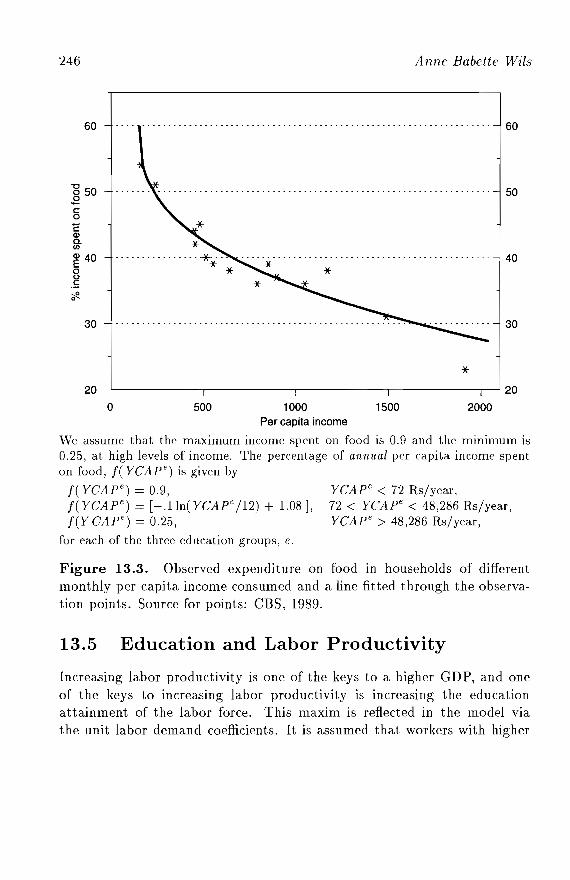
246 A nne Babette Wils
60 60
-g 50.EcoCQla.CIl
~ 40oo.~
fl.
30
*.................*....* * *
50
40
30
*20 L------r------r------r------,.-----J 20
20001500
YCApe < 72 Rsjyear,72 < YCApe < 48,286 Rsjyear,YCApe > 48,286 Rsjyear,
500o 1000Per capita income
We assume that the maximum income spent on food is 0.9 and the minimum is0.25, at high levels of income. The percentage of annual per capita income spenton food, f( YCAF') is given by
f( YCApe) = 0.9,f(YCApe) = [-.1In(YCApej12) + 1.08],f(Y CApe) = 0.25,
for each of the three education groups, e.
Figure 13.3. Observed expenditure on food in households of differentmonthly per capita income consumed and a line fitted through the observation points. Source for points: CBS, 1989.
13.5 Education and Labor Productivity
Increasing labor productivity is one of the keys to a higher GDP, and oneof the keys to increasing labor productivity is increasing the educationattainment of the labor force. This maxim is reflected in the model viathe unit labor demand coefficients. It is assumed that workers with higher
The Economic Module 247
education are more productive, even at the same job. Further, it is assumed that changes in the education distribution of the employed mirrorthe changes in the distribution of education in the whole labor force.
A better-educated labor force means more educated workers employedand more productivity. When the labor force is more productive, the unitlabor coefficients decrease (fewer people necessary to produce one unit ofoutput). For more details, see Wils (1993).
Labor productivity can also change exogenously from technological innovation. The scenario maker gives a proposed increase in productivity whichis supposed to come from some technical innovation. This is exogenous.
Higher productivity would result in the paradox of increased unemployment if the economy stagnates. However, in cases of relatively full employment, and a growing economy, increased productivity is the only way toincrease per capita wealth.
13.6 Changes in Capital Intensity
The capital ratio vector KR, discussed in Section 13.3, can be interpretedas being an indicator of the efficiency of the capital used for production.It indicates how much capital (in present money value) is needed per unitproduction of output in a given year. A change in the capital ratio is one ofthe indicators of technological change. Conceptually, technological changecan be divided into two categories: increasing capital intensity and increasingcapital efficiency.
More capital-intensive production means that one uses more capital toproduce a given value of output. This development must always be accompanied by higher labor productivity and lower labor costs, or a decrease inother costs, in order to be economically rational. An economy with a traditional artisan type of production has a very low capital ratio, say needlesand scissors for output of dresses. But in these economies per capita output or labor productivity is also low. The introduction of new machinesincreases the capital ratio, and therewith capital costs, but it also increaseslabor productivity and this is one of the main sources of increased economicwealth. The decision to invest in a machine is only rational if one can savecosts elsewhere, so that ultimate profit increases. With a sewing machine,each worker can make five dresses a day compared with only one in the daysof hand-sewing. A more advanced machine increases output even more.
248
13.7 Exogenous Balances
Anne Babette Wits
In the economic module, there are pairs of variables that must have similarvalues or where only one of the two can be larger than the other, such aslabor supply and demand. Some of these pairs are automatically adjusted inthe model: for example, consumer demand and disposable consumer incomeand investment spending and investment funds. Other pairs are not hardwired together, and so the user must check them while making scenarios.These are:
• Taxes and government consumption must be roughly equal. In somescenarios, there may initially be an enormous government consumptiondeficit or surplus. The user needs to go back to the scenario settingand make a policy decision: Will there be tax cuts? Or tax increases?Should there be decreased consumption, and, if so, in what area?
• Labor demand should not exceed labor supply, although the converseis allowed and means unemployment. If there is a labor shortage, themodel does not intervene, but results show this is an impossible situation. The user has to increase labor productivity, increase migration, ordecrease demand. It is possible that shortages in skilled labor of a certain type constrain the economy, but this is beyond the immediate scopeof the model. However, the model can be used to estimate the types oflabor that will be needed. The model produces scenario estimates of thedemand for labor in each sector. If the user has an idea of the types ofskills needed in that sector, then the model can be used to estimate therequirements for specific labor skills.
• Investment spending and savings must be equal. The model allows fluctuations in the proportion of savings, depending on the calculated needfor new capital and so this pair is largely equaled. When the scenariomaker changes the KR vector, it is wise to check that this continues tohold. In scenarios where there are no changes in KR, the investmentsare balanced internally by the model.
When the user makes a scenario, it usually takes a few steps of calibration before the first two pairs above fit, and a few more steps before theenvironment variables also fit. It is only when all pairs fit that there is arealistic or possible scenario. In the course of this effort, the user will acquire an understanding of the interactions in the system. This is probablyas important as the results of the final scenarios themselves.
Chapter 14
Land Use and RegionalDistribution
Einar Holm
14.1 Introduction
The island of Mauritius has a total area of 1,860 km 2 , and a coastline lengthof 322 km; it is of volcanic origin, with low coastlands and a high plateau.The narrow coastal strip is a valuable land resource for the country. Coralreefs encompass a large portion of the island, resulting in sheltered lagoons.These, in turn, contribute to the attractiveness of the beaches for recreation and tourism, the latter of which has expanded rapidly during the pastdecade. Because of the sheltered nature of the lagoons, along with theirincreased use for recreation and tourism, an important environmental concern arises regarding the use of methods which avoid the accumulation ofcontaminated water.
Before the first known settlements in the 17th century, the island waslargely covered by natural forest - including substantial numbers of ebonytrees. The transformation of the landscape began with the deforestation ofthis valuable resource, and was accelerated with the introduction of sugarcane almost a century later. It eventually became the largest spatially dominant economic land use of the island.
The gradual conversion of forests and grasslands into sugar-cane production culminated in the 20th century. In 1965, 53 percent of all land on
250 Einar Holm
the island was used for the cultivation of sugar cane; only 4 percent of theland was used for growing other agricultural products. Hence, for a substantial period of time, Mauritius has imported at least two- thirds of its foodincluding foodcrops, livestock, and poultry.
Before describing the land-use module of the PDE model, we look atmore general questions which concern the relationship between land-usechange and the development of the economy, the population, and the environment in Mauritius. We also explore several possibilities and constraintswhich are designed to help achieve sustainable development on the island.
Following this is a description of the land-use module of the Mauritiusmodel. This section includes discussions on the module's assumptions, limitations, and construction principles; its relationship to the Mauritian economy; the population and water modules; the scope of potential questions toraise; and the different output alternatives.
14.2 Mauritian Land Use from anInternational Perspective
From a land-use perspective, Mauritius is dominated by agriculture. According to FAO statistics, slightly more than 60 percent of its total land areawas used for agriculture in 1988 - including arable land, permanent crops,and permanent pasture. In comparison, the international average for agricultural land use was approximately 37 percent. Single country examplesare the USA at 46 percent, China at 45 percent, the former Soviet Union at27 percent, and Canada at 9 percent. A mere 15 percent of the world's totalland area belongs to countries which have a higher proportion of their landarea devoted to agriculture than Mauritius.
Human settlement is another kind of land use on Mauritius. Mauritianpopulation density is very high on a global comparison; close to 600 inhabitants per km 2 • This corresponds to an average population distance (thedistance between an inhabitant and his or her nearest neighbor, assumingthat all individuals live evenly distributed over the total land area of thecountry) of 44 meters. In China, the distance "between people" is greater,97 meters (122 inhabitants per km 2 ); in USA, 206 meters (27 inhabitants perkm 2 ); in the former USSR, 299 meters (13 inhabitants per km2 ); in Canada,634 meters (3 inhabitants per km2
). The difference between the Mauritianand the Canadian population distance - 44 meters and 634 meters, respectively - is indeed substantial, but not as great as the difference between 600
Land Use and Regional Distribution 251
inhabitants per km2 and 3 inhabitants per km2 would imply. This might wellbe seen as a technical point, but subjective interpretations of different measures probe the mind. One old and prevailing stream of thought which dealswith the prospects of developing countries is the Malthusian idea of relatingdevelopment to carrying capacity or density, especially with regard to agricultural land. The expected disadvantage of high density is exponentiallyrelated to measures of density. A hypothesis for this chapter is that such aview is almost totally irrelevant for Mauritius - as well as for other countries- as it develops out of the constraints of a pure, static subsistence economy.The domain-oriented spatial production and reproduction constraints of aharvesting society are gradually replaced by the "linear" constraints of anemerging network society, where industrial and service production is basedon spatial interaction between more or less specialized individuals.
However measured, Mauritius's relative position on the globalpopulation-density scale is extreme. Only six countries are more denselypopulated than Mauritius. Including Mauritius, these countries occupy just0.1 percent of total world land area, yet contain 2.3 percent of the global population. One-half of the global population lives in countries with one-tenthof the total land area of the world.
Mauritius has a very low rating in a global comparison of available agricultural land area per inhabitant (ca. 0.1 hectares per inhabitant). Mostcountries have at least 10 times this agricultural land ratio (1 hectare perinhabitant), although a considerably smaller proportion of their total landarea is devoted to agriculture. This is, of course, a reflection of the extremelyhigh population density on the island.
If the mere possession of large areas of land suitable for agriculture per inhabitant - were an important prerequisite for agricultural productionand for economic development in general, then Mauritius and other denselypopulated regions would occupy a very disadvantageous position.
Table 14.1 shows GNP from agriculture per capita and per hectare ofland; the amount of agricultural land; and population density on Mauritiusand other selected regions and countries relative to the world average. Theglobal average of each factor is set to 100.
Several conclusions can be drawn for Mauritius and the other countriesand regions. Mauritian agricultural production per capita is 41 percenthigher than the global average. This is the combined result of a land productivity that is 11 times higher than the global average, a 55 percent highershare of total land area used for agriculture than the average, and a level
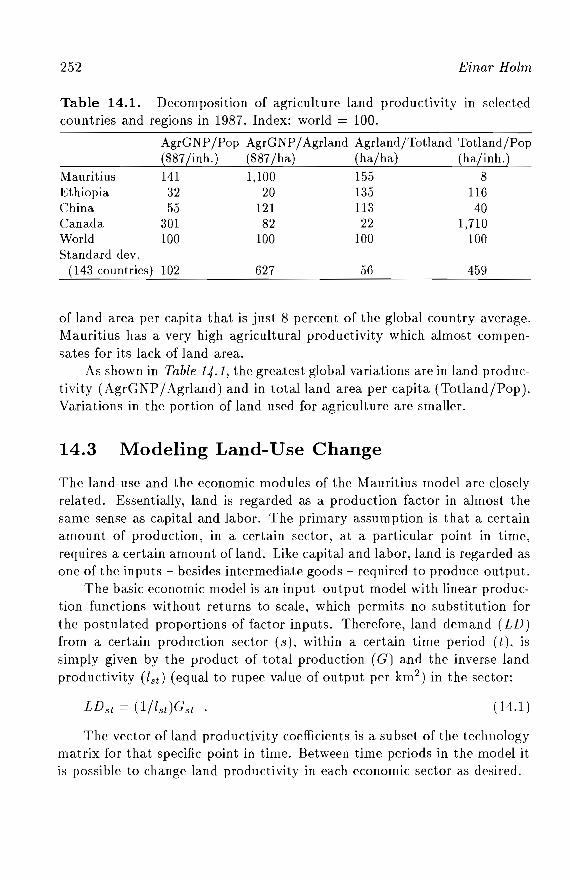
252 Einar Holm
Table 14.1. Decomposition of agriculture land productivity in selectedcountries and regions in 1987. Index: world = 100.
AgrGNP/Pop AgrGNP/ Agrland Agrland/Totland Totland/Pop($87 /inh.) ($87/ha) (ha/ha) (ha/inh.)141 1,100 155 832 20 135 11655 121 113 40
301 82 22 1,710100 100 100 100
MauritiusEthiopiaChinaCanadaWorldStandard dev.
(143 countries) 102 627 56 459
of land area per capita that is just 8 percent of the global country average.Mauritius has a very high agricultural productivity which almost compensates for its lack of land area.
As shown in Table 14.1, the greatest global variations are in land productivity (AgrGNP / Agrland) and in total land area per capita (Totland/Pop).Variations in the portion of land used for agriculture are smaller.
14.3 Modeling Land-Use Change
The land-use and the economic modules of the Mauritius model are closelyrelated. Essentially, land is regarded as a production factor in almost thesame sense as capital and labor. The primary assumption is that a certainamount of production, in a certain sector, at a particular point in time,requires a certain amount of land. Like capital and labor, land is regarded asone of the inputs - besides intermediate goods - required to produce output.
The basic economic model is an input-output model with linear production functions without returns to scale, which permits no substitution forthe postulated proportions of factor inputs. Therefore, land demand (LD)from a certain production sector (8), within a certain time period (i), issimply given by the product of total production (G) and the inverse landproductivity (lsd (equal to rupee value of output per km 2
) in the sector:
( 14.1)
The vector of land productivity coefficients is a su bset of the technologymatrix for that specific point in time. Between time periods in the model itis possible to change land productivity in each economic sector as desired.
Land Use and Regional Distribution 253
It should be noted that the division of behavioral assumptions in twodifferent time scales is implicit in this model. Everything that is triggeredby changes in final demand is assumed to work out and approach a newequilibrium at the beginning of each five-yea.r time period. Contrary tothis, (most) changes in final demand itself, the structure of the economy,productivity estimates, labor supply, among other variables, are explicitlychanged between five-year periods.
Assumptions regarding land use are also divided in the same way. Theland productivity coefficients for different kinds of land use might be changedbetween periods. The actual land- use pattern - the division of the islalldspace into different usages - is determined at the beginning of each fiveyear time period. It is constrained by the amount of land available and theamount of water available for irrigation. In case of a land or water conflictthe solution is found through the iteration. If there is a land shortage, themodel endogenously changes final demand - which is primarily supplied exogenously - until a production mix is achieved which fits the land constraints.The model uses priority rules (see Section 14.3.6) to decide which sectors offinal demand to reduce. Figure 14-1 gives an overview of the model's timingof main activities, including user interaction.
14.3.1 Land-use transformations
Some special properties of land resources distinguish it from labor and capitaL The total amount of land can rarely be increased, neither can land itselfbe moved. It is seldom possible to invent and construct a new piece of landas can be done with capital equipment. It is only the usage of a piece of landthat can be changed gradually: every new use of land replaces the formeruse of the same land. In addition, the transition from one type of land useto another is often heavily constrained and not symmetrical. It is, in mostcases, easy to convert agricultural land into urban land, whereas the opposite demands capital demolition - to say the least. The quality of land andits suitability for different uses is heavily affected by its presellt and formeruses. It is possible to degrade soils by irrigation and fertilizers to such anextent that the land is no longer suitable for even the same agriculture useas before, or a trallsition into another use may trigger a sudden release ofnitrogen into the ground water.
011 Mauritius, the main change ill land use since 1965 has bePll thetransformation of sugar-cane land into urban space. Figure 14.2 illustratesthis point. Up to 1986, the area llsed for growing sugar cane had decreased
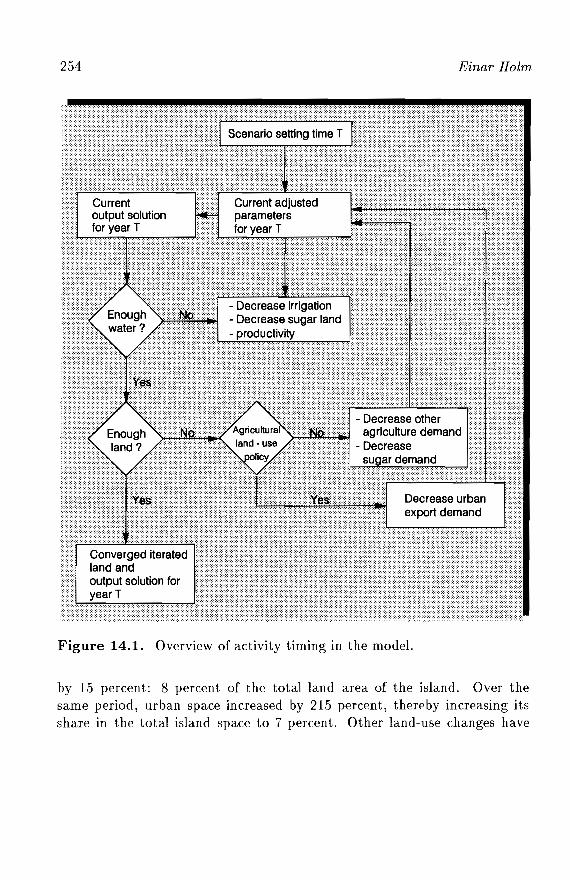
254 Einar Holm
Figure 14.1. Overview of activity timing in the model.
by 15 percent: 8 percent of the total land area of the island. Over thesame period, urban space increased by 215 percent, thereby increasing itsshare in the total island space to 7 percent. Other land-use changes have
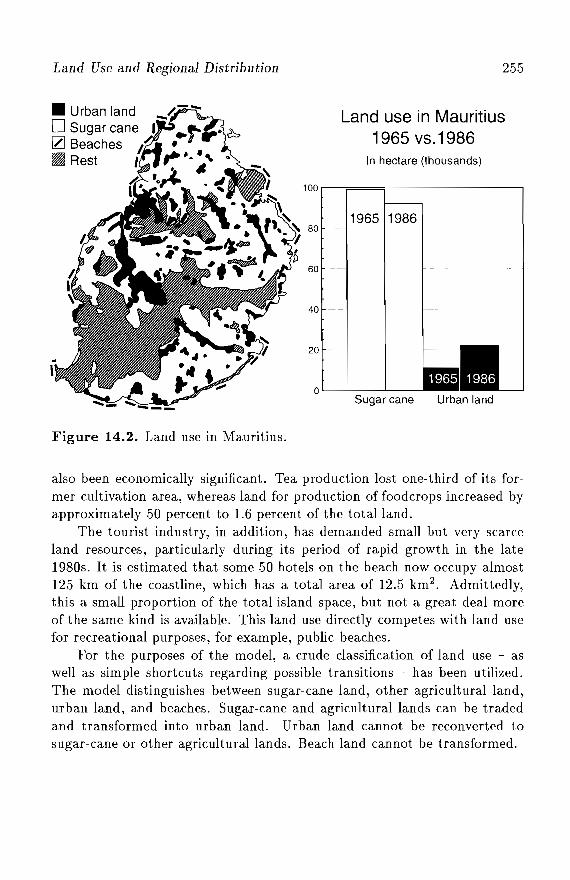
Land Use and Regional Distribution 255
60 --
40 -
Urban landSugarcane
1965 1986
In hectare (thousands)
Land use in Mauritius1965 vS.1986
oL-------'-__-'--__
20
100 r------;===,------------,
Figure 14.2. Land use in Mauritius.
also been economically significant. Tea production lost one-third of its former cultivation area, whereas land for production of foodcrops increased byapproximately 50 percent to 1.6 percent of the total land.
The tourist industry, in addition, has demanded small but very scarceland resources, particularly during its period of rapid growth in the late1980s. It is estimated that some 50 hotels on the beach now occupy almost125 km of the coastline, which has a total area of 12.5 km2
• Admittedly,this a small proportion of the total island space, but not a great deal moreof the same kind is available. This land use directly competes with land usefor recreational purposes, for example, public beaches.
For the purposes of the model, a crude classiflcation of land use - aswell as simple shortcuts regarding possible transitions - has been utilized.The model distinguishes between sugar-cane land, other agricultural land,urban land, and beaches. Sugar-cane and agricultural lands can be tradedand transformed into urban land. Urban land cannot be reconverted tosugar-cane or other agricultural lands. Beach land cannot be transformed.
2.56 Einar Holm
The main simplification in the land-use module is that the transitions areprimarily classified by category and area only - not by location. For example, the model calculates how much land is transferred from sugar-cane useinto residential use during each period, but not the specific locations of thedifferent sections of land transferred. There is no detailed spatial constrainton the transition. Suppose there is an extreme (and not actual) situationwhere all urban areas are surrounded by other agricultural land; the modelwould ignore this and still convert sugar-cane land directly into urban land.However, the aggregated results - changes in land use by category for theisland as a whole - are not severely affected by this lack of spatial constraint.There is enough direct spatial contact between, for example, sugar-cane landand urban land for all calculated transitions to become possible. Urban landincreases in accordance with user-specified policy options regarding the spatial distribution of future urban growth (concentrated around present mainurban centers or decentralized growth of small urban centers). What is lacking is the certainty that the availability of suitable local land to transfer inspecific surroundings would not act as a constraint on total land transitioninto urban use.
14.3.2 Agricultural land
Agricultural land use is divided into two categories in the model: sugar-caneland and other agriculture. These two categories can be transferred into eachother in the model and can also overlap via intercropping. Intercropped landis that part of agriculture land simultaneously utilized for both sugar-canecultivation and other agriculture. The user specifies the change over timein the percentage of other agriculture land that is also used for sugar cane.It is possible to take agricultural land out of use without transferring it tourban use.
Land demand for sugar growing and for other crops is determined byequation (14.1) - just as in determining commercial land use. Sugar andother agricultural land productivity change over time are set by the user,but this user setting might become partly endogenously overridden duringexecution. If there is a shortage of water for irrigation, agricultural landproductivity decreases.
If total water demand on the island is larger than total supply - in a certain time period at a user-specified quaJity level - then as much as possibleof the shortage is directl.'¥' carried over to reduced use of irrigation in sugarcane agriculture, since it is the dominant consumer of water on the island.
Land Use and Regional Distribution 257
Correspondingly, productivity is decreased. The user supplies a value (between 0 and 1) of an elasticity measure (et), which summarizes the impacton production of irrigation cover, along with the importance of irrigation onproduction. The impact on production is channeled through the changedproductivity of land. If e = 1, then water shortages will reduce production proportionally; if it is 0.1, then 10 percent less water than demandedwill reduce production by 1 percent. The impact of user setting and watershortage is implemented as follows:
(14.2)
In equation (14.2), s is the sugar-cane production sector; luser,s,t is thepart of land productivity set by the user; WSs,t is the available water supplyremaining for sugar agriculture after satisfying all other water demands;WDs,t is water demanded by sugar-cane agriculture before correction (ifthere is an initial shortage, then WDs,t is equal to WSs,t after correction).
14.3.3 Urban land
Urban land use is treated as an absorbing state in the model: it is possibleto convert agriculture land into urban use, but once that is done it remainsurban land. The only source for urban land in the model is agricultural land,which - empirically speaking - is also the dominating origin. Urban land isprimarily divided into commercial and residential land. The level of demandfor commercial land is directly connected to the corresponding output of theeconomy's production sectors given in equation (14.1), whereas the demandfor residential land is mainly a function of household consumption and landprice:
(14.3)
Here s is the residential sector only; hI is the minimum residential spaceper person (default 10 m2 ); P is total population; h2 is the share of privateconsumption spent on housing (default 9 percent); C is private consumption;and h3 is price (value) of residential land per m2
• The parameters are setby the user for the entire scenario period over time. Hence, the elasticity ofhousing demand - with respect to income per capita - is assumed to be 1.
14.3.4 Beaches
Beaches are regarded as the key resource for tourism. Following from this,all economic activity in the hotel and restaurant sectors is directly related
258 Einar Holm
to the length of beaches, even though many are not directly located on thebeach. The beach land is divided in two categories in the model. The firstcategory consists mainly of the present number of beaches used primarily bytourists. This is estimated to be some 125 km in length, based on descriptivematerial prepared by the National Physical Development Plan (NPDP, 1990)and the map of Mauritius (Figure 14.2). It is also assumed that this partof the coastal strip is the best, most attractive, and the one most easilyused for tourism. Essentially, this land use is never changed by the model.What could be changed is, for example, the numbers and concentrationof the tourists. In addition to these primary beaches, a list of potentialsecondary beaches - covering some 46 km - has been drawn up, based on thesame sources. This land use includes hotels under construction, along withother parts of the coast that could be transformed into beaches for touristhotels with some investments, regardless of present use. The assumptionis implemented by giving secondary beaches a capital output ratio twice ashigh as beaches in the first category. (For a discussion of capital outputratio, see Chapter 13.)
14.3.5 Other land
"Other land" consists of mountains, forests, savannahs, grasslands, andmeadows which currently are only marginally used in the economy of Mauritius (see Figures 14.2 and 14.8). It is possible for the user to redefine totalavailable land for urban and agriculture by transferring some land to andfrom the "other land" category.
14.3.6 Land-use competition
In order to obtain a crude indicator of the degree to which a certain kind ofland use contributes to the support and welfare of a population, one can useeconomic indicators such as production and consumption.
A comparison of value added and space requirements reveals that ruralland use produces less than Rs 3 million per km2
, whereas the economicactivities on the coastal strip have been estimated at Rs 35 million per km2 ,
and the different urban activities create values of some Rs 64 million perkm 2 . These figures hint at the strength behind the economic forces gearedtoward substituting rural land for use by industry, urbanization, and exportactivities during a development process.
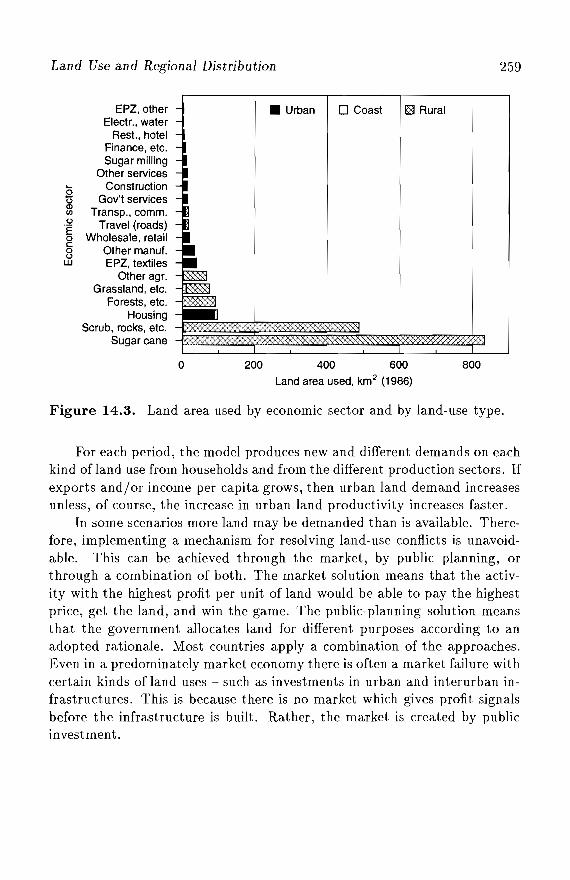
Land Use and Regional Distribution 259
EPZ, otherElectr., water
Rest., hotelFinance, etc.Sugar milling
Other services~ Construction~ Gov't services<Jl Transp., comm..~ Travel (roads)g Wholesale, retail8 Other manuf.W EPZ, textiles
Other agr.Grassland, etc.
Forests, etc.Housing
Scrub, rocks, etc.Sugarcane
• Urban o Coast !3 Rural
o 200 400 600
Land area used, km2 (1986)
800
Figure 14.3. Land area used by economic sector and by land-use type.
For each period, the model produces new and different demands on eachkind ofland use from households and from the different production sectors. Ifexports and/or income per capita grows, then urban land demand increasesunless, of course, the increase in urban land productivity increases faster.
In some scenarios more land may be demanded than is available. Therefore, implementing a mechanism for resolving land-use conflicts is unavoidable. This can be achieved through the market, by public planning, orthrough a combination of both. The market solution means that the activity with the highest profit per unit of land would be able to pay the highestprice, get the land, and win the game. The public-planning solution meansthat the government allocates land for different purposes according to anadopted rationale. Most countries apply a combination of the approaches.Even in a predominately market economy there is often a market failure withcertain kinds of land uses - such as investments in urban and interurban infrastructures. This is because there is no market which gives profit signalsbefore the infrastructure is built. Rather, the market is created by publicinvestment.
260 Einar Holm
The solution chosen for the model is also a combination of the twoapproaches. The market principle is used as the baseline mechanism, but theoutcome can also be heavily constrained by public intervention. Two specialpolicy options are explicitly formulated: "sugar policy" and "agriculturalpolicy."
The market principle of allocating land cannot be directly implementedin the model as this requires markets with supply, demand, and resultingprices. However there are no markets or prices in the model, only demandat fixed prices and - in the case of land - a given supply. One can considerprofit per unit ofland as a substitute, but this is also based on (almost) fixedrelations to total production rather than on market prices. In the model,profit per unit of land is almost proportional to production per unit of land,so the latter is certainly available as a substitute.
Figure 14.4 gives a detailed picture of the production of values per unitof land by the different sectors. Other agriculture produces more value perunit of land than sugar-cane growing. The consumption value of residentialhousing is higher than agricultural use of the same land, but considerablylower per unit of land in comparison to all other remaining sectors. InMauritius, the production of value added per unit of land of tourist beachhotels is superior to all other land-use categories - including urban use.
The ratio of the extremes - tourist hotels and sugar cane - is 70 to1. On average, urban activities produce at least 20 times more per unit ofland than rural activities. Approximately 80 percent of the value producedor consumed is based on activities that occupy a mere 10 percent of theland area. Only sugar-cane production rates highly in both land used andabsolute value added.
As can be seen, production or value added per unit ofland varies tremendously between the main land uses: agriculture, tourism, and urban activities. Therefore, one further simplification of the decision rule for the modelhas been applied. Instead of monitoring the changes in production per unitof land over time, it is assumed that there is no variation over time of theranking. This suggests a simple decision rule:
In the case of conflict, urban land demand wins over agricultural landdemand unless a specific policy to preserve agricultural land is stipulated bythe user.
If there is no policy stipulated, and if the land available for sugar andother agriculture is less than demanded when the urban land demand issatisfied, then both of the agricultural sectors decrease proportionally. The
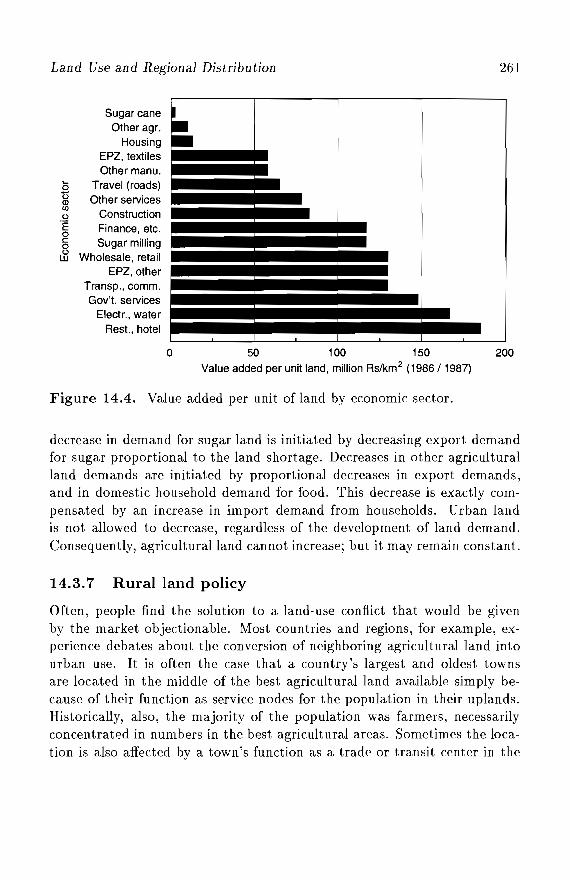
Land Use and Regional Distribution 261
SugarcaneOther agr.
HousingEPZ, textilesOther manu.
(; Travel (roads)~ Other services~ Construction'E Finance, etc.o§ Sugar milling
t1J Wholesale, retailEPZ, other
Transp., comm.Gov't. services
Electr., waterRest., hotel
o 50 100 150Value added per unit land, million Rs/km 2 (1986/1987)
200
Figure 14.4. Value added per unit of land by economic sector.
decrease in demand for sugar land is initiated by decreasing export demandfor sugar proportional to the land shortage. Decreases in other agriculturalland demands are initiated by proportional decreases in export demands,and in domestic household demand for food. This decrease is exactly compensated by an increase in import demand from households. Urban landis not allowed to decrease, regardless of the development of land demand.Consequently, agricultural land cannot increase; but it may remain constant.
14.3.7 Rural land policy
Often, people find the solution to a land- use conflict that would be givenby the market objectionable. Most countries and regions, for example, experience debates about the conversion of neighboring agricultural land intourban use. It is often the case that a country's largest and oldest townsare located in the middle of the best agricultural land available simply because of their function as service nodes for the population in their uplands.Historically, also, the majority of the population was farmers, necessarilyconcentrated in numbers in the best agricultural areas. Sometimes the location is also affected by a town's function as a trade or transit center in the
262 Einar Holm
transport, coastal, or river network. Opposition to further urbanization isstrengthened by the argument that this land is not just average agriculturalland, but often the very best agricultural land. This is promoted by a traditional overestimation of the importance of agriculture in all but the leastdeveloped economies, through the popular belief that self-sufficiency in foodproduction is desirable, and by the fact that those surroundings often alsocontain large parts of the country's historical heritage: they are often thesite of the most well-known cultural landscapes of the country.
Other arguments are also posed against urban proliferation. A denseand concentrated urban environment might be made more transport efficient with a program aimed at increasing the use of public transport andencouraging walking - which has the added advantage of reducing CO2 emissions. There is also the danger of a nitrogen time bomb being released intogroundwater as a result of the change in land use, because continuous useof fertilizers has built up remainders in the soils, which in turn have beenkept at a point of equilibrium by demands from currently grown agriculturalcrops such as sugar cane.
To facilitate an exploration of the economic and environmental consequences of putting constraints on urban growth, for whatever reason, twopolicy options have been prepared for the model. These have been labeled"sugar policy" and "agricultural policy." If the user specifies sugar policy, then sugar agriculture gets preferential treatment, and hence the landit demands even if the same land is demanded by urban activities. Withan agricultural policy, then other agricultural land is maintained at its demanded level wherever possible. The main consequence of these policies isthat urban growth is constrained, and hence the growth of various urbaneconomic activities becomes restricted.
If there are both sugar and non-sugar agricultural poHcies, then the finaldemand in urban sectors is decreased proportional to the shortage of land.If there is only a sugar policy, then demand in urban activities and otheragriculture is decreased first. If that is not sufficient, then sugar land demandis also decreased (via decreased sugar demand). On the other hand, if onlyan other agricultural policy exists, then other agriculture absorbs the landit requires from sugar land, and sugar demand is decreased so that its landdemand fits its remaining stock of land.
The rural land policies might put a constraint on urban growth. If so,then final demand for exports from the urban sectors, as well as household
Land Use and Regional Distribution 263
demand for food and other goods, is reduced proportionally. The decreaseddomestic household demand is exactly compensated with increased imports.
14.3.8 Settlement distribution
The model calculates the increase in population, and in the total size of urban areas for the island as a whole, based on specific scenario assumptionsregarding the development of population, economy, land use, and environment. In addition, the model calculates the spatial distribution of the totalpopulation for each year based on user-supplied assumptions about settlement behavior and policy. The results are presented on maps. The followingalternatives are considered in the model:
1. Distribution proportional to initial number of inhabitants. This uncomplicated principle assumes population to grow at equal rates in all urbanareas. Although simple, it is difficult to find empirical and theoreticalsupport for this type of urban growth.
2. Distribution proportional to change in population 1985-1990. This alternative is based on the observed change in spatial population distribution on the island. The important observation is that it also producesa very different distribution compared to the result from alternative 1.The difference is most obvious for Port Louis. Its population was almost unchanged during the period given, and the small increase thatdid occur was only the result of population momentum, since there wasa net out-migration to several other areas near the capital city. However, at the same time there was a general ongoing local decentralizationfrom the core of the densest towns to their surroundings: a process ofdecentralized concentration.
14.4 Summary
Because of its high degree of integration with the population and economicparts of PDE Mauritius, the land-use module cannot be run independently.The land-use module divides land into five main categories: sugar, otheragriculture, urban, beach, and "other" noncommercial land. Land demandis determined by the economic output and the land productivities of eachsector. In case of a land conflict, when more land is demanded than available,the model reduces the economic output according to specified priority rules.

Chapter 15
Modeling the WaterSystems
Ferenc L. Toth *
15.1 Introduction
This chapter is concerned with the water systems in Mauritius. Section 15.2identifies water management and land use as the most important long-termenvironmental issues in Mauritius. Section 15.3 provides a brief overviewof various components of water systems within Mauritius. The conceptualframework and principles of operation of the surface freshwater model, whichincludes water supply, water demand, and water balance, are described inSection 15.4. This section is followed by the presentation of the lagoon modelin Section 15.5. Finally, Section 15.6 presents the user interfaces of the watermodels, through a discussion of the principles for scenario constrnction andthe user-specified water-policy varia.bles.
*This chapter is a substantially revised version of Toth (1992). The author is indebtedto Laszlo Somly6dy and Toolseeram Ramjeawon for their comments on earlier versions.Special thanks are due to Laszl6 Somly6dy and Gunther Fischer for their help in developingand formulating the lagoon model. Any remaining errors are the sole responsibility of theauthor.
266
15.2
Ferenc L. Toth
Water Management and Land Use
Mauritius has, so far, been able to avoid the disruptive environmental implications of hard-core poverty and fast economic development. Althoughthere are signs of environmental degradation, up to now they have not beenvery severe. Environmental problems in the past were largely episodic, localized events. Fly ash emissions from burning bagasse at sugar factories,dust releases at stone-crushing plants, and exhaust emissions from vehicles incongested urban areas are the most typical forms of air pollution (MEQOL,1991). Due to massive fertilization of sugar-cane plantations, high values ofnitrates (30 to 50 mg per liter) have been measured at some groundwaterextraction points, but they were short lived (CWA, 1991). There are alsolocalized water-quality degradation problems in estuaries near urbanized orindustrial areas, and in closed segments of the lagoons in the vicinity ofhigh-density tourist locations. By and large, however, various componentsof the environment in Mauritius are still in relatively good condition.
Mauritian society has successfully completed demographic transition.Fertility rate dropped to near-replacement level within a few years in the late1960s and early 1970s (Lutz and Wils, 1991; Xenos, 1991). The Mauritianeconomy is beyond the takeoff phase of economic development; real annualGDP growth rates scored between 5 percent and 9 percent in the mid-1980s;industry grew between 8 percent and 16 percent annually; and industrialinvestments doubled (Rs 747 million to Rs 1,480 million) between 1984 and1988 (CSO, 1988a). Unlike in most LDCs, especially in the African region,future pressure on the environment in Mauritius will not originate with afast-growing population, but rather with the increasing wealth of the slowlygrowing population which is expected to stabilize at 120 percent to 140percent of the present population si.ze (Prinz, 1992).
Now beyond demographic transition and economic takeoff, Mauritiushas reached a critical phase of development. In less than a decade, thegovernment has successfully solved the problems of the early 1980s: inflation,unemployment, balance of payment problems in the domestic economy andassociated foreign exchange shortages, debt problems in the internationaleconomic relations. Now there is a possibility of looking further into thefuture to assess the fulJ range of available development options (see, forexample, MIlT, 1990). Current economic policies will shape the next cycleof investments and may lead to changes - desired or undesired - in theeconomy, society, and environment of the country.
Modeling the Water Systems 267
Today, there is increasing concern about longer-term prospects for economic development, and for the environmental quality to support it. Anoption that has gained some popularity in many developing countries is tospeed up economic development at the expense of the environment and restore the environment later when it is easily affordable. This is simply notviable for Mauritius for several reasons. First, due to the small area and highpopulation density, relatively small levels of degradation would be felt evenin the short term, in the form of health effects for the population and natural resource constraints for the economy. Second, island ecosystems tend tobe more fragile than their continental counterparts, making it possible thatminor degradations may be irreversible. Third, the tangible finiteness of theresource base (soils, groundwater) on an island makes any loss much morepainful than at other locations where reserve areas are available.
These concerns support the proposition that the sooner Mauritius findsits way toward sustainable development, the better. This was recognizedin the late 1980s by the government of Mauritius and several internationalagencies. As a result of their joint effort, a national environmental actionplan was developed. This meant that Mauritius became the first countryin Africa to implement an environmental strategy in accordance with therecommendations of the Brundtland report: economic growth and environmental protection are to be considered mutually reinforcing (Rathnam andOpsal, 1989):
The foundation of our national policy is: to protect and improve the environment as well as to foster harmony between the quality of life andsustainable development for the economic, social and cultural benefits ofthe present and future generations. [GOM, 1991, p. 1]
The geographical location of Mauritius reduces the usually long list ofenvironmental concerns to problems related to water and land use. Althoughincidents of local visibility degradation and dust pollution are occasionallyreported, their long-term impacts are negligible. Air pollutants are sweptout by the almost constant medium-speed winds (between 7 and 16 knots)and distributed over the ocean. (In the least windy month of April, thereare fewer than three days of calm altogether.) Deforestation was by andlarge completed by the 1930s leaving a meager 1 percent covered by nativevegetation.
This situation leaves us with two major environmental and resource management issues. The first issue is one of allocating land to its most suitable
268 Ferenc L. 10th
use among the many competing land-use options (conservation, tourism, settlement, agriculture, industry), combined with a sustainable management ofland use. These issues are addressed by Holm (1992). The second issue isa major concern for environmental management: water. This chapter dealswith the surface freshwater system and the lagoons of Mauritius.
The highly acclaimed Brundtland report (1987) has been severely criticized for its failure to adequately address the issue of the role of water insustainable development (Falkenmark, 1988). Humanity's interaction withthe global water cycle has substantially intensified over the past few decades.Even more significant are the disruptions to, or degradation of, water resources on the regional and local scales in many parts of the world. Theadvantage that Mauritius has is that, being an island, inhabitants have complete control over their own water resource base.
Sustainable development in terms of water managements implies a longterm availability of water in required quantity and appropriate quality. Theaims implicit in any meaningful sustainability study means that we are primarily concerned with gross, highly aggregated figures and indicators whichdetect and analyze imbalances at this aggregated level. As a consequence,attention to regional and seasonal imbalances are omitted in our waterquantity analyses, along with episodic high levels of pollutant dischargesand the associated environmental damages.
The modeling approach for the water part of the Mauritius model system was selected to fit the purposes of a long-term, sustainability study.Additional selection criteria included the special characteristics of the hydrologic system of the island, and the availability of data on both quantityand quality aspects of natural water systems and water use from Mauritiansources.
15.3 Overview
Mauritius's hydrological network follows the typical pattern of small volcanicislands. Rivers originate in the center and flow toward the coast through adense and heterogeneous river network. Were the island a perfect circle, theaverage river length would be 24.3 km. Of the 93 rivers registered by theCentral Water Authority, the shortest one is 130 meters long (des Galets),while the longest river is 38.4 km (Grand River South East). The averageriver length is 9.38 km.
Modeling the Water Systems 269
In most regions, the rivers intersect with the rich and versatile groundwater systems of the island. A geological heritage of volcanic origin is presentin the form of aquifers. These are permeable basaltic lava rocks that lie between two relatively impermeable strata. The aquifers receive their rechargein an area where they are exposed at the surface (mainly in the centralplateau region). The infiltrating water percolates downward through openings in the rocks (spaces between the grains of sedimentary rocks, lava tubes,openings between lava flow layers) until it reaches an impermeable stratumat the bottom. At this point, water accumulates in the rock. Wherever theland surface intersects the water table, the water flows out as springs.
An example of the diverse relationships between surface-water andgroundwater systems is found in the central-east region of Mauritius. RiverFran~oise provides a significant amount of water to the underlying aquifer,while further downstream the same aquifer feeds Deep River, especially during the dry season. In the north, several perennial rivers (River du Tombeau,River des Calebasses, among others) are known to be connected to theaquifers of the region. In the south, flow values of River Tabac were observedto be connected to fluctuations of the water table in the region, indicatingthat there is a water transfer from the river to the aquifer (CWA, 1991).
This geophysical network is operated by the annual climate cycle. Themoderate tropical climate dominating in Mauritius is characterized by twoseasons. Rainy and warm summers (November to April) often bring tropicalcyclones - which are sometimes devastating, but also provide large amountsof rainfall. In cyclone-free years, precipitation is normally not sufficientfor surface reservoirs to completely refill and underground aquifers to fullyrecharge. Cool and dry winters (May to October) sometimes bring droughts,especially between September and November. The amount and spatial distribution of long-term average rainfall for four characteristic months arepresented in Chapter 10. Average monthly rainfall data for the whole islandare summarized in Table 15.1, and demonstrate that the annual distributionof precipitation in Mauritius is uneven though not extreme.
The relatively high annual levels of rainfall do not guarantee that asufficient amount of water is always available. A major source of water lossin Mauritius is evaporation and evapotranspiration, both direct functionsof the heat input which is in turn determined by the net global radiation.Data on sunshine hours (annual mean) and mean monthly temperatures (forFebruary and August) are shown in Figure 15.1. The spatial distribution ofthe resulting mean annual evaporation rates is presented in Figu.re 15.2.
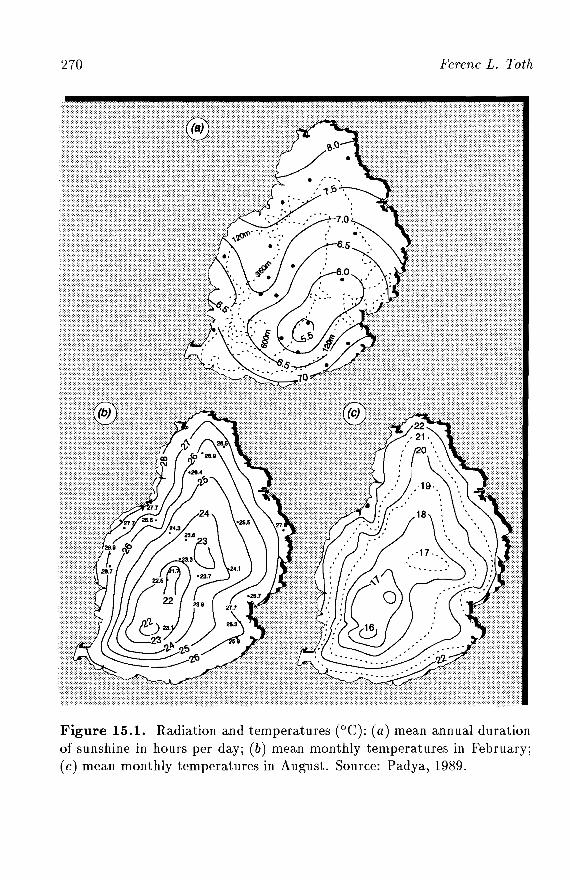
270 Ferenc L. Toth
Figure 15.1. Radiation and temperatures (DC): (a) mean annual durationof sunshine in hours per day; (b) mean monthly temperatures in February;(c) mean monthly temperatures in August. Source: Padya, 1989.
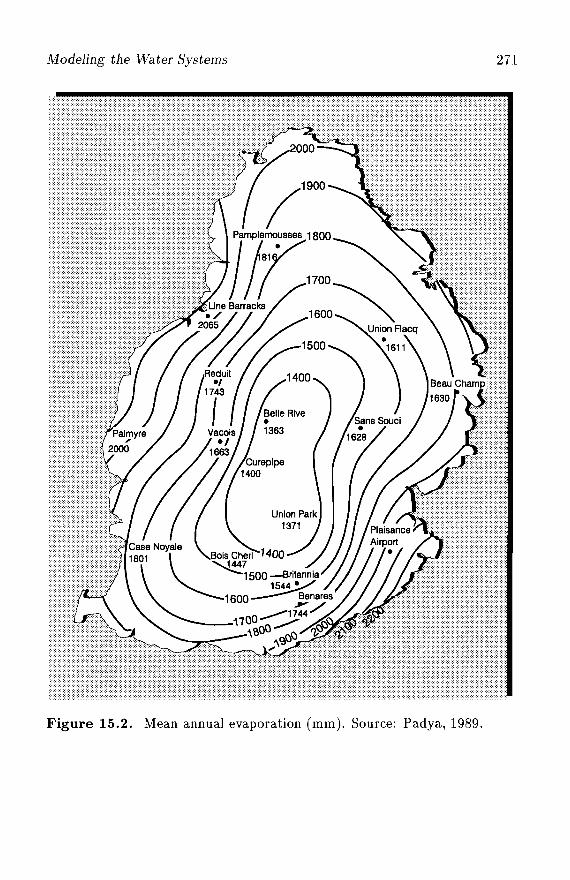
Modeling the Water Systems 271
Figure 15.2. Mean annual evaporation (mm). Source: Padya, 1989.
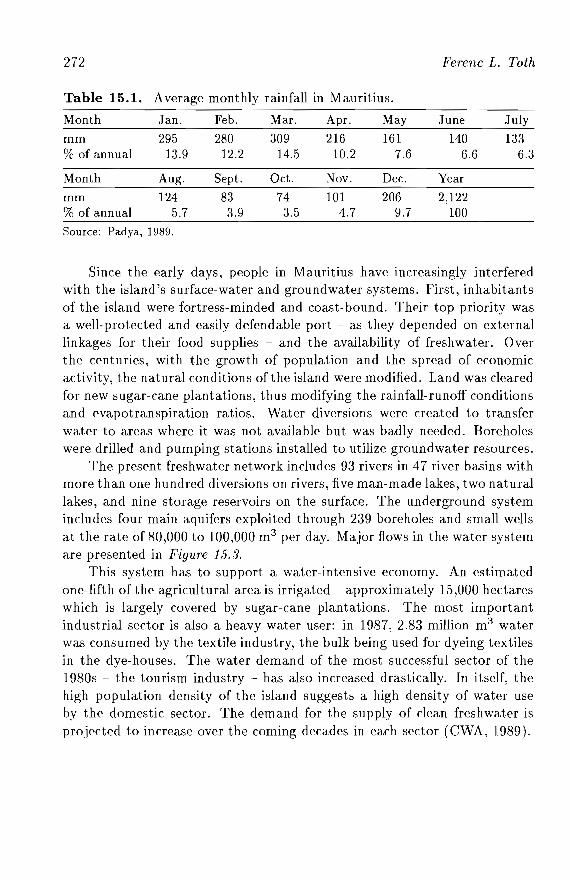
272
Table 15.1. Average monthly rainfall in Mauritius.
Month Jan. Feb. Mar. Apr. May
mm 295 280 309 216 161% of annual 13.9 12.2 14.5 10.2 7.6
Month Aug. Sept. Oct. Nov. Dec.
mm 124 83 74 101 206% of annual 5.7 3.9 3.5 4.7 9.7
Ferenc L. Toth
June July
140 1336.6 6.3
Year
2,122100
Source: Padya, 1989.
Since the early days, people in Mauritius have increasingly interferedwith the island's surface-water and groundwater systems. First, inhabitantsof the island were fortress-minded and coast-bound. Their top priority wasa well-protected and easily defendable port - as they depended on externallinkages for their food supplies - and the availability of freshwater. Overthe centuries, with the growth of population and the spread of economicactivity, the natural conditions of the island were modified. Land was clearedfor new sugar-cane plantations, thus modifying the rainfall-runoff conditionsand evapotranspiration ratios. Water diversions were created to transferwater to areas where it was not available but was badly needed. Boreholeswere drilled and pumping stations installed to utilize groundwater resources.
The present freshwater network includes 93 rivers in 47 river basins withmore than one hundred diversions on rivers, five man-made lakes, two naturallakes, and nine storage reservoirs on the surface. The underground systemincludes four main aquifers exploited through 239 boreholes and small wellsat the rate of 80,000 to 100,000 m3 per day. Major flows in the water systemare presented in Figure 15.3.
This system has to support a water-intensive economy. An estimatedone-fifth of the agricultural area is irrigated - approximately 15,000 hectareswhich is largely covered by sugar-cane plantations. The most importantindustrial sector is also a heavy water user: in 1987, 2.83 million m3 waterwas consumed by the textile industry, the bulk being used for dyeing textilesin the dye-houses. The water demand of the most successful sector of the1980s - the tourism industry - has also increased drastically. In itself, thehigh population density of the island suggests a high density of water useby the domestic sector. The demand for the supply of clean freshwater isprojected to increase over the coming decades in each sector (CWA, 1989).
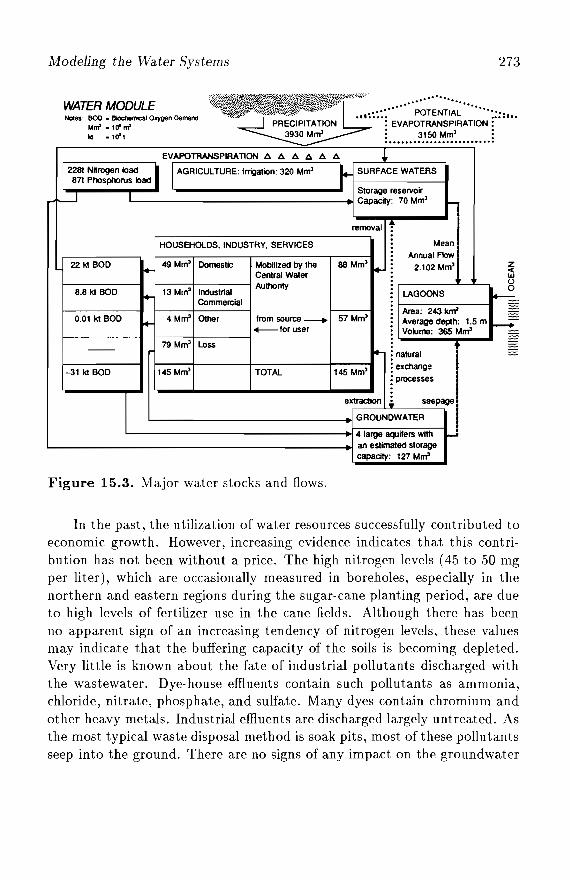
Modeling the Water Systems 273
WATER MODULE ~' ..........;;;;~;;;;: ...........Nol..: BOO • Biochomical Or;gen Oomand "·~ITATION ••••••• ~ EVAPOTRANSPIRATION r·· ..·Mm' .10' m'
loS .10'1 3930 Min' : ••••••• ~.'.~~.':4~:........:EVAPOTRANSPIRATION t>. t>. t>. t>. t>. t>. ~
12281 N~rogen load I IAGRICULTURE: Irrigation: 320 Min'
~SURFACE WATERS
87\ Phosphorus load
f...--JStorage reservoirCapacity: 70 Min' -
removal ~
HOUSEHOLDS, INDUSTRY, SERVICES Mean
Annual Flow22 kI BOD
~49 Mm' Domestic Mobilized by the 88 Mm'
~2.102 Mm' z
«;Central Water UJ
Authority(J
8.8 kI BOD 13 Mm' Industrial 0~
LAGOONS 1-=CommercialArea: 243 knf
0.01 kI BOD +- 4 Mm' Other from source _ 57 Mm' Average depth: 1.5 m r--_lor user Volume: 365 Min'
-- 79 Mm' Loss~ ~ nalUral
-31 kI BOD 145 Mm' TOTAL 145 Mm': exchange
: processes
extraction I. ssepage
GROUNDWATER
4 large aqu~ers wi1ll ..Jan estimated storagecapacity: 127 Min'
Figure 15.3. Major water stocks and flows.
In the past, the utilization of water resources successfully contributed toeconomic growth. However, increasing evidence indicates that this contribution has not been without a price. The high nitrogen levels (4.5 to .50 mgper liter), which are occasionally measured in boreholes, especially in thenorthern and eastern regions during the sugar-cane planting period, are dueto high levels of fertilizer use in the cane fields. Although there has beenno apparent sign of an increasing tendency of nitrogen levels, these valuesmay indicate that the buffering capacity of the soils is becoming depleted.Very little is known about the fate of industrial pollutants discharged withthe wastewater. Dye-house effluents contain such pollutants as ammonia,chloride, nitrate, phosphate, and sulfate. Many dyes contain chromium andother heavy metals. Industrial effluents are discharged largely untreated. Asthe most typical waste disposal method is soak pits, most of these pollutantsseep into the ground. There are no signs of any impact on the groundwater
274 Ferenc L. Toth
system yet, but if this practice continues the Mauritians may well be buildingan underground chemical time bomb for themselves.
Because rivers in the island are short and relatively fast-flowing, thereis little chance for pollutants to undergo biochemical degradation. However,this also implies that the possibility for deposition of pollutants in river bedsand sediments is also very limited. The ultimate result is that most pollutants are transported by rivers to the lagoons, which are formed by a barrierreef around most of the island's coastline. They are shallow, partly open,and partly closed bodies of water that are regularly renewed by a relativelylarge volume of tidal exchange. Despite this, signs of local degradation ofboth water and sediment quality have been detected in several segments ofthe lagoon. It is, therefore, important to trace the fate of pollutants in the lagoons by examining the potential accumulation processes and the long-termchanges in concentrations of pollutants in the water and in the sediment.
Freshwater comprises a substantial part of the very limited natural resource base of Mauritius. Being a vital resource, there is a definite need tostudy the water constraints when we look at long-term development optionsand want to ensure the sustainability of development. Studies and modelsmust include both quantity and quality aspects. This involves modeling boththe resource and the waste-management implications of alternative development paths. The lack of appropriate data, together with the uncertaintiesassociated with such long time horizons as the present project is examining,inhibits the building of very detailed models. On the other hand, there isno real need for them. The level of aggregation in the water model corresponds to that of the economic model. Despite this, the approach chosenmakes it possible to analyze long-term trends and constraints and to finda sustainable development strategy for a long-term balance between watersupply and water requirements.
15.4 The Surface Freshwater Model
The surface freshwater part of the water module is an integrated economicecological model covering both the quantity and quality aspects of watermanagement. The primary objective of the model is to calculate the balanceof water requirements (demand) and water availability (supply) for any givenscenario of demographic and economic development according to the waterpolicy specified by the user.
Modeling the Water Systems 275
Some of the basic ideas used in this model originate in a study preparedby the Resources for the Future (see Wollman and Bonem, 1971) in the1960s. The RFF model in turn draws on the work done by the SenateSelect Committee on National Water Resources (Wollman, 1960). The watersupply section of the Committee report was considerably improved by astudy conducted by Lof and Hardison (1966).
The present model considers Mauritius a single region. There are several arguments for and against this treatment. One could argue that thenonhomogeneous hydrological network, along with the uneven distributionof population and economic activities, would call for a regionally disaggregated approach. This would not be practical for several reasons. Firstly,the population and economic modules track demographic and developmentprocesses at the level of national aggregates. An attempt to decompose theseprocesses for smaller regions would increase the complexity of the model tosuch an extent that would simply not be justifiable considering the area ofthe island. (The total area of Mauritius is far below the typical unit size inregional development and environment models.)
The second reason for the aggregated approach also follows from thesmall geographical size. It is relatively inexpensive to divert water fromregions (watersheds) of abundance to those of shortage or to allocate waterintensive activities in regions where the resource is available. Similar arguments are valid on the water pollution side. One strategy would be to locatenew polluting activities in regions where present discharge levels are low,thereby spreading pollution around an average level (the model does justthis). Alternatively, one could concentrate these economic sectors in specificareas, which would make the provision of treatment facilities economicallymore efficient and reduce pollutant discharge altogether (this option is alsoavailable in the model).
Supply of and demand for water are specified by the physical quantitiesin the water model. An overview of the water model is presented in Figure15.4. For each time step, the size of the population and the level and structure of economic activities are considered in order to calculate the demandfor water. Demand is also affected by two water-policy variables, which inturn determine the dilution flow component of water demand (see below):firstly, the user's target for water quality, which is specified by the requiredwater-quality standards for rivers; secondly, the user's decision about investments in wastewater treatment.
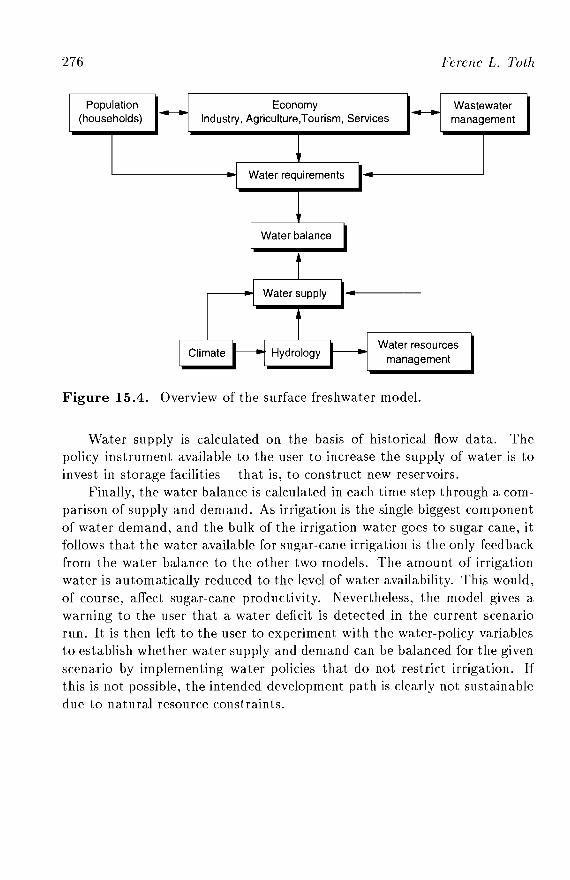
276
Population(households)
EconomyIndustry, Agriculture,Tourism, Services
Ferenc L. 10th
Wastewatermanagement
Water resourcesmanagement
Figure 15.4. Overview of the surface freshwater model.
Water supply is calculated on the basis of historical flow data. Thepolicy instrument available to the user to increase the supply of water is toinvest in storage facilities - that is, to construct new reservoirs.
Finally, the water balance is calculated in each time step through a comparison of supply and demand. As irrigation is the single biggest componentof water demand, and the bulk of the irrigation water goes to sugar cane, itfollows that the water available for sugar-cane irrigation is the only feedbackfrom the water balance to the other two models. The amount of irrigationwater is automatically reduced to the level of water availability. This would,of course, affect sugar-cane productivity. Nevertheless, the model gives awarning to the user that a water deficit is detected in the current scenariorun. It is then left to the user to experiment with the water-policy variablesto establish whether water supply and demand can be balanced for the givenscenario by implementing water policies that do not restrict irrigation. Ifthis is not possible, the intended development path is clearly not sustainabledue to natural resource constraints.
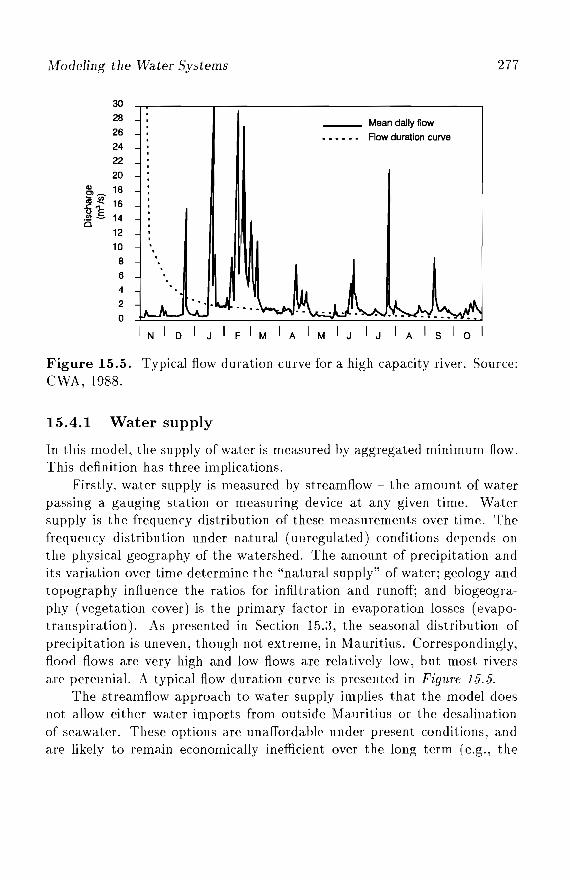
Modeling the Water Systems 277
302826
242220
~~ 18~!?- 16.~.§. 14o
12
10
8
6
4
2o
___ Mean dally flow
• • • • •• Flow duration curve
Figure 15.5. Typical flow duration curve for a high capacity river. Source:CWA.1988.
15.4.1 Water supply
In this model, the supply of water is measured by aggregated minimum flow.This definition has three implications.
Firstly, water supply is measured by streamflow - the amount of waterpassing a gauging station or measuring device at any given time. Watersupply is the frequency distribution of these measurements over time. Thefrequency distribution under natural (unregulated) conditions depends onthe physical geography of the watershed. The amount of precipitation andits variation over time determine the "natural supply" of water; geology andtopography influence the ratios for infiltration and runoff; and biogeography (vegetation cover) is the primary factor in evaporation losses (evapotranspiration). As presented in Section 15.3, the seasonal distribution ofprecipitation is uneven, though not extreme, in Mauritius. Correspondingly,flood flows are very high and low flows are relatively low, but most riversare perennial. A typical flow duration curve is presented in Figure 15.5.
The streamflow approach to water supply implies that the model doesnot allow either water imports from outside Mauritius or the desalinationof seawater. These options are unaffordable under present conditions, andare likely to remain economically inefficient over the long term (e.g., the
278 Ferenc L. Toth
use of desalinized seawater for irrigation). The model also assumes thataquifers discharge into a surface-watercourse, hence automatically including their contribution in the measures of surface flow. The diverse linkagesbetween surface flows and the groundwater system were presented in Section 15.3. These linkages demonstrate the important role of groundwaterin measurements of surface flows. There are no slowly recharging "stocktype" underground aquifers in Mauritius (like the Ogallala aquifer in NorthAmerica or the huge aquifer under the desert in Libya), therefore groundwater abstraction and recharge processes can be considered additions andsubtractions from the same resource of surface flows. A minor source of errorcan arise from the fact that past and present utilization of groundwater resources has not yet reached the maximum sustainable level. The historicallyobserved minimum flow value should be revised upward, to the extent thatadditional groundwater mobilization can increase the minimum dependableflow (the bottleneck in the low-flow period), but this error is estimated tobe below 3 percent. As long as groundwater abstraction and recharge arekept in balance, the model provides a reasonably accurate representation ofthe water resources.
Secondly, water supply is the minimum amount of water that is availableat a specified level of reliability over time. It is also called the minimum dependable flow. In this model, the flow that is equaled or exceeded 95 percentof the time under present regulatory (storage) conditions is considered to bethe present minimum flow. The minimum-flow approach fits the overall objective of our model system: to find water-management strategies that satisfythe water demand of the population and the economy over the long term,without extended periods of water deficiency when water-related activitieswould need to be reduced or temporarily suspended. Minimum dependableflow at 90 percent of reliability implies a 10 percent chance of deficiency.This corresponds to a deficiency period of more than one month every yearwhen irrigation and water-intensive industrial activities, the two most important foreign exchange earners, would need to be reduced. The economicimplications of regularly returning periods of extended water shortage wouldprobably be severe. This supports the proposition that environmentally unsustainable development is also not affordable economically.
Thirdly, flow data from all watersheds are combined to provide the totalamount of water available. Aggregated flow data indicate the sum of flowmeasurements from those gauging stations located closest to the discharge
Modeling the Water Systems 279
point in each watershed. Due to the special circumstances in Mauritius (irrigation is by far the biggest water user), and, because the relatively short20-to-30-year flow records do not take into account the amount of water lostupstream via irrigation, the minimum flow data have had to be modified tokeep the model consistent. This was achieved by increasing the level of minimum flow by the amount of water lost (evaporated and evapotranspirated)due to irrigation upstream in the period when minimum flow values weremeasured.
Virgin or unregulated flow conditions can be modified by adding storagecapacities to the hydrologic system. The purpose of additional storage capacity is to smooth the flood frequency curve by retaining water from floodflows and using it to increase the level of minimum dependable flow in periods of low flow. The theoretical maximum flow that could be achievedby maximum regulation is the mean annual flow. This is the level of watersupply when the surplus flow gained from additional storage is equal to theevaporation losses resulting from the newly added storage facility.
Flood control storage requires special treatment in this formulation of aflow-storage relationship. Due to specific operating considerations, storagecapacities created explicitly for flood control purposes are only partiallyuseful for minimum flow regulation. As the river basin approaches maximumregulation, the need for separate flood control storage capacity decreases.The model takes care of this assumption by including only that fraction ofexisting flood control storage corresponding to the ratio of present (actual)flow to maximum attainable flow. It turns out that none of the reservoirs inMauritius is explicitly operated as a flood control storage facility. Regardlessof this, the procedure to handle flood control storage has been implementedin order to keep the model general and easy to implement for other countries.
The data base of the model includes inventories of past and possiblefuture storage facilities. Data in the past reservoir inventory (PRI) includethe most important parameters of all reservoirs completed before the baseyear of the model, such as purpose (irrigation, flood control, hydroelectric,recreation, or mixed), capacity, and depth. Similarly, data in the new reservoir inventory (NRI) cover all possible sites where future reservoir constructions are either planned or being considered by the Central Water Authority.Again, the parameters include purpose (as above), location, capacity, depth,surface area, evaporation rate, total cost, and cost per unit of storage capacity (Rs per m3 ).
280 Ferenc L. Toth
The user's water policy, related to water supply, is entered in the modelvia the NRI table. The most relevant data in the table are displayed underthe appropriate submenu in the scenario-setting phase. The user can decidewhich reservoirs should be constructed and when by entering the year inwhich construction should be started. The total costs are automaticallyaccounted for, in the economic model, under the government expenditurescategory. Completion is assumed to take five years with the newly builtstorage becoming available at the beginning of the next period.
The supply section of the model begi.ns by calculating the initial floodcontrol storage - that is, the total amount of storage capacities that werebuilt primarily for flood control purposes prior to the initial year of themodel. This capacity would gradually be included in the available total grossstorage at the rate at which total capacity is approaching full regulation.
For each time step (every five-year period), the model calculates thepresent minimum flow - that is, the level of water supply. The procedure isstarted by determining the present total gross storage by adding the newlycompleted storage capacities (depending on the user-specified investment decisions) to the already existing storage capacity. Due to the special treatmentof the initial flood control storage capacity, some adjustment is necessary.The present total available storage is computed by adding a fraction of theinitial flood control storage (according to the ratio of the present net flowin the previous time stop to the mean annual flow) to the present totalgross storage.
The flow-storage function describes the relationship between the totalstorage capacity available for flow regulation and the level of minimum sustained flow. The next step in the model makes use of the flow-storagefunction to determine the present gross flow from the present total available storage. The resulting value, however, needs to be adjusted for theevaporation losses from the newly completed reservoirs.
Evaporation losses from existing storage (from those completed beforethe base year) are already captured by the historical flow data. The evaporation loss rate is derived by subtracting the basic evapotranspiration rate ofthe vegetation cover before the reservoir was constructed from the reservoirevaporation rate. Total evaporation loss is then the product of evaporationloss rates and the area of reservoirs.
Finally, present net flow is calculated by reducing the amount of grossflow according to the total evaporation losses. This, then, gives the levelof water supply on which the population and the economy in Mauritius
Modeling the Water Systems 281
can count on with 95 percent reliability. Results from the demand sectionof the model determine whether it is sufficient for the given socioeconomicdevelopment scenario.
Depending on the user's decision, this procedure can be used in themodel to test water availability with a reliability of 98 percent. In this case,a modified flow-storage function is used to determine the actual flow values.In addition, the model makes it possible for the user to study the impacts ofunusually long drought periods. For these experiments, the level of presentnet flow is reduced according to a user-specified shortage ratio.
15.4.2 Water demand
The demand for water in this model is also expressed in physical quantities.Water demand represents the total amount of water required for varioususes. Hydrologists and water managers distinguish three categories of wateruse: withdrawal uses, when water is physically removed from the naturalwatercourse (households, industry, agriculture, services); on-site uses, forwhich the amount of water available in the watercourse is critical (navigation, water required to keep the ecological balance of swamps and wetlandsor to control soil erosion); and flow uses, when the rate of water availabilityis the key factor (hydroelectric power generation, waste dilution, estuarymaintenance). Some uses do not affect water quality, while others severelydowngrade the quality of water when the water returns to the natural watercourse. Some uses return practically the same amount of water as wasdiverted, while other uses such as irrigation result in high rates of water loss.
Due to the size, geographical characteristics, and hydrological conditionsof Mauritius, and partly due to data limitations, two components of waterdemand are considered in this model: losses from withdrawal uses and thedilution flow required to keep water quality in streams and rivers above thestandard values. Through these components, water quantity and qualityconsiderations are linked in the model. Total water demand is expressed instreamflow (e.g., m3 per second) and is comparable to water supply.
Withdrawal Losses
There are two components of losses associated with water withdrawals foruse in households and the economic sectors. The first component is net water consumption, which is the amount of water not returned to the naturalwatercourse because it was evaporated, transpirated by plants, incorporated
282 Ferenc L. Toth
into products, or used another way. The second follows from a special featureof wastewater management in Mauritius: a considerable fraction of residential and industrial sewage is directly discharged into the lagoons. (Thereare plans to extend sewage outfalls beyond the reef and discharge sewageinto the ocean.) This water is lost as a freshwater resource, thus the directdischarge part of water loss includes the total amount of wastewater whichis discharged into receiving media other than rivers and ground.
Net water consumption is derived from the population module for households and from the input-output model for the economy. Specific grossintake figures (m3 per person-year and m3 per million rupees of output)were calculated from the 1987 input-output table, irrigation data, and water statistics of the Central Water Authority. Total gross water intake, ineach time step, is computed by the model using actual population size andactual levels of economic activity in each sector. For each present (and possible future) sector of the economy, rates of loss are also estimated, indicatingwhat fraction of the water intake is used up (evaporated, incorporated intoproducts, etc.) by the given sector. Net water consumption is then calculated from gross intake values and rates of loss.
Direct discharge, the second component of withdrawal losses, accountsfor the amount of water which is not returned to the freshwater course, butrather discharged into salty waters - in the case of Mauritius, the lagoons.Direct discharge is calculated in this model by reducing the amount of return flow (gross intake minus net consumption) according to the ratios ofwastewater discharge into lagoons and, when appropriate, the ocean.
Dilution Flow
Required dilution flow is calculated according to the user-specified waterquality standards from the amount of pollutants discharged into streamsand rivers after various levels of wastewater treatment. Three types of pollutants are considered in this model: organic wastes expressed in terms ofbiochemical oxygen demand (BOD), nitrogen (N), and phosphorous (P). Required dilution flow is calculated for each pollutant, and the largest of thethree values is taken as the ruling dilution flow.
Specific gross BOD discharge rates (kg BOD per person-year and kgBOD per million rupees of output) were derived from the 1987 input-outputtable and various studies conducted by the Central Water Authority. Thesespecific values are combined in the water model with actual population figures from the demographic model, along with the structure and levels of
Modeling the Water Systems 283
economic activities in the input-output model, in order to provide grossBOD production values for each of the 16 sectors (15 economic sectors andthe domestic sector).
Although the current level of wastewater treatment in Mauritius is verylow, the model provides the necessary tools to analyze the environmentalimpacts of alternative development strategies on both waste production andwaste management, as well as to keep track of costs and necessary investments to prevent environmental degradation. Four levels of treatment areconsidered in the model: no treatment (raw discharge), primary treatment,secondary treatment, and tertiary treatment. Fractions of wastewater, fromall sectors subject to one of the three real treatment levels, depend on theamount of sewage generated and the available treatment capacities.
For each period in a given scenario run, the user can allocate moneyto construct new treatment capacities for each treatment level. Specifictreatment costs include annualized construction and operating costs per m3
of wastewater treated. Newly added treatment capacities are derived froma combination of the investment decisions specified by the user and thespecific treatment costs stored in the model's data base. Thus, new treatment facilities can become available with a one-period delay. Given theupdated inventory of treatment capacities, the model calculates what fraction of wastewater from the different sectors is going through each of thefour levels of treatment.
Based on the treated amount and the efficiency of treatment, we get thetotal amount of pollutant discharge. Only part of the total wastewater discharge goes into rivers. Therefore, only the fraction discharged into streamsand rivers is considered when we calculate the required dilution flow. ForBOD, a simple biodegradation model is used to calculate the level of flownecessary to meet the water-quality standard specified. The biodegradationmodel calculates the waste assimilation capacity of the freshwater system.It is based on the amount of water available for the re-oxygenation process, and the specific reaction coefficients characterizing decomposition andre-aeration processes under Mauritian conditions.
The procedures to calculate the required dilution flows for nitrogen (N)and phosphorous (P) are quite similar. Amounts of discharge are linked toamounts of BOD discharges through sector-specific ratios. Sectors 1 and2 (sugar-cane production and other agriculture) are notable exceptions; noBOD is produced in the sugar-cane sector, but the amount of Nand Pleaching into the groundwater and rivers are significant due to high ratios of
284 Ferenc L. 70th
fertilizer use. There is some BOD discharge from the other agriculture sectorbecause it includes animal husbandry, but it is impossible to keep track of itsshare from the total output value in the input-output model. Wastewaterdischarge from the animal husbandry sector goes to the ground anyway, soit does not affect the quality of inland surface waters and the quality ofwater in the lagoon. Therefore, only the Nand P loads to rivers from otheragriculture is taken into account. Parts of the Nand P discharges will beconsumed in biodegradation processes. Actual amounts depend on BODavailability and on the ratio at which N, P, and BOD enter these processes.Any remaining amounts of Nand P need to be diluted according to the userspecified water-quality standards. These procedures provide three values ofminimum flows which are necessary to dilute the amounts of BOD, N, andP reaching the surface freshwater system in Mauritius. The ruling dilutionflow will be the highest of these three required flows.
15.4.3 Water balance
The sum of the required dilution flow and withdrawal losses is taken as totalwater demand. It is expressed by flow (m3 per second) in order to makeit comparable to the level of water availability, which is also calculated interms of streamflow. The resulting water balance is reported to the user,together with other results of the model.
The only implication of a negative water balance on the demographicprocesses or economic development is the reduced availability of water forirrigation. Unless there is a real danger of absolute water shortage when thephysical quantity of water is insufficient or the water is so polluted that itcannot be used even for the least demanding industrial purposes - which isnot the case in Mauritius - this approach is realistic. Poor water qualitydoes not necessarily inhibit economic growth. Witness the Chao PhrayaRiver which has been practically dead for years, yet Thailand's economicgrowth - headquartered in Bangkok - still continues at double digit rates.
In particular, there is no feedback to the population module in the formof increasing mortality or morbidity rates. Despite increasing evidence thatvarious forms of environmental pollution affect the health status of the population, these relationships are difficult to quantify. Therefore, any attemptto include this linkage in a simple aggregated model like the one built forMauritius would have resulted in obscure relationships. The model does notinclude economic feedbacks either. There is no penalty for increasing costs
Modeling the Water Systems 28,5
of providing potable water due to higher treatment requirements from riverabstraction points when water quality in rivers declines. These are cleardeficiencies of the model, but they cannot be avoided if we want to keepthe model defendable. The information provided by the surface freshwatermodel is nonetheless useful and important for the user. In Section 1.1.6, itsuses for formulating water policies are discussed.
15.5 The Lagoon Model
The coral reef surrounding the island of Mauritius encloses a shallow bodyof water. The reef extends over 70 percent to 80 percent of the coastline ata distance of from one hundred meters to several hundred meters. There areboth positive and negative consequences of this formation. On the positiveside, the barrier reef breaks the high energy waves of the ocean far off thecoast, thus significantly reducing coastline erosion and beach erosion. On thenegative side, however, the reeftraps part ofthe pollutants from inland. Thisleads to considerable degradation of water and sediment quality, especiallyill the closed parts of the lagoon.
The coral reef itself is in danger. Coral and coral sand are extractedat rates far above natural replenishment (Manrakhan, 1991). Shells andfish are selectively removed by both spearfishing and aquarium collecting(GOM/World Bank, 1988), thus disturbing food chains and the ecologicalbalance. Raw sewage being pumped into the lagoons is also killing the livingcoral. Still existing illegal fishing methods using explosives and the use ofchemicals (poison) by aquarium fish catchers (World Bank, 1989) are themain coral killers. An estimated one-third of the corals is already dead.
The economic value of the lagoons is significant. The Ministry of Economic Planning and Development (MEPD, 1988) estimated the economicvalue of various activities related to the lagoons at Rs 2.8 billion per year. Direct employment in these activities involves more than 10/iOO people. Some98 percent of the economic value and 73 percent of employment is associatedwith the tourism industry.
It follows that the reef and the lagoons play an important role in maintaining the environmental quality and economic prosperity of the island.Therefore, the future of the lagoons must be addressed by any sustainability study concerned with the management of the island's limited naturalresou r'es.
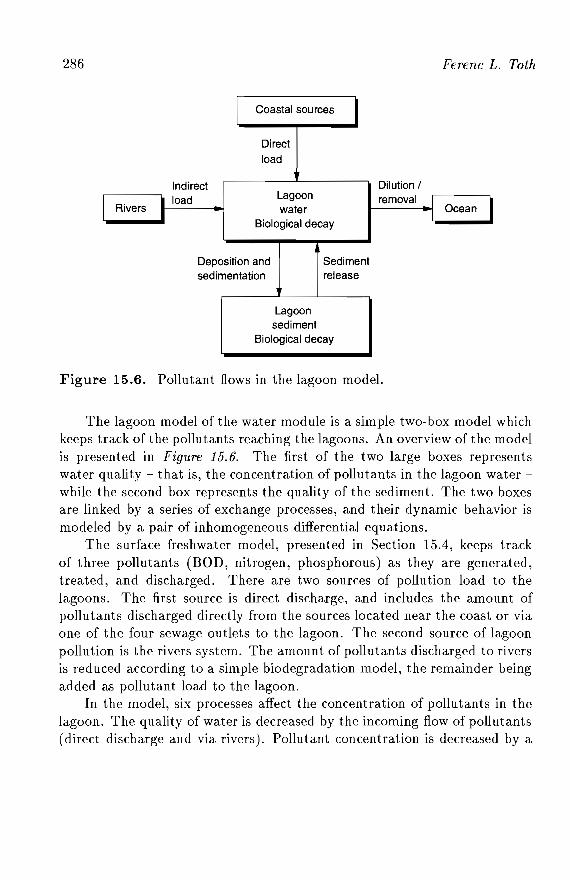
286 Ferenc L. Toth
ICoastal sources I
Directload
Indirect Dilution /
II load Lagoon removal I
Ocean IRiversI water I
Biological decay
Deposition and Sedimentsedimentation release
Lagoonsediment
Biological decay
Figure 15.6. Pollutant flows in the lagoon model.
The lagoon model of the water module is a simple two-box model whichkeeps track of the pollutants reaching the lagoons. An overview of the modelis presented in Figure 15.6. The first of the two large boxes representswater quality - that is, the concentration of pollutants in the lagoon water while the second box represents the quality of the sediment. The two boxesare linked by a series of exchange processes, and their dynamic behavior ismodeled by a pair of inhomogeneous differential equations.
The surface freshwater model, presented in Section 15.4, keeps trackof three pollutants (BOD, nitrogen, phosphorous) as they are generated,treated, and discharged. There are two sources of pollution load to thelagoons. The first source is direct discharge, and includes the amount ofpollutants discharged directly from the sources located near the coast or viaone of the four sewage outlets to the lagoon. The second source of lagoonpollution is the rivers system. The amount of pollutants discharged to riversis reduced according to a simple biodegradation model, the remainder beingadded as pollutant load to the lagoon.
In the model, six processes affect the concentration of pollutants in thelagoon. The quality of water is decreased by the incoming flow of pollutants(direct discharge and via rivers). Pollutant concentration is decreased by a
Modeling the Water Systems 287
biological decay process. The amount of water delivered to the lagoon byrivers causes the same amount of outflow from the lagoon, thus removingthe corresponding amount of pollutants from the lagoon. Tidal water bringssignificant amounts of water to the lagoon in a regular cycle. This waterdilutes pollutants in the lagoon water and removes part of them with thelow tide. The rate of dilution depends on turbidity and the rate of exchange- that is, the ratio of the volume of water coming in with the tidal watersto the volume cf water in the lagoon at low tide. The current version ofthe model assumes complete mixing, taking the whole lagoon volume aseffective volume.
The process of sedimentation also reduces the concentration of pollutants in the water by depositing and accumulating pollutants in the bottomsediment. Depending on the relative concentration of pollutants in the waterand in the sediment, this process can also go in the opposite direction. Inthis case, the sediment is releasing pollutants back to the water. The rateof sedimentation is a function of turbidity and pollutant concentration.
The accumulation of pollutants in the sediment is primarily driven bythe concentration of pollutants in the water. Deteriorating water quality(higher pollutant concentration) leads to more intensive sedimentation andresults in increasing accumulation of pollutants in the sediment. Dependingon the oxygen balance of the sediment and the availability of oxygen in thesystem, part of the deposited pollutants will undergo biological decay in thesediment. In turn, high pollutant concentration in the sediment will increasethe internal load of pollutants as a result of a higher level of sediment release.The process also works in the opposite direction: if external pollutant loadis reduced and water quality thus improved, internal load will decrease aswell with a certain time lag.
While in the case of the surface freshwater system the aggregated approach is appropriate for purposes of the present model system, it is muchless defendable for the lagoon model. Extended parts of the coastline, especially in the south, are completely open and the coral fringe is missingaltogether. Pollutants discharged or delivered to the ocean in this regionare immediately diluted and washed away by the ocean. At the opposite extreme, closed segments of the lagoons in the vicinity of outflows of pollutedrivers and dense industrial and tourist areas show signs of severe degradation. These parts of the lagoons receive much more pollution per unit ofwater volume, while processes of pollutant removal (outflow, biological decay) are limited. Averaging out these regional differences is a serious source
288 Ferenc L. Toth
of error in the current version of the model. Despite intensive efforts, however, it was impossible to get access to the appropriate data that would havemade regionalization of the lagoon model possible. Yet, the possibility isthere. The same model could be used for one or more selected segments ofthe lagoon by replacing current aggregated values by appropriate parameters(volume, area, pollution load, rates of deposition, decay, etc.) characterizingthe lagoon segment at hand.
Also due to lack of data, the only pollutant considered in the currentversion of the lagoon model is BOD. With the appropriate data on nitrogenand phosphorous available, the model could easily be supplemented with asimple eutrophication model. Yet again, this extension would only makesense for a regionally disaggregated version of the lagoon model.
Results of the lagoon model are reported to the user together with resultsof the surface freshwater model. The two most important output variablesa.re the pollutant concentration figures for the water and for the sediment.
There is no feedback from the lagoon water quality to any other part ofthe system. This means that deterioration of the lagoon ca.n reach arbitrarily high levels without any implication on the population or the economy.This is, of course, unrealistic. It is obvious from the economic data presented at the beginning of this section that a major loser due to pollutedlagoons would be the tourism industry. Yet, it would take heroic assumptions to quantify the decrease in tourism demand as a function of pollutantconcentration in the lagoon. Considering the Mauritian aspiration to discourage cheap, package-tour tourists and attract the "upmarket clientele"of the "high-spending segment of the long-haul affluent markets" (MEQOL,1991, p. 224), a decline of the tourism sector would be rather steep as aresult of declining water quality in the lagoon.
If the user is not satisfied with the long-term trend of water quality inthe lagoon as it was reported from a given scenario run, the most usefuloption available is to increase sewage treatment. By investing in additionalwastewater treatment facilities, pollutant content of the direct dischargeand the amount of pollutants delivered by rivers can be reduced. The fateof pollutants, once they get to the lagoon, is largely governed by naturalprocesses, so there is not much a manager could do. In situ, rehabilitationtechniques like sediment dredging or sludge removal are not permitted bythe current version of the model, although they could be considered for adisaggregated version.
Modeling the Water Systems 289
15.6 Scenarios and Water Policies
In the water module it is not possible to predefine exact scenanos at thebeginning of a 60-year time horizon. Water requirements and water quality will depend on the user's economic and social policies, along with whathappens in the population and economic models as a result. Models in thewater module measure the environmental implications of the given population and economic development scenario in terms of water balance in theinland surface-water system and in terms of water quality in the lagoons.The only resource constraint defined in the form of a direct feedback relationship is between the surface-water model and the economic model. Whenwater shortage is detected by the model, the amount of water available forirrigation will automatically be reduced to restore the water balance. Reduced irrigation leads to lower yields and lower sugar-cane production. Thisimplies that the user should apply a trial-and-error approach by resettingthe water-policy variables for the same demographic and economic scenarios, should it be found that the results are not satisfactory in terms of wateravailability and/or water quality.
15.6.1 Water-policy variables
There are three groups of variables in the water module that reflect theuser's preferences or intentions in terms of water management. These are:required water quality standards (RWQS), investments in treatment, andinvestments in storage. Since the model combines quality and quantity aspects, water balance requirements for any given scenario of population andeconomic development can be met by a large set of combinations of the threepolicy variables. The principal difference between the quality standards andthe other two variables is that the former reflects the user's preference forenvironmental quality, whereas the treatment and storage variables are thebasic instruments to achieve the given environmental quality.
Thus, the scenarios can be classified by the following target environmental qualities:
• Moderate. RWQS is 4 mg per liter for dissolved oxygen (DO), 10 rng perliter for N, and 0.1 mg per liter for P; these are the current environmentalstandards in Mauritius and also the default values that appear in thescenario-set ting menu.
290 Ferenc L. Toth
• High. RWQS for DO could be pushed as high as 6 mg per liter, whilethey can be reduced to 5 mg per liter for N and to 0.05 mg per literfor P.
• Low. RWQS for DO can be reduced to 1 mg per liter, while permittedNand P concentrations can be allowed to increase up to 30 mg per literand 0.3 mg per liter, respectively.
Due to the nonlinearities characterizing the system both on the inputside (pollutant discharge vs. treatment) and on the impact side (eutrophication, biochemical degradation, and other processes), small changes in theRWQS parameters tend to generate major shifts both in the water balance(calculated and reported by the system) and in the induced environmentalimpacts (not represented in the system).
Water-management strategies are specified by allocating investments inwastewater treatment and water-storage facilities. Again, there are majordifferences associated with each option. Investments in treatment reducethe overall load on the water system by abating pollutants before the wastewater is returned to the natural watercourse. They also reduce the requireddilution flow necessary to maintain the specified RWQS. In contrast, investments in storage will increase the minimum sustained flow, thus the amountof flow available to dilute pollution discharge in order to meet the specifiedRWQS will be higher. In the short rivers of Mauritius, however, biochemicaldegradation is limited. Therefore, the use of increased dilution flow as astrategy to maintain water quality in the rivers implies a pushing out of theproblems to the lagoons, which will thus receive much higher pollutant loadsthan they would under a treatment-oriented strategy. Additional flaws ofthe storage-oriented strategy include the land area lost due to inundationto construct dams and reservoirs, along with other environmental impactsof dam construction and operation. Nonetheless, both the treatment andstorage options are available in the model.
The attempt to define sensible scenarios for investments in either treatment or storage should be based on knowledge of the economic developmentscenario. Some directions in economic development imply heavy increasesin the "production" of water pollutants included in our model, others mayimply discharge of pollutants not included, and still others may not affectthe water system at all. An expansion of leather tanning as an EPZ sector would fall in the first category, some branches of the electronics industry with their heavy metal problems are examples of the second, and some
Modeling the Water Systems 291
service industries such as information technology or financial services (offshore banking) have no water-related effects. Yet, an attempt to defineextreme water strategies might involve the following:
A) Treatment
• No investment in water treatment.• "Low investment" scenario, e.g., 1 percent of the current government
investments allocated for wastewater treatment.• "High investment" scenario, e.g., 10 percent of the current government
investments allocated for wastewater treatment.
B) Storage
• No investment in water storage.• "Low investment" scenario, e.g., one-quarter of the potential dams con
structed between 1990 and 2050 in ascending order of the cost per unitof storage.
• "High investment" scenario, e.g., all potential dams constructed between1990 and 2050 in ascending order of the cost per unit of storage.
It will take some experimentation with the model for any user to determine the cost-effectiveness of the default scenarios and water policies. Theauthor's recommendation for a default scenario is the following: unless thespecified economic policy is expected to generate drastic increases in the discharge of BOD, N, and P from industrial and agricultural sources, the bestuse of resources implies a combination of moderate investments in treatment(somewhere between the "low" and "high" treatment scenarios) and no investment in storage. This scenario might also help to keep water quality inthe lagoon at an acceptable level.
A combination of the recommended default scenarios for RWQS andfor water management should keep a positive water balance in the riverflows. This may still imply unacceptable deterioration of water quality inthe lagoons. It was not possible to build a large number of meaningful anddefendable feedback relationships into the model. Therefore, for the defaultrun and for any subsequent scenario runs, the user should always check andevaluate environmental implications of population and economic scenarios,both in the inland surface water quality and in the lagoon water quality.
292 Ferenc L. Toth
15.6.2 Other water-management parameters
There are four environmental media receiving wastewater discharge in thecurrent version of the model: groundwater, rivers, lagoon, and the oceanbeyond the reef. Direct discharges to the rivers and the lagoon and pollutanttransport by the rivers to the lagoon are properly handled by the model. Themissing link in the present version of the model is the pollutant transportfrom groundwater to rivers and the pollutant absorption capacity of thegroundwater system.
Lacking any data on groundwater movement and quality, it is impossibleto construct a meaningful model of these processes. It is evident, however,that the absorption capacity of the groundwater system is limited. Therefore,direct discharge of untreated sewage from domestic and industrial sourcesto absorption pits must eventually be phased out. The user can model thistransition by modifying the disposal matrix that indicates what fraction ofthe wastewater from different sectors is discharged to which receiving media.Even if this redirected discharge is treated, it will pose an additional load tothe surface flow or the lagoon model.
When and how fast this transition takes place depends on when and howfast the signs of contaminating groundwater will make it necessary. Threebasic scenarios can be proposed as default:
• Transition soon and fast: phasing out groundwater discharge starts in1995 and is completed by 2015.
• Transition soon and gradual: phasing out starts in 1995 and is completedby 2040.
• Transition later and gradual: phasing out starts in 2020 and groundwaterdischarge is reduced to 30 percent of its original value by 2050.
The geographical location of Mauritius would clearly permit the discharge of untreated sewage in the ocean beyond the reef. If the pipes gosufficiently beyond the reef, wastes are diluted by the ocean and are notexpected to pose any significant repercussions on either the corals or thelagoon. Yet, this solution does not appear to be environmentally friendly.Moreover, the costs of building and operating these kinds of disposal facilities might well be close to what it would take to build and operate treatmentplants. Currently none of the sewage outlets go beyond the reef. We haveno clata about the construction and opera.tion costs of such facilities. Should1his option be seriously considered in the future, the model can be easilymodified to accommodate it.
Chapter 16
Scenarios for Mauritius,1990-2050
Christopher Prinz and Anne Babette Wils
16.1 Introduction
The scenarios described in this chapter and Chapter 17 serve to answer someof the main questions raised by the project: What is the effect of populationgrowth and education on development? Can economic development occurwithout population control? What is the effect of population on environment? In this chapter the answers to these questions relate to the very specific situation of Mauritius and its population, economy, and environment,but are generalized whenever possible.
To answer those questions our PDE Mauritius model is used to calculatealternative future paths in the population, development, and environmentcomponents, and the interactions between these components. The time horizon chosen in this application of PDE Mauritius is 60 years, starting in 1990.This time horizon is sufficiently long to see the long-term effects of our assumptions. Longer time horizons with this model become too speculative.
Often in modeling the main question is: What is most likely to happen?Under such circumstances one needs to have one baseline scenario, possiblywith a few variations. This is typically the case of a prediction model.
Models like PDE Mauritius are to be used for policy making, to see whatpossible futures exist and what the alternative policy reactions are. Such a
294 Christopher Prinz and Anne Babette Wils
model can be used to explore which policies would be most robust even inthe face of different futures. The model is also used to answer questions oninteractions. To understand a system, it is important to explore alternatives.What happens when I change one particular variable? What is the main environmental constraint, given different economic developments? How doesthe size and the education of the population matter to development? To findthe answers, different alternatives need to be compared. In contrast to econometric models, PDE Mauritius is not used to predict the future, but ratherto understand the complex population-development-environment system.
The scenario approach is used both to demonstrate the strength of themodel and to find reasonable and robust policies. In this type of approach theif-then nature of the calculation is emphasized more than a likely prediction.A scenario approach is expected to make all assumptions very explicit andto offer a sensitivity analysis over the assumptions chosen. Scenarios aredeveloped on the basis of a possible "story" which has content, rather than"high" and "low" deviations from the "likely" path.
To understand the interactions, two subscenarios were chosen for eachof the three PDE components - population, development, and environment.We feel these subscenarios reflect possible extreme developments in eachcomponent. Each partial scenario is already a complex composite. In eachcomponent the two partial scenarios represent what might be considered amodern, successful path versus a traditional, passive path.
Section 16.2 discusses the basic scenario definitions in detail. It alsoprovides an explanation of the resulting scenario combinations. Section 16.3presents unbalanced, raw scenario results. Here, population is discussed inmore detail since - in the discussion of population and environment - it isimportant to understand the dynamics of population growth and populationinertia, and possible effects of education campaigns and female labor-forceparticipation. In Section 16.4, the unbalanced, raw combinations are modified into a form that makes them consistent multi-sectoral scenarios. Anumber of specific issues, such as food self-sufficiency, sectoral distributionof the economy, and water treatment, are addressed.
16.2 Scenario Setting
16.2.1 Scenario assumptions
Table J6. J gives a detailed description of the definition of the scenario assumptions for population, the economy, and the environment.
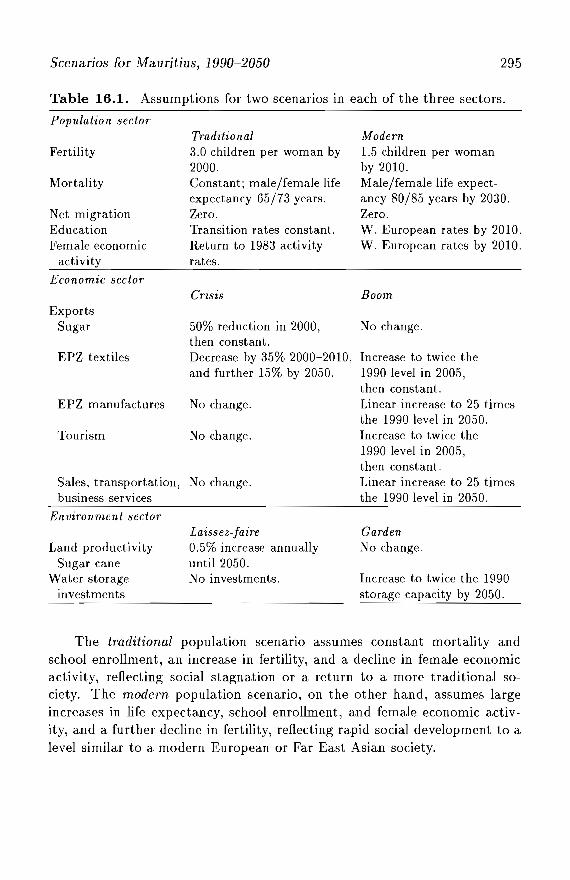
Scenarios for Mauritius, 1990-2050 295
Table 16.1. Assumptions for two scenarios in each of the three sectors.
Population sector
Sales, transportation, No change.business services
Environment sector
Fertility
Mortality
Net migrationEducationFemale economic
activity
Economic sector
ExportsSugar
EPZ textiles
EPZ manufactures
Tourism
Land productivitySugar cane
Water storageinvestments
Traditional3.0 children per woman by2000.Constant; male/female lifeexpectancy 65/73 years.Zero.Transition rates constant.Return to 1983 activityrates.
Crisis
50% reduction in 2000,then constant.Decrease by 35% 2000-2010,and further 15% by 2050.
No change.
No change.
Laiss ez-fa ire0.5% increase annuallyuntil 2050.No investments.
Modern1.5 children per womanby 2010.Male/female life expectancy 80/85 years by 2030.Zero.W. European rates by 2010.W. European rates by 2010.
Boom
No change.
Increase to twice the1990 level in 2005,then constant.Linear increase to 25 timesthe 1990 level in 2050.Increase to twice the1990 level in 2005,then constant.Linear increase to 25 timesthe 1990 level in 2050.
GardenNo change.
Increase to twice the 1990storage capacity by 2050.
The traditional population scenario assumes constant mortality andschool enrollment, an increase in fertility, and a decline in female economicactivity, reflecting social stagnation or a return to a more traditional society. The modern population scenario, on the other hand, assumes largeincreases in life expectancy, school enrollment, and female economic activity, and a further decline in fertility, reflecting rapid social development to alevel similar to a modern European or Far East Asian society.
296 Christopher Prinz and Anne Babette Wiis
The economic crzszs scenario assumes a discontinuation of the LomeConvention in 2000, which results in a drastic decrease in sugar and textileexports. The other potential export sectors are too weak to compensatefor these losses, and stay constant. Or, alternatively, the world market ingeneral does not demand as much as before due to a global economic crisis.Total exports decline by some 25 percent in the first 10 years of crisis andthen remain stagnant. In contrast, in the economic boom scenario, the LomeConvention remains in force. The present rapid increase in exports continues.The current sources of wealth - sugar, textile, and tourism - remain constantor grow slightly, but are overtaken by other much more dynamic, futureoriented non-textile EPZ industries and service export sectors. Total exportgrowth is about 5 percent annually until 2020 and 1.5 percent annuallyuntil 2050.
In the laissez-faire environmental policy scenario no environmental management policies are implemented, and no care is taken of water: reservoircapacities remain at 1990 levels. Higher fertilizer use and better seeds leadto a 0.5 percent annual increase in sugar yields per hectare. The main feature of the garden policy scenario is the investment in water resources toensure water quantity and quality on the island. Storage capacity is increased considerably, which adds some 70 percent to the present net waterflow. Fertilizer use is not increased further causing a stagnation in sugar-caneland yields.
It must be said that within the ranges of today's world these scenarios are a narrow band. Under Mauritius's present condition, it is hard toimagine changes that would lead to certain world extremes in demographicand economic indicators. The combination of these scenarios gives eight(2x2x2) raw base scenarios:
1. traditional/ crisis/laissez- faire2. traditional/boom /laissez-faire3. traditional/crisis/garden4. traditional/boom/garden.5. modern / crisis /laissez-faire6. modern/boom/laissez- faire7. modern/crisis/garden8. modern/boom/garden
Some of these combinations are more likely and thus sketch a morerealistic future for Mauritius than others. For example, we can well imagine the traditionaljcrisis/laissez-faire scenario because it fits the image of
Scenarios for Mauritius, 1990~2050 297
many existing developing countries which are poor, have high fertility, haveno environmental protection measures, etc. The modern/crisis/laissez-Jairescenario is more uncommon, as it denotes a demographically advanced society that is still caught in poverty. The Indian state Kerala and Sri Lankamay be considered examples of such areas. Much more difficult to imagine is the traditional/crisis/garden combination: here we have a traditional,poor society, which, for some reason, rather than investing in its population and economy, is saving its natural resources. This is what is sometimesprescribed to developing countries by the industrialized world, for example,when it comes to the discussion of emission "rights" of CO2 into the atmosphere or the "right" to pollute the oceans or the "right" to cut downrainforests. Equally unusual is the modern/crisis/garden scenario: this isthe idealistic society which is responsible to its members in a social senseand cares for the environment - over and above what is simply necessary forconservation - but which is poor.
We can very well imagine the modern/boom scenarios, reflecting a society that completed the demographic transition, with a modern, growingeconomy, like Mauritius, the Small Tigers, or Thailand. There are also anumber of examples for a traditional/boom combination, such as the bigoil producers and exporters on the Arabian peninsula which still show verytraditional demographic behavior. Any boom scenario combination is realistic with either garden care or a laissez-Jaire approach to environmentalconservation.
16.2.2 Scenario making with PDE Mauritius
As is described in Chapter 11, the hard-wired model is mostly hierarchical.The population input produces population results. These results, plus theinput for the economy, provide the economic results. And again, the population results, plus the economic results, plus the input for water and landprovide environmental results. These are uni-directional effects which arehard-wired in the model. What is crucial, however, in PDF: modeling, is thefeedback. That means, we are concerned not only with the influence of thepopulation on the economy, but also with influences of the economy on thepopulation; not only with the influence of the economy on the environment,but also with influences of the environment on the economy.
The nature and the strength of many of,these feedbacks are subject tomuch debate among scientists (see Chapter 11); therefore, we have not hardwired many of them in the model. These feedbacks need to be defined by the
298 Christopher Prinz and Anne Babette Wils
scenario maker. There are two types of feedbacks. One is the balances: thatis, supplies of any goods and/or resources must always be greater than demands. The other feedbacks are influences, such as the effect of the standardof living on fertility or labor productivity.
The feedbacks discussed in this chapter are of both types. We discussthe balances first and why some balances are not solved internally by themodel. The variables that are not balanced internally are: labor, governmentspending and taxes, and - to a certain extent - water and land. Otherbalances are resolved internally, in the form of hard-wired feedbacks. Mostimportantly these are household income and expenditure and investmentsand savings plus debts. We have chosen not to balance labor, government,and all water and land internally because in case of a conflict, multiplesolutions are possible.
The PDE model does not stop calculating when it runs into imbalancesin these selected variables. It continues to run, "as if" there were sufficientlabor, sufficient money, and sufficient water and land. However, in the presentation of the results of the scenario the imbalance is shown. After runninga scenario, the user has to check the results - in particular, the results of thevariables that need to be balanced. If there is an imbalance, the scenariomaker needs to decide how to deal with it.
The resolution oflabor, budget, water, and land conflicts is not unequivocal. For example, the scenario which specifies an economic boom and a traditional (uneducated, unproductive) population results in a labor shortage.Now, something has to be changed. The economic demand has to decreaseor the technology must be improved to demand less labor or the populationassumptions must be changed. \Ve, as the modelers, have not hard-wired the'decision of which element has to change and how much, because we feel thatvarious solutions are possible in reality: if there is tension on the labor market, the economy will react by growing less than it otherwise could or laborproductivity will increase or the labor force will adapt or any combinationof the three alternatives.
Conflict can also occur in water demand and supply. Say a given economic scenario increases the demand for water beyond the supply. \Vhatshould happen? Would economic growth be stunted? Or would the government build water-treatment and water-recycling plants? Or would waterconservation methods be imposed? We do not know what is best withouttrying out the different options. The advantage of PDE Mauritius is that all
Scenarios for Mauritius, 1990-2050 299
sorts of options are indeed available (see Chapter 13 concerning the economyand Chapter 15 concerning water for more details).
A very important element of this kind of model is that the user can testvarious types of reactions, and see which one would lead to a more desirablefuture. Also, with this model, if the user runs into a conflict somewherein a future scenario year, he or she can go back to the starting year, withknowledge of the conflict, and change the path of the future, to see if anotherplan works better.
The other type of feedback is that of influences such as the idea thathigher income lowers fertility or that a higher level of pollution increasesmortality. This type of feedback was discussed in Chapter 3. The significanceof such feedbacks is the strength or the elasticity of the feedback loop. Welearned in Chapter 3 that depending on the speed of the advance of pollutionabatement technology, a model could compute a wonderful or a catastrophicfuture. The problem is that we do not know the speed of technologicaladvance; we do not know the strength of the relationship between, say,migration and unemployment. We deliberately did not include this typeof feedback internally in the model, because the debate on these feedbackscontinues. With our model the effects of various assumptions, such as incomedoes not influence fertility or higher income reduces fertility, can be tested.
16.3 Raw, Unbalanced Scenarios
16.3.1 Population results
A main concern of the project is the interplay between population and theenvironment. The environment, without influence from human activity, isrelatively stable over a long period of time - that is, the same annual cycles,the same soil type, the same coral reefs, etc. The environment of Mauritius,by itself, would remain in more or less the same state as it was described inSection 16.2. Not so the human population. Population is an element thatexperiences faster change than the environment, with regard to both its sizeand its composition. It is also subject to lagged changes; a fertility decline in1990 only significantly affects population size and growth in one generation'stime. It is therefore useful to look at the dynamics of population change inmore detail - how changes in fertility, mortality, education, and such wouldaffect the future of the population - before turning to the interaction withthe environment and the economy.
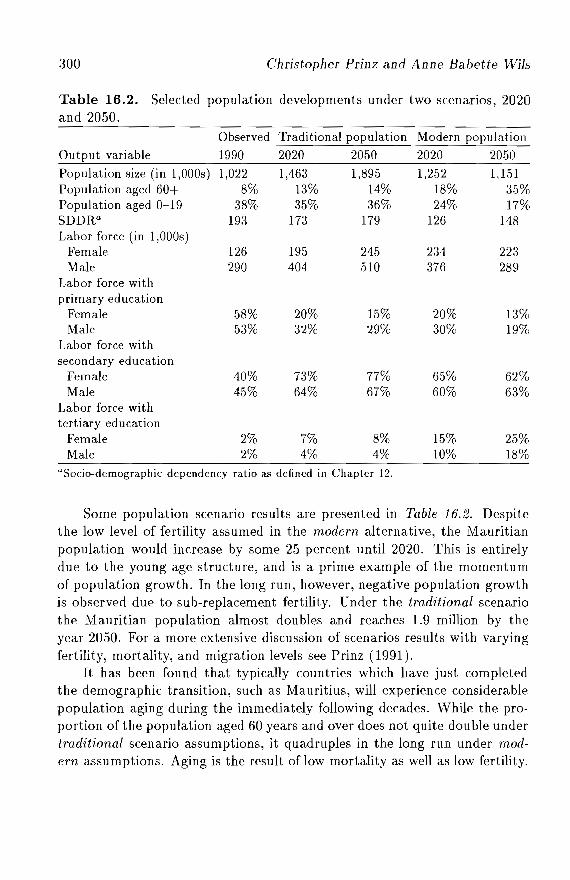
300 Christopher Prinz and Anne Babette Wils
Table 16.2. Selected population developments under two scenarios, 2020and 2050.
Observed Traditional population Modern populationOutput variable 1990 2020 2050 2020 2050Population size (in 1,000s) 1,022 1,463 1,895 1,252 1,151Population aged 60+ 8% 13% 14% 18% 35%Population aged 0-19 38% 35% 36% 24% 17%SDDRa 193 173 179 126 148Labor force (in 1,000s)
Female 126 19.5 245 234 223Male 290 404 510 376 289
Labor force withprimary education
Female 58% 20% 15% 20% 13%Male 53% 32% 29% 30% 19%
Labor force withsecondary education
Female 40% 73% 77% 65% 62%Male 45% 64% 67% 60% 63%
Labor force withtertiary education
Female 2% 7% 8% 15% 25%Male 2% 4% 4% 10% 18%
aSocio-demographic dependency ratio as defined in Chapter 12.
Some population scenario results are presented in Table 16.2. Despitethe low level of fertility assumed in the modern alternative, the Mauritianpopulation would increase by some 25 percent until 2020. This is entirelydue to the young age structure, and is a prime example of the momentumof population growth. In the long run, however, negative population growthis observed due to sub-replacement fertility. Under the traditional scenariothe Mauritian population almost doubles and reaches 1.9 million by theyear 2050. For a more extensive discussion of scenarios results with varyingfertility, mortality, and migration levels see Prinz (1991).
It has been found that typically countries which have just completedthe demographic transition, such as Mauritius, will experience considerablepopulation aging during the immediately following decades. While the proportion of the population aged 60 years and over does not quite double undertraditional scenario assumptions, it quadruples in the long run under modern assumptions. Aging is the result of low mortality as well as low fertility.
Scenarios [or Mauritius, 1990~2050 301
Strong population aging seems probable, since a long-term return to a fertility level as high as that assumed under the traditional scenario (overall TFRequal to about three children per woman) has so far never been experiencedby any country that has completed the demographic transition. Dependingon the fertility assumptions, the proportion of children declines significantly;even under traditional assumptions the proportion is always below the 38percent observed in 1990, but under modern assumptions this proportion iscut in half.
The development of the socio-demographic dependency ratio (SDDR), adependency ratio considering economic activity, productivity (or education)of the labor force, and age of dependents (see Chapter 12 for more details),develops surprisingly similar in the long run with the two different scenarioassumptions. First, it never again reaches a level as high as the 193 dependents per 100 actives observed in 1990. The SDDR strongly declines duringthe next three decades under modern population assumptions, by 35 percent, as a consequence of very low fertility. Under traditional assumptions itwould still decline by some 15 percent by the turn of the century. By 2020,the SDDR starts to increase again under the modern scenario as a consequence of rapid aging, i.e., the immense increase in the number of elderly.Due to the fertility recovery, under the traditional scenario after around2010 the socio-demographic dependency ratio varies from 170 to 180. Iflower SDDRs have a positive influence on the economy as indicated in someof the literature, then further economic development is favored during thecoming decades simply by changes in the socio-demographic composition ofthe population.
In the medium term the size of the labor force develops in a similarmanner under both scenarios. While under the traditional scenario the morethan 40 percent increase in the labor force by 2020 is caused by high fertility,under the modern scenario it is to a large extent due to increased femalelabor-force participation. In the long run, however, the effect of high fertilitywill be much stronger. Table 16.2 also gives some information on genderspecific characteristics of the Mauritian labor force. The share of the femalelabor force in the total labor force increases from 30 percent in 1990 tobetween 32 percent by the year 2020 under traditional assumptions and 44percent by 2050 under modern scenario settings.
The educational distribution of the labor force and of the population asa whole is in a state of transition. While even in 1990 a majority of thelabor force had only primary education, this proportion declines rapidly to
302 Christopher Prinz and Anne Babette Wils
about one-fifth among the female and about one-third among the male population by 2020 in both scenarios (see Table 16.2). The lower proportionof primary-educated among working women results from higher labor-forceparticipation rates among secondary- and tertiary-educated women, as compared to primary-educated women. Interestingly, especially among women,there is little difference between traditional and modern assumptions as regards the proportion of primary-educated workers in the labor force. Thisis due to the combined effect of increasing labor-force participation ratesand increased educational attainment. In the total population, the percentage with only primary education is around one-third and is slightly higheramong women than among men by 2050 (only one-fourth in the case ofmodern population development).
Most striking is the projected increase in the number and proportion oftertiary-educated people. Taking both sexes together, the tertiary-educatedproportion increases to around one-fifth of the labor force by 2050 undermodern population development. Among the total population the figures are8 percent and 14 percent for the female and male population, respectively.This huge increase would give tremendous room for changes in the structureof the Mauritian economy. Under traditional assumptions the increase inthe tertiary-educated proportion is small.
16.3.2 Multi-sectoral results
The combination of the 2x2x2 scenarios produces eight raw scenarios. Inthese scenarios, technology is assumed to remain unchanged, hence, laborand land productivity is kept constant at their 1990 levels. Selected resultsfor the eight scenarios are shown in Table 16.3. The table gives supplies,demands, and resulting balances of four important variables that will eventually have to be balanced: budget, labor, water, and land.
The first four columns of Table 16.3 show the supply results of the fourvariables. Taxes are a result of production levels which in Mauritius largelydepend on assumed export levels. In the boom scenario, taxes increase to sixtimes the 1990 value in the long run, while in the crisis scenario they declineslightly. The labor supply is purely the result of the population module, inparticular of school enrollment ratios and labor-force participation rates. Inthe traditional scenario there are 755,000 people in the labor force in 2050,and in the modern scenario, with the smaller population, 512,000. Up until2020, no significant difference between the two scenarios exists since lowerfertility rates in the modern scenario are compensated by higher education
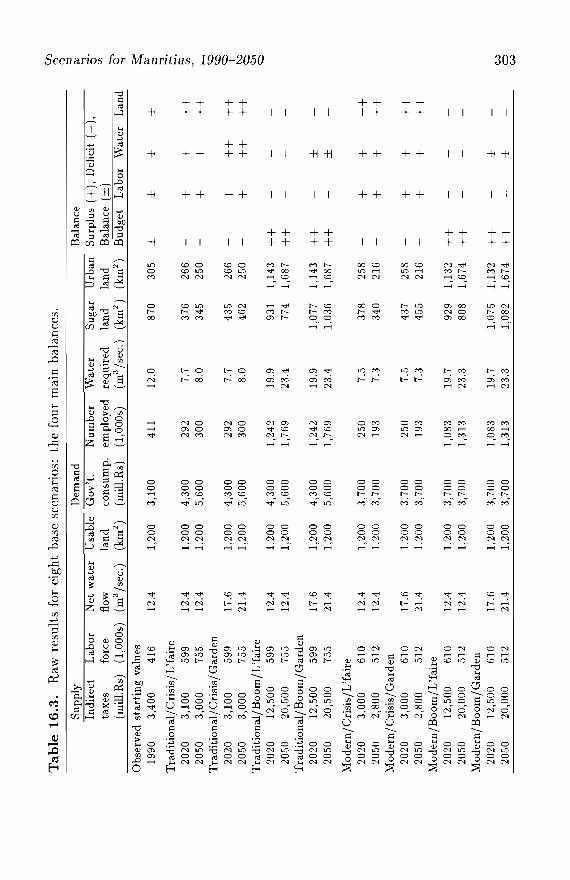
Ta
ble
16
.3.
Raw
resu
lts
for
eigh
tba
sesc
enar
ios:
the
four
mai
nba
lanc
es.
CJ) '"' <1>
Sup
ply
Dem
and
Bal
ance
::l
I;\l ..,
Indi
rect
Lab
orN
etw
ater
Usa
ble
Go
v't
.N
um
ber
Wat
erS
ugar
Urb
anS
urpl
us(+
),D
efic
it(-
),-. a
taxe
sfo
rce
flow
land
empl
oyed
requ
ired
land
land
Bal
ance
(±)
CIl
cons
ump.
(mil
l.R
s)(1
,OO
Os)
(m3/s
ec.)
(km
2)
(mil
l.R
s)(l,
OO
Os)
(m3
/sec
.)(k
m2
)(k
m2
)B
udge
tL
abor
Wat
erL
and
0' ..,O
bser
ved
star
tin
gva
lues
~19
903,
400
416
12.4
1,20
03,
100
411
12.0
870
305
±±
±±
I;\l :::: ..,
Tra
dit
ion
al/C
risi
s/L
'fai
re-..,.. -.
2020
3,10
059
912
.41,
200
4,30
029
27.
737
626
6-
++
++
J~20
503,
000
755
12.4
1,20
05,
600
300
8.0
345
250
-+
++
+.....
Tra
dit
ion
al/C
risi
s/G
ard
en'0 '0
2020
3,10
059
917
.61,
200
4,30
029
27.
743
526
6-
++
++
+<::
::> I20
503,
000
755
21.4
1,20
05,
600
300
8.0
462
250
-+
++
++
~ <::::>
Tra
dit
ion
al/B
oo
m/L
'fai
re'""<::
::>20
2012
,500
599
12.4
1,20
04,
300
1,24
219
.993
11,
143
++
2050
20,5
0075
512
.41,
200
5,60
01,
769
23.4
774
1,68
7+
+T
rad
itio
nal
/Bo
om
/Gar
den
2020
12,5
0059
917
.61,
200
4,30
01,
242
19.9
1,07
71,
143
++
±20
5020
,500
755
21.4
1,20
05,
600
1,76
923
.41,
036
1,68
7+
+±
Mo
der
n/C
risi
s/L
'fai
re20
203,
000
610
12.4
1,20
03,
700
250
7.5
378
258
-+
++
+20
502,
800
512
12.4
1,20
03,
700
193
7.3
340
216
++
++
Mo
der
n/C
risi
s/G
ard
en20
203,
000
610
17.6
1,20
03,
700
250
7.5
437
258
-+
++
+20
502,
800
512
21.4
1,20
03,
700
193
7.3
455
216
-+
++
+M
od
ern
/Bo
om
/L'f
aire
2020
12,5
0061
012
.41,
200
3,70
01,
083
19.7
929
1,13
2+
+20
5020
,000
512
12.4
1,20
03,
700
1,31
323
.380
81,
674
++
Mo
der
n/B
oo
m/G
ard
en20
2012
,500
610
17.6
1,20
03,
700
1,08
319
.71,
075
1,13
2+
+-
±w
2050
20,0
0051
221
.41,
200
3,70
01,
313
23.3
1,08
21,
674
++
-±
0 w
304 Christopher Prinz and Anne Babette Wils
and labor-force participation levels. The water supply is purely a result ofthe two environmental scenarios concerning water investments. In the gardenscenario, water supply increases from 12.4 m3 of water per second to 21.4m3 per second by 2050 because of increased reservoir capacity (see Chapter15 for the workings of the water module). In the laissez-faire scenario, thewater supply remains stationary at the 1990 level.
The usable land supply remains stationary in all scenarios - that is,around 1,200 km2 • There is no scenario input that the land available increases by reclaiming land or decreases through inundation. The possibilityof land losses due to a sea-level rise is not discussed in this chapter, because climate-change impacts in Mauritius are largely unknown, but couldbe tested by the model.
The supplies have to be equal to or greater than the corresponding demand levels. The next five columns in Table 16.3 show budget demand,labor demand, water demand, and sugar and urban land demand. Thesedemand levels are complex results. Government expenditure results fromthe combination of population results and per capita government consumption. Since this variable does not include the environmental expendituresand because group- and age-specific government consumption (mainly education, health, and pension expenditures) was kept constant in all scenarios,different results are obtained only for the two population scenarios. Undertraditional assumptions government expenditure increases linearly in accordance with the population size increase. In the modern scenario, after animmediate increase, government expenditure remains almost constant. Thelower costs of a smaller population size is compensated by higher governmentcosts of aging and the longer average schooling of the population.
The labor demand results mainly from three factors: the export level;tlle population size and structure; and the education of the labor force (seeChapter 13 for details). Hence, both demographic and economic assumptionsmatter. Due to the shrinking economy in the crisis scenarios the employment figure declines. Under boom scenario assumptions. 011 the contrary,em ployment increases rapidly as a consequence of the booming economy(the assumption of constant labor productivity by education group mustbe re-emphasized). Within the crisis or boom scenarios, each of which iscombined with a modern and a traditional population, the differences inemployment are almost totally due to the very different educational struct ure of the labor force. As a consequence of the built-in prod uctivity increasefrom higher education levels, with a booming economy and almost the same
Scenarios for Mauritius, 1990-2050 305
level of production, 1.7 million employees are needed under the conditions inthe traditional scenario, while only 1.3 million employees are needed if theyare better educated (modern scenario).
Water requirements result mainly from production levels and treatmentlevels and have only a slight dependence on population size and structure.In the raw scenarios, treatment levels are equal (zero) for all the scenarios.Hence, water demand is almost solely the result of economic assumptions,with a declining demand under crisis assumptions and a doubling of 1990requirements by the year 2050 under boom assumptions. Under the latterscenario water requirements do not increase parallel to production levels because the big current water consumers (the sugar and the textile industries)decline in relative size compared to the growing other EPZ, other manufacturing, and service sectors.
Land requirements mainly result from production levels and to a smallerextent from demand for private housing. The better-educated, wealthier,people in the modern scenario demand more land per capita; however, thiseffect is compensated by the larger population size under the traditionalscenario. For sugar-land demand, the assumption of continued sugar-caneland productivity increases under the laissez-faire scenario gives significantlylower land requirements when compared to the garden scenario. The negative effect of this assumption, badly polluted water as a consequence ofincreased fertilizer use, does not show up in the water results in Table 16.3.This is because pollution is measured by taking the "largest polluter" of biological oxygen demand (BOD), nitrates, or phosphates. In these scenarios,BOD is always the largest polluter (see Chapter 15 for the workings of thedilution flow in the water module).
In case of an economic crisis, no land conflicts would arise; under aneconomic boom, however, raw land requirements at (unrealistic) constantproductivity would increase far beyond the actual size of the island.
Several conclusions can be drawn from the raw scenario exercise (seethe last four columns in Table 16.3). In the crisis scenarios no physicalconstraints - neither water nor land - are to be expected. On the otherhand, large underemployment is likely and a significant budget deficit, inparticular with traditional population developments, unavoidable. In theboom scenarios, on the contrary, substantial water and land conflicts occurand have to be resolved. Water constraints are to a large extent eased byan environmental garden policy. Land conflicts have to be settled by lowerproduction or higher land productivity. It is difficult to provide a sufficiently
306 Christopher Prinz and Anne Babette Wils
large and educated labor force, in particular with a traditional population.The high income from taxes, on the other hand, would allow for an enormousincrease in per capita government expenditures. Alternatively, taxes couldbe reduced substantially.
Several of the raw scenario combinations are impossible, and all of themneed further adjustments in order to become consistent. These adjustmentsare discussed in Section 16.4. The adjustments lead to completely new scenarios which differ from the eight raw scenarios. The reader may ask thenwhy not make balanced scenarios straight away? The raw scenarios serveas starting points for a discussion of possible future developments and illustrate structural inconsistencies which become evident in the multi-sectoralapproach.
16.4 Balanced Multi-sectoral Scenarios
As was explained in Section 16.2, four criteria for a balanced scenario haveto be checked by the user: the labor balance must be positive and desirablyclose to zero; taxes and government consumption must be balanced; thewater balance must at least be positive; and land demand cannot exceedavailable land. Small water and land constraints are automatically solved bythe model but may alternatively be influenced by the user through changesin the water module or in land productivity.
The process of balancing the scenarios reveals many alternatives. Howdo we choose between them? In the case of a water shortage, for example, dowe decrease the economic activity on the island or let the government enlargethe water storage capacities or rather invest in water-treatment plants?
This section describes a stepwise movement from a traditional, crisissociety with a laissez-faire attitude to the environment, via successive movements, to a modern, prosperous, boom economy with concern to keep theenvironment of the island clean, like a garden. The path uses different combinations. The section also includes details on alternatives such as agricultural, industrial, or service development; food self-sufficiency; a sugar policywhich gives priority to sugar over all other economic expansion; and early orlate treatment of wastewater. The objective in each step, or scenario, is tofind the maximum economic welfare in 2050 within a balanced scenario andwithin the given scenario framework.
Scenarios for Mauritius, 1990-2050
16.4.1 The crisis scenarios: Population and environmentin poverty
307
The first ofthe raw, base scenarios is the traditional/crisisjlaissez-/aire combination. By 2050 the population is 1.9 million and growing at a rate of 1percent annually. Labor is extremely imbalanced - there are 755,000 personsin the labor force and only 300,000 employed. There is a positive land andwater balance calculated for 2050, and government consumption exceeds taxincome (see Table 16.3).
Underemployment
The huge unemployment in this scenario is socially unacceptable and alsonot likely to materialize. The lack of possibilities would certainly discouragepeople from being in the labor force. Although labor-force participation ofwomen is already low in this traditional population - for example, 34 percentfor women aged 35-39 in 2000 as compared to 46 percent in 1990 - we returnto the starting year 1990 and assume a 2 percent annual decrease in femalelabor-force entrance rates from 1990-2050. We further assume that the malelabor-force participation rate also decreases from 1990 via early retirementof men. This is expressed in a 2 percent annual increase in labor-force exitrates (see Chapter 12 for details). Keeping the scenario input otherwiseexactly the same, these two changes result in a labor-force size of 683,000 in2050, and a labor balance with 56 percent unemployed. Other results in thescenario stay the same.
The line marked traditional in Figure 16.1 shows the development ofthe labor force with the original scenario assumptions, and the line markedtraditional/crisis shows the reduced labor-force size. The reduction is small.This is because the bulk of the labor force, young and middle-aged men,has not been affected. This group, despite discouragement, would probably remain looking for work in order to survive. They would probably bewilling to work for lower wages and accept fewer working hours: the typicalunderemployment situation of many poor countries. This development canbe simulated by decreasing labor productivity - a person working 50 percent would register with half of the labor productivity of a person workingfull-time and be considered 50 percent underemployed. To balance the laborforce with this mechanism, labor productivity has to be decreased to lessthan one-half of the 1990 level by 2050.
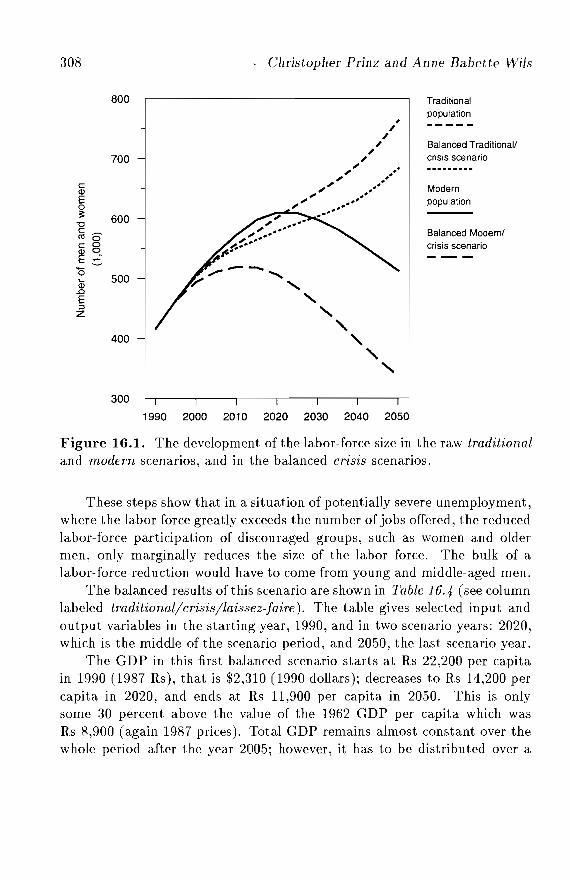
308 Christopher Prinz and Anne Babette Wils
800
700
c<DE0;:
600""0
~oC 0<D 0E~'0
500CD.0E:::lZ
400
300
Traditionalpopulation
Balanced Traditional/crisis scenario
Modernpopulation
Balanced Modern/crisis scenario
1990 2000 2010 2020 2030 2040 2050
Figure 16.1. The development of the labor-force size in the raw traditionaland modern scenarios, and in the balanced crisis scenarios.
These steps show that in a situation of potentially severe unemployment,where the labor force greatly exceeds the number of jobs offered, the reducedlabor-force participation of discouraged groups, such as women and oldermen, only marginally reduces the size of the labor force. The bulk of alabor-force reduction would have to come from young and middle-aged men.
The balanced results ofthis scenario are shown in Table 16.4 (see columnlabeled traditional!crisis/laissez-jaire). The table gives selected input andoutput variables in the starting year, 1990, and in two scenario years: 2020,which is the middle of the scenario period, and 2050, the last scenario year.
The GDP in this first balanced scenario starts at Rs 22,200 per capitain 1990 (1987 Rs), that is $2,310 (1990 dollars); decreases to Rs 14,200 percapita in 2020, and ends at Rs 11,900 per capita in 2050. This is onlysome 30 percent above the value of the 1962 GDP per capita which wasRs 8,900 (again 1987 prices). Total GDP remains almost constant over thewhole period after the year 2005; however, it has to be distributed over a
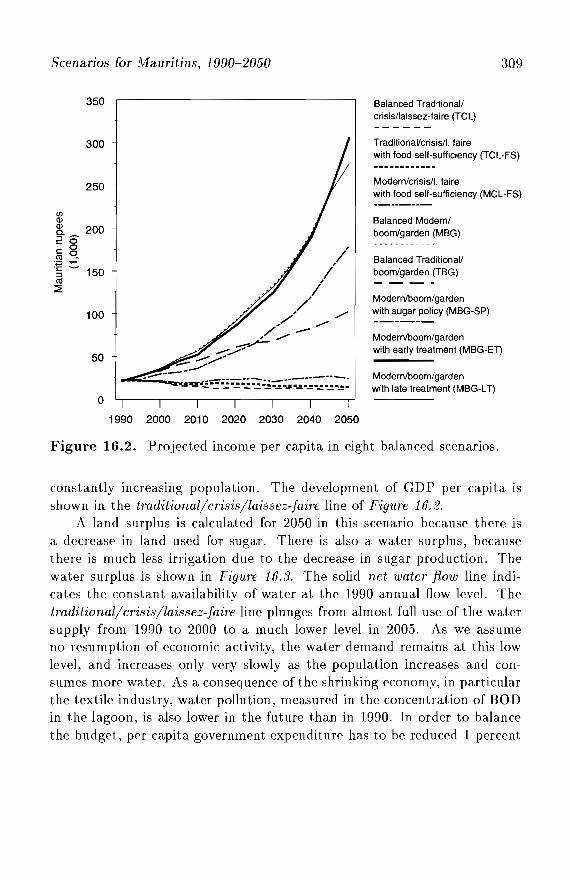
Scenarios for Mauritius, 1990-2050 309
350
300
250
(fJ
QlQ) 200c.:::>~~O
cO<1l 0.
:;:; T""""i::,-
150:::><1l
:::2:
100
50
o
Balanced Traditional/crisis/laissez-faire (TCL)
Traditional/crisis/I. fairewith food self-sufficiency (TCL-FS)
Modern/crisis/I. fairewith food self-sufficiency (MCL-FS)
Balanced Modern/boom/garden (MBG)
Balanced Traditional!boom/garden (TBG)
Modern/boom/gardenwith sugar policy (MBG-SP)
Modernlboom/gardenwith early treatment (MBG-ET)
Modern/boom/gardenwith late treatment (MBG-LT)
1990 2000 2010 2020 2030 2040 2050
Figure 16.2. Projected income per capita in eight balanced scenarios.
constantly increasing population. The development of GDP per capita isshown in the tmditionaljcrisis/laissez-Jaire line of Figure 16.2.
A land surplus is calculated for 2050 in this scenario because there isa decrease in land used for sugar. There is also a water surplus, becausethere is much less irrigation due to the decrease in sugar production. Thewater surplus is shown in Figure 16.3. The solid net water flow line indicates the constant availability of water at the 1990 annual flow level. Thetmditionaljcrisis/laissez-Jaire line plunges from almost full use of the watersupply from 1990 to 2000 to a much lower level in 2005. As we assumeno resumption of economic activity, the water demand remains at this lowlevel, and increases only very slowly as the population increases and consumes more water. As a consequence of the shrinking economy, in particularthe textile industry, water pollution, measured in the concentration of BODin the lagoon, is also lower in the future than in 1990. In order to balancethe budget, per capita government expenditure has to be reduced 1 percent
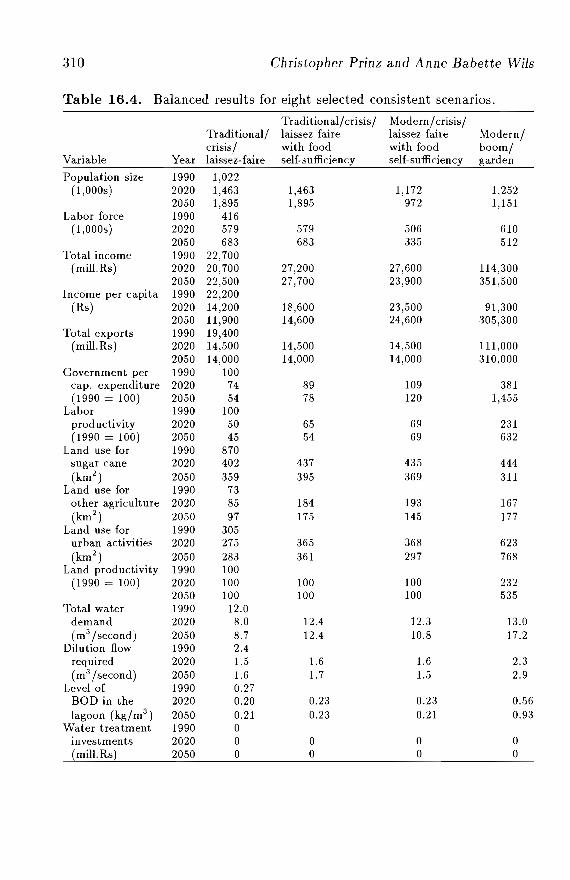
310 Christopher Prinz and Anne Babette Wils
Table 16.4. Balanced results for eight selected consistent scenarios.
Traditionaljcrisisj ModernjcrisisjTraditionalj laissez-faire laissez-faire Modernjcrisisj with food with food boomj
Variable Year laissez- faire self-sufficiency self-sufficiency garden
Population size 1990 1,022(1 ,000s) 2020 1,463 1,463 1,172 l,252
2050 1,895 1,895 972 1,151Labor force 1990 416
(l,OOOs) 2020 579 579 506 6102050 683 683 335 512
Total income 1990 22,700(mill.Rs) 2020 20,700 27,200 27,600 114,300
2050 22,500 27,700 23,900 351,500Income per capita 1990 22,200
(Rs) 2020 14,200 18,600 23,500 91,3002050 11,900 14,600 24,600 305,300
Total exports 1990 19,400(miII.Rs) 2020 14,500 14,500 14,500 111,000
2050 14,000 14,000 14,000 310,000Government per 1990 100
cap. expenditure 2020 74 89 109 381(1990 = 100) 2050 54 78 120 1,455
Labor 1990 100prod uctivity 2020 50 65 69 231(1990 = 100) 2050 45 54 69 632
Land use for 1990 870sugar cane 2020 402 437 435 444(km2
) 2050 359 395 369 311Land use for 1990 73
other agriculture 2020 85 184 193 167(km2
) 2050 97 175 145 177Land use for 1990 305
urban activities 2020 275 365 368 623(km2
) 2050 283 361 297 768Land productivity 1990 100
(1990 = 100) 2020 100 100 100 2322050 100 100 100 535
Total water 1990 12.0demand 2020 8.0 12.4 12.3 13.0(m3 jsecond) 2050 8.7 12.4 10.8 17.2
Dilution flow 1990 2.4required 2020 1.5 1.6 1.6 2.3(m3 jsecond) 2050 1.6 1.7 1.5 2.9
Level of 1990 0.27BOD in the 2020 0.20 0.23 0.23 0.56lagoon (kgjm3
) 2050 0.21 0.23 0.21 0.93Water treatment 1990 0
investments 2020 0 0 0 0(milI.Rs) 2050 0 0 0 0
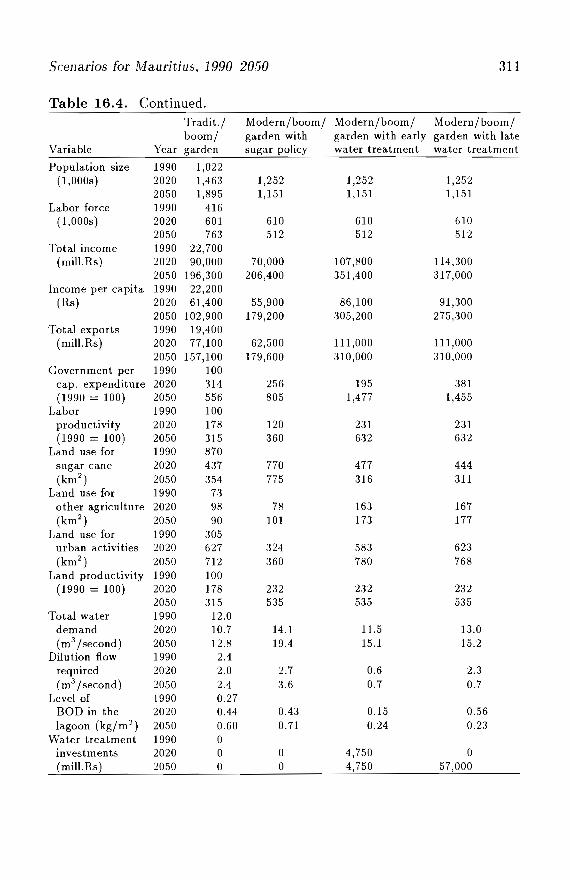
Scenarios [or Mauritius, 1990-2050 311
Table 16.4. Continued.Tradit.j Modern/boom/ Modern/boom/ Modern/boom/boom/ garden with garden with early garden with late
Variable Year garden sugar policy water treatment water treatment
Population size 1990 1,022(l,OOOs) 2020 1,463 1,252 1,252 1,252
2050 1,895 1,151 1,151 1,151Labor force 1990 416
(1,OOOs) 2020 601 610 610 6102050 763 512 512 512
Total income 1990 22,700(mill.Rs) 2020 90,000 70,000 107,800 114,300
2050 196,300 206,400 351,400 317,000Income per capita 1990 22,200
(Rs) 2020 61,400 55,900 86,100 91,3002050 102,900 179,200 305,200 275,300
Total exports 1990 19,400(mill.Rs) 2020 77,100 62,500 III ,000 111,000
2050 157,100 179,600 310,000 310,000Government per 1990 100
cap. expenditure 2020 314 256 195 381(1990 = 100) 2050 556 805 1,477 1,455
Labor 1990 100productivity 2020 178 120 231 231(1990 = 100) 2050 315 360 632 632
Land use for 1990 870sugar cane 2020 437 770 477 444(km") 2050 354 775 316 311
Land use for 1990 73other agriculture 2020 98 78 163 167(km") 2050 90 101 173 177
Land use for 1990 305urban activities 2020 627 324 583 623(km") 2050 712 360 780 768
Land productivity 1990 100(1990 = 100) 2020 178 232 232 232
2050 315 535 535 535Total water 1990 12.0
demand 2020 10.7 14.1 11.5 13.0(m3 /second) 2050 12.8 19.4 15.1 15.2
Dilution flow 1990 2.4required 2020 2.0 2.7 0.6 2.3(m3 /second) 2050 2.4 3.6 0.7 0.7
Level of 1990 0.27BOD in the 2020 0.44 0.43 0.15 0.56lagoon (kg/m 3
) 2050 0.60 0.71 0.24 0.23Water treatment 1990 0
investments 2020 0 0 4,750 0(miII.Rs) 2050 0 0 4,750 57,000
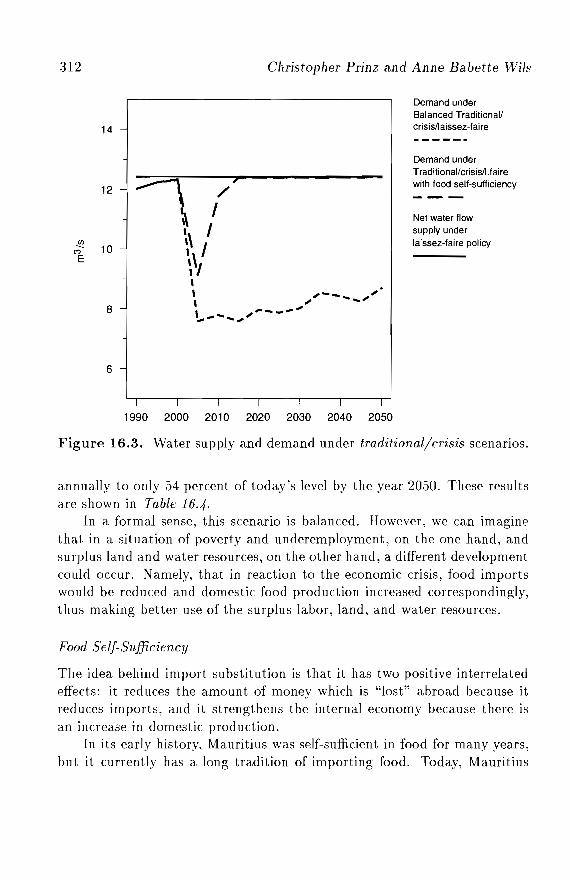
312
14
Christopher Prinz and Anne Babette Wils
Demand underBalanced Traditionallcrisis/laissez-faire
12
10
8
6
Demand underTraditi onal/crisis/l. fai rewith food self-sufficiency
Net water flowsupply underlaissez-faire policy
1990 2000 2010 2020 2030 2040 2050
Figure 16.3. Water supply and demand under traditional/crisis scenarios.
annually to only 54 percent of today's level by the year 2050. These resultsare shown in Table 16.4.
In a formal sense, this scenario is balanced. However, we can imaginethat in a situation of poverty and underemployment, on the one hand, andsurplus land and water resources, on the other hand, a different developmentcould occur. Namely, that in reaction to the economic crisis, food importswould be reduced and domestic food production increased correspondingly,thus making better use of the surplus labor, land, and water resources.
Food Self-Sufficiency
The idea behind import substitution is that it has two positive interrelatedeffects: it reduces the amount of money which is "lost" abroad because itreduces imports, and it strengthens the internal economy because there isan increase in domestic production.
In its early history, Mauritius was self-sufficient in food for many years,but it currently has a long tradition of importing food. Today, Mauritius
Scenarios [or Mauritius, 1990-2050 313
produces about one-third of the food its population consumes, and in theoriginal crisis scenarios would continue to do so. Food self-sufficiency doesnot necessarily have high priority in an open export-oriented economy, butit may be a good strategy of sustainable development and resilience to international crises.
During World War II when transportation of food to the island wasseverely curtailed, Mauritius tried to attain temporary food self-sufficiency(see Chapter 7). Selected food crops, such as maize, cassava, potatoes, andsweet potatoes, were grown. Today, these staples are grown marginally.Fruits and vegetables are grown on the island, and deer, pigs, and chickensare bred. Mauritius is largely self-sufficient in these foods today. Major foodimports include rice, wheat, maize, beef, and milk. In the food self-sufficientscenario, there would be a major dietary change.
To explore the effects of import substitution in the traditional/crisis/laissez-faire scenario, we assume almost complete food self-sufficiency bythe year 2010. Domestic food demand is increased by 50 percent every fiveyears from 2000 to 2010 to around 80 percent of total food consumption, andimports are reduced by SO percent in the period 2000-2005 (to the remaining20 percent of food consumption). This new production obviously demandsan increase in the proportion of land to be used for agriculture. In the crisisscenario, this land is available, because of available sugar land. [n 2020, theland use for other agriculture is 184 km2 compared to 73 km 2 in 1990. Thetotal land use in that year is 986 km2
, which leaves room for more expansion.However, as the additional food has to be grown and hence irrigated on
the island, the limits of water availability are reached already by 2020.[1]After that year, no further increases in food production are possi ble. Thewater balance also includes the higher evapotranspiration from more foodcrops. Of course, more efficient irrigation methods could be used and thesea could be harvested. But all this must be seen in the context of thescenario: Mauritius is poor in this future, and limited in its technical andcreative resources.
Figure 16.3 shows the development of the water demand in this foodself-sufficiency scenario. The water demand dips from 2000 to 2005 as thecrisis sets in, but the reaction to produce domestic food has not been fullycompleted. By 2010, the water demand increases again, because of increasedirrigation for local food crops. We see that after 2010 the curve flattens.[n 2020, it hits the supply curve again. At this point, the model reducesirrigation and the productivity of agriculture, depending on the extent of
314 Christopher Prinz and Anne Babette Wils
the water shortage. The fact that the water demand curve hits the supplycurve means that the water shortage is solved internally for the rest of thescenano years.
A garden policy with investments in water storage capacity would allow the food production to increase further, parallel to population growth.On the other hand, due to the high investment costs, the gains from additional local production would about equal the losses from higher governmentexpenditures.
What is the effect of food self-sufficiency on total GDP? In the year ofthe crisis (2000), it decreases from Rs 24,000 to Rs 22,000 million. This is thecombined result oflower GDP from lower exports and higher GDP from localfood production. After that, exports stabilize and GDP increases because ofreduced imports and increased local production. The scenario value for GDPin 2020, when the water limits for food production are reached, is Rs 27,000million (see traditional/crisis/laissez-jaire scenario with food self-sufficiencyin Table 16.4). The increase between 2000 and 2020 is almost completely dueto food self-sufficiency (some increase in GDP is due to a larger populationbase). However, because in this scenario the water limits are reached bythe year 2020, no further increase in GDP is possible along this path. Aspopulation increases, the per capita income decreases correspondingly. In2020, per capita income is still Rs 18,600; in 2050 it is only Rs 14,600. Thisis 23 percent higher than without food self-sufficiency, but is still only atthe 1982 level of per capita income, and the trend in 2050 in this scenario isdecreasing income, as shown in the TCL- FS line of Figure 16.2.
The underemployment. or low labor productivity situation, in this scenario is a little better than the TeL scenario without food self-sufficiency,because we assume that there are more people active in agriculture. The reduction in labor productivity which would occur with a balanced labor forceis only some 10 percentage points less than without food self-sufficiency, withthe same assumptions about lower female labor-force entrance and early maleretirement. The results of this scenario are shown in Table 16.4.
Small Modern Population
Taking the economic crisis and the food self-sufficiency option describedabove as fixed parts of the balanced crisis scenario, what other developments or changes in the scenario path are possible? With a smaller modernpopulation the relatively fixed GDP would not have to be divided over agrowing population. With this scenario, population size is only 1.15 million
Scenarios for Mauritius, 1990-2050 315
in 2050. Exports are at the same, low level: Rs 14,000 million in 2050, i.e.,only two-thirds of what they were in 1990. We expect GDP to be lower inthis scenario than in the crisis scenario with traditional population, becausethere is less income produced by the domestic market and activities as aconsequence of the lower number of people.
The labor force is again completely imbalanced. The labor entrance andexit rates and the productivity changes found in the scenario above havebeen replaced by the inputs for the modern scenario. There is paradoxicallyhigh unemployment with the small population in the raw scenario. The labordemand is 193,000 persons and the supply is 512,000. Figure 16.1 shows thedevelopment of the labor force in the modern scenario. There is a peak inlabor-force size in 2020. After that, the reduced fertility assumed in thisscenario starts to affect the size of the labor force.
The labor demand is some 35 percent lower than the 300,000 workersneeded with the traditional labor force. This is partly because of lowereconomic activity with a smaller population. It is also because of higherproductivity due to higher education of the labor force and consequentlylower labor demand even with the same economic development.[2]
Before the crisis in the scenario year 2000, labor already becomes slightlyimbalanced. Then, in the five crisis years, the labor demand decreases from400,000 to 300,000, while the labor force increases from 500,000 to .5.50,000.Hence, unemployment jumps up from 20 percent to 45 percent. In the rawscenario, no reaction from the side of the labor force is envisioned. However,the labor balance as calculated in this raw scenario would not have cometrue. The unemployment would have prompted a reaction. The workerdiscouragement phenomenon would have induced men and women to leavethe labor force early or refrain from entering. A reduction in labor-forceentrance rates for women (2 percent annually) and an increase in labor-forceexits for men (also 2 percent annually) results in the same, lower labor-forceparticipation rates as in the traditional/crisis scenario. This reduces thelabor-force size in 2050 from 512,000 to 412,000.
Further, the well-educated Mauritians would seek to emigrate, as theydid in the 1960s and 1970s. Since we are assuming a world crisis in thisscenario, the emigration could not be very great. In the period from 1962to 198.5, before the island's economic takeoff, average annual emigration wasabout 3,000. We use this estimate as a reasonable maximum. We, therefore,include emigration of 3,000 annually from 1995 to 2050. This reduces thelabor force further to about 335,000 in 2050. The development of the labor
316 Christopher Prinz and Anne Babette Wils
force with these changed scenario assumptions is shown in the modern/crisisline in Figure 16.1. In this scenario, there is a substantial difference in laborforce size with the changed scenario assumptions. Since this labor-force sizeis still too high, labor productivity would have to be decreased to a levelsome 30 percent below the current level.
The key in this scenario was emigration, and not only lower productivity as in the former traditional/crisis scenario. Emigration is assumed tobe possible because of the high education of the work force. We do observethat there is emigration of highly educated personnel from Asia, for example, nurses from the Philippines. Because the population base of Mauritiusis so small and the ties to receiving countries, particularly France and GreatBritain, so strong, we can assume emigration levels which alleviate unemployment. In this respect, the Mauritius scenario is not applicable to mostother places of the world. As a consequence of emigration, not only thelabor force but also the total population decreases, to less than 1 million by2050. It should be noted that this scenario does not advocate the impliedbrain-drain. Rather, it points out that in a world of migration competition,only the well educated have a chance. \Ve also cannot speak of harmfulbrain-drain in a situation where many well-educated people remain behind as in this scenario - many of them being only consumers and not producers.Moreover, emigrants are often a valued source of transfer.
In this scenario, with the low economic activity and the small population,the water and the land balances are always positive, even with the assumedfood self-sufficiency. The GDP, which is calculated in the balanced scenario,is Rs 24,000 million in 2050 or Rs 24,600 per capita, roughly equal to the1990 level, as shown in the MCL-FS line in Figure 16.2. Results are alsogiven in Table 16.4 for the modern/crisis/laissez-faire scenario with foodself-sufficiency. Another main advantage of the smaller population in thisscenario is that government consumption is very low. To match total taxincome, in this scenario it is even possible to increase per capita governmentconsumption 0.33 percent annually to some 20 percent above the current levelby 2050. Thus, the quality of education and health care would increase.
Total exports in this scenario are still only Rs 14,000 million; however,in terms of income, the reduction of food imports and the increase of local production is able to fully compensate a one-third reduction in exports.In present-day Mauritius this is not possible because both land and water are used for sugar-cane cultivation. In the crisis scenario, it is possible because the sugar-cane production is reduced by half. This balanced
Scenarios for Mauritius, 1990-2050 317
modem/crisis/laissez-faire scenario with food self-sufficiency cannot be further improved by building water reservoirs, because there is sufficient wateron the island for this level of population and economic activity.
16.4.2 The boom scenarios: Population and environmentin prosperity
Scenarios which are probably more relevant to Mauritius are those whichforesee a continuation of the economic growth that the island has experiencedrecently. In the five years from 1985 to 1990, GDP at factor cost and constantprices grew at a rate of around 8.9 percent annually. The growth in 1991was lower, 4.1 percent, but still a healthy level (calculated from World Bank,1993). The respective export growth rates were 1.5 percent and 2.4 percent.The growth since 1985 has been due to the sudden mushrooming of the textileindustry (see Chapter 7). Recently, growth has slowed down; the reason forthis slowdown - whether market saturation, higher wages in Mauritius, orfull-employment levels - is a topic for another analysis. The intention is todiversify the export economy. In the boom scenarios, this is successful.
In the raw boom scenarios, GDP would increase roughly sixfold, to abouttwo-thirds of the 1993 GECD per capita levels. We consider this increase tobe rather low for the optimistic scenario. Some experimentation with plausible labor- and land-productivity increases and with the optimistic goal ofseeing what would be necessary to raise Mauritian per capita GDP levelsto the current level of Switzerland resulted in slightly different boom inputs.The balanced boom scenarios envision a 7.6 percent average annual increasein the service exports (compared to 25 percent in the raw scenarios), anincrease that is possible given the present low level of service exports andthat would be necessary if Mauritius wants to be successful in, e.g., offshorebanking. The rest of the scenario assumptions are unchanged. These scenarios are reminiscent of the usual scenario for development which is decreasingpopulation growth, increasing education, and increasing economic growthgoing from an agricultural to an industrial to a postindustrial society. Thedifference with the usual scenario is that we must embed our results in thelimited supply of population and natural resources.
Traditionally there is no explicit care for the environment: nature isregarded as the unending supplier of resources. This philosophy is reflectedin the raw modern/boom/laissez-faire scenario. However, from the raw scenarios we see an enormous water shortage. The shortage could be removed
:318 Christopher Prinz and Anne Babette Wils
almost entirely simply by investing in water storage capacities - the garden assumption. Therefore, in the following, boom scenario assumptionsare combined only with garden assumptions, in which reservoir capacity increases such that water supply increases from 12.4 m3 per second in 1990 to21.4 m3 per second by 2050.
Increasing Productivity
From Table 16.3 we see that the raw modern/boom/garden scenario resultsin an enormous land conflict, and also an immense labor shortage. Due tothe installation of reservoirs the water shortage is small. On the other hand,taxes by far exceed government expenditures. With the new assumptions onexport growth, the labor and land shortages are even greater; but labor andland must be balanced.
Under the assumption of a booming national and international economy,unchanged fixed technologies as were assumed in the raw boom scenariosare unlikely. In the model, changes in technology are first of all expressedthrough changes in labor productivity. Second, if a given number of peopleare producing more, then we can assume that they are producing greatervalue without using much more space. Land productivity also increases. Inour experimentation, we concluded with a 3 percent annual increase in laborproductivity (independent of the economic sector), which we feel could reflecta plausible optimistic technological advance, and a 3 percent annual increasein urban land productivity. By 2050, labor productivity and land productivity are five times higher than their values in 1990 because of this change.
Through this productivity increase, labor demand from the economygrows slowly, and keeps pace with the size of the labor force provided withmodern population assumptions (610,000 in 2020, and 512,000 in 2050) untilaround 2035 even with the large assumed increases in production. However,by 2050 a labor shortage of some 100,000 appears again. During this latestage Mauritius enters the situation that could be facing the Northern countries in a few years: the population and the labor force are declining in size,while the economy is expected to continue to grow.
If we want to keep the export settings, that is, keep the economic growth,what must be done to come to grips with the shrinking labor force? Thereare a number of options: labor immigration; early improved education of thepopulation (resulting in higher productivity); or additional assumed changesin technology, i.e., in labor productivity. For the first option, we would needsome 6,500 well-educated immigrants (workers) annually between 2035 and
Scenarios for Mauritius, 1990-2050 319
2050. If migration is not restricted to temporary labor migration, the totalyearly number of immigrants would be close to 15,000. In total then, in15 years, 200,000 foreigners would enter a society of a million inhabitants,as has been observed in the past (for example, the influx of labor to smalloil-producing states). Still, this is a number that might be difficult to obtainand particularly to integrate.
Alternatively, the productivity of the labor force could be increased byimprovements in education. The labor could be balanced by 2050 if themajority of Mauritians continued schooling beyond the secondary level beginning in the year 2000. The influence of this great increase in tertiaryeducation would only be felt slowly in the labor force because it takes atleast 50 years for a new schooling policy to penetrate completely into thelabor force. By 2050, the higher education would both reduce labor demand- through higher productivity of tertiary-educated labor - and increase laborsupply - through higher labor-force participation rates of tertiary-educatedmen and women. Since tertiary-educated women have less children on average, this change would also slightly reduce the total population size andexacerbate the labor shortage. However, a population with two-thirds of thelabor force being educated at the tertiary level has not been observed in anycountry today and may not be likely in the future either.
A third option to solve the labor shortage in the period 2035-2050is to increase labor productivity further to fit the need. We have chosenthis option for the balanced modern/boom/garden scenario: labor productivity is increased 4 percent annually between 2035 and 2045, and 5 percent annually during the last five-year period, just enough to balance laborsupply and demand. These are assumptions necessary to attain the 1993Swiss level of GDP with high education, low fertility rates, and ultimatepopulation decline.
What happens to the land when we assume 3 percent annual productivity increases in the urban sectors? In general, in case of small land conflicts,the solution offered by the model is to take land away from the least productive commercial sector (sugar) and to use it for more productive urbanexpansion. However, land conflicts arising from urban activities themselvescannot be solved by the model. In this scenario, with the large increase inservice exports, land demand from urban activities alone would exceed landsupply by more than 100 percent at present land productivity levels. Thisis why a 3 percent annual increase in land productivity is necessary, multiplying urban land productivity by five in the long run. Sugar-cane land
:320 Christ.opher Prinz and Anne Babet.te Wils
productivity increases only 0.5 percent annually; other agriculture land productivity increases 1.6 percent per year. With these productivity changesthe remaining land conflict is within the boundaries that can be handledby the model itself: sugar production is reduced to give way for all othersectors. Land used for sugar cane declines from 870 km 2 in 1990 to 311 km 2
in 2050, while land used for urban activities increases from 305 km 2 to 768km 2 in this scenario (see Table 16.4).
Figure 16.4 shows the development ofland used for sugar in the balancedboom scenarios. There is a smooth, monotonic decrease as urban activitiesincreasingly crowd out sugar activities. The figure also shows the development of land used for sugar in the crisis scenario, in which sugar land dropsto half of its previous level in the assumed crisis period from 2000 to 2005.Ultimately, both the boom and the crisis scenarios result in the same, lowlevel of sugar land, but for very different reasons. These results are discussedin the next section on sugar policy.
As with land, the model can solve small water conflicts by removingwater for irrigation purposes - which reduces the productivity of sugar caneslightly - and using it for other sectors. The water shortage is small in thisscenario. The irrigation reduction is (more than) sufficient to reduce waterdemand below the net water flow supplied throughout the scenario. If waterdemand from non-irrigation exceeded water supply, this conflict would haveto be solved by the user.
In contrast to the poverty scenarios discussed above, in the raw boomscenarios the budget balance is highly positive. As before, we chose to lettax rates remain unchanged and increase per capita government consumption, which mainly comprise education, health, and pension expenditures. Inorder to compensate the huge tax increase, per capita government consumption can be increased .5 percent annually over the whole period, or 4-fold by2020 and more than 14-fold by 2050 (Table 16.4)! The immense increases inthe quality of education and health care are parallel to the labor productivityincreases, although this is not a hard-wired result of the model itself.
What is the income effect of all these changes that have eventually ledto a balanced modern/boom/garden scenario? Total GDP grows at a remarkable speed - some 4.G percent annually over a. GO-year period, parallelto the export growth. Per capita. income increases to more than Rs 300,000per year, a. level that more or less corresponds to today's income level inSwitzerland. Due to substantially lower housing costs - simpler construction and no heating - and because the present GDP is an understatement
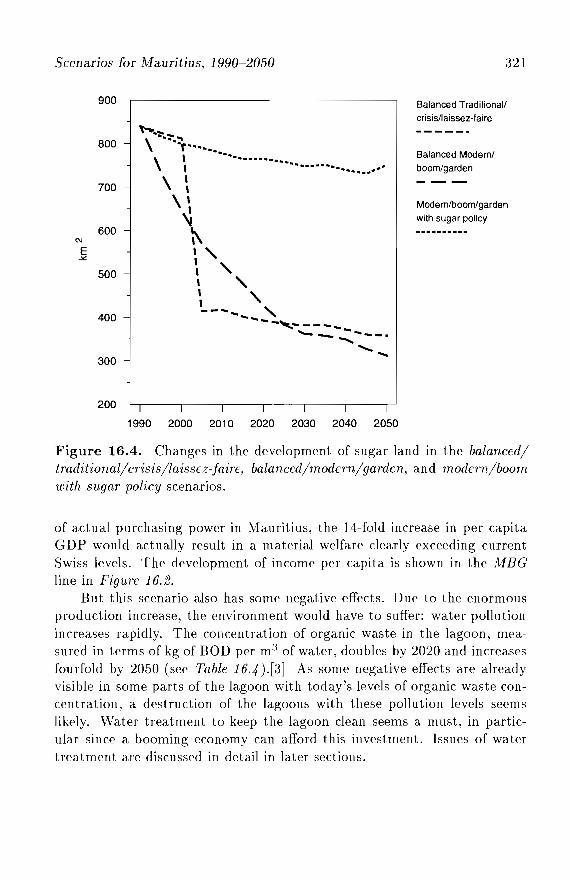
Scenarios for Mauritius, 1990-2050 321
N
E~
900
800 -
700 -
600 -
500 -
400 -
300 -
h~
\ "'::',,"·r···...\ ' ., -_.\ \\'~\\"\ ,, ,\ ,-- ......... ,
........,------'- -- .............. _-
"- ....
Balanced Traditional/
crisis/laissez-faire
Balanced Modern/
boom/garden
Modern/boom/garden
with sugar policy
200 I
1990I
2000I
2010I
2020I
2030I
2040I
2050
Figure 16.4. Changes in the development of sugar land in the balanced/tmditional/crisis/laissez-Jaire, balanced/modern/garden, and modern/boomwith sugar policy scenarios.
of actual purchasing power in Mauritius, the 14-fold increase in per capitaGDP would actually result in a material welfare clearly exceeding currentSwiss levels. The development of income per capita is shown in the MBGline in Figure 16.2.
But this scenario also has some negative effects. Due to the enormousproduction increase, the environment would have to suffer: water pollutionincreases rapidly. The concentration of organic waste in the lagoon, measured in terms of kg of BOD per m3 of water, doubles by 2020 and increasesfourfold by 20.50 (see Table 16.4 ).[3] As some negative effects are alreadyvisible in some parts of the lagoon with today's levels of organic waste concentration, a destruction of the lagoons with these pollution levels seemslikely. Water treatment to keep the lagoon clean seems a must, in particular since a booming economy can afford this investment. Issues of watertreatment are discussed in detail in later sections.
322 Christopher Prinz and Anne Babette Wils
Sugar Policy
In the balanced modern/boom/garden scenario land conflicts are solved insuch a way that sugar cane has to give way for more productive urbanactivities. This feature, however, is contrary to current government policy.For many, often idealistic, reasons, Mauritius is reluctant to give up its sugarcane, and the current policy is to keep the present sugar output. Would itbe possible to have both wealth and sugar?
Choosing the option "sugar policy" in the land-use module of the PDEmodel takes current government views into account. Under these conditions,any demand for sugar is satisfied first, and the remaining land is distributedto the remaining economic activities. A direct impact of this is that industrial and service production is constrained at a lower level than is demandeddomestically and from abroad, triggering a contraction of the whole economy.
The development of the modern/boom/garden scenario, with a 14-foldincrease in per capita GDP, is discussed above. With a sugar policy thedevelopment is quite different. Due to some land productivity increases forsugar, in the future somewhat less land is required to produce the presentamount of sugar. This is shown in the sugar policy line of Figure 16.4 onsugar land. Losing in the case of a land conflict, urban activities are reduceddrastically and, as a consequence, total exports are reduced by some 40percent (compare Table 16.4). Hence, by 20.50 total GDP increases 9-foldinstead of I.5-fold. This is shown in the MEG-SP (sugar policy) line inFigure 16.2.
As a consequence of the lower level of exports, there are a number ofadditional differences between the balanced modern/boom/garden scenarioand the balanced sugar policy scenario. Per capita government expenditureincreases are lower, and labor productivity increases due to technologicaladvance need not be as high. Water demand, on the other hand, would behigher. Sugar production is the most intense water user in Mauritius. Muchwater is "lost" through evapotranspiration of the sugar cane, and then muchwater is necessary to dilute the biological waste from sugar-cane processing.Compared to the previous modern/boom scenario, with regard to water pollution an unusual result arises: river water pollution (wastewater dilution)is higher (24 percent by 20.50), while lagoon water pollution (organic wasteconcentration) is lower (-2.5 percent by 20.50). This is documented in Figure16.5 and Figure 16.6, which give lagoon and river water pollution undervarious scenarios.
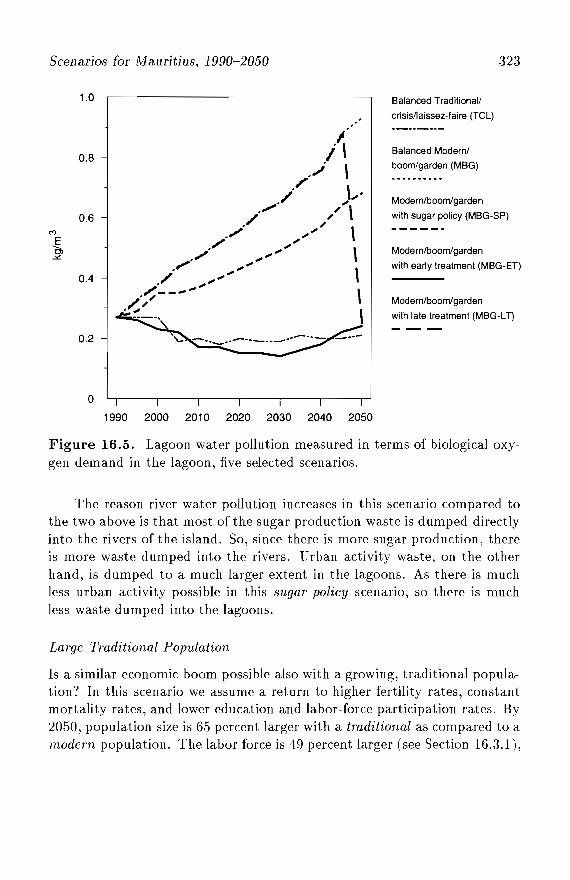
Scenarios for Mauritius, 1990-2050
1.0
323
Balanced Traditional/
crisis/laissez-faire (Tel)
0.8
0.6
0.4
0.2
o
Balanced Modern/
boom/garden (MBG)
Modern/boom/garden
with sugar policy (MBG-SP)
Modern/boom/garden
with early treatment (MBG-ET)
Modern/boom/garden
with late treatment (MBG-lT)
1990 2000 2010 2020 2030 2040 2050
Figure 16.5. Lagoon water pollution measured in terms of biological oxygen demand in the lagoon, five selected scenarios.
The reason river water pollution increases in this scenario compared tothe two above is that most of the sugar production waste is dumped directlyinto the rivers of the island. So, since there is more sugar production, thereis more waste dumped into the rivers. Urban activity waste, on the otherhand, is dumped to a much larger extent in the lagoons. As there is muchless urban activity possible in this sugar policy scenario, so there is muchless waste dumped into the lagoons.
Large Traditional Population
Is a similar economic boom possible also with a growing, traditional population? In this scenario we assume a return to higher fertility rates, constantmortality rates, and lower education and labor-force participation rates. By2050, population size is 65 percent larger with a traditional as compared to amodern population. The labor force is 49 percent larger (see Section 16.3.1),
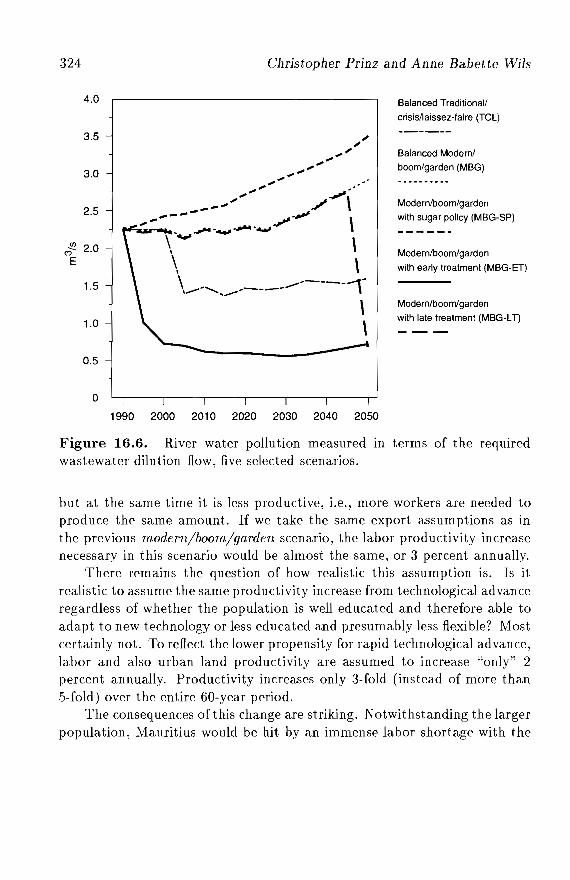
324
4.0
3.5
3.0
2.5
In 2.0M-E
1.5
1.0
0.5
o
Christopher Prinz and Anne Babette Wils
Balanced Traditional/
crisis/laissez-faire (Tel)
Balanced Modern/
boom/garden (MBG)
Modern/boom/garden
with sugar policy (MBG-SP)
Modern/boom/garden
with early treatment (MBG-ET)
Modern/boom/garden
with late treatment (MBG-lT)
1990 2000 2010 2020 2030 2040 2050
Figure 16.6. River water pollution measured III terms of the requiredwastewater dilution flow, five selected scenarios.
but at the same time it is less productive, i.e., more workers are needed toproduce the same amount. If we take the same export assumptions as inthe previous modem/boom/garden scenario, the labor productivity increasenecessary in this scenario would be almost the same, or 3 percent annually.
There remains the question of how realistic this assumption is. Is itrealistic to assume the same productivity increase from technological advanceregardless of whether the population is well educated and therefore able toadapt to new technology or less educated and presumably less flexible'? Mostcertainly not. To reflect the lower propensity for rapid technological advance,labor a.nd also urban land productivity are assumed to increase "only" 2percent annually. Productivity increases only 3-fold (instead of more than5-fold) over the entire 50-year period.
The consequences of this change are striking. Notwithstanding the largerpopulation, Mauritius would be hit by an immense labor shortage with the
Scenarios for Mauritius, 1990-2050 325
high export demand discussed in the section above on increasing productivity. In order to match the labor supply, total exports would have to becut in half. EPZ other exports increase only 2-fold (instead of 25-fold), and- except for the finance sector which remains unchanged - service exportsincrease only 25-fold. As a consequence, by 2050 total GDP increases toRs 196,000 million under this traditional/boom/garden scenario, comparedto Rs 351,000 million with modern population development. Not only mustthe income be divided over a larger - and still increasing - population, butalso total GDP generated is lower. Per capita income increases 2.5 percentannually, on average, with a traditional population, but 4.4 percent annuallywith a modern population. By 2020, GDP per capita is 50 percent largerwith a smaller, better educated population, by 2050 it is 200 percent larger.The development of the slower income per capita growth in this scenario isshown in the T BG line of Figure 16.2.
Also because of the larger population and the reduction in exports, inthis scenario per capita government expenditures increase only fivefold inthe long run. The quality of education and health care would certainly belower than with a modern population development.
Water demand, river pollution, and lagoon pollution are much lowerthan under modern/boom/garden settings. These environmental results seemsomewhat surprising under the traditional/boom/garden assumptions. Thelower concentration of organic waste in the lagoon is a direct consequenceof lower production. The lower water demand (both for irrigation and forwaste dilution), however, is mainly a consequence of reduced urban landproductivity, which creates severe land conflicts and hence causes a reductionin production of sugar and other agriculture. The larger population size hasonly a marginal impact on the environment.
Early Water Treatment
A negative effect of the balanced modern/boom/garden scenario is the rapidincrease in organic waste concentration in the extremely sensitive lagoon.This is shown in the MBG line in Figure 16.5. The biological oxygen demandincreases from 0.27 kg per m 3 in 1990 to 0.56 in 2020 and to 0.93 in 2050.The high BOD levels mean there is a nutrient enrichment in the lagoon eutrophication. Eutrophication results in the proliferation of certain species,usually algae, but also sea urchins in Mauritius, at the cost of other species,and results in an impoverishment of aquatic life. It is believed that this may
326 Christopher Prinz and Anne Babette Wils
kill the corals. In 1982, a UNEP study showed that roughly two-thirds of thecorals were still alive but that "urgent immediate measures must be takenin order to prevent further deterioration" (Ramjeawon, 1991).
If the corals die and the lagoons are polluted, this certainly would meanthe end of the tourism industry in Mauritius and would deprive Mauritiansof a great source of quality of life. Would it be threatening in other respects?It is not known how fast dead corals would degrade and stop their function ofprotecting the island from the high seas. Nor is it known how much artificialprotection (for example, concrete) would cost.
Even if we do not know at what BOD levels life in the lagoon wouldor could eventually die, we know that already with current organic wasteconcentrations some smaller parts of the lagoon have started to die. Ittherefore seems wise to set an upper limit of organic waste concentration;we have set it at the 1990 level: 0.27 kg required BOD per m3
. Is it possible,with a rapidly growing economy, to keep lagoon pollution below this level?And, if it is, what are the costs and to what extent is income growth affected?
In the modern/boom/garden scenario with early water treatment everything stays the same as in the balanced scenario without water treatment,except that no increase in the organic waste concentration in the lagoon isallowed. In order to do so, a considerable amount of wastewater has to betreated so that it can be reused in the production processes. In the watermodule, water treatment is possible at three different treatment levels whichdiffer by unit cost and effectiveness. For example, to remove 30 percent ofthe BOD from textiles costs Rs 172 per m3 of wastewater; to remove 90 percent costs Rs 604; and to remove 95 percent costs Rs 741 all at 1987 priceswith present technology. Treatment at the secondary level turns out to bethe best combination of costs and effectiveness in almost all sectors. Thesectors that produce large amounts of BOD in Mauritius are sugar milling,the three manufacturing sectors, and tourism. The other sectors produce virtually none (see Toth, 1992). At the most extreme, sugar milling produces1,155 kg of biological oxygen demand per Rs 1 million of output, comparedto between 2 and 14 kg per Rs 1 million of output in the service sectors (thedifferences lie in the productivity of the workers in these service sectors).Only the five most polluting sectors have been chosen for treatment. Theresults are shown in the early treatment line in Figure 16.5. The BOD levelin the lagoons remains low. As a matter of fact, the level is as low as in thecrisis scenarios which have very much lower economic activity.
Scenarios for Mauritius, 1990-2050 327
Over the whole period 1990-2050, Rs 285 billion would have to be invested in wastewater treatment in this scenario to keep organic waste concentration in the lagoons at the 1990 level. This is 12 times the 1990 totalGDP (1987 prices). One-third of the total goes into other EPZ industries,one-third into other manufacturing, and one-ninth into each of the threeother sectors (sugar milling, textiles, tourism). To distribute the burden onthe economy equally, in the early water treatment scenario Rs 4.75 billionare invested each year. This gives a relatively heavy burden on the economyduring the first years (for example, 20 percent of total GDP in 1990), but aninsignificant burden in the long run (only 1 percent of total G DP in 2050).The model assumes that the machines for water treatment are not producedin Mauritius, but are imported. Therefore, investments in water treatmentare actually lost from the Mauritian economy.
The reader may ask why not invest a constant percentage of GDP inwater treatment, to spread the treatment burden evenly in a relative sense.This is not possible because there is a greater concentration of more pollutingactivities in 1990 (particularly textile and sugar) compared to the productionenvisioned for the future in this scenario. In order to keep the same levelof cleanliness in the lagoons in the next few years, while still being activein more polluting activities, Mauritius would actually have to invest a largeportion of its GDP in treatment plants.
The consequences of early water treatment are convincing. Firstly, withsuch a policy it is possible to keep the organic waste concentration below the1990 level throughout the projection period. The BOD level is below 0.20during most of the period and increases to 0.24 by 2050 (see Figure 16.5).Secondly, river water pollution is reduced to only one-third of its current 1990level. This is a combined effect of wastewater treatment and of increases inurban production at the expense of sugar production, which is the mainsource of river water pollution in Mauritius (see Figure 16.6). And thirdly,in the long run this policy does not have any negative effect on wealth; totalGDP increases to the same high level as under the no treatment scenario.As we can be sure that life in the lagoon will stay alive, perhaps only in thisearly water treatment scenario could the projected income growth actuallybe achieved.
The main difficulty of this policy is that, in the short run, it wouldlower the income growth. Per capita government expenditures could not beincreased before the turn of the century, since all of the additional tax income would have to be spent for the installation of water-treatment plants.
328 Christopher Prinz and Anne Babette Wils
Throughout the period, however, per capita income would only lag 5 percentbehind the no treatment scenario. In Figure 16.2, the early treatment linefor per capita income is slightly below the MEG line and the late treatmentline until 2040. On the other hand, it is necessary to start treating waterimmediately in order to avoid a rapid destruction of the lagoon; and the current economic boom indeed makes the huge investments possible. Moreover,early treatment avoids the necessity of sudden, huge investments later on andone-time higher costs, as we explore in the late water treatment scenario.
Late Water Treatment
What would or could happen if the Mauritian government does not enact anearly water treatment policy, but instead starts to install treatment plantsonly after the destruction of the lagoon becomes evident?
The environmental consequences cannot be tested in the model. If thegovernment adopts such an ad hoc policy, various possibilities exist: thelagoon may be dead before the late wastewater treatment is begun; part ofthe lagoon may be dead while other parts are alive or at least revivable; in themost optimistic case, the process of lagoon destruction might be reversible.For the last possibility, we can at least calculate the economic costs of sucha late water treatment policy. Although it does not necessarily reflect themost likely option.
For the modem/boom/garden scenario with late water' treatment we assume that no water-treatment plants are installed until the year 2045. Everything has developed as under the balanced modern/boom/garden scenario,and BOD in the lagoon has increased to 0.88 kg per m3 by 2045. Suddenly,the lagoon collapses or for some other reason the government decides to takeimmediate water-treatment actions. The same amount of Rs 285 billion isinvested during the period 2045-2050, or Rs 57 billion annually (that is, forexample, 20 percent of total GDP in 2050). The level of pollution is immediately decreased, as is shown by the late treatment line in Figure 16.5and also in Figure 16.6.[4] To pay for this investment, taxes have to beincreased by 120 percent. This tax increase lowers the total and per capitaGDP in 2050 compared to the early water treatment scenario by not lessthan 10 percent. The cost of this scenario is seen in Figure 16.2 where thelate treatment line dips below the MEG and the tarly treatment line in thelast period.
Scenarios for Mauritius, 1990-2050 329
16.5 Conclusions
In this chapter a series of alternative future scenarios for Mauritius are presented. There are two main groups of scenarios: population and environmentin poverty and in prosperity. In the description of the crisis scenarios, theeffects of a large, traditional versus a small, modern population are discussed. Import substitution via food self-sufficiency is investigated. Underthe assumption of an economic boom, we explore differential sectoral developments and their effects on wealth and the environment. The problems of alarger, less educated and a smaller, more educated labor force are compared.Conscientious early and ad hoc late pollution abatement are considered alternatives. In this section we provide a comprehensive summary for each ofthe eight scenarios.
16.5.1 Population and environment in poverty
• Underemployment: In an assumed export crisis in Mauritius, a greatsurplus of labor, land, and water occurs. Income per capita decreases. Areduction of the labor-force participation rate of women and older mendoes not alleviate unemployment greatly because the majority of thelabor force, young and middle-aged men, is not affected. A reasonablereduction in the labor-force participation rates is not a mechanism whichcan "solve" substantial unemployment. The economy that does not reactto a reduction in exports by increasing domestic production underutilizesthe resources that have been freed up by the export reduction.
• Food self-sufficiency: In the case of excess labor, land, and water resources and a small export market, simple production of locally neededgoods - in this scenario, food - does help increase income. Because ofthe low level of technology assumed, land productivity cannot be increased; and because of low income, water supply cannot be improved.This results in a ceiling beyond which the simple economy cannot grow.
• Small modern population: With lower fertility rates the population stabilizes so that the island is able to provide food for the whole populationwithin the water and land constraints given. Higher education rates(which indirectly contribute to lower fertility) are the basis for assuming certain emigration in a world of migration competition. This alsoalleviates some of the island's problems. Together, these developmentsresult in a significantly higher income per capita.
330 Christopher Prinz and Anne Babette Wils
16.5.2 Population and environment in prosperity
• Increasing productivity: For the economy of Mauritius to reach currentWestern and Japanese standards of income, exports and, hence, GDPhave to increase an average of 4.5 percent annually over the next 60years. Such growth is only possible with significant changes in technology. Labor would be a major limiting factor. This rapid increase inwealth would also coincide with rapid environmental destruction, if therewere no concern for the environment in the form of wastewater treatment - even if the rapid growth would essentially concern a relatively"clean" service economy.
• Sugar policy: Strict agricultural policies, in this scenario to protectsugar, would constrain a rapidly growing and developing economy. Giving priority to sugar was reasonable at an earlier stage of development,but it will not be beneficial in the future, if it is possible to expand inother directions. To avoid the drawbacks of rapid urban expansion thetransition from agriculture should be well planned and managed.
• Large traditional population: A large, growing population with insufficient education obstructs a booming economy in various ways. Witha less educated labor force, technological advance would be slower andeconomic growth would be more restricted by labor than with a moreeducated population. In addition, any increase in wealth has to be distributed over the larger, and still increasing, population. Environmentalproblems could be less dramatic because of lower production, but theycould also be more dramatic because of increased production in morepolluting economic sectors. In both cases, the lower income would makeenvironmental care relatively more expensive.
• Early water treatment: To keep the sensitive lagoon, the coral reef, andthe variety of species alive, immediate measures have to be taken. Byinstalling wastewater-treatment facilities today, organic waste concentrations in the lagoon can be kept below the current level even with arapidly growing economy. In the short run, an early treatment policywould be a relatively heavy burden for the economy. In the long run,however, these investments would be paid back - and possible environmental disasters can be avoided.
• Late water treatment: Water pollution could be kept consistently lowwith early treatment. With late treatment, pollution levels could increase greatly before being reduced to some low, acceptable level. If
Scenarios [or Mauritius, 1990-2050 331
some types of lagoon life die in the interim, this loss would be irreparable, even if subsequent cleaning efforts returned the water to a qualitythat could sustain life.
In conclusion, this extensive exercise of defining a few selected scenariosamong the myriad of possibilities and discussing their results prove oncemore the extent to which results depend on assumptions in any modelingeffort of this kind. The advantage of this specific exercise, however, is thatit is deeply embedded into the actual Mauritian situation. Empirical datafill most parts of the model, and the degree of variations introduced throughmodel assumptions is initially very limited, but increases over time.
Since the future is inherently uncertain and the alternative scenarios considered are at least theoretically possible alternative paths of development,we still think that such modeling exercises can make a useful contributionto a better understanding of the options for sustainable development in aplace like Mauritius.
Notes
[1] In the scenario it is assumed that a large part of the additional food productioncomes from "private agriculture," grown in the households' gardens. Therefore, as a consequence of higher demand for irrigation, two water variables werechanged for the household sector: specific gross intake (+65 percent every fiveyears between 2000 and 2010) and the rate of water loss (+50 percent every fiveyears over the same period).
[2] The higher productivity can be calculated as follows (see Wils, 1993). In themodern scenario, in 2050, 25 percent of the labor force has tertiary education,with a productive weight four; 60 percent, secondary education with a productive weight two; and 15 percent, primary education only with a productiveweight one. The productivity index of this distribution is (25x4) + (60x2) +15 == 235. In the traditional scenario, 6 percent of the labor force has tertiaryeducation, 70 percent secondary, and 24 percent primary. The productivity index of this distribution is (6x4) + (70x2) + 24 == 188. The modern labor-forceproductivity is 25 percent higher than the traditional.
[3] The biological oxygen demand (BOD) is the inverse of the organic waste concentration; i.e., it is the oxygen demand needed to keep the current organic wasteconcentration unchanged.
[4] This immediate reduction of the organic waste concentration presupposes thatno additional harm is done to the environment through accumulation of organicwaste.

Chapter 17
Alternative HistoriesSince 1962
Christopher Prinz
17.1 Introduction
In Chapter 16 alternative future pathways for Mauritius to 2050 are developed and discussed. The analysis shows how PDE Mauritius can be applied,how scenarios can be created, and which results the model can provide.These scenarios of the future can help Mauritian decision makers to evalnate some possible policy actions concerning the population, the economy,and the environment.
PDE Mauritius cannot only be used for the period from 1990 to 2050.It can be used for any period, provided data for the starting year are available. In the following application the period from 1962 to 1987 has beenselected.[l] There are several good reasons for running PDE Mauritius forthis particular period.
First, it is an ideal way of testing the model's equations, data reliability,and the parameter estimation. If the model is reasonably capable of estimating the demographic and economic structure of Mauritius in the late 1980sand early 1990s based on input parameters for the year 1962, it should alsobe able to do so for the future based on input parameters for the year 1990.
334 Christopher Prinz
Since no economic data were available before the early 1960s, the census year1962 has been chosen as the starting year. This year is the most suitablestarting year because both the sudden demographic transition and the rapideconomic development took place afterward.
Given the reasonable reconstruction of the period 1962-1987 we can startto specify alternative historical scenarios to improve our understanding ofpopulation-development-environment interactions even more. By varyingthe assumptions we may be able to determine some reasons for the rapideconomic growth, and we may be able to find answers to several interestingquestions. Was the fertility decline a major driving force for development?Or was the driving force the rapidly increasing educational level of the population? Was the socio-demographic development important at all? Or wereexternal trade and foreign investment the main source of growth? Wouldeconomic growth have been possible without the Lome Convention, which,among other things, regulates the amount and price of sugar exports? Wassetting up the EPZ industries, especially the textile industry, crucial? Wasit worth destroying parts of the coast and polluting the lagoon to providehotels for the tourism industry?
Section 17.2 is concerned with testing the PDE Mauritius model byreconstructing the past, i.e., the period from 1962 to 1987.[2] Some of thedemographic, economic, and environmental variables and parameters arediscussed in more detail, including some information on data sources anddata estimation.
Section 17.3 deals with the population module of PDE Mauritius whichcan also be run separately. Several historical population scenarios are designed, and the demographic results are discussed in detail. The projectionsare carried out for the period from 1962 to 2022 in order to accentuate thelong-term impact of demographic changes, such as increasing fertility. Speculations are made concerning the possibilities for economic growth on thebasis of socio-demographic development paths.
In Section 17.4 the demographic assumptions of Section 17.3 are supplemented by economic assumptions to enable the application of the fullPDE Mauritius model for the period from 1962 to 2002. Nine alternativescenarios are specified to answer the questions raised above. Also, answersto the speculations in Section 17.3 are given. Comprehensive conclusions aredrawn for each scenario.
Alternative Histories Since 1962 335
17.2 Reconstructing the Past
Testing a model by applying it to a historical period for which empiricalinput and output data are available is a common procedure to assess thequality of a model. Model results and thus the reliability of the model'sequations and of the parameter estimation procedures involved can easilybe checked on the basis of observed real data. The main restriction forsuch a "controlled experiment" is the availability of input parameters fora sufficiently long period. Not surprisingly, for a country like Mauritius,which is just about to leave the stage of a poor developing country, manyif not most of the model parameters are simply not known. However, sincesome of the main parameters, such as fertility, mortality, education, laborforce participation, export demand, import demand, wages, and governmentexpenditures, were available or could reasonably be estimated for at leastsome years in the past, an application of the PDE Mauritius model startingin 1962 turned out to be possible. In the following sections some of the realand estimated parameters are discussed in detail for each of the modules.
17.2.1 Population
In contrast to other sections of the model, reconstructing the historical population development is to a large extent based on observed data. The structure of the starting population for the year 1962, including information onsex, age, and labor-force status, was taken from 1962 census publications.Estimates of the educational distribution, which is a result of previous (unknown) school-leaving rates, were based on available figures. The relatederror is less of a problem because by 1962 the majority of the adult population still had only primary education.
Information on fertility and mortality, the two main components determining population growth, was readily available from the publications ofthe Central Statistical Office (CSO) in Mauritius (Digest of DemographicStatistics, census publications). Mortality was assumed to be independentof education and labor-force status. Since 1962, mortality rates declinedcontinuously to a level that was typical for Europe some 20 to 30 years ago.Female life expectancy at birth increased by 11 years (from 62 years in 1962to 73 years in 1990), while male life expectancy increased by 6 years (from59 to 65 years). At the same time, Mauritius experienced an extremely
336 Christopher Prinz
rapid fertility decline, and is now beyond the demographic transition. Thetotal fertility rate, which gives the average number of children born to eachwoman, declined from around six children in the early 1960s to fewer thantwo children in 1985-1986. It has increased slightly since, reaching the levelof 2.3 children in 1990. There is a strong negative correlation between fertility and education, i.e., fertility is lower among well-educated women. Agespecific fertility rates by level of education are only available for 1983 (fromthe fertility analysis report of the housing and population census). It wasassumed that educational differentials in fertility did not change over theperiod considered (1962-1987).
Despite the existing data on fertility and mortality, it is difficult to reconstruct the exact age structure of the Mauritian population as data on thesex and age structure of migrants to and from Mauritius are missing. The annual number of net emigrants, which fluctuated around 3,000 between 1962and 1988, is the only figure available. Model migration patterns were used todistribute those 3,000 annual emigrants across sex and age, while crude assumptions were made concerning their education and labor-force status distribution. The basic assumption was that well-educated people have a higherpropensity to leave the country, be it for personal or professional reasons.
Information on age-specific enrollment ratios, which are required for thereconstruction of the educational distribution of the population, was takenfrom different CSO publications (Digest of Educational Statistics, EducationA nalysis Report). In the critical age span school enrollment ratios increasedsignificantly, in particular among women: from 45 percent to 78 percent andfrom 8 percent to 33 percent for age groups 10-15 and 15-20, respectively,compared with changes from 60 percent to 78 percent and from 24 percentto 36 percent among men. Today, there is virtually no gender difference inschooling in Mauritius.
Labor-force participation rates among primary- and secondary-educatedwomen increased rapidly, for example, from 14 percent to 40 percent andfrom 33 percent to 57 percent at ages 30-39. Among tertiary-educatedwomen and among all men, economic activity has always been between 90and 100 percent and has not changed significantly in the last three decades.
In summary, due to both limited data availability and the translationof existing data into model parameters. the educational structures and, inparticular, the labor-force structure of the population were less preciselyreconstructed than its size and age structure.
Alternative Histories Since 1962
17.2.2 Economy
337
Reconstructing the economic history of Mauritius is more difficult in thesense that several parameters had to be estimated on the basis of very limited information. It is at the same time less difficult in the sense that ithas to match fewer criteria, i.e., it has a higher degree of freedom. First,the heart of the economic module, the input-output (1-0) table, had tobe constructed for the starting year 1962. Second, for each parameter areasonable time path had to be estimated. The 1962 1-0 table was builtand adjusted combining our knowledge on Mauritius with information fromthe Annual Digest of Statistics (CSO), publications from the Bank of Mauritius, and the Economic and Social Data Sheets published by the World Bank(World Tables 1976, 1980, 1988-1989). Changes over the period 1962-1987were reproduced as closely as possible in order to match the observed data.Since each parameter had to be specified sector by sector, the whole exerciseinvolved the estimation of a time path of some 600 parameters, the mostimportant ones are discussed below.
In 1962, export demand was dominated by sugar milling. Sugar exportswere equal to Rs 2,660 million (1987 prices) or 87 percent of all exports.By 1987 sugar-milling exports increased to Rs 4,400 million, but their shareamong total export demand declined to less than 30 percent. The EPZtextile sector was the leading sector in 1987 (Rs 5,500 million or 37 percent);other important sectors included transport and communication (11 percent),EPZ other (7 percent), tourism (7 percent), and finance (5 percent).
For wages, an increase of 5 percent for each five-year period, in all sectors and for each educational level, was found to be reasonable. Sectoraland educational differentials were kept at the 1987 level throughout the period. For example, wages in the finance sector are five times higher thanin the other agriculture sector; wages of employees with tertiary educationare two times the wages of those with secondary education; and wages ofworkers with secondary education are again two times the wages of thosewith primary education.
Government expenditure is calculated according to one of the following:student status (education expenditure), age and sex (health expenditure),or per capita (other government expenditure, except water). These patternswere kept constant throughout the period 1962-1987, but per unit government expenditure was adjusted to approximately match observed government revenues. Between 1962 and 1987 per unit government expenditure
338 Christopher Prinz
increased by 80 percent, the largest increase having occurred between 1972and 1977.
For some parameters - for example, unit domestic household demand(by type of demand and by sector), the capital/output ratios (by sector),taxes per unit of output (by sector), per unit import demand (by sector), orvalue added per unit of output (by sector) - 1987 data were used throughoutthe whole period. Other parameters- such as labor-productivity increasefrom technological change (by sector), employment per unit of output (bysector and education), or unit domestic intermediate demand, the centerpiece of the input-output matrix - have been specified in detail but are notdiscussed here.
17.2.3 Land use
For the land-use module, which is closely connected to the economic module,only a few parameters have to be specified to reconstruct the history. Someparameters, like total usable land available, are constant by nature. Anothervery important land-use variable, such as fertilizer use, can be set constantat the current level throughout the period because approximately the sameamount of fertilizers was already in use in the 1960s. Intercropping, i.e.,planting tomatoes or other crops within sugar-cane fields, was very limitedin the early 1960s. We specified the percentage of other agriculture obtainedfrom intercropping sugar-cane fields to have increased linearly from 0 percentin 1962 to the 40 percent observed in 1987.
Land-use productivity, a critical parameter in case of land conflicts, hasincreased steeply: 20 percent in each subsequent five-year period.
17.2.4 Water
In the historical analysis, the water module is a very special case. All of thenumerous parameters can be kept constant at current levels. Some parameters were kept constant for natural and physical reasons; these parametersinclude precipitation, river length, river velocity, minimum available flow,dissolved oxygen saturation level, or ratios of biological oxygen demand(BOD) to nitrates and BOD to phosphates in wastewater. Other parameters, like water-quality standards, are qualitative. Water supply, which isdetermined not only by precipitation and evaporation but also by the availability of reservoirs is also constant, as all (except one small) reservoirs werecompleted between 1914 and 1962. Some features of the water module, like
Alternative Histories Since 1962 339
wastewater disposal and treatment, are not of importance for the historicalexercise.
Water demand by sector per unit of output has to be kept constant atthe current level as no information exists for the past. In addition, it seemsreasonable to assume that gross water intake and the rate of water loss peruni t (by sector) have not changed significantly.
Given the satisfactory reconstruction of the period from 1962 to 1987,one can start forming "what-if" questions. For this historical period, environment is only a small issue, as neither water nor land constraints - thetwo major issues for the future - were observed.
17.3 Population Histories
The uniqueness of the population module lies in its combination of puredemographic factors - fertility, mortality, and migration - and some sociodemographic factors - student status, completed educational status, andlabor-force status. The advantage of this sort of classification is made clearin Section 17.3.3 on socio-demographic dependency ratios. To accentuate thelong-term impacts of demographic changes the following analysis is based onprojections for the period from 1962 to 2022.
17.3.1 Scenario specification
Before we can turn to the discussion of "what-if" questions, we have tospecify some alternative population histories in detail. Five scenarios havebeen selected for the analysis:
1. Reconstructed development scenario:[3] assuming observed developmentbetween 1962 and 1987, i.e., assumptions for this period correspond tothe assumptions in Section 17.2.1, and keeping all parameters constantafter 1987.
2. Constant parameters scenario: keeping all parameters constant at their1962 level throughout the whole period 1962-2022 and evaluating whatwould have happened until today and further into the future if nothingwould have changed since 1962.
3. Fertility stagnation scenario: assuming constant 1962 fertility throughout the whole projection period, everything else being equal to the reconstructed development scenario, thus isolating the socio-demographiceffect of the rapid fertility decline.
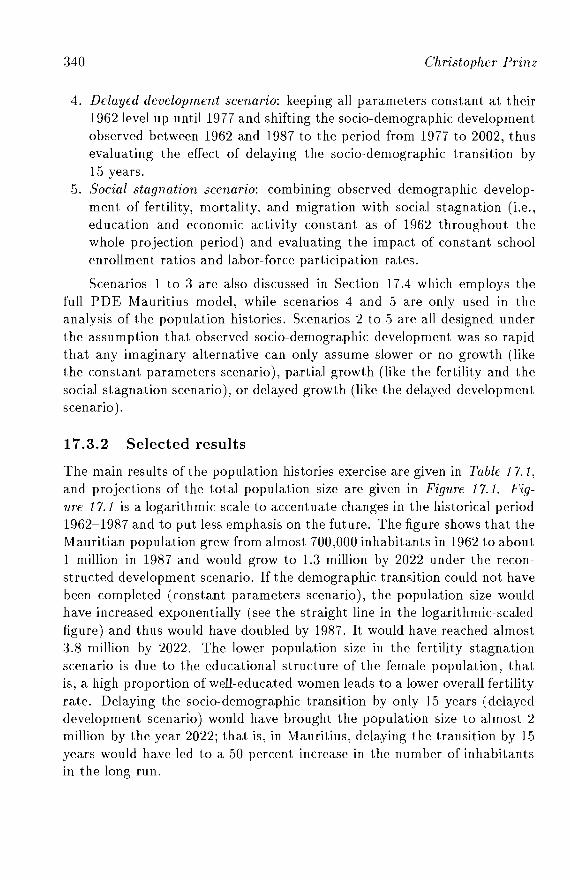
340 Christopher Prinz
4. Delayed development scenario: keeping all parameters constant at their1962 level up until 1977 and shifting the socio-demographic developmentobserved between 1962 and 1987 to the period from 1977 to 2002, thusevaluating the effect of delaying the socio-demographic transition by15 years.
5. Social stagnation scenario: combining observed demographic development of fertility, mortality, and migration with social stagnation (i.e.,education and economic activity constant as of 1962 throughout thewhole projection period) and evaluating the impact of constant schoolenrollment ratios and labor-force participation rates.
Scenarios 1 to 3 are also discussed in Section 17.4 which employs thefull PDE Mauritius model, while scenarios 4 and .5 are only used in theanalysis of the population histories. Scenarios 2 to 5 are all designed underthe assumption that observed socio-demographic development was so rapidthat any imaginary alternative can only assume slower or no growth (likethe constant parameters scenario), partial growth (like the fertility and thesocial stagnation scenario), or delayed growth (like the delayed developmentscenario).
17.3.2 Selected results
The main results of the population histories exercise are given in Table 17.1,and projections of the total population size are given in Figure 17.1. Figure 17.1 is a logarithmic scale to accentuate changes in the historical period1962-1987 and to put less emphasis on the future. The figure shows that theMauritian population grew from almost 700,000 inhabitants in 1962 to about1 million in 1987 and would grow to 1.3 million by 2022 under the reconstructed development scenario. If the demographic transition could not havebeen completed (constant parameters scenario), the population size wouldhave increased exponentially (see the straight line in the logarithmic-scaledfigure) and thus would have doubled by 1987. It would have reached almost3.8 million by 2022. The lower population size in the fertility stagnationscenario is due to the educational structure of the female population, thatis, a high proportion of well-educated women leads to a lower overall fertilityrate. Delaying the socio-demographic transition by only 15 years (delayeddevelopment scenario) would have brought the population size to almost 2million by the year 2022; that is, in Mauritius, delaying the transition by 15years would have led to a 50 percent increase in the number of inhabitantsin the long run.
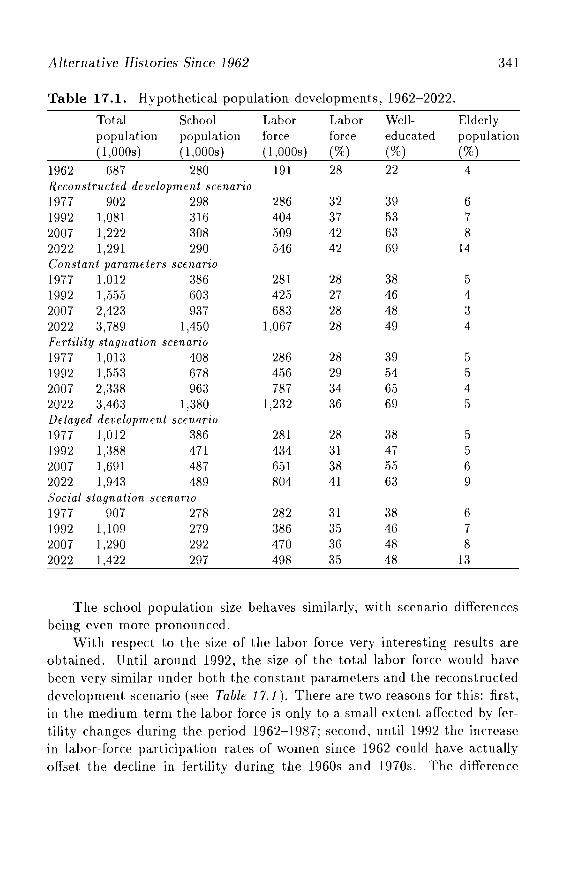
Alternative Histories Since 1962 341
Table 17.l. Hypothetical population developments, 1962-2022.
Total School Labor Labor We11- Elderlypopulation population force force educated population(1,0008) (1,0008) (1,0008) (%) (%) (%)
1962 687 280 191 28 22 4Reconstructed development scenario1977 902 298 286 32 39 61992 1,081 316 404 37 53 72007 1,222 308 509 42 63 82022 1,291 290 546 42 69 14Constant parameters scenario1977 1,012 386 281 28 38 51992 1,555 603 425 27 46 42007 2,423 937 683 28 48 32022 3,789 1,450 1,067 28 49 4Fertility stagnation scenario1977 1,013 408 286 28 39 51992 1,553 678 456 29 54 52007 2,338 963 787 34 65 42022 3,463 1,380 1,232 36 69 5Delayed development scenario1977 1,012 386 281 28 38 51992 1,388 471 434 31 47 52007 1,691 487 651 38 55 62022 1,943 489 804 41 63 9Social stagnation scenario1977 907 278 282 31 38 61992 1,109 279 386 3.5 46 72007 1,290 292 470 36 48 82022 1,422 297 498 35 48 13
The school population size behaves similarly, with scenario differencesbeing even more pronounced.
With respect to the size of the labor force very interesting results areobtained. Until around 1992, the size of the total labor force would havebeen very similar under both the constant parameters and the reconstructeddevelopment scenario (see Table 17.1). There are two reasons for this: first,in the medium term the labor force is only to a small extent affected by fertility changes during the period 1962-1987; second, until 1992 the increasein labor-force participation rates of women since 1962 could have actuallyoffset the decline in fertility during the 1960s and 1970s. The difference
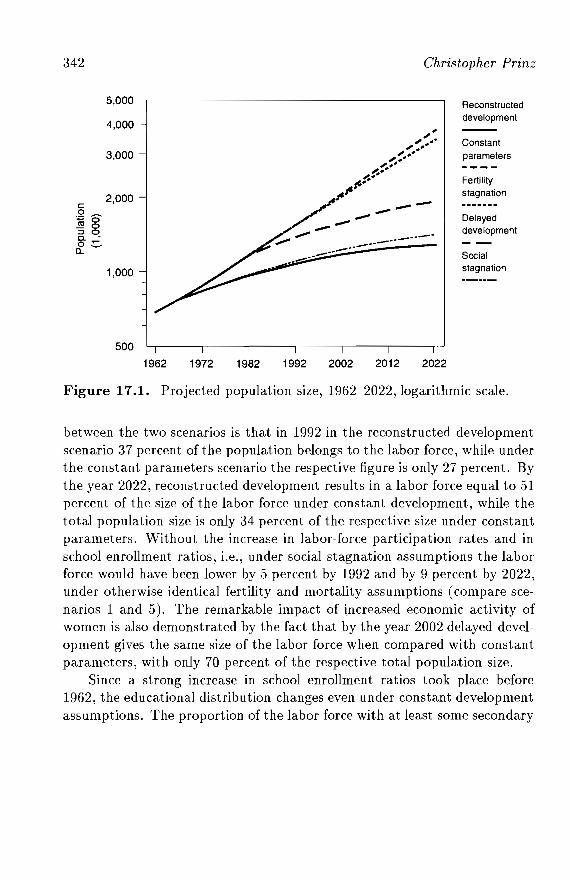
342
5,000
4,000
3,000
c2,000
.Q ~-0.!!!o~ 00. •0:::-c...
1,000
500
Christopher Prinz
Reconstructeddevelopment
Constantparameters
Fertilitystagnation
Delayeddevelopment
Socialstagnation
1962 1972 1982 1992 2002 2012 2022
Figure 17.1. Projected population size, 1962-2022, logarithmic scale.
between the two scenarios is that in 1992 in the reconstructed developmentscenario 37 percent of the population belongs to the labor force, while underthe constant parameters scenario the respective figure is only 27 percent. Bythe year 2022, reconstructed development results in a labor force equal to 51percent of the size of the labor force under constant development, while thetotal population size is only 34 percent of the respective size under constantparameters. Without the increase in labor-force participation rates and inschool enrollment ratios, i.e., under social stagnation assumptions the laborforce would have been lower by 5 percent by 1992 and by 9 percent by 2022,under otherwise identical fertility and mortality assumptions (compare scenarios 1 and 5). The remarkable impact of ~ncreased economic activity ofwomen is also demonstrated by the fact that by the year 2002 delayed development gives the same size of the labor force when compared with constantparameters, with only 70 percent of the respective total population size.
Since a strong increase in school enrollment ratios took place before1962, the educational distribution changes even under constant developmentassumptions. The proportion of the labor force with at least some secondary
Alternative Histories Since 1962 343
education would have increased from 22 percent in 1962 to 43 percent in 1987(see Table 17.1, column labeled "well-educated"). With reconstructed sociodemographic development, the respective increase would be or was muchstronger: to more than 50 percent of the labor force by 1992, and even upto 70 percent in the long run. With delayed development assumptions therespective proportion would be some 10 percentage points lower during mostof the period but would converge in the long run.
A phenomenon that can be observed in any country that has completedits demographic transition, and thus also in Mauritius, is the remarkable aging of the population. Even without additional mortality improvements after1987, the proportion ofthe population aged 60 years and over would increasefrom currently 7 percent to 14 percent by 2022 (Table 17.1, reconstructeddevelopment scenario). With constant 1962 development - without completion of the demographic transition - no aging would have taken place. A15-year delay in the transition would have directly translated into a 15-yeardelay in the aging process.
17.3.3 Socio-demographic dependency ratios
As in Chapters 12 and 16, the development of the socio-demographic dependency ratio (SDDR) should be emphasized. This ratio measures the burdenof the labor force considering its educational distribution and status and ageof the dependents. As can be seen from Figure 17.2, the SDDR declinedfrom 376 in 1962 to 225 in 1987 and it would continue to decline to 162by the year 2012 under constant 1987 assumptions (compare reconstructeddevelopment scenario).
With constant 1962 development, the socio-demographic dependencyratio would have ranged between 330 and 350 throughout the projectionperiod. Assuming a certain correlation between the development of theeconomy and the SDDR, significant economic development would probablynot have taken place. Delaying the demographic transition and the sociodemographic development by 15 years would have delayed the decline of theSDDR and thus possibly the economic boom by some 15 years.
Looking at the results for the social stagnation scenario, which combines the observed demographic transition with social stagnation, i.e., nochange in schooling and economic activity, one can conclude that during theperiod 1962-1977 the socio-demographic dependency ratio was dominated
344
400
Christopher Prinz
Reconstructeddevelopment
a:ooen
350
300
250
200
150
-- ...,,""" ......'. .... ... ...\ ..._--------\ .
\ .\ '.'.'.. \ ............, ...
......... -'..-.~--_ ..-...-......... .......-- ....
Constantparameters
Fertilitystagnation
Delayeddevelopment
Socialstagnation
1962 1972 1982 1992 2002 2012 2022
Figure 17.2. Projected socio-demographic dependency ratio (dependentequivalents per 100 active equivalents), 1962-2022.
by changes in the age structure of the population, while after 1982 socioeconomic changes started to prevail. Comparing reconstructed developmentwith social stagnation, the socio-demographic dependency ratio would havebeen 9 percent higher by 1992 and even 38 percent higher by 2022 withoutchanges in labor-force participation rates and school enrollment ratios. Ascan be seen in Figure 17.2, in the long run the social stagnation scenario givesan SDD R that is as high as the fertility stagnation scenario, even though itwas 30 percent lower in 1992.
Whether alternative developments of the socio-demographic dependencyratio hinder or favor economic development can be tested by the fullpopulation~development-environment model. A general conclusion will bedifficult since the relation depends on the economic strategy adopted. Thefull model will also be able to trigger the effects of alternative populationdevelopments on the environment, again mainly via economic development.The ability to identify the impact of population changes, such as extremeaging or excessive growth, on both economic development and environmentaldegradation is one of the features of the model.
Alternative Histories Since 1962 345
17.4 Population-Development-EnvironmentHistories
When running the full PDE model one is confronted with a complex scenario design. Hundreds of parameters can be manipulated and specified butto make the comparison of different scenarios understandable one has to concentrate on a few major parameters. If we change only one or two values wecan more easily project what will happen to the population, to the economy,and to the environment. The analysis that makes use of the full PDE modelis only carried out for the period 1962-2002, since it is not reasonable to keepeconomic parameters constant over a longer period of time. Nevertheless,by projecting until 2002 instead of 1987 one can get an idea of what couldhave happened in the future under alternative historical pathways.
17.4.1 Scenario specification
As in Section 17.3, a first step in the analysis is the detailed description ofthe scenarios to be investigated. After careful consideration, nine scenarioswere specified:
1. Reconstructed development scenario: assuming observed developmentin all areas between 1962 and 1987, i.e., assumptions for this periodcorrespond to the assumptions in Sections 17.2.1 to 17.2.4, and keepingall parameters constant after 1987.
2. Constant parameters scenario: keeping all parameters in all areas constant at 1962 levels throughout the period 1962-2002, thus evaluatingwhat would have happened if nothing had changed since 1962 or, alternatively, what would have happened without any economic and sociodemographic development.
3. Fertility stagnation scenario: assuming the constant 1962 fertility levelthroughout the whole projection period; all other parameters are equalto the reconstructed development scenario, thus isolating the economicand environmental effects of the rapid fertility decline.
4. Socio-demographic stagnation scenario: combining reconstructed development in all economic and environmental parameters with sociodemographic stagnation (i.e., fertility, mortality, migration, education,and economic activity constant as of 1962 throughout the whole projection period), thus evaluating the impact of high fertility and mortalityrates and low school enrollment ratios and labor-force participation rates
346 Christopher Prinz
on the economy and the environment. Government education and healthexpenditures were reduced to reflect higher mortality and lower educational levels.
5. Economic stagnation scenario: combining reconstructed development inall population-related parameters with economic stagnation (i.e., stageof the economy constant as of 1962 throughout the whole projectionperiod), thus evaluating the impact of economic underdevelopment together with rapid socio-demographic development.
6. Sugar drop scenario: assuming that the sugar protocol of the LomeConvention was not signed in 1970 and thus sugar exports were reducedto one-third of their actual level throughout the period 1972-2002; allother parameters are equal to the reconstructed development scenario,thus isolating the contribution of sugar exports to the actual economicdevelopment and environmental degradation.
7. Tourism stagnation scenario: assuming that the tourism industry wasnot developed after 1962; all other parameters are equal to the reconstructed development scenario, thus isolating the contribution of tourismto the actual economic development and environmental degradation.
8. No EPZ exports scenario: assuming that the EPZ textile and EPZ electronics and other sectors were not introduced; all other parameters areequal to the reconstructed development scenario, thus isolating the contribution of the successful EPZ industries to the actual economic development and environmental degradation.
9. EPZ export boom scenario: assuming that EPZ textile and EPZ electronics and other exports would have been twice the observed amountof exports; all other parameters are equal to the reconstructed development scenario, thus isolating the effect of even faster growth in thesuccessful EPZ industries. To make this assumption possible the laborforce participation rate of secondary-educated women had to be raisedto that of tertiary-educated women.
Scenarios 2 to 5 were designed to answer some general questions withinthe population-development-environment debate. For example, what wasthe contribution of population development to the development of Mauritius,on the one hand, and to environmental degradation, on the other hand, asopposed to developments in the economy? What was the contribution of thefertility decline as compared with socio-demographic development?
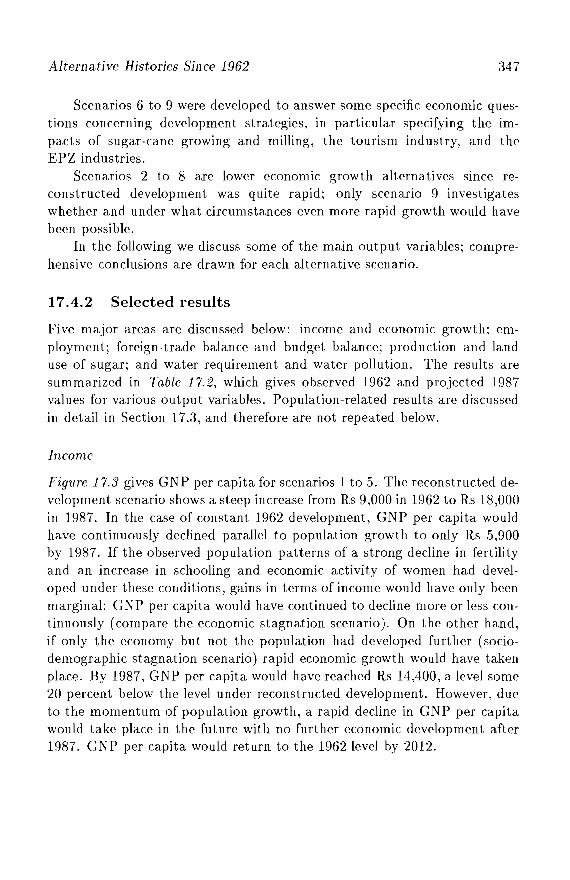
Alternative Histories Since 1962 347
Scenarios 6 to 9 were developed to answer some specific economic questions concerning development strategies, in particular specifying the Impacts of sugar-cane growing and milling, the tourism industry, and theEPZ industries.
Scenarios 2 to 8 are lower economic growth alternatives since reconstructed development was quite rapid; only scenario 9 investigateswhether and under what circumstances even more rapid growth would havebeen possible.
In the following we discuss some of the main output variables; comprehensive conclusions are drawn for each alternative scenario.
17.4.2 Selected results
Five major areas are discussed below: income and economic growth; employment; foreign-trade balance and budget balance; production and landuse of sugar; and water requirement and water pollution. The results aresummarized in Table 17.2, which gives observed 1962 and projected 1987values for various output variables. Population-related results are discussedin detail in Section 17.3, and therefore are not repeated below.
Income
Figure 17.3 gives GNP per capita for scenarios 1 to 5. The reconstructed development scenario shows a steep increase from Rs 9,000 in 1962 to Rs 18,000in 1987. In the case of constant 1962 development, GNP per capita wouldhave continuously declined parallel to population growth to only Rs 5,900by 1987. If the observed population patterns of a strong decline in fertilityand an increase in schooling and economic activity of women had developed under these conditions, gains in terms of income would have only beenmarginal: GNP per capita would have continued to decline more or less continuously (compare the economic stagnation scenario). On the other hand,if only the economy but not the population had developed further (sociodemographic stagnation scenario) rapid economic growth would have takenplace. By 1987, GNP per capita would have reached Rs 14,400, a level some20 percent below the level under reconstructed development. However, dueto the momentum of population growth, a rapid decline in GNP per capitawould take place in the future with no further economic development after1987. GNP per capita would return to the 1962 level by 2012.
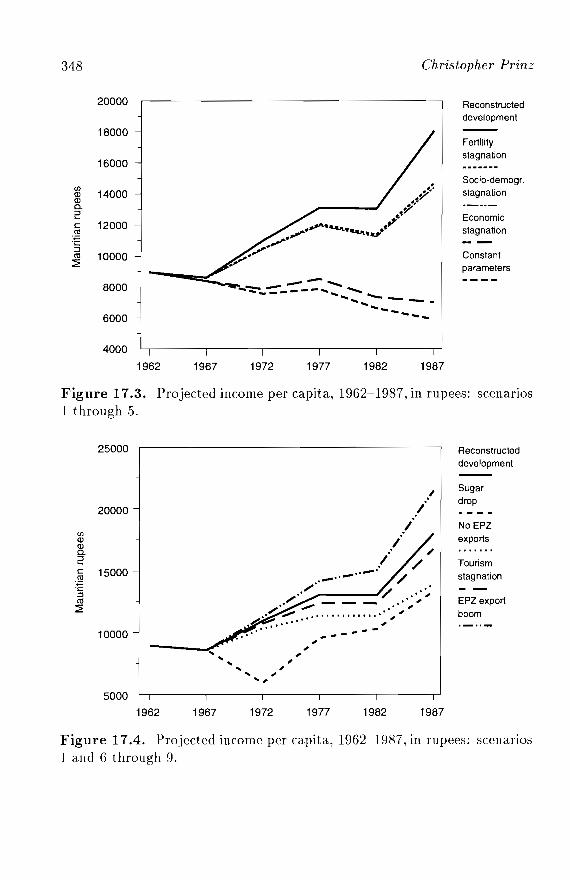
Christopher Prinz
Reconstructeddevelopment
Socio-demogr.stagnation
Fertility
stagnation
Constantparameters
Economicstagnation
1987198219771972
--""-....'"'::::--.-=----- ..................................... _--...................
1967
348
20000
18000
16000
(/)
14000Q)Q)c.2c 12000ell..;:::;
·C::3ell 10000:2
8000
6000
4000
1962
Figure 17.3. Projected income per capita, 1962--1987, in rupees: scenarios1 through 5.
25000 Reconstructeddevelopment
20000
(/)Q)Q)c.2c 15000ell..;:::;.§ell:2
10000
.'..1
./.I
.I...................,,;'.' '/ ... :,
, I" ,
./.;,. ~.~.~.~. ','.~.......... "I" _-----
Sugardrop
No EPZ
exports
Tourism
stagnation
EPZ export
boom
,,.. ,.... ,.. ,.. ,.. ,5000
1962 1967 1972 1977 1982 1987
Figure 17.4. Projected income per capita, 1962-1987, in rupees: scenarIOS1 and 6 through 9.
Alternative Histories Since 1962 349
Taking into account the fertility stagnation scenario we conclude thatalmost all of the drop in per capita income resulting from the sociodemographic stagnation scenario is due to high fertility. The main conclusions that can be drawn from Figure 17.3 are that changes in the economyare far more important for development than population changes, in particular in the short and medium term, and that education is less important fordevelopment than fertility as far as income is concerned.
Figure 17.4 gives GNP per capita for scenario 1 and scenarios 6 to 9. Inany of the purely economic scenarios income growth would have been rapidand would have gone beyond or close to the level we would have reachedunder the socio-demographic stagnation scenario. Population changes turnout to be as important for development as any single economic measure.
Interestingly, both under the assumption of a drop in sugar exports toonly one-third of the observed level and under the assumption that no EPZindustry would have developed, GNP per capita would have reached aroundRs 13,600 by 1987, a level some 2.5 percent below reconstructed development,however, with significantly different development paths. Altogether, sugarand EPZ exports were equally important for Mauritius's rapid development.The relatively marginal contribution of tourism to economic growth is alsoshown in Figure 17.4.
Comparing the observed development with the EPZ export boom scenario shows that in theory even faster development of the economy wouldhave been possible. However, in practice this development path wouldnot have been feasible. It would have lacked the required labor force andcould have been realized only if labor-force participation rates of secondaryeducated women had been equal to those of tertiary-educated women, i.e.,around 90 percent. Alternatively, much larger labor-productivity increaseswould have been necessary.
Table 17.2 also gives total income produced in Mauritius. Due to thelarger internal demand from a larger population, total income is larger underthe two constant 1962 fertility stagnation scenarios when compared with thereconstructed development scenario.
Dnder the reconstructed path scenario, average annual growth in incomeper capita was 2.8 percent over the period considered. It would have beenmore than 1..5 percent under all other scenarios, except for those that assumed economic stagnation. Dnder the latter assumption, the Mauritiuspopulation would clearly have become poorer.
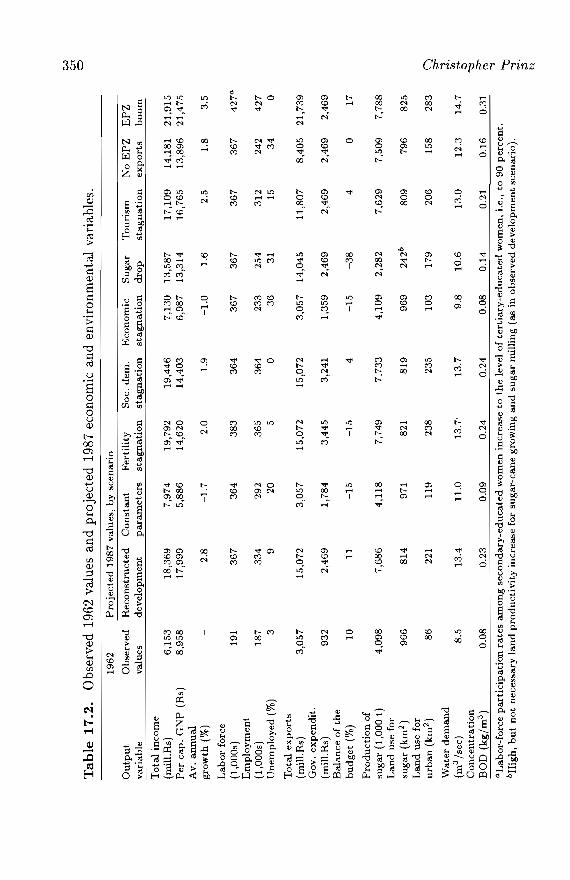
w C;1
Obs
erve
d19
62va
lues
and
proj
ecte
d19
87ec
onom
ican
den
viro
nmen
tal
vari
able
s.0
Tab
le1
7.2
.
19
62
Pro
jecte
d1
98
7v
alu
es,
by
scen
ario
Ou
tpu
tO
bse
rved
Rec
on
stru
cted
Co
nst
an
tF
erti
lity
So
c.de
mo
Eco
no
mic
Su
gar
To
uri
smN
oE
PZ
EP
Zv
aria
ble
val
ues
dev
elo
pm
ent
para
mete
rsst
ag
nati
on
stag
nati
on
stag
nati
on
dro
pst
ag
nati
on
exp
ort
sb
oo
m
To
tal
inco
me
(mil
l.R
s)6
,15
31
8,3
69
7,9
74
19
,79
21
9,4
46
7,1
30
13
,58
71
7,1
09
14
,18
12
1,9
15
Per
cap_
GN
P(R
s)8
,95
81
7,9
99
5,8
86
14
,62
01
4,4
03
6,9
87
13
,31
41
6,7
65
13
,89
62
1,4
75
Av
.an
nu
al
gro
wth
(%)
2.8
-1.7
2.0
1.9
-1.0
1.6
2.5
1.8
3.5
Lab
or
forc
e(1
,00
0s)
191
36
73
64
38
33
64
36
73
67
36
73
67
42
7a
Em
plo
ym
ent
(1,0
00s)
18
73
34
292
365
36
423
325
43
12
242
42
7U
nem
plo
yed
(%)
39
205
03
63
115
34
0
To
tal
ex
po
rts
(mil
l.R
s)3
,05
71
5,0
72
3,0
57
15
,07
21
5,0
72
3,0
57
14
,04
51
1,8
07
8,4
05
21
,73
9G
ov
.ex
pen
dit
.(m
ill.
Rs)
93
22
,46
91
,78
43
,44
53,
241
1,3
59
2,4
69
2,4
69
2,4
69
2,4
69
Bal
ance
of
the
bu
dg
et(%
)1
011
-15
-15
4-1
5-3
84
01
7
Pro
du
cti
on
of
sug
ar(1
,00
0t)
4,0
98
7,6
86
4,1
18
7,7
49
7,7
33
4,1
09
2,28
27
,62
97
,50
97
,78
8L
and
use
for
sug
ar(k
m2
)9
66
81
497
182
18
19
96
92
42
b8
09
796
82
5L
and
use
for
urb
an
(km
2)
86
221
11
923
823
51
03
17
920
61
58
283
QW
ater
dem
an
d.., ....
(m3
/sec
)8
.51
3.4
11
.013
.7-
13
.79
.81
0.6
13
.01
2.3
14
.7'" '"""
Co
nce
ntr
atio
n.g
BO
D(k
g/m
3)
0.0
80
.23
0.0
90
.24
0.2
40
.08
0.1
40.
210
.16
0.31
;:,-
("1> ..,
aLab
or-
forc
ep
arti
cip
atio
nra
tes
amo
ng
seco
nd
ary
-ed
uca
ted
wo
men
incr
ease
toth
ele
vel
of
tert
iary
-ed
uca
ted
wo
men
,i.
e.,
to9
0p
erce
nt.
'\:lbH
igh,
bu
tn
ot
nec
essa
ryla
nd
pro
du
ctiv
ity
incr
ease
for
sug
ar-c
ane
gro
win
gan
dsu
gar
mil
lin
g(a
sin
ob
serv
edd
evel
op
men
tsc
enar
io).
.., .... ;:3 N
Alternative Histories Since 1962
Employment
351
Table 17.2 gives employment and unemployment figures for each of the ninescenarios. According to the reconstructed development scenario, unemployment was high in the 1970s and early 1980s and at 9 percent in 1987. With nofurther economic development, unemployment would increase steeply thereafter and reach some 30 percent by 2002. Notwithstanding the larger sizeof the population and thus also of the labor force, during the period 19621987 population changes alone (fertility stagnation and socio-demographicstagnation scenarios) would have hardly affected the unemployment rate.Until 1987 unemployment would have been lower since the large number ofwell-educated people in the labor force, resulting from higher fertility rates,would even have accentuated the productivity of urban activities and couldhave easily been employed in the economy. The continuously increasingpopulation would have had to struggle with over-proportionally increasingunemployment only in the long run.
Constant 1962 development would have led to continuously rising unemployment, up to one-fifth of the labor force by 1987. Employment wouldhave been only at 85 percent of the observed level by 1987 and would reachthe same level by 2002, however, with significantly higher unemploymentdue to the large size of the labor force. Much lower employment and muchhigher unemployment rates would have been realized under the economicstagnation scenario. Together with economic stagnation the low size of thelabor force stemming from population development hinders the developmentof the industrial sectors and thus increases unemployment.
Both the sugar drop and the no EPZ exports scenarios result in highunemployment rates over the whole period. In accordance with the scenarioassumption, the sugar drop scenario leads to a sudden increase in unemployment by 1972, while it remains around 30 percent until 1992. Withoutthe successful introduction ofthe EPZ industries, unemployment would haverisen more or less continuously to some 34 percent by 1987, nearly as highas under the economic stagnation scenario.
The tourism industry makes a more significant contribution to totalemployment than to total income. By 1987, the unemployment rate wouldhave been 15 percent if the tourism industry had not been developed furtherafter 1962. The EPZ export boom scenario would have resulted in fullemployment over the whole period, and it would even have been difficultto recruit enough labor force for the large employment produced.
352 Christopher Prinz
Interestingly, the correlation between GNP per capita and unemployment is very high. Scenarios that result in lower economic growth simultaneously result in higher unemployment and vice versa.
Foreign- Trade and Budget Balances
Exports, which are given in Table 17.2, are entirely input-determined; imports also depend on the size and structure of the population. Under the reconstructed development paths, the foreign-trade balance was positive overthe whole period. Exports exceed imports by some 20 percent. The economic scenarios 6 through 9 do not significantly deviate from this pattern.Economic stagnation would have led to an increase in imports without anincrease in exports making the trade balance deteriorate to -20 percent by1987. Due to the increasing size of the population, socio-demographic stagnation on top of economic stagnation, i.e., constant development, would haveaccentuated the increase in imports and worsened the foreign-trade balance(-33 percent by 1987).
Socio-demographic stagnation alone, however, would not have affectedthe trade balance. At least until 1987, the higher demand from the largerpopulation would have been compensated by its lower education and thuslower per capita demand of the population. In the case of fertility stagnationthe trade balance would have worsened somewhat as the large number ofhighly educated people would have demanded more expensive goods andthus would have increased imports, without any compensating effects.
Government expenditure is a function of the size, age structure, andeducational structure of the population, on the one hand, and of the percapita expenditure, on the other. Under the reconstructed developmentscenario total government expenditure, which comprises education, health,and other expenditures, would have increased from around Rs 930 million in1962 to around Rs 2,500 million by 1987 (see Table 17.2). Under the fertilitystagnation scenario, with its large size and well-educated population, thisincrease would have been much larger (Rs 3,500 million by 1987) and wouldbe especially large in the long run. At the other extreme we find the economicstagnation scenario. Government expenditure would have increased to onlyRs 1,360 million by 1992 under this scenario due to the small size of thepopulation and the low 1962 per capita expenditure.
Taxes are somewhat artificial in Mauritius since the large producers,the EPZ industries, are exempted from paying taxes. As a consequence,the budget balance, which is slightly positive during the whole period under
Alternative Histories Since 1962 353
the reconstructed development scenario, would have remained positive alsounder the EPZ scenarios. Assumptions ofthe sugar drop scenario would havereduced taxes and thus would have worsened the budget balance to about-30 percent between 1972 and 2002. The population stagnation scenariosall lead to very significant budget deficits, especially in the long run, forexample, -15 percent by 1987 under the constant development alternative.
Sugar Production
Table 17.2 gives total production of sugar measured in 1,000 tons. Dueto the increase in land and labor productivity, the amount of sugar produced almost doubled from 4.1 million tons in 1962 to more than 7.6 millionby 1987. However, as a consequence of increasing land productivity, theamount of land needed to produce this sugar declined from 81 percent to68 percent of total arable land. At the same time, urban activities (i.e., industries, services, and households) rapidly increased; land requirements forthese activities increased as sugar-land requirements decreased. Under constant development, both the amount of sugar produced and the land requiredto produce it would have remained close to its 1962 levels; urban activitieswould have slightly increased as a consequence of population growth.
Under the sugar drop scenario, sugar production would have gone downto only 2 million tons in 1972 and would have remained at that level. Ifland productivitiy had increased further, the amount of land needed to produce that sugar would have declined accordingly, thus freeing land for urbanactivities.
Water Requirement and Pollution
The amount of water required, measured in m3 per second, by some of thedevelopment paths is shown in Figure 17.5. According to the reconstructeddevelopment scenario, water requirement would have increased from 8.5 m3
per second in 1962 to 13.7 m3 per second in 1987. Pollution of rivers, measured as the dilution flow required to clean up the water, would have increased proportionally. Pollution of the lagoon, however, measured as theconcentration of organic waste in lagoon water and sediments (DO D concentration), would have almost tripled (see Table 17.2).
Without changes in the economy (economic stagnation scenario) theincrease in both water requirement and water pollution would have corresponded to the population growth. Adding socio-demographic stagnation
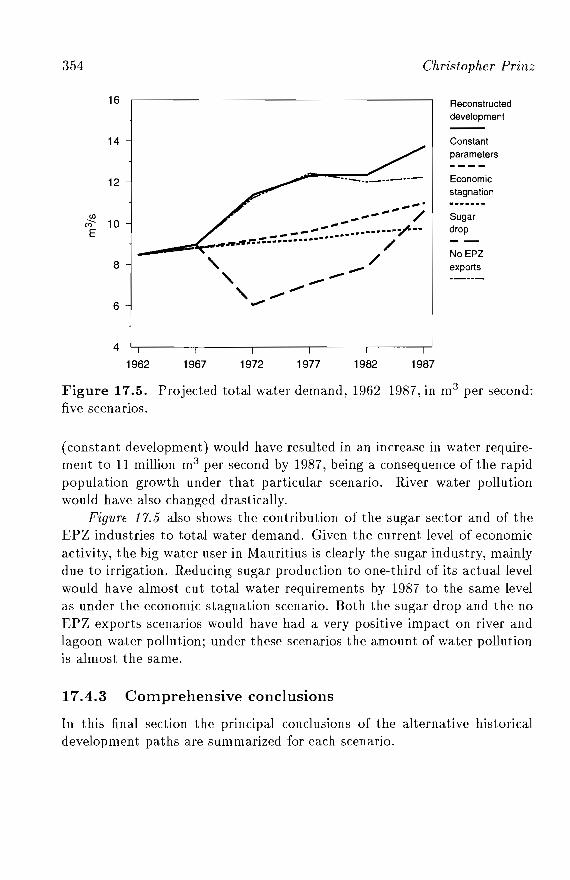
354
16
Christopher Prinz
Reconstructeddevelopment
14
12
(J)
;:;- 10E
8
6
4
._-- ....---_....-
........".."..",.,- /
......_.".."."". •••••••• .J:. ••--- .,,--___......r.-.~,~~~~J:::........... ~, /, -----, ...............,.,.
Constantparameters
Economicstagnation
Sugardrop
No EPZexports
1962 1967 1972 1977 1982 1987
Figure 17.5. Projected total water demand, 1962-1987, in m3 per second:fi ve scenarios.
(constant development) would have resulted in an increase in water requirement to 11 million m3 per second by 1987, being a consequence of the rapidpopulation growth under that particular scenario. River water pollutionwould have also changed drastically.
Figure 17.5 also shows the contribution of the sugar sector and of theEPZ industries to total water demand. Given the current level of economicactivity, the big water user in Mauritius is clearly the sugar industry, mainlydue to irrigation. Reducing sugar production to one-third of its actual levelwould have almost cut total water requirements by 1987 to the same levelas under the economic stagnation scenario. Both the sugar drop and the noEPZ exports scenarios would have had a very positive impact on river andlagoon water pollution; under these scenarios the amount of water pollutionis almost the same.
17.4.3 Comprehensive conclusions
In this final section the principal conclusions of the alternative historicaldevelopment paths are summarized for each scenario.
Alternative Histories Since 1962 355
1. Reconstructed development scenario: the full PDE Mauritius model wasreasonably able to reconstruct the history of Mauritian developmentduring the period from 1962 to 1987. The economy grew with amazingspeed, doubling GNP per capita to Rs 18,000. The educational level ofthe population increased remarkably, as did economic activity of women.Unemployment was brought down to a reasonable level; the foreigntrade balance was significantly positive; and the budget was generallybalanced. Production of sugar doubled, albeit using much less land togrow sugar; however, water demand and in particular water pollutionincreased in accordance with economic growth.
2. Constant parameters scenario: if neither the population nor the economyhad developed further after 1962, population size would have increasedat a remarkable rate to more than 1.5 million by now, while the economywould have stagnated. As a consequence, GNP per capita would havefallen continuously to only a few thousand rupees in the long run. Mauritius would, by today, be a poor developing country. Unemploymentwould be tremendous (around 20 percent by 1987); the foreign-trade andthe budget deficit would soon have reached unsustainable levels. Onlythe environment would have benefited - due to economic stagnation as both water requirement and water pollution would have increased toa smaller extent.
3. Fertility stagnation scenario: if Mauritian women had continued to bearmore than five children on average, development would clearly havebeen much more difficult. Until the 1990s remarkable economic growthwould have occurred albeit at a significantly lower level, but in the longrun continued population growth would have increasingly made development difficult if not impossible. For some periods, unemployment rateswould have been lower than under reconstructed development, whilethe foreign-trade, and in particular the budget balance, would have developed in an alarming manner. Due to the large number of people,water demand and pollution would have been some 10 percent higherby 1987 under this scenario than under the reconstructed developmentscenario. By 1987, high fertility would not have entirely hindered development, but in the long run a reduction in fertility would have beenvery advantageous.
4. Socio-demographic stagnation scenario: adding socio-demographic stagnation to constant fertility would first and foremost have led to a completely different educational structure of the Mauritian population. As a
356 Christopher Prinz
consequence, and also due to accentuated population growth, the development of the economy would have been even more difficult (as comparedwith the fertility stagnation scenario) and GNP per capita would havedeveloped at a slower speed. Also as a consequence of different educationdevelopments, both the foreign-trade balance (less-educated people demand less expensive goods and reduce imports) and the budget balance(fewer people in school reduce education expenditures) would have developed slightly more favorable. In the long run, however, no advancementin education would have put strong restrictions on possible developmentin Mauritius. Limitations already imposed by continued high fertilitywould have been accentuated by a steady low educational level.
5. Economic stagnation scenario: economic stagnation combined with reconstructed population developments would have resulted in an economic disaster almost as bad as under the constant parameters scenario.Unemployment would even have been worse; by 1987 more than a thirdof the population willing to work would have been unemployed. Due tothe lower population size, GNP per capita, the foreign-trade balance,and the budget deficit would have developed more favorably than underconstant development, but still in an unsustainable manner. One shouldnote that in this scenario benefits from the higher educational level ofthe population were not economically realized.
6. Sugar drop scenario: assuming that the sugar protocol of the LomeConvention had not been signed in 1970 clearly shows the importanceof the contribution of the sugar industry to development in Mauritiusduring the last three decades. GNP per capita would have been reducedby more than 25 percent (1987), while unemployment would have beenhigh (some 20 percent to 30 percent) throughout the period. Both theforeign- trade balance (sugar exports hardly need any imports) and, inparticular, the budget deficit (the sugar industry is one of the main taxpayers) would have developed very unfavorably. Interestingly, the largedrop in land required for sugar-cane growing could not have been usedby any other agricultural, industrial, or service sector; 50 percent of totalusable land would not have been used under this scenario. Since sugaris a major water user in Mauritius - at least until today - total waterdemand would have increased by only 25 percent since 1962 and waterpollution increases would have been lower.
Alternative Histories Since 1962 357
7. Tourism stagnation scenario: in terms of output variables from the PDEmodel, tourism had only a small share in overall development of Mauritius. GNP per capita would have been somewhat lower; unemployment,some 5 percentage points higher. The budget deficit and, particularly,the foreign-trade balance would have developed less favorably. The indirect value of tourism, for example, familiarizing visitors with the islandin the Indian Ocean and therefore making them interested in investing inMauritius, is not measured by the model but should not be disregarded.
8. No EPZ eJ:ports scenario: not having introduced EPZ industries wouldhave lowered Mauritian development to a level comparable to the sugardrop scenario. Unemployment would have increased rapidly to levelsthat would have been observed under economic stagnation, indicatingthat EPZ industries are the main employers in Mauritius today. In contrast to the sugar drop scenario, the budget deficit (the EPZ industriesare tax exempt), the foreign-trade balance, and to a lesser degree waterdemand would have developed very much like they have under reconstructed development. Water pollution, however, would have decreasedbecause the textile factories are significant polluters.
9. EPZ export boom scenario: doubling EPZ exports would have reinforcedeconomic growth in Mauritius, through zero unemployment and a higheramount of imports and exports. But, the high labor demand could haveonly been satisfied if economic activity of secondary-educated womenhad been increased to the level of tertiary-educated women or if laborproductivity had increased more rapidly. It seems justifiable to say thaton the basis of the already very rapid observed socio-demographic development during the period 1962 to 1987 not much higher economicdevelopment would have been possible in Mauritius.
Notes
[1] The calculations have been carried out until 2002 - and for the population parteven until 2022 - but without considering further changes in model parameterafter 1987, i.e., keeping all parameters confitant as of 1987.
[2] Since data for the year 1992 are not available yet, a reliable historical reconstruction starting in 1962 and using a model that is based on fi ve-year calculationsshould cover the period 1962-1987; moreover, the most recent complete inputoutput table available in Mauritius goes back to the year 1987.
[3] Here, and also in the following, "observed development" refers to the reCOllfitructed historical path and not to the observed data.

Part IV
Our Present Understanding:What Have We Learned?

Chapter 18
Lessons from Mauritiusthe Global Context
Wolfgang Lutz
•In
18.1 Introduction
This concluding chapter of the book is an attempt to synthesize the information provided in Part II ("Understanding Through History") and Part III("Understanding Through Modeling") and to relate it to the present globalpopulation-environment debate. For doing so, five substantive questionshave been singled out that, on the one hand, capture some of the main arguments stressed in the debate and, on the other, belong to areas where ourempirical work on Mauritius can make real contributions. These two criteriaexclude questions of a purely conceptual nature and questions to which theanswers are already known.
Part of the problem in the population-environment debate is that inmany cases, the models chosen predetermine the answer. If certain variables are not included in the model (be it a conceptual model or a computermodel), the results can never attribute these vaTiables any significance. Similarly, the structure of the model and the way in which variables are linkedmay exclude some relevant mechanisms. As discussed in Chapter 1, forinstance, the Ehrlich identity in its simple multiplicative form, assumingindependence between population size, affiuence, and technology, does not
362 Wolfgang Lutz
cover the case in which population growth has a positive effect on technology (the Boserup / Simon argument) or the case in which population growthdiminishes affluence (the Malthusian argument) or when increasing affluencelowers population growth (the usual development argument).
It is not possible to design a model that is entirely free from personalviews or the views dominant in scientific disciplines as well as society. Certainbasic approaches to analysis always predetermine our questions, our datacategories, and the structure of our models. The only approach we can takein this is to take advantage of the multitude of scientific views expressedwithin disciplines and across disciplines and to try to develop models thatdo not already predetermine apparently controversial issues.
A major challenge for the PDE model for Mauritius was to define suchan interdisciplinary and intersubjective model that can be accepted in itsbasic structure by the bulk of participants in the population -developmentenvironment discussion and is quantitatively operational, i.e., consists ofmore than general words. The approach chosen was to have two parts ofthe model: the hard-wired model, which only includes unambiguous relationships on which scientific consensus can be expected; and the soft model,which can quantify aU kinds of feedbacks and interactions that the user wantsto define. With this approach differences in assumptions and results can benailed down and evaluated in a specific and clear form.
The emphasis of this book is on the process of better understanding thecomplex mechanisms that link population, development, and environmentalvariables. This understanding has been approached both through the analytical description of man-environment interactions in the history of Mauritiusas well as through quantitative modeling. When discussing the following fivequestions to which the Mauritius study can make a contribution, referenceis made to both approaches.
18.2 How Did Population Density Affect theEnvironment and Human Life Over theCenturies?
The popular argument is that with limited agricultural space and limitednatural resources, increasing population density results in increasing stresson food supplies and damage to the environment. The food aspect of this argument goes essentially back to Malthus, whereas the explicit environmentalconcerns are of a much more recent date. Here the most frequently stated
Lessons [rom Mauritius in the Global Context 363
argument is that higher density forces people to utilize marginal lands resulting in deforestation, species extinction, soil erosion, desertification, andultimately war or starvation. Support for this density-stress argument comesfrom animal ecology, where the basic concept of a limited carrying capacityis self-evident.
This density argument, however, has been challenged by scholars mostlyfrom the field of economics. Boserup (1981) and Simon (1982) even saythat under certain conditions increasing density is conducive to technologicaladvance because societies are pressed for innovations. A somewhat differentargument is based on the concept of economies of scale, which points to thebenefits of higher density because of a larger market, better infrastructure,and greater division of labor.
The history of a small, densely populated, and very remote island seemsto be an ideal setting for checking the empirical validity of these arguments.
18.2.1 Population density and deforestation
When the first Dutch merchant ships came to Mauritius in 1638 the uninhabited island was almost completely covered with lush tropical forests inwhich a large variety of unique species lived. By the end of the 17th century200 Dutch and about 100 slaves had managed to strip the island of most ofits valuable ebony trees, changing the composition of the forests forever.
As can be seen in Figure 18.1 significant deforestation started duringthe French rule in the late 18th century. The French, aiming at permanentsettlement of the island, were interested in food self-sufficiency and alsostarted to expand sugar-cane production. Hence there were three differentreasons for deforestation: land required for food production, land requiredfor sugar-cane production, and wood required for construction and cookingincluding the refining of sugar. Population density increased very slowlyduring this period.
The most significant deforestation in Mauritian history happened during the 1840s. Within a decade almost two-thirds of the remaining forestdisappeared. This event coincided with the abolition of slavery in 1833 andthe immigration of large numbers of indentured laborers from India, but thepeak of Indian immigration was a decade after this massive deforestation.Because of this timing, deforestation can hardly be explained by the subsistence needs of the immigrants. However, the first arriving Indians wereprobably instrumental as laborers in clearing the woods. At this time thefirst modern sugar factory was built requiring more firewood.
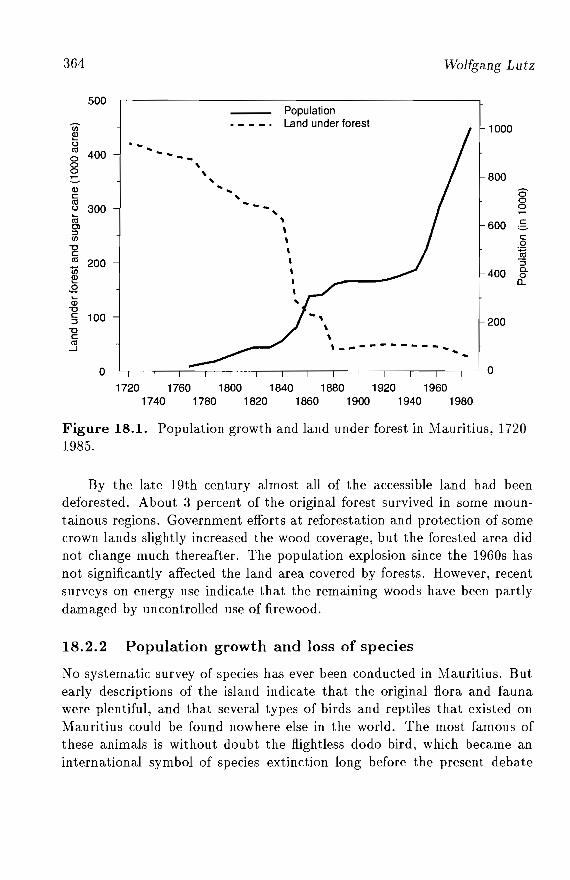
Figure 18.1. Population growth and land under forest in Mauritius, 17201985.
By the late 19th century almost all of the accessible land had beendeforested. About 3 percent of the original forest survived in some mountainous regions. Government efforts at reforestation and protection of somecrown lands slightly increased the wood coverage, but the forested area didnot change much thereafter. The population explosion since the 1960s hasnot significantly affected the land area covered by forests. However, recentsurveys on energy use indicate that the remaining woods have been partlydamaged by uncontrolled use of firewood.
18.2.2 Population growth and loss of species
No systematic survey of species has ever been conducted in Mauritius. Butearly descriptions of the island indicate that the original flora and faunawere plentiful, and that several types of birds and reptiles that existed onMauritius could be found nowhere else in the world. The most famous ofthese animals is without doubt the flightless dodo bird, which became aninternational symbol of species extinction long before the present debate
Lessons from Mauritius in the Global Context 365
on biodiversity. The dodo disappeared during the 17th century most likelythrough the consumption of the eggs rather than through direct hunting(there have been reports about the bad taste of the meat).
Aside from the extinction of many unique species that was largely theconsequence of the destruction of their habitat - the original forest - manyother species retreated from Mauritius (most notably the giant turtle), whileother plants and animals were brought to the island deliberately (e.g., sugarcane, vegetables, spices, and domestic animals) or unintentionally (such asrats). Currently Mauritius officially lists one mammal species and threebird species as being threatened by extinction. In international comparisonsconsidering land area this gives a very high value per 10,000 km2 (Green,1992), which is a consequence of its remote island status. Concerning themicrofauna in the soils there are indications that the original balance stillexists in some remote mountain areas but is being threatened by the intrusionof other species.
Since most of the lost species in Mauritius presumably disappeared during the early history of human settlement on the island when populationdensity was still very low, it is difficult to draw direct causal connectionsbetween the two variables based on Mauritian evidence.
18.2.3 Population density and food supply
The Dutch settlers in the 17th century were interested in short-term exploitation rather than sustainable agriculture, so food supply was a permanent problem. The French, who considered Mauritius strategically important and wanted to sustain their presence for a long period, emphasized theexpansion of food production to make the island self-sufficient and robustagainst crises. The British thereafter opted for cash crops at the expenseof food production. Food was partly imported from other British colonies.This, together with the fact that the population had doubled through Indianimmigration, made the food supply more vulnerable to external events.
One such event was World War II. But the worst could be avoided inMauritius because, expecting major problems with food imports, the government ordered sugar plantations to use about one-quarter of their land exclusively for food cultivation. Although food production targets were neverreached, this quick response showed the flexibility and robustness of theMauritian system. This strategy, however, cannot necessarily be generalizedto other countries. The well-developed infrastructure and the small size of
366 Wolfgang Lutz
the island made this success possible. After the war, however, this foodprogram was ended, despite frequent food supply problems.
To combat the vulnerability to food crises and also to feed the rapidlygrowing population, Mauritius made another effort at food self-sufficiency inthe 1970s as part of a general import substitution policy. Some improvementswere achieved with potatoes and other food crops, but, because of cheapand often subsidized food imports, the economics of these diversificationprograms were not favorable. It was simply more profitable to produce sugarand buy cheap food on the world market. If the infrastructure is sufficientfor a high volume of international trade, as is the case in Mauritius, and thecountry is rich enough to pay for the food, population size and density ofa specific place do not seem to negatively influence food supply. Whetherthere is enough food on the world market is another question.
As part of our future scenario calculations using the PDE Mauritiusmodel, we also studied whether a certain minimal degree of food selfsufficiency would be advisable under sustainable development criteria. Inshort, the results show that under an assumed future economic crisis, it isadvantageous to have a rather high proportion of food self-sufficiency, whichalso helps reduce unemployment. Under prosperous economic conditions,however, increased food production would mean lower income. Hence thekey to robust policies is to assure maximum flexibility that allows a quickincrease in food production (similar to World War II), should the state ofinternational trade require it.
18.2.4 Population density and disease environment
Originally Mauritius must have been a very healthy place for humans. Thefirst inhabitants were said to have been a group of seriously ill sailors abandoned by their ship. Some time later when the ship returned, all the sailorswere in good health.
In the following centuries many diseases came to the island via immigrants or merchant ships. Death rates in the 19th century show frequentpeaks due to cholera, smallpox, and other epidemics. Prior to 1862 malaria,a major killer in subsequent years, was not endemic to Mauritius. However,once malaria reached Mauritius it induced the resettlement of many Mauritians from the coast to the cooler highlands. In 1919 the Spanish flu killedmore than 6 percent of the population. The spread of these diseases resultedfrom high density, poor sanitation, and a lack of treatment possibilities.
Lessons from Mauritius in the Global Context 367
After 1945 the death rate dropped to less than half its previous levelwithin a few years as a consequence of malaria eradication, antibiotics, andpreventive medicine. Today the mortality conditions in Mauritius are similarto those in Europe with no visible negative influence of population density.
18.2.5 Conclusion
The evidence shows that in the early days, very low population density wasan obstacle to sustainable agriculture and development on the island. Mostof the deforestation and species loss were not related to population densitybut to shortsighted economic exploitation. Some of the human suffering,however, especially that due to diseases before modern medicine, seems tobe related to population density beyond a certain threshold. Pollution due tothe recent industrialization, again, seems to have resulted more from a lackof environmental legislation than from population density. The increasingproportion of land used for urban purposes is certainly related to increasingdensity but does not automatically imply environmental destruction.
Saying that the density-stress argument could not be verified for Mauritius as a direct cause of environmental destruction, however, does not excludethe possibility of more indirect effects operating through attitudes. In orderto find jobs for the rapidly increasing number of young people (a consequenceof population growth), society as well as government may give more weightto attracting international companies without many conditions, than to setting strict pollution standards. This issue, which is only indirectly relatedto density and more to international competition in production costs, is aproblem not specific to Mauritius but affecting most countries of the world.
18.3 What Triggered the World's Most RapidFertility Decline?
As described in Chapter 4, the total fertility rate in Mauritius declinedfrom 6.2 in 1963 to only 3.2 in 1972. This decline happened essentiallysimultaneously within all ethnic groups. It is assumed to be the most rapidfertility decline in the world at least at the national level. In this section,an attempt is made to identify the most important factors that contributedto this drastic and completely voluntary change in Mauritian reproductivepatterns.
368 Wolfgang Lutz
18.3.1 Social and economic development before thefertility decline
A most remarkable feature of the Mauritian fertility decline is that it happened in the absence of any economic growth. Per capita income was verylow and stagnant during the 1950s and 1960s (see Figur'e 18.4 below). Thiscontradicts the popular view that economic development is the main reasonfor a decline in desired family size and consequently fertility. Figure 18.2,however, shows that the relationship between economic growth and fertilitydecline varies in developing countries. In some countries such as Mauritius,Bangladesh, and to some extent Thailand, the fertility decline preceded economic growth. The historical fertility transitions of some Northern Europeancountries (e.g., Finland) also followed this pattern. In a number of countriesfertility declined simultaneously with increasing income, and in a third group(mostly Arab countries) income grew without much fertility decline. Thiscomparison shows that on an empirical basis, it is hard to argue that incomegrowth is an essential determinant of declining fertility. Similar diversity ofthe fertility-income relationship is also shown at individual levels (such asin the World Fertility Survey, Cleland and Scott, 1987).
In Mauritius, income had not grown in the years prior to the onset of thefertility decline, but social development and especially education were welladvanced by this time. Already in 1960 nearly universal primary educationhad been achieved in Mauritius and aspirations for secondary educationfor girls almost equaled that for boys. This high educational status of theyounger generation and especially of younger women is probably the singlemost important factor in explaining the Mauritian fertility decline. Thisassumed effect of female education on fertility can be seen as operatingthrough three different mechanisms: first, it increases the age at marriage,and indeed it could be shown that about half of the steep fertility decline inMauritius is attributable to changing marriage patterns; second, educationis likely to change the value system by putting more emphasis on the lifeopportunities of children and women than on large families; third, there isevidence that education increases the acceptance of family-planning methodsby women and increases the relative status of a woman within the family tocarry ou t her own (usually lower) desired family size.
In sharp contrast to the non-relationship between fertility and incomein Figure 18.2, Figure 18.3 shows that the strong association between basicfemale education and the onset of fertility transition that has been observedin Mauritius is very common in the rest of the world as well. As the sample of
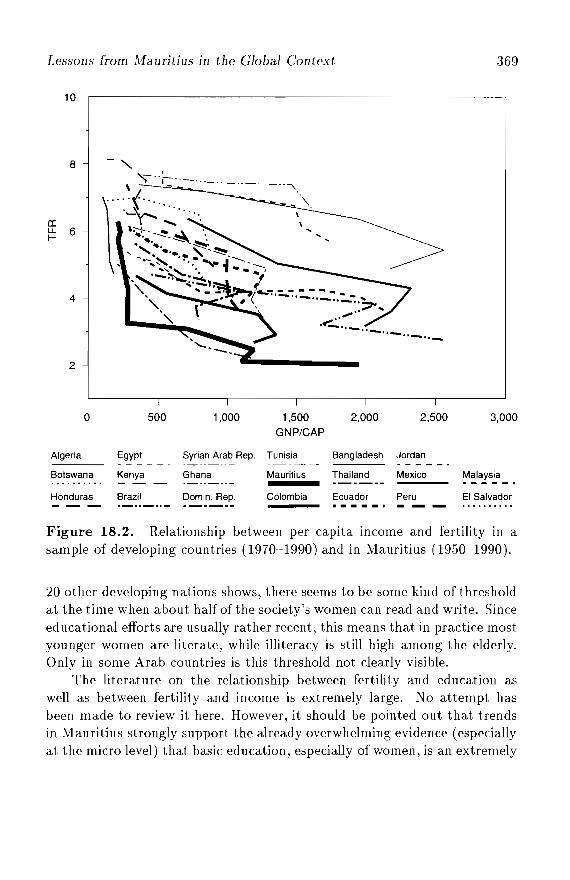
Lessons [rom Mauritius in the Global Context 369
10
-,
.. '.,. ~ ~, ~'~- .... .. ..-.....
, - " ". """".I '_. ',., e. "I ...... I
, -~~~I::::=L~ 1\. ...... -'-_~/-- ------~, • , \. 11_11_11_.1':..",,:.'
, , •• :::=" ...\. ~ .......
. -.1-.1- ..- .. "-
2
4
B
a::~ 6
0 500 1,000 1,500 2,000 2,500 3,000
GNP/CAP
Algeria Egypt Syrian Arab Rep. Tunisia Bangladesh Jordan-----~ -_ ..-.-- ------ ------
Botswana Kenya Ghana Mauritius Thailand Mexico Malaysia.......... - - - 0_ .. _"- .. _---- ----- .Honduras Brazil Domin. Rep. Colombia Ecuador Peru EI Salvador- - - 0_ .. _0.- ----_. ------ - - - •• 1.1 ••• II
Figure 18.2. Relationship between per capita income and fertility in asample of developing countries (1970-1990) and in Mauritius (1950-1990).
20 other developing nations shows, there seems to be some kind of thresholdat the time when about half of the society's women can read and write. Sinceeducational efforts are usually rather recent, this means that in practice mostyounger women are literate, while illiteracy is still high among the elderly.Only in some Arab countries is this threshold not clearly visible.
The literature on the relationship between fertility and education aswell as between fertility and income is extremely large. No attempt hasbeen made to review it here. However, it should be pointed out that trendsin Mauritius strongly support the already overwhelming evidence (especiallyat the micro level) that basic education, especially of women, is an extremely
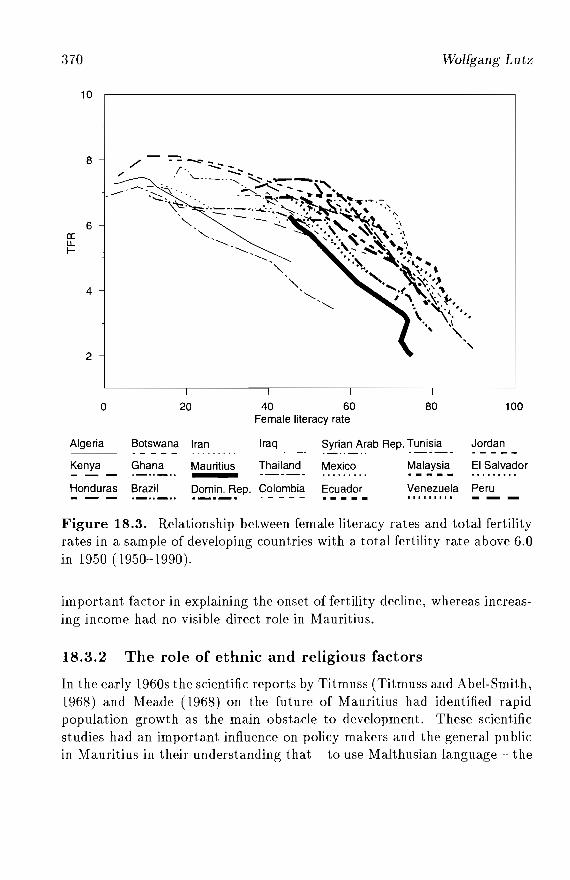
370
10
8
6a:u..f-
4
2
Wolfgang Lutz
0 20 40 60 80 100Female literacy rate
Algeria Botswana Iran Iraq Syrian Arab Rep. Tunisia Jordan- - - - - - - - ------- ----- - - - --
Kenya Ghana Mauritius Thailand Mexico Malaysia EI Salvador- - - .-.._ .. - ----- • 0 •• 0 •• 0. .---- .........Honduras Brazil Domin. Rep. Colombia Ecuador Venezuela Peru- - - ._.._.. ' ----- - - - - - .---- III1IIIII - - -
Figure 18.3. Relationship between female literacy rates and total fertilityrates in a sample of developing countries with a total fertility rate above 6.0in 1950 (1950-1990).
important factor in explaining the onset of fertility decline, whereas increasing income had no visible direct role in Mauritius.
18.3.2 The role of ethnic and religious factors
In the early 1960s the scientific reports by Titmuss (Titmuss and Abel-Smith,1968) and Meade (1968) on the future of Mauritius had identified rapidpopulation growth as the main obstacle to development. These scientificstudies had an important influence on policy makers and the general publicin Mauritius in their understanding that - to use Malthusian language - the
Lessons from Mauritius in the Global Context 371
island would have to suffer from a positive check (i.e., increased mortality),or at least severe poverty, if no preventive check (i.e., declining fertility)was found.
The influential religious communities, although traditionally pronatalist(Roman Catholic, Hindu, Muslim), found it difficult to oppose this argument, especially on a small island where spatial limitations were clearlyvisible. With regard to the Catholic church, which was most influentialin Mauritius, it was largely one individual, the French Jesuit Lestapis,who convinced Catholic authorities and politicians that the church doctrine was not against family planning in general but only against certainmethods. As a consequence, Catholics did not block the introduction ofgovernment-supported family-planning programs, and established their ownfamily-planning organization which propagated natural methods and alsoreceived government support.
In his report Titmuss (published as Titmuss and Abel-Smith, 1968) hadexpected that the great ethnic diversity of Mauritius would present a majorproblem to the acceptance and success of his recommendations. But this wasnot the case in Mauritius. Fertility declines within the Hindu, Muslim, andChinese communities were even more rapid than in the total population thatincluded the "General Population" (a residual category including Europeans,Africans, etc.) in which fertility had already been below average in 1962. InMauritius other factors were obviously strong enough to easily overcome thepotential impediment of ethnic diversity. There has always been peacefulcoexistence between the religions in Mauritius, and religious leaders haveshown flexibility on the family-planning issue.
18.3.3 The role of family planning
The declines in age-specific fertility and marriage rates as well as the useof various family-planning methods since 1962 have been well monitoredin Mauritius (Xenos, 1991). It has been calculated that about half of thebirths averted between 1962 and 1972 were attributable to marriage postponement, the other half to a drop in marital fertility. This coincidence ofrapid transition in marriage patterns and in marital fertility may explain theextraordinary speed of the Mauritian fertility decline. In 1952, 57 percentof the young Indian women aged 15-19 were married in Mauritius. By 1962,this percentage had declined to 37 percent, and further declined by morethan half to 15 percent in 1972. In the age group 20-24, the percentage fell
372 Wolfgang Lutz
from 85 percent in 1962 to .58 percent in 1972. This trend toward increasingage at marriage was universal among all ethnic groups.
The decline in marital fertility was strongest in the higher age groups,a typical pattern for fertility transition. In the age group 30-34 the birthrate declined from 0.256 in 1963 to only 0.128 in 1972. For all age groupsabove 35 the rates more than halved over these few years. The index of familylimitation (m) increased threefold over this period. This is directly related tothe strong family-planning efforts in both propagating smaller families andproviding efficient contraceptive methods, together with improved healthcare and counseling.
Although the decision to launch strong family- planning efforts was basedon a broad national consensus and saw active government support, the external financial contributions of IPPF and UNFPA were also instrumentalfor the successful implementation on a larger scale. The number of new participants in the two Mauritian family-planning programs grew very rapidlyduring the late 1960s and peaked between 1970 and 1972. Surveys showthat contraceptive use had reached 46 percent in 1975 (30 percent "supplied" methods and 16 percent "natural" methods) and 74 percent in 1985(44 percent "supplied" and 30 percent "natural"). In the early 1970s thedensity of family-planning clinics was one of the highest in the world.
18.3.4 Conclusion
Based on extensive surveys of historical and modern fertility transitions,Coale (1974) specified three preconditions for the introduetion of deliberatefamily limitation, i.e., fertility control dependent upon the number of children already born. All three of these conditions find strong support fromthe study of the Mauritian fertility transition.
1. "Fertility must be within the calculus of conscious choice." This refers toa psychological and cultural transition that seems to be intimately tiedto education, especially female education. Also the fact that Mauritiushad a minority group of French origin with already lower fertility in1962 may have facilitated a kind of cultural diffusion process on thisissue similar to that in Europe at the beginning of this century.
2. "Reduced fertility must be advantageous." It was at both the macro andmicro levels that Mauritians understood that lower fertility was advantageous to them. At the macro level the scientific reports by Titmussand Meade seem to have been of crucial importance. At the level of
Lessons [rom Mauritius in the Global Context 373
families it seems to have been the rather high cost of education togetherwith the high desirability of education as a prerequisite for a career thatmade some difference. Also the early introduction of social policies tosupport the disabled and elderly made parents less dependent on theirad ult children.
3. "Effective techniques of fertility reduction must be available." Thewide distribution of modern contraceptive methods, especially the pill,through family-planning organizations certainly facilitated the rapid decline in fertility. Both international aid and good local family-planningorganizations offering a wide variety of methods were also instrumental.
18.4 Did Declining Fertility Stimulate EconomicDevelopment?
In the previous section we concluded that economic growth was not amongthe factors bringing down the fertility rate in Mauritius. Now we considerthe opposite direction of causation: Did fertility decline and the slowingpopulation growth rate exert a positive influence on the start of the economicboom of the 1980s? Does the traditional Coale and Hoover (1958) argumenton capital shortage due to many children hold for Mauritius? Or were othermechanisms dominant during the past three decades?
At the international level the aggregate empirical evidence on this issue seems to be very mixed depending to a large degree on the choice ofvariables. In a 1986 report the US National Academy of Sciences presenteda summary of recent research on the economic consequences of populationgrowth in developing countries. Most of that report focuses on the question of whether slowing population growth is advantageous under certaineconomic and resource availability criteria. The conclusions distinguish between short-term and long-term consequences. For the short term the reportgenerally sees beneficial consequences of slower population growth. But forthe long run, it stresses the possibility of positive effects of population growthdue to incentives for improved organization and technology.
Such general statements on the long-term behavior of highly complexand hard-to-understand societal and economic systems, however, are largelybased on abstract concepts with little possibility for empirical support. Consequently the report concludes:
In short, the effects of rapid population growth are likely to be conditionedby the quality of markets, the nature of government policies, and features
374 Wolfgang Lutz
of the natural environment. Since the effects are so dependent on theseconditions, a reliable assessment of many of the net effects of populationgrowth can best be carried out on the national level. [NAS, 1986, p. 89]
In this section we look at the evidence for Mauritius.
18.4.1 Fertility, population growth, and income
Figure 18.4 plots the evolution of three basic variables in Mauritius: percapita income, population size, and fertility. The timing of changes in thesevariables gives important indications of their relationship. The first observation on the demographic side is that despite dramatic fertility decline, totalpopulation size is rather inert and increases steadily. This trend is due to themomentum of population growth and the fact that mortality also improved.
Because of the almost linear trend in population size between 1950 and1990, it is difficult to make any argument directly related to GNP which, ona per capita basis, fluctuated between Rs 9,000 and Rs 12,750 between 1950and 1970 and then shows two big jumps in the 1970s and the late 1980s. Ifincreasing population size should have induced economic growth, one mustmake the unlikely assumption that some magic population density thresholdswere reached in 1970 and 1985. Based on these data, it is equally difficultto argue that total population size was an obstacle to economic growth.
It is much more instructive, however, to study the relationship of incometo fertility instead of total population size, which is quite a different questionbecause of different assumed mechanisms of causation. (Looking at the ratesof population growth would be a mixture of these two aspects.) It is remarkable to see that the first big increase in income followed immediately afterthe first big fertility decline. The second jump in income followed anothermoderate fertility decline that brought fertility down to replacement level.
Several chapters in this book have extensively discussed the nondemographic factors associated with the phases of economic development.In the late 1980s the introduction of the Export Producing Zone (EPZ)policies seems to be the overwhelming determinant. In the 1970s the external reasons for the rapid income growth are less clear. It coincides withMauritian independence, its first industrialization efforts, favorable international conditions, and stable sugar prices. But the preceding fertility declinemay have well been instrumental for this economic takeoff.
We can think of two arguments in addition to the Coale-Hoover savingsargument that support a causal effect from declining fertility to increasingincome. The first relates to the increase of young women in the labor force
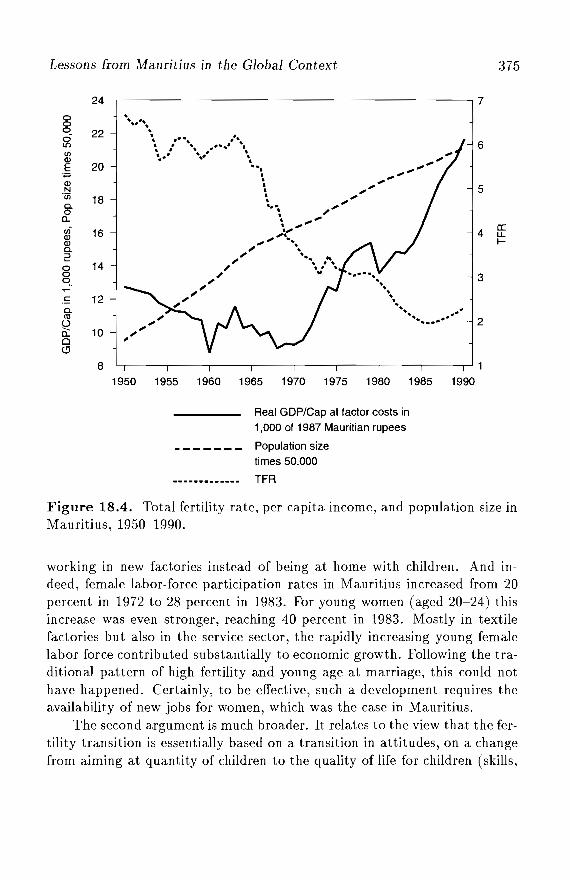
Lessons from Mauritius in the Global Context 375
24
000 22ciLClenOJE 20
'.."OJN'iii 18c.0a.ui 16OJOJc.20 1400_
,~ 12c.C1l
~ 10Cl<9
---,----------------------------,7
6
5
4 fE.....
3
2
8 1
1950 1955 1960 1965 1970 1975 1980 1985 1990
Real GOP/Cap at factor costs in1,000 of 1987 Mauritian rupees
Population sizetimes 50,000
TFR
Figure 18.4. Total fertility rate, per capita income, and population size inMauritius, 1950-1990.
working in new factories instead of being at home with children. And indeed, female labor-force participation rates in Mauritius increased from 20percent in 1972 to 28 percent in 1983. For young women (aged 20-24) thisincrease was even stronger, reaching 40 percent in 1983. Mostly in textilefactories but also in the service sector, the rapidly increasing young femalelabor force contributed substantially to economic growth. Following the traditional pattern of high fertility and young age at marriage, this could nothave happened. Certainly, to be effective, such a development requires theavailability of new jobs for women, which was the case in Mauritius.
The second argument is much broader. It relates to the view that the fertility transition is essentially based on a transition in attitudes, on a changefrom aiming at quantity of children to the quality of life for children (skills,
376 Wolfgang Lutz
higher status). This refers to the first of Coale's basic conditions for a sustained marital fertility decline as discussed above. Some even call it a transition from fatalism to individual rationality. Now the argument is, onceindividual planning has been introduced into one's private life, it is this psychological transition that consequently results in longer-term investmentsinto the future, including training (of oneself and of children) and economicactivities. Such longer-term investments at the individual as well as at thefamilial and societal levels are also the basis for any economic development.In this sense the fertility decline may be seen as being closely related to atakeoff in economic development.
There are several other countries where the sequence of fertility declineand economic growth is similar to Mauritius (most notably China), but, asshown above, the two developments may also be simultaneous or in specificcases (such as some Arab oil-exporting states) in reversed order.
18.4.2 What would have happened without fertility decline?
The PDE Mauritius model developed for this study not only makes projections into the distant future but can also be used to construct alternativehistories (see Chapter 17). In this case 1962 (a census year) is chosen as theinitial state. Thereafter the observed development for 25 years (up to 1987)is reconstructed as one scenario. But several hypothetical alternative scenarios also have been calculated, four of which will be briefly discussed here for aquantitative assessment of the role of population variables in income growth.
Table 18.1 shows that the development observed between 1962 and 1987brought a 101 percent increase in per capita GNP. If no development hadtaken place - i.e., all demographic, social, and economic parameters hadremained at their 1962 level - GNP per capita would have declined to twothirds of the already very low level by 1987. If, however, fertility had declinedand education had improved with constant economic parameters, per capitaincome would have declined by only 22 percent. Hence a fertility declinewould have made a bad situation somewhat (a third) better.
In the case of assumed progress in the economic parameters along thecircumstances actually observed between 1962 and 1987 but without a fertility decline, per capita income would have increased by "only" 63 percentinstead of 101 percent, i.e, one-third less. If one also assumed no socialdevelopment, which mostly refers to observed education patterns, GNP percapita would have increased by "only" 61 percent, i.e., somewhat more thanhalf of the observed increase.
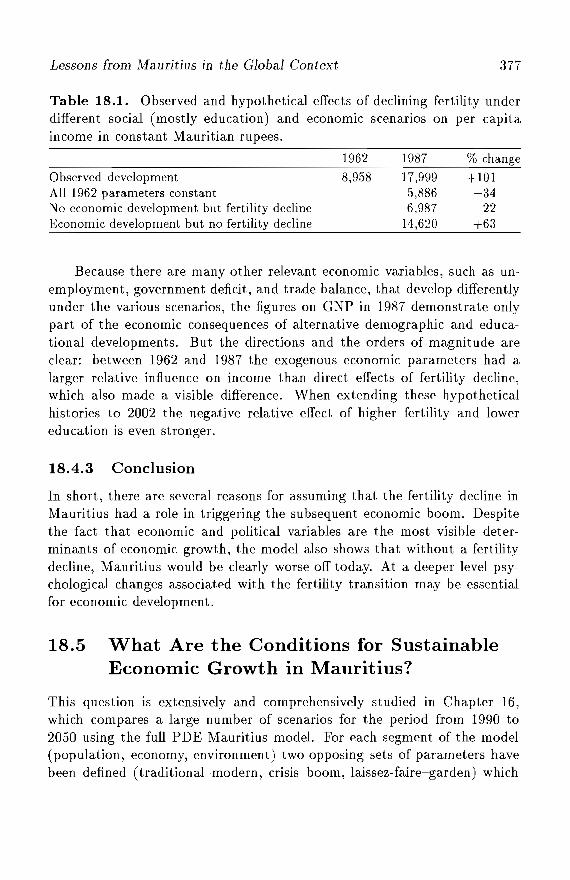
Lessons from Mauritius in the Global Context 377
Table 18.1. Observed and hypothetical effects of declining fertility underdifferent social (mostly education) and economic scenarios on per capitaincome in constant Mauritian rupees.
Observed developmentAll 1962 parameters constantNo economic development but fertility declineEconomic development but no fertility decline
1962
8,958
1987
17,999.5,8866,987
14,620
% change
+101-34-22+63
Because there are many other relevant economic variables, such as unemployment, government deficit, and trade balance, that develop differentlyunder the various scenarios, the figures on GNP in 1987 demonstrate onlypart of the economic consequences of alternative demographic and educational developments. But the directions and the orders of magnitude areclear: between 1962 and 1987 the exogenous economic parameters had alarger relative influence on income than direct effects of fertility decline,which also made a visible difference. When extending these hypotheticalhistories to 2002 the negative relative effect of higher fertility and lowereducation is even stronger.
18.4.3 Conclusion
In short, there are several reasons for assuming that the fertility decline inMauritius had a role in triggering the subsequent economic boom. Despitethe fact that economic and political variables are the most visible determinants of economic growth, the model also shows that without a fertilitydecline, Mauritius would be clearly worse off today. At a deeper level psychological changes associated with the fertility transition may be essentialfor economic development.
18.5 What Are the Conditions for SustainableEconomic Growth in Mauritius?
This question is extensively and comprehensively studied in Chapter 16,which compares a large number of scenarios for the period from 1990 to2050 using the full PDE Mauritius model. For each segment of the model(population, economy, environment) two opposing sets of parameters havebeen defined (traditional-modern, crisis-boom, laissez- faire-garden) which
378 Wolfgang Lutz
are then combined in aggregate scenarios and adjusted to meet the basicrequired balances (water, labor, budget) and some user-defined feedbackmechanisms. Specific policy options (such as priority to sugar or food selfsufficiency) have also been tested in this context. A concise summary of theresults of these alternative model runs is given in Section 16.4. This sectionhighlights some of the key results under a somewhat broader perspective.
18.5.1 Water as the basic physical constraint even on atropical island
The international discussion on resource availability has recently given moreattention to the management of renewable resources since the concern aboutnonrenewable resources has somewhat diminished. Water is a very specialkind of renewable resource because its local availability is essentially determined by the climate and topography, and can only be transported overlonger distances under specific conditions. On Mauritius total freshwateravailability must essentially be considered as a "fixed resource" with significant seasonal and annual variations.
Whether Mauritius has scarce or plentiful freshwater resources dependson whether we consider water per person or water per land area. Figure 18.5shows a cross-classification of a number of countries according to these twovariables. Mauritius is found in the lower-right side of the graph, indicatingthat, because of its tropical climate and mountains, Mauritius has morewater per km2 than most other countries in the world, whereas it has verylow per capita water resources. The discrepancy results from the very highpopulation density of Mauritius.
The set of future scenarios consistently shows that water availability at agiven high standard of quality is the essential environmental constraint to unlimited economic growth in Mauritius. Whether this constraint will actuallyinhibit economic growth depends on the investment made into water storageand treatment. Under environmental laissez-faire policies, together with anexport-driven economic boom, the limits will be met relatively soon. But themodel also shows that timely investment into water-management infrastructure will make possible very rapid additional economic growth. This is especially the case when growth is not based on irrigation-intensive sugar canebut rather on industry and services. Among the many relevant aspects ofwater management, wastewater treatment comes out as the most significant.
Another aspect which is considered in the water module of the PDEmodel is the water quality of the lagoon which surrounds large parts of
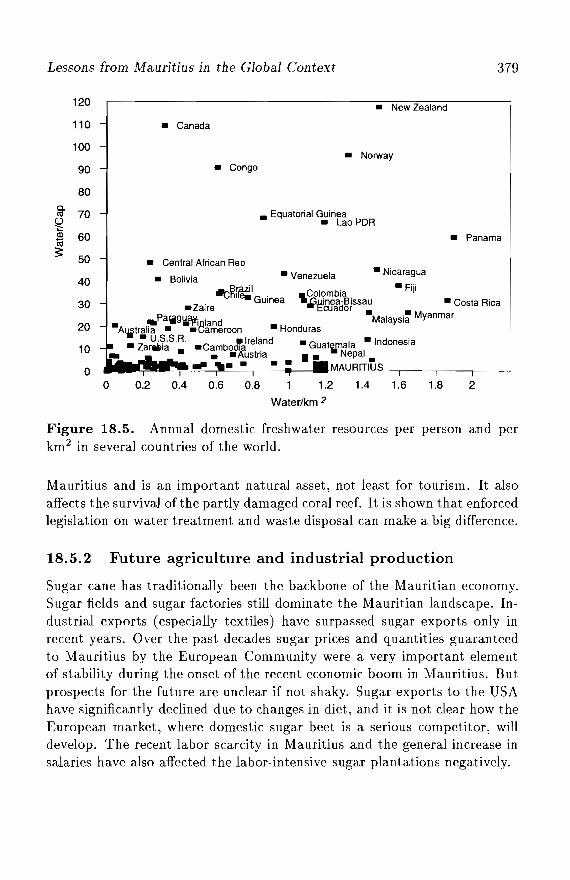
Lessons from Mauritius in the Global Context 379
2
• Panama
1.81.6
• Nicaragua
-Fiji
1.40.8 1 1.2
Water/km 2
0.60.4
• New Zealand
• Norway• Congo
• Equatorial Guinea• Lao PDR
• Canada
• Central African Rep
• Bolivia
0.2
• Venezuela......Brazil-,-,nile. Guinea ,Colombia
.Zaire .,gi£Jgd~issa~..Costa Rica
• .Pa~gw.~iDland Malaysia MyanmarAljtralia. .t.;ameroon • Honduras
• U.S.S.R. ..Ireland. G • Indonesia- ZanMlla • .CamboOla . uatlrJala• • Austria • _ Nepal _
.". _. •• MAURITIUS ---,-__,---_---,__---J
120
110
100
90
800-
70<llU~Q) 60~::: 50
40
30
20
10
00
Figure 18.5. Annual domestic freshwater resources per person and perkm2 in several countries of the world.
Mauritius and is an important natural asset, not least for tourism. It alsoaffects the survival of the partly damaged coral reef. It is shown that enforcedlegislation on water treatment and waste disposal can make a big difference.
18.5.2 Future agriculture and industrial production
Sugar cane has traditionally been the backbone of the Mauritian economy.Sugar fields and sugar factories still dominate the Mauritian landscape. Industrial exports (especially textiles) have surpassed sugar exports only inrecent years. Over the past decades sugar prices and quantities guaranteedto Mauritius by the European Community were a very important elementof stability during the onset of the recent economic boom in Mauritius. Butprospects for the future are unclear if not shaky. Sugar exports to the USAhave significantly declined due to changes in diet, and it is not clear how theEuropean market, where domestic sugar beet is a serious competitor, willdevelop. The recent labor scarcity in Mauritius and the general increase insalaries have also affected the labor-intensive sugar plantations negatively.
380 Wolfgang Lutz
Several scenarios have been calculated that assume drastic changes ininternational sugar demand and domestic factors such as a sugar policy forreasons of tradition rather than profitability. The general result is that itdoes not make sense to intensify sugar growing (which already has veryhigh fertilizer and irrigation inputs) for economic and environmental reasons. Sugar refining, however, can be made more efficient especially byusing the large energy potential of bagasse. To prohibit the conversion ofsugar land for industrial or urban use is neither economical nor practical,but the present land conversion tax that depends on the fertility of the soilis an interesting solution.
Future industrial growth is assumed to be mostly driven by export demand. If Mauritius remains in the export market dominated by textiles, itcould significantly increase its per capita income to several times the presentGNP Icapita. Through a structural change in the economy, toward highervalue-added products and especially services, however, its economic growthcould potentially be even more rapid (following the example of the AsianTigers) and achieve income levels by 2050 that are higher than today's European levels. Because of a move toward less polluting and less water-intensiveindustries, this would also be possible from an ecological perspective. Asidefrom favorable international conditions one domestic prerequisite for such arapid and sustainable development is a highly skilled labor force.
18.5.3 Role of tourism
Despite the rapid growth of international tourism in Mauritius over the pastyears, in 1990 foreign exchange earnings from tourism comprised only 15percent of the total exports and an estimated 3.3 percent of the GDP. Butthere are also important indirect benefits from tourism. Mauritius has madea clear choice for high-quality expensive hotels and has put a limit on thenumber of hotel rooms. Because of the limited availability of attractivebeaches there is an inherent conflict between private and public access thatrequires careful management.
In an international perspective Mauritius is still in the early stage of thetourist resort cycle (see Debbage, 1991) in which very rapid expansion maybe followed by stagnation and even decline because of loss of attractiveness.To avoid destructive development, such as that on the Bahamas, Mauritius\tlust regulate and limit the expansion of tourism. The present policy ofhigh-cost and quantitative limitations (no charter flights are allowed to landin Mauritius) seems to be a move in the right direction. But to remain
Lessons from Mauritius in the Global Context 381
internationally competitive in the future, attention must also be given tothe water quality in the lagoon, the status of the reefs, the preservation oforiginal landscapes, and cultural events.
In a way high-level selective tourism in international competition turnsout to be conducive to environmental protection. It provides a very quickeconomic feedback mechanism that cannot be ignored even in short-termpolitics. SmalJ signs of environmental destruction and pollution may causetourists to go to cleaner islands.
18.5.4 Population and labor force
The role of population variables in actual and hypothetical past developments has been discussed extensively above. Because Mauritius has nowpassed the fertility transition, it is highly unlikely that it will return to thehigh premodern levels. The population is currently growing by 1 percent peryear which is entirely due to the momentum of population growth, i.e., theyoung age structure of the population and some mortality improvements.Alternative future fertility assumptions have been considered separately foraU three educational groups of women, and result in fertility levels somewhatabove replacement level ("traditional") or below replacement level ("modern"). Fertility is also influenced by the changing educational compositionsof the population. In the "traditional" case the total population size ofMauritius would increase from today's 1.1 million to 1.9 million by 2050; inthe "modern" case it would only increase to 1.2.5 million in 2020 and thendecline to 1.15 million by 2050.
These alternative population sizes and structures also have a sizeableimpact on the future trends in the economic variables of the model. Whencomparing the two scenarios, which have the "boom" assumptions in theeconomic sector and the "garden" assumptions in the environmental sector,the "modern" assumptions in the population-education sector result in a 64percent higher per capita income in 2050 than the one using the "traditional"assumptions. Hence stagnation in the social development that brings lowerfertility and higher productivity through better education would have seriousnegative effects even under otherwise very favorable economic conditions.
The size and quality of the labor force are of special concern. For the pasttwo decades the World Bank has identified the Mauritian labor force, including an increasing number of educated women, as "the engine of economicgrowth." If Mauritius is to be successful in expanding into new marketsrequiring higher technology, the quality of the labor force once again will
382 Wolfgang Lutz
be the key to success. For this reason the economic development plans ofthe government put high emphasis on further technical training of the laborforce. As long as the local expertise is flexible enough to adjust to new technologies, investment into human capital will be one of the most effective andmost robust strategies for sustainable economic development in Mauritius.
18.5.5 Dependence on the global economy and theglobal environment
Although Mauritius is rather isolated geographically, it is interwoven intothe global economy. The overwhelming dependence on export earnings andimports of food and most other consumer goods has a long tradition. Achange in this situation does not seem to be possible without a significantloss in welfare. Especially with a further diversification of export and importmarkets that makes Mauritius less vulnerable to possible crises in specificworld regions, the benefits of such an international orientation far outweighthe risks. But significant flexibility in the change of markets and necessaryimports is an important component of resilient development strategies.
Mauritius is hardly affected by any transport of pollutants from othercountries, but it would certainly be affected by changes in the global climate.The Mauritian contribution to global warming is negligible not only becauseof its small population but because it has one of the lowest CO 2 emissions perGNP in the world. Present general circulation models are not yet detailedenough to study the impact of a doubling of CO 2 on rainfall and temperature,given the Mauritian topography. For the region, the various models tend toshow a temperature increase of between 2 and 3 degrees Celsius and alsosome increase in precipitation in the already wet months. Effects of a possibleincrease in the sea level depends on, among others things, whether the coralreefs are healthy enough to grow with the same speed. Probably the mostrelevant question for Mauritius is the future of cyclones, since Mauritiusis situated in the usual path of cyclones through the Indian Ocean. Anincrease in the intensity of cyclones would be destructive; a change in theirpaths might be advantageous; and an increase in the frequency of cycloneswith lower intensity may also be good because of the possibility of more rain.
18.5.6 Conclusion: Toward a prosperous garden island
The scenario that combines all the "good" assumptions in the three segments of the PDE Mauritius ("modern" for the population sector, "boom"
Lessons from Mauritius in the Global Context 383
for the economy, and "garden" for the environment) can be called the "Prosperous Garden Island Scenario." This scenario points the direction towardsustainable development. It is called "garden island" because Mauritius haslittle original nature left and has a largely man-made environment. For thisreason the metaphor of a man-made, well-kept garden is seen as appropriatefor Mauritius. It also reflects the high population density and need not bein conflict with economic growth and prosperity. In fact some wealth is necessary to sustain the garden. It also requires wise environmental legislation,good infrastructure, as well as the skills and willingness of the population totake good care of the garden. In most of these aspects Mauritius seems tobe on the right track.
18.6 What Are the Policy Priorities?
After extensive elaboration of the many specific questions that include numerous qualifications and differentiations because of the intrinsic complexityof the system, it is justified at this point to ask for the most significant policypriorities that follow from the study. Two important policy issues becomeapparent when studying the history and the future of Mauritius under atruly comprehensive perspective.
18.6.1 Foresight and accountability
Throughout Mauritian history, things went well when government policyconsidered a longer time horizon; irreparable damage was caused when immediate advantages were the only objective. For example, the scientificstudies on Mauritius in the 1960s, showing that a change was necessary, hada long time horizon, and were fortunately heard by responsible politiciansand understood at the individual and societal levels. Such flexibility andforesight was the basis for the Mauritian success story. Similar foresight isbeing shown now in the first steps being taken by Mauritian authorities toward sustainable development that cares about the environmental heritage.
A comparison of Mauritius to other countries in the African region sincethe 1960s shows that one of the main nonmaterial differences is that duringthe whole period, Mauritius had a truly democratic system. Despite theextreme ethnic heterogeneity, this system managed to settle conflicts peacefully and develop a sophisticated balance of power. Although this dimensionis beyond our quantitative model, it comes out as most important under aholistic perspective in the historical analysis.
384 Wolfgang Lutz
Many things could have gone wrong in Mauritian politics that couldhave inhibited development or even ruined the island. Desperate economicconditions and extremely high unemployment - in 1983 still half of the maleyouth cohort born around 1960 was unemployed - could have easily startedethnic tension and conflict over still severe social inequalities.
There are several reasons for the peaceful coexistence of very diverse ethnic groups that differ not only by language, religion, and skin color but to alarge extent also by social class in Mauritius. One reason is that no groupcan claim to be the original population of the island; everyone descendedfrom immigrants. Another reason is that under the British rule, 1810-1967,the very influential and rich Franco-Mauritian estate owners were allowedto keep their land and language but not political power; they learned tofind other mechanisms to serve their interests. Finally, after independencethe first prime minister, Sir Ramgoolam, established an important Mauritian tradition of ruling by consensus, by inviting the Conservative Party toshare power although his Independence Party had a sufficient majority inParliament (see Chapter 4).
Despite many political squabbles, in most issues of real importance,foresight was paired with personal accountability. Decision makers who areaccountable to the majority of the population, including families and thechildren who represent the future generation, and who do not primarily servetheir own interests or those of a subgroup seem to be a basic prerequisite forsustainable development.
The political accountability in Mauritius is extended to the individuallevel where it is understood that one is accountable for one's own choices,including the number of children, educational level, and the environment.This may be regarded as a prerequisite for demographic transition as well asfor modern economic development in balance with the natural environment.This empowerment of the people seems to be the underlying reason for theMauritian success story. The people can read, they are informed aboutmost critical issues, and they have shown that they can take an active rolein determining their country's fate.
18.6.2 Investment in human skills and the status of women
The second important policy lesson is the crucial importance of the humanresource in sustainable development. The story of Mauritius tells us thatthe first policy priority in international efforts for sustainable developmentshould focus on the development of people or what economists call human
Lessons [rom Mauritius in the Global Context 38.5
capital. This is the "ultimate resource" under a longer time horizon, but interms of skills (and attitudes) rather than sheer quantity. It is not the starving and unskilled desperate who bring about progress, but those that havethe skills and the possibility of thinking creatively and caring about others atall different levels. The Mauritian experience suggests that education is thekey, especially basic education of broad segments of the population ratherthan of elites in an otherwise illiterate society.
More specifically, it is the basic education of women and their statusin society that seems to have a very important role in the transition tolower fertility. It may also be conducive to sustainable development throughincreased female activity and greater weight of women in decision makingtogether with their supposed tendency to care more about their children'sfuture and harmony with nature than about unnecessary consumption andtechnology. On this last presumption, however, little empirical analysis hasbeen done. But the gender dimension at familial and societal levels certainlyneeds more attention in th~ context of sustainable development.
The provision of family-planning services, one specific and heatedly debated policy issue, is one factor that is conducive to the fertility transitionand is desirable not only for macro-level considerations but also for facilitating individual choice and personal life-course planning. Family planning,however, should not be singled out ofthe context offemale status and healthcare, and pushed as an independent "engineering" solution. This does notwork and can be counterproductive. Instead it should be viewed as one aspect of empowering women, men, and families to more actively plan theirlives and to make a difference in their society. It is part of the investmentin the human resource.
With respect to the priorities in international development policies, thissuggests a radical change of emphasis. Less attention should be given tolarge-scale technological projects that often prove to be inappropriately designed for the specific local conditions and may even turn out to be harmfulto the environment and the social fabric. In contrast, investment into thehuman resource - education, health, and family planning - can hardly bewrong, but is likely to result in immeasurable and far-reaching benefits toindividuals, communities, and nations. It is a very robust policy that mayonly show modest immediate results, but a great payoff in the long run.

Chapter 19
Epilogue: How Useful is theMauritius Study for OtherParts of the World?
TVolfgang Lutz
The question of transferability of the Mauritius model and of some of thebasic findings to other countries under different social, economic, and environmental conditions is legitimate and has often been asked. It needs to beanswered at three different levels.
19.1 Application to Small Tropical Island States
The model as it stands, as well as much of the substantive analysis in thefields of water management, land use, agriculture, tourism, energy, etc.,could rather easily be applied to a number of small tropical island states inthe Caribbean or Pacific that show surprising partial parallels to Mauritius,not only in terms of climate and the dominating role of sugar cane butin some cases in terms of population and political histories. Here again,one could distinguish between a more formal application of PDE Mauritiusand a simple transfer of the Mauritius findings. In the first case one couldessentially use the same software and adjust the data base to the islandchosen. By this, one could derive new empirical findings of direct relevanceto the selected island. Currently, one such study is being conducted for
388 Wolfgang Lutz
the Cape Verde Islands. The other, certainly much smaller, effort would beto simply take the findings from Mauritius and see how much of the basicmessages could be reasonably transferred to the other island's situation. Forgeneral policy guidelines this may even be sufficient.
19.2 Development of New PDE Models forVery Different Regions
The PDE model presents a general approach that can be applied to anyregion in the world. For PDE Mauritius a number of specific choices had tobe made for operationalizing the model and adhering to the principle thatonly sectors should be considered that can potentially make a difference. Forthis reason, PDE Mauritius does not have a separate air pollution module.Currently, applying the PDE framework to countries radically different fromMauritius is being considered. One candidate is Bolivia, where ecologicaland ethnic diversity is so great that the model definitely needs to distinguishbetween different regions and different ethnic groups within regions. Alsothe economic module requires significant modification for a country with avery important informal sector.
For a better understanding of the interactions between population, development, and environment under a global perspective it would certainly bedesirable to have a number of case studies using the same general approachbut being carried out under very diverse social, economic, and environmentalconditions.
19.3 Contribution to Scientific Discussion andA wareness Creation
The scientific aspirations of the study presented in this book clearly go beyond the island of Mauritius. It has been our hope that the study will helpstructure the still highly confused debate on population-environment issueswhich cuts across various disciplines by looking at specific empirical evidencein terms of both a qualitative historical analysis and a clearly structuredquantitative computer model. The design of the model should be acceptableto most social scientists as well as natural scientists. Opposing views on thepopulation-environment issue can be made very explicit through alternativeassumptions on the basis of this common quantitative model. This could

Epilogue 389
help prepare the groundwork for a common understanding across disciplinesand between traditional opponents by more clearly identifying the differencesand putting them into perspective.
Another use of the PDE Mauritius model and future models for otherregions lies in the training of students, scholars, and policy makers worldwideto help them view the issues of population change, socioeconomic development, and environmental change in an interconnected and comprehensiveway. Viewing these processes under a longer time horizon, be it the study ofhistorical trends or running the model into the future, will contribute to theunderstanding of the notion of sustainable development in specific contexts.

References
Action Familiale, 19S5, Action Familiale 1963-1988, Port Louis, Mauritius.Addison, J., and Hazareesingh, K., 19S4, A New History of Mauritius, Macmillan,
London, UK.Arcia, G., Merino, L., Mata, A., and O'Hanlon, B., 1991, Modelo Interactivo de
Poblacion y M edio A mbiente en Costa Rica - A nalisis y Proyecciones para elValle Central, Asociaci6n Demogra.fica Costarricense, San Jose, Costa Rica.
Baguant, J., 19S9, Energy data book: Energy supply and consumption, 197019S9, in Energy Use and Policy Planning in Mauritius, Vol. 1, University ofMauritius.
Baguant, J., and Beeharry, P.R., 19S9, Household energy consumption survey, inEnergy Use and Policy Planning in Mauritius, Vol. II, University of Mauritius.
Baguant, J., and Manrahhan, J., 1990, Energy Use and Policy Planning in Mauritius, Energy Data Bank: Energy Supply and Consumption 1970-1989, University of Mauritius.
Baguant, J., and Manrahhan, J., 1991, Use of petroleum products: Opportunitiesand constraints - Power sector, in African Energy Policy Research Network,University of Mauritius.
Barney, G.O., 19S0, Global 2000: The Report to the President, Entering the 21stCentury, US Government Printing Office, Washington, DC, USA.
Barney, G.O., Kreutzer, W.B., and Garrett, M.J., eds., 1991, Managing A Nation:The Microcomputer Software Catalog, 2nd Edition, Westview Press, Boulder,CO, USA.
Barnwell, J.P., and Toussaint, A., 1949, A Short History of Mauritius, Longmans,London, UK.
Beeharry, R.P., 1992, Decarbonization of Energy Supply in Small Developing Countries: A Study of Long- Term Policy Options for Mauritius, Draft Paper, IlASA,Laxenburg, Austria.
Bell, D., 1990, Contradictions of modernity, Society MarchiApril:43-50.Bheenick, R., and Hanoomanjee, E., 19S9, Mauritius: Towards an Industrial Train
ing Strategy, Ministry of Economic Planning and Development, Port Louis,Mauritius.
Bheenick, R., and Schapiro, M.O., 19S9, Mauritius: A case study of the exportprocessing zone, in R. Bheenick et al., eds., Successful Development in Africa:
392 References
Case Studies oj Projects, Programmes and Policies, World Bank, Washington,DC, USA.
Bingham, A., 19S5, Singapore traps urban runoff, Worldwater May:33-35.Bissoondoyal, S., 1963, A Concise History oj Mauritius, Bharatiya Vidya Bhavan,
Bombay, India.Boserup, E., 19S1, Population and Technological Change, University of Chicago
Press, Chicago, IL, USA.Boserup, E., 1990, Economic and Demographic Relationships in Development, Es
says selected and introduced by T.P. Schultz, Johns Hopkins University Press,Baltimore and London.
BouIIe, B., 19S9, The Sugar Protocol and Mauritius, Mauritius Sugar Syndicate,Port Louis, Mauritius.
Braudel, F., 1979, Civilization materiel/e, economie et capitalisme, X Ve- VXIIIesircle. Tome 1; Les structures du quotidien: Ie possible et I'impossible, ArmandColin, Paris, France.
Brookfield, H.C., 1957, Mauritius: Demographic upsurge and prospect, PopulationStudies 11(2):102-122.
Brookfield, H.C., 19S1, Man, environment and development in the outer islands ofFiji, Ambio 10(2-3):59-67.
Brundtland, G.H., Chairman, World Commission on Environment and Development, 19S7, Our Common Future, Oxford University Press, Oxford, UK.
Brundtland, G.H., 19S9, How to secure our common future, Scientific American261:190.
Bury, J .B., 19S2, The Idea oj Progress: An Inquiry into Its Origin and Growth,Greenwood, Westport, CT, USA (reprint of 1932 edition).
CBS (Central Bureau of Statistics), 19S9, Mauritian Household Survey, 1989, PortLouis, Mauritius.
Chan, P.K., and Chan, N.W., 19S1, Water resources development in Hong Kong,in Proceedings oj a Seminar on Water Management in Small Island States,Cyprus Joint Technical Council and Commonwealth Engineering Council.
Cleland, .I., and Scott, c., eds., 19S7, The World Fertility Survey: An Assessment,Oxford University Press, New York, NY, USA.
Coale, A., 1974, The demographic transition, in UN, The Population Debate,Dimensions and Perspectives: Papers oj the World Population Conference,Bucharest, New York, NY, USA.
Coale, A.J., and Hoover, E.M., 1955, Population Growth and Economic Development in Low-Income Countries, Princeton University Press, Princeton, NJ,USA.
Cole, H.S.D., Freeman, c., Jahoda, M., and Pavitt, K.L.R., eds., 1973, Models ojDoom: A Critique oj The Limits to Growth, Universe Books, New York, NY,USA.
Colony of Mauritius, IS79, Admznistrative Report, 1879, Port Louis, Mauritius.Commoner, B.H., 1971, The Closing Circle: Nature, Man, and Technology, Alfred
A. Knopf, New York, NY, USA.
References 393
Coombes, A.N., 1963, Aper9u de l'evolution de I'agric1tlture a /'ile Maurice, PortLouis, Mauritius.
CSO (Central Statistical Office), 1947, 1957, 1967, Yearbook of Statistics, Ministryof Economic Planning and Development, Port Louis, Mauritius.
CSO (Central Statistical Office), 1956, Natality and Fertility in Mauritius, PortLouis, Mauritius.
CSO (Central Statistical Office), 1976-1988, Annual Digest of Agricultural Statistics, Ministry of Economic Planning and Development, Port Louis, Mauritius.
CSO (Central Statistical Office), 1985-1990, National Accounts of Mauritius, Ministry of Economic Planning and Development, Port Louis, Mauritius.
CSO (Central Statistical Office), 1987, Digest of Statistics, Port Louis, Mauritius.CSO (Central Statistical Office), 1988a, Digest of Industrial Statistics 1988, Rose
Hill, Mauritius.CSO (Central Statistical Office), 1988b, Housing and Population Census of Mauri
tius, 1983, Volume VI: Health, Morbidity and Mortality, Port Louis, Mauritius.CSO (Central Statistical Office), 1989, 1990, Digest of Agricultural Statistics, Min
istry of Economic Planning and Development, Port Louis, Mauritius.CSO (Central Statistical Office), 1990a, Annual Yearbook of Statistics, Port Louis,
Mauritius.CSO (Central Statistical Office of Mauritius), 1990b, Housing and Population Cen
sus of Mauritius, Port Louis, Mauritius.CSO (Central Statistical Office), 1991, Handbook of StatistIcal Data on Tourism,
December 1991, Port Louis, Mauritius.CWA (Central Water Authority), 1988, Hydrology Year Book 1984 - 1985 - 1986,
GOM Ministry of Energy, Water Resources, and Postal Services, Port Louis,Mauritius.
CWA (Central Water Authority), 1991, Master Plan Study on Water Resourcesof Mauritius: Conclusions and Recommendations, GOM Ministry of Energy,Water Resources, and Postal Services, Port Louis, Mauritius.
Daly, H.E., 1986, Review of population growth and economic development: Policyquestions, Population and Development Review 12(3):582-585.
Darwin, C., 1934, Charles Darwin's Diary of the Voyage of the H.M.S. "Beagle,"Cambridge University Press, Cambridge, UK, excerpt reprinted in PopulatIOnBulletin 18(5)[1 962J: 114-115.
Dean, W., 1983, Deforestation in southeastern Brazil, in R.P Tucker and J.F.Richards, eds., Global Deforestation and the Nineteenth-Century World Economy, Duke University Press, Durham, NC, USA.
Debbage, K.G., 1991, Tourist destination cycles and sustainable development: Acomparative analysis of the Bahamas and Mauritius, in W. Lutz and F.L. Toth,eds., Population, Economy, and Environment in MauritIUS, CP-91-01, lIASA,Laxenburg, Austria.
De Sornay, P., 1950, Isle de France - Ile Maurice, Port Louis, Mauritius.
394 References
Deville, J., and Ng Kee Kwong, K.F., 1984, Nitrogen leaching from soils croppedwith sugar cane under the humid tropical climate of Mauritius, Indian Ocean,Journal of Environmental Quality 13:471-474.
Dornbush, R., and Fischer, S., 1981, Macro-Economics, 2nd Edition, McGraw-Hill,New York, NY, USA.
Echiburu, R., 1977, Energy Analysis of Energy and Labor Substitution in Manufacturing, Energy Studies Unit, Strathclyde University, Glasgow, Scotland.
Edmonds, J.A., and Reilly, J., 1983, A long-term global energy-economic model ofcarbon dioxide release from fossil fuel use, Energy Economics 5(2):74-88.
Edmonds, J.A., and Reilly, J., 1985, Global Energy: Assessing the Future, OxfordUniversity Press, New York, NY, USA.
Edmonds, J.A., Pitcher, H.M., Barns, D., Baron, R., and Wise, M.A., 1991, Modeling future greenhouse gas emissions: The second generation model description, Paper prepared for the United Nations University Conference on GlobalChanges and Modeling, Tokyo, October, Pacific Northwest Laboratory, Washington, DC, USA (to be published by UN University Press).
Ehrlich, P., 1968, The Population Bomb, Ballantine, New York, NY, USA.Ehrlich, P.R., and Ehrlich, A.H., 1970, Population, Resources, Environment, Free
man, San Francisco, CA, USA.Ehrlich, P.R., and Ehrlich, A.H., 1990, The Population Explosion, Simon and Schus
ter, New York, NY, USA.Ertuna, 1988, Treatment and use of sewage effluent for irrigation in Western Asia,
in FAD Regional Seminar on the Treatment and Use of Sewage Effiuent forIrrigation, Butterworths, London, UK.
Falkenmark, M., 1988, Sustainable development as seen from a water perspective,in Stockholm Group for Studies on Natural Resource Management (SG N),Perspectives of Sustainable Development: Some Critical Issues Related to theBrundtland Report, SGN, Stockholm, Sweden.
Food Production Board, 1950, Memorandum on Long Term Policy, Government ofMauritius, Port Louis, Mauritius.
German Development Institute (GDI), 1992, Perspectives of the Clothing and Textile Industry in Mauritius in the Face of Changing External and Internal Conditions - Challenges for Enterprises and Institutions.
Gilbert, A.J., and Braat, L.C., eds., 1991, Modelling for Population and SustainableDevelopment, Routledge, London, UK.
Gleadow, F., 1904, Report on the Forests of Mauriti'us with a Preliminary WorkingPlan, Government of Mauritius, Port Louis, Mauritius.
GOM (Government of Mauritius), 1991, White Paper on National EnvironmentalPolicy, Port Louis, Mauritius.
GOM (Government of Mauritius)/World Bank, 1988, Mauntius: EnvironmentalInvestment Program for Sustainable Development, Port Louis, Mauritius.
Green, C.P., 1992, The Environment and Population Growth: Decade for Action,Series M, No. 10, May, UNFPA, New York, NY, USA.
References 395
Hardin, G., 1993, Living Within Limits: Ecology, Economics, and PopulationTaboos, Oxford University Press, New York, NY, USA.
Holm, E., 1992, Land-use Change on Mauritius, Manuscript, nASA, Laxenburg,Austria.
Hopkins, A.G., 1973, An Economic History of West Africa, Longmans, London,UK.
Jevons, S., 1909, The Coal Question: An Enquiry Concerning the Progress of theNations and the Probable Exhaustion of Our Coal Mines, Macmillan, London,UK.
Keyfitz, N., 1985, Applied Mathematical Demography, 2nd Edition, Springer-Verlag,New York, NY, USA.
Keyfitz, N., 1991, Population growth can prevent the development that would slowpopulation growth, in J .T. Mathews, ed., Preserving the Global Environment:The Challenge of Shared Leadership, Norton, New York, NY, USA.
Keyfitz, N., and Flieger, W., 1990, World Population Growth and Aging, Universityof Chicago Press, Chicago, IL, USA.
King, J., 1991, The ECCO approach to planning sustainable development, in A.J.Gilbert and L.C. Braat, eds., Modelling for Population and Sustainable Development, Routledge, London, UK.
King, H., and Dowd, J .E., 1991, The health status of the Mauritian population andprospects for change, in W. Lutz and F.L. Toth, eds., Population, Economy,and Environment in Mauritius, CP-91-01, nASA, Laxenburg, Austria.
Kostolany, A., 1987, Kostolany's Wunderland von Geld und Borse, Busse and Seewald, Herford, Germany.
Lewis, W.A., 1955, The Theory of Economic Growth, Allen and Unwin, London,UK.
Lof, G.O.G., and Hardison, C.H., 1966, Storage requirements for water in the UnitedStates, Water Resources Research 2(3):323-354.
Lutz, W., forthcoming, What do we need more urgently: Better data, better models,or better questions, in J. Clarke and B, Zaba, eds., Environment and PopulationChange, Ordina Editions, Liege, Belgium.
Lutz, W., and Toth, F.L., eds., 1991, Population, Economy, and Environment inMauritius, CP-91-01, nASA, Laxenburg, Austria.
Lutz, W., and Wils, A.B., 1991, The demographic discontinuities of Mauritius,in W. Lutz and F.L. Toth, eds., Population, Economy, and Environment inMauritius, CP-91-01, nASA, Laxenburg, Austria.
Lutz, W., Wils, A.B., and Prinz, C., 1990, Rapid fertility decline through familyplanning preceding economic growth: The case of Mauritius, Paper presentedat the CICREDjUNFPA Meeting on "Effects of Family Planning on Fertility,"New York, 7-9 November.
Ly-Tio-Fane, 1958, Mauritius and the Spice Trade: The Odyssey of Point Poivre,Esclapon Ltd., Port Louis, Mauritius.
Malthus, T.R., [1798] 1967, Population: The First Essay, with a foreword by K.E.Boulding, University of Michigan Press, Ann Arbor, MI, USA.
396 References
Mannick, A.R., 1979, Mauritius: Development of a Plural Society, Spokesman,Nottingham, UK.
Mannick, A.R., 1989, Mauritius: The Politics of Change, Dodo Books, Mayfield,UK.
Manrahhan, J., 1991, "Mauritius 2000" and the I1ASA research framework: A viewfrom the Reduit Campus, in W. Lutz and F.L. Toth, eds., Population, Economy, and Environment in Mauritius, CP-91-01, IIASA, Laxenburg, Austria.
Mauritius Chamber of Agriculture, 1953-1991, Annual Reports of the President,Port Louis, Mauritius.
Mauritius Chamber of Agriculture, The Mauritius Chamber of Agriculture 18531953, Port Louis, Mauritius.
Mauritius Chamber of Agriculture, 1991, The Sugar Industry - Situatzon and Outlook: Elements for a Strategic Re-appraisal, Port Louis, Mauritius.
Meade, J .E., 1967, Population explosion, the standard of living, and social conflict,The Economic Journal 77(June):233-255.
Meade, J .E., Foggon, G., Houghton, H., Lees, N., Marchall, R.S., Roddan, G.M.,and Selwyn, P., 1968, The Economic and Social Structure of MauritlUs, FrankCass, London, UK.
Meadows, D.H, Meadows, D.L., Randers, J., and Behrens III, W.W., 1972, TheLimits to Growth, Universe Books, New York, NY, USA.
Meadows, D.L., Behrens III, W.W., Meadows, D.H., Naill, R.F., Randers, J., andZahn, E.K.O., 1974, Dynamics of Growth in a Finite World, Wright-AllenPress, Cambridge, MA, USA.
Meadows, D.H., Richardson, J., and Bruckmann, G., 1982, Groping in the Dark:The First Decade of Global Modelling, John Wiley & Son, Chichester, UK.
Meadows, D.H., Meadows, D.L., and Randers. J., 1992a, Beyond the Limits: Confronting Global Collapse, Envisioning a Sustainable Future, Chelsea Green Publishing, Post Mills, VT, USA.
Meadows, D.H., Meadows, D.L., and Randers, J., 1992b, Beyond the Limits: GlobalCollapse or a Sustaznable Future, Earthscan Publications Limited, London,UK.
Meier, R.L., 1959, Modern Science and the Human Fertzlity Problem, Wiley, NewYork, NY, USA.
MEPD, 1988, National Development Plan 1988-1990, Ministry of Economic Planning and Development, Port Louis, Mauritius.
MEQOL, 1991, State of the Environment in Mauritius, GOM Ministry of Environment and Quality of Life, Port Louis, Mauritius.
MIlT, 1990, Mauritius at Crossroads: The Industrial Challenges Ahead, Ministryof Industry and Industrial Technology, Port Louis, Mauritius.
Ministry of Economic Planning and Development, 1984, Digest of Industrial Statzstics, Port Louis, Mauritius.
Ministry of Economic Planning and Development, 1986, Report of the Fact-FindingCommittee on Crownlands, Government of Mauritius, Port Louis, Mauritius.
References 397
Ministry of Economic Planning and Development, 1990, Digest of Industrial Statistics, Port Louis, Mauritius.
Ministry of Education and Science, 1991, Master Plan for Education, Port Louis,Mauritius.
Ministry of Environment and Quality of Life, 1991, State of the Environment ofMauritius, Government of Mauritius, Port Louis, Mauritius.
Ministry of Health, 1987. Family Planning and Demographic Yearbook, Port Louis,Mauritius.
Ministry of Housing, Lands, and the Environment, 1990, Land Resources: Preliminary Analysis, Port Louis, Mauritius.
Ministry ofindustry and Industrial Technology, 1990, Mauritius at Crossroads: TheIndustrial Challenges Ahead, Port Louis, Mauritius.
Mitchell, B.R., 1982, Historical Statistics, Macmillan, London, UK.Myrdal, G., 1968, Asian Drama: An Inquiry into the Poverty of Nations, Twentieth
Century Fund, New York, NY, USA.NAS (US National Academy of Sciences), 1986, Population Growth and Economic
Development: Policy Questions, National Academy Press, Washington, DC,USA.
Ng Kee Kwong, K.F., Figon, L.C., and Deville, J., 1990, Nitrogen Fertilization ofSugar Cane in Mauritius - The Ecologists' Way, Mauritius Sugar IndustryResearch Institute, Reduit, Mauritius, unpublished manuscript.
NPDP (National Physical Development Plan), 1990, Coastal Zone Appraisal Survey, Paper No. 6.1, May, Planning Division, Ministry of Housing, Lands, andEnvironment, Port Louis, Mauritius.
Padya, B.M., 1989, Weather and Climate in Mauritius, Mahatma Gandhi Institute,Moka, Mauritius.
Parahoo, K.A., 1986, Early colonial health developments in Mauritius, InternationalJournal of Health Services 16(3):409-423.
Parikh, J .K., 1980, Energy Systems and Development, Oxford University Press,Delhi, India.
Paturau, M., 1988, Histoire Economique de file Mauritius, Port Louis, Mauritius.Picardi, A.C., 1974, A systems analysis of pastoralism in the West African Sahel,
Annex 5 to A Framework for Evaluating Long- Term Strategies for the Development of the Sahel-Sudan Region, Center for Policy Alternatives Report CPA74-9, MIT, Cambridge, MA, USA.
Prinz, Ch., 1991, Scenarios for future demographic trends in Mauritius, in W. Lutzand F.L. Toth, eds., Population, Economy, and Environment in Mauritius,CP-91-01, IASA, Laxenburg, Austria.
Prinz, Ch., 1992, Modeling the Population of Mauritius, WP-92-43, llASA, Laxenburg, Austria.
Proops, J .L.R., 1984, Energy intensities, input output-analysis and economic development, in M. Ciaschini, ed., Input-Output Analysis: Current Developments,Chapman and Hall, London, UK.
398 References
Ramjeawon, T., 1991, Water systems and water management on the island of Mauritius, in W. Lutz and F.L. Toth, eds., Population, Economy, and Environmentin Mauritius, CP-91-01, IIASA, Laxenburg, Austria.
Rathnam, M.S.V., and Opsal, K., 1989, Preparation of an Environmental ActionPlan for Mauritius, UNEP Industry and Environment, July-December 1989,Nairobi, Kenya.
Repetto, R., 1992, Accounting for environmental assets, Scientific American266(6):64-70.
Richards, J.F., 1986, World environmental history and economic development, inW.C. Clark and R.E. Munn, eds., Sustainable Development of the Biosphere,Cambridge University Press, Cambridge, UK.
Richards, J.F., 1990, Land transformation, in B.L. Turner II, w.e. Clark, R.W.Kates, J.F. Richards, J.T. Mathews, and W.B. Meyer, eds., The Earth asTransformed by Human Action: Global and Regional Changes in the Biosphereover the Past 300 Years, Cambridge University Press, Cambridge, UK.
Rogbeer, G., 1984, Mauritius water resources, in Proceedings of a Regional Workshop on Water Resources of Small Islands, Suva, Fiji, Technical PublicationSeries No. 182, Part 3, Commonwealth Science Council.
Rogers, A., and Willekens, F., eds., 1986, Migration and Settlement: A MultiregionalComparative Study, D. Reidel, Dordrecht, Netherlands.
Rosenbluth, G., 1976, Economists and the growth controversy, Canadian PublicPolicy 11(2):225-239.
Roth, D.M., 1983, Philippine forest and forestry: 1565-1920, in R.P. Tucker andJ. F. Richards, eds., Global Deforestation and the Nineteenth- Century WorldEconomy, Duke University Press, Durham, NC, USA.
Rouillard, G., 1990, Historique de la Cenne Ii sucre a L 'ile Maurice 1639-1989,Mauritius' Chamber of Agriculture, Port Louis, Mauritius.
Rowe, J.S., 1990, Summing it up, in C. Mungall and D.J. McLaren, eds., PlanetUnder Stress, Oxford University Press, Toronto, Canada.
Sanderson, W.C., 1980, Economic-Demographic Simulation Models: A Review ofTheir Usefulness for Policy Analysis, RR-80-14, IIASA, Laxenburg, Austria.
Simon, J.L., 1981, The Ultimate Resource, Princeton University Press, Princeton,NJ, USA.
Simon, J .L., 1982, A scheme to promote world economic development with migration, in J.L. Simon and P.H. Lindert, eds., Research in Population Economics,Volume 4, JAI Press, Greenwich, CT, USA.
Singer, H.F., 1992, Warming theories need warning label, The Bulletm of the AtomiCScientists 48(5):34-39.
Slesser, M., 1991, Planning for sustainable development, in A.J. Gilbert and L.C.Braat, eds. , Modelling for Population and Sustainable Development, Routledge,London, UK.
Slesser, M., and King, J., 1988, Resource accounting: An application to developmentplanning, World Development 16(2):293-303.
References 399
Smil, V., and Knowland, W.E., 1980, Energy in the Developing World, OxfordUniversity Press, Oxford, UK.
Thomson, T., 1881, Report on the Forests of Mauritius: Their Present Condition and Future Management, Colonial Government of Mauritius, Port Louis,Mauritius.
Titmuss, R., and Abel-Smith, B., 1968, Social Policies and Population Growth inMauritius, Frank Cass, London, UK.
Toth, F.L., 1992, Models of the Water Systems in Mauritius, WP-92-71, IIASA,Laxenburg, Austria.
UNEP (United Nations Environment Programme), 1982, Environmental Problemsof the East-African Region, UNEP Regional Seas Report and Studies No. 12,Nairobi, Kenya.
UNEP (United Nations Environment Programme), 1991, Freshwater Pollution,UNEP/ GEMS Environment Library No.6, Nairobi, Kenya.
Wallerstein, I., 1974, The Modern World System, Academic Press, New York, NY,USA.
Wallerstein, I., 1976, Three stages of African involvement in the world economy, inP. Gutkind and I. Wallerstein, eds., The Political Economy of ContemporaryAfrica, Sage, London, UK.
Wallerstein, I., 1980, The Modern World System II, Academic Press, New York,NY, USA.
Walter, A., 1910, The Sugar Industry of Mauritius: A Study in Correlation, A.L.Humphreys, London, UK.
WHO (World Health Organization), 1993, World Health Statistics Quarterly,Geneva, Switzerland.
Williams, F., 1964, British Historians and the West Indies, P.N.M. Publishing, Portof Spain, Trinidad.
Williams, M., 1990, Forest, in B.L. Turner II, W.C. Clark, R.W. Kates, J.F.Richards, J.T. Mathews, and W.B. Meyer, eds., The Earth as Transformedby Human Action: Global and Regional Changes in the Biosphere over thePast 300 Years, Cambridge University Press, Cambridge, UK.
Wils, A.B., 1993, Input-Output Model for a Small, Open Economy Applied to Mauritius, WP-93-56, IIASA, Laxenburg, Austria.
Wilson, E.O., ed., 1988, Biodiversity, National Academy of Sciences/SmithsonianInstitution, Washington, DC, USA.
Wittfogel, K.A., 1957, Oriental Despotism, Yale University Press, New Haven, CT,USA.
Wollman, N., 1960, Water Supply and Demand, Committee Print No. 32, SenateSelect Committee on National Water Resources, 86th Congress, 2nd Session,Washington, DC, USA.
Wollman, N., and Bonem, G.W., 1971, The Outlook for Water: Quality, Quantity,and National Growth, Johns Hopkins University Press, Baltimore, MD, USA.
World Bank, 1984, World Development Report, World Bank, Washington, DC, USA.
400 References
World Bank, ]986, Mauritius: The Sugar Sector, Problems and Prospects, Washington, DC, USA.
World Bank, ]989, Economic Development with Environmental Management:Strategies for Mauritius, Mimeo, World Bank, Washington, DC, USA.
World Bank, ]992a, Mauritius: Expanding Horizons, Washington, DC, USA.World Bank, ]992b, World Development Report 1992: Development and the Envi
ronment, Oxford University Press, New York, NY, USA.World Bank, ]993, World Tables 1993, Johns Hopkins University Press, Baltimore,
MD, USA.Worldwater/WHO, ]987, The International Drinking Water Supply and Sanitation
Decade Directory, Edition 3, Thomas Telford Ltd., London, UK.Xenos, C., ]977, Fertility Change in Mauritius and the Impact of the Family Plan
ning Programme, Ministry of Health, Port Louis, Mauritius.Xenos, C., ]99], Family planning and fertility change in Mauritius, in W. Lutz and
F.L. Toth, eds., Population, Economy, and Environment in Mauritius, CP-91a], IIASA, Laxenburg, Austria.