Embed Size (px)
Citation preview

1
Unemployment Insurance for Mortgage Borrowers: Is it viable and does it cover those most in need?* MARGARET KEOGHAN AND GWILYM PRYCE
Department of Urban Studies, University of Glasgow, 25 Bute Gardens, Glasgow, G12 8RS * This paper extends work funded by Scottish Homes examining safety nets for mortgage borrowers (Pryce and Keoghan, 1999). Logistic regression analysis of the Scottish House Condition Survey which formed the main part of the Scottish Homes project is forthcoming in Housing Studies (Keoghan and Pryce, 2001). We would like to thank the members of the steering group for their helpful comments and suggestions on the early stages of this work. The usual disclaimer applies.

2
Unemployment Insurance for Mortgage Borrowers: Is it viable and does it cover those most in need?*
ABSTRACT:
One of the principal downside risks of financial deregulation is the possible deleterious effect it may have on the incidence of mortgage arrears and possessions. Successive UK governments have enthusiastically pursued both financial deregulation and the promotion of private mortgage payment protection insurance (MPPI) as the primary safety-net for mortgage borrowers. As such, the UK is an important test case for other European countries considering either or both avenues of policy. With this motivation, we review the mortgage payment protection insurance (MPPI) debate in the UK and examine whether mortgage borrowers who choose to remain uninsured do so because they are in the most stable forms of employment and/or have sufficient financial resources to cover periods of unemployment, or because their employment risks are not covered by MPPI and/or they cannot afford the premium. These are important questions because if affordability proves to be a key driver of take-up, then private mortgage insurance is fundamentally flawed as an antidote to the risks that follow from financial deregulation. Family Resources Survey data are used to examine the characteristics of the uninsured which are then compared to data on employment stability in an attempt to identify those groups of mortgage borrowers most at risk. Income and savings of the uninsured are also examined to establish whether borrowers consider personal financial resources to be substitute for insurance. We find that neither those in the riskiest categories of employment, nor those with the least financial resources, have the highest rates of MPPI take-up. We also find a surprisingly large variation in the take-up across household types. In particular, we find that households with a greater number of children relative to adults have significantly lower MPPI take-up rates. These findings provide evidence that affordability is an important driver of MPPI take-up, for whilst there is no obvious reason why having more children reduces the default risk of a household, it is clear that the number of children will have a direct effect on the ratio of outgoings to earnings and hence on a households ability to afford MPPI. Inability of certain borrowers to afford MPPI may explain why the highest risk groups do not have the highest levels of take-up. The corollary of our results is that MPPI is not viable as a widespread safety net for mortgage borrowers, and so the assumption that private mortgage insurance can be a substitute for state provided protection is fundamentally flawed.

3
INTRODUCTION
In the UK post war period, homeownership has been promoted by both mainstream
political parties as the preferred tenure. The 1953 Conservative White Paper stated that,
‘One object of future housing policy will be to continue to promote, by all possible
means, the building of new houses for owner occupation. Of all forms of saving this is
one of the best. Of all forms of ownership this is one of the most satisfying to the
individual and the most beneficial to the nation’ (quoted in Hamnett, 1999, p.53). The
Labour 1965 White Paper demonstrated similar enthusiasm, ‘The expansion of building
for owner occupation ... is normal: it reflects a long term social advance…’ (ibid).
Perhaps the strongest expression of the British preoccupation with owner occupation,
however, came under the 1980s Thatcher government which was responsible for both the
introduction of Right to Buy (a policy which allowed Local Authority tenants to purchase
their own homes), and financial deregulation of the mortgage market. As
homeownership rates have risen, however, so have the concerns over the downside risks
of financial deregulation and the associated sustainability of home ownership (Maclennan
et al 1997).
These concerns are not limited to the UK. The internationalisation of credit (Ritzer 1980)
and the general growth in pervasiveness of market forces has resulted in mortgage
markets everywhere facing pressures to liberalise and so both the positive and negative
aspects of the UK experience will be of interest to policy makers across Europe. Britain

4
is effectively a test case for the consequences of financial liberalisation and flexible
labour markets, for “even if not directly paralleled elsewhere, [these developments] are
nonetheless, an exemplar of the influences on, and outcomes of, change in owner
occupied markets’ (Ford and Quilgars 2001, p.148). That there has been a significant rise
in the incidence of house repossession Britain following housing-finance restructuring is
therefore of European and not just UK concern. As Figure 1 shows, although the number
of repossessions as a proportion of the total mortgage stock has recently stabilised, there
is evidence that the long-term trend is strongly upward. Each successive economic slump
since 1970 (measured by the unemployment rate) has been accompanied by successively
higher peaks in the repossession rate, and each economic boom has been accompanied by
successively higher troughs in the repossession rate.
Although financial deregulation is cited as a cause of this trend (on the basis that the
rising supply of mortgage credit has broadened the risk base of borrowers to include
those previously considered too risky to be eligible for mortgage finance -- Stephens
1993; Hamnett 1999 p. 55-57), it is not the only cause. Structural changes to the labour
market resulting in more ‘flexible’ forms of employment (Ford, 1989, 1998; Maclennan
and Pryce, 1996; Ford et al 2001 chapter 3), and relationship breakdown (Bull, 1995)
have also been listed as drivers. (See Ford et al 2001 chapters 2,3,5,6 and 7 for a full
examination of the causes and consequences of mortgage arrears and possessions).

5
A further factor, and one most relevant to the focus of the current paper, is the role of,
and reforms to, the welfare safety net for mortgage borrowers. The state safety net for
mortgagors was first introduced into the UK in 1948 and for almost forty years remained
substantially unchanged, covering full mortgage interest for those eligible for means
tested welfare benefits. This provision, which came to be called ISMI (Income Support
for Mortgage Interest), remained relatively unchanged until 1987 when mortgage
borrowers claiming Income Support became entitled to only half interest payments for
the first two months, and full eligible interest thereafter. These changes, however, were
insignificant compared with the reforms that were to follow in October 1995, from which
time existing mortgagors receive no support for eight weeks, followed by up to 50 per
cent of their eligible interest for the next 18 weeks and full coverage thereafter; and new
mortgagors (including re-mortgagors) receive no support for 39 weeks followed by full
eligible interest thereafter. (It should be noted, however, that many mortgagors are
unaffected by these changes because they would not be entitled to Income Support in the
event of job loss or ill health, due to savings over the ISMI threshold or the income of a
second earner).
In reducing ISMI, the government’s aim was to promote the take-up of Mortgage
Payment Protection Insurance (MPPI), a private mortgage insurance product. MPPI had
been available in the UK since the 1970s as a means of covering monthly repayment
costs (usually for 12 months following a 30-60 day waiting period) in the event of
unemployment or ill-health, but take-up was relatively low even into the early nineties

6
(Ford and Quilgars 2001). In one sense, MPPI is more comprehensive than ISMI because
it covers not just interest payments, but amortization also. Thus, it was hoped that the
ISMI reforms would boost take-up of MPPI particularly amongst high risks and actually
reduce arrears and repossessions (Oldman & Kemp, 1996, p.44). Increasingly, however,
the product’s structure, claims procedure and interface with ISMI has come under
criticism (Ford et al 1995; Ford and Kempson 1997; Keoghan and Pryce, 1999;
Kempson et al, 1999, Ford and Quilgars 2001, Ford et al 2001), and the viability of MPPI
as a long term, widely used product has been called into question due to some of the
fundamental problems associated with any type of private unemployment insurance
(Walker et al 1995).

7
Figure 1
Unemployment and Repossessions RatesSource: Labour Market Trends (Jan 1996, p.7; Feb 1999, S38) and Council for Mortgage
Lenders (Press Release on 27/01/99)
0
2
4
6
8
10
12
14
1970
1975
1980
1981
1982
1983
1984
1985
1986
1987
1988
1989
1990
1991
1992
1993
1994
1995
1996
1997
1998
Unemployment rate %
0
0.1
0.2
0.3
0.4
0.5
0.6
0.7
0.8
0.9
Repossession Rate %
Unemployment Rate (Claimant) Repossession Rate (No. reposseesions as % of No. Mortgages at year end)
Emerging from the debate over ISMI and MPPI is a return to the fundamental question
over whether the pursuit of a ‘property owning democracy’ (Mrs Thatcher’s stated policy
goal for the sale of council housing—see Hamnett, 1999, p.54) is intrinsically compatible
with a simultaneous shift towards private insurance based mortgage safety net. This is
an important question because it asks whether it is efficacious to expand the role and
freedom of the private financial sector as the major recipient of housing expenditures,
whilst at the same time increasing society’s reliance on the sector as the primary insurers
of those expenditures. In a sense, one could argue that the answer lies in the market’s
response: if consumers are increasingly sovereign, then the efficacy of being in
possession of MPPI will be reflected in take-up. The evidence so far has suggested that

8
borrowers have been slow to be persuaded of MPPI’s value, and take-up is still some way
short of the predicted “need” for cover (estimated by Holmans & Whitehead, 1999, to be
55 per cent). Estimates of overall take-up are still below 30 per cent, leaving the majority
of borrowers with a significantly less comprehensive safety net than they had before the
1995 ISMI reforms.
It is possible that take-up of MPPI is low, however, because only a minority of
mortgagors are sufficiently at risk to require protection. The corollary of this argument
would be that those who choose to remain uninsured, do so because they are in stable
employment, or have sufficient financial resources to cover periods of unemployment.
However, there are two rather less optimistic explanations: first, that take-up is low
because some of the most important risks are not covered by MPPI policies; and second,
that MPPI is not affordable by those most at risk. If there is evidence to support either of
the latter two explanations, then the case for MPPI as a viable substitute for ISMI is
substantially weakened.
Whilst fairly extensive work has been done on the true extent of cover offered by MPPI
through an examination of the claims process (Kempson et al 1999; Ford and Quilgars
2001, Ford et al 2001), relatively little has been done to examine in detail the take-up of
MPPI across different types of claimant. The econometric models of take-up (Pryce
1998a,b; Pryce and Keoghan 2001) that have been developed so far may have proved
useful in shedding light on the responsiveness of take-up to premiums, the risks of

9
unemployment and a range of other financial factors, but the techniques used have tended
to mask or simplify the complexities of the relationship between take-up and household
structure. The aim of the current paper is to provide the first detailed examination of
MPPI take-up across a broad spectrum of borrower types using large sample evidence.
By using both the 1994/95 and 1995/96 Family Resources Surveys, we achieved a
combined sample of over 18,000, and this allowed us to provide the first robust estimates
of take-up amongst a number of relatively small groups of borrowers which normally
would have to be subsumed into broader categories. We have, for example, been able to
consider whether for single parents take-up of MPPI declines with the number of children
and this has helped to illuminate the affordability versus risk question raised by Pryce
(1998) and others (see discussion of Table 6 in section 3).
The remainder of the paper will be structured as follows: section 1 will provide a
background to the MPPI debate summarising the arguments for and against MPPI, and
outlining the theoretical explanations of why those most at risk may not be the most
likely to take out insurance. Section 2 compares the employment characteristics of the
uninsured using 1994/95 and 1995/96 Family Resources Survey data, with recent labour
market data and research to establish whether those most at risk are indeed the most
likely to take out insurance. Section 3 examines the affordability issue by utilizing FRS
data on the personal financial resources of borrowers in order to investigate whether
mortgagors in unstable employment, who decide to refrain from taking out MPPI, do so
because savings and surplus earnings provide adequate protection.

10
SECTION 1: BACKGROUND TO THE MPPI DEBATE
In this section we summarise some of the issues surrounding MPPI, including the
problem of only bad risks applying (“adverse selection”), the problem of “favourable
selection” (the converse of adverse selection), the implications of mass unemployment;
and finally, affordability.
Only bad risks apply – “Adverse Selection”
One criterion for profitable insurance is that the risk being insured has to be reasonably
constant across individuals, or at least, that the insured do not know more about his/her
risk than the insurer. Should either of these conditions be violated, there may be perverse
incentives associated with insurance contracts. Bad risks may have greater incentive to
purchase insurance than good risks, for example, particularly if information asymmetry
results in all risks being charged the same premium (see Rothschild and Stiglitz, 1976;
Brueckner, 1985; Clauretie and Jameson, 1990; Hirshleifer and Riley,1995). This
tendency has become known in the economics literature as ‘adverse selection’ and it is
potentially a major barrier to insurance against unemployment.
Fairly complex theoretical variations on the adverse selection theme have been proposed
by Chiu and Karni (1998) which show that the market outcome in the absence of state
intervention may actually be to provide no unemployment insurance whatsoever. In the
UK, of course, there is no question that a market for unemployment insurance exists, and

11
indeed has done so in some form or another since 1911 (Walker et al, 1995) and in the
form of MPPI since the late 1970s (Kempson et al 1999). But it has always been a niche
market, and the question remains as to whether this is due to some fundamental
characteristic of unemployment insurance, or whether it is due to the existence of
publicly provided safety nets for the unemployed (ISMI crowds-out MPPI by stifling
demand, for example). If crowding-out is the cause, then the curtailment of ISMI in the
mid-1990s would have produced a large rise in take-up. That this has not happened does
not necessarily invalidate the crowding-out argument, however, because there has, at the
same time, been a substantial reduction in unemployment risk in most parts of the
country due to a prolonged economic boom. However, logistic regression analysis by
Pryce (1998a, b) and Pryce and Keoghan (1999, 2001) controlled for the effect of falling
unemployment and still found take-up to be insensitive to changes in ISMI. These
results, therefore, appear to support the argument that low take-up of MPPI is due to
some fundamental characteristic of unemployment insurance, and not simply to
crowding-out.
One ‘fundamental characteristic’ of MPPI which might be preventing take-up is the
possibility that insurers are effectively rationing cover in order to screen out bad risks, or
are charging premiums at a high enough rate to preclude widespread take-up.
Interestingly, the investigation into adverse selection using the British Household Panel
Survey by Burchardt and Hills (1997a,b; 1998) found that policy holders did not have
significantly greater unemployment risks than uninsured mortgagors. This may be

12
indicative of the success that insurers have achieved at structuring policies in such a way
as to screen out bad risks and identify a profitable niche market.
Certainly, one of the problems highlighted by both Walker et al (1995) and Ford and
Kempson (1997) is the plethora of clauses written into MPPI contracts precluding certain
categories of claims. Walker et al, cite the following as being categories typically
excluded from mortgage protection policies: (i) the first 30 days of unemployment or
financial insolvency; (ii) unemployment occurring during the first 90 days of the plan
(with a new mortgage) or 180 days (for a further advance or re-mortgage); (iii)
unemployment beyond twelve months; (iv) those without regular and continuous work
for at least twelve months prior to claiming; (v) voluntary unemployment or insolvency;
(vi) unemployment that is a recurrent, regular or seasonal feature of the job; (vii)
unemployment at the end of a fixed-term contract; (viii) periods when a payment is taken
instead of notice; and (ix) unemployment occurring outside the United Kingdom. Walker
et al (op cit.) go on to note that ‘While the financial rationale for these exclusions is self-
evident, the net result is to exclude many of those whose circumstances result from the
trends towards a more flexible labour market: the long term unemployed and those in
precarious forms of employment.” Because of the extensive clauses attached to MPPI
policies, many policy holders do not even make a claim (Ford et al 1995 found that ‘only
a quarter of those in arrears and with insurance, had tried to claim’), and of those that do,
many find their claims to be unsuccessful (only a third of claims were successful in the
Ford et al sample). This led Ford et al to conclude in 1995 that MPPI policies ‘at present

13
offer inadequate cover to people who need them most’ (p.61). More recent research has
reached similar conclusions,
‘A third of borrowers have arrears for reasons not covered by MPPI. MPPI is not able to insure certain unemployment risks, nor does it normally provide long-term cover for those with ongoing health problems. Private insurance works best for those out of work for short periods of time, who have someone else in the household with earned income, redundancy or savings. It benefits most those who need the support the least. It provides the worst cover for those with unstable work histories and ill-health – that is those who need it most.’ (Quilgars, 1999; see also Kempson et al, 1999)
Problems such as these have prompted the recent move to set baseline standards for
MPPI products (ABI and CML, 1999; Armstrong, 1999) though the new clauses are not
so different from those of existing mainstream policies (they include a maximum 60 day
qualifying period, exclusions for pre-existing medical conditions, and only a limited
broadening of cover for self employed and contract workers). It is inevitable, however,
that extensive clauses will remain a permanent feature of MPPI arrangements since (in
the words of the CML/ABI 1999): ‘Lenders and insurers are both in business. They
cannot get into undertakings that do not offer a profit.’ It is because private insurance
may be fundamentally unprofitable at certain points in time, and for certain groups, that
some form of state safety net will always be necessary. If the most severe employment
risks are not actually covered by unemployment insurance then this will ultimately be
reflected in patterns of take-up across employment categories and even result in the
worrying possibility that jobs with the highest risks may not have the highest rate of take-
up of MPPI.

14
Favourable Selection
Whilst there may be economic forces at work which result in adverse selection, there may
at the same time be perverse incentives intrinsic to unemployment insurance which result
in favourable selection of risks. Information asymmetry in the mortgage insurance market
may mean that MPPI incurs a greater ‘option value’ to workers with larger stocks of
human capital. First, note that for the uninsured, unemployed mortgagor, any job offer
during the ‘ISMI gap’ period that pays more (net of travel costs) than state welfare
benefits, will be difficult to refuse given the risk of repossession. If the borrower has
taken out MPPI, however, then he/she may perceive his/her house to be much less at risk
for the twelve months of MPPI cover (although Kempson et al 1999 have found that
possession of MPPI is not an absolute guarantee against repossession), and even after the
twelve months of MPPI cover, the mortgagor may be eligible for ISMI. The insured
mortgage borrower thus has the financial option to turn down job offers below his
expected wage. The longer he/she waits, the more chance that a higher paid job will be
offered, resulting in a ‘moral hazard’ effect (i.e. having MPPI gives one less incentive to
return to work during the insured period than if one did not have MPPI). This effect may
be offset by the depreciation of human capital whilst unemployed (the ‘wilting flowers’
effect), but the moral hazard effect may still dominate.
For those with relatively low levels of education and training, however, the spectrum of
wage offers over the twelve month period following redundancy is likely to be very
narrow, and so there has been little to gain from the ‘option’ to reject job offers. This

15
compares with the much wider spectrum of job offers available to those with a wealth of
experience and education. Thus, insured mortgagors with a considerable accumulation of
human capital, MPPI may incur a greater ‘option value’ than for those with little.
Because lower skilled workers tend also to have higher unemployment risks, this may
actually provide a rationale for ‘favourable selection’: i.e. employment groups with the
highest redundancy rates will not necessarily have the highest take-up of MPPI. This
might explain why Burchardt and Hills (1997a, b; 1998) did not find any evidence of
adverse selection: the countervailing forces of favourable and adverse selection may
effectively cancel each other out. (We will consider this issue again in the empirical
section of the paper where we will examine the distribution of MPPI take-up rates across
employment categories).
Unemployment cycles
Important factors in the determination of the housing fall-out of recession, include: (1)
the extent of ISMI cover; and (2) the pattern of MPPI take-up. The second of these is
partly determined by the long-term profitability to insurers of widespread take-up of
employment insurance, which in turn is determined inter alia by the responsiveness of
MPPI take-up to unemployment risks. If responsive, take-up will be unsustainable as a
widespread alternative to ISMI. This is because sensitivity to unemployment risks will
imply that only mortgagors in high risk areas will take out MPPI and/or that mortgagors
will only take out insurance at the outset of a downswing, and insurers will be unable to
subsidize bad years with good. Insurers may try to offset losses by raising premiums

16
during recessions, but this may have the effect of making MPPI too expensive to
purchase when most needed, and superfluous when affordable.
Pryce and Keoghan (1999, p.29) found take-up to be fairly insensitive to variations in the
local unemployment rate, with take-up only rising by 1% for every 10% increase in the
unemployment rate. This evidence may again point simply to the success of insurers at
combating the deleterious effects of asymmetric information on the quality of their
insurance portfolio. There is evidence (Goodman 1998) that MPPI premiums do indeed
rise during slumps and fall during booms, and this may have been sufficient to counter-
balance cyclical adverse selection. Pryce’s (1998a,b) finding that take-up is relatively
responsive to the size of premium is perhaps further evidence in support of this
explanation.
Affordability
Sensitivity of MPPI take-up to premiums is linked to another important issue in the MPPI
debate: that of affordability. If borrowers do not take out MPPI because they do not feel
they can afford the premiums, then they are effectively saying that, despite the risks and
the grave personal cost of repossession, other areas of current consumption are
sufficiently important to warrant priority. The theoretical model developed by Pryce
(1998a) attempts to capture this by allowing insurance choices to be affected by the level
of household subsistence consumption (i.e. the minimum household expenditure
necessary for a basic standard of living). The greater the mortgage payments and the

17
larger the number of household members, the greater will be the minimum expenditure
(and hence income) necessary to maintain subsistence consumption. In considering
whether or not to purchase MPPI, the household has to take into account the consumption
foregone in paying the premium. If this foregone consumption is perceived to fall within
the category of basic living essentials, then the household is less likely to purchase MPPI,
even though the risks of repossession may be high. In effect, the consumer has to decide
how to weight current consumption over and against future consumption. Insurance
guarantees some level of future consumption at the expense of current consumption.
Obviously no consumer will be prepared to starve in order to ensure future mortgage
payments.
We will now move on to the empirical section of the paper. We first consider whether
there is any evidence that highest risk employment categories do not have the highest rate
of MPPI take-up (section 2). We will then consider whether there is any evidence that
this is due to affordability (section 3).
SECTION 2: UNEMPLOYMENT RISK AND MPPI TAKE-UP
Although a variety of surveys of mortgage borrowers have been carried out to provide
details of MPPI policy holders (for example, Ford and Kempson, 1997; Ford, Kempson,
and Wilson, 1995), little work has been done using large sample evidence to investigate
the nature of take-up across different types of borrower. The two exceptions are (1) the
Burchardt and Hills (1998) study, which is primarily concerned with modeling the

18
regressive implications of moving to private safety nets for mortgage borrowers using the
British Household Panel Survey, and (2) the logistic regression analysis of Pryce and
Keoghan (1999) using the Scottish House Condition Survey. Considerably larger than
both these samples, however, is the Family Resources Survey which has the added
advantage that it is collected annually and so adjacent years can be combined to produce
an even larger sample. It should be noted in the following discussion, that figures on
MPPI take-up rates from any of the large scale national surveys are likely to be somewhat
inflated because of the tendency for respondents to confuse other insurance products with
MPPI. However, the FRS data is probably the most reliable of the large scale surveys
because of the careful wording of the question and the additional details requested in the
survey. In order to boost the number of observations, most of the tables below refer to
the combined sample of the FRS for the years 1994/95 and 1995/96. However, for tables
and figures employing the income variable, changes in definition over time mean that
only 1995/96 results are presented.
First, consider the rates of insurance take-up by socio-economic group listed in Table 1.
It can be seen that the highest rates of non-insurance are amongst unskilled manual
workers (rate of non-insurance = 74%), non-manual ancillary workers (74%), self-
employed non-professionals (73%) and agricultural workers (81%). A similar pattern
emerges in Table 2. where unskilled mortgagors are indicated as having the highest rate
of non-insurance (74%) of all Standard Occupational Groups (the armed forces
excepted).

19
It is not possible to provide precise figures on the differences in risk between each of
these employment categories because the published unemployment rate data uses a
slightly different classification system. Nevertheless, it can be seen from the following
three tables that unemployment risk is greatest amongst manual and unskilled
occupations. Table 3 lists the Industrial Labour Organisation unemployment rates by
previous occupation and demonstrates clear variation across employment type, with plant
and machine operators and manual workers having the highest unemployment rates
(7.6% and 6.9% respectively). The order is slightly different for females for whom craft
and related previous employment has the second highest unemployment rate at 7.9%.
These unemployment rates, however, are not necessarily the best guide to the
unemployment risks faced by those still in employment because the figures include
workers who have been unemployed for a long time, having for example, been made
redundant during a period of industrial decline which may have since plateaued. Perhaps
a better indicator, therefore, is the redundancy rate listed in tables 4 and 5 by occupation
and by industry respectively.

20
TABLE 1. MPPI Take-Up Rates Insurance rates by Socio-Economic Group
Socio Economic Group Proportion of mortgagors with MPPI
Size of Group as a Proportion of All Mortgagors
1.1 Employers in industry etc. (large establishments) 18.8 0.2 1.2 Managers in government, industry etc. (large establishments) 28.6 16.2 2.1 Employers in industry etc. (small establishments) 26.8 3.2 2.2 Managers in government, industry etc. (small establishments) 30.5 6.5 3 Professional workers – self employed 26.7 2.0 4 Professional workers – employees 27.5 8.0 5.1 Non-manual ancillary workers etc. 25.6 10.0 5.2 Non-manual foremen & supervisors 29.5 2.9 6 Junior non-manual workers 28.0 10.6 7 Personal service workers 30.3 1.4 8 Manual foremen and supervisors 32.6 5.4 9 Skilled manual workers 31.3 14.3 10 Semi-skilled manual workers 30.7 7.4 11 Unskilled manual workers 26.1 2.0 12 Self-employed workers (non-professional) 8.4 8.8 13 Farmers – employers and managers 0.1 0.2 14 Farmers – own account 0.2 0.2 15 Agricultural workers 0.2 0.3 16 Members of armed forces 0.3 0.5 UK 28.7 100 (Source: FRS 1994/95 and FRS 1995/96 combined; sample size of mortgagors = 18,566)
TABLE 2. Rates of Take-up by Standard Occupational Code Group
Standard Occupation Code Group Proportion of mortgagors with MPPI
Size of Group as a Proportion of All
Mortgagors 1 Professional 27.5 10.1 2 Managerial & technical 27.9 35.1 3 Non-manual skilled 28.6 14.7 4 Manual skilled 30.6 27.3 5 Partly skilled 29.0 9.9 6 Unskilled 26.2 2.4 7 Armed forces 16.3 0.5 UK 28.7 100 (Source: FRS 1994/95 and FRS 1995/96 combined; sample size of mortgagors = 18,566)

21
TABLE 3. ILO Unemployment Rates by Previous Occupation** Occupation ILO Unemployment Rates by Previous Occupation All Male Female All 6.2 6.8 5.4 Manual 6.9 7.5 5.6 Non-Manual 3.1 3.1 3.1 Managers & Admin 2.3 2.3 2.2 Professional 1.9 1.7 2.2 Associated Professional & Technical 3.0 3.7 2.2 Clerical 4.2 6.7 3.3 Craft & Related 5.4 5.2 7.9 Personal & Protective Services 5.1 6.9 4.2 Selling 5.4 6.1 4.9 Plant & Machine Operators 7.6 7.4 8.7 (Source: Labour Market Trends February 1999, S37)
TABLE 4. Redundancy Rates by Occupation# M
anag
ers &
A
dmin
istra
tors
Prof
essi
onal
s
Ass
ocia
te
prof
essi
onal
&
Tech
nica
l
Cle
rical
&
Secr
etar
ial
Cra
ft &
Rel
ated
Pers
onal
&
Prot
ectiv
e Se
rvic
es
Sale
s
Plan
t & M
achi
ne
Ope
rativ
es
Oth
er
Summer 94 0.8 * 0.6 0.7 1.8 0.6 1.1 1.4 1.3 Autumn 94 0.7 0.5 0.6 0.8 1.5 0.5 1.1 1.3 0.9 Winter 94 0.4 0.5 * 0.5 0.8 * 0.8 0.9 0.7 Spring 95 1.0 0.5 0.8 1.0 1.6 0.6 1.3 1.3 1.0 Summer 95 0.9 0.5 0.9 0.8 1.6 0.4 1.2 1.6 1.1 Autumn 95 1.0 0.5 0.7 1.0 1.4 0.7 1.0 1.4 1.0 Winter 95 1.0 * 0.6 0.9 1.6 0.6 1.3 1.8 1.2 Spring 96 0.8 0.7 0.5 0.9 1.4 0.6 1.1 1.4 1.2 Summer 96 1.0 0.5 0.6 0.8 1.7 0.7 1.2 1.4 0.9 Autumn 96 0.8 0.5 0.6 0.8 1.4 0.6 1.0 1.0 1.1 Average 0.76 0.43 0.59 0.75 1.35 0.53 1.01 1.23 0.95 Source: Labour Market Trends Jun 1997 S43 and February 1999, S37 # Number of redundancies in each category divided by number employed in each category. * Fewer than 10,000 redundancies for the quarter in question: estimate not given (N.B. Agriculture & fishing and Energy & water industries had fewer than 10,000 redundancies for all quarters)

22
TABLE 5. Redundancy Rates by Industry# M
anuf
actu
ring
Con
stru
ctio
n
Dis
tribu
tion,
H
otel
s &
R
esta
uran
ts
Tran
spor
t
Ban
king
, fin
ance
&
Insu
ranc
e
Publ
ic
adm
in,
educ
atio
n &
he
alth
Oth
er se
rvic
es
Autumn 95 1.4 1.9 1.1 1.1 0.9 0.5 * Winter 95 1.4 3.0 1.0 1.1 1.1 0.3 1.1 Spring 96 1.4 2.6 1.0 1.0 0.9 0.3 0.8 Summer 96 1.4 2.1 1.0 0.8 1.0 0.3 1.0 Autumn 96 0.9 2.0 1.0 0.8 0.9 0.3 * Summer 97 1.3 2.0 0.8 * 0.9 0.3 * Autumn 97 1.0 1.9 0.7 1.0 0.7 0.3 * Winter 97 1.3 1.4 1.1 0.7 0.8 0.2 * Spring 98 1.5 1.1 0.9 1.0 0.9 0.2 1.1 Summer 98 1.4 1.7 0.9 1.0 0.7 0.2 * Autumn 98 1.6 1.7 0.7 1.0 0.9 0.3 * All 1.22 1.78 0.85 0.78 0.81 0.27 0.28 # Number of redundancies in each sector divided by number employed in each sector. * Fewer than 10,000 redundancies for the quarter in question: estimate not given (N.B. Agriculture & fishing and Energy & water industries had fewer than 10,000 redundancies for all quarters) Source: Labour Market Trends Jun 1997 S43 and February 1999, S37
It can be seen from Table 4 that plant and machine operatives and craft and related
professions are the highest risk groups with redundancy rates of 1.35% and 1.23%
respectively (rates that are several times greater than the redundancy rate for
professionals, for example). The differences are even greater when considered by
industry (Table 5), with construction and manufacturing sectors (where unskilled and
manual workers are most concentrated) having the highest rates (1.78 and 1.22), which
are respectively 659% and 452% greater than the rate for those in the ‘public admin,
education and health’ category.

23
Estimates by Walker et al (1995) of the odds of becoming unemployed in the next three
months, only confirm this pattern. Walker et al find the odds for the following
categories of male worker in 1992-3 to be: 1 in 31 for professionals; 1 in 27 for clerical
workers; 1 in 25 for a skilled manual workers; 1 in 19 for semi-skilled workers; and 1 in
13 for unskilled workers. Moreover, the figures listed in Gregg and Wadsworth
(1994a,b) indicate that the proportion of mortgagors who fall into to the categories of
workers excluded by many MPPI policies because they are temporary or unstable, may
be substantial. Their figures show that though the majority of jobs overall were
permanent and full-time, most of the new jobs were not. Walker et al note that, ‘because
the turnover of temporary jobs is quicker they inevitably constitute a disproportionate
number of the vacancies available. Moreover, unemployed claimants have to compete
for the comparatively few ‘proper’ jobs that are on offer with people who are already in
employment’ (p.42). (It can be seen from the figures presented in Table 1 that non-
manual ancillary workers, and self-employed non-professionals – both of which have
below average MPPI take-up – constitute nearly a fifth of the workforce).
There remains the question, however, as to why the highest risk groups have the lowest
MPPI take-up rates. One explanation (to be considered in the next section) is that these
groups have lower income levels and so are less likely to be able to ‘afford’ MPPI. A
second explanation is the ‘favourable selection’ effect noted earlier (i.e. the option to turn
down job offers during the ISMI gap which mortgage protection insurance provides, may
be of lower value to the unskilled, and explain why they are less likely to take out the

24
insurance). Absence of research into this conjecture means that it is not possible to
quantify its effect but it may account for some of the variation in take-up across
employment. A third explanation is that the risks faced by the most vulnerable groups
are not covered by MPPI policies. Employees without a stable employment history or
who are already aware of the termination date of their current contract are unlikely to find
adequate cover, and so are less likely to consider the purchase of MPPI to be worthwhile.
A group for which this latter cause is particularly pertinent is that of self employed
workers, a group that has constituted a growing proportion of the workforce (10% of the
workforce in 1980 and 14% in 1996; CIH, 1997) and identified by Ford et al (1995) and
Burrows and Ford (1998) to be particularly vulnerable to substantial income reduction
during recessions. Burrows and Ford (1998) make a distinction between those self
employed who have employees and those without employees. Those without employees
are also separated into three categories: self-employed professionals; self-employed non-
manual workers; and self-employed manual workers. Their analysis (based on head of
household) indicates that the majority of the self-employed are owner occupiers. Across
all categories the self-employed are less likely than employees to be in the social rented
sector. In general, compared to employees, the self-employed tend to live in larger and
more expensive accommodation. The self employed are also much more likely to have a
higher mortgage as a percent of their income. A reason for this could be that self-
employed workers make use of additional borrowing for the purpose of ‘business

25
investment rather than just for the purchase or improvement of the home’ (op cit),
particularly since mortgage finance is one of the cheapest forms of borrowing.
Burrows and Ford also find that the self employed are much more likely than other
employment categories to face repayment problems. Using the Survey of English
Housing they found that, of the self employed with a mortgage, over one quarter were
either in mortgage arrears of some sort or are having difficulties meeting mortgage
repayments. Multivariate analysis of the odds of mortgage indebtedness among the self
employed, controlling for a range of variables, revealed that, ‘We can be confident that
the association between self-employment and an increased odds of mortgage
indebtedness is real and robust’. Part of the reason for this is the inherently precarious
and volatile nature of self employment. Moreover, Burchardt and Hills’ (1997a) survey of
MPPI policies found that, at the start of 1996, one third of the 103 available policies
excluded self employed borrowers. This is in many ways unsurprising since it would not
be viable for insurance companies to bear the much higher risks faced by small
businesses and yet charge the same flat rate premium as it does to workers in normal
employment. What it does perhaps suggest, however, is the need for some form of
publicly administered mortgage insurance for self-employed workers (along the lines, for
example, of the existing Loan Guarantee Scheme – see Cowling, 1996), particularly since
there are general benefits to the economy as a whole from promoting entrepreneurship.

26
SECTION 3 PERSONAL FINANCIAL RESOURCES
In addition to the unemployment risks faced by mortgage borrowers, an important
determinant of the risk of arrears and repossession is the financial resources at the
mortgagor’s disposal relative to his/her essential outgoings and mortgage payments. For
example, a single person with a small mortgage and sizable savings is more likely to be
able to survive a short bout of unemployment than someone with many dependents, a
large mortgage, and meager savings. One would, therefore, anticipate higher levels of
insurance take-up amongst households that have diminutive savings relative to family
outgoings. However, this story is complicated by the fact that the ability to save is
determined by disposable income, as is the capacity to afford MPPI premiums.
Disposable income is in turn determined by gross household income, size of mortgage
payments, and the number of persons in the household. The question is whether it is
affordability that dominates the MPPI take-up decision (hence the greater the household’s
financial resources the greater the take-up propensity), or whether it is the risk of
arrears/repossession that dominates (i.e. the greater the household’s financial resources,
the lower the take-up propensity).
This is an interesting socio-economic question since it reflects on the extent to which
mortgage borrowers weigh up perceived probabilities against current monetary demands.
It is a complex question and one to which we shall only be able to provide a partial
answer. Nevertheless, consideration of take-up rates across different brackets of

27
household structure, savings, income and mortgage payments, will give valuable insight
into the fundamental behavioral patterns of mortgage borrowers.
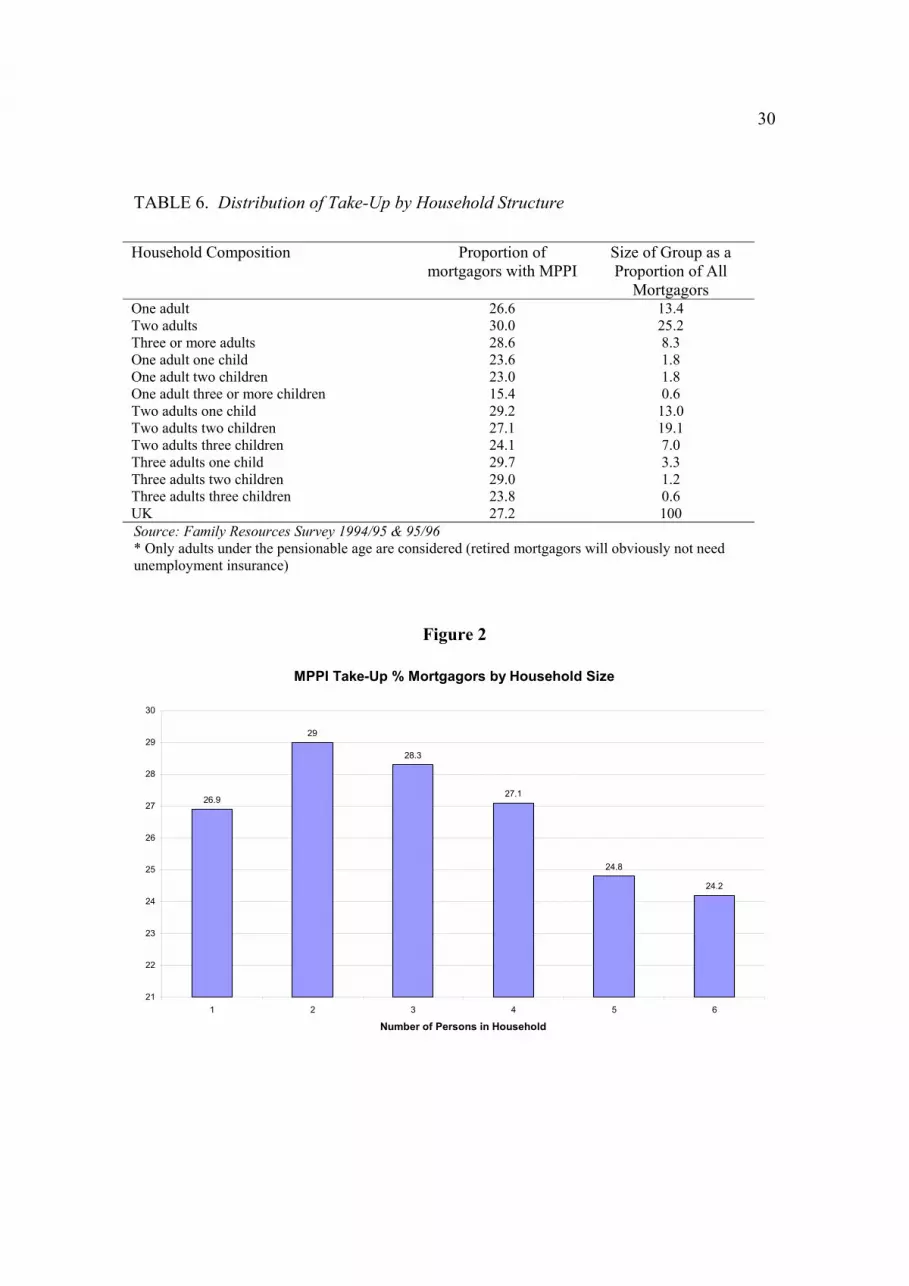
Consider first the rate of take-up of across different household structures. Figure 3
demonstrates that MPPI take-up varies considerably across household size, with take-up
declining with the size of household for multi-person households. Table 6 confirms the
surprisingly strong variation in of MPPI take-up across household types, and reveals that
households with more children relative to the number of adults are less likely to take-out
MPPI. For example, hypothesis tests show that the take-up of MPPI is significantly
greater amongst households with one adult and one child than amongst households with
two adults and one child (significance level = 0.02). Similarly, the take-up of MPPI is
significantly greater amongst households with one adult and three children than it is
amongst households with one adult and one child (significance level = 0.02), or one adult
and two children (significance level = 0.03). The take-up of MPPI is also significantly
greater amongst households with two adults and three children than it is amongst
households with two adults and two children (significance level = 0.02). (The hypothesis
tests were done using one-tailed z-score tests of differences between population
proportions).
These results strongly support the affordability argument outlined above, for although
greater household size has direct implications for household expenditure, there is no
obvious rationale why it should reduce the risk of the household facing repayment

28
problems. For households with more than one adult, it might be possible to argue that
interpretation of the result is complicated by the implications for repayment risk of the
second adult seeking or continuing in employment should the first adult face redundancy
or ill-health. But no such contingency is possible where household size increases because
of additional children, particularly for single adult households, and so the data on single
parent households (which has not been considered before due to limited sample sizes)
would appear to provide the clearest evidence that affordability is an important cause of
low take-up of MPPI.
It should be said that the results reported in Table 6 are somewhat surprising given that
the econometric models of Pryce (1998a,b) and Pryce and Keoghan (2001) have found
take-up to be fairly unresponsive to premiums (Pryce, 1998a, for example finds that for
every 10% fall in premiums, take-up would rise by only 5%). One possible explanation
is that the lack of variation in the premium and/or significant measurement error
associated with this variable dulls the estimated responsiveness of take-up to it in
regression analysis. Even more puzzling, however, is the fact that estimates by Pryce and
Keoghan (2001) did not find number of children in the household to be a statistically
significant determinant of take-up (though the variable did have a negative, if very small,
coefficient). It is not likely that this could be put down to measurement error alone, but it
could well be the result of non-linearities in the relationship between take-up,
affordability and household structure (a possibility reinforced by the results of Figures 3,
4 and 5, and Appendix 1, discussed below). Nevertheless, it is still odd that the strength

29
of the effect of the number of children suggested by Table 6 is not in some way reflected
in econometric estimates.
30
TABLE 6. Distribution of Take-Up by Household Structure
Household Composition Proportion of mortgagors with MPPI
Size of Group as a Proportion of All
Mortgagors One adult 26.6 13.4 Two adults 30.0 25.2 Three or more adults 28.6 8.3 One adult one child 23.6 1.8 One adult two children 23.0 1.8 One adult three or more children 15.4 0.6 Two adults one child 29.2 13.0 Two adults two children 27.1 19.1 Two adults three children 24.1 7.0 Three adults one child 29.7 3.3 Three adults two children 29.0 1.2 Three adults three children 23.8 0.6 UK 27.2 100 Source: Family Resources Survey 1994/95 & 95/96 * Only adults under the pensionable age are considered (retired mortgagors will obviously not need unemployment insurance)
Figure 2
MPPI Take-Up % Mortgagors by Household Size
26.9
29
28.3
27.1
24.8
24.2
21
22
23
24
25
26
27
28
29
30
1 2 3 4 5 6
Number of Persons in Household

31
One possible alternative explanation, at least of the strength of the result for single parent
households, is that single parents would be more likely to be entitled to ISMI in the event
of unemployment than a two adult household. This is because, if both of the adults work
and one becomes unemployed, the household may not be entitled to Income Support
because of the wage of the second adult, even though this is not sufficient to meet the
costs of mortgage payments. Whether this actually affects the insurance decision of lone
parents is central to the debate over whether changes to ISMI have any significant effect
on the take-up of MPPI. Because the regression models of Pryce (1998a,b) and Pryce
and Keoghan (2001) include estimates of the probability of redundancy, the effect of
household structure may be captured by, or be interacting with, probability of
redundancy, rather than the “number of children” variable. It does seem questionable,
however, that this explanation plays a significant role in the light of existing research
regarding the levels of ignorance surrounding ISMI rules (Ford and Kempson, 1997) and
the results of Pryce (1998a,b) and Pryce and Keoghan (1999) which find ISMI to have
little effect on MPPI take-up. It should also be noted that even if ISMI rules were to
blame for the low take of MPPI amongst single parent households, the financial
implications for the Exchequer are likely to be constrained by the fact that such
households constitute less than five per cent of all mortgage borrowers (see column three
of Table 6). In fact, large families generally constitute a only a small proportion of the
population of mortgage borrowers. Column three of Table 6 shows that in 1994-96
households with more than four members constitute less than ten per cent of all

32
households with mortgages; and that more than a quarter of owners with a mortgage
belong to a two adult household.
Income and Savings
Consider now the take-up rates by category of income and savings (Table 7 and Table 8)
It is clear that those in the lowest income bracket are the least likely to have MPPI but
also that take-up tends to decline as income rises. (Income is particularly important
because, as well as having an important effect on the ability to meet mortgage
repayments, it is also indicative of ease of getting another job – Gregg and Wadsworth
1995).
A similar trend is evident across savings categories, although it should be noted that these
tables do not reveal the complexities that arise when household structure is taken into
account. For example, amongst single parents in the lowest savings category, only 22.5%
of households have MPPI, whereas take-up is 34.6% amongst singe parents in the £1,500
to £8,000 category. More than 80 per cent of single parent owners with two children have
savings of less than £1,500, and those with savings of between £1,500-£8,000 are least
likely to have MPPI and those with savings of between £8,000 - £20,000 are most likely.
Perhaps even more importantly, these figures do not consider the impact on take-up of
mortgage outgoings relative to income, and it is to this we now turn.

33
TABLE 7. MPPI Take-up Rates by Income Group of Head of Household Net Weekly Take-Home Pay £
Proportion of Mortgagors with MPPI
Size of Group as a Proportion of All Mortgagors
0 - 49 18.3 0.9 50 – 99 32.6 2.2 100 – 149 30.4 6.1 150 – 199 30.1 14.2 200 – 249 30.7 20.0 250 – 299 28.5 19.9 300 – 349 28.0 13.3 350 – 399 26.7 8.2 400 – 499 27.1 8.3 500 – 599 27.2 3.5 600 – 699 26.2 1.3 700 – 799 26.6 0.6 800 – 899 22.6 0.5 900 – 999 50.0 0.3 1000 + 22.1 0.7 UK 28.9 100 (Source: FRS 1995/96)
TABLE 8. MPPI Take-Up Rates by Levels of Savings
Total Savings of Respondent and Partner
Proportion of Mortgagors with MPPI
%
Number of Cases with MPPI
Proportion of All Mortgagors
less than £1,500 28.3 2906 51.1 £1,500 - £8000 28.0 1570 27.8 £8,000 - £20,000 25.0 512 10.2 £20,000+ 24.3 394 8.1 Non Response 23.1 133 2.9 UK 27.4 5515 100 (Source: FRS 1995/96)

34
MPPI Take-Up and the Mortgage Payments to Income Ratio
As a means of arriving at a more meaningful breakdown of MPPI take-up without
running into sample size problems, we have calculated the ratio of mortgage payments to
gross household income and graphed the take-up of MPPI across the deciles of this ratio.
Figure 3 shows this relationship as an average across all two to five person households.
One person households are excluded because they possess a relationship between MPPI
take-up and the mortgage to income ratio (M) that is distinct from all other sizes of
household (compare Figure 4 with Figure 5). The shape of the curves in Figure 3 and
Figure 4 suggests that there is a clearly identifiable non-linear relationship between MPPI
take-up and M. For households with mortgage payments that are very low relative to
income (M = 1% to 3%) take-up of MPPI is negatively related to M. For households with
slightly higher mortgage payments relative to income (M = 6% to 13%) the relationship
of take-up of MPPI to M becomes positive. For multi-person households with mortgage
payments in excess of 16% of their income, the affordability effect appears to dominate,
since the relationship is consistently positive. Moreover, the affordability argument is
reinforced by the strict ordering of MPPI take-up by household size from households
with M greater than 16%: larger households having noticeably higher take-up rates than
smaller ones (see Figure 4).
The complexity of the relationship for multi-person households with M less than 13% is
likely to be because of the interaction of various factors (affordability, vulnerability to
repayment difficulties, favorable selection etc.) each of which has its strongest effect

35
relative to the other effects at different levels of M. An additional complicating factor is
the affect of the size of mortgage payment on the MPPI premium. Premiums are
calculated per £1 of monthly mortgage payment and so, for borrowers with very small
mortgage payments, the premiums are correspondingly small. This perhaps explains the
high rates of take-up amongst borrowers in the lowest category of M. Conversely, the
greater the size of the mortgage payment relative to income, the greater the size of the
MPPI premium relative to income – reinforcing the affordability effect. Regression
results presented in the Appendix suggest the following cubic relationship between take-
up rate and the mortgage payments to income ratio for multi-person households:
3100
32101241 MMMPr −+−−=
where r is the MPPI take-up rate, P is the number of persons per household, and M is the
ratio of mortgage payments to household income.
For single person households the affordability effect seems to kick-in much higher up the
M scale – no significant fall in MPPI take-up is evident before the penultimate category
of M in Figure 5. Up to that point, the relationship appears to be generally positive (if
somewhat uneven), suggesting that factors other than affordability are uppermost in the
single person’s mind when making the insurance decision.

36
Figure 3
Average Take-Up Across Two-Five Person HHs by Mortgage Payment to HH Income Ratio
0
5
10
15
20
25
30
35
40
45
1 to 3 4 to 5 6 to 7 8 to 9 10 to 11 12 to 13 14 to 15 16 to 18 19 to 24 25 plus
Ratio of Mortgage Payments to Household Income (%)
MPP
I Tak
e-U
p R
ate
(%)
Figure 4
Take up of MPPI by Mortgage Payment to Income Ratio and HH Size
0
5
10
15
20
25
30
35
40
45
1 to 3 4 to 5 6 to 7 8 to 9 10 to 11 12 to 13 14 to 15 16 to 18 19 to 24 25 plus
Ratio of Mortgage Payments to Household Income (%)
MPP
I Tak
e-U
p R
ate
(%)
Two Person HHsThree Person HHsFour Person HHsFive Person HHs

37
Figure 5
One Adult, No Children
0
5
10
15
20
25
30
35
40
45
0.01 to0.03
0.04 to0.05
0.06 to0.07
0.08 to0.09
0.10 to0.11
0.12 to0.13
0.14 to0.15
0.16 to0.18
0.19 to0.24
0.25 plus
Ratio of Mortgage Payments to Household Income (%)
MPP
I Tak
e-up
(%)
One Adult, No Children

38
CONCLUSION
This paper began by noting the changing interface in the UK between housing,
employment and welfare, driven in part by financial deregulation and the greater role
ascribed to private mortgage insurance. We argued, as Ford and Quilgars (2001) have
argued, that the outcome of this shift is of international interest: “These changes are
embedded in and flow from global pressures that have implications for all areas of
national, regional, local and individual lives” (p. 148). The developments in the UK,
“even if not directly paralleled elsewhere, are nonetheless, an exemplar of the influences
on, and outcomes of, change in owner occupied markets” (p. 148). The corollary is that
the focus of the current paper, on the positives and negatives of the UK policy of
promoting mortgage payment protection insurance, will be of interest to policy makers
and housing analysts across Europe and not just in Britain. It could be argued that an
important measure of the efficacy of greater reliance on private insurance is the consumer
response to it. Consumer sovereignty can after all be a double edged sword, and if those
most in need of a mortgage safety net have snubbed what the market has to offer, then
one could conclude that liberalised mortgage finance has failed to successfully coexist
with the privatisation of welfare, at least in the UK context.
With this motivation, the paper has reviewed the mortgage insurance debate and
examined whether mortgage borrowers, who choose to remain uninsured, do so because
they are in the most stable forms of employment and/or have sufficient financial
resources to cover periods of unemployment, or because their main employment risks are
39
not covered by MPPI policies and/or because MPPI is perceived to be too expensive.
Two years of Family Resources Survey data were combined to produce a sample of over
18,000 mortgage borrowers which formed the basis of the most detailed and robust
investigation to date of the characteristics of the insured vs the uninsured.
Employment characteristics of borrowers were compared to data on employment stability
in an attempt to identify those groups of mortgage borrowers most at risk. We found that
those in the riskiest categories of employment were not necessarily those most likely to
take out private mortgage protection insurance, and so we conclude that it is not possible
to say that all those who remain uninsured do so because of low employment risks.
Income and savings of the uninsured were also examined in order to establish whether
borrowers were more or less likely to take our insurance if they have high levels of
income relative to mortgage payments. We found that those with the least financial
resources were not necessarily the most likely to take-out insurance. Part of the
explanation of low take-up amongst these groups may be that their risks are not covered
by such policies. Affordability of MPPI is also a potentially important explanation,
particularly for those on low incomes who abstain from insurance even though they may
be most vulnerable to repayment difficulties. We found a surprisingly large variation in
the take-up across household types. In particular, we found that households with a
greater number of children relative to adults have significantly lower MPPI take-up rates.
These findings provide evidence that affordability is indeed an important driver of MPPI
take-up, for whilst there is no obvious reason why having more children reduces the

40
default risk of a household, it is clear that the number of children will have a direct effect
on the ratio of outgoings to earnings and hence on a households ability to afford MPPI.
Analysis of the relationship between the take-up of MPPI and the ratio of mortgage
payments to household income suggested a complex interaction of the affordability effect
with other factors that affect the MPPI decision, factors such as the reduced risk from
greater financial resources, and the higher cost of the premium for households with larger
mortgage payments.
Despite their complexity, these results do nothing to alleviate the concerns raised in the
existing literature regarding the adequacy of MPPI to protect those left most vulnerable
by the 1995 ISMI changes. Of particular policy significance is the issue of affordability
which clearly has an important role in determining the take-up of MPPI. If the inability
to afford MPPI is an important cause of the low take-up rates of vulnerable groups, then
the whole policy of protecting mortgagors using private insurance without subsidy or
means tested assistance, is fundamentally flawed. Although the new baseline MPPI
product introduced at the start of 1999 may help cover some of the risks previously
neglected, it will do nothing to remedy the affordability problem. And, unlike other
shortcomings in MPPI products, such as the poor track record on claims and the
inadequate interface with ISMI, affordability problems conflict with the very nature of
private insurance, and cannot be remedied by the market alone.

41
These conclusions strike at the very heart of UK housing welfare policy over the past two
decades and offer important lessons for other European countries considering financial
deregulation. Britain has currently reached a position where ‘half the poor are home-
owners, yet they receive only 8 per cent of the state help with housing costs targeted on
low-income households’ (Burrows et al, 2000, p.12). At the same time, there is a clear
evidence of an upward trend in house possessions: each successive peak and trough is
higher than the previous peak and trough. The corollary of this trend and the findings
presented here, is that European policy makers will have to think seriously about whether
greater precariousness in housing tenure and employment is an acceptable price to pay
for greater financial and labour market efficiency. Whether similar efficiency gains can
be achieved without greater reliance on private insurance has yet to be tested. But it may
be that the political constraints on the state’s ability to bear the risks associated with
liberalisation will make financial deregulation and private mortgage insurance forever
mutually dependent. And if these two policy goals are inseparable, then the failure of
MPPI in the UK will inevitably have implications for the efficacy of financial
liberalisation in general.

42
REFERENCES
Armstrong, H. (1999) ‘Better Mortgage Protection Insurance Welcomed’, DETR Press
Release, No.150, 23rd February 1999.
ABI (1995) ‘Risk, Insurance and Welfare: Changing the Balance Between Public and
Private Protection,’ Association of British Insurers, London
ABI and CML (1999) ‘Lenders and Insurers announce Better Home-Buyer Protection in
New Public/Private Partnership with Government’, Council of Mortgage Lenders
and Association of British Insurers Press Release, 23rd February 1999.
Beck, U. (1992) ‘Risk Society’ London: Sage
Brueckner J K (1985) ‘A Simple Model Of Mortgage Insurance’, AREUEA Journal,
Vol.13, No.2, Pp.129-142.
Bull, J. (1995) The Housing Consequences of Relationship Breakdown, York: University
of York, Centre for Housing Policy.
Burchardt, T. And Hills, J. (1997a) ‘Private Welfare Insurance And Social Security:
Pushing The Boundaries’, York, YPS For The Joseph Rowntree Foundation.
Burchardt, T. And Hills, J. (1997b) ‘Mortgage Payment Protection: Replacing State
Provision’, Housing Finance, 33, pp. 24-31.
Burchardt, T. And Hills, J. (1998) ‘From Public To Private: The Case Of Mortgage
Payment Insurance In Great Britain’, Housing Studies, 13, Pp. 311-323.

43
Burrows, R. (1997) ‘Mortgage indebtedness in England: an ‘epidemiology’, Housing
Studies, 13, 1, pp. 5-22.
Burrows, R. and Ford, J. (1998) ‘Self-employment and Home Ownership after the
Enterprise Culture’, Work, Employment & Society, Vol. 12, No. 1.
Burrows, R., Ford, J. and Wilcox, S. (2000) ‘Half the Poor?’ in Steven Wilcox 2000,
‘Housing Finance Review 2000’, Joseph Rowntree Foundation, York
CIH (1997) ‘Sustainable Home Ownership: New Policies for a New Government’,
Chartered Institute of Housing, London.
Chiu, W. H. And Karni, E. (1998) ‘Endogenous Adverse Selection And Unemployment
Insurance’, Journal Of Political Economy, 106, 4, Pp. 806-827.
Clauretie T M And Jameson M (1990) ‘Interest Rates And The Foreclosure Process:
An Agency Problem In FHA Mortgage Insurance’, Journal Of Risk And
Insurance, Vol. 57, 4, Pp. 701-711
CML (1999a) ‘Mortgage Arrears and Possessions’, Council of Mortgage Lenders Press
Release 27/01/99, Tables 1 and 2, www.cml.org.uk/press/1999
CML (1999b) ‘Arrears And Possessions Stable’ Council of Mortgage Lenders Press
Release, Wednesday 28 July 1999.
Cowling, M. (1996) “Initial Tests On The Sensitivity Of The Parameters Of The UK
Loan Guarantee Scheme”, Public Finance, Vol. 50(3), Pp. 356-70.
De Leeuw, F. and Ekanem, N.F. (1971) ‘The Supply of Rental Housing’, American
Economic Review, 61(5), pp. 806-817

44
Douetil, D J (1994) ‘The Interrelationship Between The Mortgage And Insurance
Industries In The United Kingdom’, Housing Policy Debate, Vol.5, Issue 3,
Pp.275-306
Ford, J. (1989) ‘Casual work and owner occupation’, Work, Employment and Society, 3,
1, pp. 29-48.
Ford, J. (1988) ‘Risks: Home Ownership and Job Insecurity’, Shelter, London.
Ford, J., Kempson, E., and Wilson, M. (1995) ‘Mortgage Arrears and Possessions;
Perspectives from Borrowers, Lenders and the Courts,’ Department of the
Environment, London: HMSO
Ford, J. and Kempson, E. (1997) ‘Bridging The Gap? Safety Nets For Mortgage
Borrowers’, Centre For Housing Policy, University Of York.
Ford, J. & Quilgars, D. (2001) Failing Home Owners? The Effectiveness of Public and
Private Safety-nets. Housing Studies 16[2], 147-162.
Ford, J., Burrows, R. and Nettleton, S. (2001) ‘Home Ownership in a Risk Society’, The
Policy Press, Bristol.
Goodman, M. (1998) ‘Payment Protection,’ Mortgage Finance Gazette, Nov 1998, p.39ff
Gregg, P. and Wadsworth, J. (1994a) ‘More Work in Fewer Households?’ National
Institute of Economic and Social Research, Discussion Paper 72.
Gregg, P. and Wadsworth, J. (1994b) ‘Opportunity Knocks? Job Separations,
Engagements and Claimant Status’ National Institute of Economic and Social
Research.

45
Gregg, P. & Wadsworth, J. (1995) ‘A short history of labor turnover, job tenure, and job
security, 1975-93’, Oxford Review Of Economic Policy, 1995, Vol.11, No.1,
Pp.73-90.
Hamnett,C (1999) Winners and Losers: Home Ownership in Modern Britain UCL Press,
London.
Hirshleifer, J. And Riley, J. (1995) ‘The Analytics Of Uncertainty And Information’,
Cambridge Surveys Of Economic Literature, CUP.
Jenkinson, S. (1992) ‘Repossessed: A Fresh Look at Mortgage Lending Practice,’
Catholic Housing Aid Society, London
Kempson, E., Ford, J. and Quilgars, D. (1999) ‘Unsafe Safety Nets?’, Centre for Housing
Policy, University of York.
Maclennan, D. & Pryce, G. (1996) ‘Global Economic Change, Labour Market
Adjustment, and the Challenges for Housing Policies’, Urban Studies, 33, 10,
1849-1865.
Maclennan, D., Meen, G., Gibb, K. and Stephens, M. (1997) ‘Fixed commitments,
uncertain incomes: Sustainable owner-occupation and the economy’, Joseph
Rowntree Foundation, York.
Oldham, C. & Kemp, P. (1996) “Income Support For Mortgage Interest: Current Issues
And Future Prospects”, Council For Mortgage Lenders.
Pryce, G. (1998a) ‘ISMI and the Take-Up of Mortgage Protection Insurance’, CHRUS
Occasional Paper 45.

46
Pryce, G. (1998b) ‘Income Support for Mortgage Interest and the Crowding Out of
Mortgage Payment Protection Insurance’, Housing Finance, 39, August 1998, pp.
27-31.
Pryce, G. & Keoghan, M. (1999) ‘Safety Nets for Mortgage Borrowers’, Scottish Homes
Report: Edinburgh.
Pryce, G. & Keoghan, M. (2001) ‘Determinants of MPPI Take-Up’, Housing Studies,
16(2), 179-198.
Quilgars, D. (1999) ‘High and Dry Down Acacia Avenue,’ Roof, March/April 1999,
p22ff.
Ritzer, G. (1990) Expressing America, London: Pine Forge Press.
Rothschild M And Stiglitz J (1976) ‘Equilibrium In Competitive Insurance Markets:
An Essay On The Economics Of Imperfect Information’, Quarterly Journal Of
Economics, 90, 629-649
Stephens, M. (1993) ‘Housing Finance Deregulation: Britain’s Experience’, Netherlands
Journal of Housing and the Built Environment, Vol 8, No 2, pp 159-175
Walker, R., Shaw, A. And Hull, M. (1995) ‘Responding To The Risk Of
Unemployment’, In: Association Of British Insurers, ‘Risk, Insurance And
Welfare’, (London, ABI).
Wilcox, S. (1995) ‘Housing Finance Review 1995/96’, Joseph Rowntree Foundation,
York
Wilcox, S. (1998) ‘Housing Finance Review 1998/99’, Joseph Rowntree Foundation,
York

47
APPENDIX 1
Regression Results for Multi Person Households: Dependent Variable = Take-Up Rates (r)
Variable Coefficient t-value Significance
Level P -1.111 -2.425 .021 M -1.685 -2.301 .028 M 2 .104 1.779 .084 M 3 -.003 -1.875 .069 Constant 40.547 13.569 .000 N 40 Adjusted R2 0.626 F 17.332 0.000
The data for different household sizes from Figure 6 was pooled to give forty observations on M and r. The regression results suggest a cubic relationship between the MPPI take-up rate (r) and M in multi-person households because the coefficient on M3 is significant at the 90% level of confidence, and because linear versions of the model had lower Adjusted R2. It is worth noting that linear versions indicated a negative coefficient on M of around –0.8. This suggests that there is an overall negative relationship between r and M, that is, the relationship is dominated on the whole by the affordability effect. Other variables (such as employment type) have not been included in the regressions because this would result in a greater number of categories for which M and r have to be calculated, and result in insufficient sample sizes in some categories.


