Embed Size (px)
Citation preview

UNIQUE VANADIUM-RICH EMERALD
FROM MALIPO, CHINA Yang Hu and Ren Lu
FEATURE AR ICLES
Emeralds were discovered in Malipo County in southwestern China more than 30 years ago. Malipo emeralds
are still being extracted and are expected to be available over the next decade. This study provides a full set of data through standard gemological properties, inclusion scenes, color characteristics, and advanced spectro-scopic and chemical analyses including Raman, XRD, micro UV-Vis-NIR, EPR, and LA-ICP-MS. Multiphase in-clusions in Malipo emerald are distinct with various shapes and occasionally a colorless transparent crystal. Abundant vanadium substitutes for aluminum in the octahedral site and serves as the predominant coloring
agent, leading to a yellowish green color. Among significant known deposits, Malipo emerald has a unique chem-ical composition in its combination of high V, low Cr, and moderate Fe, as well as high Li and Cs concentrations.
Malipo County in Yunnan Province of south-western China is a valuable source of emer-ald (figure 1). The mine is located near the
village of Dayakou in the Wenshan Autonomous Pre-fecture, about 30 km from the border city of Ha Giang, Vietnam (figure 2). Emerald was first mined as an accessory mineral from a tungsten deposit. Over the past two decades, large quantities of emer-ald have been extracted and collected as mineral crystal specimens or fashioned into carvings of tra-ditional Chinese objects and themes. Some gem-quality crystals have been cut into cabochons for jewelry use (figure 3). This is the only commercial emerald source being actively mined in China.
Previous studies of Malipo emeralds focused mainly on the regional geology, metallogenic condi-tions, and mineralogical properties (Zhang et al., 1998, 1999; Zhang and Lan, 1999; Xue et al., 2010; Huang et al., 2015, 2017). However, some significant gemological features of these emeralds were still in-sufficiently studied, including multiphase inclusion scenes, color characteristics, and chemical composi-tion analysis. These features significantly affect iden-tification and evaluation, as well as geographic origin determination.
This article provides an overview of the history, resource potential, and geology for Malipo emeralds.
Standard gemological techniques were used to char-acterize this material. Multiphase inclusion scenes
See end of article for About the Authors and Acknowledgments. GEMS & GEMOLOGY, Vol. 55, No. 3, pp. 338–352, http://dx.doi.org/10.5741/GEMS.55.3.338 © 2019 Gemological Institute of America
Figure 1. A traditional carved snuff bottle (7.5 × 11 cm) of emerald from Malipo with a lid made of garnet from the nearby town of Maguan. The carving also contains associated quartz at the bottom of bottle. Photo courtesy of Daowen Ye.
338 EMERALD FROM MALIPO, CHINA G EMS & GEMOLOGY F ALL 2019

, .. \ ,. , ' ,
, .,, -, - ;' . ., \-.,
' '
•
•
Yunnan
CHINA
Malipo
Maguan
CHINA
VIETNAM
Dayakou
Hoang Su Phi
Ha Giang
0 20 km
Figure 2. The emerald mine in Malipo County is located near the village of Dayakou in the southeastern region of Yunnan Province, about 20 km from the Vietnamese border. The red rectangle on the right corresponds to the geo-logic map of the emerald deposits in Dayakou in figure 6.
were summarized, and some inclusions and acces-sory minerals were identified by Raman and XRD. Above all, micro UV-Vis-NIR, LA-ICP-MS, and EPR were used to investigate the chemical composition, optical absorption, and color features of Malipo emeralds.
CULTURAL HERITAGE AND RESOURCE Malipo County is part of Wenshan Autonomous Pre-fecture, known for the cultural heritage of its minority
ethnic groups. Two prominent ethnic groups, the Miao and the Zhuang, wear distinctive ethnic dress and sumptuous silver jewelry (http://m.visit ourchina.com/blog/detail-348.html). Numerous mi-nority groups there have given birth to a rich and col-orful culture that has been passed down from generation to generation. Wenshan Autonomous Pre-fecture’s cultural heritage includes traditional folk lit-erature, music, dance, art, architecture, crafts, and drama. In addition to this important cultural resource,
Figure 3. These gem-quality rough and pol-ished emeralds from Malipo, used in the present study, show medium to intense yel-lowish green color. The polished emeralds range from 0.20 to 1.00 ct and the rough crys-tals from 1.75 to 3.00 ct. Photo by Yang Hu.
EMERALD FROM MALIPO, CHINA G EMS & GEMOLOGY F ALL 2019 339

In Brief • Emeralds from Malipo County, in southwest China’s
Yunnan Province, occur in association with quartz and pegmatite veins and Proterozoic granofels.
• The Malipo emerald deposit has produced mineral specimens, traditional carvings, and cabochons.
• AbundantV3+ in octahedral coordination is the pre-dominant chromophore, leading to a yellowish green color.
• A distinctive combination of highV, low Cr, and mod-erate Fe, as well as high Li and Cs concentrations, helps separate Malipo emerald from other deposits.
Figure 4. A collector’s item, found in 2011, of emerald crystal speci-mens in matrix from the Dayakou mine in Malipo County, China. The longest emerald crystal measures about 93 mm. The matrix mainly consists of quartz, feldspar, and dark muscovite. Cour-tesy of Arkenstone, Robert Lavinsky collection.
340 EMERALD FROM MALIPO, CHINA G EMS & GEMOLOGY F ALL 2019
Malipo County is known for its rich ore resources, namely the strategically important metal tungsten. Significant tungsten deposits were first discovered in 1943 (Jin et al., 1943), and 23 occurrences were located by 2012.
Emeralds were first discovered in the Malipo re-gion in the late 1980s as associated minerals during tungsten mining. From 1996 to 1997, the regional ge-ology and emerald resources in the area were system-atically surveyed by the Yunnan Bureau of Geology and Mineral Resources. According to Wang et al. (1996), 22 pegmatites and 8 quartz veins related to emerald had been documented, with an estimated emerald reserve of about 7 tons.
Local villagers were collecting minerals and ore materials sporadically for years before government regulation. In 2009, the local government authorized a mining company to extract tungsten ore, and the associated emeralds were mined specifically from then on. Some of these emerald specimens have been acquired by domestic and international museums and private collectors (figure 4). At present, the tung-sten mine is still in operation, and emeralds have also been produced in Dayakou (figure 5). But no emerald mining activity or production are reported officially by this government-authorized tungsten mining company.
With China’s increasing awareness and interest in gems, the local government started to promote Malipo emerald as “Chinese emerald.” Indeed, China’s emer-ald industry is supported and protected by the local government. Public auctions for Malipo emeralds
have been organized, and trading centers have been es-tablished. Moreover, gem and jewelry processing com-panies were created and introduced new techniques. Policies were enacted to protect emerald resources and to regulate the mining activity.

Figure 5. The Malipo emerald mine is located to the right of the middle mountain ridge, about 1,800 meters above sea level. Residences are located at the foot of the mountain. Photo by Daowen Ye.
EMERALD FROM MALIPO, CHINA G EMS & GEMOLOGY F ALL 2019 341
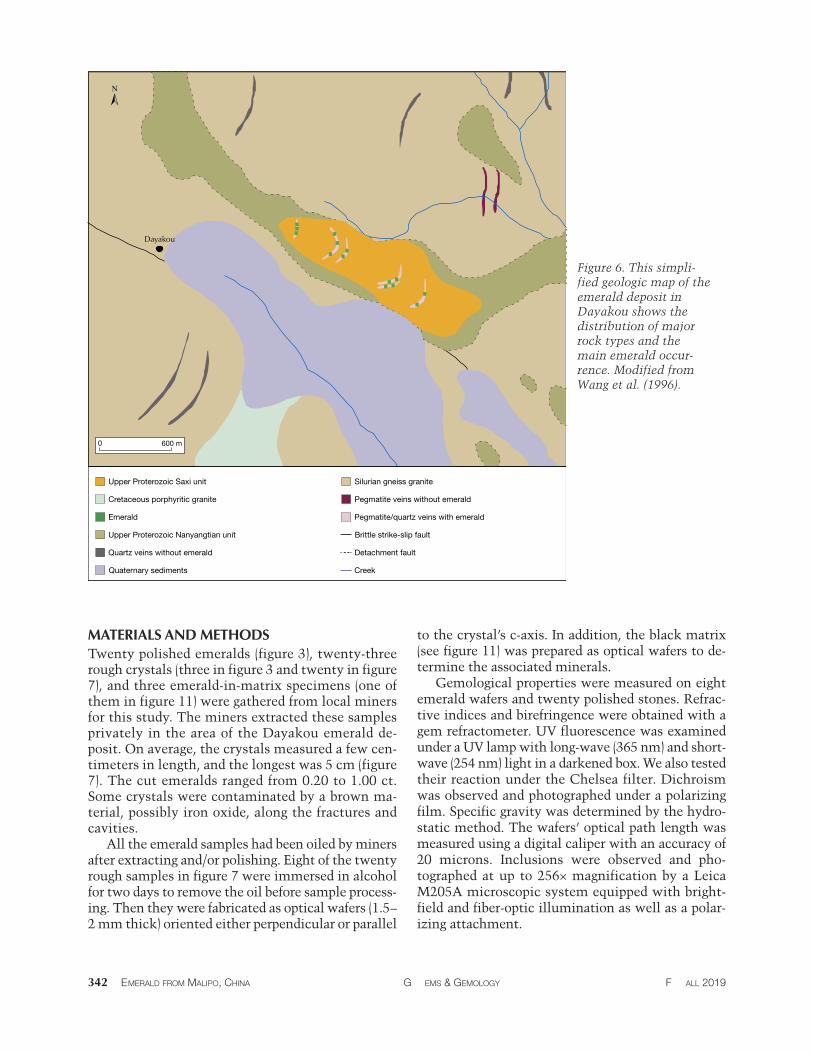
GEOLOGY The Dayakou emerald occurrence lies in the northern part of the Laojunshan–Song Chay metamorphic core complex (Zhang et al., 1999; Feng et al., 2000). The core complex covers an area of approximately 2,000 km2, and nearly one-third of that is in China. The Chinese counties of Malipo and Maguan and the Ha Giang Province of northern Vietnam are all in this area. The core complex is composed of a Proterozoic metamorphosed core and an upper cover of Paleozoic metasedimentary rocks (Zhang et al., 1998). The metamorphosed core consists of Silurian gneiss gran-ites, Cretaceous porphyritic granites, and granitic to pegmatitic intrusions. Patches of the Proterozoic Mengdong succession are also situated locally within the core. The Mengdong succession consists of struc-turally layered metamorphic rocks: the basal Nan-yangtian unit and the overlying Saxi unit (Zhang et al., 1999) (figure 6). The Nanyangtian unit is generally composed of schist. The Saxi unit is comprised of gra-nofels, gneiss, amphibolites, and calcareous sedimen-tary rocks, with granofels as the main host rock for emerald mineralization at Dayakou (Xue et al., 2010).
Emerald at Dayakou generally occurs in north-west-southeast-trending quartz veins and northeast-southwest-trending pegmatite veins intruding deformed Proterozoic granofels, gneiss, and schist of the Nanyangtian and overlying Saxi units (Xue et al., 2010) (figure 6). Some emeralds also mineralize in the contact zone with host rocks. Dozens of emerald-bearing pegmatite veins cover an area of 10 km2. The length of the ore body is between 20 and 280 m, and the width is 0.2 to 1.5 m. According to the classifica-tion of emerald type provided by Schwarz and Giu-liani (2001), this is a granite-related emerald deposit (Groat et al., 2008).
In general, the emeralds that occur in the quartz veins at Dayakou are of better quality, with saturated green color and high transparency. In contrast, the emeralds within the pegmatite veins are larger, more abundant, and idiomorphic. Various associated min-erals occur in emerald-bearing quartz and pegmatitic veins, such as potassic feldspar and mica, as well as minor scheelite, fluorite, calcite, tourmaline, and some sulfide assemblages (Zhang et al., 1999; Feng et al., 2000).
)
- '
(
' ' - J
' -- ,
Figure 6. This simpli-fied geologic map of the emerald deposit in Dayakou shows the distribution of major rock types and the main emerald occur-rence. Modified from Wang et al. (1996).
Upper Proterozoic Saxi unit
Upper Proterozoic Nanyangtian unit
Silurian gneiss granite
Cretaceous porphyritic granite
Quartz veins without emerald
Pegmatite veins without emerald
Emerald
Brittle strike-slip fault
Creek
Detachment fault
Pegmatite/quartz veins with emerald
Quaternary sediments
Dayakou
N
0 600 m
342 EMERALD FROM MALIPO, CHINA G EMS & GEMOLOGY F ALL 2019
MATERIALS AND METHODS Twenty polished emeralds (figure 3), twenty-three rough crystals (three in figure 3 and twenty in figure 7), and three emerald-in-matrix specimens (one of them in figure 11) were gathered from local miners for this study. The miners extracted these samples privately in the area of the Dayakou emerald de-posit. On average, the crystals measured a few cen-timeters in length, and the longest was 5 cm (figure 7). The cut emeralds ranged from 0.20 to 1.00 ct. Some crystals were contaminated by a brown ma-terial, possibly iron oxide, along the fractures and cavities.
All the emerald samples had been oiled by miners after extracting and/or polishing. Eight of the twenty rough samples in figure 7 were immersed in alcohol for two days to remove the oil before sample process-ing. Then they were fabricated as optical wafers (1.5– 2 mm thick) oriented either perpendicular or parallel
to the crystal’s c-axis. In addition, the black matrix (see figure 11) was prepared as optical wafers to de-termine the associated minerals.
Gemological properties were measured on eight emerald wafers and twenty polished stones. Refrac-tive indices and birefringence were obtained with a gem refractometer. UV fluorescence was examined under a UV lamp with long-wave (365 nm) and short-wave (254 nm) light in a darkened box. We also tested their reaction under the Chelsea filter. Dichroism was observed and photographed under a polarizing film. Specific gravity was determined by the hydro-static method. The wafers’ optical path length was measured using a digital caliper with an accuracy of 20 microns. Inclusions were observed and pho-tographed at up to 256× magnification by a Leica M205A microscopic system equipped with bright-field and fiber-optic illumination as well as a polar-izing attachment.

Raman spectra were obtained with a Bruker Sen-terra R200 spectrometer coupled with a 532 nm laser to identify the associated mineral assemblages of the host rock and inclusions. The resolution was set at 5 cm–1, and the laser energy was 20 mW. Two scans with 20 s integration time for each scan were taken for a single spectrum. Raman spectra from at least three spots on each sample were recorded to ensure the consistency of the data. X-ray powder diffraction (XRPD) was carried out on associated mineral assem-blages from 3° to 64° on a PANalytical X’pert Pro dif-fractometer with Cu-Kα radiation (λ = 1.5405 Å, 40 kV, 40 mA), using a step size (2θ) of 0.02° and a step time of 0.15 s each.
Trace element contents of eight emerald wafers were analyzed by laser ablation–inductively cou-pled plasma–mass spectrometry (LA-LCP-MS) using an Agilent 7700 ICP-MS combined with a GeoLas 193 nm laser. We set the laser fluence at 9 J/cm2 with a 6 Hz repetition rate and the laser spot size at 44 μm diameter. Element concentrations were calibrated against multiple reference materi-als (BCR-2G, BHVO-2G, and BIR-1G) without using an internal standard (Liu et al., 2008), and Al was chosen as the normalizing element. Standard refer-ence material NIST 610 glass was also applied to time-drift correction. Three laser spots for each sample were applied on a clean area with uniform
yellowish green color, where UV-Vis-NIR spectra were also collected.
The absorption coefficients were calculated based on the Beer-Lambert Law with polarized ultravio-let/visible/near-infrared (UV-Vis-NIR) spectra of eight emerald wafers. These spectra were recorded by a Jasco MSV-5200 micro-spectrometer equipped with a microscope and a Glan-Taylor polarizer system over the range of 250–2500 nm with 1 nm bandwidth in the UV-Vis region and 8 nm bandwidth in the NIR region, at a scan speed of 200 nm/min. The optical aperture was set at 200 nm and 0.5 nm data interval. Both ordinary ray (o-ray) and extraordinary ray (e-ray) spectra were obtained for each sample. Electron para-magnetic resonance (EPR) spectroscopy was per-formed by a JEOL JES-FA200 EPR spectrometer at the X-band (9.1536 GHz microwave frequency, 5 mW microwave power) with the crystal c-axis parallel and normal to the magnetic field H (H ||c and H⊥c) at room temperature (300K). Measurement parameters were set at 3200 Gauss center field, 5000 Gauss sweep width, 30 s sweep time, 0.03 ms time con-stant, and 100 kHz modulation frequency.
RESULTS Gemological Properties. The Malipo emeralds typi-cally showed medium to intense yellowish green color. Color zoning was present in some crystals per-
Figure 7. A group of medium- to low-qual-ity rough Malipo emer-ald crystals were investigated in this study. Eight of them were processed as opti-cal wafers for LA-ICP-MS, UV-Vis-NIR, and EPR measurements, as well as for color zoning study. Associated min-erals and brown con-taminant were present on some crystals. The crystals shown here av-erage a few centimeters in length. Photo by Yang Hu.
EMERALD FROM MALIPO, CHINA G EMS & GEMOLOGY F ALL 2019 343

/
Figure 8. Color zoning in Malipo emerald crystals perpendicular to the c-axis ranges from a yellowish green rim to a colorless or white core. The sample on the left shows parallel intergrowth of at least three crystals (labeled by the black dotted line). Photo by Yang Hu.
2 mm
344 EMERALD FROM MALIPO, CHINA G EMS & GEMOLOGY F ALL 2019
pendicular to the c-axis, ranging from a yellowish green rim to a colorless core (figure 8). Some samples were near-transparent to translucent owing to the presence of fractures along and/or normal to the c-axis. Parallel growth striations were seen on pris-matic faces. In addition, we observed parallel intergrowth for some emerald crystals (e.g., the one on the left in figure 8).
The refractive indices varied from 1.576–1.582 for ne and 1.582–1.589 for no. Birefringence ranged from 0.006 to 0.008. Specific gravity was 2.66–2.71. Malipo emerald had no reaction under the Chelsea filter. No fluorescence was shown under either long-wave or short-wave UV. Under a polarizing film, bluish green could be observed along the e-ray and yellowish green along the o-ray.
Microscopic Characteristics. Two-phase inclusions with a gas bubble suspended in fluid were the most common inclusion in Malipo emeralds (figure 9). These two-phase inclusions were several to hundreds of microns long, and the width ranged from several to tens of microns. The inclusions displayed various shapes: rectangular, rod-like, needle-like, jagged, and oval or some irregular shapes. The gas bubble usually occupied less than one-third of the volume of the cavity hosting the two-phase inclusion at room tem-
perature. Gas bubbles were sometimes deformed and flattened owing to the outline of the two-phase in-clusions. The hosted gaseous phase was identified by Raman spectra as CO2 and N2. In addition, dense growth tubes oriented parallel to the c-axis were pres-ent in some samples.
Occasionally, a colorless transparent crystal was observed in the multiphase inclusions (figure 10). When observed, these crystals were slightly smaller than the accompanying gas bubbles. The outline of the crystals was near-cubic or irregular, and they were absent in adjacent multiphase inclusions of the same mineralization period. They were somewhat different from the common cubic halite in multi-phase inclusions. It was also difficult to determine if they were singly or doubly refractive under cross-po-larized illumination. Therefore, we could not con-firm whether the crystal was halite, or beryl itself, or other minerals. Huang et al. (2017) determined the presence of halite in Malipo emeralds based only on the oval outline of the crystal. Thus far, no specific evidence of halite in multiphase inclusions has been confirmed in Malipo emeralds.
Various associated minerals were identified by Raman spectra and XRPD in the host rock of our samples, including microcline, calcite, quartz, tour-maline (likely foitite), fluorite, phlogopite, pale yel-

20 µm
50 µm
100 µm
20 µm
100 µm
100 µm
A B
C D
E F
Figure 9. Variously shaped two-phase in-clusions in Malipo emeralds. A: Rectangu-lar two-phase inclu-sions containing round gas bubbles. B: Needle-like two-phase inclu-sions hosting small gas bubbles. C: A jagged two-phase inclusion with a round gas bub-ble inside. D: Rod-like and oval two-phase in-clusions parallel to the c-axis. E and F: Irregu-lar two-phase inclu-sions hosting round or deformed bubbles. Pho-tomicrographs by Yang Hu, brightfield illumi-nation.
EMERALD FROM MALIPO, CHINA G EMS & GEMOLOGY F ALL 2019 345
low scheelite, and pyrrhotite (figure 11). Scheelite is an especially significant ore mineral for extracting tungsten in the nearby Dayakou tungsten mine. It displayed pale orange color, octahedral shape, and strong bluish fluorescence under short-wave UV. Some of these associated minerals were sometimes seen in Malipo emeralds as single-phase inclusions.
Trace Element Analysis. Eight Malipo emerald wafers were analyzed by LA-ICP-MS, and the results are shown in table 1. Concentrations of alkali metals ranged from highest content to lowest as follows: Na 6003–9481 ppmw (averaging 7524 ppmw), Cs 1730– 2560 ppmw (averaging 2087 ppmw), Li 259–350 ppmw (averaging 306 ppmw), K 83–301 ppmw (aver-
aging 155 ppmw), and Rb 18–32 ppmw (averaging 25 ppmw). Total alkali element concentrations includ-ing Li, Na, K, Rb, and Cs ranged from 8318 to 12403 ppmw. Malipo emerald also contained a significant amount of Mg (3941–7406 ppmw), and trace amounts of Sc (71–168 ppmw), Zn (17–187 ppmw), and Ga (12– 15 ppmw).
The emerald samples contained abundant transi-tion element V from 966 to 4568 ppmw, averaging 3473 ppmw, and a lower amount of Cr (3–870 ppmw, averaging 186 ppmw). Chromium content was as low as 3 ppmw in sample E4. The ratio of Cr to V was be-tween 0.001 and 0.20. Iron content varied in a rela-tively narrow range from 2519 to 3770 ppmw and averaged 3474 ppmw. Trace amounts of Mn (averag-

50 µm 50 µm
Figure 10. Three-phase inclusions in Malipo emeralds, shown in brightfield illumination. Colorless transparent crystals with near-cubic (left) or irregular shape (right) were visible (indicated by the arrows), along with oval to near-round gas bubbles in the blocky and irregular multiphase inclusions. Photomicrographs by Yang Hu.
ing 70 ppmw) were also detected. It is worth noting that the low Cr concentrations listed in table 1 were all detected from yellowish green zones instead of colorless zones. The low Cr content and the presence
Figure 11. An emerald-in-matrix hand specimen asso-ciated with microcline, quartz, pale yellow scheelite, phlogopite, and pyrrhotite. Photo by Yang Hu.
Pyrrhotite
Scheelite
Phlogopite
Emerald Quartz
Microcline
of Fe could be responsible for the lack of UV fluores-cence in Malipo emeralds.
UV-Vis-NIR Spectroscopy. Representative UV-Vis-NIR spectra of Malipo emerald samples showed quantitative information on chromophoric absorp-tion (250–1100 nm) and water molecular vibrations (900–2500 nm); see figure 12. Relative contributions from all absorption features are readily compared across the whole spectral range.
The region of chromophoric absorption (250–1100 nm) showed the main absorption of trivalent vana-dium ions. Two absorption maxima at 432 and 611 nm (o-ray) and 425 and 644 nm (e-ray), as well as an absorption shoulder at 395 nm for the o-ray and e-ray in sample E7, were assigned to V3+ ions, according to the absorption of vanadium-doped synthetic emerald (Schmetzer et al., 2006). This absorption assignment was in agreement with our EPR result, theoretical crystal field energy levels of V3+ in beryl (Beckwith and Troup, 1973; Schmetzer et al., 1978), and distinctly higher vanadium content in Malipo emerald. These absorptions of V3+ were prominent in all of our emer-ald samples.
The anisotropic absorption of V3+ at 425–432 nm was obvious. The maximum absorption coefficient at 425–432 nm in the o-ray was nearly twice as high as in the e-ray. In addition, a weak shoulder centered at 675 nm was present for the o-ray. It was not a sharp line and obvious in the o-ray, distinguished
346 EMERALD FROM MALIPO, CHINA G EMS & GEMOLOGY F ALL 2019

-
7 ---7 I 7 I 7 7
-
TABLE 1. Chemical composition (in ppmw) of eight Malipo emeralds, obtained by LA-ICP-MS.
E2 E E4 E6 E7 E8 E9 E10
Li
Na
Mg
K
Sc
V
Cr
Mn
Fe
Zn
Ga
Rb
Cs
Cr/V
Data of three spots in yellowish green area for each sample were reported. ppmw = parts per million by weight.
from R lines of Cr3+. This shoulder was also shown in emerald sample E4, which had almost no Cr (3–4 ppmw). Therefore, this 675 nm shoulder should also be attributed to vanadium ions.
A moderate 830 nm absorption band was present for the o-ray of sample E7. This band has usually
Detection limit
(ppmw)
0.2
4.8
0.2
14.7
0.3
0.1
1.8
1.1
30.2
0.5
0.2
0.2
0.1
been attributed to specific Fe2+ ions (Wood and Nas-sau, 1968). All other emerald samples showed a sim-ilar 830 nm band height and an absorption coefficient unit no higher than 4 cm–1 , consistent with the nar-row range of Fe content (2519 to 3770 ppmw). This band height range was typical for Malipo emeralds.
UV-VIS-NIR SPECTRA
AB
SOR
PTIO
N C
OEF
FIC
IEN
T (c
m–1
)
0
5
10
15
20
425 644
962 1152
1403
1467 1792
1896
395
432
611 830
1409 1843
2150
o-ray e-ray
V: 3793 ppmw Cr: 105 ppmw Fe: 2848 ppmw
675
1897
o-ray e-ray
500 1000 1500 2000 2500
WAVELENGTH (nm)
Figure 12. Representative UV-Vis-NIR spectra of sam-ple E7. In the region of chro-mophoric absorption, it shows intense V3+ absorp-tion (432 and 611 nm for the o-ray, 425 and 644 nm for the e-ray, and a 395 nm shoulder for the o- and e-rays) and moderate Fe2+ ab-sorption (830 nm for the o-ray). Type I water absorp-tion is shown at 1897, 1896, 1792, 1467, and 1403 nm. The inset photos display ob-vious dichroism: a yellow-ish green color for the o-ray and a bluish green color for the e-ray. Chromophore ele-ment contents of sample E7 are shown on the top right.
EMERALD FROM MALIPO, CHINA G EMS & GEMOLOGY F ALL 2019 347
347 343 333 285 288 342 315 308 309 302 308 300 259 264 261 326 306 312 338 350 341 267 274 273
9481 8749 8725 6003 6095 7375 9344 9180 9186 7236 7301 7585 6340 6173 6381 7970 8261 8053 6489 6924 6253 7123 7053 7286
7406 6609 6853 3941 4002 4981 7349 7375 7216 5432 5430 5783 4363 4387 4512 5977 6301 6257 4787 4895 4581 5438 5360 5624
159 284 155 122 97 125 229 196 200 146 151 161 128 128 128 115 126 123 83 301 97 159 148 172
168 160 164 82 79 71 142 152 154 113 108 104 143 132 137 100 114 119 156 159 163 126 128 129
4015 3349 3502 1013 999 966 4416 4554 4654 3368 3313 3420 3814 3757 3811 3346 3384 3479 4568 4489 4455 3464 3485 3731
118 99 109 65 66 67 3 3 4 20 18 225 109 99 110 115 108 105 857 847 870 133 132 182
71 89 68 68 64 96 66 68 66 74 73 76 53 52 53 78 83 86 68 72 69 65 66 64
3545 3133 3248 2810 2706 3088 3728 3689 3770 3260 3554 3537 2809 2886 2850 3182 3429 3392 2588 3064 2519 3486 3518 3578
27 187 27 17 22 17 35 34 31 33 32 35 29 25 27 23 21 24 15 19 16 32 34 30
13 13 13 14 13 14 15 14 15 15 13 14 13 13 12 13 14 13 13 12 13 15 15 14
27 25 28 20 21 22 30 32 31 26 22 28 22 23 23 22 24 25 18 18 19 27 26 29
1876 2117 2158 1990 1915 2103 2485 2405 2317 1976 2028 1841 1730 1731 1752 2029 2179 2205 2513 2498 2560 1900 1898 1888
0.029 0.030 0.031 0.065 0.066 0.070 0.001 0.001 0.001 0.006 0.005 0.066 0.029 0.026 0.029 0.035 0.032 0.030 0.188 0.189 0.195 0.038 0.038 0.049

rrrrr,
No other Fe-related absorption was observed in any of the samples, such as the band centered at 620 nm or the 427 and 372 nm peaks seen in emeralds from other localities.
Weak Cr3+ absorption was sometimes accompa-nied by absorptions of V3+ and Fe2+ ions in the sam-ples. According to Wood and Nassau (1968), Cr3+ in emerald could lead to the main absorption bands at approximately 430 and 600 nm for the o-ray and 420 and 630 nm for the e-ray. These absorption bands were superimposed over those of vanadium ions, but a series of weak peaks at 658, 646, and 637 nm and sharp R lines at 680/683 nm were distinctive for Cr3+
in emerald, especially for the e-ray. Absorption of Cr3+ ions was not observed for the low Cr content (105 ppmw) in sample E7. But other Malipo emerald samples with slightly higher Cr content displayed a series of weak peaks (658, 646, and 637 nm) and R lines, such as sample E9, which averaged 858 ppmw Cr. Specifically, 680/683 nm R lines were superim-posed on the broad V3+ shoulder centered at 675 nm for the o-ray.
In the region of water molecular vibrations (900– 2500 nm), Malipo emerald showed absorption of type I water molecules. Water molecules in beryl occur in two configurations in structural channels called “type I” and “type II” (Wood and Nassau, 1967). Peaks between 1100 and 2500 nm were attributed to the overtone and combination vibrations of type I and/or type II water molecules. Strong peaks at 1897 nm (5271 cm–1), 1896 nm (5274 cm–1), and 1403 nm (7127 cm–1), as well as weak peaks at 1792 nm (5580 cm–1) and 1467 nm (6816 cm–1), were displayed for all the samples (figure 12), and these peaks were as-signed to type I water (Wood and Nassau, 1967). So Malipo emeralds were dominated by type I water, the same as most emeralds from other major sources ex-cept Kafubu, Zambia (Saeseaw et al., 2014). Sodium ions interacted with adjacent type II water molecules in the channels, and the low content of type II water was in agreement with the low Na content in Malipo emeralds.
EPR Spectra. Electron paramagnetic resonance (EPR) is an electron absorption technique using magnetic fields to measure transition energy of impurity ele-ments, radicals, or defects with unpaired electrons. EPR spectra can provide useful information for tran-sition metal impurities on valence, ion occupation, site symmetry, and pair arrangements in crystals.
For the EPR of Malipo emeralds (figure 13), the signal of transition metal impurities differed greatly,
with the c-axis either parallel to the magnetic field H (H ||c) or normal to the magnetic field H (H⊥c). Two strong peaks were detected at g = 2.866 and g = 1.968 in orientation H ||c. Peaks centered at g = 1.968 and their side peaks were assigned to Cr3+ ions. Be-cause of the large zero-field splitting of Cr3+ ions, only one set of EPR (transition from ms = +1/2 to –1/2) could be seen in the X-band (Ohkura et al., 1987). This Cr3+ center may also be overlapped by Fe3+ ion– related centers for similar g factors. The assignment of the peak at g = 2.866 was uncertain. In orientation H⊥c, the characteristic six-fold hyperfine structure of Mn2+ (ms = +1/2 to –1/2) was shown (Gaite et al., 2001). The peak at g = 3.893 probably arose from the Fe3+ ion (Lin et al., 2013).
The super-hyperfine structure of V2+ and V4+ in the form of vanadyl ions (VO2+) was previously detected in Australian emerald and Biron gamma-irradiated vanadium-doped synthetic emerald by X-band EPR at room temperature (Hutton et al., 1991). But we were unable to detect any obvious EPR signal of V2+
V4+ or , indicating that the abundant vanadium de-tected in Malipo emerald should be in another va-lence state. Vanadium in minerals is usually present in the valence of +3 and +4 (Rossman, 2014). V3+ (3d2) was hardly detectable by room temperature X-band EPR due to outer paired electrons. Thus, we con-cluded that nearly all vanadium in Malipo emerald was in the trivalent state.
EPR SPECTRA
Mn2+ H⊥c H||c
INTE
NSI
TY (
AR
B. U
NIT
S)
MAGNETIC FIELD (G)
1000 2000 3000 4000
g=2.866 g=1.968
Cr3+
Fe3+
g=2.073 g=3.893
Figure 13. EPR spectra of Malipo emerald E7 showed signals of Cr3+ , Mn2+, and possibly the Fe3+ center, and no indications of any vanadium signal measured at 300 K.
348 EMERALD FROM MALIPO, CHINA G EMS & GEMOLOGY F ALL 2019

♦
• X
+
◊
0
10000
1000
100
10
0
Cs
(ppm
w)
Malipo, China
Davdar, China
Panjshir, Afghanistan
Kafubu, Zambia
Musakashi, Zambia
Coscuez, Colombia
Muzo, Colombia
Penas Blancas, Colombia
La Pita, Colombia
Chivor, Colombia
Rio Grande do Norte, Brazil
10 100 1000
Li (ppmw)
DISCUSSION Multiphase Inclusions. The multiphase inclusion scene in Malipo emerald was quite distinct from that of other deposits investigated by Saeseaw et al. (2014). First, the multiphase inclusions in Malipo emerald were relatively small, less than two hundred microns in length and width. Second, multiphase in-clusions in Malipo emerald displayed rectangular, rod-like, needle-like, jagged, and other irregular shapes. The rectangular multiphase inclusions were similar to those of emerald from Kafubu, Zambia. Elongated needle-like multiphase inclusions some-what resembled those in emerald from Panjshir Val-ley, Afghanistan. Jagged multiphase inclusions resembled classic jagged multiphase inclusions in Colombian emeralds. Moreover, the crystal phase as part of a multiphase inclusion was occasionally ob-served in our samples. But emeralds from Kafubu, Panjshir, and Colombia usually host one or more crystals.
Trace Element Analysis. Malipo emeralds contained large amounts of Li and Cs, and the ratio of Cs to Li distinguished them from emeralds of all other signif-
Figure 14. Malipo emer-alds contained high concentrations of Li and Cs (within the red oval) and a unique ratio of Li to Cs among significant deposits. Other sources are from Saeseaw et al. (2014).
icant localities. Li concentration in our emerald sam-ples was relatively high (259–350 ppmw), just below that of Kafubu, Zambia, despite a slight overlap with emeralds from Panjshir, Afghanistan (see figure 14). Meanwhile, Cs concentration was the highest (1730– 2560 ppmw) among all other deposits except Kafubu, which has a similar range of Cs content. Therefore, the ratio of Cs to Li was exclusively separate from other significant deposits. Concentrations of other alkali elements (Na, K, and Rb) and Mg, Sc, Zn, and Ga were low to moderate in Malipo emeralds, and more or less overlapped with those from some other deposits.
The combination of high V, low Cr, and moderate Fe content was distinctive for Malipo emeralds, as seen in the Fe-Cr-V ternary diagram in figure 15. V content was relatively high (averaging 3473 ppmw), just below some emeralds from Colombia and Nor-way, behaving as the most significant chromophore element in Malipo emerald. Meanwhile, Cr content was extremely low (averaging 186 ppmw) and similar to emeralds from Lened, Canada, and Gandao, Pak-istan. Fe concentration was medium (averaging 3474 ppmw), in the same range as emeralds from many lo-
EMERALD FROM MALIPO, CHINA G EMS & GEMOLOGY F ALL 2019 349

* /;
• ♦
0
X
+
" ◊
0
EE
El)
Malipo, China
Davdar, China
Panjshir, Afghanistan
Kafubu, Zambia Fe 0.00 1.00
Musakashi, Zambia
Coscuez, Colombia
Muzo, Colombia
Peñas Blancas, Colombia 0.25 0.75
La Pita, Colombia
Chivor, Colombia
Rio Grande do Norte, Brazil
Gandao, Pakistan 0.50 0.50 Lened, Canada
Eidsvoll, Norway
0.75 0.25
calities. Moreover, the plot field of Fe-Cr-V chemical composition was quite distinctive for Malipo emer-ald, though there was some overlap with Gandao and Lened emeralds. Li and Cs contents were previously unreported for Gandao emerald, and Cs content (850–1590 ppmw) of Lened emerald (Marshall et al., 2004) was just slightly lower than that of Malipo emerald. Therefore, concentrations of Li and Cs were not available to effectively separate Gandao and Lened emeralds. As emeralds from these two deposits are not found in large quantities on the gem market, this overlap has little influence on geographic origin determination. In addition, Li and Cs concentrations of Malipo emerald were close to Kafubu, but the dif-ference in Fe-Cr-V chemical composition offered a straightforward means to distinguish them.
Color Characteristics. Trivalent vanadium was the predominant chromophore for Malipo emeralds, leading to a typically yellowish green color. Malipo emerald contained distinctly high vanadium content and showed the main absorption of V3+ ions in the visible light region. Ionic radii of V3+ (0.640 Å) were close to Al3+ (0.535 Å) in the six-fold coordinated oc-tahedral site (Shannon, 1976), facilitating effective substitution of isovalent V3+ for Al3+ in the AlO6 oc-tahedral site. The AlO6 octahedron is the key color-ing structural unit in both beryl and a few important gems (e.g., sapphire, jadeite, and chrysoberyl). Their coloring characteristics from Cr3+, Fe2+, Fe3+, and V3+
appear to follow the typical crystal field behaviors of
Figure 15. Plot of Fe– Cr–V (ppmw) chemical composition for emer-alds from Malipo and other localities. The plot field of Malipo emeralds (within the red oval) was distinc-tive for the combina-tion of high V, low Cr, and moderate Fe con-tent. Other sources are from Hammarstrom (1989), Marshall et al. (2004), Rondeau et al. (2008), Marshall et al. (2012), Zwaan et al. (2012), and Saeseaw et al. (2014).
AlO6 octahedra, which directly lead to gem colors. Incorporation of abundant V3+ ions in the AlO6 octa-hedral site was responsible for the yellowish green color of Malipo emeralds. Compared with emerald colored by Cr3+ ions, the color caused by V3+ tended to be more yellowish, owing to stronger absorption in the violet to blue region.
A significant anisotropic absorption band at 425– 432 nm is an important spectral feature of V3+ in the AlO6 octahedral site of beryl and other minerals, such as corundum. V3+ ions substituting in similar AlO6 octahedra led to the anisotropic absorption cen-tered at 400 nm in synthetic vanadium-dominated corundum (author’s unpublished data). The absorp-tion coefficient in the o-ray was twice as high as in the e-ray for emerald sample E4, which had almost no Cr (3–4 ppmw). This coefficient difference is the maximum value. With the ratio of V to Cr increas-ing, the difference of absorption coefficient between the o-ray and the e-ray would become larger (o-ray>e-ray), no more than double in emerald. Moreover, this absorption difference led to a noticeable yellowish green color in the o-ray and bluish green color in the e-ray under a polarized film (see inset photos in figure 12). And the color of the o-ray tended to be more yel-lowish as the V to Cr ratio increased.
The chromophore effectiveness of V3+ was ex-pected to be comparable to that of Cr3+ ions in emer-ald. Absorption cross section is a constant for a particular chromophore in a specific matrix and could be used as an indication of chromophore effec-
350 EMERALD FROM MALIPO, CHINA G EMS & GEMOLOGY F ALL 2019
1.00 0.00
Cr 0.00 0.25 0.50 0.75 1.00 V

tiveness. Because an accurate cross section of V3+ and Cr3+ ions in emerald had not been investigated in pre-vious studies, we estimated the cross section based on the Beer-Lambert law. Malipo emerald E7 con-tained V (3793 ppmw), a similar concentration level as the Cr (3347 ppmw) in Cr-dominated emerald (fig-ure 21B in Saeseaw et al., 2014). The atomic weights of V and Cr are similar, and so are their atomic con-centrations in ppma, which are used to compare the cross sections and chromophore effectiveness. At the same time, concentrations of Cr in sample E7 (105 ppmw) and V in Cr-dominated emerald (116 ppmw) were relatively low, so it was suitable to obtain the cross section of relatively pure V and Cr. These two emerald samples showed a similar range of absorp-tion coefficients, less than 7 cm–1 for V3+ and Cr3+ ab-sorption. So the calculated cross section of V3+ and Cr3+ should be similar. We concluded that the color effectiveness of Cr3+ and V3+ were comparable. In ad-dition, Malipo V-rich emeralds and other Cr-rich emeralds containing similar amounts of V and Cr, re-spectively, demonstrated a similar range of color sat-urations. Several thousand ppma of V or Cr could lead to a relatively saturated greenish color for emer-ald. More quantitative data are needed to compare color effectiveness of Cr3+ and V3+ in the future.
Transition elements other than vanadium had lit-tle effect on coloration in our samples. The Cr ion absorption was rather weak for the low level of Cr content determined, so the coloration produced by Cr was weak for Malipo emeralds. The broad absorp-tion band centered at 620 nm could add a bluish color to emerald, especially in the e-ray, caused by
Fe2+-Fe3+ pairs (Lin et al., 2013). However, this band was nearly invisible because of insufficient Fe con-tent in Malipo emeralds. The tail of a moderate 830 nm Fe2+-related band seems to extend slightly into the visible light region (again, see figure 12). Because the strong tail was also present in colorless beryl, this tail could not produce any visible color for the emerald samples.
CONCLUSIONS A significant granite-related emerald occurrence is situated in Malipo County in China, a region with rich natural mineral and strategic ore resources. Min-eral specimens, carvings, and faceted gems from the Malipo emerald deposit have been produced since the 1990s.
The scene of multiphase inclusions in Malipo emerald is distinctive, with various shapes and occa-sionally a colorless transparent crystal. Abundant vanadium (averaging 3473 ppmw) is the predominant chromophore, leading to a typically yellowish green color. Inadequate Fe and Cr contribute little to the color. The distinctive combination of high V, moder-ate Fe, and low Cr content separates this locality from most known emerald deposits. Moreover, the high Li and Cs content in Malipo emerald are unique among significant localities in the world, which can help in their geographic origin determination.
Emeralds have become part of the identity of Malipo as awareness of top-color stones has pro-gressed in China in recent years. With abundant re-maining emerald reserves, more production can be anticipated in the future.
ABOUT THE AUTHORS Mr. Hu ([email protected]) is a PhD student at the Gemo-logical Institute, China University of Geosciences in Wuhan. Dr. Lu ([email protected]) is a distinguished professor at the Gemo-logical Institute, China University of Geosciences in Wuhan.
ACKNOWLEDGMENTS The authors would like to thank Daowen Ye for providing Malipo emerald samples, valuable photos, and related information. We are also grateful to Dr. Robert Lavinsky for providing the photo from his collection. We sincerely thank Dr. George Rossman, Dr. Benjamin Rondeau, and an anonymous reviewer for their con-structive comments and suggestions. This study was funded by the Center for Innovative Gem Testing Technology, China Univer-sity of Geosciences (CIGTXM-S201821).
REFERENCES Beckwith P.J., Troup G.J. (1973) The optical and infrared absorption Chinese emerald deposit. Yunnan Geology, Vol. 19, pp. 37−42
of V3+ in beryl (Be Al Si O ). Physica Status Solidi, Vol. 16, No. [in Chinese]. 3 2 6 18 1, pp. 181–186, http://dx.doi.org/10.1002/pssa.2210160119 Gaite J.M., Izotov V.V., Nikitin S.I., Prosvirnin S.Y. (2001) EPR and
Feng M.G., Zhang S.T., Lu W. (2000) Geological characters of the optical spectroscopy of impurities in two synthetic beryls. Ap-
EMERALD FROM MALIPO, CHINA G EMS & GEMOLOGY F ALL 2019 351

plied Magnetic Resonance, Vol. 20, No. 3, pp. 307–315, http://dx.doi.org/10.1007/BF03162283
Groat L. A., Giuliani G., Marshall, D.D., Turner D. (2008) Emerald deposits and occurrences: a review. Ore Geology Reviews, Vol. 34, No. 1-2, pp. 87–112, http://dx.doi.org/10.1016/j.oregeorev. 2007.09.003
Hammarstrom J.M. (1989) Mineral chemistry of emeralds and some associated minerals from Pakistan and Afghanistan: An electron microprobe study. In A.H. Kazmi and L.W. Snee, Eds., Emeralds of Pakistan: Geology, Gemology & Genesis. Van Nostrand Reinhold, New York, pp. 125–150.
Huang W.Q., Ni P., Shui T., Yang P. (2015) Mineralogical charac-teristics of emerald from Malipo, Yunnan Province. Acta Petro-logica et Mineralogica, Vol. 34, No. 1, pp. 103–109 [in Chinese].
Huang W.Q., Shui T., Ni P. (2017) Fluid inclusion studies on emer-alds from Malipo area, Yunnan Province, China. Acta Miner-alogica Sinica, Vol. 37, No. 1/2, pp. 75–82 [in Chinese].
Hutton D.R., Darmann F.A., Troup G.J. (1991) Electron spin reso-nance of V4+(VO2+) in beryl. Australian Journal of Physics, Vol. 44, No. 4, pp. 429–434, http://dx.doi.org/10.1071/PH910429
Jin Y.H., Yang B.Q. (1943) Genesis and significance of Laojunshan scheelite deposit in Wenshan, Yunnan. Geological Review, Vol. 8, No. Z1, pp. 170–171 [in Chinese].
Lin J., Chen N., Huang D., Pan Y. (2013) Iron pairs in beryl: New insights from electron paramagnetic resonance, synchrotron X-ray absorption spectroscopy, and ab initio calculations. American Mineralogist, Vol. 98, No. 10, pp. 1745–1753, http://dx.doi.org/10.2138/am.2013.4472
Liu Y.S., Hu Z.C., Gao S., Günther D., Xu J., Gao C.G., Chen H.H. (2008) In situ analysis of major and trace elements of anhy-drous minerals by LA-ICP-MS without applying an internal standard. Chemical Geology, Vol. 257, No. 1-2, pp. 34–43, http://dx.doi.org/10.1016/j.chemgeo.2008.08.004
Marshall D.D., Groat L.A., Falck H., Giuliani G., Neufeld H. (2004) The Lened emerald prospect, Northwest Territories, Canada: Insights from fluid inclusions and stable isotopes, with implications for Northern Cordilleran emerald. Cana-dian Mineralogist, Vol. 42, No. 5, pp. 1523–1539, http://dx.doi.org/10.2113/gscanmin.42.5.1523
Marshall D.D., Pardieu V., Loughrey L., Jones P., Xue G. (2012) Conditions for emerald formation at Davdar, China: fluid in-clusions, trace element and stable isotope studies. Mineralog-ical Magazine, Vol. 76, No. 1, pp. 213–226, http://dx.doi.org/ 10.1180/minmag.2012.076.1.213
Ohkura H., Hashimoto H., Mori Y., Chiba Y., Isotani S. (1987) The luminescence and ESR of a synthetic emerald and the natural ones mined from Santa Terezinha in Brazil. Japanese Journal of Applied Physics, Vol. 26, No. 26, pp. 1422–1428, http://dx.doi.org/10.1143/JJAP.26.1422
Rondeau B., Fritsch E., Peucat J.J., Nordrum F.S., Groat L. (2008) Characterization of emeralds from a historical deposit: Byrud (Eidsvoll), Norway. G&G, Vol. 44, No. 2, pp. 108–122,
http://dx.doi.org/10.5741/GEMS.44.2.108 Rossman G.R. (2014) Optical spectroscopy. Reviews in Mineral-
ogy and Geochemistry, Vol. 78, No, 1, pp. 371–398, http://dx.doi.org/10.2138/rmg.2014.78.9
Saeseaw S., Pardieu V., Sangsawong S. (2014) Three-phase inclu-sions in emerald and their impact on origin determination. G&G, Vol. 50, No. 2, pp. 114–132, http://dx.doi.org/10.5741/ GEMS.50.2.114
Schmetzer K. (1978) Vanadium III als Farbträger bei natürlichen Silikaten und Oxiden – ein Beitrag zur Kristallchemie des Vana-diums. Inaugural-Dissertation zue Erlangung der Doktorwürde des Naturwissenschaftlichen Gesamtfakultät der Ruprecht-Karl-Universität Heidelberg, 200 pp. [in German].
Schmetzer K., Schwarz D., Bernhardt H.J., Häger T. (2006) A new type of Tairus hydrothermally-grown synthetic emerald, coloured by vanadium and copper. Journal of Gemmology, Vol. 30, No 1/2, pp. 59–74.
Schwarz D., Giuliani G. (2001) Emerald deposits—a review. Aus-tralian Gemmologist, Vol. 21, pp. 17–23.
Shannon R.D. (1976) Revised effective ionic radii and systematic studies of interatomic distances in halides and chalcogenides. Acta Crystallographica Section A, Vol. 32, Part 5, pp. 751–767, http://dx.doi.org/10.1107/S0567739476001551
Wang H.Q., Zhang S.T., Zhang M.W., Lu W., Li K.G. (1996) 1:10000 geologic mapping at the Dyakou emerald showing: Yunnan, China. Yunnan Geological Survey Report, 33 pp. [in Chinese].
Wood D.L., Nassau K. (1967) Infrared spectra of foreign molecules in beryl. The Journal of Chemical Physics, Vol. 47, No. 7, pp. 2220–2228, http://dx.doi.org/10.1063/1.1703295
Wood D.L., Nassau K. (1968) The characterization of beryl and emerald by visible and infrared absorption spectroscopy. Amer-ican Mineralogist, Vol. 53, No. 5, pp. 777–800.
Xue G., Marshall D., Zhang S., Ullrich T.D., Bishop T., Groat L.A., Thorkelson D.J., Giuliani G., Fallick A.E. (2010) Conditions for Early Cretaceous emerald formation at Dyakou, China: Fluid inclusion, Ar-Ar, and stable isotope studies. Economic Geol-ogy, Vol. 105, No. 2, pp. 339–349, http://dx.doi.org/10.2113/ gsecongeo.105.2.339
Zhang L.J., Lan Y. (1999) Gemological characteristics and deposit geology of Yunnan emerald. Acta Mineralogica Sinica, Vol. 19, No. 2, pp. 189–197 [in Chinese].
Zhang S.T., Feng M.G., Lu W. (1998) Analysis of the Nanwenhe metamorphic core complex in southeastern Yunnan. Regional Geology of China, Vol. 17, p. 390−397 [in Chinese].
Zhang S.T., Feng M.G., Wang H.Q., Lu W., Yang M. (1999) Geo-logical features and genesis of emerald deposit in Malipo County, Yunnan Province, China. Geological Science and Technology Information, Vol. 18, No. 1, pp. 50–54 [in Chinese].
Zwaan J.C., Jacob D.E., Häger T., Cavalcanti Neto M.T.O., Kanis J. (2012) Emeralds from the Fazenda Bonfim region, Rio Grande do Norte, Brazil. G&G, Vol. 48, No. 1, pp. 2–17, http://dx.doi.org/10.5741/GEMS.48.1.2
352 EMERALD FROM MALIPO, CHINA G EMS & GEMOLOGY F ALL 2019


