Embed Size (px)
Citation preview
UNITED STATES SECURITIES AND EXCHANGE COMMISSION
Washington, D.C. 20549
FORM 20-F
� REGISTRATION STATEMENT PURSUANT TO SECTION 12(b) OR (g) OF THE SECURITIES EXCHANGE ACT OF 1934
OR � ANNUAL REPORT PURSUANT TO SECTION 13 OR 15(d) OF THE SECURITIES EXCHANGE ACT OF 1934
For the fiscal year ended March 31, 2014 OR
� TRANSITION REPORT PURSUANT TO SECTION 13 OR 15(d) OF THE SECURITIES EXCHANGE ACT OF 1934 OR
� SHELL COMPANY REPORT PURSUANT TO SECTION 13 OR 15(d) OF THE SECURITIES EXCHANGE ACT OF 1934
Commission file number: 333-13896
Nihon Densan Kabushiki Kaisha (Exact name of Registrant as specified in its charter)
NIDEC CORPORATION (Translation of Registrant’s name into English)
Japan 338 Kuzetonoshiro-cho,
Minami-ku, Kyoto 601-8205 Japan (Jurisdiction of incorporation or organization) (Address of principal executive offices)
Masahiro Nagayasu, +81-75-935-6140, [email protected], address is same as above (Name, Telephone, E-mail and/or Facsimile number and Address of Company Contact Person)
Securities registered or to be registered pursuant to Section 12(b) of the Act:
Title of each class Name of each exchange on which registered
Common Stock* New York Stock Exchange
American Depositary
Shares each representing
one-fourth of one share of
common stock
New York Stock Exchange
Securities registered or to be registered pursuant to Section 12(g) of the Act: None
(Title of Class) Securities for which there is a reporting obligation pursuant to Section 15(d) of the Act:
None (Title of Class)
Indicate the number of outstanding shares of each of the issuer’s classes of capital or common stock as of the close of the period covered by the annual report.
As of March 31, 2014, 290,150,160 shares of common stock were outstanding, including 2,325,696 shares represented by
9,302,784 American Depositary Shares and 14,343,952 shares held in treasury. **
Indicate by check mark if the registrant is a well-known seasoned issuer, as defined in Rule 405 of the Securities Act. Yes � No �
If this report is an annual or transition report, indicate by check mark if the registrant is not required to file reports pursuant to Section 13 or 15(d) of the Securities Exchange Act of 1934. Yes � No �
Note - Checking the box above will not relieve any registrant required to file reports pursuant to Section 13 or 15(d) of the Securities Exchange Act of 1934 from their obligations under those Sections.
Indicate by check mark whether the registrant: (1) has filed all reports required to be filed by Section 13 or 15(d) of the Securities Exchange Act of 1934 during the preceding 12 months (or for such shorter period that the registrant was required to file such reports), and (2) has been subject to such filing requirements for the past 90 days. Yes � No �
Indicate by check mark whether the registrant has submitted electronically and posted on its corporate Web site, if any, every Interactive Data File required to be submitted and posted pursuant to Rule 405 of Regulation S-T (§232.405 of this chapter) during the preceding 12 months (or for such shorter period that the registrant was required to submit and post such files). Yes � No �
Indicate by check mark whether the registrant is a large accelerated filer, an accelerated filer, or a non-accelerated filer. See definition of “accelerated filer and large accelerated filer” in Rule 12b-2 of the Exchange Act. (Check one):
Large accelerated filer � Accelerated filer � Non-accelerated filer �
Indicate by check mark which basis of accounting the registrant has used to prepare the financial statements included in this filing:
U.S. GAAP �
International Financial Reporting Standards as issued by the International Accounting Standards
Board � Other �
If "Other" has been checked in response to the previous question, indicate by check mark which financial statement item the registrant has elected to follow. Item 17 � Item 18 �
If this is an annual report, indicate by check mark whether the registrant is a shell company (as defined in Rule 12b-2 of the Exchange Act). Yes � No �
* Not for trading, but only in connection with the listing of the American Depositary Shares, or ADSs. ** Retroactively adjusted to reflect the effect of the two-for-one stock split of our common stock, effective April 1, 2014, with
the ratio of shares of our common stock per ADS remaining unchanged at one-fourth of one share of our common stock per ADS.
3
TABLE OF CONTENTS
Part I
Item 1. Identity of Directors, Senior Management and Advisers. · · · · · · · · · · · · · · · · · · · · · · · · · · · · · · · · · · · · · · · · · · · · · · · · · 5
Item 2. Offer Statistics and Expected Timetable. · · · · · · · · · · · · · · · · · · · · · · · · · · · · · · · · · · · · · · · · · · · · · · · · · · · · · · · · · · · · · · · · · · · · 5
Item 3. Key Information. · · · · · · · · · · · · · · · · · · · · · · · · · · · · · · · · · · · · · · · · · · · · · · · · · · · · · · · · · · · · · · · · · · · · · · · · · · · · · · · · · · · · · · · · · · · · · · · · 6
Item 4. Information on the Company. · · · · · · · · · · · · · · · · · · · · · · · · · · · · · · · · · · · · · · · · · · · · · · · · · · · · · · · · · · · · · · · · · · · · · · · · · · · · · · · · 24
Item 4A. Unresolved Staff Comments. · · · · · · · · · · · · · · · · · · · · · · · · · · · · · · · · · · · · · · · · · · · · · · · · · · · · · · · · · · · · · · · · · · · · · · · · · · · · · · 51
Item 5. Operating and Financial Review and Prospects. · · · · · · · · · · · · · · · · · · · · · · · · · · · · · · · · · · · · · · · · · · · · · · · · · · · · · · · · · · · 51
Item 6. Directors, Senior Management and Employees. · · · · · · · · · · · · · · · · · · · · · · · · · · · · · · · · · · · · · · · · · · · · · · · · · · · · · · · · · · · 96
Item 7. Major Shareholders and Related Party Transactions. · · · · · · · · · · · · · · · · · · · · · · · · · · · · · · · · · · · · · · · · · · · · · · · · · · · 103
Item 8. Financial Information. · · · · · · · · · · · · · · · · · · · · · · · · · · · · · · · · · · · · · · · · · · · · · · · · · · · · · · · · · · · · · · · · · · · · · · · · · · · · · · · · · · · · · · 106
Item 9. The Offer and Listing.· · · · · · · · · · · · · · · · · · · · · · · · · · · · · · · · · · · · · · · · · · · · · · · · · · · · · · · · · · · · · · · · · · · · · · · · · · · · · · · · · · · · · · · 107
Item10. Additional Information. · · · · · · · · · · · · · · · · · · · · · · · · · · · · · · · · · · · · · · · · · · · · · · · · · · · · · · · · · · · · · · · · · · · · · · · · · · · · · · · · · · · · 109
Item 11. Quantitative and Qualitative Disclosures About Market Risk. · · · · · · · · · · · · · · · · · · · · · · · · · · · · · · · · · · · · · · · 127
Item 12. Description of Securities Other Than Equity Securities. · · · · · · · · · · · · · · · · · · · · · · · · · · · · · · · · · · · · · · · · · · · · · · 131
Item 13. Defaults, Dividend Arrearages and Delinquencies. · · · · · · · · · · · · · · · · · · · · · · · · · · · · · · · · · · · · · · · · · · · · · · · · · · · · 132
Item 14. Material Modifications to the Rights of Security Holders and Use of Proceeds. · · · · · · · · · · · · · · · · · · 132
Item 15. Controls and Procedures. · · · · · · · · · · · · · · · · · · · · · · · · · · · · · · · · · · · · · · · · · · · · · · · · · · · · · · · · · · · · · · · · · · · · · · · · · · · · · · · · · · 133
Item 16A. Audit Committee Financial Expert. · · · · · · · · · · · · · · · · · · · · · · · · · · · · · · · · · · · · · · · · · · · · · · · · · · · · · · · · · · · · · · · · · · · · 134
Item 16B. Code of Ethics. · · · · · · · · · · · · · · · · · · · · · · · · · · · · · · · · · · · · · · · · · · · · · · · · · · · · · · · · · · · · · · · · · · · · · · · · · · · · · · · · · · · · · · · · · · · 134
Item 16C. Principal Accountant Fees and Services. · · · · · · · · · · · · · · · · · · · · · · · · · · · · · · · · · · · · · · · · · · · · · · · · · · · · · · · · · · · · · · 134
Item 16D. Exemptions from the Listing Standards for Audit Committees. · · · · · · · · · · · · · · · · · · · · · · · · · · · · · · · · · · · 135
Item 16E. Purchases of Equity Securities by the Issuer and Affiliated Purchasers. · · · · · · · · · · · · · · · · · · · · · · · · · · 137
Item 16F. Change in Registrant’s Certifying Accountant. · · · · · · · · · · · · · · · · · · · · · · · · · · · · · · · · · · · · · · · · · · · · · · · · · · · · · · · 138
Item 16G. Corporate Governance. · · · · · · · · · · · · · · · · · · · · · · · · · · · · · · · · · · · · · · · · · · · · · · · · · · · · · · · · · · · · · · · · · · · · · · · · · · · · · · · · · · 138
Item 16H. Mine Safety Disclosure. · · · · · · · · · · · · · · · · · · · · · · · · · · · · · · · · · · · · · · · · · · · · · · · · · · · · · · · · · · · · · · · · · · · · · · · · · · · · · · · · · 140
Item 17. Financial Statements. · · · · · · · · · · · · · · · · · · · · · · · · · · · · · · · · · · · · · · · · · · · · · · · · · · · · · · · · · · · · · · · · · · · · · · · · · · · · · · · · · · · · · · 140
Item 18. Financial Statements. · · · · · · · · · · · · · · · · · · · · · · · · · · · · · · · · · · · · · · · · · · · · · · · · · · · · · · · · · · · · · · · · · · · · · · · · · · · · · · · · · · · · · · 140
Item 19. Exhibits. · · · · · · · · · · · · · · · · · · · · · · · · · · · · · · · · · · · · · · · · · · · · · · · · · · · · · · · · · · · · · · · · · · · · · · · · · · · · · · · · · · · · · · · · · · · · · · · · · · · · · 141
Index to Consolidated Financial Statements and Information .................................................................... F-1
As used in this annual report, unless otherwise specified, references to “Nidec” are to Nidec Corporation,
and references to “we,” “our” and “us” are to Nidec Corporation and, except as the context otherwise requires, its consolidated subsidiaries.
As used in this annual report, “U.S. dollar” or “$” means the lawful currency of the United States of
America, “yen” or “¥” means the lawful currency of Japan, “euro,” EUR” or “€” means the lawful currency of those member states of the European Union which are participating in the European Economic and Monetary Union pursuant to the Treaty of the European Union, “forint” or “HUF” means the lawful currency of Hungary, “peso” or “MXN” means the lawful currency of the United Mexican States, “rupiah” or “IDR” means the lawful currency of the Republic of Indonesia, “yuan” means the lawful currency of People’s Republic of China traded inside the mainland China, and “Chinese Hongkong” or “CNH” means the yuan traded outside of the mainland China.
As used in this annual report, “U.S. GAAP” means accounting principles generally accepted in the United
States, and “Japanese GAAP” means accounting principles generally accepted in Japan. As used in this annual report, “ADS” means an American Depositary Share, and “ADR” means an
American Depositary Receipt. In tables appearing in this annual report, figures may not add up to totals due to rounding.
4
Special Note Regarding Forward-looking Statements This annual report contains forward-looking statements that are based on our current expectations,
assumptions, estimates and projections about our business, our industry and capital and financial markets around the world. These forward-looking statements are subject to various risks and uncertainties. Generally, these forward-looking statements can be identified by the use of forward-looking terminology such as “may,” “will,” “expect,” “anticipate,” “estimate,” “plan,” “intend” or similar words. These statements discuss future expectations, identify strategies, contain projections of results of operations or of our financial condition, or state other forward-looking information. Known and unknown risks, uncertainties and other factors could cause the actual results to differ materially from those contained in any forward-looking statement. We cannot promise that our expectations expressed in these forward-looking statements will turn out to be correct. Our actual results could be materially different from and worse than our expectations. Important risks and factors that could cause our actual results to be materially different from our expectations are set forth in “Item 3.D. Key Information—Risk Factors” and elsewhere in this annual report and include, but are not limited to:
• general economic conditions in the computer, information storage and communication technology, home appliance, industrial and commercial machinery and equipment, automobile and related product markets, particularly levels of consumer spending and capital expenditures by companies,
• our ability to design, develop, mass produce and win acceptance of our products, particularly those that use the hard disk spindle motor technology, which are offered in highly competitive markets characterized by continual new product introductions, rapid technological development and shifts in use, as well as automotive, appliance, commercial and industrial products,
• abrupt changes in our customers’ market position, particularly as a result of mergers and acquisitions,
• the effectiveness of our measures designed to reduce costs and improve profitability,
• our ability to acquire and successfully integrate companies with complementary technologies, product lines, and marketing and sales networks,
• any negative impact on our businesses of natural or human-caused disasters and other incidents beyond our control in the countries where our manufacturing and research and development operations are concentrated, including Japan, Thailand and China,
• increase in raw material and labor costs,
• exchange rate fluctuations, particularly between the Japanese yen and the U.S. dollar and other currencies in which we make significant sales or in which our assets and liabilities are denominated,
• fluctuations in interest rates, and
• any failure to comply with applicable laws and regulations, including due to adverse changes in laws, regulations or economic policies in any of the countries where we have manufacturing or other operations.

5
PART I
Item 1. Identity of Directors, Senior Management and Advisers. Not applicable.
Item 2. Offer Statistics and Expected Timetable.
Not applicable.
6
Item 3. Key Information.
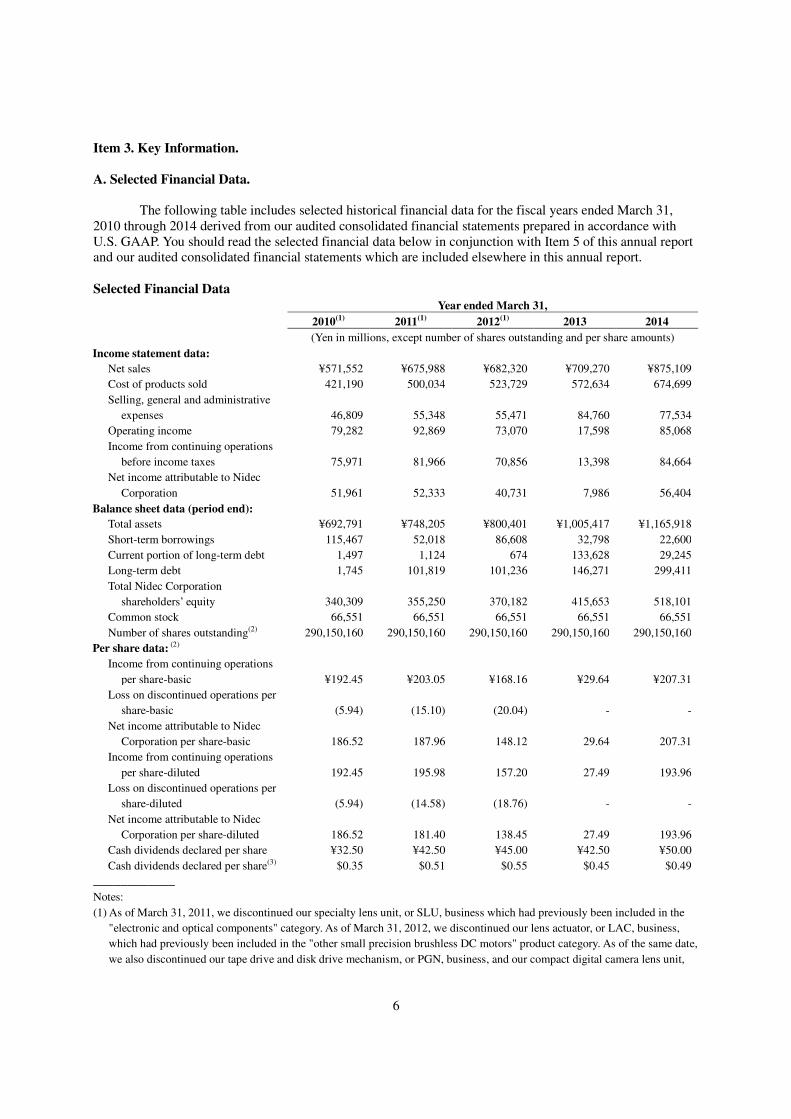
A. Selected Financial Data. The following table includes selected historical financial data for the fiscal years ended March 31,
2010 through 2014 derived from our audited consolidated financial statements prepared in accordance with U.S. GAAP. You should read the selected financial data below in conjunction with Item 5 of this annual report and our audited consolidated financial statements which are included elsewhere in this annual report.
Selected Financial Data
Year ended March 31,
2010(1) 2011(1) 2012(1) 2013 2014
(Yen in millions, except number of shares outstanding and per share amounts)
Income statement data:
Net sales ¥571,552 ¥675,988 ¥682,320 ¥709,270 ¥875,109
Cost of products sold 421,190 500,034 523,729 572,634 674,699
Selling, general and administrative
expenses 46,809 55,348 55,471 84,760 77,534
Operating income 79,282 92,869 73,070 17,598 85,068
Income from continuing operations
before income taxes 75,971 81,966 70,856 13,398 84,664
Net income attributable to Nidec
Corporation 51,961 52,333 40,731 7,986 56,404
Balance sheet data (period end):
Total assets ¥692,791 ¥748,205 ¥800,401 ¥1,005,417 ¥1,165,918
Short-term borrowings 115,467 52,018 86,608 32,798 22,600
Current portion of long-term debt 1,497 1,124 674 133,628 29,245
Long-term debt 1,745 101,819 101,236 146,271 299,411
Total Nidec Corporation
shareholders’ equity 340,309 355,250 370,182 415,653 518,101
Common stock 66,551 66,551 66,551 66,551 66,551
Number of shares outstanding(2) 290,150,160 290,150,160 290,150,160 290,150,160 290,150,160
Per share data: (2)
Income from continuing operations
per share-basic ¥192.45 ¥203.05 ¥168.16 ¥29.64 ¥207.31
Loss on discontinued operations per
share-basic (5.94) (15.10) (20.04) - -
Net income attributable to Nidec
Corporation per share-basic 186.52 187.96 148.12 29.64 207.31
Income from continuing operations
per share-diluted 192.45 195.98 157.20 27.49 193.96
Loss on discontinued operations per
share-diluted (5.94) (14.58) (18.76) - -
Net income attributable to Nidec
Corporation per share-diluted 186.52 181.40 138.45 27.49 193.96
Cash dividends declared per share ¥32.50 ¥42.50 ¥45.00 ¥42.50 ¥50.00
Cash dividends declared per share(3) $0.35 $0.51 $0.55 $0.45 $0.49
____________
Notes:
(1) As of March 31, 2011, we discontinued our specialty lens unit, or SLU, business which had previously been included in the
"electronic and optical components" category. As of March 31, 2012, we discontinued our lens actuator, or LAC, business,
which had previously been included in the "other small precision brushless DC motors" product category. As of the same date,
we also discontinued our tape drive and disk drive mechanism, or PGN, business, and our compact digital camera lens unit,
7
CLU, business, both of which had previously been included in the "electronic and optical components" product category. The
operating results of the SME, SLU, LAC, PGN and CLU businesses and exit costs with related taxes were recorded as "net
loss on discontinued operations" in our audited consolidated statements of income in accordance with ASC 205-20
"Presentation of Financial Statements-Discontinued Operations" (formerly SFAS No.144, “Accounting for the impairment or
disposal of Long-Lived Assets”). All prior period, SME, SLU, LAC, PGN and CLU amounts in the above table, except for the
balance sheet data, have also been so reclassified as to enable comparisons between the relevant amounts for the fiscal years
ended March 31, 2010 through 2014.
(2) We implemented a two-for-one stock split of our common stock effective April 1, 2014. The number of shares outstanding
and per share amounts have been adjusted to reflect the effect of the stock split.
(3) U.S. dollar amounts for dividends are translated from the respective Japanese yen amounts for convenience at the exchange
rate as of the end of each period.
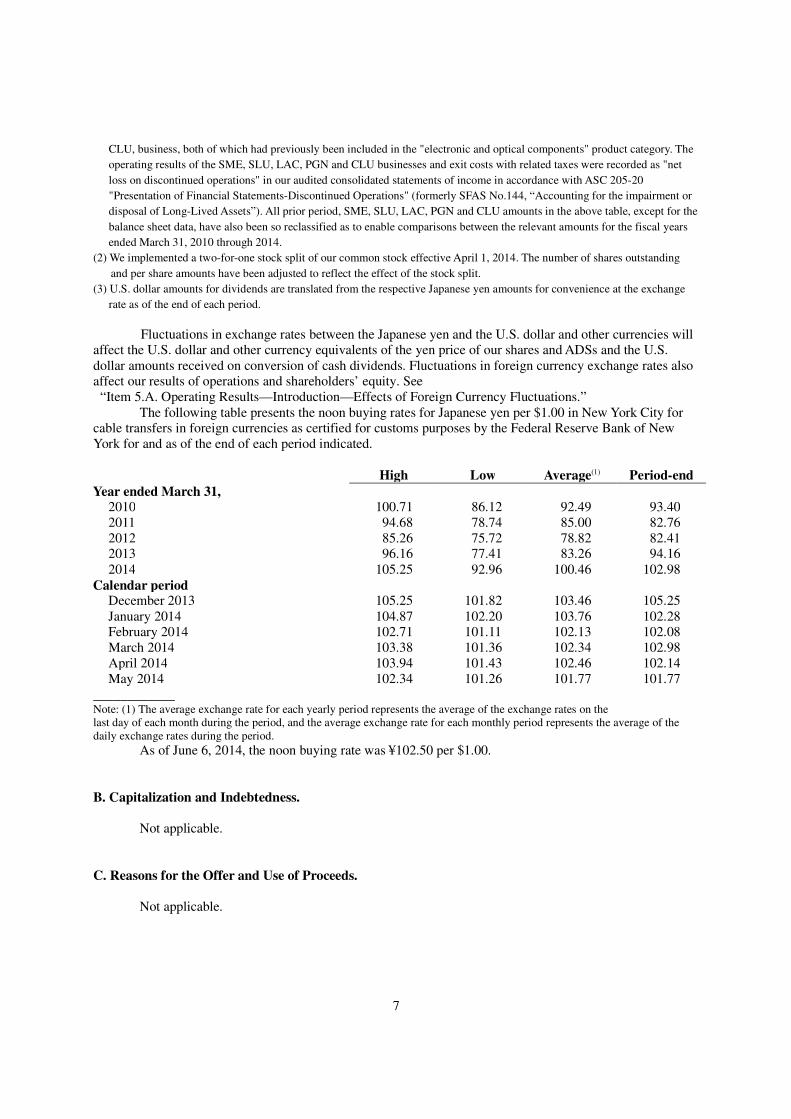
Fluctuations in exchange rates between the Japanese yen and the U.S. dollar and other currencies will
affect the U.S. dollar and other currency equivalents of the yen price of our shares and ADSs and the U.S. dollar amounts received on conversion of cash dividends. Fluctuations in foreign currency exchange rates also affect our results of operations and shareholders’ equity. See
“Item 5.A. Operating Results—Introduction—Effects of Foreign Currency Fluctuations.” The following table presents the noon buying rates for Japanese yen per $1.00 in New York City for
cable transfers in foreign currencies as certified for customs purposes by the Federal Reserve Bank of New York for and as of the end of each period indicated.
High Low Average(1) Period-end
Year ended March 31, 2010 100.71 86.12 92.49 93.40 2011 94.68 78.74 85.00 82.76 2012 85.26 75.72 78.82 82.41 2013 96.16 77.41 83.26 94.16 2014 105.25 92.96 100.46 102.98
Calendar period December 2013 105.25 101.82 103.46 105.25 January 2014 104.87 102.20 103.76 102.28 February 2014 102.71 101.11 102.13 102.08 March 2014 103.38 101.36 102.34 102.98 April 2014 103.94 101.43 102.46 102.14 May 2014 102.34 101.26 101.77 101.77
____________ Note: (1) The average exchange rate for each yearly period represents the average of the exchange rates on the last day of each month during the period, and the average exchange rate for each monthly period represents the average of the daily exchange rates during the period.
As of June 6, 2014, the noon buying rate was ¥102.50 per $1.00.
B. Capitalization and Indebtedness.
Not applicable.
C. Reasons for the Offer and Use of Proceeds. Not applicable.
8
D. Risk Factors.
If any of the risks described below actually occurs, our business, financial condition or results of
operations could be adversely affected.
We derive a substantial portion of our net sales from sales of spindle motors for hard disc drives, and a
decrease in demand for, or prices of, HDDs could harm our business. Net sales of spindle motors for HDDs in computers, and digital home appliances, such as DVD
recorders, were 25.9%, 23.3% and 21.2% of our total net sales in the fiscal years ended March 31, 2012, 2013, and 2014, respectively. Reduced demand for, or lower prices of, HDDs could result in a decrease in our net sales, adversely affecting our results of operations.
Demand for HDDs declined in recent periods and may further decline as a result of a shift in the
information storage and communication industry to alternative storage technologies, such as solid-state drives, or SSDs. Demand for HDDs may further decline if the trend continues or accelerates where small portable PCs using HDDs are replaced by smart phones, tablet devices and other products, using SSDs, with functions overlapping with those of PCs. If the price per memory capacity for SSDs or other alternative technologies is reduced in the future to a level competitive with that for HDDs, demand for HDDs could decline, which in turn could result in reduced sales of our spindle motors.
During an economic downturn, manufacturers of HDDs may suspend or reduce purchases of
additional inventory from suppliers such as us. The rate of decline in average selling price accelerates when manufacturers lower prices to absorb excess capacity, liquidate excess inventories, restructure or attempt to increase their market share.
Many of our customers implement a just-in-time inventory control system. Accordingly, we generally
maintain inventory at or near our customers’ production facilities based on estimated demand. A substantial amount of capital and cost is required to maintain inventory sufficient to meet orders from our customers in a timely manner. In addition, our estimates of future customer demand may prove excessive, exposing us to the risk of unsold inventory becoming obsolete and prices of our products being reduced.
HDD manufacturers recently did, and may in the future, merge or otherwise restructure their
operations and, as part of their restructurings, may seek to reduce costs and inventories. Such restructurings may result in increasing downward pressure on spindle motor prices, which could reduce our margins. Our customers may also re-allocate their procurement orders to our competitors, which could reduce our sales volumes. Such restructurings or similar moves by HDD manufacturers could have a material negative impact on our results of operations.
Because of our dependence on the information storage and communication industry, our business may
be adversely affected by a decline in the market. A substantial portion of our net sales depends on sales of information storage and communication
equipment and peripherals that incorporate our products, including small precision motors. Although we have been diversifying our products and entering into new markets, such as motors for use in home appliances and automobiles, we expect to continue to derive a significant portion of our revenues from the sale of products for use in information storage and communication equipment and peripherals. For example, our net sales were negatively affected in the fiscal year ended March 31, 2014 as the markets for HDDs and optical disk drives experienced a significant slowdown due to increased pricing pressure with respect to, and decreasing demand for, traditional disk drive products. The markets for information storage and communication equipment and peripherals may be further affected by:
• rapid technological change,
9
• emergence of new processes for or approaches to data storage,
• frequent new product introductions and short product life cycles,
• significant price competition and price erosion,
• fluctuating inventory levels,
• over-capacity or capacity constraints due, in part, to cyclical and seasonal market patterns,
• variations in manufacturing costs and yields, and
• significant expenditures for manufacturing equipment and product development.
If any of the foregoing factors leads to a decline in the market for information storage and communication equipment and peripherals, our net sales could decrease, and our results of operations could be materially and adversely affected.
Our customer base for motors for HDDs is limited, and our sales would suffer if one or more of our
significant customers substantially reduce or cancel orders for our products. We are dependent on a limited number of large customers for a substantial portion of our net sales of
motors for HDDs. Sales to our largest customer, Western Digital Corporation, including sales to Hitachi Global Storage Technologies, which Western Digital acquired in March 2012, represented 12.2%, 10.6% and 9.4% of our total net sales for the fiscal years ended March 31, 2012, 2013 and 2014, respectively. Sales to our second largest customer, Seagate Technology LLC, including sales to the hard disk drive, or HDD, business of Samsung Electronics Co., Ltd., which Seagate Technology acquired in December 2011, represented 9.9%, 9.5% and 8.0% of total net sales for the fiscal years ended March 31, 2012, 2013 and 2014, respectively. Our sales to the two largest customers relate to motors used in HDDs for the computer market, which has experienced a significant slowdown due to increased pricing pressure with respect to, and decreasing demand, for traditional disk drive products in recent periods. In the fiscal year ended March 31, 2014, approximately 44.3% and 37.6% of net sales of motors used in HDDs came from Western Digital and Seagate Technology, respectively. We expect that, for the foreseeable future, sales to a limited number of customers will continue to account for a high percentage of our net sales. If current customers do not continue to place orders with us, we may not be able to replace those orders with orders from new customers. As a result, our business, operating results and financial condition could be adversely impacted in the event of:
• a significant reduction, delay or cancellation of orders from one or more of our significant customers,
• a decision by one or more of our significant customers to select products manufactured or technologies developed by a competitor, or its own internally developed components, for inclusion in future product generations, or
• operating or financial difficulties affecting one or more of our significant customers.
In addition, because there are only a limited number of hard disk drive manufacturers in the world, if one or more of our customers merge with or are otherwise acquired by another hard disk drive manufacturer, our business could be adversely affected to the extent that the downward pricing pressure increases or actual or potential sales are lost as a result of the surviving manufacturer’s decision not to purchase our products.
10
Because our facilities are concentrated in a limited number of locations, disruptions in one or more of
those locations could have a material adverse impact on our business operations. Our headquarters and key research and development facilities are located in Japan, and our major
manufacturing facilities are located in a few countries and regions, including Thailand and China. A large number of companies in the information technology industry, including many of our customers and other companies in our and our customers’ supply chains as well as ourselves, are concentrated in those countries and regions, particularly where local governments have implemented policies designed to encourage information technology companies to relocate to their respective jurisdictions. A large-scale natural disaster or political unrest occurring in or affecting those countries or regions or other limitations of those regions could have a material adverse impact on us or the information technology industry on a global basis. The flooding that occurred in Thailand in October 2011, for example, severely disrupted our operations as well as those of our customers and other companies in the supply chains of computer and other information technology products worldwide. Due to the geographic concentration of our facilities, our business is vulnerable to similar events and disruptions, which could have a material adverse impact on our results of operations and financial condition.
We are facing downward pricing pressure in all markets where we provide our products, and price
declines could reduce our revenues and gross margins. We expect downward pricing pressure to continue in all markets where we provide our products. The
hard disk drive industry, where competition is particularly harsh, is characterized by rapidly declining selling prices over the life of a product even for those products which are competitive and timely to market. For example, if we did not have the benefit of the Japanese yen depreciation, sales of our spindle motors for HDDs would have decreased for the fiscal year ended March 31, 2014 compared to that of the previous fiscal year due to lower average unit price and shipment volume. In general, the selling price of a spindle motor decreases over time as the supply of such products increases and as the existing technology becomes obsolete. Intense price competition among customers may pressure us to lower the prices of our products while the price of raw materials used in our products may increase due to rising demand for such raw materials in emerging economies, which may make it difficult for us to maintain the current level of profitability. Also, the general purchaser preference particularly in the computer market is steadily shifting from higher-priced end-products to lower-priced end-products. If this trend further accelerates, or if the trend continues significantly longer than our expectation, there may be additional downward pricing pressure on our products, and our results of operations may be adversely affected. If we are not able to achieve cost reductions, or develop new products with lower production costs, our business, financial condition and results of operations could be adversely impacted.
If raw materials or components for our products are not available in quantities or at prices that we
expect, our production could be significantly harmed. We rely on third party suppliers for some of the raw materials, such as aluminum and rare earth
materials, and some of the components, such as connectors, electric circuits, magnets and other unit assemblies, used in our manufacturing processes. Our production capacity will be limited if one or more of these materials or components become unavailable or available in reduced quantities due to increased prices for such materials. Financial or operational disruptions or slowdowns suffered by our principal suppliers or shippers may negatively affect the availability of raw materials or components. Governmental action that adds conditions to the use of raw materials or components or imposes additional disclosure or other regulatory compliance requirements relating to such materials or components may also affect their availability. For example, regulatory developments imposing due diligence and disclosure requirements regarding the use of “conflict” minerals mined from the Democratic Republic of Congo and adjoining countries may limit the pool of suppliers that can provide us with materials and components that do not contain any such materials or may result in reputational challenges with our customers and other stakeholders if we are unable to sufficiently verify the origins of the minerals used in our products. In addition, the availability of components may be
11
adversely affected by a supplier’s decision to cease to manufacture or allocate adequate resources to develop products that we require.
If the sources or availability of materials or components necessary for our products becomes limited,
we may have to devote significant resources to secure alternative suppliers or shippers, find substitutes for such materials or components, or develop designs and technologies that reduce or eliminate the need for such materials or components. If our sources of materials and supplies are unavailable for a significant period of time without any such substitute, design or technology, our operating results will be adversely affected.
We face aggressive competition both in the markets where we supply our main products and in the
markets into which we are attempting to expand our business, which could have a material adverse
effect on our business and results of operations. In the markets where we supply our main products, including small precision motors, we are under
intensive price competitive pressure to reduce our prices as our competitors attempt to expand their market shares. In the markets in which we are attempting to expand our market share, including the automotive, appliance, commercial and industrial product markets, we compete with competitors that may have larger financial, research and development, manufacturing, sales, marketing and service capabilities and sources of support than we do, and that may also have established market recognition and long-standing customer relationships. In emerging markets, including those for electric and hybrid vehicle control systems, we also face severe competition with other new market entrants as they seek to expand their market share.
To maintain our competitiveness in the markets where we supply our main products, and to enhance
our competitiveness in the markets into which we are attempting to expand our business, we believe that we should maintain, or may need to increase, our substantial level of investment in research and development, expand our production, sales and marketing capabilities, enhance services and support, timely develop new products, and further improve our existing products.
We may not be able to successfully compete in all or some of our markets in the future if:
• any of our markets develops faster than our expectations due to rapidly increasing demand or otherwise, causing our market share to decline relative to our competitors who are able to better meet increasing demand or otherwise cope with developing markets;
• we are unable to achieve technological advancement necessary for our products to meet stricter environmental and other regulatory standards and to be accepted in the markets;
• our competitors’ competitive efforts result in technological innovations, improved manufacturing efficiencies or enhanced research and developmental capabilities, rendering our products and technologies obsolete or uncompetitive;
• mergers or consolidations among our competitors result in a relative decline in our competitive position; or
• we are unable to obtain financial, technological, human and other resources necessary to maintain or enhance our investments.
Our failure to maintain or enhance our competitive position could result in reduced profitability.
12
We may be unable to commercialize customized products that satisfy customers’ needs, or our customers
may be unable to commercialize products that incorporate our products, which could damage our
reputation and reduce sales. Our customers generally require us to provide customized products within a set delivery timetable. If
we are unable to commercialize new product lines including design, manufacture and delivery of customized products, we will not be able to meet our customers’ needs. Our customers are increasingly demanding that we provide them with more complex products on a shorter timetable. Any future failure to meet significant customer requirements could damage our reputation, result in a decline in our market share and reduction of our sales and profit ratio, and impede the business development of these new products and the expansion of the products’ markets.
In addition, if a customer fails to successfully commercialize or sell products that incorporate in them
any customized product which we have invested significant resources to develop, our business and results of operations would be materially adversely affected.
If any defect is discovered in our products, or if any of the end-products in which our products are
incorporated malfunctions, our reputation and results of operations may suffer by lost sales or costs
associated with recalls, legal proceedings or management distraction. We manufacture complex, state-of-the-art motors and other electronic products and, as a result, are
exposed to potential warranty and product liability claims arising from alleged or actual defects in our products in the normal course of business. In particular, widespread malfunction of any end-product in which our products are incorporated may lead to consumer dissatisfaction, recalls and, potentially, lawsuits. In the automotive, home appliance, social infrastructure, commercial and industry motor and other parts markets, where we seek to expand our business, strict safety standards are imposed by applicable regulations and demanded by the public as malfunctioning vehicles, equipment or machinery could result in serious property damage, personal injuries and even death. If such malfunction is caused by or attributed or alleged to be attributed to defects in our products, our brand image could be damaged, we might be subject to adverse regulatory action or drawn into disputes with our customers, or our results of operations might be adversely affected by lost sales or costs associated with recalls. In addition, significant financial and human resources might be incurred, and management’s attention might be diverted, if we are required to defend ourselves against legal claims.
We generally maintain insurance against product liability claims, but our insurance coverage may not
be adequate for any potential liability ultimately incurred. In addition, insurance could become unavailable in the future on terms acceptable to us. A successful claim that exceeds our available insurance coverage or a significant product recall could have a material adverse impact on our financial condition and results of operations.
We rely to a large extent on production and sales in developing countries which may become politically
or economically unstable and face risks resulting from unanticipated developments in those countries. We manufacture and sell a large percentage of our products at locations in developing countries such
as China, Thailand, the Philippines, Vietnam, Malaysia, Mexico and Indonesia, in order to take advantage of more competitive production and sales costs and develop new markets for our products. We also seek to expand our operations into other developing markets, including India and Brazil, where we have little or no prior experience. These countries and markets are still in the process of developing their economic, social and other infrastructures and are susceptible to various uncertainties. The political, social and economic situations of these countries may not continue to provide an environment in which we can continue to manufacture our products cost-efficiently in proximity to our customers. The governmental authorities of those countries may impose regulations or restrictions that would make it difficult, impractical or impossible, whether economically, legally or otherwise, for us to conduct our business there.
13
Furthermore, business activities overseas exposes us to the following various risks related to foreign
business transactions, and these risks may adversely affect our business, operating results, and financial condition:
• economic slowdown or downturn in the relevant industries in foreign markets,
• international currency fluctuations,
• general strikes or other disruptions in working conditions,
• labor shortage and the labor cost increase, especially in China and Thailand,
• political instability,
• changes in trade restrictions and tariffs,
• the difficulties associated with staffing and managing international operations,
• generally longer receivables collection periods,
• unexpected changes in or imposition of new legislative or regulatory requirements,
• relatively limited protection for intellectual property rights in some countries,
• potentially adverse taxes,
• cultural and trade differences,
• additional cost of products exported overseas, including tariffs, shipping costs, and other duties and impositions, which may make our products less competitive in terms of price, and
• significant time and capital required for expanding overseas businesses before achieving capital return.
Our business structure streamlining measures may fail to achieve their intended goals and may result in
significantly increased costs and expenses.
We experienced rapid and significant declines in demand for some of our major products, including
components for personal computers, digital cameras and LCD panel manufacturing equipment, in the fiscal year ended March 31, 2012 due to declining spending and decreasing demand for traditional disk drive products. As a result, sales of these products decreased, and the utilization rate of some of our manufacturing facilities declined to below previous levels. In response, we implemented several measures to streamline our business structure designed to improve our profitability, and incurred restructuring charges during the fiscal year ended March 31, 2013.
We may implement similar or additional business structure streamlining measures in the future and
may incur significant costs and expenses in connection with such measures, which costs and expenses may exceed the targeted benefits. For example, declines in demand for our products or cancellations of orders for our products in large volumes may result in inventory valuation losses. If our manufacturing capabilities remain under-utilized and fail to generate sufficient cash flows, impairment losses on relevant assets may also need to be recognized. In addition, if we are unable to improve our profitability as expected and, as a result, the
14
fair value of any of our reporting units declines below the fair value of related assets net of liabilities, we may be required to record impairment losses relating to goodwill in future periods. Restructuring charges in connection with business structure streamlining measures are recorded primarily in cost of sales, selling, general and administrative expenses, and other operating expense, and thus adversely affect our operating income and net income, in addition to our financial condition.
Our quarterly operating results do not necessarily indicate a trend of our future operating results.
We have experienced, and expect to continue to experience, fluctuations in sales and operating results
from one quarter to the next. As a result, we believe that quarter-to-quarter comparisons of our operating results are not necessarily meaningful, and that such comparisons cannot be relied upon as indicators of future performance. Our operating results may be subject to significant quarterly fluctuations as a result of the various factors, including:
• fluctuations in product demand as a result of the cyclical and seasonal nature of the markets in which our products are sold and used, including the information storage and communication, home appliance, commercial and industrial products markets,
• translation effect of exchange rate fluctuations on the results of our overseas subsidiaries and monetary assets and liabilities denominated in foreign currencies,
• the availability and extent of utilization of our manufacturing capacity,
• changes in our product, customer, or competitor mix, which can occur on short notice,
• cancellation or rescheduling of significant orders, which can occur on short notice;
• deferrals of customer orders for our new products, and
• component and raw material costs and availability, particularly with respect to those obtained from sole or limited sources which can occur on short notice.
Because our production and inventory are planned in advance of anticipated customer demand, if actual
demand is significantly different from our projections, we may suffer losses or lose market share.
We typically plan our production and inventory levels based on customers’ advance orders,
commitments or forecasts, as well as our internal assessment and forecasts of customer demand, which are highly unpredictable and can fluctuate substantially, especially if competition becomes more intense or the demand is reduced due to seasonality or other factors. In order to secure sufficient production scale and productivity, we may make capital investments in advance of anticipated customer demand. We plan to make additional capital investments to expand our manufacturing capabilities particularly in emerging economic regions. If our manufacturing capabilities are under-utilized due to lower demand for our products, unavailability of raw materials or components, or for any other reason, such under-utilization could result in increases in utilization costs, impairment losses and inventory valuation losses or otherwise lower our profit margins, and could have a greater material adverse impact on our results of operations and financial condition. On the other hand, if we underestimate our customers’ needs and fail to make the necessary capital investments, we may lose market share due to our inability to meet customers’ demands.
In addition, in anticipation of long lead times to obtain inventory and materials from our suppliers, we
may also from time to time order materials in advance of anticipated customer demand. This advance investment and ordering may result in excess inventory levels, resulting in unanticipated inventory write-downs if expected orders fail to materialize. As of March 31, 2014, our inventory was ¥123.9 billion.
15
In addition, our operating expenses are relatively fixed, and we thus have limited ability to reduce expenses quickly in response to any revenue shortfalls resulting from a decrease in demand. Consequently, our operating results will be harmed if our revenues do not meet our revenue projections.
Our growth has been based in part on acquisitions of, or investments in, other companies, and our
future growth could be adversely affected if we make acquisitions or investments that fail to achieve
their intended benefits, or if we are unable to find suitable acquisition or investment targets. We have achieved much of our growth by acquiring and otherwise investing in other companies that
have provided us with complementary technologies, product lines, marketing and sales networks, and customer base. From time to time, we intend to seek and pursue appropriate opportunities for acquiring and investing in other companies and increasing our ownership interests in the existing affiliates and investees. To the extent that we are unable to make successful acquisitions or investments, we may not be able to continue to expand our product range, marketing or sales network or customer base, and our growth rates could be adversely affected.
Critical to the success of our acquisitions is the ordered, efficient integration of acquired businesses
into our organization, which has in the past required, and may continue to require, significant resources. Our acquisitions may not generate the operational and financial returns we expect. The success of our future acquisitions will depend upon factors such as:
• our ability to manufacture and sell the products of the businesses acquired,
• continued demand for these acquired products by our customers,
• our ability to integrate the acquired businesses’ operations, products and personnel,
• our ability to retain key personnel of the acquired businesses,
• our ability to extend our financial and management controls as well as our reporting and compliance systems and procedures to acquired businesses,
• accuracy of financial and legal due diligence, and
• our ability to identify possible liabilities that could negatively affect our business, operations or reputation during the due diligence process.
Our new and additional investments in other companies are subject to other uncertainties that may have a material adverse impact on our business. For example, the fair value of our investments in other companies may be impaired if their business results deteriorate, or as a result of a decline in the fair value of their securities that is other than temporary. Changes in economic policies of local governments, laws and regulations, and accounting rules applicable to companies in which we invest may also have a significant adverse effect on our financial results. In addition, in cases where we have a non-controlling interest in an investee, we typically cannot control the operations and the assets of the investee or make major decisions without the consent of other shareholders, or participants, or at all, or acquiring a controlling interest by increasing our shareholding interest.
Failure to succeed in acquisitions or investments, or an inability to find suitable acquisition or
investment targets, could have a material adverse effect on our business, results of operations and financial condition.
16
Our growth places significant burden on our management and operational and financial resources. Our future success depends to a large extent on our ability to integrate and manage our group of
companies as we seek to expand our business and operations organically or through acquisitions of or investments in businesses in accordance with our growth strategy. However, our growth has placed, and is expected to continue to place, significant burden on our management and operational and financial resources. As we pursue our growth strategy, we may face increasing burden on management and our resources and, as a result, fail to timely and appropriately enhance our group-wide administrative, operational, information technology, and financial and compliance management systems. Such failure may have a material adverse impact on our business, results of operations and financial condition.
We rely on our founder, President and CEO, Mr. Shigenobu Nagamori, the loss of whom could have a
material adverse effect on our business. Our continued success will depend to a significant extent on the efforts and abilities of our founder
and current President and CEO, Mr. Shigenobu Nagamori. Mr. Nagamori is actively engaged in our management and determines our strategic direction, especially with regard to acquisition activities. While we are in the process of establishing a management structure designed to reduce our dependence on Mr. Nagamori, his sudden departure or reduced attention to us could have a material adverse effect on our operations, financial condition and operating results.
Any material failure to successfully achieve our corporate objectives or business strategies due to
changes in the economic environment or otherwise may have an adverse impact on our reputation and
business.
One of our major corporate objectives is to contribute to society, and we endeavor to implement
various policies to further this objective, including those intended to provide a stable employment environment and create new jobs. We believe such objectives and policies contribute significantly to building a positive corporate image and brand.
While endeavoring to achieve our corporate objectives, we pursue business strategies that include,
among others, seeking growth opportunities through acquisitions of and investments in businesses as well as organic expansion. We may be, however, unable to achieve the profitability or returns expected by management. Changes in the business and economic environments in which we currently operate or aim to operate and other uncertain or unforeseen factors may make it difficult or impractical for us to achieve the targets management has set.
If we are unable to achieve our corporate objectives due to such difficulty or impracticality, or are
compelled by economic or other factors to adopt measures that are inconsistent with our corporate objectives, including our recent decision to implement workforce reductions as part of the measures designed to streamline our business structure, our corporate brand may be damaged, adversely affecting our business and results of operations.
We rely on monthly financial data from operating segments that are not prepared on a U.S. GAAP basis
and are not comparable between segments, which potentially reduces the usefulness of this data to us in
making management decisions. We assess our performance and make operating decisions based on financial information received
from the 14 operating segments and others that we report in our consolidated financial statements: Nidec Corporation, Nidec Electronics (Thailand), Nidec (Zhejiang), Nidec (Dalian), Nidec Singapore, Nidec (H.K.), Nidec Philippines, Nidec Sankyo, Nidec Copal, Nidec Tosok, Nidec Copal Electronics, Nidec Techno Motor, Nidec Motor, and Nidec Motors & Actuators. This segmental information is prepared in accordance with the accounting principles in each segment’s respective country of domicile. For example, Nidec Corporation’s
17
operating profit or loss is determined using Japanese GAAP while Nidec Singapore Pte. Ltd. applies Singaporean accounting principles. Therefore, our segment data has not been prepared under U.S. GAAP on a basis that is consistent with the consolidated financial statements or on any other single basis that is consistent between segments.
In addition, year-end closing adjustments and other items are not included in segment totals. These
aspects of our segment data could make it more difficult for us to evaluate the relative performance of individual segments and our overall operations in a timely manner, as compared with segment data compiled on a uniform U.S. GAAP basis.
We are subject to various laws and regulations, and our failure to comply may harm our business.
We conduct our business subject to ongoing regulation and associated regulatory compliance risks,
including the effects of changes in laws, regulations, policies, voluntary codes of practice, accounting standards and interpretations in Japan and other countries in which we conduct our business. As we expand the range of our products and the geographical scope of our business, we will be exposed to risks that are unique to particular industries, markets or jurisdictions. Our compliance risk management systems and programs may not be fully effective in preventing all violations of laws, regulations and rules.
Our business activities are subject to a wide range of environmental laws and regulations in Japan,
Asia, the Americas, Europe and other areas. These laws and regulations include those relating to discharge of chemicals into the air and water, management, treatment and disposal of hazardous substances and wastes, product recycling, prevention of global warming and the obligation to investigate and clean up soil and groundwater contamination. Many of our operations require environmental permits, the terms of which may impose limits on our manufacturing activities and require the incurrence of costs to achieve compliance, and which may be subject to modification, renewal and revocation by the issuing authorities. We may be held responsible for payments or other compensation for noncompliance with or otherwise pursuant to applicable environmental laws, regulations and permits, in which case our reputation as well as our results of operations could be adversely affected. Moreover, if these laws, regulations and permits become more stringent in the future, the amount of capital expenditures and other expenses which might be required to complete remedial actions and to continue to comply with applicable environmental laws, regulations and permits could increase and be significant, which would materially and adversely affect our business, financial condition and results of operations.
Our business activities are also subject to various other governmental regulations, both local and
international, including antitrust, anti-bribery, anti-terrorism, intellectual property, consumer protection, taxation, export regulations, tariffs, foreign trade and exchange controls. Because a significant portion of our sales are derived from small precision motor sales and because we have a dominant market share globally for small precision motors, any regulatory development or measure that affects sales or manufacturing of small precision motors in particular could reduce our sales or otherwise negatively affect our business. In addition, as our common stock is listed on the Tokyo Stock Exchange, and American Depositary Shares representing shares of our common stock are listed on the New York Stock Exchange, we must also comply with applicable securities laws and regulations and accounting standards. Compliance with these and other applicable laws, regulations and standards could require significant financial, human and other resources. Moreover, as we expand our operations into new products and geographical markets, we may be required to further enhance our compliance policies and procedures. Our failure or inability to comply fully with applicable laws, regulations and standards could lead to fines, public reprimands, damage to reputation, enforced suspension of operations or, in extreme cases, withdrawal of authorization to operate, adversely affecting our business and results of operations.
In addition, future developments or changes in laws, regulations, policies, voluntary codes of practice,
accounting standards, fiscal or other policies and their effects are unpredictable and beyond our control. Such developments and changes may require additional financial, administrative and human resources.
18
We may experience difficulties implementing effective internal controls over financial reporting.
As a public company, it is essential for us to have effective internal controls, corporate compliance
functions, and accounting systems to manage our assets and operations. Moreover, under the U.S. Sarbanes-Oxley Act of 2002, which applies by reason of our status as a company subject to the reporting obligations under the U.S. Securities Exchange Act of 1934, we are required to establish internal control over our financial reporting, and our management is required to assess the effectiveness of our internal control over financial reporting and disclose whether such internal control is effective. Our independent registered public accounting firm must also conduct an audit on the effectiveness of our internal control over financial reporting. We are also subject to regulations on internal control over financial reporting under Japanese law.
Designing and implementing an effective system of internal controls capable of monitoring and
managing our business and operations requires significant management, human and other resources. Once we identify any significant deficiencies or material weaknesses in our internal control systems, we may require additional resources and incur additional costs for remediating such deficiencies or weaknesses.
Furthermore, if management determines that our internal control over financial reporting is not
effective for any period, we may be unable to timely file reports required under the Japanese Financial Instruments and Exchange Law or the U.S. Securities and Exchange Act of 1934, and our market perception could be negatively affected. Depending on the severity of, and causes and other factors relating to, a material weakness in internal control over financial reporting, we could be subject to liabilities or sanctions, including enforcement action by the SEC for violations of the U.S. securities laws and by the Japanese Financial Services Agency for violations of the Financial Instruments and Exchange Law and other applicable laws and regulations. In addition, we could be restricted in our ability to access U.S., Japan and other markets for capital raising.
We could be harmed by litigation involving patents and other intellectual property rights.
Our business is dependent on our ability to protect the proprietary rights to our technologies and
products and other intellectual property, which we seek to protect through patent, trade secret, trademark, copyright and other legal protection afforded to intellectual property rights as well as contractual provisions and our internal information control system. Despite these efforts, we face the following risks:
• we could incur substantial costs in defending against claims of infringement of the intellectual property of others and such claims could result in damage awards against us, in orders to pay for the use of previously unrecognized third-party intellectual property or in injunctions preventing us from continuing aspects of our business, which could in turn have a material adverse effect on our business, financial condition and results of operations;
• our protective measures may not be adequate to protect our proprietary rights;
• other parties, including competitors with substantially greater resources, may independently develop or otherwise acquire equivalent or superior technology, and we may be required to pay royalties to license the intellectual property of those parties;
• patents may not be issued pursuant to our current or future patent applications, and patents issued pursuant to such applications, or any patents we own or have licenses to use, may be invalidated, circumvented or challenged;
• the rights granted under any such patents may not provide competitive advantages to us or adequately safeguard and maintain our technology;
19
• we could incur substantial costs in seeking enforcement of our patents against infringement or the unauthorized use of our trade secrets, proprietary know how or other intellectual property by others; and
• the laws of foreign countries in which our products are manufactured and sold may not protect our products and intellectual property rights to the same extent as the laws of Japan and the United States, and such laws may not be enforced in an effective manner.
For information relating to our intellectual properties disputes, see “Item 4.B. Information on the Company—Business Overview—Legal Proceedings.”
Leaks of confidential information may adversely affect our business.
In the normal course of business, we possess personal and other confidential information on our
customers, other companies and other third parties with whom we do business as well as our own confidential information and personal information of our employees. Although we have security measures in place to protect such information, we may be subject to liability or regulatory action if any of such information is leaked due to human or technical error, unauthorized access or other illegal conduct, or otherwise. Failure to protect confidential information could also lead to a loss of our competitive advantage and customer and market confidence in us, adversely affecting our business, financial condition and results of operations.
In addition, there is a risk that our confidential information may be leaked due to human or technical
error or illegal conduct by a third party or other causes that are beyond our control. In such cases, including where our competitive advantage is lost because of the leak, our business, financial condition or results of operations may be adversely affected.
For our business to continue effectively, we will need to attract and retain qualified personnel.
Our business depends on the continued employment of our senior management, engineers and other
technical personnel, many of whom would be extremely difficult to replace. To maintain our current market position and support future growth, we will need to hire, train, integrate and retain significant numbers of additional highly skilled managerial, engineering, manufacturing, sales, marketing, support and administrative personnel. Competition worldwide for such personnel is extremely intense, and we and our affiliates may be unable to attract and retain such additional personnel.
Losses relating to our pension plans and a decline in returns on our plan assets may negatively affect our
results of operations and financial condition. We have defined benefit pension plans covering employees who meet eligibility requirements. We
may incur losses if the fair value of our pension plans’ assets declines, if the rate of return on our pension assets declines, or if there is a change in the actuarial assumptions on which the calculations of the projected benefit obligations are based. We may also experience unrecognized service costs in the future due to amendments to existing pension plans. Changes in the interest rate environment and other factors may also adversely affect the amount of unfunded pension obligations and the resulting annual amortization expense. In addition, the assumptions used in the computation of future pension expenses may not remain constant.
If our goodwill and long-lived assets become impaired, we may be required to record impairment
charges, which would adversely affect our financial results.
We have significant goodwill and long-lived assets, including plants, property and equipment. As of
March 31, 2014, we had ¥154.9 billion of goodwill and ¥298.9 billion of plants, property and equipment. In connection with any acquisition we make in the future, we may record additional goodwill depending on the terms of the acquisition. In accordance with U.S. GAAP, we review goodwill for impairment annually and
20
goodwill and long-lived assets for impairment whenever events or changes in circumstances indicate that the carrying amount of an asset may not be recoverable. Goodwill is tested by initially estimating fair value and then comparing it against the carrying amount. If the carrying amount of a reporting unit exceeds its estimated fair value, we are required to record an impairment loss. In addition, if long-lived assets do not generate sufficient cash flows, impairment losses will also have to be recognized. Any significant amount of such impairment losses will adversely affect our results of operations and financial condition.
Our results of operations will be negatively affected if we are required to reduce our deferred tax assets.
As part of the process of preparing our consolidated financial statements in accordance with U.S.
GAAP, we must assess the likelihood that our deferred tax assets will be recovered from future taxable income and, to the extent we believe that recovery is not likely, we must establish a valuation allowance. In the event of a deterioration in market conditions or results of operations, in which we determine that there is additional uncertainty regarding realization of all or part of our net deferred tax assets, an adjustment to our deferred tax assets would decrease our income during the period in which such determination is made.
Because our sales to overseas customers are denominated predominantly in U.S. dollars, we are exposed
to exchange rate risks that could harm our results of operations and shareholders’ equity.
Sales to customers outside Japan accounted for 74.1%, 77.8% and 81.9% of our consolidated net sales
during the fiscal years ended March 31, 2012, 2013 and 2014, respectively. A significant portion of our overseas sales is denominated in currencies other than the Japanese yen, primarily the U.S. dollar, Euro, Renminbi and Thai Baht. As a result, the appreciation of the Japanese yen and other currencies against the U.S. dollar and Euro will generally have a negative effect on our sales, operating income, and net income. We may experience volatility in our shareholders’ equity as a result of foreign currency exchange rate fluctuations when the results of operations of subsidiaries operating in currencies other than the yen are consolidated into our financial statements, which are reported in Japanese yen.
We also experience foreign exchange risk to the extent that our sales and expenses or those of our
subsidiaries are denominated in different currencies. In order to mitigate against this risk, in recent years we have been attempting to offset a portion of our foreign currency revenue by matching the currency of revenue with the currency of expense. For example, if revenue for a particular product is in U.S. dollars, we attempt to purchase the supplies and resources used to produce that product in U.S. dollars. Nevertheless, we remain exposed to the effects of foreign exchange fluctuations.
Interest rate fluctuations may adversely affect our financial condition.
We have long-term receivables and debt, with fixed and variable rates, and we enter into interest rate
swaps and other contracts in order to stabilize the fair values and cash flows of those receivables and debts. We enter into interest rate swaps and other contracts to reduce our market risk exposure from changes in interest rates. To the extent that their effects are not hedged, we are exposed to interest rate fluctuation risks which may affect our operational costs, interest expenses, interest income and the value of financial assets and liabilities.
An unexpected drastic decline in the global economies may result in reduced demand for our products.
Demand for our products may be adversely affected by unexpected economic trends in the countries
or regions in which our products are sold. Economic downturns and declines in purchasing activities in markets worldwide may result in a decline in demand for our products. In particular, our products are often used in end-products that are subject to discretionary spending, such as personal computers, consumer electronic goods and automobiles, and thus, a downturn in the economy could affect our sales. For example, our operating results for the fiscal year ended March 31, 2013 were adversely affected by the deterioration in the global economic environment due to the credit and financial crises in Europe as well as the weakened consumer spending. Our operating results and financial condition may be further adversely affected due to
21
negative economic trends in future periods.
Our ability to collect on our accounts receivable may be adversely affected by our customers’ worsening
financial conditions. As of March 31, 2014, we had ¥196.2 billion of trade notes and accounts receivable, net of allowance
for doubtful accounts. While we are taking measures to mitigate and manage credit risks with respect to our customers and business partners, if changes in the economic conditions of our major markets or the business environment surrounding our customers lead to unexpected levels of bankruptcies or defaults or otherwise result in our customers being unable to pay for our products on schedule or at all, our operating results and financial condition may be negatively affected. Changes in the business environment adversely affecting the liquidity situation of our two largest customers, which represented 8.0% and 5.1% of our gross accounts receivable at March 31, 2013, and 6.1% and 3.5% of our gross accounts receivable at March 31, 2014, respectively, could have a substantial negative impact on our results of operations and financial condition.
Decreases in the value of Japanese or foreign stocks may adversely affect our financial results.
We hold Japanese and foreign stocks as part of our investment securities. The value of these stocks are
inherently volatile and may decline substantially due to economic conditions or other factors, potentially resulting in our recording an impairment loss on such securities. Decreases in the value of Japanese or foreign stocks may also reduce stockholders’ equity on our balance sheet since, in accordance with U.S. GAAP, we include unrealized holding losses on available-for-sale securities, if any, in our accumulated other comprehensive income or loss, while other-than-temporary declines in market value, are charged to income for the period when the loss occurs.
If our access to liquidity and capital is restricted, our business could be harmed.
We rely to a large extent on debt and equity financing to finance our operations, capital expenditures
and acquisitions of other companies. If, due to changes in financial market conditions or other factors, financial institutions reduce, terminate or otherwise modify the amounts or terms of their lending or credit lines to us, and if we are unable to find alternative financing sources on equally or more favorable terms, our business may be materially adversely affected. In addition, if there is a significant downgrade of our credit ratings by one or more credit rating agencies as a result of any deterioration of our financial condition or if investor demand significantly decreases due to economic downturns or otherwise, we may not be able to access funds when we need them on acceptable terms, our access to capital markets may become more restricted, or the cost of financing our operations through indebtedness may significantly increase. This could adversely affect our results of operations and financial condition.
Natural disasters, public health issues, armed hostilities, terrorism, cyber security breaches and other
causes over which we have little or no control could harm our business.
Natural disasters, including earthquakes and floods, fires, the spread of infectious diseases and other
public health issues, armed hostilities, terrorism and other incidents, whether in Japan or any other country in which we operate, could cause damage or disruption to us, our suppliers or customers, or could create political or economic instability, any of which could harm our business. For example, natural disasters could adversely affect our operations by damaging industrial and other infrastructures, causing power outages, rendering our employees unable to work, reducing customer demand or disrupting our suppliers’ operations. Our network and information systems are important for normal operations, but such systems are vulnerable to shutdowns caused by unforeseen events such as power outages or natural disasters or terrorism, hardware or software defects, or computer viruses and computer hacking. The earthquake in northern Japan in March 2011 and subsequent events have disrupted the supply chains and infrastructures for Japan’s major manufacturing industries, including the computer and automobile industries. In addition, the flooding in Thailand in October 2011 severely disrupted the supply chains of IT products, including computers. Any similar events, over which
22
we have little or no control, could cause a decrease in demand for our products or services, make it difficult or impossible for us to deliver products, for our suppliers to deliver components or for our customers to manufacture products, require large expenditures to repair or replace our facilities, or create delays and inefficiencies in our supply chain.
We maintain third party insurance coverage for various types of property, casualty and other risks. The
types and amounts of insurance that we obtain vary from time to time and from location to location, depending on its availability and cost and our decisions as to risk retention. Our insurance policies are subject to deductibles, policy limits and exclusions that result in our retention of a level of risk on a self-insured basis. While we believe our insurance coverage is comparable to the coverage maintained by similar companies in our industry, losses not covered by insurance could be significant, adversely affecting our financial condition and results of operations.
Large shareholders may sell their shares of our common stock at any time, and such sale may cause our
stock price to decline, even if our business is doing well. As of March 31, 2014, there were 275,806,208 outstanding shares of our common stock (reflecting the
effect of the two-for-one stock split of our common stock, effective April 1, 2014, and excluding treasury stock), of which 41,550,352 shares, or 15.0%, of the outstanding shares are beneficially owned by our President and CEO, Mr. Shigenobu Nagamori. These shares and, generally, the shares owned by other shareholders, can be sold on the Tokyo Stock Exchange and otherwise in Japan at any time. Additional sales of a substantial amount of our common stock in the public market by a large shareholder, or the perception that such sales may occur, could cause the market price of our common stock to decline. This could also impair our ability to raise additional capital through the issuance or sale of our securities. Also, in the future, we may issue or sell securities to raise cash for additional capital expenditures, working capital, research and development or acquisitions. We may also pay for interests in additional subsidiary or affiliated companies by using cash, common stock or both. We may also issue securities convertible into our common stock. Any of these events may dilute your ownership interest in us and have an adverse impact on the price of our common stock.
Japan’s unit share system imposes restrictions in holdings of our common stock that do not constitute
whole units.
Our Articles of Incorporation provide that 100 shares of our stock constitute one “unit.” The Company
Law of Japan imposes significant restrictions and limitations on holdings of shares that constitute less than a whole unit. Holders of shares constituting less than a unit do not have the right to vote. A shareholder who owns shares representing less than one unit will not be able to exercise any rights relating to voting rights, such as the right to participate in a demand for the resignation of a director, the right to participate in a demand for the convocation of a general meeting of shareholders and the right to join with other shareholders to propose an agenda item to be addressed at a general meeting of shareholders. Under the unit share system, holders of shares constituting less than a unit have the right to require us to purchase their shares. However, holders of ADSs that represent other than multiples of whole units cannot withdraw the underlying shares representing less than one unit and, therefore, they will be unable to exercise the right to require us to purchase the underlying shares. As a result, holders of ADSs representing shares in lots of less than one unit may not have access to the Japanese markets to sell their shares through the withdrawal mechanism.
Rights of shareholders under Japanese law may be more limited than under the laws of other
jurisdictions.
Our Articles of Incorporation, Regulations of the Board of Directors, Share Trading Regulations and
the other related regulations, as well as the Company Law govern our corporate affairs. Legal principles relating to such matters as the validity of corporate procedures, directors’ and officers’ fiduciary duties and shareholders’ rights may be different from those that would apply if we were a non-Japanese company. Shareholders’ rights under Japanese law may not be as extensive as shareholders’ rights under the laws of other
23
countries or jurisdictions within the United States. You may have more difficulty in asserting your rights as a shareholder than you would as a shareholder of a corporation organized in another jurisdiction. In addition, Japanese courts may not be willing to enforce liabilities against us in actions brought in Japan which are based upon the securities laws of the United States or any U.S. state.
A holder of our ADSs will have fewer rights than a shareholder has and will have to act through the
depositary to exercise those rights. The rights of the shareholders under Japanese law to take actions, including voting their shares,
receiving dividends and distributions, bringing derivative actions, examining our accounting books and records and exercising appraisal rights are available only to holders of record. Because the depositary, through its custodian agent, is the record holder of the shares underlying the ADSs, only the depositary can exercise those rights in connection with the deposited shares. The depositary will make efforts to vote the shares underlying ADSs as instructed by the ADS holder and will pay to ADS holders the dividends and distributions collected from us. However, as an ADS holder, you will not be able to bring a derivative action, examine our accounting books and records or exercise appraisal rights in your capacity as ADS holder.
Because of daily price range limitations under Japanese stock exchange rules, you may not be able to sell
your shares of our common stock at a particular price on any particular trading day, or at all. Stock prices on Japanese stock exchanges are determined on a real-time basis by the equilibrium
between bids and offers. These exchanges are order-driven markets without specialists or market makers to guide price formation. To prevent excessive volatility, these exchanges set daily upward and downward price fluctuation limits for each stock, based on the previous day’s closing price. Although transactions may continue at the upward or downward limit price if the limit price is reached on a particular trading day, no transactions may take place outside these limits. Consequently, an investor wishing to sell at a price above or below the relevant daily limit may not be able to sell his or her shares at such price on a particular trading day, or at all.
Foreign exchange fluctuations may affect the dollar value of our ADSs and dividends payable to holders
of our ADSs.
Market prices for our ADSs may fall if the value of the yen declines against the U.S. dollar. In
addition, the U.S. dollar amount of cash dividends and other cash payments made to holders of our ADSs would be reduced if the value of the yen declines against the U.S. dollar.
It may not be possible for investors to effect service of process within the United States upon us or our
directors or Audit and Supervisory Board members or to enforce against us or these persons judgments
obtained in United States courts predicated upon the civil liability provisions of the federal securities
laws of the United States.
We are a limited liability, joint-stock corporation incorporated under the laws of Japan. Most of our
directors and Audit and Supervisory Board members reside in Japan. A substantial portion of our assets and all or substantially all of the assets of these persons are located in Japan and elsewhere outside the United States. It may not be possible, therefore, for investors to effect service of process within the United States upon us or these persons or to enforce against us or these persons judgment obtained in United States courts predicated upon the civil liability provisions of the federal securities laws of the United States. There is doubt as to the enforceability in Japan, in original actions for enforcement of judgments of United States courts, of liabilities predicated solely upon the federal securities laws of the United States.
24
Item 4. Information on the Company.
A. History and Development of the Company. Nidec Corporation is a joint stock corporation that was incorporated and registered under the Japanese
Commercial Code (which was replaced by the Company Law in May 2006) of Japan on July 23, 1973 under the name of Nihon Densan Kabushiki Kaisha. Our corporate headquarters are located at 338 Kuzetonoshiro-cho, Minami-ku, Kyoto 601-8205, Japan. Our main telephone number is 81-75-935-6140. As of March 31, 2014, we had 229 subsidiaries located in 31 countries, and five affiliated companies located in three countries. We had 100,394 employees worldwide, 91.6% of which were employed outside Japan, as of March 31, 2014.
We are one of the leading global manufacturers of electric motors and related components and
equipment. We aim to achieve sustainable business growth by solidifying our leadership position in motor drive technology and expanding our product portfolio into a broader spectrum of the global electric motor market. With a particular focus on brushless direct current motors, or brushless DC motors, we have constantly explored new ways to serve the global market through the introduction of energy-efficient, environment-conscious motor drives. Our growth as a manufacturer of electric motors to our current size and status has largely been the result of the acquisition and integration of businesses that have enabled us to build a strong product offering. We regard our ability to identify, purchase and integrate acquisition targets as an essential part of our core strategy and strength.
Our recent acquisition and intra-group realignment transactions include the following:
• In October 2013, to more effectively manage, and more effectively share, resources among our group companies, we made Nidec Copal Corporation a wholly owned subsidiary through a share exchange transaction between Nidec Corporation and Nidec Copal. Immediately prior to the share exchange transaction, we held a 66.5% ownership interest in Nidec Copal.
• In October 2013, to more effectively manage, and more effectively share, resources among our group companies, we made Nidec Tosok Corporation a wholly owned subsidiary through a share exchange transaction between Nidec Corporation and Nidec Tosok. Immediately prior to the share exchange transaction, we held a 72.3% ownership interest in Nidec Tosok.
• In January 2014, we acquired Mitsubishi Materials C.M.I. Corporation, a Japanese company which develops, manufactures and sells small motors, electric contact products and other products, to expand our automotive product business. The company was subsequently renamed “Nidec Sankyo CMI Corporation.”
• In March 2014, we acquired Honda Elesys Co., Ltd., a Japanese company which develops, manufactures and sells electronic control units for automobiles, to expand our automotive product business. The company was subsequently renamed “Nidec Elesys Corporation.”
• In April 2014, we and Nidec-Read Corporation, a consolidated subsidiary in which we held an approximately 65.5% ownership interest as of March 31, 2014, entered into a share exchange agreement to make Nidec-Read our wholly owned subsidiary. The share exchange transaction is expected to become effective on October 1, 2014 in accordance with a resolution adopted at an ordinary general meeting of Nidec-Read shareholders held on June 17, 2014.
• In April 2014, we and Nidec Copal Electronics Corporation, a consolidated subsidiary in which we held an approximately 65.4% ownership interest as of March 31, 2014, entered into a share exchange agreement to make Nidec Copal Electronics our wholly owned subsidiary. The share exchange transaction is expected to become effective on October 1, 2014 in accordance with a
25
resolution adopted at an ordinary general meeting of Nidec Copal Electronics shareholders held on June 20, 2014.
Effective April 1, 2014, we implemented a two-for-one stock split of our common stock. The stock
split did not result in any change in the ratio of shares of our common stock per ADS, which has remained unchanged at one-fourth of one share of our common stock per ADS.
The following list presents a selected history of our major acquisition activities relating to the
expansion of our businesses involving small precision motors, automotive, appliance, commercial and industrial products, machinery, electronic and optical components and other products:
During
Fiscal
Year
Ended
March 31,
Event
1989 We acquired Shinano Tokki Co., Ltd., a Japanese manufacturer of spindle motors for hard disk drives, from Teac Corporation in March 1989. As a result, we gained the largest market share of spindle motors in the world.
1995 We acquired newly-issued shares of Shimpo Industries Co., Ltd., currently Nidec-Shimpo Corporation, in February 1995 constituting 36.7% of its then outstanding shares.
1998 We acquired 17.7% of the outstanding shares of Copal Co., Ltd., currently Nidec Copal Corporation, from Fujitsu Limited in February 1998.
In connection with our acquisition of Nidec Copal’s shares, we acquired 32.3% of the outstanding shares of Copal Electronics Corporation, currently Nidec Copal Electronics Corporation, from Nidec Copal in February 1998.
We acquired the assets relating to the motor division of Shibaura Engineering Works Co., Ltd. and established a joint venture, Nidec Shibaura Corporation, with Toshiba Corporation and Shibaura Engineering in October 1998. We initially owned 40.0% of the joint venture.
2000 We acquired 67.0% of the outstanding shares of Y-E Drive Corporation, subsequently renamed Nidec Power Motor Corporation, from Yasukawa Electric Corporation in March 2000.
2001 We subsequently dissolved the joint venture and purchased the remaining 60.0% interest from our former joint venture partners, and Nidec Shibaura became our wholly-owned subsidiary in September 2000.
2002 We increased our ownership of Nidec-Shimpo to 51% in February 2002. As a result, Read Corporation, currently Nidec-Read Corporation, a subsidiary of Nidec-Shimpo, became our majority-owned subsidiary.
2004 We acquired approximately 40% of the outstanding shares of Sankyo Seiki Mfg. Co., Ltd., currently Nidec Sankyo Corporation, in October 2003. We increased our ownership of Nidec Sankyo to 51.0% in February 2004.
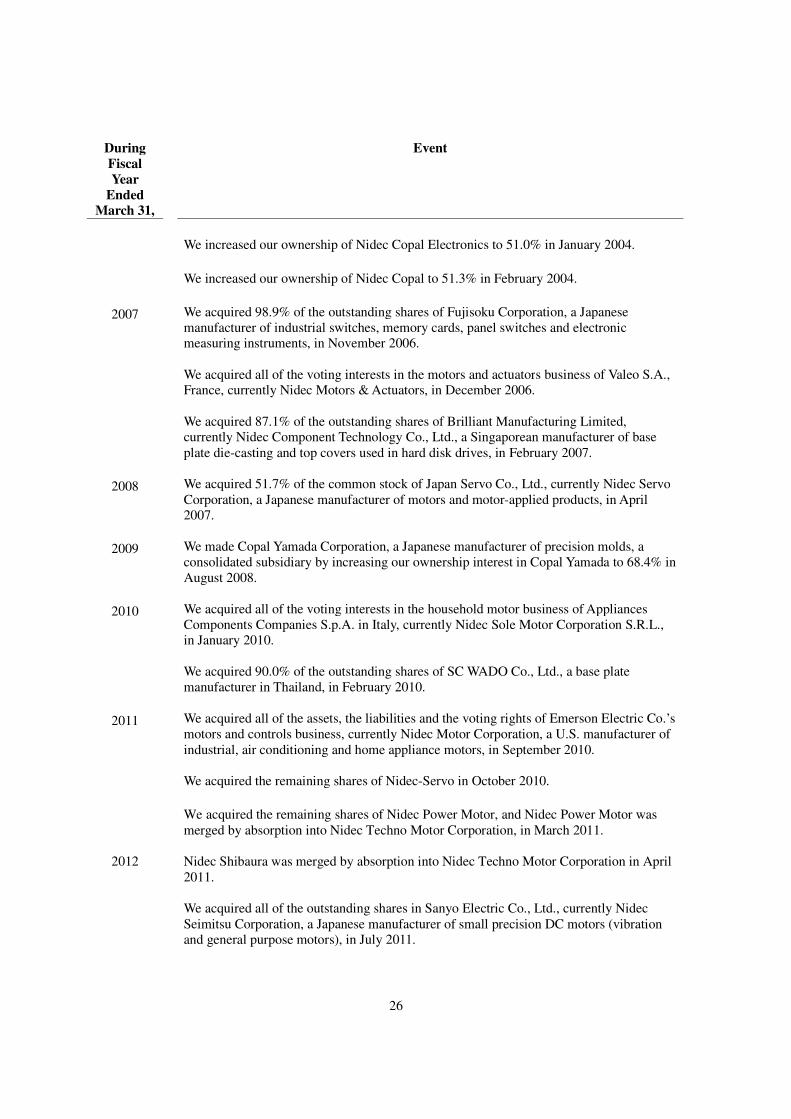
26
During
Fiscal
Year
Ended
March 31,
Event
We increased our ownership of Nidec Copal Electronics to 51.0% in January 2004.
We increased our ownership of Nidec Copal to 51.3% in February 2004.
2007 We acquired 98.9% of the outstanding shares of Fujisoku Corporation, a Japanese manufacturer of industrial switches, memory cards, panel switches and electronic measuring instruments, in November 2006.
We acquired all of the voting interests in the motors and actuators business of Valeo S.A., France, currently Nidec Motors & Actuators, in December 2006.
We acquired 87.1% of the outstanding shares of Brilliant Manufacturing Limited, currently Nidec Component Technology Co., Ltd., a Singaporean manufacturer of base plate die-casting and top covers used in hard disk drives, in February 2007.
2008 We acquired 51.7% of the common stock of Japan Servo Co., Ltd., currently Nidec Servo Corporation, a Japanese manufacturer of motors and motor-applied products, in April 2007.
2009 We made Copal Yamada Corporation, a Japanese manufacturer of precision molds, a consolidated subsidiary by increasing our ownership interest in Copal Yamada to 68.4% in August 2008.
2010 We acquired all of the voting interests in the household motor business of Appliances Components Companies S.p.A. in Italy, currently Nidec Sole Motor Corporation S.R.L., in January 2010.
We acquired 90.0% of the outstanding shares of SC WADO Co., Ltd., a base plate manufacturer in Thailand, in February 2010.
2011 We acquired all of the assets, the liabilities and the voting rights of Emerson Electric Co.’s motors and controls business, currently Nidec Motor Corporation, a U.S. manufacturer of industrial, air conditioning and home appliance motors, in September 2010.
We acquired the remaining shares of Nidec-Servo in October 2010.
We acquired the remaining shares of Nidec Power Motor, and Nidec Power Motor was merged by absorption into Nidec Techno Motor Corporation, in March 2011.
2012 Nidec Shibaura was merged by absorption into Nidec Techno Motor Corporation in April 2011.
We acquired all of the outstanding shares in Sanyo Electric Co., Ltd., currently Nidec Seimitsu Corporation, a Japanese manufacturer of small precision DC motors (vibration and general purpose motors), in July 2011.
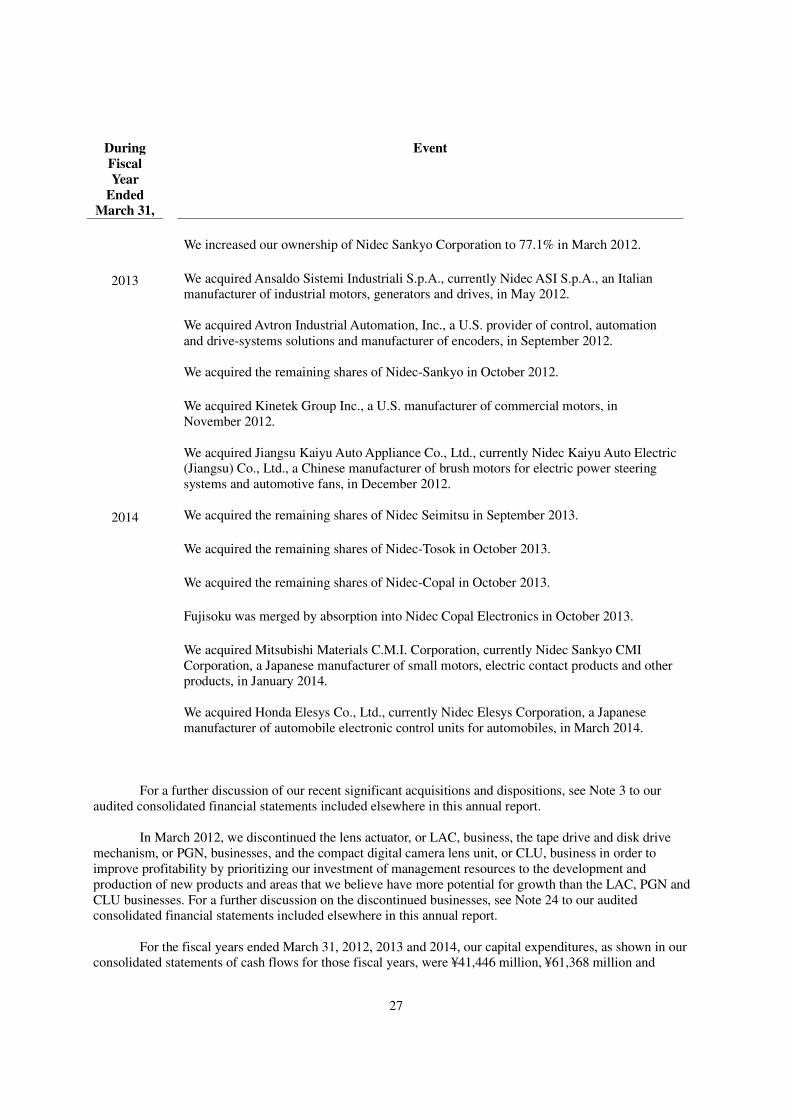
27
During
Fiscal
Year
Ended
March 31,
Event
We increased our ownership of Nidec Sankyo Corporation to 77.1% in March 2012.
2013 We acquired Ansaldo Sistemi Industriali S.p.A., currently Nidec ASI S.p.A., an Italian manufacturer of industrial motors, generators and drives, in May 2012.
We acquired Avtron Industrial Automation, Inc., a U.S. provider of control, automation and drive-systems solutions and manufacturer of encoders, in September 2012.
We acquired the remaining shares of Nidec-Sankyo in October 2012.
We acquired Kinetek Group Inc., a U.S. manufacturer of commercial motors, in November 2012.
We acquired Jiangsu Kaiyu Auto Appliance Co., Ltd., currently Nidec Kaiyu Auto Electric (Jiangsu) Co., Ltd., a Chinese manufacturer of brush motors for electric power steering systems and automotive fans, in December 2012.
2014 We acquired the remaining shares of Nidec Seimitsu in September 2013.
We acquired the remaining shares of Nidec-Tosok in October 2013.
We acquired the remaining shares of Nidec-Copal in October 2013.
Fujisoku was merged by absorption into Nidec Copal Electronics in October 2013.
We acquired Mitsubishi Materials C.M.I. Corporation, currently Nidec Sankyo CMI Corporation, a Japanese manufacturer of small motors, electric contact products and other products, in January 2014.
We acquired Honda Elesys Co., Ltd., currently Nidec Elesys Corporation, a Japanese manufacturer of automobile electronic control units for automobiles, in March 2014.
For a further discussion of our recent significant acquisitions and dispositions, see Note 3 to our
audited consolidated financial statements included elsewhere in this annual report. In March 2012, we discontinued the lens actuator, or LAC, business, the tape drive and disk drive
mechanism, or PGN, businesses, and the compact digital camera lens unit, or CLU, business in order to improve profitability by prioritizing our investment of management resources to the development and production of new products and areas that we believe have more potential for growth than the LAC, PGN and CLU businesses. For a further discussion on the discontinued businesses, see Note 24 to our audited consolidated financial statements included elsewhere in this annual report.
For the fiscal years ended March 31, 2012, 2013 and 2014, our capital expenditures, as shown in our
consolidated statements of cash flows for those fiscal years, were ¥41,446 million, ¥61,368 million and
28
¥40,297 million, respectively. Major capital expenditures in the last three fiscal years included investments used to manufacture hard disk spindle motors in Thailand. In addition, in the last 2 years, our major capital expenditures also included investments used to manufacture automotive, appliance, commercial and industrial products in the United States.
Our capital expenditures for the fiscal year ending March 31, 2015 are planned to include investments
of approximately ¥18,278 million in manufacturing plants and facilities, mainly in Asia and the United States, and other investments for the following purposes:
• to construct an additional research facility for automotive, appliance, commercial and industrial
products in Obama City, Fukui Prefecture, Japan, • to renew production-line equipment in our Asian factories manufacturing spindle motors, and • to renew production-line equipment in our Asian and American factories manufacturing motors
and modules for automotive, appliances, commercial and industrial products. For more information on our capital expenditure, see "Item 5.B. Operating and Financial Review and
Prospects—Liquidity and Capital Resources." In the fiscal year ended March 31, 2013, in order to optimize the utilization of our manufacturing
plants and facilities in response to weaker demand for some of our major products, including components for personal computers, digital cameras and LCD panel manufacturing equipment, we disposed of, or otherwise made adjustments to, some of our plants, equipment and other fixed assets in Asia. See "Item 5.A. Operating and Financial Review and Prospects—Operating Results."
Our Basic Strategy Electricity power shortages and environmental degradation are issues that are becoming increasingly
critical for all industries today. Growth in demand for electricity frequently outpaces the expansion of electricity generation and supply capacity primarily due to the continuing growth in the world population and improvements in the living standards in emerging countries. In the meantime, safety concerns over nuclear power generation and high costs associated with the operation and development of “green” energy resources (notably solar and wind power energy) pose practical challenges to accelerating the expansion of electricity generation capacity without compromising the environment on a global basis.
Under the international framework favoring a gradual shift from the current overdependence on fossil
fuels to expanded use of alternative, “renewable” energy sources, reflecting concerns over climate change and depletion of fossil fuels, all industry participants are expected to become increasingly committed to seeking efficient use of available energy supply resources.
According to a study conducted by the International Energy Agency in 2011 it is estimated that
electric motors and motor systems account for approximately one half of all electricity consumed around the world. As this study illustrates, the efficiency of electric motors and motor drive systems has the potential to make a significant difference in the world’s electricity power consumption. Inefficient motors result in significant energy waste. With an increase in electricity costs, energy lost due to inefficient motors essentially translates into economic loss. Furthermore, since a large portion of the electricity generated in the world currently comes from burning fossil fuels energy wasted due to motor inefficiency translates into the need for compensating capacity in other modes of power generation, including thermal power generation. Wider use of advanced, high-efficiency electric motor solutions is expected to lower energy costs for end users, reduce the aggregate amount of fossil fuels burnt in the process of generating electricity, and curb harmful emissions released into the atmosphere.
29
The Nidec Group is a world-leading comprehensive manufacturer of electric motors and associated drive technologies and has grown to date by developing and mass-producing energy efficient, highly controllable products, notably brushless DC motors primarily for use in computer data storage devices. Backed by its strong market position, the Nidec Group has derived a significant portion of its sales and profit streams from the market for hard disk drive motors and optical disk drive motors for personal computers, servers and consumer electronics. Looking at the long-term product development and market trends, however, traditional personal computing hardware appears to be nearing maturity, with the concept of cloud computing solidly grounded. The cloud computing environment has led to the proliferation of multifunctional mobile devices, such as smartphones and tablets, whose data storage spaces are virtually located in remote data centers rather than being built within the devices. The proliferation of these cloud-oriented digital devices has put the personal computer market under constant competitive pressure, consequently resulting in a slowdown in the small-form-factor hard disk drive market. While serving as a strong catalyst for high-capacity hard disk drives for data center servers, the cloud computing environment is basically considered to be a constraint on unit volume growth in the hard disk drive market.
Having assessed new opportunities and risks arising from the value shift going on in the global market,
we have set out to establish new and well-balanced product portfolios closely aligned with burgeoning market opportunities from both geographic and technological perspectives. Our business growth going forward is expected to largely hinge on our ability to provide energy-efficient, life-enhancing, and environmentally superior motor drive solutions beyond our traditional geographic and market boundaries. Our new strategic roadmap focuses on gaining stronger market share positions even outside of the data storage industry by providing high-efficiency motor drive systems for automotive, home appliance and industrial applications, which are generally driven by medium- to large-size motors operating with a high power consumption load.
This market exploration initiative involves both organic and external, or acquisition-oriented, business
growth approaches. At the core of our organic growth approach lies an effort to expand applications for our products by building upon our already proven technological advantages in the development of compact and energy-efficient motors. In specific terms, the focus is on making our high efficiency motors expand into automotive, household and industrial applications for which alternating current, or AC, motors and brush DC motors have been traditionally used as the mainstream motor types. Meanwhile, our external growth approach aims to achieve two key objectives. First, we seek business acquisitions that allow us to gain access to prospective technologies, new customer groups and untapped geographic markets. This is particularly the case when addressing the markets for automotive systems, home appliances and industrial equipment, which are vastly diversified and prone to exhibit distinct regional variations in consumer preferences. In other words, business acquisitions will help swiftly globalize our motor production and supply networks in a manner that matches each regional need. Second, we will pursue business acquisitions that effectively diversify our business risks. Through a phased implementation of well-planned acquisition schemes, we seek to optimize our product portfolio and reduce our dependence on the personal computer market, which is characterized by volatile demand and short product life cycles.
As discussed above, the Nidec Group’s entire business operations have revolved around providing
highly efficient electric motors that contribute to enhancing the energy efficiency of end products. Going forward, the Nidec Group seeks to expand its business horizon to include power generation and distribution in order to address the issue of energy constraint in a broader perspective.
See “Item 3.D. Key Information—Risk Factors—We face aggressive competition both in the markets
where we supply our main products and in the markets into which we are attempting to expand our business, which could have a material adverse effect on our business and results of operations.”
Our Business Model
We pursue sustainable enhancement of corporate value by leveraging our core competencies in the
electric motor drive technology and associated manufacturing and marketing expertise, which are designed
30
flexibly to align with future changes and developments in the relevant markets. Our business model is to provide specialized motor drive solutions to global customers who seek to
build and maintain a top tier product portfolio in terms of efficiency, differentiation, price competitiveness and speed to market. The business model has evolved over time in alignment with the customers’ changing value priorities and based on our strategic foresight in identifying potential growth areas to concentrate our resources on. We constantly assess our visions and strategies in light of the evolving business environment and, if necessary, seek to reposition ourselves by proactively taking measures, including investments, mergers and acquisitions, and divestiture or transformation of operations.
As an independent participant in multiple supply chains in multiple product markets, we supply
products to higher-tier suppliers and ODM and OEM customers. We provide our specialized capabilities in motor-drive solutions that customers otherwise do not have direct access to, or cannot cost-effectively create or manage internally. We seek to maintain and further develop these capabilities to compete with our current and potential competitor suppliers worldwide. The customers in the supply chains we currently serve generally have the following attributes:
• They expect highly innovative products with an increasing focus on energy-saving, environment-conscious features;
• They require large quantities at a low price; and
• They purchase on short notice and expect quick delivery, service and support. We aim for the highest market share in our chosen areas of operations, and believe that we have
developed a flexible and agile manufacturing framework to ensure rapid responses to changes in customer demand, timely resolution of quality problems, and fast implementation of new product features.
We believe our key strengths and capabilities can be summarized as follows:
• strategic foresight to identify future growth opportunities and challenges, and agility in responding to the accompanying changes in technologies, markets and trends,
• rich pool of specialized proprietary technologies and related expertise in customization and processing,
• short time to market enabled by highly specialized, focused operations,
• cost advantages generated by effectively spreading the costs of specialized capabilities over significantly large production volume for serving multiple customers,
• ability to build long-term, close relationships with customers based on an in-depth understanding of their challenges and goals,
• corporate culture that prioritizes employees’ creativity, labor enthusiasm, and swiftness in decision-making, and
• extensive experience in successful mergers and acquisitions and post-merger integration. Our competitive advantages, particularly from a perspective of responsiveness to customers, reflect,
and are primarily driven by, the following operational elements:
31
Technology Continuing improvement in product design, manufacturing and process technologies is critical to
differentiate ourselves from our competitors and, from time to time, to ease pricing pressure. We aim to have all of our design activities focus on future growth markets and potential applications well-matched with the context of the times.
From a technical perspective, our business model first demonstrated its validity in establishing our
leadership in the global market for spindle motors for hard disk drives. In the 1980’s, the computer industry was seeking innovative solutions that would enable smaller-footprint computer for home and office uses (personal computers, or PCs) without compromising performance. The manufacturers of the hard disk drive, a storage device used to store digitally encoded data in the computer and server, were also looking for innovative ways to dramatically reduce the size and improve the performance of their hard disk drives. They needed a new platter, new read and write head, and among all things, a new type of electric motor. We had anticipated the need for smaller yet higher-performing motors early on and successfully developed our proprietary brushless DC motor technology and associated mass-production expertise ahead of our competitors. Our brushless DC motor quickly replaced the traditional brush-commutated DC motor, or brush DC motor, to become the mainstream motor solution for hard disk drives, and subsequently, optical disk drives.
Our motor drive technology has since evolved through waves of innovation and modification to fulfill
a role fine-tuned to the needs of the times. Exhibiting enhanced rotation accuracy, controllability, lightness, quietness and operating life, coupled with significantly improved energy-efficiency and environmental advantages, our motor portfolio has extended its reach beyond the information technology field into many other market segments where we find new demand. Our current focus is on new applications arising from consumers’ preference toward energy-saving lifestyle, greater comfort and safety. Among the most prospective application areas, we place particular emphasis on electric and hybrid automobiles, home electric appliances and industrial equipment, for which we believe highly controllable, energy-saving and environmentally motors are increasingly sought after.
See “Item 3.D. Key Information—Risk Factors—We may be unable to commercialize customized
products that satisfy customers’ needs, or our customers may be unable to commercialize products that incorporate our products, which could damage our reputation and reduce sales.”
Production
Our customers, to a greater or lesser degree, serve various electronics markets which typically require
large quantities of high-quality precision components, including electric motors, on short notice and at competitively low prices. Attaining a sustainable leadership position in these markets is essentially synonymous with having industry-leading manufacturing capacities and flexible manufacturing techniques that enable competitive quantity, quality, speed and price. For this reason, we constantly explore new application areas with high growth potential to continue securing sufficient production volume for better economies of scale and scope. Our manufacturing initiatives towards the leading market position basically begin with establishing substantially large manufacturing capacities in close proximity to major groups of customers so that we can meet quality and quantity demand better and make delivery times shorter than our competitors. Further, we carefully measure the value added along the production lines over the course of time and, at a scale deemed appropriate, standardize and automate production lines for lower cost manufacturing operations.
See “Item 3.D. Key Information—Risk Factors—Because our facilities are concentrated in a limited
number of locations, disruptions in one or more of those locations could have a material adverse impact on our business operations.”
32
Inventory and Delivery Our major revenue streams currently come from the customers who adopt either a just-in-time system
(JIT) or vender-managed inventory (VMI) under which the customers produce only what is required in the correct quantity and at the correct time, to keep their stock levels to a minimum. Accordingly, we are expected to deliver our products to the customers’ loading bays within a narrow time slot.
Both JIT and VMI are very responsive manufacturing methods, and yet very reliant on suppliers. If
stock is not delivered on time, the customer’s entire production schedule would most likely be delayed. Customers without inventory must avoid such a supply system problem that creates a shortage of parts. This makes supplier relationships extremely important for our customers, and our responsiveness here is primarily measured by our ability to keep sufficient levels of inventory readily available to the customers at many locations worldwide. To fulfill these customer needs, our global manufacturing network is flexibly coordinated to ensure geographical proximity to the factories and warehouses of our customers. At the same time, we pay significant attention to the demand conditions in downstream markets in order to mitigate the risk of overstocking on our side.
See “Item 3.D. Key Information—Risk Factors—Because our production and inventory are planned in
advance of anticipated customer demand, if actual demand is significantly smaller than projected, we may suffer losses.”
Quality
Our quality initiatives revolve around continuous improvement and optimization of all processes—from product development, purchasing, production and sales to delivery—in order to provide maximum value for our customers. We adopt quality as a competitive strategy and implement techniques, such as ISO 9001 certification and statistical process controls, to meet customer demands and improve overall business performance.
As an internationally operating company, our quality responsibility involves reducing the environment
burdens of our products and operations beyond national borders. In addition to compliance with international environmental standards, such as ISO14001, REACH (Registration, Evaluation, Authorization and Restriction of Chemical substances) and RoHS (Restriction of Hazardous Substances Directive), we seek to address environmental considerations and work on the reduction of raw materials used per unit of product.
See “Item 3.D. Key Information—Risk Factors—If any defect is discovered in our products, or if any
of the end-products in which our products are incorporated malfunctions, our reputation and results of operations may suffer by lost sales or costs associated with recalls or management distraction.”
Strategic Investments and Business Acquisitions
Strategic investments and business acquisitions in potentially higher value areas are essential to our
success in terms of broadening our technological horizons, enriching our products and customer portfolio, and eventually developing an optimal mix of revenue and profit streams. Specifically, our core investment efforts are currently being directed to the following areas:
• research and development of energy-efficient, environment-conscious electric motors,
• expansion of selling and manufacturing capacities in emerging countries, and
• mergers and acquisitions of electric motor businesses in the household appliance, automotive, commercial and industrial motor industries.
33
See “Item 3.D. Key Information—Risk Factors—Our growth has been based in part on acquisitions of, or investments in, other companies, and our future growth could be adversely affected if we make acquisitions or investments that fail to achieve their intended benefits, or if we are unable to find suitable acquisition or investment targets.”
B. Business Overview. We classify our products into five business groups based primarily on the similarity of products in
type and use. The business groups and major categories of products offered in each business group as of March 31, 2014 are as follows:
• Small Precision Motors: Hard disk drives spindle motors and other small precision motors for optical disk drives, laser printers, copiers, polygon scanners, electronic cooling fans, refrigerators, mobile phones, DVD recorders, automobiles, and other applications;
• Automotive, Appliance, Commercial and Industrial Products: Automotive motors and electronic controls (for power steering systems, dual-clutch transmission systems, engine and fuel cell cooling systems, seat adjusters, window lifts, door lock actuators, vehicle traction systems, collision avoidance and mitigation systems, and other products), home appliances motors (for air conditioning systems, air purification systems, washing machines, refrigerators, dish washers and other products), and industrial motors and systems solutions (for processing lines, rolling mills, mining equipment, heat pump and water heater systems, elevators, escalators, commercial food refrigerators, floor care equipment, utility vehicles, material handling vehicles, aerial lifts, monitoring systems, barrier-free facilities, electric tools, air compressors, marine propulsion systems, wind power generation systems, photovoltaic power generation systems, and other products);
• Machinery: Transfer robots (for liquid-crystal-display panels, semiconductor wafers, and other products), card readers, high-speed pressing machines, food packaging machines and power transmission systems;
• Electronic and Optical Components: Shutters and lens units (for digital still cameras and mobile phones), switches, trimmer potentiometers, precision plastic moldings and plastic metal casings, and
• Others: Logistics services and music box products.
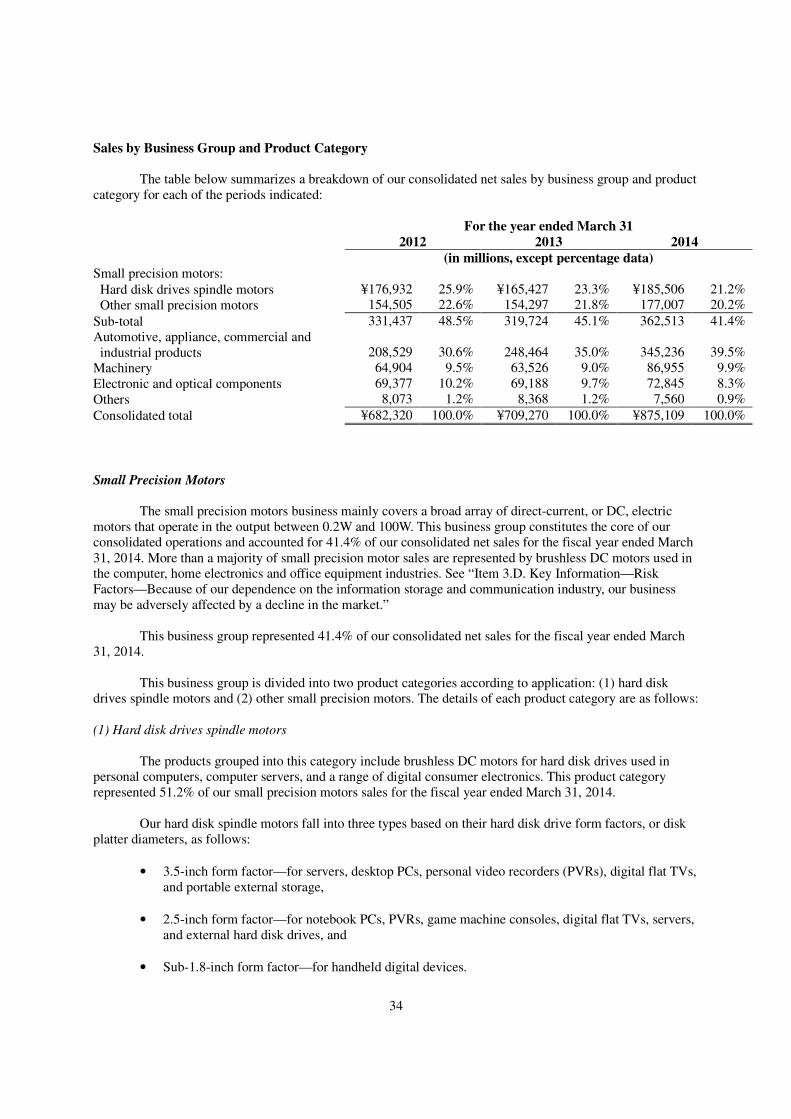
34
Sales by Business Group and Product Category The table below summarizes a breakdown of our consolidated net sales by business group and product
category for each of the periods indicated:
For the year ended March 31
2012 2013 2014
(in millions, except percentage data) Small precision motors:
Hard disk drives spindle motors ¥176,932 25.9% ¥165,427 23.3% ¥185,506 21.2% Other small precision motors 154,505 22.6% 154,297 21.8% 177,007 20.2%
Sub-total 331,437 48.5% 319,724 45.1% 362,513 41.4% Automotive, appliance, commercial and
industrial products 208,529 30.6% 248,464 35.0% 345,236 39.5% Machinery 64,904 9.5% 63,526 9.0% 86,955 9.9% Electronic and optical components 69,377 10.2% 69,188 9.7% 72,845 8.3% Others 8,073 1.2% 8,368 1.2% 7,560 0.9%
Consolidated total ¥682,320 100.0% ¥709,270 100.0% ¥875,109 100.0%
Small Precision Motors The small precision motors business mainly covers a broad array of direct-current, or DC, electric
motors that operate in the output between 0.2W and 100W. This business group constitutes the core of our consolidated operations and accounted for 41.4% of our consolidated net sales for the fiscal year ended March 31, 2014. More than a majority of small precision motor sales are represented by brushless DC motors used in the computer, home electronics and office equipment industries. See “Item 3.D. Key Information—Risk Factors—Because of our dependence on the information storage and communication industry, our business may be adversely affected by a decline in the market.”
This business group represented 41.4% of our consolidated net sales for the fiscal year ended March
31, 2014. This business group is divided into two product categories according to application: (1) hard disk
drives spindle motors and (2) other small precision motors. The details of each product category are as follows:
(1) Hard disk drives spindle motors The products grouped into this category include brushless DC motors for hard disk drives used in
personal computers, computer servers, and a range of digital consumer electronics. This product category represented 51.2% of our small precision motors sales for the fiscal year ended March 31, 2014.
Our hard disk spindle motors fall into three types based on their hard disk drive form factors, or disk
platter diameters, as follows:
• 3.5-inch form factor—for servers, desktop PCs, personal video recorders (PVRs), digital flat TVs, and portable external storage,
• 2.5-inch form factor—for notebook PCs, PVRs, game machine consoles, digital flat TVs, servers, and external hard disk drives, and
• Sub-1.8-inch form factor—for handheld digital devices.
35
A significant portion of the operations relating to this product category is conducted by Nidec
Corporation. We currently supply spindle motors to all of the major hard-disk drive manufacturers in the world. In
the fiscal year ended March 31, 2014, approximately 44.3% and 37.6% of our hard disk drive spindle motor sales came from Western Digital Corporation and Seagate Technology LLC, respectively. See “Item 3.D. Key Information—Risk Factors—Our customer base is highly concentrated, and our sales would suffer if one or more of our significant customers substantially reduce or cancel orders for our products.”
Substantially all of our sales of hard disk drive spindle motor are denominated in U.S. dollars. In this market, we currently compete with two motor suppliers: Samsung Electro-Mechanics Co., Ltd.
and Minebea Technology Co., Ltd. The following are some of the recent general market trends we consider significant to our hard disk
drives spindle motor business:
• Global demand for electronic data storage is expected to maintain sustainable growth, reflecting continued proliferation of personal and enterprise digital content that is stored, shared, protected and distributed in increasingly high volume.
• The hard disk drives industry’s focus is shifting further to cloud storage, a model of networked online storage where data is stored on multiple third-party servers at data centers.
• Handheld devices (e.g., smartphones and tablet PCs) will remain a major competitor against the conventional small-form-factor PCs. Operating in the cloud storage environment and using solid-state drives as their only built-in storage media, these handheld devices are, on one hand, serving as a catalyst for the high-capacity, server-oriented hard disk drives market but, on the other hand, posing a constraint on the low-capacity hard disk drives market.
See “Item 3.D. Key Information—Risk Factors—We derive a substantial portion of our net sales from
sales of spindle motors for hard disc drives, and a decrease in demand for, or prices of, HDDs could harm our business.”
Demand for hard disk drive spindle motors typically peaks in the autumn-winter season, driven by
corporate IT spending and consumer spending in the back-to-school and holiday shopping seasons. However, the normal seasonal pattern paused in the fiscal year ended March 31, 2013 as the PC market underwent a downturn against the background of European debt crisis and intensified competition from smartphones and tablets. See “Item 3.D. Key Information—Risk Factors—Our business structure streamlining measures may fail to achieve their intended goals and may result in significantly increased costs and expenses.”
(2) Other small precision motors The products within this category are primarily used in the following application areas:
• optical disk drives for PCs, car navigation systems, and home electronics such as digital video recorders, flat-screen TVs and game machines,
• office equipment (e.g., laser printers and hybrid copiers),
• cooling fans for PCs, servers, smartphones, tablets, game machine consoles, telecom base
36
stations, and other products,
• home appliances (e.g., refrigerators, stand mixers, juicers, hair dryers, food processors, and other products),
• vibration mechanism for smartphones and mobile phones,
• position or motion control mechanism for industrial control equipment and home electronics (e.g., camcorders, digital single-lens-reflex cameras, and car navigation systems), and
• factory automation control units. This product category represented 48.8% of our small precision motors sales for the fiscal year ended
March 31, 2014. The types of electric motors we manufacture for these applications range from brush and brushless DC
motors to stepping motors, coreless motors, servo motors and silent geared motors. A significant portion of the operations relating to this product category is conducted by Nidec Corporation, Nidec Sankyo Corporation, Nidec Copal Corporation, Nidec Copal Electronics Corporation and Nidec Servo Corporation. In this product category, our major customers are Japanese, Korean, Taiwanese and Chinese electronics companies. Our primary competitors are Asian component manufacturers, including our customers’ motor manufacturing divisions.
Automotive, appliance, commercial and industrial products This business group is mainly comprised of mid- to large-sized motors and related control electronics
for use in diverse applications, including:
• automobiles,
• air-conditioning systems and other home appliances,
• commercial elevators and escalators,
• industrial automation systems, and
• renewable energy management systems. In general, electric motors for these applications are designed to operate across a wide range of
voltages and power ratings to match light- to heavy-load conditions. Demand patterns vary depending on the nature of their end uses but indicate similar sensitivity to corporate capital expenditure and regulatory trends in the context of energy conservation and environmental protection. A rapid emergence of the Chinese and Indian markets and the resulting shift of production and sales to the Asian regions are becoming increasingly evident in these industries.
This business group represented 39.5% of our consolidated net sales for the fiscal year ended March
31, 2014.
(1) Automotive motors Our automotive products mainly consist of mid-size electric motors (with up to 1,100W output power)
and associated motion control modules that power a variety of vehicle control mechanisms, including electric power steering systems, dual-clutch transmissions, engine-cooling systems, seat adjusters, sunroof systems,
37
anti-lock breaking systems and advanced driver assistance systems. The automotive business is primarily managed by Nidec Corporation, Nidec Motors & Actuators
Corporation, Nidec Tosok Corporation and Nidec Elesys Corporation. These companies supply products to the world’s leading automotive system manufacturers and automobile manufacturers. Our largest customers include electric power steering manufacturers such as JTEKT Corporation, NSK Ltd. and TRW Automotive Holdings Corp. We compete with independent electric motor suppliers and our customers’ own motor manufacturing units worldwide.
The global automotive industry, broadly characterized by product regionalization, application
fragmentation and market saturation, is currently experiencing major technological and market shifts arising from sustainability-oriented value changes.
Enhancing a vehicle’s fuel economy and environmental performance, while keeping additional costs at
an acceptable level without compromising advanced safety and comfort features, is the overriding issue shared among today’s automobile manufactures and related supply chains. The ever-increasing global energy demands and accompanying concerns over fossil fuel supply shortages and oil price volatility underlie the increasing market interest in low fuel consumption vehicles. Alongside energy concerns, global warming and climate change issues are drawing greater public awareness, stimulating legislative controls on vehicle CO2 emissions worldwide. In addition, more advanced and active driver-assistance technologies, such as collision avoidance and electronic stability control, are increasingly perceived to be standard features for automobiles.
Reducing emissions and improving fuel-efficiency are practically synonymous with reducing vehicle
weight and engine thermal loss, improving powertrains (such as transmission, etc.), and redesigning other vehicle subsystems (such as power steering, brakes, etc.). Most of the solutions designed for these purposes are dependent on electronics and associated electric motor-based power systems. Electronic control solutions help downsize vehicle systems across the board, enable effective use of energy generated from the internal combustion engine and, in turn, support the development of hybrid, electric and fuel-cell vehicles. Electronic features in conjunction with sensors and control units also power the collision avoidance and mitigation system and the advanced driver assistance system, which are designed to prevent various errors that could be made by drivers.
(2) Appliance, commercial and industrial motors
The products within the appliance, commercial and industrial product category include mid- to
large-size electric motors and control systems for:
• household applications, including washing machines, air-conditioners, drying tumblers and dishwashers, and
• commercial and industrial applications, including mining equipment, heat pump and water heater systems, elevators, escalators, material handling equipment, compressors, marine propulsion systems, and wind and solar power generation systems.
The operations relating to this product category are mainly conducted by Nidec Motor Corporation,
Nidec ASI S.p.A., Nidec Kinetek Corporation, Nidec Sole Motor Corporation, Nidec Techno Motor Corporation, Nidec Avtron Automation Corporation and Nidec Corporation. We compete with independent electric motor suppliers and our customers’ own motor manufacturing units worldwide. Our largest customers include Whirlpool Corporation, AB Electrolux and Haier Group.
Asia-Pacific, including China and India, is the largest as well as the fastest growing regional market,
driven by the burgeoning middle class and increasing residential and commercial construction. Western Europe and North America and Japan have relatively mature and well established markets mainly led by replacement
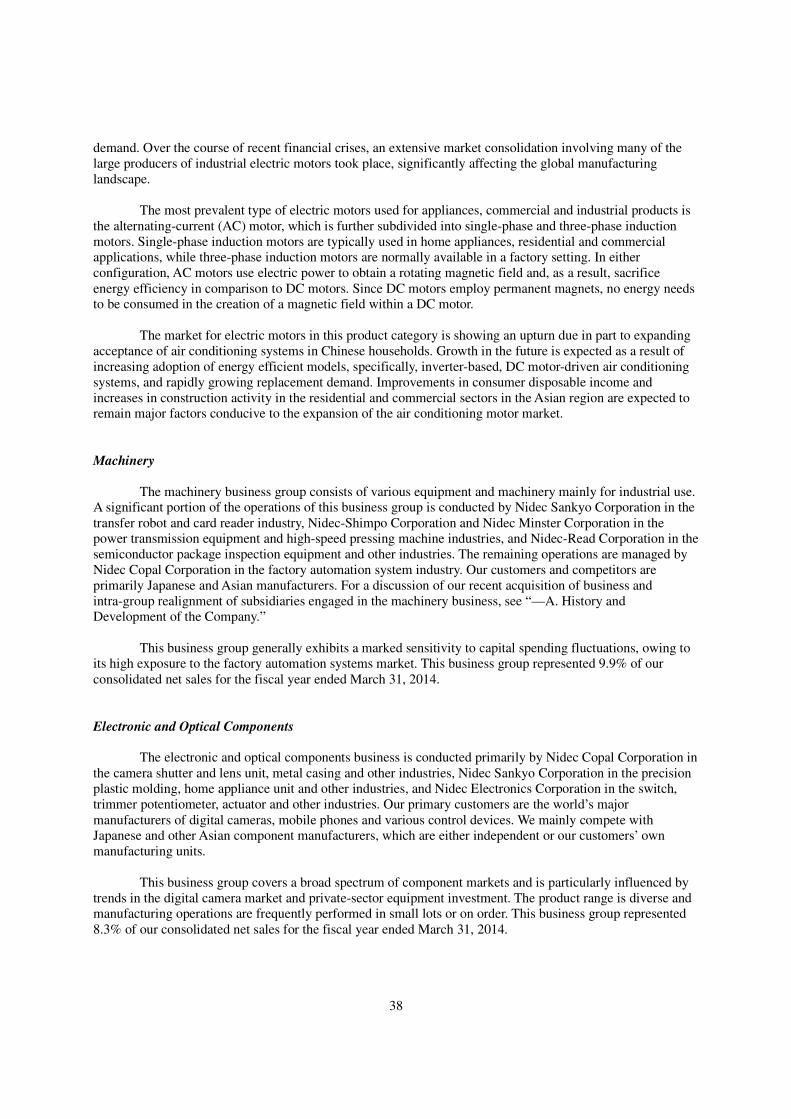
38
demand. Over the course of recent financial crises, an extensive market consolidation involving many of the large producers of industrial electric motors took place, significantly affecting the global manufacturing landscape.
The most prevalent type of electric motors used for appliances, commercial and industrial products is
the alternating-current (AC) motor, which is further subdivided into single-phase and three-phase induction motors. Single-phase induction motors are typically used in home appliances, residential and commercial applications, while three-phase induction motors are normally available in a factory setting. In either configuration, AC motors use electric power to obtain a rotating magnetic field and, as a result, sacrifice energy efficiency in comparison to DC motors. Since DC motors employ permanent magnets, no energy needs to be consumed in the creation of a magnetic field within a DC motor.
The market for electric motors in this product category is showing an upturn due in part to expanding
acceptance of air conditioning systems in Chinese households. Growth in the future is expected as a result of increasing adoption of energy efficient models, specifically, inverter-based, DC motor-driven air conditioning systems, and rapidly growing replacement demand. Improvements in consumer disposable income and increases in construction activity in the residential and commercial sectors in the Asian region are expected to remain major factors conducive to the expansion of the air conditioning motor market.
Machinery The machinery business group consists of various equipment and machinery mainly for industrial use.
A significant portion of the operations of this business group is conducted by Nidec Sankyo Corporation in the transfer robot and card reader industry, Nidec-Shimpo Corporation and Nidec Minster Corporation in the power transmission equipment and high-speed pressing machine industries, and Nidec-Read Corporation in the semiconductor package inspection equipment and other industries. The remaining operations are managed by Nidec Copal Corporation in the factory automation system industry. Our customers and competitors are primarily Japanese and Asian manufacturers. For a discussion of our recent acquisition of business and intra-group realignment of subsidiaries engaged in the machinery business, see “—A. History and Development of the Company.”
This business group generally exhibits a marked sensitivity to capital spending fluctuations, owing to
its high exposure to the factory automation systems market. This business group represented 9.9% of our consolidated net sales for the fiscal year ended March 31, 2014.
Electronic and Optical Components The electronic and optical components business is conducted primarily by Nidec Copal Corporation in
the camera shutter and lens unit, metal casing and other industries, Nidec Sankyo Corporation in the precision plastic molding, home appliance unit and other industries, and Nidec Electronics Corporation in the switch, trimmer potentiometer, actuator and other industries. Our primary customers are the world’s major manufacturers of digital cameras, mobile phones and various control devices. We mainly compete with Japanese and other Asian component manufacturers, which are either independent or our customers’ own manufacturing units.
This business group covers a broad spectrum of component markets and is particularly influenced by
trends in the digital camera market and private-sector equipment investment. The product range is diverse and manufacturing operations are frequently performed in small lots or on order. This business group represented 8.3% of our consolidated net sales for the fiscal year ended March 31, 2014.
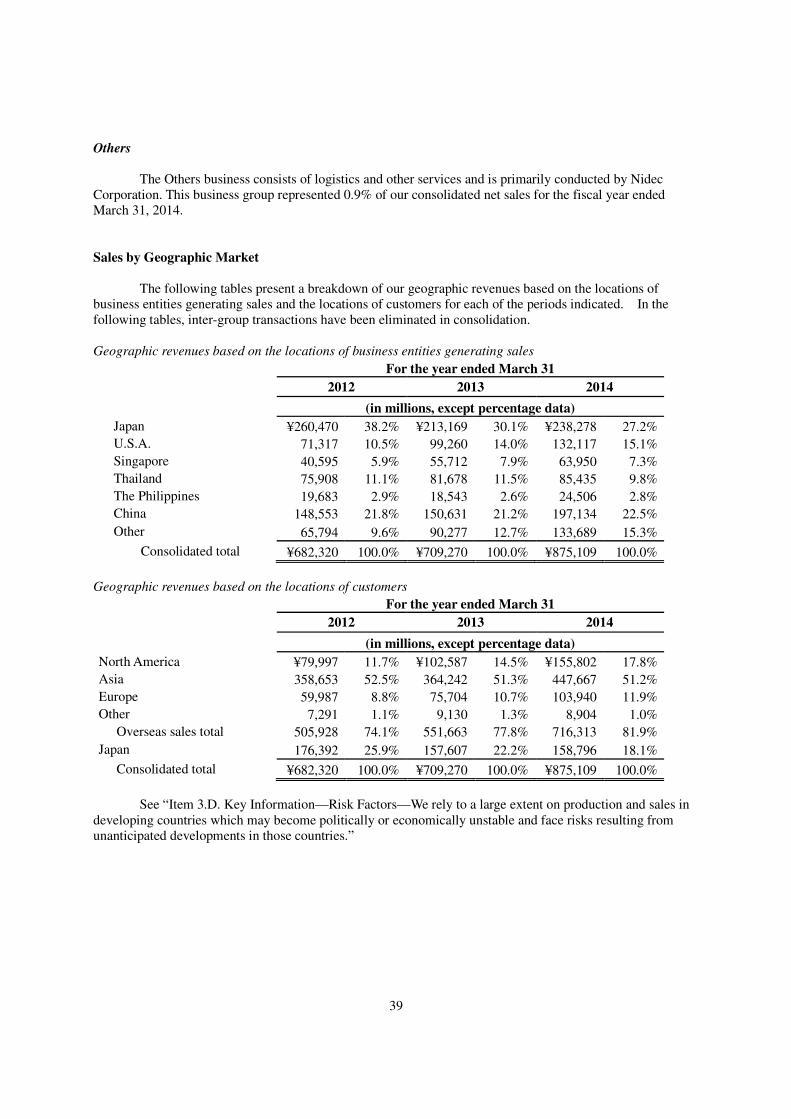
39
Others The Others business consists of logistics and other services and is primarily conducted by Nidec
Corporation. This business group represented 0.9% of our consolidated net sales for the fiscal year ended March 31, 2014.
Sales by Geographic Market The following tables present a breakdown of our geographic revenues based on the locations of
business entities generating sales and the locations of customers for each of the periods indicated. In the following tables, inter-group transactions have been eliminated in consolidation.
Geographic revenues based on the locations of business entities generating sales
For the year ended March 31
2012 2013 2014
(in millions, except percentage data)
Japan ¥260,470 38.2% ¥213,169 30.1% ¥238,278 27.2%
U.S.A. 71,317 10.5% 99,260 14.0% 132,117 15.1%
Singapore 40,595 5.9% 55,712 7.9% 63,950 7.3%
Thailand 75,908 11.1% 81,678 11.5% 85,435 9.8%
The Philippines 19,683 2.9% 18,543 2.6% 24,506 2.8%
China 148,553 21.8% 150,631 21.2% 197,134 22.5%
Other 65,794 9.6% 90,277 12.7% 133,689 15.3%
Consolidated total ¥682,320 100.0% ¥709,270 100.0% ¥875,109 100.0%
Geographic revenues based on the locations of customers
For the year ended March 31
2012 2013 2014
(in millions, except percentage data)
North America ¥79,997 11.7% ¥102,587 14.5% ¥155,802 17.8%
Asia 358,653 52.5% 364,242 51.3% 447,667 51.2%
Europe 59,987 8.8% 75,704 10.7% 103,940 11.9%
Other 7,291 1.1% 9,130 1.3% 8,904 1.0%
Overseas sales total 505,928 74.1% 551,663 77.8% 716,313 81.9%
Japan 176,392 25.9% 157,607 22.2% 158,796 18.1%
Consolidated total ¥682,320 100.0% ¥709,270 100.0% ¥875,109 100.0%
See “Item 3.D. Key Information—Risk Factors—We rely to a large extent on production and sales in
developing countries which may become politically or economically unstable and face risks resulting from unanticipated developments in those countries.”
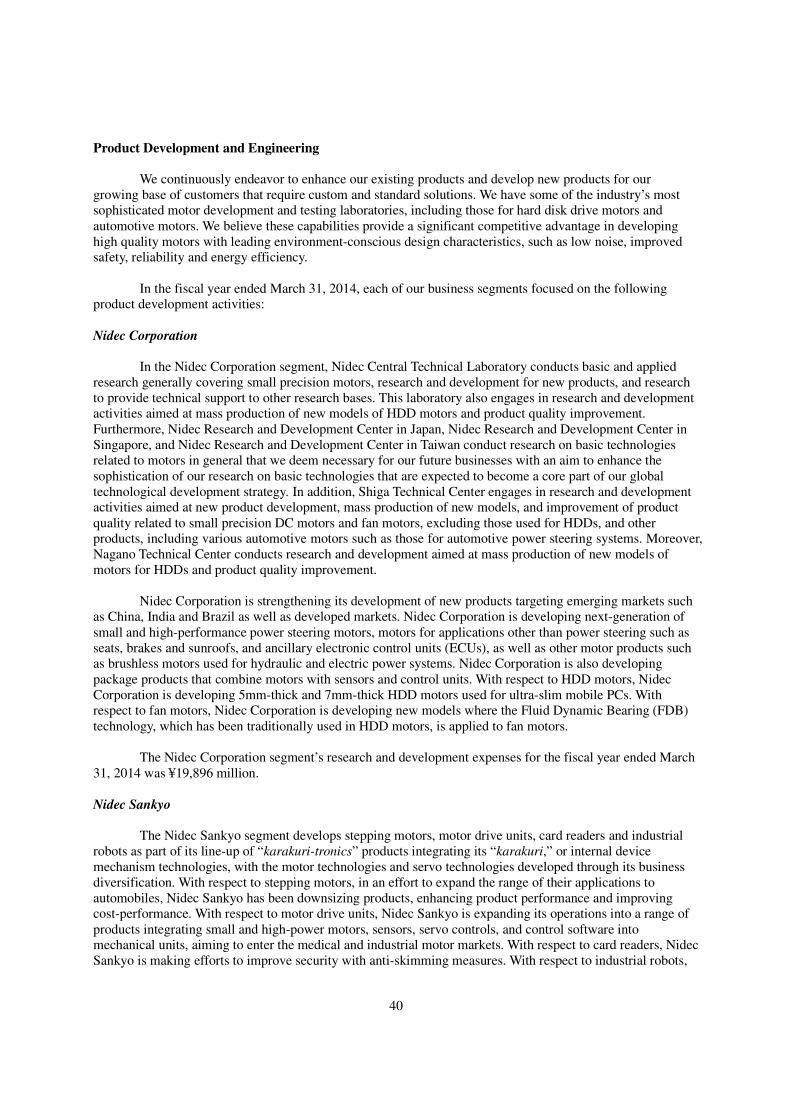
40
Product Development and Engineering We continuously endeavor to enhance our existing products and develop new products for our
growing base of customers that require custom and standard solutions. We have some of the industry’s most sophisticated motor development and testing laboratories, including those for hard disk drive motors and automotive motors. We believe these capabilities provide a significant competitive advantage in developing high quality motors with leading environment-conscious design characteristics, such as low noise, improved safety, reliability and energy efficiency.
In the fiscal year ended March 31, 2014, each of our business segments focused on the following
product development activities:
Nidec Corporation In the Nidec Corporation segment, Nidec Central Technical Laboratory conducts basic and applied
research generally covering small precision motors, research and development for new products, and research to provide technical support to other research bases. This laboratory also engages in research and development activities aimed at mass production of new models of HDD motors and product quality improvement. Furthermore, Nidec Research and Development Center in Japan, Nidec Research and Development Center in Singapore, and Nidec Research and Development Center in Taiwan conduct research on basic technologies related to motors in general that we deem necessary for our future businesses with an aim to enhance the sophistication of our research on basic technologies that are expected to become a core part of our global technological development strategy. In addition, Shiga Technical Center engages in research and development activities aimed at new product development, mass production of new models, and improvement of product quality related to small precision DC motors and fan motors, excluding those used for HDDs, and other products, including various automotive motors such as those for automotive power steering systems. Moreover, Nagano Technical Center conducts research and development aimed at mass production of new models of motors for HDDs and product quality improvement.
Nidec Corporation is strengthening its development of new products targeting emerging markets such
as China, India and Brazil as well as developed markets. Nidec Corporation is developing next-generation of small and high-performance power steering motors, motors for applications other than power steering such as seats, brakes and sunroofs, and ancillary electronic control units (ECUs), as well as other motor products such as brushless motors used for hydraulic and electric power systems. Nidec Corporation is also developing package products that combine motors with sensors and control units. With respect to HDD motors, Nidec Corporation is developing 5mm-thick and 7mm-thick HDD motors used for ultra-slim mobile PCs. With respect to fan motors, Nidec Corporation is developing new models where the Fluid Dynamic Bearing (FDB) technology, which has been traditionally used in HDD motors, is applied to fan motors.
The Nidec Corporation segment’s research and development expenses for the fiscal year ended March
31, 2014 was ¥19,896 million.
Nidec Sankyo The Nidec Sankyo segment develops stepping motors, motor drive units, card readers and industrial
robots as part of its line-up of “karakuri-tronics” products integrating its “karakuri,” or internal device mechanism technologies, with the motor technologies and servo technologies developed through its business diversification. With respect to stepping motors, in an effort to expand the range of their applications to automobiles, Nidec Sankyo has been downsizing products, enhancing product performance and improving cost-performance. With respect to motor drive units, Nidec Sankyo is expanding its operations into a range of products integrating small and high-power motors, sensors, servo controls, and control software into mechanical units, aiming to enter the medical and industrial motor markets. With respect to card readers, Nidec Sankyo is making efforts to improve security with anti-skimming measures. With respect to industrial robots,
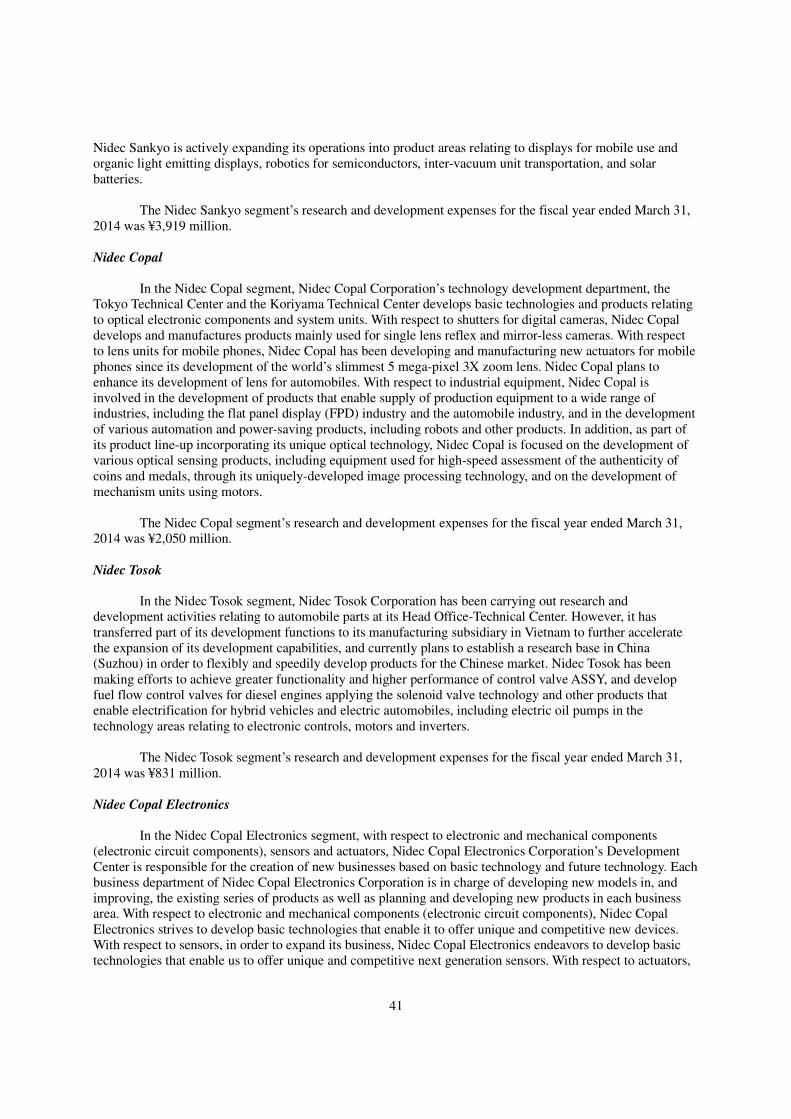
41
Nidec Sankyo is actively expanding its operations into product areas relating to displays for mobile use and organic light emitting displays, robotics for semiconductors, inter-vacuum unit transportation, and solar batteries.
The Nidec Sankyo segment’s research and development expenses for the fiscal year ended March 31,
2014 was ¥3,919 million.
Nidec Copal In the Nidec Copal segment, Nidec Copal Corporation’s technology development department, the
Tokyo Technical Center and the Koriyama Technical Center develops basic technologies and products relating to optical electronic components and system units. With respect to shutters for digital cameras, Nidec Copal develops and manufactures products mainly used for single lens reflex and mirror-less cameras. With respect to lens units for mobile phones, Nidec Copal has been developing and manufacturing new actuators for mobile phones since its development of the world’s slimmest 5 mega-pixel 3X zoom lens. Nidec Copal plans to enhance its development of lens for automobiles. With respect to industrial equipment, Nidec Copal is involved in the development of products that enable supply of production equipment to a wide range of industries, including the flat panel display (FPD) industry and the automobile industry, and in the development of various automation and power-saving products, including robots and other products. In addition, as part of its product line-up incorporating its unique optical technology, Nidec Copal is focused on the development of various optical sensing products, including equipment used for high-speed assessment of the authenticity of coins and medals, through its uniquely-developed image processing technology, and on the development of mechanism units using motors.
The Nidec Copal segment’s research and development expenses for the fiscal year ended March 31,
2014 was ¥2,050 million.
Nidec Tosok In the Nidec Tosok segment, Nidec Tosok Corporation has been carrying out research and
development activities relating to automobile parts at its Head Office-Technical Center. However, it has transferred part of its development functions to its manufacturing subsidiary in Vietnam to further accelerate the expansion of its development capabilities, and currently plans to establish a research base in China (Suzhou) in order to flexibly and speedily develop products for the Chinese market. Nidec Tosok has been making efforts to achieve greater functionality and higher performance of control valve ASSY, and develop fuel flow control valves for diesel engines applying the solenoid valve technology and other products that enable electrification for hybrid vehicles and electric automobiles, including electric oil pumps in the technology areas relating to electronic controls, motors and inverters.
The Nidec Tosok segment’s research and development expenses for the fiscal year ended March 31,
2014 was ¥831 million.
Nidec Copal Electronics In the Nidec Copal Electronics segment, with respect to electronic and mechanical components
(electronic circuit components), sensors and actuators, Nidec Copal Electronics Corporation’s Development Center is responsible for the creation of new businesses based on basic technology and future technology. Each business department of Nidec Copal Electronics Corporation is in charge of developing new models in, and improving, the existing series of products as well as planning and developing new products in each business area. With respect to electronic and mechanical components (electronic circuit components), Nidec Copal Electronics strives to develop basic technologies that enable it to offer unique and competitive new devices. With respect to sensors, in order to expand its business, Nidec Copal Electronics endeavors to develop basic technologies that enable us to offer unique and competitive next generation sensors. With respect to actuators,
42
Nidec Copal Electronics strives to develop basic technologies, including motor acceleration and control technologies, and has also been endeavoring to develop innovative new products based on these unique technologies and further expand its business.
The Nidec Copal Electronics segment’s research and development expenses for the fiscal year ended
March 31, 2014 was ¥1,435 million.
Nidec Techno Motor The Nidec Techno Motor segment develops air conditioner motors and industrial motors in Fukui
Prefecture and Fukuoka Prefecture, in Japan, China (Pinghu) and Thailand. With respect to air conditioner motors, Nidec Techno Motor has been making efforts to expand its product portfolio of motors for medium and large-sized air conditioners to improve its competitive position. In addition, Nidec Techno Motor develops low-end AC motors mainly designed for emerging markets, and hermetic motors for compressors as a new business. With respect to industrial motors, Nidec Techno Motor engages in the development of highly-efficient induction motors compatible with energy conservation regulations.
The Nidec Techno Motor segment’s research and development expenses for the fiscal year ended
March 31, 2014 was ¥1,201 million.
Nidec Motor The Nidec Motor segment mainly conducts research and development of motors, gears and control
units for residential, commercial, home appliance and industrial uses, drive systems, encoders, and elevator components. With respect to motors for commercial and residential uses, Nidec Motor develops motors, gears and control units for air conditioning equipment, commercial refrigeration equipment, golf carts, floor care equipment and commercial cooking equipment. With respect to motors for home appliances, Nidec Motor mainly engages in the development of motors for washing machines and dryer machines. With respect to industrial motors, Nidec Motor develops various pump motors, including those for water supply and sewerage systems, irrigation, and oil and gas extraction, as well as motor systems for large-scale power plants. With respect to vehicle driving motors, Nidec Motor engages in modularization of motors with encoders based upon its rare earth-free SR motor technology, and in development activities aimed at hybridization and electrification of large-sized vehicles such as construction and agricultural machinery. In addition, Nidec Motor engages in development activities aimed at providing comprehensive product packages, including motors for elevators and other components.
The Nidec Motor segment’s research and development expenses for the fiscal year ended March 31,
2014 was ¥4,689 million.
Nidec Motors & Actuators The Nidec Motors & Actuators segment conducts research and development on automotive motors
mainly in Germany and Spain. In Germany, Nidec Motors & Actuators aims to commercialize lighter weight and rare earth-free small motors for use in automobile seats and sunroof. In cooperation with Nidec Corporation, Nidec Motors & Actuators develops ABS motors that are more durable and downsized compared to the existing products. In Spain, Nidec Motors & Actuators develops small and lightweight brush fan motors for engine cooling systems. In addition, starting in the fiscal year ended March 31, 2014, Nidec Motors & Actuators began developing high value-added products equipped with ECUs and inverters.
The Nidec Motors & Actuators segment’s research and development expenses for the fiscal year ended
March 31, 2014 was ¥1,491 million.
43
Others In the Others segment, research and development activities are currently conducted on
machinery-related products, small precision motors and other products. The Others segment’s research and development expenses for the fiscal year ended March 31, 2014
was ¥1,844 million. None of the Nidec Electronics (Thailand), Nidec (Zhejiang), Nidec (Dalian), Nidec Singapore, Nidec
(H.K.) and Nidec Philippines segments engages in research and development activities. As of March 31, 2014, we employed 3,973 people engaged in research and development activities
mainly in Japan as well as in China, the United States, Vietnam, Italy, Taiwan, Germany, Mexico, Singapore, South Korea, Spain, Thailand, Canada, Indonesia, Poland, the Philippines, France and Russia.
We anticipate spending approximately ¥45,000 million on research and development in the year
ending March 31, 2015. For further information on our research and development facilities, see “—D. Property, Plants and
Equipment.”
Supply Sources Our major requirements for basic raw materials include aluminum, steel, copper, electronics, and to a
lesser extent, rare earth minerals, plastics and other petroleum-based chemicals. We have multiple supply sources for each of our major requirements, and we seek to avoid being significantly dependent on any one or a few suppliers. All of the raw materials and various purchased components required for our products have generally been available in sufficient quantities.
See “Item 3.D. Key Information—Risk Factors—If raw materials or components for our products are
not available in quantities or at prices that we expect, our production could be significantly harmed.”
Government Regulation and Environmental Standards Our business activities are subject to various governmental regulations in the jurisdictions in which we
operate, including those relating to customs, import and export control, foreign exchange controls, competition or antitrust, intellectual property, protection of the environment, product safety, and labor.
In Japan, we are subject to environmental regulation under the Air Pollution Control Law, the Water
Pollution Control Law, the Wastes Disposal and Public Cleaning Law, the Law for the Promotion of Effective Utilization of Resources, the Basic Law for Establishing a Recycling-based Society and other laws. We are also subject to local regulations which in some cases impose requirements more stringent than the national requirements. However, we currently do not believe that these regulations have a significant impact on our operations since we do not use large volumes of hazardous or toxic chemicals to manufacture our products or dispose of large amounts of waste into the environment.
Our overseas operations are also subject to environmental regulation. Our operations in the United
States, for example, are subject to extensive federal and state environmental laws and regulations. Our operations in the European Union ("EU") are also subject to EU and national environmental laws and regulations. Any electronic or electrical equipment sold in the EU are subject to the Restriction of Hazardous Substances Directive (RoHS) 2002/95/EC. This Directive indicates that any products entering the EU must
44
comply with its limits on the content of certain hazardous substances. In addition, as part of a concerted effort worldwide to reduce energy consumption, CO2 emissions and
the impact of industrial operations on the environment, various regulatory authorities in many jurisdictions have introduced or are planning legislation to encourage the manufacture and use of higher efficiency motors. The United States and Canada are international leaders in terms of setting electric motor energy efficiency standards, as they introduced regulations for motors in the late 1990s, followed by China in 2002. The European Union passed minimum energy performance standards legislation for electric motors in 2009 as an implementing measure under the Eco-design Directive. Australia, Korea, Brazil, Mexico, Taiwan and several other countries with large electricity consumption from electric motors have already adopted minimum energy performance standards. At the international level, the International Electrotechnical Commission (IEC), which is responsible for international standardization, defines and harmonizes the worldwide efficiency classes as IE1 (Standard efficiency), IE2 (High efficiency) and IE3 (Premium efficiency) for low-voltage three-phase induction motors mainly used in applications such as compressors, pumps, fans and industrial handling systems. Starting in 2015, mid-size AC induction motors that are rated from 7.5 to 375 kW and sold in the EU will have to be IE3 or to be IE2 and installed with a variable-speed drive. In the United States, the standards were introduced in 2010 for larger motors, and are expected to become applicable to smaller motors in 2017. In Japan, the IE3-equivallent standards are scheduled to take effect in April 2015.
See “Item 3.D. Key Information—Risk Factors—We are subject to various laws and regulations, and
our failure to comply may harm our business.”
Intellectual Property
In the ordinary course of business, we submit additional patent applications in Japan, the United States,
China and other jurisdictions. We also seek patent protection in various foreign jurisdictions where our patented technologies are used. While, from time to time, we seek to enforce our patents in patent infringement lawsuits or otherwise, we do not believe that there is any single patent or group of patents which are critical to our principal business segments.
Legal Proceedings Nidec Sankyo has been involved in a series of lawsuits with YASKAWA Electric Corporation since
2008 concerning Japanese Patent Nos. 3973006 and 3973048, which are owned by Nidec Sankyo and relate to LCD panel handling robots. In 2013, Nidec Sankyo and Yaskawa entered into a settlement agreement. As part of this agreement, Nidec Sankyo and Yaskawa withdrew all related litigation with prejudice.
On October 31, 2012, Hirata Corporation filed a lawsuit in the Tokyo District Court against Nidec
Sankyo Corporation for infringement of Japanese Patent No. 3488393, which is related to LCD panel handling robots. The lawsuit is pending in the Tokyo District Court as of March 31, 2014.
We are also involved in several other actions and proceedings in Japan and overseas in the ordinary
course of our business. Based upon the information currently available to us and our domestic and overseas legal counsel, we believe that the ultimate resolution of such actions and proceedings will not, in the aggregate, have a material adverse effect on our financial conditions or result of operations.
See “Item 3.D. Key Information—Risk Factors—We could be harmed by litigation involving patents
and other intellectual property rights.”
45
Disclosure under Section 13(r) of the U.S. Securities Exchange Act of 1934 Section 13(r) of the U.S. Securities Exchange Act of 1934 (Exchange Act), which was added by
Section 219 of the Iran Threat Reduction and Syria Human Rights Act of 2012, requires an issuer to disclose whether it or any of its affiliates knowingly engaged in certain activities, transactions or dealings relating to Iran or with natural persons or entities designated by the U.S. government under Executive Orders. The scope of activities that must be reported includes activities not prohibited by U.S. law and conducted outside the United States in compliance with applicable local law.
During the fiscal year ended March 31, 2014, Nidec Servo Corporation, which is our wholly-owned
subsidiary in Japan, sold to Para Industries Inc., indirectly through a third-party Japanese trading company, five thousand units of brushless DC motors to be used in banknote counters manufactured and sold by Para Industries to Bank Melli Iran. The sales of such motors, which were denominated in Japanese yen, generated total gross revenues of ¥4.0 million, and a smaller amount of net profit. Nidec Servo has ceased the sale-purchase transactions since June 2013.
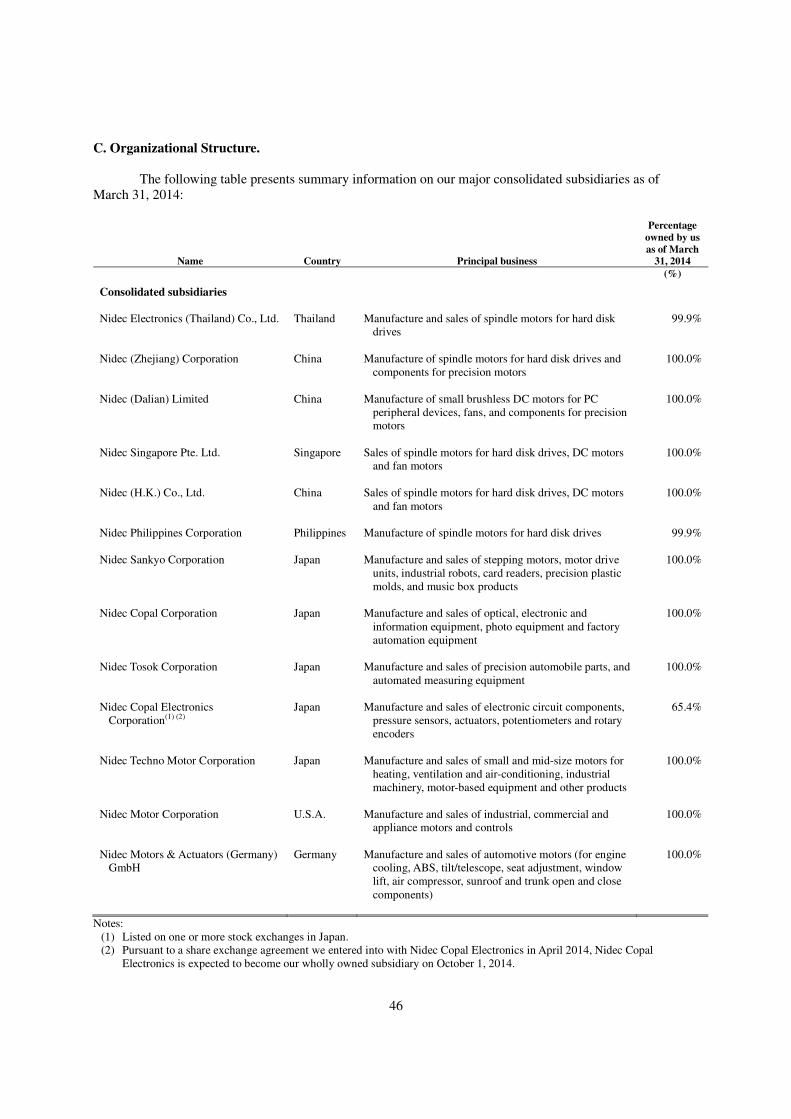
46
C. Organizational Structure. The following table presents summary information on our major consolidated subsidiaries as of
March 31, 2014:
Name Country Principal business
Percentage
owned by us
as of March
31, 2014
(%)
Consolidated subsidiaries
Nidec Electronics (Thailand) Co., Ltd. Thailand Manufacture and sales of spindle motors for hard disk drives
99.9%
Nidec (Zhejiang) Corporation China Manufacture of spindle motors for hard disk drives and components for precision motors
100.0%
Nidec (Dalian) Limited China Manufacture of small brushless DC motors for PC peripheral devices, fans, and components for precision motors
100.0%
Nidec Singapore Pte. Ltd. Singapore Sales of spindle motors for hard disk drives, DC motors and fan motors
100.0%
Nidec (H.K.) Co., Ltd. China Sales of spindle motors for hard disk drives, DC motors and fan motors
100.0%
Nidec Philippines Corporation Philippines Manufacture of spindle motors for hard disk drives
99.9%
Nidec Sankyo Corporation Japan Manufacture and sales of stepping motors, motor drive units, industrial robots, card readers, precision plastic molds, and music box products
100.0%
Nidec Copal Corporation Japan Manufacture and sales of optical, electronic and information equipment, photo equipment and factory automation equipment
100.0%
Nidec Tosok Corporation Japan Manufacture and sales of precision automobile parts, and automated measuring equipment
100.0%
Nidec Copal Electronics Corporation(1) (2)
Japan Manufacture and sales of electronic circuit components, pressure sensors, actuators, potentiometers and rotary encoders
65.4%
Nidec Techno Motor Corporation Japan Manufacture and sales of small and mid-size motors for heating, ventilation and air-conditioning, industrial machinery, motor-based equipment and other products
100.0%
Nidec Motor Corporation U.S.A. Manufacture and sales of industrial, commercial and appliance motors and controls
100.0%
Nidec Motors & Actuators (Germany) GmbH
Germany Manufacture and sales of automotive motors (for engine cooling, ABS, tilt/telescope, seat adjustment, window lift, air compressor, sunroof and trunk open and close components)
100.0%
Notes: (1) Listed on one or more stock exchanges in Japan. (2) Pursuant to a share exchange agreement we entered into with Nidec Copal Electronics in April 2014, Nidec Copal
Electronics is expected to become our wholly owned subsidiary on October 1, 2014.
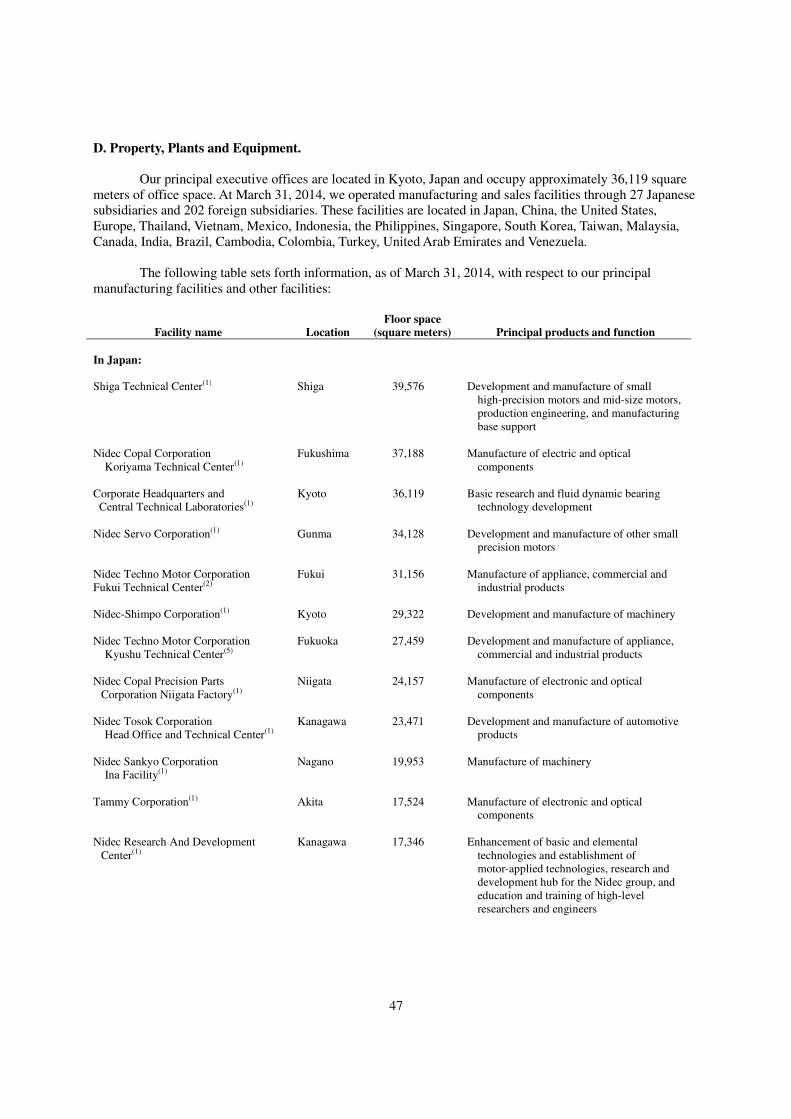
47
D. Property, Plants and Equipment. Our principal executive offices are located in Kyoto, Japan and occupy approximately 36,119 square
meters of office space. At March 31, 2014, we operated manufacturing and sales facilities through 27 Japanese subsidiaries and 202 foreign subsidiaries. These facilities are located in Japan, China, the United States, Europe, Thailand, Vietnam, Mexico, Indonesia, the Philippines, Singapore, South Korea, Taiwan, Malaysia, Canada, India, Brazil, Cambodia, Colombia, Turkey, United Arab Emirates and Venezuela.
The following table sets forth information, as of March 31, 2014, with respect to our principal
manufacturing facilities and other facilities:
Facility name Location
Floor space
(square meters) Principal products and function
In Japan:
Shiga Technical Center(1) Shiga 39,576 Development and manufacture of small high-precision motors and mid-size motors, production engineering, and manufacturing base support
Nidec Copal Corporation Koriyama Technical Center(1)
Fukushima 37,188 Manufacture of electric and optical components
Corporate Headquarters and
Central Technical Laboratories(1) Kyoto 36,119 Basic research and fluid dynamic bearing
technology development
Nidec Servo Corporation(1) Gunma 34,128 Development and manufacture of other small precision motors
Nidec Techno Motor Corporation Fukui Technical Center(2)
Fukui 31,156 Manufacture of appliance, commercial and industrial products
Nidec-Shimpo Corporation(1)
Kyoto 29,322 Development and manufacture of machinery
Nidec Techno Motor Corporation Kyushu Technical Center(5)
Fukuoka 27,459 Development and manufacture of appliance, commercial and industrial products
Nidec Copal Precision Parts
Corporation Niigata Factory(1)
Niigata 24,157 Manufacture of electronic and optical components
Nidec Tosok Corporation Head Office and Technical Center(1)
Kanagawa 23,471 Development and manufacture of automotive products
Nidec Sankyo Corporation Ina Facility(1)
Nagano 19,953 Manufacture of machinery
Tammy Corporation(1)
Akita 17,524 Manufacture of electronic and optical components
Nidec Research And Development
Center(1)
Kanagawa 17,346 Enhancement of basic and elemental technologies and establishment of motor-applied technologies, research and development hub for the Nidec group, and education and training of high-level researchers and engineers
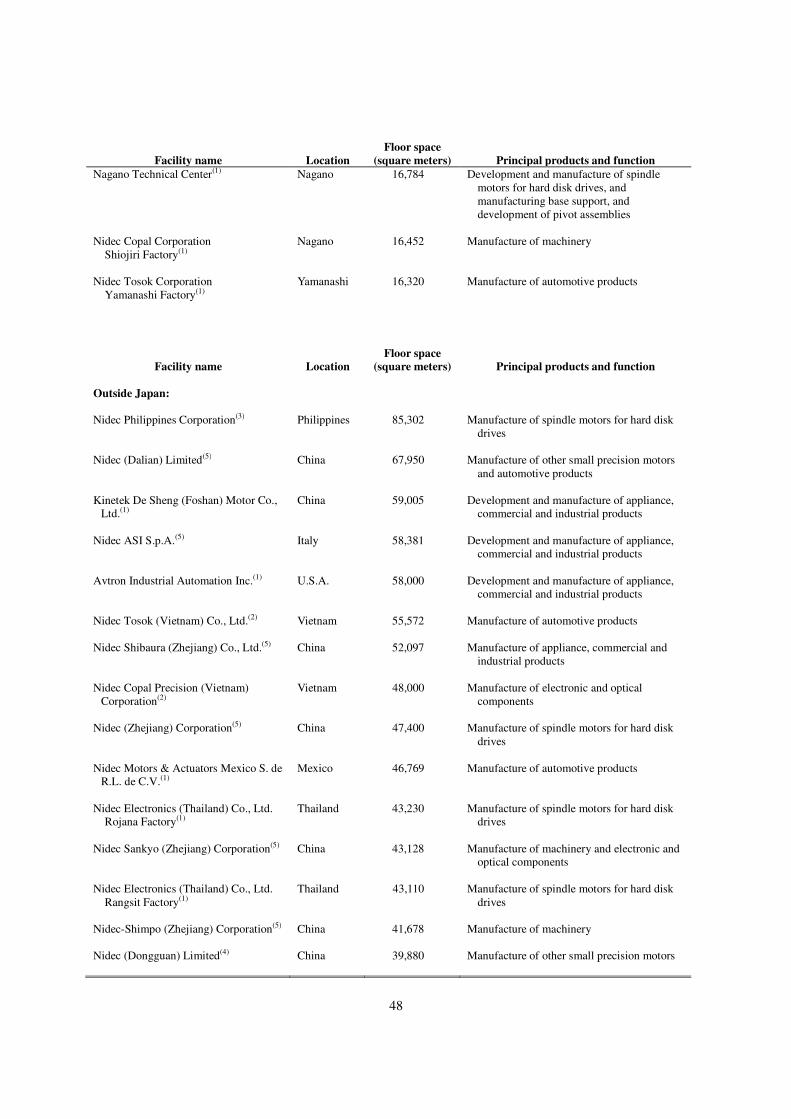
48
Facility name Location
Floor space
(square meters) Principal products and function
Nagano Technical Center(1) Nagano 16,784 Development and manufacture of spindle motors for hard disk drives, and manufacturing base support, and development of pivot assemblies
Nidec Copal Corporation Shiojiri Factory(1)
Nagano 16,452 Manufacture of machinery
Nidec Tosok Corporation Yamanashi Factory(1)
Yamanashi 16,320 Manufacture of automotive products
Facility name Location
Floor space
(square meters) Principal products and function
Outside Japan:
Nidec Philippines Corporation(3) Philippines 85,302 Manufacture of spindle motors for hard disk drives
Nidec (Dalian) Limited(5) China 67,950 Manufacture of other small precision motors
and automotive products
Kinetek De Sheng (Foshan) Motor Co., Ltd.(1)
China 59,005 Development and manufacture of appliance, commercial and industrial products
Nidec ASI S.p.A.(5)
Italy 58,381 Development and manufacture of appliance, commercial and industrial products
Avtron Industrial Automation Inc.(1)
U.S.A. 58,000 Development and manufacture of appliance, commercial and industrial products
Nidec Tosok (Vietnam) Co., Ltd.(2) Vietnam 55,572 Manufacture of automotive products
Nidec Shibaura (Zhejiang) Co., Ltd.(5) China 52,097 Manufacture of appliance, commercial and
industrial products
Nidec Copal Precision (Vietnam) Corporation(2)
Vietnam 48,000 Manufacture of electronic and optical components
Nidec (Zhejiang) Corporation(5) China 47,400 Manufacture of spindle motors for hard disk
drives
Nidec Motors & Actuators Mexico S. de R.L. de C.V.(1)
Mexico 46,769 Manufacture of automotive products
Nidec Electronics (Thailand) Co., Ltd. Rojana Factory(1)
Thailand 43,230 Manufacture of spindle motors for hard disk drives
Nidec Sankyo (Zhejiang) Corporation(5) China 43,128 Manufacture of machinery and electronic and
optical components
Nidec Electronics (Thailand) Co., Ltd. Rangsit Factory(1)
Thailand 43,110 Manufacture of spindle motors for hard disk drives
Nidec-Shimpo (Zhejiang) Corporation(5)
China 41,678 Manufacture of machinery
Nidec (Dongguan) Limited(4) China 39,880 Manufacture of other small precision motors
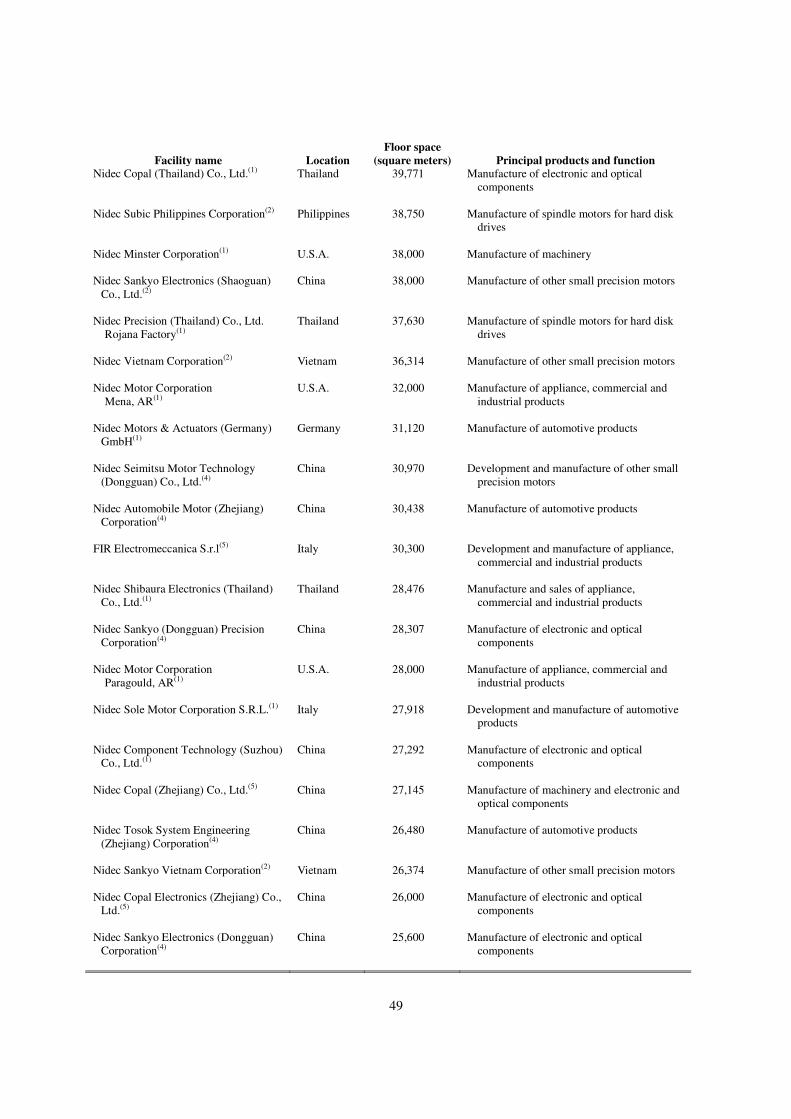
49
Facility name Location
Floor space
(square meters) Principal products and function Nidec Copal (Thailand) Co., Ltd.(1) Thailand 39,771 Manufacture of electronic and optical
components
Nidec Subic Philippines Corporation(2) Philippines 38,750 Manufacture of spindle motors for hard disk drives
Nidec Minster Corporation(1)
U.S.A. 38,000 Manufacture of machinery
Nidec Sankyo Electronics (Shaoguan) Co., Ltd.(2)
China 38,000 Manufacture of other small precision motors
Nidec Precision (Thailand) Co., Ltd. Rojana Factory(1)
Thailand 37,630 Manufacture of spindle motors for hard disk drives
Nidec Vietnam Corporation(2) Vietnam 36,314 Manufacture of other small precision motors
Nidec Motor Corporation Mena, AR(1)
U.S.A. 32,000 Manufacture of appliance, commercial and industrial products
Nidec Motors & Actuators (Germany)
GmbH(1)
Germany 31,120 Manufacture of automotive products
Nidec Seimitsu Motor Technology (Dongguan) Co., Ltd.(4)
China 30,970 Development and manufacture of other small precision motors
Nidec Automobile Motor (Zhejiang)
Corporation(4)
China 30,438 Manufacture of automotive products
FIR Electromeccanica S.r.l(5)
Italy 30,300 Development and manufacture of appliance, commercial and industrial products
Nidec Shibaura Electronics (Thailand)
Co., Ltd.(1) Thailand 28,476 Manufacture and sales of appliance,
commercial and industrial products
Nidec Sankyo (Dongguan) Precision Corporation(4)
China 28,307 Manufacture of electronic and optical components
Nidec Motor Corporation Paragould, AR(1)
U.S.A. 28,000 Manufacture of appliance, commercial and industrial products
Nidec Sole Motor Corporation S.R.L.(1) Italy 27,918 Development and manufacture of automotive
products
Nidec Component Technology (Suzhou) Co., Ltd.(1)
China 27,292 Manufacture of electronic and optical components
Nidec Copal (Zhejiang) Co., Ltd.(5) China 27,145 Manufacture of machinery and electronic and
optical components
Nidec Tosok System Engineering (Zhejiang) Corporation(4)
China 26,480 Manufacture of automotive products
Nidec Sankyo Vietnam Corporation(2) Vietnam 26,374 Manufacture of other small precision motors
Nidec Copal Electronics (Zhejiang) Co., Ltd.(5)
China 26,000 Manufacture of electronic and optical components
Nidec Sankyo Electronics (Dongguan)
Corporation(4) China 25,600 Manufacture of electronic and optical
components
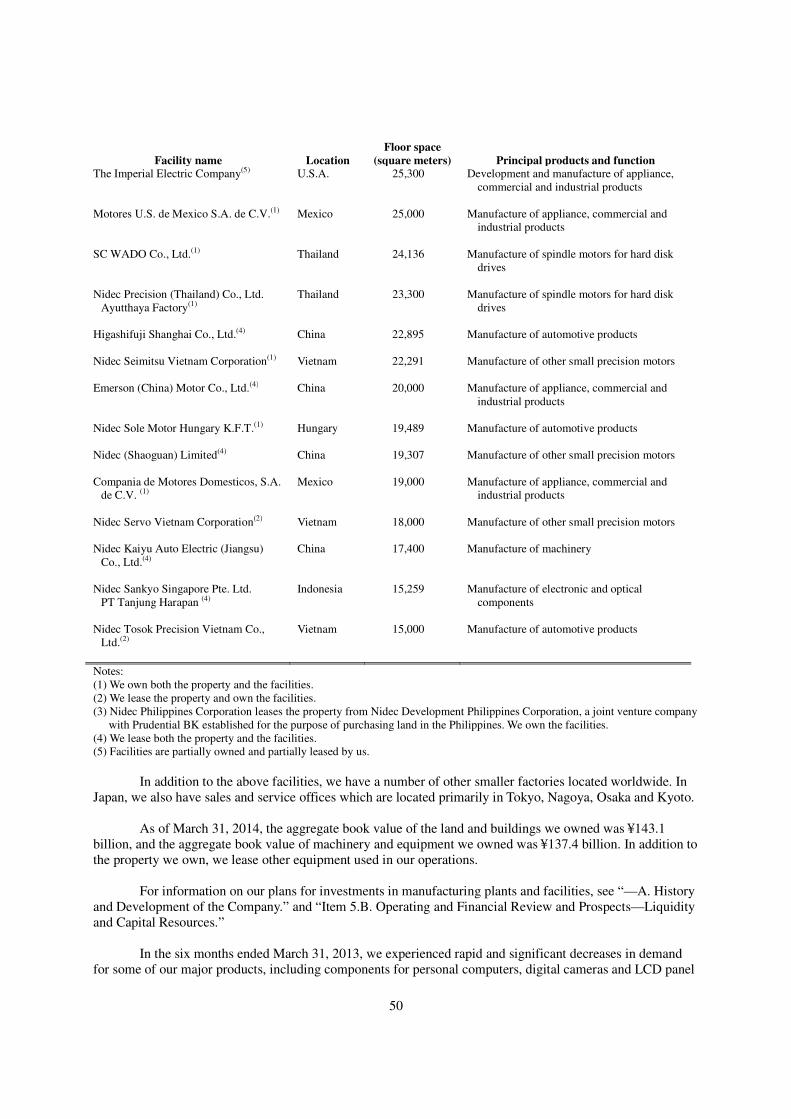
50
Facility name Location
Floor space
(square meters) Principal products and function The Imperial Electric Company(5)
U.S.A. 25,300 Development and manufacture of appliance, commercial and industrial products
Motores U.S. de Mexico S.A. de C.V.(1) Mexico 25,000 Manufacture of appliance, commercial and
industrial products
SC WADO Co., Ltd.(1) Thailand 24,136 Manufacture of spindle motors for hard disk drives
Nidec Precision (Thailand) Co., Ltd.
Ayutthaya Factory(1) Thailand 23,300 Manufacture of spindle motors for hard disk
drives
Higashifuji Shanghai Co., Ltd.(4)
China 22,895 Manufacture of automotive products
Nidec Seimitsu Vietnam Corporation(1)
Vietnam 22,291 Manufacture of other small precision motors
Emerson (China) Motor Co., Ltd.(4) China 20,000 Manufacture of appliance, commercial and industrial products
Nidec Sole Motor Hungary K.F.T.(1) Hungary 19,489 Manufacture of automotive products
Nidec (Shaoguan) Limited(4) China 19,307 Manufacture of other small precision motors
Compania de Motores Domesticos, S.A.
de C.V. (1) Mexico 19,000 Manufacture of appliance, commercial and
industrial products
Nidec Servo Vietnam Corporation(2) Vietnam 18,000 Manufacture of other small precision motors
Nidec Kaiyu Auto Electric (Jiangsu) Co., Ltd.(4)
China 17,400 Manufacture of machinery
Nidec Sankyo Singapore Pte. Ltd. PT Tanjung Harapan (4)
Indonesia 15,259 Manufacture of electronic and optical components
Nidec Tosok Precision Vietnam Co.,
Ltd.(2)
Vietnam 15,000 Manufacture of automotive products
Notes: (1) We own both the property and the facilities. (2) We lease the property and own the facilities. (3) Nidec Philippines Corporation leases the property from Nidec Development Philippines Corporation, a joint venture company
with Prudential BK established for the purpose of purchasing land in the Philippines. We own the facilities. (4) We lease both the property and the facilities. (5) Facilities are partially owned and partially leased by us.
In addition to the above facilities, we have a number of other smaller factories located worldwide. In
Japan, we also have sales and service offices which are located primarily in Tokyo, Nagoya, Osaka and Kyoto. As of March 31, 2014, the aggregate book value of the land and buildings we owned was ¥143.1
billion, and the aggregate book value of machinery and equipment we owned was ¥137.4 billion. In addition to the property we own, we lease other equipment used in our operations.
For information on our plans for investments in manufacturing plants and facilities, see “—A. History
and Development of the Company.” and “Item 5.B. Operating and Financial Review and Prospects—Liquidity and Capital Resources.”
In the six months ended March 31, 2013, we experienced rapid and significant decreases in demand
for some of our major products, including components for personal computers, digital cameras and LCD panel
51
manufacturing equipment, and the utilization rate of some of our manufacturing facilities declined. In response, we implemented measures to streamline our business structure in an effort to optimize our manufacturing capacity and recover and improve our profitability. As part of such measures, we disposed of, or otherwise made adjustments to, some of our plants, equipment and other fixed assets in Asia. As a result, we recorded ¥10,300 million of losses on sales, disposal or impairment of property, plant and equipment in our audited consolidated cash flow statement for the fiscal year ended March 31, 2013. We also recorded losses in connection with our new sale and lease-back arrangements relating to certain manufacturing equipment and other fixed assets in Asia.
For more information on our business structure streamlining measures, see “Item 3.D. Key
Information—Risk Factors—Our business structure streamlining measures may fail to achieve their intended goals and may result in significantly increased costs and expenses.” and “Item 5.A. Operating and Financial Review and Prospects—Operating Results.”
See also “Item 3.D. Key Information—Risk Factors—Because our facilities are concentrated in a
limited number of locations, disruptions in one or more of those locations could have a material adverse impact on our business operations.”
Item 4A. Unresolved Staff Comments.
None.
Item 5. Operating and Financial Review and Prospects.
A. Operating Results.
You should read the following discussion of our financial condition and results of operations together with our
audited consolidated financial statements and related notes and other information included elsewhere in this
annual report. This discussion and analysis contains forward-looking statements that involve risks,
uncertainties and assumptions. Our actual results may differ materially from those anticipated in these
forward-looking statements as a result of certain factors, including, but not limited to, those set forth in "Item
3.D. Key Information—Risk Factors" and elsewhere in this annual report.
Introduction
We are one of the leading global manufacturers of electric motors and related components and
equipment, particularly in the global market for spindle motors for hard disk drives. We manufacture and sell spindle motors for hard disk drives and various other small precision brushless direct current electricity, or DC, motors, as well as automotive, home appliance, commercial and industrial products through 27 subsidiaries in Japan and 202 subsidiaries in other countries, including China, Thailand, Vietnam, the United States, Singapore, Mexico, Indonesia, the Philippines, Taiwan, Germany, South Korea, Malaysia, the United Kingdom, India, Brazil, the Netherlands, France, Poland, Italy, Spain, Hungary, Canada, Colombia, Venezuela, Cambodia, Luxembourg, Romania, Russia, Turkey, and the United Arab Emirates, as of March 31, 2014. Our Recent Acquisition Activities
As discussed in "Item 4.A. Information on the Company—History and Development of the Company,"
we have sought growth by acquiring or investing in companies with motors, drives and other related products and technologies. Depending on the circumstances, we acquire a majority interest or a substantial minority
52
interest in the target companies. Our approach has been to identify underperforming companies with advanced products and technologies. We have recently entered into the following transactions:
• In September 2013, Nidec Corporation made Nidec Seimitsu Corporation a wholly owned subsidiary through a share exchange transaction. Immediately prior to the share exchange transaction, Nidec Corporation held an 85.5% ownership interest, and Nidec Copal Corporation held the remaining 14.5% ownership interest, in Nidec Seimitsu. Nidec Corporation acquired the 14.5% interest in Nidec Seimitsu from Nidec Copal in exchange for 4,150 shares of Nidec Corporation common stock previously held in treasury.
• In October 2013, we made Nidec Copal Corporation, a majority-owned subsidiary publicly traded in Japan, a wholly owned subsidiary through a share exchange transaction. Immediately prior to the share exchange transaction, we held a 66.5% ownership interest in Nidec Copal. We acquired the remaining ownership interest in Nidec Copal in exchange for 4,856,764 shares of our common stock previously held in treasury.
• In October 2013, we made Nidec Tosok Corporation, a majority-owned subsidiary publicly traded in Japan, a wholly owned subsidiary through a share exchange transaction. Immediately prior to the share exchange transaction, we held a 72.3% ownership interest in Nidec Tosok. We acquired the remaining ownership interest in Nidec Tosok in exchange for 2,624,000 shares of our common stock previously held in treasury.
• In January 2014, we acquired all of the voting rights in Mitsubishi Materials C.M.I. Corporation, a Japanese manufacturer of small motors, electric contact products and other products, for ¥5,228 million in cash to expand our automotive, appliance, commercial and industrial products business.
• In March 2014, we acquired all of the voting rights in Honda Elesys Co., Ltd., a Japanese manufacturer of automobile electronic control units for car bodies, for ¥24,320 million in cash to expand our automotive, appliance, commercial and industrial products business.
• In April 2014, we and Nidec Copal Electronics Corporation, a majority-owned subsidiary publicly traded in Japan in which we held an approximately 65.3% ownership interest as of March 31, 2014, entered into a share exchange agreement to acquire the remaining interest in Nidec Copal Electronics. The share exchange transaction is expected to become effective on October 1, 2014. An aggregate of 3,160,584 shares of our common stock held in treasury are expected to be delivered in connection with the share exchange transaction.
• In April 2014, we and Nidec-Read Corporation, a majority-owned subsidiary publicly traded in Japan in which we held an approximately 65.5% ownership interest as March 31, 2014, entered into a share exchange agreement to acquire the remaining interest in Nidec-Read. The share exchange transaction is expected to become effective on October 1, 2014. An aggregate of 1,421,513 shares of our common stock held in treasury are expected to be delivered in connection with the share exchange transaction.
For more information, see Notes 3 and 26 to our audited consolidated financial statements included
elsewhere in this annual report, "Item 3.D. Key Information—Risk Factors—Our growth has been based in part on acquisitions of, or investments in, other companies, and our future growth could be adversely affected if we make acquisitions or investments that fail to achieve their intended benefits, or if we are unable to find suitable acquisition or investment targets." and “Item 4.A. Information on the Company—History and Development of the Company.”
53
Effects of Foreign Currency Fluctuations A significant portion of our business is conducted in currencies other than the Japanese yen, most
significantly, the U.S. dollar. Our business is thus sensitive to fluctuations in foreign currency exchange rates, especially the yen-U.S. dollar exchange rate. As of March 31, 2012, 2013 and 2014, the exchange rate of the yen against the U.S. dollar was ¥82.19, ¥94.05 and ¥102.92 to the U.S. dollar, respectively. As of June 6, 2014, the yen-U.S. dollar exchange rate was ¥102.50 to the U.S. dollar. We currently expect the Japanese yen to be stronger in the current fiscal year compared to the previous fiscal year. We are generally managing our foreign currency exposure consistent with such expectations.
Our consolidated financial statements are subject to both translation risk and transaction risk.
Translation risk is the risk that our consolidated financial statements for a particular period or for a particular date are affected by changes in the prevailing exchange rates of the currencies in those countries in which we conduct business against the Japanese yen. The translation effect, even if it is substantial, is a reporting consideration and does not reflect our underlying results of operations.
Transaction risk arises when the currency structure of our costs and liabilities deviates from the
currency structure of our sales proceeds and assets. A substantial portion of our overseas sales are made in U.S. dollars. While sales denominated in U.S. dollars are, to a significant extent, offset by U.S. dollar denominated costs, we generally have had a significant net long U.S. dollar position. With respect to costs not denominated in U.S. dollars, we believe that we have been able to reduce the level of transaction risk to the extent that our overseas subsidiaries incur costs in currencies that generally follow the U.S. dollar. Transaction risk remains for products sold in U.S. dollars to the extent that we must purchase parts for our products from Japan, the costs for which are denominated in yen.
Any appreciation of the Japanese yen particularly against the U.S. dollar and Euro generally has an
adverse impact on our results of operations and financial condition, particularly our net sales and income from continuing operations before income taxes as well as our shareholders’ equity, as we have a substantial amount of sales of products and purchases of inventory denominated in these foreign currencies, and we have expanded, and continue to seek opportunities to expand, our overseas operations. Conversely, any future depreciation of the Japanese yen against the U.S. dollar and Euro is generally expected to have a positive impact on our results of operations and financial condition although the impact may be limited due to various factors. Such factors include an increase in costs and expenses incurred in U.S. dollars or Euro, as well as the recent shift in our financing strategy from short-term borrowings to long-term debt denominated in U.S. dollars, Euro and Japanese yen, as a result of which we may be more susceptible to market changes, including interest rate fluctuations.
See “Item 3.D. Key Information—Risk Factors—Because our sales to overseas customers are
denominated predominantly in U.S. dollars, we are exposed to exchange rate risks that could harm our results of operations and shareholders’ equity.”
Because of various subsidiary operations outside of Japan, we are also exposed to the risk of
fluctuations in the Mexican peso and the Thai baht. Changes in the fair values of our foreign currency forward contracts and changes in option prices
under our currency option contracts are recognized as gains or losses on derivative instruments in our consolidated statement of income. For a more detailed discussion of these instruments, see “Item 11. Quantitative and Qualitative Disclosures About Market Risk.” and Note 19 to our audited consolidated financial statements included elsewhere in this annual report.
54
Other Recent Developments Two-for-One Stock Split. Effective April 1, 2014, we implemented a two-for-one stock split of our
common stock. The stock split did not result in any change in the ratio of shares of our common stock per ADS, which has remained unchanged at one-fourth of one share of our common stock per ADS.
Issuance of Straight Bonds. In December 2013, we issued ¥50.0 billion aggregate principal amount
of corporate bonds due 2016. The net proceeds from the issuance of the bonds were primarily used to repay short-term borrowings. These bonds were issued pursuant to a shelf registration statement we filed with the Director General of the Kanto Local Finance Bureau of the Ministry of Finance of Japan in March 2012 for the issuance from time to time of up to ¥200 billion aggregate principal amount of bonds in Japan between April 5, 2012 and April 4, 2014.
In March 2014, we filed a shelf registration statement with the Director General of the Kanto Local
Finance Bureau of the Ministry of Finance of Japan for the issuance from time to time of up to ¥200 billion aggregate principal amount of bonds in Japan between April 5, 2014 and April 4, 2016. The shelf registration was intended to further enhance our flexibility and agility in obtaining funding from the capital markets as an alternative source of funding in addition to financing through financial institutions and other sources and, through the further diversification of funding sources, improve our financial stability. We plan to use the net proceeds from any future issuances of such bonds for equipment and machinery, investments, repayment and redemption of short-term borrowings, bonds and other long-term debt, and general corporate purposes, including working capital and other operating expenses.
For further information, see Note 11 to our audited consolidated financial statements included
elsewhere in this annual report.
Partial Early Redemption of Convertible Bonds. On September 20, 2013, the early redemption right attached to the aggregate principal amount of ¥100,000 million of euro yen convertible bonds due 2015, which we issued in September 2010, expired. Prior to the expiration of the early redemption right, holders of approximately ¥4,250 million aggregate principal amount of such convertible bonds exercised their right to redeem the bonds at 100% of their principal amount. As of March 31, 2014, the conversion price per share was ¥5,313, and the aggregate number of shares of our common stock into which the outstanding bonds would be converted, assuming that all of the outstanding stock acquisition rights were exercised, was 18,021,833.
For further information, see Note 11 to our audited consolidated financial statements included
elsewhere in this annual report.
Principal Items in Our Statement of Operations Net sales. Our net sales are generated primarily from the sales of our products. We recognize
revenue when persuasive evidence of an arrangement exists, delivery has occurred, the sale price is fixed and collectability is reasonably assured. As such, revenue is generally recognized at the time of delivery to customers in domestic sales and at the time of shipment for export sales with respect to small precision motors, automotive, appliance, commercial and industrial products, and electronic and optical components, and upon receipt of final customer acceptance with respect to machinery. We maintain data with respect to net sales by product type. We also maintain data with respect to net sales of our products based on the entities which are our operating segments. For a detailed discussion of our operating segments, see "—Segment Information" below.
Cost of products sold. Our cost of sales consists of fixed costs and variable costs, which are
primarily material, parts, and manufacturing expenses, including personnel costs, depreciation, and facility maintenance costs. We periodically assess the market value of our inventory based on sales trends and forecasts and technological changes. We write off inventories when it is apparent that there is no possibility of
55
future sales or usage. The write off of inventory is recorded as cost of sales. Fixed costs limit our ability to reduce costs in times of decreased demand, which may have an adverse effect on our operating results.
Selling, general and administrative expenses. Our selling, general and administrative expenses
consist primarily of salaries, commissions, and other expenses relating to our selling, general and administrative activities.
Research and development expenses. Research and development expenses primarily related to
personnel costs and depreciation of equipment relating to our research and development activities. For more information, see "—C. Research and Development, Patents and Licenses, etc." and “Item 4.B. Information on the Company—Business Overview—Product Development and Engineering.”
Other income (expense). Other income (expense) consists primarily of foreign exchange gains or
losses and gains or losses on marketable securities.
56
Results of Operations The following table sets forth selected information relating to our income and expense items for each
of the three years ended March 31: Yen in millions
For the year ended
March 31 2012 2013 2014
Net sales ¥682,320 ¥709,270 ¥875,109
Operating expenses: Cost of products sold 523,729 572,634 674,699 Selling, general and administrative expenses 55,471 84,760 77,534 Research and development expenses 30,050 34,278 37,808 609,250 691,672 790,041
Operating income 73,070 17,598 85,068
Other income (expense):
Interest and dividend income 1,634 1,831 2,376
Interest expense (299) (679) (1,526)
Foreign exchange loss, net (1,756) (2,973) (56)
(Loss) gain on marketable securities, net (202) (87) 245
Other, net (1,591) (2,292) (1,443)
(2,214) (4,200) (404)
Income from continuing operations before income taxes 70,856 13,398 84,664
Income taxes (18,801) (6,562) (25,729) Equity in net income (loss) of affiliated companies 0 13 (25) Income from continuing operations 52,055 6,849 58,910 Loss on discontinued operations (7,768) - -
Consolidated net income 44,287 6,849 58,910 Less: Net (income) loss attributable to noncontrolling
interests (3,556) 1,137 (2,506)
Net income attributable to Nidec Corporation ¥40,731 ¥7,986 ¥56,404
Yen Per share data:
(1)
Earning per share - basic Income from continuing operations attributable to Nidec
Corporation ¥168.16 ¥29.64 ¥207.31 Loss on discontinued operations attributable to Nidec
Corporation (20.04) - -
Net income attributable to Nidec Corporation 148.12 29.64 207.31
Earning per share - diluted Income from continuing operations attributable to Nidec
Corporation ¥157.20 ¥27.49 ¥193.96 Loss on discontinued operations attributable to Nidec
Corporation (18.75) - -
Net income attributable to Nidec Corporation 138.45 27.49 193.96
Cash dividends paid ¥45.00 ¥45.00 ¥42.50
Note: (1) Effective April 1, 2014, we implemented a two-for-one stock split of our common stock. All prior per share
amounts in this table have been retroactively adjusted to reflect the effect of the stock split.
57
Yen in millions
For the year ended
March 31
2012 2013 2014
Net income attributable to Nidec Corporation Income from continuing operations attributable to Nidec
Corporation ¥46,242 ¥7,986 ¥56,404 Loss on discontinued operations attributable to Nidec
Corporation (5,511) - - Net income attributable to Nidec Corporation ¥40,731 ¥7,986 ¥56,404
As of March 31, 2012, we discontinued our lens actuator (“LAC”) business which had previously
been included in the "other small precision brushless DC motors" product category. As of the same date, we also discontinued our tape drive and disk drive mechanism (“PGN”) businesses and our compact digital camera lens unit (“CLU”) business, both of which had previously been included in the "electronic and optical components" product category. All prior period LAC, PGN and CLU amounts have been reclassified to discontinued operations pursuant to the ASC 205-20 "Presentation of Financial Statements-Discontinued Operations" to enable comparisons between the relevant amounts for the periods indicated.
For more information, see Note 24 to our audited consolidated financial statements included
elsewhere in this annual report. Pursuant to ASC 805 “Business Combinations,” our consolidated financial statements for the fiscal
years ended March 31, 2012 and 2013 have been retrospectively adjusted to reflect our valuation of the fair values of the assets acquired and the liabilities assumed upon the acquisition of SCD Co., Ltd. and Nidec Kaiyu Auto Electric (Jiangsu) Co., Ltd. in the fiscal year ended March 31, 2013. During the three months ended September 30, 2013, we completed our valuation of such assets and liabilities of SCD and Nidec Kaiyu Auto Electric (Jiangsu).
We are currently evaluating the fair values of the assets acquired and liabilities assumed upon our
acquisitions of Nidec Sankyo CMI Corporation and Nidec Elesys Co., Ltd. These assets and liabilities have been reflected in our results of operations for the fiscal year ended, and our financial condition as of, March 31, 2014, based on management’s preliminary estimates as of March 31, 2014.
For more information, see Note 3 to our audited consolidated financial statements included elsewhere
in this annual report.
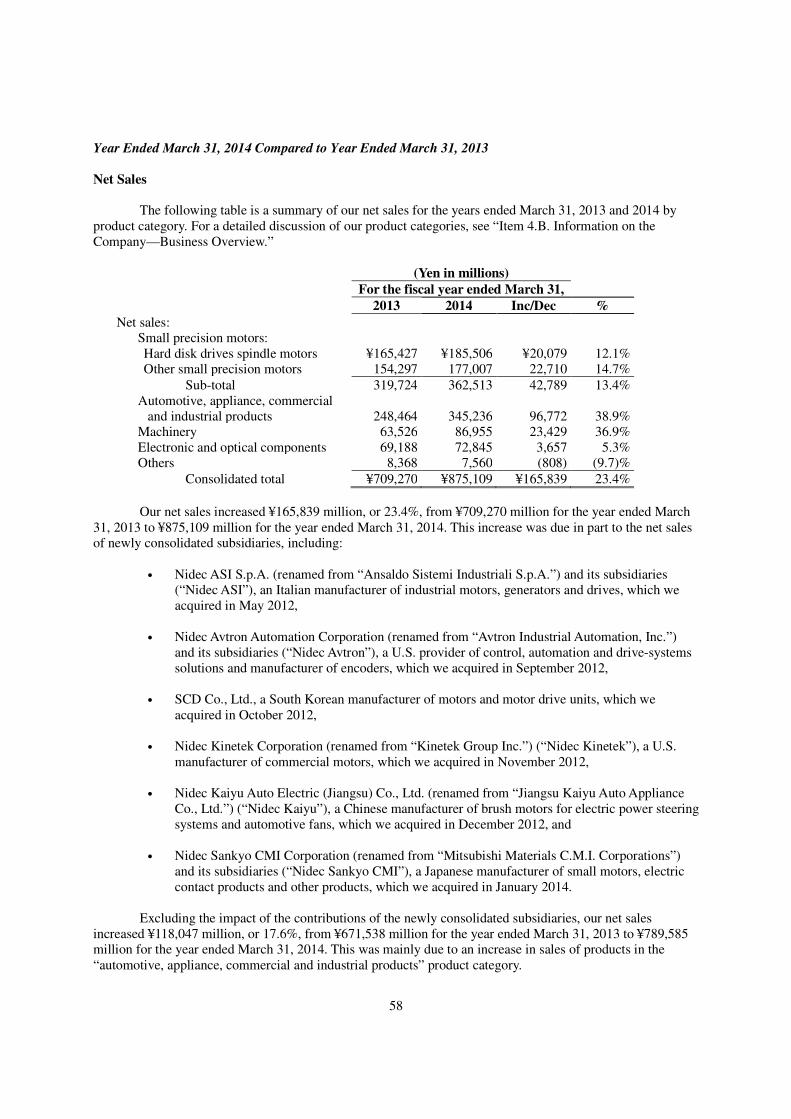
58
Year Ended March 31, 2014 Compared to Year Ended March 31, 2013
Net Sales The following table is a summary of our net sales for the years ended March 31, 2013 and 2014 by
product category. For a detailed discussion of our product categories, see “Item 4.B. Information on the Company—Business Overview.”
(Yen in millions)
For the fiscal year ended March 31,
2013 2014 Inc/Dec %
Net sales: Small precision motors: Hard disk drives spindle motors ¥165,427 ¥185,506 ¥20,079 12.1% Other small precision motors 154,297 177,007 22,710 14.7%
Sub-total 319,724 362,513 42,789 13.4% Automotive, appliance, commercial
and industrial products 248,464 345,236 96,772 38.9% Machinery 63,526 86,955 23,429 36.9% Electronic and optical components 69,188 72,845 3,657 5.3% Others 8,368 7,560 (808) (9.7)%
Consolidated total ¥709,270 ¥875,109 ¥165,839 23.4%
Our net sales increased ¥165,839 million, or 23.4%, from ¥709,270 million for the year ended March
31, 2013 to ¥875,109 million for the year ended March 31, 2014. This increase was due in part to the net sales of newly consolidated subsidiaries, including:
• Nidec ASI S.p.A. (renamed from “Ansaldo Sistemi Industriali S.p.A.”) and its subsidiaries
(“Nidec ASI”), an Italian manufacturer of industrial motors, generators and drives, which we acquired in May 2012,
• Nidec Avtron Automation Corporation (renamed from “Avtron Industrial Automation, Inc.”)
and its subsidiaries (“Nidec Avtron”), a U.S. provider of control, automation and drive-systems solutions and manufacturer of encoders, which we acquired in September 2012,
• SCD Co., Ltd., a South Korean manufacturer of motors and motor drive units, which we
acquired in October 2012, • Nidec Kinetek Corporation (renamed from “Kinetek Group Inc.”) (“Nidec Kinetek”), a U.S.
manufacturer of commercial motors, which we acquired in November 2012,
• Nidec Kaiyu Auto Electric (Jiangsu) Co., Ltd. (renamed from “Jiangsu Kaiyu Auto Appliance Co., Ltd.”) (“Nidec Kaiyu”), a Chinese manufacturer of brush motors for electric power steering systems and automotive fans, which we acquired in December 2012, and
• Nidec Sankyo CMI Corporation (renamed from “Mitsubishi Materials C.M.I. Corporations”)
and its subsidiaries (“Nidec Sankyo CMI”), a Japanese manufacturer of small motors, electric contact products and other products, which we acquired in January 2014.
Excluding the impact of the contributions of the newly consolidated subsidiaries, our net sales
increased ¥118,047 million, or 17.6%, from ¥671,538 million for the year ended March 31, 2013 to ¥789,585 million for the year ended March 31, 2014. This was mainly due to an increase in sales of products in the “automotive, appliance, commercial and industrial products” product category.
59
The average exchange rate between the Japanese yen and the U.S. dollar for the year ended March 31,
2014 was ¥100.24 to the dollar, which represents a depreciation of the Japanese yen against the U.S. dollar of ¥17.14, or approximately 21%, compared to the year ended March 31, 2013. The average exchange rate between the Japanese yen and the Euro for the year ended March 31, 2014 was ¥134.37 to the Euro, which represents a depreciation of the Japanese yen against the Euro of ¥27.23, or approximately 25%, compared to the year ended March 31, 2013. The fluctuations of the foreign currency exchange rates had a positive effect on our net sales of approximately ¥118,200 million for the year ended March 31, 2014, compared to the year ended March 31, 2013.
(Small precision motors) Net sales of small precision motors increased ¥42,789 million, or 13.4%, from ¥319,724 million for
the year ended March 31, 2013 to ¥362,513 million for the year ended March 31, 2014. This increase was mainly due to the depreciation of the Japanese yen against the U.S. dollar. Net sales of each product category included in “small precision motors” are as discussed below.
Hard disk drives spindle motors
Net sales of hard disk drives spindle motors increased ¥20,079 million, or 12.1%, from ¥165,427
million for the year ended March 31, 2013 to ¥185,506 million for the year ended March 31, 2014. The positive effect of foreign currency exchange rate fluctuations more than offset the negative impact of an approximately 3% decline in the number of units sold of small precision motors for hard disk drives for the year ended March 31, 2014 compared to the year ended March 31, 2013. We do not expect a recovery in the number of units sold at least during the remainder of the year ending March 31, 2015, as we anticipate demand for personal computers and other devices containing our products will remain stagnant mainly due to weak spending and shifts in device preferences.
Net sales of hard disk drives spindle motors accounted for 23.3% of total net sales for the year ended
March 31, 2013 and 21.2% of total net sales for the year ended March 31, 2014.
Other small precision motors
Net sales of other small precision motors increased ¥22,710 million, or 14.7%, from ¥154,297 million
for the year ended March 31, 2013 to ¥177,007 million for the year ended March 31, 2014. This increase was mainly due to the depreciation of the Japanese yen against the U.S. dollar.
Net sales of other small precision motors accounted for 21.8% of total net sales for the year ended
March 31, 2013 and 20.2% of total net sales for the year ended March 31, 2014.
(Automotive, appliance, commercial and industrial products)
Net sales of our automotive, appliance, commercial and industrial products increased ¥96,772 million,
or 38.9%, from ¥248,464 million for the year ended March 31, 2013 to ¥345,236 million for the year ended March 31, 2014.
Net sales of appliance, commercial and industrial products for the year ended March 31, 2014
increased 42.2% compared to the year ended March 31, 2013. This increase was primarily due to larger sales of motors for air conditioning equipment, and the contribution of sales of Nidec ASI, Nidec Avtron and Nidec Kinetek, which were not consolidated for the full fiscal year ended March 31, 2013, as well as the positive effect of the foreign currency exchange rate fluctuations.
60
Net sales of automotive products for the year ended March 31, 2014 increased 32.9% compared to the
year ended March 31, 2013. This was primarily due to the contribution of Nidec Sankyo CMI, which was newly consolidated in January 2014, and the commencement of mass-production of new product models of motors for electric power steering and other products and the commencement of mass-production of other new automotive product models for new customers, as well as the positive effect of the foreign currency exchange rate fluctuations.
The depreciation of the Japanese yen against the U.S. dollar and the Euro had a positive effect on net
sales of automotive, appliance, commercial and industrial products of approximately ¥48,900 million for the year ended March 31, 2014 compared to the year ended March 31, 2013.
Net sales of our automotive, appliance, commercial and industrial products accounted for 35.0% of
our total net sales for the year ended March 31, 2013 and 39.5% of total net sales for the year ended March 31, 2014.
(Machinery)
Net sales of our machinery increased ¥23,429 million, or 36.9%, from ¥63,526 million for the year
ended March 31, 2013 to ¥86,955 million for the year ended March 31, 2014. The increase was mainly due to an increase of ¥15,510 million, or 90.9%, in sales of LCD panel handling robots and card readers at the Nidec Sankyo group.
Net sales of our machinery accounted for 9.0% of our total net sales for the year ended March 31,
2013 and 9.9% of total net sales for the year ended March 31, 2014.
(Electronic and optical components) Net sales of our electronic and optical components increased ¥3,657 million, or 5.3%, from ¥69,188
million for the year ended March 31, 2013 to ¥72,845 million for the year ended March 31, 2014. This was mainly due to an increase of ¥2,842 million, or 17.7%, in sales of household equipment at the Nidec Copal Electronics group.
Net sales of electronic and optical components accounted for 9.7% of our total net sales for the year
ended March 31, 2013 and 8.3% of total net sales for the year ended March 31, 2014.
(Others) Net sales of our other products decreased ¥808 million, or 9.7%, from ¥8,368 million for the year
ended March 31, 2013 to ¥7,560 million for the year ended March 31, 2014. Net sales of other products accounted for 1.2% of total net sales for the year ended March 31, 2013
and 0.9% of total net sales for the year ended March 31, 2014.
Cost of Products Sold Our cost of products sold increased ¥102,065 million, or 17.8%, from ¥572,634 million for the year
ended March 31, 2013 to ¥674,699 million for the year ended March 31, 2014. Excluding the impact of Nidec ASI, Nidec Avtron, SCD, Nidec Kinetek, Nidec Kaiyu and Nidec Sankyo CMI (the“Newly Consolidated
61
Subsidiaries”), our cost of products sold increased ¥66,419 million, or 12.2%, from ¥542,293 million for the year ended March 31, 2013 to ¥608,712 million for the year ended March 31, 2014. This increase mainly corresponded to the overall increase in sales, and reflected the depreciation of the Japanese yen against other currencies.
As a percentage of net sales, our cost of products sold decreased from 80.7% for the year ended March 31, 2013 to 77.1% for the year ended March 31, 2014. Excluding the impact of the Newly Consolidated Subsidiaries, as a percentage of net sales, cost of products sold decreased from 80.8% for the year ended March 31, 2013 to 77.1% for the year ended March31, 2014. This decrease was mainly due to the impact of increases in the numbers of units sold of products with higher margins, improved fixed costs per unit compared to the year ended March 31, 2013 when we recorded losses on inventory write-offs resulting from rapid and significant declines in sales of some of our major products, and lower raw material costs. Selling, General and Administrative Expenses
Our selling, general and administrative expenses decreased ¥7,226 million, or 8.5%, from ¥84,760
million for the year ended March 31, 2013 to ¥77,534 million for the year ended March 31, 2014. Excluding the impact of the Newly Consolidated Subsidiaries, our selling, general and administrative expenses decreased ¥12,699 million, or 16.6%, from ¥76,682 million for the year ended March 31, 2013 to ¥63,983 million for the year ended March 31, 2014. This decrease mainly reflected the losses related to fixed assets recorded in the year ended March 31, 2013 in connection with the measures we implemented to streamline our business structure and the losses recognized when we entered into the sale-and-lease back arrangements relating to certain manufacturing equipment and other fixed assets in Asia in the second half of the year ended March 31, 2013, as we experienced rapid and significant declines in demand for some of our major products, including components for personal computers, digital cameras and LCD panel manufacturing equipment.
As a percentage of net sales, selling, general and administrative expenses decreased from 12.0% for the year ended March 31, 2013 to 8.9% for the year ended March 31, 2014. Excluding the impact of the Newly Consolidated Subsidiaries, as a percentage of net sales, our selling, general and administrative expenses decreased from 11.4% for the year ended March 31, 2013 to 8.1% for the year ended March 31, 2014.
Research and Development Expenses
Our research and development expenses increased ¥3,530 million, or 10.3%, from ¥34,278 million for
the year ended March 31, 2013 to ¥37,808 million for the year ended March 31, 2014. Excluding the impact of the Newly Consolidated Subsidiaries, our research and development expenses increased ¥2,587 million, or 7.7%, from ¥33,525 million for the year ended March 31, 2013 to ¥36,112 million for the year ended March 31, 2014. This increase was mainly due to our increased spending on research and development activities relating to products in the automotive, appliance, commercial and industrial products category and the small precision motors category.
For further information on our research and development expenses, including a discussion on an operating segment basis, see “—C. Research and Development, Patents and Licenses, etc.”
As a percentage of net sales, research and development expenses decreased from 4.8% for the year
ended March 31, 2013 to 4.3% for the year ended March 31, 2014. Excluding the impact of the Newly Consolidated Subsidiaries, as a percentage of net sales, our research and development expenses decreased from 5.0% for the year ended March 31, 2013 to 4.6% for the year ended March 31, 2014.
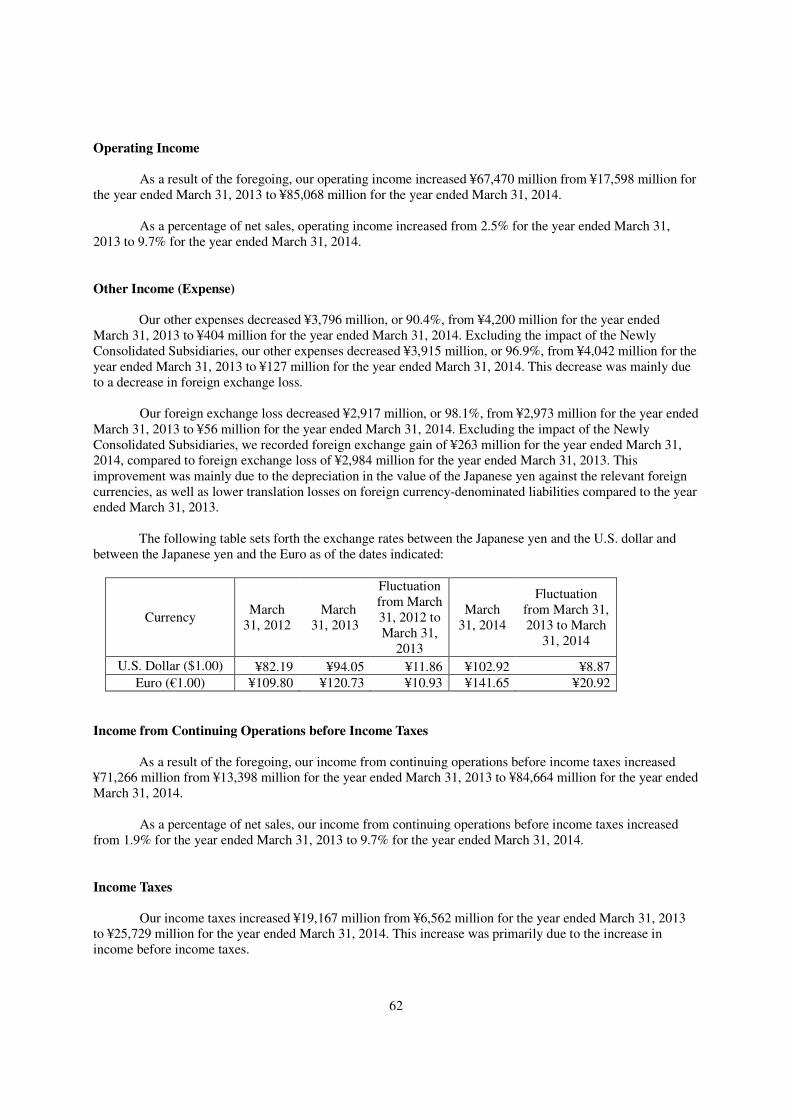
62
Operating Income As a result of the foregoing, our operating income increased ¥67,470 million from ¥17,598 million for
the year ended March 31, 2013 to ¥85,068 million for the year ended March 31, 2014. As a percentage of net sales, operating income increased from 2.5% for the year ended March 31,
2013 to 9.7% for the year ended March 31, 2014.
Other Income (Expense)
Our other expenses decreased ¥3,796 million, or 90.4%, from ¥4,200 million for the year ended March 31, 2013 to ¥404 million for the year ended March 31, 2014. Excluding the impact of the Newly Consolidated Subsidiaries, our other expenses decreased ¥3,915 million, or 96.9%, from ¥4,042 million for the year ended March 31, 2013 to ¥127 million for the year ended March 31, 2014. This decrease was mainly due to a decrease in foreign exchange loss.
Our foreign exchange loss decreased ¥2,917 million, or 98.1%, from ¥2,973 million for the year ended March 31, 2013 to ¥56 million for the year ended March 31, 2014. Excluding the impact of the Newly Consolidated Subsidiaries, we recorded foreign exchange gain of ¥263 million for the year ended March 31, 2014, compared to foreign exchange loss of ¥2,984 million for the year ended March 31, 2013. This improvement was mainly due to the depreciation in the value of the Japanese yen against the relevant foreign currencies, as well as lower translation losses on foreign currency-denominated liabilities compared to the year ended March 31, 2013.
The following table sets forth the exchange rates between the Japanese yen and the U.S. dollar and between the Japanese yen and the Euro as of the dates indicated:
Currency March
31, 2012 March 31, 2013
Fluctuation from March 31, 2012 to March 31,
2013
March 31, 2014
Fluctuation from March 31, 2013 to March
31, 2014
U.S. Dollar ($1.00) ¥82.19 ¥94.05 ¥11.86 ¥102.92 ¥8.87 Euro (€1.00) ¥109.80 ¥120.73 ¥10.93 ¥141.65 ¥20.92
Income from Continuing Operations before Income Taxes As a result of the foregoing, our income from continuing operations before income taxes increased
¥71,266 million from ¥13,398 million for the year ended March 31, 2013 to ¥84,664 million for the year ended March 31, 2014.
As a percentage of net sales, our income from continuing operations before income taxes increased
from 1.9% for the year ended March 31, 2013 to 9.7% for the year ended March 31, 2014.
Income Taxes Our income taxes increased ¥19,167 million from ¥6,562 million for the year ended March 31, 2013
to ¥25,729 million for the year ended March 31, 2014. This increase was primarily due to the increase in income before income taxes.
63
The effective income tax rate decreased approximately 18.6 percentage points from 49.0% for the year ended March 31, 2013 to 30.4% for the year ended March 31, 2014. This was mainly due to provision for valuation allowance relating to the tax losses at some of our subsidiaries carried forward for the year ended March 31, 2013, which was more than offset by reversal of valuation allowance for the year ended March 31, 2014 at some of our other subsidiaries due to recovery in their business performance.
For more information, see Note 16 to our audited consolidated financial statements included elsewhere
in this annual report.
Equity in Net Income (Loss) of Affiliated Companies
We recorded equity in net loss of ¥25 million for the year ended March 31, 2014, compared to equity
in net income of ¥13 million for the year ended March 31, 2013.
Consolidated Net Income
As a result of the foregoing, our consolidated net income increased ¥52,061 million from ¥6,849
million for the year ended March 31, 2013 to ¥58,910 million for the year ended March 31, 2014.
Net (Income) Loss Attributable to Noncontrolling Interests We had net income attributable to noncontrolling interests in the amount of ¥2,506 million for the year
ended March 31, 2014, compared to net loss attributable to noncontrolling interests in the amount of ¥1,137 million for the year ended March 31, 2013. This was primarily due to higher profits of group companies in which we own less than 100%, including the Nidec Copal Electronics group. Net Income Attributable to Nidec Corporation
As a result of the foregoing, our net income attributable to Nidec Corporation increased ¥48,418
million from ¥7,986 million for the year ended March 31, 2013 to ¥56,404 million for the year ended March 31, 2014.
As a percentage of net sales, our net income attributable to Nidec Corporation increased from 1.1% for
the year ended March 31, 2013 to 6.4% for the year ended March 31, 2014.
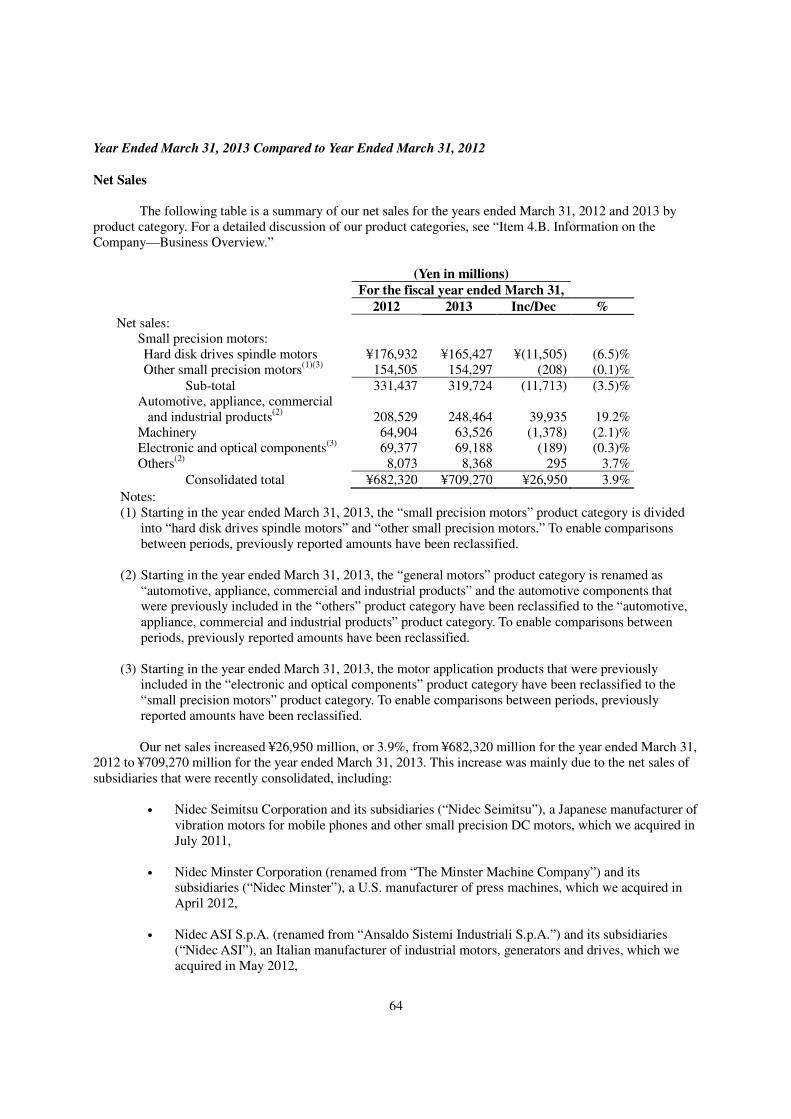
64
Year Ended March 31, 2013 Compared to Year Ended March 31, 2012
Net Sales The following table is a summary of our net sales for the years ended March 31, 2012 and 2013 by
product category. For a detailed discussion of our product categories, see “Item 4.B. Information on the Company—Business Overview.”
(Yen in millions)
For the fiscal year ended March 31,
2012 2013 Inc/Dec %
Net sales: Small precision motors: Hard disk drives spindle motors ¥176,932 ¥165,427 ¥(11,505) (6.5)% Other small precision motors
(1)(3) 154,505 154,297 (208) (0.1)%
Sub-total 331,437 319,724 (11,713) (3.5)% Automotive, appliance, commercial
and industrial products(2)
208,529 248,464 39,935 19.2% Machinery 64,904 63,526 (1,378) (2.1)% Electronic and optical components(3) 69,377 69,188 (189) (0.3)% Others
(2) 8,073 8,368 295 3.7%
Consolidated total ¥682,320 ¥709,270 ¥26,950 3.9%
Notes: (1) Starting in the year ended March 31, 2013, the “small precision motors” product category is divided
into “hard disk drives spindle motors” and “other small precision motors.” To enable comparisons between periods, previously reported amounts have been reclassified.
(2) Starting in the year ended March 31, 2013, the “general motors” product category is renamed as
“automotive, appliance, commercial and industrial products” and the automotive components that were previously included in the “others” product category have been reclassified to the “automotive, appliance, commercial and industrial products” product category. To enable comparisons between periods, previously reported amounts have been reclassified.
(3) Starting in the year ended March 31, 2013, the motor application products that were previously
included in the “electronic and optical components” product category have been reclassified to the “small precision motors” product category. To enable comparisons between periods, previously reported amounts have been reclassified. Our net sales increased ¥26,950 million, or 3.9%, from ¥682,320 million for the year ended March 31,
2012 to ¥709,270 million for the year ended March 31, 2013. This increase was mainly due to the net sales of subsidiaries that were recently consolidated, including:
• Nidec Seimitsu Corporation and its subsidiaries (“Nidec Seimitsu”), a Japanese manufacturer of
vibration motors for mobile phones and other small precision DC motors, which we acquired in July 2011,
• Nidec Minster Corporation (renamed from “The Minster Machine Company”) and its
subsidiaries (“Nidec Minster”), a U.S. manufacturer of press machines, which we acquired in April 2012,
• Nidec ASI S.p.A. (renamed from “Ansaldo Sistemi Industriali S.p.A.”) and its subsidiaries
(“Nidec ASI”), an Italian manufacturer of industrial motors, generators and drives, which we acquired in May 2012,
65
• Nidec Avtron Automation Corporation (renamed from “Avtron Industrial Automation, Inc.”)
and its subsidiaries (“Nidec Avtron”), a U.S. provider of control, automation and drive-systems solutions and manufacturer of encoders, which we acquired in September 2012,
• SCD Co., Ltd. (“SCD”), a South Korean manufacturer of motors and motor drive units, which
we acquired in October 2012, and • Nidec Kinetek Corporation (renamed from “Kinetek Group Inc.”) (“Nidec Kinetek”), a U.S.
manufacturer of commercial motors, which we acquired in November 2012. Excluding the impact of the contributions of these recently consolidated subsidiaries, our net sales
decreased ¥27,225 million, or 4.1%, from ¥670,301 million for the year ended March 31, 2012 to ¥643,076 million for the year ended March 31, 2013. This was mainly due to decreases in sales of products in the “small precision motors” and “machinery” categories primarily due to weaker demand for such products particularly in the second half of the fiscal year ended March 31, 2013.
The average exchange rate between the Japanese yen and the U.S. dollar for the year ended March 31,
2013 was ¥83.10 to the dollar, which represents a depreciation of the Japanese yen against the U.S. dollar of ¥4.02, or approximately 5%, compared to the year ended March 31, 2012. The average exchange rate between the Japanese yen and the Euro for the year ended March 31, 2013 was ¥107.14 to the Euro, which represents an appreciation of the Japanese yen against the Euro of ¥1.84, or approximately 2%, compared to the year ended March 31, 2011. The fluctuations of the foreign currency exchange rates had a positive effect on our net sales of approximately ¥21,400 million and a positive effect on our operating income of approximately ¥2,500 million for the year ended March 31, 2013, compared to the same period of the prior year.
(Small precision motors) Starting in the year ended March 31, 2013, the “small precision motors” product category is divided
into “hard disk drives spindle motors” and “other small precision motors.” In addition, starting in the year ended March 31, 2013, the motor application products that were previously included in the “electronic and optical components” product category are reclassified to the “small precision motors” product category. To enable comparisons between periods, previously reported amounts have been reclassified.
Net sales of small precision motors decreased ¥11,713 million, or 3.5%, from ¥331,437 million for the
year ended March 31, 2012 to ¥319,724 million for the year ended March 31, 2013, although the depreciation of the Japanese yen and other Asian currencies against the U.S. dollar had a positive effect of approximately ¥13,300 million on our sales of small precision motors for the year ended March 31, 2013, compared to the prior year. Net sales of each product category included in “small precision motors” are as discussed below.
Hard disk drives spindle motors
Net sales of hard disk drives spindle motors decreased ¥11,505 million, or 6.5%, from ¥176,932
million for the year ended March 31, 2012 to ¥165,427 million for the year ended March 31, 2013. The number of units sold of small precision motors for hard disk drives for the year ended March 31, 2013 decreased approximately 16% compared to the year ended March 31, 2012. This decrease was mainly due to rapid and significant declines in demand for some of our major products, including components for personal computers, in the second half of the year ended March 31, 2013, primarily resulting from weaker spending and shifts in device preferences. The average unit price of hard disk drives spindle motors for the year ended March 31, 2013, however, increased approximately 5% on a U.S. dollar basis and increased approximately 11% on a Japanese yen basis compared to the year ended March 31, 2012, reflecting the 5% depreciation of the Japanese yen against the U.S. dollar.
66
Sales of spindle motors for 2.5-inch hard disk drives for the year ended March 31, 2013 decreased
approximately 9% compared to the year ended March 31, 2012, and sales of spindle motors for 3.5-inch hard disk drives for the year ended March 31, 2013 decreased approximately 3%, compared to the year ended March 31, 2012. The number of units sold of spindle motors for 2.5-inch hard disk drives for the year ended March 31, 2013 decreased approximately 16% compared to the year ended March 31, 2012, and the number of units sold of spindle motors for 3.5-inch hard disk drives for the year ended March 31, 2013 decreased approximately 14%, compared to the year ended March 31, 2012. The average unit price of spindle motors for 2.5-inch hard disk drives for the year ended March 31, 2013 increased approximately 4% on a U.S. dollar basis and increased approximately 9% on a Japanese yen basis compared to the year ended March 31, 2012. The average unit price of spindle motors for 3.5-inch hard disk drives for the year ended March 31, 2013 increased approximately 8% on a U.S. dollar basis and increased approximately 13% on a Japanese yen basis compared to the year ended March 31, 2012.
Net sales of hard disk drives spindle motors accounted for 25.9% of total net sales for the year ended
March 31, 2012 and 23.3% of total net sales for the year ended March 31, 2013.
Other small precision motors
Net sales of other small precision motors decreased ¥208 million, or 0.1%, from ¥154,505 million for
the year ended March 31, 2012 to ¥154,297 million for the year ended March 31, 2013. This was primarily due to a decrease in sales of other small precision brushless DC motors. Sales of
other small precision brushless DC motors at Nidec Corporation and its direct-line subsidiaries for the year ended March 31, 2013 decreased approximately 10% compared to the year ended March 31, 2012. This was mainly due to an approximately 11% decrease in the number of units sold and a 3% decrease in the average unit price on a U.S. dollar basis for the year ended March 31, 2013 compared to the year ended March 31, 2012. The decrease in sales of other small precision brushless DC motors was partially offset by the contribution of Nidec Seimitsu and SCD. Nidec Seimitsu’s net sales were included in our consolidated net sales for the year ended March 31, 2012 only after our acquisition on July 1, 2011. Nidec Seimitsu’s sales for the three months ended June 30, 2012 were ¥3,369 million. Nidec Seimitsu’s net sales were included in our consolidated net sales only for the year ended March 31, 2013. SCD’s sales for the year ended March 31, 2013 were ¥1,378 million. Sales of brushless DC fans at Nidec Corporation and its direct-line subsidiaries for the year ended March 31, 2013 increased approximately 6% compared to the year ended March 31, 2012. This was mainly due to a 13% increase in the average unit price on a U.S. dollar basis compared to the year ended March 31, 2012, although the number of units sold for the year ended March 31, 2013 decreased approximately 11% compared to the year ended March 31, 2012.
Net sales of other small precision motors accounted for 22.7% of total net sales for the year ended
March 31, 2012 and 21.8% of total net sales for the year ended March 31, 2013.
(Automotive, appliance, commercial and industrial products)
Starting in the year ended March 31, 2013, the “general motors” product category is renamed as
“automotive, appliance, commercial and industrial products” and the automotive components that were previously included in the “others” product category are reclassified to the “automotive, appliance, commercial and industrial products” product category. To enable comparisons between periods, previously reported amounts have been reclassified.
67
Net sales of our automotive, appliance, commercial and industrial products increased ¥39,935 million, or 19.2%, from ¥208,529 million for the year ended March 31, 2012 to ¥248,464 million for the year ended March 31, 2013. This increase was primarily due to the contributions of Nidec ASI, Avtron and Kinetek. Excluding the impact of these subsidiaries that were newly consolidated, net sales of automotive, appliance, commercial and industrial products increased ¥3,580 million, or 1.7%, from ¥208,529 million for the year ended March 31, 2012 to ¥212,109 million for the year ended March 31, 2013. This increase consisted of a ¥1,239 million, or 1.0%, increase in sales of appliance, commercial and industrial products a ¥2,341 million, or 2.8%, increase in sales of automotive products between the two periods. The increase in sales of appliance, commercial and industrial products was primarily due to stronger demand in China at Nidec Techno Motor. The increase in sales of appliance, commercial and industrial products was partially offset by a decrease in sales of Nidec Motor Corporation, primarily reflecting weaker market demand for home appliances in Europe and the United States. The increase in sales of automotive products was mainly due to an approximately 13% increase in sales of automotive motors for electric power steering at Nidec Corporation and its direct-line subsidiaries primarily as a result of our efforts to expand our customer base. The increase in sales of the automotive products was partially offset by a decrease in sales of Nidec Motors & Actuators Corporation.
Net sales of our automotive, appliance, commercial and industrial products accounted for 30.5% of
our total net sales for the year ended March 31, 2012 and 35.0% of total net sales for the year ended March 31, 2013.
(Machinery) Net sales of our machinery decreased ¥1,378 million, or 2.1%, from ¥64,904 million for the year
ended March 31, 2012 to ¥63,526 million for the year ended March 31, 2013. The decrease was mainly due to a decrease in sales of products such as LCD panel handling robots at the Nidec Sankyo group of ¥8,637 million, or 34%, a decrease in sales of press machines for electronic components at the Nidec-Shimpo group of ¥2,635 million, or 13%, and a decrease in sales of peripheral equipment for chip mounters at the Nidec Copal group of ¥1,893 million, or 32%, between the two periods. These decreases in sales reflected weakening demand for LCD television sets and other machinery products particularly during the second half of the year ended March 31, 2013. The decreases in sales were partially offset by ¥12,113 million in sales at Nidec Minster, which we acquired in April 2012.
Net sales of our machinery accounted for 9.5% of our total net sales for the year ended March 31,
2012 and 9.0% of total net sales for the year ended March 31, 2013.
(Electronic and optical components) Starting in the year ended March 31, 2013, the motor application products that were previously
included in the “electronic and optical components” product category are reclassified to the “small precision motors” product category. To enable comparisons between periods, previously reported amounts have been reclassified.
Net sales of our electronic and optical components decreased ¥189 million, or 0.3%, from ¥69,377
million for the year ended March 31, 2012 to ¥69,188 million for the year ended March 31, 2013. This was primarily due to decreased sales at the Nidec Copal Electronics group of ¥1,803 million, or 10%, which were partially offset by an increase in sales at the Nidec Copal group of ¥857 million, or 2%, and an increase in sales at the Nidec Sankyo group of ¥758 million, or 5%, between the two periods. The decrease in sales at the Nidec Copal Electronics group was mainly due to weaker investments in the semiconductor manufacturing equipment, pneumatic and information-communications industries. The increase in sales at the Nidec Copal group mainly reflected stronger demand for lenses and other components for single-lens digital cameras, which was partially offset by a decrease in sales of components for compact digital cameras. The increase in sales at
68
the Nidec Sankyo group mainly reflected the positive impact of Tammy Corporation, a Japanese manufacturer of precision component molds, which we acquired in November, 2011.
Net sales of electronic and optical components accounted for 10.2% of our total net sales for the year
ended March 31, 2012 and 9.7% of total net sales for the year ended March 31, 2013.
(Others) Starting in the year ended March 31, 2013, the automotive products that were previously included in
the “others” product category are reclassified to the “automotive, appliance, commercial and industrial products” product category. To enable comparisons between periods, previously reported amounts have been reclassified.
Net sales of our other products increased ¥295 million, or 3.7%, from ¥8,073 million for the year
ended March 31, 2012 to ¥8,368 million for the year ended March 31, 2013. Net sales of other products accounted for 1.2% of total net sales for the year ended March 31, 2013
remained at the same level compared to the year ended March 31, 2012.
Cost of Products Sold Our cost of products sold increased ¥48,905 million, or 9.3%, from ¥523,729 million for the year
ended March 31, 2012 to ¥572,634 million for the year ended March 31, 2013. Excluding the impact of Nidec Seimitsu, Nidec Minster, Nidec ASI, Nidec Avtron, Nidec Kinetek and SCD (the“Recently Consolidated Subsidiaries”), our cost of products sold increased ¥5,143 million, or 1.0%, from ¥513,402 million for the year ended March 31, 2012 to ¥518,545 million for the year ended March 31, 2013. This increase was mainly due to higher raw material and labor costs.
As a percentage of net sales, our cost of products sold increased from 76.8% for the year ended March
31, 2012 to 80.7% for the year ended March 31, 2013. Excluding the impact of the Recently Consolidated Subsidiaries, as a percentage of net sales, cost of products sold increased from 76.6% for the year ended March 31, 2012 to 80.6% for the year ended March31, 2013. This increase was mainly due to declines in the operation rates and the capacity utilization rates of some of our manufacturing facilities as well as losses on inventory write-offs resulting from rapid and significant declines in sales of some of our major products, including components for personal computers, digital cameras and LCD panel manufacturing equipment, as well as decreases in the numbers of units sold of products with higher margins.
Selling, General and Administrative Expenses Our selling, general and administrative expenses increased ¥29,289 million, or 52.8%, from ¥55,471
million for the year ended March 31, 2012 to ¥84,760 million for the year ended March 31, 2013. Excluding the impact of the Recently Consolidated Subsidiaries, our selling, general and administrative expenses increased ¥17,461 million, or 32.1%, from ¥54,319 million for the year ended March 31, 2012 to ¥71,780 million for the year ended March 31, 2013. This increase was mainly due to personnel expenses and losses related to fixed assets, which were incurred or recorded in connection with the measures we implemented to streamline our business structure and our new sale and lease-back arrangements relating to certain manufacturing equipment and other fixed assets in Asia, as we experienced rapid and significant declines in demand for some of our major products, including components for personal computers, digital cameras and LCD panel manufacturing equipment, in the second half of the year ended March 31, 2013. As a result, our losses related to fixed assets and personnel expenses related to severance payments increased ¥12,704 million
69
and ¥1,762 million, respectively, for the year ended March 31, 2013 compared to the previous year. As a percentage of net sales, selling, general and administrative expenses increased from 8.1% for the
year ended March 31, 2012 to 12.0% for the year ended March 31, 2013. Excluding the impact of the Recently Consolidated Subsidiaries, as a percentage of net sales, our selling, general and administrative expenses increased from 8.1% for the year ended March 31, 2012 to 11.2% for the year ended March 31, 2013.
Research and Development Expenses Our research and development expenses increased ¥4,228 million, or 14.1%, from ¥30,050 million for
the year ended March 31, 2012 to ¥34,278 million for the year ended March 31, 2013. Excluding the impact of the Recently Consolidated Subsidiaries, our research and development expenses increased ¥3,115 million, or 10.4%, from ¥30,002 million for the year ended March 31, 2012 to ¥33,117 million for the year ended March 31, 2013. This increase was mainly due to our increased investments in research and development activities relating to products in the “automotive, appliance, commercial and industrial products” category and the “small precision motors” category.
For further information on our research and development expenses, including a discussion on an operating segment basis, see “—C. Research and Development, Patents and Licenses, etc.”
As a percentage of net sales, research and development expenses increased from 4.4% for the year
ended March 31, 2012 to 4.8% for the year ended March 31, 2013. Excluding the impact of the Recently Consolidated Subsidiaries, as a percentage of net sales, our research and development expenses increased from 4.5% for the year ended March 31, 2012 to 5.1% for the year ended March 31, 2013.
Operating Income As a result of the foregoing, our operating income decreased ¥55,472 million, or 75.9%, from ¥73,070
million for the year ended March 31, 2012 to ¥17,598 million for the year ended March 31, 2013. As a percentage of net sales, operating income decreased from 10.7% for the year ended March 31,
2012 to 2.5% for the year ended March 31, 2013.
Other Income (Expense)
Our other expenses increased ¥1,986 million, or 89.7%, from ¥2,214 million for the year ended March 31, 2012 to ¥4,200 million for the year ended March 31, 2013. Excluding the impact of the Recently Consolidated Subsidiaries, our other expenses increased ¥2,659 million, or 115.9%, from ¥2,295 million for the year ended March 31, 2012 to ¥4,954 million for the year ended March 31, 2013. This increase was mainly due to an increase in foreign exchange loss.
Our foreign exchange loss increased ¥1,217 million, or 69.3%, from ¥1,756 million for the year ended March 31, 2012 to ¥2,973 million for the year ended March 31, 2013. Excluding the impact of the Recently Consolidated Subsidiaries, our foreign exchange loss increased ¥2,030 million, or 108.8%, from ¥1,865 million for the year ended March 31, 2012 to ¥3,895 million for the year ended March 31, 2013. This increase was mainly due to an increase in U.S.dollar-denominated liabilities for the year ended March 31, 2013 compared to the year ended March 31, 2012, despite the depreciation of the Japanese yen against the U.S. dollar on an average basis between the two periods.
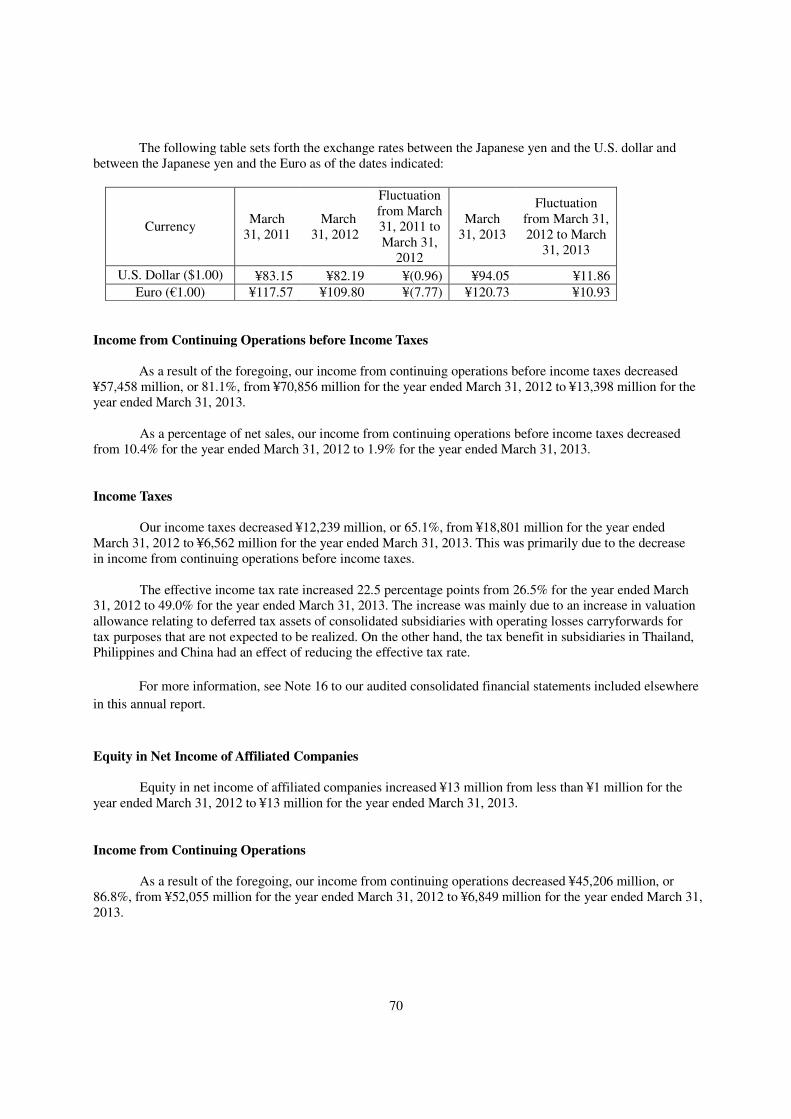
70
The following table sets forth the exchange rates between the Japanese yen and the U.S. dollar and between the Japanese yen and the Euro as of the dates indicated:
Currency March
31, 2011 March 31, 2012
Fluctuation from March 31, 2011 to March 31,
2012
March 31, 2013
Fluctuation from March 31, 2012 to March
31, 2013
U.S. Dollar ($1.00) ¥83.15 ¥82.19 ¥(0.96) ¥94.05 ¥11.86
Euro (€1.00) ¥117.57 ¥109.80 ¥(7.77) ¥120.73 ¥10.93
Income from Continuing Operations before Income Taxes As a result of the foregoing, our income from continuing operations before income taxes decreased
¥57,458 million, or 81.1%, from ¥70,856 million for the year ended March 31, 2012 to ¥13,398 million for the year ended March 31, 2013.
As a percentage of net sales, our income from continuing operations before income taxes decreased
from 10.4% for the year ended March 31, 2012 to 1.9% for the year ended March 31, 2013.
Income Taxes Our income taxes decreased ¥12,239 million, or 65.1%, from ¥18,801 million for the year ended
March 31, 2012 to ¥6,562 million for the year ended March 31, 2013. This was primarily due to the decrease in income from continuing operations before income taxes.
The effective income tax rate increased 22.5 percentage points from 26.5% for the year ended March
31, 2012 to 49.0% for the year ended March 31, 2013. The increase was mainly due to an increase in valuation allowance relating to deferred tax assets of consolidated subsidiaries with operating losses carryforwards for tax purposes that are not expected to be realized. On the other hand, the tax benefit in subsidiaries in Thailand, Philippines and China had an effect of reducing the effective tax rate.
For more information, see Note 16 to our audited consolidated financial statements included elsewhere
in this annual report.
Equity in Net Income of Affiliated Companies
Equity in net income of affiliated companies increased ¥13 million from less than ¥1 million for the
year ended March 31, 2012 to ¥13 million for the year ended March 31, 2013.
Income from Continuing Operations As a result of the foregoing, our income from continuing operations decreased ¥45,206 million, or
86.8%, from ¥52,055 million for the year ended March 31, 2012 to ¥6,849 million for the year ended March 31, 2013.
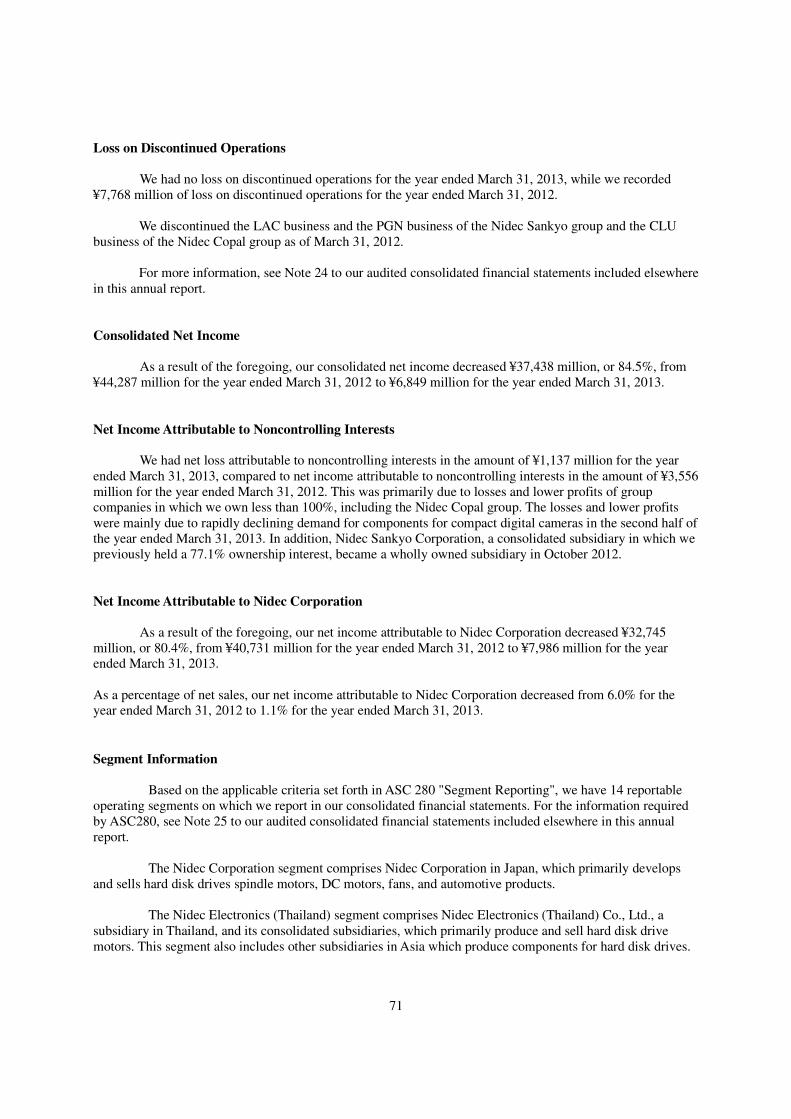
71
Loss on Discontinued Operations We had no loss on discontinued operations for the year ended March 31, 2013, while we recorded
¥7,768 million of loss on discontinued operations for the year ended March 31, 2012. We discontinued the LAC business and the PGN business of the Nidec Sankyo group and the CLU
business of the Nidec Copal group as of March 31, 2012.
For more information, see Note 24 to our audited consolidated financial statements included elsewhere in this annual report.
Consolidated Net Income As a result of the foregoing, our consolidated net income decreased ¥37,438 million, or 84.5%, from
¥44,287 million for the year ended March 31, 2012 to ¥6,849 million for the year ended March 31, 2013.
Net Income Attributable to Noncontrolling Interests We had net loss attributable to noncontrolling interests in the amount of ¥1,137 million for the year
ended March 31, 2013, compared to net income attributable to noncontrolling interests in the amount of ¥3,556 million for the year ended March 31, 2012. This was primarily due to losses and lower profits of group companies in which we own less than 100%, including the Nidec Copal group. The losses and lower profits were mainly due to rapidly declining demand for components for compact digital cameras in the second half of the year ended March 31, 2013. In addition, Nidec Sankyo Corporation, a consolidated subsidiary in which we previously held a 77.1% ownership interest, became a wholly owned subsidiary in October 2012.
Net Income Attributable to Nidec Corporation As a result of the foregoing, our net income attributable to Nidec Corporation decreased ¥32,745
million, or 80.4%, from ¥40,731 million for the year ended March 31, 2012 to ¥7,986 million for the year ended March 31, 2013.
As a percentage of net sales, our net income attributable to Nidec Corporation decreased from 6.0% for the year ended March 31, 2012 to 1.1% for the year ended March 31, 2013.
Segment Information
Based on the applicable criteria set forth in ASC 280 "Segment Reporting", we have 14 reportable operating segments on which we report in our consolidated financial statements. For the information required by ASC280, see Note 25 to our audited consolidated financial statements included elsewhere in this annual report.
The Nidec Corporation segment comprises Nidec Corporation in Japan, which primarily develops
and sells hard disk drives spindle motors, DC motors, fans, and automotive products. The Nidec Electronics (Thailand) segment comprises Nidec Electronics (Thailand) Co., Ltd., a
subsidiary in Thailand, and its consolidated subsidiaries, which primarily produce and sell hard disk drive motors. This segment also includes other subsidiaries in Asia which produce components for hard disk drives.
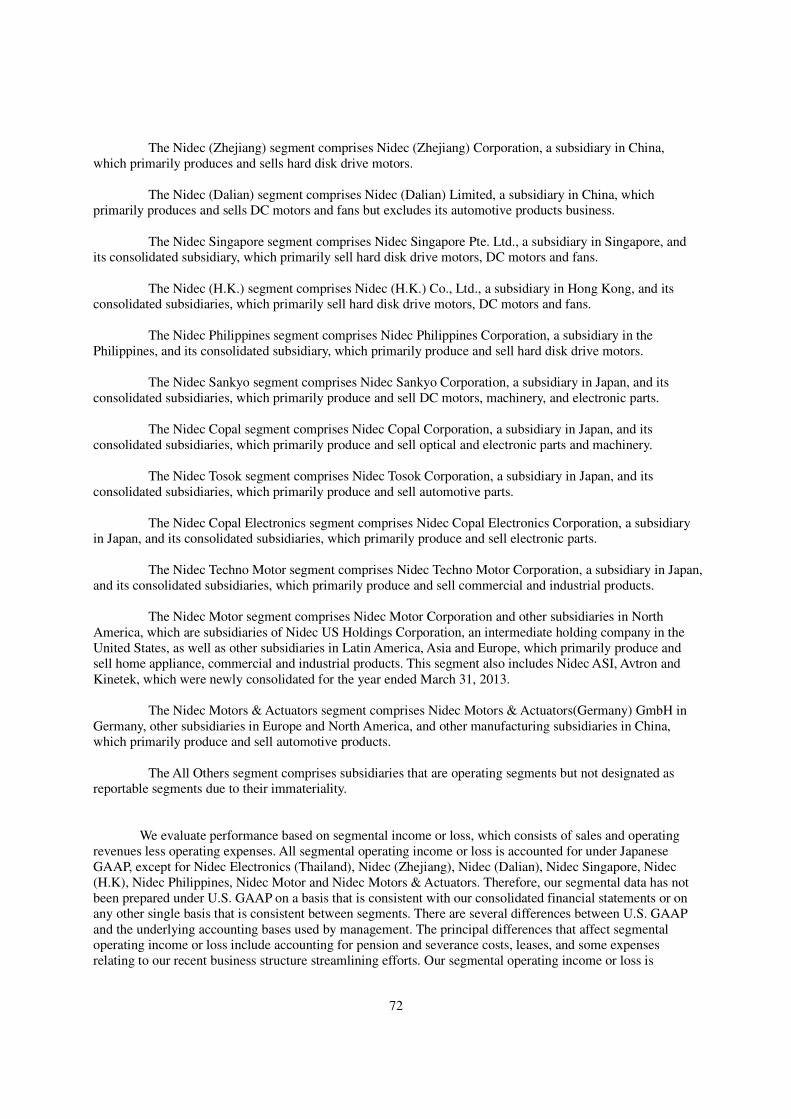
72
The Nidec (Zhejiang) segment comprises Nidec (Zhejiang) Corporation, a subsidiary in China, which primarily produces and sells hard disk drive motors.
The Nidec (Dalian) segment comprises Nidec (Dalian) Limited, a subsidiary in China, which
primarily produces and sells DC motors and fans but excludes its automotive products business. The Nidec Singapore segment comprises Nidec Singapore Pte. Ltd., a subsidiary in Singapore, and
its consolidated subsidiary, which primarily sell hard disk drive motors, DC motors and fans. The Nidec (H.K.) segment comprises Nidec (H.K.) Co., Ltd., a subsidiary in Hong Kong, and its
consolidated subsidiaries, which primarily sell hard disk drive motors, DC motors and fans. The Nidec Philippines segment comprises Nidec Philippines Corporation, a subsidiary in the
Philippines, and its consolidated subsidiary, which primarily produce and sell hard disk drive motors. The Nidec Sankyo segment comprises Nidec Sankyo Corporation, a subsidiary in Japan, and its
consolidated subsidiaries, which primarily produce and sell DC motors, machinery, and electronic parts. The Nidec Copal segment comprises Nidec Copal Corporation, a subsidiary in Japan, and its
consolidated subsidiaries, which primarily produce and sell optical and electronic parts and machinery. The Nidec Tosok segment comprises Nidec Tosok Corporation, a subsidiary in Japan, and its
consolidated subsidiaries, which primarily produce and sell automotive parts. The Nidec Copal Electronics segment comprises Nidec Copal Electronics Corporation, a subsidiary
in Japan, and its consolidated subsidiaries, which primarily produce and sell electronic parts. The Nidec Techno Motor segment comprises Nidec Techno Motor Corporation, a subsidiary in Japan,
and its consolidated subsidiaries, which primarily produce and sell commercial and industrial products. The Nidec Motor segment comprises Nidec Motor Corporation and other subsidiaries in North
America, which are subsidiaries of Nidec US Holdings Corporation, an intermediate holding company in the United States, as well as other subsidiaries in Latin America, Asia and Europe, which primarily produce and sell home appliance, commercial and industrial products. This segment also includes Nidec ASI, Avtron and Kinetek, which were newly consolidated for the year ended March 31, 2013.
The Nidec Motors & Actuators segment comprises Nidec Motors & Actuators(Germany) GmbH in
Germany, other subsidiaries in Europe and North America, and other manufacturing subsidiaries in China, which primarily produce and sell automotive products.
The All Others segment comprises subsidiaries that are operating segments but not designated as
reportable segments due to their immateriality.
We evaluate performance based on segmental income or loss, which consists of sales and operating
revenues less operating expenses. All segmental operating income or loss is accounted for under Japanese GAAP, except for Nidec Electronics (Thailand), Nidec (Zhejiang), Nidec (Dalian), Nidec Singapore, Nidec (H.K), Nidec Philippines, Nidec Motor and Nidec Motors & Actuators. Therefore, our segmental data has not been prepared under U.S. GAAP on a basis that is consistent with our consolidated financial statements or on any other single basis that is consistent between segments. There are several differences between U.S. GAAP and the underlying accounting bases used by management. The principal differences that affect segmental operating income or loss include accounting for pension and severance costs, leases, and some expenses relating to our recent business structure streamlining efforts. Our segmental operating income or loss is
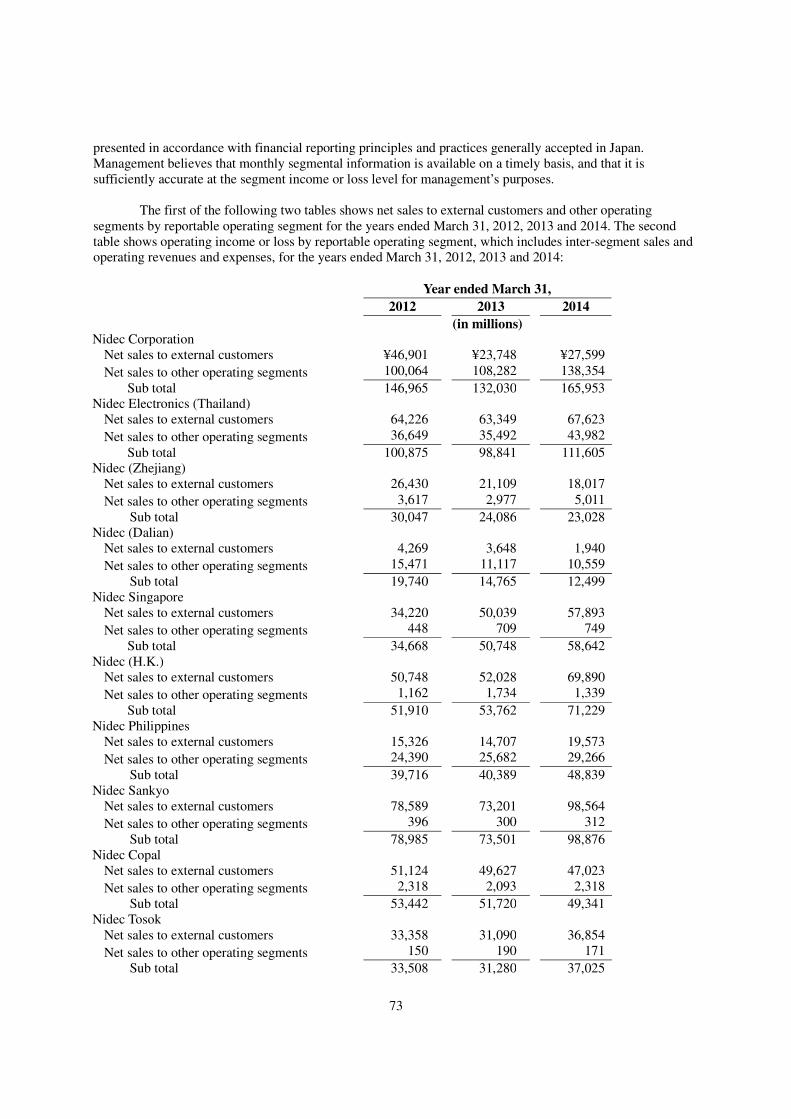
73
presented in accordance with financial reporting principles and practices generally accepted in Japan. Management believes that monthly segmental information is available on a timely basis, and that it is sufficiently accurate at the segment income or loss level for management’s purposes.
The first of the following two tables shows net sales to external customers and other operating segments by reportable operating segment for the years ended March 31, 2012, 2013 and 2014. The second table shows operating income or loss by reportable operating segment, which includes inter-segment sales and operating revenues and expenses, for the years ended March 31, 2012, 2013 and 2014:
Year ended March 31,
2012 2013 2014
(in millions) Nidec Corporation
Net sales to external customers ¥46,901 ¥23,748 ¥27,599
Net sales to other operating segments 100,064 108,282 138,354
Sub total 146,965 132,030 165,953 Nidec Electronics (Thailand)
Net sales to external customers 64,226 63,349 67,623
Net sales to other operating segments 36,649 35,492 43,982
Sub total 100,875 98,841 111,605 Nidec (Zhejiang)
Net sales to external customers 26,430 21,109 18,017
Net sales to other operating segments 3,617 2,977 5,011
Sub total 30,047 24,086 23,028 Nidec (Dalian)
Net sales to external customers 4,269 3,648 1,940
Net sales to other operating segments 15,471 11,117 10,559
Sub total 19,740 14,765 12,499 Nidec Singapore
Net sales to external customers 34,220 50,039 57,893
Net sales to other operating segments 448 709 749
Sub total 34,668 50,748 58,642 Nidec (H.K.)
Net sales to external customers 50,748 52,028 69,890
Net sales to other operating segments 1,162 1,734 1,339
Sub total 51,910 53,762 71,229 Nidec Philippines
Net sales to external customers 15,326 14,707 19,573
Net sales to other operating segments 24,390 25,682 29,266
Sub total 39,716 40,389 48,839 Nidec Sankyo
Net sales to external customers 78,589 73,201 98,564
Net sales to other operating segments 396 300 312
Sub total 78,985 73,501 98,876 Nidec Copal
Net sales to external customers 51,124 49,627 47,023
Net sales to other operating segments 2,318 2,093 2,318
Sub total 53,442 51,720 49,341 Nidec Tosok
Net sales to external customers 33,358 31,090 36,854
Net sales to other operating segments 150 190 171
Sub total 33,508 31,280 37,025
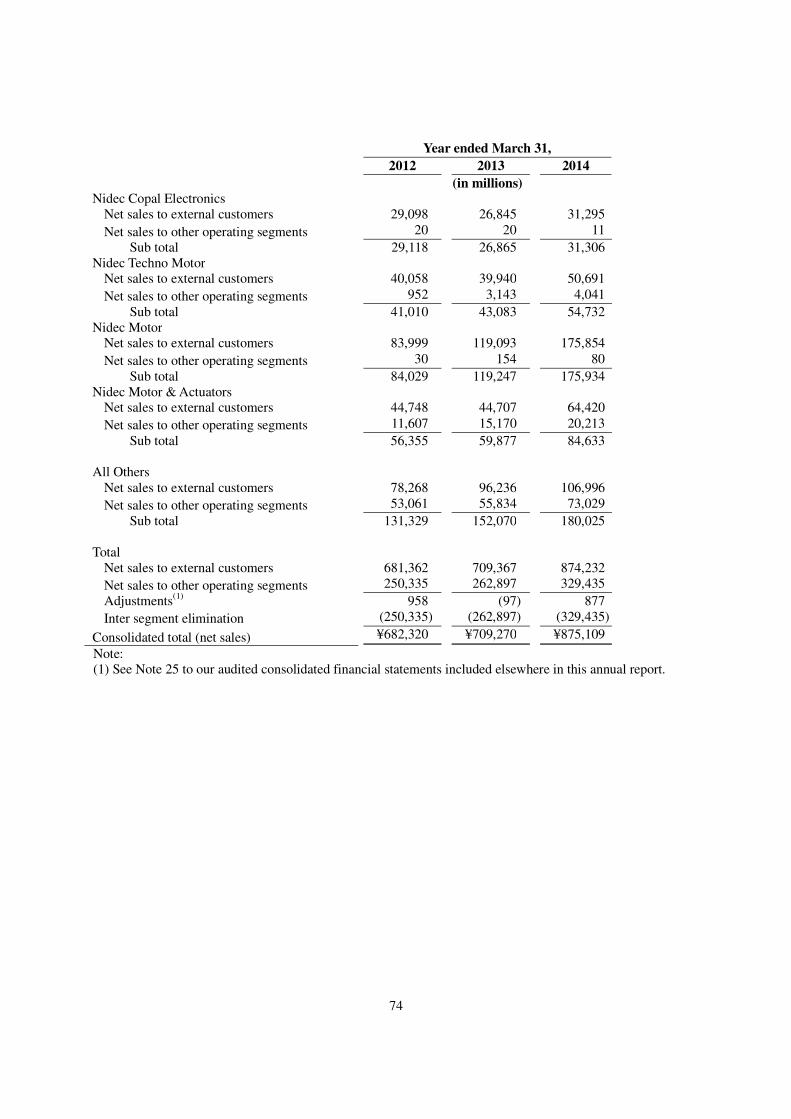
74
Year ended March 31,
2012 2013 2014
(in millions) Nidec Copal Electronics
Net sales to external customers 29,098 26,845 31,295
Net sales to other operating segments 20 20 11
Sub total 29,118 26,865 31,306 Nidec Techno Motor
Net sales to external customers 40,058 39,940 50,691
Net sales to other operating segments 952 3,143 4,041
Sub total 41,010 43,083 54,732 Nidec Motor
Net sales to external customers 83,999 119,093 175,854
Net sales to other operating segments 30 154 80
Sub total 84,029 119,247 175,934 Nidec Motor & Actuators
Net sales to external customers 44,748 44,707 64,420
Net sales to other operating segments 11,607 15,170 20,213
Sub total 56,355 59,877 84,633 All Others
Net sales to external customers 78,268 96,236 106,996
Net sales to other operating segments 53,061 55,834 73,029
Sub total 131,329 152,070 180,025 Total
Net sales to external customers 681,362 709,367 874,232
Net sales to other operating segments 250,335 262,897 329,435
Adjustments(1)
958 (97) 877
Inter segment elimination (250,335) (262,897) (329,435)
Consolidated total (net sales) ¥682,320 ¥709,270 ¥875,109
Note: (1) See Note 25 to our audited consolidated financial statements included elsewhere in this annual report.
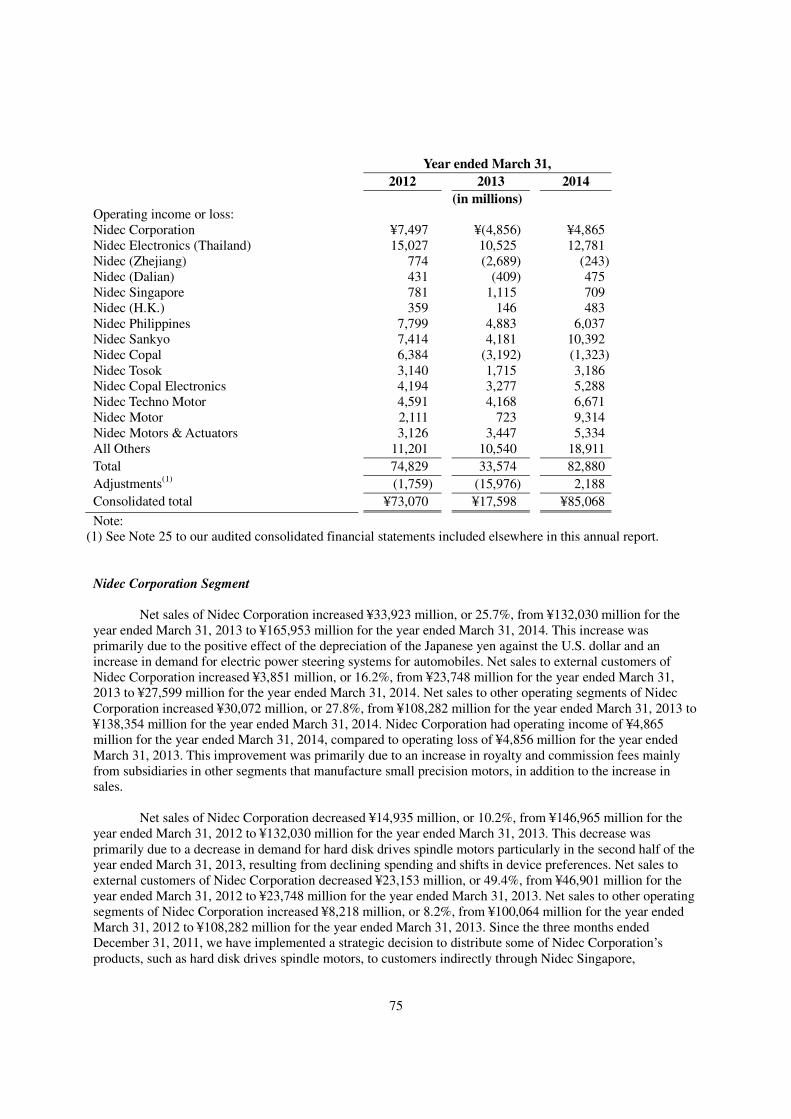
75
Year ended March 31,
2012 2013 2014
(in millions) Operating income or loss: Nidec Corporation ¥7,497 ¥(4,856) ¥4,865 Nidec Electronics (Thailand) 15,027 10,525 12,781 Nidec (Zhejiang) 774 (2,689) (243) Nidec (Dalian) 431 (409) 475 Nidec Singapore 781 1,115 709 Nidec (H.K.) 359 146 483 Nidec Philippines 7,799 4,883 6,037 Nidec Sankyo 7,414 4,181 10,392 Nidec Copal 6,384 (3,192) (1,323) Nidec Tosok 3,140 1,715 3,186 Nidec Copal Electronics 4,194 3,277 5,288 Nidec Techno Motor 4,591 4,168 6,671 Nidec Motor 2,111 723 9,314 Nidec Motors & Actuators 3,126 3,447 5,334 All Others 11,201 10,540 18,911
Total 74,829 33,574 82,880
Adjustments(1)
(1,759) (15,976) 2,188
Consolidated total ¥73,070 ¥17,598 ¥85,068
Note: (1) See Note 25 to our audited consolidated financial statements included elsewhere in this annual report.
Nidec Corporation Segment Net sales of Nidec Corporation increased ¥33,923 million, or 25.7%, from ¥132,030 million for the
year ended March 31, 2013 to ¥165,953 million for the year ended March 31, 2014. This increase was primarily due to the positive effect of the depreciation of the Japanese yen against the U.S. dollar and an increase in demand for electric power steering systems for automobiles. Net sales to external customers of Nidec Corporation increased ¥3,851 million, or 16.2%, from ¥23,748 million for the year ended March 31, 2013 to ¥27,599 million for the year ended March 31, 2014. Net sales to other operating segments of Nidec Corporation increased ¥30,072 million, or 27.8%, from ¥108,282 million for the year ended March 31, 2013 to ¥138,354 million for the year ended March 31, 2014. Nidec Corporation had operating income of ¥4,865 million for the year ended March 31, 2014, compared to operating loss of ¥4,856 million for the year ended March 31, 2013. This improvement was primarily due to an increase in royalty and commission fees mainly from subsidiaries in other segments that manufacture small precision motors, in addition to the increase in sales.
Net sales of Nidec Corporation decreased ¥14,935 million, or 10.2%, from ¥146,965 million for the year ended March 31, 2012 to ¥132,030 million for the year ended March 31, 2013. This decrease was primarily due to a decrease in demand for hard disk drives spindle motors particularly in the second half of the year ended March 31, 2013, resulting from declining spending and shifts in device preferences. Net sales to external customers of Nidec Corporation decreased ¥23,153 million, or 49.4%, from ¥46,901 million for the year ended March 31, 2012 to ¥23,748 million for the year ended March 31, 2013. Net sales to other operating segments of Nidec Corporation increased ¥8,218 million, or 8.2%, from ¥100,064 million for the year ended March 31, 2012 to ¥108,282 million for the year ended March 31, 2013. Since the three months ended December 31, 2011, we have implemented a strategic decision to distribute some of Nidec Corporation’s products, such as hard disk drives spindle motors, to customers indirectly through Nidec Singapore,
76
contributing to the decrease in Nidec Corporation’s net sales to external customers and the increase in Nidec Corporation’s net sales to other operating segments. Nidec Corporation had operating loss of ¥4,856 million for the year ended March 31, 2013, compared to operating income of ¥7,497 million for the year ended March 31, 2012. This decrease was primarily due to a decrease in royalty and commission fees from subsidiaries relating to hard disk drives spindle motors and an increase in material costs for automotive motors for electric power steering, in addition to the decrease in sales.
Nidec Electronics (Thailand) Segment
Net sales of Nidec Electronics (Thailand) increased ¥12,764 million, or 12.9%, from ¥98,841 million
for the year ended March 31, 2013 to ¥111,605 million for the year ended March 31, 2014. This increase was primarily due to the positive effect of the depreciation of the Japanese yen against the Thai baht, despite the decrease in demand for hard disk drives spindle motors. Operating income of Nidec Electronics (Thailand) increased ¥2,256 million, or 21.4%, from ¥10,525 million for the year ended March 31, 2013 to ¥12,781 million for the year ended March 31, 2014. This increase was primarily due to decreases in depreciation and losses on inventory write-offs relating to excess inventories to nil for the year ended March 31, 2014, in addition to the increase in sales.
Net sales of Nidec Electronics (Thailand) decreased ¥2,034 million, or 2.0%, from ¥100,875 million
for the year ended March 31, 2012 to ¥98,841 million for the year ended March 31, 2013. This decrease was primarily due to our decision to shift a portion of our production of hard disk drives spindle motors from Thailand to the Philippines in response to the flooding in Thailand in October 2011. Operating income of Nidec Electronics (Thailand) decreased ¥4,502 million, or 30.0%, from ¥15,027 million for the year ended March 31, 2012 to ¥10,525 million for the year ended March 31, 2013. This decrease was primarily due to higher manufacturing costs such as wages and material costs, as well as losses on inventory write-offs relating to excess inventories, in addition to the decrease in sales.
Nidec (Zhejiang) Segment
Net sales of Nidec (Zhejiang) decreased ¥1,058 million, or 4.4%, from ¥24,086 million for the year
ended March 31, 2013 to ¥23,028 million for the year ended March 31, 2014. This decrease was primarily due to a decrease in demand for hard disk drives spindle motors, despite the positive effect of the depreciation of the Japanese yen against the U.S. dollar. Operating loss of Nidec (Zhejiang) decreased ¥2,446 million from ¥2,689 million for the year ended March 31, 2013 to ¥243 million for the year ended March 31, 2014. The smaller loss was primarily due to cost reduction mainly resulting from the business structure streamlining measures that were implemented during the previous fiscal year.
Net sales of Nidec (Zhejiang) decreased ¥5,961 million, or 19.8%, from ¥30,047 million for the year ended March 31, 2012 to ¥24,086 million for the year ended March 31, 2013. This decrease was primarily due to a decrease in demand for hard disk drives spindle motors particularly in the second half of the year ended March 31, 2013, resulting from declining spending and shifts in device preferences. Nidec (Zhejiang) had operating loss of ¥2,689 million for the year ended March 31, 2013, compared to operating income of ¥774 million for the year ended March 31, 2012. This decrease was primarily due to an increase in expense incurred in connection with the business structure streamlining measures designed to improve our operation efficiency, the negative effect of our declining operation rate and changes in the product mix, in addition to the decrease in sales.
Nidec (Dalian) Segment
Net sales of Nidec (Dalian) decreased ¥2,266 million, or 15.3%, from ¥14,765 million for the year
ended March 31, 2013 to ¥12,499 million for the year ended March 31, 2014. This decrease was primarily due to the negative impact of the transfer of a portion of the DC motor and DC fan manufacturing operations to the All Others segment. However, Nidec (Dalian) had operating income of ¥475 million for the year ended
77
March 31, 2014, compared to operating loss of ¥409 million for the year ended March 31, 2013. This improvement was primarily due to increased sales of products with higher margins resulting from changes in the product mix.
Net sales of Nidec (Dalian) decreased ¥4,975 million, or 25.2%, from ¥19,740 million for the year ended March 31, 2012 to ¥14,765 million for the year ended March 31, 2013. This decrease was primarily due to a decrease in demand for DC motors. Nidec (Dalian) had operating loss of ¥409 million for the year ended March 31, 2013, compared to operating income of ¥431 million for the year ended March 31, 2012. This decrease was primarily due to higher manufacturing costs such as wages and material costs, as well as losses on inventory write-offs relating to excess inventories, in addition to the decrease in sales. Nidec Singapore Segment
Net sales of Nidec Singapore increased ¥7,894 million, or 15.6%, from ¥50,748 million for the year ended March 31, 2013 to ¥58,642 million for the year ended March 31, 2014. This increase was primarily due to the positive effect of the depreciation of the Japanese yen against the U.S. dollar, despite the decrease in demand for hard disk drives spindle motors. However, operating income of Nidec Singapore decreased ¥406 million, or 36.4%, from ¥1,115 million for the year ended March 31, 2013 to ¥709 million for the year ended March 31, 2014. This decrease was primarily due to an increase in depreciation resulting from increased investments in property, plant and equipment.
Net sales of Nidec Singapore increased ¥16,080 million, or 46.4%, from ¥34,668 million for the year ended March 31, 2012 to ¥50,748 million for the year ended March 31, 2013. This increase was primarily due to the implementation of our strategic decision to distribute some of Nidec Corporation’s products to customers indirectly through Nidec Singapore since the three months ended December 31, 2011. Operating income of Nidec Singapore increased ¥334 million, or 42.8%, from ¥781 million for the year ended March 31, 2012 to ¥1,115 million for the year ended March 31, 2013. This increase was primarily due to the increase in sales. Nidec (H.K.) Segment
Net sales of Nidec (H.K.) increased ¥17,467 million, or 32.5%, from ¥53,762 million for the year ended March 31, 2013 to ¥71,229 million for the year ended March 31, 2014. This increase was primarily due to the depreciation of the Japanese yen against the Hong Kong dollar and an increase in demand for DC motors. Operating income of Nidec (H.K.) increased ¥337 million, from ¥146 million for the year ended March 31, 2013 to ¥483 million for the year ended March 31, 2014. This increase was primarily due to the increase in sales.
Net sales of Nidec (H.K.) increased ¥1,852 million, or 3.6%, from ¥51,910 million for the year ended March 31, 2012 to ¥53,762 million for the year ended March 31, 2013. This increase was primarily due to the depreciation of the Japanese yen against the Hong Kong dollar. However, operating income of Nidec (H.K.) decreased ¥213 million, or 59.3%, from ¥359 million for the year ended March 31, 2012 to ¥146 million for the year ended March 31, 2013. This decrease was primarily due to increases in salaries resulting from the increase in headcount and marketing costs.
Nidec Philippines Segment
Net sales of Nidec Philippines increased ¥8,450 million, or 20.9%, from ¥40,389 million for the year
ended March 31, 2013 to ¥48,839 million for the year ended March 31, 2014. This increase was primarily due to the depreciation of the Japanese yen against the U.S. dollar. Operating income of Nidec Philippines increased ¥1,154 million, or 23.6%, from ¥4,883 million for the year ended March 31, 2013 to ¥6,037 million for the year ended March 31, 2014. This increase was primarily due to a decrease in depreciation of property, plant and equipment, in addition to the increase in sales.
78
Net sales of Nidec Philippines increased ¥673 million, or 1.7%, from ¥39,716 million for the year
ended March 31, 2012 to ¥40,389 million for the year ended March 31, 2013. This increase was primarily due to the depreciation of the Japanese yen against the U.S. dollar. However, operating income of Nidec Philippines decreased ¥2,916 million, or 37.4%, from ¥7,799 million for the year ended March 31, 2012 to ¥4,883 million for the year ended March 31, 2013. This decrease was primarily due to higher manufacturing costs including material costs, as well as losses on inventory write offs relating to excess inventories.
Nidec Sankyo Segment
Net sales of Nidec Sankyo increased ¥25,375 million, or 34.5%, from ¥73,501 million for the year ended March 31, 2013 to ¥98,876 million for the year ended March 31, 2014. This increase was primarily due to increases in sales of LCD panel handling robots and card readers and the contribution of the newly consolidated subsidiaries, including SCD and Nidec Sankyo CMI, in addition to the depreciation of the Japanese yen against the U.S. dollar. Operating income of Nidec Sankyo increased ¥6,211 million from ¥4,181 million for the year ended March 31, 2013 to ¥10,392 million for the year ended March 31, 2014. This increase was primarily due to the increase in sales.
Net sales of Nidec Sankyo decreased ¥5,484 million, or 6.9%, from ¥78,985 million for the year ended March 31, 2012 to ¥73,501 million for the year ended March 31, 2013. This decrease was primarily due to a decrease in sales of LCD panel handling robots resulting from declining demand for LCD television sets. Operating income of Nidec Sankyo decreased ¥3,233 million, or 43.6%, from ¥7,414 million for the year ended March 31, 2012 to ¥4,181 million for the year ended March 31, 2013. This decrease was primarily due to higher overseas manufacturing costs, including labor costs, and the negative effect of changes in the product mix, in addition to the decrease in sales. Nidec Copal Segment
Net sales of Nidec Copal decreased ¥2,379 million, or 4.6%, from ¥51,720 million for the year ended
March 31, 2013 to ¥49,341 million for the year ended March 31, 2014. This decrease was primarily due to the declining digital camera market, adversely affecting the sales of shutters for digital cameras, despite the launch of new product models and the depreciation of the Japanese yen against the U.S. dollar and the Thai baht. Operating loss of Nidec Copal decreased ¥1,869 million, or 58.6%, from ¥3,192 million for the year ended March 31, 2013 to ¥1,323 million for the year ended March 31, 2014. The smaller loss was primarily due to
our efforts to lower fixed costs.
Net sales of Nidec Copal decreased ¥1,722 million, or 3.2%, from ¥53,442 million for the year ended March 31, 2012 to ¥51,720 million for the year ended March 31, 2013. This decrease was primarily due to rapidly and significantly declining demand for our silent geared motors for digital still cameras and reduced orders for system units during the second half of the year ended March 31, 2013. Nidec Copal had operating loss of ¥3,192 million for the year ended March 31, 2013, compared to operating income of ¥6,384 million for the year ended March 31, 2012. This decrease was primarily due to significant declines in the operation rates and the capacity utilization rates of manufacturing facilities due to rapidly declining demand for our products. Nidec Tosok Segment
Net sales of Nidec Tosok increased ¥5,745 million, or 18.4%, from ¥31,280 million for the year ended March 31, 2013 to ¥37,025 million for the year ended March 31, 2014. This increase was primarily due to the commencement of mass-production of new product models of automotive products for new customers and the depreciation of the Japanese yen against the Chinese yuan. Operating income increased ¥1,471 million, or 85.8%, from ¥1,715 million for the year ended March 31, 2013 to ¥3,186 million for the year ended March 31, 2014. This increase was primarily due to the increase in sales and our cost reduction measures.
79
Net sales of Nidec Tosok decreased ¥2,228 million, or 6.6%, from ¥33,508 million for the year ended March 31, 2012 to ¥31,280million for the year ended March 31, 2013. This decrease was primarily due to lower demand for automotive parts in the Chinese and European markets. Operating income decreased ¥1,425 million, or 45.4%, from ¥3,140 million for the year ended March 31, 2012 to ¥1,715 million for the year ended March 31, 2013. This decrease was primarily due to an increase in fixed costs resulting from investments to enhance the manufacturing and research and development operations, in addition to the decrease in sales. Nidec Copal Electronics Segment
Net sales of Nidec Copal Electronics increased ¥4,441 million, or 16.5%, from ¥26,865 million for the year ended March 31, 2013 to ¥31,306 million for the year ended March 31, 2014. This increase was mainly due to increases in sales of such products as motors for gaming consoles and components for household equipment. Operating income increased ¥2,011 million, or 61.4%, from ¥3,277 million for the year ended March 31, 2013 to ¥5,288 million for the year ended March 31, 2014. This increase was primarily due to our cost reduction measures, in addition to the increase in sales.
Net sales of Nidec Copal Electronics decreased ¥2,253 million, or 7.7%, from ¥29,118 million for the
year ended March 31, 2012 to ¥26,865 million for the year ended March 31, 2013. This decrease was mainly due to weaker investments in the semiconductor manufacturing equipment, pneumatic and information-communications industries. Operating income decreased ¥917 million, or 21.9%, from ¥4,194 million for the year ended March 31, 2012 to ¥3,277 million for the year ended March 31, 2013. This decrease was primarily due to the negative effect of changes in the product mix, in addition to the decreases in sales.
Nidec Techno Motor Segment
Net sales of Nidec Techno Motor increased ¥11,649 million, or 27.0%, from ¥43,083 million for the
year ended March 31, 2013 to ¥54,732 million for the year ended March 31, 2014. This increase was primarily due to an increase in sales of motors for air conditioning equipment in Asia, in addition to the depreciation of the Japanese yen against the Chinese yuan. Operating income increased ¥2,503 million, or 60.1%, from ¥4,168 million for the year ended March 31, 2013 to ¥6,671 million for the year ended March 31, 2014. This increase was primarily due to the increase in sales.
Net sales of Nidec Techno Motor increased ¥2,073 million, or 5.1%, from ¥41,010 million for the year ended March 31, 2012 to ¥43,083 million for the year ended March 31, 2013. This increase was primarily due to stronger demand for home appliance motors in China. However, operating income decreased ¥423 million, or 9.2%, from ¥4,591 million for the year ended March 31, 2012 to ¥4,168 million for the year ended March 31, 2013. This decrease was primarily due to the negative effect of changes in the product mix and losses on inventory write-offs relating to excess inventories. Nidec Motor Segment
Net sales of Nidec Motor increased ¥56,687 million, or 47.5%, from ¥119,247 million for the year
ended March 31, 2013 to ¥175,934 million for the year ended March 31, 2014. This increase was primarily due to the contribution of the newly consolidated subsidiaries, including Nidec ASI, Nidec Avtron and Nidec Kinetek, in addition to the depreciation of the Japanese yen against the U.S. dollar. Operating income increased ¥8,591 million from ¥723 million for the year ended March 31, 2013 to ¥9,314 million for the year ended March 31, 2014. This increase was primarily due to the positive impact of the newly consolidated subsidiaries and the increase in sales.
Net sales of Nidec Motor increased ¥35,218 million, or 41.9%, from ¥84,029 million for the year ended March 31, 2012 to ¥119,247 million for the year ended March 31, 2013. This increase was primarily due to the contribution of the newly consolidated subsidiaries. However, operating income decreased ¥1,388 million, or 65.8%, from ¥2,111 million for the year ended March 31, 2012 to ¥723 million for the year ended
80
March 31, 2013. This decrease was primarily due to the personnel expenses incurred as part of our business structure streamlining measures, in addition to the negative effect of some of the newly consolidated subsidiaries. Nidec Motors & Actuators Segment
Net sales of Nidec Motors & Actuators increased ¥24,756 million, or 41.3%, from ¥59,877 million for
the year ended March 31, 2013 to ¥84,633 million for the year ended March 31, 2014. This increase was primarily due to the commencement of mass-production of new product models of motors for electric power steering systems and the depreciation of the Japanese yen against the U.S. dollar and the Euro. Operating income increased ¥1,887 million, or 54.7%, from ¥3,447 million for the year ended March 31, 2013 to ¥5,334 million for the year ended March 31, 2014. This increase was primarily due to the increase in sales.
Net sales of Nidec Motors & Actuators increased ¥3,522 million, or 6.2%, from ¥56,355 million for the year ended March 31, 2012 to ¥59,877 million for the year ended March 31, 2013. This increase was primarily due to an increase in sales of automotive motors for electric power steering mainly as a result of efforts to expand our customer base and increase in sales to the existing customers. Operating income increased ¥321 million, or 10.3%, from ¥3,126 million for the year ended March 31, 2012 to ¥3,447 million for the year ended March 31, 2013. This increase was primarily due to our cost reduction measures, in addition to the increase in sales. All Others
With respect to the All Others segment, net sales increased ¥27,955 million, or 18.4%, from ¥152,070
million for the year ended March 31, 2013 to ¥180,025 million for the year ended March 31, 2014. This increase was primarily due to the transfer of a portion of the DC motor and DC fan manufacturing operations from the Nidec (Dalian) segment, in addition to the depreciation of the Japanese yen against the U.S. dollar. Operating income increased ¥8,371 million, or 79.4%, from ¥10,540 million for the year ended March 31, 2013 to ¥18,911 million for the year ended March 31, 2014. This increase was primarily due to our cost reduction measures, in addition to the increase in sales.
With respect to the All Others segment, net sales increased ¥20,741 million, or 15.8%, from ¥131,329
million for the year ended March 31, 2012 to ¥152,070 million for the year ended March 31, 2013. This increase was primarily due to the contribution of Nidec Seimitsu and Nidec Minster. However operating income decreased ¥661 million, or 5.9%, from ¥11,201 million for the year ended March 31, 2012 to ¥10,540 million for the year ended March 31, 2013. This decrease was primarily due to personnel expenses incurred as part of our business structure streamlining measures and losses on inventory write-offs relating to excess inventories.
Accounting Changes
As of April 1, 2013, we adopted FASB Accounting Standards Codification™ (ASC) 350 “Intangibles-Goodwill and Other” updated by Accounting Standards Update (ASU) No. 2012-02 “Testing Indefinite-Lived Intangible Assets for Impairment.” ASU 2012-02 allows an entity the option of performing a qualitative assessment before calculating the fair value of an indefinite-lived intangible asset and performing the quantitative impairment test. If an entity determines, on the basis of qualitative factors, that it is more likely than not that the asset is impaired, the quantitative impairment test would be required. The adoption of this standard did not have material impact on our consolidated financial position, results of operations and liquidity.
81
As of April 1, 2013, we adopted FASB ASC 220 “Comprehensive income.” updated by ASU No. 2013-02 “Reporting of Amounts Reclassified Out of Accumulated Other Comprehensive Income.” ASU 2013-02 requires an entity to present, either on the face of the statement where net income is presented or in the notes, significant amounts reclassified out of accumulated other comprehensive income by the respective line items of net income but only if the amount reclassified is required under U.S. GAAP to be reclassified to net income in its entirety in the same reporting period. The standard is provision for disclosure. The adoption of this standard did not have any impact on our consolidated financial position, results of operations and liquidity.
Recent Accounting Pronouncements to Be Adopted in Future Periods In July 2013, the FASB issued ASU No. 2013-11, “Income taxes (Topic 740): Presentation of an
Unrecognized Tax Benefit When a Net Operating Loss Carryforward, a Similar Tax Loss, or a Tax Credit Carryforward Exists.” ASU 2013-11 clarifies that an unrecognized tax benefit, or a portion of an unrecognized tax benefit, should be presented in the financial statements as a reduction to a deferred tax asset for a net operating loss carryforward, a similar tax loss, or a tax credit carryforward if such settlement is required or expected in the event the uncertain tax position is disallowed. In situations where a net operating loss carry forward, a similar tax loss, or a tax credit carryforward is not available at the reporting date under the tax law of the applicable jurisdiction or the tax of the jurisdiction does not require, and the entity does not intend to use, the deferred tax asset for such purpose, the unrecognized tax benefit should be presented in the financial statements as a liability and should not be combined with deferred tax assets. ASU 2013-11 is effective for reporting periods beginning after December 15, 2013. Early adoption and retrospective application are permitted. This standard is provision for disclosure. The adoption of this standard will not have any impact on our consolidated financial position, results of operations or liquidity.
In April 2014, the FASB issued ASU No. 2014-08, “Presentation of Financial Statements (Topic 205)
and Property, Plant, and Equipment (Topic 360): "Reporting Discontinued Operations and Disclosures of Disposals of Components of an Entity." Under the new standard, a disposal of a component or a group of components of an entity is required to be reported in discontinued operations if the disposal represents a strategic shift that has (or will have) a major effect on an entity’s operations and financial results when the component meets the criteria to be classified as held for sale or is disposed. The amendments in this update also require additional disclosures about discontinued operations and disposal of an individually significant component of an entity that does not qualify for discontinued operations. ASU 2014-08 is effective for annual and interim periods beginning after December 15, 2014. Early adoption is permitted. The impact of the adoption of ASU 2014-08 on our consolidated financial position, results of operations and liquidity will depend on, and may be significant depending on, the size and nature of our future disposal.
In May 2014, the FASB issued ASU No. 2014-09, “Revenue from Contracts with Customers (Topic
606)." Under the new standard, an entity should recognize revenue to depict the transfer of promised goods or services to customers in an amount that reflects the consideration to which the entity expects to be entitled in exchange for those goods or services. An entity should recognize revenue when (or as) it satisfies a performance obligation by transferring a promised good or service to a customer, and the transaction price should be allocated to the performance obligation in the contract. The new standard also requires an entity to disclose sufficient information to enable users of financial statements to understand the nature, amount, timing, and uncertainty of revenue and cash flows arising from contracts with customers. ASU 2014-09 is effective for annual and interim periods beginning after December 15, 2016. Early application is not permitted. We are currently evaluating the potential impact from adopting ASU 2014-09 on our consolidated financial position, results of operations and liquidity.
82
Application of Critical Accounting Policies Nidec Corporation and its subsidiaries in Japan maintain their records and prepare their financial
statements in accordance with accounting principles generally accepted in Japan, and its foreign subsidiaries in conformity with those of their countries of domicile. Certain adjustments and reclassifications have been incorporated in the accompanying consolidated financial statements to conform to U.S. GAAP. The preparation of these financial statements requires the use of estimates, judgments and assumptions that affect the reported amounts of assets and liabilities at the date of financial statements and the reported amounts of revenues and expenses during the periods presented. Actual results may differ from these estimates, judgments and assumptions.
An accounting estimate in our financial statements is a critical accounting estimate if it requires us to
make assumptions about matters that are highly uncertain at the time the accounting estimate is made, and either different estimates that we reasonably could have used in the current period, or changes in the accounting estimate that are reasonably likely to occur from period to period, would have a material impact on the presentation of our financial condition, changes in financial condition or results of operations. We have identified the following critical accounting policies with respect to our financial presentation.
Inventories
Our inventories are stated at the lower of cost or market value. Cost is determined principally using
the weighted average cost method and the market value is mainly based on net realizable value less direct sales costs. These products are exposed to frequent innovation, the introduction of new products to the market and short product life cycles due to rapid technological advances and model changes. We periodically assess the market value of our inventory, based on sales trends and forecasts and technological changes and write off inventories with no movement for one year or when it is apparent that there is no possibility of future sales or usage. We may have to recognize large amounts of inventory write-offs as a result of an unexpected decline in market conditions, changes in demand or our product line.
Other-than-temporary Losses on Marketable Securities
We review the market value of our marketable securities at the end of each fiscal quarter. Our
marketable securities consist of available-for-sale securities and held-to-maturity securities. Other-than-temporary losses on individual marketable securities are charged to income in the period as incurred. Losses on available-for-sale securities are classified as other-than-temporary based on the length of time and the extent to which the fair value has been less than the carrying amount. Our management employs a systematic methodology to assess the recoverability of such investments by reviewing the financial position of underlying companies and prevailing market conditions in which these companies operate to determine if our investment in each of these companies is impaired and whether the impairment is other-than-temporary. Held-to-maturity securities are recorded at amortized cost and adjusted for the amortization or accretion of premiums or discounts.
We believe that the accounting estimate related to investment impairment is a critical accounting
policy because:
• it is highly susceptible to change from period to period because it requires our management to make assumptions about future financial condition and cash flows of investees; and
• the impact that recognizing an impairment would have on the total assets reported on our balance sheet as well as our net income attributable to Nidec Corporaiton would be material.
As of March 31, 2014, the estimated fair value of our marketable securities was ¥14,785 million. We recorded a net gain from marketable securities in the amount of ¥245 million for the year ended March 31,
83
2014. The following table shows the other-than-temporary losses on marketable securities.
Year ended March 31,
2012 2013 2014
(in millions)
Other-than-temporary losses on marketable securities ¥253 ¥435 ¥3
Allowance for Doubtful Accounts
We maintain an allowance for doubtful accounts based on the historical rate of credit losses
experienced. We additionally provide allowances for specific customer accounts deemed uncollectible. Management assesses the need for specific allowances based on changes in the customers’ financial condition and length of time the account has remained overdue. As our customer base is highly concentrated, the nonfulfillment or delay in payment caused by even one of our major customers may require us to record a significant additional allowance. For the year ended March 31, 2014, sales to our two largest customers represented approximately 17% of our net sales. Our accounts receivable are likewise concentrated. At March 31, 2014, the two customers represented ¥17,706 million, or 10%, of our gross accounts receivable. In addition, during economic downturns, a certain number of our customers may have difficulty with their cash flows.
Although we believe that we can make reliable estimates for doubtful accounts, customer
concentrations as well as overall economic conditions may affect our ability to accurately estimate the allowance for doubtful accounts. Our allowance for doubtful accounts amounted to ¥1,126 million as of March 31, 2014. Our trade notes and accounts receivable balance, net of allowance for doubtful accounts, as of March 31, 2014, was ¥196,284 million.
The following table shows the provision for doubtful accounts, net of reversal.
Year ended March 31,
2012 2013 2014 (in millions)
Provision for doubtful accounts, net of reversal ¥30 ¥166 ¥366
Deferred Tax Assets
As part of the process of preparing our consolidated financial statements, we are required to estimate
our income taxes in each of the jurisdictions in which we operate. This process requires us to estimate our actual current tax exposure together with assessing temporary differences resulting from differing treatment of items, such as deferred revenue, for tax and accounting purposes. These differences resulted in deferred tax assets and liabilities, which were included within our consolidated balance sheet. As of March 31, 2014, we had deferred tax assets in the amount of ¥32,840 million. We must then assess the likelihood that our deferred tax assets will be recovered from future taxable income and to the extent we believe that recovery is not likely, we must establish a valuation allowance. To the extent we establish a valuation allowance or increase this allowance in a period, we must include an expense within the tax provision in our income statement.
Significant management judgment is required in determining our provision for income taxes, our
deferred tax assets and liabilities and any valuation allowance recorded against our net deferred tax assets. We have recorded a valuation allowance of ¥14,561 million as of March 31, 2014, due to uncertainties related to our ability to utilize some of our deferred tax assets, primarily consisting of certain net operating losses carried forward for tax purposes incurred by our subsidiaries. Our determination to record valuation allowances is
84
based on a history of unprofitable periods by the subsidiaries and their estimated future profitability. In the event that actual results differ from these estimates or we adjust these estimates in future periods, we may need to establish an additional valuation allowance which could have an adverse effect on our financial position and results of operations.
Impairment of Long-lived Assets
Long-lived assets consist primarily of property, plant and equipment, comprising approximately
25.6% of our total assets as of March 31, 2014, and other intangible assets. We carefully monitor the appropriateness of the estimated useful lives of these assets. Since the fiscal year ended March 31, 2003, the first year we adopted testing for impairment of long-lived assets under ASC 360 "Property, Plant and Equipment", whenever events or changes in circumstances indicate that the carrying amounts of these asset groups may not be recoverable, we have reviewed the respective asset groups for impairment. An impairment loss is recognized when the carrying amount of an asset group exceeds the estimated undiscounted future cash flows of the group. We review idle assets for possible impairment based on their condition or based on the probability of future use. Changes in technology, market demand, our planned product mix, or in our intended use of these assets, may cause the estimated period of use or the value of these assets to change. In addition, changes in general industry conditions such as increased competition could cause the value of a certain amount of these assets to change. Estimates and assumptions used in both estimating the useful life and evaluating potential impairment issues require a significant amount of judgment. As such, our judgment as to the recoverability of capitalized amounts and the amount of any impairment will be significantly impacted by such factors.
Acquisitions
In recent years, we have made a number of significant business acquisitions, which had been
accounted for using the purchase method of accounting until the fiscal year ended March 31, 2009. As of April 1, 2009, we adopted ASC 805 “Business Combinations”. ASC 805 requires that business acquisitions be accounted for using the acquisition method of accounting. Application of the purchase method and the acquisition method requires our management to make complex judgments about the measurement of fair value of the net assets we acquire and estimation of the related useful lives. The determinations of fair value of assets and liabilities are primarily based on factors such as a cash flow analysis and quoted market prices among others. We also obtained independent appraisers' reports for significant purchases.
Valuation of Goodwill
Under ASC 350 “Intangibles — Goodwill and Other”, goodwill acquired in business combinations is
not amortized but tested annually for impairment. We test for impairment at the reporting unit level on January 1 of each year. In addition, we test for impairment between annual tests if an event occurs or circumstances change that would more likely than not reduce the fair value of a reporting unit below its carrying amount. Factors we consider important which could trigger an impairment review include the following:
• significant underperformance relative to expected historical or projected future operating results;
• significant changes in the manner of our use of the acquired assets or the strategy for our overall business;
• significant negative industry or economic trends;
• significant decline in the stock price of the acquired entity for a sustained period; and
• market capitalization of the acquired entity relative to its net book value.
85
This test is a two-step process. The first step of the goodwill impairment test, used to identify potential impairment, compares the fair value of the reporting unit with its carrying amount, including goodwill. If the fair value, which is based on discounted future cash flows, exceeds the carrying amount, goodwill is not considered impaired. If the carrying amount exceeds the fair value, the second step must be performed to measure the amount of the impairment loss, if any. The second step compares the implied fair value of the reporting unit’s goodwill with the carrying amount of that goodwill.
In order to evaluate the sensitivity of the fair value calculations on the impairment analysis, we apply
a hypothetical decrease to the fair value of each reporting unit. Based on our discounted cash flow models, at the test date, there was sufficient fair value above the carrying amount of each reporting unit so that we would not expect near term changes in the operating results to trigger an impairment. Also, among the reporting units, when testing the goodwill for impairment allocated to our listed subsidiaries, consideration is given to each listed subsidiary’s carrying amount and its market capitalization adjusted to include an estimated control premium, among other factors. The estimated control premium is derived from reviewing observable transactions involving the purchase of controlling interests in comparable companies. Although exchange traded, trading volumes may be low and the markets for the listed subsidiaries shares may not always be highly liquid. The market capitalization before including the estimated control premium is calculated using the relevant shares outstanding and a stock price at the test date.
When we determine that the carrying value of goodwill and other intangibles may not be recoverable,
based upon the existence of one or more of the above indicators of impairment, we measure any impairment based on a projected discounted cash flow determined by our management to be commensurate with the risk inherent in our current business model. These models include assumptions which are subject to uncertainty, including forecasted cash flows, changes in technology, customer demand and the pace of economic recovery from natural disasters, which could differ from actual performance. Goodwill amounted to ¥154,927 million as of March 31, 2014.
Pension Plans
We account for our defined benefit pension plans based on actuarial valuations. For periodic pension
calculation, we are required to assume some components, which include expected return on plan assets, discount rate, rate of increase in compensation levels and average remaining years of service. We use long-term historical actual return information and estimated future long-term investment returns by reference to external sources to develop our expected rate of return on plan assets. The discount rate is assumed based on the rates available on high-quality fixed-income debt instruments (rated AA by a recognized rating agency) for which the timing and amount of cash inflows approximates the estimated outflows of the defined benefit plan. We assume a rate of increase in compensation levels and average remaining years of service based on our historical data. Changes in these assumptions will have an impact on our net periodic pension cost.
The following table shows the sensitivity to a change in discount rates and the expected rate of return
on plan assets, holding all other assumptions constant.
Yen in millions
Effect on pre-tax income Effect on pension benefit obligation
For the year ending March 31, 2015 As of March 31, 2014
Discount rates 0.5% decrease ¥13 ¥2,162 0.5% increase (27) (2,144)
Expected rate of return on plan assets 0.5% decrease ¥(108) 0.5% increase 108
86
Income Taxes We adopted FASB Accounting Standards Codification™ (ASC) 740 “Income Taxes” on April 1,
2007. We consider many factors when evaluating and estimating income tax uncertainties. These factors include an evaluation of the technical merits of the tax positions as well as the amounts and probabilities of the outcomes that could be realized upon settlement. The actual resolutions of those uncertainties will inevitably differ from those estimates, and such differences may be material to the financial statements.
Revenue recognition
We recognize revenue when persuasive evidence of an arrangement exists, delivery has occurred, the
sales price is fixed or determinable and collectibility is reasonably assured. For small precision motors, automotive, appliance, commercial and industrial products, and electronic and optical components, these criteria are generally met at the time a product is delivered to the customers’ site, which is the time the customer has taken title to the product and the risk and rewards of ownership have been substantively transferred. These conditions are met at the time of delivery to customers in domestic sales (FOB destination) and at the time of shipment for export sales (FOB shipping point). Revenue for machinery sales is recognized upon receipt of final customer acceptance. At the time the related revenue is recognized, we make provisions for estimated product returns. Revenue from a part of sales of automotive, appliance, commercial and industrial products under long-term construction type arrangements are recognized under the percentage-of-completion method. Under the percentage-of-completion method, revenue is recognized as a percentage of estimated total revenue that incurred costs to date bear to estimated total costs after giving effect to estimates of costs to complete based upon the most recent information.
B. Liquidity and Capital Resources. Our primary sources of liquidity include our net cash flows from operating activities and long-term
debt. A critical part of our liquidity management to improve our cash flows is our focus on efficient use of working capital, which is defined as current assets less current liabilities. Between March 31, 2013 and March 31, 2014, our working capital increased from ¥135,813 million to ¥333,553 million, as described below. In an effort to efficiently use our working capital, we continue to make effective use of our cash management system, where cash is managed and shared among our subsidiaries in Japan and among our subsidiaries in China, respectively.
We had cash and cash equivalents of ¥247,740 million as of March 31, 2014, compared to ¥193,420
million as of March 31, 2013. As of March 31, 2014, approximately 87% of our cash and cash equivalents were held by our consolidated subsidiaries outside of Japan.
Cross-border cash transfers between group companies are subject to restrictions in certain
circumstances. Where local restrictions prevent efficient intercompany transfers of funds, particularly to Nidec Corporation from its subsidiaries outside of Japan, Nidec Corporation seeks to meet its liquidity needs through ongoing cash flows, external borrowings, or both, as further discussed below. We do not expect such restrictions on transfers of funds held outside of Japan to have a material effect on our overall liquidity, financial condition or results of operations.
Our principal capital needs include (1) purchases of property, plant and equipment and other assets,
(2) research and development activities, (3) purchases of raw materials, (4) employees’ salaries, wages and other payroll costs, (5) mergers and acquisitions, (6) investments in subsidiaries, (7) repayment of short-term borrowings and long-term debt, and (8) repurchase of shares of our common stock. As of March 31, 2014, we had ¥166,383 million of trade notes and accounts payable, ¥22,600 million of short-term borrowings, and ¥328,656 million of long-term debt, including the current portion of long-term debt. As of the same date, we had unused lines of credit from banks amounting to ¥228,674 million, under which we are authorized to obtain
87
short-term financing at prevailing interest rates. Investments for the purchase of property, plant, equipment and other assets totaled ¥40,297 million for
the year ended March 31, 2014. We plan to invest approximately ¥18,278 million in additions to the property, plant and equipment for the year ending March 31, 2015. Outstanding commitments for the purchase of property, plant and equipment and other assets amounted to ¥2,425 million as of March 31, 2014.
Research and development expenses were ¥37,808 million for the year ended March 31, 2014, and are
expected to reach approximately ¥45,000 million for the year ending March 31, 2015. For further information on our research and development expenses, see “—C. Research and Development, Patents and Licenses, etc.”
In the year ended March 31, 2014, we acquired Nidec Sankyo CMI for ¥5,228 million in cash and
Nidec Elesys Corporation (renamed from “Honda Elesys Co., Ltd.”) and its subsidiaries (“Nidec Elesys”) for ¥24,320 million in cash. We intend to continue to seek opportunities for acquiring other companies and making additional investments in our subsidiaries.
Our short-term borrowings, consisting of bank loans was ¥22,600 million as of March 31, 2014, a
decrease of ¥10,198 million from ¥32,798 million as of March 31, 2013. This decrease was mainly due to repayment of yen-denominated short-term borrowings with a portion of the proceeds from the issuance in December 2013 of ¥50,000 million aggregate principal amount of corporate bonds due 2016, as further discussed below. We had no commercial paper outstanding as of March 31, 2014 and the date of this report.
Our current portion of long-term debt was ¥29,245 million as of March 31, 2014, a decrease of
¥104,383 million from ¥133,628 million as of March 31, 2013. This decrease was mainly due to the reclassification of approximately ¥96,000 million aggregate principal amount of zero coupon euro yen convertible bonds due 2015 from current portion of long-term debt to long-term debt, as the unexercised early redemption right attached to the convertible bonds expired on September 20, 2013. Prior to the expiration, holders of ¥4,250 million aggregate principal amount of such convertible bonds exercised their early redemption right. As a result, our current portion of long-term debt as of March 31, 2014 consisted of the current portion of the Euro-denominated and U.S. dollar-denominated bank loans we obtained in July 2012 and December 2012, respectively, under a special government program, as further described below.
Our long-term debt was ¥299,411 million as of March 31, 2014, an increase of ¥153,140 million from
¥146,271 million as of March 31, 2013. This increase was mainly due to the reclassification of the outstanding convertible bonds from current portion of long-term debt to long-term debt, the proceeds from the issuance in December 2013 of ¥50,000 million aggregate principal amount of domestic bonds due 2016, as further described below, and new borrowings of ¥30,000 million from banks on a yen basis in March 2014. This was partially offset by the reclassification of portions of the Euro-denominated and U.S. dollar-denominated bank loans, as further described below, from long-term debt to current portion of long-term debt. As a result, our long-term debt as of March 31, 2014 consisted of the approximately ¥96,000 million aggregate principal amount of the outstanding convertible bonds, ¥50,000 million aggregate principal amount of domestic bonds issued in December 2013, the remaining portions of the Euro-denominated and U.S. dollar-denominated bank loans, and ¥100,000 million aggregate principal amount of domestic bonds issued in November 2012 as described below, and the new borrowings of ¥30,000 million from banks on a yen basis.
In July 2012, in an effort to reduce financing costs and foreign exchange risks, we borrowed €240
million from major Japanese private commercial banks based on Euro-denominated credit lines to fund our future acquisition transactions under a special program of the Japan Bank for International Cooperation (“JBIC”), which has been implemented in response to the appreciation of the Japanese yen against other currencies. In December 2012, we borrowed an additional $500 million from major Japanese private commercial banks based on U.S. dollar-denominated credit lines to fund our acquisition transactions under the JBIC program. As of March 31, 2014, we had €60 million and $333 million of loans outstanding under the program, which were recorded in long-term debt and current portion of long-term debt on our audited
88
consolidated balance sheet as of the same date. In November 2012, we issued ¥65,000 million aggregate principal amount of domestic corporate
bonds due 2017, ¥15,000 million aggregate principal amount of domestic corporate bonds due 2019, and ¥20,000 million aggregate principal amount of domestic corporate bonds due 2022. The net proceeds from the issuance of the bonds were primarily used to repay commercial paper and other short-term borrowings. In addition, in December 2013, we issued ¥50,000 million aggregate principal amount of domestic corporate bonds due 2016. The net proceeds from the issuance of the bonds were primarily used to repay short-term borrowings. These bonds were issued pursuant to a shelf registration statement we filed with the Director General of the Kanto Local Finance Bureau of the Ministry of Finance of Japan in March 2012 for the issuance from time to time of up to ¥200,000 million aggregate principal amount of bonds in Japan between April 5, 2012 and April 4, 2014. The shelf registration was intended to enhance our flexibility and agility in obtaining funding as an alternative source of funding in addition to financing through financial institutions and other sources and, through the further diversification of funding sources, improve our financial stability.
In addition, In March 2014, we filed a shelf registration statement with the Director General of the
Kanto Local Finance Bureau of the Ministry of Finance of Japan for the issuance from time to time of up to ¥200,000 million aggregate principal amount of bonds in Japan between April 5, 2014 and April 4, 2016. The shelf registration was intended to further enhance our flexibility and agility in obtaining funding from the capital markets as an alternative source of funding in addition to financing through financial institutions and other sources and, through the further diversification of funding sources, improve our financial stability. We plan to use the net proceeds from any future issuances of such bonds for equipment and machinery, investments, repayment and redemption of short-term borrowings, bonds and other long-term debt, and general corporate purposes, including working capital and other operating expenses. As of the date of this annual report, we have not issued any bonds under the shelf registration statement.
A substantial portion of our unsecured funding is raised by the parent company (Nidec Corporation),
and is then lent to its subsidiaries to meet their respective capital requirements. Under this subsidiary funding policy, we seek to lower the financing cost, maintain sufficient line of credit, and ensure agile funding for our group companies.
We expect to seek additional financing in connection with, among other things, our future mergers and
acquisitions, research and development activities, and facility investments. We may also consider and obtain additional financing in order to enhance our financial agility in mergers and acquisitions, research and development activities, and facility investments in the future.
We currently have a share repurchase plan pursuant to which we are authorized to repurchase the
smaller of an aggregate of 4,000,000 shares of our common stock and an aggregate of ¥24,000 million between January 27, 2014 and January 26, 2015. On January 24, 2014, our previous share repurchase plan expired. Under the plan, we repurchased an aggregate of 1,000,000 shares for approximately ¥2,700 million between April 1, 2013 and January 24, 2014. We did not repurchase any shares under the plan between January 27, 2014 and May 31, 2014.
For more information on our stock repurchase plan, see “Item 16E. Purchases of Equity Securities by
the Issuer and Affiliated Purchasers.” For information on our recent share exchange transactions and other mergers and acquisitions, see “—A. Operating Results—Introduction—Our Recent Acquisition Activities.”
In October, 2013, we entered into a share exchange transaction with each of Nidec Copal Corporation
and Nidec Tosok Corporation to make each a wholly owned subsidiary. Prior to the transactions, we had a 66.5% ownership interest in Nidec Copal and a 72.3% ownership interest in Nidec Tosok. In connection with the transactions, we allocated 4,856,764 shares of our common stock previously held in treasury to Nidec Copal shareholders and 2,624,000 shares of our common stock previously held in treasury to Nidec Tosok shareholders.
89
We believe that these funding sources, together with our cash flows from operations and undrawn
credit lines will sufficiently meet our capital requirements for the fiscal year ending March 31, 2015.
Assets, liabilities and shareholders’ equity
Our total assets increased ¥160,501 million, or 16.0%, from ¥1,005,417 million as of March 31, 2013
to ¥1,165,918 million as of March 31, 2014. Excluding the impact of Nidec Sankyo CMI, Nidec Elesys and other subsidiaries newly consolidated during the year ended March 31, 2014, total assets increased ¥115,266 million from ¥1,005,417 million as of March 31, 2013 to ¥1,120,683 million as of March 31, 2014. The increase in total assets of ¥160,501 million was primarily due to an increase in cash and cash equivalents of ¥54,320 million as described below under “Cash Flows,” and an increase in trade accounts receivable of ¥35,490 million as a result of the increase in sales and the depreciation of the Japanese yen against other currencies. The increase in total assets was also due to an increase in inventories of ¥24,055 million as a result of stronger customer demand and the stronger Japanese yen, an increase of goodwill of ¥22,152 million as a result of our acquisitions of Nidec Sankyo CMI and Nidec Elesys, and an increase in property, plant and equipment of ¥20,904 million mainly due to our acquisitions and the stronger Japanese yen.
Our total liabilities increased ¥73,413 million, or 13.3%, from ¥551,600 million as of March 31, 2013
to ¥625,013 million as of March 31, 2014. Excluding the impact of Nidec Sankyo CMI, Nidec Elesys and other subsidiaries newly consolidated during the year ended March 31, 2014, total liabilities increased ¥25,166 million from ¥551,600 million as of March 31, 2013 to ¥576,552 million as of March 31, 2014. The increase in total liabilities of ¥73,413 million was due in part to an increase in long-term debt, including current portion of long-term debt, of ¥48,757 million, due to the issuance in December 2013 of ¥50,000 million aggregate principal amount of domestic corporate bonds due 2016 as described above and the new long-term borrowings of ¥30,000 million from banks on a yen basis, partially offset by the early redemption of ¥4,250 million aggregate principal amount of convertible bonds due 2015 and the partial repayments on the Euro-denominated and U.S. dollar-denominated bank loans under the JBIC program. The increase in total liabilities was also due to an increase in trade notes and accounts payable of ¥32,218 million, reflecting stronger customer demand and the depreciation of the Japanese yen against other currencies. These increases in liabilities were partially offset by a decrease in short-term borrowings of ¥10,198 million primarily as a result of our repayment of yen-denominated borrowings with the proceeds from the issuance of domestic corporate bonds in December 2013.
Our working capital, defined as current assets less current liabilities, increased ¥197,740 million from
¥135,813 million as of March 31, 2013 to ¥333,553 million as of March 31, 2014. This increase was mainly due to a decrease in current portion of long-term debt of ¥104,383 million primarily resulting from the reclassification of the approximately ¥96,000 million aggregate principal amount of the outstanding convertible bonds due 2015 from current portion of long-term debt to long-term debt, and an increase in cash and cash equivalents of ¥54,320 million as described below under “Cash Flows.”
Our receivable turnover ratio is calculated by dividing net sales for a fiscal year by the fiscal year-end
trade notes and accounts receivable balance. Our receivable turnover ratio was 4.5 points for each of the years ended March 31, 2013, and 2014. The inventory turnover ratio is calculated by dividing cost of products sold for a given year by the year-end inventory balance. Our inventory turnover ratio decreased 0.3 points from 5.7 points for the year ended March 31, 2013 to 5.4 points for the year ended March 31, 2014. This was mainly due to an increase in inventories as a result of our acquisitions.
Our total Nidec Corporation shareholders’ equity increased ¥102,448 million, or 24.6%, from
¥415,653 million as of March 31, 2013 to ¥518,101 million as of March 31, 2014. This increase was primarily due to an increase in retained earnings of ¥44,979 million, an increase in positive foreign currency translation adjustments of ¥41,903 million, which reflected the depreciation of the Japanese yen against other currencies,
90
and a decrease in treasury stock, at cost, of ¥17,367 million primarily due to our share exchange transactions with some of our consolidated subsidiaries to make them wholly owned subsidiaries. As a result of the foregoing, the ratio of Nidec Corporation shareholders’ equity to total assets increased 3.1 percentage points from 41.3% as of March 31, 2013 to 44.4% as of March 31, 2014.
Cash Flows
Cash Flows from Operating Activities
Net cash provided by operating activities decreased ¥23,067 million from ¥110,286 million for the
year ended March 31, 2013 to ¥87,219 million for the year ended March 31, 2014. The decrease in net cash provided by operating activities was primarily due to the negative impact of changes in operating assets and liabilities of ¥70,794 million, which consisted of an increase in operating assets of ¥97,512 million and an increase in operating liabilities of ¥26,718 million, partially offset by the increase in consolidated net income of ¥52,061 million.
For the year ended March 31, 2014, we had ¥87,219 million of net cash inflows provided by operating
activities primarily due to consolidated net income of ¥58,910 million. However, net cash provided by operating activities were negatively impacted by changes in operating assets and liabilities of ¥12,003 million, which consisted of an increase in operating assets of ¥30,201 million and an increase in operating liabilities of ¥18,198 million. Operating assets and operating liabilities increased primarily due to the increase in sales, reflecting stronger customer demand towards the end of March 31, 2014 compared to the same period of the previous year.
For the year ended March 31, 2013, we had ¥110,286 million of net cash inflows provided by
operating activities primarily due to the positive impact of changes in operating assets and liabilities of ¥58,791 million, which consisted of a decrease in operating assets of ¥67,311 million and a decrease in operating liabilities of ¥8,520 million. The decrease in operating assets was primarily due to efforts to shorten our account receivable collection periods and to reduce inventories through improved management of, and coordination between, our manufacturing and sales operations. In addition, consolidated net income was ¥6,849 million.
Net cash provided by operating activities increased ¥53,574 million from ¥56,712 million for the year
ended March 31, 2012 to ¥110,286 million for the year ended March 31, 2013. The increase in net cash provided by operating activities was primarily due to the positive impact of changes in operating assets and liabilities of ¥84,187 million, partially offset by the decrease in consolidated net income of ¥37,438 million.
For the year ended March 31, 2013, we had ¥110,286 million of net cash inflows provided by
operating activities primarily due to the positive impact of changes in operating assets and liabilities of ¥58,791 million, which consisted of a decrease in operating assets of ¥67,311 million and a decrease in operating liabilities of ¥8,520 million. The decrease in operating assets was primarily due to efforts to shorten our account receivable collection periods and to reduce inventories through improved management of, and coordination between, our manufacturing and sales operations. In addition, consolidated net income was ¥6,849 million.
For the year ended March 31, 2012, we had ¥56,712 million of cash inflows provided by operating
activities mainly due to consolidated net income of ¥44,287 million. However, net cash provided by operating activities were negatively impacted by changes in operating assets and liabilities of ¥25,396 million, which consisted of an increase in operating assets of ¥15,076 million and a decrease in operating liabilities of ¥10,320 million. The increase in operating assets of ¥15,076 million was primarily due to the recovering demand of some customers for our products subsequent to the flooding in Thailand.
91
Cash Flows from Investing Activities Net cash used in investing activities decreased ¥70,676 million from ¥133,854 million for the year
ended March 31, 2013 to ¥63,178 million for the year ended March 31, 2014. The decrease in net cash used in investing activities was primarily due to a decrease in acquisitions of business, net of cash acquired, of ¥56,534 million and a decrease in additions to property, plant and equipment of ¥21,071 million.
For the year ended March 31, 2014, we had ¥63,178 million of net cash outflows in investing
activities mainly due to additions to property, plant and equipment of ¥40,297 million and acquisitions of business, net of cash acquired, of ¥23,350 million.
For the year ended March 31, 2013, we had ¥133,854 million of net cash outflows in investing
activities mainly due to acquisitions of business, net of cash acquired, of ¥79,884 million and additions to property, plant and equipment of ¥61,368 million.
Net cash used in investing activities increased ¥113,936 million from ¥19,918 million for the year
ended March 31, 2012 to ¥133,854 million for the year ended March 31, 2013. The increase in net cash used in investing activities was primarily due to an increase in acquisitions of business, net of cash acquired, of ¥85,085 million, a decrease in insurance proceeds related to property, plant and equipment damaged in flood of ¥19,924 million, and an increase in additions to property, plant and equipment of ¥19,922 million.
For the year ended March 31, 2013, we had ¥133,854 million of net cash outflows in investing
activities mainly due to acquisitions of business, net of cash acquired, of ¥79,884 million and additions to property, plant and equipment of ¥61,368 million.
For the year ended March 31, 2012, ¥19,918 million of cash outflows was mainly due to additions to
property, plant and equipments of ¥41,446 million, which was partially offset by insurance proceeds related to property, plant and equipment damaged in flood of ¥20,804 million.
Cash Flows from Financing Activities Net cash provided by financing activities decreased ¥47,646 million from ¥61,117 million for the year
ended March 31, 2013 to ¥13,471 million for the year ended March 31, 2014. The decrease in net cash provided by financing activities was primarily due to decreases in proceeds from issuance of corporate bonds of ¥50,000 million and proceeds from issuance of long-term debt of ¥41,307 million, and an increase in repayments of long-term debt of ¥21,931 million, partially offset by the decreases in short-term borrowings of ¥40,378 million and purchases of treasury stock of ¥28,439 million.
For the year ended March 31, 2014, we had ¥13,471 million of net cash inflows from financing
activities due to proceeds from issuance of corporate bonds of ¥50,000 million and proceeds from issuance of long-term debt of ¥30,000 million, partially offset by repayments of long-term debt of ¥34,323 million, a decrease in short-term borrowings of ¥11,821 million, and dividends paid to shareholders of Nidec Corporation of ¥11,425 million.
For the year ended March 31, 2013, we had ¥61,117 million of net cash inflows from financing
activities mainly due to ¥100,000 million of proceeds from issuance of corporate bonds and ¥71,307 million of proceeds from issuance of long-term debt, partially offset by a decrease in short-term borrowings of ¥52,199 million and purchases of treasury stock of ¥31,277 million.
92
Net cash provided by financing activities was ¥61,117 million for the year ended March 31, 2013,
while net cash used in financing activities was ¥814 million for the year ended March 31, 2012. For the year ended March 31, 2013, we had ¥61,117 million of net cash inflows from financing
activities mainly due to ¥100,000 million of proceeds from issuance of corporate bonds and ¥71,307 million of proceeds from issuance of long-term debt, partially offset by a decrease in short-term borrowings of ¥52,199 million and purchases of treasury stock of ¥31,277 million.
For the year ended March 31, 2012, ¥814 million of the cash outflows was primarily due to dividends
paid to shareholders of Nidec Corporation of ¥12,399 million and purchases of treasury stock of ¥10,155 million. Our cash inflows for the year ended March 31, 2012 resulted from an increase in short-term borrowings of ¥26,060 million.
Cash and Cash Equivalents As a result of the foregoing factors and the effect of exchange rate changes, our total outstanding
balance of cash and cash equivalents increased ¥54,320 million from ¥193,420 million as of March 31, 2013 to ¥247,740 million as of March 31, 2014. We hold our cash and cash equivalents primarily in U.S. dollars, Thai baht, Chinese yuan, Japanese yen, and Euros.
C. Research and Development, Patents and Licenses, etc. In order to remain competitive, we need to maintain the ability to create products with specialized
quality attributes that precisely meet the evolving performance and environmental requirements of our customers. In addition to the continued emphasis on improved running accuracy, controllability, compactness, operational quietness and energy efficiency, we have our research and development activities focus on designing ecology conscious and cost effective products that require less raw materials and energy to manufacture and operate in order to reduce our and our customers' environmental burden and manufacturing costs.
We allocate our research and development resources primarily towards the development of motors in
the “automotive, appliance, commercial and industrial products” and “small precision motors” categories with key priorities placed on the following areas:
• Prototype development targeted at new markets and applications,
• Design improvements intended to reduce raw materials used in our products and thereby achieving superior suitability for miniaturization and low-cost automation,
• Internal development of electronic control units and integrated modular motor drives for automotive systems, and
• Network-based, convergence research and development projects at Nidec Research Center, aimed at identifying, combining and evolving future mainstream technologies and products.
We incurred research and development expenses of ¥30,050 million, ¥34,278 million and ¥37,808
million for the fiscal years ended March 31, 2012, 2013 and 2014, respectively.
93
The following table sets forth our research and development expenses by operating segment for the year ended March 31, 2014: For the year ended
March 31, 2014
(in millions)
Nidec Corporation ..................................... ¥19,896 Nidec Electronics (Thailand) ..................... - Nidec (Zhejiang) ....................................... - Nidec (Dalian) ........................................... - Nidec Singapore ........................................ - Nidec (H.K.) ............................................. - Nidec Philippines ...................................... - Nidec Sankyo ............................................ 3,919 Nidec Copal .............................................. 2,050 Nidec Tosok .............................................. 831 Nidec Copal Electronics ............................ 1,435 Nidec Techno Motor .................................. 1,201 Nidec Motor .............................................. 4,689 Nidec Motors & Actuators ......................... 1,491 All Others ................................................. 2,296
Total ..................................................... ¥37,808 Much of our research and development is conducted by our domestic subsidiaries, which we then
reimburse for costs incurred. We also cooperate with our affiliates to conduct significant research and development. We anticipate spending approximately ¥45,000 million on research and development in the year ending March 31, 2015. We believe that our research and development expenses are sufficient for sustaining our competitiveness in the motor industry and other industries.
For more information on our research and development activities, see “Item 4.B. Information on the
Company—Business Overview—Product Development and Engineering.”
D. Trend Information. The information required by this item is set forth in "—A. Operating Results," "—B. Liquidity and
Capital Resources" and "Item 4.B. Information on the Company—Business Overview."
E. Off-Balance Sheet Arrangements. We have guaranteed approximately ¥60 million of bank loans for employees in connection with their
housing costs at March 31, 2014. If an employee defaults on his or her loan payments, we would be liable under the guarantees. The maximum undiscounted amount of our obligation to make future payments in the event of defaults is approximately ¥60 million. The current carrying amount of the liabilities for our obligations under the guarantees is zero.
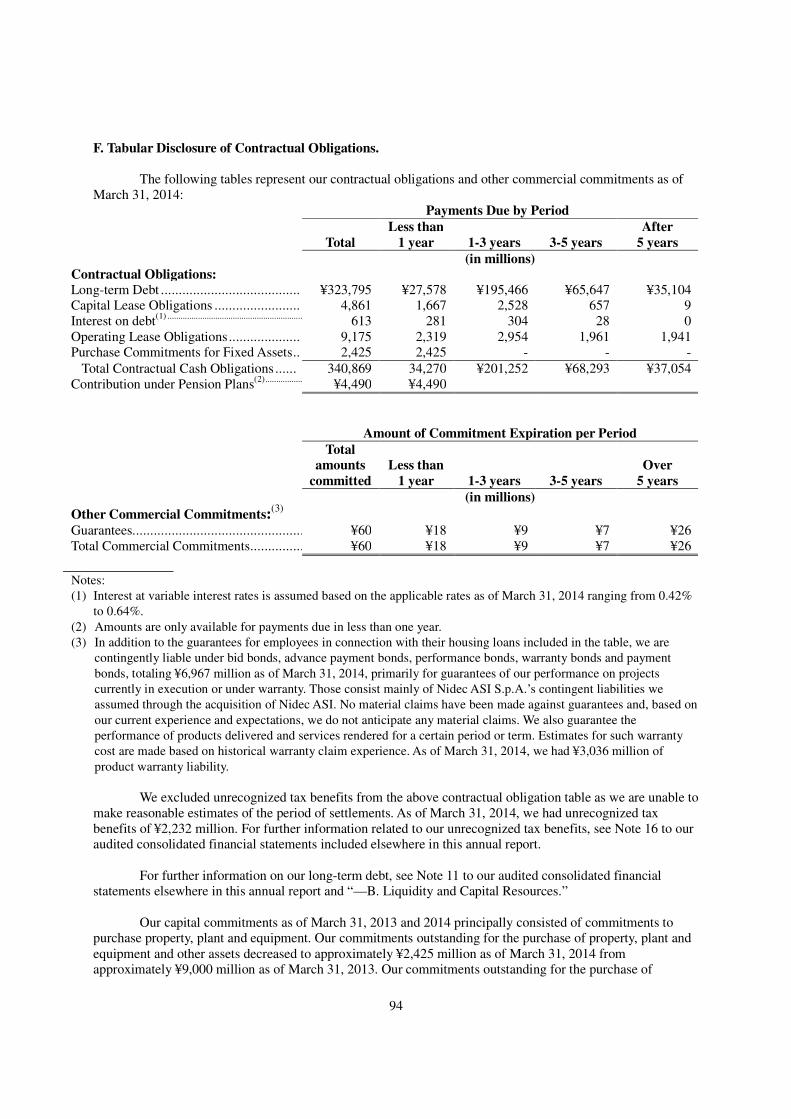
94
F. Tabular Disclosure of Contractual Obligations. The following tables represent our contractual obligations and other commercial commitments as of
March 31, 2014: Payments Due by Period
Total
Less than
1 year 1-3 years 3-5 years
After
5 years
(in millions) Contractual Obligations: Long-term Debt ....................................... ¥323,795 ¥27,578 ¥195,466 ¥65,647 ¥35,104 Capital Lease Obligations ........................ 4,861 1,667 2,528 657 9 Interest on debt
(1) ..............................................................613 281 304 28 0
Operating Lease Obligations .................... 9,175 2,319 2,954 1,961 1,941 Purchase Commitments for Fixed Assets .. 2,425 2,425 - - -
Total Contractual Cash Obligations ...... 340,869 34,270 ¥201,252 ¥68,293 ¥37,054 Contribution under Pension Plans
(2) .................¥4,490 ¥4,490
Amount of Commitment Expiration per Period
Total
amounts
committed
Less than
1 year 1-3 years 3-5 years
Over
5 years
(in millions)
Other Commercial Commitments:(3)
Guarantees................................................................¥60 ¥18 ¥9 ¥7 ¥26 Total Commercial Commitments ................................¥60 ¥18 ¥9 ¥7 ¥26
Notes:
(1) Interest at variable interest rates is assumed based on the applicable rates as of March 31, 2014 ranging from 0.42%
to 0.64%.
(2) Amounts are only available for payments due in less than one year.
(3) In addition to the guarantees for employees in connection with their housing loans included in the table, we are
contingently liable under bid bonds, advance payment bonds, performance bonds, warranty bonds and payment
bonds, totaling ¥6,967 million as of March 31, 2014, primarily for guarantees of our performance on projects
currently in execution or under warranty. Those consist mainly of Nidec ASI S.p.A.’s contingent liabilities we
assumed through the acquisition of Nidec ASI. No material claims have been made against guarantees and, based on
our current experience and expectations, we do not anticipate any material claims. We also guarantee the
performance of products delivered and services rendered for a certain period or term. Estimates for such warranty
cost are made based on historical warranty claim experience. As of March 31, 2014, we had ¥3,036 million of
product warranty liability.
We excluded unrecognized tax benefits from the above contractual obligation table as we are unable to
make reasonable estimates of the period of settlements. As of March 31, 2014, we had unrecognized tax benefits of ¥2,232 million. For further information related to our unrecognized tax benefits, see Note 16 to our audited consolidated financial statements included elsewhere in this annual report.
For further information on our long-term debt, see Note 11 to our audited consolidated financial
statements elsewhere in this annual report and “—B. Liquidity and Capital Resources.” Our capital commitments as of March 31, 2013 and 2014 principally consisted of commitments to
purchase property, plant and equipment. Our commitments outstanding for the purchase of property, plant and equipment and other assets decreased to approximately ¥2,425 million as of March 31, 2014 from approximately ¥9,000 million as of March 31, 2013. Our commitments outstanding for the purchase of
95
property, plant and equipment and other assets increased from approximately ¥7,292 million as of March 31, 2012 to approximately ¥9,000 million as of March 31, 2013. The fluctuations in our capital commitments between March 31, 2012 and 2014 were mainly due to the commitments for constructions of our new research and development facilities in Japan, which were completed in January 2014.
We expect to make capital expenditures in addition to those for which we have outstanding
commitments. See "Item 4.A. Information on the Company—History and Development of the Company." and Item 4.D. Information on the Company—Property, Plants and Equipment.”
G. Safe Harbor. See the discussion under “Special Note Regarding Forward-looking Statements.”
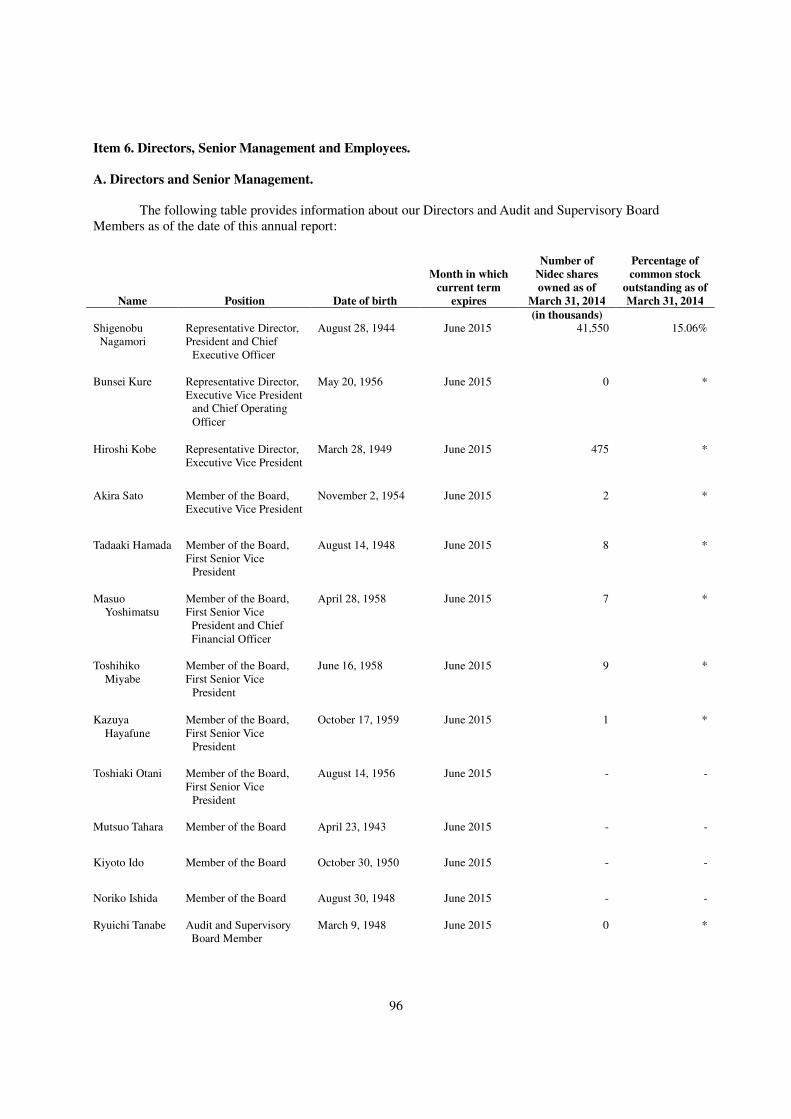
96
Item 6. Directors, Senior Management and Employees.
A. Directors and Senior Management. The following table provides information about our Directors and Audit and Supervisory Board
Members as of the date of this annual report:
Name Position Date of birth
Month in which
current term
expires
Number of
Nidec shares
owned as of
March 31, 2014
Percentage of
common stock
outstanding as of
March 31, 2014
(in thousands) Shigenobu
Nagamori Representative Director, President and Chief
Executive Officer
August 28, 1944 June 2015
41,550 15.06%
Bunsei Kure Representative Director, Executive Vice President
and Chief Operating Officer
May 20, 1956 June 2015
0 *
Hiroshi Kobe Representative Director, Executive Vice President
March 28, 1949 June 2015
475 *
Akira Sato Member of the Board, Executive Vice President
November 2, 1954 June 2015
2 *
Tadaaki Hamada Member of the Board, First Senior Vice
President
August 14, 1948 June 2015
8 *
Masuo Yoshimatsu
Member of the Board, First Senior Vice
President and Chief Financial Officer
April 28, 1958 June 2015
7 *
Toshihiko Miyabe
Member of the Board, First Senior Vice
President
June 16, 1958 June 2015
9 *
Kazuya Hayafune
Member of the Board, First Senior Vice
President
October 17, 1959 June 2015
1 *
Toshiaki Otani Member of the Board, First Senior Vice
President
August 14, 1956 June 2015
- -
Mutsuo Tahara Member of the Board April 23, 1943 June 2015
- -
Kiyoto Ido Member of the Board October 30, 1950 June 2015
- -
Noriko Ishida
Member of the Board August 30, 1948 June 2015
- -
Ryuichi Tanabe
Audit and Supervisory Board Member
March 9, 1948
June 2015
0 *
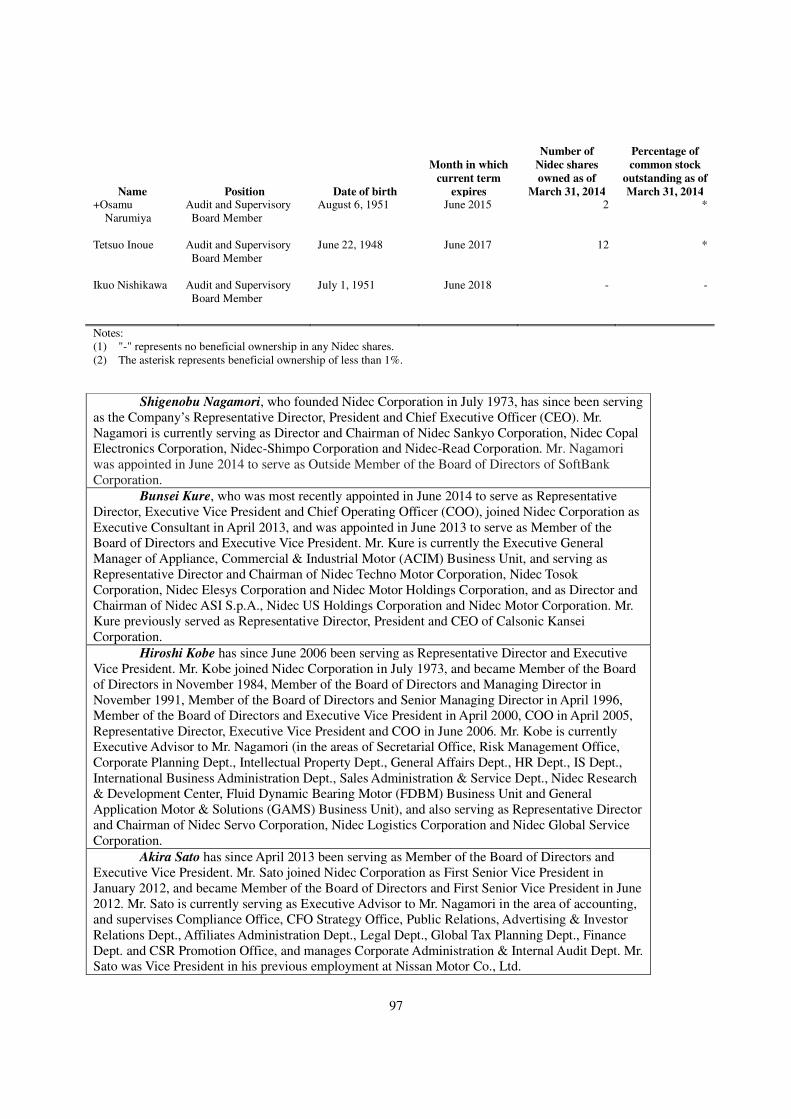
97
Name Position Date of birth
Month in which
current term
expires
Number of
Nidec shares
owned as of
March 31, 2014
Percentage of
common stock
outstanding as of
March 31, 2014 +Osamu
Narumiya
Audit and Supervisory Board Member
August 6, 1951
June 2015
2 *
Tetsuo Inoue Audit and Supervisory Board Member
June 22, 1948
June 2017 12 *
Ikuo Nishikawa Audit and Supervisory Board Member
July 1, 1951 June 2018 - -
Notes: (1) "-" represents no beneficial ownership in any Nidec shares. (2) The asterisk represents beneficial ownership of less than 1%.
Shigenobu Nagamori, who founded Nidec Corporation in July 1973, has since been serving as the Company’s Representative Director, President and Chief Executive Officer (CEO). Mr. Nagamori is currently serving as Director and Chairman of Nidec Sankyo Corporation, Nidec Copal Electronics Corporation, Nidec-Shimpo Corporation and Nidec-Read Corporation. Mr. Nagamori was appointed in June 2014 to serve as Outside Member of the Board of Directors of SoftBank Corporation.
Bunsei Kure, who was most recently appointed in June 2014 to serve as Representative Director, Executive Vice President and Chief Operating Officer (COO), joined Nidec Corporation as Executive Consultant in April 2013, and was appointed in June 2013 to serve as Member of the Board of Directors and Executive Vice President. Mr. Kure is currently the Executive General Manager of Appliance, Commercial & Industrial Motor (ACIM) Business Unit, and serving as Representative Director and Chairman of Nidec Techno Motor Corporation, Nidec Tosok Corporation, Nidec Elesys Corporation and Nidec Motor Holdings Corporation, and as Director and Chairman of Nidec ASI S.p.A., Nidec US Holdings Corporation and Nidec Motor Corporation. Mr. Kure previously served as Representative Director, President and CEO of Calsonic Kansei Corporation.
Hiroshi Kobe has since June 2006 been serving as Representative Director and Executive Vice President. Mr. Kobe joined Nidec Corporation in July 1973, and became Member of the Board of Directors in November 1984, Member of the Board of Directors and Managing Director in November 1991, Member of the Board of Directors and Senior Managing Director in April 1996, Member of the Board of Directors and Executive Vice President in April 2000, COO in April 2005, Representative Director, Executive Vice President and COO in June 2006. Mr. Kobe is currently Executive Advisor to Mr. Nagamori (in the areas of Secretarial Office, Risk Management Office, Corporate Planning Dept., Intellectual Property Dept., General Affairs Dept., HR Dept., IS Dept., International Business Administration Dept., Sales Administration & Service Dept., Nidec Research & Development Center, Fluid Dynamic Bearing Motor (FDBM) Business Unit and General Application Motor & Solutions (GAMS) Business Unit), and also serving as Representative Director and Chairman of Nidec Servo Corporation, Nidec Logistics Corporation and Nidec Global Service Corporation.
Akira Sato has since April 2013 been serving as Member of the Board of Directors and Executive Vice President. Mr. Sato joined Nidec Corporation as First Senior Vice President in January 2012, and became Member of the Board of Directors and First Senior Vice President in June 2012. Mr. Sato is currently serving as Executive Advisor to Mr. Nagamori in the area of accounting, and supervises Compliance Office, CFO Strategy Office, Public Relations, Advertising & Investor Relations Dept., Affiliates Administration Dept., Legal Dept., Global Tax Planning Dept., Finance Dept. and CSR Promotion Office, and manages Corporate Administration & Internal Audit Dept. Mr. Sato was Vice President in his previous employment at Nissan Motor Co., Ltd.
98
Tadaaki Hamada has since June 2009 been serving as Member of the Board of Directors and First Senior Vice President. Mr. Hamada, originally from The Mitsubishi Bank, Ltd.(currently, The Bank of Tokyo-Mitsubishi UFJ, Ltd.) which he joined in April 1971, joined Nidec Corporation as Executive Director in February 2000, and was appointed to serve as Member of the Board of Directors in June 2004, Managing Director in April 2005, and Member of the Board of Directors and Senior Vice President in June 2008. Mr. Hamada currently supervises Human Resources Dept. and Nidec Research and Development Center, manages Corporate Planning Dept., Intellectual Property Dept. and International Business Administration Dept. and is currently serving as General Manager of Corporate Planning Dept. as well as Chairman of Trade Control Committee for Security.
Masuo Yoshimatsu has since April 2013 been serving as Member of the Board of Directors, First Senior Vice President and Chief Financial Officer (CFO). Mr. Yoshimatsu joined Nidec Corporation as Executive Consultant in January 2008, and was appointed to serve as Member of the Board of Directors and Vice President in June 2008. He has since June 2009 served as Member of the Board, Senior Vice President and CFO. Mr. Yoshimatsu currently supervises Accounting Dept., manages CFO Strategy Office, Public Relations, Advertising & Investor Relations Dept., Global Tax Planning Dept., Finance Dept. and CSR Promotion Office, and serves as General Manager of CFO Strategy Office. He also serves as Director and Chairman of Nidec Management Shanghai Corporation. Mr. Yoshimatsu was Member of the Board of Directors and General Manager of Finance and Accounting Division in his previous employment at SS Pharmaceutical Co., Ltd.
Toshihiko Miyabe was most recently reappointed in June 2014 to serve as Member of the Board of Directors and First Senior Vice President. Mr. Miyabe joined Nidec Corporation in April 1983, and is currently serving as Executive General Manager of Fluid Dynamic Bearing Motor (FDBM) Business Unit and Senior General Manager of Production Division, as well as Director and Chairman of Nidec Electronics (Thailand) Co., Ltd., Nidec (Zhejiang) Corporation, Nidec Philippines Corporation and Nidec Subic Philippines Corporation.
Kazuya Hayafune, who was appointed to serve as Member of the Board of Directors and First Senior Vice President of Nidec Corporation in June 2013, joined Nidec as Executive Consultant in August 2010 and was appointed to serve as Vice President in October 2010, Senior Vice President in April 2012 and First Senior Vice President in January 2013. Mr. Hayafune is currently serving as Executive General Manager of Nidec Corporation’s Automotive Motor & Electronic Control (AMEC) Business Unit and Senior General Manager of Shiga Technical Center’s Engineering & Business Service Unit, as well as Representative Director, Chairman and CEO of Nidec Electronics GmbH, and Director and Chairman of Nidec Automobile Motor (Zhejiang) Corporation, Nidec Kaiyu Auto Electric (Jiangsu) Co., Ltd. and Nidec Automotive Motor Americas.
Toshiaki Otani, who was most recently appointed to serve as Member of the Board of Directors and First Senior Vice President of Nidec Corporation in June 2014, joined the Company as First Senior Vice President in April 2014. Mr. Otani, who is currently serving as Executive General Manager of Global Purchasing Management Division, was Senior Vice President in his previous employment at Nissan Motor Co., Ltd.
Mutsuo Tahara, who was most recently appointed to serve as Outside Member of the Board of Directors in June 2014, joined as an attorney Ryuzo Doku Law Firm in April 1969, Showa Law Office in April 1975 and Habataki Law Office in May 1998, and was appointed to serve as Outside Member of the Board of Directors of SG Holdings Co., Ltd. in March 2006, and as Judge in Japan’s Supreme Court in November 2006. Mr. Tahara is currently serving as Special Advisor to Habataki Law Office.
Kiyoto Ido, who was appointed to serve as Outside Member of the Board of Directors in June 2014, joined Japan’s Ministry of Finance in April 1973, and was appointed to serve as Consul of the Japanese Consulate General in Frankfurt, West Germany in March 1980, Deputy General Manager of Inter-American Development Bank’s Finance Bureau in July 1989, Director of the Japanese Ministry of Finance’s International Finance Bureau in June 1993, Counselor of Minister’s Secretariat (Deputy Vice Minister) and Deputy Director General of Minister's Secretariat (in charge of International Bureau) in July 1998, Minister of the Embassy of Japan in the USA in June 1999, Deputy Director General of Minister’s Secretariat for the Ministry of Finance of Japan (in charge of
99
International Bureau)in July 2002, Director General of International Bureau of the Ministry in July 2004 and Executive Director of the Bank of Japan in August 2006. Mr. Ido is currently serving as Deputy Chairman of the Institute for International Economic Studies (IIES).
Noriko Ishida has since June 2012 been serving as Outside Member of the Board of Directors. Ms. Ishida became Osaka Bar Association’s registered attorney in April 1976, Deputy Chairperson of the Association in April 2001, Executive Board Member of Japan Federation of Bar Associations in April 2010 and Refugee Examination Counselor in May 2010. Ms. Ishida is currently serving as President of Ishida Law Firm (currently, Lion Bashi Law Firm), Chairperson of Osaka Bar Association and Deputy Chairperson of Japan Federation of Bar Associations.
Ryuichi Tanabe was appointed to serve as Outside Member of the Audit and Supervisory Board in June 2011. Mr. Tanabe joined Ministry of Foreign Affairs of Japan in April 1970. He was appointed to serve as Director of Overseas Public Relations of Information Bureau in May 1986, and became Counselor of the Japanese Embassy in Germany in July 1988, Minister of the Japanese Embassy in Saudi Arabia in October 1990, Minister of the Japanese Embassy in Austria in August 1992, Consul-General in Munich, Germany in August 1994, Minister of the Japanese Embassy in India in July 1997, Director-General for International Affairs of the Tokyo Metropolitan Government in July 1999, Ambassador Extraordinary and Plenipotentiary of Japan to Serbia and Montenegro in April 2003, Ambassador Extraordinary and Plenipotentiary of Japan in charge of Afghanistan Assistance Coordination in September 2005, Ambassador Extraordinary and Plenipotentiary of Japan to Poland in September 2006, Ambassador Extraordinary and Plenipotentiary for Kansai Region in September 2009 and Representative of the Government of Japan in June 2010.
Osamu Narumiya was appointed to serve as Member of the Audit and Supervisory Board in June 2011. Mr. Narumiya joined the Ministry of International Trade and Industry (currently, Ministry of Economy, Trade and Industry) of Japan in April 1976. He was appointed to serve as First Secretary at the Embassy of Japan in Singapore in April 1987, and became Director of the Information Management Division at Minister’s Secretariat in May 1995, Deputy Director-General (responsible for bilateral cooperation) at the Minister’s Secretariat in July 2002, Director of the Japan Bicycle Racing Association in September 2003, and Senior Managing Director of the National Federation of Small Business Associations in June 2004. Mr. Narumiya joined Nidec Corporation as Executive Consultant in June 2007 and became Member of the Board in the same month. Mr. Narumiya served as Vice President of Nidec Corporation from June 2008 to June 2011.
Tetsuo Inoue was appointed to serve as Member of the Audit and Supervisory Board in June 2013. Mr. Inoue joined The Sumitomo Bank (currently, Sumitomo Mitsui Banking Corporation) in April 1972, joined Nidec Corporation as Executive Director in December 1999, and was appointed to serve as Member of the Board of Directors from June 2002 to June 2008, Member of the Board and Vice President from June 2008 to June 2010, and Member of the Board and Senior Vice President from June 2010 to June 2013.
Ikuo Nishikawa was most recently appointed to serve as Outside Member of the Audit and Supervisory Board in June 2014. Mr. Nishikawa joined Eikoh Company, Certified Public Accountants (currently, Ernst & Young ShinNihon LLC) in October 1974, and was appointed to serve as Representative Partner of Century Audit Corporation (currently, Ernst & Young ShinNihon LLC) in September 1990, Executive Director of the Japanese Institute of Certified Public Accountants in July 1995, Vice Chairman of Financial Accounting Standards Foundation’s Accounting Standards Board of Japan in August 2001 and Chairman of the Board in April 2007. Mr. Nishikawa is currently a professor at the Faculty of Business & Commerce of Keio University.
The following two individuals were elected Substitute Members of the Audit and Supervisory Board at the ordinary general shareholders meeting in June 2014. Pursuant to the Company law of Japan, in the event of termination of the office of an Audit and Supervisory Board Member prior to the expiration of the current term of his or her office, a Substitute Member succeeds to the office. In such event, the term of the office of the succeeding Member expires on the same date as the expiration of the term of the office of the predecessor Member. The current Substitute Members of the Audit and Supervisory Board are listed below in the order of succession in such event. If no succession occurs, the term of the office of the current Substitute Members
100
expires in June 2015. Our Substitution Members of the Audit and Supervisory provide no services to us and are compensated a nominal amount in cash in their capacity as such.
Name Date of birth Business experience
Susumu Ono November 12,
1948
Apr. 1974: Prosecutor, Osaka District Public Prosecutor’s Office Apr. 1983: Seconded to the Ministry of Foreign Affairs of Japan to
serve as First Secretary at the Japanese Embassy in the People’s Republic of China
Apr. 1988: Prosecutor, Osaka District Public Prosecutor’s Office Apr. 1995: Deputy General Manager, Criminal Investigations
Department, Osaka District Public Prosecutor’s Office Jul. 1996: General Manager, Criminal Investigations Department,
Kyoto District Public Prosecutor’s Office Apr. 1998: General Manager, General Affairs Department, Osaka
District Public Prosecutor’s Office May 1999: Registered attorney, establishes Susumu Ono Law
Office (incumbent) Jun. 2004: Outside Member of Audit & Supervisory Board,
GemCEREY CORPORATION (incumbent) Jun. 2007: Outside Member of the Audit & Supervisory Board,
Nidec Corporation Sep. 2008: Outside Member of the Audit & Supervisory Board,
WORLD・LOGI Co., Ltd.
Chihiro Suematsu January 29,
1956
Nov. 1985: McKinsey & Company Dec. 1988: Representative Director & President, Advanced
Consulting Network, Inc. Apr. 2001: Assistant Professor, Kyoto University Graduate School
of Economics May 2005: Professor, economics, Kyoto University Graduate
School of Economics (incumbent) Apr. 2006: Professor, economics, at Kyoto University Graduate
School of Management (incumbent) Aug. 2006: Outside Member of the Board of Directors, Zero-Sum,
Ltd. (incumbent) Jun. 2010: Outside Member of the Audit & Supervisory Board,
Nidec Corporation
Our Board of Directors has the ultimate responsibility for the administration of our affairs. Our
Articles of Incorporation provide for not more than twenty Directors. Directors are elected at a general meeting of shareholders, and the normal term of office of Directors is one year, although they may serve any number of consecutive terms. The Board of Directors elects one or more Representative Directors, who have the authority individually to represent us. The Board of Directors may also elect one Chairman of the Board of Directors, one or more Vice Chairmen of the Board of Directors, one President, and one or more Executive Vice Presidents, First Senior Vice Presidents, Senior Vice Presidents, and Vice Presidents. Shigenobu Nagamori is Representative Director, President and Chief Executive Officer. Bunsei Kure is Representative Director, Executive Vice President and Chief Operating Officer, Hiroshi Kobe is Representative Director, and Executive Vice President, and Masuo Yoshimatsu is Member of the Board, First Senior Vice President and Chief Financial Officer. Our Executive Officers serve at the discretion of the Board of Directors.
Our Articles of Incorporation provide for not more than five Audit and Supervisory Board Members.
Currently, we have four Audit and Supervisory Board Members: Ryuichi Tanabe, Osamu Narumiya, Tetsuo Inoue, and Ikuo Nishikawa. The Audit and Supervisory Board Members may not at the same time be directors, officers or employees of us or any of our subsidiaries, and at least one-half of them must be a person who has
101
never been a director, officer or employee of us or any of our subsidiaries at any time prior to their election as an Audit and Supervisory Board Member. Audit and Supervisory Board Members are elected at a general meeting of shareholders, and the normal term of office of an Audit and Supervisory Board Member is four years, although they may serve any number of consecutive terms.
Three of our Audit and Supervisory Board Members, Ryuichi Tanabe, Osamu Narumiya, and Tetsuo
Inoue are full-time Audit and Supervisory Board Members. Two of our Audit and Supervisory Board Members, Ryuichi Tanabe and Ikuo Nishikawa are from outside the Nidec group. Our four Audit and Supervisory Board Members form our Audit and Supervisory Board. Audit and Supervisory Board Members are under a statutory duty to review the administration of our affairs by the Directors, to examine our financial statements and business reports to be submitted by the Board of Directors to the general meetings of shareholders and to report their opinions thereon to the shareholders. They are required to attend meetings of the Board of Directors and are entitled to express their opinions, but they are not entitled to vote. Audit and Supervisory Board Members also have a statutory duty to provide their report to the Audit and Supervisory Board, which must submit its audit report to the Representative Directors. The Audit and Supervisory Board also determines matters relating to the duties of the Audit and Supervisory Board Members, such as auditors’ policy and methods of investigation of our affairs.
In addition to Audit and Supervisory Board Members, we must appoint independent certified public
accountants, who have the statutory duties to examine the financial statements to be submitted by the Board of Directors to the annual general meeting of shareholders, report on the financial statements to the Audit and Supervisory Board and the Representative Directors, and examine the financial statements to be filed with the Minister of Finance of Japan.
No family relationship exists among any of our Directors and Audit and Supervisory Board Members.
None of the members of our Board of Directors or Audit and Supervisory Board is party to a service contract with us that provides for benefits upon termination of their respective services as such.
B. Compensation.
The aggregate compensation paid, including bonuses and benefits in kind granted, but excluding
retirement allowances paid, to our Directors and Audit and Supervisory Board Members by Nidec Corporation during the fiscal year ended March 31, 2014 was ¥395 million. Of this amount, an aggregate of ¥328 million was paid to our Directors (excluding our outside Directors), an aggregate of ¥27 million to our Audit and Supervisory Board Members (excluding our outside Audit and Supervisory Board Members), and an aggregate of ¥40 million to our outside Directors and outside Audit and Supervisory Board Members. None of our Directors and Audit and Supervisory Board Members were paid any compensation for their respective services in any capacities to our subsidiaries.
Under the applicable Japanese disclosure rules, we are required to disclose the amount of
compensation paid by us and our subsidiaries to a Director or Audit and Supervisory Board Member on an individual basis if the amount is ¥100 million or more during a fiscal year. For the fiscal year ended March 31, 2014, none of our Directors or Audit and Supervisory Board Members received compensation equal to or exceeding ¥100 million.
On a group-wide basis, the aggregate compensation paid, including bonuses and benefits in kind
granted, but excluding retirement allowances paid, to our Directors and Audit and Supervisory Board Members by Nidec Corporation and to the directors and audit and supervisory board members of our subsidiaries by such subsidiaries during the fiscal year ended March 31, 2014 was ¥2,424 million.
In accordance with customary Japanese business practices, a retiring director or audit and supervisory
board member receives a lump-sum retirement allowance, which is subject to the approval of the general meeting of shareholders. In the fiscal year ended March 31, 2014, no such retirement allowance was paid to
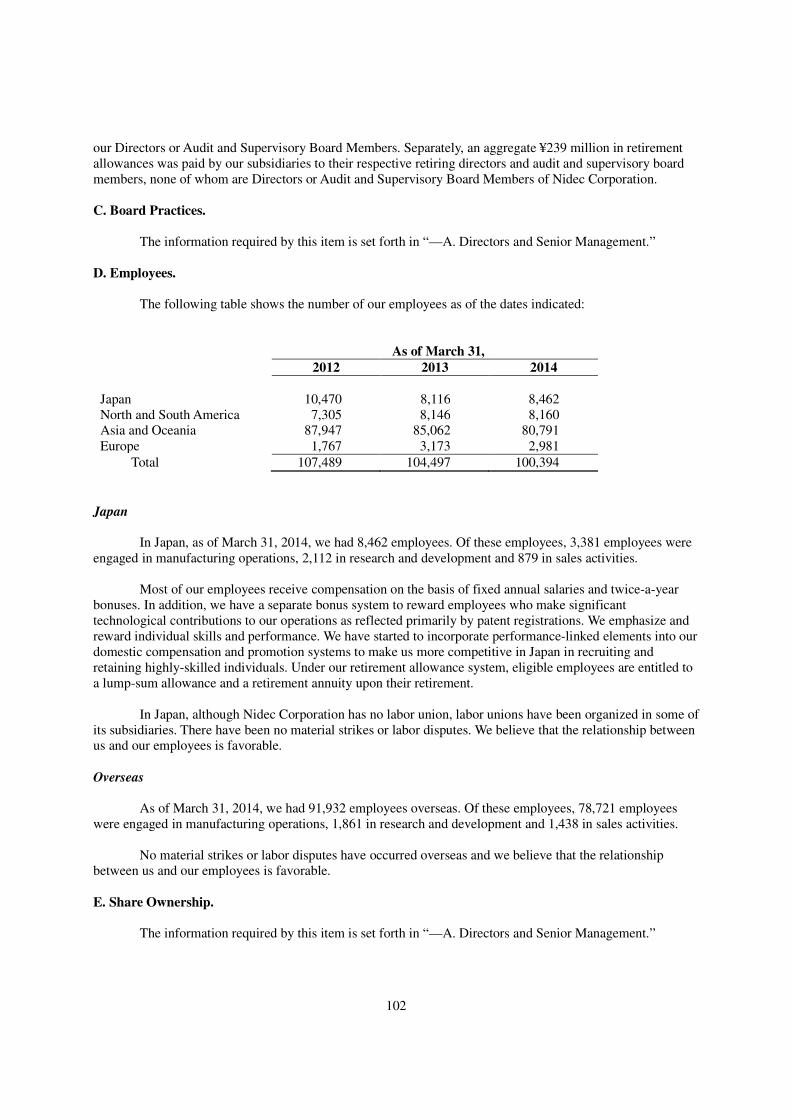
102
our Directors or Audit and Supervisory Board Members. Separately, an aggregate ¥239 million in retirement allowances was paid by our subsidiaries to their respective retiring directors and audit and supervisory board members, none of whom are Directors or Audit and Supervisory Board Members of Nidec Corporation.
C. Board Practices.
The information required by this item is set forth in “—A. Directors and Senior Management.”
D. Employees.
The following table shows the number of our employees as of the dates indicated:
As of March 31,
2012 2013 2014
Japan 10,470 8,116 8,462 North and South America 7,305 8,146 8,160 Asia and Oceania 87,947 85,062 80,791 Europe 1,767 3,173 2,981
Total 107,489 104,497 100,394
Japan In Japan, as of March 31, 2014, we had 8,462 employees. Of these employees, 3,381 employees were
engaged in manufacturing operations, 2,112 in research and development and 879 in sales activities. Most of our employees receive compensation on the basis of fixed annual salaries and twice-a-year
bonuses. In addition, we have a separate bonus system to reward employees who make significant technological contributions to our operations as reflected primarily by patent registrations. We emphasize and reward individual skills and performance. We have started to incorporate performance-linked elements into our domestic compensation and promotion systems to make us more competitive in Japan in recruiting and retaining highly-skilled individuals. Under our retirement allowance system, eligible employees are entitled to a lump-sum allowance and a retirement annuity upon their retirement.
In Japan, although Nidec Corporation has no labor union, labor unions have been organized in some of
its subsidiaries. There have been no material strikes or labor disputes. We believe that the relationship between us and our employees is favorable.
Overseas
As of March 31, 2014, we had 91,932 employees overseas. Of these employees, 78,721 employees
were engaged in manufacturing operations, 1,861 in research and development and 1,438 in sales activities. No material strikes or labor disputes have occurred overseas and we believe that the relationship
between us and our employees is favorable.
E. Share Ownership. The information required by this item is set forth in “—A. Directors and Senior Management.”
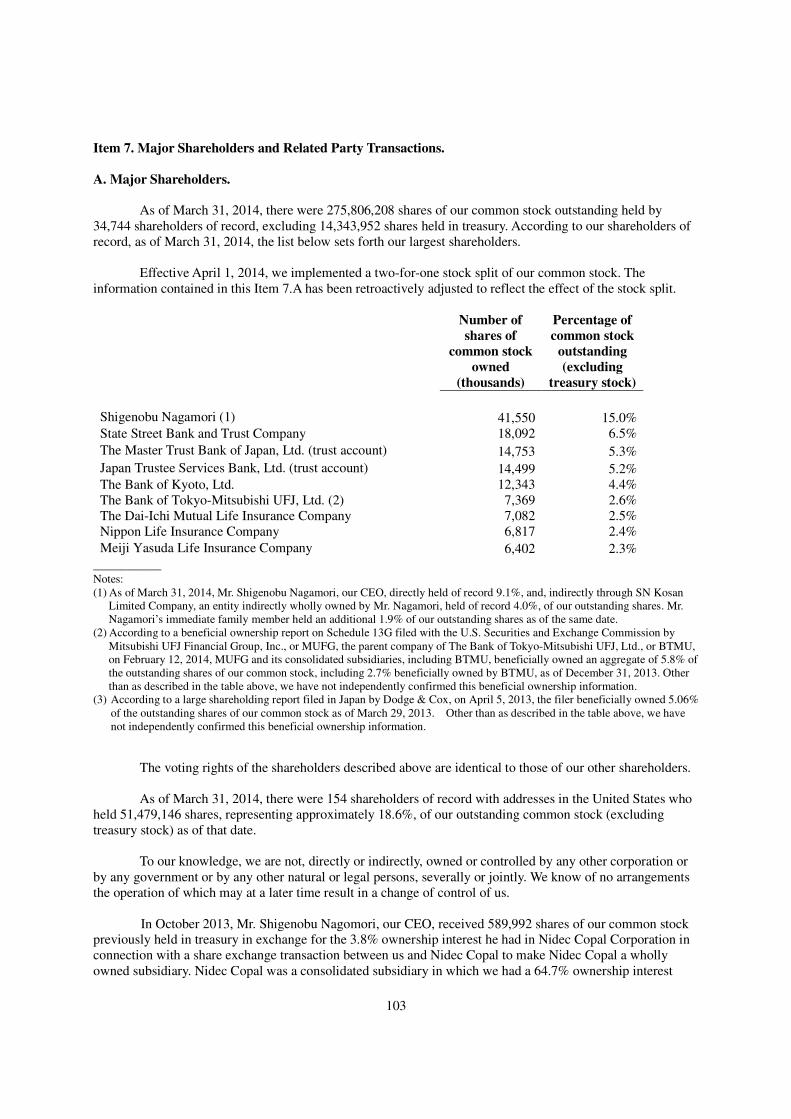
103
Item 7. Major Shareholders and Related Party Transactions.
A. Major Shareholders. As of March 31, 2014, there were 275,806,208 shares of our common stock outstanding held by
34,744 shareholders of record, excluding 14,343,952 shares held in treasury. According to our shareholders of record, as of March 31, 2014, the list below sets forth our largest shareholders.
Effective April 1, 2014, we implemented a two-for-one stock split of our common stock. The
information contained in this Item 7.A has been retroactively adjusted to reflect the effect of the stock split.
Number of
shares of
common stock
owned
(thousands)
Percentage of
common stock
outstanding
(excluding
treasury stock)
Shigenobu Nagamori (1) 41,550 15.0% State Street Bank and Trust Company 18,092 6.5%
The Master Trust Bank of Japan, Ltd. (trust account) 14,753 5.3%
Japan Trustee Services Bank, Ltd. (trust account) 14,499 5.2% The Bank of Kyoto, Ltd. 12,343 4.4% The Bank of Tokyo-Mitsubishi UFJ, Ltd. (2) 7,369 2.6% The Dai-Ichi Mutual Life Insurance Company 7,082 2.5% Nippon Life Insurance Company 6,817 2.4%
Meiji Yasuda Life Insurance Company 6,402 2.3% __________ Notes: (1) As of March 31, 2014, Mr. Shigenobu Nagamori, our CEO, directly held of record 9.1%, and, indirectly through SN Kosan
Limited Company, an entity indirectly wholly owned by Mr. Nagamori, held of record 4.0%, of our outstanding shares. Mr. Nagamori’s immediate family member held an additional 1.9% of our outstanding shares as of the same date.
(2) According to a beneficial ownership report on Schedule 13G filed with the U.S. Securities and Exchange Commission by Mitsubishi UFJ Financial Group, Inc., or MUFG, the parent company of The Bank of Tokyo-Mitsubishi UFJ, Ltd., or BTMU, on February 12, 2014, MUFG and its consolidated subsidiaries, including BTMU, beneficially owned an aggregate of 5.8% of the outstanding shares of our common stock, including 2.7% beneficially owned by BTMU, as of December 31, 2013. Other than as described in the table above, we have not independently confirmed this beneficial ownership information.
(3) According to a large shareholding report filed in Japan by Dodge & Cox, on April 5, 2013, the filer beneficially owned 5.06% of the outstanding shares of our common stock as of March 29, 2013. Other than as described in the table above, we have not independently confirmed this beneficial ownership information.
The voting rights of the shareholders described above are identical to those of our other shareholders. As of March 31, 2014, there were 154 shareholders of record with addresses in the United States who
held 51,479,146 shares, representing approximately 18.6%, of our outstanding common stock (excluding treasury stock) as of that date.
To our knowledge, we are not, directly or indirectly, owned or controlled by any other corporation or
by any government or by any other natural or legal persons, severally or jointly. We know of no arrangements the operation of which may at a later time result in a change of control of us.
In October 2013, Mr. Shigenobu Nagomori, our CEO, received 589,992 shares of our common stock
previously held in treasury in exchange for the 3.8% ownership interest he had in Nidec Copal Corporation in connection with a share exchange transaction between us and Nidec Copal to make Nidec Copal a wholly owned subsidiary. Nidec Copal was a consolidated subsidiary in which we had a 64.7% ownership interest
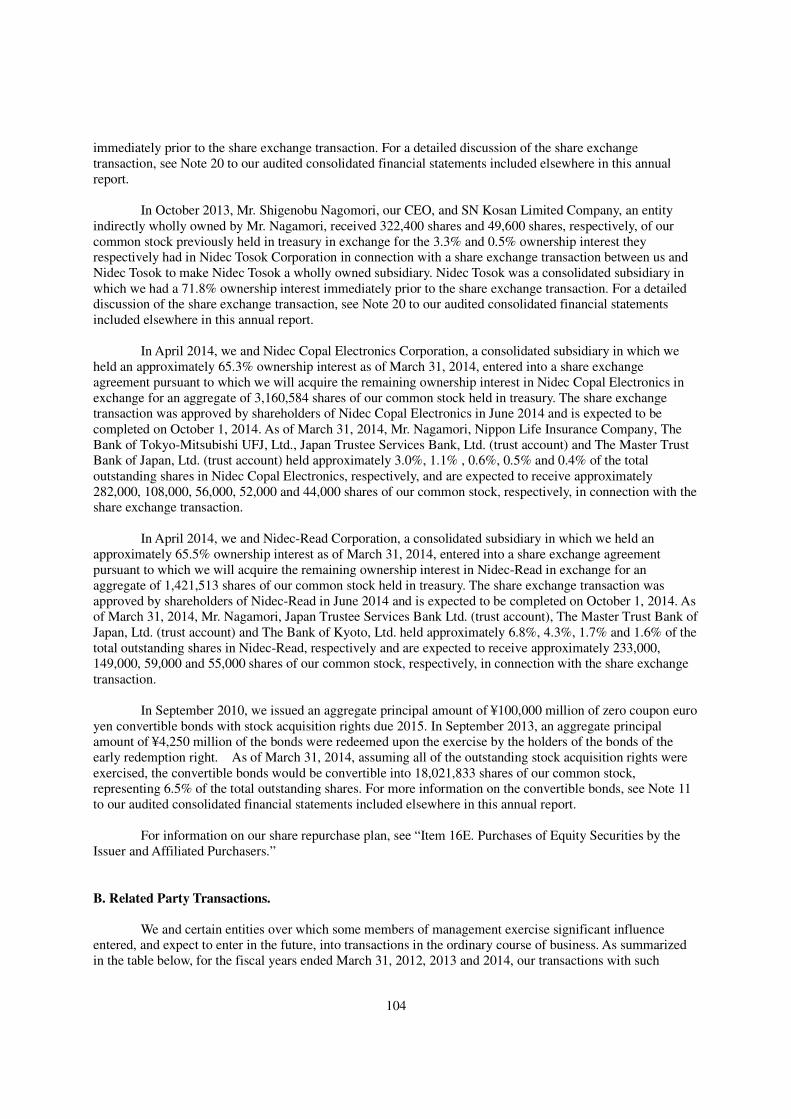
104
immediately prior to the share exchange transaction. For a detailed discussion of the share exchange transaction, see Note 20 to our audited consolidated financial statements included elsewhere in this annual report.
In October 2013, Mr. Shigenobu Nagomori, our CEO, and SN Kosan Limited Company, an entity indirectly wholly owned by Mr. Nagamori, received 322,400 shares and 49,600 shares, respectively, of our common stock previously held in treasury in exchange for the 3.3% and 0.5% ownership interest they respectively had in Nidec Tosok Corporation in connection with a share exchange transaction between us and Nidec Tosok to make Nidec Tosok a wholly owned subsidiary. Nidec Tosok was a consolidated subsidiary in which we had a 71.8% ownership interest immediately prior to the share exchange transaction. For a detailed discussion of the share exchange transaction, see Note 20 to our audited consolidated financial statements included elsewhere in this annual report.
In April 2014, we and Nidec Copal Electronics Corporation, a consolidated subsidiary in which we
held an approximately 65.3% ownership interest as of March 31, 2014, entered into a share exchange agreement pursuant to which we will acquire the remaining ownership interest in Nidec Copal Electronics in exchange for an aggregate of 3,160,584 shares of our common stock held in treasury. The share exchange transaction was approved by shareholders of Nidec Copal Electronics in June 2014 and is expected to be completed on October 1, 2014. As of March 31, 2014, Mr. Nagamori, Nippon Life Insurance Company, The Bank of Tokyo-Mitsubishi UFJ, Ltd., Japan Trustee Services Bank, Ltd. (trust account) and The Master Trust Bank of Japan, Ltd. (trust account) held approximately 3.0%, 1.1% , 0.6%, 0.5% and 0.4% of the total outstanding shares in Nidec Copal Electronics, respectively, and are expected to receive approximately 282,000, 108,000, 56,000, 52,000 and 44,000 shares of our common stock, respectively, in connection with the share exchange transaction.
In April 2014, we and Nidec-Read Corporation, a consolidated subsidiary in which we held an
approximately 65.5% ownership interest as of March 31, 2014, entered into a share exchange agreement pursuant to which we will acquire the remaining ownership interest in Nidec-Read in exchange for an aggregate of 1,421,513 shares of our common stock held in treasury. The share exchange transaction was approved by shareholders of Nidec-Read in June 2014 and is expected to be completed on October 1, 2014. As of March 31, 2014, Mr. Nagamori, Japan Trustee Services Bank Ltd. (trust account), The Master Trust Bank of Japan, Ltd. (trust account) and The Bank of Kyoto, Ltd. held approximately 6.8%, 4.3%, 1.7% and 1.6% of the total outstanding shares in Nidec-Read, respectively and are expected to receive approximately 233,000, 149,000, 59,000 and 55,000 shares of our common stock, respectively, in connection with the share exchange transaction.
In September 2010, we issued an aggregate principal amount of ¥100,000 million of zero coupon euro
yen convertible bonds with stock acquisition rights due 2015. In September 2013, an aggregate principal amount of ¥4,250 million of the bonds were redeemed upon the exercise by the holders of the bonds of the early redemption right. As of March 31, 2014, assuming all of the outstanding stock acquisition rights were exercised, the convertible bonds would be convertible into 18,021,833 shares of our common stock, representing 6.5% of the total outstanding shares. For more information on the convertible bonds, see Note 11 to our audited consolidated financial statements included elsewhere in this annual report.
For information on our share repurchase plan, see “Item 16E. Purchases of Equity Securities by the
Issuer and Affiliated Purchasers.”
B. Related Party Transactions. We and certain entities over which some members of management exercise significant influence
entered, and expect to enter in the future, into transactions in the ordinary course of business. As summarized in the table below, for the fiscal years ended March 31, 2012, 2013 and 2014, our transactions with such
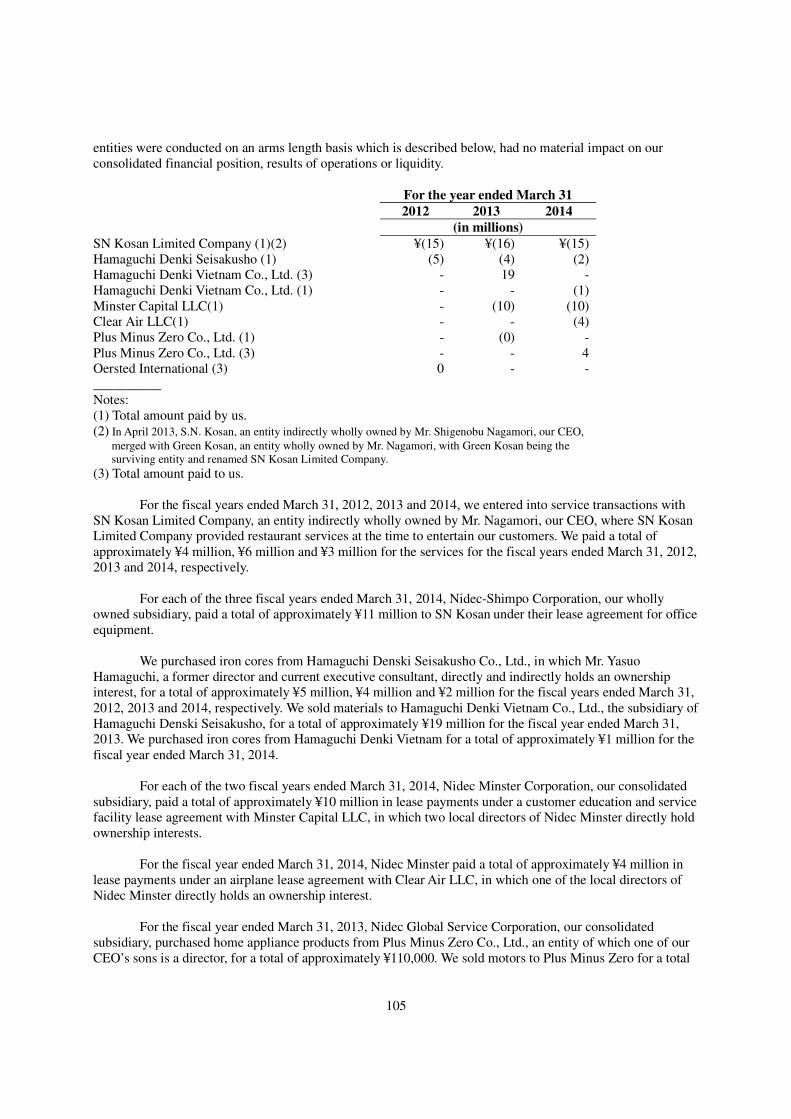
105
entities were conducted on an arms length basis which is described below, had no material impact on our consolidated financial position, results of operations or liquidity.
For the year ended March 31
2012 2013 2014
(in millions)
SN Kosan Limited Company (1)(2) ¥(15) ¥(16) ¥(15) Hamaguchi Denki Seisakusho (1) (5) (4) (2) Hamaguchi Denki Vietnam Co., Ltd. (3) - 19 - Hamaguchi Denki Vietnam Co., Ltd. (1) - - (1) Minster Capital LLC(1) - (10) (10) Clear Air LLC(1) - - (4) Plus Minus Zero Co., Ltd. (1) - (0) - Plus Minus Zero Co., Ltd. (3) - - 4 Oersted International (3) 0 - - __________ Notes: (1) Total amount paid by us. (2) In April 2013, S.N. Kosan, an entity indirectly wholly owned by Mr. Shigenobu Nagamori, our CEO,
merged with Green Kosan, an entity wholly owned by Mr. Nagamori, with Green Kosan being the surviving entity and renamed SN Kosan Limited Company.
(3) Total amount paid to us. For the fiscal years ended March 31, 2012, 2013 and 2014, we entered into service transactions with
SN Kosan Limited Company, an entity indirectly wholly owned by Mr. Nagamori, our CEO, where SN Kosan Limited Company provided restaurant services at the time to entertain our customers. We paid a total of approximately ¥4 million, ¥6 million and ¥3 million for the services for the fiscal years ended March 31, 2012, 2013 and 2014, respectively.
For each of the three fiscal years ended March 31, 2014, Nidec-Shimpo Corporation, our wholly
owned subsidiary, paid a total of approximately ¥11 million to SN Kosan under their lease agreement for office equipment.
We purchased iron cores from Hamaguchi Denski Seisakusho Co., Ltd., in which Mr. Yasuo
Hamaguchi, a former director and current executive consultant, directly and indirectly holds an ownership interest, for a total of approximately ¥5 million, ¥4 million and ¥2 million for the fiscal years ended March 31, 2012, 2013 and 2014, respectively. We sold materials to Hamaguchi Denki Vietnam Co., Ltd., the subsidiary of Hamaguchi Denski Seisakusho, for a total of approximately ¥19 million for the fiscal year ended March 31, 2013. We purchased iron cores from Hamaguchi Denki Vietnam for a total of approximately ¥1 million for the fiscal year ended March 31, 2014.
For each of the two fiscal years ended March 31, 2014, Nidec Minster Corporation, our consolidated
subsidiary, paid a total of approximately ¥10 million in lease payments under a customer education and service facility lease agreement with Minster Capital LLC, in which two local directors of Nidec Minster directly hold ownership interests.
For the fiscal year ended March 31, 2014, Nidec Minster paid a total of approximately ¥4 million in
lease payments under an airplane lease agreement with Clear Air LLC, in which one of the local directors of Nidec Minster directly holds an ownership interest.
For the fiscal year ended March 31, 2013, Nidec Global Service Corporation, our consolidated
subsidiary, purchased home appliance products from Plus Minus Zero Co., Ltd., an entity of which one of our CEO’s sons is a director, for a total of approximately ¥110,000. We sold motors to Plus Minus Zero for a total
106
of approximately ¥4 million for the fiscal year ended March 31, 2014. As of March 31, 2013 and 2014, the son of our CEO and SN Kosan held an aggregate 5.2% and 5.2% ownership interest in LEC Inc., the parent company of Plus Minus Zero, respectively.
For the fiscal year ended March 31, 2012, Nidec Logistics Corporation, our consolidated subsidiary,
received from Oersted International, Ltd., in which one of our CEO’s sons directly holds an ownership interest, a total of approximately ¥157 thousand in fees for logistics services.
In addition, we entered, and expect in the future to enter, into various manufacturing, sales and
purchase transactions with our affiliates, most of which involve the production of components or products that we sell.
C. Interests of Experts and Counsel. Not applicable.
Item 8. Financial Information.
A. Consolidated Statements and Other Financial Information.
Financial Statements The information required by this item is set forth in our audited consolidated financial statements
included elsewhere in this annual report.
Legal or Arbitration Proceedings
The information on legal or arbitration proceedings required by this item is set forth in “Item 4.B.
Information on the Company—Business Overview—Legal Proceedings.”
Dividend Policy We generally aim to pay cash dividends twice per year. Our Board of Directors resolves a year-end
dividend to be paid following the end of each fiscal year. If approved by resolution of our Board of Directors, the dividend is paid to holders of record as of the immediately preceding March 31. In addition to year-end dividends, we may pay interim dividends in the form of cash distributions from our retained earnings to our shareholders of record as of September 30 in each year by resolution of our Board of Directors. If paid, the interim dividend is generally paid in December and the year-end dividend is generally paid in June.
Based on the viewpoint that “shareholders own the company,” we aim to maximize shareholder value
by achieving higher growth, profit and stock prices over the long-term with a vision that enables us to effectively respond to the constantly changing business environment. We seek to distribute our profits to shareholders through regular dividend payments, and aim to maintain our dividend payments to around 30% of net income attributable to Nidec Corporation per share (basic), subject to future earnings, financial condition and other factors, including statutory and other restrictions with respect to the payment of dividends.
Reserves are used to strengthen our operational structure and expand our business to improve
profitability. Our Board of Directors has determined to set the year-end dividend at ¥27.5 per share for the fiscal
year ended March 31, 2014. As a result, together with the interim dividend of ¥22.5 per share, the full-year
107
dividend will be ¥50.0 per share. The dividend payout ratio, which is obtained by dividing the full-year dividend declared for a fiscal year by net income attributable to Nidec Corporation for the fiscal year, for the fiscal year ended March 31, 2014 is approximately 24.1%.
The following table sets forth the year-end and interim dividends paid (or to be paid) to holders of
record of our common stock for each of the record dates shown: Dividends per share Record date: September 30, 2009 ...................................................................................¥12.5 March 31, 2010 .........................................................................................20.0 September 30, 2010 ...................................................................................20.0 March 31, 2011 .........................................................................................22.5 September 30, 2011 ...................................................................................22.5 March 31, 2012 .........................................................................................22.5 September 30, 2012 ...................................................................................22.5 March 31, 2013 .........................................................................................20.0 September 30, 2013 ...................................................................................22.5 March 31, 2014 .........................................................................................27.5
Effective April 1, 2014, we implemented a two-for-one stock split of our common stock. The ratio of
shares of our common stock per ADS remains unchanged at one-fourth of one share of our common stock per ADS. The per share dividend amounts in the table above have been retroactively adjusted to reflect the effect of the stock split.
Dividends paid to shareholders outside Japan on shares of common stock or ADSs are generally
subject to a Japanese withholding tax at the standard rate of 15.315%. Reduced rates for withholding apply to shareholders in some countries which have income tax treaties with Japan. U.S. holders eligible for the benefits of the income tax treaty between the United States of America and Japan are generally subject to a maximum withholding rate of 10% under the treaty. If the applicable tax rate under the domestic tax law is lower than that promulgated under the applicable income tax treaty, then the domestic tax rate is still applicable due to the so-called preservation doctrine.
For more information, see “Item 10.D. Additional Information—Exchange Controls” and “Item 10.E.
Additional Information—Taxation.”
B. Significant Changes. Other than as described in this annual report, we are not aware of any significant changes since
March 31, 2014, the date of our last audited consolidated financial statements.
Item 9. The Offer and Listing.
A. Offer and Listing Details. In Japan, our common stock is listed on the First Section of the Tokyo Stock Exchange. ADSs, each
representing one-fourth of one share of our common stock, are quoted on the New York Stock Exchange under the symbol, “NJ”.
The following table sets forth, for the periods indicated, the closing high and low sale prices per share
of our common stock on the Tokyo Stock Exchange and the closing high and low sale prices per ADS of our ADSs on the New York Stock Exchange:
108
Tokyo Stock Exchange
Price Per Share of
Common Stock(1)(2)
New York Stock
Exchange Price
Per ADS(1)
High Low High Low
Year ended March 31, 2010 ................................................................¥5,015 ¥2,175 $13.68 $5.66 2011 ................................................................5,025 3,175 13.53 10.08 2012 ................................................................3,930 2,910 12.60 9.40 2013 ................................................................3,795 2,340 11.54 6.82
First Quarter................................................................3,795 3,010 11.54 9.56 Second Quarter ................................ 3,355 2,830 10.56 9.09 Third Quarter ................................ 2,840 2,340 8.95 6.99 Fourth Quarter ................................ 2,880 2,515 7.75 6.82
2014 ................................................................6,370 2,660 15.49 6.78 First Quarter................................................................3,650 2,660 9.02 6.78 Second Quarter ................................ 4,265 3,435 10.63 8.70 Third Quarter ................................ 5,150 4,010 12.35 10.29 Fourth Quarter ................................ 6,370 5,075 15.49 12.12
Calendar period December 2013 ................................ 5,150 4,655 12.35 11.47 January 2014 ................................................................5,935 5,075 14.20 12.12 February 2014 ................................................................6,355 5,342 15.43 13.37 March 2014 ................................................................6,370 5,955 15.49 14.51 April 2014 ................................................................6,441 5,651 15.65 13.96 May 2014 ................................................................5,990 5,462 14.76 13.40
Notes:
(1) The amounts in this table prior to April 1, 2014 have been adjusted to reflect the two-for-one stock split of our common stock, effective April 1, 2014. The ratio of shares of our common stock per ADS remains unchanged at one-fourth of one share of our common stock per ADS.
(2) The prices per share of our common stock in this table represent the closing high and low sale prices per share on the Osaka Securities Exchange up to July 12, 2013, and those on the Tokyo Stock Exchange since July 16, 2013, as adjusted per Note (1) above.
B. Plan of Distribution.
Not applicable.
C. Markets.
The information required by this item is set forth in “—A. Offer and Listing Details.”
D. Selling Shareholders. Not applicable.
109
E. Dilution.
Not applicable.
F. Expenses of the Issue. Not applicable.
Item10. Additional Information.
A. Share Capital. Not applicable.
B. Memorandum and Articles of Association.
Objects and Purposes in Our Articles of Incorporation
Article 2 of our Articles of Incorporation, which are attached as Exhibit 1.1 to this annual report,
provides our corporate objects and purposes, including:
• manufacture, sales and development of electric, electronic, precision, industrial and other equipment, machines, drives, components and other products,
• insurance agent business,
• sales, purchase, lease, brokering, and management of moveable and real property, and
• travel agent and advertising businesses.
Provisions Regarding Our Directors There is no provision in our Articles of Incorporation as to a Director’s power to vote on a proposal in
which the Director is materially interested but, under the Company Law of Japan and our Regulations of the Board of Directors, a Director is required to refrain from voting on such matters at meetings of the Board of Directors.
The Company Law provides that compensation for directors is determined at a general meeting of
shareholders of a company. Within the upper limit approved by the shareholders’ meeting, the board of directors will determine the amount of compensation for each director. The board of directors may, by its resolution, leave such decision to the discretion of the company’s representative director.
The Company Law requires directors to “perform their duties faithfully on behalf of the company,”
thus subjecting directors to a duty of loyalty (chujitsu gimu). This duty is supplemented by other duties such as to avoid self-dealing and competition with the company as well as to abide by all laws and regulations, articles of incorporation and resolutions of general meetings of shareholders.
110
Directors can be held liable for damages caused by their negligence in performing their duties, including any action to violate a law, an ordinance or articles of incorporation. For example, directors can be liable for damages caused by declaring an unlawful dividend or distribution of money or by offering some benefit to a shareholder in exchange for the exercise of that shareholder’s rights as shareholder.
There is no mandatory retirement age for our Directors under the Company Law or our Articles of
Incorporation. There is no requirement concerning the number of shares one individual must hold in order to qualify
him or her as a Director either under the Company Law or our Articles of Incorporation. Holding of Our Shares by Foreign Investors
There are no limitations on the rights of non-residents or foreign shareholders to hold or exercise
voting rights on our shares imposed by the laws of Japan or our Articles of Incorporation or our other constituent documents.
Rights of Our Shareholders Set forth below is information relating to our common stock, including brief summaries of the relevant
provisions of our Articles of Incorporation and Share Trading Regulations, as currently in effect, and of the Company Law and related legislation.
General
Our authorized share capital is 480,000,000 shares, of which 145,075,080 shares were issued and
outstanding as of March 31, 2014. As a result of the stock split effective on April 1, 2014, our authorized share capital became 960,000,000 shares, of which 290,150,160 shares were issued and outstanding as of the same date. For information as to stock splits, see “—Stock Splits” below.
The shares of all Japanese companies listed on any Japanese stock exchange, including our shares, are
subject to the central clearing system established pursuant to the Law Concerning Book-Entry Transfer of Corporate Bond, Stocks, etc. (including regulations promulgated thereunder, the “Book-Entry Law”). Currently, Japan Securities Depository Center, Inc. (“JASDEC”) is the only institution that is designated by the relevant authorities as a clearing house which is permitted to engage in the clearing operations of shares of Japanese listed companies under the Book-Entry Law. Under the clearing system, in order for any person to hold, sell or otherwise dispose of shares of Japanese listed companies, it must have an account at an account managing institution unless such person has an account at JASDEC. “Account managing institutions” are financial instruments firms (i.e., securities companies), banks, trust companies and certain other financial institutions which meet the requirements prescribed by the Book-Entry Law.
Under the Book-Entry Law, transfer of shares is effected through entry in the books maintained by
JASDEC and the account management institutions, and title to the shares passes to the transferee at the time when the transferred number of the shares is recorded at the transferee’s account at JASDEC or an account managing institution. The holder of an account at JASDEC or an account managing institution is presumed to be the legal owner of the shares held in such account.
111
Under the Company Law and the Book-Entry Law, in order for shareholders to assert against us the rights they are entitled to as of a record date, including the rights to vote at a general meeting of shareholders or to receive dividends, shareholders must have their names and addresses registered in our register of shareholders. Under the central book-entry system operated by JASDEC, shareholders shall notify the relevant account managing institutions of certain information prescribed under the Book-Entry Law, including their names and addresses, and the registration of shareholders in our register is made upon our receipt of necessary information from JASDEC. On the other hand, in order for shareholders to assert against us the rights they are entitled to regardless of the record date, such as the minority shareholders' right to propose a matter to be considered at a general meeting of shareholders, they only need to request an account management institution to have JASDEC issue a notification of certain information to us, including the names and addresses of such shareholders. We can subsequently request such shareholders to submit a reception sheet (uketsuke-hyou) issued by the account management institution in connection with their request for JASDEC’s notification as well as their identifications in accordance with our Share Trading Regulations. See “—Share Registrar” and “—Record Date” below.
The registered beneficial holder of deposited shares underlying the ADSs is the depositary for the ADSs. Accordingly, holders of ADSs will not be able to directly assert shareholders’ rights.
Shareholders’ Rights to Bring Actions Against Directors The Company Law provides for the Japanese shareholder derivative action mechanism, which allows
any shareholder who has held a share for the previous six months to demand that the corporation take action to protect the company and enforce a director’s duties. Derivative actions may be brought to “enforce the liability of directors” which refers to situations including, but not limited to, those where directors engage in self-interested transactions, or violate any law, ordinance or the articles of incorporation. If the board has not instituted an action within sixty days, the plaintiff-shareholder may initiate a lawsuit as a derivative action. The Company Law provides an exception to the sixty day waiting period, however, for cases in which waiting sixty days might cause the company irreparable damage. In such cases, the shareholder may institute the action immediately, but after having brought the action must notify the company without delay. So, for example, if a company might suffer irreparable damage from an illegal act of a director, a shareholder who has owned a share (in our case, under our Articles of Incorporation, excluding a holder of shares representing less than one unit under the unit share system described below) continuously for the previous six months may seek a provisional injunction prohibiting the director from performing the illegal act.
Distribution of Surplus
General
Under the Company Law, distributions of cash or other assets by joint stock corporations to their
shareholders, so called “dividends,” are referred to as “distributions of Surplus” (“Surplus” is defined in “—Restriction on Distributions of Surplus” below). We may make distributions of Surplus to the shareholders any number of times per fiscal year, subject to certain limitations described in “—Restriction on Distributions
of Surplus.” Under the Company Law, distributions of Surplus are required to be authorized by a resolution of a general meeting of shareholders unless the board of directors is so authorized under the articles of incorporation. Our Articles of Incorporation provide that the Board of Directors has the authority to decide to make distribution of Surplus except for limited exceptions as provided by the Company Law, since we have satisfied the following requirements:
112
(a) the normal term of office of our Directors terminates on or prior to the date of conclusion of the ordinary general meeting of shareholders relating to the last fiscal year ending within the period of one year from the election of the Directors; and
(b) our non-consolidated annual financial statements and certain documents for the last fiscal year
present our assets and profit or loss fairly, as required by the ordinances of the Ministry of Justice. Under our Articles of Incorporation, year-end dividends and interim dividends, if any, may be
distributed to shareholders (or pledgees) appearing in the register of shareholders as of March 31 and September 30 of each year, respectively, pursuant to a resolution of our Board of Directors. In addition, as stated above, under the Company Law and our Articles of Incorporation, we may make further distributions of Surplus by resolution of our Board of Directors. Under our Articles of Incorporation, we are not obliged to pay any dividends in the form of cash that are left unclaimed for a period of three years after the date on which they first became payable.
Distributions of Surplus may be distributed in cash or in kind in proportion to the number of shares
held by each shareholder. A resolution of our Board of Directors authorizing a distribution of Surplus must specify the kind and aggregate book value of the assets to be distributed, the manner of allocation of such assets to shareholders, and the effective date of the distribution. If a distribution of Surplus is to be made in kind, we may, pursuant to a resolution of our Board of Directors, grant a right to our shareholders to require us to make such distribution in cash instead of in kind. If no such right is granted to shareholders, the relevant distribution of Surplus must be approved by a special resolution of a general meeting of shareholders.
Restriction on Distributions of Surplus
When we make a distribution of Surplus, we must, until the aggregate amount of our additional
paid-in capital and legal reserve reaches one-quarter of our stated capital, set aside in our additional paid-in capital and/or legal reserve an amount equal to one-tenth of the amount of Surplus so distributed.
The amount of Surplus at any given time shall be calculated in accordance with the following formula:
A + B + C + D – (E + F + G) In the above formula:
“A” = the total amount of ‘other capital surplus’ and ‘other retained earnings’, each such amount being that appearing on our non-consolidated balance sheet as of the end of the last fiscal year;
“B” = (if we have disposed of our treasury stock after the end of the last fiscal year) the amount of
the consideration for such treasury stock received by us less the book value thereof;
“C” = (if we have reduced our stated capital after the end of the last fiscal year) the amount of such reduction less the portion thereof that has been transferred to additional paid-in capital or legal reserve (if any);
“D” = (if we have reduced our additional paid-in capital or legal reserve after the end of the last
fiscal year) the amount of such reduction less the portion thereof that has been transferred to stated capital (if any);
“E” = (if we have cancelled our treasury stock after the end of the last fiscal year) the book value of
such treasury stock;
113
“F” = (if we have distributed Surplus to our shareholders after the end of the last fiscal year) the total book value of the Surplus so distributed; and
“G” = certain other amounts set forth in the ordinances of the Ministry of Justice, including (if we
have reduced Surplus and increased our stated capital, additional paid-in capital or legal reserve after the end of the last fiscal year) the amount of such reduction and (if we have distributed Surplus to our shareholders after the end of the last fiscal year) the amount set aside in our additional paid-in capital or legal reserve (if any) as required by the ordinances of the Ministry of Justice.
The aggregate book value of Surplus distributed by us may not exceed a prescribed distributable
amount (the “Distributable Amount”), as calculated on the effective date of such distribution. The Distributable Amount at any given time shall be equal to the amount of Surplus less the aggregate of the followings:
(a) the book value of our treasury stock;
(b) the amount of consideration for our treasury stock disposed of by us after the end of the last
fiscal year; and
(c) certain other amounts set forth in the ordinances of the Ministry of Justice, including (if the sum of one-half of goodwill and the deferred assets exceeds the total of stated capital, additional paid-in capital and legal reserve, each such amount being that appearing on our non-consolidated balance sheet as of the end of the last fiscal year) all or certain part of such exceeding amount as calculated in accordance with the ordinances of the Ministry of Justice.
If we have become at our option a company with respect to which consolidated balance sheets should
also be taken into consideration in the calculation of the Distributable Amount (renketsu haito kisei tekiyo
kaisha), it will be required to further deduct from the amount of Surplus the excess amount, if any, of (x) the total amount of shareholders’ equity appearing on our non-consolidated balance sheet as of the end of the last fiscal year and certain other amounts set forth in the ordinances of the Ministry of Justice over (y) the total amount of shareholders’ equity and certain other amounts set forth in the ordinances of the Ministry of Justice appearing on our consolidated balance sheet as of the end of the last fiscal year.
If we have prepared interim financial statements as described below, and if such interim financial
statements have been approved by the Board of Directors or (if so required by the Company Law) by a general meeting of shareholders, the Distributable Amount must be adjusted to take into account the amount of profit or loss, and the amount of consideration for our treasury stock disposed of by us, during the period in respect of which such interim financial statements have been prepared. We may prepare non-consolidated interim financial statements consisting of a balance sheet as of any date subsequent to the end of the last fiscal year and an income statement for the period from the first day of the current fiscal year to the date of such balance sheet. Interim financial statements so prepared by us must be approved by the Board of Directors and audited by our independent auditors, as required by the ordinances of the Ministry of Justice.
For information as to Japanese taxes on dividends, see “―E. Taxation―Japanese Taxation.”
114
Capital and Reserves When we issue new shares, the entire amount of cash or other assets paid or contributed by
subscribers for those new shares is required to be accounted for as stated capital, although we may account for an amount not exceeding one-half of the amount of such cash or assets as additional paid-in capital by resolution of the Board of Directors.
We may reduce our additional paid-in capital or legal reserve generally by resolution of a general
meeting of shareholders, and in the case of reduction of additional paid-in capital and if so decided by the same resolution, may account for the whole or any part of the amount of such reduction as stated capital. On the other hand, we may reduce our stated capital generally by special resolution of a general meeting of shareholders and, if so decided by the same resolution, may account for the whole or any part of the amount of such reduction as additional paid-in capital. In addition we may reduce our Surplus and increase either (i) stated capital or (ii) additional paid-in capital and/or legal reserve by the same amount, in either case by resolution of a general meeting of shareholders.
Stock Splits We may at any time split the issued shares into a greater number of shares by resolution of our Board
of Directors. When a stock split is to be made, so long as the only class of our outstanding stock is our common stock, we may increase the number of authorized shares to the extent that the ratio of such increase in authorized shares does not exceed the ratio of such stock split by amending our Articles of Incorporation, which amendment may be made without approval by shareholders.
Before a stock split, we must give public notice of the stock split, specifying the record date therefor,
not less than two weeks prior to such record date. Under the new clearing system, we must also give notice to JASDEC regarding a stock split at least two weeks prior to the relevant effective date. On the effective date of the stock split, the numbers of shares recorded in all accounts held by our shareholders at account managing institutions or JASDEC will be increased in accordance with the applicable ratio.
Pursuant to the procedures, we implemented a two-for-one stock split effective on April 1, 2014. The
stock split of our common stock did not affect the ratio of shares of our common stock per ADS, which remains unchanged at one-fourth of one share of our common stock per ADS.
Japanese Unit Share System Our Articles of Incorporation provide that 100 shares of common stock constitute one “unit.” The
Company Law permits us, by resolution of our Board of Directors, to reduce the number of shares that constitutes one unit or abolish the unit share system, and amend our Articles of Incorporation to this effect without the approval of a shareholders’ meeting. The number of shares constituting a unit may not exceed 1,000 shares.
Transferability of Shares Representing Less Than One Unit
Under the new clearing system, shares constituting less than one unit are transferable. Under the rules
of the Japanese stock exchanges, however, shares constituting less than one unit do not comprise a trading unit, except in limited circumstances, and accordingly may not be sold on the Japanese stock exchange.
Right of a Holder of Shares Representing Less Than One Unit to Require Us to Purchase Its Shares
115
A holder of shares representing less than one unit may at any time require us to purchase our shares through the relevant account management institution. These shares will be purchased at:
• the closing price of our shares reported by the Tokyo Stock Exchange on the day a request to purchase is made; or
• if our shares are not traded on the Tokyo Stock Exchange on such day or if the Tokyo Stock Exchange is closed on such day, the price at which our shares are first traded on the Tokyo Stock Exchange on the following day; or
• if our shares are not traded on the Tokyo Stock Exchange on such following day, the price at which our shares are first traded on the Tokyo Stock Exchange thereafter.
In such case, we will request payment of an amount equal to the brokerage commission applicable to
the shares purchased. However, because holders of ADSs representing less than one unit are not able to withdraw the underlying shares from deposit, these holders will not be able to exercise this right as a practical matter.
Voting Right of a Holder of Shares Representing Less Than One Unit
A holder of shares representing less than one unit cannot exercise any voting rights pertaining to those
shares. In calculating the quorum for various voting purposes, the aggregate number of shares representing less than one unit will be excluded from the number of outstanding shares. A holder of shares representing one or more whole units will have one vote for each unit of shares, except as stated in “— Voting Rights” below.
A holder of shares representing less than one unit does not have any rights relating to voting, such as
the right to participate in a demand for the resignation of a director, the right to participate in a demand for the convocation of a general meeting of shareholders and the right to join with other shareholders to propose an agenda item to be addressed at a general meeting of shareholders. In addition, a holder of shares constituting less than one unit does not have the right to institute a representative action by shareholders.
Other Rights of a Holder of Shares Representing Less Than One Unit
In accordance with the Company Law, our Articles of Incorporation provide that a holder of shares
representing less than one unit does not have any other rights of a shareholder in respect of those shares, other than those provided by our Articles of Incorporation including the following rights:
• to receive distribution of dividends;
• to receive shares, cash or other assets in case of consolidation or split of shares, exchange or transfer of shares or corporate merger;
• to be allotted rights to subscribe for new shares and other stock acquisition rights when such rights are granted to shareholders; and
• to participate in any distribution of surplus assets upon liquidation.
116
Ordinary General Meeting of Shareholders We normally hold our annual general meeting of shareholders in June of each year. In addition, we
may hold an extraordinary general meeting of shareholders whenever necessary by giving at least two weeks’ advance notice. Under the Company Law, notice of any shareholders’ meeting must be given to each shareholder having voting rights or, in the case of a non-resident shareholder, to his resident proxy or mailing address in Japan in accordance with our Share Trading Regulations, at least two weeks prior to the date of the meeting.
Voting Rights A shareholder is generally entitled to one vote per one unit of shares, as described under “— Japanese
Unit Share System” above. In general, under the Company Law, a resolution can be adopted at a general meeting of shareholders by a majority of the voting rights represented at the meeting. The Company Law and our Articles of Incorporation require a quorum for the election of Directors and Audit and Supervisory Board Members of not less than one-third of the voting rights. Our shareholders are not entitled to cumulative voting in the election of Directors. A corporate shareholder whose outstanding voting rights are in turn more than one-quarter directly or indirectly owned by us does not have voting rights. Shareholders may exercise their voting rights through proxies, provided that those proxies are also shareholders who have voting rights.
The Company Law and our Articles of Incorporation provide that certain important matters shall be
approved by a “special resolution” of general meeting of shareholders. Our Articles of Incorporation provide that the quorum for a special resolution is one-third of the total number of voting rights and the approval of at least two-thirds of the voting rights presented at the meeting is required for adopting a special resolution. Such important matters include:
(a) reduction of the stated capital;
(b) amendment to the Articles of Incorporation;
(c) establishment of a 100% parent-subsidiary relationship by way of share exchange or share transfer;
(d) dissolution, merger or consolidation;
(e) company split;
(f) transfer of the whole or an important part of our business;
(g) taking over of the whole of the business of any other corporation;
(h) removal of an Audit and Supervisory Board Member;
(i) any issuance of shares or transfer of existing shares as treasury stock to persons other than the shareholders at a “specially favorable” price;
(j) any issuance of stock acquisition rights (including those incorporated in bonds with stock acquisition rights) to persons other than the shareholders under “specially favorable” conditions;
(k) purchase of shares by us from a specific shareholder other than our subsidiary;
(l) consolidation of shares;
117
(m) distribution of Surplus in kind with respect to which shareholders are not granted the right to require us to make such distribution in cash instead of in kind; and
(n) exemption from a portion of liability of the Directors, Audit and Supervisory Board Members or independent auditors.
However, under the Company Law, no shareholder approval, whether by an ordinary resolution or a
special resolution at a general meeting of shareholders, is required for any matter described in (a) through (g) above, and such matter may be decided by the Board of Directors, if it satisfies certain criteria prescribed by the Company Law as are necessary to determine that its impact is immaterial.
The voting rights of holders of ADSs are exercised by the depositary subject to the Deposit Agreement
based on instructions from those holders, which instructions are subject to procedures of brokers or financial institution nominees. See “―American Depositary Receipts.”
Subscription Rights Holders of shares have no pre-emptive rights. Authorized but unissued shares may be issued at such
times and upon such terms as our Board of Directors determines, subject to the limitations as to the issue of new shares at a ‘‘specially favorable’’ price in which case a special resolution of general meeting of
shareholders is required as described in ‘‘-Voting Rights’’ above. The Board of Directors may, however, determine that shareholders be given subscription rights in connection with a particular issue of new shares. In this case, such rights must be given on uniform terms to all shareholders as of a specified record date of which not less than two weeks’ prior public notice must be made. Each of the shareholders to whom such rights are given must also be given at least two weeks’ prior notice of the date on which such rights will expire.
Stock Acquisition Rights We may issue stock acquisition rights (shinkabu yoyakuken) or bonds with stock acquisition rights
(shinkabu yoyakuken-tsuki shasai). Except where the issue would be on ‘‘specially favorable’’ conditions, the issue of stock acquisition rights or bonds with stock acquisition rights may be authorized by a resolution of the Board of Directors. Subject to the terms and conditions thereof, holders of stock acquisition rights may acquire a prescribed number of shares by exercising their stock acquisition rights and paying the exercise price at any time during the exercise period thereof. Upon exercise of stock acquisition rights, we will be obliged to either issue the relevant number of new shares or transfer the necessary number of existing shares held by us as treasury stock to the holder.
Liquidation Rights In the event of liquidation, the assets remaining after payment of all debts, liquidation expenses and
taxes will be distributed among the shareholders in proportion to the number of shares they own.
Liability to Further Calls or Assessments All of our currently outstanding shares, including shares represented by the ADSs, are fully paid and
nonassessable.
118
Share Registrar Sumitomo Mitsui Trust Bank, Limited is the share registrar for the shares. Sumitomo Mitsui Trust’s
office is located at 5-33, Kitahama 4-chome, Chuo-ku, Osaka, 540-0041, Japan. Under the new clearing system, Sumitomo Mitsui Trust maintains our register of shareholders and records transfers of record ownership upon our receipt of necessary information from JASDEC and other information in the register of shareholders.
Record Date The close of business on March 31 is the record date for our year-end dividends, if paid, and the close
of business on September 30 is the same for our interim dividends, if paid. A holder of shares constituting one or more “units” who is registered as a holder on our register of shareholders at the close of business as of March 31 is also entitled to exercise shareholders’ voting rights at the annual general meeting of shareholders with respect to the fiscal year ending on March 31. In addition, we may set a record date for determining the shareholders entitled to other rights and for other purposes by giving at least two weeks’ public notice.
Under the Book-Entry Law, we are required to give notice of each record date to JASDEC at least two
weeks prior to such record date. JASDEC is required to promptly give us notice of the names and addresses of our shareholders, the numbers of shares held by them and other relevant information as of such record date.
The shares are generally traded ex-dividend or ex-rights in the Japanese stock exchanges on the
second business day before a record date (or if the record date is not a business day, the third business day prior thereto), for the purpose of dividends or rights offerings.
Repurchase by Nidec of Shares Under the Company Law and our Articles of Incorporation, we may acquire our shares (i) by soliciting
all our shareholders to offer to sell our shares held by them (in this case, the certain terms of such acquisition, such as the total number of the shares to be purchased and the total amount of consideration, shall be set by an ordinary resolution of a general meeting of shareholders in advance, and acquisition shall be effected pursuant to a resolution of the Board of Directors), (ii) from a specific shareholders other than any of our subsidiaries (pursuant to a special resolution of a general meeting of shareholders), (iii) from any of our subsidiaries (pursuant to a resolution of the Board of Directors), or (iv) by way of purchase on any Japanese stock exchange on which our shares are listed or by way of tender offer (in either case pursuant to a resolution of the Board of Directors). In the case of (ii) above, any other shareholder may make a request to the Board of Directors that such other shareholder be included as a seller in the proposed purchase, provided that no such right will be available if the purchase price or any other consideration to be received by the relevant specific shareholder will not exceed the last trading price of the shares calculated in a manner set forth in the ordinances of the Ministry of Justice.
These acquisitions are subject to the condition that the aggregate amount of the purchase price must
not exceed the Distributable Amount as described in “— Distribution of Surplus” above. We may hold our shares acquired in compliance with the provisions of the Company Law, and may generally dispose of or cancel such shares by resolution of the Board of Directors.
In addition, we may acquire our shares by means of repurchase of any number of shares constituting
less than one “unit” upon the request of the holder of those shares, as described under “― Japanese Unit Share System” above.
119
American Depositary Receipts JPMorgan Chase Bank, N.A., as depositary, will issue the American Depositary Shares, or ADSs.
Each ADS will represent an ownership interest in one-fourth of a share of our common stock deposited with the custodian, as agent of the depositary, under the deposit agreement among us, the depositary and you as an ADS holder. Each ADS will also represent any securities, cash or other property deposited with the depositary but not distributed to ADS holders. Your ADSs will be evidenced by what are known as American depositary receipts, or ADRs. The depositary's office is located at 1 Chase Manhattan Plaza, Floor 58 New York, NY 10005.
You may hold ADSs either directly or indirectly through your broker or other financial institution. If
you hold ADSs directly, by having an ADS registered in your name on the books of the depositary, you are an ADS holder. If you hold the ADSs through your broker or financial institution nominee, you must rely on the procedures of such broker or financial institution to assert the rights of an ADS holder. You should consult with your broker or financial institution to find out what those procedures are.
Because the depositary’s nominee will actually be the registered owner of the shares, you will have to
rely on it to exercise your rights as a shareholder on your behalf. The obligations of the depositary and its agents are set out in the deposit agreement. The deposit agreement and the ADSs are governed by New York law.
For more information on the ADSs, see the amended and restated deposit agreement, including the
form of ADR, filed as an exhibit to the registration statements on Form F-6 with the SEC on February 21, 2012. See “―H. Documents on Display.”
For a description of the fees relating to the ADSs, see “Item 12.D. Description of Securities Other
Than Equity Securities―American Depositary Shares.”
Reporting of Substantial Shareholdings The Financial Instruments and Exchange Law of Japan and its related regulations require any person
who has become, solely or jointly, a holder of more than 5% of the total issued shares with voting rights of a company that is listed on any Japanese stock exchange to file a report with the Director of the competent Local Finance Bureau of the Ministry of Finance within five business days. With certain exceptions, a similar report must also be filed in respect of any subsequent change of 1% or more in the holding of shares with voting rights or of any specified changes set out in any previously-filed reports. For this purpose, shares issuable to such person upon exercise of stock acquisition rights are taken into account in determining both the number of shares with voting rights held by the holder and the issuer’s total issued shares with voting rights.
Daily Price Fluctuation Limits under Japanese Stock Exchange Rules Share prices on Japanese stock exchanges are determined on a real-time basis by the equilibrium
between bids and offers. These exchanges are order-driven markets without specialists or market makers to guide price formation. To prevent excessive volatility, these exchanges set daily upward and downward price fluctuation limits for each share, based on the previous day’s closing price. Although transactions may continue at the upward or downward limit price if the limit price is reached on a particular trading day, no transactions may take place outside these limits. Consequently, an investor wishing to sell at a price above or below the relevant daily limit may not be able to sell shares at such price on a particular trading day, or at all.
On June 6, 2014, the closing price of our shares on the Tokyo Stock Exchange was ¥6,006 per share.
The following table shows the daily price limit for a stock on the Tokyo Stock Exchange with a closing price
120
of between ¥5,000 and ¥7,000 per share, as well as the daily price limit if our per share price were to rise to between ¥7,000 and ¥10,000, or ¥10,000 and ¥15,000, or fall to between ¥3,000 and ¥5,000. Other daily price limits would apply if our per share price moved to other ranges.
Selected Daily Price Limits
Previous Day’s Closing Price or Special Quote Maximum Daily
Price Movement
Over ¥3,000 Less than ¥5,000 ¥700 Over 5,000 Less than 7,000 1,000 Over 7,000 Less than 10,000 1,500 Over 10,000 Less than 15,000 3,000
For a history of the trading price of our shares on the Osaka Securities Exchange, which was
integrated with the Tokyo Stock Exchange on July 16, 2013, see “Item 9.A. The Offer and Listing—Offer and Listing Details.”
C. Material Contracts.
Except as described elsewhere in this annual report, we have not entered into any material contracts,
other than in the ordinary course of business, within the two years immediately preceding the date of this document or any contract, other than in the ordinary course of business, which contains any provision under which we have any obligation or entitlement which is material to us as of the date of this document.
D. Exchange Controls.
Acquisition or Disposition of Shares or ADSs The Foreign Exchange and Foreign Trade Law of Japan governs certain aspects relating to the
acquisition and holding of securities by “non-residents of Japan” and “foreign investors.” In general, acquisition of shares of stock of a Japanese company listed on any Japanese stock
exchange by a non-resident of Japan from a resident of Japan is not subject to any prior notification requirement, but subject to a post reporting requirement by the resident.
If a foreign investor acquires shares of a Japanese company listed on a Japanese stock exchange and as
a result of this acquisition directly or indirectly holds, aggregated with existing holdings, 10% or more of the issued shares of the company, the foreign investor is, in general, required to report the acquisition to the Minister of Finance and any other competent ministers via the Bank of Japan by the 15th day of the month immediately following the month in which such acquisition took place. In exceptional cases, a prior notification is required in respect of the acquisition.
“Non-residents of Japan” are generally defined as individuals who are not resident in Japan and
corporations whose principal offices are located outside Japan. Branches and other offices of Japanese corporations located outside Japan are considered as non-residents of Japan, and branches and other offices located within Japan of foreign corporations are considered as residents of Japan. “Foreign investors” are generally defined to be (i) individuals not resident in Japan, (ii) corporations which are organized under the laws of foreign countries or whose principal offices are located outside Japan, and (iii) corporations of which (a) 50% or more of the shares are held directly or indirectly by (i) or (ii) above, (b) a majority of officers consists of non-residents of Japan or (c) a majority of officers having the power of representation consists of non-residents of Japan.
121
Dividends and Proceeds of Sale
Under the Foreign Exchange and Foreign Trade Law, dividends paid on, and the proceeds of sales in
Japan of, shares held by non-residents of Japan may in general be converted into any foreign currency and repatriated abroad. Under the terms of the deposit agreement pursuant to which our ADSs are issued, the depositary is required, to the extent that in its judgment it can convert yen on a reasonable basis into dollars and transfer the resulting dollars to the United States, to convert all cash dividends that it receives in respect of deposited shares into dollars and to distribute the amount received (after deduction of applicable withholding taxes) to the holder of ADSs.
For additional information regarding our ADSs, see “—B. Memorandum and Articles of
Association―American Depositary Receipts” and “Item 12.D. Description of Securities Other Than Equity Securities―American Depositary Shares.”
E. Taxation.
United States Federal Income Taxation This section describes the material United States federal income tax consequences of owning and
disposing of our shares or ADSs to a U.S. holder (as defined below). This discussion is not a complete analysis or listing of all of the possible tax consequences of transactions relating to our shares or ADSs and does not address all tax considerations that might be relevant to particular holders in light of their personal circumstances. This discussion applies to you only if you are a U.S. holder and you hold our shares or ADSs as capital assets for tax purposes. This section does not apply to you if you are a member of a special class of holders subject to special rules, including:
• a financial institution;
• a regulated investment company;
• a real estate investment trust;
• a dealer or trader in securities or currencies;
• a tax-exempt organization;
• an insurance company;
• a person liable for alternative minimum tax;
• a person that actually or constructively owns 10% or more of our voting stock;
• a person that holds our shares or ADSs as part of a straddle or a hedging or conversion transaction;
• a person who acquired our shares or ADSs through the exercise or cancellation of employee stock options or otherwise as compensation for their services;
• a U.S. expatriate; or
• a person whose functional currency is not the U.S. dollar.
122
This section is based on the United States Internal Revenue Code of 1986, as amended (the "Code"), its legislative history, existing and proposed Treasury regulations, published rulings and court decisions and the laws of the United States all as currently in effect, as well as on the 2003 income tax treaty between the United States of America and Japan (the “Treaty”). These laws are subject to change, possibly on a retroactive basis. We have not requested, and will not request, a ruling from the U.S. Internal Revenue Service (the “IRS”) with respect to any of the U.S. federal income tax consequences described below, and as a result there can be no assurance that the IRS will not disagree with or challenge any of the conclusions we have reached and describe herein. In addition, this section is based in part upon the representations of the depositary and the assumption that each obligation in the deposit agreement and any related agreement will be performed in accordance with its terms.
As used herein, a “U.S. holder” is a beneficial owner of our shares or ADSs that is:
• a citizen or resident alien of the United States, as determined for U.S. federal income tax purposes;
• a corporation (or other entity treated as a corporation for U.S. federal income tax purposes) created or organized under the laws of the United States or any state thereof or the District of Columbia;
• an estate whose income is subject to United States federal income tax regardless of its source; or
• a trust if (1) a United States court can exercise primary supervision over the trust’s administration and one or more United States persons are authorized to control all substantial decisions of the trust or (2) the trust has a valid election in effect under applicable Treasury regulations to be treated as a U.S. person.
If a partnership or other pass-through entity for U.S. federal income tax purposes is a beneficial owner of our shares or ADSs, the tax treatment of a partner or other owner will generally depend upon the status of the partner (or other owner) and the activities of the entity. If you are a partner (or other owner) of a pass-through entity that acquires our shares or ADSs, you should consult your tax advisor regarding the tax consequences of owning or disposing of our shares or ADSs.
You should consult your own tax advisor regarding the United States federal, state and local and
the Japanese and other tax consequences of owning and disposing of our shares or ADSs in your
particular circumstances.
In general, and taking into account the earlier assumptions, for United States federal income tax
purposes, if you hold ADRs evidencing ADSs, you will be treated as the owner of the shares represented by those ADRs. Exchanges of shares for ADRs, and ADRs for shares, generally will not be subject to United States federal income tax.
Notwithstanding the foregoing, the U.S. Treasury has expressed concerns that intermediaries in the
chain of ownership between the holder of an ADS and the issuer of the security underlying the ADS may be taking actions that are inconsistent with the beneficial ownership of the underlying shares by the holder of the ADS (for example, pre-releasing ADSs to persons who do not have the beneficial ownership of the securities underlying the ADSs). Accordingly, the analysis of the creditability of Japanese taxes and the availability of the favorable rate of tax for dividends received by certain non-corporate U.S. holders, each as described below, could be affected by actions taken by intermediaries in the chain of ownership between the holder of ADSs and us if, as a result of such actions, the holders of ADSs are not properly treated as beneficial owners of the underlying shares. We are not aware of any intention to take any such actions, and accordingly, the remainder of this discussion assumes that holders of ADSs will be properly treated as beneficial owners of the underlying shares.
123
Taxation of Dividends Under the United States federal income tax laws, and subject to the passive foreign investment
company (“PFIC”) rules as discussed below, if you are a U.S. holder, the gross amount of any distribution paid by us out of our current or accumulated earnings and profits (as determined for United States federal income tax purposes) will be subject to U.S. federal income taxation as foreign source dividend income. The dividend will be taxable to you when you, in the case of shares, or the depositary, in the case of ADSs, receive the dividend, in accordance with your regular method of accounting for U.S. federal income tax purposes, actually or constructively.
You must include any Japanese tax withheld from the dividend payment in this gross amount even
though you do not in fact receive it. For a discussion of applicable Japanese withholding tax, see “—Japanese Taxation” below. The amount of the dividend distribution that you must include in income as a U.S. holder will be the U.S. dollar value of the yen payments made, determined at the spot yen/U.S. dollar rate on the date the dividend distribution is includible in your income, regardless of whether the payment is in fact converted into U.S. dollars. Generally, any gain or loss resulting from currency exchange fluctuations during the period from the date you include the dividend payment in income to the date you convert the payment into U.S. dollars will be treated as ordinary income or loss and will not be eligible for the special tax rate applicable to qualified dividend income (discussed below). Such currency gain or loss generally will be income or loss from sources within the United States for foreign tax credit limitation purposes.
Dividends we pay with respect to the shares or ADSs generally will be qualified dividend income. If
you are a non-corporate U.S. holder, dividends paid to you that constitute qualified dividend income will be taxable to you at the favorable rates applicable to long-term capital gains provided that you hold the shares or ADSs for more than 60 days during the 121-day period beginning 60 days before the ex-dividend date and meet other holding period requirements. Dividends we pay will not be eligible for the dividends-received deduction generally allowed to United States corporations in respect of dividends received from other United States corporations.
Distributions in excess of our current and accumulated earnings and profits, as determined for United
States federal income tax purposes, will be treated as a non-taxable return of capital to the extent of your basis in the shares or ADSs and thereafter as capital gain. However, we do not maintain calculations of our earnings and profits in accordance with U.S. federal income tax principles, and you should therefore assume that any distribution by us with respect to our shares or ADSs will constitute ordinary dividend income.
If you are eligible for benefits under the Treaty, you may be able to claim a reduced rate of Japanese
withholding tax, see “—Japanese Taxation” below for a discussion of the Treaty. You should consult your own tax advisor about your eligibility for reduction of Japanese withholding tax. You may claim a deduction or a foreign tax credit, subject to other applicable limitations, only for tax withheld at the appropriate rate. You generally will not be allowed a foreign tax credit for withholding tax for any portion of the tax that could have been avoided by claiming benefits under the Treaty. Dividends paid with respect to our shares or ADSs will, depending on your circumstances, be “passive” or “general” income which, in either case, is treated separately from other types of income for purposes of computing the foreign tax credit allowable to you. The rules governing the foreign tax credit are complex and involve the application of rules that depend upon your particular circumstances. Accordingly, you are urged to consult your tax advisor regarding the availability of the foreign tax credit under your particular circumstances.
Taxation of Capital Gains Subject to the PFIC rules as discussed below, if you are a U.S. holder and you sell, exchange or
124
otherwise dispose of our shares or ADSs, you generally will recognize capital gain or loss for United States federal income tax purposes equal to the difference between the U.S. dollar value of the amount that you realize and your tax basis, determined in U.S. dollars, in your shares or ADSs. Such gain or loss will be long-term capital gain or loss if such holder held the shares or ADSs for more than one year. If you are a non-corporate U.S. holder, long-term capital gains are subject to taxation at favorable rates. The deductibility of capital losses is subject to limitations under the Code.
The gain or loss will generally be income or loss from sources within the United States for foreign tax
credit limitation purposes. Consequently, you may not be able to use any foreign tax credits arising from any Japanese tax imposed on the sale, exchange or other taxable disposition of shares unless such credit can be applied (subject to applicable limitations) against tax due on other income treated as derived from foreign sources or unless the Treaty provides otherwise.
PFIC Rules
Special, and generally unfavorable, U.S. federal income tax rules apply to U.S. persons owning stock
of a PFIC. A foreign corporation will be considered a PFIC for any taxable year in which (i) 75% or more of its gross income is passive income, or (ii) 50% or more of the average value (or, if elected, the adjusted tax basis) of its assets are considered “passive assets” (generally, assets that generate passive income).
We believe that we currently are not a PFIC for United States federal income tax purposes. However,
the determination of PFIC status is a factual determination that is made annually and thus it is possible that we may become a PFIC in the current taxable year or in future years. If we were treated as a PFIC for any taxable year during which a U.S. holder held our shares or ADSs, gain recognized by a U.S. holder on the sale or other disposition of our shares or ADSs would be allocated ratably over its holding period for such shares or ADSs. The amounts allocated to the taxable year of the sale or other disposition and to any year before we became a PFIC would be taxed as ordinary income. The amount allocated to each other taxable year would be subject to tax at the highest rate in effect in such taxable year for individuals or corporations, as appropriate, and an interest charge would be imposed on the tax liability attributable to such allocated amounts. Further, any distribution in respect of our shares or ADSs in excess of 125% of the average of the annual distributions on such shares or ADSs received by a U.S. holder during the preceding three years or its holding period, whichever is shorter, would be subject to taxation as described immediately above. Certain elections (including a mark-to-market election) may be available to a U.S. holder that may mitigate the adverse tax consequences resulting from PFIC status. However, we do not intend to provide information necessary for U.S. holders to make a “qualified electing fund” election, which is sometimes available to shareholders of a PFIC. Notwithstanding any elections, dividends received from us by a U.S. holder would not be eligible for the special tax rates applicable to qualified dividend income if we were treated as a PFIC with respect to the U.S. holder either in the taxable year of the distribution or the preceding taxable year.
You are urged to consult your tax advisor concerning the U.S. federal income tax consequences of
holding our shares or ADSs if we are considered a PFIC in any taxable year.
Medicare Tax on Net Investment Income
Certain non-corporate U.S. holders will be subject to an additional 3.8% tax on all or a portion of their
“net investment income,” which may include dividends on, or capital gains from the sale or other disposition of, our shares or ADSs. U.S. holders should consult their tax advisors regarding the applicability of this tax to any of their income or gains in respect of our shares or ADSs.
Information Reporting and Backup Withholding
In general, information reporting will apply to dividends paid to you in respect of our shares or ADSs
and the proceeds received by you from the sale, exchange or other disposition of our shares or ADSs within the
125
United States unless you are a corporation or other exempt recipient. A backup withholding tax may apply to such payments if you fail to provide a taxpayer identification number or certification of exempt status or fail to report in full dividend and interest income.
Backup withholding is not an additional tax. Any amounts withheld under the backup withholding
rules will be allowed as a refund or credit against your U.S. federal income tax liability, provided that the required information is furnished to the IRS.
Certain U.S. holders who are individuals may be required to report information relating to their
ownership of an interest in certain foreign financial assets, including stock of a non-U.S. person, generally on IRS Form 8938, subject to certain exceptions (including an exception for stock in custodial accounts maintained by a U.S. financial institution). Failure to report the required information could be subject to substantial penalties. Certain U.S. holders that are entities may be subject to similar rules in the future. U.S. holders are urged to consult their tax advisors regarding their reporting obligations with respect to our shares or ADSs.
Japanese Taxation
The following is a summary of the principal Japanese tax consequences to owners of our shares who
are non-resident individuals or non-Japanese corporations without a permanent establishment in Japan to which the relevant income is attributable. The changes are subject to changes in the applicable Japanese laws or double taxation conventions occurring after that date. This summary is not exhaustive of all possible tax considerations which may apply to a particular investor. Potential investors should satisfy themselves as to:
• the overall tax consequences of the acquisition, ownership and disposition of shares or ADSs, including specifically the tax consequences under Japanese law;
• the laws of the jurisdiction of which they are resident; and
• any tax treaty between Japan and their country of residence,
by consulting their own tax advisers.
Generally, a non-resident shareholder is subject to Japanese withholding tax on dividends on the
shares paid by us. A stock split is not subject to Japanese income or corporation tax, as it is characterized merely as an increase of number of shares (as opposed to an increase of value of shares) from Japanese tax perspectives. A conversion of retained earnings or legal reserve (but other than additional paid-in capital, in general) into stated capital on a non-consolidated basis is not characterized as a deemed dividend for Japanese tax purposes, and therefore such a conversion does not trigger Japanese withholding taxation.
Unless applicable tax treaties, conventions or agreements reducing the maximum rate of withholding
tax apply, the rate of Japanese withholding tax applicable to dividends on the listed shares such as those paid by us to non-resident shareholders is currently 15.315% for dividends to be paid during the period between January 1, 2014 and December 31, 2037, and 15% for dividends paid thereafter. Notwithstanding the foregoing, with respect to dividends paid to any individual shareholder who holds 3% or more of the outstanding shares, the applicable rate is 20.42% until December 31, 2037 and will be 20% thereafter. These withholding tax rates during the period beginning on January 1, 2013 and ending on December 31, 2037 include a special surtax aimed to secure funds for reconstruction from the Great East Japan Earthquake, which is calculated by multiplying the original tax rate by 2.1%.
126
Japan is a party to a number of income tax treaties, conventions and agreements (collectively, “tax treaties”), whereby the maximum withholding tax rate for dividend payment is set at, in most cases, 15% for portfolio investors who are non-resident shareholders. Such tax treaties setting the maximum tax rate at 15% have been entered into with, among other countries, Belgium, Canada, Denmark, Finland, Germany, Ireland, Italy, Luxembourg, New Zealand, Norway, Singapore, Spain and Sweden. Japan's income tax treaties with Australia, France, the Netherlands, Switzerland and the United Kingdom have been amended to generally reduce the maximum withholding tax rate to 10%. Pursuant to the tax treaty between the United States and Japan, portfolio investors who are qualified U.S. residents eligible for benefits of the treaty are subject to 10% withholding tax on dividends paid by a Japanese corporation if they do not have a permanent establishment in Japan and the shares for which such dividends are paid are not effectively connected with such permanent establishment. It shall be noted that, under the treaty, pension funds that are qualified U.S. residents eligible for benefits of the treaty are exempt from such withholding, provided that the dividends are not derived from the carrying on of a business, directly or indirectly, by such pension funds.
Non-resident shareholders who are entitled to a reduced treaty rate of Japanese withholding tax on
payment by us of dividends on the shares are required to submit an Application Form for Income Tax Convention regarding Relief from Japanese Income Tax on Dividends in advance through us, which is the case for ADS holders, or (in cases where the relevant withholding taxpayer for the dividend payment is not us but a financial institution in Japan) through the financial institution, to the relevant tax authority before payment of dividends. A standing proxy for non-resident shareholders may provide such application service. See Item 10.B. of this annual report. Non-resident shareholders who do not submit an application in advance will be entitled to claim the refund of withholding taxes withheld in excess of the rate of an applicable tax treaty from the relevant Japanese tax authority.
While the treaty rate normally overrides the tax rate under the domestic law, if the Japanese statutory
rate of withholding tax on dividends is lower than the rate applicable under the applicable income tax treaty, then the Japanese statutory tax rate applies due to the so-called “preservation doctrine.” If the Japanese statutory tax rate still applies, no treaty application is required to be filed. However, as mentioned above, since the current Japanese statutory rate of withholding tax on dividends is 15.315% which applies for the period between January 1, 2014 and December 31, 2037, and since the rate is higher than the treaty rate of 15% or 10% mentioned above, the preservation doctrine does not operate and in order to enjoy the lower treaty rate, the filing of the treaty application is needed.
Gains derived from the sale of shares outside Japan, or from the sale of shares within Japan by a
non-resident shareholder as a portfolio investor, are generally not subject to Japanese income or corporation taxes.
Japanese inheritance and gift taxes may be assessed against an individual who has acquired shares as a
legatee, heir or donee, even if the individual is not a Japanese resident. F. Dividends and Paying Agents.
Not applicable.
G. Statement by Experts.
Not applicable.
127
H. Documents on Display. We file periodic reports and other information with the U.S. Securities and Exchange Commission.
You may read and copy any document that we file with the SEC at the SEC’s public reference room at 100 F Street, N.E., Washington, D.C. 20549. Please call the SEC at 1-800-SEC-0330 for further information on the operation of its public reference room. The SEC also maintains a web site at www.sec.gov that contains reports, proxy statements and other information regarding registrants that file electronically with the SEC. Some of this information may also be found on our website at www.nidec.co.jp/english/ir/index.html. Information on our website does not form part of this annual report.
As a foreign private issuer, we are exempt from the rules under the U.S. Securities Exchange Act of
1934 prescribing the furnishing and content of proxy statements to shareholders.
I. Subsidiary Information. Not applicable.
Item 11. Quantitative and Qualitative Disclosures About Market Risk.
We hold financial instruments in the normal course of business and are exposed to market risk,
including changes in foreign exchange rates, interest rates, equity prices and commodity prices. We employ a variety of measures to manage market risk related to our financial instruments, including cash and cash equivalents, financial receivables, securities investments, long-term debt and other borrowings.
We make an effort to manage the exposures to fluctuations in foreign exchange rates, interest rates and
commodity prices through the use of derivative financial instruments, including foreign exchange forward contracts, currency option contracts, interest rate swap agreements and commodities futures. Foreign exchange forward contracts and currency option contracts are designed to reduce our exposure to losses resulting from adverse fluctuations in foreign exchange rates on our foreign currency accounts receivable, other receivables and accounts payable. Interest rate swap agreements are designed to reduce our exposure to losses resulting from adverse fluctuations in interest rates on our financial instruments. Commodity futures are designed to reduce our exposure to losses resulting from adverse fluctuations in commodity prices, mainly prices of metals used to manufacture our products.
Foreign Currency Exchange Rate Risk
Transaction Risk
A significant portion of our business is conducted in currencies other than the Japanese yen, most
significantly the U.S. dollar and Euro. Our sales denominated in a currency other than the Japanese yen are, to a significant extent, offset by costs denominated in the same currency. To the extent that there are any open foreign currency positions, we are exposed to the risk of foreign currency fluctuations. Any resulting gains and losses are recorded in our results of operations for the relevant period. Foreign exchange gains and losses represent the differences between the value of monetary assets and liabilities when they are originated at exchange rates when a purchase or sale occurs and their value at the prevailing exchange rate when they are settled or translated at year-end. Foreign currency-denominated monetary assets may include bank deposits, trade receivables and other receivables, and foreign currency-denominated monetary liabilities may include trade and notes payable, borrowings and debt.
128
Translation Risk
Our reporting currency is the Japanese yen. We have assets and liabilities outside Japan that are
subject to fluctuations in foreign currency exchange rates. Our assets and liabilities that are outside Japan are primarily located in Singapore, the United States, China and Thailand. We prepare financial statements of our foreign operations in their functional currencies prior to consolidation in our financial statements. Translation gains and losses arising from changes in the value of the reporting currency relative to the functional currencies of the underlying operations are recorded outside of our statement of operations in other comprehensive income until the relevant foreign operation is disposed of or liquidated.
Foreign Currency Risk Management
From time to time we utilize foreign currency forward contracts and currency option contracts
derivative instruments to manage exposure to exchange rate volatility for accounts payable, accounts receivable and anticipated transactions denominated in foreign currencies. However, we do not use instruments with leverage, or exotic options, to mitigate market risk. Changes in the fair value of derivatives are charged to current earnings. However, certain derivatives may qualify for hedge accounting as a cash flow hedge, if the hedging relationship is expected to be highly effective in achieving offsetting of cash flows of the hedging instruments and hedged items. Under hedge accounting, changes in the fair value of the effective portion of these derivatives designated as cash flow hedge derivatives are deferred in accumulated other comprehensive income and charged to earnings when the underlying transaction being hedged occurs. The table below sets forth the aggregate contract amounts and weighted-average contracted forward rates for annual maturities of our foreign exchange forward contracts and currency option contracts for the next five years and thereafter as well as the fair value of each item.
Foreign Currency Derivatives at March 31, 2014
Maturity date
For the year ending March 31,
2015 2016 2017 2018 2019
There-
after Total
Fair
Value
Foreign Exchange Forward Contracts:
Sell U.S. dollars (Buy Mexican
Peso) Contract amounts (Yen in millions) ................................¥6,151 ¥2,712 - - - - ¥8,863 ¥266 Weighted-average contracted
forward Rate (MXN per U.S.$1) ................................13.68 13.90 - - - - 13.75 Sell U.S. dollars (Buy Chinese
Hongkong)
Contract amounts (Yen in millions) ................................¥243 - - - - - ¥243 ¥(1) Weighted-average contracted
forward Rate (CNH per U.S.$1) ................................6.22 - - - - - 6.22 Sell U.S. dollars (Buy Euro)
Contract amounts (Yen in millions) ................................¥1,635 ¥6 - - - - ¥1,641 ¥(0) Weighted-average contracted
forward Rate (EUR per U.S.$1) ................................1.38 1.40 - - - - 1.38 Sell Euro (Buy Hungarian Forint)
Contract amounts (Yen in millions) ................................¥630 - - - - - ¥630 ¥5 Weighted-average contracted
forward Rate (HUF per €1) ................................311.23 - - - - - 311.23 Sell Yen (Buy Euro)
Contract amounts (Yen in millions) ................................¥18 ¥37 - - - - ¥55 ¥0
129
Weighted-average contracted forward Rate (EUR per ¥1) ................................141.09 140.87 - - - - 140.94
Sell Yen (Buy Indonesia Rupiah) Contract amounts (Yen in millions) ................................¥104 - - - - - ¥104 ¥4 Weighted-average contracted
forward Rate (IDR per ¥1) ................................0.0087 - - - - - 0.0087 Currency Option Contracts:
Sell Yen (Buy Euro) Contract amounts (Yen in millions) ................................¥53 - - - - - ¥53 ¥7 Weighted-average contracted
forward Rate (EUR per ¥1) ................................111.00 - - - - - 111.00 As our investments in foreign subsidiaries with functional currencies other than the Japanese yen are
generally considered long-term, we do not hedge these net investments.
Interest Rate Risk We have long-term receivables and debt, with fixed and variable rates. We enter into interest rate swap
agreements and other contracts to reduce our market risk exposure to changes in interest rates and to stabilize the fair values and cash flows of our receivables and debt.
The table below sets forth information about our financial instruments that are sensitive to changes in
interest rates. For our loan receivables and debt, the table indicates whether the interest component is fixed or variable, the amount of the cash flows and the expected weighted-average interest rate for the next five years and thereafter as well as the fair value. For our interest rate swap agreements, the table presents payment type, notional principal amounts and weighted-average interest rates by expected (contracted) maturity dates and the fair value. Notional amounts are used to calculate the contractual payments to be exchanged under the contracts.
Interest Rate Risk at March 31, 2014
Maturity date
For the year ending March 31,
2015 2016 2017 2018 2019
There-af
ter Total
Fair
Value
Long-term Loan Receivable: (Yen in millions, except percentages) Fixed Rate
Principal cash flows ................................21 11 5 2 1 8 48 50 Weighted-average
interest rate ................................0.00% 0.56% 0.46% 0.21% 0.00% 0.00% 0.19% Long-term Debt:
Fixed Rate (long-term
loans) Principal cash flows ................................62 108 30,549 623 23 104 31,469 31,151 Weighted-average
interest rate ................................
0.63%
0.25%
0.19%
1.25%
0.16%
0.26%
0.21% Fixed Rate (straight bonds)
Principal cash flows ................................100 - 50,000 65,000 - 35,000 150,100 150,868 Weighted-average
interest rate ................................0.72% - 0.21% 0.39% - 0.80% 0.42% Fixed Rate (convertible
bonds) Principal cash flows ................................- 95,750 - - - - 95,750 120,985
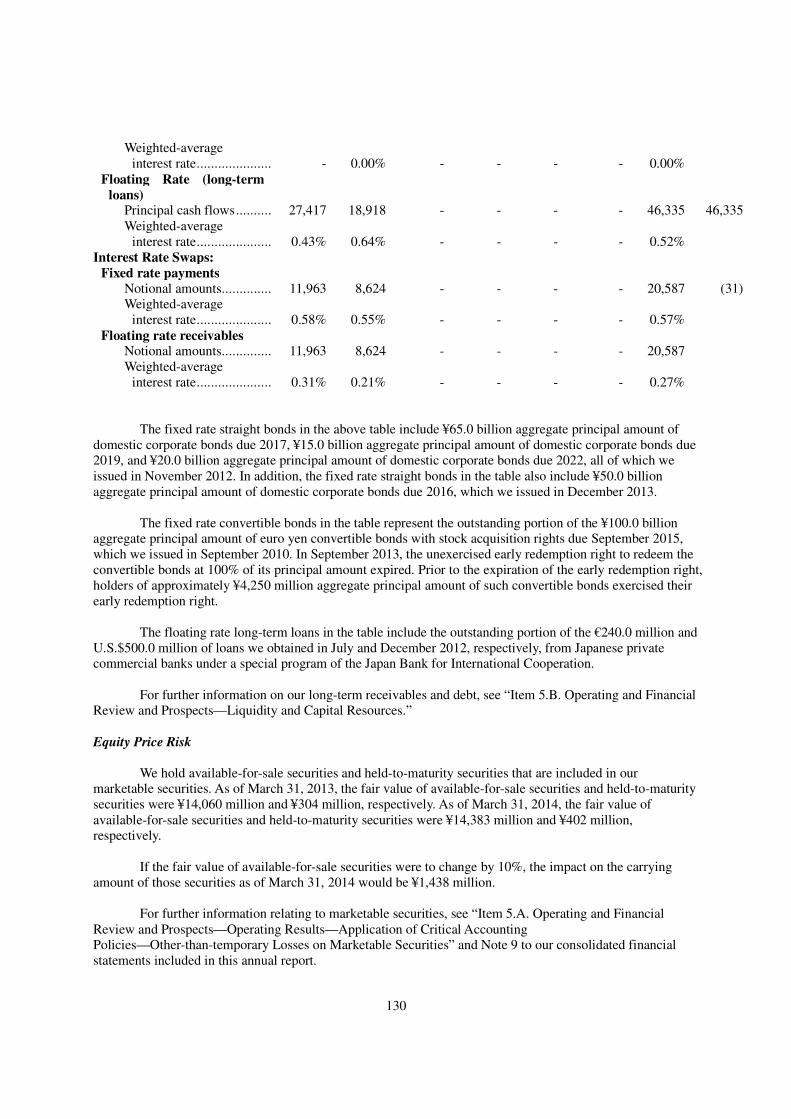
130
The fixed rate straight bonds in the above table include ¥65.0 billion aggregate principal amount of
domestic corporate bonds due 2017, ¥15.0 billion aggregate principal amount of domestic corporate bonds due 2019, and ¥20.0 billion aggregate principal amount of domestic corporate bonds due 2022, all of which we issued in November 2012. In addition, the fixed rate straight bonds in the table also include ¥50.0 billion aggregate principal amount of domestic corporate bonds due 2016, which we issued in December 2013.
The fixed rate convertible bonds in the table represent the outstanding portion of the ¥100.0 billion
aggregate principal amount of euro yen convertible bonds with stock acquisition rights due September 2015, which we issued in September 2010. In September 2013, the unexercised early redemption right to redeem the convertible bonds at 100% of its principal amount expired. Prior to the expiration of the early redemption right, holders of approximately ¥4,250 million aggregate principal amount of such convertible bonds exercised their early redemption right.
The floating rate long-term loans in the table include the outstanding portion of the €240.0 million and
U.S.$500.0 million of loans we obtained in July and December 2012, respectively, from Japanese private commercial banks under a special program of the Japan Bank for International Cooperation.
For further information on our long-term receivables and debt, see “Item 5.B. Operating and Financial
Review and Prospects—Liquidity and Capital Resources.”
Equity Price Risk We hold available-for-sale securities and held-to-maturity securities that are included in our
marketable securities. As of March 31, 2013, the fair value of available-for-sale securities and held-to-maturity securities were ¥14,060 million and ¥304 million, respectively. As of March 31, 2014, the fair value of available-for-sale securities and held-to-maturity securities were ¥14,383 million and ¥402 million, respectively.
If the fair value of available-for-sale securities were to change by 10%, the impact on the carrying
amount of those securities as of March 31, 2014 would be ¥1,438 million. For further information relating to marketable securities, see “Item 5.A. Operating and Financial
Review and Prospects—Operating Results—Application of Critical Accounting Policies—Other-than-temporary Losses on Marketable Securities” and Note 9 to our consolidated financial statements included in this annual report.
Weighted-average interest rate ................................ - 0.00% - - - - 0.00%
Floating Rate (long-term
loans) Principal cash flows ................................27,417 18,918 - - - - 46,335 46,335 Weighted-average
interest rate ................................0.43% 0.64% - - - - 0.52% Interest Rate Swaps:
Fixed rate payments Notional amounts ................................11,963 8,624 - - - - 20,587 (31) Weighted-average
interest rate ................................0.58% 0.55% - - - - 0.57% Floating rate receivables
Notional amounts ................................11,963 8,624 - - - - 20,587 Weighted-average
interest rate ................................0.31% 0.21% - - - - 0.27%
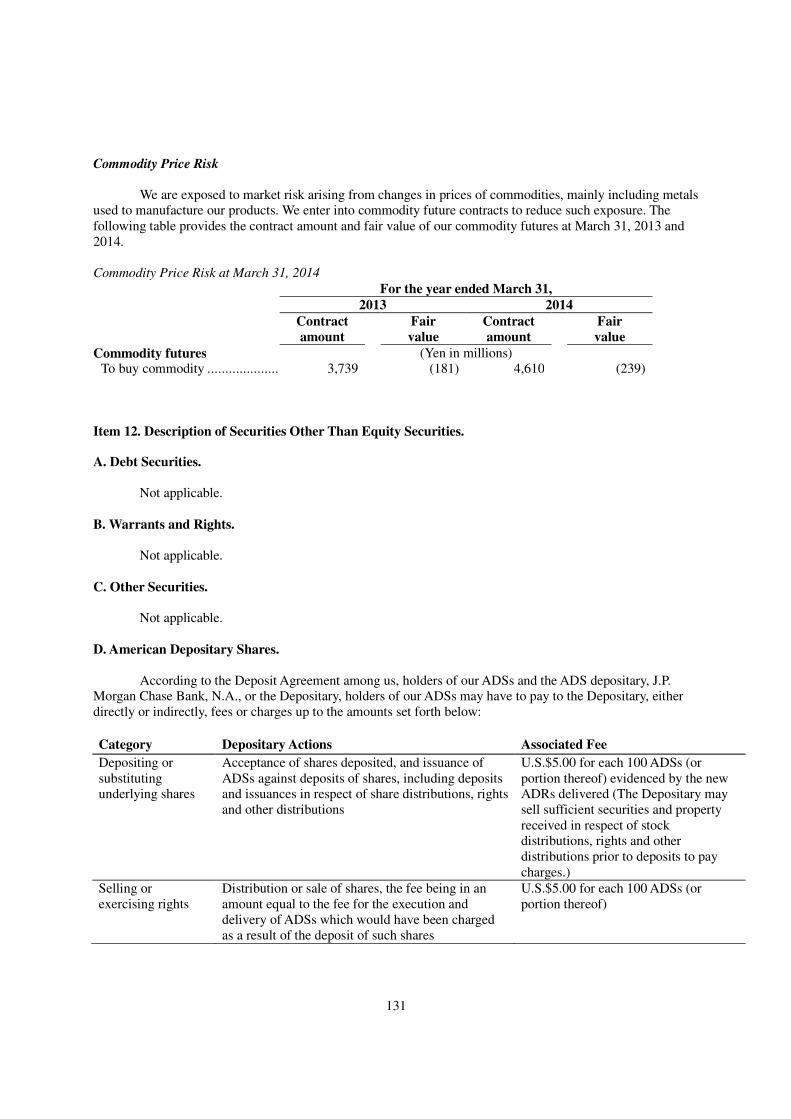
131
Commodity Price Risk
We are exposed to market risk arising from changes in prices of commodities, mainly including metals
used to manufacture our products. We enter into commodity future contracts to reduce such exposure. The following table provides the contract amount and fair value of our commodity futures at March 31, 2013 and 2014. Commodity Price Risk at March 31, 2014
For the year ended March 31,
2013 2014 Contract
amount
Fair
value
Contract
amount Fair
value
Commodity futures (Yen in millions) To buy commodity ................................ 3,739 (181) 4,610 (239)
Item 12. Description of Securities Other Than Equity Securities.
A. Debt Securities. Not applicable.
B. Warrants and Rights. Not applicable.
C. Other Securities. Not applicable.
D. American Depositary Shares.
According to the Deposit Agreement among us, holders of our ADSs and the ADS depositary, J.P.
Morgan Chase Bank, N.A., or the Depositary, holders of our ADSs may have to pay to the Depositary, either directly or indirectly, fees or charges up to the amounts set forth below:
Category Depositary Actions Associated Fee
Depositing or substituting underlying shares
Acceptance of shares deposited, and issuance of ADSs against deposits of shares, including deposits and issuances in respect of share distributions, rights and other distributions
U.S.$5.00 for each 100 ADSs (or portion thereof) evidenced by the new ADRs delivered (The Depositary may sell sufficient securities and property received in respect of stock distributions, rights and other distributions prior to deposits to pay charges.)
Selling or exercising rights
Distribution or sale of shares, the fee being in an amount equal to the fee for the execution and delivery of ADSs which would have been charged as a result of the deposit of such shares
U.S.$5.00 for each 100 ADSs (or portion thereof)
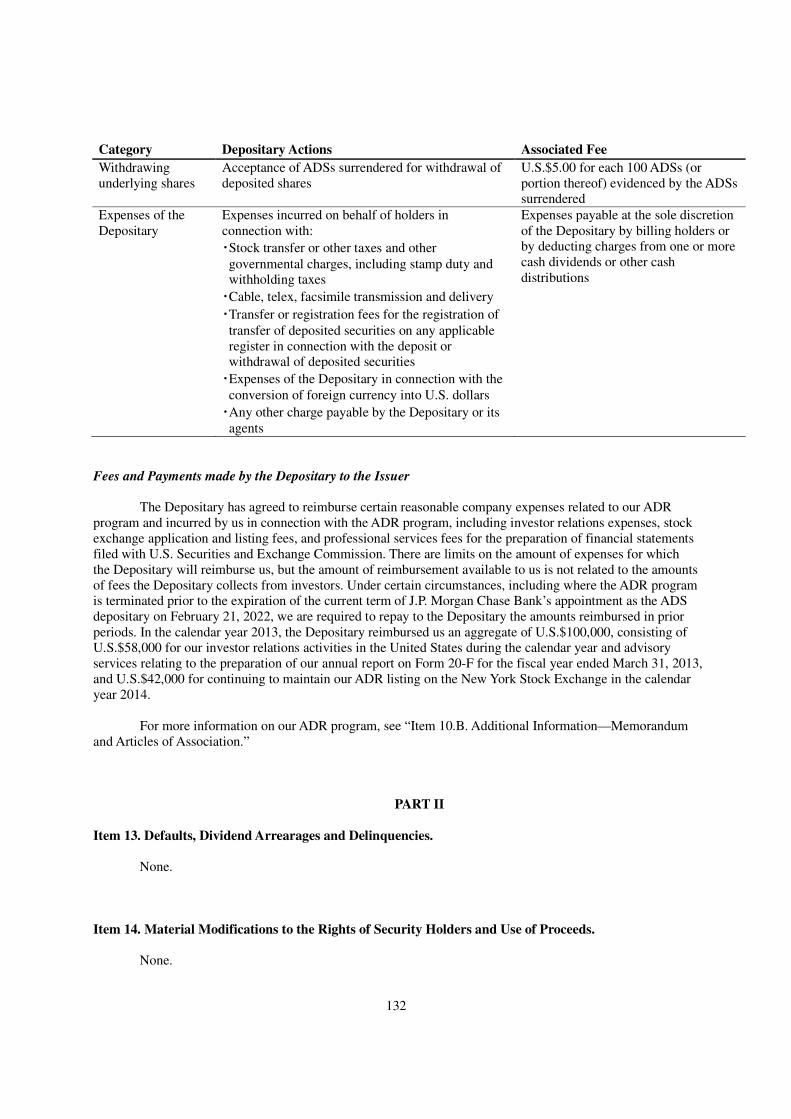
132
Category Depositary Actions Associated Fee
Withdrawing underlying shares
Acceptance of ADSs surrendered for withdrawal of deposited shares
U.S.$5.00 for each 100 ADSs (or portion thereof) evidenced by the ADSs surrendered
Expenses of the Depositary
Expenses incurred on behalf of holders in connection with:
・Stock transfer or other taxes and other governmental charges, including stamp duty and withholding taxes
・Cable, telex, facsimile transmission and delivery
・Transfer or registration fees for the registration of transfer of deposited securities on any applicable register in connection with the deposit or withdrawal of deposited securities
・Expenses of the Depositary in connection with the conversion of foreign currency into U.S. dollars
・Any other charge payable by the Depositary or its agents
Expenses payable at the sole discretion of the Depositary by billing holders or by deducting charges from one or more cash dividends or other cash distributions
Fees and Payments made by the Depositary to the Issuer
The Depositary has agreed to reimburse certain reasonable company expenses related to our ADR program and incurred by us in connection with the ADR program, including investor relations expenses, stock exchange application and listing fees, and professional services fees for the preparation of financial statements filed with U.S. Securities and Exchange Commission. There are limits on the amount of expenses for which the Depositary will reimburse us, but the amount of reimbursement available to us is not related to the amounts of fees the Depositary collects from investors. Under certain circumstances, including where the ADR program is terminated prior to the expiration of the current term of J.P. Morgan Chase Bank’s appointment as the ADS depositary on February 21, 2022, we are required to repay to the Depositary the amounts reimbursed in prior periods. In the calendar year 2013, the Depositary reimbursed us an aggregate of U.S.$100,000, consisting of U.S.$58,000 for our investor relations activities in the United States during the calendar year and advisory services relating to the preparation of our annual report on Form 20-F for the fiscal year ended March 31, 2013, and U.S.$42,000 for continuing to maintain our ADR listing on the New York Stock Exchange in the calendar year 2014.
For more information on our ADR program, see “Item 10.B. Additional Information—Memorandum
and Articles of Association.”
PART II
Item 13. Defaults, Dividend Arrearages and Delinquencies.
None.
Item 14. Material Modifications to the Rights of Security Holders and Use of Proceeds. None.
133
Item 15. Controls and Procedures.
Disclosure Controls and Procedures Under the supervision and with the participation of our management, including our Chief Executive
Officer and Chief Financial Officer, management conducted an evaluation of the effectiveness of our disclosure controls and procedures (as such term is defined in Rules 13a-15(e) and 15d-15(e) under the Securities Exchange Act of 1934, as amended, or the Exchange Act), as of March 31, 2014. Based on this evaluation, our Chief Executive Officer and Chief Financial Officer have concluded that, as of March 31, 2014, our disclosure controls and procedures were effective. Our disclosure controls and procedures are designed to ensure that information required to be disclosed in reports filed or submitted under the Exchange Act is recorded, processed, summarized and reported within the time periods specified in the U.S. Securities and Exchange Commission's rules and forms, and that such information is accumulated and communicated to our management, including our Chief Executive Officer and Chief Financial Officer, as appropriate, to allow timely decisions regarding required disclosure.
Management's Report on Internal Control over Financial Reporting
Our Management is responsible for establishing and maintaining adequate internal control over
financial reporting, as such term is defined in Exchange Act Rules 13a-15(f) and 15d-15(f). Our internal control over financial reporting is a process designed to provide reasonable assurance regarding the reliability of financial reporting and the preparation of financial statements for external purposes in accordance with applicable generally accepted accounting principles.
Because of its inherent limitations, internal control over financial reporting may not prevent or detect
misstatements. Also, projections of any evaluation of effectiveness to future periods are subject to the risk that controls may become inadequate because of changes in conditions, or that the degree of compliance with the policies or procedures may deteriorate.
Our management has evaluated the effectiveness of our internal control over financial reporting based
upon criteria established in "Internal Control — Integrated Framework (1992)" issued by the Committee of Sponsoring Organizations of the Treadway Commission.
Based on this evaluation, management determined that we maintained effective internal control over
financial reporting as of March 31, 2014. Our independent registered public accounting firm, PricewaterhouseCoopers Kyoto, has audited the
effectiveness of our internal control over financial reporting as of March 31, 2014, as stated in their report which appears on page F-2 of this annual report.
Changes in Internal Control over Financial Reporting
There has been no change in our internal control over financial reporting during the fiscal year ended
March 31, 2014 that has materially affected, or is reasonably likely to materially affect, our internal control over financial reporting.
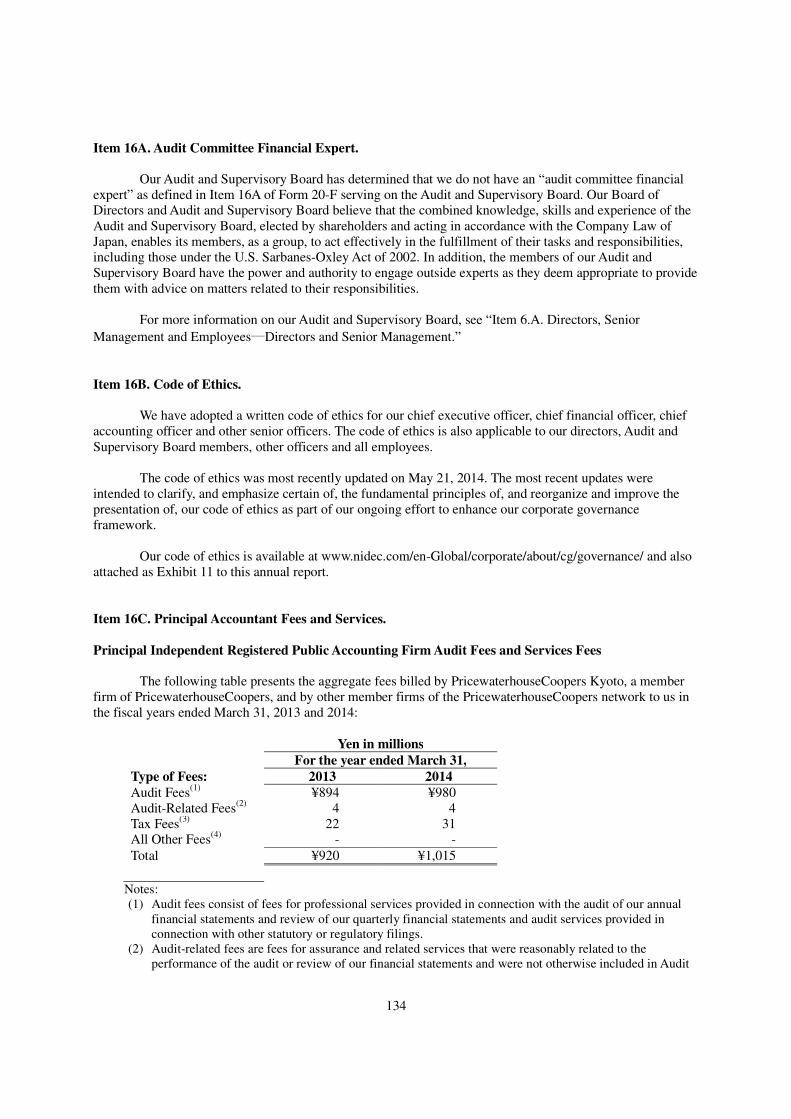
134
Item 16A. Audit Committee Financial Expert. Our Audit and Supervisory Board has determined that we do not have an “audit committee financial
expert” as defined in Item 16A of Form 20-F serving on the Audit and Supervisory Board. Our Board of Directors and Audit and Supervisory Board believe that the combined knowledge, skills and experience of the Audit and Supervisory Board, elected by shareholders and acting in accordance with the Company Law of Japan, enables its members, as a group, to act effectively in the fulfillment of their tasks and responsibilities, including those under the U.S. Sarbanes-Oxley Act of 2002. In addition, the members of our Audit and Supervisory Board have the power and authority to engage outside experts as they deem appropriate to provide them with advice on matters related to their responsibilities.
For more information on our Audit and Supervisory Board, see “Item 6.A. Directors, Senior
Management and Employees―Directors and Senior Management.”
Item 16B. Code of Ethics.
We have adopted a written code of ethics for our chief executive officer, chief financial officer, chief
accounting officer and other senior officers. The code of ethics is also applicable to our directors, Audit and Supervisory Board members, other officers and all employees.
The code of ethics was most recently updated on May 21, 2014. The most recent updates were
intended to clarify, and emphasize certain of, the fundamental principles of, and reorganize and improve the presentation of, our code of ethics as part of our ongoing effort to enhance our corporate governance framework.
Our code of ethics is available at www.nidec.com/en-Global/corporate/about/cg/governance/ and also
attached as Exhibit 11 to this annual report.
Item 16C. Principal Accountant Fees and Services.
Principal Independent Registered Public Accounting Firm Audit Fees and Services Fees The following table presents the aggregate fees billed by PricewaterhouseCoopers Kyoto, a member
firm of PricewaterhouseCoopers, and by other member firms of the PricewaterhouseCoopers network to us in the fiscal years ended March 31, 2013 and 2014:
Yen in millions
For the year ended March 31,
Type of Fees: 2013 2014
Audit Fees(1)
¥894 ¥980 Audit-Related Fees
(2) 4 4
Tax Fees(3)
22 31 All Other Fees
(4) - -
Total ¥920 ¥1,015
Notes: (1) Audit fees consist of fees for professional services provided in connection with the audit of our annual
financial statements and review of our quarterly financial statements and audit services provided in connection with other statutory or regulatory filings.
(2) Audit-related fees are fees for assurance and related services that were reasonably related to the performance of the audit or review of our financial statements and were not otherwise included in Audit
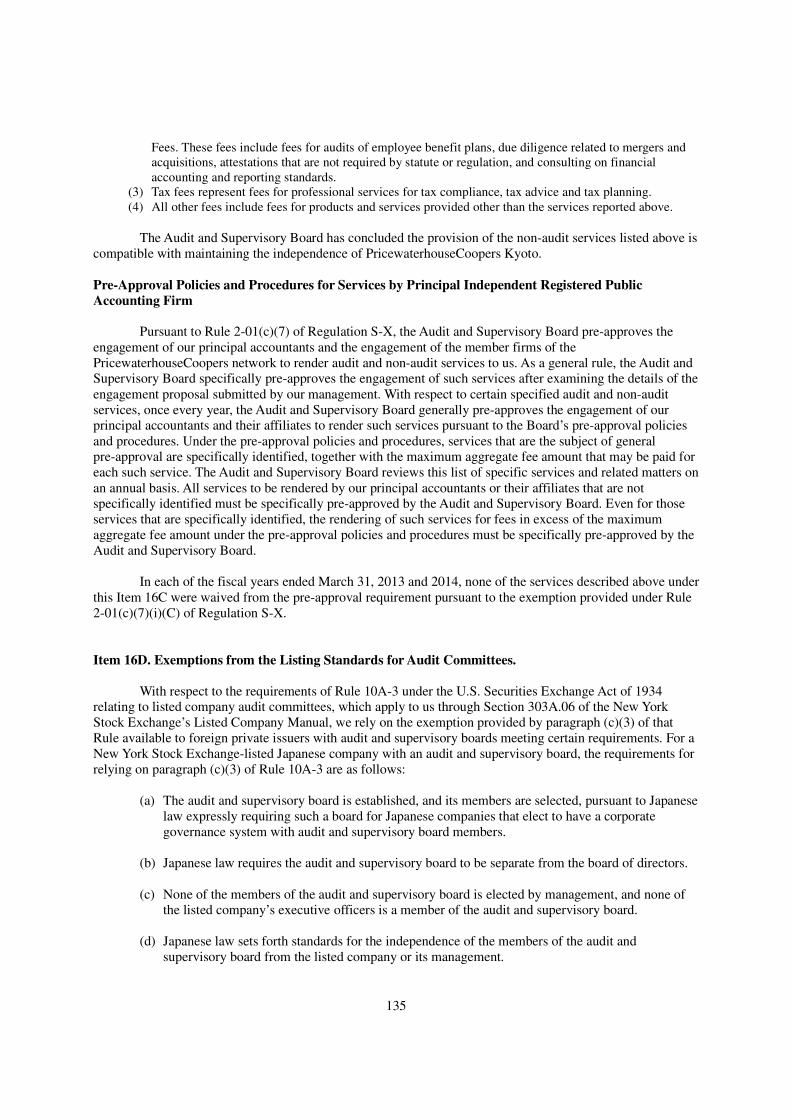
135
Fees. These fees include fees for audits of employee benefit plans, due diligence related to mergers and acquisitions, attestations that are not required by statute or regulation, and consulting on financial accounting and reporting standards.
(3) Tax fees represent fees for professional services for tax compliance, tax advice and tax planning. (4) All other fees include fees for products and services provided other than the services reported above.
The Audit and Supervisory Board has concluded the provision of the non-audit services listed above is
compatible with maintaining the independence of PricewaterhouseCoopers Kyoto.
Pre-Approval Policies and Procedures for Services by Principal Independent Registered Public
Accounting Firm Pursuant to Rule 2-01(c)(7) of Regulation S-X, the Audit and Supervisory Board pre-approves the
engagement of our principal accountants and the engagement of the member firms of the PricewaterhouseCoopers network to render audit and non-audit services to us. As a general rule, the Audit and Supervisory Board specifically pre-approves the engagement of such services after examining the details of the engagement proposal submitted by our management. With respect to certain specified audit and non-audit services, once every year, the Audit and Supervisory Board generally pre-approves the engagement of our principal accountants and their affiliates to render such services pursuant to the Board’s pre-approval policies and procedures. Under the pre-approval policies and procedures, services that are the subject of general pre-approval are specifically identified, together with the maximum aggregate fee amount that may be paid for each such service. The Audit and Supervisory Board reviews this list of specific services and related matters on an annual basis. All services to be rendered by our principal accountants or their affiliates that are not specifically identified must be specifically pre-approved by the Audit and Supervisory Board. Even for those services that are specifically identified, the rendering of such services for fees in excess of the maximum aggregate fee amount under the pre-approval policies and procedures must be specifically pre-approved by the Audit and Supervisory Board.
In each of the fiscal years ended March 31, 2013 and 2014, none of the services described above under
this Item 16C were waived from the pre-approval requirement pursuant to the exemption provided under Rule 2-01(c)(7)(i)(C) of Regulation S-X.
Item 16D. Exemptions from the Listing Standards for Audit Committees. With respect to the requirements of Rule 10A-3 under the U.S. Securities Exchange Act of 1934
relating to listed company audit committees, which apply to us through Section 303A.06 of the New York Stock Exchange’s Listed Company Manual, we rely on the exemption provided by paragraph (c)(3) of that Rule available to foreign private issuers with audit and supervisory boards meeting certain requirements. For a New York Stock Exchange-listed Japanese company with an audit and supervisory board, the requirements for relying on paragraph (c)(3) of Rule 10A-3 are as follows:
(a) The audit and supervisory board is established, and its members are selected, pursuant to Japanese
law expressly requiring such a board for Japanese companies that elect to have a corporate governance system with audit and supervisory board members.
(b) Japanese law requires the audit and supervisory board to be separate from the board of directors. (c) None of the members of the audit and supervisory board is elected by management, and none of
the listed company’s executive officers is a member of the audit and supervisory board. (d) Japanese law sets forth standards for the independence of the members of the audit and
supervisory board from the listed company or its management.
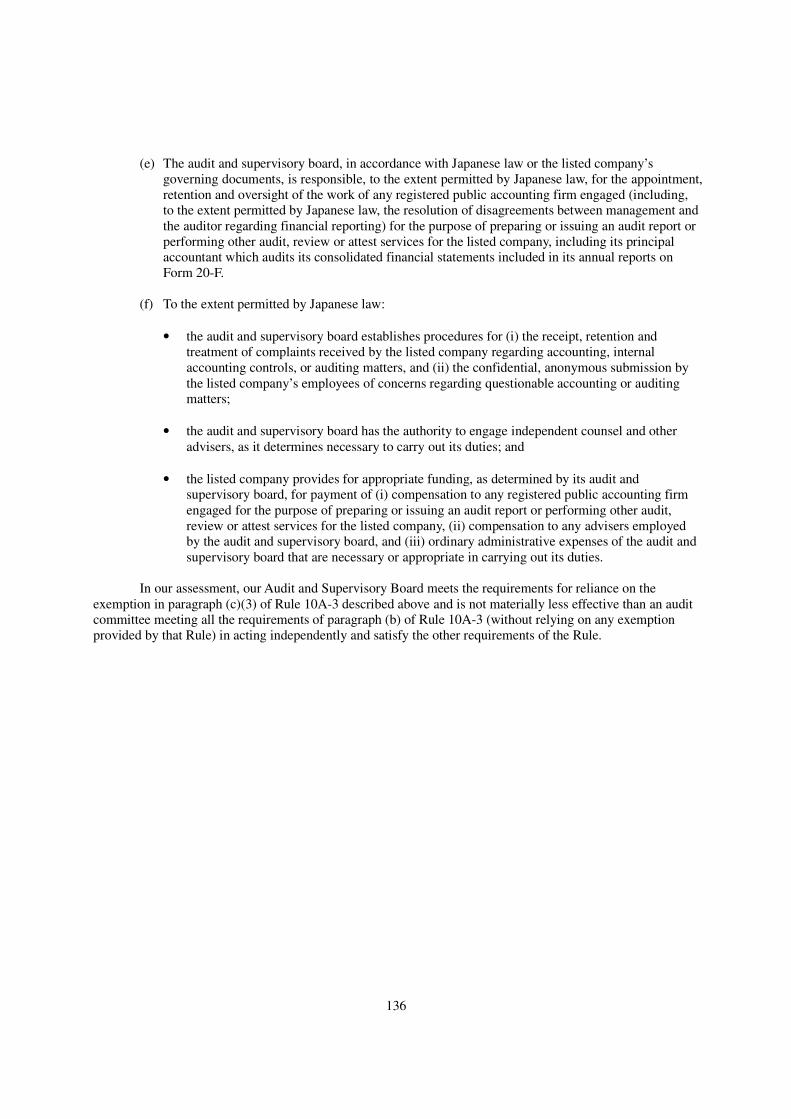
136
(e) The audit and supervisory board, in accordance with Japanese law or the listed company’s
governing documents, is responsible, to the extent permitted by Japanese law, for the appointment, retention and oversight of the work of any registered public accounting firm engaged (including, to the extent permitted by Japanese law, the resolution of disagreements between management and the auditor regarding financial reporting) for the purpose of preparing or issuing an audit report or performing other audit, review or attest services for the listed company, including its principal accountant which audits its consolidated financial statements included in its annual reports on Form 20-F.
(f) To the extent permitted by Japanese law:
• the audit and supervisory board establishes procedures for (i) the receipt, retention and treatment of complaints received by the listed company regarding accounting, internal accounting controls, or auditing matters, and (ii) the confidential, anonymous submission by the listed company’s employees of concerns regarding questionable accounting or auditing matters;
• the audit and supervisory board has the authority to engage independent counsel and other advisers, as it determines necessary to carry out its duties; and
• the listed company provides for appropriate funding, as determined by its audit and supervisory board, for payment of (i) compensation to any registered public accounting firm engaged for the purpose of preparing or issuing an audit report or performing other audit, review or attest services for the listed company, (ii) compensation to any advisers employed by the audit and supervisory board, and (iii) ordinary administrative expenses of the audit and supervisory board that are necessary or appropriate in carrying out its duties.
In our assessment, our Audit and Supervisory Board meets the requirements for reliance on the
exemption in paragraph (c)(3) of Rule 10A-3 described above and is not materially less effective than an audit committee meeting all the requirements of paragraph (b) of Rule 10A-3 (without relying on any exemption provided by that Rule) in acting independently and satisfy the other requirements of the Rule.
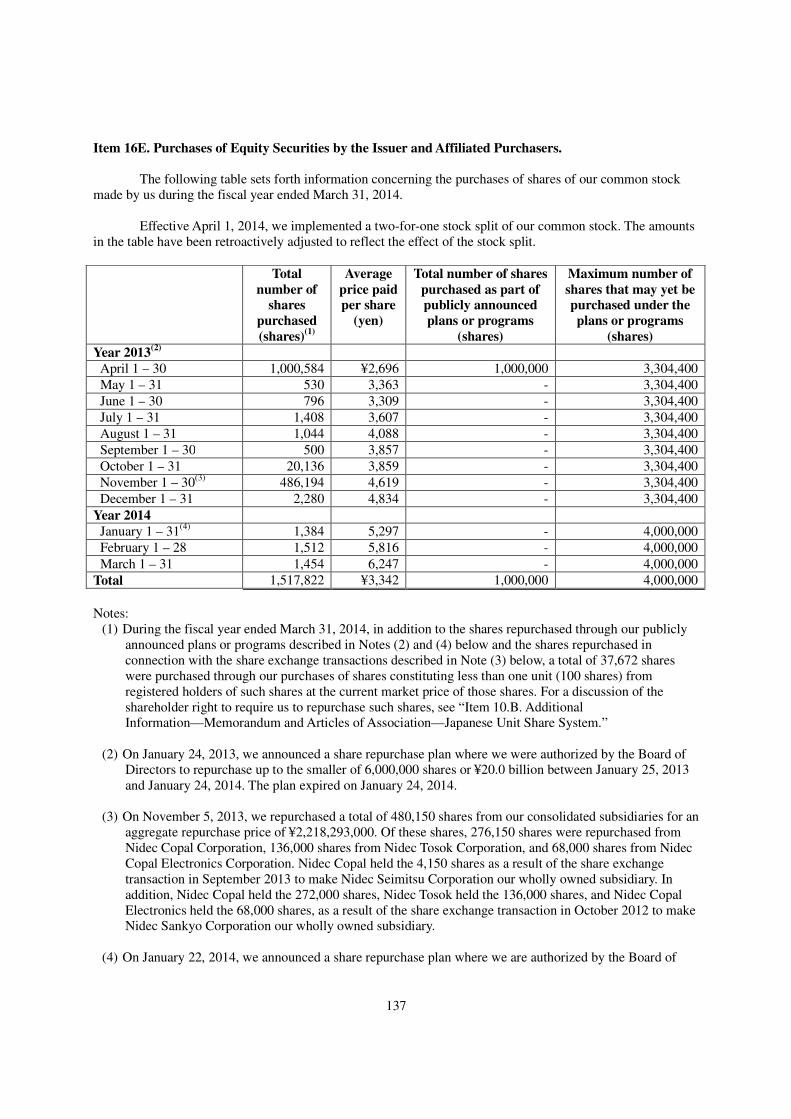
137
Item 16E. Purchases of Equity Securities by the Issuer and Affiliated Purchasers. The following table sets forth information concerning the purchases of shares of our common stock
made by us during the fiscal year ended March 31, 2014. Effective April 1, 2014, we implemented a two-for-one stock split of our common stock. The amounts
in the table have been retroactively adjusted to reflect the effect of the stock split.
Total
number of
shares
purchased
(shares)(1)
Average
price paid
per share
(yen)
Total number of shares
purchased as part of
publicly announced
plans or programs
(shares)
Maximum number of
shares that may yet be
purchased under the
plans or programs
(shares)
Year 2013(2)
April 1 – 30
1,000,584 ¥2,696 1,000,000 3,304,400
May 1 – 31 530 3,363 - 3,304,400
June 1 – 30 796 3,309 - 3,304,400
July 1 – 31 1,408 3,607 - 3,304,400
August 1 – 31 1,044 4,088 - 3,304,400
September 1 – 30 500 3,857 - 3,304,400
October 1 – 31 20,136 3,859 - 3,304,400
November 1 – 30(3) 486,194 4,619 - 3,304,400
December 1 – 31 2,280 4,834 - 3,304,400
Year 2014
January 1 – 31(4)
1,384 5,297 - 4,000,000
February 1 – 28 1,512 5,816 - 4,000,000
March 1 – 31 1,454 6,247 - 4,000,000
Total 1,517,822 ¥3,342 1,000,000 4,000,000
Notes:
(1) During the fiscal year ended March 31, 2014, in addition to the shares repurchased through our publicly announced plans or programs described in Notes (2) and (4) below and the shares repurchased in connection with the share exchange transactions described in Note (3) below, a total of 37,672 shares were purchased through our purchases of shares constituting less than one unit (100 shares) from registered holders of such shares at the current market price of those shares. For a discussion of the shareholder right to require us to repurchase such shares, see “Item 10.B. Additional Information—Memorandum and Articles of Association—Japanese Unit Share System.”
(2) On January 24, 2013, we announced a share repurchase plan where we were authorized by the Board of Directors to repurchase up to the smaller of 6,000,000 shares or ¥20.0 billion between January 25, 2013 and January 24, 2014. The plan expired on January 24, 2014.
(3) On November 5, 2013, we repurchased a total of 480,150 shares from our consolidated subsidiaries for an
aggregate repurchase price of ¥2,218,293,000. Of these shares, 276,150 shares were repurchased from Nidec Copal Corporation, 136,000 shares from Nidec Tosok Corporation, and 68,000 shares from Nidec Copal Electronics Corporation. Nidec Copal held the 4,150 shares as a result of the share exchange transaction in September 2013 to make Nidec Seimitsu Corporation our wholly owned subsidiary. In addition, Nidec Copal held the 272,000 shares, Nidec Tosok held the 136,000 shares, and Nidec Copal Electronics held the 68,000 shares, as a result of the share exchange transaction in October 2012 to make Nidec Sankyo Corporation our wholly owned subsidiary.
(4) On January 22, 2014, we announced a share repurchase plan where we are authorized by the Board of
138
Directors to repurchase up to the smaller of 4,000,000 shares or ¥24.0 billion between January 27, 2014 and January 26, 2015.
Between April 1, 2014 and May 31, 2014, we did not repurchase any shares of our common stock under the current share repurchase plan described above.
Item 16F. Change in Registrant’s Certifying Accountant. None.
Item 16G. Corporate Governance. Companies listed on the New York Stock Exchange, or NYSE must comply with certain listing
standards regarding corporate governance under the NYSE’s Listed Company Manual, or NYSE Corporate Governance Standards. Listed companies that are foreign private issuers, such as us, however, are permitted, with certain exceptions, to follow home country practices in lieu of the NYSE Corporate Governance Standards. Our corporate governance practices, which comply with Japanese laws, regulations and stock exchange rules, and the NYSE Corporate Governance Standards followed by U.S. listed companies have the following significant differences:
Director Independence
A company listed on the NYSE must have a majority of directors that meet the independent
requirements under Section 303A of the NYSE’s Listed Company Manual. The Company Law (Law No.86, 2005) of Japan, or the Company Law, does not require Japanese companies with audit and supervisory boards, such as us, to have a director who is independent as defined in the NYSE Corporate Governance Standards, on their boards of directors.
Audit Committee
A company listed on the NYSE must have an audit committee composed entirely of independent
directors. We are generally exempted, with some exceptions, from this requirement by virtue of paragraph (c)(3) of Rule 10A-3 of the U.S. Securities Exchange Act of 1934, or the Exchange Act.
Consistent with the requirements of the Company Law, the members of our Audit and Supervisory
Board are elected by a resolution at a general meeting of shareholders. We currently have five members on our Audit and Supervisory Board, which exceeds the minimum of three audit and supervisory board members required by the Company Law. Our Audit and Supervisory Board has a statutory duty to monitor, review and report on the administration of our affairs and accounts for the benefit of our shareholders.
The Company Law requires that at least half of a company’s audit and supervisory board members be
“outside audit and supervisory board members,” which is defined as an audit and supervisory board member who has not been a director, executive officer, manager or employee of the company or any of its subsidiaries at any time prior to his or her election. Two of the four current members of our Audit and Supervisory Board are outside audit and supervisory board members as of the date of this annual report.
Compensation Committee
A company listed on the NYSE must have a compensation committee comprised entirely of
independent directors. A compensation committee must also have authority to retain or obtain the advice of compensation advisers, subject to prescribed independence criteria that the committee must consider prior to
139
engaging any compensation adviser. We are generally exempted from these requirements by virtue of paragraph (b)(5)(i) of Rule 10C-1 of the Exchange Act.
Under the Company Law, we and other Japanese companies with audit and supervisory boards are not
required to establish a compensation committee. The Company Law requires that the total amount of remuneration to be paid to all directors and the total amount of remuneration to be paid to all audit and supervisory board members be approved by a resolution of the general meeting of shareholders, unless their remuneration is provided for in the articles of incorporation. The distribution of remuneration among directors is broadly delegated to the board of directors, and the distribution of remuneration among audit and supervisory board members is determined by consultation among the audit and supervisory board members.
Nominating/Corporate Governance Committee
A company listed on the NYSE must also have a nominating or corporate governance committee
comprised entirely of independent directors. Under the Company Law, we and other Japanese companies with audit and supervisory boards are not required to establish a nominating or corporate governance committee. Pursuant to the Company Law, our Board of Directors nominates and submits a proposal for election of directors for shareholder approval. Our shareholders elect or dismiss directors by a simple majority of votes at a general meeting of shareholders. The members of our Audit and Supervisory Board are also elected or dismissed at a general meeting of shareholders. A proposal by our Board of Directors to elect a member of the Audit and Supervisory Board needs the consent of our Audit and Supervisory Board.
Corporate Governance Guidelines
A company listed on the NYSE must adopt and disclose corporate governance guidelines. Under the
Financial Instruments and Exchange Law of Japan and applicable stock exchange rules, we are not required to adopt or disclose corporate governance guidelines. However, we are required to disclose policies and the present status of our corporate governance under the Financial Instruments and Exchange Law of Japan in respect of timely disclosure.
Code of Business Conduct and Ethics
A company listed on the NYSE must adopt and disclose a code of business conduct and ethics for
directors, officers and employees, and promptly disclose any waivers of the code for directors and executive officers. Under the Company Law, the Financial Instruments and Exchange Law of Japan and applicable stock exchange rules, we are not required to adopt or disclose such code of business conduct and ethics. However, we maintain and disclose as an exhibit to this annual report our Compliance Code of Conduct, which we believe is consistent with the code of ethics described under Section 406 of the U.S. Sarbanes-Oxley Act of 2002.
Shareholder Approval of Equity-Compensation Plans
A company listed on the NYSE must obtain shareholder approval for an equity compensation plan.
Under the Company Law, a public company seeking to issue rights to acquire from the company shares of its stock at a prescribed price, or “stock acquisition rights,” must obtain the approval of its board of directors.
Under the Company Law, if a company desires to adopt an equity-compensation plan in which stock
acquisition rights are granted on specially favorable terms to the plan's recipients, then the company must obtain shareholder approval by a "special resolution" of a general meeting of shareholders, where the quorum is one-third of the total number of voting rights and the approval of at least two-thirds of the voting rights represented at the meeting is required.
140
Executive Sessions A company listed on the NYSE must hold regularly scheduled executive sessions where participants
are limited to non-management directors. Under the Company Law, Japanese corporations are not required to hold such executive sessions.
Item 16H. Mine Safety Disclosure. Not applicable.
PART III
Item 17. Financial Statements. In lieu of responding to this item, we have responded to Item 18 of this annual report.
Item 18. Financial Statements.
The information required by this item is set forth in our audited consolidated financial statements
included elsewhere in this annual report.
141
Item 19. Exhibits.
Exhibit
Number Description
1.1 Articles of Incorporation of Nidec Corporation (English translation) (last updated June 18, 2014)
1.2 Share Handling Regulations of Nidec Corporation (English translation) (last updated on July 16, 2013)
(Incorporated by reference to Nidec’s annual report on Form 20-F for the year ended March 31, 2013 filed on July 19, 2013)
1.3 Regulations of the Board of Directors of Nidec Corporation (English translation) (last updated on June 24, 2008)
1.4 Regulations of the Audit and Supervisory Board of Nidec Corporation (English translation) (last updated on July 5, 2008) (Incorporated by reference to Nidec’s annual report on Form 20-F for the year ended March 31,
2013 filed on July 19, 2013) 2.1 Form of Deposit Agreement, amended and restated as of February 21, 2012, among Nidec
Corporation, JPMorgan Chase Bank, N.A. as Depositary, and holders of American Depositary Receipts
(Incorporated by reference to the Registration Statement on Form F-6 (file no. 333-179604) filed on February 21, 2012)
2.2 Form of American Depositary Receipt (Incorporated by reference to the Registration Statement on Form F-6 (file no. 333-179604) filed on February 21, 2012)
4.1 Share Exchange Agreement, dated April 23, 2013 between Nidec Corporation and Nidec Copal Corporation (English translation) (Incorporated by reference to Nidec’s annual report on Form 20-F for the year ended March 31, 2013 filed on July 19, 2013)
4.2 Share Exchange Agreement, dated April 23, 2013 between Nidec Corporation and Nidec Tosok Corporation (English translation) (Incorporated by reference to Nidec’s annual report on Form 20-F for the year ended March 31, 2013 filed on July 19, 2013)
4.3 Share Exchange Agreement, dated April 22, 2014 between Nidec Corporation and Nidec Copal Electronics Corporation (English translation)
4.4 Share Exchange Agreement, dated April 22, 2014 between Nidec Corporation and Nidec-Read Corporation (English translation)
8.1 Subsidiaries of Nidec Corporation 11.1 Compliance Code of Conduct (English translation) 12.1 Certification of the Chief Executive Officer required by Rule 13a-14(a) 12.2 Certification of the Chief Financial Officer required by Rule 13a-14(a) 13.1 Certification of the Chief Executive Officer required by Rule 13a-14(b) and Section 1350 of
Chapter 63 of Title 18 of the United States Code 13.2 Certification of the Chief Financial Officer required by Rule 13a-14(b) and Section 1350 of
Chapter 63 of Title 18 of the United States Code 101.INS XBRL Instance Document 101.SCH XBRL Taxonomy Extension Schema 101.CAL XBRL Taxonomy Extension Calculation Linkbase 101.DEF XBRL Taxonomy Extension Definition Linkbase 101.LAB XBRL Taxonomy Extension Label Linkbase 101.PRE XBRL Taxonomy Extension Presentation Linkbase
We have not included as exhibits certain instruments with respect to our long-term debt, the amount of
debt authorized under each of which does not exceed 10% of our total assets, and we agree to furnish a copy of

142
any such instrument to the U.S. Securities and Exchange Commission upon request.
NIDEC CORPORATION
INDEX TO CONSOLIDATED FINANCIAL STATEMENTS
F-1
Page
Report of Independent Registered Public Accounting Firm F-2 Consolidated balance sheets at March 31, 2013 and 2014 F-4 Consolidated statements of income for the years ended March 31, 2012, 2013 and 2014 F-6 Consolidated statements of changes in equity for the years ended March 31, 2012, 2013
and 2014 F-9 Consolidated statements of cash flows for the years ended March 31, 2012, 2013 and
2014
F-11 Notes to consolidated financial statements F-13
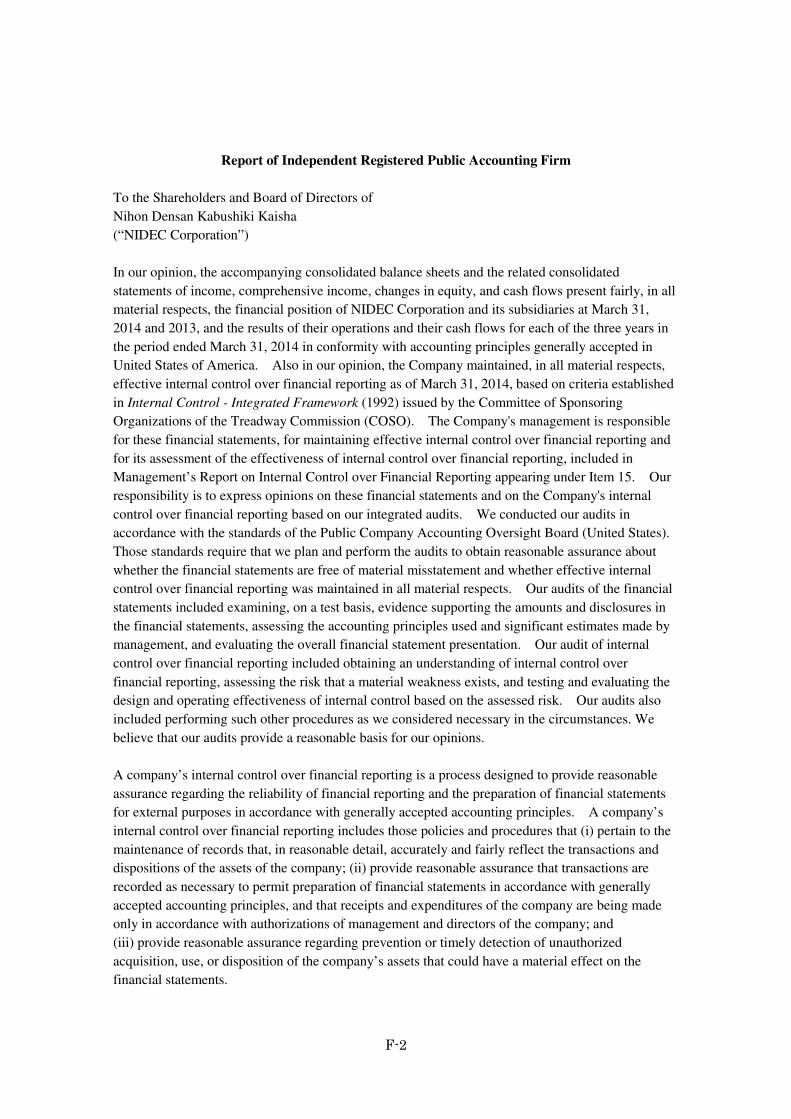
F-2
Report of Independent Registered Public Accounting Firm
To the Shareholders and Board of Directors of
Nihon Densan Kabushiki Kaisha
(“NIDEC Corporation”)
In our opinion, the accompanying consolidated balance sheets and the related consolidated
statements of income, comprehensive income, changes in equity, and cash flows present fairly, in all
material respects, the financial position of NIDEC Corporation and its subsidiaries at March 31,
2014 and 2013, and the results of their operations and their cash flows for each of the three years in
the period ended March 31, 2014 in conformity with accounting principles generally accepted in
United States of America. Also in our opinion, the Company maintained, in all material respects,
effective internal control over financial reporting as of March 31, 2014, based on criteria established
in Internal Control - Integrated Framework (1992) issued by the Committee of Sponsoring
Organizations of the Treadway Commission (COSO). The Company's management is responsible
for these financial statements, for maintaining effective internal control over financial reporting and
for its assessment of the effectiveness of internal control over financial reporting, included in
Management’s Report on Internal Control over Financial Reporting appearing under Item 15. Our
responsibility is to express opinions on these financial statements and on the Company's internal
control over financial reporting based on our integrated audits. We conducted our audits in
accordance with the standards of the Public Company Accounting Oversight Board (United States).
Those standards require that we plan and perform the audits to obtain reasonable assurance about
whether the financial statements are free of material misstatement and whether effective internal
control over financial reporting was maintained in all material respects. Our audits of the financial
statements included examining, on a test basis, evidence supporting the amounts and disclosures in
the financial statements, assessing the accounting principles used and significant estimates made by
management, and evaluating the overall financial statement presentation. Our audit of internal
control over financial reporting included obtaining an understanding of internal control over
financial reporting, assessing the risk that a material weakness exists, and testing and evaluating the
design and operating effectiveness of internal control based on the assessed risk. Our audits also
included performing such other procedures as we considered necessary in the circumstances. We
believe that our audits provide a reasonable basis for our opinions.
A company’s internal control over financial reporting is a process designed to provide reasonable
assurance regarding the reliability of financial reporting and the preparation of financial statements
for external purposes in accordance with generally accepted accounting principles. A company’s
internal control over financial reporting includes those policies and procedures that (i) pertain to the
maintenance of records that, in reasonable detail, accurately and fairly reflect the transactions and
dispositions of the assets of the company; (ii) provide reasonable assurance that transactions are
recorded as necessary to permit preparation of financial statements in accordance with generally
accepted accounting principles, and that receipts and expenditures of the company are being made
only in accordance with authorizations of management and directors of the company; and
(iii) provide reasonable assurance regarding prevention or timely detection of unauthorized
acquisition, use, or disposition of the company’s assets that could have a material effect on the
financial statements.
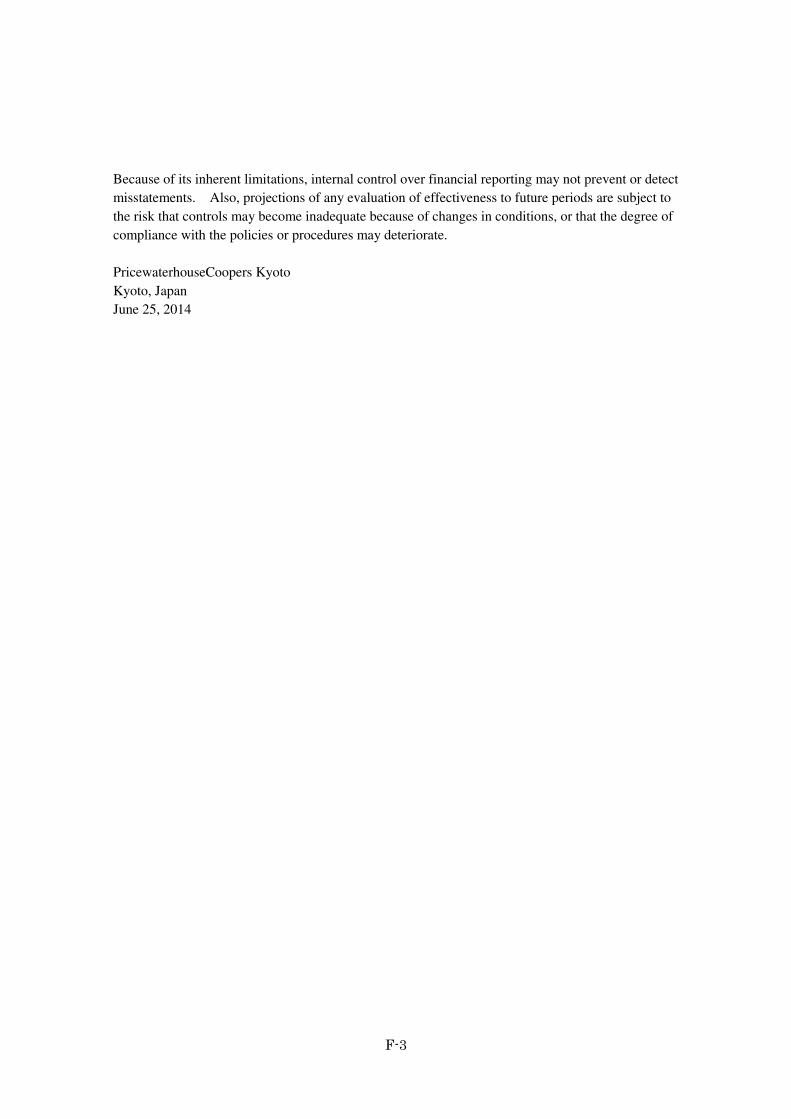
F-3
Because of its inherent limitations, internal control over financial reporting may not prevent or detect
misstatements. Also, projections of any evaluation of effectiveness to future periods are subject to
the risk that controls may become inadequate because of changes in conditions, or that the degree of
compliance with the policies or procedures may deteriorate.
PricewaterhouseCoopers Kyoto
Kyoto, Japan
June 25, 2014
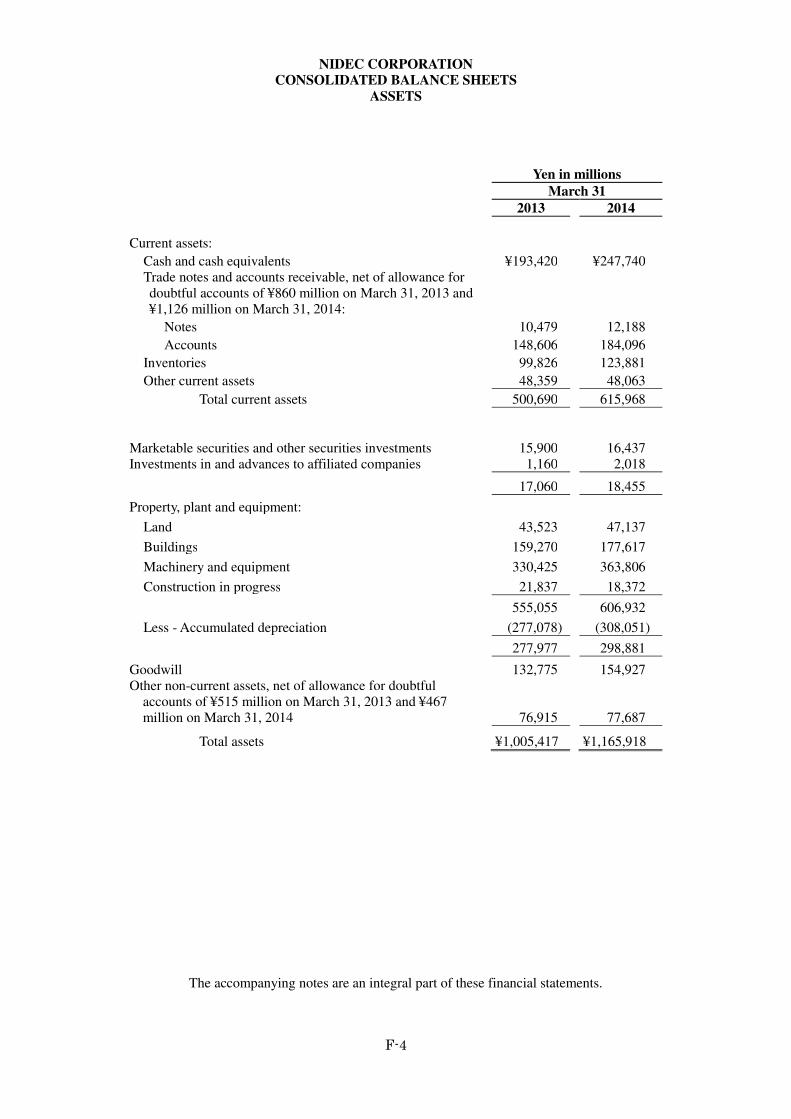
NIDEC CORPORATION
CONSOLIDATED BALANCE SHEETS
ASSETS
F-4
Yen in millions
March 31
2013 2014
Current assets:
Cash and cash equivalents ¥193,420 ¥247,740 Trade notes and accounts receivable, net of allowance for doubtful accounts of ¥860 million on March 31, 2013 and ¥1,126 million on March 31, 2014:
Notes 10,479 12,188
Accounts 148,606 184,096
Inventories 99,826 123,881
Other current assets 48,359 48,063
Total current assets 500,690 615,968
Marketable securities and other securities investments 15,900 16,437 Investments in and advances to affiliated companies 1,160 2,018
17,060 18,455
Property, plant and equipment:
Land 43,523 47,137
Buildings 159,270 177,617
Machinery and equipment 330,425 363,806
Construction in progress 21,837 18,372
555,055 606,932
Less - Accumulated depreciation (277,078) (308,051)
277,977 298,881
Goodwill 132,775 154,927 Other non-current assets, net of allowance for doubtful
accounts of ¥515 million on March 31, 2013 and ¥467 million on March 31, 2014 76,915 77,687
Total assets ¥1,005,417 ¥1,165,918
The accompanying notes are an integral part of these financial statements.
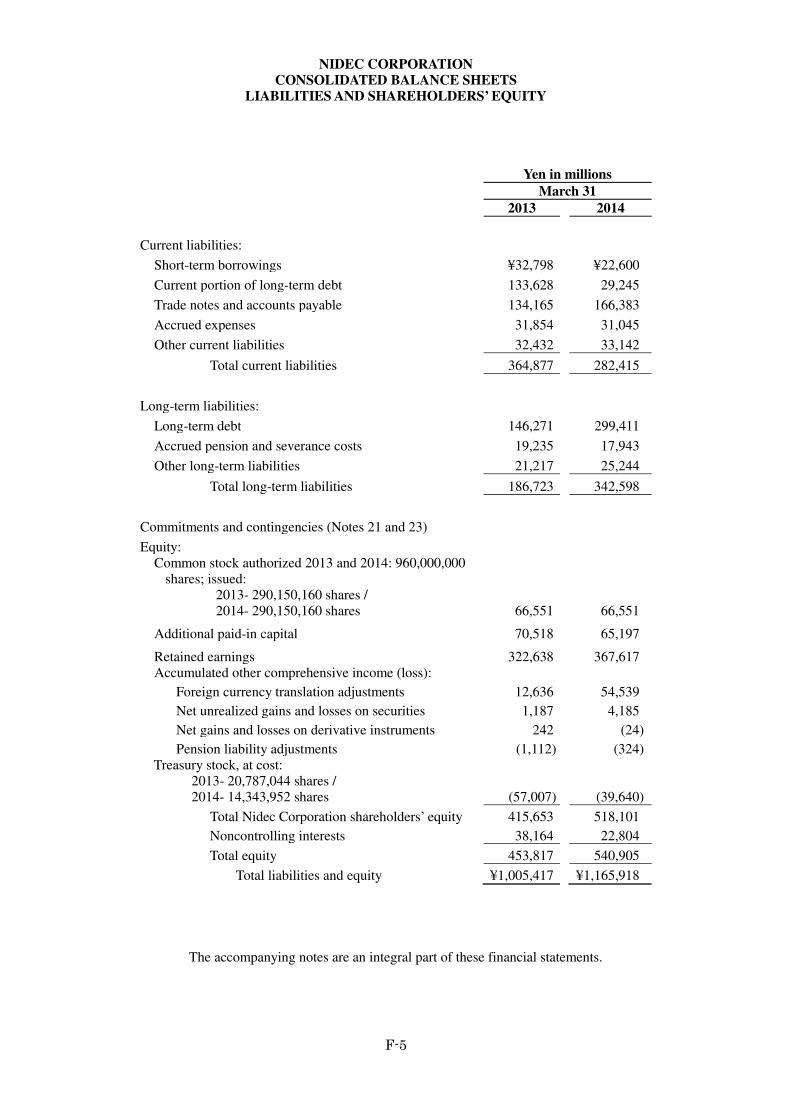
NIDEC CORPORATION
CONSOLIDATED BALANCE SHEETS
LIABILITIES AND SHAREHOLDERS’ EQUITY
F-5
Yen in millions
March 31
2013 2014
Current liabilities:
Short-term borrowings ¥32,798 ¥22,600
Current portion of long-term debt 133,628 29,245
Trade notes and accounts payable 134,165 166,383
Accrued expenses 31,854 31,045
Other current liabilities 32,432 33,142
Total current liabilities 364,877 282,415
Long-term liabilities:
Long-term debt 146,271 299,411
Accrued pension and severance costs 19,235 17,943
Other long-term liabilities 21,217 25,244
Total long-term liabilities 186,723 342,598
Commitments and contingencies (Notes 21 and 23)
Equity: Common stock authorized 2013 and 2014: 960,000,000
shares; issued: 2013- 290,150,160 shares / 2014- 290,150,160 shares 66,551 66,551
Additional paid-in capital 70,518 65,197
Retained earnings 322,638 367,617 Accumulated other comprehensive income (loss):
Foreign currency translation adjustments 12,636 54,539
Net unrealized gains and losses on securities 1,187 4,185
Net gains and losses on derivative instruments 242 (24)
Pension liability adjustments (1,112) (324) Treasury stock, at cost:
2013- 20,787,044 shares / 2014- 14,343,952 shares (57,007) (39,640)
Total Nidec Corporation shareholders’ equity 415,653 518,101
Noncontrolling interests 38,164 22,804
Total equity 453,817 540,905
Total liabilities and equity ¥1,005,417 ¥1,165,918
The accompanying notes are an integral part of these financial statements.
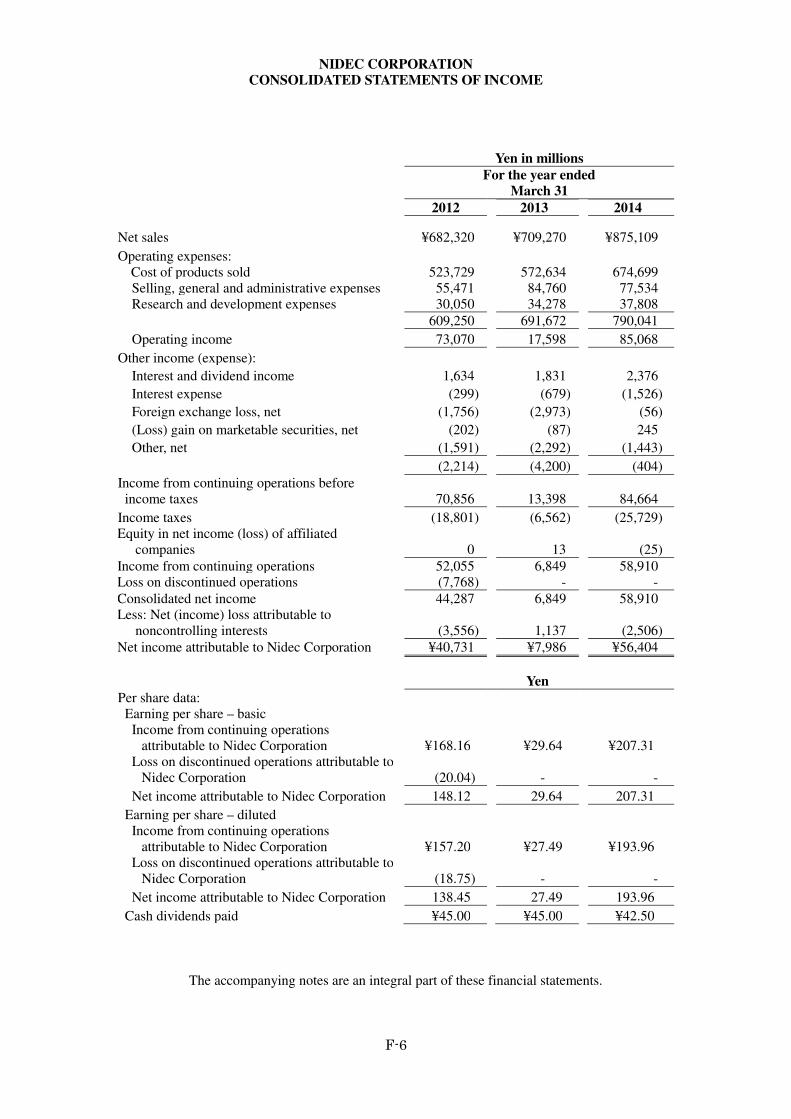
NIDEC CORPORATION
CONSOLIDATED STATEMENTS OF INCOME
F-6
Yen in millions
For the year ended
March 31
2012 2013 2014
Net sales
¥682,320 ¥709,270 ¥875,109
Operating expenses: Cost of products sold 523,729 572,634 674,699 Selling, general and administrative expenses 55,471 84,760 77,534 Research and development expenses 30,050 34,278 37,808
609,250 691,672 790,041
Operating income 73,070 17,598 85,068
Other income (expense):
Interest and dividend income 1,634 1,831 2,376
Interest expense (299) (679) (1,526)
Foreign exchange loss, net (1,756) (2,973) (56)
(Loss) gain on marketable securities, net (202) (87) 245
Other, net (1,591) (2,292) (1,443)
(2,214) (4,200) (404)
Income from continuing operations before income taxes 70,856 13,398 84,664
Income taxes (18,801) (6,562) (25,729) Equity in net income (loss) of affiliated
companies
0 13 (25)
Income from continuing operations 52,055 6,849 58,910 Loss on discontinued operations (7,768) - -
Consolidated net income 44,287 6,849 58,910 Less: Net (income) loss attributable to
noncontrolling interests
(3,556) 1,137 (2,506)
Net income attributable to Nidec Corporation ¥40,731 ¥7,986 ¥56,404
Yen
Per share data: Earning per share – basic
Income from continuing operations attributable to Nidec Corporation
¥168.16 ¥29.64 ¥207.31
Loss on discontinued operations attributable to Nidec Corporation (20.04) - -
Net income attributable to Nidec Corporation 148.12 29.64 207.31
Earning per share – diluted Income from continuing operations
attributable to Nidec Corporation ¥157.20 ¥27.49 ¥193.96 Loss on discontinued operations attributable to
Nidec Corporation (18.75) - -
Net income attributable to Nidec Corporation 138.45 27.49 193.96
Cash dividends paid ¥45.00 ¥45.00 ¥42.50
The accompanying notes are an integral part of these financial statements.
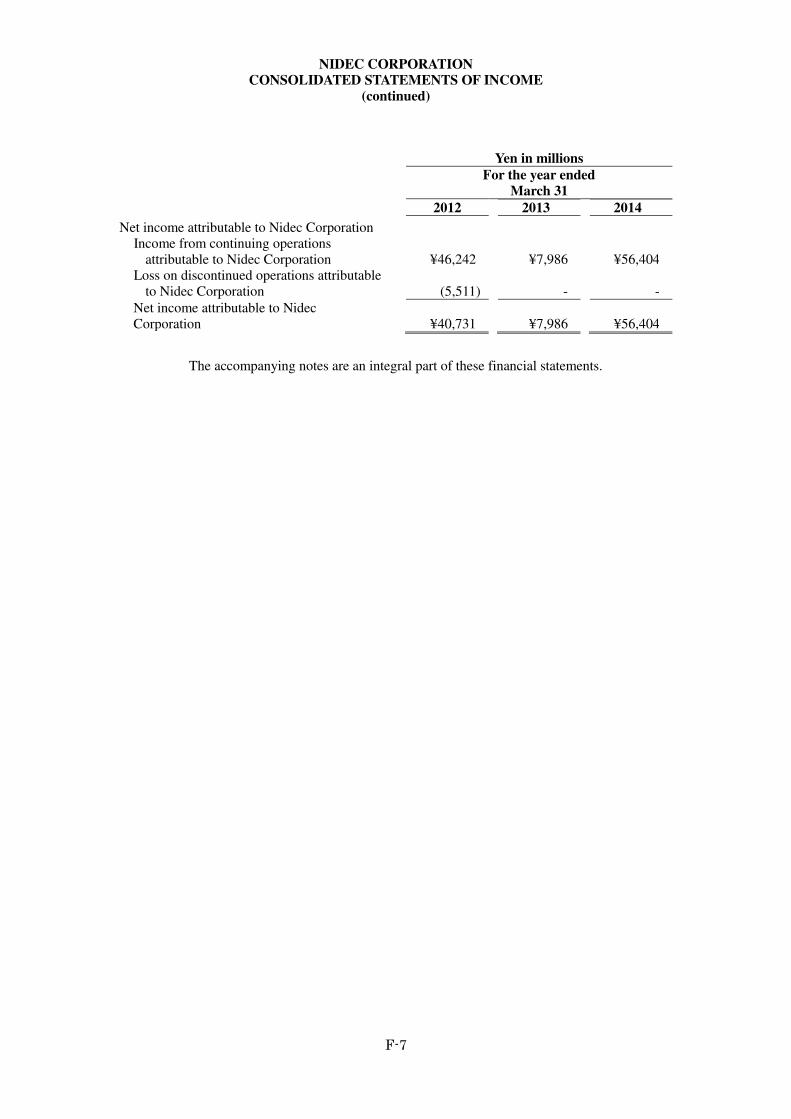
NIDEC CORPORATION
CONSOLIDATED STATEMENTS OF INCOME
(continued)
F-7
Yen in millions
For the year ended
March 31
2012 2013 2014
Net income attributable to Nidec Corporation Income from continuing operations
attributable to Nidec Corporation ¥46,242 ¥7,986 ¥56,404 Loss on discontinued operations attributable
to Nidec Corporation (5,511) - -
Net income attributable to Nidec Corporation ¥40,731 ¥7,986 ¥56,404
The accompanying notes are an integral part of these financial statements.
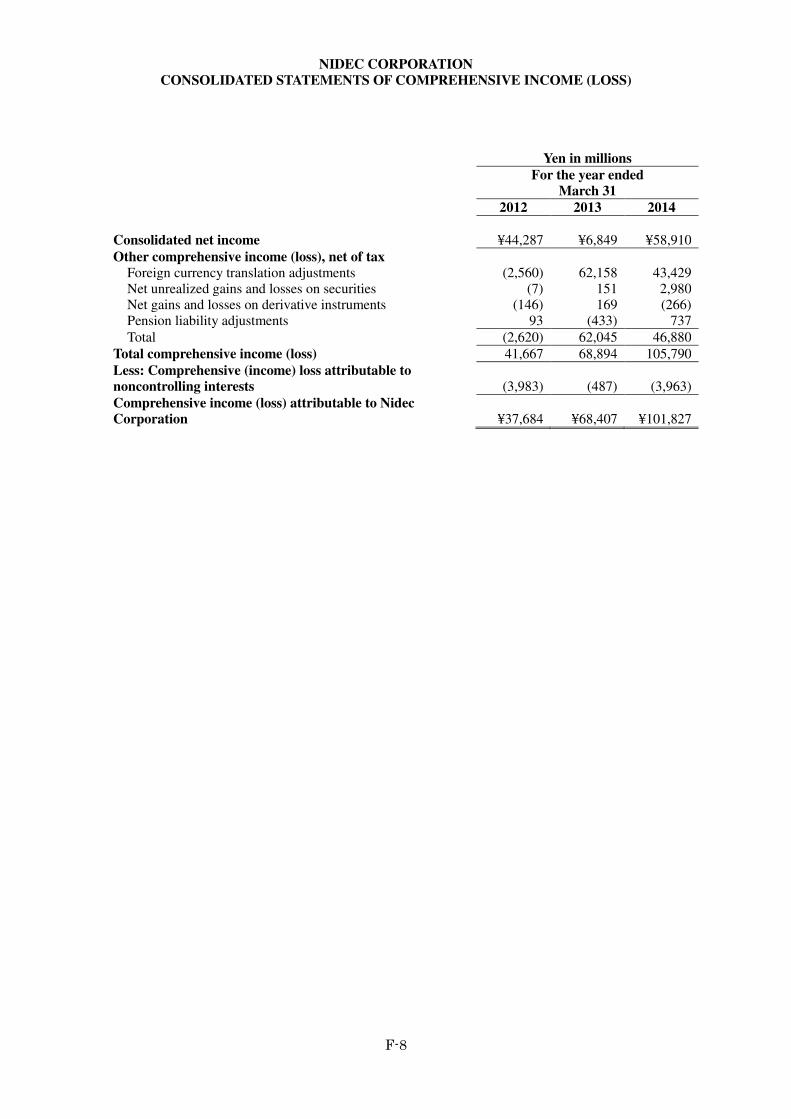
NIDEC CORPORATION
CONSOLIDATED STATEMENTS OF COMPREHENSIVE INCOME (LOSS)
F-8
Yen in millions
For the year ended
March 31
2012 2013 2014
Consolidated net income ¥44,287 ¥6,849 ¥58,910
Other comprehensive income (loss), net of tax Foreign currency translation adjustments (2,560) 62,158 43,429 Net unrealized gains and losses on securities (7) 151 2,980 Net gains and losses on derivative instruments (146) 169 (266) Pension liability adjustments 93 (433) 737
Total (2,620) 62,045 46,880
Total comprehensive income (loss) 41,667 68,894 105,790
Less: Comprehensive (income) loss attributable to
noncontrolling interests (3,983) (487) (3,963)
Comprehensive income (loss) attributable to Nidec
Corporation ¥37,684 ¥68,407 ¥101,827
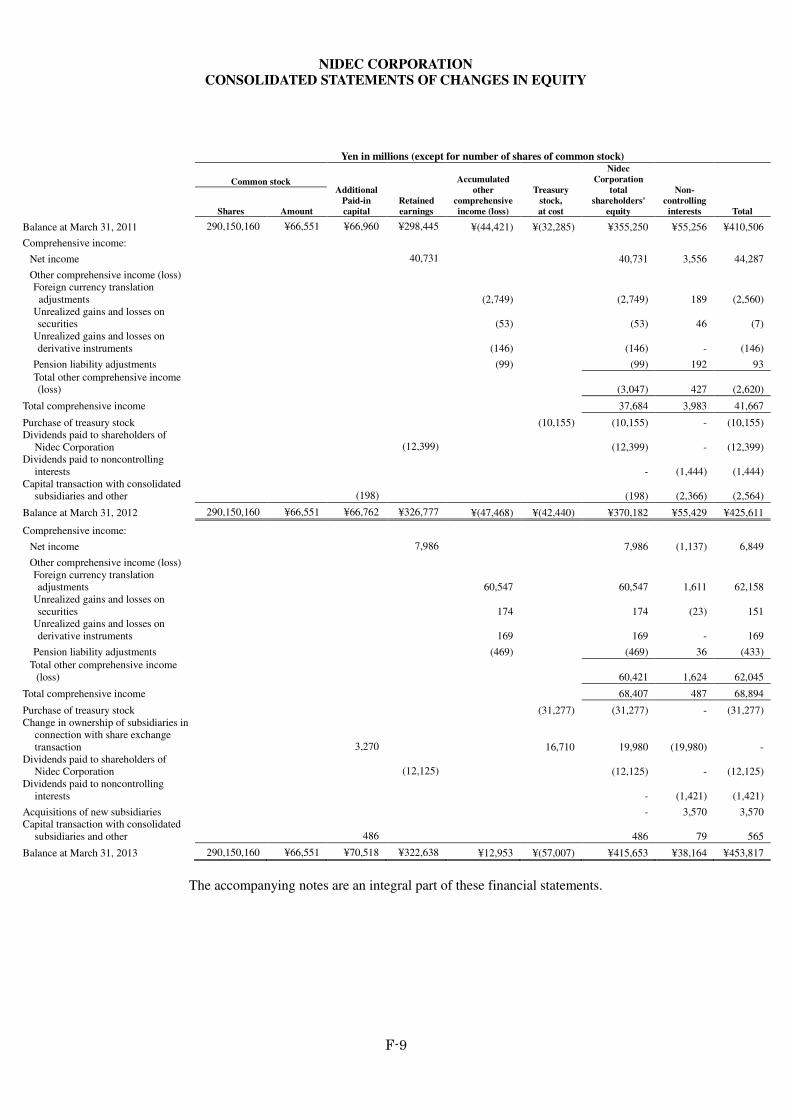
NIDEC CORPORATION
CONSOLIDATED STATEMENTS OF CHANGES IN EQUITY
F-9
Yen in millions (except for number of shares of common stock)
Common stock Additional
Paid-in
capital
Retained
earnings
Accumulated
other
comprehensive
income (loss)
Treasury
stock,
at cost
Nidec
Corporation
total
shareholders'
equity
Non-
controlling
interests Total Shares Amount
Balance at March 31, 2011 290,150,160 ¥66,551 ¥66,960 ¥298,445 ¥(44,421) ¥(32,285) ¥355,250 ¥55,256 ¥410,506
Comprehensive income:
Net income 40,731 40,731 3,556 44,287
Other comprehensive income (loss) Foreign currency translation adjustments (2,749) (2,749) 189 (2,560)
Unrealized gains and losses on securities (53) (53) 46 (7)
Unrealized gains and losses on derivative instruments (146) (146) - (146)
Pension liability adjustments (99) (99) 192 93
Total other comprehensive income (loss) (3,047) 427 (2,620)
Total comprehensive income 37,684 3,983 41,667
Purchase of treasury stock (10,155) (10,155) - (10,155) Dividends paid to shareholders of
Nidec Corporation (12,399)
(12,399) - (12,399) Dividends paid to noncontrolling
interests - (1,444) (1,444) Capital transaction with consolidated
subsidiaries and other (198) (198) (2,366) (2,564)
Balance at March 31, 2012 290,150,160 ¥66,551 ¥66,762 ¥326,777 ¥(47,468) ¥(42,440) ¥370,182 ¥55,429 ¥425,611
Comprehensive income:
Net income 7,986 7,986 (1,137) 6,849
Other comprehensive income (loss) Foreign currency translation adjustments 60,547 60,547 1,611 62,158
Unrealized gains and losses on securities 174 174 (23) 151
Unrealized gains and losses on derivative instruments 169 169 - 169
Pension liability adjustments (469) (469) 36 (433)
Total other comprehensive income (loss) 60,421 1,624 62,045
Total comprehensive income 68,407 487 68,894
Purchase of treasury stock (31,277) (31,277) - (31,277) Change in ownership of subsidiaries in
connection with share exchange transaction 3,270 16,710 19,980 (19,980) -
Dividends paid to shareholders of Nidec Corporation (12,125) (12,125) - (12,125)
Dividends paid to noncontrolling interests - (1,421) (1,421)
Acquisitions of new subsidiaries - 3,570 3,570 Capital transaction with consolidated
subsidiaries and other 486 486 79 565
Balance at March 31, 2013 290,150,160 ¥66,551 ¥70,518 ¥322,638 ¥12,953 ¥(57,007) ¥415,653 ¥38,164 ¥453,817
The accompanying notes are an integral part of these financial statements.
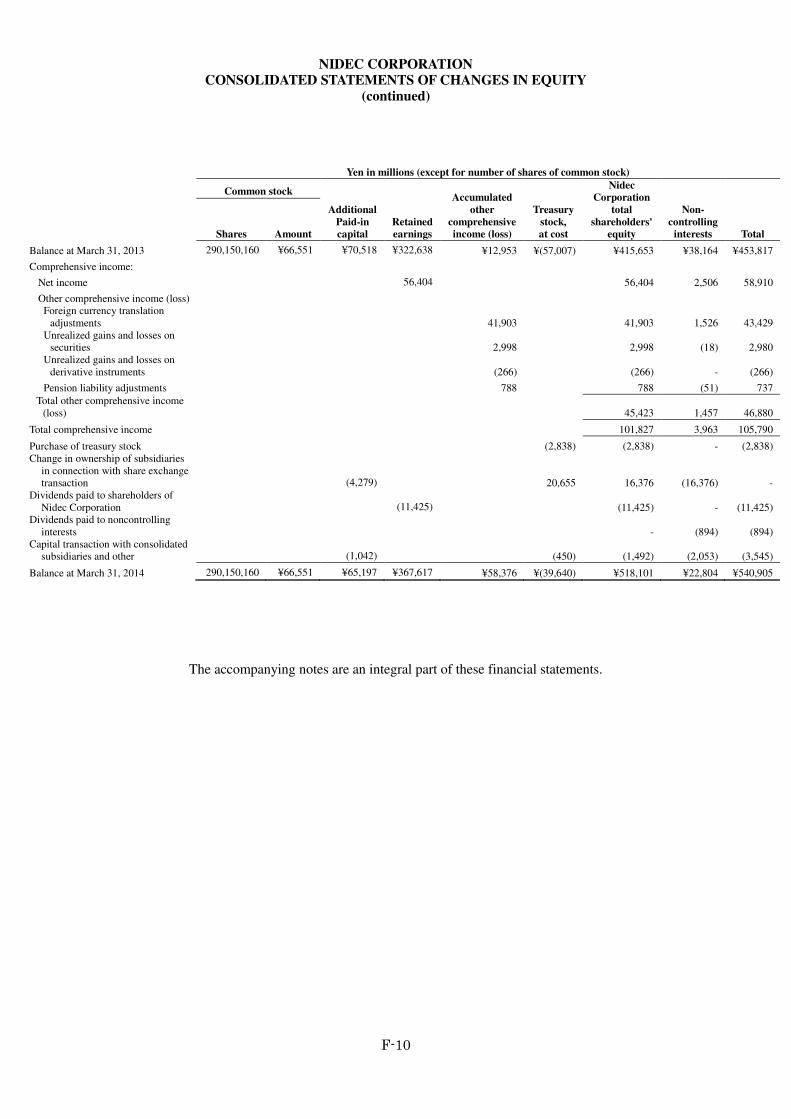
NIDEC CORPORATION
CONSOLIDATED STATEMENTS OF CHANGES IN EQUITY
(continued)
F-10
Yen in millions (except for number of shares of common stock)
Common stock
Additional
Paid-in
capital Retained
earnings
Accumulated
other
comprehensive
income (loss)
Treasury
stock,
at cost
Nidec
Corporation
total
shareholders'
equity
Non-
controlling
interests Total Shares Amount
Balance at March 31, 2013 290,150,160 ¥66,551 ¥70,518 ¥322,638 ¥12,953 ¥(57,007) ¥415,653 ¥38,164 ¥453,817
Comprehensive income:
Net income 56,404 56,404 2,506 58,910
Other comprehensive income (loss) Foreign currency translation
adjustments 41,903 41,903 1,526 43,429 Unrealized gains and losses on
securities 2,998 2,998 (18) 2,980 Unrealized gains and losses on
derivative instruments (266) (266) - (266)
Pension liability adjustments 788 788 (51) 737
Total other comprehensive income (loss) 45,423 1,457 46,880
Total comprehensive income 101,827 3,963 105,790
Purchase of treasury stock (2,838) (2,838) - (2,838) Change in ownership of subsidiaries
in connection with share exchange transaction (4,279) 20,655 16,376 (16,376) -
Dividends paid to shareholders of Nidec Corporation (11,425) (11,425) - (11,425)
Dividends paid to noncontrolling interests - (894) (894)
Capital transaction with consolidated subsidiaries and other (1,042) (450) (1,492) (2,053) (3,545)
Balance at March 31, 2014 290,150,160 ¥66,551 ¥65,197 ¥367,617 ¥58,376 ¥(39,640) ¥518,101 ¥22,804 ¥540,905
The accompanying notes are an integral part of these financial statements.
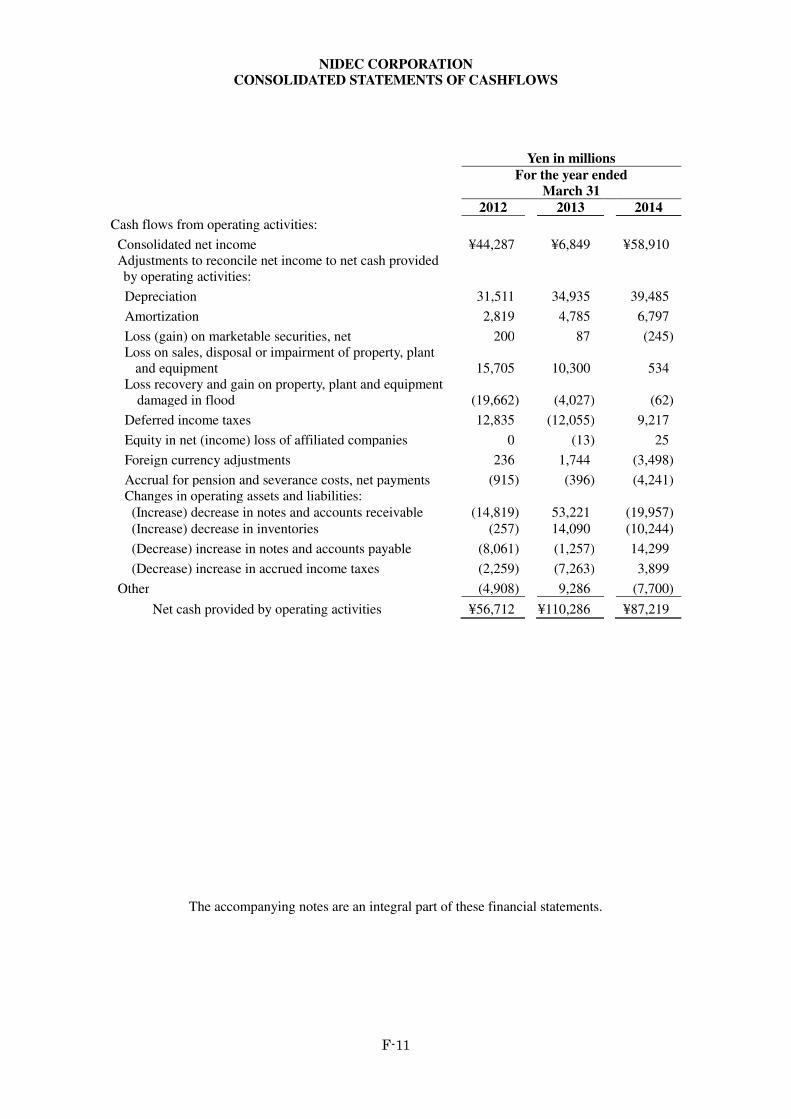
NIDEC CORPORATION
CONSOLIDATED STATEMENTS OF CASHFLOWS
F-11
Yen in millions
For the year ended
March 31
2012 2013 2014
Cash flows from operating activities:
Consolidated net income ¥44,287 ¥6,849 ¥58,910 Adjustments to reconcile net income to net cash provided
by operating activities:
Depreciation 31,511 34,935 39,485
Amortization 2,819 4,785 6,797
Loss (gain) on marketable securities, net 200 87 (245) Loss on sales, disposal or impairment of property, plant
and equipment
15,705 10,300 534 Loss recovery and gain on property, plant and equipment
damaged in flood
(19,662) (4,027) (62)
Deferred income taxes 12,835 (12,055) 9,217
Equity in net (income) loss of affiliated companies 0 (13) 25
Foreign currency adjustments 236 1,744 (3,498)
Accrual for pension and severance costs, net payments (915) (396) (4,241) Changes in operating assets and liabilities: (Increase) decrease in notes and accounts receivable (14,819) 53,221 (19,957) (Increase) decrease in inventories (257) 14,090 (10,244)
(Decrease) increase in notes and accounts payable (8,061) (1,257) 14,299
(Decrease) increase in accrued income taxes (2,259) (7,263) 3,899
Other (4,908) 9,286 (7,700)
Net cash provided by operating activities ¥56,712 ¥110,286 ¥87,219
The accompanying notes are an integral part of these financial statements.
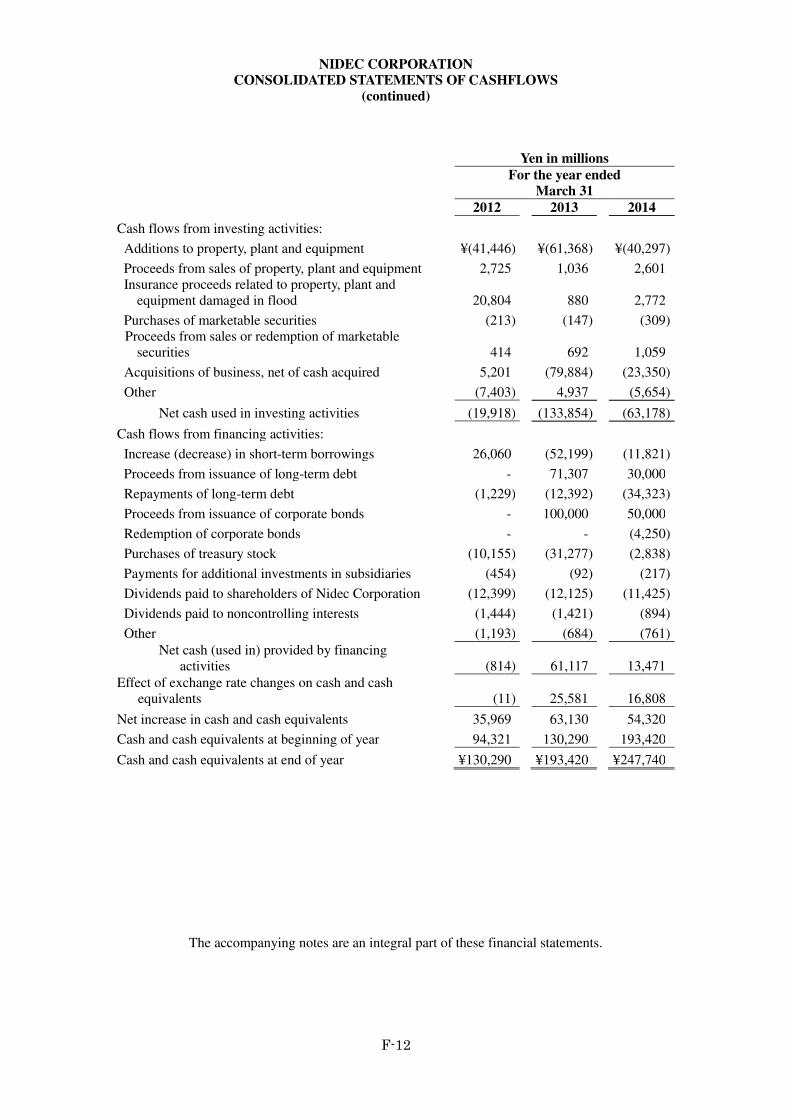
NIDEC CORPORATION
CONSOLIDATED STATEMENTS OF CASHFLOWS
(continued)
F-12
Yen in millions
For the year ended
March 31
2012 2013 2014
Cash flows from investing activities:
Additions to property, plant and equipment ¥(41,446) ¥(61,368) ¥(40,297)
Proceeds from sales of property, plant and equipment 2,725 1,036 2,601 Insurance proceeds related to property, plant and
equipment damaged in flood
20,804 880 2,772
Purchases of marketable securities (213) (147) (309) Proceeds from sales or redemption of marketable
securities
414 692 1,059
Acquisitions of business, net of cash acquired 5,201 (79,884) (23,350)
Other (7,403) 4,937 (5,654)
Net cash used in investing activities (19,918) (133,854) (63,178)
Cash flows from financing activities:
Increase (decrease) in short-term borrowings 26,060 (52,199) (11,821)
Proceeds from issuance of long-term debt - 71,307 30,000
Repayments of long-term debt (1,229) (12,392) (34,323)
Proceeds from issuance of corporate bonds - 100,000 50,000
Redemption of corporate bonds - - (4,250)
Purchases of treasury stock (10,155) (31,277) (2,838)
Payments for additional investments in subsidiaries (454) (92) (217)
Dividends paid to shareholders of Nidec Corporation (12,399) (12,125) (11,425)
Dividends paid to noncontrolling interests (1,444) (1,421) (894)
Other (1,193) (684) (761)
Net cash (used in) provided by financing activities
(814) 61,117 13,471
Effect of exchange rate changes on cash and cash equivalents
(11) 25,581 16,808
Net increase in cash and cash equivalents 35,969 63,130 54,320
Cash and cash equivalents at beginning of year 94,321 130,290 193,420
Cash and cash equivalents at end of year ¥130,290 ¥193,420 ¥247,740
The accompanying notes are an integral part of these financial statements.
NIDEC CORPORATION
NOTES TO CONSOLIDATED FINANCIAL STATEMENTS
F-13
1. Nature of operations:
NIDEC Corporation (the “Company”) and its subsidiaries (collectively “NIDEC”) are
primarily engaged in the design, development, manufacture and marketing of i) small precision
motors, which include spindle motors for hard disk drives, motors for optical disk drives, small
precision fans, motor appliances and other small motors; ii) automotive, appliance, commercial and
industrial products, which are used in various electric household appliances, commercial and
industrial equipment and automobiles; iii) machinery, which includes, test systems, measuring
equipment, power transmission equipment, factory automation systems, press machines, card readers
and industrial robots; iv) electronic and optical components, which include camera shutters, camera
lens units, switches, trimmer potentiometers, processing and precision plastic mold products; and v)
other products, which include other services. Manufacturing operations are located primarily in Asia
(China, Thailand, Vietnam and the Philippines), North America and Japan, and sales subsidiaries are
primarily located in Asia, Japan, North America and Europe.
The main customers for NIDEC are manufacturers of hard disk drives. NIDEC also sells
its products to the manufacturers of various electric household appliances, automation equipment,
automotive components, home video game consoles, telecommunication equipment and audio-visual
equipment.
2. Summary of significant accounting policies:
The Company and its subsidiaries in Japan maintain their records and prepare their
financial statements in accordance with accounting principles generally accepted in Japan, and its
foreign subsidiaries in conformity with those of their countries of domicile. Certain adjustments and
reclassifications have been incorporated in the accompanying consolidated financial statements to
conform with accounting principles generally accepted in the United States of America. Significant
accounting policies after reflecting adjustments for the above are as follows:
Estimates -
The preparation of NIDEC’s consolidated financial statements in conformity with
accounting principles generally accepted in the United States of America requires management to
make estimates and assumptions that affect the reported amounts of assets and liabilities and
contingent assets and liabilities at the date of the financial statements, as well as the reported
amounts of revenues and expenses during the reporting period. Some of the more significant
estimates include the valuation of inventories, allowance for doubtful accounts, depreciation and
amortization of long-lived assets, valuation allowance for deferred tax assets, valuation of
investment securities, fair value of financial instruments, uncertain tax positions, pension liabilities,
the recoverability of long-lived assets and goodwill, and fair value of assets acquired and liabilities
assumed. Actual results could differ from those estimates.
NIDEC CORPORATION
NOTES TO CONSOLIDATED FINANCIAL STATEMENTS
(continued)
F-14
Basis of consolidation and accounting for investments in affiliated companies -
The consolidated financial statements include the accounts of the Company and those of
its majority-owned subsidiary companies. All significant intercompany transactions and accounts
have been eliminated. Companies over which NIDEC exercises significant influence, but which it
does not control, are classified as affiliated companies and accounted for using the equity method.
Consolidated net income includes NIDEC’s equity in current earnings (losses) of such companies,
after elimination of unrealized intercompany profits.
On occasion, NIDEC may acquire additional shares of the voting rights of a consolidated
subsidiary or dispose of a part of those shares or a Nidec consolidated subsidiary may issue its shares
to third parties. With respect to such transactions, all transactions for changes in a parent’s
ownership interest in a subsidiary that do not result in the subsidiary ceasing to be a subsidiary are
recognized as equity transactions.
Translation of foreign currencies -
Non monetary asset and liability accounts of foreign subsidiaries and affiliates are
translated into Japanese yen at the year-end exchange rates and all income and expense accounts are
translated at exchange rates that approximate those prevailing at the time of the transactions. The
resulting translation adjustments are included as a component of accumulated other comprehensive
income in shareholders’ equity.
Monetary assets and liabilities denominated in foreign currencies are translated at the
year-end exchange rates and the resulting transaction gains or losses are taken into income.
Cash and cash equivalents -
Cash and cash equivalents include all highly liquid investments, with original maturities of
three months or less that are readily convertible to known amounts of cash and are so near maturity
that they present insignificant risk of changes in value because of changes in interest rates.
Inventories -
Inventories are stated at the lower of cost or market. Cost is determined principally on the
weighted average cost basis. Cost includes the cost of materials, labor and applied factory overhead.
Projects in progress, which mainly relate to production of factory automation equipment based on
contracts with customers, are stated at the lower of cost or market, cost being determined as the
accumulated production cost.
Marketable securities -
Marketable securities consist of equity securities that are listed on recognized stock
exchanges and debt securities. Equity securities designated as available-for-sale are carried at fair
value with changes in unrealized gains or losses included as a component of accumulated other
comprehensive income in shareholders’ equity, net of applicable taxes. Realized gains and losses are
determined on the average cost method and are reflected in the statement of income. Other than
temporary declines in market value of individual securities classified as available-for-sale are
charged to income in the period the loss occurs. Debt securities designated as held-to-maturity
securities are recorded at amortized cost, adjusted for the amortization or accretion of premiums or
NIDEC CORPORATION
NOTES TO CONSOLIDATED FINANCIAL STATEMENTS
(continued)
F-15
discounts.
Derivative financial instruments -
NIDEC manages the exposures of fluctuations in foreign exchange rate, interest rate and
commodity prices through the use of derivative financial instruments which include foreign
exchange forward contracts, currency option contracts, interest rate swap agreements and
commodity future contracts. NIDEC does not hold derivative financial instruments for trading
purposes.
Derivatives are accounted for under ASC 815, “Derivatives and Hedging.” All derivatives
are recorded as either assets or liabilities on the balance sheet and measured at fair value. Changes in
the fair value of derivatives are charged in current earnings. However certain derivatives may qualify
for hedge accounting as a cash flow hedge, if the hedging relationship is expected to be highly
effective in achieving offsetting of cash flows of the hedging instruments and hedged items. Under
hedge accounting, changes in the fair value of the effective portion of these derivatives designated as
cash flow hedge derivatives are deferred in accumulated other comprehensive income and charged to
earnings when the underlying transaction being hedged occurs.
NIDEC designates certain foreign exchange forward contracts, interest rate swap
agreements and commodity future contracts as cash flow hedges. NIDEC formally documents all
relationships between hedging instruments and hedged items, as well as its risk management
objective and strategy for undertaking various hedge transactions. This process includes linking all
derivatives designated as cash flow hedges to specific assets and liabilities on the balance sheet or
forecasted transactions. NIDEC also formally assesses, both at the hedge’s inception and on an
ongoing basis, whether the derivatives that are used in hedging transactions are highly effective in
offsetting cash flows of hedged items. When it is determined that a derivative is not a highly
effective hedge or that it has ceased to be a highly effective hedge, NIDEC discontinues hedge
accounting prospectively. When a cash flow hedge is discontinued, the previously recognized net
derivative gains or losses remain in accumulated other comprehensive income until the hedged
transaction occurs, unless it is probable that the forecasted transaction will not occur at which point
the derivative gains or losses are reclassified into earnings immediately.
Property, plant and equipment -
Property, plant and equipment are stated at cost. Major renewals and improvements are
capitalized; minor replacements, maintenance and repairs are charged to expense in the year
incurred.
Depreciation of property, plant and equipment is computed on the straight-line method at
rates based on the estimated useful lives of the assets. Estimated useful lives range from 7 to 47
years for factories to produce NIDEC's products, 50 years for the head office and sales offices, from
3 to 18 years for leasehold improvements, and from 2 to 15 years for machinery and equipment.
Depreciation expense amounted to ¥31,511 million, ¥34,935 million, and ¥39,485 million
for the years ended March 31, 2012, 2013 and 2014, respectively.
NIDEC CORPORATION
NOTES TO CONSOLIDATED FINANCIAL STATEMENTS
(continued)
F-16
Lease-
NIDEC capitalizes leases and related obligations when any of the four criteria are met
within the guidance of ASC 840 "Leases". Under ASC840, these leases and related obligations are
capitalized at the commencement of the lease at the lower of the fair value of the leased property and
the present value of the minimum lease payments.
Goodwill and other intangible assets -
Goodwill and other intangible assets are accounted for under ASC350, “Intangibles -
Goodwill and Other”.
Goodwill acquired in business combinations is not amortized but tested annually for
impairment. NIDEC tests for impairment at the reporting unit level on January 1st of each year. In
addition, NIDEC tests for impairment between annual tests if an event occurs or circumstances
change that would more likely than not reduce the fair value of a reporting unit below its carrying
amount. This test is a two-step process. The first step of the goodwill impairment test, used to
identify potential impairment, compares the fair value of the reporting unit with its carrying amount,
including goodwill. If the fair value, which is based on discounted future cash flows, exceeds the
carrying amount, goodwill is not considered impaired. If the carrying amount exceeds the fair value,
the second step must be performed to measure the amount of the impairment loss, if any. The second
step compares the implied fair value of the reporting unit’s goodwill with the carrying amount of that
goodwill.
Other intangible assets include proprietary technology and customer relationships, as well
as software and other intangible assets acquired in business combinations. Intangible assets with an
indefinite life are not subject to amortization and are tested for impairment once on January 1st of
each year or more frequently if an event occurs or circumstances change. Intangible assets with a
definite life are amortized on a straight-line basis over their estimated useful lives. The weighted
average amortization period for proprietary technology, customer relationships and software are 12
years, 18 years and 5 years, respectively.
Long-lived assets -
NIDEC reviews its long-lived assets for impairment whenever events or changes in
circumstances indicate that the carrying amount of an asset group may not be recoverable. An
impairment loss would be recognized when the carrying amount of an asset group exceeds the
estimated undiscounted future cash flows expected to result from the use of the asset group and its
eventual disposition. The amount of the impairment loss to be recorded is calculated as the excess of
the assets group's carrying value over its fair value. Long-lived assets that are to be disposed of other
than by sale are considered to be held and used until the disposal. Long-lived assets that are to be
disposed of by sale are reported at the lower of their carrying value or fair value less costs to sell.
Reductions in carrying value are recognized in the period in which long-lived assets are classified as
held for sale.
Revenue recognition -
NIDEC recognizes revenue when persuasive evidence of an arrangement exists, delivery
has occurred, the sales price is fixed or determinable and collectibility is reasonably assured. For
small precision motors, automotive, appliance, commercial and industrial products and electronic
NIDEC CORPORATION
NOTES TO CONSOLIDATED FINANCIAL STATEMENTS
(continued)
F-17
and optical components, these criteria are generally met at the time a product is delivered to the
customers’ site which is the time the customer has taken title to the product and the risk and rewards
of ownership have been substantively transferred. These conditions are met at the time of delivery to
customers in domestic sales (FOB destination) and at the time of shipment for export sales (FOB
shipping point). Revenue for machinery sales is recognized upon receipt of final customer
acceptance. At the time the related revenue is recognized, NIDEC makes provisions for estimated
product returns. Revenue from a part of sales of automotive, appliance, commercial and industrial
products under long-term construction type arrangements are recognized under the
percentage-of-completion method. Under the percentage-of-completion method, revenue is
recognized as a percentage of estimated total revenue that incurred costs to date bear to estimated
total costs after giving effect to estimates of costs to complete based upon the most recent
information.
Research and development expenses-
Research and development expenses, mainly consisting of personnel and depreciation
expenses at research and development branches, are charged to operations as incurred.
Advertising costs -
Advertising and sales promotion costs are expensed as incurred. Advertising costs were
¥228 million, ¥296 million, and ¥477 million for the years ended March 31, 2012, 2013 and 2014,
respectively.
Income taxes -
The provision for income taxes is computed based on the pretax income included in the
consolidated statement of income. The asset and liability approach is used to recognize deferred tax
assets and liabilities for the expected future tax consequences of temporary differences between the
carrying amounts and the tax bases of assets and liabilities. Deferred tax assets and liabilities are
measured using enacted tax rates expected to apply to taxable income in the years in which those
temporary differences are expected to be recovered or settled. Valuation allowances are recorded to
reduce deferred tax assets when it is more likely than not that a tax benefit will not be realized.
NIDEC recognizes the financial statement effects of tax positions when it is more likely
than not, based on the technical merits, that the tax positions will be sustained upon examination by
the tax authorities. Benefits from tax positions that meet the more-likely-than-not recognition
threshold are measured at the largest amount of benefit that is greater than 50 percent likely of being
realized upon settlement. Interest and penalties accrued related to unrecognized tax benefits are
included in other, net in the consolidated statements of income.
Earnings per share -
Basic net income per common share is calculated by dividing net income by the
weighted-average number of shares outstanding during the reported period. The calculation of
diluted net income per common share is similar to the calculation of basic net income per share,
except that the weighted-average number of shares outstanding includes the additional dilution from
potential common stock equivalents such as convertible bonds and options.
NIDEC CORPORATION
NOTES TO CONSOLIDATED FINANCIAL STATEMENTS
(continued)
F-18
Reclassification
Certain reclassifications of previously reported amounts have been made to the
consolidated statements of income and cash flows for the years ended March 31, 2012 and 2013 to
conform to the current year presentation.
As of March 31, 2012, NIDEC discontinued its lens actuator business and its tape drive
and disk drive mechanism business included within the Nidec Sankyo reportable segment, and its
compact digital camera lens unit business included within the Nidec Copal reportable segment. The
operating results of the discontinued businesses and exit costs with related taxes were recorded as
"Loss on discontinued operations" in the consolidated statement of income in accordance with ASC
205-20, "Presentation of Financial Statements-Discontinued Operations".
Accounting Changes
As of April 1, 2013, NIDEC adopted FASB Accounting Standards Codification™ (ASC)
350 “Intangibles-Goodwill and Other” updated by Accounting Standards Update (ASU) No.
2012-02 “Testing Indefinite-Lived Intangible Assets for Impairment.” ASU 2012-02 allows an entity
the option of performing a qualitative assessment before calculating the fair value of an
indefinite-lived intangible asset and performing the quantitative impairment test. If an entity
determines, on the basis of qualitative factors, that it is more likely than not that the asset is impaired,
the quantitative impairment test would be required. The adoption of this standard did not have
material impact on NIDEC’s consolidated financial position, results of operations and liquidity.
As of April 1, 2013, NIDEC adopted FASB ASC 220 “Comprehensive income.” updated
by ASU No. 2013-02 “Reporting of Amounts Reclassified Out of Accumulated Other
Comprehensive Income.” ASU 2013-02 requires an entity to present, either on the face of the
statement where net income is presented or in the notes, significant amounts reclassified out of
accumulated other comprehensive income by the respective line items of net income but only if the
amount reclassified is required under U.S. GAAP to be reclassified to net income in its entirety in
the same reporting period. The standard is provision for disclosure. The adoption of this standard did
not have any impact on NIDEC’s consolidated financial position, results of operations and liquidity.
Recent Accounting Pronouncements to be adopted in future periods
In July 2013, the FASB issued ASU No. 2013-11, “Income taxes (Topic 740):
Presentation of an Unrecognized Tax Benefit When a Net Operating Loss Carryforward, a Similar
Tax Loss, or a Tax Credit Carryforward Exists.” ASU 2013-11 clarifies that an unrecognized tax
benefit, or a portion of an unrecognized tax benefit, should be presented in the financial statements
as a reduction to a deferred tax asset for a net operating loss carryforward, a similar tax loss, or a tax
credit carryforward if such settlement is required or expected in the event the uncertain tax position
is disallowed. In situations where a net operating loss carry forward, a similar tax loss, or a tax credit
carryforward is not available at the reporting date under the tax law of the applicable jurisdiction or
the tax of the jurisdiction does not require, and the entity does not intend to use, the deferred tax
asset for such purpose, the unrecognized tax benefit should be presented in the financial statements
as a liability and should not be combined with deferred tax assets. ASU 2013-11 is effective for
reporting periods beginning after December 15, 2013. Early adoption and retrospective application
are permitted. This standard is provision for disclosure. The adoption of this standard will not have
NIDEC CORPORATION
NOTES TO CONSOLIDATED FINANCIAL STATEMENTS
(continued)
F-19
any impact on NIDEC’s consolidated financial position, results of operations or liquidity.
In April 2014, the FASB issued ASU No. 2014-08, “Presentation of Financial Statements
(Topic 205) and Property, Plant, and Equipment (Topic 360): "Reporting Discontinued Operations
and Disclosures of Disposals of Components of an Entity." Under the new standard, a disposal of a
component or a group of components of an entity is required to be reported in discontinued
operations if the disposal represents a strategic shift that has (or will have) a major effect on an
entity’s operations and financial results when the component meets the criteria to be classified as
held for sale or is disposed. The amendments in this update also require additional disclosures about
discontinued operations and disposal of an individually significant component of an entity that does
not qualify for discontinued operations. ASU 2014-08 is effective for annual and interim periods
beginning after December 15, 2014. Early adoption is permitted. The impact of the adoption of ASU
2014-08 on NIDEC's consolidated financial position, results of operations and liquidity will depend
on, and may be significant depending on, the size and nature of its future disposal.
In May 2014, the FASB issued ASU No. 2014-09, “Revenue from Contracts with
Customers (Topic 606)" Under the new standard, an entity should recognize revenue to depict the
transfer of promised goods or services to customers in an amount that reflects the consideration to
which the entity expects to be entitled in exchange for those goods or services. An entity should
recognize revenue when (or as) it satisfies a performance obligation by transferring a promised good
or service to a customer, and the transaction price should be allocated to performance obligation in
the contract. The new standard also requires an entity to disclose sufficient information to enable
users of financial statements to understand the nature, amount, timing, and uncertainty of revenue
and cash flows arising from contracts with customers. ASU 2014-09 is effective for annual and
interim periods beginning after December 15, 2016. Early application is not permitted. NIDEC is
currently evaluating the potential impact from adopting ASU 2014-09 on its consolidated financial
position, results of operations and liquidity.
3. Acquisitions
On July 1, 2011, NIDEC acquired all of the voting rights of Sanyo Seimitsu Co., Ltd.
which consists of small precision motor product category, particularly vibration motors for mobile
phones of Sanyo Electric Co., Ltd., in order to further develop and expand our small precision motor
product category by effectively using the operational resources of, and efficiently developing new
products and expanding sales opportunities for small precision motor product category. Sanyo
Seimitsu Co., Ltd. was subsequently renamed Nidec Seimitsu Corporation. This acquisition did not
have a material impact on NIDEC’s consolidated financial position, results of operations or liquidity.
On April 2, 2012, NIDEC acquired all of the voting rights in The Minster Machine
Company (“Minster”), which consists of machinery product category, particularly medium-sized and
large-sized high-speed, high-rigidity press machines and large-sized press machines for dies for
motor parts for cash of ¥9,202 million, in order to continue to pursue NIDEC’s group-wide growth
strategy by seeking to increase sales by expanding our business not only in NIDEC’s existing
electronic parts market but also in wider markets, including the beverage can and automobile parts
NIDEC CORPORATION
NOTES TO CONSOLIDATED FINANCIAL STATEMENTS
(continued)
F-20
markets. The Minster Machine Company was subsequently renamed Nidec Minster Corporation.
On May 31, 2012, NIDEC acquired all of the voting rights in Ansaldo Sistemi Industriali
S.p.A. (“Nidec ASI”), an Italian company, which consists of automotive, appliance, commercial and
industrial products business for cash of ¥36,564 million, where NIDEC has increasingly focused our
efforts as one of the principal growth area, in order to accelerate the global expansion of NIDEC’s
industrial motor business by gaining sales platforms in markets where NIDEC currently does not
have significant sales and by expanding NIDEC’s product offering to include a wide range of
products that are currently not in our product portfolio. Ansaldo Sistemi Industriali S.p.A was
subsequently renamed Nidec ASI S.p.A.
On September 28, 2012, NIDEC acquired all of the voting rights in Avtron Industrial
Automation, Inc. (“Avtron”), which consists of rich system engineering resources, experience, the
customer relationship and a sales channel in North America for cash of ¥4,861 million, in order to
strengthen the industrial motor and automation solutions business and accelerate our strategy to
achieve synergies with acquired companies.
On October 2, 2012, NIDEC acquired 51.4% of the voting rights of SCD Co., Ltd.
(“SCD”), a South Korean company, which consists of development, manufacturing and sale of
motor drive units for refrigerators and motors for air conditioners for cash of ¥3,305 million, in order
to gain an opportunity to enter into business with South Korean home appliance manufacturers that
have a strong presence in emerging economies, and seek to expand sales of its rich product line-up.
On November 1, 2012, NIDEC acquired all of the voting rights in Kinetek Group Inc.
(“Kinetek”), which conducts its commercial motor business on a global basis and occupies a leading
position in various markets for commercial motors used in such end-products as elevators/escalators,
commercial food refrigerators, floor care equipment, golf and utility vehicles, material handling
vehicles and aerial lifts for cash of ¥35,697 million, in order to strengthen NIDEC’s commercial
motor business.
On December 28, 2012, NIDEC acquired 51.0% of the voting rights of Nidec Kaiyu Auto
Electric (Jiangsu) Co., Ltd. (“Kaiyu”), a Chinese company, which consists of development,
manufacturing and sale of brush motors for electric power steering (“EPS”) systems and automotive
fans for cash of ¥1,018 million, in order to acquire technologies for brush motors for EPS systems,
which NIDEC currently does not possess, and business opportunities in the Chinese automobile
market, new entry into which has been difficult.
On January 1, 2014, NIDEC acquired all of the voting rights in Mitsubishi Materials C.M.I.
Corporation (“CMI”), a Japanese company, which consists of development, manufacturing and sale
of small motors, electric contact products and other products for cash of ¥5,228 million, in order to
strengthen our automotive product business and enhance our product portfolio.
On March 31, 2014, NIDEC acquired all of the voting rights in Honda Elesys Co., Ltd.
(“Elesys”), a Japanese company, which consists of development, manufacturing and sale of
automobile electronic control units for car bodies for cash of ¥24,320 million, mainly in order to
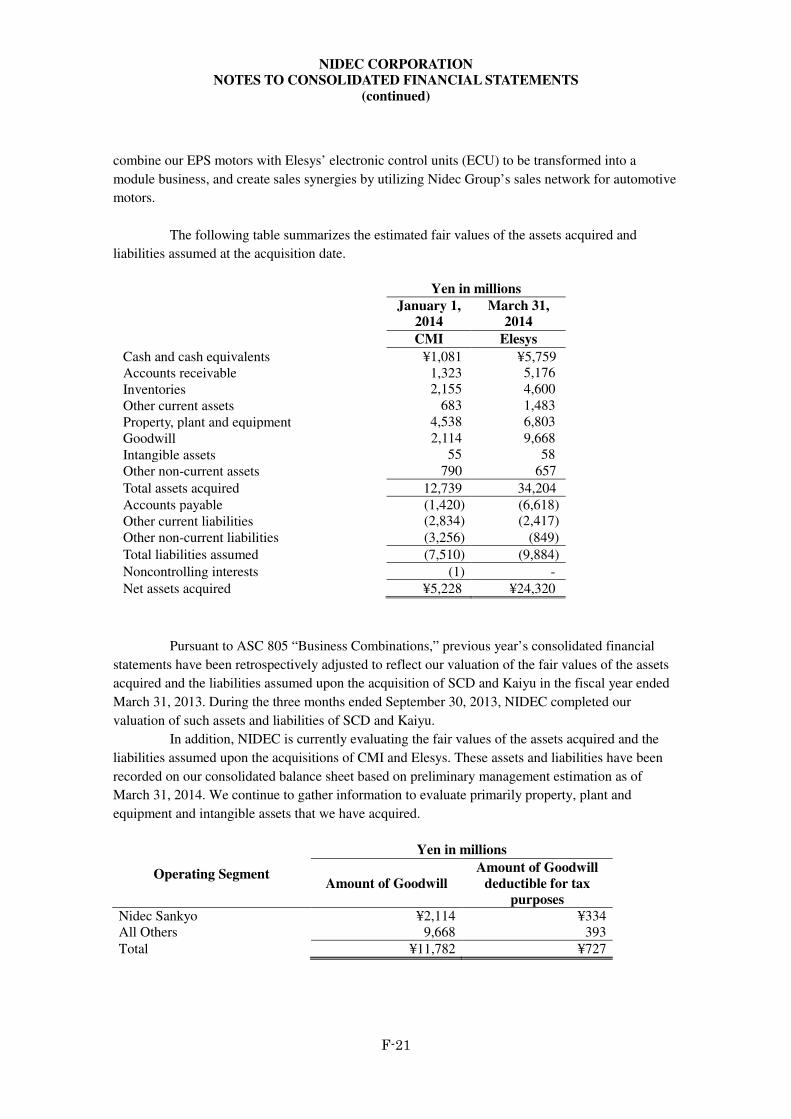
NIDEC CORPORATION
NOTES TO CONSOLIDATED FINANCIAL STATEMENTS
(continued)
F-21
combine our EPS motors with Elesys’ electronic control units (ECU) to be transformed into a
module business, and create sales synergies by utilizing Nidec Group’s sales network for automotive
motors.
The following table summarizes the estimated fair values of the assets acquired and
liabilities assumed at the acquisition date.
Yen in millions
January 1,
2014
March 31,
2014
CMI Elesys
Cash and cash equivalents ¥1,081 ¥5,759 Accounts receivable 1,323 5,176
Inventories 2,155 4,600
Other current assets 683 1,483
Property, plant and equipment 4,538 6,803
Goodwill 2,114 9,668
Intangible assets 55 58
Other non-current assets 790 657
Total assets acquired 12,739 34,204
Accounts payable (1,420) (6,618) Other current liabilities (2,834) (2,417)
Other non-current liabilities (3,256) (849)
Total liabilities assumed (7,510) (9,884)
Noncontrolling interests (1) -
Net assets acquired ¥5,228 ¥24,320
Pursuant to ASC 805 “Business Combinations,” previous year’s consolidated financial
statements have been retrospectively adjusted to reflect our valuation of the fair values of the assets
acquired and the liabilities assumed upon the acquisition of SCD and Kaiyu in the fiscal year ended
March 31, 2013. During the three months ended September 30, 2013, NIDEC completed our
valuation of such assets and liabilities of SCD and Kaiyu.
In addition, NIDEC is currently evaluating the fair values of the assets acquired and the
liabilities assumed upon the acquisitions of CMI and Elesys. These assets and liabilities have been
recorded on our consolidated balance sheet based on preliminary management estimation as of
March 31, 2014. We continue to gather information to evaluate primarily property, plant and
equipment and intangible assets that we have acquired.
Operating Segment
Yen in millions
Amount of Goodwill
Amount of Goodwill
deductible for tax
purposes
Nidec Sankyo ¥2,114 ¥334 All Others 9,668 393
Total ¥11,782 ¥727
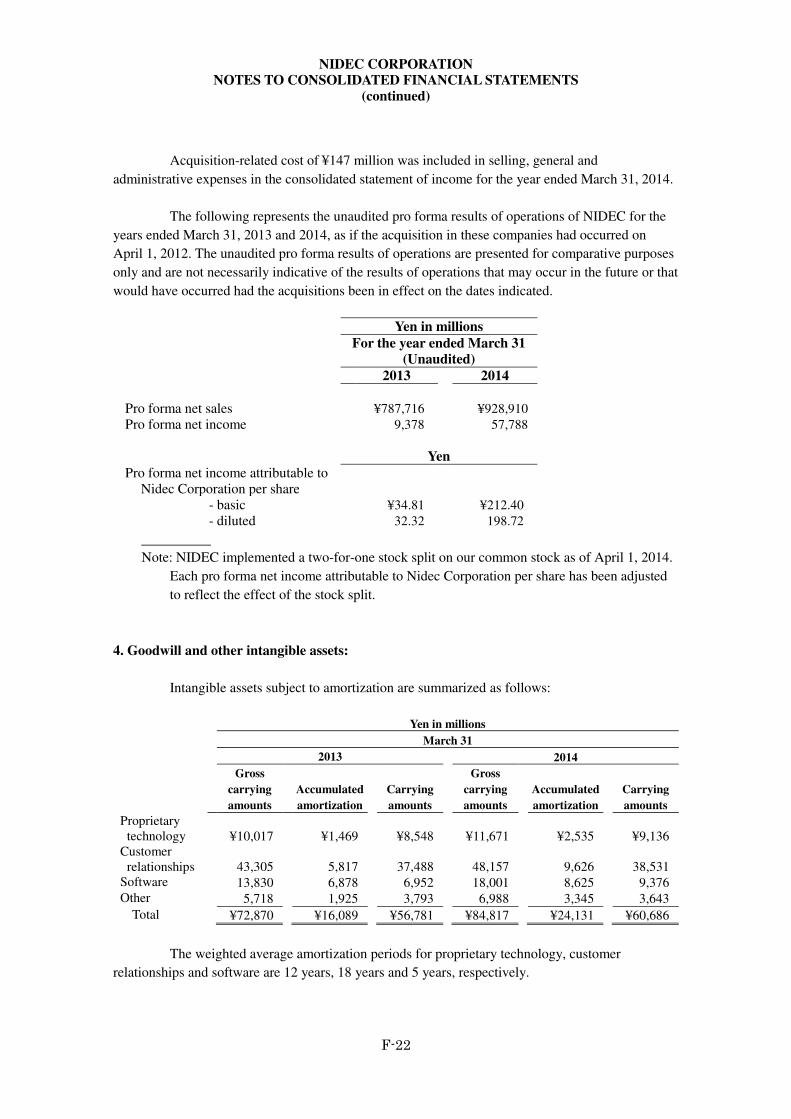
NIDEC CORPORATION
NOTES TO CONSOLIDATED FINANCIAL STATEMENTS
(continued)
F-22
Acquisition-related cost of ¥147 million was included in selling, general and
administrative expenses in the consolidated statement of income for the year ended March 31, 2014.
The following represents the unaudited pro forma results of operations of NIDEC for the
years ended March 31, 2013 and 2014, as if the acquisition in these companies had occurred on
April 1, 2012. The unaudited pro forma results of operations are presented for comparative purposes
only and are not necessarily indicative of the results of operations that may occur in the future or that
would have occurred had the acquisitions been in effect on the dates indicated.
Yen in millions
For the year ended March 31
(Unaudited)
2013 2014
Pro forma net sales ¥787,716 ¥928,910 Pro forma net income 9,378 57,788
Yen
Pro forma net income attributable to Nidec Corporation per share
- basic ¥34.81 ¥212.40 - diluted 32.32 198.72
Note: NIDEC implemented a two-for-one stock split on our common stock as of April 1, 2014.
Each pro forma net income attributable to Nidec Corporation per share has been adjusted
to reflect the effect of the stock split.
4. Goodwill and other intangible assets:
Intangible assets subject to amortization are summarized as follows:
Yen in millions
March 31
2013 2014
Gross
carrying
amounts Accumulated
amortization
Carrying
amounts
Gross
carrying
amounts Accumulated
amortization
Carrying
amounts
Proprietary technology
¥10,017 ¥1,469 ¥8,548 ¥11,671 ¥2,535 ¥9,136
Customer relationships
43,305 5,817 37,488 48,157 9,626 38,531
Software 13,830 6,878 6,952 18,001 8,625 9,376 Other 5,718 1,925 3,793 6,988 3,345 3,643
Total ¥72,870 ¥16,089 ¥56,781 ¥84,817 ¥24,131 ¥60,686
The weighted average amortization periods for proprietary technology, customer
relationships and software are 12 years, 18 years and 5 years, respectively.
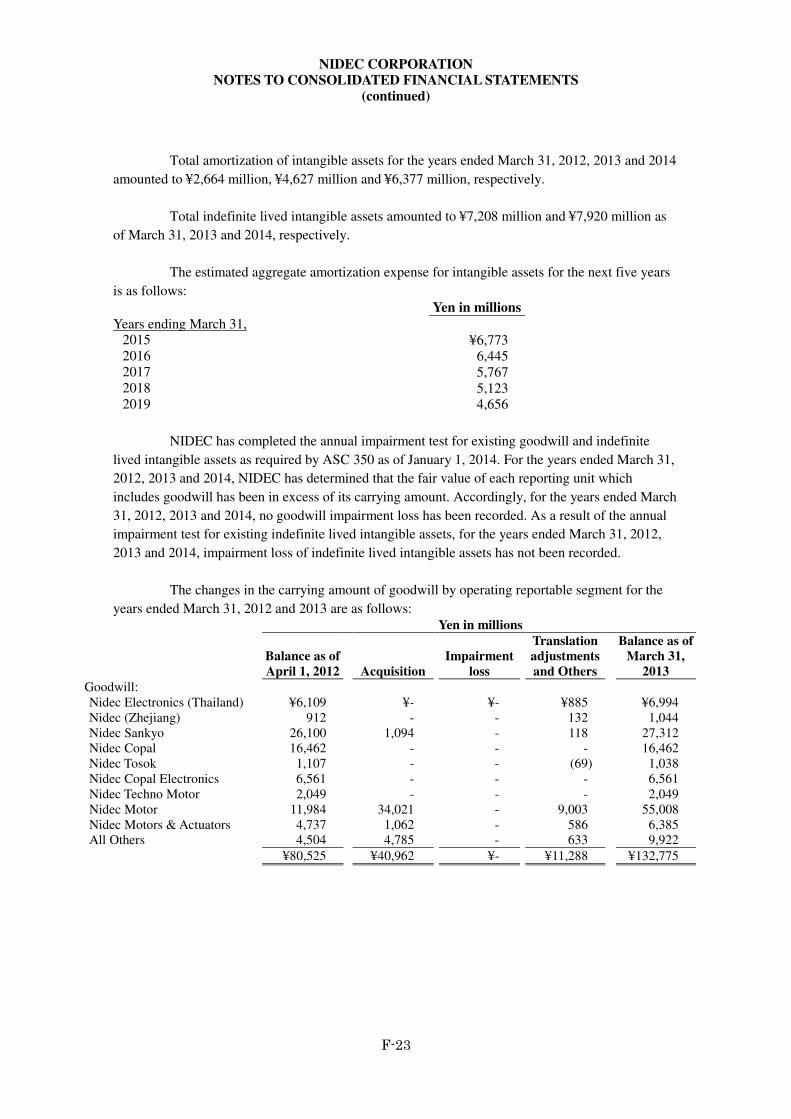
NIDEC CORPORATION
NOTES TO CONSOLIDATED FINANCIAL STATEMENTS
(continued)
F-23
Total amortization of intangible assets for the years ended March 31, 2012, 2013 and 2014
amounted to ¥2,664 million, ¥4,627 million and ¥6,377 million, respectively.
Total indefinite lived intangible assets amounted to ¥7,208 million and ¥7,920 million as
of March 31, 2013 and 2014, respectively.
The estimated aggregate amortization expense for intangible assets for the next five years
is as follows:
Yen in millions
Years ending March 31,
2015 ¥6,773 2016 6,445 2017 5,767 2018 5,123 2019 4,656
NIDEC has completed the annual impairment test for existing goodwill and indefinite
lived intangible assets as required by ASC 350 as of January 1, 2014. For the years ended March 31,
2012, 2013 and 2014, NIDEC has determined that the fair value of each reporting unit which
includes goodwill has been in excess of its carrying amount. Accordingly, for the years ended March
31, 2012, 2013 and 2014, no goodwill impairment loss has been recorded. As a result of the annual
impairment test for existing indefinite lived intangible assets, for the years ended March 31, 2012,
2013 and 2014, impairment loss of indefinite lived intangible assets has not been recorded.
The changes in the carrying amount of goodwill by operating reportable segment for the
years ended March 31, 2012 and 2013 are as follows: Yen in millions
Balance as of
April 1, 2012 Acquisition Impairment
loss
Translation
adjustments
and Others
Balance as of
March 31,
2013
Goodwill: Nidec Electronics (Thailand) ¥6,109 ¥- ¥- ¥885 ¥6,994 Nidec (Zhejiang) 912 - - 132 1,044 Nidec Sankyo 26,100 1,094 - 118 27,312 Nidec Copal 16,462 - - - 16,462 Nidec Tosok 1,107 - - (69) 1,038 Nidec Copal Electronics 6,561 - - - 6,561 Nidec Techno Motor 2,049 - - - 2,049 Nidec Motor 11,984 34,021 - 9,003 55,008 Nidec Motors & Actuators 4,737 1,062 - 586 6,385 All Others 4,504 4,785 - 633 9,922
¥80,525 ¥40,962 ¥- ¥11,288 ¥132,775
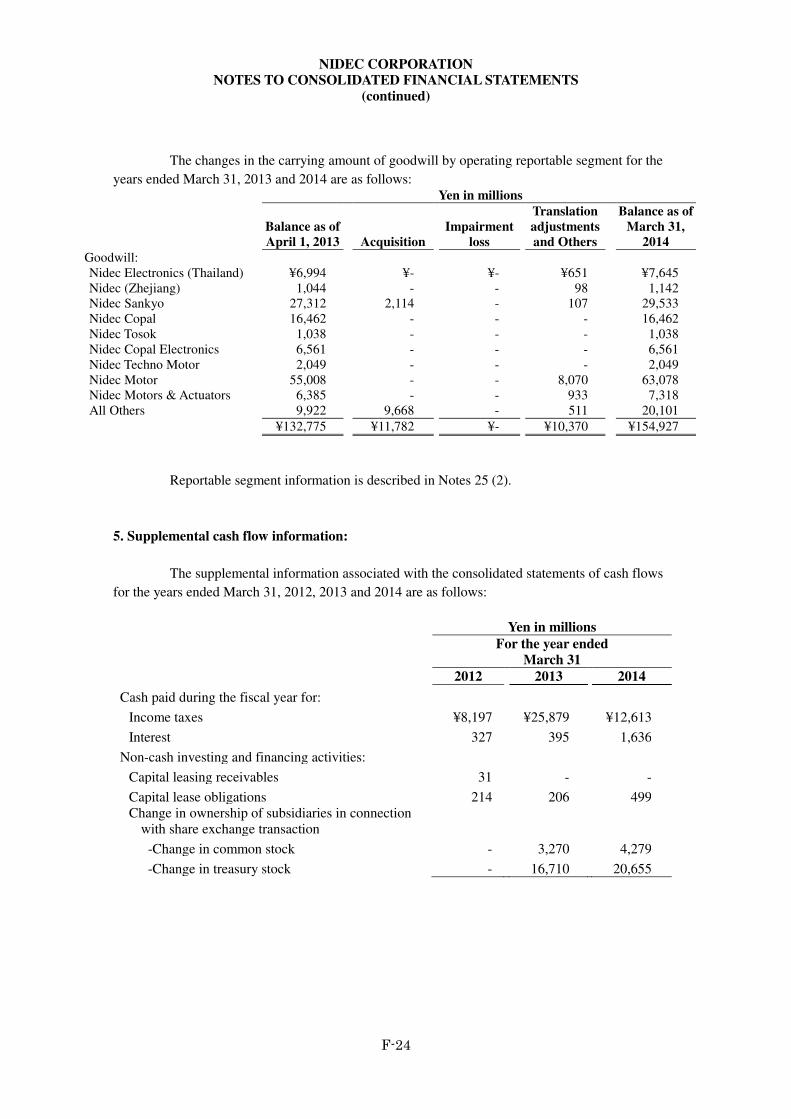
NIDEC CORPORATION
NOTES TO CONSOLIDATED FINANCIAL STATEMENTS
(continued)
F-24
The changes in the carrying amount of goodwill by operating reportable segment for the
years ended March 31, 2013 and 2014 are as follows: Yen in millions
Balance as of
April 1, 2013 Acquisition Impairment
loss
Translation
adjustments
and Others
Balance as of
March 31,
2014
Goodwill: Nidec Electronics (Thailand) ¥6,994 ¥- ¥- ¥651 ¥7,645 Nidec (Zhejiang) 1,044 - - 98 1,142 Nidec Sankyo 27,312 2,114 - 107 29,533 Nidec Copal 16,462 - - - 16,462 Nidec Tosok 1,038 - - - 1,038 Nidec Copal Electronics 6,561 - - - 6,561 Nidec Techno Motor 2,049 - - - 2,049 Nidec Motor 55,008 - - 8,070 63,078 Nidec Motors & Actuators 6,385 - - 933 7,318 All Others 9,922 9,668 - 511 20,101
¥132,775 ¥11,782 ¥- ¥10,370 ¥154,927
Reportable segment information is described in Notes 25 (2).
5. Supplemental cash flow information:
The supplemental information associated with the consolidated statements of cash flows
for the years ended March 31, 2012, 2013 and 2014 are as follows:
Yen in millions
For the year ended
March 31
2012 2013 2014
Cash paid during the fiscal year for:
Income taxes ¥8,197 ¥25,879 ¥12,613
Interest 327 395 1,636
Non-cash investing and financing activities:
Capital leasing receivables 31 - -
Capital lease obligations 214 206 499 Change in ownership of subsidiaries in connection
with share exchange transaction
-Change in common stock - 3,270 4,279
-Change in treasury stock - 16,710 20,655
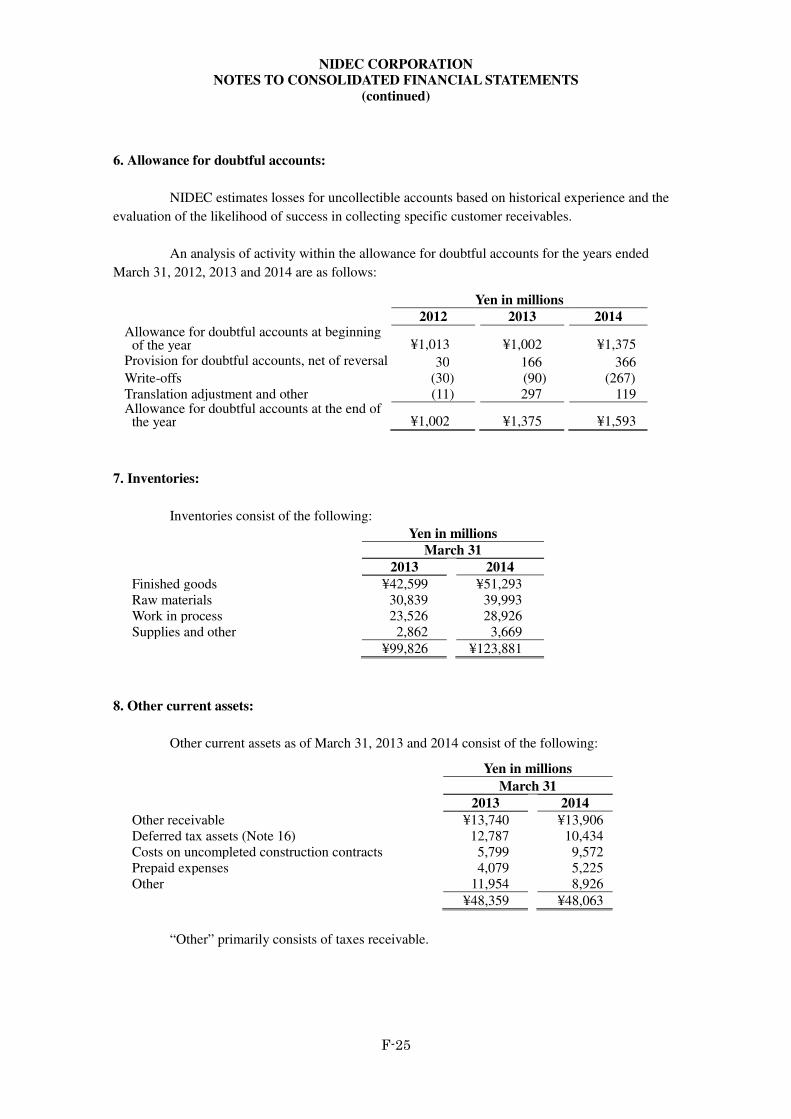
NIDEC CORPORATION
NOTES TO CONSOLIDATED FINANCIAL STATEMENTS
(continued)
F-25
6. Allowance for doubtful accounts:
NIDEC estimates losses for uncollectible accounts based on historical experience and the
evaluation of the likelihood of success in collecting specific customer receivables.
An analysis of activity within the allowance for doubtful accounts for the years ended
March 31, 2012, 2013 and 2014 are as follows:
Yen in millions
2012 2013 2014 Allowance for doubtful accounts at beginning
of the year ¥1,013 ¥1,002 ¥1,375 Provision for doubtful accounts, net of reversal 30 166 366 Write-offs (30) (90) (267) Translation adjustment and other (11) 297 119 Allowance for doubtful accounts at the end of
the year ¥1,002 ¥1,375 ¥1,593
7. Inventories:
Inventories consist of the following:
Yen in millions
March 31
2013 2014
Finished goods ¥42,599 ¥51,293 Raw materials 30,839 39,993 Work in process 23,526 28,926 Supplies and other 2,862 3,669
¥99,826 ¥123,881
8. Other current assets:
Other current assets as of March 31, 2013 and 2014 consist of the following:
Yen in millions
March 31
2013 2014
Other receivable ¥13,740 ¥13,906 Deferred tax assets (Note 16) 12,787 10,434 Costs on uncompleted construction contracts 5,799 9,572 Prepaid expenses 4,079 5,225 Other 11,954 8,926
¥48,359 ¥48,063
“Other” primarily consists of taxes receivable.
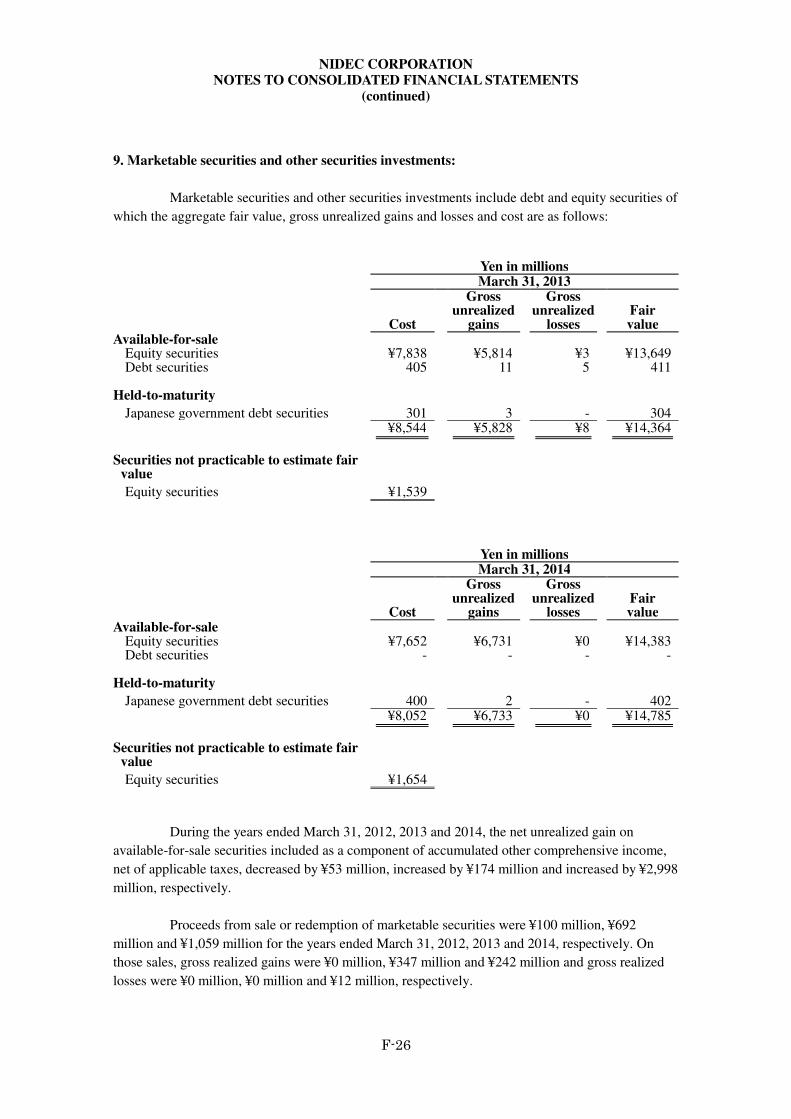
NIDEC CORPORATION
NOTES TO CONSOLIDATED FINANCIAL STATEMENTS
(continued)
F-26
9. Marketable securities and other securities investments:
Marketable securities and other securities investments include debt and equity securities of
which the aggregate fair value, gross unrealized gains and losses and cost are as follows:
Yen in millions
March 31, 2013
Cost
Gross unrealized
gains
Gross unrealized
losses
Fair value
Available-for-sale Equity securities ¥7,838 ¥5,814 ¥3 ¥13,649 Debt securities 405 11 5 411
Held-to-maturity
Japanese government debt securities 301 3 - 304
¥8,544 ¥5,828 ¥8 ¥14,364
Securities not practicable to estimate fair
value
Equity securities ¥1,539
Yen in millions March 31, 2014
Cost
Gross unrealized
gains
Gross unrealized
losses
Fair value
Available-for-sale Equity securities ¥7,652 ¥6,731 ¥0 ¥14,383 Debt securities - - - -
Held-to-maturity
Japanese government debt securities 400 2 - 402
¥8,052 ¥6,733 ¥0 ¥14,785
Securities not practicable to estimate fair
value
Equity securities ¥1,654
During the years ended March 31, 2012, 2013 and 2014, the net unrealized gain on
available-for-sale securities included as a component of accumulated other comprehensive income,
net of applicable taxes, decreased by ¥53 million, increased by ¥174 million and increased by ¥2,998
million, respectively.
Proceeds from sale or redemption of marketable securities were ¥100 million, ¥692
million and ¥1,059 million for the years ended March 31, 2012, 2013 and 2014, respectively. On
those sales, gross realized gains were ¥0 million, ¥347 million and ¥242 million and gross realized
losses were ¥0 million, ¥0 million and ¥12 million, respectively.
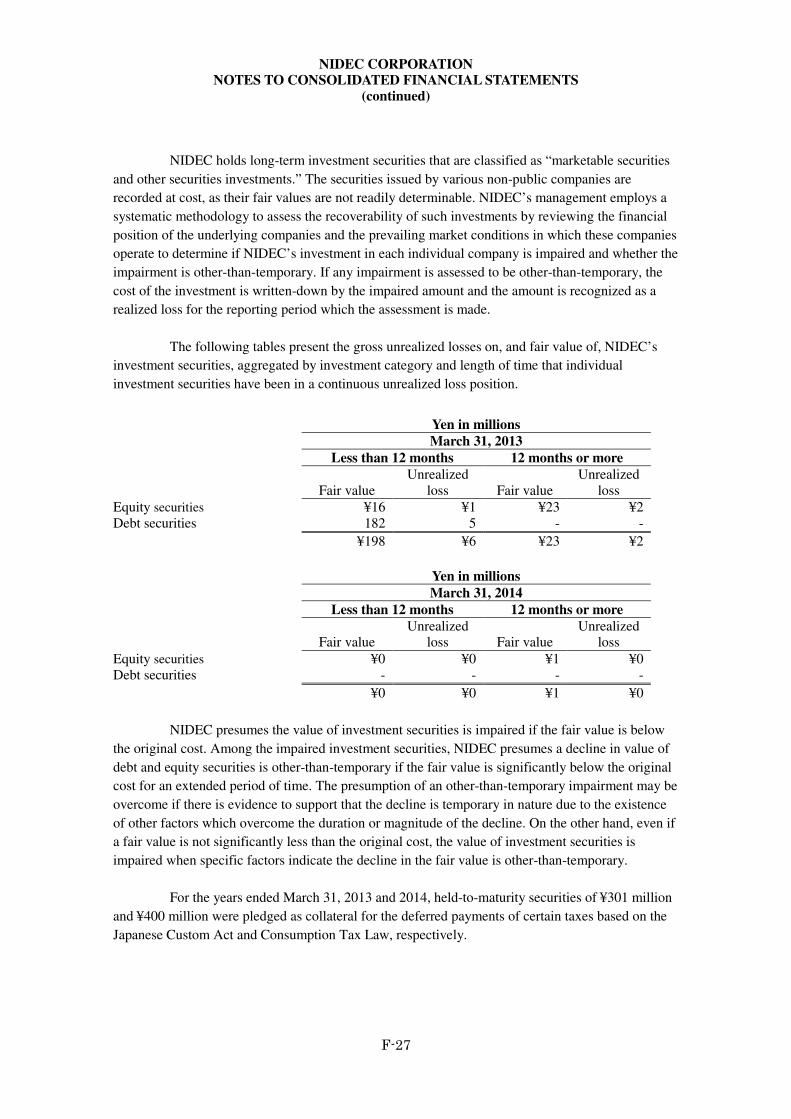
NIDEC CORPORATION
NOTES TO CONSOLIDATED FINANCIAL STATEMENTS
(continued)
F-27
NIDEC holds long-term investment securities that are classified as “marketable securities
and other securities investments.” The securities issued by various non-public companies are
recorded at cost, as their fair values are not readily determinable. NIDEC’s management employs a
systematic methodology to assess the recoverability of such investments by reviewing the financial
position of the underlying companies and the prevailing market conditions in which these companies
operate to determine if NIDEC’s investment in each individual company is impaired and whether the
impairment is other-than-temporary. If any impairment is assessed to be other-than-temporary, the
cost of the investment is written-down by the impaired amount and the amount is recognized as a
realized loss for the reporting period which the assessment is made.
The following tables present the gross unrealized losses on, and fair value of, NIDEC’s
investment securities, aggregated by investment category and length of time that individual
investment securities have been in a continuous unrealized loss position.
Yen in millions
March 31, 2013
Less than 12 months 12 months or more
Fair value Unrealized
loss Fair value Unrealized
loss
Equity securities ¥16 ¥1 ¥23 ¥2 Debt securities 182 5 - -
¥198 ¥6 ¥23 ¥2
Yen in millions
March 31, 2014
Less than 12 months 12 months or more
Fair value Unrealized
loss Fair value Unrealized
loss
Equity securities ¥0 ¥0 ¥1 ¥0 Debt securities - - - -
¥0 ¥0 ¥1 ¥0
NIDEC presumes the value of investment securities is impaired if the fair value is below
the original cost. Among the impaired investment securities, NIDEC presumes a decline in value of
debt and equity securities is other-than-temporary if the fair value is significantly below the original
cost for an extended period of time. The presumption of an other-than-temporary impairment may be
overcome if there is evidence to support that the decline is temporary in nature due to the existence
of other factors which overcome the duration or magnitude of the decline. On the other hand, even if
a fair value is not significantly less than the original cost, the value of investment securities is
impaired when specific factors indicate the decline in the fair value is other-than-temporary.
For the years ended March 31, 2013 and 2014, held-to-maturity securities of ¥301 million
and ¥400 million were pledged as collateral for the deferred payments of certain taxes based on the
Japanese Custom Act and Consumption Tax Law, respectively.
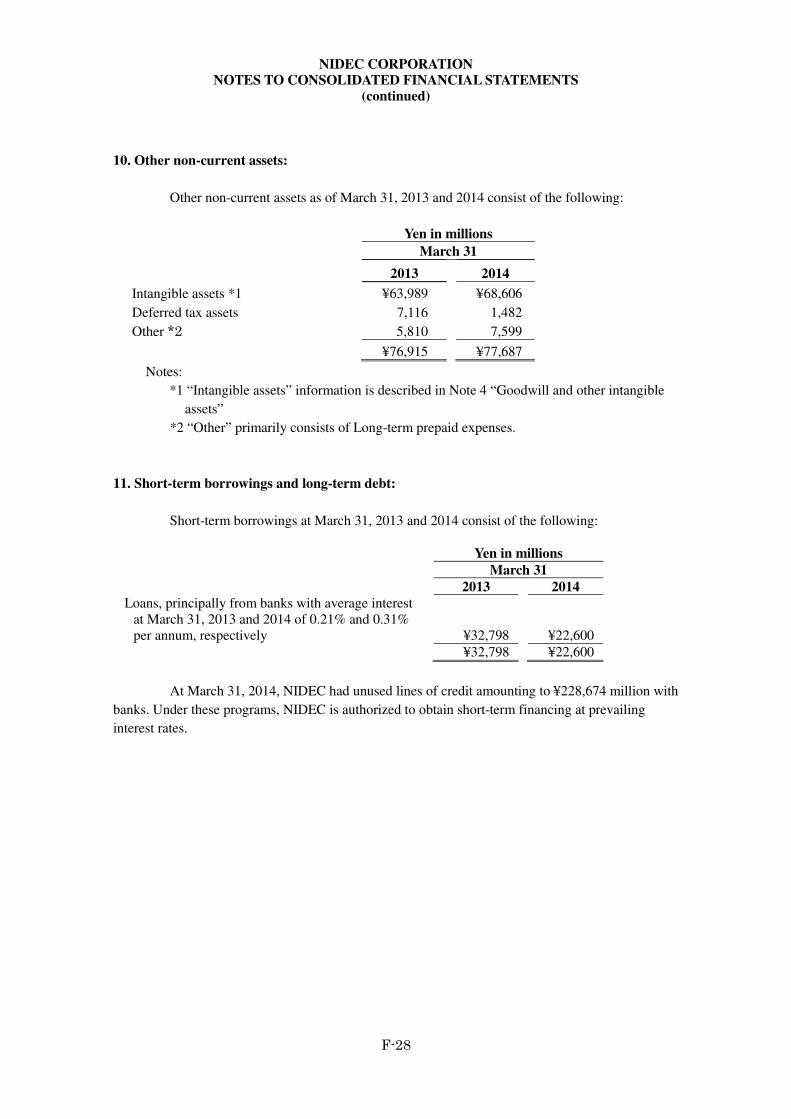
NIDEC CORPORATION
NOTES TO CONSOLIDATED FINANCIAL STATEMENTS
(continued)
F-28
10. Other non-current assets:
Other non-current assets as of March 31, 2013 and 2014 consist of the following:
Yen in millions
March 31
2013 2014
Intangible assets *1 ¥63,989 ¥68,606
Deferred tax assets 7,116 1,482
Other *2 5,810 7,599
¥76,915 ¥77,687
Notes:
*1 “Intangible assets” information is described in Note 4 “Goodwill and other intangible
assets”
*2 “Other” primarily consists of Long-term prepaid expenses.
11. Short-term borrowings and long-term debt:
Short-term borrowings at March 31, 2013 and 2014 consist of the following:
Yen in millions
March 31
2013 2014
Loans, principally from banks with average interest at March 31, 2013 and 2014 of 0.21% and 0.31% per annum, respectively ¥32,798 ¥22,600
¥32,798 ¥22,600
At March 31, 2014, NIDEC had unused lines of credit amounting to ¥228,674 million with
banks. Under these programs, NIDEC is authorized to obtain short-term financing at prevailing
interest rates.
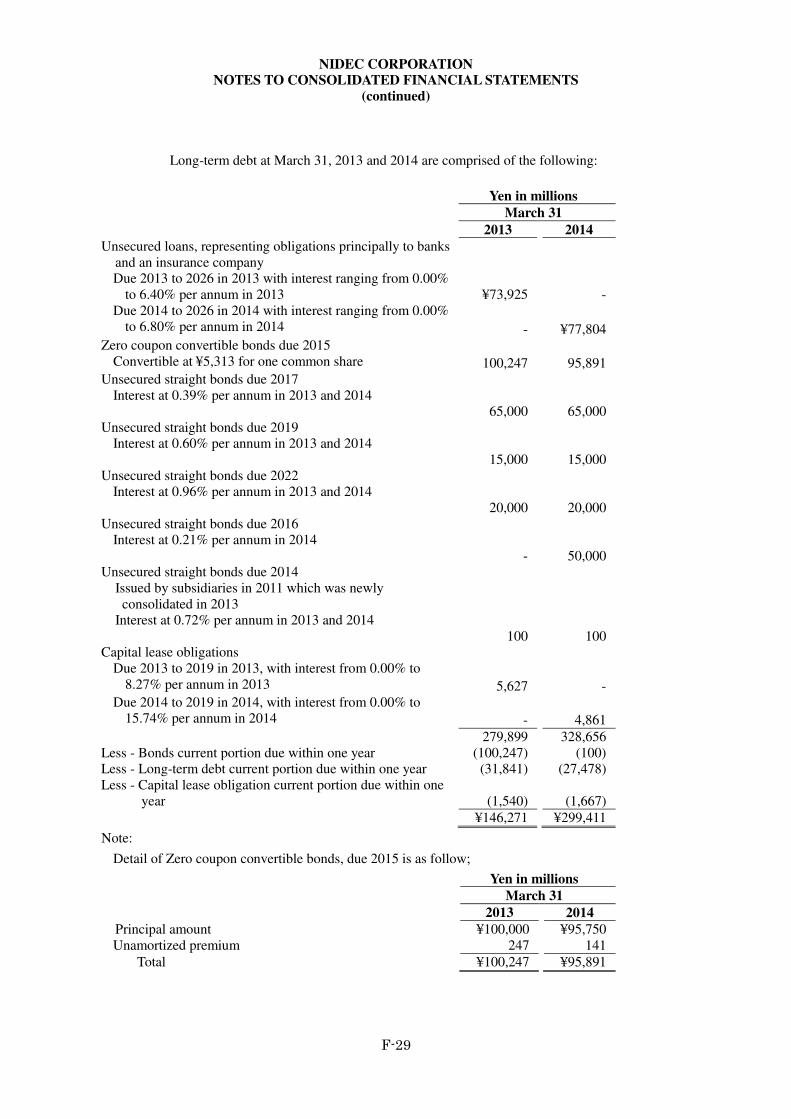
NIDEC CORPORATION
NOTES TO CONSOLIDATED FINANCIAL STATEMENTS
(continued)
F-29
Long-term debt at March 31, 2013 and 2014 are comprised of the following:
Yen in millions March 31
2013 2014
Unsecured loans, representing obligations principally to banks and an insurance company Due 2013 to 2026 in 2013 with interest ranging from 0.00%
to 6.40% per annum in 2013 ¥73,925 - Due 2014 to 2026 in 2014 with interest ranging from 0.00%
to 6.80% per annum in 2014 - ¥77,804 Zero coupon convertible bonds due 2015
Convertible at ¥5,313 for one common share 100,247 95,891 Unsecured straight bonds due 2017
Interest at 0.39% per annum in 2013 and 2014 65,000 65,000 Unsecured straight bonds due 2019
Interest at 0.60% per annum in 2013 and 2014 15,000 15,000 Unsecured straight bonds due 2022
Interest at 0.96% per annum in 2013 and 2014 20,000 20,000 Unsecured straight bonds due 2016
Interest at 0.21% per annum in 2014 - 50,000 Unsecured straight bonds due 2014
Issued by subsidiaries in 2011 which was newly consolidated in 2013
Interest at 0.72% per annum in 2013 and 2014 100 100 Capital lease obligations
Due 2013 to 2019 in 2013, with interest from 0.00% to 8.27% per annum in 2013 5,627 -
Due 2014 to 2019 in 2014, with interest from 0.00% to 15.74% per annum in 2014 - 4,861
279,899 328,656 Less - Bonds current portion due within one year (100,247) (100) Less - Long-term debt current portion due within one year (31,841) (27,478) Less - Capital lease obligation current portion due within one
year (1,540) (1,667)
¥146,271 ¥299,411
Note:
Detail of Zero coupon convertible bonds, due 2015 is as follow;
Yen in millions March 31
2013 2014
Principal amount ¥100,000 ¥95,750 Unamortized premium 247 141
Total ¥100,247 ¥95,891
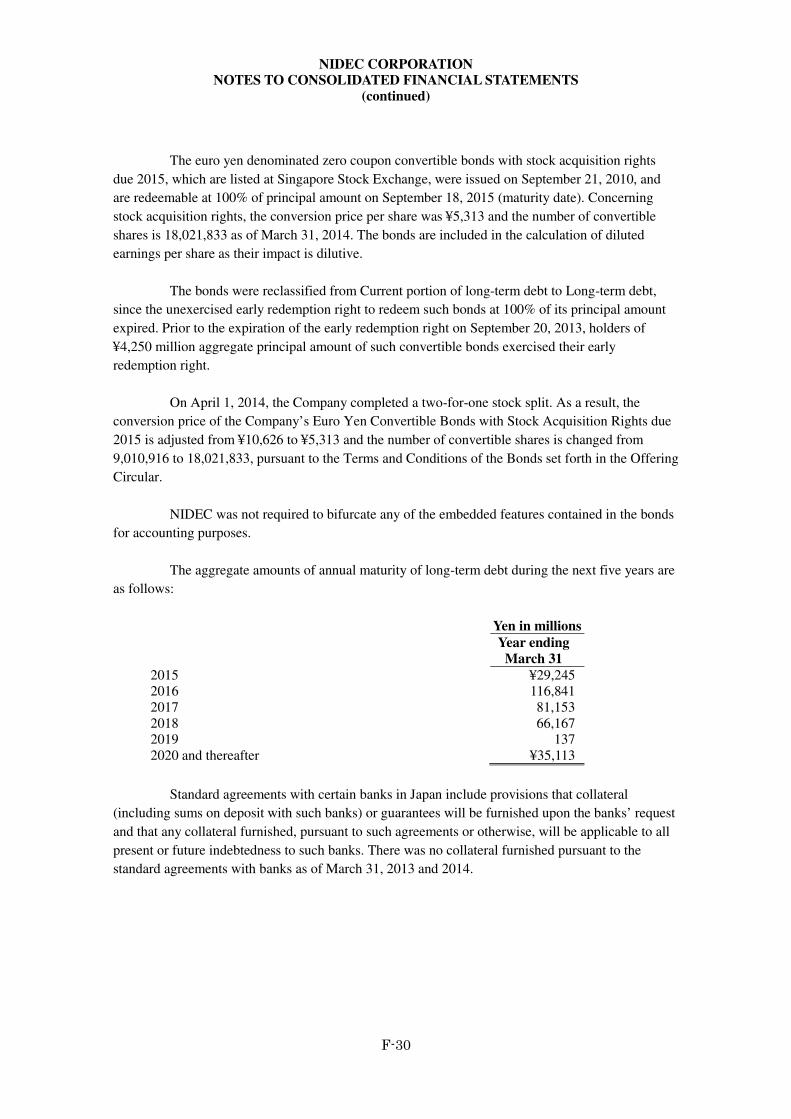
NIDEC CORPORATION
NOTES TO CONSOLIDATED FINANCIAL STATEMENTS
(continued)
F-30
The euro yen denominated zero coupon convertible bonds with stock acquisition rights
due 2015, which are listed at Singapore Stock Exchange, were issued on September 21, 2010, and
are redeemable at 100% of principal amount on September 18, 2015 (maturity date). Concerning
stock acquisition rights, the conversion price per share was ¥5,313 and the number of convertible
shares is 18,021,833 as of March 31, 2014. The bonds are included in the calculation of diluted
earnings per share as their impact is dilutive.
The bonds were reclassified from Current portion of long-term debt to Long-term debt,
since the unexercised early redemption right to redeem such bonds at 100% of its principal amount
expired. Prior to the expiration of the early redemption right on September 20, 2013, holders of
¥4,250 million aggregate principal amount of such convertible bonds exercised their early
redemption right.
On April 1, 2014, the Company completed a two-for-one stock split. As a result, the
conversion price of the Company’s Euro Yen Convertible Bonds with Stock Acquisition Rights due
2015 is adjusted from ¥10,626 to ¥5,313 and the number of convertible shares is changed from
9,010,916 to 18,021,833, pursuant to the Terms and Conditions of the Bonds set forth in the Offering
Circular.
NIDEC was not required to bifurcate any of the embedded features contained in the bonds
for accounting purposes.
The aggregate amounts of annual maturity of long-term debt during the next five years are
as follows:
Yen in millions
Year ending
March 31 2015 ¥29,245 2016 116,841 2017 81,153 2018 66,167 2019 137 2020 and thereafter ¥35,113
Standard agreements with certain banks in Japan include provisions that collateral
(including sums on deposit with such banks) or guarantees will be furnished upon the banks’ request
and that any collateral furnished, pursuant to such agreements or otherwise, will be applicable to all
present or future indebtedness to such banks. There was no collateral furnished pursuant to the
standard agreements with banks as of March 31, 2013 and 2014.
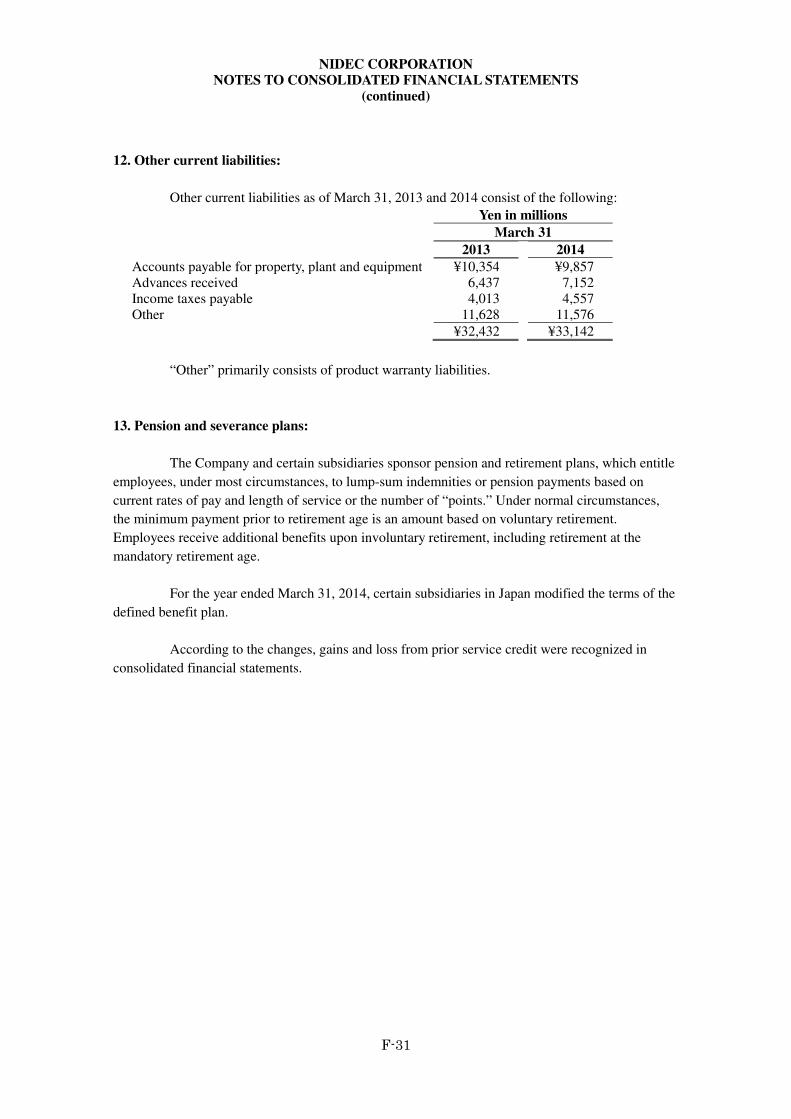
NIDEC CORPORATION
NOTES TO CONSOLIDATED FINANCIAL STATEMENTS
(continued)
F-31
12. Other current liabilities:
Other current liabilities as of March 31, 2013 and 2014 consist of the following:
Yen in millions
March 31
2013 2014
Accounts payable for property, plant and equipment ¥10,354 ¥9,857 Advances received 6,437 7,152 Income taxes payable 4,013 4,557 Other 11,628 11,576
¥32,432 ¥33,142
“Other” primarily consists of product warranty liabilities.
13. Pension and severance plans:
The Company and certain subsidiaries sponsor pension and retirement plans, which entitle
employees, under most circumstances, to lump-sum indemnities or pension payments based on
current rates of pay and length of service or the number of “points.” Under normal circumstances,
the minimum payment prior to retirement age is an amount based on voluntary retirement.
Employees receive additional benefits upon involuntary retirement, including retirement at the
mandatory retirement age.
For the year ended March 31, 2014, certain subsidiaries in Japan modified the terms of the
defined benefit plan.
According to the changes, gains and loss from prior service credit were recognized in
consolidated financial statements.
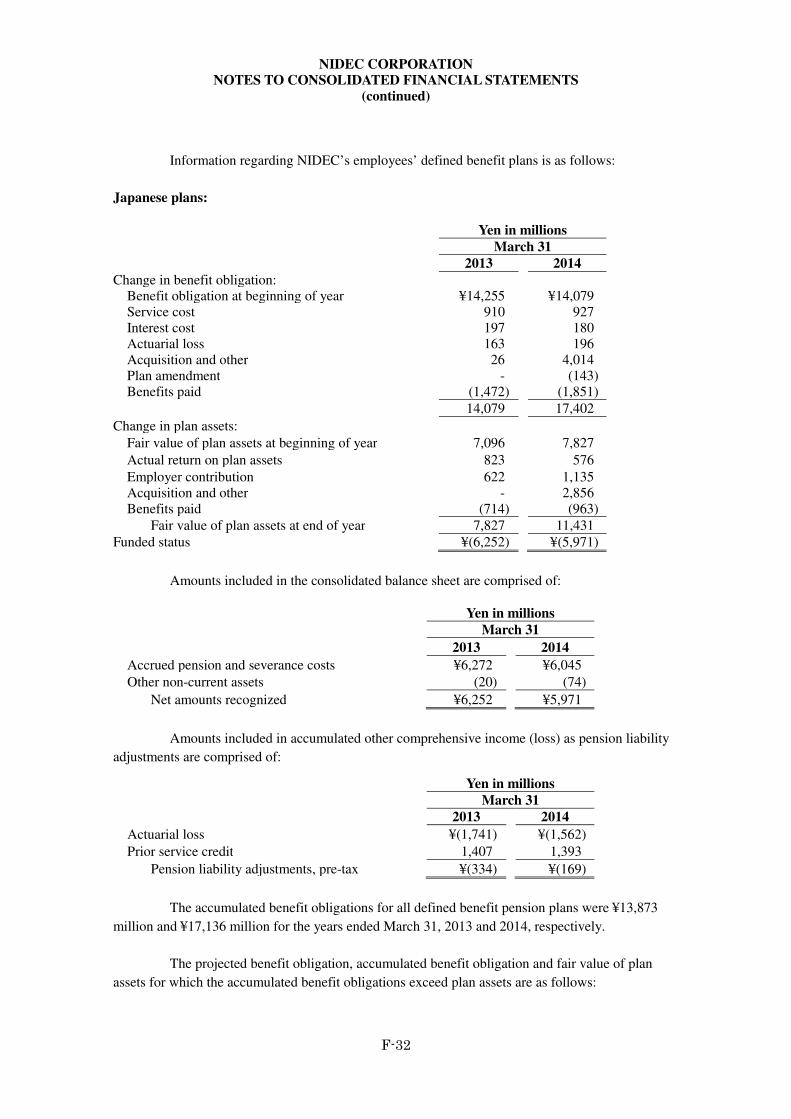
NIDEC CORPORATION
NOTES TO CONSOLIDATED FINANCIAL STATEMENTS
(continued)
F-32
Information regarding NIDEC’s employees’ defined benefit plans is as follows:
Japanese plans:
Yen in millions
March 31
2013 2014
Change in benefit obligation: Benefit obligation at beginning of year ¥14,255 ¥14,079 Service cost 910 927 Interest cost 197 180 Actuarial loss 163 196 Acquisition and other 26 4,014 Plan amendment - (143) Benefits paid (1,472) (1,851)
14,079 17,402
Change in plan assets:
Fair value of plan assets at beginning of year 7,096 7,827
Actual return on plan assets 823 576
Employer contribution 622 1,135 Acquisition and other - 2,856 Benefits paid (714) (963)
Fair value of plan assets at end of year 7,827 11,431
Funded status ¥(6,252) ¥(5,971)
Amounts included in the consolidated balance sheet are comprised of:
Yen in millions
March 31
2013 2014
Accrued pension and severance costs ¥6,272 ¥6,045
Other non-current assets (20) (74)
Net amounts recognized ¥6,252 ¥5,971
Amounts included in accumulated other comprehensive income (loss) as pension liability
adjustments are comprised of:
Yen in millions
March 31
2013 2014
Actuarial loss ¥(1,741) ¥(1,562)
Prior service credit 1,407 1,393
Pension liability adjustments, pre-tax ¥(334) ¥(169)
The accumulated benefit obligations for all defined benefit pension plans were ¥13,873
million and ¥17,136 million for the years ended March 31, 2013 and 2014, respectively.
The projected benefit obligation, accumulated benefit obligation and fair value of plan
assets for which the accumulated benefit obligations exceed plan assets are as follows:
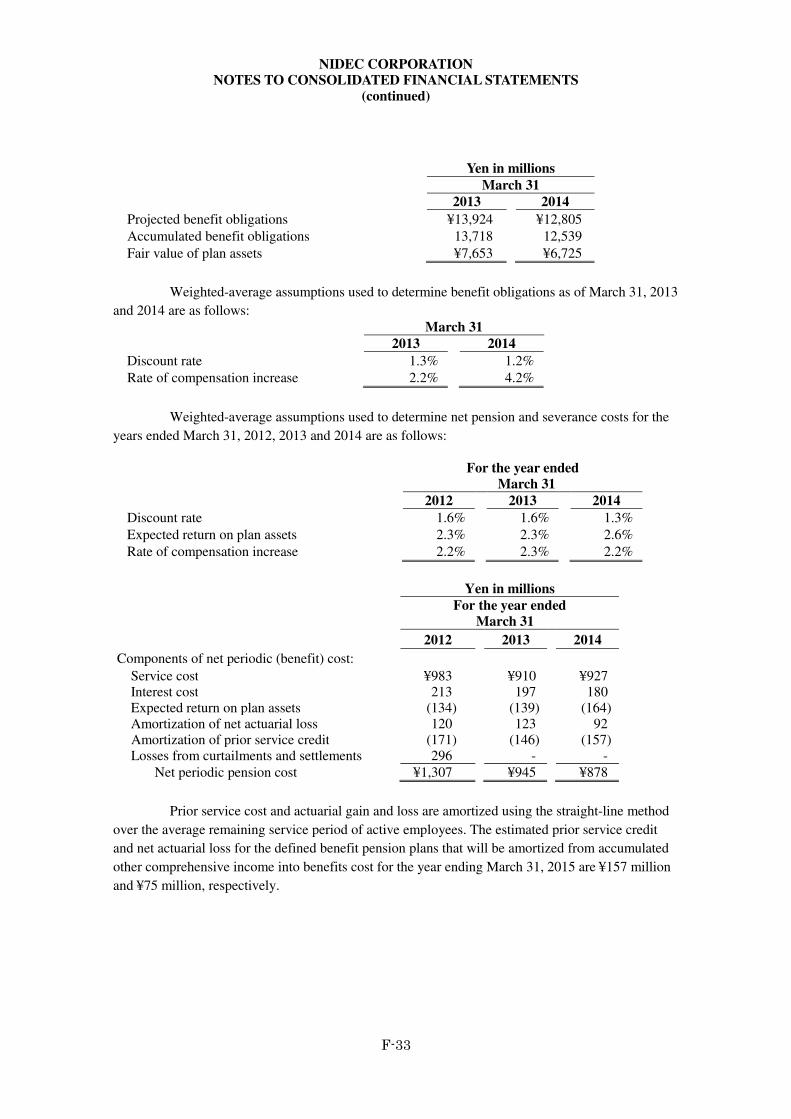
NIDEC CORPORATION
NOTES TO CONSOLIDATED FINANCIAL STATEMENTS
(continued)
F-33
Yen in millions
March 31
2013 2014
Projected benefit obligations ¥13,924 ¥12,805
Accumulated benefit obligations 13,718 12,539
Fair value of plan assets ¥7,653 ¥6,725
Weighted-average assumptions used to determine benefit obligations as of March 31, 2013
and 2014 are as follows:
March 31
2013 2014
Discount rate 1.3% 1.2%
Rate of compensation increase 2.2% 4.2%
Weighted-average assumptions used to determine net pension and severance costs for the
years ended March 31, 2012, 2013 and 2014 are as follows:
For the year ended March 31
2012 2013 2014
Discount rate 1.6% 1.6% 1.3%
Expected return on plan assets 2.3% 2.3% 2.6%
Rate of compensation increase 2.2% 2.3% 2.2%
Yen in millions
For the year ended March 31
2012 2013 2014
Components of net periodic (benefit) cost:
Service cost ¥983 ¥910 ¥927 Interest cost 213 197 180 Expected return on plan assets (134) (139) (164) Amortization of net actuarial loss 120 123 92 Amortization of prior service credit (171) (146) (157) Losses from curtailments and settlements 296 - -
Net periodic pension cost ¥1,307 ¥945 ¥878
Prior service cost and actuarial gain and loss are amortized using the straight-line method
over the average remaining service period of active employees. The estimated prior service credit
and net actuarial loss for the defined benefit pension plans that will be amortized from accumulated
other comprehensive income into benefits cost for the year ending March 31, 2015 are ¥157 million
and ¥75 million, respectively.
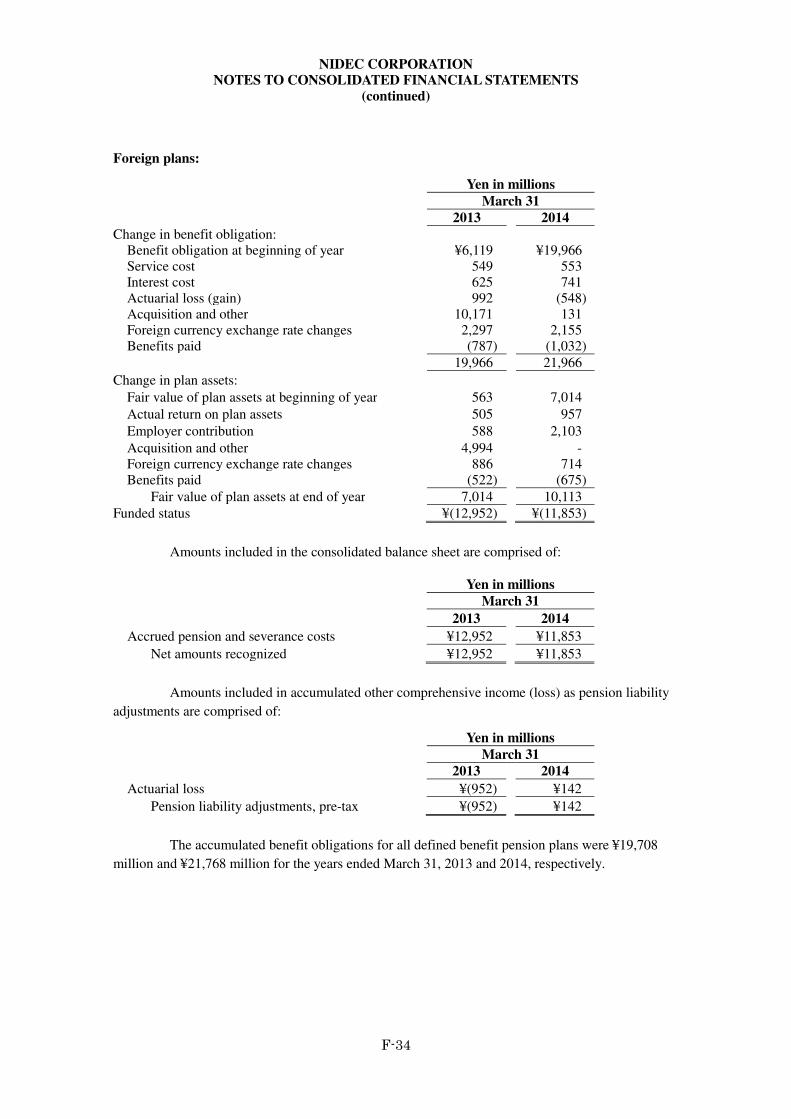
NIDEC CORPORATION
NOTES TO CONSOLIDATED FINANCIAL STATEMENTS
(continued)
F-34
Foreign plans:
Yen in millions
March 31
2013 2014
Change in benefit obligation: Benefit obligation at beginning of year ¥6,119 ¥19,966 Service cost 549 553 Interest cost 625 741 Actuarial loss (gain) 992 (548) Acquisition and other 10,171 131 Foreign currency exchange rate changes 2,297 2,155 Benefits paid (787) (1,032)
19,966 21,966
Change in plan assets:
Fair value of plan assets at beginning of year 563 7,014
Actual return on plan assets 505 957
Employer contribution 588 2,103
Acquisition and other 4,994 - Foreign currency exchange rate changes 886 714 Benefits paid (522) (675)
Fair value of plan assets at end of year 7,014 10,113
Funded status ¥(12,952) ¥(11,853)
Amounts included in the consolidated balance sheet are comprised of:
Yen in millions
March 31
2013 2014
Accrued pension and severance costs ¥12,952 ¥11,853
Net amounts recognized ¥12,952 ¥11,853
Amounts included in accumulated other comprehensive income (loss) as pension liability
adjustments are comprised of:
Yen in millions
March 31
2013 2014
Actuarial loss ¥(952) ¥142
Pension liability adjustments, pre-tax ¥(952) ¥142
The accumulated benefit obligations for all defined benefit pension plans were ¥19,708
million and ¥21,768 million for the years ended March 31, 2013 and 2014, respectively.
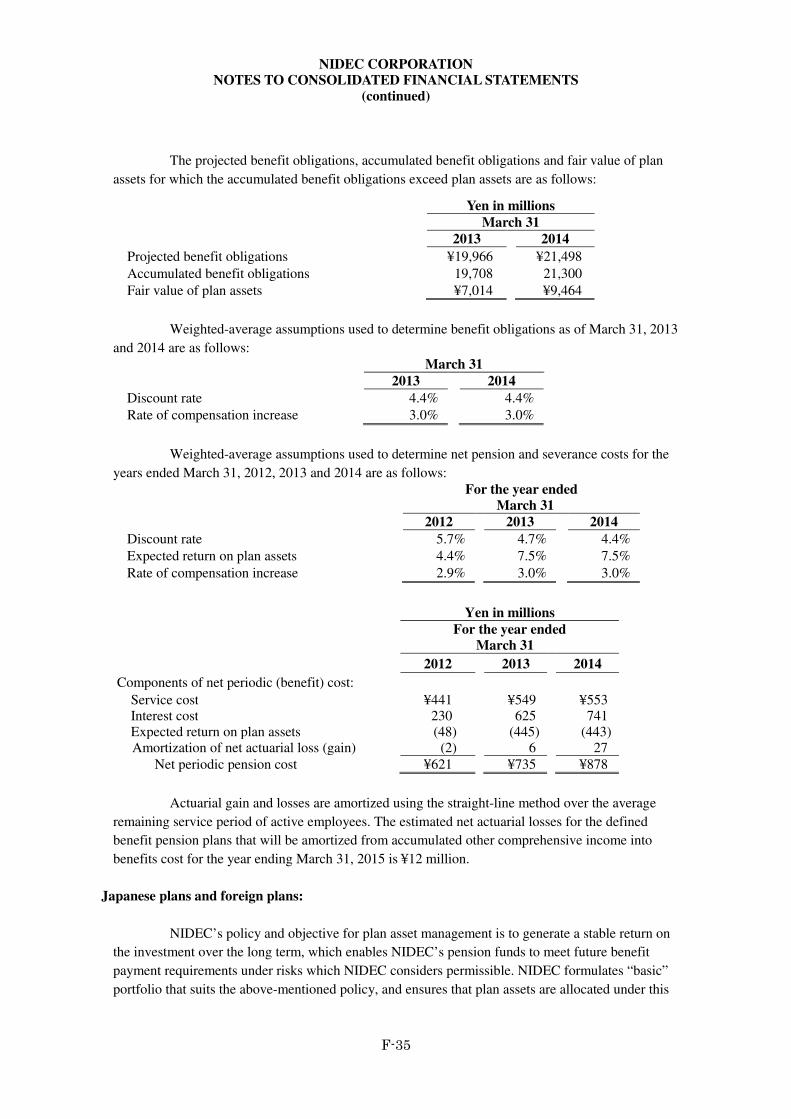
NIDEC CORPORATION
NOTES TO CONSOLIDATED FINANCIAL STATEMENTS
(continued)
F-35
The projected benefit obligations, accumulated benefit obligations and fair value of plan
assets for which the accumulated benefit obligations exceed plan assets are as follows:
Yen in millions
March 31
2013 2014
Projected benefit obligations ¥19,966 ¥21,498
Accumulated benefit obligations 19,708 21,300
Fair value of plan assets ¥7,014 ¥9,464
Weighted-average assumptions used to determine benefit obligations as of March 31, 2013
and 2014 are as follows: March 31
2013 2014
Discount rate 4.4% 4.4%
Rate of compensation increase 3.0% 3.0%
Weighted-average assumptions used to determine net pension and severance costs for the
years ended March 31, 2012, 2013 and 2014 are as follows:
For the year ended
March 31
2012 2013 2014
Discount rate 5.7% 4.7% 4.4%
Expected return on plan assets 4.4% 7.5% 7.5%
Rate of compensation increase 2.9% 3.0% 3.0%
Yen in millions
For the year ended March 31
2012 2013 2014
Components of net periodic (benefit) cost:
Service cost ¥441 ¥549 ¥553 Interest cost 230 625 741 Expected return on plan assets (48) (445) (443) Amortization of net actuarial loss (gain) (2) 6 27
Net periodic pension cost ¥621 ¥735 ¥878
Actuarial gain and losses are amortized using the straight-line method over the average
remaining service period of active employees. The estimated net actuarial losses for the defined
benefit pension plans that will be amortized from accumulated other comprehensive income into
benefits cost for the year ending March 31, 2015 is ¥12 million.
Japanese plans and foreign plans:
NIDEC’s policy and objective for plan asset management is to generate a stable return on
the investment over the long term, which enables NIDEC’s pension funds to meet future benefit
payment requirements under risks which NIDEC considers permissible. NIDEC formulates “basic”
portfolio that suits the above-mentioned policy, and ensures that plan assets are allocated under this
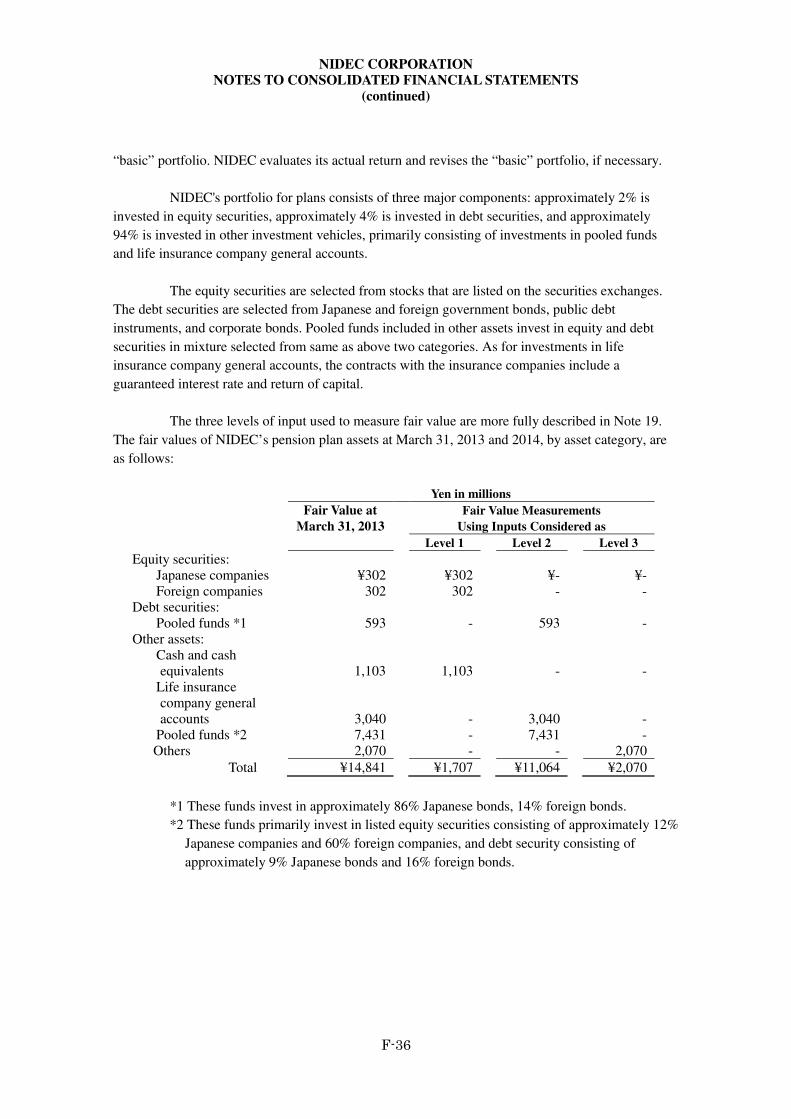
NIDEC CORPORATION
NOTES TO CONSOLIDATED FINANCIAL STATEMENTS
(continued)
F-36
“basic” portfolio. NIDEC evaluates its actual return and revises the “basic” portfolio, if necessary.
NIDEC's portfolio for plans consists of three major components: approximately 2% is
invested in equity securities, approximately 4% is invested in debt securities, and approximately
94% is invested in other investment vehicles, primarily consisting of investments in pooled funds
and life insurance company general accounts.
The equity securities are selected from stocks that are listed on the securities exchanges.
The debt securities are selected from Japanese and foreign government bonds, public debt
instruments, and corporate bonds. Pooled funds included in other assets invest in equity and debt
securities in mixture selected from same as above two categories. As for investments in life
insurance company general accounts, the contracts with the insurance companies include a
guaranteed interest rate and return of capital.
The three levels of input used to measure fair value are more fully described in Note 19.
The fair values of NIDEC’s pension plan assets at March 31, 2013 and 2014, by asset category, are
as follows:
Yen in millions
Fair Value at
March 31, 2013
Fair Value Measurements
Using Inputs Considered as
Level 1 Level 2 Level 3
Equity securities:
Japanese companies ¥302 ¥302 ¥- ¥- Foreign companies 302 302 - -
Debt securities: Pooled funds *1 593 - 593 -
Other assets: Cash and cash equivalents 1,103 1,103 - -
Life insurance company general accounts 3,040 - 3,040 -
Pooled funds *2 7,431 - 7,431 - Others 2,070 - - 2,070
Total ¥14,841 ¥1,707 ¥11,064 ¥2,070
*1 These funds invest in approximately 86% Japanese bonds, 14% foreign bonds.
*2 These funds primarily invest in listed equity securities consisting of approximately 12%
Japanese companies and 60% foreign companies, and debt security consisting of
approximately 9% Japanese bonds and 16% foreign bonds.
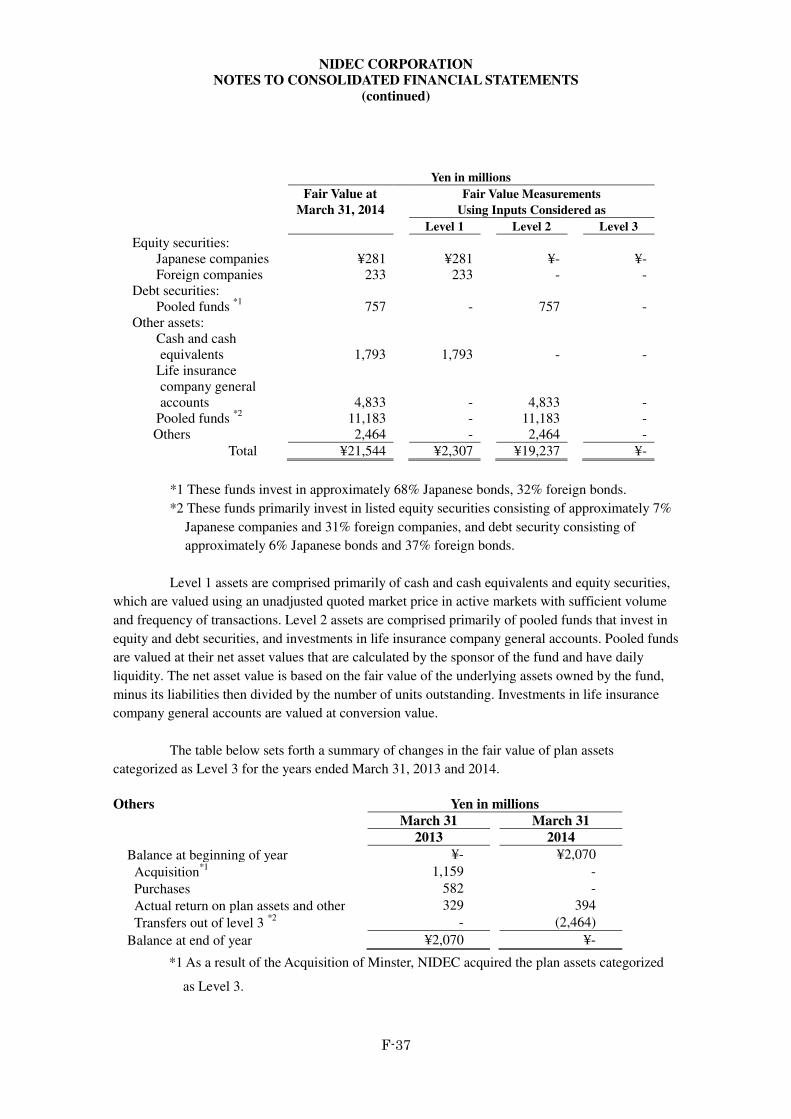
NIDEC CORPORATION
NOTES TO CONSOLIDATED FINANCIAL STATEMENTS
(continued)
F-37
Yen in millions
Fair Value at
March 31, 2014
Fair Value Measurements
Using Inputs Considered as
Level 1 Level 2 Level 3
Equity securities:
Japanese companies ¥281 ¥281 ¥- ¥- Foreign companies 233 233 - -
Debt securities: Pooled funds
*1 757 - 757 -
Other assets: Cash and cash equivalents 1,793 1,793 - -
Life insurance company general accounts 4,833 - 4,833 -
Pooled funds *2
11,183 - 11,183 - Others 2,464 - 2,464 -
Total ¥21,544 ¥2,307 ¥19,237 ¥-
*1 These funds invest in approximately 68% Japanese bonds, 32% foreign bonds.
*2 These funds primarily invest in listed equity securities consisting of approximately 7%
Japanese companies and 31% foreign companies, and debt security consisting of
approximately 6% Japanese bonds and 37% foreign bonds.
Level 1 assets are comprised primarily of cash and cash equivalents and equity securities,
which are valued using an unadjusted quoted market price in active markets with sufficient volume
and frequency of transactions. Level 2 assets are comprised primarily of pooled funds that invest in
equity and debt securities, and investments in life insurance company general accounts. Pooled funds
are valued at their net asset values that are calculated by the sponsor of the fund and have daily
liquidity. The net asset value is based on the fair value of the underlying assets owned by the fund,
minus its liabilities then divided by the number of units outstanding. Investments in life insurance
company general accounts are valued at conversion value.
The table below sets forth a summary of changes in the fair value of plan assets
categorized as Level 3 for the years ended March 31, 2013 and 2014.
Others Yen in millions
March 31 March 31
2013 2014
Balance at beginning of year ¥- ¥2,070
Acquisition*1 1,159 -
Purchases 582 -
Actual return on plan assets and other 329 394
Transfers out of level 3 *2
- (2,464)
Balance at end of year ¥2,070 ¥-
*1 As a result of the Acquisition of Minster, NIDEC acquired the plan assets categorized
as Level 3.
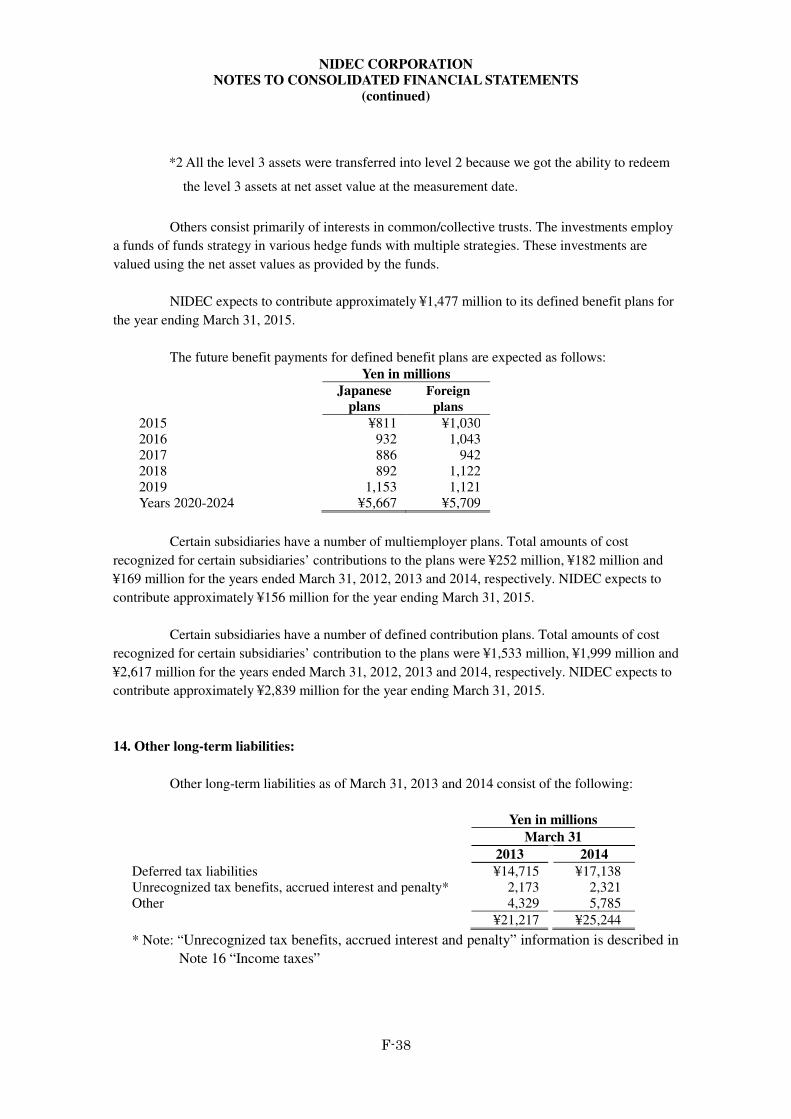
NIDEC CORPORATION
NOTES TO CONSOLIDATED FINANCIAL STATEMENTS
(continued)
F-38
*2 All the level 3 assets were transferred into level 2 because we got the ability to redeem
the level 3 assets at net asset value at the measurement date.
Others consist primarily of interests in common/collective trusts. The investments employ
a funds of funds strategy in various hedge funds with multiple strategies. These investments are
valued using the net asset values as provided by the funds.
NIDEC expects to contribute approximately ¥1,477 million to its defined benefit plans for
the year ending March 31, 2015.
The future benefit payments for defined benefit plans are expected as follows:
Yen in millions
Japanese
plans
Foreign
plans
2015 ¥811 ¥1,030 2016 932 1,043 2017 886 942 2018 892 1,122 2019 1,153 1,121 Years 2020-2024 ¥5,667 ¥5,709
Certain subsidiaries have a number of multiemployer plans. Total amounts of cost
recognized for certain subsidiaries’ contributions to the plans were ¥252 million, ¥182 million and
¥169 million for the years ended March 31, 2012, 2013 and 2014, respectively. NIDEC expects to
contribute approximately ¥156 million for the year ending March 31, 2015.
Certain subsidiaries have a number of defined contribution plans. Total amounts of cost
recognized for certain subsidiaries’ contribution to the plans were ¥1,533 million, ¥1,999 million and
¥2,617 million for the years ended March 31, 2012, 2013 and 2014, respectively. NIDEC expects to
contribute approximately ¥2,839 million for the year ending March 31, 2015.
14. Other long-term liabilities:
Other long-term liabilities as of March 31, 2013 and 2014 consist of the following:
Yen in millions
March 31
2013 2014
Deferred tax liabilities ¥14,715 ¥17,138 Unrecognized tax benefits, accrued interest and penalty* 2,173 2,321 Other 4,329 5,785
¥21,217 ¥25,244
* Note: “Unrecognized tax benefits, accrued interest and penalty” information is described in
Note 16 “Income taxes”
NIDEC CORPORATION
NOTES TO CONSOLIDATED FINANCIAL STATEMENTS
(continued)
F-39
15. Equity:
The Japanese Company Law (the “Company Law”) provides that an amount equal to 10%
of cash dividends from retained earnings by the Company and its Japanese subsidiaries must be
appropriated as a legal reserve. No further appropriations are required when the sum of the legal
reserves reaches 25% of stated capital. These reserves currently exceed 25% of stated capital and are
available for dividends under the Company Law subject to approval at the shareholders’ meeting.
Certain foreign subsidiaries are also required to appropriate their earnings to legal reserves under the
laws of the respective countries.
The amount of statutory retained earnings of the Company available for dividend
payments to shareholders was ¥69,109 million and ¥91,137 million for the years ended March 31,
2013 and 2014, respectively. In accordance with customary practice in Japan, the appropriations are
not accrued in the financial statements for the period to which they relate, but are recorded in the
subsequent accounting period. Retained earnings for the year ended March 31, 2014 includes
amounts representing final cash dividends of ¥7,585 million, ¥27.5 per share.
Repurchased treasury stock is not entitled to a dividend under the Company Law. NIDEC
resolved to repurchase its own shares at several meetings of its Board of Directors during the years
ended March 31, 2013 and 2014. In accordance with the resolution, NIDEC repurchased 10,156,400
shares of treasury stock for the aggregate cost of ¥31,209 million and 1,000,000 shares of treasury
stock for the aggregate cost of ¥2,696 million during years ended March 31, 2013 and 2014.
NIDEC owned 20,311,044 shares, or ¥56,109 million and 14,343,952 shares, or ¥40,527 million of
treasury stock repurchased for the years ended March 31, 2013 and 2014, which were restricted
regarding the payment of cash dividend.
On October 1, 2012, NIDEC made the Nidec Sankyo Corporation (“NSNK”) a wholly
owned subsidiary through a share exchange transaction. NIDEC allocated 6,350,630 shares of its
common stock held in treasury to holders of NSNK stock in connection with the share exchange
transaction. As a result of the share exchange transaction, NIDEC's equity interests in NSNK
increased from 77.1% to 100%.
On October 1, 2013, NIDEC made the Nidec Copal Corporation (“NCPL”) a wholly
owned subsidiary through a share exchange transaction. NIDEC allocated 4,856,764 shares of its
common stock held in treasury to holders of NCPL stock in connection with the share exchange
transaction. As a result of the share exchange transaction, NIDEC's equity interest in NCPL
increased from 66.5% to 100.0%.
On October 1, 2013, NIDEC made the Nidec Tosok Corporation (“NTSC”) a wholly
owned subsidiary through a share exchange transaction. NIDEC allocated 2,624,000 shares of its
common stock held in treasury to holders of NTSC stock in connection with the share exchange
transaction. As a result of the share exchange transaction, NIDEC's equity interest in NTSC
increased from 72.3% to 100.0%.
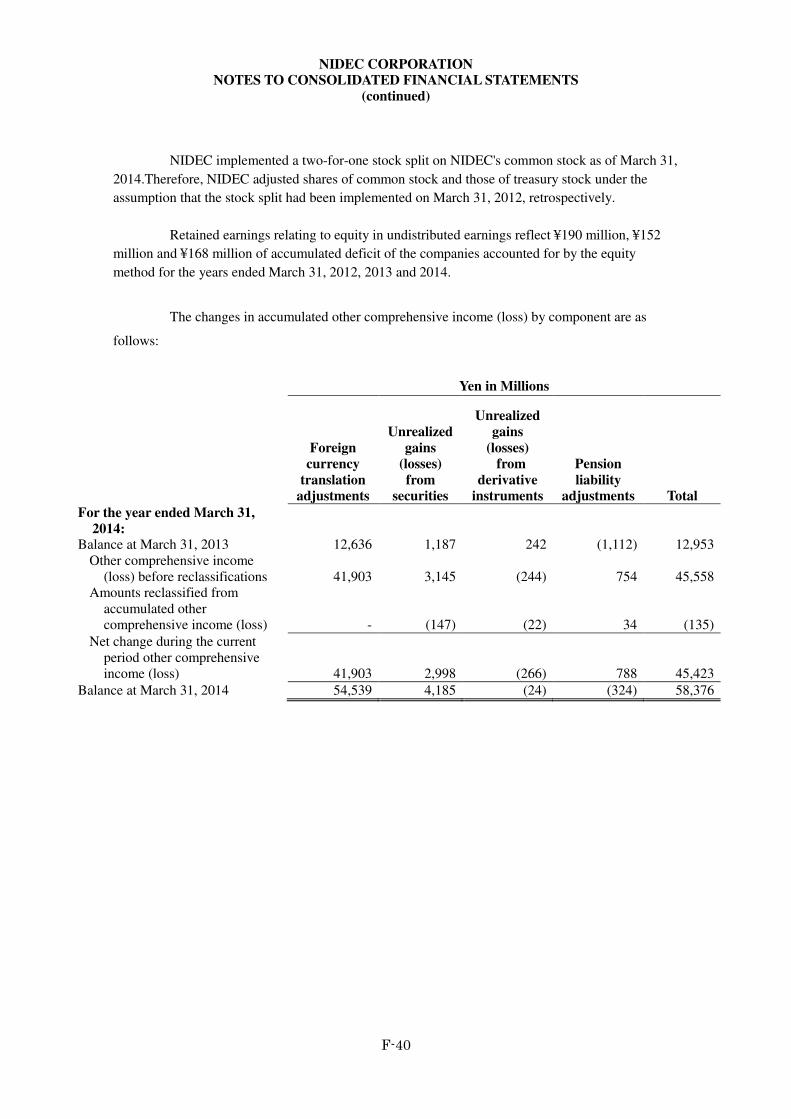
NIDEC CORPORATION
NOTES TO CONSOLIDATED FINANCIAL STATEMENTS
(continued)
F-40
NIDEC implemented a two-for-one stock split on NIDEC's common stock as of March 31,
2014.Therefore, NIDEC adjusted shares of common stock and those of treasury stock under the
assumption that the stock split had been implemented on March 31, 2012, retrospectively.
Retained earnings relating to equity in undistributed earnings reflect ¥190 million, ¥152
million and ¥168 million of accumulated deficit of the companies accounted for by the equity
method for the years ended March 31, 2012, 2013 and 2014.
The changes in accumulated other comprehensive income (loss) by component are as
follows:
Yen in Millions
Foreign
currency
translation
adjustments
Unrealized
gains
(losses)
from
securities
Unrealized
gains
(losses)
from
derivative
instruments
Pension
liability
adjustments Total
For the year ended March 31,
2014: Balance at March 31, 2013 12,636 1,187 242 (1,112) 12,953
Other comprehensive income (loss) before reclassifications 41,903 3,145 (244) 754 45,558
Amounts reclassified from accumulated other comprehensive income (loss) - (147) (22) 34 (135)
Net change during the current period other comprehensive income (loss) 41,903 2,998 (266) 788 45,423
Balance at March 31, 2014 54,539 4,185 (24) (324) 58,376
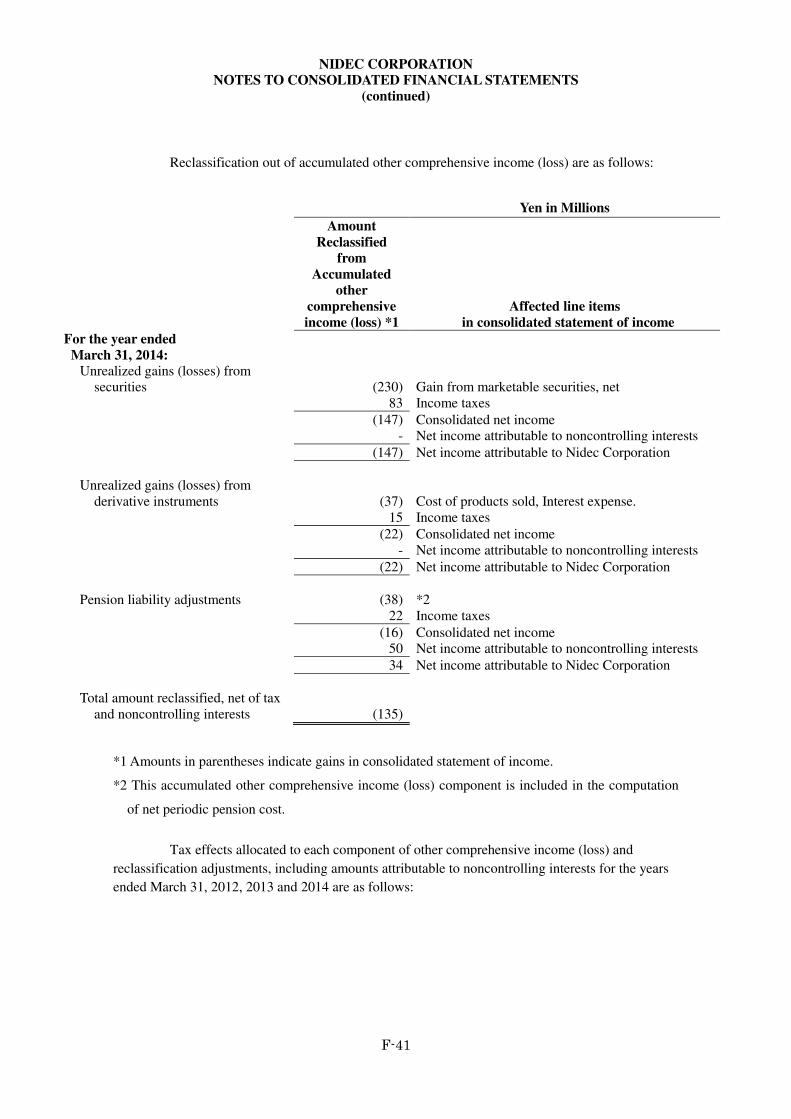
NIDEC CORPORATION
NOTES TO CONSOLIDATED FINANCIAL STATEMENTS
(continued)
F-41
Reclassification out of accumulated other comprehensive income (loss) are as follows:
Yen in Millions
Amount
Reclassified
from
Accumulated
other
comprehensive
income (loss) *1
Affected line items
in consolidated statement of income
For the year ended
March 31, 2014: Unrealized gains (losses) from
securities (230) Gain from marketable securities, net 83 Income taxes
(147) Consolidated net income - Net income attributable to noncontrolling interests
(147) Net income attributable to Nidec Corporation
Unrealized gains (losses) from
derivative instruments (37) Cost of products sold, Interest expense. 15 Income taxes
(22) Consolidated net income - Net income attributable to noncontrolling interests
(22) Net income attributable to Nidec Corporation
Pension liability adjustments (38) *2
22 Income taxes
(16) Consolidated net income 50 Net income attributable to noncontrolling interests
34 Net income attributable to Nidec Corporation
Total amount reclassified, net of tax
and noncontrolling interests (135)
*1 Amounts in parentheses indicate gains in consolidated statement of income.
*2 This accumulated other comprehensive income (loss) component is included in the computation
of net periodic pension cost.
Tax effects allocated to each component of other comprehensive income (loss) and
reclassification adjustments, including amounts attributable to noncontrolling interests for the years
ended March 31, 2012, 2013 and 2014 are as follows:
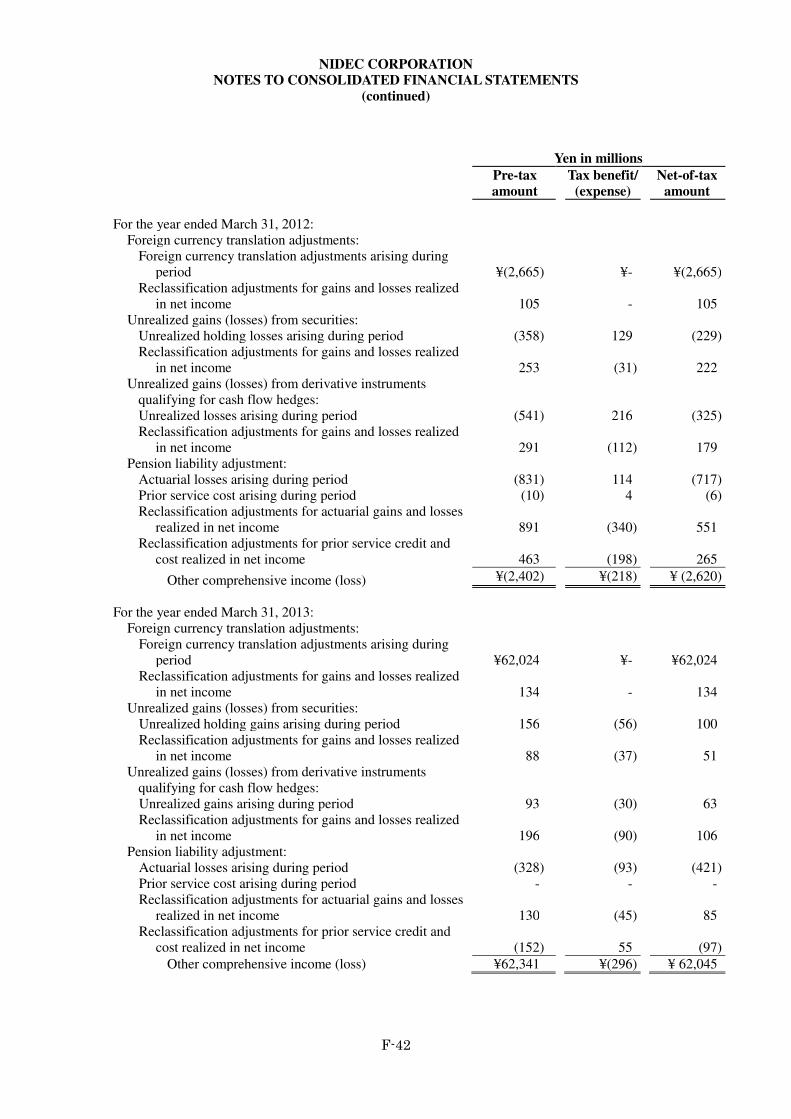
NIDEC CORPORATION
NOTES TO CONSOLIDATED FINANCIAL STATEMENTS
(continued)
F-42
Yen in millions
Pre-tax
amount Tax benefit/
(expense) Net-of-tax
amount
For the year ended March 31, 2012:
Foreign currency translation adjustments: Foreign currency translation adjustments arising during
period ¥(2,665) ¥- ¥(2,665) Reclassification adjustments for gains and losses realized
in net income 105 - 105 Unrealized gains (losses) from securities:
Unrealized holding losses arising during period (358) 129 (229) Reclassification adjustments for gains and losses realized
in net income 253 (31) 222 Unrealized gains (losses) from derivative instruments
qualifying for cash flow hedges: Unrealized losses arising during period (541) 216 (325) Reclassification adjustments for gains and losses realized
in net income 291 (112) 179 Pension liability adjustment:
Actuarial losses arising during period (831) 114 (717) Prior service cost arising during period (10) 4 (6) Reclassification adjustments for actuarial gains and losses
realized in net income 891 (340) 551 Reclassification adjustments for prior service credit and
cost realized in net income 463 (198) 265
Other comprehensive income (loss) ¥(2,402) ¥(218) ¥ (2,620)
For the year ended March 31, 2013:
Foreign currency translation adjustments: Foreign currency translation adjustments arising during
period ¥62,024 ¥- ¥62,024 Reclassification adjustments for gains and losses realized
in net income 134 - 134 Unrealized gains (losses) from securities:
Unrealized holding gains arising during period 156 (56) 100 Reclassification adjustments for gains and losses realized
in net income 88 (37) 51 Unrealized gains (losses) from derivative instruments
qualifying for cash flow hedges: Unrealized gains arising during period 93 (30) 63 Reclassification adjustments for gains and losses realized
in net income 196 (90) 106 Pension liability adjustment:
Actuarial losses arising during period (328) (93) (421) Prior service cost arising during period - - - Reclassification adjustments for actuarial gains and losses
realized in net income 130 (45) 85 Reclassification adjustments for prior service credit and
cost realized in net income (152) 55 (97)
Other comprehensive income (loss) ¥62,341 ¥(296) ¥ 62,045
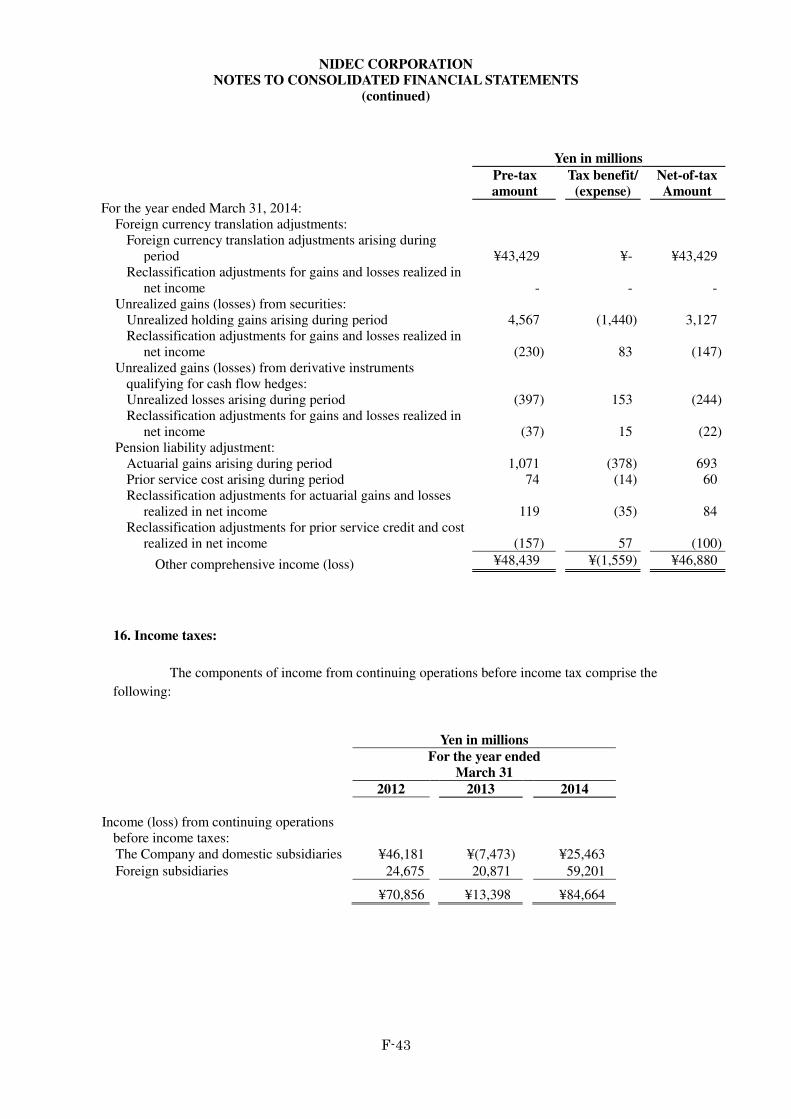
NIDEC CORPORATION
NOTES TO CONSOLIDATED FINANCIAL STATEMENTS
(continued)
F-43
Yen in millions
Pre-tax
amount Tax benefit/
(expense) Net-of-tax
Amount
For the year ended March 31, 2014: Foreign currency translation adjustments:
Foreign currency translation adjustments arising during period ¥43,429 ¥- ¥43,429
Reclassification adjustments for gains and losses realized in net income - - -
Unrealized gains (losses) from securities: Unrealized holding gains arising during period 4,567 (1,440) 3,127 Reclassification adjustments for gains and losses realized in
net income (230) 83 (147) Unrealized gains (losses) from derivative instruments
qualifying for cash flow hedges: Unrealized losses arising during period (397) 153 (244) Reclassification adjustments for gains and losses realized in
net income (37) 15 (22) Pension liability adjustment:
Actuarial gains arising during period 1,071 (378) 693 Prior service cost arising during period 74 (14) 60 Reclassification adjustments for actuarial gains and losses
realized in net income 119 (35) 84 Reclassification adjustments for prior service credit and cost
realized in net income (157) 57 (100)
Other comprehensive income (loss) ¥48,439 ¥(1,559) ¥46,880
16. Income taxes:
The components of income from continuing operations before income tax comprise the
following:
Yen in millions
For the year ended
March 31
2012 2013 2014
Income (loss) from continuing operations
before income taxes:
The Company and domestic subsidiaries ¥46,181 ¥(7,473) ¥25,463
Foreign subsidiaries 24,675 20,871 59,201
¥70,856 ¥13,398 ¥84,664
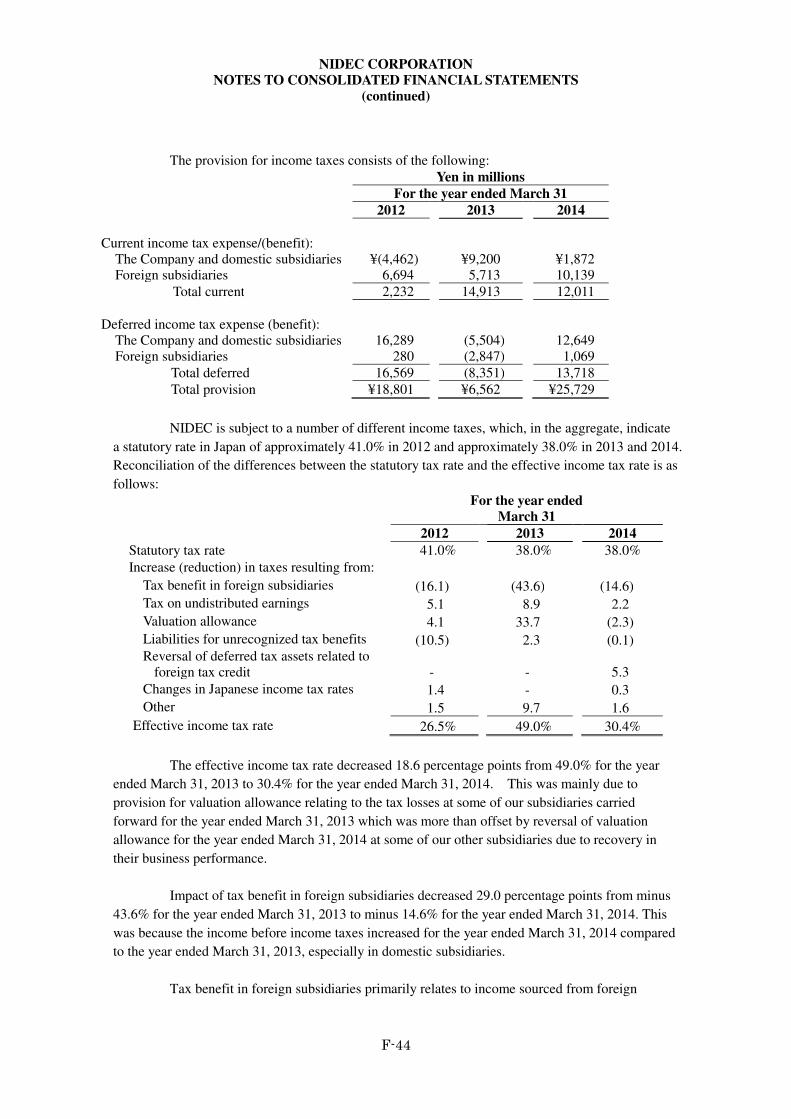
NIDEC CORPORATION
NOTES TO CONSOLIDATED FINANCIAL STATEMENTS
(continued)
F-44
The provision for income taxes consists of the following:
Yen in millions
For the year ended March 31
2012 2013 2014
Current income tax expense/(benefit):
The Company and domestic subsidiaries ¥(4,462) ¥9,200 ¥1,872 Foreign subsidiaries 6,694 5,713 10,139
Total current 2,232 14,913 12,011
Deferred income tax expense (benefit):
The Company and domestic subsidiaries 16,289 (5,504) 12,649 Foreign subsidiaries 280 (2,847) 1,069
Total deferred 16,569 (8,351) 13,718
Total provision ¥18,801 ¥6,562 ¥25,729
NIDEC is subject to a number of different income taxes, which, in the aggregate, indicate
a statutory rate in Japan of approximately 41.0% in 2012 and approximately 38.0% in 2013 and 2014.
Reconciliation of the differences between the statutory tax rate and the effective income tax rate is as
follows:
For the year ended
March 31
2012 2013 2014
Statutory tax rate 41.0% 38.0% 38.0%
Increase (reduction) in taxes resulting from:
Tax benefit in foreign subsidiaries (16.1) (43.6) (14.6)
Tax on undistributed earnings 5.1 8.9 2.2
Valuation allowance 4.1 33.7 (2.3)
Liabilities for unrecognized tax benefits (10.5) 2.3 (0.1) Reversal of deferred tax assets related to
foreign tax credit - - 5.3
Changes in Japanese income tax rates 1.4 - 0.3
Other 1.5 9.7 1.6
Effective income tax rate 26.5% 49.0% 30.4%
The effective income tax rate decreased 18.6 percentage points from 49.0% for the year
ended March 31, 2013 to 30.4% for the year ended March 31, 2014. This was mainly due to
provision for valuation allowance relating to the tax losses at some of our subsidiaries carried
forward for the year ended March 31, 2013 which was more than offset by reversal of valuation
allowance for the year ended March 31, 2014 at some of our other subsidiaries due to recovery in
their business performance.
Impact of tax benefit in foreign subsidiaries decreased 29.0 percentage points from minus
43.6% for the year ended March 31, 2013 to minus 14.6% for the year ended March 31, 2014. This
was because the income before income taxes increased for the year ended March 31, 2014 compared
to the year ended March 31, 2013, especially in domestic subsidiaries.
Tax benefit in foreign subsidiaries primarily relates to income sourced from foreign
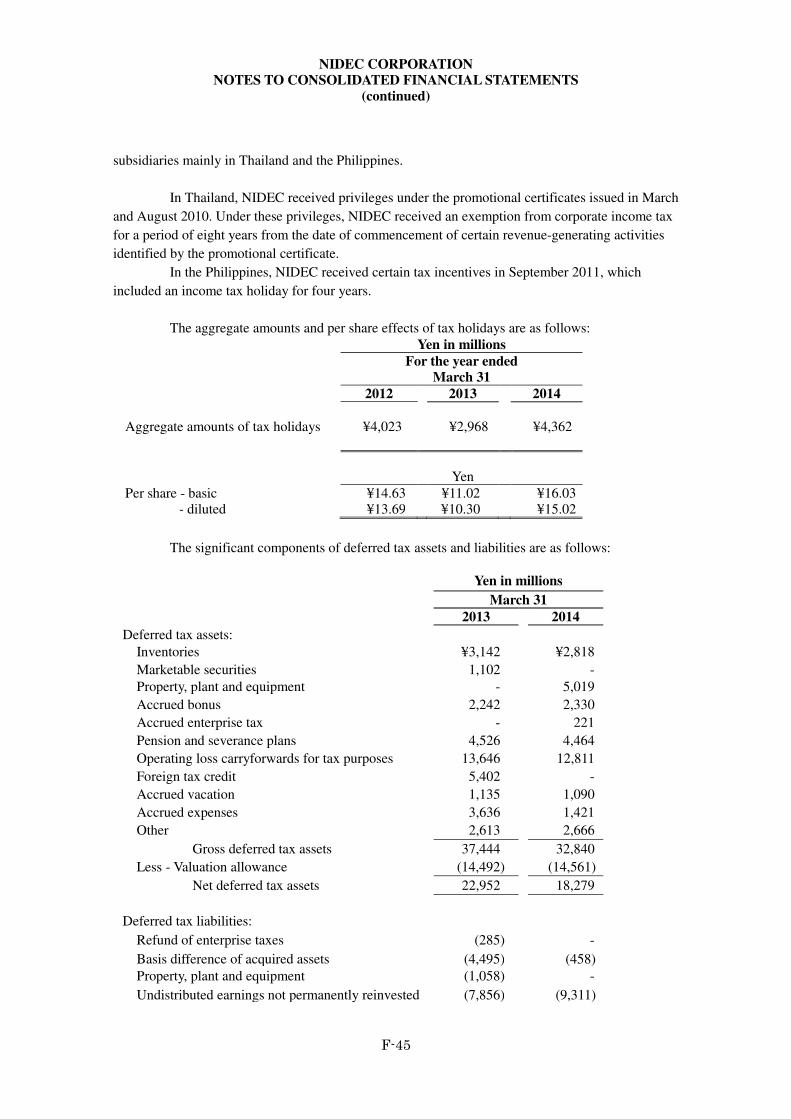
NIDEC CORPORATION
NOTES TO CONSOLIDATED FINANCIAL STATEMENTS
(continued)
F-45
subsidiaries mainly in Thailand and the Philippines.
In Thailand, NIDEC received privileges under the promotional certificates issued in March
and August 2010. Under these privileges, NIDEC received an exemption from corporate income tax
for a period of eight years from the date of commencement of certain revenue-generating activities
identified by the promotional certificate.
In the Philippines, NIDEC received certain tax incentives in September 2011, which
included an income tax holiday for four years.
The aggregate amounts and per share effects of tax holidays are as follows:
Yen in millions
For the year ended
March 31
2012 2013 2014
Aggregate amounts of tax holidays ¥4,023 ¥2,968 ¥4,362
Yen
Per share - basic ¥14.63 ¥11.02 ¥16.03 - diluted ¥13.69 ¥10.30 ¥15.02
The significant components of deferred tax assets and liabilities are as follows:
Yen in millions
March 31
2013 2014
Deferred tax assets:
Inventories ¥3,142 ¥2,818
Marketable securities 1,102 -
Property, plant and equipment - 5,019
Accrued bonus 2,242 2,330
Accrued enterprise tax - 221
Pension and severance plans 4,526 4,464
Operating loss carryforwards for tax purposes 13,646 12,811
Foreign tax credit 5,402 -
Accrued vacation 1,135 1,090
Accrued expenses 3,636 1,421
Other 2,613 2,666
Gross deferred tax assets 37,444 32,840
Less - Valuation allowance (14,492) (14,561)
Net deferred tax assets 22,952 18,279
Deferred tax liabilities:
Refund of enterprise taxes (285) -
Basis difference of acquired assets (4,495) (458)
Property, plant and equipment (1,058) -
Undistributed earnings not permanently reinvested (7,856) (9,311)
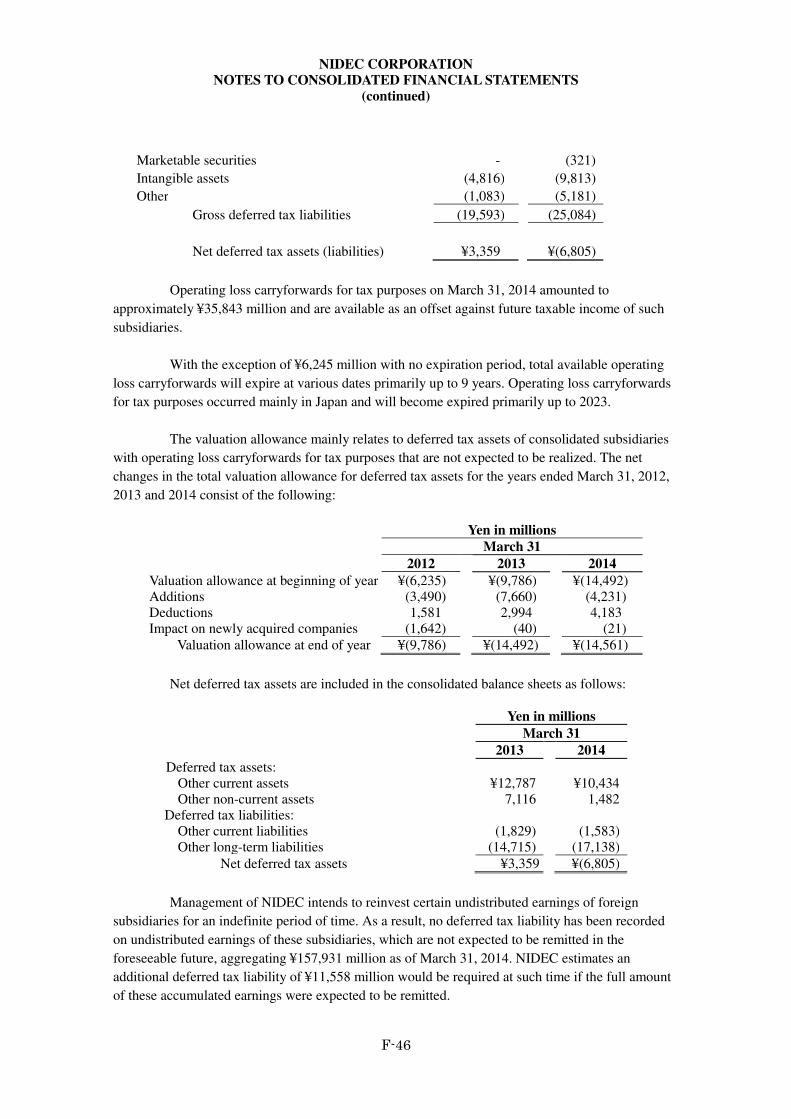
NIDEC CORPORATION
NOTES TO CONSOLIDATED FINANCIAL STATEMENTS
(continued)
F-46
Marketable securities - (321)
Intangible assets (4,816) (9,813)
Other (1,083) (5,181)
Gross deferred tax liabilities (19,593) (25,084)
Net deferred tax assets (liabilities) ¥3,359 ¥(6,805)
Operating loss carryforwards for tax purposes on March 31, 2014 amounted to
approximately ¥35,843 million and are available as an offset against future taxable income of such
subsidiaries.
With the exception of ¥6,245 million with no expiration period, total available operating
loss carryforwards will expire at various dates primarily up to 9 years. Operating loss carryforwards
for tax purposes occurred mainly in Japan and will become expired primarily up to 2023.
The valuation allowance mainly relates to deferred tax assets of consolidated subsidiaries
with operating loss carryforwards for tax purposes that are not expected to be realized. The net
changes in the total valuation allowance for deferred tax assets for the years ended March 31, 2012,
2013 and 2014 consist of the following:
Yen in millions
March 31
2012 2013 2014
Valuation allowance at beginning of year ¥(6,235) ¥(9,786) ¥(14,492) Additions (3,490) (7,660) (4,231) Deductions 1,581 2,994 4,183 Impact on newly acquired companies (1,642) (40) (21)
Valuation allowance at end of year ¥(9,786) ¥(14,492) ¥(14,561)
Net deferred tax assets are included in the consolidated balance sheets as follows:
Yen in millions
March 31
2013 2014
Deferred tax assets: Other current assets ¥12,787 ¥10,434 Other non-current assets 7,116 1,482
Deferred tax liabilities: Other current liabilities (1,829) (1,583) Other long-term liabilities (14,715) (17,138)
Net deferred tax assets ¥3,359 ¥(6,805)
Management of NIDEC intends to reinvest certain undistributed earnings of foreign
subsidiaries for an indefinite period of time. As a result, no deferred tax liability has been recorded
on undistributed earnings of these subsidiaries, which are not expected to be remitted in the
foreseeable future, aggregating ¥157,931 million as of March 31, 2014. NIDEC estimates an
additional deferred tax liability of ¥11,558 million would be required at such time if the full amount
of these accumulated earnings were expected to be remitted.
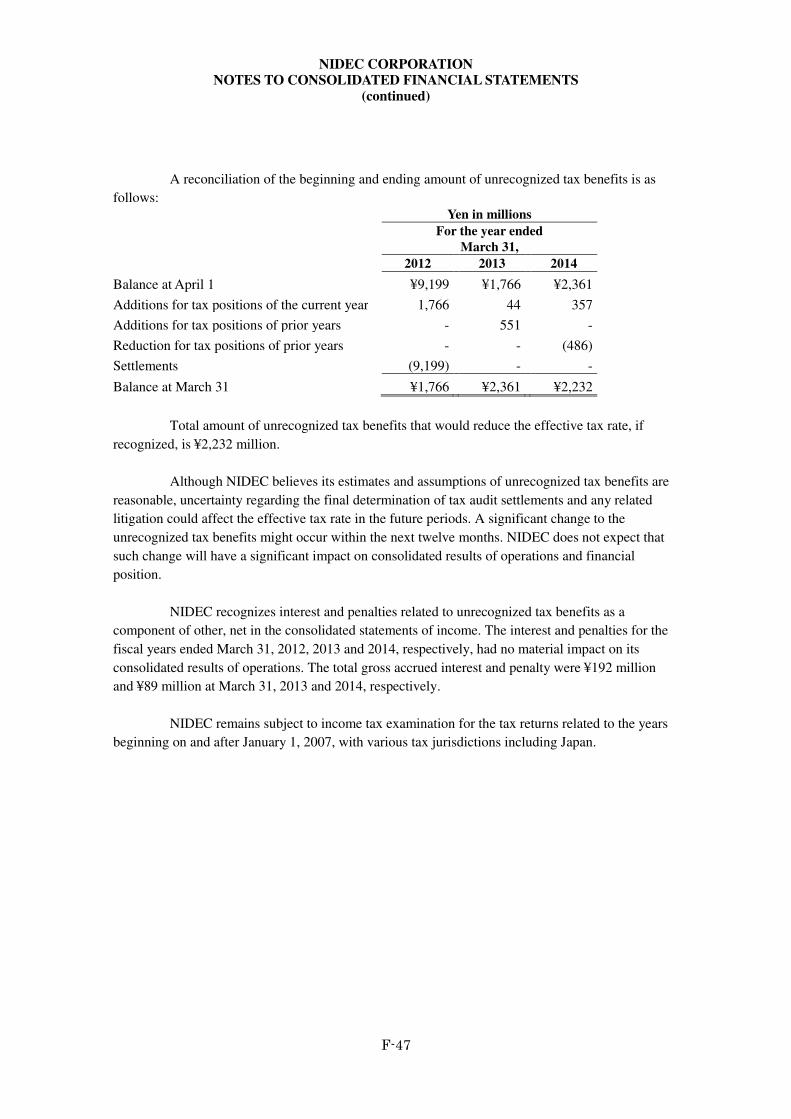
NIDEC CORPORATION
NOTES TO CONSOLIDATED FINANCIAL STATEMENTS
(continued)
F-47
A reconciliation of the beginning and ending amount of unrecognized tax benefits is as
follows:
Yen in millions
For the year ended
March 31,
2012 2013 2014
Balance at April 1 ¥9,199 ¥1,766 ¥2,361
Additions for tax positions of the current year 1,766 44 357
Additions for tax positions of prior years - 551 -
Reduction for tax positions of prior years - - (486)
Settlements (9,199) - -
Balance at March 31 ¥1,766 ¥2,361 ¥2,232
Total amount of unrecognized tax benefits that would reduce the effective tax rate, if
recognized, is ¥2,232 million.
Although NIDEC believes its estimates and assumptions of unrecognized tax benefits are
reasonable, uncertainty regarding the final determination of tax audit settlements and any related
litigation could affect the effective tax rate in the future periods. A significant change to the
unrecognized tax benefits might occur within the next twelve months. NIDEC does not expect that
such change will have a significant impact on consolidated results of operations and financial
position.
NIDEC recognizes interest and penalties related to unrecognized tax benefits as a
component of other, net in the consolidated statements of income. The interest and penalties for the
fiscal years ended March 31, 2012, 2013 and 2014, respectively, had no material impact on its
consolidated results of operations. The total gross accrued interest and penalty were ¥192 million
and ¥89 million at March 31, 2013 and 2014, respectively.
NIDEC remains subject to income tax examination for the tax returns related to the years
beginning on and after January 1, 2007, with various tax jurisdictions including Japan.
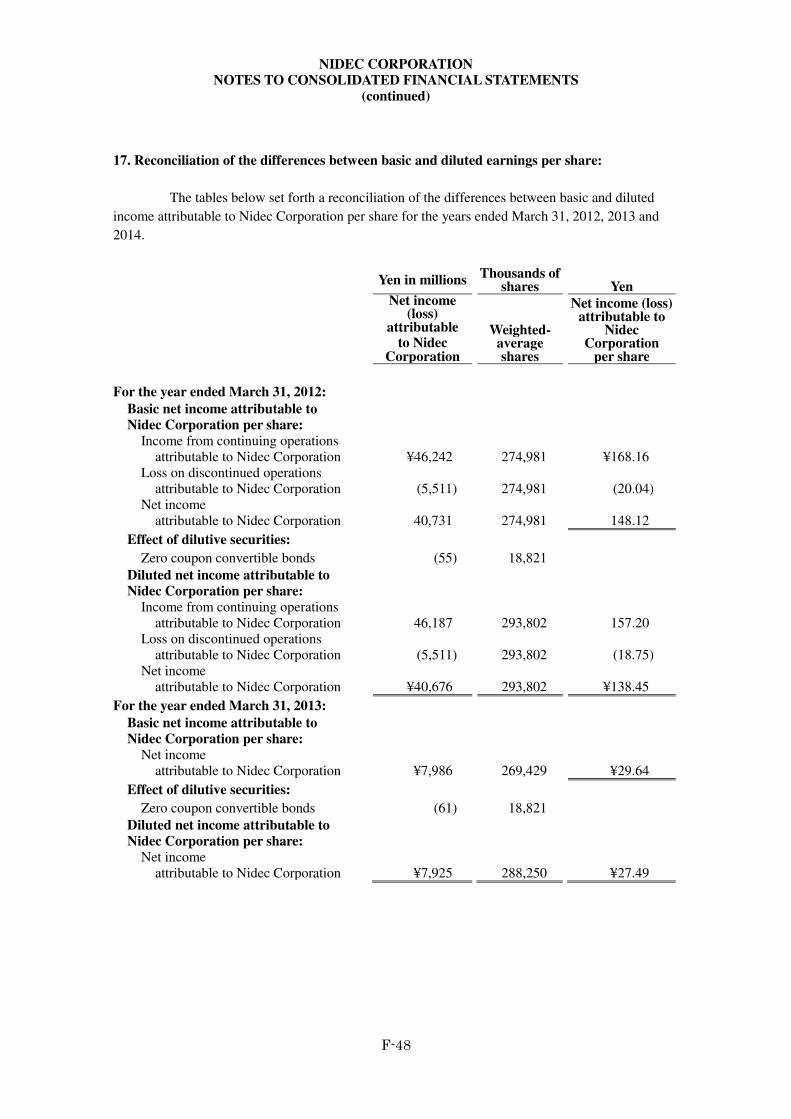
NIDEC CORPORATION
NOTES TO CONSOLIDATED FINANCIAL STATEMENTS
(continued)
F-48
17. Reconciliation of the differences between basic and diluted earnings per share:
The tables below set forth a reconciliation of the differences between basic and diluted
income attributable to Nidec Corporation per share for the years ended March 31, 2012, 2013 and
2014.
Yen in millions Thousands of
shares
Yen
Net income (loss)
attributable to Nidec
Corporation
Weighted- average shares
Net income (loss) attributable to
Nidec Corporation
per share
For the year ended March 31, 2012:
Basic net income attributable to
Nidec Corporation per share:
Income from continuing operations attributable to Nidec Corporation
¥46,242
274,981
¥168.16
Loss on discontinued operations attributable to Nidec Corporation
(5,511)
274,981
(20.04)
Net income attributable to Nidec Corporation
40,731
274,981
148.12
Effect of dilutive securities:
Zero coupon convertible bonds (55) 18,821
Diluted net income attributable to
Nidec Corporation per share:
Income from continuing operations attributable to Nidec Corporation
46,187
293,802
157.20
Loss on discontinued operations attributable to Nidec Corporation
(5,511)
293,802
(18.75)
Net income attributable to Nidec Corporation
¥40,676
293,802
¥138.45
For the year ended March 31, 2013:
Basic net income attributable to
Nidec Corporation per share:
Net income attributable to Nidec Corporation
¥7,986
269,429
¥29.64
Effect of dilutive securities:
Zero coupon convertible bonds (61) 18,821
Diluted net income attributable to
Nidec Corporation per share:
Net income attributable to Nidec Corporation
¥7,925
288,250
¥27.49
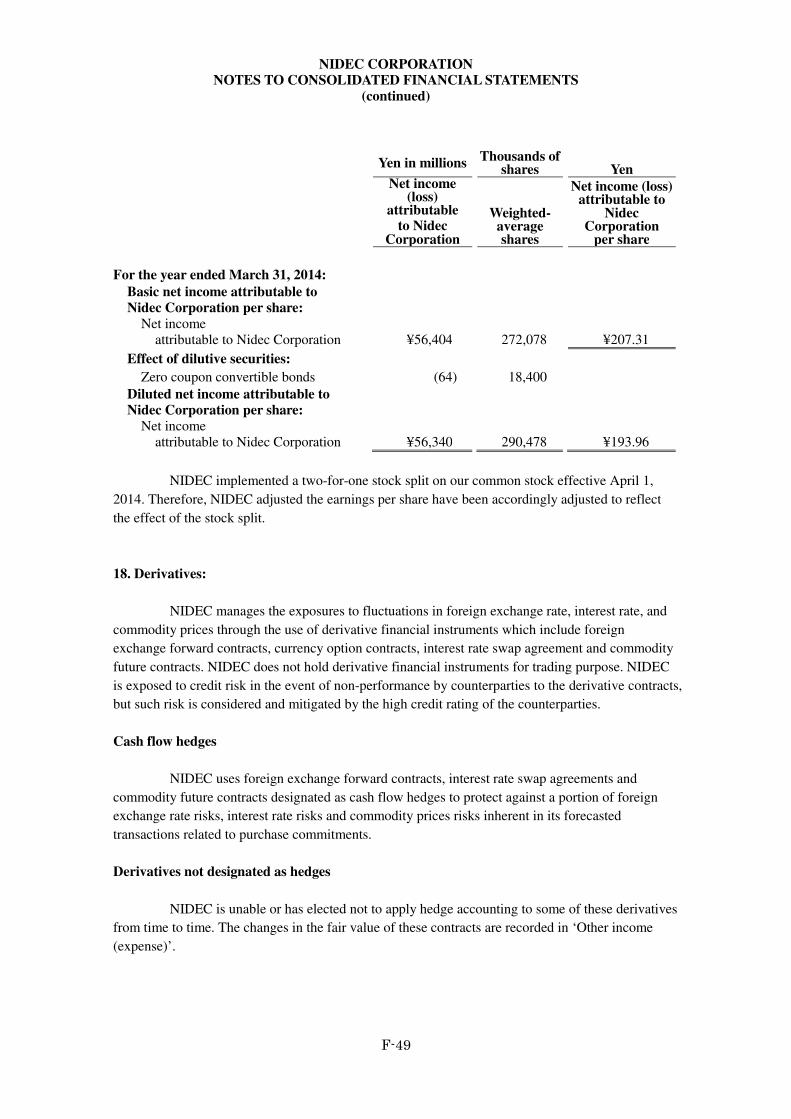
NIDEC CORPORATION
NOTES TO CONSOLIDATED FINANCIAL STATEMENTS
(continued)
F-49
Yen in millions Thousands of
shares
Yen
Net income (loss)
attributable to Nidec
Corporation
Weighted- average shares
Net income (loss) attributable to
Nidec Corporation
per share
For the year ended March 31, 2014:
Basic net income attributable to
Nidec Corporation per share:
Net income attributable to Nidec Corporation
¥56,404
272,078
¥207.31
Effect of dilutive securities:
Zero coupon convertible bonds (64) 18,400
Diluted net income attributable to
Nidec Corporation per share:
Net income attributable to Nidec Corporation
¥56,340
290,478
¥193.96
NIDEC implemented a two-for-one stock split on our common stock effective April 1,
2014. Therefore, NIDEC adjusted the earnings per share have been accordingly adjusted to reflect
the effect of the stock split.
18. Derivatives:
NIDEC manages the exposures to fluctuations in foreign exchange rate, interest rate, and
commodity prices through the use of derivative financial instruments which include foreign
exchange forward contracts, currency option contracts, interest rate swap agreement and commodity
future contracts. NIDEC does not hold derivative financial instruments for trading purpose. NIDEC
is exposed to credit risk in the event of non-performance by counterparties to the derivative contracts,
but such risk is considered and mitigated by the high credit rating of the counterparties.
Cash flow hedges
NIDEC uses foreign exchange forward contracts, interest rate swap agreements and
commodity future contracts designated as cash flow hedges to protect against a portion of foreign
exchange rate risks, interest rate risks and commodity prices risks inherent in its forecasted
transactions related to purchase commitments.
Derivatives not designated as hedges
NIDEC is unable or has elected not to apply hedge accounting to some of these derivatives
from time to time. The changes in the fair value of these contracts are recorded in ‘Other income
(expense)’.
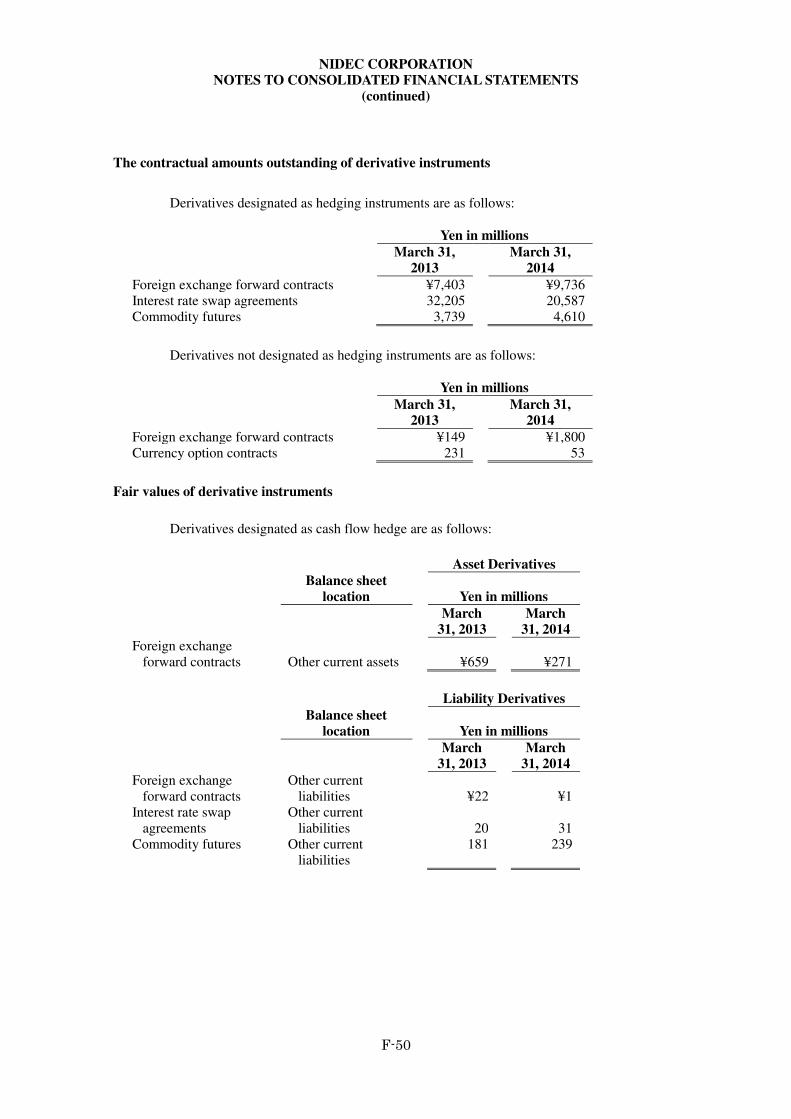
NIDEC CORPORATION
NOTES TO CONSOLIDATED FINANCIAL STATEMENTS
(continued)
F-50
The contractual amounts outstanding of derivative instruments
Derivatives designated as hedging instruments are as follows:
Yen in millions
March 31,
2013
March 31,
2014
Foreign exchange forward contracts ¥7,403 ¥9,736 Interest rate swap agreements 32,205 20,587 Commodity futures 3,739 4,610
Derivatives not designated as hedging instruments are as follows:
Yen in millions
March 31,
2013
March 31,
2014
Foreign exchange forward contracts ¥149 ¥1,800 Currency option contracts 231 53
Fair values of derivative instruments
Derivatives designated as cash flow hedge are as follows:
Asset Derivatives
Balance sheet
location
Yen in millions
March
31, 2013
March
31, 2014
Foreign exchange forward contracts Other current assets ¥659 ¥271
Liability Derivatives
Balance sheet
location
Yen in millions
March
31, 2013
March
31, 2014
Foreign exchange forward contracts
Other current liabilities ¥22 ¥1
Interest rate swap agreements
Other current liabilities 20 31
Commodity futures Other current liabilities
181 239
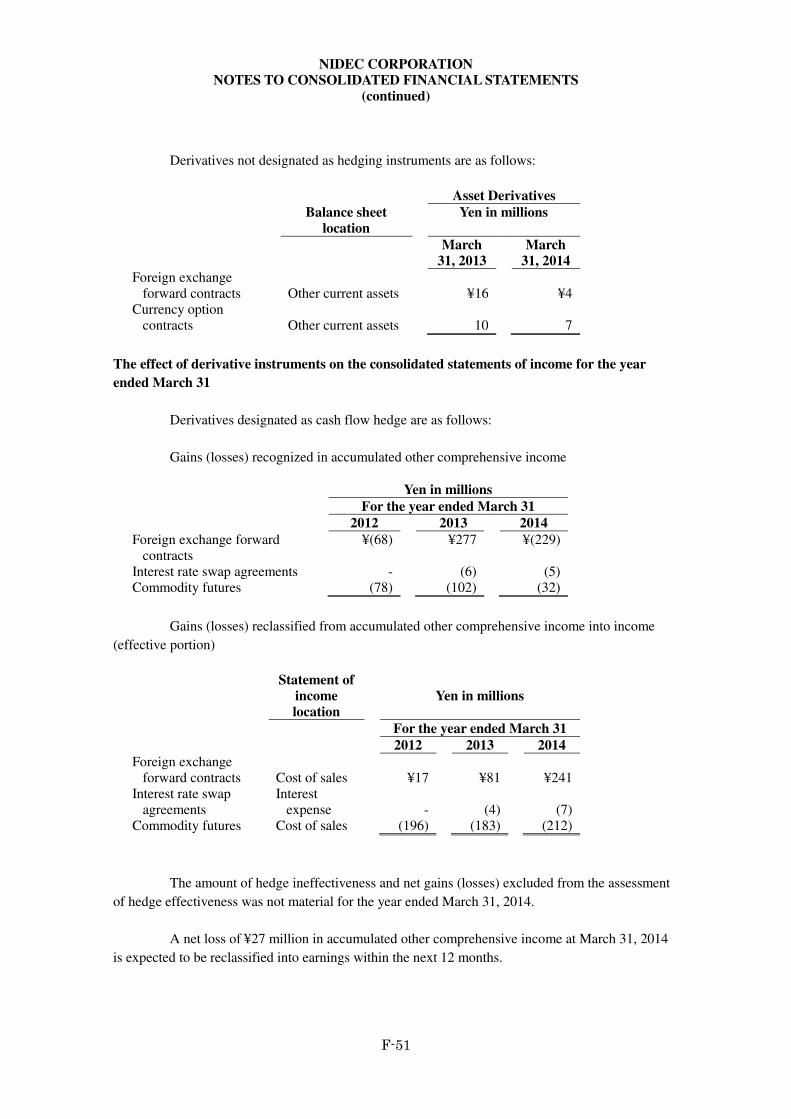
NIDEC CORPORATION
NOTES TO CONSOLIDATED FINANCIAL STATEMENTS
(continued)
F-51
Derivatives not designated as hedging instruments are as follows:
Asset Derivatives
Balance sheet
location
Yen in millions
March
31, 2013
March
31, 2014
Foreign exchange forward contracts Other current assets ¥16 ¥4
Currency option contracts Other current assets 10 7
The effect of derivative instruments on the consolidated statements of income for the year
ended March 31
Derivatives designated as cash flow hedge are as follows:
Gains (losses) recognized in accumulated other comprehensive income
Yen in millions
For the year ended March 31
2012 2013 2014
Foreign exchange forward contracts
¥(68) ¥277 ¥(229)
Interest rate swap agreements - (6) (5) Commodity futures (78) (102) (32)
Gains (losses) reclassified from accumulated other comprehensive income into income
(effective portion)
Statement of
income
location
Yen in millions
For the year ended March 31
2012 2013 2014
Foreign exchange forward contracts Cost of sales
¥17 ¥81 ¥241
Interest rate swap agreements
Interest expense
- (4) (7)
Commodity futures Cost of sales (196) (183) (212)
The amount of hedge ineffectiveness and net gains (losses) excluded from the assessment
of hedge effectiveness was not material for the year ended March 31, 2014.
A net loss of ¥27 million in accumulated other comprehensive income at March 31, 2014
is expected to be reclassified into earnings within the next 12 months.
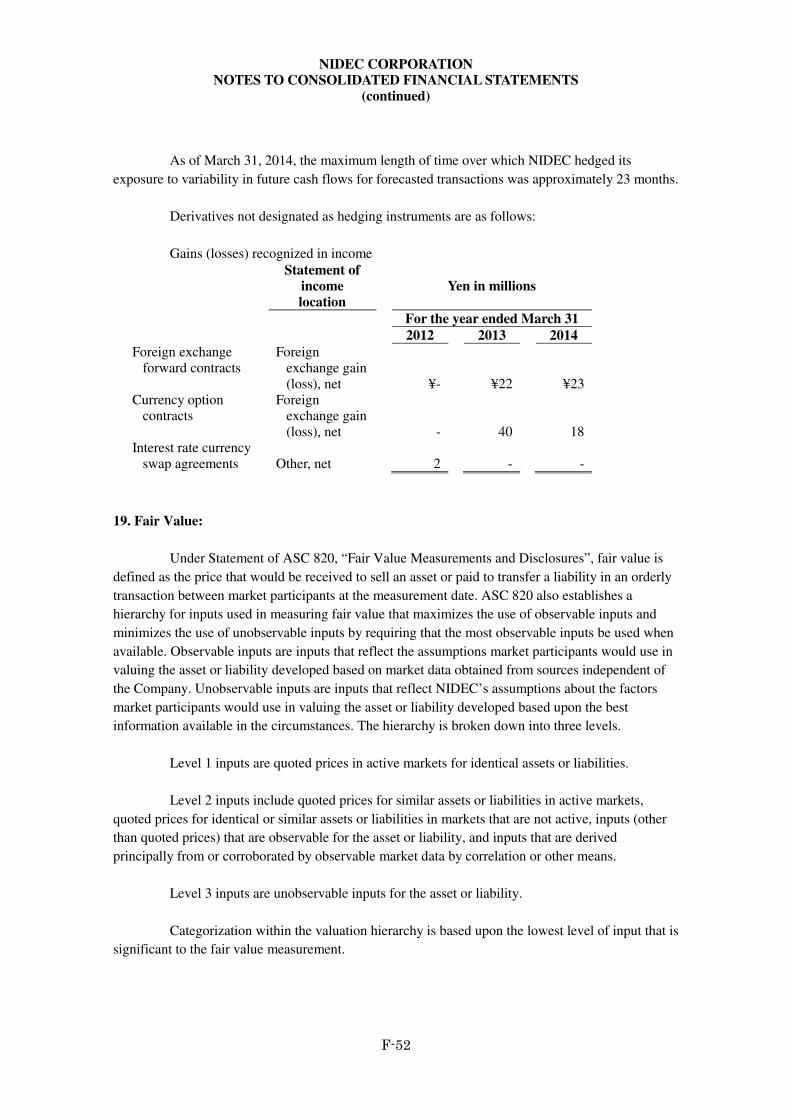
NIDEC CORPORATION
NOTES TO CONSOLIDATED FINANCIAL STATEMENTS
(continued)
F-52
As of March 31, 2014, the maximum length of time over which NIDEC hedged its
exposure to variability in future cash flows for forecasted transactions was approximately 23 months.
Derivatives not designated as hedging instruments are as follows:
Gains (losses) recognized in income
Statement of
income
location
Yen in millions
For the year ended March 31
2012 2013 2014
Foreign exchange forward contracts
Foreign exchange gain (loss), net
¥- ¥22 ¥23 Currency option
contracts Foreign
exchange gain (loss), net
- 40 18 Interest rate currency
swap agreements Other, net
2 - -
19. Fair Value:
Under Statement of ASC 820, “Fair Value Measurements and Disclosures”, fair value is
defined as the price that would be received to sell an asset or paid to transfer a liability in an orderly
transaction between market participants at the measurement date. ASC 820 also establishes a
hierarchy for inputs used in measuring fair value that maximizes the use of observable inputs and
minimizes the use of unobservable inputs by requiring that the most observable inputs be used when
available. Observable inputs are inputs that reflect the assumptions market participants would use in
valuing the asset or liability developed based on market data obtained from sources independent of
the Company. Unobservable inputs are inputs that reflect NIDEC’s assumptions about the factors
market participants would use in valuing the asset or liability developed based upon the best
information available in the circumstances. The hierarchy is broken down into three levels.
Level 1 inputs are quoted prices in active markets for identical assets or liabilities.
Level 2 inputs include quoted prices for similar assets or liabilities in active markets,
quoted prices for identical or similar assets or liabilities in markets that are not active, inputs (other
than quoted prices) that are observable for the asset or liability, and inputs that are derived
principally from or corroborated by observable market data by correlation or other means.
Level 3 inputs are unobservable inputs for the asset or liability.
Categorization within the valuation hierarchy is based upon the lowest level of input that is
significant to the fair value measurement.
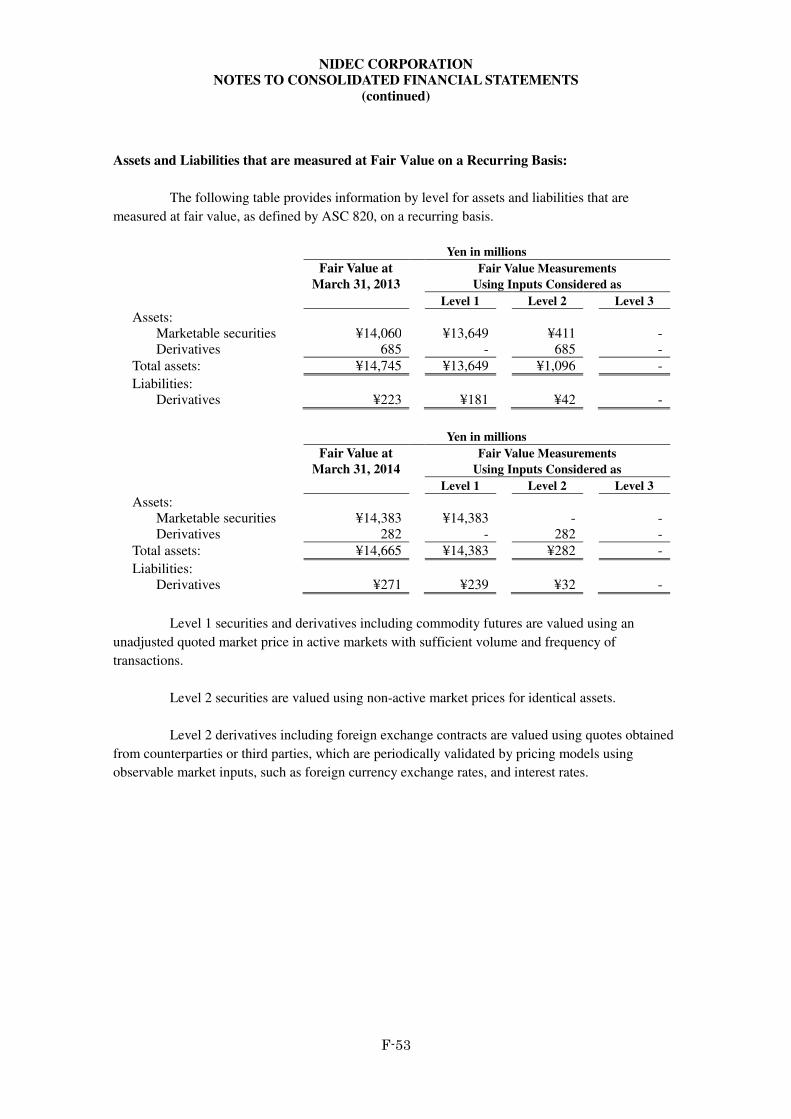
NIDEC CORPORATION
NOTES TO CONSOLIDATED FINANCIAL STATEMENTS
(continued)
F-53
Assets and Liabilities that are measured at Fair Value on a Recurring Basis:
The following table provides information by level for assets and liabilities that are
measured at fair value, as defined by ASC 820, on a recurring basis.
Yen in millions
Fair Value at
March 31, 2013
Fair Value Measurements
Using Inputs Considered as
Level 1 Level 2 Level 3
Assets:
Marketable securities ¥14,060 ¥13,649 ¥411 - Derivatives 685 - 685 -
Total assets: ¥14,745 ¥13,649 ¥1,096 -
Liabilities: Derivatives ¥223 ¥181 ¥42 -
Yen in millions
Fair Value at
March 31, 2014
Fair Value Measurements
Using Inputs Considered as
Level 1 Level 2 Level 3
Assets:
Marketable securities ¥14,383 ¥14,383 - - Derivatives 282 - 282 -
Total assets: ¥14,665 ¥14,383 ¥282 -
Liabilities: Derivatives ¥271 ¥239 ¥32 -
Level 1 securities and derivatives including commodity futures are valued using an
unadjusted quoted market price in active markets with sufficient volume and frequency of
transactions.
Level 2 securities are valued using non-active market prices for identical assets.
Level 2 derivatives including foreign exchange contracts are valued using quotes obtained
from counterparties or third parties, which are periodically validated by pricing models using
observable market inputs, such as foreign currency exchange rates, and interest rates.
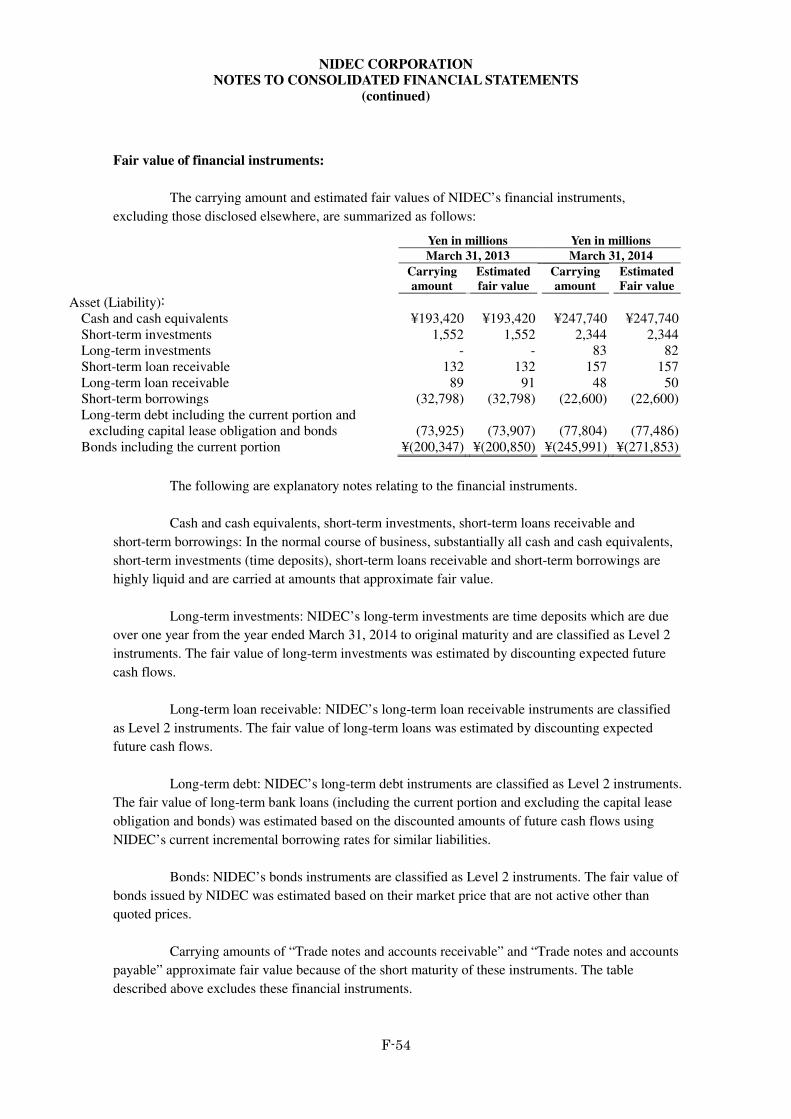
NIDEC CORPORATION
NOTES TO CONSOLIDATED FINANCIAL STATEMENTS
(continued)
F-54
Fair value of financial instruments:
The carrying amount and estimated fair values of NIDEC’s financial instruments,
excluding those disclosed elsewhere, are summarized as follows:
Yen in millions Yen in millions
March 31, 2013 March 31, 2014
Carrying
amount
Estimated
fair value
Carrying
amount
Estimated
Fair value
Asset (Liability):
Cash and cash equivalents ¥193,420 ¥193,420 ¥247,740 ¥247,740 Short-term investments 1,552 1,552 2,344 2,344 Long-term investments - - 83 82 Short-term loan receivable 132 132 157 157 Long-term loan receivable 89 91 48 50 Short-term borrowings (32,798) (32,798) (22,600) (22,600) Long-term debt including the current portion and
excluding capital lease obligation and bonds
(73,925) (73,907) (77,804) (77,486) Bonds including the current portion ¥(200,347) ¥(200,850) ¥(245,991) ¥(271,853)
The following are explanatory notes relating to the financial instruments.
Cash and cash equivalents, short-term investments, short-term loans receivable and
short-term borrowings: In the normal course of business, substantially all cash and cash equivalents,
short-term investments (time deposits), short-term loans receivable and short-term borrowings are
highly liquid and are carried at amounts that approximate fair value.
Long-term investments: NIDEC’s long-term investments are time deposits which are due
over one year from the year ended March 31, 2014 to original maturity and are classified as Level 2
instruments. The fair value of long-term investments was estimated by discounting expected future
cash flows.
Long-term loan receivable: NIDEC’s long-term loan receivable instruments are classified
as Level 2 instruments. The fair value of long-term loans was estimated by discounting expected
future cash flows.
Long-term debt: NIDEC’s long-term debt instruments are classified as Level 2 instruments.
The fair value of long-term bank loans (including the current portion and excluding the capital lease
obligation and bonds) was estimated based on the discounted amounts of future cash flows using
NIDEC’s current incremental borrowing rates for similar liabilities.
Bonds: NIDEC’s bonds instruments are classified as Level 2 instruments. The fair value of
bonds issued by NIDEC was estimated based on their market price that are not active other than
quoted prices.
Carrying amounts of “Trade notes and accounts receivable” and “Trade notes and accounts
payable” approximate fair value because of the short maturity of these instruments. The table
described above excludes these financial instruments.
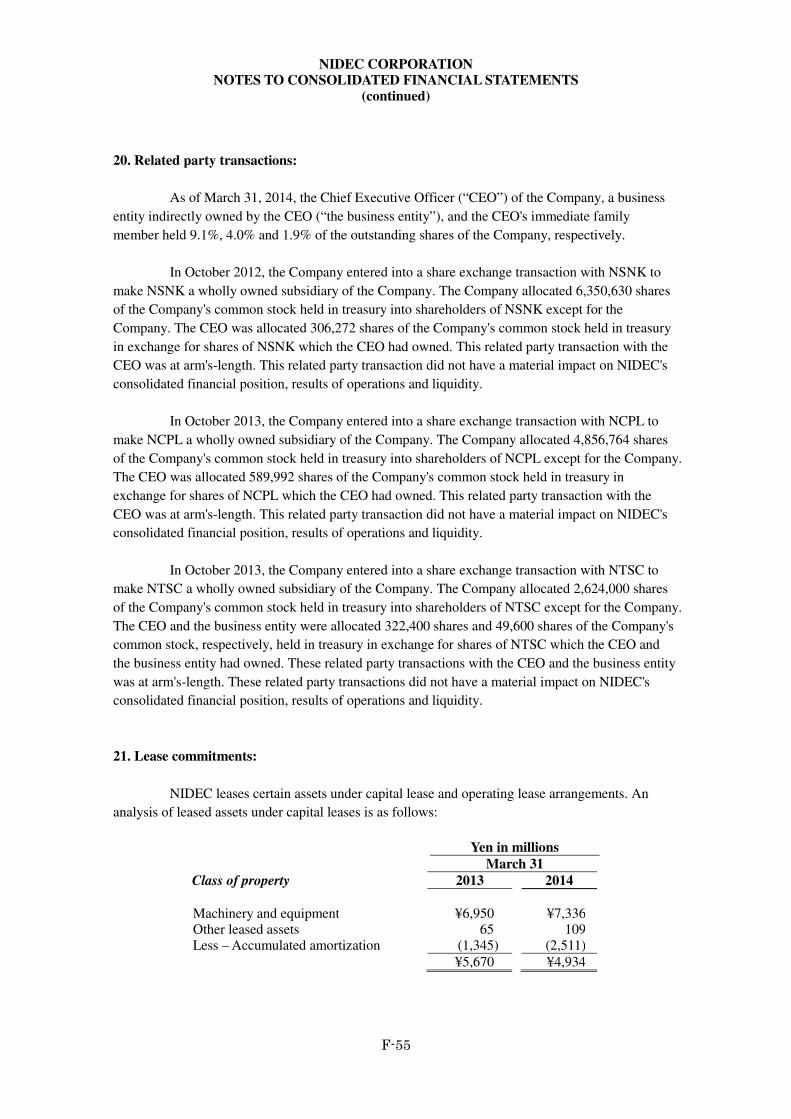
NIDEC CORPORATION
NOTES TO CONSOLIDATED FINANCIAL STATEMENTS
(continued)
F-55
20. Related party transactions:
As of March 31, 2014, the Chief Executive Officer (“CEO”) of the Company, a business
entity indirectly owned by the CEO (“the business entity”), and the CEO's immediate family
member held 9.1%, 4.0% and 1.9% of the outstanding shares of the Company, respectively.
In October 2012, the Company entered into a share exchange transaction with NSNK to
make NSNK a wholly owned subsidiary of the Company. The Company allocated 6,350,630 shares
of the Company's common stock held in treasury into shareholders of NSNK except for the
Company. The CEO was allocated 306,272 shares of the Company's common stock held in treasury
in exchange for shares of NSNK which the CEO had owned. This related party transaction with the
CEO was at arm's-length. This related party transaction did not have a material impact on NIDEC's
consolidated financial position, results of operations and liquidity.
In October 2013, the Company entered into a share exchange transaction with NCPL to
make NCPL a wholly owned subsidiary of the Company. The Company allocated 4,856,764 shares
of the Company's common stock held in treasury into shareholders of NCPL except for the Company.
The CEO was allocated 589,992 shares of the Company's common stock held in treasury in
exchange for shares of NCPL which the CEO had owned. This related party transaction with the
CEO was at arm's-length. This related party transaction did not have a material impact on NIDEC's
consolidated financial position, results of operations and liquidity.
In October 2013, the Company entered into a share exchange transaction with NTSC to
make NTSC a wholly owned subsidiary of the Company. The Company allocated 2,624,000 shares
of the Company's common stock held in treasury into shareholders of NTSC except for the Company.
The CEO and the business entity were allocated 322,400 shares and 49,600 shares of the Company's
common stock, respectively, held in treasury in exchange for shares of NTSC which the CEO and
the business entity had owned. These related party transactions with the CEO and the business entity
was at arm's-length. These related party transactions did not have a material impact on NIDEC's
consolidated financial position, results of operations and liquidity.
21. Lease commitments:
NIDEC leases certain assets under capital lease and operating lease arrangements. An
analysis of leased assets under capital leases is as follows:
Yen in millions
March 31
Class of property 2013 2014
Machinery and equipment ¥6,950 ¥7,336 Other leased assets 65 109 Less – Accumulated amortization (1,345) (2,511)
¥5,670 ¥4,934
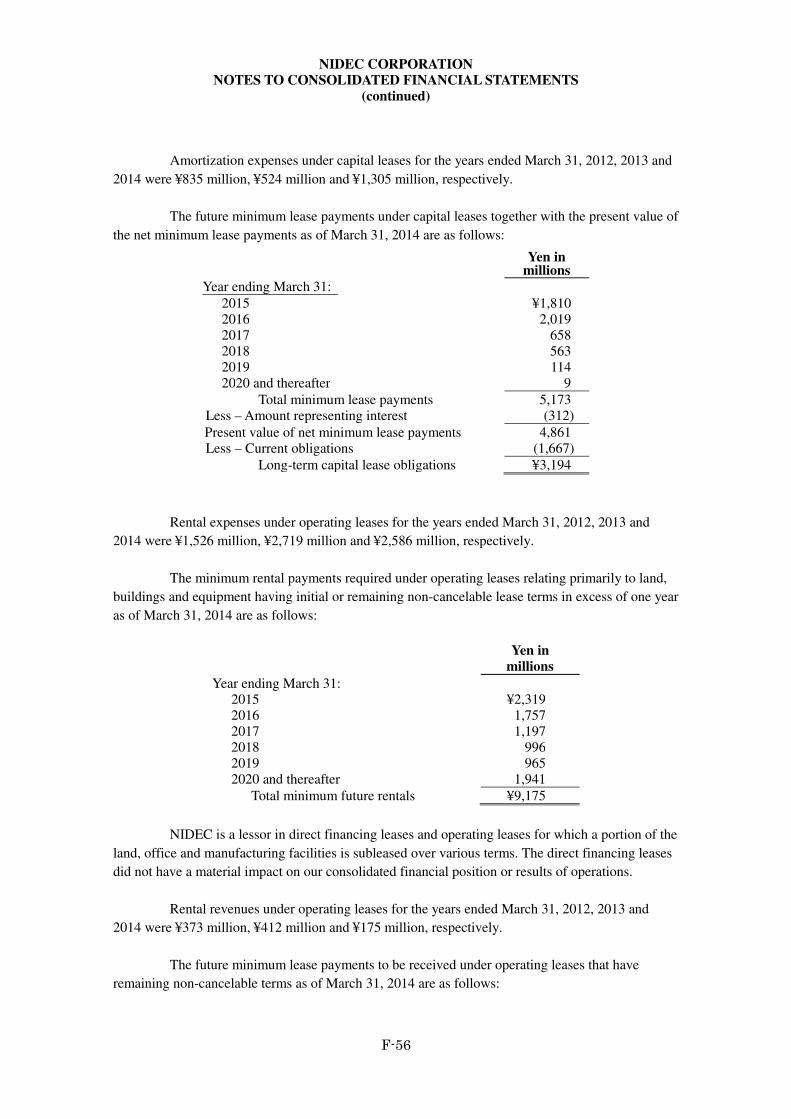
NIDEC CORPORATION
NOTES TO CONSOLIDATED FINANCIAL STATEMENTS
(continued)
F-56
Amortization expenses under capital leases for the years ended March 31, 2012, 2013 and
2014 were ¥835 million, ¥524 million and ¥1,305 million, respectively.
The future minimum lease payments under capital leases together with the present value of
the net minimum lease payments as of March 31, 2014 are as follows:
Yen in
millions
Year ending March 31:
2015 ¥1,810 2016 2,019 2017 658 2018 563 2019 114 2020 and thereafter 9
Total minimum lease payments 5,173 Less – Amount representing interest (312)
Present value of net minimum lease payments 4,861 Less – Current obligations (1,667)
Long-term capital lease obligations ¥3,194
Rental expenses under operating leases for the years ended March 31, 2012, 2013 and
2014 were ¥1,526 million, ¥2,719 million and ¥2,586 million, respectively.
The minimum rental payments required under operating leases relating primarily to land,
buildings and equipment having initial or remaining non-cancelable lease terms in excess of one year
as of March 31, 2014 are as follows:
Yen in
millions
Year ending March 31: 2015 ¥2,319 2016 1,757 2017 1,197 2018 996 2019 965 2020 and thereafter 1,941
Total minimum future rentals ¥9,175
NIDEC is a lessor in direct financing leases and operating leases for which a portion of the
land, office and manufacturing facilities is subleased over various terms. The direct financing leases
did not have a material impact on our consolidated financial position or results of operations.
Rental revenues under operating leases for the years ended March 31, 2012, 2013 and
2014 were ¥373 million, ¥412 million and ¥175 million, respectively.
The future minimum lease payments to be received under operating leases that have
remaining non-cancelable terms as of March 31, 2014 are as follows:
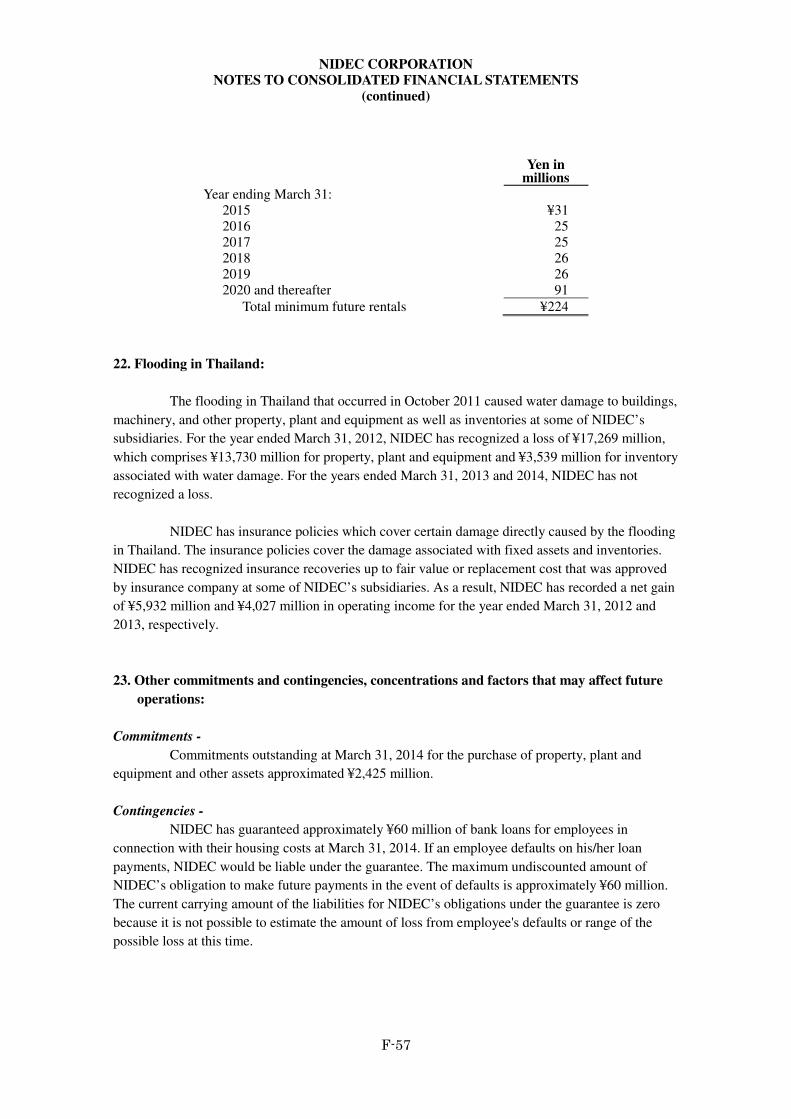
NIDEC CORPORATION
NOTES TO CONSOLIDATED FINANCIAL STATEMENTS
(continued)
F-57
Yen in
millions
Year ending March 31: 2015 ¥31 2016 25 2017 25 2018 26 2019 26 2020 and thereafter 91
Total minimum future rentals ¥224
22. Flooding in Thailand:
The flooding in Thailand that occurred in October 2011 caused water damage to buildings,
machinery, and other property, plant and equipment as well as inventories at some of NIDEC’s
subsidiaries. For the year ended March 31, 2012, NIDEC has recognized a loss of ¥17,269 million,
which comprises ¥13,730 million for property, plant and equipment and ¥3,539 million for inventory
associated with water damage. For the years ended March 31, 2013 and 2014, NIDEC has not
recognized a loss.
NIDEC has insurance policies which cover certain damage directly caused by the flooding
in Thailand. The insurance policies cover the damage associated with fixed assets and inventories.
NIDEC has recognized insurance recoveries up to fair value or replacement cost that was approved
by insurance company at some of NIDEC’s subsidiaries. As a result, NIDEC has recorded a net gain
of ¥5,932 million and ¥4,027 million in operating income for the year ended March 31, 2012 and
2013, respectively.
23. Other commitments and contingencies, concentrations and factors that may affect future
operations:
Commitments -
Commitments outstanding at March 31, 2014 for the purchase of property, plant and
equipment and other assets approximated ¥2,425 million.
Contingencies -
NIDEC has guaranteed approximately ¥60 million of bank loans for employees in
connection with their housing costs at March 31, 2014. If an employee defaults on his/her loan
payments, NIDEC would be liable under the guarantee. The maximum undiscounted amount of
NIDEC’s obligation to make future payments in the event of defaults is approximately ¥60 million.
The current carrying amount of the liabilities for NIDEC’s obligations under the guarantee is zero
because it is not possible to estimate the amount of loss from employee's defaults or range of the
possible loss at this time.
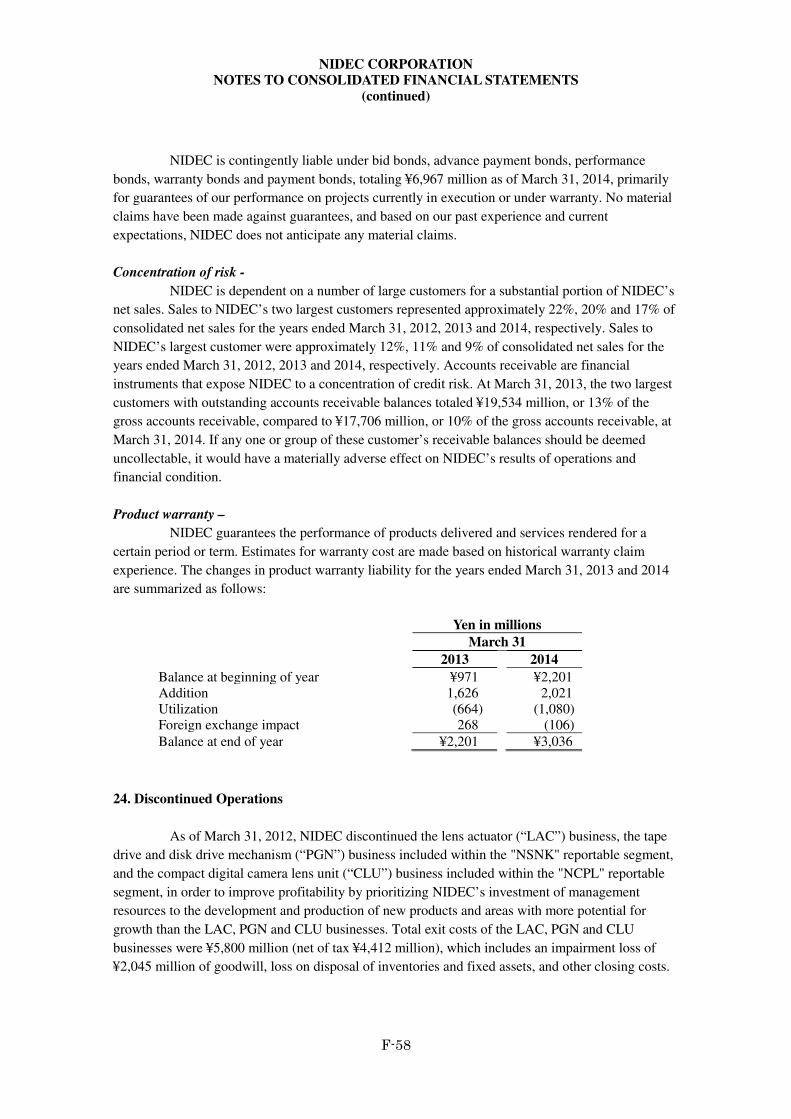
NIDEC CORPORATION
NOTES TO CONSOLIDATED FINANCIAL STATEMENTS
(continued)
F-58
NIDEC is contingently liable under bid bonds, advance payment bonds, performance
bonds, warranty bonds and payment bonds, totaling ¥6,967 million as of March 31, 2014, primarily
for guarantees of our performance on projects currently in execution or under warranty. No material
claims have been made against guarantees, and based on our past experience and current
expectations, NIDEC does not anticipate any material claims.
Concentration of risk -
NIDEC is dependent on a number of large customers for a substantial portion of NIDEC’s
net sales. Sales to NIDEC’s two largest customers represented approximately 22%, 20% and 17% of
consolidated net sales for the years ended March 31, 2012, 2013 and 2014, respectively. Sales to
NIDEC’s largest customer were approximately 12%, 11% and 9% of consolidated net sales for the
years ended March 31, 2012, 2013 and 2014, respectively. Accounts receivable are financial
instruments that expose NIDEC to a concentration of credit risk. At March 31, 2013, the two largest
customers with outstanding accounts receivable balances totaled ¥19,534 million, or 13% of the
gross accounts receivable, compared to ¥17,706 million, or 10% of the gross accounts receivable, at
March 31, 2014. If any one or group of these customer’s receivable balances should be deemed
uncollectable, it would have a materially adverse effect on NIDEC’s results of operations and
financial condition.
Product warranty –
NIDEC guarantees the performance of products delivered and services rendered for a
certain period or term. Estimates for warranty cost are made based on historical warranty claim
experience. The changes in product warranty liability for the years ended March 31, 2013 and 2014
are summarized as follows:
Yen in millions
March 31
2013 2014
Balance at beginning of year ¥971 ¥2,201 Addition 1,626 2,021 Utilization (664) (1,080) Foreign exchange impact 268 (106)
Balance at end of year ¥2,201 ¥3,036
24. Discontinued Operations
As of March 31, 2012, NIDEC discontinued the lens actuator (“LAC”) business, the tape
drive and disk drive mechanism (“PGN”) business included within the "NSNK" reportable segment,
and the compact digital camera lens unit (“CLU”) business included within the "NCPL" reportable
segment, in order to improve profitability by prioritizing NIDEC’s investment of management
resources to the development and production of new products and areas with more potential for
growth than the LAC, PGN and CLU businesses. Total exit costs of the LAC, PGN and CLU
businesses were ¥5,800 million (net of tax ¥4,412 million), which includes an impairment loss of
¥2,045 million of goodwill, loss on disposal of inventories and fixed assets, and other closing costs.
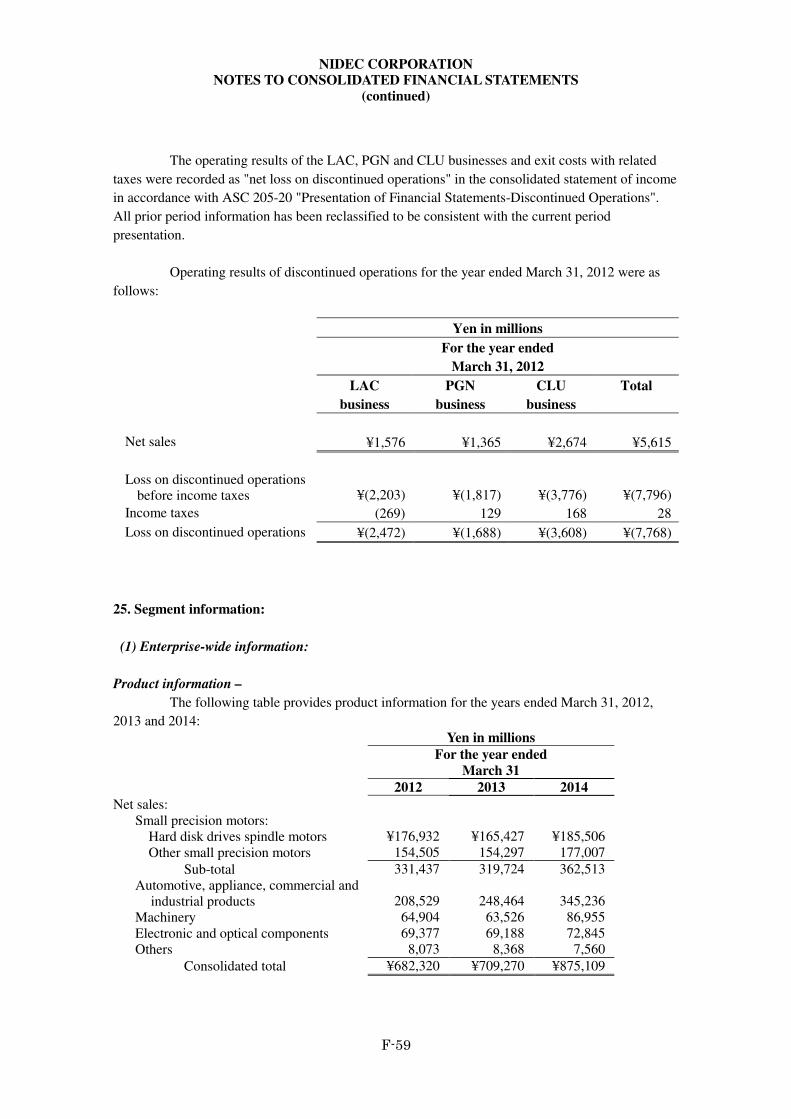
NIDEC CORPORATION
NOTES TO CONSOLIDATED FINANCIAL STATEMENTS
(continued)
F-59
The operating results of the LAC, PGN and CLU businesses and exit costs with related
taxes were recorded as "net loss on discontinued operations" in the consolidated statement of income
in accordance with ASC 205-20 "Presentation of Financial Statements-Discontinued Operations".
All prior period information has been reclassified to be consistent with the current period
presentation.
Operating results of discontinued operations for the year ended March 31, 2012 were as
follows:
Yen in millions
For the year ended
March 31, 2012
LAC
business
PGN
business
CLU
business
Total
Net sales ¥1,576 ¥1,365 ¥2,674 ¥5,615
Loss on discontinued operations
before income taxes ¥(2,203) ¥(1,817) ¥(3,776) ¥(7,796)
Income taxes (269) 129 168 28
Loss on discontinued operations ¥(2,472) ¥(1,688) ¥(3,608) ¥(7,768)
25. Segment information:
(1) Enterprise-wide information:
Product information –
The following table provides product information for the years ended March 31, 2012,
2013 and 2014:
Yen in millions
For the year ended
March 31
2012 2013 2014
Net sales: Small precision motors:
Hard disk drives spindle motors ¥176,932 ¥165,427 ¥185,506 Other small precision motors 154,505 154,297 177,007
Sub-total 331,437 319,724 362,513 Automotive, appliance, commercial and
industrial products 208,529 248,464 345,236 Machinery 64,904 63,526 86,955 Electronic and optical components 69,377 69,188 72,845 Others 8,073 8,368 7,560
Consolidated total ¥682,320 ¥709,270 ¥875,109
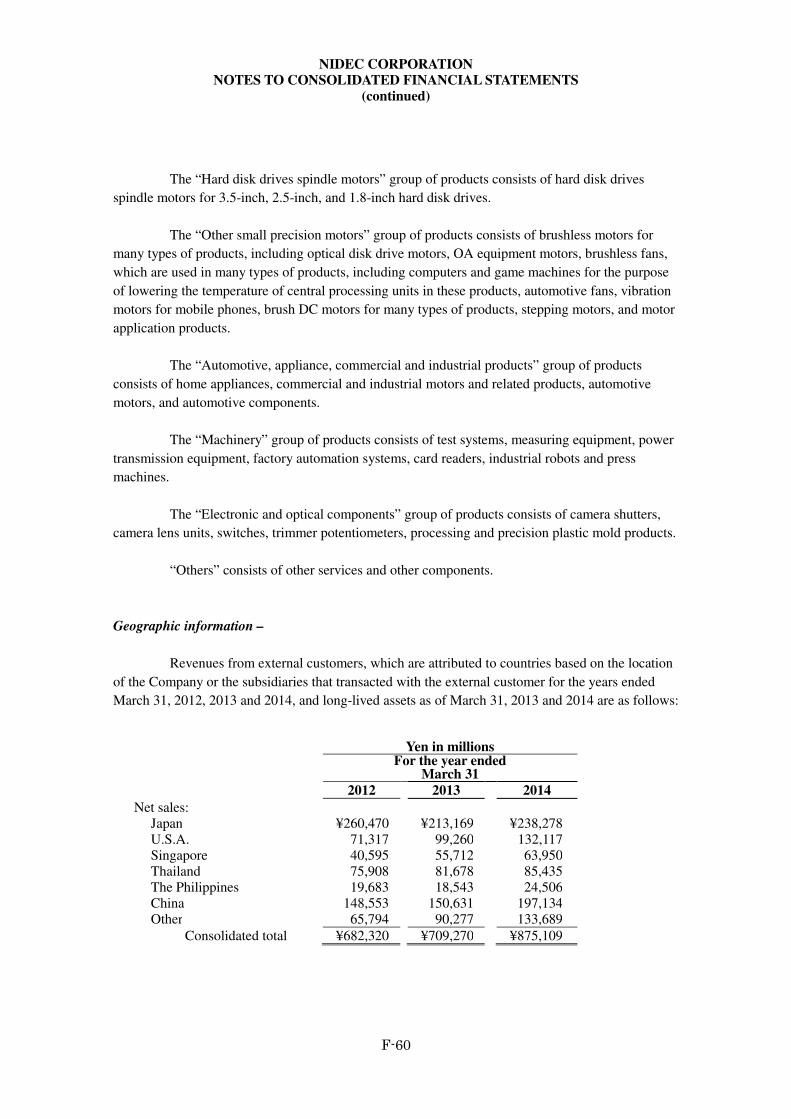
NIDEC CORPORATION
NOTES TO CONSOLIDATED FINANCIAL STATEMENTS
(continued)
F-60
The “Hard disk drives spindle motors” group of products consists of hard disk drives
spindle motors for 3.5-inch, 2.5-inch, and 1.8-inch hard disk drives.
The “Other small precision motors” group of products consists of brushless motors for
many types of products, including optical disk drive motors, OA equipment motors, brushless fans,
which are used in many types of products, including computers and game machines for the purpose
of lowering the temperature of central processing units in these products, automotive fans, vibration
motors for mobile phones, brush DC motors for many types of products, stepping motors, and motor
application products.
The “Automotive, appliance, commercial and industrial products” group of products
consists of home appliances, commercial and industrial motors and related products, automotive
motors, and automotive components.
The “Machinery” group of products consists of test systems, measuring equipment, power
transmission equipment, factory automation systems, card readers, industrial robots and press
machines.
The “Electronic and optical components” group of products consists of camera shutters,
camera lens units, switches, trimmer potentiometers, processing and precision plastic mold products.
“Others” consists of other services and other components.
Geographic information –
Revenues from external customers, which are attributed to countries based on the location
of the Company or the subsidiaries that transacted with the external customer for the years ended
March 31, 2012, 2013 and 2014, and long-lived assets as of March 31, 2013 and 2014 are as follows:
Yen in millions
For the year ended March 31
2012 2013 2014
Net sales: Japan ¥260,470 ¥213,169 ¥238,278 U.S.A. 71,317 99,260 132,117 Singapore 40,595 55,712 63,950 Thailand 75,908 81,678 85,435 The Philippines 19,683 18,543 24,506 China 148,553 150,631 197,134 Other 65,794 90,277 133,689
Consolidated total ¥682,320 ¥709,270 ¥875,109
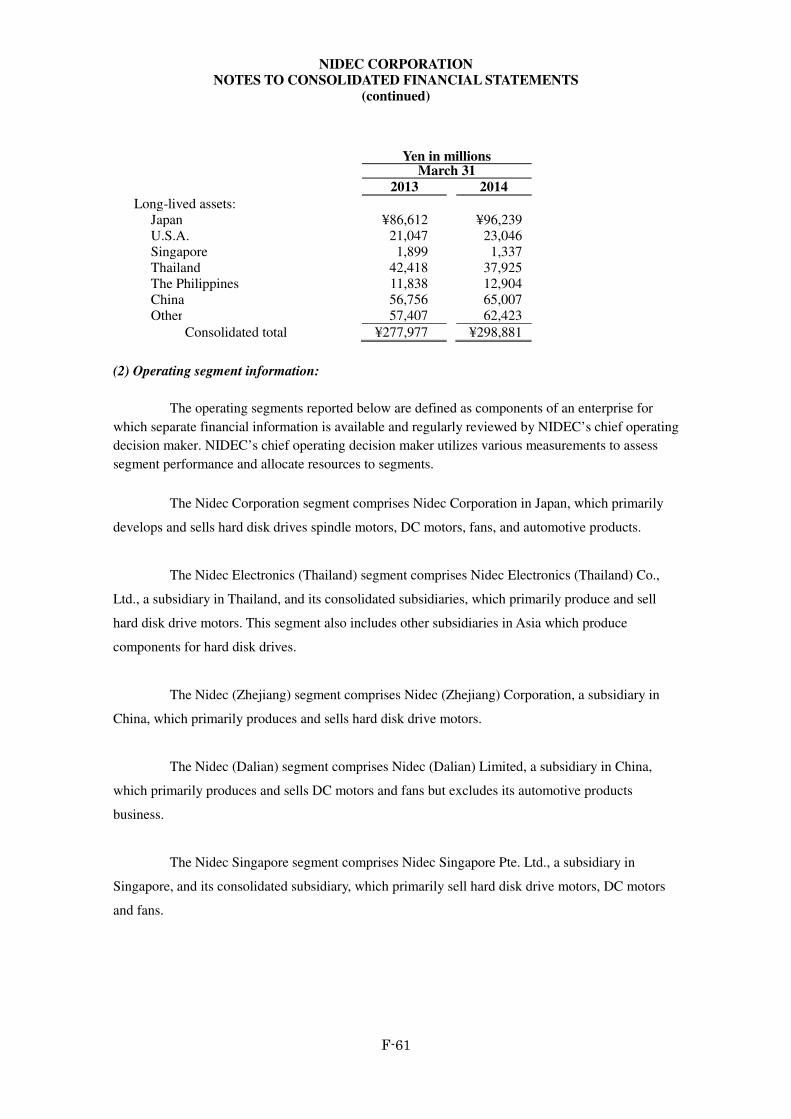
NIDEC CORPORATION
NOTES TO CONSOLIDATED FINANCIAL STATEMENTS
(continued)
F-61
Yen in millions March 31
2013 2014
Long-lived assets: Japan ¥86,612 ¥96,239 U.S.A. 21,047 23,046 Singapore 1,899 1,337 Thailand 42,418 37,925 The Philippines 11,838 12,904 China 56,756 65,007 Other 57,407 62,423
Consolidated total ¥277,977 ¥298,881
(2) Operating segment information:
The operating segments reported below are defined as components of an enterprise for
which separate financial information is available and regularly reviewed by NIDEC’s chief operating
decision maker. NIDEC’s chief operating decision maker utilizes various measurements to assess
segment performance and allocate resources to segments.
The Nidec Corporation segment comprises Nidec Corporation in Japan, which primarily
develops and sells hard disk drives spindle motors, DC motors, fans, and automotive products.
The Nidec Electronics (Thailand) segment comprises Nidec Electronics (Thailand) Co.,
Ltd., a subsidiary in Thailand, and its consolidated subsidiaries, which primarily produce and sell
hard disk drive motors. This segment also includes other subsidiaries in Asia which produce
components for hard disk drives.
The Nidec (Zhejiang) segment comprises Nidec (Zhejiang) Corporation, a subsidiary in
China, which primarily produces and sells hard disk drive motors.
The Nidec (Dalian) segment comprises Nidec (Dalian) Limited, a subsidiary in China,
which primarily produces and sells DC motors and fans but excludes its automotive products
business.
The Nidec Singapore segment comprises Nidec Singapore Pte. Ltd., a subsidiary in
Singapore, and its consolidated subsidiary, which primarily sell hard disk drive motors, DC motors
and fans.
NIDEC CORPORATION
NOTES TO CONSOLIDATED FINANCIAL STATEMENTS
(continued)
F-62
The Nidec (H.K.) segment comprises Nidec (H.K.) Co., Ltd., a subsidiary in Hong Kong,
and its consolidated subsidiaries, which primarily sell hard disk drive motors, DC motors and fans.
The Nidec Philippines segment comprises Nidec Philippines Corporation, a subsidiary in
the Philippines, and its consolidated subsidiary, which primarily produce and sell hard disk drive
motors.
The Nidec Sankyo segment comprises Nidec Sankyo Corporation, a subsidiary in Japan,
and its consolidated subsidiaries, which primarily produce and sell DC motors, machinery, and
electronic parts.
The Nidec Copal segment comprises Nidec Copal Corporation, a subsidiary in Japan, and
its consolidated subsidiaries, which primarily produce and sell optical and electronic parts and
machinery.
The Nidec Tosok segment comprises Nidec Tosok Corporation, a subsidiary in Japan, and
its consolidated subsidiaries, which primarily produce and sell automotive parts.
The Nidec Copal Electronics segment comprises Nidec Copal Electronics Corporation, a
subsidiary in Japan, and its consolidated subsidiaries, which primarily produce and sell electronic
parts.
The Nidec Techno Motor segment comprises Nidec Techno Motor Corporation, a
subsidiary in Japan, and its consolidated subsidiaries, which primarily produce and sell commercial
and industrial products.
The Nidec Motor segment comprises Nidec Motor Corporation and other subsidiaries in
North America, which are subsidiaries of Nidec US Holdings Corporation, an intermediate holding
company in the United States, as well as other subsidiaries in Latin America, Asia and Europe,
which primarily produce and sell home appliance, commercial and industrial products. This segment
also includes Nidec ASI, Avtron and Kinetek, which were newly consolidated for the year ended
March 31, 2013.
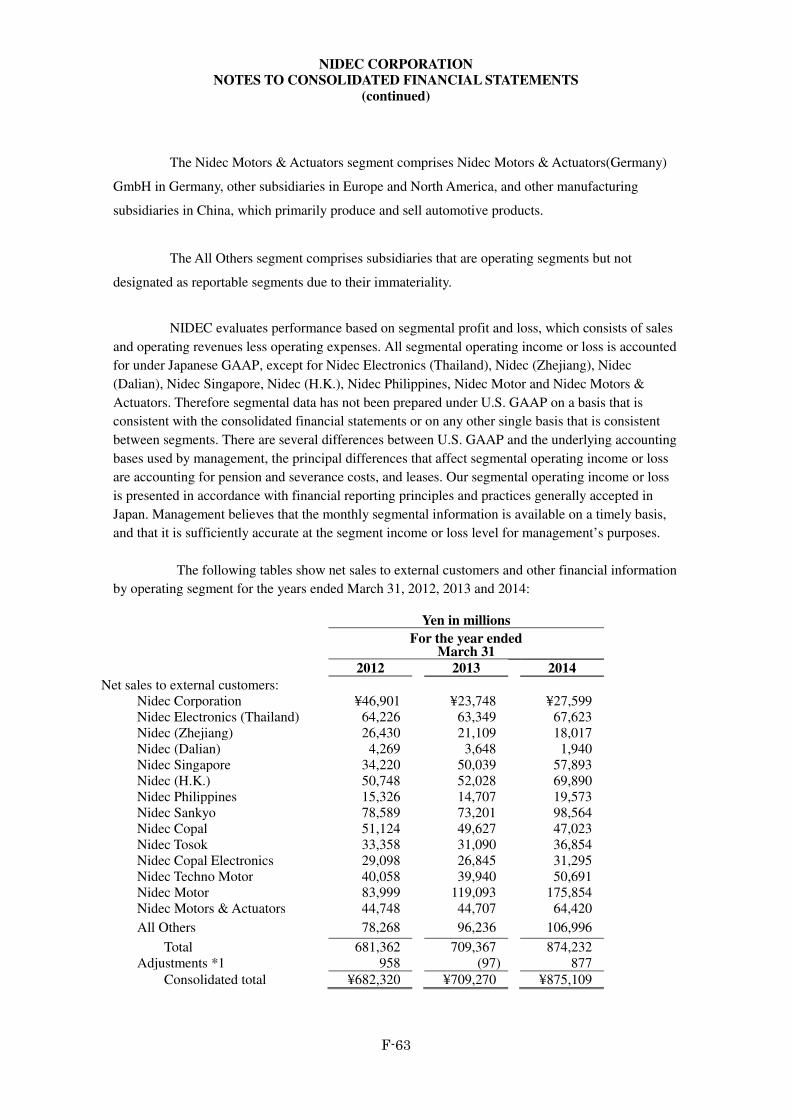
NIDEC CORPORATION
NOTES TO CONSOLIDATED FINANCIAL STATEMENTS
(continued)
F-63
The Nidec Motors & Actuators segment comprises Nidec Motors & Actuators(Germany)
GmbH in Germany, other subsidiaries in Europe and North America, and other manufacturing
subsidiaries in China, which primarily produce and sell automotive products.
The All Others segment comprises subsidiaries that are operating segments but not
designated as reportable segments due to their immateriality.
NIDEC evaluates performance based on segmental profit and loss, which consists of sales
and operating revenues less operating expenses. All segmental operating income or loss is accounted
for under Japanese GAAP, except for Nidec Electronics (Thailand), Nidec (Zhejiang), Nidec
(Dalian), Nidec Singapore, Nidec (H.K.), Nidec Philippines, Nidec Motor and Nidec Motors &
Actuators. Therefore segmental data has not been prepared under U.S. GAAP on a basis that is
consistent with the consolidated financial statements or on any other single basis that is consistent
between segments. There are several differences between U.S. GAAP and the underlying accounting
bases used by management, the principal differences that affect segmental operating income or loss
are accounting for pension and severance costs, and leases. Our segmental operating income or loss
is presented in accordance with financial reporting principles and practices generally accepted in
Japan. Management believes that the monthly segmental information is available on a timely basis,
and that it is sufficiently accurate at the segment income or loss level for management’s purposes.
The following tables show net sales to external customers and other financial information
by operating segment for the years ended March 31, 2012, 2013 and 2014:
Yen in millions
For the year ended March 31
2012 2013 2014
Net sales to external customers: Nidec Corporation ¥46,901 ¥23,748 ¥27,599 Nidec Electronics (Thailand) 64,226 63,349 67,623 Nidec (Zhejiang) 26,430 21,109 18,017 Nidec (Dalian) 4,269 3,648 1,940 Nidec Singapore 34,220 50,039 57,893 Nidec (H.K.) 50,748 52,028 69,890 Nidec Philippines 15,326 14,707 19,573 Nidec Sankyo 78,589 73,201 98,564 Nidec Copal 51,124 49,627 47,023 Nidec Tosok 33,358 31,090 36,854 Nidec Copal Electronics 29,098 26,845 31,295 Nidec Techno Motor 40,058 39,940 50,691 Nidec Motor 83,999 119,093 175,854 Nidec Motors & Actuators 44,748 44,707 64,420
All Others 78,268 96,236 106,996
Total 681,362 709,367 874,232 Adjustments *1 958 (97) 877
Consolidated total ¥682,320 ¥709,270 ¥875,109
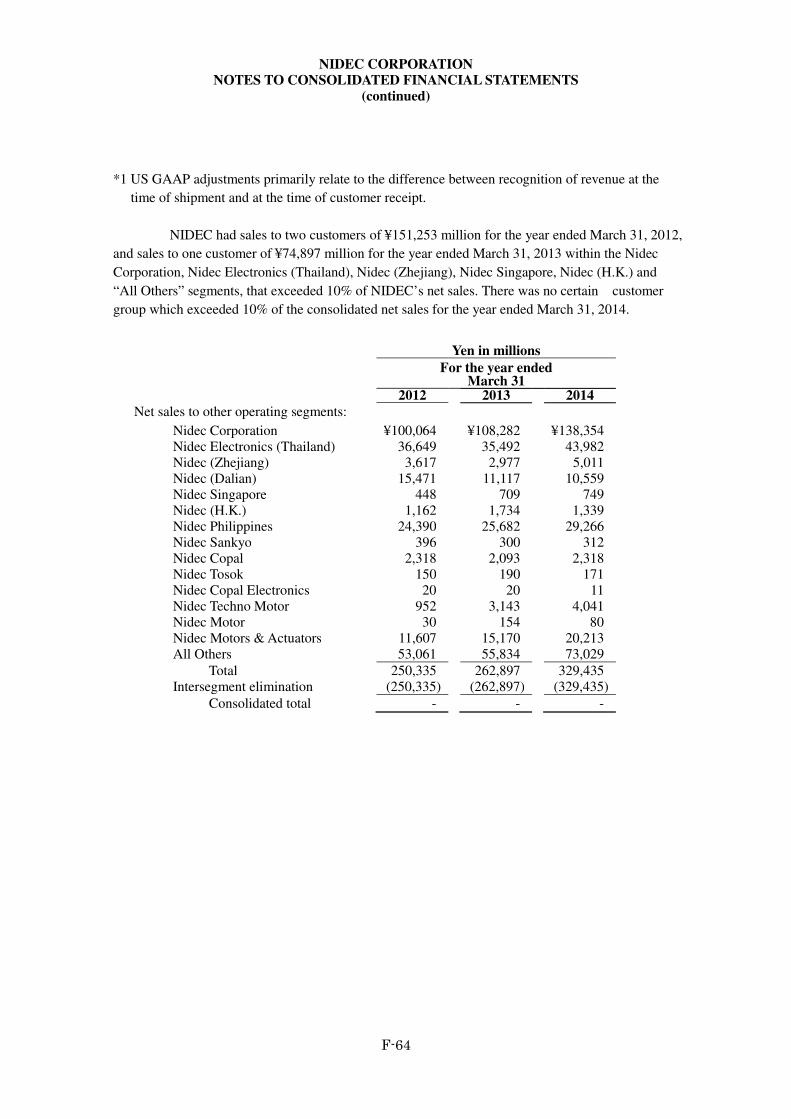
NIDEC CORPORATION
NOTES TO CONSOLIDATED FINANCIAL STATEMENTS
(continued)
F-64
*1 US GAAP adjustments primarily relate to the difference between recognition of revenue at the
time of shipment and at the time of customer receipt.
NIDEC had sales to two customers of ¥151,253 million for the year ended March 31, 2012,
and sales to one customer of ¥74,897 million for the year ended March 31, 2013 within the Nidec
Corporation, Nidec Electronics (Thailand), Nidec (Zhejiang), Nidec Singapore, Nidec (H.K.) and
“All Others” segments, that exceeded 10% of NIDEC’s net sales. There was no certain customer
group which exceeded 10% of the consolidated net sales for the year ended March 31, 2014.
Yen in millions
For the year ended March 31
2012 2013 2014
Net sales to other operating segments:
Nidec Corporation ¥100,064 ¥108,282 ¥138,354 Nidec Electronics (Thailand) 36,649 35,492 43,982 Nidec (Zhejiang) 3,617 2,977 5,011 Nidec (Dalian) 15,471 11,117 10,559 Nidec Singapore 448 709 749 Nidec (H.K.) 1,162 1,734 1,339 Nidec Philippines 24,390 25,682 29,266 Nidec Sankyo 396 300 312 Nidec Copal 2,318 2,093 2,318 Nidec Tosok 150 190 171 Nidec Copal Electronics 20 20 11 Nidec Techno Motor 952 3,143 4,041 Nidec Motor 30 154 80 Nidec Motors & Actuators 11,607 15,170 20,213 All Others 53,061 55,834 73,029
Total 250,335 262,897 329,435 Intersegment elimination (250,335) (262,897) (329,435)
Consolidated total - - -
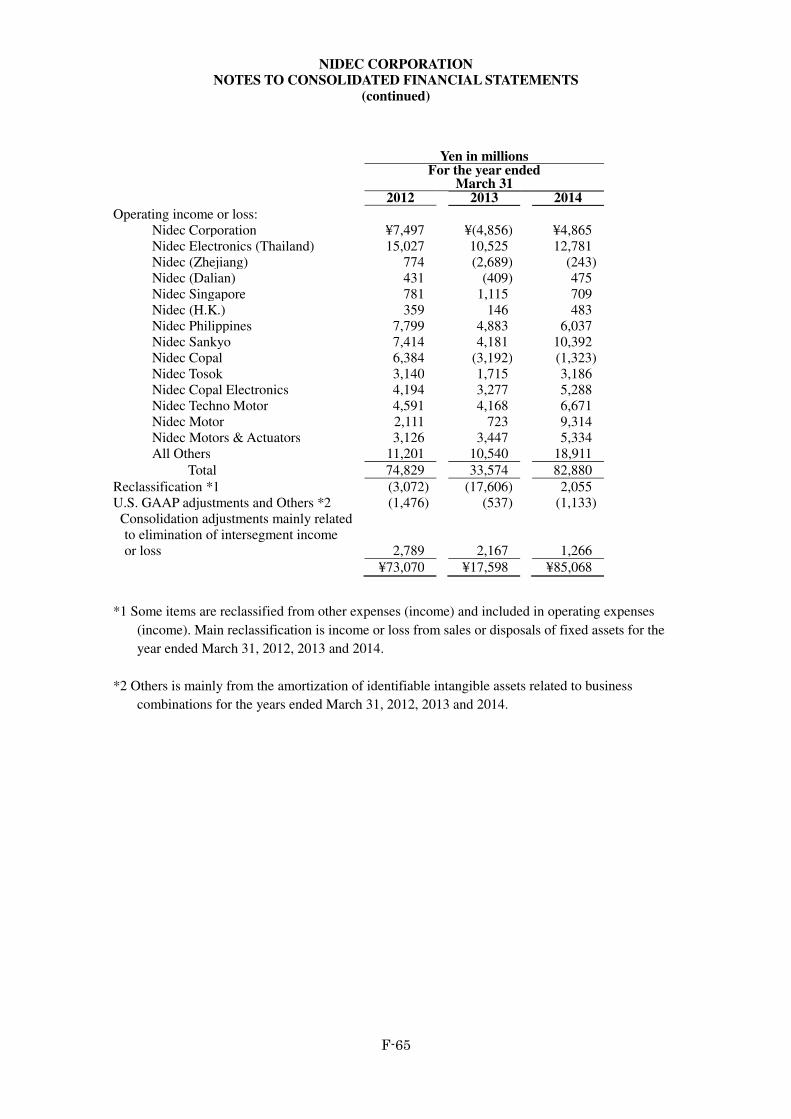
NIDEC CORPORATION
NOTES TO CONSOLIDATED FINANCIAL STATEMENTS
(continued)
F-65
Yen in millions
For the year ended
March 31 2012 2013 2014
Operating income or loss: Nidec Corporation ¥7,497 ¥(4,856) ¥4,865 Nidec Electronics (Thailand) 15,027 10,525 12,781 Nidec (Zhejiang) 774 (2,689) (243) Nidec (Dalian) 431 (409) 475 Nidec Singapore 781 1,115 709 Nidec (H.K.) 359 146 483 Nidec Philippines 7,799 4,883 6,037 Nidec Sankyo 7,414 4,181 10,392 Nidec Copal 6,384 (3,192) (1,323) Nidec Tosok 3,140 1,715 3,186 Nidec Copal Electronics 4,194 3,277 5,288 Nidec Techno Motor 4,591 4,168 6,671 Nidec Motor 2,111 723 9,314 Nidec Motors & Actuators 3,126 3,447 5,334 All Others 11,201 10,540 18,911
Total 74,829 33,574 82,880
Reclassification *1 (3,072) (17,606) 2,055 U.S. GAAP adjustments and Others *2 (1,476) (537) (1,133) Consolidation adjustments mainly related
to elimination of intersegment income or loss
2,789 2,167 1,266
¥73,070 ¥17,598 ¥85,068
*1 Some items are reclassified from other expenses (income) and included in operating expenses
(income). Main reclassification is income or loss from sales or disposals of fixed assets for the
year ended March 31, 2012, 2013 and 2014.
*2 Others is mainly from the amortization of identifiable intangible assets related to business
combinations for the years ended March 31, 2012, 2013 and 2014.
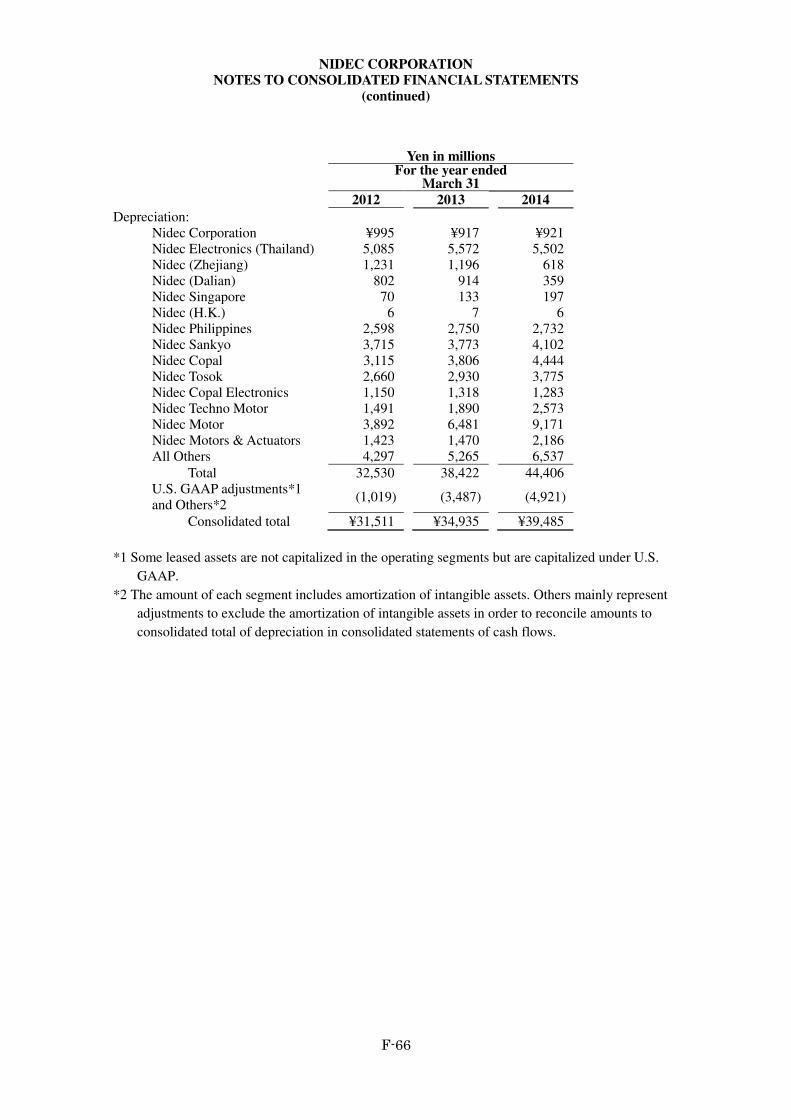
NIDEC CORPORATION
NOTES TO CONSOLIDATED FINANCIAL STATEMENTS
(continued)
F-66
Yen in millions For the year ended
March 31
2012 2013 2014
Depreciation: Nidec Corporation ¥995 ¥917 ¥921 Nidec Electronics (Thailand) 5,085 5,572 5,502 Nidec (Zhejiang) 1,231 1,196 618 Nidec (Dalian) 802 914 359 Nidec Singapore 70 133 197 Nidec (H.K.) 6 7 6 Nidec Philippines 2,598 2,750 2,732 Nidec Sankyo 3,715 3,773 4,102 Nidec Copal 3,115 3,806 4,444 Nidec Tosok 2,660 2,930 3,775 Nidec Copal Electronics 1,150 1,318 1,283 Nidec Techno Motor 1,491 1,890 2,573 Nidec Motor 3,892 6,481 9,171 Nidec Motors & Actuators 1,423 1,470 2,186 All Others 4,297 5,265 6,537
Total 32,530 38,422 44,406 U.S. GAAP adjustments*1 and Others*2
(1,019) (3,487) (4,921)
Consolidated total ¥31,511 ¥34,935 ¥39,485
*1 Some leased assets are not capitalized in the operating segments but are capitalized under U.S.
GAAP.
*2 The amount of each segment includes amortization of intangible assets. Others mainly represent
adjustments to exclude the amortization of intangible assets in order to reconcile amounts to
consolidated total of depreciation in consolidated statements of cash flows.
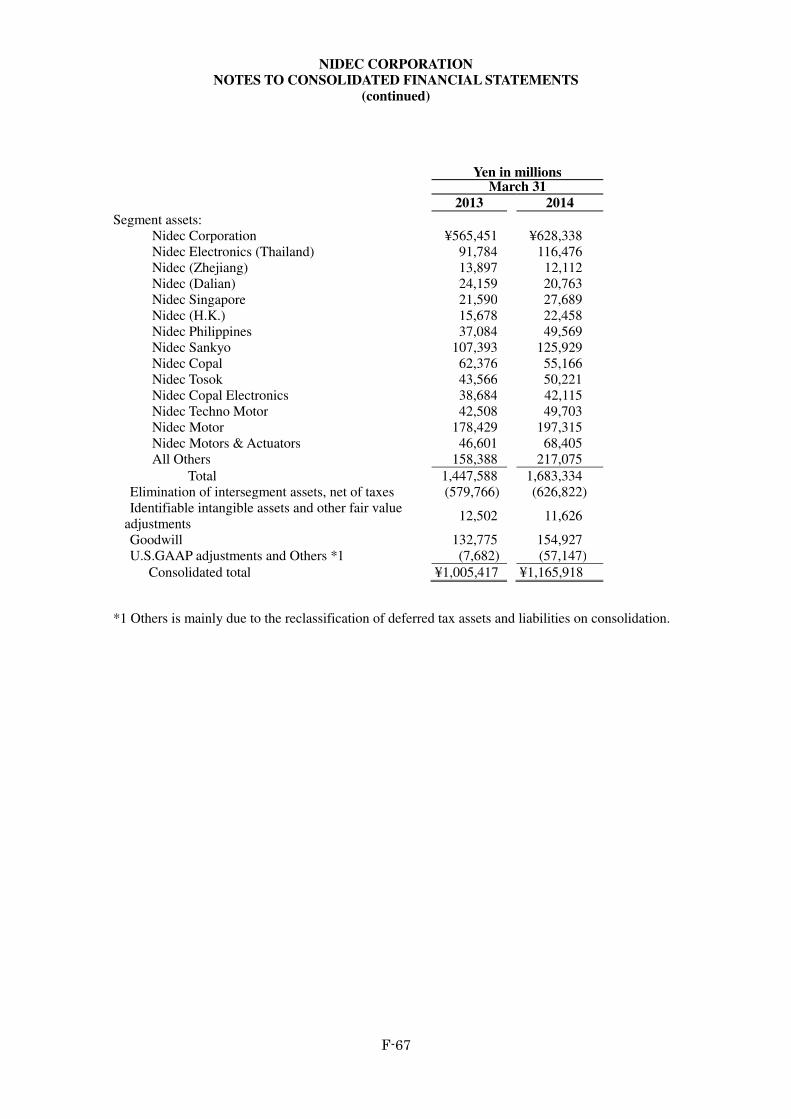
NIDEC CORPORATION
NOTES TO CONSOLIDATED FINANCIAL STATEMENTS
(continued)
F-67
Yen in millions March 31
2013 2014
Segment assets: Nidec Corporation ¥565,451 ¥628,338 Nidec Electronics (Thailand) 91,784 116,476 Nidec (Zhejiang) 13,897 12,112 Nidec (Dalian) 24,159 20,763 Nidec Singapore 21,590 27,689 Nidec (H.K.) 15,678 22,458 Nidec Philippines 37,084 49,569 Nidec Sankyo 107,393 125,929 Nidec Copal 62,376 55,166 Nidec Tosok 43,566 50,221 Nidec Copal Electronics 38,684 42,115 Nidec Techno Motor 42,508 49,703 Nidec Motor 178,429 197,315 Nidec Motors & Actuators 46,601 68,405 All Others 158,388 217,075
Total 1,447,588 1,683,334 Elimination of intersegment assets, net of taxes (579,766) (626,822) Identifiable intangible assets and other fair value
adjustments 12,502 11,626
Goodwill 132,775 154,927 U.S.GAAP adjustments and Others *1 (7,682) (57,147)
Consolidated total ¥1,005,417 ¥1,165,918
*1 Others is mainly due to the reclassification of deferred tax assets and liabilities on consolidation.
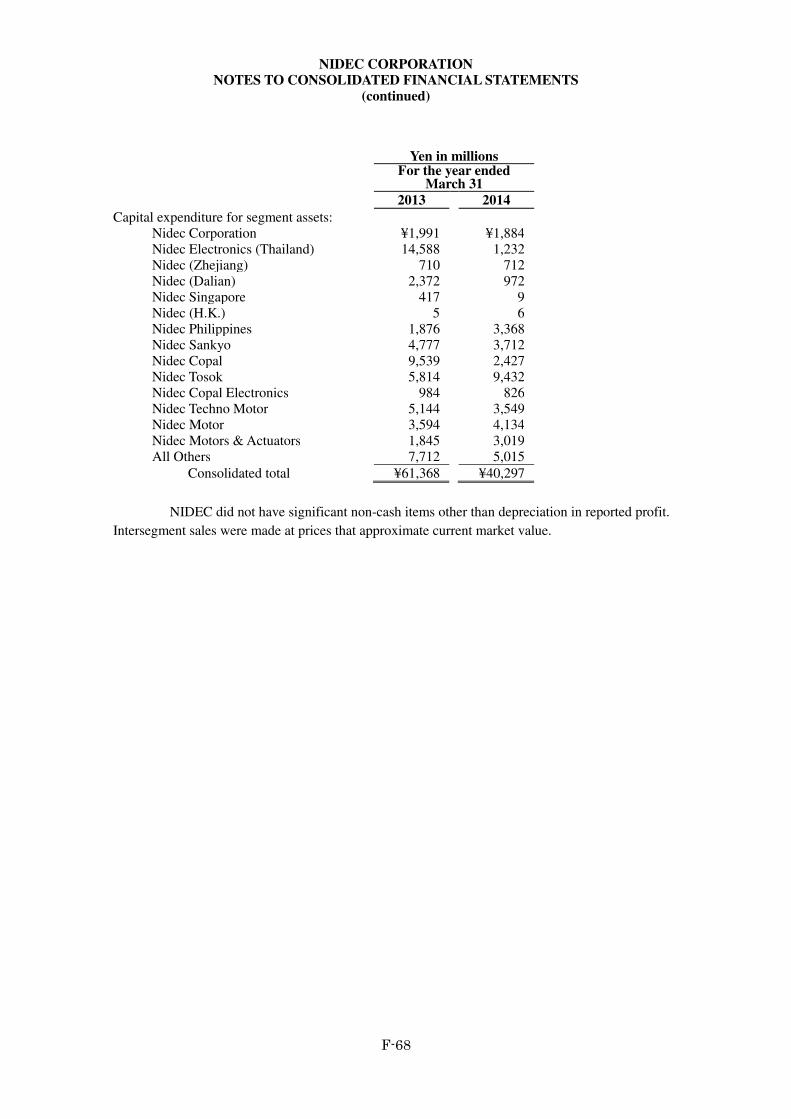
NIDEC CORPORATION
NOTES TO CONSOLIDATED FINANCIAL STATEMENTS
(continued)
F-68
Yen in millions For the year ended
March 31
2013 2014
Capital expenditure for segment assets: Nidec Corporation ¥1,991 ¥1,884 Nidec Electronics (Thailand) 14,588 1,232 Nidec (Zhejiang) 710 712 Nidec (Dalian) 2,372 972 Nidec Singapore 417 9 Nidec (H.K.) 5 6 Nidec Philippines 1,876 3,368 Nidec Sankyo 4,777 3,712 Nidec Copal 9,539 2,427 Nidec Tosok 5,814 9,432 Nidec Copal Electronics 984 826 Nidec Techno Motor 5,144 3,549 Nidec Motor 3,594 4,134 Nidec Motors & Actuators 1,845 3,019 All Others 7,712 5,015
Consolidated total ¥61,368 ¥40,297
NIDEC did not have significant non-cash items other than depreciation in reported profit.
Intersegment sales were made at prices that approximate current market value.
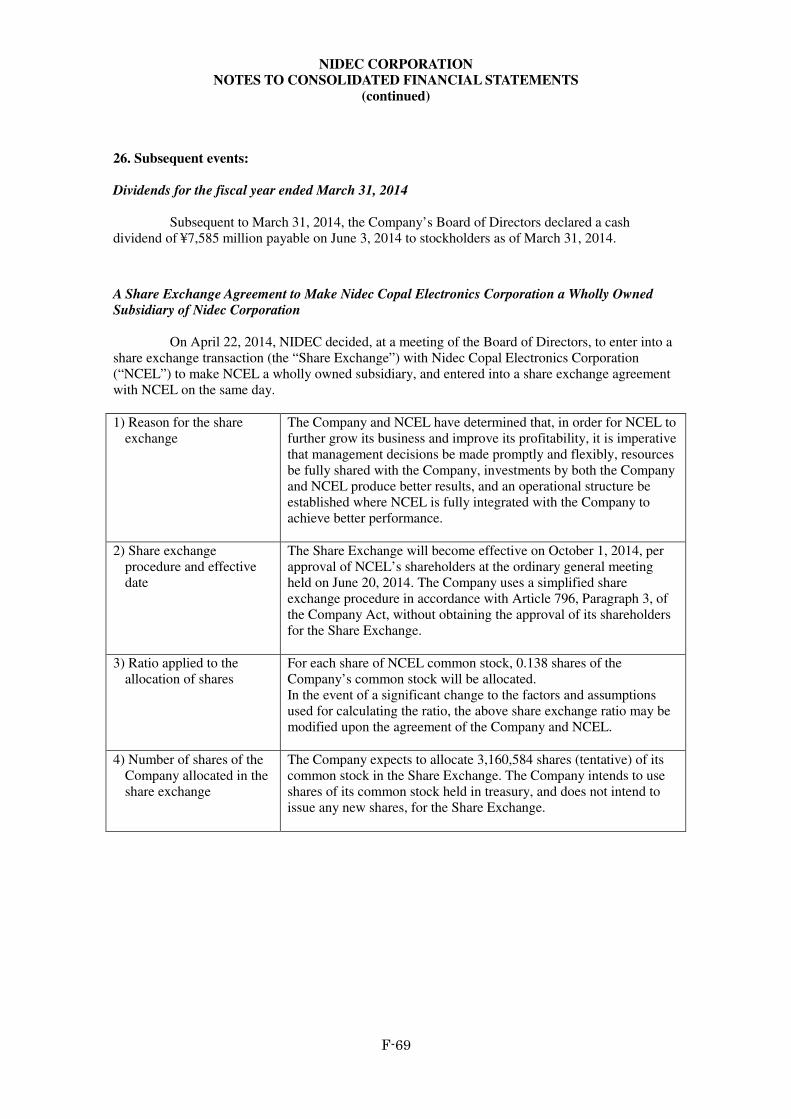
NIDEC CORPORATION
NOTES TO CONSOLIDATED FINANCIAL STATEMENTS
(continued)
F-69
26. Subsequent events:
Dividends for the fiscal year ended March 31, 2014
Subsequent to March 31, 2014, the Company’s Board of Directors declared a cash
dividend of ¥7,585 million payable on June 3, 2014 to stockholders as of March 31, 2014.
A Share Exchange Agreement to Make Nidec Copal Electronics Corporation a Wholly Owned
Subsidiary of Nidec Corporation
On April 22, 2014, NIDEC decided, at a meeting of the Board of Directors, to enter into a
share exchange transaction (the “Share Exchange”) with Nidec Copal Electronics Corporation (“NCEL”) to make NCEL a wholly owned subsidiary, and entered into a share exchange agreement with NCEL on the same day.
1) Reason for the share exchange
The Company and NCEL have determined that, in order for NCEL to further grow its business and improve its profitability, it is imperative that management decisions be made promptly and flexibly, resources be fully shared with the Company, investments by both the Company and NCEL produce better results, and an operational structure be established where NCEL is fully integrated with the Company to achieve better performance.
2) Share exchange procedure and effective date
The Share Exchange will become effective on October 1, 2014, per approval of NCEL’s shareholders at the ordinary general meeting held on June 20, 2014. The Company uses a simplified share exchange procedure in accordance with Article 796, Paragraph 3, of the Company Act, without obtaining the approval of its shareholders for the Share Exchange.
3) Ratio applied to the allocation of shares
For each share of NCEL common stock, 0.138 shares of the Company’s common stock will be allocated. In the event of a significant change to the factors and assumptions used for calculating the ratio, the above share exchange ratio may be modified upon the agreement of the Company and NCEL.
4) Number of shares of the Company allocated in the share exchange
The Company expects to allocate 3,160,584 shares (tentative) of its common stock in the Share Exchange. The Company intends to use shares of its common stock held in treasury, and does not intend to issue any new shares, for the Share Exchange.
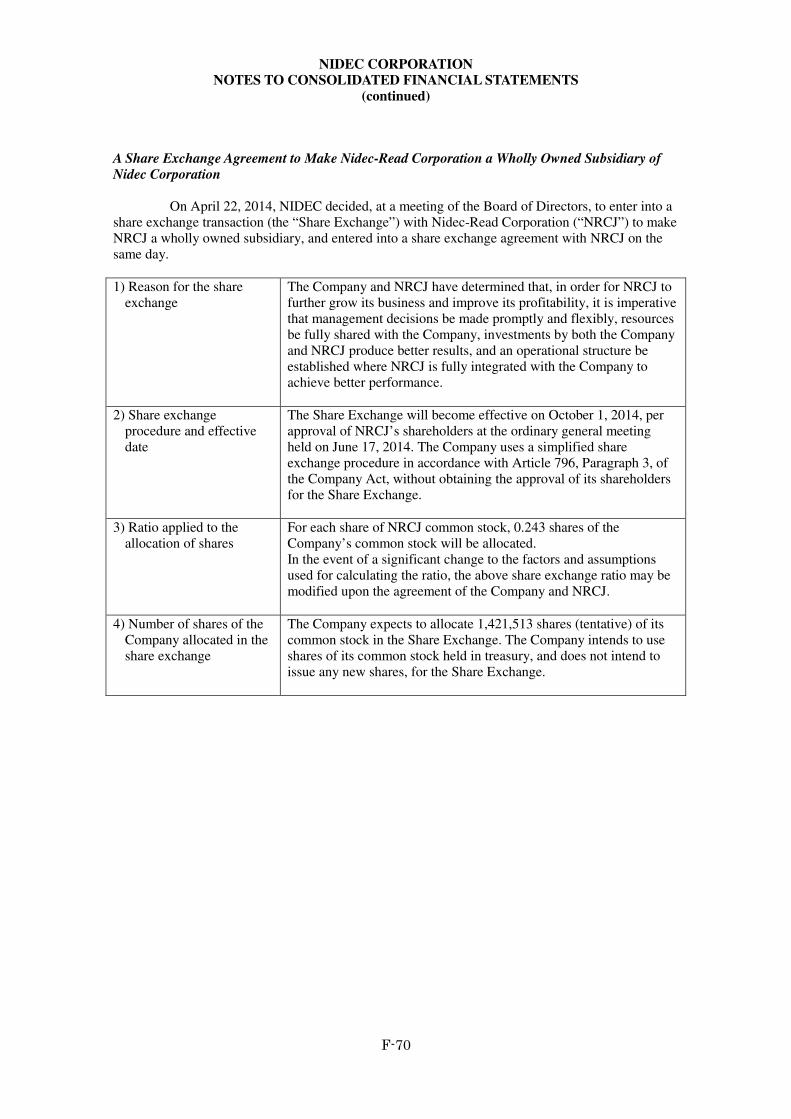
NIDEC CORPORATION
NOTES TO CONSOLIDATED FINANCIAL STATEMENTS
(continued)
F-70
A Share Exchange Agreement to Make Nidec-Read Corporation a Wholly Owned Subsidiary of
Nidec Corporation
On April 22, 2014, NIDEC decided, at a meeting of the Board of Directors, to enter into a
share exchange transaction (the “Share Exchange”) with Nidec-Read Corporation (“NRCJ”) to make NRCJ a wholly owned subsidiary, and entered into a share exchange agreement with NRCJ on the same day.
1) Reason for the share exchange
The Company and NRCJ have determined that, in order for NRCJ to further grow its business and improve its profitability, it is imperative that management decisions be made promptly and flexibly, resources be fully shared with the Company, investments by both the Company and NRCJ produce better results, and an operational structure be established where NRCJ is fully integrated with the Company to achieve better performance.
2) Share exchange procedure and effective date
The Share Exchange will become effective on October 1, 2014, per approval of NRCJ’s shareholders at the ordinary general meeting held on June 17, 2014. The Company uses a simplified share exchange procedure in accordance with Article 796, Paragraph 3, of the Company Act, without obtaining the approval of its shareholders for the Share Exchange.
3) Ratio applied to the allocation of shares
For each share of NRCJ common stock, 0.243 shares of the Company’s common stock will be allocated. In the event of a significant change to the factors and assumptions used for calculating the ratio, the above share exchange ratio may be modified upon the agreement of the Company and NRCJ.
4) Number of shares of the Company allocated in the share exchange
The Company expects to allocate 1,421,513 shares (tentative) of its common stock in the Share Exchange. The Company intends to use shares of its common stock held in treasury, and does not intend to issue any new shares, for the Share Exchange.
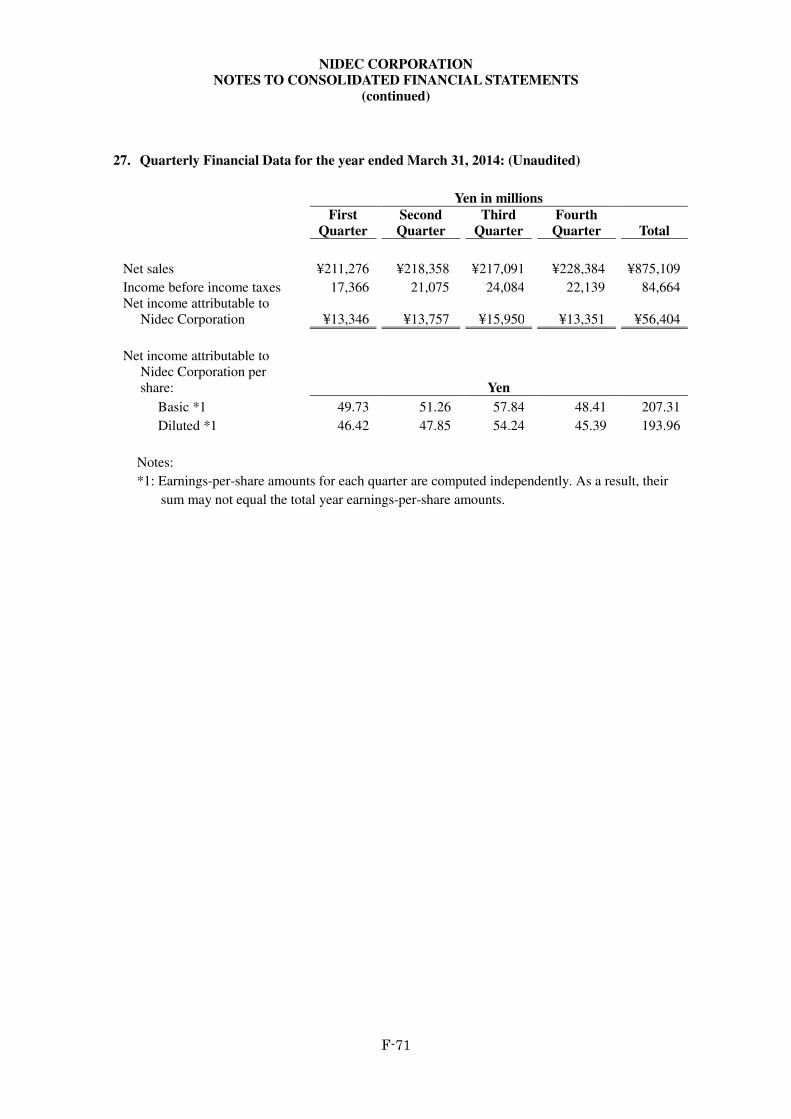
NIDEC CORPORATION
NOTES TO CONSOLIDATED FINANCIAL STATEMENTS
(continued)
F-71
27. Quarterly Financial Data for the year ended March 31, 2014: (Unaudited)
Yen in millions
First
Quarter
Second
Quarter
Third
Quarter
Fourth
Quarter Total
Net sales ¥211,276 ¥218,358 ¥217,091 ¥228,384 ¥875,109
Income before income taxes 17,366 21,075 24,084 22,139 84,664 Net income attributable to
Nidec Corporation
¥13,346 ¥13,757 ¥15,950 ¥13,351 ¥56,404
Net income attributable to Nidec Corporation per share:
Yen
Basic *1 49.73 51.26 57.84 48.41 207.31
Diluted *1 46.42 47.85 54.24 45.39 193.96
Notes:
*1: Earnings-per-share amounts for each quarter are computed independently. As a result, their
sum may not equal the total year earnings-per-share amounts.
SIGNATURES
The registrant hereby certifies that it meets all of the requirements for filing on Form 20-F and that it has duly caused and authorized the undersigned to sign this annual report on its behalf.
NIDEC CORPORATION
By: /s/ Shigenobu Nagamori
Name: Shigenobu Nagamori Title: President, Chief Executive Officer and
Representative Director Date: June 26, 2014
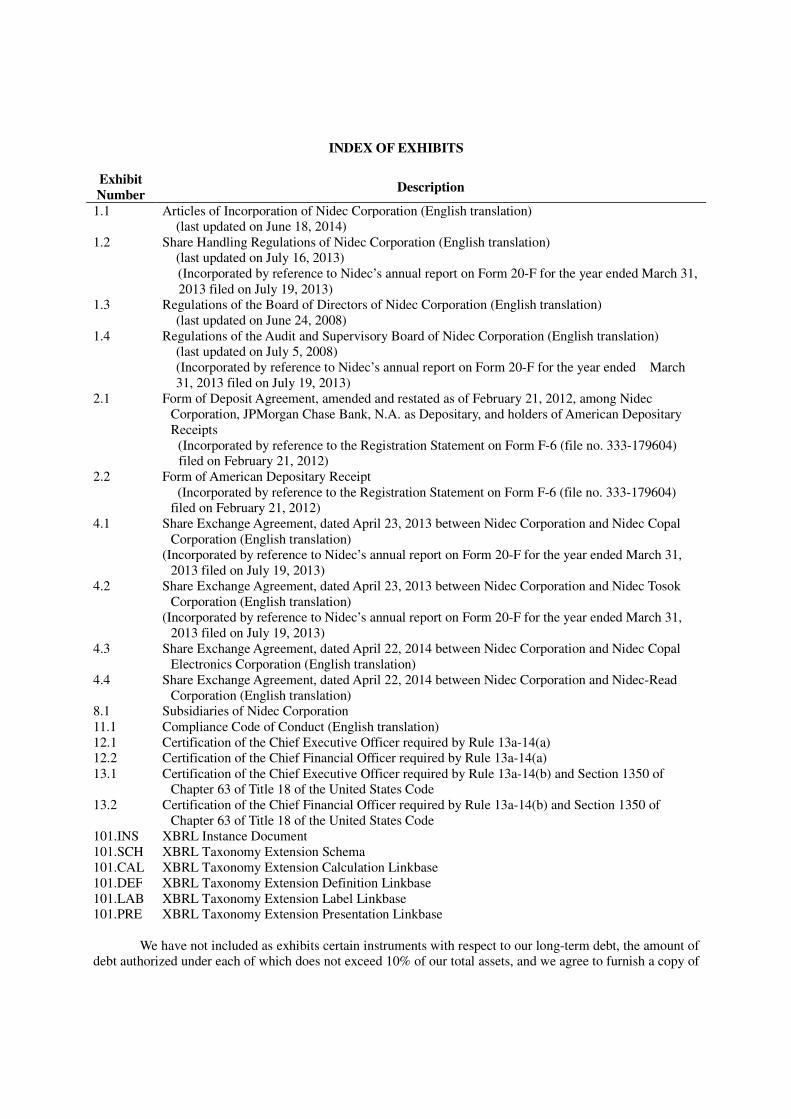
INDEX OF EXHIBITS
Exhibit
Number Description
1.1 Articles of Incorporation of Nidec Corporation (English translation) (last updated on June 18, 2014)
1.2 Share Handling Regulations of Nidec Corporation (English translation) (last updated on July 16, 2013)
(Incorporated by reference to Nidec’s annual report on Form 20-F for the year ended March 31, 2013 filed on July 19, 2013)
1.3 Regulations of the Board of Directors of Nidec Corporation (English translation) (last updated on June 24, 2008)
1.4 Regulations of the Audit and Supervisory Board of Nidec Corporation (English translation) (last updated on July 5, 2008) (Incorporated by reference to Nidec’s annual report on Form 20-F for the year ended March
31, 2013 filed on July 19, 2013) 2.1 Form of Deposit Agreement, amended and restated as of February 21, 2012, among Nidec
Corporation, JPMorgan Chase Bank, N.A. as Depositary, and holders of American Depositary Receipts
(Incorporated by reference to the Registration Statement on Form F-6 (file no. 333-179604) filed on February 21, 2012)
2.2 Form of American Depositary Receipt (Incorporated by reference to the Registration Statement on Form F-6 (file no. 333-179604)
filed on February 21, 2012) 4.1 Share Exchange Agreement, dated April 23, 2013 between Nidec Corporation and Nidec Copal
Corporation (English translation) (Incorporated by reference to Nidec’s annual report on Form 20-F for the year ended March 31,
2013 filed on July 19, 2013) 4.2 Share Exchange Agreement, dated April 23, 2013 between Nidec Corporation and Nidec Tosok
Corporation (English translation) (Incorporated by reference to Nidec’s annual report on Form 20-F for the year ended March 31,
2013 filed on July 19, 2013) 4.3 Share Exchange Agreement, dated April 22, 2014 between Nidec Corporation and Nidec Copal
Electronics Corporation (English translation) 4.4 Share Exchange Agreement, dated April 22, 2014 between Nidec Corporation and Nidec-Read
Corporation (English translation) 8.1 Subsidiaries of Nidec Corporation 11.1 Compliance Code of Conduct (English translation) 12.1 Certification of the Chief Executive Officer required by Rule 13a-14(a) 12.2 Certification of the Chief Financial Officer required by Rule 13a-14(a) 13.1 Certification of the Chief Executive Officer required by Rule 13a-14(b) and Section 1350 of
Chapter 63 of Title 18 of the United States Code 13.2 Certification of the Chief Financial Officer required by Rule 13a-14(b) and Section 1350 of
Chapter 63 of Title 18 of the United States Code 101.INS XBRL Instance Document 101.SCH XBRL Taxonomy Extension Schema 101.CAL XBRL Taxonomy Extension Calculation Linkbase 101.DEF XBRL Taxonomy Extension Definition Linkbase 101.LAB XBRL Taxonomy Extension Label Linkbase 101.PRE XBRL Taxonomy Extension Presentation Linkbase
We have not included as exhibits certain instruments with respect to our long-term debt, the amount of
debt authorized under each of which does not exceed 10% of our total assets, and we agree to furnish a copy of

any such instrument to the U.S. Securities and Exchange Commission upon request.
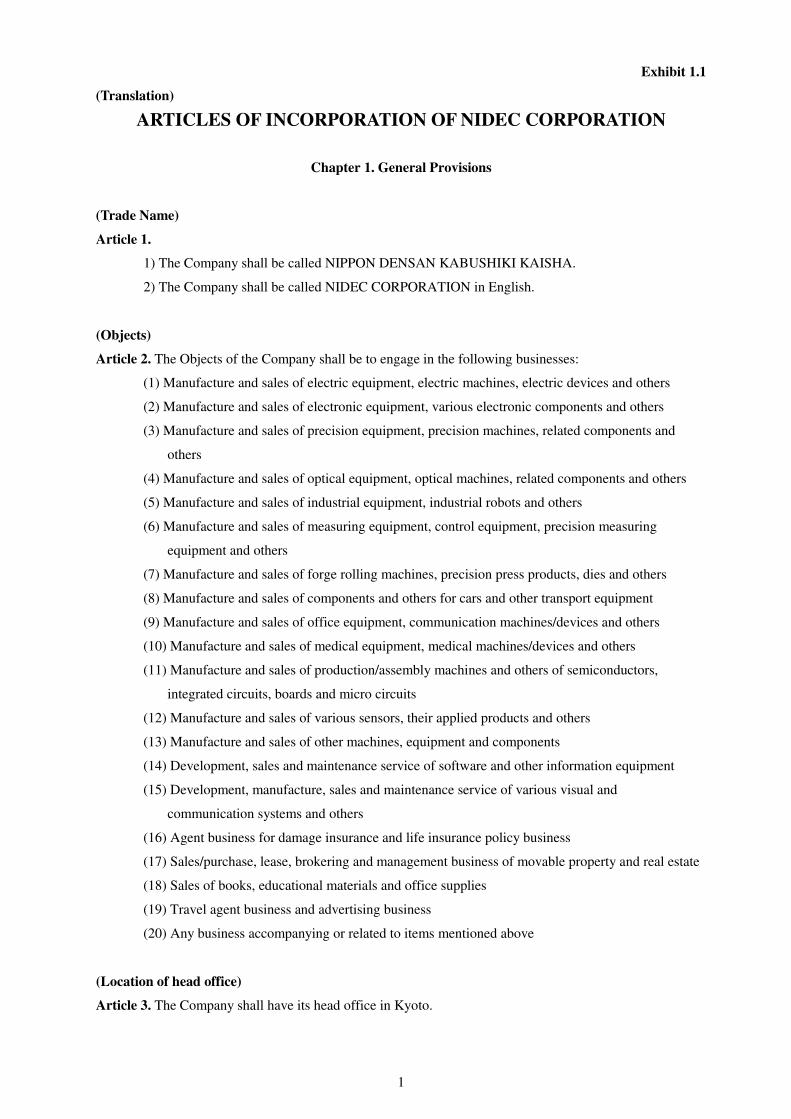
1
Exhibit 1.1
(Translation)
ARTICLES OF INCORPORATION OF NIDEC CORPORATION
Chapter 1. General Provisions
(Trade Name)
Article 1.
1) The Company shall be called NIPPON DENSAN KABUSHIKI KAISHA.
2) The Company shall be called NIDEC CORPORATION in English.
(Objects)
Article 2. The Objects of the Company shall be to engage in the following businesses:
(1) Manufacture and sales of electric equipment, electric machines, electric devices and others
(2) Manufacture and sales of electronic equipment, various electronic components and others
(3) Manufacture and sales of precision equipment, precision machines, related components and
others
(4) Manufacture and sales of optical equipment, optical machines, related components and others
(5) Manufacture and sales of industrial equipment, industrial robots and others
(6) Manufacture and sales of measuring equipment, control equipment, precision measuring
equipment and others
(7) Manufacture and sales of forge rolling machines, precision press products, dies and others
(8) Manufacture and sales of components and others for cars and other transport equipment
(9) Manufacture and sales of office equipment, communication machines/devices and others
(10) Manufacture and sales of medical equipment, medical machines/devices and others
(11) Manufacture and sales of production/assembly machines and others of semiconductors,
integrated circuits, boards and micro circuits
(12) Manufacture and sales of various sensors, their applied products and others
(13) Manufacture and sales of other machines, equipment and components
(14) Development, sales and maintenance service of software and other information equipment
(15) Development, manufacture, sales and maintenance service of various visual and
communication systems and others
(16) Agent business for damage insurance and life insurance policy business
(17) Sales/purchase, lease, brokering and management business of movable property and real estate
(18) Sales of books, educational materials and office supplies
(19) Travel agent business and advertising business
(20) Any business accompanying or related to items mentioned above
(Location of head office)
Article 3. The Company shall have its head office in Kyoto.
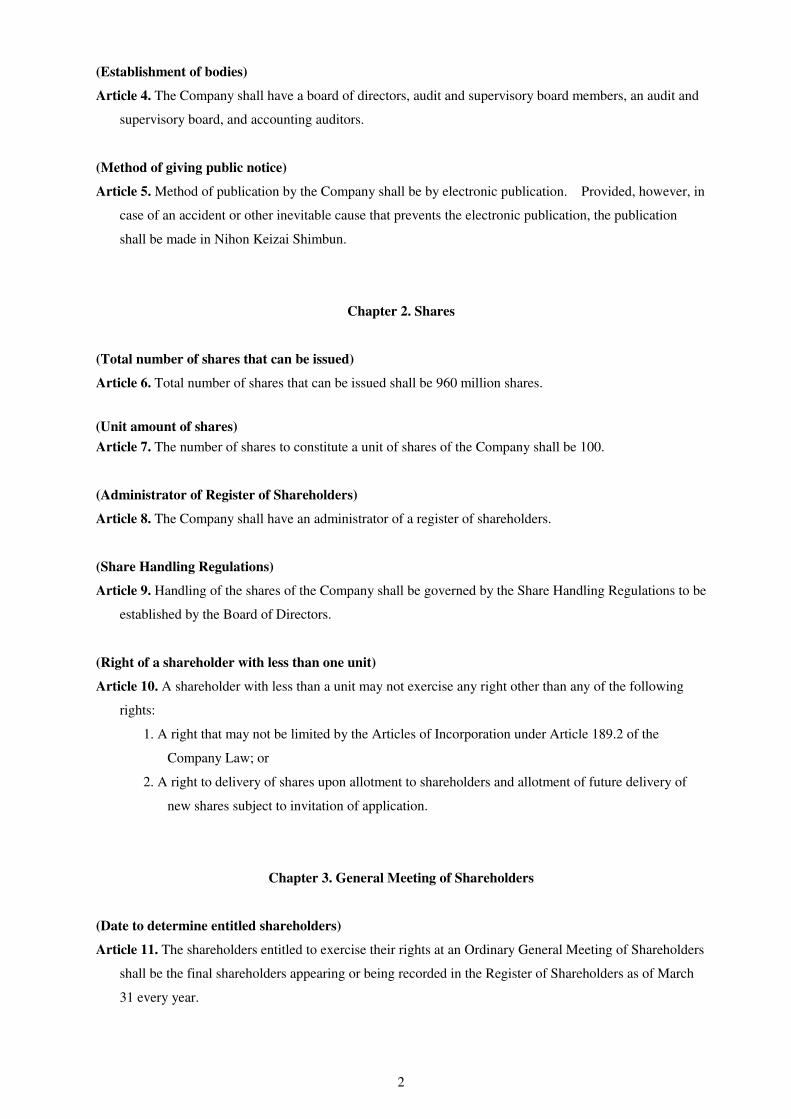
2
(Establishment of bodies)
Article 4. The Company shall have a board of directors, audit and supervisory board members, an audit and
supervisory board, and accounting auditors.
(Method of giving public notice)
Article 5. Method of publication by the Company shall be by electronic publication. Provided, however, in
case of an accident or other inevitable cause that prevents the electronic publication, the publication
shall be made in Nihon Keizai Shimbun.
Chapter 2. Shares
(Total number of shares that can be issued)
Article 6. Total number of shares that can be issued shall be 960 million shares.
(Unit amount of shares)
Article 7. The number of shares to constitute a unit of shares of the Company shall be 100.
(Administrator of Register of Shareholders)
Article 8. The Company shall have an administrator of a register of shareholders.
(Share Handling Regulations)
Article 9. Handling of the shares of the Company shall be governed by the Share Handling Regulations to be
established by the Board of Directors.
(Right of a shareholder with less than one unit)
Article 10. A shareholder with less than a unit may not exercise any right other than any of the following
rights:
1. A right that may not be limited by the Articles of Incorporation under Article 189.2 of the
Company Law; or
2. A right to delivery of shares upon allotment to shareholders and allotment of future delivery of
new shares subject to invitation of application.
Chapter 3. General Meeting of Shareholders
(Date to determine entitled shareholders)
Article 11. The shareholders entitled to exercise their rights at an Ordinary General Meeting of Shareholders
shall be the final shareholders appearing or being recorded in the Register of Shareholders as of March
31 every year.
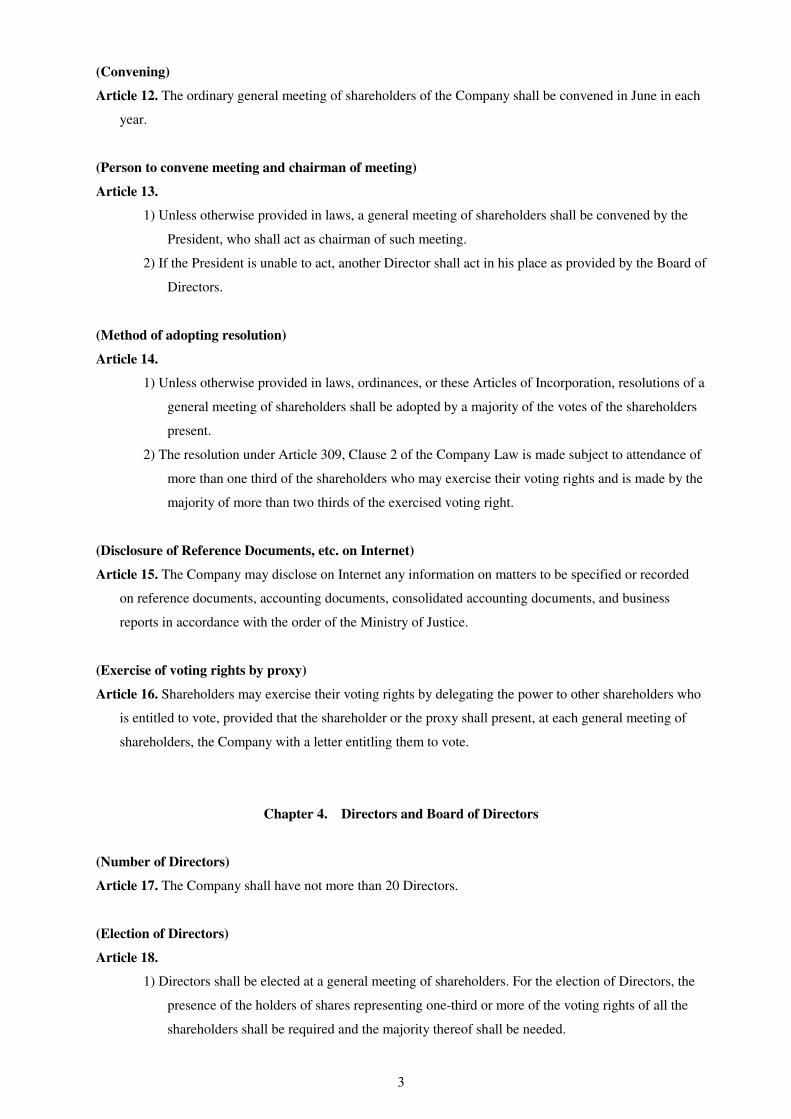
3
(Convening)
Article 12. The ordinary general meeting of shareholders of the Company shall be convened in June in each
year.
(Person to convene meeting and chairman of meeting)
Article 13.
1) Unless otherwise provided in laws, a general meeting of shareholders shall be convened by the
President, who shall act as chairman of such meeting.
2) If the President is unable to act, another Director shall act in his place as provided by the Board of
Directors.
(Method of adopting resolution)
Article 14.
1) Unless otherwise provided in laws, ordinances, or these Articles of Incorporation, resolutions of a
general meeting of shareholders shall be adopted by a majority of the votes of the shareholders
present.
2) The resolution under Article 309, Clause 2 of the Company Law is made subject to attendance of
more than one third of the shareholders who may exercise their voting rights and is made by the
majority of more than two thirds of the exercised voting right.
(Disclosure of Reference Documents, etc. on Internet)
Article 15. The Company may disclose on Internet any information on matters to be specified or recorded
on reference documents, accounting documents, consolidated accounting documents, and business
reports in accordance with the order of the Ministry of Justice.
(Exercise of voting rights by proxy)
Article 16. Shareholders may exercise their voting rights by delegating the power to other shareholders who
is entitled to vote, provided that the shareholder or the proxy shall present, at each general meeting of
shareholders, the Company with a letter entitling them to vote.
Chapter 4. Directors and Board of Directors
(Number of Directors)
Article 17. The Company shall have not more than 20 Directors.
(Election of Directors)
Article 18.
1) Directors shall be elected at a general meeting of shareholders. For the election of Directors, the
presence of the holders of shares representing one-third or more of the voting rights of all the
shareholders shall be required and the majority thereof shall be needed.
4
2) For the election of Directors, no cumulative voting shall be used.
(Term of office of Directors)
Article 19.
1) The term of office of Directors shall expire at the close of the ordinary general meeting of
shareholders for the business year to terminate within one year after their appointment.
2) The term of office of Directors elected to increase their number or to fill vacancies shall be the
same with the unexpired balance of the term of office of the other Directors currently in office.
(Representative Directors and Directors with specific titles)
Article 20.
1) The Board of Directors shall appoint Representative Directors from among the directors.
2) By resolution of the Board of Directors, the Company may appoint one board Chairman, one or
more board Vice Chairman, one President and one or more Executive Vice Presidents, Senior
Managing Directors and Managing Directors.
(Person to convene the Board of Directors and chairman of meeting)
Article 21.
1) Unless otherwise provided in laws, the Board of Directors shall be convened by the President
who shall be chairman of the meeting.
2) If the President is unable to act, another Director shall act in his place as provided by the Board of
Directors.
(Notice of meeting of the Board of Directors)
Article 22. Notice for convening a meeting of the Board of Directors shall be dispatched to each Director
and each Audit and Supervisory Board Member three days prior to the date of the meeting; provided,
however, that such period of notice may be shortened in case of urgency.
(Resolution of the a Meeting of the Board of Directors)
Article 23.
1) For resolution of the Board of Directors, the presence of a majority of Directors who may join the
deliberation of such matter shall be required. And the resolution thereof shall be adopted by a
majority of Directors present.
2) If a director proposes any matter subject to resolution by the Board of Directors, the matter shall
be deemed as resolved and approved by the Board of Directors if all of the directors who can
participate in the resolution consent by written or electro-magnetic record and any of the Audit
and Supervisory Board Members shall not raise an objection.
5
Chapter 5. Audit and Supervisory Board Members and Audit and Supervisory Board
(Number of Audit and Supervisory Board Members)
Article 24. The Company shall have not more than five Audit and Supervisory Board Members.
(Election of Audit and Supervisory Board Members)
Article 25. Audit and Supervisory Board Members shall be elected upon attendance of one third or more of
shareholders who may exercise their voting rights at a general meeting of shareholders and the majority
thereof shall be needed.
(Term of office of Audit and Supervisory Board Members)
Article 26.
1) The term of office of Audit and Supervisory Board Members shall expire at the close of the
ordinary general meeting of shareholders for a business year last to occur within four years after
their appointment.
2) The term of office of Audit and Supervisory Board Members elected to fill vacancies shall be the
same with the unexpired balance of the term of the retired Audit and Supervisory Board
Members.
(Full-time Audit and Supervisory Board Members)
Article 27. The Audit and Supervisory Board Members shall appoint a full time Audit and Supervisory
Board Member or Audit and Supervisory Board Members from among their members.
(Notice of meeting of the Audit and Supervisory Board)
Article 28. Notice for convening a meeting of the Audit and Supervisory Board shall be dispatched to each
Audit and Supervisory Board Member three days prior to the date of the meeting; provided, however,
that such period of notice may be shortened in case of urgency.
(Resolution of the Audit and Supervisory Board)
Article 29. Unless otherwise provided in laws, for resolutions of the Audit and Supervisory Board, a
majority of Audit and Supervisory Board Members shall be required.
Chapter 6. Release from Liabilities of Outside Directors and Audit and Supervisory Board Members
(Release in part of Compensation of Damage)
Article 30. The Company may execute with an outside Director(s) and Audit and Supervisory Board
Member(s) an agreement on liability of compensation of damage to the Company. Provided, however,
that the maximum limit of the compensation shall be 8 million Yen or more, or the amount fixed by the
law, whichever is higher.
6
Chapter 7. Accounts
(Business year)
Article 31. The business year of the Company shall begin on April 1 in each year and end on March 31 in
the following year.
(Body to determine distribution of surplus)
Article 32. The Company may distribute surplus and execute other matters stipulated in the items of Article
459-1 of the Company Law of Japan upon resolution of the Board of Directors in accordance with the
laws and regulations.
(Date to determine the distribution of dividend)
Article 33. Dividend of profit at the end of the year may be distributed to the shareholders or registered
pledgees appearing or being registered in the Register of Shareholders as of March 31 in each year, and
interim dividend as of September 30 every year.
(Period of limitations)
Article 34. The Company shall be relieved of the obligation to pay any dividend of profit at the end of the
year or interim dividend upon expiration of three years from the day on which such dividend became
first due and payable. Further the Company shall not pay any interest on dividend of profit or interim
dividend.
Exhibit 1.3
(Translation)
NIDEC CORPORATION
REGULATIONS OF THE BOARD OF DIRECTORS
(As amended on June 24, 2008)
(Purpose)
Article 1. The purpose of these regulations is to provide for the functions and powers of the board of
directors of the company and the procedures for conducting its meeting and thereby to
attain reasonable conduct of its meetings.
2. The matters relating to the board of directors shall be governed by these regulations as
well as by laws, ordinances or the articles of incorporation.
(Treatment of doubts)
Article 2. Any doubt that may arise in connection with the administration of these regulations shall
be dealt with by resolution of the board of directors.
(Composition)
Article 3. The board of directors shall be composed of all of the directors. Statutory auditors have
to be present and give their opinions at any meeting of the board of directors if need were.
(Time of holding meetings)
Article 4. The meetings of the board of directors shall consist of ordinary meetings and
extraordinary meetings.
2. Ordinary meetings of the board of directors shall be held once every month and
extraordinary meetings of the board of directors shall be held whenever the necessity
arises.
3. The ordinary meetings of the board of directors mentioned in the preceding paragraph
may be postponed or called off depending on the circumstances; provided, however, that
such meetings shall not be called off consecutively for three months.
(Person having convening power)
Article 5. Each meeting of the board of directors shall be convened by the president. If the president
is unable to act, another director shall act in his place in the order previously determined
by the board of directors.
2. Any directors may request the convening of a meeting of the board of directors by
presenting to the person having convening power mentioned in the preceding paragraph a
document setting forth the matters to be considered and the reasons therefor.
(Convening procedure)
Article 6. Notice for convening a meeting under the preceding article shall be dispatched not later
than three days prior to the date of the meeting; provided, however, that such period of
notice may be shortened in case of urgency.
2. If consented to by all the directors and the statutory auditors, a meeting of the board of
directors may be held without following the convening procedure.
(Chairman)
Article 7. Chairmanship of each meeting of the board of directors shall be assumed by the president.
If the president is unable to act, another director shall act in his place in the order
previously determined by the board of directors.
(Attendance by counselors, etc)
Article 8. If the board of directors deems it necessary, it may require the counselors and other
persons to attend its meeting and give their reports or opinions.
(Method of adopting resolutions)
Article 9. Resolutions of the board of directors shall be adopted at its meeting at which a majority of
the directors shall be present, by a majority of the directors so present.
2. Directors interested in any of the resolutions mentioned in the preceding paragraph can
not participate in such resolution. In that case, the number of such directors shall not be
counted in the number of directors present.
3. In cases where a director makes a proposal on a matter to be resolved in a meeting of the
board of directors, if all directors who can join the resolution of the matter express their
approval on the proposal in writing or by electromagnetic record, and if statutory auditors
do not object to the proposal, the resolution of the proposal shall be regarded as approved.
(Matters to be submitted)
Article 10. The matters to be submitted to the board of directors for consideration shall be as
follows;
1. Statutory matters:
(1) Establishment, removal or abolition of head office or branch offices.
(2) Decision on the convening of a general meeting of shareholders and the matters to be
submitted thereto.
(3) Appointment and removal of representative directors and directors with specific titles.
(4) Approval of directors competitive transactions.
(5) Approval of transactions between directors and the company
(6) Decision on the matters relating to the issuance of shares, bonds, acquisition rights of
shares and bonds with acquisition rights of shares.
(7) Decision on the matters relating to the capitalization of legal reserves and the issuance of
shares for free distribution.
(8) Decision on the matters relating to dividends of surplus.
(9) Decision on the matters relating to a subdivision of shares.
(10) Selection, removal and change of a manager of the register of shareholders and its
business office.
(11) Decision on the record date of the register of shareholders.
(12) Decision on the matters relating to purchase of own shares.
(13) Decision on the matters relating to dispose of own shares, purchase of own shares from
subsidiaries and depreciation of own shares.
(14) Decision on the matters relating to decrease of number of shares (one unit) or to abolish
the rule of number.
(15) Such other matter as the board of directors may deem important.
2. Important matters relating to business:
(1) Matters relating to the incorporation of affiliated companies.
(2) Matters relating to business cooperation or joint ventures with other companies.
(3) Decision on new projects (meaning those requiring amendment of the articles of
incorporation and those requiring no such amendment but requiring investment of ¥100
million or more in each instance).
(4) Such other matters as the board of directors may deem necessary.
3. Matters relating to accounting:
(1) Approval of accounting documents and their accompanying detailed statements.
(2) Approval of proposed appropriation of profits or losses.
(3) Monthly financial report.
(4) Compilation and drafting of annual business plans.(statement income, balance sheet,
manpower planning, cash flow planning, borrowed money planning)
(5) Establishment of borrowing limits and determination of borrowings over such limits.
(6) Establishment of limits to acquisition of securities, a acquisition, pledge, loans and
disposition of securities above such limits.
(7) Acquisition, repair and disposition of fixed assets and important property worth ¥300
million in each instance.
(8) Making investment of ¥300 million or more in each instance.
(9) Lending of assets or making loans or giving guarantee or offering a mortgage of
obligations worth ¥300 million or more in each instance.
(10) Borrowing or leasing of assets worth ¥300 million or more in each instance.
(11) Adjustment, release from obligations in respect of bad debts of ¥20 million or more in
each instance.
(12) Such other matter as the board of directors may deem necessary.
4. Matters relating to personnel affairs:
(1) Selection of directors with specific titles.
(2) Appointment and removal of executive officers.
(3) Selection and removal of executive officers with specific titles.
(4) Such other matter as the board of directors may deem important.
5. Others:
(1) Institution and defense of legal actions of managerial importance, policies for settling such
actions and selection of counsels.
(2) Making court settlement or withdrawal of suits of managerial importance, and settlement
policies and settlement of disputes of managerial importance.
(3) Approval of establishment, amendment or repeal of important rules and regulations (e.g.,
the share handling regulations, the regulations of the board of directors, the executive
officers regulations, the proposal processing regulations, company regulations concerning
insider trading, the CSR regulations, compliance regulations, risk management regulations).
(4) Other matters provided for in laws, ordinances or the articles of incorporation and such
other matter as the board of directors may deem important.
(Ratification)
Article 11. If there arises any matter which can not be submitted to the board of directors for
consideration because it requires an urgent action or for any other unavoidable cause,
representative directors may take such action as they may deem fit, notwithstanding the
provisions of article 9. In that case, ratification of the board of directors must be sought at
its next meeting.
(Reporting)
Article 12. The president shall report to the board of directors the state of execution of business of
the company and other necessary matters at least once every three months; provided,
however, that depending on the case, the president may cause such report to be made by
other directors in charge of the business in question.
2. A director who has made a competitive transaction or a transaction with the company shall
report to the board of directors the important facts about such transaction without delay.
(Minutes)
Article 13. The proceedings in outline and the resultant actions taken at each meeting of the board of
directors shall be recorded in minutes and the directors and statutory auditors present shall
affix their names and seals thereto and such minutes shall be kept on file at the company
permanently.
2. If a matter is approved in writing in a meeting of the board of directors, the documents or
electronic medium where the directors expressed their opinions on the matter shall be kept
on file at the company for ten (10) years.
(Secretariat)
Article 14. The administrative affairs relating to the board of directors shall be under the charge of
the manager of the general affairs department and the minutes shall be kept on file at the
general affairs department.
(Amendment and repeal)
Article 15. Any amendment or repeal of these regulations shall be made by resolution of the board
of directors.
1
Exhibit 4.3
(Translation)
Share Exchange Agreement
Nidec Corporation (hereinafter, “Nidec”) and Nidec Copal Electronics Corporation (hereinafter, “Nidec Copal Electronics”) hereby conclude a Share Exchange Agreement (hereinafter, “the Agreement”) as detailed below.
Article 1 Exchange of Shares
In accordance with the provisions of the Agreement, Nidec and Nidec Copal Electronics shall undertake an exchange of shares (hereinafter: “the Share Exchange”) in which Nidec Copal Electronics becomes a wholly owned subsidiary of Nidec. As a result of the Share Exchange, Nidec shall acquire all the outstanding shares in Nidec Copal Electronics.
Article 2 Names and Registered Addresses of Parties to Share Exchange
The names and registered addresses of Nidec and Nidec Copal Electronics are presented below.
(1) Nidec
1) Name: Nidec Corporation
2) Address: 338 Kuzetonoshiro-cho, Minami-ku, Kyoto, Japan
(2) Nidec Copal Electronics
1) Name: Nidec Copal Electronics Corporation
2) Address: 7-5-25, Nishi-Shinjuku, Shinjuku-ku, Tokyo, Japan
Article 3 Effective Date
The effective date of the Share Exchange shall be October 1, 2014. In accordance with the provisions of Article 790 of the Companies Act, this date can be altered by mutual agreement between Nidec and Nidec Copal Electronics if it is deemed necessary to ensure that the Share Exchange proceeds. In such event, Nidec Copal Electronics shall publish the revised effective date no later than the day prior to the original effective date (or the day prior to the revised effective date, if the latter is earlier than the original effective date).
Article 4 Number and Allocation of Shares to Effect the Share Exchange
1. Nidec shall grant a number of shares of Nidec common stock equivalent to the total number of shares of common stock in Nidec Copal Electronics owned by Nidec Copal Electronics minority shareholders (hereinafter: “Final Shareholders”) registered at the time (hereinafter: “Cut-Off Date”) immediately prior to Nidec’s acquisition via the Share Exchange of all outstanding shares in Nidec Copal Electronics, multiplied by 0.138 (rounding down any fractional amount of less than one share) to the Final Shareholders in exchange for their shares in Nidec Copal Electronics.
2. To implement the Share Exchange, Nidec shall allocate to every Final Shareholder 0.138 shares of Nidec common stock for every share of common stock in Nidec Copal Electronics owned by the shareholder in question.
2
3. Fractional amounts of less than one share of Nidec common stock that are allocated to Final Shareholders through the Share Exchange shall be handled in accordance with the provisions of Article 234 of the Companies Act.
Article 5 Effect on Capital and Reserves
The increases in the capital and reserves of Nidec resulting from the Share Exchange shall be as follows:
(1) Capital stock: ¥0
(2) Legal capital surplus: Change in shareholders’ equity as stipulated in Article 39 of the Corporate Accounting Regulations
(3) Legal retained earnings: ¥0
Article 6 Approval Procedures
1. In accordance with the provisions of Article 796 Paragraph 3 of the Companies Act, Nidec shall conduct the Share Exchange without gaining the consent of Nidec shareholders via a resolution of a General Meeting of Shareholders. However, in accordance with the provisions of Article 796 Paragraph 4 of the Companies Act, if the consent of Nidec shareholders is required, Nidec shall put the necessary resolutions regarding approval of the Agreement and the Share Exchange before Nidec shareholders at a General Meeting of Shareholders to be held no later than the day prior to the effective date of the Share Exchange.
2. Nidec Copal Electronics shall put the necessary resolutions regarding approval of the Agreement and the Share Exchange before Nidec Copal Electronics shareholders at the General Meeting of Shareholders to be held on June 20, 2014. This arrangement can be altered by mutual agreement between Nidec and Nidec Copal Electronics if it is deemed necessary to ensure that the Share Exchange proceeds.
Article 7 Sale of Treasury Stock
As of the Cut-Off Date, Nidec Copal Electronics shall cancel all shares of treasury stock it owns as of the Cut-Off Date (including any treasury shares acquired from dissenting shareholders exercising their appraisal rights in connection with the Share Exchange, as stipulated in Article 785 Paragraph 1 of the Companies Act) by resolution of a meeting of its Board of Directors to be held no later than the day prior to the effective date of the Share Exchange.
Article 8 Management of Corporate Assets
During the period from the date of the Agreement to the day prior to the effective date of the Share Exchange, Nidec and Nidec Copal Electronics shall execute their respective business operations and manage their respective financial assets in good faith, and shall seek to gain prior mutual agreement for any actions with a significant material impact on these financial assets or related rights and obligations.
Article 9 Changes in the Share Exchange and Cancellation of the Agreement
During the period from the date of the Agreement to the day prior to the effective date of the Share Exchange, based on mutual discussion, Nidec or Nidec Copal Electronics may seek to change the terms of or cancel the Agreement if there are any materially adverse changes in the financial assets or business condition of either party, or if any serious deterrent to implementation of the Share Exchange or other circumstances obstructing achievement of the objectives of the Agreement should arise. Article 10 Validity of the Agreement
3
The Agreement shall be invalidated if the parties fail to gain the necessary consent for the Share Exchange based on the approval procedures stipulated in Article 6, or otherwise fail to gain the requisite permission, registration or other form of regulatory approval from the responsible authorities.
Article 11 Negotiation of Terms
In accordance with the purposes of the Agreement, any terms required for the Share Exchange other than those already stipulated in the Agreement shall be determined based on negotiations conducted in good faith between the parties.
Two copies of the Agreement shall be prepared, and representatives of both parties shall sign each copy, with each party retaining a single signed copy of the Agreement.
April 22, 2014
Shigenobu Nagamori
Chairman of the Board, President & Chief Executive Officer Nidec Corporation 338 Kuzetonoshiro-cho, Minami-ku, Kyoto, Japan Sho Kikuchi
President Nidec Copal Electronics Corporation 7-5-25, Nishi-Shinjuku, Shinjuku-ku, Tokyo, Japan
Exhibit 4.4
(Translation)
Share Exchange Agreement
Nidec Corporation (“Nidec”) and Nidec-Read Corporation (“Nidec-Read”) hereby enter into this Share Exchange
Agreement (this “Agreement”).
Article 1: Share Exchange
Nidec and Nidec-Read shall execute a share exchange (the “Share Exchange”) with Nidec becoming the
wholly-owning parent company of Nidec-Read and Nidec-Read becoming the wholly-owned subsidiary of Nidec
in accordance with this Agreement, and Nidec will acquire all outstanding shares of Nidec-Read pursuant to the
Share Exchange.
Article 2: Trade Names and Addresses of Nidec and Nidec-Read
The trade names and addresses of Nidec and Nidec-Read are as set forth below.
(1) Nidec
1. Trade name: Nidec Corporation
2. Address: 338 Tonoshiro-cho, Kuze, Minami-ku, Kyoto
(2) Nidec-Read
1. Trade name: Nidec-Read Corporation
2. Address: 10 Tsutsumisoto-cho, Nishikyogoku, Ukyo-ku, Kyoto
Article 3: Effective Date
The effective date of the Share Exchange shall be October 1, 2014; provided, however, that the effective date may
be modified upon consultations between Nidec and Nidec-Read if necessary based on the progress of the Share
Exchange procedures in accordance with Article 790 of the Companies Act. In this case, Nidec-Read shall give
public notice of the modified effective date by the day before the pre-modification effective date (if the modified
effective date is before the pre-modification effective date, then the modified effective date).
Article 4: Matters relating to the Number of Shares Granted and Allocation of Shares Pursuant to the
Share Exchange
1. When executing the Share Exchange, in exchange for Nidec-Read common stock, Nidec shall grant Nidec
common stock equal to the number of Nidec-Read common shares owned multiplied by 0.243 (fractions less
than one share shall be rounded down) to Nidec-Read shareholders of record (excluding Nidec; referred to as
“Shareholders at the Reference Time”) immediately prior to the acquisition of all Nidec-Read issued shares
by Nidec pursuant to the Share Exchange (the “Reference Time”).
2. When executing the Share Exchange, Nidec shall allocate the Nidec common stock to Shareholders at the
Reference Time at a rate of 0.243 shares of Nidec common stock for each one share of Nidec-Read common
stock owned.
3. When executing the Share Exchange, if any of Nidec-Read shareholder receives fractional shares of less than
one share of Nidec common stock as a result of allocation pursuant to the preceding subsection at the
Reference Time, Nidec shall handle such fractional shares in accordance with Article 234 of the Companies
Act.
Article 5: Matters relating to Capital and Reserves
The amounts of Nidec’s capital and reserves to be increased in conjunction with the Share Exchange are set forth
below.
Capital: Zero (0) yen
Capital reserves: Amount of change in shareholder’s equity stipulated in Article 39 of the Corporate
Accounting Rules
Retained earnings reserve: Zero (0) yen
Article 6: Approval Procedures
1. Pursuant to Article 796, Paragraph 3 of the Companies Act, Nidec shall execute the Share Exchange without
obtaining approval of this Agreement by resolution of its general shareholders meeting; provided, however,
that if approval of Nidec’s general shareholders meeting is required pursuant to Article 796, Paragraph 4 of
the Companies Act, Nidec shall seek approval of this Agreement and the adoption of resolutions concerning
necessary matters from its general shareholders meeting by the day before the effective date.
2. Nidec-Read shall seek approval of this Agreement and the adoption of resolutions concerning matters
necessary for the Share Exchange at its ordinary general shareholders meeting scheduled for June 17, 2014;
provided, however, that this may be modified upon consultation between Nidec and Nidec-Read if necessary
according to the progress of the Share Exchange procedures.
Article 7: Handling of Treasury Shares
Nidec-Read shall cancel all treasury shares (including any treasury shares acquired from dissenting shareholders
exercising their purchase demand rights in connection with the Share Exchange pursuant to Article 785, Paragraph
1 of the Companies Act) that it holds as of the Reference Time effective as of the Reference Time by resolution of
Nidec-Read’s board of directors adopted at a meeting to be held by the day before the effective date.
Article 8: Management of Corporate Assets
Nidec and Nidec-Read shall conduct operations and manage and administer their assets with the due care of a good
manager from the day of execution of this Agreement until the day before the effective date of the Share Exchange,
and any conduct that will have a material impact on those assets and rights and duties shall be performed upon
consultation and agreement between Nidec and Nidec-Read.
Article 9: Modification of the Share Exchange Conditions and Cancellation of this Agreement
If during the period from the date of execution of this Agreement until the day before the effective date of the Share
Exchange any material changes to the assets or management status of Nidec or Nidec-Read occur, any
circumstances that would materially impede execution of the Share Exchange occur, or it otherwise becomes
difficult to achieve the objectives of this Agreement, upon consultation between Nidec and Nidec-Read, the share
exchange conditions may be modified or this Agreement may be canceled.
Article 10: Effectiveness of this Agreement
If any lawful institutional decisions of Nidec or Nidec-Read specified in Article 6 or permits, licenses, registrations,
approvals, and the like from the competent authorities necessary for the execution of the Share Exchange cannot be
obtained, this Agreement shall cease to be effective.
Article 11: Consultation Matters
Further to the provisions of this Agreement, Nidec and Nidec-Read shall engage in consultations and make a
determination in accordance with the intent of this Agreement concerning any necessary matters relating to the
Share Exchange.
IN WITNESS WHEREOF, this Agreement shall be prepared in duplicate, and following execution by Nidec and
Nidec-Read, each shall retain one copy.
April 22, 2014
Nidec:
Nidec Corporation
338 Tonoshiro-cho, Kuze, Minami-ku, Kyoto
By: Shigenobu Nagamori, Chairman of the Board, President and Chief Executive Officer

Nidec-Read:
Nidec-Read Corporation
10 Tsutsumisoto-cho, Nishikyogoku, Ukyo-ku, Kyoto
By: Michio Kaida, President and COO
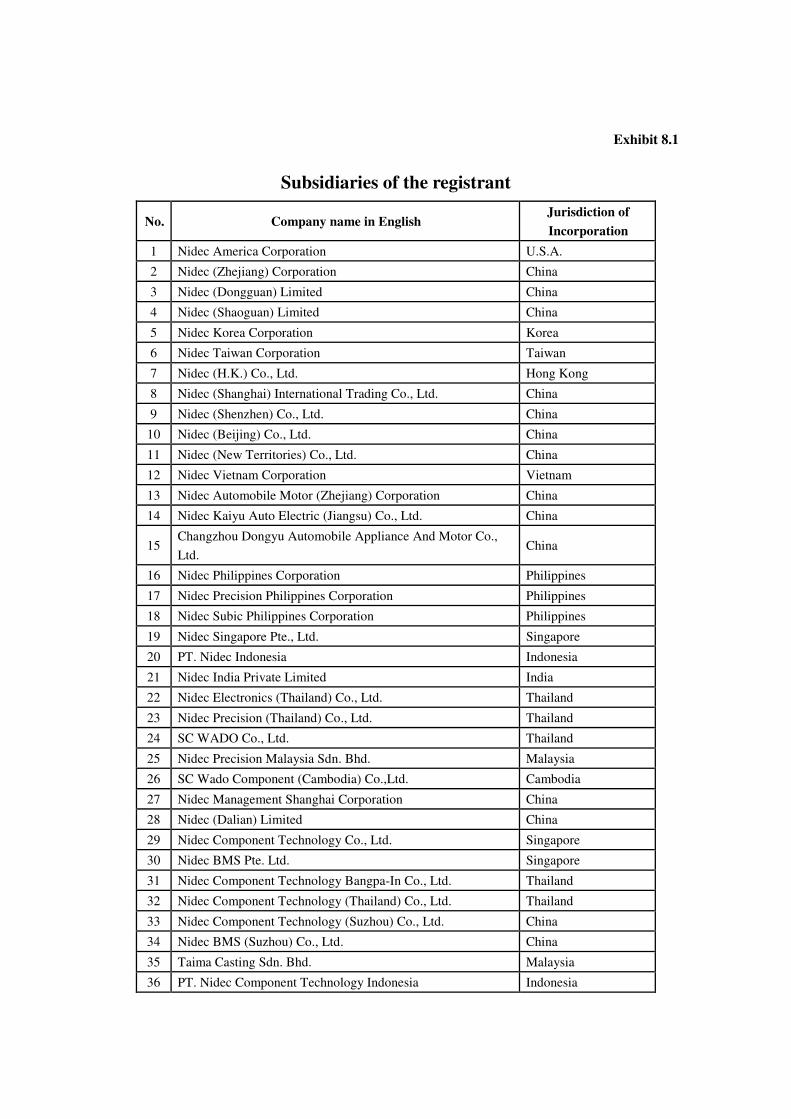
Exhibit 8.1
Subsidiaries of the registrant
No. Company name in English Jurisdiction of
Incorporation
1 Nidec America Corporation U.S.A.
2 Nidec (Zhejiang) Corporation China
3 Nidec (Dongguan) Limited China
4 Nidec (Shaoguan) Limited China
5 Nidec Korea Corporation Korea
6 Nidec Taiwan Corporation Taiwan
7 Nidec (H.K.) Co., Ltd. Hong Kong
8 Nidec (Shanghai) International Trading Co., Ltd. China
9 Nidec (Shenzhen) Co., Ltd. China
10 Nidec (Beijing) Co., Ltd. China
11 Nidec (New Territories) Co., Ltd. China
12 Nidec Vietnam Corporation Vietnam
13 Nidec Automobile Motor (Zhejiang) Corporation China
14 Nidec Kaiyu Auto Electric (Jiangsu) Co., Ltd. China
15 Changzhou Dongyu Automobile Appliance And Motor Co.,
Ltd. China
16 Nidec Philippines Corporation Philippines
17 Nidec Precision Philippines Corporation Philippines
18 Nidec Subic Philippines Corporation Philippines
19 Nidec Singapore Pte., Ltd. Singapore
20 PT. Nidec Indonesia Indonesia
21 Nidec India Private Limited India
22 Nidec Electronics (Thailand) Co., Ltd. Thailand
23 Nidec Precision (Thailand) Co., Ltd. Thailand
24 SC WADO Co., Ltd. Thailand
25 Nidec Precision Malaysia Sdn. Bhd. Malaysia
26 SC Wado Component (Cambodia) Co.,Ltd. Cambodia
27 Nidec Management Shanghai Corporation China
28 Nidec (Dalian) Limited China
29 Nidec Component Technology Co., Ltd. Singapore
30 Nidec BMS Pte. Ltd. Singapore
31 Nidec Component Technology Bangpa-In Co., Ltd. Thailand
32 Nidec Component Technology (Thailand) Co., Ltd. Thailand
33 Nidec Component Technology (Suzhou) Co., Ltd. China
34 Nidec BMS (Suzhou) Co., Ltd. China
35 Taima Casting Sdn. Bhd. Malaysia
36 PT. Nidec Component Technology Indonesia Indonesia
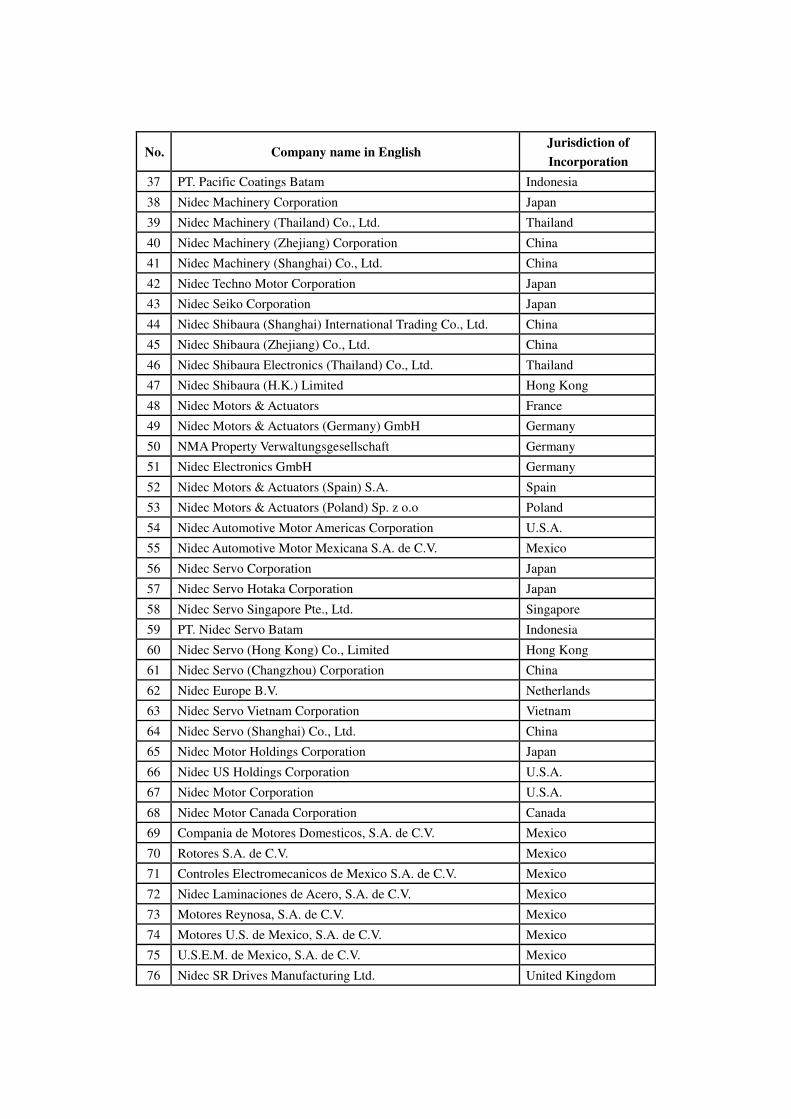
No. Company name in English Jurisdiction of
Incorporation
37 PT. Pacific Coatings Batam Indonesia
38 Nidec Machinery Corporation Japan
39 Nidec Machinery (Thailand) Co., Ltd. Thailand
40 Nidec Machinery (Zhejiang) Corporation China
41 Nidec Machinery (Shanghai) Co., Ltd. China
42 Nidec Techno Motor Corporation Japan
43 Nidec Seiko Corporation Japan
44 Nidec Shibaura (Shanghai) International Trading Co., Ltd. China
45 Nidec Shibaura (Zhejiang) Co., Ltd. China
46 Nidec Shibaura Electronics (Thailand) Co., Ltd. Thailand
47 Nidec Shibaura (H.K.) Limited Hong Kong
48 Nidec Motors & Actuators France
49 Nidec Motors & Actuators (Germany) GmbH Germany
50 NMA Property Verwaltungsgesellschaft Germany
51 Nidec Electronics GmbH Germany
52 Nidec Motors & Actuators (Spain) S.A. Spain
53 Nidec Motors & Actuators (Poland) Sp. z o.o Poland
54 Nidec Automotive Motor Americas Corporation U.S.A.
55 Nidec Automotive Motor Mexicana S.A. de C.V. Mexico
56 Nidec Servo Corporation Japan
57 Nidec Servo Hotaka Corporation Japan
58 Nidec Servo Singapore Pte., Ltd. Singapore
59 PT. Nidec Servo Batam Indonesia
60 Nidec Servo (Hong Kong) Co., Limited Hong Kong
61 Nidec Servo (Changzhou) Corporation China
62 Nidec Europe B.V. Netherlands
63 Nidec Servo Vietnam Corporation Vietnam
64 Nidec Servo (Shanghai) Co., Ltd. China
65 Nidec Motor Holdings Corporation Japan
66 Nidec US Holdings Corporation U.S.A.
67 Nidec Motor Corporation U.S.A.
68 Nidec Motor Canada Corporation Canada
69 Compania de Motores Domesticos, S.A. de C.V. Mexico
70 Rotores S.A. de C.V. Mexico
71 Controles Electromecanicos de Mexico S.A. de C.V. Mexico
72 Nidec Laminaciones de Acero, S.A. de C.V. Mexico
73 Motores Reynosa, S.A. de C.V. Mexico
74 Motores U.S. de Mexico, S.A. de C.V. Mexico
75 U.S.E.M. de Mexico, S.A. de C.V. Mexico
76 Nidec SR Drives Manufacturing Ltd. United Kingdom
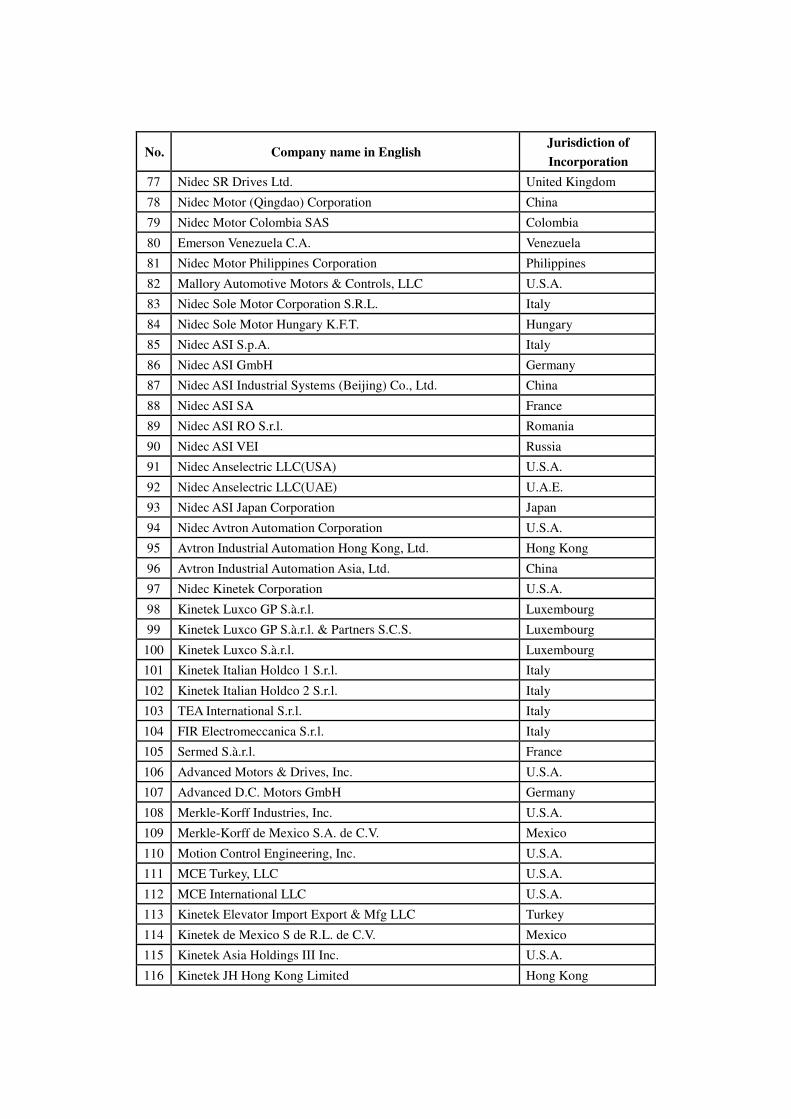
No. Company name in English Jurisdiction of
Incorporation
77 Nidec SR Drives Ltd. United Kingdom
78 Nidec Motor (Qingdao) Corporation China
79 Nidec Motor Colombia SAS Colombia
80 Emerson Venezuela C.A. Venezuela
81 Nidec Motor Philippines Corporation Philippines
82 Mallory Automotive Motors & Controls, LLC U.S.A.
83 Nidec Sole Motor Corporation S.R.L. Italy
84 Nidec Sole Motor Hungary K.F.T. Hungary
85 Nidec ASI S.p.A. Italy
86 Nidec ASI GmbH Germany
87 Nidec ASI Industrial Systems (Beijing) Co., Ltd. China
88 Nidec ASI SA France
89 Nidec ASI RO S.r.l. Romania
90 Nidec ASI VEI Russia
91 Nidec Anselectric LLC(USA) U.S.A.
92 Nidec Anselectric LLC(UAE) U.A.E.
93 Nidec ASI Japan Corporation Japan
94 Nidec Avtron Automation Corporation U.S.A.
95 Avtron Industrial Automation Hong Kong, Ltd. Hong Kong
96 Avtron Industrial Automation Asia, Ltd. China
97 Nidec Kinetek Corporation U.S.A.
98 Kinetek Luxco GP S.à.r.l. Luxembourg
99 Kinetek Luxco GP S.à.r.l. & Partners S.C.S. Luxembourg
100 Kinetek Luxco S.à.r.l. Luxembourg
101 Kinetek Italian Holdco 1 S.r.l. Italy
102 Kinetek Italian Holdco 2 S.r.l. Italy
103 TEA International S.r.l. Italy
104 FIR Electromeccanica S.r.l. Italy
105 Sermed S.à.r.l. France
106 Advanced Motors & Drives, Inc. U.S.A.
107 Advanced D.C. Motors GmbH Germany
108 Merkle-Korff Industries, Inc. U.S.A.
109 Merkle-Korff de Mexico S.A. de C.V. Mexico
110 Motion Control Engineering, Inc. U.S.A.
111 MCE Turkey, LLC U.S.A.
112 MCE International LLC U.S.A.
113 Kinetek Elevator Import Export & Mfg LLC Turkey
114 Kinetek de Mexico S de R.L. de C.V. Mexico
115 Kinetek Asia Holdings III Inc. U.S.A.
116 Kinetek JH Hong Kong Limited Hong Kong
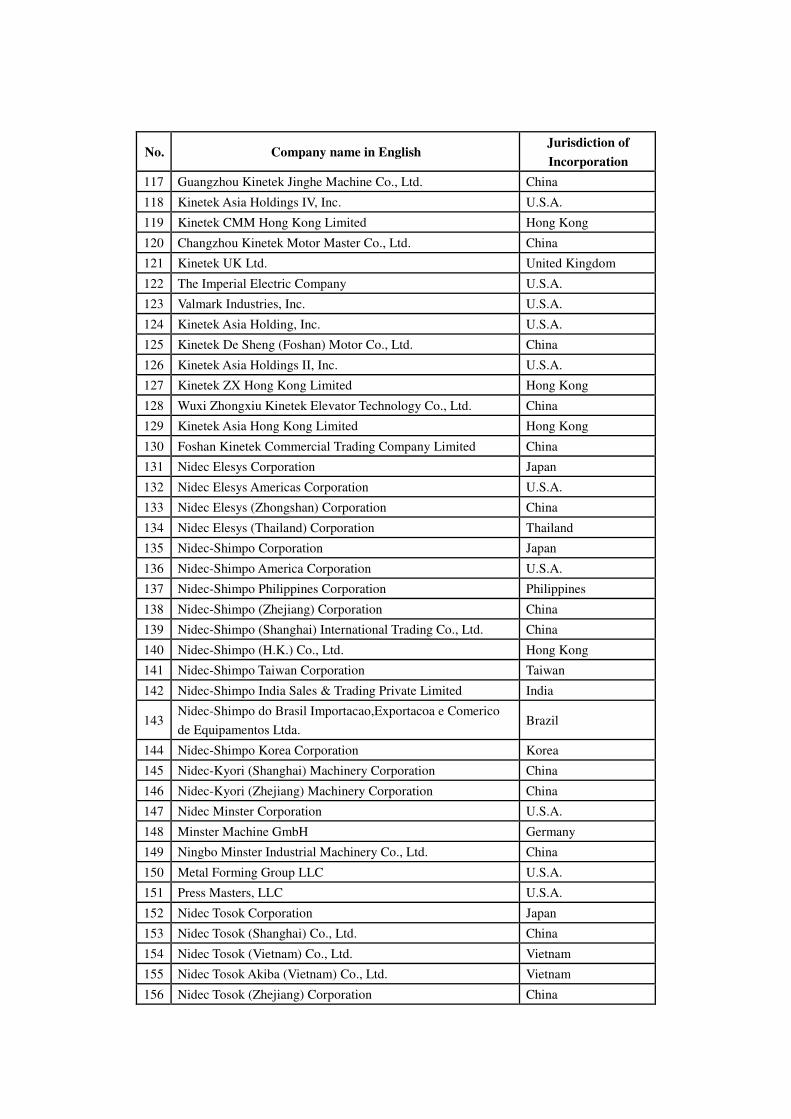
No. Company name in English Jurisdiction of
Incorporation
117 Guangzhou Kinetek Jinghe Machine Co., Ltd. China
118 Kinetek Asia Holdings IV, Inc. U.S.A.
119 Kinetek CMM Hong Kong Limited Hong Kong
120 Changzhou Kinetek Motor Master Co., Ltd. China
121 Kinetek UK Ltd. United Kingdom
122 The Imperial Electric Company U.S.A.
123 Valmark Industries, Inc. U.S.A.
124 Kinetek Asia Holding, Inc. U.S.A.
125 Kinetek De Sheng (Foshan) Motor Co., Ltd. China
126 Kinetek Asia Holdings II, Inc. U.S.A.
127 Kinetek ZX Hong Kong Limited Hong Kong
128 Wuxi Zhongxiu Kinetek Elevator Technology Co., Ltd. China
129 Kinetek Asia Hong Kong Limited Hong Kong
130 Foshan Kinetek Commercial Trading Company Limited China
131 Nidec Elesys Corporation Japan
132 Nidec Elesys Americas Corporation U.S.A.
133 Nidec Elesys (Zhongshan) Corporation China
134 Nidec Elesys (Thailand) Corporation Thailand
135 Nidec-Shimpo Corporation Japan
136 Nidec-Shimpo America Corporation U.S.A.
137 Nidec-Shimpo Philippines Corporation Philippines
138 Nidec-Shimpo (Zhejiang) Corporation China
139 Nidec-Shimpo (Shanghai) International Trading Co., Ltd. China
140 Nidec-Shimpo (H.K.) Co., Ltd. Hong Kong
141 Nidec-Shimpo Taiwan Corporation Taiwan
142 Nidec-Shimpo India Sales & Trading Private Limited India
143 Nidec-Shimpo do Brasil Importacao,Exportacoa e Comerico
de Equipamentos Ltda. Brazil
144 Nidec-Shimpo Korea Corporation Korea
145 Nidec-Kyori (Shanghai) Machinery Corporation China
146 Nidec-Kyori (Zhejiang) Machinery Corporation China
147 Nidec Minster Corporation U.S.A.
148 Minster Machine GmbH Germany
149 Ningbo Minster Industrial Machinery Co., Ltd. China
150 Metal Forming Group LLC U.S.A.
151 Press Masters, LLC U.S.A.
152 Nidec Tosok Corporation Japan
153 Nidec Tosok (Shanghai) Co., Ltd. China
154 Nidec Tosok (Vietnam) Co., Ltd. Vietnam
155 Nidec Tosok Akiba (Vietnam) Co., Ltd. Vietnam
156 Nidec Tosok (Zhejiang) Corporation China
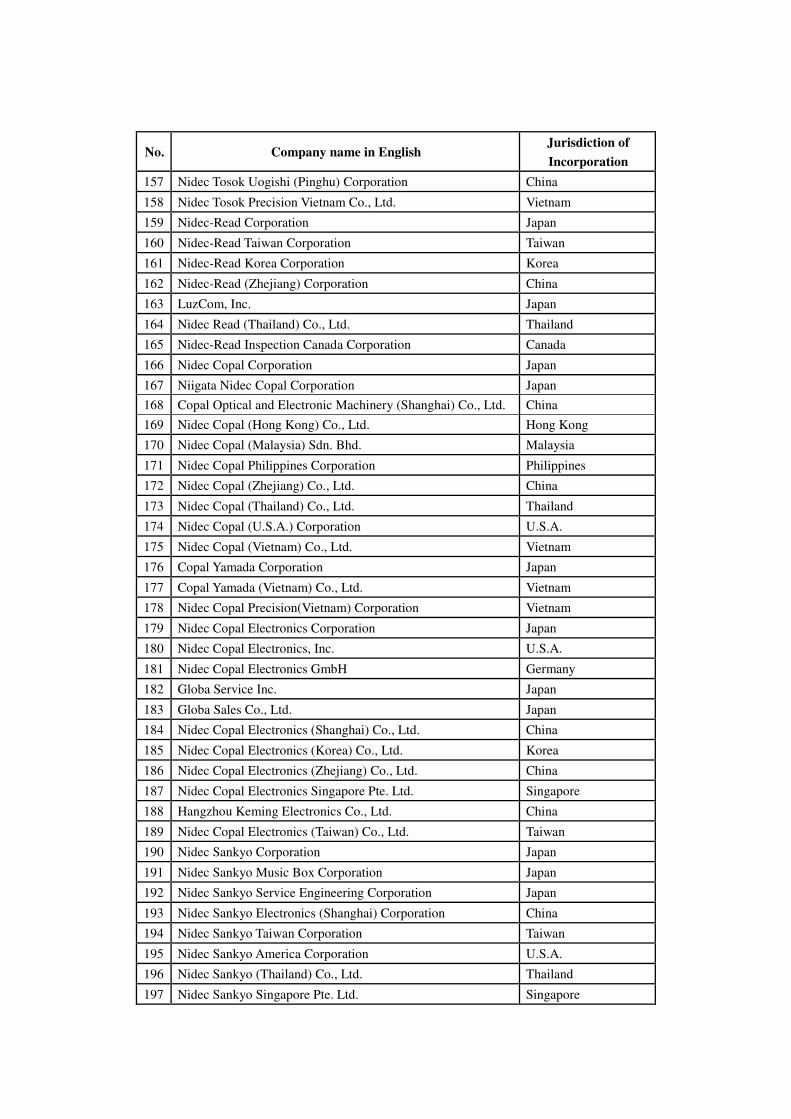
No. Company name in English Jurisdiction of
Incorporation
157 Nidec Tosok Uogishi (Pinghu) Corporation China
158 Nidec Tosok Precision Vietnam Co., Ltd. Vietnam
159 Nidec-Read Corporation Japan
160 Nidec-Read Taiwan Corporation Taiwan
161 Nidec-Read Korea Corporation Korea
162 Nidec-Read (Zhejiang) Corporation China
163 LuzCom, Inc. Japan
164 Nidec Read (Thailand) Co., Ltd. Thailand
165 Nidec-Read Inspection Canada Corporation Canada
166 Nidec Copal Corporation Japan
167 Niigata Nidec Copal Corporation Japan
168 Copal Optical and Electronic Machinery (Shanghai) Co., Ltd. China
169 Nidec Copal (Hong Kong) Co., Ltd. Hong Kong
170 Nidec Copal (Malaysia) Sdn. Bhd. Malaysia
171 Nidec Copal Philippines Corporation Philippines
172 Nidec Copal (Zhejiang) Co., Ltd. China
173 Nidec Copal (Thailand) Co., Ltd. Thailand
174 Nidec Copal (U.S.A.) Corporation U.S.A.
175 Nidec Copal (Vietnam) Co., Ltd. Vietnam
176 Copal Yamada Corporation Japan
177 Copal Yamada (Vietnam) Co., Ltd. Vietnam
178 Nidec Copal Precision(Vietnam) Corporation Vietnam
179 Nidec Copal Electronics Corporation Japan
180 Nidec Copal Electronics, Inc. U.S.A.
181 Nidec Copal Electronics GmbH Germany
182 Globa Service Inc. Japan
183 Globa Sales Co., Ltd. Japan
184 Nidec Copal Electronics (Shanghai) Co., Ltd. China
185 Nidec Copal Electronics (Korea) Co., Ltd. Korea
186 Nidec Copal Electronics (Zhejiang) Co., Ltd. China
187 Nidec Copal Electronics Singapore Pte. Ltd. Singapore
188 Hangzhou Keming Electronics Co., Ltd. China
189 Nidec Copal Electronics (Taiwan) Co., Ltd. Taiwan
190 Nidec Sankyo Corporation Japan
191 Nidec Sankyo Music Box Corporation Japan
192 Nidec Sankyo Service Engineering Corporation Japan
193 Nidec Sankyo Electronics (Shanghai) Corporation China
194 Nidec Sankyo Taiwan Corporation Taiwan
195 Nidec Sankyo America Corporation U.S.A.
196 Nidec Sankyo (Thailand) Co., Ltd. Thailand
197 Nidec Sankyo Singapore Pte. Ltd. Singapore
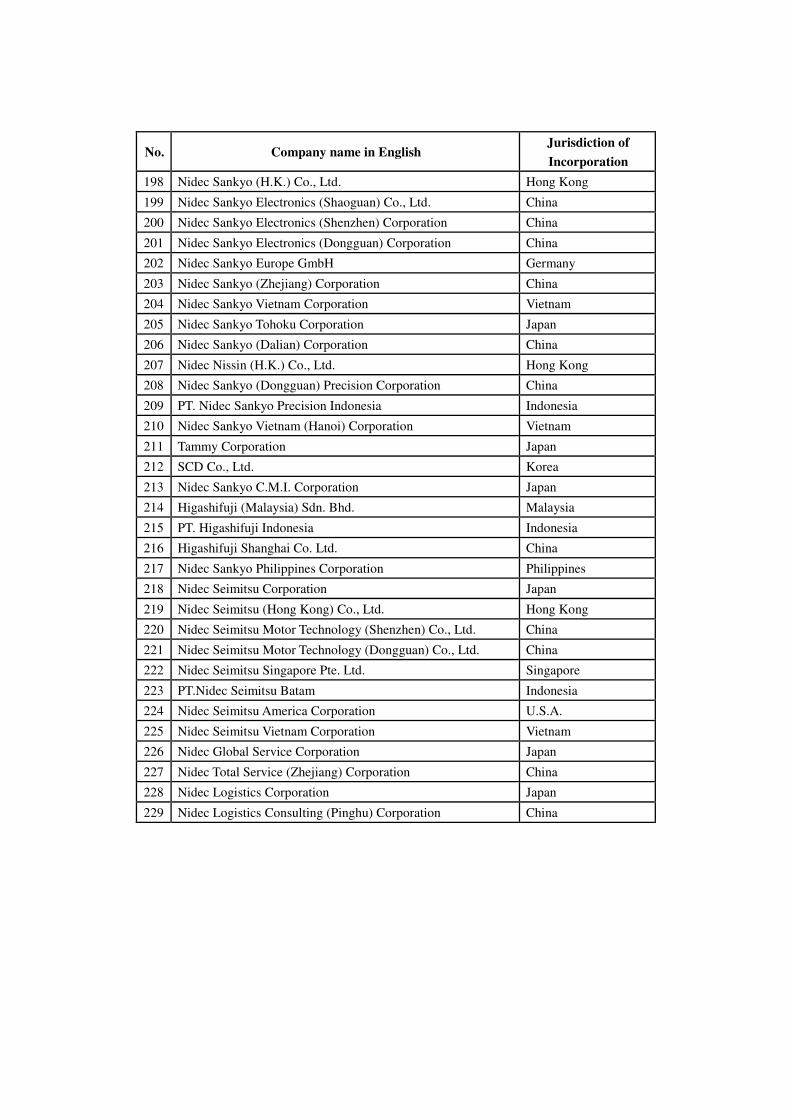
No. Company name in English Jurisdiction of
Incorporation
198 Nidec Sankyo (H.K.) Co., Ltd. Hong Kong
199 Nidec Sankyo Electronics (Shaoguan) Co., Ltd. China
200 Nidec Sankyo Electronics (Shenzhen) Corporation China
201 Nidec Sankyo Electronics (Dongguan) Corporation China
202 Nidec Sankyo Europe GmbH Germany
203 Nidec Sankyo (Zhejiang) Corporation China
204 Nidec Sankyo Vietnam Corporation Vietnam
205 Nidec Sankyo Tohoku Corporation Japan
206 Nidec Sankyo (Dalian) Corporation China
207 Nidec Nissin (H.K.) Co., Ltd. Hong Kong
208 Nidec Sankyo (Dongguan) Precision Corporation China
209 PT. Nidec Sankyo Precision Indonesia Indonesia
210 Nidec Sankyo Vietnam (Hanoi) Corporation Vietnam
211 Tammy Corporation Japan
212 SCD Co., Ltd. Korea
213 Nidec Sankyo C.M.I. Corporation Japan
214 Higashifuji (Malaysia) Sdn. Bhd. Malaysia
215 PT. Higashifuji Indonesia Indonesia
216 Higashifuji Shanghai Co. Ltd. China
217 Nidec Sankyo Philippines Corporation Philippines
218 Nidec Seimitsu Corporation Japan
219 Nidec Seimitsu (Hong Kong) Co., Ltd. Hong Kong
220 Nidec Seimitsu Motor Technology (Shenzhen) Co., Ltd. China
221 Nidec Seimitsu Motor Technology (Dongguan) Co., Ltd. China
222 Nidec Seimitsu Singapore Pte. Ltd. Singapore
223 PT.Nidec Seimitsu Batam Indonesia
224 Nidec Seimitsu America Corporation U.S.A.
225 Nidec Seimitsu Vietnam Corporation Vietnam
226 Nidec Global Service Corporation Japan
227 Nidec Total Service (Zhejiang) Corporation China
228 Nidec Logistics Corporation Japan
229 Nidec Logistics Consulting (Pinghu) Corporation China
1
Exhibit 11.1
(Translation)
The Nidec Group Compliance Code of Conduct The Nidec Group’s business philosophy is to grow healthily and contribute to the global society (the “royal road of business management”). Our reputation for honesty and integrity among our customers, shareholders, investors, and other stakeholders is a key to the growth and prosperity of the Group. We will not achieve any result through violations of laws and regulations or through disingenuous business transactions. This Nidec Group Compliance Code of Conduct (this “Code of Conduct”) provides for specific guidance for all Nidec Group management members, executives and employees to comply with not only domestic/foreign laws and regulations but also social rules, ethics, etc. in the Company’s daily business activities, in order to stay on the royal road of business management. This Code of Conduct will apply to Nidec Corporation, its consolidated companies, and all of their management members, executives and employees after undergoing these companies’ required procedures. I. The Basic Philosophy (The Seven Compliance Principles) We hereby establish the following “Seven Compliance Principles” as the basic philosophy of this Code of Conduct, and, as the global society’s legal, regulatory, and corporate requirements change with the times, we will always keep in mind the spirit of the Principles, promote healthy business activities, and stay on the “royal road of business management” as a global manufacturer that contributes to establishing a sustainable society.
1. We will comply with all laws and regulations and act based on noble business ethics. 2. We, as a global manufacturing company, will ensure we produce defect-free and quality
products. 3. We will ensure we disclose timely and accurate information. 4. We will ensure we properly manage and use company information and assets. 5. We will ensure we keep our work environments safe and comfortable. 6. We will compete freely and fairly, and we will not engage in any anticompetitive conduct. 7. We will ensure we create and maintain a compliance system that is necessary and sufficient to
comply with the Code of Conduct. II. The Compliance Code of Conduct 1. Compliance with all laws, regulations, and business ethics
We will comply with all laws and regulations and act based on noble business ethics.
(Staying on the “royal road of business management”) - We must recognize ourselves as members of the international society, comply with each
country’s domestic and international laws and regulations, fulfill the Company’s social responsibilities based on high business ethics and stay on the “royal road of business management.”
- We will avoid acts that can be misunderstood by society as improper or against corporate ethics. (Respecting basic human rights and banning discriminatory treatments) - In all of our business activities, we must respect basic human rights, and not engage in any
discriminatory treatment or human rights violations.
2
(Ban on bribery, etc., and maintaining transparent political and governmental relations) - We must maintain healthy and transparent political and governmental relations. - Inside or outside of our country, we will not provide or promise any improper money, goods, or
any other economic profit to any government officials or those equivalents. (Ban on insider trading) - We will not engage in any act that violates insider trading regulations, such as trading in the
Company’s securities while in possession of material non-public information regarding the Company and/or tip or pass on non-public information to any other person.
(Environmental protection) - We recognize that global environmental protection is a social responsibility of a global company,
comply with individual countries’ environmental regulations, use resources proactively and effectively, and strive to conserve energy.
(Securing self-correcting functions) - If we identify any violation or threatened violation of laws, regulations, internal rules, etc. by our
management members, executives or employees, we will correct such violation immediately, and strictly handle such violation.
(Compliance with this Code of Conduct) - We recognize that any violation to this Code of Conduct may result in a disciplinary action, etc.
based on applicable laws, regulations, internal rules, etc., and comply with this Code of Conduct. 2. Securing product safety and quality
We, as a global manufacturing company, will ensure we produce defect-free and quality products.
(Securing product safety) - To secure the safety of our products, we must comply with each country’s relevant laws,
regulations, rules, etc. on product safety, quality and reliability, and properly ensure the safety of all of our products.
(Prevention of misrepresentation, accidents and disputes) - We will not present or advertise any information in any misleading way to our customers, and we
will do our very best to prevent accidents and disputes by preparing easy-to-understand specifications, user manuals, etc.
- If any defect is found in any of our company’s products, we must consider the product user’s safety and interest as the first priority and will promptly take action to minimize negative consequences such as quickly communicating the defect to the product’s users.
(Providing high-quality products) - To respond to society’s and our customers’ expectations, we will ensure that we efficiently
produce and supply high-quality products. 3. Proper information disclosure
We will ensure we disclose timely and accurate information.
(Timely disclosure of company information) - To ensure our business management’s transparency, we will disclose our company information to
our shareholders, investors, and other stakeholders proactively, timely, properly, and clearly. (Accurate recording and document filing) - We will properly record all work-related information based on laws, regulations, internal rules,
etc., ensure that no misleading or false statement or error will be on internal documents, and
3
keep such documents for a specified period of time. (Proper accounting and account reporting) - We must always ensure accuracy of our company’s accounting reports based on the proper
accounting in compliance with relevant laws, regulations, and standards. 4. Protecting and proper use of company information and assets
We will ensure we properly manage and use company information and assets.
(Management of confidential information) - We must strictly manage personal information and other confidential information of the
Company both during and after employment, based on internal rules, etc. to prevent improper disclosure or leak of such information, and we will not use such information either improperly or unfairly.
- We will not unfairly obtain any information on our customers, suppliers or any other business partners, etc., and will not use any of such information obtained in the course of our business for any purpose other than legitimate purposes.
(Appropriate management of company property) - We must promote the reasonable management and use of the Company’s assets and ensure that
they are used efficiently and for legitimate business purposes, and must not use any company assets, tangible or intangible, for personal purposes, or lose or damage any of such assets unfairly.
(Appropriate use of intellectual property rights and non-violation of intellectual property rights of others) - We will actively strive to create intellectual property rights such as patent rights, trademarks,
copyrights, and similar rights, and we will use such rights in an appropriate manner. Any violation of the intellectual property rights of others will not be tolerated.
- If intellectual property is created during the course of professional duty, employees shall
cooperate with the patent application process of the Company, conduct appropriate patent maintenance, and ensure its integrity.
(Ban on acts that cause conflict of interest) - We will not tolerate any personal act of our executives or employees that results in detriment to
the Nidec Group’s corporate activities, or that interferes or conflicts, or has the potential to interfere or conflict, with the interests of the Nidec Group.
5. Safe and comfortable work environment
We will ensure we keep our work environments safe and comfortable.
- We will give first priority to the respect for human rights, comply with labor-related laws and
regulations, and realize safe and comfortable work environments. - Based on the understanding that the most important management resource of a company is its
human resource, we endeavor to create comfortable work environments, in which all Nidec Group executives and employees can feel their work is worthwhile and fully exercise their abilities.
6. Ban on unfair competition
We will compete freely and fairly, and we will not engage in any anticompetitive conduct.
4
(Fair trade and free competition) - We will comply with all individual countries’ competition and antimonopoly laws, and engage in
fair business transactions. - We will not engage in cartel, price fixing, bid-rigging, market allocations, or any other act that
impedes fair and free competitions, or engage in any act that would cause suspicion for such act. (Ensuring transparency in transactions with customers and vendors) - When selecting vendors, we will conduct a fair and transparent evaluation, in accordance with
such selection standards as safety, quality, environmental aspects, price and delivery time as well as with applicable laws and regulations. There is no differentiation between domestic and non-Japanese service providers, and we will have our doors open to the entire world.
(Ensuring transparent relations with stakeholders) - When communicating with our stakeholders, we will refrain from any acts that may be
misleading or suspicious to the public, and we will be open, honest, and moderate. - We will not offer our private customers any personal rebates, commissions, or any other
improper benefits. (Prohibition of illegal acquisition of information and attentiveness towards wrongdoing of customers and vendors) - Information about other companies must be obtained by appropriate methods and handled
carefully. Due care with regards to wrongdoing of customers or partner companies will be exercised.
(Prohibition of acts causing obstruction of business) - We will not engage in any acts causing obstruction of other companies’ businesses or in any
misleading representations of products and similar unfair business practices. 7. Designing a compliance system
We will ensure we create and maintain a compliance system that is necessary and sufficient to comply with the Code of Conduct.
(Maintenance and operation of a compliance system) - In order to continuously maintain and improve our compliance system, (i) the principal executive
officers shall assume the responsibility for maintaining, operating and evaluating a compliance system based on the basic framework for internal control as established by the board of directors, and (ii) the manager-level employees shall be responsible for maintaining and operating a compliance system with regards to the sections and duty assignments under their supervision.
- We will prepare and maintain a detailed compliance manual and measures based on the Code of Conduct, and ensure our ability to appropriately address various situations in our daily business activities.
- The Compliance Committee, the Compliance Office as well as the compliance managers who shall be responsible for compliance in each department and at each business unit shall perform a central role at their respective levels in the system.
(Utilization of an internal reporting system) - When it is discovered that one’s own actions or the actions of any other management members,
executives or employees are in actual or possible violation of legal requirements or company policies or procedures, such actions will be immediately reported to the Compliance Office or the Nidec Global Compliance Hotline.
- Any person who is reporting any such violation via the internal reporting system may choose to remain anonymous in reporting such violation. We prohibit retaliatory action against anyone who, in good faith, reports such violation.
(Systematic response to antisocial forces)
5
- If we are approached by antisocial forces, we will promptly take necessary action. We, as a company, will stand firmly against any illegitimate claims and requests for illegal transactions.
(Awareness-raising for management members, executives and employees) - In addition to raising awareness of and disseminating this Code of Conduct through educational
and training activities, the management members, executives and employees should also deeply internalize the principles embodied in this Code of Conduct, and carry out a true compliance practice in which each individual thinks independently and acts properly.
(Effective monitoring and evaluation) - The Internal Audit Department will conduct monitoring and evaluation of the compliance system
through audits of operational activities, and, in the event it identifies significant concerns and problems, it will propose and recommend improvement measures to eliminate those concerns and problems.
(Responsible conduct in a crisis) - In the case of socially-prohibited behavior, for example illegal or other improper activities
occurring within the Company, or if such behavior is suspected, we will take appropriate action, such as informing, and fully cooperating with any investigation by, the competent authorities.
(Amendments of this Code of Conduct) - Any amendment of this Code of Conduct will be made only by the Board of Directors and will
be disclosed as required or indicated by law or stock exchange regulation.
Exhibit 12.1
CERTIFICATION
I, Shigenobu Nagamori, certify that:
1. I have reviewed this annual report on Form 20-F of Nidec Corporation;
2. Based on my knowledge, this report does not contain any untrue statement of a material fact or
omit to state a material fact necessary to make the statements made, in light of the circumstances
under which such statements were made, not misleading with respect to the period covered by
this report;
3. Based on my knowledge, the financial statements, and other financial information included in this
report, fairly present in all material respects the financial condition, results of operations and
cash flows of the company as of, and for, the periods presented in this report;
4. The company’s other certifying officer and I are responsible for establishing and maintaining
disclosure controls and procedures (as defined in Exchange Act Rules 13a-15(e) and 15d-15(e))
and internal control over financial reporting (as defined in Exchange Act Rules 13a-15(f) and
15d-15(f)) for the company and have:
(a) Designed such disclosure controls and procedures, or caused such disclosure controls and
procedures to be designed under our supervision, to ensure that material information
relating to the company, including its consolidated subsidiaries, is made known to us by
others within those entities, particularly during the period in which this report is being
prepared;
(b) Designed such internal control over financial reporting, or caused such internal control over
financial reporting to be designed under our supervision, to provide reasonable assurance
regarding the reliability of financial reporting and the preparation of financial statements for
external purposes in accordance with generally accepted accounting principles;
(c) Evaluated the effectiveness of the company’s disclosure controls and procedures and
presented in this report our conclusions about the effectiveness of the disclosure controls
and procedures, as of the end of the period covered by this report based on such evaluation;
and
(d) Disclosed in this report any change in the company’s internal control over financial reporting
that occurred during the period covered by the annual report that has materially affected, or
is reasonably likely to materially affect, the company’s internal control over financial
reporting; and
5. The company’s other certifying officer and I have disclosed, based on our most recent evaluation
of internal control over financial reporting, to the company’s auditors and the audit committee of
the company’s board of directors (or persons performing the equivalent functions):
(a) All significant deficiencies and material weaknesses in the design or operation of internal
control over financial reporting which are reasonably likely to adversely affect the
company’s ability to record, process, summarize and report financial information; and
(b) Any fraud, whether or not material, that involves management or other employees who have
a significant role in the company’s internal control over financial reporting.
Date: June 26 2014
/s/ Shigenobu Nagamori
Shigenobu Nagamori
President, Chief Executive Officer
and Representative Director

Exhibit 12.2
CERTIFICATION
I, Masuo Yoshimatsu, certify that:
1. I have reviewed this annual report on Form 20-F of Nidec Corporation;
2. Based on my knowledge, this report does not contain any untrue statement of a material fact or
omit to state a material fact necessary to make the statements made, in light of the circumstances
under which such statements were made, not misleading with respect to the period covered by
this report;
3. Based on my knowledge, the financial statements, and other financial information included in this
report, fairly present in all material respects the financial condition, results of operations and
cash flows of the company as of, and for, the periods presented in this report;
4. The company’s other certifying officer and I are responsible for establishing and maintaining
disclosure controls and procedures (as defined in Exchange Act Rules 13a-15(e) and 15d-15(e))
and internal control over financial reporting (as defined in Exchange Act Rules 13a-15(f) and
15d-15(f)) for the company and have:
(a) Designed such disclosure controls and procedures, or caused such disclosure controls and
procedures to be designed under our supervision, to ensure that material information
relating to the company, including its consolidated subsidiaries, is made known to us by
others within those entities, particularly during the period in which this report is being
prepared;
(b) Designed such internal control over financial reporting, or caused such internal control over
financial reporting to be designed under our supervision, to provide reasonable assurance
regarding the reliability of financial reporting and the preparation of financial statements for
external purposes in accordance with generally accepted accounting principles;
(c) Evaluated the effectiveness of the company’s disclosure controls and procedures and
presented in this report our conclusions about the effectiveness of the disclosure controls
and procedures, as of the end of the period covered by this report based on such evaluation;
and
(d) Disclosed in this report any change in the company’s internal control over financial reporting
that occurred during the period covered by the annual report that has materially affected, or
is reasonably likely to materially affect, the company’s internal control over financial
reporting; and
5. The company’s other certifying officer and I have disclosed, based on our most recent evaluation
of internal control over financial reporting, to the company’s auditors and the audit committee of
the company’s board of directors (or persons performing the equivalent functions):
(a) All significant deficiencies and material weaknesses in the design or operation of internal
control over financial reporting which are reasonably likely to adversely affect the
company’s ability to record, process, summarize and report financial information; and
(b) Any fraud, whether or not material, that involves management or other employees who have
a significant role in the company’s internal control over financial reporting.
Date: June 26, 2014
/s/ Masuo Yoshimatsu
Masuo Yoshimatsu
First Senior Vice President,
Chief Financial Officer and
Director

Exhibit 13.1
CERTIFICATION
Pursuant to 18 U.S.C. § 1350, the undersigned officer of Nidec Corporation (the
“Company”) hereby certifies, to such officer’s knowledge, that the Company’s annual report on
Form 20-F for the fiscal year ended March 31, 2014 (the “Report”) fully complies with the
requirements of Section 13(a) or 15(d), as applicable, of the U.S. Securities Exchange Act of 1934,
and that the information contained in the Report fairly presents, in all material respects, the financial
condition and results of operations of the Company.
Dated: June 26, 2014
/s/ Shigenobu Nagamori
Shigenobu Nagamori
President, Chief Executive Officer and
Representative Director
Exhibit 13.2
CERTIFICATION
Pursuant to 18 U.S.C. § 1350, the undersigned officer of Nidec Corporation (the
“Company”) hereby certifies, to such officer’s knowledge, that the Company’s annual report on
Form 20-F for the fiscal year ended March 31, 2014 (the “Report”) fully complies with the
requirements of Section 13(a) or 15(d), as applicable, of the U.S. Securities Exchange Act of 1934,
and that the information contained in the Report fairly presents, in all material respects, the financial
condition and results of operations of the Company.
Dated: June 26, 2014
/s/ Masuo Yoshimatsu
Masuo Yoshimatsu
First Senior Vice President, Chief
Financial Officer and Director


