Embed Size (px)
Citation preview

UNIVERSITY OF CALGARY
An Epidemiologic Investigation into Risk Factors for Methicillin Resistant
Staphylococcus aureus (MRSA) Transmission Among Acute Care Patients in the Calgary
Health Region 2001-2006. A Novel Use of Geographic Information Systems Technology
by
Taranisia Feroza MacCannell
A THESIS
SUBMITTED TO THE FACULTY OF GRADUATE STUDIES
IN PARTIAL FULFILMENT OF THE REQUIREMENTS FOR THE
DEGREE OF DOCTOR OF PHILOSOPHY
DEPARTMENT OF COMMUNITY HEALTH SCIENCES
CALGARY, ALBERTA
SEPTEMBER, 2009
© TARANISIA FEROZA MACCANNELL 2009
Library and Archives Canada
Bibliothèque et Archives Canada
Published Heritage Branch
Direction du Patrimoine de l’édition
395 Wellington Street Ottawa ON K1A 0N4 Canada
395, rue Wellington Ottawa ON K1A 0N4 Canada
Your file Votre référence ISBN: 978-0-494-54437-2Our file Notre référence ISBN: 978-0-494-54437-2
NOTICE: The author has granted a non-exclusive license allowing Library and Archives Canada to reproduce, publish, archive, preserve, conserve, communicate to the public by telecommunication or on the Internet, loan, distribute and sell theses worldwide, for commercial or non-commercial purposes, in microform, paper, electronic and/or any other formats. .
AVIS: L’auteur a accordé une licence non exclusive permettant à la Bibliothèque et Archives Canada de reproduire, publier, archiver, sauvegarder, conserver, transmettre au public par télécommunication ou par l’Internet, prêter, distribuer et vendre des thèses partout dans le monde, à des fins commerciales ou autres, sur support microforme, papier, électronique et/ou autres formats.
The author retains copyright ownership and moral rights in this thesis. Neither the thesis nor substantial extracts from it may be printed or otherwise reproduced without the author’s permission.
L’auteur conserve la propriété du droit d’auteur et des droits moraux qui protège cette thèse. Ni la thèse ni des extraits substantiels de celle-ci ne doivent être imprimés ou autrement reproduits sans son autorisation.
In compliance with the Canadian Privacy Act some supporting forms may have been removed from this thesis. While these forms may be included in the document page count, their removal does not represent any loss of content from the thesis.
Conformément à la loi canadienne sur la protection de la vie privée, quelques formulaires secondaires ont été enlevés de cette thèse. Bien que ces formulaires aient inclus dans la pagination, il n’y aura aucun contenu manquant.

ii
UNIVERSITY OF CALGARY
FACULTY OF GRADUATE STUDIES
The undersigned certify that they have read, and recommend to the Faculty of Graduate
Studies for acceptance, a thesis entitled "An Epidemiologic Investigation into Risk
Factors for Methicillin Resistant Staphylococcus aureus (MRSA) Transmission Among
Acute Care Patients in the Calgary Health Region 2001-2006. A Novel Use of
Geographic Information Systems Technology" submitted by Taranisia Feroza
MacCannell in partial fulfilment of the requirements of the degree of Doctor of
Philosophy.

iii
Abstract
Background: Methicillin resistant Staphylococcus aureus (MRSA) is a bacterium known
to cause a range of host illnesses from benign commensal carriage to systemic infection.
MRSA primarily spreads through direct and indirect contact transmission pathways.
Infection prevention strategies to control the spread of this organism are known to be
effective, but are not consistently put into practice by healthcare providers. The role of
the environment, as a reservoir for MRSA, was examined in this study through binary-
outcome logistic modeling as well as through novel applications of GIS software using
ESRI Corporation’s ArcGIS™ suite. Methods: Linking several secondary datasets from
the Calgary Health Region’s (CHR) Departments of Planning and Design, Pharmacy,
Nursing Integrated Systems, and Finance, along with laboratory and clinical data
provided by the Canadian Nosocomial Infections Surveillance Program (CNISP) and the
CHR Infection Prevention and Control department, clinical, spatial, and temporal data
were merged to model the likelihood of healthcare-associated MRSA acquisition using
logistic regression, as well as use these data, paired with the Pulsed Field Gel
Electrophoresis (PFGE) to look at transmission patterns of MRSA in GIS. Results: The
binary logistic model determined an increasing OR=1.45 (95% CI 1.27-1.64) for each 25
day shared environment score , OR=1.61 (95% CI 1.08-2.39) for every increment in
average workload score, glycopeptide exposure OR=2.80 (95% CI 1.43-5.18), OR=1.22
(95% CI 1.06-1.38) for increases in year of admission, and OR=2.72 (95% CI 1.43-5.18)
if patients were admitted to Unit 62 . Spatial autocorrelation estimates failed to reject the
null and from the available data, the Moran’s I and Simpson’s Index, there was no clear

iv
evidence to consider private rooms protective for MRSA as the dispersion of cases was
heterogeneous with both of these measures. Conclusions: The inclusion of spatially-
oriented variables contributes significant insight into the nature of disease transmission
and complement traditional clinical risk factor analyses for MRSA.

v
Acknowledgements
Thank you to Dr. Betty Ann Henderson for being such a fantastic mentor to me, not only
academically, but professionally. You have extended yourself in ways that make you
such an exceptional supervisor, and I am forever grateful. As one of your many baby
chicks (ok, there was seriously too many in the nest for awhile), thanks for balancing the
need for a mentor with the need for a kick in the pants.
A very big thank you to my PhD co-supervisor, Dr. Nigel Waters, as well as my entire
examining committee. Nigel, I know this was a departure from students you normally
supervise, but thank you for taking the risk and taking me under your wing. I never
thought I would speak of MRSA transmission as an analogy of traffic collisions….
Also, a very big thank you to my committee members: Drs. Peter Faris, Dan Gregson,
Elizabeth Bryce, Mike Mulvey, and Richard Levy, as well as to Dr. John Conly who
served as my external on my candidacy exam. I am honored that you all agreed to be
part of this commitment and have learned a great deal from your collective expertise and
the benchmarks for sound science you have each set in your respective fields. Also a
special thank you to Steve McClure at George Mason University, who worked tirelessly
to produce several of the GIS choropleths and Moran’s I calculations. It certainly affirms
the old adage that it takes a village to raise a child, and in that spirit, a PhD student as
well.

vi
Dedication
The past four years have been packed with career game-changers and life milestones.
Sometimes the priority of a PhD had to be saved it from being swallowed by the tractor
beam of a new marriage, new career, new city, new baby, and generally, a new life.
Thanks to so many for helping me “keep my eye on the prize” (E.Ghann, personal
communication).
I would like to dedicate this work to my most amazing best friend, partner in crime, and
husband Duncan. Thanks for being so patient, and knowing when to push and encourage,
and when to hide under a mattress. This PhD wouldn’t have been birthed if not for you.
Period. I love you with every last fibre. I promise, no more degrees….meh.
What would a PhD be without a newborn baby to make things interesting?? Thank you
to our darling and cherished Finnleigh Ross MacCannell for coming into our world,
turning it upside down, but giving life and meaning to the things we strive for. You are
our everything. To say I love you is an understatement.
I would like to thank the people who have unconditionally supported and loved me no
matter what my path in life would hold: my parents, Mohamed and Judy, and my sister,
Thas. I know, and have always known, what you have given up to secure our future and I
don’t think I can ever repay that, but will never forget those sacrifices. And Thas, you

vii
are such a positive energy and amazing talent, and I already sit back and admire all that
you have become. Love you, hc.
Also, a very big thank you to the MacCannell family who have been so supportive and
loving, and a constant source of encouragement. I couldn’t have wished for a more
awesome family-in law. Thank you for sharing in this process!!
And of course, the comic relief section goes to my furry little friends and constant
companions, the original dynamic duo, Schroeder and Siska (1998-2009), and now
Maisy. You make me appreciate the loveliness in all things, whether it be a leaf, a sunny
day, or a crumb on the carpet.
And last but certainly not least, to my cheering squad in Calgary and Atlanta: Meenu
Ahluwalia-Brar, Krystyna Vocadlo, Rebecca McEvoy-Halston, Karen Hope, Sally
Strople, Cindy Ma, Kate Ellingson, Carol Rao, and Melissa Schaefer. Chaos, but I did
it!!!!! Let’s celebrate…..

viii
Table of Contents
Approval Page ..................................................................................................................... ii Abstract .............................................................................................................................. iii Acknowledgements ..............................................................................................................v Dedication .......................................................................................................................... vi Table of Contents ............................................................................................................. viii List of Tables ................................................................................................................... xiii List of Figures and Illustrations .........................................................................................xv List of Symbols, Abbreviations and Nomenclature ........................................................ xvii
CHAPTER ONE: INTRODUCTION ..................................................................................1 1.1 Research Question .....................................................................................................5 1.2 Specific Objectives ....................................................................................................5
CHAPTER TWO: LITERATURE REVIEW ......................................................................6 2.1 The Pathophysiology of Staphylococcus aureus .......................................................6 2.2 The Molecular Evolution of Staphylococcus aureus .................................................9 2.3 MRSA Epidemiology ..............................................................................................10 2.4 MRSA in North America .........................................................................................12 2.5 Canadian MRSA Straintypes ...................................................................................14 2.6 MRSA in the Calgary Health Region ......................................................................16 2.7 Host Risk Factors for MRSA ...................................................................................18 2.8 Costs to Prevent and Manage Healthcare-associated MRSA ..................................19 2.9 Identification Methods for MRSA ...........................................................................21 2.10 Guidelines for the Prevention and Control of MRSA ............................................24 2.11 Efficacy of Infection Prevention and Control Measures .......................................26 2.12 Transmission of MRSA in Healthcare: The role of the Physical Environment .....27 2.13 The Calgary Health Region: MRSA Management and Surveillance ....................30
2.13.1 Management ..................................................................................................30 2.13.2 Surveillance ...................................................................................................31
2.14 Calgary Health Region Infection Prevention and Control Practices .....................33 2.15 Geographic Information Systems ..........................................................................38 2.16 Rationale for Study ................................................................................................44 2.17 Study Objectives ....................................................................................................45
CHAPTER THREE: METHODS ......................................................................................50 3.1 Study Setting ............................................................................................................50 3.2 Study Design ............................................................................................................51
3.2.1 Study Population .............................................................................................51 3.2.2 Case Selection .................................................................................................52 3.2.3 Control Selection .............................................................................................53 3.2.4 Sample Size Calculation ..................................................................................54
3.3 Study Definitions and Assumptions ........................................................................56 3.3.1 Roommate contacts .........................................................................................56 3.3.2 Unit length of stay ...........................................................................................56 3.3.3 Date of Culture as a Surrogate for Date of First Positive ................................56

ix
3.3.4 Healthcare-associated MRSA Cases ...............................................................57 3.3.5 Community-associated MRSA cases ..............................................................57 3.3.6 Incident MRSA Cases .....................................................................................58 3.3.7 Prevalent MRSA Cases ...................................................................................58 3.3.8 Antibiotic Days ................................................................................................58 3.3.9 Shared Status ...................................................................................................59 3.3.10 MRSA Burden ...............................................................................................60
3.4 Data Sources ............................................................................................................60 3.4.1 Administrative Data .........................................................................................61
3.4.1.1 Patient Location Data .............................................................................61 3.4.1.2 Workload Data .......................................................................................62
3.4.2 Clinical Data ....................................................................................................65 3.4.2.1 Quality, Safety, and Health Information Data .......................................65 3.4.2.2 The Charlson Index ................................................................................66 3.4.2.3 Patient Care Units ..................................................................................68 3.4.2.4 Pharmacy Data .......................................................................................69 3.4.2.5 CHR Infection Prevention and Control Antibiotic Resistant
Organism Data ........................................................................................70 3.4.2.6 Laboratory and Straintype Data .............................................................71
3.4.3 Geographical Data ...........................................................................................72 3.5 Laboratory Methods .................................................................................................72
3.5.1 Isolation and Confirmation of MRSA .............................................................72 3.5.2 Molecular Straintyping of MRSA using PFGE ...............................................73
3.6 Data Management and Analysis ..............................................................................74 3.6.1 Data Analysis Software ...................................................................................75 3.6.2 Data Importation ..............................................................................................75
3.7 Data Management, Storage, and Cleaning ...............................................................76 3.7.1 Data Management ............................................................................................76 3.7.2 Data cleaning ...................................................................................................76
3.7.2.1 Recoding Data ........................................................................................78 3.7.2.2 Reformatting Data ..................................................................................79
3.7.3 Dataset Linkage and Integration ......................................................................80 3.7.3.1 Key Linking Variables ...........................................................................80 3.7.3.2 Process of Merging Data ........................................................................82 3.7.3.3 Process of Linking Data .........................................................................82
3.8 Building GIS Datasets .............................................................................................83 3.8.1 Use of Desktop ArcGIS 9-ArcCatalog™(ESRI) .............................................84 3.8.2 ArcGIS 9 –ArcMap™ (ESRI) .........................................................................84
3.9 Variable Definitions .................................................................................................86 3.10 Descriptive Statistical Methods .............................................................................88
3.10.1 Multivariate Logistic Regression Modeling ..................................................90 3.11 Spatial Analysis Methods ......................................................................................92
3.11.1 Assessment of Spatial Autocorrelation .........................................................92 3.11.2 Assessment of Spatial and Straintype Heterogeneity ....................................93
3.12 Tracking Analyst ....................................................................................................94 3.13 Scientific and Ethical Approval .............................................................................95

x
3.14 Confidentiality .......................................................................................................95
CHAPTER FOUR: RESULTS I - DESCRIPTIVE STATISTICS ....................................97 4.1 Patient Activity at Foothills Medical Centre ...........................................................97 4.2 Estimates of MRSA Incident Cases .......................................................................101 4.3 Molecular Epidemiology of MRSA in the Calgary Health Region, 2001-2006 ...109 4.4 Straintype Diversity among Community and Long-term Care Patients ................117 4.5 Comparability of Case Subset to the Larger MRSA Population ...........................117 4.6 Challenges to Generating New Datasets with Secondary Data Sources ...............120 4.7 Validation of computed Charlson Index values using 50 ICD-9 / ICD10CA
codes ....................................................................................................................121
CHAPTER FIVE: RESULTS II - LOGISTIC MODELING ..........................................123 5.1 Variables Selected as Effect Modifiers and Confounders of MRSA Acquisition .123 5.2 Assessment for Normality among Continuous Variables ......................................126 5.3 Assessment of Covariate Effect Modification and Confounding Using Non-
Statistical Tests ....................................................................................................130 5.4 Multivariate Logistic Regression ...........................................................................132 5.5 Interpreting the Final Model Relating the Odds of MRSA to Predictor
Variables ..............................................................................................................134 5.6 Evaluating Goodness of Fit ....................................................................................135 5.7 Assessment for Collinearity in the Model .............................................................137 5.8 Prediction Variables ...............................................................................................137 5.9 Predicted Probabilities of E (TotalShare) ..............................................................138 5.10 Test of Assumption to Utilize a Composite TotalShare Main Effect Variable
from Length of Stay and Shared Accomodation ..................................................139
CHAPTER SIX: RESULTS III - GEOSPATIAL ANALYSES ......................................142 6.1 Preparation of GIS Materials .................................................................................142
6.1.1 Selection and extraction of the Google Earth Image .....................................142 6.1.2 Resolving the Google Earth Image with Hospital Geographic Coordinates .142 6.1.3 Preparation of the FMC Floorplans ...............................................................144
6.1.3.1 Selected Unit Floorplans and Characteristics ......................................145 6.1.3.2 Importation and Georectification .........................................................146
6.2 Moran’s I Statistic Calculations .............................................................................149 6.3 Time Series Choropleth Maps of MRSA on Unit 61 (2001-2006) ........................159 6.4 Inverse Distance Weighting Maps .........................................................................160 6.5 Tracking Analyst ....................................................................................................162
CHAPTER SEVEN: DISCUSSION ................................................................................167 7.1 Study Population and Patient Characteristics: Implications for Study Design ......167
7.1.1 The Use of Patients with MSSA as a Control Group ....................................168 7.1.2 Older Age and Mortality ...............................................................................169 7.1.3 Co-Infection with Vancomycin-resistant Enterococcus (VRE) ....................170
7.2 The Epidemiology of MRSA in Calgary and the Foothills Medical Centre .........170 7.2.1 Incidence Rates of MRSA .............................................................................171 7.2.2 Extrapolating Trends in MRSA Acquisition at FMC ....................................173

xi
7.2.3 Molecular Epidemiology of MRSA at Foothills Medical Center .................174 7.3 Modelling Risk Factors for MRSA Acquisition: Logistic Regression ..................179
7.3.1 Selection of Variables for Logistic Modeling ...............................................179 7.3.2 The Inclusion of Measures that Reflect MRSA Burden ................................180 7.3.3 Antibiotic Exposures as a Risk Factor ...........................................................182 7.3.4 Univariate Modeling ......................................................................................185 7.3.5 Multivariate Modeling ...................................................................................186 7.3.6 Multivariate Logistic Model of MRSA Acquisition .....................................187 7.3.7 Assessment of Collinearity ............................................................................188 7.3.8 Goodness of Fit ..............................................................................................188
7.4 Geographic Information Systems (GIS) as Applied to the Study of MRSA .........188 7.4.1 The Use of Surrogate Temporal and Spatial Measures .................................188 7.4.2 Preparation of Hospital Floor Plans for Mapping in GIS ..............................189 7.4.3 Moran’s I Calculations ..................................................................................190
7.4.3.1 Aggregated MRSA data by room on Unit 61 ......................................190 7.4.3.2 Individual assessments of Moran’s I at six-month intervals. ...............191
7.4.4 Simpson’s Index ............................................................................................191 7.4.5 Inverse Distance Weighting (IDW) Maps .....................................................192 7.4.6 Tracking Analyst ...........................................................................................192
7.4.6.1 Visualizing the spread of multiple strains of MRSA for one year .......193 7.4.6.2 Visualizing the clonal spread of MRSA across Unit 62 over 32
months ...................................................................................................193 7.4.7 Summary of GIS as an Application to MRSA Transmission ........................194 7.4.8 Feasibility of GIS and Infectious Disease Modeling .....................................195
7.5 Strengths and Limitations ......................................................................................197 7.5.1 Strengths ........................................................................................................197 7.5.2 Limitations and Bias ......................................................................................198 7.5.3 Limitations of GIS .........................................................................................204
7.6 Assessment of Study Validity ................................................................................206 7.7 Generalizability of Study Findings ........................................................................208 7.8 Infection Control Recommendations .....................................................................209 7.9 Areas for Future Research .....................................................................................213
7.9.1 Three-Dimensional Modeling of Units .........................................................213 7.9.2 Inclusion of Alternative Composite Variables in Future Models ..................214 7.9.3 Risk of MRSA Infection, Colonization vs No MRSA ..................................214 7.9.4 Paired Environmental and Clinical Isolates to Develop MRSA
Contamination Density Maps ........................................................................215 7.9.5 The Use of Prospective Data to Assess the Contribution of Spatial
Autocorrelation with Higher Event Densities ................................................216
CHAPTER EIGHT: CONCLUSIONS ............................................................................218
APPENDIX A: PHARMACY DATA - ANTIBIOTICS AND CLASSES .....................223
APPENDIX B: CLINICAL AND OTHER WORKLOAD INDICATORS FOR CALCULATION OF DAILY PATIENT WORKLOAD SCORE .........................224

xii
APPENDIX C: THE ARO REGISTRY ..........................................................................226
REFERENCES ................................................................................................................227

xiii
List of Tables
Table 2.1: Criteria for PFGE interpretation. ..................................................................... 23
Table 3.1: ICD-9 and ICD10-CA codes for S. aureus and MRSA ................................... 54
Table 3.2: Sample Size Calculations ................................................................................ 55
Table 3.3: Patient Workload Reference Values ................................................................ 63
Table 3.4: Assigned condition weights for the Charlson index ........................................ 66
Table 3.5: Predictor and Outcome Variables .................................................................... 86
Table 4.1. Total Patient Days, Patient Days by Unit and Percent Occupancy for each Patient Care Unit, 2000-2006 ................................................................................... 99
Table 4.2: Percent of Total FMC Patient Days per Year for Selected Patient Care Units (2000-6) ......................................................................................................... 100
Table 4.3: Mean Patient Length of Stay for Selected FMC Patient Care Units (2001-2006 Fiscal Years) ........................................................................................ 101
Table 4.4: Patients Admitted with Previously Known MRSA to FMC Study Units (2001-2006) ............................................................................................................. 107
Figure 4.5a: Diversity of CMRSA Epidemic types from FMC, 2001-6 (CNISP) .......... 110
Figure 4.6: CMRSA-2 pattern distribution by year, FMC Study Units, 2001-6 ........... 113
Table 4.5: Simpson’s Indices for CMRSA epidemic types and overall PFGE diversity, Select Units, FMC, 2001-2006 ............................................................... 116
Table 4.6: Comparison of population subsets to assess for homogeneity among cases 120
Table 5.1: Point estimates for univariate modeling among categorical or dichotomous variables .................................................................................................................. 125
Table 5.2: Summary of Univariate Assessments on Continuous Predictors by Outcome Strata ........................................................................................................ 130
Table 5.3: Univariate analysis for potential effect modifiers and confounders .............. 132
Table 5.4: Final Logistic Regression Model: Analysis of Maximum Likelihood Estimates ................................................................................................................. 134
Table 5.5: Odds Ratio Estimates for the Main Effects Explaining MRSA Acquisition at FMC .................................................................................................................... 135

xiv
Table 5.6: Sample data were generated to predict the odds of MRSA in potential patients .................................................................................................................... 138
Table 5.7: Predicted Probabilities of MRSA (all other variables held constant) ............ 139
Table 5.8: Comparisons of Wald Chi Square Estimates with Main Effects and Interaction Terms to Describe the Impact of Shared Patient Environments and Length of Hospital Stay .......................................................................................... 140
Table 6.1: Moran’s I Calculations for Unit 61* .............................................................. 153
Table 6.2: Simpson’s Index for Heterogeneity of MRSA Dispersion among Beds on Selected Units. FMC 2001-2006 ............................................................................. 158

xv
List of Figures and Illustrations
Figure 2.1: Rates of Healthcare-associated MRSA in Canadian hospitals (1995-2007) .. 14
Figure 2.2: CMRSA Straintypes ....................................................................................... 16
Figure 2.3: Hotspots of Nosocomially-acquired MRSA (through July 31, 2006) ............ 18
Figure 2.4: Comparison of vector and raster data types in spatial representation ............ 40
Figure 3.1: Datasets and linkages used in this study. ....................................................... 80
Figure 4.1: Rates of Incident MRSA by FMC patient care unit, 2001-2006 .................. 105
Figure 4.2: Rate of healthcare-associated MRSA among selected FMC patient care units, 2001-06 ......................................................................................................... 106
Figure 4.3: MRSA Burden: Prevalence of MRSA on Select Units (per 1000 patient days, FMC 2001-2006) ........................................................................................... 107
Figure 4.4: MRSA Burden: MRSA patient days per 1,000 patient days in FMC, Select Study Units (2001-6) ............................................................................................... 109
Figure 4.5b: Pattern diversity within CMRSA-2, Selected FMC Study Wards, 2001-2006 (CNISP) .......................................................................................................... 111
Figure 4.7: Data linkages, attrition and case control selection ....................................... 119
Figure 4.8: Percent of columns populated by ICD9/10CA data for Charlson Index calculations ............................................................................................................. 122
Figure 5.1(a-d): BoxPlots of Continuous Predictor Variables, AGE, CHARLSON_INDEX, BURDENDY and AVGWORKLOAD ............................. 126
Figure 5.2: Assessment of influential data on goodness of model fit using Pearson chi-square residual values ....................................................................................... 136
Figure 6.1: Aerial view of Foothills Medical Centre campus, Calgary 2009. ................ 142
Figure 6.2: Summary output of geo-rectifying process for FMC campus ...................... 144
Figure 6.3: Preparation of raw architectural drawings in AutoCAD for importation into ArcMap ............................................................................................................ 147
Figure 6.4: Geocoded layers for Unit 36 superimposed over the original Google Earth image ....................................................................................................................... 148
Figure 6.5: Calculation of the Moran’s I in ArcMap. ................................................... 151

xvi
Figure 6.6: Choropleth map of summarized MRSA activity (colonizations and infections) by room, 2001-2006 .............................................................................. 152
Figure 6.7: Choropleth map of Unit 61 and potential clustering of MRSA cases (unknown epi-linkages) for one of two time points, January 15, 2004 (n=2 cases) 154
Figure 6.8: Choropleth map of Unit 61 and potential clustering of MRSA cases (unknown epi-linkages) for one of two time points, July 15, 2006 (n=3 cases) ..... 156
Figure 6.9: Choropleth map of Unit 61 and dispersion of MRSA cases (unknown epi-linkages) for July 15, 2004 ...................................................................................... 157
Figure 6.10: Choropleth map of Unit 61 and dispersion of MRSA cases, January 15, 2002. ........................................................................................................................ 160
Figure 6.11: Inverse distance weighting (IDW) of Unit 62 cases for 2004 .................... 161
Figure 6.12: Tracking Analyst visually representing the movements of patients identified with CMRSA-2, Pattern 30 from February 2002 to September 2004 .... 164
Figure 7.1: Raw numbers of MRSA isolates and the diversity of epidemic strains (1995-2004). ............................................................................................................ 175
Figure 7.2: 2006 Sample CNISP dendogram of MRSA PFGE and SmaI Patterns ........ 177

xvii
List of Symbols, Abbreviations and Nomenclature
Symbol Definition ADT Admissions, Discharges and Transfers AIA The American Institute of Architects AIDS Acquired Immune Deficiency Syndrome ARO Antibiotic resistant organism BHI Brain-Heart Infusion CDC Centers for Disease Control and Prevention CHEC Canadian Hospital Epidemiology Committee CHR Calgary Health Region CLSI Clinical Laboratory Standards Institute CMRSA(-#) Canadian MRSA (Epidemic type)
CNISP Canadian Nosocomial Infection Surveillance Program
DNA Deoxyribonucleic acid
EARSS European Antimicrobial Resistance Surveillance System
EMRSA(-#) Epidemic MRSA
FOIPP Freedom of Information and Protection of Privacy Act
GIS Geographic Information Systems
GRASP Grace-Reynolds Application and Study of PETO
HIA Health Information Act
HICPAC Hospital Infection Control Practices Advisory Committee
ICD(-9/-10/-10-CA/-10-CM)
International Statistical Classification of Diseases and Related Health Problems (Formerly: International Classification of Diseases)
IPC Infection Prevention and Control ICU Intensive care unit IP Infection preventionist LIMS Laboratory Information Management System MDRO Multi-drug resistant organism MLE Maximum Likelihood Estimate MRSA Methicillin-resistant Staphylococcus aureus MSA Manitol salt agar MSSA Methicillin-sensitive Staphylococcus aureus MTU Medical Teaching Unit NML National Microbiology Laboratory
NCCLS National Committee on Clinical Laboratory Standards
PCR Polymerase chain reaction

xviii
PFGE Pulsed-field gel electrophoresis PHN Provincial Health Number PPE Personal protective equipment PRN Project Research in Nursing PVL Panton-Valentine leukocidin QSHI Quality, Safety and Health Information RHRN Regional Health Record Number
SHEA Society for Healthcare Epidemiology of America
TBE Tris-Borate Ethylenediaminetetraacetic acid TSB Tryptic Soy Broth VDP Variance Decomposition Proportions VRE Vancomycin-resistant Enterococcus
1
Chapter One: Introduction
Since it was first described in 1961, methicillin-resistant Staphylococcus aureus
or MRSA, has become a significant challenge to eradicate in both healthcare and
community environments [1]. Humans can harbor the bacteria commensally for
prolonged periods of time, and more recently, other animal reservoirs, such as household
pets or livestock, have been identified [2, 3]. Colonized hosts can serve as reservoirs for
infection to themselves, and can spread the organism to close contacts, as well as to
environmental surfaces [4-8]. As a result, MRSA can manifest in transient, recurrent, or
persistent combinations of colonization and/or infection, and can be difficult to eradicate.
Strategies to control its spread have ranged from educational packages, enhanced
environmental cleaning, index case isolation or cohorting, active surveillance of hospital
admissions or prevalence surveys, antibiotic restrictions, ward closures, and
decolonization regimens, and medical therapies [9, 10].
Infectious disease transmission is often conceptualized as a chain of infection, a
metaphor which underscores the cyclical relationship between susceptible hosts, infecting
agents, and the environment that surrounds them. Successful disease transmission
depends on an infectious agent’s ability to evade and survive both environmental
challenges and host defenses, with subsequent replication, proliferation and spread into a
new host. In most infectious diseases, this cycle of infection can often be interrupted at
any link in the chain through adherence to standard precautions, which include hand
hygiene practices and barrier precautions, safe sex behavior, vaccination/herd immunity,
prudent antibiotic stewardship, environmental controls and cleaning, etc. In particular,

2
simple interventions such as hand hygiene and other standard precautions are recognized
as effective mechanisms to break the cycle of infection for MRSA, yet they are not
routinely or consistently practiced by healthcare personnel when caring for patients [11-
14].
Over the past decade, MRSA has infiltrated healthcare facilities in almost every
country and socioeconomic stratum, and continues to spread at a quickening pace. The
first documented outbreaks of MRSA in Canada were reported in the Central provinces
during the mid-1990s, primarily among hospitals in southern Ontario The emergence of
MRSA in Canadian hospitals reinforced the need for a national nosocomial surveillance
program to gain better insight into the evolving burden of both MRSA and Vancomycin-
resistant Enterococcus (VRE) in Canada, and to establish, improve upon, and standardize
effective strategies for their control. This need for coordinating oversight was met with
the establishment of the Canadian Hospitals Epidemiology Committee (CHEC) and the
Canadian Nosocomial Infection Surveillance Program (CNISP) in 1995. Through these
national surveillance programs, laboratory information and patient demographics are
collected for each new isolate of MRSA from participating hospital sites across the
country [15]. In addition, CNISP conducts periodic pulsed-field gel electrophoresis
(PFGE) strain typing surveys of clinical isolates from participating sentinel laboratories,
furnishing much-needed information on MRSA straintype distribution and regional
differences in disease incidence.
In addition to these national surveillance initiatives, many health jurisdictions
also maintain extensive and ongoing surveillance for MRSA through provincial or

3
regional infection control programs to document and respond to local changes in MRSA
rates, transmission or straintype characteristics.
In the Calgary Health Region, nosocomial cases have increased significantly since
1999, with a concomitant rise in the surrounding community. In 2004, a large outbreak of
community-associated MRSA was identified, and elevated rates continue to persist
throughout the region. In Calgary area hospitals, infection control measures to manage
MRSA positive patients have been in place for many years, and while they remain an
effective means of containing the spread of MRSA in the clinical setting, these efforts
have been unable to reduce, or even stabilize, yearly incidence rates. As case rates
continue to rise, it becomes increasingly critical to consider new approaches to the
implementation of infection control measures and to explore the application of newer
technologies to these efforts. Ultimately, innovation from other fields may help us to
understand the salient factors that mediate disease transmission, and to better implement
and support traditional or proven infection control strategies for MRSA,
Geographic information systems (GIS) are one promising avenue of research.
Since its commercial inception during the 1980s, applications of GIS have focused
primarily on land use, urban planning and natural resource development [16]. GIS is
geographically-based software that is used to visualize patterns of events occurring on
one or more spatial planes. The software allows users to store, display, and analyze
geographic data, to present data in a spatially meaningful way, and to extract information
from the proximity and timing of events.
In the biological sciences, GIS has had applications in characterizing disease
exposure and incidence within select geographic boundaries and timeframes. Public

4
health research into infectious diseases such as malaria, the hemorrhagic fevers, sexually
transmitted illness, and West Nile virus have all applied GIS to complement to field
epidemiology practices and to visualize “hotspots” of disease [17-21]. These studies are
typically performed at a national or regional scale, however, and using GIS as a tool to
track infectious diseases in micro-spatial environments such as hospital layouts is a novel
application of the software platform. This innovative approach will allow for a more
comprehensive integration of host and environmental risk factors for MRSA transmission
modeling, combining detailed clinical, microbiological, and demographic data with the
robust and flexible capabilities of GIS to provide better insight and prediction capabilities
into the distribution and patterns of disease propagation in acute care.
As in many health jurisdictions, the spread of MRSA has been challenging to the
acute care infection control program within the Calgary Health Region, despite ongoing
surveillance and rigorous infection control measures. In the larger picture, visualizing the
spread of MRSA in hospital environments through the use of GIS may provide important
insight into not only the location and timing of hotspots for MRSA infection, but lead to a
better understanding of the host and environment risk factors that mediate this
transmission. This thesis describes the implementation of GIS modeling in select
hospital wards of the Calgary Health Region between 2001 and 2006, the visualization
and predictive utility of geospatial and statistical models, and their implications for
infection control.

5
1.1 Research Question
Are there geographic and temporal patterns or clusters characterizing the
transmission of methicillin-resistant Staphylococcus aureus (MRSA) by strain and patient
location within adult inpatient areas in the Foothills Medical Centre, Calgary Health
Region between 2001 and 2006?
1.2 Specific Objectives
1. To determine the feasibility of Geographic Information Systems (GIS)
technology in characterizing patient movements in time and space, and
outlining the difficulties, if any, in departing from traditional approaches to
GIS analysis for micro-spatial environments.
2. To characterize the spatial pattern and distribution of MRSA strains in select
inpatient population from the Calgary Health Region using retrospective data
from 2001-2006.
3. To model the process of contact transmission using retrospective data, and
predict future geographic areas likely to experience new infiltration or an
increased MRSA burden.
4. To analyze the likelihood of MRSA acquisition with respect to particular host,
staff workload index, and geographic attributes.
5. To determine whether having private compared to shared accommodation in
hospital facilities reduces the risk of MRSA transmission to susceptible
inpatients.

6
Chapter Two: Literature Review
This chapter describes the history and evolving epidemiology of methicillin-
resistant Staphylococcus aureus in healthcare settings and its regional impact upon
infection prevention and control strategies. An exploration of key risk factors that
mediate disease as well as transmission among susceptible populations will also be
reviewed. Finally, the utility of geographic information systems as a tool for visualizing
and modeling MRSA disease transmission in hospital environments will be explained in
the context and scope of the present study.
2.1 The Pathophysiology of Staphylococcus aureus
Staphylococcus aureus is a gram-positive bacterium, whose genus-species name
literally translates as “golden cluster seed”, referring to its characteristic golden-coloured
colonies seen on rich media. The anterior nares is a preferred ecological reservoir among
humans but many other body sites may harbour the bacteria, including the groin, the
axillae, and the gastrointestinal tract [22]. Persisent commensal methicillin-sensitive S.
aureus (MSSA) carriage occurs in approximately 20-30% of the population [23]
compared to less than 1% nasal colonization with MRSA, according to the National
Health and Nutrition Examination Survey (NHANES), conducted in the US between
2001 and 2002 [24]. Among healthcare personnel, the prevalence of S. aureus carriage
was 28%, with MRSA representing only 2% [25]. A more recent survey, conducted in
2006, estimated the prevalence of MRSA among emergency room staff to be as high as
15% [26].
7
Colonization is defined as the proliferation of a microorganism at body sites
without evidence of infection, and in contrast, infection is the process of proliferation,
colonization and invasion of the host with an accompanying clinical or immunological
response [27]. Humans are the most notable host for MSSA colonization or infection,
although cases are common in the veterinary practice. MSSA can encompass a wide
spectrum of different presentations ranging from benign skin colonizations to fatal
systemic or organ space infections [24]. Colonization is not without risk, since the
likelihood of developing surgical site infection or bacteremia with S. aureus is several-
fold greater if a person is already colonized with the organism [24]. In a 2004 study, of
the 21% originally colonized patients with MSSA on admission, 2% went on to develop
infection with MSSA. This is in comparison to MRSA, where 3.4% were originally
identified on admission screening, and of these patients, 25% subsequently developed
infection [28]. This study failed to stratify patients into risk groups for the purpose of
this analysis, so it unclear whether the screened groups with, and without outcomes of
infection were comparable. However, other reports have also reported a four-fold risk of
MRSA infection after being colonized [29, 30].
MSSA is the most common cause of healthcare-associated infections in hospitals
[27, 31]. MSSA and MRSA may commonly manifest as soft tissue infections, cellulitis,
bacteremia, endocarditis, pneumonia, and surgical site infections. Risk of infection with
either form of S. aureus increases as a function of increasing host susceptibility [32].
While cases of both MRSA and MSSA are common in the community setting,
healthcare-associated acquisition of either sensitive or resistant S. aureus can result in
serious complications in vulnerable patient populations. Patients who develop

8
healthcare-associated MRSA tend to have an older median age at the time of detection
compared to community-acquired isolates than MSSA (68 vs 23 years respectively).
Also, 75% of community-acquired cases involve soft tissue infections compared to the
37% seen in hospital cases (OR 4.25, 95% CI 2.97-5.9) [33]. Among a spectrum of
presentations, infections with MRSA can commonly manifest as bacteremia, skin and
soft tissue or surgical wound infections, endocarditis, or pneumonia, and with limited
treatment options (compared to MSSA), the likelihood of poor clinical outcomes
increases [34]. Inpatients, with higher co-morbidity indices and increased likelihood of
receiving invasive procedures, are at a greater risk for acquiring MSSA or MRSA
infection during hospitalization by contact or droplet transmission.
Studies have shown that MRSA acquisition is associated with longer hospital
stays, chronic illness, antibiotic use, prior history of hospitalization, advancing age, long
term care residency, as well as increased mortality and morbidity after infection [35-40].
There is no clear distinction as to why some individuals have a greater propensity to
become colonized or infected with MRSA versus MSSA, but it is likely that antibiotic
pressure, bacterial virulence factors and differing patient risk factors may play a part in
determining the likelihood of these events. Among patients with healthcare-associated
infections with either MSSA or MRSA, one study concluded that the patient populations
were statistically indistinguishable from each other in terms of mean age, gender,
underlying illness, and admitting medical service [37]. Clinical healthcare-associated
infection with either MRSA or MSSA can present similarly, but mortality from MRSA
infection can be significantly greater than mortality associated with MSSA infection [32,
41-43].

9
2.2 The Molecular Evolution of Staphylococcus aureus
It is postulated that MRSA evolved from a methicillin-sensitive Staphylococcus
aureus (MSSA) and acquired the transposon, a type of mobile genetic element,
containing a staphylococcal chromosomal cassette encoding for methicillin resistance
(SCCmec). Based on ancestral specimens, the ST8-MSSA strain likely gave rise to the
first MRSA strains with the gradual emergence of four main SCCmec subtypes [44, 45].
Subsequent point mutation and recombination are the most probable mechanisms by
which MRSA has continued to evolve [46]. The SCCmec resistance element is
hypothesized to have originated from Staphylococcus scuiri and is a genomic region that
is generally well conserved. This transposon, which is approximately 40-60Kbases,
encodes for the mecA gene which confers methicillin resistance through the production of
a variant penicillin-binding protein, PBP2a [46, 47] This binding protein acts to cross-
link glycan segments of peptidoglycan matrix surrounding the bacterium and thus serves
an important role in the maintenance of cellular integrity.
PBP2a is largely unaffected by the presence of beta-lactams, which allows these
strains to survive despite exposure to these bactericidal agents [48]. MRSA is frequently
resistant to other classes of antibiotics such as aminoglycosides, other subclasses of beta-
lactams (cephalosporins, carbapenems), and quinolones. As a result of this resistance, in
certain MRSA strains, only a handful of antibiotics classes remain effective for the
treatment of infection. The current first- and second-line antibiotics used to treat MRSA
infections include Vancomycin, Rifampin, and Linezolid; each have known in-vivo
toxicity issues. For non-severe soft tissue infections, tetracycline or trimethoprim-

10
sulfamethoxazole (TMP-SMX; Septra) can also be indicated as appropriate antibiotic
therapy. With increasing numbers of reported treatment failures with Vancomycin,
however, newer agents such as Tigecycline and Daptomycin have been used and show
robust activity against MRSA for the treatment of skin and well as bloodstream infections
[49, 50].
Emerging strains of MRSA, including the Canadian community strain, CMRSA-
10, carry bacteriophage-borne genes that encode Panton-Valentine leukocidins (PVL).
These leukocidins function as cytotoxins, and can cause severe tissue damage and
leukocytosis in the host [24, 51, 52]. PVL carriage is predominantly associated with
SCCmec Type IV elements, and was first characterized in Germany in the fall of 2001
[52]. The emergence of CMRSA-10 in Canadian community settings is increasing at an
alarming rate, however, and its eventual infiltration into health care environments may
greatly escalate the bioburden of MRSA in these susceptible populations.
2.3 MRSA Epidemiology
Before the introduction of antibiotics, documented fatalities from infections with
S. aureus approached 90% [53]. Resistance to Penicillin G was reported as early as 1942,
only a few years after its introduction as the world’s first manufactured antibiotic, and by
1945, up to 22% of S. aureus and coagulase negative Staphylococcus (CNS) isolates
were resistant to penicillin[54]. By 1982, 90% of S. aureus isolates demonstrated
resistance to penicillin [54]. Methicillin and other derivatives of the original penicillin
compounds offered a wider spectrum of antimicrobial activity, but were also challenged
by the evolution of these resistant bacterial strains.

11
Methicillin resistant Staphylococcus aureus (MRSA) was first isolated in 1961 in
the UK, only two years after the antibiotic, methicillin (or meticillin), was introduced as
an effective semi-synthetic therapeutic against S. aureus and other gram-positive
organisms. MRSA was also isolated in a patient in the US in that same year [55], but
prior to 1967, there were only sporadic reports of MRSA clinical infections in the US and
Europe [56-58]. Although cases remained sporadic, once MRSA had emerged in a new
geographic location, cases tended to persist [55]. Clinical interest in MRSA waned
during the 1970s but with a sudden upsurge in identified cases in the 1980s, the rising
incidence of MRSA became a major healthcare concern across the globe [55].
As part of the European Antimicrobial Resistance Surveillance System (EARSS),
data collected from 27 countries between 1999 and 2002 showed significant increases in
MRSA activity in Belgium, the Netherlands, Germany, the UK, and Ireland [59]. Over
the course of the survey, the overall prevalence of MRSA increased from 5 to 20%. The
UK alone reported a 15-fold increase in MRSA-associated mortality between 1993 and
2002, with bacteremia increasing 24-fold in this same timeframe [60]. In Helsinki, the
incidence of their predominant E1 strain rose 68-fold, from 0.2 in 1991 to 13.6 per
100,000 in only three years [61]. After aggressive infection control measures were
implemented to control this outbreak of 210 cases, the incidence fell to 0.7 per 100,000 in
the subsequent year.
Another surveillance study by Oliveira et al in 2001 [62] demonstrated that five
major MRSA clonal types account for 68% of strains seen in Northern and Southern
Europe, Latin America, and the US. These epidemic strains were named the Iberian
(SCCmec type IA element), Brazilian (SCCmec type IIIA element), Hungarian (SCCmec
12
type III element), New York/Japan (SCCmec type II element), and pediatric clones
(SCCmec type IV element). The Iberian clone was originally detected in 1989 as part of
an outbreak in Barcelona, Spain and has been responsible for outbreaks across Western
Europe and the US. The Brazilian clone is now widely disseminated across South
America and Europe, and the New York/Japan strain accounts for 79% of MRSA seen in
the US [63]. These strains continue to serve as the benchmarks for MRSA phylogeny
and assist with tracking the spread of MRSA globally [64].
2.4 MRSA in North America
The United States has reported a dramatic increase in MRSA cases since the mid-
1970s. In 1975 only 2.4% of hospitals reported MRSA compared to 29% in 1991.
Among hospitals with a bed capacity over 500 patients, the percentage of MRSA among
S. aureus clinical isolates rose to 38.3% by 1991 [65]. In analyzing data from the
National Hospital Discharge Survey (1999-2000), 43.2% of all S. aureus clinical isolates
were MRSA, but included both community and healthcare-acquired cases [66].
According to this study, there are geographic differences in the rates of MRSA across the
US, with rates ranging between 2.84/1,000 discharges in the West to 4.45/1,000
discharges in the Southern states. The US continues to struggle to control MRSA both
within hospitals and in the community, and in many healthcare facilities, its prevalence
has reached levels where isolating large volumes of patients is no longer feasible as a
primary means to control its spread.
The first Canadian isolate of MRSA was reported in 1981 in the province of
Ontario[67]. National surveillance data for MRSA was not available until 1995 with the

13
formation of the Canadian Hospital Epidemiology Committee and Canadian Nosocomial
Infection Surveillance Program (CNISP). Originally, twenty-two participating facilities
submitted MRSA isolates for laboratory characterization, as well as clinical and
demographic information [68]. Since 1995, the number of participating centres
increased to forty, with seven of the ten provinces represented. After five years of
surveillance in Canada, CNISP data revealed that the rates of MRSA acquisition rose
from 0.46 per 1,000 admissions in 1995 to 4.12 per 1,000 admissions in 1999 (p=0.002).
The majority of this extraordinary increase was seen in the provinces of Quebec and
Ontario, although a steady increase in acquisition was reported across all provinces and
territories. In 2007, the overall national rate of MRSA acquisition jumped significantly
again to 8.62 per 1,000 admissions [69]. Across Eastern Canada, the overall rate was
6.70/1,000 admissions, with Central Canadian facilities reporting the highest rate at
10.12/1,000 admissions, and the Western Canada also reporting an increase at 7.30/1,000
admissions. These updated statistics represent a proportional increase in incidence from
the 2006 reported data. Among healthcare associated cases of MRSA, both rates of
colonization and infection have tapered, with only a modest rise in rate from 6.07/1,000
admissions in 2006 to 6.15/1,000 admissions in 2007.

14
Figure 2.1: Rates of Healthcare-associated MRSA in Canadian hospitals (1995-2007)
Source: Surveillance for Methicillin-resistant Staphylococcus aureus (MRSA) in Patients Hospitalized in Canadian Acute-Care Hospitals Participating in CNISP, 2006-2007 Preliminary Results
In 86% of cases, MRSA was attributed to hospital acquisition with 53% of new
cases having an epidemiological link to another MRSA positive patient in close temporal
or spatial proximity. Of all received isolates, 36% of new MRSA cases were identified as
a result of clinical infection [67].
2.5 Canadian MRSA Straintypes
Regional differences in the distribution and characteristics of circulating clonal
types are another important factor in understanding the molecular epidemiology and
transmission of MRSA. An understanding of these differences began to emerge in a
2002 CNISP surveillance report, which described molecular strain typing results from
sentinel hospitals across the country [15]. At the time of this review, six main strain

15
types were identified across the country. CMRSA-1 clustered around central Canada
where it accounted for up to 94% of isolates. CMRSA-1 was also present in the Eastern
provinces, but in much lower proportions, representing only 4.2% of recovered isolates.
CMRSA-2 and 4 were distributed evenly throughout the provinces, whereas CMRSA-3
was predominantly isolated from hospital sites in the Western provinces. It is believed
that the CMRSA-3 strain was introduced into Canada from the Punjab region of India in
1993, and has since spread eastward, contributing to outbreaks of MRSA as far east as
Winnipeg [70]. Despite this expansion, CMRSA-3 and 6 were both found almost
exclusively at single sites in Western Canada in a 1999 report by Simor et al. [71].
Compared to MRSA clones found elsewhere in the world, CMRSA-2 was
indistinguishable from the New York outbreak clone, one of five global epidemic strains,
and falls into the USA100/800 straintype group. Both CMRSA-3 and CMRSA-6 have
over 80% pattern similarity to the Brazilian epidemic clone. The CMRSA-4 pattern was
indistinguishable from the EMRSA-16 (USA200) clone found in multiple outbreaks
across Western Europe, particularly the United Kingdom [15]. Like CMRSA-4,
CMRSA-1 (USA600), CMRSA-8 (EMRSA-15) and CMRSA-5 (USA500) are more
commonly associated with hospital-based outbreaks in both North America and abroad.
Conversely, CMRSA-7 and CMRSA-10 correspond to the USA400 and USA300
straintypes that are increasingly implicated in cases of community-associated MRSA
(Figure 2.2).

16
Figure 2.2: CMRSA Straintypes
2.6 MRSA in the Calgary Health Region
In the Calgary Health Region, the predominant healthcare-associated strain
isolated from clinical and screening isolates is CMRSA-2, regardless of specimen source
or patient acuity. A retrospective review of MRSA bacteremia in the Calgary Health
Region from 2000-2006 demonstrated that CMRSA-2 was the predominant clone (89%)
among healthcare-associated and nosocomial cases, underscoring its regional importance
in Calgary area hospitals [43].
Since early 2004, however, CMRSA strains that have been traditionally
associated with community acquisition have begun to emerge in healthcare settings at an
alarming rate [72]. Newly characterized CMRSA-7 and CMRSA-10 strains have already
been isolated in individuals with clinical infection, and in 2004, a community-based
outbreak of CMRSA-10 was identified as a result of numerous clinical cases (n=40) in
the incarcerated and marginalized populations of Calgary [73]. CMRSA-10 continues to
expand within the region: In 2004, there were 84 new cases of CMRSA-10 identified
within the boundaries of the Calgary Health Region, and as of 2005, the annual rate had
risen to 299 [74].

17
In Calgary, significant increases in nosocomially-acquired MRSA resulted in an
explosive rise in MRSA acquisition rates, ranging from 0.06 per 1,000 patient days
between 1995 and 1998, to 0.47 per 1,000 patient days in 2005, which represents an
eight-fold increase within seven years. Between 2004 and 2005 alone, the rate of new
cases of MRSA that were diagnosed in Calgary hospitals doubled. Infection Prevention
and Control data indicate an overall rate of nosocomial MRSA acquisition of 0.57 per
1,000 patient days in 2005, but rates in select clinical areas have been as high as 5.54 per
1,000 patient days [72]. According to aggregate data from the Calgary Laboratory
Services, healthcare-associated strains of MRSA (ie. primarily CMRSA-2) have been
detected in greater numbers every year since 2000. In 2000, there were 29 new cases of
CMRSA-2 and in 2005, the number of new cases rose to 348. Other MRSA genotypes
that have been on the rise include community strains, such as CMRSA-7 and CMRSA-8.
Figure 2.3 illustrates patient care area hotspots of nosocomial cases of MRSA identified
in the three adult acute care facilities (Peter Lougheed Centre, Foothills Medical Centre,
and the Rockyview General Hospital) within the Calgary Health Region between January
to July 2006 according to PFGE strain type [72].

18
Hotspots of Nosocomially-acquired MRSA in Adult Acute Care Hospitals, to July 31, 2006
0
2
4
6
8
10
12
14
16
ICU
PC
U 4
3: G
ener
alM
ed/P
allia
tive
PC
U 5
3: V
ascu
lar
Sur
gery
ICU
PC
U 4
6: N
euro
-re
habi
litat
ion
PC
U 5
7: G
AR
P
PC
U 5
8: G
AR
P
PC
U 7
3: M
edic
al
PC
U 7
4:R
espi
rato
ry/M
edic
ine
ICU
PC
U 1
02: G
ener
alS
urge
ry
PC
U 3
0:B
urns
/Pla
stic
s
PC
U 3
2: G
ener
alM
edic
ine
PC
U 6
2: M
edic
alTe
achi
ng U
nit
PLC RGH FMC
Patient Care Areas
Num
bers
of C
ases
Community MRSA identified in admitted ptsCMRSA unknownCMRSA OtherCMRSA10CMRSA 2
Figure 2.3: Hotspots of Nosocomially-acquired MRSA (through July 31, 2006)
2.7 Host Risk Factors for MRSA
The risk factors that perpetuate the acquisition of MRSA in healthcare settings are
mediated by a complex combination of host, environmental, and MRSA virulence
characteristics. Several studies have determined that the clinical presentations between
patients who develop either MRSA or MSSA are remarkably similar [22, 37, 38]. These
risk factors may also be pertinent in determining a patient’s likelihood to acquire not only
S. aureus, but other pathogens common to healthcare settings. Risk factors that have

19
been correlated with MRSA infection include: previous colonization with MRSA,
admission to medical inpatient services (compared with surgical patients), chronic skin
ulcerations, exposure to specific classes of antibiotics, increasing dependency for
ambulation, continence or feeding, and documented proximal exposures to other MRSA
colonized or infected patients [24, 43, 75]. Evidence also suggests that prolonged
hospital stays and prior antibiotic exposures may select for those patients who are more
likely to develop MRSA versus MSSA infection [37, 38]. According to one study from
the UK, the risk of acquiring MRSA among ICU patients is 1% in the first week of
hospitalization, and increases 3% per day after the first week [76]. In this prospective
survey, MRSA acquisition was associated with length of admission to ICU.
In a recent paper summarizing local Calgary Health Region risk data for 2000-
2006, patients with underlying comorbidities such as renal failure/hemodialysis, diabetes,
HIV or hepatitis C infection, or those with heart disease, stroke, cancer, or chronic
obstructive pulmonary disease (COPD) represented a greater than 5.0 fold risk of MRSA
bloodstream infections [43]. Other studies have echoed these common themes of risk for
multi-resistant organisms such as MRSA, which include increasing severity of illness,
extended lengths of prior hospitalization, the use of invasive devices or procedures, and
exposure to antimicrobial therapy [29, 77-79].
2.8 Costs to Prevent and Manage Healthcare-associated MRSA
Healthcare facilities are already financially extended in terms of rising operating
costs and increased demand for services. Attenuating the spread of MRSA in healthcare
settings is essential, especially when low-cost interventions such as improved basic hand

20
hygiene practices and appropriate use of personal protective equipment have been met
with low adherence. Across the United States, excess costs for MRSA management
have been estimated at $1.5 to 4.1 billion, and associated with 120,000 excess admissions
per year [80]. Patients with S. aureus infections may experience hospitalization three
times the length of an average patient stay, and face a five-fold greater risk of mortality
than those without infection [81].
Resistant pathogens such as MRSA adds between $14 and 26 million in direct
healthcare associated costs in Canada, but at its current pace, the margin may be expected
to rise to $104-187 million and does not factor in diminished quality of life and
infrastructure costs [82]. Based on a limited sample size of 20 infected and 79 colonized
patients in a Toronto-area hospital, MRSA-acquisition was associated an additional cost
of $14,360 for treatment and $1,363 for isolation for each new MRSA case [83].
Prevention programs are also expensive to maintain, but in comparison to
preventing cases of MRSA, they appear to worth the investment. MRSA comes with
both measurable and immeasurable costs associated with mortality and morbidity, in
addition to the psychological stress of having a communicable and potentially long-term
illness [84]. Infection prevention strategies involving enhancing infection control staff,
admission and re-admission screening policies, and the enforcement of strict isolation are
expensive and may extend into several million dollars per year, but have numerous
benefits amortized over the long-term [85].

21
2.9 Identification Methods for MRSA
Laboratory protocols for identifying and characterizing clinical and surveillance
specimens as MRSA are standardized by the Clinical and Laboratory Standards Institutes,
or CLSI (formerly the National Committee on Clinical Laboratory Standards). In most
laboratories, preliminary culture and testing for MRSA is followed by confirmatory tests.
Pure cultures of presumptive MRSA are selected after growth on selective media such as
mannitol salt agar (MSA), oxacillin resistant screening agar, or Baird Parker media.
Selective media contains concentrations of inhibitory agents that will retard the growth of
organisms sensitive to these agents and allow those bacteria resistant to them to
proliferate. MSA with a cefoxitin disk is the most common plate-method used and
selects for MRSA by inhibiting organisms that cannot metabolize mannitol under
hypersaline conditions and those that are sensitive to cefoxitin. S. aureus (MSSA) grows
in MSA but is unable to proliferate in the presence of cefoxitin. MRSA on the other
hand, is able to grow under both of these selection criteria, since the presence of cefoxitin
induces the production of increased quantities of penicillin-binding protein 2a (PBP2a)
rendering them non-sensitive to beta-lactam antibiotics. Once pure colonies of
presumptive MRSA are selected, they are subjected to confirmatory biochemical and
molecular testing.
Commercially available products such as CHROMagar are patented
formulations that display pink-to-mauve colored colonies that distinguish S.aureus
resistant to beta-lactams (ie MRSA) from MSSA and other bacteria. Chromogenic media
such as CHROMagar eliminate the need to plate specimens onto additional rounds of
selective media, and have become increasingly popular among high volume diagnostic

22
labs. According to published comparisons, this test nears 90% sensitivity and 95%
specificity [86-88].
Molecular identification and characterization assays have evolved over the last
couple of decades, progressing from the use of phage and ribotyping techniques, to
highly sensitive and specific polymerase chain reaction (PCR)-based assays. PCR is an
in-vitro process of rapidly amplifying deoxyribonucleic acid (DNA) segments using 5’
and 3’ end primers which simultaneously replicates denatured DNA unpaired strands.
Cycles of denaturation, polymerization, and extension result in the amplification of
specific DNA targets by a factor of at least 106, and with modern real-time approaches,
primers and probes can be customized to amplify and detect specific genetic markers on a
bacterial genome within hours. To confirm MRSA, primers and probes often target the
region encoding for, or flanking, the Staphylococal chromosomal cassette, SCCMec,
encoding for methicillin resistance. In some of the newer commericial assays and
platforms, such as BD GeneOhm™ or Cepheid Xpert™, sensitive and specific real-time
PCR may be conducted directly on clinical specimens using probes that are unique to
MRSA. While PCR can provide rapid results and distinguish genetic variations among
MRSA strains through the amplification of specific virulence genes, such as Panton-
Valentine leukocidin (PVL), it remains an expensive laboratory procedure ($96 per
patient for PCR versus $67 per patient for culture) and not all facilities are capable of
performing PCR routinely [89].
At this time, the standard laboratory method for differentiating MRSA strain types
on a molecular level is the through the use of pulsed-field gel electrophoresis (PFGE).
Following extraction and purification from cellular material, MRSA genomic DNA is

23
typically digested with the restriction enzyme, SmaI, and separated by contour-clamped
homogenous electric field (CHEF) electrophoresis. Under these electrophoretic
conditions, restriction fragments are subjected to pulsed, directional electrical current
during their migration through the gel, and is capable of accurately separating fragments
ranging from several kilobases to several megabases according to fragment size. Larger
DNA fragments do not move as readily, as compared to smaller pieces, which migrate
further down the gel. The resulting pattern of restriction fragments for each isolate is
both characteristic and reproducible, and may be used to compare against reference
patterns (eg: CMRSA-2) [15, 90]. When evaluating isolates for their degree of
relatedness based on their PFGE profile, criteria for distinguishing genetically-related
strains is as follows:
Table 2.1: Criteria for PFGE interpretation.
Category Fragment Differences in PFGE banding patterns
Epidemiologic Interpretation
Indistinguishable 0 Isolate is part of clonal spread Closely related 2-3 Isolate is probably part of clonal
spread (eg. point mutation) Possibly related 4-6 Isolate is possibly part of clonal
spread Different ≥7 Isolate is not part of clonal spread
(Adapted from Tenover et al, 1995) [91]
The ability to discriminate between strains of MRSA using PFGE is beneficial in
epidemiologic investigations and may help to determine whether clusters or outbreaks of
MRSA are caused by a point source, or whether an outbreak has been propagated through
several sources with differing nosocomial and/or community-associated genotypes. With

24
an ever-growing phylogeny of straintype and molecular information, sophisticated
software packages such as BioNumerics™, are necessary to characterize, organize and
analyze molecular findings to assess the likelihood of epidemiologic association. For the
present study, PFGE data are critical in tracking clonal distribution, transmission and the
evolution of MRSA through patient care areas.
2.10 Guidelines for the Prevention and Control of MRSA
In 2003, the Society for Healthcare Epidemiology of America (SHEA) issued
guidelines for the prevention of nosocomial spread of multi-drug resistant pathogens such
as MRSA. These guidelines are based upon a thorough review of published studies, and
recommendations include active surveillance cultures both at the time of admission as
well as periodic testing during a patient’s admission, the promotion of hand hygiene
compliance among visitors, patients and staff, the use of barrier precautions in patients
suspect or known MRSA, attention to antibiotic stewardship programs with a focus on
reducing inappropriate or excessive antibiotic prophylaxis or therapy, the decolonization
of known colonized patients, the implementation of adequate environmental disinfection
measures, access to dedicated patient equipment, and provisions for ongoing education
for staff on exposure and transmission risks [92]. More recently, the Healthcare
Infection Control Practices Advisory Committee (HICPAC) released the “2006
Management of Multi-Drug Resistant Organisms in Healthcare Settings” as well as the
“2007 Isolation Guidelines”, both of which were in support of the SHEA guidelines with
explicitly outlined strategies to control and reduce the spread of multi-drug resistant
organisms (MDRO) like MRSA.

25
These evidence-based recommendations offer a tiered approach to reducing
MDROs through the implementation of seven key control steps: 1. Garnering
administrative support with fiscal and personnel resources, 2. Provision of targeted
education, 3. Judicious use and planning of antimicrobial drugs, 4. Surveillance of
MDROs from clinical cultures and asymptomatic carriage, 5. Infection control
precautions, 6. Environmental measures such as using dedicated patient equipment,
environmental cultures, and cleaning performance metrics, and 7. Selected decolonization
strategies for colonized individuals [93]. To date, the Public Health Agency of Canada
has not issued specific guidance for Canadian health care providers on the management
of MDROs to mirror the HICPAC guidelines.
Recommendations by the American Institute of Architects (AIA) included
guidelines to support the design of healthcare facilities with single patient rooms with
dedicated bathrooms as well as access to adequate hand hygiene stations between patients
to facilitate the reduction of infectious disease transmission between patients in close
proximity [94, 95]. A number of studies have demonstrated the importance of patient
density and ward architecture on the transmission of nosocomial pathogens, and
increasing beds in shared environments is routinely linked to increased rates of cross-
infection. In a 1998 study looking at the impact of increasing a four-bed shared room by
one additional bed in an acute medical ward increased the risk of MRSA acquisition by a
relative risk of 3.15 compared to those rooms configured for four patients [96].

26
2.11 Efficacy of Infection Prevention and Control Measures
The routine management of MRSA relies heavily on the implementation and
maintenance of infection control measures for safer patient care. Efforts such as the
promotion of hand hygiene as well as emphasizing standard and contact precautions
compliance are cornerstones to basic infection control in a healthcare setting. The
prevalence of MRSA in North American healthcare has escalated over the past decade,
and in many facilities, rising rates which would previously have been considered
indicative of an outbreak, are now considered normal endemic acquisition patterns as
MRSA becomes increasingly difficult to control.
As an example of the efficacy of stringent control measures for MRSA, several
European countries have opted for a zero tolerance policy with impressive results. Strict
measures were instituted in Sweden in 1997 during a point source outbreak of EMRSA-
16 representing 65 new cases. Infection control measures included closure of wards to
admission upon the detection of one new colonized case, dedicating nursing assignments
to isolated patients, and screening and isolation of all transfers into affected hospitals
until proven to be MRSA negative. Within six months, the successful and sustained
eradication of EMRSA-16 had been achieved [85]. The Netherlands have implemented
this same “search and destroy” policy, despite formidable implementation costs. These
strategies have included strict enforcement of staff and patient cohorting, isolation
measures, antibiotic stewardship, and temporary suspension of colonized staff from
regular patient care duties. With these strategies, the incidence of MRSA has remained
less than 0.5% between 1991 and 2000 [97]. Other strategies that have been
implemented in clinical settings include enhanced housekeeping to control environmental

27
load of MRSA, general admission screening and weekly surveillance cultures,
longitudinal surveillance, and decolonization therapy for MRSA positive patients and
staff [98].
Infection control programs have always focused resources towards the education
of staff, visitors and patients, and have expanded over the past decade to include new
avenues for promoting hand hygiene, standard precautions, and early detection of MRSA.
The Centers for Disease Control and Prevention (CDC) have recently launched the
National MRSA Education Initiative, a highly publicized program to prevent and
recognize MRSA skin and soft tissue infections, and the Campaign to Prevent
Antimicrobial Resistance, a 12-step program to help healthcare facilities improve their
antimicrobial stewardship programs [99].
Practically speaking, it is difficult to assess whether a specific strategy, or
combination of strategies, is responsible for the successful eradication or reduction of
MRSA. Such practices are typically implemented as part of a multi-pronged infection
prevention and control protocol, and the effectiveness of each individual measure is not
easily determined.
2.12 Transmission of MRSA in Healthcare: The role of the Physical Environment
MRSA is primarily spread through contact and droplet mechanisms. This means
that an individual who is either transiently or persistently colonized or infected with
MRSA can transmit the bacteria between individuals either by direct contact or by
droplet transfer from the upper airways, typically through coughing or sneezing. MRSA
is able to survive on environmental surfaces for prolonged periods of time and thus

28
indirect means of transmission may also occur [6-8]. Boyce et al studied the role of
environment, and found that 27% of rooms occupied by MRSA positive patients had
environmental surfaces that were also positive for MRSA [5]. Furthermore, the level of
environmental contamination detected in patient rooms may actually be proportional to
the number of MRSA-positive body sites on each patient [100].
The chain of transmission cycles between a colonized or infected host and a
supportive external environment where pathogens suited to survival on surfaces like
hands or fomites can persist or thrive. In general, it is believed that the primary mode of
transmission for MRSA is via transient carriage on the hands of healthcare personnel who
spread the organism by direct contact [101]. A 2004 study in Australia demonstrated that
on average, 17% of direct contacts between a healthcare provider and patient resulted in
the transmission of MRSA onto the gown and gloves worn by the healthcare provider
[14]. Moreover, among 52 colonized patients in two ICUs, the matching straintype of
MRSA was recovered from surfaces in their room in 65% of cases. One of the strains
circulating on the units was cultured from a physician’s hand as well as from a telephone
which emphasizes both the need for routine and thorough environmental cleaning, and
the strict adherence to hand hygiene practices among healthcare personnel [102].
Other key environmental risk factors that impact the transmission of MRSA in
healthcare environments include the effects of patient crowding, nursing workload, and
exposure to colonized or infected roommates. Several studies have highlighted increased
rates of MRSA during periods of overcrowding in both intensive care and general wards,
and this likely points to the decrease in hand hygiene compliance, increased staff
workload with less time to attend to basic infection control measures, decreased ability to

29
cohort or isolate patients, and increased patient movements as beds become available or
transitional or makeshift beds are created [103-106]. In an ICU-focused observational
study by Bracco et al, single rooms were identified as an effective means to control
transmission of MRSA compared to patients that were cared for in open bays. In this
study, the incidence density of nosocomial MRSA was 4.1/1,000 patient days in the open
bay rooms compared to 1.3/1,000 patient days in single rooms (p<0.001). The patients in
both groups had similar characteristics, except that those in bay rooms experienced
higher mortality [107].
In a recent retrospective study, exposure to roommates colonized or infected with
MRSA was associated with a 12.6% increased likelihood of acquiring the same strain of
MRSA within 10 days, and an additional 2% of patients tested MRSA positive within 18
days of their last exposure to a positive roommate [75]. This finding not only highlights
proximity as a significant exposure risk to MRSA negative patients, but may also allude
to an incubation period for MRSA acquisition.
If not for the use of active surveillance cultures at admission, 85% of colonized
patients would go undetected. Of the patients tested, 15% of colonized patients were
identified because clinical cultures were taken to rule out infection [108]. Colonization
pressure, defined as the number of MRSA positive patient days over the total number of
patient days, was a salient risk factor in the determination of nosocomial MRSA
transmission rates. When this ratio rose above the median, the likelihood of both
transmission, and outbreaks of MRSA increased proportionally [109]. The downstream
effects of crowding and undetected MRSA reservoirs emphasize the role of the

30
environment and poor basic hygiene on MRSA spread in constrained spaces, and will be
a focus or consideration of subsequent modeling efforts.
2.13 The Calgary Health Region: MRSA Management and Surveillance
2.13.1 Management
The management of incident as well as previously identified cases of MRSA
consumes a significant proportion time from infection control professionals (ICP) in the
Calgary Health Region. New cases may be identified through active surveillance cultures
taken upon admission to high-risk acute care units or high-risk areas, sporadic point
prevalence surveys, or through routine clinical cultures. Upon receiving notification of
positive preliminary or final culture results, ICPs locate index cases and recommend
isolation precautions and private rooms. A patient’s electronic health record as well as
their physical chart are flagged to notify staff that the patient is on isolation and both
standard and contact precautions should be observed.
ICPs also order baseline specimens to evaluate the extent of MRSA colonization
or infection by requesting swabs of the nares, rectum, and any open wounds from nursing
staff caring for the patient so long as they are not on a current course of antimicrobials
with activity against MRSA. If a new case has been in a shared patient environment,
nares and rectal screening cultures are ordered on roommates with more than 72 hours of
exposure to the index case. Rapid results on all new or repeat cultures are processed and
reported by Calgary Laboratory Services (CLS). Clinical specimens are forwarded to the
Southern Alberta Provincial Laboratory for further characterization by PFGE and PCR.

31
Calgary Laboratory Services performs PFGE and PCR on screening specimens as of
2005.
If it is appropriate, patients and their families are also provided with educational
consultations and fact sheets to explain what MRSA is, and to stress the importance of
basic hygiene. ICPs continue to monitor MRSA patients through the course of their
admission, and often mediate their transfer or discharge by communicating their isolation
requirements to the receiving areas.
During MRSA outbreaks, ICPs communicate their strategies for control with the
regional management team, which includes the medical director for infection control, the
regional manager and director for the program, as well as any relevant stakeholders of the
patient care unit, the facility, laboratories, and/or local communicable disease unit. In
these circumstances, enhanced cleaning protocols, active surveillance, decolonization
procedures, cohorting, and staff screening may be suggested.
2.13.2 Surveillance
Infection Prevention and Control (IPC) monitors and responds to changes in the
incidence and prevalence of MRSA in the Calgary Health Region through facility-wide
prospective surveillance. The CHR participates in CNISP data collection, and reports
new cases of MRSA via standardized forms outlining demographic, clinical, and
epidemiologic data. If an incident case meets the appropriate case definitions, it is
assigned a sequentially ordered unique identifier and a record is completed for CNISP
surveillance. The name and new identifier are then faxed to CLS where an aliquot of the
corresponding specimen is saved, batched for processing, and sent to the National

32
Microbiology Laboratory in Winnipeg, MB for independent PFGE and PCR
characterization. The new alphanumeric identifier is the only retained link between the
surveillance form and isolate.
CNISP surveillance does not collect sufficient personal data to identify or locate
an individual. Each participating site has access to its own data and may view aggregate
regional data and compare against national trends of MRSA. CNISP data are submitted
by each participating hospital and copies are retained for recordkeeping and program
reimbursement. The epidemiological data are paired with the forthcoming PFGE and
PCR typing completed by the National Microbiology Laboratory.
To monitor local trends of both MRSA and VRE, a patient registry was developed
in 2002 to capture MRSA culture result across the acute care sector. The registry, called
the Antibiotic Resistant Organism database or ARO database, contains patient identifiers
and demographics as well as epidemiologic data fields that characterize whether cases
originated in the community or healthcare setting, severity of illness, basic risk factors
such as demographics and members of the renal outpatient program, and outcomes such
as death or successful decolonization of MRSA.
This database enables longitudinal tracking of MRSA infection and carriage
among patients accessing the acute care sector of the Calgary Health Region, allows for
entry of MRSA screening results, both positive and negative, over subsequent patient
admissions, and aids in determining whether individual patients require ongoing isolation
precautions. The ARO database collects and tracks information on patients who are also
submitted as cases for CNISP surveillance as well as others who do not meet CNISP
criteria (ie. community cases and persistent carriers of MRSA). The database is used

33
throughout the Calgary Health Region by ICPs who use this tool to query the status or
history of a patient with MRSA and/or VRE, to generate line lists of cases on units with
elevated MRSA activity, and to track patient screening. The database is updated and
managed by infection control practitioners and MRSA and VRE activity reports are
generated quarterly to highlight hotspots for transmission or to monitor areas where
interventions to reduce cases have been implemented. These reports serve to inform the
site and regional hospital administration and steer infection control committee decisions
and interventions.
2.14 Calgary Health Region Infection Prevention and Control Practices
MRSA was first identified in Calgary hospitals as part of an outbreak that
occurred between December 1990 and 1992 [110]. Contact isolation precautions were
the only measures instituted in January 1991 for patients identified with MRSA, but were
effective at containing the outbreak. In the decades since its emergence in the Calgary
region, infection control measures have expanded to include isolation or cohorting
(“isolation without walls”) either colonized or infected patients in a private patient room
with a dedicated bathroom, door signage to indicate isolation precautions were in effect,
education to staff and visitors on the importance of hand hygiene, daily room cleaning,
and surveillance of nasal, rectal, and open wound cultures. Infection control
practitioners respond to new adult cases of MRSA by initiating contact (+/- droplet, if
respiratory involvement is identified) isolation precautions, screening the nares, rectum
and open wounds for MRSA, reviewing patient charts for risk factors and potential
location of MRSA acquisition, physician notification, and re-enforcing strict adherence

34
standard precautions - hand hygiene and use of personal protective equipment (PPE) such
as single-use gloves, masks, and gowns.
The Calgary Health Region’s health information system at two of the adult acute
care facilities allows an electronic flag to be placed on the electronic record of patients
positive for MRSA. The automatic flag enables positive patients to be preferentially
placed under contact isolation in a private room by Patient Placement Services when they
are admitted to hospital. If a private room is unavailable, patients may be placed on
another ward until they can be moved, or, upon consultation with Infection Prevention
and Control, be temporarily cohorted with another MRSA positive patient. Flagged
patients require these isolation precautions until three consecutive sets of surveillance
cultures are negative, taken from the nares, rectum and any sites of open drainage, with
each set spaced one week apart and taken in the absence of antibiotics with activity
against MRSA. Once three sets of negative cultures are obtained, a patient is considered
clear of MRSA and no longer requires isolation. The electronic flag is inactivated in the
health information system, however cleared patients remain in the ARO database and
upon re-admission, are screened nasally and rectally, but not placed under isolation
precautions. Patients occasionally revert back to being a carrier for MRSA and are re-
flagged in the database as an “active MRSA” and placed on contact isolation.
In 2006, the Calgary Health Region began an MRSA decolonization clinic for
acute care patients. Eligibility criteria included patients colonized with MRSA but
without patent invasive devices or open wounds, with the rationale that simple cases
would represent better candidates for successful eradication. The treatment regimen

35
consisted of systemic antibiotics plus a seven day course of nasal mupirocin ointment and
2% chlorhexidine gluconate body wash [111].
Currently, there is no formal antibiotic stewardship program at the Calgary Health
Region, but trends in antimicrobial use are monitored and compared with emerging
antibiotic resistance patterns among circulating local and national MRSA strains.
Neither antibiotic cycling, nor formulary restrictions have been implemented as part of
interventions to control rising MRSA incidence, despite recommendations by HICPAC or
SHEA guidance documents [92, 93]. In a recent survey, however, 75% of the 28
responding CNISP hospitals reported having a program for antimicrobial restriction, with
most implementing restriction policies for the use of oral vancomycin as well as linezolid
and quinupristin/dalfopristin [112].
Screening for MRSA carriage upon admission to hospital occurs periodically in
select patient populations, and for every admission or transfer to critical care units. In a
point prevalence survey conducted on May 4-5, 2002 across the Calgary Health Region
among all inpatients, it was determined that for every patient with known MRSA
carriage, there were seven more positive patients whose carriage status remained
undiscovered [113]. Point prevalence surveys are difficult to coordinate but yield
provide real-time estimates of the regional burden of MRSA in acute care. Screening of
close contacts or healthcare workers may be requested by IPC when outbreaks of MRSA
have occurred and a point source for the spike in incidence has not been identified
through epidemiologic links. Screening of healthcare personnel is more complicated,
since it often requires close consultation with relevant labour unions, hospital

36
management, Infectious Diseases specialists, and occupational health departments before
screening is approved.
Other efforts to control MRSA in the Calgary Health Region have included
garnering support from the regional hospital administration to continue with admission
screening protocols in high risk clinical areas, benchmarking regional MRSA rates
through surveillance, providing financial support to enhance environmental cleaning
services on high risk units, support for increasing the numbers of isolation rooms and
sinks for new construction and renovation projects, prioritizing the importance of region-
wide basic infection control education during new staff orientations and annual training,
and receiving endorsement by the regional administration for an intense social marketing
campaign on hand hygiene, accompanied by the addition of alcohol hand sanitizer
products throughout the Calgary Heath Region.
Despite the ongoing and serious commitment to providing safe patient care by the
Calgary Health Region, a number of nosocomial clusters or outbreaks involving MRSA
have occurred over the past 18 years. Each investigation is contextually different, and
may require adaptive strategies to respond to and contain the increase in MRSA activity.
Yet in many cases, the core elements remain the same:
Consultation with the medical director of Infection Prevention and Control
Definition for inclusion or exclusion of cases with respect to time, geography, and
patient risk factors
Audit of clinical and hand hygiene practices, antibiotic prophylaxis,
environmental cleaning regimens and products, recent product or practice changes
Plausibility of transmission among cases

37
Screening of close contacts and roommates with exposure greater than 72 hours
Enhanced environmental cleaning
Pulsed field gel electrophoresis (PFGE) typing of saved isolates
Patient cohorting and isolation strategies
Patient and staff education
Enhanced infection control surveillance within affected clinical areas
These steps outline the core activities of outbreak investigations within acute care
facilities, and in some clinical areas these measures have become commonplace with
multiple clusters of MRSA throughout the year.
From a recent survey of infection control practices across acute care facilities in
Canada, only 60% of recommended control activities were implemented and 67% of
facilities performed routine surveillance to monitor MRSA, Clostridium difficile, and
Vancomycin-resistant Enterococcus (VRE) rates [114]. Only 10% of acute care facilities
reported that they had implemented at least 80% of the recommended infection control
practices, which included appropriate resourcing with infection control professionals,
surveillance activities to monitor trends in infectious diseases, development and
implementation of infection control policies, reporting surveillance activities, and access
to laboratory information. Another survey administered in 2003 through participating
CNISP sites identified 92.9% of sites implemented isolation for MRSA in both critical
and non-critical care settings and 96.4% had an admission screening policy and a
roommate screening protocol [112].

38
2.15 Geographic Information Systems
One of the first and rudimentary applications of Geographic Information Systems
(GIS) was implemented with John Snow’s investigation into a cholera outbreak in
London during the mid-1850s. Snow painstakingly mapped the location of water pumps,
residences and factories, as well as the locations of those who died due to cholera. While
Snow’s map did not help him conclude that the disease vector was water-borne, it did
assist him in identifying the clustering of cases near one main landmark, the Broad Street
pump, which was ultimately determined to be the point source of the contagion [16].
Geography has always played an integral part in epidemiologic investigations by
answering the “where” component of the person, time, and place elements involved in
the source and spread of disease. In recent years, spatial patterning using GIS methods
has emerged as a powerful tool to visualize infectious disease spread.
GIS are tools to capture, store, analyze, and display data in a spatially-meaningful
context [115, 116]. Spatial data includes locator information such as postal codes or
other static or mobile geographic markers to reference events or features and situate them
in space and time. The underlying technologies for GIS emerged alongside
advancements in computing during the 1970s and have been applied to almost every
major industry, including healthcare. GIS software can assist with visualizing the
geographic propagation of disease by characterizing the spatial elements that impact or
mediate the chain of infectious disease transmission. At its most basic level of
conceptualization, GIS can be used to highlight geographic areas where hotspots of
infection occur in hospitals, help to streamline prevention strategies, and determine the
most judicious use of educational or medical resources to impact these target areas. GIS

39
can also assist in characterizing the spatial components of disease dynamics by
visualizing transmission events over time, potentially revealing patterns that traditional
analytics approaches cannot resolve. When the interval between exposure and outcome
is short, geographic mapping can be a powerful tool to assist in illustrating associations
between cause and effect [16]. Traditionally, using GIS for the development of
predictive models has focused on the creation of suitability models that were generally
not mathematically validated. Many model building endeavors have first attempted to
visualize geographic trends, and with subsequent validation against expert opinion to
determine their predictive utility [117]. An example of this type of approach is the use of
environmental modeling to predict the potential multi-factorial impact of events that
change the environment, such as disaster, pandemics, or proposed construction.
Extensions to the current ESRI ArcView package, such as EpiAnalyst or Tracking
Analyst, and statistics packages like S-Plus may assist with approaching analyses of
spatial data with the intention of mathematically quantifying disease spread and move
beyond the typical descriptive statistics that are reported with traditional GIS analysis.
Another popular software package used to model space-time associations is SaTScan
which was developed by Martin Kulldorff to model and evaluate spatial clusters and
based on Poisson event distributions and Markov chain Monte Carlo simulation
theories[118].
Prior to any analyses, GIS data that are intended for input into computer software
packages must be formatted as either raster (image type) or vector data (line type).
Raster formats are commonly used with satellite imagery and are represented as grids on
a Cartesian coordinate system. Spatial accuracy in raster formats is dependent on the

40
resolution of the grid itself [16]. Conversely, vector format GIS depicts features in two-
dimensions as points, polygons, or lines. Figure 2.4 compares the features of data
represented through raster or vector data types.
Figure 2.4: Comparison of vector and raster data types in spatial representation
From: Boulos et al, 2001 [117]
Data can be layered by feature onto the geographic plane of study which is helpful
in visually and mathematically assessing the impact of proximity to the outcome of
interest. For example, in monitoring the spread of Lyme disease in the United states,
being able to add and subtract features such as tick population densities, vegetation, and
human Lyme disease case locations permit better visualization of the salient elements that
mediate disease transmission [117, 119]. Over the past several decades, GIS has been

41
applied to numerous infectious disease phenomena to characterize its detection,
distribution, risk factors, and focusing on hotspots for surveillance. One clear advantage
of incorporating spatial data, is the ability to focus on specific geographic areas and
examine commonalities and features that may set it apart from, or unite it with other
geographic subsets. These results can be visually highlighted on a map and data points
within these areas can be cross-checked to attributes, potentially revealing patterns or risk
factors that might be overlooked by non-spatial analysis methods [117].
One of the a-priori assumptions in traditional data analysis methods is the axiom
that events occur independently. However, in spatial analysis this is rarely the case, as
new events often occur simply because of their proximity to another event. This
observation is especially true in the context of infectious disease transmission, where data
points clearly are not independent events. Transmission occurs because of an interaction
between infected or colonized hosts that act as vectors of disease to a susceptible new
host. Therefore, when analyzing epidemiologic phenomena such as the clustering of
cases of disease, it is important to account for spatial dependence.
Tobler’s Law states that objects that are nearer to each other are more
related[120]. To correct for this analytic conundrum in GIS, spatial autocorrelation
indices are used to assist in the determination of the overall effect of data dependency
prior to performing spatial analyses. In effect, spatial autocorrelation reduces the
number of degrees of freedom in the assessment of the degree of association between
events and the outcome of interest [120]. Calculation of local Moran’s I is a classic
method of measuring the importance of spatial autocorrelation, and is calculated as
follows [120, 121]:

42
2)()(
))((
yyw
yyyywnI
i
n
iij
n
j
n
i
jiij
n
j
n
i
−
−−=
∑∑∑
∑∑
where n defines the number of regions, w is the spatial adjacency between regions i and j,
and y is the observed value and y-bar is the mean value at location i or j [120].
Moran’s I is the equivalent of the Pearson Product Moment Correlation
Coefficient. Thus, if its value is close to +1, it indicates that similar attributes are
clustering around a geographic space, while a value that approaches -1, suggests that
dissimilar attributes are clustered in a continuous space, or perfectly dispersed, an
observation that is extremely rare. A value of 0 indicates that the attributes are randomly
located in space and that their distribution is independent. Correction for spatial data
with autocorrelation indices such as Moran’s I reduces the risk of Type I error and leads
to more accurate and less biased estimates of the true variance [120].
While GIS is frequently used to identify and describe spatial patterns of known
events, its ability to model and predict future events has been less well studied in
epidemiology, especially once spatial-temporal interactions are factored in. Many
different methodologies have been used to simulate the progression of disease in a
population.
Such methodologies include stochastic cellular automata, which were originally
adapted from the field of artificial intelligence, and are now used to simulate the spread
of events across geographic areas over the course of time [122]. In its most simple form,
cellular automata may function as a spatial lattice with a starting point source state that is
affected by the state of its neighbors. Once a value changes over time in any surrounding
43
cell, the state of the original cell will change according to a set of simple preset rules.
The result is a stochastic transition that may follow a Poisson distribution, where a
change of state in any one cell of the matrix results in a change of state that ripples
progressively through all other cells. This methodology has been used to simulate the
spread of SARS as well as influenza, and is the premise behind British mathematician
John Conway’s now-famous artificial simulation from the early 1970’s, The Game of
Life (http://www.bitstorm.org/gameoflife/). Spatial cellular automata have its roots in
other stochastic simulation processes that follow simple, cascading rulesets, like Monte
Carlo and Markov Chain methods.
Without the availability of spatial data, traditional statistics would be employed to
describe the factors that mediate the transmission of infectious agents within a
population. The chain of transmission involves host and infectious agent, but without
factoring the impact of the surrounding environment, modeling MRSA transmission may
miss key elements to determine mechanisms for enabling disease transmission. Including
spatial components into this analysis is important in providing insight and feedback to
longstanding infection prevention and control policies on the merits of isolation and hand
hygiene practices, and rationalize healthcare provider workload.
Variables such as patient room locations and roommates at the time of, and prior
to, identification with MRSA could not be included meaningfully in the analysis. As
discussed earlier in this chapter, univariate and multivariate analyses have typically found
that MRSA is associated with longer patient stays, the presence of indwelling devices,
chronic disease, previous hospitalization, antibiotic use, long-term care, and advancing
patient age [33, 36, 123-125]. This dissertation describes an investigative approach that

44
will model a step-wise logistic regression using non-spatial information, and then factor
in applicable spatial methods to account for the presence of geographic features that
predict MRSA acquisition.
Currently, most geospatial analyses rely on the use of known coordinate systems
to map out features, such as postal or zip codes, census tracts, or universal geographic
positioning coordinates [126, 127]. GIS modeling of infectious disease transmission in
healthcare, or micro-spatial, environments is a novel application of the technology, and
modifications to the process of geocoding locations and the development of an
appropriate coordinate system will need to be devised.
2.16 Rationale for Study
Several studies have investigated the risk factors for MRSA acquisition in
hospital and community environments. Other studies have made significant contributions
in quantifying mathematical models to describe and model the transmission of infectious
diseases using Monte Carlo simulations [128, 129]. With the rapid and significant rise of
MRSA in the Calgary Health Region over the past five years, however, the incorporation
of robust and versatile GIS-based approaches as a tool to better visualize and document
MRSA activity in the hospital microenvironment is both timely and relevant. MRSA
acquisition continues to escalate in many patient populations, and is particularly vexing
in tertiary healthcare facilities where infection control interventions are aggressive, and
yet the incidence of MRSA continues to increase without falter. The use of GIS may
help to better direct infection control efforts by highlighting clinical areas that experience
clusters of activity or manage the greatest bioburden of MRSA. The interplay of
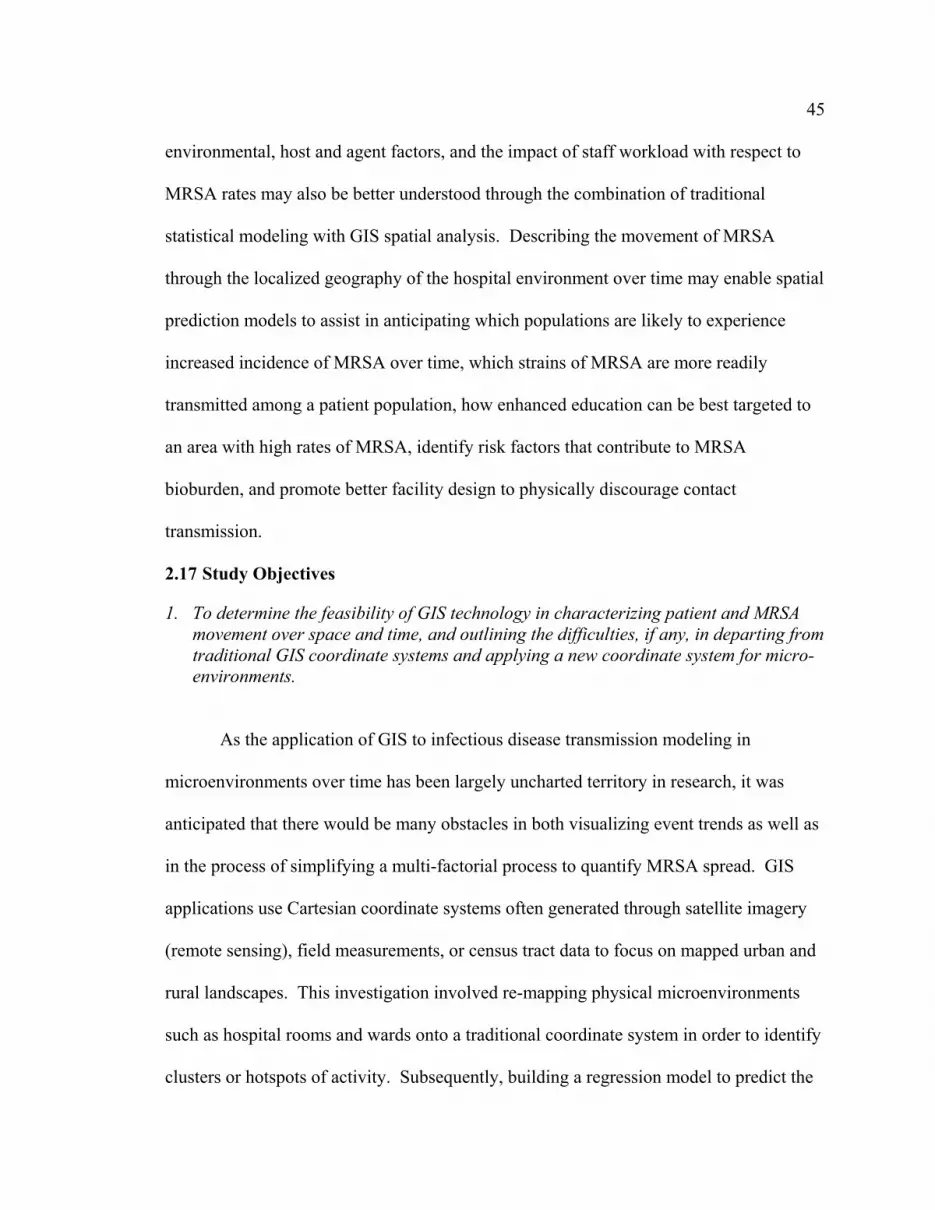
45
environmental, host and agent factors, and the impact of staff workload with respect to
MRSA rates may also be better understood through the combination of traditional
statistical modeling with GIS spatial analysis. Describing the movement of MRSA
through the localized geography of the hospital environment over time may enable spatial
prediction models to assist in anticipating which populations are likely to experience
increased incidence of MRSA over time, which strains of MRSA are more readily
transmitted among a patient population, how enhanced education can be best targeted to
an area with high rates of MRSA, identify risk factors that contribute to MRSA
bioburden, and promote better facility design to physically discourage contact
transmission.
2.17 Study Objectives
1. To determine the feasibility of GIS technology in characterizing patient and MRSA movement over space and time, and outlining the difficulties, if any, in departing from traditional GIS coordinate systems and applying a new coordinate system for micro-environments.
As the application of GIS to infectious disease transmission modeling in
microenvironments over time has been largely uncharted territory in research, it was
anticipated that there would be many obstacles in both visualizing event trends as well as
in the process of simplifying a multi-factorial process to quantify MRSA spread. GIS
applications use Cartesian coordinate systems often generated through satellite imagery
(remote sensing), field measurements, or census tract data to focus on mapped urban and
rural landscapes. This investigation involved re-mapping physical microenvironments
such as hospital rooms and wards onto a traditional coordinate system in order to identify
clusters or hotspots of activity. Subsequently, building a regression model to predict the
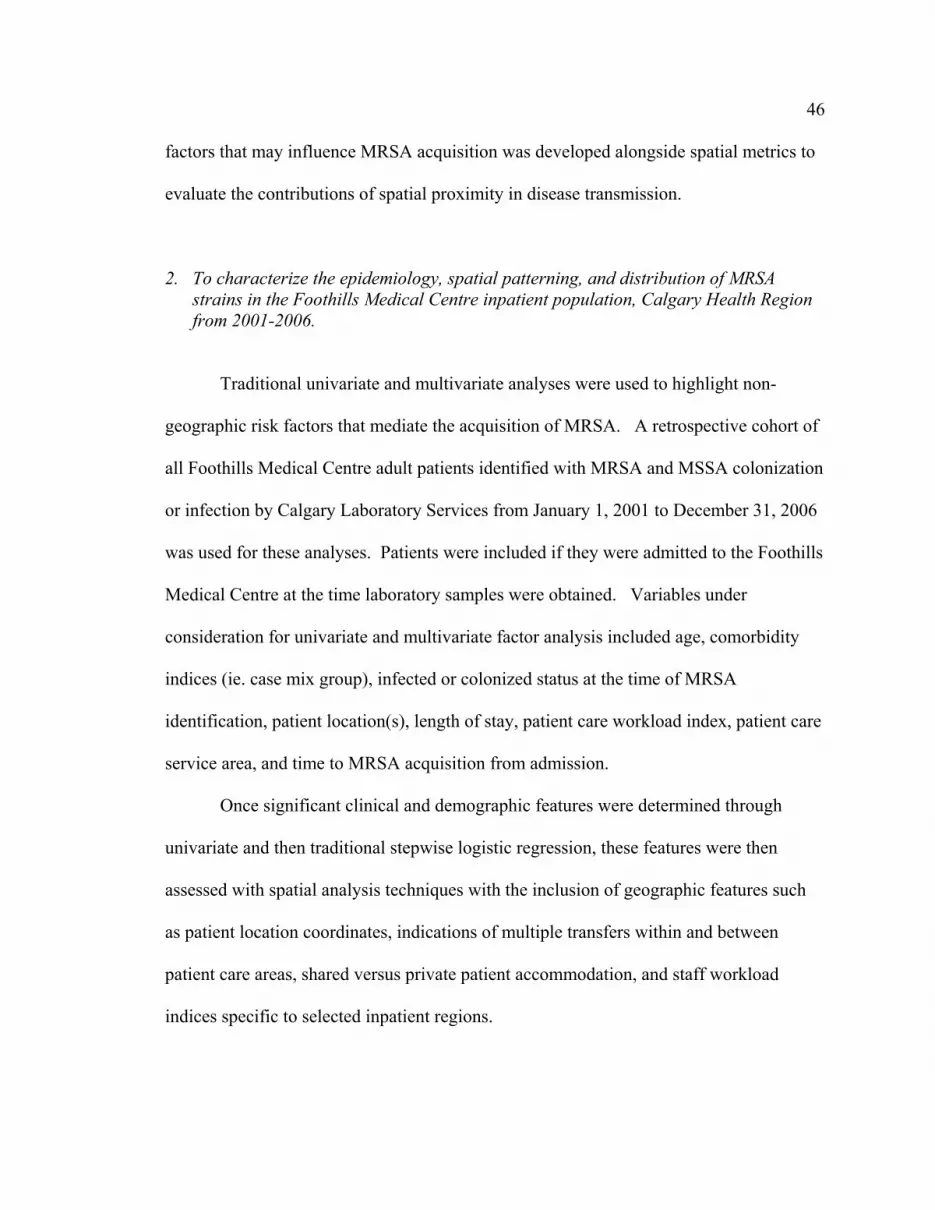
46
factors that may influence MRSA acquisition was developed alongside spatial metrics to
evaluate the contributions of spatial proximity in disease transmission.
2. To characterize the epidemiology, spatial patterning, and distribution of MRSA strains in the Foothills Medical Centre inpatient population, Calgary Health Region from 2001-2006.
Traditional univariate and multivariate analyses were used to highlight non-
geographic risk factors that mediate the acquisition of MRSA. A retrospective cohort of
all Foothills Medical Centre adult patients identified with MRSA and MSSA colonization
or infection by Calgary Laboratory Services from January 1, 2001 to December 31, 2006
was used for these analyses. Patients were included if they were admitted to the Foothills
Medical Centre at the time laboratory samples were obtained. Variables under
consideration for univariate and multivariate factor analysis included age, comorbidity
indices (ie. case mix group), infected or colonized status at the time of MRSA
identification, patient location(s), length of stay, patient care workload index, patient care
service area, and time to MRSA acquisition from admission.
Once significant clinical and demographic features were determined through
univariate and then traditional stepwise logistic regression, these features were then
assessed with spatial analysis techniques with the inclusion of geographic features such
as patient location coordinates, indications of multiple transfers within and between
patient care areas, shared versus private patient accommodation, and staff workload
indices specific to selected inpatient regions.
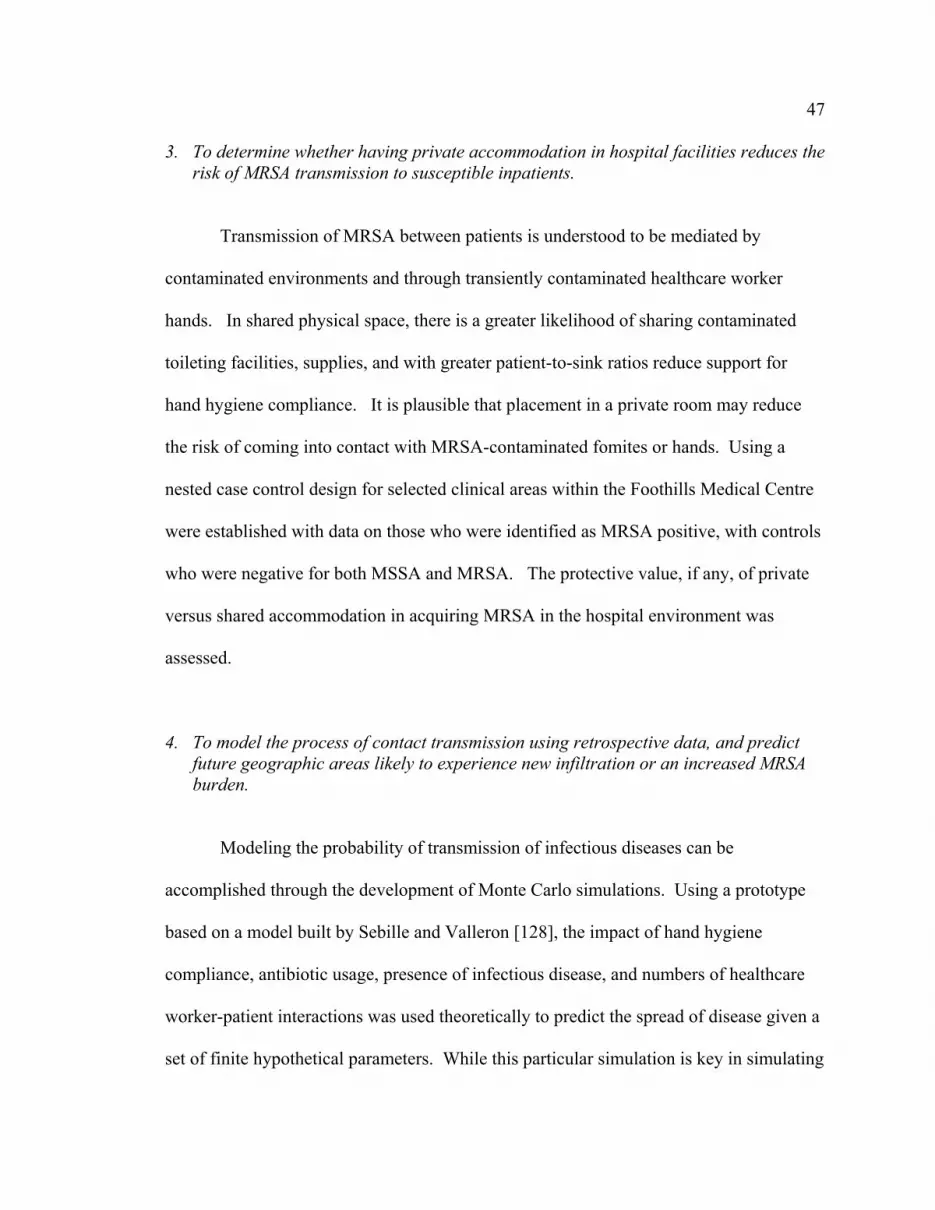
47
3. To determine whether having private accommodation in hospital facilities reduces the risk of MRSA transmission to susceptible inpatients.
Transmission of MRSA between patients is understood to be mediated by
contaminated environments and through transiently contaminated healthcare worker
hands. In shared physical space, there is a greater likelihood of sharing contaminated
toileting facilities, supplies, and with greater patient-to-sink ratios reduce support for
hand hygiene compliance. It is plausible that placement in a private room may reduce
the risk of coming into contact with MRSA-contaminated fomites or hands. Using a
nested case control design for selected clinical areas within the Foothills Medical Centre
were established with data on those who were identified as MRSA positive, with controls
who were negative for both MSSA and MRSA. The protective value, if any, of private
versus shared accommodation in acquiring MRSA in the hospital environment was
assessed.
4. To model the process of contact transmission using retrospective data, and predict future geographic areas likely to experience new infiltration or an increased MRSA burden.
Modeling the probability of transmission of infectious diseases can be
accomplished through the development of Monte Carlo simulations. Using a prototype
based on a model built by Sebille and Valleron [128], the impact of hand hygiene
compliance, antibiotic usage, presence of infectious disease, and numbers of healthcare
worker-patient interactions was used theoretically to predict the spread of disease given a
set of finite hypothetical parameters. While this particular simulation is key in simulating

48
burden of illness, the model would still require validation and population with actual
data. In comparison, the use of spatial visualization tools, such as ArcGIS software, and
spatial analysis software such as S-plus allowed for point pattern analysis and subsequent
regression methods to quantify a model for actual versus simulated retrospective data.
Unlike likelihood simulations with specified conditions, concepts such as cellular
automata would use decision rules as opposed to prescribed conditions to develop a
transmission model based on actual events in space and over time. Further to developing
a model based on risk factors for MRSA transmission, this prototype could be validated
with prospective data on selected units at the Foothills Medical Centre.

49
5. To analyze the likelihood of MRSA acquisition to a patient with respect to particular host, staff workload index, and geographic attributes.
Based on modeling techniques involving logistic regression using maximum
likelihood estimates, host, agent, and environmental features significant from multivariate
analysis were used to develop a model that predicts factors mediating MRSA acquisition,
and to identify salient variables that illustrate factors that are protective against MRSA
acquisition. Having retrospective data for those patients matched to presumably similar
characteristics and geography, but not identified with MRSA, allows for regression
modeling techniques to validate risk factor evidence seen in the literature to the Calgary
hospital population. With the inclusion of spatial characteristics, the proposed analysis
will incorporate the hypothesis that patients in close proximity to known MRSA carriers
are at greater risk of acquiring MRSA through non-intentional transmission.

50
Chapter Three: Methods
The following chapter describes the materials and methods used in the project
analyses, including the extraction of datasets from available secondary data sources,
creating linkages between disparate datasets, data cleaning, geocoding spatial data
elements, as well as handling and interpolating missing data. Two different statistical
approaches were examined with these data: univariate and multivariate modeling using
non-spatial regression techniques as well as point estimates for evaluating spatial
dispersion of MRSA. A novel way to model and view events over time and hospital
environments using a GIS-based application tool, Tracking Analyst, is also described.
3.1 Study Setting
In 2006, the Calgary Health Region (CHR) was one of nine health regions within
the province of Alberta. The CHR delivers publically funded health care, and is
primarily funded by the Alberta provincial government for its operating costs. The CHR
serves a population of approximately 1.2 million residents of Calgary and several satellite
communities in the southern Alberta region (37% of Alberta’s population), and spans
over 39,000 square kilometres. The CHR also serves as a referral centre to almost 1.5
million other Southern Albertans who travel to Calgary for medical care. The CHR’s
urban jurisdiction consists of three adult tertiary acute care centres, one children’s acute
care hospital, plus several ambulatory, rehabilitation, continuing and extended care and
hospice care sites. Total acute care bed capacity is 2,213 among a total of 8,224 beds.

51
This study focused on the adult patient admissions at one of the three adult acute
care hospitals, the Foothills Medical Centre (FMC). The FMC was built in 1966,
originally as a single tower of 766 beds, with additions such as the Special Services
Building, the Tom Baker Cancer Centre, North and South towers, and the University of
Calgary Medical Clinics following afterwards. The FMC is a medical-teaching facility
and home to several specialty units and programs including: the Stroke Program, High
Risk Maternity and Level III Neonatal Intensive Care Unit (NICU), the Southern Alberta
renal program, an intra-operative magnetic resonance centre (Seaman Family MR
Research Centre), a cardiac magnetic resonance facility (Stephenson Cardiac MR
Centre), and also is also the principal trauma centre for Southern Alberta.
3.2 Study Design
3.2.1 Study Population
This project considered all adult patient (over the age of 18) admissions to select
medical, surgical and critical care units at FMC between January 1, 2001 and December
31, 2006. In particular, patients admitted to units 32, 36 (from May 2004 onward after
unit construction was complete), 61, 62, 102, and ICU were included into the study.
Those who were admitted to these units for only a portion of their admission were also
included into the study, but patient locator data only focused on the portions of time spent
on one of the six selected units.

52
3.2.2 Case Selection
An incident case was defined as a CHR patient receiving a confirmed, positive
culture for MRSA that was obtained within the CHR and processed by Calgary
Laboratory Services and subject to molecular analysis by the National Microbiology Lab
(Winnipeg, MB), between January 1, 2001 and December 31, 2006. In comparison to
controls, potential cases were originally identified through query-based line lists for
MRSA generated from the Antibiotic Resistant Organism Registry as of May 2007.
According to the Clinical Laboratory Standards Institute, S. aureus isolates should
demonstrate resistance to a minimum of 4 micrograms/mL of oxacillin to meet criteria as
MRSA [130]. Cases included those who tested positive for MRSA at any body site and
were classified as either colonized or infected. Only the initial positive culture per
individual was considered in this analysis. Subsequent specimens obtained to confirm
the extent of MRSA colonization or infection were not considered, nor were culture
results to screen patients for MRSA eradication.
If cases from other regions or countries were imported into the Calgary Health
Region, either the original lab confirmation was requested and/or new lab orders to assess
infected/colonized status were entered to verify MRSA status (all open wounds, sites of
current clinical infection, nasal, and rectal cultures). For the purposes of this study, all
incident cases, including clinical infection as well as colonized cases from surveillance
isolates, were classified as cases.
Case selection procedures also included an evaluation of a patient’s admission
history prior to developing MRSA. Those individuals with admissions to FMC in the
month prior to identification with MRSA were selected as cases. Additional admissions

53
after the date of first positive MRSA were not included as these timepoints went beyond
the outcome of interest.
3.2.3 Control Selection
Controls were selected from the pool of all adult admissions to FMC from
January 1, 2001 to December 31, 2006. Data generated by the Calgary Health Region’s
Quality, Safety and Health Information (QSHI) department captured all admissions to the
selected six FMC patient care units during this period. The dataset included the patient
identifiers (RHRN, FMC ID, and Encounter), demographics (date of birth, gender, age at
the time of admission, patient unit cost centre), the Charlson comorbidity scores, and
ICD-9 codes for patient illness (Section 3.4.2.1).
Once cases from the ARO registry (all CHR sites, all years) were joined to the
larger QSHI dataset, the pool of unmatched patients became the putative source for
controls. Opting to initially join all MRSA cases with the QSHI database would likely
remove almost all known MRSA patients from the remaining controls. Many patients
may carry either MSSA or MRSA and go undetected until they are screened for S. aureus
or develop clinical symptoms of infection. Thus, while known or newly identified
MRSA patients were summarily removed from the cohort of “control” patients, it is
assumed that there were unidentified patients among the controls who were
asymptomatic carriers.
As an additional measure to detect S. aureus among controls, ICD-9 and ICD-
10CA patient discharge codes for S. aureus septicemia, pneumonia, and other infection as
well as the single code for MRSA were compared to all fifty diagnostic fields in the

54
QSHI database and those records with cross-matches were removed from the pool of
controls (see Table 3.1). Not all codes were in effect for the entire study period and the
repertoire of codes were updated periodically.
Table 3.1: ICD-9 and ICD10-CA codes for S. aureus and MRSA ICD10-CA CODE Clinical Description A410 S. aureus septicemia A411 Other Staphylococcus septicemia A412 Other Staphylococcus, unspecified B956 S. aureus as the cause of disease classified to other chapters
B957 Other Staphylococcus as the cases of diseases classified to other chapters
B958 Unspecified Staphylococcus as the cause of diseases classified to other chapters
J152 Staphylococcus pneumonia P232 Congenital Staphylococcus pneumonia ICD9 CODE 00841 Staphylococcus enteritis 0411 Staphylococcus 04110 Unspecified Staphylococcus infection 04111 Staphylococcus infection 04119 Other Staphylococcus infection 4824 Staphylococcus pneumonia 48240 Staphylococcus pneumonia 48241 Staphylococcus aureus pneumonia 48249 Other Staphylococcus pneumonia U000 Methicillin resistant S. aureus Source: Conversion codes courtesy of CHR Quality Safety and Health Information, 2007.
3.2.4 Sample Size Calculation
The sample size for this retrospective unmatched case-control study was
calculated for a two-sided test α=0.05 with an 80% power to detect a difference between

55
groups. The proportion of controls with the exposure of interest was conservatively
estimated as 70% since most patients would typically require admission. Because the
groups comprised a large retrospective case-control group, the proportion of cases-to-
controls was 1:40. It was assumed that the proportion of cases with the exposure of
interest (total shared patient environments) would be high, and estimated at 90%.
Therefore, the estimated number of cases was 42 to 1676 controls using Kelsey’s
methods [131].
Table 3.2: Sample Size Calculations
Two-sided confidence level(1-alpha) 95 Power(% chance of detecting) 80 Ratio of Controls to Cases 40 Hypothetical proportion of controls with exposure 70 Hypothetical proportion of cases with exposure: 90 Least extreme Odds Ratio to be detected: 3.86
Kelsey Fleiss Fleiss with CC
Sample Size - Cases 42 34 39 Sample Size - Controls 1673 1356 1554
Total sample size: 1715 1390 1593

56
3.3 Study Definitions and Assumptions
3.3.1 Roommate contacts
A roommate of a MRSA positive patient was defined as an inpatient physically
sharing a room and typically, also sharing a bathroom, for a minimum of 72 hours.
Because evidence suggested that conversion to MRSA positive status may take upwards
of 18 days to an unknown maximum, a conservative window of exposure to a
“roommate” was defined as having a shared patient room <30 days prior to an incidence
case of MRSA.
3.3.2 Unit length of stay
The time, represented in days, a patient is admitted to a patient care unit before
transfer, discharge, or death. ie. [Date of discharge/transfer/death from unit or room]-
[Date of admission to unit or room]=Unit length of stay
3.3.3 Date of Culture as a Surrogate for Date of First Positive
MRSA does not have a definite incubation period, and it is likely that acquisition
time for MRSA is host dependent. For the purposes of surveillance as well as this
analysis, the date stamp associated with the day a patient was cultured was captured as
the day of MRSA acquisition. This operational definition was problematic, especially

57
with cultures that identify patients colonized with MRSA. The actual date of onset is
very rarely known. MRSA screening, such as active surveillance programs and contact
tracing, may detect prevalent cases in the majority of instances.
3.3.4 Healthcare-associated MRSA Cases
Patients who acquire MRSA during their hospitalization; healthcare-acquired
disease is attributed to exposure within healthcare if a patient is identified with MRSA a
minimum of 72 hours after admission to 72 hours after hospital discharge. Some
judgment by an infection preventionist was required to ascertain healthcare or community
acquisition if patients were symptomatic for MRSA infection either upon or within 72
hours of admission but laboratory testing was ordered after the 72 hours elapsed. The
surveillance definition for healthcare-associated (formerly, “nosocomial”) was changed
in 2006 to reflect the changing epidemiology of MRSA and included admissions from
long term care facilities, as well as any prior admission to a healthcare facility within one
year, in addition to the usual 72 hour rule of thumb.
3.3.5 Community-associated MRSA cases
Community acquisition of MRSA is defined as the development of symptoms or
its detection by screening or surveillance 72 hours post-discharge or within 72 hours of
admission. Because the incubation period of MRSA is unknown, the use of a 72 hour
cut-off is arbitrary[132]. Confirmation of community-associated MRSA is aided by
performing PFGE strain typing on strains such as CMRSA-7 and CMRSA-10 which were
more prevalent among community settings than hospitals.

58
3.3.6 Incident MRSA Cases
MRSA identified during the study period (2001-06) were selected through the
ARO registry, and were individuals with no prior documented history of MRSA
identified locally or out-of-region. For the purposes of this project, only those new
MRSA who were newly identified on six selected FMC units and who had at least 72
hours and up to 30 days of exposure to these units prior to having a culture taken for
MRSA were considered cases.
3.3.7 Prevalent MRSA Cases
During the study period, active MRSA cases that had been previously identified
or identified on patient care units or facilities were excluded as cases. However, these
patients were included as a risk factor to those who developed MRSA, since these
individuals were capable of transmitting MRSA to others and were also being admitted to
these units of interest during the same timeframe. The impact of previous cases was
calculated as a function of MRSA Patient Days, similar to what was outlined in a paper
by Williams et al (2008) [109].
3.3.8 Antibiotic Days
The exposure to seven classes of selected antibiotics over time was calculated as a
function of total antibiotic days. Antibiotic days were estimated by the date therapy
stopped – date therapy started for each course of antibiotic + 1 day. During each
patient’s admission, antibiotic days were grouped by class of antibiotic (penicillins, 1st,
2nd, and 3rd generation cephalosporins, carbapenems, and vancomycin), but also
aggregated by all classes to produce a single measure of antibiotic pressure, expressed in

59
days. Traditionally, antibiotic exposures have been standardized to units of defined daily
doses, but upon consultation with the pharmacist leading antimicrobial stewardship
programs at the CHR, it was best to characterize local exposures as a measure of
antibiotic days [Bruce Dalton, Personal Communication]. In collapsing antibiotics days
by drug classes, the assumption is that the effect of each contributing antibiotic has an
equal weight. By selecting the most likely drugs and drug classes that select for MRSA,
these agents are more likely to exert similar antimicrobial selection pressures than if other
classes were included. Exposures were also expressed as any prior antimicrobial class
exposure within 30 days of MRSA diagnosis.
3.3.9 Shared Status
Upon admission to the selected inpatient wards, patients will either receive private
or shared accommodations. The SharedStatus variable indicates the occupancy capacity
of each room. Since the occupancy rate on these selected units averages to greater that
90%, the assumption is that all beds are occupied at any given time (Calgary Health
Region QSHI internal data, 2008). An additional feature of shared status was a measure
(TotalShare) of exposure to shared equipment, and bathrooms and sinks by the number of
days present in each bed location. For example, if Patient X were initially admitted to a
private room in the ICU for 4 days and then to a 4-bed ward for 5 days, the total
TotalShare value was (1*4)+(4*5)=24 shared days. The assumption is that exposure to
shared environments may increase the risk of MRSA acquisition proportionately, through
an increased likelihood of sharing toilets, equipment, contaminated fomites, and nursing
resources.

60
3.3.10 MRSA Burden
The ecological pressure of known MRSA patients who were admitted to the
selected units of interest during the study period was incorporated as a potential predictor
variable for new cases of healthcare-associated MRSA. The measure of burden as a
reservoir for MRSA was described in a French study as well as a Canadian study in 2008
[109, 133, 134]. The measurement of colonization pressure included only prevalent
cases and a calculation of monthly MRSA patient-days were used (MRSA positive
patient-days * 100/total number of patient-days). In this study, MRSA pressure was
calculated as numbers of previously identified MRSA cases admitted to select units
between the 2001-2006 study period over the number of patient-days for those units/year.
As patients were known to frequent different units regularly or intermittently, each
admission contributed days of ‘MRSA pressure’ to the ecology of the unit for that period
of time. Ecological burden with MRSA was estimated for each year on each of the
selected units, as an exposure variable.
3.4 Data Sources
Secondary data were extracted from several enterprise-level clinical and
administrative databases from the Calgary Health Region as well as from the Canadian
Nosocomial Infections Surveillance Program (CNISP). CHR data were collected for
billing purposes, internal quality assurance programs, as well as for national healthcare
facility accreditation through the Canadian Council on Health Services Accreditation.
CNISP data were collected as part of the national surveillance program for methicillin-

61
resistant Staphylococcus aureus (MRSA) among participating infection control programs,
based primarily in acute care. All four acute care hospitals in the CHR participate in this
surveillance program.
3.4.1 Administrative Data
3.4.1.1 Patient Location Data
The CHR’s Accounts Receivable Department collects data on all patient locations
within a facility, noting a patient’s initial admission, intra- and inter-unit transfers, as well
as discharge. These data can be subject to irregularities in reporting or missing data
because clinical unit staff responsible for reporting patient locations through a daily
electronic census may take several hours before a patient discharge or transfer is logged
into the CERNER (Cerner Corporation, Kansas City MO) laboratory information
management system (LIMS). Additionally, patients who transfer beds several times
within a given 24 hour period will only be tagged at a single location during that interval.
Key fields obtained from this data extraction were the patient’s unique, ten-digit
identifier, the Regional Health Record Number (RHRN), an ENCOUNTER number
(denotes a unique admission for every patient), Patient Care Unit, Room, and Date of
Census. The data were extracted based on an algorithm prepared by CHR financial
services staff, and included only FMC patients between January 1, 2001 and December
31, 2006.
The RHRN and Encounter number were merged into a composite variable that
was used to select for unique patient admissions at FMC, and this was used to link the
other datasets. An alternative mechanism was considered to collect this same

62
information through the Admissions, Discharges, and Transfers (ADT) system, which
stores every patient bed movement, or event, within each acute care facility. However,
formatting these data into a useable format proved impossible, since they were archived
by event, in individual time-stamped folder, and compressed in chronological order over
daily system compilations. The server and programming resources required to extract
and link discrete data events representing each patient encounter and identifier were
considered insurmountable.
3.4.1.2 Workload Data
Workload measurement was a means of monitoring the utilization of personnel
and is typically used to support human resource planning and budget allocations.
Electronic systems to classify patients have been in use since the mid-1980s and aid in
determining patient nursing care needs [135].
The most popular systems used to measure healthcare workload are Project
Research in Nursing (PRN), Medicus, and the Grace-Reynolds Application and Study of
PETO (GRASP). However, the three systems tend not to correlate well with each other
when applied against similar patient populations [136]. The CHR uses Medicus™ (now
QuadraMed™; QuadraMed Corporation, Reston VA) for workload measurement and
uses a factor evaluation tool to assess patient requirements for nursing staff using 37
different indicators (see Appendix B).
The CHR’s department of Regional Workload Management provided FMC data
for the 2001-06 fiscal years. Critical indicators categorize each patient into one of six
types, scaled ordinally [135, 137, 138]. These values represent the level of care and staff

63
resources required for a given patient relative to other patients on that unit. A unit value
of 1 signifies a patient requiring minimal nursing resources, while those with values
approaching 6 are patients requiring total, intensive care. The average staff workload
value is 3 and a critical care patient typically falls between 5 and 6 [138].
Daily scores are submitted and calculated on each patient, based on standardized
and weighted indicators. Regression weights are assigned to each indicator selected.
For example, a patient requiring 1:1 care would receive a regression weighting value of
58 on that indicator, while those on isolation precautions receive a weighting of 1 on that
indicator. The summation of these critical indicators modified by the weights can range
from 0 to greater than 115, and translates into a relative value between 0.7 and 4.6 (see
Table 3.3).
Table 3.3: Patient Workload Reference Values
Acuity Classification Points Relative Value Type I 0-15 0.7 Type II 16-40 1.0 Type III 41-61 1.5 Type IV 62-85 2.3 Type V 86-114 3.1 Type VI ≥115 4.6
The relative values are then multiplied by the number of hours patients remain
admitted to a unit over a 24 hour period. For example, a Type III patient admitted for 24
hours would have a daily workload of 24 hours (one day), divided by 24, times the
Relative Value (ie.1.5) for their acuity level, resulting in a score of 1.5 for the day. This

64
score indicates that for the admitting unit, this patient required 1.5 times the nursing
resources for their care for 24 hours that they were admitted, compared to a Type II
patient (relative value=1.0) [138].
Workload data were routinely collected by nursing units to be able to anticipate
and budget for the appropriate staffing levels and nursing skill mix to meet the demands
of the average patient population. Staffing requirements, or target hours, were assigned
by each patient care unit manager in consultation with a nursing workload specialist.
Aggregate calculations of workload were based on a summary value for all levels of
acuity within a patient care unit multiplied by the number of inpatients in each acuity
level and then divided by the number of patients present on the unit for that day. Because
the clinical acuity benchmarks for each unit may differ, a daily NI_COUNT (Relative
Value) of 3.1 for an ICU patient may describe a very different clinical picture than a
patient with an NI_COUNT of 3.1 who is from a general medical ward [138].
Data elements in the dataset provided by Regional Workload Management
included a CDR_KEY which is a six-digit unique administrative identifier assigned to a
patient and a specific encounter. The variables of interest are the NI_COUNT and
QUANTITY values calculated for each patient encounter, which represent a patient’s
overall acuity level (nursing resources consumed over the span of an admission to a
single unit) and their length of stay on that unit, respectively. The AVERAGE measure is
calculated from NI_COUNT divided by QUANTITY, and represents the patient-level
requirement for direct or indirect nursing care over their stay on a particular unit [137,
138].

65
3.4.2 Clinical Data
3.4.2.1 Quality, Safety, and Health Information Data
The CHR routinely collects basic demographics, comorbidity and outcome data
from all patient encounters. These data are extracted from the enterprise electronic health
information systems such as TDS (Lockheed), Clinibase (Logibec), and Sunrise Clinical
Manager™ (Eclipsys). The department of Quality, Safety, and Health Information
(QSHI) interprets these data, with a focus on quality improvements, effectiveness of
safety initiatives and reporting, and increasing overall access to healthcare resources.
Many key determinants of health and outcomes are captured with every patient visit, and
so QSHI data was central to linking several of the other datasets together through
common unique identifiers. CDR_KEY and RHRN were contained in this database,
which enabled the other extracted datasets (ie. patient locators, pharmacy data, and
workload measurements) to be linked into a common record. QSHI data was prepared by
the QSHI department based on a Calgary Health Region Ethics Board-approved request
for the above data, and included all admissions to selected FMC units (Patient Care
Units: 32, 36, 61, 62, 102, ICU) between January 1, 2001-December 31, 2006.
Demographics such as age and sex were captured in this dataset, along with the
admission and discharge dates for each facility visit. Comorbidities were captured from
standardized discharge coding using International Classification of Diseases (ICD), 9th
edition. Because the dataset spanned five years, there were differences in the codes used
to classify particular conditions. The dataset contains coding schemes from both ICD-9
and ICD-10 CA (Canadian-specific codes) and occasionally, new or updated codes that

66
were implemented into the event coding schema. Coders at CHR health records may
select up to fifty comorbidity codes to describe a patient’s condition upon discharge. In
order to meaningfully summarize the severity of patient illness and use a composite risk
factor as a potential surrogate for patient acuity, a Charlson Index was calculated for each
FMC admission.
3.4.2.2 The Charlson Index
Originally developed in 1987 as a tool to predict the impact of select, weighted
comorbidities on a one-year mortality risk, the Charlson index has become a widely used
composite measure of general patient morbidity. A patient’s comorbid conditions were
given a score of 1, 2, 3 or 6, weighted approximately according to their increasing
likelihood of mortality. For example, a score of 1 includes conditions such as myocardial
infarct, cerebrovascular disease, diabetes, while a score of 6 which includes metastatic
solid tumors and AIDS. The full list of Charlson comorbidities are listed in Table 3.4.
The Charlson index sums the values of all the assigned weights ascribed to a patient’s
comorbidities [139]. So for example, a patient with known dementia (score=1) and colon
cancer (score=6) would have a combined Charlson score of 7.
Table 3.4: Assigned condition weights for the Charlson index
Assigned Weights Conditions 1 Myocardial infact
Congestive heart failure Peripheral vascular disease Cerebrovascular disease Dementia Chronic pulmonary disease

67
Ulcer disease Mild liver disease Diabetes
2 Hemiplegia Moderate or severe renal disease Diabetes with end organ damage Any tumor Leukemia Lymphoma
3 Moderate or severe liver disease 6 Metastatic solid tumor
AIDS
ICD-9 and 10 codes can be translated into Charlson indices using administrative
data. Using customized coding algorithms, ICD codes are mapped to one of the 17
diseases specified by the Charlson index. In research by Quan et al. using Calgary Health
Region administrative data from 2001-03, the first 16 ICD-9 CM (Clinical Modification)
and ICD-10 codes were scanned for matches to Charlson comorbidities [140]. The Quan
et al study assessed the reliability of this coding schema against other algorithms and
found to be robust and produced comparable prevalence estimates of comorbidities. The
process of coding these 17 diseases for the Charlson index was replicated for this study
using the ICD-9 CA and ICD-10 contained in the QSHI discharge dataset, and by
applying all 50 columns that contained ICD codes.
An internal validation step was used to confirm whether all 50 ICD codes were
necessary to extract meaningful data from QSHI discharge codes, and to determine
whether all were necessary to accurately calculate a Charlson Index. It was unclear
whether more fields of coding would change the sensitivity of the measure. This was
accomplished by searching the CHR 2001-2006 dataset for all codes for the 17 key
comorbidities included in the Charlson Index, as outlined by Quan et al (2005). Using an

68
Excel spreadsheet of the results, the list of all applicable Charlson Index ICD-9 and ICD-
10-CA codes were filtered for each of the 50 diagnostic columns and it was noted how
many columns of codes were required to comprehensively calculate this index.
3.4.2.3 Patient Care Units
Based on quarterly and annual reports of MRSA rates across the Calgary Health
Region, selected units reported chronically elevated levels of MRSA activity from 2004
to 2006. The rate in these areas ranged between 0.5-2.1 new cases/1,000 admissions in
2005 and 2006. These rates were not the highest among all medical, surgical, and critical
care units within the CHR, but represented consistent and sustained MRSA activity
within the FMC. The medical units that comprised the hotspots for MRSA incidence
were units 32, 61, and 62. Critical care was also selected as a clinical area with higher
counts of new MRSA, as was a single surgical unit, 102.
Unit 36 was a completely renovated unit when it opened May 4, 2004 and was
designed to meet or surpass current infection control recommendations for infrastructure
with 80% private rooms, a short-stay high observation area, and an entire wing of
isolation rooms capable of being individually or collectively placed under negative
pressure [141]. Unit 36 is a complex medical patient-teaching unit (MTU) located in
FMC’s Special Services Building. It was coined the ‘Ward of the 21st Century’ as it
incorporated several technological features such as SmartBoards (SMART Technologies,
Calgary AB), and was designed to be flexible enough to be disaster-ready if additional
critical care beds were needed quickly. In addition to the physical layout, patient care on

69
Unit 36 was re-structured to incorporate multi-disciplinary teams, and combined
activities such as patient rounds. The unit has 28 private/isolation rooms out of its 36-bed
capacity, which remains a stand-out feature for infection control when most similarly-
sized units in the CHR have only 4-5 private rooms. It was anticipated that a healthcare
setting with so many private rooms and bathrooms would translate into reduced rates of
MRSA transmission.
Unit 36 was selected for the present study to compare the effect of a unit with an
optimized physical layout with traditionally configured medical units, such as Units 32,
61, and 62. Unit 36 staff and patient population previously occupied Unit 61, in the main
FMC tower, and as of 2004, Unit 61 continues to specialize in complex medical care, but
is no longer the MTU for the hospital and the University of Calgary.
3.4.2.4 Pharmacy Data
Antibiotic orders filled through the Calgary Health Region electronic medical
record system, Centricity® (General Electric Healthcare) were extracted for patients
admitted to units of interest between 2001 and 2006. Classes of antibiotics examined in
this study included penicillins, cephalosporins, carbapenems, and the glycopeptide,
vancomycin, chosen for their ecological pressure toward selection for antimicrobial
resistance and proliferation over sensitive strains of S. aureus. All inpatient dispensing is
captured by the system, however, some units, like the ICU, use ward stocks to administer
the first dose of select antimicrobial agents, and consequently consumption of these stat
medications is not reflected in Centricity pharmacy records. In these situations,
individual patient records would have to be examined to calculate specific antibiotic

70
doses. This dataset contained the RHRN identifier as the primary means to link
pharmacy data with the other datasets. Pharmacy variables included basic
demographics, patient ward location at the time of discharge, start and stop dates for each
of the selected antibiotics, dosage, and frequency of administration. As mentioned
previously, the unit of measurement was originally antibiotics days,
3.4.2.5 CHR Infection Prevention and Control Antibiotic Resistant Organism Data
Since 2002, the CHR’s Infection Prevention and Control (IPC) department has
used a Microsoft Access database to enter, track, and longitudinally manage patients who
are flagged as positive for one or more antibiotic resistant organisms. The annual
CNISP/CHEC data collection form provided the initial template for the database, but it
has been tailored and augmented over time to fit the needs of managing complex patients
(see Appendix C). Patients become permanent entries into the database once a positive
MRSA test result is confirmed. Repeat positive cultures as well as negative screens are
also logged under the patient’s profile.
The key data elements extracted from this dataset were demographics, outcomes
(living, dead, cleared of active MRSA status), location (patient care unit) of first positive,
reason for initial culture, receipt of hemodialysis, colonization or infection with MRSA at
initial testing, epidemiologic linkages with other known cases of MRSA, community or
healthcare onset, and severity of illness. The database is maintained and populated by
infection preventionists (IPs), with secondary data extracted from patient chart review or
laboratory reports. Using established case definitions provided by CNISP or set by
subcommittees within the regional infection control program, IPs also complete

71
evaluations of current disease status and likely setting for MRSA acquisition. This
database is housed on an internal CHR server and users limited to staff and administrators
within CHR Infection Prevention and Control.
3.4.2.6 Laboratory and Straintype Data
The National Microbiology Laboratory (NML), located in Winnipeg, Manitoba,
provides pulsed field gel electrophoresis (PFGE) results on positive specimens of
incident cases of MRSA that have been submitted in the course of ongoing CNISP
surveillance. As part of the CNISP surveillance network of 48 participating hospitals
across 9 provinces, Calgary’s four acute care facilities all routinely submit data and
isolates for MRSA surveillance. Each incident case is assigned a sequentially numbered
identifier prefixed by their facility number and year of surveillance (eg. 001-06-001),
known as the CHEC number. Each CHEC number is paired with a laboratory isolate
identified also bearing the same CHEC identifier and sent to NML for molecular analysis.
NML provides yearly reports to facilities on regionally aggregated data as well as
detailed case reports and genotyping returned to the sites from where the data originated.
The laboratory line lists contain the CHEC number and the genotypic information such as
PFGE straintype, PVL (Panton-Valentine leukocidin) carriage status, mecA carriage and
SCCMec type. PVL and SCCMec data were only reported for isolates submitted after
2003.

72
3.4.3 Geographical Data
CHR Planning and Development provided two-dimensional, detailed floor plans
of all the selected FMC patient care units current to 2006. These were provided as a
series of AutoCAD files (.dwg files) that were created as architectural and mechanical
drawings, and the scale ratio was not specified. Details on the drawings included
mechanical, exterior and interior glazing, wall structures, millwork, permanent fixtures
such as toilets and sinks, door locations, elevator and stairwell shafts, and structural
columns and posts.
In order to map the hospital floorplans to a known geographic projection, aerial
images of the hospital were imported to ArcGIS from Google Earth satellite imagery.
These images, saved as a jpeg, were superimposed onto a previously georectified Calgary
roadways files set in a Calgary_3 Transverse Mercator_WGS_1984_W114 projection
coordinate system and collectively used to establish a baseline for mapping hospital floor
layers in ArcGIS.
3.5 Laboratory Methods
3.5.1 Isolation and Confirmation of MRSA
Calgary Laboratory Services, or CLS, is a high-volume laboratory that processes
thousands of specimens requesting confirmation of MRSA specifically, or through
clinical specimens that, as part of a general work-up based on the type of specimen
submitted, are identified through a series of protocols that narrow the likely etiologic
agent to S. aureus.

73
Both the laboratory identification of S. aureus, and its confirmation as MRSA, are
relatively standard procedures in many healthcare facilities and testing laboratories.
Upon specimen receipt, patient swabs are typically plated to selective media, such as
mannitol salt agar (MSA), and incubated aerobically. An initial broth enrichment step, in
which the swab is immersed in tryptic soy broth (TSB) or another liquid medium, may
help to improve recovery efficiency. Growth on MSA produces morphologically
consistent yellow or golden colonies, due the fermentation of mannitol, which may be
confirmed as Staphylococcus aureus by Gram stain (Gram positive in pairs, tetrads or
clusters), catalase (positive), and coagulase (positive). Those specimens marked
specifically for confirmation of S. aureus, such as active surveillance cultures for MRSA,
are plated directly to chromogenic agar plates which both select for S. aureus and provide
rapid colorimetric confirmation for MRSA [142].
Historically, methicillin resistance in S. aureus has been demonstrated
phenotypically, with resistance to oxacillin, either by disc diffusion test, PBP2a-specific
latex agglutination, or agar dilution-based methods. More routinely, automated
instrumentation, such as the bioMerieux Vitek™, Trek Microscan™, or BD Phoenix™,
are used for speciation and/or antibiotic resistance profiling [142].
3.5.2 Molecular Straintyping of MRSA using PFGE
Pulsed-field gel electrophoresis (PFGE) remains the gold standard for straintype
determination. PFGE separates large genomic restriction fragments, using an alternating
electrical field, and allows for the resolution of fragments in the kilobase to megabase
range.

74
Briefly, a single colony was used to inoculate brain heart infusion (BHI) broth,
and was allowed to incubate overnight. After recovery of a cell pellet from the broth
suspension, cells were resuspended in TE buffer and recombinant lysostphin added, along
with molten agarose to create plugs for insertion into the electrophoresis. Prepared plugs
are washed with TE buffer, sliced, and each plug subjected to SmaI restriction
endonuclease digestion. Digested plug samples were cast in agarose and Tris-Borate
EDTA buffer (TBE) and loaded into BioRad™. Electrophoretic separation is carried out
for 20 to 22 hours at 6.0V/cm and 14˚C, with switch times that ramp from 5 seconds to
40 seconds over the course of the run [142].
3.6 Data Management and Analysis
The study’s main endpoints for analysis were to describe the epidemiology of
MRSA in selected hotspot units at the Foothills Medical Centre for the period of 2001-
2006 using non-spatial and spatial methods. Cases of MRSA would be compared against
control patients who were admitted to the same selected units at the FMC for the 2001-
2006 period. Quantitative methods were utilized to describe the incidence of MRSA,
estimate the burden of MRSA on each ward by predominant PFGE subtypes, and
understand the persistence as well as characterize risk factors that are associated with the
development of MRSA colonization and infection through univariate and multivariate
logistic modeling. Geographic modeling techniques were used to identify whether new
MRSA cases were correlated by their spatial distribution through the use of Moran’s I
and Simpson Index of Heterogeneity, which are point measures to assess spatial

75
autocorrelation and spatial heterogeneity, respectively. Tracking Analyst was also used
to document the appearance of new MRSA cases in units over a longitudinal timeframe.
3.6.1 Data Analysis Software
Several software packages were used to analyze both the spatial and non-spatial
predictors of MRSA incidence. Microsoft Access and Excel were primarily used to
contain large repositories of raw data and generate basic queries to clean data. Excel was
also used to collapse variables as well as create new ones, such as Total Antibiotic Days.
SAS 9.2 (SAS Institute, Cary NC) was used in many of the data manipulation techniques,
recoding of variables, data cleaning, and both the univariate and multivariate modeling.
AutoCAD 2009 (Autodesk Inc., San Rafael CA), Google Earth 5.0 (Google Inc.,
Mountain View CA), and ArcGIS 9.2 (ESRI, Redlands CA) were used in the process of
taking static floorplans, mapping them to the Earth’s surface using aerial projections.
ArcCatalog and ArcView, both from the ArcGIS package, were used to manage and
display the data for analysis.
3.6.2 Data Importation
Data received from CHR QSHI and CHR QIHI-Performance and Utilization’s
workload data were extracted into a SAS dataset and was directly imported and stored
into a SAS library. Patient Location data from the CHR Accounts Receivable department
were sent in an MS Excel format where data were re-coded to create “Segment LOS” (ie.
Length of stay per admission segment, in days) and “SharedStatus” (ie. the number of
occupants per room) variables. Similarly, Antimicrobial Exposure data from the CHR

76
Pharmacy were initially sent as an Microsoft Excel file with the raw data specifying
repeat information for each day of a patient’s drug therapy. Prior to exporting to SAS,
“Drug Category” and “Antibiotics Days” variables were created and calculated which
allowed records from the raw file to be condensed.
3.7 Data Management, Storage, and Cleaning
3.7.1 Data Management
A single relational database was created in Microsoft Access 2007 to contain,
organize, and secure raw data comma separated and Microsoft Excel files that were
received by different CHR departments as well as CNISP datasets. As all of these
datasets had identifiable and sensitive patient information at the outset, hence, the data
were handled as per the current Canadian Federal and Provincial Health Information and
Privacy legislation. The database server met or exceeded the standards set by the Health
Information Act (HIA) and the Freedom of Information and Protection of Privacy
(FOIPP) Act. A single laptop computer was used to access these data and sensitive
information was not copied to other portable hardware. Encrypted, automated backups of
the data occurred daily in the event of data loss or corruption.
3.7.2 Data cleaning
Data cleaning for the series of clinical and administrative databases was
extensive. As these were large secondary datasets, cross-matching and validating
missing, incorrect or transposed data were challenging. Frequency tables and basic
descriptive statistics were performed for continuous variables for data elements such as
77
age, Charlson indices, patient and antibiotic days, and average workload. Outliers were
examined for potential data entry errors and cross-checked, where possible, against other
datasets for indications that these were plausible data points. Remaining data points that
were valid, but potential outliers, were flagged.
The majority of the data cleaning process involved converting numeric patient
identifiers with the matching identifiers that were saved as text, and cross-checking
patient identifier variables. In both Microsoft Access and SAS, data type mismatches
were not tolerated and would result in no matches when linking datasets. In most cases,
and where possible, identifiers were converted to text, as some identifiers like the
Encounter consisted of alphanumeric data. Once issues with mismatched data types
were set to a common type, the next step involved resolving either missing or incorrect
identifier data. It was assumed that QSHI data, while subject to stochastic errors like all
datasets, was likely to have the most correct data since it is maintained for quality
assurance programs as well utilized for CHR research. Hence, it was considered to be the
least error prone than the five other datasets.
The process for identifying missing or error-prone data was to run join queries for
matched and unmatched table records. Those results containing the matches between the
ARO and QSHI datasets by RHRN were also evaluated on whether the date of the first
positive MRSA (ARO database) fell within a 30-day window to be considered at-risk for
MRSA acquisition. For example, if a patient was identified as MRSA positive by culture
on April 20, 2004, QSHI-logged admissions after April 20, 2004 or prior to March 20,
2004 would be excluded. Because RHRN was the only identifier shared between these
datasets, duplicate matches were common and had to be excluded manually. Join
78
queries would also generate an unmatched group which was then evaluated for matching
on a different variable such as the 7-digit Foothills Medical Centre unique identifier or
provincial health number. If matches were made on other unique variables and one
dataset provided an RHRN, this value was copied into the empty field of the deficient
dataset. In cases where matching occurred through alternate identifiers but where RHRN
values were entered but differed, then another dataset was used as a third resource to
determine which value might be correct. Three different identifiers were used in an
attempt to maximize the numbers of MRSA cases matched to QSHI data, so the process
of matching was iterative. The ARO database was particularly fraught with data entry
errors, mostly due to reversed digits. The database had no data entry restrictions for
identifiers, or user error checking messages to address real-time errors. Due to resource
constraints there was little oversight to maintain these data, nor a periodic validation and
cleaning of the data.
3.7.2.1 Recoding Data
In preparation for modeling the risk factors that mediate the acquisition of MRSA,
some continuous as well as text field variables required recoding. From the original
ARO database, recoded variables included dichotomous data such as Gender, as well as
nominal and categorical variables such as Patient Service, MRSA Culture Types,
Acquisition of MRSA, Clinical Severity, and Ethnicity. Recoding was done in both
Microsoft Excel or in SAS, depending on the size of the dataset.

79
3.7.2.2 Reformatting Data
Patient location data from CHR Accounts Receivable was received in a series of
zipped Excel files for each fiscal year which required concatenation. The raw dataset for
patient location surpassed 1.3 million records, representing 5 years of daily census
information on all FMC inpatients. Because patients were often in the same unit, room
and bed for many census days at a time, this file was collapsed to represent a patient’s
location (e.g., unit, room, and bed) and the duration of those coordinates. A simple IF
function in Excel was used to compress these records to represent a patient’s location and
the length of stay at that particular location (new variable = SegLOS).
With the exception of the QSHI and ARO merged datasets, pharmacy, workload,
and patient location data all required an iterative process to create a single record from
datasets that contained multiple records within each admission. Prior to merging data
with the already merged QSHI-ARO dataset containing demographic, clinical, and co-
morbid variables, the other datasets required compression to take multiple data points
(e.g, antibiotics, antibiotic days per drug, all patient unit and room locations, and
workload measures for each unit admission) from each admission and transpose them
into one record. The method to best address this data manipulation step was through the
use of the PROC TRANSPOSE statement in SAS 9.2 to create temporary datasets for
each transposed variable. A final merge statement and NODUPKEY function to remove
any duplicate records regrouped all of the temporary datasets with the original database
containing all other variables not requiring transposition.

80
3.7.3 Dataset Linkage and Integration
The linkages between data sources are outlined in Figure 3.1. As these datasets
were not designed to connect with one another, common unique identifiers were required
to perform all of the merges. No one dataset could be merged with all of the others, so
the process of linking data was, by necessity, sequential in nature.
Figure 3.1: Datasets and linkages used in this study.
3.7.3.1 Key Linking Variables
The key linking variables to join datasets were the Regional Health Record
Number (RHRN), Encounter identifiers, CDR_KEYs, and CHEC numbers. Both
Encounter and CDR_KEY identifiers were automatically and sequentially generated by
Oracle Systems databases that process incoming entries for archiving patient health
record data. Hence, these two variables were very reliable and accurate in all instances

81
where they were assessed for missing or outlier entries. A new Encounter was generated
for every new patient admission, regardless of whether patients had previous admissions
to FMC or other CHR hospitals. Encounter was a 13-character alphanumeric value
containing the first two letters of the admitting hospital, plus 11 numbers. The
CDR_KEY was assigned to financially evaluated datasets and was a seven digit number.
Other key identifiers included the RHRN, which was a 10-digit numeric value
that identified patients. Each patient was to be issued only a single RHRN, similar to the
9-digit provincial health number (PHN). RHRN identifiers replaced the 7-digit PPR
number and well as the FMC-specific 7-digit identifier in 2005-06, as the growing
number of persons accessing services at CHR Alberta was beginning to exceed the
number of unique PPR and FMC identifiers that could be issued. An algorithm was
created by CHR financial services to retrospectively assign persons who had previous
medical information stored at the CHR to be assigned an RHRN. This algorithm was
applied to FMC identifiers going back to 1972 and assigned new RHRN to these files.
The RHRN was also consistently available for all financial datasets, and absent from the
Pharmacy dataset. Since the introduction of RHRN was in late 2005, the ARO Registry
had not been updated with the new numbers and only newer entries had RHRN. The
process of data cleaning included back-entering RHRN into the registry in order to
maximize the matches between ARO data and other data when joins were created.
CHEC numbers were assigned to isolates and new MRSA cases as part of the
enrolment process for CNISP surveillance. New cases could be healthcare or
community associated but required admission to a facility. Emergency room patients
with newly identified MRSA were excluded. Also, in recent years, CNISP has requested

82
that sites with yearly incidence of MRSA greater than 100, submit surveillance data only
during specified months within a calendar year. A CHEC number was assigned to a
surveillance form and corresponding lab isolate. In rare instances, MRSA positive cases
who were previously known in regions not participating in CNISP surveillance, were
reported as new cases to CNISP upon their first positive culture obtained by CHR.
3.7.3.2 Process of Merging Data
QSHI data was initially merged with selected fields of ARO data, since these two
datasets contained the most pertinent clinical data and would become the core dataset to
which all other case information would be linked. Matching to the QSHI dataset
required the ARO data to first be filtered to select for only MRSA cases, but was not
filtered for cases identified at FMC. All new adult MRSA cases across CHR were used
in the raw merge.
Merging was accomplished through both Query Design functions in Microsoft
Access 2007 as well as through merge statements in SAS 9.2 (SAS Corporation, Cary,
NC). Those individuals that were unmatched with the ARO dataset initially comprised
the pool of putative controls. Because all MRSA cases were linked to the QSHI dataset
at the outset, this reduced the likelihood that MRSA cases from other facilities who were
admitted to FMC between 2001 and 2006 would be mixed into the control pool.
3.7.3.3 Process of Linking Data
Linking data from disparate clinical, surveillance, quality improvement, and
financial sources was a challenging process because no one identifier was common to all
datasets. Once data had been cleaned, data types reformatted, missing identifier data

83
imputed through cross-matching, and multiple records for a single admission transposed
horizontally into a single record, the data were merged using the common identifiers
listed in Figure 3.1. Patient location data and then antibiotic exposure data were merged
with the QSHI-MRSA data based on the common Encounter and RHRN. Subsequently,
CHR nursing workload data were merged with the QSHI-MRSA-Patient Location-
Antibiotic Exposure dataset for cases based on the CDR_KEY. Both Encounter and
CDR_KEY data were complete for all of the datasets they were used in (Workload,
Patient Location, Antibiotic Exposures). Finally, CNISP laboratory surveillance data
were merged with the dataset through the use of the CHEC-number. Merges were
completed in SAS 9.2 by first applying the PROC SORT statement to the linking
identifier (e.g., Encounter, RHRN, or CDR_KEY) and then merge statement where the
identifiers match in all datasets.
3.8 Building GIS Datasets
Unlike standard geographic maps with external features and formations that can
be characterized through techniques such as remote sensing or through established
geographic coordinate systems such as postal and zip code mapping, geocoding hospital
floorplans required a novel approach to morphing two-dimensional floorplans into a
entity that retained positional properties and attributes. The CHR floorplans for FMC’s
units 32, 36, 61, 62, 102 and ICU were imported into AutoCAD2009 as a .dwg file and
all layers of each floor were turned to the “ON” position. The goal was to clean the
drawing to the greatest extent possible for superimposing room polygons and point data
84
overtop the floorplan for GIS analysis. Using the LAYDEL command, extraneous layers
such as overlays of internal and external glazing, door placement, elevator shafts, and
millwork were deleted. The ERASE command also removed individual layer elements.
Larger footprints could be cleaned of almost all features except for the external and wall
structure by freezing the layer of interest to protect it from modification and erasing
several sections of layers with the ERASE command. Once the floorplans were
simplified and identified only key structures such as walls, toilet, and sinks, the file was
saved as a new drawing (.dwg).
3.8.1 Use of Desktop ArcGIS 9-ArcCatalog™(ESRI)
ArcCatalog software is used for managing documentation, datasets and
geodatabases, as well as organizing the schema for geographic data layers. The software
was used to originally create folders and a corresponding geodatabase for each patient
care unit. The contents of the geodatabase included point and polygon feature class data
for patient bed locations and rooms, respectively. This table was joined with a polygon
feature class specifying the locations of rooms, as represented by polygons. The
AutoCAD files, and the shape files for the footprint of the FMC tower and SSB were
saved to this folder.
3.8.2 ArcGIS 9 –ArcMap™ (ESRI)
ArcMap is another application in the ArcGIS software suite, and was designed to
primarily perform mapping tasks such as displaying, editing, querying, and analyzing
spatial data. Several extensions are available, including modules for spatial analysis,
spatial adjustment, and tracking analyst.

85
The shape file for the floorplan perimeter was imported and because it had
previously been georeferenced to the 3TM-Calgary projection, this formed the reference
layer for all other imported layers in terms of providing geographic coordinates to
measure the distances between patient rooms and beds within a ward. The ward-specific
floorplan was initially added as a drawing to the map, but immediately exported as a
layer so that it could not only be superimposed onto reference shapefiles but be linked to
spatial attributes. Outside of annotations to specify feature labels, scales, and
orientations, drawings themselves do not have inherent spatial properties.
Once the reference layer and the floorplan were added to the map, spatial
adjustments to align and superimpose the floorplan to the layer were performed. Spatial
adjustment techniques involve finding distinct features common to the reference layer
and the object that does not yet have spatial coordinates. A tagging procedure to link
these features was initially used, and using these common spatial points allows the
software to rotate and align the hospital floorplan image on top of the reference layer.
Following geocoding of the hospital unit infrastructure to the general hospital
footprint, a point feature class file (created in ArcCatalog) was added to the map as a new
layer, and the attributes table populated with point data for each unit’s bed locations.
These point data would now have X,Y coordinates associated with them and would be
referenced to a larger geographic projection. The error associated with mapping objects
onto the 3TM projection is unknown. Having AutoCAD drawings to outline the basic
architectural features of the hospital and paired with the UTM satellite projection, it was
assumed that the margin of error was within 1-2 centimetres.

86
To also evaluate the relationship of MRSA cases between rooms, room polygons
had to be created using ArcMap sketch tools. Similar to creating a geographic dataset
containing point data on bed locations, polygons representing rooms were also created.
The empty polygon feature class layer created in ArcCatalog was added to the map, and
the unit floorplan was used as a rough scaffold to outline the location of each patient
room. Polygons were sketched using the vertices of each room, and its data saved into
the layer’s attribute table. Once this last set of data for each patient care unit was
completed, the data files and an .mxd index file to save the actions performed on the map
elements were saved. The .mxd file contained all the information on the locations of the
input layers as well as all of the actions performed to re-create the current map.
3.9 Variable Definitions
The key predictor and outcome variables that were used for this study are defined
in Table 3.5 as follows:
Table 3.5: Predictor and Outcome Variables Variable Name Variable Type Analysis Portion Operational Definition Status (outcome) Binary Spatial/Non-
spatial Documented MRSA positive status
PatientStatus (outcome)
Discrete Non-spatial Living (active with MRSA, inactive with MRSA, no history of MRSA), or deceased
OrgIndexCxSite* Date Non-spatial Body site of initial MRSA positive culture
SampleReason* Discrete Non-spatial Primary reason identified for obtaining first culture
ClinicalSeverity (outcome)*
Discrete Spatial/Non-spatial
At the time of case identification, severity of MRSA presentation as infection or colonization (carrier state)
Age Continuous Spatial/Non-spatial
Age in completed years
Gender Binary Spatial/Non- Male or female

87
spatial Pt_Service Discrete Non-spatial Designation of patients to clinical
services offered at the FMC Diagnosis_Code Discrete Non-spatial ICD-9 coding for diagnosis upon
discharge CharlsonScore Continuous Non-spatial Calculated Charlson Index co-
morbidity score AdmissionDate Date Spatial Date of admission to the FMC DischargeDate Date Spatial Date of discharge from the FMC LOS Continuous Non-spatial Length of stay in days NI_COUNT Continuous Non-spatial Number of workload unit resources
required by an individual patient during their length of stay on a unit
Quantity Continuous Non-spatial Number of billed patient days on a single unit
Average Continuous Non-spatial Calculated value of NI_COUNT/Quantity; interpreted as the average nursing workload resources required by a single patient for an admission to a specific unit
WorkUnit Discrete Non-spatial One of six selected units where patients were admitted, and where workload hours were billed
Abx_any Binary Non-spatial Evidence of fulfilled inpatient prescriptions to any one of five classes of antibiotics
DrugCat Discrete Non-spatial Drug categories for antibiotic classes considered risk factors for MRSA acquisition
Abx_total Continuous Non-spatial Number of total days of antibiotic consumption for each drug category specified
Abx_all Continuous Non-spatial Calculated number of total antibiotic days from five specific classes of antibiotics and administered during the course of an inpatient admission. Prior antibiotic exposures from the community or prescriptions filled in the community and taken in the hospital were not counted.
Unit Discrete Spatial/Non-spatial
Patient care unit where patient was admitted
Room Discrete Spatial/Non-spatial
Room and bed location where patient was assigned at approximately 10:30am each morning when census logs were captured
SharedStatus Discrete Spatial/Non-spatial
Maximum bed occupancy in patient rooms
TotalShare Discrete Non-spatial Total bed days calculated from a patient’s length of stay multiplied by SharedStatus for each patient location segment
StartDate Date Spatial Commencing date of admission to a

88
new bed location EndDate Date Spatial Discharge date from a bed location
(may indicate an intra or inter hospital transfer, death, or discharge)
SegLos Continuous Spatial/Non-spatial
Segment of time, expressed in days, per bed assignmemt
* Variables unique to only MRSA patients (cases). Bolded variables were considered for univariate and multivariate modeling
3.10 Descriptive Statistical Methods
Basic hospital facility operations, including bed capacities, average patient
lengths of stay, patient days, and overall bed utilization rates were extracted and
calculated in order to contextualize the selected FMC units with estimates of hospital-
wide patient burdens. These data are available from the Calgary Health Region’s QSHI
intranet site as part of quarterly and annual facility quality assurance and activity reports.
Overall rates and outcomes of MRSA at FMC were calculated to establish a
general framework for the magnitude of MRSA activity on the selected six units, but to
also compare these local results with the overall national and regional activity of MRSA
reported by CNISP.
Descriptive measures such as frequency tables and charting were created in SAS
to characterize both the predictor and outcome variables. Where possible, on continuous
variables, descriptive statistics such as mean, median, range, and standard deviation were
calculated to assess for normality using PROC UNIVARIATE in SAS. Also, where the
intent was to break continuous variables into categories, assessments of these descriptive
results assisted with deriving those break points.
Individual categorical or dichotomous predictor variables outlined in Table 3.5
were compared to the expected outcome between cases and controls. Odds ratios were
calculated for the key outcomes of MRSA (1=MRSA cases versus 0=no known MRSA),

89
and Severity of MRSA (1=Infected, 0=Colonized). The Mantel-Haenszel test was
considered for the stratified and pooled odds ratios, where the odds ratios for strata were
compared against the overall test for association between the outcome and risk factor to
determine which point estimate best described the data. Additionally, if there was
evidence that stratum-specific estimates (i.e., adjusted odds ratio) most appropriately
described the data, then these would influence the likelihood of testing for interaction and
confounding in multivariate modeling. The Mantel-Haenszel test is similar to the χ2 test
and is based on a hypergeometric model for several study designs, including case-control
studies [143].
Based on the literature cited in the background section, as well as identifying and
creating novel variables that may explain non-clinical factors for MRSA, the predictor
variables selected for univariate analysis included age, gender, patient service, Charlson
Co-morbidity Index, overall length of stay, average nursing workload resources
consumed, patient care unit, recent history of antibiotic exposure (within one month of
new MRSA case identification), total days of selected Antibiotic Pressure, and the sum of
Shared Patient Accommodation (TotalShare) days. It is suggested that some variables
may exhibit collinearity, such as measures of workload and Charlson Index values, as
well as Patient Unit and Patient Service. The non-spatial outcome variables would be
presence or absence of healthcare-associated MRSA, or severity of healthcare associated
MRSA.
Calculating the crude odds ratio for β1 (TotalShare, or TS), for example, would be
coded into SAS using the following script:
90
Logit P(X) = α + β1(TS)
Data Phd.FirstOdds; Set Temp; Status = (mrsa=1) proc contents data=NewTemp; Run;
Proc logistic data=NewTemp descending; Model Status = TS/rl ; Run;
Once a crude estimate is generated, a further assessment will evaluate whether
this odds ratio can be explained by other mediating confounders or effect modifiers such
as age, gender, antibiotic exposures, workload, etc. An adjusted odds ratio will identify
whether stratum-specific factors act differentially upon the outcome, or whether there
may be evidence for confounding if stratum specific odds ratios are homogeneous among
the strata but different from the pooled estimate.
3.10.1 Multivariate Logistic Regression Modeling
The following full variable set and model for logistic regression was evaluated
initially as univariate predictors and screened based on their suitability as confounders,
effect modifiers, or potential clinically relevant main effects to explain E:
Logit P(X) = α + β1E + β2C1 + β3C2 + β4C3 + β5C4 + β6C5 + β7C6 + β8C7 + …
Where: E = Cumulative shared patient days; C1 = Age; C2 = Gender (0,1); C3 = Patient Service; C4 = Charlson Index; C5 = Length of Stay (LOS); C6 = Average Nursing Workload; C7 = Patient Care Unit; C8 = History of Select Antibiotic Exposure (0,1); C9 = Total days of antibiotics;

91
C10 = 1st Generation Cephalosporins; C11= 2nd Generation Cephalosporins; C12=3rd Generation Cephalosporins; C13= BetaLactams; C14=Carbapenems; C15=Vancomycin; C16=MRSA Burden
The logit function to assess the linear relationship between the main exposure of
interest and the outcome, MRSA, was calculated. The estimate for β1 without any other
predictor variables was compared to inclusions of each of the other relevant predictors.
Each of the predictors listed above were inserted into the model to assess (through the use
of the Wald Test) for interaction and confounding. The criterion for determining whether
confounding was present was a greater than 10% change in the value of the β1 coefficient
with the inclusion of the variable Cn.
Once both confounding and effect modification were assessed, those variables
with evidence of either were included into the model along with the relevant interaction
terms. A conservative approach was taken and in addition to these key variables, other
potential effect modifiers or confounders were controlled for in the model despite the
indication that we failed to reject the null hypothesis on their individual assessments.
Once all key determinants were in the model, stepwise backward elimination was
performed, with the least or non-significant estimates were taken out sequentially. As
with the univariate screening process, changes to β1 by greater than 10% were indications
that the inclusion of particular covariates made for an unstable model.
The modeling process was iterative, but each was subject to an assessment of the
regression diagnostics, including the Hosmer-Lemeshow Goodness of Fit test, R2 test,
and an assessment of collinearity through evaluating Variance Decomposition

92
Proportions (VDP). For the latter, the assumption was collinearity may be present if the
conditional index was greater than 30 for any one predictor variable [144].
3.11 Spatial Analysis Methods
3.11.1 Assessment of Spatial Autocorrelation
A Moran’s I value was calculated for each unit, once for the entire period of five
years, as well as over multiple time points over the five years (every January/July 15
from 2001 to 2006) to estimate whether events of new MRSA identified attributed to
specific patient beds or rooms bore any spatial correlation with other new MRSA events
occurring in adjacent beds or rooms. The Moran’s I measures the similarity between
adjacent and more distant spaces separated by boundaries (between beds and between
rooms, in this scenario). If there is no spatial dependence between events, then the
Moran’s I will approach zero and if the value approaches +1, then there is clustering of
events, or clusters of MRSA occurring between rooms or beds [120, 121]. A Moran’s I
value approaching -1 indicates perfect dispersion. Here, the estimate is the likelihood
that the spatial location of one MRSA case will have an impact upon the spatial location
of another, concurrent MRSA case. Therefore the null hypothesis is that there is no
spatial autocorrelation between MRSA cases (dispersion of cases is random), which
would imply that the physical closeness of cases, without any other mediating factor, is
not the main mechanism of MRSA transmission.

93
3.11.2 Assessment of Spatial and Straintype Heterogeneity
Because MRSA events are relatively rare occurrences, measuring the likelihood
that cases follow a clustered or random pattern of dispersion can be applied to both the
spatial distribution of cases as well as to PFGE strain typing. Simpson’s index of
diversity (D) is based on information theory, and represents the probability that two
randomly selected elements of a population will fall into separate clusters or
partitions[145]. Thus, as the diversity of the population increases (and partition size
decreases correspondingly), the value of Simpson’s index approaches 1.00 (or 100%).
Simpson’s index is calculated as follows:
Where N is the total size of the population, s is the number of partitions identified,
and n are the number of elements in each j partition [146]. For the purposes of
interpretation, partitions typically include straintype clusters, although a similar
partitioning logic may be extended to quantify “hotspots” among the beds of a ward.
Confidence intervals for D were determined as described by Grundmann et al. [147].
Therefore, the application of this test was applied to both the dispersion of MRSA cases
on individual units over a discrete time period as well as used to assess whether MRSA
strain types demonstrated significant homogeneity, or a tendency to see clustering toward
a dominant or emerging strain.

94
3.12 Tracking Analyst
Tracking Analyst is an extension, or plug-in module, that is offered by ESRI as
part of the ArcGIS software suite. This function allows for data points to be displayed in
a temporal sequence. Temporal data can originate from a fixed time source, such as
retrospective data on lightning strikes, or can be real-time, such as for airline flight
tracking. For the purposes of this analysis, a fixed temporal (or tracking) data table
containing date stamps of new MRSA events arranged by PFGE strain typing was used.
This table was joined by a common linkage specifying unique patient beds on a single
unit. Additional data to describe the event, such as MRSA severity (e.g., infection or
colonization) or patient demographics, were also linked to tracking data as a temporal
object component.
Once the related tables for tracking events were organized within a geodatabase in
ArcCatalog, these files were imported to ArcMap using the Tracking Analyst wizard
function. Tracking Analyst adds a new layer to an existing map and contains the
attributes for visualizing spatial changes through time. The sequence of events can be
structured so each second of visual playback can represent the time in seconds, hours,
days, weeks, etc. Playback consists of point data, in this case, the date and patient
location of MRSA on the day they initially tested positive. Tracking Analyst would
demonstrate the clustering of cases, linked by common MRSA PFGE types, within a
patient unit. The intent was to not only evaluate the temporal sequence of new MRSA
cases on select units, but also to establish plausible timeframes for common spatial
exposures between new MRSA cases and previously-known MRSA patients with these
same strains.

95
3.13 Scientific and Ethical Approval
The project was approved by the University of Calgary Conjoint Health Research
Ethics Board in May 2007. Individual consent for permission to view identified
retrospective patient data was waived under Section 50 of the Health Information Act.
Two subsequent amendments were submitted and approved in October 2007 and
February 2008 which requested additional data extractions from the Calgary Health
Region Accounts Receivable Department and from the Calgary Health Region Pharmacy
database, Centricity.
Vulnerable subgroups such as patients unable to issue consent due to temporary or
permanent medical condition or language, incarcerated persons and pregnant women
were included in the study population because 1) there was no way to identify and select
these patients prior to the extraction of the datasets, and 2) the study used retrospective
clinical, laboratory, and administrative data which did not influence the medical care
patients received.
3.14 Confidentiality
Data for this project were initially collected for the Infection Prevention and
Control program as well as for the Canadian Nosocomial Infection Surveillance Program.
Combined clinical and isolate information are currently housed on a single database on
an internal, secure Calgary Health Region server. Contacting individual patients was not
feasible due to the age of some of the isolates, and because personal contact information
was not stored on the Infection Prevention and Control database. This investigation was

96
observational and had no direct impact to an individual’s past or current care. Relevant
host risk factors, hospital geographic information (eg. room placement, patient care area),
and strain typing of isolates will be essential elements to the analysis, but the identity of
patients has little bearing on the study. Patient identifiers were initially retained for
linkages between datasets, and once the datasets were linked, the final dataset was
stripped of identifiers such as names, Alberta health numbers, and hospital-assigned
identification numbers, and replaced with a randomly generated identifier to prevent
unauthorized sub-analysis.
Traditionally, geographic locators such as postal codes, require a randomizing
algorithm to prevent sensitive data from being pinpointed to personal residence. In this
investigation, the scale of the geographic analysis is at the level of a patient’s room and
patient care area, and is not a reflection of a patient’s permanent personal residence or
socioeconomic status. The findings from these geographic data are presented in
aggregate, used primarily as the basis of mathematical models and large scale spatial
patterning. Thus, patterns of disease transmission as it pertains to individual patients
cannot be extracted. For the purposes of publication or presentation, no patient-specific
data were used, and all hard copies of sensitive or privileged
information/communications were deleted.

97
Chapter Four: Results I - Descriptive Statistics
This is the first of three results chapters, and provides context to the epidemiology
of MRSA at the Foothills Medical Centre, Calgary Health Region. This chapter includes
descriptive statistics for MRSA across the health region and among the patients of select
study units. PFGE straintype data from CNISP surveillance activities were examined,
within the context of specific study units and the greater FMC, and the implications of
strain diversity to geospatial and logistic modeling were considered. Finally, measures to
evaluate data quality, imputation, and error checking were described.
4.1 Patient Activity at Foothills Medical Centre
The Foothills Medical Centre is one of the most active tertiary acute care centres
in Western Canada, offering specialized medical and surgical programs for Southern
Alberta, Western Saskatchewan, and the British Columbia interior. As part of this study,
units 32, 36, 61, 62, 102, and ICU were chosen as areas demonstrating particularly high
and sustained levels of MRSA activity compared to other clinical areas over the period of
the study. Units 32, 61, and 62 serve acutely ill medical patients. Unit 36 was a newly-
renovated medical teaching unit that opened in May 2004, and routinely and
preferentially accepts complex medical patients. Most of the rooms on all of these units
were designed for multi-patient occupancy, with layouts ranging from 2 to 4 patients per
room. Unit 36 has a maximum bed capacity of 36 patients, while the other medical units
were each built to accept 38. Unit 102 is a 38-bed surgical unit which specializes in, but
is not limited to, gynecological surgeries. Thus, for this unit, the patient population was

98
predominantly female. The intensive care unit contains 22 beds for medical/surgical
trauma patients and was designed as an open-concept ward with 12 beds in the central
area, and 10 beds enclosed by rigid walls around the periphery.
With the exception of the ICU, patient care units had a single nursing station
located centrally where charting and administrative activities would occur. A medication
preparation room was typically adjacent to the nursing station. The ICU had nursing
stations but a common medication preparation area. Units with capabilities for 36-38
beds were often staffed primarily by registered or baccalaureate-trained nurses, each with
3-4 patients. ICU patients often required 1:1 care, and most were mechanically
ventilated. Supportive nursing staff, such as licensed practical nurses, nursing assistants,
and unit aides would assist with basic patient needs, and depending on the acuity of the
patients, one or more would be present per shift on each of these units. Depending on
the task, nurses would often assist their colleagues with wound care, lifting or
transferring patients, insertion of central or peripheral lines, etc. Several times during the
day, medical and surgical consultants, volunteers, visitors, environmental services staff
would enter patient care areas or patient rooms. Not all entries result in direct patient
contact, but most entering persons would likely make contact with surfaces or equipment
within the room.
The level of patient activity and the corresponding percent occupancy on the units
per year are describe in Table 4.1 below. With bed occupancy at FMC that consistently
approaches 100% (operationally, this was most likely the norm), estimates for shared
accommodations were assumed to be at capacity for each room on these wards (Table

99
4.1). Patient days summarized in this table were used to calculate the incidence of
MRSA at FMC.
Table 4.1. Total Patient Days, Patient Days by Unit and Percent Occupancy for each Patient Care Unit, 2000-2006
FMC Patient Days (N) FMC Unit 2000
(n) 2001 (n)
2002 (n)
2003 (n) 2004 (n) 2005 (n)
2006 (n)
102 13,207 12,762 12,721 13,063 13,058 13,106 13,191
32 13,155 11,867 9,175 10,221 13,377 13,605 13,050
36 n/a n/a n/a n/a 8,331 12,187 13,756
61 13,354 13,508 13,664 13,482 10,893 13,494 13,133
62 12,671 13,566 13,569 13,558 3,696 13,606 13,765
ICU 6,453 6,682 6,791 6,852 6,805 7,275 7,402
FMC Total 250,000 247,584 253,421 260,588 264,657 286,253 290,263
% Occupancy
94.3% 91.4 – 93.9%
91.4 – 93.0%
90.8 – 90.9%
89.2 – 90.4%
90.8 – 91.3%
93.0 – 94.4%
Table 4.2, on the following page, illustrates the contribution of each unit to the
total yearly patient day capacities at FMC. These data suggest that these six units
collectively admitted approximately 25% of all patients coming to FMC. Additionally,
these patients incurred longer mean lengths of stay than the average FMC unit,
especially on the large medical units. Collectively the six units comprised 210 acute care
beds. Aside from the Orthopedics and Cardiology portfolios, these units accounted for
the greatest number of patient days per annum at FMC.

100
Table 4.2: Percent of Total FMC Patient Days per Year for Selected Patient Care Units (2000-6)
Percent of Total FMC Patient Days (N%)
Unit 2000 2001 2002 2003 2004 2005 2006 Cumulative
102 5.28 5.15 5.02 5.01 4.93 4.58 4.54 4.92
32 5.26 4.79 3.62 3.92 5.05 4.75 4.50 4.56
36 n/a n/a n/a n/a 3.15 4.26 4.74 4.07
61 5.34 5.46 5.39 5.17 4.11 4.71 4.52 4.42
62 5.07 5.48 5.35 5.20 1.40 4.75 4.74 4.56
ICU 2.58 2.70 2.68 2.63 2.57 2.54 2.55 2.60
Until 2003, Unit 32 primarily served the renal inpatient population, but after a
new inpatient renal and renal transplant unit (37A/B) opened later that year, Unit 32 was
split into an acute medical (32B) and stroke unit (32A). A 13-bed stroke specialty area,
designated Unit 100, opened shortly thereafter, and Unit 32 reverted to servicing only
acute medicine. Unit 61 was the primary medical teaching unit (MTU) for FMC until
Unit 36 opened in May 2004. Prior to 2004, Unit 36 housed medical auxiliary patients
and was closed to patients for renovations during most of 2002 and 2003.
Table 4.3 compared the mean lengths of stay on the patient care units of interest,
and determined that the duration of admission varied considerably between units, but
between years, units appeared to demonstrate a general consistency in the length of time
an average patient would remain admitted. Of note, after the re-structuring of the Unit
61 patient population, the overall patient length of stay declined on Unit 61 when Unit 36

101
assumed the responsibility of the sole medical teaching unit at FMC in 2004. Despite
the year-to-year variations in patient lengths of stay on these units, the overall hospital
length of stay remained stable with 5.50-6.70 days for the average patient. With the
exception of the ICU, each of the selected units for this study reported longer patient
lengths of stay than the mean for the hospital. ICU patients were discharged, transferred,
or had died typically within a week of their admission. Being critical care patients, the
likelihood was that their admissions and recoveries were actually longer and continued on
other units after they had been stabilized enough to be transferred elsewhere.
Table 4.3: Mean Patient Length of Stay for Selected FMC Patient Care Units (2001-2006 Fiscal Years)
Mean Length of Patient Stay (Days) FMC Unit 2001-02 2002-03 2003-04 2004-05 2005-06 2006-07 102 6.60 6.40 6.70 8.10 8.50 7.60 32 10.90 10.40 4.30* 9.70 10.10 11.70 32B 9.60* 36 n/a n/a n/a 9.40 8.50 9.10 61 11.30 11.30 9.60 7.70 7.40 7.50 61A 7.80 62 10.10 9.00 8.20 7.00 10.50 11.50 62A 9.60 ICU 6.50 7.00 6.20 6.30 5.90 5.50 FMC Total
6.40 6.70 6.60 6.20 5.50 5.50
*32A (stroke unit) = 14 beds and 32B (acute medicine) = 24 beds after unit 37 (renal in/outpatient) opened with 43 beds in 2003 Source: QSHI fiscal reporting data, 2008
4.2 Estimates of MRSA Incident Cases
The most comprehensive and useful data source for the identification and
classification of new cases of MRSA within the Calgary Health Region is the CERNER

102
laboratory reporting system (Cerner Corporation, Kansas City MO) which was
administered by Calgary Laboratory Services (CLS). These data were indexed by unique
laboratory accession numbers which were assigned by CLS upon specimen receipt, and
were associated with individual patients by one or more of an array of patient identifiers,
which include: FMC number, Provincial Health Number (PHN), PPR, and/or Name and
Patient Date of Birth. Review of historical CERNER data reveals considerable
inconsistency in the use and reporting of these patient identifiers, and the lack of a single
patient identifier code posed considerable challenges for linking to clinical information.
Furthermore, repeat cultures on known positive MRSA patients were not flagged in the
data extractions, and this, in combination with inconsistent patient identifiers, inferred
that manual data linking was the only feasible option. A separately extracted file on
patients who screened negative for MRSA was retained, but these data were not linked
with information that indicated the reason for screening (e.g. admission screening
protocols, post-exposure screening, or screening for discontinuation of isolation). Also,
if patients became positive for MRSA, these results had not been updated to reflect a
change in MRSA status.
As such, the Antibiotic Resistant Organism (ARO) registry was a preferred source
primarily because clinical and epidemiologic data were both included, the main table
contained information on the incident event for MRSA per patient with subsequent
positive and negative results stored in a separate, linked table, and contained consistently-
used identifiers to link to other datasets used within the CHR. Prior to linking to the
QSHI or CHR Finance data, the ARO dataset included 1,870 instances of new MRSA
cases across the CHR, with the earliest case dating back to 1995. Of these, 43 cases were

103
identified at the Alberta Children’s Hospital, 781 at the FMC, 432 at the Peter Lougheed
Centre (PLC), 493 from the Rockyview Hospital (RGH), and 121 cases from rural areas,
long term care, non-CHR (imported), or community facilities. Additionally, among the
1,870 MRSA, 108 were co-infected or co-colonized with Vancomycin-resistant
Enterococcus (5.8%).
Within the 781 incident cases of FMC-identified MRSA, that were identified by
Infection Prevention and Control (IPC) between January 1, 2001 and December 31, 2006,
513 continued to be actively colonized or infected with MRSA (65.7%), 190 died
(24.4%), and 78 (10.0%) were cleared of MRSA. This last group of patients remained
flagged in the ARO system for IPC follow-up on any subsequent re-admissions, but no
longer required isolation. These numbers at FMC compare well to the overall
proportions for the CHR, where 67.3% retained actively colonized/infected with MRSA,
23% died, and 10% were cleared of the organism. Among those patients who had died,
there was no specification listed in the registry that MRSA was the definitive cause of
death; the average age of MRSA acquisition in this group was 73.2 years (range: 0 – 96.6
years) for the entire CHR, and 69.9 years among those at FMC (range: 17.4-94.0 years).
The average age for MRSA acquisition in the CHR is 60.9 (59.5 years at FMC), thus
patients that died tended to be in a slightly older demographic.
The MRSA positive cohort of 1,870 patients included 1,071 males (57.3%), 786
females (42.0%), and 13 patients missing or unknown gender (0.70%). Among FMC
MRSA cases, females represented 41.1% of cases, which follows the gender proportions
observed at the regional level. As a comparison, females with admissions to the selected
units of study represented 48.4% of controls.

104
The 781 cases of MRSA from FMC were further parsed out into whether the
patients were initially identified as infections or colonization, as determined by each
patient’s clinical status. Seventy-one percent (71%) of clinical isolates (n=555), were
attributed to new cases between 2001 and 2006 that were consistent with infection,
according to CNISP criteria. Of these, 323 were MRSA infections with specific
epidemiologic ties to acute care, and within this group of patients 82.9% were determined
to be healthcare-associated. Thirty-seven (37) cases were identified as new onset
infections linked to cluster investigations, with 30 of these cases occurring on the six
selected clinical areas that were included in the present study (units 32, 36, 61, 62, 102,
and ICU). By comparison, across entire the CHR, 47.2% of clinical MRSA isolates
were classified as healthcare-associated during the same period of time.

105
Figure 4.1: Rates of Incident MRSA by FMC patient care unit, 2001-2006
As shown in Figure 4.1, the incidence of MRSA varied from year to year among
the six patient care areas, with a notable spike in rate on Unit 62 and ICU in 2006, as well
as a general increase in the rate of new cases detected on each unit year over year. The
overall rate of MRSA among these units increased from 0.36 cases per 1000 patient days
in 2001 to 1.56 cases per 1000 patient days in 2006. This represented almost a five fold
increase in six years. If this trend were to extend to all units at FMC, 453 cases of new
MRSA would be diagnosed in 2006. In 2006, 285 cases of new MRSA were actually
identified at FMC.
These data were based on case reports extracted from the Antibiotic Resistant
Organism registry, and included additional cases that did not have PFGE strain typing

106
available. There were a total of 86 cases of MRSA detected at FMC prior to 2000, and
22 in 2000.
Figure 4.2: Rate of healthcare-associated MRSA among selected FMC patient care units, 2001-06
Similarly, Figure 4.2 shows the rate of healthcare-associated MRSA (as defined
by CNISP criteria) and also highlights the overall increasing rates of MRSA positivity
year over year. Here, the rate rose from 0.32/1000 patient days in 2001 to 1.00/1000
patient days in 2006, almost a three-fold increase. Of note, the Antibiotic Resistant
Organism registry was implemented in 2002 and cases prior to this time were entered
retrospectively from available, but largely incomplete, paper records.

107
Table 4.4: Patients Admitted with Previously Known MRSA to FMC Study Units (2001-2006)
Patients Admitted to Select Units with Previously Known MRSA (n)
Year ICU 32 36 61 62 102
2001 0 7 n/a 1 5 1
2002 4 5 n/a 3 3 3
2003 3 1 n/a 3 5 1
2004 4 9 9 15 14 9
2005 1 2 2 0 1 0
2006 21 22 48 8 20 4
Figure 4.3: MRSA Burden: Prevalence of MRSA on Select Units (per 1000 patient days, FMC 2001-2006)

108
In order to assess the potential impact of previously known MRSA patients as
potential exposures to those without MRSA, a summary of the number of yearly
admissions per unit are detailed in Table 4.4. The table does not denote their length of
stay for each admission, nor whether they were colonized or infected. The numbers of
re-admitted MRSA patients appears conservative, although in the process of compiling
these data, patients who were identified as incident cases of MRSA were excluded in
prevalence estimates if they were re-admitted to FMC within the same year. The data
actually demonstrated that once a patient was identified as MRSA positive, their re-
admission rate was generally higher in the first year than subsequent ones. Note that per
annum, known MRSA patients would be transferred between units, or admitted to more
than one of these units within an admission, and potentially re-admitted to FMC multiple
times over the course of the six years of study.
Because the “exposure” periods were aggregated into a measure of ecological
MRSA pressure for lengths of time on each unit, each re-admission by unique patients
were counted each time in the event of multiple re-admissions or transfers. Those
patients who became positive for MRSA early in the study period were considered risk
factors to others, but only in the subsequent calendar years after their first positive. As
such, a new variable to represent ecological burden / environmental contamination with
known MRSA was prepared as a potential effect modifier or confounder in the
relationship between the likelihood of healthcare-associated MRSA and shared space on
a unit.

109
Figure 4.4 shows that, relative to one another, the burden of MRSA spiked on unit
62 in 2004 and again on Unit36 and the ICU in 2006. There was a general increase in
MRSA days on each of the units. 2006 seemed to indicate that the burden and
management of re-admitted or known transferred MRSA patients increased over previous
years.
Figure 4.4: MRSA Burden: MRSA patient days per 1,000 patient days in FMC, Select Study Units (2001-6)
4.3 Molecular Epidemiology of MRSA in the Calgary Health Region, 2001-2006
The changing epidemiology of MRSA in Calgary during this six year period was
dynamic, and several subtypes within the primary CMRSA epidemic strains emerged on
the FMC units included in this study. The overall diversity of MRSA strains showed a
predominance of CMRSA-2 (USA100), a circulating epidemic straintype that is

110
traditionally associated with healthcare settings in the Calgary area. CMRSA-2 isolates
accounted for 70% of all the detected strain types identified at FMC (Figure 4.5). Within
the CMRSA-2 epidemic type, there were several dozen different PFGE pattern variants
that were identified during the study period, and among these, a few key PFGE patterns,
such as 18, 30, 552, and 903 were considerably more prevalent than most. CMRSA-10
(USA300) and CMRSA-7 (USA400), which are traditionally associated with community-
based MRSA, accounted for 9% and 6%, respectively, of all Calgary-area FMC strains
that were typed by NML for CNISP surveillance.
Figure 4.5a: Diversity of CMRSA Epidemic types from FMC, 2001-6 (CNISP)

111
Figure 4.5b: Pattern diversity within CMRSA-2, Selected FMC Study Wards, 2001-2006 (CNISP)
* Wards 32, 36, 61, 62, 102 and ICU only. Duplicate patient isolates redacted. (■ CMRSA2-18; ■ CMRSA2-30; ■ CMRSA2-552; ■ CMRSA2-903; ■ CMRSA2-919)
Upon a review of PFGE strain type data for each unit, no clear pattern emerged
either between or within units from year to year, indicating considerable diversity of
MRSA strains. Several key CMRSA-2 PFGE pattern types emerged in outbreaks, and
others appears to persist over time in sporadic healthcare-associated cases but in low
numbers (Figure 4.6). For example, CMRSA-2 SmaI pattern 18 appears throughout all
six patient care units across all time points, but in low frequencies. CMRSA-2 SmaI
PFGE pattern 1567 demonstrates a similar pattern on units 102, 32, 36, and 62 but with
less consistency than PFGE pattern 18. CMRSA-10 appeared for the first time among
isolates from FMC inpatients in 2002, and gradually increased in case number over the
following four years, which suggests a changing composition of MRSA types in the
hospital to include a balance of community-originating strains (Figure 4.5a).

112
For all units with the exception of Units 36, it appears as though fewer strains
were endemic among these units in 2005/06 calendar years. Previous years have shown a
wide diversity in the quality of strains that were circulating, yet these latter years show
only a few strains were populating these clinical areas despite noticeable increases in
cases. The Simpson’s Index also corroborated this finding in that the measure for
heterogeneity was also in decline from year to year.

113
Figure 4.6: CMRSA-2 pattern distribution by year, FMC Study Units, 2001-6
a. Unit 102 b. ICU/Unit 104
c. Unit 32 d. Unit 36
e. Unit 61 f. Unit 62
* FMC wards 32, 36, 61, 62, 102, and ICU only. Patients with multiple identical isolates redacted. Numbered patterns (eg: 18, 30, 1520) are sequentially-assigned PFGE subpatterns of CMRSA2. (■ CMRSA2-18; ■ CMRSA2-30; ■ CMRSA2-552; ■ CMRSA2-903; ■ CMRSA2-919)

114
To assess whether the diversity of the MRSA strains among the six units was
heterogenous or indicative of non-random distributions, Simpson’s Diversity Indices
were calculated on both the reported epidemic straintypes (eg: CMRSA-1 through 10) as
well as the more specific SmaI PFGE pattern types. Table 4.5 reports these statistics by
year, and suggests that the diversity of epidemic strains was not completely random, with
potential clusters of CMRSA-2 isolates across all six years. Because data were
aggregated over an entire year, however, the statistic may not correctly estimate the
magnitude of a point source cluster or discrete outbreak that occurred during that time.
Furthermore, CMRSA epidemic types represent a collection of closely related PFGE
patterns, which are typically associated with the epidemic type on the basis of Tenover’s
criteria or overall pattern similarity of 80% or greater [91]. Thus, while CMRSA-2 was
by far the predominant straintype at FMC (>70%), analysis at the level of individual
clonal PFGE patterns within CMRSA-2 suggested that strain diversity was nonetheless
heterogeneous and randomly distributed. Upon further interpretation, these diversity
calculations may suggest that while CMRSA-2 was the dominant epidemic type at FMC
across all time points, no particular subtype strain emerged to suggest improved
ecological fitness and persistence. By contrast, a single CMRSA-10 clone appeared to be
emerging as a significant straintype among FMC inpatients, mirroring the emergence of
USA300 and CA-MRSA in the United States and abroad.
If one considers all six years of CNISP data for the FMC, quantifying an overall
PFGE pattern diversity for all nosocomial MRSA cases results in a Simpson’s index of
99.34%, with 87 unique partitions. This global diversity statistic suggests a highly
heterogenous MRSA straintype population, and although relatively small clusters or

115
outbreaks may appear over time, individual clonal lineages have not established a clear
pattern of sustained transmission among the FMC inpatient population. Furthermore, this
high degree of MRSA clonal diversity has important implications for logistic or
geospatial modeling, since it indicates that widespread and sustained clonal transmission
was not occurring at FMC during this time period, or within these clinical areas.
Despite this heterogeneity, certain PFGE pattern types, such as CMRSA-2 type 18
or 30 appear to have been endemic or associated with sporadic cases on several different
wards (Figure 4.4). Minor PFGE pattern variation within outbreak clusters is not
unusual, in accordance with Tenover’s criteria, and so interpretation at the level of
broader epidemic types (eg: CMRSA-2 vs. CMRSA-10) may be more epidemiologically
meaningful than unique patterns with single band differences.

116
Table 4.5: Simpson’s Indices for CMRSA epidemic types and overall PFGE diversity, Select Units, FMC, 2001-2006
N (CMRSA/Total Patterns)
# Partitions CMRSA Types Diversity of CMRSA Epidemic Subtypes [D (95%CI)]
Overall PFGE Pattern Diversity [D (95%CI)]
2000 15/21 2 CMRSA2 (6) CMRSA8 (9)
51.43 (41.31-61.55)
100.00 (100.00-100.00)
2001 42/45 6 CMRSA1 (1) CMRSA2 (30) CMRSA5 (1) CMRSA6 (4) CMRSA7 (5) CMRSA8 (1)
47.62 (30.09-65.15)
89.66 (83.73-95.59)
2002 78/83 7 CMRSA1 (1) CMRSA2 (55) CMRSA4 (2) CMRSA6 (3) CMRSA7 (8) CMRSA8 (8) CMRSA10 (1)
48.55 (35.61-61.50)
88.95 (83.19-94.71)
2003 73/83 7 CMRSA1 (1) CMRSA2 (54) CMRSA4 (1) CMRSA6 (7) CMRSA7 (1) CMRSA8 (7) CMRSA10 (2)
43.91 (30.25-57.58) 94.78 (92.45-97.12)
2004 87/89 8 CMRSA1 (1) CMRSA2 (58) CMRSA4 (1) CMRSA6 (3) CMRSA7 (7) CMRSA8 (2) CMRSA9 (1) CMRSA10 (14)
52.71 (41.23-64.19) 94.08 (91.89-96.27)
2005 68/79 4 CMRSA2 (47) CMRSA7 (2) CMRSA8 (2) CMRSA10 (17)
46.49 (35.41-57.57) 92.56 (89.77-95.35)
2006 68/77 4 CMRSA2 (48) CMRSA6 (1) CMRSA7 (2) CMRSA10 (17)
44.47 (33.44-55.50) 94.84 (92.28-97.39)

117
4.4 Straintype Diversity among Community and Long-term Care Patients
Interestingly, using CNISP surveillance criteria to query the ARO registry for
FMC cases attributed to community and long term care facility exposures, 137 cases were
identified. Linking these data back to their epidemic strains and corresponding PFGE
patterns revealed that of the 137, 69 cases were CMRSA-2 even among those identified
as originating from the community. Long term care, with 15 cases, were mostly
CMRSA-2 with single cases of CMRSA-8 and CMRSA-10 also noted. All of the
CMRSA-2 cases had PFGE patterns common to the strains noted for healthcare-
associated cases (CMRSA-2 PFGE Patterns: 18, 552, 1567,903, 919, and 702). The
findings support a hypothesis that CMRSA-2 has permeated most settings, and a
diminished ability to use geographic boundaries to distinguish strain types.
4.5 Comparability of Case Subset to the Larger MRSA Population
A key methodological requirement of the present study was extensive linking
across several extracted datasets using various unique identifiers. While this process was
conducted in as careful and thorough a manner as possible, retention of many MRSA
case records was limited by the completeness of the unique identifiers and paucity of
information in the different datasets. Key datasets such as the QSHI, Pharmacy, and
CHR Workload datasets, contained more complete and accurate data because they were
subject to regular data quality checks and internal validation processes. However, other
datasets originating from CHR Accounts Receivable (patient locator data) and Infection
Prevention and Control’s ARO registry were more vulnerable to errors in data entry and
data type due to operator error or misclassification.

118
Data formatting and data type mismatched were also issues that required
resolution through tools such as using “Text to Columns’ in Microsoft Excel to reset prior
formatting. Patient location information (containing data on patient care unit, room, and
bed placement) was found to have errors in the 2006 Oracle data extraction from CHR
Finance and resulted in rooms from Units 62 and 36 being coded as dates within Excel.
Each of these records required extensive recoding to change the format to represent
rooms on these respective units. Other files from Accounts Receivable did not contain
these same errors, which may have been generated after Unit 36 was re-opened, and may
have resulted from the re-numbering of Unit 62 rooms and beds in 2006. In both
instances, the units had re-numbered their rooms.
As shown in the schematic below, from the original 1,870 MRSA cases identified
within the CHR between 2001 and 2006, through a series of linkages, the final count of
new healthcare-associated cases associated with exposure to one of six FMC units was
reduced to 123. The reduction in cases was primarily attributed to missing or invalid
unique identifiers in the ARO registry. Several records could not be matched to the
larger datasets containing QSHI, Patient Locations, Pharmacy, or Workload data. The
combination dataset of Workload, Patient Locations, and QSHI data yielded 6,569 unique
records. A total of 5,323 were selected as controls after matches to cases were
completed.

119
Figure 4.7: Data linkages, attrition and case control selection
Because the original group of 948 patients with putative healthcare-associated
MRSA to the selected six units were reduced in half due to missing identifiers, it was
important to determine whether this subset of total eligible cases were representative of
the larger FMC cohort of patients with new MRSA. Table 4.6 below describes basic
comparisons of healthcare-associated MRSA at FMC with subsets of this group. The

120
characteristics of the case subsets were comparable and the exclusion of other cases
during the process of data linkage did not intentionally introduce systematic error into the
case population of interest.
Table 4.6: Comparison of population subsets to assess for homogeneity among cases
Mean Age Gender (% female)
Severity of Illness (% infected)
All incident cases at FMC, n=405* 64.0 (SD 20.3) 63.0 67.8 Incident cases on selected units (CNISP criteria), n=109
67.6 (SD 19.2) 42.2 65.1
Incident cases on selected units (study criteria), n=123*
67.5 (SD 18.8) 64.6 65.9
*Note: As stated in the methods, the definition of healthcare-associated MRSA was operationally redefined for this study and CNISP criteria for healthcare-associated MRSA were defined as detection of MRSA >72 hrs after admission and <72hours after discharge from hospital. Healthcare-associated MRSA for the study was refined to consider admission to FMC <30 days prior to detection of MRSA
4.6 Challenges to Generating New Datasets with Secondary Data Sources
The process of linking datasets was resource intense, and one of the major
challenges to generating a comprehensive repository of case and control records centred
around the need to resolve rather than reject cases with missing or incorrect data.
Processes of imputation were required by cross-referencing other key identifiers to
determine the missing values of primary linking variables such as Encounter and RHRN.
QSHI provided a table with RHRN and Foothills hospital ID numbers as a reference table
which allowed 390 ARO registry records to be updated with correct RHRNs. Other
means included referring to paper records, CLS-generated patient lists for both MRSA
positive and negative patients, cross-checking composite identifiers such as concatenated
dates of birth and dates of admission to make matches between orphan records.

121
Other challenges included redefining the format of several variables, mostly dates
and identifiers, to allow for queries and joins. Both SAS and Microsoft Access were
sensitive to mismatches in data types and were hard coded as a particular data format. In
these circumstances, the best approach was to use a text-to-columns function in Microsoft
Excel to redefine the variables of interest.
Because each patient could have multiple patient locations, workload values, and
antibiotic class exposures within a single admission, the records in the datasets were
originally linked as a one-to-many relationship, and in a flat table, meant that each
admission was replicated multiple times to show each change in patient unit/room as well
as changes in antibiotic or workload measurement. For the purposes of preparing the
data for geocoding as well as logistic regression, the SAS function, PROC TRANSPOSE
was use to transform the data horizontally for each patient admission. Hence, one record
represented one admission, but with several new variables to account for changes in one
variable over a patient’s length of stay.
4.7 Validation of computed Charlson Index values using 50 ICD-9 / ICD10CA codes
The QSHI data extraction of demographic and comorbidities, included calculated
values for the Charlson Index. The extraction was based on an algorithm outlined by
Quan et al (2005)[140]. This study had validated the use seventeen columns of ICD10
codes to calculate the Charlson Index The work by Quan et al had also incorporated
previously established codes for translating ICD9 codes from administrative data. The
method of extraction used by QSHI was different than the published study and included
50 columns of data. Figure 4.8 illustrates that by the 17th column iteration, only 6% of

122
patients had data for potential inclusion into the score and by the 25th iteration, only 1.8%
had codes to consider. Therefore, the addition all 50 available ICD code columns beyond
the first 17 would likely not change the reliability of the score, nor its accuracy. Primary
comorbidities should also be listed earlier in terms of column order.
Figure 4.8: Percent of columns populated by ICD9/10CA data for Charlson Index calculations

123
Chapter Five: Results II - Logistic Modeling
This chapter will report the results using binary logistic regression to explain the
relationship between the odds of healthcare-associated MRSA acquisition and its
association with the key exposure variable, the length of time patients were exposed to
single and/or shared inpatient environments. Univariate analyses of the putative main
effects, confounders, and effect modifiers are described, and provide the basis of a
multivariate logistic model building strategy. Alternative and final models are presented
as well as goodness of fit and collinearity estimates to assist with selecting the model that
best explains the outcome.
5.1 Variables Selected as Effect Modifiers and Confounders of MRSA Acquisition
Several variables were initially selected as potential effect modifiers or
confounders to explain the relationship between a cumulative measure of shared hospital
environments (exposure of interest) and the odds of acquiring MRSA with those who did
not acquire MRSA. A preliminary assessment of discrete variables (ie GENDER,
ABX_ANY, CLASS1-7, YEAR, UNIT1) using the PROC FREQ function and Chi-
square point estimates looked at the likelihood of influential cells on the expected
distribution of data for categorical data, and to explore their likelihood of confounding or
interaction on any main effects. Similarly, continuous variables (AGE,
CHARLSON_INDEX, BURDENDY, and AVGWORKLOAD) were evaluated for
normality using box plots and QQ plots. The PROC UNIVARIATE and PROC TTEST

124
(continuous variables) functions were used in SAS to generate these estimates as well as
general descriptors of these variables.
The traditional approach to evaluating relevant variables that moderate the true
effect between an exposure of interest and outcome included an initial exploration of
these univariate relationships. Each variable was compared to the outcome, both as a
crude estimate, and then by stratum-specific estimates or estimates adjusted by the levels
of an exposure. Based on comparisons of crude and stratum specific estimates against a
chi-square distribution, there was no evidence to suggest confounding, but there were
initial indications that CLASS3, CLASS6, CLASS7 and UNIT1 and ADMYEAR be
considered as effect modifiers in the relationship between TOTALSHARE with the
outcome of MRSA STATUS. This was primarily determined on the observation that the
stratum specific estimates for the odds ratio were significantly different and the
confidence intervals for these estimates did not overlap, suggesting differing distributions
for the point estimates. A summary of the individual test characteristics for each variable
is listed in Table 5.1.

125
Table 5.1: Point estimates for univariate modeling among categorical or dichotomous variables
Variable Mantel-Haenszel Chi-Square
DF p-Value ORcrude, 95% CI MH stratum specific odds estimates on dichotomous variables, 95% CI
TotalShare 47.6 4 <0.0001
Class1: Betalactams
2.75 1 0.097 1.48 (0.93-2.37)
1.01 (0.97-1.02)
0.68 (0.43-1.07)
Class2: 1st Generation Cephalosporins
0.053 1 0.81 0.91 (0.42-1.97)
1.00 (0.98-1.01)
1.09 (0.51-2.32)
Class3: 2nd generation Cephalosporins
5.77 1 0.016 3.89 (1.17-12.84)
1.06 (0.97-1.17)
0.27(0.09-0.82)
Class4: 3rd generation Cephalosporins
0.73 1 0.39 1.31 (0.70-2.46)
1.00(0.99-1.03)
0.77(0.42-1.42)
Class5: 4th generation Cephalosporins
0.12 1 0.74 n/a (0 cells)
Class6: Carbapenems
5.56 1 0.018 2.89 (1.15-7.26)
1.04(0.99-1.10)
0.36(0.15-0.86)
Class7: Glycopeptides (Vancomycin)
18.92 1 <0.0001 3.78(1.99-7.18)
1.05(1.01-1.11)
0.28(0.15-0.51)
AdmYear 19.94 5 0.02
Gender 0.78 1 0.38 1.18(0.82-1.69)
1.00(1.00-1.01)
0.85(0.60-1.21)
Abx_Any 3.35 1 0.07 1.43(0.97-2.12)
1.00(1.00-1.02)
0.71(0.48-1.03)
Unit1 4.54 1 0.03
Shaded areas indicate potential effect modifiers, no evidence for confounding

126
5.2 Assessment for Normality among Continuous Variables
The continuous variables, AGE, CHARLSON_INDEX, BURDENDY (measure
of MRSA burden), and AVGWORKLOAD (average nursing workload) were evaluated
for normality, and for all four variables the null hypothesis stating that these variables
were normally distributed was rejected.
Figure 5.1(a-d): BoxPlots of Continuous Predictor Variables, AGE, CHARLSON_INDEX, BURDENDY and AVGWORKLOAD
a) AGE

127
b) CHARLSON_INDEX
c) BURDENDY

128
d) AVGWORKLOAD
These four box plots and histograms point to the skewed nature of the data,
particularly with the Charlson Index and Average NursingWorkload scores which
contained valid data, but the majority of patients clustered around the lowest of scores in
the Index (mean=2.7) and workload measurement, both indicating that the patient
population represented an average patient case mix with relatively few critical care
patients. This was supported by the data that ICU patients represented only 2.6% of the
overall FMC patient days.
Several outliers were noted beyond the inter-quartile range. BurdenDy, or the
measure of MRSA prevalence on units per year also demonstrated a non-normal
distribution, as it was a scaled index of one of 36 values assigned to each patient as a
potential risk weighting for MRSA. The BurdenDy as an index might be handled as an

129
ordinal categorical variable, but given a wider breadth of years and units to consider, it
was best considered continuous, just not normally distributed in these circumstances.
Opting to use the Wilcoxon-Rank Sum test as a non-parametric means to evaluate
variables with asymmetric distributions instead of a traditional t-test (increases the power
to detect a difference between means), p=0.008 in comparing AGE by STATUS, p=0.04
in comparing the Charlson Index by STATUS, and p <0.0001 for AvgWorkload by
STATUS. These data indicated that for the three variables there were as many
asymmetric distributions for each level of STATUS. However, the Wilcoxon-Rank sum
test indicated that there was a similar underlying distribution among BURDENDY
grouped by STATUS (2-sided p-value was 0.41). Again with the Mantel-Haenszel test
for association of BURDENDY with STATUS in a two-way contingency table supported
the indication that the distributions were the same for each level of STATUS.
Additional evidence from the kurtosis estimates and the QQ plots also support the
non-normality of the data. The variance estimate for AGE was greatly inflated, and
kurtosis (ideal value: 3) and skewness (ideal value: 0) values for each of the variable
plots indicate the data were shifted significantly. AGE was negatively skewed toward
older individuals, and both the Charlson Index and BURDENDY were positively skewed
towards small values on their respective scales. AvgWorkload was only modestly
positively skewed with a value of 0.93.
The assumption was that a normal distribution for these variables might be
expected if patients were selected randomly and independently from a given population.
The selection criteria for cases and controls were based on their dates of admission
(2001-2006), the clinical units patients were admitted to, and their known MRSA and

130
MSSA status. While homoscedascity was violated, the validity of logistic regression
modeling with these variables did not depend upon having a normally distributed
population as much as linear regression, especially among larger samples. Table 5.2
summarized the univariate assessments using PROC UNIVARIATE with the selected
continuous predictor variables.
Table 5.2: Summary of Univariate Assessments on Continuous Predictors by Outcome Strata
Variable Crude Mean (95%CI) – overall and stratum specific
Standard Deviation
Variance Normality (Kolmogorov-Smirnov), D
Equality of Variance
Age 63.10
Controls: 63.00(62.49-63.52)
Cases: 67.46(64.11-70.82)
19.22 369.55 0.081 p<0.01 -2.55 p=0.01
Charlson Index
2.48
Controls: 2.47 (2.40-2.54)
Cases: 2.75 (2.3-3.20)
2.72 7.38 0.207 p<0.01 -1.10 p=0.27
MRSA Burden
3.96
Controls: 3.96 (3.87-4.06)
Cases: 4.07 (3.52-4.62)
3.57 12.73 0.236 p<0.01 -0.35 p=0.73
Average Nursing Workload
1.57
Controls: 1.57 (1.55-1.59)
Cases: 1.68 (1.57-1.80)
0.72 0.52 0.207 p<0.01 -1.73 p=0.08
5.3 Assessment of Covariate Effect Modification and Confounding Using Non-Statistical Tests
To screen for suitable variables for logistic modeling and assess for convergence
between the two approaches, an epidemiologic method for considering effect modifiers

131
and confounders was explored. The PROC LOGISTIC function was used to generate a
maximum likelihood estimates (MLE) around the exposure of interest and individual
variables as well as their interaction term. A baseline MLE for the TOTALSHARE1
variable was 0.3849 with a standard error of 0.059. A 10% margin for MLE shifts
estimated the MLE (TOTALSHARE1) range: 0.3464-0.4234 [144].
Sequential additions of each variable to the exposure, E, indicated that only
CLASS7 was a potential effect modifier, as the chi-square p-value was significant
(probability of observing a value this extreme or more was less than 5%) at 0.013. Both
the main effect and interaction term were significant, yet the meaning of the interaction
was questionable. The interpretation was that with evidence of increasing shared
environment exposure, the likelihood of MRSA would reduce if patients were also
exposed to vancomycin (interaction term was negative compared to the main effects,
CLASS7 (vancomycin) and TOTALSHARE1 were positive).
No evidence of confounding was apparent, as the inclusion of each term as a main
effect did not change the MLE(TOTALSHARE1) by more than 10%. From this
evaluation, the sole covariate to explain the relationship between the total shared days in
hospital and MRSA acquisition was the exposure to vancomycin prior to MRSA
identification.

132
Table 5.3: Univariate analysis for potential effect modifiers and confounders
Parameter Maximum Likelihood Estimate (MLE)
Chi-Square p-value with the inclusion of an interaction term
TotalShare* 0.3849 NS
Class1: Betalactams 0.3821 NS
Class2: 1st Generation Cephalosporins 0.3968 NS
Class3: 2nd generation Cephalosporins 0.3825 NS
Class4: 3rd generation Cephalosporins 0.3842 NS
Class5: 4th generation Cephalosporins 0.3845 NS
Class6: Carbapenems 0.3764 NS
Class7: Glycopeptides (Vancomycin) 0.3667 0.013
AdmYear 0.3839 NS
Gender 0.3841 NS
Abx_Any 0.3793 NS
Unit1 0.3845 NS
Age 0.3647 NS
Charlson Index 0.3815 NS
MRSA Burden 0.3886 NS
Average Nursing Workload
TotalShare1*Class7
0.4060
-0.6787
NS
0.013
*Exposure of interest
5.4 Multivariate Logistic Regression
The final dataset with parameter estimates for both cases and controls contained
5446 observations: 123 were cases, and 5323 were controls. The PROC LOGISTIC
statement was used in SAS to generate the log odds and odds ratio of MRSA given
selected explanatory parameters. As indicated by the parameter estimate when
TotalShare was the only independent variable, the odds ratio for MRSA among those
with one unit of exposure to cumulative shared days in a hospital environment (eg. 1-25

133
days) was 1.47 (95% CI 1.31-1.65) compared to those patients without exposure to
hospital environments (<24hours of exposure).
After evaluating the individual variables for their likely role in the modeling
process along with relevant variables that were potential main effects as a result of the
literature review and local trends at CHR, the following full model was proposed:
Where:
E = Total shared days as a hospital inpatient (TotalShare) *C1 = Average nursing workload required by a patient (AvgWorkload) * C2 = Year of Admission (AdmYear) *C3 = First unit of Admission (Unit1) C4 = Charlson index (Charlson_Index) C5 = MRSA burden (prevalent cases of MRSA) (BurdenDy) *C6 = Prior exposure to Vancomycin (Class7) In adding relevant variables into the model, a backwards elimination scheme was
used. The first iteration of fitting the full model indicated that MRSA Burden was not
significant among the main effects (Estimate: -0.0173, SE: 0.0392, Wald Chi-Square:
0.1955, p= 0.66). The Charlson Index was also not significantly associated with the
outcome. All other Wald Chi-Square parameters were significant (p<0.05).
While it was significant, removing the interaction term from the model still
resulted in a logical series of predictors to explain the outcome and had virtually no effect
on the point estimates or standard error for E. From an epidemiologic standpoint, the
interaction term was likely spurious and difficult to interpret clinically so was removed
from the modeling process. The inclusion of average nursing workload into the model

134
despite a modest contribution (p=0.07) was supported due to its importance as a factor to
explain the complexity and acuity of patient management, which was not otherwise
represented in the model by another variable.
The final model to assess the variables that impact MRSA acquisition at FMC
was:
Table 5.4: Final Logistic Regression Model: Analysis of Maximum Likelihood Estimates
Parameter DF ML Estimate Std Error Wald Chi-Square
Pr>Chi-Sq
Intercept 1 -5.97 0.503 140.93 <0.0001
TotalShare1 1 0.370 0.064 33.851 <0.0001
AvgWorkload 1 0.473 0.204 5.394 0.0202
Class7 1 1.031 0.343 9.014 0.0027
AdmYear 1 0.196 0.066 8.736 0.0031
Unit1 – 102/61 1 0.794 0.430 0.034 0.854
Unit1 – 32/61 1 0.270 0.368 0.536 0.464
Unit1 – 36/61 1 0.184 0.388 0.225 0.635
Unit1 – 62/61 1 1.002 0.327 9.375 0.002
Unit1 –ICU/61 1 0.245 0.409 0.486 0.486
5.5 Interpreting the Final Model Relating the Odds of MRSA to Predictor Variables
When controlling for all other main effects, the odds of healthcare associated
MRSA was 1.45 times greater among those with 26-50 days of hospital exposure
compared to those with hospital exposure less than 25 shared days. Similarly, controlling

135
for all other variables in the model, the odds of MRSA was 1.61 times greater for every
one point increase in nursing workload. In terms of antibiotic exposures, those with prior
exposure to vancomycin were 2.80 more likely to acquire healthcare-associated MRSA
than those without vancomycin exposure. Temporally, those who were admitted to FMC
in 2005 were 1.22 times more likely to develop MRSA than any other years, and finally,
those admitted to unit 62 were 2.72 more likely to develop healthcare associated MRSA
than admission to other units, while controlling for all other variables in the model.
Table 5.5: Odds Ratio Estimates for the Main Effects Explaining MRSA Acquisition at FMC
Main Effect Point Estimate 95% Wald Confidence
Limits
TotalShare1 1.45 1.27-1.64
AvgWorkload 1.61 1.08-2.39
Class7 2.80 1.43-5.49
AdmYear 1.22 1.06-1.38
Unit1 (102 v. 61) 1.08 0.47-2.52
Unit1 (32 v. 61) 1.31 0.64-2.70
Unit1 (36 v. 61) 1.20 0.56-2.58
Unit1 (62 v. 61) 2.72 1.43-5.18
Unit1 (ICU v. 61) 1.34 0.60-2.96
5.6 Evaluating Goodness of Fit
To estimate the model’s goodness of fit, the Hosmer-Lemeshow test indicated a
chi-square value of 12.79 on 8 degrees of freedom, p=0.1194. Therefore we were unable
to reject the null hypothesis that there was a significant difference between observed and

136
expected frequencies and the model fits the data reasonably well. To further confirm
these results, a plot of the Pearson chi-square residuals did not reveal any clear outliers
outside of a single covariate pattern which is circled in red (see Figure 5.2). This test
assesses the influence of specific observations that contribute to any divergence in the
predicted and actual values in the model. One issue with a goodness of fit assessment
when the number of covariate patterns are almost as large as the sample size (e.g. several
variables were continuous), is that some covariate patterns may account for most of the
observations. For this reason, the better estimate of goodness of fit was the Hosmer
Lemeshow statistic.
Figure 5.2: Assessment of influential data on goodness of model fit using Pearson chi-square residual values
One Step Difference in Pearson Chisquare
0
10
20
30
40
50
60
70
80
90
100
110
120
130
140
150
160
170
180
190
Estimated Probability
0.00 0.02 0.04 0.06 0.08 0.10 0.12 0.14 0.16 0.18 0.20 0.22 0.24 0.26 0.28 0.30 0.32
0.00467717490.0046771749 0.0411735267
128.03984339
81.296355408
23.023666406
0.0564085355
43.880026065
14.050080457
43.690582832
0.09373860770.1005770181 0.1923502201
0.2174309834
16.86074619213.002735044
77.38564469884.131737895
62.482598047
66.280721693
43.240026645
0.22650714640.2268916764
103.5938389798.233232324
7.7875263389
95.605934509
133.7188237
20.376515463
0.41051015220.4742343151
0.325491463
182.31743703

137
5.7 Assessment for Collinearity in the Model
Collinearity diagnostics were performed to assess whether there were indications
that any of the independent variables were correlated with other predictor variables. If
the conditional indices produced for each of the β’s in the model were greater than 30
(indications for highly correlated variables) then the main effects were correlated. Based
the Conditional Indices, none of the model variables were above 30 and thus
demonstrated that collinearity was not an issue (Appendix D: Statistical Output).
5.8 Prediction Variables
To demonstrate the predictive value of the logistic regression model, some risk
factor data were generated to examine the log odds of developing MRSA at the FMC
during 2001-2006.

138
Table 5.6: Sample data were generated to predict the odds of MRSA in potential patients
Variable Patient 1 Patient2 Patient3 Patient4
TotalShare (days) 60 (2) 10 (0) 30 (1) 67 (2)
AvgWorkload 1.5 4.0 2.2 1.8
AdmissionYear 2003 (2) 2005 (4) 2006 (5) 2004 (3)
First Unit Admitted ICU ICU 62 32
Exposure to Vancomycin <30days
0 1 0 0
Logit P(x) -3.88 -2.02 -1.84 -3.79
ep(x)/1+ ep(x) 2.0 11.7 13.7 2.2
The table demonstrates the odds of MRSA given various exposures. For example, with
Patient 3, who has 30 shared admission days in 2006 on unit 62 was had an odds of 13.7
of MRSA compared to those without those same exposures.
5.9 Predicted Probabilities of E (TotalShare)
The probability of MRSA given ranges in TotalShare while all other variables
were held constant showed that for every groupwise increase in 25 days of shared patient
environments, there was a steady increase in the probability of MRSA. Table 5.7
illustrates the increases, where AvgWorkload was held at its mean of 1.57, Admission
Year was set to the median year of 2003 (2), and each patient care unit was given a value
of 0.2 to give each unit equal weighting, and vancomycin exposure was set to 0. The
predicted probabilities increase from 1.29% - 5.43% per group of shared days.

139
Table 5.7: Predicted Probabilities of MRSA (all other variables held constant)
Value of TotalShare Predicted Probabilties of MRSA
0 : ≤25 days 1.29%
1 : 26-50 days 1.86%
2: 51-75 days 2.67%
3: 76-100 days 3.82%
4: >100 days 5.43%
5.10 Test of Assumption to Utilize a Composite TotalShare Main Effect Variable
from Length of Stay and Shared Accomodation
As defined in section 3.3.9, the variable TOTALSHARE was comprised of
measures of patient room occupancy, or shared environments, with the lengths of stay
associated with each room per patient. As this variable is a composite from two other
variables within the raw dataset, a separate logistic regression model was run to assess
whether these single variables would be significant predictors of MRSA versus using the
TOTALSHARE variable. The variables AVSHARE, or average occupancy per room per
patient admission, and TOTSEGLOS, or total length of stay, were assessed as main
effects within the model and then as an interaction term AVSHARE*TOTSEGLOS,
which would roughly approximate TOTALSHARE.
In retaining the other predictors that defined the model, and removing
TotalShare1, the results indicated that AVSHARE was not a significant predictor of
MRSA but TOTSEGLOS, or length of stay, was significantly associated with MRSA.
The interaction term AVSHARE*TOTSEGLOS was a significant predictor in the model,
but these individual main effects became non-significant. Of note, when TOTSEGLOS

140
as a main effect is included in the model, it was a strong predictor of the outcome (Wald
ChiSq=34.0, p<0.0001), yet when this and the interaction term were included, each effect
was attenuated where both TOTSEGLOS (Wald ChiSq=0.14, p=0.71) and
AVSHARE*TOTSEGLOS (Wald ChiSq=4.50, p=0.03) were modest or ineffectual
predictors of the outcome. This suggested collinearity between length of stay and the
composite variable, which would be expected. After testing the assumption that
AVSHARE, TOTSEGLOS, and its interaction term did not appreciably modify the
model nor its interpretation, it was assumed that the use of the composite variable
TOTALSHARE (and TOTALSHARE1, a categorical variable) was appropriate. Table
5.8 illustrates the change in estimates of each predictor variable with TOTALSHARE1,
AVSHARE, TOTSEGLOS, and AVSHARE*TOTSEGLOS.
Table 5.8: Comparisons of Wald Chi Square Estimates with Main Effects and Interaction Terms to Describe the Impact of Shared Patient Environments and Length of Hospital Stay
Main Effect DF Wald Chi
Square
P value
TOTALSHARE1 1 33.9 <0.0001
AvgWorkload 1 5.4 0.02
Class7 1 9.0 0.003
AdmYear 1 8.7 0.003
Unit1 5 14.9 0.01
TOTSEGLOS 1 34.0 <0.0001

141
AVSHARE 1 0.4 0.55
AvgWorkload 1 4.7 0.04
Class7 1 9.5 0.002
AdmYear 1 11.4 <0.001
Unit1 5 17.7 0.003
TOTSEGLOS 1 0.14 0.71
AVSHARE 1 0.21 0.64
AVSHARE*TOTSEGLOS 1 4.5 0.03
AvgWorkload 1 4.3 0.04
Class7 1 8.8 0.003
AdmYear 1 10.1 0.002
Unit1 5 16.8 0.005

142
Chapter Six: Results III - Geospatial Analyses
6.1 Preparation of GIS Materials
6.1.1 Selection and extraction of the Google Earth Image
The process of developing an applicable methodology to visualize and model the
transmission of MRSA in hospital settings was challenging but accomplished through
several preparatory steps to create maps for the hospital. The use of Google Earth
provided the first template allowing for the imposition of a reference coordinate system
and scale (Figure 6.1).
Figure 6.1: Aerial view of Foothills Medical Centre campus, Calgary 2009.
6.1.2 Resolving the Google Earth Image with Hospital Geographic Coordinates
Google Earth images are static and at this time, not dynamically linked to a
remote sensing system. The initial challenge was to create a geographic reference to base

143
all other measurements and determine relative distances between patient unit features,
such as rooms and beds. The Google Earth image was imported into ArcMap and a
Calgary roadways file, with specifications for a Calgary_3TM_WGS_1984_W114
projection, was superimposed over this image of the hospital and the roadways around it.
Using the major as well as minor roadways to set and orient the building features of the
Foothills Medical Centre, the Spatial Adjustment tool in ArcMap refined the congruence
between the building landmarks and the referent roads. The Trans-Canada highway, the
hospital loop road, and the 29th Street NW artery were used to adjust the Calgary 3TM-
based projection and provided a scaffold of geographic coordinates. It was assumed
there might be some very minor distortions to the original 3TM projection in order to
georectify the image of the hospital campus. Figure 6.2 shows a summary of the
resultant map layer of FMC.

144
Figure 6.2: Summary output of geo-rectifying process for FMC campus
6.1.3 Preparation of the FMC Floorplans
FMC consists of a single 12-floor main tripod-shaped tower as well as an adjacent
Special Services Building. Other buildings comprise the FMC campus, but the main
inpatient areas were within these two buildings. Five of the six units selected for study
were within the FMC tower, and Unit 36 is located on the 3rd floor of the Special Services
building. Units 32, 62, and 102 are units with similar footprints and stacked upon each
other within the tower (e.g. occupied the same X,Y coordinates). Units 61 shared the
same floor with Unit 62, separated by offices and the main elevator and service elevator

145
cores. Unit 61 is a mirror image to the other aforementioned units. The ICU was located
on the main floor and had a distinct open concept floor plan. It was originally located on
the 10th floor of the hospital, until renovations were completed in the mid-1990s. The
ICU is positioned between the Emergency Department as well as key medical services
such as Diagnostic Radiology and Magnetic Resonance Imaging departments, and the
main floor Operating Theatres.
6.1.3.1 Selected Unit Floorplans and Characteristics
Units 32, 61, 62, and 102 each had a bed capacity of 38 and represented by 17
patient rooms. These units had six private rooms with private bathrooms, six semi-
privates with a 2:1 patient to toilet ratio, and five 4-bed rooms each with either a 4:1 or
8:1 patient to toilet ratio. As toilets have been commonly identified as sources for
environmental contamination, the greater numbers of patients who share them
simultaneously may increase the degree of pathogen spread in and between patient rooms
[148]. The ICU was comprised of 22 beds, with 10 rooms on the perimeter, each with 3
fixed walls and a sliding glass door for the fourth wall. The remainder of the rooms was
configured as two blocks of patients in the middle of the unit, separated by curtains with
corridor running between groupings of patients.
As described previously, Unit 36 was unique in that it had 33 private rooms with
private bathrooms, a single 4-bed high observation area, and two semi-private rooms.
The lone 4-bed room had stainless steel sinks and pull-out toilets for each bed. The
toilets were not used often, as patients found the area too small to use and privacy issues
were of a concern. Instead, ambulating patients often preferred to use the public

146
bathroom across the hallway. The semi-privates each had one bathroom/shower for two
patients. Ten rooms on Unit36 were equipped with airborne infection isolation
capabilities and could be switched to negative pressure relative to the hallway.
Of the remaining units, ICU had negative pressure capabilities in each of their
enclosed rooms, and unit 61 had 2 rooms (Rooms 618 and 619) that could accommodate
patients requiring negative pressure.
6.1.3.2 Importation and Georectification
To-scale architectural drawings provided by CHR Planning and Development
allowed for the identification of the mechanical and structural elements for each floor of
the hospital. Non-essential data elements such as glazing features, some millwork,
tracks for curtains, elevator shafts, etc were removed by deleting layers or individual
features with commands within AutoCAD. Only physical walls, toilets and sinks and
exterior glazing elements were retained from the original drawings. No spatial data were
originally ascribed to these drawings. Figure 6.3 highlights the process of preparing the
hospital footprint in AutoCAD which was then exported as a drawing into ArcMap.

147
Figure 6.3: Preparation of raw architectural drawings in AutoCAD for importation into ArcMap
The floorplans for the six units were linked to the Calgary 3TM spatial coordinate
system, using the Spatial Adjustment tool in ArcMap. As illustrated, several points on
the architectural drawing were mapped to external building features on the corresponding
Google Map image. With the Editor enabled, the referent Google Map image was linked
to the floorplan using Displacement Linkages that were manually selected. The Spatial
Adjustment tool reconciled the two images by rotating the floorplan to match the
coordinates specified by the referent layer. As a result, the floorplan was rotated to
match the orientation of the unit as it actually lies in space relative to the projection
selected. This step signified that the floorplan, represented as a map layer, now
contained spatial properties. This map layer was then exported as a shape feature and
saved as a file within the geodatabase for that unit. Figure 6.4 illustrates the final

148
geocoded hospital layout with rooms (polygon feature class) and beds (point feature
class) added as data elements required to calculate spatial statistics.
Figure 6.4: Geocoded layers for Unit 36 superimposed over the original Google Earth image
* Polygon and point features are also displayed as shape files.
A geodatabase, containing polygon and point feature classes to represent rooms
and beds respectively, was created for each unit using the Sketch Tool and an attribute
table was populated with specific room and bed locations. The feature classes were
created in ArcCatalog as data elements within the geodatabase. Each attribute table was
originally populated with non-spatial information on the geometry of data elements such
as the length and width of rooms, plus their labels (i.e., room and bed numbers). These

149
tables were later joined to the tables containing the corresponding spatial coordinates in
ArcMap.
In preparation for the analysis with Moran’s I statistic and theTracking Analyst
extension, the data tables required a re-configuring of the data to assign beds and rooms
as the unit of measurement. Traditionally, medical data are centred so that each patient
record lists the events pertaining to an individual, in this case, rooms and beds they had
occupied for each admission. For GIS analysis, the unit of analysis was at the level of the
bed or the room, and so each record now represented activity per physical unit of space.
Weighting factors also needed to be integrated, as rooms and beds may be spatially
adjacent, but were separated by physical boundaries such as walls.
6.2 Moran’s I Statistic Calculations
The process of geocoding the FMC units into layers with spatial coordinates was
a methodology that had to be developed to suit the unique nature of this study. Once this
process was completed and compiled into folders for each unit, select maps were
evaluated for any geo-statistical association between events, and ready as a backdrop to
observing the spatial and temporal spread of MRSA in finite hospital environments.
Select patient care units were analyzed for the possibility that healthcare-
associated cases of MRSA were non-random events and spatially auto-correlated. Units
61 and 62 were initially chosen as the template units to develop the methodology for
calculating Moran’s I and Inverse Distance Weighting (IDW) interpolations, as well as
using the Tracking Analyst extension in ArcGIS since these clinical areas were known to

150
be hotspots of MRSA. These estimations would provide more robust estimates with
larger numbers and with higher scatter densities for interpolation.
Spatial auto-correlation estimates are similar to the Pearson correlation
coefficient, and rely on the summed differences between spatial locations of interest
compared to its mean distance from the centroid of the area unit. Adjacent points have
the highest weight of 1, and non-contiguous points have a weighting less than 1, hence
contiguous points exert proportionately more influence on the estimate. MRSA events
and their corresponding bed locations were coded into a table with bed and room
locations as the unit of measurement. Using a choropleth map, a corresponding table of
calculated distances between rooms, as well as the default IDW settings assigned to
nearby data points, Moran’s I was computed within the ArcMap software (Figure 6.5).
The z-scores were compared to a two-tailed distribution with an α=0.05.
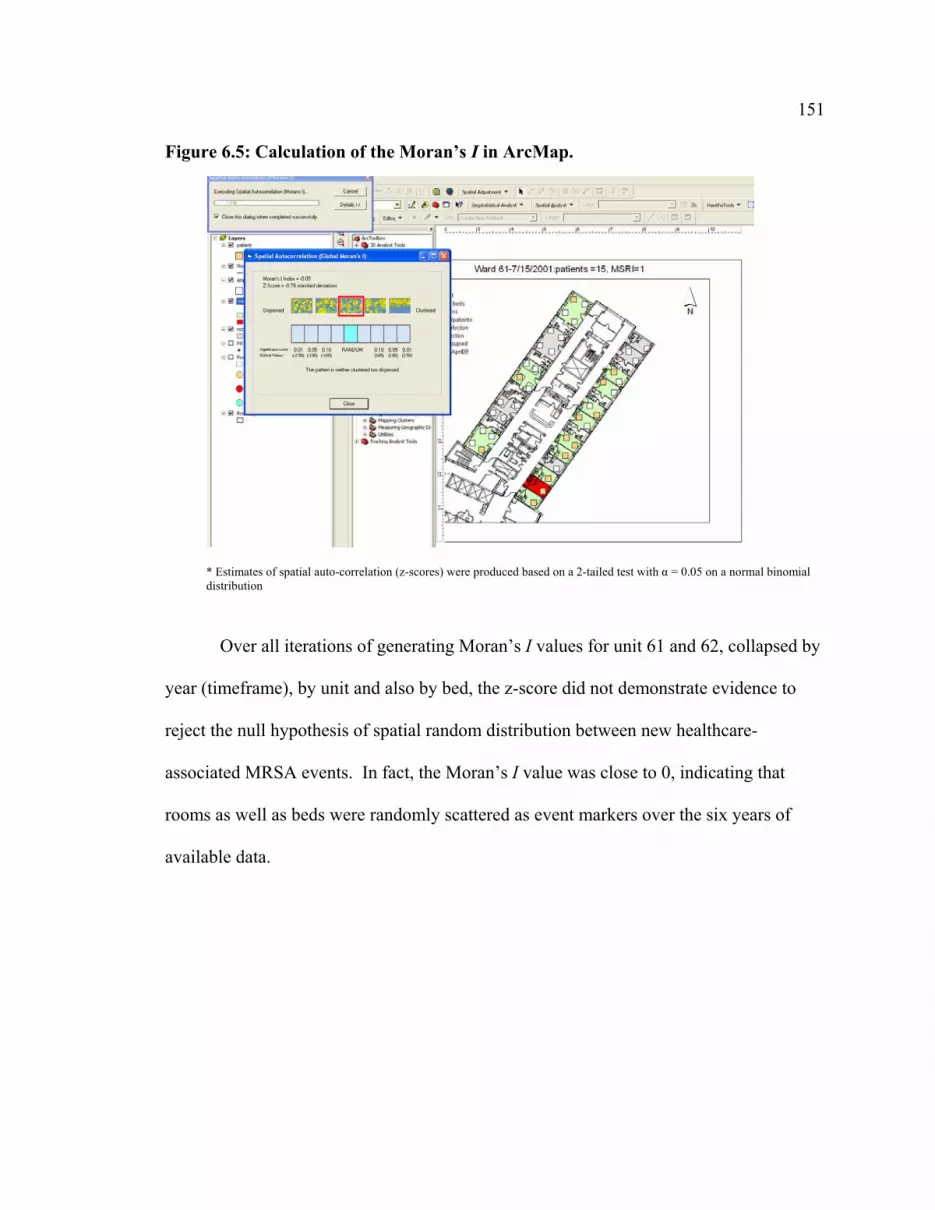
151
Figure 6.5: Calculation of the Moran’s I in ArcMap.
* Estimates of spatial auto-correlation (z-scores) were produced based on a 2-tailed test with α = 0.05 on a normal binomial distribution
Over all iterations of generating Moran’s I values for unit 61 and 62, collapsed by
year (timeframe), by unit and also by bed, the z-score did not demonstrate evidence to
reject the null hypothesis of spatial random distribution between new healthcare-
associated MRSA events. In fact, the Moran’s I value was close to 0, indicating that
rooms as well as beds were randomly scattered as event markers over the six years of
available data.

152
Figure 6.6: Choropleth map of summarized MRSA activity (colonizations and infections) by room, 2001-2006
Analysis of the six years, parsed into six month intervals was also considered, in
an attempt to observe local clusters of activity at the patient room level if spatial auto-
correlation were present. For every January 15 and July 15 date from 2001 to 2006, the
activity and presence of MRSA on Unit 61 was captured as a snapshot to evaluate local
changes in MRSA burden and/or clustering on one unit known to have sustained levels of
MRSA. Unit 61 was selected and the results of the Moran’s I for each time point are
demonstrated in Table 6.1.
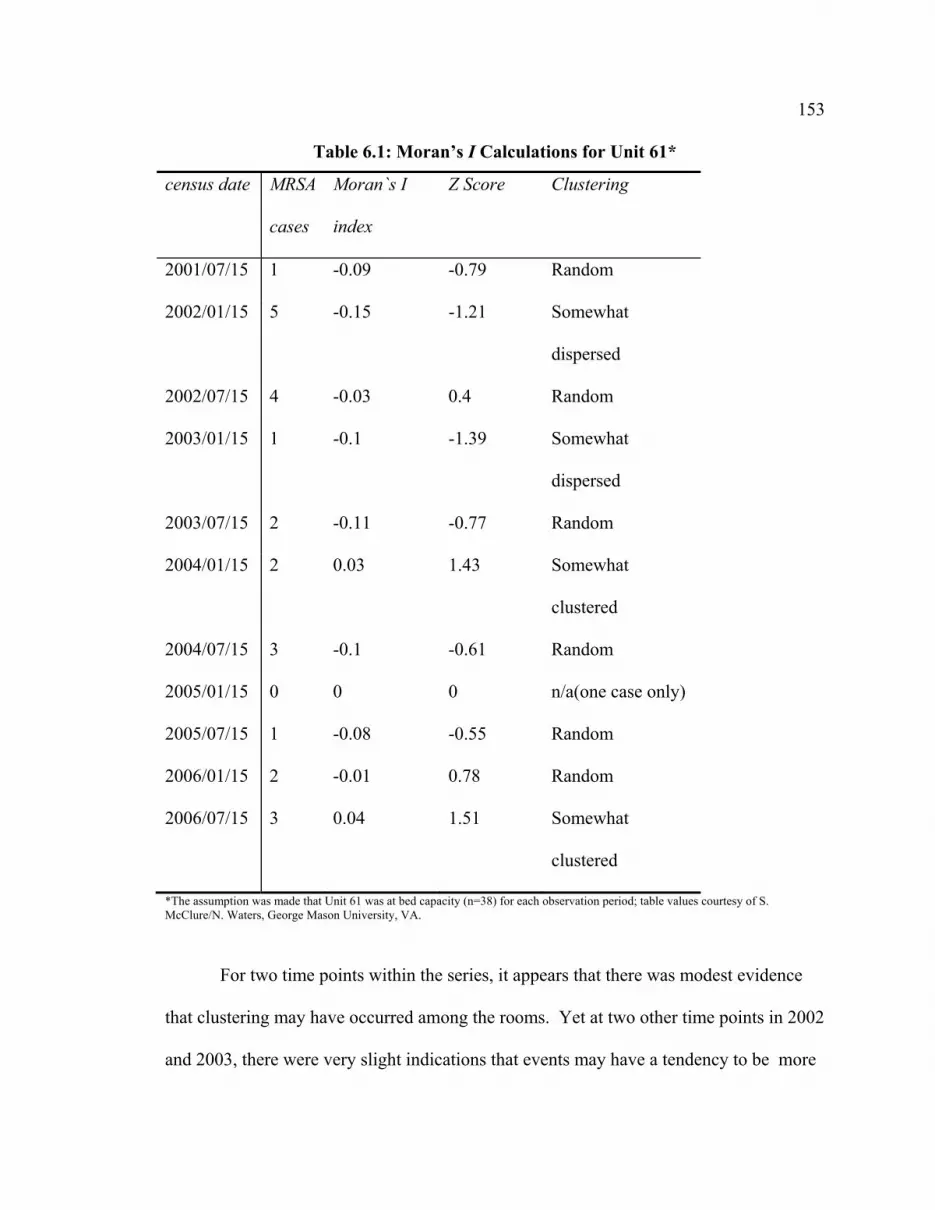
153
Table 6.1: Moran’s I Calculations for Unit 61*
census date MRSA
cases
Moran`s I
index
Z Score Clustering
2001/07/15 1 -0.09 -0.79 Random
2002/01/15 5 -0.15 -1.21 Somewhat
dispersed
2002/07/15 4 -0.03 0.4 Random
2003/01/15 1 -0.1 -1.39 Somewhat
dispersed
2003/07/15 2 -0.11 -0.77 Random
2004/01/15 2 0.03 1.43 Somewhat
clustered
2004/07/15 3 -0.1 -0.61 Random
2005/01/15 0 0 0 n/a(one case only)
2005/07/15 1 -0.08 -0.55 Random
2006/01/15 2 -0.01 0.78 Random
2006/07/15 3 0.04 1.51 Somewhat
clustered
*The assumption was made that Unit 61 was at bed capacity (n=38) for each observation period; table values courtesy of S. McClure/N. Waters, George Mason University, VA.
For two time points within the series, it appears that there was modest evidence
that clustering may have occurred among the rooms. Yet at two other time points in 2002
and 2003, there were very slight indications that events may have a tendency to be more

154
dispersed than clustered, hence where events were non-random and spatially divergent
from one another. To further evaluate what these data suggested, choropleth maps were
generated for each of the eleven time points. Figures 6.7 and 6.8 shows two of the eleven
dates for which clustering of events were indicated.
From reviewing the data, it appears that point data (case locations) aligned to one
side of the unit exert more influence in determining whether there was spatial clustering.
While it may be true that these cases were epidemiologically linked, the more likely
scenario for the Figure 6.8 was that patients were being appropriately isolated in the
available private rooms. In contrast, Figure 6.7 pointed to potential proximal and shared
environments as a vehicle for transmission alongside a very realistic potential for a
shared nursing assignment mixed with the absence of full compliance with recommended
isolation measures, enabling MRSA transmission.
Figure 6.7: Choropleth map of Unit 61 and potential clustering of MRSA cases (unknown epi-linkages) for one of two time points, January 15, 2004 (n=2 cases)

155

156
Figure 6.8: Choropleth map of Unit 61 and potential clustering of MRSA cases (unknown epi-linkages) for one of two time points, July 15, 2006 (n=3 cases)
As a comparison of Moran’s I, the choropleth map from MRSA activity on July
15, 2004 indicates that cases were randomly dispersed. Figure 6.9 visually demonstrates
the dispersion of cases across Unit 61 on this day. Moran’s I calculations were based on
the influence of adjacent data points, and as such, cases of MRSA that were identified
and placed in disparate locations across a unit may diminish the effect of Moran’s I
despite having a greater number of cases per time point. This is in comparison with the
above map (Figure 6.8) where two cases were situated next to each other, possibly
indicating a potential reservoir for transmission, as both patients were clearly not placed
under recommended isolation precautions (ie. both patients were in 4-bed shared
environments).
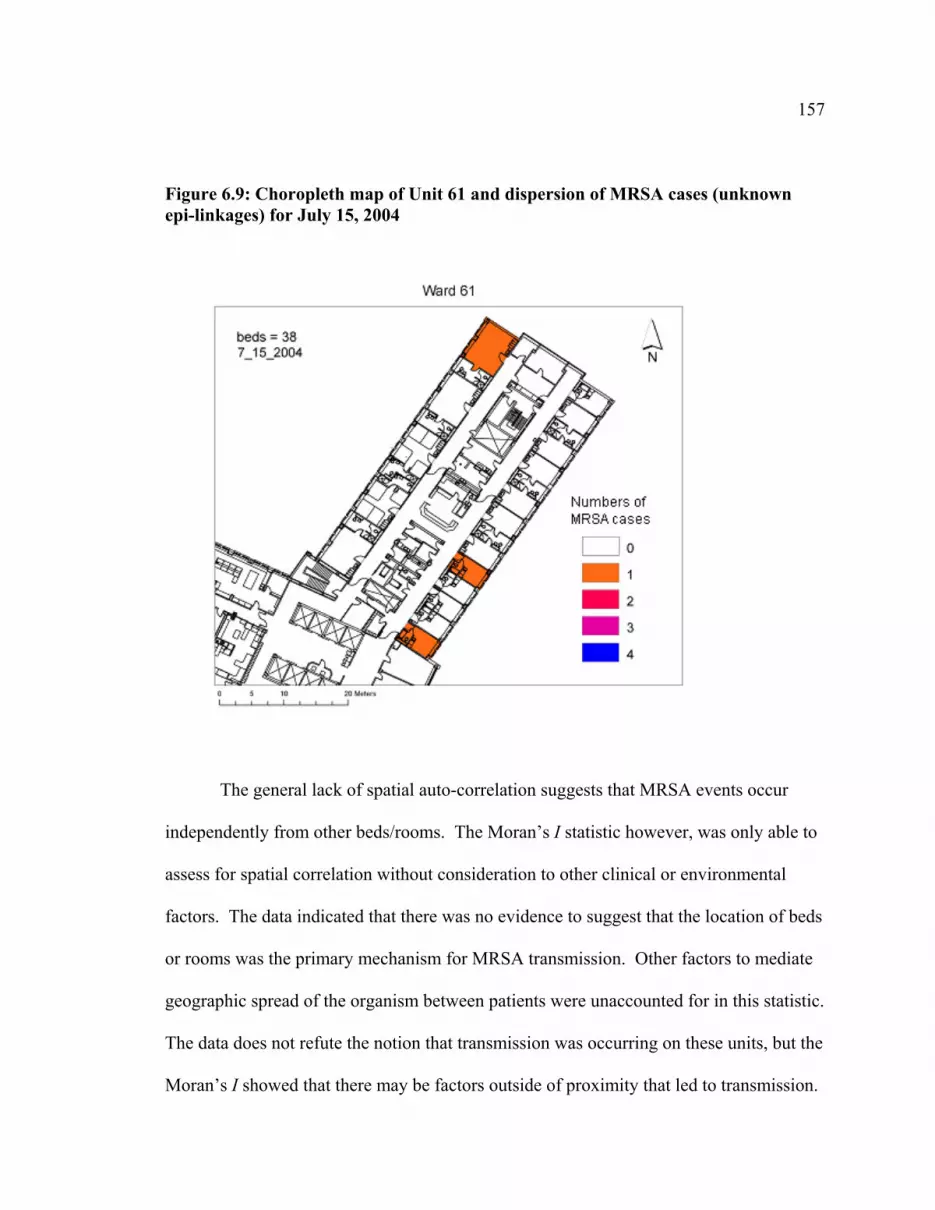
157
Figure 6.9: Choropleth map of Unit 61 and dispersion of MRSA cases (unknown epi-linkages) for July 15, 2004
The general lack of spatial auto-correlation suggests that MRSA events occur
independently from other beds/rooms. The Moran’s I statistic however, was only able to
assess for spatial correlation without consideration to other clinical or environmental
factors. The data indicated that there was no evidence to suggest that the location of beds
or rooms was the primary mechanism for MRSA transmission. Other factors to mediate
geographic spread of the organism between patients were unaccounted for in this statistic.
The data does not refute the notion that transmission was occurring on these units, but the
Moran’s I showed that there may be factors outside of proximity that led to transmission.

158
To complement the Moran’s I computations, the Simpson’s Index was also
calculated to assess whether the overall dispersion of sentinel events of MRSA in rooms
and beds were randomly distributed or showed evidence of clustering. Based on six
years of data for Unit 61, the Simpson’s Index was 92.01% and was consistent with the
results from the Moran’s I calculations, in that the location of rooms were independent
from the detection of MRSA i.e., there was no relationship between room location and
the revealed occurrence of MRSA. Even parsing the MRSA and bed data into years in
the event that temporally clustered data may emerge, the heterogeneity of room
occupation and MRSA events were just as high. Hence, events were randomly
distributed among rooms and beds. Table 6.2 shows data for the Simpson’s Index for the
six selected units over six years. The sample size indicated the number of MRSA-2 cases
attributed to these units, and the number of unique partitions is the different MRSA-2
subtypes identified.
Table 6.2: Simpson’s Index for Heterogeneity of MRSA Dispersion among Beds on Selected Units. FMC 2001-2006
FMC Unit Sample Size Unique Partitions
Simpson’s Index, 95% CI
ICU 45 20 95.86 (94.27-97.45) 102 20 8 87.57 (80.98-95.76) 32 52 17 92.46 (89.97-94.95) 36 66 28 96.97 (96.02-97.92) 61 86 26 92.01 (89.59-94.43) 62 116 33 93.00 (91.19-94.87)
Simpson’s Index calculation tool source: http://www.comparingpartitions.info/

159
6.3 Time Series Choropleth Maps of MRSA on Unit 61 (2001-2006)
In qualitatively evaluating the series of eleven choropleth maps spanning 2001 to
2006, the burden and presence of newly detected MRSA over time increased and
suggested that given more time, there may be a change in the detection of spatial auto-
correlation between rooms that were presumably reservoirs for environmental
contamination with MRSA. Conversely, the choropleth maps may primarily be an
indicator of compliance with recommended contact isolation precautions for MRSA
patients.
Within the series of choropleths for one unit, the Moran’s I values appeared
sensitive to the influence of non-contiguous point outliers, as shown in Figure 6.10
below. Here, the Moran’s I value was -0.15, an indication that there was modest
dispersion of cases, yet the two cases on the A Hallway are adjacent to each other in
semi-private rooms and share a washroom. This particular point in time was just prior to
a large outbreak on this unit of CMRSA2 Pattern 30 in February 2002.
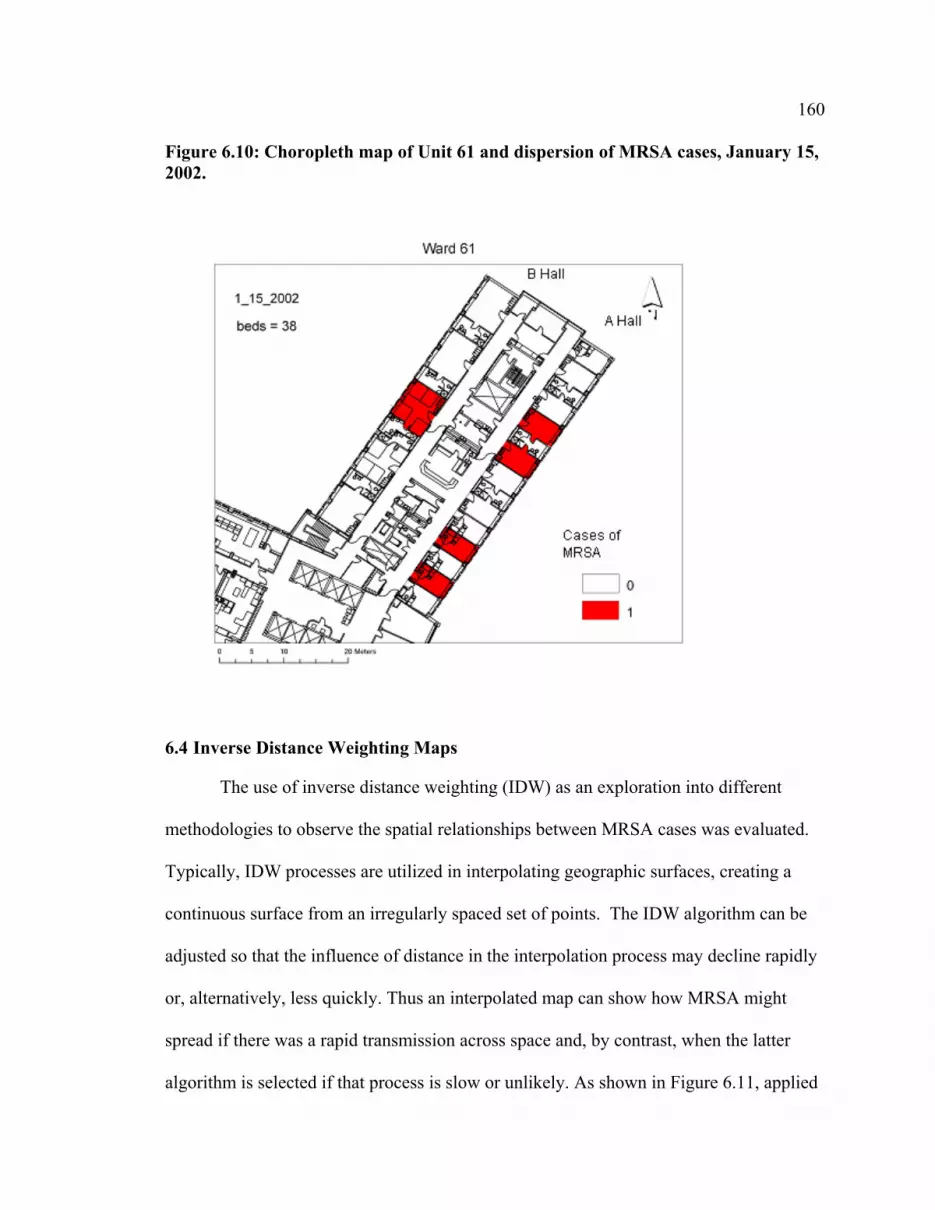
160
Figure 6.10: Choropleth map of Unit 61 and dispersion of MRSA cases, January 15, 2002.
6.4 Inverse Distance Weighting Maps
The use of inverse distance weighting (IDW) as an exploration into different
methodologies to observe the spatial relationships between MRSA cases was evaluated.
Typically, IDW processes are utilized in interpolating geographic surfaces, creating a
continuous surface from an irregularly spaced set of points. The IDW algorithm can be
adjusted so that the influence of distance in the interpolation process may decline rapidly
or, alternatively, less quickly. Thus an interpolated map can show how MRSA might
spread if there was a rapid transmission across space and, by contrast, when the latter
algorithm is selected if that process is slow or unlikely. As shown in Figure 6.11, applied

161
to the context of hospital units, the graded surface of unit 61 showed that several rooms
were not significantly associated with the presence of MRSA activity. Private rooms
with private washrooms would be expected to have higher proportions of utilization for
isolating MRSA patients. Two of the semi-privates appear to not be used by patients
with MRSA, and may indicate that these beds were blocked. The ArcGIS default, IDW
algorithm selected represented a rapid fall off in transmission speed.
Figure 6.11: Inverse distance weighting (IDW) of Unit 62 cases for 2004

162
6.5 Tracking Analyst
Tracking analyst provided a means to visualize the spread of MRSA as cases were
detected on patient care units using an animation-type format. Two approaches were
considered: one observed all strains of MRSA within a single unit for a specified period
of time, and the other observed the appearance and spread of a single strain on one unit
also for a specified period of time. In this way, events were visualized over time, and in
particular, room occupancy was reviewed to identify room occupants who developed the
same strain of MRSA, suggestive of potential environmental contamination. Conversely,
in reviewing the strain diversity on a single unit may also provide a glimpse into the
fitness of MRSA strains and its persistence in different patient groups.
The challenge with using the Tracking Analyst extension was in being able to
represent “incubation”, or periods of colonization and demonstrate those putative time
periods differently than those periods of an admission where a person was actively
isolated for MRSA. The duration of patient stay on the unit was modeled, but the date of
their first positive MRSA was not distinctly visualized within the animation’s timeline.
The animations indicated that the appearance and persistence of cases may be of utility
when assessing exposures to rooms previously occupied by MRSA patients, or exposures
suggestive of contact with other adjacent MRSA patients.
In joining a patient’s length of stay on a unit and MRSA status with their
geocoded locations on the unit (unit 62 was selected), Tracking Analyst can be adjusted
to play as a movie on any time scale (e.g., real-time, 1 week represented by 1 second,
etc). Tracking analyst did export composite images of the animation, illustrating the
timeline on a circular clock (by Month and Year) of the detection of new MRSA cases.

163
Figure 6.12 showed the tracking of CMRSA2, Pattern 30 across Unit 61 over the
period of 32 months (February 2002-September 2004). There were 17 patients that were
identified as part of an initial cluster of cases in February 2002, and then showed
evidence of sustained activity in the remaining months. The choropleth map at the
bottom left of the image shows the overall dispersion by patient room, of this strain on
Unit 61. This image highlights the fact that cases were detected in many different
patient rooms and among shared settings. The greatest number of cases was placed in
Bed 618, which was one of the isolation rooms on the unit (also capable of negative
pressure). These data indicate not only bed utilization for isolation (e.g, where patients
were placed after MRSA was first identified), but also where new cases of MRSA were
detected. Overall this application outlined the geographic spread of a single strain of
CMRSA-2 pattern 30 across a unit within 32 months.

164
Figure 6.12: Tracking Analyst visually representing the movements of patients identified with CMRSA-2, Pattern 30 from February 2002 to September 2004
The data represented these movements in Tracking Analyst, but without the
current ability to do more than flagged events, this software extension was unable to
pinpoint potential spatially auto-correlated events. While not explicitly visualized in the
Tracking Analyst extension, the selected time period highlighted some interesting

165
transmission possibilities, enabled through the unique fingerprint of the MRSA strain.
Most notably, there were five patients who were epidemiologically linked together by
virtue of their shared patient environments. Room 633 was a four-bed room and within
two days, 2 roommates were identified with CMRSA-2 Pattern 30 infection. Both were
discharged on February 11, 2002. A new patient was admitted Febuary 12 to one of the
two newly vacant beds and subsequently developed CMRSA-2 Pattern 30 infection eight
days later. No roommates of this patient tested positive for MRSA. Similarly, adjacent
Rooms 627 and 628, both semi-private rooms, detected three new positive MRSA
patients among roommates within a few days of one another. One of these patients was
previously an occupant of Room 633. No additional roommates of Room 633 appeared
to have acquired MRSA. These vignettes, commonly experienced by in-house infection
control staff, detailed some of the challenges with tracking MRSA spread, but with better
granularity of the ArcGIS Tracking Analyst extension, this progression may easily be
determined.
Similarly, Tracking Analyst was utilized to explore the overall MRSA strain
diversity within a unit over one year (2004). Here, Unit62 was modeled and illustrated
the movements of 21 patients carrying 13 distinct strains among 5 different epidemic
types of CMRSA. From these data, is was clear that there was no evidence for MRSA
transmission despite three patients with CMRSA-2, Pattern 18 being admitted and then
diagnosed with MRSA in January, February, and June of 2004. These individuals do not
appear to have shared the same space and their admissions did not overlap. CMRSA-10,
Pattern 473 also did not appear to transmit among patients, as two patients admitted in

166
August and September were identified as clinical cases after admission but no further
cases of this strain were detected on Unit 62 in 2004 upon their discharge.

167
Chapter Seven: Discussion
This chapter provides a summary and a synthesis of the three preceding results
chapters. A detailed summary of the salient findings will be presented along with a
comparison of these data with other published works. The chapter will focus on a
discussion of the significance of the results and more importantly, what implications to
local or regional infection control practices these findings may have. The utility of using
a Geographic Information Systems approach to infectious disease transmission will be
discussed, in context with the highlights and limitations of using these techniques. Also,
a critical review of the study’s strengths and weaknesses are explored, along with
suggestions for future research.
7.1 Study Population and Patient Characteristics: Implications for Study Design
As was shown in the descriptive analysis, patients admitted to these selected units,
with the exception of the ICU, report longer average unit stays which may be indicative
of poorer health status and the complexity of patients’ medical conditions. The average
Charlson (2.75 for cases and 2.47 for controls) and Nursing workload scores (1.68 for
cases and 1.57 for controls) were generally low, even after factoring in critical care
patient admissions. However, the mean number of shared days among MRSA cases was
52.1 days and among controls, was approximately half at 26.7 days. This may be a
feature of these particular units, and that all other things being relatively similar, patients
with greater exposure to shared accommodations were more likely to acquire MRSA.

168
7.1.1 The Use of Patients with MSSA as a Control Group
Controls were screened for both MRSA and MSSA status, and wherever possible,
those records with ICD-9 codes with indications of either infection or colonization with
S. aureus were removed. However, the possibility still exists that controls might have
had the outcome, MRSA, just not detected. Upwards of 30% of the population are
commensal or transient carriers of MSSA, and most are unaware of their status[23, 149,
150]. Hence, the estimate that 5323 controls were used in this study may be tempered by
the fact that potentially 1600 were carriers of MSSA, with an even smaller proportion to
be silent carriers of MRSA. Therefore, estimates from the modeling process may be
difficult to detect because the controls and cases may be more similar than different to
each other, another unmeasured source of selection bias.
MSSA was originally considered as the potential comparator group to define the
risk factors MRSA as many other studies have done [151-154]. However, upon further
consideration, the temporal and spatial risk factors that underlie the differences between
susceptible versus resistant strains of an organism would require a much larger sample
size to detect a meaningful difference. Studies have shown that the risk factors for
MRSA and MSSA infection tend to be very similar, and both can manifest in similar
degrees of clinical severity[37, 41, 155, 156]. From a practical standpoint, the predicted
odds of MRSA compared to those without S. aureus is a more relevant metric to infection
control programs in terms of isolation resources, surveillance, and case management.
MSSA status is generally not tested for (exception: pregnant patients with vaginal MSSA
prenatal swabs are treated prior to vaginal delivery), and colonization does not requires
treatment nor isolation, but the assumption is that >70% of the population will be MSSA

169
negative. Therefore, data that calculates the odds of MRSA relative to no MRSA (applies
to 70% of the population), versus MSSA (applies to <30% of the population), is more
applicable as a measure of disease likelihood.
7.1.2 Older Age and Mortality
Twenty-four percent of the total FMC sample of healthcare-associated MRSA
cases died. The overall proportion of MRSA patients across the CHR who also died was
similar at 23%. Data were updated by the regional infection preventionists as the
information became available, but was not collected systematically through a formal
process of notification by the medical examiner or the provincial Vital Statistics branch
of Alberta Health and Wellness. Among those admitted to one or more of the selected
units of study, the average age among controls was 63 years compared to 67.5 years
among cases. The data did not specify the cause of death. The older age of onset among
cases may suggest that potential increases in age-related comorbidities and a general
suppression of the immune system may increase the likelihood of MRSA and potentially,
poorer outcomes. Age was a factor for consideration in the logistic modeling process
but was not significantly associated with MRSA. Age may be a salient risk factor[157,
158], yet in multivariate modeling it was not a main predictor of MRSA for those
selected patient care units.
Unlike the general FMC patient population, admission to the selected patient care
units at FMC was likely associated with older age as a function of an aging population’s
need for acute medical services. With limited numbers it would be difficult to clearly
identify MRSA-specific risk factors causing death, but can be an option for future study

170
in another case control series with death and survival as outcomes of MRSA. Advanced
age might be more predictive among a more diverse patient population, but the likelihood
was that admission to these units selected for older patients who meet the criteria for
complex medical and surgical care. Hence, the distribution of cases and controls may be
more similar to each other than the overall FMC general population.
7.1.3 Co-Infection with Vancomycin-resistant Enterococcus (VRE)
Just under six percent of all MRSA across the CHR were co-colonized or co-
infected with Vancomycin-resistant Enterococcus. The significance of having two
resistant organisms has been associated with longer and multiple patient admissions,
increasing comorbidities such as renal dysfunction, admission to critical care, and prior
treatment with antimicrobials. Other studies have shown co-colonized patients ranging
from 2.7-9.5% of patient populations [159-161]. The concern with patients who harbor
both organisms was the increased likelihood of transmitting the VanA gene through a
plasmid- or chromosomally-mediated transfer to MRSA which potentially enable
resistance to Vancomycin, and create a more potent, and difficult to treat hybrid,
Vancomycin-resistant Staphylococcus aureus (VRSA) [162]. To date, there have been
no cases of documented VRSA in the Calgary Health Region.
7.2 The Epidemiology of MRSA in Calgary and the Foothills Medical Centre
The detection and large-scale risk management of MRSA in the Calgary Health
Region has been relatively recent in comparison to its long history in clinical settings
abroad, in the United States, and even compared to MRSA activity in Eastern Canada

171
where the first cases were detected in the early 1980s [67]. However, in the span of just
over a decade, MRSA has spread throughout acute care settings in Calgary and the
province of Alberta. The CMRSA-2, as well as the community-based CMRSA-10, strain
have become firmly established as a dominant part of the local S.aureus ecology. The
burden of MRSA in healthcare settings continues to increase and incident MRSA data
obtained from the Antibiotic Resistant Organism Registry since 2002 have indicated that
all three of the adult tertiary acute care centres have experienced a vast increase in cases
of MRSA in just a few years.
7.2.1 Incidence Rates of MRSA
Using study criteria for healthcare-associated case ascertainment, there were 449
unique cases of healthcare associated MRSA in FMC with 123 of those being identified
among the six units considered for the scope of the project. Rates of MRSA have
increased from 0.36 cases per 1000 patient days to over 1.56 new cases per 1000 patient
days, which suggest a five-fold increase in incident MRSA, and based on yearly patient
days predicted 453 new cases among high risk medical and critical care patients at FMC.
Each of the six units comprising the medical, critical care, and surgical portfolios
demonstrated an increasing MRSA trend with the ICU reporting the greatest incidence of
MRSA by 2006, at 3.4 per 1000 patient days. Of note, all of the CHR ICUs have an
admission screening protocol which recommends that all new admissions and transfers be
screened for MRSA (nasal and rectal swabs). These changes took place as a result of
climbing incidence, and may have contributed to an increased sensitivity in detecting
cases. When compared to the incidence of healthcare-associated MRSA, the ICU rate

172
was 1.9 per 1000 patient days. Unit 62 began periodic active screening in 2006 which
may also account for some increases in the rate (2.9/1000 patient days); however, among
healthcare-associated cases, the rate was adjusted only marginally (2.3/1000 patient days)
which implies that the burden of MRSA detected were clinical cases.
Compared to the other units, Unit 61 appeared to have consistently elevated rates
of MRSA, suggestive of an endemic presence of this organism. Despite transitioning
from a medical teaching patient population in 2004 to general acute medicine, there was
no appreciable change in MRSA incidence among this population. After Unit 36 began
admitting medical teaching unit patients in May 2004, the rate of healthcare associated
MRSA appeared to remain at the lower echelons of incidence compared to the other
units, but then spiked in rate in 2006.
The results for Unit 36 were surprising given the unit’s increased capacity for
additional hand hygiene stations, and having private rooms for 78% of their patients.
Among healthcare-associated MRSA, the rate was 0.43/1000 patients in 2006 which was
one of the lowest MRSA rates in the cohort of six units but still represented 6 cases of
MRSA compared to only 2 new cases of MRSA in 2005. The workplace leadership and
staff culture were pro-active and engaged with infection control prevention strategies,
such as more hand hygiene stations available per patient than in any other unit of its size.
While the overall MRSA rate of 1.36/1000 patient days was comparable to the other units
in 2006, it was a doubling from the initial rate of 0.60/1000 patient days when the unit
was first opened.
It was unclear whether compliance with hand hygiene and other infection control
behaviors was low on Unit 36, which can be typical of other clinical settings. Paired

173
with the fact that medical teaching units typically accept patients with complex medical
histories, receive medically acute patients directly from the ICU and Emergency
Departments, or were burdened with more isolation patients (including managing known
MRSA patients) because of the unit’s increased capacity for private rooms, these factors
may have promulgated the higher incidence of MRSA. The preliminary data suggested
that the physical environment may not provide enough of a barrier for MRSA
transmission to persist.
Comparing these local rates with more recent CNISP data, the overall rate in
Western Canada for 2006 was 0.94 per 1000 patient days and 0.99 per 1000 patient days
across all participating CNISP sites[69]. Additionally, the healthcare associated rate of
MRSA in the Western provinces was 0.52/1000 patient days and 0.60/1000 patient days
across CNISP sites. This suggests that MRSA rates at FMC were disproportionately high
compared to the national and regionally reported rates[69].
7.2.2 Extrapolating Trends in MRSA Acquisition at FMC
In extrapolating these data further, a point prevalence survey conducted across the
Calgary Health Region (then known as the Calgary Regional Health Authority) in May
2002, indicated that for every known MRSA case, there were an additional seven that had
been identified (Infection Prevention and Control, Calgary AB, unpublished data) .
Acknowledging that the reservoir for MRSA can range from 8% to as high as 14%
among an inpatient population [134, 163, 164], these incidence estimates would boost the
numbers of expected MRSA to over 450 new cases if the general population were as
vulnerable as the study population. Such a notion would be unprecedented, and

174
potentially these explosive numbers do not materialize due to the dutiful activities of
infection preventionists at the Calgary Health Region as well as the general population
being less acute.
It is entirely likely that the anticipation of 453 cases was met with only 285 in
2006 due to a risk reductions from ongoing infection control strategies. Similarly, a
three-fold increase in healthcare-associated MRSA from 2001 to 2006 predicted a
potential 290 cases of incident MRSA epidemiologically attributed to healthcare at FMC
in 2006. In reality, there were 75 reported cases among one of the highest risk groups
which comprised the study. Therefore, the assumption that the risk of MRSA is as high
among all patients yields inflated estimates. At the outset then, the predicted risks of
MRSA that have emerged from this study were generalizable mainly to risk groups with
comparable patient profiles.
7.2.3 Molecular Epidemiology of MRSA at Foothills Medical Center
Epidemic clones of MRSA that emerged from this analysis identified CMRSA-2
as clearly the most predominant strain compared to others. CMRSA-1 and CMRSA-2 are
epidemic strains most commonly associated with healthcare environments[165]. Other
healthcare-associated strains include CMRSA-3-6, CMRSA-8 and CMRSA-9 but none
have risen to the proportions documented by the first two. CMRSA-7 and CMRSA-10
are typically associated with community-based strains, and CMRSA-10 outbreaks of skin
and soft tissue infections in community settings and among vulnerable populations have
overshadowed other MRSA activities in recent years.

175
According to Christianson et al (2007), nationally aggregated CNISP data showed
that the balance of dominant healthcare associated MRSA strains have shifted from
CMRSA-1 to CMRSA-2 since 2001 (see Figure 7.1) [165]. Local data suggests that
CMRSA-1 was never a dominant strain in the Calgary region, with CMRSA-2 having
established itself as the most common of MRSA strains (70% of all isolates) since testing
was initiated.
Compared to Figure 7.1, the year-to-year distribution of FMC epidemic strains
was not nearly as diverse as the national estimates, with very limited cases of CMRSA-1,
and CMRSA 3-6 over the past six years. The virtual disappearance of CMRSA-8 in the
CHR was unexplained; most of these isolates originated from infected wounds.
Epidemiologically there was no indication of why the strain was unable to thrive within
the FMC population, but genetically, it is most similar to the European strain EMRSA-15
[166].
Figure 7.1: Raw numbers of MRSA isolates and the diversity of epidemic strains (1995-2004).

176
* Source: Christianson et al (2007) [165]
Within the largest grouping of epidemic strains, CMRSA-2 PFGE patterns were
diffuse and over the six years, no one PFGE pattern appeared to dominate. There was
evidence of some temporal clustering with a particular PFGE pattern as a result of
localized outbreaks, but from year-to-year no one pattern emerged. A few notable
strains, CMRSA-2 PFGE pattern 18, 30, 552, and 1567 were independently associated as
outbreak strains. Pattern 18 and 1567 appeared in all six units and across all years, but in
low numbers.
In a more detailed post-hoc analysis, these PFGE patterns were compared to a 2006
CNISP dendogram (all isolates digested with the SmaI enzyme), and functionally,
patterns 30, 552 and 1567 are nearly indistinguishable (Figure 7.2). Pattern 18 was

177
separated by a single band difference from this grouping, and could be considered related
but not indistinguishable from the other three by Tenover’s criteria. Additionally, PFGE
pattern 903 circulated in low numbers across several units from 2003 onward, and was
also considered highly similar, if not identical to CMRSA-2 pattern 18. In the process of
modeling the spread of MRSA using GIS, collapsing these PFGE strains into a single
epidemic pattern may have increased the likelihood of detecting spatial autocorrelation
between MRSA patients within a unit.
Figure 7.2: 2006 Sample CNISP dendogram of MRSA PFGE and SmaI Patterns
Source: CNISP 2006 PFGE SmaI typing results, M. Mulvey, National Microbiology Lab, Winnipeg, MB

178
In a recent analysis of the broader CNISP isolates from 1995 onward, molecular
work by Christianson et al (2007) may shed light on the ability for CMRSA2 to persist in
healthcare environments. According to their analysis comparing the open reading frames
(ORF) of CMRSA1 and 2, they hypothesized that as a group, CMRSA-2 may have an
evolutionary advantage due to genetic sequences that encode for virulence factors such as
leukotoxins, exotoxins, serine proteases, adhesion factors, and other regulatory
effectors[165]. Community strains of MRSA such as CMRSA-10 have been
phenotypically associated with higher virulence, which includes variations on many of
the same classes of virulence factors. The data analyzed in the project using surveillance
data were not able to discriminate between clinical outcomes specific to individual
CMRSA strain types.
The diversity of MRSA as measured by Simpson’s Index showed that by
epidemic type, strains of MRSA were clustered in favor of CMRSA-2. CMRSA-2
clearly dominated the numbers of isolates typed by CNISP up until 2004, with a sudden
rise in cases of CMRSA-10. While CMRSA-10 is usually considered a community-
based strain, patients were developing illness serious enough to introduce these strains
into the acute care sector. Despite its introduction into the healthcare setting, CMRSA-10
has not been responsible for many instances of healthcare-associated transmission of
MRSA. However, its presence has changed the composition of circulating epidemic
strains within FMC from 2004 onward.
On a PFGE pattern level, there remains significant heterogeneity of circulating
strains as the Simpson’s Index ranged from 89-100% heterogeneity, which may speak to
the overall fitness of individual subtypes in that there may not be any genetic advantage

179
or differential selection among these strains. Simpson’s Index is a simple score to assess
the likelihood of clustering, but as these data were compiled yearly, it may be difficult to
parse out small clusters or outbreaks compared to the overall strain diversity. Variations
in PFGE patterns occur often and mutations or point shifts are expected as part of the
bacterial replication process, and consequently, PFGE patterns will naturally drift with
time. While individual PFGE typing is helpful as an epidemiologic tool for tracking
discrete events like outbreaks and often provides conclusive forensics to assess clonal
spread, epidemic strains are more useful in terms of describing MRSA overall trends and
changes on larger temporal scales.
7.3 Modelling Risk Factors for MRSA Acquisition: Logistic Regression
7.3.1 Selection of Variables for Logistic Modeling
The predictors for logistic modeling were selected as measures that would address
meaningful factors relating to environmental and other host exposures that may
contribute to MRSA and shed light upon the complexities of host-pathogen- and
environmental interactions. Some variables were selected in an effort to complement the
spatial risk factors that were assessed through statistical and geographical representations
using GIS software. The main objective was to determine how temporal as well as
spatial component contributed, if any, to the transmission of MRSA in healthcare
environments.
The creation of a composite variable to measure not only the length of time a
patient was exposed to hospital environments was important, but also to moderate that
effect with the impact of shared environments. It was hypothesized that patients who

180
were exposed to shared accommodation versus private accommodations were potentially
at greater risk for environmental contamination from multiple sources such as shared
washrooms, toilets, and high touch surfaces. A measure based on the degree to which a
patient was sharing resources, including their physical environment, was created for
every unit, room, and bed that they occupied while they were admitted.
The calculation of the TotalShare1 variable was assumed to be additive, where
each bed day was based on the maximum occupancy of the room they were placed in.
The TotalShare1 variable was the exposure of interest and in the univariate evaluation,
was significantly associated with the binary outcome of MRSA (or no MRSA=0).
7.3.2 The Inclusion of Measures that Reflect MRSA Burden
The inclusion of a measure to address the ecological pressure of MRSA in
healthcare settings was used to assess whether the presence of known, or prevalent, cases
of MRSA contribute to the likelihood of a patient acquiring MRSA. The presence of
MRSA on units may contribute to the overall environmental contamination or physical
burden of MRSA, and since MRSA can persist on surfaces for several weeks, this
contribution may not be insignificant [6, 7, 167]. Logically, the more cases of MRSA
that were managed per unit of time on a unit would exert greater levels of environmental
contamination as patients ambulate throughout the unit (with the exception of the very
ill), or staff who fail to decontaminate their hands move about the unit transiently
colonized with MRSA.
Patients requiring isolation were recommended to stay in their rooms, but were
not restricted from most common patient areas with the exception of other patient rooms

181
and the patient kitchen areas. Hence, many opportunities exist for widespread MRSA
contamination by staff or patients, and by insufficiently cleaned shared patient
equipment. When patient care units manage and isolate patients with MRSA, new and
known cases were each placed in isolation rooms, which are adjacent. In circumstances
where private rooms were unavailable, the policy was to cohort MRSA patients together
in a semi or even four-bed room and institute “contact isolation without walls”. Studies
have supported the increased likelihood of MRSA in being recovered from the
environment from MRSA colonized (69%) or infected (73%)patients, and diarrheal
patients inflate the degree to which their environment is contaminated with MRSA[5,
100, 168, 169].
The CHR has conducted several investigations to examine environmental
contamination of fomites and determined that there was evidence of contamination of
patient privacy curtains, toilets, commodes, and sat-probe equipment, to name a few
items (Infection Prevention and Control, Calgary AB, unpublished data). All of these
items should be cleaned, but in recognizing that there was often a failure to accomplish
this, there was a fair precedent to recognize that MRSA burden was present alongside
other hospital pathogens on these units and can be a direct source of fomite exposure. As
in studies that have evaluated environmental spread of MRSA, there is sufficient
evidence to suggest that unit contamination is potentially proportional to the number of
patient days contributed by MRSA positive patients [169]. A study by Williams et al
(2008) calculated MRSA burden similarly, and determined that for every increase in
colonization pressure over the median rate of 6.7%, there was a 7.6% increased risk of
MRSA acquisition [109].

182
As part of the univariate assessment, MRSA Burden (BurdenDy) was calculated
based on the length of stay by previously known MRSA patients and adjusted by total
patient days for that unit per year. This measure excluded re-admissions by patients who
had been identified with MRSA within the first calendar year of being positive, or
additional patient days logged in after initially being identified with MRSA. This was
done to avoid having MRSA case records be represented by their own data (e.g.
increasing the relative contribution of data per record to the outcome).
The BurdenDy variable could be considered an ordinal, unit-level variable. As
there were 36 different possible values for BurdenDy, these categories were more
conveniently examined as a continuous predictor. Had this variable also been expanded
to other units, or the entire facility, the treatment of BurdenDy as a continuous variable
was more obvious and sensible. BurdenDy could be conceptualized as a unit-level
variable, yet each patient’s admission may involve factoring in different measures of
MRSA burden if they were to move between different units, hence a variable that was
unique to the patient-level of analysis. The measure of MRSA Burden was not
significantly associated with the outcome in the univariate analysis, but because of its
potential clinical significance and support for its use in the published literature, it was
added into multivariate modeling. MRSA Burden was not significantly associated with
the outcome when simultaneously controlling for other salient main effects.
7.3.3 Antibiotic Exposures as a Risk Factor
A range of effect modifiers were considered for the model including specific
classes of antibiotics: the beta-lactams (including four discrete classes of cephalosporins

183
and penicillins), glycopeptides, and the carbapenems. These drug classes were selected
for their direct pharmacokinetic action on the Staphylococcus genus. For each class of
drug, the total antibiotic days were compiled for all patients and therefore was a patient-
level variable. Among cases, the drug had to be administered within 30 days of onset of
MRSA, a largely arbitrary time point, but considered to be reasonable. One systematic
review by Tacconelli (2008), used a mean exposure period of 124 days prior to the onset
of MRSA and another study by Muller did not specify an exposure timeframe, but was
assumed to be the time from admission to first positive MRSA result [170, 171].
The one major drawback to the use of the CHR Pharmacy database was that
antimicrobial use was only available when a patient was an inpatient. Additionally,
antimicrobials that were stored as unit stock items may have been administered STAT
without an official drug order and there would be no electronic documentation of the
exposure. In the univariate analysis, exposure to carbapenems (OR: 2.89, 95% CI 1.15-
7.26), glycopeptides (OR: 3.78, 95%CI 1.99-7.18), and second generation cephalosporins
(OR: 3.89, 95% CI 1.17-12.84) were significantly and independently associated with
MRSA. However, in the multivariate model all but glycopeptides exposure was
significant to MRSA acquisition while controlling for all other variables (OR: 2.80
95%CI 1.43-5.49). Other research has shown a 2.9 (95% CI: 2.4-3.5) greater risk among
those with prior exposure to glyopeptides [171, 172].
Average nursing workload was a variable obtained from Nursing Integrated
Systems and has been previously associated with increased risk of hospital-acquired
infections, including MRSA [173-175]. Logically, the more nursing care required by a
patient translates into higher patient need and increased patient to nurse interactions, not

184
necessarily acuity. Patients who are bed-ridden and unable to ambulate require
considerable assistance to perform basic tasks. In contrast, patients who are mechanically
ventilated or have multiple indwelling catheters or monitors also require increased
nursing resources, but are also high in acuity.
Univariate analysis showed that this variable did not independently predict
MRSA, but because of its clinical significance, was retained in the stepwise multivariate
model and was included in the final model (OR: 1.61 95%CI 1.08-2.39). Therefore,
controlling for all other variables, MRSA acquisition increases by an odds of 1.61 for
every one-unit increase in average nursing workload. This assessment highlighted that
an increasing odds of MRSA varies with increases in average workload is appreciable.
Typically, the average medical patient scores a 2 for daily workload, and critical care
patients can score between a 5 and 6, which is also indicative of 1:1 nursing. More
importantly, measures of nursing workload have been used as indicators of the frequency
of direct patient contact [173-175]. Therefore increasing workload is an indirect
measurement of potential transmission possibilities. Patients requiring more direct care,
compounded with the presence of other patients, many who may be reservoirs for MRSA,
may enable the spread of MRSA through unwashed healthcare provided hands. An
alternative way to incorporate this variable in the model may consider the highest
workload measurement or first workload measurement per patient admission, where the
latter would likely measure the most acute phase of a patient’s admission on these units.

185
7.3.4 Univariate Modeling
For all univariate relationships considered, criteria were used to assess the
likelihood of confounding as well as a test for interaction. Two different methodologies
were considered: the first compared the odds ratios for the point estimates and whether
the stratum specific estimates were indicative of confounding. None of the variables
were suspected of being confounders, and this was confirmed by these assessments.
Interaction was evaluated by the p-values of the Mantel Haenszel chi-square statistic.
The prior exposure of glycopeptides seemed to be an effect modifier of TotalShare, but
was not clinically interpretable, and was dropped from the model. The inclusion or
exclusion of this term did not significantly impact the standard error among the key main
effects. Using this method, only TotalShare1 and exposure to Glycopeptides were
potential main effects.
The second approach was less driven by statistical testing and more criterion-
based. The logit function was modeled the relationship between MRSA as an outcome
with the main exposure, TotalShare1. Changes in the beta coefficient (+/- 10%) were
monitored with the addition of each relevant univariate predictor. Any change in the
estimate was an indicator of potential confounding. Subsequently, interaction was
evaluated on whether the inclusion of an epidemiologically important interaction term in
the model was significant. This approach showed that 2nd and 3rd generation
Cephalosporin and Glycopeptide exposures were noteworthy to include in the modeling
phase in addition to TotalShare1. Functionally, both approaches assessed confounding
and interaction, one comparing the crude and adjusted odds point estimates as well as

186
effect modification through significant interaction estimates, and the other assessed the
relative changes to the exposure coefficient.
7.3.5 Multivariate Modeling
A stepwise backward elimination strategy was used to model the outcome of
MRSA with the main effect of TotalShare1. The assumption was that the data followed a
binomial distribution. Variables that were considered potentially important to describing
the relationship between MRSA and shared patient days intially included MRSA Burden,
the Charlson Index, and two traditional demographic indicators, age and gender. All four
variables failed to explain the outcome compared to other included variables both in the
univariate and multivariate analysis (refer to Appendix D).
In retrospect, the control group, selected from those patients who were admitted to
the same six units as the cases and during the same timeframe, was more like the cases
than the general FMC patient population. Thus, the mean differences between cases and
controls for several variables may be smaller than if the cases were compared to any
patient admitted to FMC between 2001 and 2006. However, in the interest of controlling
for the spatial layout (i.e, rooms and shared bed spaces), the demographic and clinical
characteristics may be more convergent. One feature that mitigated potential small
differences between cases and controls on selected variables, was that the 40:1 controls to
cases sample size should offer sufficient power to avoid Type II error and detect a true
difference if present.

187
7.3.6 Multivariate Logistic Model of MRSA Acquisition
The final model is stated above and describes the relationship between healthcare-
associated MRSA and the main effects that mediate the outcome. Predicted probabilities
of MRSA based on samples of hypothetical data as well as the increasing probability of
MRSA when holding all other variables constant were presented in the Results III
section. For the latter estimations, when the value of the total shared hospital days was
less than or equal to 25 days among the six FMC units, the baseline risk of MRSA was
1.29% compared to those patients who were not admitted for greater than 24 hours.
These risks increase to 1.86% among those who have a shared exposure time of 26-50
days, up to greater than 100 days where the risk is 5.43% compared to those without the
exposure. For example, if a patient was admitted for two weeks and was located in a
four-bed room for their entire admission (total share=56 days), their risk of MRSA would
be 3.82% while holding the other factors constant. Similarly, a different patient would
have the same risk if they were in a private room for 56 days, assuming the other
variables are controlled for. The risk of MRSA is not zero when patients are admitted to
private rooms only, but the risk is greatly attenuated.

188
7.3.7 Assessment of Collinearity
Collinearity is a condition where more than one variable explains the same
variance in a logistic regression model. Collinearity reduces the precision of each
estimate and inflates the standard error. Upon examination of the conditional index, the
values for each main effect fell under the threshold of 30, indicating that there was no
evidence to suggest collinearity in the model.
7.3.8 Goodness of Fit
After the logistic model was fitted to the data, both the Hosmer-Lemeshow
goodness-of-fit test as well as a plot of the change in the Pearson chi-square (change in
the chi-square value with and without the ith observation) against the predicted values
were calculated to look for influential observations. The Hosmer-Lemeshow test was not
significant, indicative of reasonable fit of the model to the data. The plots of residuals
did not reveal any egregious outliers or erroneous data points, thus satisfying the general
criteria specifying adequate model fit.
7.4 Geographic Information Systems (GIS) as Applied to the Study of MRSA
7.4.1 The Use of Surrogate Temporal and Spatial Measures
Both the year of admission and the first unit of admission for each patient were
incorporated as temporal and spatial indicators in modeling the likelihood of MRSA.
Both were not significant as independent predictors of MRSA and also as main effects
within the final model. Here, the odds of MRSA increased by 1.22 (95%CI 1.06-1.38)
for every incremental year considered in the modeling process (i.e, 2001-2006) while

189
controlling for all other variables in the model. Similarly, the unit of admission was
associated with a significant increase in MRSA likelihood. Specifically, relative to
Unit61, admission to Unit 62 was significantly associated with an increased odds of
MRSA by a factor of 2.72 (95% CI 1.43-5.18).
7.4.2 Preparation of Hospital Floor Plans for Mapping in GIS
The process to prepare standard architectural drawings and convert them into
usable geographic maps in ArcGIS was met with several challenges. Typically, GIS
applications focus on the relationship between geographic or geologic features, and a
customized methodology needed to model patient-level events occurring within the
confines of a single building. Starting with an image of the Foothills Medical Centre
taken from Google Earth and superimposed with a Calgary roadways file with attributes
from a local 3TM referent projection, the image adopted the properties of the coordinate
system. Every subsequent layer representing features such as the beds and rooms of the
selected patient care unit was rotated and fitted through spatial adjustment tools over top
of this master file. A related geodatabase stores relational files (tables) containing spatial
and non-spatial information about the rooms and beds such as their room and bed labels
that were linkages with clinical patient-level data on MRSA onset, admission and
discharge dates, room and bed locations, as well as PFGE strain typing information. Data
that were originally created from clinical and administrative datasets were patient-centred
and for the purposes of geographic analysis the data required transposing to reflect events
based by the geographic unit (room or bed).

190
Many other coordinate systems projections are available as free files for
download, and ArcGIS has a repertoire of commonly used projections. Each projection
is based on a slightly different approach to viewing the surface of the Earth. Some
projections are based on a cone superimposed over the North Pole, others are positioned
like a cylinder around the Earth, etc and each will exhibit distortions that are more
noticeable at the equator, Northern or Southern hemisphere. Because Calgary is in the
Northern Hemisphere, a 3TM projection offers the least amount of distortion to features
at this latitude. The US Geological Survey website has made available many of these
projections (http://egsc.usgs.gov/isb/pubs/MapProjections/projections.html).
7.4.3 Moran’s I Calculations
7.4.3.1 Aggregated MRSA data by room on Unit 61
The Moran’s I calculations revealed that for the total density of rooms with cases
of healthcare-associated MRSA from 2001 to 2006 there did not appear to be any
indications of spatial autocorrelation. While this result was somewhat surprising, the data
show that private rooms were utilized the most. When there was a high index of
suspicion that these patients required isolation precautions before the final results were
confirmed and pre-emptively placed under contact isolation, or the date stamp on the
original isolate may have indicated the date of the final culture result as opposed to the
date received by CLS. Cases appear to have been identified in virtually all the rooms on
the unit. Some rooms had zero counts of cases, which were unexplained, given the
virtually random distribution.

191
7.4.3.2 Individual assessments of Moran’s I at six-month intervals.
To assess whether smaller clusters of MRSA were occurring over discrete time
points, snapshots of new MRSA activity were selected, spaced every six months. The
data were very sparse at each time frame and it was again not possible to detect any
evidence of spatial autocorrelation among new cases. A few individual choropleth maps
were examined to determine what exerted the most influence within the Moran’s I
calculations. The linear distance between sparse points, especially among cases that were
identified on the same side of the clinical wing exerted more influence than calculations
involving cases across the unit corridor. In evaluating these relationships based on such
sparse data points, often with case numbers less than 5, one would expect large
confidence estimates around each estimate. The assumption was that Unit 61 was at
capacity for the purposes of calculating the proportion of MRSA per unit of time.
While no spatial autocorrelation was identified in the six years of MRSA cases on
Unit61, these were still rare events with many zero cell counts and hence, unstable
estimates. A larger sample of more densely clustered events (e.g at least more than five
events per time point) would be required to rule out spatial autocorrelation with more
certainty.
7.4.4 Simpson’s Index
As an adjunct measure to look at the heterogeneity of MRSA across patient care
room on Unit 61, a Simpson’s Index was also calculated for these data, just as it was
done earlier to assess for MRSA pattern and strain heterogeneity Over the entire period,
the Simpson’s Index was 92.01% which essentially confirms that there is no

192
homogeneity, or indications of spatial clustering, among patients who became MRSA
positive. These measures were more robust than the Moran’s I values with confidence
intervals that centred closely to the point estimate. Therefore, based on the available
data, there was no evidence to support clustered or a non-random distribution of MRSA
cases.
7.4.5 Inverse Distance Weighting (IDW) Maps
For Unit 62, a slightly different approach was taken in the exploration into the
effect of spatially correlated data. Inverse distance weighting is an interpolation
technique that creates a graded surface to represent geographic areas of high and low
MRSA activity. The results for 2004 indicated that the highest MRSA activity was
dispersed throughout most of the unit, again supportive of the concept that MRSA
detection and potentially acquisition, occurs independently of the rooms they are placed
in. One interesting feature from this map was that Rooms 6207, 6209, and 6211, which
were all semi-privates, each sharing a washroom with another semi-private room, had
generally low weighting scores. Therefore, virtually no MRSA had been detected in
these rooms. A plausible reason for this observation was that the rooms on the other side
of the washroom had been blocked to admissions.
7.4.6 Tracking Analyst
The utility of ArcGIS’ Tracking Analyst extension was explored as a potential
mechanism to represent temporal and spatial data in a dynamic format. The playback
feature of Tracking Analyst is useful in showcasing events that occur in space over time.

193
The study used the previously geocoded data for Unit 61 and Unit 62 to visualize two
different modeling events.
7.4.6.1 Visualizing the spread of multiple strains of MRSA for one year
One iteration displayed the admission, MRSA onset, and discharge dates for
patients who were admitted in 2004. While on the unit, exposures to other MRSA
patients were visually represented in space when they occupied the same room as
converging points. This exercise used data from all newly identified MRSA patients with
any strain of CMRSA-2. The movie showed the arrival and departure of people with
different colors to represent the CMRSA-2 pattern they had. The visualization showed
the strain diversity that flows through a given physical space over time. On a molecular
level, 13 strains among 21 patients were introduced during the 12 month period, yet after
almost two years, no particular strain emerged as dominant.
7.4.6.2 Visualizing the clonal spread of MRSA across Unit 62 over 32 months
The second modeling event was to look at a single pattern (Pattern 30) of MRSA
over 32 months and review the epidemiologic links between cases. Here, there was a
cluster of 17 patients of which several were epidemiologically connected. Some patients
became positive after unknowing exposures to those who were later identified as
colonized or infected with MRSA. If programmed carefully, this software extension has
some interesting capabilities in being able to look at prior, undetected exposures between
roommates. Tracking Analyst may assist in determining temporal ranges for patient
incubation periods by identifying subtle exposures that may not readily indicate a

194
transmission event. Paired with real-time monitoring of staff entry and other metrics to
identify patient contacts would enhance the utility of this feature immensely.
7.4.7 Summary of GIS as an Application to MRSA Transmission
The use of GIS in examining transmission characteristics and dynamics was
demonstrated as a proof of concept in this study. GIS is robust in terms of its ability to
synthesize data across a spectrum of sources and here, it was shown that by looking at
disease transmission as a function of geography there is much that can be learned from
the way that infectious organisms interact with the environment. Even with a limited
ability to demonstrate its capabilities, the contribution by the GIS analysis has already
indicated that incubation periods for disease may be better visualized with these tools.
The finding that there is no evidence to support spatial autocorrelation in MRSA
transmission, and comparing that with results that showed a predictive relationship
between patient shared environments is not contradictory. What the data indicate is that
the environment-host relationship is mediated by local intra-spatial interactions more than
inter-spatial interactions. Hence the likelihood of MRSA s still localized to a smaller
radius than a larger geographic area, and may explain why indirect measures of overall
MRSA burden do not predict MRSA strongly. With more data, a between-beds spatial
autocorrelation measure may show a non-random or clustered relationship. Conversely,
if spatial autocorrelation does not exist between patients, then the requirement for a
spatially-weighted term to control for correlated data is moot in regression modeling.

195
7.4.8 Feasibility of GIS and Infectious Disease Modeling
GIS as it applies to public health research has limitless possibilities and this
project attempted to evaluate this technology as a proof of concept that future work can
incorporate both temporal and spatial elements of infectious disease transmission. GIS
has already been applied to visualizations of infectious diseases, but typically at the level
of communities and larger populations. Thus, GIS often focuses its application on
macro-scaled environments where the larger scales of topography apply. Extrapolating
traditional GIS capabilities to relatively small spaces can be challenging when tools with
applications to larger units of study require adaptations for hospital layouts. The
preliminary work compiled within the scope of this project supports further exploration
into modeling disease spread, with potential applications to more pathogens outside of
MRSA.
The process of evaluating the feasibility of using GIS to model MRSA in
healthcare settings could be divided into broad themes of data acquisition and quality, as
well as software adaptations. The setup and geocoding of the hospital layout posed few
barriers, especially in having AutoCAD specification drawings that provided to-scale
details and projection coordinate systems that are based on fairly accurate satellite
imaging. However, the paucity of admission surveillance cultures did introduce
uncertainty as to whether patients classified as a healthcare associated case of MRSA
were indeed classified appropriately. Without a known incubation period and the ability
to remain an asymptomatic carrier of MRSA, there were concerns that incident cases are
actually undetected prevalent cases. Unfortunately without baseline results, the quality
of the data were limited to first clinical culture positive for MRSA to define incidence.

196
Active admission surveillance cultures for MRSA have been implemented across several
healthcare systems, and could provide a baseline to better classify newly identified
MRSA. However, active surveillance can become cost-prohibitive. A study to evaluate
MRSA transmission dynamics using GIS or other means may yield more conclusive
results if each case patient had a baseline negative culture.
What is also crucial to utilizing GIS for assessing transmission dynamics is the
ability to track individual patients to every room and bed that they occupy. While these
data were available in this study, other healthcare systems may not have access to these
crucial tracking data. Greatly enhancing the ability to define the risk factors for MRSA
transmission would be having data that tracked patient movements to areas such as
diagnostic imaging, physiotherapy, or other clinical settings where transmission is rarely
monitored. These data would collectively document the spectrum of patient-to-patient
and patient-to-staff interactions over the course of a patient admission as well as capture
many more spatial elements that bed and room location cannot.
Lastly, the ArcGIS platform is still very much geared toward large-scale
geographic areas and several adaptations within the software needed to be made in order
for clinical and micro-spatial environment data to be recognized by ArcMap. Hence, US
states were associated with hospital rooms and large spaces, whereas local area zipcodes
were associated with individual room information. Increasing the feasibility to model
MRSA transmission dynamics would likely involve changes to the ArcMap software
package to recognize institutional micro-spatial areas but also allow the inclusion of other
clinical features to display within extensions such as Tracking Analyst.

197
7.5 Strengths and Limitations
7.5.1 Strengths
Taking the approach that MRSA transmission may depend upon environmental
factors such as the effects of sharing space, as well as time and location, has not been
assessed using both logistic regression modeling nor complementing it with a novel
exploration of GIS technology. In examining the likelihood that the built environment
can perpetuate disease transmission is not new; however, evaluating the effects of spatial
autocorrelation and hypothesizing that patient space can be potentially viewed as a map
of hotspots of disease on a two-dimensional plane has vast applications in the modeling
of other healthcare associated infections. Mapping the hospital layouts using static to-
scale drawings and morphing them into a projection in the larger context of space
suddenly bridges the realm between micro and macro-spatial modeling, and enables the
same geographic mapping tools to be applied to hospital environments just as they have
been done for disease tracking across larger geographic units.
A notable strength from this study was its ability to assess disease movement and
spread through the use of the ArcGIS Tracking Analyst extension. The core data was
paired not only with the spatial (bed locations expressed as coordinates) and temporal
data required to visualize events, but also with MRSA PFGE typing data to confirm that
spread was either clonal or a series of genetically unrelated evemts. As DNA
fingerprinting capabilities refine, the epidemiologic ability to visualize and link events in
healthcare settings together over both time and geography will increase in its precision.
Clearly the aim is to use these and other GIS methods to predict events and assist in

198
preventing disease or even on a more basic level, target infection control interventions in
areas that experience a greater likelihood of disease spread.
Typically studies that examine the risk factors for disease look at clinical and
demographic features that may point to modifiable risks that can be changed through
behavior modification, prevention, or treatment. This study moved beyond the
traditional risk factor evaluation and attempted to redefine the risks for MRSA by
focusing on elements of the hospital environment as surrogates for fomite transmission.
The merging of very different datasets, while challenging, determined that there is value
in characterizing external risks to patients.
Finally, the application of GIS to micro-spatial healthcare settings is novel but is
an area that could benefit from tools to re-evaluate the nature of disease spread outside of
the traditional shoe-leather epidemiological methods. John Snow, the father of modern
epidemiology, was probably the first scientist to incorporate a visual component to
contact tracing methods as a supplement to his line lists and interview data. This is
evidence of the first crude application of GIS to disease tracking. In this study, the use of
the ArcGIS Tracking Analyst extension was a convincing proof of concept that spatially
related events may have precursor exposures that may explain the nature of disease
spread that are not obvious without examining the role of geography.
7.5.2 Limitations and Bias
While this study explored some interesting concepts to detail the factors that may
enable MRSA transmission, several limitations were identified that may be improved
upon, or considered for future analyses. As mentioned in the results section, there was

199
considerable attrition in the numbers of eligible cases that were excluded from the final
model because of missing unique identifiers. A brief analysis was conducted between the
records that were excluded by this one detail, and those records that were included.
The results indicated that on the available comparisons between the sample of 123
cases to the larger pool of total eligible cases (n=449), the samples appeared to be
relatively homogeneous in terms of age range, gender, and severity of illness (whether
they were initially infected or colonized with MRSA). Thus, there was sufficient
information to conclude that the populations were similar between the included cases and
the larger pool of all potential cases, but that does not completely rule out the possibility
of sampling error. The biggest consequence of losing almost 75% of cases was that the
precision of the estimates might be greatly reduced, but were somewhat compensated for
in the power to detect small differences by the inclusion of a substantially-sized control
group.
Resolving this issue would involve additional measures to link unique identifiers
with excluded cases would involve looking each patient up by name or searching through
Clinibase/SCM™ by date of birth in combination with other identifiers. It would be
prudent that key patient registries such as the ARO registry be periodically cleaned and /
or error checking features added into the application at the point of user entry.
Unfortunately, at the time of the study, there was no one clear patient identifier that could
unify patient encounters across the CHR. The introduction of the RHRN in 2005 was
intended to accomplish this, but archived ARO registry data had to be retrospectively
amended manually. The loss of valuable data did not introduce bias into the modeling
processes, but did impact the precision of the estimates.

200
For the GIS analysis, the calculation of inverse distance weighting (IDW)
measures (data interpolation) was highly dependent on increasing scatter density to make
precise estimates of nearest neighbor measurements. Sparse data will lead to large
confidence intervals and standard error of the estimate. With the use of the Tracking
Analyst extension, the number of event data per patient care unit was crucial in
determining the periods of temporal and spatial overlap between known and exposed
patients.
The a priori selection of six medical/surgical/critical care units was a decision to
both maximize the number of cases of MRSA to model, using units with greater than
average activity, given that these occurrences were still relatively rare. Units with higher
than average numbers of cases were chosen for study, with the inclusion of Unit 36
because of its novel physical design, as cases of MRSA were not randomly distributed
across segments of the patient population. Clinical areas like Psychiatry and
Maternity/Post-Partum encountered cases rarely, if any, from year to year. Therefore,
these populations not only had higher incidence rates of MRSA but were also known to
have patients with elevated acuity levels. Epidemiologically, the impact of selecting
units for higher case-rates but also for the built environment may reduce the
generalizability of the findings to other clinical areas, even within FMC. The tradeoff
was that the precision of the estimates were higher with a larger sample size. Also,
because the study was longitudinal, as opposed to several cross-sections of outbreak
periods, the data were adjusted across quiescent, endemic, and well as epidemic periods.
Use of secondary data can be extremely useful for exploratory analyses and
usually consist of large datasets suitable for data mining. In contrast, secondary data may

201
be collected for an entirely different purpose so it may be difficult to simply use such data
without knowing the context in which it originated[176]. This study used several
administrative, quality assurance, antibiotic management, and financial datasets. The
intention for most of these databases was for patient billing purposes or to establish fiscal
funding schemes for patient care units. As a result, the data were indexed by cost centre
codes or by time period and there were challenges to reorganizing data to suit the needs
of this analysis. However, compared with the numerous user errors seen in the ARO
Registry, data were rarely missing in these financial and administrative databases because
of the high level of accountability (R. Padgham, CHR Financial Case Costing, personal
communication). Because these datasets were created to serve a different function, there
may be selection bias when they are linked to clinical datasets. For example, if a patient
did not have an admission lasting greater than 24 hours, they may be excluded from
receiving a nursing workload evaluation and not be represented in the system. Because
the process of data linkages required all case-control records to have these variables,
those without linking records could not be included and would introduce systematic
selection bias.
Reconciling the discrepancies between surveillance definitions with research
definitions of MRSA acquisition was challenging. Over the period of the study, the
surveillance definitions in evolved in 2006 to reflect new information about the
epidemiology of MRSA, where MRSA was no longer classified into categories of
nosocomial and community acquisition. The definitions changed subtlety and cases were
now assessed as healthcare-associated and community-associated. The major change
within those definitions was the inclusion of any prior hospitalizations, surgeries,

202
dialysis, or long-term care admissions in the preceding twelve months as markers of
healthcare-associated MRSA. The switch in definitions was not updated in the local
Infection Prevention and Control ARO Registry, so different criteria populated the same
data field, and meant that infection preventionists who evaluated cases as community-
based in 2004 may have re-evaluated this same case as healthcare-associated in 2006.
This change may introduce misclassification bias in a longitudinal analysis where more
cases would now be considered healthcare-associated than with the previously used
criteria.
Within the 2001 to 2006 timeframe, the technology and corresponding laboratory
protocols for MRSA diagnostics changed. The inclusion of polymerase chain reaction
(PCR) assays changed the degree of granularity with which MRSA is characterized, but
more importantly, the inclusion of a protocol for MRSA SmaI restriction endonuclease
has enabled the identification of within-group PFGE strain variations. While the
resolving power to detect fine differences between isolates has increased dramatically,
not all isolates have been typed using SmaI restriction enzymes, so the analysis of MRSA
molecular profiles was limited to 2002 onward. Also, to cope with the increasing
numbers of MRSA per year, sites like FMC were instructed by CNISP to submit a
selection of isolates per year from 2004 onward. Hence, not all of the new MRSA cases
have PFGE typing information. This was a limitation when modeling disease spread on
units because those patients without typing data were excluded from the analysis.
Another limitation of the study was the inclusion of healthcare-associated cases of
MRSA that were detected through active surveillance which was instituted at the FMC
ICU and temporarily on Unit 62 for all new admissions and transfers. The enhanced

203
testing may have been responsible for some of the increases in MRSA rates seen in 2005
and 2006 on these units. Sampling bias may also occur because of select programs that
invest more resources to identify MRSA within the Calgary Health Region. During
outbreaks or clusters of MRSA activity, particular clinical areas will temporarily increase
patient screening detection of MRSA. Areas such as Critical Care Medicine screen all
new patients and transfers for MRSA, and as a result of a concerted effort to increase
MRSA detection among carriers, the case-finding protocols will reflect higher incidence
of MRSA in these areas.
Artificially increased detection through active surveillance cultures is a source of
bias in the data, but arguably, the typical rates of MRSA are likely a chronic
underestimate of incidence compared to the actual numbers of MRSA carriers. The fact
that all units were not unilaterally conducting admission screening increases the severity
of detection bias. Conducting active surveillance may inflate unit-level MRSA rates
compared to others.
Because the nature of this study was to evaluate the impact of environmental
contamination and proximal patient-to-patient MRSA transmission, a logical but arbitrary
criterion for the potential incubation period of MRSA from the time of exposure was set
at 30 days prior to the onset of MRSA. Without evidence to suggest a timeframe for
MRSA incubation, 30 days was consistent with the outer detection limits of MRSA
environmental persistence and recovery data [6-8, 109, 169]. The assumption was that
patients who were exposed to a positive roommate contact traced to within 30 days of
MRSA identification represented a viable epidemiologic lead. Setting the limit to seven
days may increase the strength of the evidence linking patients together, but 30 days was

204
still plausible, especially among colonized patients. In comparison, CNISP surveillance
definitions use a year of prior hospital exposures as sufficient epidemiologic timeframe to
link cases of MRSA to healthcare-associated exposures. Such a timeframe would be too
wide to relate exposures to roommate and environmental sources as a putative etiology,
and difficult to infer causality. PFGE typing data would also provide greater strength to
the evidence if strains were matched and no other epidemiologic explanation was viable.
In light of new information to demonstrate that MRSA generally incubates or out-
competes existing normal flora within a much shorter timeframe, this criterion would no
longer be relevant and point to detection bias within cases.
7.5.3 Limitations of GIS
While the utility of GIS functions were explored in this study, it became clear that
there were some limitations to ArcGIS software, specifically ArcMap. Using GIS
software for micro-spatial environments is a relatively new concept, let alone one that can
be readily mapped. Many of the geocoding settings had to be adjusted to use state and
zipcode hierarchies in order to represent rooms and beds in a hospital. A major limiting
feature was the inability to dynamically incorporate time, so calculations of spatial
autocorrelation had to be developed as snapshots of time or were aggregated as if all
events had occurred in an instant. Tracking Analyst did display events over time, but it
was difficult to visualize any other features outside of the event itself. Tracking Analyst
can retain multiple variables as part its backend relational database, but would not
simultaneously display multiple variables. It is anticipated that more work in this area
205
will uncover processes to incorporate and display multiple variables, and potentially
analyze movements as a function of risk.
Ideally, modeling disease risk in hospitals would not be confined to maps of
patient care units without some ability to connect units together. As seen in the analyses,
patients can be admitted to several units, rooms, and beds over the course of an
admission. While it is unknown whether these patterns of patient movements are a local
phenomenon, a result of increasing pressure to find any available bed for waiting
patients, or a new trend in patient management, observing patient movements when they
are confined to only a selected few units may fail to detect exposures that occur
elsewhere. A three-dimensional dynamic image of hospital floorplans would assist with
showing the inter-connections between MRSA exposures, and spread between
individuals. Preliminary work to look at three-dimensional modeling of disease spreasd
has been explored at the University of Iowa, the Department of Computational
Epidemiology (P. Polgreen) and uses rules similar to cellular automata to generate
simulations.
At the time of this analysis, there was no validated spatial logistic modeling
strategy that would not only enable multivariate, multi-level analysis but also be able to
redefine non-spatial variables (e.g., demographics) as spatial main effects. Spatial linear
regression was widely available in the GeoDa software package (University of Arizona),
but was not well suited to the variables under consideration.

206
7.6 Assessment of Study Validity
The variables that were selected for logistic regression modeling were surrogate
variables to measure concepts such as effect of commonly shared space, equipment, and
washrooms on the likelihood of MRSA. The composite variable, TotalShare, was a
measure of days in shared environments as an additive effect. There is currently no
known validated or Gold Standard index that specifically assesses the impact of
environmental load on an individual patient. The use of this calculated measure appeared
to have face validity because as a variable it incorporates the effect of shared space with
estimations of shared time for each segment of patient’s admission.
Year and first unit of admission are also good measures for determining whether
there are increased odds associated with occupied space and an increased odds of MRSA
for a patient given the timeframe they are admitted. Conceivably, the measures of unit of
admission and year of admission may also tap into features that are not inherently
operating at a patient-level. For example, depending on the year or the unit, there may be
higher loads of antimicrobial use, another ecological effect that may be indirectly
associated with place or time in healthcare settings. As a limitation, the first unit of
admission was selected to be in the model compared to determining the unit where a
patient spent their longest stay. In most instances, the unit with the longest length of stay
was the first patient care unit within an admission.
Glycopeptide use was an aggregated value which was simplified into a
dichotomous variable to address whether direct exposure to these antibiotics had an
impact on the odds of MRSA acquisition. The only drug comprising this antibiotic class
was Vancomycin, and hence, face validity was satisfied. Measures of nursing workload

207
are used to set fiscal benchmarks for staffing. However, nursing workload was a direct
measurement of an individual patient’s need for nursing care and time. The variable aims
to underscore patient risk category and assess the likelihood that despite providing
feedback on the needs of their patients, transmission still occurs. The workload index is
quantitatively and qualitatively different from the Charlson Index because it is calculated
daily (as opposed to upon discharge) and is a serial, real-time measure of patient need,
averaged over their admission. It may also be a better surrogate measure of how likely
nursing staff are to comply with infection control activities, like hand hygiene.
The combination of variables to explain the acquisition odds of healthcare-
associated MRSA given exposure to one or more predictors demonstrates an internally
valid model to conceptualize the likelihood of MRSA given variables that, for the most
part, cohesively represent the spatial and temporal factors. As an exploratory study to
consider the main effects that mediate an exposure of increasing shared patient days with
an outcome of MRSA, it is likely that other variables will emerge to better explain the
impact of time, space, and individual patient acuity or needs.
With respect to the validity of the measurements used to observe trends in GIS,
both temporal and spatial variables were used to track MRSA spread and measure spatial
autocorrelation. Autocorrelation as well as calculations of Simpson Indices for beds and
rooms used the raw spatial data to estimate these effects. Using a static projection map to
establish a grid of coordinates with which to base measurements were slightly distorted
with respect to other features on the Calgary map. More importantly, appropriate relative
distances between rooms and beds appeared to be correct compared to Calgary Health
Region floorplan schematics. This may introduce measurement bias into the spatial

208
modeling process, but it was assumed to be negligible and not relevant to the outcome
[121].
Polygon and point features with spatial coordinate information (eg. X, and Y
values) were used to signify patient location with relative accuracy but they were traced
in ArcGIS by hand which will confer deviance from the true hospital perimeter
measurements. As these maps were a representation of actual patient care units, they
were oriented in space and to the level of accuracy that the 3TM-Calgary projections and
the Calgary Health Region’s Department of Planning and Development floorplans could
provide. In these circumstances, the measurement validity was not a critical element
compared to relative distances between patients, rooms or beds.
7.7 Generalizability of Study Findings
The findings from the study, primarily the spatial and clinical considerations that
increase the likelihood of MRSA, may be generalizable to other patient populations of
similar acuity. As the model incorporates elements of time that has passed, the
performance of the model in another temporal context is unknown. As long as the trend
in healthcare-associated MRSA incidence continues to increase at the rate established by
the modeling process, the model may be predictive in other adult acute care settings or
have applicability to the patient care units where the model was based. Individual
parameter estimates may not apply to the general patient population, but the concept that
shared space, workload, and temporal factors mediate MRSA acquisition may be
important to extend to a wider range of inpatient settings.

209
The process to examine spatial autocorrelation among cases within selected
patient care units failed to detect a significant effect of MRSA clustering to the level of
either rooms or beds, from year to year, or aggregated over several years for patient care
units 61 and 62. The likelihood is that measures of spatial autocorrelation would differ
on different units, and may potentially identify unit layouts that increase or decrease
spatial autocorrelation. Units 61 and 62 are more similar to each other than different, as
one is a physical mirror image of the other and they occupy the same floor of the FMC
tower. Comparisons to the ICU, a generally open floorplan, and Unit 36, the “Ward of
the 21st Century” with mostly private, enclosed rooms, would be worthwhile units to
assess for spatial autocorrelation because of their distinct floorplans, high patient acuity,
and the different philosophies that shaped the design of each.
The use of outbreak data to model disease transmission is subject to criticism
because these events model time periods of highly clustered cases, with more virulent
strains of pathogen, and address timeframes where resources are stretched out of the
norm. The data from this study were longitudinal and may offer a more stable model,
applicable to a breadth of endemic and epidemic periods of MRSA.
7.8 Infection Control Recommendations
Current infection control recommendations for the management of MRSA
positive patients include the provision for contact isolation precautions (droplet isolation
precautions are also indicated if there is clinical evidence to suggest a patient has a
productive cough, indicative of MRSA pneumonia). Choropleth mapping demonstrated
that private rooms were more heavily utilized for patients who had been identified with

210
MRSA. The implication was that for the majority of cases, MRSA patients were placed
in private rooms and compliant with infection control recommendations.
The results from calculating spatial autocorrelation and inverse distance
weighting estimates for Units 61 and 62 indicated that the identification of MRSA were
independently associated with patient rooms. Therefore, the point estimates which factor
in each room location, demonstrate that rooms in of themselves do not factor into the
transmission of MRSA. Therefore, these data suggest that fomite contamination with
MRSA is not the primarily vehicle of transmission or one would expect cases to be
clustered around areas that potentially do not receive adequate cleaning or are repeatedly
contaminated with MRSA. The data suggests that patients are equally likely to develop
MRSA in any room on Unit 61.
In what may seem like a contrary finding, the non-spatial logistic regression
model showed that the predicted risk of MRSA was 1.45 greater among those patients
with three to five weeks of shared patient days compared to those with approximately
three weeks or less of shared patient days. Calculations of spatial autocorrelation were
not weighted by occupancy, but rather, by the weighted linear distances between positive
MRSA patients (healthcare associated). While a helpful utility, spatially autocorrelated
data indicate that the potential to develop MRSA can realistically in any room type.
These findings are also tempered by the fact that data for particular time points were
sparse, which can greatly influence the likelihood of determining clusters.
In terms of whether private rooms are useful in the management of MRSA cases,
the logistic model supports the need to control the environmental spread of MRSA
through hand hygiene. The non-systematic pattern of MRSA detection indicated that

211
MRSA does not exist as a static reservoir in rooms, but does suggest the need for a
human reservoir, which can be a moving target if MRSA is carried transiently on the
hands of healthcare personnel. If this hypothesis were true, then isolation precautions
would reduced the spread of MRSA by healthcare workers through contaminated hands
and uniforms. Especially among patients who are diarrheal or have draining wounds, the
degree of environmental contamination by MRSA has been known to increase.
According to a survey from 2006, nurses perceive that multiple occupancy rooms pose
additional challenges to their work environment because of the lack of space for the
separation of clean and dirty supplies, laundry, and equipment, plus with multiple
patients, it is difficult to perform single tasks uninterrupted [177]. Hence the likelihood
for poorer adherence to infection control may be more problematic within these spaces.
Patients who are placed in private rooms for the duration of their admission, are
at the lowest odds of MRSA acquisition up until 25 days have elapsed, which is several
days after a typical length of stay. Conversely, those in shared accommodation, for
example, placed in a four-bed room would have the same risk of MRSA by the 6th day of
their admission, and those in a semi-private room would have a 1.45 greater odds of
MRSA within two weeks of admission, controlling for all other variables. The logistic
model indicates that the odds of MRSA can be accelerated when patients are placed in
shared accommodation and not necessarily in direct contact with known MRSA patients.
This also suggests that the main mode of MRSA transmission is likely from contact with
the unwashed hands of healthcare providers or shared patient equipment, as patients tend
not to move from room to room. The sporadic nature of where MRSA cases are detected
from the autocorrelation estimates is most likely attributed to very sparse data per

212
timepoint. Also, with just mapping the locations of where patients were identified as
MRSA may not address their prior exposures, a feature that is more helpful when
observing the output from Tracking Analyst. One might consider the benefits of looking
at a larger window of time to account for a protracted period of pathogen incubation or
exposures.
In examining the process of tracking cases of MRSA and any precursor exposures
to other MRSA patients, there was evidence that clonal spread can persist over several
hosts within a short period of time. In many instances MRSA cases appear to be
sporadic, without any connection to other patients, which may speak to the iceberg effect:
for every one case of MRSA that has been identified (the visible iceberg), several more
exist that remain undetected (ice beneath the surface). While active surveillance
culturing is an expensive and resource-consuming endeavor, the clear benefit of investing
in such programs is the ability to respond to MRSA cases sooner than later by placing
positive patients on isolation. The other issue that emerges with active surveillance is the
need to isolate many more patients, potentially exceeding unit capacities for isolation.
MRSA may not eradicate on its own, and carriage can vary from months to years,
depending on the patients. Prolonged isolation can be stigmatizing to a patient and
studies have shown that patients on isolation may receive poorer care[177-180].
In 2006, the Calgary Health Region began a program where decolonization
treatments were offered to low risk patients with MRSA. Once patients were medically
stable, 2% mupirocin, rifampin and doxycycline, plus 2% chlorhexidine gluconate bath
washes were offered to patients and their household contacts for a minimum of seven

213
days. In other Canadian acute care centres, sites have reported 75% eradication that
persists for a minimum of eight months[181].
According to the proposed 2010 AIA guidelines, single occupancy patient rooms
for acute care hospitals are being recommended for newly constructed or renovated
clinical areas, provided unless the functional program can demonstrate the value of multi-
bed arrangements. For those rooms that currently exist in multi-bed arrangements,
programs may renovate clinical areas but should maintain a maximum occupancy of four
beds per room [141]. Therefore, the value of single patient occupancy for not only
curbing infectious disease spread, but for reasons of privacy and improvements to
medical recovery, is becoming incorporated into elements of engineering controls as an
integral component of the built healthcare environment.
7.9 Areas for Future Research
7.9.1 Three-Dimensional Modeling of Units
Currently, three-dimensional modeling of hospital floorplans use radio frequency
identification (RFID) tags for real-time monitoring to track healthcare personnel
movements or by examining personnel movements based on badge or computer access
points. These are interesting areas of research to pursue, as healthcare personnel can be a
key factor in the contact transmission of infectious diseases among patients [182, 183].
However, research is also needed in detailing patient movements between and
within hospital units. This study was hindered by the fact that a patient’s movements
were truncated when they were transferred off the unit, leaving unanswered questions
regarding potential exposures that would not receive consideration. The present study

214
highlighted the fact that patient movements are fluid and a better picture of disease
transmission contains all of their spatial risk factors. Modeling patient movements in
three-dimensions may lend insight into the patterns of transmission that are missed when
analysis is limited to only two dimensions. While such research would be
computationally challenging, modeling a dynamic environment may be a value-added
endeavor in gaining a better understanding of MRSA clonal and non-clonal spread.
7.9.2 Inclusion of Alternative Composite Variables in Future Models
Characterizing the additive impact of increasing numbers of roommates in
hospitals was significantly associated with an increased odds of healthcare-associated
MRSA. In the absence of existing variables that index the degree of environmental
contamination, such as daily frequency of room or bedside cleaning, number of missed
hand hygiene opportunities by healthcare personnel per patient per day, or beds-to-toilet
ratios, these are variables to potentially include in future assessments on the role of the
environment in MRSA transmission. It was clear from this study that the environment
likely plays a role in MRSA transmission, but there are host factors and virulence factors
that simultaneously contribute to the disease process. To tease these individual effects
apart may be difficult, as their role is quite likely dependent on one another.
7.9.3 Risk of MRSA Infection, Colonization vs No MRSA
For the purpose of this research, the outcome was collapsed into the likelihood of
healthcare-associated MRSA without consideration of any differential odds of acquiring
an infection, becoming colonized, or having no evidence of MRSA. A study addressing a

215
polytomous model would require a sizable sample, and because of that requirement, was
beyond the capabilities of the present research. The difficulty in evaluating the odds of
MRSA infection versus colonization is mostly due to the fact that a significant proportion
of cases will have had both outcomes, initially colonized with MRSA and then
progressing to infection. Again, like MRSA and MSSA, these populations are likely
more similar than different to each other, so a larger sample would be required to detect
even a modest significant difference. However, such as study would be interesting to
evaluate the individual-level clinical risk factor differences.
7.9.4 Paired Environmental and Clinical Isolates to Develop MRSA Contamination Density Maps
An interesting concept to evaluate in future research would be a prospective study
to examine the relationship between measured levels of environmental contamination
with MRSA (in colony forming units) and proximity to MRSA positive patients. If
environmental swabs were collected uniformly across a unit or floor, then each room and
common area would be given an adjusted value of contamination, if any. Mapped to
create an overall layer of unit-level MRSA contamination, such a layer could be
smoothed using interpolation methods. This would be a valuable teaching tool to both
healthcare personnel, visitors, and environmental cleaning personnel on the degree to
which contamination can occur, and potential redefine what high touch surfaces are
necessary to include for regular cleaning.

216
7.9.5 The Use of Prospective Data to Assess the Contribution of Spatial Autocorrelation with Higher Event Densities
One of the major challenges in developing better interpretations of the spatial
autocorrelation statistic and Tracking Analyst output, was the relative paucity of event
data. Data from the ARO Registry had to be linked to CNISP molecular typing
information as well as patient location data in order to show patient movement, date of
onset, and epidemic strain type and PFGE pattern. Missing links between records would
automatically exclude the record and as a result, hundreds of potential cases were
diminished to only a fraction of that initial cohort. As was learned during this study,
geographic analysis requires high density data in order to maximize the precision of
spatial estimators. This suggests that geographic estimations are better suited to
predicting the outcome of common diseases or compiling outbreak data, compared to rare
events.
A prospective study that was aimed at ensuring these data were collected on new
MRSA cases may be able to better illustrate the relationship between rooms or beds and
the role of the physical environment on MRSA acquisition. The inclusion of PFGE data
is invaluable by complementing the epidemiologic information with potential
confirmatory results indicating clonal transmission.
In some scenarios, transmission of a strain of MRSA may be a result of a single
point source, or in other instances, a measure of propagated transmission through
secondary carriers. It is assumed that each person infected or colonized with MRSA has
an equal probability of shedding MRSA into the environment, when it is possible that in a
given population there will be super-shedders and those who do not have high enough
217
counts of MRSA to transmit the organism [184]. Those who have MRSA pneumonia are
more likely to shed more bacteria through contact and droplet mechanisms, but this has
not been validated. In such complicated event chains, it is impossible to characterize all
of the elements that converge on a sentinel outcome. More importantly, the time from
exposure to MRSA acquisition is variable. If a patient is first colonized with MRSA
before expressing clinical signs of infection, it is difficult to ascertain whether acquisition
occurred in the current hospital environment, from a previous hospitalization, through
household or close contacts.

218
Chapter Eight: Conclusions
The epidemiology of MRSA in the Calgary Health Region has been dynamic over
the last decade, and its emergence and establishment in the healthcare settings have posed
numerous challenges to clinicians, administrators, and infection preventionists alike.
Without a known incubation period, an entire spectrum of clinical manifestations, and in
some cases, very limited treatment options, prevention and control struggle to understand
the mechanisms of its spread and persistence in hospitals. Basic infection prevention
strategies, while simple, do not appear to be enough to control its spread despite evidence
to suggest that hand hygiene and personal protective equipment are sufficient to break the
chain of infection. MRSA typically is spread through contact means, and as such,
transmission in healthcare environments are approached through the implementation of
adequate environmental cleaning for surfaces and patient equipment, as well as
engineering controls, to complement the use of hand hygiene and protective barriers. The
most likely means of spread is primarily through the contaminated hands of healthcare
providers, with indirectly contaminated environmental surfaces as well as direct patient-
to-patient contact being secondary forms of MRSA transfer.
This study took a novel approach to evaluating the role of both space and time on
the likelihood of MRSA. Examining the role of the environment and factors related to
clinical and demographic factors, but also spatial and temporal components, are of value
in understanding why MRSA strains persist in some environments than others.
Transmission dynamics are similar to forensics, and tools like GIS can complement
epidemiologic work to help visualize the nature of disease spread. Several objectives
219
were outlined at the commencement of the project, and a summary of the conclusions are
outlined.
6. To determine the feasibility of Geographic Information Systems (GIS) technology in
characterizing patient movements in time and space, and outlining the difficulties, if
any, in departing from traditional approaches to GIS analysis for micro-spatial
environments.
GIS applications, while still requiring some work to refine and adjust for
healthcare and micro-spatial environments, were found to be a useful tool in visualizing
disease as a gradient of risk. Improvements to data quality and availability, as well as
changes to the available software packages would vastly improve our ability to collect
robust data to analyse transmission patterns in healthcare settings. Use of both
interpolation and visual tracking applications are promising tools to evaluate MRSA
spread. MRSA transmission is complex, but GIS has extraordinary capabilities to move
beyond traditional epidemiologic and statistical tools to better understand these
complexities.
7. To characterize the spatial pattern and distribution of MRSA strains in select
inpatient populations from the Calgary Health Region using retrospective data from
2001-2006.

220
The distribution of MRSA strains showed that among high risk inpatient
populations, there is a wide diversity of MRSA strains, with no one strain within even the
largest clade, CMRSA-2 emerged as dominant in any of these populations. A review of
these data suggest that there is no one strain that is more ecologically fit than others, and
also suggests that the wide diversity of MRSA may be an indicator of multiple etiologies
or point source introductions to these hospital environments. To further evaluated its
significance, PFGE strain analysis should be conducted on a macro level across all CHR
facilities.
8. To model the process of contact transmission using retrospective data, and predict
future geographic areas likely to experience new infiltration or an increased MRSA
burden.
The data was unable to provide a clear picture of the mode of MRSA transmission
within the confines of a unit. If isolate data and hospital floorplans were merged to
represent both a larger physical layout to include more units, as well as timeframes, there
may be better resolution to visualize and predict the mechanism of disease spread. One
of the major challenges is that MRSA can also persist without any evidence of clinical
infection, and accounting for transmission with an unknown reservoir of MRSA will need
to be addressed in future modeling projects.
9. To analyze the likelihood of MRSA acquisition with respect to particular host, staff
workload index, and geographic attributes.

221
The logistic modeling process was able to identify the role of both nursing
workload, shared environments, exposure to Vancomycin, as well as indicators of
calendar year and unit location as significant factors that predict the likelihood of
healthcare-associated MRSA. Spatially weighted regression was not performed for this
project, although the parameters for creating a spatially weighted surface to represent
MRSA likelihood could be accomplished with the development of other spatially-
oriented variables such as maps of nursing assignments or locations of high touch
surfaces.
10. To determine whether having private compared to shared accommodation in hospital
facilities reduces the risk of MRSA transmission to susceptible inpatients.
The logistic regression model to evaluate the role of cumulative shared
accommodation with respect to MRSA, highlighted the fact that patients who spent
greater portions of their time in private accommodations had a lower predicted risk of
MRSA than those who spent all or some of their admissions in shared accommodations.
Those that were in exclusively private rooms did not have a zero risk for MRSA even
after controlling for all other variables in the model, but experienced longer lengths of
stay at the lowest odds of acquiring MRSA. Measures of spatial autocorrelation which
measured the interdependence of MRSA as a function of rooms, demonstrated that the
likelihood of acquiring MRSA was independent of the room type. However, these
estimates were based on cells with values of 5 or less, thus producing highly vulnerable

222
results. An increased density of scattered data points per unit time would provide
considerably better estimates of clustering.
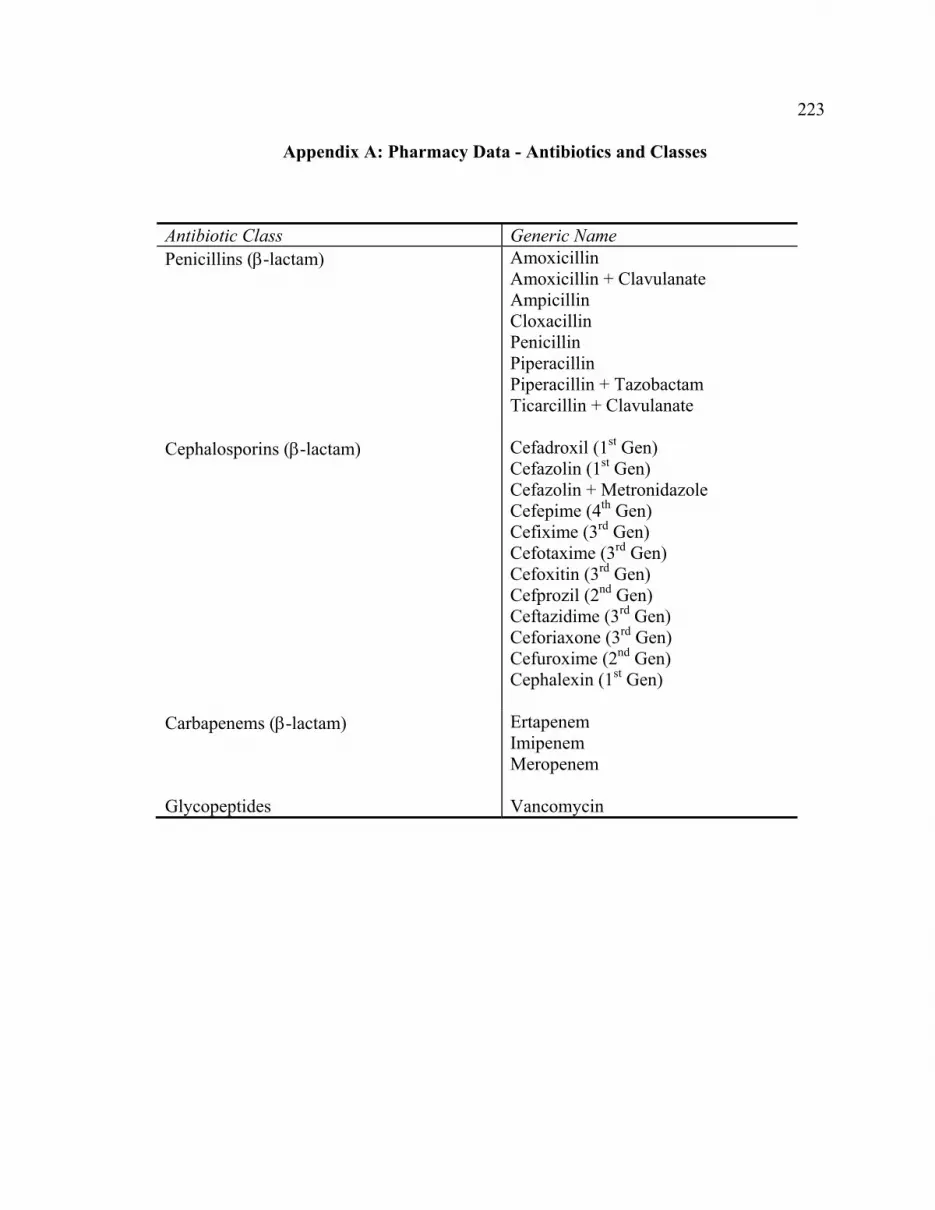
223
Appendix A: Pharmacy Data - Antibiotics and Classes
Antibiotic Class Generic Name Penicillins (β-lactam) Amoxicillin
Amoxicillin + Clavulanate Ampicillin Cloxacillin Penicillin Piperacillin Piperacillin + Tazobactam Ticarcillin + Clavulanate
Cephalosporins (β-lactam) Cefadroxil (1st Gen) Cefazolin (1st Gen) Cefazolin + Metronidazole Cefepime (4th Gen) Cefixime (3rd Gen) Cefotaxime (3rd Gen) Cefoxitin (3rd Gen) Cefprozil (2nd Gen) Ceftazidime (3rd Gen) Ceforiaxone (3rd Gen) Cefuroxime (2nd Gen) Cephalexin (1st Gen)
Carbapenems (β-lactam) Ertapenem Imipenem Meropenem
Glycopeptides Vancomycin
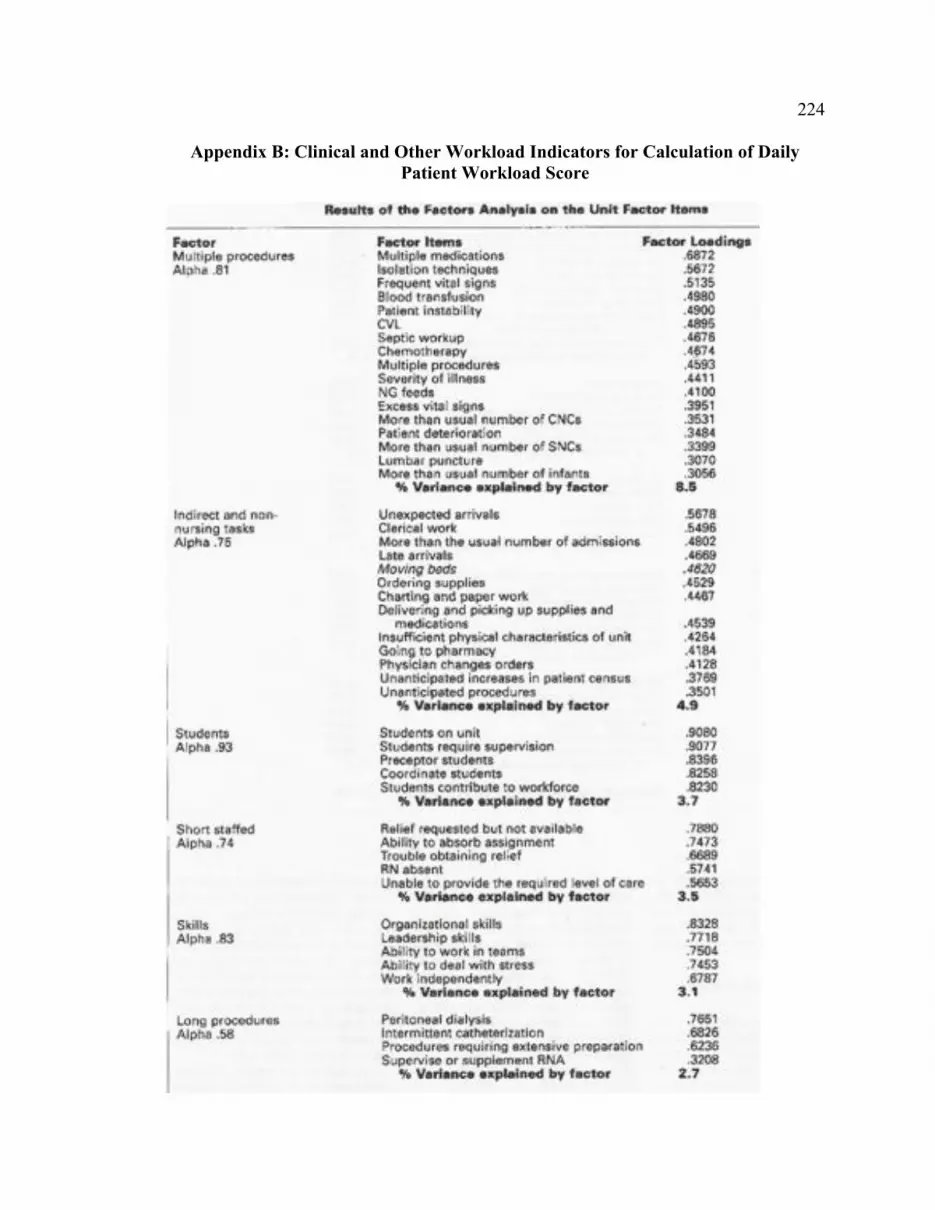
224
Appendix B: Clinical and Other Workload Indicators for Calculation of Daily Patient Workload Score

225
Source: Nursing Economics, 1997 [185]

226
Appendix C: The ARO Registry

227
References
1. Kowalski, T.J., E.F. Berbari, and D.R. Osmon, Epidemiology, treatment, and prevention of community-acquired methicillin-resistant Staphylococcus aureus infections. Mayo Clin Proc, 2005. 80(9): p. 1201-7; quiz 1208.
2. Wulf, M.W., et al., MRSA carriage in healthcare personnel in contact with farm animals. J Hosp Infect, 2008. 70(2): p. 186-90.
3. Weese, J.S., et al., Suspected transmission of methicillin-resistant Staphylococcus aureus between domestic pets and humans in veterinary clinics and in the household. Vet Microbiol, 2006. 115(1-3): p. 148-55.
4. Sanford, M.D., et al., Efficient detection and long-term persistence of the carriage of methicillin-resistant Staphylococcus aureus. Clin Infect Dis, 1994. 19(6): p. 1123-8.
5. Boyce, J.M., et al., Environmental contamination due to methicillin-resistant Staphylococcus aureus: possible infection control implications. Infect Control Hosp Epidemiol, 1997. 18(9): p. 622-7.
6. Oie, S. and A. Kamiya, Survival of methicillin-resistant Staphylococcus aureus (MRSA) on naturally contaminated dry mops. J Hosp Infect, 1996. 34(2): p. 145-9.
7. Wagenvoort, J.H., W. Sluijsmans, and R.J. Penders, Better environmental survival of outbreak vs. sporadic MRSA isolates. J Hosp Infect, 2000. 45(3): p. 231-4.
8. Walther, B.A. and P.W. Ewald, Pathogen survival in the external environment and the evolution of virulence. Biol Rev Camb Philos Soc, 2004. 79(4): p. 849-69.
9. Hughes, C.M., M.B. Smith, and M.M. Tunney, Infection control strategies for preventing the transmission of meticillin-resistant Staphylococcus aureus (MRSA) in nursing homes for older people. Cochrane Database Syst Rev, 2008(1): p. CD006354.
10. Krishna, B.V., A. Patil, and M.R. Chandrasekhar, Methicillin resistant Staphylococcus aureus infections-implications in hospital infection control. Indian J Public Health, 2007. 51(1): p. 43-6.
11. Muder, R.R., et al., Implementation of an industrial systems-engineering approach to reduce the incidence of methicillin-resistant Staphylococcus aureus infection. Infect Control Hosp Epidemiol, 2008. 29(8): p. 702-8, 7 p following 708.
12. Cromer, A.L., et al., Monitoring and feedback of hand hygiene compliance and the impact on facility-acquired methicillin-resistant Staphylococcus aureus. Am J Infect Control, 2008.
13. Gillespie, E.E., et al., A sustained reduction in the transmission of methicillin resistant Staphylococcus aureus in an intensive care unit. Crit Care Resusc, 2007. 9(2): p. 161-5.
14. McBryde, E.S., et al., An investigation of contact transmission of methicillin-resistant Staphylococcus aureus. J Hosp Infect, 2004. 58(2): p. 104-8.
15. Simor, A.E., et al., Laboratory characterization of methicillin-resistant Staphylococcus aureus in Canadian hospitals: results of 5 years of National Surveillance, 1995-1999. J Infect Dis, 2002. 186(5): p. 652-60.

228
16. Glass, G., Geographic Information Systems, in Infectious Disease Epidemiology, E.N. Nelson, C. Masters Williams, and N.M.H. Graham, Editors. 2001, Aspen Publishers: Gaithersburg, Maryland. p. 231-253.
17. Schellenberg, J.A., et al., An analysis of the geographical distribution of severe malaria in children in Kilifi District, Kenya. Int J Epidemiol, 1998. 27(2): p. 323-9.
18. Mostashari, F., et al., Dead bird clusters as an early warning system for West Nile virus activity. Emerg Infect Dis, 2003. 9(6): p. 641-6.
19. Wylie, J.L., T. Cabral, and A.M. Jolly, Identification of networks of sexually transmitted infection: a molecular, geographic, and social network analysis. J Infect Dis, 2005. 191(6): p. 899-906.
20. Ali, M., et al., Use of a geographic information system for defining spatial risk for dengue transmission in Bangladesh: role for Aedes albopictus in an urban outbreak. Am J Trop Med Hyg, 2003. 69(6): p. 634-40.
21. Fang, L., et al., Spatial analysis of hemorrhagic fever with renal syndrome in China. BMC Infect Dis, 2006. 6: p. 77.
22. Gordon, R.J. and F.D. Lowy, Pathogenesis of methicillin-resistant Staphylococcus aureus infection. Clin Infect Dis, 2008. 46 Suppl 5: p. S350-9.
23. Graham, P.L., 3rd, S.X. Lin, and E.L. Larson, A U.S. population-based survey of Staphylococcus aureus colonization. Ann Intern Med, 2006. 144(5): p. 318-25.
24. Kuehnert, M.J., et al., Prevalence of Staphylococcus aureus nasal colonization in the United States, 2001-2002. J Infect Dis, 2006. 193(2): p. 172-9.
25. Johnston, C.P., et al., Staphylococcus aureus colonization among healthcare workers at a tertiary care hospital. Infect Control Hosp Epidemiol, 2007. 28(12): p. 1404-7.
26. Bisaga, A., et al., A Prevalence Study of Methicillin-Resistant Staphylococcus aureus Colonization in Emergency Department Health Care Workers. Ann Emerg Med, 2008. 52(5): p. 525-8.
27. Hospital Epidemiology and Infection Control, ed. C.G. Mayhall. 1996, Baltimore: Williams and Wilkins.
28. Davis, K.A., et al., Methicillin-resistant Staphylococcus aureus (MRSA) nares colonization at hospital admission and its effect on subsequent MRSA infection. Clin Infect Dis, 2004. 39(6): p. 776-82.
29. Safdar, N. and E.A. Bradley, The risk of infection after nasal colonization with Staphylococcus aureus. Am J Med, 2008. 121(4): p. 310-5.
30. Schweizer, M.L., et al., Clinical utility of infection control documentation of prior methicillin-resistant Staphylococcus aureus colonization or infection for optimization of empirical antibiotic therapy. Infect Control Hosp Epidemiol, 2008. 29(10): p. 972-4.
31. Emori, T.G. and R.P. Gaynes, An overview of nosocomial infections, including the role of the microbiology laboratory. Clin Microbiol Rev, 1993. 6(4): p. 428-42.
32. Cimolai, N., Are all MRSA made equal? Canadian Journal of Microbiology, 2002. 48: p. 560-566.

229
33. Naimi, T.S., et al., Comparison of community- and health care-associated methicillin-resistant Staphylococcus aureus infection. Jama, 2003. 290(22): p. 2976-84.
34. Klevens, R.M., et al., Invasive methicillin-resistant Staphylococcus aureus infections in the United States. Jama, 2007. 298(15): p. 1763-71.
35. Fishbain, J.T., et al., Nosocomial transmission of methicillin-resistant Staphylococcus aureus: a blinded study to establish baseline acquisition rates. Infect Control Hosp Epidemiol, 2003. 24(6): p. 415-21.
36. Jernigan, J.A., et al., Prevalence of and risk factors for colonization with methicillin-resistant Staphylococcus aureus at the time of hospital admission. Infect Control Hosp Epidemiol, 2003. 24(6): p. 409-14.
37. Hershow, R.C., W.F. Khayr, and N.L. Smith, A comparison of clinical virulence of nosocomially acquired methicillin-resistant and methicillin-sensitive Staphylococcus aureus infections in a university hospital. Infect Control Hosp Epidemiol, 1992. 13(10): p. 587-93.
38. Kopp, B.N., DE; Armstrong, EP, Clinical and economic analysis of methicillin-susceptible and -resistant Staphylococcus aureus infections. The Annals of Pharmacotherapy, 2004. 38: p. 1377-82.
39. Shurland, S., et al., Comparison of mortality risk associated with bacteremia due to methicillin-resistant and methicillin-susceptible Staphylococcus aureus. Infect Control Hosp Epidemiol, 2007. 28(3): p. 273-9.
40. Cosgrove, S.E., et al., The impact of methicillin resistance in Staphylococcus aureus bacteremia on patient outcomes: mortality, length of stay, and hospital charges. Infect Control Hosp Epidemiol, 2005. 26(2): p. 166-74.
41. Melzer, M., et al., Is methicillin-resistant Staphylococcus aureus more virulent than methicillin-susceptible S. aureus? A comparative cohort study of British patients with nosocomial infection and bacteremia. Clin Infect Dis, 2003. 37(11): p. 1453-60.
42. Peacock, J.M., DR; Wenzel, RP; Mandell, GL, Methicillin-resistant Staphylococcus aureus: microbiologic characteristics, antimicrobial susceptibilities, and assessment of virulence of an epidemic strain. Journal of Infectious Diseases, 1981. 144: p. 575-582.
43. Laupland, K.B., T. Ross, and D.B. Gregson, Staphylococcus aureus bloodstream infections: risk factors, outcomes, and the influence of methicillin resistance in Calgary, Canada, 2000-2006. J Infect Dis, 2008. 198(3): p. 336-43.
44. Robinson, D.A. and M.C. Enright, Multilocus sequence typing and the evolution of methicillin-resistant Staphylococcus aureus. Clin Microbiol Infect, 2004. 10(2): p. 92-7.
45. Oliveira, D.C., A. Tomasz, and H. de Lencastre, Secrets of success of a human pathogen: molecular evolution of pandemic clones of meticillin-resistant Staphylococcus aureus. Lancet Infect Dis, 2002. 2(3): p. 180-9.
46. Enright, M.C., et al., The evolutionary history of methicillin-resistant Staphylococcus aureus (MRSA). Proc Natl Acad Sci U S A, 2002. 99(11): p. 7687-92.

230
47. Hiramatsu, K., et al., The emergence and evolution of methicillin-resistant Staphylococcus aureus. Trends Microbiol, 2001. 9(10): p. 486-93.
48. Stapleton, P.T., PW, Methicillin resistance in Staphylococcus aureus: mechanisms and modulation. Science Progress, 2002. 85(1): p. 57-72.
49. Tverdek, F.P., C.W. Crank, and J. Segreti, Antibiotic therapy of methicillin-resistant Staphylococcus aureus in critical care. Crit Care Clin, 2008. 24(2): p. 249-60, vii-viii.
50. Tsuji, B.T., et al., Community- and health care-associated methicillin-resistant Staphylococcus aureus: a comparison of molecular epidemiology and antimicrobial activities of various agents. Diagn Microbiol Infect Dis, 2007. 58(1): p. 41-7.
51. Gosbell, I.B., Epidemiology, clinical features and management of infections due to community methicillin-resistant Staphylococcus aureus (cMRSA). Intern Med J, 2005. 35 Suppl 2: p. S120-35.
52. Witte, W., et al., Emergence of methicillin-resistant Staphylococcus aureus with Panton-Valentine leukocidin genes in central Europe. Eur J Clin Microbiol Infect Dis, 2005. 24(1): p. 1-5.
53. Smith, I.M. and A.B. Vickers, Natural history of 338 treated and untreated patients with staphylococcal septicaemia (1936-1955). Lancet, 1960. 1(7138): p. 1318-22.
54. Atkinson, B.A. and V. Lorian, Antimicrobial agent susceptibility patterns of bacteria in hospitals from 1971 to 1982. J Clin Microbiol, 1984. 20(4): p. 791-6.
55. Maranan, M.C., et al., Antimicrobial resistance in staphylococci. Epidemiology, molecular mechanisms, and clinical relevance. Infect Dis Clin North Am, 1997. 11(4): p. 813-49.
56. Benner, E.J. and V. Morthland, Methicillin-resistant Staphylococcus aureus. Antimicrobial susceptibility. N Engl J Med, 1967. 277(13): p. 678-80.
57. Bulger, R.J., A methicillin-resistant strain of Staphylococcus aureus. Clinical and laboratory experience. Ann Intern Med, 1967. 67(1): p. 81-9.
58. Seligman, S., Resistant Staphylococcus aureus. . N Engl J Med, 1967. 277: p. 1267.
59. Tiemersma, E.W., et al., Methicillin-resistant Staphylococcus aureus in Europe, 1999-2002. Emerg Infect Dis, 2004. 10(9): p. 1627-34.
60. Griffiths, C., et al., Trends in MRSA in England and Wales: analysis of morbidity and mortality data for 1993-2002. Health Stat Q, 2004(21): p. 15-22.
61. Pastila, S., et al., Control of methicillin-resistant Staphylococcus aureus outbreak involving several hospitals. J Hosp Infect, 2004. 58(3): p. 180-6.
62. Oliveira, D.C., A. Tomasz, and H. de Lencastre, The evolution of pandemic clones of methicillin-resistant Staphylococcus aureus: identification of two ancestral genetic backgrounds and the associated mec elements. Microb Drug Resist, 2001. 7(4): p. 349-61.
63. da Silva Coimbra, M.V., et al., Clonal spread of methicillin-resistant Staphylococcus aureus in a large geographic area of the United States. J Hosp Infect, 2003. 53(2): p. 103-10.

231
64. Crisostomo, M.I., et al., The evolution of methicillin resistance in Staphylococcus aureus: similarity of genetic backgrounds in historically early methicillin-susceptible and -resistant isolates and contemporary epidemic clones. Proc Natl Acad Sci U S A, 2001. 98(17): p. 9865-70.
65. Panlilio, A.L., et al., Methicillin-resistant Staphylococcus aureus in U.S. hospitals, 1975-1991. Infect Control Hosp Epidemiol, 1992. 13(10): p. 582-6.
66. Kuehnert, M.J., et al., Methicillin-resistant-Staphylococcus aureus hospitalizations, United States. Emerg Infect Dis, 2005. 11(6): p. 868-72.
67. Simor, A.E., et al., The evolution of methicillin-resistant Staphylococcus aureus in Canadian hospitals: 5 years of national surveillance. Cmaj, 2001. 165(1): p. 21-6.
68. Zoutman, D.E., et al., The state of infection surveillance and control in Canadian acute care hospitals. Am J Infect Control, 2003. 31(5): p. 266-72; discussion 272-3.
69. Canadian Nosocomial Infection Surveillance Program. Surveillance for Methicillin-resistant Staphylococcus aureus (MRSA) in Patients Hospitalized in Canadian Acute-Care Hospitals Participating in CNISP 2006-2007 Preliminary Results 2008 [cited; Available from: http://www.phac-aspc.gc.ca/nois-sinp/reports-rapport/mrsa-sarm_result-eng.php.
70. Roman, R.S., et al., Rapid geographic spread of a methicillin-resistant Staphylococcus aureus strain. Clin Infect Dis, 1997. 25(3): p. 698-705.
71. Simor, A., et al., Characterization and proposed nomenclature of epidemic strains of methicillin-resistant Staphylococcus aureus in Canada. Can Commun Dis Rep, 1999. 25(12): p. 105-8.
72. Lye, T.L., TJ, METHICILLIN RESISTANT STAPHYLOCOCCUS AUREUS (MRSA) ACTVITY WITHIN ACUTE CARE PATIENT CARE UNITS. 2006, Calgary Health Region: Calgary.
73. Gilbert, M., et al., Outbreak in Alberta of community-acquired (USA300) methicillin-resistant Staphylococcus aureus in people with a history of drug use, homelessness or incarceration. Cmaj, 2006. 175(2): p. 149-54.
74. Gregson, D., Calgary Health Region aggregate MRSA data 2002-2006. 2006: Calgary, AB.
75. Moore, C., et al., Risk factors for methicillin-resistant Staphylococcus aureus (MRSA) acquisition in roommate contacts of patients colonized or infected with MRSA in an acute-care hospital. Infect Control Hosp Epidemiol, 2008. 29(7): p. 600-6.
76. Thompson, D.S., Methicillin-resistant Staphylococcus aureus in a general intensive care unit. J R Soc Med, 2004. 97(11): p. 521-6.
77. Deurenberg, R.H., et al., The molecular evolution of methicillin-resistant Staphylococcus aureus. Clin Microbiol Infect, 2007. 13(3): p. 222-35.
78. Khurram, I.M., et al., Risk factors for clinical infection in patients colonized with methicillin resistant Staphylococcus aureus (MRSA). J Pak Med Assoc, 2004. 54(8): p. 408-12.
79. Layton, M.C., W.J. Hierholzer, Jr., and J.E. Patterson, The evolving epidemiology of methicillin-resistant Staphylococcus aureus at a university hospital. Infect Control Hosp Epidemiol, 1995. 16(1): p. 12-7.
232
80. Rojas, E. and L. Liu, Annual cost of for the treatment of patients hospitalized with Methicillin resistant Staphylococcus aureus in the United States in 10th Annual International Meeting of the Society of Pharmacoeconomics and Outcomes Research. 2005: Washington DC.
81. Noskin, G.A., et al., The burden of Staphylococcus aureus infections on hospitals in the United States: an analysis of the 2000 and 2001 Nationwide Inpatient Sample Database. Arch Intern Med, 2005. 165(15): p. 1756-61.
82. Birnbaum, D., Antimicrobial resistance: a deadly burden no country can afford to ignore. Can Commun Dis Rep, 2003. 29(18): p. 157-64.
83. Kim, T., P.I. Oh, and A.E. Simor, The economic impact of methicillin-resistant Staphylococcus aureus in Canadian hospitals. Infect Control Hosp Epidemiol, 2001. 22(2): p. 99-104.
84. Gould, I.M., Costs of hospital-acquired methicillin-resistant Staphylococcus aureus (MRSA) and its control. Int J Antimicrob Agents, 2006. 28(5): p. 379-84.
85. Bjorholt, I. and E. Haglind, Cost-savings achieved by eradication of epidemic methicillin-resistant Staphylococcus aureus (EMRSA)-16 from a large teaching hospital. Eur J Clin Microbiol Infect Dis, 2004. 23(9): p. 688-95.
86. Boyce, J.M. and N.L. Havill, Comparison of BD GeneOhm methicillin-resistant Staphylococcus aureus (MRSA) PCR versus the CHROMagar MRSA assay for screening patients for the presence of MRSA strains. J Clin Microbiol, 2008. 46(1): p. 350-1.
87. Hedin, G. and H. Fang, Evaluation of two new chromogenic media, CHROMagar MRSA and S. aureus ID, for identifying Staphylococcus aureus and screening methicillin-resistant S. aureus. J Clin Microbiol, 2005. 43(8): p. 4242-4.
88. Rahbar, M., P. Islami, and M. Saremi, Evaluation of a new CHROMagar medium for detection of methicillin-resistant Staphylococcus aureus. Pak J Biol Sci, 2008. 11(3): p. 496-8.
89. Conterno, L.O., et al., Real-time polymerase chain reaction detection of methicillin-resistant Staphylococcus aureus: impact on nosocomial transmission and costs. Infect Control Hosp Epidemiol, 2007. 28(10): p. 1134-41.
90. Tenover, F.C., R.D. Arbeit, and R.V. Goering, How to select and interpret molecular strain typing methods for epidemiological studies of bacterial infections: a review for healthcare epidemiologists. Molecular Typing Working Group of the Society for Healthcare Epidemiology of America. Infect Control Hosp Epidemiol, 1997. 18(6): p. 426-39.
91. Tenover, F.C., et al., Interpreting chromosomal DNA restriction patterns produced by pulsed-field gel electrophoresis: criteria for bacterial strain typing. J Clin Microbiol, 1995. 33(9): p. 2233-9.
92. Muto, C.A., et al., SHEA guideline for preventing nosocomial transmission of multidrug-resistant strains of Staphylococcus aureus and enterococcus. Infect Control Hosp Epidemiol, 2003. 24(5): p. 362-86.
93. Siegel JD, R.E., Jackson M, Chiarello L, Healthcare Infection Control Practices Advisory Committee. , Management of multidrug-resistant organisms in healthcare settings, 2006. . 2006.
233
94. Sehulster, L. and R.Y. Chinn, Guidelines for environmental infection control in health-care facilities. Recommendations of CDC and the Healthcare Infection Control Practices Advisory Committee (HICPAC). MMWR Recomm Rep, 2003. 52(RR-10): p. 1-42.
95. 2006 Guidelines for Design and Construction of Health Care Facilities. 2006: American Institute of Architects.
96. Kibbler, C.C., A. Quick, and A.M. O'Neill, The effect of increased bed numbers on MRSA transmission in acute medical wards. J Hosp Infect, 1998. 39(3): p. 213-9.
97. Vriens, M., et al., Costs associated with a strict policy to eradicate methicillin-resistant Staphylococcus aureus in a Dutch University Medical Center: a 10-year survey. Eur J Clin Microbiol Infect Dis, 2002. 21(11): p. 782-6.
98. Schelenz, S., et al., Significant reduction of endemic MRSA acquisition and infection in cardiothoracic patients by means of an enhanced targeted infection control programme. J Hosp Infect, 2005. 60(2): p. 104-10.
99. Centers for Disease Control and Prevention. [cited June 2009]; Available from: http://www.cdc.gov/mrsa/.
100. Rohr, U., et al., Colonization of patients and contamination of the patients' environment by MRSA under conditions of single-room isolation. Int J Hyg Environ Health, 2008.
101. Mulligan, M.E., et al., Methicillin-resistant Staphylococcus aureus: a consensus review of the microbiology, pathogenesis, and epidemiology with implications for prevention and management. Am J Med, 1993. 94(3): p. 313-28.
102. Wilson, A.P., et al., Importance of the environment for patient acquisition of methicillin-resistant Staphylococcus aureus in the intensive care unit: a baseline study. Crit Care Med, 2007. 35(10): p. 2275-9.
103. Andersen, B.M., et al., Spread of methicillin-resistant Staphylococcus aureus in a neonatal intensive unit associated with understaffing, overcrowding and mixing of patients. J Hosp Infect, 2002. 50(1): p. 18-24.
104. Borg, M.A., Bed occupancy and overcrowding as determinant factors in the incidence of MRSA infections within general ward settings. J Hosp Infect, 2003. 54(4): p. 316-8.
105. Borg, M.A., D. Suda, and E. Scicluna, Time-series analysis of the impact of bed occupancy rates on the incidence of methicillin-resistant Staphylococcus aureus infection in overcrowded general wards. Infect Control Hosp Epidemiol, 2008. 29(6): p. 496-502.
106. Clements, A., et al., Overcrowding and understaffing in modern health-care systems: key determinants in meticillin-resistant Staphylococcus aureus transmission. Lancet Infect Dis, 2008. 8(7): p. 427-34.
107. Bracco, D., et al., Single rooms may help to prevent nosocomial bloodstream infection and cross-transmission of methicillin-resistant Staphylococcus aureus in intensive care units. Intensive Care Med, 2007. 33(5): p. 836-40.
108. Salgado, C.D. and B.M. Farr, What proportion of hospital patients colonized with methicillin-resistant Staphylococcus aureus are identified by clinical microbiological cultures? Infect Control Hosp Epidemiol, 2006. 27(2): p. 116-21.

234
109. Williams, V.R., et al., The role of colonization pressure in nosocomial transmission of methicillin-resistant Staphylococcus aureus. Am J Infect Control, 2008.
110. Embil, J., et al., Methicillin-resistant Staphylococcus aureus in tertiary care institutions on the Canadian prairies 1990-1992. Infect Control Hosp Epidemiol, 1994. 15(10): p. 646-51.
111. Alberta. Alberta Health and Wellness., Provincial methicillin resistant staphylococcus aureus (MRSA) infection prevention and control guidelines. 2007, Edmonton, Alta.: Alberta Health and Wellness. 1 electronic text (57 ).
112. Ofner-Agostini, M., et al., Infection control and antimicrobial restriction practices for antimicrobial-resistant organisms in Canadian tertiary care hospitals. Am J Infect Control, 2007. 35(9): p. 563-8.
113. Louie, T.A., N, Calgary Health Region Point Prevalence study. 2002. 114. Zoutman, D.E. and B.D. Ford, The relationship between hospital infection
surveillance and control activities and antibiotic-resistant pathogen rates. Am J Infect Control, 2005. 33(1): p. 1-5.
115. Clarke, K.C., S.L. McLafferty, and B.J. Tempalski, On epidemiology and geographic information systems: a review and discussion of future directions. Emerg Infect Dis, 1996. 2(2): p. 85-92.
116. USGS. Geographic Information Systems. United States Geological Survey 2007 [cited 2008 11/12]; Available from: http://egsc.usgs.gov/isb/pubs/gis_poster/index.html
117. Boulos, M.N., A.V. Roudsari, and E.R. Carson, Health geomatics: an enabling suite of technologies in health and healthcare. J Biomed Inform, 2001. 34(3): p. 195-219.
118. Kulldorff, M. SaTScan software. 2009 [cited 2009 July]; Available from: www.satscan.org.
119. Kitron, U. and J.J. Kazmierczak, Spatial analysis of the distribution of Lyme disease in Wisconsin. Am J Epidemiol, 1997. 145(6): p. 558-66.
120. Rogerson, P., Statistical Methods for Geography. 2001, London: SAGE Publications.
121. Elliott, P., et al., Spatial Epidemiology: Methods and Applications. 2000, New York: Oxford University Press.
122. Venkatachalam, S.M., AR. Towards computational epidemiology: Using stochastic cellular automata in modeling spread of diseases. in Proc. of the 4th Annual International Conference on Statistics. Jan 2005. Honolulu, HI.
123. Fukuda, M., et al., High-risk populations for nasal carriage of methicillin-resistant Staphylococcus aureus. J Infect Chemother, 2004. 10(3): p. 189-91.
124. Marshall, C., et al., Acquisition of methicillin-resistant Staphylococcus aureus in a large intensive care unit. Infect Control Hosp Epidemiol, 2003. 24(5): p. 322-6.
125. Oztoprak, N., et al., Risk factors for ICU-acquired methicillin-resistant Staphylococcus aureus infections. Am J Infect Control, 2006. 34(1): p. 1-5.
126. Crosier, S., ArcGIS 9: Geocoding in ArcGIS. 2004, Redlands, CA: ESRI Press. 193.

235
127. Vine, M.F., D. Degnan, and C. Hanchette, Geographic information systems: their use in environmental epidemiologic research. Environ Health Perspect, 1997. 105(6): p. 598-605.
128. Sebille, V. and A.J. Valleron, A computer simulation model for the spread of nosocomial infections caused by multidrug-resistant pathogens. Comput Biomed Res, 1997. 30(4): p. 307-22.
129. Raboud, J., et al., Modeling transmission of methicillin-resistant Staphylococcus aureus among patients admitted to a hospital. Infect Control Hosp Epidemiol, 2005. 26(7): p. 607-15.
130. CLSI., Performance standards for antimicrobial susceptibility testing: CLSI approved standard M100-S17. 2007, Wayne, PA: Clinical and Laboratory Standards Institute.
131. Kelsey, J., et al., Methods in Observational Epidemiology 2nd Edition ed. 1996, Oxford: Oxford University Press. Table 12-15.
132. Mulvey, M., MRSA Surveillance Protocol: Surveillance for Methicillin-resistant Staphylococcus aureus (MRSA) In CNISP health care facilities, C.N.I.S. Program, Editor. 2006.
133. Talon, D., et al., Modelling the usefulness of a dedicated cohort facility to prevent the dissemination of MRSA. J Hosp Infect, 2003. 54(1): p. 57-62.
134. Lucet, J.C., et al., Prevalence and risk factors for carriage of methicillin-resistant Staphylococcus aureus at admission to the intensive care unit: results of a multicenter study. Arch Intern Med, 2003. 163(2): p. 181-8.
135. Graf, C.M.P.R.N., et al., Patients' Needs for Nursing Care: Beyond Staffing Ratios. Journal of Nursing Administration, 2003. 33(2): p. 76-81.
136. Introduction to Nursing Informatics. 3rd ed, ed. K. Hannah, M.J.A. Edwards, and M.J. Ball. 2006: Springer-Verlag.
137. Greensword, L., CHR Manager of Patient Case Costing. 2008. 138. Lonergan, J., CHR Integrated Nursing Systems Workload Consultant. 2007. 139. Charlson, M.E., et al., A new method of classifying prognostic comorbidity in
longitudinal studies: development and validation. J Chronic Dis, 1987. 40(5): p. 373-83.
140. Quan, H., et al., Coding algorithms for defining comorbidities in ICD-9-CM and ICD-10 administrative data. Med Care, 2005. 43(11): p. 1130-9.
141. American Institute of Architects, Guidelines for Design and Construction of Health Care Facilities, ed. t.A.A.o.A.f.H. Facilities Guidelines Institute, U.S. Department of Health and Human Services 2006, Washington DC: American Institutes of Architect Press.
142. Clinical and Laboratory Standards Institute, Abbreviated Identification of Bacteria and Yeast; Approved Guideline - Second Edition. Second ed. 2008, Boston: Massachusetts General Hospital.
143. Kleinbaum, D.K., LL; Morgenstern H, Epidemiologic Research: Principles and Quantitative Methods. 1982, New York: John Wiley and Sons, Inc.
144. Kleinbaum, D. 2009: Atlanta. 145. Simpson, E.H., Measurement of Diversity. Nature, 1949. 163: p. 688.

236
146. Hunter, P.R. and M.A. Gaston, Numerical index of the discriminatory ability of typing systems: an application of Simpson's index of diversity. J Clin Microbiol, 1988. 26(11): p. 2465-6.
147. Grundmann, H., S. Hori, and G. Tanner, Determining confidence intervals when measuring genetic diversity and the discriminatory abilities of typing methods for microorganisms. J Clin Microbiol, 2001. 39(11): p. 4190-2.
148. Giannini, M.A., D. Nance, and J.A. McCullers, Are toilet seats a vector for transmission of methicillin-resistant Staphylococcus aureus? Am J Infect Control, 2009.
149. Mainous, A.G., 3rd, et al., Nasal carriage of Staphylococcus aureus and methicillin-resistant S aureus in the United States, 2001-2002. Ann Fam Med, 2006. 4(2): p. 132-7.
150. Niven, D.J., et al., Epidemiology of Staphylococcus aureus nasal colonization and influence on outcome in the critically ill. J Crit Care, 2009.
151. Abramson, M.A. and D.J. Sexton, Nosocomial methicillin-resistant and methicillin-susceptible Staphylococcus aureus primary bacteremia: at what costs? Infect Control Hosp Epidemiol, 1999. 20(6): p. 408-11.
152. Drinka, P., et al., A comparison of previous antibiotic therapy following isolation of MRSA versus MSSA in nursing home residents: a preliminary investigation. J Am Med Dir Assoc, 2002. 3(6): p. 356-9.
153. Blot, S.I., et al., Outcome and attributable mortality in critically Ill patients with bacteremia involving methicillin-susceptible and methicillin-resistant Staphylococcus aureus. Arch Intern Med, 2002. 162(19): p. 2229-35.
154. Weber, S.G., et al., Fluoroquinolones and the risk for methicillin-resistant Staphylococcus aureus in hospitalized patients. Emerg Infect Dis, 2003. 9(11): p. 1415-22.
155. Peres-Bota, D., et al., Are infections due to resistant pathogens associated with a worse outcome in critically ill patients? J Infect, 2003. 47(4): p. 307-16.
156. Manzur, A., et al., Predictive factors of meticillin resistance among patients with Staphylococcus aureus bloodstream infections at hospital admission. J Hosp Infect, 2007. 66(2): p. 135-41.
157. Simor, A.E., et al., Clinical and epidemiologic features of methicillin-resistant Staphylococcus aureus in elderly hospitalized patients. Infect Control Hosp Epidemiol, 2005. 26(10): p. 838-41.
158. Asensio, A., et al., Colonization and infection with methicillin-resistant Staphylococcus aureus: associated factors and eradication. Infect Control Hosp Epidemiol, 1996. 17(1): p. 20-8.
159. Warren, D.K., et al., Occurrence of co-colonization or co-infection with vancomycin-resistant enterococci and methicillin-resistant Staphylococcus aureus in a medical intensive care unit. Infect Control Hosp Epidemiol, 2004. 25(2): p. 99-104.
160. Furuno, J.P., et al., Methicillin-resistant Staphylococcus aureus and vancomycin-resistant Enterococci co-colonization. Emerg Infect Dis, 2005. 11(10): p. 1539-44.
237
161. Han, S.H., et al., Recovery of both vancomycin-resistant enterococci and methicillin-resistant Staphylococcus aureus from culture of a single clinical specimen from colonized or infected patients. Infect Control Hosp Epidemiol, 2009. 30(2): p. 130-8.
162. Sievert, D.M., et al., Vancomycin-resistant Staphylococcus aureus in the United States, 2002-2006. Clin Infect Dis, 2008. 46(5): p. 668-74.
163. Lucet, J.C., et al., High prevalence of carriage of methicillin-resistant Staphylococcus aureus at hospital admission in elderly patients: implications for infection control strategies. Infect Control Hosp Epidemiol, 2005. 26(2): p. 121-6.
164. Rioux, C., et al., Acquisition of methicillin-resistant Staphylococcus aureus in the acute care setting: incidence and risk factors. Infect Control Hosp Epidemiol, 2007. 28(6): p. 733-6.
165. Christianson, S., et al., Comparative genomics of Canadian epidemic lineages of methicillin-resistant Staphylococcus aureus. J Clin Microbiol, 2007. 45(6): p. 1904-11.
166. Richardson, J.F. and S. Reith, Characterization of a strain of methicillin-resistant Staphylococcus aureus (EMRSA-15) by conventional and molecular methods. J Hosp Infect, 1993. 25(1): p. 45-52.
167. Oie, S., et al., Association between isolation sites of methicillin-resistant Staphylococcus aureus (MRSA) in patients with MRSA-positive body sites and MRSA contamination in their surrounding environmental surfaces. Jpn J Infect Dis, 2007. 60(6): p. 367-9.
168. Boyce, J.M., et al., Widespread environmental contamination associated with patients with diarrhea and methicillin-resistant Staphylococcus aureus colonization of the gastrointestinal tract. Infect Control Hosp Epidemiol, 2007. 28(10): p. 1142-7.
169. Cimolai, N., MRSA and the environment: implications for comprehensive control measures. Eur J Clin Microbiol Infect Dis, 2008. 27(7): p. 481-93.
170. Muller, A., et al., Effect of individual- and group-level antibiotic exposure on MRSA isolation: a multilevel analysis. J Antimicrob Chemother, 2006. 58(4): p. 878-81.
171. Tacconelli, E., et al., Does antibiotic exposure increase the risk of methicillin-resistant Staphylococcus aureus (MRSA) isolation? A systematic review and meta-analysis. J Antimicrob Chemother, 2008. 61(1): p. 26-38.
172. Marshall, C., et al., Risk factors for acquisition of methicillin-resistant Staphylococcus aureus (MRSA) by trauma patients in the intensive care unit. J Hosp Infect, 2004. 57(3): p. 245-52.
173. Vicca, A.F., Nursing staff workload as a determinant of methicillin-resistant Staphylococcus aureus spread in an adult intensive therapy unit. J Hosp Infect, 1999. 43(2): p. 109-13.
174. Farrington, M., et al., Effects on nursing workload of different methicillin-resistant Staphylococcus aureus (MRSA) control strategies. J Hosp Infect, 2000. 46(2): p. 118-22.
175. Bignardi, G.E. and C. Askew, Workload may be related to the spread of MRSA and other infections. J Hosp Infect, 2000. 45(1): p. 78-80.

238
176. Rothman, K.J., Modern Epidemiology. Second edition ed. 1998, Philadelphia: Lippincott Williams and Wilkins.
177. Chaudhury, H., A. Mahmood, and M. Valente, Nurses' perception of single-occupancy versus multioccupancy rooms in acute care environments: an exploratory comparative assessment. Appl Nurs Res, 2006. 19(3): p. 118-25.
178. Catalano, G., et al., Anxiety and depression in hospitalized patients in resistant organism isolation. South Med J, 2003. 96(2): p. 141-5.
179. Tarzi, S., et al., Methicillin-resistant Staphylococcus aureus: psychological impact of hospitalization and isolation in an older adult population. J Hosp Infect, 2001. 49(4): p. 250-4.
180. Newton, J.T., D. Constable, and V. Senior, Patients' perceptions of methicillin-resistant Staphylococcus aureus and source isolation: a qualitative analysis of source-isolated patients. J Hosp Infect, 2001. 48(4): p. 275-80.
181. Simor, A.E., et al., Randomized controlled trial of chlorhexidine gluconate for washing, intranasal mupirocin, and rifampin and doxycycline versus no treatment for the eradication of methicillin-resistant Staphylococcus aureus colonization. Clin Infect Dis, 2007. 44(2): p. 178-85.
182. Kho, A., et al., Implementing an animated geographic information system to investigate factors associated with nosocomial infections: a novel approach. Am J Infect Control, 2006. 34(9): p. 578-82.
183. Kho, A.N., et al., Connecting the dots: creation of an electronic regional infection control network. Stud Health Technol Inform, 2007. 129(Pt 1): p. 213-7.
184. Getz, W.L.-S., JO; Cross, PC; Bar-David, S; Johnson, PL; Porco, TC; Sanchez, MS, Modeling the invasion and spread of contagious diseases in heterogeneous populations. DIMACS: Series in Discrete Mathematics and Theoretical Computer Science: Disease Evolution: Models, Concepts, and Data Analyses, ed. Z.D. Feng, U; Levin, S. Vol. 71. 2006.
185. O'Brien-Pallas, L., et al., Measuring Nursing Workload: Understanding the Variability. Nursing Economics, 1997. 15(4): p. 171-82.


