Embed Size (px)
Citation preview
This is the author manuscript accepted for publication and has undergone full peer review but has not
been through the copyediting, typesetting, pagination and proofreading process, which may lead to
differences between this version and the Version of Record. Please cite this article as doi:
10.1111/jiec.12705.
This article is protected by copyright. All rights reserved.
[running head: RESEARCH AND ANALYSIS]
[running foot: Paul et al., Urban Water Metabolism of Bangalore City]
Urban Metabolism of Bangalore City: A Water Mass Balance Analysis
Reba Paul1, Steven Kenway2, Brian McIntosh3,4, and Pierre Mukheibir1
1 Institute for Sustainable Futures (ISF), University of Technology Sydney (UTS), Sydney, Australia
2 Water-Energy-Carbon Group, School of Chemical Engineering, University of Queensland (UA),
Brisbane, Australia
3 International Water Centre (IWC), Brisbane, Australia
4 University of Queensland (UQ), Brisbane, Australia
Summary
Cities are increasingly depending on energy- intensive water sources such as distant rivers
and the ocean to meet their water demand. However, such expensive sources could be
avoided using alternative local sources of water such as wastewater, rainwater, and
stormwater. Many cities do not have robust accounts of those localized water resources, as
estimating those resources requires comprehensive accounting in complex urban water
This article is protected by copyright. All rights reserved.
systems. In this article, we investigate whether an urban metabolism evaluation framework
built on the Urban Water Mass Balance can help analyze these resources, especially in a
rapidly growing developing city. We first refined the water mass balance equation
developed by Kenway et al. (2011) for a developing country context with the inclusion of
some significant components such as system loss. Then we apply it to Bangalore city for
the year 2013-2014 which is a rare mass balance analysis in a developing country. The
refined equation helps analyze Bangalore‟s urban water system. The total available
wastewater, stormwater and rainwater were 656 gigaliters. The gap between water demand
and supply could be met if 54% of this recycled potential were harnessed. Wastewater had
enough potential (362 gigaliters) to replace the whole centralized water supply from the
Cauvery. A scenario analysis showed that the gap between water demand and supply in
2021 can be met if 60% of total recycled potential is utilized. This approach can be used
to help other cities identify the potential of alternative water sources and support integrated
water planning and monitoring water metabolic performance.
Keywords: urban water accounting, system boundary, alternative water resources, water
reuse, urban water planning, water performance indicator
Conflict of interest statement: The authors have no conflict to declare.
Address correspondence to: Reba Paul, Doctoral Researcher and Research Assistant,
Institute for Sustainable Futures (ISF), University of Technology Sydney, Level 11,
Building 10, 235 Jones Street, Ultimo NSW 2007, Australia. Email: [email protected]
This article is protected by copyright. All rights reserved.
Introduction
The growing population, urbanization and global climate change will increase
demand for water, energy and other resources. By 2050, about two thirds of the world‟s
population will be living in cities or urban areas (UN 2014). In 2014, 54% of the world‟s
population was already living in urban areas (UN 2014). Fast growing cities will be facing
serious problems to meet basic services needed for their people in terms of limited world
resources such as water, energy and nutrients. Further, the current practice of linear
(without resource reuse) management of resources is pushing cities to depend on their
hinterlands to cope with growing pressures of resource supplies, which in many cases
requires substantial energy (Bai 2007; Kenway et al. 2011; Kennedy et al. 2011; Agudelo-
Vera et al. 2012).
Water is a major resource in an urban system which requires dedicated management
attention. In 1965, Abel Wolman pioneered the use of Urban Metabolism as an evaluation
framework to analyze a hypothetical American city (New York) with one million
populations. Wolman developed this concept to address the water and air quality of
American cities (Wolman 1965). His study included only the inputs of centralized flows of
water managed by urban infrastructure and estimated that the input of water was 625000
tonnes/day for one million people in the United States of America compared to just 9500
tonnes and 2000 tonnes of fuel and wood respectively (Wolman 1965). Most of this inflow is
discharged as wastewater with the remainder being lost by various human activities. His
This article is protected by copyright. All rights reserved.
study showed that wastewater (outflow) represents between 75% and 100% of supplied
water (inflow). This was further stressed by Larsen et al. (2016) in her review article on
„Emerging Solutions to the water challenges of an Urbanized World‟. The huge percentage
of this wastewater can be tapped to meet urban water demand to avoid importing of
remote water resources which involves substantial energy. Again system loss from a
centralized urban water system is very significant in many developing cities from 30-50%
example for Bangalore city (CSE 2011; Raj et al. 2013; Mehta et al. 2014; Kingdom et al.
2012) This water loss has also high potential to reduce water demand in supply main.
Few cities globally have a comprehensive accounting of their urban water
resources. Systematic quantification requires good data and a thorough understanding of
resources available (Kennedy et al. 2010; Kenway et al. 2011; Renouf et al. 2016). An
urban metabolism framework provides a broader picture of resources flow as well as
quantitative analysis of all inputs and outputs, stock of water, energy, waste, nutrients
and other materials (Wolman 1965; Kennedy et al. 2010; Kenway et al. 2011). This can be
used as a conceptual and analytical framework (Kenway at al. 2011, Renouf et al. 2016;
Farooqui et al. 2016).
There are many approaches and methods for analyzing resources flow in urban
water systems such as „Life Cycle Assessment (LCA)‟, „Environmental Footprints‟ and
„Integrated Water Cycle Modelling‟. LCA quantifies the resource use embodied in goods
and services in an urban system (such as water and energy foot prints), „Environmental
This article is protected by copyright. All rights reserved.
Footprints‟ originates in LCA, and the Inputs-Outputs analysis is a top-down method to
quantify resources flows through an entire urban entity or economy (both direct and
indirect flows). Integrated Water Cycle Modelling considers a water system within an
urban entity such as a precinct but not the entire urban entity or whole economy (Bach et
al. 2014).
Urban metabolism can be used at different scales from global to city and household
levels (Agudelo-Vera et al. 2012) and can generate inventories of resources flow (water,
energy, nutrients/pollutants, carbon and other materials) over time with trends of resource
utilization (Kennedy et al. 2007). Such accounting also helps compare from city to city
(Kennedy et al. 2015).
Since Wolman (1965), several studies have been undertaken on Urban Metabolism,
however few focused on water (Kenway et al. 2011; Hermanowicz and Asano 1999; Baker
et al. 2001; Thériault and Laroche 2009; Kenway et al. 2011). Kenway et al. (2011)
developed a comprehensive Water Mass Balance Framework for a better understanding of
water and related energy and material flows in cities, however system losses were not
incorporated and can be a significant component of an urban water mass balance in a
developing city. There are also other flows in a developing city such as water supplied by
various water retailers (Raj 2013) which are important. Moreover, urban water mass balance
analysis has been done so far for a limited number of cities as real case studies (Kenway et al.
2011; Farooqui et al. 2016).
This article is protected by copyright. All rights reserved.
Consequently, in this study, we first refine the original water mass balance developed
by Kenway et al. (2011) for a developing country context. Then we apply this to Bangalore, a
fast growing developing city, as a real case study.
Literature Review
Studies on Urban Metabolism focusing on water after Wolman were done
in the cities of Hong Kong, Toronto, Tokyo, Vienna, Brussels, London, Cape Town,
Sydney as well as other Australian cities (Duvignead and Denaeyer-De Smet 1997;
Hendriks et al. 2003; Gasson 2002; Chrysoulakis et al. 2015; Chartered Institute of
Waste Management 2002; Sahely 2003; Gandy 2004; Kennedy et al. 2007, Decker et al.
2000; Browne et al. 2011; Kenway et al. 2011; Holmes and Pincetl 2012; Renouf and
Kenway 2016). Kennedy et al. (2010) did an extensive literature review on Urban
Metabolism which included more than 50 papers on cities from eight global regions. His
study showed that most Urban Metabolism studies had focused on the quantification of
flows of energy, wastes, nutrients, materials, food, greenhouse gas emissions (GHG), food
and eco-foot prints (Bhole 1994; Zucehetto 1995; Hanya and Ambe 1976; Nilson 1995;
Huang 1998; Warren-Rhodes and Koenig 2001; Barrett et al. 2002; Baker et al. 2001; Gasson
2002; Zhang et al. 2009; Forkes 2007; Barles 2009). Only three papers in his study
focused on water (Hermanowicz and Asano 1999; Baker et al. 2009; Gandy 2009). Some
studies in his literature review were related to livability (Newman et al. 1999) and eco-
efficiency (Zhang and Yang 2007) and others were on comprehensive metabolism study
This article is protected by copyright. All rights reserved.
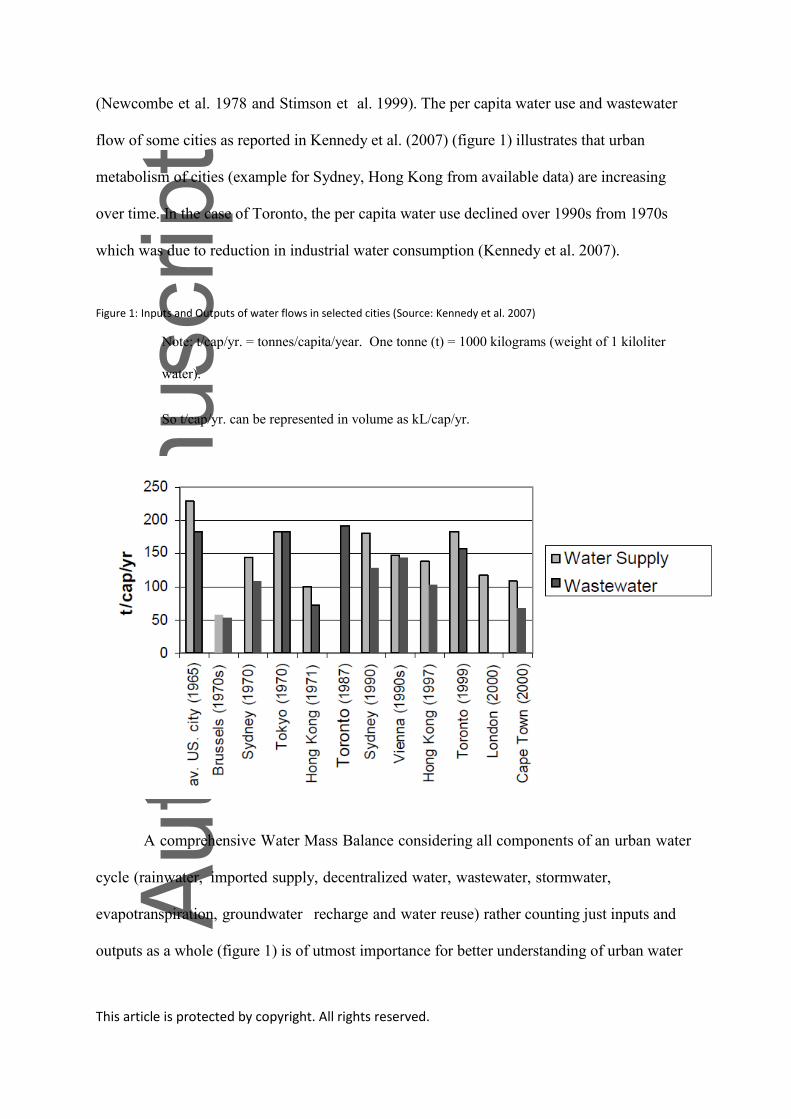
(Newcombe et al. 1978 and Stimson et al. 1999). The per capita water use and wastewater
flow of some cities as reported in Kennedy et al. (2007) (figure 1) illustrates that urban
metabolism of cities (example for Sydney, Hong Kong from available data) are increasing
over time. In the case of Toronto, the per capita water use declined over 1990s from 1970s
which was due to reduction in industrial water consumption (Kennedy et al. 2007).
Figure 1: Inputs and Outputs of water flows in selected cities (Source: Kennedy et al. 2007)
Note: t/cap/yr. = tonnes/capita/year. One tonne (t) = 1000 kilograms (weight of 1 kiloliter
water).
So t/cap/yr. can be represented in volume as kL/cap/yr.
A comprehensive Water Mass Balance considering all components of an urban water
cycle (rainwater, imported supply, decentralized water, wastewater, stormwater,
evapotranspiration, groundwater recharge and water reuse) rather counting just inputs and
outputs as a whole (figure 1) is of utmost importance for better understanding of urban water
This article is protected by copyright. All rights reserved.
metabolism of cities facing increased water scarcities so as to find alternative local water
sources and quantify their recycling potentials. But past studies followed the method of
Materials Flow Analysis (MFA). A MFA provides 1) the overall mass fluxes of resources
(energy, materials, food and pollutants such as nutrients, carbon), 2) helps understand the
use of resources and their trends over time, and 3) assists environmental reporting (Kennedy
et al. 2007; Kenway et al. 2011; Renouf et al. 2016). But when it comes to water, MFA
cannot integrate individual flows such as decentralized water supplies, or hydrological flows
such as rainwater, groundwater infiltration, surface runoff, and evapotranspiration so
cannot provide information for the improved and holistic management of water resources.
This was first understood by Kenway et al. (2011), who developed a comprehensive Urban
Water Mass Balance Framework for a better understanding of water and related energy and
material flows in a city.
Kenway et al. (2011) explained the critical importance of a clear system boundary to
define the volume flowing across the boundary and volume stored within the boundary, as
shown in figure 2a (Kenway et al. 2011). If B is a defined system boundary and A is the
boundary area with a depth d, water mass balance based on principles of mass conservation
is inputs (Qi) minus outputs (Qo) and the change in stores (volume or mass) ∆S in the
system boundary over a time period t1-t2 can be expressed in equation (1).
∆S = (St1-St2) = Qi (t1-t2) – Qo (t1-t2) ----------- (1)
This article is protected by copyright. All rights reserved.
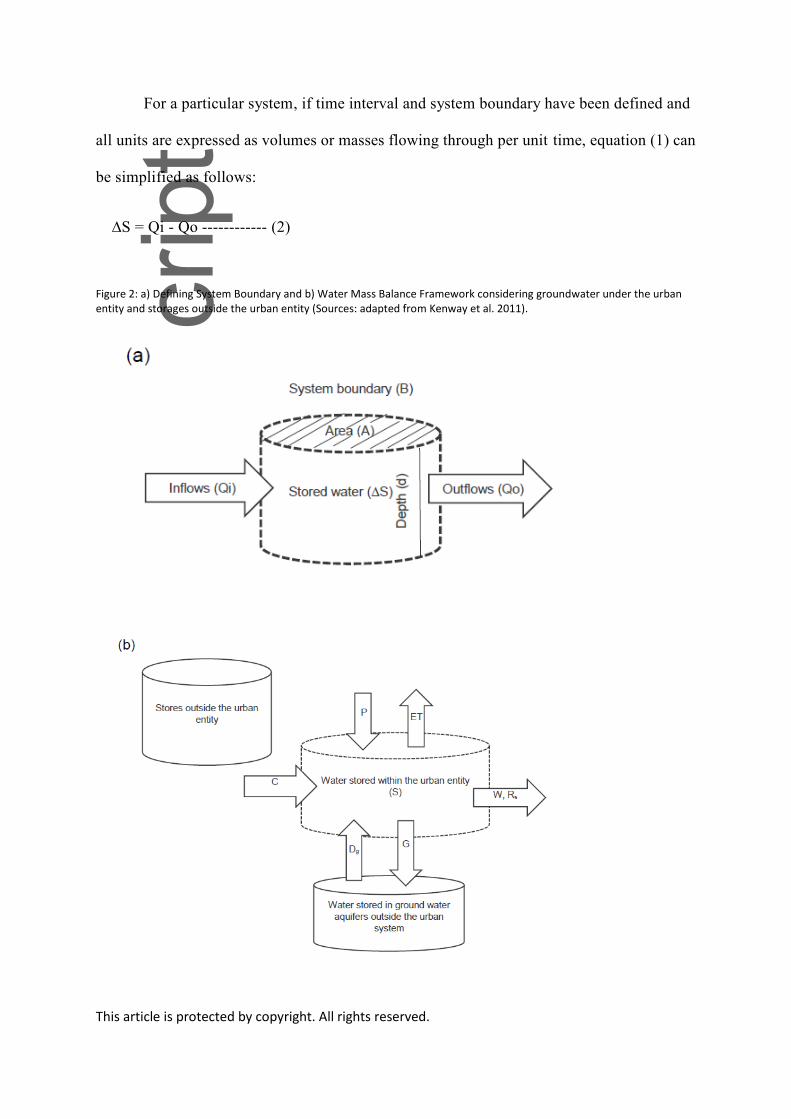
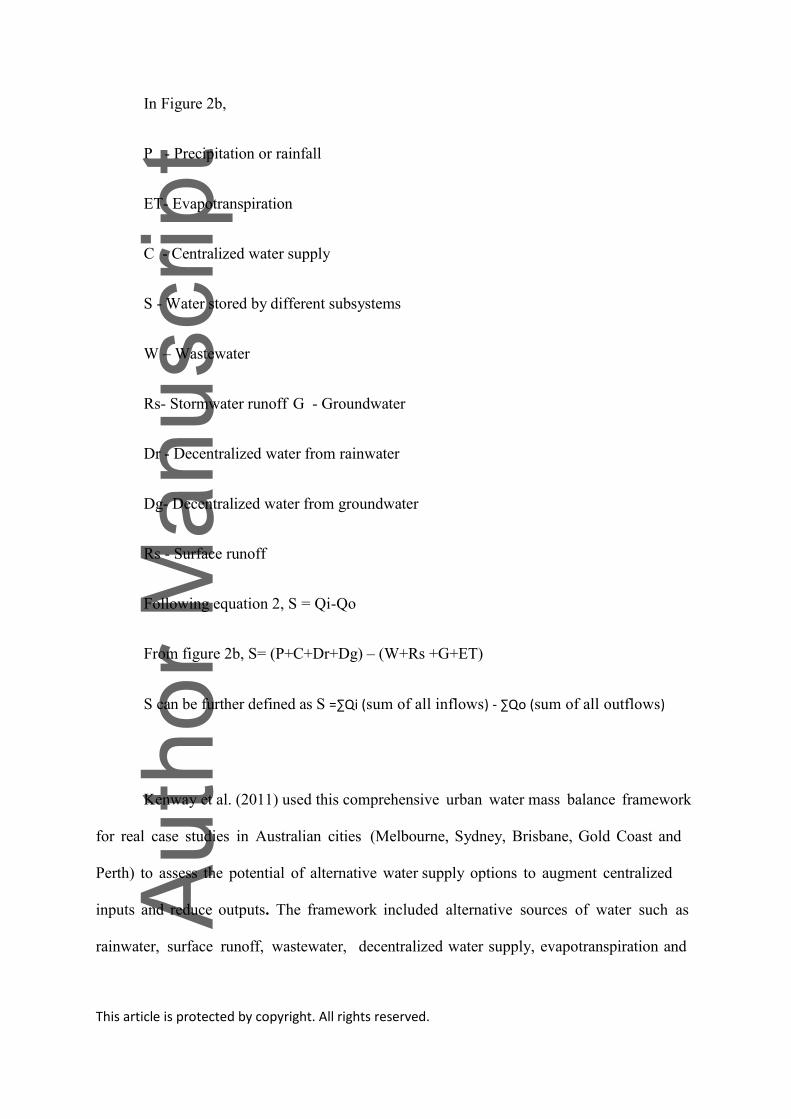
For a particular system, if time interval and system boundary have been defined and
all units are expressed as volumes or masses flowing through per unit time, equation (1) can
be simplified as follows:
∆S = Qi - Qo ------------ (2)
Figure 2: a) Defining System Boundary and b) Water Mass Balance Framework considering groundwater under the urban entity and storages outside the urban entity (Sources: adapted from Kenway et al. 2011).
This article is protected by copyright. All rights reserved.
In Figure 2b,
P - Precipitation or rainfall
ET- Evapotranspiration
C - Centralized water supply
S - Water stored by different subsystems
W – Wastewater
Rs- Stormwater runoff G - Groundwater
Dr - Decentralized water from rainwater
Dg- Decentralized water from groundwater
Rs - Surface runoff
Following equation 2, S = Qi-Qo
From figure 2b, S= (P+C+Dr+Dg) – (W+Rs +G+ET)
S can be further defined as S =∑Qi (sum of all inflows) - ∑Qo (sum of all outflows)
Kenway et al. (2011) used this comprehensive urban water mass balance framework
for real case studies in Australian cities (Melbourne, Sydney, Brisbane, Gold Coast and
Perth) to assess the potential of alternative water supply options to augment centralized
inputs and reduce outputs. The framework included alternative sources of water such as
rainwater, surface runoff, wastewater, decentralized water supply, evapotranspiration and
This article is protected by copyright. All rights reserved.
groundwater infiltration. Recently this framework was further refined by Farooqui et al.
(2016) by incorporating other flows such as decentralized recycled water within and outside
an urban system. But Renouf et al. (2016) reported that the framework has further scope to
develop by incorporating water use for ecosystem services. However, they did not still
underscore how this framework can be fit into a developing country context apart from the
need of incorporation of water use for ecosystem services.
Every city has its unique characteristics in respect to its water management and
geographical location. Urban Water Metabolism Evaluation Framework (UWMF) may
differ from city to city based on a city‟s typology (system boundary, types of water
supplies/inputs, uses, reuses, losses, scales, time and other factors). Further past studies
followed different scales, approaches and perspectives of UWMF (Kenway et al. 2011 and
Farooqui et al. 2016). Moreover, the latest UWMF still does not include components such
as system loss which is a significant flow component of UWMF (30-50%) in developing
countries and also in some other parts of the world (CSE 2011; Kingdom et al. 2012; Raj
2013; Mehta et al. 2014). It also has large impact on hydrological cycle. One evidence of
this was found in the study done by Mehta et al. (2014). He used Lump Model under a
social-ecological framework, considering the loss of water from city pipelines and city
return flows with a number of assumptions because of the unavailability of data to measure
the groundwater recharge and variation in groundwater table in Bangalore. His study found
that the ground water table in Bangalore has increased in the core city area but not in the
periphery of the city where people experience more shortage of water and extract ground
water (Mehta et al. 2014). Kenway et al. (2011) also strongly recommended for
This article is protected by copyright. All rights reserved.
incorporation of such components within a defined system boundary to get better mass
balance results. Among other water flows in developing countries, water supply by
retailers or water tankers is increasing when the utilities are failing to provide adequate water
supply to the city people. Such components need to be included in UWMF for a
comprehensive water mass balance analysis. In this study, we have refined the Urban
Metabolism framework built on Water Mass Balance framework originally developed by
Kenway et al. (2011) by incorporating system loss and other supplies to fit into a developing
country context for analysis.
Kenway et al. (2011) identified that a system boundary helps incorporate all water
inputs and outputs within an urban water system. Prior to Kenway et al. (2007), Water
Balance of an urban catchment was described by Mitchell et al. (2003) and Sahely et al.
(2003). They made efforts to include key inputs and outputs, but they excluded many
components in absence of a system boundary in their analysis. Again, Mitchell et al. (2003)
used a water balance equation to know the hydrological performance of a catchment but not
the performance of an urban entity. Sahely et al. (2003) however, used it for cities; no
system boundary was followed except for the „greater Toronto‟ area and they used
wastewater and storm water as a joint output, with other flows not clearly incorporated. In
1991, Baccini and Brunner developed MFA which was able to quantify the stocks and
flows of resources in terms of mass but it also did not consider a system boundary. In this
study, selection of a system boundary was given due importance to incorporate all inputs and
outputs in Bangalore city.
This article is protected by copyright. All rights reserved.
Kenway et al. (2011) also developed some performance indicators such „supply
centralization‟, „Centralized supply replaceability‟ and „total water use replaceability‟ of
wastewater, rainwater and stormwater and developed methods to calculate these
indicators for a city (table 1). They applied these indicators in a number of Australian cities
and found variation from 0.1-22% in rainfall harvesting, 257-397% in centralized
replaceability by rainfall, 26-86% replaceability potential of wastewater recycling, 47-
104% in stormwater reuses potential and 1-4% in reuse of anthropogenic inputs water in
2004-2005. These indicators illustrate that these cities are not designed appropriately to use
the full potential of these substantial flows and those are rather dependent on centralized
fresh water supplies. But Perth is an exception where recycled water is used to a great extent
(Kenway et al. 2011). As mentioned earlier a UWMF depends on various factors for a
particular urban setting and considerations of various water flows in and outside of a city.
The new indicators could be evolved, for example for „water loss recovery‟ and could
become important urban water performance indicators in a developing country context.
The literature reviews further found that an Urban Metabolism Framework built
on Water Mass Balance is useful to analyze complex urban water systems, but this
framework has not yet been tested with real cases in developing countries, for example the
Urban Water Metabolism Evaluation framework (UWMF) of Kenway et al. (2011) refined by
Farooqui et al. (2016) was tested for a hypothetical urban development area in Australia. In
this study, we have applied the refined Urban Metabolism framework/equation to Bangalore,
a fast growing developing city as a real case example.
This article is protected by copyright. All rights reserved.
Background of Bangalore City
Bangalore (officially called Bengaluru, the capital of Karnataka State in South India)
is a mega city situated in inland, in the middle of a semi- arid region of India. It is one of the
fastest growing city in India and the population was 8.5 million in 2011(Census of India.
2011) and now its populations exceed 10 million (a mega city) (Deccan Herald 2012). The
city is a hub for education, IT & BT industries, sophisticated high tech health care and many
MNC industries and has nice climate which attract people to the city. The city is naturally
water scarce and has no perennial source of water in the city except some seasonal lakes
and waterbodies which are now polluted (CSE 2011; Lele et al. 2013; CGWB 2011).
Groundwater is overexploited and polluted by nitrates, pathogens and other contaminants
(Mehta et al. 2013). The water bodies have been filled up from rapid urbanization. The city
now brings water from a distant freshwater source (the Cauvery River, 100 km away and
500 meter below the city) without due consideration of energy and cost, a disregard for the
conflicts over the shared river between its four states for irrigation, hydropower, water
supply and other needs, and dismissal of the process‟ ecological footprints (Gronwall,
2008, Novotny, 2010). BWSSB spends 60-70% of their annual operating budget for
energy to provide water services to the people (CSE 2011; IBM 2010). The Cauvery Water
Dispute Tribunal has earmarked 1,470 MLD or 600 Cusec for Bangalore city for its water
supply (CSE 2011; Lele et al. 2013). There is no further scope for Bangalore to withdraw
This article is protected by copyright. All rights reserved.
water from the Cauvery River as per the Tribunal agreement (Raj, 2013). However,
Bangalore is still looking for more abstraction of water from the Cauvery (Raj 2013).
Bangalore also faces power crisis, and the city is dependent on i ts State Karnataka
to supply energy. On May 6, 2014, the Energy Minister announced that the current daily
power cuts would vary from 2-6 hours across the state. In Bangalore core area it was two
hours daily, with northern Bangalore influenced the most with more than six hours‟ daily
power cut. (The Times of India 2014; The Hindu 2014).
Neither Bangalore nor any other city in India enjoys a 24-hour continuous water
supply. The piped water supply in Bangalore is intermittent and available only for a few
hours a day (World Bank 2013; Raj 2013). Even the wealthy in Bangalore receive 2-4 hours‟
water supply on alternate days ((Raj 2013). The rich install expensive water tanks, pumps
and filters while the poor struggle to access water (World Bank 2013; Raj 2013). Further
people in Bangalore has low per capita water consumption (75 lpcd) which is much below the
requisite standard 150-200 lpcd (Raj 2013). Bangalore Water Supply and Sewerage Board
(BWSSB) reports it as 65 lpcd (BWSSB 2013). This is due to a huge system loss or
„Unaccounted- for Water‟ (UFW) or Non-Revenue Water (NRW) which varies from 55-
60% (CSE 2011; Raj, 2013). Leakage alone is estimated at 37-40% of supply (Mehta et al.
2013). People who live in slums receive no water or a much lesser quantity (CSE 2011 and
Lele et al. 2013).
This article is protected by copyright. All rights reserved.
Methodology
Selecting System Boundary
Identifying a system boundary is very important for a comprehensive water mass
balance analysis that considers all inflows and outflows within and throughout a city
(Kenway et al. 2008)]. In this study, we define the system boundary as the core of
Bangalore city and the adjacent built up area that is the BWSSB‟s service area, called
greater Bangalore, considering one kilometer under the ground (figure S 1). The sub-system
boundaries have been identified as Water Treatment Plants (WTPs), Wastewater
Treatment Plants (WWTPs), various sub-sectors or land uses such as residential,
commercial, industrial, public and semi-public institutions, parks and open space, transport
and communication, agriculture and lakes and ponds. Water stores outside the city and
ground water aquifers beneath the city have not been considered as part of the system. The
inflows into and outflows from the city through natural waterbodies and streams have
also been excluded in order to separate the city from the natural environment, as followed
by Kenway et al. (2011). The subsystem boundaries and their percentages compared to the
system boundary are shown in table S1 in the supporting information available on the
Journal‟s website. These values were used for the calculation of sub-boundary
precipitation, runoff and groundwater recharge. The land use by WTP and WWTP were
This article is protected by copyright. All rights reserved.
considered as negligible compared to the area of the system boundary, which is 800 sq.km
(BWSSB 2013).
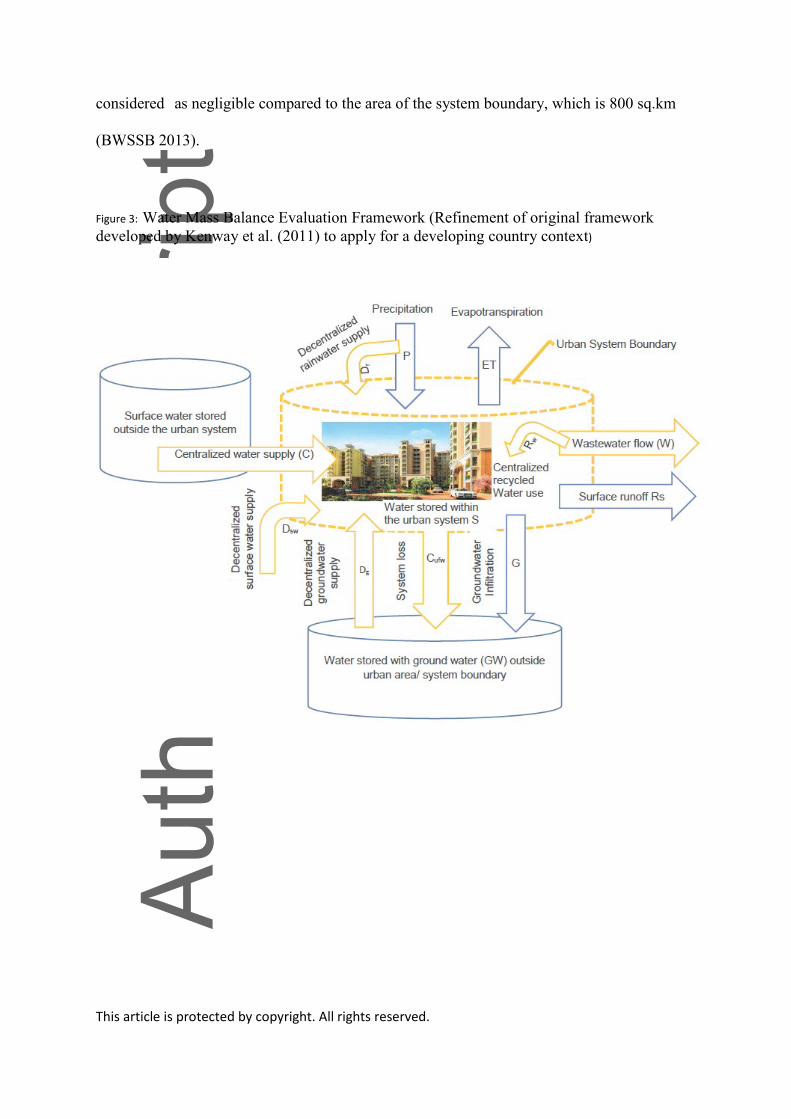
Figure 3: Water Mass Balance Evaluation Framework (Refinement of original framework
developed by Kenway et al. (2011) to apply for a developing country context)
This article is protected by copyright. All rights reserved.
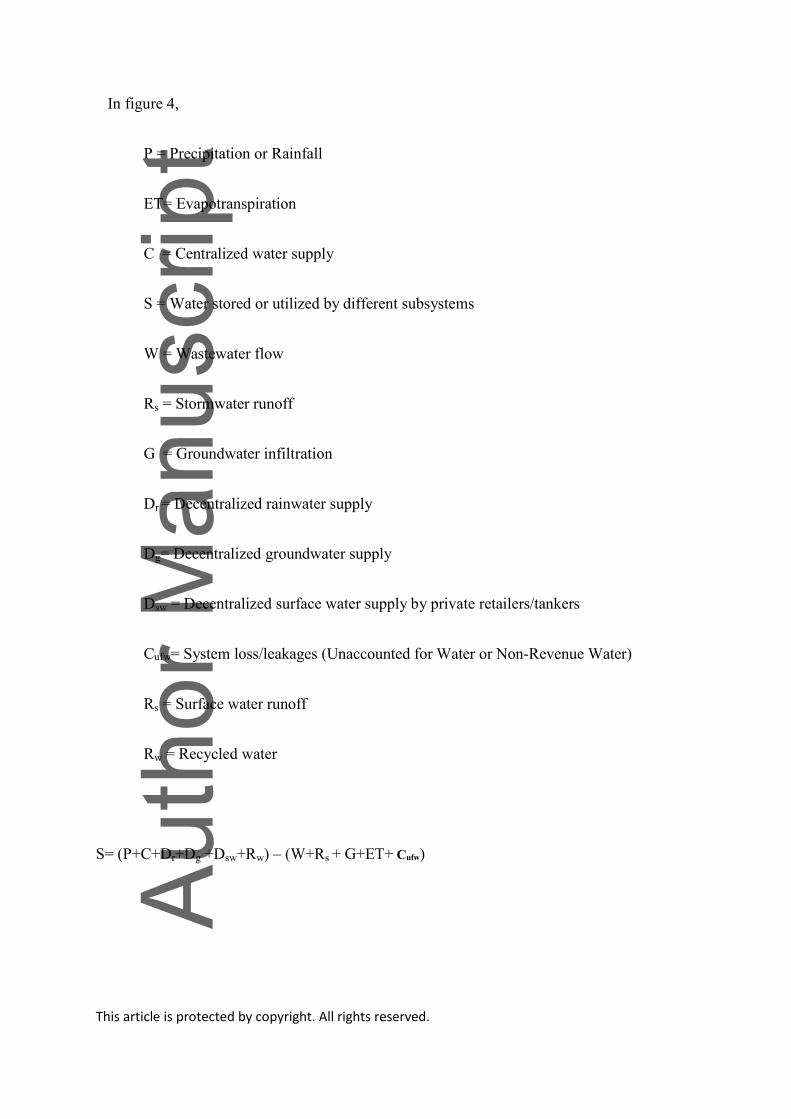
In figure 4,
P = Precipitation or Rainfall
ET= Evapotranspiration
C = Centralized water supply
S = Water stored or utilized by different subsystems
W = Wastewater flow
Rs = Stormwater runoff
G = Groundwater infiltration
Dr = Decentralized rainwater supply
Dg= Decentralized groundwater supply
Dsw = Decentralized surface water supply by private retailers/tankers
Cufw= System loss/leakages (Unaccounted for Water or Non-Revenue Water)
Rs = Surface water runoff
Rw = Recycled water
S= (P+C+Dr+Dg +Dsw+Rw) – (W+Rs + G+ET+ Cufw)
This article is protected by copyright. All rights reserved.
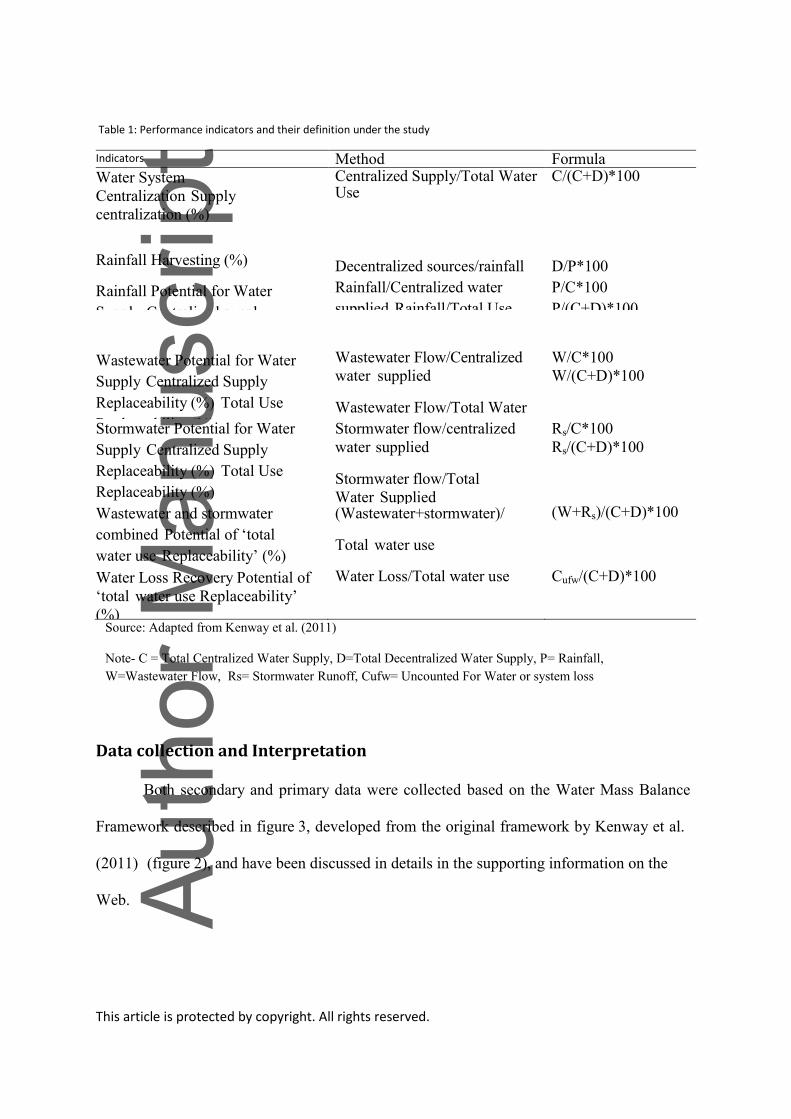
Table 1: Performance indicators and their definition under the study
Indicators
Indicators
Method Formula
Water System
Centralization Supply
centralization (%)
Centralized Supply/Total Water Use
C/(C+D)*100
Rainfall Harvesting (%)
Rainfall Potential for Water
Supply Centralized supply
replaceability (%) Total Use
Replaceability (%)
Decentralized sources/rainfall
Rainfall/Centralized water
supplied Rainfall/Total Use
D/P*100
P/C*100
P/(C+D)*100
Wastewater Potential for Water
Supply Centralized Supply
Replaceability (%) Total Use
Replaceability (%)
Wastewater Flow/Centralized
water supplied
Wastewater Flow/Total Water
Use
W/C*100
W/(C+D)*100
Stormwater Potential for Water
Supply Centralized Supply
Replaceability (%) Total Use
Replaceability (%)
Stormwater flow/centralized
water supplied
Stormwater flow/Total
Water Supplied
Rs/C*100
Rs/(C+D)*100
Wastewater and stormwater
combined Potential of „total
water use Replaceability‟ (%)
(Wastewater+stormwater)/
Total water use
(W+Rs)/(C+D)*100
Water Loss Recovery Potential of
„total water use Replaceability‟
(%)
Water Loss/Total water use Cufw/(C+D)*100
Source: Adapted from Kenway et al. (2011)
Note- C = Total Centralized Water Supply, D=Total Decentralized Water Supply, P= Rainfall,
W=Wastewater Flow, Rs= Stormwater Runoff, Cufw= Uncounted For Water or system loss
Data collection and Interpretation
Both secondary and primary data were collected based on the Water Mass Balance
Framework described in figure 3, developed from the original framework by Kenway et al.
(2011) (figure 2), and have been discussed in details in the supporting information on the
Web.
This article is protected by copyright. All rights reserved.
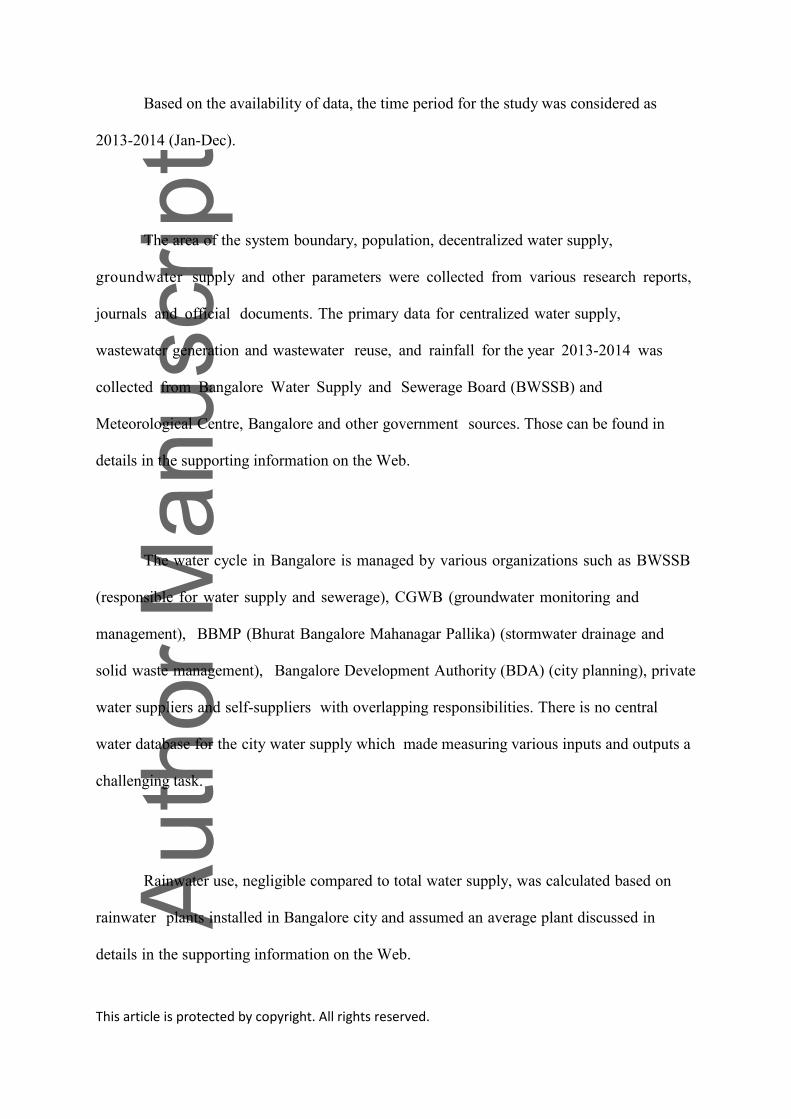
Based on the availability of data, the time period for the study was considered as
2013-2014 (Jan-Dec).
The area of the system boundary, population, decentralized water supply,
groundwater supply and other parameters were collected from various research reports,
journals and official documents. The primary data for centralized water supply,
wastewater generation and wastewater reuse, and rainfall for the year 2013-2014 was
collected from Bangalore Water Supply and Sewerage Board (BWSSB) and
Meteorological Centre, Bangalore and other government sources. Those can be found in
details in the supporting information on the Web.
The water cycle in Bangalore is managed by various organizations such as BWSSB
(responsible for water supply and sewerage), CGWB (groundwater monitoring and
management), BBMP (Bhurat Bangalore Mahanagar Pallika) (stormwater drainage and
solid waste management), Bangalore Development Authority (BDA) (city planning), private
water suppliers and self-suppliers with overlapping responsibilities. There is no central
water database for the city water supply which made measuring various inputs and outputs a
challenging task.
Rainwater use, negligible compared to total water supply, was calculated based on
rainwater plants installed in Bangalore city and assumed an average plant discussed in
details in the supporting information on the Web.
This article is protected by copyright. All rights reserved.
Measuring groundwater recharge was difficult due to the unavailability of continuous
water table monitoring data in Bangalore city. It was therefore calculated following the
detailed Guidelines for Implementing Groundwater Estimation Methodology (CGWB
2009) and the Groundwater Resource Estimation Methodology (GEM) Report -1997
(MoWR 2009) recommended by Groundwater Resource Estimation Committee (MoWR
2009) elaborated in the supporting information on the Web.
The runoff coefficient for various land uses have been used for this study based on the
typical values of runoff coefficients in an urban area as elaborated in Chapter-11 of the Urban
Drainage Book (Butler and Davies 2011). Evapotranspiration for sub-boundaries has been
calculated with the following formula from respective values: ET = P-R-G.
Results and Discussion
The collected primary and secondary data were used for the water mass balance
analysis of Bangalore city using the water mass balance equation described in
methodology section and also mentioned below. The results of this analysis have been
shown in table 2. All inputs and outputs were considered in the analysis (details of water
mass balance flow chart can be seen in f igure S 5). The equation was applied to both
This article is protected by copyright. All rights reserved.
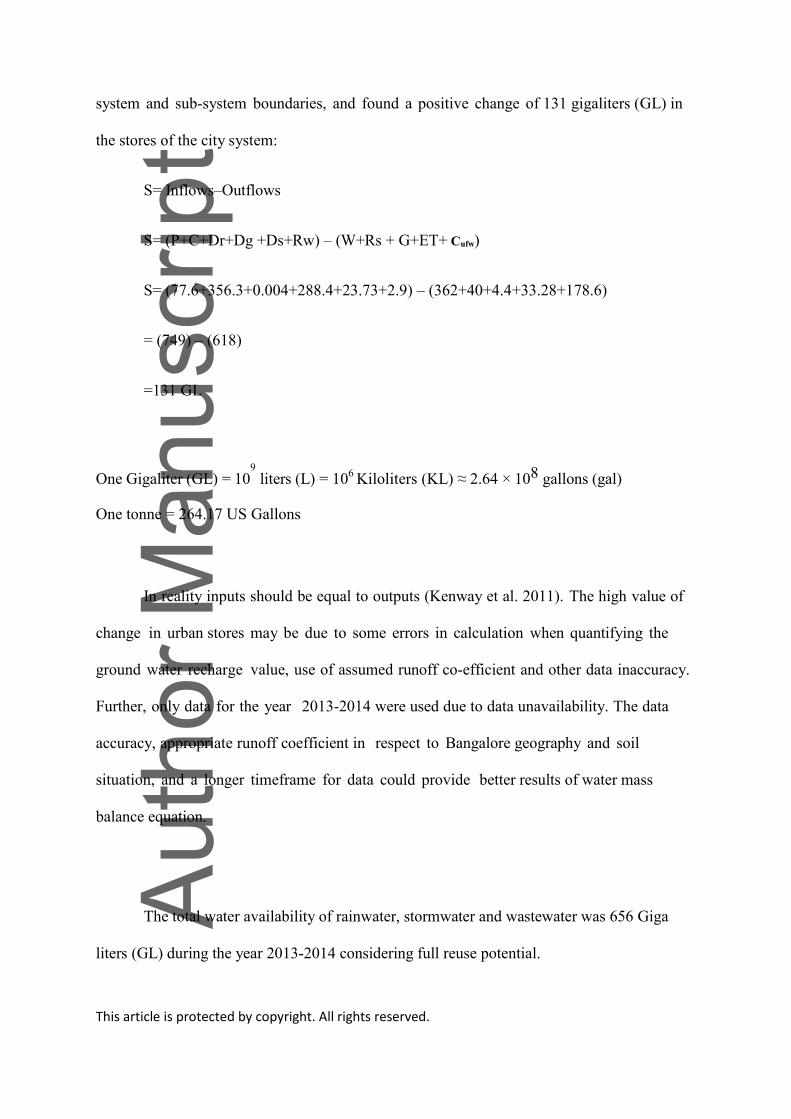
system and sub-system boundaries, and found a positive change of 131 gigaliters (GL) in
the stores of the city system:
S= Inflows–Outflows
S= (P+C+Dr+Dg +Ds+Rw) – (W+Rs + G+ET+ Cufw)
S= (77.6+356.3+0.004+288.4+23.73+2.9) – (362+40+4.4+33.28+178.6)
= (749) – (618)
=131 GL
One Gigaliter (GL) = 109 liters (L) = 10
6 Kiloliters (KL) ≈ 2.64 × 10⁸ gallons (gal)
One tonne = 264.17 US Gallons
In reality inputs should be equal to outputs (Kenway et al. 2011). The high value of
change in urban stores may be due to some errors in calculation when quantifying the
ground water recharge value, use of assumed runoff co-efficient and other data inaccuracy.
Further, only data for the year 2013-2014 were used due to data unavailability. The data
accuracy, appropriate runoff coefficient in respect to Bangalore geography and soil
situation, and a longer timeframe for data could provide better results of water mass
balance equation.
The total water availability of rainwater, stormwater and wastewater was 656 Giga
liters (GL) during the year 2013-2014 considering full reuse potential.
This article is protected by copyright. All rights reserved.
The water performance indicators were derived based on the formula described in
table 1, the results of which have been tabulated in table 3 and table 4.
The „water supply centralization‟ of Bangalore city was 52% which illustrates that
the Bangalore water supply system is not fully centralized. About 48% of water demand
is met from groundwater and other sources. The „total water use replaceablity‟ of
wastewater was 55% and centralized replaceability was 107% which means the amount of
wastewater (362 GL) could solely replace present centralized water supply in 2013 ( 356
GL), imported from the Cauvery river. The „total use replaceability‟ of alternative
rainwater and stormwater was 12% and 6%, respectively, which illustrates that 78 GL
and 40 GL could be used as inputs in the whole urban system from these two sources.
The replaceability potential of wastewater (362 GL) is about 5 times and 9 times higher than
rainwater (78 GL) and stormwater (40 GL), respectively, which indicates Bangalore is a dry
city.
This article is protected by copyright. All rights reserved.
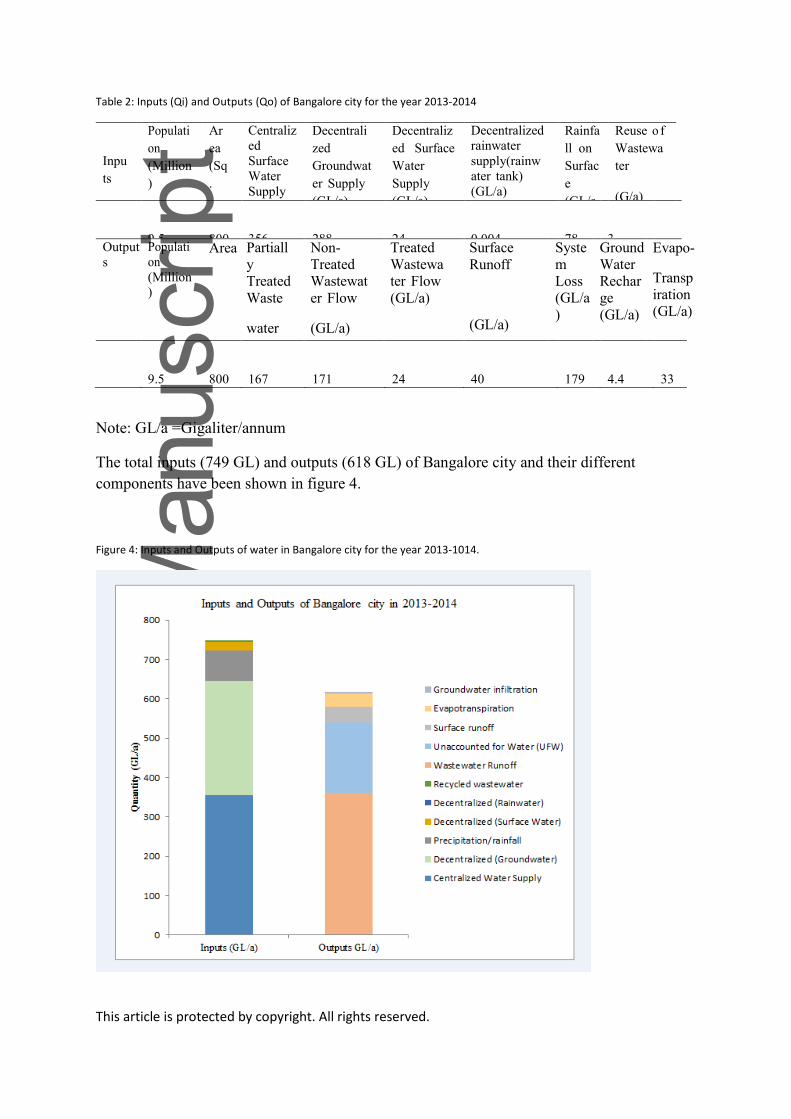
Table 2: Inputs (Qi) and Outputs (Qo) of Bangalore city for the year 2013-2014
Inpu
ts
Populati
on
(Million
)
Ar
ea
(Sq
.
km)
Centraliz
ed
Surface
Water
Supply
(GL/a)
Decentrali
zed
Groundwat
er Supply
(GL/a)
Decentraliz
ed Surface
Water
Supply
(GL/a)
Decentralized
rainwater
supply(rainw
ater tank)
(GL/a)
Rainfa
ll on
Surfac
e
(GL/a
)
Reuse o f
Wastewa
ter
(G/a)
9.5
800
356
288
24
0.004
78
3
Output
s
Populati
on
(Million)
Area Partiall
y
Treated
Waste
water
Flo
w
(GL/
a)
Non-
Treated
Wastewat
er Flow
(GL/a)
Treated
Wastewa
ter Flow
(GL/a)
Surface
Runoff
(GL/a)
Syste
m
Loss
(GL/a
)
Ground
Water
Rechar
ge
(GL/a)
Evapo-
Transp
iration
(GL/a)
9.5
800
167
171
24
40
179
4.4
33
Note: GL/a =Gigaliter/annum
The total inputs (749 GL) and outputs (618 GL) of Bangalore city and their different
components have been shown in figure 4.
Figure 4: Inputs and Outputs of water in Bangalore city for the year 2013-1014.
This article is protected by copyright. All rights reserved.
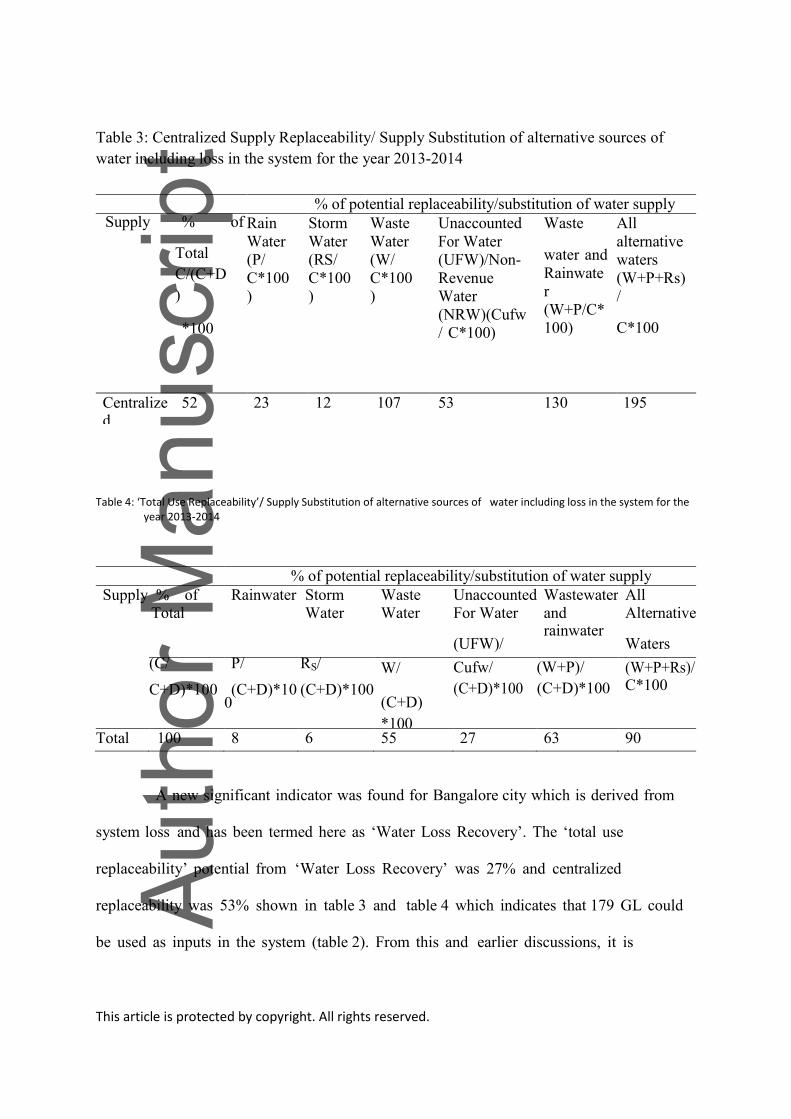
Table 3: Centralized Supply Replaceability/ Supply Substitution of alternative sources of
water including loss in the system for the year 2013-2014
Table 4: ‘Total Use Replaceability’/ Supply Substitution of alternative sources of water including loss in the system for the year 2013-2014
% of potential replaceability/substitution of water supply
Supply % of Rainwater Storm Waste Unaccounted Wastewater All Total Water Water For Water
(UFW)/
NRW
and rainwater
Alternative
Waters
(C/
C+D)*100
P/
(C+D)*100
RS/
(C+D)*100
W/
(C+D)
*100
Cufw/
(C+D)*100
((W+P)/
(C+D)*100
(W+P+Rs)/ C*100
Total Use
100 8 6 55 27 63 90
A new significant indicator was found for Bangalore city which is derived from
system loss and has been termed here as „Water Loss Recovery‟. The „total use
replaceability‟ potential from „Water Loss Recovery‟ was 27% and centralized
replaceability was 53% shown in table 3 and table 4 which indicates that 179 GL could
be used as inputs in the system (table 2). From this and earlier discussions, it is
% of potential replaceability/substitution of water supply Supply % of
Total
C/(C+D
)
*100
Rain
Water
(P/
C*100
)
Storm
Water
(RS/
C*100
)
Waste
Water
(W/
C*100
)
Unaccounted
For Water
(UFW)/Non-
Revenue
Water
(NRW)(Cufw
/ C*100)
Waste
water and
Rainwate
r
(W+P/C*
100)
All
alternative
waters
(W+P+Rs)
/
C*100
Centralized
52 23 12 107 53 130 195
This article is protected by copyright. All rights reserved.
evident that wastewater recycling and improving water efficiency in the water supply
network have good potentials for augmenting water in Bangalore city system.
Investigation of roof rainwater harvesting potential in Bangalore city found that
out of total rainwater potential, the roof surface available in Bangalore currently can
harvest 14 GL annually (BWSSB 2013, Citizen Charter, BWSSB and Rainwater
Guidelines BWSSB). If we consider this potential of rainwater, the total potential of
roof rainwater harvesting, stormwater and wastewater recycling and loss recovery stands
at 550 GL annually or 46 GL monthly or 1.5 GL daily.
A scenario analysis was done using various water performance indicators and the
current and projected water demand of Bangalore city as discussed in the supporting
information on the Web. The water demand in Bangalore in 2013 was 1260 million liters
per day (MLD); the actual water supply was 927 MLD as found from primary data and
thus the actual gap was 815 MLD (considering water received by the end users after
system loss). It was found that this gap could easily be met if even 54% of recycling
potential was utilized. The actual water supply in 2014 was 754 MLD (adding 500 MLD
Cauvery Stage-IV Phase-II-supply and 53% UFW) and the actual gap was 675 MLD. This
gap could be met if 45% of recycling potential was utilized. The water demand of
Bangalore is expected to rise to 1650 MLD in 2021 as estimated based on Population
growth by the census of Bangalore city with the addition of 10% more slum dwellers and
using 120 lpcd. The gap between water demand and supply in 2021was calculated as 895
This article is protected by copyright. All rights reserved.
MLD (if present UFW 53% prevails). This gap can easily be met if 60% of recycling
potential is used.
It was observed that a single source of water such as wastewater or rainwater or
stormwater or system loss alone cannot meet the water demand of Bangalore. An integrated
management of rainwater, stormwater and wastewater; and reduction in system loss/UFW is
of the utmost importance along with current centralized water supply. This can avoid
import of water from distant river the Cauvery and save energy. Recycling of water can
ensure increased water security and reliability, and provide environmental benefits
through reduction of water pollution and improvement in ecosystems in Bangalore city.
Conclusion
Many cities around the world do not have robust accounts of all alternative
resources of water in their water systems. The study explored a suitable framework or
method to apply in Bangalore city, a rapidly growing developing city which faces
serious water stress, to quantify all of its alternative water resources. The refined
urban water mass balance framework originally developed by Kenway et al. (2011) was
found to be very useful in a developing country context, and could be used also as a
physical model (Water Mass Balance Flow Chart in figure S 5). The new addition to the
original equation was system loss which is a significant component of water mass balance
in a developing country and other water supplies by private retailers, which is common in
This article is protected by copyright. All rights reserved.
developing countries. It also included centralized recycled water though it is not common
practice in developing countries. Because of a lack of data, decentralized recycled water
was assumed „zero‟. The system boundary and the refined framework helped calculate
all inflows and outflows within and outside Bangalore city. The high figure of water
mass balance may be due to some errors in calculation especially those for quantifying
the groundwater recharge value, which can be further studied. Moreover, data on
decentralized recycled water can provide more accurate mass balance figure.
It was also explored how the refined water mass balance equation can improve
accounting of all sources of water and help planners, engineers, water managers and
policy makers improve the city water performance and management. The analysis found
that the wastewater solely had the potential of 362 GL which was enough to replace
centralized water supply (338 GL) However, it was found that a single alternative source
either rainwater or storm water or wastewater has not potential to meet the total water
demand in Bangalore city. An integrated water management of all waters sources,
including present centralized supply, and improving the efficiency of the water supply
network to recover system loss is essential. This can avoid further withdrawal of water
from the Cauvery River and reduce the energy cost to provide water services.
The water performance indicators for Bangalore as developed will help engineers
and water managers to monitor water performance of Bangalore city and follow various
strategies to improve its overall performance over time. The robust accounting used in this
This article is protected by copyright. All rights reserved.
study is not only important for Bangalore but also for other cities especially fast growing
cities in developing countries which are facing serious water shortages and moving towards
distant river sources or deep aquifers or seawater to meet demand.
For improved results, more accurate data on groundwater infiltration rates and
various coefficients based on local situations and decentralized water use from various
sources were needed. Further this water mass balance needs to be updated as cities grow
both horizontally and vertically with time.
Acknowledgement
This study was done by Reba Paul under her joint Master‟s Program on „Integrated
Water Management‟ between the University of Queensland, University of Western
Australia, Monash University, Griffith University and International Water Centre. The
authors greatly acknowledge the support of Bangalore Water Supply and Sewerage
Board ( BW SS B) with providing data and information to enable this study especially
Mr. S.M. Ravisankar, Former Chairman of BWSSB for his kind cooperation and instruction
to the officials in accessing data. The authors provide their sincere gratitude to Dr. P.N.
Ravindra, Executive Engineer, BWSSB; Mr. V.C. Kumar, Executive Engineer, BWSSB;
Mr. Guru P. Srinath, Technical Assistant to Chief Engineer, Cauvery Division and his
assistant or data keeper Mr. Eswara and other officials in BWWSB to make necessary data
available for this study. The authors also thank the anonymous reviewers and their feedback
This article is protected by copyright. All rights reserved.
particularly Erika Whillas for poof reading of part of the article at some stage and Gautam
Joshii for his kind support to facilitate field work in Bangalore. The authors extend their
gratitude to Mr. V. C. Kumar for his kind support to Ms. Paul for her field visit to a
number of wastewater treatment plants and access data. The authors finally thank the
University of Queensland to use their wonder library facilities to access valuable journals
for the study.
Funding Information
The study was funded by International Water Centre in Australia and Global Water
Partnership at Stockholm, Sweden. Dr. Kenway also acknowledges DECRA funding DE
160101322.
References
Agudelo-Vera, C. M., W. R. Leduc, A. R. Mels, and H. H. M., Rijnaarts. 2012. Harvesting
urban resources towards more resilient cities. Resources, Conservation and
Recycling 64: 3-12.
Alberti, M. 1996. Measuring urban sustainability. Environmental impact assessment review
16(4-6):381-424
Baccini, P. and P. H. Brunner. 1991. Metabolism of the Anthroposphere (10-46). Springer
Berlin Heidelberg.
Bach, P. M., W. Rauch, P. S. Mikkelsen, D. T. McCarthy, and A. Deletic. 2014. A critical
review ofintegrated urban water modelling–Urban drainage and
beyond. Environmental Modelling & Software 54: 88-107
This article is protected by copyright. All rights reserved.
Bai, X. 2007, Industrial Ecology and the Global Impacts of Cities. Journal of Industrial
Ecology.
Baker, L. A., D. Hope, Y. Xu, J. Edmonds, and L. Lauver. 2001. Nitrogen balance for the
CentralArizona–Phoenix (CAP) ecosystem. Ecosystems 4(6): 582-602.
Bangalore Water Supply and Sewerage Board (BWSSB) 2013. www.bwssb.gov.in. accessed
on April 27, 2014
Barles, S. 2009. Urban metabolism of Paris and its region. Journal of Industrial Ecology,
13(6):898-913
Barrett, J., H. Vallack, A. Jones, and G. Haq. 2002. A material flow analysis and ecological
footprint of York. Stockholm, Stockholm Environment Institute.
Bohle, H.G. 1994. Metropolitan food systems in developing countries: The perspective of
Urban Metabolism. GeoJournal 34(3):245-251
Browne, D., B. O‟Regan, and R. Moles. 2009. Assessment of total urban metabolism and
metabolic inefficiency in an Irish city-region. Waste Management 29(10):2765-2771
Center for Science and Environment (CSE). 2011. Water waste Portrait, viewed on 10
November 2013 at http://cseindia.org/userfiles/bangaluru_portrait.pdf.
Chartered Institute of Wastes Management (CIWM). 2002. A Resource Flow and Ecological
Footprint Analysis of Greater London. Best Foot Forward, London.
City Development Authority (CDA). 2009. Bangalore Master Plan 2015. Bangalore, India.
Deccan Herald. 2012. Bangalore among top polluted mega cities. Published
on Nov 28, www.deccanherald.com/content/295160/bangalore-among-
top-polluted-mega.html. Accessed on 13 March, 2014
Deccan Herald. 2013. Only 44,000 houses in City have RWH. published on 26 Feb.
www.deccanherald.com/content/315171/only-44000-houses-city- have.html. Accessed
on 3rd
April, 2014
Decker, E. H., S. Elliott, F. A. Smith, D. R. Blake, and F. S. Rowland. 2000. Energy and
material flow through the urban ecosystem. Annual review of energy and the
environment 25.
Duvigneaud, P., and S. Denayeyer-De Smet. 1977. The urban ecosystem of Brussels.
L'Ecosystéme Urbs, in L'Ecosystéme Urbain Bruxellois, in Productivité en Belgique. In:
Duvigneaud, P., Kestemont, P. (Eds.), Traveaux de la Section Belge du Programme
Biologique International Bruxelles 581-597
This article is protected by copyright. All rights reserved.
ETH Globe. 2010. Future Cities. International Edition. Zurich
Færge, J., J. Magid, and F. W. P. de Vries. 2001. Urban nutrient balance for
Bangkok. Ecological modelling 139(1): 63-74.
Farooqi, M. A. 2011. Groundwater Management in Bangalore: Impact of Municipal Waste
Disposal Practices on Groundwater Quality. Journal of the Geological Society of India
78(5): 488-489
Farooqui, T. A., M. A. Renouf, and S. J. Kenway. 2016. A metabolism perspective on
alternative urban water servicing options using water mass balance. Water
research 106: 415-428
Gandy, M. 2004. Rethinking urban metabolism: water, space and the modern city. City 8(3),
363-379.
Gasson, B. 2002. The ecological footprint of Cape Town: Unsustainable resource use and
planning implications. Paper presented a National Conference of the South African
Planning Institution, 18-20 September, Durban, South Africa
Gronwall, J.T., M. Mulenga, and G. McGranahan. 2010. Groundwater, self-supply and
poor urban dwellers: A review with case studies of Bangalore and Lusaka.
Human Settlements Working Paper Series, Water and Sanitation 26,
International Institute for Environment and Development, London, UK.
Hanya, T. and Y. Ambe. 1976. A Study on the Metabolism of Cities, In: Science for a Better
Environment. HSEC, Science Council of Japan, 228-233
Hermanowicz, S.W. and T. Asano. 1999. Abel Wolman's “The Metabolism of Cities”
revisited: a case for water recycling and reuse. Water Science and Technology 40(4-
5): 29-36
Hegde, G. V. and K.S. Chandra. 2012. Resource availability for water supply to Bangalore
city, Karnataka." Current Science (Bangalore) 102(8): 1102-1104.
Hendriks, C., R. Obernosterer, D. Müller, S. Kytzia, P. Baccini, and P. H. Brunner. 2000.
Material flow analysis: a tool to support environmental policy decision making. Case-
studies on the city of Vienna and the Swiss lowlands. Local Environment 5(3): 311-
328.
Holmes, T. and S. Pincetl. 2012. Urban metabolism literature review. Los Angeles, California
Centre for Sustainable Communities at UCLA.
International Business Machines (IBM). 2010. Rain to Drain: A roadmap to gaining
control over water resource management using Information management and
predictive analytics. NY, USA.
This article is protected by copyright. All rights reserved.
Kennedy, C., J. Cuddihy, and J. Engel‐Yan. 2007. The changing metabolism of
cities. Journal of industrial ecology 11(2): 43-59
Kennedy, C., S. Pincetl, and P. Bunje. 2011. The study of urban metabolism and its
applications to urban planning and design. Environmental pollution
159(8):1965-1973.
Kenway, S., A. Gregory and J. McMahon. 2011. Urban water mass balance
analysis. Journal of Industrial Ecology 15(5): 693-706.
Kenway, S. J. 2013. The water-energy nexus and urban metabolism-Connections in
cities. Brisbane: Urban Water Security Research Alliance.
Kenway, S., J. McMahon, V. Elmer, S. Conrad, and J. Rosenblum. 2013. Managing
water-related energy in future cities–a research and policy roadmap. Journal of
Water and Climate Change, 4(3), 161-175.
Kingdom, B., R. Liemberger, and P. Marin. 2006. The challenge of reducing non-
revenue water (NRW) in developing countries. How the private sector can
help: A look at performance-based service contracting. World Bank Group;
Water Supply & Sanitation Sector Board; PPIAF, Discussion Paper Series, 8,
Washington DC. USA
Lele, S., V. Srinivasan, P. Jamwal, B.Thomas, M. Eswar, and T. Zuhail. 2013. Water
Management in Arkabhaty River: A Situation Analysis, Environment and
Development, Working paper No-1, Ashoka Trust for Research in Ecology and
the Environment (ATREE), Bangalore, Karnataka, India.
Mitchell, V.G., R. G. Mein, and T. A. McMahon. 2001. Modelling the urban water
cycle. Environmental Modelling & Software 16(7), 615-629
Newcombe, K., J. D. Kalma, and A. R. Aston. 1978. The metabolism of a city: the
case of Hong Kong. Ambio 3-15
Newman, P. W. 1999. Sustainability and cities: extending the metabolism
model. Landscape and urban planning 44(4): 219-226.
Nilsson, J. 1995. A phosphorus budget for a Swedish municipality. Journal of
Environmental Management 45(3): 243-253.
Novotny, V., V. Elmer, H. Furumai, S. Kenway, and O. Phills. 2010, Water and Energy
Footprints for sustainable communities, International Water Association. Monteal,
Canada.
This article is protected by copyright. All rights reserved.
Mehta, V. K., R. Goswami, E. Kemp-Benedict, S. Muddu, and D. Malghan. 2014.
Metabolic urbanism and environmental justice: the water conundrum in
Bangalore, India. Environmental Justice, 7(5):130-137
Pincetl, S., P. Bunje, and T. Holmes 2012. An expanded urban metabolism method: Toward a
systems approach for assessing urban energy processes and causes. Landscape and
urban planning 107(3):193-202.
Raj, K. 2013. Where All the Water has gone? An Analysis of Unreliable Water Supply
in BangaloreCity. Working Paper, Institute of Social and Economic Change
(ISEC). Bangalore, India
Rapoport, E. 2011. Interdisciplinary Perspectives on Urban Metabolism. A Review of
Literature. UCl Environmental Institute Working Paper. London: University
College London, Development Planning Unit.
Renouf, M., S. Kenway, S. Serao-Neumann, and D. Low Choy. 2016. Urban Metabolism for
Planning Water Sensitive Cities: Concept for an Urban Water Metabolism
Framework. Victoria: Cooperative Research Centre for Water Sensitive Cities.
Sahely, H. R., S. Dudding, and C.A. Kennedy. 2003. Estimating the urban metabolism of
Canadian cities: GTA case study. Canadian Journal for Civil Engineering 30: 468–
483.
Schulz, N.B. 2007. The direct material inputs into Singapore‟s development.
Journal of Industrial Ecology 11 (2): 117-131.
Stimson, R., J. Western, P. Mullins, and R. Simpson. 1999. Urban metabolism as a
framework for investigating quality of life and sustainable development in
the Brisbane-Southeast Queensland Metro region. Urban quality of life:
Critical issues and options 43-168
The Hindu. 2014. Karnataka resorts to load-shedding. www.thehindu.com/todays
paper/tp national/karnataka-resorts-to-loadshedding/article5980608.ece.
Accesses May 2014.
The Times of India. 2014. Karnataka to face two-hour long power cuts daily.
http://timesofindia.indiatimes.com/city/bengaluru/Karnataka-to-face-two-hour-
long-power-cuts-daily/articleshow/34706488.cms?. Accessed on May 2014
Theriault, J. and A.M. Laroche. 2009. Evaluation of the urban hydrologic metabolism of
the Greater Moncton region, New Brunswick. Canadian Water Resources
Journal 34 (3):255-268.
This article is protected by copyright. All rights reserved.
United Nations (UN). 2014. World Urbanization Prospects The 2014 Revision
Highlights. Economic and Social Affairs, New York, USA
Warren-Rhodes, K. and A. Koenig. 2001. Escalating Trends in the Urban
Metabolism of Hong Kong: 1971–1997, AMBIO: A Journal of the
Human Environment, 30(7):429-438.
Van Leeuwen, C. J., J. Frijns, A. Van Wezel, and F. H. M. Van De Ven. 2012. City
Blueprints: 24Indicators To Assess The Sustainability of The Urban Water
Cycle. Water Resources Management, 26, 2177-2197.
Wolman, A. 1965. The metabolism of cities. Scientific American 213(3): 179–190.
World Bank. 2013. Karnataka: Three Towns Pilot 24/7 Water Supply.
http://www.worldbank.org/en/news/feature/2013/01/01/karna
taka-three-towns-pilot-water-supply. Accessed April 2014.
Zhang, Y. and Z. Yang. 2007. Eco-efficiency of urban material metabolism: a case study in
Shenzhen, China. Acta Ecologica Sinica 27 (8): 3124-3131.
Zucchetto, J. 1975. Energy, economic theory and mathematical models for combining
the systems of man and nature. Case study, the urban region of Miami.
Ecological Modelling 1, 241-268
Supporting Information
Supporting information is linked to this article on the JIE website:
Supporting Information S1: This supporting information discusses 1) system and sub-system boundaries and how those were selected, 2) all primary and secondary data collected and how these were interpreted and used for water mass balance analysis, 3) the water mass balance analysis of Bangalore city (which can be interpreted as a physical model), 4) various performance indicators to monitor metabolic performances of Bangalore city, and 5) a scenario analysis presenting the future challenges of Bangalore city with respect to water demand and supply, and how those challenges can be met by harnessing alternative sources of water and by discontinuing withdrawal of water from the Cauvery River.


