Embed Size (px)
Citation preview
U.S. END MARKET ANALYSIS FOR KENYAN
CUT FLOWERS
December 2017
DISCLAIMER The authors’ views expressed in this report do not necessarily reflect the views of the United States Agency for
International Development or the United States Government.

3 | U.S. END MARKET ANALYSIS FOR CUT FLOWERS FROM KENYA
TABLE OF CONTENTS
ACRONYMS AND ABBREVIATIONS 4
EXECUTIVE SUMMARY 5
1. TARGET PRODUCTS 6
1.1 The Kenyan Flower Industry 6
1.2 Kenyan Flower Exports to the U.S. 8
1.3 Competitiveness of the Kenyan Flower Sector Vis-à-vis the U.S. Market 10
2. U.S. MARKET STRUCTURE, CHARACTERISTICS AND TRENDS 11
2.1 Historical Perspective 11
2.2 Market Size and Composition – The U.S. Domestic Floral Market 11
2.3 Floriculture Trade Flow – U.S. Exports and Imports 14
3. U.S. TARIFF STRUCTURE 29
4. NON-TARIFF REQUIREMENTS 30
4.1 Import Regulations 30
4.2 Standards, Regulations and Certifications 30
5. U.S. DISTRIBUTION – LOGISTICS AND TRANSPORT 33
5.1 Supplier Selection 33
5.2 Contract and Payment Terms 33
5.3 Transport and Points of Entry 34
5.4 Distribution Channels 35
6. CONSUMPTION PATTERNS FOR TARGET PRODUCTS AND PRICES 39
6.1 Cut Flower Consumption Patterns in the U.S. 39
6.2 Prices 39
7. SALES PROMOTION 43
7.1 Key Trade Fairs 43
7.2 Sources of information and promotional opportunities 43
8. COMPETITION – KEY SUPPLIERS OF CUT FLOWERS TO THE U.S. 45
9. RECOMMENDATIONS – ACTION PLAN 51
U.S. END MARKET ANALYSIS FOR CUT FLOWERS FROM KENYA | 4
ACRONYMS AND ABBREVIATIONS
AFIF Association of Floral Importers of Florida
AGOA African Growth and Opportunity Act
APHIS Animal and Plant Health Inspection Service
ASOCOLFLORES Colombian Association of Flower Exporters
ATPADEA Andean Trade Promotion and Drug Eradication Act
CBP Customs and Border Protection
CDN Cushion Daisy Novelty
CIF Cost Insurance and Freight
CITES Convention on International Trade in Endangered Species of Wild Fauna and Flora
COLEACP Europe-Africa-Caribbean-Pacific Liaison Committee
COMESA Common Market for Eastern and Southern Africa
EAC East African Community
ESA Endangered Species Act
EU European Union
EUREPGAP Europe-Africa-Caribbean-Pacific Liaison Committee
EXPOFLORES Ecuadorian Association of Flower Exporters
FOB Free on Board
FPO Flower Promotion Organization
FTA Free Trade Agreement
FTD Florist’s Transworld Delivery
Ha
HS
Hectares
Harmonized System
HTS Harmonized Tariff Schedule
IFE International Floriculture Expo
IFTEX International Floriculture Trade Expo
IPM Integrated Pest Management
ITC International Trade Commission
KEPHIS Kenya Plant Health Inspectorate Service
KFC Kenya Flower Council
MNS Market News Service
MPS Ecological Floriculture Project
NAFTA North American Free Trade Agreement
NASS National Agriculture Statistics Service
PMA Produce Marketing Association
PPQ Plant Protection and Quarantine
SAF The Society of American Florists
SCS Scientific Certification Systems
SWOT Strengths, Weaknesses, Opportunities and Threats
TIFA Trade and Investment Framework Agreements
UAE
UN
United Arab Emirates
United Nations
U.S. United States
USDA U.S. Department of Agriculture
USITC U.S. International Trade Commission
WCO World Customs Organization
WF&FSA
WTO
Wholesale Florists & Florist Supplier Association
World Trade Organization
5 | U.S. END MARKET ANALYSIS FOR CUT FLOWERS FROM KENYA
EXECUTIVE SUMMARY
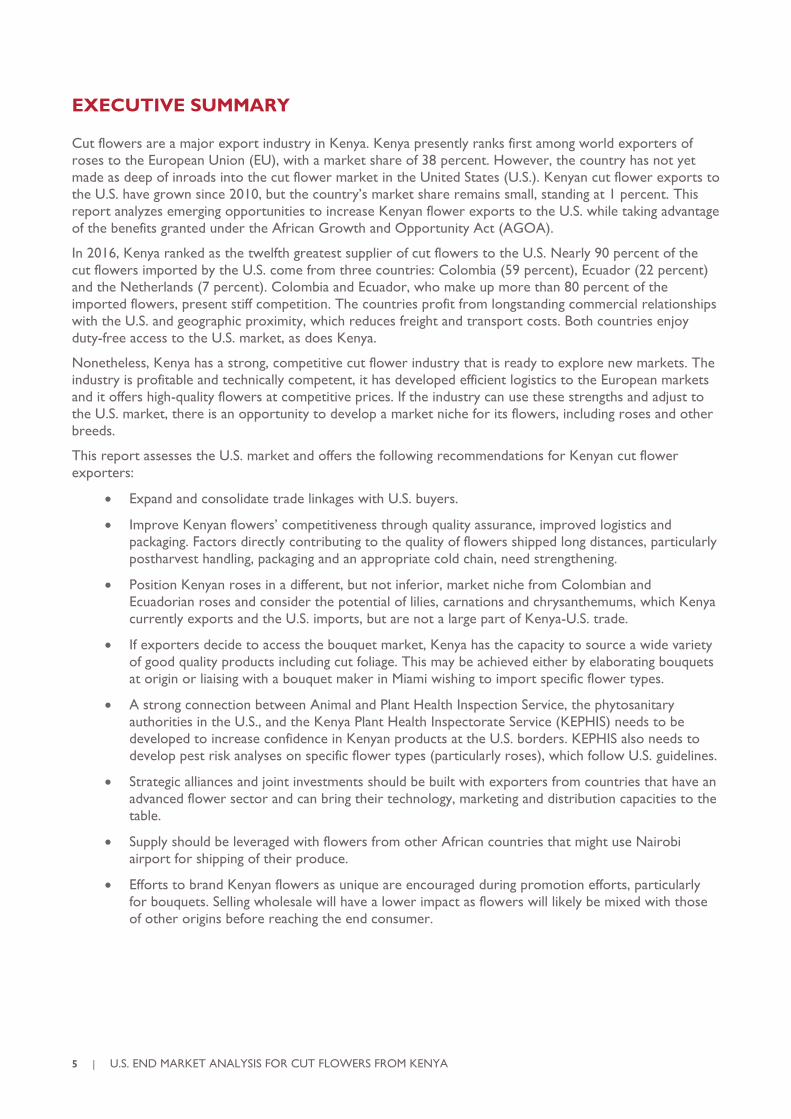
Cut flowers are a major export industry in Kenya. Kenya presently ranks first among world exporters of
roses to the European Union (EU), with a market share of 38 percent. However, the country has not yet
made as deep of inroads into the cut flower market in the United States (U.S.). Kenyan cut flower exports to
the U.S. have grown since 2010, but the country’s market share remains small, standing at 1 percent. This
report analyzes emerging opportunities to increase Kenyan flower exports to the U.S. while taking advantage
of the benefits granted under the African Growth and Opportunity Act (AGOA).
In 2016, Kenya ranked as the twelfth greatest supplier of cut flowers to the U.S. Nearly 90 percent of the
cut flowers imported by the U.S. come from three countries: Colombia (59 percent), Ecuador (22 percent)
and the Netherlands (7 percent). Colombia and Ecuador, who make up more than 80 percent of the
imported flowers, present stiff competition. The countries profit from longstanding commercial relationships
with the U.S. and geographic proximity, which reduces freight and transport costs. Both countries enjoy
duty-free access to the U.S. market, as does Kenya.
Nonetheless, Kenya has a strong, competitive cut flower industry that is ready to explore new markets. The
industry is profitable and technically competent, it has developed efficient logistics to the European markets
and it offers high-quality flowers at competitive prices. If the industry can use these strengths and adjust to
the U.S. market, there is an opportunity to develop a market niche for its flowers, including roses and other
breeds.
This report assesses the U.S. market and offers the following recommendations for Kenyan cut flower
exporters:
• Expand and consolidate trade linkages with U.S. buyers.
• Improve Kenyan flowers’ competitiveness through quality assurance, improved logistics and
packaging. Factors directly contributing to the quality of flowers shipped long distances, particularly
postharvest handling, packaging and an appropriate cold chain, need strengthening.
• Position Kenyan roses in a different, but not inferior, market niche from Colombian and
Ecuadorian roses and consider the potential of lilies, carnations and chrysanthemums, which Kenya
currently exports and the U.S. imports, but are not a large part of Kenya-U.S. trade.
• If exporters decide to access the bouquet market, Kenya has the capacity to source a wide variety
of good quality products including cut foliage. This may be achieved either by elaborating bouquets
at origin or liaising with a bouquet maker in Miami wishing to import specific flower types.
• A strong connection between Animal and Plant Health Inspection Service, the phytosanitary
authorities in the U.S., and the Kenya Plant Health Inspectorate Service (KEPHIS) needs to be
developed to increase confidence in Kenyan products at the U.S. borders. KEPHIS also needs to
develop pest risk analyses on specific flower types (particularly roses), which follow U.S. guidelines.
• Strategic alliances and joint investments should be built with exporters from countries that have an
advanced flower sector and can bring their technology, marketing and distribution capacities to the
table.
• Supply should be leveraged with flowers from other African countries that might use Nairobi
airport for shipping of their produce.
• Efforts to brand Kenyan flowers as unique are encouraged during promotion efforts, particularly
for bouquets. Selling wholesale will have a lower impact as flowers will likely be mixed with those
of other origins before reaching the end consumer.
U.S. END MARKET ANALYSIS FOR CUT FLOWERS FROM KENYA | 6
1. TARGET PRODUCTS
This report focuses on floral/ornamental products imported by the U.S. Although all segments of the
ornamental sector are analyzed, an emphasis is placed on cut flowers, which is what Kenya is primarily
seeking to introduce in the U.S. These include roses, carnations, alstroemerias, lilies and gypsophylas.
1.1 THE KENYAN FLOWER INDUSTRY
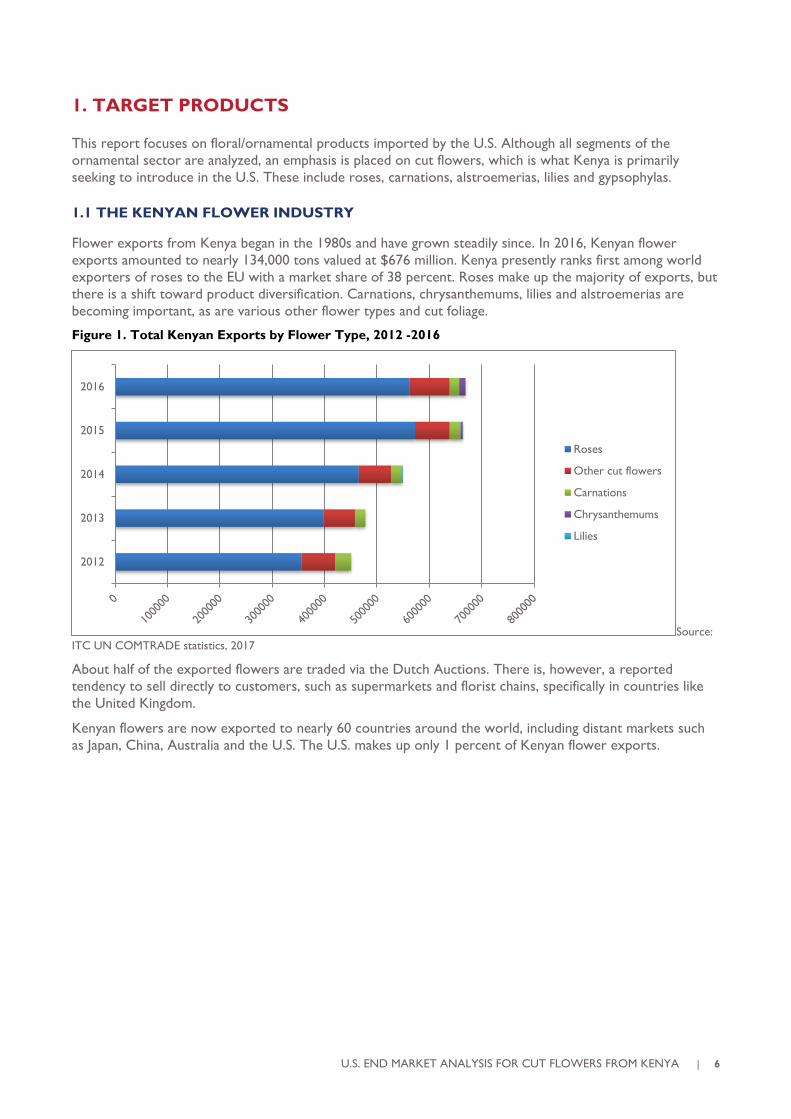
Flower exports from Kenya began in the 1980s and have grown steadily since. In 2016, Kenyan flower
exports amounted to nearly 134,000 tons valued at $676 million. Kenya presently ranks first among world
exporters of roses to the EU with a market share of 38 percent. Roses make up the majority of exports, but
there is a shift toward product diversification. Carnations, chrysanthemums, lilies and alstroemerias are
becoming important, as are various other flower types and cut foliage.
Figure 1. Total Kenyan Exports by Flower Type, 2012 -2016
Source:
ITC UN COMTRADE statistics, 2017
About half of the exported flowers are traded via the Dutch Auctions. There is, however, a reported
tendency to sell directly to customers, such as supermarkets and florist chains, specifically in countries like
the United Kingdom.
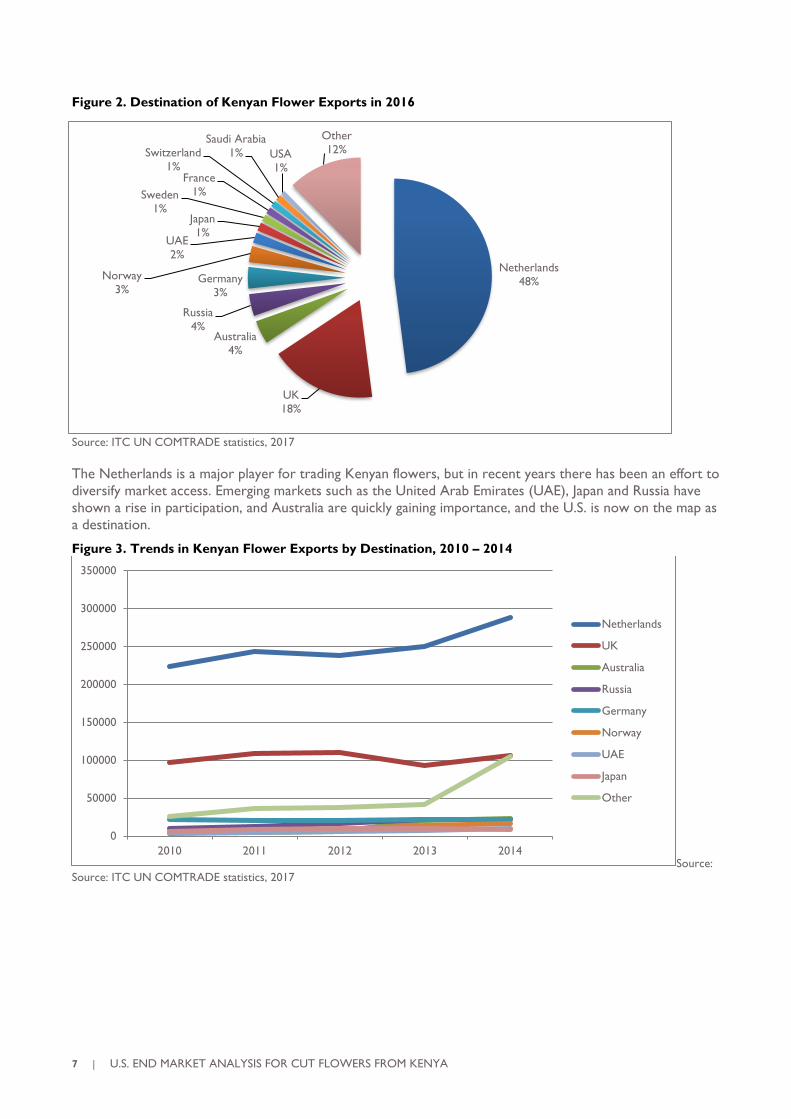
Kenyan flowers are now exported to nearly 60 countries around the world, including distant markets such
as Japan, China, Australia and the U.S. The U.S. makes up only 1 percent of Kenyan flower exports.
2012
2013
2014
2015
2016
Roses
Other cut flowers
Carnations
Chrysanthemums
Lilies
7 | U.S. END MARKET ANALYSIS FOR CUT FLOWERS FROM KENYA
Figure 2. Destination of Kenyan Flower Exports in 2016
Source: ITC UN COMTRADE statistics, 2017
The Netherlands is a major player for trading Kenyan flowers, but in recent years there has been an effort to
diversify market access. Emerging markets such as the United Arab Emirates (UAE), Japan and Russia have
shown a rise in participation, and Australia are quickly gaining importance, and the U.S. is now on the map as
a destination.
Figure 3. Trends in Kenyan Flower Exports by Destination, 2010 – 2014
Source:
Source: ITC UN COMTRADE statistics, 2017
0
50000
100000
150000
200000
250000
300000
350000
2010 2011 2012 2013 2014
Netherlands
UK
Australia
Russia
Germany
Norway
UAE
Japan
Other
Netherlands
48%
UK
18%
Australia
4%
Russia
4%
Germany
3%
Norway
3%
UAE
2%
Japan
1%
Sweden
1%
France
1%
Switzerland
1%
Saudi Arabia
1% USA
1%
Other
12%
U.S. END MARKET ANALYSIS FOR CUT FLOWERS FROM KENYA | 8
1.2 KENYAN FLOWER EXPORTS TO THE U.S.
TOTAL EXPORTS OF ORNAMENTAL PRODUCTS FROM KENYA TO THE U.S.
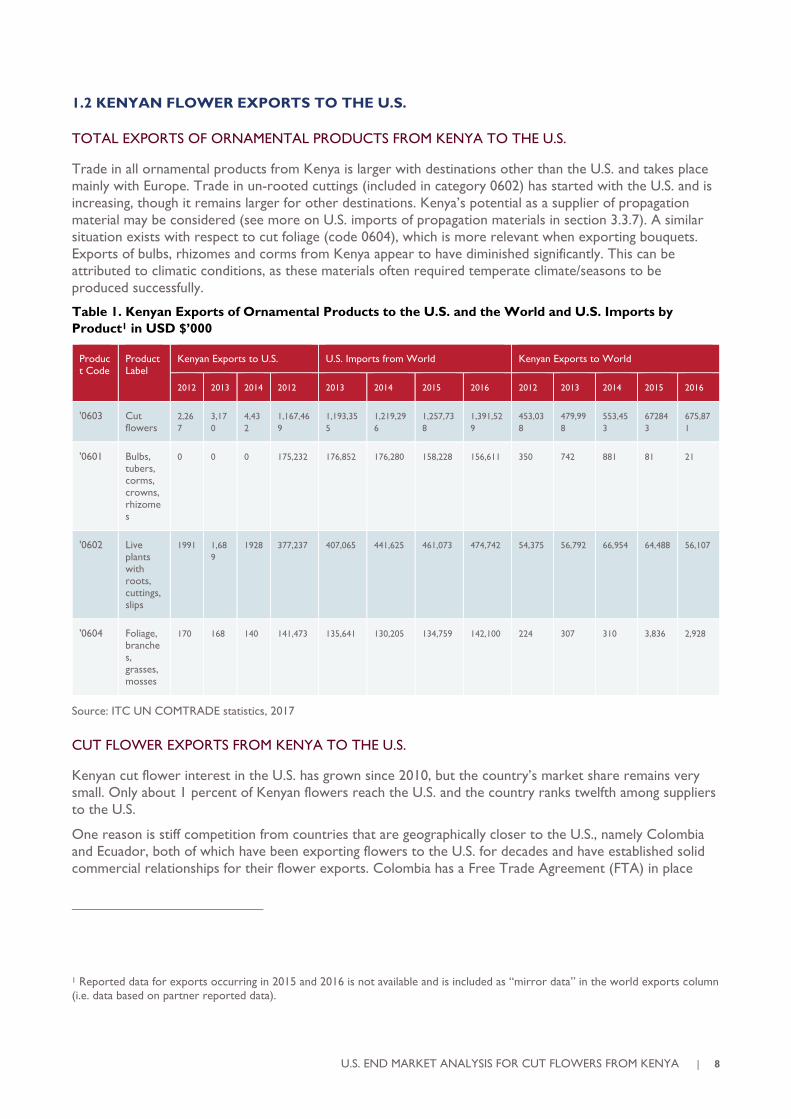
Trade in all ornamental products from Kenya is larger with destinations other than the U.S. and takes place
mainly with Europe. Trade in un-rooted cuttings (included in category 0602) has started with the U.S. and is
increasing, though it remains larger for other destinations. Kenya’s potential as a supplier of propagation
material may be considered (see more on U.S. imports of propagation materials in section 3.3.7). A similar
situation exists with respect to cut foliage (code 0604), which is more relevant when exporting bouquets.
Exports of bulbs, rhizomes and corms from Kenya appear to have diminished significantly. This can be
attributed to climatic conditions, as these materials often required temperate climate/seasons to be
produced successfully.
Table 1. Kenyan Exports of Ornamental Products to the U.S. and the World and U.S. Imports by
Product1 in USD $’000
Source: ITC UN COMTRADE statistics, 2017
CUT FLOWER EXPORTS FROM KENYA TO THE U.S.
Kenyan cut flower interest in the U.S. has grown since 2010, but the country’s market share remains very
small. Only about 1 percent of Kenyan flowers reach the U.S. and the country ranks twelfth among suppliers
to the U.S.
One reason is stiff competition from countries that are geographically closer to the U.S., namely Colombia
and Ecuador, both of which have been exporting flowers to the U.S. for decades and have established solid
commercial relationships for their flower exports. Colombia has a Free Trade Agreement (FTA) in place
1 Reported data for exports occurring in 2015 and 2016 is not available and is included as “mirror data” in the world exports column
(i.e. data based on partner reported data).
Product Code
Product Label
Kenyan Exports to U.S. U.S. Imports from World Kenyan Exports to World
2012 2013 2014 2012 2013 2014 2015 2016 2012 2013 2014 2015 2016
'0603 Cut flowers
2,26
7
3,17
0
4,43
2
1,167,46
9
1,193,35
5
1,219,29
6
1,257,73
8
1,391,52
9
453,03
8
479,99
8
553,45
3
67284
3
675,87
1
'0601 Bulbs, tubers, corms, crowns, rhizomes
0 0 0 175,232 176,852 176,280 158,228 156,611 350 742 881 81 21
'0602 Live plants with roots, cuttings, slips
1991 1,68
9
1928 377,237 407,065 441,625 461,073 474,742 54,375 56,792 66,954 64,488 56,107
'0604 Foliage, branches, grasses, mosses
170 168 140 141,473 135,641 130,205 134,759 142,100 224 307 310 3,836 2,928
9 | U.S. END MARKET ANALYSIS FOR CUT FLOWERS FROM KENYA
with the U.S. that allows for tariff-free access, and Ecuador is compensating tariffs due to exporters on some
cut flowers (roses in particular) through government incentives.
Kenya has developed significant markets for its cut flowers around the world, particularly in the Netherlands
and the EU. It can offer good quality products that show potential for the U.S. market. Access to the U.S.
market is however limited by logistics, particularly shipping time and freight costs (see Chapter 6). The
introduction of direct passenger flights from Kenya to the U.S. will help overcome this hurdle, but wider
freight capacity may be needed.
Exports of ornamental products from Kenya to the U.S. as reported by COMTRADE are summarized in the
table below. Reported data is not available for Kenyan flower exports in 2015 and 2016 and is included as
“mirror data” in the world exports column (i.e. data based on partner reported data).
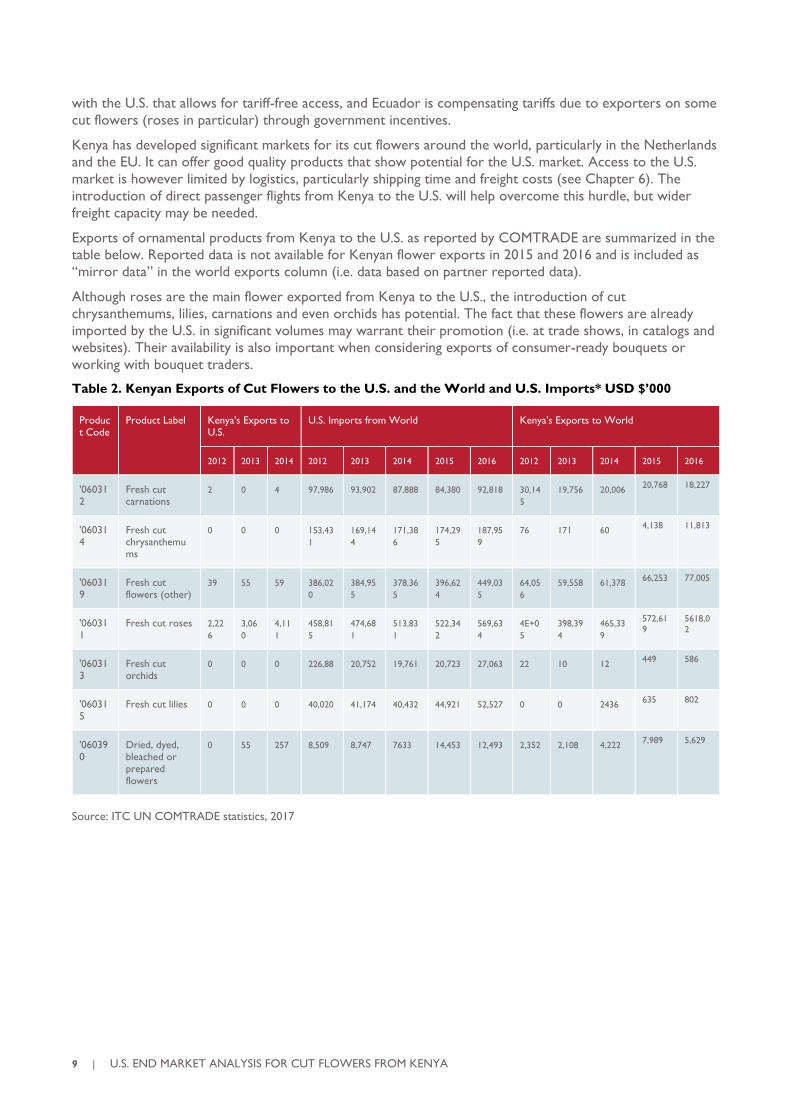
Although roses are the main flower exported from Kenya to the U.S., the introduction of cut
chrysanthemums, lilies, carnations and even orchids has potential. The fact that these flowers are already
imported by the U.S. in significant volumes may warrant their promotion (i.e. at trade shows, in catalogs and
websites). Their availability is also important when considering exports of consumer-ready bouquets or
working with bouquet traders.
Table 2. Kenyan Exports of Cut Flowers to the U.S. and the World and U.S. Imports* USD $’000
Source: ITC UN COMTRADE statistics, 2017
Product Code
Product Label Kenya's Exports to U.S.
U.S. Imports from World Kenya's Exports to World
2012 2013 2014 2012 2013 2014 2015 2016 2012 2013 2014 2015 2016
'060312
Fresh cut carnations
2 0 4 97,986 93,902 87,888 84,380 92,818 30,14
5
19,756 20,006 20,768 18,227
'060314
Fresh cut chrysanthemums
0 0 0 153,43
1
169,14
4
171,38
6
174,29
5
187,95
9
76 171 60 4,138 11,813
'060319
Fresh cut flowers (other)
39 55 59 386,02
0
384,95
5
378,36
5
396,62
4
449,03
5
64,05
6
59,558 61,378 66,253 77,005
'060311
Fresh cut roses 2,22
6
3,06
0
4,11
1
458,81
5
474,68
1
513,83
1
522,34
2
569,63
4
4E+0
5
398,39
4
465,33
9
572,61
9
5618,0
2
'060313
Fresh cut orchids
0 0 0 226,88 20,752 19,761 20,723 27,063 22 10 12 449 586
'060315
Fresh cut lilies 0 0 0 40,020 41,174 40,432 44,921 52,527 0 0 2436 635 802
'060390
Dried, dyed, bleached or prepared flowers
0 55 257 8,509 8,747 7633 14,453 12,493 2,352 2,108 4,222 7,989 5,629
U.S. END MARKET ANALYSIS FOR CUT FLOWERS FROM KENYA | 10
1.3 COMPETITIVENESS OF THE KENYAN FLOWER SECTOR VIS-À-VIS THE U.S.
MARKET
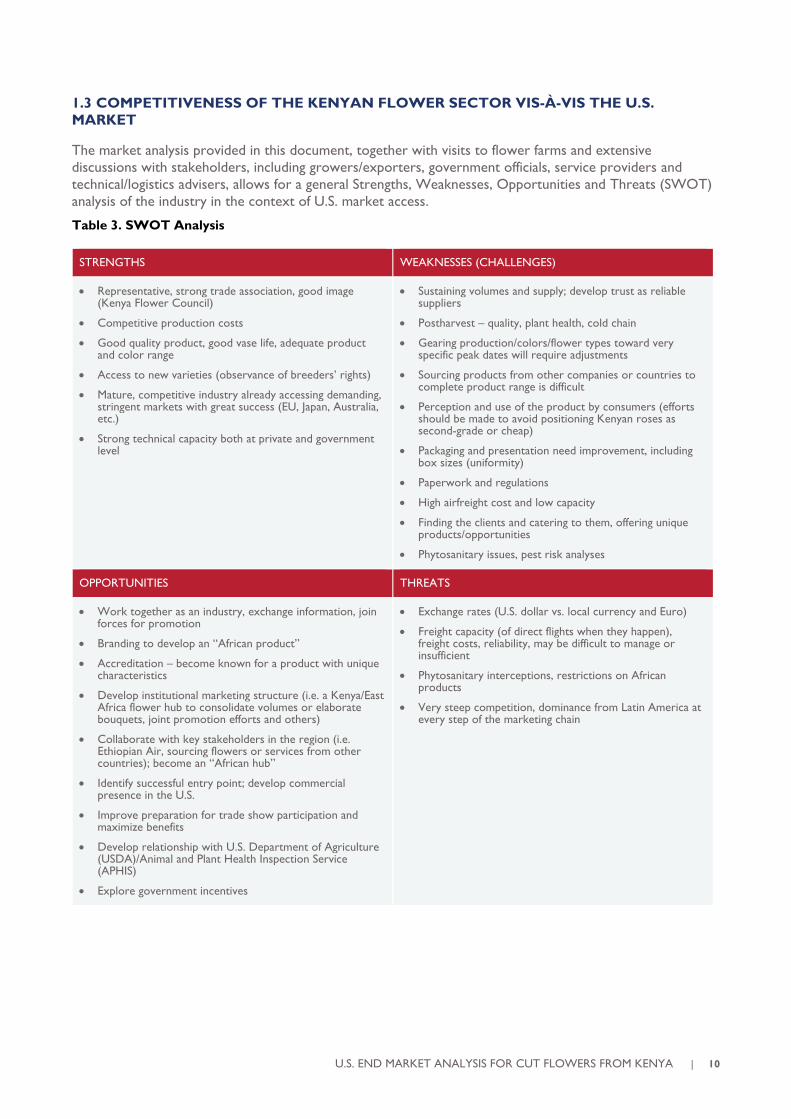
The market analysis provided in this document, together with visits to flower farms and extensive
discussions with stakeholders, including growers/exporters, government officials, service providers and
technical/logistics advisers, allows for a general Strengths, Weaknesses, Opportunities and Threats (SWOT)
analysis of the industry in the context of U.S. market access.
Table 3. SWOT Analysis
STRENGTHS WEAKNESSES (CHALLENGES)
• Representative, strong trade association, good image (Kenya Flower Council)
• Competitive production costs
• Good quality product, good vase life, adequate product and color range
• Access to new varieties (observance of breeders’ rights)
• Mature, competitive industry already accessing demanding, stringent markets with great success (EU, Japan, Australia, etc.)
• Strong technical capacity both at private and government level
• Sustaining volumes and supply; develop trust as reliable suppliers
• Postharvest – quality, plant health, cold chain
• Gearing production/colors/flower types toward very specific peak dates will require adjustments
• Sourcing products from other companies or countries to complete product range is difficult
• Perception and use of the product by consumers (efforts should be made to avoid positioning Kenyan roses as second-grade or cheap)
• Packaging and presentation need improvement, including box sizes (uniformity)
• Paperwork and regulations
• High airfreight cost and low capacity
• Finding the clients and catering to them, offering unique products/opportunities
• Phytosanitary issues, pest risk analyses
OPPORTUNITIES THREATS
• Work together as an industry, exchange information, join forces for promotion
• Branding to develop an “African product”
• Accreditation – become known for a product with unique characteristics
• Develop institutional marketing structure (i.e. a Kenya/East Africa flower hub to consolidate volumes or elaborate bouquets, joint promotion efforts and others)
• Collaborate with key stakeholders in the region (i.e. Ethiopian Air, sourcing flowers or services from other countries); become an “African hub”
• Identify successful entry point; develop commercial presence in the U.S.
• Improve preparation for trade show participation and maximize benefits
• Develop relationship with U.S. Department of Agriculture (USDA)/Animal and Plant Health Inspection Service (APHIS)
• Explore government incentives
• Exchange rates (U.S. dollar vs. local currency and Euro)
• Freight capacity (of direct flights when they happen), freight costs, reliability, may be difficult to manage or insufficient
• Phytosanitary interceptions, restrictions on African products
• Very steep competition, dominance from Latin America at every step of the marketing chain
11 | U.S. END MARKET ANALYSIS FOR CUT FLOWERS FROM KENYA
2. U.S. MARKET STRUCTURE, CHARACTERISTICS AND TRENDS
2.1 HISTORICAL PERSPECTIVE
During the second half of the 20th century, the U.S. floriculture sector underwent significant changes. In the
1950s, local family businesses operating near large market centers like New York, Chicago and Philadelphia
led cut flower production. Production was kept near consumers, even if the climate was not ideal, to keep
flowers from perishing during ground transportation. In these locations, year-round production was possible,
but at a high cost, since greenhouses required heating and cooling and the day’s length was artificially altered
by supplementary lighting or shading according to the season.
With the arrival of commercial aviation, however, transportation now allowed flower and plant production
to move to states with more suitable climates, such as California and Florida. It soon became evident that it
was possible to source flowers from production areas as far away such as Colombia, where climatic
conditions were ideal, hand labor was available and production costs were stable throughout the year, as
environmental controls (i.e., heating and cooling) were not necessary. Soon other suppliers joined the scene,
including Ecuador, Costa Rica and Chile. The face of U.S. floriculture changed significantly, and today over 70
percent of the cut flowers sold in the U.S. are imported. To sustain its high cut flower consumption, the U.S.
has become the largest importer of cut flowers in the world.
A large number of information sources were consulted, including published studies, trade magazines and
interviews. With respect to statistics, two main sources of information were used: the COMTRADE system
of the United Nations World Trade Organization (UN/WTO) and the National Agriculture Statistics Service
(NASS) of the USDA. Data from these two sources do not always align, possibly due to differences in
measurement and reporting methods. However, general trends do match and the sources are thus
complementary and useful in establishing trends.
There are some instances where data is not registered – for example, data for specific flower types, or
where access to such data is restricted as is the case of certain associations (i.e. of importers or traders),
where information is only available to members.
2.2 MARKET SIZE AND COMPOSITION – THE U.S. DOMESTIC FLORAL MARKET
The wholesale flower and ornamental plant sector of the U.S. was valued at $4,370 million in 2015 by the
USDA, showing an increase of 4 percent from the previous year, and of about 9 percent since 2006. An
estimated 6,000 producers of flowers and ornamental farms are in operation, of which approximately 2,600
are currently concentrated in 15 states and collectively report annual sales of over $100,000.
California has traditionally led production, with crop production valued at $1,080 million in 2015. Florida is
the second largest producer, with a wholesale value of $1,030 million. Its production has increased over
time, showing a 12 percent increase from 2012 to 2014. Together, these two states account for 49 percent
of the total value produced in the 15 states. For 2015, the five states accounting for about 70 percent of the
total value ($3,000 million) were California, Florida, Michigan, North Carolina and Ohio. Interestingly, Texas
and New York no longer belong to this group, as production in North Carolina and Ohio has overtaken
them.
The ornamental sector of the U.S. can be summarized as follows:
• 3,874 hectares (ha) of greenhouses
• 3,326 ha under shade or temporary cover
• 16,200 ha of open field production.
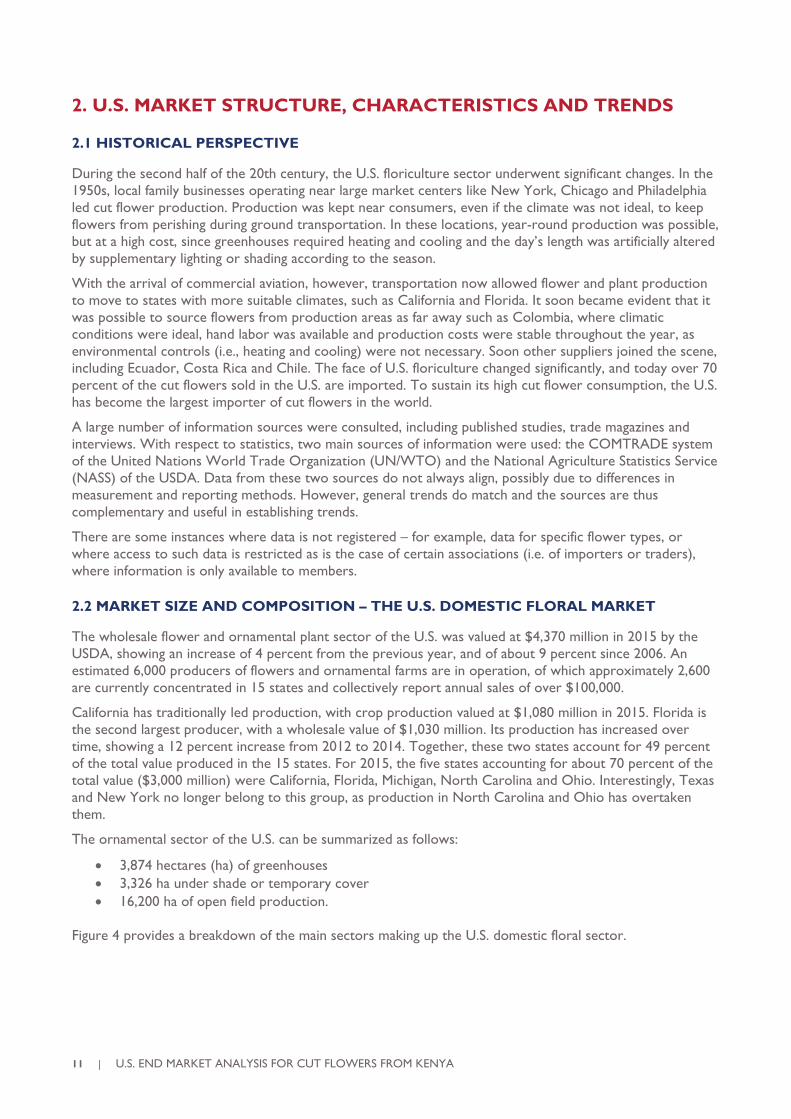
Figure 4 provides a breakdown of the main sectors making up the U.S. domestic floral sector.
U.S. END MARKET ANALYSIS FOR CUT FLOWERS FROM KENYA | 12
Figure 4. Composition of the Ornamental Sector of the U.S. (2015)
Source:
Floriculture Crops Summary 2016 Agriculture Statistics Board, National Agriculture Statistics Service (NASS), USDA
CUT FLOWERS
The domestic cut flower sector of the U.S. has shown a sustained downward trend over several decades,
particularly in the 1980s and 1990s, as a result of increasing flower imports. In 2007, cut flowers represented
10.2 percent of the total ornamental sector with a wholesale value of $416 million. In 2015, this value was
reported to be $374 million (9 percent of the total ornamental sector). This figure was 3 percent above that
of the previous year, possibly as a result of active campaigns encouraging consumers to buy local flowers
(see later sections in this report). Nearly 80 percent of the sales originate from California.
In response to imports, the product mix in this sector has also changed. While the main products 30 to 40
years ago were “traditional” flowers such as roses, chrysanthemums and carnations, the mix has gradually
shifted toward “specialty” cut flowers such as dephinium, gladioli, gerberas, lilies, iris, orchids, tulips and
peonies, which are imported in lower quantities (or not at all). Since 2006, the USDA has kept track of
floriculture-related data in the 15 states where this activity is significant, and from companies reporting sales
over $100,000 per year. In 2015, there were 444 cut flower growers, up from 316 in 2010, but down from
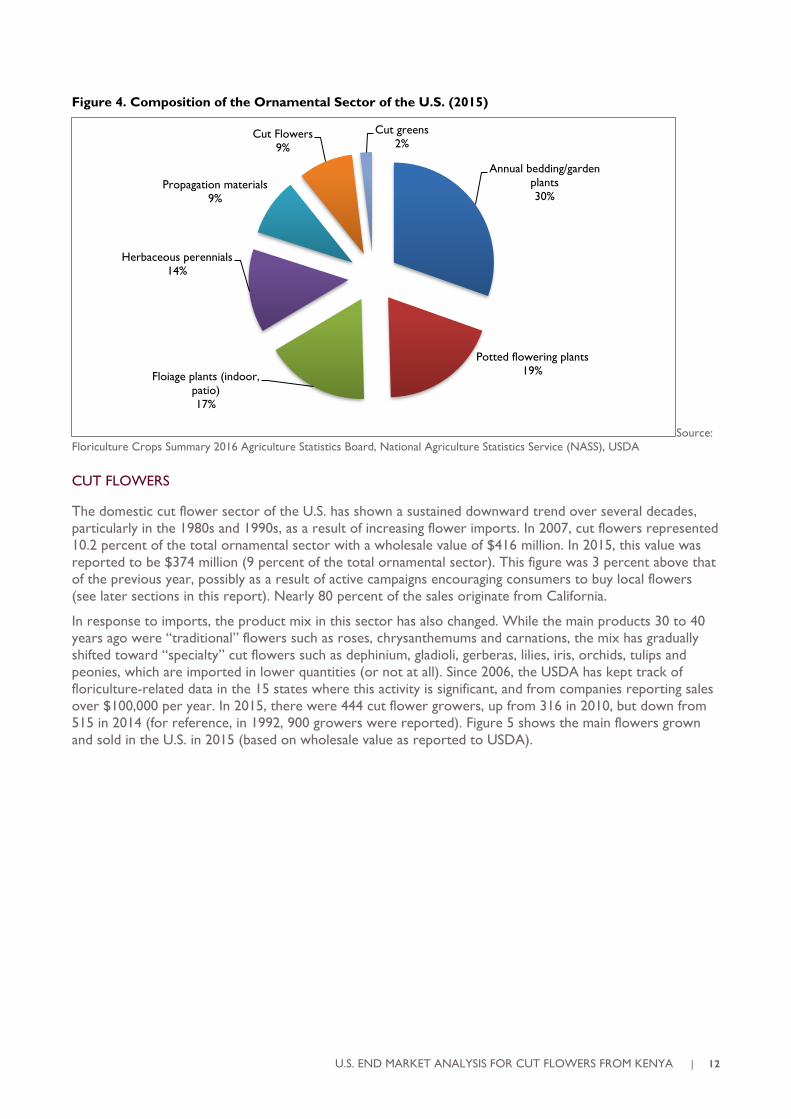
515 in 2014 (for reference, in 1992, 900 growers were reported). Figure 5 shows the main flowers grown
and sold in the U.S. in 2015 (based on wholesale value as reported to USDA).
Annual bedding/garden
plants
30%
Potted flowering plants
19%Floiage plants (indoor,
patio)
17%
Herbaceous perennials
14%
Propagation materials
9%
Cut Flowers
9%
Cut greens
2%
13 | U.S. END MARKET ANALYSIS FOR CUT FLOWERS FROM KENYA
Figure 5. Sales of Domestically Grown Cut Flowers in the U.S. in 2015
Source:
Floriculture Crops Summary 2007, 2011, 2016 Agriculture Statistics Board, NASS, USDA
For most flowers, production has picked up slightly or remained stable in the past five years, with certain
flowers consolidating as main players, such as lilies, tulips, iris and gerberas. The “other flowers” segment has
also increased and diversified. Flowers which are predominantly imported (i.e. roses, carnations,
alstroemerias) are produced in much lower quantities. Nearly 80 percent of domestic commercial cut flower
production takes place in California.
CUT FOLIAGE (CUT GREENS)
Cultivated cut greens occupy the smallest segment within the U.S. ornamental industry. After experiencing a
decline ten years ago, the segment has experienced a change over the past five years. Cultivated cut greens
had a wholesale value of $80.4 million in 2015, a 10 percent increase over the previous year. Two hundred
and fifty-seven producers were registered in 2015, about 15 percent less than in 2014 (but up from 166 in
2007). Florida is the leading state in this segment, with 76 percent of total category sales. Leather leaf fern
Rhumora adiantiformis and tree fern Asparagus virgatus are the most important species (composing over 40
percent of the total), but in the past decade many new cut foliage types have joined the scene, including salal,
Gaultheria shallon, Ruscus, bear grass, myrtles, musas, Phyloendron and many more. Other states with sizable
cut foliage production are California (14 percent) and Oregon (5 percent). Since 2003, domestic production
of leatherleaf fern has reduced, giving way to new kinds of cut foliage, but this can also be attributed to
increased imports from Central America, specifically Costa Rica and Honduras.
PLANT PROPAGATION MATERIALS
Plant propagation materials or “unfinished plants” include cuttings, bulbs and grafted plants. They are used
for propagating bedding and garden plants, herbaceous perennials, flowering and foliage plants, cut flowers
and cut greens. This sector presently comprises 9 percent of the total ornamental sector. Its wholesale value
was estimated at $395 million in 2015, a 15 percent increase with respect to the previous year, but about
the same as was reported a decade earlier in 2006.
This is an important sector since it affects the development and introduction of new cultivars. Research
related to breeding and improving ornamentals is often limited in developing countries. Consequently, many
developing countries depend on plant breeding efforts conducted in developed nations. The U.S. is a supplier
of base material for other countries. Many breeding companies pursue cultivar selection programs in
3% 1%
9%
5%
3%
17%
1%
2%5%
4%15%
35%
Pompoms
Delphinium
Gerbera
Gladiolus
Iris
Lilium
Lisianthus
Orchids
Roses
Snapdragons
Tulips
Other
U.S. END MARKET ANALYSIS FOR CUT FLOWERS FROM KENYA | 14
conjunction with producers/exporters to ensure that these new varieties develop optimally under
commercial production conditions. In this context, observance of breeders’ rights and payment of royalties
to guarantee access to new varieties is highly important.
2.3 FLORICULTURE TRADE FLOW – U.S. EXPORTS AND IMPORTS
WORLD TRADE OF FLOWERS AND PLANTS
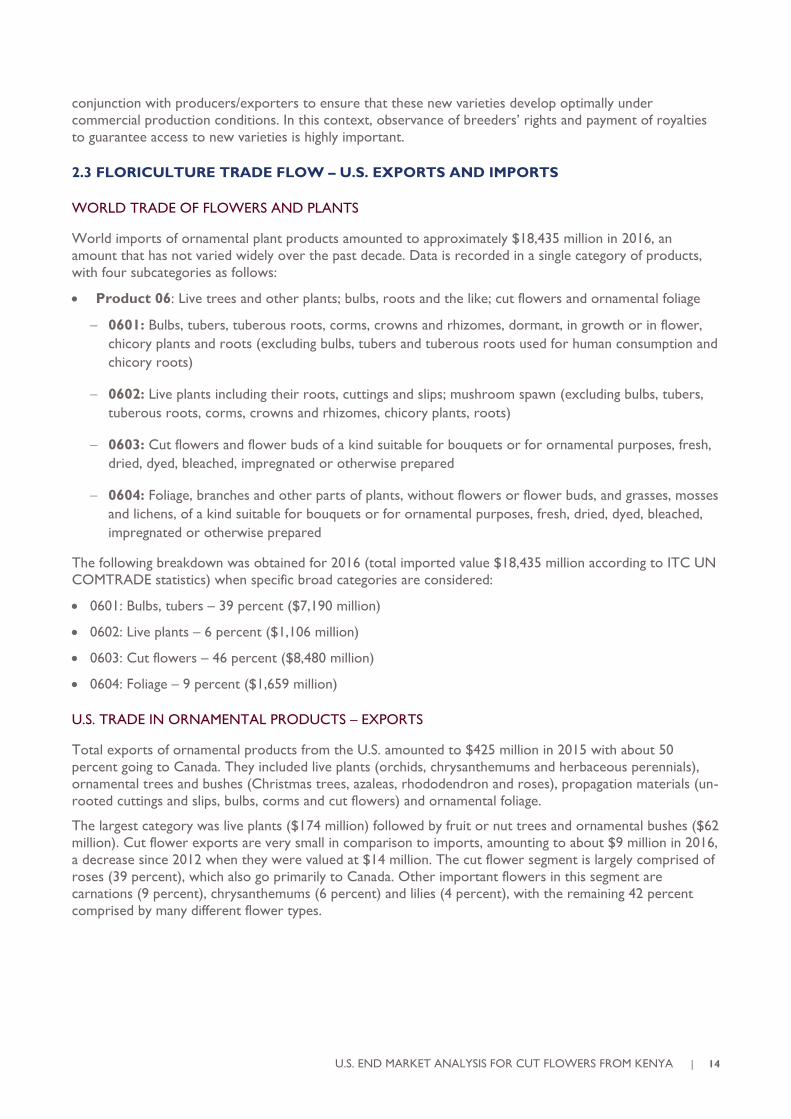
World imports of ornamental plant products amounted to approximately $18,435 million in 2016, an
amount that has not varied widely over the past decade. Data is recorded in a single category of products,
with four subcategories as follows:
• Product 06: Live trees and other plants; bulbs, roots and the like; cut flowers and ornamental foliage
− 0601: Bulbs, tubers, tuberous roots, corms, crowns and rhizomes, dormant, in growth or in flower,
chicory plants and roots (excluding bulbs, tubers and tuberous roots used for human consumption and
chicory roots)
− 0602: Live plants including their roots, cuttings and slips; mushroom spawn (excluding bulbs, tubers,
tuberous roots, corms, crowns and rhizomes, chicory plants, roots)
− 0603: Cut flowers and flower buds of a kind suitable for bouquets or for ornamental purposes, fresh,
dried, dyed, bleached, impregnated or otherwise prepared
− 0604: Foliage, branches and other parts of plants, without flowers or flower buds, and grasses, mosses
and lichens, of a kind suitable for bouquets or for ornamental purposes, fresh, dried, dyed, bleached,
impregnated or otherwise prepared
The following breakdown was obtained for 2016 (total imported value $18,435 million according to ITC UN
COMTRADE statistics) when specific broad categories are considered:
• 0601: Bulbs, tubers – 39 percent ($7,190 million)
• 0602: Live plants – 6 percent ($1,106 million)
• 0603: Cut flowers – 46 percent ($8,480 million)
• 0604: Foliage – 9 percent ($1,659 million)
U.S. TRADE IN ORNAMENTAL PRODUCTS – EXPORTS
Total exports of ornamental products from the U.S. amounted to $425 million in 2015 with about 50
percent going to Canada. They included live plants (orchids, chrysanthemums and herbaceous perennials),
ornamental trees and bushes (Christmas trees, azaleas, rhododendron and roses), propagation materials (un-
rooted cuttings and slips, bulbs, corms and cut flowers) and ornamental foliage.
The largest category was live plants ($174 million) followed by fruit or nut trees and ornamental bushes ($62
million). Cut flower exports are very small in comparison to imports, amounting to about $9 million in 2016,
a decrease since 2012 when they were valued at $14 million. The cut flower segment is largely comprised of
roses (39 percent), which also go primarily to Canada. Other important flowers in this segment are
carnations (9 percent), chrysanthemums (6 percent) and lilies (4 percent), with the remaining 42 percent
comprised by many different flower types.
15 | U.S. END MARKET ANALYSIS FOR CUT FLOWERS FROM KENYA
U.S. TRADE IN ORNAMENTAL PLANT PRODUCTS – IMPORTS
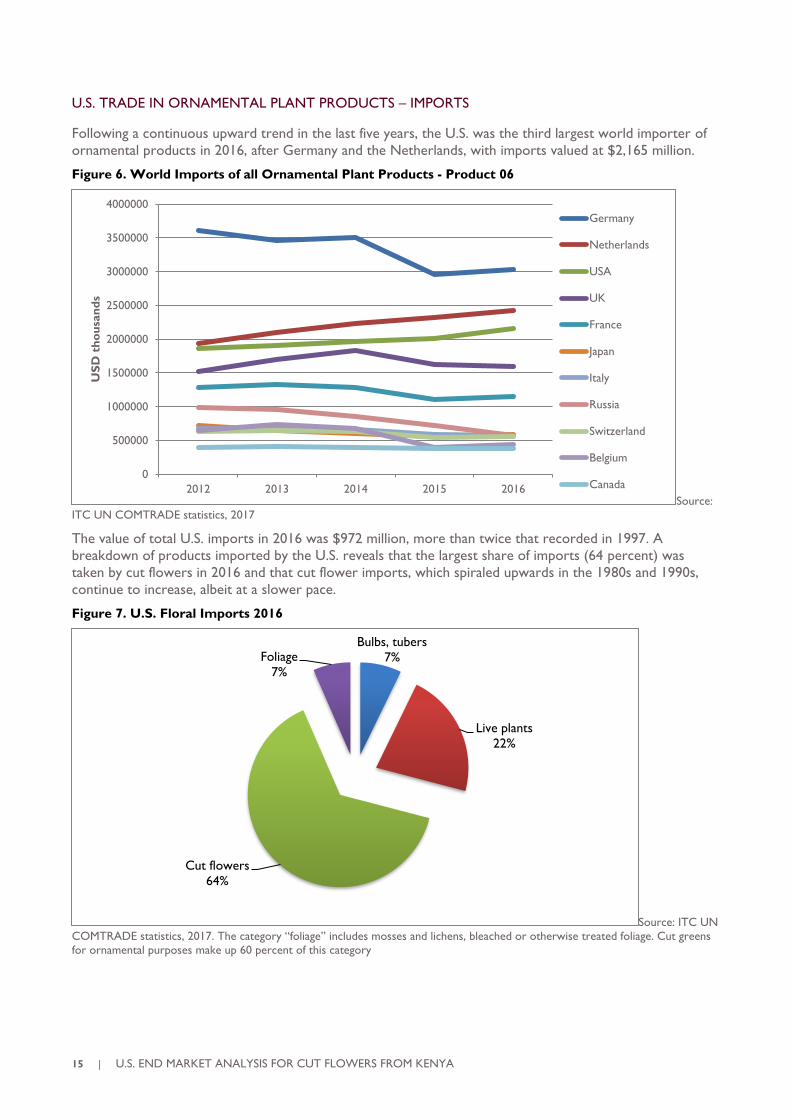
Following a continuous upward trend in the last five years, the U.S. was the third largest world importer of
ornamental products in 2016, after Germany and the Netherlands, with imports valued at $2,165 million.
Figure 6. World Imports of all Ornamental Plant Products - Product 06
Source:
ITC UN COMTRADE statistics, 2017
The value of total U.S. imports in 2016 was $972 million, more than twice that recorded in 1997. A
breakdown of products imported by the U.S. reveals that the largest share of imports (64 percent) was
taken by cut flowers in 2016 and that cut flower imports, which spiraled upwards in the 1980s and 1990s,
continue to increase, albeit at a slower pace.
Figure 7. U.S. Floral Imports 2016
Source: ITC UN
COMTRADE statistics, 2017. The category “foliage” includes mosses and lichens, bleached or otherwise treated foliage. Cut greens
for ornamental purposes make up 60 percent of this category
0
500000
1000000
1500000
2000000
2500000
3000000
3500000
4000000
2012 2013 2014 2015 2016
US
D t
ho
usa
nd
s
Germany
Netherlands
USA
UK
France
Japan
Italy
Russia
Switzerland
Belgium
Canada
Bulbs, tubers
7%
Live plants
22%
Cut flowers
64%
Foliage
7%
U.S. END MARKET ANALYSIS FOR CUT FLOWERS FROM KENYA | 16
CUT FLOWER IMPORTS TO THE U.S.
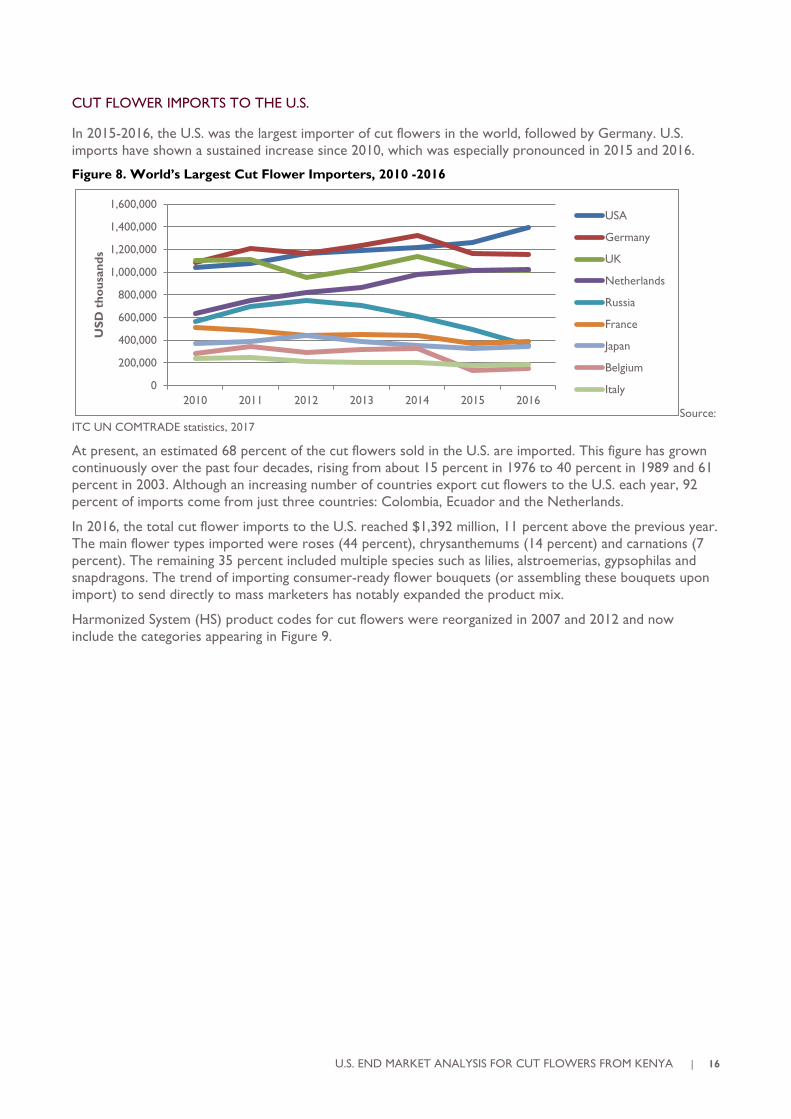
In 2015-2016, the U.S. was the largest importer of cut flowers in the world, followed by Germany. U.S.
imports have shown a sustained increase since 2010, which was especially pronounced in 2015 and 2016.
Figure 8. World’s Largest Cut Flower Importers, 2010 -2016
Source:
ITC UN COMTRADE statistics, 2017
At present, an estimated 68 percent of the cut flowers sold in the U.S. are imported. This figure has grown
continuously over the past four decades, rising from about 15 percent in 1976 to 40 percent in 1989 and 61
percent in 2003. Although an increasing number of countries export cut flowers to the U.S. each year, 92
percent of imports come from just three countries: Colombia, Ecuador and the Netherlands.
In 2016, the total cut flower imports to the U.S. reached $1,392 million, 11 percent above the previous year.
The main flower types imported were roses (44 percent), chrysanthemums (14 percent) and carnations (7
percent). The remaining 35 percent included multiple species such as lilies, alstroemerias, gypsophilas and
snapdragons. The trend of importing consumer-ready flower bouquets (or assembling these bouquets upon
import) to send directly to mass marketers has notably expanded the product mix.
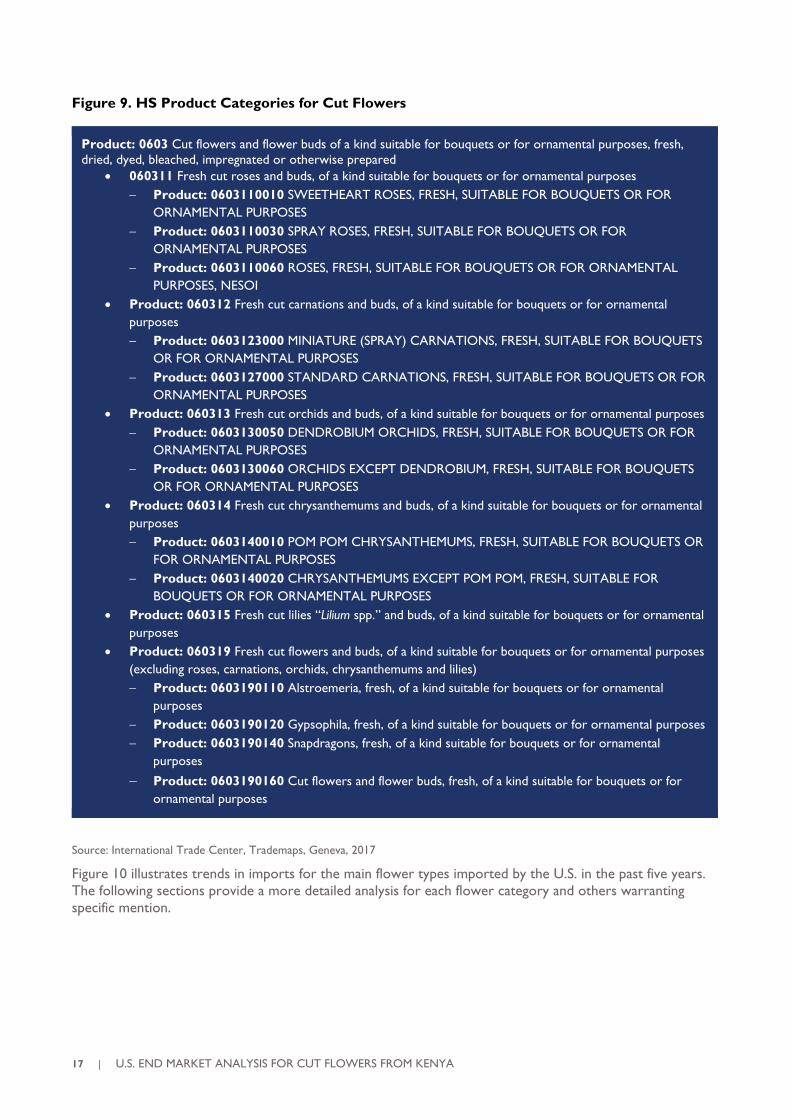
Harmonized System (HS) product codes for cut flowers were reorganized in 2007 and 2012 and now
include the categories appearing in Figure 9.
0
200,000
400,000
600,000
800,000
1,000,000
1,200,000
1,400,000
1,600,000
2010 2011 2012 2013 2014 2015 2016
US
D t
ho
usa
nd
s
USA
Germany
UK
Netherlands
Russia
France
Japan
Belgium
Italy
17 | U.S. END MARKET ANALYSIS FOR CUT FLOWERS FROM KENYA
Figure 9. HS Product Categories for Cut Flowers
Product: 0603 Cut flowers and flower buds of a kind suitable for bouquets or for ornamental purposes, fresh,
dried, dyed, bleached, impregnated or otherwise prepared
• 060311 Fresh cut roses and buds, of a kind suitable for bouquets or for ornamental purposes
− Product: 0603110010 SWEETHEART ROSES, FRESH, SUITABLE FOR BOUQUETS OR FOR
ORNAMENTAL PURPOSES
− Product: 0603110030 SPRAY ROSES, FRESH, SUITABLE FOR BOUQUETS OR FOR
ORNAMENTAL PURPOSES
− Product: 0603110060 ROSES, FRESH, SUITABLE FOR BOUQUETS OR FOR ORNAMENTAL
PURPOSES, NESOI
• Product: 060312 Fresh cut carnations and buds, of a kind suitable for bouquets or for ornamental
purposes
− Product: 0603123000 MINIATURE (SPRAY) CARNATIONS, FRESH, SUITABLE FOR BOUQUETS
OR FOR ORNAMENTAL PURPOSES
− Product: 0603127000 STANDARD CARNATIONS, FRESH, SUITABLE FOR BOUQUETS OR FOR
ORNAMENTAL PURPOSES
• Product: 060313 Fresh cut orchids and buds, of a kind suitable for bouquets or for ornamental purposes
− Product: 0603130050 DENDROBIUM ORCHIDS, FRESH, SUITABLE FOR BOUQUETS OR FOR
ORNAMENTAL PURPOSES
− Product: 0603130060 ORCHIDS EXCEPT DENDROBIUM, FRESH, SUITABLE FOR BOUQUETS
OR FOR ORNAMENTAL PURPOSES
• Product: 060314 Fresh cut chrysanthemums and buds, of a kind suitable for bouquets or for ornamental
purposes
− Product: 0603140010 POM POM CHRYSANTHEMUMS, FRESH, SUITABLE FOR BOUQUETS OR
FOR ORNAMENTAL PURPOSES
− Product: 0603140020 CHRYSANTHEMUMS EXCEPT POM POM, FRESH, SUITABLE FOR
BOUQUETS OR FOR ORNAMENTAL PURPOSES
• Product: 060315 Fresh cut lilies “Lilium spp.” and buds, of a kind suitable for bouquets or for ornamental
purposes
• Product: 060319 Fresh cut flowers and buds, of a kind suitable for bouquets or for ornamental purposes
(excluding roses, carnations, orchids, chrysanthemums and lilies)
− Product: 0603190110 Alstroemeria, fresh, of a kind suitable for bouquets or for ornamental
purposes
− Product: 0603190120 Gypsophila, fresh, of a kind suitable for bouquets or for ornamental purposes
− Product: 0603190140 Snapdragons, fresh, of a kind suitable for bouquets or for ornamental
purposes
− Product: 0603190160 Cut flowers and flower buds, fresh, of a kind suitable for bouquets or for
ornamental purposes
Source: International Trade Center, Trademaps, Geneva, 2017
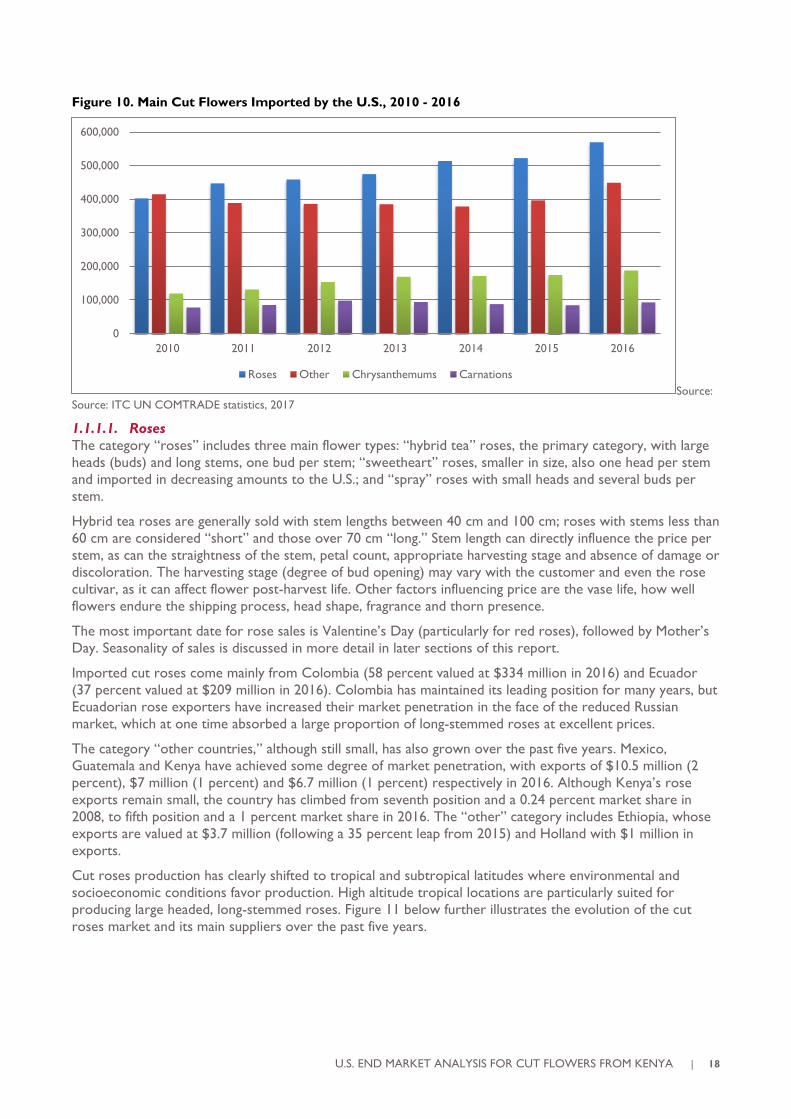
Figure 10 illustrates trends in imports for the main flower types imported by the U.S. in the past five years.
The following sections provide a more detailed analysis for each flower category and others warranting
specific mention.
U.S. END MARKET ANALYSIS FOR CUT FLOWERS FROM KENYA | 18
Figure 10. Main Cut Flowers Imported by the U.S., 2010 - 2016
Source:
Source: ITC UN COMTRADE statistics, 2017
1.1.1.1. Roses
The category “roses” includes three main flower types: “hybrid tea” roses, the primary category, with large
heads (buds) and long stems, one bud per stem; “sweetheart” roses, smaller in size, also one head per stem
and imported in decreasing amounts to the U.S.; and “spray” roses with small heads and several buds per
stem.
Hybrid tea roses are generally sold with stem lengths between 40 cm and 100 cm; roses with stems less than
60 cm are considered “short” and those over 70 cm “long.” Stem length can directly influence the price per
stem, as can the straightness of the stem, petal count, appropriate harvesting stage and absence of damage or
discoloration. The harvesting stage (degree of bud opening) may vary with the customer and even the rose
cultivar, as it can affect flower post-harvest life. Other factors influencing price are the vase life, how well
flowers endure the shipping process, head shape, fragrance and thorn presence.
The most important date for rose sales is Valentine’s Day (particularly for red roses), followed by Mother’s
Day. Seasonality of sales is discussed in more detail in later sections of this report.
Imported cut roses come mainly from Colombia (58 percent valued at $334 million in 2016) and Ecuador
(37 percent valued at $209 million in 2016). Colombia has maintained its leading position for many years, but
Ecuadorian rose exporters have increased their market penetration in the face of the reduced Russian
market, which at one time absorbed a large proportion of long-stemmed roses at excellent prices.
The category “other countries,” although still small, has also grown over the past five years. Mexico,
Guatemala and Kenya have achieved some degree of market penetration, with exports of $10.5 million (2
percent), $7 million (1 percent) and $6.7 million (1 percent) respectively in 2016. Although Kenya’s rose
exports remain small, the country has climbed from seventh position and a 0.24 percent market share in
2008, to fifth position and a 1 percent market share in 2016. The “other” category includes Ethiopia, whose
exports are valued at $3.7 million (following a 35 percent leap from 2015) and Holland with $1 million in
exports.
Cut roses production has clearly shifted to tropical and subtropical latitudes where environmental and
socioeconomic conditions favor production. High altitude tropical locations are particularly suited for
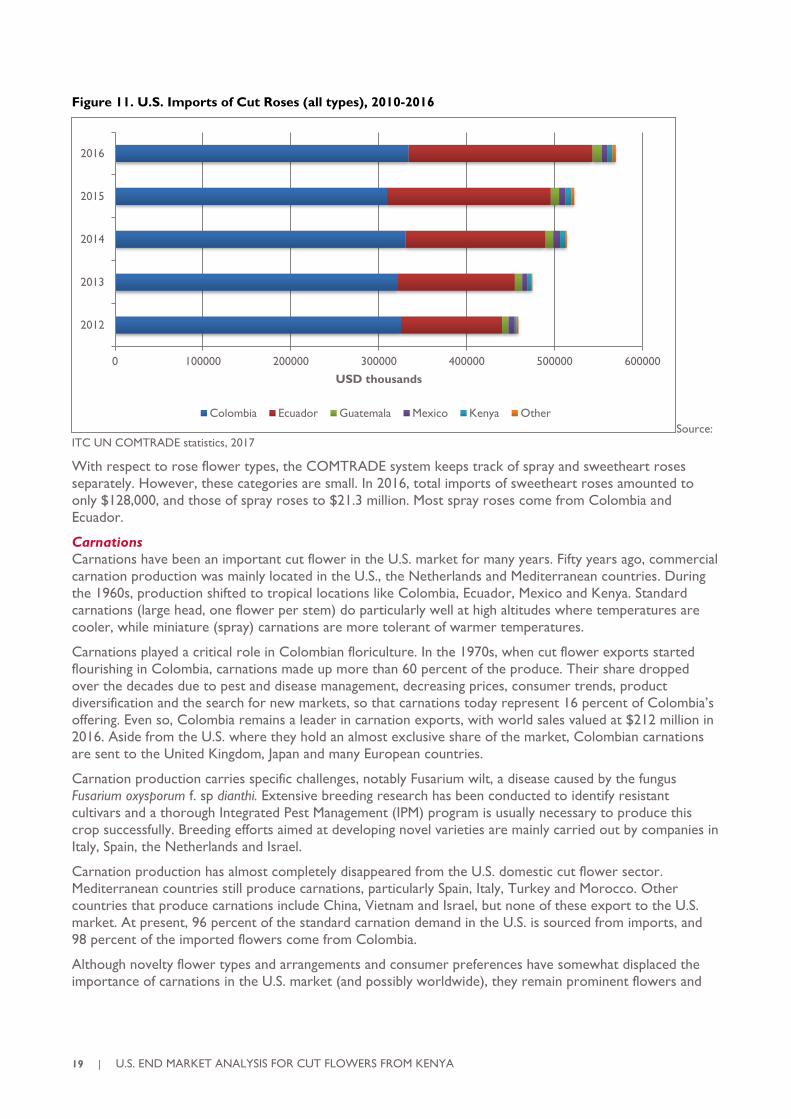
producing large headed, long-stemmed roses. Figure 11 below further illustrates the evolution of the cut
roses market and its main suppliers over the past five years.
0
100,000
200,000
300,000
400,000
500,000
600,000
2010 2011 2012 2013 2014 2015 2016
Roses Other Chrysanthemums Carnations
19 | U.S. END MARKET ANALYSIS FOR CUT FLOWERS FROM KENYA
Figure 11. U.S. Imports of Cut Roses (all types), 2010-2016
Source:
ITC UN COMTRADE statistics, 2017
With respect to rose flower types, the COMTRADE system keeps track of spray and sweetheart roses
separately. However, these categories are small. In 2016, total imports of sweetheart roses amounted to
only $128,000, and those of spray roses to $21.3 million. Most spray roses come from Colombia and
Ecuador.
Carnations
Carnations have been an important cut flower in the U.S. market for many years. Fifty years ago, commercial
carnation production was mainly located in the U.S., the Netherlands and Mediterranean countries. During
the 1960s, production shifted to tropical locations like Colombia, Ecuador, Mexico and Kenya. Standard
carnations (large head, one flower per stem) do particularly well at high altitudes where temperatures are
cooler, while miniature (spray) carnations are more tolerant of warmer temperatures.
Carnations played a critical role in Colombian floriculture. In the 1970s, when cut flower exports started
flourishing in Colombia, carnations made up more than 60 percent of the produce. Their share dropped
over the decades due to pest and disease management, decreasing prices, consumer trends, product
diversification and the search for new markets, so that carnations today represent 16 percent of Colombia’s
offering. Even so, Colombia remains a leader in carnation exports, with world sales valued at $212 million in
2016. Aside from the U.S. where they hold an almost exclusive share of the market, Colombian carnations
are sent to the United Kingdom, Japan and many European countries.
Carnation production carries specific challenges, notably Fusarium wilt, a disease caused by the fungus
Fusarium oxysporum f. sp dianthi. Extensive breeding research has been conducted to identify resistant
cultivars and a thorough Integrated Pest Management (IPM) program is usually necessary to produce this
crop successfully. Breeding efforts aimed at developing novel varieties are mainly carried out by companies in
Italy, Spain, the Netherlands and Israel.
Carnation production has almost completely disappeared from the U.S. domestic cut flower sector.
Mediterranean countries still produce carnations, particularly Spain, Italy, Turkey and Morocco. Other
countries that produce carnations include China, Vietnam and Israel, but none of these export to the U.S.
market. At present, 96 percent of the standard carnation demand in the U.S. is sourced from imports, and
98 percent of the imported flowers come from Colombia.
Although novelty flower types and arrangements and consumer preferences have somewhat displaced the
importance of carnations in the U.S. market (and possibly worldwide), they remain prominent flowers and
0 100000 200000 300000 400000 500000 600000
2012
2013
2014
2015
2016
USD thousands
Colombia Ecuador Guatemala Mexico Kenya Other
U.S. END MARKET ANALYSIS FOR CUT FLOWERS FROM KENYA | 20
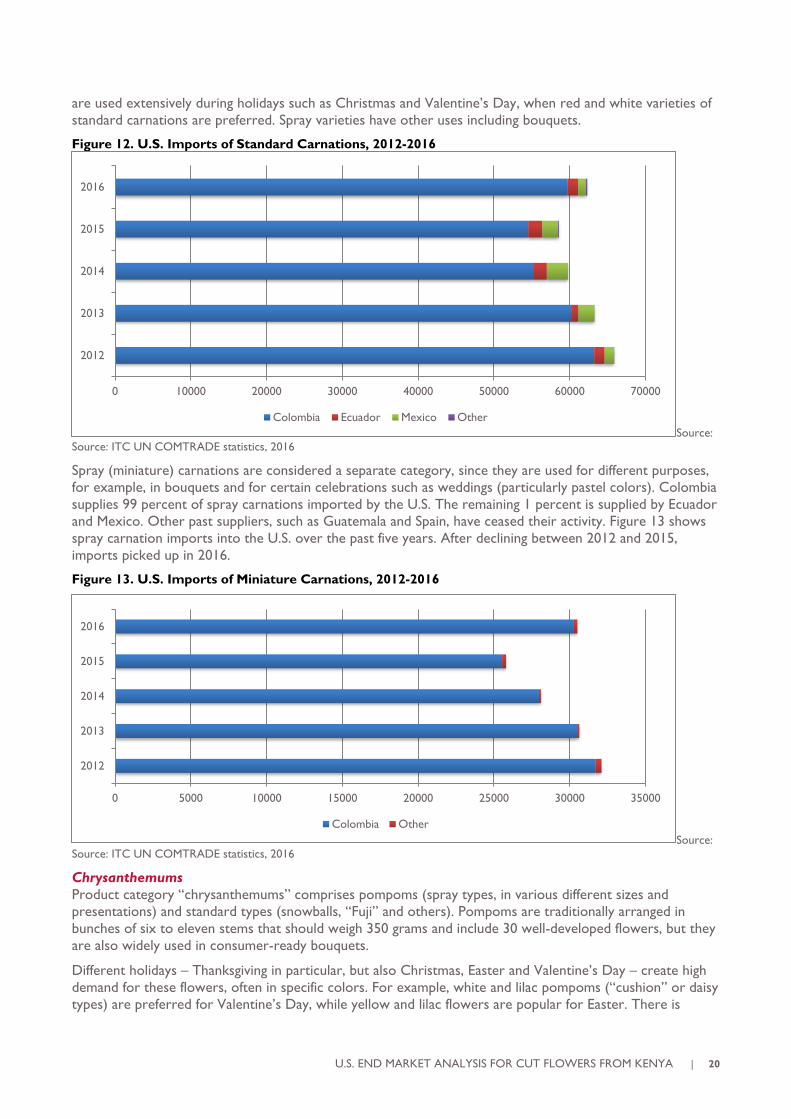
are used extensively during holidays such as Christmas and Valentine’s Day, when red and white varieties of
standard carnations are preferred. Spray varieties have other uses including bouquets.
Figure 12. U.S. Imports of Standard Carnations, 2012-2016
Source:
Source: ITC UN COMTRADE statistics, 2016
Spray (miniature) carnations are considered a separate category, since they are used for different purposes,
for example, in bouquets and for certain celebrations such as weddings (particularly pastel colors). Colombia
supplies 99 percent of spray carnations imported by the U.S. The remaining 1 percent is supplied by Ecuador
and Mexico. Other past suppliers, such as Guatemala and Spain, have ceased their activity. Figure 13 shows
spray carnation imports into the U.S. over the past five years. After declining between 2012 and 2015,
imports picked up in 2016.
Figure 13. U.S. Imports of Miniature Carnations, 2012-2016
Source:
Source: ITC UN COMTRADE statistics, 2016
Chrysanthemums
Product category “chrysanthemums” comprises pompoms (spray types, in various different sizes and
presentations) and standard types (snowballs, “Fuji” and others). Pompoms are traditionally arranged in
bunches of six to eleven stems that should weigh 350 grams and include 30 well-developed flowers, but they
are also widely used in consumer-ready bouquets.
Different holidays – Thanksgiving in particular, but also Christmas, Easter and Valentine’s Day – create high
demand for these flowers, often in specific colors. For example, white and lilac pompoms (“cushion” or daisy
types) are preferred for Valentine’s Day, while yellow and lilac flowers are popular for Easter. There is
0 10000 20000 30000 40000 50000 60000 70000
2012
2013
2014
2015
2016
Colombia Ecuador Mexico Other
0 5000 10000 15000 20000 25000 30000 35000
2012
2013
2014
2015
2016
Colombia Other
21 | U.S. END MARKET ANALYSIS FOR CUT FLOWERS FROM KENYA
typically a high demand for bronze and yellow cushions for Thanksgiving Day (late November) and for white
at Christmas.
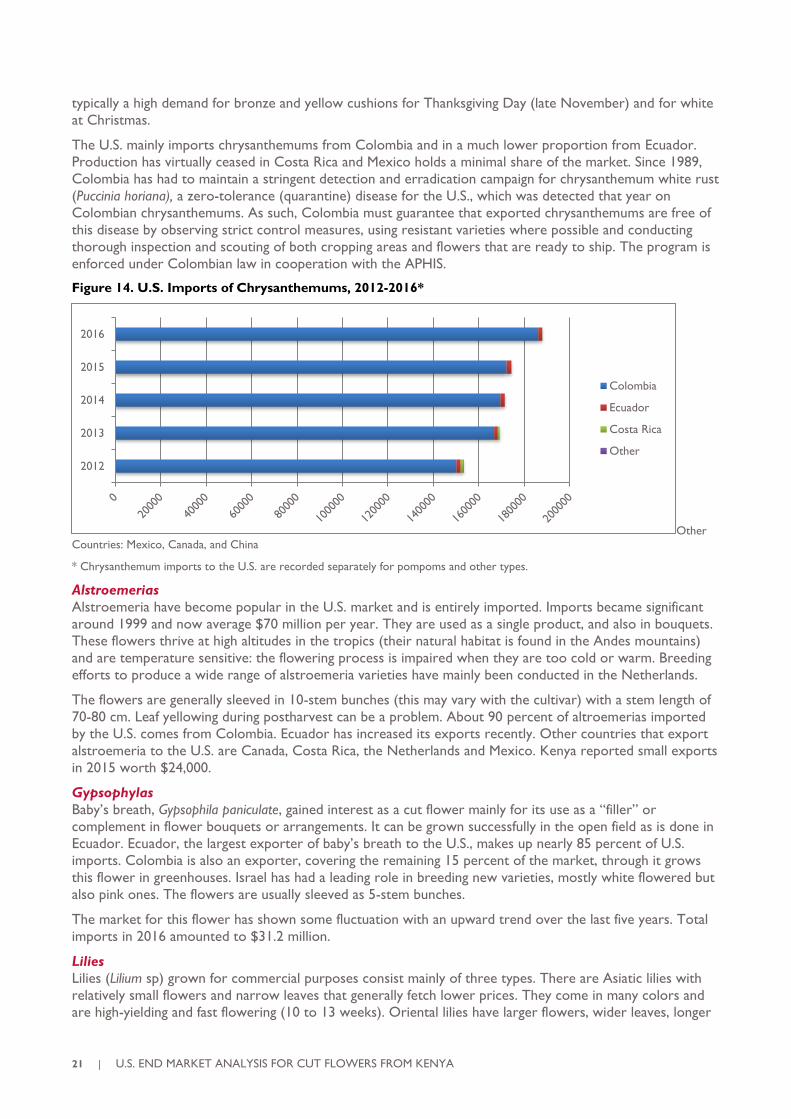
The U.S. mainly imports chrysanthemums from Colombia and in a much lower proportion from Ecuador.
Production has virtually ceased in Costa Rica and Mexico holds a minimal share of the market. Since 1989,
Colombia has had to maintain a stringent detection and erradication campaign for chrysanthemum white rust
(Puccinia horiana), a zero-tolerance (quarantine) disease for the U.S., which was detected that year on
Colombian chrysanthemums. As such, Colombia must guarantee that exported chrysanthemums are free of
this disease by observing strict control measures, using resistant varieties where possible and conducting
thorough inspection and scouting of both cropping areas and flowers that are ready to ship. The program is
enforced under Colombian law in cooperation with the APHIS.
Figure 14. U.S. Imports of Chrysanthemums, 2012-2016*
Other
Countries: Mexico, Canada, and China
* Chrysanthemum imports to the U.S. are recorded separately for pompoms and other types.
Alstroemerias
Alstroemeria have become popular in the U.S. market and is entirely imported. Imports became significant
around 1999 and now average $70 million per year. They are used as a single product, and also in bouquets.
These flowers thrive at high altitudes in the tropics (their natural habitat is found in the Andes mountains)
and are temperature sensitive: the flowering process is impaired when they are too cold or warm. Breeding
efforts to produce a wide range of alstroemeria varieties have mainly been conducted in the Netherlands.
The flowers are generally sleeved in 10-stem bunches (this may vary with the cultivar) with a stem length of
70-80 cm. Leaf yellowing during postharvest can be a problem. About 90 percent of altroemerias imported
by the U.S. comes from Colombia. Ecuador has increased its exports recently. Other countries that export
alstroemeria to the U.S. are Canada, Costa Rica, the Netherlands and Mexico. Kenya reported small exports
in 2015 worth $24,000.
Gypsophylas
Baby’s breath, Gypsophila paniculate, gained interest as a cut flower mainly for its use as a “filler” or
complement in flower bouquets or arrangements. It can be grown successfully in the open field as is done in
Ecuador. Ecuador, the largest exporter of baby’s breath to the U.S., makes up nearly 85 percent of U.S.
imports. Colombia is also an exporter, covering the remaining 15 percent of the market, through it grows
this flower in greenhouses. Israel has had a leading role in breeding new varieties, mostly white flowered but
also pink ones. The flowers are usually sleeved as 5-stem bunches.
The market for this flower has shown some fluctuation with an upward trend over the last five years. Total
imports in 2016 amounted to $31.2 million.
Lilies
Lilies (Lilium sp) grown for commercial purposes consist mainly of three types. There are Asiatic lilies with
relatively small flowers and narrow leaves that generally fetch lower prices. They come in many colors and
are high-yielding and fast flowering (10 to 13 weeks). Oriental lilies have larger flowers, wider leaves, longer
2012
2013
2014
2015
2016
Colombia
Ecuador
Costa Rica
Other
U.S. END MARKET ANALYSIS FOR CUT FLOWERS FROM KENYA | 22
vase life and a longer production cycle (14 to 19 weeks). As a result, they usually fetch a higher price. Some
varieties like “Siberia,” “Sorbonne” and “Casablanca” are sold by name and have been popular for many
years. Hybrid types or Longifolium lilies are cross hybrids with trumpet-like flowers. They are relatively easy
to produce, but challenging at the post-harvest stage. Other hybrids are asiaticum x longiflorum.
The U.S. imports lilies from several countries, notably Costa Rica, Colombia and Ecuador. The Netherlands
was an important supplier in the past and still retains a 2.5 percent market share. Mexico produces high-
quality Lilium, however internal consumption is high, so exports are low. Lilies are generally packed and
shipped in sleeved bunches of five to ten stems. Lily exports have shown a sustained increase over the past 5
years, rising by 30 percent between 2012 and 2016 with total imports into the U.S. valued at $53 million in
2016.
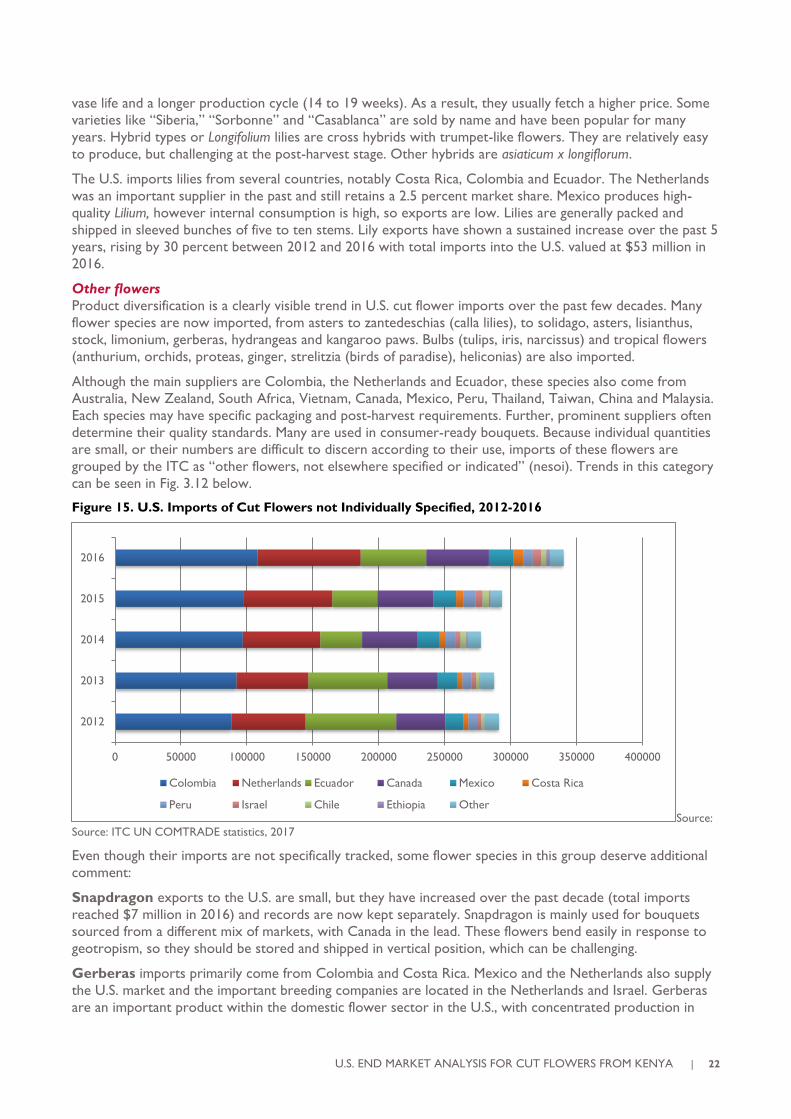
Other flowers
Product diversification is a clearly visible trend in U.S. cut flower imports over the past few decades. Many
flower species are now imported, from asters to zantedeschias (calla lilies), to solidago, asters, lisianthus,
stock, limonium, gerberas, hydrangeas and kangaroo paws. Bulbs (tulips, iris, narcissus) and tropical flowers
(anthurium, orchids, proteas, ginger, strelitzia (birds of paradise), heliconias) are also imported.
Although the main suppliers are Colombia, the Netherlands and Ecuador, these species also come from
Australia, New Zealand, South Africa, Vietnam, Canada, Mexico, Peru, Thailand, Taiwan, China and Malaysia.
Each species may have specific packaging and post-harvest requirements. Further, prominent suppliers often
determine their quality standards. Many are used in consumer-ready bouquets. Because individual quantities
are small, or their numbers are difficult to discern according to their use, imports of these flowers are
grouped by the ITC as “other flowers, not elsewhere specified or indicated” (nesoi). Trends in this category
can be seen in Fig. 3.12 below.
Figure 15. U.S. Imports of Cut Flowers not Individually Specified, 2012-2016
Source:
Source: ITC UN COMTRADE statistics, 2017
Even though their imports are not specifically tracked, some flower species in this group deserve additional
comment:
Snapdragon exports to the U.S. are small, but they have increased over the past decade (total imports
reached $7 million in 2016) and records are now kept separately. Snapdragon is mainly used for bouquets
sourced from a different mix of markets, with Canada in the lead. These flowers bend easily in response to
geotropism, so they should be stored and shipped in vertical position, which can be challenging.
Gerberas imports primarily come from Colombia and Costa Rica. Mexico and the Netherlands also supply
the U.S. market and the important breeding companies are located in the Netherlands and Israel. Gerberas
are an important product within the domestic flower sector in the U.S., with concentrated production in
0 50000 100000 150000 200000 250000 300000 350000 400000
2012
2013
2014
2015
2016
Colombia Netherlands Ecuador Canada Mexico Costa Rica
Peru Israel Chile Ethiopia Other
23 | U.S. END MARKET ANALYSIS FOR CUT FLOWERS FROM KENYA
California. The gerbera market is dynamic, as there is a wide selection of varieties (about 500 standard and
400 miniature) combining productivity, flower head size and color, including variations in the flower center,
double or single flowers and stem length, among others. Stem lengths of 50+ cm and medium-sized heads
are preferred for consumer-ready bouquets. Gerberas are often packed in special boxes and trays to protect
the flower heads. Some exporters place a protective net around the head and tie them in bunches of five
stems each. They need post-harvest treatment and the cold chain is a decisive factor influencing vase life.
Limonium sinuatum (statice) and other species and hybrids (L. altaica, L. sinensis, L. scabiosa) are an
important element of consumer-ready bouquets. Colombia and Ecuador are the main suppliers, with other
countries such as Mexico and Peru exporting lower amounts. It is a flower with a high light intensity
requirement, which can generally be grown in open fields at lower production cost. It requires a low
temperature period, which may be subsitituted with gibberelic acid to reduce production costs.
Gladiolus was one of the most popular cut flowers among U.S. consumers during the second half of the
20th century thanks to its appearance, range of colors and long vase life (14 to 21 days). The diversity of
floral products now offered in the U.S. has reduced its market share, but it is still an important product.
Although it can withstand warm temperatures, it needs to be transported in vertical position to avoid the
stem bending in response to its natural geotropism. The U.S. imports small quantities of gladioli from
Mexico, but most of the cut flower production is domestic.
Hydrangeas are a relatively recent addition to the cut flower mix, mainly grown around Medellín,
Colombia, at a lower altitude than Bogotá (capital city). White flowers and different shades of blue, pink and
purple are selling well. Notably, post-harvest management and vase life can be challenging.
TROPICAL FLOWERS
This category includes cut flowers such as anthuriums, heliconias and ginger, as well as some subtropical
species like Strelitzia reginae (birds of paradise) and proteas. Various kinds of orchids are often grouped in
this segment (Dendroboium, Phalaenopsis, Cymbidium), and presently compose the largest proportion of
imported tropicals to the U.S. Anthurium imports, which were substantial in the past, have nearly
disappeared, but the Hawaiian anthurium industry has recovered after years of battling with bacterial blight.
Hawaii is also a substantial producer of cut orchids.
In the global context, the tropical cut flower market is small, accounting for only about 5 percent of the total
flowers traded. In the U.S., less than 2 percent of imported flowers are tropical; the fact that Hawaii is an
important domestic supplier of such flowers undoubtably influences this.
Tropical cut flowers can offer an interesting (albeit small) market niche where “different” or “exotic”
products are valued. This includes, for example, hotels, resorts and specialty landscapes. In tropical latitudes,
these flowers are mostly grown in open fields or shade houses; however, in temperate countries (e.g. the
Netherlands and Canada), they are successfully produced in climate-controlled greenhouses. The
Netherlands, for example, is an important exporter of orchids and anthurium (and also a breeder of new
cultivars); the majority of Dendrobium orchids and cut anthurium sold in the EU are grown in the
Netherlands.
Larger producers of tropical flowers include the Netherlands, Costa Rica, Ecuador, Mauritius, U.S. (Hawaii),
Ivory Coast and Cameroon. Colombia has increased the cropping area of tropical flowers in regions
previously dedicated to coffee and banana production. On a lower scale, Jamaica, Mexico, Dominica,
Malaysia, Singapore, New Zealand and Australia are also producers. The Dominican Republic, Spain (Canary
Islands) and Portugal (Madeira) also produce tropical flowers, but sell them primarily within the domestic
market.
The main tropical cut flowers sold in the U.S. are discussed in the following paragraphs.
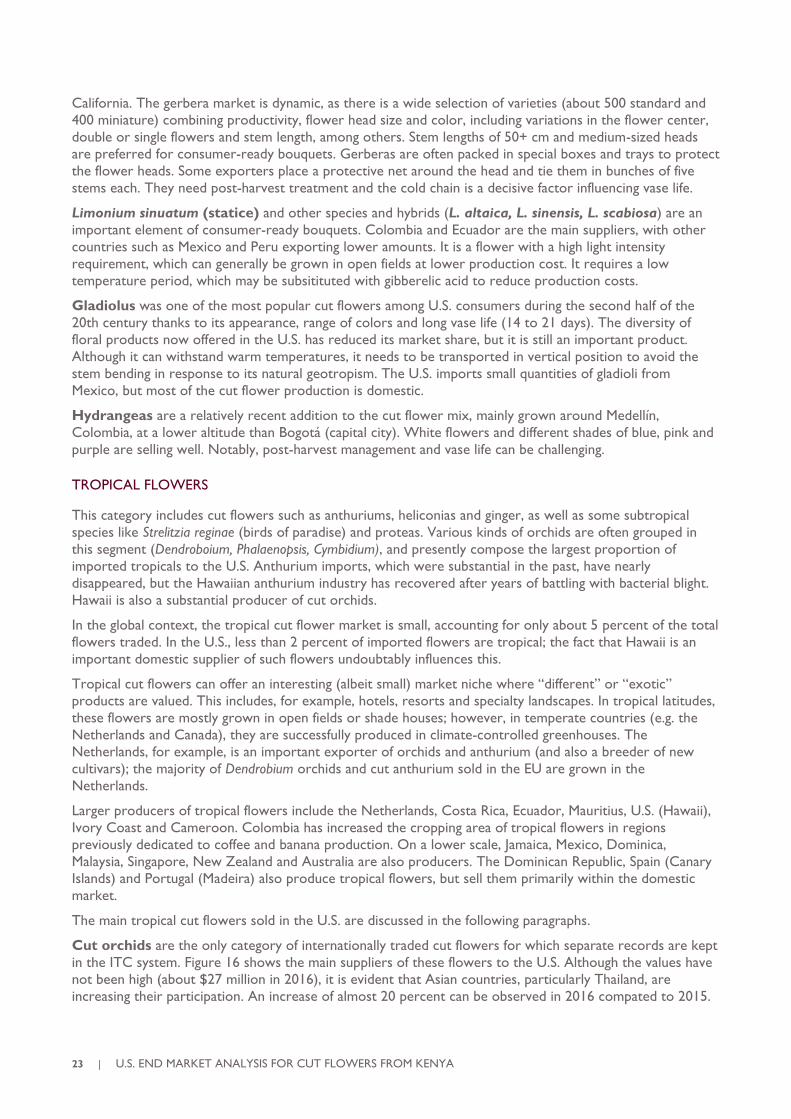
Cut orchids are the only category of internationally traded cut flowers for which separate records are kept
in the ITC system. Figure 16 shows the main suppliers of these flowers to the U.S. Although the values have
not been high (about $27 million in 2016), it is evident that Asian countries, particularly Thailand, are
increasing their participation. An increase of almost 20 percent can be observed in 2016 compated to 2015.
U.S. END MARKET ANALYSIS FOR CUT FLOWERS FROM KENYA | 24
Figure 16. Origin of Imports of Cut Orchids to the U.S., 2012-2016
Source:
ITC UN COMTRADE statistics, 2017
The “gingers” category is primarily made up of red and pink Alpinia purpurata. The largest supplier of
gingers to the U.S. is Costa Rica with exports valued at $1.7 million in 2016. Jamaica, Mexico and Ecuador
are also important suppliers. Their imports are complemented by domestic production in Hawaii, which was
valued at $0.7 million in 2015.
Many species of Heliconia are of commercial interest, particularly H. psittacorum, H. hirsuta, H. rostrata, H.
caribea and H. lathispata. The wide variety of flowers and colors and a generally long vase life make these
flowers an attractive option for many consumers. However, their weight and size can make transportation
costly. Costa Rica is one of the main suppliers of heliconias to the U.S., with exports valued at $2.5 million in
2016. Ecuador offers a wide range of varieties including smaller flowers that can easily be arranged in
bouquets suitable for mass markets. Other suppliers are Mexico, Jamaica, Brazil and Suriname. Notably,
production in Hawaii was valued at $0.5 million in 2015.
Strelitzia reginae, commonly know as bird of paradise, is a popular flower in many countries including the
U.S. They are grown in open fields in tropical countries and in areas with cooler temperatures (mid to high
altitude, around 1,800-2,000 m above sea level). Mexico offers very good quality flowers and is the main
exporter to the U.S., followed by Guatemala and Jamaica. Domestically, the largest production is in
California, followed by Hawaii.
Tropical cut flowers’ introduction and marketing entails particular challenges, such as:
• Scheduling flowering seasons to meet periods of higher demand
• Achieving uniform production and quality
• Efficient propagation
• Post-harvest handling
− Due to their tropical origin, tropical flowers cannot be kept at the usual low temperatures
(0-2ºC) used for storing temperate flowers. They need to be kept and handled at
temperatures between 13-15ºC, which cause logistical problems in the distribution chain. In
addition, large tropical flowers may be heavy, so transport and handling may be expensive
and inefficient.
• Arrangements
− Consumers may experience difficulties arranging tropical flowers at home. Some producers
and traders offer them in consumer-friendly presentations such as bouquets, favor smaller
0 5000 10000 15000 20000 25000 30000
2012
2013
2014
2015
2016
Thailand Netherlands New Zealand Malaysia Viet Nam Taipei, Chinese Other
25 | U.S. END MARKET ANALYSIS FOR CUT FLOWERS FROM KENYA
sized flowers, or include specific information and suggestions on these products when
marketing them.
IMPORTS OF CUT FOLIAGE
In the international cut flower trade, cut greens are increasingly important as “fillers” or complements in
bouquets or flower arrangements. Their imports have grown, but they still account for only 3 percent of
total imports of florals to the U.S. Statistics on their production and exports are not abundant and they are
rarely broken down into different species of foliage. Breaking statistics down is made more difficult by the
fact that foliage is often included in the general “bouquets” category. Nonetheless, it is an increasingly
important segment with small but steady growth worldwide.
The Europe-Africa-Caribbean-Pacific Liaison Committee (COLEACP) offers the following classification for
cut greens according to their place of origin:
Tropical foliage. For many years, leatherleaf fern (Rhumora adiantiformis) was the dominant species. It is
still produced in Florida and is no longer imported in large quantities from Costa Rica where the cropping
areas have been significantly reduced. This category also includes a wide variety of species such as
Chamaedora palms, Aspidistra, Anthurium, Monstera and tree fern and Asparagus virgatus. The important
producing/exporting countries are Guatemala, Israel, South Africa, Mexico, Colombia and India. Some cut
greens are seasonal, making it difficult for producers to adjust production to particular times of the year.
Continental or temperate-origin foliage. These are produced mainly by Canada, the U.S., some
countries in Central Europe, the United Kingdom and others, including Colombia and Ecuador. The group
includes species such as salal (Gaulteria shallon) and Bear Grass (Xerophyllum tenax).
Mediterranean foliage. These include different species of Eucalyptus, Ruscus and some palms, originally
produced in France, Italy and other Mediterranean regions. They are now produced in most countries where
export floriculture is important.
“Proteaceous” foliage or Cape greens. Originally produced in South Africa, Australia and New
Zealand, they include species such as Leucadendron, which are now produced in many other countries.
Market studies indicate that consumers mainly seek:
• Foliage with smaller leaves that are suitable for bouquets (however, some larger leaves like
anthurium, calla and some palm leaves are becoming popular)
• Stem length of minimum 50 cm (suitable for bouquets)
• Cheap foliage that does not significantly increase the final price of a bouquet
• Good quality, long-lasting foliage
• Novel, non-traditional presentation
The segment is also undergoing changes in consumption, such as decreasing leatherleaf fern consumption and
rising grasses and greens with fruit (such as Hypericum or tropicals) consumption.
The U.S. produces various kinds of cut greens, but information is general. The only species separately
identified is leatherleaf fern. Domestic production and sales of leatherleaf fern have been relatively stable
over the past five years and were reported at $33.8 million in 2015.
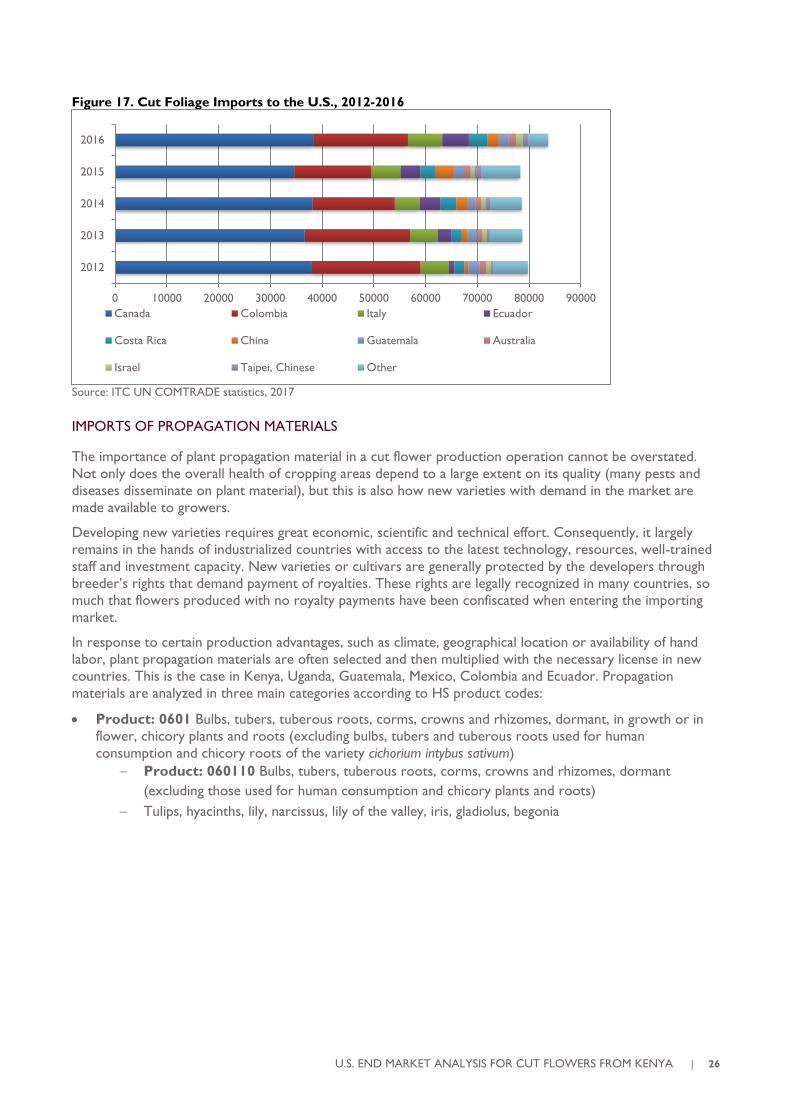
Figure 17 shows cut foliage imports to the U.S. between 2012 and 2016, based on the statistics
corresponding to HS product code 060420: Foliage, branches and other parts of plants, without flowers or flower
buds, and grasses, mosses and lichens, being goods of a kind suitable for bouquets or for ornamental purposes, fresh.
U.S. END MARKET ANALYSIS FOR CUT FLOWERS FROM KENYA | 26
Figure 17. Cut Foliage Imports to the U.S., 2012-2016
Source: ITC UN COMTRADE statistics, 2017
IMPORTS OF PROPAGATION MATERIALS
The importance of plant propagation material in a cut flower production operation cannot be overstated.
Not only does the overall health of cropping areas depend to a large extent on its quality (many pests and
diseases disseminate on plant material), but this is also how new varieties with demand in the market are
made available to growers.
Developing new varieties requires great economic, scientific and technical effort. Consequently, it largely
remains in the hands of industrialized countries with access to the latest technology, resources, well-trained
staff and investment capacity. New varieties or cultivars are generally protected by the developers through
breeder’s rights that demand payment of royalties. These rights are legally recognized in many countries, so
much that flowers produced with no royalty payments have been confiscated when entering the importing
market.
In response to certain production advantages, such as climate, geographical location or availability of hand
labor, plant propagation materials are often selected and then multiplied with the necessary license in new
countries. This is the case in Kenya, Uganda, Guatemala, Mexico, Colombia and Ecuador. Propagation
materials are analyzed in three main categories according to HS product codes:
• Product: 0601 Bulbs, tubers, tuberous roots, corms, crowns and rhizomes, dormant, in growth or in
flower, chicory plants and roots (excluding bulbs, tubers and tuberous roots used for human
consumption and chicory roots of the variety cichorium intybus sativum)
− Product: 060110 Bulbs, tubers, tuberous roots, corms, crowns and rhizomes, dormant
(excluding those used for human consumption and chicory plants and roots)
− Tulips, hyacinths, lily, narcissus, lily of the valley, iris, gladiolus, begonia
0 10000 20000 30000 40000 50000 60000 70000 80000 90000
2012
2013
2014
2015
2016
Canada Colombia Italy Ecuador
Costa Rica China Guatemala Australia
Israel Taipei, Chinese Other
27 | U.S. END MARKET ANALYSIS FOR CUT FLOWERS FROM KENYA
• Product: 0602 Live plants incl. their roots, cuttings and slips; mushroom spawn (excluding bulbs,
tubers, tuberous roots, corms, crowns and rhizomes, and chicory plants and roots)
− Product: 060210 Un-rooted cuttings and slips
− Product: 0602400000 Roses, grafted or not
− Product: 060290 Live plants, incl. their roots, and mushroom spawn (excluding bulbs, tubers,
tuberous roots, corms, crowns and rhizomes, incl. chicory plants and roots, un-rooted cuttings
and slips, fruit and nut trees, rhododendrons, azaleas and roses)
Un-rooted cuttings and slips
These comprise plant parts that can be used to vegetatively propagate a particular flower, such as carnation
or chrysanthemum cuttings. It also involves cuttings to propagate garden and bedding or pot plants. Mainly
due to cost issues, licensed propagators (and even flower growers with the required license) often import
only enough cuttings to establish a mother plant nucleus, which is maintained under strict plant health and
hygiene growing conditions. The mother plant nucleus is then used to produce production cuttings for
rooting in production areas.
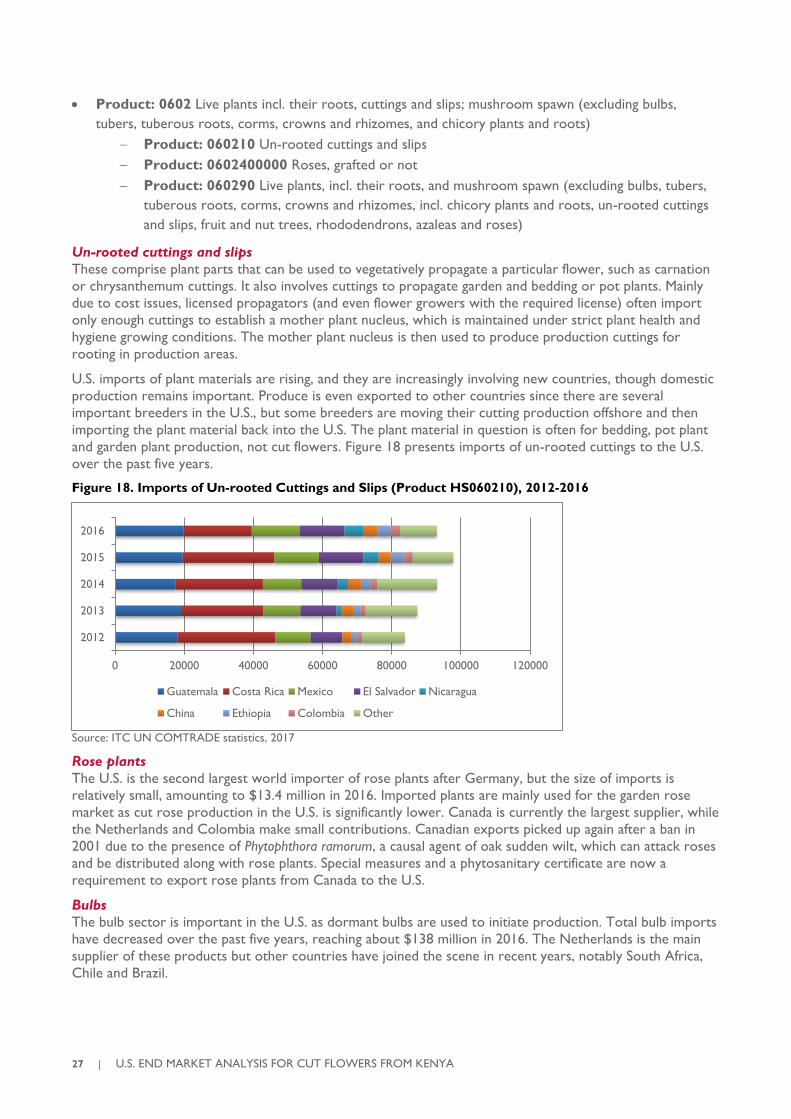
U.S. imports of plant materials are rising, and they are increasingly involving new countries, though domestic
production remains important. Produce is even exported to other countries since there are several
important breeders in the U.S., but some breeders are moving their cutting production offshore and then
importing the plant material back into the U.S. The plant material in question is often for bedding, pot plant
and garden plant production, not cut flowers. Figure 18 presents imports of un-rooted cuttings to the U.S.
over the past five years.
Figure 18. Imports of Un-rooted Cuttings and Slips (Product HS060210), 2012-2016
Source: ITC UN COMTRADE statistics, 2017
Rose plants
The U.S. is the second largest world importer of rose plants after Germany, but the size of imports is
relatively small, amounting to $13.4 million in 2016. Imported plants are mainly used for the garden rose
market as cut rose production in the U.S. is significantly lower. Canada is currently the largest supplier, while
the Netherlands and Colombia make small contributions. Canadian exports picked up again after a ban in
2001 due to the presence of Phytophthora ramorum, a causal agent of oak sudden wilt, which can attack roses
and be distributed along with rose plants. Special measures and a phytosanitary certificate are now a
requirement to export rose plants from Canada to the U.S.
Bulbs
The bulb sector is important in the U.S. as dormant bulbs are used to initiate production. Total bulb imports
have decreased over the past five years, reaching about $138 million in 2016. The Netherlands is the main
supplier of these products but other countries have joined the scene in recent years, notably South Africa,
Chile and Brazil.
0 20000 40000 60000 80000 100000 120000
2012
2013
2014
2015
2016
Guatemala Costa Rica Mexico El Salvador Nicaragua
China Ethiopia Colombia Other
U.S. END MARKET ANALYSIS FOR CUT FLOWERS FROM KENYA | 28
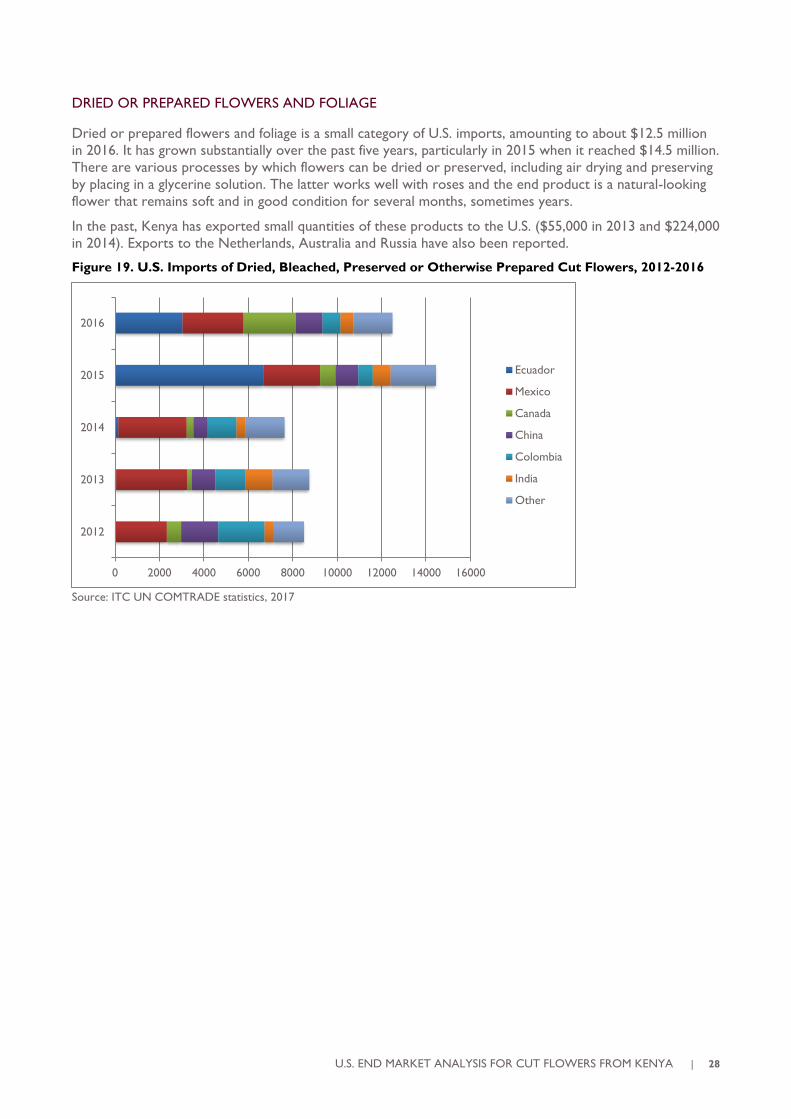
DRIED OR PREPARED FLOWERS AND FOLIAGE
Dried or prepared flowers and foliage is a small category of U.S. imports, amounting to about $12.5 million
in 2016. It has grown substantially over the past five years, particularly in 2015 when it reached $14.5 million.
There are various processes by which flowers can be dried or preserved, including air drying and preserving
by placing in a glycerine solution. The latter works well with roses and the end product is a natural-looking
flower that remains soft and in good condition for several months, sometimes years.
In the past, Kenya has exported small quantities of these products to the U.S. ($55,000 in 2013 and $224,000
in 2014). Exports to the Netherlands, Australia and Russia have also been reported.
Figure 19. U.S. Imports of Dried, Bleached, Preserved or Otherwise Prepared Cut Flowers, 2012-2016
Source: ITC UN COMTRADE statistics, 2017
0 2000 4000 6000 8000 10000 12000 14000 16000
2012
2013
2014
2015
2016
Ecuador
Mexico
Canada
China
Colombia
India
Other
29 | U.S. END MARKET ANALYSIS FOR CUT FLOWERS FROM KENYA
3. U.S. TARIFF STRUCTURE
The U.S. International Trade Commission (USITC) is the entity in charge of establishing tariff positions and
taxes imposed on all products imported into the country. To this end, the Harmonized Tariff Schedule
(HTS) program was put together, containing a list of tariffs that should be paid for imported products. These
are classified according to the Harmonized System of Codification and Classification of Goods (Harmonized
System) as developed by the World Customs Organization (WCO). Virtually all countries around the world
use this system to facilitate world trade.
Current information on the U.S. HTS can be found on the following web page:
http://www.usitc.gov/tata/hts/bychapter/index.htm.
Chapter 6 Section II (https://hts.usitc.gov/current) relates to vegetable products including ornamental plant
materials such as cut flowers and foliage, live plants, bulbs and others. Information is updated to 2017.
Many countries enjoy a zero tariff status for the cut flowers they export to the U.S. It is estimated that
about 85 percent of flowers entering the U.S. do not pay tariffs, as agreed under various preferential trade
programs.
In the case of Kenya, AGOA grants zero tariff status for cut flowers. Further, the U.S. signed Trade and
Investment Framework Agreements (TIFA) with the East African Community (EAC) in 2008, and with the
Common Market for Eastern and Southern Africa (COMESA) in 2001. Kenya is a member of both regional
organizations.
U.S. END MARKET ANALYSIS FOR CUT FLOWERS FROM KENYA | 30
4. NON-TARIFF REQUIREMENTS
In the U.S., trade channels and clear rules are in place for flower imports.
4.1 IMPORT REGULATIONS
Currently, import permits are only granted to legal U.S. residents. In other words, U.S. citizens in the
importing country must be part of the importing company. This has led to many joint ventures between
importing and exporting companies over the years.
4.2 STANDARDS, REGULATIONS AND CERTIFICATIONS
CUT FLOWER STANDARDS
There are no state requirements with respect to quality and grading. Standards adopted by the industry are
normally communicated to the foreign producer by importers/distributors and are adjusted to market
requirements. In general, different quality standards (e.g., select, fancy or standard grades) are agreed upon
and help determine the price for flowers. Such standards relate to characteristics such as stem length, size of
the flower head and flower appearance/condition (freshness, absence of damage, color of blossoms and
leaves). The grower/exporter is therefore required to grade flowers as strictly as possible before packing to
ensure consistent standards. This is especially important when assembling consumer bunches or bouquets.
Post-harvest handling and treatments – in particular flower food or preservatives and the cold chain – are
essential to ensure appropriate flower longevity and vase life for the end consumer. While this topic is
extensive and lies beyond the scope of this report, a wealth of information is available to assist
growers/exporters.
PACKAGING AND LABELING
As with grading, there are no set specifications in the U.S. for flower packaging, which has led to many
different options. Packaging influences the post-harvest life of flowers, making it a critical component of the
distribution chain. There are several measures that can be used to protect flowers, maintain their
presentation and support a high market value, including cold treatments and refrigerated transport, sleeves
to protect flower bunches and bouquets, bud nets and paper or plastic sheets of different types according to
flower type. Packaging and labeling are particularly important when selling consumer-ready bouquets, and
when the exporter brands his/her product.
Bar codes are widely used, and are printed on sleeves protecting bunches or bouquets. This allows tracking
of their origin, date of harvest, price and other marketing details.
ECO-LABELS AND CERTIFICATION
Environmental awareness continues to grow worldwide, and floriculture is no exception. Flower growers all
over the world are ensuring that production processes are sustainable and environment-friendly. This is
often in response to government restrictions and regulations, and to pressure from importing countries
where consumers increasingly prefer – and often demand – flowers produced within such parameters.
Environmental awareness started to be addressed more than 25 years ago. In the late 1990s, “Eco-labels” or
certification schemes began considering the flower sector. In 2001, Fairtrade International started certifying
flowers in East Africa. Today they work all over the world and are well known among consumers, including
in the U.S. Since 2014, they also certify propagation materials.
GLOBALG.A.P., has its roots in the European Supermarkets Good Agricultural Practice (EUREPGAP), a
common standard for farm management, founded in 1997. EUREPGAP became GLOBALG.A.P in September
2007 to reflect its expanding international role in establishing Good Agricultural Practices between multiple
retailers and their suppliers, and now has a dedicated chapter for flowers and plants and recently launched
31 | U.S. END MARKET ANALYSIS FOR CUT FLOWERS FROM KENYA
the GLOBALG.A.P. To improve transparency, GLOBALG.A.P. established a 13-digit seal called the GGN
that allows consumers to track the origin of flowers and plants and check that they come from certified
farms.
Dutch growers launched the Ecological Floriculture Project - MPS, in 1995. It is a benchmarking
accreditation program that now has members in various countries around the world, including the U.S.
The Rainforest Alliance started working on sustainability in various agricultural sectors, including flowers and
plants, in the 1990s. Since 2012, it offers Rainforest Alliance Certified Ferns and Cut Flowers. The green frog
logo is well known in many countries and sectors, including among U.S. floral consumers, particularly in
supermarkets.
In 2007, a group of flower growers from the state of California launched the Veriflora initiative, a label open
to wholesalers, distributors and florists aside from producers of all ornamental products around the world.
Compliance is verified by Scientific Certification Systems (SCS).
The Colombian Association of Flower Exporters (ASOCOLFLORES) launched its social and environmental
program FLORVERDE Sustainable Flowers in 1996. The Ecuadorian Association of Flower Exporters
(EXPOFLORES) has its own FlorEcuador program.
Developments also took place on the consumer side. Although importers/marketers trust and often prefer
an accreditation scheme (for example Fairtrade is popular with supermarkets in the U.S.), some mass
marketers have developed their own labels. For example, Whole Foods Market in the U.S., a countrywide
supermarket chain selling sustainable products, developed its own WholeTrade label. All these schemes
include similar components: flower growers must comply with a series of parameters including the safe and
rational use of pesticides; IPM, soil and water management to avoid contamination; occupational health
programs that reduce health hazards to a minimum; appropriate worker protection standards; and waste
management, recycling and adequate disposal, including postharvest treatments. Verification bodies regularly
supervise compliance with such parameters directly on-site.
There have been efforts by stakeholders to align the schemes and labels as the variety confused producers
and consumers. FLORVERDE, for example, reached equivalency and mutual acceptance with GLOBALG.A.P.
in 2008. The WholeTrade label partners with Fairtrade and Rainforest Alliance for accreditation. U.S.
supermarket giants Walmart and Costco also partner in similar ways.
Most importantly, the Floriculture Sustainable Initiative was launched in 2012. It is a market-driven effort to
bring together stakeholders of the global floriculture industry with a common goal. Its members include
trade associations such as ASOCOLFLORES, the Kenya Flower Council (KFC), as well as breeders,
individual growers and suppliers. It brings together 14 sustainability standards and schemes in the social and
environmental fronts including Rainforest Alliance, MPS, Fairtrade, FLORVERDE, KFC assurance and
GLOBALG.A.P.
The recent launch of the “American Grown” campaign by the California Cut Flower Commission, which
promotes consumption of locally grown cut flowers among U.S. consumers, is also worth mentioning.
Campaign advocates are reaching out to the U.S. Congress, donating flowers for official and public events,
hosting dinners and other social occasions and holding shows and flower arrangement contests to showcase
locally grown flowers. The campaign seeks to increase consumption of domestic flowers and is reportedly
receiving good results.
CUSTOMS PROCEDURES – PHYTOSANITARY BARRIERS
Phytosanitary regulations are the only non-tariff measure currently affecting exports of cut flowers, cut
foliage and plant propagation materials, all of which are inspected on arrival by APHIS, in conjunction with
Customs and Border Protection (CBP) officials. They are inspected to avoid introducing and/or
disseminating noxious pests, diseases and weeds. In general, inspectors will open one box of flowers per
variety in each shipment, which can be a considerable job in ports of entry such as Miami. Flowers are
inspected to determine the presence of restricted pests. If they are found, an inspector can order their
treatment (often with methyl bromide) and even their destruction, at the exporter’s expense. It is also
possible to return the product to origin at the exporter’s expense.
U.S. END MARKET ANALYSIS FOR CUT FLOWERS FROM KENYA | 32
In 2008, APHIS renovated its facilities for plant health inspection at the Miami Airport, doubling their
capacity. An estimated 88 percent of all cut flowers and 74 percent of all fruits and vegetables imported into
the U.S. enter the country via Miami. The amount of work associated with flower inspection is monumental.
During the 2016 Valentine’s Day season alone, CBP agriculture specialists processed about 525 million cut
flower stems and intercepted 1,806 pests (about 82 per day). During regular operations, interceptions can
average 58 per day. Commonly intercepted pests are Noctuidae (Moths), Aphididae (Aphids), Frankliniella sp.
(Thrips), and Tetranychus sp. (Mites).
Manuals used by APHIS inspectors are publicly available and can be downloaded by any person.
• Cut flowers and greens:
https://www.aphis.usda.gov/import_export/plants/manuals/ports/downloads/cut_flower_imports.pdf
• Plant propagation materials:
https://www.aphis.usda.gov/import_export/plants/manuals/ports/downloads/plants_for_planting.pdf
In these manuals, the main import products are classified according to their risk level, which may vary
according to origin. For example, alstroemerias, gypsophylas and chrysanthemums coming from Africa are
labeled as high risk and will require more thorough inspection.
As of September 25, 1997, the Plant Protection and Quarantine (PPQ) division of APHIS eliminated written
import permits for cut flowers and foliage. Unless they have berries attached, they are regulated under the
Convention on International Trade in Endangered Species of Wild Fauna and Flora (CITES) or are transiting
through the U.S. The U.S. Code of Federal Regulations is often updated and contains specific information on
flower types and their origin: https://www.gpo.gov/fdsys/pkg/CFR-2017-title7-vol5/xml/CFR-2017-title7-vol5-
part319.xml.
OTHER REGULATIONS: BIOTERRORISM LAW AND CITES
The Agricultural Bioterrorism Protection Act of 2002 is contained within the Public Health Security and
Bioterrorism Preparedness Response Act. These treaties require that private, statutory and federal entities
(including laboratories, research centers, universities and companies manufacturing vaccines) who possess,
use or transfer agents or toxins that may constitute a threat to public health (or animal or plant health)
register such agents with the corresponding federal department. The law was designed to improve U.S.
capacity to prevent, prepare and eventually respond to bioterrorism and other public health emergencies
that could threaten the U.S. population or its agriculture. Complete and updated texts of these treaties can
be found on the APHIS website.
Ralstonia solanacearum, race 3, biovar 2 is probably the only agent of importance for plant material exporters.
This bacterium causes geranium blight and was the cause of stringent and expansive eradications in geranium
plantations in Costa Rica and Guatemala, where large numbers of geranium cuttings are produced for export
to the U.S. None of the agents above are associated to cut flowers.
CITES and the Endangered Species Act (ESA) apply to cut flower exports to the U.S. if the exports involved
species that are protected under them. Updated information on protected species can be found at
https://www.aphis.usda.gov/aphis/ourfocus/planthealth/import-information/permits/plants-and-plant-products-
permits/cites. Kenya has been a signatory and member of the CITES convention since 1978.
33 | U.S. END MARKET ANALYSIS FOR CUT FLOWERS FROM KENYA
5. U.S. DISTRIBUTION – LOGISTICS AND TRANSPORT
Over the years, various negotiation schemes have been used in the U.S. floral market. The most
advantageous system may vary for different companies and will depend on a series of factors.
5.1 SUPPLIER SELECTION
Marketing flowers in the U.S. is a highly personalized business. The main exporters of cut flowers to the U.S.
rely on business relationships with wholesalers, importers, distributors and even mass marketers that go
back years, sometimes even generations.
Even with instant, modern communications, the U.S. floral market is still based on personalized, direct
relationships. It is essential to build trust, an image and a reputation as a reliable supplier. Sales staff must be
quick and effectively respond to clients, and the company must maintain strong internal communication (for
example between technical and commercial areas). Punctuality is vital when delivering shipments, sending
samples, replying to calls and emails and attending meetings. Exporters should also organize a system to
respond to supplier complaints, which can help build their reputation as a reliable, professional supplier.
5.2 CONTRACT AND PAYMENT TERMS
Different kinds of business options can be agreed with clients including Cost, Insurance and Freight (CIF),
Free on Board (FOB) consignment, standing orders and others. Selection of the best option will depend on
negotiations between clients and suppliers, products, peak seasons, etc.
CONSIGNMENT SALES
When flowers are sent on consignment to an importer/seller/distributor in Miami (or another port of entry),
the latter is often a subsidiary of the exporting company, which guarantees transparency and security of the
transaction. The company in Miami receives the flowers, sells them, deducts a commission (usually 15
percent) and charges a handling fee or "box charge" per box. In addition, import and shipping costs (air
freight), and customs clearance (tariff) costs, if applicable, are deducted. The cosignatory usually sends the
net remaining amount to the exporting company 30, 60 or even 90 days later, with no interest or late
payment penalty. Financing costs associated to this “dead” period need to be considered.
This modality, which in the past was used by some exporters because they were able to benefit from high
prices associated to peak seasons, is not widely used today. Importers find it more profitable to adjust
purchased quantities more closely – only what they are certain they can sell – and they prefer to buy from
several farms rather than just one or a few. In addition, exporters find clear benefits in selling directly when
possible. Mass marketer sales, known as "farm direct," are dealt directly with the client, bypassing the
importer/vendor/distributor in Miami.
FOB OR CIF SALES
FOB sales (at point of export) are an alternative to consignment sales. This generally means the flowers are
delivered to the cold room of the cargo agency selected by the importer in the country of origin. Another
modality is CIF or Cost and Freight at Miami, or in the case of some large supermarkets, CIF at their shops
or regional distribution centers. In FOB purchases, if flowers are spoiled or lost before arriving at their final
destination, the importer or client will incur heavy losses, including freight and import costs. In a CIF sale, if
flower losses occur before they arrive to their final destination, associated costs including freight will be at
the expense of the exporter.
It is always important to agree and be aware of who conducts inspections to determine if flowers are of
marketable quality. Notably, air cargo companies will normally provide compensation for damaged flowers.
This applies only to delays of over 48 hours and shorter periods, otherwise more beneficial conditions may
be difficult to negotiate.
U.S. END MARKET ANALYSIS FOR CUT FLOWERS FROM KENYA | 34
FIXED PRICE SALES (STANDING ORDERS)
This is a modality where the exporter agrees on a fixed price with the importer for the year. In some cases,
it can be revised biannually or quarterly. A contract is drawn where flowers are supplied for the duration of
the agreed period at a fixed price; price adjustments may be included, most often for peak holidays such as
Christmas, Valentine’s Day and Mother’s Day. This adjustment can be substantial and has been known to go
up to 150 percent over the fixed price.
In some cases, prices are fixed weekly and daily, the latter being an instance where the importer/buyer
informs the exporter of the new price (higher when more flowers are needed and lower if there are too
many flowers in stock). The risk is that there may be an irreconcilable disagreement between what the
importer wishes to pay and what the exporter expects to receive.
DIRECT SALES
Direct sales are conducted without intermediaries. They are mainly performed between exporters and mass
marketers such as supermarkets, florist chains and garden or home centers. Direct sales are growing as a
marketing option because net returns to the exporter are much higher. It is estimated that 65 percent of
Colombia’s flower sales are now direct.
Direct sales can be extremely sophisticated and exporters must have the capacity to supply flowers directly
to subsidiary shops or specific sales points of supermarkets. For example, a grower/marketing group (which
can comprise 50 different farms) is able to export about 10,000 boxes of flowers per day, consolidated
under the same Airway bill, then divided into 5,000 sub-bills in Miami, so that two boxes are delivered to
each shop or sales point. This requires extremely fast communication capacity (generally satellite) and very
detailed packaging capacity and skills at the farm. A general program is usually agreed upon, but sales may be
modified daily via email or social media. These modifications usually concern stem (or bouquet) quantities,
colors, combinations and stem length.
Direct sales may involve e-business, where a customer orders flower arrangements directly from a farm on
the internet. Intricate logistics are involved and require a “brick and mortar” approach where orders are
filled by a local business, such as ProFlowers or Florist’s Transworld Delivery (FTD). Shipping also becomes
local and is done by FedEx, UPS or a similar courier. This approach – where the client requires a local buyer
or representative – is also present when dealing with supermarkets, like Costco.
With direct sales, net returns to the farm are much higher than when importers, wholesalers and
distributors are involved. However, they are not always easy to achieve, and competition is very high. It is
estimated that five marketing groups (including growers/exporters) now conduct 70 percent of direct sales
in the U.S. mass market. Consequently, a balance should be sought among different types of clients
(wholesalers, retail chains, mass marketers), as well as a good yearly price average that fluctuates between
peak season highs and lower prices at other times.
5.3 TRANSPORT AND POINTS OF ENTRY
Given the vast distances to be covered in the U.S., shipping flowers from the farm to the port of entry
(mostly Miami but also Los Angeles and other cities) to the consumer is a critical factor in the cost of the
final product. The freight and transport cost will depend on flight availability, internal regulations in the
country of origin and volumes of flowers shipped, among other considerations.
Airfreight costs can limit the success of cut flower exports. They can vary greatly from one country to
another and may not necessarily depend on the distance traveled. As of April 2018, airfreight cost for cut
flowers from Bogotá, Colombia to Miami, U.S. was quoted at $1.10/kg, and $1.60/kg from Quito, Ecuador to
Miami. In Kenya, freight forwarders quoted costs between $3.60 and $3.80/kg from Nairobi to Miami.
Travel times also vary. A direct flight from Bogotá to Miami is 3.5 hours, and 4.5 hours from Quito to Miami.
Current shipping times from Nairobi to Miami (with a stopover in Amsterdam or London, or even involving
ground transport from Amsterdam to London) are 19 hours minimum. Even with direct flights, a significantly
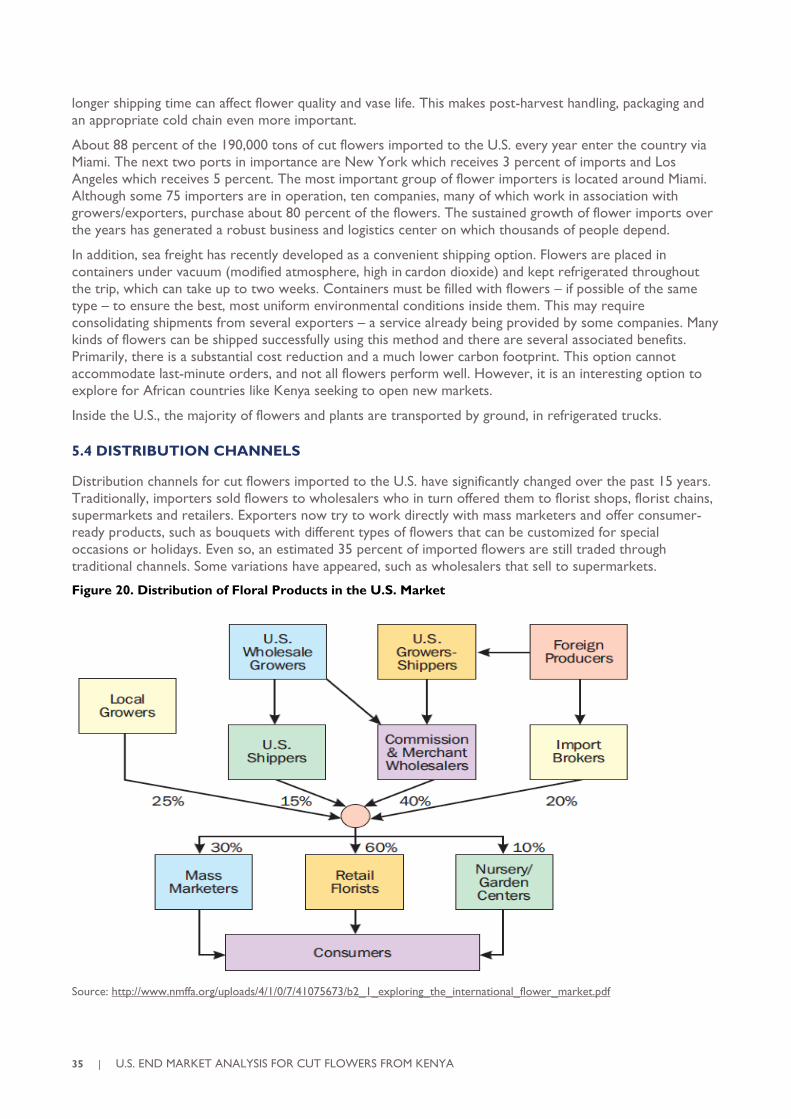
35 | U.S. END MARKET ANALYSIS FOR CUT FLOWERS FROM KENYA
longer shipping time can affect flower quality and vase life. This makes post-harvest handling, packaging and
an appropriate cold chain even more important.
About 88 percent of the 190,000 tons of cut flowers imported to the U.S. every year enter the country via
Miami. The next two ports in importance are New York which receives 3 percent of imports and Los
Angeles which receives 5 percent. The most important group of flower importers is located around Miami.
Although some 75 importers are in operation, ten companies, many of which work in association with
growers/exporters, purchase about 80 percent of the flowers. The sustained growth of flower imports over
the years has generated a robust business and logistics center on which thousands of people depend.
In addition, sea freight has recently developed as a convenient shipping option. Flowers are placed in
containers under vacuum (modified atmosphere, high in cardon dioxide) and kept refrigerated throughout
the trip, which can take up to two weeks. Containers must be filled with flowers – if possible of the same
type – to ensure the best, most uniform environmental conditions inside them. This may require
consolidating shipments from several exporters – a service already being provided by some companies. Many
kinds of flowers can be shipped successfully using this method and there are several associated benefits.
Primarily, there is a substantial cost reduction and a much lower carbon footprint. This option cannot
accommodate last-minute orders, and not all flowers perform well. However, it is an interesting option to
explore for African countries like Kenya seeking to open new markets.
Inside the U.S., the majority of flowers and plants are transported by ground, in refrigerated trucks.
5.4 DISTRIBUTION CHANNELS
Distribution channels for cut flowers imported to the U.S. have significantly changed over the past 15 years.
Traditionally, importers sold flowers to wholesalers who in turn offered them to florist shops, florist chains,
supermarkets and retailers. Exporters now try to work directly with mass marketers and offer consumer-
ready products, such as bouquets with different types of flowers that can be customized for special
occasions or holidays. Even so, an estimated 35 percent of imported flowers are still traded through
traditional channels. Some variations have appeared, such as wholesalers that sell to supermarkets.
Figure 20. Distribution of Floral Products in the U.S. Market
Source: http://www.nmffa.org/uploads/4/1/0/7/41075673/b2_1_exploring_the_international_flower_market.pdf
U.S. END MARKET ANALYSIS FOR CUT FLOWERS FROM KENYA | 36
The Society of American Florists (SAF) records the following segments in relation to marketing of floral
products in the U.S.:
• Retail florists
• Supermarkets selling flowers
• Nurseries and garden centers
• Floral wholesalers
Since 2005, there has been a reduction in the number of retail florists. However, those that have remained
in the business have reported increases in sales.
TRADITIONAL FLORISTS
Although traditional florist numbers have reduced, some traditional florists remain active and make large
annual sales in the millions of dollars. They rarely import flowers directly, but instead purchase from
wholesalers. These businesses still sell high-value flower arrangements which set them apart from other
retailers selling consumer-ready bouquets and flower bunches. To many consumers, flowers purchased from
a florist are “more sophisticated, of better quality and fresher” than those offered by supermarkets.
Consumers most often purchase at florist shops for special occasions and holidays such as Valentine’s Day
and Mother’s Day.
Even so, florist shops have lost participation to retail mass marketers and e-commerce, which are often
favored by consumers, especially in the younger generations.
MASS MARKETERS
An estimated 36,000 supermarket chain stores operate in the U.S. and Canada and about 60 percent have
dedicated floral departments. These include chain and independent supermarkets, grocery wholesalers and
other mass marketers. In a recent study (2015), the Product Marketing Association and Produce Marketing
Association (PMA) analyzed percentages of total floral sales in supermarkets, and found that most sales were
in-store and regular purchases (68 percent), while holiday purchases only reached 31 percent. Wedding,
sympathy (i.e. funeral) and website sales were very low, between 2-4 percent.2
Most floral departments offer cut flowers, live plants, floral art, dried flower arrangements, accessories and
delivery services. Increasingly, supermarket chains purchase flowers directly from large importers in Miami
who have bouquet divisions, and to some extent, directly from exporters. The tendency among these
companies is to request ready-made bouquets shipped directly from the farms so that all that is required in
2 https://www.pma.com/~/media/pma-files/research-and-development/floral-trends-report.pdf?la=en
37 | U.S. END MARKET ANALYSIS FOR CUT FLOWERS FROM KENYA
Miami is sticking a bar code on the bouquet sleeve (if this hasn’t been already done by the exporter), placing
it in water and delivering the bouquet.
Examples of supermarkets/mass marketers buying large amounts of flowers are:
• Wholefoods
• Walmart
• Giant
• Costco
• Trader Joe’s
• Target
Cut flower arrangements and bouquets are offered via the internet by sellers such as Amazon, ProFlowers,
FTD, 1-800-Flowers, Teleflora and Sam’s Club. According to the PMA study, consumers still prefer in-
person purchases, but internet purchases are clearly on the rise.
Bouquet suppliers are increasingly consolidating, with no more than ten companies handling over 80 percent
of the trade. Noted bouquet suppliers are:
• The Queen’s Flowers
• Elite Flowers
• Sunshine Bouquet
• Passion Growers
• Nature’s Flowers
• Falcon Farms
OTHER RETAILERS
Although a very high share of all flowers and plants marketed in the U.S. are sold by supermarkets and
florists, there is another segment of sales that includes street vendors, garden centers, toll-free phone
orders (also included in the previous section), catalog sales, department stores, decoration and home
centers and others.
WHOLESALERS
SAF reports that there are between 500 to 700 wholesalers in different cities in the U.S. Some are
associated through groups, but may buy individually or have a central purchasing office. Only larger
wholesalers usually buy from Latin American suppliers, mostly at fixed price and selecting from prices
reported on a daily basis by large Miami importers.
This sector, on average, operates under low operational profit. Smaller wholesalers often demand payment
terms of 45 to 60 days. It is important to carefully analyze finances before offering credit to floral
wholesalers.
The Wholesale Florists and Floral Services Association (WF&FSA), a commercial organization with more
than 500 members, has changed over the years, but still offers many services including networking meetings,
flower marketing training courses, marketing studies and price information.
Wholesalers can also be importers, selling flowers to other wholesalers and florist shops. Many have a large
zone of influence and some (often called shippers or producers-shippers), particularly in California, Texas
and Florida, serve both retailers and wholesalers around the U.S. Some use cold rooms to store and market
flowers while others provide refrigerated trucks to their clients.
U.S. END MARKET ANALYSIS FOR CUT FLOWERS FROM KENYA | 38
MAIN IMPORTERS
Until the 1990s, the only ports of entry in the U.S. equipped by APHIS and USDA to conduct plant product
inspections were Miami and New York. This is the main reason why the most important flower importers
are established around Miami. Even though importers can also be found in Atlanta, Boston, Chicago,
Houston, Los Angeles, San Francisco and New York, Miami continues to be by far the main flower trade
hub.
Many of these Miami companies are partially owned by Colombian entrepreneurs who purchase a large
proportion of their product directly from Colombian farms, although they also handle produce from other
countries. Some have investments in Ecuador or other countries. Several companies have installed facilities
for manufacturing bouquets. However, this is more frequently done on-site at the farm because costs are
lower, hand labor is more availabile and the vase life of flowers is extended through less handling.
Brokers and importers are often known as importers-distributors. Their facilities have cold rooms and
complete distribution services, with the capacity to deliver products in refrigerated trucks to ground
transportation companies or airlines. Armellini Express Lines is one example that has been in operation for
many decades. It has a fleet of 250 refrigerated trucks reaching all corners of the U.S. and Canada.
Importers-distributors sell mainly to wholesalers throughout the country. A small number supplies
supermarkets, often using different commercial names. They may buy at fixed prices and receive orders on
consignment on which a commission or fixed price may be agreed. They are in charge of clearing orders and
paying import fees, very often requesting a box fee or box charge that is transferred to the wholesaler or
the grower.
The majority of importers is affiliated to an association through which it receives important support in the
form of market studies, sector news and client contacts. The most important associations are:
• Wholesale Florists & Florist Supplier Association (WF&FSA) www.wffsa.org
• Association of Floral Importers of Florida (AFIF) www.afifnet.org
• The Society of American Florists (SAF) www.safnow.org
IMPORTANT FLORAL MARKETS ACROSS THE U.S.
Some large cities in the U.S. operate wholesale flower markets, which can be an interesting resource for
flower sellers initiating business relationships. The following are important examples:
• Los Angeles Flower District Association www.laflowerdistrict.com
• San Diego International Floral Trade Center www.sdfloraltradecenter.com
• The Boston Flower Exchange (now the New England Flower Exchange)
www.newenglandflowerexchange.com
• Chicago Flower Exchange www.chicagoflowerexchange.com
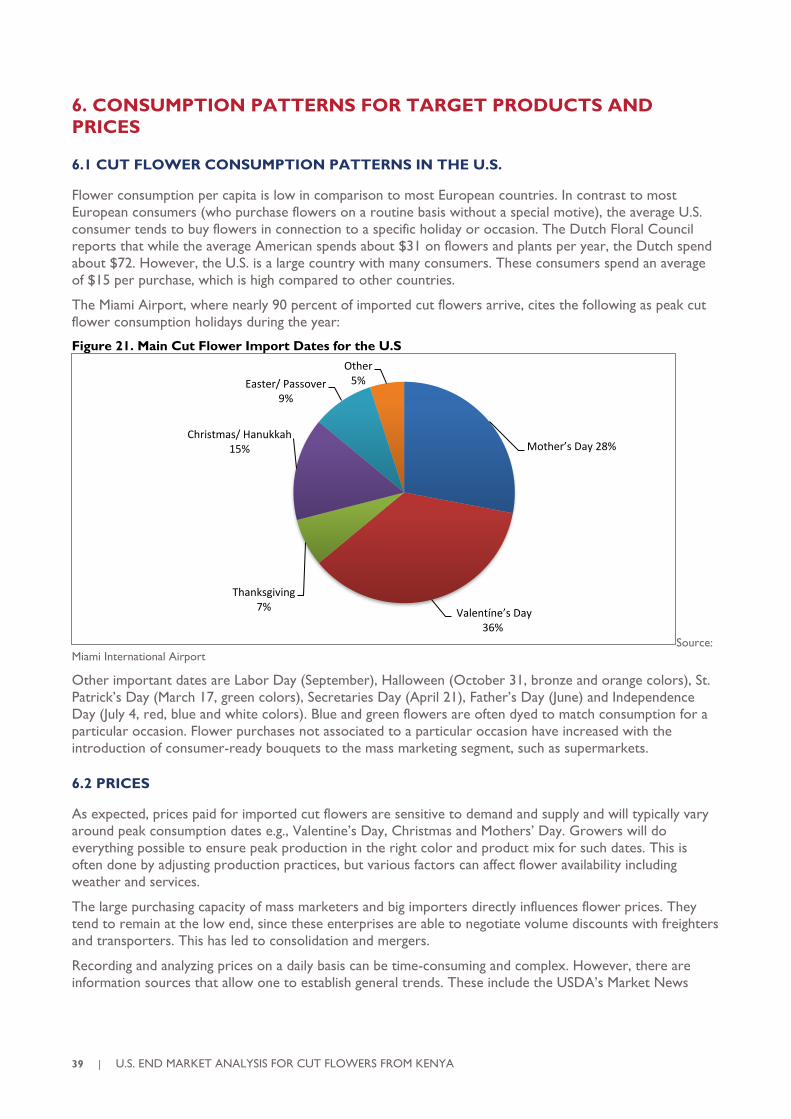
39 | U.S. END MARKET ANALYSIS FOR CUT FLOWERS FROM KENYA
6. CONSUMPTION PATTERNS FOR TARGET PRODUCTS AND
PRICES
6.1 CUT FLOWER CONSUMPTION PATTERNS IN THE U.S.
Flower consumption per capita is low in comparison to most European countries. In contrast to most
European consumers (who purchase flowers on a routine basis without a special motive), the average U.S.
consumer tends to buy flowers in connection to a specific holiday or occasion. The Dutch Floral Council
reports that while the average American spends about $31 on flowers and plants per year, the Dutch spend
about $72. However, the U.S. is a large country with many consumers. These consumers spend an average
of $15 per purchase, which is high compared to other countries.
The Miami Airport, where nearly 90 percent of imported cut flowers arrive, cites the following as peak cut
flower consumption holidays during the year:
Figure 21. Main Cut Flower Import Dates for the U.S
Source:
Miami International Airport
Other important dates are Labor Day (September), Halloween (October 31, bronze and orange colors), St.
Patrick’s Day (March 17, green colors), Secretaries Day (April 21), Father’s Day (June) and Independence
Day (July 4, red, blue and white colors). Blue and green flowers are often dyed to match consumption for a
particular occasion. Flower purchases not associated to a particular occasion have increased with the
introduction of consumer-ready bouquets to the mass marketing segment, such as supermarkets.
6.2 PRICES
As expected, prices paid for imported cut flowers are sensitive to demand and supply and will typically vary
around peak consumption dates e.g., Valentine’s Day, Christmas and Mothers’ Day. Growers will do
everything possible to ensure peak production in the right color and product mix for such dates. This is
often done by adjusting production practices, but various factors can affect flower availability including
weather and services.
The large purchasing capacity of mass marketers and big importers directly influences flower prices. They
tend to remain at the low end, since these enterprises are able to negotiate volume discounts with freighters
and transporters. This has led to consolidation and mergers.
Recording and analyzing prices on a daily basis can be time-consuming and complex. However, there are
information sources that allow one to establish general trends. These include the USDA’s Market News
Mother’s Day 28%
Valentíne’s Day36%
Thanksgiving7%
Christmas/ Hanukkah15%
Easter/ Passover9%
Other5%
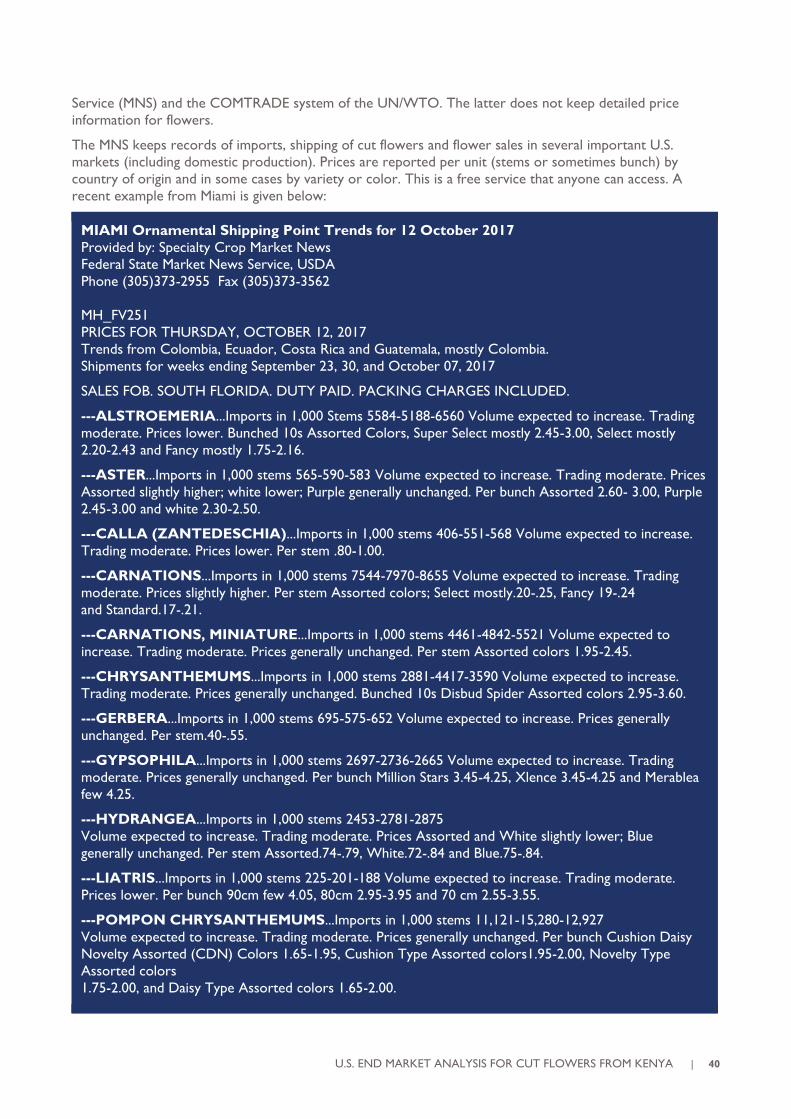
U.S. END MARKET ANALYSIS FOR CUT FLOWERS FROM KENYA | 40
Service (MNS) and the COMTRADE system of the UN/WTO. The latter does not keep detailed price
information for flowers.
The MNS keeps records of imports, shipping of cut flowers and flower sales in several important U.S.
markets (including domestic production). Prices are reported per unit (stems or sometimes bunch) by
country of origin and in some cases by variety or color. This is a free service that anyone can access. A
recent example from Miami is given below:
MIAMI Ornamental Shipping Point Trends for 12 October 2017
Provided by: Specialty Crop Market News
Federal State Market News Service, USDA
Phone (305)373-2955 Fax (305)373-3562
MH_FV251
PRICES FOR THURSDAY, OCTOBER 12, 2017
Trends from Colombia, Ecuador, Costa Rica and Guatemala, mostly Colombia.
Shipments for weeks ending September 23, 30, and October 07, 2017
SALES FOB. SOUTH FLORIDA. DUTY PAID. PACKING CHARGES INCLUDED.
---ALSTROEMERIA...Imports in 1,000 Stems 5584-5188-6560 Volume expected to increase. Trading
moderate. Prices lower. Bunched 10s Assorted Colors, Super Select mostly 2.45-3.00, Select mostly
2.20-2.43 and Fancy mostly 1.75-2.16.
---ASTER...Imports in 1,000 stems 565-590-583 Volume expected to increase. Trading moderate. Prices
Assorted slightly higher; white lower; Purple generally unchanged. Per bunch Assorted 2.60- 3.00, Purple
2.45-3.00 and white 2.30-2.50.
---CALLA (ZANTEDESCHIA)...Imports in 1,000 stems 406-551-568 Volume expected to increase.
Trading moderate. Prices lower. Per stem .80-1.00.
---CARNATIONS...Imports in 1,000 stems 7544-7970-8655 Volume expected to increase. Trading
moderate. Prices slightly higher. Per stem Assorted colors; Select mostly.20-.25, Fancy 19-.24
and Standard.17-.21.
---CARNATIONS, MINIATURE...Imports in 1,000 stems 4461-4842-5521 Volume expected to
increase. Trading moderate. Prices generally unchanged. Per stem Assorted colors 1.95-2.45.
---CHRYSANTHEMUMS...Imports in 1,000 stems 2881-4417-3590 Volume expected to increase.
Trading moderate. Prices generally unchanged. Bunched 10s Disbud Spider Assorted colors 2.95-3.60.
---GERBERA...Imports in 1,000 stems 695-575-652 Volume expected to increase. Prices generally
unchanged. Per stem.40-.55.
---GYPSOPHILA...Imports in 1,000 stems 2697-2736-2665 Volume expected to increase. Trading
moderate. Prices generally unchanged. Per bunch Million Stars 3.45-4.25, Xlence 3.45-4.25 and Merablea
few 4.25.
---HYDRANGEA...Imports in 1,000 stems 2453-2781-2875
Volume expected to increase. Trading moderate. Prices Assorted and White slightly lower; Blue
generally unchanged. Per stem Assorted.74-.79, White.72-.84 and Blue.75-.84.
---LIATRIS...Imports in 1,000 stems 225-201-188 Volume expected to increase. Trading moderate.
Prices lower. Per bunch 90cm few 4.05, 80cm 2.95-3.95 and 70 cm 2.55-3.55.
---POMPON CHRYSANTHEMUMS...Imports in 1,000 stems 11,121-15,280-12,927
Volume expected to increase. Trading moderate. Prices generally unchanged. Per bunch Cushion Daisy
Novelty Assorted (CDN) Colors 1.65-1.95, Cushion Type Assorted colors1.95-2.00, Novelty Type
Assorted colors
1.75-2.00, and Daisy Type Assorted colors 1.65-2.00.
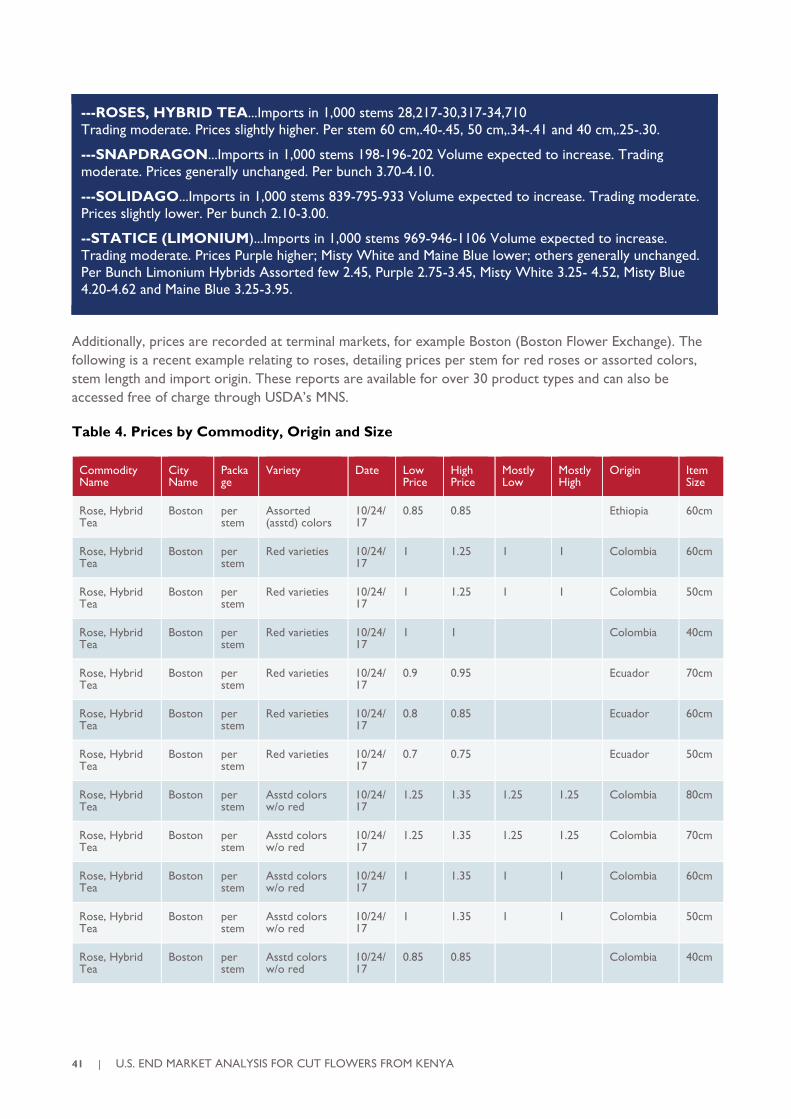
41 | U.S. END MARKET ANALYSIS FOR CUT FLOWERS FROM KENYA
---ROSES, HYBRID TEA...Imports in 1,000 stems 28,217-30,317-34,710
Trading moderate. Prices slightly higher. Per stem 60 cm,.40-.45, 50 cm,.34-.41 and 40 cm,.25-.30.
---SNAPDRAGON...Imports in 1,000 stems 198-196-202 Volume expected to increase. Trading
moderate. Prices generally unchanged. Per bunch 3.70-4.10.
---SOLIDAGO...Imports in 1,000 stems 839-795-933 Volume expected to increase. Trading moderate.
Prices slightly lower. Per bunch 2.10-3.00.
--STATICE (LIMONIUM)...Imports in 1,000 stems 969-946-1106 Volume expected to increase.
Trading moderate. Prices Purple higher; Misty White and Maine Blue lower; others generally unchanged.
Per Bunch Limonium Hybrids Assorted few 2.45, Purple 2.75-3.45, Misty White 3.25- 4.52, Misty Blue
4.20-4.62 and Maine Blue 3.25-3.95.
Additionally, prices are recorded at terminal markets, for example Boston (Boston Flower Exchange). The
following is a recent example relating to roses, detailing prices per stem for red roses or assorted colors,
stem length and import origin. These reports are available for over 30 product types and can also be
accessed free of charge through USDA’s MNS.
Table 4. Prices by Commodity, Origin and Size
Commodity Name
City Name
Package
Variety Date Low Price
High Price
Mostly Low
Mostly High
Origin Item Size
Rose, Hybrid Tea
Boston per stem
Assorted (asstd) colors
10/24/17
0.85 0.85 Ethiopia 60cm
Rose, Hybrid Tea
Boston per stem
Red varieties 10/24/17
1 1.25 1 1 Colombia 60cm
Rose, Hybrid Tea
Boston per stem
Red varieties 10/24/17
1 1.25 1 1 Colombia 50cm
Rose, Hybrid Tea
Boston per stem
Red varieties 10/24/17
1 1 Colombia 40cm
Rose, Hybrid Tea
Boston per stem
Red varieties 10/24/17
0.9 0.95 Ecuador 70cm
Rose, Hybrid Tea
Boston per stem
Red varieties 10/24/17
0.8 0.85 Ecuador 60cm
Rose, Hybrid Tea
Boston per stem
Red varieties 10/24/17
0.7 0.75 Ecuador 50cm
Rose, Hybrid Tea
Boston per stem
Asstd colors w/o red
10/24/17
1.25 1.35 1.25 1.25 Colombia 80cm
Rose, Hybrid Tea
Boston per stem
Asstd colors w/o red
10/24/17
1.25 1.35 1.25 1.25 Colombia 70cm
Rose, Hybrid Tea
Boston per stem
Asstd colors w/o red
10/24/17
1 1.35 1 1 Colombia 60cm
Rose, Hybrid Tea
Boston per stem
Asstd colors w/o red
10/24/17
1 1.35 1 1 Colombia 50cm
Rose, Hybrid Tea
Boston per stem
Asstd colors w/o red
10/24/17
0.85 0.85 Colombia 40cm
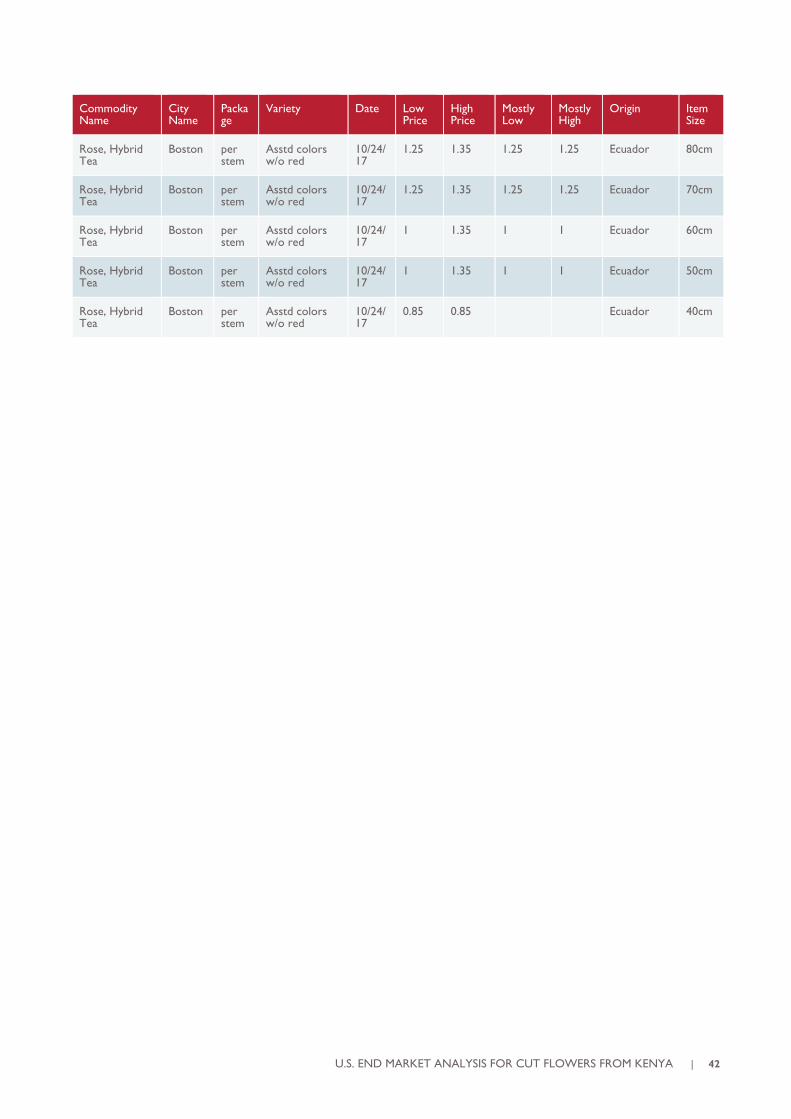
U.S. END MARKET ANALYSIS FOR CUT FLOWERS FROM KENYA | 42
Commodity Name
City Name
Package
Variety Date Low Price
High Price
Mostly Low
Mostly High
Origin Item Size
Rose, Hybrid Tea
Boston per stem
Asstd colors w/o red
10/24/17
1.25 1.35 1.25 1.25 Ecuador 80cm
Rose, Hybrid Tea
Boston per stem
Asstd colors w/o red
10/24/17
1.25 1.35 1.25 1.25 Ecuador 70cm
Rose, Hybrid Tea
Boston per stem
Asstd colors w/o red
10/24/17
1 1.35 1 1 Ecuador 60cm
Rose, Hybrid Tea
Boston per stem
Asstd colors w/o red
10/24/17
1 1.35 1 1 Ecuador 50cm
Rose, Hybrid Tea
Boston per stem
Asstd colors w/o red
10/24/17
0.85 0.85 Ecuador 40cm
43 | U.S. END MARKET ANALYSIS FOR CUT FLOWERS FROM KENYA
7. SALES PROMOTION
7.1 KEY TRADE FAIRS
Several trade fairs take place in the U.S. every year that bring together flower exporters and buyers. They
offer excellent opportunities to showcase products and start, strengthen or expand floral businesses. In
addition, it may be worth considering attending tradeshows in countries that supply the U.S. market,
particularly Colombia and Ecuador. The following is a list of key events taking place in 2018/2019:
World Floral Expo – HPP Exhibitions
March 22-24, 2018
Chicago, Illinois, U.S.
www.hppexhibitions.com/floriculture/2018/wfe/
International Floriculture Expo
June 25-27, 2018
McCormick Place
Chicago, Illinois, U.S.
www.floriexpo.com
Expoflor Ecuador – EXPOFLORES
September 19-21, 2018
Quito, Ecuador
www.expoflores.com
Agriflor Ecuador 2018 – HPP Exhibitions
October 3-5, 2018
Quito, Ecuador
www.hppexhibitions.com/floriculture/2018/ecuador/
PMA Fresh Summit, Convention and Expo
October 18-20, 2018
Orlando, Florida, U.S.
www.pma.com/events/freshsummit
Wholesale Florist & Florist Supplier Association – Floral Distribution Company
October 17-19, 2018
Miami Airport Convention Center
Miami, Florida, U.S.
www.wffsa.org/aws/WFFSA/pt/sp/conference_home
7.2 SOURCES OF INFORMATION AND PROMOTIONAL OPPORTUNITIES
TRADE MAGAZINES AND BLOGS
Trade magazines and websites/blogs are important sources of information. They also provide promotion
opportunities in the form of advertisements, interviews with players in Kenyan floriculture, articles
showcasing the flower sector, key events, etc. These opportunities can be arranged through direct contact
with editors and visits. These visits can be held in conjunction with the annual tradeshow held in Nairobi.
Some of these magazines maintain a printed version while others only have digital presence. Publications
with a good presence in the U.S. floral industry include:
• FloraCulture International. Monthly, international magazine owned by FloraHolland with
worldwide circulation. www.floraculture.eu
• Grower Talks. Directed at growers and circulates mainly in North America.
www.growertalks.com
U.S. END MARKET ANALYSIS FOR CUT FLOWERS FROM KENYA | 44
• Green Profit. Directed to the flower consumer (wholesalers, mass marketers, retailers, florists).
Circulates mainly in the U.S. and is a sister publication to Grower Talks.
• Greenhouse Grower. Directed to growers mainly in the U.S. www.greenhousegrower.com
• Florists’ Review. Monthly magazine specializing in the retail market. www.floristsreview.com
• SuperFloral Retailing. Directed at mass marketers and retailers. www.superfloralretailing.com
• Hortibiz. International news on the horticulture and floriculture industries. www.hortibiz.com
Additionally, there are many blogs and websites that provide promotion and networking opportunities, as
well as relevant information on events, trends and news. They usually require registration, but membership
is mostly free. Some examples include:
• Flowers and Cents. www.flowersandcents.com
• Flowers Supergroup. A LinkedIn group. www.linkedin.com
• American Floral Endowment. www.endowment.org
PROMOTIONAL MATERIALS AND OPTIONS
Flower exporters around the world continue to invest in high-quality, professionally made catalogs
showcasing their products. These materials are important when attending tradeshows and meeting
prospective buyers.
The value of a good website cannot be underestimated. For many years, flower companies have used the
internet (websites and social media) to deliver information on their farms, production processes, company
history and social and environmental programs. They are increasingly using it as a sales tool (e-commerce) to
promote products, support their participation in trade shows and make direct sales. Companies can check
on what the competition is doing to inform their internet activity and presence.
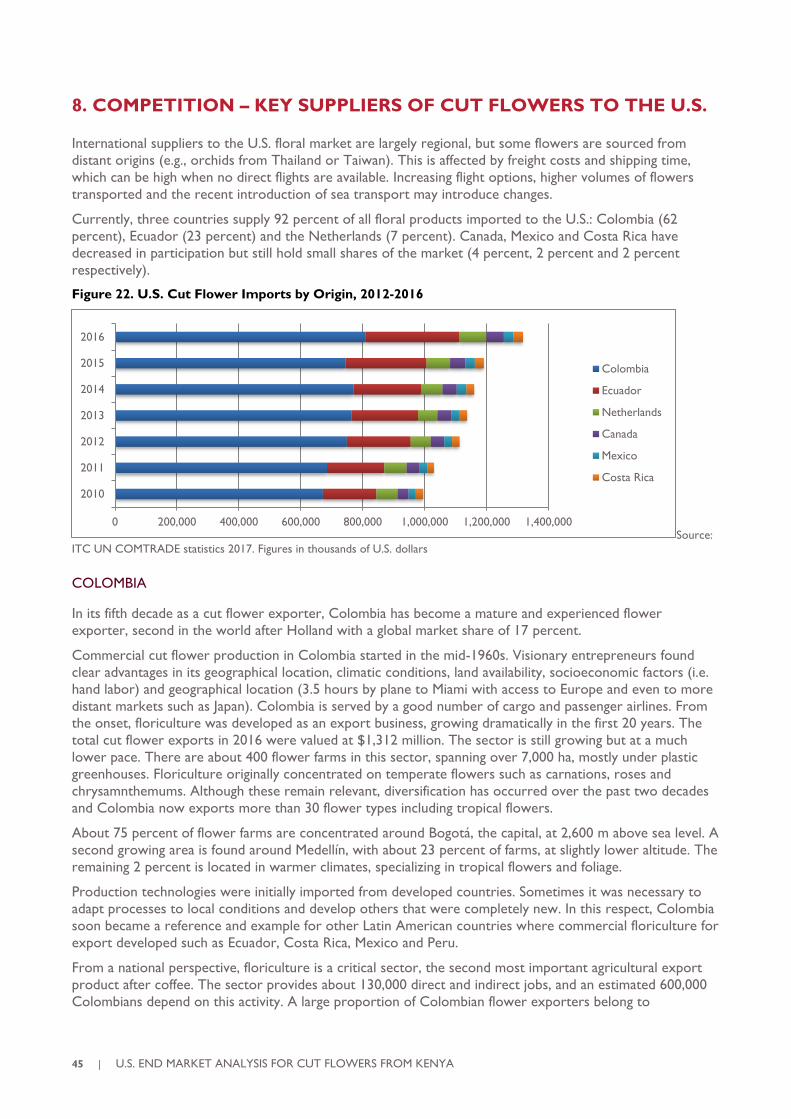
45 | U.S. END MARKET ANALYSIS FOR CUT FLOWERS FROM KENYA
8. COMPETITION – KEY SUPPLIERS OF CUT FLOWERS TO THE U.S.
International suppliers to the U.S. floral market are largely regional, but some flowers are sourced from
distant origins (e.g., orchids from Thailand or Taiwan). This is affected by freight costs and shipping time,
which can be high when no direct flights are available. Increasing flight options, higher volumes of flowers
transported and the recent introduction of sea transport may introduce changes.
Currently, three countries supply 92 percent of all floral products imported to the U.S.: Colombia (62
percent), Ecuador (23 percent) and the Netherlands (7 percent). Canada, Mexico and Costa Rica have
decreased in participation but still hold small shares of the market (4 percent, 2 percent and 2 percent
respectively).
Figure 22. U.S. Cut Flower Imports by Origin, 2012-2016
Source:
ITC UN COMTRADE statistics 2017. Figures in thousands of U.S. dollars
COLOMBIA
In its fifth decade as a cut flower exporter, Colombia has become a mature and experienced flower
exporter, second in the world after Holland with a global market share of 17 percent.
Commercial cut flower production in Colombia started in the mid-1960s. Visionary entrepreneurs found
clear advantages in its geographical location, climatic conditions, land availability, socioeconomic factors (i.e.
hand labor) and geographical location (3.5 hours by plane to Miami with access to Europe and even to more
distant markets such as Japan). Colombia is served by a good number of cargo and passenger airlines. From
the onset, floriculture was developed as an export business, growing dramatically in the first 20 years. The
total cut flower exports in 2016 were valued at $1,312 million. The sector is still growing but at a much
lower pace. There are about 400 flower farms in this sector, spanning over 7,000 ha, mostly under plastic
greenhouses. Floriculture originally concentrated on temperate flowers such as carnations, roses and
chrysamnthemums. Although these remain relevant, diversification has occurred over the past two decades
and Colombia now exports more than 30 flower types including tropical flowers.
About 75 percent of flower farms are concentrated around Bogotá, the capital, at 2,600 m above sea level. A
second growing area is found around Medellín, with about 23 percent of farms, at slightly lower altitude. The
remaining 2 percent is located in warmer climates, specializing in tropical flowers and foliage.
Production technologies were initially imported from developed countries. Sometimes it was necessary to
adapt processes to local conditions and develop others that were completely new. In this respect, Colombia
soon became a reference and example for other Latin American countries where commercial floriculture for
export developed such as Ecuador, Costa Rica, Mexico and Peru.
From a national perspective, floriculture is a critical sector, the second most important agricultural export
product after coffee. The sector provides about 130,000 direct and indirect jobs, and an estimated 600,000
Colombians depend on this activity. A large proportion of Colombian flower exporters belong to
0 200,000 400,000 600,000 800,000 1,000,000 1,200,000 1,400,000
2010
2011
2012
2013
2014
2015
2016
Colombia
Ecuador
Netherlands
Canada
Mexico
Costa Rica
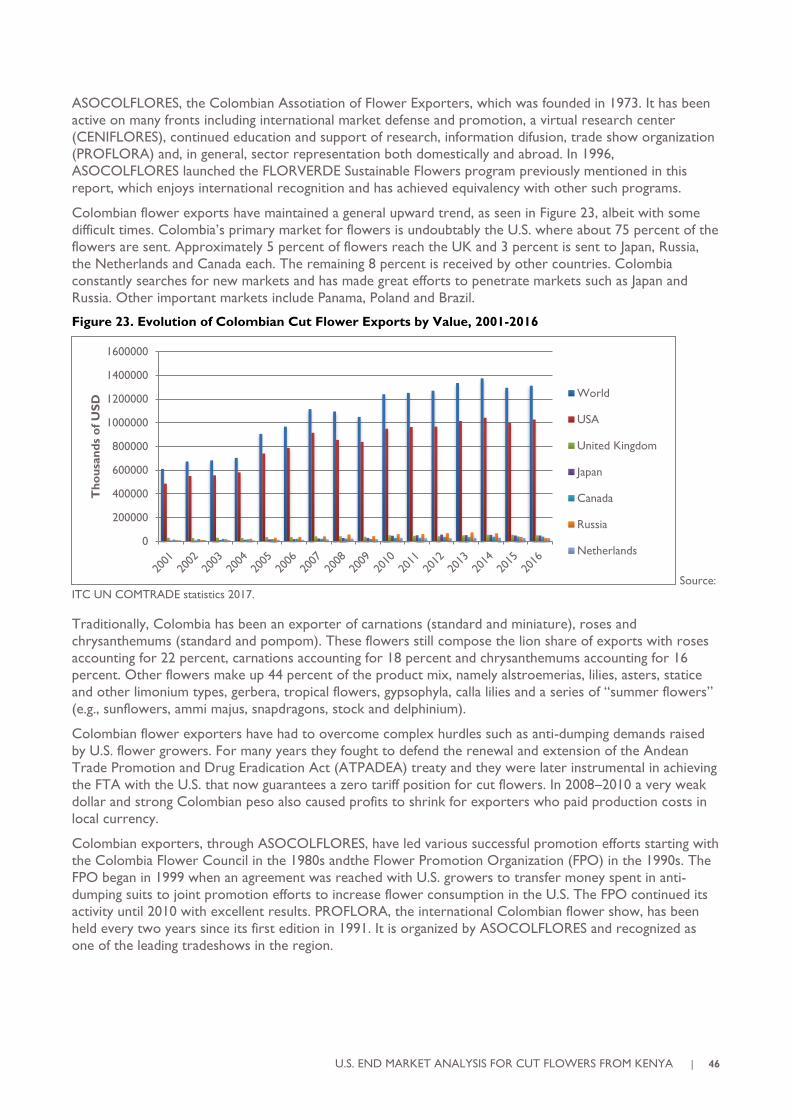
U.S. END MARKET ANALYSIS FOR CUT FLOWERS FROM KENYA | 46
ASOCOLFLORES, the Colombian Assotiation of Flower Exporters, which was founded in 1973. It has been
active on many fronts including international market defense and promotion, a virtual research center
(CENIFLORES), continued education and support of research, information difusion, trade show organization
(PROFLORA) and, in general, sector representation both domestically and abroad. In 1996,
ASOCOLFLORES launched the FLORVERDE Sustainable Flowers program previously mentioned in this
report, which enjoys international recognition and has achieved equivalency with other such programs.
Colombian flower exports have maintained a general upward trend, as seen in Figure 23, albeit with some
difficult times. Colombia’s primary market for flowers is undoubtably the U.S. where about 75 percent of the
flowers are sent. Approximately 5 percent of flowers reach the UK and 3 percent is sent to Japan, Russia,
the Netherlands and Canada each. The remaining 8 percent is received by other countries. Colombia
constantly searches for new markets and has made great efforts to penetrate markets such as Japan and
Russia. Other important markets include Panama, Poland and Brazil.
Figure 23. Evolution of Colombian Cut Flower Exports by Value, 2001-2016
Source:
ITC UN COMTRADE statistics 2017.
Traditionally, Colombia has been an exporter of carnations (standard and miniature), roses and
chrysanthemums (standard and pompom). These flowers still compose the lion share of exports with roses
accounting for 22 percent, carnations accounting for 18 percent and chrysanthemums accounting for 16
percent. Other flowers make up 44 percent of the product mix, namely alstroemerias, lilies, asters, statice
and other limonium types, gerbera, tropical flowers, gypsophyla, calla lilies and a series of “summer flowers”
(e.g., sunflowers, ammi majus, snapdragons, stock and delphinium).
Colombian flower exporters have had to overcome complex hurdles such as anti-dumping demands raised
by U.S. flower growers. For many years they fought to defend the renewal and extension of the Andean
Trade Promotion and Drug Eradication Act (ATPADEA) treaty and they were later instrumental in achieving
the FTA with the U.S. that now guarantees a zero tariff position for cut flowers. In 2008–2010 a very weak
dollar and strong Colombian peso also caused profits to shrink for exporters who paid production costs in
local currency.
Colombian exporters, through ASOCOLFLORES, have led various successful promotion efforts starting with
the Colombia Flower Council in the 1980s andthe Flower Promotion Organization (FPO) in the 1990s. The
FPO began in 1999 when an agreement was reached with U.S. growers to transfer money spent in anti-
dumping suits to joint promotion efforts to increase flower consumption in the U.S. The FPO continued its
activity until 2010 with excellent results. PROFLORA, the international Colombian flower show, has been
held every two years since its first edition in 1991. It is organized by ASOCOLFLORES and recognized as
one of the leading tradeshows in the region.
0
200000
400000
600000
800000
1000000
1200000
1400000
1600000
Th
ou
san
ds
of
US
D
World
USA
United Kingdom
Japan
Canada
Russia
Netherlands
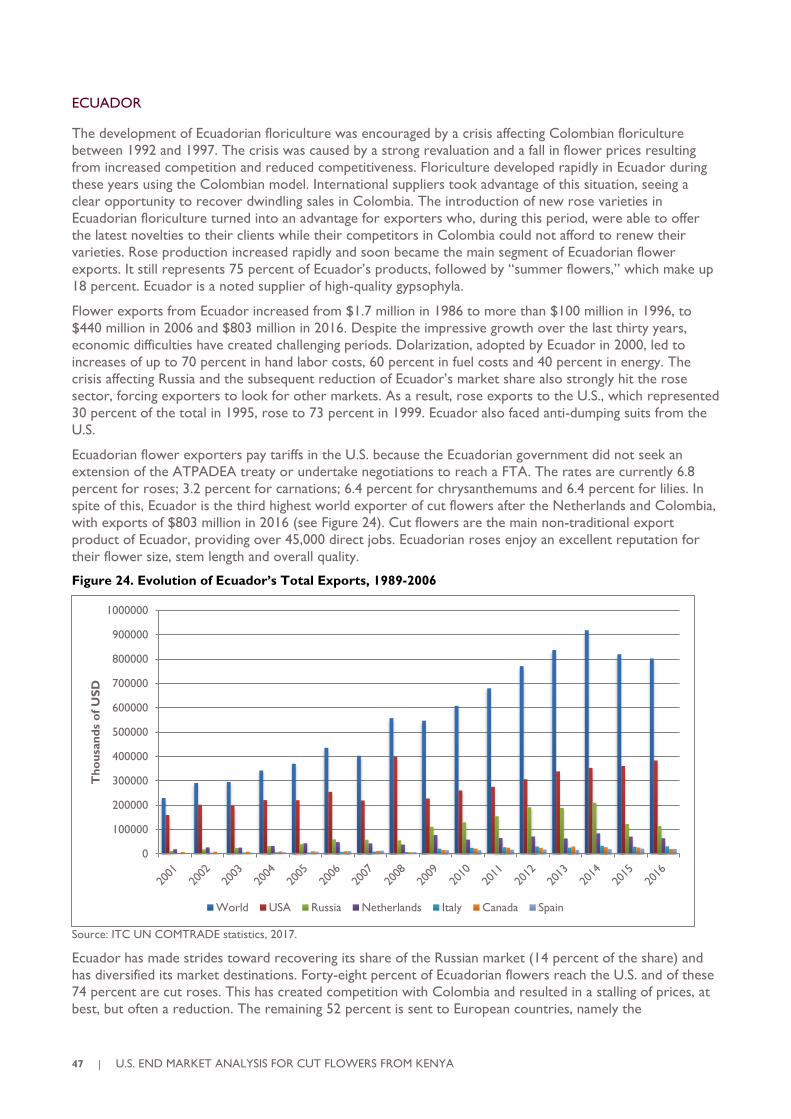
47 | U.S. END MARKET ANALYSIS FOR CUT FLOWERS FROM KENYA
ECUADOR
The development of Ecuadorian floriculture was encouraged by a crisis affecting Colombian floriculture
between 1992 and 1997. The crisis was caused by a strong revaluation and a fall in flower prices resulting
from increased competition and reduced competitiveness. Floriculture developed rapidly in Ecuador during
these years using the Colombian model. International suppliers took advantage of this situation, seeing a
clear opportunity to recover dwindling sales in Colombia. The introduction of new rose varieties in
Ecuadorian floriculture turned into an advantage for exporters who, during this period, were able to offer
the latest novelties to their clients while their competitors in Colombia could not afford to renew their
varieties. Rose production increased rapidly and soon became the main segment of Ecuadorian flower
exports. It still represents 75 percent of Ecuador’s products, followed by “summer flowers,” which make up
18 percent. Ecuador is a noted supplier of high-quality gypsophyla.
Flower exports from Ecuador increased from $1.7 million in 1986 to more than $100 million in 1996, to
$440 million in 2006 and $803 million in 2016. Despite the impressive growth over the last thirty years,
economic difficulties have created challenging periods. Dolarization, adopted by Ecuador in 2000, led to
increases of up to 70 percent in hand labor costs, 60 percent in fuel costs and 40 percent in energy. The
crisis affecting Russia and the subsequent reduction of Ecuador’s market share also strongly hit the rose
sector, forcing exporters to look for other markets. As a result, rose exports to the U.S., which represented
30 percent of the total in 1995, rose to 73 percent in 1999. Ecuador also faced anti-dumping suits from the
U.S.
Ecuadorian flower exporters pay tariffs in the U.S. because the Ecuadorian government did not seek an
extension of the ATPADEA treaty or undertake negotiations to reach a FTA. The rates are currently 6.8
percent for roses; 3.2 percent for carnations; 6.4 percent for chrysanthemums and 6.4 percent for lilies. In
spite of this, Ecuador is the third highest world exporter of cut flowers after the Netherlands and Colombia,
with exports of $803 million in 2016 (see Figure 24). Cut flowers are the main non-traditional export
product of Ecuador, providing over 45,000 direct jobs. Ecuadorian roses enjoy an excellent reputation for
their flower size, stem length and overall quality.
Figure 24. Evolution of Ecuador’s Total Exports, 1989-2006
Source: ITC UN COMTRADE statistics, 2017.
Ecuador has made strides toward recovering its share of the Russian market (14 percent of the share) and
has diversified its market destinations. Forty-eight percent of Ecuadorian flowers reach the U.S. and of these
74 percent are cut roses. This has created competition with Colombia and resulted in a stalling of prices, at
best, but often a reduction. The remaining 52 percent is sent to European countries, namely the
0
100000
200000
300000
400000
500000
600000
700000
800000
900000
1000000
Th
ou
san
ds
of
US
D
World USA Russia Netherlands Italy Canada Spain
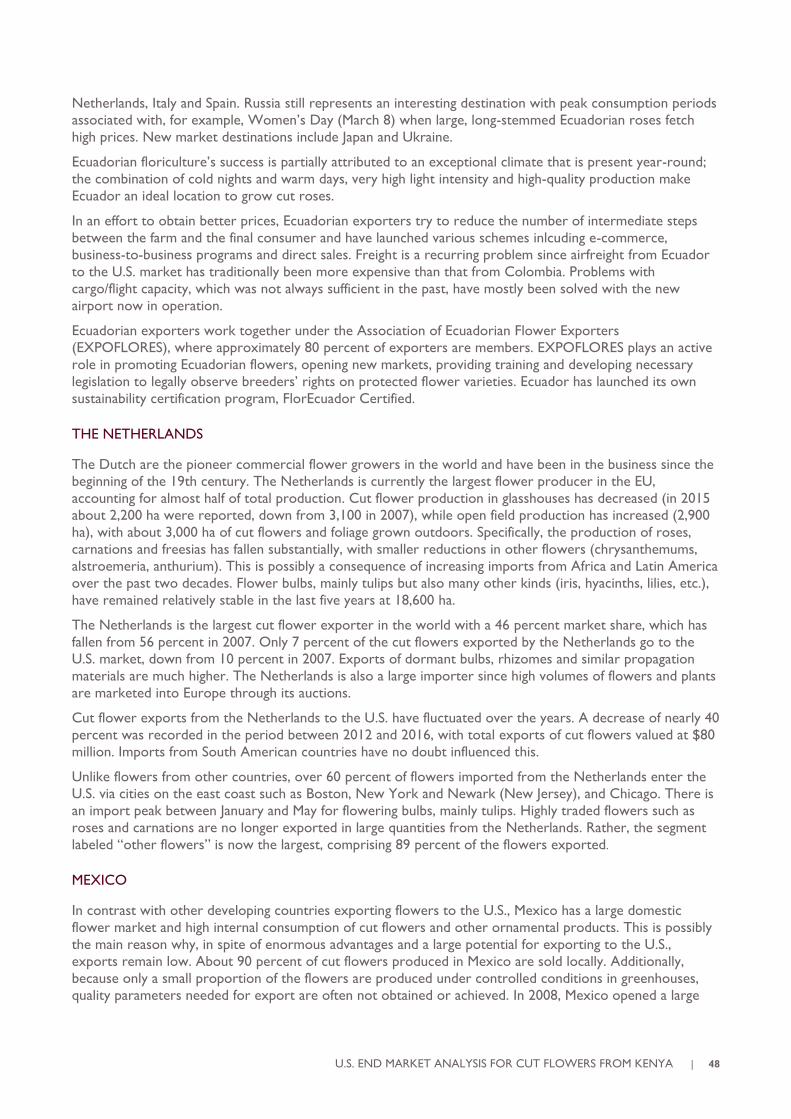
U.S. END MARKET ANALYSIS FOR CUT FLOWERS FROM KENYA | 48
Netherlands, Italy and Spain. Russia still represents an interesting destination with peak consumption periods
associated with, for example, Women’s Day (March 8) when large, long-stemmed Ecuadorian roses fetch
high prices. New market destinations include Japan and Ukraine.
Ecuadorian floriculture’s success is partially attributed to an exceptional climate that is present year-round;
the combination of cold nights and warm days, very high light intensity and high-quality production make
Ecuador an ideal location to grow cut roses.
In an effort to obtain better prices, Ecuadorian exporters try to reduce the number of intermediate steps
between the farm and the final consumer and have launched various schemes inlcuding e-commerce,
business-to-business programs and direct sales. Freight is a recurring problem since airfreight from Ecuador
to the U.S. market has traditionally been more expensive than that from Colombia. Problems with
cargo/flight capacity, which was not always sufficient in the past, have mostly been solved with the new
airport now in operation.
Ecuadorian exporters work together under the Association of Ecuadorian Flower Exporters
(EXPOFLORES), where approximately 80 percent of exporters are members. EXPOFLORES plays an active
role in promoting Ecuadorian flowers, opening new markets, providing training and developing necessary
legislation to legally observe breeders’ rights on protected flower varieties. Ecuador has launched its own
sustainability certification program, FlorEcuador Certified.
THE NETHERLANDS
The Dutch are the pioneer commercial flower growers in the world and have been in the business since the
beginning of the 19th century. The Netherlands is currently the largest flower producer in the EU,
accounting for almost half of total production. Cut flower production in glasshouses has decreased (in 2015
about 2,200 ha were reported, down from 3,100 in 2007), while open field production has increased (2,900
ha), with about 3,000 ha of cut flowers and foliage grown outdoors. Specifically, the production of roses,
carnations and freesias has fallen substantially, with smaller reductions in other flowers (chrysanthemums,
alstroemeria, anthurium). This is possibly a consequence of increasing imports from Africa and Latin America
over the past two decades. Flower bulbs, mainly tulips but also many other kinds (iris, hyacinths, lilies, etc.),
have remained relatively stable in the last five years at 18,600 ha.
The Netherlands is the largest cut flower exporter in the world with a 46 percent market share, which has
fallen from 56 percent in 2007. Only 7 percent of the cut flowers exported by the Netherlands go to the
U.S. market, down from 10 percent in 2007. Exports of dormant bulbs, rhizomes and similar propagation
materials are much higher. The Netherlands is also a large importer since high volumes of flowers and plants
are marketed into Europe through its auctions.
Cut flower exports from the Netherlands to the U.S. have fluctuated over the years. A decrease of nearly 40
percent was recorded in the period between 2012 and 2016, with total exports of cut flowers valued at $80
million. Imports from South American countries have no doubt influenced this.
Unlike flowers from other countries, over 60 percent of flowers imported from the Netherlands enter the
U.S. via cities on the east coast such as Boston, New York and Newark (New Jersey), and Chicago. There is
an import peak between January and May for flowering bulbs, mainly tulips. Highly traded flowers such as
roses and carnations are no longer exported in large quantities from the Netherlands. Rather, the segment
labeled “other flowers” is now the largest, comprising 89 percent of the flowers exported.
MEXICO
In contrast with other developing countries exporting flowers to the U.S., Mexico has a large domestic
flower market and high internal consumption of cut flowers and other ornamental products. This is possibly
the main reason why, in spite of enormous advantages and a large potential for exporting to the U.S.,
exports remain low. About 90 percent of cut flowers produced in Mexico are sold locally. Additionally,
because only a small proportion of the flowers are produced under controlled conditions in greenhouses,
quality parameters needed for export are often not obtained or achieved. In 2008, Mexico opened a large
49 | U.S. END MARKET ANALYSIS FOR CUT FLOWERS FROM KENYA
flower market close to Mexico City where significant volumes of flowers are traded every day in the
dometic market.
As a subtropical country, Mexico enjoys a variety of climates suitable for producing many flower types,
including bulbs, species needing temperate conditions (e.g. large headed roses, best produced at high
altitude) and tropical flowers in warmer areas. About 15,000 ha are dedicated to ornamentals, of which
approximately 6,000 ha are dedicated to cut flowers. The main producing areas are the states of Mexico,
Baja, California and Chiapas.
Mexico has additional advantages for exporting cut flowers to the U.S. This includes its shared border, which
allows for ground shipping; the North American Free Trade Agreement (NAFTA) agreement, which, since
1994, allows tariff-free market access; and ample hand labor. Mexican exports have traditionally remained
low. They have, however, exhibited an upward trend over the past five years. Cut flower exports in 2016
amounted to $38.4 million. The main export market is the U.S. where nearly 99 percent of the exported
flowers are sent. The remaining 2 percent is currently sent to Canada. The main flower types exported
appear in Figure 25.
Figure 25. Destination of Mexican Flower Exports, 2012-2016
Source:
ITC UN COMTRADE statistics, 2017.
COSTA RICA
Although export floriculture is by no means a new activity in Costa Rica – the first exports date back to the
1960s – the flower sector has changed during the last decade. Costa Rica was, for years, an important
supplier of chrysanthemums and cut foliage (specifically leatherleaf fern) both to the U.S. and Europe.
However, production of this flower has all but disappeared and been largely replaced by tropical flowers
(heliconias, gingers, anthirium, birds of paradise) and lilies (Lilium sp). The total cut flower exports from
Costa Rica were $38.5 million, and about 90 percent were exported to the U.S. Other markets include
Canada, Nicaragua, the UK and Panama.
Costa Rican exports of propagation plant materials, mainly un-rooted cuttings, have increased substantially
over the past years, again mostly to the U.S. These are mainly used to propagate ornamental plants (bedding
and garden plants, pot plants, both flowering and foliage).
0
5000
10000
15000
20000
25000
2012 2013 2014 2015 2016
Th
ou
san
ds
of
US
D Other cut flowers
Roses
Dried or prepared flowers
Carnations
Lilies
Chrysanthemum
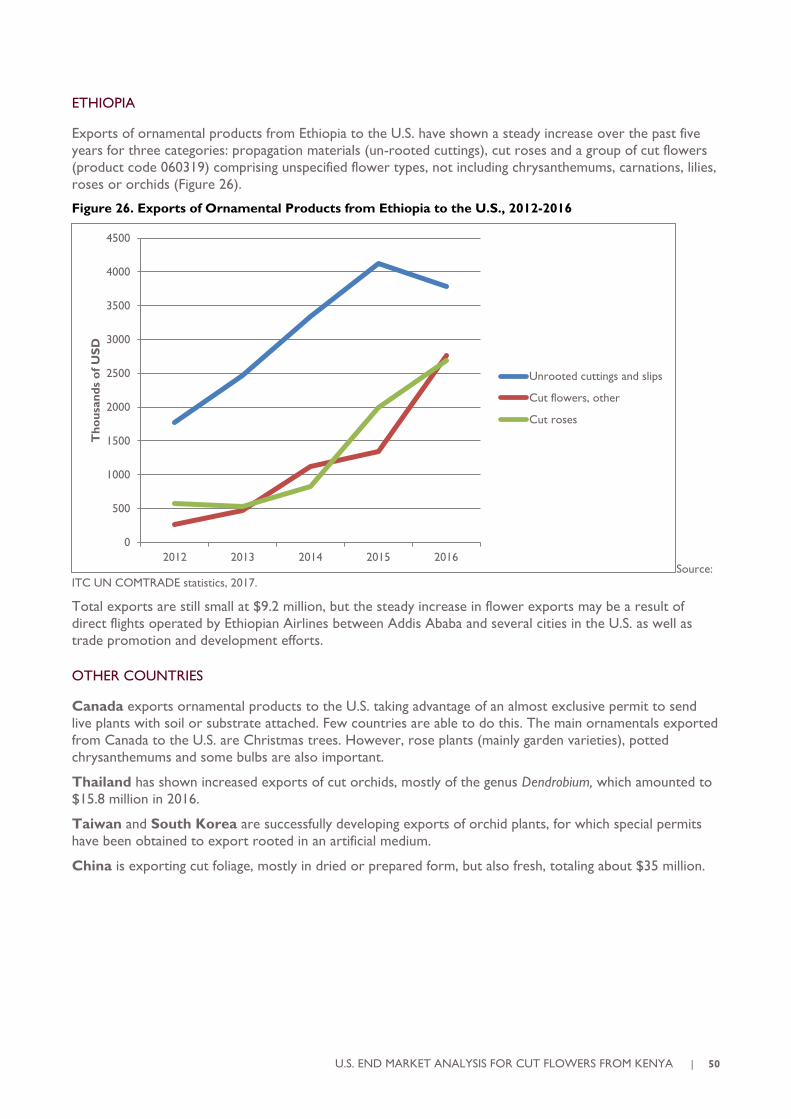
U.S. END MARKET ANALYSIS FOR CUT FLOWERS FROM KENYA | 50
ETHIOPIA
Exports of ornamental products from Ethiopia to the U.S. have shown a steady increase over the past five
years for three categories: propagation materials (un-rooted cuttings), cut roses and a group of cut flowers
(product code 060319) comprising unspecified flower types, not including chrysanthemums, carnations, lilies,
roses or orchids (Figure 26).
Figure 26. Exports of Ornamental Products from Ethiopia to the U.S., 2012-2016
Source:
ITC UN COMTRADE statistics, 2017.
Total exports are still small at $9.2 million, but the steady increase in flower exports may be a result of
direct flights operated by Ethiopian Airlines between Addis Ababa and several cities in the U.S. as well as
trade promotion and development efforts.
OTHER COUNTRIES
Canada exports ornamental products to the U.S. taking advantage of an almost exclusive permit to send
live plants with soil or substrate attached. Few countries are able to do this. The main ornamentals exported
from Canada to the U.S. are Christmas trees. However, rose plants (mainly garden varieties), potted
chrysanthemums and some bulbs are also important.
Thailand has shown increased exports of cut orchids, mostly of the genus Dendrobium, which amounted to
$15.8 million in 2016.
Taiwan and South Korea are successfully developing exports of orchid plants, for which special permits
have been obtained to export rooted in an artificial medium.
China is exporting cut foliage, mostly in dried or prepared form, but also fresh, totaling about $35 million.
0
500
1000
1500
2000
2500
3000
3500
4000
4500
2012 2013 2014 2015 2016
Th
ou
san
ds
of
US
D
Unrooted cuttings and slips
Cut flowers, other
Cut roses
51 | U.S. END MARKET ANALYSIS FOR CUT FLOWERS FROM KENYA
9. RECOMMENDATIONS – ACTION PLAN
The reasons why Kenya has achieved prominence among suppliers of cut roses to Europe are clear: the
sector is profitable and technically competent, it has developed efficient logistics and it offers high-quality
flowers – not only roses – at competitive prices. These factors make for a strong, competitive product,
ready to explore new markets.
The U.S. market, however, has distinct characteristics that will require adjustments to Kenyan production
processes, product mix offerings and choice of varieties. For example, consumption is heavily influenced by
peak holidays. Packaging and presentation (including harvesting stage) often differ from those for Europe and
are very important as suppliers attempt to direct sales to mass marketers. Kenyan producers interested in
the U.S. market need to become closely acquainted with U.S. consumer preferences and marketing options
and will need to capture the interest of prospective buyers. They must be prepared to send high-quality
samples that quickly reach prospective clients and participate in trade shows.
Import requirements, particularly phytosanitary issues, can also be quite specific in the U.S. While there is a
wealth of publicly available information in this respect, it will be important to develop a strong relationship
with USDA/APHIS and conduct pest risk analyses for the main flower types to be exported (initially roses).
Currently, phytosanitary authorities are using guidelines set for the EU. These should be specified for the
U.S. Exporters should also be familiar and compliant with required U.S. export paperwork (export permits,
certificate of origin to confirm tariff-free status, phytosanitary inspection if needed, and others).
These factors, together with the relatively long distance between Kenya and the U.S. (compared to
Colombia and Ecuador), pose challenges. The prospect of direct flights between Kenya and the U.S. is
encouraging, however, sufficient cargo capacity at a reasonable freight cost will need to be developed (a few
passenger flights per week may not be enough).
Suggestions were made to attempt cooperation with neighboring countries, particularly Ethiopia, which
already has a good number of direct flights in operation, to achieve reliable, shorter and more economically
feasible shipping options. African countries would likely benefit more from cooperation than competition,
even though this may not be a simple endeavor.
Promotion efforts should be geared toward branding Kenyan flowers to make them stand out as unique,
distinct and special products; they should not be placed in direct competition with products from other
suppliers. This is especially true if Kenyan producers decide to export consumer-ready bouquets where
flowers will reach consumers as shipped (not unpacked and reassembled together with flowers from other
origins) and packaging becomes the means to identify flowers.
Table 5 provides a general action plan for Kenyan flowers, together with challenges and possible
opportunities, which can be incorporated into the general AGOA strategy and action plan for Kenya.
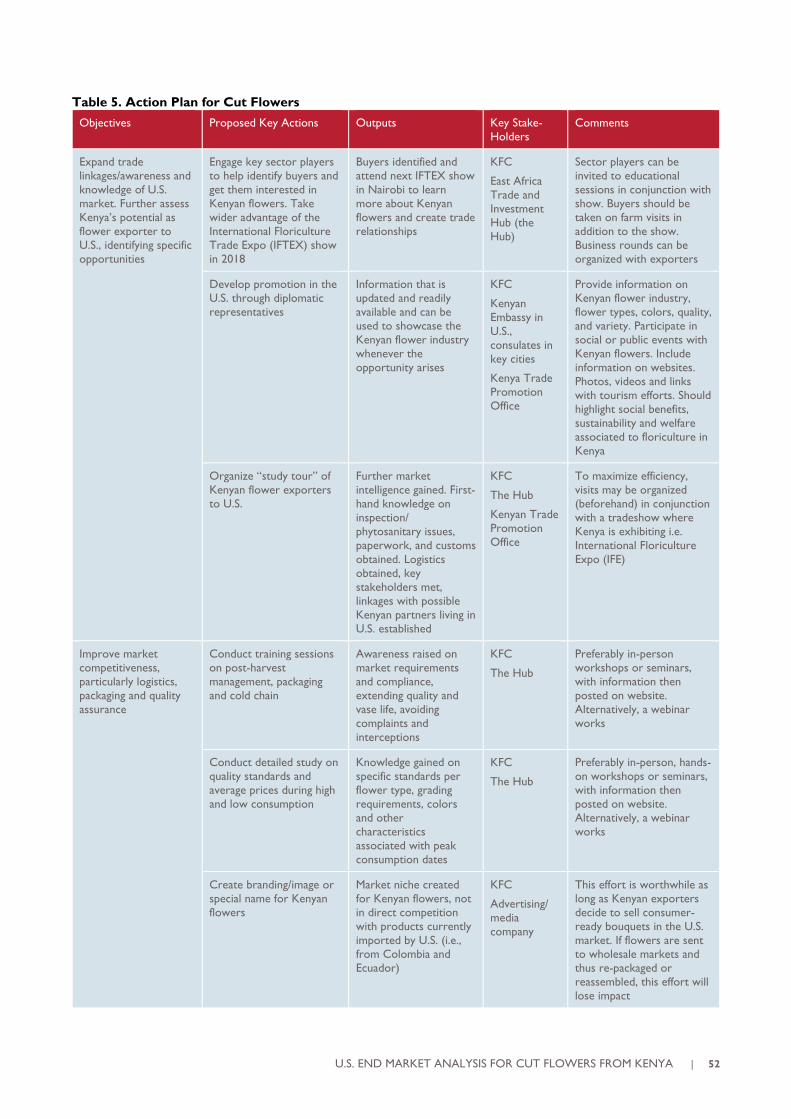
U.S. END MARKET ANALYSIS FOR CUT FLOWERS FROM KENYA | 52
Table 5. Action Plan for Cut Flowers
Objectives Proposed Key Actions Outputs Key Stake-
Holders
Comments
Expand trade
linkages/awareness and
knowledge of U.S.
market. Further assess
Kenya’s potential as
flower exporter to
U.S., identifying specific
opportunities
Engage key sector players
to help identify buyers and
get them interested in
Kenyan flowers. Take
wider advantage of the
International Floriculture
Trade Expo (IFTEX) show
in 2018
Buyers identified and
attend next IFTEX show
in Nairobi to learn
more about Kenyan
flowers and create trade
relationships
KFC
East Africa
Trade and
Investment
Hub (the
Hub)
Sector players can be
invited to educational
sessions in conjunction with
show. Buyers should be
taken on farm visits in
addition to the show.
Business rounds can be
organized with exporters
Develop promotion in the
U.S. through diplomatic
representatives
Information that is
updated and readily
available and can be
used to showcase the
Kenyan flower industry
whenever the
opportunity arises
KFC
Kenyan
Embassy in
U.S.,
consulates in
key cities
Kenya Trade
Promotion
Office
Provide information on
Kenyan flower industry,
flower types, colors, quality,
and variety. Participate in
social or public events with
Kenyan flowers. Include
information on websites.
Photos, videos and links
with tourism efforts. Should
highlight social benefits,
sustainability and welfare
associated to floriculture in
Kenya
Organize “study tour” of
Kenyan flower exporters
to U.S.
Further market
intelligence gained. First-
hand knowledge on
inspection/
phytosanitary issues,
paperwork, and customs
obtained. Logistics
obtained, key
stakeholders met,
linkages with possible
Kenyan partners living in
U.S. established
KFC
The Hub
Kenyan Trade
Promotion
Office
To maximize efficiency,
visits may be organized
(beforehand) in conjunction
with a tradeshow where
Kenya is exhibiting i.e.
International Floriculture
Expo (IFE)
Improve market
competitiveness,
particularly logistics,
packaging and quality
assurance
Conduct training sessions
on post-harvest
management, packaging
and cold chain
Awareness raised on
market requirements
and compliance,
extending quality and
vase life, avoiding
complaints and
interceptions
KFC
The Hub
Preferably in-person
workshops or seminars,
with information then
posted on website.
Alternatively, a webinar
works
Conduct detailed study on
quality standards and
average prices during high
and low consumption
Knowledge gained on
specific standards per
flower type, grading
requirements, colors
and other
characteristics
associated with peak
consumption dates
KFC
The Hub
Preferably in-person, hands-
on workshops or seminars,
with information then
posted on website.
Alternatively, a webinar
works
Create branding/image or
special name for Kenyan
flowers
Market niche created
for Kenyan flowers, not
in direct competition
with products currently
imported by U.S. (i.e.,
from Colombia and
Ecuador)
KFC
Advertising/
media
company
This effort is worthwhile as
long as Kenyan exporters
decide to sell consumer-
ready bouquets in the U.S.
market. If flowers are sent
to wholesale markets and
thus re-packaged or
reassembled, this effort will
lose impact
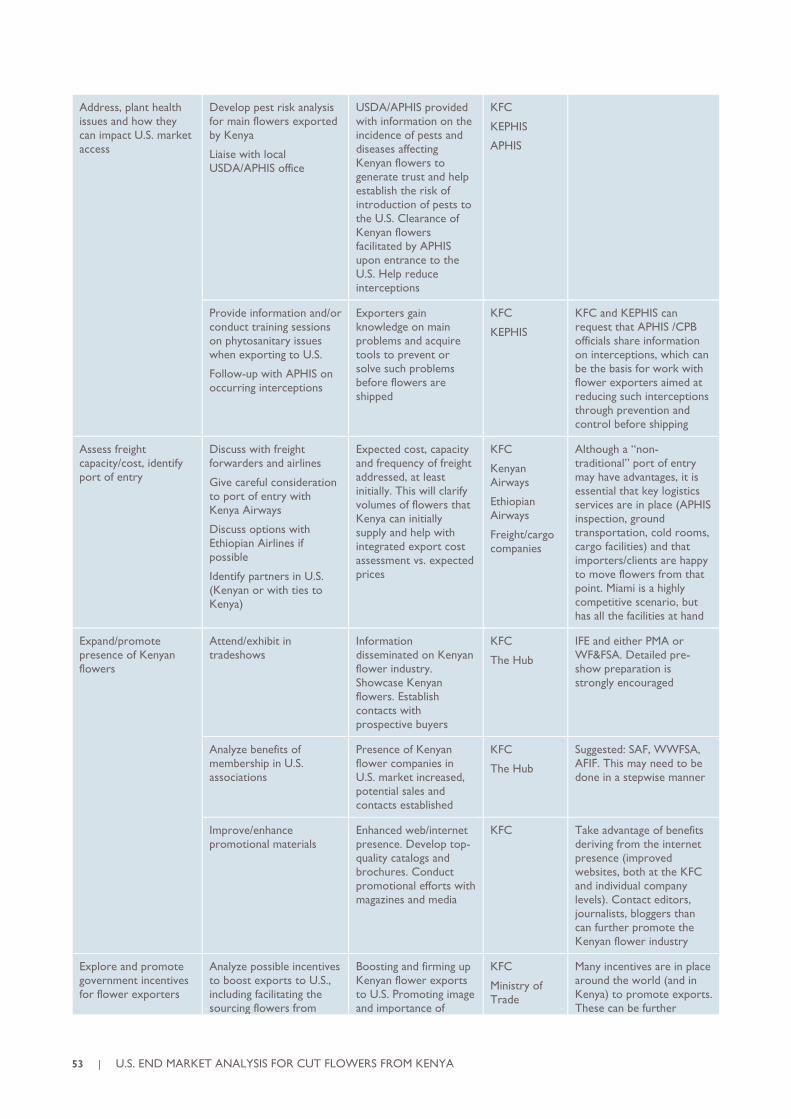
53 | U.S. END MARKET ANALYSIS FOR CUT FLOWERS FROM KENYA
Address, plant health
issues and how they
can impact U.S. market
access
Develop pest risk analysis
for main flowers exported
by Kenya
Liaise with local
USDA/APHIS office
USDA/APHIS provided
with information on the
incidence of pests and
diseases affecting
Kenyan flowers to
generate trust and help
establish the risk of
introduction of pests to
the U.S. Clearance of
Kenyan flowers
facilitated by APHIS
upon entrance to the
U.S. Help reduce
interceptions
KFC
KEPHIS
APHIS
Provide information and/or
conduct training sessions
on phytosanitary issues
when exporting to U.S.
Follow-up with APHIS on
occurring interceptions
Exporters gain
knowledge on main
problems and acquire
tools to prevent or
solve such problems
before flowers are
shipped
KFC
KEPHIS
KFC and KEPHIS can
request that APHIS /CPB
officials share information
on interceptions, which can
be the basis for work with
flower exporters aimed at
reducing such interceptions
through prevention and
control before shipping
Assess freight
capacity/cost, identify
port of entry
Discuss with freight
forwarders and airlines
Give careful consideration
to port of entry with
Kenya Airways
Discuss options with
Ethiopian Airlines if
possible
Identify partners in U.S.
(Kenyan or with ties to
Kenya)
Expected cost, capacity
and frequency of freight
addressed, at least
initially. This will clarify
volumes of flowers that
Kenya can initially
supply and help with
integrated export cost
assessment vs. expected
prices
KFC
Kenyan
Airways
Ethiopian
Airways
Freight/cargo
companies
Although a “non-
traditional” port of entry
may have advantages, it is
essential that key logistics
services are in place (APHIS
inspection, ground
transportation, cold rooms,
cargo facilities) and that
importers/clients are happy
to move flowers from that
point. Miami is a highly
competitive scenario, but
has all the facilities at hand
Expand/promote
presence of Kenyan
flowers
Attend/exhibit in
tradeshows
Information
disseminated on Kenyan
flower industry.
Showcase Kenyan
flowers. Establish
contacts with
prospective buyers
KFC
The Hub
IFE and either PMA or
WF&FSA. Detailed pre-
show preparation is
strongly encouraged
Analyze benefits of
membership in U.S.
associations
Presence of Kenyan
flower companies in
U.S. market increased,
potential sales and
contacts established
KFC
The Hub
Suggested: SAF, WWFSA,
AFIF. This may need to be
done in a stepwise manner
Improve/enhance
promotional materials
Enhanced web/internet
presence. Develop top-
quality catalogs and
brochures. Conduct
promotional efforts with
magazines and media
KFC Take advantage of benefits
deriving from the internet
presence (improved
websites, both at the KFC
and individual company
levels). Contact editors,
journalists, bloggers than
can further promote the
Kenyan flower industry
Explore and promote
government incentives
for flower exporters
Analyze possible incentives
to boost exports to U.S.,
including facilitating the
sourcing flowers from
Boosting and firming up
Kenyan flower exports
to U.S. Promoting image
and importance of
KFC
Ministry of
Trade
Many incentives are in place
around the world (and in
Kenya) to promote exports.
These can be further
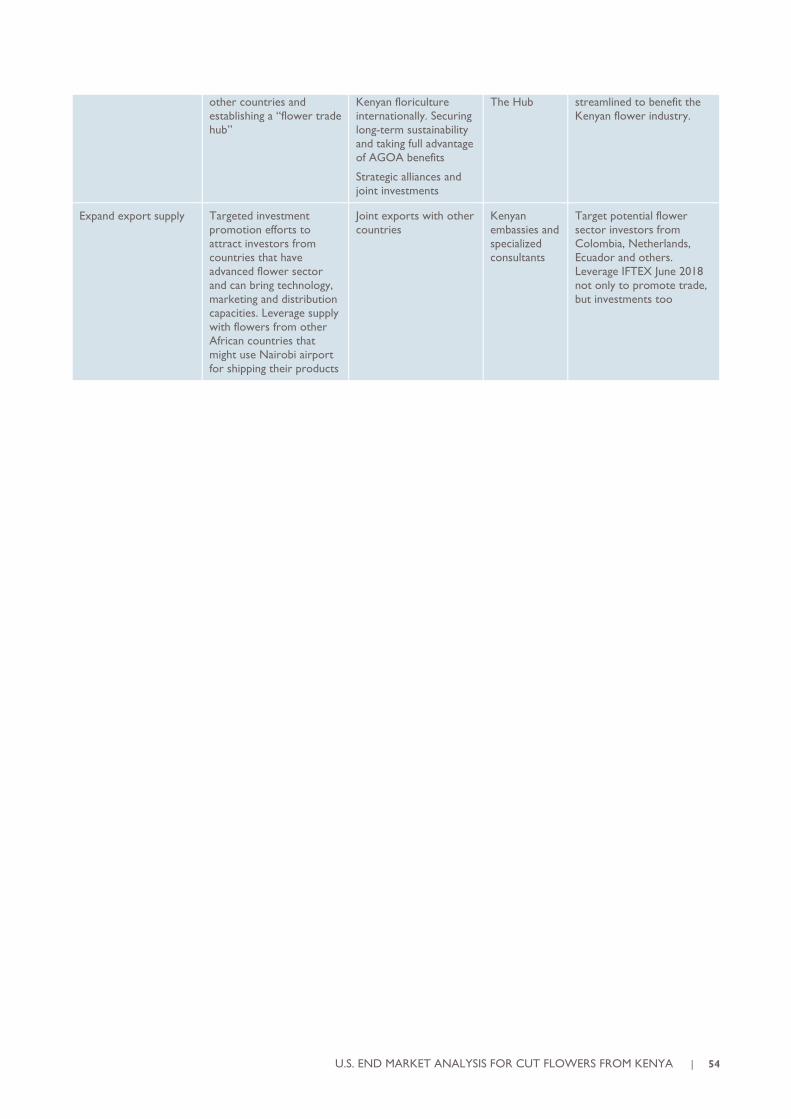
U.S. END MARKET ANALYSIS FOR CUT FLOWERS FROM KENYA | 54
other countries and
establishing a “flower trade
hub”
Kenyan floriculture
internationally. Securing
long-term sustainability
and taking full advantage
of AGOA benefits
Strategic alliances and
joint investments
The Hub streamlined to benefit the
Kenyan flower industry.
Expand export supply
Targeted investment
promotion efforts to
attract investors from
countries that have
advanced flower sector
and can bring technology,
marketing and distribution
capacities. Leverage supply
with flowers from other
African countries that
might use Nairobi airport
for shipping their products
Joint exports with other
countries
Kenyan
embassies and
specialized
consultants
Target potential flower
sector investors from
Colombia, Netherlands,
Ecuador and others.
Leverage IFTEX June 2018
not only to promote trade,
but investments too


