Embed Size (px)
Citation preview
U.S. International Trade Commission
COMMISSIONERS
Jennifer A. Hillman, Vice ChairmanDeanna Tanner Okun, Chairman
Address all communications toSecretary to the Commission
United States International Trade CommissionWashington, DC 20436
Charlotte R. Lane
Marcia E. MillerStephen Koplan
Robert A. RogowskyDirector of Operations
Robert B. KoopmanDirector of Economics
U.S. International Trade CommissionWashington, DC 20436
Publication 3637 September 2003
www.usitc.gov
Andean Trade Preference Act:Impact on U.S. Industries and Consumers
and on Drug Crop Eradicationand Crop Substitution
Ninth Report 2002
Investigation No. 332-352
Country and Regional Analysis DivisionArona M. Butcher, Chief
This report was prepared by
Project LeaderJoanne Guth
[email protected]; (202) 205-3264
Primary ReviewerAmelia Preece
Contributing AuthorsMagdolna KornisWalker Pollard
Edward C. Wilson
Office of IndustriesWarren Payne, Coordinator
Timothy McCartyLaura Rodriguez
Technical AssistanceOffice of Information Services
Patricia Holland
Supporting assistance was provided byPatricia M. Thomas, Secretarial Services
i
ABSTRACT
The submission of this study to Congress continues a series of annual reports by the U.S.International Trade Commission (“the Commission”) on the impact of the AndeanTrade Preference Act (ATPA) on U.S. industries and consumers. The current studyfulfills the Commission’s reporting requirement for calendar year 2002 andrepresents the ninth in the series.
ATPA, enacted on December 4, 1991, authorized the President to proclaim duty-freetreatment for eligible articles from Bolivia, Colombia, Ecuador, and Peru. ATPAexpired 10 years later on December 4, 2001, but was renewed and modified under theAndean Trade Promotion and Drug Eradication Act (ATPDEA) on August 6, 2002.Section 206 of the ATPA requires the Commission to assess the economic impact of theact “on United States industries and consumers, and in conjunction with otheragencies, the effectiveness of this Act in promoting drug-related crop eradication andcrop substitution efforts of beneficiary countries.” The Commission is required tosubmit its report to Congress annually by September 30.
The overall effect of ATPA-exclusive imports (those ineligible for other tariffpreferences) on the U.S. economy and consumers continued to be negligible in 2002.However, U.S. imports of ATPA-exclusive asparagus, which accounted for 7 percentof all ATPA-exclusive imports, were estimated to have potentially significant effects onthe domestic asparagus industry, primarily because of imports from Peru. U.S. importsof all of the 20 leading ATPA-exclusive items produced net welfare gains for U.S.consumers in 2002. The probable future effect of ATPA on the United States, asestimated by an examination of export-oriented investment in the beneficiarycountries, is also expected to be minimal in most sectors. Nonetheless, the Commissionidentified recent investments in the textile and apparel sector in response to ATPDEAbenefits. These investments will likely generate increased U.S. imports of textile andapparel articles in the future.
ATPA continued to have a small, indirect, but positive effect on drug-crop eradicationand crop substitution efforts in the ATPA countries in 2002. Coca eradication reacheda record high, driven primarily by the largest-ever eradication efforts in Colombia,where net cultivation declined for the first time in a decade. ATPA trade preferences,by supporting such industries as flowers in Colombia and asparagus in Peru, alsoprovided jobs for workers who might otherwise have participated in illicit cocacultivation.

ii
The information provided in this report is for the purpose of this report only. Nothing inthis report should be construed as indicating what the Commission’s determinationwould be in an investigation involving the same or similar subject matter conductedunder other statutory authority.
iii
TABLE OF CONTENTS
PageAbstract i. . . . . . . . . . . . . . . . . . . . . . . . . . . . . . . . . . . . . . . . . . . . . . . . . . . . .Executive summary vii. . . . . . . . . . . . . . . . . . . . . . . . . . . . . . . . . . . . . . . . . . . . .Chapter 1. Introduction 1-1. . . . . . . . . . . . . . . . . . . . . . . . . . . . . . . . . . . . . . . . . .
Organization of the report 1-2. . . . . . . . . . . . . . . . . . . . . . . . . . . . . . . . . . .Summary of the ATPA program 1-2. . . . . . . . . . . . . . . . . . . . . . . . . . . . . .
Beneficiaries 1-3. . . . . . . . . . . . . . . . . . . . . . . . . . . . . . . . . . . . . . . . . . . .Trade benefits under ATPA 1-4. . . . . . . . . . . . . . . . . . . . . . . . . . . . . . . .Qualifying rules 1-5. . . . . . . . . . . . . . . . . . . . . . . . . . . . . . . . . . . . . . . . .ATPA and GSP 1-8. . . . . . . . . . . . . . . . . . . . . . . . . . . . . . . . . . . . . . . . . .
Analytical approach 1-9. . . . . . . . . . . . . . . . . . . . . . . . . . . . . . . . . . . . . . .Chapter 2. U.S. trade with the Andean region 2-1. . . . . . . . . . . . . . . . . . . . . . . .
Introduction 2-1. . . . . . . . . . . . . . . . . . . . . . . . . . . . . . . . . . . . . . . . . . . . . .U.S. imports 2-4. . . . . . . . . . . . . . . . . . . . . . . . . . . . . . . . . . . . . . . . . . . . . .
A transitional year 2-9. . . . . . . . . . . . . . . . . . . . . . . . . . . . . . . . . . . . . . .January-July 2002: ATPA is not in effect 2-19. . . . . . . . . . . . . . . . . . .August-October 2002: original ATPA is reauthorized 2-9. . . . . . . . .November-December 2002: ATPDEA is implemented 2-11. . . . . . . . .The year 2002 2-11. . . . . . . . . . . . . . . . . . . . . . . . . . . . . . . . . . . . . . .
Duty treatment 2-12. . . . . . . . . . . . . . . . . . . . . . . . . . . . . . . . . . . . . . . . . .Leading imports under ATPA 2-15. . . . . . . . . . . . . . . . . . . . . . . . . . . . . . .
New leading imports under ATPDEA 2-15. . . . . . . . . . . . . . . . . . . . . .Mineral fuels and derivatives 2-15. . . . . . . . . . . . . . . . . . . . . . . .
Other leading imports 2-20. . . . . . . . . . . . . . . . . . . . . . . . . . . . . . . . .Copper cathodes 2-20. . . . . . . . . . . . . . . . . . . . . . . . . . . . . . . . . .Flowers 2-21. . . . . . . . . . . . . . . . . . . . . . . . . . . . . . . . . . . . . . . . .Jewelry 2-22. . . . . . . . . . . . . . . . . . . . . . . . . . . . . . . . . . . . . . . . .Asparagus 2-23. . . . . . . . . . . . . . . . . . . . . . . . . . . . . . . . . . . . . .Pigments 2-24. . . . . . . . . . . . . . . . . . . . . . . . . . . . . . . . . . . . . . . .Cigarettes 2-25. . . . . . . . . . . . . . . . . . . . . . . . . . . . . . . . . . . . . . .Guavas and mangoes 2-25. . . . . . . . . . . . . . . . . . . . . . . . . . . . . .Onions 2-25. . . . . . . . . . . . . . . . . . . . . . . . . . . . . . . . . . . . . . . . .Articles of wood 2-26. . . . . . . . . . . . . . . . . . . . . . . . . . . . . . . . . .
Former leading imports under the original ATPA 2-26. . . . . . . . . . . . .Sugar 2-28. . . . . . . . . . . . . . . . . . . . . . . . . . . . . . . . . . . . . . . . . .Zinc 2-28. . . . . . . . . . . . . . . . . . . . . . . . . . . . . . . . . . . . . . . . . . . .Tuna not in airtight containers 2-29. . . . . . . . . . . . . . . . . . . . . . . .Nonadhesive plates and sheets 2-29. . . . . . . . . . . . . . . . . . . . . . .Gold ropes and chains 2-30. . . . . . . . . . . . . . . . . . . . . . . . . . . . .Iron or non-alloyed steel tubing 2-30. . . . . . . . . . . . . . . . . . . . . .
Textile and apparel articles 2-31. . . . . . . . . . . . . . . . . . . . . . . . . . . . . . . .U.S. imports by country 2-32. . . . . . . . . . . . . . . . . . . . . . . . . . . . . . . . . . .
Colombia 2-32. . . . . . . . . . . . . . . . . . . . . . . . . . . . . . . . . . . . . . . . . . .Peru 2-36. . . . . . . . . . . . . . . . . . . . . . . . . . . . . . . . . . . . . . . . . . . . . . .
iv
TABLE OF CONTENTS-Continued
PageChapter 2. U.S. trade with the Andean region–Continued
U.S. imports by country–ContinuedEcuador 2-36. . . . . . . . . . . . . . . . . . . . . . . . . . . . . . . . . . . . . . . . . . . .Bolivia 2-36. . . . . . . . . . . . . . . . . . . . . . . . . . . . . . . . . . . . . . . . . . . . .
U.S. exports 2-36. . . . . . . . . . . . . . . . . . . . . . . . . . . . . . . . . . . . . . . . . . . . . .Colombia 2-37. . . . . . . . . . . . . . . . . . . . . . . . . . . . . . . . . . . . . . . . . . . . . .Ecuador 2-44. . . . . . . . . . . . . . . . . . . . . . . . . . . . . . . . . . . . . . . . . . . . . .Peru 2-45. . . . . . . . . . . . . . . . . . . . . . . . . . . . . . . . . . . . . . . . . . . . . . . . . .Bolivia 2-46. . . . . . . . . . . . . . . . . . . . . . . . . . . . . . . . . . . . . . . . . . . . . . . .
Chapter 3. Impact of ATPA on the United States and probablefuture effects 3-1. . . . . . . . . . . . . . . . . . . . . . . . . . . . . . . . . . . . . . . . . . .
Impact of ATPA on the United States in 2002 3-1. . . . . . . . . . . . . . . . . . . .Products that benefited exclusively from ATPA in 2002 3-2. . . . . . . . . . .Welfare and displacement effects of ATPA on U.S. industries and
consumers in 2002 3-6. . . . . . . . . . . . . . . . . . . . . . . . . . . . . . . . . . .Items analyzed 3-6. . . . . . . . . . . . . . . . . . . . . . . . . . . . . . . . . . . . . .Estimated effects on consumers and producers 3-7. . . . . . . . . . . . . .
Effects on U.S. consumers 3-7. . . . . . . . . . . . . . . . . . . . . . . . . . .Effects on U.S. producers 3-9. . . . . . . . . . . . . . . . . . . . . . . . . . .
Highlights of U.S. industries most affected by ATPA 3-14. . . . . . . . . . . . . .Fresh or chilled asparagus 3-14. . . . . . . . . . . . . . . . . . . . . . . . . . . . .
Probable future effects of ATPA 3-17. . . . . . . . . . . . . . . . . . . . . . . . . . . . . . .Bolivia 3-18. . . . . . . . . . . . . . . . . . . . . . . . . . . . . . . . . . . . . . . . . . . . . . . .
Textile and apparel industry 3-20. . . . . . . . . . . . . . . . . . . . . . . . . . . .Colombia 3-20. . . . . . . . . . . . . . . . . . . . . . . . . . . . . . . . . . . . . . . . . . . . . .
Textile and apparel industry 3-21. . . . . . . . . . . . . . . . . . . . . . . . . . . .Ecuador 3-22. . . . . . . . . . . . . . . . . . . . . . . . . . . . . . . . . . . . . . . . . . . . . . .
Textile and apparel industry 3-23. . . . . . . . . . . . . . . . . . . . . . . . . . . .Peru. . . . 3-24. . . . . . . . . . . . . . . . . . . . . . . . . . . . . . . . . . . . . . . . . . . . . . .
Textile and apparel industry 3-25. . . . . . . . . . . . . . . . . . . . . . . . . . . .Conclusion 3-27. . . . . . . . . . . . . . . . . . . . . . . . . . . . . . . . . . . . . . . . . . . . .
Chapter 4. Impact of ATPA on drug-related crop eradication andcrop substitution 4-1. . . . . . . . . . . . . . . . . . . . . . . . . . . . . . . . . . . . . . . . .
Overview 4-1. . . . . . . . . . . . . . . . . . . . . . . . . . . . . . . . . . . . . . . . . . . . . . . .Role of ATPA in counternarcotics efforts 4-2. . . . . . . . . . . . . . . . . . . . . . . . .Regional cultivation and eradication trends during 2002 4-3. . . . . . . . . . . .Country profiles on eradication and alternative development
during 2002 4-6. . . . . . . . . . . . . . . . . . . . . . . . . . . . . . . . . . . . . . . .Bolivia 4-6. . . . . . . . . . . . . . . . . . . . . . . . . . . . . . . . . . . . . . . . . . . . . . . .
Alternative development 4-7. . . . . . . . . . . . . . . . . . . . . . . . . . . . . . .Colombia 4-9. . . . . . . . . . . . . . . . . . . . . . . . . . . . . . . . . . . . . . . . . . . . . .
Alternative development 4-10. . . . . . . . . . . . . . . . . . . . . . . . . . . . . . .Ecuador 4-11. . . . . . . . . . . . . . . . . . . . . . . . . . . . . . . . . . . . . . . . . . . . . . .
Alternative development 4-11. . . . . . . . . . . . . . . . . . . . . . . . . . . . . . .
v
TABLE OF CONTENTS-Continued
PageChapter 4. Impact of ATPA on drug-related crop eradication and
crop substitution–ContinuedCountry profiles on eradication and alternative development
during 2002–ContinuedPeru 4-12. . . . . . . . . . . . . . . . . . . . . . . . . . . . . . . . . . . . . . . . . . . . . . . . . .
Alternative development 4-13. . . . . . . . . . . . . . . . . . . . . . . . . . . . . . .AppendixesA. Federal Register notice A-1. . . . . . . . . . . . . . . . . . . . . . . . . . . . . . . . . . . . . .B. Summary of submissions in response to the Federal Register notice B-1. . . .C. Technical notes to chapter 3 C-1. . . . . . . . . . . . . . . . . . . . . . . . . . . . . . . . . .D. List of frequently used abbreviations and acronyms D-1. . . . . . . . . . . . . . . .Figures2-1. U.S. trade with ATPA countries, 1998-2002 2-3. . . . . . . . . . . . . . . . . . . . . .2-2. Composition of U.S. imports for consumption from ATPA countries,
by major product categories, 1998 and 2002 2-7. . . . . . . . . . . . . . . . . .2-3. U.S. imports under ATPA, by specified periods, 2001 and 2002 2-10. . . . . .2-4. U.S. imports from ATPA countries, by specified periods, 2001
and 2002 2-10. . . . . . . . . . . . . . . . . . . . . . . . . . . . . . . . . . . . . . . . . . . . . .2-5. U.S. imports for consumption under ATPA, by sources, 1998-2002 2-34. . . .2-6. Composition of U.S. exports to ATPA countries, by major product
categories, 1998 and 2002 2-40. . . . . . . . . . . . . . . . . . . . . . . . . . . . . . . .2-7. U.S. exports to ATPA countries, by markets, 1998-2002 2-43. . . . . . . . . . . .4-1. Net coca cultivation: Bolivia, Colombia, and Peru, 1991-2002 4-6. . . . . . .C-1. Partial equilibrium analysis of the effects of ATPA duty provisions on
U.S. imports C-4. . . . . . . . . . . . . . . . . . . . . . . . . . . . . . . . . . . . . . . . . . . .Tables1-1. Andean Trade Promotion and Drug Eradication Act: Key textile and
apparel provisions 1-7. . . . . . . . . . . . . . . . . . . . . . . . . . . . . . . . . . . . . . . . .2-1. U.S. trade with ATPA countries, 1991-2002 2-2. . . . . . . . . . . . . . . . . . . . . .2-2. Leading U.S. imports for consumption from ATPA countries, by major
product categories, 1998-2002 2-5. . . . . . . . . . . . . . . . . . . . . . . . . . . . .2-3. Leading U.S. imports for consumption from ATPA countries, by HTS
provisions, 2000-02 2-8. . . . . . . . . . . . . . . . . . . . . . . . . . . . . . . . . . . . . .2-4. U.S. imports for consumption from ATPA countries: Dutiable value,
calculated duties, and average duty, 1998-2002 2-12. . . . . . . . . . . . . . . .2-5. U.S. imports for consumption from Bolivia, Colombia, Ecuador, and
Peru, by duty treatments, 1998-2002 2-15. . . . . . . . . . . . . . . . . . . . . . . . .2-6. Leading U.S. imports for consumption under ATPA, by HTS provisions,
2000-02 2-16. . . . . . . . . . . . . . . . . . . . . . . . . . . . . . . . . . . . . . . . . . . . . .2-7. Leading U.S. imports under ATPA in 2002, change in value of U.S.
imports from ATPA countries in 2002 from 2001, and mode of entryas a share of total imports, by HTS provisions, 2001-02 2-18. . . . . . . . . .
vi
TABLE OF CONTENTS-ContinuedPage
Tables–Continued2-8. Leading imports under ATPA in 2001 that ceased to be leading imports
under ATPA in 2002, change in value of U.S. imports from ATPAcountries in 2002 from 2001, and mode of entry as a share of totalimports, by HTS provisions, 2001-02 2-27. . . . . . . . . . . . . . . . . . . . . . . . .
2-9. Textiles and apparel: U.S. general imports from ATPA countries,by sources, 1998-2002 2-32. . . . . . . . . . . . . . . . . . . . . . . . . . . . . . . . . . .
2-10. U.S. imports for consumption from ATPA countries, by sources,1998-2002 2-33. . . . . . . . . . . . . . . . . . . . . . . . . . . . . . . . . . . . . . . . . . . . .
2-11. U.S. imports for consumption under ATPA, by sources, 1998-2002 2-33. . . .2-12. Leading U.S. imports for consumption entered under ATPA, by sources,
2000-02 2-35. . . . . . . . . . . . . . . . . . . . . . . . . . . . . . . . . . . . . . . . . . . . . .2-13. U.S. exports to ATPA countries, by major product categories,
1998-2002 2-38. . . . . . . . . . . . . . . . . . . . . . . . . . . . . . . . . . . . . . . . . . . . .2-14. Leading U.S. exports to ATPA countries, by HTS provisions, 2000-02 2-41. .2-15. U.S. exports to ATPA countries, by markets, 1998-2002 2-45. . . . . . . . . . . .3-1. Total imports from ATPA beneficiaries, imports entered under ATPA, and
imports that benefited exclusively from ATPA, 1998-2002 3-3. . . . . . . . .3-2. Leading imports that benefited exclusively from ATPA, 2002 3-5. . . . . . . . .3-3. Leading imports that benefited exclusively from ATPA, apparent U.S.
consumption, and ATPA-exclusive market share, 2002 3-8. . . . . . . . . . .3-4. Estimated welfare effects on the United States of leading imports that
benefited exclusively from ATPA, 2002 3-10. . . . . . . . . . . . . . . . . . . . . . .3-5. Estimated displacement effects on the United States of leading imports
that benefited exclusively from ATPA, 2002 3-12. . . . . . . . . . . . . . . . . . . .3-6. Foreign direct investment inflows, by host regions and by economies,
1990-2001 3-18. . . . . . . . . . . . . . . . . . . . . . . . . . . . . . . . . . . . . . . . . . . . .4-1. Coca cultivation and eradication in the ATPA countries, in hectares,
1991-2002 4-5. . . . . . . . . . . . . . . . . . . . . . . . . . . . . . . . . . . . . . . . . . . . .
OMB No.: 3117--0188
09/03
ITC READER SATISFACTION SURVEYAndean Trade Preference Act: Impact on U.S. Industries and Consumersand on Drug Crop Eradication and Crop Substitution, Ninth Report 2002
The U.S. International Trade Commission (USITC) is interested in your voluntary com-ments (burden less than 10 minutes) to help assess the value and quality of our reports, and to assistin improving future products. Please return survey by facsimile (202-205-2340) or by mail to theUSITC, or visit the USITC Internet home page(http://reportweb.usitc.gov/reader_survey/readersurvey.html) to electronically submit a Web version ofthe survey.
(Please print; responses below not for attribution):
Your name and title:
Organization (if applicable):
Which format is most useful to you? - CD-ROM - Hardcopy - USITC Internet site
Circle your assessment of each factor below: SA = strongly agree, A = agree, N = no opinion,D = disagree, or SD = strongly disagree.
Value of this report:" Statistical data are useful SA A N D SD. . . . . . . . . . . . . . . . . . . . . . . . . . . . . ." Other non-numerical facts are useful SA A N D SD. . . . . . . . . . . . . . . . . . ." Analysis augments statistical data/other facts SA A N D SD. . . . . . . . . . . ." Relevant topic(s)/subject matter SA A N D SD. . . . . . . . . . . . . . . . . . . . . . . ." Primary or leading source of information on this subject SA A N D SD. .
Quality of this report:" Clearly written SA A N D SD. . . . . . . . . . . . . . . . . . . . . . . . . . . . . . . . . . . . . . ." Key issues are addressed SA A N D SD. . . . . . . . . . . . . . . . . . . . . . . . . . . . . . ." Charts and graphs aid understanding SA A N D SD. . . . . . . . . . . . . . . . . . ." References cite pertinent sources SA A N D SD. . . . . . . . . . . . . . . . . . . . . . .
Other preferred source of information on this subject:
Specify chapters, sections, or topics in report that are most useful:
Identify any type of additional information that should have been included in report:
Suggestions for improving report:
Please update your mailing and electronic addresses below (voluntary)-
Mailing address:
City, state, and zip code:
E-mail address:
UNITED STATESINTERNATIONAL TRADE COMMISSION
WASHINGTON, DC 20436
OFFICIAL BUSINESSPENALTY FOR PRIVATE, USE $300
FOLD
NO POSTAGENECESSARY
IF MAILEDIN THE
UNITED STATES
BUSINESS REPLY MAILFIRST CLASS PERMIT NO. 12840 WASHINGTON, DC
POSTAGE WILL BE PAID BY ADDRESSEE
U.S INTERNATIONAL TRADE COMMISSION500 E STREET, SW.WASHINGTON, DC 20277--2840
ATTN:OFFICE OF ECONOMICSThe Impact of the Andean TradePreference Act, Ninth Report 2002
vii
EXECUTIVE SUMMARY
The Andean Trade Preference Act (ATPA) was enacted in December 1991 and expired10 years later on December 4, 2001. On August 6, 2002, the President signed into lawthe Andean Trade Promotion and Drug Eradication Act (ATPDEA). ATPDEA renewedATPA preferences retroactive to December 4, 2001, through December 31, 2006, andauthorized the extension of ATPA preferences to additional products. ATPDEAamendments were implemented by Presidential proclamation on October 31, 2002.ATPA, as amended by ATPDEA (hereinafter ATPA), authorizes eligible products fromfour Andean countries–Bolivia, Colombia, Ecuador, and Peru–to enter the UnitedStates free of duty. The primary goal of ATPA is to promote broad-based economicdevelopment and viable economic alternatives to coca cultivation and cocaineproduction by offering Andean products broader access to the U.S. market. WhereasATPA applies to the same tariff categories covered by the more restrictive U.S.Generalized System of Preferences (GSP) program, it also adds a broader productcoverage and has more liberal product-qualifying rules.
This report, the ninth in a series, covers the impact on the United States of ATPA duringcalendar year 2002. Section 206 of ATPA requires the Commission to prepare anannual report assessing both the actual and the probable future effects of ATPA on theU.S. economy generally, on U.S. industries, and on U.S. consumers, and to estimatethe effect of ATPA on drug-related crop eradication and crop substitution efforts of thebeneficiary countries.
Partial-equilibrium analysis was used to estimate the impact of ATPA on the UnitedStates. The probable future effect of ATPA on the United States was estimated by anexamination of ATPA-eligible investment in the beneficiary countries during 2002.Sources of information included data from the U.S. Department of Commerce,interviews with other government agencies, reports from U.S. embassies, and otherpublished sources. In addition, the Commission solicited public comment for thisinvestigation by publishing a notice in the Federal Register.1
Main Commission findings
S Of the $1.0 billion in U.S. imports that entered under ATPA in 2002, importsvalued at $740 million could not have received tariff preferences under anyother program. The five leading items benefiting exclusively from ATPA in2002 were copper cathodes from Peru, which had exceeded its GSPcompetitive-need limit; light crude oil; fresh-cut roses; heavy crude oil; andcertain asparagus. Both light crude oil and heavy crude oil became newlyeligible for duty-free treatment under ATPDEA in 2002.
1 Appendix A contains a copy of the Federal Register notice and appendix B contains a summary of asubmission received in response to the notice.
viii
S The overall effect of ATPA-exclusive imports on the U.S. economy and onconsumers continued to be negligible in 2002. With the expiration of ATPA inlate 2001, U.S. imports under ATPA declined 40.2 percent in 2002 comparedwith 2001. In 2002, the value of duty-free U.S. imports under ATPA accountedfor just 0.09 percent of total U.S. imports, or nearly 0.01 percent of the U.S.gross domestic product (GDP).
S Asparagus provided the largest gain in consumer surplus ($7.0 million to$7.4 million) from lower prices and higher consumption. Fresh-cut rosesprovided the second-largest gain in consumer surplus ($4.4 million to $4.6million) resulting exclusively from ATPA tariff preferences in 2002. U.S.imports of all of the 20 leading ATPA-exclusive items produced net welfaregains (consumer surplus net of U.S. Treasury losses) for U.S. consumers in2002. Asparagus yielded the largest net welfare gain, valued at $234,000 to$616,000, followed by fresh-cut roses and cigarettes.
S The Commission’s economic and industry analyses indicate that one U.S.industry–asparagus–may have experienced displacement of more than 5percent of the value of U.S. production in 2002 (2.0 percent to 7.3 percentdisplacement, valued at $2.1 million to $7.4 million).
S The probable future effect of ATPA on the United States is expected to beminimal in most economic sectors. ATPA’s lapse during the first 7 months of2002 and the uncertainty regarding its renewal likely dampened investmentin some ATPA-eligible products. The largest future effect of ATPA willprobably result from the enhanced preferences granted under ATPDEA. TheCommission was able to identify recent investments in the textile and apparelsector in response to ATPDEA benefits. The Commission was also able toidentify investments in the export-oriented production of other ATPA-eligibleproducts, including jewelry and wood manufactures.
S In 2002, ATPA continued to have a small, indirect, but positive effect insupport of illicit coca eradication and crop substitution efforts in the Andeanregion, despite the program’s lapse for much of 2002. Coca eradication inthe region reached a record high in 2002, driven primarily by thelargest-ever eradication efforts in Colombia. As a result, net cultivation inColombia declined for the first time in a decade. ATPA also remained animportant source of employment creation for workers who might otherwisehave grown illicit coca or entered the drug trade by supporting such industriesas flowers in Colombia and asparagus in Peru.
ix
Trade-related activities in 2002
S In 2002, the U.S. merchandise trade deficit with ATPA countries narrowedslightly, amounting to $3.1 billion. U.S. exports to ATPA countries, at $6.5billion, were up slightly compared with 2001; U.S. imports from ATPAcountries, at $9.6 billion, remained virtually the same as in 2001. The lack ofgrowth in overall U.S. imports from the Andean region may be attributed tothe economic slowdown in the United States, which dampened U.S. demandfor most imports, as well as the expiration of both the ATPA and GSPprograms during the first 7 months of the year.
S Since October 31, 2002, when ATPDEA’s benefits were implemented, all ofthe 20 leading imports from ATPA countries in 2002, except canned tuna,have been free of duty. These 19 products can enter duty-free either underNormal Trade Relations (NTR) tariff rates, ATPA, or GSP.
S During the atypical year of 2002, U.S. imports under ATPA were affected bytwo special factors: (a) the lapse of ATPA trade preferences during the first 7months of the year, which had an adverse effect on this trade, and (b) theimplementation of ATPDEA during the last 2 months of the year, whichincreased U.S. imports under the program.
S U.S. imports under ATPA declined 40.2 percent in 2002 to $1.0 billion,representing 10.4 percent of total U.S. imports from ATPA countries. Thedecline was caused largely by the lapse of ATPA trade preferences anduncertainties about the program’s future during the first 7 months of the year.Furthermore, the lack of an administrative system to allow entries of otherwiseeligible goods to be identified (as used whenever GSP benefits expire) mayalso have contributed to the decline. A portion of potential ATPA trade shiftedto GSP, and another portion became dutiable.
S Despite the implementation of ATPDEA for only 2 months of the year, it causedmajor changes to the list of the 20 leading imports entering under ATPA incalendar year 2002. Five formerly ineligible petroleum-derivative productsappeared on the list, displacing some other products that in prior years hadbeen leading imports under ATPA. Copper cathodes, however, remained thenumber one item on the list, followed by petroleum oils and roses. Petroleumderivatives accounted for nearly all U.S. imports under ATPDEA during 2002.
S In 2002, Colombia accounted for 40.4 percent of all imports entering underATPA, Peru for 38.2 percent, Ecuador for 17.8 percent, and Bolivia for 3.7percent. Notable was the rise in Ecuador’s share (up from 12.9 percent in2001), which resulted from the inclusion of petroleum products underATPDEA.
x
S Electrical and non-electrical machinery–principally for oil and gas extraction,other mining, data processing, and communications–remained the leadingU.S. exports to the region, even though such exports continued to decline in2002. Conversely, U.S. exports in most other major productcategories–organic chemicals, cereals, plastics, instruments, andaircraft–were up during 2002.
S In 2002, Colombia received 51.8 percent, Ecuador 23.1 percent, Peru 22.3percent, and Bolivia 2.8 percent of all U.S. exports to ATPA countries. Ecuadorwas the only ATPA country to which U.S. exports were higher in 2002 than in2001.
1-1
CHAPTER 1Introduction
The U.S. Congress enacted the Andean Trade Preference Act (ATPA)1 in 1991 toencourage the South American Andean countries of Bolivia, Colombia, Ecuador, andPeru to reduce drug-crop cultivation and production by fostering the production andexports of nontraditional products. ATPA authorizes the President to proclaimpreferential rates of duty on many Andean products entering the United States. Thepreferential trade benefits provided under ATPA are broadly similar to those providedto Caribbean Basin countries under the Caribbean Basin Economic Recovery Act(CBERA),2 but ATPA is not a permanent tariff program.
ATPA expired on December 4, 2001, but was renewed retroactive to that date onAugust 6, 2002, under the Andean Trade Promotion and Drug Eradication Act(ATPDEA), part of the Trade Act of 2002.3ATPDEA amended ATPA to authorizeduty-free treatment for certain products previously excluded from ATPA tradepreferences. ATPDEA amendments were implemented by Presidential proclamationon October 31, 2002.4 ATPA, as amended, will expire on December 31, 2006.
During the period when ATPA was not in effect, imports of goods previously eligible toclaim the ATPA tariff preference were subject to ordinary or column 1-general duties atthe time of entry.5 Because the U.S. Generalized System of Preferences (GSP)program also had lapsed during this time period, GSP tariff preferences were notavailable for goods eligible under that program.6 Duties paid on ATPA-eligible
1 ATPA was passed by Congress on Nov. 26, 1991, and signed into law on Dec. 4, 1991 (Public Law102-182, title II; 105 Stat. 1236, 19 U.S.C. 3201 et seq.). Minor amendments to ATPA were made by PublicLaw 102-583. ATPA became effective July 22, 1992, for Colombia and Bolivia (Presidential Proclamation6455, 57 F.R. 30069, and Presidential Proclamation 6456, 57 F.R. 30087, respectively); Apr. 30, 1993,for Ecuador (Presidential Proclamation 6544, 58 F.R. 19547); and Aug. 31, 1993, for Peru (PresidentialProclamation 6585, 58 F.R. 43239).
2 CBERA was enacted Aug. 5, 1983, as Public Law 98-67, title II; 97 Stat. 384, 19 U.S.C. 2701 et seq.and became effective Jan. 1, 1984 (Presidential Proclamation 5133, 48 F.R. 54453). Minor amendmentsto CBERA were made by Public Laws 98-573, 99-514, 99-570, and 100-418. Major amendments weremade to CBERA by Public Law 106-200, the Caribbean Basin Trade Partnership Act, effective Oct. 1,2000.
3 Public Law 107-210, title XXXI.4 67 F.R. 67283.5 Effective Feb. 15, 2002, by Presidential directive the importers of articles that formerly qualified for
duty-free treatment under ATPA were granted the option to defer the payment of estimated duties andfees after entry of these products until May 16, 2002. Because Congress did not renew or extend ATPAprior to May 16, 2002, importers were required to pay all applicable duties and fees by May 16, 2002.See 67 F.R. 7070 and U.S. Customs Service memo, “Expiration of Deferred Payment Period forMerchandise Previously Eligible for Duty-Free Treatment Under the Andean Trade Preference Act,” May6, 2002, found at Internet address http://www.customs.gov/impoexpo/expandean.htm, retrieved June13, 2002. This deferral did not apply to goods formerly eligible for reduced-duty benefits under ATPA asthat status was not mentioned in the directive; reduced-duty preferences were terminated by ATPDEA.
6 For more information on the relationship between ATPA and GSP, see the section on GSP later inthis chapter.
1-2
articles became eligible for refund when ATPA was renewed on August 6, 2002,retroactive to December 4, 2001.7 However, unlike the treatment made available toidentify GSP-eligible shipments during such lapses of authority, no administrativesystem was set up to assist in the identification of ATPA shipments.
This report fulfills a statutory mandate under ATPA that the U.S. International TradeCommission (“USITC” or “the Commission”) report annually on the economic impact ofATPA on U.S. industries, consumers, and the economy in general, as well as on theestimated effect of ATPA on drug-related crop eradication and crop substitution effortsof the beneficiary countries.8 The report is the ninth in the series and covers calendaryear 2002. Thus, this report covers the approximately 7-month period (January1-August 6, 2002) when ATPA was not in effect as well as November-December 2002when ATPDEA amendments were first implemented.
Throughout this report, the term “ATPA” refers to ATPA as amended by ATPDEA. Forpurposes of identifying the original ATPA program that expired in December 2001, theterm “original ATPA” shall be used so that the scope and requirements of that statutecan be discussed.
Organization of the Report
The present chapter summarizes the provisions of ATPA and describes the analyticalapproach used in the report. Chapter 2 analyzes U.S. trade with ATPA beneficiariesduring 2002. Chapter 3 estimates the effects of ATPA in 2002 on the U.S. economygenerally, as well as on U.S. industries and consumers. That chapter also examines theprobable future effects of ATPA. Chapter 4 analyzes the impact of ATPA on drug-croperadication and crop substitution in the beneficiary countries.
Appendix A reproduces the Federal Register notice by which the Commission solicitedpublic comment and appendix B contains a summary of a submission received inresponse to the Federal Register notice. Appendix C explains the economic model usedto derive the findings presented in chapter 3. Finally, appendix D contains a list offrequently used abbreviations.
Summary of the ATPA Program
ATPA authorizes the President to grant certain unilateral preferential trade benefits toBolivia, Colombia, Ecuador, and Peru in the form of duty-free treatment of eligible
7 U.S. Customs Service memo, “Retroactive Renewal of the Andean Trade Preference Act,” Aug. 7,2002, found at Internet address http://www.customs.gov/impoexpo/atparenewal.htm, retrievedOct. 10, 2002.
8 The reporting requirement is set forth in sec. 206(b) of ATPA (19 U.S.C. 3204(b)).
1-3
products imported into the customs territory of the United States, based on importerclaims for this treatment. The following sections summarize ATPA provisionsconcerning beneficiaries, trade benefits, and qualifying rules, and the relationshipbetween ATPA and the GSP.
BeneficiariesBolivia, Colombia, Ecuador, and Peru are the only countries eligible under the statuteto be designated by the President for ATPA benefits.9 The statute authorizes thePresident to terminate such designations or suspend or limit a country’s ATPA benefitsat any time;10 the President can withdraw or limit ATPDEA benefits even if preferencesunder the original ATPA are continued. The statute requires the President, whendetermining whether to designate a country for benefits under the original ATPA, totake into account a number of considerations, including whether that country has metthe criteria for U.S. narcotics cooperation certification.11 ATPA beneficiaries are alsorequired, among other things, to take steps to afford internationally recognizedworker rights as defined under the GSP program12 and to provide effective protectionof intellectual property rights (IPR), including copyrights for film and televisionmaterial.13 By 1993, all four countries had been designated for ATPA benefits.14
During the 10 years that the original ATPA was in effect, its benefits were notwithdrawn from any country on the basis of worker rights, inadequate protection ofIPR, or lack of U.S. certification for cooperation on narcotics.15
Each ATPA beneficiary country is eligible to be designated by the President for theadditional trade benefits under the ATPDEA. The statute provides the President with alist of criteria that he or she must consider in designating countries as ATPDEAbeneficiary countries,16 including those criteria that apply to country eligibility underthe original ATPA,17 as well as several new criteria.18 The additional criteria that mustbe taken into account by the President include the extent to which the country hasimplemented its World Trade Organization (WTO) commitments and participated inthe Free-Trade Area of the Americas (FTAA) process; provides protection of IPR and
9 19 U.S.C. 3202(b). Although Venezuela is a member of the Andean Community along with the fourATPA beneficiary countries, it is not eligible under the statute to be designated as an ATPA beneficiarycountry.
10 19 U.S.C. 3202(e).11 19 U.S.C. 3202(d)(11). These criteria are set forth in 22 U.S.C. 2291(h)(2)(A).12 Sec. 502(b)(2)(G) and 502(c)(7), Trade Act of 1974, and 19 U.S.C. 2462(b)(2)(G) or 2462(c)(7).13 19 U.S.C. 3202(c).14 Bolivia and Colombia were designated for ATPA benefits in 1992; Ecuador and Peru were
designated in 1993.15 Commission staff interview with the Office of the U.S. Trade Representative (USTR), June 18, 2002.16 19 U.S.C. 3203(b)(6)(B).17 Sections 203(c) and 203(d).18 Section 204(b)(6)(B).
1-4
internationally recognized worker rights; has implemented its commitments toeliminate the worst forms of child labor; has cooperated with the United States oncounternarcotics initiatives; has implemented an international anticorruptionconvention; has applied transparent, nondiscriminatory, and competitive proceduresin government procurement; and has cooperated with the United States to combatterrorism. Following enactment of ATPDEA on August 6, 2002, the Office of the U.S.Trade Representative (USTR) conducted an extensive review of ATPA beneficiaries’compliance with these requirements. On October 31, 2002, the President designatedall four ATPA beneficiary countries as ATPDEA beneficiary countries.19
Trade Benefits Under ATPAATPA provides duty-free treatment to qualifying imports from designated beneficiarycountries.20 For some products, duty-free entry under ATPA is subject to certainconditions in addition to basic preference eligibility rules. Imports of sugar, like those ofsome other agricultural products, remain subject to any applicable and generallyimposed U.S. tariff-rate quotas (TRQs) and food-safety requirements.21 Under theoriginal ATPA, certain leather handbags, luggage, flat goods (such as wallets andportfolios), work gloves, and leather wearing apparel from ATPA countries wereeligible to enter at reduced rates of duty.22 Not eligible for any preferential dutytreatment under the original ATPA were most textiles and apparel, certain footwear,canned tuna, petroleum and petroleum derivatives, certain watches and watch parts,certain sugar products, and rum and tafia.23
19 Presidential Proclamation 7616 of October 31, 2002, 67 F.R. 67283. For more information on theeligibility criteria, see Office of the U.S. Trade Representative, First Report to the Congress on theOperation of the Andean Trade Preference Act As Amended, Apr. 30, 2003. ATPA, as amended,requires USTR to submit a report by April 30, 2003, and every 2 years thereafter on the operation ofATPA, including a general review of the beneficiary countries based on the eligibility criteria andconsiderations described in the statute.
20 General note 3(c) to the Harmonized Tariff Schedule (HTS) summarizes the special tarifftreatment for eligible products of designated countries under various U.S. trade programs, includingATPA. General note 11 covers ATPA.
21 These U.S. measures include TRQs on imports of sugar, dairy products, beef, certain foodpreparations, and cotton fibers established pursuant to sections 401 and 404 of the Uruguay RoundAgreements Act (URAA), with the exception of quotas on sugar, which had already been converted toTRQs in 1990 as a result of a GATT ruling. These provisions abolished former absolute quotas on importsof agricultural products of WTO members; U.S. quotas had been created under section 22 of theAgricultural Adjustment Act of 1933 (7 U.S.C. 624) and under the Meat Import Act of 1979 (Public Law88-482). The URAA also amended ATPA by excluding from tariff preferences any imports frombeneficiary countries in quantities exceeding the new TRQ global trigger levels. Imports of agriculturalproducts from beneficiary countries remain subject to sanitary and phytosanitary restrictions, such asthose administered by the U.S. Animal and Plant Health Inspection Service.
22 This provision applied to certain articles that were not designated for GSP duty-free entry as ofAug. 5, 1983 (the date of enactment of the CBERA). Under the provisions of the original ATPA, beginningin 1992, duties on those goods were reduced by a total of 20 percent, not to exceed 2.5 percent advalorem, in five equal annual stages (19 U.S.C. 3203(c)). ATPDEA eliminated this provision and allowedthe President to decide if duty-free entry is appropriate.
23 19 U.S.C. 3203(b).
1-5
ATPDEA authorizes duty-free treatment for some of the products previously ineligiblefor ATPA preferences, including certain textiles and apparel, footwear,24 tuna in foilor other flexible airtight packages (not cans), petroleum and petroleum derivatives,and watches and watch parts (including cases, bracelets, and straps). Certainhandbags, luggage, flat goods, work gloves, and leather wearing apparel,previously eligible for reduced rates of duty under the original ATPA,25 are alsoeligible for duty-free treatment under ATPDEA. Nearly 6,300 rate lines or productsare now covered by ATPA trade preferences, of which about 700 were added byATPDEA.26 The following products continue to be excluded by statute from receivingpreferential treatment: textile and apparel articles not otherwise eligible forpreferential treatment under ATPDEA; canned tuna; above-quota imports of certainagricultural products subject to tariff-rate quotas, including sugars, syrups, andsugar-containing products; and rum and tafia.
Qualifying RulesTo be eligible for ATPA treatment, ATPA products must either be wholly grown,produced, or manufactured in a designated ATPA country or be “new or different”articles made from substantially transformed non-ATPA inputs.27 The cost or value ofthe local (ATPA region) materials and the direct costs of processing in one or moreATPA countries must total at least 35 percent of the appraised customs value of theproduct at the time of entry. ATPA countries are permitted to pool their resources tomeet the value-content requirement and to count inputs from Puerto Rico, the U.S.Virgin Islands, and countries designated under CBERA28 in full toward the valuethreshold. In addition, goods with an ATPA content of 20 percent of the customs valueand the remaining 15 percent attributable to U.S.-made (excluding Puerto Rican)materials or components,29 and goods containing inputs that undergo double
24 While the President extended ATPDEA duty-free treatment to most eligible products, he did notinclude 17 footwear rate lines on the basis of their import sensitivity in the context of imports from ATPDEAcountries.
25 As mentioned above, ATPDEA repealed 19 U.S.C. 3203(c), which had previously provided dutyreductions for certain handbags, luggage, flat goods, work gloves, and leather wearing apparel.
26 USTR, “New Andean Trade Benefits,” Fact Sheet, Sept. 25, 2002. Accordingly, approximately90 percent of rate lines provide duty-free treatment to U.S. imports from the ATPA region (60 percentunder ATPA and 30 percent are duty free under Normal Trade Relations (NTR) rates). U.S. imports underthe remaining approximately 10 percent of rate lines are dutiable.
27 Products undergoing the following operations do not qualify: simple combining or packagingoperations, dilution with water, or dilution with another substance that does not materially alter thecharacteristics of the article, (19 U.S.C. 3203(a)(2)).
28 Those countries are Antigua, Aruba, the Bahamas, Barbados, Belize, British Virgin Islands, CostaRica, Dominica, Dominican Republic, El Salvador, Grenada, Guatemala, Guyana, Haiti, Honduras,Jamaica, Montserrat, Netherlands Antilles, Nicaragua, Panama, St. Kitts and Nevis, St. Lucia, St. Vincentand the Grenadines, and Trinidad and Tobago.
29 19 U.S.C. 3203(a).
1-6
substantial transformation within the ATPA countries and are counted with otherqualifying inputs to total 35 percent, are deemed to meet the 35 percent value-contentrequirement.30
With respect to textiles and apparel, ATPDEA extended for the first time duty-freetreatment to specified imported textile and apparel articles from designated ATPDEAbeneficiary countries, effective on October 31, 2002. ATPDEA authorizes unlimitedduty-free and quota-free treatment for imports of textile and apparel articles made inATPA countries from fabrics or fabric components wholly formed, or componentsknit-to-shape, in the United States of U.S. and Andean yarns, provided the fabrics arealso dyed, printed, and finished in the United States.31 ATPDEA also includes unlimitedpreferential treatment for apparel assembled from Andean fabrics or fabriccomponents formed, or components knit-to-shape, of llama, alpaca, or vicuña. Thisprovision was important for Bolivia and Peru whose production is based not only oncotton and wool, but also on specialty fine hairs from indigenous llamas, alpacas, andvicuña.32
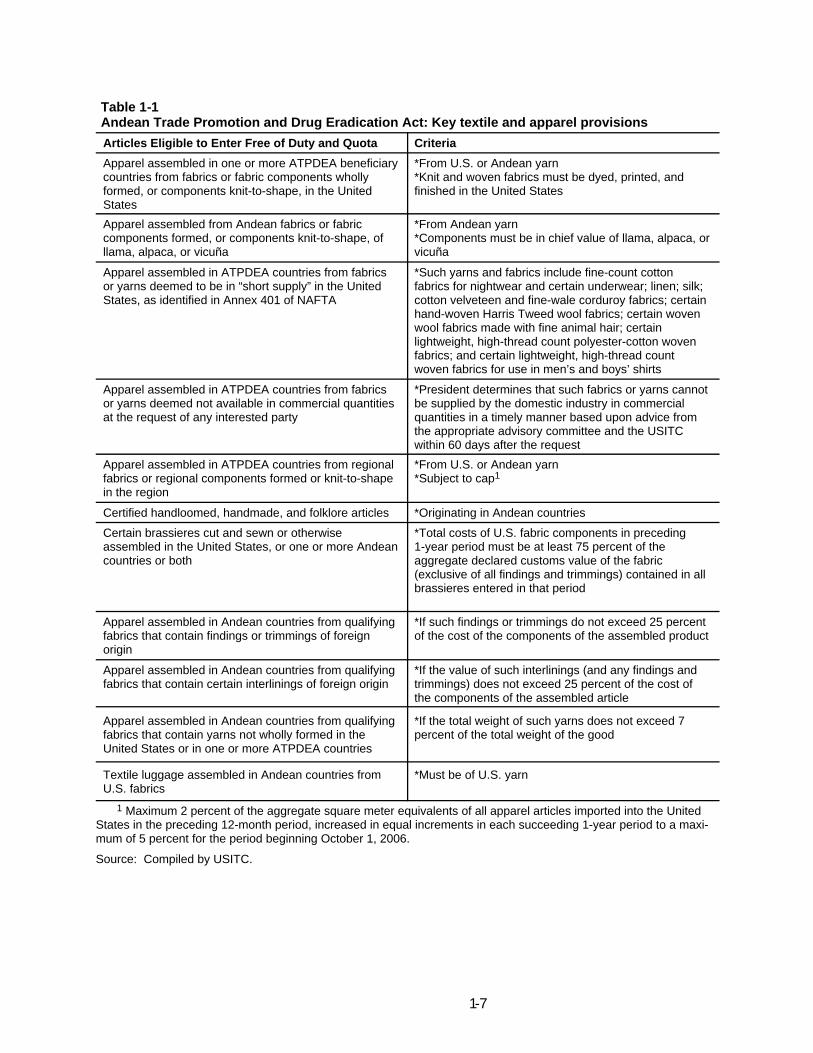
Apparel assembled in ATPDEA countries from regional fabrics or regionalcomponents formed or knit-to-shape in the region of U.S. or Andean yarn are alsoeligible to enter free of duty and ordinary quota but subject to a cap. The cap on U.S.imports of apparel made in the Andean countries from regional knit or woven fabricswas set at 2 percent of the aggregate square meter equivalent of total U.S. imports ofapparel from the world for the 1-year period beginning on October 1, 2002, andincreasing in each of the four succeeding 1-year periods by equal increments up to amaximum of 5 percent for the period beginning October 1, 2006. In calendar year2002, U.S. imports of apparel from the Andean countries accounted for about 0.5percent of total U.S. apparel imports. The expansion of the cap from 2 percent to 5percent therefore allows for significant growth of exports of apparel from the Andeancountries made from regional fabrics. Inclusion of the regional fabric provisions wasimportant to the Andean countries, because these countries, particularly Colombiaand Peru, have established textile industries. The principal textile and apparelprovisions of ATPDEA are summarized in table 1-1.
30 Double substantial transformation involves transforming foreign material into a new or differentproduct that, in turn, becomes the constituent material used to produce a second new or different article inthe beneficiary country. Thus, ATPA countries can import inputs from non-ATPA countries, transform theinputs into intermediate material, and transform the intermediate material into ATPA-eligible articles. Thecost or value of the constituent intermediate material can be counted toward the 35 percent ATPA contentrequirement. For additional information, see U.S. Department of Commerce and U.S. Agency forInternational Development, Guidebook to the Andean Trade Preference Act (Washington, D.C.:Government Printing Office, July 1992), p. 5.
31 The dyeing, printing, and finishing requirement does not refer to post-assembly and otheroperations such as garment dyeing and stone washing.
32 Numerous industry sources in these countries report that the specialty fine hairs from indigenousllamas, alpacas, and vicuña are sought in high-end apparel articles that create unique niche apparelmarkets for Bolivia and Peru.
1-7
Table 1-1Andean Trade Promotion and Drug Eradication Act: Key textile and apparel provisions
Articles Eligible to Enter Free of Duty and Quota Criteria
Apparel assembled in one or more ATPDEA beneficiarycountries from fabrics or fabric components whollyformed, or components knit-to-shape, in the UnitedStates
*From U.S. or Andean yarn*Knit and woven fabrics must be dyed, printed, andfinished in the United States
Apparel assembled from Andean fabrics or fabriccomponents formed, or components knit-to-shape, ofllama, alpaca, or vicuña
*From Andean yarn*Components must be in chief value of llama, alpaca, orvicuña
Apparel assembled in ATPDEA countries from fabricsor yarns deemed to be in “short supply” in the UnitedStates, as identified in Annex 401 of NAFTA
*Such yarns and fabrics include fine-count cottonfabrics for nightwear and certain underwear; linen; silk;cotton velveteen and fine-wale corduroy fabrics; certainhand-woven Harris Tweed wool fabrics; certain wovenwool fabrics made with fine animal hair; certainlightweight, high-thread count polyester-cotton wovenfabrics; and certain lightweight, high-thread countwoven fabrics for use in men’s and boys’ shirts
Apparel assembled in ATPDEA countries from fabricsor yarns deemed not available in commercial quantitiesat the request of any interested party
*President determines that such fabrics or yarns cannotbe supplied by the domestic industry in commercialquantities in a timely manner based upon advice fromthe appropriate advisory committee and the USITCwithin 60 days after the request
Apparel assembled in ATPDEA countries from regionalfabrics or regional components formed or knit-to-shapein the region
*From U.S. or Andean yarn*Subject to cap1
Certified handloomed, handmade, and folklore articles *Originating in Andean countries
Certain brassieres cut and sewn or otherwiseassembled in the United States, or one or more Andeancountries or both
*Total costs of U.S. fabric components in preceding1-year period must be at least 75 percent of theaggregate declared customs value of the fabric(exclusive of all findings and trimmings) contained in allbrassieres entered in that period
Apparel assembled in Andean countries from qualifyingfabrics that contain findings or trimmings of foreignorigin
*If such findings or trimmings do not exceed 25 percentof the cost of the components of the assembled product
Apparel assembled in Andean countries from qualifyingfabrics that contain certain interlinings of foreign origin
*If the value of such interlinings (and any findings andtrimmings) does not exceed 25 percent of the cost ofthe components of the assembled article
Apparel assembled in Andean countries from qualifyingfabrics that contain yarns not wholly formed in theUnited States or in one or more ATPDEA countries
*If the total weight of such yarns does not exceed 7percent of the total weight of the good
Textile luggage assembled in Andean countries fromU.S. fabrics
*Must be of U.S. yarn
1 Maximum 2 percent of the aggregate square meter equivalents of all apparel articles imported into the UnitedStates in the preceding 12-month period, increased in equal increments in each succeeding 1-year period to a maxi-mum of 5 percent for the period beginning October 1, 2006.
Source: Compiled by USITC.
1-8
ATPA and GSPThe four ATPA beneficiaries also are GSP beneficiaries.33 ATPA and GSP provisionsare similar in many ways, and many products can enter the United States free of dutyunder either program. Both programs offer increased access to the U.S. market. LikeATPA, GSP requires that eligible imports (1) be imported directly from beneficiariesinto the customs territory of the United States, (2) meet the (usually double) substantialtransformation requirement for any foreign inputs, and (3) contain a minimum of 35percent qualifying value content. The documentary requirements necessary to claimeither ATPA or GSP duty-free entry are identical—a Certificate of Origin Form A hasto be presented at the time the qualifying products enter the United States, thoughslightly varying value-related information is required under the two programs.
However, the two programs differ in several ways that tend to make Andeanproducers prefer the more liberal ATPA. First, ATPA authorizes duty-free treatment onmore tariff categories than GSP, including some textile and apparel articles ineligiblefor GSP treatment. Unless specifically excluded, all products under ATPA can bedesignated as having a tariff preference. Second, by law, U.S. imports under ATPAare not subject to GSP competitive-need and country-income restrictions. Under GSP,products that achieve a specified level of imports into the United States, either inabsolute terms or as a percentage of U.S. imports–the competitive-need limit–can beexcluded from GSP eligibility; products so restricted under GSP can continue to enterfree of duty under ATPA. Countries can lose all GSP privileges once their nationalincome grows to exceed a specified amount. Third, ATPA qualifying rules forindividual products are more liberal than those of GSP. GSP requires that 35 percentof the value of the product be added in a single beneficiary or in a specified associationof GSP-eligible countries, whereas ATPA allows regional aggregation within ATPAplus U.S. and Caribbean content.
In addition, since July 31, 1995, the tariff preferences of the U.S. GSP program havebeen in effect only intermittently;34 even though they have been renewed retroactively,the interruptions have encouraged suppliers to use ATPA instead. Most recently, GSPtariff preferences expired on September 30, 2001, but were renewed August 6, 2002,retroactive to October 1, 2001 and continuing through December 31, 2006.35 All
33 The U.S. GSP program originally was enacted for 10 years pursuant to title V of the Trade Act of1974 (Public Law 93-618, 88 Stat. 2066 and following) and was renewed for an additional 10 yearspursuant to title V of the Trade and Tariff Act of 1984 (Public Law 98-573, 98 Stat. 3018 and following), asamended (19 U.S.C. 2461 and following). Since that time, the GSP program has expired and beenrenewed several times. GSP expiration and renewal issues are discussed later in this section.
34 GSP tariff preferences expired at midnight on July 31, 1995; the provisions of the program wererenewed Oct. 1, 1996, retroactive to Aug. 1, 1995 through May 31, 1997 (61 F.R. 52078-52079). The GSPprogram expired again on May 31, 1997, but was renewed Aug. 5, 1997, retroactive to June 1, 1997through June 30, 1998 (62 F.R. 46549-46550). On June 30, 1998, the program expired again but wasrenewed Oct. 21, 1998, retroactive to July 1, 1998 through June 30, 1999 (63 F.R. 67169-67170). Theprogram expired on June 30, 1999, but was renewed Dec. 17, 1999, retroactive to July 1, 1999 throughSept. 30, 2001 (65 F.R. 11367-11368).
35 Public Law 107-210, sec. 4101.
1-9
imports of goods designated as eligible for claiming the GSP tariff preference thatentered during periods when GSP was not in effect were generally subject to column1-general rates of duty at the time of entry, unless other preferential treatment–such asATPA–was claimed. Duties paid on such articles were eligible for refund after the GSPbecame operative again, if importers had continued to supply documentation ofeligibility; however, there were cash flow burdens even for such importers. Because thelapse in GSP was particularly long in 1995 and 1996, suppliers in ATPA-eligiblecountries could be sure only that the preferential tariff provisions of ATPA were inforce. As a result, there was a marked shift away from using GSP to ATPA in 1995 and1996, although this trend was already apparent. Many Andean suppliers continued toenter GSP-eligible goods under ATPA even after the GSP program was reauthorized.In 2002, there was a notable shift in the opposite direction–from using ATPA to usingGSP.36 Although both ATPA and GSP were not in effect in 2002 until August 6, whenthe Trade Act of 2002 renewed both programs, the experience of Andean supplierswith previous lapses in GSP reportedly left them more certain that the GSP programwould be renewed retroactively, and that duties paid or posted would be refunded.37
Analytical Approach
The original ATPA program allowed duty-free or reduced-duty treatment forqualifying products of designated beneficiary countries. The duty elimination foralmost all eligible products occurred in a single action as countries became designatedbeneficiaries—there was no phase-in of duty elimination. Subsequent limited dutyreductions for the remaining eligible goods were phased in over 5 years. Direct effectsof such a one-time duty elimination can be expected to consist primarily of increasedU.S. imports from beneficiary countries resulting from trade and resource diversion totake advantage of lower duties in the U.S. market, including: (1) a diversion ofbeneficiary-country production away from domestic sales and non-U.S. foreignmarkets; and (2) a diversion of variable resources (such as labor and materials) awayfrom production for domestic and non-U.S. foreign markets. In general, these directeffects are likely to occur within a short time (probably 1 or 2 years) after the dutyelimination. It is therefore likely that these effects were fully realized in prior years forthe original ATPA, because it became effective for all beneficiary countries during1992-1993. Imports of products that became eligible with the implementation ofATPDEA on October 31, 2002, are just beginning to have an effect on the U.S.economy as a whole and on U.S. industries and consumers.
36 See chapter 2 for an analysis of the trends in the use of GSP and ATPA.37 Furthermore, unlike the case when ATPA expired, each time the GSP has expired the Customs
Service has outlined in a Federal Register notice specific procedures for importing GSP-eligible productsto facilitate refunds should the GSP be renewed with retroactive effect. See 66 F.R. 50248. This systemalso makes it more likely that all eligible entries can be located and data correctly compiled.
1-10
Over a longer period, the effects of ATPA likely will flow mostly from investment inindustries in beneficiary countries that benefit from the duty elimination. Both theshort-term and long-term effects are limited by the small size of the ATPAbeneficiary-country economies, and the long-term effects are likely to be difficult todistinguish from other market forces in play since the programs were initiated.Investment, however, has been tracked in past ATPA reports in order to examine thetrends in, and composition of, investment in the Andean region.
The effects of ATPA on the U.S. economy, industries, and consumers are assessedthrough (1) an analysis of imports entered under the program and trends in U.S.consumption of those imports; (2) estimates of gains to U.S. consumers due to lowerprices or greater availability of goods, losses to the U.S. Treasury resulting fromreduced tariff revenues, and potential displacement in U.S. industries competing withthe leading U.S. imports that benefited exclusively from the ATPA program in 2002;38
and (3) an examination of trends in production and other economic factors in theindustries identified as likely to be particularly affected by such imports. Generaleconomic and trade data come from official statistics of the U.S. Department ofCommerce and from materials developed by country/regional and industry analystsof the Commission. The report also incorporates public comments received in responseto the Commission’s Federal Register notice regarding the investigation.39
As in previous reports in this series, the effects of ATPA are analyzed by estimating thedifferences in benefits to U.S. consumers, levels of U.S. tariff revenues, and U.S.industry production that likely would have occurred if NTR tariffs had been in place forbeneficiary countries in 2002. Actual 2002 market conditions are compared with ahypothetical case in which NTR duties are imposed for the year.40 The effects of ATPAduty reductions for 2002 are estimated by using a standard economic approach formeasuring the impact of a change in the prices of one or more goods. Specifically, apartial-equilibrium model is used to estimate gains to consumers, losses in tariffrevenues, and industry displacement.41 Previous analyses in this series have shownthat since ATPA went into effect, U.S. consumers have benefited from lower prices andhigher consumption, competing U.S. producers have experienced lower sales, andtariff revenues to the U.S. Treasury have been lower.
Generally, the net welfare effect is measured by adding three components: (1) thechange in consumer surplus, (2) the change in tariff revenues to the U.S. Treasuryresulting from the ATPA duty reduction, and (3) the change in producer surplus.42 The
38 That is, those that are not excluded or do not receive unconditional column 1-general duty-freetreatment or duty-free treatment under other preference programs such as GSP.
39 A copy of the notice appears in appendix A.40 The lapses of ATPA and GSP during the first 7 months of 2002 produced disruptions in both trade
patterns and recordkeeping. “Actual” market conditions used for analysis reflect reported data.41 A more detailed explanation of the approach can be found in appendix C.42 Consumer surplus is a dollar measure of the total net gain to U.S. consumers from lower prices. It
is defined as the difference between the total value consumers receive from the consumption of aparticular good and the total amount they pay for the good. Producer surplus is a dollar measure of the
1-11
model used in this analysis assumes that the supply of U.S. domestic production isperfectly elastic; that is, U.S. domestic prices do not fall in response to ATPA dutyreductions. Thus, decreases in U.S. producer surplus are not captured in this analysis,but the effects of ATPA duty reductions on most U.S. industries are expected to be small.
This analysis estimates potential net welfare effects and industry displacement, andthese estimates reflect a range of assumed substitutabilities between ATPA productsand competing U.S. output. The upper estimates reflect the assumption of highsubstitution elasticities,43 whereas the lower estimates reflect the assumption of lowsubstitution elasticities. Upper estimates are used to identify items that could be mostaffected by ATPA.
The Commission’s analysis covers the 20 leading items that benefited exclusively fromATPA tariff preferences (table 3-2).44 The analysis provides estimates of welfare andpotential U.S. industry displacement. Industries for which estimated upper potentialdisplacement is more than 5 percent of the value of U.S. production are selected forfurther analysis.
Commission analysis of the probable future effects of ATPA was based on a qualitativeanalysis of economic trends and investment patterns in beneficiary countries and incompeting U.S. industries. The primary sources for information on investment inATPA-related production facilities are U.S. embassies in the region. To assess theimpact of ATPA on drug-crop eradication and crop substitution, the Commission reliedprimarily on information from other U.S. Government agencies, such as theDepartment of State and the Agency for International Development, as well as otherpublished sources.
42—Continuedtotal net loss to competing U.S. producers from increased competition with imports. It is defined as thereturn to entrepreneurs and owners of capital that exceeds earnings for their next-best opportunities. SeeWalter Nicholson, Microeconomic Theory: Basic Principles and Extensions (New York: The Dryden Press,1989), for further discussion of consumer and producer surplus. The welfare effects do not includeshort-run adjustment costs to the economy from reallocating resources among different industries.
43 Commission industry analysts provided evaluations of the substitutability of ATPA products andcompeting U.S. products, which were translated into a range of substitution elasticities—3 to 5 for highsubstitutability, 2 to 4 for medium, and 1 to 3 for low. Although there is no theoretical upper limit toelasticities of substitution, a substitution elasticity of 5 is consistent with the upper range of estimates in theeconomics literature. Estimates in the literature tend to be predominantly lower. See, for example, ClintonR. Shiells, Robert M. Stern, and Alan V. Deardorff, “Estimates of the Elasticities of Substitution BetweenImports and Home Goods for the United States,” Weltwirtschaftliches Archiv, 122 (1986), pp. 497-519;and Michael P. Gallaway, Christine A. McDaniel, and Sandra A. Rivera, “Short-Run and Long-RunEstimates of U.S. Armington Elasticities,” North American Journal of Economics and Finance, 14 (2003),pp. 49-68.
44 Commission industry analysts provided estimates of U.S. production and exports for the 20leading items that benefited exclusively from ATPA, as well as evaluations of the substitutability ofATPA-exclusive imports and competing U.S. products.

2-1
CHAPTER 2U.S. Trade With the Andean Region
Introduction
This chapter covers U.S. trade with the four countries that are designated as ATPA andATPDEA beneficiaries: Bolivia, Colombia, Ecuador, and Peru. The principal purposeof the chapter is to examine U.S. imports under the preferential provisions of ATPA, asamended by ATPDEA1 during 2002, but total U.S. imports from ATPA countries andU.S. exports to ATPA countries are also examined.
The year 2002 was an atypical year in the history of ATPA. As discussed in chapter 1,for the major part of the year (Jan.1-Aug. 6), the program was inoperative. On August6, 2002, ATPA was renewed retroactively and amended by ATPDEA. However,retroactive application was not fully achieved, and ATPDEA amendments were notimplemented by proclamation until October 31.2 Because of the changes in the scopeof ATPA during 2002, and the administrative difficulties in handling programchanges, imports under the program are not strictly comparable with such importsrecorded in prior years and will not be strictly comparable with imports recorded infuture years. Moreover, recordkeeping for customs entries that might be eligible underATPA was disrupted because of the lapse, and the automated entry system was notfully updated until 2003.3
The chapter is organized as follows. First, it reviews trends in overall U.S. imports fromATPA countries and discusses the effects of ATPA’s legislative developments during thetransitional year of 2002 on U.S. imports under the ATPA program and total U.S.imports from ATPA countries. Then, the chapter analyzes leading U.S. imports underATPA (which includes imports eligible under the original ATPA as well as newly eligibleimports under ATPDEA), and finally, U.S. exports to ATPA countries. Throughout thechapter, trade is discussed primarily on an 8-digit Harmonized Tariff Schedule (HTS)subheading basis. The relative importance of individual beneficiary countries assources of and destinations for this trade also is covered.
During 2002, economic growth in the Andean region continued to be sluggish. Peru,with a 4.5-percent gross domestic product (GDP) growth (preliminary) had the highest
1 As discussed in chapter 1, the term “ATPA” refers to ATPA as amended by ATPDEA, and the term“original ATPA” is used to identify the original ATPA program that expired in December 2001.
2 For more detail on these developments, see chapter 1, and the section entitled “A TransitionalYear” in chapter 2.
3 ATPA data covering the period when ATPA was not in effect are incomplete and may be subject tofuture revision. ATPDEA data, which were only collected for 2 months in 2002, may include collectionerrors.
2-2
growth rate and also a positive trade and payments balance. The rate of growth in theother three ATPA countries was lower, and their trade deficits widened. The slowdownof oil extraction in Colombia and Ecuador, along with the deterioration of the naturalgas industry in Bolivia, had a negative impact on the economies of these countries; onthe other hand, the construction of a crude oil pipeline contributed to an estimatedgrowth rate of 3.5 percent in Ecuador.4
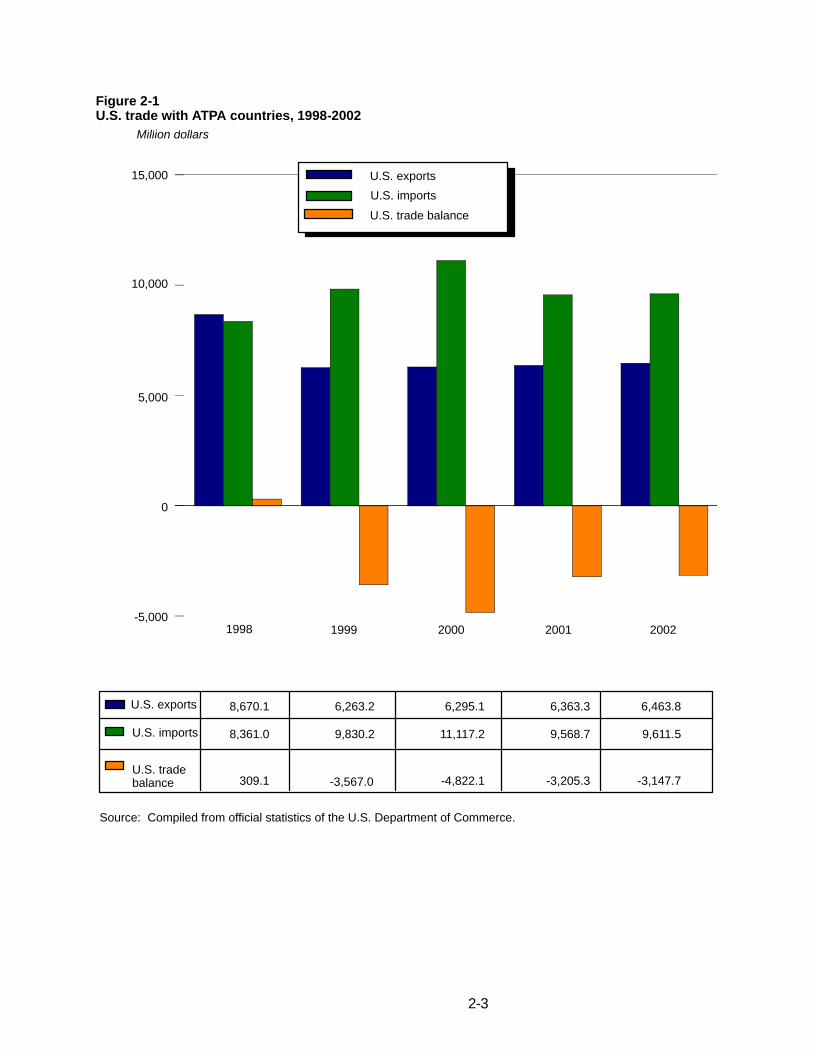
All ATPA countries suffered from weak demand in the United States and in theirregional partner countries owing to economic slowdown. They also shared theproblem of external indebtedness. Meanwhile, U.S. data show a collective deficit ofthe United States in merchandise trade5 with ATPA countries in 2002, which hasexisted since 1999 (table 2-1 and figure 2-1). The trade deficit largely reflects thesignificant share of total imports from the region accounted for by petroleum. U.S.data also show a trade deficit in 2002 vis-à-vis each ATPA country, except Bolivia.
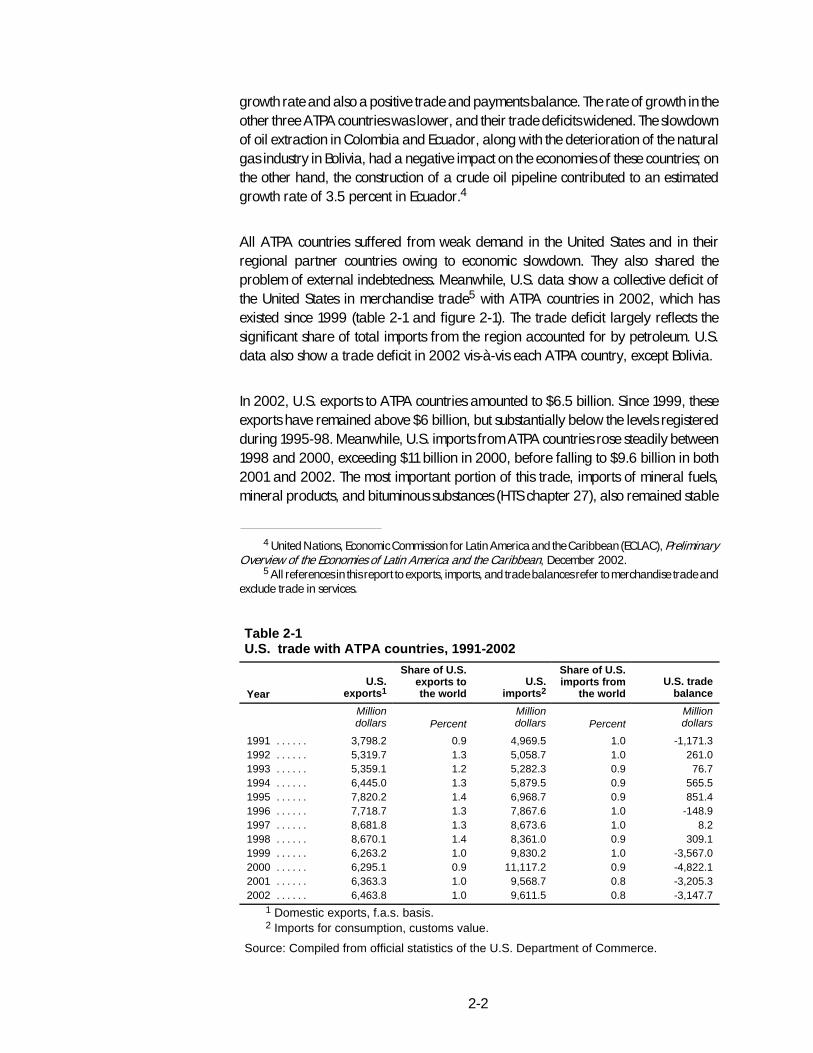
In 2002, U.S. exports to ATPA countries amounted to $6.5 billion. Since 1999, theseexports have remained above $6 billion, but substantially below the levels registeredduring 1995-98. Meanwhile, U.S. imports from ATPA countries rose steadily between1998 and 2000, exceeding $11 billion in 2000, before falling to $9.6 billion in both2001 and 2002. The most important portion of this trade, imports of mineral fuels,mineral products, and bituminous substances (HTS chapter 27), also remained stable
4 United Nations, Economic Commission for Latin America and the Caribbean (ECLAC), PreliminaryOverview of the Economies of Latin America and the Caribbean, December 2002.
5 All references in this report to exports, imports, and trade balances refer to merchandise trade andexclude trade in services.
Table 2-1U.S. trade with ATPA countries, 1991-2002
YearU.S.
exports1
Share of U.S.exports tothe world
U.S.imports2
Share of U.S.imports from
the worldU.S. trade
balance
Milliondollars Percent
Milliondollars Percent
Milliondollars
1991 . . . . . . 3,798.2 0.9 4,969.5 1.0 -1,171.31992 . . . . . . 5,319.7 1.3 5,058.7 1.0 261.01993 . . . . . . 5,359.1 1.2 5,282.3 0.9 76.71994 . . . . . . 6,445.0 1.3 5,879.5 0.9 565.51995 . . . . . . 7,820.2 1.4 6,968.7 0.9 851.41996 . . . . . . 7,718.7 1.3 7,867.6 1.0 -148.91997 . . . . . . 8,681.8 1.3 8,673.6 1.0 8.21998 . . . . . . 8,670.1 1.4 8,361.0 0.9 309.11999 . . . . . . 6,263.2 1.0 9,830.2 1.0 -3,567.02000 . . . . . . 6,295.1 0.9 11,117.2 0.9 -4,822.12001 . . . . . . 6,363.3 1.0 9,568.7 0.8 -3,205.32002 . . . . . . 6,463.8 1.0 9,611.5 0.8 -3,147.7
1 Domestic exports, f.a.s. basis.2 Imports for consumption, customs value.
Source: Compiled from official statistics of the U.S. Department of Commerce.
2-3
Figure 2-1U.S. trade with ATPA countries, 1998-2002
8,670.1 6,263.2 6,295.1 6,363.3 6,463.8
8,361.0 9,830.2 11,117.2 9,568.7 9,611.5
309.1 -4,822.1 -3,205.3 -3,147.7
U.S. exports
U.S. imports
U.S. tradebalance -3,567.0
U.S. imports
U.S. exports
U.S. trade balance
Source: Compiled from official statistics of the U.S. Department of Commerce.
0
5,000
10,000
15,000
-5,0001998 1999 2000 2001 2002
Million dollars
2-4
in 2002 compared with 2001 (table 2-2). The economic slowdown in the United Statesdampened U.S. demand for most imports, including imports from the Andean region.The expiration of both the ATPA and GSP programs–a lapse that continued during thebetter part of the year–may also have contributed to the lack of growth in overall U.S.imports from ATPA countries.
The collective share of ATPA countries as a market for U.S. exports rose from 0.9percent of the world market in 1991 to a peak of 1.4 percent in 1995 and 1998. In theperiod 1999 through 2002, the share dropped to 1.0 percent or less (table 2-1). Thecombined share of ATPA countries as a supplier of the U.S. market ranged between0.9 and 1.0 percent of overall U.S. imports from the world through the year 2000. Thisratio dropped, however, to 0.8 percent in 2001 and 2002.
U.S. Imports
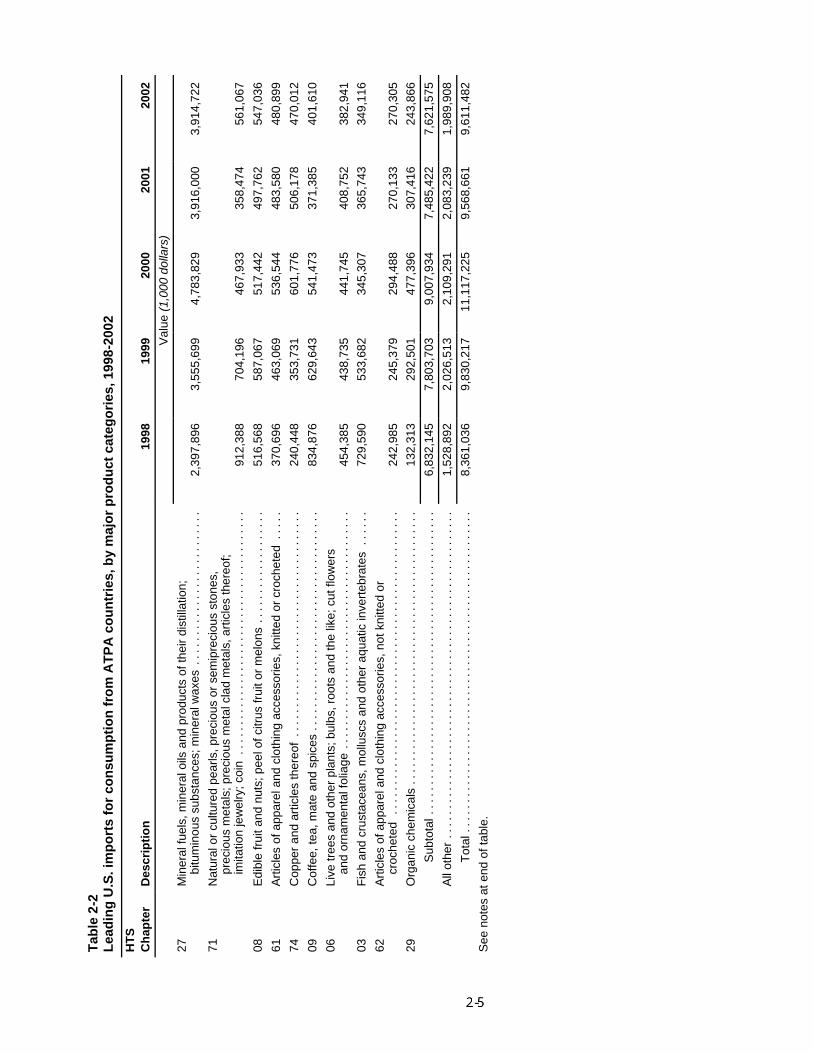
Total U.S. imports from ATPA countries (including both the portions eligible andineligible for ATPA preferences) remained virtually the same in 2002 as in 2001,amounting to $9.6 billion. ATPA countries collectively were the 23rd largest supplier ofU.S. imports from the world (the same as in 2001), larger than Switzerland but smallerthan Indonesia. Table 2-2 shows the composition of total U.S. imports from ATPAcountries by major product categories during 1998-2002. Mineral products andbituminous substances (HTS chapter 27), the dominant category of U.S. imports fromATPA countries, have accounted for over 40 percent of the total in the last 3 years .
Figure 2-2 shows how the composition of U.S. imports from ATPA countries haschanged during the last 5 years. In 1998, jewelry, coffee, and fish were leading U.S.import categories after the dominant mineral group. However, since then, a shift injewelry imports away from most South American sources to Far Eastern ones, anddepressed prices of gold and gemstones, have lowered the relative significance ofjewelry in U.S. imports from ATPA countries. The relative importance of coffee also hasdiminished as coffee prices have declined. U.S. imports of fish from the Andeanregion, in which shrimp dominates, have been reduced by a virus that stunted thegrowth of shrimp larvae. Thus, in 2002, the dominance of minerals has become morepronounced, jewelry a less important second-ranking category, and coffee and fishwere replaced by fruits and nuts (primarily bananas) and knitted apparel as thethird-ranking and fourth-ranking product groups in U.S. imports from ATPA countries.
Table 2-3 lists the 20 leading U.S. imports from ATPA countries during 2002 on an8-digit HTS subheading basis, ranked by their 2002 import value. Since October 31,2002, all 20 leading imports from ATPA countries, except canned tuna, have beenallowed to enter the United States free of duty under column 1-general or NormalTrade Relations (NTR) tariff rates, GSP, or under ATPA as amended.6
6 The imports of the new ATPA products, as well as of others that entered in prior years under theoriginal ATPA, will be discussed in some detail later in this chapter.
Tab
le2-
2L
ead
ing
U.S
.im
po
rts
for
con
sum
pti
on
fro
mA
TP
Aco
un
trie
s,b
ym
ajo
rp
rod
uct
cate
go
ries
,199
8-20
02
HT
SC
hap
ter
Des
crip
tio
n19
9819
9920
0020
0120
02
Val
ue(1
,000
dolla
rs)
27M
iner
alfu
els,
min
eral
oils
and
prod
ucts
ofth
eir
dist
illat
ion;
bitu
min
ous
subs
tanc
es;m
iner
alw
axes
....
....
....
....
....
....
..2,
397,
896
3,55
5,69
94,
783,
829
3,91
6,00
03,
914,
722
71N
atur
alor
cultu
red
pear
ls,p
reci
ous
orse
mip
reci
ous
ston
es,
prec
ious
met
als;
prec
ious
met
alcl
adm
etal
s,ar
ticle
sth
ereo
f;im
itatio
nje
wel
ry;c
oin
....
....
....
....
....
....
....
....
....
....
.91
2,38
870
4,19
646
7,93
335
8,47
456
1,06
7
08E
dibl
efr
uita
ndnu
ts;p
eelo
fcitr
usfr
uito
rm
elon
s..
....
....
....
....
.51
6,56
858
7,06
751
7,44
249
7,76
254
7,03
6
61A
rtic
les
ofap
pare
land
clot
hing
acce
ssor
ies,
knitt
edor
croc
hete
d..
...
370,
696
463,
069
536,
544
483,
580
480,
899
74C
oppe
ran
dar
ticle
sth
ereo
f..
....
....
....
....
....
....
....
....
....
240,
448
353,
731
601,
776
506,
178
470,
012
09C
offe
e,te
a,m
ate
and
spic
es..
....
....
....
....
....
....
....
....
...
834,
876
629,
643
541,
473
371,
385
401,
610
06Li
vetr
ees
and
othe
rpl
ants
;bul
bs,r
oots
and
the
like;
cutf
low
ers
and
orna
men
talf
olia
ge..
....
....
....
....
....
....
....
....
....
..45
4,38
543
8,73
544
1,74
540
8,75
238
2,94
103
Fis
han
dcr
usta
cean
s,m
ollu
scs
and
othe
raq
uatic
inve
rteb
rate
s..
....
729,
590
533,
682
345,
307
365,
743
349,
116
62A
rtic
les
ofap
pare
land
clot
hing
acce
ssor
ies,
notk
nitte
dor
croc
hete
d..
....
....
....
....
....
....
....
....
....
....
....
....
.24
2,98
524
5,37
929
4,48
827
0,13
327
0,30
529
Org
anic
chem
ical
s..
....
....
....
....
....
....
....
....
....
....
....
132,
313
292,
501
477,
396
307,
416
243,
866
Sub
tota
l...
....
....
....
....
....
....
....
....
....
....
....
....
6,83
2,14
57,
803,
703
9,00
7,93
47,
485,
422
7,62
1,57
5
All
othe
r..
....
....
....
....
....
....
....
....
....
....
....
....
....
.1,
528,
892
2,02
6,51
32,
109,
291
2,08
3,23
91,
989,
908
Tot
al..
....
....
....
....
....
....
....
....
....
....
....
....
....
8,36
1,03
69,
830,
217
11,1
17,2
259,
568,
661
9,61
1,48
2
See
note
sat
end
ofta
ble.
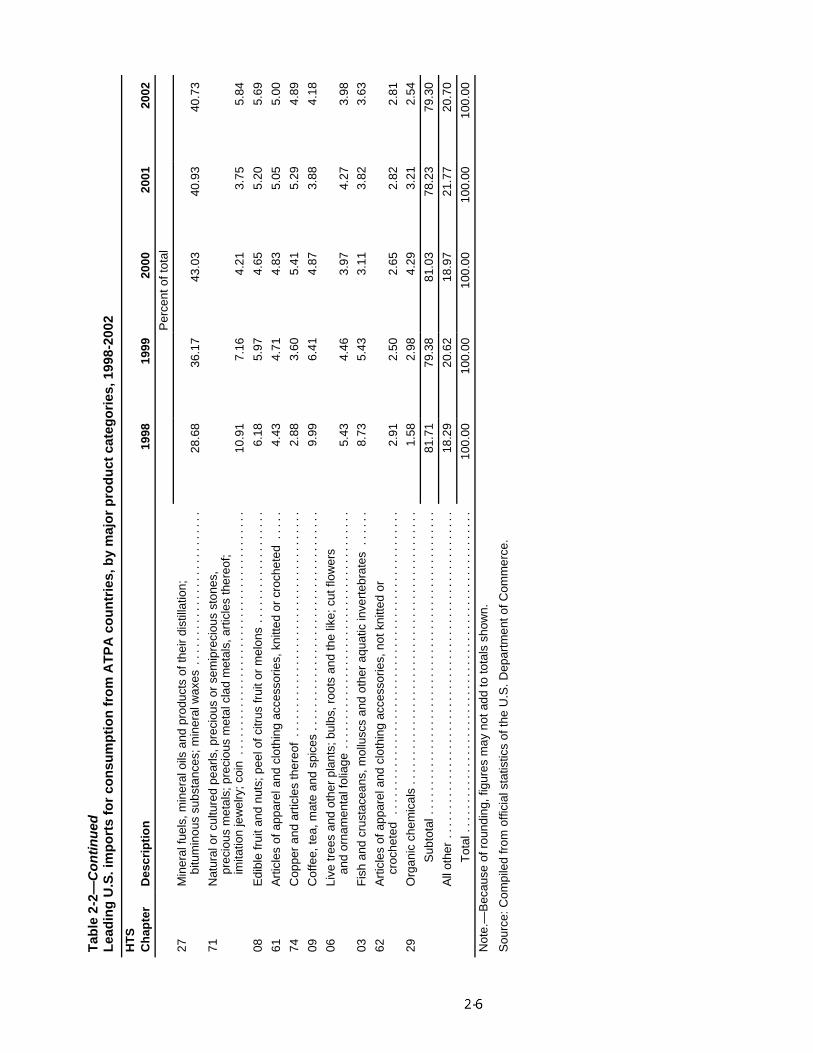
Tab
le2-
2—C
on
tin
ued
Lea
din
gU
.S.i
mp
ort
sfo
rco
nsu
mp
tio
nfr
om
AT
PA
cou
ntr
ies,
by
maj
or
pro
du
ctca
teg
ori
es,1
998-
2002
HT
SC
hap
ter
Des
crip
tio
n19
9819
9920
0020
0120
02
Per
cent
ofto
tal
27M
iner
alfu
els,
min
eral
oils
and
prod
ucts
ofth
eir
dist
illat
ion;
bitu
min
ous
subs
tanc
es;m
iner
alw
axes
....
....
....
....
....
....
..28
.68
36.1
743
.03
40.9
340
.73
71N
atur
alor
cultu
red
pear
ls,p
reci
ous
orse
mip
reci
ous
ston
es,
prec
ious
met
als;
prec
ious
met
alcl
adm
etal
s,ar
ticle
sth
ereo
f;im
itatio
nje
wel
ry;c
oin
....
....
....
....
....
....
....
....
....
....
.10
.91
7.16
4.21
3.75
5.84
08E
dibl
efr
uita
ndnu
ts;p
eelo
fcitr
usfr
uito
rm
elon
s..
....
....
....
....
.6.
185.
974.
655.
205.
69
61A
rtic
les
ofap
pare
land
clot
hing
acce
ssor
ies,
knitt
edor
croc
hete
d..
...
4.43
4.71
4.83
5.05
5.00
74C
oppe
ran
dar
ticle
sth
ereo
f..
....
....
....
....
....
....
....
....
....
2.88
3.60
5.41
5.29
4.89
09C
offe
e,te
a,m
ate
and
spic
es..
....
....
....
....
....
....
....
....
...
9.99
6.41
4.87
3.88
4.18
06Li
vetr
ees
and
othe
rpl
ants
;bul
bs,r
oots
and
the
like;
cutf
low
ers
and
orna
men
talf
olia
ge..
....
....
....
....
....
....
....
....
....
..5.
434.
463.
974.
273.
9803
Fis
han
dcr
usta
cean
s,m
ollu
scs
and
othe
raq
uatic
inve
rteb
rate
s..
....
8.73
5.43
3.11
3.82
3.63
62A
rtic
les
ofap
pare
land
clot
hing
acce
ssor
ies,
notk
nitte
dor
croc
hete
d..
....
....
....
....
....
....
....
....
....
....
....
....
.2.
912.
502.
652.
822.
8129
Org
anic
chem
ical
s..
....
....
....
....
....
....
....
....
....
....
....
1.58
2.98
4.29
3.21
2.54
Sub
tota
l...
....
....
....
....
....
....
....
....
....
....
....
....
81.7
179
.38
81.0
378
.23
79.3
0
All
othe
r..
....
....
....
....
....
....
....
....
....
....
....
....
....
.18
.29
20.6
218
.97
21.7
720
.70
Tot
al..
....
....
....
....
....
....
....
....
....
....
....
....
....
100.
0010
0.00
100.
0010
0.00
100.
00
Not
e.—
Bec
ause
ofro
undi
ng,f
igur
esm
ayno
tadd
toto
tals
show
n.
Sou
rce:
Com
pile
dfr
omof
ficia
lsta
tistic
sof
the
U.S
.Dep
artm
ento
fCom
mer
ce.
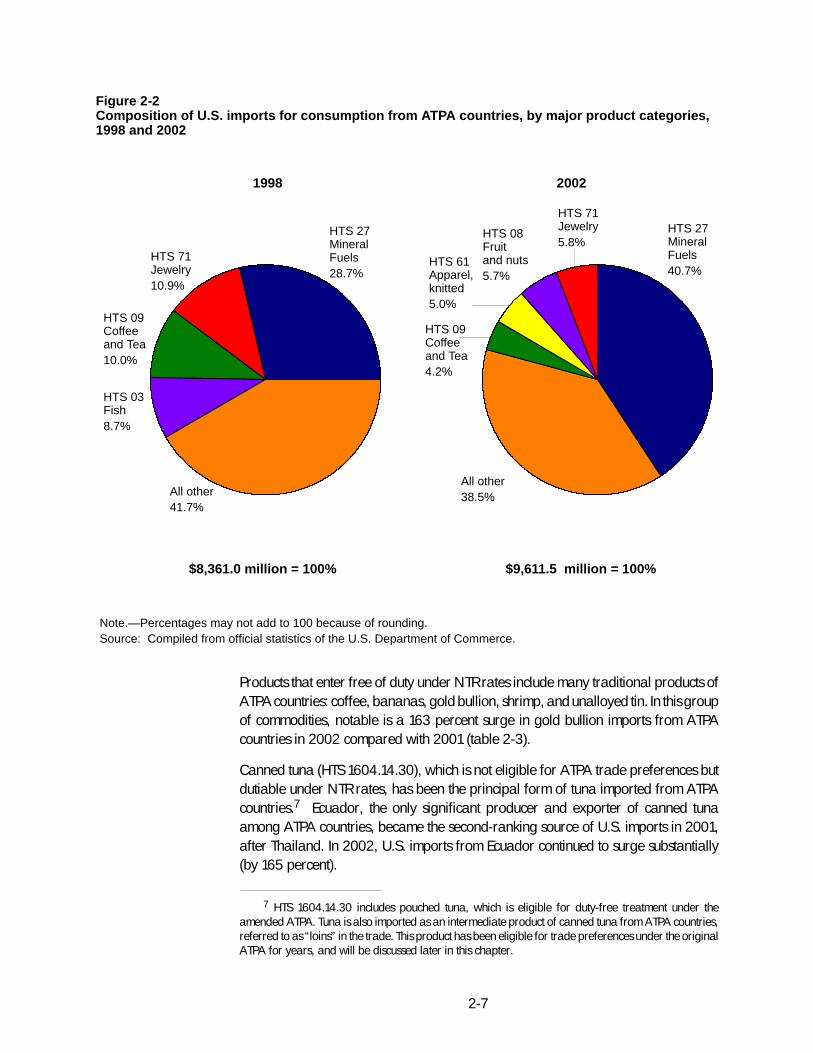
2-7
Figure 2-2Composition of U.S. imports for consumption from ATPA countries, by major product categories,1998 and 2002
HTS 08Fruitand nuts5.7%
HTS 27MineralFuels28.7%
HTS 71Jewelry10.9%
HTS 09Coffeeand Tea10.0%
HTS 03Fish8.7%
All other41.7%
HTS 27MineralFuels40.7%
HTS 71Jewelry5.8%
HTS 61Apparel,knitted5.0%
All other38.5%
Note.—Percentages may not add to 100 because of rounding.Source: Compiled from official statistics of the U.S. Department of Commerce.
1998 2002
$8,361.0 million = 100% $9,611.5 million = 100%
HTS 09Coffeeand Tea4.2%
Products that enter free of duty under NTR rates include many traditional products ofATPA countries: coffee, bananas, gold bullion, shrimp, and unalloyed tin. In this groupof commodities, notable is a 163 percent surge in gold bullion imports from ATPAcountries in 2002 compared with 2001 (table 2-3).
Canned tuna (HTS 1604.14.30), which is not eligible for ATPA trade preferences butdutiable under NTR rates, has been the principal form of tuna imported from ATPAcountries.7 Ecuador, the only significant producer and exporter of canned tunaamong ATPA countries, became the second-ranking source of U.S. imports in 2001,after Thailand. In 2002, U.S. imports from Ecuador continued to surge substantially(by 165 percent).
7 HTS 1604.14.30 includes pouched tuna, which is eligible for duty-free treatment under theamended ATPA. Tuna is also imported as an intermediate product of canned tuna from ATPA countries,referred to as “loins” in the trade. This product has been eligible for trade preferences under the originalATPA for years, and will be discussed later in this chapter.
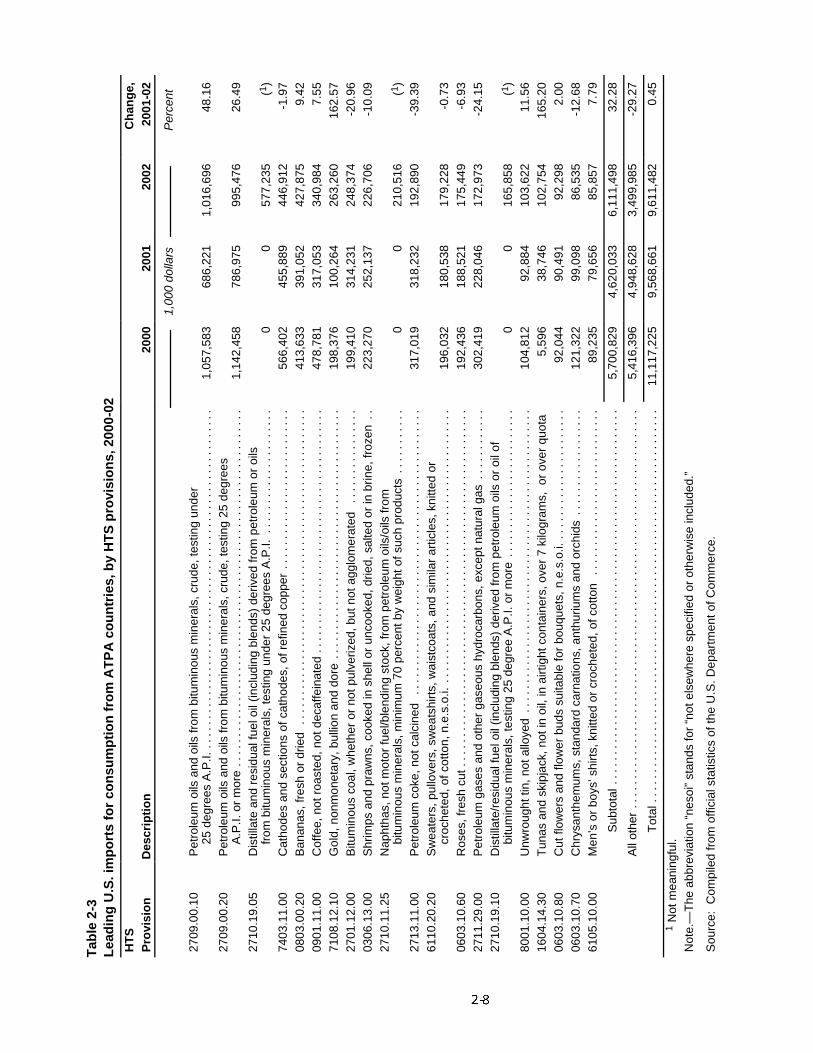
Tab
le2-
3L
ead
ing
U.S
.im
po
rts
for
con
sum
pti
on
fro
mA
TP
Aco
un
trie
s,b
yH
TS
pro
visi
on
s,20
00-0
2H
TS
Ch
ang
e,P
rovi
sio
nD
escr
ipti
on
2000
2001
2002
2001
-02
1,00
0do
llars
Per
cent
2709
.00.
10P
etro
leum
oils
and
oils
from
bitu
min
ous
min
eral
s,cr
ude,
test
ing
unde
r25
degr
ees
A.P
.I...
....
....
....
....
....
....
....
....
....
....
....
....
....
...
1,05
7,58
368
6,22
11,
016,
696
48.1
627
09.0
0.20
Pet
role
umoi
lsan
doi
lsfr
ombi
tum
inou
sm
iner
als,
crud
e,te
stin
g25
degr
ees
A.P
.I.or
mor
e..
....
....
....
....
....
....
....
....
....
....
....
....
....
....
..1,
142,
458
786,
975
995,
476
26.4
927
10.1
9.05
Dis
tilla
tean
dre
sidu
alfu
eloi
l(in
clud
ing
blen
ds)
deriv
edfr
ompe
trol
eum
oroi
lsfr
ombi
tum
inou
sm
iner
als,
test
ing
unde
r25
degr
ees
A.P
.I...
....
....
....
....
...
00
577,
235
(1)
7403
.11.
00C
atho
des
and
sect
ions
ofca
thod
es,o
fref
ined
copp
er..
....
....
....
....
....
....
.56
6,40
245
5,88
944
6,91
2-1
.97
0803
.00.
20B
anan
as,f
resh
ordr
ied
....
....
....
....
....
....
....
....
....
....
....
....
....
.41
3,63
339
1,05
242
7,87
59.
4209
01.1
1.00
Cof
fee,
notr
oast
ed,n
otde
caffe
inat
ed..
....
....
....
....
....
....
....
....
....
...
478,
781
317,
053
340,
984
7.55
7108
.12.
10G
old,
nonm
onet
ary,
bulli
onan
ddo
re..
....
....
....
....
....
....
....
....
....
....
198,
376
100,
264
263,
260
162.
5727
01.1
2.00
Bitu
min
ous
coal
,whe
ther
orno
tpul
veriz
ed,b
utno
tagg
lom
erat
ed..
....
....
....
..19
9,41
031
4,23
124
8,37
4-2
0.96
0306
.13.
00S
hrim
psan
dpr
awns
,coo
ked
insh
ello
run
cook
ed,d
ried,
salte
dor
inbr
ine,
froz
en..
223,
270
252,
137
226,
706
-10.
0927
10.1
1.25
Nap
htha
s,no
tmot
orfu
el/b
lend
ing
stoc
k,fr
ompe
trol
eum
oils
/oils
from
bitu
min
ous
min
eral
s,m
inim
um70
perc
entb
yw
eigh
tofs
uch
prod
ucts
....
....
...
00
210,
516
(1)
2713
.11.
00P
etro
leum
coke
,not
calc
ined
....
....
....
....
....
....
....
....
....
....
....
....
317,
019
318,
232
192,
890
-39.
3961
10.2
0.20
Sw
eate
rs,p
ullo
vers
,sw
eats
hirt
s,w
aist
coat
s,an
dsi
mila
rar
ticle
s,kn
itted
orcr
oche
ted,
ofco
tton,
n.e.
s.o.
i...
....
....
....
....
....
....
....
....
....
....
....
196,
032
180,
538
179,
228
-0.7
306
03.1
0.60
Ros
es,f
resh
cut.
....
....
....
....
....
....
....
....
....
....
....
....
....
....
...
192,
436
188,
521
175,
449
-6.9
327
11.2
9.00
Pet
role
umga
ses
and
othe
rga
seou
shy
droc
arbo
ns,e
xcep
tnat
ural
gas
....
....
....
302,
419
228,
046
172,
973
-24.
1527
10.1
9.10
Dis
tilla
te/r
esid
ualf
uelo
il(in
clud
ing
blen
ds)
deriv
edfr
ompe
trol
eum
oils
oroi
lof
bitu
min
ous
min
eral
s,te
stin
g25
degr
eeA
.P.I.
orm
ore
....
....
....
....
....
....
.0
016
5,85
8(1
)80
01.1
0.00
Unw
roug
httin
,not
allo
yed
....
....
....
....
....
....
....
....
....
....
....
....
...
104,
812
92,8
8410
3,62
211
.56
1604
.14.
30T
unas
and
skip
jack
,not
inoi
l,in
airt
ight
cont
aine
rs,o
ver
7ki
logr
ams,
orov
erqu
ota
5,59
638
,746
102,
754
165.
2006
03.1
0.80
Cut
flow
ers
and
flow
erbu
dssu
itabl
efo
rbo
uque
ts,n
.e.s
.o.i.
....
....
....
....
....
..92
,044
90,4
9192
,298
2.00
0603
.10.
70C
hrys
anth
emum
s,st
anda
rdca
rnat
ions
,ant
huriu
ms
and
orch
ids
....
....
....
....
..12
1,32
299
,098
86,5
35-1
2.68
6105
.10.
00M
en’s
orbo
ys’s
hirt
s,kn
itted
orcr
oche
ted,
ofco
tton
....
....
....
....
....
....
....
89,2
3579
,656
85,8
577.
79
Sub
tota
l...
....
....
....
....
....
....
....
....
....
....
....
....
....
....
....
5,70
0,82
94,
620,
033
6,11
1,49
832
.28
All
othe
r..
....
....
....
....
....
....
....
....
....
....
....
....
....
....
....
....
.5,
416,
396
4,94
8,62
83,
499,
985
-29.
27
Tot
al..
....
....
....
....
....
....
....
....
....
....
....
....
....
....
....
....
11,1
17,2
259,
568,
661
9,61
1,48
20.
451
Not
mea
ning
ful.
Not
e.—
The
abbr
evia
tion
“nes
oi”
stan
dsfo
r“n
otel
sew
here
spec
ified
orot
herw
ise
incl
uded
.”
Sou
rce:
Com
pile
dfr
omof
ficia
lsta
tistic
sof
the
U.S
.Dep
artm
ento
fCom
mer
ce.
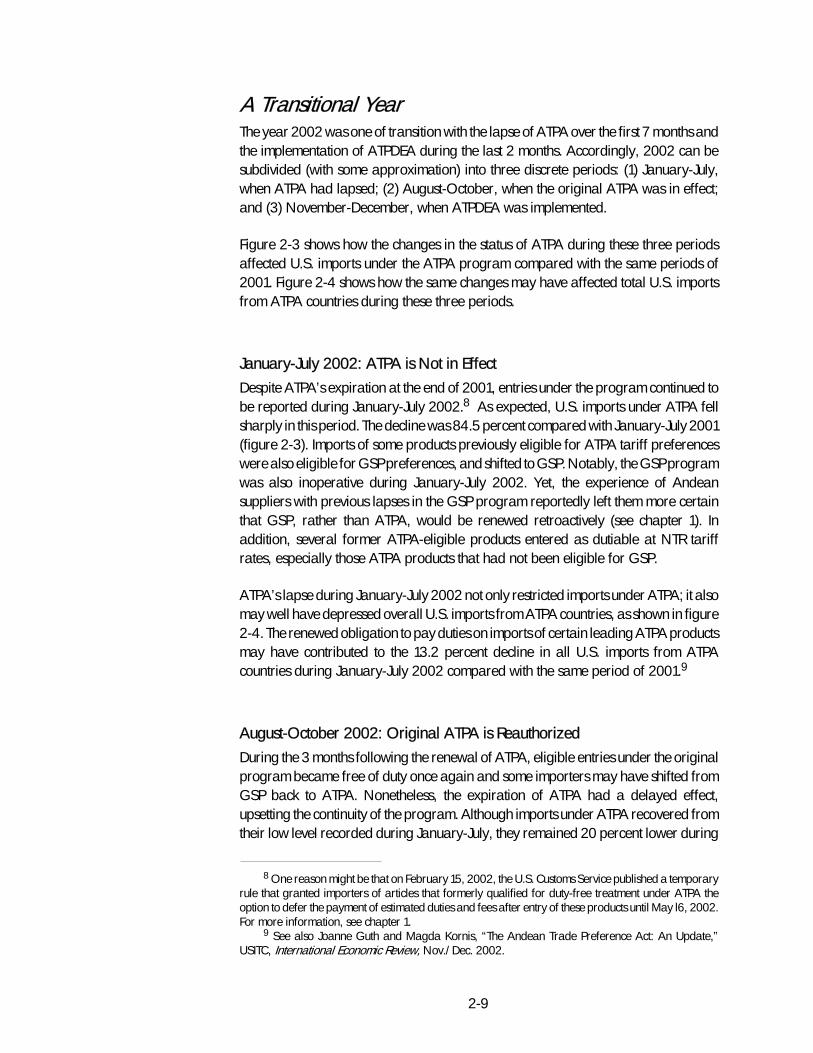
2-9
A Transitional YearThe year 2002 was one of transition with the lapse of ATPA over the first 7 months andthe implementation of ATPDEA during the last 2 months. Accordingly, 2002 can besubdivided (with some approximation) into three discrete periods: (1) January-July,when ATPA had lapsed; (2) August-October, when the original ATPA was in effect;and (3) November-December, when ATPDEA was implemented.
Figure 2-3 shows how the changes in the status of ATPA during these three periodsaffected U.S. imports under the ATPA program compared with the same periods of2001. Figure 2-4 shows how the same changes may have affected total U.S. importsfrom ATPA countries during these three periods.
January-July 2002: ATPA is Not in EffectDespite ATPA’s expiration at the end of 2001, entries under the program continued tobe reported during January-July 2002.8 As expected, U.S. imports under ATPA fellsharply in this period. The decline was 84.5 percent compared with January-July 2001(figure 2-3). Imports of some products previously eligible for ATPA tariff preferenceswere also eligible for GSP preferences, and shifted to GSP. Notably, the GSP programwas also inoperative during January-July 2002. Yet, the experience of Andeansuppliers with previous lapses in the GSP program reportedly left them more certainthat GSP, rather than ATPA, would be renewed retroactively (see chapter 1). Inaddition, several former ATPA-eligible products entered as dutiable at NTR tariffrates, especially those ATPA products that had not been eligible for GSP.
ATPA’s lapse during January-July 2002 not only restricted imports under ATPA; it alsomay well have depressed overall U.S. imports from ATPA countries, as shown in figure2-4. The renewed obligation to pay duties on imports of certain leading ATPA productsmay have contributed to the 13.2 percent decline in all U.S. imports from ATPAcountries during January-July 2002 compared with the same period of 2001.9
August-October 2002: Original ATPA is ReauthorizedDuring the 3 months following the renewal of ATPA, eligible entries under the originalprogram became free of duty once again and some importers may have shifted fromGSP back to ATPA. Nonetheless, the expiration of ATPA had a delayed effect,upsetting the continuity of the program. Although imports under ATPA recovered fromtheir low level recorded during January-July, they remained 20 percent lower during
8 One reason might be that on February 15, 2002, the U.S. Customs Service published a temporaryrule that granted importers of articles that formerly qualified for duty-free treatment under ATPA theoption to defer the payment of estimated duties and fees after entry of these products until May l6, 2002.For more information, see chapter 1.
9 See also Joanne Guth and Magda Kornis, “The Andean Trade Preference Act: An Update,”USITC, International Economic Review, Nov./Dec. 2002.
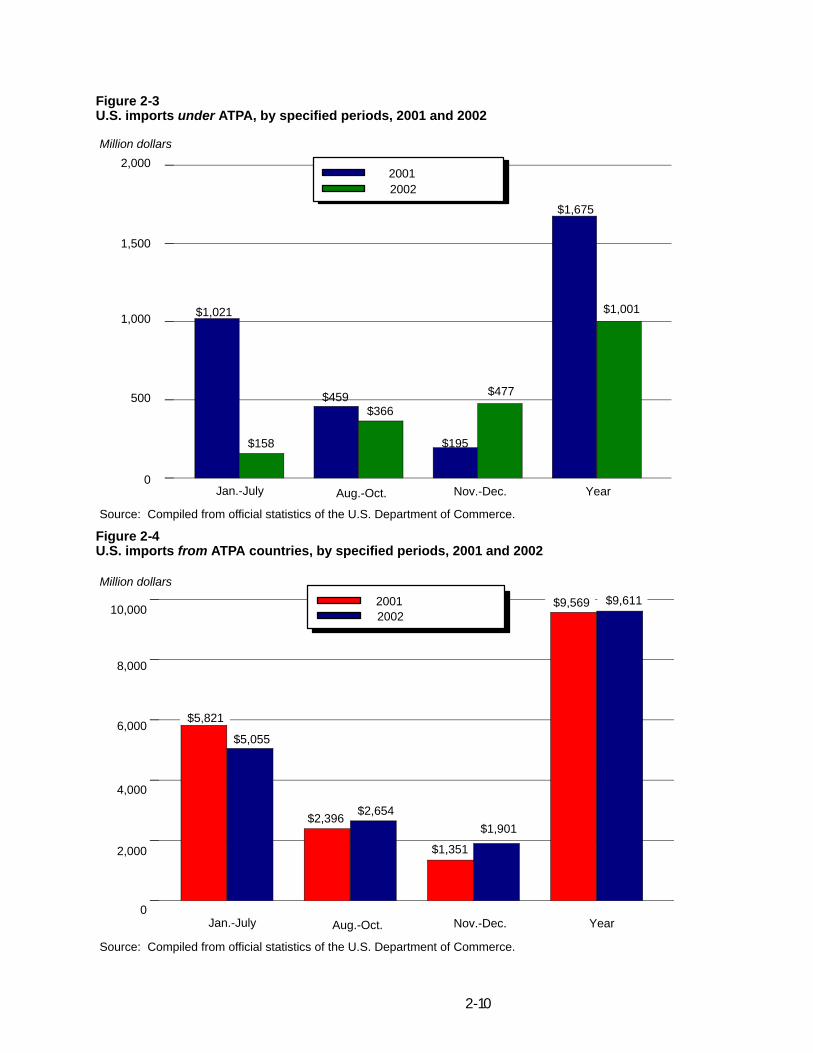
2-10
Figure 2-3U.S. imports under ATPA, by specified periods, 2001 and 2002
Source: Compiled from official statistics of the U.S. Department of Commerce.
0
500
1,000
Jan.-July Aug.-Oct. Nov.-Dec. Year
1,500
2,000
$1,021
$158
$459$366
$195
$477
$1,675
$1,001
20012002
Million dollars
Figure 2-4U.S. imports from ATPA countries, by specified periods, 2001 and 2002
Source: Compiled from official statistics of the U.S. Department of Commerce.
0
2,000
6,000
Jan.-July Aug.-Oct. Nov.-Dec. Year
8,000
10,000
$5,055
$2,396$2,654
$1,351
$1,901
20012002
4,000
Million dollars
$5,821
$9,611$9,569
2-11
August-October 2002 than in the comparable period of 2001 (figure 2-3). OverallU.S. imports from ATPA countries also recovered after ATPA’s renewal. As figure 2-4shows, such imports were 11 percent higher during August-October 2002 than in thecomparable 3 months of 2001.
November-December 2002: ATPDEA is Implemented
The new eligibility of petroleum and derivatives for tariff preferences under ATPDEAresulted in a substantial increase in imports under ATPA for this short period. Importsunder ATPA were 145 percent higher during November-December 2002 than theyhad been in the comparable period of 2001 (figure 2-3). Overall U.S. imports were up41 percent (figure 2-4).
The Year 2002
The positive effect on U.S. imports of the implementation of ATPDEA during the last 2months of the atypical year of 2002 only partly offset the negative effect of the lapse ofATPA during the first 7 months. This resulted in a 40 percent decline of imports underATPA in 2002 (figure 2-3). The long lapse of ATPA and the relatively small volume oftrade believed to have been given the preference retroactively, apparently depressedoverall imports from ATPA countries as well; they remained essentially unchangedfrom 2001 (figure 2-4).
U.S. imports under ATPDEA totaled $212 million in 2002.10 Petroleum-based productsaccounted for the overwhelming portion of this trade. No imports of textile or apparelarticles, or pouched tuna under ATPDEA were officially recorded in 2002,11 and onlynegligible amounts of the other newly eligible items were recorded.
Developments in the last 2 months of 2002 foreshadow significant changes in thescope and composition of imports under the expanded ATPA. Five petroleumderivatives that were excluded from preferences under the original ATPA were amongthe leading imports under ATPA for the year 2002, displacing other products from thelist.12 By the end of 2003, after ATPDEA has been in effect for the entire year, majorchanges will likely emerge in the patterns of ATPA trade by commodity and bycountry.13
10 See table 2-5 later in this chapter.11 Trade in textiles and apparel is discussed separately below. Although ATPDEA duty-free entry is
provided to certain tuna in foil or flexible containers weighing with their contents no more than 6.8 kg, nosuch imports were recorded in 2002.
12 See table 2-6 in “Leading Imports Under ATPA” later in this chapter.13 As noted in chapter 3, during the first 4 months of 2003, petroleum and petroleum products
accounted for over half of the value of U.S. imports under ATPA.
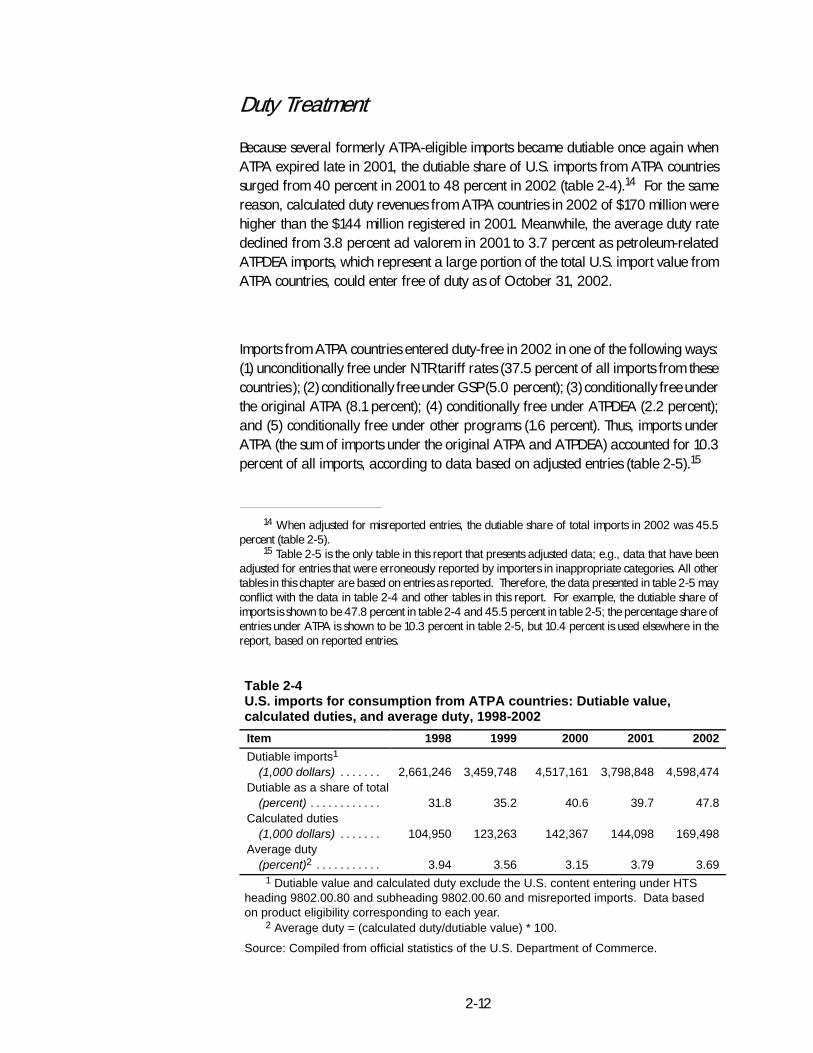
2-12
Duty Treatment
Because several formerly ATPA-eligible imports became dutiable once again whenATPA expired late in 2001, the dutiable share of U.S. imports from ATPA countriessurged from 40 percent in 2001 to 48 percent in 2002 (table 2-4).14 For the samereason, calculated duty revenues from ATPA countries in 2002 of $170 million werehigher than the $144 million registered in 2001. Meanwhile, the average duty ratedeclined from 3.8 percent ad valorem in 2001 to 3.7 percent as petroleum-relatedATPDEA imports, which represent a large portion of the total U.S. import value fromATPA countries, could enter free of duty as of October 31, 2002.
Imports from ATPA countries entered duty-free in 2002 in one of the following ways:(1) unconditionally free under NTR tariff rates (37.5 percent of all imports from thesecountries ); (2) conditionally free under GSP (5.0 percent); (3) conditionally free underthe original ATPA (8.1 percent); (4) conditionally free under ATPDEA (2.2 percent);and (5) conditionally free under other programs (1.6 percent). Thus, imports underATPA (the sum of imports under the original ATPA and ATPDEA) accounted for 10.3percent of all imports, according to data based on adjusted entries (table 2-5).15
14 When adjusted for misreported entries, the dutiable share of total imports in 2002 was 45.5percent (table 2-5).
15 Table 2-5 is the only table in this report that presents adjusted data; e.g., data that have beenadjusted for entries that were erroneously reported by importers in inappropriate categories. All othertables in this chapter are based on entries as reported. Therefore, the data presented in table 2-5 mayconflict with the data in table 2-4 and other tables in this report. For example, the dutiable share ofimports is shown to be 47.8 percent in table 2-4 and 45.5 percent in table 2-5; the percentage share ofentries under ATPA is shown to be 10.3 percent in table 2-5, but 10.4 percent is used elsewhere in thereport, based on reported entries.
Table 2-4U.S. imports for consumption from ATPA countries: Dutiable value,calculated duties, and average duty, 1998-2002
Item 1998 1999 2000 2001 2002
Dutiable imports1
(1,000 dollars) . . . . . . . 2,661,246 3,459,748 4,517,161 3,798,848 4,598,474Dutiable as a share of total
(percent) . . . . . . . . . . . . 31.8 35.2 40.6 39.7 47.8Calculated duties
(1,000 dollars) . . . . . . . 104,950 123,263 142,367 144,098 169,498Average duty
(percent)2 . . . . . . . . . . . 3.94 3.56 3.15 3.79 3.691 Dutiable value and calculated duty exclude the U.S. content entering under HTS
heading 9802.00.80 and subheading 9802.00.60 and misreported imports. Data basedon product eligibility corresponding to each year.
2 Average duty = (calculated duty/dutiable value) * 100.
Source: Compiled from official statistics of the U.S. Department of Commerce.
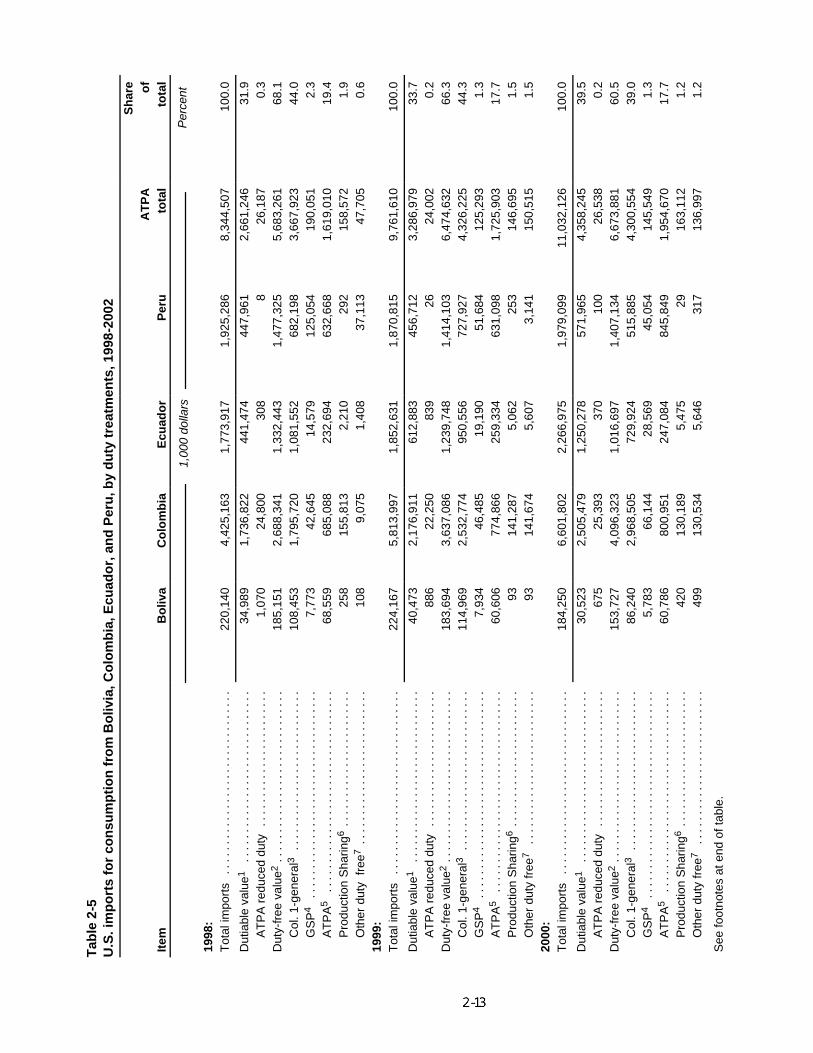
Tab
le2-
5U
.S.i
mp
ort
sfo
rco
nsu
mp
tio
nfr
om
Bo
livia
,Co
lom
bia
,Ecu
ado
r,an
dP
eru
,by
du
tytr
eatm
ents
,199
8-20
02S
har
eA
TP
Ao
fIt
emB
oliv
aC
olo
mb
iaE
cuad
or
Per
uto
tal
tota
l
1,00
0do
llars
Per
cent
1998
:T
otal
impo
rts
....
....
....
....
....
....
....
...
220,
140
4,42
5,16
31,
773,
917
1,92
5,28
68,
344,
507
100.
0
Dut
iabl
eva
lue1
....
....
....
....
....
....
....
.34
,989
1,73
6,82
244
1,47
444
7,96
12,
661,
246
31.9
AT
PA
redu
ced
duty
....
....
....
....
....
...
1,07
024
,800
308
826
,187
0.3
Dut
y-fr
eeva
lue2
....
....
....
....
....
....
....
.18
5,15
12,
688,
341
1,33
2,44
31,
477,
325
5,68
3,26
168
.1C
ol.1
-gen
eral
3..
....
....
....
....
....
....
.10
8,45
31,
795,
720
1,08
1,55
268
2,19
83,
667,
923
44.0
GS
P4
....
....
....
....
....
....
....
....
...
7,77
342
,645
14,5
7912
5,05
419
0,05
12.
3A
TP
A5
....
....
....
....
....
....
....
....
..68
,559
685,
088
232,
694
632,
668
1,61
9,01
019
.4P
rodu
ctio
nS
harin
g6..
....
....
....
....
....
.25
815
5,81
32,
210
292
158,
572
1.9
Oth
erdu
tyfr
ee7
....
....
....
....
....
....
..10
89,
075
1,40
837
,113
47,7
050.
619
99:
Tot
alim
port
s..
....
....
....
....
....
....
....
.22
4,16
75,
813,
997
1,85
2,63
11,
870,
815
9,76
1,61
010
0.0
Dut
iabl
eva
lue1
....
....
....
....
....
....
....
.40
,473
2,17
6,91
161
2,88
345
6,71
23,
286,
979
33.7
AT
PA
redu
ced
duty
....
....
....
....
....
...
886
22,2
5083
926
24,0
020.
2D
uty-
free
valu
e2..
....
....
....
....
....
....
...
183,
694
3,63
7,08
61,
239,
748
1,41
4,10
36,
474,
632
66.3
Col
.1-g
ener
al3
....
....
....
....
....
....
...
114,
969
2,53
2,77
495
0,55
672
7,92
74,
326,
225
44.3
GS
P4
....
....
....
....
....
....
....
....
...
7,93
446
,485
19,1
9051
,684
125,
293
1.3
AT
PA
5..
....
....
....
....
....
....
....
....
60,6
0677
4,86
625
9,33
463
1,09
81,
725,
903
17.7
Pro
duct
ion
Sha
ring6
....
....
....
....
....
...
9314
1,28
75,
062
253
146,
695
1.5
Oth
erdu
tyfr
ee7
....
....
....
....
....
....
..93
141,
674
5,60
73,
141
150,
515
1.5
2000
:T
otal
impo
rts
....
....
....
....
....
....
....
...
184,
250
6,60
1,80
22,
266,
975
1,97
9,09
911
,032
,126
100.
0
Dut
iabl
eva
lue1
....
....
....
....
....
....
....
.30
,523
2,50
5,47
91,
250,
278
571,
965
4,35
8,24
539
.5A
TP
Are
duce
ddu
ty..
....
....
....
....
....
.67
525
,393
370
100
26,5
380.
2D
uty-
free
valu
e2..
....
....
....
....
....
....
...
153,
727
4,09
6,32
31,
016,
697
1,40
7,13
46,
673,
881
60.5
Col
.1-g
ener
al3
....
....
....
....
....
....
...
86,2
402,
968,
505
729,
924
515,
885
4,30
0,55
439
.0G
SP
4..
....
....
....
....
....
....
....
....
.5,
783
66,1
4428
,569
45,0
5414
5,54
91.
3A
TP
A5
....
....
....
....
....
....
....
....
..60
,786
800,
951
247,
084
845,
849
1,95
4,67
017
.7P
rodu
ctio
nS
harin
g6..
....
....
....
....
....
.42
013
0,18
95,
475
2916
3,11
21.
2O
ther
duty
free
7..
....
....
....
....
....
....
499
130,
534
5,64
631
713
6,99
71.
2
See
foot
note
sat
end
ofta
ble.
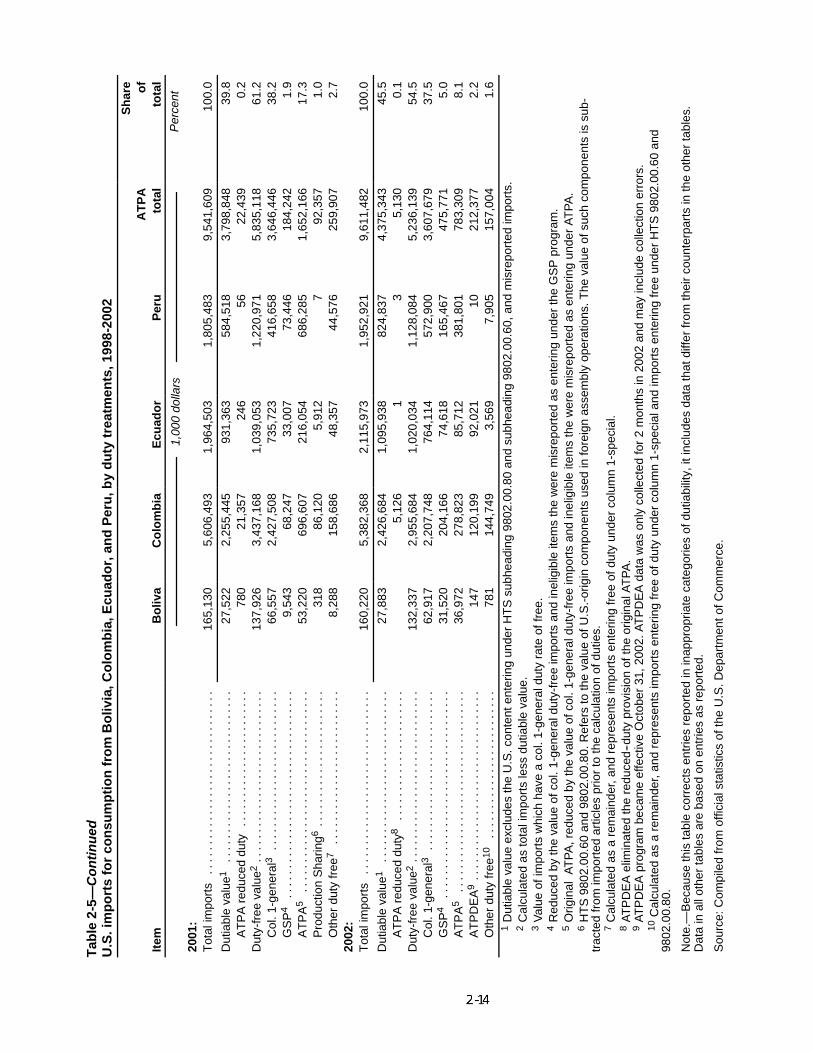
Tab
le2-
5—C
on
tin
ued
U.S
.im
po
rts
for
con
sum
pti
on
fro
mB
oliv
ia,C
olo
mb
ia,E
cuad
or,
and
Per
u,b
yd
uty
trea
tmen
ts,1
998-
2002
Sh
are
AT
PA
of
Item
Bo
liva
Co
lom
bia
Ecu
ado
rP
eru
tota
lto
tal
1,00
0do
llars
Per
cent
2001
:T
otal
impo
rts
....
....
....
....
....
....
....
...
165,
130
5,60
6,49
31,
964,
503
1,80
5,48
39,
541,
609
100.
0
Dut
iabl
eva
lue1
....
....
....
....
....
....
....
.27
,522
2,25
5,44
593
1,36
358
4,51
83,
798,
848
39.8
AT
PA
redu
ced
duty
....
....
....
....
....
...
780
21,3
5724
656
22,4
390.
2D
uty-
free
valu
e2..
....
....
....
....
....
....
...
137,
926
3,43
7,16
81,
039,
053
1,22
0,97
15,
835,
118
61.2
Col
.1-g
ener
al3
....
....
....
....
....
....
...
66,5
572,
427,
508
735,
723
416,
658
3,64
6,44
638
.2G
SP
4..
....
....
....
....
....
....
....
....
.9,
543
68,2
4733
,007
73,4
4618
4,24
21.
9A
TP
A5
....
....
....
....
....
....
....
....
..53
,220
696,
607
216,
054
686,
285
1,65
2,16
617
.3P
rodu
ctio
nS
harin
g6..
....
....
....
....
....
.31
886
,120
5,91
27
92,3
571.
0O
ther
duty
free
7..
....
....
....
....
....
....
8,28
815
8,68
648
,357
44,5
7625
9,90
72.
720
02:
Tot
alim
port
s..
....
....
....
....
....
....
....
.16
0,22
05,
382,
368
2,11
5,97
31,
952,
921
9,61
1,48
210
0.0
Dut
iabl
eva
lue1
....
....
....
....
....
....
....
.27
,883
2,42
6,68
41,
095,
938
824,
837
4,37
5,34
345
.5A
TP
Are
duce
ddu
ty8
....
....
....
....
....
..5,
126
13
5,13
00.
1D
uty-
free
valu
e2..
....
....
....
....
....
....
...
132,
337
2,95
5,68
41,
020,
034
1,12
8,08
45,
236,
139
54.5
Col
.1-g
ener
al3
....
....
....
....
....
....
...
62,9
172,
207,
748
764,
114
572,
900
3,60
7,67
937
.5G
SP
4..
....
....
....
....
....
....
....
....
.31
,520
204,
166
74,6
1816
5,46
747
5,77
15.
0A
TP
A5
....
....
....
....
....
....
....
....
..36
,972
278,
823
85,7
1238
1,80
178
3,30
98.
1A
TP
DE
A9
....
....
....
....
....
....
....
....
147
120,
199
92,0
2110
212,
377
2.2
Oth
erdu
tyfr
ee10
....
....
....
....
....
....
.78
114
4,74
93,
569
7,90
515
7,00
41.
61
Dut
iabl
eva
lue
excl
udes
the
U.S
.con
tent
ente
ring
unde
rH
TS
subh
eadi
ng98
02.0
0.80
and
subh
eadi
ng98
02.0
0.60
,and
mis
repo
rted
impo
rts.
2C
alcu
late
das
tota
lim
port
sle
ssdu
tiabl
eva
lue.
3Va
lue
ofim
port
sw
hich
have
aco
l.1-
gene
rald
uty
rate
offr
ee.
4R
educ
edby
the
valu
eof
col.
1-ge
nera
ldut
y-fr
eeim
port
san
din
elig
ible
item
sth
ew
ere
mis
repo
rted
asen
terin
gun
der
the
GS
Ppr
ogra
m.
5O
rigin
alAT
PA,r
educ
edby
the
valu
eof
col.
1-ge
nera
ldut
y-fr
eeim
port
san
din
elig
ible
item
sth
ew
ere
mis
repo
rted
asen
terin
gun
der
ATPA
.6
HT
S98
02.0
0.60
and
9802
.00.
80.R
efer
sto
the
valu
eof
U.S
.-or
igin
com
pone
nts
used
info
reig
nas
sem
bly
oper
atio
ns.T
heva
lue
ofsu
chco
mpo
nent
sis
sub-
trac
ted
from
impo
rted
artic
les
prio
rto
the
calc
ulat
ion
ofdu
ties.
7C
alcu
late
das
are
mai
nder
,and
repr
esen
tsim
port
sen
terin
gfr
eeof
duty
unde
rco
lum
n1-
spec
ial.
8AT
PD
EA
elim
inat
edth
ere
duce
d--d
uty
prov
isio
nof
the
orig
inal
ATPA
.9
ATP
DE
Apr
ogra
mbe
cam
eef
fect
ive
Oct
ober
31,2
002.
ATP
DE
Ada
taw
ason
lyco
llect
edfo
r2
mon
ths
in20
02an
dm
ayin
clud
eco
llect
ion
erro
rs.
10C
alcu
late
das
are
mai
nder
,and
repr
esen
tsim
port
sen
terin
gfr
eeof
duty
unde
rco
lum
n1-
spec
iala
ndim
port
sen
terin
gfr
eeun
der
HT
S98
02.0
0.60
and
9802
.00.
80.
Not
e.—
Bec
ause
this
tabl
eco
rrec
tsen
trie
sre
port
edin
inap
prop
riate
cate
gorie
sof
dutia
bilit
y,it
incl
udes
data
that
diffe
rfr
omth
eir
coun
terp
arts
inth
eot
her
tabl
es.
Dat
ain
allo
ther
tabl
esar
eba
sed
onen
trie
sas
repo
rted
.
Sou
rce:
Com
pile
dfr
omof
ficia
lsta
tistic
sof
the
U.S
.Dep
artm
ento
fCom
mer
ce.
2-15
Imports under GSP increased from 1.9 percent of total imports from ATPA countries in2001 to 5.0 percent in 2002, as a portion of imports of formerly ATPA-eligible itemsshifted to GSP during the 7 months that ATPA was not in effect. The share of importsfree of duty under NTR tariff rates declined slightly from 38.2 percent in 2001 to 37.5percent of the total in 2002, yet they continued to be the largest group of U.S. importsfrom ATPA countries.
Leading Imports Under ATPATable 2-6 shows that five of the six new products on the list of 20 leading imports underATPA in 2002 are attributable to the inclusion of formerly ineligible products in theexpanded program. Conversely, some products that had been prominent in 2001 areabsent from the 2002 list, because they either were dutiable when ATPA was not ineffect, or were entered under GSP, or were simply displaced by the new items.
New Leading Imports under ATPDEAAs mentioned earlier, five leading petroleum derivatives that had not been eligible fortrade preferences under the original ATPA, became leading ATPA imports in 2002.Only gold rope necklaces and neck chains (HTS 7113.19.21), the sixth new leadingimport product under ATPA, did not achieve leading import status owing to ATPDEA’simplementation.16
Mineral fuels and derivativesLight petroleum oils (HTS 2709.00.10)17 and heavy petroleum oils (HTS 2709.00.20)18
were number two and number four on the list of leading products imported in 2002under ATPA (table 2-6 and table 2-7). The other three leading petroleum-relatedimports were distillate and residual fuel oils derived from either light petroleum oils(HTS 2710.19.05)19 or heavy petroleum oils (HTS 2710.19.10),20 and naphthas (HTS2710.11.25).21
All five petroleum derivatives eligible under the amended ATPA are also on the list ofleading imports from ATPA countries (table 2-3). One other major petroleumderivative imported from ATPA countries, petroleum gases (HTS 2711.29.00), is free ofduty on an NTR basis.
16 For more information on jewelry, see “Jewelry” later in this chapter.17 Light petroleum oils (HTS 2709.00.10) are also on the list of leading items that benefited
exclusively from ATPA (see chapter 3).18 Heavy petroleum oils (HTS 2709.00.20) are also on the list of leading items that benefited
exclusively from ATPA (see chapter 3).19 Distillate and residual fuel oils derived from light oil (HTS 2710.19.05) are also on the list of
leading items that benefited exclusively from ATPA (see chapter 3).20 Distillate and residual fuel oils derived from heavy oil (HTS 2710.19.10) are also on the list of
leading items that benefited exclusively from ATPA (see chapter 3).21 Naphthas (HTS 2710.11.25) are also on the list of leading items that benefited exclusively from
ATPA (see chapter 3).
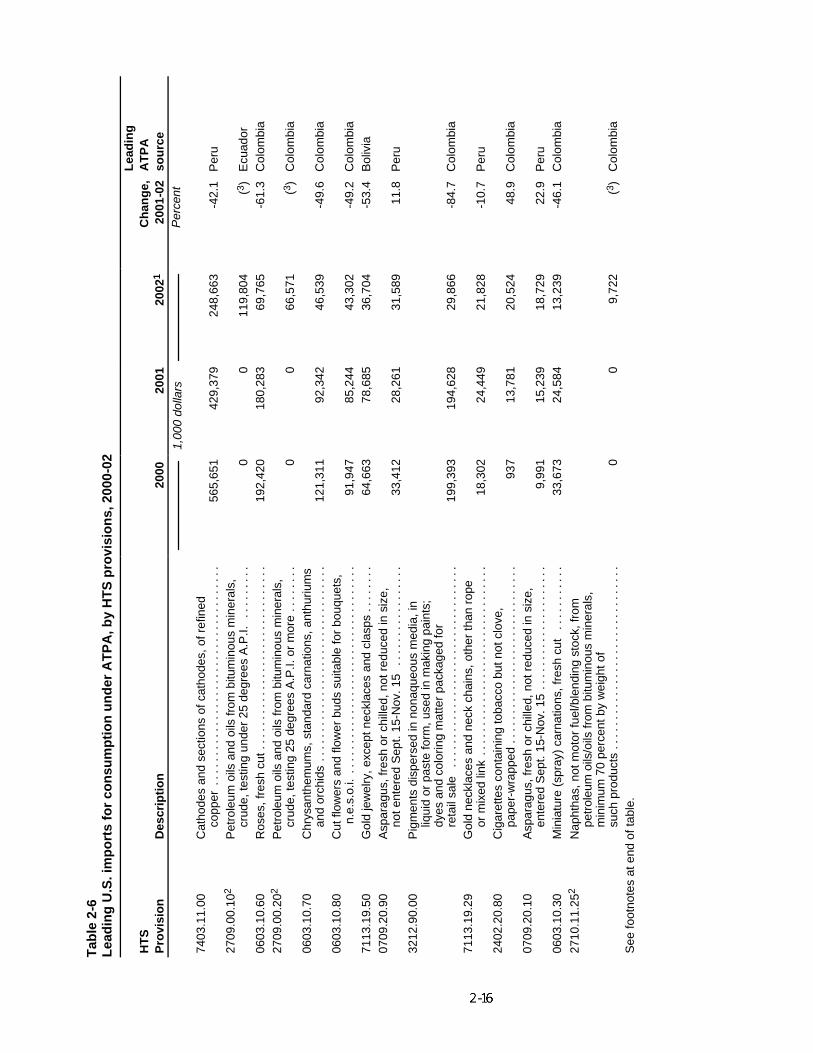
Tab
le2-
6L
ead
ing
U.S
.im
po
rts
for
con
sum
pti
on
un
der
AT
PA
,by
HT
Sp
rovi
sio
ns,
2000
-02
Lea
din
gH
TS
Ch
ang
e,A
TP
AP
rovi
sio
nD
escr
ipti
on
2000
2001
2002
120
01-0
2so
urc
e1,
000
dolla
rsP
erce
nt
7403
.11.
00C
atho
des
and
sect
ions
ofca
thod
es,o
fref
ined
copp
er..
....
....
....
....
....
....
....
....
...
565,
651
429,
379
248,
663
-42.
1P
eru
2709
.00.
102
Pet
role
umoi
lsan
doi
lsfr
ombi
tum
inou
sm
iner
als,
crud
e,te
stin
gun
der
25de
gree
sA
.P.I.
....
....
.0
011
9,80
4(3
)E
cuad
or06
03.1
0.60
Ros
es,f
resh
cut.
....
....
....
....
....
....
....
..19
2,42
018
0,28
369
,765
-61.
3C
olom
bia
2709
.00.
202
Pet
role
umoi
lsan
doi
lsfr
ombi
tum
inou
sm
iner
als,
crud
e,te
stin
g25
degr
ees
A.P
.I.or
mor
e..
....
..0
066
,571
(3)
Col
ombi
a06
03.1
0.70
Chr
ysan
them
ums,
stan
dard
carn
atio
ns,a
nthu
rium
san
dor
chid
s..
....
....
....
....
....
....
....
...
121,
311
92,3
4246
,539
-49.
6C
olom
bia
0603
.10.
80C
utflo
wer
san
dflo
wer
buds
suita
ble
for
bouq
uets
,n.
e.s.
o.i.
....
....
....
....
....
....
....
....
...
91,9
4785
,244
43,3
02-4
9.2
Col
ombi
a71
13.1
9.50
Gol
dje
wel
ry,e
xcep
tnec
klac
esan
dcl
asps
....
....
64,6
6378
,685
36,7
04-5
3.4
Bol
ivia
0709
.20.
90A
spar
agus
,fre
shor
chill
ed,n
otre
duce
din
size
,no
tent
ered
Sep
t.15
-Nov
.15
....
....
....
....
.33
,412
28,2
6131
,589
11.8
Per
u32
12.9
0.00
Pig
men
tsdi
sper
sed
inno
naqu
eous
med
ia,i
nliq
uid
orpa
ste
form
,use
din
mak
ing
pain
ts;
dyes
and
colo
ring
mat
ter
pack
aged
for
reta
ilsa
le..
....
....
....
....
....
....
....
....
199,
393
194,
628
29,8
66-8
4.7
Col
ombi
a71
13.1
9.29
Gol
dne
ckla
ces
and
neck
chai
ns,o
ther
than
rope
orm
ixed
link
....
....
....
....
....
....
....
....
18,3
0224
,449
21,8
28-1
0.7
Per
u24
02.2
0.80
Cig
aret
tes
cont
aini
ngto
bacc
obu
tnot
clov
e,pa
per-
wra
pped
....
....
....
....
....
....
....
..93
713
,781
20,5
2448
.9C
olom
bia
0709
.20.
10A
spar
agus
,fre
shor
chill
ed,n
otre
duce
din
size
,en
tere
dS
ept.
15-N
ov.1
5..
....
....
....
....
...
9,99
115
,239
18,7
2922
.9P
eru
0603
.10.
30M
inia
ture
(spr
ay)
carn
atio
ns,f
resh
cut
....
....
...
33,6
7324
,584
13,2
39-4
6.1
Col
ombi
a27
10.1
1.25
2N
apht
has,
notm
otor
fuel
/ble
ndin
gst
ock,
from
petr
oleu
moi
ls/o
ilsfr
ombi
tum
inou
sm
iner
als,
min
imum
70pe
rcen
tby
wei
ghto
fsu
chpr
oduc
ts..
....
....
....
....
....
....
....
.0
09,
722
(3)
Col
ombi
aS
eefo
otno
tes
aten
dof
tabl
e.
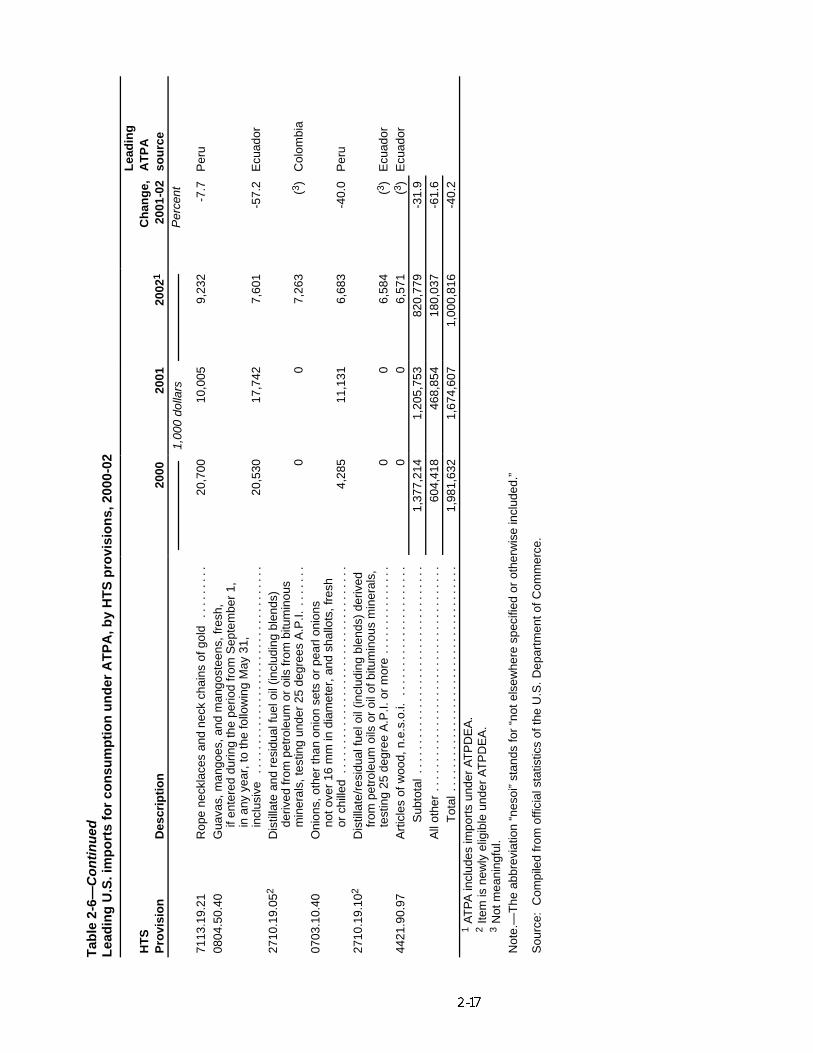
Tab
le2-
6—C
on
tin
ued
Lea
din
gU
.S.i
mp
ort
sfo
rco
nsu
mp
tio
nu
nd
erA
TP
A,b
yH
TS
pro
visi
on
s,20
00-0
2
Lea
din
gH
TS
Ch
ang
e,A
TP
AP
rovi
sio
nD
escr
ipti
on
2000
2001
2002
120
01-0
2so
urc
e1,
000
dolla
rsP
erce
nt
7113
.19.
21R
ope
neck
lace
san
dne
ckch
ains
ofgo
ld..
....
...
20,7
0010
,005
9,23
2-7
.7P
eru
0804
.50.
40G
uava
s,m
ango
es,a
ndm
ango
stee
ns,f
resh
,if
ente
red
durin
gth
epe
riod
from
Sep
tem
ber
1,in
any
year
,to
the
follo
win
gM
ay31
,in
clus
ive
....
....
....
....
....
....
....
....
...
20,5
3017
,742
7,60
1-5
7.2
Ecu
ador
2710
.19.
052
Dis
tilla
tean
dre
sidu
alfu
eloi
l(in
clud
ing
blen
ds)
deriv
edfr
ompe
trol
eum
oroi
lsfr
ombi
tum
inou
sm
iner
als,
test
ing
unde
r25
degr
ees
A.P
.I...
....
.0
07,
263
(3)
Col
ombi
a07
03.1
0.40
Oni
ons,
othe
rth
anon
ion
sets
orpe
arlo
nion
sno
tove
r16
mm
indi
amet
er,a
ndsh
allo
ts,f
resh
orch
illed
....
....
....
....
....
....
....
....
...
4,28
511
,131
6,68
3-4
0.0
Per
u27
10.1
9.10
2D
istil
late
/res
idua
lfue
loil
(incl
udin
gbl
ends
)de
rived
from
petr
oleu
moi
lsor
oilo
fbitu
min
ous
min
eral
s,te
stin
g25
degr
eeA
.P.I.
orm
ore
....
....
....
...
00
6,58
4(3
)E
cuad
or44
21.9
0.97
Art
icle
sof
woo
d,n.
e.s.
o.i.
....
....
....
....
....
..0
06,
571
(3)
Ecu
ador
Sub
tota
l..
....
....
....
....
....
....
....
....
.1,
377,
214
1,20
5,75
382
0,77
9-3
1.9
All
othe
r..
....
....
....
....
....
....
....
....
....
604,
418
468,
854
180,
037
-61.
6T
otal
....
....
....
....
....
....
....
....
....
..1,
981,
632
1,67
4,60
71,
000,
816
-40.
21
ATPA
incl
udes
impo
rts
unde
rAT
PD
EA
.2
Item
isne
wly
elig
ible
unde
rAT
PD
EA
.3
Not
mea
ning
ful.
Not
e.—
The
abbr
evia
tion
“nes
oi”
stan
dsfo
r“n
otel
sew
here
spec
ified
orot
herw
ise
incl
uded
.”
Sou
rce:
Com
pile
dfr
omof
ficia
lsta
tistic
sof
the
U.S
.Dep
artm
ento
fCom
mer
ce.
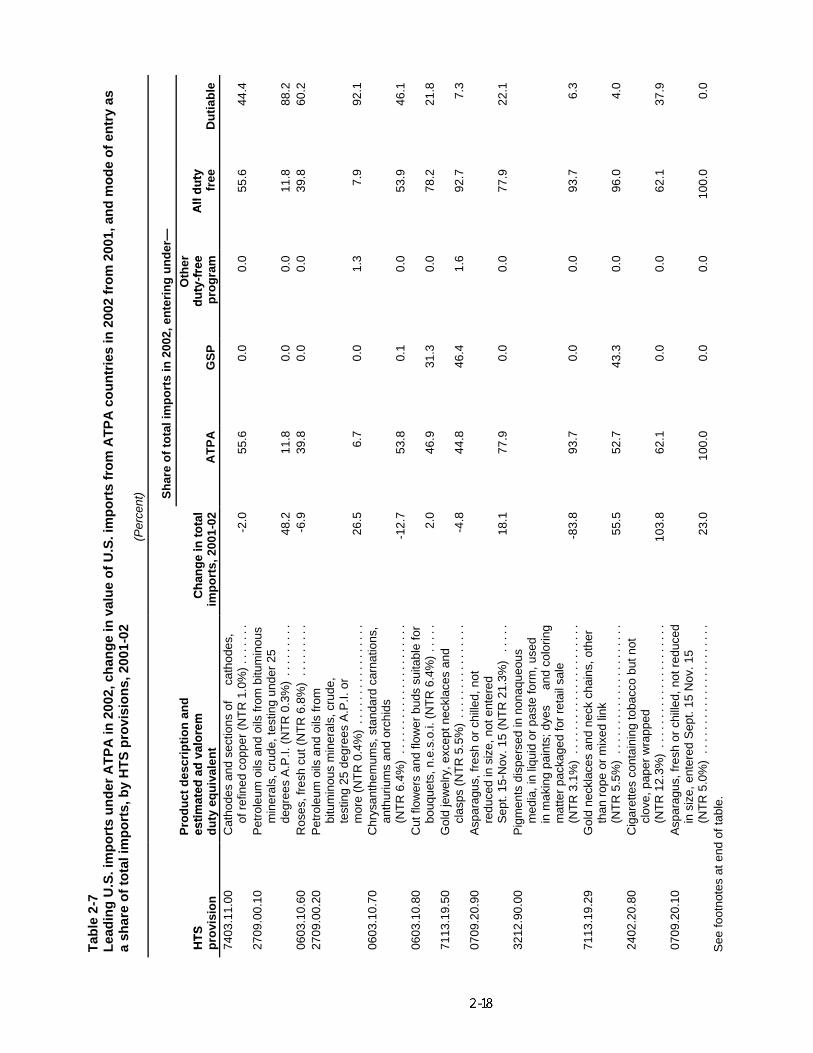
Tab
le2-
7L
ead
ing
U.S
.im
po
rts
un
der
AT
PA
in20
02,c
han
ge
inva
lue
of
U.S
.im
po
rts
fro
mA
TP
Aco
un
trie
sin
2002
fro
m20
01,a
nd
mo
de
of
entr
yas
ash
are
of
tota
lim
po
rts,
by
HT
Sp
rovi
sio
ns,
2001
-02
(Per
cent
) Sh
are
of
tota
lim
po
rts
in20
02,e
nte
rin
gu
nd
er—
HT
SP
rod
uct
des
crip
tio
nan
des
tim
ated
adva
lore
mC
han
ge
into
tal
Oth
erd
uty
free
All
du
tyH
TS
pro
visi
on
esti
mat
edad
valo
rem
du
tyeq
uiv
alen
tC
han
ge
into
tal
imp
ort
s,20
01-0
2A
TP
AG
SP
du
ty-f
ree
pro
gra
mA
lld
uty
free
Du
tiab
le74
03.1
1.00
Cat
hode
san
dse
ctio
nsof
cath
odes
,of
refin
edco
pper
(NT
R1.
0%)
....
...
-2.0
55.6
0.0
0.0
55.6
44.4
2709
.00.
10P
etro
leum
oils
and
oils
from
bitu
min
ous
min
eral
s,cr
ude,
test
ing
unde
r25
degr
ees
A.P
.I.(N
TR
0.3%
)..
....
...
48.2
11.8
0.0
0.0
11.8
88.2
0603
.10.
60R
oses
,fre
shcu
t(N
TR
6.8%
)..
....
...
-6.9
39.8
0.0
0.0
39.8
60.2
2709
.00.
20P
etro
leum
oils
and
oils
from
bitu
min
ous
min
eral
s,cr
ude,
test
ing
25de
gree
sA
.P.I.
orm
ore
(NT
R0.
4%)
....
....
....
....
.26
.56.
70.
01.
37.
992
.106
03.1
0.70
Chr
ysan
them
ums,
stan
dard
carn
atio
ns,
anth
uriu
ms
and
orch
ids
(NT
R6.
4%)
....
....
....
....
....
..-1
2.7
53.8
0.1
0.0
53.9
46.1
0603
.10.
80C
utflo
wer
san
dflo
wer
buds
suita
ble
for
bouq
uets
,n.e
.s.o
.i.(N
TR
6.4%
)..
...
2.0
46.9
31.3
0.0
78.2
21.8
7113
.19.
50G
old
jew
elry
,exc
eptn
eckl
aces
and
clas
ps(N
TR
5.5%
)..
....
....
....
..-4
.844
.846
.41.
692
.77.
307
09.2
0.90
Asp
arag
us,f
resh
orch
illed
,not
redu
ced
insi
ze,n
oten
tere
dS
ept.
15-N
ov.1
5(N
TR
21.3
%)
....
.18
.177
.90.
00.
077
.922
.132
12.9
0.00
Pig
men
tsdi
sper
sed
inno
naqu
eous
med
ia,i
nliq
uid
orpa
ste
form
,use
din
mak
ing
pain
ts;d
yes
and
colo
ring
mat
ter
pack
aged
for
reta
ilsa
le(N
TR
3.1%
)..
....
....
....
....
....
-83.
893
.70.
00.
093
.76.
371
13.1
9.29
Gol
dne
ckla
ces
and
neck
chai
ns,o
ther
than
rope
orm
ixed
link
(NT
R5.
5%)
....
....
....
....
....
..55
.552
.743
.30.
096
.04.
024
02.2
0.80
Cig
aret
tes
cont
aini
ngto
bacc
obu
tnot
clov
e,pa
per
wra
pped
(NT
R12
.3%
)..
....
....
....
....
...
103.
862
.10.
00.
062
.137
.907
09.2
0.10
Asp
arag
us,f
resh
orch
illed
,not
redu
ced
insi
ze,e
nter
edS
ept.
15N
ov.1
5(N
TR
5.0%
)..
....
....
....
....
....
23.0
100.
00.
00.
010
0.0
0.0
See
foot
note
sat
end
ofta
ble.
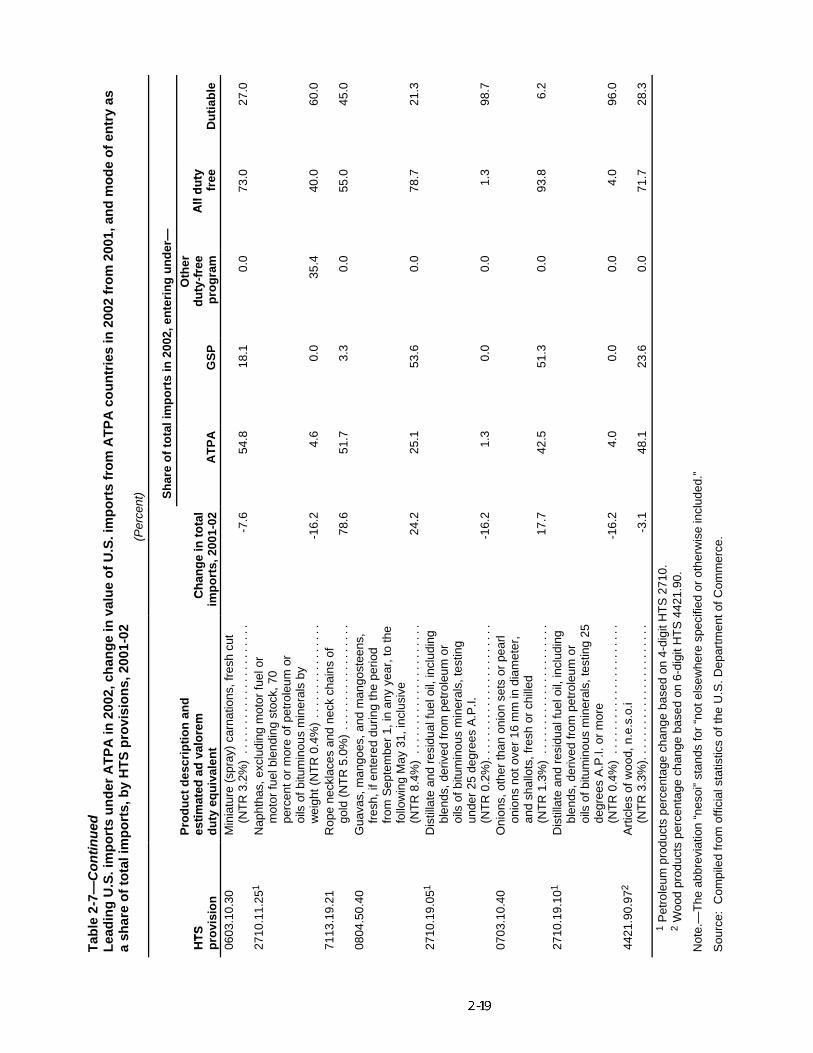
Tab
le2-
7—C
on
tin
ued
Lea
din
gU
.S.i
mp
ort
su
nd
erA
TP
Ain
2002
,ch
ang
ein
valu
eo
fU
.S.i
mp
ort
sfr
om
AT
PA
cou
ntr
ies
in20
02fr
om
2001
,an
dm
od
eo
fen
try
asa
shar
eo
fto
tali
mp
ort
s,b
yH
TS
pro
visi
on
s,20
01-0
2(P
erce
nt) Sh
are
of
tota
lim
po
rts
in20
02,e
nte
rin
gu
nd
er—
HT
SP
rod
uct
des
crip
tio
nan
des
tim
ated
adva
lore
mC
han
ge
into
tal
Oth
erd
uty
free
All
du
tyH
TS
pro
visi
on
esti
mat
edad
valo
rem
du
tyeq
uiv
alen
tC
han
ge
into
tal
imp
ort
s,20
01-0
2A
TP
AG
SP
du
ty-f
ree
pro
gra
mA
lld
uty
free
Du
tiab
le06
03.1
0.30
Min
iatu
re(s
pray
)ca
rnat
ions
,fre
shcu
t(N
TR
3.2%
)..
....
....
....
....
....
-7.6
54.8
18.1
0.0
73.0
27.0
2710
.11.
251
Nap
htha
s,ex
clud
ing
mot
orfu
elor
mot
orfu
elbl
endi
ngst
ock,
70pe
rcen
tor
mor
eof
petr
oleu
mor
oils
ofbi
tum
inou
sm
iner
als
byw
eigh
t(N
TR
0.4%
)..
....
....
....
..-1
6.2
4.6
0.0
35.4
40.0
60.0
7113
.19.
21R
ope
neck
lace
san
dne
ckch
ains
ofgo
ld(N
TR
5.0%
)..
....
....
....
....
78.6
51.7
3.3
0.0
55.0
45.0
0804
.50.
40G
uava
s,m
ango
es,a
ndm
ango
stee
ns,
fres
h,if
ente
red
durin
gth
epe
riod
from
Sep
tem
ber
1,in
any
year
,to
the
follo
win
gM
ay31
,inc
lusi
ve(N
TR
8.4%
)..
....
....
....
....
....
24.2
25.1
53.6
0.0
78.7
21.3
2710
.19.
051
Dis
tilla
tean
dre
sidu
alfu
eloi
l,in
clud
ing
blen
ds,d
eriv
edfr
ompe
trol
eum
oroi
lsof
bitu
min
ous
min
eral
s,te
stin
gun
der
25de
gree
sA
.P.I.
(NT
R0.
2%).
....
....
....
....
....
..-1
6.2
1.3
0.0
0.0
1.3
98.7
0703
.10.
40O
nion
s,ot
her
than
onio
nse
tsor
pear
lon
ions
noto
ver
16m
min
diam
eter
,an
dsh
allo
ts,f
resh
orch
illed
(NT
R1.
3%)
....
....
....
....
....
..17
.742
.551
.30.
093
.86.
227
10.1
9.10
1D
istil
late
and
resi
dual
fuel
oil,
incl
udin
gbl
ends
,der
ived
from
petr
oleu
mor
oils
ofbi
tum
inou
sm
iner
als,
test
ing
25de
gree
sA
.P.I.
orm
ore
(NT
R0.
4%)
....
....
....
....
....
..-1
6.2
4.0
0.0
0.0
4.0
96.0
4421
.90.
972
Art
icle
sof
woo
d,n.
e.s.
o.i
(NT
R3.
3%).
....
....
....
....
....
..-3
.148
.123
.60.
071
.728
.31
Pet
role
umpr
oduc
tspe
rcen
tage
chan
geba
sed
on4-
digi
tHT
S27
10.
2W
ood
prod
ucts
perc
enta
gech
ange
base
don
6-di
gitH
TS
4421
.90.
Not
e.—
The
abbr
evia
tion
“nes
oi”
stan
dsfo
r“n
otel
sew
here
spec
ified
orot
herw
ise
incl
uded
.”
Sou
rce:
Com
pile
dfr
omof
ficia
lsta
tistic
sof
the
U.S
.Dep
artm
ento
fCom
mer
ce.
2-20
Total U.S. imports from ATPA countries of light petroleum oils increased by almost onehalf of their 2001 value, and imports of heavy oils rose by 26.5 percent, even thoughonly relatively small portions of such imports entered in 2002 under ATPA (table 2-7).The remainder was dutiable at relatively low rates, ranging from 0.2 percent to 0.4percent ad valorem. The increases of these imports resulted from higher annualaverage prices that refiners pay for crude petroleum.22
It should be noted that total U.S. imports from ATPA countries of goods of HTS chapter27 (mineral fuels, oils, bituminous substances) products did not rise in 2002 (table 2-2),because the increases in imports of the oil derivatives mentioned above were offset bysharp declines in imports of some other products in the category, including petroleumcokes and gases. In addition, the terrorist group Fuerzas Armadas Revolucionarias23
(F.A.R.C.) frequently disrupted the flow of petroleum in northeastern Colombia in 2001and 2002, reducing Colombia’s exports of petroleum to the United States.
Other Leading Imports
Most of the other leading imports under the enhanced ATPA during 2002 appearedon lists of leading imports under the original ATPA in earlier years. They are coppercathodes, various cut flowers, two kinds of asparagus, pigments, cigarettes, guavasand mangoes, onions, and articles of wood.
Copper cathodes
In 2002, for the fifth year in a row, refined copper cathodes (HTS 7403.11.00)24
continued to be the number one product on the list of leading U.S. imports under ATPA.Copper cathodes were also the fourth-leading import item from ATPA countries underall entry categories (table 2-3). Refined copper cathodes are the major traded form ofcopper produced by mining companies.
Peru is the sole U.S. supplier of this product in the ATPA community, and continues to bethe largest supplier of refined copper cathodes to the United States among allcountries. In 2002, Peru accounted for nearly one-third of all U.S. imports of thisproduct, shipping somewhat more than Canada, the second-largest supplier, andChile, the third-largest. The value of imports from Peru began to drop in 2001, asworldwide oversupply depressed copper prices. Although imports by value declinedagain in 2002, Peru increased its share of total U.S. imports.
22 Prices, starting out low in January, increased steadily throughout 2002.23 F.A.R.C. stands for Revolutionary Armed Forces of Colombia, a wing of the country’s Communist
Party, and Colombia’s oldest, best equipped guerilla group.24 Refined copper cathodes (HTS provision 7403.11.00) are also on the list of leading items that
benefited exclusively from ATPA (see chapter 3).
2-21
During the years before 2002, most U.S. imports of refined copper cathodes from Peruentered under ATPA because they exceeded GSP competitive-need limits and thuswere eligible for duty-free entry only under ATPA. Thus, in 2002, when ATPA was notin effect, the product became dutiable (table 2-7). The product’s dutiable status,however, does not seem to have significantly affected overall U.S. imports of coppercathodes from Peru on an annual basis; their 2-percent decline may have been acontinuation of a downward trend related to market conditions.
FlowersThe flower sector has been the number one beneficiary of the ATPA program since itsimplementation in 1991. All four flower items that were previously among the leadingimports under ATPA–roses, chrysanthemums,25 cut flowers suitable for bouquets, andminiature carnations–remained on the 2002 list of leading imports under ATPA (table2-6). However, the value of total imports of fresh cut flowers from ATPA countries (HTS0603.10) dropped 6.4 percent during this atypical year. Three flower productsimported from ATPA countries–roses, chrysanthemums, and cut flowers suitable forbouquets–also appear on the 2002 list of leading imports under all entry categoriesfrom ATPA countries (table 2-3).
Roughly two-thirds of the U.S. cut flower market continues to be served by imports.26
Colombia and Ecuador are the number one and number two U.S. suppliers of flowersamong all countries of the world, accounting in 2002 for 54.7 percent and 16.5percent, respectively, of all U.S. imports. The Dole Fresh Fruit International Co. ownsand operates 23 flower farms in Colombia and Ecuador through its subsidiary,Americaflor Limitada, the world’s largest grower of fresh flowers.27 The competitiveedge of both Colombia and Ecuador in meeting U.S. demand for flowers is attributableto a favorable climate, relatively low production costs, and adequate air-freightservice and distribution infrastructure.
The removal of ATPA duty-free treatment for flowers in December 2001 was regardedas a major competitive disadvantage by interested parties. Both Colombian andEcuadoran flower growers warned that, because profit margins are so slim in thehighly competitive flower business (an average of 2 to 4 percent),28 the cost of the duty(between 3.2 and 6.8 percent ad valorem) imposed on flower imports after ATPAexpired threatened the viability of some of the flower farms. According to the
25 Roses (HTS 0603.10.60) and chrysanthemums (HTS 0603.10.70) are also on the list of leadingitems that benefited exclusively from ATPA (see chapter 3).
26 United States International Trade Commission, “Imports Continue to Dominate the U.S. FlowerMarket,” Press Release, 03-24, March 6, 2003.
27 Richard Harrah, President, Dole Fresh Fruit International Co., his prepared statement to theSubcommittee on International Trade, United States Senate, for a hearing held on the Andean TradePreference Act, Aug. 3, 2001.
28 Submission to the Commission by Susan M. Schmidt, Counsel for Colombian Flower ExportersAssociation, received July 2, 2002, in connection with USITC, Andean Trade Preference Act: Impact onU.S. Industries and Consumers and on Drug Crop Eradication and Crop Substitution, Eighth Report 2001,Inv. No. 332-352, September 2002.
2-22
Colombian Flower Exporters Association (Asocolflores), the tariffs cost the floralindustry about $2.5 million per month, and affected shipments in 2002 for Valentine’sDay and Mother’s Day, which represent the major portion of total annual shipments.29
As a result of the reimposition of duties on cut flower imports, flower growers in ATPAcountries began to take various measures to control expenses, such as curtailinginvestment, market development, training, and social and environmental programs.Asocolflores noted that profit margins are less than the tariff preference granted byATPA.30 The Association of Floral Importers of Florida claimed that the expiration ofATPA jeopardized the continued viability of the association’s members and its 6,100employees, as well as 220,000 other U.S. jobs dependent on imported flowers fromATPA countries.31
Imports continued to decline in 2002, as they had done in 2001, and profit marginsmay have suffered as well. Imports of roses from ATPA countries dropped 6.9 percentduring the year as 60.2 percent became dutiable (roses are not eligible for duty-freetreatment under GSP). Imports of chrysanthemums were down 13 percent as 46percent of imports entered in the dutiable category. Imports of miniature carnationsdropped 7.6 percent; 27 percent of their imports became dutiable and there was ashift from ATPA to GSP (table 2-7). Imports of cut flowers suitable for bouquets,however, were up 2 percent in 2002 with 21.8 percent of imports subject to duties.
JewelryThe 2002 list of leading imports under ATPA continued to feature three gold jewelryproducts classified under HTS provision 7113.19; the same number as contained in the2001 list (table 2-6). U.S. imports of jewelry (HTS provision 7113) from ATPA countrieshave declined in recent years. In contrast, U.S. trade data show increases in imports ofthese products from sources such as India, Thailand, Hong Kong, and China.
In view of the downward trend of imports of recent years, a less than 5 percent declineof jewelry (HTS 7113) imports from ATPA countries in 2002 does not indicate thatATPA’s expiration had an adverse effect on this trade. More than 90 percent of variousitems of jewelry and jewelry parts (HTS 7113.19.50) entered free of duty in 2002 asimports took greater advantage of the GSP program than they had in prior years(table 2-7).32 Similarly, 96 percent of imports of gold necklaces and neck chains (HTS7113.19.29) were free of duty in 2002, owing to entries switching from ATPA to GSP.Total imports of this product reached record levels in 2002, surging 55.5 percent.
29 Ibid.30 Ibid.31 Submission to the Commission by Lin Watts, Executive Vice President of Association of Floral
Importers of Florida, received June 28, 2002, in connection with USITC, Andean Trade Preference Act:Impact on U.S. Industries and Consumers and on Drug Crop Eradication and Crop Substitution, EighthReport 2001, Inv. No. 332-352, September 2002.
32 In 2001, only 10 percent of imports entered under GSP and 89 percent entered under ATPA.
2-23
Imports of gold rope necklaces (HTS 7113.19.21)33 were up 79 percent, recoveringfrom their low level in 2001, even though 45 percent of imports of this product enteredas dutiable, at a rate of 5 percent ad valorem. As mentioned earlier, this jewelryproduct is the only non-petroleum product that newly appeared on the 2002 list ofleading items under ATPA.
Peru, which ranks as the 13th-largest jewelry (HTS 7113) supplier to the United States,was a major U.S. source of all three items, and the number one U.S. supplier of goldrope necklaces and chains. It is also the largest U.S. jewelry supplier among ATPAcountries. However, U.S. imports from Peru declined in 2002. Jewelry importsincreased, meanwhile, from Bolivia and Colombia, the other ATPA-country suppliers.
AsparagusFresh asparagus (HTS subheadings 0709.20.10 and 0709.20.90)34 has beenconsistently among the leading products imported under ATPA, and remained so in2002.35 Virtually all U.S. imports of asparagus from ATPA countries originate in Peru,which is the second-ranking U.S. supplier of fresh asparagus, accounting for 43percent of all U.S. imports in 2002. Most of the remaining imports are from Mexico, thenumber one supplier. Mexico’s advantage of lower transportation costs to U.S.markets is believed to offset some of the advantage ATPA countries may have in theircost of production.36
Asparagus is a labor-intensive, high-value perennial crop, generally harvested insignificant amounts 3 years after planting. As such, its production represents asignificant long-term investment for growers. The Peruvian asparagus industry hasdramatically increased production in the past decade, and is now producing freshasparagus virtually year round. As a result of ATPA’s implementation, asparagus hasbecome Peru’s second largest export crop.37 The country is virtually the sole foreignsupplier of asparagus entering the United States from September 15 to November 15,when domestic production is low.
In 2002, total U.S. imports of asparagus from ATPA countries under HTS subheading0709.20.10 were up by 23 percent and under HTS subheading 0709.20.90 were upby 18 percent (table 2-7). The continued growth in imports indicates that the absence of
33 Gold rope necklaces (HTS 7113.19.21) are also on the list of leading items that benefitedexclusively from ATPA (see chapter 3).
34 HTS subheading 0709.20.10 includes fresh or chilled asparagus not reduced in size, enteredduring the period from September 15 to November 15, inclusive, in any year, and transported to theUnited States by air. HTS subheading 0709.20.90 includes all other fresh or chilled asparagus.
35 Fresh asparagus imported under both HTS subheading 0709.20.10 and HTS subheading0709.20.90 are also on the list of leading items that benefited exclusively from ATPA (see chapter 3).
36 United States General Accounting Office, “Impacts of the Andean Trade Preference Act onAsparagus Producers and Consumers,” GAO-01-315, found at Internet addresshttp://www.GAO.gov/, retrieved June 3, 2002.
37 Ibid.
2-24
preferential duty treatment under ATPA did not adversely affect Peruvian supply. TheU.S. asparagus industry has expressed concern about the competition of Peruvianasparagus in the U.S. market, stating that “Peruvian imports are displacing U.S.asparagus production at an alarming rate.”38
PigmentsPigment dispersions (HTS 3212.90.00)39 remained a leading import under ATPA in2002, even though imports (both total and under ATPA) dropped precipitously, bymore than four-fifths of their 2001 value.40 The United States first imported pigmentdispersions from the ATPA region (Colombia) in 1997, when the ColombianGovernment offered export subsidies for these products to stimulate theirmanufacturing and exports, and bring hard currency into the country.41
In 1999, Colombia was the leading U.S. supplier of pigment dispersions among allcountries in the world as U.S. imports surged from that country. U.S. imports continuedto grow in 2000, with pigments becoming the second-leading ATPA item that year. Theupward trend of imports stopped in 2001, when they dipped somewhat. Until 2002,virtually all such imports from Colombia entered under ATPA.
In January 2002, the Colombian Government reduced the export subsidies, and inAugust 2002 removed them.42 For the year, Colombia accounted for less thanone-third of all U.S. imports of HTS 3212.90.00 pigment dispersions, compared withfour-fifths of the total in 1999. The share of Germany and Canada, the second- andthird-largest U.S. suppliers, increased significantly, although Colombia continued tobe the principal U.S. source of this product.
Pigments seem to be the only leading import under ATPA in which total U.S. importsdropped spectacularly, by more than four-fifths, in 2002 (table 2-7). The removal ofColombian export subsidies might have been mostly responsible for this steep decline,because without subsidies it became less economical for Colombian companies tomanufacture this product.43 ATPA’s long lapse during the year, and uncertaintybefore August 6, 2002 about whether ATPA would be renewed, may also havecontributed to U.S. customers sourcing this product away from Colombia. Shifting
38 Michigan Farm Bureau, statement submitted to the Subcommittee on International Trade of theUnited States Senate, at a hearing held on the Andean Trade Preference Act, Aug. 3, 2001.
39 The pigments in question refer to specialized gold dispersions in an organic solvent. The presenceof gold accounts for the high value of imports of this product. Potential uses are for the application ofextremely thin coatings of gold as an electronic conductor on circuit boards and for decorative purposes.
40 Pigments are also on the list of leading items that benefited exclusively from ATPA (see chapter 3).41 Based on a telephone conversation and e-mail communication with Mr. Bruce Edwards, Metalor
USA Refining Corp., Aug. 12, 2003.42 Ibid.43 Colombia is committed to phase out export subsidies, which are inconsistent with the WTO
Agreement on Subsidies and Countervailing Measures, and issued various decrees to correct itsrestrictive trade practices. See, USTR, 2002 National Trade Estimate Report on Foreign Trade Barriers,p. 75.
2-25
entries to GSP to avoid duties was not an option, because imports of Colombianpigments exceeded the competitive-need limit and thus were eligible for duty-freetreatment only under ATPA.
CigarettesTotal U.S. imports of cigarettes (HTS 2402.20.80)44 from ATPA countries more thandoubled in 2002 compared with 2001, the first year in which U.S. cigarette importswere recorded in meaningful quantities from the ATPA region, specifically fromColombia. In 2002, Colombia was the second-ranking U.S. supplier of this productworldwide, preceded only by Japan. Canada was the third-ranking U.S. source.Notably, Peru joined Colombia in 2002 as an ATPA supplier of cigarettes.
Whereas in 2001 virtually all cigarettes the United States imported from ATPAcountries entered under ATPA free of duty, during 2002, 38 percent of importsbecame dutiable (table 2-7). The ad valorem rate of duty for this product is 12.3percent. Had ATPA been operative throughout the year, cigarette imports would likelyhave increased even more.
Guavas and mangoesSeasonal guavas and mangoes (HTS 0804.50.40), which enter the United States fromSeptember 1 through May 31, come from Peru and Ecuador in the ATPA region.Worldwide, the principal U.S. suppliers are Mexico (almost 40 percent of U.S. importsin 2002), and Brazil (24 percent in 2002). Peru was the third-ranking U.S. supplier in2002, accounting for 17.7 percent of total U.S. imports, and Ecuador was fourth, with9.2 percent.
Whereas U.S. imports of guavas and mangoes were up 16.1 percent from all countriesin 2002, imports from ATPA countries increased more, by 24.2 percent, indicating noobvious adverse effect on trade of ATPA’s expiration during part of the year. Morethan one-half of U.S. imports entered under GSP, and a quarter of the total enteredunder ATPA; thus the bulk of the trade remained free of duty. The remainder wasdutiable at a rate of 8.4 percent ad valorem.
OnionsFor the past 2 years, onions (HTS 0703.10.40) have been a leading import under
ATPA. Peru was the third-ranking U.S. supplier of imported onions among all countriesin 2002, accounting for over 10 percent of total U.S. imports. Most onions the UnitedStates imports originate in Mexico (71 percent of total imports in 2002), followed byCanada (14 percent).
44 Cigarettes (HTS 2402.20.80) are also on the list of leading items that benefited exclusively fromATPA (see chapter 3).
2-26
The United States first registered significant imports of onions from ATPA countries,mostly under ATPA, some under GSP, in 1999. After dropping substantially in 2000,onion imports under ATPA rose in 2001. In 2002, during the better part of whichpreferential treatment under ATPA had lapsed, over one-half of U.S. onion importsfrom ATPA countries entered duty-free under GSP, and only 6.2 percent entered asdutiable, at a rate of 1.3 percent ad valorem (table 2-7). Overall imports of onionswere up 18 percent from all ATPA countries in 2002, but 23 percent from Peru, theprincipal ATPA supplier. Imports from Ecuador and Colombia were very small fromthe outset, and further declined in 2002. Thus, continued growth of U.S. imports in2002 indicates that onion imports were not affected by the lack of preferentialtreatment under ATPA.
Articles of woodIn 2002, total U.S. imports of articles of wood not elsewhere specified or included(n.e.s.o.i.) (HTS 4421.90.97) from ATPA countries declined 3.1 percent, comparedwith imports of articles of wood n.e.s.o.i (HTS 4421.90.98) in 2001.45 Because of thelapse of ATPA during part of the year, 28 percent entered in the dutiable category at3.3 percent ad valorem, and 24 percent entered under GSP (table 2-7). Owing to thefluctuation of U.S. wood products’ (HTS 4421.90) imports from ATPA countries inrecent years, the small decline in 2002 imports is probably not attributable to ATPA’slapse during part of the year.
Virtually the only ATPA-country source of U.S. imports was Ecuador, which was theninth-ranking U.S. supplier worldwide of HTS 4421.90.97 in 2002. The United Statesimports wood products primarily from Canada and China.
Former Leading Imports Under the Original ATPAThe six new products on the 2002 list of leading imports under ATPA (table 2-6)replaced six products that had been on the list in 2001. Table 2-8 shows those productsthat ceased to be leading imports under ATPA in 2002, including the percentagechange in total U.S. imports from ATPA countries of these products from 2001 to 2002,and other data that might explain how ATPA’s expiration contributed to a decline intheir relative importance in ATPA trade.
For each product listed in table 2-8, a sharply diminished portion of total imports wasentered under ATPA in 2002 compared with 2001. Entries of some products shiftedfrom ATPA to GSP, as importers hoped to retroactively obtain duty-free treatmentunder that program. Other entries were dutiable. Also, total imports (i.e., importsentered under all categories) of each of these products significantly declined in 2002,except for nonadhesive plates and sheets (table 2-8).
45 Both the 2002 and 2001 tariff lines were basket categories. Despite their reclassification, HTS4421.90.97 (in the 2002 HTS) and HTS 4421.90.98 (in the 2001 HTS) are believed to be largelycomparable.
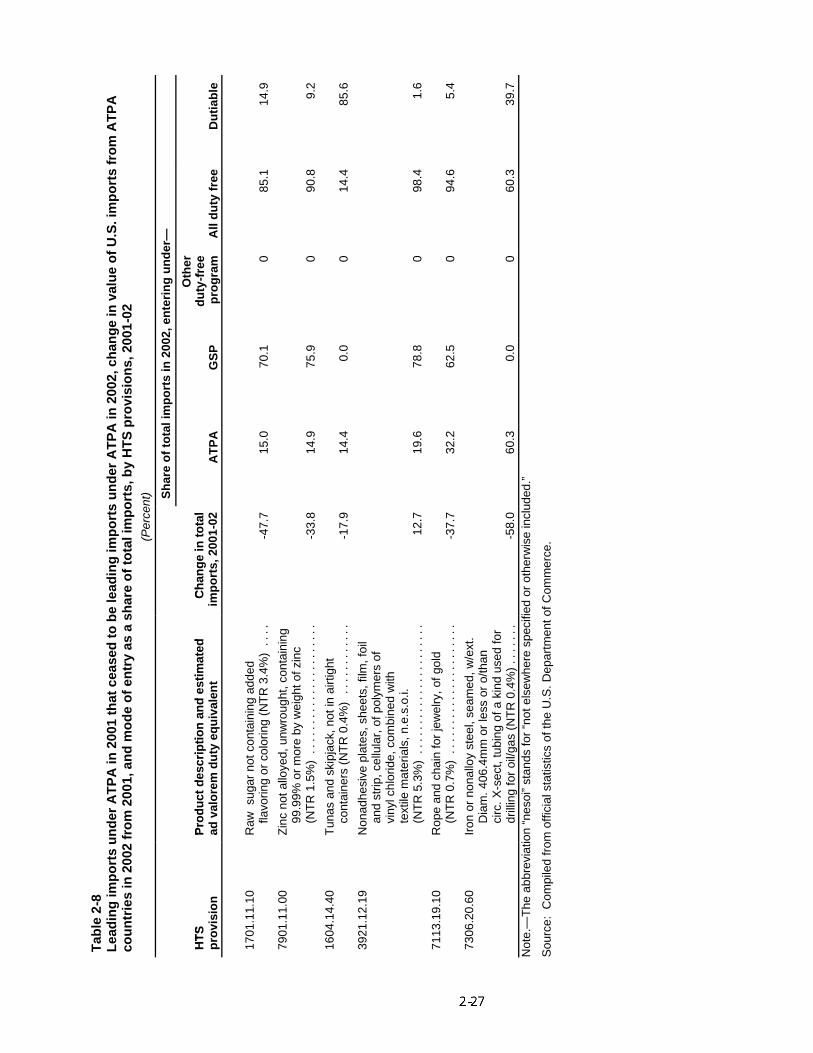
Tab
le2-
8L
ead
ing
imp
ort
su
nd
erA
TP
Ain
2001
that
ceas
edto
be
lead
ing
imp
ort
su
nd
erA
TP
Ain
2002
,ch
ang
ein
valu
eo
fU
.S.i
mp
ort
sfr
om
AT
PA
cou
ntr
ies
in20
02fr
om
2001
,an
dm
od
eo
fen
try
asa
shar
eo
fto
tali
mp
ort
s,b
yH
TS
pro
visi
on
s,20
01-0
2(P
erce
nt) Sh
are
of
tota
lim
po
rts
in20
02,e
nte
rin
gu
nd
er—
HT
SP
rod
uct
des
crip
tio
nan
des
tim
ated
Ch
ang
ein
tota
lO
ther
du
tyfr
eeH
TS
pro
visi
on
Pro
du
ctd
escr
ipti
on
and
esti
mat
edad
valo
rem
du
tyeq
uiv
alen
tC
han
ge
into
tal
imp
ort
s,20
01-0
2A
TP
AG
SP
du
ty-f
ree
pro
gra
mA
lld
uty
free
Du
tiab
le
1701
.11.
10R
awsu
gar
notc
onta
inin
gad
ded
flavo
ring
orco
lorin
g(N
TR
3.4%
)..
..-4
7.7
15.0
70.1
085
.114
.9
7901
.11.
00Z
inc
nota
lloye
d,un
wro
ught
,con
tain
ing
99.9
9%or
mor
eby
wei
ghto
fzin
c(N
TR
1.5%
)..
....
....
....
....
....
-33.
814
.975
.90
90.8
9.2
1604
.14.
40T
unas
and
skip
jack
,not
inai
rtig
htco
ntai
ners
(NT
R0.
4%)
....
....
....
-17.
914
.40.
00
14.4
85.6
3921
.12.
19N
onad
hesi
vepl
ates
,she
ets,
film
,foi
lan
dst
rip,c
ellu
lar,
ofpo
lym
ers
ofvi
nylc
hlor
ide,
com
bine
dw
ithte
xtile
mat
eria
ls,n
.e.s
.o.i.
(NT
R5.
3%)
....
....
....
....
....
..12
.719
.678
.80
98.4
1.6
7113
.19.
10R
ope
and
chai
nfo
rje
wel
ry,o
fgol
d(N
TR
0.7%
)..
....
....
....
....
....
-37.
732
.262
.50
94.6
5.4
7306
.20.
60Ir
onor
nona
lloy
stee
l,se
amed
,w/e
xt.
Dia
m.4
06.4
mm
orle
ssor
o/th
anci
rc.X
-sec
t,tu
bing
ofa
kind
used
for
drill
ing
for
oil/g
as(N
TR
0.4%
)..
....
.-5
8.0
60.3
0.0
060
.339
.7N
ote.
—T
heab
brev
iatio
n“n
esoi
”st
ands
for
“not
else
whe
resp
ecifi
edor
othe
rwis
ein
clud
ed.”
Sou
rce:
Com
pile
dfr
omof
ficia
lsta
tistic
sof
the
U.S
.Dep
artm
ento
fCom
mer
ce.
2-28
SugarSugar imports from ATPA countries are measured on a fiscal year basis, as they aresubject to tariff-rate quotas (TRQs). Even when ATPA preferences lapsed, ATPAcountries filled (or nearly filled) their TRQs in fiscal year 2002. The in-quota tariffs arenegligible, but there was a shift from ATPA to GSP to receive duty-free treatment.Already in 2001, a year during which ATPA was in effect for 11 months, duty-freeimports began to enter under GSP instead of ATPA. This shift to GSP continued in2002; imports under GSP accounted for 70 percent of total imports compared with 42percent in 2001 (table 2-8). Whereas no sugar imports from ATPA countries had beendutiable in 2001, 15 percent entered in the dutiable category in 2002 at a 3.4 percentad valorem rate.
While calendar year 2002 data show a drop in sugar imports from Colombia andPeru, it is not to be seen as an actual decline in such imports. Timing is such that thesecountries shipped sugar in calendar year 2001 to fill the fiscal year 2002 TRQ. FromEcuador, unlike in prior years, there were no U.S. sugar imports at all during 2002,because Ecuador sold back its quota to the Commodity Credit Corporation of the U.S.Department of Agriculture.
ZincTotal U.S. imports of unwrought zinc (HTS 7901.11.00) from ATPA countries droppedby 34 percent in 2002, continuing a downward trend, which followed a peak of suchimports in 1999 (table 2-8). The steady 3-year decline of U.S. zinc imports from ATPAcountries, as well as from other countries since 1999, reflects worldwide oversupply,depressed prices, high inventories, and declining U.S. demand in recent years, owingto the sluggish U.S. economy.
Through the years, virtually all zinc imports from ATPA countries have entered theUnited States under preferential provisions, mostly under ATPA, some under GSP. In2001, two-thirds of such imports entered under ATPA and 26 percent under GSP.These proportions changed in 2002, when ATPA accounted for 15 percent of entries,GSP for more than three-fourths, and the remainder became dutiable at 1.5 percentad valorem. The lapse of ATPA, as well as of GSP during 2002, might have contributedto the decline of U.S. zinc imports from ATPA countries during the year, but the declinewas probably mostly the result of sustained, depressed market conditions for the metal,and competition from other suppliers.
Peru is the only U.S. supplier among ATPA countries of this product.46 Worldwide,Peru was the second-largest U.S. supplier of zinc after Canada until 2001, whenMexico pushed Peru to third place. Peru remained the third-ranking U.S. supplier in2002, but accounted for only 5.6 percent of all U.S. imports, compared with 16percent for Mexico, and 67 percent for Canada. In 1999, Peru’s share of the U.S.market was almost 10 percent.
46 Most of the zinc from Peru is reportedly imported by a Canadian company that also has U.S.operations in the states of Washington and Alaska.
2-29
Tuna not in airtight containersHTS provision 1604.14.40 is an intermediate product, referred to as “loins” in thetrade, which is used in canneries as input for canned or pouched tuna, the finalproduct. Only loins were eligible for duty-free treatment under the original ATPA, butpouched tuna became eligible under ATPDEA.
U.S. imports of “loins” from ATPA countries have been declining since their peak in1999. In 2002, such imports dropped by 18 percent (table 2-8). Although Ecuador wasstill the second-ranking U.S. supplier of loins worldwide, its share of U.S. importscontinued to fall. Ecuador accounted for 28 percent of total U.S. imports in 2002,compared with 71 percent in 2000. Thailand, the third-ranking supplier, accounted for16 percent of the total in 2002.
In 2001, almost four-fifths of all imports of loins from Ecuador entered under ATPA; theremainder was dutiable. In 2002, ATPA’s long lapse reversed these proportions; 85.6percent of U.S. imports entered as dutiable, at a rate of 0.4 percent ad valorem, andonly 14.4 percent entered under ATPA. For years, Ecuador, the region’s only bigexporter of loins, had also been the leading U.S. supplier of this product worldwide. In2001, however, Fiji displaced Ecuador to second leading source, as Ecuador’s shareof total U.S. imports fell to 35.5 percent, and Fiji’s share soared to 53.6 percent.
Ecuador’s diminishing importance in U.S. loin imports during 2000 and 2001 resulted,in part, from an action of the StarKist company. StarKist, which had imported theEcuadorian intermediate tuna product, closed its cannery in Puerto Rico and movedthose operations to Ecuador. This move enabled Ecuador to produce more of thehigher value-added tuna in airtight containers (mostly canned tuna).47 As a result, aportion of the loins from Ecuador were withdrawn from the trade, and U.S. importsfrom that country declined.
In addition, Bumble Bee Seafoods converted most of its plant in Puerto Rico to loinprocessing, thus becoming a competitor for Ecuadorian loins. Before this happened,the Ecuadorian operations of Bumble Bee Seafoods had performed the labor-intensive“loining” phase for Bumble Bee’s canned tuna, and shipped the cooked filets toautomated plants in California, which then did the canning.
Nonadhesive plates and sheetsNonadhesive plates and sheets (HTS provision 3921.12.19), a leading U.S. importunder ATPA in 2001, was not on the list in 2002, even though overall U.S. imports fromATPA countries of this product were up 12.7 percent (table 2-8). Nonadhesive platesand sheets are used as upholstery or upholstery coverings in a variety of end uses,including automotive, restaurant seating, boats, wheelchairs, etc.
47 Ecuador is also the second-ranking supplier of the U. S. market of canned and pouched tuna(collectively referred to as “tuna in airtight containers”), which is one of the leading U.S. imports fromATPA countries (table 2-3).
2-30
Colombia, the only ATPA-country supplier, was the number one U.S. source of thisparticular 8-digit item in 2002 worldwide, followed by Taiwan and Canada.Colombia had been the second-leading source of the entire HTS 6-digit provision ofthis and similar products (HTS provision 3921.12) for years through 2001, afterCanada. In 2002, Colombia became the number one supplier of the 6-digit productgroup (as well as of the 8-digit specific product), accounting for almost one quarter ofall U.S. imports, followed by Canada, with 15.8 percent.
The long absence of ATPA in 2002, and the reimposition of duties on U.S. imports ofnonadhesive plates and sheets at a rate of 5.4 percent, caused an initial decline inimports, but does not seem to have adversely affected trade in 2002 on an annualbasis.48
Gold ropes and chains
Overall imports of gold ropes and chains (HTS 7113.19.10)–predominantly from Peru,but some from Bolivia–fell 38 percent in 2002 (table 2-8). Owing to ATPA’s expiration,almost two-thirds of U.S. imports entered under GSP, whereas during 2001 and prioryears, most imports entered under ATPA. In 2002, only 5.4 percent of imports enteredas dutiable.
It is unlikely that the large decline in total imports was caused by ATPA’s lapse, sincetotal imports of the other three major jewelry items from ATPA countries eitherincreased substantially or declined only marginally in 2002.49
Iron or non-alloyed steel tubing
In December 2001, immediately after ATPA’s expiration, total U.S. imports of iron ornon-alloyed steel tubing (HTS 7306.20.60) from ATPA countries, specifically fromColombia, plummeted by 71.9 percent compared with imports in December 2000. A58 percent decline of such imports for the year 2002, which followed a surge inimports in both 2000 and 2001, removed the product from the list of leading importsunder ATPA (table 2-8). This decline in imports from Colombia reflected mostly aprecautionary strategy by the importer,50 in view of U.S. unfair trade investigations ofoil-country tubular goods that have been instituted with respect to imports from severalnations. Two-fifths of imports became dutiable during the year at a rate of 0.4 percentad valorem; the remainder entered under ATPA.
48 In December 2001, the first month of ATPA’s lapse, U.S. imports of nonadhesive plates and sheets(HTS subheading 3921.12.19) from ATPA countries dropped 46.4 percent, compared with imports inDecember 2000.
49 See more on “jewelry” in the section above on “Other Leading Imports Under ATPA.”50 Based on a telephone conversation of USITC staff with Mr. Byron Dunn, CEO of Lone Star Steel
Company, June 16, 2003.
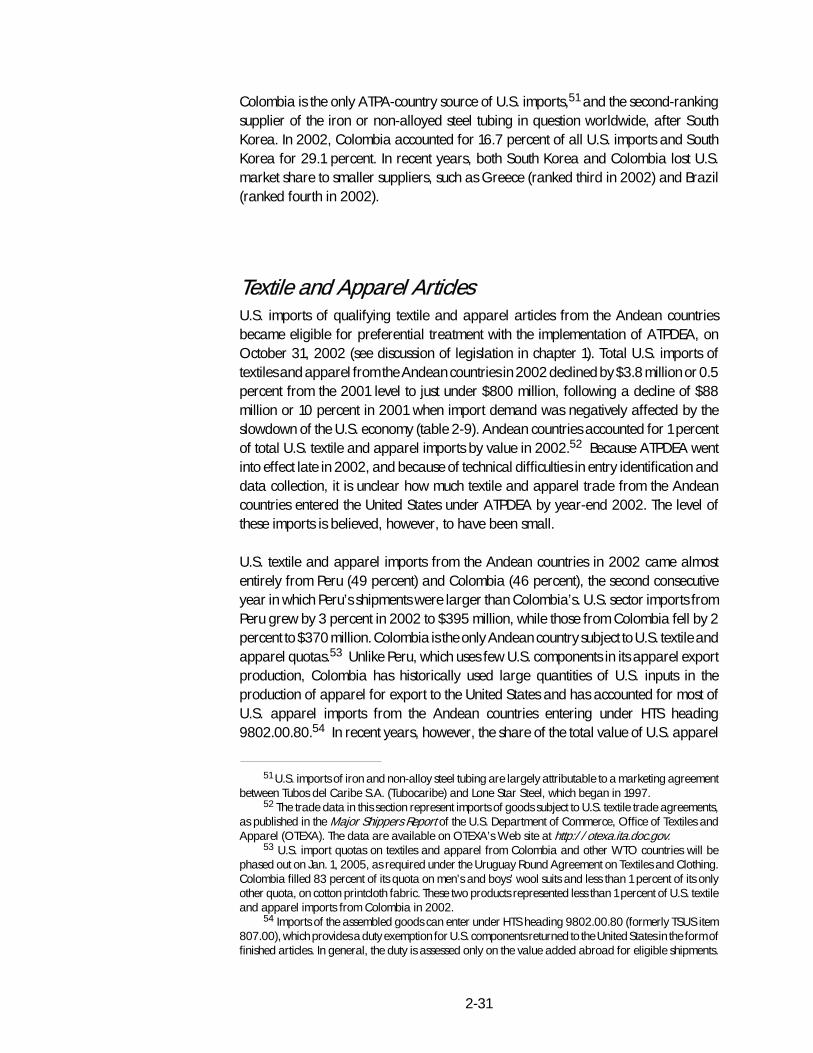
2-31
Colombia is the only ATPA-country source of U.S. imports,51 and the second-rankingsupplier of the iron or non-alloyed steel tubing in question worldwide, after SouthKorea. In 2002, Colombia accounted for 16.7 percent of all U.S. imports and SouthKorea for 29.1 percent. In recent years, both South Korea and Colombia lost U.S.market share to smaller suppliers, such as Greece (ranked third in 2002) and Brazil(ranked fourth in 2002).
Textile and Apparel ArticlesU.S. imports of qualifying textile and apparel articles from the Andean countriesbecame eligible for preferential treatment with the implementation of ATPDEA, onOctober 31, 2002 (see discussion of legislation in chapter 1). Total U.S. imports oftextiles and apparel from the Andean countries in 2002 declined by $3.8 million or 0.5percent from the 2001 level to just under $800 million, following a decline of $88million or 10 percent in 2001 when import demand was negatively affected by theslowdown of the U.S. economy (table 2-9). Andean countries accounted for 1 percentof total U.S. textile and apparel imports by value in 2002.52 Because ATPDEA wentinto effect late in 2002, and because of technical difficulties in entry identification anddata collection, it is unclear how much textile and apparel trade from the Andeancountries entered the United States under ATPDEA by year-end 2002. The level ofthese imports is believed, however, to have been small.
U.S. textile and apparel imports from the Andean countries in 2002 came almostentirely from Peru (49 percent) and Colombia (46 percent), the second consecutiveyear in which Peru’s shipments were larger than Colombia’s. U.S. sector imports fromPeru grew by 3 percent in 2002 to $395 million, while those from Colombia fell by 2percent to $370 million. Colombia is the only Andean country subject to U.S. textile andapparel quotas.53 Unlike Peru, which uses few U.S. components in its apparel exportproduction, Colombia has historically used large quantities of U.S. inputs in theproduction of apparel for export to the United States and has accounted for most ofU.S. apparel imports from the Andean countries entering under HTS heading9802.00.80.54 In recent years, however, the share of the total value of U.S. apparel
51 U.S. imports of iron and non-alloy steel tubing are largely attributable to a marketing agreementbetween Tubos del Caribe S.A. (Tubocaribe) and Lone Star Steel, which began in 1997.
52 The trade data in this section represent imports of goods subject to U.S. textile trade agreements,as published in the Major Shippers Report of the U.S. Department of Commerce, Office of Textiles andApparel (OTEXA). The data are available on OTEXA’s Web site at http://otexa.ita.doc.gov.
53 U.S. import quotas on textiles and apparel from Colombia and other WTO countries will bephased out on Jan. 1, 2005, as required under the Uruguay Round Agreement on Textiles and Clothing.Colombia filled 83 percent of its quota on men’s and boys’ wool suits and less than 1 percent of its onlyother quota, on cotton printcloth fabric. These two products represented less than 1 percent of U.S. textileand apparel imports from Colombia in 2002.
54 Imports of the assembled goods can enter under HTS heading 9802.00.80 (formerly TSUS item807.00), which provides a duty exemption for U.S. components returned to the United States in the form offinished articles. In general, the duty is assessed only on the value added abroad for eligible shipments.
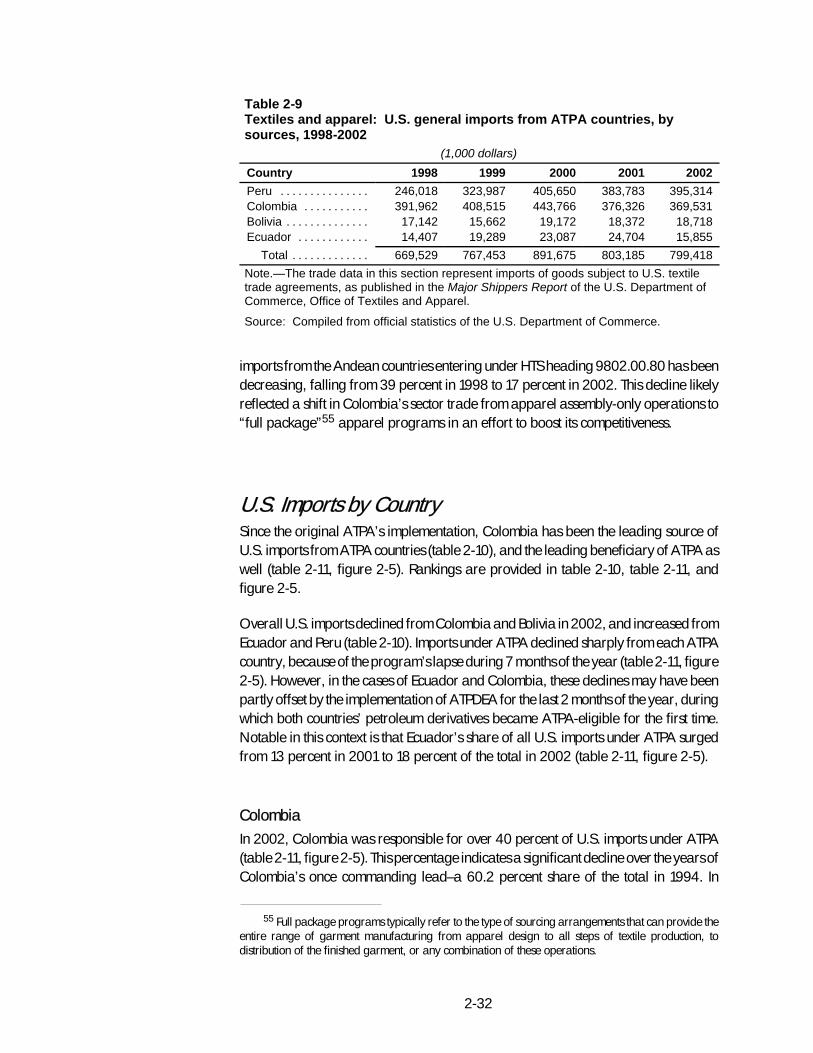
2-32
Table 2-9Textiles and apparel: U.S. general imports from ATPA countries, bysources, 1998-2002
(1,000 dollars)
Country 1998 1999 2000 2001 2002
Peru . . . . . . . . . . . . . . . 246,018 323,987 405,650 383,783 395,314Colombia . . . . . . . . . . . 391,962 408,515 443,766 376,326 369,531Bolivia . . . . . . . . . . . . . . 17,142 15,662 19,172 18,372 18,718Ecuador . . . . . . . . . . . . 14,407 19,289 23,087 24,704 15,855
Total . . . . . . . . . . . . . 669,529 767,453 891,675 803,185 799,418
Note.—The trade data in this section represent imports of goods subject to U.S. textiletrade agreements, as published in the Major Shippers Report of the U.S. Department ofCommerce, Office of Textiles and Apparel.
Source: Compiled from official statistics of the U.S. Department of Commerce.
imports from the Andean countries entering under HTS heading 9802.00.80 has beendecreasing, falling from 39 percent in 1998 to 17 percent in 2002. This decline likelyreflected a shift in Colombia’s sector trade from apparel assembly-only operations to“full package”55 apparel programs in an effort to boost its competitiveness.
U.S. Imports by CountrySince the original ATPA’s implementation, Colombia has been the leading source ofU.S. imports from ATPA countries (table 2-10), and the leading beneficiary of ATPA aswell (table 2-11, figure 2-5). Rankings are provided in table 2-10, table 2-11, andfigure 2-5.
Overall U.S. imports declined from Colombia and Bolivia in 2002, and increased fromEcuador and Peru (table 2-10). Imports under ATPA declined sharply from each ATPAcountry, because of the program’s lapse during 7 months of the year (table 2-11, figure2-5). However, in the cases of Ecuador and Colombia, these declines may have beenpartly offset by the implementation of ATPDEA for the last 2 months of the year, duringwhich both countries’ petroleum derivatives became ATPA-eligible for the first time.Notable in this context is that Ecuador’s share of all U.S. imports under ATPA surgedfrom 13 percent in 2001 to 18 percent of the total in 2002 (table 2-11, figure 2-5).
ColombiaIn 2002, Colombia was responsible for over 40 percent of U.S. imports under ATPA(table 2-11, figure 2-5). This percentage indicates a significant decline over the years ofColombia’s once commanding lead–a 60.2 percent share of the total in 1994. In
55 Full package programs typically refer to the type of sourcing arrangements that can provide theentire range of garment manufacturing from apparel design to all steps of textile production, todistribution of the finished garment, or any combination of these operations.
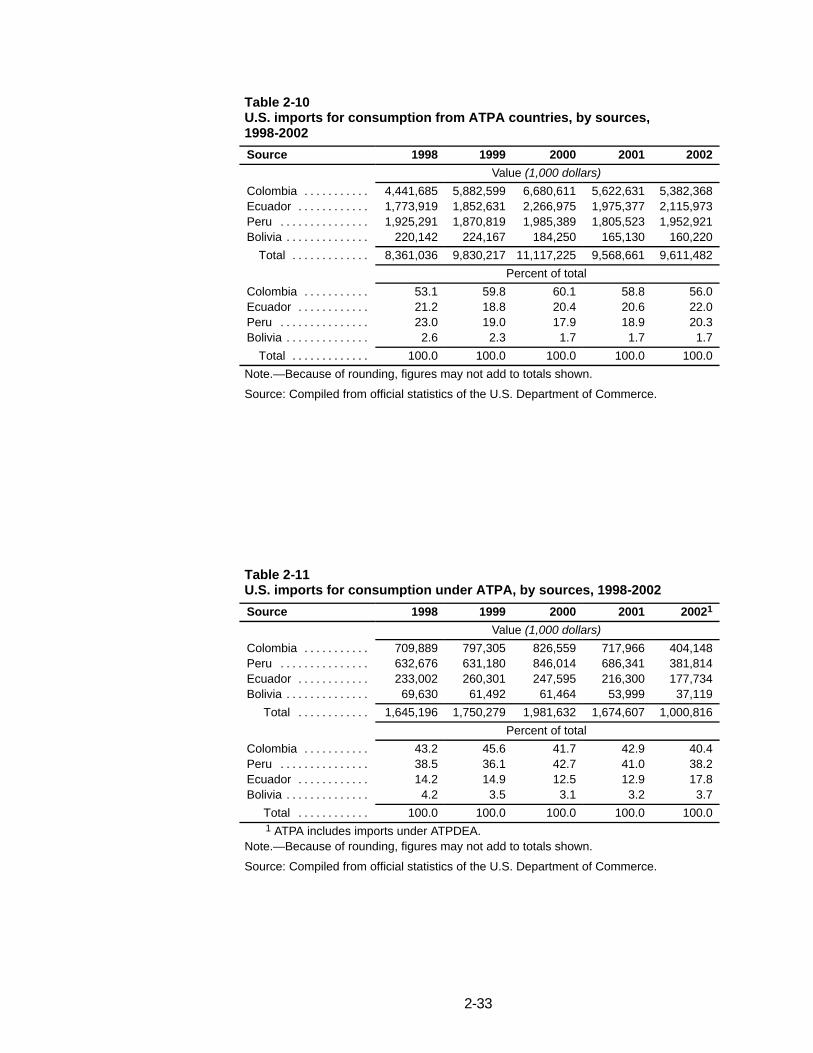
2-33
Table 2-10U.S. imports for consumption from ATPA countries, by sources,1998-2002
Source 1998 1999 2000 2001 2002
Value (1,000 dollars)
Colombia . . . . . . . . . . . 4,441,685 5,882,599 6,680,611 5,622,631 5,382,368Ecuador . . . . . . . . . . . . 1,773,919 1,852,631 2,266,975 1,975,377 2,115,973Peru . . . . . . . . . . . . . . . 1,925,291 1,870,819 1,985,389 1,805,523 1,952,921Bolivia . . . . . . . . . . . . . . 220,142 224,167 184,250 165,130 160,220
Total . . . . . . . . . . . . . 8,361,036 9,830,217 11,117,225 9,568,661 9,611,482
Percent of total
Colombia . . . . . . . . . . . 53.1 59.8 60.1 58.8 56.0Ecuador . . . . . . . . . . . . 21.2 18.8 20.4 20.6 22.0Peru . . . . . . . . . . . . . . . 23.0 19.0 17.9 18.9 20.3Bolivia . . . . . . . . . . . . . . 2.6 2.3 1.7 1.7 1.7
Total . . . . . . . . . . . . . 100.0 100.0 100.0 100.0 100.0
Note.—Because of rounding, figures may not add to totals shown.
Source: Compiled from official statistics of the U.S. Department of Commerce.
Table 2-11U.S. imports for consumption under ATPA, by sources, 1998-2002
Source 1998 1999 2000 2001 20021
Value (1,000 dollars)
Colombia . . . . . . . . . . . 709,889 797,305 826,559 717,966 404,148Peru . . . . . . . . . . . . . . . 632,676 631,180 846,014 686,341 381,814Ecuador . . . . . . . . . . . . 233,002 260,301 247,595 216,300 177,734Bolivia . . . . . . . . . . . . . . 69,630 61,492 61,464 53,999 37,119
Total . . . . . . . . . . . . 1,645,196 1,750,279 1,981,632 1,674,607 1,000,816
Percent of total
Colombia . . . . . . . . . . . 43.2 45.6 41.7 42.9 40.4Peru . . . . . . . . . . . . . . . 38.5 36.1 42.7 41.0 38.2Ecuador . . . . . . . . . . . . 14.2 14.9 12.5 12.9 17.8Bolivia . . . . . . . . . . . . . . 4.2 3.5 3.1 3.2 3.7
Total . . . . . . . . . . . . 100.0 100.0 100.0 100.0 100.01 ATPA includes imports under ATPDEA.
Note.—Because of rounding, figures may not add to totals shown.
Source: Compiled from official statistics of the U.S. Department of Commerce.
2-34
Figure 2-5U.S. imports for consumption under ATPA, by sources, 1998-2002
1998 1999 2000 2001 2002
Ecuador Bolivia
ATPA Country
$1,645$1,750
$1,982
$1,675
$1,001
PeruColombia
Million dollars
2,000
1,800
1,600
1,400
1,200
1,000
800
600
400
200
0
Source: Compiled from official statistics of the U.S. Department of Commerce.
2002, the country was the major source of nine leading products entered under ATPA,four of which were flowers (table 2-6). Flowers continued to be the largest productcategory among imports under ATPA from Colombia, despite its diminishing relativeimportance over time.56 Three other leading imports under ATPA, principally fromColombia–naphthas and two petroleum oil products–were new leading items thatentered under ATPDEA.57 The remaining Colombian products on the list werepigments and cigarettes (see also table 2-12).
Although Colombia gained new, important preferences under ATPDEA throughduty-free treatment for its petroleum and derivatives, the country’s relative share inATPA trade continued to decline in 2002 (table 2-11, figure 2-5). This can be explainedby the drop in U.S. imports of Colombia’s original ATPA products, including flowersand, especially, pigments.
56 As a means of consolidating their markets, Colombian exporters and importers in Florida formedthe Colombia Flower Council (CFC) in 1987 in Miami, with the objective of promoting the consumption ofColombian flowers in the U.S market. (Source: http://www.colombianflowers.com/, retrieved on June 3,2002.)
57 Ecuador is also an important source of petroleum derivatives.
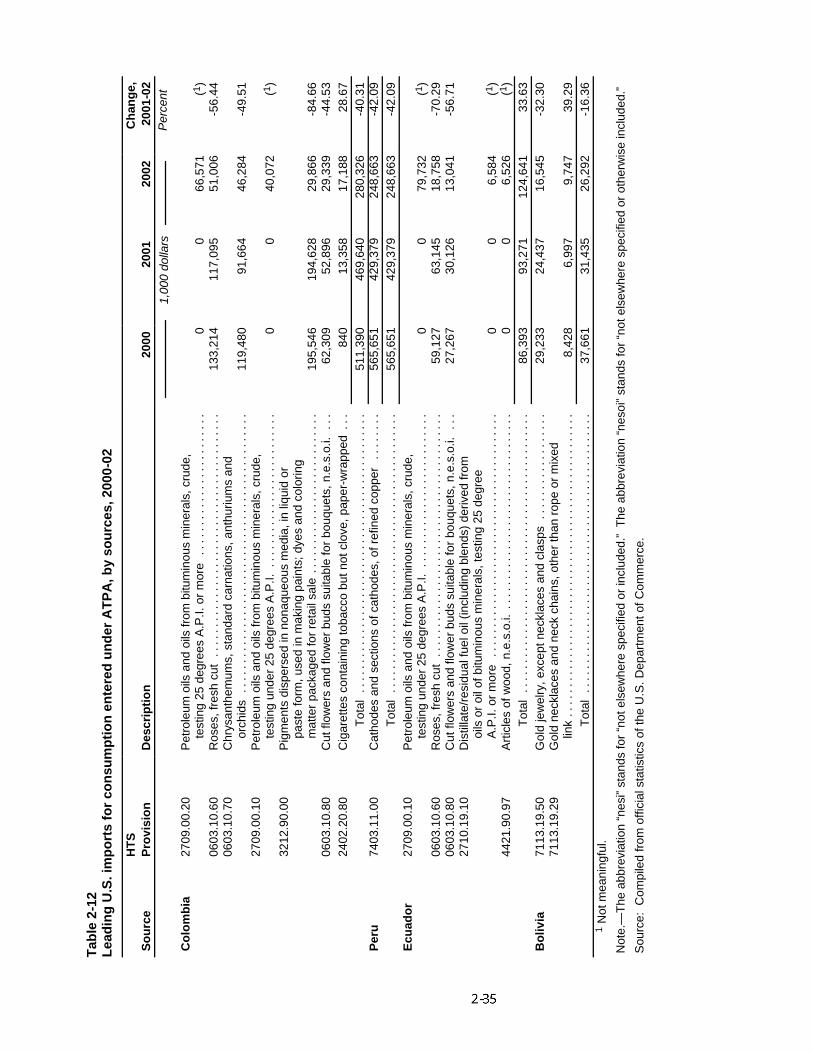
Tab
le2-
12L
ead
ing
U.S
.im
po
rts
for
con
sum
pti
on
ente
red
un
der
AT
PA
,by
sou
rces
,200
0-02
HT
SC
han
ge,
So
urc
eP
rovi
sio
nD
escr
ipti
on
2000
2001
2002
2001
-02
1,00
0do
llars
Per
cent
Co
lom
bia
2709
.00.
20P
etro
leum
oils
and
oils
from
bitu
min
ous
min
eral
s,cr
ude,
test
ing
25de
gree
sA
.P.I.
orm
ore
....
....
....
....
....
....
00
66,5
71(1
)06
03.1
0.60
Ros
es,f
resh
cut
....
....
....
....
....
....
....
....
....
....
.13
3,21
411
7,09
551
,006
-56.
4406
03.1
0.70
Chr
ysan
them
ums,
stan
dard
carn
atio
ns,a
nthu
rium
san
dor
chid
s..
....
....
....
....
....
....
....
....
....
....
....
.11
9,48
091
,664
46,2
84-4
9.51
2709
.00.
10P
etro
leum
oils
and
oils
from
bitu
min
ous
min
eral
s,cr
ude,
test
ing
unde
r25
degr
ees
A.P
.I...
....
....
....
....
....
....
00
40,0
72(1
)32
12.9
0.00
Pig
men
tsdi
sper
sed
inno
naqu
eous
med
ia,i
nliq
uid
orpa
ste
form
,use
din
mak
ing
pain
ts;d
yes
and
colo
ring
mat
ter
pack
aged
for
reta
ilsa
le..
....
....
....
....
....
....
.19
5,54
619
4,62
829
,866
-84.
6606
03.1
0.80
Cut
flow
ers
and
flow
erbu
dssu
itabl
efo
rbo
uque
ts,n
.e.s
.o.i.
...
62,3
0952
,896
29,3
39-4
4.53
2402
.20.
80C
igar
ette
sco
ntai
ning
toba
cco
butn
otcl
ove,
pape
r-w
rapp
ed..
.84
013
,358
17,1
8828
.67
Tot
al..
....
....
....
....
....
....
....
....
....
....
....
.51
1,39
046
9,64
028
0,32
6-4
0.31
Per
u74
03.1
1.00
Cat
hode
san
dse
ctio
nsof
cath
odes
,ofr
efin
edco
pper
....
....
565,
651
429,
379
248,
663
-42.
09T
otal
....
....
....
....
....
....
....
....
....
....
....
...
565,
651
429,
379
248,
663
-42.
09E
cuad
or
2709
.00.
10P
etro
leum
oils
and
oils
from
bitu
min
ous
min
eral
s,cr
ude,
test
ing
unde
r25
degr
ees
A.P
.I...
....
....
....
....
....
....
00
79,7
32(1
)06
03.1
0.60
Ros
es,f
resh
cut
....
....
....
....
....
....
....
....
....
....
.59
,127
63,1
4518
,758
-70.
2906
03.1
0.80
Cut
flow
ers
and
flow
erbu
dssu
itabl
efo
rbo
uque
ts,n
.e.s
.o.i.
...
27,2
6730
,126
13,0
41-5
6.71
2710
.19.
10D
istil
late
/res
idua
lfue
loil
(incl
udin
gbl
ends
)de
rived
from
oils
oroi
lofb
itum
inou
sm
iner
als,
test
ing
25de
gree
A.P
.I.or
mor
e..
....
....
....
....
....
....
....
....
....
...
00
6,58
4(1
)44
21.9
0.97
Art
icle
sof
woo
d,n.
e.s.
o.i.
....
....
....
....
....
....
....
....
.0
06,
526
(1)
Tot
al..
....
....
....
....
....
....
....
....
....
....
....
.86
,393
93,2
7112
4,64
133
.63
Bo
livia
7113
.19.
50G
old
jew
elry
,exc
eptn
eckl
aces
and
clas
ps..
....
....
....
....
29,2
3324
,437
16,5
45-3
2.30
7113
.19.
29G
old
neck
lace
san
dne
ckch
ains
,oth
erth
anro
peor
mix
edlin
k..
....
....
....
....
....
....
....
....
....
....
....
....
.8,
428
6,99
79,
747
39.2
9T
otal
....
....
....
....
....
....
....
....
....
....
....
...
37,6
6131
,435
26,2
92-1
6.36
1N
otm
eani
ngfu
l.
Not
e.—
The
abbr
evia
tion
“nes
i”st
ands
for
“not
else
whe
resp
ecifi
edor
incl
uded
.”T
heab
brev
iatio
n“n
esoi
”st
ands
for
“not
else
whe
resp
ecifi
edor
othe
rwis
ein
clud
ed.”
Sou
rce:
Com
pile
dfr
omof
ficia
lsta
tistic
sof
the
U.S
.Dep
artm
ento
fCom
mer
ce.
2-36
Peru
Peru accounted for 38.2 percent of all U.S. imports under ATPA in 2002 (table 2-11,figure 2-5). Six leading ATPA products listed in table 2-6 originated mainly, orexclusively, in Peru: refined copper cathodes, two types of asparagus, gold chainnecklaces, gold necklaces, and onions (table 2-6 and table 2-12). Although U.S.imports of copper cathodes from Peru under ATPA were down considerably during2002, this product alone accounted for two-thirds of all imports under ATPA fromPeru.
Ecuador
Ecuador accounted for 18 percent of 2002 imports under ATPA (table 2-11, figure2-5); it was the major source of four leading imports under the program, two of thempetroleum derivatives (table 2-6).58 Even though ATPDEA was in effect for only 2months of 2002, petroleum derivatives came to dominate 2002 imports from Ecuadorunder ATPA, accounting for more than 52 percent of this trade.
Roses and cut flowers, which were both leading imports under the program,constituted another important portion of Ecuador’s trade under ATPA. In addition,guavas and mangoes, and wood products were imported principally from Ecuador in2002 (table 2-6, table 2-12) .
Bolivia
Bolivia’s share of U.S. imports under ATPA was 3.7 percent in 2002 (table 2-11, figure2-5). The country was the source of only one leading import item under ATPA: goldjewelry and parts (table 2-6). This remained a leading ATPA product, even thoughduring 2002 Bolivia entered a larger portion of U.S. imports under GSP than underATPA.
U.S. Exports
In 2002, ATPA countries combined ranked 20th as a U.S. export market, ahead ofIreland, but behind Switzerland. U.S. exports to ATPA countries, which increasedthrough 1997 to $8.7 billion, were down sharply in 1999; thereafter they increasedonly slightly each year owing to weak demand resulting from the poor performance ofthe ATPA economies. U.S. exports to ATPA countries amounted to $6.5 billion in 2002,25 percent less than in 1998 (table 2-1).
58 Colombia is also an important source of petroleum derivatives.
2-37
Nonelectrical and electrical machinery, equipment, and parts (HTS chapters 84 and85) remained the two leading 2-digit HTS product categories of U.S. exports to theregion, even though such exports declined during the year (table 2-13, figure 2-6).59
Combined, the value of U.S. exports of these two machinery groups to ATPA countrieswas 30 percent lower in 2002 than in 1998, and 5 percent lower than in 2001.
Among the 20 leading U.S. exports to ATPA countries in 2002 in terms of HTS 8-digitprovisions, six were classified as nonelectrical machinery, equipment, appliances, andparts; they were destined principally for oil and gas extraction, other mining, and thedata processing industries. Only one leading export was an electrical machineryproduct: transmission apparatus for communications (table 2-14).
Exports to ATPA countries of goods in most other major product groups were up in2002. Exports of organic chemicals (HTS chapter 29)–the third leading category ofU.S. exports to the region–have expanded in recent years, and gained relative sharein total U.S. exports to ATPA countries. Such exports were up 13 percent in 2002compared with 2001 (table 2-13). Within the category, exports of vinyl chloride (anorganic chemical) were up 37 percent (table 2-14) and propene (propylene) 177percent during the year. Exports in the aircraft category were up 69 percent60 andexports of cereals rose 22 percent.
Table 2-15 ranks the four ATPA countries as U.S. export markets in 2002 in thefollowing order: Colombia, Ecuador, Peru, and Bolivia (see also figure 2-7). Thisranking is the same in 2002 as the ranking for the U.S. import side (table 2-10).Ecuador replaced Peru during 2002 as the second-largest recipient of U.S. exportsamong ATPA countries. Ecuador alone accounts for the slight increase of U.S. exportsto the entire region during the year (table 2-15) as U.S. exports to the other ATPAcountries declined.
ColombiaIn 2002, the Colombian economy grew by only 1.6 percent.61 The continuedcontraction of the petroleum extraction industry since its peak in 1999 was a majorfactor thwarting Colombia’s economic growth and exports. The sluggish economies ofColombia’s important trading partners, the United States and Latin American nations,and their consequent lower demand for Colombian products, also played a part in
59 In the United States, export data are commonly referred to as being reported under Schedule B,the separate U.S. export schedule based on the Harmonized Tariff Schedule. For purposes of this report,and for ease of comparison with the analysis on imports, Schedule B numbers are referred to here as HTSprovisions. All Schedule B provisions mirror the HTS or aggregate to HTS provisions, except as noted inthe HTS Notice to Exporters, which enumerates unique Schedule B categories that must be used forreporting covered exports.
60 However, this figure is misleading, because exports of military helicopters, used for drugeradication in Colombia, were reported in 2002 for the first time as foreign trade.
61 United Nations, ECLAC, Preliminary Overview of the Economies of Latin America and theCaribbean, 2002, December 2002. All numbers concerning the economies of the four ATPA countriesare preliminary, based on data covering the first three quarters of the year.
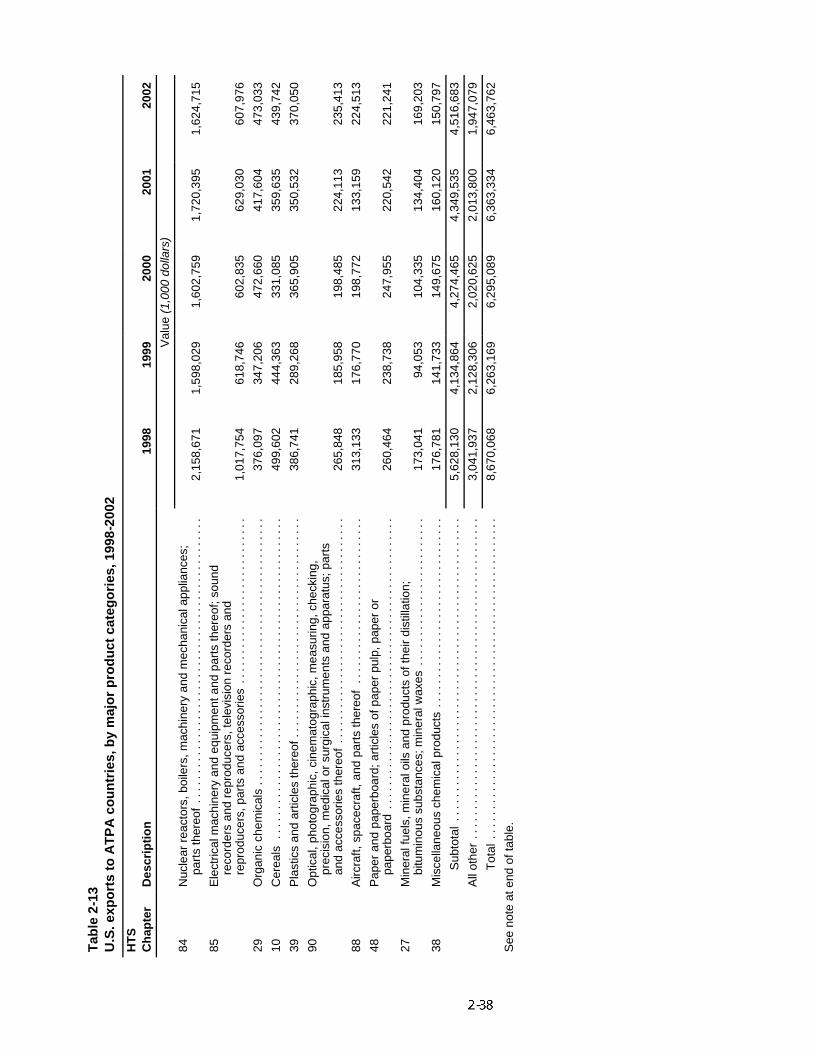
Tab
le2-
13U
.S.e
xpo
rts
toA
TP
Aco
un
trie
s,b
ym
ajo
rp
rod
uct
cate
go
ries
,199
8-20
02
HT
SC
hap
ter
Des
crip
tio
n19
9819
9920
0020
0120
02
Val
ue(1
,000
dolla
rs)
84N
ucle
arre
acto
rs,b
oile
rs,m
achi
nery
and
mec
hani
cala
pplia
nces
;pa
rts
ther
eof
....
....
....
....
....
....
....
....
....
....
....
....
2,15
8,67
11,
598,
029
1,60
2,75
91,
720,
395
1,62
4,71
5
85E
lect
rical
mac
hine
ryan
deq
uipm
enta
ndpa
rts
ther
eof;
soun
dre
cord
ers
and
repr
oduc
ers,
tele
visi
onre
cord
ers
and
repr
oduc
ers,
part
san
dac
cess
orie
s..
....
....
....
....
....
....
..1,
017,
754
618,
746
602,
835
629,
030
607,
976
29O
rgan
icch
emic
als
....
....
....
....
....
....
....
....
....
....
....
.37
6,09
734
7,20
647
2,66
041
7,60
447
3,03
3
10C
erea
ls..
....
....
....
....
....
....
....
....
....
....
....
....
....
499,
602
444,
363
331,
085
359,
635
439,
742
39P
last
ics
and
artic
les
ther
eof.
....
....
....
....
....
....
....
....
....
386,
741
289,
268
365,
905
350,
532
370,
050
90O
ptic
al,p
hoto
grap
hic,
cine
mat
ogra
phic
,mea
surin
g,ch
ecki
ng,
prec
isio
n,m
edic
alor
surg
ical
inst
rum
ents
and
appa
ratu
s;pa
rts
and
acce
ssor
ies
ther
eof
....
....
....
....
....
....
....
....
....
..26
5,84
818
5,95
819
8,48
522
4,11
323
5,41
3
88A
ircra
ft,sp
acec
raft,
and
part
sth
ereo
f..
....
....
....
....
....
....
..31
3,13
317
6,77
019
8,77
213
3,15
922
4,51
3
48P
aper
and
pape
rboa
rd;a
rtic
les
ofpa
per
pulp
,pap
eror
pape
rboa
rd..
....
....
....
....
....
....
....
....
....
....
....
...
260,
464
238,
738
247,
955
220,
542
221,
241
27M
iner
alfu
els,
min
eral
oils
and
prod
ucts
ofth
eir
dist
illat
ion;
bitu
min
ous
subs
tanc
es;m
iner
alw
axes
....
....
....
....
....
....
.17
3,04
194
,053
104,
335
134,
404
169,
203
38M
isce
llane
ous
chem
ical
prod
ucts
....
....
....
....
....
....
....
....
176,
781
141,
733
149,
675
160,
120
150,
797
Sub
tota
l..
....
....
....
....
....
....
....
....
....
....
....
....
.5,
628,
130
4,13
4,86
44,
274,
465
4,34
9,53
54,
516,
683
All
othe
r..
....
....
....
....
....
....
....
....
....
....
....
....
....
3,04
1,93
72,
128,
306
2,02
0,62
52,
013,
800
1,94
7,07
9
Tot
al..
....
....
....
....
....
....
....
....
....
....
....
....
....
8,67
0,06
86,
263,
169
6,29
5,08
96,
363,
334
6,46
3,76
2
See
note
aten
dof
tabl
e.
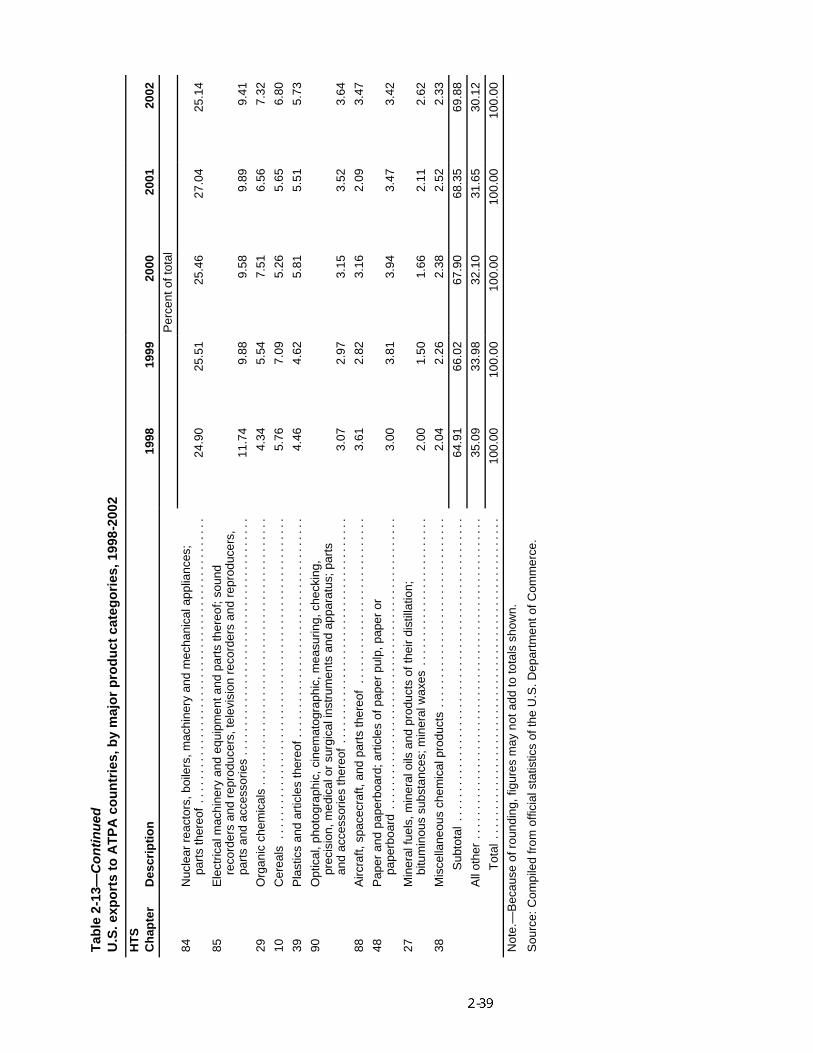
Tab
le2-
13—
Co
nti
nu
edU
.S.e
xpo
rts
toA
TP
Aco
un
trie
s,b
ym
ajo
rp
rod
uct
cate
go
ries
,199
8-20
02
HT
SC
hap
ter
Des
crip
tio
n19
9819
9920
0020
0120
02
Per
cent
ofto
tal
84N
ucle
arre
acto
rs,b
oile
rs,m
achi
nery
and
mec
hani
cala
pplia
nces
;pa
rts
ther
eof
....
....
....
....
....
....
....
....
....
....
....
....
24.9
025
.51
25.4
627
.04
25.1
4
85E
lect
rical
mac
hine
ryan
deq
uipm
enta
ndpa
rts
ther
eof;
soun
dre
cord
ers
and
repr
oduc
ers,
tele
visi
onre
cord
ers
and
repr
oduc
ers,
part
san
dac
cess
orie
s..
....
....
....
....
....
....
....
....
....
..11
.74
9.88
9.58
9.89
9.41
29O
rgan
icch
emic
als
....
....
....
....
....
....
....
....
....
....
....
.4.
345.
547.
516.
567.
32
10C
erea
ls..
....
....
....
....
....
....
....
....
....
....
....
....
....
5.76
7.09
5.26
5.65
6.80
39P
last
ics
and
artic
les
ther
eof.
....
....
....
....
....
....
....
....
....
4.46
4.62
5.81
5.51
5.73
90O
ptic
al,p
hoto
grap
hic,
cine
mat
ogra
phic
,mea
surin
g,ch
ecki
ng,
prec
isio
n,m
edic
alor
surg
ical
inst
rum
ents
and
appa
ratu
s;pa
rts
and
acce
ssor
ies
ther
eof
....
....
....
....
....
....
....
....
....
..3.
072.
973.
153.
523.
64
88A
ircra
ft,sp
acec
raft,
and
part
sth
ereo
f..
....
....
....
....
....
....
..3.
612.
823.
162.
093.
47
48P
aper
and
pape
rboa
rd;a
rtic
les
ofpa
per
pulp
,pap
eror
pape
rboa
rd..
....
....
....
....
....
....
....
....
....
....
....
...
3.00
3.81
3.94
3.47
3.42
27M
iner
alfu
els,
min
eral
oils
and
prod
ucts
ofth
eir
dist
illat
ion;
bitu
min
ous
subs
tanc
es;m
iner
alw
axes
....
....
....
....
....
....
.2.
001.
501.
662.
112.
62
38M
isce
llane
ous
chem
ical
prod
ucts
....
....
....
....
....
....
....
....
2.04
2.26
2.38
2.52
2.33
Sub
tota
l..
....
....
....
....
....
....
....
....
....
....
....
....
.64
.91
66.0
267
.90
68.3
569
.88
All
othe
r..
....
....
....
....
....
....
....
....
....
....
....
....
....
35.0
933
.98
32.1
031
.65
30.1
2
Tot
al..
....
....
....
....
....
....
....
....
....
....
....
....
....
100.
0010
0.00
100.
0010
0.00
100.
00
Not
e.—
Bec
ause
ofro
undi
ng,f
igur
esm
ayno
tadd
toto
tals
show
n.
Sou
rce:
Com
pile
dfr
omof
ficia
lsta
tistic
sof
the
U.S
.Dep
artm
ento
fCom
mer
ce.
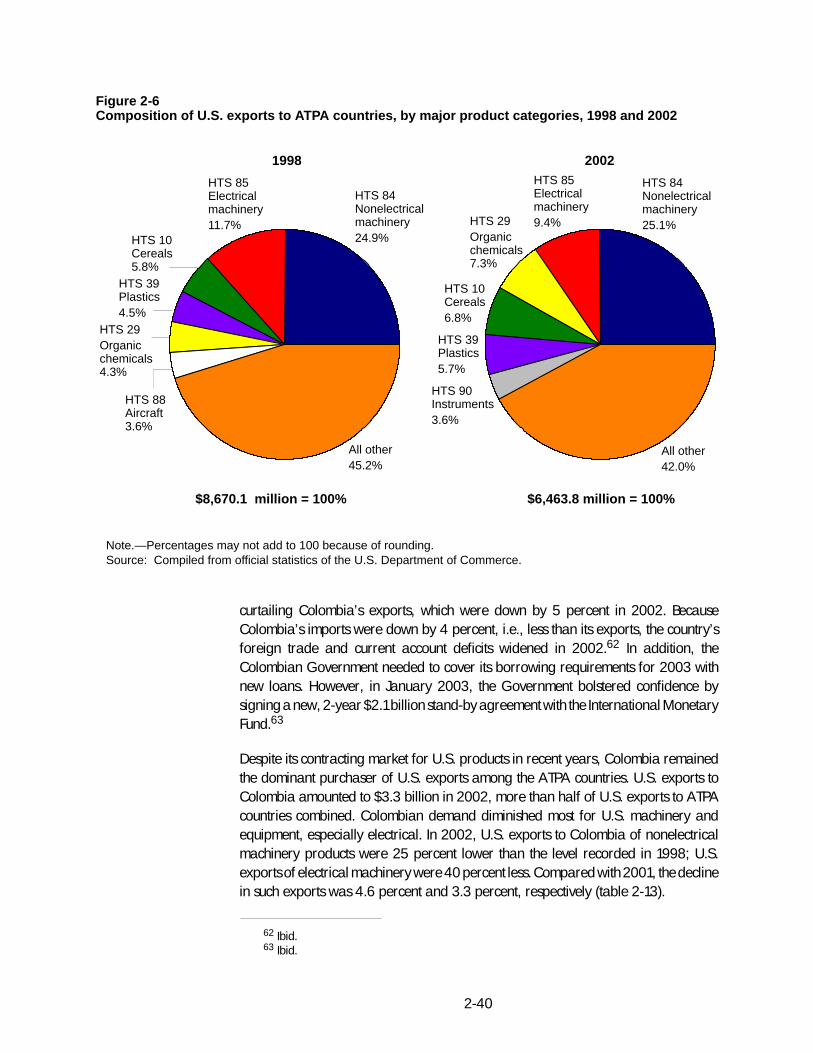
2-40
Figure 2-6Composition of U.S. exports to ATPA countries, by major product categories, 1998 and 2002
HTS 10Cereals5.8%
HTS 84Nonelectricalmachinery24.9%
HTS 85Electricalmachinery11.7%
HTS 29Organicchemicals4.3%
All other45.2%
Note.—Percentages may not add to 100 because of rounding.Source: Compiled from official statistics of the U.S. Department of Commerce.
1998 2002
HTS 88Aircraft3.6%
HTS 39Plastics4.5%
HTS 84Nonelectricalmachinery25.1%
HTS 85Electricalmachinery9.4%
HTS 39Plastics5.7%
HTS 90Instruments3.6%
All other42.0%
$8,670.1 million = 100% $6,463.8 million = 100%
HTS 10Cereals6.8%
HTS 29Organicchemicals7.3%
curtailing Colombia’s exports, which were down by 5 percent in 2002. BecauseColombia’s imports were down by 4 percent, i.e., less than its exports, the country’sforeign trade and current account deficits widened in 2002.62 In addition, theColombian Government needed to cover its borrowing requirements for 2003 withnew loans. However, in January 2003, the Government bolstered confidence bysigning a new, 2-year $2.1 billion stand-by agreement with the International MonetaryFund.63
Despite its contracting market for U.S. products in recent years, Colombia remainedthe dominant purchaser of U.S. exports among the ATPA countries. U.S. exports toColombia amounted to $3.3 billion in 2002, more than half of U.S. exports to ATPAcountries combined. Colombian demand diminished most for U.S. machinery andequipment, especially electrical. In 2002, U.S. exports to Colombia of nonelectricalmachinery products were 25 percent lower than the level recorded in 1998; U.S.exports of electrical machinery were 40 percent less. Compared with 2001, the declinein such exports was 4.6 percent and 3.3 percent, respectively (table 2-13).
62 Ibid.63 Ibid.
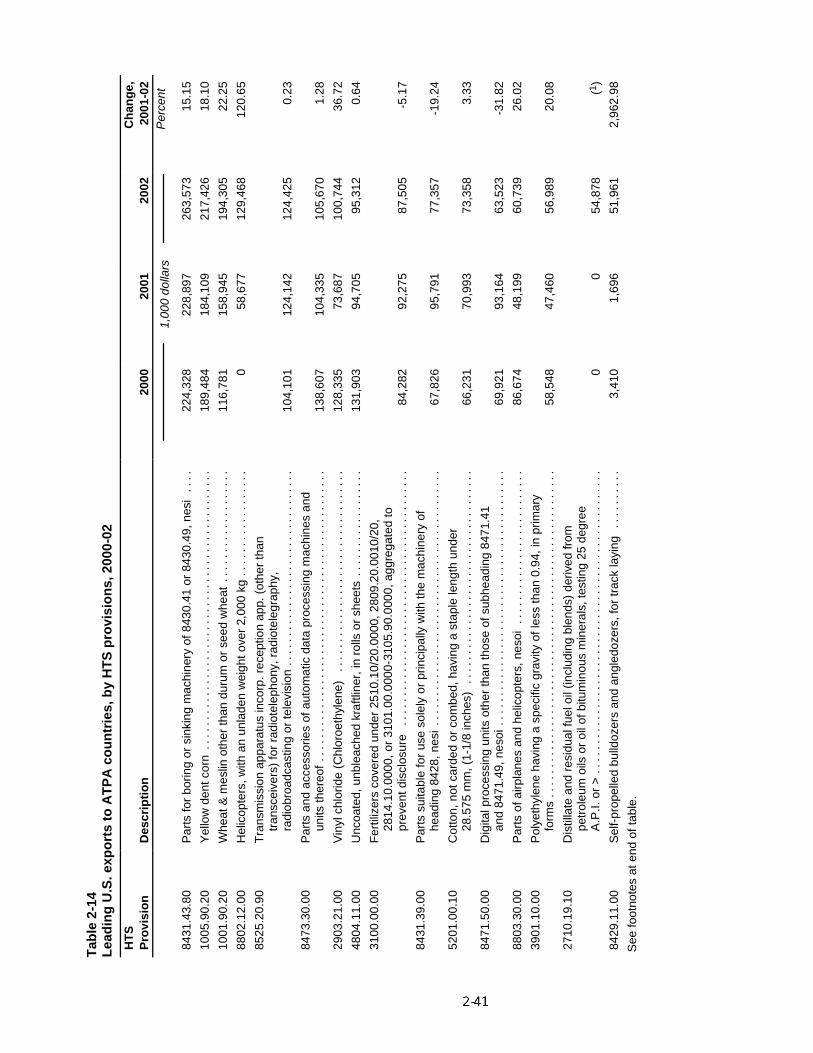
Tab
le2-
14L
ead
ing
U.S
.exp
ort
sto
AT
PA
cou
ntr
ies,
by
HT
Sp
rovi
sio
ns,
2000
-02
HT
SC
han
ge,
Pro
visi
on
Des
crip
tio
n20
0020
0120
0220
01-0
2
1,00
0do
llars
Per
cent
8431
.43.
80P
arts
for
borin
gor
sink
ing
mac
hine
ryof
8430
.41
or84
30.4
9,ne
si..
..22
4,32
822
8,89
726
3,57
315
.15
1005
.90.
20Y
ello
wde
ntco
rn..
....
....
....
....
....
....
....
....
....
....
....
.18
9,48
418
4,10
921
7,42
618
.10
1001
.90.
20W
heat
&m
eslin
othe
rth
andu
rum
orse
edw
heat
....
....
....
....
...
116,
781
158,
945
194,
305
22.2
5
8802
.12.
00H
elic
opte
rs,w
ithan
unla
den
wei
ghto
ver
2,00
0kg
....
....
....
....
..0
58,6
7712
9,46
812
0.65
8525
.20.
90T
rans
mis
sion
appa
ratu
sin
corp
.rec
eptio
nap
p.(o
ther
than
tran
scei
vers
)fo
rra
diot
elep
hony
,rad
iote
legr
aphy
,ra
diob
road
cast
ing
orte
levi
sion
....
....
....
....
....
....
....
....
.10
4,10
112
4,14
212
4,42
50.
23
8473
.30.
00P
arts
and
acce
ssor
ies
ofau
tom
atic
data
proc
essi
ngm
achi
nes
and
units
ther
eof.
....
....
....
....
....
....
....
....
....
....
....
....
138,
607
104,
335
105,
670
1.28
2903
.21.
00V
inyl
chlo
ride
(Chl
oroe
thyl
ene)
....
....
....
....
....
....
....
....
..12
8,33
573
,687
100,
744
36.7
2
4804
.11.
00U
ncoa
ted,
unbl
each
edkr
aftli
ner,
inro
llsor
shee
ts..
....
....
....
....
131,
903
94,7
0595
,312
0.64
3100
.00.
00F
ertil
izer
sco
vere
dun
der
2510
.10/
20.0
000,
2809
.20.
0010
/20,
2814
.10.
0000
,or
3101
.00.
0000
-310
5.90
.000
0,ag
greg
ated
topr
even
tdis
clos
ure
....
....
....
....
....
....
....
....
....
....
...
84,2
8292
,275
87,5
05-5
.17
8431
.39.
00P
arts
suita
ble
for
use
sole
lyor
prin
cipa
llyw
ithth
em
achi
nery
ofhe
adin
g84
28,n
esi
....
....
....
....
....
....
....
....
....
....
...
67,8
2695
,791
77,3
57-1
9.24
5201
.00.
10C
otto
n,no
tcar
ded
orco
mbe
d,ha
ving
ast
aple
leng
thun
der
28.5
75m
m,(
1-1/
8in
ches
)..
....
....
....
....
....
....
....
....
..66
,231
70,9
9373
,358
3.33
8471
.50.
00D
igita
lpro
cess
ing
units
othe
rth
anth
ose
ofsu
bhea
ding
8471
.41
and
8471
.49,
neso
i...
....
....
....
....
....
....
....
....
....
....
69,9
2193
,164
63,5
23-3
1.82
8803
.30.
00P
arts
ofai
rpla
nes
and
helic
opte
rs,n
esoi
....
....
....
....
....
....
..86
,674
48,1
9960
,739
26.0
2
3901
.10.
00P
olye
thyl
ene
havi
nga
spec
ific
grav
ityof
less
than
0.94
,in
prim
ary
form
s..
....
....
....
....
....
....
....
....
....
....
....
....
....
.58
,548
47,4
6056
,989
20.0
8
2710
.19.
10D
istil
late
and
resi
dual
fuel
oil(
incl
udin
gbl
ends
)de
rived
from
petr
oleu
moi
lsor
oilo
fbitu
min
ous
min
eral
s,te
stin
g25
degr
eeA
.P.I.
or>
....
....
....
....
....
....
....
....
....
....
....
....
...
00
54,8
78(1
)
8429
.11.
00S
elf-
prop
elle
dbu
lldoz
ers
and
angl
edoz
ers,
for
trac
kla
ying
....
....
..3,
410
1,69
651
,961
2,96
2.98
See
foot
note
sat
end
ofta
ble.
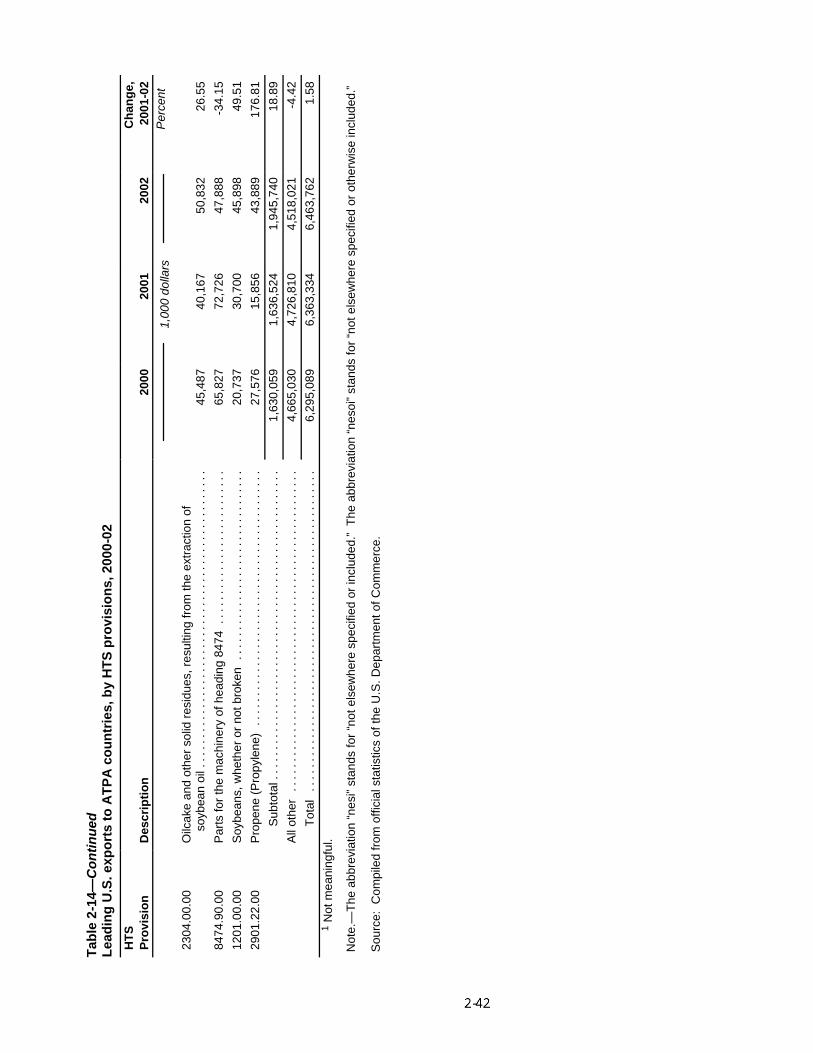
Tab
le2-
14—
Co
nti
nu
edL
ead
ing
U.S
.exp
ort
sto
AT
PA
cou
ntr
ies,
by
HT
Sp
rovi
sio
ns,
2000
-02
HT
SC
han
ge,
Pro
visi
on
Des
crip
tio
n20
0020
0120
0220
01-0
2
1,00
0do
llars
Per
cent
2304
.00.
00O
ilcak
ean
dot
her
solid
resi
dues
,res
ultin
gfr
omth
eex
trac
tion
ofso
ybea
noi
l...
....
....
....
....
....
....
....
....
....
....
....
...
45,4
8740
,167
50,8
3226
.55
8474
.90.
00P
arts
for
the
mac
hine
ryof
head
ing
8474
....
....
....
....
....
....
..65
,827
72,7
2647
,888
-34.
15
1201
.00.
00S
oybe
ans,
whe
ther
orno
tbro
ken
....
....
....
....
....
....
....
....
20,7
3730
,700
45,8
9849
.51
2901
.22.
00P
rope
ne(P
ropy
lene
)..
....
....
....
....
....
....
....
....
....
....
.27
,576
15,8
5643
,889
176.
81
Sub
tota
l...
....
....
....
....
....
....
....
....
....
....
....
....
.1,
630,
059
1,63
6,52
41,
945,
740
18.8
9
All
othe
r..
....
....
....
....
....
....
....
....
....
....
....
....
....
4,66
5,03
04,
726,
810
4,51
8,02
1-4
.42
Tot
al..
....
....
....
....
....
....
....
....
....
....
....
....
....
6,29
5,08
96,
363,
334
6,46
3,76
21.
581
Not
mea
ning
ful.
Not
e.—
The
abbr
evia
tion
“nes
i”st
ands
for
“not
else
whe
resp
ecifi
edor
incl
uded
.”T
heab
brev
iatio
n“n
esoi
”st
ands
for
“not
else
whe
resp
ecifi
edor
othe
rwis
ein
clud
ed.”
Sou
rce:
Com
pile
dfr
omof
ficia
lsta
tistic
sof
the
U.S
.Dep
artm
ento
fCom
mer
ce.
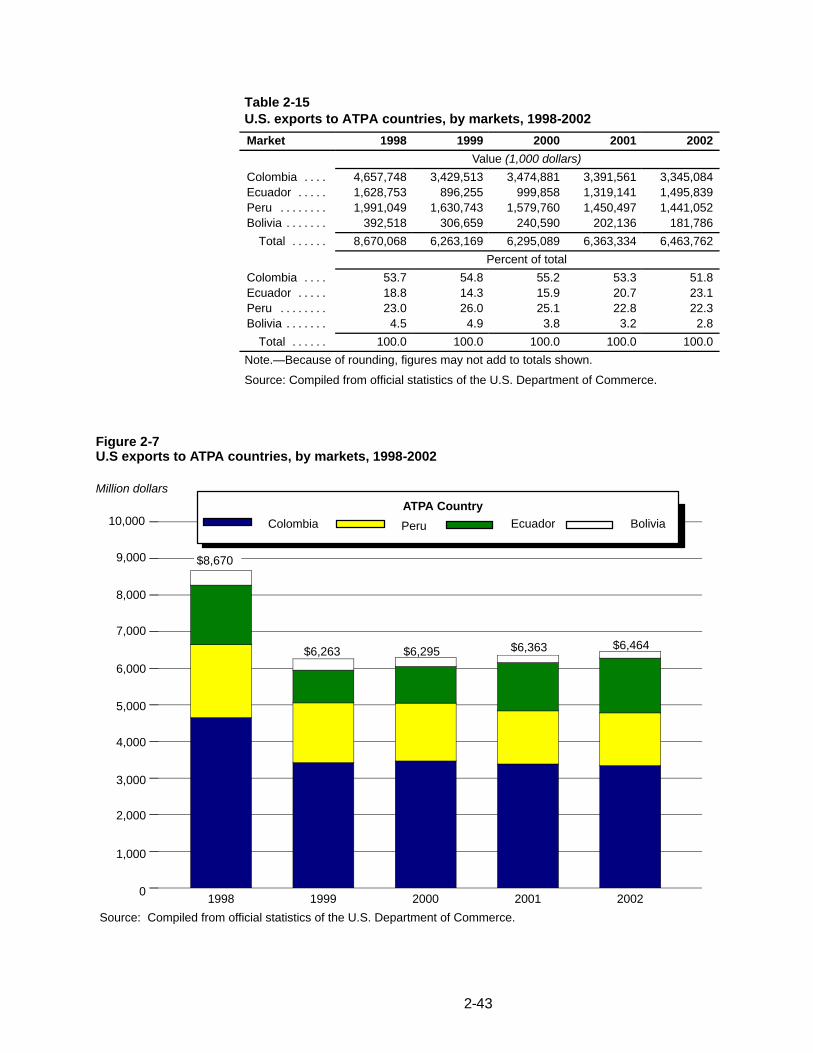
2-43
Table 2-15U.S. exports to ATPA countries, by markets, 1998-2002
Market 1998 1999 2000 2001 2002
Value (1,000 dollars)
Colombia . . . . 4,657,748 3,429,513 3,474,881 3,391,561 3,345,084Ecuador . . . . . 1,628,753 896,255 999,858 1,319,141 1,495,839Peru . . . . . . . . 1,991,049 1,630,743 1,579,760 1,450,497 1,441,052Bolivia . . . . . . . 392,518 306,659 240,590 202,136 181,786
Total . . . . . . 8,670,068 6,263,169 6,295,089 6,363,334 6,463,762
Percent of total
Colombia . . . . 53.7 54.8 55.2 53.3 51.8Ecuador . . . . . 18.8 14.3 15.9 20.7 23.1Peru . . . . . . . . 23.0 26.0 25.1 22.8 22.3Bolivia . . . . . . . 4.5 4.9 3.8 3.2 2.8
Total . . . . . . 100.0 100.0 100.0 100.0 100.0
Note.—Because of rounding, figures may not add to totals shown.
Source: Compiled from official statistics of the U.S. Department of Commerce.
Figure 2-7U.S exports to ATPA countries, by markets, 1998-2002
1998 1999 2000 2001 2002
Million dollars
Source: Compiled from official statistics of the U.S. Department of Commerce.
Ecuador BoliviaPeruColombia
6,000
5,000
4,000
3,000
2,000
1,000
ATPA Country
0
9,000
8,000
7,000
10,000
$6,263 $6,295 $6,363 $6,464
$8,670
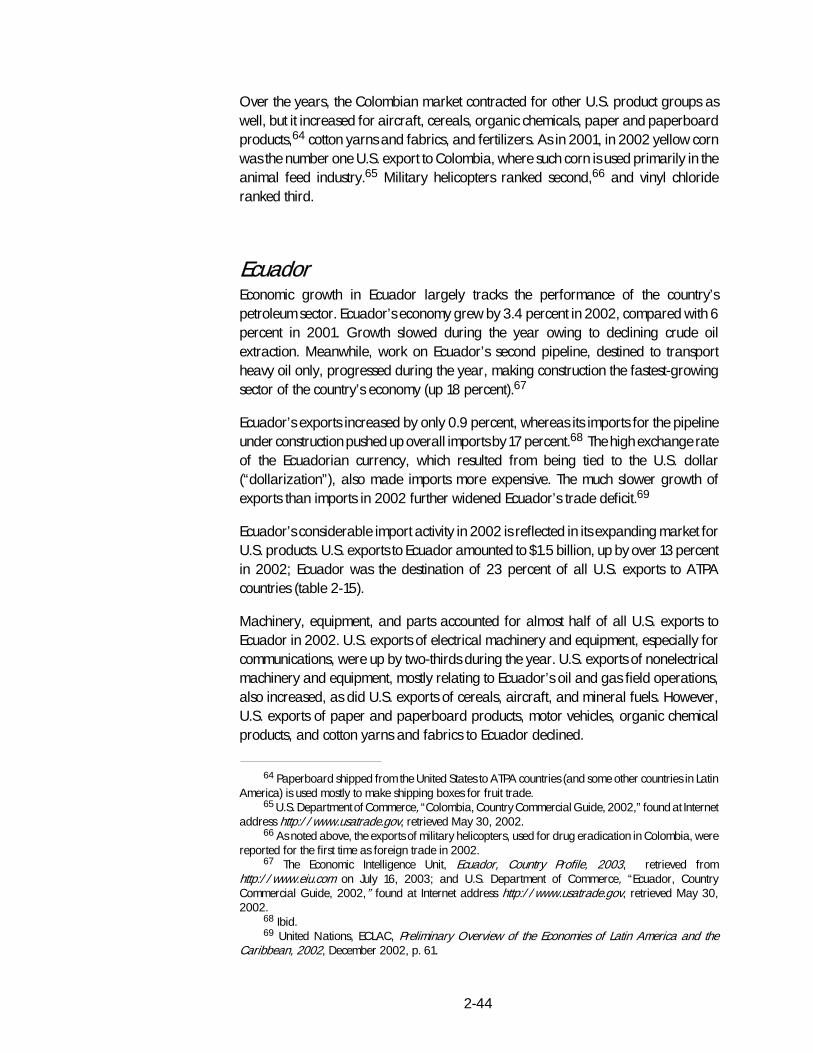
2-44
Over the years, the Colombian market contracted for other U.S. product groups aswell, but it increased for aircraft, cereals, organic chemicals, paper and paperboardproducts,64 cotton yarns and fabrics, and fertilizers. As in 2001, in 2002 yellow cornwas the number one U.S. export to Colombia, where such corn is used primarily in theanimal feed industry.65 Military helicopters ranked second,66 and vinyl chlorideranked third.
EcuadorEconomic growth in Ecuador largely tracks the performance of the country’spetroleum sector. Ecuador’s economy grew by 3.4 percent in 2002, compared with 6percent in 2001. Growth slowed during the year owing to declining crude oilextraction. Meanwhile, work on Ecuador’s second pipeline, destined to transportheavy oil only, progressed during the year, making construction the fastest-growingsector of the country’s economy (up 18 percent).67
Ecuador’s exports increased by only 0.9 percent, whereas its imports for the pipelineunder construction pushed up overall imports by 17 percent.68 The high exchange rateof the Ecuadorian currency, which resulted from being tied to the U.S. dollar(“dollarization”), also made imports more expensive. The much slower growth ofexports than imports in 2002 further widened Ecuador’s trade deficit.69
Ecuador’s considerable import activity in 2002 is reflected in its expanding market forU.S. products. U.S. exports to Ecuador amounted to $1.5 billion, up by over 13 percentin 2002; Ecuador was the destination of 23 percent of all U.S. exports to ATPAcountries (table 2-15).
Machinery, equipment, and parts accounted for almost half of all U.S. exports toEcuador in 2002. U.S. exports of electrical machinery and equipment, especially forcommunications, were up by two-thirds during the year. U.S. exports of nonelectricalmachinery and equipment, mostly relating to Ecuador’s oil and gas field operations,also increased, as did U.S. exports of cereals, aircraft, and mineral fuels. However,U.S. exports of paper and paperboard products, motor vehicles, organic chemicalproducts, and cotton yarns and fabrics to Ecuador declined.
64 Paperboard shipped from the United States to ATPA countries (and some other countries in LatinAmerica) is used mostly to make shipping boxes for fruit trade.
65 U.S. Department of Commerce, “Colombia, Country Commercial Guide, 2002,” found at Internetaddress http://www.usatrade.gov, retrieved May 30, 2002.
66 As noted above, the exports of military helicopters, used for drug eradication in Colombia, werereported for the first time as foreign trade in 2002.
67 The Economic Intelligence Unit, Ecuador, Country Profile, 2003, retrieved fromhttp://www.eiu.com on July 16, 2003; and U.S. Department of Commerce, “Ecuador, CountryCommercial Guide, 2002,” found at Internet address http://www.usatrade.gov, retrieved May 30,2002.
68 Ibid.69 United Nations, ECLAC, Preliminary Overview of the Economies of Latin America and the
Caribbean, 2002, December 2002, p. 61.
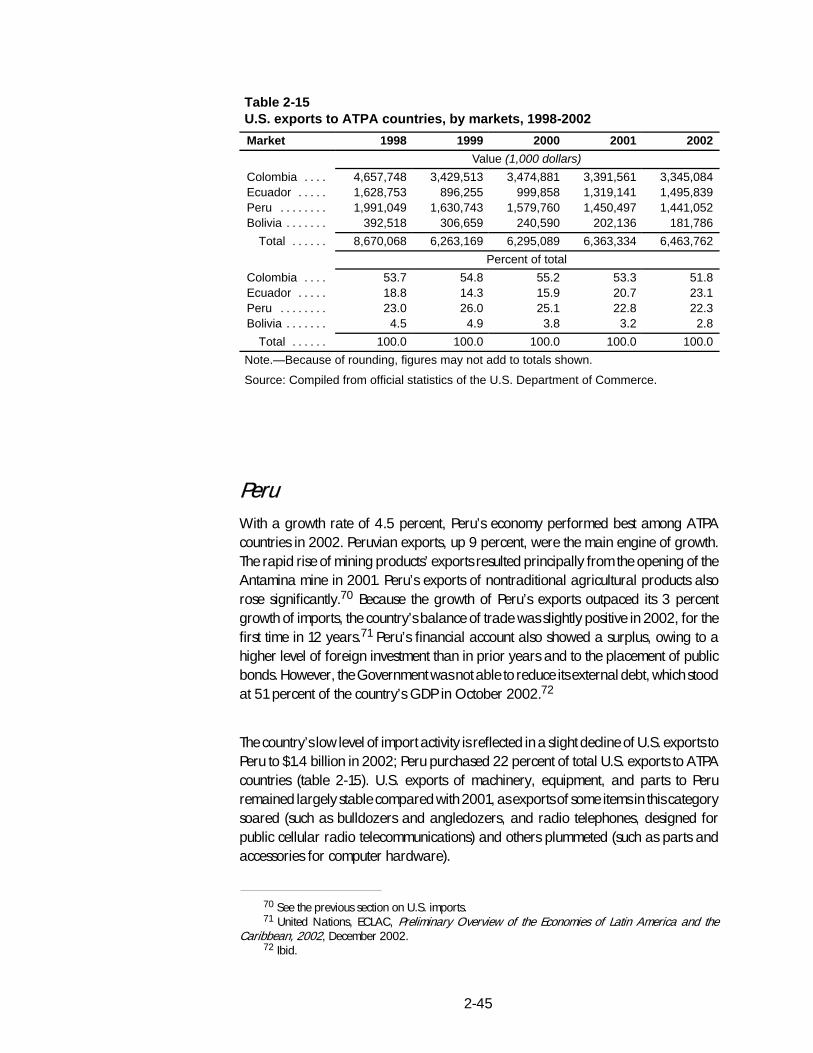
2-45
Table 2-15U.S. exports to ATPA countries, by markets, 1998-2002
Market 1998 1999 2000 2001 2002
Value (1,000 dollars)
Colombia . . . . 4,657,748 3,429,513 3,474,881 3,391,561 3,345,084Ecuador . . . . . 1,628,753 896,255 999,858 1,319,141 1,495,839Peru . . . . . . . . 1,991,049 1,630,743 1,579,760 1,450,497 1,441,052Bolivia . . . . . . . 392,518 306,659 240,590 202,136 181,786
Total . . . . . . 8,670,068 6,263,169 6,295,089 6,363,334 6,463,762
Percent of total
Colombia . . . . 53.7 54.8 55.2 53.3 51.8Ecuador . . . . . 18.8 14.3 15.9 20.7 23.1Peru . . . . . . . . 23.0 26.0 25.1 22.8 22.3Bolivia . . . . . . . 4.5 4.9 3.8 3.2 2.8
Total . . . . . . 100.0 100.0 100.0 100.0 100.0
Note.—Because of rounding, figures may not add to totals shown.
Source: Compiled from official statistics of the U.S. Department of Commerce.
PeruWith a growth rate of 4.5 percent, Peru’s economy performed best among ATPAcountries in 2002. Peruvian exports, up 9 percent, were the main engine of growth.The rapid rise of mining products’ exports resulted principally from the opening of theAntamina mine in 2001. Peru’s exports of nontraditional agricultural products alsorose significantly.70 Because the growth of Peru’s exports outpaced its 3 percentgrowth of imports, the country’s balance of trade was slightly positive in 2002, for thefirst time in 12 years.71 Peru’s financial account also showed a surplus, owing to ahigher level of foreign investment than in prior years and to the placement of publicbonds. However, the Government was not able to reduce its external debt, which stoodat 51 percent of the country’s GDP in October 2002.72
The country’s low level of import activity is reflected in a slight decline of U.S. exports toPeru to $1.4 billion in 2002; Peru purchased 22 percent of total U.S. exports to ATPAcountries (table 2-15). U.S. exports of machinery, equipment, and parts to Peruremained largely stable compared with 2001, as exports of some items in this categorysoared (such as bulldozers and angledozers, and radio telephones, designed forpublic cellular radio telecommunications) and others plummeted (such as parts andaccessories for computer hardware).
70 See the previous section on U.S. imports.71 United Nations, ECLAC, Preliminary Overview of the Economies of Latin America and the
Caribbean, 2002, December 2002.72 Ibid.
2-46
Notable was the increase in U.S. exports to Peru of plastics, organic chemicals,soybean products, and light oils. These increases were offset by declines of wheat,gold bullion, and fertilizer exports. Nonetheless, wheat continued to be the numberone U.S. product shipped to Peru in 2002.
BoliviaFor the fourth consecutive year, the Bolivian economy remained stagnant. A decline indemand and prices for Bolivian exports brought a downturn in 1999, and thatlower-level activity persisted into 2002.73 The country’s GDP expanded by barely 2percent in 2002 as the value of the country’s exports declined slightly. Boliviaperformed poorly in its important mining sector, particularly in the natural gasindustry. Sales of Bolivian natural gas contracted almost 10 percent in 2002, asexpectations of gas sales to Brazil failed to materialize.74 Because overall Bolivianimports increased significantly in 2002, the country’s trade and current accountsbalances continued to deteriorate. An outflow of capital, triggered by the uncertainprospects of Bolivia’s domestic economy and the external economic factors on which itdepended, aggravated the deterioration of the country’s current accounts deficit,which was double the level recorded in the preceding year.75 In 2002, Brazil overtookthe United States as Bolivia’s principal trading partner, owing to Bolivia’s significantgas exports to that country.76
U.S. exports to Bolivia amounted to $182 million in 2002, 9 percent less than in 2001.These exports amounted to only 42 percent of their 1998 value; since that point theyhave contracted each year (table 2-15). In 2002, Bolivia accounted for only 2.8percent of total U.S. exports to all ATPA countries compared with 4.5 percent in 1998.Machinery, equipment, and parts, both electrical and nonelectrical, some relating togas fields, led the decline. Similarly, U.S. sales of instruments and parts to Boliviadeclined markedly; they increased, however, in some smaller export categories,including jewelry, cereals, inorganic chemicals, and pharmaceuticals.
73 The Economic Intelligence Unit, Bolivia, Country Profile, 2003, retrieved fromhttp://www.eiu.com on July 16, 2003.
74 Ibid., and United Nations, ECLAC, Preliminary Overview of the Economies of Latin America andthe Caribbean, 2002, December 2002.
75 Ibid.76 The Economic Intelligence Unit, Bolivia, Country Profile, 2003, retrieved from
http://www.eiu.com on July 16, 2003.
3-1
CHAPTER 3Impact of ATPA on the United States andProbable Future Effects
Two issues are addressed in this chapter: the impact of the ATPA trade preferenceprogram on the United States in 2002 and the probable future effects of the program.1
Items most affected by ATPA preferences were identified in an impact analysis andspecific U.S. industries were examined. Information on ATPA-related investment in thecountries was the main source for the estimates of probable future effects. Thisinformation was collected from U.S. embassies in the region.
Impact of ATPA on the United States in 2002
Since it was implemented in 1992,2 ATPA has had a minimal effect on the overalleconomy of the United States. In each year from 1992 through 2002, the value ofATPA duty-free U.S. imports has been 0.02 percent or less of U.S. gross domesticproduct. As pointed out in chapter 2, the total value of U.S. imports from ATPAcountries remained small in 2002, amounting to 0.83 percent of total U.S. imports,while imports under ATPA provisions totaled 0.09 percent of total U.S. imports.
In addition, the value of the ATPA program to countries and its potential for affectingthe U.S. economy, consumers, and industries has fallen over time because of theerosion of the margin of preference for many ATPA products.3 Sources of this erosioninclude phased tariff cuts under the Uruguay Round, tariff cuts and eliminations undersectoral trade negotiations, the extension of preferential trading arrangements suchas the North American Free Trade Agreement (NAFTA), and the erosion of the advalorem equivalent of specific duties because of inflation.4
Because most U.S. imports from ATPA countries can enter the United States free of dutyat general rates or under GSP or are excluded from the program, the Commissionfocused its analysis of the impact of ATPA on products that can enter free of duty or atreduced duties only under ATPA and not under other programs.
1 As discussed in chapter 1, the term “ATPA” shall refer to ATPA as amended by ATPDEA, and theterm “original ATPA” shall be used to identify the original ATPA program that expired in December 2001.
2 ATPA was enacted in December 1991 but the tariff preferences were implemented in 1992 and1993. See footnote 1 in chapter 1.
3 The higher the ad valorem column 1-general duty rate for any given product, the greater thebenefit to ATPA beneficiaries—the higher the margin of preference. ATPA beneficiaries also benefit moreif the column 1-general rate is more extensively applied—that is, if fewer non-ATPA countries enjoypreferential rates.
4 For a more detailed analysis of the erosion of the margin of preference, see USITC, ATPA, FifthReport, 1997, p. 132.
3-2
Because the original ATPA preferences were enacted for a longer time period (theinitial program was for the 10 years 1991-2001), ATPA has provided greaterassurance than the GSP program that GSP-eligible products from ATPA countrieswould enter the United States free of duty, making investment related to such productsmore attractive than would be the case in the absence of ATPA. Investment indeveloping countries that depends solely on GSP for duty-free preferences has provedriskier because of the recent lapses in program authorization and uncertainties aboutwhen renewal would occur, and because of the possibility that imports of a particulargood might exceed competitive-need limits and lose GSP eligibility, as discussed inchapter 1. In 2001, both GSP and ATPA expired–GSP on September 30 and ATPA onDecember 4–introducing additional uncertainties for ATPA-country exporters.President Bush signed legislation to renew both programs retroactively on August 6,2002.5 Recordkeeping and data collection for potential ATPA-eligible entries weredisrupted by ATPA’s lapse and reported data may be incomplete or inaccurate. In theanalysis described in this chapter, no attempt was made to quantify any of theseuncertainties or disruptions. Data for 2002 and analysis based on that data aretherefore not strictly comparable with data and analysis in prior ATPA reports and willnot be comparable with data and analysis in future ATPA reports. The addition ofnewly eligible products under ATPDEA alters the comparability of data and analysis in2002 with past reports somewhat, but imports of these products occurred in onlylimited quantities toward the end of the year. Preliminary analysis of data in 2003indicates that imports of the newly eligible products will play a dominant role amongfuture imports of products benefiting exclusively from ATPA.6
The material that follows in this section defines products that benefit exclusively fromATPA; presents quantitative estimates of the impact of ATPA on U.S. consumers, theU.S. Treasury, and U.S. industries whose goods compete with U.S. imports underATPA; and describes the U.S. imports that benefited exclusively from ATPA in 2002and had the largest potential impact on competing U.S. industries.
Products That Benefited Exclusively From ATPA in 2002U.S. imports of products benefiting exclusively from ATPA in 2002 were defined asthose that entered free of duty under ATPA or under the reduced-duty provisions of theoriginal ATPA7 and were not eligible to enter free of duty under column 1-generalrates or under other provisions, such as GSP. Consistent with this definition,GSP-eligible goods imported from ATPA countries that were entered under ATPApreferences were considered to benefit exclusively from ATPA only if imports of the
5 Public Law 107-210, the Trade Act of 2002. The Andean Trade Promotion and Drug EradicationAct (ATPDEA) is Title XXXI of the Act.
6 For example, for the first 4 months of 2003, petroleum and petroleum products accounted formore than half of the value of products entered under ATPA.
7 As mentioned in chapter 1, the reduced-duty preferences were terminated by ATPDEA.
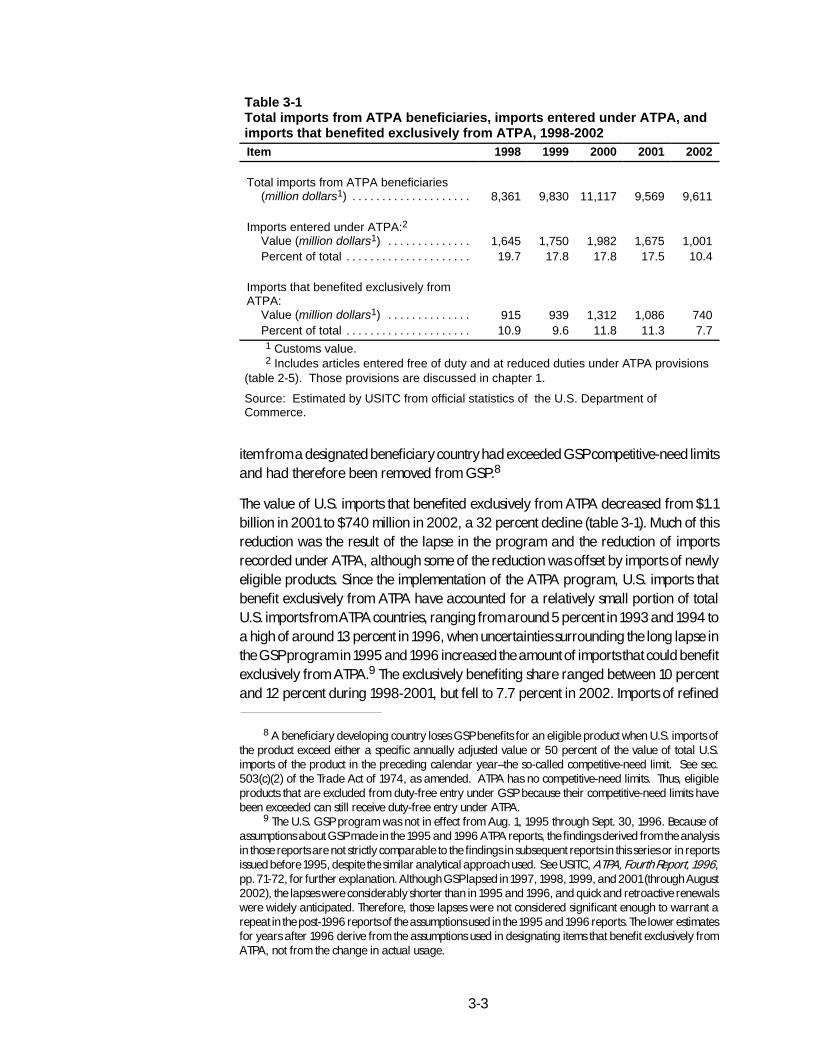
3-3
Table 3-1Total imports from ATPA beneficiaries, imports entered under ATPA, andimports that benefited exclusively from ATPA, 1998-2002Item 1998 1999 2000 2001 2002
Total imports from ATPA beneficiaries(million dollars1) . . . . . . . . . . . . . . . . . . . . 8,361 9,830 11,117 9,569 9,611
Imports entered under ATPA:2Value (million dollars1) . . . . . . . . . . . . . . 1,645 1,750 1,982 1,675 1,001Percent of total . . . . . . . . . . . . . . . . . . . . . 19.7 17.8 17.8 17.5 10.4
Imports that benefited exclusively fromATPA:
Value (million dollars1) . . . . . . . . . . . . . . 915 939 1,312 1,086 740Percent of total . . . . . . . . . . . . . . . . . . . . . 10.9 9.6 11.8 11.3 7.71 Customs value.2 Includes articles entered free of duty and at reduced duties under ATPA provisions
(table 2-5). Those provisions are discussed in chapter 1.
Source: Estimated by USITC from official statistics of the U.S. Department ofCommerce.
item from a designated beneficiary country had exceeded GSP competitive-need limitsand had therefore been removed from GSP.8
The value of U.S. imports that benefited exclusively from ATPA decreased from $1.1billion in 2001 to $740 million in 2002, a 32 percent decline (table 3-1). Much of thisreduction was the result of the lapse in the program and the reduction of importsrecorded under ATPA, although some of the reduction was offset by imports of newlyeligible products. Since the implementation of the ATPA program, U.S. imports thatbenefit exclusively from ATPA have accounted for a relatively small portion of totalU.S. imports from ATPA countries, ranging from around 5 percent in 1993 and 1994 toa high of around 13 percent in 1996, when uncertainties surrounding the long lapse inthe GSP program in 1995 and 1996 increased the amount of imports that could benefitexclusively from ATPA.9 The exclusively benefiting share ranged between 10 percentand 12 percent during 1998-2001, but fell to 7.7 percent in 2002. Imports of refined
8 A beneficiary developing country loses GSP benefits for an eligible product when U.S. imports ofthe product exceed either a specific annually adjusted value or 50 percent of the value of total U.S.imports of the product in the preceding calendar year–the so-called competitive-need limit. See sec.503(c)(2) of the Trade Act of 1974, as amended. ATPA has no competitive-need limits. Thus, eligibleproducts that are excluded from duty-free entry under GSP because their competitive-need limits havebeen exceeded can still receive duty-free entry under ATPA.
9 The U.S. GSP program was not in effect from Aug. 1, 1995 through Sept. 30, 1996. Because ofassumptions about GSP made in the 1995 and 1996 ATPA reports, the findings derived from the analysisin those reports are not strictly comparable to the findings in subsequent reports in this series or in reportsissued before 1995, despite the similar analytical approach used. See USITC, ATPA, Fourth Report, 1996,pp. 71-72, for further explanation. Although GSP lapsed in 1997, 1998, 1999, and 2001 (through August2002), the lapses were considerably shorter than in 1995 and 1996, and quick and retroactive renewalswere widely anticipated. Therefore, those lapses were not considered significant enough to warrant arepeat in the post-1996 reports of the assumptions used in the 1995 and 1996 reports. The lower estimatesfor years after 1996 derive from the assumptions used in designating items that benefit exclusively fromATPA, not from the change in actual usage.
3-4
copper cathodes from Peru (HTS subheading 7403.11.00) have come to dominate thiscategory, accounting for around 40 percent of imports benefiting exclusively fromATPA in 2000 and 2001.10 The share of imports benefiting exclusively from ATPAaccounted for by copper cathodes in 2002 dropped to 23 percent. Without coppercathodes, the share benefiting exclusively from ATPA would have been 5.1 percent oftotal imports from ATPA countries in 2002.
The 20 leading items that benefited exclusively from ATPA are shown in table 3-2. Themost notable change in the value of such imports was for refined copper cathodes fromPeru, which decreased by $181 million in value, or 42 percent, from 2001 to 2002.Exclusively benefiting imports of copper cathodes increased rapidly in recent years,more than tripling from 1997 to 2000. However, total imports of copper cathodes fromPeru fell only 2 percent in 2002. Because the duty rate for copper cathodes is only 1percent ad valorem, ATPA preferences probably have a very small influence onimports of such items. Other notable reductions include exclusively benefiting importsof pigments (HTS 3212.90.00) from Colombia, down by $165 million in value from2001 to 2002, or 85 percent; fresh-cut roses (HTS 0603.10.60), down by $111 million,or 61 percent; fresh-cut chrysanthemums, standard carnations, anthuriums, andorchids (HTS 0603.10.70) from Colombia, down $45 million, or 50 percent; and tunasand skipjack (HTS 1604.14.40), down by $23 million, or 85 percent. For most of theseitems, the drop in total imports from ATPA-beneficiary countries was not nearly aslarge as the drop in exclusively benefiting imports, with the exception of pigments fromColombia, which experienced a drop in total imports of 84 percent. There were otherlarge relative changes in the value of imports of leading items, but these changes weregenerally from relatively small bases.
Six products were added to the list of 20 leading import items in 2002–light crude oil(HTS 2709.00.10), heavy crude oil (HTS 2709.00.20), naphthas (HTS 2710.11.25),light residual fuel oil (HTS 2710.19.05), and heavy residual fuel oil (HTS2710.19.10)–all traditional ATPA-country exports made newly eligible for preferencesby ATPDEA–and fresh grapes (HTS 0806.10.60), which experienced a large increasein imports.
Leading imports that were identified in previous annual ATPA reports as benefitingexclusively from ATPA between 1992 and 2001 continued to rank among the leadingU.S. imports in 2002. Those imports were fresh-cut roses and chrysanthemums andother flowers under HTS 0603.10.70 from Colombia, which have consistently rankedamong the leading items benefiting exclusively from ATPA since the implementation ofthe program.
10 For a more detailed discussion of copper cathodes see Walker Pollard, “Renewal and Expansionof ATPA Could Enhance Effectiveness of the Program,” International Economic Review, USITC publication3442, July/August 2001, pp. 17-22.
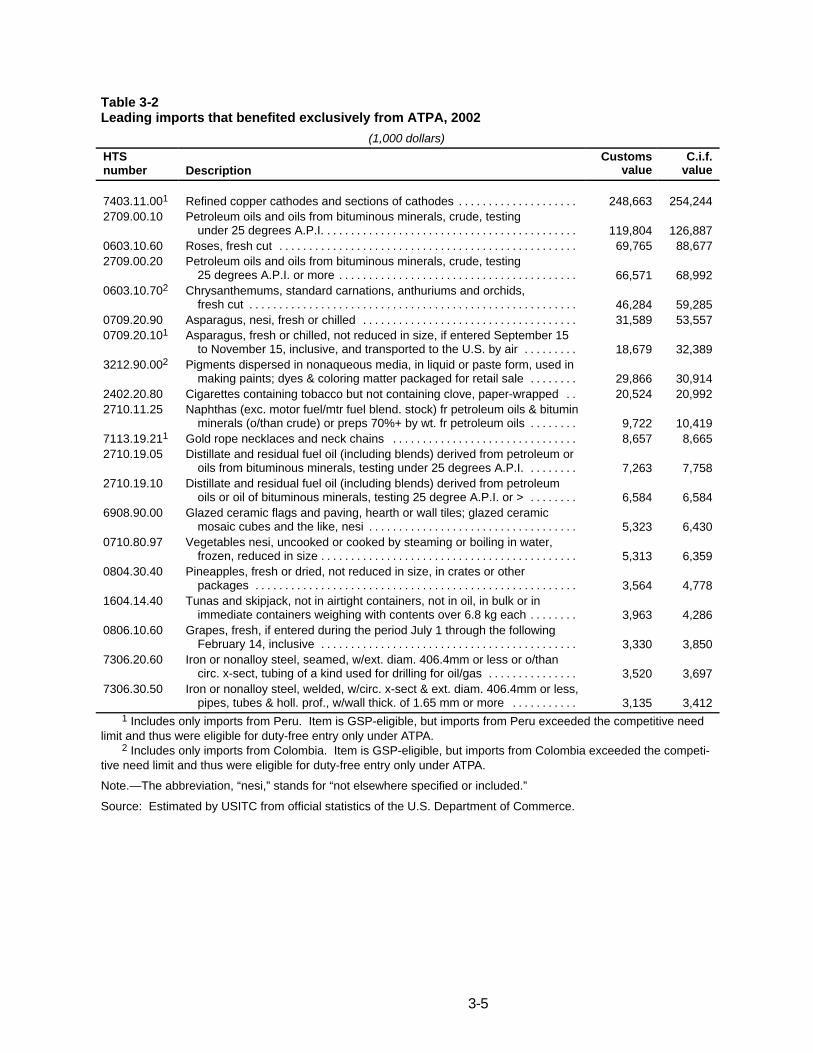
3-5
Table 3-2Leading imports that benefited exclusively from ATPA, 2002
(1,000 dollars)
HTSnumber Description
Customsvalue
C.i.f.value
7403.11.001 Refined copper cathodes and sections of cathodes . . . . . . . . . . . . . . . . . . . . 248,663 254,2442709.00.10 Petroleum oils and oils from bituminous minerals, crude, testing
under 25 degrees A.P.I. . . . . . . . . . . . . . . . . . . . . . . . . . . . . . . . . . . . . . . . . . . 119,804 126,8870603.10.60 Roses, fresh cut . . . . . . . . . . . . . . . . . . . . . . . . . . . . . . . . . . . . . . . . . . . . . . . . . . 69,765 88,6772709.00.20 Petroleum oils and oils from bituminous minerals, crude, testing
25 degrees A.P.I. or more . . . . . . . . . . . . . . . . . . . . . . . . . . . . . . . . . . . . . . . . 66,571 68,9920603.10.702 Chrysanthemums, standard carnations, anthuriums and orchids,
fresh cut . . . . . . . . . . . . . . . . . . . . . . . . . . . . . . . . . . . . . . . . . . . . . . . . . . . . . . . 46,284 59,2850709.20.90 Asparagus, nesi, fresh or chilled . . . . . . . . . . . . . . . . . . . . . . . . . . . . . . . . . . . . 31,589 53,5570709.20.101 Asparagus, fresh or chilled, not reduced in size, if entered September 15
to November 15, inclusive, and transported to the U.S. by air . . . . . . . . . 18,679 32,3893212.90.002 Pigments dispersed in nonaqueous media, in liquid or paste form, used in
making paints; dyes & coloring matter packaged for retail sale . . . . . . . . 29,866 30,9142402.20.80 Cigarettes containing tobacco but not containing clove, paper-wrapped . . 20,524 20,9922710.11.25 Naphthas (exc. motor fuel/mtr fuel blend. stock) fr petroleum oils & bitumin
minerals (o/than crude) or preps 70%+ by wt. fr petroleum oils . . . . . . . . 9,722 10,4197113.19.211 Gold rope necklaces and neck chains . . . . . . . . . . . . . . . . . . . . . . . . . . . . . . . 8,657 8,6652710.19.05 Distillate and residual fuel oil (including blends) derived from petroleum or
oils from bituminous minerals, testing under 25 degrees A.P.I. . . . . . . . . 7,263 7,7582710.19.10 Distillate and residual fuel oil (including blends) derived from petroleum
oils or oil of bituminous minerals, testing 25 degree A.P.I. or > . . . . . . . . 6,584 6,5846908.90.00 Glazed ceramic flags and paving, hearth or wall tiles; glazed ceramic
mosaic cubes and the like, nesi . . . . . . . . . . . . . . . . . . . . . . . . . . . . . . . . . . . 5,323 6,4300710.80.97 Vegetables nesi, uncooked or cooked by steaming or boiling in water,
frozen, reduced in size . . . . . . . . . . . . . . . . . . . . . . . . . . . . . . . . . . . . . . . . . . . 5,313 6,3590804.30.40 Pineapples, fresh or dried, not reduced in size, in crates or other
packages . . . . . . . . . . . . . . . . . . . . . . . . . . . . . . . . . . . . . . . . . . . . . . . . . . . . . . 3,564 4,7781604.14.40 Tunas and skipjack, not in airtight containers, not in oil, in bulk or in
immediate containers weighing with contents over 6.8 kg each . . . . . . . . 3,963 4,2860806.10.60 Grapes, fresh, if entered during the period July 1 through the following
February 14, inclusive . . . . . . . . . . . . . . . . . . . . . . . . . . . . . . . . . . . . . . . . . . . 3,330 3,8507306.20.60 Iron or nonalloy steel, seamed, w/ext. diam. 406.4mm or less or o/than
circ. x-sect, tubing of a kind used for drilling for oil/gas . . . . . . . . . . . . . . . 3,520 3,6977306.30.50 Iron or nonalloy steel, welded, w/circ. x-sect & ext. diam. 406.4mm or less,
pipes, tubes & holl. prof., w/wall thick. of 1.65 mm or more . . . . . . . . . . . 3,135 3,4121 Includes only imports from Peru. Item is GSP-eligible, but imports from Peru exceeded the competitive need
limit and thus were eligible for duty-free entry only under ATPA.2 Includes only imports from Colombia. Item is GSP-eligible, but imports from Colombia exceeded the competi-
tive need limit and thus were eligible for duty-free entry only under ATPA.
Note.—The abbreviation, “nesi,” stands for “not elsewhere specified or included.”
Source: Estimated by USITC from official statistics of the U.S. Department of Commerce.
3-6
Welfare and Displacement Effects of ATPA on U.S.Industries and Consumers in 2002The analytical approach for estimating the welfare and displacement effects of ATPAis described in the introduction to this report and is discussed in more detail in appendixC. Upper estimates and lower estimates are reported, reflecting the assumption ofhigher substitution elasticities and lower substitution elasticities, respectively.
The analysis was conducted on the 20 leading items that benefited exclusively fromATPA (table 3-2).11 Estimates of welfare and potential U.S. industry displacementeffects were made. Industries that experienced estimated displacement of more than 5percent of the value of U.S. production, based on upper estimates, were selected forfurther analysis.
Items Analyzed
Although a large number of products are eligible for tariff preferences under ATPA, arelatively small group accounts for most of the imports that benefit exclusively fromATPA. Table 3-2 presents the 20 leading items that benefited exclusively from ATPA in2002; they are ranked on the basis of their c.i.f. import values.12 Those productsrepresented 96 percent of the $740 million in imports that benefited exclusively fromATPA during 2002.13 The five leading ATPA-exclusive imports in 2002 were (1) coppercathodes from Peru (which exceeded its GSP competitive-need limit), (2) light crude oil,(3) fresh-cut roses, (4) heavy crude oil, and (5) chrysanthemums and other flowersunder HTS 0603.10.70 from Colombia (which exceeded its GSP competitive-needlimit). Peru was the leading supplier of copper cathodes; Colombia was the leadingsupplier of each of the two flower provisions, as well as heavy crude oil; and Ecuadorwas the leading supplier of light crude oil.14 In 2001, copper cathodes ranked firstamong ATPA-exclusive imports, and fresh-cut roses ranked second.15
11 USITC industry analysts provided estimates of U.S. production and exports for the 20 leading itemsthat benefited exclusively from ATPA, as well as evaluations of the substitutability of ATPA-exclusiveimports and competing U.S. products.
12 In the analysis, U.S. market expenditure shares were used to compute estimates of welfare anddomestic production displacement effects. Because U.S. expenditures on imports necessarily includefreight and insurance charges and duties, when applicable, the analysis, where indicated in the text andsupporting tables, used c.i.f. values for duty-free items and landed, duty-paid values for reduced-dutyitems benefiting exclusively from ATPA, and landed, duty-paid values for the remaining imports.Technically, landed, duty-paid values are equal to c.i.f. values for items entering free of duty.
13 The import values reported in tables 3-2 and 3-3 reflect only that portion of imports under eachHTS provision that entered free of duty or at reduced duty under ATPA. Even though all of these items wereeligible for ATPA tariff preferences, full duties were paid on a certain portion of imports under each HTSprovision for a variety of reasons, such as failure to claim preferences, insufficient documentation,indirect shipment patterns, or the lapse of the program during part of 2002.
14 Leading ATPA suppliers are shown in table 2-6.15 For the list of items benefiting exclusively from ATPA in 2001, see ATPA, Eighth Report, 2001,
p. 3-4.
3-7
For any particular item, the U.S. market share accounted for by ATPA-exclusiveimports (value of imports benefiting exclusively from ATPA relative to apparentconsumption) was a major factor in determining the estimated impact on competingdomestic producers.16 These market shares varied considerably in 2002 (table 3-3).For instance, the market share of ATPA-exclusive imports of fresh-cut chrysanthemumsand other flowers under HTS 0603.10.70 from Colombia was approximately 37percent, whereas the market share of ATPA-exclusive imports of light residual fuel oilwas 0.01 percent.
Estimated Effects on Consumers and Producers
Tables 3-4 and 3-5 present the estimated impact of ATPA tariff preferences on the U.S.economy in 2002.17 Estimates of the gains in consumer surplus and the losses in tariffrevenue, as well as measures of the potential displacement of U.S. production, arediscussed next.
Effects on U.S. consumersAsparagus (HTS subheadings 0709.20.10 and 0709.20.90) provided the largest gainin consumer surplus, from $7.0 million to $7.4 million, resulting exclusively from ATPAtariff preferences in 2002 (table 3-4). Without ATPA, the price that U.S. consumerswould have paid for imports of asparagus from ATPA countries would have beenapproximately 8.9 percent higher18 (the ad valorem duty rate, adjusted for freight andinsurance charges). Fresh-cut roses provided the second-largest gain in consumersurplus, from $4.4 million to $4.6 million. Without ATPA, the price of imports offresh-cut roses from ATPA countries would have been approximately 5.4 percenthigher. In general, items providing the largest gains in consumer surplus also haveeither the highest column 1-general tariff rates or the largest volumes of imports, orboth.
ATPA preferences also reduced U.S. tariff revenues, offsetting much of the gain inconsumer surplus. For example, for glazed ceramic tiles (HTS 6908.90.00), lowertariff revenues offset 84 percent to 92 percent of the gain in consumer surplus; for goldrope necklaces and neck chains (HTS 7113.19.21) from Peru, the offset was about 89percent to 93 percent; and for cigarettes (HTS 2402.20.80), the offset was about 89percent to 95 percent. For most of the other items listed in table 3-4, lower tariffrevenues offset nearly all of the gain in consumer surplus; this typically occurs whencolumn 1-general duty rates are relatively low, as is the case with most ATPA-exclusiveitems.
16 Other factors include the ad valorem equivalent tariff rate; the substitutability among beneficiaryimports, nonbeneficiary imports, and domestic production; and the overall demand elasticity for theproduct category.
17 The methodology used is described in appendix C.18 Weighted average for both asparagus categories.
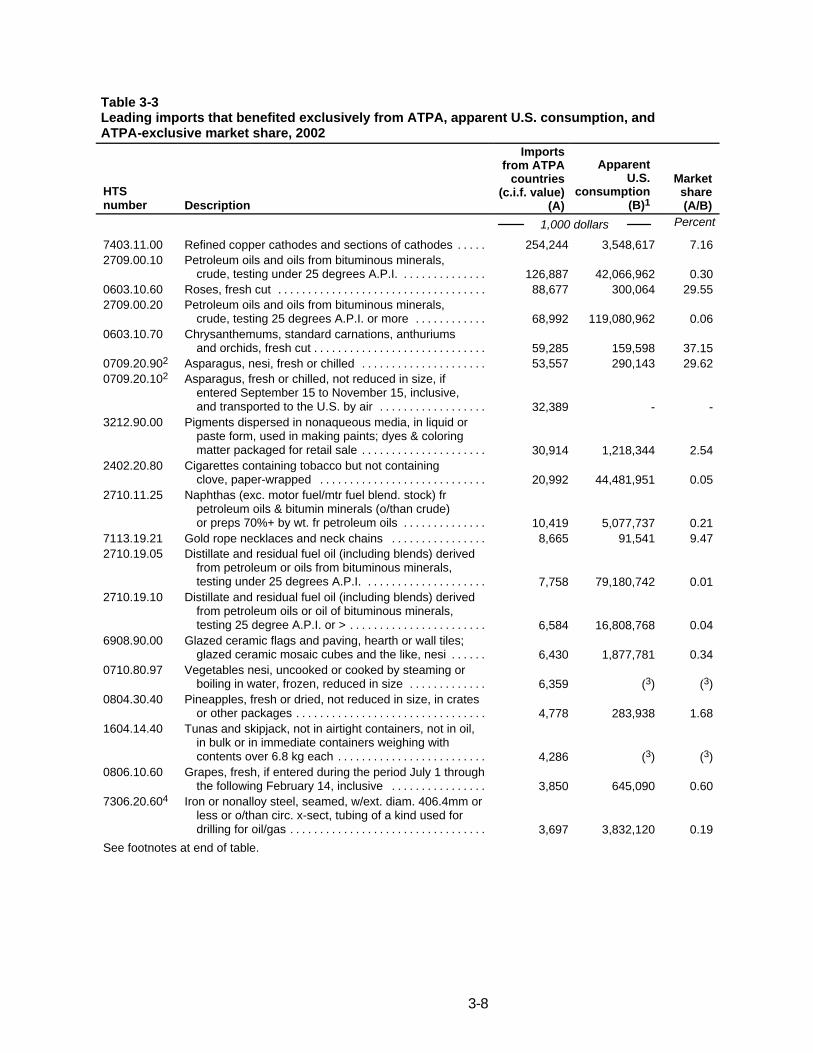
3-8
Table 3-3Leading imports that benefited exclusively from ATPA, apparent U.S. consumption, andATPA-exclusive market share, 2002
HTSnumber Description
Importsfrom ATPA
countries(c.i.f. value)
(A)
ApparentU.S.
consumption(B)1
Marketshare(A/B)
1,000 dollars Percent
7403.11.00 Refined copper cathodes and sections of cathodes . . . . . 254,244 3,548,617 7.162709.00.10 Petroleum oils and oils from bituminous minerals,
crude, testing under 25 degrees A.P.I. . . . . . . . . . . . . . . 126,887 42,066,962 0.300603.10.60 Roses, fresh cut . . . . . . . . . . . . . . . . . . . . . . . . . . . . . . . . . . . 88,677 300,064 29.552709.00.20 Petroleum oils and oils from bituminous minerals,
crude, testing 25 degrees A.P.I. or more . . . . . . . . . . . . 68,992 119,080,962 0.060603.10.70 Chrysanthemums, standard carnations, anthuriums
and orchids, fresh cut . . . . . . . . . . . . . . . . . . . . . . . . . . . . . 59,285 159,598 37.150709.20.902 Asparagus, nesi, fresh or chilled . . . . . . . . . . . . . . . . . . . . . 53,557 290,143 29.620709.20.102 Asparagus, fresh or chilled, not reduced in size, if
entered September 15 to November 15, inclusive,and transported to the U.S. by air . . . . . . . . . . . . . . . . . . 32,389 - -
3212.90.00 Pigments dispersed in nonaqueous media, in liquid orpaste form, used in making paints; dyes & coloringmatter packaged for retail sale . . . . . . . . . . . . . . . . . . . . . 30,914 1,218,344 2.54
2402.20.80 Cigarettes containing tobacco but not containingclove, paper-wrapped . . . . . . . . . . . . . . . . . . . . . . . . . . . . 20,992 44,481,951 0.05
2710.11.25 Naphthas (exc. motor fuel/mtr fuel blend. stock) frpetroleum oils & bitumin minerals (o/than crude)or preps 70%+ by wt. fr petroleum oils . . . . . . . . . . . . . . 10,419 5,077,737 0.21
7113.19.21 Gold rope necklaces and neck chains . . . . . . . . . . . . . . . . 8,665 91,541 9.472710.19.05 Distillate and residual fuel oil (including blends) derived
from petroleum or oils from bituminous minerals,testing under 25 degrees A.P.I. . . . . . . . . . . . . . . . . . . . . 7,758 79,180,742 0.01
2710.19.10 Distillate and residual fuel oil (including blends) derivedfrom petroleum oils or oil of bituminous minerals,testing 25 degree A.P.I. or > . . . . . . . . . . . . . . . . . . . . . . . 6,584 16,808,768 0.04
6908.90.00 Glazed ceramic flags and paving, hearth or wall tiles;glazed ceramic mosaic cubes and the like, nesi . . . . . . 6,430 1,877,781 0.34
0710.80.97 Vegetables nesi, uncooked or cooked by steaming orboiling in water, frozen, reduced in size . . . . . . . . . . . . . 6,359 (3) (3)
0804.30.40 Pineapples, fresh or dried, not reduced in size, in cratesor other packages . . . . . . . . . . . . . . . . . . . . . . . . . . . . . . . . 4,778 283,938 1.68
1604.14.40 Tunas and skipjack, not in airtight containers, not in oil,in bulk or in immediate containers weighing withcontents over 6.8 kg each . . . . . . . . . . . . . . . . . . . . . . . . . 4,286 (3) (3)
0806.10.60 Grapes, fresh, if entered during the period July 1 throughthe following February 14, inclusive . . . . . . . . . . . . . . . . 3,850 645,090 0.60
7306.20.604 Iron or nonalloy steel, seamed, w/ext. diam. 406.4mm orless or o/than circ. x-sect, tubing of a kind used fordrilling for oil/gas . . . . . . . . . . . . . . . . . . . . . . . . . . . . . . . . . 3,697 3,832,120 0.19
See footnotes at end of table.
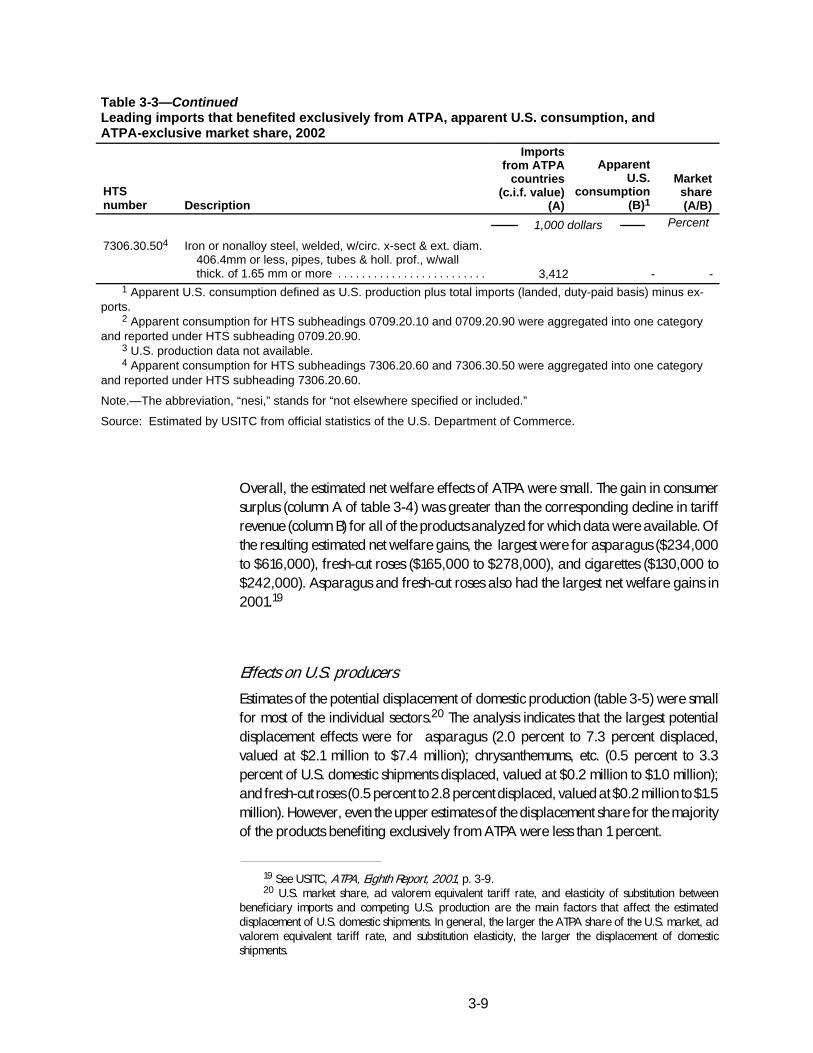
3-9
Table 3-3—ContinuedLeading imports that benefited exclusively from ATPA, apparent U.S. consumption, andATPA-exclusive market share, 2002
HTSnumber Description
Importsfrom ATPA
countries(c.i.f. value)
(A)
ApparentU.S.
consumption(B)1
Marketshare(A/B)
1,000 dollars Percent
7306.30.504 Iron or nonalloy steel, welded, w/circ. x-sect & ext. diam.406.4mm or less, pipes, tubes & holl. prof., w/wallthick. of 1.65 mm or more . . . . . . . . . . . . . . . . . . . . . . . . . 3,412 - -
1 Apparent U.S. consumption defined as U.S. production plus total imports (landed, duty-paid basis) minus ex-ports.
2 Apparent consumption for HTS subheadings 0709.20.10 and 0709.20.90 were aggregated into one categoryand reported under HTS subheading 0709.20.90.
3 U.S. production data not available.4 Apparent consumption for HTS subheadings 7306.20.60 and 7306.30.50 were aggregated into one category
and reported under HTS subheading 7306.20.60.
Note.—The abbreviation, “nesi,” stands for “not elsewhere specified or included.”
Source: Estimated by USITC from official statistics of the U.S. Department of Commerce.
Overall, the estimated net welfare effects of ATPA were small. The gain in consumersurplus (column A of table 3-4) was greater than the corresponding decline in tariffrevenue (column B) for all of the products analyzed for which data were available. Ofthe resulting estimated net welfare gains, the largest were for asparagus ($234,000to $616,000), fresh-cut roses ($165,000 to $278,000), and cigarettes ($130,000 to$242,000). Asparagus and fresh-cut roses also had the largest net welfare gains in2001.19
Effects on U.S. producers
Estimates of the potential displacement of domestic production (table 3-5) were smallfor most of the individual sectors.20 The analysis indicates that the largest potentialdisplacement effects were for asparagus (2.0 percent to 7.3 percent displaced,valued at $2.1 million to $7.4 million); chrysanthemums, etc. (0.5 percent to 3.3percent of U.S. domestic shipments displaced, valued at $0.2 million to $1.0 million);and fresh-cut roses (0.5 percent to 2.8 percent displaced, valued at $0.2 million to $1.5million). However, even the upper estimates of the displacement share for the majorityof the products benefiting exclusively from ATPA were less than 1 percent.
19 See USITC, ATPA, Eighth Report, 2001, p. 3-9.20 U.S. market share, ad valorem equivalent tariff rate, and elasticity of substitution between
beneficiary imports and competing U.S. production are the main factors that affect the estimateddisplacement of U.S. domestic shipments. In general, the larger the ATPA share of the U.S. market, advalorem equivalent tariff rate, and substitution elasticity, the larger the displacement of domesticshipments.
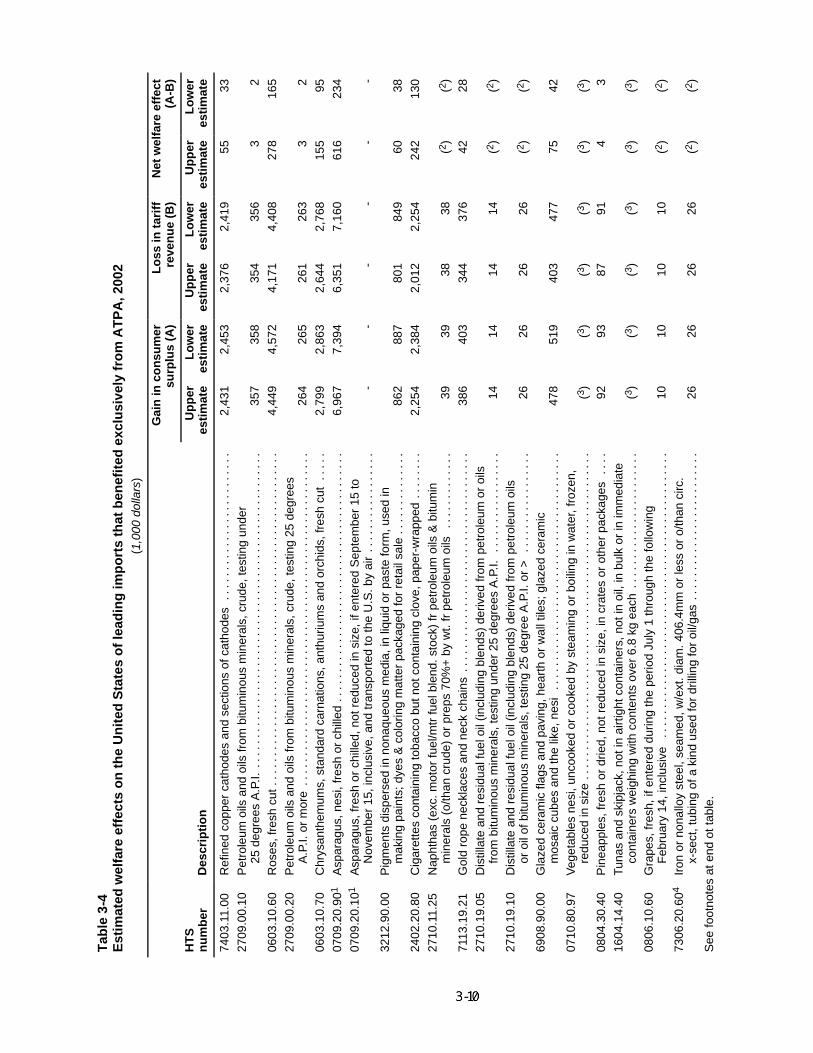
Tab
le3-
4E
stim
ated
wel
fare
effe
cts
on
the
Un
ited
Sta
tes
of
lead
ing
imp
ort
sth
atb
enef
ited
excl
usi
vely
fro
mA
TP
A,2
002
(1,0
00do
llars
)
Gai
nin
con
sum
ersu
rplu
s(A
)L
oss
inta
riff
reve
nu
e(B
)N
etw
elfa
reef
fect
(A-B
)
HT
Sn
um
ber
Des
crip
tio
nU
pp
eres
tim
ate
Lo
wer
esti
mat
eU
pp
eres
tim
ate
Lo
wer
esti
mat
eU
pp
eres
tim
ate
Lo
wer
esti
mat
e
7403
.11.
00R
efin
edco
pper
cath
odes
and
sect
ions
ofca
thod
es..
....
....
....
....
....
...
2,43
12,
453
2,37
62,
419
5533
2709
.00.
10P
etro
leum
oils
and
oils
from
bitu
min
ous
min
eral
s,cr
ude,
test
ing
unde
r25
degr
ees
A.P
.I...
....
....
....
....
....
....
....
....
....
....
....
....
...
357
358
354
356
32
0603
.10.
60R
oses
,fre
shcu
t...
....
....
....
....
....
....
....
....
....
....
....
....
....
.4,
449
4,57
24,
171
4,40
827
816
527
09.0
0.20
Pet
role
umoi
lsan
doi
lsfr
ombi
tum
inou
sm
iner
als,
crud
e,te
stin
g25
degr
ees
A.P
.I.or
mor
e..
....
....
....
....
....
....
....
....
....
....
....
....
....
..26
426
526
126
33
206
03.1
0.70
Chr
ysan
them
ums,
stan
dard
carn
atio
ns,a
nthu
rium
san
dor
chid
s,fr
esh
cut
....
.2,
799
2,86
32,
644
2,76
815
595
0709
.20.
901
Asp
arag
us,n
esi,
fres
hor
chill
ed..
....
....
....
....
....
....
....
....
....
....
6,96
77,
394
6,35
17,
160
616
234
0709
.20.
101
Asp
arag
us,f
resh
orch
illed
,not
redu
ced
insi
ze,i
fent
ered
Sep
tem
ber
15to
Nov
embe
r15
,inc
lusi
ve,a
ndtr
ansp
orte
dto
the
U.S
.by
air
....
....
....
....
.-
--
--
-32
12.9
0.00
Pig
men
tsdi
sper
sed
inno
naqu
eous
med
ia,i
nliq
uid
orpa
ste
form
,use
din
mak
ing
pain
ts;d
yes
&co
lorin
gm
atte
rpa
ckag
edfo
rre
tail
sale
....
....
....
..86
288
780
184
960
3824
02.2
0.80
Cig
aret
tes
cont
aini
ngto
bacc
obu
tnot
cont
aini
ngcl
ove,
pape
r-w
rapp
ed..
....
..2,
254
2,38
42,
012
2,25
424
213
027
10.1
1.25
Nap
htha
s(e
xc.m
otor
fuel
/mtr
fuel
blen
d.st
ock)
frpe
trol
eum
oils
&bi
tum
inm
iner
als
(o/th
ancr
ude)
orpr
eps
70%
+by
wt.
frpe
trol
eum
oils
....
....
....
.39
3938
38(2
)(2
)71
13.1
9.21
Gol
dro
pene
ckla
ces
and
neck
chai
ns..
....
....
....
....
....
....
....
....
...
386
403
344
376
4228
2710
.19.
05D
istil
late
and
resi
dual
fuel
oil(
incl
udin
gbl
ends
)de
rived
from
petr
oleu
mor
oils
from
bitu
min
ous
min
eral
s,te
stin
gun
der
25de
gree
sA
.P.I.
....
....
....
....
.14
1414
14(2
)(2
)27
10.1
9.10
Dis
tilla
tean
dre
sidu
alfu
eloi
l(in
clud
ing
blen
ds)
deriv
edfr
ompe
trol
eum
oils
oroi
lofb
itum
inou
sm
iner
als,
test
ing
25de
gree
A.P
.I.or
>..
....
....
....
...
2626
2626
(2)
(2)
6908
.90.
00G
laze
dce
ram
icfla
gsan
dpa
ving
,hea
rth
orw
allt
iles;
glaz
edce
ram
icm
osai
ccu
bes
and
the
like,
nesi
....
....
....
....
....
....
....
....
....
....
478
519
403
477
7542
0710
.80.
97V
eget
able
sne
si,u
ncoo
ked
orco
oked
byst
eam
ing
orbo
iling
inw
ater
,fro
zen,
redu
ced
insi
ze..
....
....
....
....
....
....
....
....
....
....
....
....
....
.(3
)(3
)(3
)(3
)(3
)(3
)08
04.3
0.40
Pin
eapp
les,
fres
hor
drie
d,no
tred
uced
insi
ze,i
ncr
ates
orot
her
pack
ages
....
9293
8791
43
1604
.14.
40Tu
nas
and
skip
jack
,not
inai
rtig
htco
ntai
ners
,not
inoi
l,in
bulk
orin
imm
edia
teco
ntai
ners
wei
ghin
gw
ithco
nten
tsov
er6.
8kg
each
....
....
....
....
....
...
(3)
(3)
(3)
(3)
(3)
(3)
0806
.10.
60G
rape
s,fr
esh,
ifen
tere
ddu
ring
the
perio
dJu
ly1
thro
ugh
the
follo
win
gF
ebru
ary
14,i
nclu
sive
....
....
....
....
....
....
....
....
....
....
....
....
1010
1010
(2)
(2)
7306
.20.
604
Iron
orno
nallo
yst
eel,
seam
ed,w
/ext
.dia
m.4
06.4
mm
orle
ssor
o/th
anci
rc.
x-se
ct,t
ubin
gof
aki
ndus
edfo
rdr
illin
gfo
roi
l/gas
....
....
....
....
....
....
.26
2626
26(2
)(2
)S
eefo
otno
tes
aten
dot
tabl
e.
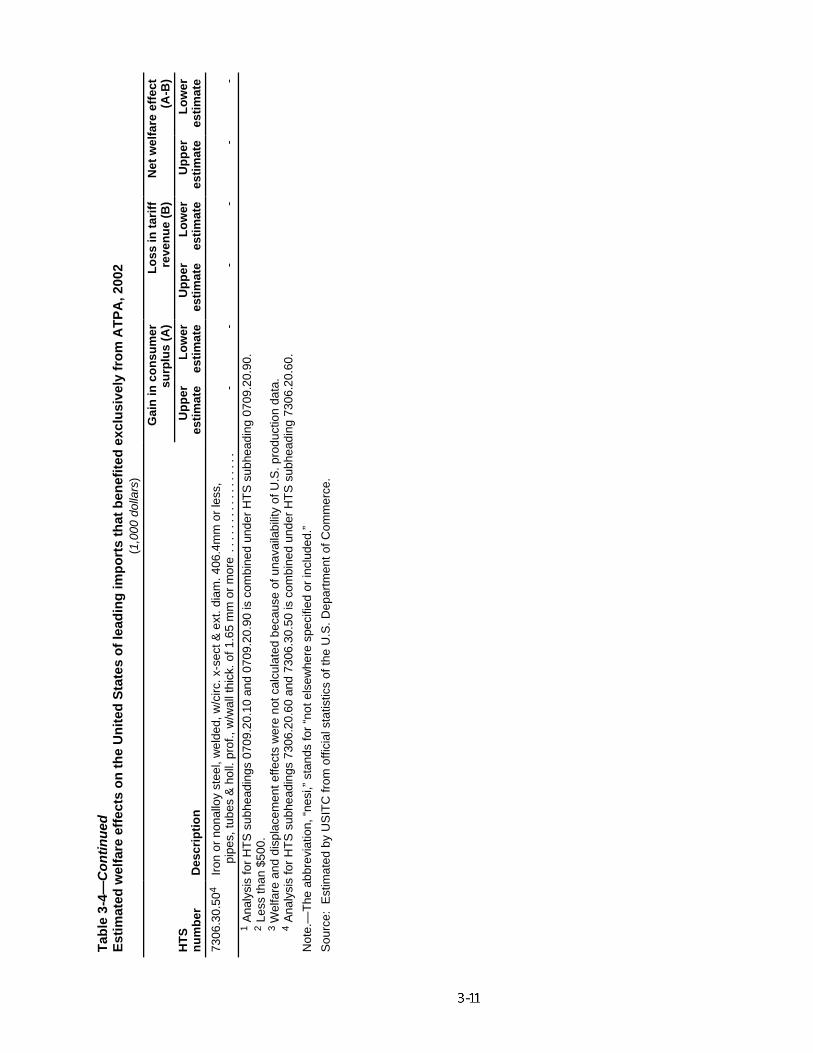
Tab
le3-
4—C
on
tin
ued
Est
imat
edw
elfa
reef
fect
so
nth
eU
nit
edS
tate
so
fle
adin
gim
po
rts
that
ben
efit
edex
clu
sive
lyfr
om
AT
PA
,200
2(1
,000
dolla
rs)
Gai
nin
con
sum
ersu
rplu
s(A
)L
oss
inta
riff
reve
nu
e(B
)N
etw
elfa
reef
fect
(A-B
)H
TS
nu
mb
erD
escr
ipti
on
Up
per
esti
mat
eL
ow
eres
tim
ate
Up
per
esti
mat
eL
ow
eres
tim
ate
Up
per
esti
mat
eL
ow
eres
tim
ate
7306
.30.
504
Iron
orno
nallo
yst
eel,
wel
ded,
w/c
irc.x
-sec
t&ex
t.di
am.4
06.4
mm
orle
ss,
pipe
s,tu
bes
&ho
ll.pr
of.,
w/w
allt
hick
.of1
.65
mm
orm
ore
....
....
....
....
.-
--
--
-1
Ana
lysi
sfo
rH
TS
subh
eadi
ngs
0709
.20.
10an
d07
09.2
0.90
isco
mbi
ned
unde
rH
TS
subh
eadi
ng07
09.2
0.90
.2
Less
than
$500
.3
Wel
fare
and
disp
lace
men
teffe
cts
wer
eno
tcal
cula
ted
beca
use
ofun
avai
labi
lity
ofU
.S.p
rodu
ctio
nda
ta.
4A
naly
sis
for
HT
Ssu
bhea
ding
s73
06.2
0.60
and
7306
.30.
50is
com
bine
dun
der
HT
Ssu
bhea
ding
7306
.20.
60.
Not
e.—
The
abbr
evia
tion,
“nes
i,”st
ands
for
“not
else
whe
resp
ecifi
edor
incl
uded
.”
Sou
rce:
Est
imat
edby
US
ITC
from
offic
ials
tatis
tics
ofth
eU
.S.D
epar
tmen
tofC
omm
erce
.
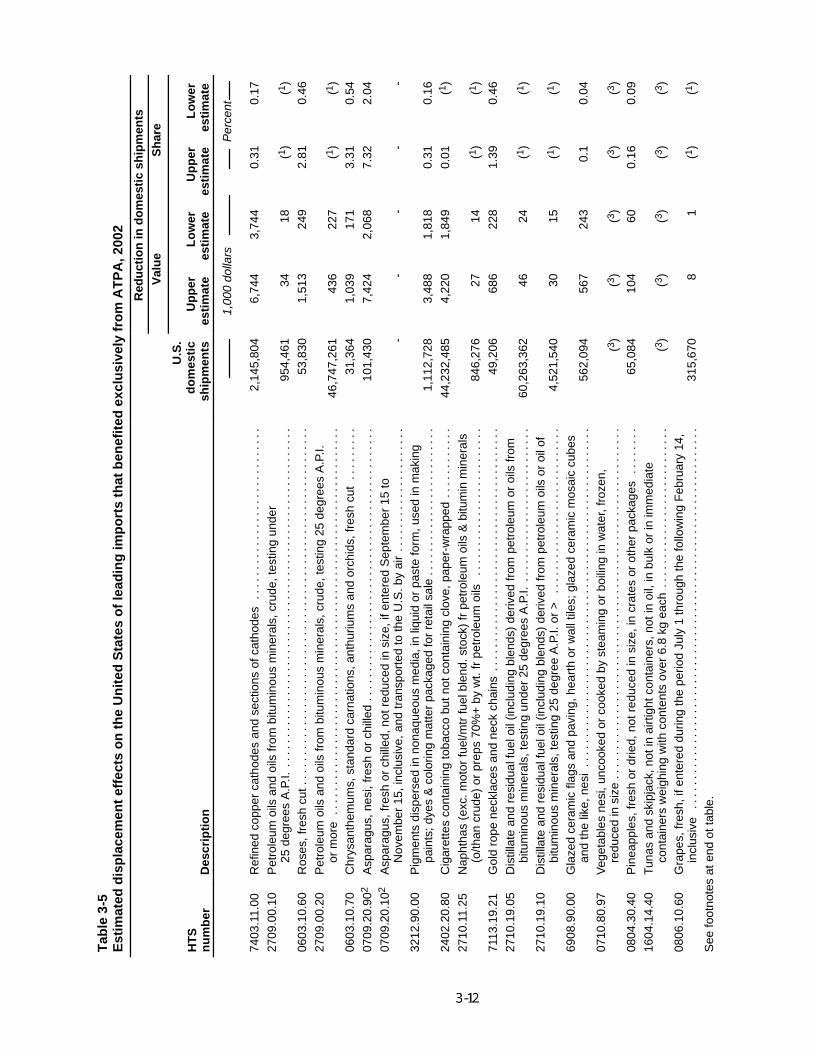
Tab
le3-
5E
stim
ated
dis
pla
cem
ent
effe
cts
on
the
Un
ited
Sta
tes
of
lead
ing
imp
ort
sth
atb
enef
ited
excl
usi
vely
fro
mA
TP
A,2
002
Red
uct
ion
ind
om
esti
csh
ipm
ents
Val
ue
Sh
are
HT
Sn
um
ber
Des
crip
tio
n
U.S
.d
om
esti
csh
ipm
ents
Up
per
esti
mat
eL
ow
eres
tim
ate
Up
per
esti
mat
eL
ow
eres
tim
ate
1,00
0do
llars
Per
cent
7403
.11.
00R
efin
edco
pper
cath
odes
and
sect
ions
ofca
thod
es..
....
....
....
....
....
....
...
2,14
5,80
46,
744
3,74
40.
310.
1727
09.0
0.10
Pet
role
umoi
lsan
doi
lsfr
ombi
tum
inou
sm
iner
als,
crud
e,te
stin
gun
der
25de
gree
sA
.P.I.
....
....
....
....
....
....
....
....
....
....
....
....
....
....
.95
4,46
134
18(1
)(1
)06
03.1
0.60
Ros
es,f
resh
cut.
....
....
....
....
....
....
....
....
....
....
....
....
....
....
...
53,8
301,
513
249
2.81
0.46
2709
.00.
20P
etro
leum
oils
and
oils
from
bitu
min
ous
min
eral
s,cr
ude,
test
ing
25de
gree
sA
.P.I.
orm
ore
....
....
....
....
....
....
....
....
....
....
....
....
....
....
....
....
.46
,747
,261
436
227
(1)
(1)
0603
.10.
70C
hrys
anth
emum
s,st
anda
rdca
rnat
ions
,ant
huriu
ms
and
orch
ids,
fres
hcu
t..
....
...
31,3
641,
039
171
3.31
0.54
0709
.20.
902
Asp
arag
us,n
esi,
fres
hor
chill
ed..
....
....
....
....
....
....
....
....
....
....
....
101,
430
7,42
42,
068
7.32
2.04
0709
.20.
102
Asp
arag
us,f
resh
orch
illed
,not
redu
ced
insi
ze,i
fent
ered
Sep
tem
ber
15to
Nov
embe
r15
,inc
lusi
ve,a
ndtr
ansp
orte
dto
the
U.S
.by
air
....
....
....
....
....
.-
--
--
3212
.90.
00P
igm
ents
disp
erse
din
nona
queo
usm
edia
,in
liqui
dor
past
efo
rm,u
sed
inm
akin
gpa
ints
;dye
s&
colo
ring
mat
ter
pack
aged
for
reta
ilsa
le..
....
....
....
....
....
...
1,11
2,72
83,
488
1,81
80.
310.
1624
02.2
0.80
Cig
aret
tes
cont
aini
ngto
bacc
obu
tnot
cont
aini
ngcl
ove,
pape
r-w
rapp
ed..
....
....
..44
,232
,485
4,22
01,
849
0.01
(1)
2710
.11.
25N
apht
has
(exc
.mot
orfu
el/m
trfu
elbl
end.
stoc
k)fr
petr
oleu
moi
ls&
bitu
min
min
eral
s(o
/than
crud
e)or
prep
s70
%+
byw
t.fr
petr
oleu
moi
ls..
....
....
....
....
....
...
846,
276
2714
(1)
(1)
7113
.19.
21G
old
rope
neck
lace
san
dne
ckch
ains
....
....
....
....
....
....
....
....
....
....
.49
,206
686
228
1.39
0.46
2710
.19.
05D
istil
late
and
resi
dual
fuel
oil(
incl
udin
gbl
ends
)de
rived
from
petr
oleu
mor
oils
from
bitu
min
ous
min
eral
s,te
stin
gun
der
25de
gree
sA
.P.I.
....
....
....
....
....
....
..60
,263
,362
4624
(1)
(1)
2710
.19.
10D
istil
late
and
resi
dual
fuel
oil(
incl
udin
gbl
ends
)de
rived
from
petr
oleu
moi
lsor
oilo
fbi
tum
inou
sm
iner
als,
test
ing
25de
gree
A.P
.I.or
>..
....
....
....
....
....
....
..4,
521,
540
3015
(1)
(1)
6908
.90.
00G
laze
dce
ram
icfla
gsan
dpa
ving
,hea
rth
orw
allt
iles;
glaz
edce
ram
icm
osai
ccu
bes
and
the
like,
nesi
....
....
....
....
....
....
....
....
....
....
....
....
....
....
.56
2,09
456
724
30.
10.
0407
10.8
0.97
Veg
etab
les
nesi
,unc
ooke
dor
cook
edby
stea
min
gor
boili
ngin
wat
er,f
roze
n,re
duce
din
size
....
....
....
....
....
....
....
....
....
....
....
....
....
....
...
(3)
(3)
(3)
(3)
(3)
0804
.30.
40P
inea
pple
s,fr
esh
ordr
ied,
notr
educ
edin
size
,in
crat
esor
othe
rpa
ckag
es..
....
..65
,084
104
600.
160.
0916
04.1
4.40
Tuna
san
dsk
ipja
ck,n
otin
airt
ight
cont
aine
rs,n
otin
oil,
inbu
lkor
inim
med
iate
cont
aine
rsw
eigh
ing
with
cont
ents
over
6.8
kgea
ch..
....
....
....
....
....
....
.(3
)(3
)(3
)(3
)(3
)08
06.1
0.60
Gra
pes,
fres
h,if
ente
red
durin
gth
epe
riod
July
1th
roug
hth
efo
llow
ing
Feb
ruar
y14
,in
clus
ive
....
....
....
....
....
....
....
....
....
....
....
....
....
....
....
....
315,
670
81
(1)
(1)
See
foot
note
sat
end
otta
ble.
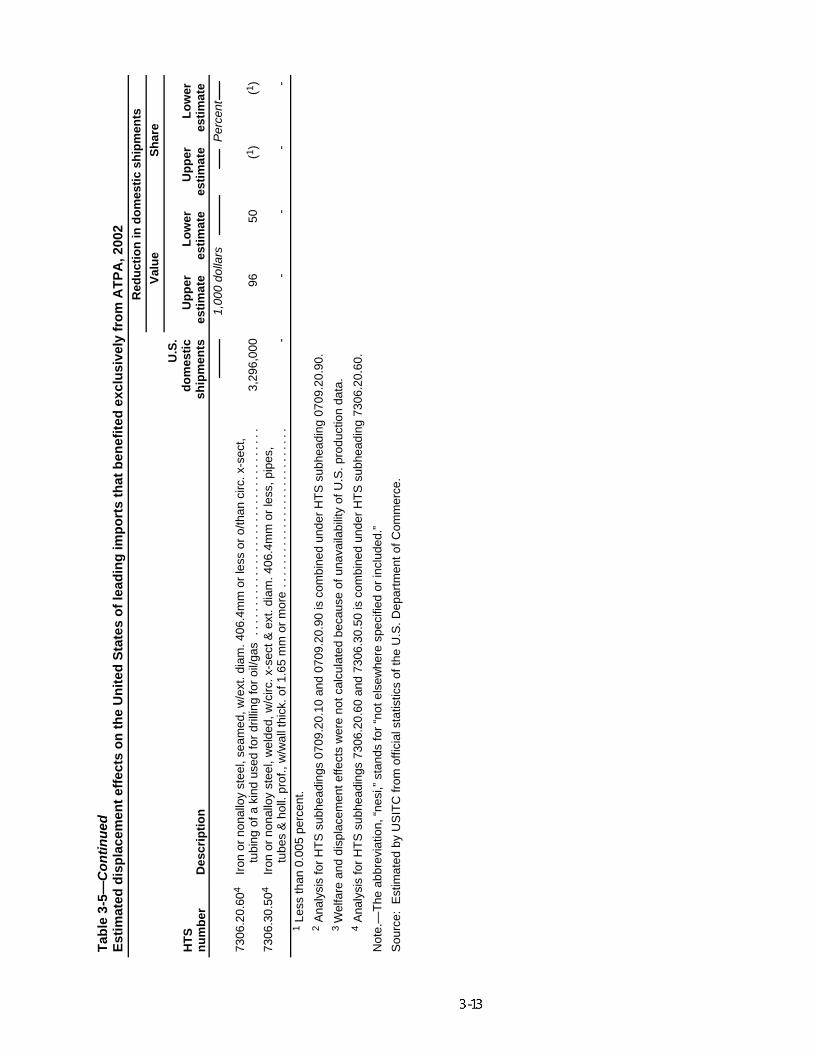
Tab
le3-
5—C
on
tin
ued
Est
imat
edd
isp
lace
men
tef
fect
so
nth
eU
nit
edS
tate
so
fle
adin
gim
po
rts
that
ben
efit
edex
clu
sive
lyfr
om
AT
PA
,200
2R
edu
ctio
nin
do
mes
tic
ship
men
tsV
alu
eS
har
e
HT
Sn
um
ber
Des
crip
tio
n
U.S
.d
om
esti
csh
ipm
ents
Up
per
esti
mat
eL
ow
eres
tim
ate
Up
per
esti
mat
eL
ow
eres
tim
ate
1,00
0do
llars
Per
cent
7306
.20.
604
Iron
orno
nallo
yst
eel,
seam
ed,w
/ext
.dia
m.4
06.4
mm
orle
ssor
o/th
anci
rc.x
-sec
t,tu
bing
ofa
kind
used
for
drill
ing
for
oil/g
as..
....
....
....
....
....
....
....
....
.3,
296,
000
9650
(1)
(1)
7306
.30.
504
Iron
orno
nallo
yst
eel,
wel
ded,
w/c
irc.x
-sec
t&ex
t.di
am.4
06.4
mm
orle
ss,p
ipes
,tu
bes
&ho
ll.pr
of.,
w/w
allt
hick
.of1
.65
mm
orm
ore
....
....
....
....
....
....
...
--
--
-1
Less
than
0.00
5pe
rcen
t.2
Ana
lysi
sfo
rH
TS
subh
eadi
ngs
0709
.20.
10an
d07
09.2
0.90
isco
mbi
ned
unde
rH
TS
subh
eadi
ng07
09.2
0.90
.3
Wel
fare
and
disp
lace
men
teffe
cts
wer
eno
tcal
cula
ted
beca
use
ofun
avai
labi
lity
ofU
.S.p
rodu
ctio
nda
ta.
4A
naly
sis
for
HT
Ssu
bhea
ding
s73
06.2
0.60
and
7306
.30.
50is
com
bine
dun
der
HT
Ssu
bhea
ding
7306
.20.
60.
Not
e.—
The
abbr
evia
tion,
“nes
i,”st
ands
for
“not
else
whe
resp
ecifi
edor
incl
uded
.”
Sou
rce:
Est
imat
edby
US
ITC
from
offic
ials
tatis
tics
ofth
eU
.S.D
epar
tmen
tofC
omm
erce
.
3-14
Highlights of U.S. Industries Most Affected by ATPAIndustries having estimated displacements of 5 percent or more, based on upperestimates, were chosen for further analysis. In 2002, only one product that benefitedexclusively from ATPA met this criterion: asparagus. This product category also wasidentified as having an estimated displacement of 5 percent or more in 2001.21
Asparagus is discussed in greater detail in the following section.
Fresh or Chilled AsparagusU.S. imports of fresh or chilled asparagus entered under HTS subheading 0709.20.10in 2002 were dutiable at the column 1-general rate of 5 percent ad valorem–and ifentered under HTS 0709.20.90 in 2002, 21.3 percent ad valorem.22 Imports enteredunder each of these provisions are eligible for duty-free treatment under ATPA,CBERA, the United States-Israel Free Trade Agreement, and the United States-JordanFree Trade Agreement. Under NAFTA,23 duties on imports of fresh asparagus fromMexico under HTS 0709.20.10 were eliminated in 1999, and the duty on imports fromMexico under HTS 0709.20.90 will be reduced to zero in 2009.24 Imports under HTS0709.20.10 were eligible for duty-free treatment under GSP from all designatedbeneficiary developing countries except Peru, which had exceeded thecompetitive-need limit and thus was ineligible in 2002. Imports entered under HTS0709.20.90 are eligible for duty-free treatment under GSP if they are the product of aleast-developed beneficiary country. (No ATPA country qualifies as a least-developedbeneficiary country.)
U.S. imports of fresh asparagus from ATPA countries have risen over the past decadeto account for nearly one-half of total U.S. fresh asparagus consumption.25 Imports offresh asparagus amounted to $135.3 million in 2002, up 16 percent from $116.9million in 2001, with rising imports from Peru and Mexico accounting for the bulk of theincrease.26 Other important foreign suppliers included Chile and Colombia. Duringperiods of low product availability from traditional global suppliers, Guatemala andNicaragua have also supplied significant amounts of fresh asparagus to the U.S.market. U.S. imports of all fresh asparagus from ATPA countries amounted to $59.3million in 2002, up 20 percent from $49.6 million in 2001, with imports from Peruaccounting for 98 percent of total imports from ATPA countries in 2002. Peru remains
21 See, USITC, ATPA, Eighth Report, 2001, p. 3-12.22 Fresh or chilled asparagus entered under HTS 0709.20.10 is the same product as that entered
under HTS 0709.20.90, except that it has not been reduced in size, has been entered from September 15to November 15, and has been transported to the United States by air.
23 Imports of fresh or chilled asparagus from Canada are accorded duty-free status.24 In 2002, imports of fresh or chilled green asparagus from Mexico under HTS 0709.20.90 were
dutiable at a rate of 7 percent ad valorem if entered during the month of January and 10 percent advalorem if entered during the period from February 1 to June 30, inclusive.
25 Impacts of the Andean Trade Preference Act on Asparagus Producers and Consumers, Report ToCongressional Subcommittees, U.S. General Accounting Office, Washington, D.C., GAO-01-315,March 2001, p. 1.
26 Includes HTS 0709.20.10 and 0709.20.90.
3-15
the largest overall foreign supplier and, as such, the major Andean supplier of freshasparagus to the U.S. market in recent years, supplying 40 percent and 43 percent,respectively, of total imports in 2001 and 2002. In recent years, significant amounts offresh asparagus imports have been entered from Chile, principally during Octoberand November.
U.S. production of fresh-market asparagus amounted to 126.7 million pounds in2002, down 5 percent from 2001 and down 14 percent from 2000.27 Productionvalue was down 26 percent from 2001 to $139.6 million in 2002, mostly brought on bya reduction in market prices, and down 19 percent from 2000.28 The leading statesproducing fresh-market asparagus in 2002 included California (which sells virtuallyall of its production to the fresh market), Washington, and Michigan. The leadingstates producing asparagus for processing were Washington and Michigan, withMichigan asparagus growers supplying greater amounts to the fresh market in recentyears because the market for canned and frozen asparagus has remainedstagnant.29 U.S. per capita consumption of fresh-market asparagus was forecast at0.9 pounds for 2002, the same as in 2001 but up from 0.6 pounds annually in theyears prior to ATPA.30 Per capita consumption of canned and frozen asparagus hasbeen stagnant at 0.2 and 0.1 pounds, respectively, for a number of years.
The displacement of U.S. production by imports from ATPA countries is likely to becloser to the lower estimate shown in table 3-5–that is, closer to 2.04 percent than 7.32percent–resulting in a small impact from ATPA on the U.S. fresh-market asparagusindustry. Historically, the season for U.S. production has differed somewhat from thatof most imports from ATPA countries, with the bulk of fresh asparagus imports fromATPA countries entering between July and the following January when overall U.S.production is low but California production is starting to become available. In recentyears, however, imports from ATPA countries (mainly Peru) and Mexico have beenentered in significant amounts during June and the following February and March,when U.S. production would normally be at its peak, resulting in some displacement ofdomestic production.
27 Production for 2000 was reported at 150.4 million pounds and for 2001 at 137.2 million pounds,but included estimates for production in New Jersey and Oregon. Reported production for 2002 does notinclude estimates for these two states. Production changes reported in the text exclude New Jersey andOregon production as well. Excluding those two states yields production of 146.5 million pounds and134.0 million pounds for 2000 and 2001, respectively. USDA, National Agricultural Statistics Service,Vegetables, publication No. Vg 1-2 (03), January 2003, p. 47.
28 Production value changes reported in text exclude New Jersey and Oregon. Total productionvalue was reported at $176.0 million in 2000 and $192.3 million in 2001. Excluding New Jersey andOregon yields production values of $173.2 million in 2000 and $189.9 million in 2001. USDA, NationalAgricultural Statistics Service, Vegetables, publication No. Vg 1-2 (03), January 2003, p. 47.
29 “Asparagus Growers Pledge Unity to Fight Unfair Foreign Imports, Anti-bargaining Tactics onHome Soil,” AgriNotes & News, Michigan Farm Bureau, Apr. 4, 2002, found at Internet addresshttp://www.michiganfarmbureau.com, retrieved May 19, 2003.
30 USDA, Economic Research Service, Vegetables and Melons Situation and Outlook Yearbook,publication No. VGS-2002, July 2002, p. 15.
3-16
Mexico remains the most important foreign supplier of fresh asparagus to the U.S.market, even though the overall cost of production for asparagus in Mexico has risenowing to increased costs of imported inputs and water usage.31 The country’sasparagus production was forecast to rise in 2002 by 18 percent.32 Although domesticasparagus consumption in Mexico is forecast to rise somewhat in the near future,exports of the bulk of the country’s production to the United States are expected tocontinue. Also, production advantages in ATPA countries are partially offset by lowertransportation rates for Mexican asparagus shipments to U.S. markets.33
The growth of U.S. fresh-asparagus imports from ATPA countries is expected to remainsteady in the near future. Peru is still one of the largest global producers of asparagus,with annual production levels greater than those in the United States and Mexicocombined, and asparagus remains the second-leading agricultural export from Peruin recent years.34 Peruvian asparagus production rose 6 percent from 2001 to 2002,and is forecast to rise 5 percent from 2002 to 2003.35 Changes in land tenure areattracting greater amounts of local and foreign investment capital, with investorslooking to support the production of exportable crops such as asparagus with a stableforeign demand. Large tracts of land owned by cooperatives and once used for sugarproduction are now being planted with asparagus.36 Growers are relying more ondrip irrigation systems to conserve water and are able to produce high-qualityasparagus in Peru year-round because of the warm weather and fertile soils. Exportsof fresh asparagus from Peru have risen considerably in recent years, up 7 percentfrom 2001 to 2002. The United States has been the major export market for Peruvianshipments of green asparagus for a number of years and continues to be so,accounting for about 82 percent of such exports in 2001.37 Peruvian asparagusexports are being assisted by an export promotion committee (Prompex) and thePeruvian Asparagus Institute (IPE), which provide assistance to growers and exportersin the areas of foreign technology transfer, product research and development,product promotion, and foreign market development.38
The impact of ATPA on U.S. consumers has been significant in that imports of Peruvianfresh-market asparagus enter the U.S. market principally when U.S.-produced freshasparagus is not as readily available, resulting in greater availability of freshasparagus throughout the year. This extended availability of fresh-marketasparagus,39 together with the overall consumer awareness of, and preference for,
31 USDA, FAS, Mexico Asparagus Annual 2002, GAIN Report #MX2095, June 14, 2002, p. 2.32 Ibid., p. 1.33 For more information, see USITC, ATPA, Eighth Report, 2001, p. 3-17.34 USDA, FAS, World Horticultural Trade and U.S. Export Opportunities, Circular FHORT 11-02,
November 2002, “Asparagus Production and Trade in Selected Countries,” pp. 50-55, found at Internetaddress http://www.fas.usda.gov, retrieved May 19, 2003.
35 USDA, FAS, Peru Asparagus Annual 2002, GAIN Report #PE2011, June 13, 2002, p. 3.36 Ibid., p. 3.37 Ibid., p. 4.38 Ibid., pp. 5-6.39 For more information, see USITC, ATPA, Seventh Report, 1999, p. 46.
3-17
healthy foods,40 may be partly responsible for its continuing higher per capita annualconsumption in recent years. The increase in product availability also may haveresulted in lower prices for consumers, although monthly average shipping-pointprices for domestically produced fresh-market asparagus have trended upward since1997.41
Probable Future Effects of ATPA
The first part of this chapter analyzed the effects on the United States of the eliminationof import duties under the original and expanded ATPA. As previously reported in thisseries, most of the effects on the U.S. economy and consumers of a one-timeelimination of duties under a preference program such as ATPA are expected to occurwithin 2 years of the program’s implementation. Other effects, which are discussed inthis part of the chapter, are expected to occur over time as a result of an increase inexport-oriented investment in the region. Such investment in new production facilitiesor in the expansion of existing facilities may occur in response to the availability ofATPA tariff preferences and lead to increased exports under ATPA to the UnitedStates. Therefore, the Commission continued to monitor ATPA-related investment in theAndean region in 2002, using investment expenditures as a proxy for future tradeeffects of ATPA on the United States.42 With the implementation of ATPDEA in 2002,the Commission also monitored investment in those products newly eligible forduty-free treatment under ATPDEA.
The most recent official foreign direct investment (FDI) statistics show that FDI flows intothe ATPA region increased slightly in 2001 to $5.1 billion, despite substantial declinesworldwide, including the Latin America and the Caribbean region (LAC), owing to theglobal slowdown (table 3-6).43 Because FDI in the Andean region is concentrated inresource-based industries, such as hydrocarbons and mining, it was less affected bythe unfavorable international situation.44 In 2001, inflows of FDI increased to Ecuadorand Peru, and declined to Bolivia and Colombia. The large increase of FDI to Ecuadorprimarily reflected investment in the oil sector, including construction of theTrans-Andean Heavy Oil Pipeline. Preliminary statistics for 2002 show that FDI flows
40 USDA, FAS, World Horticultural Trade and U.S. Export Opportunities, Circular FHORT 11-02,November 2002, “Asparagus Production and Trade in Selected Countries,” pp. 50-55, found at Internetaddress http://www.fas.usda.gov, retrieved May 19, 2003.
41 USDA, Economic Research Service, Vegetables and Melons Situation and Outlook Yearbook,publication No. VGS-2002, July 2002, p. 33.
42 The methodology of using investment to assess the probable future economic effects on the UnitedStates was developed as part of the Commission’s reporting requirement on the Caribbean BasinEconomic Recovery Act (CBERA). For a more detailed discussion of the methodology, see USITC, CBERA,First Report, 1984-85, USITC publication 1907, September 1986, p. 4-1.
43 United Nations Conference on Trade and Development, World Investment Report 2002:Transnational Corporations and Export Competitiveness, New York and Geneva, 2002, pp. 303-304.
44 United Nations, Economic Commission for Latin America and the Caribbean, Foreign Investmentin Latin America and the Caribbean, 2002, April 2003, pp. 13, found at Internet addresshttp://www.eclac.org/, retrieved June 3, 2003.
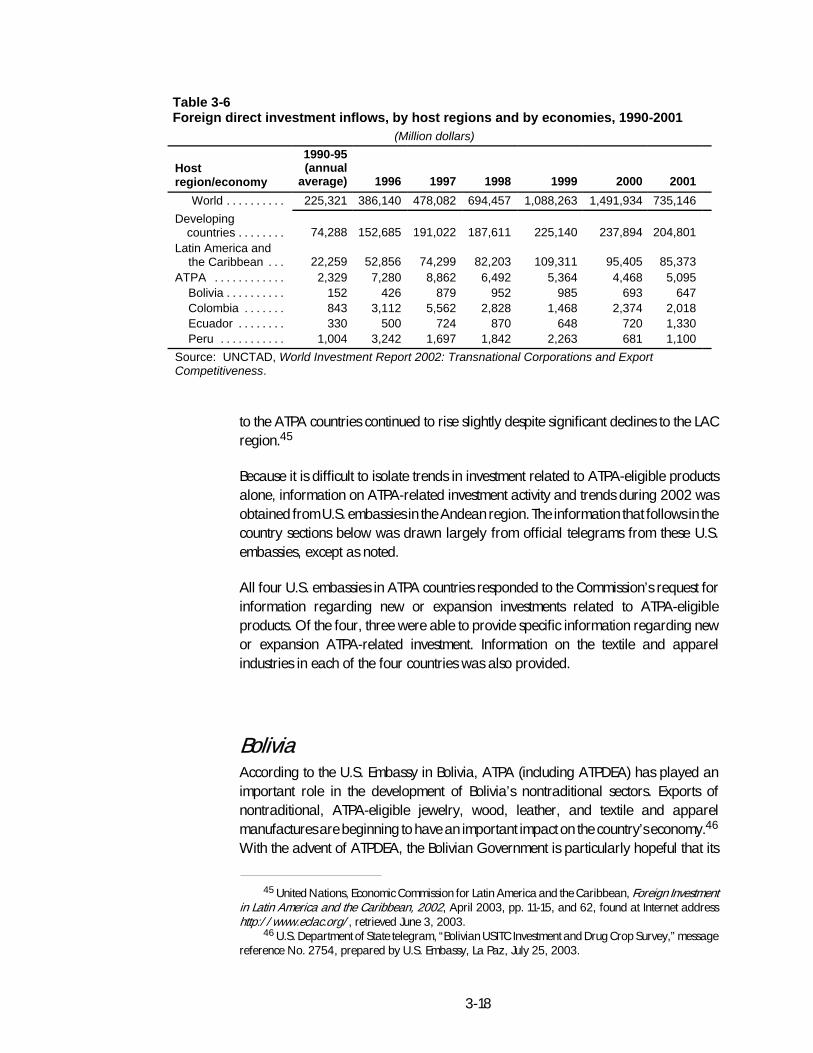
3-18
Table 3-6Foreign direct investment inflows, by host regions and by economies, 1990-2001
(Million dollars)
Hostregion/economy
1990-95(annual
average) 1996 1997 1998 1999 2000 2001
World . . . . . . . . . . 225,321 386,140 478,082 694,457 1,088,263 1,491,934 735,146
Developingcountries . . . . . . . . 74,288 152,685 191,022 187,611 225,140 237,894 204,801
Latin America andthe Caribbean . . . 22,259 52,856 74,299 82,203 109,311 95,405 85,373
ATPA . . . . . . . . . . . . 2,329 7,280 8,862 6,492 5,364 4,468 5,095Bolivia . . . . . . . . . . 152 426 879 952 985 693 647Colombia . . . . . . . 843 3,112 5,562 2,828 1,468 2,374 2,018Ecuador . . . . . . . . 330 500 724 870 648 720 1,330Peru . . . . . . . . . . . 1,004 3,242 1,697 1,842 2,263 681 1,100
Source: UNCTAD, World Investment Report 2002: Transnational Corporations and ExportCompetitiveness.
to the ATPA countries continued to rise slightly despite significant declines to the LACregion.45
Because it is difficult to isolate trends in investment related to ATPA-eligible productsalone, information on ATPA-related investment activity and trends during 2002 wasobtained from U.S. embassies in the Andean region. The information that follows in thecountry sections below was drawn largely from official telegrams from these U.S.embassies, except as noted.
All four U.S. embassies in ATPA countries responded to the Commission’s request forinformation regarding new or expansion investments related to ATPA-eligibleproducts. Of the four, three were able to provide specific information regarding newor expansion ATPA-related investment. Information on the textile and apparelindustries in each of the four countries was also provided.
BoliviaAccording to the U.S. Embassy in Bolivia, ATPA (including ATPDEA) has played animportant role in the development of Bolivia’s nontraditional sectors. Exports ofnontraditional, ATPA-eligible jewelry, wood, leather, and textile and apparelmanufactures are beginning to have an important impact on the country’s economy.46
With the advent of ATPDEA, the Bolivian Government is particularly hopeful that its
45 United Nations, Economic Commission for Latin America and the Caribbean, Foreign Investmentin Latin America and the Caribbean, 2002, April 2003, pp. 11-15, and 62, found at Internet addresshttp://www.eclac.org/, retrieved June 3, 2003.
46 U.S. Department of State telegram, “Bolivian USITC Investment and Drug Crop Survey,” messagereference No. 2754, prepared by U.S. Embassy, La Paz, July 25, 2003.
3-19
economically depressed textile and apparel sector can increase output rapidly usingthe estimated 50 percent unused capacity in the sector, which could result in a boost of$22 million in output and an additional 18,000 new jobs in the short term.47
On April 30, 2003, the Bolivian Government announced an ambitious export plan totake advantage of ATPDEA benefits (Supreme Decree 27020).48 The plan establishesincentives for export production and measures to improve the organization of smalland micro manufacturers in four sectors–textiles and apparel, jewelry, leather, andwood products–chosen according to their production and market potential. The plan isfocusing first on Bolivia’s textile and apparel industry. It will create a series of largeproduction centers, dubbed maquicentros, that will bring together small producersand artisans lacking export resources to act as subcontractors for the few large firmsalready operating at capacity and accustomed to large-scale export operations. Taxincentives focused on working capital will seek to induce firms to begin exporting or toexport more. The government has also created two initial funds totaling $3.6 million(expected to increase to $6 million eventually) to finance new investments and workingcapital. The plan is designed primarily to create jobs, but it will also raise tax revenuefor the government. In the short term, the Government of Bolivia estimates new exportsin these sectors will increase by one-third and generate 8,000 new jobs. However,developed only recently, the maquicentro program still must address a number ofissues, including logistics, training to ensure quality control, and protection ofintellectual property rights.49
According to the U.S. Embassy, the majority of firms in the jewelry, wood, leather, andtextile and apparel sectors limited their new investments in 2002 until ATPA wasrenewed and Bolivia received eligibility for ATPDEA trade benefits in October 2002.Actual data on investment in these sectors are not available. However, the U.S.Embassy conducted a survey of major companies in the textiles and apparel, jewelry,and wood manufacturing sectors, producing cotton garments; gold, silver, and otherjewelry; and wood furniture, doors, and frames, respectively. The survey revealed thattogether these companies made investments related to expansion and/or newfacilities totaling $13.4 million in 2002. All companies indicated that they used inputsfrom either the United States, Caribbean, or other ATPA beneficiary countries. In eachsector, at least half of the companies indicated that investments would not have beenmade in the absence of ATPA trade preferences.
47 U.S. Department of State telegram, “ATPA Scores Big in Bolivia,” message reference No. 2877,prepared by U.S. Embassy, La Paz, Aug. 9, 2002.
48 U.S. Department of State telegram, ”8000 Jobs by Christmas? Bolivia Unveils ATPDEA Plan,”message reference No. 1710, prepared by the U.S. Embassy, La Paz, May 9, 2003; and U.S. Departmentof State telegram, “Bolivian USITC Investment and Drug Crop Survey,” message reference No. 2754,prepared by U.S. Embassy, La Paz, July 25, 2003.
49 Ibid.
3-20
Textile and Apparel Industry
Bolivia’s textile and apparel sector is considered to be in its infancy, but is viewed ascapable of competing in the global market because of its high quality andcompetitively priced products.50 The sector accounted for 22 percent of the country’sindustrial labor force in 2000.51 Sector production is based on cotton, wool, andspecialty fine hairs from indigenous llamas and alpacas. The textile and apparel sectorconsists mostly of small establishments and has some vertically integrated mills.Estimates on the number of textile firms vary widely, ranging up to 3,500;52 there arean estimated 10,000 apparel firms.53
Although Bolivia is a very small supplier of textiles and apparel to the United States, theimplementation of the ATPDEA prompted Bolivian textile and apparel producers tofocus on increasing export opportunities to the U.S. market. Bolivian textile andapparel producers are seeking to attract new FDI to expand existing plant capacityand to establish new facilities in order to boost exports to the U.S. market.54 Boliviangovernment officials estimated that the ATPDEA’s tariff benefits could generate $200million in FDI and up to 50,000 new jobs in the sector over the next 5 years.55
ColombiaAccording to the U.S. Embassy in Colombia, ATPA has “particularly benefitedColombia over the past decade.”56 During its first 10 years, ATPA created anestimated 150,000 jobs in Colombia and ATPDEA is expected to create an additional200,000 new jobs. Colombian statistics show that exports to the United States underATPA (including ATPDEA) surged during the first quarter of 2003, with petroleum,flowers, and apparel accounting for 93 percent of the exports.57
Information on investment in ATPA-related products in 2002 is not available. The U.S.Embassy reported that according to the Colombian Central Bank and Colombia’sinvestment promotion agency Coinvertir, new FDI in Colombia declined 11 percent in2001 to $2.5 billion and by 19.5 percent in 2002 to $2 billion, largely because of
50 U.S. Department of State telegram, “Bolivians Propose Tariff and Quota Free Access to U.S.Textiles Market,” message reference No. 3788, prepared by U.S. Embassy, La Paz, Aug. 31, 2000.
51 Ibid. The telegram states that because much of the apparel trade occurs in the “informaleconomy,” it is difficult to compile credible data on the Bolivian textile and apparel sector.
52 Embassy of Bolivia, “Estudio tecnico de los sector textil y madera en el marco ATPDE,” (Technicalstudy of the textile and wood sector in the ATPDEA market), Apr. 30, 2003.
53 “Bolivia, Brazil, Chile,” Apparel Industry, Sept. 2000, p. 48.54 U.S. Department of State telegram, “Bolivians Want Their Piece of the ATPDEA Pie,” message
reference No. 3008, prepared by U.S. Embassy, La Paz, Aug. 19, 2002.55 U.S. Department of State telegram,“ATPA Scores Big in Bolivia,” message reference No. 2877,
prepared by U.S. Embassy, La Paz, Aug. 9, 2002.56 U.S. Department of State telegram, “ATPA/ATPDEA Investment Activity During 2002,” message
reference No. 7412, prepared by U.S. Embassy, Bogota, Aug. 8, 2003.57 Ibid.
3-21
“on-going security problems contributing to the perceived high-risk investmentenvironment.” FDI is expected to recover in 2003 as the security situation improves.58
Both the Colombian Government and the private sector anticipate that ATPDEA willcreate jobs and provide important new opportunities in the textile and apparel, leathergoods, footwear, tuna, and petroleum sectors.59 According to Colombian officials,ATPDEA will provide the most immediate benefits to the textile and apparel sector.Longer-term prospects are seen for the opening of the tuna and petroleum sectors.60
Textile and Apparel IndustryThe textile and apparel industries continue to be a significant source of economicactivity and employment for the Andean countries. According to data attributed toColombia’s official manufacturing association, DANE, the textile and apparel sectoraccounts for 22 percent of manufacturing employment in Colombia.61 Colombia’stextile and apparel firms are concentrated in Medellin and Bogota and the apparelindustry is known as a high-quality, just-in-time provider, especially for women’sunderwear, babies’ apparel, and swimwear.62 Colombia imports a substantialamount of fibers, primarily from the United States, which it uses in its textile andapparel production. Colombia’s cotton fiber imports account for more than 65 percentof the country’s cotton consumption whereas imports account for over 90 percent ofthe synthetic fibers used by its textile industry.63
Colombia’s textile and apparel sector stagnated in the late 1990s, losing ground tocountries that benefit from preferential access to the U.S. apparel market, particularlyMexico and the Caribbean Basin countries.64 Consequently, Colombia’s governmentand textile and apparel sector responded positively to the ATPDEA as a mechanism forimproving the country’s economy and creating new jobs.65 In anticipation of theATPDEA, Colombia’s textile and apparel sector began to focus its efforts on increasingexport production for the U.S. market. Dyeing and finishing capacity that had beendirected principally to the domestic market was expanded to boost exports.66
58 Ibid.59 U.S. Department of State telegram, “Scenesetter: New Challenges and Opportunities for
Colombia,” message reference No. 6906, prepared by U.S. Embassy, Bogota, Aug. 2, 2002; and U.S.Department of State telegram, “ATPA/ATPDEA Investment Activity During 2002,” message referenceNo. 7412, prepared by U.S. Embassy, Bogota, Aug. 8, 2003.
60 U.S. Department of State telegram, “Overwhelmingly Positive Colombian Reaction to ATPARenewal,” message reference No. 7033, prepared by U.S. Embassy, Bogota, Aug. 8, 2002.
61 Director of Marketing, Colombia Trade Bureau, ProExport Colombia, facsimile to USITC staff, July17, 2003.
62 U.S. Department of State telegram, “Colombia’s Textile Industry After Quotas: Stagnant orWorse,” message reference No. 3809, prepared by U.S. Embassy, Bogota, Apr. 26, 2002.
63 Ibid.64 Ibid.; and U.S. Department of State telegram, “Overwhelming Positive Colombian Reaction to
ATPA Renewal,” message reference No. 7033, prepared by U.S. Embassy, Bogota, Aug. 8, 2002.65 U.S. Department of State telegram, “Overwhelming Positive Colombian Reaction to ATPA
Approval,” message reference No. 7033, prepared by U.S. Embassy, Bogota, Aug. 8, 2002.66 Director of Marketing, Colombian Government Trade Bureau, Proexport Colombia, interview by
USITC staff, Dec. 7, 2002.
3-22
Colombia’s textile and apparel sector also began implementing programs to ensurecompliance with labor, social, and environmental codes, criteria increasingly used byU.S. companies in selecting foreign partners.67 According to a published report, theGovernment’s trade bureau, ProExport, has most recently focused on facilitatingbusiness relationships between U.S. manufacturers, retailers, and buyers, andColombian textile and apparel producers.68
Colombia’s textile and apparel sector has sought to attract additional FDI in order tofinance the expansion of production capacity for textile products in which it isespecially competitive, such as fabrics (poplin, denim, corduroy, sheeting, andtwills).69 To date, however, FDI in Colombia’s textile and apparel sector has beenlimited. A few producers of manmade fibers are foreign-owned or have foreigncapital investment.70 Colombia still faces challenges in overcoming investors’concerns about security dangers and their perception of Colombia as a high-riskcountry.71
EcuadorAccording to the U.S. Embassy in Ecuador, the country’s Central Bank reported thatprovisional foreign investment flows into Ecuador in 2002 reached $1.3 billion, ofwhich $1.1 billion was accounted for by the petroleum and mining sector. Foreigndirect investment also was made in agriculture and fishing ($15.0 million),manufacturing ($56.5 million), finance ($63.0 million), and commerce ($45.4million).
Ecuador’s Ministry of Foreign Affairs cites flowers as Ecuador’s greatest ATPA successstory, noting that their share in total exports grew from 1.3 percent in 1993 to over 4percent in 2002. However, the U.S. Embassy reported that the flower boom may beending. Increased competition from the Colombian and Venezuelan flower industriesdue to the devaluations of these countries’ currencies has reduced the competitivenessof Ecuador’s flower exports. For example, because of the 29.3 percent devaluation ofColombia’s currency during the first trimester of 2003, Colombian flowers are now 25percent less expensive than those produced in Ecuador. Also, Ecuador pays higherfreight costs to the United States than Colombia. According to ExpoFlores, Ecuador’s
67 “Colombia: Local Industry and Market,” Export Advantage, found at Internet addresshttp://web.ita.doc.gov/tacgi/overseas.nsf, retrieved Jan. 23, 2003.
68 Jerry Haar and Silvia Reyes, “Trade Liberalization and Market Competitiveness of the ColombianApparel Industry,” Multinational Business Review, Fall 2002, p. 16.
69 As discussed earlier, Colombia has distinguished itself in the production of high-quality, fashionapparel. The emphasis on expansion of its textile production capacity likely reflects the industry’s shiftfrom apparel assembly to full package programs to boost its competitiveness.
70 Director of Marketing, Colombia Trade Bureau, interview by USITC staff, Dec. 7, 2002, andfacsimile to USITC staff, Feb. 7, 2003.
71 U.S. Department of State, “Background Note: Colombia,” Apr. 4, 2002, found at Internet addresshttp://www.state.gov, retrieved June 25, 2003; and “Colombia–Economic Outlook,” Caribbean/LatinAmerican Profile 2003 (Miami, FL: Caribbean Publishing Co.), p. D-28.
3-23
principal association of flower exporters, in June 2003, 12 flower producer-exportersclosed down citing their failure to recover invested capital. ExpoFlores also noted that“financing for the sector is virtually nonexistent” and predicted that the recent surge ofbankruptcies will continue to affect the sector.72
The U.S. Embassy also reported that the National Chamber of Fisheries indicated inDecember 2002 that several local tuna packing plants had retooled to take advantageof ATPDEA trade preferences for pouched tuna. As a result, the Embassy said that twoshipments of pouched tuna were exported to the United States in 2003. However, theGovernment of Ecuador remains concerned that canned tuna remains excluded fromU.S. trade preferences. The National Fisheries Chamber indicated that if Ecuadoriantuna received the same treatment as that of Mexico and Central America, 50,000 newjobs would be created over the next 5 years in Ecuador.
Textile and Apparel Industry
Ecuador’s textile and apparel sector is small, but its products are among the country’stop export priorities.73 Ecuador’s textile and apparel industries accounted for anestimated 4 percent of the labor force in 2002.74 The sector produces spun yarns,fabrics, household items, and apparel and its products are known for their “highquality, innovative designs, and low cost.”75 Ecuador’s textile and apparel sector islargely vertically integrated, with spinning, weaving, cutting, and sewing operationsusually managed by the same firm. Most Ecuadorian textile production involves cottonand cotton-blended fabrics and some wool. Because Ecuador’s domestic cottonproduction meets only 10 percent of demand, the Ecuadorian textile and apparelsector imports most of the cotton it consumes in its textile and apparel production.76
Apparel accounted for 66 percent of the quantity but 84 percent of the total value ofU.S. textile and apparel imports from Ecuador in 2002; textiles and apparel totaledjust under $16 million or 2 percent of total U.S. imports from the Andean countries. Theenactment of the ATPDEA in August 2002 was viewed positively by Ecuadorian textileproducers and is expected to benefit Ecuador’s textile and apparel sector byincreasing access to the U.S. market.77
72 U.S. Department of State telegram, “Ecuador’s Report to the USITC Annual Andean Investmentand Drug Crop Survey,” message reference No. 2513, prepared by U.S. Embassy, Quito, July 25, 2003.
73 U.S. Department of State telegram, “Ecuador’s Export Priorities,” message reference No. 3693,prepared by U.S. Embassy, Quito, Oct. 31, 2002.
74 U.S. Department of State telegram, “Ecuador’s Textile Industry,” message reference No. 65849,prepared by U.S. Embassy, Quito, June 5, 2002.
75 “Textiles–Sector Overview,” found at Internet addresshttp://www.ecuadorexports.com/textiles.htm, retrieved Dec. 31, 2002.
76 Unfavorable weather conditions caused by El Niño during the late 1990s led to declines inEcuador’s domestic cotton production. U.S. and Foreign Commercial Service, “Best Prospects forNon-Agricultural Foods and Services,” Ecuador Country Commercial Guide FY 2002, found at Internetaddress http://www.usatrade.gov, retrieved Oct. 30, 2002.
77 U.S. Department of State telegram, “Tuna Types Aside, Ecuador is Satisfied with ATPA,” messagereference No. 2525, July 31, 2002; and U.S. Department of State telegram, “Ecuador’s Export Priorities,”message reference No. 3693, prepared by U.S. Embassy, Quito, Oct. 31, 2002.
3-24
The U.S. Embassy reported forecasts about the industry made by the Textile IndustryAssociation of Ecuador (AITE), which estimates that Ecuadorian garment exports to theUnited States could reach $176 million by 2006, a 47-percent increase over currentlevels, if the industry takes full advantage of ATPDEA benefits. Such an increase wouldgenerate 24,000 to 52,600 new jobs. According to AITE, the textile sector invested$12.4 million in capital goods in 2002 and $2.2 million in capital goods during the firsttrimester of 2003. The ready-made garment sector invested $13.4 million in capitalgoods in 2002, and $2.7 million during the first trimester of 2003. This $30.8 million ininvestment was aimed at improving productivity and adjusting production to meetinternational standards.78
The U.S. Embassy in Ecuador also conducted a survey of textile and apparelcompanies that revealed that they have invested nearly $1 million in 2002 and 2003 inresponse to ATPDEA benefits. These companies expect to export about $4.7 millionannually to the United States–primarily garments. The survey also revealed that someof the companies purchase up to 85 percent of their inputs, including cotton, from theUnited States.
PeruAccording to the U.S. Embassy in Peru, the expiration of ATPA had a negative effect onexports and slowed new investment in 2002. Peru’s National Industries Society (SNI)reported that ATPA’s long lapse caused Peruvian exporters to delay or cancelshipments, reduce prices, and/or absorb the amount of the duties. Despite thesesetbacks, the Embassy notes that ATPA continued to play an important role inencouraging investment in nontraditional export-oriented products and diversificationof the production base in Peru. Asparagus exports continued to serve as an example ofthe positive effect of ATPA preferences. Such exports to the United States increasedtwentyfold between 1992 and 2002, and are expected to continue to increase, albeitat a slower pace.79 Exports to the United States of certain fruits, including mangoesand grapes, have also grown in response to ATPA, from nil in 1992 to $24.3 millionand $5 million, respectively, in 2002. With the expansion of ATPA benefits underATPDEA, large increases in nontraditional exports such as apparel, handicrafts, andshoes are expected. Exports of jewelry are also expected to climb.80
More generally, the Government of Peru announced an economic package in March2003 to stimulate economic growth and improve government efficiency. This packageincludes measures to promote overall investment and exports, including exports to take
78 U.S. Department of State telegram, “Ecuador’s Report to the USITC Annual Andean Investmentand Drug Crop Survey,” message reference No. 2513, prepared by U.S. Embassy, Quito, July 25, 2003.
79 U.S. Department of State telegram, “Peru Scenesetter for Under Secretary J.B. Penn Visit,”message reference No. 5481, prepared by U.S. Embassy, Lima, Oct. 18, 2002.
80 U.S. Department of State telegram, “ITC Annual ATPA/ATPDEA Report Input,” messagereference No. 3383, prepared by U.S. Embassy, Lima, July 8, 2003.
3-25
better advantage of trade benefits under ATPDEA.81 The Government’s goal is toincrease total exports from $7 billion currently to $15 billion by 2006.82 Prompex, theagency charged with promotion of Peruvian exports, has indicated that textiles andapparel is a high-priority sector.83 Nonetheless, the Government of Peru argues thatATPDEA trade benefits, which are scheduled to expire in 2006, are not a sufficientdraw for wary investors. Instead, the Government is pushing to conclude a morepermanent bilateral free trade agreement with the United States to consolidateATPDEA gains and get a head start in attracting U.S. investors prior to the conclusionof negotiations for a FTAA.84
Textile and Apparel IndustryPeru’s textile and apparel sector is vertically integrated from the production of rawmaterial inputs (cotton, alpaca, llama, and vicuña) and fabric production to apparelsewing and packaging. Textile and apparel manufacturing is a major source ofemployment. Almost 10 percent of the country’s population depends on the textileindustry, which directly accounted for an estimated 150,000 workers in 2002.85
Peru’s textile and apparel sector benefits from domestic supplies of high-quality pimaand tanguis cotton and fine animal hairs from its indigenous alpaca, llama, andvicuña. In recent years, Peruvian textile and apparel manufacturers have increasinglyemphasized higher value-added products because they have been unable to competeon price with textile and apparel products from Mexico and the Caribbean Basincountries that benefit from duty-free and quota-free preferential arrangements or withlow-cost products from Asian suppliers.86
Peru’s domestic market for textiles and apparel is small, and therefore a significantshare of the country’s textile and apparel production is exported. In 2001, for the firsttime, Peru supplanted Colombia as the largest Andean supplier of textiles and apparelto the United States. Peru’s textile and apparel companies have been seeking toincrease their presence in the global marketplace in recent years. Many haverestructured their production operations and have been implementing newquality-control programs to increase efficiencies and reduce costs.87 The textile and
81 U.S. Department of State telegram, “Peru Announces Growth and Fiscal Measures,” messagereference No. 1563, prepared by U.S. Embassy, Lima, Mar. 26, 2003.
82 U.S. Department of State telegram, “Peru Economic Notes, April 7, 2003,” message referenceNo. 1762, prepared by U.S. Embassy, Lima, Apr. 7, 2003.
83 U.S. Department of State telegram, “DUS Timothy Hauser Visit to Peru,” message reference No.1764, prepared by U.S. Embassy, Lima, Apr. 7, 2003.
84 U.S. Department of State telegram, “Peru to Lobby USTR for Bilateral FTA as ATPDEA InvestmentDisputes Still Linger,” message reference No. 1303, prepared by U.S. Embassy, Lima, Mar. 11, 2003.
85 Peruvian Government, written submission to the Commission in connection with “Textiles andApparel: Assessment of the Competitiveness of Certain Foreign Suppliers to the U.S. Market,”Investigation No. 332-448, Feb. 3, 2003.
86 EXPORAMERICA, “Inclusion of Textiles and Apparel in the Andean Trade Preference Act:Contribution to the Battle Against Coca Production and Illegal Drug Trafficking,” Sept. 2000, p. 17.
87 Olga G. West, “Peru Moda to Focus on Expanding Market Horizons,” Bobbin, May 2000,pp. 2-18.
3-26
apparel sector has been anticipating new trade opportunities resulting frompreferential access to the United States. ATPDEA provisions granting preferentialtreatment for apparel made in Andean countries from regional fabric wereconsidered particularly important for Peru, because its vertically integrated textile andapparel sector uses few U.S. textile inputs.
Actual investment targeting the textile and apparel sector in Peru is not available.According to the U.S. Embassy in Peru, some textile and apparel companies delayedor limited new investment during 2002 until the country was designated eligible toreceive ATPDEA benefits. The U.S. Embassy indicated that some of the largermanufacturers began capacity-building investment projects, ranging from a fewhundred thousand dollars to a total of $16 million in late 2002 and 2003. In a surveyconducted by the U.S. Embassy, several Peruvian textile and apparel companiesindicated that they had together invested about $1.6 million to expand capacity inresponse to ATPDEA benefits. These companies plan to export primarily apparel, butalso woven fabric, valued at approximately $20 million in the near future.
Both the local (foreign-owned) Wiese Sudameris Bank and the Textiles Committee ofSNI have made estimates regarding future investment and exports in the textile andapparel sector in response to ATPDEA. According to the U.S. Embassy, in late 2002Wiese Sudameris Bank estimated that ATPDEA-driven investment in the textile andapparel sector during the period 2002-2006 will range between $220 million (mostlikely case scenario) and $340 million (optimistic scenario). Most of this investmentwould be made in the 2004-2006 period, since there is still unused installed capacityin the industry. Also, according to the bank, businesspeople, and other observers,there will not likely be any large investments but rather, the investment will be made toexpand and/or refurbish existing facilities. The Textiles Committee of SNI recentlyestimated that investments should reach $108 million in the 2003-2005 period.
Wiese Sudameris Bank also estimated that apparel exports to the United States couldincrease by 2006 to a range of $712 to $906 million, compared with $375 million in2002. The SNI Textiles Committee forecasts that exports of apparel will range between$745 million to $1.03 billion in 2006. This Committee also estimates that Peruvianexports of fabrics and other textile products could climb from $14 million in 2002 to$16-18 million in 2006.
Immediately following the enactment of ATPDEA, the trade press reported thatPeruvian President, Alejandro Toledo, announced that ATPDEA would generate nofewer than 1 million new jobs.88 Subsequent estimates from industry sources in Peruhave suggested more modest employment growth–about 205,000 new jobs in cottonproduction and textile manufacturing as a result of the ATPDEA.89 Wiese SudamerisBank estimated that the number of new textile and apparel jobs created by textile and
88 “U.S. Duty-Free Treatment Could Boost Peru’s Textile Industry,” found at Internet addresshttp://www.emergingtextiles.com, retrieved Aug. 14, 2002.
89 Economist Intelligence Unit, “Peru: Fading Export Expectations,” Business Latin America, Sept. 23,2002, found at Internet address http://db.eiu.com, retrieved Nov. 4, 2002.
3-27
apparel sector investments prompted by the ATPDEA could total as high as 135,700.90
Some Peruvian business leaders have voiced their concern, however, that withoutsubstantial foreign investment, the level of new direct and indirect textile jobs will likelybe limited.91 Currently, 90 percent of Peru’s textile and apparel firms are owned byPeruvians.92
ConclusionBased on an examination of ATPA-related investment in 2002, ATPA is likely tocontinue to have minimal future effects on the U.S. economy in general. As described inchapter 2, the share of total U.S. imports composed of imports from ATPA countries in2002 was small (0.83 percent by value). Imports that benefited exclusively from ATPAin 2002 made up an even smaller share–just 0.06 percent, lower than recent yearsbecause of ATPA’s lapse for 7 months in 2002. ATPA’s expiration in December 2001and the accompanying uncertainty regarding its renewal likely dampened investmentin certain ATPA-eligible goods during the year. However, ATPDEA may promoteincreased exports to the United States of products newly eligible for tradepreferences–for example, textile and apparel articles and pouched tuna. ATPDEAwas only in effect for 2 months during 2002 and little, if any, trade was recorded in thenewly eligible items, with the exception of petroleum-based products. However, theCommission identified a number of new investments in textiles and apparel valued at$4.5 million in 2002 and early 2003 in the Andean region, which are likely togenerate increased exports to the United States in the future.
90 U.S. Department of State telegram,“ITC Annual ATPA/ATPDEA Report Input,” messagereference No. 3383, prepared by U.S. Embassy, Lima, July 8, 2003.
91 The Economist Intelligence Unit, “Peru: Fading Export Expectations,” Sept. 23, 2002, found atInternet address http://db.eiu.com, retrieved Nov. 4, 2002.
92 Embassy of Peru, counselor, interview by USITC staff, Jan. 8, 2003.

4-1
CHAPTER 4Impact of ATPA on Drug-Related CropEradication and Crop Substitution
The United States enacted ATPA in 1991 and renewed and enhanced it in 2002 toimprove access to U.S. markets of certain imports from Bolivia, Colombia, Ecuador,and Peru, thereby promoting economic alternatives to illicit drug activity. This chapterassesses the estimated effects of ATPA1 on the drug-related crop eradication and cropsubstitution efforts of each of these countries during 2002.
Overview
According to the U.S. Department of State, among all drugs “cocaine still poses thegreatest drug threat” to the United States.2 The coca plant is the raw material forproducing cocaine, and nearly all cocaine originates in the Andean countries ofColombia, Peru, and Bolivia.3 Ecuador, also an ATPA beneficiary, is considered by theState Department as “a major transit country for drugs and precursor chemicals” thatare used to produce cocaine.4
In addition to coca, Colombia is also a producer of opium poppy. Colombia accountsfor nearly 2 percent of the world’s opium poppy cultivation, the raw material forheroin, with virtually all of its heroin production destined for the United States.5
Colombia has taken some steps to eradicate its opium poppy, spraying over 3,000hectares in 2002, which represented nearly one-half of the 6,500 hectares of opiumpoppy detected at the end of 2001.6 Poppy cultivation and opium trafficking haveincreased in Peru as well, where farmers are supplied with seeds, technical assistance,and cash loans from Colombian narcotics traffickers.7 The U.S. Department of Statedid not report data regarding poppy cultivation for Colombia and Peru for 2002,owing to data collection difficulties.8 For this reason, this chapter focuses exclusively onthe effects of ATPA on coca cultivation, production, eradication, and crop substitution.
1 As discussed in chapter 1, the term “ATPA” refers to ATPA, as amended by ATPDEA.2 U.S. Department of State, International Narcotics Control Strategy Report (INCSR), March 2003,
p. II-3.3 For background information on coca cultivation, cocaine processing, and licit traditional uses of
coca, see USITC, ATPA, Eighth Report, 2001, pp. 4-2 and 4-3. In Bolivia and Peru, cultivation of coca leafis legal in certain “traditional” areas, often associated with indigenous peoples that have cultivated cocaas a licit crop for centuries. Peru legally produces, for example, both coca leaf and cocaine base formedical and commercial consumption in the United States and Europe. INCSR 2003, p. IV-40. For furtherdetail, see the section on trends during 2002 as well as the country sections on Bolivia and Peru.
4 Ecuador successfully eradicated a small area of illicit coca by 1992.5 INCSR 2003, p. II-3.6 Ibid., p. II-4. One hectare is 10,000 square meters, and is equal to approximately 2.54 acres.7 Ibid., pp. II-5 and IV-40.8 Ibid., p. II-14.
4-2
The Commission recognizes that ATPA is but a single element of a multifaceted effort tocombat the drug problem. Consequently, no precise estimate can be made of theimpact of ATPA on drug-related crop eradication and crop substitution or alternativedevelopment. Furthermore, as highlighted in previous reports, drug crop-eradicationprograms and alternative development efforts in the Andean region–despite somesuccess in reducing net coca cultivation and modest success in generating economicalternatives and employment–have thus far appeared to be less effective in controllingthe actual overall supply of illicit drugs.
Few licit crops can compete viably with coca. For example, coca can be cultivated insoil and climate conditions unsuitable for many commercial crops. Coca is often grownin regions controlled by armed insurgents that encourage its cultivation. Moreover, itcan take time for countries to develop licit products of sufficient quality and in sufficientquantity that are able to penetrate the U.S. market. The commercial success ofalternative development programs is often contingent on the improvement ofeconomic infrastructure in a country, such as road construction or other measures thatpromote licit economic activity where little or none was present before, which in turncan hinge on government economic policies that are affected by external factors.
The Commission estimates that during 2002, ATPA had a small, indirect, but positiveoverall effect in support of illicit coca eradication and crop substitution efforts. TheCommission’s assessments in this chapter are based on analysis of relevant literatureon the Andean region, including unclassified U.S. embassy reports and publishedreports from relevant U.S. Government agencies on drug crop control and alternativedevelopment in the Andean region.9
Role of ATPA in Counternarcotics Efforts
ATPA was enacted to provide incentives to Bolivia, Colombia, Ecuador, and Peru todiversify their economies away from narcotics production.10 As virtually all cocainesold in the United States originates in these countries, the program functions as a U.S.trade policy tool that contributes to the U.S. fight against drug production andtrafficking.11 ATPA’s trade-based incentives generally encourage new production andthe growth of new industries that otherwise might not develop in the beneficiarycountries. Not all such products or industries are direct substitutes for illicit cocacultivation, are located in coca-cultivating regions, or directly employ or attractworkers or capital from coca-cultivating regions. Nonetheless, economic activityencouraged by ATPA contributes to economic development in the beneficiarycountries through increased domestic production, exports, and employment.
9 The Commission relied extensively on data and factual information provided by other governmentand nongovernmental organizations in preparing this assessment because a USITC fact-finding field tripto the Andean region was not undertaken.
10 USTR, 2003 Trade Policy Agenda and 2002 Annual Report of the President of the United States onthe Trade Agreements Program, April 2003 (Washington D.C.: GPO, 2003), p. 146.
11 Ibid.
4-3
Along with ATPA trade benefits, the United States also assists the Andean countries inreducing illicit coca production through eradication operations and alternativedevelopment programs. The U.S. Department of State’s Agency for InternationalDevelopment (USAID) and the Department’s Bureau for International Narcotics andLaw Enforcement Affairs, in conjunction with other foreign bilateral and multilateralaid donors, provide economic and technical assistance for alternative developmentprograms in the four countries. Through alternative development programs, cocafarmers are encouraged to cultivate licit agricultural products or engage in liciteconomic activities to create alternative income and employment. alternativedevelopment programs include research to determine viable legitimate substitutecrops or economic activities, training, technical and marketing assistance, andinfrastructure development, such as providing education and health services,supplying agricultural credit, and constructing roads.12
Regional Cultivation and Eradication Trends During 2002
Net coca cultivation increased in the Andean region during 2000 and 2001, butintense eradication efforts reduced net coca cultivation in 2002, with net cultivation inColombia declining for the first time in 2002. Eradication efforts in the region hit arecord high in 2002, driven by the largest- ever eradication efforts in Colombia.However, despite aggressive eradication programs, cultivation rose in Bolivia andmore modestly in Peru in 2002.13 In Peru, prices for coca leaf and coca base havereportedly increased steadily over the past several years.14 In Bolivia, governmentprograms aimed at coca control have become enmeshed in political, economic, andcultural battles where coca growers’ movements have adapted historical tradition tococa cultivation as a pretext to resist central government policies under a banner ofindigenous rights.15
12 United Nations Office on Drugs and Crime (UNODC), Alternative Development: What IsAlternative Development? found at Internet addresshttp://www.unodc.org/unodc/en/alternative_development.html, retrieved June 18, 2003.
13 INCSR 2003, p. II-4.14 U.S. Department of State telegram, ”Coca Economics in Peru,” message reference No. 2696,
prepared by U.S. Embassy, Lima, June 2, 2003, par. 7, and table 2, “Prices of Coca Leaf andDerivatives.”
15 INCSR 2003, p. II-4. Bolivian law No. 1008 of July 19, 1988 (Ley del Regimen de la Coca ySustancias Controladas, Regime of Coca and Controlled Substances) authorizes up to 12,000 hectares ofcoca cultivation within a defined “traditional” coca growing area located largely in a mountainous regionnortheast of the city of La Paz known as the Yungas. The licit coca cultivation of the Yungas contrasts withthe illicit coca cultivation in the tropical lowland region of the Chapare, where the government’s forcedcoca eradication program has been successful in recent years, but has led to the protests in 2002 and2003 described in the country section on Bolivia. INCSR 2003, p. IV-7; and United Nations, Office onDrugs and Crime, Bolivia–Coca Survey in the Yungas of La Paz in 2002, March 2003, p. 5.
4-4
Since 1991, the year ATPA entered into effect, total net coca cultivation in the Andeancountries of Bolivia, Colombia, Ecuador, and Peru has fluctuated around 200,000hectares–between approximately 180,000 and 220,000 hectares. Net cocacultivation in the Andean region decreased from a period high in 1995 of 214,800hectares to a low of 183,000 hectares in 1999. Net cultivation then increased,reaching 223,700 hectares in 2001.16 In 2002, however, net coca cultivationdecreased to around 205,450 hectares, stemming from intensive eradication effortsthat began in 2001 and accelerated in 2002 and early 2003, which led to the firstdecrease in a decade in net coca cultivation in Colombia–the region’s largest coca leafproducer. Table 4-1 shows coca cultivation and eradication in the Andean region.
The overall trend masks substantial differences in net cultivation in the individualcountries. For example, Bolivia achieved a dramatic decrease in net coca cultivationbetween 1995 and 2000, although net cultivation has since increased. Similarly, Perureduced its net coca cultivation substantially between 1995 and 2001, althoughcultivation rose modestly in Peru in 2002. These major decreases in these two countrieshave been offset since 1992 by steady increases in Colombia where net cocacultivation in 1992 was 37,100 hectares and rose steadily to 169,800 hectares in 2001.In 2002, intense aerial spraying of illicit coca crops combined with governmentmilitary action against rebel insurgent groups controlling the coca-growing areas ofsouthern and western Colombia resulted in a decline in net coca cultivation in thecountry to around 144,450 hectares. Figure 4-1 shows net coca cultivation in Bolivia,Colombia, and Peru.
The difficulty in attributing any precise impact of ATPA on counternarcotics efforts ishighlighted by the possibility of pro-coca forces shifting location away from theconcentrated eradication efforts and military attacks mounted on crop sites inColombia back to Bolivia and Peru, where past eradication efforts were successful butwhere recent net cultivation has increased. For example, in 2002, Peruvian militaryforces have reported gunfights with Colombian rebel guerrillas in the jungle borderregion between the two countries.17
Country-specific developments in illicit coca cultivation and eradication, alternativedevelopment, and the role of ATPA, are discussed in more detail below.
16 Ecuador successfully eradicated its illicit coca cultivation by 1992, although it is still considered atransit country for coca paste, cocaine base, and cocaine. Consequently, the cultivation figures representonly Bolivia, Colombia, and Peru.
17 INCSR 2003, p. IV-40.
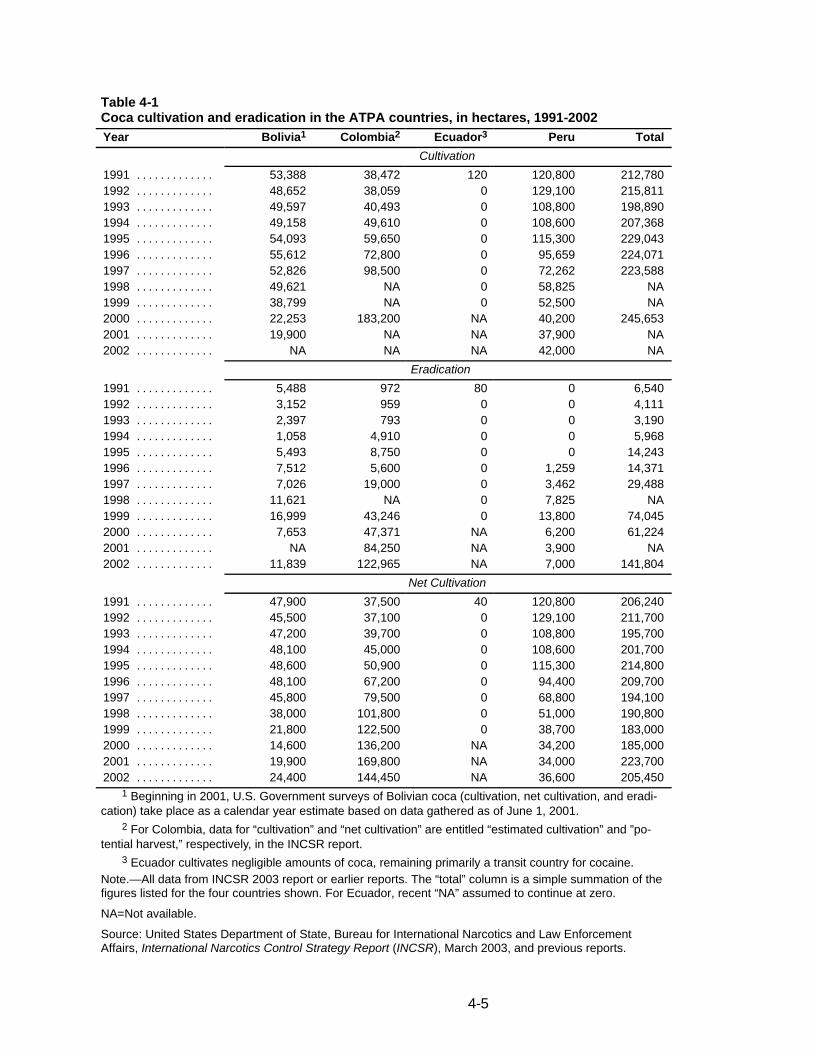
4-5
Table 4-1Coca cultivation and eradication in the ATPA countries, in hectares, 1991-2002Year Bolivia1 Colombia2 Ecuador3 Peru Total
Cultivation
1991 . . . . . . . . . . . . . 53,388 38,472 120 120,800 212,7801992 . . . . . . . . . . . . . 48,652 38,059 0 129,100 215,8111993 . . . . . . . . . . . . . 49,597 40,493 0 108,800 198,8901994 . . . . . . . . . . . . . 49,158 49,610 0 108,600 207,3681995 . . . . . . . . . . . . . 54,093 59,650 0 115,300 229,0431996 . . . . . . . . . . . . . 55,612 72,800 0 95,659 224,0711997 . . . . . . . . . . . . . 52,826 98,500 0 72,262 223,5881998 . . . . . . . . . . . . . 49,621 NA 0 58,825 NA1999 . . . . . . . . . . . . . 38,799 NA 0 52,500 NA2000 . . . . . . . . . . . . . 22,253 183,200 NA 40,200 245,6532001 . . . . . . . . . . . . . 19,900 NA NA 37,900 NA2002 . . . . . . . . . . . . . NA NA NA 42,000 NA
Eradication
1991 . . . . . . . . . . . . . 5,488 972 80 0 6,5401992 . . . . . . . . . . . . . 3,152 959 0 0 4,1111993 . . . . . . . . . . . . . 2,397 793 0 0 3,1901994 . . . . . . . . . . . . . 1,058 4,910 0 0 5,9681995 . . . . . . . . . . . . . 5,493 8,750 0 0 14,2431996 . . . . . . . . . . . . . 7,512 5,600 0 1,259 14,3711997 . . . . . . . . . . . . . 7,026 19,000 0 3,462 29,4881998 . . . . . . . . . . . . . 11,621 NA 0 7,825 NA1999 . . . . . . . . . . . . . 16,999 43,246 0 13,800 74,0452000 . . . . . . . . . . . . . 7,653 47,371 NA 6,200 61,2242001 . . . . . . . . . . . . . NA 84,250 NA 3,900 NA2002 . . . . . . . . . . . . . 11,839 122,965 NA 7,000 141,804
Net Cultivation
1991 . . . . . . . . . . . . . 47,900 37,500 40 120,800 206,2401992 . . . . . . . . . . . . . 45,500 37,100 0 129,100 211,7001993 . . . . . . . . . . . . . 47,200 39,700 0 108,800 195,7001994 . . . . . . . . . . . . . 48,100 45,000 0 108,600 201,7001995 . . . . . . . . . . . . . 48,600 50,900 0 115,300 214,8001996 . . . . . . . . . . . . . 48,100 67,200 0 94,400 209,7001997 . . . . . . . . . . . . . 45,800 79,500 0 68,800 194,1001998 . . . . . . . . . . . . . 38,000 101,800 0 51,000 190,8001999 . . . . . . . . . . . . . 21,800 122,500 0 38,700 183,0002000 . . . . . . . . . . . . . 14,600 136,200 NA 34,200 185,0002001 . . . . . . . . . . . . . 19,900 169,800 NA 34,000 223,7002002 . . . . . . . . . . . . . 24,400 144,450 NA 36,600 205,450
1 Beginning in 2001, U.S. Government surveys of Bolivian coca (cultivation, net cultivation, and eradi-cation) take place as a calendar year estimate based on data gathered as of June 1, 2001.
2 For Colombia, data for “cultivation” and “net cultivation” are entitled “estimated cultivation” and ”po-tential harvest,” respectively, in the INCSR report.
3 Ecuador cultivates negligible amounts of coca, remaining primarily a transit country for cocaine.Note.—All data from INCSR 2003 report or earlier reports. The “total” column is a simple summation of thefigures listed for the four countries shown. For Ecuador, recent “NA” assumed to continue at zero.
NA=Not available.
Source: United States Department of State, Bureau for International Narcotics and Law EnforcementAffairs, International Narcotics Control Strategy Report (INCSR), March 2003, and previous reports.
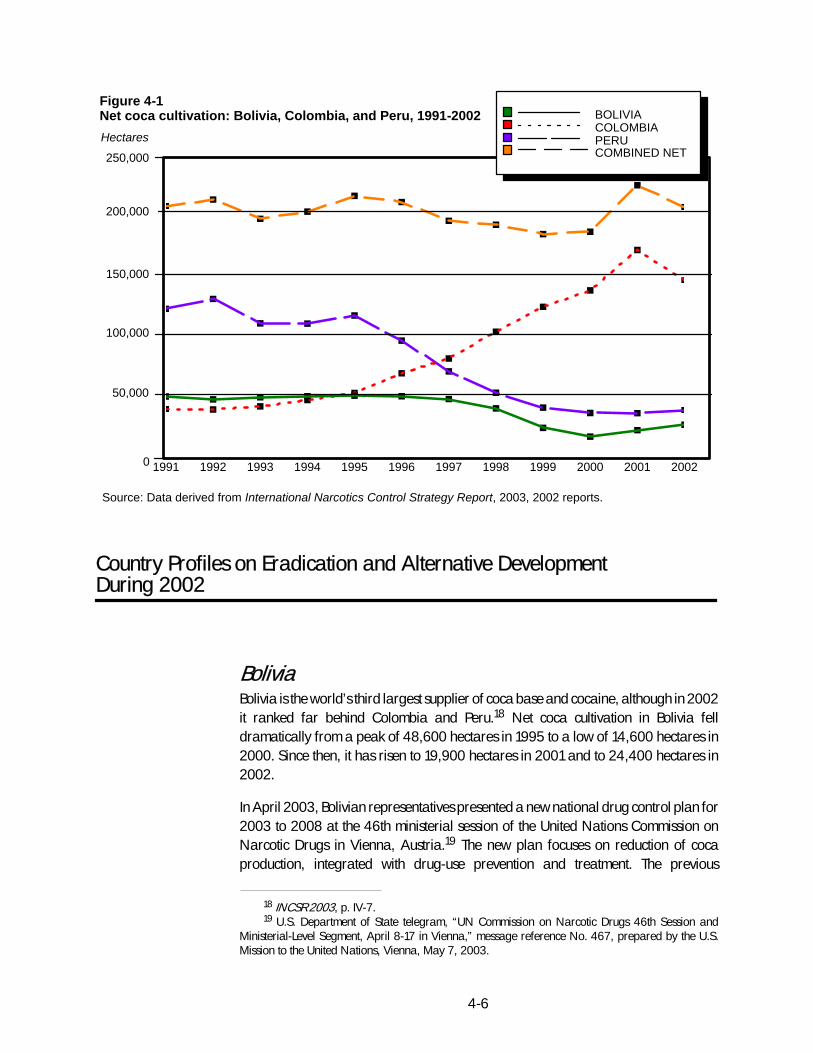
4-6
1991 1992 1993 1994 1995 1996 1997 1998 1999 2000 2001 2002
Figure 4-1Net coca cultivation: Bolivia, Colombia, and Peru, 1991-2002
Source: Data derived from International Narcotics Control Strategy Report, 2003, 2002 reports.
BOLIVIACOLOMBIAPERUCOMBINED NET
Hectares
250,000
200,000
150,000
50,000
0
100,000
Country Profiles on Eradication and Alternative DevelopmentDuring 2002
BoliviaBolivia is the world’s third largest supplier of coca base and cocaine, although in 2002it ranked far behind Colombia and Peru.18 Net coca cultivation in Bolivia felldramatically from a peak of 48,600 hectares in 1995 to a low of 14,600 hectares in2000. Since then, it has risen to 19,900 hectares in 2001 and to 24,400 hectares in2002.
In April 2003, Bolivian representatives presented a new national drug control plan for2003 to 2008 at the 46th ministerial session of the United Nations Commission onNarcotic Drugs in Vienna, Austria.19 The new plan focuses on reduction of cocaproduction, integrated with drug-use prevention and treatment. The previous
18 INCSR 2003, p. IV-7.19 U.S. Department of State telegram, “UN Commission on Narcotic Drugs 46th Session and
Ministerial-Level Segment, April 8-17 in Vienna,” message reference No. 467, prepared by the U.S.Mission to the United Nations, Vienna, May 7, 2003.
4-7
government plan for 1998 to 2002–“Plan Dignity”–set a goal to eliminate all illicit cocacultivation by the end of 2001 which, although not wholly successful, did succeed inroughly halving coca cultivation through voluntary and forced eradication.20 Despitethe transition from the caretaker Quiroga administration to the Sanchez de Lozadaadministration, 2002 eradication statistics proved to be the second-highest recorded,at 11,839 hectares.21 The Sanchez de Lozada administration has continued the strongeradication effort in the Chapare region of Bolivia, begun under the Quirogaadministration, despite the call by the pro-coca forces (so-called cocaleros) for a“pause” in eradication efforts that led to and threatens further protests using violenceand disruption through roadblocks in the region.22 Nonetheless, despite reductions inBolivian coca cultivation, the country is reportedly becoming more important as atransit country for Peruvian cocaine base destined largely for Brazil, according to theU.S. State Department.23
Alternative DevelopmentAlternative development in the Chapare region of Bolivia continued to expand in 2002and provide important alternatives to illicit coca production.24 However, in the firstweeks of 2003, road blockades, protests, and threats of violence directed at projectstaff working on the alternative development projects became increasingly frequent.25
By April 2003, these attacks on alternative development sites by the cocaleros haddestroyed irrigation systems for nurseries, as well as seedlings to grow forest andrubber trees, and coffee and black pepper bushes; set fire to offices, vehicles,computers, and documents belonging to alternative development projects; and stolenagricultural chemicals and tools.26 Death threats were made against leaders, businesspeople, and farmers involved in alternative development projects, and producerswere pressured by cocalero forces to revert to coca production. In April 2003, thecentral government sent 300 police officers and 100 soldiers to accompany lawyersand investigators to bring legal proceedings against the instigators of this violence andintimidation, although quick results are not widely expected.
20 Organization of American States, Bolivia: Evaluación del progress de control de drogas,1999-2000, found at Internet addresshttp://www.cicad.oas.org/InformesMEM/Esp/Bolivia_spa.rev2.pdf, retrieved July 3, 2002; andUNODC, Bolivia: Country Profile.
21 U.S. Department of State telegram, “Bolivian USITC Investment and Drug Crop Survey,” messagereference No. 2754, prepared by U.S. Embassy, La Paz, July 25, 2003.
22 Ibid.23 INCSR 2003, p. IV-7.24 Ibid., p. IV-8.25 U.S. Department of State telegram, ”Recent Attacks and Damage to Alternative Development
Sites in the Cochabamba Tropics,” message reference No. 1339, prepared by U.S. Embassy, La Paz,Apr. 10, 2003.
26 Some stolen goods from these attacks, such as motorcycles, were subsequently found inmunicipalities controlled by the Movimiento al Sindicalismo (MAS) political party, whose leader EvoMorales was a close runner-up in the June 2002 national elections with a platform that advocates cocacultivation in Bolivia.
4-8
By the end of 2002, USAID reported that area under cultivation for such alternativedevelopment projects in the Chapare had increased from 40,613 hectares in 1986 to127,000 hectares in 2002, raising annual family income for producers of alternativedevelopment crops to $2,138 in 2002.27 According to one Cochabamba producer,ATPA has been very beneficial for marketing canned palm hearts to the United States,a product also marketed to the United States by Ecuador under the program.28 Driedtropical fruits are also products that U.S. Embassy observers expect to be exportedfrom the Chapare to the U.S. market under ATPA in the near future.29 However,observers caution that future progress on alternative development projects aimed atsubstituting for illicit coca production is likely to be seriously compromised until securityis resumed following the protests in early 2003.30
More positively, the 20th annual Cochabamba–the main city of the Chapareregion–Fair was held in June 2003, dedicated publicly to producers, investors, andbusinesses involved in growing and processing alternative development products.31
The fair hosted over 450 national and international companies that displayed theirgoods and services to over 200,000 visitors; the alternative developmentstand–supported by USAID–featured over 30 products displayed by 27 exhibitors.32
Although negative in past coverage, the local press emphasized in its 2003 coveragethe impressive results achieved by the alternative development program despite theroad blockades, conflicts, threats of violence, and other obstacles witnessed in theChapare since the beginning of the year. However, the recession in Bolivia andArgentina, as well as the social and political disturbances in the Chapare, hadreduced exports of licit products leaving the Chapare from $36 million in 2001 tonearly $28 million in 2002.33
In June 2003, the Bolivian President and the U.S. Ambassador traveled to theYungas–another major coca-growing region of Bolivia–to help inaugurate two majoralternative development projects in the Alto Beni area.34 One was a ruralelectrification project that will ultimately benefit over 12,000 families, while the other
27 USTR, First Report to the Congress on the Operation of the Andean Trade Preference Act AsAmended, Apr. 30, 2003, pp. 24-25.
28 U.S. Department of State telegram, ”Bolivian USITC Investment and Drug Crop Survey,” messagereference No. 2754, prepared by U.S. Embassy, La Paz, July 25, 2003.
29 Ibid.30 U.S. Department of State telegram, ”Recent Attacks and Damage to Alternative Development
Sites in the Cochabamba Tropics,” message reference No. 1339, prepared by U.S. Embassy, La Paz,Apr. 10, 2003.
31 U.S. Department of State telegram, ”Chapare Alternative Development Takes Successful Show onthe Road,” message reference No. 2211, prepared by U.S. Embassy, La Paz, June 13, 2003.
32 In addition to the ”Big Five” alternative development products (plantain, corn, rice, coffee, andcacao), other featured products included ”camu camu” pulp (a tropical fruit with 30 to 60 percent morevitamin C than oranges), handicrafts, cold processed meats, marmalades, teas, spices, tropical flowers,honey, and ecologically friendly charcoal.
33 USTR, First Report to the Congress on the Operation of the Andean Trade Preference Act AsAmended, Apr. 30, 2003, pp. 24-25.
34 U.S. Department of State telegram, ”Yungas Alternative Development Makes SuccessfulInaugurations in Alto Beni,” message reference No. 2358, prepared by U.S. Embassy, La Paz, June 26,2003.
4-9
was the initial 50-kilometer length of a road improvement project. Both officialspronounced that the roads will make it possible both to bring legal agriculturalproducts grown in the region to market as well as open the region to governmentservices such as education and medical help, which will help avoid the illicit cultivationof coca and the violence that it typically involves.
ColombiaColombia continues to be the world’s leading producer and distributor of cocaine, aswell as a significant supplier of heroin.35 The installation of a new government underPresident Alvaro Uribe Velez, following national elections in August 2002, has seen acrackdown on both the illegal drug trade as well as the armed rebel groups that use thedrug trade as a major source of funding for their insurgency. The country is thethird-largest recipient of U.S. foreign aid, receiving $2.3 billion by the end of fiscal200336 in support of counternarcotics and counterterrorism efforts by the ColombianGovernment.
In 2002, aerial spraying in Colombia was extended at a record pace,37 following agovernment assessment of the environmental and health impact of aerialfumigation.38 This effort resulted in the first decline in net coca cultivation in Colombiasince 1992. The United States estimates net coca cultivation to have fallenapproximately 15 percent, from 169,800 hectares in 2001 to around 144,450hectares in 2002; the United Nations calculates this reduction to be even higher,around 30 percent.39 Supported by U.S. efforts, the program carried out by theAnti-Narcotics Directorate of the Colombian National Police surpassed its 2001coverage of around 84,500 hectares, spraying 122,695 hectares of illicit coca in2002.40 Aerial spraying in 2003 surpassed even the record pace set in 2002,reaching 47,442 hectares of coca by April 2003. This accelerated pace continued intoMay 2003 until a Colombian court ordered the government in late June 2003 tosuspend aerial spraying until its environmental effects are better known.41 In May
35 INCSR 2003, p. IV-19.36 USTR, First Report to the Congress on the Operation of the Andean Trade Preference Act As
Amended, Apr. 30, 2003, p. 32.37 INCSR 2003, p. IV-19.38 United Nations Economic and Social Council, International Narcotics Control Board (INCB),
Report of the International Narcotics Control Board for 2002, E/INCB/2002/1, Feb. 26, 2003 (Vienna:INCB, 2003), found at Internet address http://www.incb.org/e/index.htm, retrieved on June 23, 2003.
39 U.S. Department of State telegram, “ATPA/ATPDEA Investment Activity during 2002,” messagereference No. 7412, prepared by U.S. Embassy, Bogota, Aug. 8, 2003.
40 INCSR 2003, p. IV-19. For the first time in many years, total area under illicit coca cultivationdecreased according to the Integrated System for Illicit Crop Monitoring (SIMCI) of Colombia. However,reductions in one area are often paired with increases in bordering countries, notably Bolivia and Peru, inaddition to which small-scale coca cultivation has been detected in Ecuador and Venezuela. See INCB,2002, p. 49, par. 336.
41 Vanessa Arrington, ”Colombian Drug Spraying Flights Suspended,” Associated Press, June 26,2003, found at Intranet address http://www.newsedge.com, retrieved on July 1, 2003.
4-10
2003, the U.S. and Colombian governments reached agreement on the resumption ofthe Air Bridge Denial operation that interrupts illicit trafficking of drugs by small civilianaircraft, although actual flights had not resumed as of early August 2003.42
Alternative Development
The Colombian government’s “Plan Colombia” is the single most significant effort atreducing the illicit supply of drugs in South America.43 Supported by the United States,Plan Colombia has been coordinated with other countries in the region, bringingassistance in kind such as training and equipment as well as financial aid. Althoughalternative economic development measures and drug abuse prevention andtreatment are important, United Nations observers consider that the emphasis in 2002in Colombia (as well as more generally in all the Andean countries involved) appearsto have moved more toward law enforcement and suppression in which military forceshave come to play a key role.44
In Colombia, the effect of ATPA on drug crop substitution has been indirect.45 Much ofthe investment related to ATPA has flowed to regions where there is no illicit cocacultivation.46 Nonetheless, ATPA benefits assist the counternarcotics efforts in thecountry by providing alternative employment opportunities to Colombians who mightotherwise engage in the drug trade.47
The flower industry in Colombia has been cited as a dramatic example of job creationsupported by ATPA that the government seeks to consolidate and maintain.48 Thegreatest beneficiary in Colombia of such ATPA trade preferences, flowers are thefourth most important Colombian export product after oil, coal, and coffee. The flowerindustry generates roughly 75,000 direct and 50,000 indirect jobs.49 Moreover,ATPA preferences contribute to social development in the case of flowers, where 60percent of the jobs generated by the industry employ single head-of-householdwomen. In many cases, people fleeing or displaced by the violence in coca-growingregions are actively recruited to work on flower plantations.50 The current concern of
42 Ken Guggenheim, ”U.S., Colombia Agree on Anti-Drug Flights,” Washington Post, May 1, 2003,found at Internet address http://www.washingtonpost.com, retrieved on June 1, 2003; George Gedda,“Powell OKs Colombia Anti-Drug Flights,” Associated Press newswire, Aug. 5, 2003.
43 INCB 2002, p. 46, par. 318.44 INCB 2002, p. 46, par. 317.45 USTR, First Report to the Congress on the Operation of the Andean Trade Preference Act As
Amended, Apr. 30, 2003, p. 32.46 U.S. Department of State telegram, “ATPA/ATPDEA Investment Activity during 2002,” message
reference No. 7412, prepared by U.S. Embassy, Bogota, Aug. 8, 2003.47 USTR, First Report to the Congress on the Operation of the Andean Trade Preference Act As
Amended, Apr. 30, 2003, p. 32.48 U.S. Department of State, ”Secretary Snow’s Meeting with Colombian Business Leaders,”
message reference No. 3741, prepared by U.S. Embassy, Bogota, Apr. 28, 2003.49 U.S. Department of State telegram, “ATPA/ATPDEA Investment Activity during 2002,” message
reference No. 7412, prepared by U.S. Embassy, Bogota, Aug. 8, 2003.50 Ibid.
4-11
the Colombian flower industry is how to lock in the benefits of the success generated byATPA when it expires in 2006. Consequently, the flower industry would supportreplacing ATPA with a bilateral free trade agreement.
EcuadorEcuador is a major transit country for drugs and precursor chemicals, although there isno evidence that illicit crops are cultivated to any significant degree within the countryor that there is substantial processing of raw materials into market-ready drugs.51
Nonetheless, coca paste and cocaine base enter Ecuador from Colombia east of theAndes and exit to Colombia west of the Andes for refining operations. The armedviolence on the Colombian side of Ecuador’s northern border makes providingsecurity in general and drug interdiction in particular a difficult task, particularly forthe border provinces of Carchi, Esmeraldas, and Sucumbios–the latter where most ofthe country’s petroleum resources are located. Most drugs are believed to exit Ecuadorin commercial maritime containers through port cities, where heroin seizures rosesharply in 2002.
Alternative DevelopmentThe Ecuadorian Agency for Northern Border Development was established in 2000 tocoordinate economic and social development programs in the vulnerable provincesalong the northern border.52 The government’s $465 million, 4-year developmentplan aims not at “alternative” development projects– since illicit crop cultivation is notsignificant in Ecuador–but rather at “preventive” development in view of the severecoca cultivation and intense aerial eradication efforts immediately adjacent inPutumayo province, Colombia.
The rise of the cut flower industry in Ecuador is the most directly attributable resultattesting to the benefits provided by ATPA.53 Cut flowers are Ecuador’s largest exportsunder ATPA and totaled approximately $178 million in 2001. The president ofExpoflores estimates that the expiration of ATPA–leading to the reimposition of U.S.tariffs of 6.8 percent ad valorem on roses and 6.4 percent on other flowerexports–cost the Ecuadorian flower growers $32,000 per day. Cultivation of freshfruits, vegetables, and cereals in the country’s highlands are also providing legitimate,alternative industries for producers to deter them from starting to cultivate illicit crops,such as coca or opium poppy.54
51 INCSR 2003, p. IV-31.52 INCSR 2003, p. IV-34.53 U.S. Department of State, “Ecuador’s Report to the USITC Annual Andean Investment and Drug
Crop Survey,” message reference No. 2513, prepared by U.S. Embassy, Quito, July 25, 2003; U.S.Department of State, ”Flower Exporters Squeezed Since ATPA Expired,” message reference No. 196,prepared by U.S. Embassy, Quito, Jan. 17, 2002.
54 USTR, First Report to the Congress on the Operation of the Andean Trade Preference Act AsAmended, Apr. 30, 2003, p. 39.
4-12
Peru
Peru is the second-largest cocaine producer in the world, and is a major exporter ofhigh-purity cocaine and cocaine base to South America, Mexico, the United States,and Europe.55 Nevertheless, net coca cultivation has fallen dramatically from its peakof 129,100 hectares in 1992 to a low of about 34,000 hectares in 2000 and 2001. In2002, however, net cultivation rose to around 36,600 hectares, an increase ofroughly 8 percent. Although eradication efforts were stalled for most of 2002 becauseof social unrest from coca farmers similar to that in Bolivia,56 the pace of eradicationpicked up in the final quarter of 2002 spurred on by an interest in qualifying forATPDEA trade benefits as well as a new bilateral agreement reached between the U.S.and Peruvian governments about a new pilot coca eradication program and itsconcomitant alternative development projects.57
In February 2002, the Government of Peru and USAID agreed to carry out a tropicalforest management program designed, in addition to increasing household incomes inthe region, to discourage the massive deforestation that results from clearing forestland to plant illicit coca and to protect the bio-diversity found in these protectedforests.58
In September 2002, the two parties signed a 5-year cooperative agreement aimed atlinking alternative development more directly to illicit coca eradication.59 The programaims for a community to sign an agreement that commits it to the voluntary eradicationof illicit coca plantings and to remaining coca-free permanently as a condition forparticipating in the alternative development program.60 This new strategy of“auto-eradication” has already been reported to have eradicated over 900 hectaresof coca in the pilot region of Aguaytia. The Peruvian Government is to forciblyeradicate illicit coca, and withhold alternative development benefits, if the coca is notdestroyed voluntarily.61
55 INCSR 2003, p. IV-40.56 The Peruvian coca growers movement staged a number of large protests during 2002 that led the
Peruvian Government to temporarily halt coca eradication in certain regions (INCSR 2003, p. II-4). LikeBolivia, Peru has a “traditional” coca-growing area east of the city of Cuzco that produces 21 percent ofthe country’s coca cultivation (INCSR 2003, p. IV-40). Peru legally produces coca leaf and cocaine basefor medical and commercial consumption in the United States and Europe (INCSR 2003, p. IV-40). UnderPeruvian law, it is illegal to sell coca leaf to anyone other than ENACO (Empresa Nacional de Coca, theNational Coca Firm), the national government monopoly for commercialization of coca leaves (UnitedNations, Office on Drugs and Crime, Peru–Coca Survey for 2002, March 2003, p. 6).
57 U.S. Department of State telegram, ”Peru Scenesetter for Secretary of Commerce Evans’December 2-4 Visit,” message reference No. 6272, prepared by U.S. Embassy, Lima, Nov. 26, 2002;USTR, First Report to the Congress on the Operation of the Andean Trade Preference Act As Amended,Apr. 30, 2003, p. 49.
58 INCSR 2003, p. IV-44.59 Ibid.60 Ibid.61 Ibid.
4-13
The most effective drug interdiction program–the Air Bridge Denial (ABD)–remainedsuspended during 2002. The ABD operation was suspended in April 2001 followingthe shooting down by the Peruvian Air Force of an airplane carrying U.S. missionaries,an incident that killed two American citizens.62 Although the United States andColombia reached agreement to resume these drug surveillance flights in May 2003,no similar agreement has yet been reached with Peru as of mid-2003.63 Nonetheless,the United States is working with Peru to improve training and equipment with a view toresuming the operation by the end of 2003, in the hope that a resumption of theprogram could help stem drug trafficking in the region and reverse the recentincreases in net coca cultivation in Peru.
Alternative DevelopmentNet coca cultivation fell markedly in Peru during the 1990s as economic conditionsimproved, with production shifting largely to Colombia.64 In 2002, however, net cocacultivation expanded in Peru for the first time since 1995.65 The majority of thisrenewed cultivation occurred in major growing areas such as the UpperHuallaga-Tocache and Apurimac valleys. Lack of a government presence in theseareas prevents the government from either providing physical security or deliveringgovernment services or infrastructure–essentials such as potable water, electricity, androads. This situation severely limits the ability of isolated farmers to earn a living fromalternative crops or through other legal economic means. Moreover, the low marketprice of legal alternative crops relative to illicit coca cultivation66 makes farmers yetmore vulnerable to a combination of enticement and pressure from pro-coca groupsand narcotraffickers. This pressure to grow coca can range from providing farmerswith inputs such as seeds, fertilizer, and herbicide to threats of violence.
Following national elections in 2001 that brought President Alejandro Toledo’sadministration to power, U.S. economic assistance to Peru reached $254 million infiscal year 2002–of which $142 million was focused on reducing coca cultivation,promoting legal alternative economic opportunities, as well as narcotics interdictionpolicies. Although the United States has sought more aggressive coca eradication, thePeruvian Government has adopted a more cautious approach based on incentives forvoluntary cooperation, out of concern that a more aggressive approach wouldstimulate violent resistance by coca growers.67
62 INCSR 2002, p. IV-39.63 Ken Guggenheim, ”U.S., Colombia Agree on Anti-Drug Flights,” Washington Post, May 1, 2003,
found at Internet address http://www.washingtonpost.com, retrieved on June 1, 2003.64 U.S. Department of State telegram, ”Coca Economics in Peru,” message reference No. 2696,
prepared by U.S. Embassy, Lima, June 2, 2003.65 The United Nations’ INCB notes that government eradication of illicit coca cultivation in Bolivia
and Peru was highly successful until 2000, with only mixed results since then (INCB 2002, p. 48, par.335).
66 Cultivation of licit crops such as plantain, corn, rice, or even coffee and cacao currently returnbetween roughly $200 and $600 per hectare compared to $2,200 per hectare for coca leaf (U.S.Department of State telegram, ”Coca Economics in Peru,” message reference No. 2696, prepared byU.S. Embassy, Lima, June 2, 2003).
67 U.S. Department of State telegram, ”Peru Scenesetter for Secretary of Commerce Evans’December 2-4 Visit,” message reference No. 6272, prepared by U.S. Embassy, Lima, Nov. 26, 2002.
4-14
Asparagus production for export has been the most significant alternativedevelopment project in Peru over the first 10 years of ATPA, and is estimated to haveprovided over 50,000 jobs.68 Mango crops have also been developed as analternative to coca cultivation; other products traditionally benefitting from ATPA havebeen copper, zinc, and jewelry.69 Under ATPDEA, the textile and apparel industries,including cotton cultivation, are thought to have similar or better potential thanasparagus.70 The inclusion of regional fabrics as inputs in apparel assembly underATPDEA is expected to create significant job opportunities.71
In June 2003, a pilot project to convert sugar cane into ethanol and other products inthe Huallaga Valley–a major coca-growing region–was deemed a success followingits initial year of operation that included planned shipments of ethanol to Iquitos. Theproject could provide employment for over 1,000 farmers to cultivate sugar cane, aswell as construction jobs from subsequent investment estimated at $185 million to buildan ethanol pipeline over the Andes to the Pacific coast.72 It should be noted that ATPAcountries are not granted preferential access for ethanol for fuel use (HTS 2207.10.60and 2207.20.00). ATPA countries are subject to an additional excise tax, whicheffectively prohibits exports from countries other than CBERA countries.
68 U.S. Department of State telegram, “ITC Annual ATPA/ATPDEA Report Input,” messagereference No. 3383, prepared by U.S. Embassy, Lima, July 3, 2003.
69 USTR, First Report to the Congress on the Operation of the Andean Trade Preference Act AsAmended, Apr. 30, 2003, p. 41.
70 U.S. Department of State telegram, “ITC Annual ATPA/ATPDEA Report Input,” messagereference No. 3383, prepared by U.S. Embassy, Lima, July 3, 2003.
71 For further information, see the “Probable Future Effects” section of chapter 3.72 U.S. Department of State, ”Peru Economic Notes, June 18, 2003,” message reference No. 3111,
prepared by U.S. Embassy, Lima, June 20, 2003.

APPENDIX AFederal Register Notice

A-2
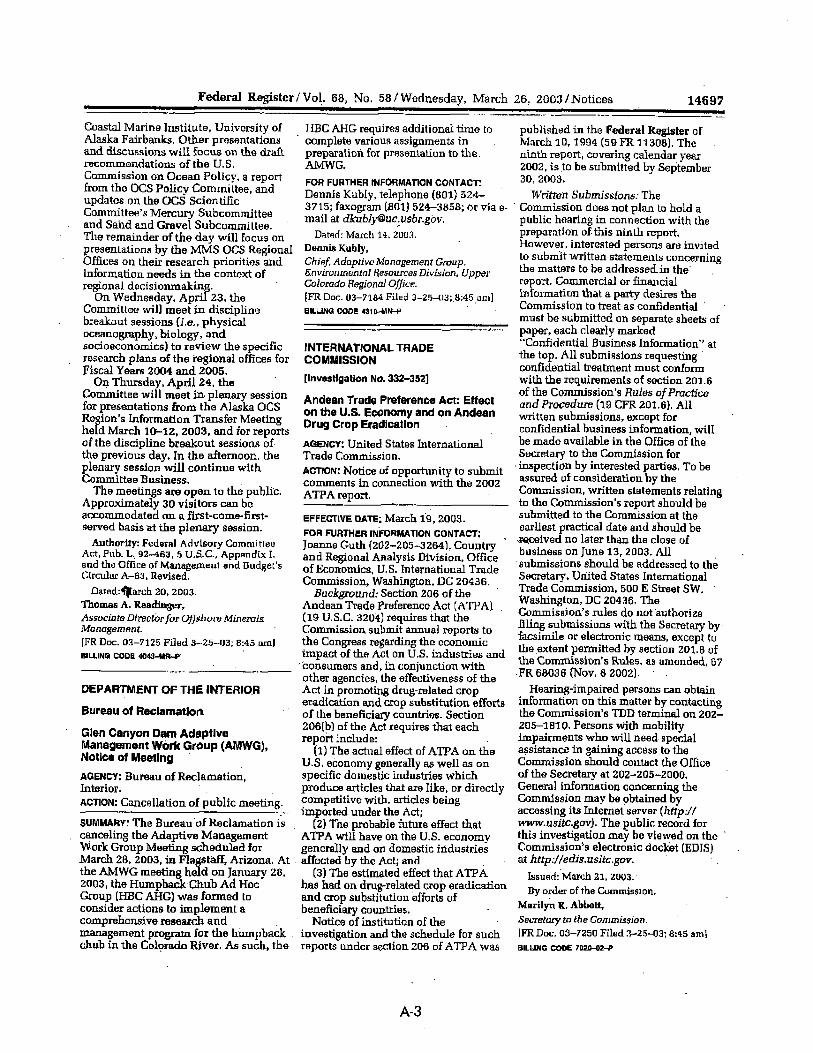


APPENDIX BSummary of Submissions in Response to theFederal Register Notice

B-2
B-3
Submissions for the RecordInvestigation No. 332-352
International Intellectual Property Alliance1
The International Intellectual Property Alliance (IIPA) is a private-sector coalition thatrepresents the U.S. copyright-based industries in bilateral and multilateral efforts toimprove international protection of copyrighted materials. The IIPA believes “that thefour ATPDEA beneficiary countries have failed to comply fully with their ATPDEAobligations to provide Ôadequate and effective protection’ to U.S. copyright owners, asrequired under the program’s eligibility criteria.” The IIPA estimates that U.S.companies suffered trade losses owing to piracy in the four ATPA countries of at least$263 million in 2002. The IIPA acknowledges that the Andean countries engaged incopyright law reform efforts in the 1990s, but asserts that most laws are inadequate.Moreover, the IIPA notes that reform alone, without adequate and effectiveenforcement, does not satisfy ATPDEA’s eligibility requirements. The IIPA included in itssubmission country reports detailing the status of copyright law reforms, piracy, andenforcement in each of the ATPA countries.
1 Submission to the Commission by Maria Strong, Vice President and General Counsel ofthe International Intellectual Property Alliance, received May 21, 2003.


APPENDIX CTechnical Notes to Chapter 3

C-2
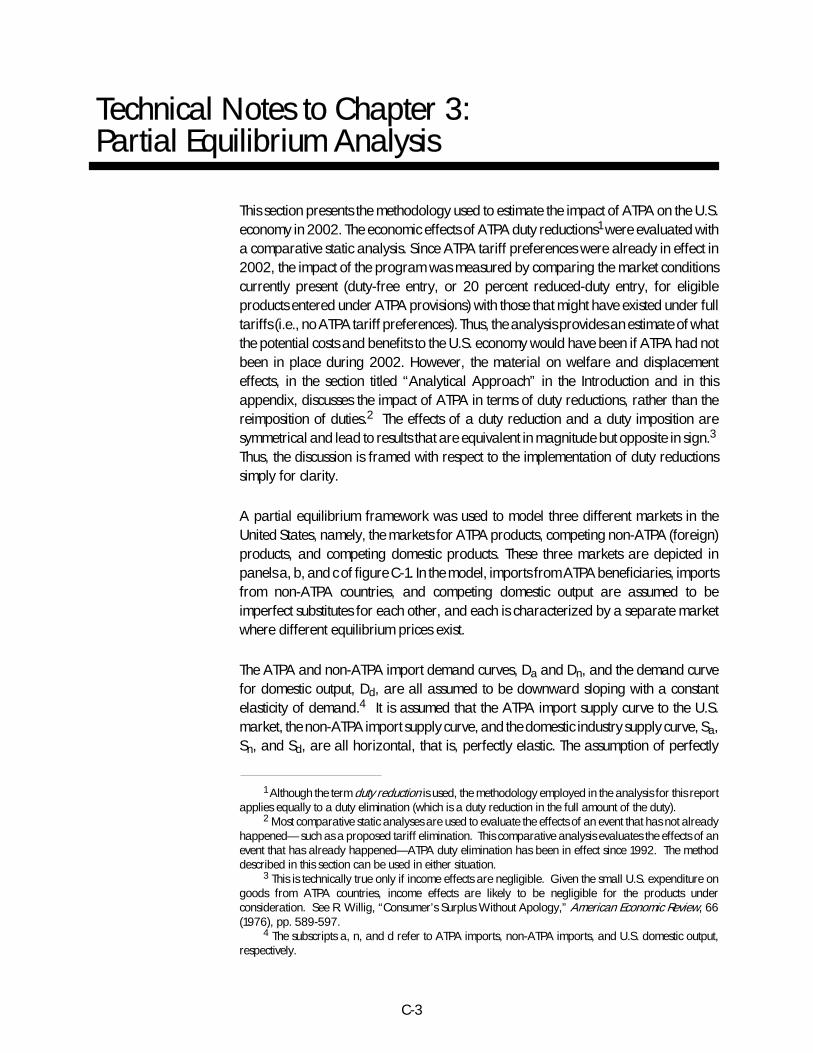
C-3
Technical Notes to Chapter 3:Partial Equilibrium Analysis
This section presents the methodology used to estimate the impact of ATPA on the U.S.economy in 2002. The economic effects of ATPA duty reductions1 were evaluated witha comparative static analysis. Since ATPA tariff preferences were already in effect in2002, the impact of the program was measured by comparing the market conditionscurrently present (duty-free entry, or 20 percent reduced-duty entry, for eligibleproducts entered under ATPA provisions) with those that might have existed under fulltariffs (i.e., no ATPA tariff preferences). Thus, the analysis provides an estimate of whatthe potential costs and benefits to the U.S. economy would have been if ATPA had notbeen in place during 2002. However, the material on welfare and displacementeffects, in the section titled “Analytical Approach” in the Introduction and in thisappendix, discusses the impact of ATPA in terms of duty reductions, rather than thereimposition of duties.2 The effects of a duty reduction and a duty imposition aresymmetrical and lead to results that are equivalent in magnitude but opposite in sign.3
Thus, the discussion is framed with respect to the implementation of duty reductionssimply for clarity.
A partial equilibrium framework was used to model three different markets in theUnited States, namely, the markets for ATPA products, competing non-ATPA (foreign)products, and competing domestic products. These three markets are depicted inpanels a, b, and c of figure C-1. In the model, imports from ATPA beneficiaries, importsfrom non-ATPA countries, and competing domestic output are assumed to beimperfect substitutes for each other, and each is characterized by a separate marketwhere different equilibrium prices exist.
The ATPA and non-ATPA import demand curves, Da and Dn, and the demand curvefor domestic output, Dd, are all assumed to be downward sloping with a constantelasticity of demand.4 It is assumed that the ATPA import supply curve to the U.S.market, the non-ATPA import supply curve, and the domestic industry supply curve, Sa,Sn, and Sd, are all horizontal, that is, perfectly elastic. The assumption of perfectly
1 Although the term duty reduction is used, the methodology employed in the analysis for this reportapplies equally to a duty elimination (which is a duty reduction in the full amount of the duty).
2 Most comparative static analyses are used to evaluate the effects of an event that has not alreadyhappened— such as a proposed tariff elimination. This comparative analysis evaluates the effects of anevent that has already happened—ATPA duty elimination has been in effect since 1992. The methoddescribed in this section can be used in either situation.
3 This is technically true only if income effects are negligible. Given the small U.S. expenditure ongoods from ATPA countries, income effects are likely to be negligible for the products underconsideration. See R. Willig, “Consumer’s Surplus Without Apology,” American Economic Review, 66(1976), pp. 589-597.
4 The subscripts a, n, and d refer to ATPA imports, non-ATPA imports, and U.S. domestic output,respectively.
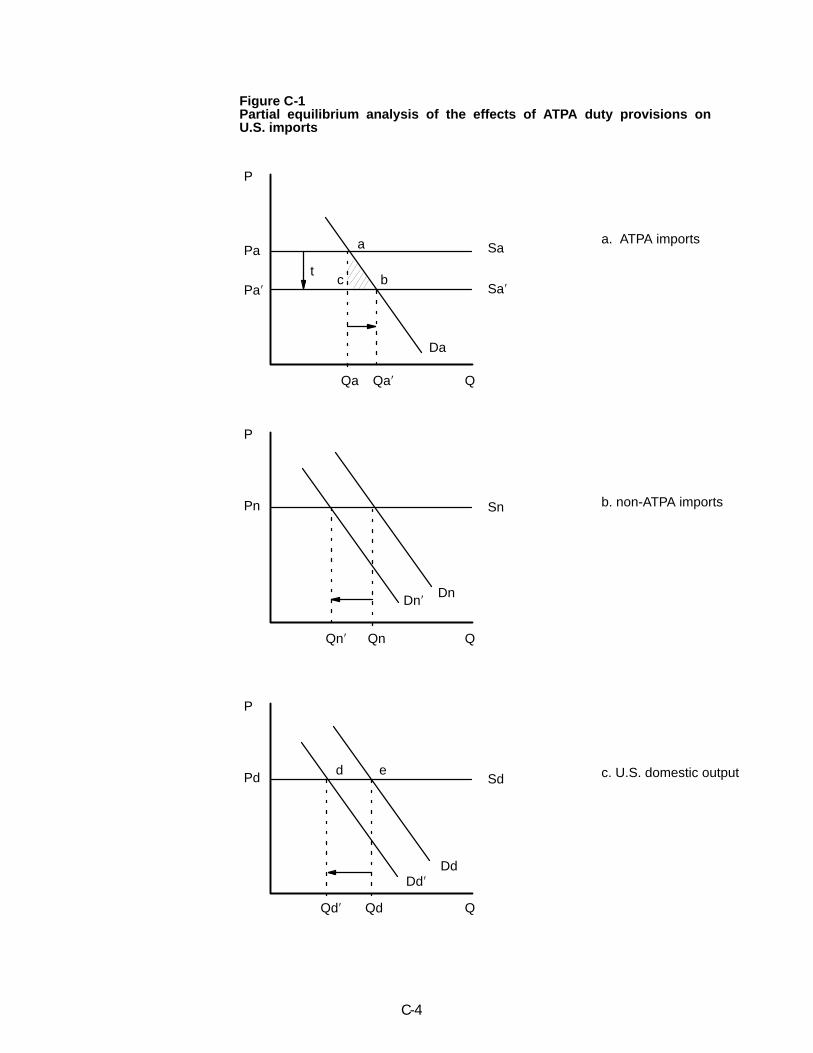
P
Pa′
Pa
c b
a
Sa′
Sa
Da
Qa′Qa Q
a. ATPA imports
b. non-ATPA imports
c. U.S. domestic output
DnDn′
SnPn
P
QnQn′ Q
P
Pd d e
QdQd′ Q
DdDd′
Sd
t
C-4
Figure C-1Partial equilibrium analysis of the effects of ATPA duty provisions onU.S. imports
C-5
elastic supply curves greatly simplifies computation although it leads to an upward biasin the estimates of the welfare and domestic displacement effects on the U.S.economy.5
The change from full tariffs to duty-free treatment for ATPA imports causes the importsupply curve, Sa, in panel a to shift down to Sa’ by the amount of the ad valorem tariff, t.Thus, the equilibrium price in the U.S. market for ATPA imports decreases from Pa toPa′, whereas the quantity imported increases from Qa to Qa′. The relationshipbetween the price with the tariff (Pa) and the tariff-free price (Pa′) is Pa = Pa′(1+t).
The decrease in the price of ATPA imports leads to a decrease in demand for similargoods from other countries and domestic U.S. producers. Thus, the demand curves forboth non-ATPA imports and domestic output, Dn and Dd, shift back to Dn′ and Dd′,respectively. Since the supply curves in both of these markets are assumed to beperfectly elastic, the equilibrium prices do not change. The equilibrium quantitysupplied in each market decreases from Qn and Qd to Qn′ and Qd′, respectively.
The impact of ATPA on the U.S. economy was measured by examining the welfareeffects of the tariff reduction in the market for ATPA imports and the domesticdisplacement effects of a decrease in demand in the competing U.S. market. Thedisplacement of non-ATPA country imports because of ATPA tariff preferences wasnot estimated because the focus of the analysis was on the direct effects of ATPAprovisions on the United States.
The decrease in the tariff for ATPA imports leads to an increase in consumer surplus forthese products. This is measured by the trapezoid PaabPa′ in panel a. There also is anaccompanying decrease in the tariff revenue collected from ATPA imports. This ismeasured by the area of the rectangle PaacPa′ in panel a.
The net welfare effect of ATPA is equal to the increase in consumer surplus plus thedecrease in tariff revenue—the trapezoid PaabPa′ minus the rectangle PaacPa′ inpanel a, that is, triangle abc.6 The dollar amount by which ATPA imports displace U.S.output is measured by the rectangle Qd′deQd in panel c.
5 Since ATPA imports account for a very small share of U.S. domestic consumption in most sectors,even the upper estimates were very small. Assuming upward-sloping supply curves would have resultedin even lower estimates.
6 Welfare effects typically include a measure of the change in producer surplus. There is no changein producer surplus for ATPA producers because of the assumption of perfectly elastic supply curves.
εaa
εna
εda
εaa
εna
εda
C-6
Given the above assumptions and the additional assumption of constant elasticitydemand curves, the markets for the three goods are described by the following threeequations:
(1) (Qa /Qa′) = (Pa /Pa′)
(2) (Qn /Qn′) = (Pa /Pa′)
(3) (Qd /Qd′) = (Pa /Pa′)
Given that Pa = Pa′(1+t), these can be restated
(1)′ (Qa /Qa′) = (1+t)
(2)′ (Qn /Qn′) = (1+t)
(3)′ (Qd /Qd′) = (1+t)
where εij is the uncompensated elasticity of demand for good i with respect to price j.The values for the elasticities εaa, εna, and εda are derived from the following relations:
(4) εaa = Vaη - Vnσan - Vdσad
(5) εna = Va (σna + η)
(6) εda = Va (σda + η)
where the Vi’s are market shares for ATPA imports, non-ATPA imports, and domesticoutput, respectively, η is the aggregate demand elasticity, and the σij’s are theelasticities of substitution between the ith and jth products.7 Estimates of the aggregatedemand elasticities were taken from the literature.8 Ranges of potential net welfareand industry displacement estimates are reported. The reported ranges reflect a rangeof assumed substitutabilities between ATPA products and competing U.S. output. Theupper estimates reflect the assumption of high substitution elasticities. The lowerestimates reflect the assumption of low substitution elasticities.9
7 Equations (4) through (6) are derived from P.R.G. Layard and A.A. Walters, MicroeconomicTheory (New York: McGraw-Hill, 1978).
8 The aggregate elasticities were taken from sources referenced in USITC, Potential Impact on theU.S. Economy and Selected Industries of the North American Free-Trade Agreement, USITC publication2596, January 1993.
9 Commission industry analysts provided evaluations of the substitutability of ATPA products andcompeting U.S. products, which were translated into a range of substitution elasticities–3 to 5 for highsubstitutability, 2 to 4 for medium, and 1 to 3 for low. Although there is no theoretical upper limit toelasticities of substitution, a substitution elasticity of 5 is consistent with the upper range of estimates in theeconomics literature. Estimates in the literature tend to be predominantly lower. See, for example,Clinton R. Shiells, Robert M. Stern, and Alan V. Deardorff, “Estimates of the Elasticities of SubstitutionBetween Imports and Home Goods for the United States,” Weltwirtschaftliches Archiv, 122 (1986),pp. 497-519; and M. Gallaway, C. McDaniel, and S. Rivera, “Long-Run Industry-Level Estimates of U.S.Armington Elasticities,” USITC Working Paper 2000-09A, Sept. 2000.
C-7
Given equations (1)′ through (4)′, one can derive the following equations forcalculating the changes in consumer surplus, tariff revenue, and domestic output:
Consumer surplus (where k is a constant)
area of Pa
trapezoid PaabPa′ = ∫ kPa dPaεaa
Pa′
(1+εaa)= [1/(1+εaa)] [(1+t) - 1 ]Pa′Qa′ if εaa ≠ -1
= k ln(1+t) if εaa = -1
Tariff revenue from U.S. imports from ATPA partners
area ofrectangle PaacPa′ = (Pa - Pa′)Qa
= Pa′tQa given Pa = Pa′(1+t)
= tPa′Qa′(1+t) given Qa = Qa′(1+t)εaa εaa
Domestic output
area ofrectangle Qd′deQd = Pd(Qd - Qd′)
= PdQd′[(1+t) -1]εda


APPENDIX DList of Frequently Used Abbreviations andAcronyms

D-2
D-3
List of Frequently Used Abbreviations andAcronyms
AD Alternative developmentATPA Andean Trade Preference ActATPDEA Andean Trade Promotion and Drug Eradication ActCBERA Caribbean Basin Economic Recovery ActCBTPA Caribbean Basin Trade Partnership ActEU European UnionFDI foreign direct investmentFTAA Free-Trade Area of the AmericasGATT General Agreement on Tariffs and TradeGDP gross domestic productGSP Generalized System of PreferencesHTS Harmonized Tariff ScheduleINCB International Narcotics Control BoardINCSR International Narcotics Control Strategy ReportIPR intellectual property rightsMFN most-favored-nationNAFTA North American Free-Trade AgreementNTR normal trade relationsTRQs Tariff-rate quotasUNODC United Nations Office on Drugs and CrimeUSAID United States Agency for International DevelopmentUSITC U.S. International Trade CommissionUSTR United States Trade RepresentativeWTO World Trade Organization


