Embed Size (px)
Citation preview

Acknowledgments
The authors would like to acknowledge to CAPES - Brazilian Federal Agency for supporting this research.
1
USING AHP AND ANP TO EVALUATE THE RELATION BETWEEN
REVERSE LOGISTICS AND CORPORATE PERFORMANCE IN
BRAZILIAN AUTOMOTIVE INDUSTRY
Cecilia Toledo Hernández
São Paulo State University (UNESP)
Guaratinguetá, SP, Brazil
E-mail: [email protected]
Fernando Augusto Silva Marins
São Paulo State University (UNESP)
Guaratinguetá, SP, Brazil
E-mail: [email protected]
Phelipe Medeiros da Rocha
PSA Peugeot Citroën Automobiles
Porto Real, RJ, Brazil
E-mail: [email protected]
ABSTRACT
Reverse Logistics (RL) activities are practiced by most Brazilian industries, including the automotive
one. However, a relevant problem is to identify how different RL programs can affect corporate
performance indicators. Analytic Hierarchy Process (AHP) is one of the analytical tools, which can be
used to handle a multi-criteria decision-making problem and the Analytic Network Process (ANP) is a
similar technique, but can capture the interdependencies between the criteria under consideration.
Both approaches were adopted here to study the influence of RL practices in automotive corporate
performance. Preliminary results indicated that both methods can be used, being AHP the most
efficient, because it requires a smaller number of judgment, and ANP the most reliable, because it
considers element dependencies, which is more compatible to the reality of the Brazilian automotive
sector.
Keywords: Analytic Hierarchy Process (AHP), Analytic Network Process (ANP), Reverse Logistics,
Brazilian Automotive Industry
1. Introduction
The sustainability theme has acquired great importance in business and academic fields, as well as in
society in general. This concept is basically being introduced in companies by environmental
regulations. Clean production, reduction, re-use, recycling and other strategies are used in order to
satisfy actual needs without compromising the future.
Reverse Logistics (RL) is defined as the business logistics area responsible for planning, operating
and controlling of raw materials reverse flows, in-process inventory, finished products, and their
information, from the consumption point to the origin point in order to recapture value or adjust
destination (Rogers & Tibben-Lembke, 1998). It can generate several benefits, including productivity
gains, which react on economic, social and environmental spheres.
2
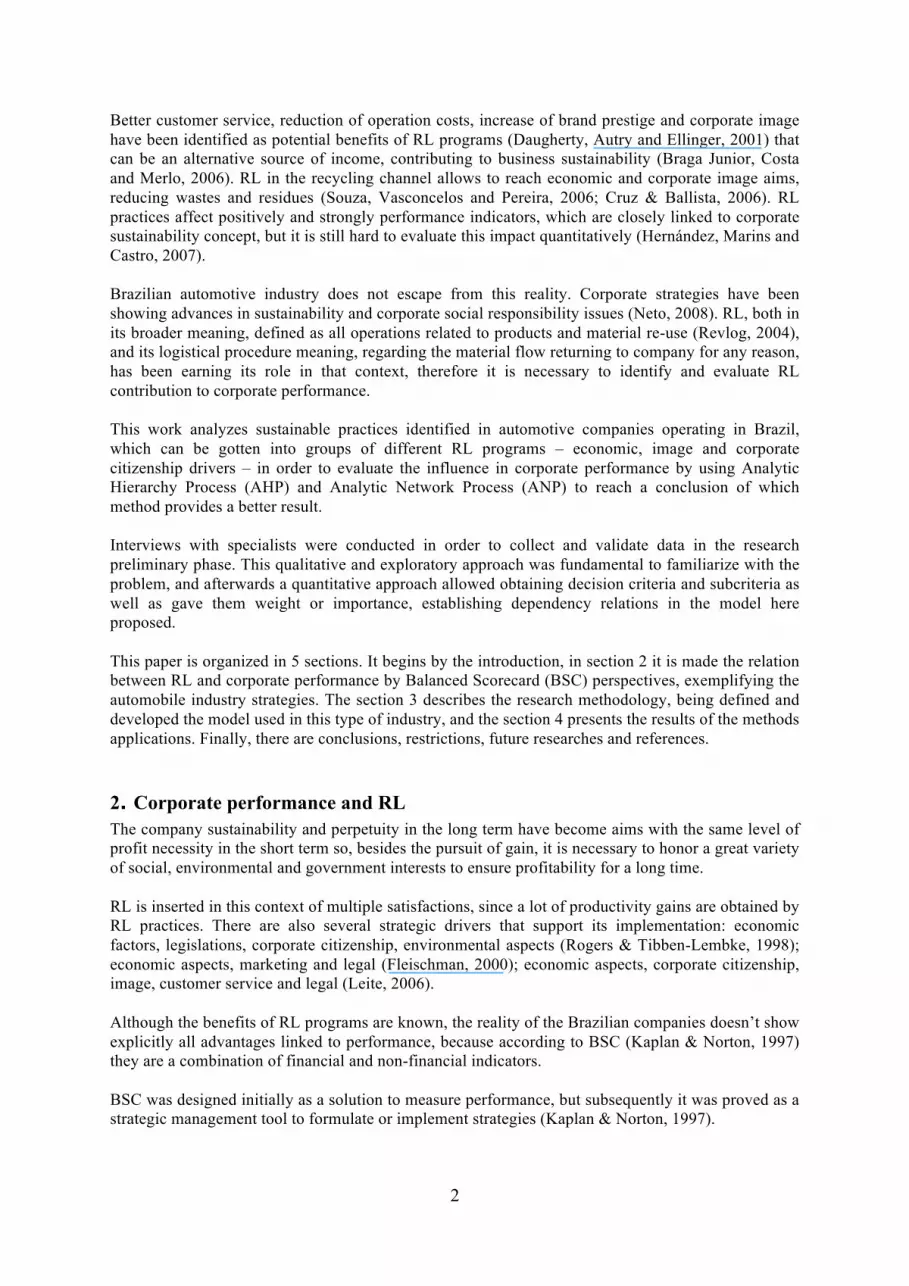
Better customer service, reduction of operation costs, increase of brand prestige and corporate image
have been identified as potential benefits of RL programs (Daugherty, Autry and Ellinger, 2001) that
can be an alternative source of income, contributing to business sustainability (Braga Junior, Costa
and Merlo, 2006). RL in the recycling channel allows to reach economic and corporate image aims,
reducing wastes and residues (Souza, Vasconcelos and Pereira, 2006; Cruz & Ballista, 2006). RL
practices affect positively and strongly performance indicators, which are closely linked to corporate
sustainability concept, but it is still hard to evaluate this impact quantitatively (Hernández, Marins and
Castro, 2007).
Brazilian automotive industry does not escape from this reality. Corporate strategies have been
showing advances in sustainability and corporate social responsibility issues (Neto, 2008). RL, both in
its broader meaning, defined as all operations related to products and material re-use (Revlog, 2004),
and its logistical procedure meaning, regarding the material flow returning to company for any reason,
has been earning its role in that context, therefore it is necessary to identify and evaluate RL
contribution to corporate performance.
This work analyzes sustainable practices identified in automotive companies operating in Brazil,
which can be gotten into groups of different RL programs – economic, image and corporate
citizenship drivers – in order to evaluate the influence in corporate performance by using Analytic
Hierarchy Process (AHP) and Analytic Network Process (ANP) to reach a conclusion of which
method provides a better result.
Interviews with specialists were conducted in order to collect and validate data in the research
preliminary phase. This qualitative and exploratory approach was fundamental to familiarize with the
problem, and afterwards a quantitative approach allowed obtaining decision criteria and subcriteria as
well as gave them weight or importance, establishing dependency relations in the model here
proposed.
This paper is organized in 5 sections. It begins by the introduction, in section 2 it is made the relation
between RL and corporate performance by Balanced Scorecard (BSC) perspectives, exemplifying the
automobile industry strategies. The section 3 describes the research methodology, being defined and
developed the model used in this type of industry, and the section 4 presents the results of the methods
applications. Finally, there are conclusions, restrictions, future researches and references.
2. Corporate performance and RL
The company sustainability and perpetuity in the long term have become aims with the same level of
profit necessity in the short term so, besides the pursuit of gain, it is necessary to honor a great variety
of social, environmental and government interests to ensure profitability for a long time.
RL is inserted in this context of multiple satisfactions, since a lot of productivity gains are obtained by
RL practices. There are also several strategic drivers that support its implementation: economic
factors, legislations, corporate citizenship, environmental aspects (Rogers & Tibben-Lembke, 1998);
economic aspects, marketing and legal (Fleischman, 2000); economic aspects, corporate citizenship,
image, customer service and legal (Leite, 2006).
Although the benefits of RL programs are known, the reality of the Brazilian companies doesn’t show
explicitly all advantages linked to performance, because according to BSC (Kaplan & Norton, 1997)
they are a combination of financial and non-financial indicators.
BSC was designed initially as a solution to measure performance, but subsequently it was proved as a
strategic management tool to formulate or implement strategies (Kaplan & Norton, 1997).

3
This work employs 4 BSC perspectives to show how RL programs can affect corporate performance
indicators in the Brazilian automotive industry. Table 1 summarizes the perspectives and the
indicators that can be affected by RL practices.
Table 1. Corporate performance indicators related to RL (Hernández, Marins and Castro, 2007).
Perspectives Corporate performance indicators
Financial
Traditional economic-financial indicators
Shareholder value
Access to capital
Customer Customer attraction and retention
Brand value and reputation
Internal processes Operational efficiency
Innovation
Learning and Growth Professional growth
Productivity of human resources
2.1. Financial perspective
Although logistics activities are consumers of financial resources, value recapture of returned
materials can be an attractive activity for many companies (Rogers & Tibben-Lembke, 1998).
Recycling provides earnings that stimulate new initiatives to development and improvement of RL
practices. According to Leite (2006), economic recovery is the basic reason to corporate use of these
practices in Brazil.
Besides providing profit, an enterprise has to generate value for its owners and shareholders.
Nowadays, this value also becomes an investment indicator. Financial institutions use social and
environmental checklists to measure credit risk. In Brazil, it is greatly used the Managerial
Sustainability Index (ISE) to evaluate investments (Silva & Quelhas, 2006).
RL programs basically with economic, image and corporate citizenship drivers are linked directly or
indirectly to economic results. Therefore, they influence most corporate performance indicators
(Hernández, Marins and Castro, 2007).
The development of RL programs has the economical issue as main propulsive. Residues recycling
and packing re-use lead to substantial savings (Neto, 2008), but the environmental protection is an
evidenced point in these programs for getting image and corporate citizenship results.
2.2. Customer perspective
According to Valente (2002) apud Chaves & Alcântara (2006) “customer satisfaction is not simply
reduced to acquisition of products and services, but a continuous evaluation before and after sale”.
Thus, RL can generate competitive advantage through increasing in the service level offered to
customers by marketing relationship after-sale.
Studies conducted by Rogers & Tibben-Lembke (1998) in American companies in the second half of
the 90’s showed that the principal strategic reason for those companies operate reverse channels were
the increase of the productivity, which enabled service differentiation.
Similar studies carried out in Brazil in 2004 and 2005 demonstrated that economic targets had been
gaining bigger importance in RL programs, but customer retention, by adoption of liberal policies to
the return of non-consumed products and offered services, keeps on an important strategic objective to
achieve competitiveness in many companies (Leite, 2006). Consumers’ requirements are a
fundamental reason for several companies operate reverse channels (Sinnecker, 2007), thus it is
possible to say that RL has strong impact on customer attraction and retention (Hernández, Marins
and Castro, 2007).

4
RL allows companies to express actions that are not directly linked to their products, but strengthen
their significance by making positive associations. Leite (2005) states that creation of corporate
image, at the consumer’s perception, has subjective character. This perception is formed from
relationship developed between company and consumer during all negotiation stages, including
relationship with society and environment. An adequate management of reverse channels can improve
corporate image from the treatment of remnants, contributing to the social welfare with donations and
environmental conservation with material recycling (Tibben-Lembke, 2000), influencing positively
and strongly in company reputation and corporate social responsibility.
In Brazil, most industries have been stood out by relations fixed to communities where they are
located. They promote social actions and environment protection programs in which are involved
common citizens (Epelbaum, 2004; Neto, 2008).
2.3. Internal processes perspective
Kaplan & Norton (2000) comment that all internal processes are important and must be well carried
out, but some of them cause bigger impact on value proposition to customers. Managers must do clear
identification of these processes, in each particular case, to a successful BSC implementation
(Campos, 2001).
Achieving operational excellence is a target of each company, productivity indicators and costs are
identified with a satisfactory processes performance. RL practices give economic gains when
manufacturing use components and materials recovered by recycling (Leite, 2005).
Rovere (2005) apud Amaral (2003) mentions the inclusion of the technological dimension on the
concept of sustainability, evaluating efforts companies make to create new technologies that are able
to develop cleaner and more economical processes. The technological innovations, which bring better
use of resources available for recycling, are extremely important to structure reverse channels.
According to Leite’s rating (2000), technology is necessary to ensure essential conditions in
establishing post-consumption reserve flows and legislation can be a modification factor because can
develop new technologies. Brazilian business reality indicates there are few programs with legal
drivers and the automotive sector does not escape from this situation, therefore legislation compliance
does not appear as an important factor in corporate scenario (Leite, 2006). But establishing of
minimum levels for recovering is part of European companies’ everyday, under the legal punishment
of lose operation license, and this may be a decisive factor for creativity and innovation increase
(Hammond & Beulles, 2007).
The concept of product life cycle for logistics comes from conception to final destination, no matter
which: discarding, repair or reusing (Triguero, 2002). Automotive companies invest strongly in
material reduction, including the application of biodegradable products. Since the conception, there is
preoccupation with destination after lifetime and this is a fundamental part of RL concept.
2.4. Learning and growth perspective
Learning and functional growth of an enterprise mean its capacity to maintain human resources in
high level of motivation, satisfaction and productivity. Norton & Kaplan (2000) cites, in a study with
different companies, value accounting of tangible assets is not greater than 15% of market value, the
last is imputed to intangible assets related to knowledge, intellectual and human capital. According to
Herrero (2005), human capital can be understood as intellectual (knowledge, information, industrial
property, experience) that can be used to generate wealth.
Therefore human capital is an important factor for companies’ survival and renewal in all activity
levels. RL policies require skilled and trained human resources and strategic investment (Hernández,
Marins and Castro, 2007).

5
Figure 1 summarizes hierarchically various indicators here analyzed. They are grouped in BSC
perspectives and it is shown how different RL programs can influence them.
It is important to mention that the effect of RL programs on performance indicators can vary
according to several factors, such as the type of business sector, value chain, and position of the
reverse channel. Then in-depth studies must be developed for each case, like this one specifically to
Brazilian automotive industry.
Figure 1. Corporate performance and RL (Hernández, Marins and Castro, 2007).
3. Research methodology
According to Lakatos & Marconi (1986), a research problem relates to analysis of a theme or a
knowledge gap still without solution, which can be set out by a question that specifies the subject. In
this study the main question is: can the methods AHP and ANP be used to evaluate the relation
between RL and corporate performance indicators? Since theoretical knowledge is limited, it needs to
touch on exploratory.
At first, in order to render the research, it was used a qualitative approach. In this type of research,
researcher is the key instrument and tends to an inductive data analysis.
Secondary data collection provides from academic literature review, fundamentally from studies
published about RL and corporate performance (Hernández, Marins and Castro, 2007, 2008),
sustainability in Brazilian automotive industry, where are described sustainable practices of 13
industries that operate in Brazil (Neto, 2008) and using of ANP to define RL strategic performances
(Ravi, Shankar and Tiwari, 2005; Wu & Lee, 2007; Cheng & Li, 2007).
Primary data were obtained from unstructured interviews with several managers and specialists of an
automotive industry, not included in the preliminary study, which was useful to complement and cross
information. This way of collection served as base to identify elements to be in-depth (Vergara, 2005)
Corporate Performance
Financial
- Economic-
financial
indicators
- Shareholder
value
- Access to
capital
Customer
- Customer
retention
- Brand value
and reputation
Internal
processes
- Operational
efficiency
- Innovation
Learning and
Growth
- Professional
growth
- Productivity of
human resources
Image Programs
(IP) Citizenship
Programs (CP)
Customer Service
Programs (CSP) Legal Programs
(LP)
Economic
Programs (EP)
Performance indicators according to BSC perspectives
RL Programs

6
and to reach specific activities developed by automotive industry to reduce its environmental impacts,
considering that it tackles just activities related to automotive production process, not those one which
are related to product use.
Figure 2. Hierarchical model for RL operations in automotive industry.
In second phase of research where, from the model shown in Figure 2 and by quantitative approach,
values of importance were attributed to criteria and subcriteria. Interviews were used as data
collection tool in order to obtain these values. Due to the way needed to get information for
AHP/ANP applications (which involve comparison of hierarchy levels for RL activities and
indicators), it was left behind the use of questionnaires. The researched population, basically
specialists and managers from logistics area, wasn’t familiar to the methods. Therefore, a face-to-face
contact was indispensable to clarify points of view.
4. Result analysis
AHP and ANP (Saaty, 2008), considering the last as an extension of the first, are Multiple Criteria
Decision Making (MCDM) methods that use a decision matrix as basic tool.
Taliscali & Ercan (2006) apud Alves, Simões and Neyra (2008) shows as fundamental advantages of
AHP/ANP, in comparison with others MCDM methods, the “user-friendly” and the application of
qualitative and quantitative factors together in the evaluation.
The basic difference between them is ANP has a network structure that allows the analysis of
dependence among elements of the model, which makes it more powerful in situations with
uncertainty, and let the problem analyzed closer to reality.
CORPORATE PERFORMANCE IN AUTOMOTIVE INDUSTRY
Financial
Perspective
Customer
Perspective
Internal Processes
Perspective
Learning and Growth
Perspective
RL Economic
Programs
(EP)
RL Image
Programs
(IP)
RL Citizenship
Programs
(CP)
- Value Recapture of
disposable packing
(VR)
- Development of
Returnable Packing
(DR)
- Reuse of
Returnable Packing
(RR)
- Effluents Treatment
(ET)
- Clean Technologies
(CT)
- Guarantee of
Correct Destination
(CD)
- Partnership for
Residue Management
(RM)
- Job Creation in
recycling activities
(JC)
- Development of
components using the
“recyclability” concept
(DP)

7
4.1. AHP application in Brazilian automotive industry
In AHP applications, the data needed are judgments to compound matrix of comparisons between
elements of the model (alternatives/subcriteria or criteria) two to two. Data generated by method
application include the decision matrix (compounded by performance values of
alternatives/subcriteria for each criterion), the consistency ratio (CR) values of the judgments and the
decision vector (compounded by global performance values of alternatives/subcriteria) (Salomon,
2004). Saaty (1994) apud Cheng & Li (2007) suggests limit values for CR in proportion to matrices’
order: 0.02 to 3x3; 0.08 to 4x4; and 0.1 to all others, being this last the most used in conjunction with
0.2, proposed years later (Saaty, 2001).
According to the model shown in Figure 2, RL programs identified in automotive industry are
economic (EP), image (IP) and citizenship (CP). Each of them has included a set of activities. In this
case particularly, we are not interested in selecting alternatives. We intend to determine the
importance of each RL program has on corporate performance, considering that indicators have same
importance in each BSC perspective.
The following tables show different judgment matrices and the final result of the AHP application.
Table 2 presents the judgments of relative importance of RL programs (criteria), according to
perception of which affects more on corporate performance.
Table 2. Judgments and importance of the criteria.
EP IP CP Decision Vector
Economic (EP) 1 7 5 0.73064
Image (IP) 1 1/3 0.08096
Citizenship (CP) 1 0.18839
Tables 3, 4 and 5 present the judgments of relative importance of each activity (subcriterion), in each
RL program, and also global performances. The CR values are between 0.0311 and 0.0516. As they
are lower than 0.2, judgments can be considered as coherent one with another.
Table 3. Judgments and global performances of the economic activities.
VR DR RR Decision vector Global performance
VR 1 1/5 3 0.18296 0.13368
DR 1 8 0.74184 0.54202
RR 1 0.07520 0.05494
Table 4. Judgments and global performances of the image activities.
RM JC DP Decision vector Global performance
RM 1 6 4 0.65480 0.05302
JC 1 1/3 0.09535 0.00772
DP 1 0.24985 0.02023
Table 5. Judgments and global performances of the citizenship activities.
ET CT CD Decision vector Global performance
ET 1 4 7 0.70491 0.13280
CT 1 3 0.21093 0.03974
CD 1 0.08416 0.01585
The analysis of these results demonstrates that RL programs with economic purpose have great
influence on corporate performance and how they are gaining increasingly relevance. In general,

8
development of returnable packing (DR), value recapture of disposable packing (VR) and effluents
treatment (ET), by reuse of water in productive process, are principal RL programs in automotive
industry.
According to Murphy et al. (1994) apud Biraes, Prado and Gilioli (2006), the highest priorities of
automobile assemblers from environmental point of view are packing and waste reduction, which is
reached through using of returnable packing (that can be recycled at the lifetime end). The results of
AHP application corroborated these affirmations.
However, there are other realities this method is not able to treat, such as: RL programs with
economic purpose cause marginal results that may be confused with image programs (Leite, 2006);
common use of RL activities as reinforcement of corporate image (Sinnecker, 2007; Neto, 2008); and
automotive industry leads investments in research and development of new products and components
that cut down environmental pollution (PNUMA, 2005). But here they are evaluated with little
importance.
We understand this result is due to implicit consideration existent in hierarchical structures: the
independence among elements of the same level. And this is assumed by AHP. The continuation
presents how influence analysis among criteria and subcriteria can be included in the model by using
ANP.
4.2. ANP application in Brazilian automotive industry
Leite (2006), in a research carried out in 44 Brazilian companies, identified RL programs in which
other results, called marginal, were achieved and could be confused with real objectives.
Specifically the relation among economic, image and citizenship programs (EP, IP and CP) is shown
in Figure 3.
Figure 3. Network structure for RL programs in automotive industry.
Managers and specialists of automobile industry interviewed have expressed that, although they have identified RL activities within each program according to fundamental target that should be achieved, as shown in Figure 2, the final result is difficult to measure because many of these activities influence other programs. Then, it allows us to think about model shown in Figure 4, being ANP the best method to apply. In Figure 4 criteria and subcriteria were grouped and arrows in each cluster indicate influence among elements, i.e., performance of a criterion or subcriterion can influence performance of another criterion or subcriterion.
CP EP
IP

9
Figure 4. Network structure for RL activities in automotive industry. The next step for ANP implementation is realization of judgments and it needs establishing dependency relations that can be represented by networks or reach ability matrices (Saaty, 1996), being these binary. We need two matrices: the global one (for dependency between clusters) and the local one (for dependency inside clusters) (Salomon, 2004). Table 6 presents global reach ability matrix for network shown in Figure 4. As criteria and subcriteria have dependency between themselves, the components “criteria x criteria” and “subcriteria x subcriteria” are 1. Other components relate to AHP application, taking into account criteria importance (component “criteria x subcriteria”) and subcriteria performance according to each criterion (component “subcriteria x criteria”). Table 6. Global reach ability matrix.
Clusters Subcriteria Criteria Subcriteria 1 1 Criteria 1 1
Even existing dependency relations among elements of each cluster, these one are not total. The network showed in Figure 3 presents criteria relations. The components represent the influence between reverse logistic activities (subcriteria) were obtained with questions like “Does DR performance influence DP performance?”. As result of replacing criteria dependence vectors and subcriteria dependence vectors (obtained from 8 new matrices with 55 judgments), and subcriteria performance vectors and criteria importance vector (obtained from AHP) is formed the Super matrix, shown in Table 7. Supermatrix must be weighted in order to become a column stochastic matrix. It is considered same weight for each cluster because we know that there is dependence, but not how a criterion or a subcriterion influences more than others. The powers of the Weighted Super matrix converge to a matrix also stochastic and with all columns equal. This matrix is denominated Limit Matrix (Table 8).
- Value Recapture of disposable
packing (VR)
- Development of Returnable
Packing (DR)
- Reuse of Returnable Packing(RR)
- Partnership for Residue
Management (RM)
- Job Creation in recycling
activities (JC)
- Development of components
using the “recyclability” concept
(DP)
- Effluents Treatment (ET)
- Clean Technologies (CT)
- Guarantee of Correct Destination
(CD)
SUBCRITERIA
(RL ACTIVITIES)
CRITERIA
(RL PROGRAMS)
- Economic Programs (EP)
- Image Programs (IP)
- Citizenship Programs (CP)
CORPORATE PERFORMANCE

10
Table 7. Supermatrix.
CD DR DP JC RM RR VR ET CT CP EP IP
CD 0.10288 0.00000 0.05047 0.00000 0.13582 0.08414 0.05912 0.09141 0.00000 0.08416 0.00000 0.00000
DR 0.00000 0.67381 0.43267 0.00000 0.00000 0.00000 0.00000 0.00000 0.53457 0.00000 0.74184 0.00000
DP 0.00000 0.22554 0.38809 0.00000 0.00000 0.00000 0.00000 0.00000 0.19630 0.00000 0.00000 0.24985
JC 0,05630 0.00000 0.00000 1.00000 0.05027 0.00000 0.00000 0.00000 0.00000 0.00000 0.00000 0.09535
RM 0.22969 0.00000 0.00000 0.00000 0.32928 0.21093 0.12029 0.00000 0.00000 0.00000 0.00000 0.65480
RR 0.00000 0.00000 0.00000 0.00000 0.00000 0.70493 0.25229 0.00000 0.00000 0.00000 0.07520 0.00000
VR 0.61114 0.00000 0.00000 0.00000 0.34882 0.00000 0.56830 0.00000 0.00000 0.00000 0.18296 0.00000
ET 0.00000 0.00000 0.00000 0.00000 0.13582 0.00000 0.00000 0.69094 0.19630 0.70491 0.00000 0.00000
CT 0.00000 0.10065 0.12876 0.00000 0.00000 0.00000 0.00000 0.21765 0.07282 0.21093 0.00000 0.00000
CP 0.18839 0.18839 0.18839 0.18839 0.18839 0.18839 0.18839 0.18839 0.18839 0.00000 0.00000 0.50000
EP 0.73064 0.73064 0.73064 0.73064 0.73064 0.73064 0.73064 0.73064 0.73064 0.50000 0.00000 0.50000
IP 0.08096 0.08096 0.08096 0.08096 0.08096 0.08096 0.08096 0.08096 0.08096 0.50000 1.0000 0.00000
Table 8. Limit Matrix.
CD DR DP JC RM RR VR ET CT CP EP IP CD 0.01640 0.01640 0.01640 0.01640 0.01640 0.01640 0.01640 0.01640 0.01640 0.01640 0.01640 0.01640 DR 0.16630 0.16630 0.16630 0.16630 0.16630 0.16630 0.16630 0.16630 0.16630 0.16630 0.16630 0.16630 DP 0.05239 0.05239 0.05239 0.05239 0.05239 0.05239 0.05239 0.05239 0.05239 0.05239 0.05239 0.05239 JC 0.02043 0.02043 0.02043 0.02043 0.02043 0.02043 0.02043 0.02043 0.02043 0.02043 0.02043 0.02043 RM 0.07436 0.07436 0.07436 0.07436 0.07436 0.07436 0.07436 0.07436 0.07436 0.07436 0.07436 0.07436 RR 0.02531 0.02531 0.02531 0.02531 0.02531 0.02531 0.02531 0.02531 0.02531 0.02531 0.02531 0.02531 VR 0.05657 0.05657 0.05657 0.05657 0.05657 0.05657 0.05657 0.05657 0.05657 0.05657 0.05657 0.05657 ET 0.05963 0.05963 0.05963 0.05963 0.05963 0.05963 0.05963 0.05963 0.05963 0.05963 0.05963 0.05963 CT 0.02860 0.02860 0.02860 0.02860 0.02860 0.02860 0.02860 0.02860 0.02860 0.02860 0.02860 0.02860 CP 0.08845 0.08845 0.08845 0.08845 0.08845 0.08845 0.08845 0.08845 0.08845 0.08845 0.08845 0.08845 EP 0.24613 0.24613 0.24613 0.24613 0.24613 0.24613 0.24613 0.24613 0.24613 0.24613 0.24613 0.24613 IP 0.16542 0.16542 0.16542 0.16542 0.16542 0.16542 0.16542 0.16542 0.16542 0.16542 0.16542 0.16542

11
The normalization of the Limit Matrix results the priorities of the criteria and the subcriteria (Table 9). Table 9. Priorities of the criteria and the subcriteria.
Criteria Economic Programs (EP) Image Programs (IP) Citizenship Programs (CP) Priorities 0.49226 0.33084 0.17691 Subcriteria VR DR RR RM JC DP ET CT CD Priorities 0.1131 0.3326 0.0506 0.1487 0.0408 0.1047 0.1192 0.0572 0.0328
The ANP application corroborates the fact of RL programs with economic purpose have the greatest influence on corporate performance, but it is lower than the one obtained with AHP application and this result is more real because of the marginal results, previously mentioned and shown in Figure 3. With regard to subcriteria (RL activities), it was also ratified that development of returnable packing (DR), value recapture of disposable packing (VR) and effluents treatment (ET) are the most important, with less importance though. The result most surprising, related to subcriteria, is the highlight given to development of components using the “recyclability” concept (DP). It reinforces ANP’s result, since it is in accordance with different references that analyze this aspect as fundamental in automotive industry (Sinnecker, 2007; Neto, 2008; PNUMA, 2005). The increase of importance to residue management (RM) can be a particular case because one of the industries analyzed belongs to a partnership for solid residue management. However, the waste reduction is among targets of automobile assemblers and a correct RM can be a way to reach it.
5. Conclusions
The analysis of relevant studies from several authors has shown that, although still without
establishing a quantitative impact, RL policies and practices affect strongly and positively corporate
performance indicators that are closely linked to the corporate sustainability concept. Therefore, it
would be necessary to find methods and tools that allow evaluating this influence.
Thus, answering the main question of this research, we are able to affirm that both methods – AHP
and ANP – can be used to evaluate the influence that RL practices have on corporate performance
indicators, but the result obtained with the application of each of them can vary in terms of efficiency
and reliability. For the specific case examined here, it was possible to establish priorities with both
methods.
From efficiency standpoint, the best method is AHP, because it requires a smaller number of
judgments (4 matrices with 12 judgments), so the consumption of time and resources decreases.
The inclusion of dependence analysis among elements improves the reliability of the results, which
are more compatible to the reality of the Brazilian automotive sector, in accordance with results
obtained from different studies, such as: Neto (2008) that shows 13 RL programs of automotive
companies operating in Brazil; Leite (2006) that demonstrates the existence of marginal results in
programs with various goals; and Sinnecker (2007) that evaluate image results of RL programs with
economic and citizenship goals in 4 great companies operating in Brazil. So, we can say the ANP
offers the best result, but it has as disadvantage the increase of time consumed (in this case, 8 new
matrices with 55 judgments).
Although advantages and disadvantages of each method, both require specific knowledge and
familiarity with processes of the company to identify correctly all activities and dependence relations
between them.

12
Future researches should analyze companies of different business sector or different type/position of
the reverse channel, since these are relevant characteristics related to RL programs and corporate
performance indicators.
With respect to AHP and ANP applications, we believe that the best way is the use combined of them,
considering that the first one can assist in the development of a hierarchy that subsequently will be
used by the second method.
REFERENCES
Alves, S.N.L., Simões, S.A.C., & Neyra, B.M.C. (2008). Literature review about ANP method
application in problem of supplier selection. Brazilian Symposium of Operational Research.
September 2-5, João Pessoa, Brazil. (in Portuguese)
Amaral, S.P. (2003). Development of indicators and a model report for environmental, social and
economic sustainability: a proposal for the Brazilian oil industry. (Doctoral dissertation, Federal
University of Rio de Janeiro, 2003). (in Portuguese)
Biraes, A., Prado, P.B., & Gilioli, R.R. (2006). The environmental logistics in the Brazilian
automotive sector. National Production Engineering Meeting, October 12-14, Fortaleza, Brazil. (in
Portuguese)
Braga Junior, S.S., Costa, P.R., & Merlo, E.M. (2006). Reverse Logistics as an alternative of gain for
the retail: a case study in a medium supermarket. Symposium of Production Administration, Logistics
and International Operations, August 29-31, São Paulo, Brazil. (in Portuguese)
Campos, L.M.S. (2001). SGADA – Environmental Performance Management and Evaluation System:
a proposal of implementation. (Doctoral dissertation, Federal University of Santa Catarina, 2001). (in
Portuguese)
Chaves, G.L.D., & Alcântara, R.L. (2006). Reverse Logistics as an activity generator of competitive
advantage for refrigerated food supply chain. Symposium of Production Engineering, November 6-8,
Bauru, Brazil. (in Portuguese)
Cheng, E. W. L., & Li, H. (2007). Application of ANP in process models: An example of strategic
partnering. Building and Environment v.42, 278–287.
Cruz, M.M., & Ballista, B.R. (2006). Reverse Logistics of the health institutions of Grande Vitória.
Symposium of Production Engineering, November 6-8, Bauru, Brazil. (in Portuguese)
Daugherty, P.J., Autry, Ch.W., & Ellinger, A. E. (2001). Reverse Logistics: The relationship between
resource commitment and program performance. Journal of Business Logistics, 22(1), 107-123.
Epelbaum, M. (2004). The influence of the environmental management on competitiveness and the
organizational success. (Master’s Dissertation, Polytechnic School of the University of São Paulo,
2004). (in Portuguese)
Fleischman, M., Krikke, H. R., Dekker, R., & Flapper, S.D.P. (2000). A characterization of logistics
network for product recovery. Omega, 28, 653-666.
Hammond, D., & Beullens, P. (2007). Closed-loop supply chain network equilibrium under
legislation. European Journal of Operational Research, 183, 115-129.

13
Hernández, C.T., Marins, F.A.S., & Castro, R.C. (2008). Reverse Logistics and Balanced Scorecard: a
proposal of application. International Conference on Business Science, October 16-19, Santa Clara,
Cuba. (in Portuguese)
Hernández, C.T., Marins, F.A.S., & Castro, R.C. (2007). Reverse Logistics and corporate social
responsibility: the influence on corporate performance indicators. Symposium of Production
Engineering, November 6-8, Bauru, Brazil. (in Portuguese)
Herrero, E.F. (2005). Balanced Scorecard and strategic management: a practical approach. Rio de
Janeiro: Campus. (in Portuguese)
Kaplan, R.S., & Norton, D.P. (2000). Organization orientated to strategy. Rio de Janeiro: Campus.
(in Portuguese)
Kaplan, R.S., & Norton, D.P. (1997). The strategy in action. Rio de Janeiro: Campus. (in Portuguese)
Lakatos, E.M., & Marconi, M.A. (1986). Scientific Methodology. São Paulo: Atlas. (in Portuguese)
Leite, P.R. (2005). Reverse Logistics: corporate categories and practices in programs implemented in
Brazil – a test of categorization. Retrieved July, 2006, from http://www.meusite.mackenzie.com.br/pl
(in Portuguese)
Leite, P.R. (2006). Strategic drivers in reverse logistics programs in Brazil. Symposium of Production
Administration, Logistics and International Operations, August 29-31, São Paulo, Brazil. (in
Portuguese)
Leite, P.R. (2000). Reverse distribution flows: factors of influence on quantities of recycled material.
Symposium of Production Administration, Logistics and International Operations, August 28-30, São
Paulo, Brazil. (in Portuguese)
Murphy, P., Poist, R.F, & Braunscheweig, C.D. (1994). Management of environmental issues in
logistics current status and potential. Transportation Journal, 34(1), 48-56.
Neto, J.A. (2008). Sustainability in the Brazilian automotive productive chain: a multiple case study.
Retrieved August, 2008, from http://www.administradores.com.br/noticias/volkswagen
PNUMA. (2005). Retrieved July, 2005, from http://www.brasilpnuma.org.br (in Portuguese)
Ravi, V., Shankar, R., & Tiwari, M.K. (2005). Analyzing alternatives in reverse logistics for end-of-
life computers: ANP and balanced scorecard approach. Computers & Industrial Engineering, 48, 327-
356.
Revlog (2004). Reverse Logistics study group. Retrieved October, 2004, from
http://www.fbk.eur.nl/OZ/REVLOG/Introduction.htm (in Portuguese)
Rogers, D.S., & Tibben-Lembke, R.S. (1998). Going Backwards: Reverse Logistics trends and
practices. Reno, University of Nevada.
Rovere, E.L. (2001). Sustainability indicators for enterprises. Managerial workshop about sustainable
development, Rio de Janeiro, Brazil. (in Portuguese)

14
Saaty T. L. (2008). Relative Measurement and Its Generalization in Decision Making Why Pairwise
Comparisons are Central in Mathematics for the Measurement of Intangible Factors The Analytic
Hierarchy/Network Process. RACSAM, v.102 n.2, 251–318.
Saaty, T. L. (2001). Analytic Hierarchy Process, vol. 2 Decision Making for Leaders. Vol. II of the
AHP Series Thomas L. Saaty, 315 pp., RWS Publ. (new ed.).
Saaty, T.L. (1996). Decision making with dependence and feedback: the analytic network process. Pittsburgh, PA: RWS Publications.
Saaty, T. L. (1994). How to make a decision: the analytic hierarchy process. Interfaces, v.24, n.6, 19–
43.
Salomon, V. (2004). Performance of decision aid modeling on Production Planning and Control
analysis. (Doctoral dissertation, Polytechnic School of the University of São Paulo, 2004). (in
Portuguese)
Silva, L.S.A., & Quelhas, O.L.G. (2006). Sustainable development and consequences for equity costs
in public companies. Management & Production, 13 (3), 385-393. (in Portuguese)
Sinnecker, C. A. (2007). Study about the importance of Reverse Logistics in four large companies of
the Metropolitan Area of Curitiba. (Master’s Dissertation, Pontifical Catholic University of Paraná,
2007). (in Portuguese).
Souza, M.T.S., Vasconcelos, M.W., & Pereira, R.S. (2006). The contribution of Reverse Logistics to
adequacy of the Solid Residue National Policy: a case study in packing sector. Symposium of Business
Management and Strategy, July 10-13, Rio de Janeiro, Brazil. (in Portuguese)
Taliscali, A.K., & Ercan, S. (2006). The Analytic Hierarchy & the Analytic Network Processes in
multicriteria decision making: a comparative study. Journal of Aeronautics and space technologies, 2
(4), 55-65.
Tibben-Lembke, R.S. (2000). Life after death – reverse logistics and the product life cycle.
International Journal of Physical Distribution & Logistics Management, 32(3), p. 223-244.
Trigueiro, F.R. (2002). Reverse Logistics. Retrieved August, 2006, from
http://www.guiadelogistica.com.br/ (in Portuguese)
Valente, T.R.G. (2002). Relationship Marketing and CRM: a customer management analysis in
financial sector. Retrieved May, 2005, from
http://www.ead.fea.usp.br/tcc/trabalhos/Artigo_Thais%20Valente.pdf (in Portuguese)
Vergara, S.C. (2005). Research methods in business administration. São Paulo: Atlas. (in Portuguese)
Wu, W. W., & Lee, Y. T. (2007). Selecting knowledge management strategies by using The Analytic
Network Process. Expert Systems with Applications, v.32, 841–847.
All in-text references underlined in blue are linked to publications on ResearchGate, letting you access and read them immediately.