Embed Size (px)
Citation preview
To be published in Proceedings of IEEE International Conference on Systems, Man, and Cybernetics San Antonio, Texas, USA: IEEE, 2009
978-1-4244-2794-9/09/$25.00 .2009 IEEE
Using Designer’s Effort for User Interface Evaluation
Carl J. Mueller Texas State University
San Marcos, TX 78666
01-512-245-8344
Dan E. Tamir Texas State University
San Marcos, TX 78666
01-512-245-0349
Oleg V. Komogortsev Texas State University
San Marcos, TX 78666
01-512-245-7528
Liam Feldman Texas State University
San Marcos, TX 78666
01-512-245-8444
Abstract—Designing Human Computer Interfaces is one of
the more important and difficult design tasks. The tools for
verifying the quality of the interface are frequently expensive or
provide feedback too far after the design of the interface as to
make it meaningless. To improve the interface usability,
designers need a verification tool providing immediate feedback
at a low cost. Using an effort-based measure of usability, it is
possible for a designer to estimate the effort a subject might
expend to complete a specific task. In this paper, we develop the
notion of designer’s effort for evaluating interface usability for
new designs and Commercial-Off-The-Shelf software. Designer’s
effort provides a technique to evaluate human interface before
completing the development of the software and provides
feedback from usability tests conducted using the effort-based
evaluation technique.
Keywords—quality, metrics, verification, human factors, interface design
I. INTRODUCTION
Human Computer Interface (HCI) designers have a number of tools to assist in designing effective, productive, and satisfying interfaces. However, users continue to report that software is frequently not effective, reduces productivity, and reduces their level of satisfaction. Solving this problem may require a different approach to evaluating the quality of an interface.
There are three accepted practices for providing interface designers with feedback about their design: prototyping, various forms of inspection, and usability testing [2, 10, 13, 15, 17]. Each of these evaluation methods has its strength and weakness, but the common issue limiting their effectiveness is cost and timeliness. Interface designers need evaluation techniques providing them with low cost timely feedback about the usability of their interface design.
Prototyping is a technique used by many development organizations to help indecisive users determine that the application under development meets their needs [13]. Current prototyping concepts describe two types of rapid prototyping: throwaway and evolutionary. A throwaway prototype is an approach to prototyping where the developers use prototyping software or driver functions displaying the human interfaces in the order that they are used. The disadvantages to this approach are the cost, the delay in designer feedback and quality of the feedback Evolutionary prototyping is an approach where the software for the application is developed rapidly without any form of verification and validation. The software is then modified
based on the user comments and incorporated into the final product. This approach has all the other problems of throwaway prototyping with the added complications of software produced with limited quality reviews.
Inspection and review is a software quality feedback technique having its origin dating from the early to middle 1970’s [4]. This approach has a variety of forms. In the HCI community, one very popular approach is the Heuristic Evaluation [10, 11]. Probably the best of the pre-development approaches, Heuristic Evaluation employs a usability expert using a precise evaluation process to review and make changes to a designers’ work. This type of evaluation has two very important drawbacks. Because a human expert is conducting the evaluation, there is a tendency to be subjective. Although less expensive than prototyping, hiring a consultant can carry a cost greater than the value of the entire project.
Usability testing is possibly the best technique for assessing the usability of a software application [2, 10, 15, 17]. Usability testing employs subjects matching the profile of the user that will use the software when deployed. These subjects complete a set of tasks, and their performance is recorded to assess the quality or usability of the software. Even though usability testing provides the most objective information about an application, according to a Swiss study, more than half of all software engineers surveyed do not conduct usability testing [18]. Researchers in the Swiss study attribute this to a lack of understanding about the importance of software usability. A more practical reason might lie in that usability testing is a validation activity conducted at the end of the development process when software engineers are frequently under a very tight dead line. Changes to the human interface can require extensive changes to software and equally extensive retesting. Since usability testing occurs at the end of the development process, the feedback comes so late in the process that it does not provide usable guidance. In many cases the designer may be on a different project or no longer with the organization.
For software engineers to improve their ability to design a more usable user interface, they need a low cost technique providing immediate feedback and a way to compare the usability of different design alternatives. Having a low cost method of comparing design alternatives permits a designer to make tradeoff decisions and present more efficient designs for later evaluation. If it were possible to evaluate an interface design in the design phase and in the usability test using the same measurements, it would provide the designer with a
closed process. Evaluating an interface in terms of effort may provide a technique that satisfies all of these needs.
II. EFFORT-BASED USABILITY
One reason for viewing the quality of the interface based on the effort expended by subject is that it eliminates most of the other factors that cause poor software performance. By isolating or pinpointing the effort expended on completing a task, designers get a better view on the quality of their design. Monitoring effort is not the only measure of interface quality, but it does provide an objective means to develop testable requirements.
A. Effort Concept The effort-based model of interface usability presented
here is in its advanced stages of development, but most of the major sources of subject effort are well known [8, 16]. It can be inferred from measurements of user activities, such as mouse and keyboard activity and mouse-keyboard transfer operations. It is a little more difficult to identify and quantify some of the other factors, such as eye and mental effort. Effort is a multidimensional entity and includes several components. The following vectors describe the main components of the total effort (𝐸) required for a human to complete a task using computer software:
𝐸 = 𝐸𝑚𝑒𝑛𝑡𝑎𝑙
𝐸𝑝ℎ𝑦𝑠𝑖𝑐𝑎𝑙
𝐸𝑚𝑒𝑛𝑡𝑎𝑙 = 𝐸𝑒𝑦𝑒𝑚𝑒𝑛𝑡𝑎𝑙
𝐸𝑜𝑡ℎ𝑒𝑟 _𝑚𝑒𝑛𝑡𝑎𝑙
𝐸𝑝ℎ𝑦𝑠𝑖𝑐𝑎𝑙 =
𝐸𝑚𝑎𝑛𝑢𝑎𝑙 _𝑝ℎ𝑦𝑠𝑖𝑐𝑎𝑙
𝐸𝑒𝑦𝑒 _𝑝ℎ𝑦𝑠𝑖𝑐𝑎𝑙
𝐸𝑜𝑡ℎ𝑒𝑟 _𝑝ℎ𝑦𝑠𝑖𝑐𝑎𝑙
Where:
𝐸𝑚𝑒𝑛𝑡𝑎𝑙 amount of mental effort to complete the task.
𝐸𝑒𝑦𝑒 _𝑚𝑒𝑛𝑡𝑎𝑙 amount of mental effort necessary to move and
focus the eyes to complete the task.
𝐸𝑜𝑡ℎ𝑒𝑟 _𝑚𝑒𝑛𝑡𝑎𝑙 amount of unspecified mental effort necessary to complete the task.
𝐸𝑝ℎ𝑦𝑠𝑖𝑐𝑎𝑙 amount of physical effort to complete the task.
𝐸𝑚𝑎𝑛𝑢𝑎𝑙 _𝑝ℎ𝑦𝑠𝑖𝑐𝑎𝑙 amount of manual effort to complete the task.
Manual effort includes, but is not limited to, the movement of fingers, hands, arms, etc.
𝐸𝑒𝑦𝑒 _𝑝ℎ𝑦𝑠𝑖𝑐𝑎𝑙 amount of eye physical effort to complete the
task.
𝐸𝑜𝑡ℎ𝑒𝑟 _𝑝ℎ𝑦𝑠𝑖𝑐𝑎𝑙 amount of unspecified physical effort to
complete the task.
It is relatively easy to acquire mouse and keyboard activity and mouse-keyboard transfers to estimate the physical effort (𝐸𝑚𝑎𝑛𝑢𝑎𝑙 _𝑝ℎ𝑦𝑠𝑖𝑐𝑎𝑙 ). There are a number of methods to convert
eye activity measured by an eye-tracking device into an effort approximation (𝐸𝑒𝑦𝑒 _𝑝ℎ𝑦𝑠𝑖𝑐𝑎𝑙 ).
Measuring cognitive load or mental activity is still an active research topic and will probably remain that way for quite some time. One approach to measuring mental effort currently under investigation is to measure eye movement and
pupil diameter Providing an accurate measure of mental effort (𝐸𝑚𝑒𝑛𝑡𝑎𝑙 ) is still several years in the future.
B. Effort Model Consider the following example. Assume a set of 𝑛
subjects selected at random complete a set of 𝑘 tasks. Further, assume that the subjects are computer literate but unfamiliar with the application under evaluation. The objective of each task is to make travel reservations, and each task requires about the same effort. The set of k tasks have the same scenario with different data and different constraints. Typically, as subjects become more familiar with an application, the time to complete tasks with the same scenario becomes shorter and shorter [3, 5, 19]. When plotting the Time-On-Task (TOT) averages (𝑇𝑎𝑣𝑔 ) for these subjects’ a
curve with a strong fit to either a power law or exponential decay curve is said to reflect learning or represents a learning curve [5, 14, 17, 19].
Selection of a model depends on how subjects learn. If a human’s performance improves based on a fixed percentage, then the exponential decay curve is appropriate. If a human’s performance improves on an ever decreasing rate, then the power law is appropriate. For this research, the power law model appears the most appropriate.
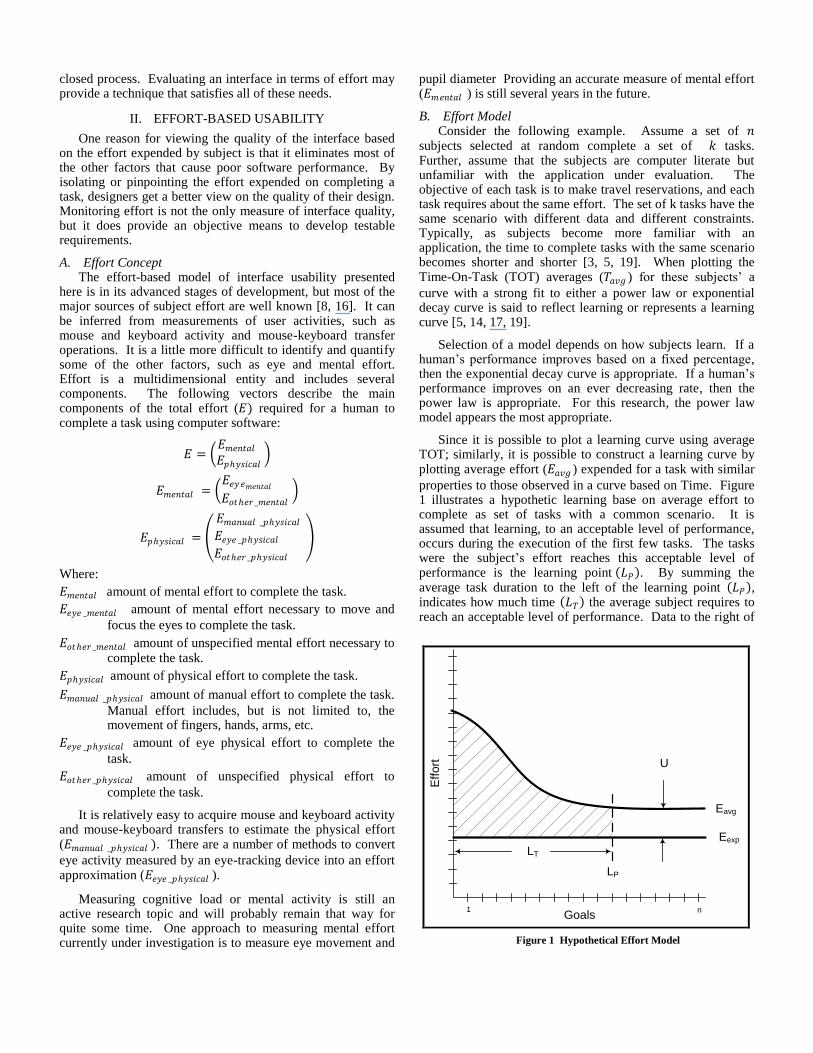
Since it is possible to plot a learning curve using average TOT; similarly, it is possible to construct a learning curve by plotting average effort (𝐸𝑎𝑣𝑔 ) expended for a task with similar
properties to those observed in a curve based on Time. Figure 1 illustrates a hypothetic learning base on average effort to complete as set of tasks with a common scenario. It is assumed that learning, to an acceptable level of performance, occurs during the execution of the first few tasks. The tasks were the subject’s effort reaches this acceptable level of performance is the learning point 𝐿𝑃 . By summing the average task duration to the left of the learning point 𝐿𝑃 , indicates how much time 𝐿𝑇 the average subject requires to reach an acceptable level of performance. Data to the right of
Effo
rt
Goals
Eexp
Eavg
LT
LP
U
1 n
Figure 1 Hypothetical Effort Model
learning point 𝐿𝑃 describes the amount of effort required to accomplish a task using a specific software application.
Expected effort (𝐸𝑒𝑥𝑝 ) and Understandability (𝑈), shown
in Figure 1, are the characteristics that put the subject’s effort into a context and provide the basis for a notion of designer’s effort. In the following section, a detailed discussion explains how these characteristics are derived and used to evaluate the quality of an interface.
In addition to the ability to learn or learnability of a specific scenario, it is possible to evaluate its ease of use or operability. Generally, tools requiring less effort to use are more desirable than those requiring more. Therefore, operability and effort are inversely related: the more operable a scenario, the less effort it requires to complete. It is also possible to use an effort-based measurement to compare the usability of different applications.
III. DESIGNER’S EFFORT
Assume that a group of 10 subjects recorded an average Time-On-Task (TOT) of 420 seconds on a specific task. Asking whether this is a good or bad TOT is meaningless. Nevertheless, if the notion of expected effort (𝐸𝑒𝑥𝑝 ) is added
to the question, then there is a basis for comparison. For example, assume that group of 10 subjects recorded an average TOT of x seconds, and an expert user recorded a time of y seconds on the same task. This provides information for sound evaluation of the usability of the application. Having an expectation of what the target software will do is also one of the fundamental principles of software testing [9].
A. Concept As shown in Figure 1, expected effort (𝐸𝑒𝑥𝑝 ) provides a
reference point placing the subject data into a context, making a meaningful evaluation possible. However, comparing the performance of an expert to a group of individuals just becoming familiar with the software is not a valuable comparison. It is only possible to compare the expert’s performance to that of the subjects after the subjects have past the learning point 𝐿𝑃 . After reaching the learning point 𝐿𝑃 , the difference between the expert and the subjects’ data describes the subjects’ understanding of how to use the software in accomplishing a specific task.
It is possible to establish a value for expected effort (𝐸𝑒𝑥𝑝 )
by either having the designer estimate the effort using a tool or rubric to estimate an ideal subject’s effort or measure the effort expended by an “expert” subject. In a new development, the best “experts” on using an application are the developers or more specifically the designer of the use case and its human interface. Since both estimates of expected effort (𝐸𝑒𝑥𝑝 ) originate from a designer’s perspective, expected
effort is referred to as Designer’s Effort.
B. New Development Evaluation Designer’s Effort is a notion providing developers with a
tool that can reduce the cost of design reviews and prototypes. It also provides the designer with feedback on the quality of the design from a usability test.
Providing an interface designer with a technique for evaluating the ideal efficiency of the interface permits the developer with a method of evaluating designs without calling a meeting or constructing a prototype. Just evaluating manual effort (𝐸𝑚𝑎𝑛𝑢𝑎𝑙 _𝑝ℎ𝑦𝑠𝑖𝑐𝑎𝑙 ) would provide a designer with a basis
for making tradeoff decisions. For example, one thing that can greatly increase effort is making a switch from the keyboard to the mouse and back. Many designers include “combo box” widget in a design. There are several different implementations of a “combo box”. Generally, they provide a drop down menu to aid the user’s selection. Some implementations require the user to make their selection with a mouse button press; other implementations permit the user to type the first character until reaching their selection. A widget requiring a mouse click takes more effort than one that doesn’t. Using an effort-based interface evaluation, the designer can see the total effect of their design and when possible can select tools or objects to make the design more physically efficient.
Calculating the effort on a new interface design is not difficult, but some designers may find the process tedious. First, the designer should count the number of keystrokes necessary for the interface. Next, count the number of mouse button clicks required by the interface. Then measure the distance necessary to move the mouse and count the number of keyboard-to-mouse interchanges. Another less tedious approach is to develop a test harness that displays the interface and a data logging utility. The test harness does not need to be functional beyond the point of operating the interface. A data logging utility is the same tool used in the evaluation to collect subject data. Another program is needed to process the data logged and convert the counts into effort.
Students learn to develop software by writing programs, then testing them and evaluating the results. Interface design is taught by giving the student a number of rules or best practices and then having the instructor act as a reviewer. The ability to calculate effort provides the developer with this feedback mechanism. Extending the notion of effort-based interface evaluation to unit testing provides students or designers with a feedback mechanism focused on a specific scenario.
C. Commercial-Off-The-Shelf Evaluation It is also possible to use the notion of designer’s effort in
the evaluation of Commercial-Off-The-Shelf (COTS) software. An evaluation team could use either results from an expert user or an analysis of the user interface to establish the designer’s effort. A software publisher could provide usability data on the application, but COTS evaluators may find that developing their own data for the application may provide a more independent review of the software. Furthermore, a publisher could provide an expert user, but designing the tasks and conducting tests must be performed on the user site. There are several methods to developing an in-house expert user. One method is to send one to six users to the available publisher training and then evaluate their performance. Another method that is more subtle is to have one of the task designers act as the expert user. The test designer should, after developing the test, have a good understanding of the application and a good knowledge of the task. Data could be
taken from a test run where the evaluation protocol is being refined.
IV. AN EFFORT-BASED USABILITY TEST
To illustrate the merit of the notion of effort-based usability evaluation, this section reports the results from the evaluation of two web-based travel reservation systems (System A and System B) using the effort-based usability framework. For more detailed information about the theory of effort-based usability and the experiments, see the technical report for this research [7, 8, 16].
A. Experimental Design and Execution A popular method for constructing tasks is to “discover”
real world situations and use them as the basis for one or more tasks [2, 10, 15]. One of the novel aspects of this research was constructing the tasks using a multi-step process to ensure that all tasks are different, yet based on the same basic scenario. This is essential for experiments that involve learning. On one hand, the goal is to administer a set of similar tasks enabling the user to learn and apply his learning. On the other hand, it is not desirable to enable the user to rely solely on his memory; for example, knowing (memorizing) exactly which button should be pushed at any given step.
A scenario based on the use case of booking a plane, hotel and car alone was too simple; hence, adding two conditions relating to hotel location and amenities made the scenario more realistic. After refining and testing a model scenario, it was translated into a template. From the template, it was possible to create and test the ten tasks for this experiment. The tests followed a protocol adapted from formal testing practices [6].
Twenty subjects volunteered to participate in the experiment, ten for each system. There is a controversy on the number of subjects necessary for a usability test [1, 10, 12]. We have made a compromise and a decision to use ten subjects with ten tasks to have a statistically relevant number of data points while staying within the constraints of available resources.
An event driven logging program recorded details of mouse and keystroke activity from the operating system’s event queue. The events logged are: Mickeys, keystrokes, mouse button clicks, mouse wheel rolling, and mouse wheel clicks. A data reduction program applied to the events log counts the total number of events (e.g., Mickeys) per task. A similar program logs data for eye activity events. Both programs execute the entire data set (log of manual activity and eye activity), which consists of several millions of points in less than an hour. With ten subjects, each completing ten tasks, the data reduction program generated 100 data points for each system evaluated. The data obtained from the data reduction stage is averaged per task per travel reservation system. Hence, a set of ten points for each system is generated where each point denotes the average count of events per task per reservation system.
B. Experiment Results and Evaluation The experiment provided a great deal of insight into the
investigation of the framework. Trend analysis of physical effort and time on task (TOT) expended by the users
corresponds to the power law as predicted in the effort hypothesis.
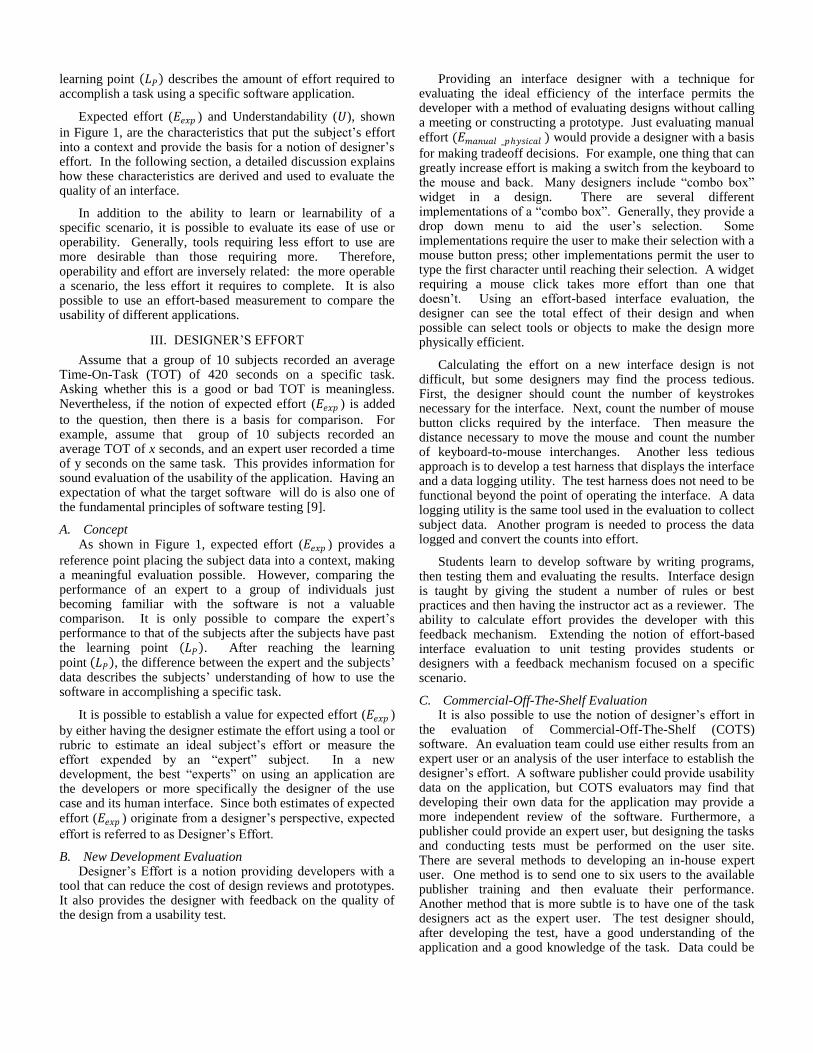
In this experiment, we use the notion that a learning curve is exhibited by a decaying exponential curve and that good fit of the curve to the power law indicates that learning occurred [14]. Figure 2 illustrates the average task-completion-time per task per system, as measured by the eye tracking software. A power law curve is used to represent the data. The coefficient of determination (R
2), which is the square of the correlation
coefficient, establishes the goodness of fit. An R2 ≥ 0.7
indicates a good fit. Both systems have a good fit, based on the coefficient of determination. System B, however, has an
almost perfect fit to a decaying exponent curve. System A has a jittered trend, yet it follows a similar slope.
System A and System B implement the same application, yet, from the data presented in Figure 2, it appears that subjects learn using System B faster than System A users. Furthermore, the figure demonstrates that System A users are less productive than System B users. This can be deduced from the fact that the task completion time for System A is more than two times longer than the completion times for System B and he standard deviation values computed for System A are higher than the standard deviation values of System B. Hence, it is safe to conclude that System A is less operable than System B. Figure 2 also suggest that the graph for System B is beginning to indicate an asymptotic characteristic, after task 5, indicating that learning has slowed.
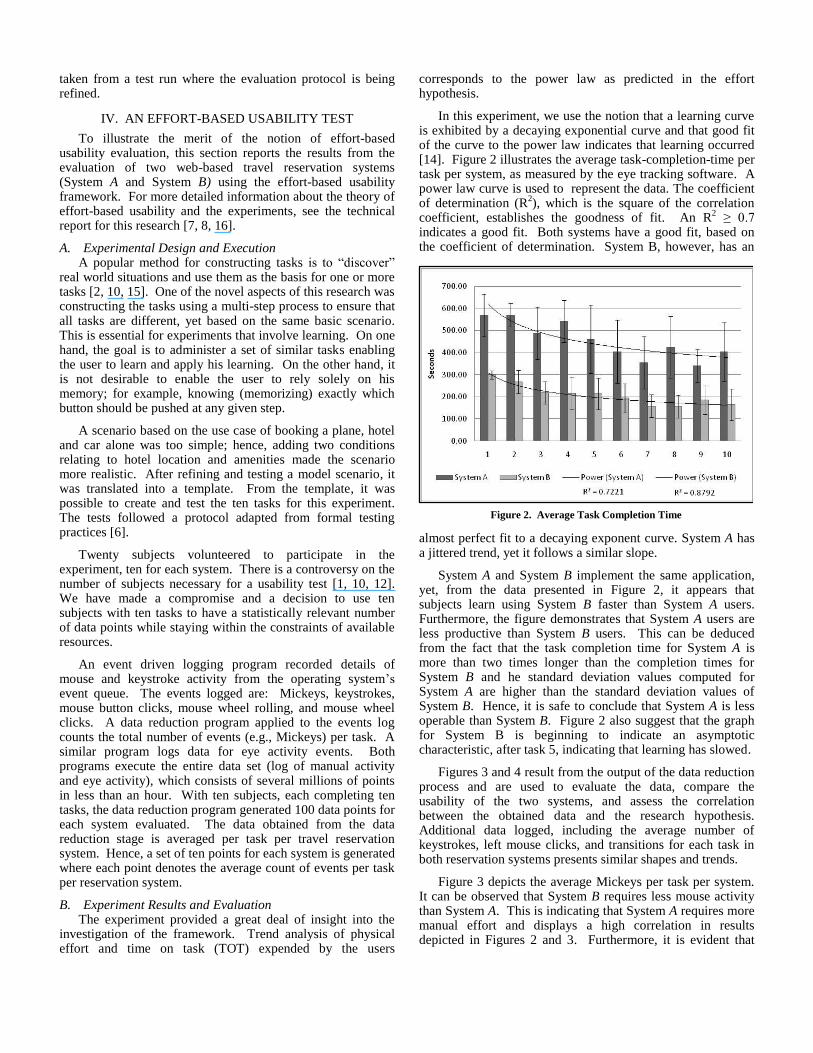
Figures 3 and 4 result from the output of the data reduction process and are used to evaluate the data, compare the usability of the two systems, and assess the correlation between the obtained data and the research hypothesis. Additional data logged, including the average number of keystrokes, left mouse clicks, and transitions for each task in both reservation systems presents similar shapes and trends.
Figure 3 depicts the average Mickeys per task per system. It can be observed that System B requires less mouse activity than System A. This is indicating that System A requires more manual effort and displays a high correlation in results depicted in Figures 2 and 3. Furthermore, it is evident that
Figure 2. Average Task Completion Time
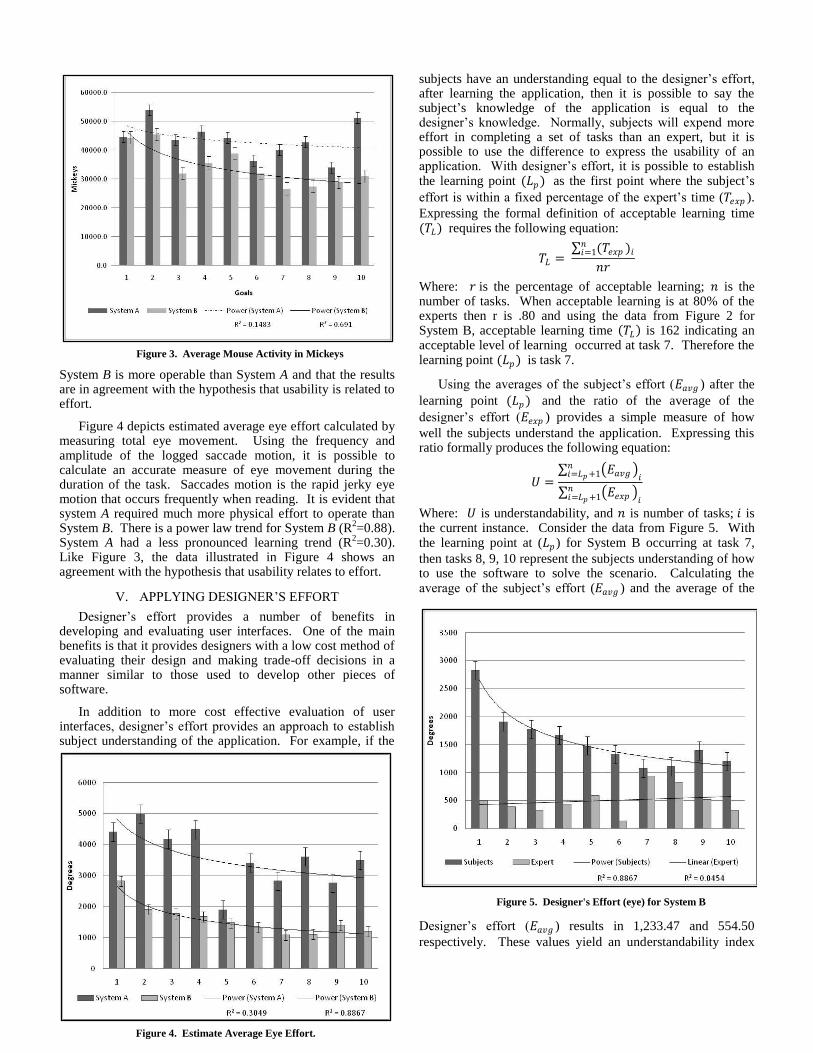
System B is more operable than System A and that the results are in agreement with the hypothesis that usability is related to effort.
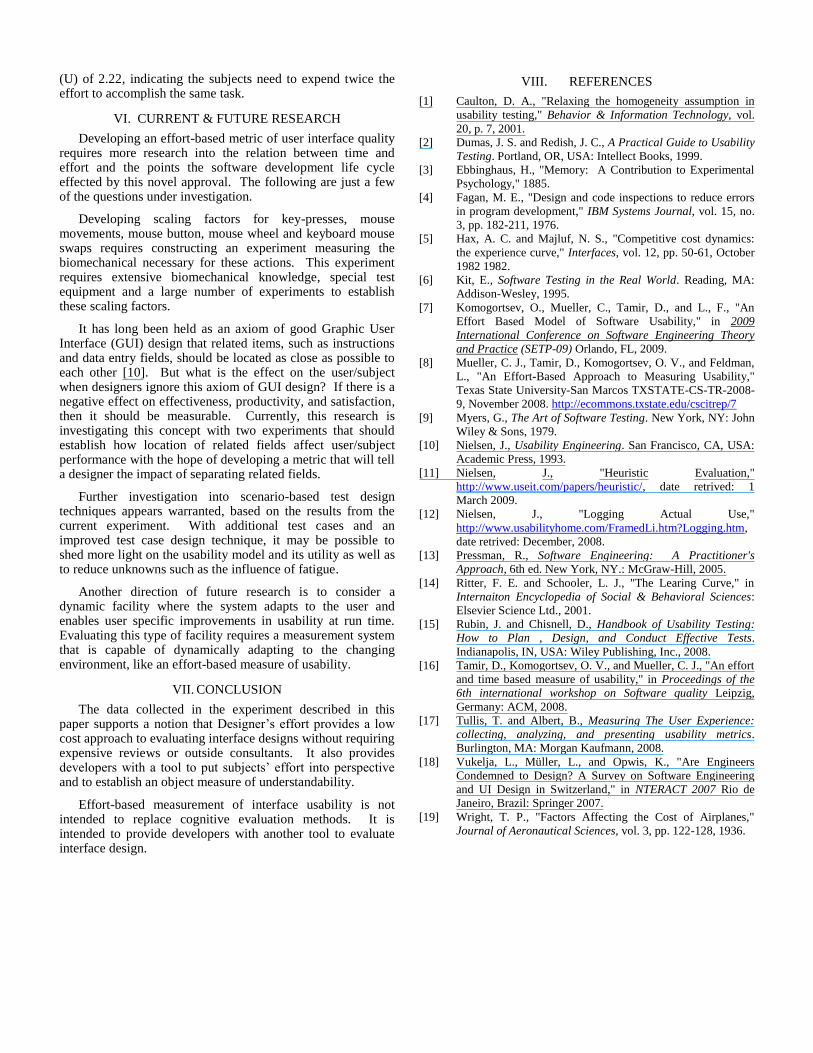
Figure 4 depicts estimated average eye effort calculated by measuring total eye movement. Using the frequency and amplitude of the logged saccade motion, it is possible to calculate an accurate measure of eye movement during the duration of the task. Saccades motion is the rapid jerky eye motion that occurs frequently when reading. It is evident that system A required much more physical effort to operate than System B. There is a power law trend for System B (R
2=0.88).
System A had a less pronounced learning trend (R2=0.30).
Like Figure 3, the data illustrated in Figure 4 shows an agreement with the hypothesis that usability relates to effort.
V. APPLYING DESIGNER’S EFFORT
Designer’s effort provides a number of benefits in developing and evaluating user interfaces. One of the main benefits is that it provides designers with a low cost method of evaluating their design and making trade-off decisions in a manner similar to those used to develop other pieces of software.
In addition to more cost effective evaluation of user interfaces, designer’s effort provides an approach to establish subject understanding of the application. For example, if the
subjects have an understanding equal to the designer’s effort, after learning the application, then it is possible to say the subject’s knowledge of the application is equal to the designer’s knowledge. Normally, subjects will expend more effort in completing a set of tasks than an expert, but it is possible to use the difference to express the usability of an application. With designer’s effort, it is possible to establish the learning point (𝐿𝑝) as the first point where the subject’s
effort is within a fixed percentage of the expert’s time (𝑇𝑒𝑥𝑝 ).
Expressing the formal definition of acceptable learning time (𝑇𝐿) requires the following equation:
𝑇𝐿 = (𝑇𝑒𝑥𝑝 )𝑖𝑛𝑖=1
𝑛𝑟
Where: 𝑟 is the percentage of acceptable learning; 𝑛 is the number of tasks. When acceptable learning is at 80% of the experts then r is .80 and using the data from Figure 2 for System B, acceptable learning time 𝑇𝐿 is 162 indicating an acceptable level of learning occurred at task 7. Therefore the learning point (𝐿𝑝) is task 7.
Using the averages of the subject’s effort (𝐸𝑎𝑣𝑔 ) after the
learning point (𝐿𝑝) and the ratio of the average of the
designer’s effort (𝐸𝑒𝑥𝑝 ) provides a simple measure of how
well the subjects understand the application. Expressing this ratio formally produces the following equation:
𝑈 = 𝐸𝑎𝑣𝑔 𝑖𝑛𝑖=𝐿𝑝+1
𝐸𝑒𝑥𝑝 𝑖𝑛𝑖=𝐿𝑝+1
Where: 𝑈 is understandability, and 𝑛 is number of tasks; 𝑖 is the current instance. Consider the data from Figure 5. With the learning point at (𝐿𝑝 ) for System B occurring at task 7,
then tasks 8, 9, 10 represent the subjects understanding of how to use the software to solve the scenario. Calculating the average of the subject’s effort (𝐸𝑎𝑣𝑔 ) and the average of the
Designer’s effort (𝐸𝑎𝑣𝑔 ) results in 1,233.47 and 554.50
respectively. These values yield an understandability index
Figure 3. Average Mouse Activity in Mickeys
Figure 4. Estimate Average Eye Effort.
Figure 5. Designer's Effort (eye) for System B
(U) of 2.22, indicating the subjects need to expend twice the effort to accomplish the same task.
VI. CURRENT & FUTURE RESEARCH
Developing an effort-based metric of user interface quality requires more research into the relation between time and effort and the points the software development life cycle effected by this novel approval. The following are just a few of the questions under investigation.
Developing scaling factors for key-presses, mouse movements, mouse button, mouse wheel and keyboard mouse swaps requires constructing an experiment measuring the biomechanical necessary for these actions. This experiment requires extensive biomechanical knowledge, special test equipment and a large number of experiments to establish these scaling factors.
It has long been held as an axiom of good Graphic User Interface (GUI) design that related items, such as instructions and data entry fields, should be located as close as possible to each other [10]. But what is the effect on the user/subject when designers ignore this axiom of GUI design? If there is a negative effect on effectiveness, productivity, and satisfaction, then it should be measurable. Currently, this research is investigating this concept with two experiments that should establish how location of related fields affect user/subject performance with the hope of developing a metric that will tell a designer the impact of separating related fields.
Further investigation into scenario-based test design techniques appears warranted, based on the results from the current experiment. With additional test cases and an improved test case design technique, it may be possible to shed more light on the usability model and its utility as well as to reduce unknowns such as the influence of fatigue.
Another direction of future research is to consider a dynamic facility where the system adapts to the user and enables user specific improvements in usability at run time. Evaluating this type of facility requires a measurement system that is capable of dynamically adapting to the changing environment, like an effort-based measure of usability.
VII. CONCLUSION
The data collected in the experiment described in this paper supports a notion that Designer’s effort provides a low cost approach to evaluating interface designs without requiring expensive reviews or outside consultants. It also provides developers with a tool to put subjects’ effort into perspective and to establish an object measure of understandability.
Effort-based measurement of interface usability is not intended to replace cognitive evaluation methods. It is intended to provide developers with another tool to evaluate interface design.
VIII. REFERENCES
[1] Caulton, D. A., "Relaxing the homogeneity assumption in
usability testing," Behavior & Information Technology, vol.
20, p. 7, 2001.
[2] Dumas, J. S. and Redish, J. C., A Practical Guide to Usability
Testing. Portland, OR, USA: Intellect Books, 1999.
[3] Ebbinghaus, H., "Memory: A Contribution to Experimental
Psychology," 1885.
[4] Fagan, M. E., "Design and code inspections to reduce errors
in program development," IBM Systems Journal, vol. 15, no.
3, pp. 182-211, 1976.
[5] Hax, A. C. and Majluf, N. S., "Competitive cost dynamics:
the experience curve," Interfaces, vol. 12, pp. 50-61, October
1982 1982.
[6] Kit, E., Software Testing in the Real World. Reading, MA:
Addison-Wesley, 1995.
[7] Komogortsev, O., Mueller, C., Tamir, D., and L., F., "An
Effort Based Model of Software Usability," in 2009
International Conference on Software Engineering Theory
and Practice (SETP-09) Orlando, FL, 2009.
[8] Mueller, C. J., Tamir, D., Komogortsev, O. V., and Feldman,
L., "An Effort-Based Approach to Measuring Usability,"
Texas State University-San Marcos TXSTATE-CS-TR-2008-
9, November 2008. http://ecommons.txstate.edu/cscitrep/7
[9] Myers, G., The Art of Software Testing. New York, NY: John
Wiley & Sons, 1979.
[10] Nielsen, J., Usability Engineering. San Francisco, CA, USA:
Academic Press, 1993.
[11] Nielsen, J., "Heuristic Evaluation,"
http://www.useit.com/papers/heuristic/, date retrived: 1
March 2009.
[12] Nielsen, J., "Logging Actual Use,"
http://www.usabilityhome.com/FramedLi.htm?Logging.htm,
date retrived: December, 2008.
[13] Pressman, R., Software Engineering: A Practitioner's
Approach, 6th ed. New York, NY.: McGraw-Hill, 2005.
[14] Ritter, F. E. and Schooler, L. J., "The Learing Curve," in
Internaiton Encyclopedia of Social & Behavioral Sciences:
Elsevier Science Ltd., 2001.
[15] Rubin, J. and Chisnell, D., Handbook of Usability Testing:
How to Plan , Design, and Conduct Effective Tests.
Indianapolis, IN, USA: Wiley Publishing, Inc., 2008.
[16] Tamir, D., Komogortsev, O. V., and Mueller, C. J., "An effort
and time based measure of usability," in Proceedings of the
6th international workshop on Software quality Leipzig,
Germany: ACM, 2008.
[17] Tullis, T. and Albert, B., Measuring The User Experience:
collecting, analyzing, and presenting usability metrics.
Burlington, MA: Morgan Kaufmann, 2008.
[18] Vukelja, L., Müller, L., and Opwis, K., "Are Engineers
Condemned to Design? A Survey on Software Engineering
and UI Design in Switzerland," in NTERACT 2007 Rio de
Janeiro, Brazil: Springer 2007.
[19] Wright, T. P., "Factors Affecting the Cost of Airplanes,"
Journal of Aeronautical Sciences, vol. 3, pp. 122-128, 1936.


