Embed Size (px)
Citation preview

PAV
N°12- 2010 127 ème annéeBi-mensuel numéro du 15 au 30 juin
Revue de l’Académie de la Vigne et du Vin - France International
L’hétérogénéité des parcelles de vignes ou les micro-terroirs

Progrès Agricole et Viticole, 2010, 127, N°
— 259 —
Abstract
This study demonstrated that remote sensing using high definition multispectral airborne imaging can be used to identify useful differences within a vineyard. Ground data for Riesling berry composition from 2006 to 2008 were used to show that there were significant differences between six vineyard blocks in a 10-hectare site at Thirty Bench vineyards in Beamsville, Ontario, and that subdivision of some blocks between low and high vigour zones was appropriate. Subdivision within blocks into three vine water status zones was also shown to be appropriate. Values for a vegetation index, NDVI green, calculated from leaf reflectance data from a ground-based spectrometer, were shown to match the pattern of NDVI green values calculated from high definition mul-tispectral airborne imaging. NDVI green correlated well with vine performance measurements such as yield and vine size, as well as leaf water potential and soil moisture. Although correlations of vegetation indices with berry and wine composition variables were not as strong as for vine performance metrics, values for red edge inflection point, another index, were used to predict the location of vineyard areas that produced high potential monoterpene concen-trations. Study of the same vineyard in the 2007 and 2008 growing seasons verified the patterns of variation between blocks and sub-zones. Hence, the spatial variability was temporally stable, and the relationships between the remotely-sensed leaf reflectance data and the ground data remained the same. We can tentatively conclude that airborne imaging might be used to help determine the vineyard segregation boundaries for small lot wine production.
Keywords:
NDVI, monoterpenes, sensory analysis
Résumé :
Cette étude a démontré que la télédétection utilisant l’image-rie aérienne multispectrale de haute définition peut être employée
USING GPS, GIS AND AIRBORNE IMAGING
TO UNDERSTAND NIAGARA TERROIR
UTILISATION DU GPS, SIG ET DE LA TÉLÉDÉTECTION
POUR COMPRENDRE LE TERROIR DE LA PÉNINSULE DU NIAGARA
1Andrew Reynolds, 2Matthieu Marciniak, 3Ralph Brown, 4Linda Tremblay, 5Lucas Baissas, 6Marc Heumann, and 6Dario Kreienbuhl,
1Professor of Viticulture; 2Graduate Research Assistant;
3Professor, School of Engineering, University of Guelph, Guelph, ON; 4Former Undergraduate Thesis Student, Brock University;
5Former Student Intern, Ecole d’IngÉnieurs de Purpan, France;Undergraduate Thesis Student, Ecole d’Ingenieurs de Changins, Nyon, Switzerland.
Cool Climate Oenology & Viticulture Institute, Brock University, St Catharines, ON L2S 3A1.
COMI TÉDE
LECTUREPAV
Viticulture / Œnologie / Socio-Economie
pour identifier des différences utiles dans un vignoble. Des données au sol pour la composition de baies de Riesling pour les millésimes 2006 à 2008 ont montré qu’il y avait des différences significatives entre six parcelles composant un site de 10 hectares à Thirty Bench Vineyards (Beamsville, Ontario) et que la subdivision de certains de ces blocs en des zones à vigueur basse ou élevée était appro-priée. La division intra-parcellaire en trois zones à statut hydrique de la vigne différent s’est également avérée appropriée. Les valeurs pour un indice de végétation, le NDVI vert, calculé à partir des données de réflexion du feuillage mesurées au sol a l’aide d’un spectromètre, ont montré une correspondance avec le modèle des valeurs calculées à partir des images aériennes multispectrales de haute définition pour le même indice. Celui-ci est bien corrélé avec des mesures quantitatives de la vigne telles que le rendement et la vigueur, aussi bien qu’avec le potentiel hydrique foliaire et l’humi-dité de sol. Bien que les corrélations des indices de végétation avec des variables de composition des baies et du vin n’aient pas été aussi fortes qu’avec la performance de la vigne, les valeurs pour le REIP, un autre indice de végétation, ont pu être utilisées pour pré-voir les secteurs du vignoble où l’on a observé des concentrations élevées en monoterpènes potentiels. L’étude du même vignoble durant les millésimes 2007 et 2008 a permis de vérifier les modè-les de variabilité entre les parcelles et les zones intra-parcellaire. Par conséquent, la variabilité spatiale a été stable dans le temps, et les relations entre les données de réflexion du feuillage mesurées par télédétection et toutes les données mesurées au sol sont restées les mêmes. Nous pouvons donc conclure que l’imagerie aérienne pourrait être employée sur un vignoble pour l’aide à la sélection et à la détermination de zones pour la production de petits lots de vin.
Mots-clés :
NDVI, monoterpènes, analyse sensorielle
COMPTE RENDU DU GiESCO 16

— 260 —
INTRODUCTION
Today, in viticultural areas around the world, a persis-tent controversy about the concept of defining wine quality has taken place. The winegrowers of the “Old World” (i.e.: France, Spain, Italy) are sincere supporters of the concept that “terroir” is responsible for wine quality (ASSELIN et al. 1983; SEGUIN 1986) One of the first appearances of such a concept in the scientific literature has been made in the 1980’s by SEGUIN (1986). He accorded a preliminary role to soil in terms of wine quality and added human factors such as viticultural and oenological techniques. Since then, this term has been refined to include physical and chemical cha-racteristics of soil (i.e.: depth, texture, composition, nutritio-nal elements, water supply), topographical and geographical factors (i.e.: relief, orientation, altitude and latitude), climatic conditions (i.e.: macro-, meso- and microclimate), rootstock, cultivar, vine age, cultural practices, vinification practices and transport of the fruit and finished wines (REYNOLDS et al. 2007b).
“New World” winegrowers (i.e. North and South Ameri-ca, South Africa, New Zealand, Australia) on the other hand, consider soil as a secondary factor that impacts vine vigour, vine growth, root growth and photosynthesis (REYNOLDS et al. 2007b). They assign a higher importance on cultivar and grape variety in combination with vineyard management (i.e. canopy management, soil vegetation, shoot and cluster thinning, irrigation).
SEGUIN (1986) was perhaps the first to study the notion of «terroir» scientifically. He found that the chemical compo-sition of the soil did not have a huge effect on the quality of the wines produced, but, he found a substantial effect of the water content of the soil. This characterization of terroir has since been studied more deeply by scientists all around the world, such as in Ontario (HAYNES 2000) or in France (VAN LEEUWEN et al. 2004). These investigators showed that soil texture can influence its water-holding capacity: the best soils theoretically would be those that can create a moderate water deficit early in the season. That deficit will generally reduce berry size and increase sugar concentration. Additionally, it could also optimize the accumulation of volatile monoter-penes that are responsible for the varietal aromas of many cultivars such as Riesling.
One of the new technologies available for the study of vineyards is multispectral remote-sensing (LAMB et al. 2002). Data could be collected either with a ground sensor, an aircraft, or a satellite. The reflectance data from remote-sen-sing would help to characterize the canopy of the vineyard, which has been shown to be correlated with the vigour of the vines (MARGUERIT et al. 2006). Because vine vigour and water status of the vines seem to be also correlated, it has been hypothesized that the remote-sensing could be used to directly appreciate the water status of vineyard areas (RODRÍGUEZ-PÉREZ et al. 2007). In the case of an aroma-tic grape variety, for example Sauvignon blanc, Viognier, or Riesling, it would also be interesting and valuable to find a relationship between remotely-sensed (reflectance) data and the concentration of volatile monoterpenes in the grapes, or even with the general composition of the grapes and the wines. The ultimate goal would be to help vine growers to
delineate areas within the vineyard from which the grapes could be used as part of a premium and unique product.
The concept of terroir
The concept of terroir represents all the factors that can be considered as part of the total natural environment of a viticultural site, including the soil, the topography and the climate. The combination of all site factors is more or less consistently reflected in its wines from year to year, regar-dless of oenological and viticultural practices, which can also have a huge impact on the general quality of a wine (FISCHER et al. 1999). All of the contributing factors are naturally occurring and as such cannot be precisely repli-cated or significantly influenced by management practices (GLADSTONES 1992). Opinions such as this result in impor-tant commercial advantages for areas with a long-standing viticultural history such as France, where the AOC system has delivered success and stability to the French wine sys-tem. In new-world viticultural areas such as Niagara, grape-growing and winemaking decisions are made without that benefit of hundreds of years of experience and observations in the same viticultural conditions. In the absence of such experience, effort is placed by the new-world countries into increasing knowledge through scientific studies.
Studies of soil based-terroir in Niagara and beyond
One of the first to work on terroir scientifically was SEGUIN (1986). He found that the chemical composition of the soil did not have an effect on the wine composition or sen-sory attributes. However, the texture of the soil was found to play a more important role. Since then, several studies have been undertaken to investigate terroir through soil type.
REYNOLDS & DE SAVIGNY (2001) in Ontario conduc-ted a 3-year study designed to find relationships between fruit composition variables like °Brix, titratable acidity (TA), and pH in Chardonnay and Riesling, plus monoterpenes in Riesling, and both soil texture and vine size. A relationship between vine size and soil type was noted, with generally smaller vines and berry weights on clay soils, and larger vine size and berry weight on sandy soils. TAYLOR (2002) looked for effects of both vine size and soil type on the varietal characteristics in Chardonnay across five sites in Niagara. The author concluded that the vintage and the site were more important for wine sensory attributes than soil texture or vine size. In another Niagara study, vine size and soil type were found to have some effects on fruit composition of Riesling grapes, but the effects were inconsistent over the 3-year study (REYNOLDS et al. 2007b).
In Bordeaux, on three red vinifera varieties (Cabernet Franc, Cabernet Sauvignon and Merlot) planted on three soil types (clay, sand and gravel) the authors proposed that the effects of climate and soil on fruit quality have to do with their influence on vine water status, due to their texture (VAN LEEUWEN & SEGUIN 2006), and that the best soils produced moderate water deficit in the vines early in the season (VAN LEEUWEN et al. 2004). Another study, conducted in Italy, showed that the soil texture had an effect on the amount of water available for the growth of the vine. Depending on the water status of the vines, the resulting wines showed dif-ferences in organoleptic complexity and a different tannic

Progrès Agricole et Viticole, 2010, 127, N°
— 261 —
structure. They concluded that measurement of soil moisture could be a technique to delineate zones representing poten-tial terroir differences and as a technique as well for the determination of wine quality (TOMASI et al. 1999, 2005). According to most of those studies, it seems that water hol-ding capacity of the soil is the principal factor to understand, and delineation of areas within a vineyard based on water status could represent particular terroirs.
A 3-year study in Anjou did not find a link between soil type and vine vigour or yield, but generally found that berries were larger with less concentrated sugars and higher acidity from vines located on strongly weathered parent material with a higher water-holding capacity (MORLAT & BODIN 2006a,b). They linked the effect of the soil to vine water status, as shallower, stonier soils provided a slight water deficit for the vines. A similar study in Spain involved two Grenache vineyards. One vineyard had soils that were loamy and fertile, when the other vineyard was stonier, less fertile and had less water holding capacity. The study found significant differences between those two vineyards: the loamy, fertile vineyard produced fruit with less phenols, and the fruit produced wine with lower colour intensity than that from the stonier vineyard with less water holding capacity (DE ANDRES-DE PRADO et al. 2007).
The use of multispectral remote sensing in viticul-ture
“Old World” viticultural regions have been established over centuries, which allowed the vintners to achieve an understanding of vintage and terroir variability (Boyer & Wolf 2000; JOHNSON et al. 2002). “New World” viticultu-ral regions on the other hand present a lack of experience of these parameters. Therefore, remote sensing techniques are often used in these regions (BOYER & WOLF 2000; HALL et al. 2001, 2002; LAMB et al. 2002; BRAMLEY & HAMILTON 2004). Multispectral remote sensing provides information about the light reflectance of a particular area. Green surfa-ces reflect nearly all of the sun’s energy in the near infra-red wavelengths (NIR; 760 to 780 nm). Areas without vegetation reflect more red light (660 to 680 nm) than highly vegetated areas. The normalised difference vegetation index (NDVI) is a measure of the amount of “greenness” in a particular location as measured by the amount of red light reflected, normalized by the amount of NIR reflected. The value for NDVI red is between -1 and 1, with higher values > 0.67 indicative of more “greenness” or chlorophyll in the form of plant biomass (HALL et al. 2003). Another vegetation index, NDVI green, is based upon the amount of green light reflected in the band 540 to 560 nm, which is high for green surfaces. Red edge inflection point (REIP) is the wavelength where the maximum gradient within the “red edge” of vege-tation occurs, caused by the rapid increase in reflectance between the red band of visible light and the infrared. A shift to shorter wavelengths for the REIP indicates loss of chlorophyll, while a shift to longer wavelengths is a measure of leaf maturity (TURNER 2001).
The aim of the use of remote sensing techniques is to explore the viticultural potential of different regions (BOYER & WOLF 2000) and to detect spatial variability of quality and yield parameters (HALL Et al. 2002; LAMB et al. 2002;
BRAMLEY & HAMILTON 2004; BRAMLEY 2005 SCHULTZ 2005; MARGUERIT et al. 2006) in order to create different management zones in the vineyard. In a several year study in Australia, BRAMLEY & HAMILTON (2004) found that such remote sensed management zones are temporally stable.
Moreover, vegetative indices calculated from reflec-tance data from multispectral remote sensing can be used in conjunction with a geographical information system (GIS) to aid vineyard management decisions for improved yield, to provide justification for site improvements, and to predict the locations of the best quality fruit (MARGUERIT et al. 2006). For large vineyards, GIS can be used to illustrate areas of heterogeneity, so that differential management can be used to increase uniformity and thus make the vineyard more suitable for mechanization and precision viticulture (MORRIS 2001). Remote sensing and GIS have been used to interpret spatial patterns in leaf canopies caused by insects such as phylloxera (JOHNSON et al. 1996), to map leaf area index (JOHNSON 2003) and vine size and vigour (HALL et al. 2003). STAMATIADIS et al. (2006) used a ground-based sensor to link leaf reflectance to biomass production and colour in a Merlot vineyard in northern Greece. Multispec-tral airborne imaging and GIS were also used successfully to establish sub-blocks within a Chardonnay vineyard in Napa Valley, California to produce a premium wine from selected low to medium vigour areas (JOHNSON et al. 2001). Vege-tation indices were shown to be correlated with the water status of Pinot noir vines planted in the Napa Valley, Cali-fornia (RODRÍGUEZ-PÉREZ et al. 2007). Finally, in an inte-resting study by LAMB et al. (2004), remote sensing was used to predict grape phenols and colour at harvest based on correlations with NDVI in a Cabernet Sauvignon vineyard in Coonawarra, Australia. The literature supports the idea that variations in vine water status in the vineyard will have an important impact on both remotely-sensed multispectral imaging and fruit and wine compositions.
Objectives and hypotheses
The objective of this study was to determine if dif-ferences attributable to terroir across six sub-blocks, and within each sub-block, of a 10 hectare vineyard at Thirty Bench Vineyards in Beamsville, Ontario could be elucidated using vegetation indices such as NDVI calculated from leaf reflectance data, and if so, whether data from multispectral airborne imaging could be used to predict yield and berry composition of the fruit, and varietal characteristics such as monoterpene concentration in fruit and the resulting wines. This research was initialized to study the terroir controversy using remote techniques such as Global Positioning Systems (GPS), Geographic Information Systems (GIS) and high-resolution, low elevation aerial photography. The first hypo-thesis was that we could correlate vegetation indices produ-ced by multispectral remote sensing of leaf reflectance with the ground data for the vine water status and the vine vigour, and that these different measurements could be correlated with yield and berry composition, and more particularly with the monoterpene aroma components. It was also hypothesi-zed that an extension of the correlations between ground and remotely-sensed data could be used to predict areas in the vineyard that could produce wines with high monoterpene aroma compound concentrations.

— 262 —
MATERIALS AND METHODS
The study site and vine management
The study took place on a 10 ha Riesling block located at Thirty Bench Vineyards, Beamsville, Ontario. The com-pany had previously designated three sub-blocks based upon location; these were referred to as Wooden Post, Steel Post, and Triangle, respectively (Fig. 1). In autumn 2005, these sub-blocks were subsequently subdivided into six sub-blocks using high-resolution, low elevation (≈1000 m) aerial pictu-res. From those photographs, it appeared that some parts of the vineyard had different potential vigour levels. Thus, the Wooden Post and Steel Post sub-blocks were split into high and low vigour sections, plus an area to the south of Wooden Post referred to as Les Erables. The Steel Post sub-blocks were located just east of the Wooden Post and Les Erables blocks. The last sub-block, Triangle, located on the eastern part of the vineyard, was separated from the five other blocks by a small woodlot.
The Riesling vines of the study site were of slightly dif-ferent age but clone (Weis 21B) and rootstock (SO 4) were the same throughout. In the Triangle, the oldest sub-block, the vines were planted in 1981. The two Steel Post sub-blocks were planted in 1983, and the Wooden Post blocks and Les Erables block were planted in 1984. The vines were plan-ted at 2.4 m x 1.2 m (row x vine) spacing, trained to a dou-ble Guyot trellis system, and pruned to two 12-node canes with renewal spurs. The canopies were managed during the growing season with regular hedging, and basal leaf removal was performed in the fruiting zone on the east side of the vines prior to berry touch. Floor management was permanent
sod in alternate rows with about 1-m herbicided strips under the vines. Each vineyard sub-block received the same viticul-tural treatment during the growing season.
Experimental design
Experimental units. Sentinel vines were chosen within each block to form a regular grid pattern across the entire study site. The number of sentinel vines in each block was proportional to the size of the block. As Les Erables was the largest block, it contained 162 sentinel vines. The two Wooden Post blocks were similar in size, so both contained 72 sentinel vines. The size of the high and the low vigour Steel Post sub-blocks was unequal, with Steel Post Blue (low vigour) containing 90 sentinel vines and Steel Post Yellow (high vigour) containing 44 sentinel vines. The Triangle block contained 79 sentinel vines. All sentinel vines were geolocated by a global positioning system (GPS900, Leica Geosystems) in 2006. Nine variables (soil moisture, green-ness ratios, yield and berry composition) were measured for each of the 519 sentinel vines and an additional three variables [leaf water potential (ψ), leaf reflectance, berry monoterpenes] were measured for a subset of 134 sentinel vines distributed across the six study sub-blocks. Although it has been shown that stem ψ can provide a more accurate depiction of vine water status, the need for acquisition of a large data set over a short time period with sufficient spatial density necessitated use of traditional leaf ψ measurement.
Global Positioning Systems (GPS) and Geographical Information Systems (GIS). The GPS was used to delineate the shape and size of the vineyard and the vineyard blocks as well as to geolocate each of the sentinel vines who were used for data collection. The GPS900 had an accuracy of about 25
Figure 1 - Aerial view of 10 hectare study site: six blocks at Thirty Bench Vineyards in Beamsville, Ontario. North is oriented to top. Block designations were as follows: WPB = Wooden Post Blue (low vigor), WPY = Wooden Post Yellow (high vigor), LE = Les Erables, SPB =
Steel Post Blue (low vigor), SPY = Steel Post Yellow (high vigor).Figure 1 - Vue aérienne du site étudié de 10ha : six blocs aux vignobles Thirty Bench à Beamsville, Ontario, Canada. Le nord est orienté
en haut. La dénomination des blocs est la suivante : WPB = Wooden Post Blue (faible vigueur), WPY = Wooden Post yellow (forte vigueur), LE = Les Erables, SPB = Steel Post Blue (faible vigueur), SPY = Steel Post Yellow (forte vigueur).

Progrès Agricole et Viticole, 2010, 127, N°
— 263 —
cm. These data collected with GPS were then used to create spatial representations of the measured variables using Geo-graphic Information Systems (GIS) software (MapInfo Pro-fessional 9.0 & Vertical Mapper 3.0, Northwood Geoscience, Ottawa, ON). The GIS software was used for capturing, sto-ring, analyzing, managing and presenting data that were spa-tially referenced (Fig. 2). Inverse distance weighting inter-polation was used to create a continuous surface from the point data, and a contour map with seven intervals was then generated with a corresponding legend. Before use, all the collected data were stored in an Excel file, saved as a *.dbf file ( dbf 4) and imported into the MapInfo application.
Soil composition. Soil samples (200 g) were collected using a 3 cm x 50 cm (diameter x length) soil probe at or near each of 519 sentinel vines (about 20 cm far from the trunk) in May 2008 and then analyzed by Agri-Food Labs, Guelph, Ontario. The spatial distribution of the soil texture (% sand, silt and clay) as well as pH, organic matter and CEC were mapped (data not shown). The sampling depth encompassed the greatest anticipated percentage of the rootsystem; high water tables and the presence of drainage tiles at ≈ 60 cm depth typically limit grapevine rootsystems in this region.
Analyses during the growing season
Soil moisture. Both SEGUIN (1986) and TOMASI et al. (2005) indicated that the physical properties of the soil and water dynamics are important factors that affect the qualitati-ve expression of the vineyard, i.e. terroir. Thus, soil hydraulic characterization has to be considered as a fundamental tool in vineyard zoning investigation. A portable time-domain reflectometer (TDR; FieldScout TDR 300 Soil Moisture Probe, Spectrum Technologies Inc., Plainfield, IL) was used to acquire measurements of soil moisture (m3 water/m3 soil) every 2 weeks from mid-June onwards. The measurements
were taken on both the southern and the northern sides of the trunk by inserting the 20 cm rods fully into the soil. All 519 sentinel vines were used for data collection. A greater measurement depth might have been desirable, however, as mentioned, a large percentage of the grapevine rootsystems were anticipated to be in the upper ≈ 30 cm. Moreover, attempting to collect TDR measurements at a 0.5 m depth or greater in the soil type in this study (containing substantial quantities of stones) would have been impractical, and would have prevented collection of a large data set over a short time period with sufficient spatial density.
Leaf water potential (Ψ). Midday leaf Ψ was measured using the Compact Plant Water Status Console (Soil-Mois-ture Equipment Corp., Santa Barbara, CA), as described by TURNER (1988). For every sentinel vine, the leaf Ψ measu-rements were made in a 2 week cycle, on the same days as soil moisture. The leaf Ψ readings were collected on sunny days and between 10h and 16h and on two fully expanded, exposed mid-shoot leaves taken from a primary (fruiting) cane. The whole procedure, from cutting the leaf from the vine to increasing the pressure, took < 20 seconds to reduce transpiration losses, which can also be a cause of possible errors (TURNER & LONG 1980). A 134-vine subset of the sentinel vines was used for data collection.
Airborne images. Every 3 to 4 weeks in 2006 to 2008, high-resolution, low-elevation airborne images of the study site were taken by small aircraft. To take these pictures, the plane flew over the vineyard at about 1000 to 1200 m above sea level (Beamsville elevation ≈150 m). The plane was equipped with a four-lens camera which was centred on red (≈650 nm), green (≈550 nm), blue (≈450 nm) and near-infra-red ≈770 nm) wavebands, connected to a laptop for a simul-taneous image capture. The images captured had a resolution
Figure 2 - Interpolation map representing the spatial distribution of the three vine water status zones based on leaf water potential: high (blue), medium (yellow) and low (red), at Thirty Bench Vineyards, Ontario, Canada. North is oriented to the top.
Figure 2 - Carte d’interpolation représentant la distribution spatiale des trois niveaux d’état hydrique de la vigne fondés sur le potentiel hydrique foliaire : élevé (zone bleue), moyen (zone jaune) et faible (zone rouge), aux vignobles Thirty Bench à Beamsville, Ontario, Canada.
Le nord est orienté en haut.

— 264 —
of 1280 X 1024 which corresponded to a ≈ 0.36 to 0.4 m ground resolution per pixel. On 4 June 2008 at solar noon, the first pictures for that season were taken. At this point in time the vegetation was not fully developed (Fig. 3A, B). Image capture software (ENVI, ITT) was then used to create and visualize two different kinds of photos. A 3 X 3 pixel region of interest centred on each sentinel vine was chosen for data extraction. A smaller region of interest (1 X 1 pixel) captured only a portion of the grapevine canopy, whereas a 5 x 5 pixel region encompassed a portion of the cover crop. The first image depicted is the colour infrared (CIR) photo, which provides an idea of the development (vigour), the heal-thiness and the age of the actual vegetation (Fig. 3A). The energy used for this reflection is the near infrared energy (NIR). The RGB photo (red-green-blue) provided an image that represented the real colours as seen by our eyes. They were used to better find elements on the CIR images. ENVI software was used to calculate five different vegetation indi-ces (NDVI red, NDVI green, greenness ratio, stress ratio and red edge inflection point). These measures calculated the amount of “greenness”/healthiness in a particular loca-tion of the vineyard. Absorbances for different wavelengths, as shown in equations 1 to 5, were used to calculate those indices.
Leaf reflectance. The leaf reflectance is the amount of reflected light of a leaf exposed to artificial light (5 Watt halogen bulb). The leaf reflectance was measured to calcu-late vegetation indices, like with the airborne images (NDVI red/green, greenness ratio, stress ratio and red edge reflec-tion point). These indices are a good indicator of the green-ness and the healthiness of the plant. These indices were compared with those calculated from the airborne images to ground-truth the measurements. The reflectance was measu-red with a Stellarnet EPP2000 (UV-VIS-1200nm) spectro-meter (fibre-optic probe at ~45° to incident light). The spec-trometer was custom built equipment by Dr. R.B. BROWN (University of Guelph) and connected to a light-weight IBM
Thinkpad equipped with the SpectraWiz Software (Stel-larNet Inc., Tampa, FL) to collect and store the data. Leaf reflectance was measured on or around the same dates as the aerial image capture, to better compare the different results. The measures were taken for a subset of 134 sentinel vines distributed across the six study sub-blocks. The abaxial sur-faces of three fully-expanded mature leaves were measured per sentinel vine.
These different calculated indices are listed below.
NDVI red (NDVI = Normalized Differenced Vegeta-tion Index; based on red band):
€
NDVIred = NIR − RED
NIR + RED [eq. 1]
• where NIR = 760 to 780 nm; RED = 660 to 680 nm
NDVI green (based on green band):
€
NDVIgreen = NIR − GREEN
NIR + GREEN [eq. 2]
• where Green = 540 to 560 nm
Greenness Ratio (measures the greenness of the vegetation):
€
GreennessRatio = R770
R550 [eq. 3]
• where R770 = 760 to 780 nm; R550 = 540 to 560 nm
Stress Ratio (indicator of chlorophyll content)
€
StressRatio = R695
R420 [eq. 4]
• where, R695 = 695 nm; R420 = 420 nm
Figure 3 - A: Colour-infrared image, and B: Red-green-blue image of the five of six sub-blocks at Thirty Bench Vineyards, Ontario, Canada. Picture was taken on 4 June 2008. North is oriented to the top of the picture.
Figure 3 - A: : Image couleur – infra rouge, et B : image rouge-verte-bleue de cinq des six blocs aux vignobles Thirty Bench à Beamsville, Ontario, Canada. Les photographies ont été prises le 4 juin 2008. Le nord est orienté en haut.

Progrès Agricole et Viticole, 2010, 127, N°
— 265 —
Red Edge Inflection Point (REIP; indicator of chlo-rophyll content):
€
Rred _ edge = R670 + R780
2 [eq. 5]
Analysis at harvest and postharvest
Harvest date was chosen each season by the winery. The 2008 harvest began on 6 October and lasted 3 days. Before to harvest, water status interpolation maps were created based upon leaf ψ (e.g. Fig. 2). At harvest, number of clusters and yield per vine were recorded. While harvesting, 100- and 400-berry samples were taken randomly from each sentinel vine. The 100-berry samples were taken from all 519 the sentinel vines, while the 400-berry samples were taken for eventual determination of the berry monoterpenes from the subset of 134 vines used throughout the season for leaf ψ and spectral reflectance measurements. Each berry sample were placed in a labelled zip lock bag and stored at -25 °C for further analysis. During the dormant period, weight of cane prunings was collected for all 519 sentinel vines to estimate vine vigour.
Winemaking
Within each block, each sentinel vine was assigned a water status category (high, medium or low) prior to harvest based on maps created from the mean leaf Ψ data collected during the summer. Creation of three categories in each sub-block was not always possible. For example, due to the very wet 2008 summer, the leaf Ψvalues were relatively high (ca. -7 bars), and spatial variability was not extensive. In 2007, on the other hand, a severe drought caused leafΨ values to be uniformly low (ca. -13 bars). Consequently, the best compro-mise in these seasons was to designate only two water status zones per sub-block. The sentinel vines of each water status designation were harvested separately within each block and the resulting fruit was treated separately throughout the wine-making process, producing a total of 18 different experimen-tal wines (2006) or 12 different experimental wines (2007 and 2008) in three replicates each, for a total of 54 (2006) or 36 experimental wines (2007 and 2008). Harvested fruit were de-stemmed and crushed using an electric crusher de-stemmer (Criveller Co., Niagara Falls, ON) and the resulting lots of grape must were treated with 50 mg/L SO2 using a 10% solution of potassium metabisulfite. A skin maceration of the grapes was conducted for 24 hours at 6 °C, in order to increase the aroma extraction. To further enhance that extraction, Cinn-Free enzyme (Lallemand Inc., Petaluma, CA) was added to the must. The grapes were then pressed using a vertical hydraulic bladder basket press (EnoRossi, Calzalaro, Italy). During the pressing, each lot was split into three fermentation replicates. Each fermentation replicate was put into a 20-L glass carboy. The musts were stored at 5 °C for 24 hours to settle and then were racked to remove the heavy lees. The replicates were inoculated with yeast (R-HST; Lallemand, Montreal QC) at 30 g/hL immediately after racking. Fermentations took place in a controlled tem-perature room (ca. 16 °C), and were fermented to dryness. The wines were then racked and transferred into 11-L car-boys and stored in a controlled temperature room at -2°C for
cold stabilization. Occasional additions of SO2 were made until bottling for a final total SO2 of 90 to 100 mg/L.
Post-harvest analysis
Berry sample preparation and analysis. Each 100-berry and 400-berry sample was weighed to determine the mean berry weight. The frozen berry samples were then heated in 250-mL beakers to an internal temperature of 80 °C in a Fisher Scientific Isotemp 228 water bath (Fisher Scientific, Ottawa, ON) to dissolve any precipitated tartaric acid. The heated berry samples were then cooled, juiced in a laboratory juicer (Omega Products Inc., Harrisburg, PA, model 500), and an approximately 35-mL portion was clarified using a IEC Centra CL2 Centrifuge (International Equipment Co., Needham Heights, MA) to remove large particles that might cause problems with the autotitrator sampling mechanism. Soluble solids (°Brix) were measured on the unclarified berry juice samples using a temperature-compensated Abbé bench refractometer (American Optical Corp., Buffalo, NY, model 10450). The pH was measured using an Accumet pH/ion meter Model AR50 (Fisher Scientific, Ottawa, ON). Titra-table acidity (TA) was measured on 5 mL clarified samples using a Man-Tech PC-Titrate autotitrator (Man-Tech Asso-ciates Inc., Guelph, ON, model PC-1300-475). Samples were titrated to an end-point of pH 8.2 with 0.1 N NaOH solution. Results were expressed as tartaric acid equivalents (g/L). Monoterpenes were analyzed for the 400-berry samples using the method developed by DIMITRIADIS & WILLIAMS (1984) as modified by REYNOLDS & WARDLE (1989a). The free volatile terpene (FVT) and potentially-volatile terpene (PVT) concentrations were expressed as mg/kg.
Wine sample preparation and analysis. Individual 250-mL samples of each wine replicate were taken at the end of fermentation and stored in high density polyethylene bottles at -25 oC for later analysis of pH, TA, monoterpenes and ethanol. Defrosted wine samples were heated to 50 oC in a Fisher Scientific Isotemp 210 water bath to re-dissolve the tartrates, and shaken frequently to enhance the dissolution of the tartrates during heating, but were not opened in order to prevent the loss of any volatile components such as ethanol and monoterpenes. After the tartrates were completely dis-solved, the bottles were cooled to room temperature before analysis. A 5-mL aliquot of each wine sample was removed and placed into a glass vial with a Teflon-lined cap for future ethanol analysis by gas chromatography. The pH of each of these samples was measured using an Accumet Model 25 pH/ion meter. A portion of each wine sample, ≈ 30 to 40 mL, was centrifuged and then analyzed for TA using a Man-Tech PC-Titrate autotitrator as previously described for berry samples. Two, 100-g aliquots of each wine sample were wei-ghed into individual 250-mL glass beakers for monoterpene analysis. These wine samples were subjected to the same dis-tillation procedure for monoterpenes as the berry homoge-nate samples. Colorimetric analysis was also similar, with an extra step required to remove interferences due to compounds in the FVT distillate sample. DIMITRIADIS & WILLIAMS (1984) indicated that trans-hex-2-en-1-ol could contribute to elevated FVT values, while BENOTEAU & REYNOLDS (1994) showed that 2-hexen-1-al and other saturated C6 com-pounds could interfere with FVT as well. SCHLOSSER (2002) also indicated that ethanol can interfere with FVT. In order

— 266 —
to remove these interferences, the wine FVT samples were subjected to a solid-phase extraction procedure (REYNOLDS et al. 2007b).
Statistical analysis
The SAS statistical package (SAS Institute, Cary, NC) was used for all statistical analysis. Analysis of variance (ANOVA) was used to analyze zonal effects on yield com-ponents, berry weight, berry, must and wine composition, and to detect differences due to vine water status. Results were also subjected to principal component analysis (PCA). Correlations were also determined between soil composi-tion, soil texture, yield components and berry composition for all vintages. MapInfo and Vertical Mapper were used to construct maps of soil texture and composition, yield com-ponents, vine size and berry composition.
RESULTS AND DISCUSSION
Differences between sub-blocks
In order to determine whether differences in the vineyard could be discerned by airborne imaging, it first needed to be established that there were indeed differences within the vineyard between the designated sub-blocks. The data pre-sented here suggest that there were differences between the six sub-blocks in terms of soil composition and leaf Ψ, soil moisture, yield and berry composition. These differences were illustrated using both statistical analyses such as ANO-VA for the data between and within sub-blocks, and by using interpolation maps of the data. The ANOVA results had the advantage of providing calculated means for each block or sub-zone, while the interpolation maps provided an overall view of the study site with regions of difference spatially represented.
Correlations. The data set used for the statistical analy-sis included 18 variables: soil texture and composition, field measurements (collected during summer and at harvest), berry composition, and the vegetation indices calculated from the ground leaf reflectance. A correlation matrix was gene-rated from this data set (Table 1). One variable, stress ratio, (R695/R420; eq. 4) was not included due to high variability in the data. Thereafter, a two-way ANOVA was conducted on the 18 variables in the data set to determine whether there were differences between sub-blocks or between the sub-zones of high, medium and low water status (within each sub-block) across the vineyard, and if there were interactions between the sub-blocks and the sub-zones, which would indi-cate that there was variation within the sub-blocks.
In the correlation matrix, Brix was inversely correlated to yield in 2008. Yield was also negatively correlated with soil moisture, which was correlated with the clay content on the soil, and inversely correlated with % sand in the soil. One can assume that the clay will affect the water holding capa-city of the soil, increasing the soil moisture. Soil moisture might have an influence on berry development and matu-rity, since a negative correlation between soil moisture and TA was apparent (COIPEL et al. 2006; KOUNDOURAS et al. 2006). This is supported by the inverse correlations between yield and soil moisture, and between yield and Brix. Fur-thermore, the soil moisture was correlated with CEC and soil pH, which confirms observations of VAN LEEUWEN & SEGUIN (2006) and COIPEL et al. (2006).
Analysis of variance. Since not all variables were measured for all vines, ANOVA was performed in groups based on the number of observations for each variable. For soil texture and composition, leaf Ψ, and the four vegeta-tion indices, the ANOVA was performed for N = 134. For soil moisture, yield components, and berry composition, the ANOVA was run for N = 495. The entire number of sentinel vines (519) could not be used because some vines contained
Table 1 - Correlation matrix (Pearson) and p-values for 18 berry variables including soil moisture and leaf water potential, and four vegetation indices, at a 10 hectare site at Thirty Bench Vineyards in Beamsville, Ontario, Canada in 2008. Significant correlations (α =
0.05) are indicated by values in bold-face type and are shaded in yellow. N=134 & N=495. Abbreviations: CEC: Cation exchange capacity; OM: Organic matter; SM: Soil moisture; LWP: Leaf water potential; GR: Greenness ratio; REIP: Red-edge inflection point.
Tableau 1 - . Matrice de corrélation (Pearson) et valeurs de p pour les 18 variables relatives au raisin, à l’humidité du sol et au potentiel hydrique foliaire, et aux quatre indices de végétation sur le site de 10 ha aux vignobles Thirty Bench à Beamsville, Ontario, Canada, en
2008. Les corrélations significatives (α = 0,05) sont indiquées par des caractères gras et un fond jaune. N = 134 & N = 495. Les abréviations : CEC = Capacité d’Echange en Cations ; OM = Matière Organique ; SM= Humidité du Sol ; LWP = Potentiel Hydrique
Foliaire ; GR = Rapport de Verdeur ; REIP = Point d’Inflexion de Limite du Rouge.

Progrès Agricole et Viticole, 2010, 127, N°
— 267 —
little or no fruit and were therefore omitted from berry analy-sis in 2008. A post-ANOVA test was then conducted to deter-mine whether significant differences occurred between sub-block and sub-zone divisions (Tables 2 and 3). The Fisher Least Significant Difference (LSD) was used to determine which sub-blocks (Table 2) or water status sub-zones (Table 3) were part of the same homogeneous group. Post-ANOVA testing was also performed for the block x sub-zone interac-tions (Table 4).
Between sub-block comparison suggested that there were substantial differences between sub-blocks (Table 2). Wooden post low vigour block was lowest in % sand, yield, and clusters per vine, and highest in % clay, CEC, soil pH, and soil moisture. The Steel Post high vigour block contai-ned highest % sand and organic matter and lowest % clay and soil moisture. The Triangle sub-block also had relatively low soil moisture but highest yield, clusters per vine, and Brix. Comparison between the three water status sub-zones (based on leaf Ψ) across all sub-blocks (Table 3) indicated that the high water status zones had slightly higher soil pH and berry
weight and also highest soil moisture; however, soil moisture in the lowest water status zone was higher (16.1 %) than in the medium sub-zones (14.7 %). This lack of a close rela-tionship between soil moisture and leaf Ψ might be due to the high clay content in the soil, which has the capability of holding substantial soil moisture, but near wilting point (13.3 % for this soil series); consequently, under such circumstan-ces, leaf water ψ would be relatively low.
Despite use of six different sub-blocks, we can consider in reality that there were four main regions, with two of them divided into two different sub-regions. This was the case for Wooden Post and Steel Post blocks, both of which were split in late 2005 into two different vigour zones. The viticultu-ral reality of some of these sub-blocks may be considered somewhat ephemeral, since the only differences between the Wooden Post and Steel Post sub-blocks were minor differen-ces in vine age and trellis construction. Similarly, the Les Erables sub-block was located to the south of the Wooden Post sub-blocks and was entirely contiguous with them; its only possible uniqueness was proximity to the arboreal area
Table 2 - Fisher least squares difference test results for 11 significantly different attributes for six vineyard blocks at a 10 hectare site at Thirty Bench Vineyards in Beamsville, Ontario, 2008. α= 0.05. Means within rows followed by different letters are significantly different,
α = 0.05.Tableau 2 - Résultats du test de Fisher de la différence des moindres carrés pour 11 attributs significativement différents pour six blocs de
vignoble sur le site de 10ha aux vignobles Thirty Bench à Beamsville, Ontario, Canada, en 2008. α = 0,05. Les moyennes dans les lignes avec des lettres différentes sont significativement différentes au seuil de α = 0,05.
Table 3 - Fisher least squares difference test results for four significantly different attributes for three water status sub-zones (based on leaf water potential) within six vineyard sub-blocks at a 10 hectare site at Thirty Bench Vineyards in Beamsville, Ontario, Canada in 2008.
Means followed by different letters are significantly different, α = 0.05.Tableau 3 - Résultats du test de Fisher de la différence des moindres carrés pour 4 attributs significativement différents pour trois sous-
zones d’état hydrique (basé sur le potentiel hydrique foliaire) dans six sous-blocs de vignoble sur le site de 10 ha aux vignobles Thirty Bench à Beamsville, Ontario, Canada, en 2008.
Les moyennes avec des lettres différentes sont significativement différentes au seuil de α = 0,05.
— 268 —
to the south. Nonetheless, it appeared of value to compare the two Wooden Post sub-blocks with one another, and the two Steel Post sub-blocks as well. The two high vigour zones in the Wooden Post and Steel Post regions had substantially higher yields than their companion low vigour zones. Steel Post high vigour was on average the highest yielding block of the four at about 5.8 kg per vine (2008), but not highest of all of the other blocks: Triangle had the highest yield in 2008, with 6.1 kg per vine. Wood Post low vigour was on average the lowest-yielding block, at about 4.1 kg per vine, which was lower than Les Erables at 4.8 kg per vine.
Unfortunately, there were no differences in the leaf ψ of the vines across the six sub-blocks in 2008. This was due to the fact that 2008 was a very wet year, with precipitation much higher than normal. However, there were sub-block differences in soil moisture. As to berry composition, sub-blocks differed in terms of Brix. The other components, TA and pH, were not different between sub-blocks in 2008.
Differences between water status sub-zones within sub-blocks
Within-sub-block variations for the 10 variables that were found significantly different for the sub-block x sub-
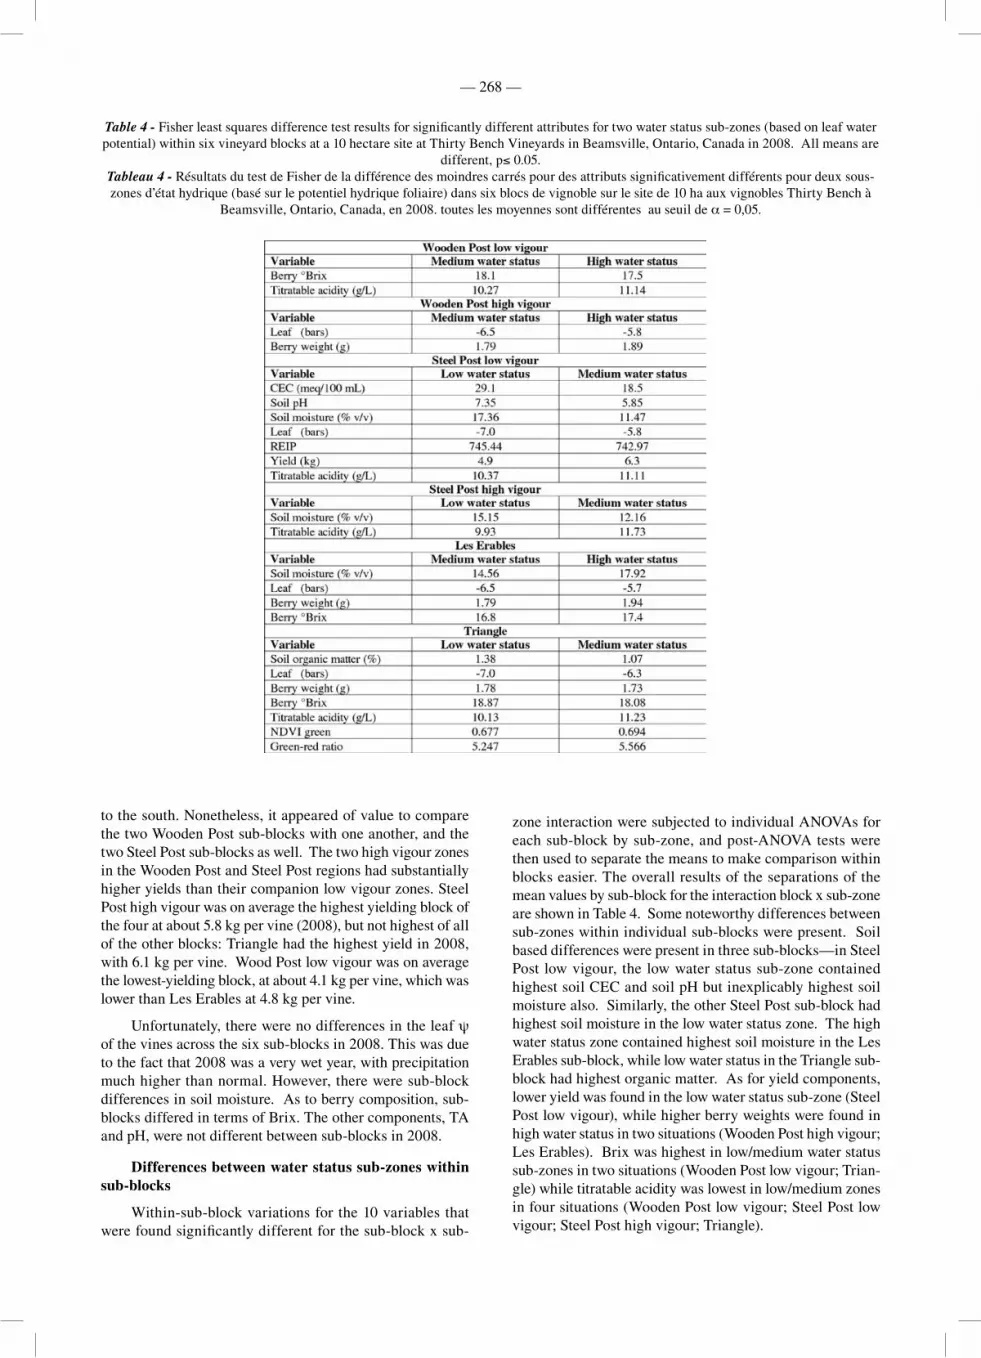
zone interaction were subjected to individual ANOVAs for each sub-block by sub-zone, and post-ANOVA tests were then used to separate the means to make comparison within blocks easier. The overall results of the separations of the mean values by sub-block for the interaction block x sub-zone are shown in Table 4. Some noteworthy differences between sub-zones within individual sub-blocks were present. Soil based differences were present in three sub-blocks—in Steel Post low vigour, the low water status sub-zone contained highest soil CEC and soil pH but inexplicably highest soil moisture also. Similarly, the other Steel Post sub-block had highest soil moisture in the low water status zone. The high water status zone contained highest soil moisture in the Les Erables sub-block, while low water status in the Triangle sub-block had highest organic matter. As for yield components, lower yield was found in the low water status sub-zone (Steel Post low vigour), while higher berry weights were found in high water status in two situations (Wooden Post high vigour; Les Erables). Brix was highest in low/medium water status sub-zones in two situations (Wooden Post low vigour; Trian-gle) while titratable acidity was lowest in low/medium zones in four situations (Wooden Post low vigour; Steel Post low vigour; Steel Post high vigour; Triangle).
Table 4 - Fisher least squares difference test results for significantly different attributes for two water status sub-zones (based on leaf water potential) within six vineyard blocks at a 10 hectare site at Thirty Bench Vineyards in Beamsville, Ontario, Canada in 2008. All means are
different, p≤ 0.05.Tableau 4 - Résultats du test de Fisher de la différence des moindres carrés pour des attributs significativement différents pour deux sous-zones d’état hydrique (basé sur le potentiel hydrique foliaire) dans six blocs de vignoble sur le site de 10 ha aux vignobles Thirty Bench à
Beamsville, Ontario, Canada, en 2008. toutes les moyennes sont différentes au seuil de α = 0,05.

Progrès Agricole et Viticole, 2010, 127, N°
— 269 —
Overall, there were clear differences in leaf ψ between sub-zones, and also differences in water status sub-zones within individual sub-blocks. Since the water status sub-zones in each block were chosen using interpolation maps based on leaf ψ data collected during the growing season, it is perhaps no surprise that both the statistical analyses and interpolation maps showed these water status sub-zones to be different with respect to leaf ψ data. However, these leaf ψ differences between each water status sub-zone were rela-tively low in magnitude; in 2008, this may have been due to the very wet conditions. There were also few differences between the sub-blocks that season in terms of leaf ψ. Nor-mally, mean leaf ψ values range between -9 and -13 bars rather than the -6 to -7 bars measured in 2008. The medium and low water status sub-zones also generally showed lower mean berry weights.
Spatial variability
Although ANOVA with a Fisher LSD separation is a useful tool for analyzing data, spatial representations have the advantage of illustrating relationships between regional variations. Thus, interpolation maps showing the different levels of a single variable across the six vineyard sub-blocks were constructed using GIS software. Even if these maps give the impression that the sub-zone information was lost, the overall spatial variability of that variable throughout the vineyard is more apparent, showing a better relationship between the geo-location of the vines and their characteris-tics for the studied variables.
Soil moisture and leaf water potential (Fig. 4). Fig. 4 provides some indication of the degree of spatial variabi-lity between the sub-blocks in terms of both soil moisture
Figure 4 - Map of soil moisture (% v/v) and leaf water potential across six vineyard sub-blocks at Thirty Bench vineyards in Beamsville Ontario, 2006 to 2008. North is oriented to the top. A to C: soil moisture 2006, 2007, and 2008, respectively; D to F: leaf water potential, 2006, 2007, and 2008, respectively. Orange-shaded areas near the right of each map are those with highest values; blue zones near the left
are lowest in value.Figure 4 - Carte d’humidité du sol (% v/v) et de potentiel hydrique foliaire sur les six sous-blocs de vignoble aux vignobles Thirty Bench à Beamsville, Ontario, Canada, en 2008. Le nord est orienté en haut. A à C : humidité du sol en 2006, 2007, et 2008, respectivement ; D à F : potentiel hydrique foliaire en 2006, 2007, et 2008, respectivement. Les zones en orange à la droite de chaque carte ont les valeurs les plus
élevées ; les zones bleues près de la gauche sont les plus faibles en valeur.

— 270 —
and leaf ψ, as well as the temporal stability in both of the-se variables. The Triangle block in particular as well as a substantial portion of the Steel Post block tended to have considerably lower mean soil moisture throughout each of the three growing seasons. On the other hand, the Wooden Post and Les Erables blocks consistently displayed highest soil moisture levels. Leaf ψ also tended to be lowest in both the Triangle and most of the Steel Post blocks in each of the three growing seasons. The Wooden Post and Les Erables blocks were consistently highest in terms of leaf ψ.
Yield components and berry composition. Spatial variability also was clear amongst other variables, including yield components, berry composition, and the various spec-tral reflectance variables. Yield generally was highest in the Triangle sub-block and lowest in portions of the Wooden Post sub-block (data not shown). Berry weight appeared to be lowest in Triangle in 2007 and 2008 (data not shown). Brix was highest in Triangle in all 3 years and TA was lowest in that sub-block in 2 of 3 seasons (data not shown). The PVT and NDVI green spatial patterns were somewhat inconclu-
sive in 2006 and 2007; the reflectance data from the Triangle and Les Erables sub-blocks were not collected in the 2006 and 2007 seasons (Fig. 5). However, there were clear spa-tial relationships between these variables in 2008 (Fig. 5), as well as between PVT and REIP, NDVI red, and greenness ratio (data not shown). Images processed from remotely-sensed NDVI data in 2008 suggested spatial relationships existed between these data and PVT (Fig. 5C,5F) as well as between remotely-accessed NDVI and both soil moisture and leaf ψ (see Fig. 4) as well as variables such as yield, clusters per vine, and weight of cane prunings (data not shown).
Principal components analysis of berry data
Another way to show the significance of a variable for a sub-block is to conduct principal components analysis (PCA) of the different variables plotted on the same graph as the different blocks. Three different PCAs were performed: one for the variables that were significantly different between sub-blocks; the second for those that were significantly dif-ferent between the three water status sub-zones, and the third
Figure 5. - Map of potentially-volatile terpenes (PVT; mg/L) and NDVI green across six vineyard sub-blocks at Thirty Bench vineyards in Beamsville ON, 2006 to 2008. North is oriented to the top. A to C: PVT, 2006, 2007, and 2008, respectively; D to F: NDVI green, 2006,
2007, and 2008, respectively. Inset in Fig 5F depicts spatial map of remotely-accessed NDVI green data. Orange-shaded areas near the right of each map are those with highest values; blue zones closer to the left are lowest in value.
Figure 5 - . Carte des Terpènes Volatils Potentiels (PVT ; mg/l) et du NDVI vert sur les six sous-blocs de vignoble aux vignobles Thirty Bench à Beamsville, Ontario, Canada, de 2006 à 2008. Le nord est orienté en haut. A à C : PVT,en 2006, 2007, et 2008, respectivement ;
D à F : NDVI vert, en 2006, 2007, et 2008, respectivement. L’insertion dans la figure 5F dépeint la carte spatiale des données de NDVI vert obtenues par télédétection. Les zones en orange près de la droite de chaque carte ont les valeurs les plus élevées ; les zones bleues près de la
gauche sont les plus faibles en valeur.

Progrès Agricole et Viticole, 2010, 127, N°
— 271 —
for significant interactions that occurred between block X sub-zone (Fig. 6). The PCA by sub-block was done with a total of 11 variables, only four variables for the PCA by sub-zone, and 10 variables for the PCA for the block x sub-zone interaction (Fig. 6).
The PCA for delineation of the sub-zones showed that there was a link between the low and the medium water status sub-zones, and both were clearly separated from the high water status areas. In the PCA for delineation of the sub-block x sub-zone interactions, the Triangle and Wood Post low vigour sub-zones clustered together, indicating that within a sub-block the differences between sub-zones were minor. Wooden Post high vigour, Steel Post low vigour and Steel Post high vigour sub-zones were somewhat scattered, indicating more significant differences within, while Les Erables showed the most scatter, with the two water status sub-zones on the opposite side of the origin of the graph.
The Wooden Post and Steel Post sub-blocks were divi-ded at the beginning of the project, in 2005, into two putative vigour zones, high and low, depending on observations made with airborne imagery. However, in the first PCA used to discriminate between sub-blocks, it was apparent that there were no actual differences between the putative high and low vigour sub-blocks when all variables were considered. This may be due to the fact that in 2005, some incipient win-ter damage was still evident in this vineyard, and it is quite possible that putative low vigour zones were in reality areas of substantial winter injury. There were, however, apparent separations between other sub-blocks. The factor pattern suggested that the Triangle and Les Erables blocks differed substantially in soil moisture, yield, clusters and berry wei-
ght. The Triangle block had the highest berry Brix, num-ber of clusters and yield, and lowest berry weight. The Les Erables block had the highest berry weight, Wooden Post low vigour the highest soil moisture and the lowest yield and number of clusters. The Steel Post high vigour sub-block had the lowest soil moisture and the lowest berry Brix.
Correlations between NDVI and other variables
The correlation matrix (Table 1) indicated that the three vegetation indices (NDVI green, greenness ratio and REIP) were highly correlated with most of the other variables. Exceptions were % sand, % silt, CEC, berry TA and berry Brix. An examination of the interpolation maps and regres-sion curves of the yield and the vegetation index NDVI green also showed strong correlations (Fig. 7A). Similarities with the contours in the six blocks were apparent. Clear spatial relationships were present between NDVI green (Fig. 7B; and NDVI red—see inset) and both yield (Fig. 7C) and weight of cane prunings (Fig. 7D). Similar regression curves were observed between the other three vegetation indices (NDVI red, REIP, greenness ratio) and variables such as yield. In general, REIP correlated with the most variables, followed by NDVI green and greenness ratio. The least number of correlations were found with NDVI red. The vegetation indi-ces calculated from the spectrometer data were generally in agreement with other studies in which higher vigour zones had higher values of NDVI red, NDVI green and green-ness ratio (HALL et al. 2003, MARGUERIT et al. 2006). An exception was the NDVI red vegetation index, since no con-sistent correlations with yield could be found. Unfortunately the airborne pictures have not yet been fully processed and the vegetation indices have not yet been calculated out of
Figure 6 - Principal components analysis for the mean values of 10 variables and 12 vineyard sub-block x sub-zones combinations at a 10 hectare site at Thirty Bench Vineyards in Beamsville, ON in 2008. Abbreviations for block designations: WPY: Wooden Post yellow (high vigor); WPB: Wooden Post blue (low vigor); SPY: Steel Post yellow (high vigor); SPB: Steel Post blue (high vigor); LE: Les Erables; TR: Triangle. Abbreviations for sub-zone designations: Low WS: low water status; Medium WS: medium water status; High WS: high water
statusFigure 6 - Analyse en Composantes Principales pour les valeurs moyennes des 10 variables et des 12 combinaisons sous-blocs de vignoble
x sous-zones sur le site de 10 ha aux vignobles Thirty Bench à Beamsville, Ontario, Canada, en 2008. La dénomination des blocs est la suivante : WPB = Wooden Post Blue (faible vigueur), WPY = Wooden Post yellow (forte vigueur), SPB = Steel Post Blue (faible vigueur), SPY = Steel Post Yellow (forte vigueur), LE = Les Erables, TR = Triangle. La dénomination des sous-zones est : Low WS = état hydrique
déficitaire ; Medium WS = état hydrique moyen ; High WS = état hydrique sans déficit.

— 272 —
these images. Therefore, up to date few comparisons have been possible between the spectrometer-calculated and the airborne image- calculated vegetation indices.
CONCLUSIONS
The six vineyard sub-blocks were shown to be diffe-rent from each other for almost all the variables measured. However, the designation of low and high vigour blocks for the Wooden Post and Steel Post blocks may have been nomi-nal at best, since there were no large inter-block differences found in the 2008 season. Subdivisions within blocks by vine water status were shown to be appropriate, although at only two levels in 2007 and 2008, high and low, rather than three as originally suggested. Generally, the two water status sub-zones within any given sub-block had similar charac-teristics. We found that sub-blocks containing medium or low water status sub-zones had higher yields (perhaps due to smaller vines and enhanced fruitfulness), whereas the sub-blocks containing medium and high water status sub-zones had higher soil moisture and a higher proportion of clay in their soil. The NDVI green and the greenness ratio showed high correlations with most of the variables, except the silt
content of the soil, CEC, berry Brix and titratable acidity. NDVI red showed almost no correlations with other varia-bles. Once the airborne pictures have been fully processed, and the vegetation indices are calculated out of these images, then comparisons will be possible between the spectrome-ter-calculated and the airborne image- calculated vegetation indices. Therefore, more conclusions should then be availa-ble by comparing these variables to the others collected.
Data collection began in 2006 and was completed at the end of 2009. This article has focused primarily on the 2008 season. With 4 full years of data, we should have a reaso-nable idea whether airborne spectral measurements might provide a consistent estimate of relevant fruit composition variables such as FVT and PVT of the berries, as well as simpler measurements such as Brix and titratable acidity. Should such relationships be demonstrated, it is possible to use airborne imagery for the delineation of premium quality sub-blocks.
LITERATURE CITED
ASSELIN C., MORLAT R., LÉON H., ROBICHET J., REMOUÉ M. & SALETTE J., 1983. Méthode d’analyse sensorielle adaptée à la caractérisation des vins rouges issus de terroirs différents. Sciences des Aliments 3: 245-263.
Figure 7 - A: Regression curve (r = 0.93) for the correlation between the NDVI green and yield, at a 10 hectare site at Thirty Bench Vineyards in Beamsville, ON in 2008. B: Spatial variation in NDVI green (inset: NDVI red). C: Spatial variation in yield. D: Spatial
variation in weight of cane prunings.Figure 7 - A : courbe de régression (r = 0,93) entre le NDVI vert et le rendement, sur le site de 10 ha aux vignobles Thirty Bench à
Beamsville, Ontario, Canada, en 2008.B : variation spatiale du NDVI vert (insertion : NDVI rouge). C : variation spatiale du rendement. D : variation spatiale du poids des bois de taille (expression végétative).
Progrès Agricole et Viticole, 2010, 127, N°
— 273 —
BENOTEAU G. & REYNOLDS A.G., 1994. Interfering substances in the colorimetric quantitation of grape monoterpenes. HortScience 29: 1181-1182.
BOYER J. & WOLF T., 2000. GIS and GPS aid the exploration of viticul-tural potential in Virginia. Vineyard & Winery Management 26(6): 48-54.
BRAMLEY R.G.V., 2005. Understanding variability in winegrape pro-duction systems. 2. Within vineyard variation in quality over several vintages. Austral. J. Grape and Wine Research 11: 33-42.
BRAMLEY R.G.V. & HAMILTON R.P., 2004. Understanding variabi-lity in winegrape production systems. 1. Within vineyard variation in yield over several vintages. Austral. J. Grape and Wine Research 10: 32-35.
CHONE X., VAN LEEUWEN C., DUBOURDIEU D. & GAUDILLE-RE, J.-P., 2001. Stem water potential is a sensitive indicator of gra-pevine water status. Annals of Botany, 87: 477-483.
COIPEL J., RODRIGUEZ LOVELLE B., SIPP C. & VAN LEEUWEN C., 2006. “Terroir” effect, as a result of environmental stress, depends more on soil depth than on soil type (Vitis vinifera L. cv. Grenache Noir, Côtes du Rhône, France, 2000). J. Int. Sci. Vigne Vin 40: 177-185.
DE ANDRES-DE PRADO R., YUSTE-ROJAS M., SORT X., ANDRES-LACUEVA C., TORRES M. & LAMUELA-RAVEN-TOS, R.M. 2007. Effect of soil type on wines produced from Vitis vinifera L. cv. Grenache in commercial vineyards. J. Agric. Food Chem., 55: 779-786.
DIMITRIADIS E. & WILLIAMS P.J., 1984. The development and use of a rapid analytical technique for estimation of free and potentially volatile monoterpene flavorants of grapes. Am. J. Enol. Vitic. 35: 66-71.
FISCHER U., ROTH D. & CHRISTMANN M., 1999. The impact of geographic origin, vintage and wine estate on sensory properties of Vitis vinifera cv. Riesling wines. Food Quality and Preference 10: 281-288.
GLADSTONES J., 1992. Viticulture and Environment. Winetitles, Ade-laide, Australia.
HALL A., LOUIS J. & LAMB D., 2001. A method for extracting detailed information from high resolution multispectral images of vineyards. Proceedings of the 6th International Conference of Geocomputation, University of Queensland, Brisbane, Australia.
HALL A., LAMB D.W., HOLZAPFEL B. & LOUIS J., 2002. Opti-cal remote sensing applications in viticulture – a review. Austral. J. Grape and Wine Research 8: 36-47.
HALL A., LOUIS J. & LAMB D., 2003. Characterising and mapping vineyard canopy using high-spatial-resolution aerial multispectral images. Computers & Geosciences 29: 813- 822.
HAYNES S.J., 2000. Geology and wine 2. A geological foundation for terroirs and potential sub-appellations of Niagara Peninsula wines, Ontario, Canada. Geoscience Canada 27: 67-87.
JOHNSON, L.F., 2003. Temporal stability of an NDVI-LAI relationship in a Napa Valley vineyard. Austral. J. Grape and Wine Res., 9: 96-101.
JOHNSON L.F., BOSCH D.F., WILLIAMS D.C. & LOBITZ B.M., 2001. Remote sensing of vineyard management zones: Implications for wine quality. Applied Engineering in Agriculture 17: 557-560.
JOHNSON, L., LOBITZ, B., ARMSTRONG, R., BALDY, R., WEBER, E., DE BENEDICTIS, J. AND BOSCH D. 1996. Airborne ima-ging aids vineyard canopy evaluation. California Agriculture, 50(4): 14-18.
KOUNDOURAS S., MARINOS V., GKOULIOTI A., KOTSERIDIS Y. & VAN LEEUWEN C., 2006. Influence of vineyard location and vine water status of fruit maturation of nonirrigated cv. Agiorgitiko (Vitis vinifera L.). Effects on wine phenolic and aroma compounds. J. Agric. Food Chem. 54: 5077-5086.
LAMB D.W., HALL A. & LOUIS J., 2002. Airborne remote sensing of vines for canopy variability and productivity. Australian Grape-grower and Winemaker 449a:89-92.
LAMB D.W, WEEDON, M.M. & BRAMLEY R.G.V., 2004. Using remote sensing to predict grape phenolics and colour at harvest in a Caberent Sauvignon vineyard: Timing observations against vine phenology and optimising image resolution. Austral. J. Grape and Wine Res., 10: 46-54.
MARGUERIT E., COSTA FERREIRA A.-M., AZAÏS C., ROBY J.-PH., GOUTOULY J.-P., GERMAIN CH., HOMAYOUNI S. & VAN LEEUWEN C., 2006. La télédétection à haute résolution pour spatialiser les variations intra-parcellaires de la vigueur de la vigne. VIème Congrès International des Terroirs Viticoles 2006, pp. 286-291.
MORLAT R. & BODIN F., 2006A. Characterization of viticultural ter-roirs using a simple field model based on soil depth- I. Validation of the water supply regime, phenology and vine vigour in the Anjou vineyard (France). Plant and Soil, 281: 37-54.
MORLAT R. & BODIN F., 2006B. Characterization of viticultural ter-roirs using a simple field model based on soil depth - II. Validation of the grape yield and berry quality in the Anjou vineyard (France). Plant and Soil, 281: 55-69.
MORRIS, J. 2001. Precision viticulture—A mechanized systems approach. In: Proceedings of Space Age Winegrowing (REYNOLDS A.G., Ed.). Amer. Soc. Enol. Vitic./ Esatern Section, pp. 103-110.
REYNOLDS A.G. & DE SAVIGNY C., 2001. Use of GPS and GIS to determine the basis for terroir. In Proceedings of Space Age Wine-growing (REYNOLDS A.G., Ed.). Amer. Soc. Enol. Vitic./ Eastern Section, pp. 79-102.
REYNOLDS A.G., LOWREY W.D., TOMEK L., HAKIMI J. & DE SAVIGNY C., 2007A. Influence of irrigation on vine performance, fruit composition and wine quality of Chardonnay in a cool, humid climate. Am. J. Enol. Vitic. 58: 217-228.
REYNOLDS A.G., SENCHUK I.V., VAN DER REEST C. & DE SAVI-GNY C., 2007B. Use of GPS and GIS for elucidation of the basis for terroir: Spatial variation in an Ontario Riesling vineyard. Am. J. Enol. Vitic. 58: 145-162.
REYNOLDS A.G. & WARDLE D.A., 1989A. Impact of several canopy manipulation practices on growth, yield, fruit composition, and wine quality of Gewurztraminer. Am. J . Enol. Vitic. 40: 121-129.
REYNOLDS A.G. & WARDLE D.A., 1989B. Influence of fruit microcli-mate on monoterpene levels of Gewurztraminer. Am. J. Enol. Vitic. 40: 149-54.
RODRIGUEZ-PÉREZ J.R., RIAÑO D., CARLISLE E., USTIN S. & SMART D.R., 2007. Evaluation of hyperspectral reflectance indices to detect grapevine water status in vineyards. Am. J. Enol. Vitic. 58: 302-317.
SCHLOSSER J., 2002. The effect of viticultural & oenological treatments on fruit and wine composition of Chardonnay musqué. MSc. Thesis, Brock University, 175 pp.
SCHULTZ H.R., 2005. Entwicklung der Weinanbautechnik: Warum Prä-zisionsweinbau?. Das Deutsche Weinbaumagazin 10: 30-33.
SEGUIN G., 1986. “Terroirs” and pedology of wine growing. Experientia 42: 861-873.
STAMATIADIS S., TASKOS D., TSADILAS C., CHRISTOFIDES C., TSADILA E. & SCHEPERS J.S., 2006. Relation of ground-sensor canopy reflectance to biomass production and grape color in two Merlot vineyards. Am. J. Enol. Vitic. 57: 415-422.
TAYLOR H.J.G., 2002. Creating a definition of Niagara terroir based upon chemical and sensory descriptive analysis of Chardonnay wines produced from different soil textures and vine sizes. Undergraduate Thesis, Brock University, St Catharines, ON.
TOMASI D., CALÒ A., BISCARO S., VETTORELLO G., PANERO L. & DI STEFANO R., 1999. Influence des caractéristiques physi-ques du sol, sur le développement de la vigne, dans la composition polyphénolique et anthocyanique des raisins et la qualité du vin de Cabernet Sauvignon. Bulletin de L’O.I.V. 819-820: 321-337.

— 274 —
TOMASI D., SIVILOTTI P., PASCARELLA G., RASERA M. & CALO A., 2005. Soil moisture: An indicator of zoning and wine quality also in small farm surfaces. Bulletin de l’O.I.V. 893-894: 447-459.
TURNER, K., 2001. Integrating remote sensing data with a GIS applica-tion for precision agriculture customers. In: Proc. 21st Annual ESRI Users Conference, ESRI, Redlands, CA.
TURNER N.C., 1988. Measurement of plant water status by the pressure chamber technique. Irrig Sci 9: 289-308.
TURNER N.C. & LONG M.J., 1980. Errors arising from rapid water loss in the measurement of leaf water potential by the pressure chamber technique. Aust. J. Plant Physiol., 7: 257.
VAN LEEUWEN C. & SEGUIN G., 2006. The concept of Terroir in viticulture. J. Wine Research 17: 1-10.
VAN LEEUWEN C., FRIANT PH., CHONÉ X., TREGOAT O., KOUNDOURAS S. & DUBOURDIEU D. 2004. Influence of cli-mate, soil and cultivar on terroir. Am. J. Enol. Vitic. 55: 207-217.
Le numéro 992 de la revue Chambres d’agriculture consacre son dossier central aux «Défis de la réforme de la PAC après 2013».
La prochaine réforme de la PAC entrera en vigueur en janvier 2014. Son contenu n’est pas encore défini, mais fait l’objet de débats depuis déjà plusieurs années. Les Chambres d’agriculture ont ainsi mené une réflexion à l’échelon natio-nal et régional sur les leviers à privilégier dans le cadre de l’après 2013.
Après un bref rappel du contexte dans lequel s’insère ce débat, leurs analyses et leurs propositions convergent vers un objectif transversal : Conforter la performance économique durable de la chaîne alimentaire:
Cet objectif se décline en 6 grands chapitres :- garantir une alimentation de qualité pour tous,- réguler les marchés et agir sur les prix,- faire face aux aléas climatiques et économiques,- promouvoir la recherche et le développement,- maintenir une production compétitive sur l’ensemble
du territoire,- fixer la valeur ajouter dans les territoires.
En amont du prochain débat budgétaire européen, elles entendent ainsi peser de toute de leur influence pour que le futur budget permette une politique agricole forte et tournée vers l’avenir.
VIENT DE PARAITRE :
DÉFIS DE LA RÉFORME DE LA PAC APRÈS 2013
Egalement dans ce numéro
Economie Agricole
Commerce extérieur agro-alimentaire : Un décrochage inquiétant
L’année 2009 s’est achevée sur une forte contraction de l’excédent agro-alimentaire de la France. Si les répercussions très négatives de la crise économique et financière en four-nissent une explication, ceci ne masque pas le fait que notre pays enregistre, depuis près d’une décennie, une érosion inquiétante de ses parts de marché
Forêt
Vers une politique forestière régionale concertée
Les bonnes relations entre l’ensemble des partenaires et des acteurs de la forêt en Franche-Comté ont permis de valider la mise en place d’un Comité d’orientation forêt au niveau de la Chambre régionale d’agriculture.
Pour toute commande, s’adresser à
APCAPôle Communication - Promotion - Tourisme
Candice Puillon - 9, avenue George V - 75008 ParisTél. : 01 53 57 11 44 - fax : 01 53 57 10 04
L’Institut d’œnologie de Bordeaux (ISVV) publie pour la première fois les résultats à 12 mois d’une étude unique au monde sur l’influence du packaging dans la conservation du vin.
Afin d’en savoir plus sur comment les vins rouges et blancs vieillissent dans la bouteille en verre, la bouteille en PET mono et multi et le bag-in-box, vous pouvez consulter le dossier de presse et la présentation en PJ.
Pour télécharger les visuels en haute définition, rendez-vous sur http://gallery.me.com/calbantine#100071 et sélec-
VIENT DE PARAITRE :
RÉSULTATS À 12 MOIS D’UNE ÉTUDE UNIQUE AU MONDE SUR L’INFLUENCE
DU PACKAGING DANS LA CONSERVATION DU VIN
tionnez votre photo, puis cliquez sur l’icône avec la flèche pour la télécharger.
Bonne lecture et n’hésitez pas à contacter pour obtenir plus d’informations.
Camille LecatCalbantine pour l’ISVV Tel +33 (0) 478 24 54 13

CARBONNEAU A. — Chronique — Au charbon ! ....................................................................................................... 257 L’intérêt du charbon de bois dans les sols en rapport avec l’activité biologique est montré, ce qui rejoint certaines pratiques ancestrales.— Go to work! or (use charcoal!) .............................................................................. 257 The interest of charcoal in the soil in relation to the biological activity is shown, that reminds some old practices.
Compte rendu du GiESCO 16 :REYNOLDS A., MARCINIAK M., BROWN R., TREMBLAY L., BAISSAS L., HEUMANN M., KREIENBUHL D. — Using GPS, GIS and airborne imaging to understand Niagara terroir ........................ 259 The article demonstrates the good link between multispectral images in remote sensing and the reality of the vineyard particularly the water status and the vigour of the vines.— Utilisation du GPS, SIG et de la télédétection pour comprendre le terroir de la Péninsule du Niagara ................................................................................... 259 L’article démontre la bonne représentativité des images multispectrales en télédétection par rapport à la réalité des parcelles, notamment le statut hydrique et la vigueur des vignes..
SYNOPSIS