Embed Size (px)
Citation preview
Bjorn Helander, Anders Bignert and Lillemor Asplund
Using Raptors as Environmental Sentinels:Monitoring the White-tailed Sea EagleHaliaeetus albicilla in Sweden
This paper summarizes results from the monitoring ofreproduction of white-tailed sea eagle in Sweden 1965–2006. Since 1989 the eagle population on the SwedishBaltic coast has been included in the National Environ-ment Monitoring Program as an indicator species forpotentially harmful chemicals. The percentage of suc-cessfully reproducing pairs and nestling brood sizedecreased in synchrony with rising concentrations ofcontaminants in the 1950s on into the 1970s. Meanproductivity was 1.3 young per pair prior to 1950 anddecreased to 0.3 in 1965–1985. Dichlorodiphenyldi-chloroethene (DDE) in eagle eggs decreased from arange of annual means in 1965–1974 of 600-1200 lg g�1
(lipid weight) to 60–140 lg g�1 in 1996–2005. Totalpolychlorinated biphenyl (PCB) concentrations averagedabove 1000 lg g�1 into the early 1980s and remained inthe range of 250–500 lg g�1 in 1996–2005. Productivitybegan to improve when concentrations of DDE and PCBsdropped below approximately 300 and 800 lg g�1,respectively. Brood size remains below the pre-1950level in one coastal region, indicating a possible impactfrom other contaminants. The power to detect significanttrends under the program is presented and discussed: ifwhite-tailed sea eagle reproduction had been monitoredearlier during the 20th century, the negative impact ofdichlorodiphenyltrichloroethane (DDT, source of DDE)would have been signaled as early as the 1950s in theBaltic Sea. The dramatic fall of white-tailed sea eaglereproduction under the influence of DDT and PCBs, andthe subsequent rise following their ban, illustrates theusefulness of raptors like sea eagles as sentinels forenvironmental pollutants.
INTRODUCTION
Raptors feeding at a high trophic level become exposed topersistent and potentially harmful pollutants. Those speciesexposed to the greatest concentrations have shown dramaticpopulation declines during the 20th century, mainly as a resultof contamination with pollutants (e.g., peregrine falcon Falcoperegrinus, white-tailed sea eagle Haliaeetus albicilla, bald eagleHaliaeetus leucocephalus). Thus, raptors can serve as powerfulsentinels for environmental monitoring. In Sweden, raptorpopulations are monitored in a few national ‘‘species projects’’that focus primarily on breeding populations and theirdistributions and reproduction—white-tailed sea eagle (1),golden eagle Aquila chrysaetos (2), peregrine falcon (3),gyrfalcon Falco rusticolus (4)—and by annual counts ofmigrants (5, 6). Regional or local surveys of breedingpopulations are also performed for a number of species, mainlyon a private basis. In addition, series of data from the ringing ofnestlings, administered by the Swedish Bird Ringing Centre, canbe useful for monitoring populations.
In this paper the terms ‘‘white-tailed sea eagle’’ and ‘‘seaeagle’’ are used synonymously. We briefly present methods and
results from the monitoring of white-tailed sea eagle reproduc-tion on the Swedish Baltic Sea coast in relation to residueconcentrations of dichlorodiphenyldichloroethylene (DDE) andpolychlorinated biphenyls (PCBs) over 42 y. We also presentdata on the power of the monitoring program to detectsignificant linear trends and differences between samples. Thesea eagle provided the earliest signal that harmful chemicals hadreached alarming concentrations in the Baltic Sea. In 1964,annual monitoring of the breeding population on the Balticcoast began and from 1989 was adopted into the NationalEnvironment Monitoring Programme under the SwedishEnvironmental Protection Agency (7). Justifications for usingthe sea eagle as an indicator in a national environmentalmonitoring program include that it feeds at the very top of thefood chain, that it has the highest concentrations of persistentpollutants measured in the Baltic, and that its reproduction isstrongly affected by contaminants. Data from an isolated andfar less contaminated population in Swedish Lapland arepresented for comparison. Residue concentrations of selectedorganochlorines in eggs from five raptor species in Sweden aresummarized in Table 1.
MATERIALS AND METHODS
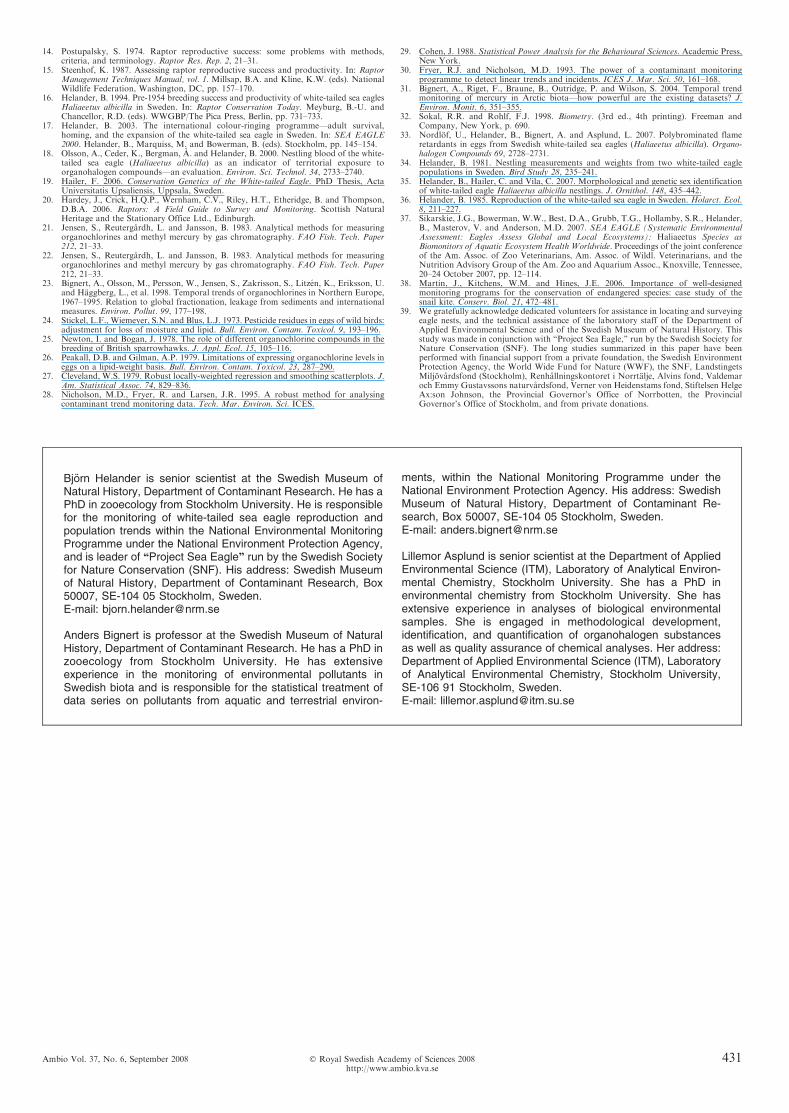
In addition to being highly exposed to persistent chemicals, thesea eagle has other features that are favorable from amonitoring perspective. Territorial adults on the Baltic Seacoast are mainly sedentary and thus reflect the regionalcontaminant situation. Mates of pairs are generally faithful toeach other and to their breeding sites, and the sites arecommonly used over many generations of eagles, providinggood opportunities for long-term studies. Of particular value, alarge portion of the breeders is currently ringed, improving thepossibilities for study of individual birds over time.
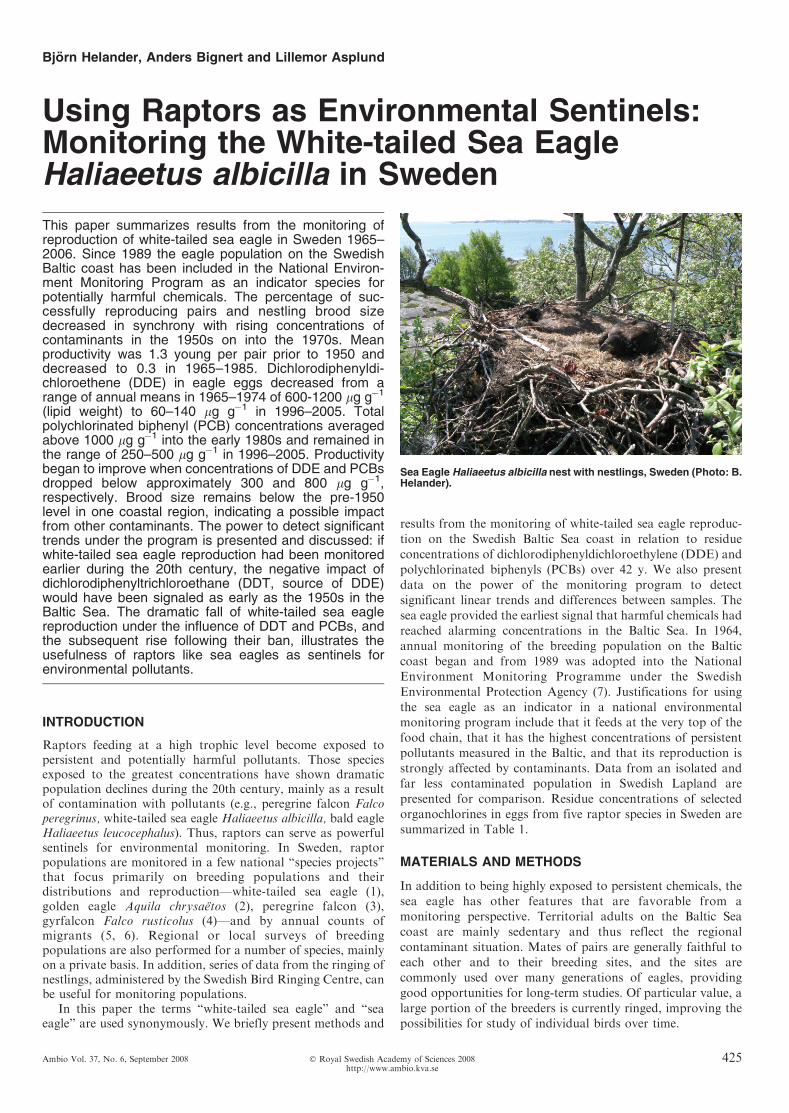
Sea Eagle Haliaeetus albicilla nest with nestlings, Sweden (Photo: B.Helander).
Ambio Vol. 37, No. 6, September 2008 425� Royal Swedish Academy of Sciences 2008http://www.ambio.kva.se
Nest Checks and Reproductive Parameters
Study areas are outlined in Figure 1. Two surveys are performedeach season on the Baltic coast, in order to obtain reliable dataon breeding success (14, 15). Breeding sites are first checkedduring incubation in March–April to confirm occupancy (7).This is done either from a helicopter, or from a safe distance onthe ground. All occupied nests are revisited on foot and climbedto, from mid-May to mid-June when nestlings are expected tobe 4–8 wk old. In Lapland, all known nest sites are surveyed byhelicopter and thus inspected from above during the nestlingperiod, and nests containing young or dead eggs are climbed to.In all regions, the monitoring of reproduction focuses on theannual distribution of nests producing no, one, two, and threenestlings (three being the maximum number of offspring in thisspecies). From these frequency distributions, two robustparameters are calculated: the proportion of reproducing pairs,denoted as ‘‘breeding success,’’ and the mean number of .4 wkold nestlings, denoted as ‘‘brood size.’’ For reference, records onbreeding success and brood size over the study period arecompared with previously derived background levels fromcarefully selected historical records (7, 16). ‘‘Productivity’’denotes the total number of nestlings produced divided by thetotal number of occupied territories checked in a year (i.e.,includes nonproductive pairs). Sample sizes increased over thestudy period as populations were growing—from a total ofabout 30 to 260 checked pairs per year on the Baltic coast from1965 to 2006 and from 12 to 60 in Lapland from 1976 to 2006.
Sampling
All accessible nestlings are color-ringed (17) and have five upperwing coverts collected. A blood sample (up to 10 ml dependingon nestling size) is drawn from the brachial vein using steriletechniques, usually from one nestling of each brood. Each bloodsample is partitioned directly upon sampling: two subsamples of0.5 ml, for genetic studies, are each mixed with 0.5 ml ofethylenediaminetetraacetic acid standard saline citrate solutionin preprepared 5-ml cryogenic vials; the remaining part of thesample is transferred to 5-ml cryogenic vials, for spinning andpartitioning of plasma and red cells by the end of the day. Vialsare individually labeled on each sampling occasion. The vialsare carried in an ice-box for cooling in the field, and the samplesare transferred to liquid nitrogen after the preparation iscompleted each day. Blood and feather samples have beenarchived for special research projects (18, 19). Nestlings areweighed on a 10-kg Pesola spring balance, and correction ismade for the estimated weight of crop content. Measurementsare taken of wing length (maximum chord), tarsus width, andtarsus depth (20). Dead eggs, shell fragments, and shed feathers
Table 1. Residue concentrations in lg g�1 lipid weight of sum of sDDT, total PCB, and polybrominated diphenylethers (PBD) in eggs fromselected raptor species in Sweden. n ¼ number of clutches; (na) ¼ not analyzed. Contaminant data for sea eagle from Helander et al. (8, 9),peregrine falcon from Lindberg et al. (10, 11, and unpubl. data), osprey Pandion haliaetus from Odsjo and Sondell (12), marsh harrier (Circusaeruginosus) from Odsjo and Sondell (13) and golden eagle from Lindberg (unpubl. data).
Species, location
1965–1980 1990–2002
sDDT* PCBs n sDDT* PCB n PBD� n
White-tailed sea eagle, Baltic Sea 825 1130 34 120 440 54 4.7 20White-tailed sea eagle, Lapland 186 275 4 17 60 21 0.94 12Peregrine falcon, S Sweden 360 792 24 3.8 24Peregrine falcon, N Sweden 337 515 15 58z 240z 9 4.5 18Osprey, S and N Sweden 184 178 111 (na) (na) (na)Marsh harrier 366 533 70 (na) (na) (na)Golden eagle, N Sweden (na) (na) 3.7 5.6 14 0.068 14
* Almost all DDE. � BDE 47, 99, 100, 153, 154, 183, 209. z S and N Sweden.
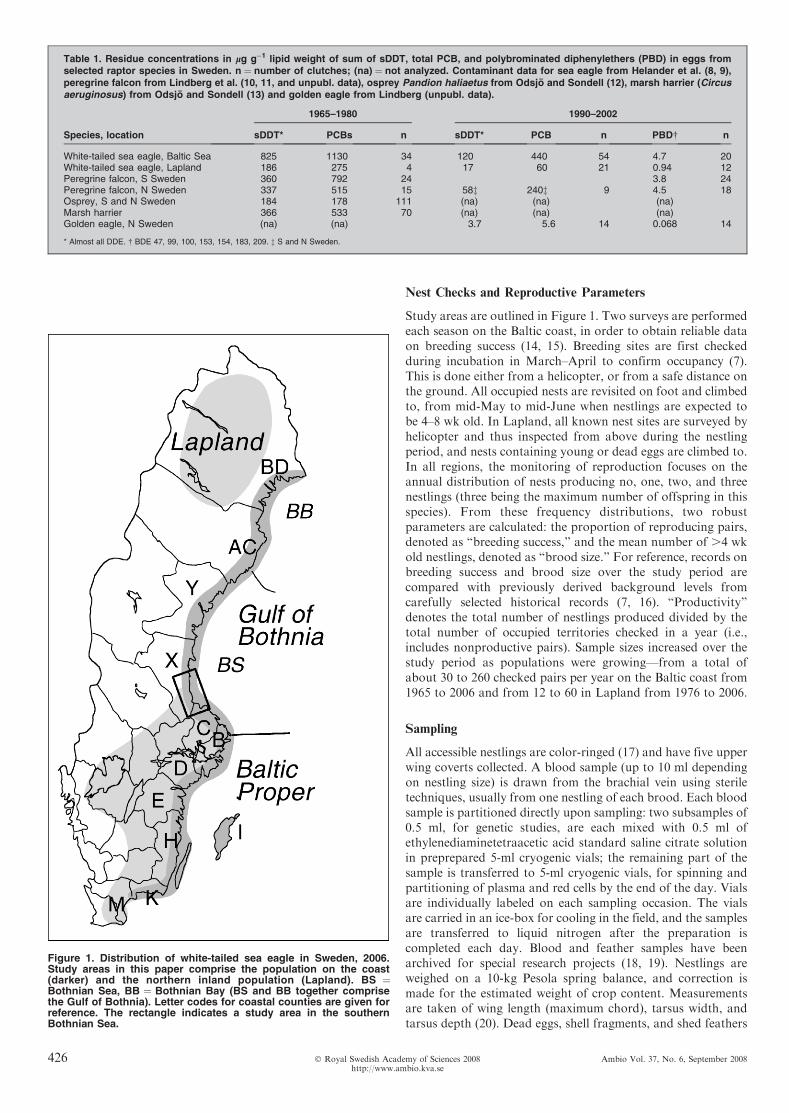
Figure 1. Distribution of white-tailed sea eagle in Sweden, 2006.Study areas in this paper comprise the population on the coast(darker) and the northern inland population (Lapland). BS ¼Bothnian Sea, BB ¼ Bothnian Bay (BS and BB together comprisethe Gulf of Bothnia). Letter codes for coastal counties are given forreference. The rectangle indicates a study area in the southernBothnian Sea.
426 Ambio Vol. 37, No. 6, September 2008� Royal Swedish Academy of Sciences 2008http://www.ambio.kva.se
of the adult birds are collected from all visited successful as wellas unsuccessful nests.
Chemical Analyses
Chemical analyses of DDTs and PCBs in egg samples have beenperformed by the Department of Applied EnvironmentalScience (ITM), Stockholm University, according to publishedprotocols (21). Previous tentative studies of dieldrin, hexachlor-obenzene, and mercury revealed no significant relationshipswith reproduction at the concentrations present in eagle eggs ofthis population (8). The sum of DDTs present in the eggs wasalmost exclusively DDE, and a sum concentration was notcalculated here. Before 1991, ‘‘total PCB’’ concentrations weredetermined from packed column gas chromatography (22).From 1991, capillary column gas chromatography was applied(23). For comparability over the study period all PCBconcentrations in sea eagle eggs are given as ‘‘total PCB,’’derived by multiplying CB-138 with a correction factorcalculated from the relationship between CB-138 (fromcapillary column chromatography) and PCB peak 10 (frompacked column chromatography), and between PCB peak 10and total PCB (9). Eggs collected after the incubation periodcan vary greatly in degree of desiccation, which needs to becorrected for if residue concentrations are to be given on a wetweight basis; this can be done based on measured, or calculated,volume of each egg (24). Some eggs in this study were crushed,and proper estimates of volume could then not be attained.Residue concentrations are here given on a lipid weight basis aslg g�1. The eagle eggs contained on average 5.08% lipids (9), soresidue concentrations on a lipid weight basis can be convertedto a wet weight basis multiplying with a factor 0.05. Only eggswith no or small embryos (,75 mm) were included, to avoid aninfluence on residue concentrations from metabolism of lipids(9, 25, 26). Arithmetic mean values were used for clutchesrepresented by more than one egg.
Statistical Tests
Simple log-linear regression analysis has been carried out toinvestigate average changes over time. To check for significantnonlinear trend components, a LOESS smoother (27) wasapplied and an analysis of variance was used to check whetherthe smoother explained significantly more than the regression
line according to a method suggested by Nicholson, Fryer, andLarsen (28). Statistical power analyses (29, 30) were used toestimate the minimum annual trend likely to be detected at astatistical power of 80% during a monitoring period of 10 y (31).To investigate the possible effect of a future reduced samplingscheme, repeated random sampling (5000 times) from 1991 to2006 in the current database was carried out, simulating amaximum of 50, 25, 20, 15, and 10 records each year.Contingency analysis, using the G-test with Williams correc-tion, a log-likelihood ratio test (32), was applied for compar-isons between geographical regions and time periods.
RESULTS AND DISCUSSION
Productivity versus DDE and PCBs over Time
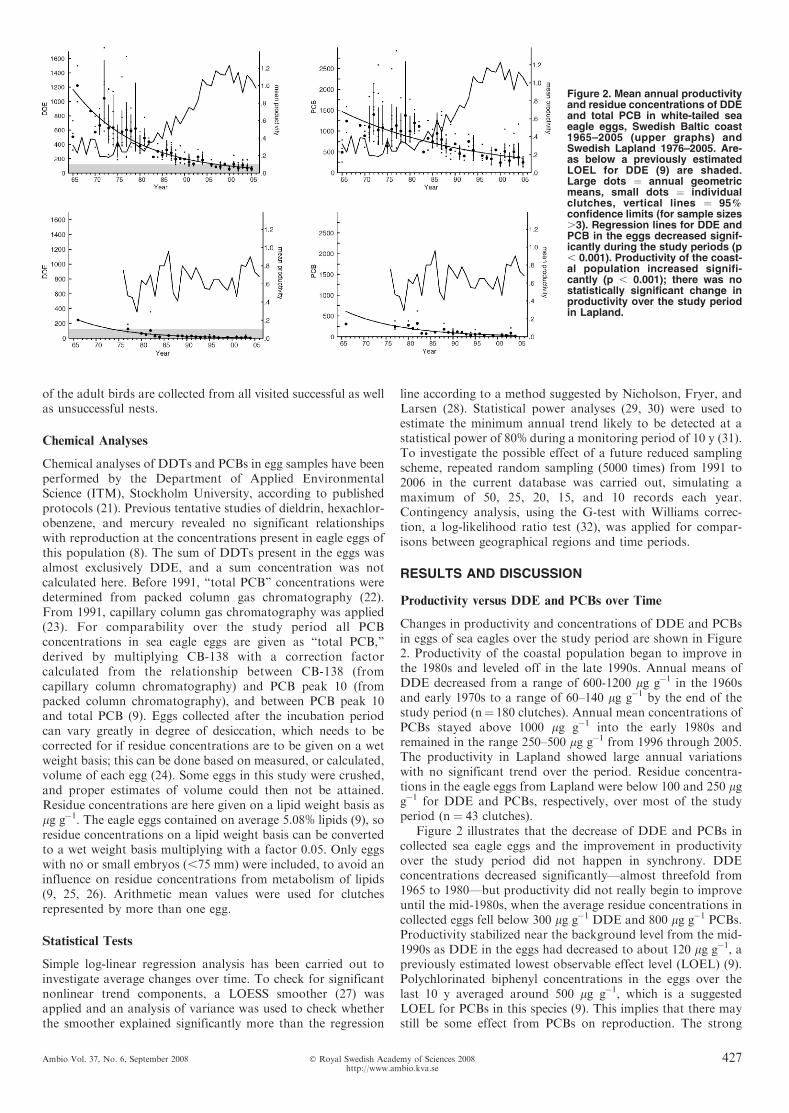
Changes in productivity and concentrations of DDE and PCBsin eggs of sea eagles over the study period are shown in Figure2. Productivity of the coastal population began to improve inthe 1980s and leveled off in the late 1990s. Annual means ofDDE decreased from a range of 600-1200 lg g�1 in the 1960sand early 1970s to a range of 60–140 lg g�1 by the end of thestudy period (n¼ 180 clutches). Annual mean concentrations ofPCBs stayed above 1000 lg g�1 into the early 1980s andremained in the range 250–500 lg g�1 from 1996 through 2005.The productivity in Lapland showed large annual variationswith no significant trend over the period. Residue concentra-tions in the eagle eggs from Lapland were below 100 and 250 lgg�1 for DDE and PCBs, respectively, over most of the studyperiod (n¼ 43 clutches).
Figure 2 illustrates that the decrease of DDE and PCBs incollected sea eagle eggs and the improvement in productivityover the study period did not happen in synchrony. DDEconcentrations decreased significantly—almost threefold from1965 to 1980—but productivity did not really begin to improveuntil the mid-1980s, when the average residue concentrations incollected eggs fell below 300 lg g�1 DDE and 800 lg g�1 PCBs.Productivity stabilized near the background level from the mid-1990s as DDE in the eggs had decreased to about 120 lg g�1, apreviously estimated lowest observable effect level (LOEL) (9).Polychlorinated biphenyl concentrations in the eggs over thelast 10 y averaged around 500 lg g�1, which is a suggestedLOEL for PCBs in this species (9). This implies that there maystill be some effect from PCBs on reproduction. The strong
Figure 2. Mean annual productivityand residue concentrations of DDEand total PCB in white-tailed seaeagle eggs, Swedish Baltic coast1965–2005 (upper graphs) andSwedish Lapland 1976–2005. Are-as below a previously estimatedLOEL for DDE (9) are shaded.Large dots ¼ annual geometricmeans, small dots ¼ individualclutches, vertical lines ¼ 95%confidence limits (for sample sizes.3). Regression lines for DDE andPCB in the eggs decreased signif-icantly during the study periods (p, 0.001). Productivity of the coast-al population increased signifi-cantly (p , 0.001); there was nostatistically significant change inproductivity over the study periodin Lapland.
Ambio Vol. 37, No. 6, September 2008 427� Royal Swedish Academy of Sciences 2008http://www.ambio.kva.se
correlation between DDE and PCB concentrations in the eggshas complicated the interpretations of effect levels for PCBs.
Breeding Success and Brood Size
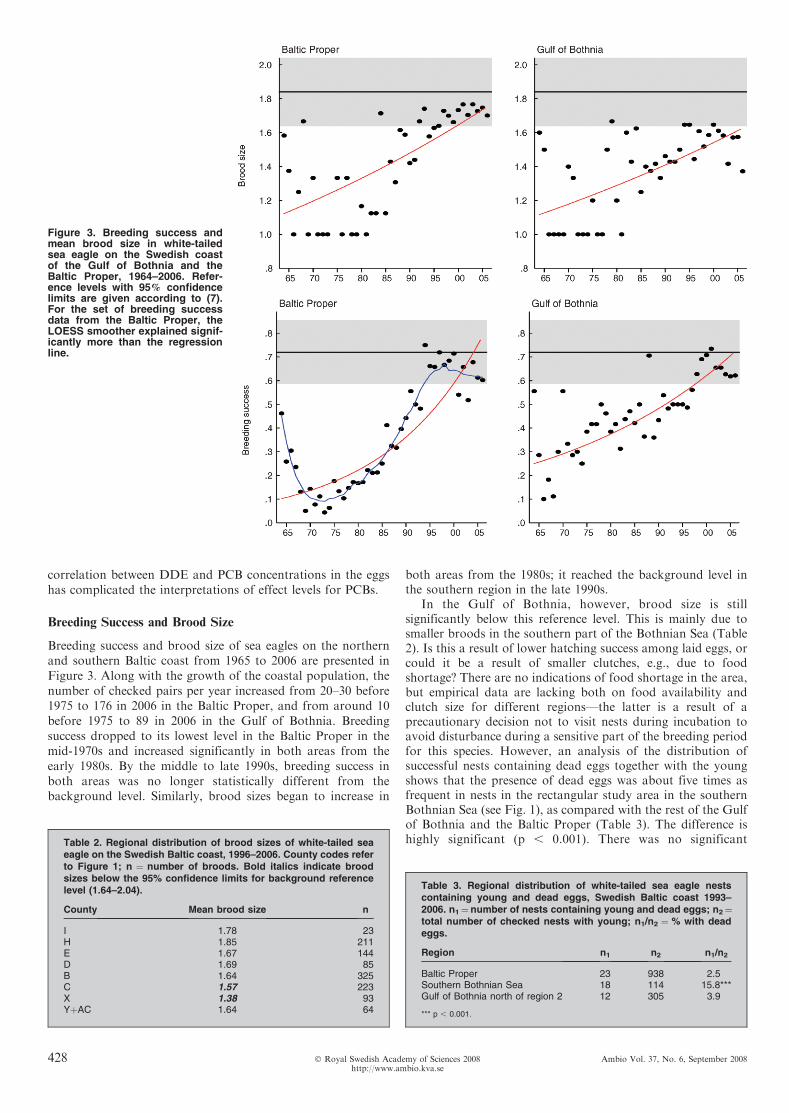
Breeding success and brood size of sea eagles on the northernand southern Baltic coast from 1965 to 2006 are presented inFigure 3. Along with the growth of the coastal population, thenumber of checked pairs per year increased from 20–30 before1975 to 176 in 2006 in the Baltic Proper, and from around 10before 1975 to 89 in 2006 in the Gulf of Bothnia. Breedingsuccess dropped to its lowest level in the Baltic Proper in themid-1970s and increased significantly in both areas from theearly 1980s. By the middle to late 1990s, breeding success inboth areas was no longer statistically different from thebackground level. Similarly, brood sizes began to increase in
both areas from the 1980s; it reached the background level inthe southern region in the late 1990s.
In the Gulf of Bothnia, however, brood size is stillsignificantly below this reference level. This is mainly due tosmaller broods in the southern part of the Bothnian Sea (Table2). Is this a result of lower hatching success among laid eggs, orcould it be a result of smaller clutches, e.g., due to foodshortage? There are no indications of food shortage in the area,but empirical data are lacking both on food availability andclutch size for different regions—the latter is a result of aprecautionary decision not to visit nests during incubation toavoid disturbance during a sensitive part of the breeding periodfor this species. However, an analysis of the distribution ofsuccessful nests containing dead eggs together with the youngshows that the presence of dead eggs was about five times asfrequent in nests in the rectangular study area in the southernBothnian Sea (see Fig. 1), as compared with the rest of the Gulfof Bothnia and the Baltic Proper (Table 3). The difference ishighly significant (p , 0.001). There was no significant
Figure 3. Breeding success andmean brood size in white-tailedsea eagle on the Swedish coastof the Gulf of Bothnia and theBaltic Proper, 1964–2006. Refer-ence levels with 95% confidencelimits are given according to (7).For the set of breeding successdata from the Baltic Proper, theLOESS smoother explained signif-icantly more than the regressionline.
Table 2. Regional distribution of brood sizes of white-tailed seaeagle on the Swedish Baltic coast, 1996–2006. County codes referto Figure 1; n ¼ number of broods. Bold italics indicate broodsizes below the 95% confidence limits for background referencelevel (1.64–2.04).
County Mean brood size n
I 1.78 23H 1.85 211E 1.67 144D 1.69 85B 1.64 325C 1.57 223X 1.38 93YþAC 1.64 64
Table 3. Regional distribution of white-tailed sea eagle nestscontaining young and dead eggs, Swedish Baltic coast 1993–2006. n1¼ number of nests containing young and dead eggs; n2¼total number of checked nests with young; n1/n2 ¼ % with deadeggs.
Region n1 n2 n1/n2
Baltic Proper 23 938 2.5Southern Bothnian Sea 18 114 15.8***Gulf of Bothnia north of region 2 12 305 3.9
*** p , 0.001.
428 Ambio Vol. 37, No. 6, September 2008� Royal Swedish Academy of Sciences 2008http://www.ambio.kva.se
difference between the areas in Table 3 in concentrations ofDDE and PCBs in the eggs. A recent study on concentrations ofbrominated flame retardants (BFRs) in eggs showed nodifference between these two regions (33). A possible influencefrom other contaminants on the hatchability of eggs in the studyarea in the southern Bothnian Sea is under investigation.
Body Mass
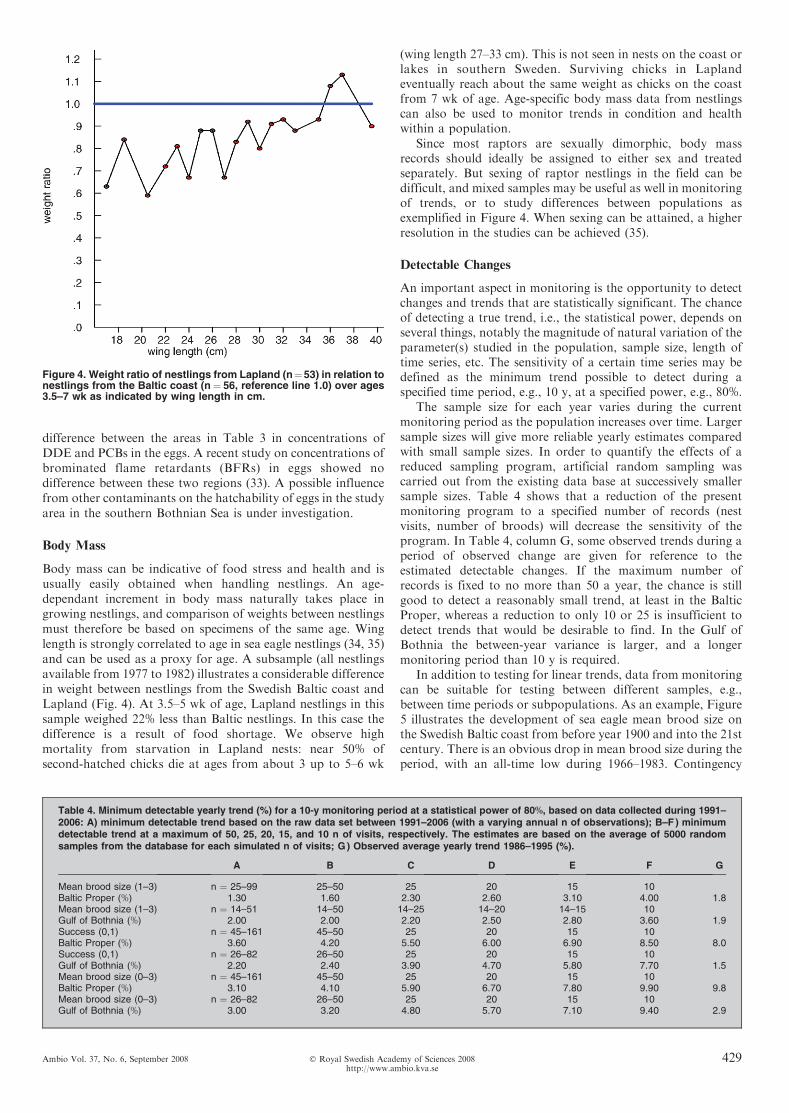
Body mass can be indicative of food stress and health and isusually easily obtained when handling nestlings. An age-dependant increment in body mass naturally takes place ingrowing nestlings, and comparison of weights between nestlingsmust therefore be based on specimens of the same age. Winglength is strongly correlated to age in sea eagle nestlings (34, 35)and can be used as a proxy for age. A subsample (all nestlingsavailable from 1977 to 1982) illustrates a considerable differencein weight between nestlings from the Swedish Baltic coast andLapland (Fig. 4). At 3.5–5 wk of age, Lapland nestlings in thissample weighed 22% less than Baltic nestlings. In this case thedifference is a result of food shortage. We observe highmortality from starvation in Lapland nests: near 50% ofsecond-hatched chicks die at ages from about 3 up to 5–6 wk
(wing length 27–33 cm). This is not seen in nests on the coast orlakes in southern Sweden. Surviving chicks in Laplandeventually reach about the same weight as chicks on the coastfrom 7 wk of age. Age-specific body mass data from nestlingscan also be used to monitor trends in condition and healthwithin a population.
Since most raptors are sexually dimorphic, body massrecords should ideally be assigned to either sex and treatedseparately. But sexing of raptor nestlings in the field can bedifficult, and mixed samples may be useful as well in monitoringof trends, or to study differences between populations asexemplified in Figure 4. When sexing can be attained, a higherresolution in the studies can be achieved (35).
Detectable Changes
An important aspect in monitoring is the opportunity to detectchanges and trends that are statistically significant. The chanceof detecting a true trend, i.e., the statistical power, depends onseveral things, notably the magnitude of natural variation of theparameter(s) studied in the population, sample size, length oftime series, etc. The sensitivity of a certain time series may bedefined as the minimum trend possible to detect during aspecified time period, e.g., 10 y, at a specified power, e.g., 80%.
The sample size for each year varies during the currentmonitoring period as the population increases over time. Largersample sizes will give more reliable yearly estimates comparedwith small sample sizes. In order to quantify the effects of areduced sampling program, artificial random sampling wascarried out from the existing data base at successively smallersample sizes. Table 4 shows that a reduction of the presentmonitoring program to a specified number of records (nestvisits, number of broods) will decrease the sensitivity of theprogram. In Table 4, column G, some observed trends during aperiod of observed change are given for reference to theestimated detectable changes. If the maximum number ofrecords is fixed to no more than 50 a year, the chance is stillgood to detect a reasonably small trend, at least in the BalticProper, whereas a reduction to only 10 or 25 is insufficient todetect trends that would be desirable to find. In the Gulf ofBothnia the between-year variance is larger, and a longermonitoring period than 10 y is required.
In addition to testing for linear trends, data from monitoringcan be suitable for testing between different samples, e.g.,between time periods or subpopulations. As an example, Figure5 illustrates the development of sea eagle mean brood size onthe Swedish Baltic coast from before year 1900 and into the 21stcentury. There is an obvious drop in mean brood size during theperiod, with an all-time low during 1966–1983. Contingency
Figure 4. Weight ratio of nestlings from Lapland (n¼53) in relation tonestlings from the Baltic coast (n¼ 56, reference line 1.0) over ages3.5–7 wk as indicated by wing length in cm.
Table 4. Minimum detectable yearly trend (%) for a 10-y monitoring period at a statistical power of 80%, based on data collected during 1991–2006: A) minimum detectable trend based on the raw data set between 1991–2006 (with a varying annual n of observations); B–F ) minimumdetectable trend at a maximum of 50, 25, 20, 15, and 10 n of visits, respectively. The estimates are based on the average of 5000 randomsamples from the database for each simulated n of visits; G) Observed average yearly trend 1986–1995 (%).
A B C D E F G
Mean brood size (1–3) n ¼ 25–99 25–50 25 20 15 10Baltic Proper (%) 1.30 1.60 2.30 2.60 3.10 4.00 1.8Mean brood size (1–3) n ¼ 14–51 14–50 14–25 14–20 14–15 10Gulf of Bothnia (%) 2.00 2.00 2.20 2.50 2.80 3.60 1.9Success (0,1) n ¼ 45–161 45–50 25 20 15 10Baltic Proper (%) 3.60 4.20 5.50 6.00 6.90 8.50 8.0Success (0,1) n ¼ 26–82 26–50 25 20 15 10Gulf of Bothnia (%) 2.20 2.40 3.90 4.70 5.80 7.70 1.5Mean brood size (0–3) n ¼ 45–161 45–50 25 20 15 10Baltic Proper (%) 3.10 4.10 5.90 6.70 7.80 9.90 9.8Mean brood size (0–3) n ¼ 26–82 26–50 25 20 15 10Gulf of Bothnia (%) 3.00 3.20 4.80 5.70 7.10 9.40 2.9
Ambio Vol. 37, No. 6, September 2008 429� Royal Swedish Academy of Sciences 2008http://www.ambio.kva.se
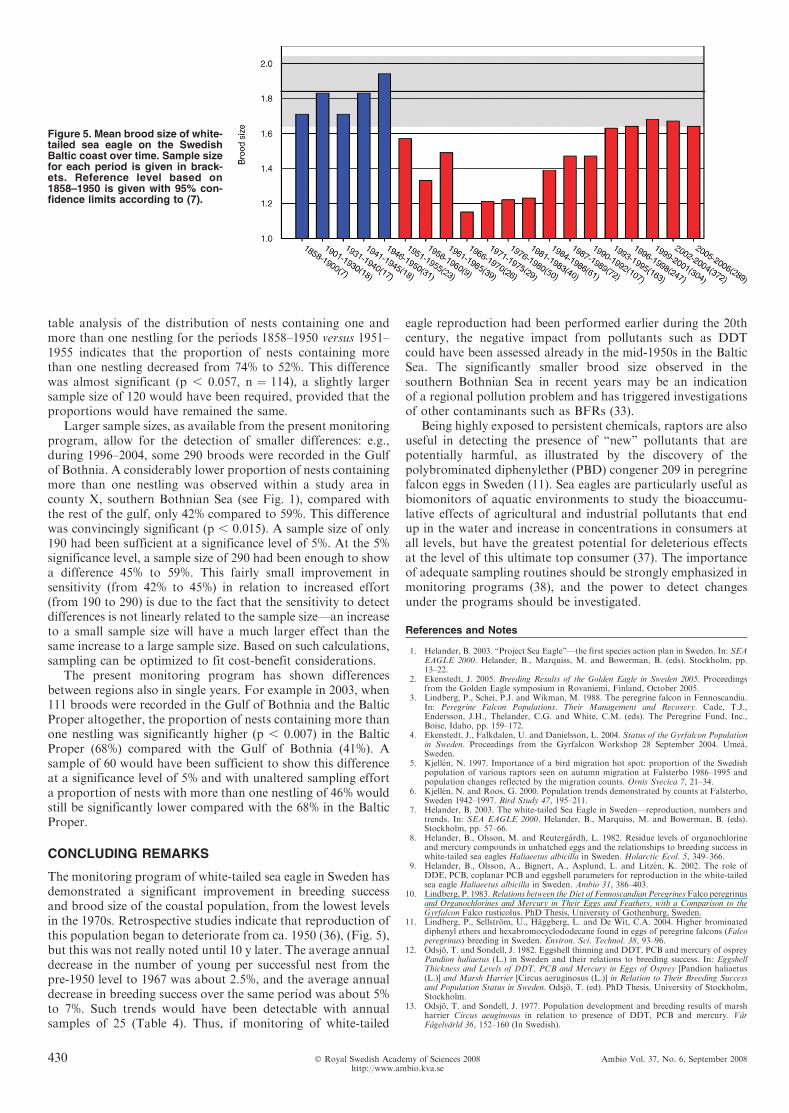
table analysis of the distribution of nests containing one andmore than one nestling for the periods 1858–1950 versus 1951–1955 indicates that the proportion of nests containing morethan one nestling decreased from 74% to 52%. This differencewas almost significant (p , 0.057, n ¼ 114), a slightly largersample size of 120 would have been required, provided that theproportions would have remained the same.
Larger sample sizes, as available from the present monitoringprogram, allow for the detection of smaller differences: e.g.,during 1996–2004, some 290 broods were recorded in the Gulfof Bothnia. A considerably lower proportion of nests containingmore than one nestling was observed within a study area incounty X, southern Bothnian Sea (see Fig. 1), compared withthe rest of the gulf, only 42% compared to 59%. This differencewas convincingly significant (p , 0.015). A sample size of only190 had been sufficient at a significance level of 5%. At the 5%significance level, a sample size of 290 had been enough to showa difference 45% to 59%. This fairly small improvement insensitivity (from 42% to 45%) in relation to increased effort(from 190 to 290) is due to the fact that the sensitivity to detectdifferences is not linearly related to the sample size—an increaseto a small sample size will have a much larger effect than thesame increase to a large sample size. Based on such calculations,sampling can be optimized to fit cost-benefit considerations.
The present monitoring program has shown differencesbetween regions also in single years. For example in 2003, when111 broods were recorded in the Gulf of Bothnia and the BalticProper altogether, the proportion of nests containing more thanone nestling was significantly higher (p , 0.007) in the BalticProper (68%) compared with the Gulf of Bothnia (41%). Asample of 60 would have been sufficient to show this differenceat a significance level of 5% and with unaltered sampling efforta proportion of nests with more than one nestling of 46% wouldstill be significantly lower compared with the 68% in the BalticProper.
CONCLUDING REMARKS
The monitoring program of white-tailed sea eagle in Sweden hasdemonstrated a significant improvement in breeding successand brood size of the coastal population, from the lowest levelsin the 1970s. Retrospective studies indicate that reproduction ofthis population began to deteriorate from ca. 1950 (36), (Fig. 5),but this was not really noted until 10 y later. The average annualdecrease in the number of young per successful nest from thepre-1950 level to 1967 was about 2.5%, and the average annualdecrease in breeding success over the same period was about 5%to 7%. Such trends would have been detectable with annualsamples of 25 (Table 4). Thus, if monitoring of white-tailed
eagle reproduction had been performed earlier during the 20thcentury, the negative impact from pollutants such as DDTcould have been assessed already in the mid-1950s in the BalticSea. The significantly smaller brood size observed in thesouthern Bothnian Sea in recent years may be an indicationof a regional pollution problem and has triggered investigationsof other contaminants such as BFRs (33).
Being highly exposed to persistent chemicals, raptors are alsouseful in detecting the presence of ‘‘new’’ pollutants that arepotentially harmful, as illustrated by the discovery of thepolybrominated diphenylether (PBD) congener 209 in peregrinefalcon eggs in Sweden (11). Sea eagles are particularly useful asbiomonitors of aquatic environments to study the bioaccumu-lative effects of agricultural and industrial pollutants that endup in the water and increase in concentrations in consumers atall levels, but have the greatest potential for deleterious effectsat the level of this ultimate top consumer (37). The importanceof adequate sampling routines should be strongly emphasized inmonitoring programs (38), and the power to detect changesunder the programs should be investigated.
References and Notes
1. Helander, B. 2003. ‘‘Project Sea Eagle’’—the first species action plan in Sweden. In: SEAEAGLE 2000. Helander, B., Marquiss, M. and Bowerman, B. (eds). Stockholm, pp.13–22.
2. Ekenstedt, J. 2005. Breeding Results of the Golden Eagle in Sweden 2005. Proceedingsfrom the Golden Eagle symposium in Rovaniemi, Finland, October 2005.
3. Lindberg, P., Schei, P.J. and Wikman, M. 1988. The peregrine falcon in Fennoscandia.In: Peregrine Falcon Populations. Their Management and Recovery. Cade, T.J.,Endersson, J.H., Thelander, C.G. and White, C.M. (eds). The Peregrine Fund, Inc.,Boise, Idaho, pp. 159–172.
4. Ekenstedt, J., Falkdalen, U. and Danielsson, L. 2004. Status of the Gyrfalcon Populationin Sweden. Proceedings from the Gyrfalcon Workshop 28 September 2004. Umea,Sweden.
5. Kjellen, N. 1997. Importance of a bird migration hot spot: proportion of the Swedishpopulation of various raptors seen on autumn migration at Falsterbo 1986–1995 andpopulation changes reflected by the migration counts. Ornis Svecica 7, 21–34.
6. Kjellen, N. and Roos, G. 2000. Population trends demonstrated by counts at Falsterbo,Sweden 1942–1997. Bird Study 47, 195–211.
7. Helander, B. 2003. The white-tailed Sea Eagle in Sweden—reproduction, numbers andtrends. In: SEA EAGLE 2000. Helander, B., Marquiss, M. and Bowerman, B. (eds).Stockholm, pp. 57–66.
8. Helander, B., Olsson, M. and Reutergardh, L. 1982. Residue levels of organochlorineand mercury compounds in unhatched eggs and the relationships to breeding success inwhite-tailed sea eagles Haliaeetus albicilla in Sweden. Holarctic Ecol. 5, 349–366.
9. Helander, B., Olsson, A., Bignert, A., Asplund, L. and Litzen, K. 2002. The role ofDDE, PCB, coplanar PCB and eggshell parameters for reproduction in the white-tailedsea eagle Haliaeetus albicilla in Sweden. Ambio 31, 386–403.
10. Lindberg, P. 1983.Relations between the Diet of Fennoscandian PeregrinesFalco peregrinusand Organochlorines and Mercury in Their Eggs and Feathers, with a Comparison to theGyrfalcon Falco rusticolus. PhD Thesis, University of Gothenburg, Sweden.
11. Lindberg, P., Sellstrom, U., Haggberg, L. and De Wit, C.A. 2004. Higher brominateddiphenyl ethers and hexabromocyclododecane found in eggs of peregrine falcons (Falcoperegrinus) breeding in Sweden. Environ. Sci. Technol. 38, 93–96.
12. Odsjo, T. and Sondell, J. 1982. Eggshell thinning and DDT, PCB and mercury of ospreyPandion haliaetus (L.) in Sweden and their relations to breeding success. In: EggshellThickness and Levels of DDT, PCB and Mercury in Eggs of Osprey [Pandion haliaetus(L.)] and Marsh Harrier [Circus aeruginosus (L.)] in Relation to Their Breeding Successand Population Status in Sweden. Odsjo, T. (ed). PhD Thesis, University of Stockholm,Stockholm.
13. Odsjo, T. and Sondell, J. 1977. Population development and breeding results of marshharrier Circus aeuginosus in relation to presence of DDT, PCB and mercury. VarFagelvarld 36, 152–160 (In Swedish).
Figure 5. Mean brood size of white-tailed sea eagle on the SwedishBaltic coast over time. Sample sizefor each period is given in brack-ets. Reference level based on1858–1950 is given with 95% con-fidence limits according to (7).
430 Ambio Vol. 37, No. 6, September 2008� Royal Swedish Academy of Sciences 2008http://www.ambio.kva.se
14. Postupalsky, S. 1974. Raptor reproductive success: some problems with methods,criteria, and terminology. Raptor Res. Rep. 2, 21–31.
15. Steenhof, K. 1987. Assessing raptor reproductive success and productivity. In: RaptorManagement Techniques Manual, vol. 1. Millsap, B.A. and Kline, K.W. (eds). NationalWildlife Federation, Washington, DC, pp. 157–170.
16. Helander, B. 1994. Pre-1954 breeding success and productivity of white-tailed sea eaglesHaliaeetus albicilla in Sweden. In: Raptor Conservation Today. Meyburg, B.-U. andChancellor, R.D. (eds). WWGBP/The Pica Press, Berlin, pp. 731–733.
17. Helander, B. 2003. The international colour-ringing programme—adult survival,homing, and the expansion of the white-tailed sea eagle in Sweden. In: SEA EAGLE2000. Helander, B., Marquiss, M. and Bowerman, B. (eds). Stockholm, pp. 145–154.
18. Olsson, A., Ceder, K., Bergman, A. and Helander, B. 2000. Nestling blood of the white-tailed sea eagle (Haliaeetus albicilla) as an indicator of territorial exposure toorganohalogen compounds—an evaluation. Environ. Sci. Technol. 34, 2733–2740.
19. Hailer, F. 2006. Conservation Genetics of the White-tailed Eagle. PhD Thesis, ActaUniversitatis Upsaliensis, Uppsala, Sweden.
20. Hardey, J., Crick, H.Q.P., Wernham, C.V., Riley, H.T., Etheridge, B. and Thompson,D.B.A. 2006. Raptors: A Field Guide to Survey and Monitoring. Scottish NaturalHeritage and the Stationary Office Ltd., Edinburgh.
21. Jensen, S., Reutergardh, L. and Jansson, B. 1983. Analytical methods for measuringorganochlorines and methyl mercury by gas chromatography. FAO Fish. Tech. Paper212, 21–33.
22. Jensen, S., Reutergardh, L. and Jansson, B. 1983. Analytical methods for measuringorganochlorines and methyl mercury by gas chromatography. FAO Fish. Tech. Paper212, 21–33.
23. Bignert, A., Olsson, M., Persson, W., Jensen, S., Zakrisson, S., Litzen, K., Eriksson, U.and Haggberg, L., et al. 1998. Temporal trends of organochlorines in Northern Europe,1967–1995. Relation to global fractionation, leakage from sediments and internationalmeasures. Environ. Pollut. 99, 177–198.
24. Stickel, L.F., Wiemeyer, S.N. and Blus, L.J. 1973. Pesticide residues in eggs of wild birds:adjustment for loss of moisture and lipid. Bull. Environ. Contam. Toxicol. 9, 193–196.
25. Newton, I. and Bogan, J. 1978. The role of different organochlorine compounds in thebreeding of British sparrowhawks. J. Appl. Ecol. 15, 105–116.
26. Peakall, D.B. and Gilman, A.P. 1979. Limitations of expressing organochlorine levels ineggs on a lipid-weight basis. Bull. Environ. Contam. Toxicol. 23, 287–290.
27. Cleveland, W.S. 1979. Robust locally-weighted regression and smoothing scatterplots. J.Am. Statistical Assoc. 74, 829–836.
28. Nicholson, M.D., Fryer, R. and Larsen, J.R. 1995. A robust method for analysingcontaminant trend monitoring data. Tech. Mar. Environ. Sci. ICES.
29. Cohen, J. 1988. Statistical Power Analysis for the Behavioural Sciences. Academic Press,New York.
30. Fryer, R.J. and Nicholson, M.D. 1993. The power of a contaminant monitoringprogramme to detect linear trends and incidents. ICES J. Mar. Sci. 50, 161–168.
31. Bignert, A., Riget, F., Braune, B., Outridge, P. and Wilson, S. 2004. Temporal trendmonitoring of mercury in Arctic biota—how powerful are the existing datasets? J.Environ. Monit. 6, 351–355.
32. Sokal, R.R. and Rohlf, F.J. 1998. Biometry. (3rd ed., 4th printing). Freeman andCompany, New York, p. 690.
33. Nordlof, U., Helander, B., Bignert, A. and Asplund, L. 2007. Polybrominated flameretardants in eggs from Swedish white-tailed sea eagles (Haliaeetus albicilla). Organo-halogen Compounds 69, 2728–2731.
34. Helander, B. 1981. Nestling measurements and weights from two white-tailed eaglepopulations in Sweden. Bird Study 28, 235–241.
35. Helander, B., Hailer, C. and Vila, C. 2007. Morphological and genetic sex identificationof white-tailed eagle Haliaeetus albicilla nestlings. J. Ornithol. 148, 435–442.
36. Helander, B. 1985. Reproduction of the white-tailed sea eagle in Sweden. Holarct. Ecol.8, 211–227.
37. Sikarskie, J.G., Bowerman, W.W., Best, D.A., Grubb, T.G., Hollamby, S.R., Helander,B., Masterov, V. and Anderson, M.D. 2007. SEA EAGLE (Systematic EnvironmentalAssessment: Eagles Assess Global and Local Ecosystems): Haliaeetus Species asBiomonitors of Aquatic Ecosystem Health Worldwide. Proceedings of the joint conferenceof the Am. Assoc. of Zoo Veterinarians, Am. Assoc. of Wildl. Veterinarians, and theNutrition Advisory Group of the Am. Zoo and Aquarium Assoc., Knoxville, Tennessee,20–24 October 2007, pp. 12–114.
38. Martin, J., Kitchens, W.M. and Hines, J.E. 2006. Importance of well-designedmonitoring programs for the conservation of endangered species: case study of thesnail kite. Conserv. Biol. 21, 472–481.
39. We gratefully acknowledge dedicated volunteers for assistance in locating and surveyingeagle nests, and the technical assistance of the laboratory staff of the Department ofApplied Environmental Science and of the Swedish Museum of Natural History. Thisstudy was made in conjunction with ‘‘Project Sea Eagle,’’ run by the Swedish Society forNature Conservation (SNF). The long studies summarized in this paper have beenperformed with financial support from a private foundation, the Swedish EnvironmentProtection Agency, the World Wide Fund for Nature (WWF), the SNF, LandstingetsMiljovardsfond (Stockholm), Renhallningskontoret i Norrtalje, Alvins fond, Valdemaroch Emmy Gustavssons naturvardsfond, Verner von Heidenstams fond, Stiftelsen HelgeAx:son Johnson, the Provincial Governor’s Office of Norrbotten, the ProvincialGovernor’s Office of Stockholm, and from private donations.
Bjorn Helander is senior scientist at the Swedish Museum ofNatural History, Department of Contaminant Research. He has aPhD in zooecology from Stockholm University. He is responsiblefor the monitoring of white-tailed sea eagle reproduction andpopulation trends within the National Environmental MonitoringProgramme under the National Environment Protection Agency,and is leader of ‘‘Project Sea Eagle’’ run by the Swedish Societyfor Nature Conservation (SNF). His address: Swedish Museumof Natural History, Department of Contaminant Research, Box50007, SE-104 05 Stockholm, Sweden.E-mail: [email protected]
Anders Bignert is professor at the Swedish Museum of NaturalHistory, Department of Contaminant Research. He has a PhD inzooecology from Stockholm University. He has extensiveexperience in the monitoring of environmental pollutants inSwedish biota and is responsible for the statistical treatment ofdata series on pollutants from aquatic and terrestrial environ-
ments, within the National Monitoring Programme under theNational Environment Protection Agency. His address: SwedishMuseum of Natural History, Department of Contaminant Re-search, Box 50007, SE-104 05 Stockholm, Sweden.E-mail: [email protected]
Lillemor Asplund is senior scientist at the Department of AppliedEnvironmental Science (ITM), Laboratory of Analytical Environ-mental Chemistry, Stockholm University. She has a PhD inenvironmental chemistry from Stockholm University. She hasextensive experience in analyses of biological environmentalsamples. She is engaged in methodological development,identification, and quantification of organohalogen substancesas well as quality assurance of chemical analyses. Her address:Department of Applied Environmental Science (ITM), Laboratoryof Analytical Environmental Chemistry, Stockholm University,SE-106 91 Stockholm, Sweden.E-mail: [email protected]
Ambio Vol. 37, No. 6, September 2008 431� Royal Swedish Academy of Sciences 2008http://www.ambio.kva.se


