Embed Size (px)
Citation preview

Agronomy Journa l • Volume 105 , I s sue 5 • 2013 1307
Biometry, Modeling & Statistics
Using the CSM-CROPGRO-Peanut Model to Simulate Late Leaf Spot Effects on Peanut Cultivars of Differing Resistance
Maninder P. Singh, John E. Erickson,* Kenneth J. Boote, James W. Jones, Barry L. Tillman, and Ariena H. C. van Bruggen
Published in Agron. J. 105:1307–1316 (2013)doi:10.2134/agronj2013.0071Copyright © 2013 by the American Society of Agronomy, 5585 Guilford Road, Madison, WI 53711. All rights reserved. No part of this periodical may be reproduced or transmitted in any form or by any means, electronic or mechanical, including photocopying, recording, or any information storage and retrieval system, without permission in writing from the publisher.
In the southeastern United States, early leaf spot (caused by Cercospora arachidicola S. Hori), and LLS are among
the most widespread and damaging foliar diseases of peanut (Nutter and Shokes, 1995). Yield reductions associated with these foliar diseases are related to premature loss of green leaf area (by tissue necrosis and defoliation) and reduction of leaf photosyn-thetic capacity (Pixley et al., 1990a; Bourgeois and Boote, 1992; Singh et al., 2011b). Late leaf spot can cause yield losses of up to 50% in some cases (Pixley et al., 1990a; Bourgeois et al., 1991). Current crop protection strategies rely largely on fungicide appli-cations, cultural practices, and resistant cultivars. Economic and environmental concerns regarding the use of fungicides, however, have increased the demand for improved management strategies based on minimizing crop losses rather than minimizing disease outbreaks. Decision support systems that can predict yield losses due to disease are one option to help meet this demand.
Crop models are important tools to evaluate growth and yield losses due to various biotic and abiotic stresses (Boote et al., 1983; Naab et al., 2004; Timsina et al., 2007). Models that have been
used to predict the impact of foliar diseases on yield have gener-ally incorporated the disease effects on defoliation and photo-synthesis (Batchelor et al., 1993; Boote et al., 1993; Teng et al., 1998). Disease-induced defoliation has been incorporated into the models by simply reducing the leaf area (Batchelor et al., 1993; Williams and Boote, 1995); however, the reduction in leaf photo-synthesis due to disease is more complex to model. The impact of LLS on leaf photosynthesis has been shown to be greater than can be accounted for by the visual lesion area (Bourgeois and Boote, 1992). To relate reductions in leaf photosynthesis to visual lesion area, Bastiaans (1991) proposed a relatively simple model:
( )b= -1y x [1]
where y is the relative photosynthetic rate of a diseased leaf com-pared with an asymptomatic leaf, x is the measured visual lesion area, and b describes the relationship between the virtual and visual lesion areas. The virtual area represents the loss of photo-synthetic capacity beyond the visual lesion area. Thus, b indicates whether the effect of disease on photosynthesis is higher than (b > 1), lower than (b < 1), or equal to (b = 1) that accounted for by the measured visual lesion area. Several studies have incorpo-rated this parameter into crop growth models to estimate growth and yield losses due to biotrophic pathogens at the canopy level (Bastiaans, 1993; Bassanezi et al., 2001; Robert et al., 2004; Ban-cal et al., 2007), but all these researchers used a single b value for all cultivars. The photosynthetic response (b parameter) can differ, however, among various genotypes in their response to a
ABSTRACTLate leaf spot (LLS) caused by Cercosporidium personatum (Berk. and Curt.) Deighton leads to significant reductions in peanut (Arachis hypogaea L.) yield worldwide. This study was conducted to improve the mechanisms and methods by which LLS effects on defoliation and photosynthesis are linked to the CSM-CROPGRO-Peanut model for simulating growth and yield reductions in peanut cultivars. Field experiments were conducted in 2008 and 2009 to collect data on the effects of LLS on biomass accumulation and partitioning, leaf necrosis and defoliation, and total canopy photosynthesis (TCP) in peanut cultivars with more (York) and less (Carver) quantitative resistance to LLS. After incorporating LLS damage as defoliation percentage and necrotic area, the model accurately simulated crop growth and development for both cultivars despite different disease dynamics. Simulated TCP and leaf, total crop, and pod yield values were in good agreement with measured data. A modification in the model code to directly reduce leaf photosynthesis and quantum efficiency according to empirical observations resulted in improved simulations of LLS effects on growth and yield. Correlations among measured defoliation and necrotic area with disease ratings indicated that visual disease ratings could be successfully used to estimate necrosis and defoliation for model inputs. Results indicated that the CSM-CROPGRO-Peanut model has adequate capability to simulate LLS effects on growth and yield in peanut cultivars with differing levels of resistance to LLS when inputs on canopy necrotic area and defoliation are provided.
M.P. Singh, Everglades REC, Univ. of Florida, 3200 E. Palm Beach Rd., Belle Glade, FL 33430; J.E. Erickson and K.J. Boote, Agronomy Dep., Univ. of Florida, P.O. Box 110500, Gainesville, FL 32611-0500; J.W. Jones, Dep. of Agricultural and Biological Engineering, Univ. of Florida, P.O. Box 110570, Gainesville, FL 32611; B.L. Tillman, Univ. of Florida, North Florida REC, 3925 Hwy. 71, Marianna, FL 32446; and A.H.C. van Bruggen, Plant Pathology Dep., Univ. of Florida, P.O. Box 100009, Gainesville, FL 32611. Received 23 Apr. 2013. *Corresponding author ([email protected]).
Abbreviations: Asat, light-saturated leaf photosynthetic rate; DAP, days after planting; LLS, late leaf spot; QE, quantum efficiency of carbon dioxide assimilation; RMSE, root mean square error; TCP, total canopy photosynthesis.
Published July 1, 2013

1308 Agronomy Journa l • Volume 105, Issue 5 • 2013
pathogen (Erickson et al., 2004; Zhang et al., 2009; Singh et al., 2011b). In these cases, using a cultivar-specific b parameter in the crop model should achieve better predictions of disease-induced reductions in C assimilation, growth, and yield. Quantifying the effects of LLS on peanut cultivars with variable levels of resistance and including the effect on photosynthesis in yield loss simulation models are of great importance for a more complete understand-ing of growth and yield responses to diseases and should increase the accuracy of yield loss estimates.
The CSM-CROPGRO-Peanut model (Boote et al., 1998a, 1998b) is a process-oriented mechanistic crop growth simulation model. This model has coupling points and procedures for enter-ing pest damage to simulate growth and yield reductions associ-ated with foliar pathogens like LLS (Batchelor et al., 1993; Boote et al., 1993). The primary impacts of disease are simulated as defoliation; however, the impacts of the virtual lesion area are cur-rently simulated by simply defoliating more leaf area (hence zero photosynthesis in that area) rather than creating a direct impact on the leaf-level photosynthesis. This subroutine has been tested by some previous studies (Naab et al., 2004; Adomou et al., 2005) to simulate LLS effects on peanut growth and yield; however, these studies did not include measured data on leaf necrosis and/or defoliation required by the disease subroutine in the model nor did they measure the leaf photosynthesis response to leaf necrosis. Either visual ICRISAT ratings were linearly regressed against necrosis values of 0 to 9% (based on data from Bourgeois et al., 1991) to obtain hypothesized necrosis values (Adomou et al., 2005) or variable defoliation and necrosis values were used to mimic leaf weight loss (Naab et al., 2004). Moreover, these studies were conducted only on cultivars lacking any known level of resis-tance to LLS and not on cultivars differing in their resistance.
The overall objective of this study was therefore to evaluate the CSM-CROPGRO-Peanut model for its ability to simulate the impacts of LLS on growth and yield reductions in peanut cultivars with variable resistance levels using measured inputs of necrosis and defoliation. The different physiological response (b values) among peanut cultivars to LLS was incorporated into the model to test its ability to accurately simulate reductions in growth and yield. In addition, the model was modified to directly impact the light-saturated leaf photosynthetic rate (Asat) and the quantum efficiency of CO2 assimilation (QE) depending on the necrotic area percentage, as observed in empirical measurements (Singh et al., 2011b). Multiple disease assessment methods were also analyzed to determine the best method to estimate necrosis and defoliation compared with deriving them from visual ratings (e.g., the Florida 1–10 scale). Thus, these objectives represented a step towards improved model simulation of LLS-induced growth and yield losses that, when coupled with a disease simulation model or subroutine, will contribute to reduced fungicide use and improved peanut cultivar development.
MATERIALS AND METHODSExperimental Site and Design
Data were obtained from field experiments conducted during the 2008 and 2009 growing seasons at the Plant Science Research and Education Unit in Citra, FL (29°23¢60² N, 82°12¢0² W) to simulate growth and yield reductions associated with LLS epidemics of peanut cultivars with differing resistance using the
CSM-CROPGRO-Peanut model. These experiments were part of a larger study conducted to quantify the growth and yield losses and underlying physiological determinants due to LLS in peanut cultivars with variable levels of resistance (Singh et al., 2011a, 2011b). The soil at the experimental site was a Gainesville loamy sand (a hyperthermic, coated Typic Quartzipsamment). The experiment was a two by two factorial arranged in a random-ized complete block design with four replications. Cultivar and fungicide application were treated as fixed effects. Two cultivars were selected for different resistance to LLS: Carver (Gorbet, 2006) has poor resistance to LLS, while York (Gorbet and Till-man, 2011) has moderate resistance (Tillman et al., 2008). Fun-gicide application included: (i) no fungicide application and (ii) an industry-standard fungicide schedule applied at a 14-d interval commencing from approximately 40 d after planting (DAP).
Sowing occurred during the latter part of the recommended planting window for north-central Florida on 20 May 2008 and 27 May 2009 to maximize LLS pressure (Wright et al., 2006). Each plot consisted of six rows spaced 0.91 m apart and 4.6 m long. Seeds were sown at a rate of 17 to 20 seeds m–1 row using a conventional planter. Standard management practices for irri-gated peanut were used in both years (Wright et al., 2006).
Measures of Growth and Yield
Starting at 35 DAP, a 61-cm section of row was harvested randomly from the outer two rows in each plot at approximately biweekly intervals to measure growth and partitioning. A rep-resentative subsample plant was selected from each harvested sample (Bourgeois et al., 1991; Pixley el al., 1990b). The remain-der of the harvested sample was immediately oven dried for 72 h at 60°C and subsequently weighed. Leaflets and pods were sepa-rated from all subsamples, and then leaves, stems, and pods were oven dried to a constant weight. Stem, leaf, and pod dry weights (DWs) were determined for the entire sample by multiplying their respective fractions of the subsample by the total weight of the harvested sample.
A 61-cm section of row was selected randomly from the outer two rows starting at around 35 DAP to measure the total canopy photosynthesis (TCP) using a 91- by 61-cm aluminum-frame Mylar chamber and a portable photosynthesis system (Li-Cor LI-6200). Total canopy photosynthesis was calculated by adding the absolute dark respiration (measured under dark conditions) to the measured C exchange rate under full sunlight conditions.
Measures of Disease Injury
The occurrence and severity of LLS were assessed visually based on the widely used Florida 1–10 scale (Chiteka et al., 1988; Woodward et al., 2008; Woodward et al., 2010). Values of 1 to 4 indicate increasing leaf spot incidence on leaflets within the lower or upper canopy but with no defoliation. Ratings from 4 to 10 are associated with increasing levels of defoliation (Chiteka et al., 1988). Ratings began when visual symptoms first appeared and continued every 7 to 10 d until harvest. Microscopic examination of lesions on leaflets indicated that C. personatum was the domi-nant pathogen in both years.
Canopy defoliation and necrosis, the components that make up the Florida scale ratings, were also measured objectively by other methods throughout the growing season to compare with

Agronomy Journa l • Volume 105, Issue 5 • 2013 1309
the more subjective Florida 1–10 scale assessment. To determine the canopy lesion area, 40 leaflets were randomly selected from the subsample plant. All leaflets were scanned at 300 dpi using a flatbed scanner (Microtek ScanMaker 5800) and stored as .tiff files. Leaf images were processed using ASSESS version 2.0 image analysis software (American Phytopathological Society) to give the necrotic area percentage (Erickson et al., 2004; Singh et al., 2011a). Leaf hue was used by the program to distinguish the necrotic lesion area.
To calculate the canopy defoliation percentage, different meth-ods were used as follows:
1. The loss of leaf DW from the peak leaf weight was used to calculate defoliation percentage for each treatment. After the occurrence of peak leaf DW, the defoliation percentage was calculated for that treatment on a given day as the ratio of the difference between the peak leaf DW and the leaf DW on the given sampling day to the peak DW observed (Pixley et al., 1990b).
2. The number of total nodes and nodes with missing leaflets were counted on the main stem of each subsample plant (Pixley et al., 1990b; Adomou et al., 2005). The defolia-tion percentage was calculated as the ratio of missing to total nodes for each plant. The first six and eight nodes were subsequently not considered in counting for Carver and York, respectively, to account for the differences in non-disease-induced leaf senescence, which varied with life cycle and branch formation from lower nodes between the two cultivars (Adomou et al., 2005). The intercept of the linear relation between missing nodes on the main stem and defoliation (based on leaf weight loss from the peak weight) was used as a starting point to reach the number of nodes to exclude (data not shown) and was further optimized by the best simulated model fit against the actual leaf DW data.
3. The number of total nodes and nodes with missing leaflets were also counted on the four dominant lateral branches and the defoliation percentage was determined as de-scribed above.
The defoliation percentage values obtained through these meth-ods were used as input for model simulations in file T under the header PCLA as described below.
To obtain estimates of necrosis and defoliation as a function of these visual disease ratings, the Florida 1–10 scale ratings were correlated to necrosis and defoliation by comparing the slopes and intercepts of the relations using the generalized least squares procedure of the nlme library of R (R Development Core Team, 2008). Data were combined if the slope and intercept of the given relation was not significant (P > 0.05).
The CSM-CROPGRO-Peanut Model
The CSM-CROPGRO-Peanut model is a mechanistic, process-oriented model designed to simulate growth and devel-opment on a daily basis using crop C, crop and soil N, and soil water balances (Boote et al., 1998a, 1998b). This model computes the canopy photosynthesis at hourly time steps using leaf-level photosynthesis and hedge-row light interception (Boote and Pickering, 1994). This approach is more mechanistic and responsive to row spacing and plant density. Absorption
of direct and diffused irradiance by sunlit vs. shaded leaves is computed based on canopy height and width, row direction, leaf angle, latitude of the site, day of the year, and the time of day along with the predicted leaf area index (LAI) (Boote and Pick-ering, 1994). Photosynthesis of sunlit and shaded leaves is com-puted using the asymptotic exponential light response equation:
é ùæ ö- ´ ÷çê ú÷= - ç ÷ê úç ÷çè øê úë ûmax
max
QE PPFD1.0 expA A
A [2]
where A is the leaf CO2 assimilation rate (mmol m–2 s–1), Amax is the light-saturated A (defined at 30°C and 350 mmol CO2 mol–1 air), QE is the quantum efficiency of the leaf (referenced at the same conditions as Amax), and PPFD is the photosynthetic pho-ton flux density. Both Amax and QE can be adjusted based on the following factors:
( ) ( ) ( )( ) ( ) ( )
= ´ ´ ´
´ ´ ´max max,g 2Temp Chill CO
leaf N SLW DIS
A A f f f
f f f [3]
( ) ( )( ) ( )
= ´ ´
´ ´g 2QE QE Temp CO
leaf N DIS
f f
f f
[4]
where Amax,g is a cultivar-specific coefficient, QEg is a C3 species-specific coefficient; and f represents a 0 to 1 adjustment function based on the temperature of the given day (Temp), the minimum temperature of the previous night (Chill), the atmospheric CO2 concentration (CO2), the leaf N concentration (leaf N), the leaf thickness (specific leaf weight, SLW), and the disease impact (DIS); f(DIS) is not present in the default model and has been introduced into the model as a part of this study (as explained below) and is calculated as
( ) ( )b= -DIS 1 PDLAf [5]
where PDLA is the visual lesion area fraction and b represents the relationship between the virtual and visual lesion areas.
Hourly canopy photosynthesis on a land-area basis is computed by multiplying the photosynthetic rates for the sunlit and shaded leaves by their respective LAIs. The hourly rates are integrated over the 24-h period to yield the total daily gross photosynthesis. Because CSM-CROPGRO is a source-driven crop model, cor-rectly predicting canopy assimilation is important. Finally, the growth of new tissues depends on the daily carbohydrate avail-ability, partitioning to various tissues, and the respiration costs of tissue synthesis.
Crop Model InputsDaily weather data (i.e., maximum and minimum temperature,
rainfall, and solar radiation) were obtained on site from the Flor-ida Automated Weather Network (http://fawn.ifas.ufl.edu/) for both growing seasons. Data on site (latitude, longitude, and eleva-tion), crop management practices (e.g., sowing date, spacing, and plant population), and soil type and properties were provided as
1310 Agronomy Journa l • Volume 105, Issue 5 • 2013
input to the model as well. All data were entered in the standard file formats (*.PNX, *.PNA, *.PNT, *.WTH, and SOIL.SOL) needed for execution of the Peanut model in DSSAT version 4.5 (Jones et al., 2003; Hoogenboom et al., 2009). Data on disease-induced necrosis and defoliation were also entered in the model input file to simulate disease damage, as explained below.
Procedure for Calibration of Genetic CoefficientsThe CSM-CROPGRO-Peanut model requires genetic coef-
ficients that describe the crop phenology, vegetative growth traits, and reproductive growth traits unique to a given cultivar (Boote et al., 1998b). Carver, the cultivar with poor resistance to LLS, is phenotypically similar to Florunner; thus the genetic coefficients of Florunner available in DSSAT version 4.5 were chosen as the starting point for calibration. For York, the genetic coefficients of Southern Runner were chosen because it is phenotypically similar to York and also has moderate levels of resistance to LLS. These coefficients were modified slightly by comparing the simulated phenology, time series growth, and yield with the observed data from the fungicide-sprayed plots only up to midseason, following the procedures outlined by Boote (1999). The extent of changes in coefficients was small (Table 1), and this exercise was done for more accurate prediction of the timing of vegetative and repro-ductive growth. Model calibration was not the point of the study.
Procedure for Simulating Disease EffectsThe effects of LLS on the growth and yield of peanut were
simulated by entering the measured levels of necrosis percentage due to disease and associated leaf defoliation percentage for the corresponding day of the year into the crop performance file (File T) of DSSAT, under the headers of PDLA (necrosis percentage) and PCLA (defoliation percentage). The default model code is designed to read this file and interpolates between dates to create leaf area loss (Batchelor et al., 1993; Boote et al., 1993). The effect of necrosis (PDLA) in the default model is amplified by the vir-tual lesion area (Bastiaans, 1991). The default model uses a virtual lesion effect of 4.0 irrespective of the cultivar used (estimated for Florunner by Bourgeois and Boote, 1992). The model accounts for this effect by defoliating more leaf area. The model then runs the remainder of the season with reduced leaf area (and mass),
resulting in reduced light interception, canopy photosynthesis, and yield.
The virtual lesion effect (b value) is known to differ for differ-ent pathosystems and cultivars (Bassanezi et al., 2001; Erickson et al., 2004) and differed for the two cultivars used in this study (Singh et al., 2011b). To account for this, b values of 3.6 and 4.6 were used for Carver and York, respectively, in all the simulations conducted in this study. Moreover, a modification was made in the model, whereby the effect of necrosis was placed directly on single-leaf photosynthesis via Asat (Eq. [3]) and QE (Eq. [4]), to correspond directly with the physiological data collected in the field study. Instead of defoliating more leaf area as a result of necrosis and virtual lesion area (as in the default model by assum-ing a linear relationship between necrotic area and effective leaf area), this modification to the model caused a cultivar-specific reduction in Asat and QE, assuming that the necrotic spot was directly in the photosynthetic area (Fig. 1; Eq. [2–5]).
Evaluation of model performance was conducted using root mean square error (RMSE) and the Willmott (1981, 1982) index of agreement (D index). These statistical indicators were computed from the observed and simulated variables (e.g., leaf mass, pod mass, and total crop biomass). The RMSE reflects the magnitude of the root mean sum of square differences between the predicted (P) and observed (O) values with time. The D index is a descriptive index that measures the dispersion of the simu-lated and observed data. A model performs well when the RMSE approaches zero and the D index is close to 1.0.
RESULTS AND DISCUSSIONLeaf Weight and Leaf Area Simulations
The model (default version with disease function turned off) predicted the leaf dry weight with good accuracy until around 95 and 85 DAP during 2008 and 2009, respectively, after which the model consistently overpredicted the leaf dry matter accumula-tion (Fig. 2 and 3). This occurred as the leaf dry weight began to decline due to LLS disease around that time, and the model did not simulate those impacts (with the disease function off, the model assumes no disease-induced necrosis and defoliation). This decline was observed even in fungicide-sprayed plots, indicating that the 14-d calendar-based fungicide program did not achieve 100% disease control.
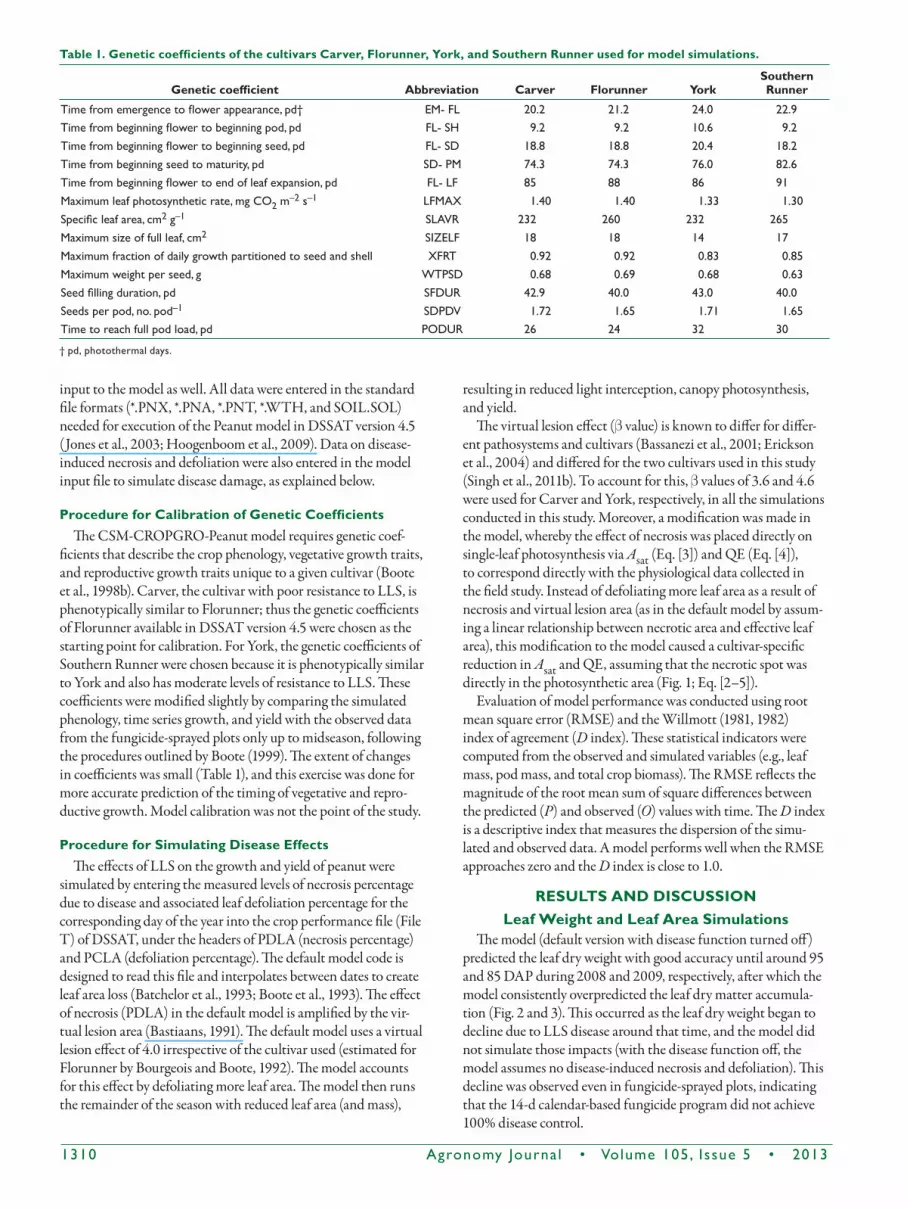
Table 1. Genetic coefficients of the cultivars Carver, Florunner, York, and Southern Runner used for model simulations.
Genetic coefficient Abbreviation Carver Florunner YorkSouthern Runner
Time from emergence to flower appearance, pd† EM- FL 20.2 21.2 24.0 22.9Time from beginning flower to beginning pod, pd FL- SH 9.2 9.2 10.6 9.2Time from beginning flower to beginning seed, pd FL- SD 18.8 18.8 20.4 18.2Time from beginning seed to maturity, pd SD- PM 74.3 74.3 76.0 82.6Time from beginning flower to end of leaf expansion, pd FL- LF 85 88 86 91Maximum leaf photosynthetic rate, mg CO2 m
–2 s–1 LFMAX 1.40 1.40 1.33 1.30Specific leaf area, cm2 g–1 SLAVR 232 260 232 265Maximum size of full leaf, cm2 SIZELF 18 18 14 17Maximum fraction of daily growth partitioned to seed and shell XFRT 0.92 0.92 0.83 0.85Maximum weight per seed, g WTPSD 0.68 0.69 0.68 0.63Seed filling duration, pd SFDUR 42.9 40.0 43.0 40.0Seeds per pod, no. pod–1 SDPDV 1.72 1.65 1.71 1.65Time to reach full pod load, pd PODUR 26 24 32 30
† pd, photothermal days.

Agronomy Journa l • Volume 105, Issue 5 • 2013 1311
To account for the LLS-induced damage, the disease func-tion in the default model was turned on, whereby defoliation (PCLA) was input over time as calculated by different methods. Inclusion of the defoliation effect resulted in improved simula-tions of leaf weight (Fig. 2 and 3; Table 2). Using the leaf weight loss percentage for the defoliation effect resulted in good agree-ment between simulated and measured values, as shown by high D-index values (close to 1) and low RMSE values (Table 2).
However, destructive growth sampling is required to collect leaf weight loss data, which is very labor intensive and time con-suming. Counting main stem nodes and/or branch nodes to cal-culate defoliation is comparatively easier but resulted in overesti-mation of the leaf weight loss due to LLS (Fig. 2 and 3). This could occur due to natural leaf senescence occurring on lower nodes and can be accounted for by subtracting the first few nodes on the main stem (Adomou et al., 2005). The first six and eight nodes
on the main stem of Carver and York, respectively, were excluded to calculate defoliation, resulting in good agreement between simulated and measured values (Fig. 2 and 3; Table 2). More nodes were excluded in York to account for higher leaf senescence of the lower nodes. Adomou et al. (2005) also did not count the first four nodes in their study. The D-index values for leaf weight obtained in this study (0.96–1.00) after accounting for defolia-tion (using leaf weight loss) were higher than those obtained in other studies using the same method (0.68–0.84, Adomou et al., 2005). Overall, the simulated LAI (data not shown) followed the same trend as described above for leaf mass. Because LAI in the model is a function of both leaf mass and specific leaf area (SLA), this indicated that the SLA simulations were also good.
Simulations of Total Biomass and Pod Weight
Without the disease function turned on, the default model simulated the total biomass and pod weight accurately up to around 110 DAP for both cultivars, after which disease reduc-tions of leaf area and assimilation became important (Fig. 4 and 5). Thus, the model not considering disease overpredicted both total biomass and pod yield, resulting in high RMSE values and only moderate D-index values (Tables 3 and 4). To account for LLS-induced damage, both measured necrosis and defoliation (calculated from leaf weight loss) were used for the disease func-tion to run the simulations. This resulted in good agreement between the simulated and measured total biomass and pod weight under both fungicide-sprayed and nonsprayed conditions across the growing season, as shown by D-index values approach-ing 1.0 and low RMSE values (Tables 3 and 4). Reductions in the total biomass and pod yield also occurred under fungicide-sprayed conditions, which corroborates other studies that showed less than optimal control of LLS even with the standard industry spray program (Monfort et al., 2004; Woodward et al., 2010). Naab et al. (2004) also showed good agreement between
Fig. 1. Relationship between necrotic area and effective leaf area in the default model and between necrotic area and rela-tive Asat (ratio of photosynthetic rate of diseased leaflet to the average of asymptomatic leaflets) and QE (quantum efficiency of CO2 assimilation) in the modified model.
Fig. 2. Simulated and measured leaf dry weight vs. days after planting (DAP) for peanut cultivars Carver (C) and York (Y) grown under fungicide-sprayed (F) and nonsprayed (NF) con-ditions during 2008. Symbols represent treatment means (n = 4). Lines represents simulations based on defoliation inputs in-cluding no defoliation input (No def), defoliation based on leaf weight loss (LW), main stem defoliation (MS), branch defolia-tion (Branch), and main stem defoliation excluding the first six and eight nodes for Carver and York, respectively (MS + offset). Vertical bars represent ± standard error of the mean.
Fig. 3. Simulated and measured leaf dry weight vs. days after planting (DAP) for peanut cultivars Carver (C) and York (Y) grown under fungicide-sprayed (F) and nonsprayed (NF) con-ditions during 2009. Symbols represents measured treatment means (n = 4). Lines represents simulations based on defolia-tion inputs including no defoliation input (No def), defoliation based on leaf weight loss (LW), main stem defoliation (MS), branch defoliation (Branch), and main stem defoliation ex-cluding first six and eight nodes for Carver and York, respec-tively (MS + offset). Vertical bars represent ± standard error of the mean.

1312 Agronomy Journa l • Volume 105, Issue 5 • 2013
simulated and measured total biomass (D index = 0.98) and pod yield (D index = 0.97) after entering necrosis and defoliation val-ues to mimic the leaf weight loss.
All model simulations for York were run using a different virtual lesion effect for York (b = 4.6) and Carver (b = 3.6). Table 5 shows improvement in RMSE values for total biomass and pod yield simulations for York with the use of the higher b value. Although the improvement in the RMSE value is small, this demonstrates the potential importance of using cultivar-specific virtual lesion effects in modeling growth and yield losses where intraspecific differences in the physiological response to disease are seen (Erickson et al., 2004; Zhang et al., 2009). Moreover, the use of cultivar-specific b values (3.6 for Carver and 4.6 for York) resulted in improved predictions in 2009 when disease incidence occurred earlier in the season and pro-gressed faster than in 2008 (data not shown). This shows that the importance of the use of different b values may depend on disease severity and the factors that contribute to greater disease severity such as time of onset, weather conditions, etc. In other cases where intraspecific variability does not exist or is minimal
(Robert et al., 2006; Bancal et al., 2007; Kumudini et al., 2010), it would be possible to use the same b value across cultivars.
Simulations showed that the slope of biomass accumulation rose smoothly after a short lag phase early in the vegetative growth period. This lag phase was longer in York than Carver. Both mea-sured and simulated values indicated a peak dry weight of around 10,000 kg ha–1 for both cultivars. Thereafter, the simulated dry matter accumulation showed a decline for both cultivars, which occurred due to LLS incidence. Comparison of the seasonal pat-terns of simulated pod weight among the cultivars also showed later initiation of pod fill, a slower pod growth rate, and a longer duration of pod fill in York than Carver.
Simulations of Canopy Photosynthesis
Without the necrosis and defoliation inputs (disease func-tion off), the model simulations of TCP had lower D-index (0.50–0.71) and higher RMSE values (0.52–0.82 mg m–2 s–1; Table 6). Canopy photosynthesis simulations improved with the use of the disease function, especially later in the season, except for the sharp drops associated with cloudy days (Fig. 6; Table 6).
Table 2. Root mean square error (RMSE) and index of agreement (D index) values for leaf dry weight for Carver and York peanut cultivars grown under with and without fungicide spray during 2008 and 2009. Defoliation inputs include no defoliation input (No def), defoliation based on leaf weight loss (LW), main stem defoliation (MS), branch defoliation (Branch), and main stem defolia-tion excluding the first six and eight nodes for Carver and York, respectively (MS + offset).
Year Cultivar Fungicide
D index RMSE
No def LW MS BranchMS + offset No def LW MS Branch
MS + offset
———————————— kg ha–1 ———————————— 2008 Carver no 0.66 1.00 0.99 0.97 1.00 951 112 133 293 108
yes 0.67 0.96 0.99 0.95 0.98 822 298 98 277 205York no 0.60 0.98 0.91 0.86 0.99 1066 235 399 487 184
yes 0.68 0.99 0.88 0.78 0.98 892 174 446 621 201
2008 Carver no 0.70 0.99 0.93 0.95 0.98 913 196 409 392 238yes 0.66 0.97 0.97 0.93 0.96 834 260 237 356 300
York no 0.61 0.99 0.87 0.84 0.99 1105 184 485 591 170yes 0.71 0.96 0.79 0.65 0.96 807 269 552 809 282
Fig. 4. Simulated and measured total biomass for peanut culti-vars Carver (C) and York (Y) grown under fungicide-sprayed (F) and nonsprayed (NF) conditions at Citra, FL, during 2008 and 2009. Symbols represents measured treatment means (n = 4). Lines represent simulations including no disease function (No dis) and disease function with necrosis and defoliation (Dis func-tion). Vertical bars represent ± standard error of the mean.
Fig. 5. Simulated and measured pod weight for peanut cultivars Carver (C) and York (Y) grown under fungicide-sprayed (F) and nonsprayed (NF) conditions at Citra, FL, during 2008 and 2009. Symbols represents measured treatment means (n = 4). Lines represent simulations including no disease function (No dis) and disease function with necrosis and defoliation (Dis func-tion). Vertical bars represent ± standard error of the mean.

Agronomy Journa l • Volume 105, Issue 5 • 2013 1313
On cloudy days, TCP was actually measured under full sun (late morning and between cloud breaks), whereas simulated photo-synthesis rates were based on total daily solar radiation and hence were low on cloudy days. Agreement between simulated and measured TCP values indicated correct crop C balance in the model. Similar reductions in TCP due to LLS were also observed by Bourgeois and Boote (1992) while studying the Florunner cultivar.
Simulations with the Modified ModelThe modified model (model recoded for direct impact of the
virtual lesion area on Asat and QE) was used to directly impact Asat and QE to account for the virtual lesion area. The modified model resulted in some improvement in the simulations as shown by the increase in the D index and decrease in RMSE values com-pared with the default model simulations for both years (Fig. 7; Tables 7 and 8). Simulations for all treatments in 2008 and under fungicide-sprayed conditions for 2009 are not shown because the trends were similar to those shown in Fig. 7. Improvement in model predictions of total crop and pod weight show the impor-tance of more mechanistically including the effects of LLS on Asat and QE in modeling LLS impacts. With higher necrotic area and/or b values, the improvement in model predictions with these modifications would be even greater than that observed in this study (Fig. 1).
Table 3. Root mean square error (RMSE) and index of agree-ment (D index) values for total biomass of two peanut culti-vars grown with and without fungicide spray at Citra, FL, dur-ing 2008 and 2009. Simulations were conducted without (No dis) and with a disease function including necrosis and defolia-tion (Dis function).
Year Cultivar Fungicide
D index RMSENo dis
Dis function
No dis
Dis function
—— kg ha–1 —— 2008 Carver no 0.93 0.99 1698 517
yes 0.93 0.98 1702 941York no 0.81 0.95 2968 1357
yes 0.90 0.97 2311 1072
2009 Carver no 0.92 0.97 1869 1071yes 0.95 0.99 1463 664
York no 0.88 0.98 2517 921yes 0.94 0.98 1838 1091
Table 4. Root mean square error (RMSE) and index of agree-ment (D index) values for pod weight of two peanut cultivars grown with and without fungicide spray at Citra, FL, during 2008 and 2009. Simulations were conducted without (No dis) and with a disease function including necrosis and defoliation (Dis function).
Year Cultivar Fungicide
D index RMSENo dis
Dis function
No dis
Dis function
—— kg ha–1 —— 2008 Carver no 0.97 0.99 638 359
yes 0.96 0.96 751 700York no 0.93 0.95 802 622
yes 0.97 0.97 522 497
2009 Carver no 0.95 0.98 790 522yes 0.98 0.99 596 477
York no 0.95 0.97 824 537yes 0.98 0.99 526 455
Table 5. Virtual lesion effect (b value) on root mean square error (RMSE) values for total biomass and pod yield of York peanut cultivar grown with and without fungicide spray during 2008 and 2009.
Year Fungicide
RMSETotal biomass Pod weight
b = 3.6 b = 4.6 b = 3.6 b = 4.6 —————————— kg ha–1 ——————————
2008 no 1393 1357 647 622yes 1108 1072 508 497
2009 no 945 921 549 537yes 1106 1091 472 455
Table 6. Root mean square error (RMSE) and index of agree-ment (D index) values for total canopy photosynthesis of two peanut cultivars grown with and without fungicide spray dur-ing 2008 and 2009. Simulations were conducted without (No dis) and with a disease function including necrosis and defolia-tion (Dis function).
Year Cultivar Fungicide
D index RMSENo dis
Dis function
No dis
Dis function
— mg m–2 s–1 —
2008 Carver no 0.60 0.89 0.74 0.43yes 0.57 0.78 0.67 0.51
York no 0.71 0.96 0.68 0.27yes 0.71 0.93 0.61 0.31
2009 Carver no 0.50 0.89 0.82 0.42yes 0.50 0.71 0.61 0.47
York no 0.64 0.93 0.65 0.32yes 0.70 0.86 0.52 0.36
Fig. 6. Simulated and measured midday total canopy photo-synthesis for peanut cultivars Carver (C) and York (Y) grown under fungicide-sprayed (F) and nonsprayed (NF) conditions at Citra, FL, during 2008 and 2009. Symbols represents mea-sured treatment means (n = 4). Lines represent simulations including no disease function (No dis) and disease function with necrosis and defoliation (Dis function).

1314 Agronomy Journa l • Volume 105, Issue 5 • 2013
Estimating Disease-Induced Necrosis Percentage and Defoliation from the Florida 1–10 Scale
The canopy necrosis percentage was positively related (P < 0.001) to the Florida 1–10 visual ratings (Fig. 8). The slope of the relation between the measured necrosis percentage and the Florida 1–10 scale visual ratings was not affected (P > 0.05)
by cultivar, fungicide treatment, or year (Fig. 8). Adomou et al. (2005) also developed a relationship between necrosis percent-age and the ICRISAT 1–9 scale, which is similar to the Florida scale; however, their relation was developed by linearly regress-ing necrosis from zero at an ICRISAT score of 1 to a maximum necrosis of 9% at an ICRISAT score of 8, based on necrosis data from Bourgeois et al. (1991). The relation established in this study is more reliable and rigorously tested because it was developed from actual measured necrosis data on two peanut cultivars under fungicide-sprayed and nonsprayed conditions across 2 yr of field peanut production. These results support the idea that visual rat-ings for disease severity can be used to derive the necrosis percent-age where measured data on necrosis are not available.
The canopy defoliation percentage (calculated from leaf weight loss) was also positively related to the Florida 1–10 scale (P < 0.001). The slope of the relation between defoliation and the Flor-ida 1–10 scale was not affected by fungicide schedule or year; how-ever, it was influenced by the cultivar used (Fig. 9). This shows that the Florida scale ratings were not consistent for defoliation among the two cultivars. These results indicate that a cultivar-specific rela-tion is required to derive defoliation from a visual rating scale.
Simulations Using Estimated Necrosis and Defoliation from the Florida 1–10 Scale
Simulations conducted using necrosis percentage and defolia-tion inputs derived from visual disease ratings (Florida 1–10 scale) were in good agreement with the values simulated using the measured disease data (Fig. 10; Tables 9 and 10). The temporal dynamics of total crop biomass and pod weight were consistent between the two simulations and were in good agreement with the measured data as well, as shown by D-index values approach-ing 1.0 and RMSE values approaching zero. These results indicate that inputs for the disease function can be derived from less labor-intensive and less time-consuming visual disease scouting methods rather than relying on intensive measurements for dis-ease-induced necrosis and defoliation. The D-index values for pod weight (0.95–0.99) obtained in this study were higher than those (0.69–0.87) obtained by Adomou et al. (2005) while using actual defoliation and estimated necrosis data. This indicates greater accuracy of the relations developed in this study in estimating quantitative disease damage from visual ratings.
Fig. 8. The relationship between necrosis percentage and the Florida 1–10 visual rating scale.Fig. 7. Simulated and measured total biomass and pod weight
for peanut cultivars Carver (C) and York (Y) grown with no fungicide application (NF) during 2009. Symbols represent measured treatment means (n = 4). Lines represents simula-tions with default and modified model routines. Vertical bars represent ± standard error of the mean.
Table 7. Comparison of the default vs. a modified model for root mean square error (RMSE) and index of agreement (D index) values for total biomass of two peanut cultivars grown with and without fungicide spray during 2008 and 2009.
Year Cultivar FungicideD index RMSE
Default Modified Default Modified —— kg ha–1 ——
2008 Carver no 0.99 0.99 517 522yes 0.98 0.98 941 845
York no 0.95 0.96 1357 1194yes 0.97 0.98 1072 930
2009 Carver no 0.97 0.97 1071 1122yes 0.99 0.99 664 623
York no 0.98 0.98 921 798yes 0.98 0.98 1091 1007
Table 8. Comparison of the default vs. a modified model for root mean square error (RMSE) and index of agreement (D in-dex) values for pod weight of two peanut cultivars grown with and without fungicide spray during 2008 and 2009.
Year Cultivar Fungicide
D index RMSE
Default Modified Default Modified
—— kg ha–1 —— 2008 Carver no 0.99 0.99 359 281
yes 0.96 0.97 700 617York no 0.95 0.96 622 540
yes 0.97 0.98 497 423
2009 Carver no 0.98 0.97 522 553yes 0.99 0.99 477 435
York no 0.97 0.98 537 482yes 0.99 0.99 455 406

Agronomy Journa l • Volume 105, Issue 5 • 2013 1315
CONCLUSIONS
The CSM-CROPGRO-Peanut model can be used to simu-late the influence of foliar diseases (e.g., LLS) on photosynthe-sis, growth, partitioning, and yield reductions in peanut culti-vars with differing levels of resistance to LLS when inputs on canopy necrotic area percentage and defoliation are provided. Estimating defoliation from main stem nodes worked well, but obtaining the appropriate starting point (excluding the first six and eight nodes for Carver and York, respectively) for disease-induced defoliation is important. Significant relations between
the Florida 1–10 visual rating scale and measured necrosis and defoliation can be used to simulate LLS-induced growth and yield reductions with reasonable accuracy where detailed sam-pling on disease damage is not conducted.
The adjustments made to the model code had relatively minor effects but resulted in improved predictions (10% overpredic-tion of final pod yield by the modified model compared with 14% by the default model across all treatments) of the effect of LLS on the growth and yield of peanut. The next release of the model will include the changes to simulate the effect of disease directly on leaf photosynthetic traits as opposed to the indirect effects on leaf defoliation. The use of a cultivar-specific b param-eter was warranted because it resulted in improved simulations of growth and yield. Future model development should include an independent disease simulator that can predict LLS-induced necrosis and defoliation based on weather conditions. This would allow improved predictions of the impacts of foliar dis-eases like LLS on growth and yield and hence result in reduced fungicide use and improved cultivar development without rely-ing on the disease damage inputs from scouting.
Fig. 10. Simulated and measured total biomass and pod weight for peanut cultivars Carver (C) and York (Y) grown with no fungicide application (NF) during 2009. Symbols represent measured treatment means (n = 4). Lines represents simula-tions, with disease function derived from measured data (Dis function-msd) and data estimated from the Florida 1–10 scale (Dis function-est). Vertical bars represent ± standard error of the mean.
Fig. 9. The relationship between defoliation and the Florida 1–10 visual rating scale for the two peanut cultivars Carver and York.
Table 9. Root mean square error (RMSE) and index of agree-ment (D index) values for total biomass of two peanut culti-vars grown with and without fungicide spray during 2008 and 2009 as simulated by the CSM-CROPGRO-Peanut model using a disease function derived from measured data or data estimated from the Florida 1–10 scale.
Year Cultivar Fungicide
D index RMSE
MeasuredEsti-
mated MeasuredEsti-
mated —— kg ha–1 ——
2008 Carver no 0.99 0.99 522 580yes 0.98 0.97 845 1004
York no 0.96 0.94 1194 1427yes 0.98 0.96 930 1242
2009 Carver no 0.97 0.96 1122 1171yes 0.99 0.99 623 644
York no 0.98 0.98 798 788yes 0.98 0.98 1007 842
Table 10. Root mean square error (RMSE) and index of agree-ment (D index) values for pod yield of two peanut cultivars grown with and without fungicide spray during 2008 and 2009 as simulated by the CSM-CROPGRO-Peanut model using a disease function derived from measured data or data estimat-ed from the Florida 1–10 scale.
Year Cultivar Fungicide
D index RMSE
MeasuredEsti-
mated MeasuredEsti-
mated
—— kg ha–1 ——
2008 Carver no 0.99 0.99 281 297yes 0.97 0.97 617 664
York no 0.96 0.95 540 645yes 0.98 0.97 423 526
2009 Carver no 0.97 0.97 553 559yes 0.99 0.99 435 398
York no 0.98 0.98 482 415yes 0.99 0.99 406 330

1316 Agronomy Journa l • Volume 105, Issue 5 • 2013
ACkNOWLEDGMENTS
We would like to acknowledge Phil Alderman, Justin McKinney, Andrew Schreffler, and Janet Lee for help with model calibration, plot establishment, plot maintenance, and data collection. This project was supported by the Southeastern Peanut Research Initiative, Florida Pea-nut Producers, and the Florida Agricultural Experiment Station.
REFERENCESAdomou, M., P.V.V. Prasad, K.J. Boote, and J. Detongnon. 2005. Disease assess-
ment methods and their use in simulating growth and yield of pea-nut crops affected by leafspot disease. Ann. Appl. Biol. 146:469–479. doi:10.1111/j.1744-7348.2005.040122.x
Bancal, M.-O., C. Robert, and B. Ney. 2007. Modelling wheat growth and yield losses from late epidemics of foliar diseases using loss of green leaf area per layer and pre-anthesis reserves. Ann. Bot. 100:777–789. doi:10.1093/aob/mcm163
Bassanezi, R.B., L. Amorim, A. Bergamin Filho, B. Hau, and R.D. Berger. 2001. Accounting for photosynthetic efficiency of bean leaves with rust, angular leaf spot and anthracnose to assess crop damage. Plant Pathol. 50:443–452. doi:10.1046/j.1365-3059.2001.00584.x
Bastiaans, L. 1991. Ratio between virtual and visual lesion size as a measure to describe reduction in leaf photosynthesis of rice due to leaf blast. Phytopathology 81:611–615. doi:10.1094/Phyto-81-611
Bastiaans, L. 1993. Effect of leaf blast on photosynthesis of rice: 1. Leaf photosynthe-sis. Neth. J. Plant Pathol. 99:197–203. doi:10.1007/BF01974664
Batchelor, W.D., J.W. Jones, K.J. Boote, and H.O. Pinnschmidt. 1993. Extending the use of crop models to study pest damage. Trans. ASAE 36:551–558.
Boote, K.J. 1999. Concepts of calibrating crop growth models. In: G. Hoogenboom et al., editors, DSSAT Version 3. A decision support system for agrotechnology transfer. Vol. 4. Univ. of Hawaii, Honolulu. p. 179–200.
Boote, K.J., W.D. Batchelor, J.W. Jones, H. Pinnschmidt, and G. Bourgeois. 1993. Pest damage relations at the field level. In: F.W.T. Penning de Vries et al., editors, Sys-tems approaches for agricultural development. Kluwer Acad. Publ., Dordrecht, the Netherlands. p. 277–296.
Boote, K.J., J.W. Jones, and G. Hoogenboom. 1998a. Simulation of crop growth: CROPGRO model. In: R.M. Peart and R.B. Curry, editors, Agricultural systems modeling and simulation. Marcel Dekker, New York. p. 651–692.
Boote, K.J., J.W. Jones, G. Hoogenboom, and N.B. Pickering. 1998b. The CROPGRO model for grain legumes. In: G.Y. Tsuji et al., editors, Understanding options for agricultural production. Kluwer Acad. Publ., Dordrecht, the Netherlands. p. 99–128.
Boote, K.J., J.W. Jones, J.W. Mishoe, and R.D. Berger. 1983. Coupling pests to crop growth simulators to predict yield reductions. Phytopathology 73:1581–1587. doi:10.1094/Phyto-73-1581
Boote, K.J., and N.B. Pickering. 1994. Modeling photosynthesis of row crop canopies. HortScience 29:1423–1434.
Bourgeois, G., and K.J. Boote. 1992. Leaflet and canopy photosynthesis of peanut affected by late leaf spot. Agron. J. 84:359–366. doi:10.2134/agronj1992.00021962008400030002x
Bourgeois, G., K.J. Boote, and R.D. Berger. 1991. Growth, development, yield, and seed quality of Florunner peanut affected by late leafspot. Peanut Sci. 18:137–143. doi:10.3146/i0095-3679-18-2-18
Chiteka, Z.A., D.W. Gorbet, F.M. Shokes, T.A. Kucharek, and D.A. Knauft. 1988. Com-ponents of resistance to late leaf spot in peanut: I. Levels and variability—Implications for selection. Peanut Sci. 15:25–30. doi:10.3146/i0095-3679-15-1-8
Erickson, J.E., G.R. Stanosz, and E.L. Kruger. 2004. Photosynthetic consequences of Marssonina leaf spot differ between two poplar hybrids. New Phytol. 161:577–583. doi:10.1046/j.1469-8137.2003.00968.x
Gorbet, D.W. 2006. Registration of ‘Carver’ peanut. Crop Sci. 46:2713–2714. doi:10.2135/cropsci2006.05.0331
Gorbet, D.W., and B.L. Tillman. 2011. Registration of ‘York’ peanut. J. Plant Reg. 5:289–294. doi:10.3198/jpr2010.11.0644crc
Hoogenboom, G., J.W. Jones, P.W. Wilkens, C.H. Porter, K.J. Boote, L.A. Hunt, et al. 2009. Decision Support System for Agrotechnology Transfer (DSSAT) Version 4.5. [CD-ROM] Univ. of Hawaii, Honolulu.
Jones, J.W., G. Hoogenboom, C.H. Porter, K.J. Boote, W.D. Batchelor, L.A. Hunt, et al. 2003. The DSSAT cropping systems model. Eur. J. Agron. 18:235–265. doi:10.1016/S1161-0301(02)00107-7
Kumudini, S., C.V. Godoy, B. Kennedy, E. Prior, J. Omielau, H.R. Boerma, and D. Hershman. 2010. Role of host-plant resistance development stage on leaf photo-synthetic competence of soybean rust infected leaves. Crop Sci. 50:2533–2542. doi:10.2135/cropsci2010.01.0003
Monfort, W.S., A.K. Culbreath, K.L. Stevenson, T.B. Brenneman, D.W. Gorbet, and S.C. Phatak. 2004. Effects of reduced tillage, resistant cultivars, and reduced fun-gicide inputs on progress of early leaf spot of peanut (Arachis hypogaea). Plant Dis. 88:858–864. doi:10.1094/PDIS.2004.88.8.858
Naab, J.B., P. Singh, K.J. Boote, J.W. Jones, and K.O. Marfo. 2004. Using the CROP-GRO-Peanut model to quantify yield gaps of peanut in the Guinean savanna zone of Ghana. Agron. J. 96:1231–1242. doi:10.2134/agronj2004.1231
Nutter, F.W., Jr., and F.M. Shokes. 1995. Management of foliar diseases caused by fungi. In: H.A. Melouk and F.M. Shokes, editors, Peanut health management. Am. Phytopathol. Soc., St. Paul, MN. p. 65–74.
Pixley, K.V., K.J. Boote, F.M. Shokes, and D.W. Gorbet. 1990a. Growth and partition-ing characteristics of four peanut genotypes differing in resistance to late leafspot. Crop Sci. 30:796–804. doi:10.2135/cropsci1990.0011183X003000040007x
Pixley, K.V., K.J. Boote, F.M. Shokes, and D.W. Gorbet. 1990b. Disease progression and leaf area dynamics of four peanut genotypes differing in resistance to late leafspot. Crop Sci. 30:789–796. doi:10.2135/cropsci1990.0011183X003000040006x
R Development Core Team. 2008. R: A language and environment for statistical com-puting. R Foundation for Statistical Computing, Vienna.
Robert, C., M.-O. Bancal, C. Lannou, and B. Ney. 2006. Quantification of the effects of Septoria tritici blotch on wheat leaf gas exchange with respect to lesion age, leaf number, and leaf nitrogen status. J. Exp. Bot. 57:225–234. doi:10.1093/jxb/eri153
Robert, C., M.-O. Bancal, P. Nicolas, C. Lannou, and B. Ney. 2004. Analysis and modelling of effects of leaf rust and Septoria tritici blotch on wheat growth. J. Exp. Bot. 55:1079–1094. doi:10.1093/jxb/erh108
Singh, M.P., J.E. Erickson, K.J. Boote, B.L. Tillman, J.W. Jones, and A.H.C. van Bruggen. 2011a. Late leaf spot effects on growth, photosynthesis, and yield dif-fer in peanut cultivars of differing resistance. Agron. J. 103:85–91. doi:10.2134/agronj2010.0322
Singh, M.P., J.E. Erickson, K.J. Boote, B.L. Tillman, A.H.C. van Bruggen, and J.W. Jones. 2011b. Photosynthetic consequences of late leaf spot differ between peanut cultivars with variable levels of resistance. Crop Sci. 51:2741–2748. doi:10.2135/cropsci2011.03.0144
Teng, P.S., W.D. Batchelor, H.O. Pinnschmidt, and G.G. Wilkerson. 1998. Simula-tion of pest effects on crops using coupled pest–crop models: The potential for decision support. In: G.Y. Tsuji, et al., editors, Understanding options for agricul-tural production. Kluwer Acad. Publ., Dordrecht, the Netherlands. p. 221–266.
Tillman, B., D. Gorbet, M. Gomillion, J. McKinney, G. Person, and B. Thomas. 2008. Peanut variety performance in Florida 2004–2007. SS AGR 311. Florida Coop. Ext. Serv., Univ. of Florida, Gainesville.
Timsina, J., K.J. Boote, and S. Duffield. 2007. Evaluating the CROPGRO soybean model for predicting impacts of insect defoliation and depodding. Agron. J. 99:148–157. doi:10.2134/agronj2005.0338
Williams, J.H., and K.J. Boote. 1995. Physiology and modeling: Predicting the “unpredictable legume”. In: H.E. Pattee and H.T. Stalker, editors, Advances in peanut science. Am. Peanut Res. Educ. Soc., Stillwater, OK. p. 301–353.
Willmott, C.J. 1981. On the validation of models. Phys. Geogr. 2:184–194. doi:10.1080/02723646.1981.10642213
Willmott, C.J. 1982. Some comments on the evaluation of model performance. Bull. Am. Meteorol. Soc. 63:1309–1313. doi:10.1175/1520-0477(1982)0632.0.CO;2
Woodward, J.E., T.B. Brenneman, R.C. Kemerait, Jr., A.K. Culbreath, and N.B. Smith. 2010. Management of peanut diseases with reduced input fungicide programs in fields with varying levels of disease risk. Crop Prot. 29:222–229. doi:10.1016/j.cropro.2009.12.008
Woodward, J.E., T.B. Brenneman, R.C. Kemerait, Jr., N.B. Smith, A.K. Culbreath, and K.L. Stevenson. 2008. Use of resistant cultivars and reduced fungicide pro-grams to manage peanut disease in irrigated and nonirrigated fields. Plant Dis. 92:896–902. doi:10.1094/PDIS-92-6-0896
Wright, D.L., B. Tillman, E. Jowers, J. Marois, J.A. Ferrell, T. Katsvairo, and E.B. Whitty. 2006. Management and cultural practices for peanuts. SS AGR 74. Flor-ida Coop. Ext. Serv., Univ. of Florida, Gainesville.
Zhang, S., S. Lu, X. Xu, H. Korpelainen, and C. Li. 2009. Changes in antioxidant enzyme activities and isozyme profiles in leaves of male and female Populus cathayana infected with Melampsora larici-populina. Tree Physiol. 30:116–128. doi:10.1093/treephys/tpp094


