Embed Size (px)
Citation preview
Sunghoon Kris Moon Seoul Urban Solutions Agency
Utilizing Big Data to
Solve Urban Issues:
The Case of Seoul
Table of Contents
Seoul: A Brief Introduction
Seoul as a Smart City
Smart City Application: Seoul’s Big Data
Introduction
Case 1: Night Owl Bus
Case 2: Neighborhood (Golmok)
Business District Analysis Service
Case 3: Traffic Accidents Analysis for
Transportation Vulnerables
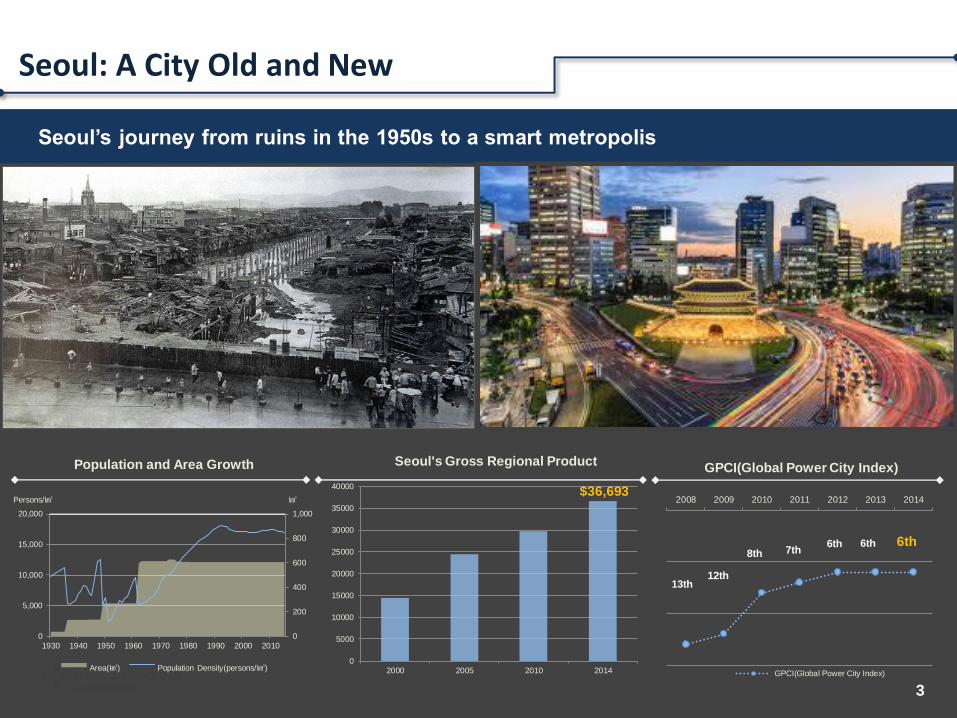
Seoul: A City Old and New
Seoul’s journey from ruins in the 1950s to a smart metropolis
Population and Area Growth
0
200
400
600
800
1,000
0
5,000
10,000
15,000
20,000
1930 1940 1950 1960 1970 1980 1990 2000 2010
Area(㎢) Population Density(persons/㎢)
㎢ Persons/㎢
GPCI(Global Power City Index)
2008 2009 2010 2011 2012 2013 2014
GPCI(Global Power City Index)
13th 12th
8th 7th 6th 6th 6th
0
5000
10000
15000
20000
25000
30000
35000
40000
2000 2005 2010 2014
Seoul's Gross Regional Product
$36,693
3
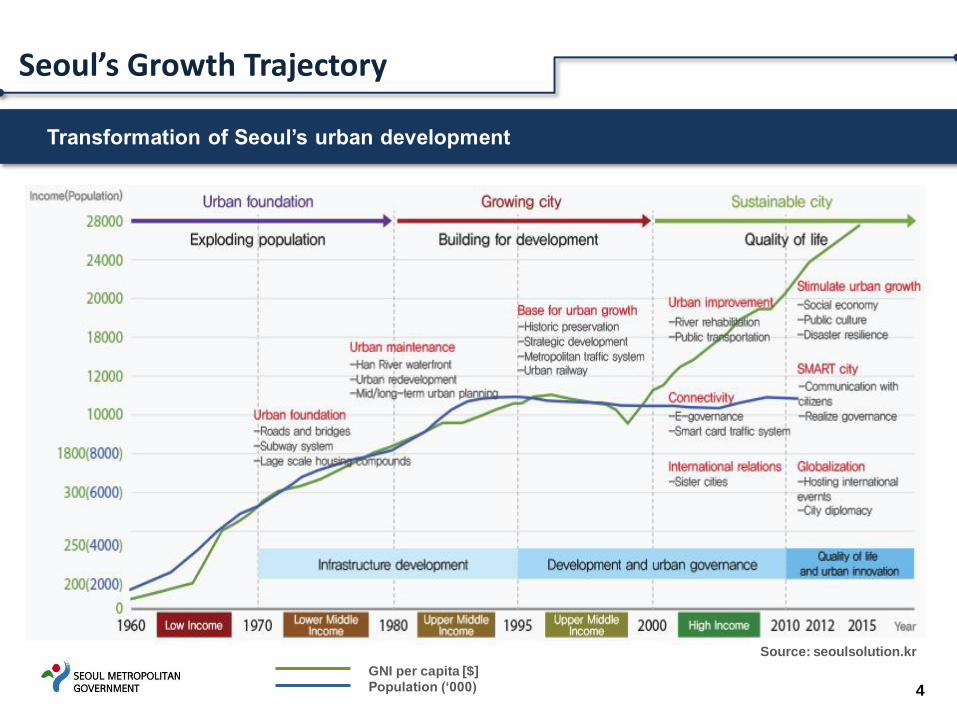
Seoul’s Growth Trajectory
Transformation of Seoul’s urban development
4
GNI per capita [$]
Population (‘000)
Source: seoulsolution.kr
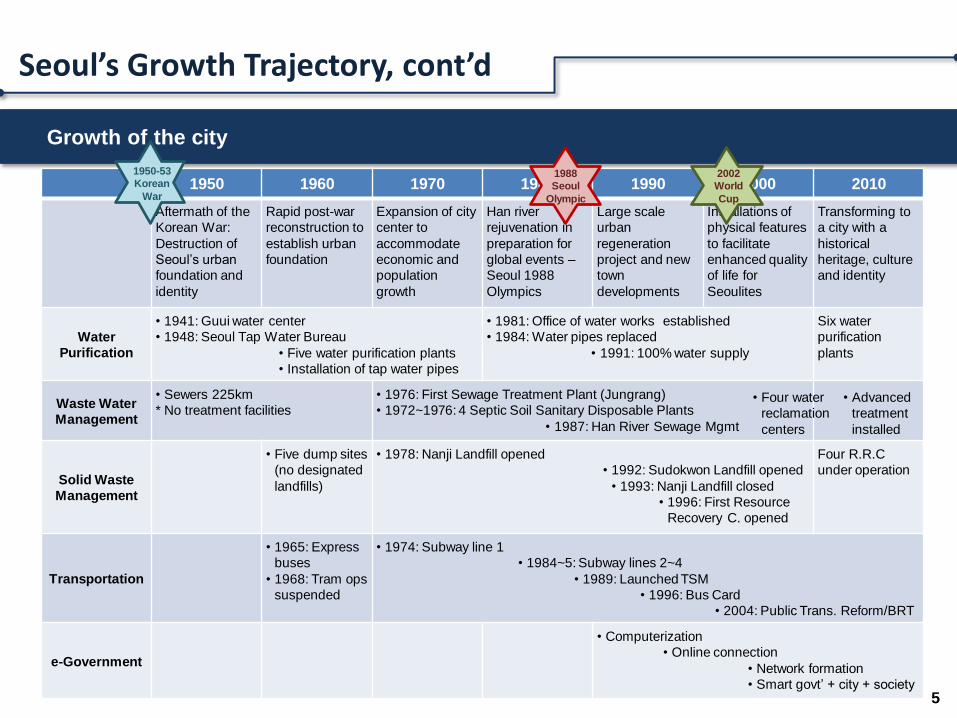
Growth of the city
5
1950 1960 1970 1980 1990 2000 2010
Aftermath of the
Korean War:
Destruction of
Seoul’s urban
foundation and
identity
Rapid post-war
reconstruction to
establish urban
foundation
Expansion of city
center to
accommodate
economic and
population
growth
Han river
rejuvenation in
preparation for
global events –
Seoul 1988
Olympics
Large scale
urban
regeneration
project and new
town
developments
Installations of
physical features
to facilitate
enhanced quality
of life for
Seoulites
Transforming to
a city with a
historical
heritage, culture
and identity
Water
Purification
• 1941: Guui water center
• 1948: Seoul Tap Water Bureau
• Five water purification plants
• Installation of tap water pipes
• 1981: Office of water works established
• 1984: Water pipes replaced
• 1991: 100% water supply
Six water
purification
plants
Waste Water
Management
• Sewers 225km
* No treatment facilities
• 1976: First Sewage Treatment Plant (Jungrang)
• 1972~1976: 4 Septic Soil Sanitary Disposable Plants
• 1987: Han River Sewage Mgmt
Solid Waste
Management
• Five dump sites
(no designated
landfills)
• 1978: Nanji Landfill opened
• 1992: Sudokwon Landfill opened
• 1993: Nanji Landfill closed
• 1996: First Resource
Recovery C. opened
Four R.R.C
under operation
Transportation
• 1965: Express
buses
• 1968: Tram ops
suspended
• 1974: Subway line 1
• 1984~5: Subway lines 2~4
• 1989: Launched TSM
• 1996: Bus Card
• 2004: Public Trans. Reform/BRT
e-Government
• Computerization
• Online connection
• Network formation
• Smart govt’ + city + society
1988
Seoul
Olympic
Seoul’s Growth Trajectory, cont’d
1950-53
Korean
War
2002
World
Cup
• Four water
reclamation
centers
• Advanced
treatment
installed
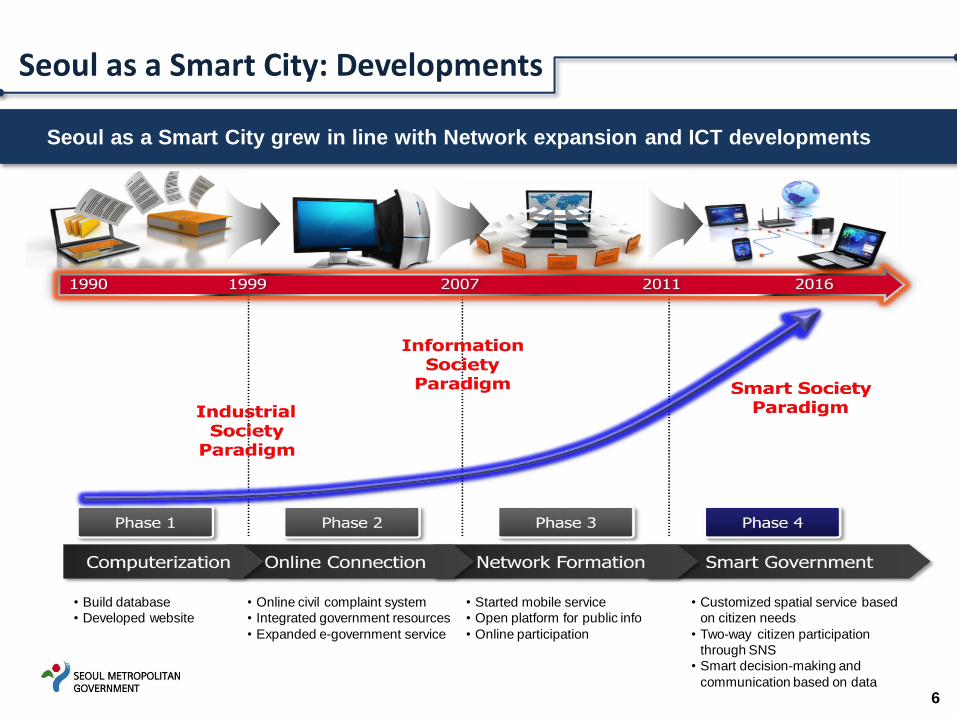
Seoul as a Smart City grew in line with Network expansion and ICT developments
6
Seoul as a Smart City: Developments
• Build database
• Developed website
• Online civil complaint system
• Integrated government resources
• Expanded e-government service
• Started mobile service
• Open platform for public info
• Online participation
• Customized spatial service based
on citizen needs
• Two-way citizen participation
through SNS
• Smart decision-making and
communication based on data
7
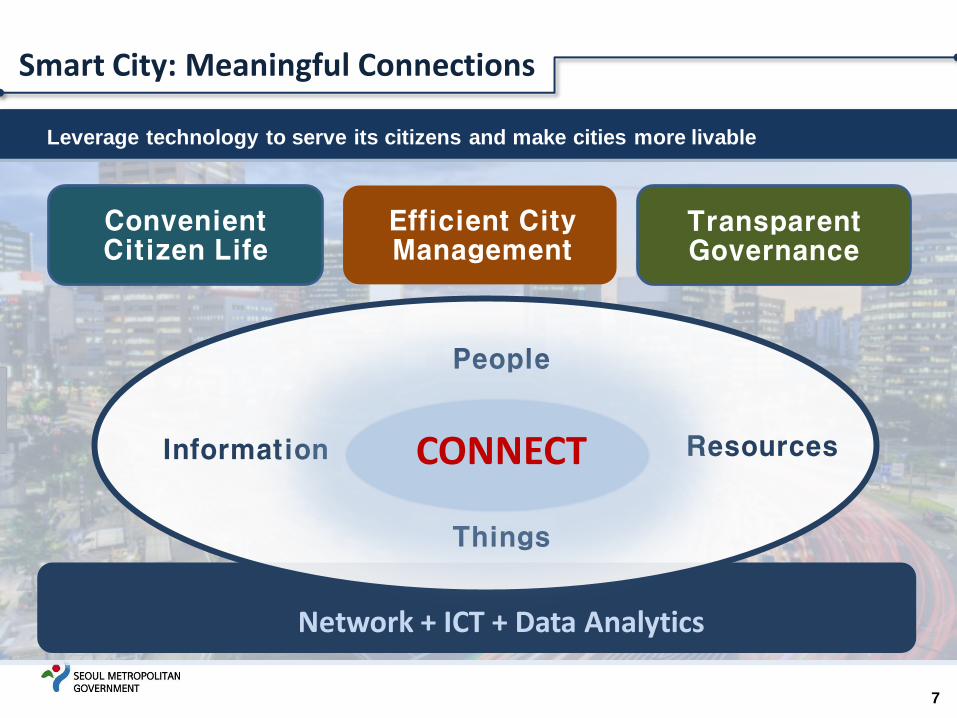
Network + ICT + Data Analytics
People
Things
Resources Information CONNECT
Leverage technology to serve its citizens and make cities more livable
Smart City: Meaningful Connections
Convenient Citizen Life
Efficient City Management
Transparent Governance
8
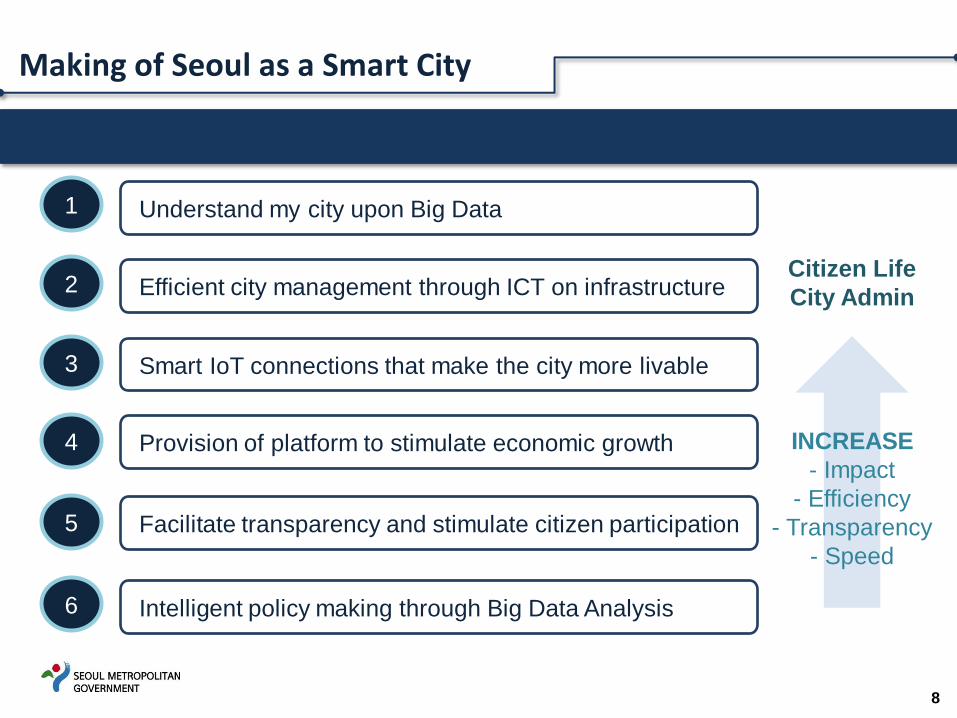
Making of Seoul as a Smart City
1
2
3
5
6
Understand my city upon Big Data
Efficient city management through ICT on infrastructure
Smart IoT connections that make the city more livable
Facilitate transparency and stimulate citizen participation
Intelligent policy making through Big Data Analysis
4 Provision of platform to stimulate economic growth
Citizen Life
City Admin
INCREASE
- Impact
- Efficiency
- Transparency
- Speed
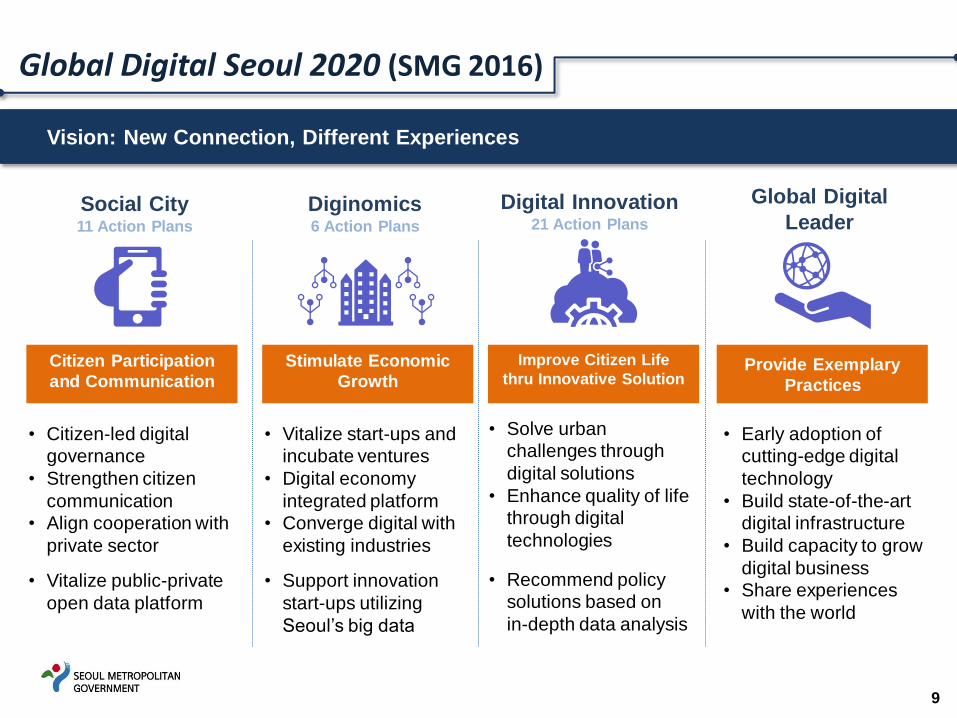
Vision: New Connection, Different Experiences
9
Global Digital Seoul 2020 (SMG 2016)
Citizen Participation
and Communication
Stimulate Economic
Growth
Improve Citizen Life
thru Innovative Solution Provide Exemplary
Practices
Social City 11 Action Plans
Diginomics 6 Action Plans
Digital Innovation 21 Action Plans
Global Digital
Leader
• Citizen-led digital
governance
• Strengthen citizen
communication
• Align cooperation with
private sector
• Vitalize public-private
open data platform
• Vitalize start-ups and
incubate ventures
• Digital economy
integrated platform
• Converge digital with
existing industries
• Support innovation
start-ups utilizing
Seoul’s big data
• Solve urban
challenges through
digital solutions
• Enhance quality of life
through digital
technologies
• Recommend policy
solutions based on
in-depth data analysis
• Early adoption of
cutting-edge digital
technology
• Build state-of-the-art
digital infrastructure
• Build capacity to grow
digital business
• Share experiences
with the world
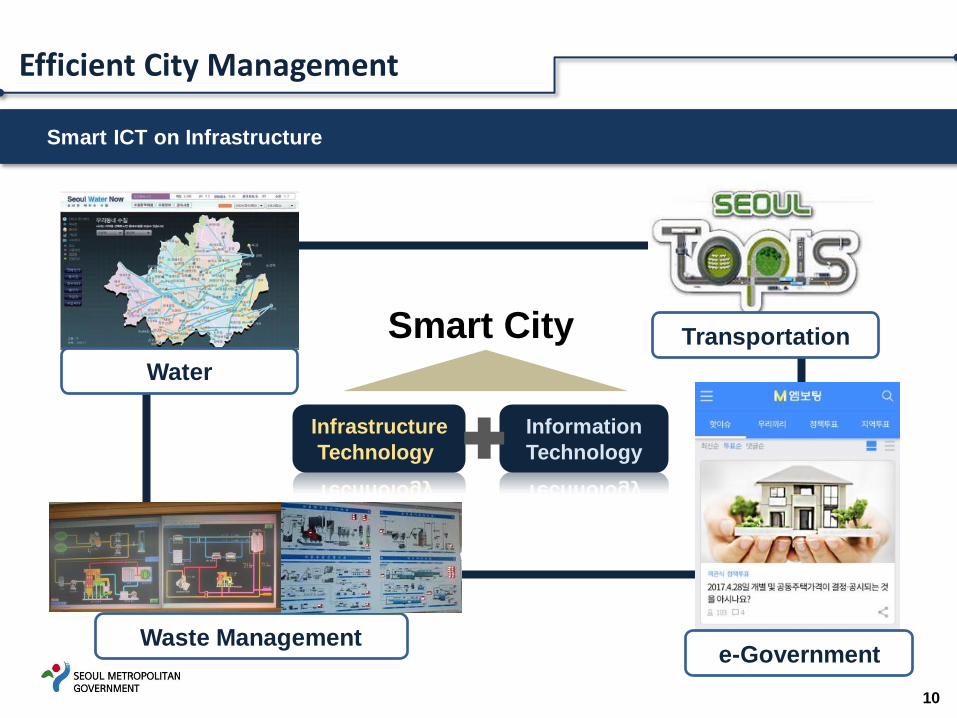
Smart ICT on Infrastructure
10
Smart City
Infrastructure
Technology
Information
Technology
e-Government
Water
Waste Management
Transportation
Efficient City Management
11
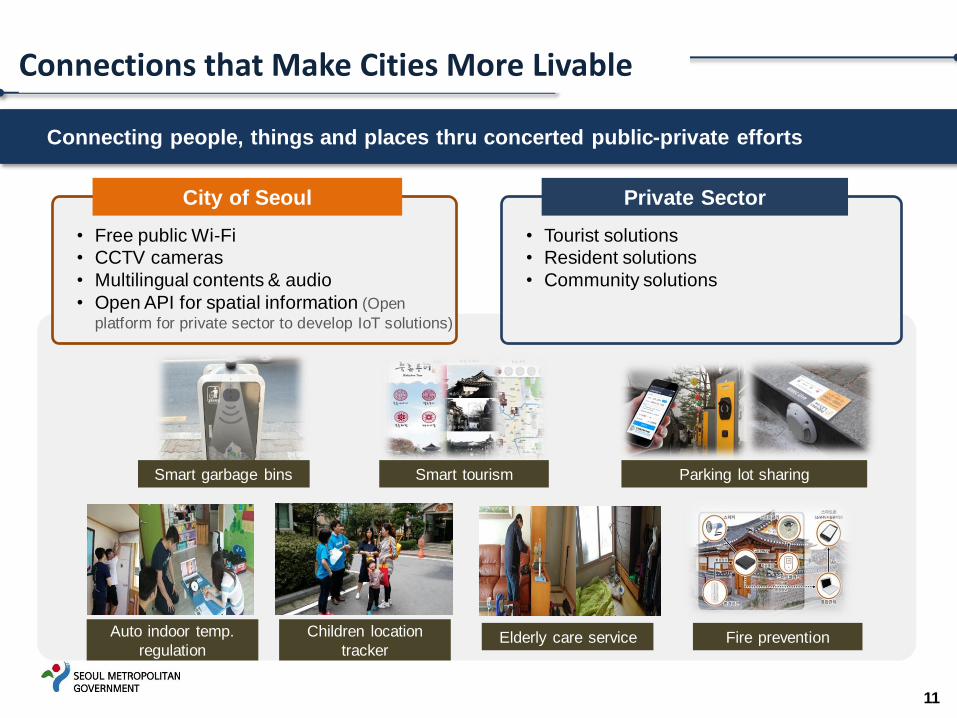
Connecting people, things and places thru concerted public-private efforts
City of Seoul
• Free public Wi-Fi
• CCTV cameras
• Multilingual contents & audio
• Open API for spatial information (Open
platform for private sector to develop IoT solutions)
Private Sector
• Tourist solutions
• Resident solutions
• Community solutions
Smart garbage bins Smart tourism Parking lot sharing
Fire prevention Auto indoor temp.
regulation
Children location
tracker Elderly care service
Connections that Make Cities More Livable
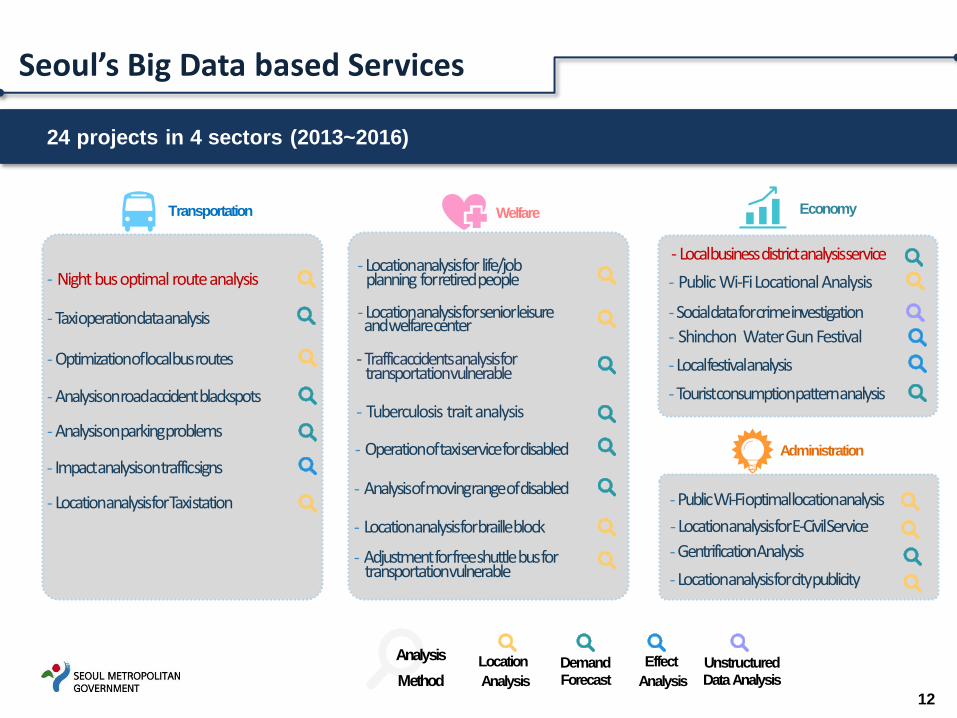
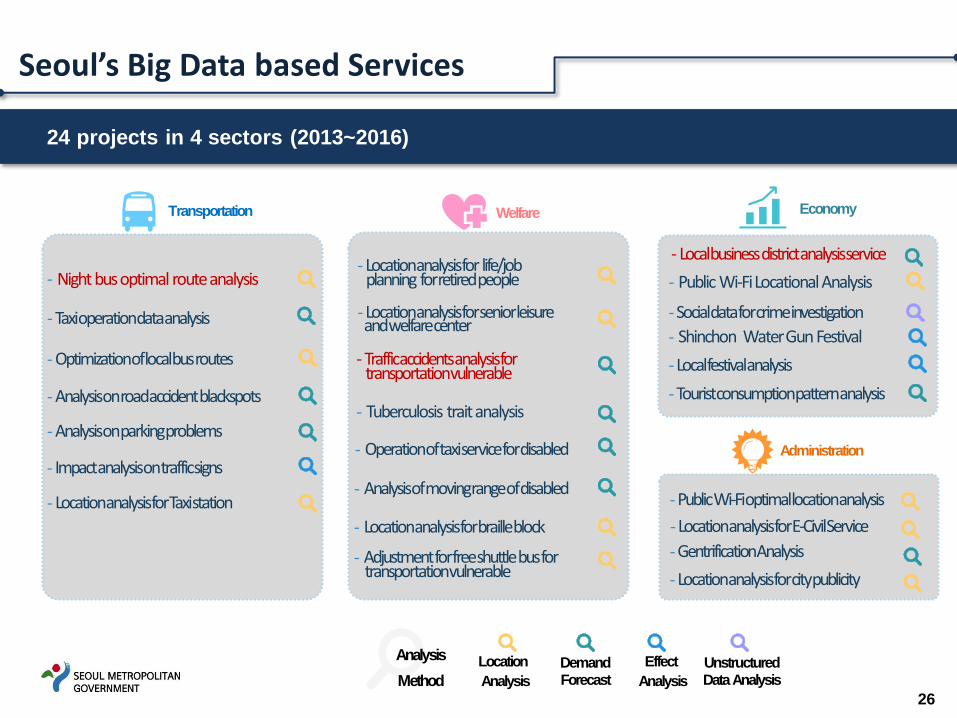
24 projects in 4 sectors (2013~2016)
12
Seoul’s Big Data based Services
- Night bus optimal route analysis -
--
-
-
-
-
-
-
-
-
-
-
-
- Local business district analysis service
-
-
-
-
-
-
-
-
Transportation Welfare Economy
Administration
Location
Analysis
Demand Forecast
Effect
Analysis
Unstructured Data Analysis
Analysis
Method
- Traffic accidents analysis for transportation vulnerable
Seoul’s Policy using Big Data Analytics
13
14
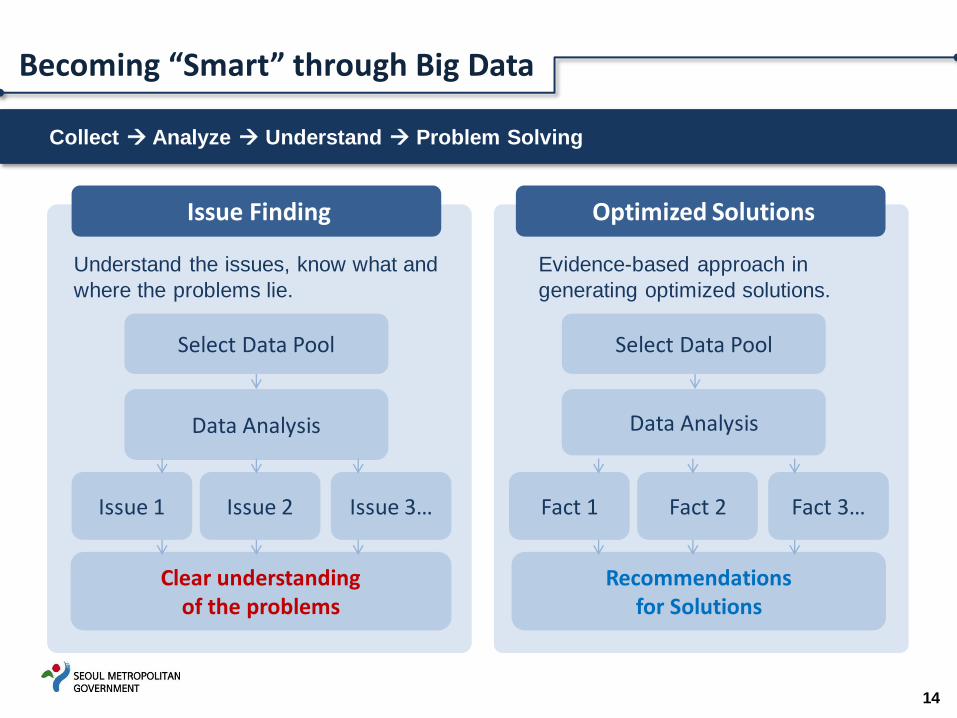
Becoming “Smart” through Big Data
Collect Analyze Understand Problem Solving
Issue Finding Optimized Solutions
Select Data Pool
Data Analysis
Issue 1 Issue 2 Issue 3…
Understand the issues, know what and
where the problems lie.
Evidence-based approach in
generating optimized solutions.
Select Data Pool
Data Analysis
Fact 1 Fact 2 Fact 3…
Recommendations for Solutions
Clear understanding of the problems
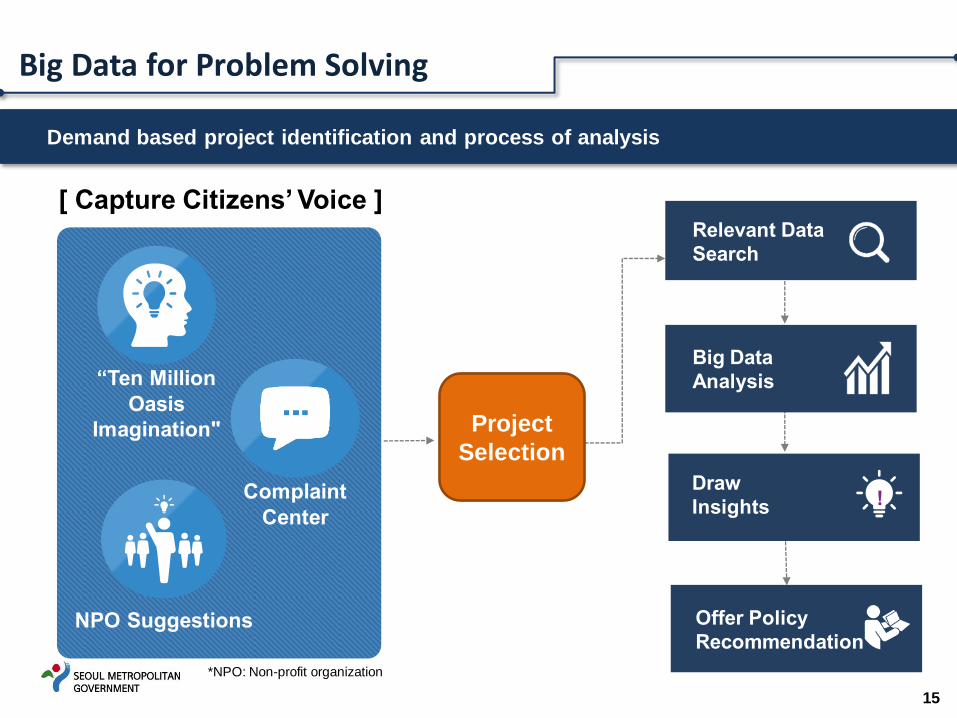
Demand based project identification and process of analysis
15
Big Data for Problem Solving
[ Capture Citizens’ Voice ]
Project
Selection
*NPO: Non-profit organization
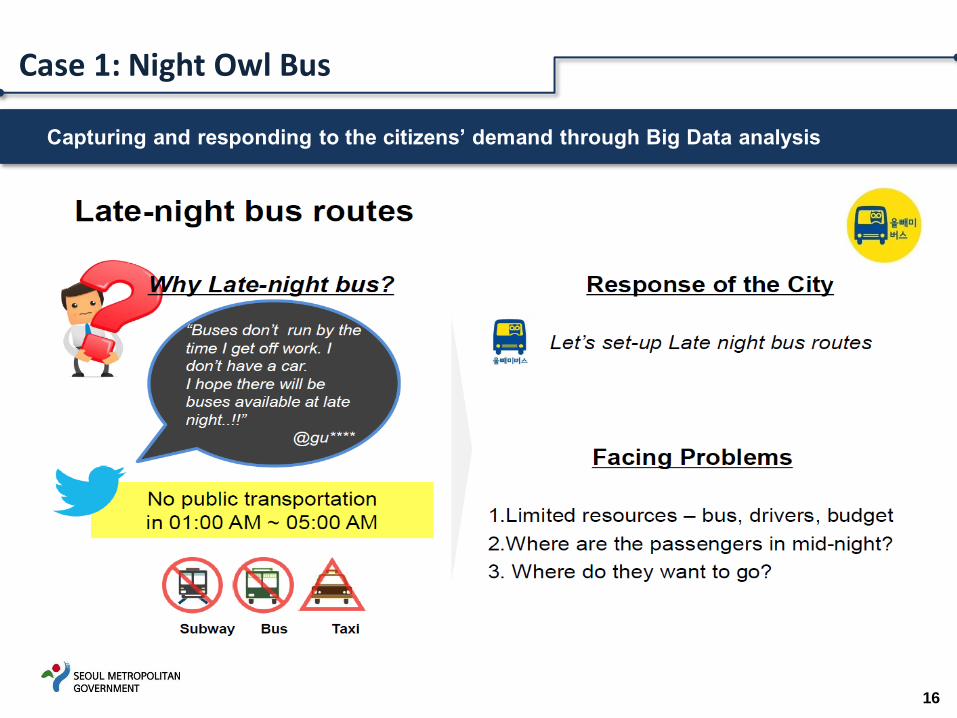
Capturing and responding to the citizens’ demand through Big Data analysis
16
Case 1: Night Owl Bus
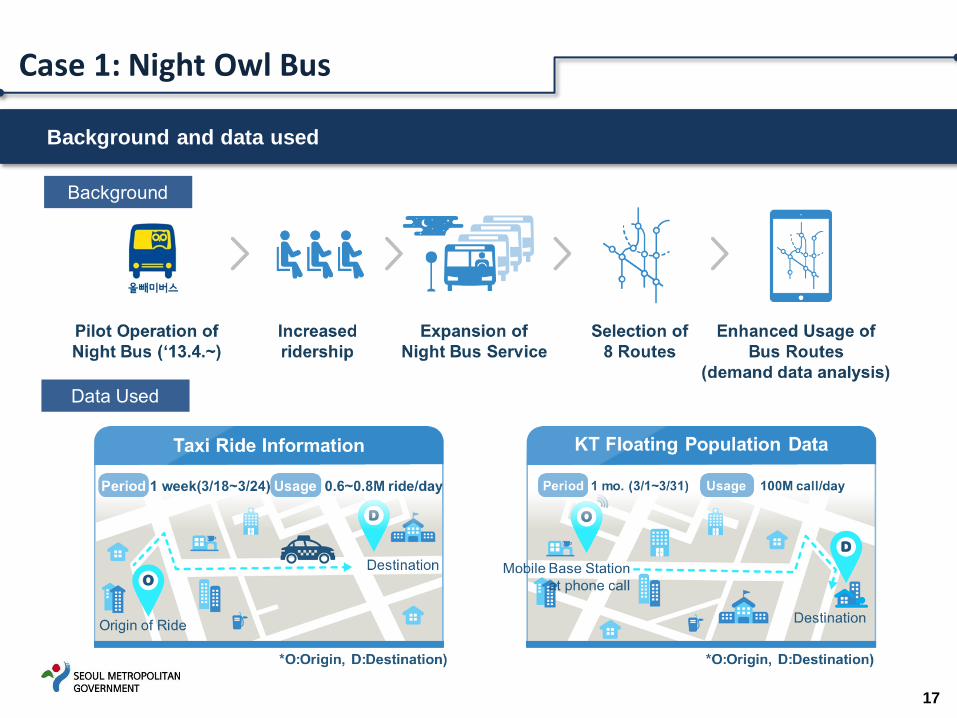
Background and data used
17
Case 1: Night Owl Bus
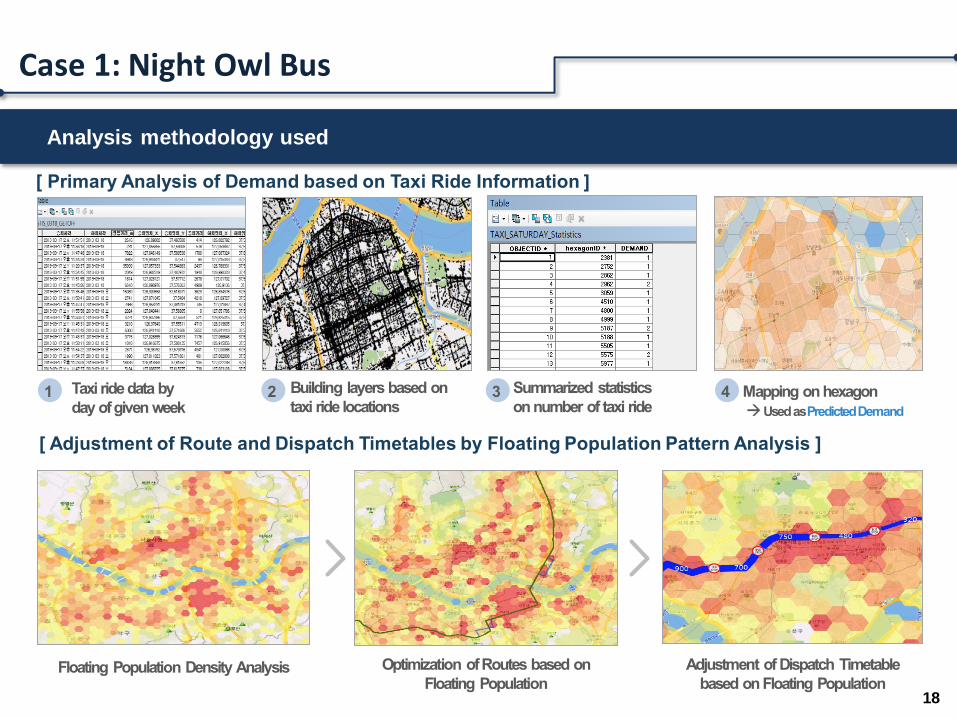
Analysis methodology used
18
Case 1: Night Owl Bus
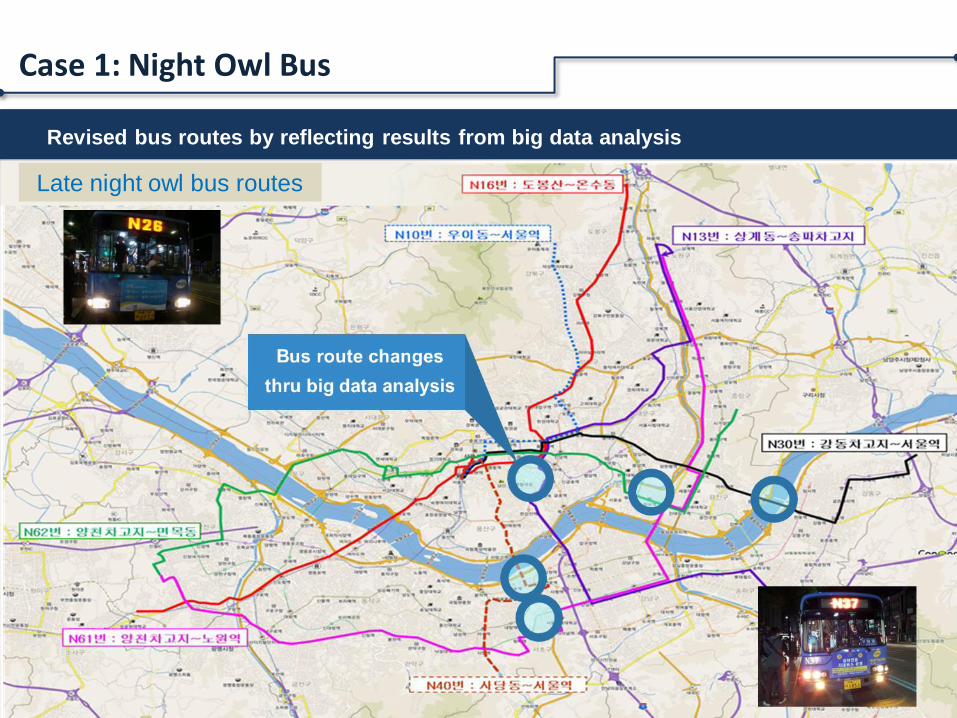
Revised bus routes by reflecting results from big data analysis
19
Case 1: Night Owl Bus
Late night owl bus routes
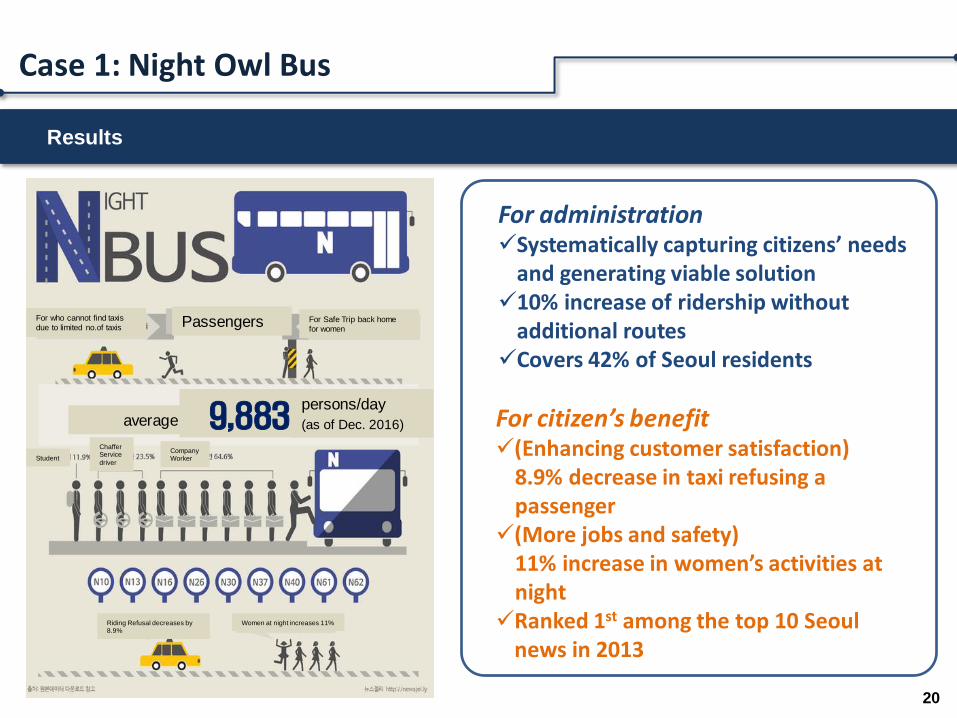
Results
20
Case 1: Night Owl Bus
For citizen’s benefit (Enhancing customer satisfaction)
8.9% decrease in taxi refusing a passenger
(More jobs and safety) 11% increase in women’s activities at night
Ranked 1st among the top 10 Seoul news in 2013
For administration Systematically capturing citizens’ needs
and generating viable solution 10% increase of ridership without
additional routes Covers 42% of Seoul residents
Passengers
average persons/day
(as of Dec. 2016)
For who cannot find taxis due to limited no.of taxis
For Safe Trip back home
for women
Student Company Worker
Chaffer Service
driver
Riding Refusal decreases by 8.9%
Women at night increases 11%
9,883
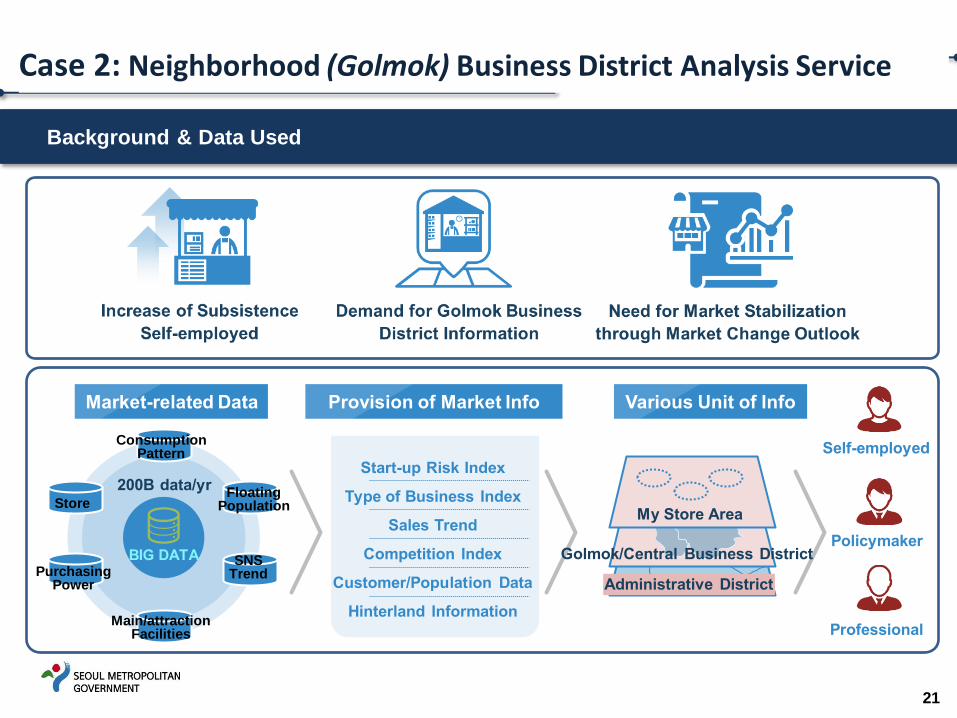
Background & Data Used
21
Store
Purchasing Power
Floating Population
SNS Trend
Consumption Pattern
Main/attraction Facilities
Case 2: Neighborhood (Golmok) Business District Analysis Service
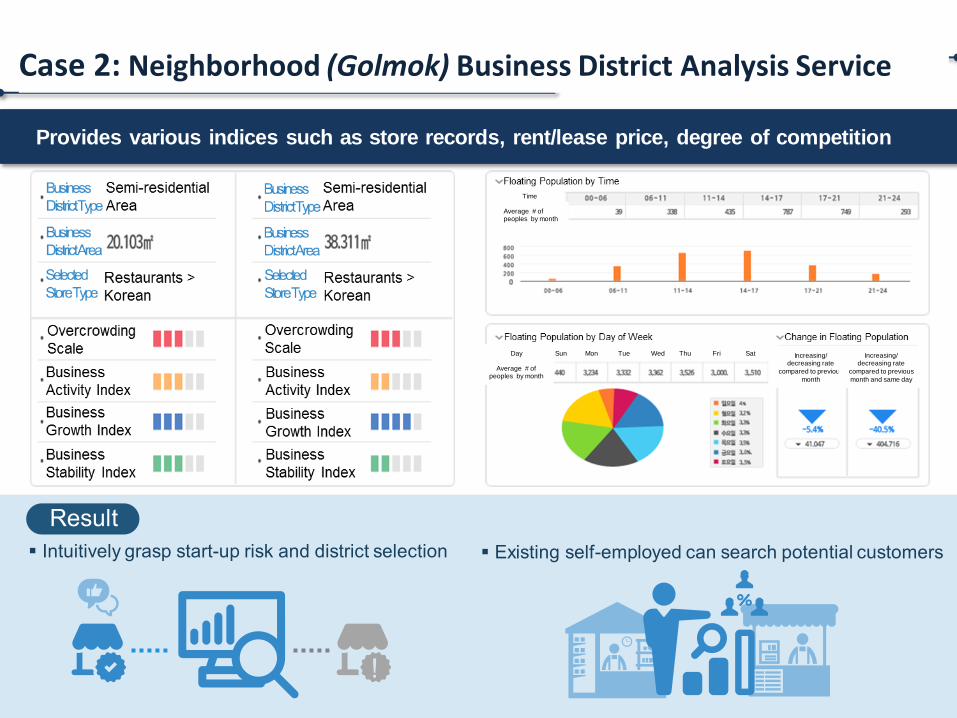
Provides various indices such as store records, rent/lease price, degree of competition
22
Case 2: Neighborhood (Golmok) Business District Analysis Service
Average # of peoples by month
Time
Average # of peoples by month
Day Sun Mon Tue Wed Thu Fri Sat Increasing/ decreasing rate
compared to previous
month
Increasing/ decreasing rate
compared to previous
month and same day
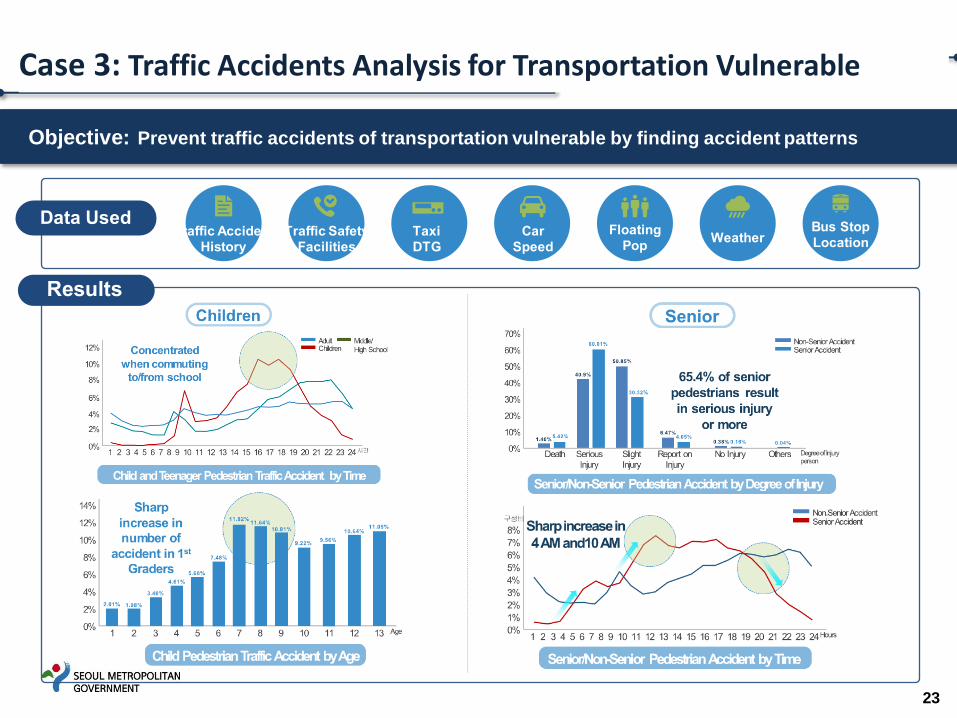
Objective: Prevent traffic accidents of transportation vulnerable by finding accident patterns
23
Case 3: Traffic Accidents Analysis for Transportation Vulnerable
Results
24
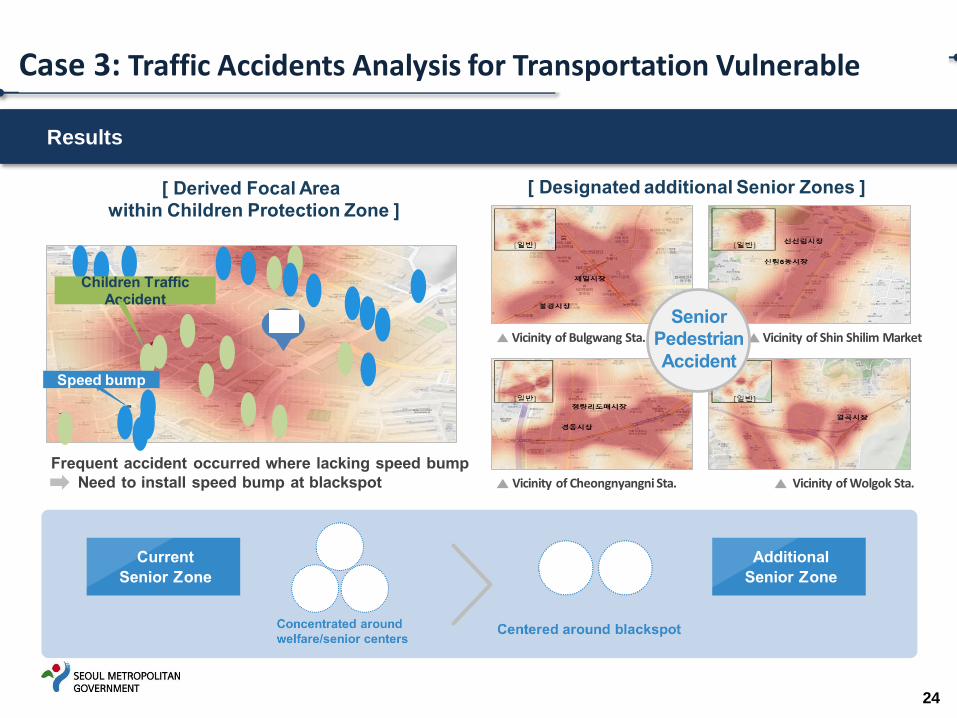
Case 3: Traffic Accidents Analysis for Transportation Vulnerable
▲ ▲
▲ ▲
25
안전 교육 컨텐츠img
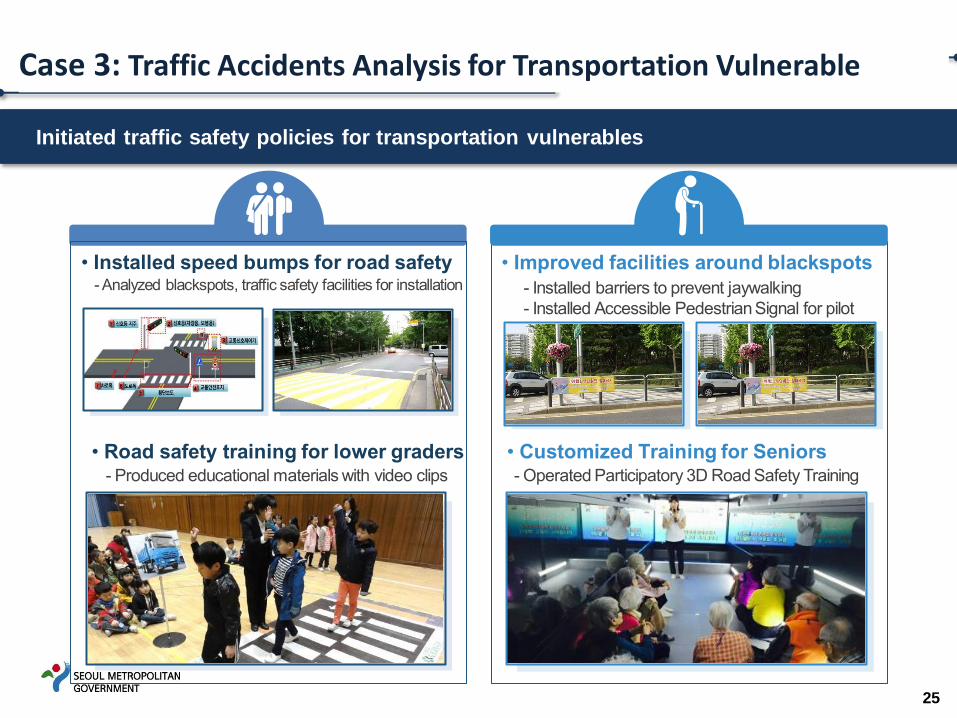
Case 3: Traffic Accidents Analysis for Transportation Vulnerable
Initiated traffic safety policies for transportation vulnerables
24 projects in 4 sectors (2013~2016)
26
Seoul’s Big Data based Services
- Night bus optimal route analysis -
--
-
-
-
-
-
-
-
-
-
-
-
- Local business district analysis service
-
-
-
-
-
-
-
-
Transportation Welfare Economy
Administration
Location
Analysis
Demand Forecast
Effect
Analysis
Unstructured Data Analysis
Analysis
Method
- Traffic accidents analysis for transportation vulnerable
27
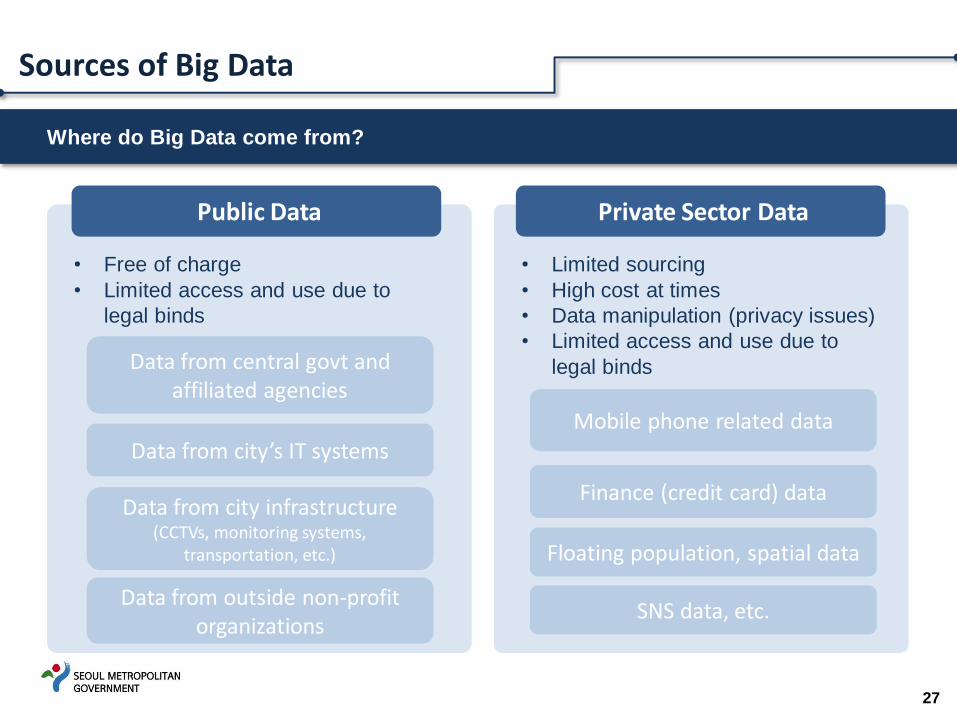
Sources of Big Data
Where do Big Data come from?
Public Data Private Sector Data
• Free of charge
• Limited access and use due to
legal binds
• Limited sourcing
• High cost at times
• Data manipulation (privacy issues)
• Limited access and use due to
legal binds Data from central govt and affiliated agencies
Data from city’s IT systems
Data from city infrastructure (CCTVs, monitoring systems,
transportation, etc.)
Mobile phone related data
Finance (credit card) data
SNS data, etc. Data from outside non-profit
organizations
Floating population, spatial data
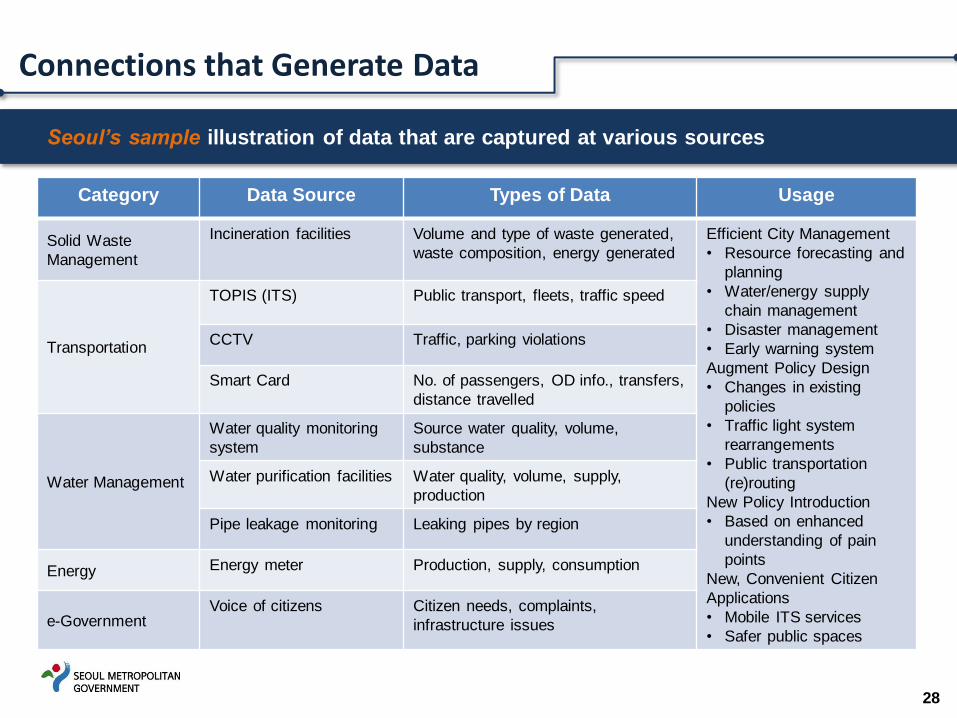
Category Data Source Types of Data Usage
Solid Waste
Management
Incineration facilities Volume and type of waste generated,
waste composition, energy generated
Efficient City Management
• Resource forecasting and
planning
• Water/energy supply
chain management
• Disaster management
• Early warning system
Augment Policy Design
• Changes in existing
policies
• Traffic light system
rearrangements
• Public transportation
(re)routing
New Policy Introduction
• Based on enhanced
understanding of pain
points
New, Convenient Citizen
Applications
• Mobile ITS services
• Safer public spaces
Transportation
TOPIS (ITS) Public transport, fleets, traffic speed
CCTV Traffic, parking violations
Smart Card No. of passengers, OD info., transfers,
distance travelled
Water Management
Water quality monitoring
system
Source water quality, volume,
substance
Water purification facilities Water quality, volume, supply,
production
Pipe leakage monitoring Leaking pipes by region
Energy Energy meter Production, supply, consumption
e-Government Voice of citizens Citizen needs, complaints,
infrastructure issues
Seoul’s sample illustration of data that are captured at various sources
28
Connections that Generate Data
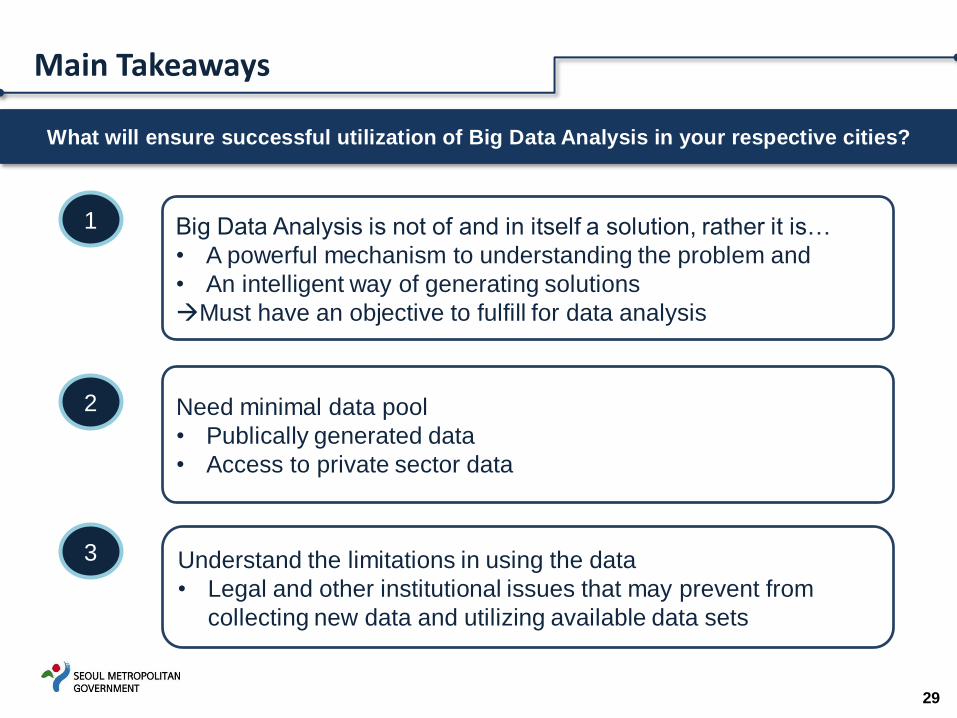
What will ensure successful utilization of Big Data Analysis in your respective cities?
29
Main Takeaways
1
2
3
Big Data Analysis is not of and in itself a solution, rather it is…
• A powerful mechanism to understanding the problem and
• An intelligent way of generating solutions
Must have an objective to fulfill for data analysis
Need minimal data pool
• Publically generated data
• Access to private sector data
Understand the limitations in using the data
• Legal and other institutional issues that may prevent from
collecting new data and utilizing available data sets
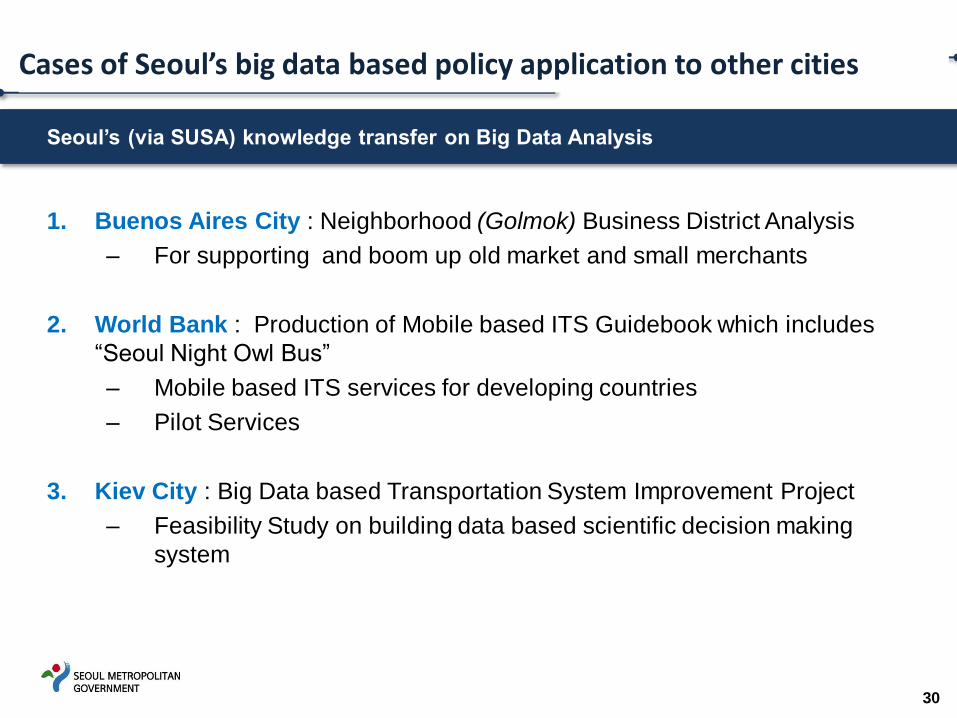
Seoul’s (via SUSA) knowledge transfer on Big Data Analysis
30
1. Buenos Aires City : Neighborhood (Golmok) Business District Analysis
– For supporting and boom up old market and small merchants
2. World Bank : Production of Mobile based ITS Guidebook which includes
“Seoul Night Owl Bus”
– Mobile based ITS services for developing countries
– Pilot Services
3. Kiev City : Big Data based Transportation System Improvement Project
– Feasibility Study on building data based scientific decision making
system
Cases of Seoul’s big data based policy application to other cities
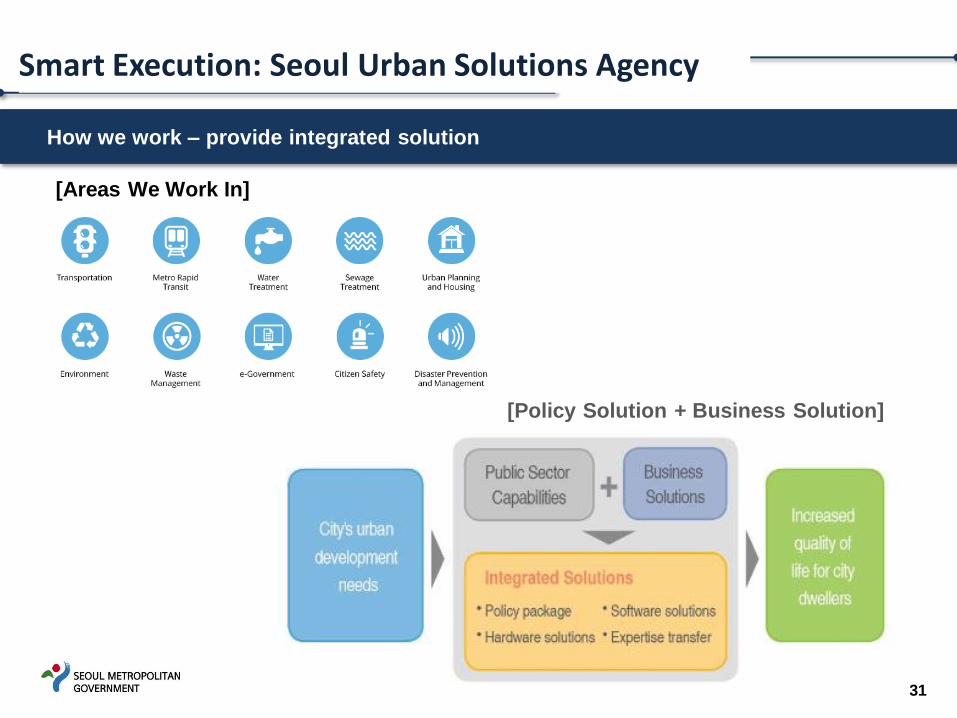
How we work – provide integrated solution
31
[Policy Solution + Business Solution]
Smart Execution: Seoul Urban Solutions Agency
[Areas We Work In]
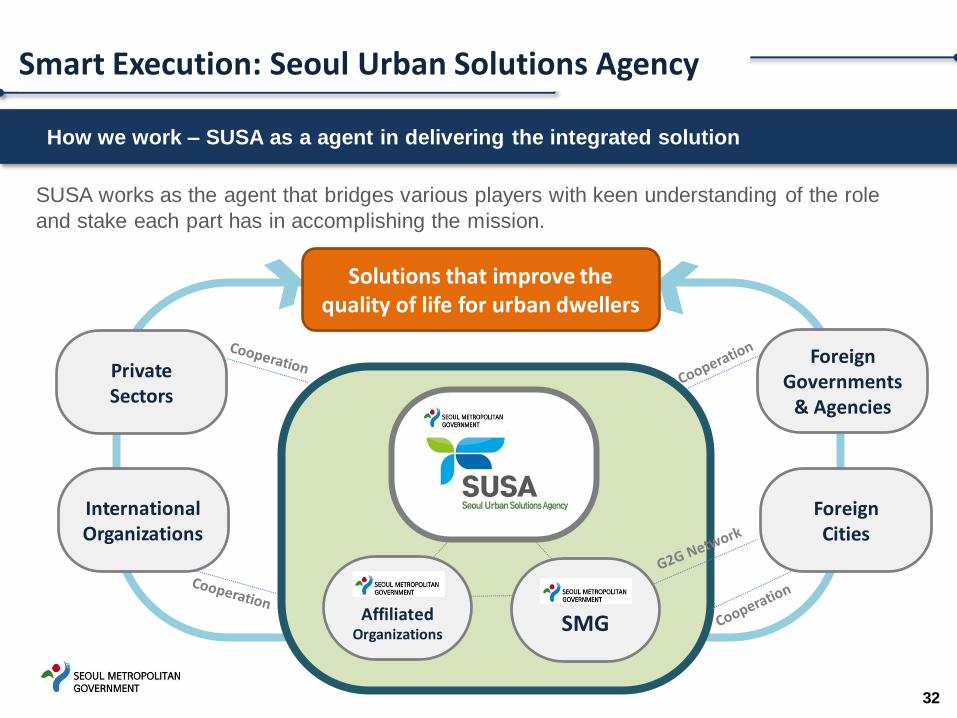
How we work – SUSA as a agent in delivering the integrated solution
32
Solutions that improve the quality of life for urban dwellers
International Organizations
Private Sectors
Foreign Governments
& Agencies
Foreign Cities
SUSA works as the agent that bridges various players with keen understanding of the role
and stake each part has in accomplishing the mission.
Smart Execution: Seoul Urban Solutions Agency
Affiliated Organizations
SMG
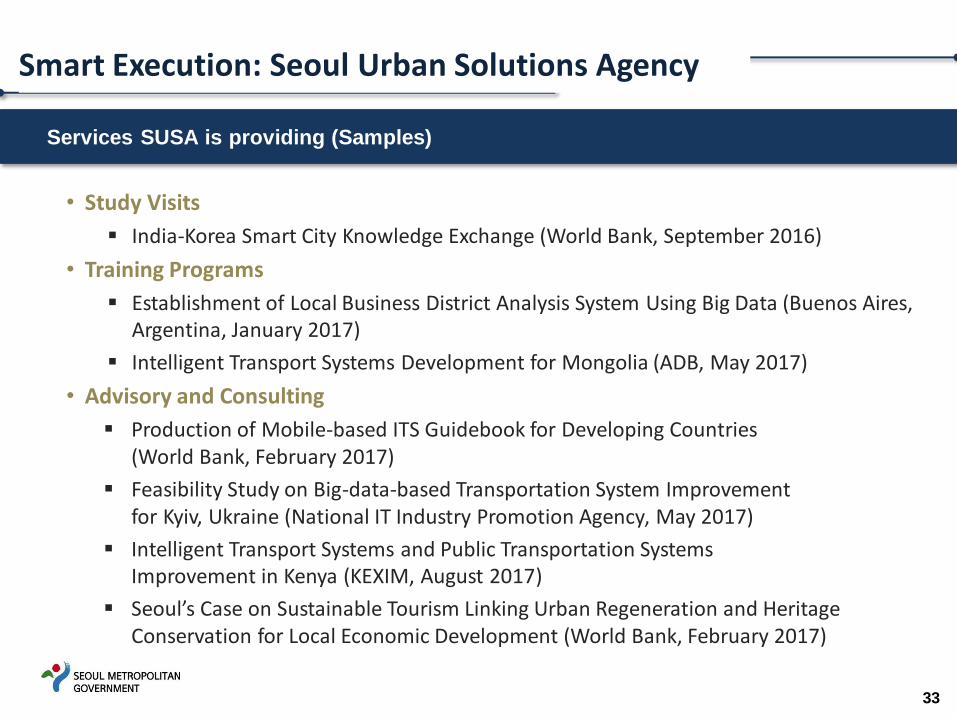
Services SUSA is providing (Samples)
33
• Study Visits
India-Korea Smart City Knowledge Exchange (World Bank, September 2016)
• Training Programs
Establishment of Local Business District Analysis System Using Big Data (Buenos Aires, Argentina, January 2017)
Intelligent Transport Systems Development for Mongolia (ADB, May 2017)
• Advisory and Consulting
Production of Mobile-based ITS Guidebook for Developing Countries (World Bank, February 2017)
Feasibility Study on Big-data-based Transportation System Improvement for Kyiv, Ukraine (National IT Industry Promotion Agency, May 2017)
Intelligent Transport Systems and Public Transportation Systems Improvement in Kenya (KEXIM, August 2017)
Seoul’s Case on Sustainable Tourism Linking Urban Regeneration and Heritage Conservation for Local Economic Development (World Bank, February 2017)
Smart Execution: Seoul Urban Solutions Agency

Thank You
www.susa.or.kr