Embed Size (px)
Citation preview
Urban Water Systems 11 Wastewater treatment © PK, 2005 – page 1
11 Wastewater Treatment
11.1 Boundary conditions 11.2 Layout of a wastewater treatment plant (WWTP) 11.3 Mechanical treatment 11.4 Biological treatment 11.5 Final clarification
Technische Universität Dresden Department of Hydro Science, Institute for Urban Water Management
Peter Krebs
Urban Water Systems
Urban Water Systems 11 Wastewater treatment © PK, 2005 – page 2
11.1 Boundary conditions
11 Wastewater treatment
Urban Water Systems 11 Wastewater treatment © PK, 2005 – page 3
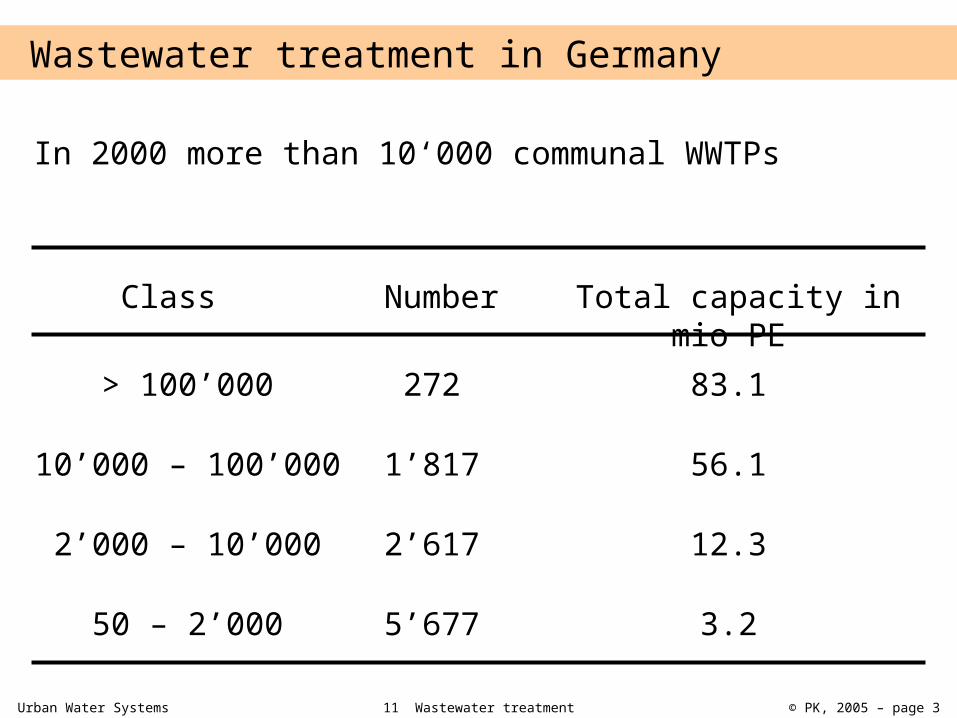
Wastewater treatment in Germany
In 2000 more than 10‘000 communal WWTPs
Class Number Total capacity in mio PE
10’000 – 100’000
> 100’000
2’000 – 10’000
50 – 2’000
272
1’817
2’617
5’677
83.1
56.1
12.3
3.2
Urban Water Systems 11 Wastewater treatment © PK, 2005 – page 4
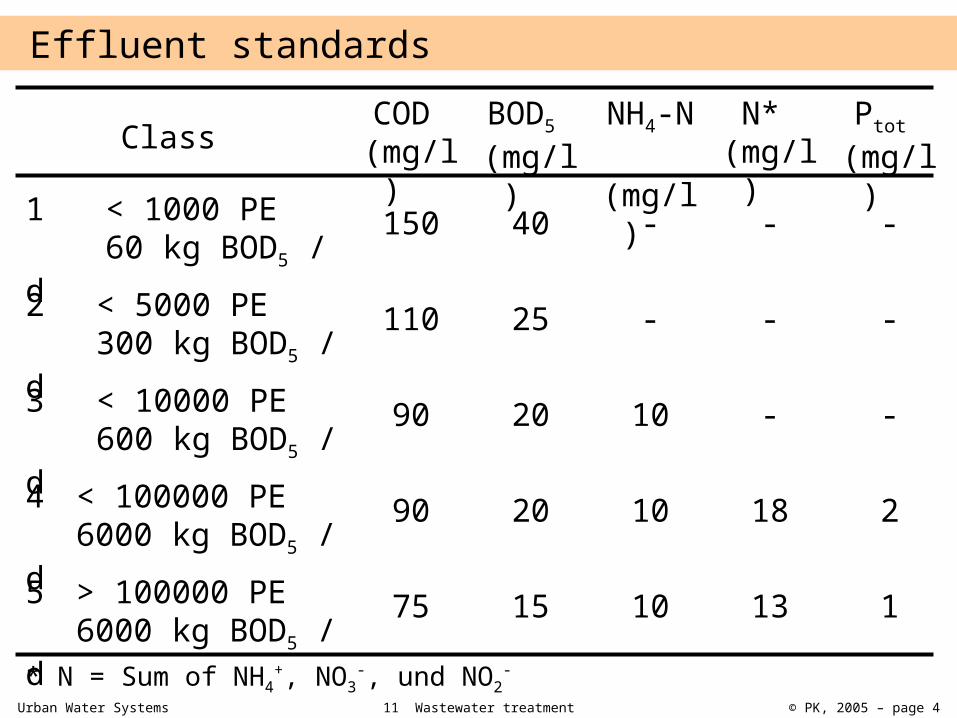
Effluent standards
Class COD (mg/l)
2 < 5000 PE 300 kg BOD5 /
d
1 < 1000 PE 60 kg BOD5 /
d
3 < 10000 PE 600 kg BOD5 /
d
5 > 100000 PE 6000 kg BOD5 /
d
4 < 100000 PE 6000 kg BOD5 /
d
BOD5 (mg/l)
NH4-N
(mg/l)
N* (mg/l)
Ptot (mg/l)
150
110
90
90
75
40
25
20
20
15
-
-
10
10
10
-
-
-
18
13
-
-
-
2
1
* N = Sum of NH4+, NO3
-, und NO2-
Urban Water Systems 11 Wastewater treatment © PK, 2005 – page 5
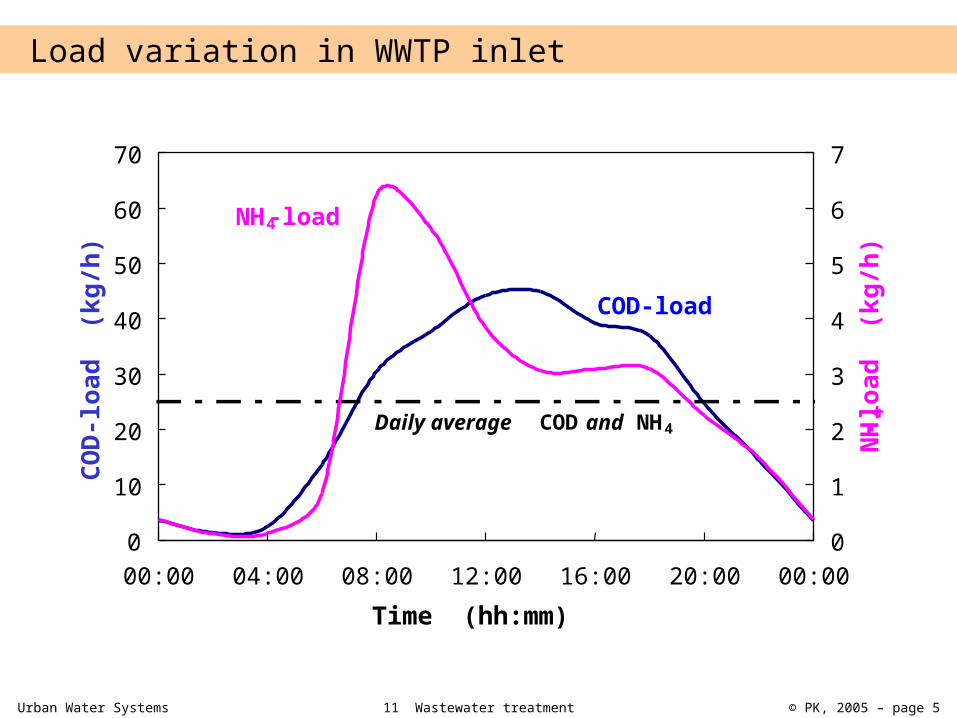
Load variation in WWTP inlet
0
10
20
30
40
50
60
70
00:00 04:00 08:00 12:00 16:00 20:00 00:00Time (hh:mm)
COD-
load
(k
g/h)
0
1
2
3
4
5
6
7
NH4-loa
d (kg
/h)
Daily average COD and NH4
NH4-load
COD-load
Urban Water Systems 11 Wastewater treatment © PK, 2005 – page 6
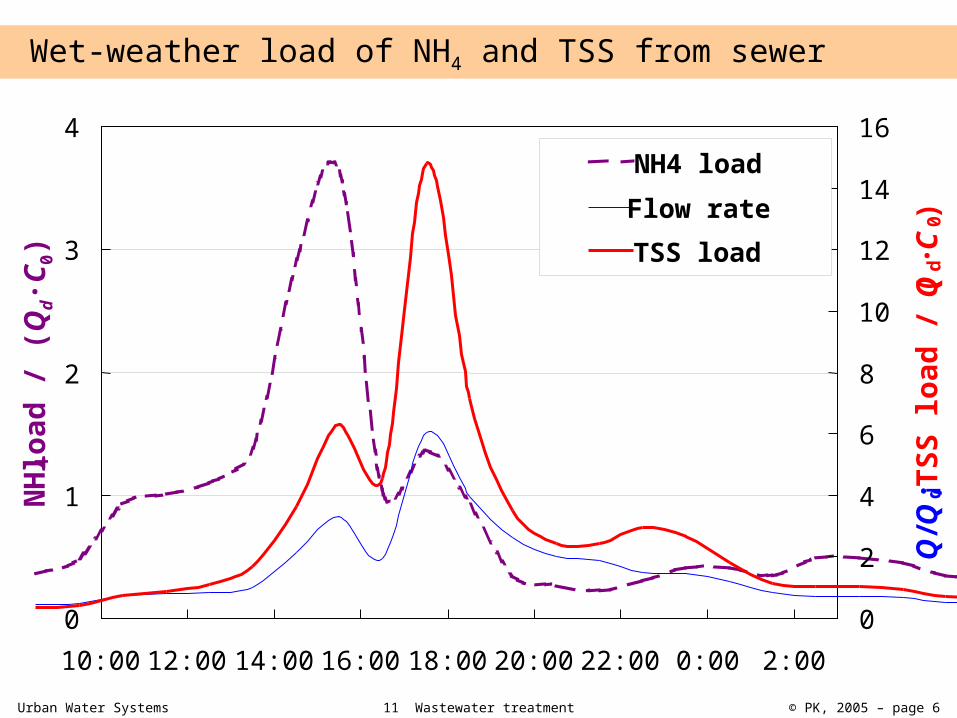
Wet-weather load of NH4 and TSS from sewer
0
1
2
3
4
10:00 12:00 14:00 16:00 18:00 20:00 22:00 0:00 2:00
NH4 loa
d / (Q
d·C 0)
0
2
4
6
8
10
12
14
16
Q/Q
d; TSS
load /
(Qd·C
0)
NH4 loadFlow rateTSS load
Urban Water Systems 11 Wastewater treatment © PK, 2005 – page 7
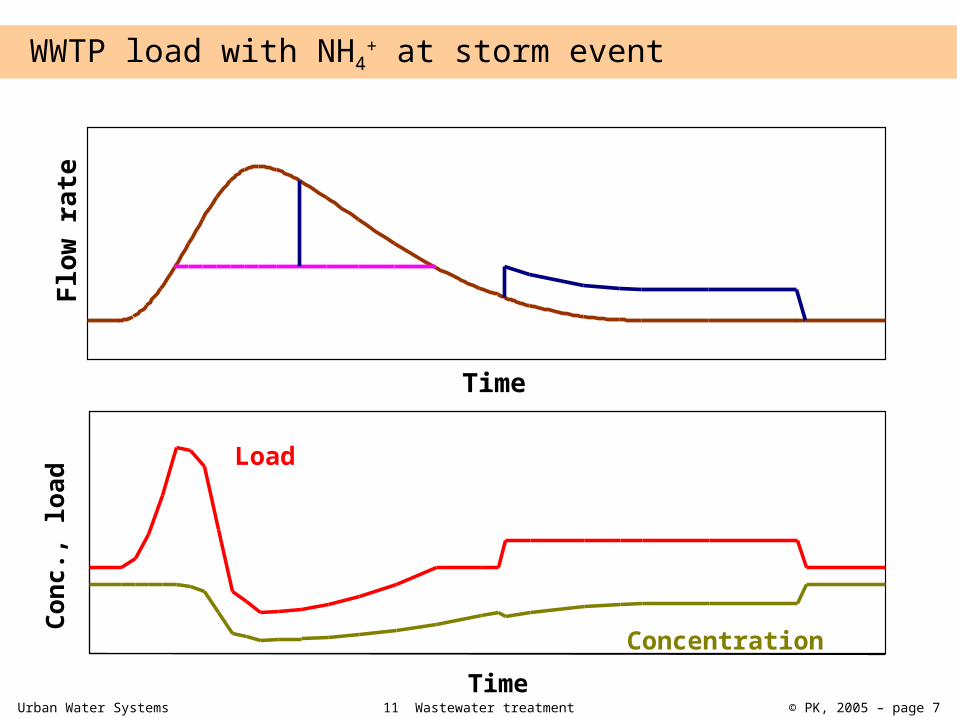
Time
Flow rat
e WWTP load with NH4
+ at storm event
Time
Conc
., loa
d Load
Concentration
Urban Water Systems 11 Wastewater treatment © PK, 2005 – page 8
11.2 Layout of a wastewater treatment plant (WWTP)
11 Wastewater treatment
Urban Water Systems 11 Wastewater treatment © PK, 2005 – page 9
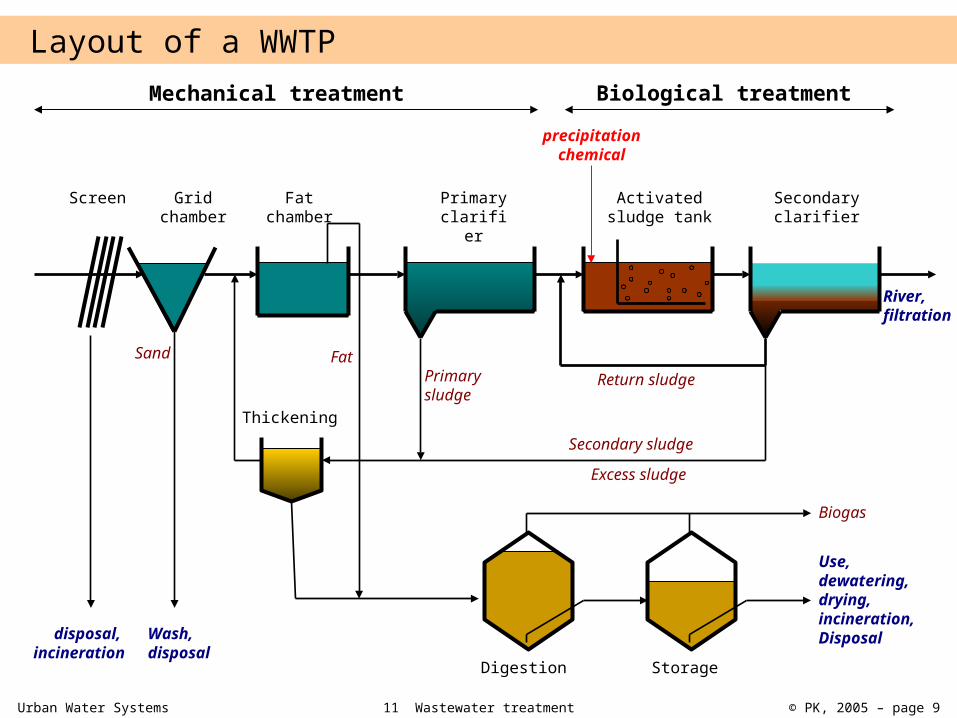
Screen Grid chamber
Fat chamber
Primary clarifi
er
Activated sludge tank
Secondary clarifier
Thickening
Digestion Storage
Return sludgePrimary sludge
FatSand
Secondary sludge
Excess sludge
Biogas
disposal, incineration
Wash, disposal
Use, dewatering, drying, incineration, Disposal
River, filtration
Mechanical treatment Biological treatmentprecipitation
chemical
Layout of a WWTP
Urban Water Systems 11 Wastewater treatment © PK, 2005 – page 10
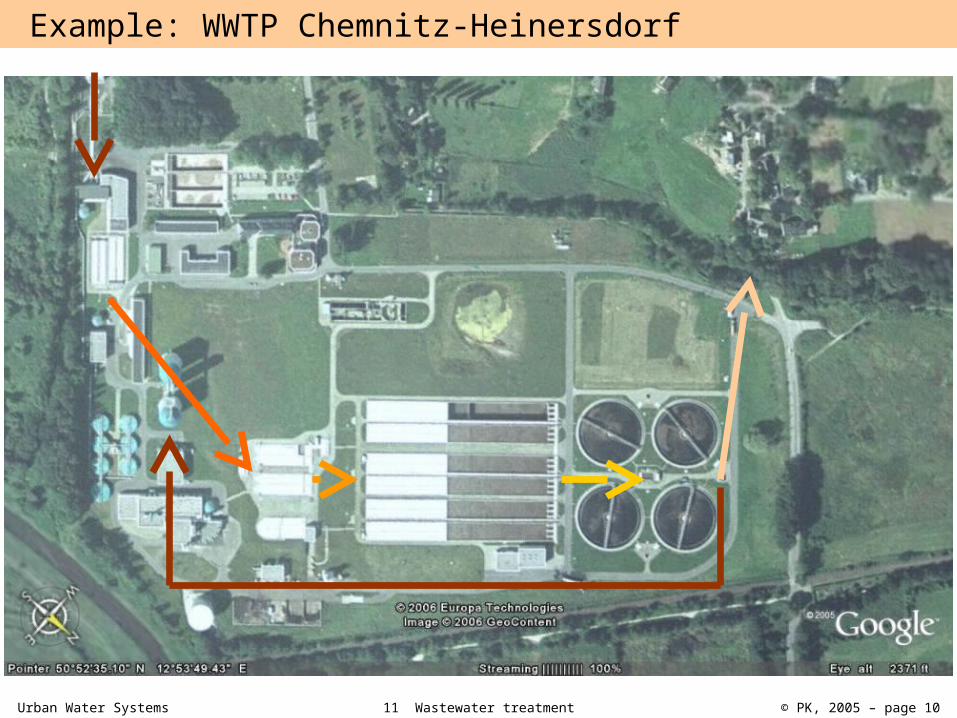
Example: WWTP Chemnitz-Heinersdorf
Urban Water Systems 11 Wastewater treatment © PK, 2005 – page 11
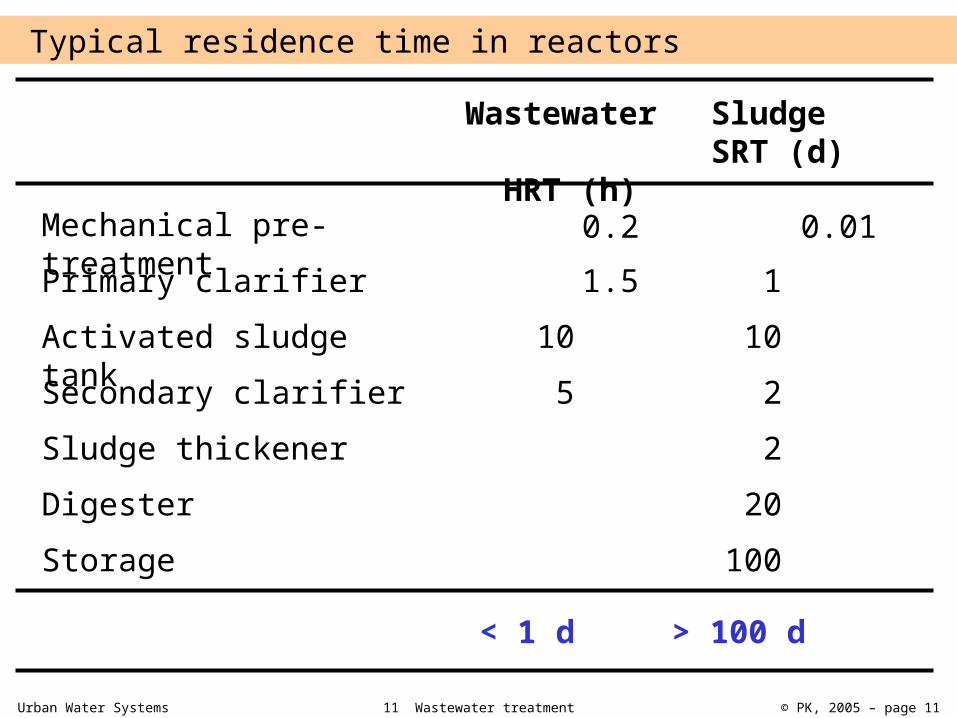
Typical residence time in reactors
Mechanical pre-treatment Primary clarifier Activated sludge tank Secondary clarifier Sludge thickenerDigester Storage
Wastewater
HRT (h)
Sludge SRT (d)
0.21.5
105
0.011102220100
< 1 d > 100 d
Urban Water Systems 11 Wastewater treatment © PK, 2005 – page 12
11.3 Mechanical treatment
11 Wastewater treatment
Urban Water Systems 11 Wastewater treatment © PK, 2005 – page 13
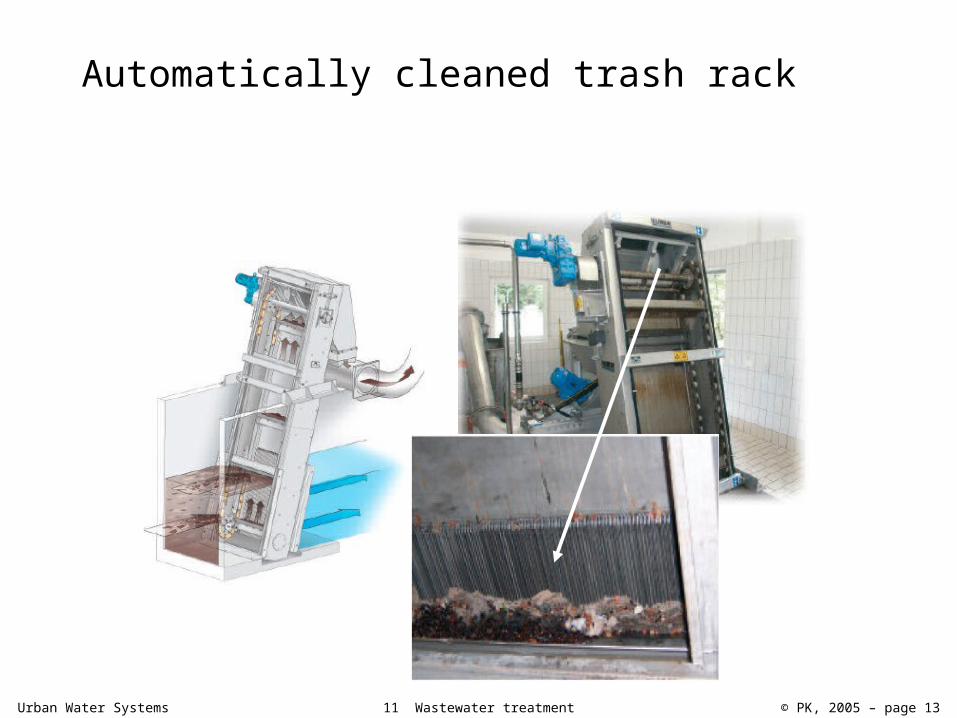
Automatically cleaned trash rack
Urban Water Systems 11 Wastewater treatment © PK, 2005 – page 14
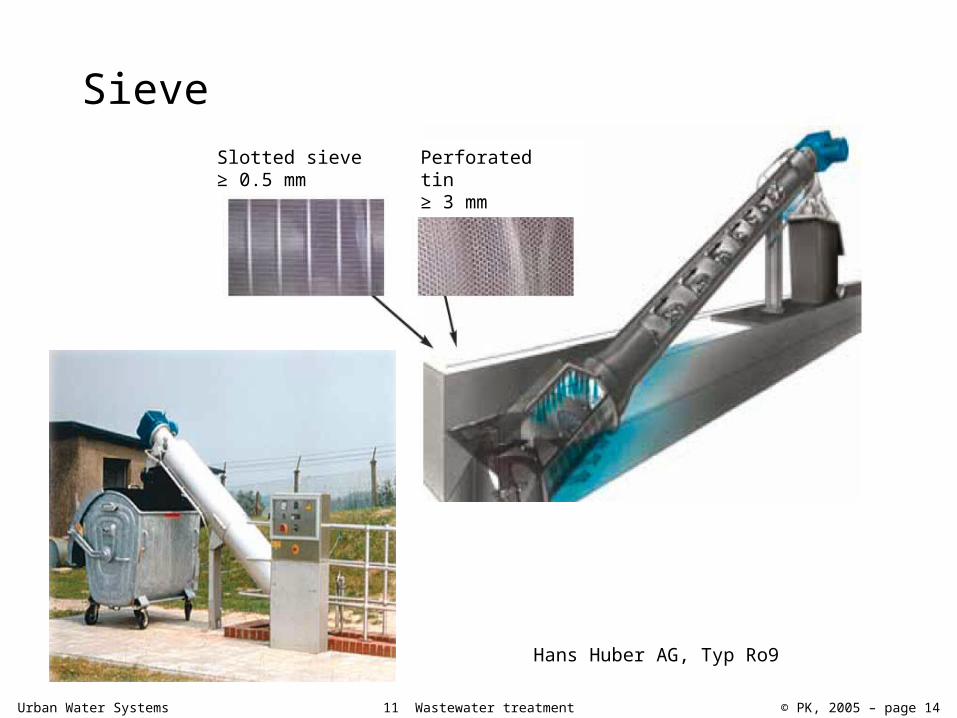
Sieve
Hans Huber AG, Typ Ro9
Slotted sieve ≥ 0.5 mm
Perforated tin ≥ 3 mm
Urban Water Systems 11 Wastewater treatment © PK, 2005 – page 15
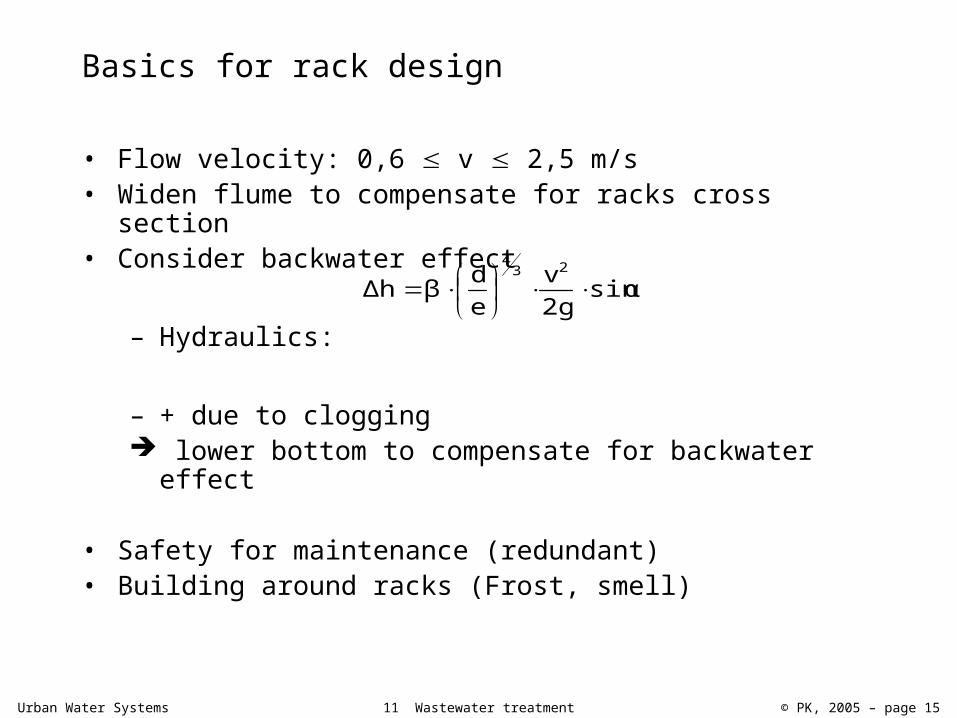
Basics for rack design
• Flow velocity: 0,6 v 2,5 m/s• Widen flume to compensate for racks cross
section • Consider backwater effect
– Hydraulics:
– + due to clogging lower bottom to compensate for backwater effect
• Safety for maintenance (redundant) • Building around racks (Frost, smell)
sinα2gv
edβΔh
234
Urban Water Systems 11 Wastewater treatment © PK, 2005 – page 16
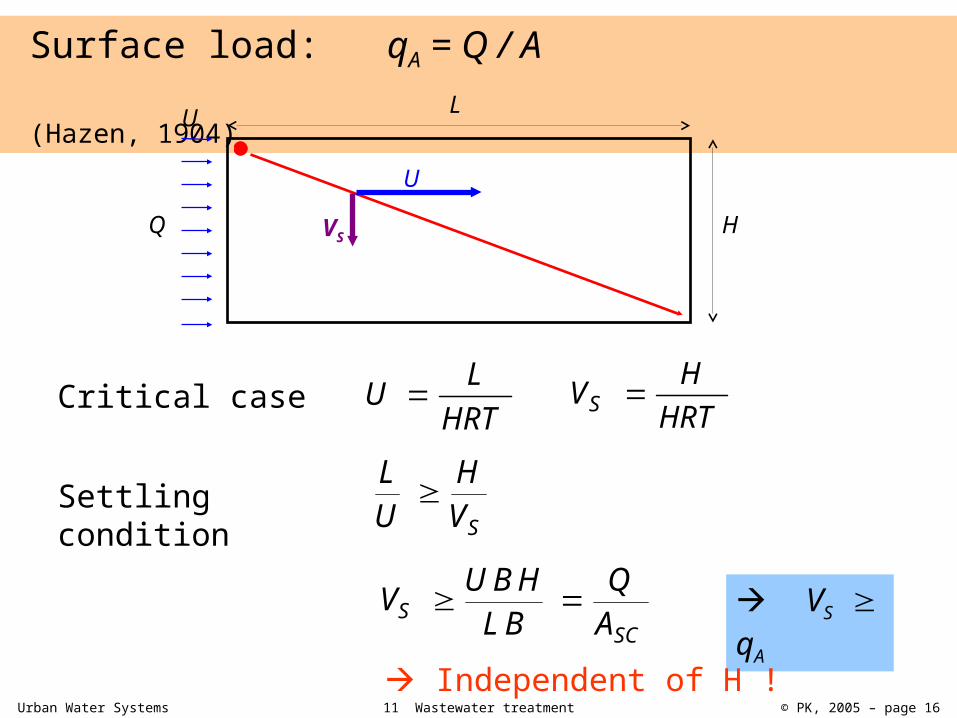
Surface load: qA = Q / A
(Hazen, 1904)L
H
U
VS
U
Q
Critical case
Settling condition
HRTLU
HRTHVS
SVH
UL
SCS A
QBLHBUV VS
qA Independent of H !
Urban Water Systems 11 Wastewater treatment © PK, 2005 – page 17
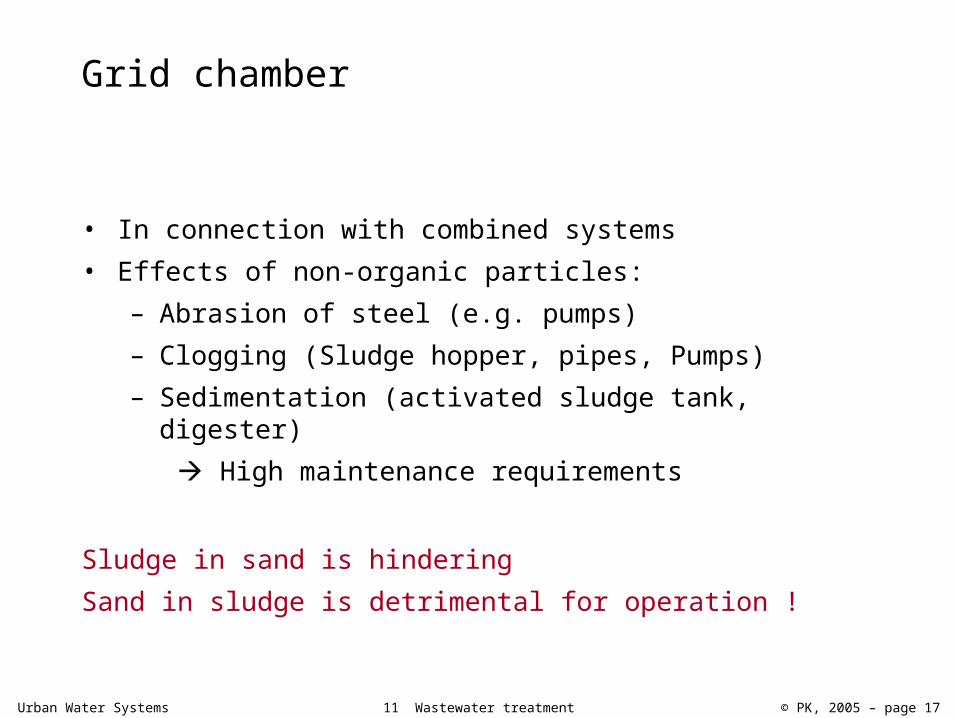
Grid chamber
• In connection with combined systems • Effects of non-organic particles:
– Abrasion of steel (e.g. pumps)– Clogging (Sludge hopper, pipes, Pumps)– Sedimentation (activated sludge tank, digester) High maintenance requirements
Sludge in sand is hindering Sand in sludge is detrimental for operation !
Urban Water Systems 11 Wastewater treatment © PK, 2005 – page 18
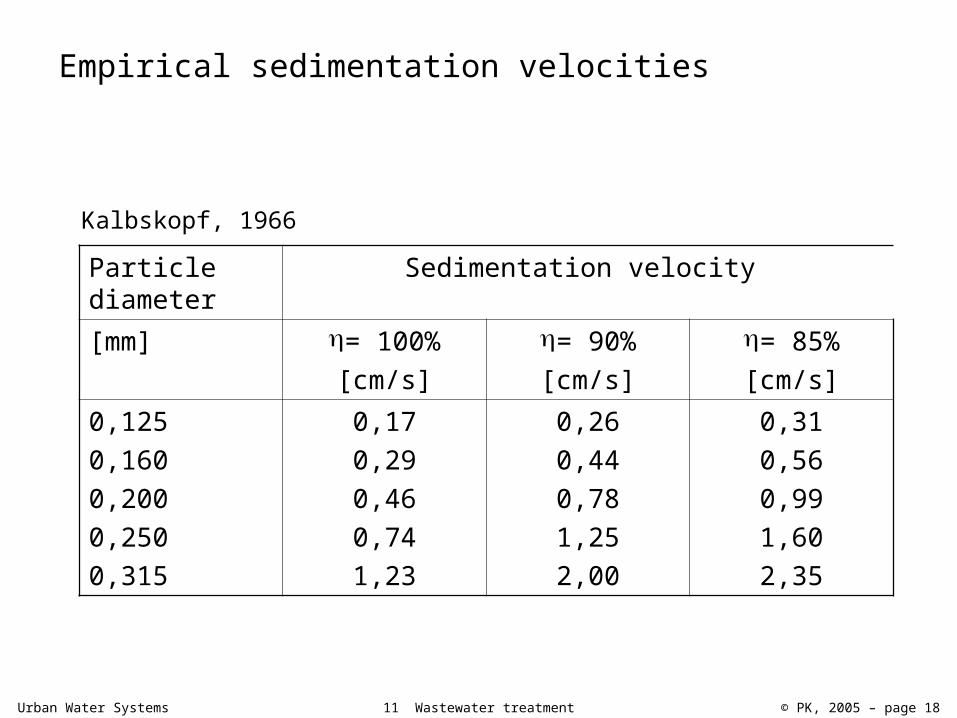
Empirical sedimentation velocities
Particle diameter
Sedimentation velocity
[mm] = 100%[cm/s]
= 90%[cm/s]
= 85%[cm/s]
0,1250,1600,2000,2500,315
0,170,290,460,741,23
0,260,440,781,252,00
0,310,560,991,602,35
Kalbskopf, 1966
Urban Water Systems 11 Wastewater treatment © PK, 2005 – page 19
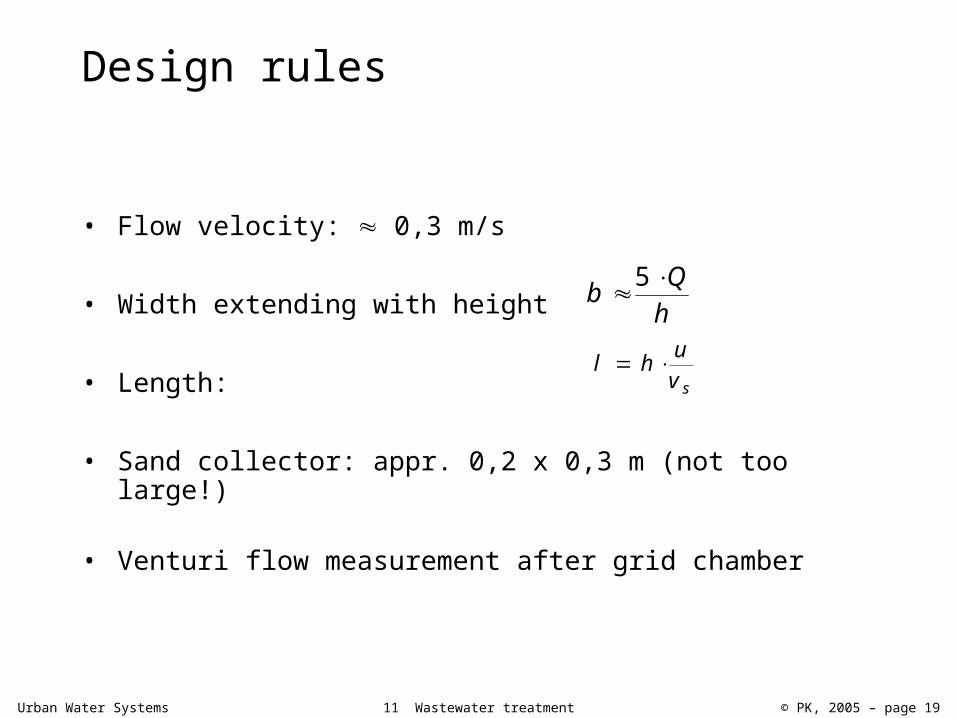
Design rules
• Flow velocity: 0,3 m/s
• Width extending with height
• Length:
• Sand collector: appr. 0,2 x 0,3 m (not too large!)
• Venturi flow measurement after grid chamber
hQb 5
svuhl
Urban Water Systems 11 Wastewater treatment © PK, 2005 – page 20
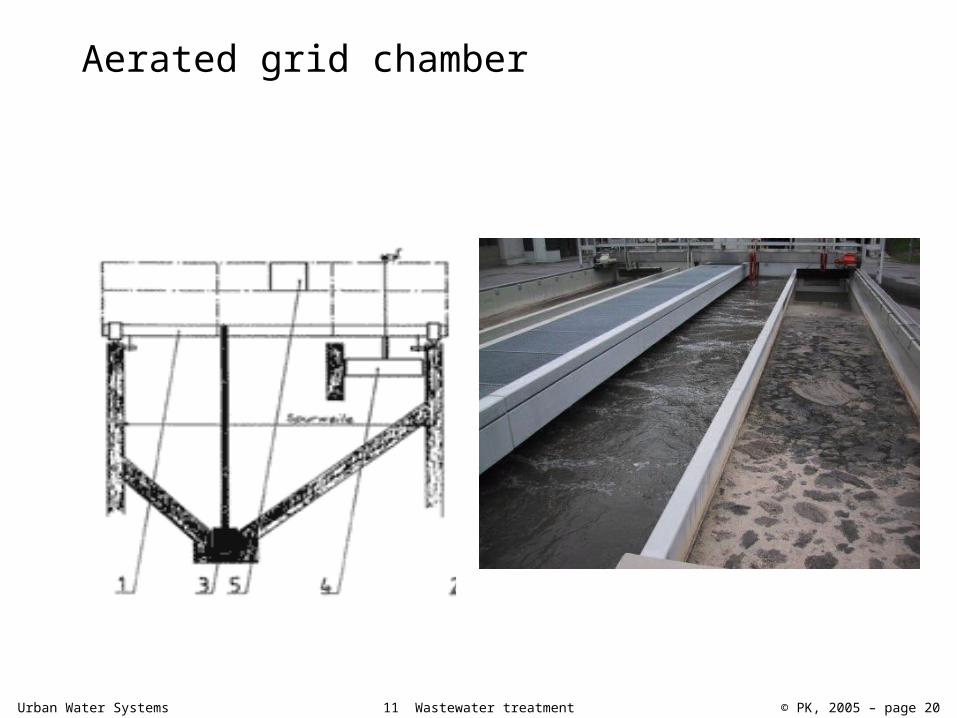
Aerated grid chamber
Urban Water Systems 11 Wastewater treatment © PK, 2005 – page 21
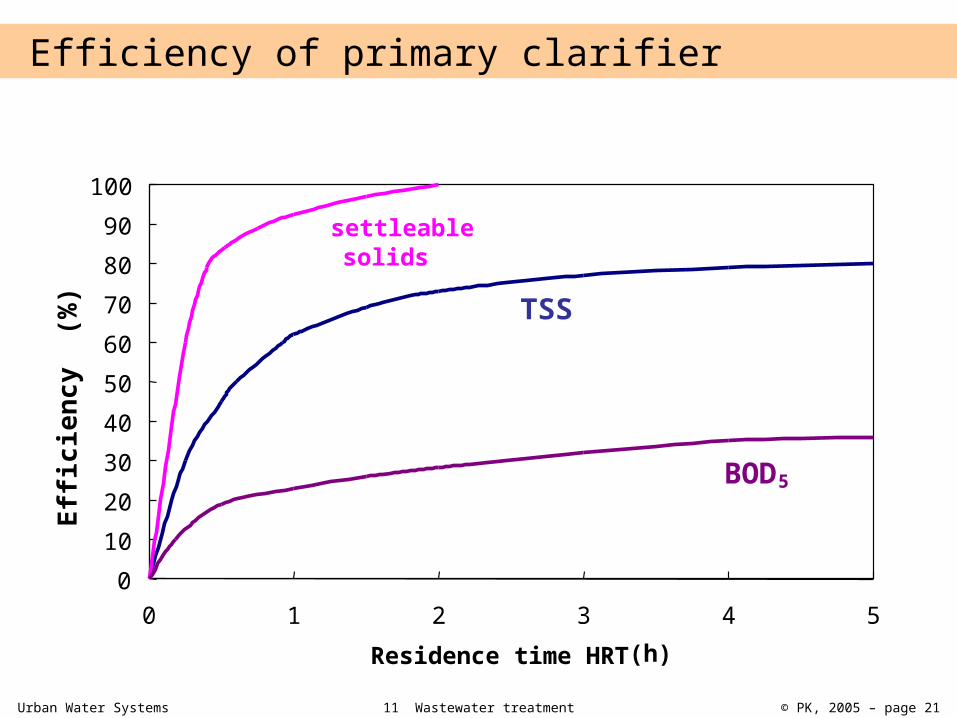
Efficiency of primary clarifier
0102030405060708090100
0 1 2 3 4 5Residence time HRT (h)
Efficiency (%)
settleable solids
TSS
BOD5
Urban Water Systems 11 Wastewater treatment © PK, 2005 – page 22
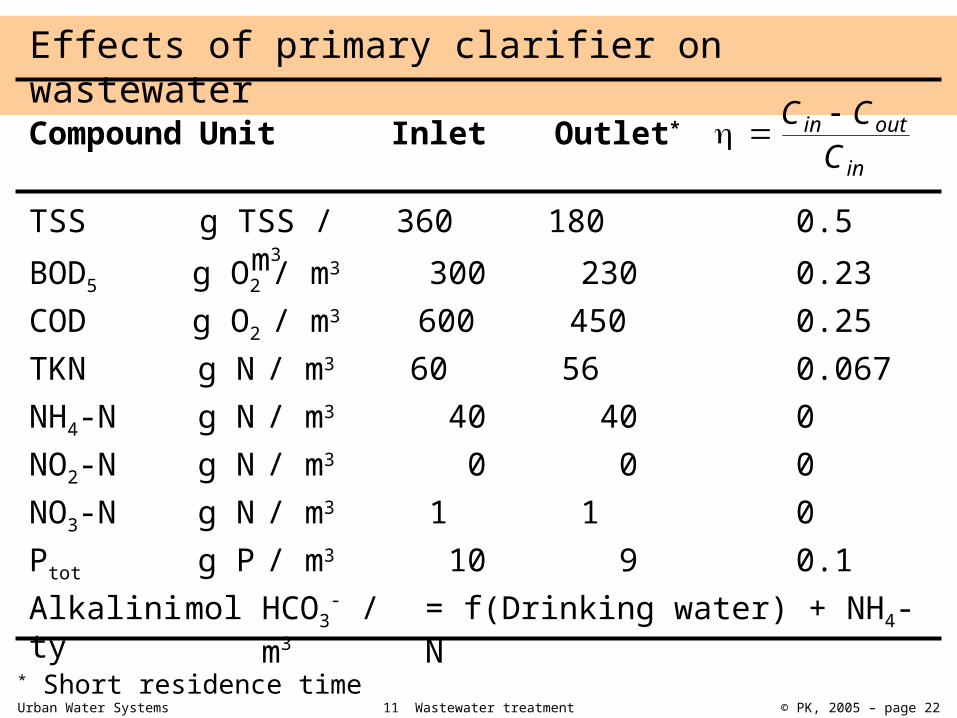
Effects of primary clarifier on wastewater Compound Unit Inlet Outlet*
in
outinC
CC
TSS BOD5
COD
TKN NH4-N NO2-N NO3-N Ptot Alkalinity
g TSS / m3g O2 / m3
g O2 / m3
g N / m3
g N / m3
g N / m3
g N / m3
g P / m3
mol HCO3- /
m3
360 300600
60 400
1 10
= f(Drinking water) + NH4-N
180 230450
56 400
1 9
0.5 0.230.25
0.067 000 0.1
* Short residence time
Urban Water Systems 11 Wastewater treatment © PK, 2005 – page 23
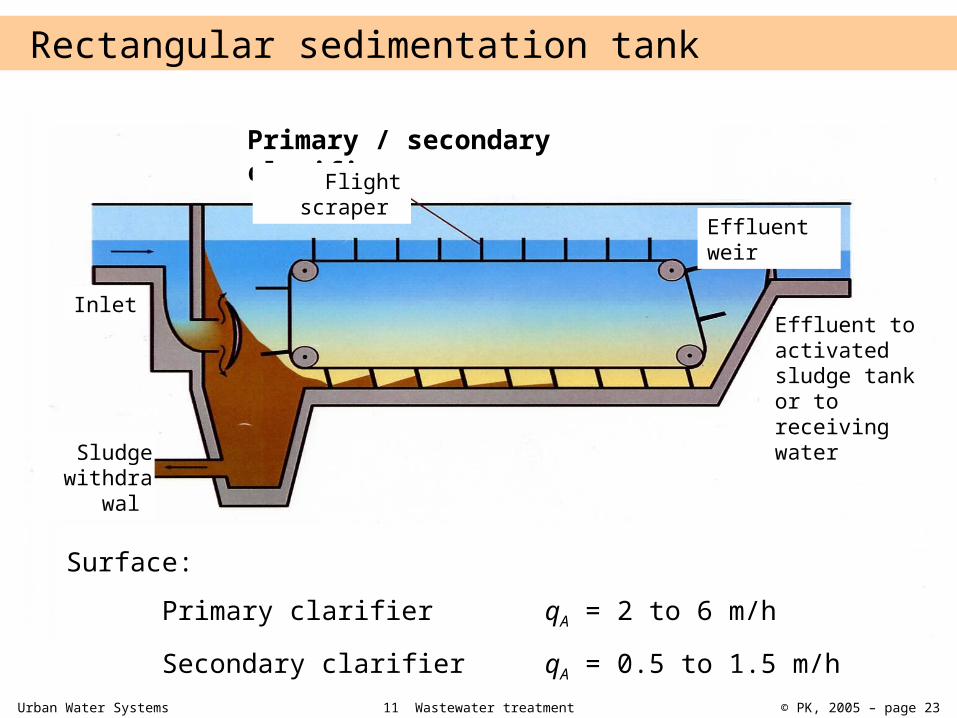
Rectangular sedimentation tank
Primary / secondary clarifier Flight
scraper Effluent weir
Inlet
Sludge withdra
wal
Effluent to activated sludge tank or to receiving water
Surface: Primary clarifier qA = 2 to 6 m/h Secondary clarifier qA = 0.5 to 1.5 m/h
Urban Water Systems 11 Wastewater treatment © PK, 2005 – page 24
11.4 Biological treatment
11 Wastewater treatment
Urban Water Systems 11 Wastewater treatment © PK, 2005 – page 25
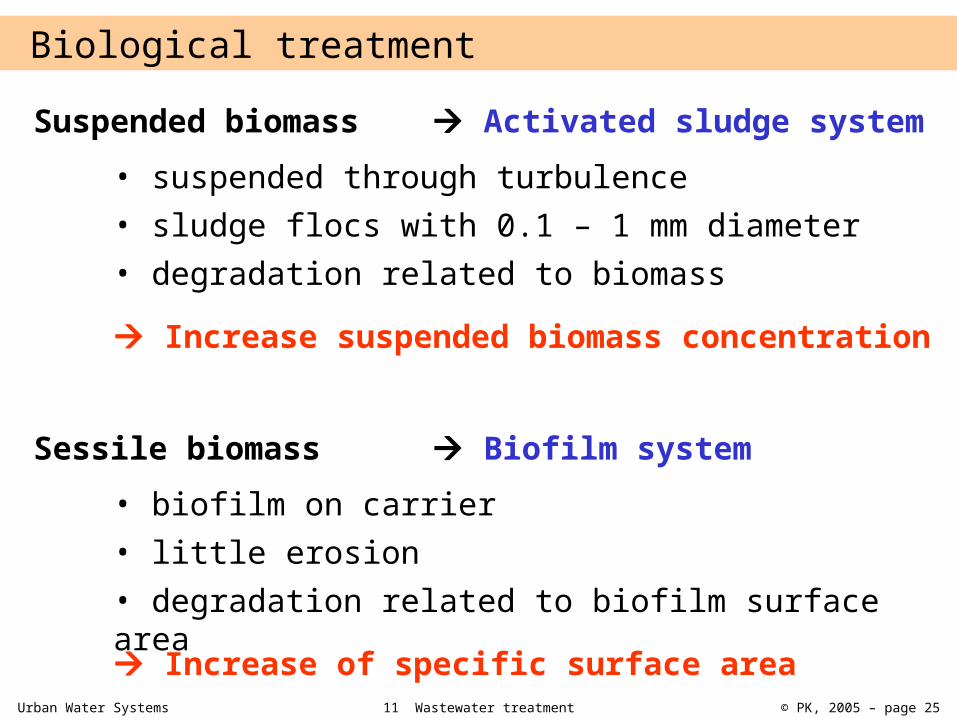
Biological treatment Suspended biomass Activated sludge system
Sessile biomass Biofilm system
• suspended through turbulence • sludge flocs with 0.1 – 1 mm diameter • degradation related to biomass
• biofilm on carrier • little erosion • degradation related to biofilm surface area
Increase suspended biomass concentration
Increase of specific surface area
Urban Water Systems 11 Wastewater treatment © PK, 2005 – page 26
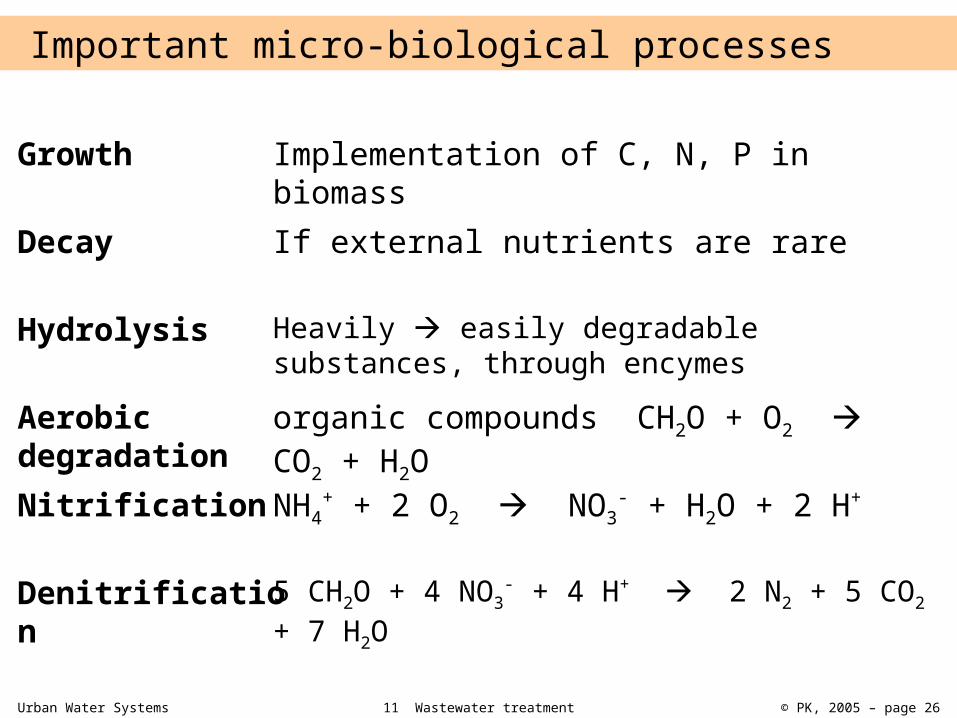
Important micro-biological processes
Growth
Decay
Hydrolysis
Aerobic degradation Nitrification
Denitrification
Implementation of C, N, P in biomass If external nutrients are rare
Heavily easily degradable substances, through encymes organic compounds CH2O + O2 CO2 + H2ONH4
+ + 2 O2 NO3- + H2O + 2 H+
5 CH2O + 4 NO3- + 4 H+ 2 N2 + 5 CO2
+ 7 H2O
Urban Water Systems 11 Wastewater treatment © PK, 2005 – page 27
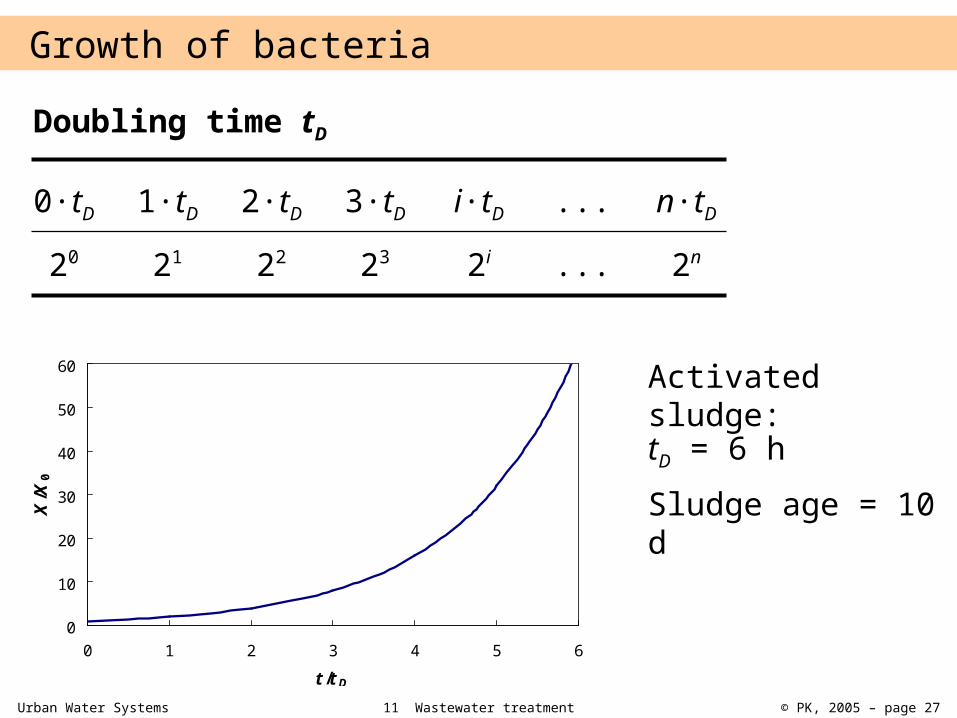
Growth of bacteria Doubling time tD
0·tD 1·tD 2·tD 3·tD i·tD ... n·tD
20 21 22 23 2i ... 2n
0
10
20
30
40
50
60
0 1 2 3 4 5 6t/tD
X/ X
0
Activated sludge:tD = 6 h Sludge age = 10 d
Urban Water Systems 11 Wastewater treatment © PK, 2005 – page 28
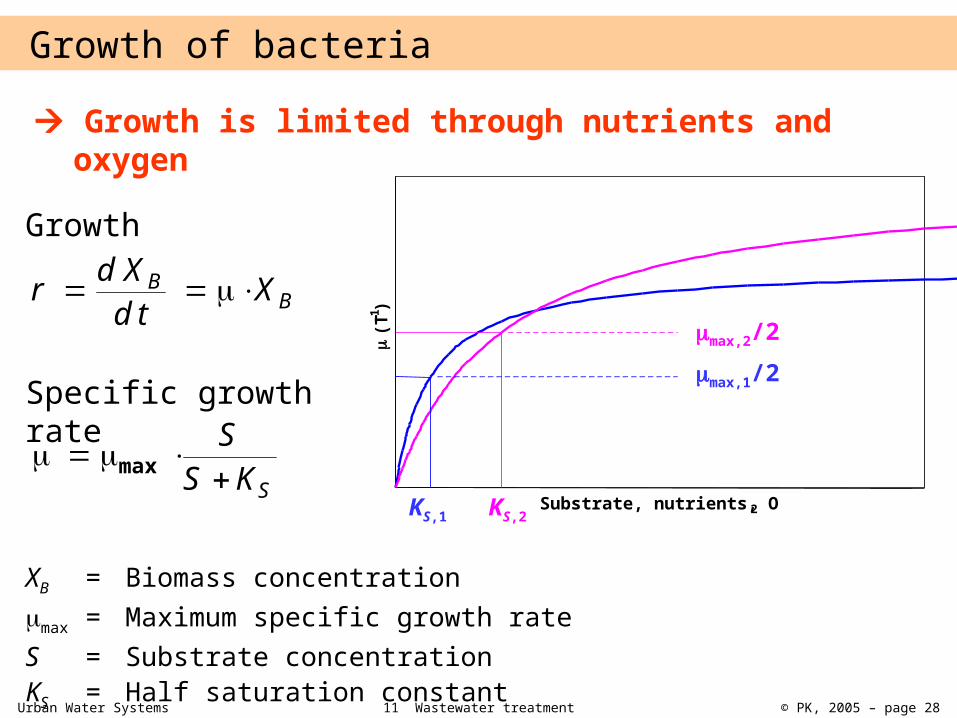
Growth of bacteria Growth is limited through nutrients and
oxygen
max,2/2max,1/2
KS,2KS,1
Growth
BB X
tdXdr
Specific growth rate
SKSS
max
XB = Biomass concentration max = Maximum specific growth rate S = Substrate concentration KS = Half saturation constant
Substrate, nutrients, O2
(T-
1 )
Urban Water Systems 11 Wastewater treatment © PK, 2005 – page 29
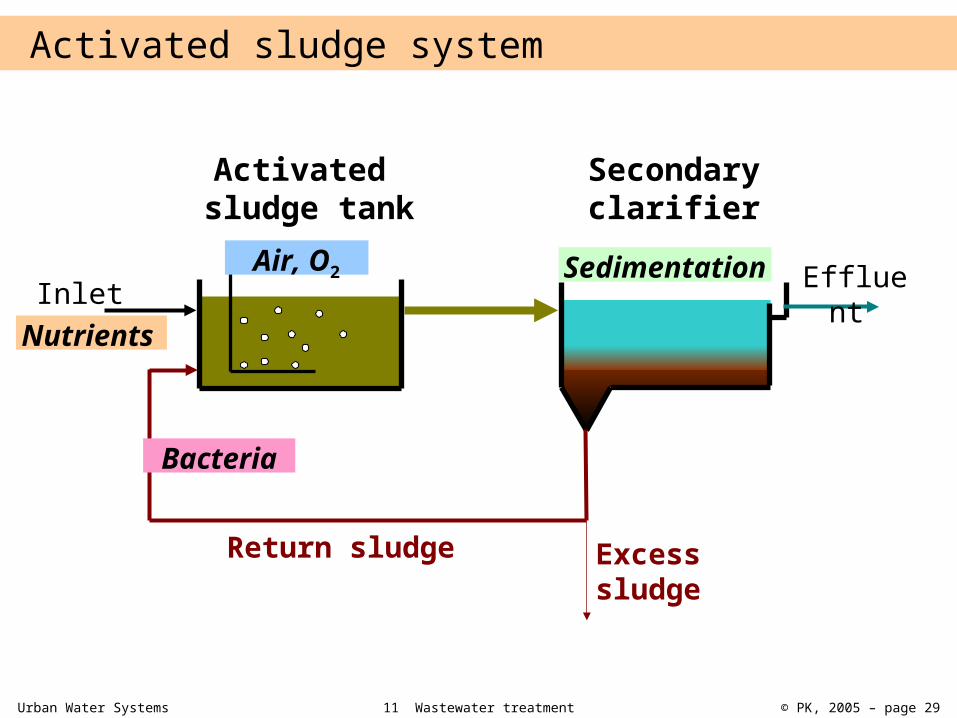
Inlet
Activated sludge tank
Secondary clarifier
Effluent
Return sludge Excesssludge
Nutrients
Bacteria
Air, O2 Sedimentation
Activated sludge system
Urban Water Systems 11 Wastewater treatment © PK, 2005 – page 30
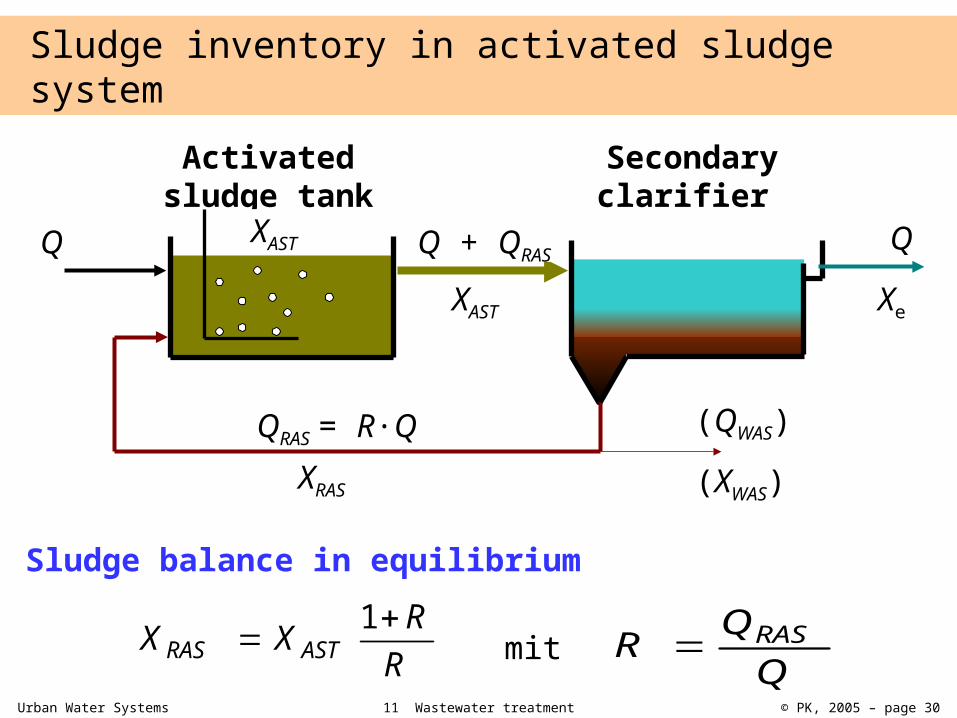
Sludge inventory in activated sludge system
Activated sludge tank
Secondary clarifier
Q Q + QRASXAST
XAST
Q
Xe
QRAS = R·QXRAS
(QWAS)(XWAS)
Sludge balance in equilibrium
RRXX ASTRAS
1Q
QR RASmit
Urban Water Systems 11 Wastewater treatment © PK, 2005 – page 31
Flow scheme of activated sludge system
Hydraulic wash-out of sludge to secondary clarifier
sludge must be returned to activated sludge tank Activated sludge is circled 20 to 50 times
sludge concentration in activated sludge tank is maintained Excess sludge is withdrawn from system
equivalent to sludge production
Through increased hydraulic loading (wet-weather condition) sludge is shifted to secondary clarifier
Urban Water Systems 11 Wastewater treatment © PK, 2005 – page 32
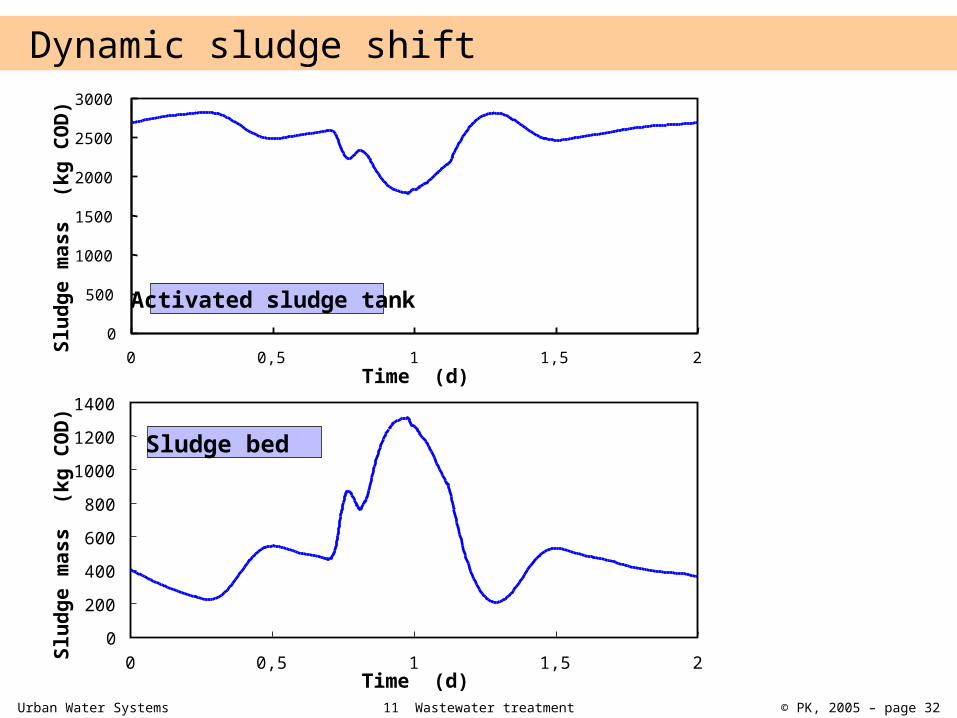
Dynamic sludge shift
0
500
1000
1500
2000
2500
3000
0 0,5 1 1,5 2Time (d)
Slud
ge m
ass
(kg
COD
)
Activated sludge tank
0200400600800
100012001400
0 0,5 1 1,5 2Time (d)
Slud
ge m
ass
(kg
COD
)
Sludge bed
Urban Water Systems 11 Wastewater treatment © PK, 2005 – page 33
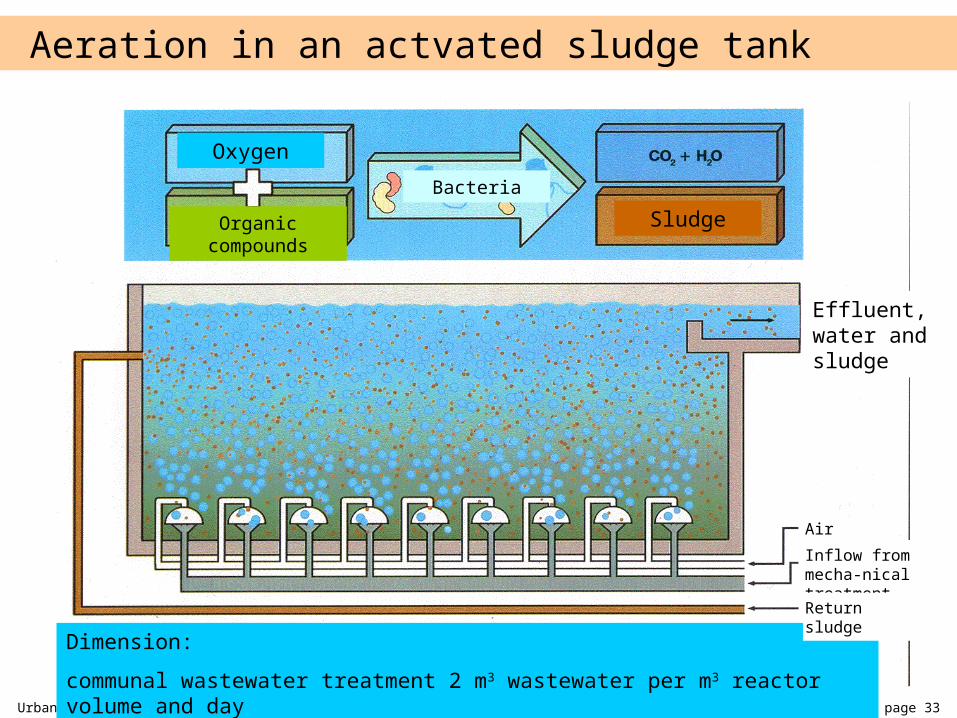
Aeration in an actvated sludge tank
Oxygen
Organic compounds
BacteriaSludge
Effluent, water and sludge
Dimension: communal wastewater treatment 2 m3 wastewater per m3 reactor volume and day
Air Inflow from mecha-nical treatment Return sludge
Urban Water Systems 11 Wastewater treatment © PK, 2005 – page 34
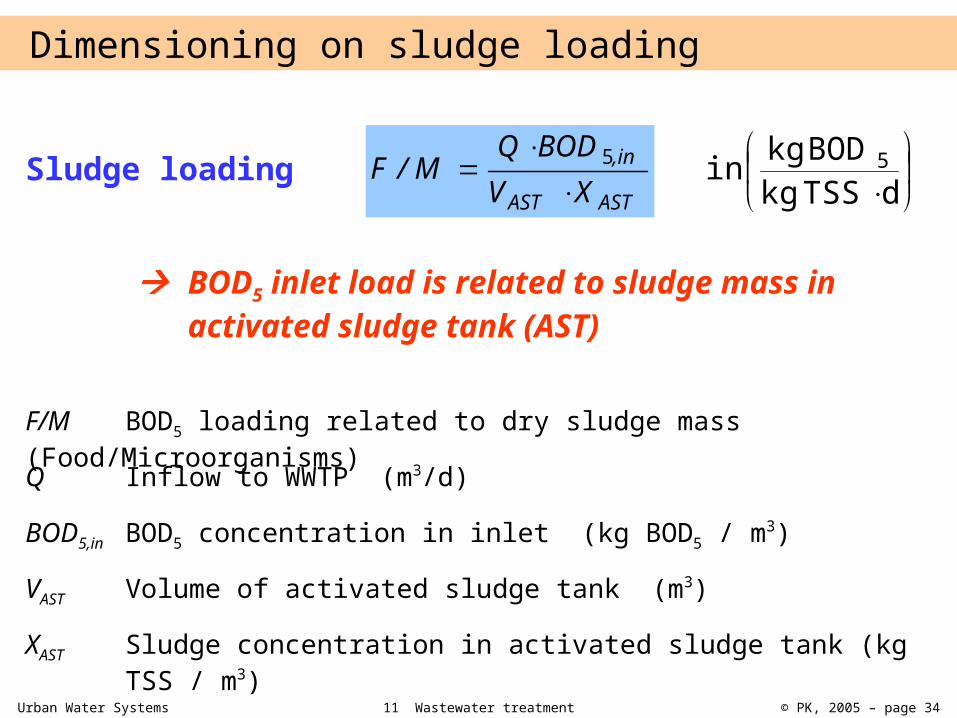
Dimensioning on sludge loading
Sludge loading ASTAST
in,XV
BODQM/F
5
dTSSkgBODkgin 5
F/M BOD5 loading related to dry sludge mass (Food/Microorganisms)Q Inflow to WWTP (m3/d)
BOD5,in BOD5 concentration in inlet (kg BOD5 / m3)
VAST Volume of activated sludge tank (m3)
XAST Sludge concentration in activated sludge tank (kg TSS / m3)
BOD5 inlet load is related to sludge mass in activated sludge tank (AST)
Urban Water Systems 11 Wastewater treatment © PK, 2005 – page 35
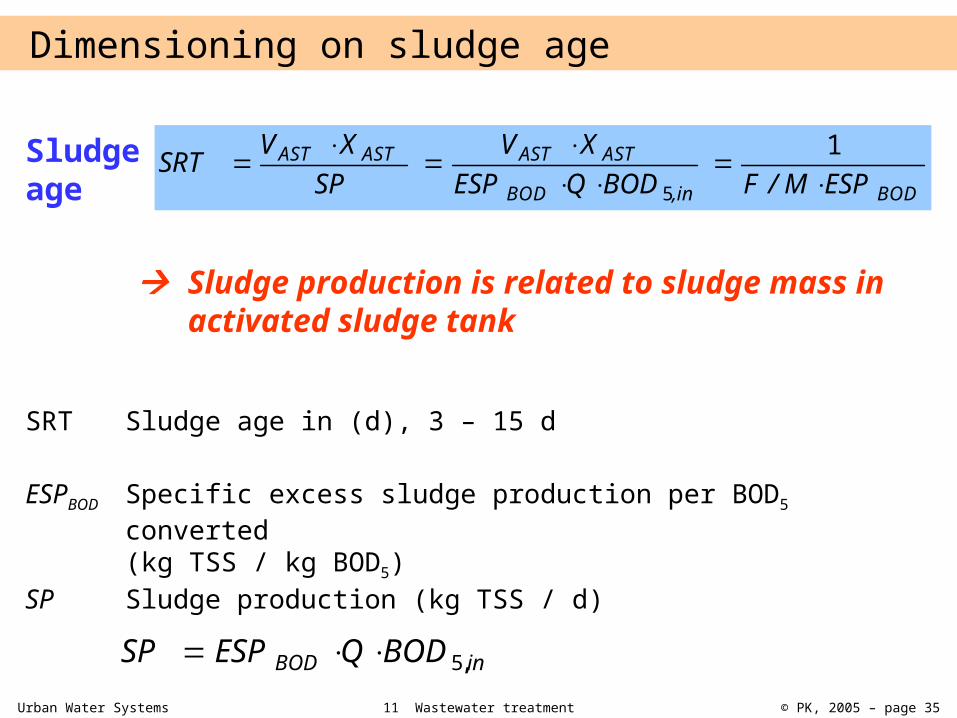
Dimensioning on sludge age
Sludge age BODin,BOD
ASTASTASTASTESPM/FBODQESP
XVSP
XVSRT
15
SRT Sludge age in (d), 3 – 15 d
SP Sludge production (kg TSS / d)
ESPBOD Specific excess sludge production per BOD5 converted (kg TSS / kg BOD5)
Sludge production is related to sludge mass in activated sludge tank
inBOD BODQESPSP ,5
Urban Water Systems 11 Wastewater treatment © PK, 2005 – page 36
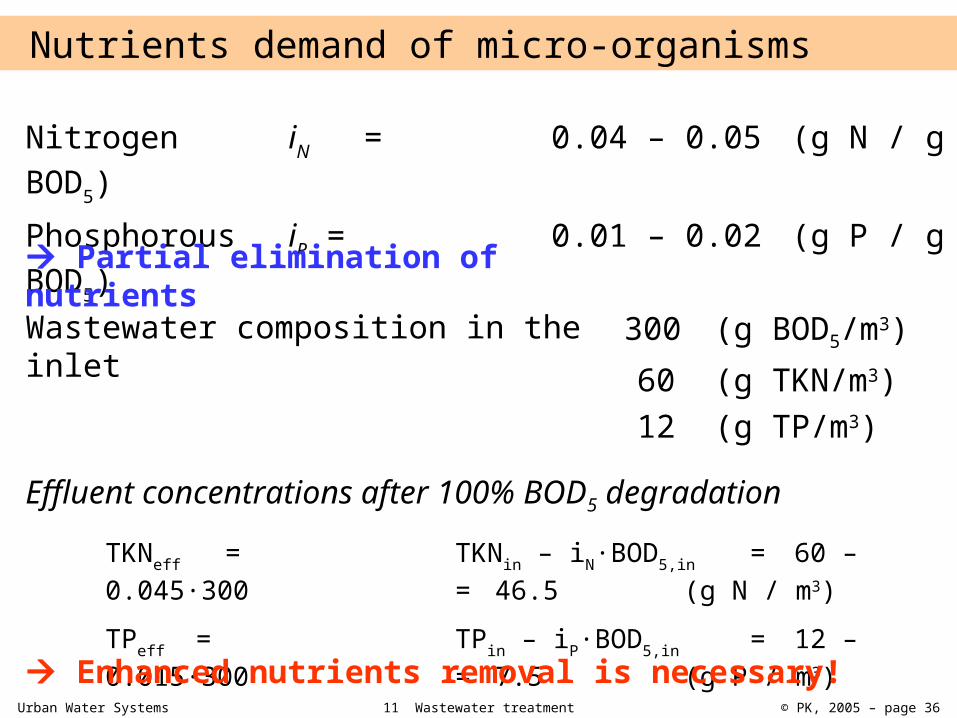
Nutrients demand of micro-organisms
Nitrogen iN = 0.04 – 0.05 (g N / g BOD5) Phosphorous iP = 0.01 – 0.02 (g P / g BOD5) Partial elimination of nutrientsWastewater composition in the inlet
300 (g BOD5/m3) 60 (g TKN/m3) 12 (g TP/m3)
Effluent concentrations after 100% BOD5 degradation TKNeff = TKNin – iN·BOD5,in = 60 – 0.045·300 = 46.5 (g N / m3) TPeff = TPin – iP·BOD5,in = 12 – 0.015·300 = 7.5 (g P / m3) Enhanced nutrients removal is necessary!
Urban Water Systems 11 Wastewater treatment © PK, 2005 – page 37
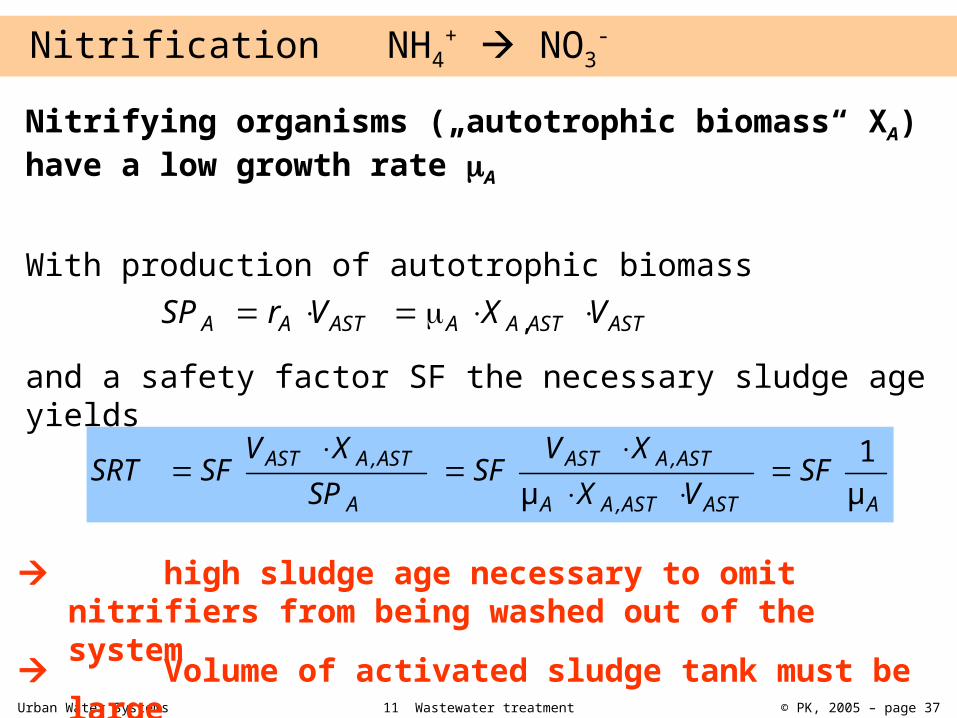
Nitrification NH4+ NO3
- Nitrifying organisms („autotrophic biomass“ XA) have a low growth rate A
high sludge age necessary to omit nitrifiers from being washed out of the system
ASTASTAAASTAA VXVrSP ,
AASTAST,AA
AST,AAST
A
AST,AAST SFVX
XVSF
SPXV
SFSRT μ1
μ
With production of autotrophic biomass
and a safety factor SF the necessary sludge age yields
Volume of activated sludge tank must be large
Urban Water Systems 11 Wastewater treatment © PK, 2005 – page 38
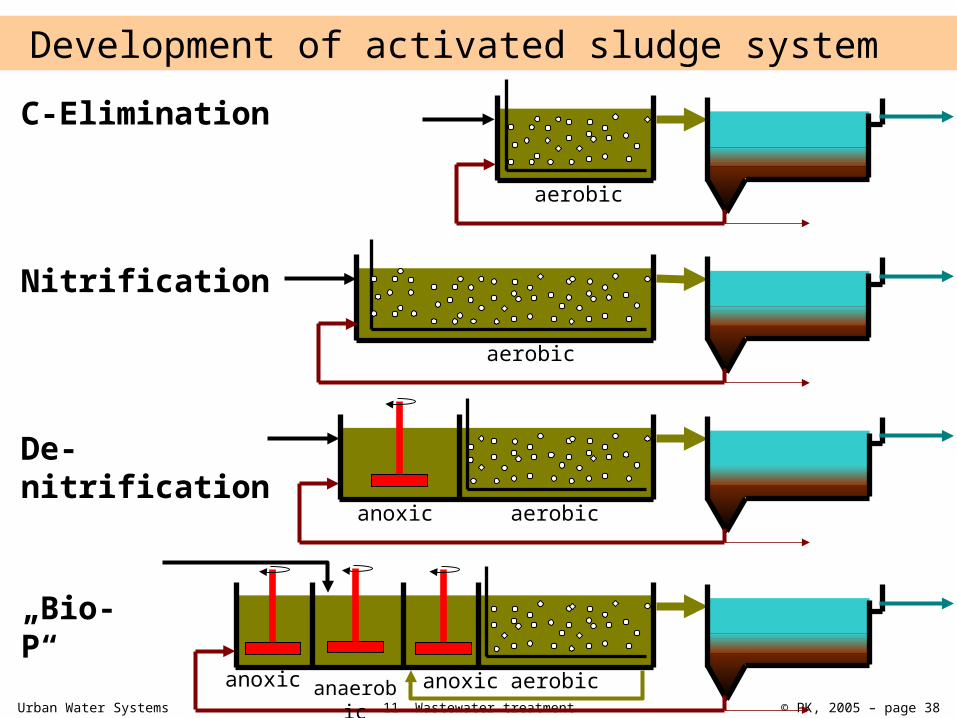
anoxic aerobic
aerobic
C-Elimination
Nitrification
De-nitrification
„Bio-P“
aerobic
anaerobic
anoxic aerobicanoxic
Development of activated sludge system
Urban Water Systems 11 Wastewater treatment © PK, 2005 – page 39
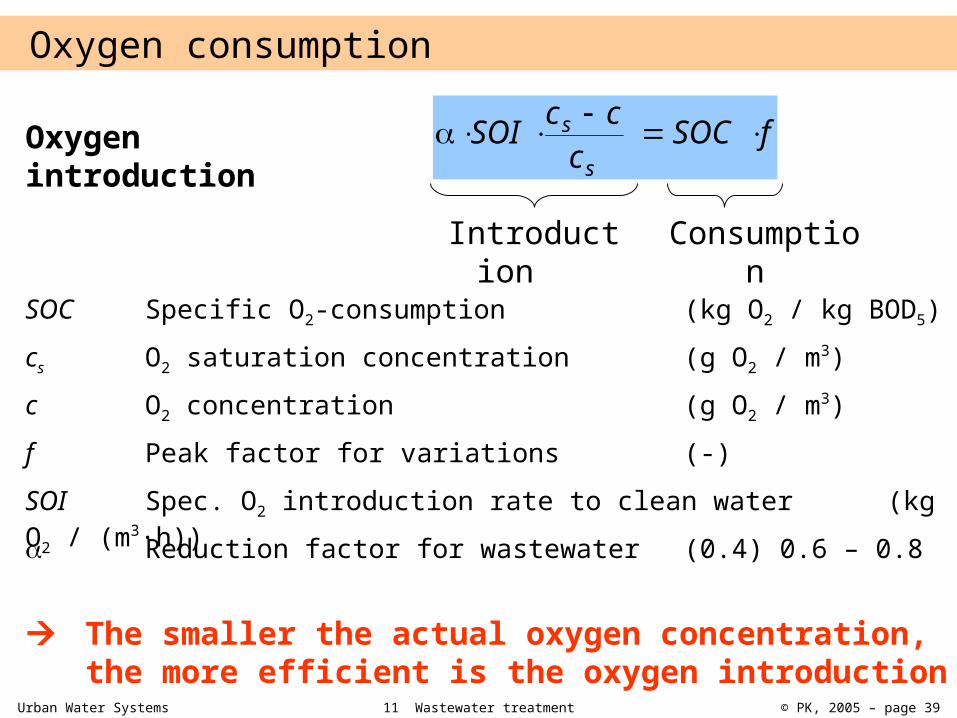
Oxygen consumption
SOC Specific O2-consumption (kg O2 / kg BOD5)
fSOCc
ccSOIs
s Oxygen introduction
cs O2 saturation concentration (g O2 / m3) c O2 concentration (g O2 / m3) f Peak factor for variations (-) SOI Spec. O2 introduction rate to clean water (kg O2 / (m3·h)) Reduction factor for wastewater (0.4) 0.6 – 0.8
Consumption
Introduction
The smaller the actual oxygen concentration, the more efficient is the oxygen introduction
Urban Water Systems 11 Wastewater treatment © PK, 2005 – page 40
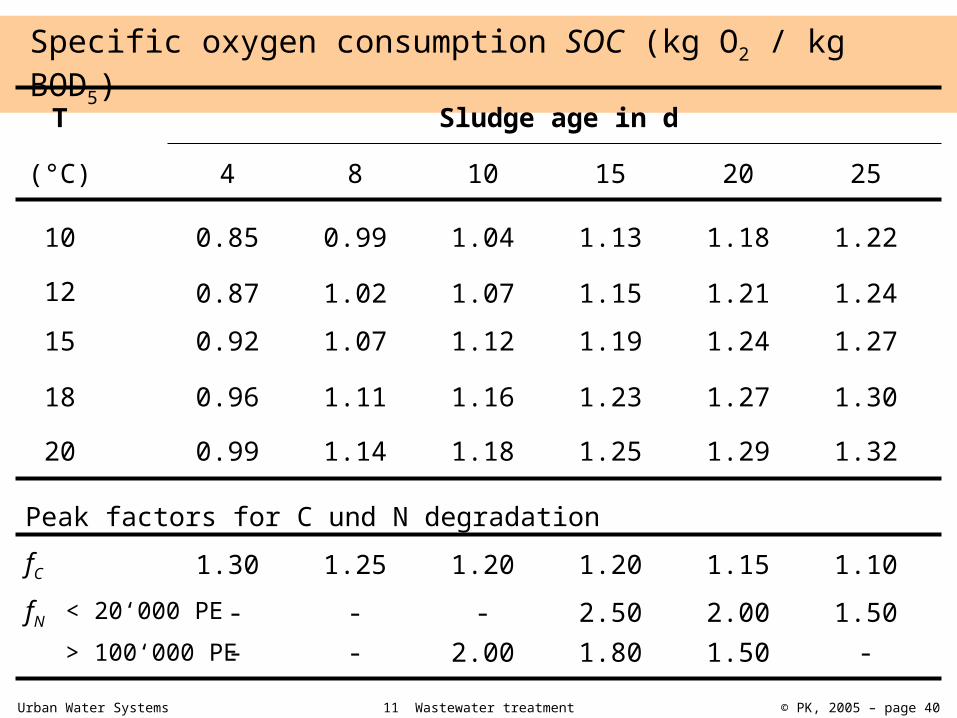
Specific oxygen consumption SOC (kg O2 / kg BOD5) T Sludge age in d
4 8 10 15 20 25
10
12 15
18
20
0.85 0.99 1.04 1.13 1.18 1.22
0.87 1.02 1.07 1.15 1.21 1.24 0.92 1.07 1.12 1.19 1.24 1.27
0.96 1.11 1.16 1.23 1.27 1.30
0.99 1.14 1.18 1.25 1.29 1.32
(°C)
Peak factors for C und N degradation fC fN < 20‘000 PE
> 100‘000 PE
1.30 1.25 1.20 1.20 1.15 1.10 - - - 2.50 2.00 1.50 - - 2.00 1.80 1.50 -
Urban Water Systems 11 Wastewater treatment © PK, 2005 – page 41
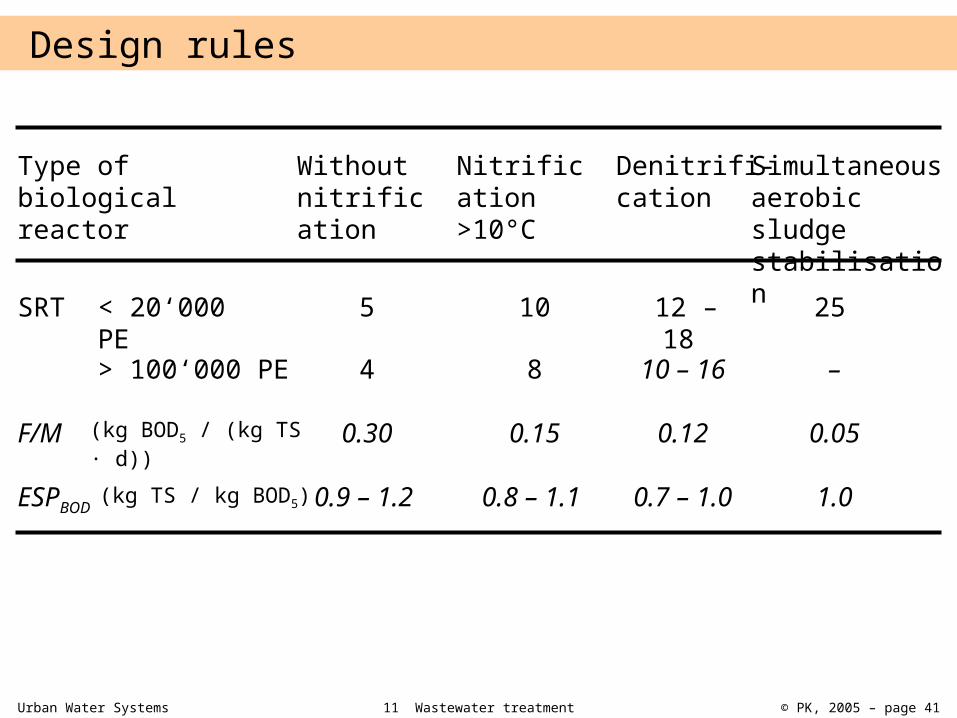
Design rules
Type of biological reactor
Without nitrification
Nitrification >10°C
Denitrifi-cation
Simultaneous aerobic sludge stabilisation SRT < 20‘000
PE> 100‘000 PE
ESPBOD
F/M
5
0.9 – 1.2
0.30
4
10
0.8 – 1.1
0.15
8
12 – 18
0.7 – 1.0
10 – 16
0.12
25
1.0
–
0.05 (kg BOD5 / (kg TS · d))(kg TS / kg BOD5)
Urban Water Systems 11 Wastewater treatment © PK, 2005 – page 42
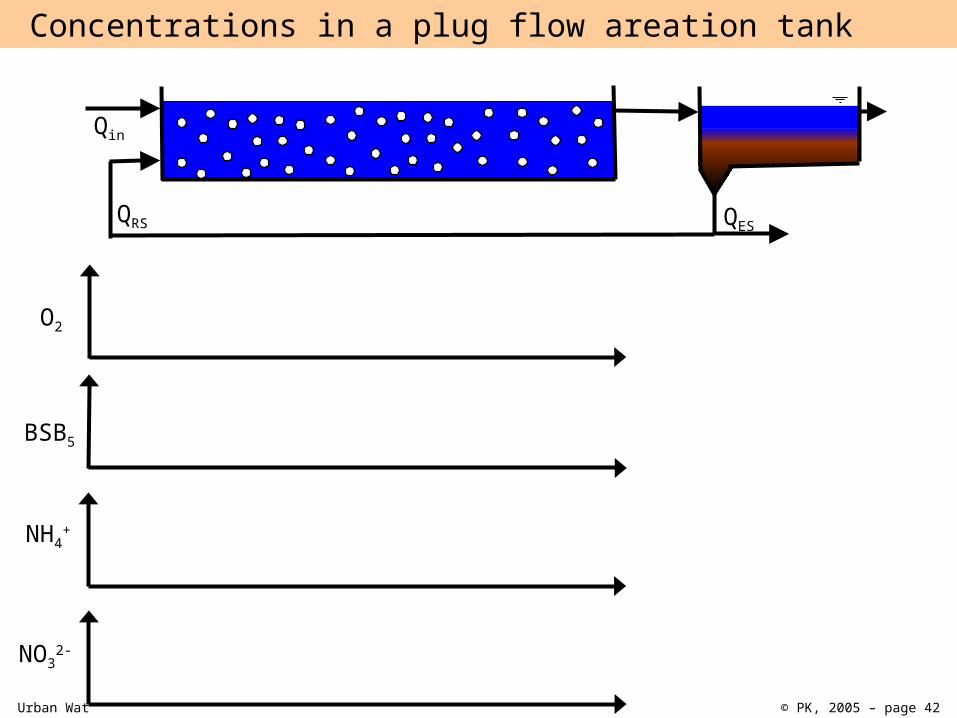
Concentrations in a plug flow areation tank
QRS
Qin
NH4+
BSB5
O2
NO32-
QES
Urban Water Systems 11 Wastewater treatment © PK, 2005 – page 43
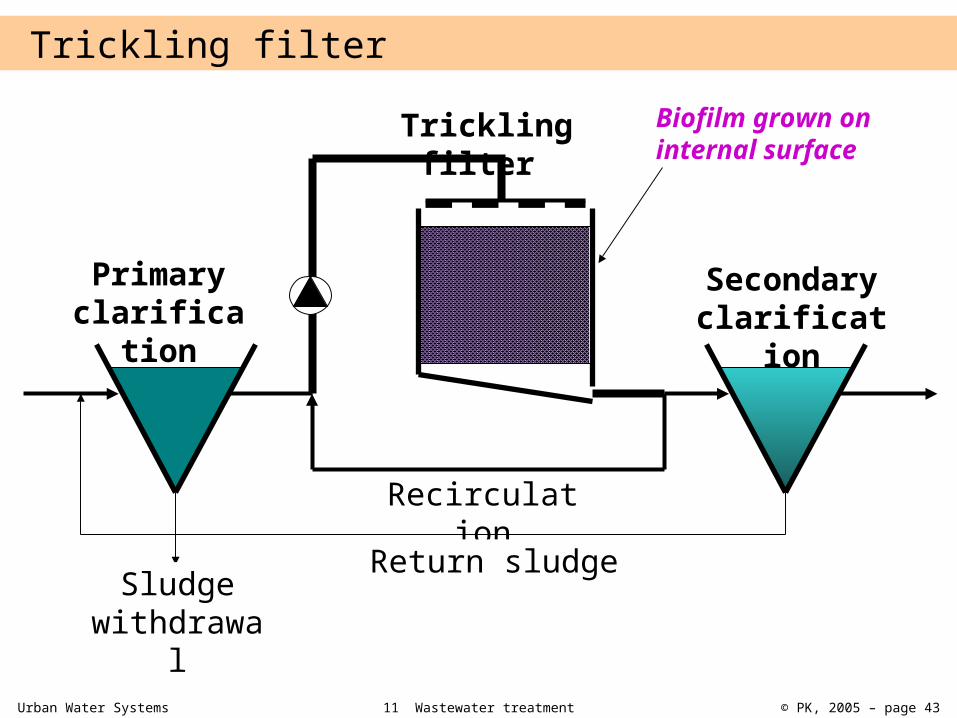
Trickling filter
Primary clarifica
tion
Trickling filter
Secondary clarificat
ion
Recirculation
Return sludgeSludge withdrawa
l
Biofilm grown on internal surface
Urban Water Systems 11 Wastewater treatment © PK, 2005 – page 44
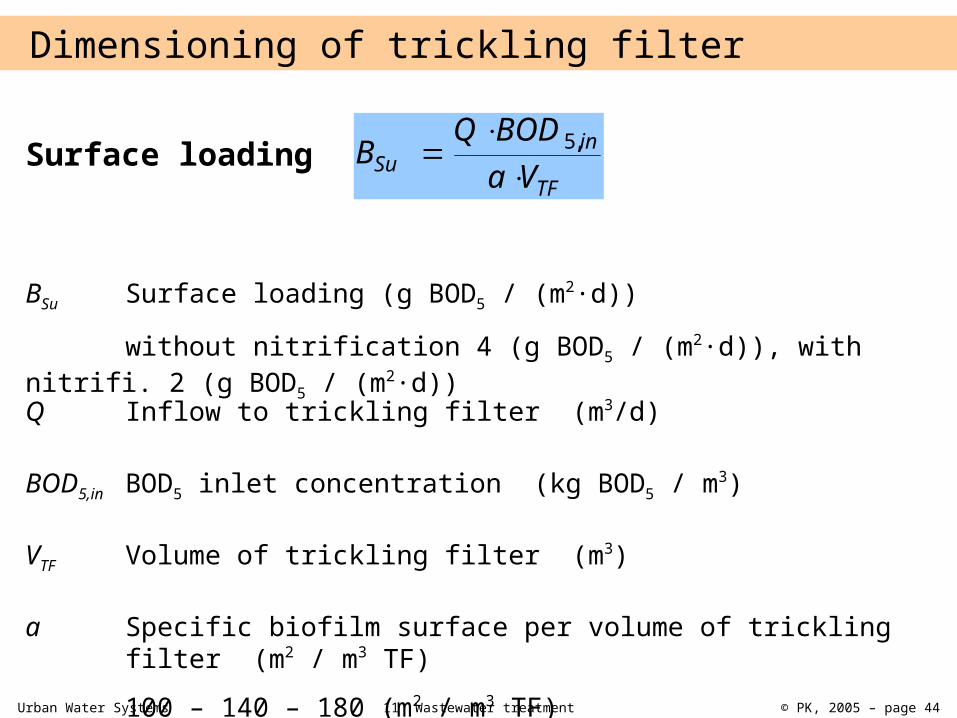
Dimensioning of trickling filter
Surface loading TF
inSu Va
BODQB
,5
BSu Surface loading (g BOD5 / (m2·d)) without nitrification 4 (g BOD5 / (m2·d)), with
nitrifi. 2 (g BOD5 / (m2·d)) Q Inflow to trickling filter (m3/d)
BOD5,in BOD5 inlet concentration (kg BOD5 / m3)
VTF Volume of trickling filter (m3)
a Specific biofilm surface per volume of trickling filter (m2 / m3 TF) 100 – 140 – 180 (m2 / m3 TF)
Urban Water Systems 11 Wastewater treatment © PK, 2005 – page 45
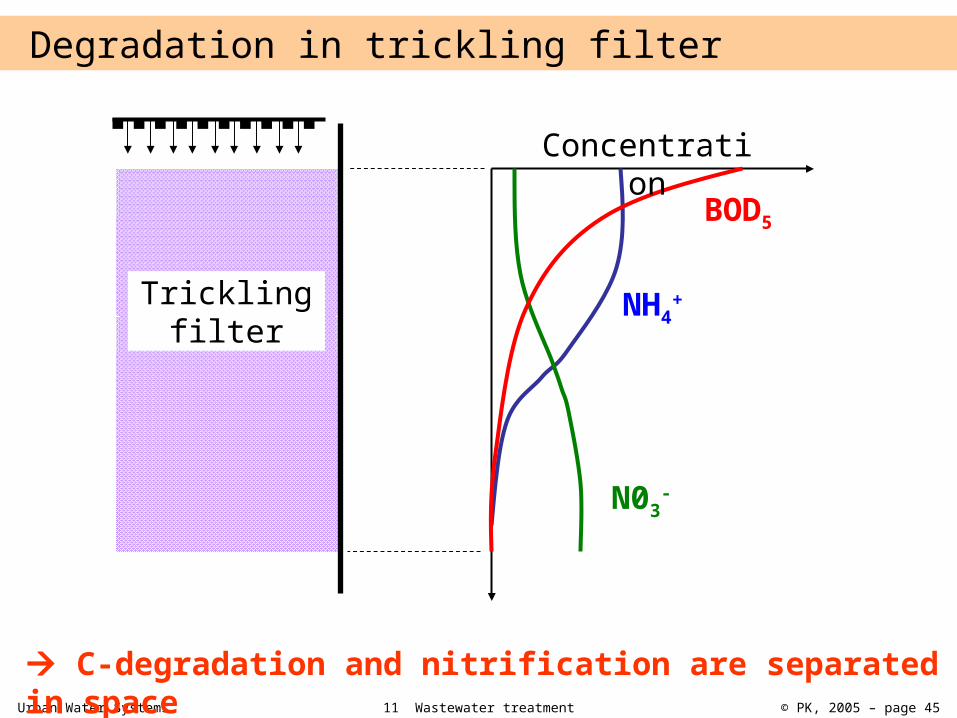
Degradation in trickling filter
Concentration
BOD5
NH4+
N03-
Trickling filter
C-degradation and nitrification are separated in space
Urban Water Systems 11 Wastewater treatment © PK, 2005 – page 46
11.5 Final clarification
11 Wastewater treatment
Urban Water Systems 11 Wastewater treatment © PK, 2005 – page 47
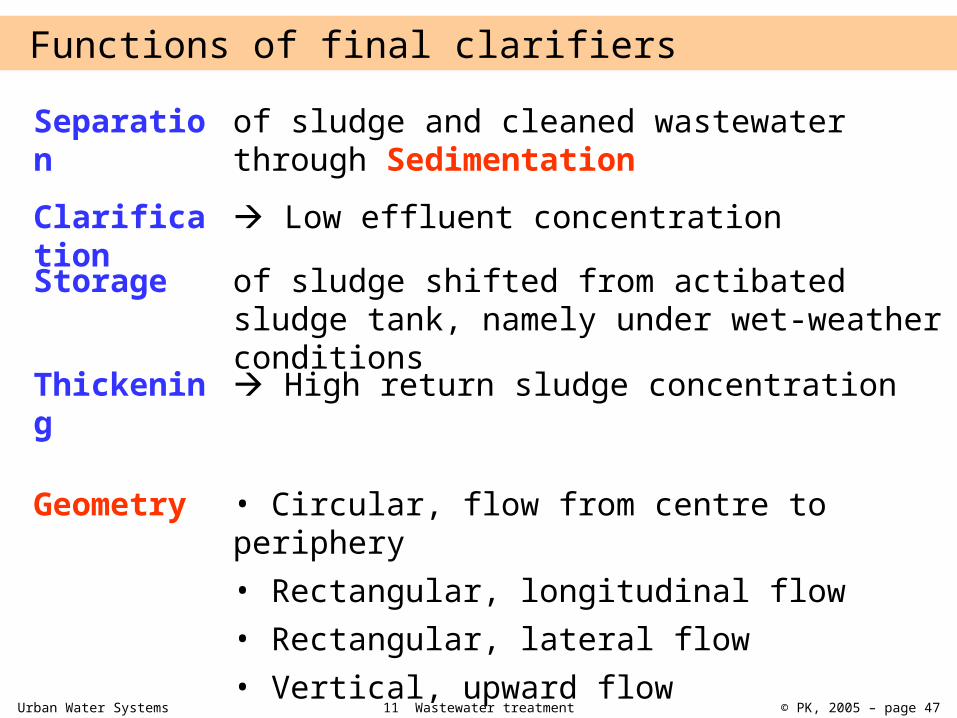
Functions of final clarifiers Separation Clarification Storage
Thickening
of sludge and cleaned wastewater through Sedimentation Low effluent concentrationof sludge shifted from actibated sludge tank, namely under wet-weather conditions High return sludge concentration
Geometry
• Circular, flow from centre to periphery • Rectangular, longitudinal flow • Rectangular, lateral flow • Vertical, upward flow
Urban Water Systems 11 Wastewater treatment © PK, 2005 – page 48
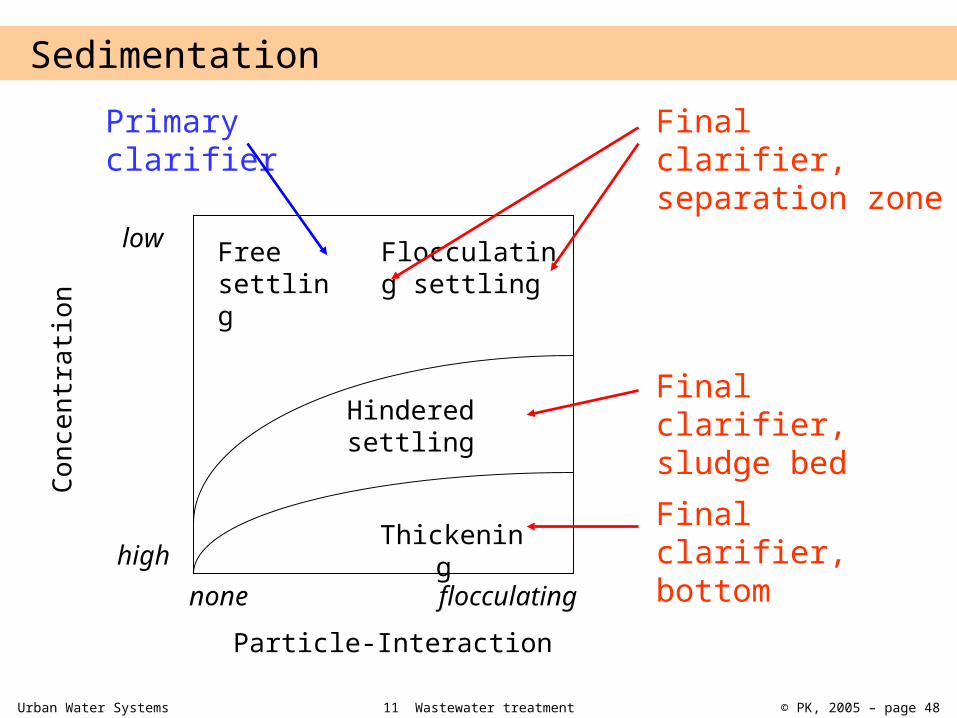
Concentration
Particle-Interaction
Thickening
Hindered settling
Flocculating settling
Free settling
none flocculatinghigh
low
Sedimentation Primary clarifier
Final clarifier, separation zone
Final clarifier, sludge bed Final clarifier, bottom
Urban Water Systems 11 Wastewater treatment © PK, 2005 – page 49
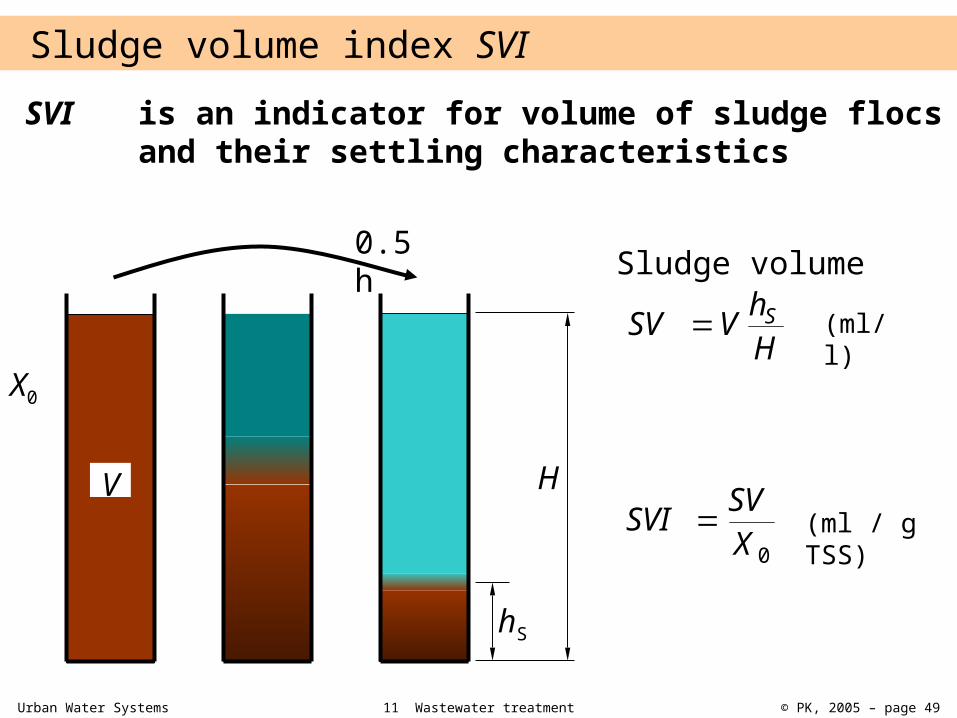
Sludge volume index SVI SVI is an indicator for volume of sludge flocs
and their settling characteristics
0.5 h
H
hS
X0
V
HhVSV S
0XSVSVI
Sludge volume (ml/l)
(ml / g TSS)
Urban Water Systems 11 Wastewater treatment © PK, 2005 – page 50
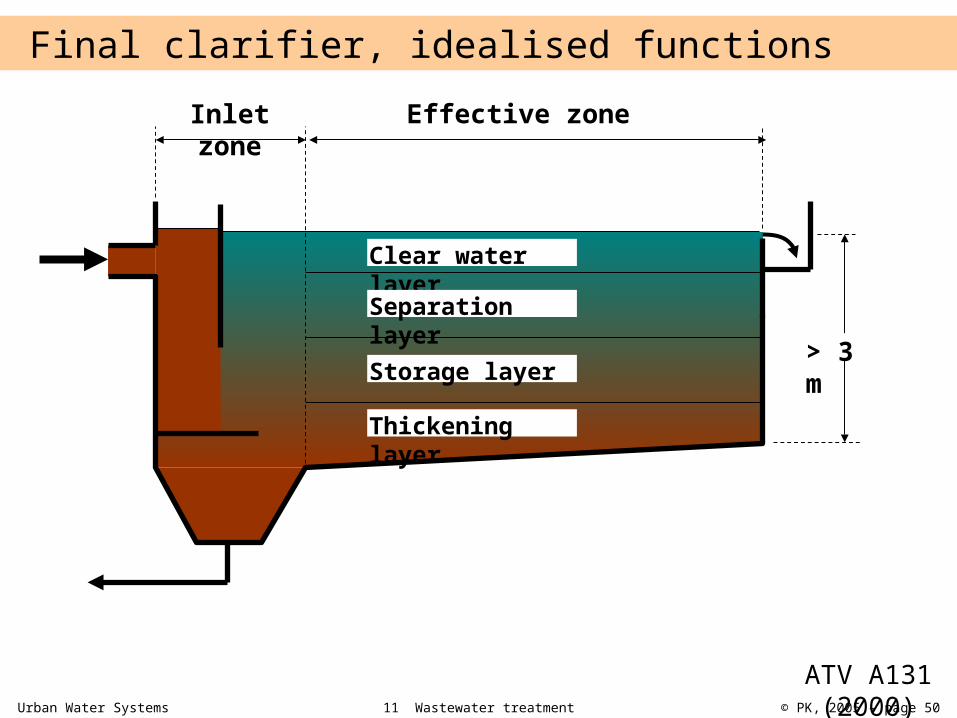
Final clarifier, idealised functions
Clear water layerSeparation layerStorage layer
Thickening layer
Inlet zone
Effective zone
> 3 m
ATV A131 (2000)
Urban Water Systems 11 Wastewater treatment © PK, 2005 – page 51
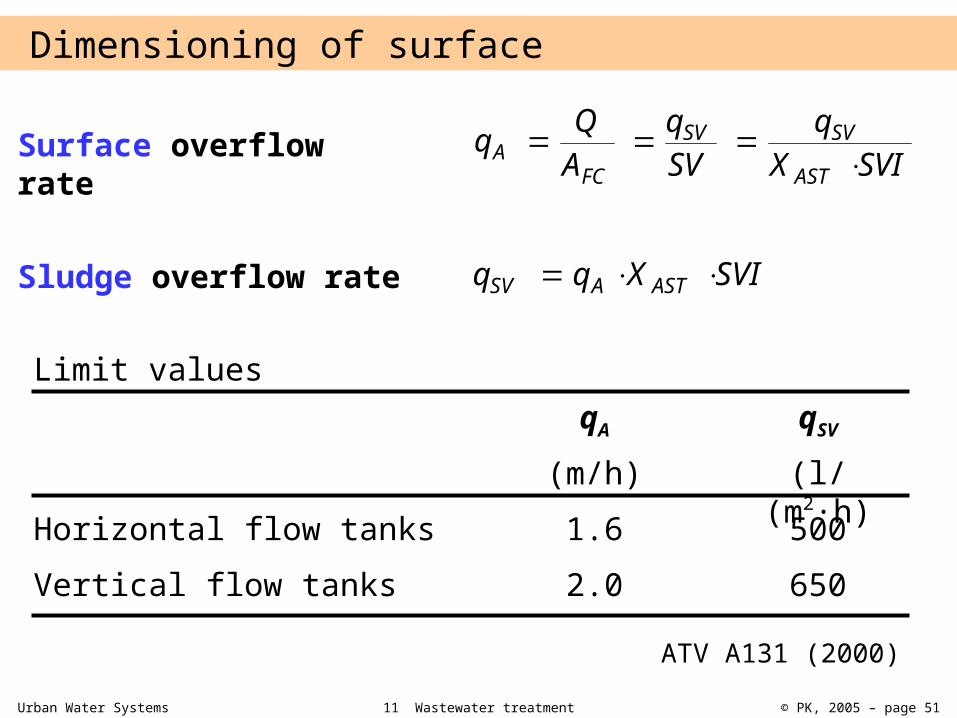
Dimensioning of surface
Surface overflow rate SVIX
qSVq
AQq
AST
SVSV
FCA
Sludge overflow rate SVIXqq ASTASV
Limit values qA qSV
(m/h) (l/(m2·h)Horizontal flow tanks
Vertical flow tanks 1.62.0 650
500
ATV A131 (2000)
Urban Water Systems 11 Wastewater treatment © PK, 2005 – page 52
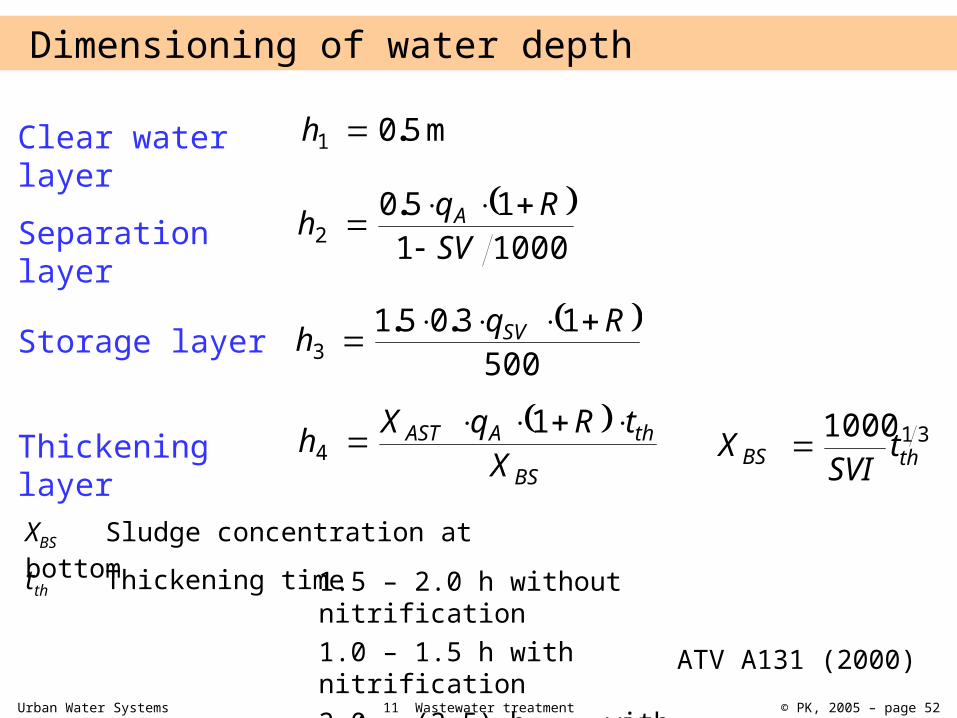
Dimensioning of water depth
Clear water layer Separation layer
Storage layer
Thickening layer
m501 .h
10001150
2 SVRqh A
.
500
130513
Rqh SV ..
BS
thAASTX
tRqXh 14
311000thBS t
SVIX
XBS Sludge concentration at bottom tth Thickening time 1.5 – 2.0 h without
nitrification 1.0 – 1.5 h with nitrification 2.0 – (2.5) h with denitrification
ATV A131 (2000)
Urban Water Systems 11 Wastewater treatment © PK, 2005 – page 53
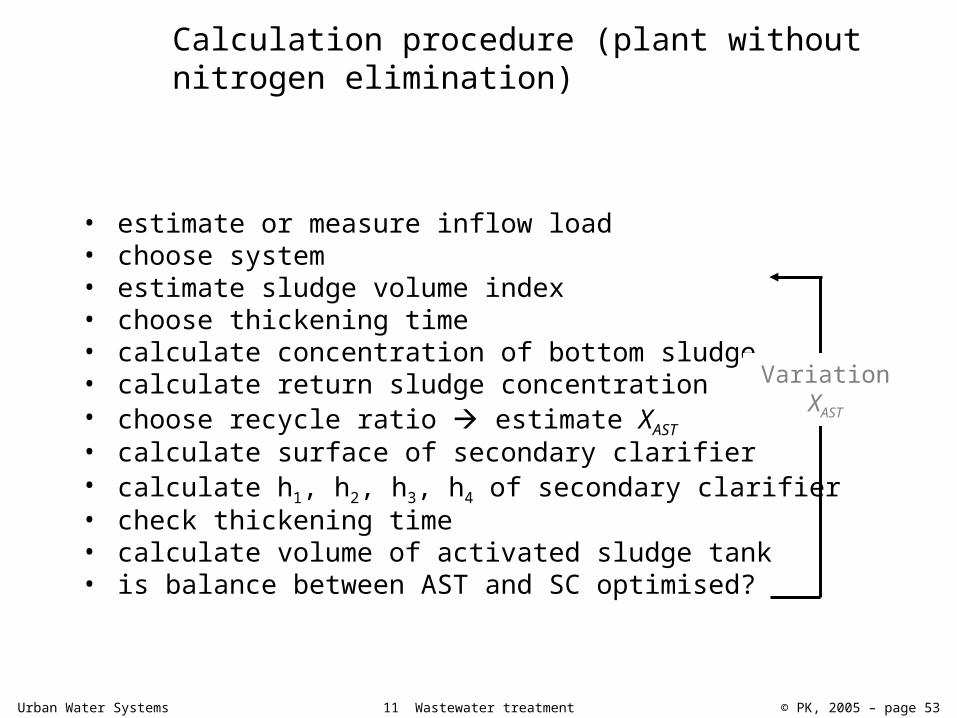
Calculation procedure (plant without nitrogen elimination)
• estimate or measure inflow load• choose system• estimate sludge volume index• choose thickening time• calculate concentration of bottom sludge• calculate return sludge concentration• choose recycle ratio estimate XAST• calculate surface of secondary clarifier• calculate h1, h2, h3, h4 of secondary clarifier• check thickening time• calculate volume of activated sludge tank• is balance between AST and SC optimised?
Variation XAST
Urban Water Systems 11 Wastewater treatment © PK, 2005 – page 54
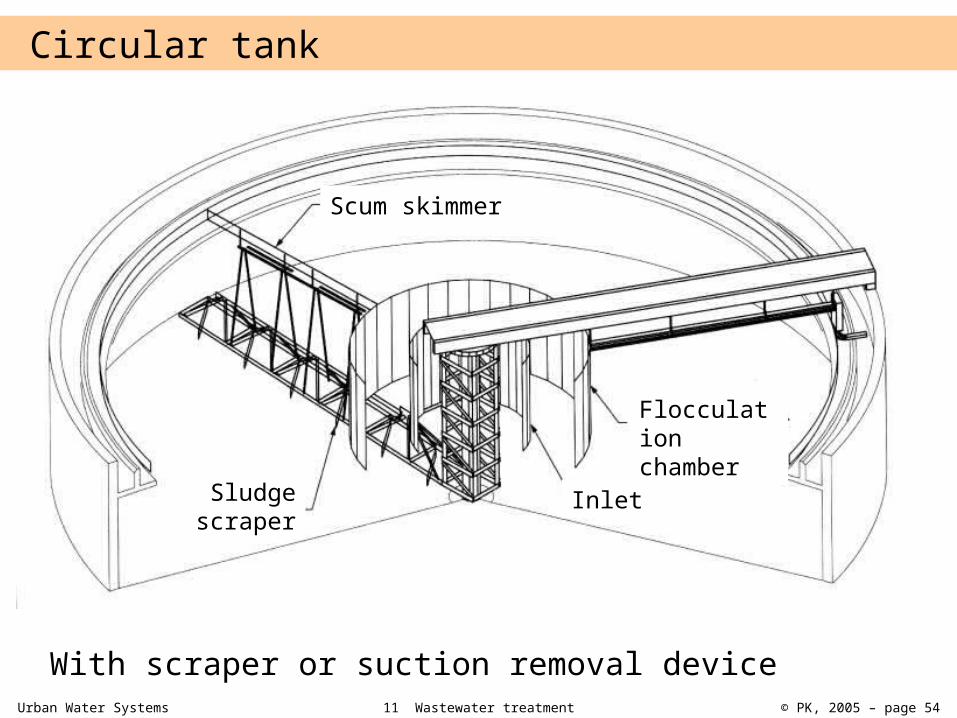
Circular tank
With scraper or suction removal device
Inlet
Flocculation chamber
Scum skimmer
Sludge scraper
Urban Water Systems 11 Wastewater treatment © PK, 2005 – page 55
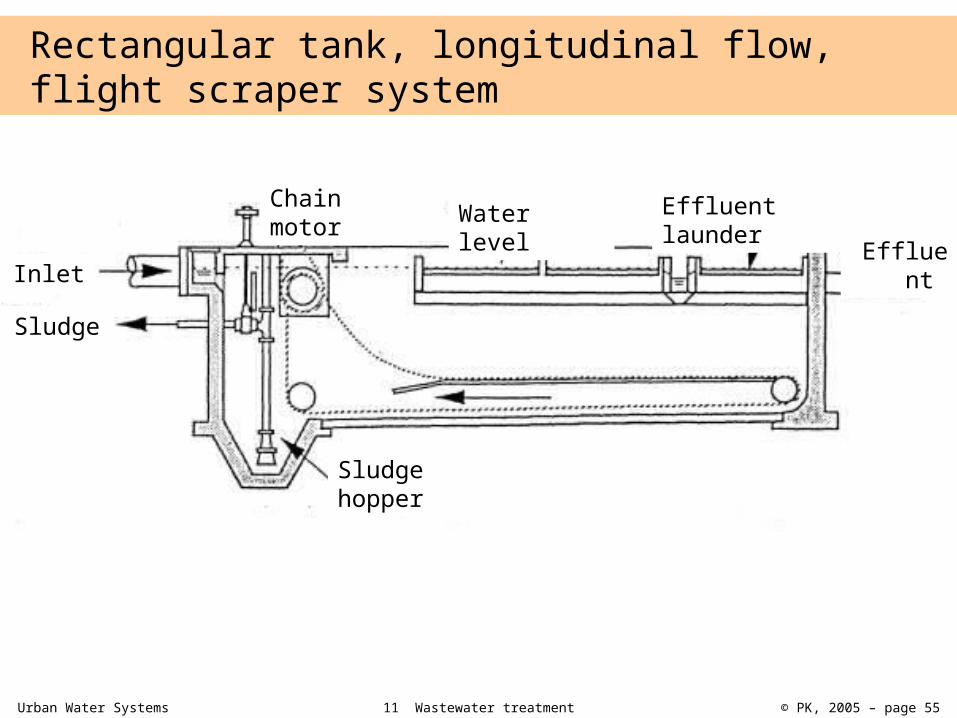
Rectangular tank, longitudinal flow, flight scraper system
Sludge hopper
Inlet
Sludge
Chain motor Water
level Effluent launder Efflue
nt
Urban Water Systems 11 Wastewater treatment © PK, 2005 – page 56
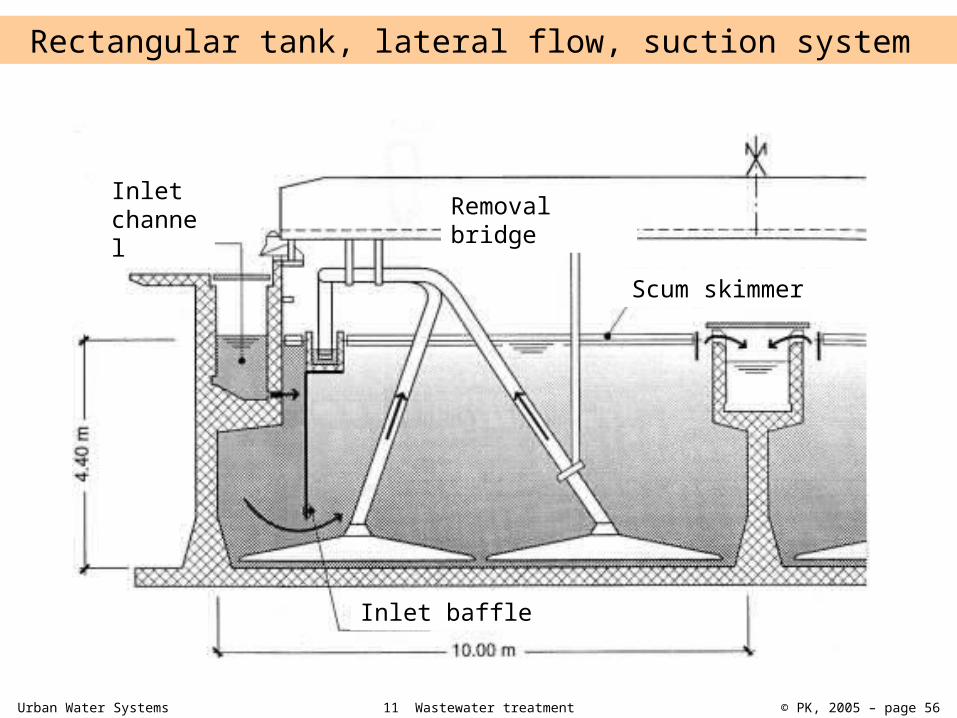
Rectangular tank, lateral flow, suction system
Removal bridge
Inlet channel
Scum skimmer
Inlet baffle
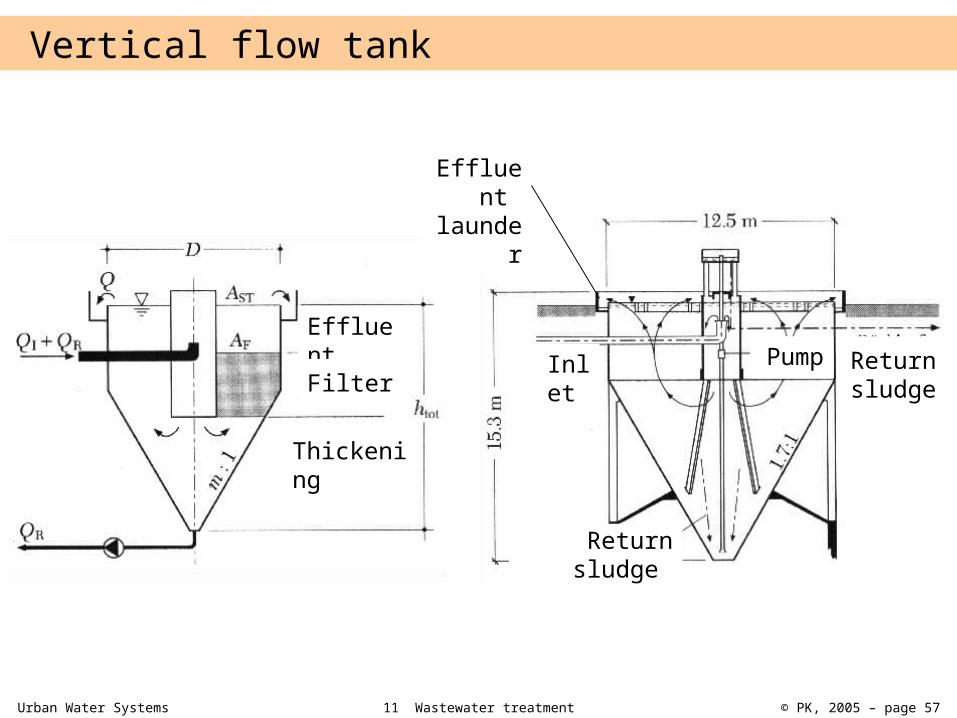
Urban Water Systems 11 Wastewater treatment © PK, 2005 – page 57
Vertical flow tank
EffluentFilter
Thickening
Inlet
Return sludge
Return sludge
Effluent
launder
Pump


