Embed Size (px)
Citation preview

Znorg. Chem. 1992,
doped analogues of these phases is intriguing and is currently under investigation.
Acknowledgment. This work was supported by the National science Foundation (Grant DMR-8913906), the Exxon Education
(22) Generated by the CAChe molecular graphics system, Tektronix Inc., Beaverton, OR.
31, 1791-1801 1791
Foundation, the Center for Superconductivity Research, and Department of Chemistry, University of Maryland. We wish to thank Mr. Cahit Eylem for assistance with the EDAX analysis.
Suppkmentwy Material Available: Text describing the structure d e termination and tables of crystallographic data, anisotropic thermal pa- rameters, and complete bond distances and bond angles (29 pages); listings of calculated and observed structure factors ( 5 pages). Ordering information is given on any current masthead page.
Contribution from the Departments of Chemistry, University of California a t San Diego, La Jolla, California 92093-0506, and University of Louisville, Louisville, Kentucky 40292,
and Microcalorimetry Research Center, Faculty of Science, Osaka University, Toyonaka, Osaka 560, Japan
Valence Detrapping in Mixed-Valence Biferrocenes: Evidence for Phase Transitionst Robert J. Webb,’ Paula M. Hagen,’ Richard J. Wittebort,*,* Michio Sorai,*v3 and David N. Hendrickson*J Received October 17, I991
The preparation and physical data characterizing valence detrapping for the PF6- and SbFC salts of the mixed-valence l’,l”’- dichlorobiferrocenium, 1’,1”’-dibromobiferrocenium, and l’, 1”’-diiodobiferroccnium cations are presented. All six compounds are shown to be valence trapped on the vibrational time scale as indicated by C-H bending bands seen in the 815-850-cm-’ region of the IR spectrum. 57Fe M h b a u e r spectra show that the recrystallized form of the dichloro PF6- complex 1 is valence trapped in the 125-350 K range, whereas the initially precipitated form also shows -50% of a valence-detrapped cation present. Powder XRD data indicate the presence of two different polymorphs of 1. Only one form of the dibromo PFC complex 2 was found, and it converts from trapped to detrapped in the Miwsbauer spectrum at 125 K. Only one polymorph of the diiodo PF6- complex 3 was found, and it is valence trapped in the 125-350 K range. Recrystallized dichloro SbF6- complex 4 does convert from trapped at low temperatures to detrapped above -250 K, whereas dibromo SbFC complex 5 remains trapped throughout 125-350 K. Detailed data are presented to show that there are two different polymorphs of diiodo SbF6- complex 6. MBssbauer data show the rapidly precipitated form valence detraps at - 140 K, whereas the recrystallized form detraps at -270 K. The EPR spectra and powder XRD patterns are different for the two polymorphs. The heat capacity of a 12.2514-0 sample of the rapidly precipitated form was determined to show one C, peak at 134 K, with a small peak at -270 K attributable to -5% of the second polymorph. The 134 K phase transition for the metastable polymorph was characterized to have AH = 740 50 J mol-’ and AS = 6.0 & 0.5 J K-I mol-’. Thus, it is shown that the valence detrapping in the metastable polymorph m u r s in a phase transition, where the observed entropy gain (AS) is quite close to a value of AS = R In 2 (=5.76 J K-’ mol-’) expected for the mixed-valence l’,l”’-diiodobiferrocenium cations converting from being trapped in one vibronic state to dynamically interconverting between two vibronic states. Solid-state I9F NMR data for a nonrotating sample of the stable (Le., recrystallized) polymorph of complex 6 show that the SbF,- anion converts from being static at 125 K to rapidly reorientating in the 225-300 K range. Valence detrapping in the mixed-valence 1’.1”’-diiodobiferrocenium cation occurs in the same temperature range as the onset of motion of the SbFC anion.
Introduction Very recently it has been shown that the solid-state environment
about a mixed-valence complex plays a dominant role in deter- mining the rate of intramolecular electron transfer: Some of the most detailed results have been reported for triangular mix- ed-valence complexes of the composition [Fe30(02ccH3)6(L)3]s, where L is a ligand such as HzO or (substituted) pyridine and S is a solvate m0lecule.~9~ The positioning of ligand substituents on L and solvate molecule S and whether they are static or dy- namic in the solid state control the rate of intramolecular electron transfer. It is clear from 57Fe Miissbauer and 2H NMR data that all of these complexes have a trapped-valence FetttzFdl description at low temperatures. From variable-temperature IR s t ~ d i e s ~ ~ , ~ * ’ it is also known that from 50 to 350 K all of these complexes have a trapped-valence Fe11t2Fe” description on the 10-1’-10-12-s time scale. At all temperatures the ground-state potential-energy surface for each complex has three or four minima, where a t low temperatures the energies of these three or four minima are not the same. One vibronic minimum has the lowest energy, and the Fe30 complex is valence-trapped in this minimum. As the crystal is heated, the environment about each FetllzFelt
complex tends to become of higher symmetry. The potential- energy surface for the ground state is symmetrized, and the en- ergies of the three or four vibronic states become equal. There are still appreciable potential-energy barriers for a complex to
‘Contribution No. 51 from the Microcalorimetry Research Center, for the calorimetric part of this paper.
0020-1669/92/1331- 1791$03.00/0
interconvert between the Fe;I1Febl1’FeJt and Fe,ltFe~llFefItt vi- bronic states, for example. However, at the higher temperatures the Fe30 complexes will have enough thermal energy to overcome the potential-energy barriers and interconvert between its three
(1) University of California at San Diego. (2) University of Louisville. (3) Osaka University. (4) (a) Hendrickson, D. N. In Mixed Valency Systems: Applications in
Chemistry, Physics and Bioloav: Prassides. K.. Ed.: Kluwer Academic Publishers: Dordrecht, The getherlands, 1991; pp 67-90. (b) Webb, R. J.; Dong, T.-Y.; Pierpont, C. G.; Boone, S. R.; Chadha, R. K.; Hendrickson, D. N. J . Am. Chem. SOC. 1991, 11.1, 48064812. (c) Webb, R. J.; Geib, S. J.; Staley, D. L.; Rhinegold, A. L.; Hendrickson, D. N. J. Am. Chem.Soc. 1990,112,5031-5042.
( 5 ) (a) Jang, H. G.; Geib, S. J.; Kaneko, Y.; Nakano, M.; Sorai, M.; Rheingold, A. L.; Montez, B.; Hendrickson, D. N. J . Am. Chem. Soc. 1989, I l l , 173. (b) Kaneko, Y.; Nakano, M.; Sorai, M.; Jang, H. G.; Hendrickson, D. N. Inorg. Chem. 1989, 28, 1067. (c) Oh, S. M.; Wilson, S. R.; Hendrickson, D. N.; Woehler, S. E.; Wittebort, R. J.; Inniss, D.; Strouse, C. E. J. Am. Chem. Soc. 1987, 109, 1073. (d) Woehler, S. E.; Wittebort, R. J.; Oh, S. M.; Kambara, T.; Hendrickson, D. N.; Inniss, D.; Strouse, C. E. J . Am. Chem. Soc. 1987, 109, 1063. (e) Woehler, S. E.; Wittebort, R. J.; Oh, S. M.; Hendrickson, D. N.; Inniss, D.; Strouse, C. E. J . Am. Chem. Soc. 1986, 108, 2938. (f) Hendrickson, D. N.; Oh, S. M.; Dong, T.-Y.; Kambara, T.; Cohn, M. J.; Moore, M. F. Comments Inorg. Chem. 1985,4, 329. (g) Sorai, M.; Kaji, K.; Hendrickson, D. N.; Oh, S. M. J. Am. Chem. Soc. 1986,108, 702. (h) Cannon, R. D.; White, R. P. Prog. Inorg. Chem. 1988, 36, 195-298.
(6) (a) Meesuk, L.; Jayasooriya, U. A.; Cannon, R. D. J . Am. Chem. Soc. 1987, 109, 2009. (b) Johnson, M. K.; Cannon, R. D.; Powell, D. B. Spectrochim. Acto 1982, 38A, 307.
(7) Oh, S. M.; Hendrickson, D. N.; Hassett, K. L.; Davis, R. E. J . Am. Chem. Soc. 1985, 107, 8009-8018.
0 1992 American Chemical Society

1792 Inorganic Chemistry, Vol. 31, No. IO, 1992
or four vibronic states. For several complexes an increase in temperature leads to a conversion from being valence trapped on the MBssbauer and NMR time scales to valence detrapped. Valencedetrapped complexes have sufficient energy to interconvert between their vibronic states faster than -IO*-- 1O’O s-I. Two other general observations have been made about the conversion from trapped to detrapped states observed for these Fe30 com- plexes. First, in all cases studied by solid-state *H NMR spec- troscopy this conversion occurs together with an onset of motion of the S solvate molecu1e.w Second, for the seven Fe30 complexes studied by adiabatic ca l~ r ime t ry~~*g%~ the trapped to detrapped conversion occurs in one or more phase transitions. The presence of intermolecular interactions leads to cooperativity associated with the onset of solvate molecule motion and the conversion from trapped to detrapped.
Several mixed-valence biferrocenium salts have been seen to convert from valence trapped at low temperatures to valence detrapped as the temperature is increased.”’ These conversions occur over a relatively large temperature range (- 100 deg). The anion in the majority of these salts is 13-; however, very recently PF6- and SbF6- have been used.“ In comparison to mixed-valence Fe30 complexes, the factors which control the rate of intramo- lecular electron transfer have not been as well delineated. It is clear that a symmetric mixed-valence biferrocenium cation located in a low-symmetry crystal site where the two iron ions are not crystallographically equivalent will tend to remain valence trapped. There are no data available to indicate whether a substituent on a biferrocenium cation or the anion in these salts converts from being static to dynamic and that this triggers off the conversion from valence trapped to detrapped. It also has not been firmly established whether phase transitions are involved in the valence detrapping of mixed-valence biferrocenium salts. There is indirect evidence for the presence of phase transitions in the form of sample history dependence. Mild grinding of a crystalline sample of l’, I”’-dibenzylbiferrocenium triiodide was shown to affect sig- nificantly the relative amounts of valence-trapped and -detrapped species.4b There have been two adiabatic calorimetry studies of mixed-valence biferrocenium salt^.'^*'^ In the case of bi- ferrocenium triiodide a higher order phase transition which starts at -220 K with the main Cp peak at 328 K was found in heat capacity measurements.I2 Mossbauer data in this same tem- perature region show that biferrocenium triiodide does change from valence trapped to valence detrapped in this phase transition. However, the entropy gain, AS = 1.77 f 0.06 J K-’ mol-’, for the phase transition falls considerably short of a simple R In 2 (=5.76 J K-I mol-’) expectation for the biferrocenium cation
Webb et al.
~~ _ _ ~ ~
(8) (a) Sorai, M.; Hendrickson, D. N. Pure Appl. Chem. 1991, 63, 1503-1510. (b) Kambara, T.; Hendrickson, D. N.; Sorai, M.; Oh, S. M. J . Chem. Phys. 1986, 85, 2895. (c) Sorai, M.; Shiomi, Y.; Hen- drickson, D. N.; Oh, S. M.; Kambara, T. Inorg. Chem. 1987, 26,223.
(9) (a) Sano, H. Hyperfine Interuct. 1990, 53, 97 and references therein. (b) Konno, M.; Sano, H. Bull. Chem. Soc. Jpn. 1988,61, 1455. (c) Kambara, T.; Sasaki, N. J. Coord. Chem. 1988, 18, 129. (d) Kai, M.; Katada, M.; Sano, H. Chem. Lett. 1988, 1523.
(10) (a) Dong, T.-Y.; Schei, C.-C.; Hsu, T.-L.; Lee, S.-L.; Li, S.-J. Inorg. Chem. 1991,30,2457. (b) Dong, T.-Y.; Schei, C.-C.; Hwang, M.-Y.; Lee, T.-Y.; Yeh, S.-K.; Wen, Y.4. J. Organomer. Chem. 1992, 1 1 , 573-582. (c) Dong, T.-Y.; Hendrickson, D. N. Bull. Inst. Chem., Acad. Sin. 1989, 36, 73.
(11) (a) Dong, T.-Y.; Cohn, M. J.; Hendrickson, D. N.; Pierpont, C. G. J . Am. Chem. SOC. 1985, 107, 4777. (b) Cohn, M. J.; Dong, T.-Y.; Hendrickson, D. N.; Geib, S. J.; Rheingold, A. L. J. Chem. Soc., Chem. Commun. 1985, 1095. (c) Dong, T.-Y.; Hendrickson, D. N.; Iwai, K.; Cohn, M. J.; Rheingold, A. L.; Sano, H.; Motoyama, I.; Nakashima, S. J. Am. Chem. Soc. 1985,107,7996. (d) Dong, T.-Y.; Hendrickson, D. N.; Pierpont, C. G.; Moore, M. F. J. Am. Chem. Soc. 1986,208,963. (e) Moore, M. F.; Wilson, S. R.; Cohn, M. J.; Dong, T.-Y.; Mueller- Westerhoff, U. T.; Hendrickson, D. N. Inorg. Chem. 1985, 24, 4559. (f) Dong, T.-Y.; Kambara, T.; Hendrickson, D. N. J. Am. Chem. SOC. 1986,108,4423. (8) Dong, T.-Y.; Kambara, T.; Hendrickson, D. N. J. Am. Chem. Soc. 1986, 108, 5857.
(12) Sorai, M.; Nishimori, A.; Hendrickson, D. N.; Dong, T.-Y.; Cohn, M. J. J. Am. Chem. Soc. 1987, 109,4266,
(13) (a) Nakashima, S.; Nishimori, A.; Masuda, Y.; Sano, H.; Sorai, M. J . Phys. Chem. Solids 1991.52, 1169. (b) For a brief discussion of these results see ref 9a.
converting from valence trapped to detrapped. Whether the conversion from valence trapped to detrapped occurs in a phase transition is not clear for mixed-valence l’, l”’-diethylbiferrocenium triiodide.” Excess heat capacity, ACp, was detected from -25 K to above 300 K. A big peak in the ACp versus temperature curve was seen at 66 K, whereas only a very small broad bump was detected at -250 K. This latter temperature corresponds to the temperature at which the MBssbauer spectrum for l’, 1”’-diethylbiferrocenium triiodide indicates the valence de- trapping is complete. It is unclear what cooperative events lead to the major heat-capacity effect seen at -66 K in the ACp curve. Mkbauer data indicate that the onset of valence detrapping starts at a much higher temperature.
The goals of the present work were to collect adiabatic calo- rimetry for a third mixed-valence biferrocenium salt and to ex- amine whether solid-state I9F NMR spectroscopy could be used to monitor any onset of motion associated with a SbF6- or PF6- anion in these salts. The following six new l’,l”’-dihalc+substituted biferrocenium salts were examined:
X = Br; Y- = PF; (2) X = I ; Y =PF6- (3) x = c1; Y’ = SbF6’ (4) x = BG Y- = SbF6‘ (5) i X = I ; Y’=SbF((6)
&4
Experimental Section Samples of l’, 1”’-dichlorobiferrocene,
1’,1’”-dibromobiferrocene, and l’, 1”’-diiodobiferrocene were prepared according to the method given by Kovar et al.“ and identified by melting point and mass spectra data. The hexafluorophosphate salts of the three l’, 1”’-dihalobiferrocenes were synthesized in the following manner. The neutral 1’,1”’-dihalobiferrocene (200 mg, 0,4554,322 mmol) was dis- solved in a minimum amount of benzene (25-50 mL). A solution con- taining a stoichiometric amount of HPF6 (Aldrich) and pbenzoquinone (Aldrich) dissolved in a 1 : 1 mixture of diethyl ether and benzene (1 5 mL total volume) was added dropwise to the stirred 1’,1”’-dihalobiferrocene benzene solution. The dark blue-purple microcrystalline solids that formed were collected by filtration and washed successively with benzene and diethyl ether to remove any unoxidized l’,l”’-dihalobiferroccne, The initial polycrystalline samples were recrystallized, where indicated, by first dissolving the solid (-200 mg) in a -75-mL portion of dichloro- methane, and then an equal volume of hexane was added. The resulting solution was concentrated to approximately half the combined volume by mild heating ( T < 50 “C) in a fume hood. When the solutions were cooled, the recrystallized solids precipitated out of the predominantly hexane solution. The solids were collected by filtration and dried in a vacuum desiccator overnight. Anal. Calcd for l’,l”’-dichlorobi- ferrocenium hexafluorophosphate (1) (CaH16Fe2C12PF6): c, 41.14; H, 2.76; Fe, 19.13. Found: C, 41.52; H, 2.70; Fe, 19.34. Calcd for l’,l”’-dibromobiferroceniam hexafluorophosphate (2) ( C ~ O H & ~ B ~ ~ P F ~ ) : C, 35.70; H, 2.40; Fe, 16.60. Found C, 36.31; H, 2.55; Fe, 16.22. Calcd for l’,l”’-diiodobiferrocenium hexafluoro- phosphate (3) ( C Z O H ~ ~ F ~ ~ I ~ P F ~ ) : c, 31.33; H, 2.10; Fe, 14.57. Found: C, 31.62; H, 2.17; Fe, 14.32.
The 1’,1”’-dihalobiferrocenium hexafluoroantimonate salts were made in a manner completely analogous to that used for the synthesis of the hexafluorophosphate salts with the substitution of HSbF6 (Strem) for HPF6. In addition, all of the reaction vessels for the SbF6- salts were made of Nalgene since HSbF6 etches glass. Anal. Calcd for l’,l”’-di- chlorobiferrocenium hexafluoroantimonate (4) (C20H16Fe2C12SbF6): c, 35.60; H, 2.39; Fe, 16.56. Found: C, 35.94; H, 2.57; Fe, 16.22. Calcd for l’,l”’-dibromobiferrocenium hexafluoroantimonate (5) (C2,,HI6Fe2Br2SbF6): C, 31.46; H, 2.11; Fe, 14.63. Found: C, 31.64; H, 2.33; Fe, 14.47. Calcd for 1’,1”’-diiodobiferrocenium hexafluoro- antimonate (6) (C&II6FeI2SbF6): c , 28.01; H, 1.88; Fe, 13.02. Found: C, 28.63; H, 1.96; Fe, 12.68.
Compound Preparation.
(14) Kovar, R. F.; Rausch, M. D.; Rosenberg, H. Organomer. Chem. Synrh. 1971, I , 173.

Mixed-Valence Biferrocenes
Physical Methods. 57Fe Mhsbauer measurements were made on a constant-acceleration instrument which has been previously described.I5 The absolute temperature accuracy is estimated to be &3 K, while the relative precision is 10.5 K. The Mijssbauer spectra were least-squares fit to Lorentzian line shapes with a computer program documented elsewhere.I6 Isomer shift data are reported relative to iron foil at 300 K but are uncorrected for temperaturedependent, second-order Doppler effects.
Variable-temperature X-band EPR spectra were recorded on a com- puter-controlled Bruker ER22OD-SRC spectrometer equipped with Air Products digital temperature controller, Varian gauss meter, and an EPI 548H frequency meter. Ambient-temperature infrared spectra were obtained with an IBM Model IR/32 FTIR spectrometer. All samples were prepared as 13-mm KBr pellets with 2-5 mg of compound thor- oughly mixed in 150 mg of KBr. The powder X-ray diffraction patterns were recorded at room temperature on a Phillips APD 3600 diffraction system, equipped with a copper X-ray tube (X(Cu Ka) = 1.5406 A) and graphite monochromator. The powder patterns reported are the result of a single scan where 28 = 5-30’ at 2O/min on a loosely packed poly- crystalline sample.
Solid-state I9F NMR spectra were collected at 237.6 MHz on a home built 5.9-T spectrometer described e1se~here.l~ A Hahn echo pulse sequence (90°-~-1800-~~bS)18 was used to obtain the spectra and minimize the distortion caused by the large I9F chemical shift anisotropy. The 90° pulse widths ranged from 2.7 to 3.0 p, while the delay between the two pulses (T) of the echo sequence was typically -20 ps. It was often necessary to left-shift the free induction decay (FID) signals to obtain a maximum as the first point in the time domain. The spin-lattice relaxation time constants were measured by standard inversion recovery methods. The NMR sample consisted of -50 mg of microcrystals tightly packed and sealed in a Delrin tube in. X in.). The sample temperature was estimated by a platinum resistance thermometer mounted in the probe -4-5 mm from the sample. The absolute tem- perture accuracy is estimated to be f 3 K, while the relative precision is &1 K. The sample and probe were allowed to thermally equilibrate at the various temperatures at least 30 min before data were collected. Chemical shift values (6) are reported relative to CC13F with positive values indicating downfield shifts.
Heat capacities of l’, 1”’-diiodobiferrocenium hexafluoroantimonate (6) were measured with an adiabatic calorimeterI9 from 13 to 300 K. The heat capacity sample was prepared by oxidizing in one batch 9.864 g of l’,l”’-diiodobiferrocene dissolved in 650 mL of benzene. Upon slow addition of a solution containing 5.78 g of a 65% HSbF6/H20 mixture and 1.714 g of benzoquinone in -200 mL of diethyl ether, a dark blue microcrystalline precipitate formed. This was collected by filtration and dried under vacuum. A calorimeter cellM made of gold-plated copper was loaded with 12.2514 g (0.0142858 mol) of polycrystalline complex 6. A small amount of helium gas was sealed in the cell to aid the heat transfer. Results and Discussion
Infrared Spectroscopy. IR spectroscopy has proven useful in determining whether a mixed-valence biferrocenium ion has a delocalized or localized electronic structure.21 The perpendicular C-H bending vibration of the cyclopentadienyl ligands is sensitive to the oxidation of the iron ion. For example, this band occurs at 8 15 cm-’ in Fe” ferrocene and a t - 850 cm-’ for Fel” ferro- cenium salts. The difference in frequency between the absorptions at 81 5 and 850 cm-’ is 9 X 10’’ Hz. If the intramolecular electron transfer is occurring slower than - lo1* s-’ in a mixed-valence binuclear ferrocene system, two perpendicular C-H bending bands are expected to occur. This is indicative of a barrier to intra- molecular electron transfer and consequently a localized electron structure. In the other extreme, if the intramolecular electron- transfer rate exceeds 10I2 s-’, a single average-valence C-H bending band near -830 cm-‘ is expected in the IR spectrum.
(15) Cohn, M. J.; Timken, M. D.; Hendrickson, D. N. J. Am. Chem. SOC.
Inorganic Chemistry, Vol. 31, No. 10, 1992 1793
This indicates that there is little or no barrier to electron transfer and that the system is electronically delocalized.
Room-temperature IR spectra of KBr pellets of the l’,l”’- dihalobiferrocenium hexafluorophosphate salts 1-3 were collected, unfortunately, they were of little use since the PF6- anion has a broad intense absorption occurring in the 800-860-cm-’ region. However, since all three of these salts exhibit valencetrapped 57Fe Mossbauer spectra a t some temperature (vide infra), it is clear that a barrier to electron transfer does indeed exist in the com- pounds 1-3.
The room-temperature IR spectra of the l’,l”’-dihalobi- ferrocenium hexafluoroantimonate salts 4-6 (figure available in the supplementary material) are not plagued by the same problem as the PF6- salts, since the analogous broad band absorption of the SbF6- anion occurs a t lower energy (Le., -655 cm-’). Two bands are seen in the 800-850-cm-’ region for each of the three hexafluoroantimonate salts. This indicates that these cations have a barrier to electron transfer and consequently a localized elec- tronic structure.
57Fe Mijssbauer Spectroscopy. It has been shown that 57Fe Mossbauer spectroscopy is particularly useful in monitoring the rate of intramolecular electron transfer in mixed-valence bi- ferrocenium The Mossbauer spectrum for a valence- trapped biferrocenium cation shows two quadrupolesplit doublets, one for the Fe” ion with a quadrupole splitting of MQ = 2.1 mm/s and the other for the Fe”’ ion with MQ in the range 0 . 5 mm/s. If the mixed-valence biferrocenium cation is detrapped, that is, it is interconverting between its two vibronic states at a rate in excess of - 108-109 s-’, then a single doublet with average spectral properties (UQ 1.1 mm/s) is seen. An electronically delocalized cation would also show one Mbssbauer doublet; however, the delocalized cation would show only one C-H bending band in the IR spectrum in the 8 15-850-cm-’ region.
Variable-temperature 57Fe Mossbauer data were collected for the six l’, 1”’-dihalobiferrocenium hexafluorometalate salts 1-6. The spectra were least-square fit with Lorentzian line shapes; the spectral fitting parameters for the three hexafluorophosphate salts 1-3 and three hexafluoroantimonate salts 4-6 are collected in Tables I and 11, respectively. Mossbauer spectra were collected on two polycrystalline samples of 1’, 1”’-dichlorobiferrocenium hexafluorophosphate (1). The first sample of complex 1 consisted of the initial precipitate from an oxidation reaction, while the second sample was recrystallized from the first in a 1:l di- chloromethane/hexane solution. The microanalytical data on these two different samples were identical within experimental error. The 57Fe MBssbauer spectrum of the initially precipitated sample of 1 was collected a t six temperatures between 125 and 300 K (figure available in the supplementary material). The spectra clearly consist of three quadrupole-split doublets which are at- tributable to two different signals: one with four equal-area lines characteristic of valence-trapped cations (MQ = 2.154 and 0.369 mm/s at 300 K) and the other consisting of two equal-area lines which are characteristic of valence-detrapped cations (MQ = 1.103 mm/s a t 300 K). The integrated area of the detrapped signal remains relatively constant at -50% of the total area a t temperatures above 200 K. However, below 200 K there is marked decrease in the area of detrapped signal. While the detrapped signal accounts for nearly 51% of the total area at 200 K, it shrinks to 29% by 125 K. These facts suggest that the initial sample of complex 1 is actually composed of two different crystalline forms of 1, one form in which the 1’,1”’-dichlorobiferrocenium cations are valence trapped at all temperatures (T C 350 K) and a second form in which the same disubstituted cations are valence detrapped above 200 K and become valence trapped at lower temperatures.
The 57Fe Mbssbauer spectrum of the second recrystallized sample of complex 1 was collected at 125,300, and 350 K. These spectra, shown on the left side of Figure 1, clearly consist of a characteristic valence-trapped, four-line pattern through the entire range 125-350 K. The similarity of the spectral parameters of the valence-trapped form of the initial sample of 1 and the re- crystallized sample of 1 (see Table I) suggests that they are identical crystalline forms of l’, 1”’-dichlorobiferrocenium hexa-
1984, 106, 6683. Chrisman, B. L.; Tumolillo, T. A. Compur. Phys. Commun. 1971, 2, 211 _ILL.
(a) Wittebort, R. J.; Subrarnanian, R.; Kulshreshtha, N. P.; DuPre, D. B. J. Chem. Phys. 1985,83, 2457. (b) Wittebort, R. J.; Woehler, S. E.; Bradley, C. H. J. Magn. Reson. 1986, 67, 143. (a) Bodenhausen, G.; Freeman, R.; Turner, D. L. J . Magn. Reson. 1977, 27, 511. (b) Rance, M.; Byrd, R. A. J . Magn. Reson. 1983, 52, 221. Sorai, M.; Kaji, K.; Kaneko, Y. J. Chem. Thermodyn. 1992, 24, 167-1 80. Ogasaham, K.; Sorai, M . ; Suga, H. Mol. Cryst. Liq. Crysf. 1981, 71, 189. Kramer, J. A.; Hendrickson, D. N. Inorg. Chem. 1980, 19, 3330.

1794 Inorganic Chemistry, Vol. 31, No. 10, 1992 Webb et al.
Table I. 57Fe Mbssbauer Spectral Fitting Parameters for the l’,l’”-Dihalobiferrocenium Hexafluorophosphate Salts 1-3 “pd T, K -Q, “1s 6,” mm/s r,b mm/s -In (area)c
1 (initial sample) 350 2.20 (3)d 0.37 (3)
1 (recrystallized)
2
3
300
125
350
300
250
225
200
125
300 125 100
85
350
300
125
2.202 (6) 0.393 (7) 2.242 (3) 0.455 (4) 2.178 (9)
0.365 (13) 2.154 (10) 1.103 (17) 0.369 (1 1) 2.178 (5) 1.130 (8) 0.391 (6) 2.180 (4) 1.168 (6) 0.414 (5) 2.174 (3) 1.164 (6) 0.408 (5) 2.105 (4) 1.213 (14) 0.539 (4) 1.230 (3) 1.282 (2) 1.671 (4) 0.976 (3) 1.784 (4) 0.904 (3) 2.147 (6) 0.331 (4) 2.153 (6) 0.333 (4) 2.154 (5) 0.352 (4)
1.00 (2)
0.418 (14) 0.437 (16) 0.416 (3) 0.420 (3) 0.410 (1) 0.425 (2) 0.419 (5) 0.443 (10) 0.429 (6) 0.413 (5) 0.451 (9) 0.424 (6) 0.410 (2) 0.425 (4) 0.423 (3) 0.409 (2) 0.422 (3) 0.413 (2) 0.406 (2) 0.413 (3) 0.411 (2) 0.398 (2) 0.406 (7) 0.398 (2) 0.405 (2) 0.398 (1) 0.394 (2) 0.399 (3) 0.393 (2) 0.403 (2) 0.417 (3) 0.403 (2) 0.419 (3) 0.409 (2) 0.412 (2) 0.407 (2)
0.45 (S), 0.31 (3) 0.43 (5), 0.45 (6) 0.400 (lo), 0.304 (7) 0.426 (12), 0.420 (12) 0.362 (5), 0.300 (4) 0.454 (7), 0.400 (6) 0.27 (2), 0.22 (2) 0.70 (6), 0.80 (7) 0.34 (5), 0.218 (16) 0.30 (3), 0.24 (2) 0.62 (7), 0.72 (8) 0.34 (2), 0.26 (2) 0.282 (12), 0.224 (10) 0.59 (3), 0.62 (3) 0.332 (12), 0.272 (1) 0.280 (10). 0.230 (8) 0.65 (3), 0.65 (3) 0.344 (lo), 0.286 (8) 0.280 (8), 0.236 (7) 0.63 (2), 0.64 (3) 0.382 (lo), 0.292 (8) 0.340 (12), 0.320 (11) 0.72 (4), 0.65 (7) 0.412 (lo), 0.340 (9) 0.308 (6), 0.314 (6) 0.418 (3), 0.420 (3) 0.408 (a), 0.402 (6) 0.368 (6), 0.364 (6) 0.388 (6). 0.392 (6) 0.364 (S), 0.362 (5) 0.384 (9), 0.384 (9) 0.296 (7), 0.278 (6) 0.408 ( l ) , 0.380 (8) 0.300 (7), 0.284 (6) 0.362 (7), 0.354 (7) 0.370 (8), 0.320 (6)
0.550
0.194
-1.289
0.669
0.148
-0.298
-0.557
-0.774
-1.534
0.593 -1.218 -1.440
-1.566
-0.106
-0.459
-1.544
‘Isomer shift relative to iron foil at room temperature. *Full width at half-height taken from least-squares fitting program. The width for the line at more negative velocity is listed first for each doublet. EMinus the natural logarithm of the background-normalized spectral area. dEstimated standard deviations in the least significant digits are given in parentheses.
100.0
98.5 100.0
08.0 100.0
92.0
100.0
97.0 100.0
96.0 100.0
91 .o -4.0 -2.0 0.0 2.0 4.0 -4.0 -2.0 0.0 2.0 4.0 -4.0 -20 0.0 2.0 4.0
Velocity (mm/s) Figure 1. Variable-temperature 57Fe Mbsbauer spectra of 1’,1”’-dihalobiferroccnium hexafluorophosphate salts: (A) recrystallized polycrystalline sample of l’,l”’-dichlorobiferrocenium hexafluorophosphate (1); (B) recrystallized polycrystalline sample of l’, 1”’-dibromoferrocenium hexafluoro- phosphate (2); (C) initially precipitated sample of l’, 1”’-diiodobiferroccnium hexafluorophosphate (3).

Mixed-Valence Biferrocenes Inorganic Chemistry, Vol. 31, No. 10, 1992 1795
Table II. 57Fe Mbsbauer Spectral Fitting Parameters for the l',l"'-Dihalobifcrrocenium Hexafluoroantimonate Salts 4-6 "pd T, K AEQ, mm/s 6,O mm/s r: mm/s -In (area)c
0.63 (a), 0.42 (3) 1.711 ~
4 310
5
6 (recrystallized)
6 (C, sample)
290
250
225
200
180
160
140
120
100
3 50
300
125
300 270 260
250
240
230
220
180
160
140
120
100
260 240 220 200 180 160 140 120
100
80
50
20
4.2
1.37 (3)d 0.99 (2) 1.38 (3) 0.972 (2) 1.495 (14) 0.947 (13) 1.569 (12) 0.927 (9) 1.630 (11) 0.919 (9) 1.672 (10) 0.896 (7) 1.765 (9) 0.862 (7) 1.484 (8) 0.821 (6) 1.941 (9) 0.798 (8) 1.991 (6) 0.732 (5) 2.006 (8) 0.542 (6) 2.045 (5) 0.481 (5) 2.090 (3) 0.465 (3) 1.202 (5) 1.213 (6) 1.431 (8) 0.950 (9) 1.576 (8) 0.840 (7) 1.693 (8) 0.763 (7) 1.784 (6) 0.707 (5) 1.844 (9) 0.671 (8) 1.975 (4) 0.599 (5) 2.031 (8) 0.590 (10) 2.082 (5) 0.573 (6) 2.079 (5) 0.557 (7) 2.083 (3) 0.540 (4) 1.223 (4) 1.236 (4) 1.239 (4) 1.249 (7) 1.251 (4) 1.254 (3) 1.264 (3) 1.517 (6) 1.043 (6) 1.667 (4) 1.019 (4) 1.753 (6) 1.012 (6) 1.827 (5) 0.958 (5) 1.902 (5) 0.858 (5) 1.923 (5) 0.774 (6)
0.396 (12) 0.382 (9) 0.437 (16) 0.372 (10) 0.418 (7) 0.402 (7) 0.427 (6) 0.415 (5) 0.414 (6) 0.416 (4) 0.406 (5) 0.411 (4) 0.403 (5) 0.404 (3) 0.396 (4) 0.407 (3) 0.406 (4) 0.409 (4) 0.403 (3) 0.412 (3) 0.388 (4) 0.375 (3) 0.395 (3) 0.379 (2) 0.3952 (12) 0.4044 (13) 0.425 (2) 0.423 (3) 0.433 (4) 0.423 (4) 0.432 (4) 0.428 (3) 0.422 (4) 0.424 (4) 0.424 (3) 0.429 (3) 0.418 (4) 0.428 (4) 0.414 (2) 0.427 (2) 0.413 (4) 0.43 (5) 0.421 (2) 0.429 (3) 0.414 (3) 0.432 (3) 0.413 (2) 0.425 (2) 0.424 (2) 0.423 (2) 0.422 (2) 0.419 (3) 0.418 (2) 0.414 (2) 0.413 (2) 0.405 (3) 0.409 (3) 0.405 (2) 0.409 (2) 0.409 (3) 0.430 (3) 0.414 (3) 0.429 (3) 0.417 (3) 0.437 (3) 0.412 0.436 (3)
0.47 (3), 0.43 (3) 0.73 (8), 0.43 (2) 0.46 (3), 0.44 (2) 0.52 (3), 0.51 (2) 0.426 (16), 0.520 (23) 0.55 (2), 0.54 (2) 0.458 (14), 0.490 (16) 0.56 (2), 0.56 (2) 0.486 (14), 0.456 (13) 0.542 (15), 0.564 (16) 0.460 (1 l), 0.462 (1 2) 0.536 (14), 0.570 (15) 0.482 (12), 0.448 (10) 0.512 (12), 0.554 (14) 0.480 (1 l), 0.432 (9) 0.428 (15), 0.462 (17) 0.490 (14), 0.434 (12) 0.426 (9), 0.462 (10) 0.438 (9), 0.384 (9) 0.312 (15), 0.316 (16) 0.378 (12), 0.380 (6) 0.346 (lo), 0.346 (10) 0.418 (lo), 0.408 (10) 0.410 ( 5 ) , 0.416 (5) 0.444 (6), 0.454 (6) 0.390 (8), 0.386 (8) 0.401 (lo), 0.396 (10) 0.434 (14), 0.410 (13) 0.428 (14), 0.420 (13) 0.454 (14), 0.422 (12) 0.416 (12), 0.396 (11) 0.440 (13), 0.410 (12) 0.410 (12), 0.396 (11) 0.420 (9), 0.384 (4) 0.376 (8), 0.392 (8) 0.404 (14), 0.372 (1 3) 0.376 (13), 0.404 (14) 0.368 (7), 0.340 (6) 0.366 (8), 0.414 (8) 0.352 (13), 0.324 (11) 0.408 (16), 0.424 (16) 0.324 (7), 0.306 (7) 0.400 (lo), 0.412 (10) 0.310 (8), 0.396 (8) 0.378 (ll), 0.396 (12) 0.296 (4), 0.296 (4) 0.362 (6), 0.368 (6) 0.384 (6), 0.384 (6) 0.384 (8), 0.388 (4) 0.402 (8), 0.400 (8) 0.398 (1 l), 0.402 (12) 0.420 (a), 0.414 (6) 0.434 (5). 0.436 (5) 0.454 (9, 0.470 (5) 0.426 (lo), 0.416 (10) 0.392 (8), 0.398 (9) 0.430 (7), 0.424 (7) 0.396 (6). 0.396 (6) 0.440 (lo), 0.450 (10) 0.430 (9), 0.468 (1 1) 0.426 (7), 0.436 (8) 0.418 (7), 0.452 (8) 0.442 (7), 0.452 (7) 0.486 (8), 0.490 (8) 0.402 (8), 0.398 (8) 0.416 (8), 0.434 (9)
1.454
0.563
0.214
0.076
-0.198
-0.41 1
-0.623
-0.846
-1.071
0.711
0.269
-1.368
0.442 0.220 0.106
0.028
-0.050
-0.129
-0.209
-0.456
-0.555
-0.694
-0.858
-0.983
1.427 1.265 1.109 1.019 0.821 0.726 0.548 0.420
0.307
"Isomer shift relative to iron foil at room temperature. "ull width at half-height taken from least-squarcs fitting program. The width for the line at more negative velocity is listed first for each doublet. CMinus the natural logarithm of the background-normalized spectral area. dEstimated standard deviations in the least significant digits are given in parentheses.
fluorophosphate. It is conceivable that during the rapid precip dynamically favored form would likely predominate. Thus, upon itation following the initial oxidation of the I f , 1"'-dichlorobi- recrystallization from dichloromethane/hexane, a single form of ferrocene by HPFs that both kinetically stable and thermody- 1, the valence trapped form, was isolated. namically stable forms of complex 1 precipitate from solution. Two additional pieces of information support the view that two However, in the slower process of recrystallization the thermo- forms or phases of complex 1 exist. First, indirect information

1796 Inorganic Chemistry, Vol. 31, No. 10, 1992
2.0
1.5
1.0
Webb et al.
- (C) --ow - - e-* -e-*
‘e O-0 \ *-*-*-*-e-*-*- \
- /-*-*-* 0 -
.* - - / /
;.*
100.0
99.6 100.0
C .- a .- E 98.5 F 100.0
CI
0 e z
88.0 100.0
97.5
o-o+-o+ 0.5 - 7
-4.0 -2.0 0.0 2.0 4.0
100.0
97.0 . 100.0
n < E E
W
U
94.0 -4.0 -2.0 0.0 2.0 4.0
Velocity (mm/s)
Figure 2. Variable-temperature s7Fe Mhsbauer spectra of a recrystal- lized, polycrystalline sample of l’, I”’-dichlorobiferrocenium hexafluoro- antimonate (4).
is available from the Mijssbauer spectrum. A plot of the -In (area) versus temperature is expected to show a linear behavior in which the slope gives the Debye temperature.22 A plot of -In (area) versus temperature for the two different samples of l’,l”’-di- chlorobiferrocenium hexafluorophosphate (1) (figure in the supplementary material) shows two different linear behaviors which indicate different Debye temperatures (126 and 119 K, respectively) for the two samples. The second piece of evidence comes from room-temperature powder X-ray diffraction (XRD) patterns collected for the initial and recrystallized samples (figure in the supplementary material). Close comparison of the two XRD patterns shows that every line in the pattern for the recrystallized sample is mirrored in the pattern of the initially precipitated sample. There are, however, lines present in the XRD patterns of the initial sample which are nor present in the recrystallized sample’s pattern. The powder XRD results conclusively show that there two crystallographically different forms of 1’, 1”’-dichloro- biferronium hexafluorophosphate. A vast disparity in electron transfer rates for the same disubstituted biferrocenium cation existing in two different crystalline packing arrangements has been reported recently for 1 ’, 1”’-dibenzylbiferrocenium t r i i ~ d i d e . ~ ~
The S7Fe Mtissbauer spectrum of a recrystallized sample of l’, 1”’-dibromobiferronium hexafluorophosphate (2) was run at four temperatures between 85 and 300 K. Three of these spectra are shown as the central panel of Figure 1. At temperatures above 125 K, the spectrum of 2 consists of a single quadrupole-split doublet with parameters typical of a valence-detrapped bi- ferrocenium salt (Le. AEQ = 1.230 mm/s and d = 0.405 mm/s at 300 K) which change little with temperature down to 125 K. However, below 125 K the spectrum is clearly a superposition of two doublets. At 85 K, the four-line pattern is more resolved. In this salt, the apparent rate of intramolecular electron transfer becomes faster than - lo9 s-I at - 125 K. In contrast to those of complex 1, the 57Fe Mossbauer properties of 2 are insensitive to recrystallization from dichloromethane/hexane.
(22) Greenwood, N. N.; Gibb, T. C. Massbuuer Spectroscopy; Chapman and Hall: London, 1971.
4
2.0
1.5 1
0.0 0 s o l m l s o 2 m ~ 3 m ~
Temperature (K) Figure 3. Temperature dependence of the quadrupole splitting (A&$: (A) l’, I”’-dichlorobiferroenium hexafuoroantimonate (4); (B) l’, 1”’- dibromobiferrocenium hexafluoroantimonate (5); (C) the two poly- morphic forms (see text) of l’, 1”’-diiodobiferrocenium hexafluoro- antimonate (6).
S7Fe Miwsbauer spectra of l’, 1”’-diiodobiferrocenium hexa- fluorophosphate (3) were collected at three temperatures. The spectra are shown on the right side in Figure 1 and indicate a valencetrapped biferrocenium system on the s7Fe MGssbauer time scale throughout the entire temperature range 125-350 K.
The 57Fe MGssbauer spectrum of a recrystallized polycrystalline sample of l’, 1”’-dichlorobiferrocenium hexafluoroantimonate (4) was run at various temperatures between 100 and 310 K; eight of these spectra are shown in Figure 2, while the fitting parameters for all of the spectra are collected in Table 11. Though at first glance the 100 K spectrum appears to consist of a typical va- lence-trapped four-line pattern, the quadrupole splittings values (hEQ = 1.991 and 0.732 mm/s) deviate somewhat from the limiting values expected for valencetrapped biferrocenium cations. This suggests that the mixed-valence cations in the sample of 4 are not completely trapped even at 100 K. When the temperature is increased above 100 K, the components of the two quadru- polesplit doublets gradually move closer together. However, even at 310 K the four components have not completely converted into a single valence-detrapped doublet. The temperature dependence of the inner and outer quadrupole splittings of 4 are shown in Figure 3A.
The 57Fe Mijssbauer spectrum of l’, 1”’-dibromobiferronium hexafluoroantimonate (5) consists of two quadrupolesplit doublets characteristic of valencetrapped cations (hEQ = 2.090 and 0.3952 mm/s at 125 K) throughout the temperature region of 125-350 K. The quadrupole splittings as a function of temperature (Figure 3B) show little sign of collapsing into a two-line pattern even at 350 K.

Mixed-Valence Biferrocenes Inorganic Chemistry, Vol. 31, No. 10, 1992 1797
100.0
98.0 100.0
C .- m .- $ 6 98.0 * 100.0
: + 0
a
98.0 100.0
98.0 , ; v , , , ,
-4.0 -2.0 0.0 2.0 4.0
.I 97.5
97.5 100.0
’ ’ ’ -4.0 -2.0 0.0 2.0 4.0
94.0
Velocity (mm/s)
Figure 4. Variable-temperature 57Fe Mijssbauer spectra of the recrys- tallized sample (platelike microcrystals) of 1‘, 1”’-diiodobiferrocenium hexafluoroantimonate (6).
Three different polycrystalline samples of l’,l”’-diiodobi- ferrocenium hexafluoroantimonate (6) were characterized by 57Fe Mksbauer spectroscopy. All three samples gave essentially the same microanalytical results. The fmt sample examined consisted of the initial precipitate from an oxidation reaction carried out on a typical scale, i.e., 200 mg of neutral l’,l”’-diiodobiferrocene. When the solid was collected and dried, this initial precipitate had the physical appearance of a powder. At first glance the 100 K spectrum of this sample appears rather curious. However, as in the case of complex 1, powder X-ray diffraction results on this first sample and two subsequent samples (figure in the supple- mentary material) indicate that the initial sample is actually a mixture of two crystallographically different forms of 6. Thus, the 100 K 57Fe MBssbauer spectrum represents a superposition of signals for the two polymorphic forms of 6.
Approximately half of the initial sample was recrystallized in a relatively large volume (-400 mL) of dichloromethane. The powder XRD pattern of this recrystallized sample shows that it is a crystallographically distinct phase of 6. Close examination of this pattern reveals that all of the lines present are mirrored in the pattern of the initial sample. This phase is present in the initial sample. The 57Fe Mkbauer spectrum of the recrystallized sample of 6, which consisted of microcrystals with platelike morphology, was collected at 12 temperatures between 100 and 300 K the fitting parameters for these spectra are given in Table 11, while selected spectra are displayed in Figure 4. At 100 K, the MBssbauer spectrum of the recrystallized second sample of 6 shows two quadrupolesplit doublets (MQ = 2.083,0.540 mm/s at 100 K) which are characteristic of a valence-trapped bi- ferrocenium system. However, above 180 K the components of the four-line pattern begin to move toward one another and at 270 K the four-line pattern is replaced by a tweline pattern typical of a valence-detrapped salt (MQ = 1.213 mm/s at 270 K). The temperature dependences of the quadrupole splittings of this sample are shown in Figure 3C.
The third sample of l’, 1’”-diiodobiferrocenium hexafluoro- antimonate was synthesized on a considerably larger scale (i.e., 9.864 g of neutral l’,l”’-diiodobiferrocene). Though the amount
100.0
99.2 100.0
C .- .- I E 6 98.5 * 100.0
5 e 2
+
98.5 100.0
98.5
T 100.0
98.5 100.0
97.5
100.0
98.0 -4.0 -2.0 0.0 2.0 4.0 -4.0 -2.0 0.0 2.0 4.0
Velocity (mm/s)
Figure 5. Variable-temperature ”Fe Miissbauer spectra of the heat capacity sample (needle microcrystals) of 1’, 1”’-diiodobiferrocenium hexafluoroantimonate (6). This sample was prepared on a large scale and was used for the heat capacity measurements.
of reactants were increased proportionately, the total volume of solvent was only -one-tenth of that required to maintain similar concentrations as in the first reaction. The microcrystals collected from this preparation have needle morphology, and the powder XRD pattern of these microcrystals shows that it is a polymorph of 6 which is crystallographically different from the second sample. Comparison of the XRD pattern of the initial sample reveals that all of the lines present in the XRD pattern of the third sample are also present in that of the initial sample. The 57Fe Mkbauer spectrum of the third sample of 6 was collected at 13 temperatures between 4.2 and 300 K eight of the spectra are shown in Figure 5 , and the fitting parameters for all 13 spectra are given in Table 11. At 4.2 K, the Mijssbauer spectrum consists of two doublets with quadrupole splittings (MQ = 1.923,0.774 mm/s at 4.2 K) which essentially indicate a valence-trapped l’,l”’-diiodobi- ferrocenium salt. With an increase in temperature the components of the four-line pattern gradually move together until at 140 K a single quadrupole-split doublet (MQ = 1.264 mm/s at 140 K) is observed (Figure 5 ) . The variation of the quadrupole splittings with temperature of this second crystallographically distinct form of 6 is also shown in Figure 3C. The differences in the s7Fe MBssbauer properties of the two polymorphic forms of complex 6 likely reflect variations in the local crystal environments of the 1 ’, 1”’-diiodobiferrocenium cations.
Heat Capacity of l’,l”’-Diiodobiferrocenium Hexafluoro- antimonate. In order to see if a phase transition is involved in the valence-detrapping transformation, the heat capacity under constant pressure, Cp, was measured for a 12.2514-g sample of complex 6 in the range 16-303 K. It is important to note that the heat capacity measurements were made before it was known that there are two polymorphs of complex 6. One peak in the Cp versus temperature data (figure in the supplementary material) is seen at 134 K, as well as a smaller broad peak at -270 K. A normal heat capacity curve was determined by the effective fre- quency-distribution method.23 The details of the measurements
(23) Sorai, M.; Seki, S. J . Phys. SOC. Jpn. 1972, 32, 382.

1798 Inorganic Chemistry, Vol. 31, No. 10, 1992 Webb et al.
H 20L + Tc’K=134
I I I I
100 200 300
T / K Figure 6. Plot of the excess heat capacity, ACp, versus temperature in the regions of the 134 and 270 K phase transitions for l’,l”’-diodobi- ferrocenium hexafluoroantimonate (6).
- 1 I 1 1 I I I I I I 220 240 260 280 300
T / K Figure 7. Plot of excess heat capacity, ACp, versus temperature in the region of the 270 K phase transition for l’,l”’-diiodobiferrocenium hexafluoroantimonate (6). The filled and open circles represent data from two separate series of measurements.
and the calculation of this normal heat capacity curve are given in another paper.24 The difference between the observed and normal heat capacities is the excess heat capacity, ACp, due to phase transitions. In Figure 6 is shown a plot of ACp versus temperature for both of the phase transitions. Multiple separate series of data were collected in the region of the Tc = 134 K and Tc = 270 K phase transitions. Excess heat capacity begins at -55 K, peaks at 134 K, and finally extends to -185 K. The enthalpy (AH) and entropy (AS) arising from the 134 K phase transition were determined by integration of ACp with respect to T and In T, respectively. For the phase transition with the critical temperature Tc = 134 K, the values of AH = 740 f 50 J mol-’ and AS = 6.0 f 0.5 J K-’ mol-’ were found. In Figure 7 is shown a plot of ACp versus temperature for the higher-temperature phase transition in an enlarged scale. Two separate series of data were collected in the region of this phase transition. For this Tc = 270 K phase transition values of AH = 60 f 35 J mol-’ and AS = 0.3 f 0.2 J K-’ mol-’ were evaluated. There is clearly considerably less excess heat capacity associated with this 270 K phase transition than for the 134 K heat capacity effect. A plot of entropy gain, AS, versus temperature is shown in Figure 8. Only -70% of the total entropy gain occurs by the critical temperature Tc = 134 K. There are elements of both long- and short-range order.
The origin of the two phase transitions is known. The powder XRD pattern for the heat capacity sample of complex 6 shows that this sample is dominated by one polymorph. As will be shown below with EPR data, however, there is a small amount of the other polymorph of complex 6 present in this heat capacity sample. Thus, we attribute the larger heat capacity effect at - 134 K to a phase transition occumng in the one polymorph which dominates
(24) Sorai, M.; Hagen, P. M.; Hendrickson, D. N. Manuscript in prepara- tion.
I I I I I
100 200 300
T / K Figure 8. Plot of entropy gain, AS, versus temperature for l’,l”’-di- iodobiferroccnium hexafluoroantimonate (6) in the regions of the 134 and 270 K phase transitions.
the heat capacity sample of 6. The fraction of this polymorph was estimated to the -95% on the basis of the transition entropies. The smaller effect at 270 K reflects the presence of the small amount of the second polymorph, which makes up only -5% of the sample. These assignments are substantiated by the Mbbauer data shown in Figures 3-5. The Miwsbauer spectrum for the heat capacity sample (Figure 5), which is dominantly one polymorph, shows the greatest changes starting around -80 K and becomes a single doublet at - 140 K. This is the temperature region where there is ACp for the Tc = 134 K phase transition. On the other hand, the Mbbauer spectrum (Figure 4) for the other polymorph of 6 (i-e., the recrystallized sample) shows the biggest change above -200 K with the collapse from two doublets to give one va- lence-detrapped doublet culminating at -270 K. Again there is a good correspondence with the ACp seen for the Tc = 270 K phase transition. Obviously, it is very desirable to have heat capacity data for the recrystallized polymorphic form of complex 6. Preparation of the large samples required for adiabatic calo- rimetry studies is tedious; however, a large sample of the re- crystallized form is being prepared and Cp data will be reported later .24
It is appropriate at this point to comment on the likely mi- croscopic nature of the phase transition observed for complex 6. Considerable effort was put into growing a good crystal of complex 6 so that the X-ray structure au ld be determined. Unfortunately, even though crystals which appeared to the eye to be well formed were obtained by evaporation of a CH2C12/hexane solution, all crystals were found to diffract poorly. Furthermore, it must be realized that the polymorph of complex 6 studied in the present heat capacity determination must be the kinetically stable (i.e., metastable) form. This polymorph precipitated immediately from the reaction medium. The other polymorph is very likely the thermodynamically stable form, for it crystallizes by slow evap- oration of a solution. ’
It is instructive to consider the entropy gain (AS = 6.0 f 0.5 J K-’ mol-’) observed for the 134 K phase transition of complex 6. The 328 K valence-detrapping phase transition observed for biferrocenium triiodide was reported12 to have AS = 1.77 f 0.06 J K-’ mol-’. These AS values for the two mixed-valence bi- ferrocenium salts are relatively small compared to the range of AS = 13.71-30.58 J K-’ mol-’ reported8 for valence-detrapping phase transitions for mixed-valence [ Fe30(02CCH3)6(L)3]S complexes. In fact, [Mn30(02CCH3)6(py)3] (py) showszs the most abrupt valence-detrapping phase transition with AS = 35.77 J K-’ mol-’. For these complexes it has been shown that AS has contributions from entropy gain for the A 3 0 complex (A = Fe, Mn), as well as entropy gain due to the onset of motion associated with the S solvate molecule. The A 3 0 complex converts in the phase transition from being statically trapped in one vibronic state which is at much lower energy than any other vibronic state to
(25) Nakano, M.; Sorai, M.; Vincent, J. B.; Christou, G.; Jang, H. G.; Hcndrickson, D. N. Inorg. Chem. 1989, 28, 4608.

Mixed-Valence Biferrocenes
dynamically interconverting between three or four energetically equivalent vibronic states. This gives an entropy contribution of either AS = R In 3 (=9.13 J K-I mol-I) or AS = R In 4 (=11.53 J K-’ mol-I).
There are basically two possible sources of entropy gain involved in the valence-detrapping phase transition of l’, 1’”-diiodobi- ferrocenium hexafluoroantimonate (6). Since the Miksbauer data indicate the cation converts from being trapped in one description (vibronic state) at low temperature to dynamically interconverting between two vibronic states above the phase transition, this onset of charge oscillation in the cation should contribute AS = R In 2 (-5.76 J K-’ mol-]). If the SbF6- anions in complex 6 also change from being static at low temperature to interconverting between two or more crystallographically different orientations (not superimposable), then the onset of the motion of the SbF6- anions will contribute to AS. However, since the transition entropy associated with the 134 K phase transition, AS = 6.0 f 0.5 J K-’ mol-’, is well accounted for in terms of R In 2 (=5.76 J K-l mol-’), we can safely conclude that this phase transition arises only from the onset of charge oscillation in the mixed-valence cation.
The onset of charge oscillation of the cation in biferrocenium triiodide also should have contributed AS = R In 2; however, a much smaller value was observed. Three possible explanations for the small experimental AS value were offered. One expla- nationI2 involved a temperaturedependent energy separation (4E) between the two vibronic states on the doublewell potential-energy diagram. In particular, it was necessary to have AE convert from -2.1 kJ mol-’ at 200 K to a nonzero value of - 1 .O kJ mol-’ above the 328 K phase transition. A second explanation for the small experimental AS value can be had by reference to papers26 in which the order-disorder fmt-order phase transition observed for mixed-valence Eu,S4 was characterized. For a microcrystalline sample of Eu3S4 the valence-detrapping phase transition was determined to have AS = 3.3 J K-’ mol-’, even though a AS = R In 3 value was theoretically expected. Heat capacity mea- surements for a single crystal of Eu3S4 did give AS = 9 f 0.9 J K-’ mol-I in agreement with theory. Apparently the micro- crystalline sample has a greater defect concentration than is preaent in the single crystal. In the case of the microcrystalline sample AS is low because there is a large amount of short-range order in the distribution of europium valencies above the 186 K phase transition. A third explanation, which is closely related to the first explanation, invokes a tunnel-splitting energy scheme for the intramolecular electron transfer.* In this case, the energy sep- aration of the tunnel splitting corresponds to - 1 .O kJ mol-’, which is the same as in the first explanation.
Solid-state 19F NMR Spectroscopy. It was of interest to see if the onset of motion of a SbF6- or PF6- anion in a paramagnetic mixed-valence biferrocenium salt could be detected by solid-state I9F NMR spectroscopy. Two compounds were selected for these initial studies: platelike microcrystalline sample of l’,l”’-di- iodobiferrocenium hexafluoroantimonate (6), which valence de- traps at -270 K, and 1’,1”’-dibenzylbiferrocenium hexafluoro- phosphate (7). The X-ray structure of complex 7 has been re- ported“ at 296 K. The Mbsbauer data for 7 show that, as the temperature is increased, the components of the two doublets (trapped signal) move together to become a single valence-de- trapped doublet at -270 K.
Fixed-sample solid-state I9F NMR spectra are dominated by two features, homonuclear dipolar coupling among the relatively abundant I9F spins, which causes symmetric Gaussian broadening, and chemical shielding anisotropy, which also broadens the powder pattern, however, to an asymmetric line shape. On the basis of the I9F NMR data for K2SiFs2’ as well as the symmetry of the anion, the 19F NMR shielding tensor for a static PF6- or SbF6- anion is expected to be axially symmetric with chemical shift
Znorganic Chemistry, Vol. 31, No. 10, 1992 1799
(26) (a) Massenet, 0.; Coey, J. M. D.; Holtzberg, F. J. Phys. (Puris) Colloq. 1976,37(C-4), 297. (b) Pott, R.; Gihtherodt, G.; Wichelhaus, W.; Ohl, M.; Bach, H. Phys. Rev. B 1983. 27, 359.
(27) Yoshioka, Y.; Nakamura, N.; Chihara, H. Bull. Chem. Soc. Jpn. 1988, 61, 3037.
300 K
275 K
250 K
225 K
200 K
175 K
100 0 -100 -200 ‘-300
6 (PPm) Figwe 9. Temperature dependence of the I9F NMR spectrum of l’,l”’-dibcnzylbiferronium hexafluorophosphate (7).
anisotropy of 57 ppm. The parallel component (less intense spectral feature) is expected to be downfield of the perpendicular component. Paramagnetic shifts on the line shape should be small due to the substantial distance between the cations and anions in complexes 6 and 7.
Temperaturedependent solid-state I9F NMR spectra for com- plex 7 are shown in Figure 9. A figure showing the spectra for complex 6 is available in the supplementary material. Chemical shifts are relative to external CC1,F. At 300 K, both samples show highly symmetric line shapes with similar Gaussian full line widths of 66 (8) and 64 (8) ppm for 6 and 7, respectively. These line widths are comparable to the expected static shielding anisotropy but are highly symmetric and thus dominated by I9F-l9F dipolar broadening, Consequently, the absence of asymmetric line shapes directly indicates that the anions undergo reorientational motion at 300 K which substantially reduces the chemical shielding an- isotropy from the static value of -57 ppm. Moreover, as the temperature is lowered to 125 K for complex 7 (Figure 9) or 150 K for complex 6, the lines show the appearance of the - 57 ppm shielding anisotropy expected for stationary or nearly stationary anions, Thus, the spectra of Figure 9, for example, indicate that in the range 225-300 K, the PF6- ions reorient rapidly in com- parison to the chemical shielding anisotropy (57 ppm = 13.54 kHz) and are essentially static at 125 K. Consequently, there is a good correlation of valence trapping in the biferrocenium cation with the slowing of anion reorientation.
Electron Paramagnetic Resonance Spectroscopy. An Fe”’ metallocene exhibits a relative anisotropic gtensor, where, for example, gll = 4.35, g, = 1.26, and the anisotropy Ag = gll - g = 3.09 for an acetone glass of ferrocenium triiodide at 20 K. 2b
(28) (a) Anderson, S. E.; Rai, R. Chem. Phys. 1973.2, 216. (b) Sohn, Y. S.; Hendrickson, D. N.; Gray, H. B. J. Am. Chem. Soc. 1971,93,3603.
Inorganic Chemistry, Vol. 31, No. 10, 1992
7 K
7 K
7 K
L - l ~ I ~ I
500 1500 2500 5500 4500 5500
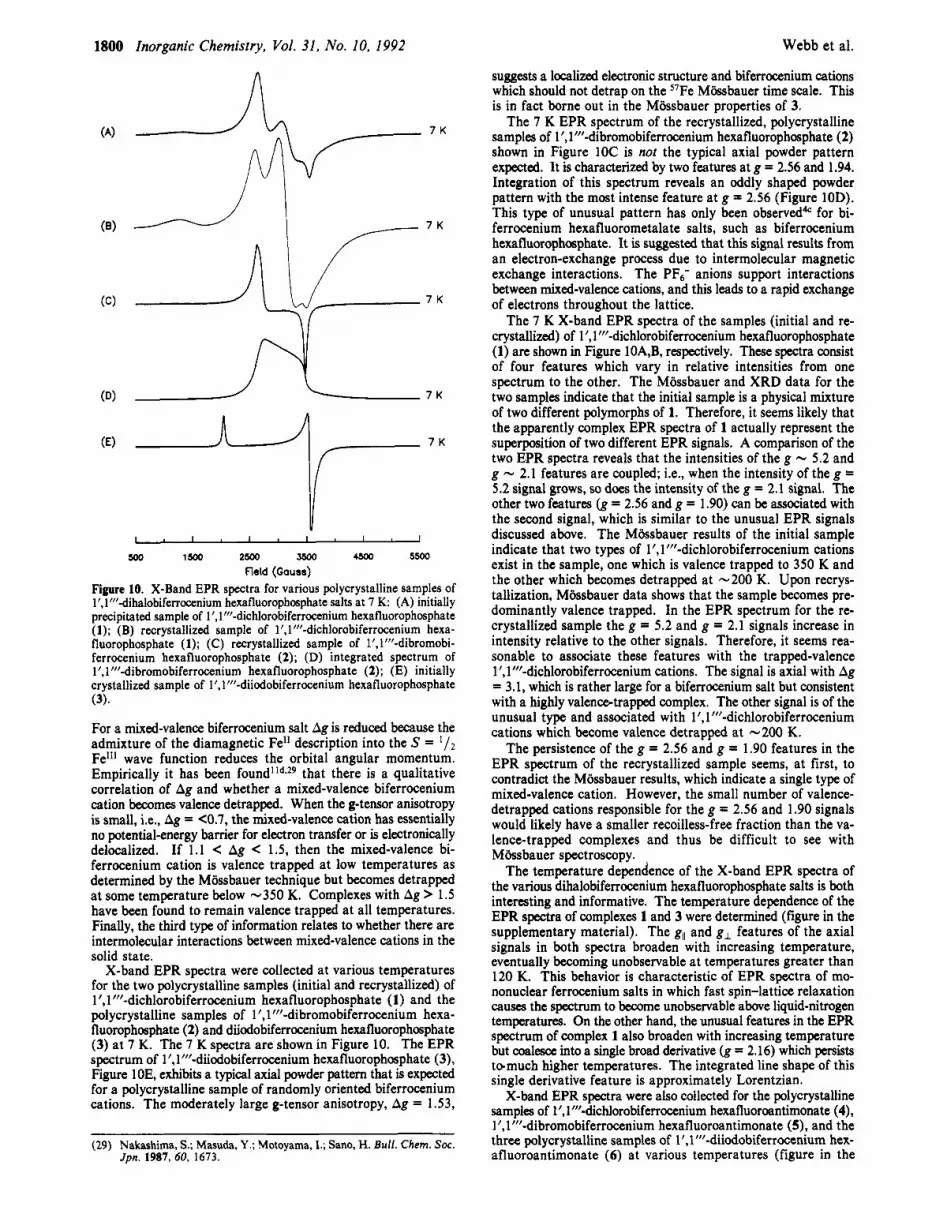
Field (Gauss) Figure 10. X-Band EPR spectra for various polycrystalline samples of l’,l”’-dihalobiferrocenium hexafluorophosphate salts at 7 K: (A) initially precipitated sample of l’, 1”’-dichlorobiferrocenium hexafluorophosphate (1); (B) recrystallized sample of l’, 1”’-dichlorobiferronium hexa- fluorophosphate (1); (C) recrystallized sample of l’,l”’-dibromobi- ferrocenium hexafluorophosphate (2); (D) integrated spectrum of l’,l”’-dibromobiferrocenium hexafluorophosphate (2); (E) initially crystallized sample of l’,l’f’-diiodobiferrocenium hexafluorophosphate (3).
For a mixed-valence biferrocenium salt Ag is reduced because the admixture of the diamagnetic Fell description into the S = Fel*I wave function reduces the orbital angular momentum. Empirically it has been found’ld*29 that there is a qualitative correlation of Ag and whether a mixed-valence biferrocenium cation becomes valence detrapped. When the g-tensor anisotropy is small, i.e., Ag = <0.7, the mixed-valence cation has essentially no potential-energy barrier for electron transfer or is electronically delocalized. If 1 . 1 < Ag < 1.5, then the mixed-valence bi- ferrocenium cation is valence trapped a t low temperatures as determined by the MBssbauer technique but becomes detrapped at some temperature below -350 K. Complexes with Ag > 1.5 have been found to remain valence trapped at all temperatures. Finally, the third type of information relates to whether there are intermolecular interactions between mixed-valence cations in the solid state.
X-band EPR spectra were collected a t various temperatures for the two polycrystalline samples (initial and recrystallized) of l’, 1”’-dichlorobiferrocenium hexafluorophosphate (1) and the polycrystalline samples of 1’,1”’-dibromobiferrocenium hexa- fluorophosphate (2) and diiodobiferrocenium hexafluorophosphate (3) at 7 K. The 7 K spectra are shown in Figure 10. The EPR spectrum of 1 ’,l”’-diiodobiferrocenium hexafluorophosphate (3), Figure 10E, exhibits a typical axial powder pattern that is expected for a polycrystalline sample of randomly oriented biferrocenium cations. The moderately large g-tensor anisotropy, Ag = 1.53,
(29) Nakashima, S.; Masuda, Y.; Motoyama, I.; Sano, H. Bull. Chem. Soc. Jpn. 1987,60, 1673.
Webb et al.
suggests a localized electronic structure and biferrocenium cations which should not detrap on the 57Fe Mbsbauer time scale. This is in fact borne out in the MBssbauer properties of 3.
The 7 K EPR spectrum of the recrystallized, polycrystalline samples of 1 I , 1’”-dibromobiferrocenium hexafluorophosphate (2) shown in Figure 1OC is not the typical axial powder pattern expected. It is characterized by two features at g = 2.56 and 1.94. Integration of this spectrum reveals an oddly shaped powder pattern with the most intense feature at g = 2.56 (Figure 10D). This type of unusual pattern has only been observedd“ for bi- ferrocenium hexafluorometalate salts, such as biferrocenium hexafluorophosphate. It is suggested that this signal results from an electron-exchange process due to intermolecular magnetic exchange interactions. The PFs- anions support interactions between mixed-valence cations, and this leads to a rapid exchange of electrons throughout the lattice.
The 7 K X-band EPR spectra of the samples (initial and re- crystallized) of l’, 1”’-dichlorobiferrocenium hexafluorophosphate (1) are shown in Figure 10A,B, respectively. These spectra consist of four features which vary in relative intensities from one spectrum to the other. The MBssbauer and XRD data for the two samples indicate that the initial sample is a physical mixture of two different polymorphs of 1. Therefore, it seems likely that the apparently complex EPR spectra of 1 actually represent the superposition of two different EPR signals. A comparison of the two EPR spectra reveals that the intensities of the g - 5.2 and g - 2.1 features are coupled; Le., when the intensity of the g = 5.2 signal grows, so does the intensity of the g = 2.1 signal. The other two features (g = 2.56 and g = 1.90) can be associated with the second signal, which is similar to the unusual EPR signals discussed above. The Mbsbauer results of the initial sample indicate that two types of 1’,1”’-dichlorobiferrocenium cations exist in the sample, one which is valence trapped to 350 K and the other which becomes detrapped at -200 K. Upon recrys- tallization, Mbssbauer data shows that the sample becomes pre- dominantly valence trapped. In the EPR spectrum for the re- crystallized sample the g = 5.2 and g = 2.1 signals increase in intensity relative to the other signals. Therefore, it seems rea- sonable to associate these features with the trapped-valence l’, 1”’-dichlorobiferrocenium cations. The signal is axial with Ag = 3.1, which is rather large for a biferrocenium salt but consistent with a highly valencetrapped complex. The other signal is of the unusual type and associated with 1’,1”’-dichlorobiferrocenium cations which become valence detrapped at -200 K.
The persistence of the g = 2.56 and g = 1.90 features in the EPR spectrum of the recrystallized sample seems, at first, to contradict the Mossbauer results, which indicate a single type of mixed-valence cation. However, the small number of valence- detrapped cations responsible for the g = 2.56 and 1.90 signals would likely have a smaller recoilless-free fraction than the va- lence-trapped complexes and thus be difficult to see with MGsbauer spectroscopy.
The temperature dependence of the X-band EPR spectra of the various dihalobiferrocenium hexafluorophosphate salts is both interesting and informative. The temperature dependence of the EPR spectra of complexes 1 and 3 were determined (figure in the supplementary material). The g,, and g, features of the axial signals in both spectra broaden with increasing temperature, eventually becoming unobservable at temperatures greater than 120 K. This behavior is characteristic of EPR spectra of mo- nonuclear ferrocenium salts in which fast spin-lattice relaxation causes the spectrum to become unobservable above liquid-nitrogen temperatures. On the other hand, the unusual features in the EPR spectrum of complex 1 also broaden with increasing temperature but coalesce into a single broad derivative (g = 2.16) which persists tDmuch higher temperatures. The integrated line shape of this single derivative feature is approximately Lorentzian.
X-band EPR spectra were also collected for the polycrystalline samples of l’, 1’”-dichlorobiferrocenium hexafluoroantimonate (4), l’, 1’”-dibromobiferrocenium hexafluoroantimonate (S), and the three polycrystalline samples of l’,l’”-diiodobiferrocenium hex- afluoroantimonate (6) a t various temperatures (figure in the

Mixed-Valence Biferrocenes Inorganic Chemistry, Vol. 31, No. 10, 1992 1801
= 1.43. The 57Fe Mkbauer results for this same sample are then consistent with the EPR results for this polymorph this polymorph becomes valence detrapped at -270 K. Although the X-band EPR spectrum of the third polycrystalline sample of 6 (Figure 11C) shows a detectable amount of the rhombic signal charac- terized for the recrystallized sample, it is dominated by an unusual signal with gvalues of 2.57 and -2.0. The Mbsbauer spectrum of this third sample of complex 6 indicates that it becomes valence detrapped at 140 K, a full 130 deg lower than sample 2. The temperature dependencies of the EPR spectra of the second and third samples of complex 6 were determined (figure in the sup- plementary material). Although the 7 K spectra and the tem- peratures at which the coalescence into a single derivative occurs are quite different, the high-temperature signals are almost identical for the two different samples. Concluding Comments
Two polymorphs were identified for each of the two mixed- valence complexes 1‘,1”’-dichlorobiferrocenium hexafluoro- phosphate (1) and l’, 1”’-diiodobiferrocenium hexafluoro- antimonate (6). In the case of complex 1 the recrystallized form is valence trapped on the s7Fe Mkbauer time scale in the 125-350 K range, whereas the initially precipitated form shows Mossbauer spectra indicating the presence of -50% of a valence-detrapped complex present. Detailed powder XRD, 57Fe Mossbauer, and EPR data were presented for the two polymorphs of complex 6. The rapidly precipitated polymorph valence detraps at - 140 K on the Mbssbauer time scale, whereas the polymorph obtained by slow crystallization detraps at -270 K. The heat capacity at constant pressure were measured from 16 to 303 K for a large sample of the rapidly precipitated polymorph of complex 6. The main feature in the AC, versus temperature plot was Seen at 134 K, which corresponds to the temperature where this polymorph of 6 valence detraps on the Mossbauer time scale. It has been shown that 1’,1”’-diiodobiferrocenium hexafluoroantimonate valence detraps in a phase transition. The IR data together with the entropy gain (AS) for the 134 K phase transition definitively show that the mixed-valence cations in the one polymorph of complex 6 are converting from being valence trapped below 134 K to valence detrapped above this phase transition temperature. I9F NMR data also show that the SbF6- anion converts from being static to dynamic in the phase transition. It must be emphasized that the mixed-valence cations are not converting from being electronically localized to electronically delocalized. As evidenced by the IR data, there is a potential-energy barrier present at all temperatures studied. It is the change in the crystal environment (dynamic SbF6- anions and more volume) which leads to a change from an asymmetric double-well to a more symmetric doublewell potential. In the latter case the mixed-valence cation can inter- convert between its two vibronic states more rapidly.
Acknowledgment. We are grateful for support from National Institutes of Health Grant HL13652 (D.N.H.) and National Science Foundation Grant CHE-91152 86 (D.N.H.). M.S. and D.N.H. are also grateful for a travel grant from the National Science Foundation (INT-9016821) and the Japan Society for the Promotion of Science.
Supplementary Material Available: Figures which show the IR, pow- der XRD, s7Fe Mhsbauer, and EPR spectra mentioned in the text (15 pages). Ordering information is given on any current masthead page.
I . 1 . 1 . 1 ’ 1 ~ 1
500 1500 2500 3500 4500 !moo
Field (Gauss) figure 11. X-Band EPR spectra for three different polycrystalline sam- ples of l’,l’’~-diiodobiferrocenium hexafluoroantimonate (6) at 7 K: (A) sample 1 , initial precipitate from small-scale reaction; (B) sample 2, platelike microcrystals formed upon recrystallization of the first sample from CH,CI,; (C) sample 3, precipitate from large-scale reaction.
supplementary material). At low temperatures the EPR spectrum of complex 4 is of the unusual type characterized by two features at g = 2.55 and g = 1.92. With an increase in temperature, this signal broadens and coalesces into a single derivative at - 130 K. The single line narrows and then broadens and becomes unobservable above -200 K. The s7Fe Mhsbauer data for 4 indicate that it valence detraps at -220 K. The 7 K spectrum of complex 5 is axial where gll = 3.43, g, = 1.79, and therefore Ag = 1.64. This salt is valence trapped at all temperatures in the s7Fe Mkbauer results as might be expected from the g-tensor anisotropy. The g,, and g, features of the EPR spectrum broaden with increasing temperature and become unobservable above 120 K.
Variabletemperature X-band EPR data were collected for the three samples of l’, I”’-diiodobiferrocenium hexafluoroantimonate (6). The 7 K spectra are shown in Figure 11. The 7 K EPR spectrum of the initially precipitated sample (Figure 11A) shows three obvious signals at g = 3.31,2.57, and 1.89. Since the 57Fe Mbsbauer and powder XRD results of this sample indicate that it is a physical mixture of two polymorphs of 6, it seems reasonable to expect that the EPR spectrum shows two signals, one for each polymorph. A typical axial pattern is easily discerned with gll = 3.31, g, = 1.89, and Ag = 1.42. This g-tensor anisotropy is intermediate in magnitude, and valence detrapping in the Mbssbauer spectrum would be expected. The second signal is undoubtedly of the unusual type with one signal at gll = 2.57 feature and a second signal at gll - 1.9.
The EPR spectrum of the second sample of complex 6, the recrystallized sample, consists of a rhombic signal (Figure 1 1 B) characterized by gx = 1.87, gy = 1.89, g, = 3.31, and hence Ag


![Rydberg-valence interactions of CO, and spectroscopic evidence characterizing the C[sup ʹ] [sup 1]Σ[sup +] valence state](https://img.pdfslide.net/doc/110x75/634ccc7ec1597a4ca90a9a6e/rydberg-valence-interactions-of-co-and-spectroscopic-evidence-characterizing-the.jpg)


![Mixed-Valence Nickel–Iron Dithiolate Models of the [NiFe]-Hydrogenase Active Site](https://img.pdfslide.net/doc/110x75/6344ce94df19c083b107c452/mixed-valence-nickeliron-dithiolate-models-of-the-nife-hydrogenase-active-site.jpg)


