Embed Size (px)
Citation preview
For Peer Review O
nly
Validation of two enzyme immunoassays for aminoglycoside residues according to European Decision 657/2002
Journal: Food Additives and Contaminants
Manuscript ID: TFAC-2006-324.R1
Manuscript Type: Original Research Paper
Date Submitted by the Author:
30-Apr-2007
Complete List of Authors: Diana, Francesca; Tecna Srl Paleologo, Maurizio; Tecna Srl Persic, Lidija; Tecna Srl
Methods/Techniques: Immunoassays, Screening - ELISA
Additives/Contaminants: Veterinary drug residues - antibiotics
Food Types: Meat, Milk
http://mc.manuscriptcentral.com/tfac Email: [email protected]
Food Additives and Contaminantspe
er-0
0577
294,
ver
sion
1 -
17 M
ar 2
011
Author manuscript, published in "Food Additives and Contaminants 24, 12 (2007) 1345-1352" DOI : 10.1080/02652030701458097
For Peer Review O
nly
Page 1 of 21
Validation of two enzyme immunoassays for aminoglycoside
residues according to European Decision 657/2002 2
4
6
FRANCESCA DIANA1, MAURIZIO PALEOLOGO
1, & LIDIJA PERSIC
1
8
1Tecna Srl, Area Science Park, Padriciano 99, Trieste, Italy 10
12
14
16
18
20
22
24
Page 1 of 33
http://mc.manuscriptcentral.com/tfac Email: [email protected]
Food Additives and Contaminants
123456789101112131415161718192021222324252627282930313233343536373839404142434445464748495051525354555657585960
peer
-005
7729
4, v
ersi
on 1
- 17
Mar
201
1
For Peer Review O
nly
Page 2 of 21
26
Abstract
Aminoglycoside antibiotics are commonly used in the treatment of bacterial infections 28
in human and veterinary practice. Because of their toxicity, the European Community
has established Maximum Residue Limits (MRL) in foodstuffs of animal origin (EEC 30
No 2377/90). In the present work the performance of two new enzyme immunoassays
(EIA), I’screen Gentamicin and I’screen Neomycin, for the quantitative detection of the 32
aminoglycosides gentamicin and neomycin in milk and tissue are described. The
validation of these EIAs has been performed in accordance to criteria of the European 34
Decision 657/2002. Assays sensitivity at the MRLs was 95% for milk samples and
100% for tissue samples, while specificity was 100% at 33% and 25% of the MRLs for 36
milk and tissues, respectively. The performance of these EIAs indicates that they can be
used as easy screening methods in the analysis of aminoglycosides in milk and tissue 38
samples.
40
Keywords: gentamicin, neomycin, EIA, drug residues 42
Page 2 of 33
http://mc.manuscriptcentral.com/tfac Email: [email protected]
Food Additives and Contaminants
123456789101112131415161718192021222324252627282930313233343536373839404142434445464748495051525354555657585960
peer
-005
7729
4, v
ersi
on 1
- 17
Mar
201
1
For Peer Review O
nly
Page 3 of 21
Introduction 44
The aminoglycosides are closely-related antibiotics produced by Streptomyces spp. and 46
Micromonospora spp. (Salisbury 1995). They have similar antibacterial properties, i.e.
inhibition of protein synthesis at the 30S ribosomal subunit, and because of their 48
toxicity towards both gram positive and gram negative bacteria (Schenck 1998), are
broad spectrum bactericidal antibiotics, widely used in human and veterinary practice. 50
In food-animal production, the most commonly used aminoglycosides are gentamicin,
neomycin, streptomycin and dihydrostreptomycin. Since 1970 EU Directives regulated 52
the use of antibiotics as additives in feed (Council Directive 70/524 EEC and following
amendments), progressively banning the use of these molecules for auxinic purposes. 54
Aminoglycosides, intended as therapeutics, are preferably administered by injection. In
this case, they accumulate in tissues in high and persistent residues. In fact, since they 56
are eliminated by renal filtration, they tend to accumulate in the kidney where they bind
to tissue proteins and macromolecules via ionic bonds (Isoherranen and Soback 1999), 58
causing nephrotoxicity (Salisbury 1995). Besides urines and kidney, aminoglycosides
can be found in cochlea, in serum, in milk and in other tissues, depending on plasma 60
levels. Antibiotic levels in milk are dependent on a number of physico-chemical
parameters, and their concentration is higher in cases of mastitis (Debackere 1995; 62
Saran 1995), following intramammary treatment.
64
For humans, aminoglycosides in food hold the risk of undesirable health effects, as
nephrotoxicity and ototoxicity (Saran 1995). Council Regulation (EEC) No 2377/90 of 66
26 June 1990 (Woodward 1995) lays down a procedure for the establishment of
Page 3 of 33
http://mc.manuscriptcentral.com/tfac Email: [email protected]
Food Additives and Contaminants
123456789101112131415161718192021222324252627282930313233343536373839404142434445464748495051525354555657585960
peer
-005
7729
4, v
ersi
on 1
- 17
Mar
201
1
For Peer Review O
nly
Page 4 of 21
Maximum Residue Limits (MRLs) of veterinary drugs in foodstuffs of animal origin. 68
The wide use of aminoglycosides in veterinary medicine requires therefore suitable
screening and confirmatory methods for their detection in edible tissues. For the 70
detection of aminoglycosides in food, microbial inhibition assays are widely used as
screening methods (Schenck 1998), but even if they are simple and relatively cheap, 72
they are time consuming, lack sensitivity (Isoherranen and Soback 1999) and do not
allow substance identification. On the other hand, chromatographic analysis (LC/MS), 74
is used as confirmatory method (Salisbury 1995), because it provides unequivocal
identification of the analyte and is aimed at preventing false positive results (Woodward 76
1995), but it is rather expensive.
78
In recent years, many enzyme immunoassays (EIA) for the detection of aminoglycoside
residues in animal tissues have been developed (Haasnoot et al. 1999; Loomans et al. 80
2003; Jin et al. 2005; Jin et al. 2006). In order to identify the contaminant following the
positive findings from microbiological screening methods, EIAs are very suitable, 82
thanks to their ease of use, sensitivity, rapidity and specificity. Nevertheless, the
sensitivity and specificity of quantitative EIA kits for gentamicin and neomycin 84
detection do not always fit with the EU MRLs for these two antibiotics.
86
The present work describes the performance evaluation of two new quantitative enzyme
immunoassays for the detection of gentamicin and neomycin in milk and tissues, 88
meeting the need for rapid sample preparation and test implementation, and having the
dosing range around the EU MRLs. The validation of the two EIAs was carried out 90
according to European Decision 657/2002 for quantitative screening methods.
Therefore, performance characteristics such as detection capability (CCβ), precision, 92
Page 4 of 33
http://mc.manuscriptcentral.com/tfac Email: [email protected]
Food Additives and Contaminants
123456789101112131415161718192021222324252627282930313233343536373839404142434445464748495051525354555657585960
peer
-005
7729
4, v
ersi
on 1
- 17
Mar
201
1
For Peer Review O
nly
Page 5 of 21
specificity and ruggedness were determined. The decision limit (CCα) and recovery for
milk and tissue samples in both assays were also investigated. 94
Materials and methods 96
Materials 98
Gentamicin sulfate salt, neomycin trisulfate salt hydrate, gentamicin solution, neomycin
solution, streptomycin sesquisulfate, kanamycin, bovine serum albumin (BSA), 100
horseradish peroxidase (HRP), N-(3-Dimethylaminopropyl)-N′-ethylcarbodiimide
hydrochloride (EDC) were purchased from Sigma. 102
N-hydroxysulfosuccinimide (sulfo-NHS) was obtained from Pierce. Protein A 104
Sepharose CL-4B was obtained from GE Healthcare Europe Gmbh. The EIA kits
I’screen Gentamicin and I’screen Neomycin (Tecna Srl, Trieste, Italy) contain all the 106
necessary materials and methods for the assay.
108
Test samples
Twenty raw milk samples, derived from untreated cows, were kind gifts from AAFVG 110
(Associazione Allevatori del Friuli Venezia Giulia). Twenty tissue samples (ten bovine
and ten swine muscles) were purchased in a supermarket, guaranteed as residue free 112
(“Prodotti con Amore”, COOP Italia).
114
Gentamicin EIA
The anti-gentamicin antibody was raised in rabbit by three cycles of immunization with 116
gentamicin-BSA conjugates, obtained using EDC and Sulpho-NHS (Hermanson 1996).
Page 5 of 33
http://mc.manuscriptcentral.com/tfac Email: [email protected]
Food Additives and Contaminants
123456789101112131415161718192021222324252627282930313233343536373839404142434445464748495051525354555657585960
peer
-005
7729
4, v
ersi
on 1
- 17
Mar
201
1
For Peer Review O
nly
Page 6 of 21
Microtiter plates were coated with anti-gentamicin antibodies purified on a Protein A 118
Sepharose CL-4B column. The assay design is a direct competitive enzyme
immunoassay, because during the first incubation, standards/samples and gentamicin-120
HRP-conjugate (obtained by EDC and Sulpho-NHS mediated conjugation procedures,
Hermanson 1996) compete for the antibodies binding sites on the microtiter plate (30 122
minutes, room temperature). The amount of enzyme conjugate which remains bound
after washings is inversely proportional to the amount of the analyte in 124
standards/samples and is determined by measuring the absorbance after a developing
reaction step of 30 minutes using tetramethyl benzydine (TMB) as chromogenic HRP-126
substrate. To stop the reaction, a sulphuric acid solution is then added, and the
absorbance is measured at 450 nm by a microplate reader (Sunrise, Tecan). 128
All the absorbance values were transformed into relative signal (OD/OD of zero 130
standard = B/B0). Results were elaborated through the software “Magellan” (Tecan).
The four parameter logistic was chosen as algorithm to fit the calibration curve 132
according to the following formula: y = (A – D) / [1+ (x/C)B] + D, where A is the
maximal absorbance, D is the minimum absorbance, C is the concentration that 134
produces a response halfway between A and D, while B is the slope at the inflection
point of the sigmoidal curve. 136
Gentamicin in tissue extracts was determined through ready-to-use buffer standard 138
solutions, while for milk samples a calibration curve in matrix was used. Milk standard
solutions were freshly prepared at each analysis. 140
Neomycin EIA 142
Page 6 of 33
http://mc.manuscriptcentral.com/tfac Email: [email protected]
Food Additives and Contaminants
123456789101112131415161718192021222324252627282930313233343536373839404142434445464748495051525354555657585960
peer
-005
7729
4, v
ersi
on 1
- 17
Mar
201
1
For Peer Review O
nly
Page 7 of 21
The anti-neomycin antibody was raised in rabbit by three cycles of immunization with
neomycin-BSA conjugates, obtained using EDC and Sulpho-NHS (Hermanson 1996). 144
Microtiter plates were coated with anti-neomycin antibodies purified on a Protein A
Sepharose CL-4B column. As the gentamicin assay, the I’screen Neomycin test kit is a 146
competitive enzyme immunoassay. The assay is carried out in the same way, except that
the first incubation is for 20 min and the second for 10 min. Data handling was also 148
performed with the same instrument, the same software, the same curve fitting. Also in
this case two different calibration curves for the analysis of milk or meat samples were 150
used, but both curves were freshly prepared at each analysis.
152
Cross-reactivities determination
Calibration curves of different aminoglycosides antibiotics (gentamicin, neomycin, 154
streptomycin, kanamicin) were prepared using the test kit dilution buffers. The cross-
reactivities values were calculated from the calibration curves obtained, according to the 156
following equation: (IC50 of gentamicin or neomycin / IC50 of the tested compound) X
100; IC50 is the concentration producing the 50% of the maximal absorbance (B/B0 = 158
50%).
160
Sample preparation
Sample preparation was the same for both EIAs. The milk samples were refrigerated 162
and centrifuged at 4°C for 10 minutes at 3000g. The fat was discarded and the skimmed
milk was diluted 10 times with the dilution buffer provided by the kit. The tissues 164
samples were extracted according to protocols previously reported (Haasnoot et al.
1999; Brown et al. 1988; Fox 1989), with some modifications. Briefly, to 1 g of tissue 4 166
ml of a 3% trichloroacetic acid solution (TCA) were added. After homogenization for 1
Page 7 of 33
http://mc.manuscriptcentral.com/tfac Email: [email protected]
Food Additives and Contaminants
123456789101112131415161718192021222324252627282930313233343536373839404142434445464748495051525354555657585960
peer
-005
7729
4, v
ersi
on 1
- 17
Mar
201
1
For Peer Review O
nly
Page 8 of 21
minute, the sample was mixed head over head for 30 minutes, then centrifuged 10 168
minutes at 2000g at 4°C. The extracts were diluted 2 times with dilution buffer and pH
was adjusted to 7.4 with a 0.1M NaOH solution. 170
Results and discussion 172
Immunoassays performance
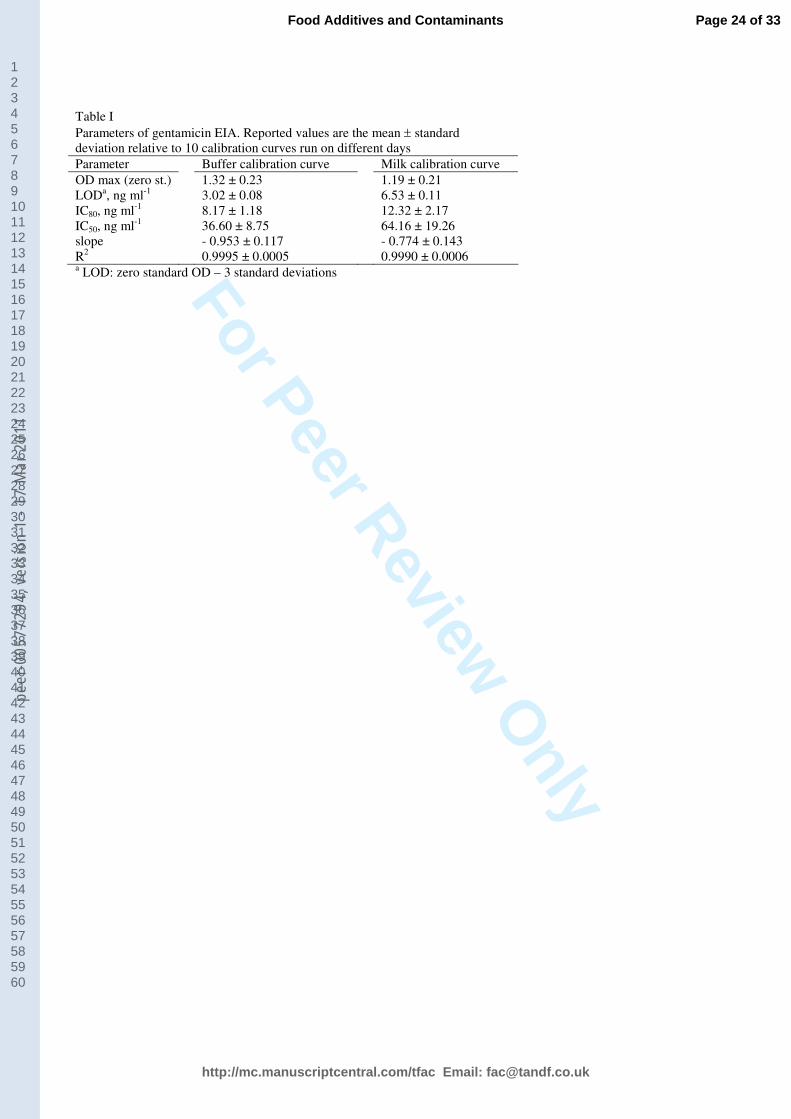
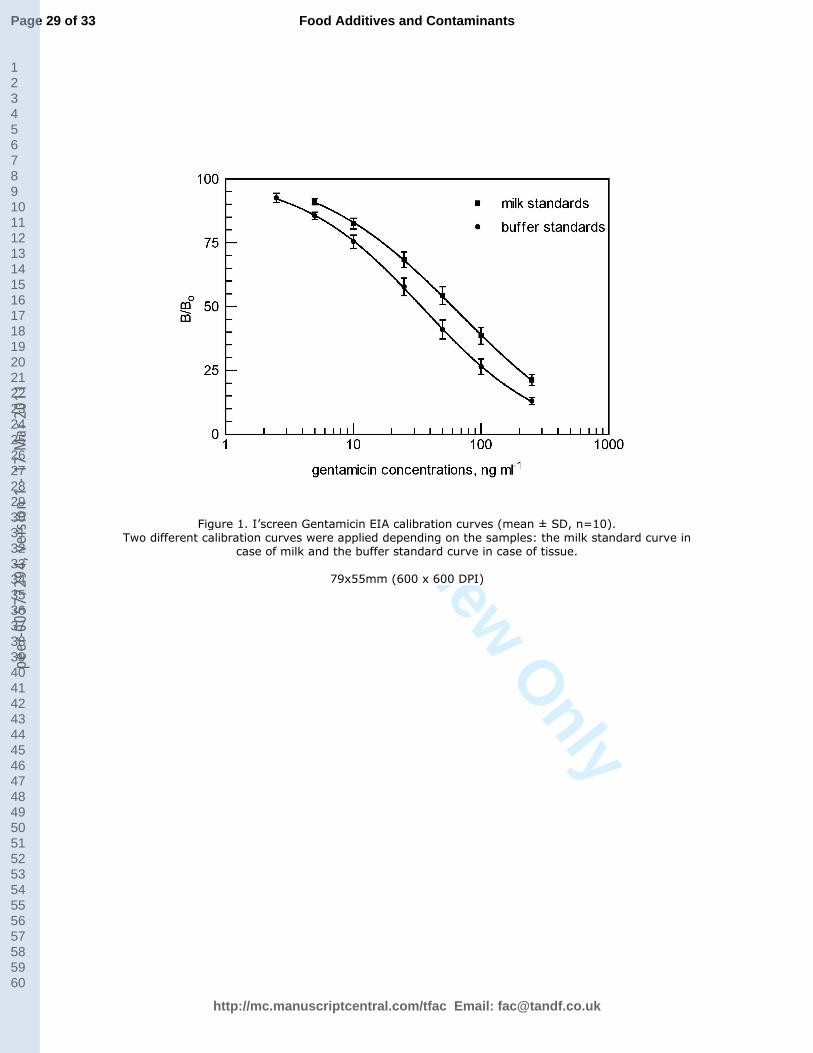
I’screen Gentamicin. Figure 1 shows calibration curves obtained (10 runs) for the 174
gentamicin enzyme immunoassay, i.e. the buffer and the milk calibration curves. In the
preliminary work carried out during the development of the assay, no matrix effect was 176
observed for tissue samples when analysed in respect to a calibration curve made from
gentamicin in buffer solutions (data not shown), obtaining a specificity of 100% for 178
negative tissue samples. On the contrary, the spiking of milk samples using a buffer
calibration curve determined an over-estimation of the analyte content because of 180
matrix interference. Therefore, in order to compensate for matrix effects and to achieve
higher specificity, it was necessary to provide two different calibration curves. Table I 182
summarizes the parameters of these calibration curves; limits of detection (LOD),
calculated as the zero standard OD minus 3 standard deviations (SD), were so low that 184
spiking ranges could start at a few ng/ml. Slopes and R2 values show a high quality of
calibration. The low values for standard deviations of LOD, IC50 and R2 show the high 186
repeatability of assay results. [Insert Figure 1 and Table I about here]
188
According to European Commission Regulation No 2377/90 and followings (EC No
2377/90; EC No 1960/2000; EC No 868/2002), maximum residue limits of gentamicin 190
(MRL) are 50 µg kg-1
for muscle, 750 µg kg-1
for kidney and 100 µg L-1
for milk. On
the basis of LODs reported in Table I, the calibration ranges chosen were 2.5-250 µg L-1
192
Page 8 of 33
http://mc.manuscriptcentral.com/tfac Email: [email protected]
Food Additives and Contaminants
123456789101112131415161718192021222324252627282930313233343536373839404142434445464748495051525354555657585960
peer
-005
7729
4, v
ersi
on 1
- 17
Mar
201
1
For Peer Review O
nly
Page 9 of 21
for the buffer calibration curve and 5-250 µg L-1
for the milk calibration curve. Since
sample preparation procedures determine a ten folds dilution factor, these calibration 194
curves allow the analysis of samples contaminated with amounts of gentamicin in the
range of 25-2500 µg kg-1
for tissue and 50-2500 µg L-1
for milk. Therefore 196
contamination levels around MRLs can be easily detected without the need of excessive
sample dilution, providing an accurate measurement. 198
The intra-assay precision of I’screen Gentamicin (calculated as Coefficient of Variation 200
%, CV) was obtained testing three duplicates of buffer and milk standard solutions. CVs
of the mean absorbances were always less than 5%. The intra-assay and inter-assay dose 202
CVs, evaluated in three runs, were below 10% in between 5 and 100 µg L-1
, both for
milk and buffer standard solutions. 204
The gentamicin EIA is highly specific, since cross reactivities against other 206
aminoglycosides (neomycin, streptomycin, kanamycin) are below 0.1%. It is stable after
storage at +4°C for 1 year, since after incubation of the kit at 37°C for 1 week, assay 208
performances (OD values and calibration curve IC50) are not significantly changed (data
not shown) (Deshpande 1996). 210
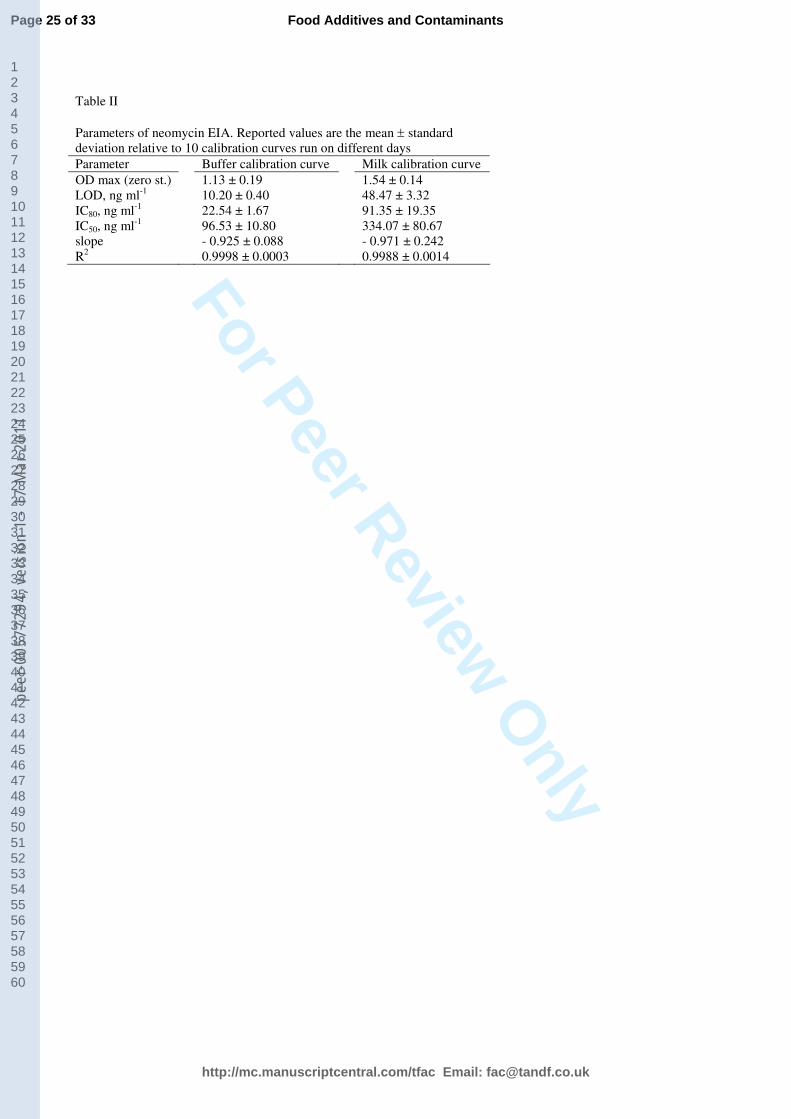
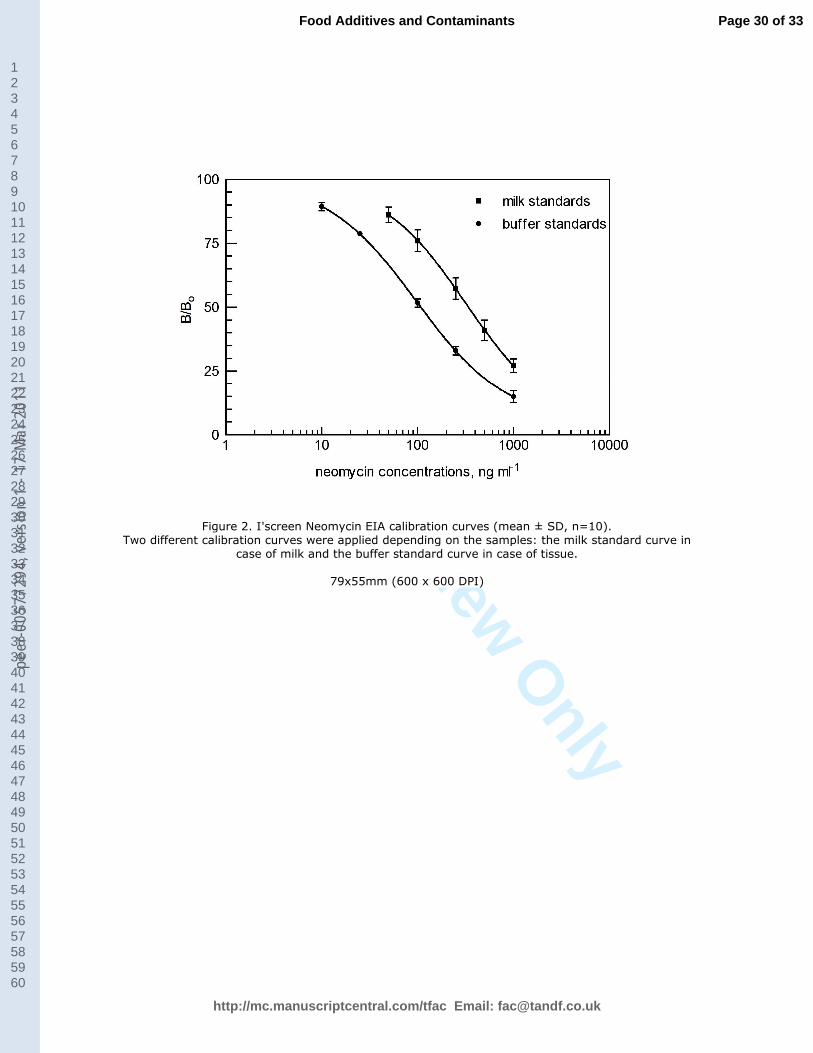
I’screen Neomycin. Figure 2 shows buffer and milk calibration curves obtained for 212
neomycin assay (mean of 10 runs) and Table II summarizes their parameters. As for the
gentamicin assay, the milk calibration curve is necessary to compensate matrix effect of 214
milk samples, while tissue samples can be analysed using a buffer calibration curve.
The values obtained for LODs, IC50, slope and R2 show also for this assay a high quality 216
of calibration, as well as a high repeatability of results in case of buffer calibration,
Page 9 of 33
http://mc.manuscriptcentral.com/tfac Email: [email protected]
Food Additives and Contaminants
123456789101112131415161718192021222324252627282930313233343536373839404142434445464748495051525354555657585960
peer
-005
7729
4, v
ersi
on 1
- 17
Mar
201
1
For Peer Review O
nly
Page 10 of 21
while milk calibration shows similar sensitivity but lower repeatability. [Insert Figure 2 218
and Table II about here]
220
According to EU Regulations (EC No 2377/90; EC No 1960/2000; EC No 1181/2002)
MRL of neomycin are 500 µg kg-1
for muscle, 5000 µg kg-1
for kidney and 1500 µg L-1
222
for milk. On the basis of LODs reported in Table II, the calibration ranges chosen were
10-1000 ng/ml for the buffer calibration curve and 50-1000 µg L-1
for the milk 224
calibration curve. Considering the ten folds dilution factor of samples (see
experimental), these calibration curves allow the detection of amounts of neomycin in 226
the range of 100-10 000 µg kg-1
in tissue and 500-10 000 µg L-1
in milk. The use of two
different calibration curves allows therefore the identification of samples contaminated 228
with levels of antibiotic around MRLs; moreover, MRLs were in both cases in the linear
part of the calibration curves. 230
The intra-assay precision of I’screen Neomycin was determined testing the standard 232
solutions with three duplicates. CVs of the mean absorbance were always < 10%. The
intra-assay dose CV testing buffer standard solutions was below 10% in between 10 and 234
100 ng/ml. The intra-assay dose CV testing milk standard solutions was below 5% in
between 100 and 500 µg L-1
. Dose inter-assay CVs, evaluated in three different 236
experiments, were less than 15% for buffer standard solutions and less than 20% for
milk standard solutions. 238
The specificity of the assay was studied by testing other aminoglycoside antibiotics 240
(gentamicin, streptomycin, kanamycin): cross-reactivities were in all cases below 0.1%.
The stability of the reagents was evaluated incubating the test kit at 37°C for one week: 242
Page 10 of 33
http://mc.manuscriptcentral.com/tfac Email: [email protected]
Food Additives and Contaminants
123456789101112131415161718192021222324252627282930313233343536373839404142434445464748495051525354555657585960
peer
-005
7729
4, v
ersi
on 1
- 17
Mar
201
1
For Peer Review O
nly
Page 11 of 21
neither the OD values, nor the calibration curve IC50 were significantly different from t0,
meaning that the kit is stable at +4°C after 1 year storage (data not shown) (Deshpande 244
1996).
246
Assays Validation
According to European Decision 657/2002, for the validation of I’screen Gentamicin 248
and I’screen Neomycin the following performance characteristics were determined:
Decision Limit (CCα), specificity, Detection Capability (CCβ), recovery, precision, and 250
ruggedness.
252
Milk samples. According to EU regulations, a screening method for the detection of
veterinary drug residues must guarantee 5% or less false negative results 254
(2002/657/EC). To be cost effective, this method must guarantee that a food sample
containing residues at a concentration lower than the MRL should be classified as 256
“negative” (compliant). The cut-off values, i.e. the Limit of Decision (CCα), should be
established taking into account both requirements. In order to keep the false non-258
compliant occurrence at a low rate, CCα values were determined as the B/B0 value of
MRL spiked samples + 1.64 SD. 260
To calculate the probability of false positive and false negative results, 20 blank 262
samples were employed; these samples were fortified at MRL concentrations (100 µg
kg-1
of gentamicin and 1500 µg kg-1
of neomycin), as well as at lower concentrations. 264
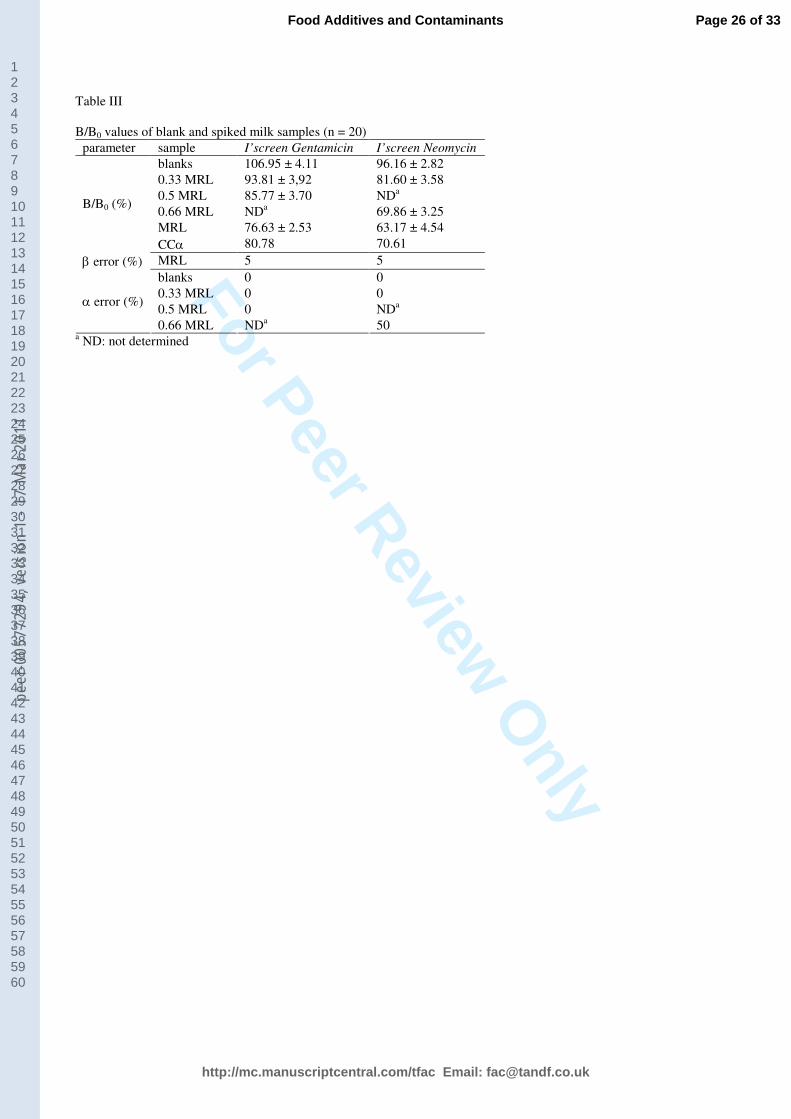
Table III shows B/B0% values for blank and fortified samples, false compliant rates (β
errors) and false non-compliant rates (α errors). [Insert Table III about here] 266
Page 11 of 33
http://mc.manuscriptcentral.com/tfac Email: [email protected]
Food Additives and Contaminants
123456789101112131415161718192021222324252627282930313233343536373839404142434445464748495051525354555657585960
peer
-005
7729
4, v
ersi
on 1
- 17
Mar
201
1
For Peer Review O
nly
Page 12 of 21
At the established Limit of Decision, in I’screen Gentamicin no false non-compliant 268
sample was obtained (0% α error) evaluating the blank milk samples, as well as spiked
at 33 µg L-1
(0.33 MRL) and at 50 µg L-1
(0.5 MRL), indicating an assay specificity of 270
100%.
272
Regarding I’screen Neomycin, no false non-compliant were obtained testing blanks or
0.33 MRL spiked samples, but the specificity decreased with samples fortified at 0.66 274
MRL, generating 50% of false non-compliant results.
276
Sensitivity evaluated at MRL contamination values for both kits was 95% (5% β error).
The detection capabilities (CCβ) were therefore 100 µg kg-1
for I’screen Gentamicin 278
and 1500 µg kg-1
for I’screen Neomycin. It can be concluded that both assays had a
good diagnostic specificity and a high sensitivity at the MRL. 280
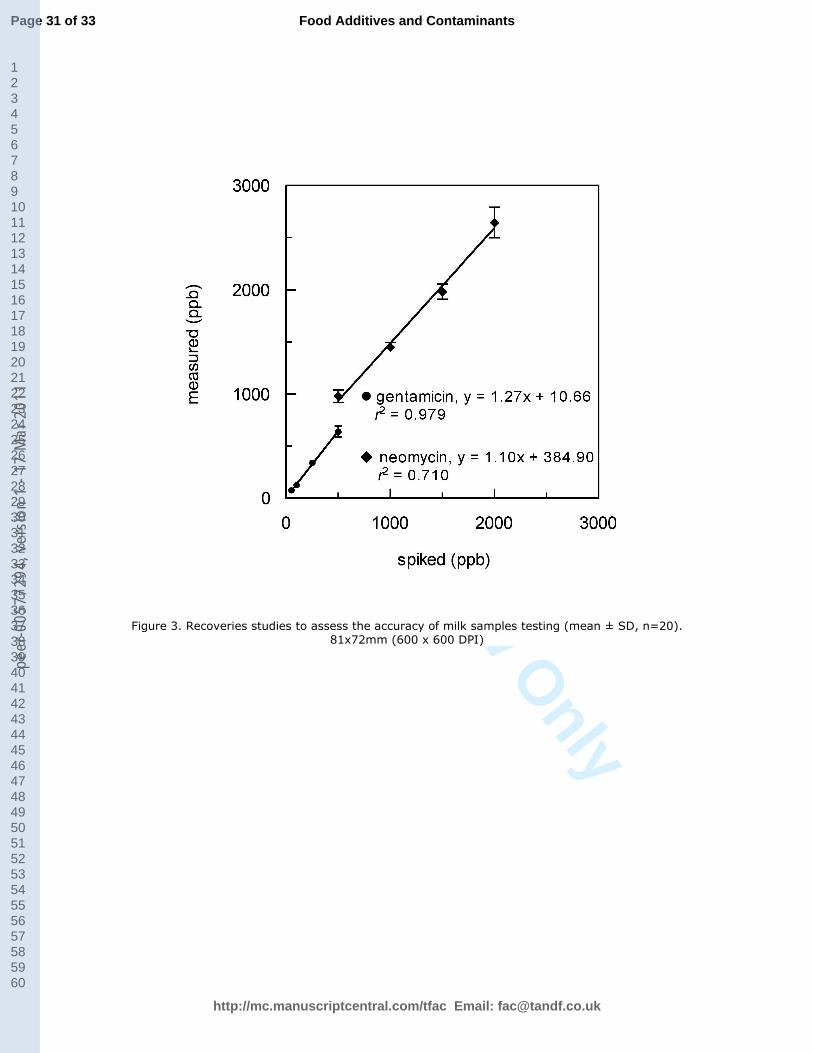
Accuracy was studied by fortification of 20 blank milk samples with four 282
concentrations of both analytes above and below respective MRLs (50, 100, 250 and
500 µg L-1
of gentamicin and 500, 100, 1500 and 2000 µg L-1
of neomycin). Results are 284
shown in Figure 3. The correlation obtained between spiked and measured
concentrations was quite good for gentamicin (r2 = 0.979, Sy.x = 32.49 µg L
-1), while it 286
was weaker for neomycin (r2 = 0.710, Sy.x = 398.9 µg L
-1). The slope of the linear
regression was, on the opposite, close to 1 in case of neomycin (1.10), higher in case of 288
gentamicin (1.27). [Insert Figure 3 about here]
290
Mean recovery at the MRL was 128±14% for gentamicin and 132±22% for neomycin.
Both assays overestimated the true content of analyte, particularly in the lower part of 292
Page 12 of 33
http://mc.manuscriptcentral.com/tfac Email: [email protected]
Food Additives and Contaminants
123456789101112131415161718192021222324252627282930313233343536373839404142434445464748495051525354555657585960
peer
-005
7729
4, v
ersi
on 1
- 17
Mar
201
1
For Peer Review O
nly
Page 13 of 21
dosing ranges, but the bias was higher in case of neomycin: the mean recoveries at each
spiking ranged in fact from 128% to 152% for gentamicin, and from 132% to 201% for 294
neomycin.
296
I’screen Gentamicin precision was calculated as Coefficient of Variation % (CV) of the
intra- (n=3 duplicates) and inter-assay measurements (n=3 days) of a blank sample 298
fortified with amounts of analyte corresponding to 0.5 MRL, MRL, and 5 MRL (50,
100 and 500 µg kg-1
). The intra-assay CVs were all below 7% (4.90, 6.84 and 0.25%, 300
respectively). The inter-assay CVs were all below 8% (7.22, 0.45 and 3.57%,
respectively). 302
In the same way was calculated I’screen Neomycin precision. A blank sample fortified 304
with amounts of analyte at 0.66 MRL and MRL levels (1000 and 1500 µg kg-1
) was
tested. The intra-assay CVs were always below 5% (3.50 and 1.93, respectively); inter-306
assay CVs were 22.99 for and 18.74 % respectively.
308
Tissue samples. A successful tissue extraction method should make the tissue-bound
aminoglycosides soluble, remove most of the proteins, eliminate other matrix 310
interferences and provide satisfactory and reproducible recoveries. Homogenization of
samples with TCA solutions is commonly used to precipitate tissue proteins and to 312
obtain high recoveries of analytes. This method was applied in the analysis of twenty
blank muscle samples (ten bovine and ten swine). 314
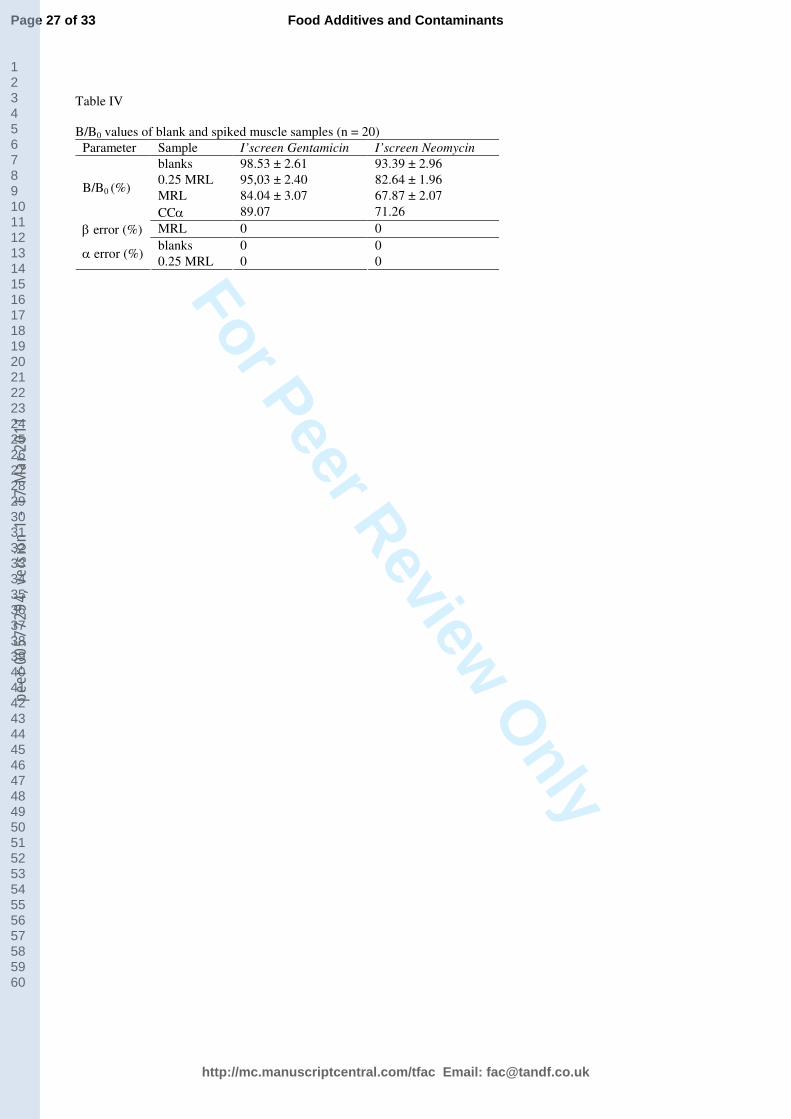
The limits of decision and the detection capabilities were established as for milk testing. 316
Table IV shows B/B0 %, and α and β errors for both kits. Evaluating the blank muscle
Page 13 of 33
http://mc.manuscriptcentral.com/tfac Email: [email protected]
Food Additives and Contaminants
123456789101112131415161718192021222324252627282930313233343536373839404142434445464748495051525354555657585960
peer
-005
7729
4, v
ersi
on 1
- 17
Mar
201
1
For Peer Review O
nly
Page 14 of 21
samples by the established limits of decision, no false non-compliant occurred by both 318
immunoassays (0% α error). No false non-compliant incurred even testing blanks
spiked at 0.25 MRL (12.5 µg kg-1
of gentamicin and 125 µg kg-1
of neomycin) by both 320
kits. The false compliant rate (β error) was 0% testing the samples spiked at the MRLs
with both test kits, indicating a 100% sensitivity at the MRLs. Considering the results 322
shown, detection capabilities (CCβ) were 50 µg kg-1
for I’screen Gentamicin, and 500
µg kg-1
for I’screen Neomycin. [Insert Table IV about here] 324
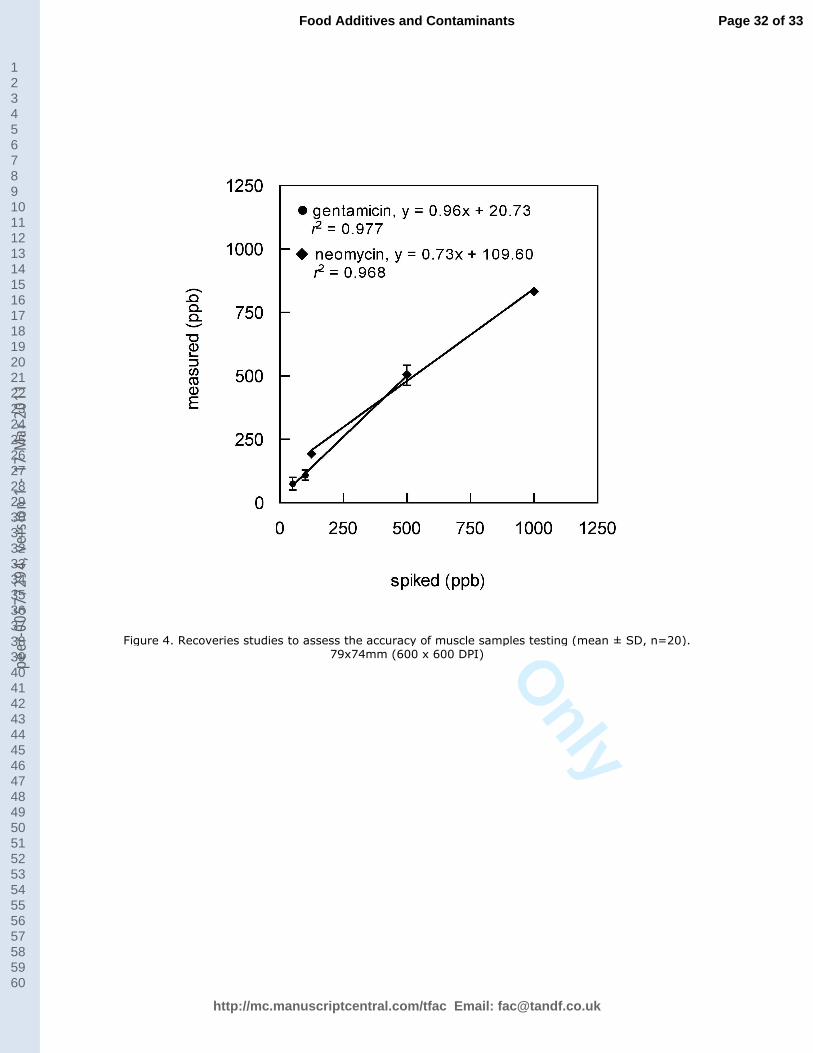
Accuracy in tissue testing was evaluated in the range 100-1000 µg kg-1
for neomycin 326
and in the range 50-500 µg kg-1
for gentamicin. The correlations between spiked and
measured concentration were quite good for both analytes (r2 > 0.95). The slope was 328
close to 1 in case of gentamicin, lower in case of neomycin (see Figure 4). Sy.x values
were also quite low: 27.78 and 46.66 µg kg-1
for gentamicin and neomycin, 330
respectively. In case of gentamicin the recovery at the MRL was 160±40%, in case of
neomycin it was 94 ± 9%. [Insert Figure 4 about here] 332
The precision of I’screen Gentamicin and I’screen Neomycin assays in tissue testing 334
was studied analysing three times the same fortified muscle sample. Gentamicin was
spiked at MRL (50 µg kg-1
) and 2 MRL (100 µg kg-1
), obtaining intra assay CVs (n=3 336
duplicates) of 5.35 and 6.84%, respectively and inter-assay CVs (n=3 days) of 12.33
and 14.56%, respectively. In the same way neomycin was spiked at MRL (500 µg kg-1
) 338
and 2 MRL (1000 µg kg-1
): intra-assay CVs were 10.44 and 5.51%, respectively and
inter-assay CVs were 16.39 and 15.58%, respectively. 340
Page 14 of 33
http://mc.manuscriptcentral.com/tfac Email: [email protected]
Food Additives and Contaminants
123456789101112131415161718192021222324252627282930313233343536373839404142434445464748495051525354555657585960
peer
-005
7729
4, v
ersi
on 1
- 17
Mar
201
1
For Peer Review O
nly
Page 15 of 21
Ruggedness. I’screen Gentamicin and I’screen Neomycin ruggedness was determined 342
using the Youden’s approach (Youden and Steiner 1975; 2002/657/EC). The method
implies the deliberate introduction of minor reasonable simultaneous variations of 344
parameters in the test and the observation of their consequences. In both tests, variations
in seven parameters in respect to established procedure were introduced: the enzyme 346
conjugate dilution factor, the enzyme conjugate batch, the assay temperature, the assay
incubation time, the development incubation time, the number of washings and the kit 348
storage temperature. According to Youden’s approach, the effect of each variation was
determined by a set of eight combinations, where the parameters were alternated in their 350
“control mode” (according to the established procedure) and “changed mode”. For each
parameter, the difference between the mean result obtained in the “control mode” and 352
the mean result obtained in the “changed mode” was determined (Di). The analyses
were carried out with a muscle sample, spiked with 100 µg kg-1
of gentamicin and 1000 354
µg kg-1
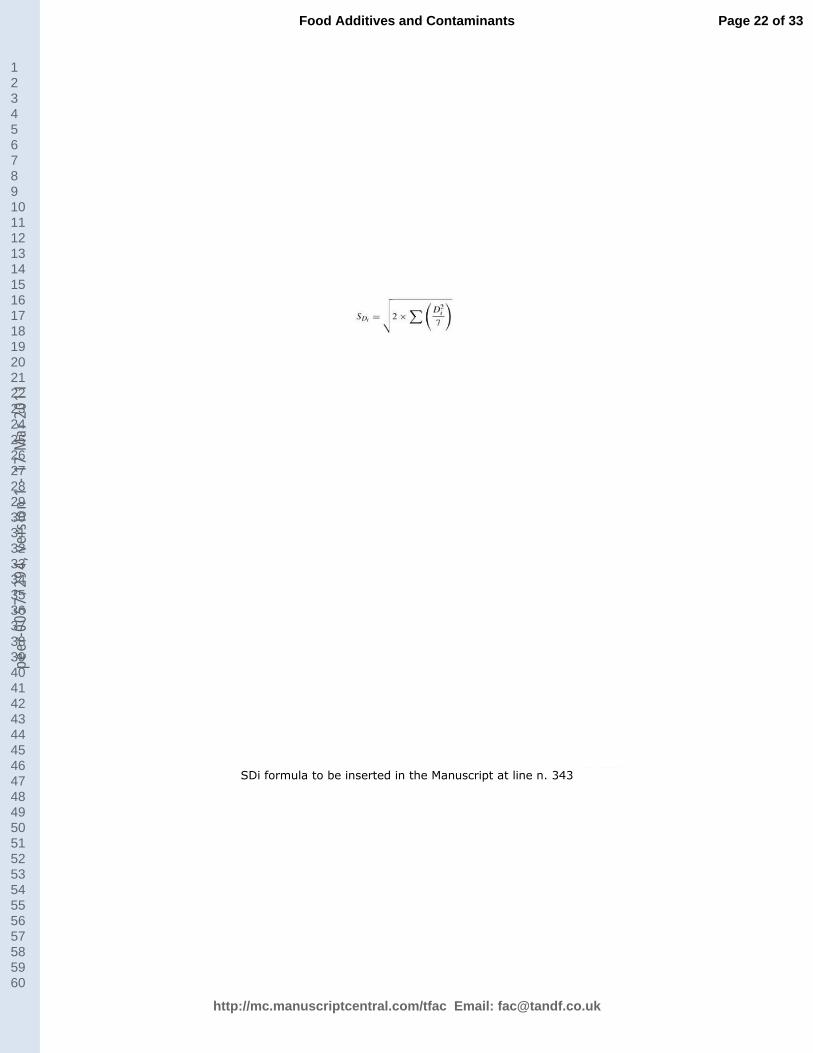
of neomycin. As shown in Table V, the effect of each parameter is given by the
calculated difference Di. The standard deviation of the differences (SDi) for each set of 356
experiments was calculated by the formula:
358
INSERT SDi FORMULA HERE
360
When the calculated value for the standard deviation of the differences is significantly
larger than the inter-assay precision, the test is considered not to be robust. Furthermore, 362
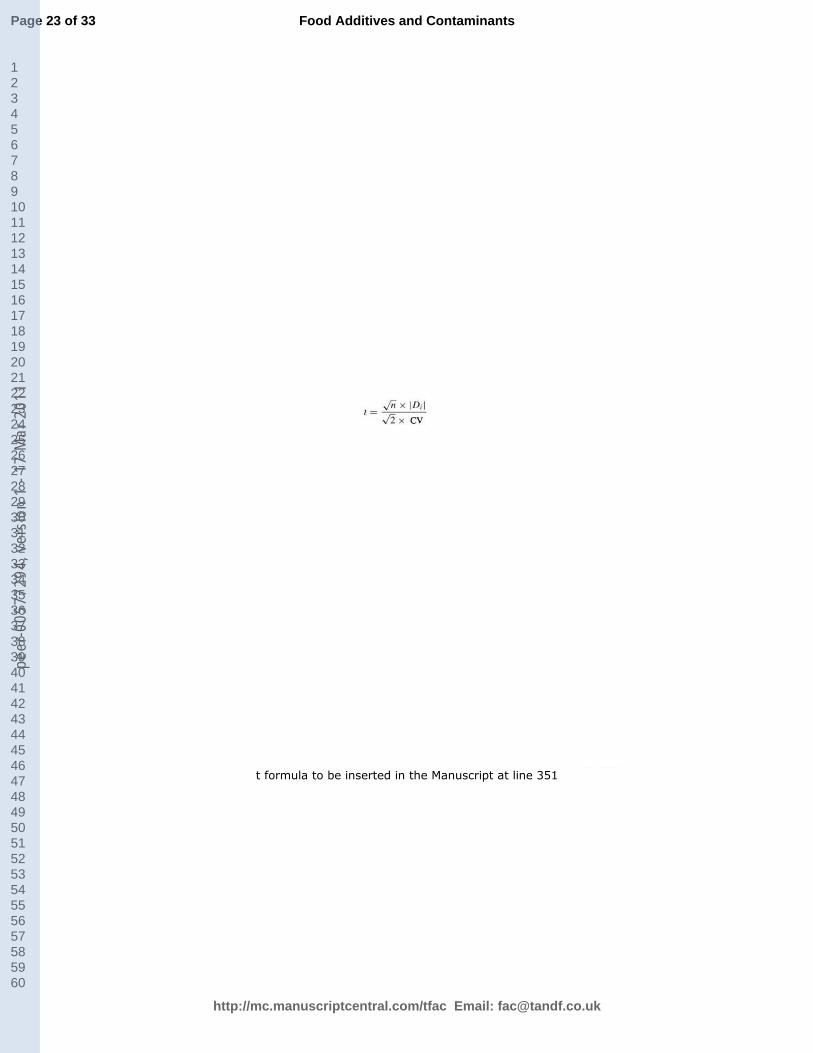
the application of a t-test for each variable gives the opportunity to identify the most
disturbing variation factors (Scortichini et al. 2005); the experimental t was calculated 364
by the formula:
366
Page 15 of 33
http://mc.manuscriptcentral.com/tfac Email: [email protected]
Food Additives and Contaminants
123456789101112131415161718192021222324252627282930313233343536373839404142434445464748495051525354555657585960
peer
-005
7729
4, v
ersi
on 1
- 17
Mar
201
1
For Peer Review O
nly
Page 16 of 21
INSERT t FORMULA HERE
368
where n (n=4) is the number of experiments carried out for each parameter in the
“control mode” or in the “changed mode”, and CV is the inter-assay precision (n=9) 370
(Forti et al. 2005).
372
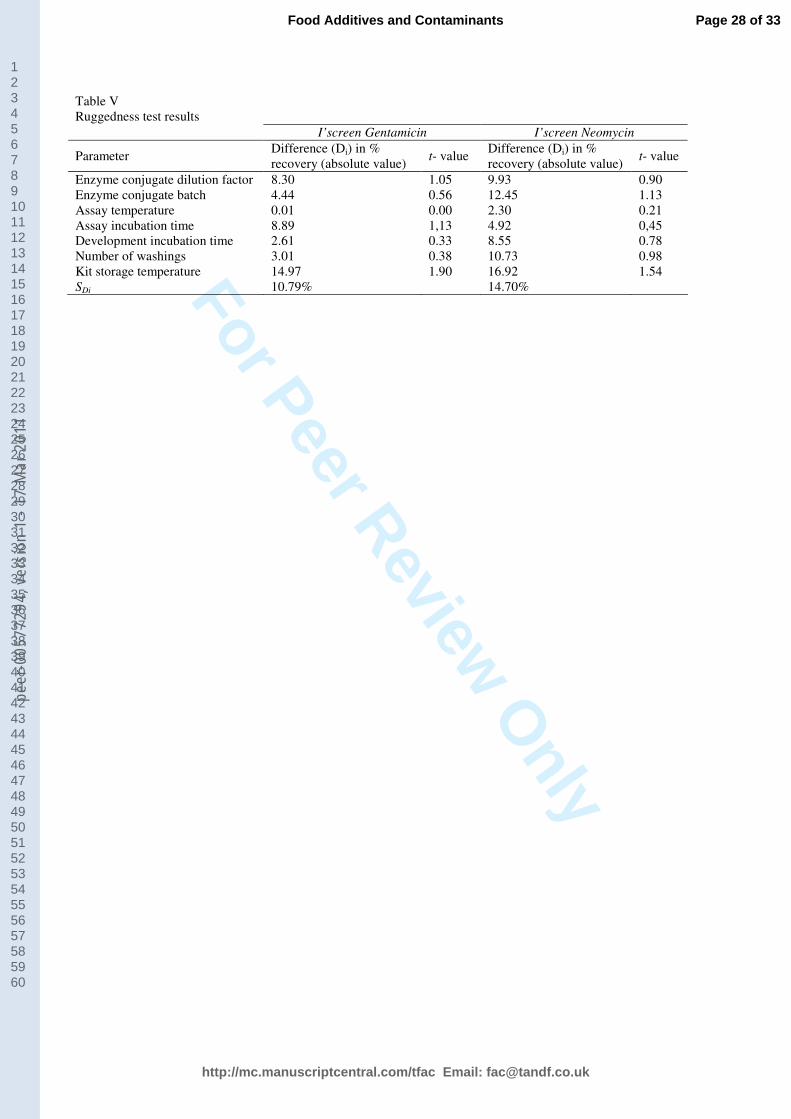
As shown in Table V, the standard deviations of the differences (10.79% for I’screen
Gentamicin and 14.70% for I’screen Neomycin) were lower than the inter-assay 374
precisions obtained for the spiked level considered (14.56% and 15.58% respectively),
indicating that both EIAs are robust. Moreover, experimental t values were always 376
lower than the two-tailed t critical value (tcrit=2.3, υ=9-1, 95% confidence level).
[Insert Table V about here] 378
From the results obtained it can be concluded that none of the changes introduced in the 380
considered parameters negatively influenced the results of the tests; however, results
shown in Table V indicate that kits storage temperature is the most critical factor for the 382
performance of I’screen Gentamicin and I’screen Neomycin and should be strictly
controlled. 384
Conclusions 386
Immunoassays previously reported in the literature for neomycin and gentamicin
detection in milk and meat did not provide data to estimate the percentage of false 388
positive and false negative results at or close to the MRL (Haasnoot et al. 1999;
Loomans et al. 2003). It has been shown that commercially available kits are easy to use 390
and very sensitive, but quite inaccurate (Jànosi et al. 2004). Moreover, the approach
Page 16 of 33
http://mc.manuscriptcentral.com/tfac Email: [email protected]
Food Additives and Contaminants
123456789101112131415161718192021222324252627282930313233343536373839404142434445464748495051525354555657585960
peer
-005
7729
4, v
ersi
on 1
- 17
Mar
201
1
For Peer Review O
nly
Page 17 of 21
employed by test kit manufacturers was not adequate for regulatory controls of 392
registered antimicrobials. In order to determine the appropriate decision limits to be
applied, as far as we are aware no validation study was performed. In accordance with 394
the European Decision 657/2002, screening methods have to be sensitive enough to
detect 95% of non-compliant samples, but, on the other hand, it is also necessary that 396
false positive rates are kept low. Without an appropriate limit of decision, the rate of
false non-compliant samples could be excessive and therefore a high number of 398
confirmatory analyses would be required. Confirmatory analyses for aminoglycosides
are quite expensive and a very small number of laboratories are accredited to perform it. 400
From the results presented, we can claim that the two I’screen test kits can satisfy both 402
the specificity and the sensitivity requirements. For milk, as well as for meat testing,
CCα have been established close enough to the EU MRLs to minimize false non-404
compliant results. The α error was actually very low even with food samples
contaminated at concentrations lower than violating levels. At the same time, violating 406
samples, contaminated at the MRL, have been correctly classified as non-compliant in
95% of milk samples, and in 100% of meat samples. 408
The use of two different calibration curves in the analysis of milk or tissue samples and 410
a moderate dilution factor contribute to the accuracy of the assays, which, at the MRL
level, was in the range between 94% and 160%. 412
Taking into account the matrices tested and the procedures of their preparation, 414
screening by the test kits here presented meets the quality criteria of EU Decision
657/2002, guaranteeing, at the same time, a low rate of false compliant results. The 416
Page 17 of 33
http://mc.manuscriptcentral.com/tfac Email: [email protected]
Food Additives and Contaminants
123456789101112131415161718192021222324252627282930313233343536373839404142434445464748495051525354555657585960
peer
-005
7729
4, v
ersi
on 1
- 17
Mar
201
1
For Peer Review O
nly
Page 18 of 21
performance of these EIA kits indicates that they can be therefore used as easy and cost-
effective screening methods in the analysis of aminoglycosides in milk and tissue 418
samples.
420
Acknowledgements
AAFVG (Associazione Allevatori del Friuli Venezia Giulia, Codroipo, Italy), for 422
providing milk samples.
424
References
Brown SA, Sugimoto K, Smith GG, Garry FB. 1988. Improved sodium hydroxide 426
digestion method without homogeneization for extraction of gentamicin from
renal tissue. Antimicrobial Agents and Chemotherapy 32:595-597. 428
Commission Decision 2002/657/EC. 17-08-2002. Official Journal of the European
Communities L221:8-36. 430
Commission Regulation (EC) No 868/2002. 25-5-2002. Official Journal of European
Communities L137:6-9. 432
Commission Regulation (EC) No 1181/2002. 2-7-2002. Official Journal of European
Communities L172:13-20. 434
Commission Regulation (EC) No 1960/2000. 16-9-2000. Official Journal of European
Communities L234:5-9. 436
Commission Regulation (EC) No 2377/90. 18-8-1990, Official Journal of European
Communities L224:1-8. 438
Debackere M. 1995. Pharmacokinetics and pharmacodynamics of antimicrobials in
relation to their residues in milk. Proceedings of the Symposium on Residues of 440
Page 18 of 33
http://mc.manuscriptcentral.com/tfac Email: [email protected]
Food Additives and Contaminants
123456789101112131415161718192021222324252627282930313233343536373839404142434445464748495051525354555657585960
peer
-005
7729
4, v
ersi
on 1
- 17
Mar
201
1
For Peer Review O
nly
Page 19 of 21
Antimicrobial Drugs and Other Inhibitors in Milk; 1995 Aug 28-31; Kiel. Kiel:
International Dairy Federation. p 41. 442
Deshpande SS. 1996. Reagent Formulations and shelf life evaluation. In: Deshpande
SS. Chapman & Hall, editors. Enzyme Immunoassays: from concept to product 444
development. New York. p 360.
Forti AF, Campana A, Simonella A, Multari M, Scortichini G. 2005. Determination of 446
chloramphenicol in honey by liquid chromatography-tandem mass spectrometry.
Analytica Chimica acta 529:257-263. 448
Fox KE. 1989. Total extraction of aminoglycosides from guinea pig and bullfrog tissues
with sodium hydroxide or triochloroacetic acid. Antimicrobial Agents and 450
Chemotherapy 33:448-451.
Haasnoot W, Stouten P, Cazemier G, Lommen A, Nouws JFM, Keukens HJ. 1999. 452
Immunochemical detection of aminoglycosides in milk and kidney. The Analyst
124:301-305. 454
Hermanson GT. 1996. Zero-lenght cross-linkers. In: Hermanson GT, editor.
Bioconjugate Techniques. San Diego: Academic Press. p 169. 456
Isoherranen N, Soback S. 1999. Chromatographic methods for analysis of
aminoglycoside antibiotics. Journal of AOAC International 82:1017-1045. 458
Jànosi A, Govaert Y, Degroodt J-M. 2004. Comparison of three ELISA kits for
aminoglycoside detection in milk. Proceedings of the Euroresidue V Conference 460
on Residues of Veterinary Drugs in Food; 2004 May 10-12; Noordwijkerhout,
The Netherlands. p 568. 462
Jin Y, Jang J-W, Han C-H, Lee M-H. 2005. Development of ELISA and
immunochromatographic assay for the detection of gentamicin. Journal of 464
Agricultural and Food Chemistry 53:7639-7643.
Page 19 of 33
http://mc.manuscriptcentral.com/tfac Email: [email protected]
Food Additives and Contaminants
123456789101112131415161718192021222324252627282930313233343536373839404142434445464748495051525354555657585960
peer
-005
7729
4, v
ersi
on 1
- 17
Mar
201
1
For Peer Review O
nly
Page 20 of 21
Jin Y, Jang J-W, Lee M-H, Han C-H. 2006. Development of ELISA and 466
immunochromatographic assay for the detection of neomycin. Clinica Chimica
Acta 364:260-266. 468
Loomans EEMG, van Wiltenburg J, Koets M, van Amerongen A. 2003. Neamin as an
immunogen for the development of a generic ELISA detecting gentamicin, 470
kanamycin and neomycin in milk. Journal of Agricultural and Food Chemistry
51:587-593. 472
Salisbury CDC. 1995. Chemical analysis of aminoglycoside antibiotics. In: Oka H,
Nakazava H, Harada K, MacNeil JD, editors. Chemical Analysis for Antibiotics 474
Used in Agriculture. Arlington: AOAC International. p 307.
Saran A, editor. 1995. Intramammary and systemic antibiotic mastitis treatment in 476
lactating and dry cows. Proceedings of the Symposium on Residues of
Antimicrobial Drugs and Other Inhibitors in Milk; 1995 Aug 28-31; Kiel. Kiel: 478
International Dairy Federation. p 85.
Schenck F. 1998. Aminoglycosides. In: Turnipseed SB, Long AR, editors. Analytical 480
Procedures for Drug residues in Food of Animal Origin. West Sacramento:
Science Technology System. p 205. 482
Scortichini G, Annunziata L, Haounet MN, Benedetti F, Krusteva I, Galarini R. 2005.
ELISA qualitative screening of chloramphenicol in muscle, eggs, honey and milk: 484
method validation according to the Commission Decision 2002/657/EC criteria.
Analytica Chimica Acta 535:43-48. 486
Woodward KN. 1995. Antibiotic use in animal production in the European Union -
Regulation and current methods for residue detection. In: Oka H, Nakazava H, 488
Harada K, MacNeil JD, editors. Chemical Analysis for Antibiotics Used in
Agriculture Arlington: AOAC International. p 47. 490
Page 20 of 33
http://mc.manuscriptcentral.com/tfac Email: [email protected]
Food Additives and Contaminants
123456789101112131415161718192021222324252627282930313233343536373839404142434445464748495051525354555657585960
peer
-005
7729
4, v
ersi
on 1
- 17
Mar
201
1
For Peer Review O
nly
Page 21 of 21
Youden WJ, Steiner EH. 1975. Statistical Manual of the AOAC- Association of Official
Analytical Chemists. Gaithersburg, MD: AOAC International. p 33. 492
Page 21 of 33
http://mc.manuscriptcentral.com/tfac Email: [email protected]
Food Additives and Contaminants
123456789101112131415161718192021222324252627282930313233343536373839404142434445464748495051525354555657585960
peer
-005
7729
4, v
ersi
on 1
- 17
Mar
201
1
For Peer Review O
nly
SDi formula to be inserted in the Manuscript at line n. 343
Page 22 of 33
http://mc.manuscriptcentral.com/tfac Email: [email protected]
Food Additives and Contaminants
123456789101112131415161718192021222324252627282930313233343536373839404142434445464748495051525354555657585960
peer
-005
7729
4, v
ersi
on 1
- 17
Mar
201
1
For Peer Review O
nly
t formula to be inserted in the Manuscript at line 351
Page 23 of 33
http://mc.manuscriptcentral.com/tfac Email: [email protected]
Food Additives and Contaminants
123456789101112131415161718192021222324252627282930313233343536373839404142434445464748495051525354555657585960
peer
-005
7729
4, v
ersi
on 1
- 17
Mar
201
1
For Peer Review O
nly
Table I
Parameters of gentamicin EIA. Reported values are the mean ± standard
deviation relative to 10 calibration curves run on different days
Parameter Buffer calibration curve Milk calibration curve
OD max (zero st.) 1.32 ± 0.23 1.19 ± 0.21
LODa, ng ml
-1 3.02 ± 0.08 6.53 ± 0.11
IC80, ng ml-1
8.17 ± 1.18 12.32 ± 2.17
IC50, ng ml-1
36.60 ± 8.75 64.16 ± 19.26
slope - 0.953 ± 0.117 - 0.774 ± 0.143
R2 0.9995 ± 0.0005 0.9990 ± 0.0006
a LOD: zero standard OD – 3 standard deviations
Page 24 of 33
http://mc.manuscriptcentral.com/tfac Email: [email protected]
Food Additives and Contaminants
123456789101112131415161718192021222324252627282930313233343536373839404142434445464748495051525354555657585960
peer
-005
7729
4, v
ersi
on 1
- 17
Mar
201
1
For Peer Review O
nly
Table II
Parameters of neomycin EIA. Reported values are the mean ± standard
deviation relative to 10 calibration curves run on different days
Parameter Buffer calibration curve Milk calibration curve
OD max (zero st.) 1.13 ± 0.19 1.54 ± 0.14
LOD, ng ml-1
10.20 ± 0.40 48.47 ± 3.32
IC80, ng ml-1
22.54 ± 1.67 91.35 ± 19.35
IC50, ng ml-1
96.53 ± 10.80 334.07 ± 80.67
slope - 0.925 ± 0.088 - 0.971 ± 0.242
R2 0.9998 ± 0.0003 0.9988 ± 0.0014
Page 25 of 33
http://mc.manuscriptcentral.com/tfac Email: [email protected]
Food Additives and Contaminants
123456789101112131415161718192021222324252627282930313233343536373839404142434445464748495051525354555657585960
peer
-005
7729
4, v
ersi
on 1
- 17
Mar
201
1
For Peer Review O
nly
Table III
B/B0 values of blank and spiked milk samples (n = 20)
parameter sample I’screen Gentamicin I’screen Neomycin
blanks 106.95 ± 4.11 96.16 ± 2.82
0.33 MRL 93.81 ± 3,92 81.60 ± 3.58
0.5 MRL 85.77 ± 3.70 NDa
0.66 MRL NDa 69.86 ± 3.25
MRL 76.63 ± 2.53 63.17 ± 4.54
B/B0 (%)
CCα 80.78 70.61
β error (%) MRL 5 5
blanks 0 0
0.33 MRL 0 0
0.5 MRL 0 NDa
α error (%)
0.66 MRL NDa 50
a ND: not determined
Page 26 of 33
http://mc.manuscriptcentral.com/tfac Email: [email protected]
Food Additives and Contaminants
123456789101112131415161718192021222324252627282930313233343536373839404142434445464748495051525354555657585960
peer
-005
7729
4, v
ersi
on 1
- 17
Mar
201
1
For Peer Review O
nly
Table IV
B/B0 values of blank and spiked muscle samples (n = 20)
Parameter Sample I’screen Gentamicin I’screen Neomycin
blanks 98.53 ± 2.61 93.39 ± 2.96
0.25 MRL 95,03 ± 2.40 82.64 ± 1.96
MRL 84.04 ± 3.07 67.87 ± 2.07 B/B0 (%)
CCα 89.07 71.26
β error (%) MRL 0 0
blanks 0 0 α error (%)
0.25 MRL 0 0
Page 27 of 33
http://mc.manuscriptcentral.com/tfac Email: [email protected]
Food Additives and Contaminants
123456789101112131415161718192021222324252627282930313233343536373839404142434445464748495051525354555657585960
peer
-005
7729
4, v
ersi
on 1
- 17
Mar
201
1
For Peer Review O
nly
Table V
Ruggedness test results
I’screen Gentamicin I’screen Neomycin
Parameter Difference (Di) in %
recovery (absolute value) t- value
Difference (Di) in %
recovery (absolute value) t- value
Enzyme conjugate dilution factor 8.30 1.05 9.93 0.90
Enzyme conjugate batch 4.44 0.56 12.45 1.13
Assay temperature 0.01 0.00 2.30 0.21
Assay incubation time 8.89 1,13 4.92 0,45
Development incubation time 2.61 0.33 8.55 0.78
Number of washings 3.01 0.38 10.73 0.98
Kit storage temperature 14.97 1.90 16.92 1.54
SDi 10.79% 14.70%
Page 28 of 33
http://mc.manuscriptcentral.com/tfac Email: [email protected]
Food Additives and Contaminants
123456789101112131415161718192021222324252627282930313233343536373839404142434445464748495051525354555657585960
peer
-005
7729
4, v
ersi
on 1
- 17
Mar
201
1
For Peer Review O
nly
Figure 1. I’screen Gentamicin EIA calibration curves (mean ± SD, n=10). Two different calibration curves were applied depending on the samples: the milk standard curve in
case of milk and the buffer standard curve in case of tissue.
79x55mm (600 x 600 DPI)
Page 29 of 33
http://mc.manuscriptcentral.com/tfac Email: [email protected]
Food Additives and Contaminants
123456789101112131415161718192021222324252627282930313233343536373839404142434445464748495051525354555657585960
peer
-005
7729
4, v
ersi
on 1
- 17
Mar
201
1
For Peer Review O
nly
Figure 2. I'screen Neomycin EIA calibration curves (mean ± SD, n=10). Two different calibration curves were applied depending on the samples: the milk standard curve in
case of milk and the buffer standard curve in case of tissue.
79x55mm (600 x 600 DPI)
Page 30 of 33
http://mc.manuscriptcentral.com/tfac Email: [email protected]
Food Additives and Contaminants
123456789101112131415161718192021222324252627282930313233343536373839404142434445464748495051525354555657585960
peer
-005
7729
4, v
ersi
on 1
- 17
Mar
201
1
For Peer Review O
nly
Figure 3. Recoveries studies to assess the accuracy of milk samples testing (mean ± SD, n=20). 81x72mm (600 x 600 DPI)
Page 31 of 33
http://mc.manuscriptcentral.com/tfac Email: [email protected]
Food Additives and Contaminants
123456789101112131415161718192021222324252627282930313233343536373839404142434445464748495051525354555657585960
peer
-005
7729
4, v
ersi
on 1
- 17
Mar
201
1
For Peer Review O
nly
Figure 4. Recoveries studies to assess the accuracy of muscle samples testing (mean ± SD, n=20). 79x74mm (600 x 600 DPI)
Page 32 of 33
http://mc.manuscriptcentral.com/tfac Email: [email protected]
Food Additives and Contaminants
123456789101112131415161718192021222324252627282930313233343536373839404142434445464748495051525354555657585960
peer
-005
7729
4, v
ersi
on 1
- 17
Mar
201
1
For Peer Review O
nly
Figure Captions
Figure 1. I’screen Gentamicin EIA calibration curves (mean ± SD, n=10).
Two different calibration curves were applied depending on the samples: the milk standard curve in
case of milk and the buffer standard curve in case of tissue.
Figure 2. I’screen Neomycin EIA calibration curves (mean ± SD, n=10).
Two different calibration curves were applied depending on the samples: the milk standard curve in
case of milk and the buffer standard curve in case of tissue.
Figure 3. Recoveries studies to assess the accuracy of milk samples testing (mean ± SD, n=20).
Figure 4. Recoveries studies to assess the accuracy of muscle samples testing (mean ± SD, n=20).
Page 33 of 33
http://mc.manuscriptcentral.com/tfac Email: [email protected]
Food Additives and Contaminants
123456789101112131415161718192021222324252627282930313233343536373839404142434445464748495051525354555657585960
peer
-005
7729
4, v
ersi
on 1
- 17
Mar
201
1


