Embed Size (px)
Citation preview

Q J R Meteorol Soc (2004) 130 pp 827ndash852 doi 101256qj03118
Variational retrieval of temperature and humidity profiles using rain rates versusmicrowave brightness temperatures
By EMMANUEL MOREAU PHILIPPE LOPEZlowast PETER BAUER ADRIAN M TOMPKINSMARTA JANISKOVA and FREDERIC CHEVALLIER
European Centre for Medium-Range Weather Forecasts Reading UK
(Received 7 July 2003 revised 20 October 2003)
SUMMARY
This paper assesses the performance of two different approaches for the retrieval of temperature and humidityprofiles from the satellite passive microwave measurements of the Tropical Rainfall Measuring Mission (TRMM)and of the Special Sensor Microwave Imager in rainy areas Both methods are based on a one-dimensionalvariational retrieval (1D-Var) approach The input to the first one is rainfall rates estimated by a standard retrievalalgorithm from the raw brightness temperatures In the second technique 1D-Var directly uses the brightnesstemperatures The retrieval experiments utilize new simplified physical parametrizations of convection and large-scale condensation specially designed for variational assimilation as well as a microwave radiative-transfer model
Several tropical and midlatitude meteorological situations are studied In all cases it is found that both1D-Var approaches are able to converge satisfactorily and produce consistent temperature and specific-humidityincrements However the convergence of 1D-Var retrievals on surface rainfall rates and to a lesser extent of1D-Var retrievals on brightness temperatures is reduced when precipitation in the background is producedthrough convection and not by large-scale processes The results of the two 1D-Var methods are then comparedin brightness temperature and rainfall rate space and are validated against independent observations from theprecipitation radar on-board the TRMM Finally the sensitivity of the 1D-Var retrievals to the specification ofobservation-error statistics is studied
KEYWORDS Precipitation SSMI TRMM 1D-Var
1 INTRODUCTION
The assimilation of observations related to clouds and precipitation has becomean important issue for a number of operational weather-forecasting centres includingthe European Centre for Medium-Range Weather Forecasts (ECMWF) In particularthe representation of the hydrological cycle in numerical weather-prediction modelswill be one of the major challenges in the next few years Observations are alreadyavailable from the Tropical Rainfall Measuring Mission (TRMM) since 1997 fromthe satellites of the USArsquos Defense Meteorological Satellite Program (DMSP) since1987 from the Aqua mission since May 2002 and from the polar-orbiting satellitesof the USArsquos National Oceanic and Atmospheric Administration This study utilizesdata from the TRMM Microwave Imager (TMI) and from the DMSP Special SensorMicrowaveImager (SSMI) In the coming years an increasing amount of observationsrelated to clouds and precipitation is likely to become available from lidars radarssounders and imagers installed on board satellite missions such as the Special SensorMicrowave ImagerSounder (SSMIS 2003) CloudSat (2004) the Cloud-Aerosol Lidarand Infrared Pathfinder Satellite Observations mission (CALIPSO 2004) the NationalPolar-orbiting Operational Environmental Satellite System (NPOESS 2006) the GlobalPrecipitation Mission (GPM 2008) and the Earth Clouds Aerosols and RadiationExplorer (EarthCARE 2008) Maximizing the benefits from this huge source of datawill require the development of assimilation procedures capable of efficiently convertingthe information on clouds and precipitation into realistic increments applicable tothe forecast modelrsquos variables (temperature humidity wind and possibly clouds andprecipitation themselves)
lowast Corresponding author ECMWF Shinfield Park Reading Berkshire RG2 9AX UKe-mail PhilippeLopezecmwfintccopy Royal Meteorological Society 2004
827
828 E MOREAU et al
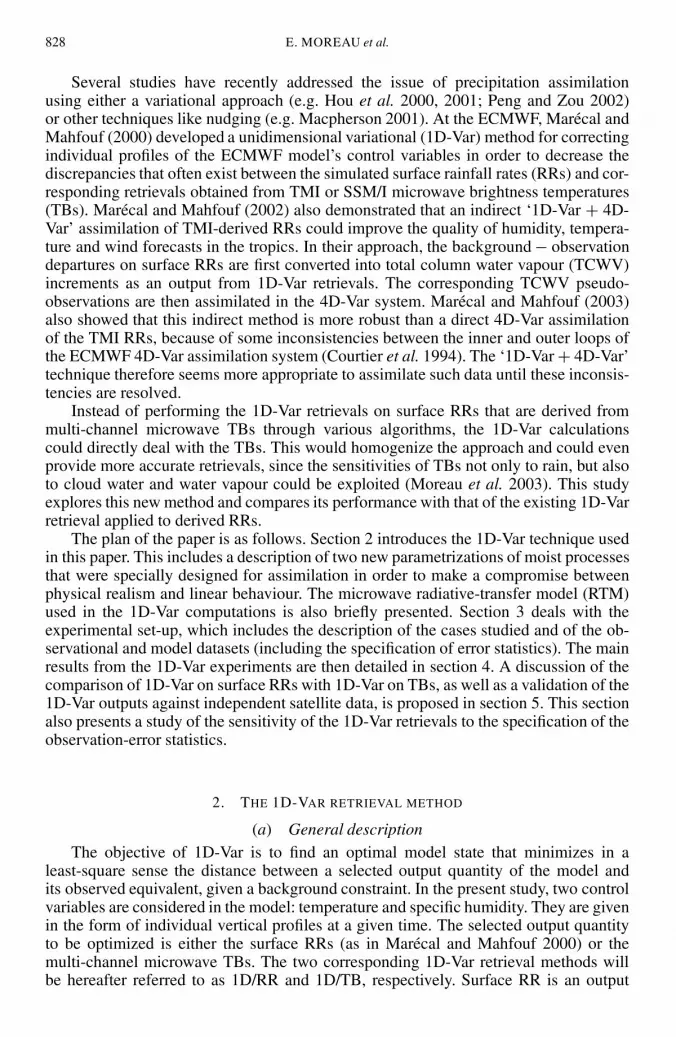
Several studies have recently addressed the issue of precipitation assimilationusing either a variational approach (eg Hou et al 2000 2001 Peng and Zou 2002)or other techniques like nudging (eg Macpherson 2001) At the ECMWF Marecal andMahfouf (2000) developed a unidimensional variational (1D-Var) method for correctingindividual profiles of the ECMWF modelrsquos control variables in order to decrease thediscrepancies that often exist between the simulated surface rainfall rates (RRs) and cor-responding retrievals obtained from TMI or SSMI microwave brightness temperatures(TBs) Marecal and Mahfouf (2002) also demonstrated that an indirect lsquo1D-Var + 4D-Varrsquo assimilation of TMI-derived RRs could improve the quality of humidity tempera-ture and wind forecasts in the tropics In their approach the background minus observationdepartures on surface RRs are first converted into total column water vapour (TCWV)increments as an output from 1D-Var retrievals The corresponding TCWV pseudo-observations are then assimilated in the 4D-Var system Marecal and Mahfouf (2003)also showed that this indirect method is more robust than a direct 4D-Var assimilationof the TMI RRs because of some inconsistencies between the inner and outer loops ofthe ECMWF 4D-Var assimilation system (Courtier et al 1994) The lsquo1D-Var + 4D-Varrsquotechnique therefore seems more appropriate to assimilate such data until these inconsis-tencies are resolved
Instead of performing the 1D-Var retrievals on surface RRs that are derived frommulti-channel microwave TBs through various algorithms the 1D-Var calculationscould directly deal with the TBs This would homogenize the approach and could evenprovide more accurate retrievals since the sensitivities of TBs not only to rain but alsoto cloud water and water vapour could be exploited (Moreau et al 2003) This studyexplores this new method and compares its performance with that of the existing 1D-Varretrieval applied to derived RRs
The plan of the paper is as follows Section 2 introduces the 1D-Var technique usedin this paper This includes a description of two new parametrizations of moist processesthat were specially designed for assimilation in order to make a compromise betweenphysical realism and linear behaviour The microwave radiative-transfer model (RTM)used in the 1D-Var computations is also briefly presented Section 3 deals with theexperimental set-up which includes the description of the cases studied and of the ob-servational and model datasets (including the specification of error statistics) The mainresults from the 1D-Var experiments are then detailed in section 4 A discussion of thecomparison of 1D-Var on surface RRs with 1D-Var on TBs as well as a validation of the1D-Var outputs against independent satellite data is proposed in section 5 This sectionalso presents a study of the sensitivity of the 1D-Var retrievals to the specification of theobservation-error statistics
2 THE 1D-VAR RETRIEVAL METHOD
(a) General descriptionThe objective of 1D-Var is to find an optimal model state that minimizes in a
least-square sense the distance between a selected output quantity of the model andits observed equivalent given a background constraint In the present study two controlvariables are considered in the model temperature and specific humidity They are givenin the form of individual vertical profiles at a given time The selected output quantityto be optimized is either the surface RRs (as in Marecal and Mahfouf 2000) or themulti-channel microwave TBs The two corresponding 1D-Var retrieval methods willbe hereafter referred to as 1DRR and 1DTB respectively Surface RR is an output
TEMPERATURE AND HUMIDITY PROFILE RETRIEVAL 829
from the modelrsquos convection and large-scale condensation parametrizations and can bederived from observed microwave TBs via a retrieval algorithm On the other hand TBscan be simulated by applying the parametrizations of moist processes to the modelrsquoscontrol variables followed by the application of a microwave RTM The main inputsto the latter model are precipitation content cloud water content cloud cover specifichumidity air and sea surface temperatures and surface wind speed In the present studythe 1D-Var method searches for the modelrsquos state vector x that minimizes the followingfunctional
J (x) = 12(x minus xb)
TBminus1(x minus xb) + 12 (H(x) minus yo)
TRminus1(H(x) minus yo) (1)
where xb is the background model state T is the transpose and H(x) is the nonlinearobservation operator that converts the modelrsquos variables into either surface RRs ormicrowave TBs yo denotes the corresponding observed quantity and R is the errorcovariance matrix of the observations which includes the instrumental errors and theerrors of H Matrix B contains the background-error covariances for the modelrsquos controlvariables (temperature and specific humidity) The result of the 1D-Var retrieval istherefore a combination of the background and of the observation weighted by theinverse of their respective error statistics
The minimization of the functional is performed using the quasi-Newton descentalgorithm (M1QN3) developed by Gilbert and Lemarechal (1989) It requires thecalculation of the gradient of the functional defined in Eq (1)
nablaJ (x) = Bminus1(x minus xb) + HTRminus1(H(x) minus yo) (2)
where HT is the transpose (or adjoint) of the Jacobian matrix of the nonlinear observa-tion operator H In this study H consists of new simplified parametrizations of convec-tion and large-scale condensation that are described in the next subsections In the caseof 1DTB H also includes the RTM designed by Bauer (2002) and Moreau et al (2002)that takes into account the scattering of microwave radiation in precipitating clouds
(b) Moist physics and the radiative-transfer model
(i) Convection Previous studies advocated an improvement of the linearized versionof the ECMWFrsquos parametrizations of moist processes especially convection to beused in the full 4D-Var and in the simpler 1D-Var algorithm developed by Marecaland Mahfouf (2000) A modified version of the operational convection scheme wastherefore developed for the future variational assimilation of clouds and precipitationobservations The modified mass-flux convection scheme was designed such as to retainsome basic similarities with the original mass-flux scheme from Tiedtke (1989) and atthe same time to remove the high degree of complexity of the latter which is a sourceof nonlinearities Its detailed description and evaluation are presented by Lopez andMoreau (2004) but its main features will be summarized here
All types of convection (shallow mid-level and deep) are treated in a similar wayIn particular the closure assumption that relates the model control variables to thesubgrid-scale cloud-base mass flux is expressed through a single formulation basedon the release of convective available potential energy in time In contrast with theoperational scheme the equations that describe the vertical evolution of the updraughtmass flux Mu (kg mminus2sminus1) and of the updraught thermodynamic variables u (ie dry
830 E MOREAU et al
static energy specific humidity and cloud condensate) are uncoupled
partMu
partz= (ε minus δ)Mu (3)
partu
partz= minusε(u minus ) (4)
where denotes field values in the environment and ε and δ are respectively thefractional entrainment and detrainment rates (in mminus1) This uncoupling allows theremoval of the iterative calculations involved in the operational code for updatingthe cloud-base mass flux thereby leading to an easier development of the adjointThe impact of this modification on the forecast is marginal
Convection is assumed to be activated only if the bulk convective updraught verticalvelocity remains positive at cloud base The updraught is assumed to originate from thesurface only if its initial vertical velocity as calculated from the surface heat fluxes usingEq (15b) of Holtslag and Moeng (1991) is positive The departures of the updraughtfrom the environment are also assumed to be dependent on the surface heat fluxes Ifconvection cannot be initiated from the surface the convective ascent may originatefrom higher levels provided relative humidity exceeds 80 In this case the initialvertical velocity of the bulk updraught is set equal to 1 m sminus1 Regardless of whether theupdraught originates from the surface or higher up the vertical evolution of its kineticenergy is computed following Simpson and Wiggert (1969)
Based on Siebesma and Jakob (personal communication) ε is parametrized ascε(z minus zst) + 10minus5 mminus1 where cε is a coefficient equal to 05 and zst is the startingaltitude of the updraught (in metres) For the detrainment δ is set equal to ε exceptclose to cloud top where a constant organized detrainment rate is added (δ = ε + 2 times10minus4 mminus1)
Simplified calculations of downdraughts and convective momentum transport basedon the operational scheme (Tiedtke 1989) are also included in the new parametrizationMore importantly the precipitation formation rate is made proportional to the updraughtcloud water content as in Tiedtke (1989)
Reasonably well-behaved physical parametrizations in terms of linearity are neces-sary to ensure the convergence of the 1D-Var retrievals Therefore the linear behaviourof the modified convection scheme compared with the operational one has also beenassessed through the calculations of nonlinear residuals For the nonlinear convectionscheme M and its tangent-linear version Mprime the nonlinear residuals are defined as
RESNL = M(x + λδx) minus M(x) minus Mprime[x]λδ(x) (5)
where x denotes input vertical profiles of temperature T and specific humidity qThe residuals have been computed for the convective tendencies partT partt and partqparttthat are produced by the convective parametrization The calculations of Eq (5) havebeen repeated for values of the perturbation scaling factor λ ranging from minus1 tominus10minus5 and from 10minus5 to 1 The reference vector of perturbations δx was set equalto typical values of the standard deviation of the background model errors An exampleof vertical profiles of such errors is shown in Fig 1 Table 1 gives the correspondencebetween model levels and pressure levels Figure 2 shows nonlinear residuals averagedover 100 convective profiles that are obtained when specific-humidity perturbationsof varying size are applied on model level 60 Results are displayed for the lowestmodel level because input perturbations imposed there result in maximum changesin the profiles of convective tendencies The x-axis gives the values of the unitless
TEMPERATURE AND HUMIDITY PROFILE RETRIEVAL 831
00 05 10 15 20 25Background error on T and q
60
50
40
30
20
Mod
el le
vel
q
T
Figure 1 Vertical profiles of typical values of the standard deviation of the model background errors ontemperature (T ) and specific humidity (q) Units are in K and g kgminus1 respectively
TABLE 1 PRESSURE ON EVERY FIVEMODEL LEVELS BETWEEN LEVELS 20AND 60 VALUES ARE GIVEN ASSUMINGA SURFACE PRESSURE OF 101325 hPa
Model level number Pressure (hPa)
20 3625 9630 20235 35340 53945 72850 88455 97960 1012
scaling factor λ that is applied to the input reference perturbation of specific humidityon model level 60 This normalization permits the comparison of the residuals obtainedwith the two parametrizations and the smaller the values of the plotted field the morevalid the linear assumption Figure 2 demonstrates that the nonlinear residuals are atleast one order of magnitude smaller with the new scheme than with the operationalone Asymmetries about the y-axis result from the fact that large negative moistureperturbations at the surface turn off convection thereby leading to a less linear behaviourof the scheme Note that similar conclusions can be drawn when input perturbations areimposed on temperature instead of specific humidity (Lopez and Moreau 2004)
(ii) Clouds Tompkins and Janiskova (2003) have recently developed a new statisticaldiagnostic cloud scheme that is intended to be implemented in place of the simplifiedparametrization currently used in the ECMWFrsquos 4D-Var tangent-linear and adjointcalculations (Janiskova et al 2002) A uniform probability density function (PDF) was
832 E MOREAU et al
-100 -10-2 -10-4 104 102 100
Scaling factor on q60 perturbation
60
50
40
30M
odel
leve
ls
-10-7
-7
-4
-4
-2
-2
-1
-1
-1
-1
a
-100 -10-2 -10-4 104 102 100
Scaling factor on q60 perturbation
60
50
40
30
Mod
el le
vels
-10
-10
-7
-7
-4
-4
-2
-2
b
-100 -10-2 -10-4 104 102 100
Scaling factor on q60 perturbation
60
50
40
30
Mod
el le
vels
-10
-10
-7
-7
-4
-4
-2
-2
-2
-1
-1
c
-100 -10-2 -10-4 104 102 100
Scaling factor on q60 perturbation
60
50
40
30M
odel
leve
ls
-10
-7
-7 -4
-4
-2
-2
-2
d
Figure 2 Nonlinear residuals of convective (a) and (b) temperature and (c) and (d) specific-humidity tendenciesas functions of model levels (y-axis) and of the size of the input specific-humidity (q) perturbation imposed onmodel level 60 (x-axis) This size is labelled according to the values of the scaling factor λ applied to the inputreference perturbation of specific humidity on model level 60 The displayed residuals have been averaged over100 convective profiles The field actually plotted is log10 (RESNLRESmax
NL ) where RESmaxNL denotes the maximum
value of the residual for a given pair of inputoutput parameters and for both studied convection schemes (ie fora given row of the figure) (a) and (c) operational scheme (b) and (d) new scheme
chosen to describe the subgrid-scale fluctuations of temperature and total water in orderto make adjoint developments easier and to ensure a reasonable degree of consistencywith the scheme used in the full operational forecast model (Tiedtke 1993) The width ofthe PDF is assumed to increase linearly when relative humidity RH varies from 100down to a critical threshold RH0 beyond which cloud formation occurs Both the slopeof this linear dependence and RH0 are functions of the normalized pressure verticalcoordinate PPsurf where P is the pressure on the current level and Psurf is the surfacepressure In particular RH0 ranges from 50 in the mid-troposphere to 85 at thesurface and at upper levels
Large-scale cloud cover is expressed as a function of RH and RH0 while con-vective cloud cover depends on the diagnostic source term associated with convective
TEMPERATURE AND HUMIDITY PROFILE RETRIEVAL 833
detrainment The new simplified cloud scheme includes a parametrization of precipita-tion generation inspired from Sundqvist et al (1989) and an original parametrization ofprecipitation evaporation based on the subgrid-scale variability of total water
Tompkins and Janiskova (2003) show that the linearity of the new simplified cloudscheme is suitable for its use in 1D-Var and 4D-Var
(iii) Microwave radiative transfer For simulating the radiative transfer in clouds andprecipitation for large data volumes the fast modelling framework RTTOVlowast (Eyre 1991Saunders et al 2002) has been chosen The multiple scattering is simulated applying theδ-Eddington approximation that has proven to provide sufficient accuracy (Kummerow1993) at microwave frequencies All hydrometeor types (rain snow cloud liquid waterand cloud ice) are assumed to be spherical and their optical properties are taken frompre-calculated look-up Mie tables to increase numerical efficiency (Bauer 2002) For thepurpose of variational retrievals as well as to increase computational efficiency thetangent-linear and the adjoint versions of the RTM are employed
3 EXPERIMENTAL SET-UP
(a) Meteorological eventsThree recent meteorologically interesting events have been identified for running
1D-Var two tropical cyclones well sampled by both the TMI and the TRMM precipita-tion radar (PR) and one extratropical front with a good observational coverage from theSSMI These cases were correctly forecast by the ECMWF operational model in termsof location but not with regards to their structure and rain intensity
The first selected situation features super-typhoon Mitag that developed over thewestern Pacific in early March 2002 1D-Var has been tested at 1200 UTC 5 March2002 when the super-typhoon reached its maximum intensity just east of the Philippines(estimated mean-sea-level pressure minimum of 930 hPa located at 142N 1299E)
The second event is tropical cyclone Zoe that developed over the western Pacificin the vicinity of the Fiji Islands between 25 December 2002 and 31 December 20021200 UTC 26 December 2002 was the date selected for running the 1D-Var At that timethe storm was in its intensification phase and its central pressure minimum of 975 hPawas located at 107S 1741E
The third case is an extratropical front that developed over the North Atlanticin January 2002 and which was dominated by large-scale precipitation The 1D-Varexperiment was run on the meteorological situation at 1200 UTC 9 January 2002
(b) ObservationsFor super-typhoon Mitag and tropical cyclone Zoe TMI data from the two TRMM
satellite orbits at 1100 UTC 5 March 2002 and 1400 UTC 26 December 2002 have beenused respectively In the case of the midlatitude front the 1D-Var experiments havebeen based on SSMI data at 1130 UTC 9 January 2002
Various algorithms have been tested for retrieving surface rainfall amounts from themulti-channel microwave TBs observed by the TMI and SSMI For TMI data both theTRMM standard rainfall product 2A12 (Kummerow et al 2001) and the Precipitationradar Adjusted TMI Estimation of Rainfall (PATER Bauer et al 2001) retrievals havebeen used PATER employs independent rainfall estimates from the TMI and PR overtheir common swath to derive a rain-dependent calibration curve A similar principle
lowast Radiative Transfer for TIROS (Television Infrared Observation Satellite) Operational Vertical sounder
834 E MOREAU et al
is applied here in order to apply PATER to SSMI data (PATER-SSMI thereafter)by simulating the SSMI observations with TMI data that is by reducing the spatialresolution and selecting the common channels
TMI surface RRs derived with 2A12 and PATER have been used in the cases ofMitag and Zoe Three retrieval algorithms namely PATER-SSMI (described above)Bauer and Schluessel (1993) and Ferraro et al (1996) have been utilized on SSMITBs in the midlatitude frontal case All observed rainfall retrievals have then beenaveraged onto the Gaussian grid of the ECMWF model that corresponds to a T511spectral truncation (ie to a grid-point resolution of about 40 km) so that observationand model points are co-located The standard deviations of the observation errors σobson the retrieved RRs have been arbitrarily set equal to 50 of the rainfall rate forBauerndashSchluessel and Ferraro For the 2A12 algorithm the rainfall-dependent errorsderived by LrsquoEcuyer and Stephens (2002) have been applied For PATER the errorshave been calculated according to Bauer et al (2002) Finally a minimum thresholdof 005 mm hminus1 has been assigned to σobs for all algorithms so as to keep a non-zeroobservation error at non-rainy points
When using TMI and SSMI TBs directly in the 1D-Var retrieval the observed valueat each model grid point has been set equal to the value at the closest TMI pixel ineach microwave channel in order to avoid interpolation problems For TBs σobs hasbeen set to 3 K (6 K) for the vertically (horizontally) polarized channels assuming noerror correlations between channels These σobs values are supposed to represent thecontributions from both the instrumental errors and the errors in the observation opera-tor The uncertainties in the RTM may arise both from the δ-Eddington approximation(Moreau et al 2002) as well as from the microphysical assumptions in particular ondrop size distributions and on the fall velocity shape and density of hydrometeorsLarger values of σobs are specified for the horizontal polarization to account for thehigher natural variability of microwave TBs observed with this polarization
Ideally the observation errors in 1D-Var should also include the errors of theforward model but these errors are currently neglected because they are difficult toestimate especially for the moist physics parametrizations The sensitivity of the 1D-Varretrievals to the specification of matrix R is assessed in section 5(c)
Finally it should be mentioned that at the end of the minimization each 1D-Varretrieval is quality controlled by rejecting it if the analysis minus observation departureexceeds plusmn3σobs In this case the retrieval is reset to the background
(c) Background fieldsThe modelrsquos background fields that enter the 1D-Var have been obtained from
three 12-hour T511 integrations of the ECMWF model that were started at 0000 UTC5 March 2002 for Mitag at 0000 UTC 26 December 2002 for Zoe and at 0000 UTC9 January 2002 for the North Atlantic front The input fields include the vertical profilesof temperature and water vapour but also some temperature and specific-humiditytendencies the surface heat fluxes and the surface momentum stress that are neededfor running the modified convection scheme described in subsection 2(b)(i) For 1DTBthe use of the RTM requires additional input fields namely 10 m wind speed surfacetemperature and 2 m temperature and humidity The covariance matrix of backgrounderrors B is taken from the operational ECMWF 4D-Var system (Rabier et al 1997)Figure 1 shows typical values of the standard deviation of the model backgrounderrors on temperature and specific humidity which appear along the leading diagonalof matrix B The assumption is made that the temperature and specific-humidity errorsare uncorrelated
TEMPERATURE AND HUMIDITY PROFILE RETRIEVAL 835
10degN10degN
15degN 15degN
125 E
125degE 130degE
130 E 135 E
135degE01
05
1
3
5
10
20
50
10degN10degN
15degN 15degN
125degE 130degE 135degE01
05
1
3
5
10
20
50
10degN10degN
15degN 15degN
125degE 130degE 135degE01
05
1
3
5
10
20
50
10degN10degN
15degN 15degN
125degE 130degE 135degE01
05
1
3
5
10
20
50
10degN10degN
15degN 15degN
125degE 130degE 135degE01
05
1
3
5
10
20
50
(a)
(b) (c)
(d) (e)
Figure 3 1D-Var on TMI-derived surface rainfall rates for the case of super-typhoon Mitag at 1200 UTC 5 March2002 rain rates from (a) model background (b) 2A12 (d) PATER and (c) and (e) from the corresponding 1DRRanalysis Units are in mm hminus1 The white hatched area indicates the region where surface convective rainfall
represents more than 50 of the total surface rainfall See text for further explanation
4 RESULTS
(a) Super-typhoon Mitag(i) 1D-Var on TMI surface rainfall retrievals Figure 3 displays the results for the1D-Var experiments on super-typhoon Mitag Figure 3(a) shows the model backgroundsurface RRs (b) the observed RRs as retrieved with the 2A12 algorithm from the TMITBs and (c) the 1D-Var retrievals of surface RRs Figures 3(d) and (e) display the samequantities when the PATER algorithm is utilized Although some heavy rain is correctlysimulated by the model in the vicinity of the typhoonrsquos core panel (a) indicates that thebackground clearly differs from the observations in the western periphery of the storm
836 E MOREAU et al
Indeed three regions with heavy precipitation that do not appear in the TMI observationsare simulated by the model
Figures 3(c) and (e) demonstrate that the 1D-Var procedure is able to correct theinitial temperature and specific-humidity profiles in such a way that the 1D-Var retrievedrainfall gets rather close to the observations This improvement on the picture of thesimulated typhoon results from both the increase and the decrease of precipitationat places where the observed value is higher respectively lower than the modelrsquosbackground value However it should be emphasized that 1DRR is efficient only atpoints where the background precipitation is non-zero At locations where the initialsimulated rainfall rate is zero the Jacobian matrix H is zero which implies thatthe minimization is ineffective Such points are rejected a priori from the 1D-Varcalculations The rainfall patterns which appear to the south-east of the storm inFigs 3(c) and (e) are created because very light precipitation (below 01 mm hminus1) isalready present there in the background (Fig 3(a)) In fact 1DRR performs ratherwell in the present case because the new simplified large-scale condensation schemeproduces widespread very light rainfall amounts around the storm which admits moreobservations to the retrieval procedure The production of more widespread precipitationin the tropics compared with the operational scheme can be partly explained bythe revised rainfall evaporation formulation used in the simplified parametrization(Tompkins and Janiskova 2003) Earlier 1D-Var tests with a simpler parametrizationthat generated more confined precipitation led to much less satisfactory analysed surfaceRRs
The convergence of the minimization is usually satisfactory except at a few gridpoints for which the analysed RRs remain far from the observations due to nonlinearitiesin the observation operator H One should also note that the observed TMI RRs fromPATER are substantially lower than the ones obtained from 2A12 Such a differencewas already demonstrated by Marecal et al (2002) Generally the agreement of the1D-Var retrieved RRs with the corresponding observed values is better when usingPATER retrievals than with 2A12 data which can be explained by the fact that thebackground is closer to PATER than to 2A12
Figure 4 displays the vertical profiles of temperature and specific-humidity incre-ments averaged over the geographical domain of Fig 3 when 1DRR is applied toPATER rainfall retrievals Increment profiles from 1DRR on 2A12 RRs are not shownbecause they are very similar to those obtained from PATER data The distinction ismade between points for which the background RR is either larger or lower than thevalue retrieved from the TMI These profiles clearly indicate that the reduction (increase)of the model surface rainfall by the 1D-Var retrieval is achieved through a drying andheating (moistening and cooling) of the troposphere below 300 hPa This latter resultcan be readily explained by the fact that these increments are mainly obtained byactivating the large-scale condensation scheme and not the convective parametrizationSuch behaviour was previously found by Fillion and Mahfouf (2000) A simple con-version of the temperature increments into equivalent increments of saturation specifichumidity shows that the 1D-Var corrections on temperature are approximately four timessmaller than the corrections on specific humidity at all levels which confirms the resultsof Marecal and Mahfouf (2000) However this conclusion is likely to depend on thetype of parametrizations used for describing moist processes
Since the specific-humidity increments largely exceed those of temperature (whenconverted into saturation specific-humidity equivalents) the global impact of the 1D-Varprocedure on the model state can be synthesized in Fig 5 which shows the TCWV back-ground field and the corresponding increments for the 2A12 and PATER experiments
TEMPERATURE AND HUMIDITY PROFILE RETRIEVAL 837
03 00 03Mean T increments (K)
60
50
40
30
21
Mod
el le
vels
RbgtRo
RbltRo
15 00 15Mean q increments (g kg 1)
60
50
40
30
21
Mod
el le
vels
RbgtRo
RbltRo(a) (b)
Figure 4 1D-Var on TMI-derived surface rainfall rates (see text) for the case of super-typhoon Mitag at1200 UTC 5 March 2002 mean vertical profiles of the increments in (a) temperature (T ) and (b) specific humidity(q) when using rainfall observations from the PATER algorithm Cases for which the background rainfall rate Rbis smaller (larger) than the observed value Ro are plotted with a dashed line (full line) Model level 60 is close to
the surface and model level 21 roughly corresponds to 50 hPa
This figure indicates that in both cases positive increments reaching 5 kg mminus2 (negativeincrements down to minus10 kg mminus2) are needed to increase (decrease) the backgroundsurface rainfall rates towards the observed values
(ii) 1D-Var on TMI brightness temperatures Other 1D-Var retrievals were obtainedwith the minimization directly performed on the TMI brightness temperatures at 1019 22 and 37 GHz in vertical polarization and at 10 19 and 37 GHz in horizontalpolarization Figure 6 displays the corresponding retrieved surface RRs Increasingthe number of microwave channels used in the 1D-Var retrieval is expected to bebeneficial especially because of their complementary sensitivity to temperature watervapour cloud water and precipitation For instance the use of the 10 GHz TBs thatare particularly sensitive to the rain content avoids the saturation of the signal (ie theweak sensitivities) that occurs in other channels in heavy-rain regions However addingchannels also implies that more constraints are imposed during the minimization whichmay hamper convergence if the relation between the TBs and the model control variablebecomes strongly nonlinear The occurrences of non-convergence can be reduced bynot using the 37 GHz channels when the depolarization of observed and simulated TBsdoes not exceed a specified fraction of the simulated clear-sky depolarization It wasfound that setting this fraction to 15 reduces the number of cases of non-convergenceby 40 Note that the 85 GHz channels have been discarded for the time being dueto their strong sensitivity to ice for which the radiative-transfer calculations may notbe as accurate as for the liquid phase Figure 6 illustrates the fact that 1DTB is ableto generate temperature and specific-humidity increments that lead to a substantialimprovement on the simulated surface RRs Indeed the background RRs (Fig 3(a))exhibited large discrepancies with respect to the observations (Figs 3(b) and (d))whereas a much better agreement is obtained with 1DTB (Fig 6) However thediscrepancies between observed and analysed RRs are larger with the TB approachthan with the method based on rainfall retrievals (Figs 3(c) and (e)) This is due tothe fact that the temperature and specific-humidity increments result from simultaneous
838 E MOREAU et al
10degN10degN
15degN 15degN
125degE 130degE 135degE
50
55
60
65
70
7351
10degN10degN
15degN 15degN
125degE 130degE 135degE-20
-10
-3
-1
1
3
10
20
10degN10degN
15degN 15degN
125degE 130degE 135degE-20
-10
-3
-1
1
3
10
20
(a)
(b)
(c)
Figure 5 1D-Var on TMI-derived surface rainfall rates for the case of super-typhoon Mitag at 1200 UTC 5 March2002 (a) background field of TCWV (b) TCWV increments from 1DRR on 2A12 rain data and (c) TCWV
increments from 1DRR on PATER rain data Units are in kg mminus2 See text for further explanation
TEMPERATURE AND HUMIDITY PROFILE RETRIEVAL 839
10degN10degN
15degN 15degN
125degE 130degE 135degE01
05
1
3
5
10
20
50
Figure 6 1D-Var on TMI microwave brightness temperatures for the case of super-typhoon Mitag at 1200 UTC5 March 2002 1D-Var retrieved surface rainfall rates in mm hminus1 See text for further explanation
corrections applied to the rain profiles but also to the profiles of cloud water Preliminarytests with less channels showed that adding the 10 GHz and 37 GHz channels leads to aslight increase of the surface RRs inside the storm and to a further decrease in its vicinityThe minimization only fails to converge at a few points and in the north-west peripheryof the super-typhoonrsquos core There the departures between simulated and observed TBsreach such high values that the minimization problem becomes highly nonlinear so thatno reasonable analysis increments can lead to the expected decrease of the simulatedsurface RRs
Figure 7 shows the vertical profiles of temperature and specific-humidity incrementsproduced by 1DTB In terms of shape they look rather similar to the profiles obtainedwith 1DRR in Fig 4 However as far as their magnitude is concerned temperatureincrements tend to be smaller with the TB approach and the maximum increment atlevel 50 (around 850 hPa) that was seen in Fig 4(a) is not present in Fig 7(a) On theother hand the specific-humidity increments again dominate and are about twice as highwhen TBs are used in the minimization instead of surface RRs
Figure 8 displays maps of the TCWV increments obtained from 1DTB Their spatialdistribution looks very similar to the one shown in Fig 5 for 1DRR with positiveTCWV corrections in the core of the storm and negative values around it It is reassuringthat two very different 1D-Var methods can lead to consistent increment patternsHowever their magnitude is much stronger with absolute values exceeding 20 kg mminus2
locally As already mentioned these larger TCWV increments can be explained by thefact that when working with TBs it is not only the amount of rain that is corrected butalso the amounts of water vapour and cloud water The spotty increments to the southof the storm are due to the fact that observed TBs are interpolated onto the model gridusing the closest-point approach
(b) Tropical cyclone ZoeIn the case of Zoe Fig 9 shows that 1DRR increments improve the surface RRs
with respect to the PATER retrieval However and contrary to the case of Mitag for
840 E MOREAU et al
03 00 03Mean T increments (K)
60
50
40
30
21
Mod
el le
vels
RbgtRo
RbltRo
15 00 15Mean q increments (g kg 1)
60
50
40
30
21
Mod
el le
vels
RbgtRo
RbltRo(a) (b)
Figure 7 1D-Var on TMI microwave brightness temperatures for the case of super-typhoon Mitag at 1200 UTC5 March 2002 mean vertical profiles of the increments in (a) temperature (T ) and (b) specific humidity (q)
Same plotting conventions as in Fig 4 See text for further explanation
10degN10degN
15degN 15degN
125degE 130degE 135degE-20
-10
-3
-1
1
3
10
20
Figure 8 1D-Var on TMI microwave brightness temperatures for the case of super-typhoon Mitag at 1200 UTC5 March 2002 TCWV increments in kg mminus2 See text for further explanation
which an almost perfect match to the observations was achieved the improvement ismainly visible in the core of Zoe while the rainfall amounts in the spiralling rainbandsin the western and southern periphery are not reduced enough Even in the central partof the storm the analysed rainfall amounts are still lower than the observed values
Comparison of the hatched areas in Fig 3(a) and Fig 9(a) shows that for Mitagmost of the simulated precipitation is fully resolved by the model (large-scale ascent)while in the case of Zoe it mainly originates from the convection scheme (subgrid-scale processes) The fact that the convective parametrization is still more likely to
TEMPERATURE AND HUMIDITY PROFILE RETRIEVAL 841
15degS 15degS
10degS10degS
170degE 175degE01
05
1
3
5
10
20
50
WB
SB
15degS 15degS
10degS10degS
170degE 175degE01
05
1
3
5
10
20
50
15degS 15degS
10degS10degS
170degE 175degE01
05
1
3
5
10
20
50
(a)
(b)
(c)
Figure 9 1D-Var on TMI-derived surface rainfall rates for the case of tropical cyclone Zoe at 1200 UTC26 December 2002 rain rates from (a) model background (b) PATER and (c) from the corresponding 1D-Var
analysis Labels (WB) and (SB) indicate the western and southern rainbands mentioned in the text
842 E MOREAU et al
15degS 15degS
10degS10degS
170degE 175degE01
05
1
3
5
10
20
50
Figure 10 1D-Var on TMI microwave brightness temperatures for the case of tropical cyclone Zoe at 1200 UTC26 December 2002 1D-Var retrieved surface rainfall rates in mm hminus1 See text for further explanation
suffer from nonlinearities than the large-scale condensation scheme explains the lesssuccessful performance of 1DRR in the case of Zoe
With 1DTB the analysed RRs (Fig 10) exhibit strong modifications compared withthe background Although observed surface RRs are not directly involved in 1DTBminimization the overall improvement on this field looks better than with 1DRRIndeed when compared with PATER observations (Fig 9(b)) one can see that 1DRRis not able to remove the western and southern rainbands present in the background(respectively labelled WB and SB in Fig 9(a)) and that it leads to a less satisfactorydescription of the north-eastern part of the storm The intensity of the RRs reaches valueslarger than 10 mm hminus1 that correspond to positive TCWV increments of up to 10 kg mminus2
locally (not shown) TCWV increments are again much stronger and more widespreadwith 1DTB than with 1DRR (not shown) In contrast with the case of 1DRR theperformance of 1DTB is not much affected by the fact that convection dominates inthe background Nonlinearities in the convection scheme are indeed less detrimental in1DTB than in 1DRR because TBs are influenced by the full vertical profiles of cloudwater and precipitation and are also directly related to specific humidity beside anyexplicit link via the moist physics
(c) A mid-latitude frontFigure 11 shows the 1DRR results for the midlatitude front The modelrsquos back-
ground RRs are systematically higher than the three SSMI observations However thegeographical location and structure of the simulated frontal rainband matches the obser-vations rather well These characteristics are very similar to the general behaviour of theECMWF forecasting system (Chevallier and Bauer 2003) that uses more elaborate moistphysical parametrizations Again the 1D-Var method is able to correct the temperatureand specific-humidity increments so that the 1D-Var retrieved surface RRs match almostperfectly the available SSMI observations Figures 11(b) (d) and (f) show respectivelythat significant differences are found between the rain fields retrieved with PATER-SSMI BauerndashSchluessel and Ferraro which is one of the major limitations of 1DRR
TEMPERATURE AND HUMIDITY PROFILE RETRIEVAL 843
35degN35degN
40degN 40degN
45degN45degN
50degN 50degN
55degN55degN
55degW 50degW 45degW 40degW 35degW 30degW01
05
1
3
5
10
20
50
35degN35degN
40degN 40degN
45degN45degN
50degN 50degN
55degN55degN
55degW 50degW 45degW 40degW 35degW 30degW01
05
1
3
5
10
20
50
35degN35degN
40degN 40degN
45degN45degN
50degN 50degN
55degN55degN
55degW 50degW 45degW 40degW 35degW 30degW01
05
1
3
5
10
20
50
35degN35degN
40degN 40degN
45degN45degN
50degN 50degN
55degN55degN
55degW 50degW 45degW 40degW 35degW 30degW01
05
1
3
5
10
20
50
35degN35degN
40degN 40degN
45degN45degN
50degN 50degN
55degN55degN
55degW 50degW 45degW 40degW 35degW 30degW01
05
1
3
5
10
20
50
35degN35degN
40degN 40degN
45degN45degN
50degN 50degN
55degN55degN
55degW 50degW 45degW 40degW 35degW 30degW01
05
1
3
5
10
20
50
35degN35degN
40degN 40degN
45degN45degN
50degN 50degN
55degN55degN
55degW 50degW 45degW 40degW 35degW 30degW01
05
1
3
5
10
20
50
(a)
(b) (c)
(d) (e)
(f) (g)
Figure 11 1D-Var on SSMI-derived surface rainfall rates for the case of the North Atlantic front at 1200 UTC9 January 2002 rain rates from (a) model background (b) PATER (d) BauerndashSchluessel (f) Ferraro and (c) (e)
and (g) from the corresponding 1DRR analysis Units are in mm hminus1 See text for further explanation
844 E MOREAU et al
35degN35degN
40degN 40degN
45degN45degN
50degN 50degN
55degN55degN
55degW 50degW 45degW 40degW 35degW 30degW
15
20
25
30
35
40
4430
35degN35degN
40degN 40degN
45degN45degN
50degN 50degN
55degN55degN
55degW 50degW 45degW 40degW 35degW 30degW-10
-4
-2
-1
1
2
4
10
35degN35degN
40degN 40degN
45degN45degN
50degN 50degN
55degN55degN
55degW 50degW 45degW 40degW 35degW 30degW-10
-4
-2
-1
1
2
4
10
35degN35degN
40degN 40degN
45degN45degN
50degN 50degN
55degN55degN
55degW 50degW 45degW 40degW 35degW 30degW-10
-4
-2
-1
1
2
4
10
(a) (b)
(c) (d)
Figure 12 1D-Var on SSMI-derived surface rainfall rates for the case of the North Atlantic front at 1200 UTC9 January 2002 (a) background field of TCWV and TCWV increments when using surface rainfall rates from
(b) PATER (c) BauerndashSchluessel and (d) Ferraro Units are in kg mminus2 See text for further explanation
The vertical profiles of temperature and specific-humidity increments (not shown) ex-hibit a shape comparable with the one that was found for super-typhoon Mitag but theiramplitude is substantially lower due to the smaller surface rainfall departures betweenbackground and observations Since the background field tends to overestimate the sur-face precipitation almost systematically over the domain Fig 12 shows that negative1D-Var TCWV increments dominate with extreme values reaching minus5 kg mminus2 locallyThe values and horizontal structure of the increments look very comparable with allthree retrieval algorithms
Figure 13 displays the analysed surface RRs for the midlatitude front with 1DTBusing SSMI observations The main change with respect to the background fieldshown in Fig 11(a) is the reduction of the intensity in the southern part of the frontalrainband (below 40N) and the slight reshaping of the front These modifications in theanalysis surface RRs are also present in Fig 14 that shows positive 1D-Var TCWVincrements in the western part of the rainband that locally exceed 4 kg mminus2 withnegative increments over the rest of the domain The analysed RRs agree fairly wellwith all three RR retrievals and in particular with the Ferraro algorithm (Fig 11(e))It should be mentioned that the unchanged light-rainfall values in the wake of the frontcorrespond to grid points that were not treated in 1DTB to save computational time(minimum threshold of 03 mm hminus1 in the background)
TEMPERATURE AND HUMIDITY PROFILE RETRIEVAL 845
35degN35degN
40degN 40degN
45degN45degN
50degN 50degN
55degN55degN
55degW 50degW 45degW 40degW 35degW 30degW01
05
1
3
5
10
20
50
Figure 13 1D-Var on SSMI microwave brightness temperatures for the case of the North Atlantic front at1200 UTC 9 January 2002 1D-Var retrieved surface rainfall rates in mm hminus1 See text for further explanation
35degN35degN
40degN 40degN
45degN45degN
50degN 50degN
55degN55degN
55degW 50degW 45degW 40degW 35degW 30degW-10
-4
-2
-1
1
2
4
10
Figure 14 As Fig 13 but for TCWV increments in kg mminus2 See text for further explanation
5 EVALUATION
It was shown that 1DRR and 1DTB lead to consistent results both in terms ofanalysed RRs and TCWV increments This section deals with the evaluation of thetwo methods based on SSMI and TRMM data that are the only reliable observationsavailable in precipitation areas over ocean First the two methods are statisticallycompared in TB and RR space Then the consistency of the vertical profiles of analysedRRs is assessed using measurements from the TRMMPR for tropical cyclones Mitag
846 E MOREAU et al
and Zoe Finally an assessment of the impact of the observation-error statistics on the1DTB retrievals is presented
(a) Evaluation in TB and RR spaceFor each of the three meteorological cases TBs have been computed from the
background fields and from the analyses given by the two methods using the RTM de-scribed in subsection 2(b)(iii) The biases and the standard deviations of background minusobservation and analysis minus observation departures are shown in Table 2 for Mitag Zoeand the midlatitude front and for each available microwave frequency Statistics referto the common points where both methods successfully converged In all histogramsthe standard deviation of the analysis departures both for 1DTB and 1DRR is reducedwith respect to the background departures The reduction is always three to four timeslarger with 1DTB than with 1DRR for all channels This is due to the fact that TBs aredirectly involved in the cost function of 1DTB
The biases of 1DRR and 1DTB analyses are generally reduced when comparedwith the background The amount depends on the meteorological case and microwavechannel In the Mitag case the bias of the background departure is small compared withthe other cases with values lower than 5 K except at 37 GHz The two analyses andthe background exhibit similar biases except at 37 GHz where a noticeable decreaseis found In fact the larger negative biases of background departures for the 37 GHzchannels are an artefact of the saturation of the microwave signal in the rainy core ofthe storm that implies the absence of offsetting large positive biases as is the case in theother channels
In the midlatitude case the bias of the background departures shows large negativevalues which corresponds to the presence of an excessive amount of precipitation andcloud liquid water in the background with respect to the observations Zoe exhibitsopposite features with large positive background biases of up to 15 K at severalfrequencies For both cases 1DTB analysis biases are reduced and do not exceed a fewK A significant reduction of the bias is found with 1DRR in the frontal case but onlya minor one in the case of Zoe In the latter the bias and the standard deviation of thesurface rainfall analysis departures remain large which indicates a poor convergenceduring the minimization For Mitag and the midlatitude case largely dominated bythe large-scale condensation scheme an almost perfect agreement is found betweenobserved and analysed surface RRs
The smaller errors of the TB analysis departures with 1DTB compared with 1DRRdo not necessarily correspond to smaller differences in terms of surface RRs especiallyfor Mitag This is due to the ambiguous link that exists between surface RRs and TBsthat integrate information on the whole atmospheric column The uncertainty on thesurface RRs obtained with the 2A12 PATER BauerndashSchluessel or Ferraro algorithmscan also provide an explanation
(b) Comparison with TRMMPR rainfall ratesVertical profiles of RRs (2A25 product Iguchi et al 2000) measured by the PR on
board the TRMM platform have been used to validate the analysed RR profiles from1DRR and 1DTB The initial 2A25 product with a horizontal (vertical) resolution of14 km (250 m) has been averaged to the model grid resolution (about 40 km (60 levels))Figure 15 shows the mean vertical profiles of RRs for Mitag and Zoe In both cases theshape of the rain profile as observed from the PR is characterized by nearly constantvalues on the vertical below 600 hPa In contrast the mean analysed rain flux for
TEMPERATURE AND HUMIDITY PROFILE RETRIEVAL 847
TAB
LE
21D
-VA
RS
TA
TIS
TIC
SF
RO
MB
AC
KG
RO
UN
D(G
UE
SS)
AN
DA
NA
LY
SIS
FO
RT
HE
1DT
BA
ND
TH
E1D
RR
EX
PE
RIM
EN
TS
(SE
ET
EX
T)
FO
RT
HE
TH
RE
ES
TU
DIE
DC
AS
ESB
IAS
ES
AN
DS
TA
ND
AR
DD
EV
IAT
ION
S(B
OL
DF
ON
T)
OF
OB
SE
RV
AT
ION
minusB
AC
KG
RO
UN
DA
ND
OB
SE
RV
AT
ION
minusA
NA
LY
SIS
DE
PAR
TU
RE
SIN
TE
RM
SO
FB
RIG
HT
NE
SS
TE
MP
ER
AT
UR
ES
AN
DIN
TE
RM
SO
FS
UR
FAC
ER
AIN
FAL
LR
AT
ES
Typh
oon
Mit
agC
yclo
neZ
oeFr
ont
Gue
ss1D
TB
1DR
RG
uess
1DT
B1D
RR
Gue
ss1D
TB
1DR
R
Cha
nnel
slowast(G
Hz)
Obs
erva
tion
minusm
odel
TB
bias
and
stan
dard
devi
atio
n(K
)10
Vminus1
611
4minus2
02
8minus0
87
06
014
0minus1
03
43
011
2mdash
mdashmdash
mdashmdash
mdash19
V0
914
42
02
24
18
610
613
61
33
07
812
6minus4
310
60
52
12
97
522
Vminus0
18
21
11
72
54
85
76
01
12
75
06
1minus1
78
31
92
03
96
437
Vminus5
315
9minus1
44
30
89
610
212
83
49
49
913
2minus7
714
2minus1
83
20
510
810
Hminus4
720
4minus5
45
0minus3
212
410
125
9minus2
76
54
520
7mdash
mdashmdash
mdashmdash
mdash19
Hminus2
126
7minus0
24
43
516
115
526
1minus1
65
210
023
9minus1
02
205
minus12
43
36
143
37H
minus10
232
1minus2
75
81
719
416
725
71
011
914
325
6minus1
75
301
minus52
69
11
233
Bia
san
dst
anda
rdde
viat
ion
ofPA
TE
Rob
serv
atio
nsminus
mod
el(m
mhminus
1)
Surf
ace
rain
fall
minus00
41
58minus0
45
173
minus00
20
112
64
61
23
02
03
5minus0
86
109
minus04
20
91minus0
02
022
lowast Vv
erti
cal
Hh
oriz
onta
l
848 E MOREAU et al
0 1 2 3 4 5Rain flux (mm h 1)
1000
900
800
700
600
500
400
Pres
sure
(hP
a) TRMMPRGuess1DRR1DTB
a
0 1 2 3 4 5Rain flux (mm h 1)
1000
900
800
700
600
500
400
Pres
sure
(hP
a)
TRMMPRGuess1DRR1DTB
b
Figure 15 Horizontally averaged vertical profiles of rainfall rates from TRMMPR observations from thebackground (Guess) from 1DRR and from 1DTB Results are shown for (a) Mitag and (b) Zoe See text for
further explanation
Mitag increases from 15 mm hminus1 at 600 hPa to 25 mm hminus1 (respectively 40) at900 hPa with 1DRR (respectively 1DTB) This particular shape is due to the factthat the large-scale condensation scheme is dominant in this case (see Fig 3(a)) andthat it produces precipitation at all vertical levels On the other hand for cyclone Zoe(see Fig 9(a)) the convective scheme is more active and precipitation generation mainlyoccurs above 600 hPa with a nearly constant rainfall profile below this level as in thePR observations The shape of the analysed rain profile seems to depend on which moistphysical parametrization is the most active in the background It should be noted thatthe partitioning between convective and large-scale precipitation remains comparable inthe 1D-Var retrieval and in the background
The biases and the standard deviations of the observation minus analysis departuresshown in Table 2 indicate that 1DRR performs better for Mitag than for Zoe Thisbetter behaviour in the Mitag case is also seen in Fig 15(a) For the 1DRR retrievalwhich optimizes the surface RRs the analysed precipitation flux closely matches theradar observations below 800 hPa In the 1DTB method the analysed precipitationprofile is computed so as to optimize the TBs which are mainly related to the integratedrain content and not to the surface rainfall Hence a strong tilt of the analysed rainprofile can be seen in Fig 15(a) This is required to ensure a good agreement betweenthe simulated and observed integrated rain contents In the case of Zoe the analysed
TEMPERATURE AND HUMIDITY PROFILE RETRIEVAL 849
TABLE 3 IMPACT OF THE INCLUSION OF TMI CHANNEL ERROR CORRELATIONS ON THE 1D-VAR RETRIEVALS (SEE TEXT) IN THE CASE OF SUPER-TYPHOON Mitag BIASES AND STANDARDDEVIATIONS (σ BOLD FONT) OF OBSERVATION minus BACKGROUND AND OBSERVATION minus ANALYSISDEPARTURES FOR ALL CHANNELS USED AND MEANS AND STANDARD DEVIATIONS OF INTEGRATED
CLOUD AND RAIN WATER CONTENTS
Correlation
Background None 05 08 2 times σobs
Channellowast (GHz) Observation minus model TB bias and standard deviation (K)10 V minus18 116 minus20 31 minus24 34 minus28 39 minus18 3719 V 06 146 19 24 08 32 01 41 19 2521 V minus02 83 11 16 01 23 minus06 30 10 1837 V minus54 162 minus15 38 minus28 40 minus34 46 minus19 3910 H minus51 207 minus54 55 minus61 63 minus67 71 minus49 6619 H minus29 270 minus04 47 minus24 62 minus38 75 minus04 5137 H minus107 326 minus30 54 minus57 61 minus71 75 minus39 61
Integrated contents Mean and standard deviation (kg mminus2)Rain water 022 032 023 044 024 045 025 045 022 039
Cloud water 064 063 062 084 064 084 064 081 062 082lowastV vertical H horizontal
TABLE 4 SAME AS IN TABLE 3 BUT FOR TROPICAL CYCLONE Zoe
Correlation
Background None 05 08 2 times σobs
Channel (GHz) Observation minus model TB bias and standard deviation (K)10 V 34 146 minus10 39 minus10 47 minus11 50 minus05 4419 V 81 143 18 31 15 38 14 45 20 3021 V 49 64 16 27 13 30 11 33 17 2437 V 80 134 25 84 23 90 18 88 26 8310 H 52 272 minus25 74 minus26 88 minus27 91 minus17 8319 H 104 276 minus04 55 minus10 64 minus13 76 minus02 5737 H 110 277 01 92 minus06 103 minus13 109 02 92
Integrated contents Mean and standard deviation (kg mminus2)Rain water 044 062 056 064 058 064 057 064 054 060
Cloud water 062 051 092 092 094 091 092 089 090 090
rain profiles from 1DRR and 1DTB are closer to the radar observations than thebackground However the 1DTB retrieval better matches the radar observations than1DRR which is consistent with the results of the comparison with PATER surface RRsshown in Figs 9 and 10 and with observed TBs (Table 2)
(c) Sensitivity to observation-error statisticsIn order to assess the impact of the uncertainties on the definition of the R matrix
some tests have been run with 1DTB including error correlations between the TMIchannels or larger standard deviations of observation errors
Since inter-channel error correlations cannot be accurately known two values of 05and 08 that are representative of a low and a high level of correlation respectively havebeen tested The corresponding biases and standard deviations of the departures betweenbackground or 1D-Var retrieval and observations as well as statistics of integratedcloud and rain water are summarized in Table 3 and Table 4 for Mitag and Zoerespectively Statistics have been computed over the points where the convergence wassuccessful As expected the inclusion of inter-channel error correlations brings the1D-Var retrievals closer to the background but this impact appears marginal
850 E MOREAU et al
Table 3 and Table 4 also show statistics obtained when the standard deviations ofthe observation errors are doubled Again the impact on the quality of the 1D-Var resultsremains weak
Therefore it appears that the 1D-Var retrievals are not very sensitive to the specifica-tion of matrix R This can be explained by the fact that because of the rather large errorsspecified in the current B matrix the contribution of the background term Jb in the totalcost function (Eq (1)) is usually very small This was confirmed by some experimentsin which Jb was set to zero Although Jb does not currently play a significant role inthe 1D-Var retrievals future improvements of the forecasting system will increase itscontribution in J to some extent Similar results were obtained with 1DRR
6 CONCLUSIONS
In this study 1D-Var retrieval experiments based on retrieved surface RRs asobserved from TMI or SSMI have been compared with 1D-Var retrieval experimentsdirectly performed on the microwave TBs for two tropical cyclones and an extratropicalfront 1DRR and 1DTB include new simplified parametrizations of moist processesthat perform similarly to the parametrizations used in the operational forecast model forthe simulation of cloud and precipitating systems as can be seen from comparing theresults presented here with the ones documented by Chevallier and Bauer (2003)
Both 1D-Var methods produce consistent temperature and specific-humidity incre-ments that correct either the modelrsquos surface RRs or the simulated TBs towards equiv-alent TMI or SSMI observations However 1DRR performs better when large-scaleprecipitation dominates in the background due to the stronger nonlinearities that some-times exist in convective conditions 1DTB seems less affected by the nature of precip-itation in the background In other respects the 1D-Var retrievals are not very sensitiveto the definition of the observation-error statistics both in terms of standard deviationsand error correlations This can be explained by the current weak contribution of thebackground term in the cost function
To summarize the respective advantages and drawbacks of the two 1D-Var methods1DRR (including the surface RR retrieval) has the main advantage of being computa-tionally cheaper than 1DTB (that requires substantial additional time for the radiative-transfer calculations) The two major drawbacks of 1DRR lie in its inefficiency wher-ever the background RR is zero and in the dependence on the performance of the se-lected rainfall algorithm On the other hand the fact that microwave TBs are sensitivenot only to precipitation but also to water vapour and cloud water makes it possible tocorrect the modelrsquos control variables outside and inside rainy areas of the backgroundin a consistent manner 1DTB also offers the possibility of selecting which channelsshould be assimilated according to the meteorological conditions (eg clear or cloudysky light or heavy precipitation) This flexibility also applies if one considers the chang-ing availability of individual channels during the lifetime of a given instrument Onelimitation of both 1DRR and 1DTB is their current inapplicability over land due to thedifficulty of dealing with heterogeneities in surface emissivity Furthermore due to thelack of high-accuracy precipitation measurements over the ocean (except maybe for theTRMMPR) 1D-Var retrieval errors cannot be properly estimated
An important issue that will deserve some attention in the future relates to the biasesof the forward model (moist physics andor radiative transfer) which may depend onthe meteorological situation and which are not dealt with at the moment in the 1D-Varretrievals
TEMPERATURE AND HUMIDITY PROFILE RETRIEVAL 851
Since neither of the two 1D-Var methods clearly outperforms the other their respec-tive potential for the future operational assimilation of precipitation at the ECMWF iscurrently under investigation in lsquo1D-Var+4D-Varrsquo experiments (Marecal and Mahfouf2002) in which pseudo-observations of TCWV produced by 1DRR or 1DTB on TMIand SSMI data are assimilated in the ECMWF forecasting system Taking advantage ofthe dynamical coherence of 4D-Var these experiments will also allow the consistencyof the 1D-Var retrievals with all other observations to be checked
ACKNOWLEDGEMENTS
We would like to thank Virginie Marecal and Jean-Francois Mahfouf for theirpioneering work on precipitation assimilation at the ECMWF and for their kind supportThe two anonymous referees should also be acknowledged for their helpful commentsabout this paper We are also grateful to the INRIA (Institut National de Rechercheen Informatique et en Automatique) for providing the M1QN3 minimization codeThis study was supported by the European Space Agency projects EuroTRMM-2(1265197NLNB) and EGPM (3-1060002NLGS)
REFERENCES
Bauer P 2002 lsquoMicrowave radiative transfer modelling in clouds and precipi-tation Part I Model descriptionrsquo Technical report Satel-lite Application Facility for Numerical Weather PredictionNWPSAF-EC-TR-005 version 10
Bauer P and Schluessel P 1993 Rainfall total water ice water and water vapor over sea frompolarized microwave simulations and Special Sensor Micro-waveImager data J Geophys Res 98 20737ndash20759
Bauer P Amayenc PKummerow C D andSmith E A
2001 Over-ocean rainfall retrieval from multi-sensor data of the Tropi-cal Rainfall Measuring Mission (TRMM) Part II Algorithmimplementation J Ocean Atmos Technol 18 1838ndash1855
Bauer P Mahfouf J-FOlson W S Marzano F SMichele S D Tassa A andMugnai A
2002 Error analysis of TMI rainfall estimates over ocean for variationaldata assimilation Q J R Meteorol Soc 128 2129ndash2144
Chevallier F and Bauer P 2003 Model rain and clouds over oceans comparison with SSMI ob-servations Mon Weather Rev 131 1240ndash1255
Courtier P Thepaut J-N andHollingsworth A
1994 A strategy for operational implementation of 4D-Var using anincremental approach Q J R Meteorol Soc 120 1367ndash1388
Eyre J R 1991 lsquoA fast radiative transfer model for satellite sounding systemsrsquoTechnical report ECMWF Technical Memorandum No 176ECMWF Reading UK
Ferraro R R Weng FGrody N C and Basist A
1996 An eight-year (1987ndash1994) time series of rainfall clouds watervapor snow cover and sea ice derived from SSMI measure-ments Bull Am Meteorol Soc 77 891ndash905
Fillion L and Mahfouf J-F 2000 Coupling of moist-convective and stratiform precipitation pro-cesses for variational data assimilation Mon Weather Rev128 109ndash124
Gilbert J-C and Lemarechal C 1989 Some numerical experiments with variable-storage quasi-Newtonalgorithms Math Programming 45 407ndash435
Holtslag A A M andMoeng C-H
1991 Eddy diffusivity and countergradient transport in the convectiveatmospheric boundary layer J Atmos Sci 48 1690ndash1698
Hou A Y Ledvina D VDa Silva A M Zhang S QJoiner J Atlas R MHuffman G J andKummerow C D
2000 Assimilation of SSMI-derived surface rainfall and Total Precip-itable Water for improving the GEOS analysis for climatestudies Mon Weather Rev 128 509ndash537
Hou A Y Zhang S QDa Silva A M Olson W SKummerow C D andSimpson J
2001 Improving global analysis and short-range forecast using rainfalland moisture observations derived from TRMM and SSMIpassive microwave sensors Bull Am Meteorol Soc 82659ndash679
852 E MOREAU et al
Iguchi T Meneghini RAwaka J Kozu T andOkamoto K
2000 Rain profiling algorithm for TRMM precipitation radar data AdvSpace Res 25 973ndash976
Janiskova M Mahfouf J-FMorcrette J-J andChevallier F
2002 Linearized radiation and cloud schemes in the ECMWF modelDevelopment and evaluation Q J R Meteorol Soc 1281505ndash1527
Kummerow C D 1993 On the accuracy of the Eddington-approximation for the radiativetransfer in microwave frequencies J Geophys Res 982757ndash2765
Kummerow C D Hong YOlson W S Yang SAdler R F McCollum JFerraro R Petty GShin D-B and Wilheit T T
2001 The evolution of the Goddard Profiling Algorithm (GPROF) forrainfall estimation from passive microwave sensors J ApplMeteorol 40 1801ndash1820
LrsquoEcuyer T S and Stephens G L 2002 An uncertainty model for Bayesian Monte Carlo retrieval algo-rithms Application to the TRMM observing system Q J RMeteorol Soc 128 1713ndash1738
Lopez P and Moreau E 2004 lsquoA convection scheme for data assimilation Description and ini-tial testsrsquo Technical report ECMWF Technical Memoran-dum No 411 ECMWF Reading UK
Macpherson B 2001 Operational experience with assimilation of rainfall data in theMet Office mesoscale model Meteorol Atmos Phys 763ndash8
Marecal V and Mahfouf J-F 2000 Variational retrieval of temperature and humidity profiles fromTRMM precipitation data Mon Weather Rev 128 3853ndash3866
2002 Four-dimensional variational assimilation of total column watervapour in rainy areas Mon Weather Rev 130 43ndash58
2003 Experiments on 4D-Var assimilation of rainfall data using anincremental formulation Q J R Meteorol Soc 129 3137ndash3160
Marecal V Mahfouf J-F andBauer P
2002 Comparison of TMI rainfall estimates and their impact on 4D-Varassimilation Q J R Meteorol Soc 128 2737ndash2758
Moreau E Bauer P andChevallier F
2002 lsquoMicrowave radiative transfer modelling in clouds and precipi-tation Part II Model evaluationrsquo Technical report Satel-lite Application Facility for Numerical Weather PredictionNWPSAF-EC-TR-005 version 10
2003 Variational retrieval of rain profiles from space-borne pas-sive microwave radiance observations J Geophys Res108(D16) ACL 11-1ndashACL 11-18
Peng S Q and Zou X 2002 Assimilation of NCEP multi-sensor hourly rainfall data using 4D-Var approach A case study of the squall line on April 51999 Meteorol Atmos Phys 81 237ndash255
Rabier F McNally AAndersson E Courtier PUnden P Eyre JHollingsworth A andBouttier F
1997 The ECMWF implementation of the three dimensional varia-tional assimilation (3D-Var) II Structure functions Q J RMeteorol Soc 124 1809ndash1829
Saunders R Brunel PChevallier F Deblonde GEnglish S J Matricardi Mand Rayer P
2002 lsquoRTTOV-7 science and validation reportrsquo Technical report MetOffice Forecasting and Research Technical Report No 387Bracknell UK
Simpson J and Wiggert V 1969 Models of precipitating cumulus towers Mon Weather Rev 97471ndash489
Sundqvist H Berge E andKristjansson J E
1989 Condensation and cloud parameterization studies with a meso-scale numerical weather prediction model Mon WeatherRev 117 1641ndash1657
Tiedtke M 1989 A comprehensive mass flux scheme for cumulus parameterizationin large-scale models Mon Weather Rev 117 1779ndash1800
1993 Representation of clouds in large-scale models Mon WeatherRev 121 3040ndash3061
Tompkins A M and Janiskova M 2003 lsquoA cloud scheme for data assimilation Description and initialtestsrsquo Technical report ECMWF Technical MemorandumNo 410 ECMWF Reading UK
828 E MOREAU et al
Several studies have recently addressed the issue of precipitation assimilationusing either a variational approach (eg Hou et al 2000 2001 Peng and Zou 2002)or other techniques like nudging (eg Macpherson 2001) At the ECMWF Marecal andMahfouf (2000) developed a unidimensional variational (1D-Var) method for correctingindividual profiles of the ECMWF modelrsquos control variables in order to decrease thediscrepancies that often exist between the simulated surface rainfall rates (RRs) and cor-responding retrievals obtained from TMI or SSMI microwave brightness temperatures(TBs) Marecal and Mahfouf (2002) also demonstrated that an indirect lsquo1D-Var + 4D-Varrsquo assimilation of TMI-derived RRs could improve the quality of humidity tempera-ture and wind forecasts in the tropics In their approach the background minus observationdepartures on surface RRs are first converted into total column water vapour (TCWV)increments as an output from 1D-Var retrievals The corresponding TCWV pseudo-observations are then assimilated in the 4D-Var system Marecal and Mahfouf (2003)also showed that this indirect method is more robust than a direct 4D-Var assimilationof the TMI RRs because of some inconsistencies between the inner and outer loops ofthe ECMWF 4D-Var assimilation system (Courtier et al 1994) The lsquo1D-Var + 4D-Varrsquotechnique therefore seems more appropriate to assimilate such data until these inconsis-tencies are resolved
Instead of performing the 1D-Var retrievals on surface RRs that are derived frommulti-channel microwave TBs through various algorithms the 1D-Var calculationscould directly deal with the TBs This would homogenize the approach and could evenprovide more accurate retrievals since the sensitivities of TBs not only to rain but alsoto cloud water and water vapour could be exploited (Moreau et al 2003) This studyexplores this new method and compares its performance with that of the existing 1D-Varretrieval applied to derived RRs
The plan of the paper is as follows Section 2 introduces the 1D-Var technique usedin this paper This includes a description of two new parametrizations of moist processesthat were specially designed for assimilation in order to make a compromise betweenphysical realism and linear behaviour The microwave radiative-transfer model (RTM)used in the 1D-Var computations is also briefly presented Section 3 deals with theexperimental set-up which includes the description of the cases studied and of the ob-servational and model datasets (including the specification of error statistics) The mainresults from the 1D-Var experiments are then detailed in section 4 A discussion of thecomparison of 1D-Var on surface RRs with 1D-Var on TBs as well as a validation of the1D-Var outputs against independent satellite data is proposed in section 5 This sectionalso presents a study of the sensitivity of the 1D-Var retrievals to the specification of theobservation-error statistics
2 THE 1D-VAR RETRIEVAL METHOD
(a) General descriptionThe objective of 1D-Var is to find an optimal model state that minimizes in a
least-square sense the distance between a selected output quantity of the model andits observed equivalent given a background constraint In the present study two controlvariables are considered in the model temperature and specific humidity They are givenin the form of individual vertical profiles at a given time The selected output quantityto be optimized is either the surface RRs (as in Marecal and Mahfouf 2000) or themulti-channel microwave TBs The two corresponding 1D-Var retrieval methods willbe hereafter referred to as 1DRR and 1DTB respectively Surface RR is an output
TEMPERATURE AND HUMIDITY PROFILE RETRIEVAL 829
from the modelrsquos convection and large-scale condensation parametrizations and can bederived from observed microwave TBs via a retrieval algorithm On the other hand TBscan be simulated by applying the parametrizations of moist processes to the modelrsquoscontrol variables followed by the application of a microwave RTM The main inputsto the latter model are precipitation content cloud water content cloud cover specifichumidity air and sea surface temperatures and surface wind speed In the present studythe 1D-Var method searches for the modelrsquos state vector x that minimizes the followingfunctional
J (x) = 12(x minus xb)
TBminus1(x minus xb) + 12 (H(x) minus yo)
TRminus1(H(x) minus yo) (1)
where xb is the background model state T is the transpose and H(x) is the nonlinearobservation operator that converts the modelrsquos variables into either surface RRs ormicrowave TBs yo denotes the corresponding observed quantity and R is the errorcovariance matrix of the observations which includes the instrumental errors and theerrors of H Matrix B contains the background-error covariances for the modelrsquos controlvariables (temperature and specific humidity) The result of the 1D-Var retrieval istherefore a combination of the background and of the observation weighted by theinverse of their respective error statistics
The minimization of the functional is performed using the quasi-Newton descentalgorithm (M1QN3) developed by Gilbert and Lemarechal (1989) It requires thecalculation of the gradient of the functional defined in Eq (1)
nablaJ (x) = Bminus1(x minus xb) + HTRminus1(H(x) minus yo) (2)
where HT is the transpose (or adjoint) of the Jacobian matrix of the nonlinear observa-tion operator H In this study H consists of new simplified parametrizations of convec-tion and large-scale condensation that are described in the next subsections In the caseof 1DTB H also includes the RTM designed by Bauer (2002) and Moreau et al (2002)that takes into account the scattering of microwave radiation in precipitating clouds
(b) Moist physics and the radiative-transfer model
(i) Convection Previous studies advocated an improvement of the linearized versionof the ECMWFrsquos parametrizations of moist processes especially convection to beused in the full 4D-Var and in the simpler 1D-Var algorithm developed by Marecaland Mahfouf (2000) A modified version of the operational convection scheme wastherefore developed for the future variational assimilation of clouds and precipitationobservations The modified mass-flux convection scheme was designed such as to retainsome basic similarities with the original mass-flux scheme from Tiedtke (1989) and atthe same time to remove the high degree of complexity of the latter which is a sourceof nonlinearities Its detailed description and evaluation are presented by Lopez andMoreau (2004) but its main features will be summarized here
All types of convection (shallow mid-level and deep) are treated in a similar wayIn particular the closure assumption that relates the model control variables to thesubgrid-scale cloud-base mass flux is expressed through a single formulation basedon the release of convective available potential energy in time In contrast with theoperational scheme the equations that describe the vertical evolution of the updraughtmass flux Mu (kg mminus2sminus1) and of the updraught thermodynamic variables u (ie dry
830 E MOREAU et al
static energy specific humidity and cloud condensate) are uncoupled
partMu
partz= (ε minus δ)Mu (3)
partu
partz= minusε(u minus ) (4)
where denotes field values in the environment and ε and δ are respectively thefractional entrainment and detrainment rates (in mminus1) This uncoupling allows theremoval of the iterative calculations involved in the operational code for updatingthe cloud-base mass flux thereby leading to an easier development of the adjointThe impact of this modification on the forecast is marginal
Convection is assumed to be activated only if the bulk convective updraught verticalvelocity remains positive at cloud base The updraught is assumed to originate from thesurface only if its initial vertical velocity as calculated from the surface heat fluxes usingEq (15b) of Holtslag and Moeng (1991) is positive The departures of the updraughtfrom the environment are also assumed to be dependent on the surface heat fluxes Ifconvection cannot be initiated from the surface the convective ascent may originatefrom higher levels provided relative humidity exceeds 80 In this case the initialvertical velocity of the bulk updraught is set equal to 1 m sminus1 Regardless of whether theupdraught originates from the surface or higher up the vertical evolution of its kineticenergy is computed following Simpson and Wiggert (1969)
Based on Siebesma and Jakob (personal communication) ε is parametrized ascε(z minus zst) + 10minus5 mminus1 where cε is a coefficient equal to 05 and zst is the startingaltitude of the updraught (in metres) For the detrainment δ is set equal to ε exceptclose to cloud top where a constant organized detrainment rate is added (δ = ε + 2 times10minus4 mminus1)
Simplified calculations of downdraughts and convective momentum transport basedon the operational scheme (Tiedtke 1989) are also included in the new parametrizationMore importantly the precipitation formation rate is made proportional to the updraughtcloud water content as in Tiedtke (1989)
Reasonably well-behaved physical parametrizations in terms of linearity are neces-sary to ensure the convergence of the 1D-Var retrievals Therefore the linear behaviourof the modified convection scheme compared with the operational one has also beenassessed through the calculations of nonlinear residuals For the nonlinear convectionscheme M and its tangent-linear version Mprime the nonlinear residuals are defined as
RESNL = M(x + λδx) minus M(x) minus Mprime[x]λδ(x) (5)
where x denotes input vertical profiles of temperature T and specific humidity qThe residuals have been computed for the convective tendencies partT partt and partqparttthat are produced by the convective parametrization The calculations of Eq (5) havebeen repeated for values of the perturbation scaling factor λ ranging from minus1 tominus10minus5 and from 10minus5 to 1 The reference vector of perturbations δx was set equalto typical values of the standard deviation of the background model errors An exampleof vertical profiles of such errors is shown in Fig 1 Table 1 gives the correspondencebetween model levels and pressure levels Figure 2 shows nonlinear residuals averagedover 100 convective profiles that are obtained when specific-humidity perturbationsof varying size are applied on model level 60 Results are displayed for the lowestmodel level because input perturbations imposed there result in maximum changesin the profiles of convective tendencies The x-axis gives the values of the unitless
TEMPERATURE AND HUMIDITY PROFILE RETRIEVAL 831
00 05 10 15 20 25Background error on T and q
60
50
40
30
20
Mod
el le
vel
q
T
Figure 1 Vertical profiles of typical values of the standard deviation of the model background errors ontemperature (T ) and specific humidity (q) Units are in K and g kgminus1 respectively
TABLE 1 PRESSURE ON EVERY FIVEMODEL LEVELS BETWEEN LEVELS 20AND 60 VALUES ARE GIVEN ASSUMINGA SURFACE PRESSURE OF 101325 hPa
Model level number Pressure (hPa)
20 3625 9630 20235 35340 53945 72850 88455 97960 1012
scaling factor λ that is applied to the input reference perturbation of specific humidityon model level 60 This normalization permits the comparison of the residuals obtainedwith the two parametrizations and the smaller the values of the plotted field the morevalid the linear assumption Figure 2 demonstrates that the nonlinear residuals are atleast one order of magnitude smaller with the new scheme than with the operationalone Asymmetries about the y-axis result from the fact that large negative moistureperturbations at the surface turn off convection thereby leading to a less linear behaviourof the scheme Note that similar conclusions can be drawn when input perturbations areimposed on temperature instead of specific humidity (Lopez and Moreau 2004)
(ii) Clouds Tompkins and Janiskova (2003) have recently developed a new statisticaldiagnostic cloud scheme that is intended to be implemented in place of the simplifiedparametrization currently used in the ECMWFrsquos 4D-Var tangent-linear and adjointcalculations (Janiskova et al 2002) A uniform probability density function (PDF) was
832 E MOREAU et al
-100 -10-2 -10-4 104 102 100
Scaling factor on q60 perturbation
60
50
40
30M
odel
leve
ls
-10-7
-7
-4
-4
-2
-2
-1
-1
-1
-1
a
-100 -10-2 -10-4 104 102 100
Scaling factor on q60 perturbation
60
50
40
30
Mod
el le
vels
-10
-10
-7
-7
-4
-4
-2
-2
b
-100 -10-2 -10-4 104 102 100
Scaling factor on q60 perturbation
60
50
40
30
Mod
el le
vels
-10
-10
-7
-7
-4
-4
-2
-2
-2
-1
-1
c
-100 -10-2 -10-4 104 102 100
Scaling factor on q60 perturbation
60
50
40
30M
odel
leve
ls
-10
-7
-7 -4
-4
-2
-2
-2
d
Figure 2 Nonlinear residuals of convective (a) and (b) temperature and (c) and (d) specific-humidity tendenciesas functions of model levels (y-axis) and of the size of the input specific-humidity (q) perturbation imposed onmodel level 60 (x-axis) This size is labelled according to the values of the scaling factor λ applied to the inputreference perturbation of specific humidity on model level 60 The displayed residuals have been averaged over100 convective profiles The field actually plotted is log10 (RESNLRESmax
NL ) where RESmaxNL denotes the maximum
value of the residual for a given pair of inputoutput parameters and for both studied convection schemes (ie fora given row of the figure) (a) and (c) operational scheme (b) and (d) new scheme
chosen to describe the subgrid-scale fluctuations of temperature and total water in orderto make adjoint developments easier and to ensure a reasonable degree of consistencywith the scheme used in the full operational forecast model (Tiedtke 1993) The width ofthe PDF is assumed to increase linearly when relative humidity RH varies from 100down to a critical threshold RH0 beyond which cloud formation occurs Both the slopeof this linear dependence and RH0 are functions of the normalized pressure verticalcoordinate PPsurf where P is the pressure on the current level and Psurf is the surfacepressure In particular RH0 ranges from 50 in the mid-troposphere to 85 at thesurface and at upper levels
Large-scale cloud cover is expressed as a function of RH and RH0 while con-vective cloud cover depends on the diagnostic source term associated with convective
TEMPERATURE AND HUMIDITY PROFILE RETRIEVAL 833
detrainment The new simplified cloud scheme includes a parametrization of precipita-tion generation inspired from Sundqvist et al (1989) and an original parametrization ofprecipitation evaporation based on the subgrid-scale variability of total water
Tompkins and Janiskova (2003) show that the linearity of the new simplified cloudscheme is suitable for its use in 1D-Var and 4D-Var
(iii) Microwave radiative transfer For simulating the radiative transfer in clouds andprecipitation for large data volumes the fast modelling framework RTTOVlowast (Eyre 1991Saunders et al 2002) has been chosen The multiple scattering is simulated applying theδ-Eddington approximation that has proven to provide sufficient accuracy (Kummerow1993) at microwave frequencies All hydrometeor types (rain snow cloud liquid waterand cloud ice) are assumed to be spherical and their optical properties are taken frompre-calculated look-up Mie tables to increase numerical efficiency (Bauer 2002) For thepurpose of variational retrievals as well as to increase computational efficiency thetangent-linear and the adjoint versions of the RTM are employed
3 EXPERIMENTAL SET-UP
(a) Meteorological eventsThree recent meteorologically interesting events have been identified for running
1D-Var two tropical cyclones well sampled by both the TMI and the TRMM precipita-tion radar (PR) and one extratropical front with a good observational coverage from theSSMI These cases were correctly forecast by the ECMWF operational model in termsof location but not with regards to their structure and rain intensity
The first selected situation features super-typhoon Mitag that developed over thewestern Pacific in early March 2002 1D-Var has been tested at 1200 UTC 5 March2002 when the super-typhoon reached its maximum intensity just east of the Philippines(estimated mean-sea-level pressure minimum of 930 hPa located at 142N 1299E)
The second event is tropical cyclone Zoe that developed over the western Pacificin the vicinity of the Fiji Islands between 25 December 2002 and 31 December 20021200 UTC 26 December 2002 was the date selected for running the 1D-Var At that timethe storm was in its intensification phase and its central pressure minimum of 975 hPawas located at 107S 1741E
The third case is an extratropical front that developed over the North Atlanticin January 2002 and which was dominated by large-scale precipitation The 1D-Varexperiment was run on the meteorological situation at 1200 UTC 9 January 2002
(b) ObservationsFor super-typhoon Mitag and tropical cyclone Zoe TMI data from the two TRMM
satellite orbits at 1100 UTC 5 March 2002 and 1400 UTC 26 December 2002 have beenused respectively In the case of the midlatitude front the 1D-Var experiments havebeen based on SSMI data at 1130 UTC 9 January 2002
Various algorithms have been tested for retrieving surface rainfall amounts from themulti-channel microwave TBs observed by the TMI and SSMI For TMI data both theTRMM standard rainfall product 2A12 (Kummerow et al 2001) and the Precipitationradar Adjusted TMI Estimation of Rainfall (PATER Bauer et al 2001) retrievals havebeen used PATER employs independent rainfall estimates from the TMI and PR overtheir common swath to derive a rain-dependent calibration curve A similar principle
lowast Radiative Transfer for TIROS (Television Infrared Observation Satellite) Operational Vertical sounder
834 E MOREAU et al
is applied here in order to apply PATER to SSMI data (PATER-SSMI thereafter)by simulating the SSMI observations with TMI data that is by reducing the spatialresolution and selecting the common channels
TMI surface RRs derived with 2A12 and PATER have been used in the cases ofMitag and Zoe Three retrieval algorithms namely PATER-SSMI (described above)Bauer and Schluessel (1993) and Ferraro et al (1996) have been utilized on SSMITBs in the midlatitude frontal case All observed rainfall retrievals have then beenaveraged onto the Gaussian grid of the ECMWF model that corresponds to a T511spectral truncation (ie to a grid-point resolution of about 40 km) so that observationand model points are co-located The standard deviations of the observation errors σobson the retrieved RRs have been arbitrarily set equal to 50 of the rainfall rate forBauerndashSchluessel and Ferraro For the 2A12 algorithm the rainfall-dependent errorsderived by LrsquoEcuyer and Stephens (2002) have been applied For PATER the errorshave been calculated according to Bauer et al (2002) Finally a minimum thresholdof 005 mm hminus1 has been assigned to σobs for all algorithms so as to keep a non-zeroobservation error at non-rainy points
When using TMI and SSMI TBs directly in the 1D-Var retrieval the observed valueat each model grid point has been set equal to the value at the closest TMI pixel ineach microwave channel in order to avoid interpolation problems For TBs σobs hasbeen set to 3 K (6 K) for the vertically (horizontally) polarized channels assuming noerror correlations between channels These σobs values are supposed to represent thecontributions from both the instrumental errors and the errors in the observation opera-tor The uncertainties in the RTM may arise both from the δ-Eddington approximation(Moreau et al 2002) as well as from the microphysical assumptions in particular ondrop size distributions and on the fall velocity shape and density of hydrometeorsLarger values of σobs are specified for the horizontal polarization to account for thehigher natural variability of microwave TBs observed with this polarization
Ideally the observation errors in 1D-Var should also include the errors of theforward model but these errors are currently neglected because they are difficult toestimate especially for the moist physics parametrizations The sensitivity of the 1D-Varretrievals to the specification of matrix R is assessed in section 5(c)
Finally it should be mentioned that at the end of the minimization each 1D-Varretrieval is quality controlled by rejecting it if the analysis minus observation departureexceeds plusmn3σobs In this case the retrieval is reset to the background
(c) Background fieldsThe modelrsquos background fields that enter the 1D-Var have been obtained from
three 12-hour T511 integrations of the ECMWF model that were started at 0000 UTC5 March 2002 for Mitag at 0000 UTC 26 December 2002 for Zoe and at 0000 UTC9 January 2002 for the North Atlantic front The input fields include the vertical profilesof temperature and water vapour but also some temperature and specific-humiditytendencies the surface heat fluxes and the surface momentum stress that are neededfor running the modified convection scheme described in subsection 2(b)(i) For 1DTBthe use of the RTM requires additional input fields namely 10 m wind speed surfacetemperature and 2 m temperature and humidity The covariance matrix of backgrounderrors B is taken from the operational ECMWF 4D-Var system (Rabier et al 1997)Figure 1 shows typical values of the standard deviation of the model backgrounderrors on temperature and specific humidity which appear along the leading diagonalof matrix B The assumption is made that the temperature and specific-humidity errorsare uncorrelated
TEMPERATURE AND HUMIDITY PROFILE RETRIEVAL 835
10degN10degN
15degN 15degN
125 E
125degE 130degE
130 E 135 E
135degE01
05
1
3
5
10
20
50
10degN10degN
15degN 15degN
125degE 130degE 135degE01
05
1
3
5
10
20
50
10degN10degN
15degN 15degN
125degE 130degE 135degE01
05
1
3
5
10
20
50
10degN10degN
15degN 15degN
125degE 130degE 135degE01
05
1
3
5
10
20
50
10degN10degN
15degN 15degN
125degE 130degE 135degE01
05
1
3
5
10
20
50
(a)
(b) (c)
(d) (e)
Figure 3 1D-Var on TMI-derived surface rainfall rates for the case of super-typhoon Mitag at 1200 UTC 5 March2002 rain rates from (a) model background (b) 2A12 (d) PATER and (c) and (e) from the corresponding 1DRRanalysis Units are in mm hminus1 The white hatched area indicates the region where surface convective rainfall
represents more than 50 of the total surface rainfall See text for further explanation
4 RESULTS
(a) Super-typhoon Mitag(i) 1D-Var on TMI surface rainfall retrievals Figure 3 displays the results for the1D-Var experiments on super-typhoon Mitag Figure 3(a) shows the model backgroundsurface RRs (b) the observed RRs as retrieved with the 2A12 algorithm from the TMITBs and (c) the 1D-Var retrievals of surface RRs Figures 3(d) and (e) display the samequantities when the PATER algorithm is utilized Although some heavy rain is correctlysimulated by the model in the vicinity of the typhoonrsquos core panel (a) indicates that thebackground clearly differs from the observations in the western periphery of the storm
836 E MOREAU et al
Indeed three regions with heavy precipitation that do not appear in the TMI observationsare simulated by the model
Figures 3(c) and (e) demonstrate that the 1D-Var procedure is able to correct theinitial temperature and specific-humidity profiles in such a way that the 1D-Var retrievedrainfall gets rather close to the observations This improvement on the picture of thesimulated typhoon results from both the increase and the decrease of precipitationat places where the observed value is higher respectively lower than the modelrsquosbackground value However it should be emphasized that 1DRR is efficient only atpoints where the background precipitation is non-zero At locations where the initialsimulated rainfall rate is zero the Jacobian matrix H is zero which implies thatthe minimization is ineffective Such points are rejected a priori from the 1D-Varcalculations The rainfall patterns which appear to the south-east of the storm inFigs 3(c) and (e) are created because very light precipitation (below 01 mm hminus1) isalready present there in the background (Fig 3(a)) In fact 1DRR performs ratherwell in the present case because the new simplified large-scale condensation schemeproduces widespread very light rainfall amounts around the storm which admits moreobservations to the retrieval procedure The production of more widespread precipitationin the tropics compared with the operational scheme can be partly explained bythe revised rainfall evaporation formulation used in the simplified parametrization(Tompkins and Janiskova 2003) Earlier 1D-Var tests with a simpler parametrizationthat generated more confined precipitation led to much less satisfactory analysed surfaceRRs
The convergence of the minimization is usually satisfactory except at a few gridpoints for which the analysed RRs remain far from the observations due to nonlinearitiesin the observation operator H One should also note that the observed TMI RRs fromPATER are substantially lower than the ones obtained from 2A12 Such a differencewas already demonstrated by Marecal et al (2002) Generally the agreement of the1D-Var retrieved RRs with the corresponding observed values is better when usingPATER retrievals than with 2A12 data which can be explained by the fact that thebackground is closer to PATER than to 2A12
Figure 4 displays the vertical profiles of temperature and specific-humidity incre-ments averaged over the geographical domain of Fig 3 when 1DRR is applied toPATER rainfall retrievals Increment profiles from 1DRR on 2A12 RRs are not shownbecause they are very similar to those obtained from PATER data The distinction ismade between points for which the background RR is either larger or lower than thevalue retrieved from the TMI These profiles clearly indicate that the reduction (increase)of the model surface rainfall by the 1D-Var retrieval is achieved through a drying andheating (moistening and cooling) of the troposphere below 300 hPa This latter resultcan be readily explained by the fact that these increments are mainly obtained byactivating the large-scale condensation scheme and not the convective parametrizationSuch behaviour was previously found by Fillion and Mahfouf (2000) A simple con-version of the temperature increments into equivalent increments of saturation specifichumidity shows that the 1D-Var corrections on temperature are approximately four timessmaller than the corrections on specific humidity at all levels which confirms the resultsof Marecal and Mahfouf (2000) However this conclusion is likely to depend on thetype of parametrizations used for describing moist processes
Since the specific-humidity increments largely exceed those of temperature (whenconverted into saturation specific-humidity equivalents) the global impact of the 1D-Varprocedure on the model state can be synthesized in Fig 5 which shows the TCWV back-ground field and the corresponding increments for the 2A12 and PATER experiments
TEMPERATURE AND HUMIDITY PROFILE RETRIEVAL 837
03 00 03Mean T increments (K)
60
50
40
30
21
Mod
el le
vels
RbgtRo
RbltRo
15 00 15Mean q increments (g kg 1)
60
50
40
30
21
Mod
el le
vels
RbgtRo
RbltRo(a) (b)
Figure 4 1D-Var on TMI-derived surface rainfall rates (see text) for the case of super-typhoon Mitag at1200 UTC 5 March 2002 mean vertical profiles of the increments in (a) temperature (T ) and (b) specific humidity(q) when using rainfall observations from the PATER algorithm Cases for which the background rainfall rate Rbis smaller (larger) than the observed value Ro are plotted with a dashed line (full line) Model level 60 is close to
the surface and model level 21 roughly corresponds to 50 hPa
This figure indicates that in both cases positive increments reaching 5 kg mminus2 (negativeincrements down to minus10 kg mminus2) are needed to increase (decrease) the backgroundsurface rainfall rates towards the observed values
(ii) 1D-Var on TMI brightness temperatures Other 1D-Var retrievals were obtainedwith the minimization directly performed on the TMI brightness temperatures at 1019 22 and 37 GHz in vertical polarization and at 10 19 and 37 GHz in horizontalpolarization Figure 6 displays the corresponding retrieved surface RRs Increasingthe number of microwave channels used in the 1D-Var retrieval is expected to bebeneficial especially because of their complementary sensitivity to temperature watervapour cloud water and precipitation For instance the use of the 10 GHz TBs thatare particularly sensitive to the rain content avoids the saturation of the signal (ie theweak sensitivities) that occurs in other channels in heavy-rain regions However addingchannels also implies that more constraints are imposed during the minimization whichmay hamper convergence if the relation between the TBs and the model control variablebecomes strongly nonlinear The occurrences of non-convergence can be reduced bynot using the 37 GHz channels when the depolarization of observed and simulated TBsdoes not exceed a specified fraction of the simulated clear-sky depolarization It wasfound that setting this fraction to 15 reduces the number of cases of non-convergenceby 40 Note that the 85 GHz channels have been discarded for the time being dueto their strong sensitivity to ice for which the radiative-transfer calculations may notbe as accurate as for the liquid phase Figure 6 illustrates the fact that 1DTB is ableto generate temperature and specific-humidity increments that lead to a substantialimprovement on the simulated surface RRs Indeed the background RRs (Fig 3(a))exhibited large discrepancies with respect to the observations (Figs 3(b) and (d))whereas a much better agreement is obtained with 1DTB (Fig 6) However thediscrepancies between observed and analysed RRs are larger with the TB approachthan with the method based on rainfall retrievals (Figs 3(c) and (e)) This is due tothe fact that the temperature and specific-humidity increments result from simultaneous
838 E MOREAU et al
10degN10degN
15degN 15degN
125degE 130degE 135degE
50
55
60
65
70
7351
10degN10degN
15degN 15degN
125degE 130degE 135degE-20
-10
-3
-1
1
3
10
20
10degN10degN
15degN 15degN
125degE 130degE 135degE-20
-10
-3
-1
1
3
10
20
(a)
(b)
(c)
Figure 5 1D-Var on TMI-derived surface rainfall rates for the case of super-typhoon Mitag at 1200 UTC 5 March2002 (a) background field of TCWV (b) TCWV increments from 1DRR on 2A12 rain data and (c) TCWV
increments from 1DRR on PATER rain data Units are in kg mminus2 See text for further explanation
TEMPERATURE AND HUMIDITY PROFILE RETRIEVAL 839
10degN10degN
15degN 15degN
125degE 130degE 135degE01
05
1
3
5
10
20
50
Figure 6 1D-Var on TMI microwave brightness temperatures for the case of super-typhoon Mitag at 1200 UTC5 March 2002 1D-Var retrieved surface rainfall rates in mm hminus1 See text for further explanation
corrections applied to the rain profiles but also to the profiles of cloud water Preliminarytests with less channels showed that adding the 10 GHz and 37 GHz channels leads to aslight increase of the surface RRs inside the storm and to a further decrease in its vicinityThe minimization only fails to converge at a few points and in the north-west peripheryof the super-typhoonrsquos core There the departures between simulated and observed TBsreach such high values that the minimization problem becomes highly nonlinear so thatno reasonable analysis increments can lead to the expected decrease of the simulatedsurface RRs
Figure 7 shows the vertical profiles of temperature and specific-humidity incrementsproduced by 1DTB In terms of shape they look rather similar to the profiles obtainedwith 1DRR in Fig 4 However as far as their magnitude is concerned temperatureincrements tend to be smaller with the TB approach and the maximum increment atlevel 50 (around 850 hPa) that was seen in Fig 4(a) is not present in Fig 7(a) On theother hand the specific-humidity increments again dominate and are about twice as highwhen TBs are used in the minimization instead of surface RRs
Figure 8 displays maps of the TCWV increments obtained from 1DTB Their spatialdistribution looks very similar to the one shown in Fig 5 for 1DRR with positiveTCWV corrections in the core of the storm and negative values around it It is reassuringthat two very different 1D-Var methods can lead to consistent increment patternsHowever their magnitude is much stronger with absolute values exceeding 20 kg mminus2
locally As already mentioned these larger TCWV increments can be explained by thefact that when working with TBs it is not only the amount of rain that is corrected butalso the amounts of water vapour and cloud water The spotty increments to the southof the storm are due to the fact that observed TBs are interpolated onto the model gridusing the closest-point approach
(b) Tropical cyclone ZoeIn the case of Zoe Fig 9 shows that 1DRR increments improve the surface RRs
with respect to the PATER retrieval However and contrary to the case of Mitag for
840 E MOREAU et al
03 00 03Mean T increments (K)
60
50
40
30
21
Mod
el le
vels
RbgtRo
RbltRo
15 00 15Mean q increments (g kg 1)
60
50
40
30
21
Mod
el le
vels
RbgtRo
RbltRo(a) (b)
Figure 7 1D-Var on TMI microwave brightness temperatures for the case of super-typhoon Mitag at 1200 UTC5 March 2002 mean vertical profiles of the increments in (a) temperature (T ) and (b) specific humidity (q)
Same plotting conventions as in Fig 4 See text for further explanation
10degN10degN
15degN 15degN
125degE 130degE 135degE-20
-10
-3
-1
1
3
10
20
Figure 8 1D-Var on TMI microwave brightness temperatures for the case of super-typhoon Mitag at 1200 UTC5 March 2002 TCWV increments in kg mminus2 See text for further explanation
which an almost perfect match to the observations was achieved the improvement ismainly visible in the core of Zoe while the rainfall amounts in the spiralling rainbandsin the western and southern periphery are not reduced enough Even in the central partof the storm the analysed rainfall amounts are still lower than the observed values
Comparison of the hatched areas in Fig 3(a) and Fig 9(a) shows that for Mitagmost of the simulated precipitation is fully resolved by the model (large-scale ascent)while in the case of Zoe it mainly originates from the convection scheme (subgrid-scale processes) The fact that the convective parametrization is still more likely to
TEMPERATURE AND HUMIDITY PROFILE RETRIEVAL 841
15degS 15degS
10degS10degS
170degE 175degE01
05
1
3
5
10
20
50
WB
SB
15degS 15degS
10degS10degS
170degE 175degE01
05
1
3
5
10
20
50
15degS 15degS
10degS10degS
170degE 175degE01
05
1
3
5
10
20
50
(a)
(b)
(c)
Figure 9 1D-Var on TMI-derived surface rainfall rates for the case of tropical cyclone Zoe at 1200 UTC26 December 2002 rain rates from (a) model background (b) PATER and (c) from the corresponding 1D-Var
analysis Labels (WB) and (SB) indicate the western and southern rainbands mentioned in the text
842 E MOREAU et al
15degS 15degS
10degS10degS
170degE 175degE01
05
1
3
5
10
20
50
Figure 10 1D-Var on TMI microwave brightness temperatures for the case of tropical cyclone Zoe at 1200 UTC26 December 2002 1D-Var retrieved surface rainfall rates in mm hminus1 See text for further explanation
suffer from nonlinearities than the large-scale condensation scheme explains the lesssuccessful performance of 1DRR in the case of Zoe
With 1DTB the analysed RRs (Fig 10) exhibit strong modifications compared withthe background Although observed surface RRs are not directly involved in 1DTBminimization the overall improvement on this field looks better than with 1DRRIndeed when compared with PATER observations (Fig 9(b)) one can see that 1DRRis not able to remove the western and southern rainbands present in the background(respectively labelled WB and SB in Fig 9(a)) and that it leads to a less satisfactorydescription of the north-eastern part of the storm The intensity of the RRs reaches valueslarger than 10 mm hminus1 that correspond to positive TCWV increments of up to 10 kg mminus2
locally (not shown) TCWV increments are again much stronger and more widespreadwith 1DTB than with 1DRR (not shown) In contrast with the case of 1DRR theperformance of 1DTB is not much affected by the fact that convection dominates inthe background Nonlinearities in the convection scheme are indeed less detrimental in1DTB than in 1DRR because TBs are influenced by the full vertical profiles of cloudwater and precipitation and are also directly related to specific humidity beside anyexplicit link via the moist physics
(c) A mid-latitude frontFigure 11 shows the 1DRR results for the midlatitude front The modelrsquos back-
ground RRs are systematically higher than the three SSMI observations However thegeographical location and structure of the simulated frontal rainband matches the obser-vations rather well These characteristics are very similar to the general behaviour of theECMWF forecasting system (Chevallier and Bauer 2003) that uses more elaborate moistphysical parametrizations Again the 1D-Var method is able to correct the temperatureand specific-humidity increments so that the 1D-Var retrieved surface RRs match almostperfectly the available SSMI observations Figures 11(b) (d) and (f) show respectivelythat significant differences are found between the rain fields retrieved with PATER-SSMI BauerndashSchluessel and Ferraro which is one of the major limitations of 1DRR
TEMPERATURE AND HUMIDITY PROFILE RETRIEVAL 843
35degN35degN
40degN 40degN
45degN45degN
50degN 50degN
55degN55degN
55degW 50degW 45degW 40degW 35degW 30degW01
05
1
3
5
10
20
50
35degN35degN
40degN 40degN
45degN45degN
50degN 50degN
55degN55degN
55degW 50degW 45degW 40degW 35degW 30degW01
05
1
3
5
10
20
50
35degN35degN
40degN 40degN
45degN45degN
50degN 50degN
55degN55degN
55degW 50degW 45degW 40degW 35degW 30degW01
05
1
3
5
10
20
50
35degN35degN
40degN 40degN
45degN45degN
50degN 50degN
55degN55degN
55degW 50degW 45degW 40degW 35degW 30degW01
05
1
3
5
10
20
50
35degN35degN
40degN 40degN
45degN45degN
50degN 50degN
55degN55degN
55degW 50degW 45degW 40degW 35degW 30degW01
05
1
3
5
10
20
50
35degN35degN
40degN 40degN
45degN45degN
50degN 50degN
55degN55degN
55degW 50degW 45degW 40degW 35degW 30degW01
05
1
3
5
10
20
50
35degN35degN
40degN 40degN
45degN45degN
50degN 50degN
55degN55degN
55degW 50degW 45degW 40degW 35degW 30degW01
05
1
3
5
10
20
50
(a)
(b) (c)
(d) (e)
(f) (g)
Figure 11 1D-Var on SSMI-derived surface rainfall rates for the case of the North Atlantic front at 1200 UTC9 January 2002 rain rates from (a) model background (b) PATER (d) BauerndashSchluessel (f) Ferraro and (c) (e)
and (g) from the corresponding 1DRR analysis Units are in mm hminus1 See text for further explanation
844 E MOREAU et al
35degN35degN
40degN 40degN
45degN45degN
50degN 50degN
55degN55degN
55degW 50degW 45degW 40degW 35degW 30degW
15
20
25
30
35
40
4430
35degN35degN
40degN 40degN
45degN45degN
50degN 50degN
55degN55degN
55degW 50degW 45degW 40degW 35degW 30degW-10
-4
-2
-1
1
2
4
10
35degN35degN
40degN 40degN
45degN45degN
50degN 50degN
55degN55degN
55degW 50degW 45degW 40degW 35degW 30degW-10
-4
-2
-1
1
2
4
10
35degN35degN
40degN 40degN
45degN45degN
50degN 50degN
55degN55degN
55degW 50degW 45degW 40degW 35degW 30degW-10
-4
-2
-1
1
2
4
10
(a) (b)
(c) (d)
Figure 12 1D-Var on SSMI-derived surface rainfall rates for the case of the North Atlantic front at 1200 UTC9 January 2002 (a) background field of TCWV and TCWV increments when using surface rainfall rates from
(b) PATER (c) BauerndashSchluessel and (d) Ferraro Units are in kg mminus2 See text for further explanation
The vertical profiles of temperature and specific-humidity increments (not shown) ex-hibit a shape comparable with the one that was found for super-typhoon Mitag but theiramplitude is substantially lower due to the smaller surface rainfall departures betweenbackground and observations Since the background field tends to overestimate the sur-face precipitation almost systematically over the domain Fig 12 shows that negative1D-Var TCWV increments dominate with extreme values reaching minus5 kg mminus2 locallyThe values and horizontal structure of the increments look very comparable with allthree retrieval algorithms
Figure 13 displays the analysed surface RRs for the midlatitude front with 1DTBusing SSMI observations The main change with respect to the background fieldshown in Fig 11(a) is the reduction of the intensity in the southern part of the frontalrainband (below 40N) and the slight reshaping of the front These modifications in theanalysis surface RRs are also present in Fig 14 that shows positive 1D-Var TCWVincrements in the western part of the rainband that locally exceed 4 kg mminus2 withnegative increments over the rest of the domain The analysed RRs agree fairly wellwith all three RR retrievals and in particular with the Ferraro algorithm (Fig 11(e))It should be mentioned that the unchanged light-rainfall values in the wake of the frontcorrespond to grid points that were not treated in 1DTB to save computational time(minimum threshold of 03 mm hminus1 in the background)
TEMPERATURE AND HUMIDITY PROFILE RETRIEVAL 845
35degN35degN
40degN 40degN
45degN45degN
50degN 50degN
55degN55degN
55degW 50degW 45degW 40degW 35degW 30degW01
05
1
3
5
10
20
50
Figure 13 1D-Var on SSMI microwave brightness temperatures for the case of the North Atlantic front at1200 UTC 9 January 2002 1D-Var retrieved surface rainfall rates in mm hminus1 See text for further explanation
35degN35degN
40degN 40degN
45degN45degN
50degN 50degN
55degN55degN
55degW 50degW 45degW 40degW 35degW 30degW-10
-4
-2
-1
1
2
4
10
Figure 14 As Fig 13 but for TCWV increments in kg mminus2 See text for further explanation
5 EVALUATION
It was shown that 1DRR and 1DTB lead to consistent results both in terms ofanalysed RRs and TCWV increments This section deals with the evaluation of thetwo methods based on SSMI and TRMM data that are the only reliable observationsavailable in precipitation areas over ocean First the two methods are statisticallycompared in TB and RR space Then the consistency of the vertical profiles of analysedRRs is assessed using measurements from the TRMMPR for tropical cyclones Mitag
846 E MOREAU et al
and Zoe Finally an assessment of the impact of the observation-error statistics on the1DTB retrievals is presented
(a) Evaluation in TB and RR spaceFor each of the three meteorological cases TBs have been computed from the
background fields and from the analyses given by the two methods using the RTM de-scribed in subsection 2(b)(iii) The biases and the standard deviations of background minusobservation and analysis minus observation departures are shown in Table 2 for Mitag Zoeand the midlatitude front and for each available microwave frequency Statistics referto the common points where both methods successfully converged In all histogramsthe standard deviation of the analysis departures both for 1DTB and 1DRR is reducedwith respect to the background departures The reduction is always three to four timeslarger with 1DTB than with 1DRR for all channels This is due to the fact that TBs aredirectly involved in the cost function of 1DTB
The biases of 1DRR and 1DTB analyses are generally reduced when comparedwith the background The amount depends on the meteorological case and microwavechannel In the Mitag case the bias of the background departure is small compared withthe other cases with values lower than 5 K except at 37 GHz The two analyses andthe background exhibit similar biases except at 37 GHz where a noticeable decreaseis found In fact the larger negative biases of background departures for the 37 GHzchannels are an artefact of the saturation of the microwave signal in the rainy core ofthe storm that implies the absence of offsetting large positive biases as is the case in theother channels
In the midlatitude case the bias of the background departures shows large negativevalues which corresponds to the presence of an excessive amount of precipitation andcloud liquid water in the background with respect to the observations Zoe exhibitsopposite features with large positive background biases of up to 15 K at severalfrequencies For both cases 1DTB analysis biases are reduced and do not exceed a fewK A significant reduction of the bias is found with 1DRR in the frontal case but onlya minor one in the case of Zoe In the latter the bias and the standard deviation of thesurface rainfall analysis departures remain large which indicates a poor convergenceduring the minimization For Mitag and the midlatitude case largely dominated bythe large-scale condensation scheme an almost perfect agreement is found betweenobserved and analysed surface RRs
The smaller errors of the TB analysis departures with 1DTB compared with 1DRRdo not necessarily correspond to smaller differences in terms of surface RRs especiallyfor Mitag This is due to the ambiguous link that exists between surface RRs and TBsthat integrate information on the whole atmospheric column The uncertainty on thesurface RRs obtained with the 2A12 PATER BauerndashSchluessel or Ferraro algorithmscan also provide an explanation
(b) Comparison with TRMMPR rainfall ratesVertical profiles of RRs (2A25 product Iguchi et al 2000) measured by the PR on
board the TRMM platform have been used to validate the analysed RR profiles from1DRR and 1DTB The initial 2A25 product with a horizontal (vertical) resolution of14 km (250 m) has been averaged to the model grid resolution (about 40 km (60 levels))Figure 15 shows the mean vertical profiles of RRs for Mitag and Zoe In both cases theshape of the rain profile as observed from the PR is characterized by nearly constantvalues on the vertical below 600 hPa In contrast the mean analysed rain flux for
TEMPERATURE AND HUMIDITY PROFILE RETRIEVAL 847
TAB
LE
21D
-VA
RS
TA
TIS
TIC
SF
RO
MB
AC
KG
RO
UN
D(G
UE
SS)
AN
DA
NA
LY
SIS
FO
RT
HE
1DT
BA
ND
TH
E1D
RR
EX
PE
RIM
EN
TS
(SE
ET
EX
T)
FO
RT
HE
TH
RE
ES
TU
DIE
DC
AS
ESB
IAS
ES
AN
DS
TA
ND
AR
DD
EV
IAT
ION
S(B
OL
DF
ON
T)
OF
OB
SE
RV
AT
ION
minusB
AC
KG
RO
UN
DA
ND
OB
SE
RV
AT
ION
minusA
NA
LY
SIS
DE
PAR
TU
RE
SIN
TE
RM
SO
FB
RIG
HT
NE
SS
TE
MP
ER
AT
UR
ES
AN
DIN
TE
RM
SO
FS
UR
FAC
ER
AIN
FAL
LR
AT
ES
Typh
oon
Mit
agC
yclo
neZ
oeFr
ont
Gue
ss1D
TB
1DR
RG
uess
1DT
B1D
RR
Gue
ss1D
TB
1DR
R
Cha
nnel
slowast(G
Hz)
Obs
erva
tion
minusm
odel
TB
bias
and
stan
dard
devi
atio
n(K
)10
Vminus1
611
4minus2
02
8minus0
87
06
014
0minus1
03
43
011
2mdash
mdashmdash
mdashmdash
mdash19
V0
914
42
02
24
18
610
613
61
33
07
812
6minus4
310
60
52
12
97
522
Vminus0
18
21
11
72
54
85
76
01
12
75
06
1minus1
78
31
92
03
96
437
Vminus5
315
9minus1
44
30
89
610
212
83
49
49
913
2minus7
714
2minus1
83
20
510
810
Hminus4
720
4minus5
45
0minus3
212
410
125
9minus2
76
54
520
7mdash
mdashmdash
mdashmdash
mdash19
Hminus2
126
7minus0
24
43
516
115
526
1minus1
65
210
023
9minus1
02
205
minus12
43
36
143
37H
minus10
232
1minus2
75
81
719
416
725
71
011
914
325
6minus1
75
301
minus52
69
11
233
Bia
san
dst
anda
rdde
viat
ion
ofPA
TE
Rob
serv
atio
nsminus
mod
el(m
mhminus
1)
Surf
ace
rain
fall
minus00
41
58minus0
45
173
minus00
20
112
64
61
23
02
03
5minus0
86
109
minus04
20
91minus0
02
022
lowast Vv
erti
cal
Hh
oriz
onta
l
848 E MOREAU et al
0 1 2 3 4 5Rain flux (mm h 1)
1000
900
800
700
600
500
400
Pres
sure
(hP
a) TRMMPRGuess1DRR1DTB
a
0 1 2 3 4 5Rain flux (mm h 1)
1000
900
800
700
600
500
400
Pres
sure
(hP
a)
TRMMPRGuess1DRR1DTB
b
Figure 15 Horizontally averaged vertical profiles of rainfall rates from TRMMPR observations from thebackground (Guess) from 1DRR and from 1DTB Results are shown for (a) Mitag and (b) Zoe See text for
further explanation
Mitag increases from 15 mm hminus1 at 600 hPa to 25 mm hminus1 (respectively 40) at900 hPa with 1DRR (respectively 1DTB) This particular shape is due to the factthat the large-scale condensation scheme is dominant in this case (see Fig 3(a)) andthat it produces precipitation at all vertical levels On the other hand for cyclone Zoe(see Fig 9(a)) the convective scheme is more active and precipitation generation mainlyoccurs above 600 hPa with a nearly constant rainfall profile below this level as in thePR observations The shape of the analysed rain profile seems to depend on which moistphysical parametrization is the most active in the background It should be noted thatthe partitioning between convective and large-scale precipitation remains comparable inthe 1D-Var retrieval and in the background
The biases and the standard deviations of the observation minus analysis departuresshown in Table 2 indicate that 1DRR performs better for Mitag than for Zoe Thisbetter behaviour in the Mitag case is also seen in Fig 15(a) For the 1DRR retrievalwhich optimizes the surface RRs the analysed precipitation flux closely matches theradar observations below 800 hPa In the 1DTB method the analysed precipitationprofile is computed so as to optimize the TBs which are mainly related to the integratedrain content and not to the surface rainfall Hence a strong tilt of the analysed rainprofile can be seen in Fig 15(a) This is required to ensure a good agreement betweenthe simulated and observed integrated rain contents In the case of Zoe the analysed
TEMPERATURE AND HUMIDITY PROFILE RETRIEVAL 849
TABLE 3 IMPACT OF THE INCLUSION OF TMI CHANNEL ERROR CORRELATIONS ON THE 1D-VAR RETRIEVALS (SEE TEXT) IN THE CASE OF SUPER-TYPHOON Mitag BIASES AND STANDARDDEVIATIONS (σ BOLD FONT) OF OBSERVATION minus BACKGROUND AND OBSERVATION minus ANALYSISDEPARTURES FOR ALL CHANNELS USED AND MEANS AND STANDARD DEVIATIONS OF INTEGRATED
CLOUD AND RAIN WATER CONTENTS
Correlation
Background None 05 08 2 times σobs
Channellowast (GHz) Observation minus model TB bias and standard deviation (K)10 V minus18 116 minus20 31 minus24 34 minus28 39 minus18 3719 V 06 146 19 24 08 32 01 41 19 2521 V minus02 83 11 16 01 23 minus06 30 10 1837 V minus54 162 minus15 38 minus28 40 minus34 46 minus19 3910 H minus51 207 minus54 55 minus61 63 minus67 71 minus49 6619 H minus29 270 minus04 47 minus24 62 minus38 75 minus04 5137 H minus107 326 minus30 54 minus57 61 minus71 75 minus39 61
Integrated contents Mean and standard deviation (kg mminus2)Rain water 022 032 023 044 024 045 025 045 022 039
Cloud water 064 063 062 084 064 084 064 081 062 082lowastV vertical H horizontal
TABLE 4 SAME AS IN TABLE 3 BUT FOR TROPICAL CYCLONE Zoe
Correlation
Background None 05 08 2 times σobs
Channel (GHz) Observation minus model TB bias and standard deviation (K)10 V 34 146 minus10 39 minus10 47 minus11 50 minus05 4419 V 81 143 18 31 15 38 14 45 20 3021 V 49 64 16 27 13 30 11 33 17 2437 V 80 134 25 84 23 90 18 88 26 8310 H 52 272 minus25 74 minus26 88 minus27 91 minus17 8319 H 104 276 minus04 55 minus10 64 minus13 76 minus02 5737 H 110 277 01 92 minus06 103 minus13 109 02 92
Integrated contents Mean and standard deviation (kg mminus2)Rain water 044 062 056 064 058 064 057 064 054 060
Cloud water 062 051 092 092 094 091 092 089 090 090
rain profiles from 1DRR and 1DTB are closer to the radar observations than thebackground However the 1DTB retrieval better matches the radar observations than1DRR which is consistent with the results of the comparison with PATER surface RRsshown in Figs 9 and 10 and with observed TBs (Table 2)
(c) Sensitivity to observation-error statisticsIn order to assess the impact of the uncertainties on the definition of the R matrix
some tests have been run with 1DTB including error correlations between the TMIchannels or larger standard deviations of observation errors
Since inter-channel error correlations cannot be accurately known two values of 05and 08 that are representative of a low and a high level of correlation respectively havebeen tested The corresponding biases and standard deviations of the departures betweenbackground or 1D-Var retrieval and observations as well as statistics of integratedcloud and rain water are summarized in Table 3 and Table 4 for Mitag and Zoerespectively Statistics have been computed over the points where the convergence wassuccessful As expected the inclusion of inter-channel error correlations brings the1D-Var retrievals closer to the background but this impact appears marginal
850 E MOREAU et al
Table 3 and Table 4 also show statistics obtained when the standard deviations ofthe observation errors are doubled Again the impact on the quality of the 1D-Var resultsremains weak
Therefore it appears that the 1D-Var retrievals are not very sensitive to the specifica-tion of matrix R This can be explained by the fact that because of the rather large errorsspecified in the current B matrix the contribution of the background term Jb in the totalcost function (Eq (1)) is usually very small This was confirmed by some experimentsin which Jb was set to zero Although Jb does not currently play a significant role inthe 1D-Var retrievals future improvements of the forecasting system will increase itscontribution in J to some extent Similar results were obtained with 1DRR
6 CONCLUSIONS
In this study 1D-Var retrieval experiments based on retrieved surface RRs asobserved from TMI or SSMI have been compared with 1D-Var retrieval experimentsdirectly performed on the microwave TBs for two tropical cyclones and an extratropicalfront 1DRR and 1DTB include new simplified parametrizations of moist processesthat perform similarly to the parametrizations used in the operational forecast model forthe simulation of cloud and precipitating systems as can be seen from comparing theresults presented here with the ones documented by Chevallier and Bauer (2003)
Both 1D-Var methods produce consistent temperature and specific-humidity incre-ments that correct either the modelrsquos surface RRs or the simulated TBs towards equiv-alent TMI or SSMI observations However 1DRR performs better when large-scaleprecipitation dominates in the background due to the stronger nonlinearities that some-times exist in convective conditions 1DTB seems less affected by the nature of precip-itation in the background In other respects the 1D-Var retrievals are not very sensitiveto the definition of the observation-error statistics both in terms of standard deviationsand error correlations This can be explained by the current weak contribution of thebackground term in the cost function
To summarize the respective advantages and drawbacks of the two 1D-Var methods1DRR (including the surface RR retrieval) has the main advantage of being computa-tionally cheaper than 1DTB (that requires substantial additional time for the radiative-transfer calculations) The two major drawbacks of 1DRR lie in its inefficiency wher-ever the background RR is zero and in the dependence on the performance of the se-lected rainfall algorithm On the other hand the fact that microwave TBs are sensitivenot only to precipitation but also to water vapour and cloud water makes it possible tocorrect the modelrsquos control variables outside and inside rainy areas of the backgroundin a consistent manner 1DTB also offers the possibility of selecting which channelsshould be assimilated according to the meteorological conditions (eg clear or cloudysky light or heavy precipitation) This flexibility also applies if one considers the chang-ing availability of individual channels during the lifetime of a given instrument Onelimitation of both 1DRR and 1DTB is their current inapplicability over land due to thedifficulty of dealing with heterogeneities in surface emissivity Furthermore due to thelack of high-accuracy precipitation measurements over the ocean (except maybe for theTRMMPR) 1D-Var retrieval errors cannot be properly estimated
An important issue that will deserve some attention in the future relates to the biasesof the forward model (moist physics andor radiative transfer) which may depend onthe meteorological situation and which are not dealt with at the moment in the 1D-Varretrievals
TEMPERATURE AND HUMIDITY PROFILE RETRIEVAL 851
Since neither of the two 1D-Var methods clearly outperforms the other their respec-tive potential for the future operational assimilation of precipitation at the ECMWF iscurrently under investigation in lsquo1D-Var+4D-Varrsquo experiments (Marecal and Mahfouf2002) in which pseudo-observations of TCWV produced by 1DRR or 1DTB on TMIand SSMI data are assimilated in the ECMWF forecasting system Taking advantage ofthe dynamical coherence of 4D-Var these experiments will also allow the consistencyof the 1D-Var retrievals with all other observations to be checked
ACKNOWLEDGEMENTS
We would like to thank Virginie Marecal and Jean-Francois Mahfouf for theirpioneering work on precipitation assimilation at the ECMWF and for their kind supportThe two anonymous referees should also be acknowledged for their helpful commentsabout this paper We are also grateful to the INRIA (Institut National de Rechercheen Informatique et en Automatique) for providing the M1QN3 minimization codeThis study was supported by the European Space Agency projects EuroTRMM-2(1265197NLNB) and EGPM (3-1060002NLGS)
REFERENCES
Bauer P 2002 lsquoMicrowave radiative transfer modelling in clouds and precipi-tation Part I Model descriptionrsquo Technical report Satel-lite Application Facility for Numerical Weather PredictionNWPSAF-EC-TR-005 version 10
Bauer P and Schluessel P 1993 Rainfall total water ice water and water vapor over sea frompolarized microwave simulations and Special Sensor Micro-waveImager data J Geophys Res 98 20737ndash20759
Bauer P Amayenc PKummerow C D andSmith E A
2001 Over-ocean rainfall retrieval from multi-sensor data of the Tropi-cal Rainfall Measuring Mission (TRMM) Part II Algorithmimplementation J Ocean Atmos Technol 18 1838ndash1855
Bauer P Mahfouf J-FOlson W S Marzano F SMichele S D Tassa A andMugnai A
2002 Error analysis of TMI rainfall estimates over ocean for variationaldata assimilation Q J R Meteorol Soc 128 2129ndash2144
Chevallier F and Bauer P 2003 Model rain and clouds over oceans comparison with SSMI ob-servations Mon Weather Rev 131 1240ndash1255
Courtier P Thepaut J-N andHollingsworth A
1994 A strategy for operational implementation of 4D-Var using anincremental approach Q J R Meteorol Soc 120 1367ndash1388
Eyre J R 1991 lsquoA fast radiative transfer model for satellite sounding systemsrsquoTechnical report ECMWF Technical Memorandum No 176ECMWF Reading UK
Ferraro R R Weng FGrody N C and Basist A
1996 An eight-year (1987ndash1994) time series of rainfall clouds watervapor snow cover and sea ice derived from SSMI measure-ments Bull Am Meteorol Soc 77 891ndash905
Fillion L and Mahfouf J-F 2000 Coupling of moist-convective and stratiform precipitation pro-cesses for variational data assimilation Mon Weather Rev128 109ndash124
Gilbert J-C and Lemarechal C 1989 Some numerical experiments with variable-storage quasi-Newtonalgorithms Math Programming 45 407ndash435
Holtslag A A M andMoeng C-H
1991 Eddy diffusivity and countergradient transport in the convectiveatmospheric boundary layer J Atmos Sci 48 1690ndash1698
Hou A Y Ledvina D VDa Silva A M Zhang S QJoiner J Atlas R MHuffman G J andKummerow C D
2000 Assimilation of SSMI-derived surface rainfall and Total Precip-itable Water for improving the GEOS analysis for climatestudies Mon Weather Rev 128 509ndash537
Hou A Y Zhang S QDa Silva A M Olson W SKummerow C D andSimpson J
2001 Improving global analysis and short-range forecast using rainfalland moisture observations derived from TRMM and SSMIpassive microwave sensors Bull Am Meteorol Soc 82659ndash679
852 E MOREAU et al
Iguchi T Meneghini RAwaka J Kozu T andOkamoto K
2000 Rain profiling algorithm for TRMM precipitation radar data AdvSpace Res 25 973ndash976
Janiskova M Mahfouf J-FMorcrette J-J andChevallier F
2002 Linearized radiation and cloud schemes in the ECMWF modelDevelopment and evaluation Q J R Meteorol Soc 1281505ndash1527
Kummerow C D 1993 On the accuracy of the Eddington-approximation for the radiativetransfer in microwave frequencies J Geophys Res 982757ndash2765
Kummerow C D Hong YOlson W S Yang SAdler R F McCollum JFerraro R Petty GShin D-B and Wilheit T T
2001 The evolution of the Goddard Profiling Algorithm (GPROF) forrainfall estimation from passive microwave sensors J ApplMeteorol 40 1801ndash1820
LrsquoEcuyer T S and Stephens G L 2002 An uncertainty model for Bayesian Monte Carlo retrieval algo-rithms Application to the TRMM observing system Q J RMeteorol Soc 128 1713ndash1738
Lopez P and Moreau E 2004 lsquoA convection scheme for data assimilation Description and ini-tial testsrsquo Technical report ECMWF Technical Memoran-dum No 411 ECMWF Reading UK
Macpherson B 2001 Operational experience with assimilation of rainfall data in theMet Office mesoscale model Meteorol Atmos Phys 763ndash8
Marecal V and Mahfouf J-F 2000 Variational retrieval of temperature and humidity profiles fromTRMM precipitation data Mon Weather Rev 128 3853ndash3866
2002 Four-dimensional variational assimilation of total column watervapour in rainy areas Mon Weather Rev 130 43ndash58
2003 Experiments on 4D-Var assimilation of rainfall data using anincremental formulation Q J R Meteorol Soc 129 3137ndash3160
Marecal V Mahfouf J-F andBauer P
2002 Comparison of TMI rainfall estimates and their impact on 4D-Varassimilation Q J R Meteorol Soc 128 2737ndash2758
Moreau E Bauer P andChevallier F
2002 lsquoMicrowave radiative transfer modelling in clouds and precipi-tation Part II Model evaluationrsquo Technical report Satel-lite Application Facility for Numerical Weather PredictionNWPSAF-EC-TR-005 version 10
2003 Variational retrieval of rain profiles from space-borne pas-sive microwave radiance observations J Geophys Res108(D16) ACL 11-1ndashACL 11-18
Peng S Q and Zou X 2002 Assimilation of NCEP multi-sensor hourly rainfall data using 4D-Var approach A case study of the squall line on April 51999 Meteorol Atmos Phys 81 237ndash255
Rabier F McNally AAndersson E Courtier PUnden P Eyre JHollingsworth A andBouttier F
1997 The ECMWF implementation of the three dimensional varia-tional assimilation (3D-Var) II Structure functions Q J RMeteorol Soc 124 1809ndash1829
Saunders R Brunel PChevallier F Deblonde GEnglish S J Matricardi Mand Rayer P
2002 lsquoRTTOV-7 science and validation reportrsquo Technical report MetOffice Forecasting and Research Technical Report No 387Bracknell UK
Simpson J and Wiggert V 1969 Models of precipitating cumulus towers Mon Weather Rev 97471ndash489
Sundqvist H Berge E andKristjansson J E
1989 Condensation and cloud parameterization studies with a meso-scale numerical weather prediction model Mon WeatherRev 117 1641ndash1657
Tiedtke M 1989 A comprehensive mass flux scheme for cumulus parameterizationin large-scale models Mon Weather Rev 117 1779ndash1800
1993 Representation of clouds in large-scale models Mon WeatherRev 121 3040ndash3061
Tompkins A M and Janiskova M 2003 lsquoA cloud scheme for data assimilation Description and initialtestsrsquo Technical report ECMWF Technical MemorandumNo 410 ECMWF Reading UK
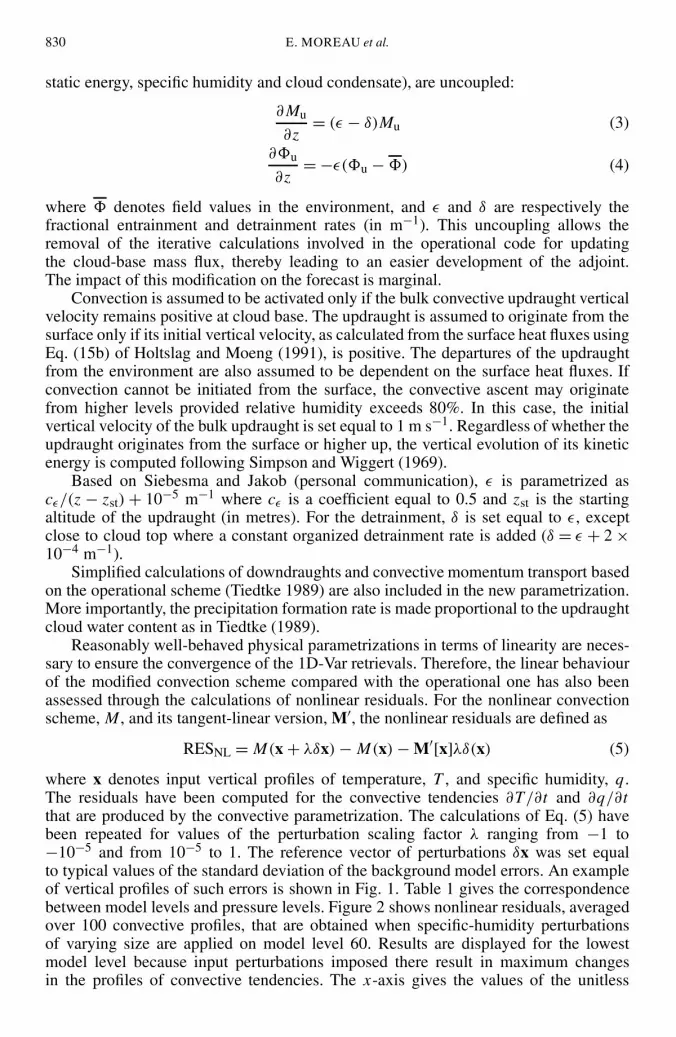
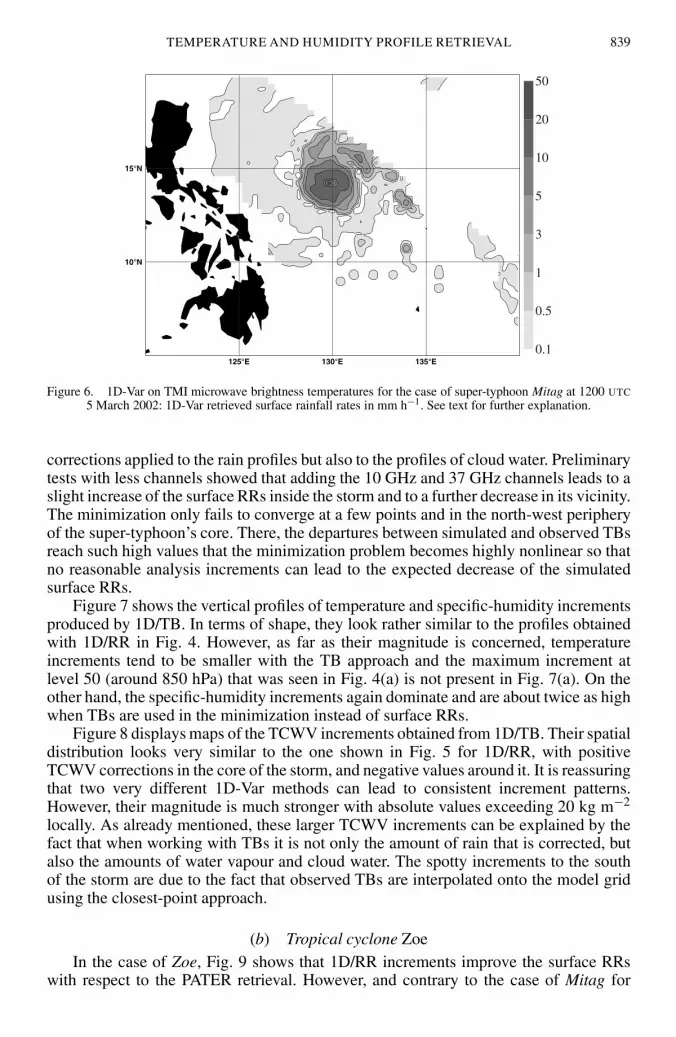
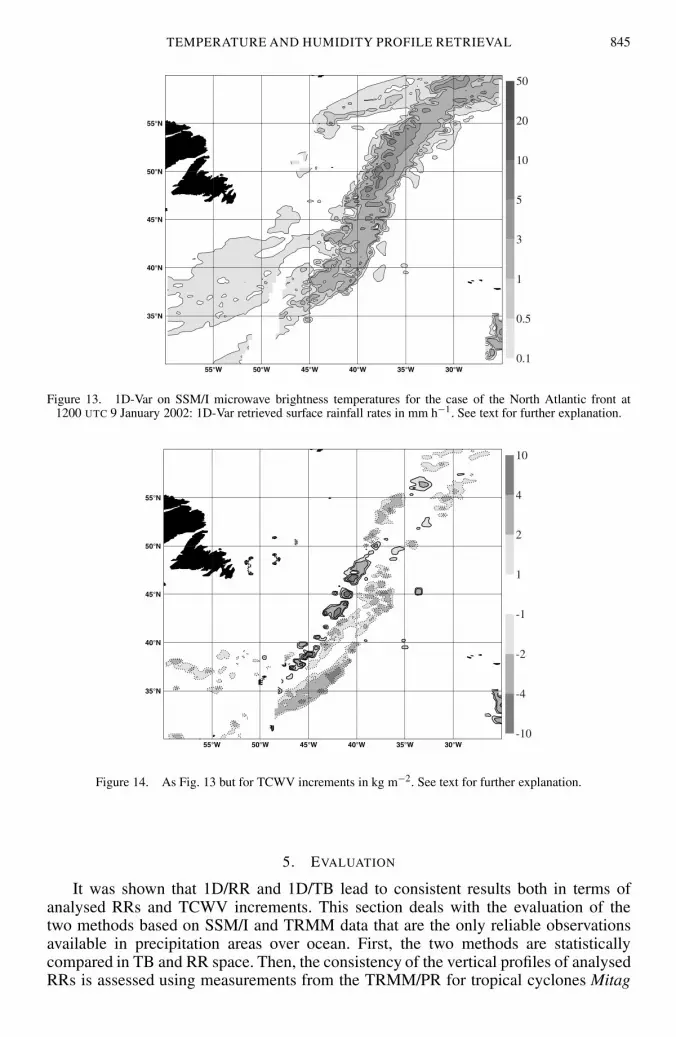
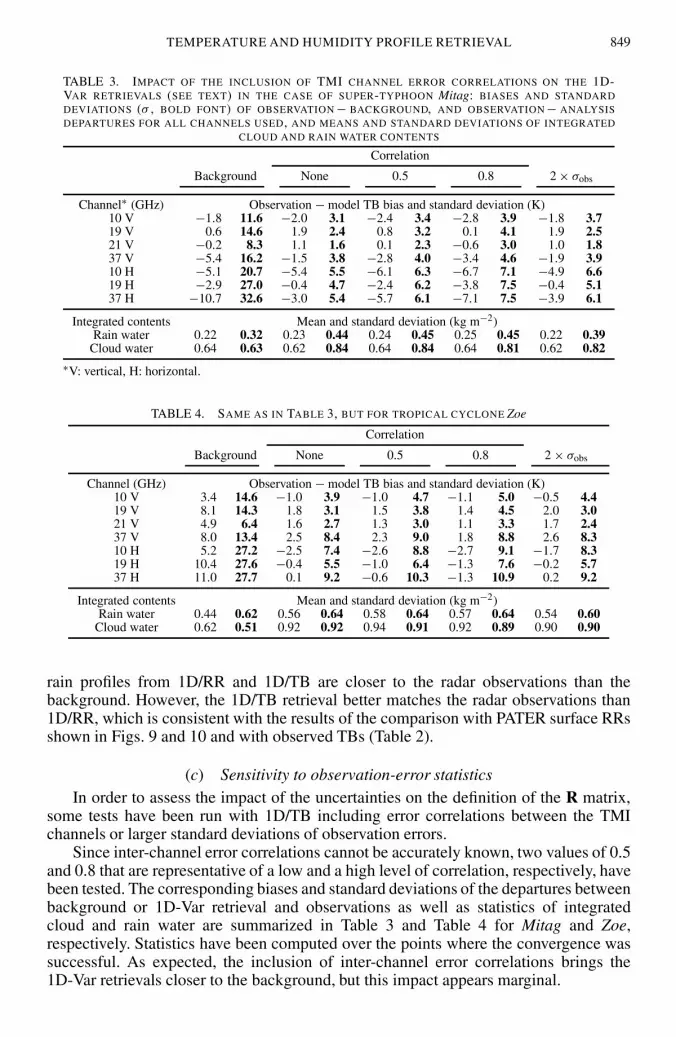


