Embed Size (px)
Citation preview
A NEW APPROACH FROM THE VEG-GAP PROJECT
edited byValeria Stacchini
Are you aware of the benefits that urban vegetation can produce to lowering temperature and improving air quality? Do you remember how you missed being in contact with nature during the lockdown?To develop effective control strategies aiming at maintaining and improving air quality within Europe-an cities, the Life VEG-GAP project consortium have deepened what are the links between vegetation, temperature and air pollution.Bologna, Madrid and Milan are the three pilot cities were the new methodology and tools were profitably tested.This provided a valuable example of transnational collaboration, showing how cities, research centres, businesses and civil society together can team up to build better cities. Thanks to the VEG-GAP project, scientific models were turn into valuable operational tools which can be profitably used by cities for better planning and monitoring their policies.
www.buponline.com
Valeria Stacchini
VEGETATION FOR URBAN GREEN AIR
QUALITY PLANS
VEGETATIO
N FO
R URBA
N G
REEN A
IR QU
ALITY PLA
NS
edited byValeria Stacchini
A NEW APPROACH FROM THE VEG-GAP PROJECT
VEGETATION FOR URBAN GREEN AIR QUALITY PLANS
Fondazione Bologna University PressVia Saragozza 10, 40123 Bolognatel. (+39) 051 232 882fax (+39) 051 221 019
This work is licensed under a Creative Commons Attribution BY-NC-SA 4.0
ISBN 979-12-5477-070-2ISBN online 979-12-5477-071-9
Graphic and layout design: Centro Stampa di Meucci Roberto
First edition: may 2022
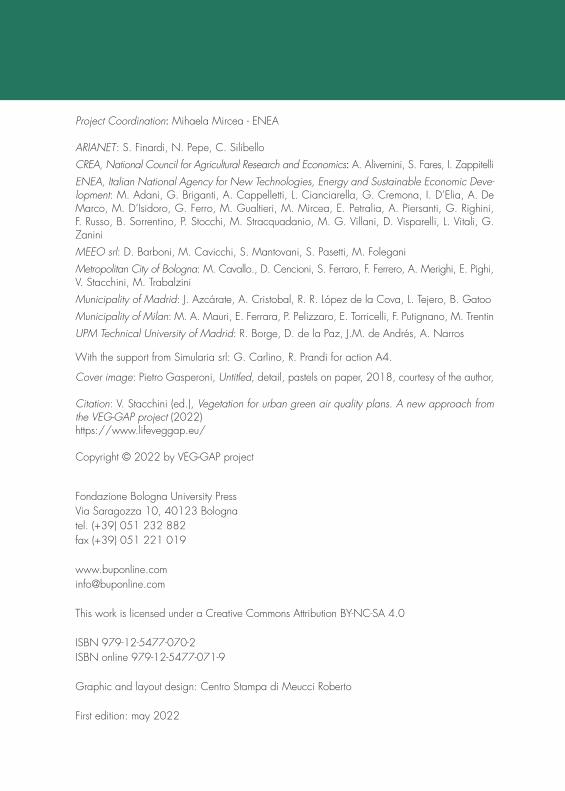
Project Coordination: Mihaela Mircea - ENEA
ARIANET: S. Finardi, N. Pepe, C. SilibelloCREA, National Council for Agricultural Research and Economics: A. Alivernini, S. Fares, I. ZappitelliENEA, Italian National Agency for New Technologies, Energy and Sustainable Economic Deve-lopment: M. Adani, G. Briganti, A. Cappelletti, L. Cianciarella, G. Cremona, I. D’Elia, A. De Marco, M. D’Isidoro, G. Ferro, M. Gualtieri, M. Mircea, E. Petralia, A. Piersanti, G. Righini, F. Russo, B. Sorrentino, P. Stocchi, M. Stracquadanio, M. G. Villani, D. Visparelli, L. Vitali, G. ZaniniMEEO srl: D. Barboni, M. Cavicchi, S. Mantovani, S. Pasetti, M. FoleganiMetropolitan City of Bologna: M. Cavallo., D. Cencioni, S. Ferraro, F. Ferrero, A. Merighi, E. Pighi, V. Stacchini, M. TrabalziniMunicipality of Madrid: J. Azcárate, A. Cristobal, R. R. López de la Cova, L. Tejero, B. GatooMunicipality of Milan: M. A. Mauri, E. Ferrara, P. Pelizzaro, E. Torricelli, F. Putignano, M. TrentinUPM Technical University of Madrid: R. Borge, D. de la Paz, J.M. de Andrés, A. Narros
With the support from Simularia srl: G. Carlino, R. Prandi for action A4.
Cover image: Pietro Gasperoni, Untitled, detail, pastels on paper, 2018, courtesy of the author,
Citation: V. Stacchini (ed.), Vegetation for urban green air quality plans. A new approach from the VEG-GAP project (2022)https://www.lifeveggap.eu/
Copyright © 2022 by VEG-GAP project
VEG-GAP project partners:
The VEG-GAP project (LIFE18 PRE IT 003) is co-financed by LIFE Sub-programme for Environment.
The opinions expressed in this report are those of the authors and do not reflect the opinions of the European Commission. The LIFE Programme authorities are not liable for any use that may be made of the information contained therein.

CONTENTS
INTRODUCTION 7Valeria Stacchini
1. The challenges addressed 13Valeria Stacchini
2. Vegetation mapping and biogenic emissions 25Sandro Finardi, Nicola Pepe, Camillo Silibello
3. Integration of vegetation inventories with data from satellites 41Ilaria Zappitelli, Alessandro Alivernini, Silvano Fares
4. Impacts of vegetation on meteorology and air quality 57Mihaela Mircea, Ettore Petralia
5. Impacts of vegetation on health and ecosystemrisks 67Rafael Borge, David de la Paz, Juan Manuel de Andrés Almeida, Adolfo Narros
6. Engaging relevant actors and co-design to gainlasting results 77Valeria Stacchini, Elisa Pighi, Marino Cavallo
7. The three pilot cities: Introduction 937.1. Reforestation and nature-based solutions in Bologna
metropole 95 Marino Cavallo, Elisa Pighi, Valeria Stacchini
7.2. Madrid is going green: programme and policies toboost the presence of vegetation and better air quality 114Luis Tejero Encinas
7.3. Green plans and projects of Milan Municipality Marta Alessandra Mauri, Piero Pelizzaro, Elisa Torricelli,Marina Trentin 129
6
8. The VEG-GAP Information Platform 141Stefania Pasetti, Simone Mantovani
References 153
List of figures and tables 169
Authors 175
6 7
How does urban green affect the temperature and air quality and, consequently, the well-being of citizens? Which species are best suited to be planted in urban areas? How much and where should vegetation be lo-cated in the city? These are some of the questions that the VEG-GAP project addressed within this publication.
This volume collects the work experience of the Life project VEG-GAP “Vege-tation for Urban Green Air Quality Plans”, funded by the Life Programme for the Environment and Climate Action. VEG-GAP is the first Life preparatory project1 in Italy as well as the first European project studying the relationship between urban green, temperature and air quality, in an integrated way. The VEG-GAP project is inspired by the awareness that urban green is an extraordinary resource for the air quality of cities, thanks to its ability to regulate thermal comfort and clean the air. However, vegetation also emits gases in atmosphere that contribute to the formation of secondary pollutants. The project task is understanding if the urban green, in some chemical and atmospheric conditions, can entail health risks for humans and vegetation ecosystems, because of compounds emitted, to the pro-duction of ozone and of secondary particulate matter. The issues that VEG-GAP faces span a wide range of interactions such as between plant ecosystems and pollution, plant ecosystems and meteorology, pollution and human health, pollution and plant ecosystem health.The cities of Bologna, Madrid and Milan were under investigation during the three years of project implementation. Eight partners – local author-ities, research institutes and companies – joined forces to offer public
1 Preparatory projects are identified by the Commission in cooperation with Member States to respond to specific needs related to the development and implementation of EU environmental policies and legislation.
INTRODUCTION
Valeria Stacchini
8
administrations useful information and tools to develop better air quality plans that take into consideration the characteristics of urban vegetation ecosystems, and to empower citizens with more information about the impact of vegetation on air quality. VEG-GAP starts from an in-depth anal-ysis of the current state of the green and air quality in the three metropoli-tan areas involved, developing an integrated approach that examines the transport and formation of pollutants in the atmosphere, from continental to city scale, together with the presence of buildings and vegetation, in different weather conditions. Then, the consortium assessed the impact of urban green development scenarios on air pollution and temperature.Papers collected in this book, represent the contributions of each VEG-GAP partners to enrich, integrate and capitalize the work carried out within, and related with, the project. The structure of the book is presented below.The first chapter by Valeria Stacchini describes the challenges addressed by the project and the European and international policy context. Here I also explain why a better planning of cities is necessary, why it is essential to adopt an integrated approach, introducing which novelties the VEG-GAP project provides, and outlining some possible future developments.Vegetation mapping and biogenic emissions is the main focus of the sec-ond chapter by Sandro Finardi, Nicola Pepe, Camillo Silibello. It explains which inventories were used and how they have been integrated to pro-vide reliable vegetation maps in the three pilot cities; the main trees’ spe-cies detected in the pilot cities, and their characteristics, are also pointed out. Then, the plant-specific emission model adopted is described. Finally, urban vegetation development scenarios and related biogenic emission estimation are detailed. The third chapter argues the pivotal role of sustainable urban forestry as ecosystem services for the citizen. Ilaria Zappitelli, Alessandro Alivernini and Silvano Fares provide information on how remote sensing technol-ogies may support analysis and future planning, providing an effective and replicable methodology. Finally, they present the products developed within the VEG-GAP project, as land use maps, leaf area index and phe-nology map, and other thematic maps.
8 9
Afterwards Mihaela Mircea and Ettore Petralia (chapter four) provide insight about the impact of vegetation on meteorology and air quality, describing the methodology and modelling systems adopted for the anal-ysis, as well as which data, and how, have been elaborated. In this chap-ter, you will find also results emerged from the simulations undertaken in the three pilot cities, according to three different scenarios analysed: current vegetation, without vegetation, and planned future.Rafael Borge, David de la Paz, Juan Manuel de Andrés Almeida, Adolfo Narros presents in the fifth chapter some of the results emerged thanks to the analysis about the impacts of vegetation on meteorology, health and ecosystem risks. In particular they provide some examples and data2 for the three pilot cities and according to the different scenarios elaborated.The sixth chapter, written by Valeria Stacchini, Elisa Pighi, Marino Caval-lo, retraces the co-design process initiated at several levels by the VEG-GAP project, presenting the actors involved, describing the most signifi-cant appointments3, outlining the challenges and difficulties encountered, as well as the benefits gained through this process itself. Finally, we point out lesson learned and steps forward. The following chapter is dedicated to the three pilot cities, Bologna Metropole, Madrid and Milan. Each of them presents their current pol-icies and plans for the future, outlining how VEG-GAP are influencing local projects and actions. In the case of the Metropolitan City of Bologna, the text by Marino Caval-lo, Elisa Pighi, Valeria Stacchini, retraces the main policies and projects implemented: the Bologna Charter for the environment, the Sustainable Development Agenda, the Guidelines for the metropolitan forestation, the metropolitan reforestation projects funded by the Italian Ministry of the
2 The data presented in the chapters 4, 5 were provided by VEG-GAP Information Platform and were produced by ENEA (M. Adani, G. Briganti, A. Cappelletti, G. Cremona, I. D’Elia, M. D’Isidoro, M. Mircea, F. Russo, Piersanti, B. Sorrentino) with support from Simularia srl (R. Prandi, G. Carlino) and by UPM (R. Borge, D. de la Paz, J.M. de Andrés, A. Narros).3 The activities described here saw the involvement of all the project partners, while coordination role was the following ones: the Metropolitan City of Bologna coordinated communication and dissemination activities, the Municipality of Milan coordinated the networking, Madrid the demon-strative days organization. Each local authority was responsible for stakeholder engagement in their local area, and for the organization of local events. ENEA, as lead partner, was in charge for the Advisory Board coordination.
10
Ecological Transition, the participation in European projects promoting nature based solutions and a new green entrepreneurship. Besides, the chapter presents the strategic goals for the next few years, such as the commitment to achieve climate neutrality in 2030.Madrid context is presented by Luis Tejero Encinas. In particular he out-lines programmes and projects related to air quality, climate change, urban green infrastructure and nature-based solutions; he also details the project background and activities carried out in the VEG-GAP frame-work. As Bologna, Madrid launched a Climate Neutrality Roadmap, it has already developed a green infrastructure and biodiversity plan, and is working to realize a Metropolitan Forest.Similarly, Marta Alessandra Mauri, Piero Pelizzaro, Elisa Torricelli and Marina Trentin describe the framework of the City of Milan, by focusing on the urban features that tend to exacerbate climate change effects and presents the policies of the city to support resilience and adaptation. In fact, the City is particularly focusing on the opportunities offered by the introduction of nature-based solutions, through different project such as VEG-GAP, ForestaMi, Oasis, Clever City, the Depaving Program, Open Squares, and more others.The eight and last chapter presents the VEG-GAP information platform, describing the development process and the implementation plan. More-over, it details the service offered, both in the basic and advanced ver-sion. The authors are Stefania Pasetti and Simone Mantovani from MEEO srl.VEG-GAP is a valuable example of transnational collaboration, and of how cities, research centres, businesses and civil society can team up to build better cities. Thanks to the project, we were able to transform sci-entific models into operational tools that can be profitably used by cities for better planning and monitoring their policies. Indeed, VEG-GAP main goal is to show how urban green affects air quality directly, through its gaseous emissions of volatile organic compounds and through its ability to filter the air, and indirectly, by changing the temperature of the air which, in turn, modifies the atmospheric processes responsible for the formation of secondary pollutants such as ozone and a part of the atmo-spheric particulate matter. VEG-GAP arises from the awareness that the
10 11
use of a natural resource, as urban green, represents a great opportunity to improve the quality of life in the city in its multiple aspects such as so-cial, economic and cultural, starting from the improvement of air quality and of the thermal comfort, basic elements of the citizens’ health and well-being.

12
12 13
1. The challenges addressed
1.1. The challenges addressedCities are places of opportunities: jobs, study, cultural, recreational. For this reason, cities attract more and more people. The increase in the population leads to an in-crease in requests for housing and resources (water, en-ergy, etc.). This leads to an aggravation of criticalities linked, for example, to the management of waste or to
traffic and associated pollution, with important impacts on citizens’ health and environment. Cities are therefore the hottest and unhealthiest areas on the planet, due to overbuilding that often prevails over green areas, and poor air quality due to emissions from vehicles, heating and cooling sys-tems for domestic use, industrial plants, and so on.By 2050, the United Nations Organization expects a population increase in cities up to 68% globally, and up to 74% in Europe. This could lead to a worsening of the current situation and the liveability of our cities. If cities do not use tools capable of allowing them an adequate assessment of the impacts caused by the changes foreseen in their urban plans, together with reductions in anthropogenic emissions. It is therefore more than ever necessary for cities to equip themselves with such tools, based on state-of the-art knowledge.Urban and peri-urban forests, as well as more in general urban vegeta-tion, are a source of ecosystem service for citizens. In particular, urban green is an extraordinary resource for air quality within cities, thanks to its ability to regulate thermal comfort and filter pollutants. Neverthe-less, vegetation may also emit gaseous substances (volatile organic com-pounds or BVOC) that take part in photochemical reactions leading to ozone (O3) and particulate production (PM10). This process is influenced by a multitude of other substances emitted into the atmosphere by human activities, and, in particular, by nitrogen dioxide (NO2) produced by road traffic. To respond to this complexity, the Life VEG-GAP project has devel-
Valeria Stacchini
14
oped an integrated approach that considers all these aspects, focusing its studies and analyses on: anthropogenic and natural emission sources, the morphology of the city, the green areas and the current plant species.Indeed, the urban greenery together with the city morphology control the urban micro-climate and the permanence of some pollutants in the air. VEG-GAP developed a strategy to produce new reliable information in support of air-quality plans, climate resilience plans, considering the characteristics of current and future urban vegetation. It could be used also in general urban planning to assess zero-impact on climate and en-vironment for city expansion or regeneration interventions.Today, cities and their decision makers do not have adequate information and tools to support resolutions regarding the quantity of vegetation, the species to be used and their distribution in urban areas to improve air quality and mitigate the effects of climate change, all the more taking into consideration the integration of the various factors. However, obtaining exhaustive data and maps is a key step for proper urban planning and monitoring. Although to collect data from private area is often challenging, remote sensing technologies may come into help by providing an effective and replicable methodology to quantify the presence of vegetation, and it can be used as a valuable tool by municipalities for better city planning.
1.2. The European and international contextEuropeans see climate change as top challenge for the EU: nine out 10 youngsters believe that tackling climate change can help improving their own health and well-being, while 84% of those aged 55 or over also agree1 on this.Pollution harms our health and our planet. It is the major environmental cause of multiple mental and physical diseases (including stroke, chron-ic obstructive pulmonary disease, trachea, bronchus and lung cancers, aggravated asthma and lower respiratory infections) and of premature deaths. Air pollution also has considerable economic impacts: reducing
1 Special Eurobarometer survey 517 ‘Future of Europe’, https://europa.eu/eurobarometer/surveys/detail/2554.
14 15
Life expectancy, increasing medical costs and reducing productivity through working days lost across different economic sectors2.Besides, pollution is one of the main reasons for the loss of biodiversity, reducing the ability of ecosystem to provide services, such as carbon sequestration and de-contamination. Cities are particularly affected by pollution: over 100 cities in the European Union still do not meet Europe-an air quality standards.On May 2021 the European Commission published the new European Zero Pollution Action Plan: the plan ties together all relevant EU policies to tackle and prevent pollution, with a special emphasis on how to use digital solutions. Looking specifically at what concerns the air pollution, the plan has set an ambitious target: to reduce the number of premature deaths due to fine particulate matter exposure by at least 55% by 2030, compared to 2005 levels. Based on the European Environmental Agency estimate of 456,000 premature deaths attributable to fine particulate mat-ter in 2005, this would be equivalent to reduce the number of premature deaths in Europe by 250,800.Moreover, it has led the European Commission to activate the revision of the Ambient Air Quality Directive (2008/50/EC), in order to align the European standards with the stricter recommendations of the World Health Organization (WHO). Actually, the Directive set limit values for ground-level ozone (O3), nitrogen dioxide (NO2) and fine particles (PM10), and whenever overruns occur, the countries and regional authorities have the legal obligation of designing Air Quality Plans, and assessing their impacts on air pollution. The revision also aspires to reinforce provisions on air quality monitoring and to develop air quality plans to help local authorities tackling air pollution.Recently, in mid-November 2021, the European Environmental Agency (EEA) published a briefing on the health impacts of air pollution in Eu-rope, presenting the latest estimates of the health impact of three key pol-lutants – fine particulate matter, nitrogen dioxide and ground-level ozone.While the pollution source varies from country to country, it originates mostly from traffic and solid fuel combustion. Then to reduce significantly
2 Air quality in Europe 2021. - ISBN 978-92-9480-403-7 - ISSN 1977-8449 - doi: 10.2800/549289.
16
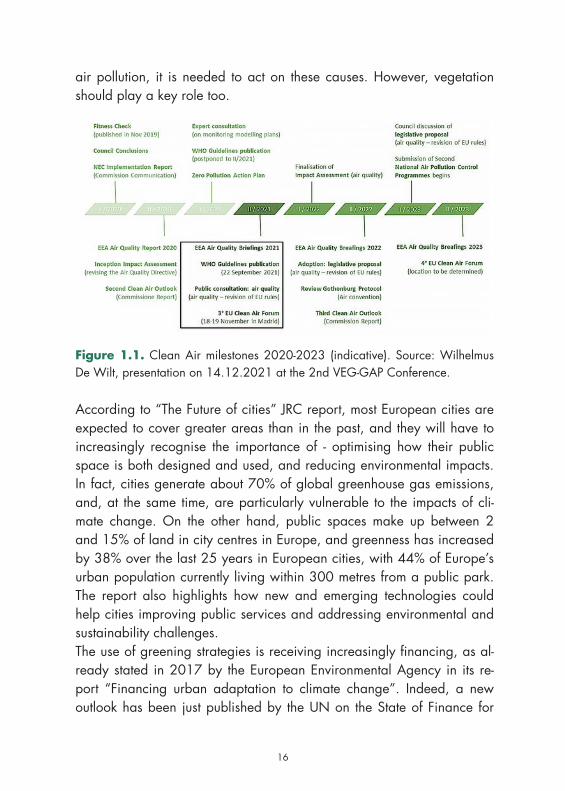
air pollution, it is needed to act on these causes. However, vegetation should play a key role too.
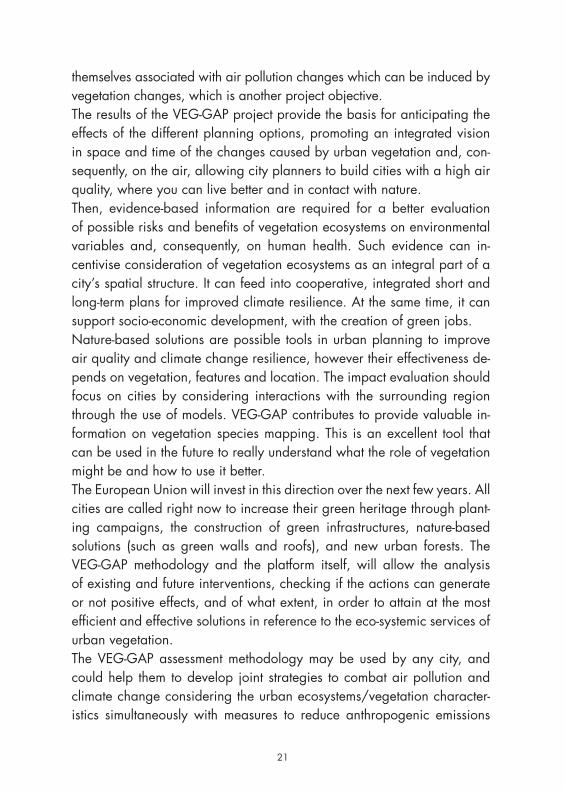
Figure 1.1. Clean Air milestones 2020-2023 (indicative). Source: Wilhelmus De Wilt, presentation on 14.12.2021 at the 2nd VEG-GAP Conference.
According to “The Future of cities” JRC report, most European cities are expected to cover greater areas than in the past, and they will have to increasingly recognise the importance of - optimising how their public space is both designed and used, and reducing environmental impacts. In fact, cities generate about 70% of global greenhouse gas emissions, and, at the same time, are particularly vulnerable to the impacts of cli-mate change. On the other hand, public spaces make up between 2 and 15% of land in city centres in Europe, and greenness has increased by 38% over the last 25 years in European cities, with 44% of Europe’s urban population currently living within 300 metres from a public park. The report also highlights how new and emerging technologies could help cities improving public services and addressing environmental and sustainability challenges.The use of greening strategies is receiving increasingly financing, as al-ready stated in 2017 by the European Environmental Agency in its re-port “Financing urban adaptation to climate change”. Indeed, a new outlook has been just published by the UN on the State of Finance for
16 17
Nature in the G20, and it reveals that current investments in nature-based solutions are insufficient, and quite low compared to the domestic gov-ernment spending. The report calls for G20 countries to scale-up annual nature-based solutions spending to tackle the inter-related nature, climate, and land degradation crises on which much of our economies are de-pendent, and provides recommendations to align development and eco-nomic recovery with nature goals. According to this report, current G20 spending is only USD 120 billion/year, while G20 countries’ investments in nature-based solutions need to reach USD 285 billion/year by 2050: they should therefore be more than doubled and seize the opportunities to increase investment in non-G20 countries as well as in the private sector. The report also stresses the necessity for G20 countries to embrace their role as influential change agents and align development and economic recovery with international nature and climate goals.On the other hand, little attention is paid to the role that vegetation and ecosystem could play in the generation, destruction and transformation of atmospheric pollutants in urban areas. Urban vegetation ecosystem impacts air quality also by reducing the air temperature. Therefore, the authorities looking for solutions to tackle air pollution and climate chal-lenges in cities need to better know the potential role of vegetation and ecosystem, and be able to access reliable data, in order to take in-formed decision in urban planning and better designing and managing of green areas.
1.3. The project’s approachThe VEG-GAP project developed an integrated approach and a set of tools to assess impact of current and future vegetation on meteorological conditions (temperature, precipitation, relative humidity, wind speed) and air quality (concentration of pollutants and their deposition), so that deci-sion makers can make choices based on scientific evidence. These were developed using state-of-the-art scientific findings and modelling tools, similar to those used for assessing climate changes (IPCC) and impact of anthropogenic emissions reductions (NEC Directive).Bologna, Madrid and Milan are the three pilot cities involved in the proj-ect implementation. They are quite different realities, even though share
18
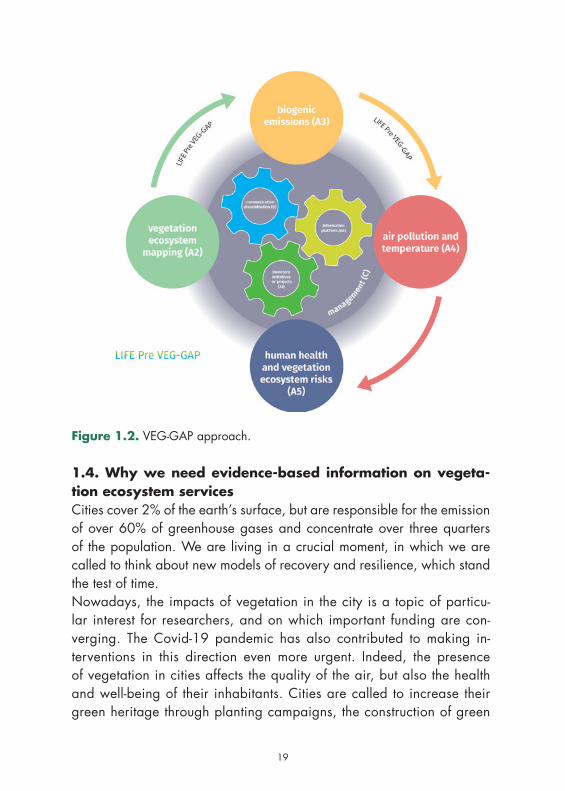
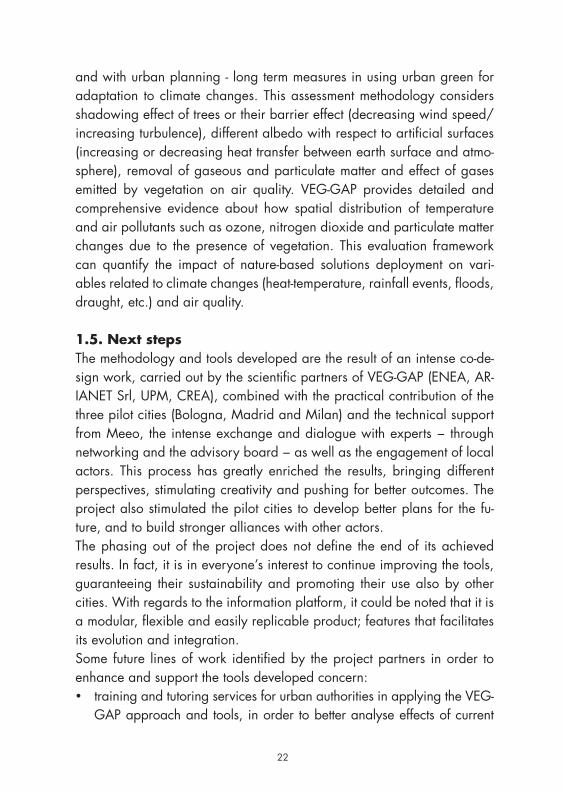
sensitivity for air quality management. Their variability of atmospheric composition allowed to gain a better understanding of the role and con-straints of vegetation ecosystems on urban air quality management. More-over, the availability of data from previous studies and the direct involve-ment of local authorities was a guarantee for the fulfilment of VEG-GAP objectives. Through the analysis of these specific realities, it was possible to test new methodologies and tools, which in the future may be applied also to other realities.The assessment made for present vegetation scenarios in these three pilot cities provide bases for testing the effect of environmental solutions such as green infrastructures, urban agriculture, urban green belts and na-ture-based solutions, on air pollution in an integrated view in space and time. Moreover, the effects of vegetation on temperature and air pollution can be assessed with air quality modelling systems (AQMS) and is a base for more “local” evaluations at street or door level.The project outcomes are made publicly available through an information platform, with the objective to communicate in an effective and easily understandable way the results of the simulations produced by the VEG-GAP scientific partners (ENEA, ARIANET Srl, UPM - Polytechnic University of Madrid, CREA). The VEG-GAP consortium set up thematic maps easily accessible in a GIS environment and all stakeholders involved in urban planning can use them, as well as modelling ecosystems services based on vegetation features. These maps are all available in the VEG-GAP information platform. Co-designed by scientists, IT experts, Municipalities and citizens, it is helping the cities of Madrid, Milan and Bologna to pro-vide simple or complex answers, to complex questions, according to the groups targeted. Even citizens could access the basic version, being sen-sitized on the benefits of the municipality’s interventions. At the same time competent authorities are supported in planning and analysis through the advanced version of the platform.The VEG-GAP approach was structured according to the scheme below (Figure 1.2): the external bubbles represent the main issue considered, while the internal gears represent how information has been reworked and disseminated.
18 19
Figure 1.2. VEG-GAP approach.
1.4. Why we need evidence-based information on vegeta-tion ecosystem servicesCities cover 2% of the earth’s surface, but are responsible for the emission of over 60% of greenhouse gases and concentrate over three quarters of the population. We are living in a crucial moment, in which we are called to think about new models of recovery and resilience, which stand the test of time.Nowadays, the impacts of vegetation in the city is a topic of particu-lar interest for researchers, and on which important funding are con-verging. The Covid-19 pandemic has also contributed to making in-terventions in this direction even more urgent. Indeed, the presence of vegetation in cities affects the quality of the air, but also the health and well-being of their inhabitants. Cities are called to increase their green heritage through planting campaigns, the construction of green
20
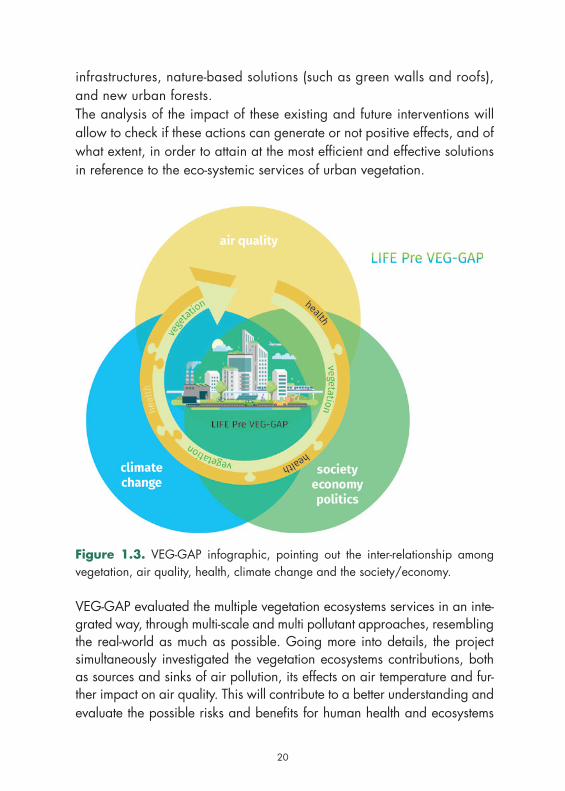
infrastructures, nature-based solutions (such as green walls and roofs), and new urban forests.The analysis of the impact of these existing and future interventions will allow to check if these actions can generate or not positive effects, and of what extent, in order to attain at the most efficient and effective solutions in reference to the eco-systemic services of urban vegetation.
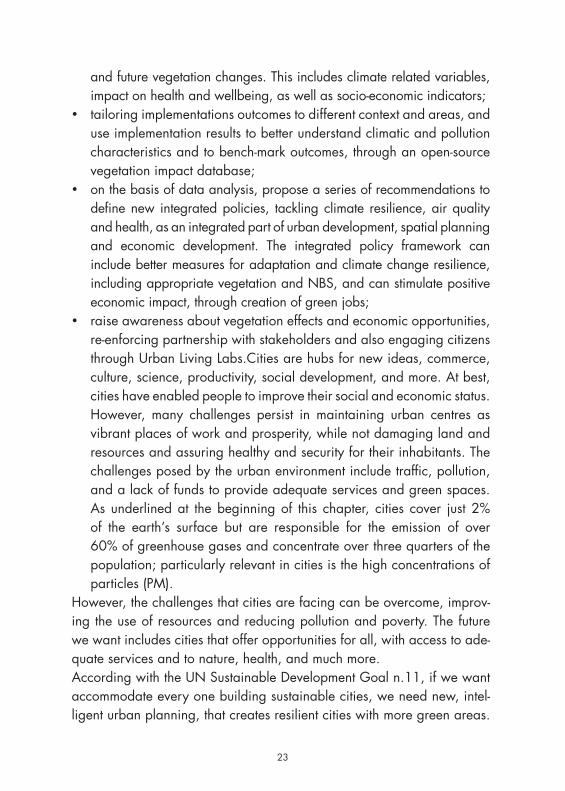
Figure 1.3. VEG-GAP infographic, pointing out the inter-relationship among vegetation, air quality, health, climate change and the society/economy.
VEG-GAP evaluated the multiple vegetation ecosystems services in an inte-grated way, through multi-scale and multi pollutant approaches, resembling the real-world as much as possible. Going more into details, the project simultaneously investigated the vegetation ecosystems contributions, both as sources and sinks of air pollution, its effects on air temperature and fur-ther impact on air quality. This will contribute to a better understanding and evaluate the possible risks and benefits for human health and ecosystems
20 21
themselves associated with air pollution changes which can be induced by vegetation changes, which is another project objective.The results of the VEG-GAP project provide the basis for anticipating the effects of the different planning options, promoting an integrated vision in space and time of the changes caused by urban vegetation and, con-sequently, on the air, allowing city planners to build cities with a high air quality, where you can live better and in contact with nature.Then, evidence-based information are required for a better evaluation of possible risks and benefits of vegetation ecosystems on environmental variables and, consequently, on human health. Such evidence can in-centivise consideration of vegetation ecosystems as an integral part of a city’s spatial structure. It can feed into cooperative, integrated short and long-term plans for improved climate resilience. At the same time, it can support socio-economic development, with the creation of green jobs.Nature-based solutions are possible tools in urban planning to improve air quality and climate change resilience, however their effectiveness de-pends on vegetation, features and location. The impact evaluation should focus on cities by considering interactions with the surrounding region through the use of models. VEG-GAP contributes to provide valuable in-formation on vegetation species mapping. This is an excellent tool that can be used in the future to really understand what the role of vegetation might be and how to use it better.The European Union will invest in this direction over the next few years. All cities are called right now to increase their green heritage through plant-ing campaigns, the construction of green infrastructures, nature-based solutions (such as green walls and roofs), and new urban forests. The VEG-GAP methodology and the platform itself, will allow the analysis of existing and future interventions, checking if the actions can generate or not positive effects, and of what extent, in order to attain at the most efficient and effective solutions in reference to the eco-systemic services of urban vegetation.The VEG-GAP assessment methodology may be used by any city, and could help them to develop joint strategies to combat air pollution and climate change considering the urban ecosystems/vegetation character-istics simultaneously with measures to reduce anthropogenic emissions
22
and with urban planning - long term measures in using urban green for adaptation to climate changes. This assessment methodology considers shadowing effect of trees or their barrier effect (decreasing wind speed/increasing turbulence), different albedo with respect to artificial surfaces (increasing or decreasing heat transfer between earth surface and atmo-sphere), removal of gaseous and particulate matter and effect of gases emitted by vegetation on air quality. VEG-GAP provides detailed and comprehensive evidence about how spatial distribution of temperature and air pollutants such as ozone, nitrogen dioxide and particulate matter changes due to the presence of vegetation. This evaluation framework can quantify the impact of nature-based solutions deployment on vari-ables related to climate changes (heat-temperature, rainfall events, floods, draught, etc.) and air quality.
1.5. Next stepsThe methodology and tools developed are the result of an intense co-de-sign work, carried out by the scientific partners of VEG-GAP (ENEA, AR-IANET Srl, UPM, CREA), combined with the practical contribution of the three pilot cities (Bologna, Madrid and Milan) and the technical support from Meeo, the intense exchange and dialogue with experts − through networking and the advisory board − as well as the engagement of local actors. This process has greatly enriched the results, bringing different perspectives, stimulating creativity and pushing for better outcomes. The project also stimulated the pilot cities to develop better plans for the fu-ture, and to build stronger alliances with other actors.The phasing out of the project does not define the end of its achieved results. In fact, it is in everyone’s interest to continue improving the tools, guaranteeing their sustainability and promoting their use also by other cities. With regards to the information platform, it could be noted that it is a modular, flexible and easily replicable product; features that facilitates its evolution and integration.Some future lines of work identified by the project partners in order to enhance and support the tools developed concern:• training and tutoring services for urban authorities in applying the VEG-
GAP approach and tools, in order to better analyse effects of current
22 23
and future vegetation changes. This includes climate related variables, impact on health and wellbeing, as well as socio-economic indicators;
• tailoring implementations outcomes to different context and areas, and use implementation results to better understand climatic and pollution characteristics and to bench-mark outcomes, through an open-source vegetation impact database;
• on the basis of data analysis, propose a series of recommendations to define new integrated policies, tackling climate resilience, air quality and health, as an integrated part of urban development, spatial planning and economic development. The integrated policy framework can include better measures for adaptation and climate change resilience, including appropriate vegetation and NBS, and can stimulate positive economic impact, through creation of green jobs;
• raise awareness about vegetation effects and economic opportunities, re-enforcing partnership with stakeholders and also engaging citizens through Urban Living Labs.Cities are hubs for new ideas, commerce, culture, science, productivity, social development, and more. At best, cities have enabled people to improve their social and economic status. However, many challenges persist in maintaining urban centres as vibrant places of work and prosperity, while not damaging land and resources and assuring healthy and security for their inhabitants. The challenges posed by the urban environment include traffic, pollution, and a lack of funds to provide adequate services and green spaces. As underlined at the beginning of this chapter, cities cover just 2% of the earth’s surface but are responsible for the emission of over 60% of greenhouse gases and concentrate over three quarters of the population; particularly relevant in cities is the high concentrations of particles (PM).
However, the challenges that cities are facing can be overcome, improv-ing the use of resources and reducing pollution and poverty. The future we want includes cities that offer opportunities for all, with access to ade-quate services and to nature, health, and much more.According with the UN Sustainable Development Goal n.11, if we want accommodate every one building sustainable cities, we need new, intel-ligent urban planning, that creates resilient cities with more green areas.
24
Target 11.6 aims in particular to reduce the environmental impact of cit-ies, paying special attention to air quality, while target 11.7 addresses the need to provide universal access to safe, inclusive and accessible, green public spaces. Again, target 11.B point out the importance of im-plementing integrated policies and plans aimed at inclusion, resource ef-ficiency, mitigation and adaptation to climate change, disaster resistance. Indeed VEG-GAP should contribute to these targets, as well as to the Goal 15, addressed to promote sustainable use of terrestrial ecosystems and sustainable management of forests, as well as to the Goal 13 on climate change resilience.The climate crisis, the biodiversity crisis and the pollution crisis persist, despite the temporary reduction of emission in 2020 related to lockdowns and other Covid-19 response measures. The Covid-19 pandemic urged for a prompt answer to the fast changes we are living. The balance be-tween city and nature is for our well-being, our health, our safety. Invest in data and information structure is critical. Policies, programmes and re-sources will inevitably fall short without the evidence to focus. Investing in data and information systems is not money and time wasted. We need to embrace innovative approach and forge stronger partnership, improving the availability of data for evidence-based decisions. VEG-GAP’s work is in this direction.
24 25
2. Vegetation mapping and biogenic emissions
2.1. IntroductionMany cities are planning to increase urban vegetation to improve the quality of life through the mitigation of heat island and the improvement of air quality and thermal com-fort, with the final aim to provide a healthy and pleasant environment to their citizens. It is recognized that planting trees in urban areas can moderate temperatures (through shading and cooling air by evapotranspiration), and re-
move air pollutants, thanks to their capacity to absorb gas and particle. Nevertheless, since plants also emit Biogenic Organic Volatile Compounds (BVOC), that can affect ozone and secondary organic aerosols, it is import-ant to select the appropriate tree species to be planted, together with their number and location, and evaluate their effect inside the air quality impact assessment of vegetation. However, the impact of urban vegetation on air quality is usually neglected by air quality model simulations finalized to eval-uate air pollution mitigation measures and verify air quality plans from city to regional scale. This limitation can be partially due to the lack of comprehen-sive land cover data sets including a proper mapping of urban vegetation. As an example, the well-known CORINE Land Cover (CLC), that is the refer-ence information source for land surface cover in Europe (https://land.co-pernicus.eu/pan-european/corine-land-cover), only identifies urban parks, but it neglects vegetation located in gardens, boulevards, etc. Even ancillary datasets available for European cities like Copernicus Urban Atlas and Street Tree Layer (https://land.copernicus.eu/local/urban-atlas) provide a partial mapping of the trees located within the urban texture and do not describe trees planted along the urban roads. Moreover, these datasets do not include a description of the tree species but characterize the vegetation through ag-gregated classes as evergreen/deciduous broadleaf or needleleaf trees.Measurements and analyses performed by different authors in different geographic and ecological context (e.g. Steinbrecher et al., 2009; Karl
Sandro Finardi,Nicola Pepe,Camillo Silibello
26
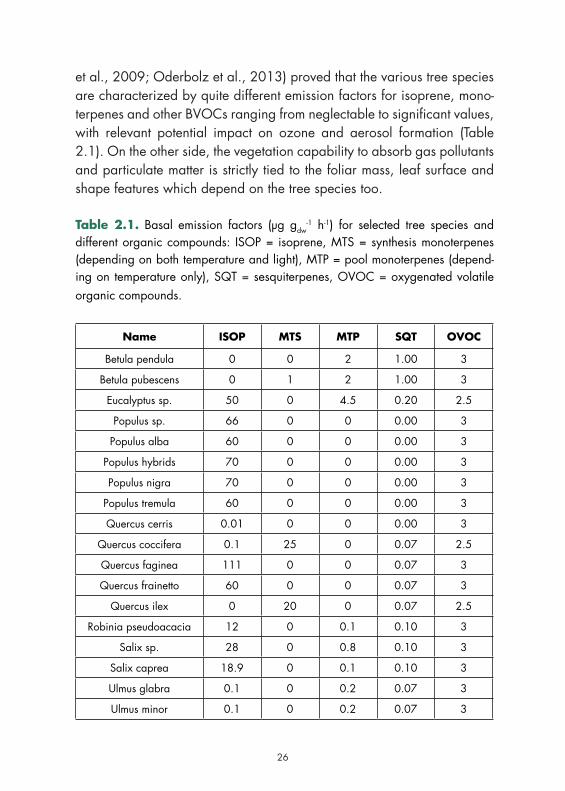
et al., 2009; Oderbolz et al., 2013) proved that the various tree species are characterized by quite different emission factors for isoprene, mono-terpenes and other BVOCs ranging from neglectable to significant values, with relevant potential impact on ozone and aerosol formation (Table 2.1). On the other side, the vegetation capability to absorb gas pollutants and particulate matter is strictly tied to the foliar mass, leaf surface and shape features which depend on the tree species too.
Table 2.1. Basal emission factors (μg gdw-1 h-1) for selected tree species and
different organic compounds: ISOP = isoprene, MTS = synthesis monoterpenes (depending on both temperature and light), MTP = pool monoterpenes (depend-ing on temperature only), SQT = sesquiterpenes, OVOC = oxygenated volatile organic compounds.
Name ISOP MTS MTP SQT OVOC
Betula pendula 0 0 2 1.00 3
Betula pubescens 0 1 2 1.00 3
Eucalyptus sp. 50 0 4.5 0.20 2.5
Populus sp. 66 0 0 0.00 3
Populus alba 60 0 0 0.00 3
Populus hybrids 70 0 0 0.00 3
Populus nigra 70 0 0 0.00 3
Populus tremula 60 0 0 0.00 3
Quercus cerris 0.01 0 0 0.00 3
Quercus coccifera 0.1 25 0 0.07 2.5
Quercus faginea 111 0 0 0.07 3
Quercus frainetto 60 0 0 0.07 3
Quercus ilex 0 20 0 0.07 2.5
Robinia pseudoacacia 12 0 0.1 0.10 3
Salix sp. 28 0 0.8 0.10 3
Salix caprea 18.9 0 0.1 0.10 3
Ulmus glabra 0.1 0 0.2 0.07 3
Ulmus minor 0.1 0 0.2 0.07 3
26 27
One of the objectives of VEG-GAP was to fill this gap by building reference specie-specific vegetation maps capable to overcome the mentioned lim-itations, and support the planned modelling activities over the three target cities: Bologna, Madrid and Milan. A preliminary investigation showed that: a) there is no European reference database describing tree species land cover: CLC level 3 it is insufficient to support VEG-GAP needs and the other pan-European and local datasets made available by Copernicus Land Monitoring Service (https://land.copernicus.eu) do not include the needed species-specific information; b) a tree species maps for European forests has been developed by the European Forest Institute (EFI; https://www.efi.int/knowledge/maps/treespecies); c) some EU states developed CLC level 4/5 including vegetation cover details with different classification criteria; d) all the regional administrative units including VEG-GAP target cities (Lombardia, Emilia-Romagna and Comunidad de Madrid) developed a forest inventory; e) all the target municipalities developed a city-wide trees inventory to support urban green maintenance. Urban vegetation invento-ries have been gathered from Bologna, Madrid and Milan municipalities and integrated with forest cover maps available at regional and national levels. The following sections describe the vegetation data processing, the reference and future scenario vegetation maps, the plant specific emission model and its application to estimate BVOC emissions referring to the pre-sent vegetation cover and to the future urban vegetation development plans in the target cities.
2.2. Vegetation mapping at urban and sub-urban levelMunicipal administrations of many European cities developed detailed digital vegetation inventories containing geographic location, species and the main features of each single tree located along the roads and within public gardens and parks. This information is often browsable through the cities’ institutional web geoportals (e.g. for Milan Municipal-ity: https://geoportale.comune.milano.it/sit/patrimonio-del-verde/). In-ventories with very similar content (Table 2.2) have been provided by the three municipalities of Bologna, Madrid and Milan as vector type data, becoming the natural starting point to describe the vegetation cover with-in and around the investigated conurbations. Since tree crown diameter
28
was not available for Bologna, it has been estimated following Hemery et al. (2005), providing “crown diameter over stem diameter ratios” esti-mates for different species of broadleaved trees.
Table 2.2. Data available for each tree included in municipal urban vegetation inventories.
City Geographic location
Species (genus,species,variety)
Height (m)
Trunk diameter
(m)
Crown diameter
(m)
Bologna X X X X
Madrid X X X X X
Milan X X X X X
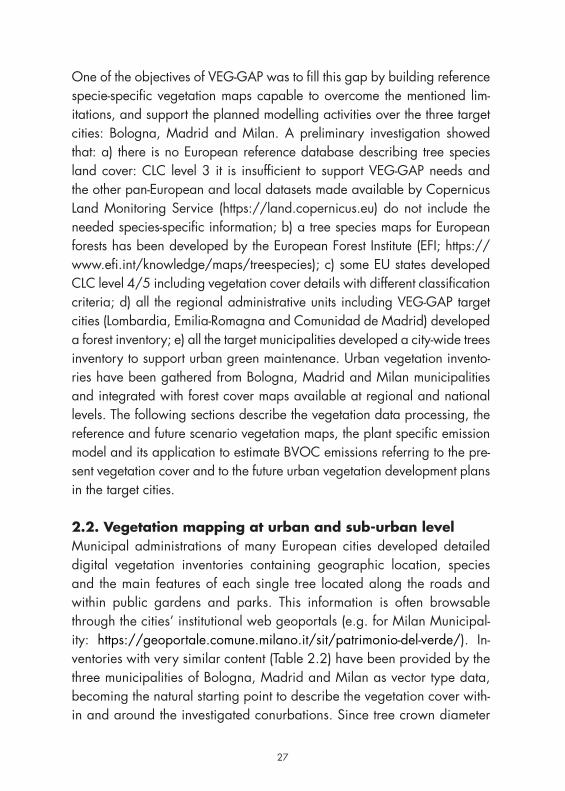
Those data have been processed using Geographic Information Systems (GIS) to estimate each tree crown horizontal projection area and then compute the fractional cover of each species within pixels of the raster landcover maps that have been built to support biogenic emissions com-putation and air quality modelling. Figure 3.1 shows, as an example, the fractional cover obtained for Platanus Acerifolia over Milan Municipality.
Figure 2.1. Platanus acerifolia fractional cover over Milan Municipality territory. Data are expressed as fraction of 1x1 km2 pixel area over a domain of 50x50 km2.
28 29
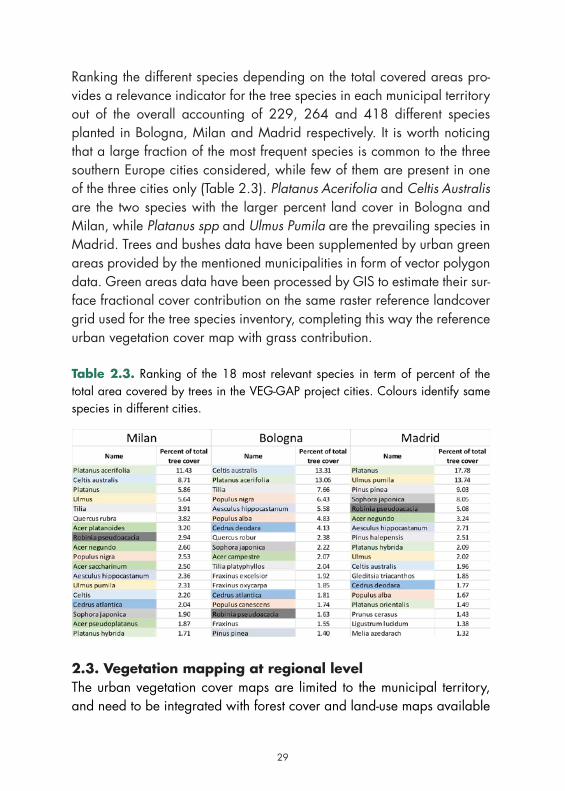
Ranking the different species depending on the total covered areas pro-vides a relevance indicator for the tree species in each municipal territory out of the overall accounting of 229, 264 and 418 different species planted in Bologna, Milan and Madrid respectively. It is worth noticing that a large fraction of the most frequent species is common to the three southern Europe cities considered, while few of them are present in one of the three cities only (Table 2.3). Platanus Acerifolia and Celtis Australis are the two species with the larger percent land cover in Bologna and Milan, while Platanus spp and Ulmus Pumila are the prevailing species in Madrid. Trees and bushes data have been supplemented by urban green areas provided by the mentioned municipalities in form of vector polygon data. Green areas data have been processed by GIS to estimate their sur-face fractional cover contribution on the same raster reference landcover grid used for the tree species inventory, completing this way the reference urban vegetation cover map with grass contribution.
Table 2.3. Ranking of the 18 most relevant species in term of percent of the total area covered by trees in the VEG-GAP project cities. Colours identify same species in different cities.
2.3. Vegetation mapping at regional levelThe urban vegetation cover maps are limited to the municipal territory, and need to be integrated with forest cover and land-use maps available
30
at regional scale to cover air quality model domains. Moreover, vege-tation data need to be completed by information concerning the other land cover types (e.g. agriculture and urban structures). The search for available information carried to the identification of forest maps delivered to the public by the technical bodies of the local government of the admin-istrative region to which the considered cities belong (Regione Emilia-Ro-magna for Bologna, Comunidad de Madrid for Madrid, and Regione Lombardia for Milan). The forest map provided by the Comunidad the Madrid showed the maximum available detail with each vector polygon completed by attributes including three species with their prescribed frac-tional cover of the area. The Emilia-Romagna forest mapping includes, for each vector polygon, information of the two ranked prevailing species, without prescribed fractional cover. To build a species-specific mapping a subjective assumption of 70% fractional cover has been attributed to the prevailing species, the rest to the second one. The Lombardy forest mapping provides instead indication of a single vegetation type for each vector polygon, with detail generally limited to the genus. The polygon area has been attributed to the most common species in the area (e.g. Castanea Sativa for chestnut grove indication).
2.4. Merged maps over the computational domainsThe air quality modelling computational domains cover areas of 60x60, 50x50 and 136x144 km2 for Milan, Bologna and Madrid respectively. Limited portions of the mentioned domains lying outside the area covered by the previously mentioned datasets have been filled by CLC level 4/5 for Italy and Spain, that provide better details concerning the type of nat-ural and cultivated vegetation cover with respect to the standard Europe wide CLC level 3, whose classes are split into subclasses to the level 4 or 5. The following Table 2.4 resumes the different vegetation datasets that have been merged to obtain the species-specific vegetation mapping over the three target cities, and the methods applied to process the different datasets. The merging process is resumed by the following steps: i) the ur-ban and regional forest datasets described in Sections 2.1 and 2.2 have been merged adding to the same class fractional cover the corresponding tree species mapped by the different sources avoiding double counting
30 31
inside the target municipalities territory; ii) the fractional contribution from classes 3.1.X.X (forests) has been removed from CLC level 4/5 to avoid double counting (they were already mapped by urban and regional forest data); iii) residual CLC classes fractional contribution (from agricultural and non-vegetation classes) has been renormalized to guarantee that in each grid cell the sum of fractional land cover of all the contributing class-es would be equal to 1.
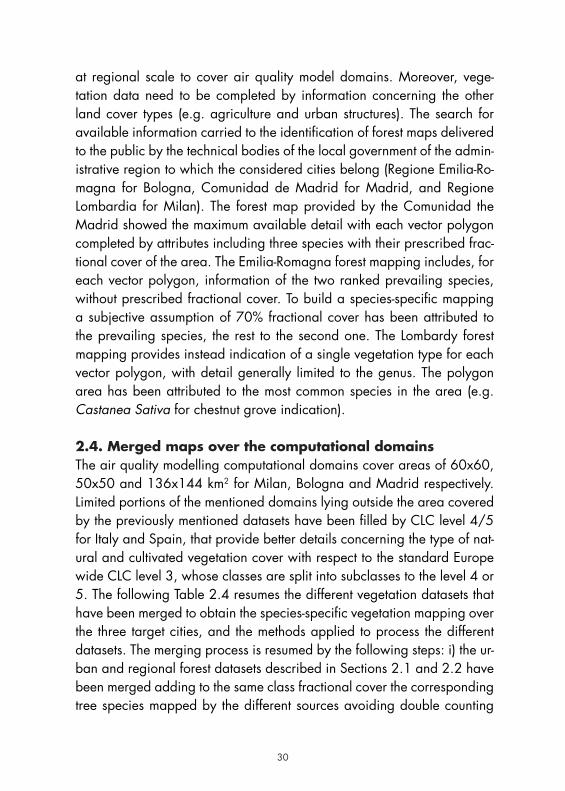
Table 2.4. Land cover datasets used to build the reference vegetation maps.
Area reference area covered data type treatment
MunicipalityBologna, Madrid and Milan Munici-palities
Single tree inventory (vector point data); green areas (vector polygon data). Sources: Bologna, Madrid and Milan Municipalities.
Estimation of the crown area and ras-terization of the area fraction covered by each single species using prescribed fractions if available
Region/County
Bologna and Mode-na Provinces; Comu-nidad de Madrid; Lombardy Region (areas external to the municipalities)
Forest map (vector polygon data):• 3 ranked species
with prescribed fractions (source: Comunidad de Madrid);
• 2 ranked species with no fraction prescribed. (source: Emilia-Ro-magna Region);
• single species or vegetation type (source: Lombardy Region)
Rasterization of the area fraction cov-ered by first,second and third species (where available)
Nation
Computational domains portion located outside Bo-logna and Modena provinces; Lombardy Region and Comuni-dad de Madrid
Corine land cover level 4/5 for Italy and Spain (vector polygon data): CLC level 3 classes subdivided into 4/5 classes. Sources: ISPRA (https://www.isprambiente.gov.it/it).
Rasterization of the area fraction cov-ered by each CLC class
32
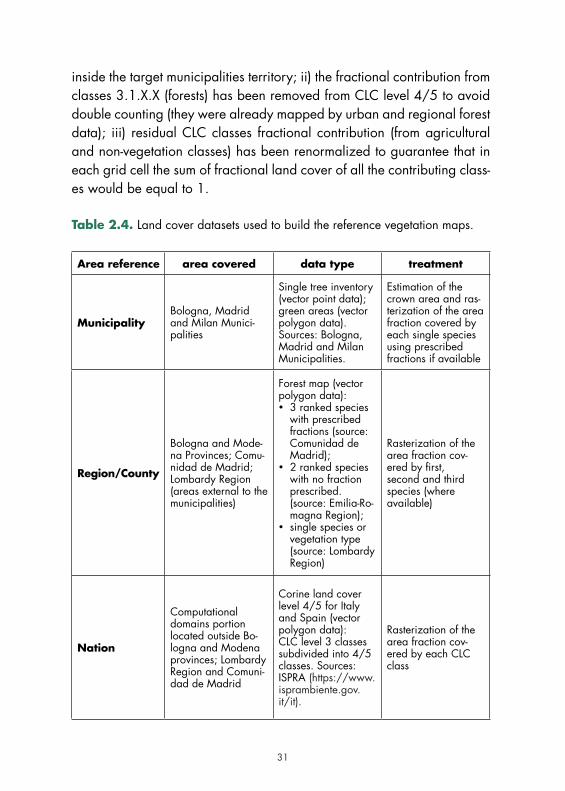
Vegetation cover data have been stored in netCDF files containing, for each grid cell, the fraction covered by each tree species and vegetation classes. Figure 2.2 provides examples of land fraction covered by Plata-nus Acerifolia, Celtis Australis and Platanus in Milan, Bologna and Madrid respectively (predominant tree species in terms of urban area fractional cover), while the fractional area covered by all trees species is illustrated in Figure 2.3 over the computational domains used for the three cities. It can be noticed that the areas characterised by large fractional wood cover are located over mountains, hills and along rivers, while the presence of trees over the agricultural areas (S of Milan, N of Bologna, NE and SW of Madrid) is sparse and often lower than inside the urban areas.
Figure 2.2. Prevailing species fractional cover over Bologna (top left panel,Cel-tis Australis), Milan (top right panel, Platanus Acerifolia) and Madrid (bottom panel, Platanus spp.) computational domains. Data are expressed as fraction of 1x1 km2 pixel area. Boundaries of Municipalities and Comunidad de Madrid autonomous community are indicated.
32 33
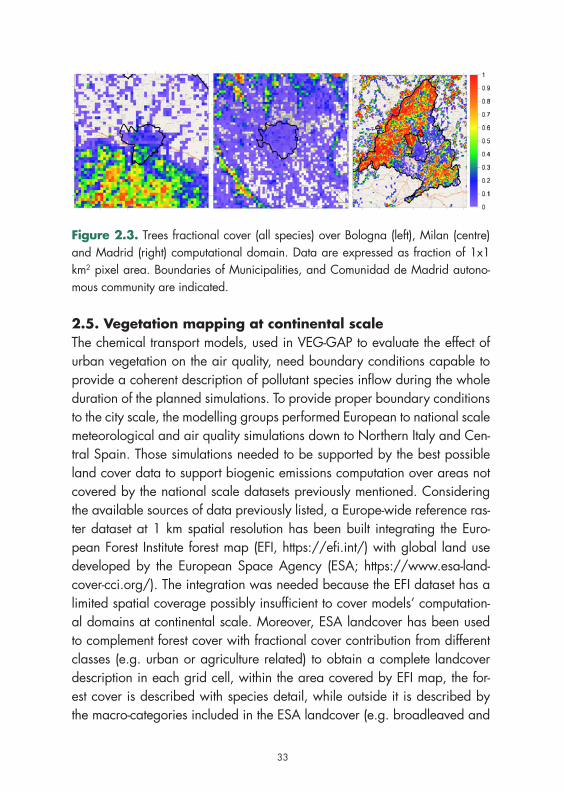
Figure 2.3. Trees fractional cover (all species) over Bologna (left), Milan (centre) and Madrid (right) computational domain. Data are expressed as fraction of 1x1 km2 pixel area. Boundaries of Municipalities, and Comunidad de Madrid autono-mous community are indicated.
2.5. Vegetation mapping at continental scaleThe chemical transport models, used in VEG-GAP to evaluate the effect of urban vegetation on the air quality, need boundary conditions capable to provide a coherent description of pollutant species inflow during the whole duration of the planned simulations. To provide proper boundary conditions to the city scale, the modelling groups performed European to national scale meteorological and air quality simulations down to Northern Italy and Cen-tral Spain. Those simulations needed to be supported by the best possible land cover data to support biogenic emissions computation over areas not covered by the national scale datasets previously mentioned. Considering the available sources of data previously listed, a Europe-wide reference ras-ter dataset at 1 km spatial resolution has been built integrating the Euro-pean Forest Institute forest map (EFI, https://efi.int/) with global land use developed by the European Space Agency (ESA; https://www.esa-land-cover-cci.org/). The integration was needed because the EFI dataset has a limited spatial coverage possibly insufficient to cover models’ computation-al domains at continental scale. Moreover, ESA landcover has been used to complement forest cover with fractional cover contribution from different classes (e.g. urban or agriculture related) to obtain a complete landcover description in each grid cell, within the area covered by EFI map, the for-est cover is described with species detail, while outside it is described by the macro-categories included in the ESA landcover (e.g. broadleaved and
34
needleleaved, evergreen and deciduous, or mixed leaf type forest). The merged dataset has been built over a wide area including the whole Euro-pean continent (longitude: -71÷92; latitude: 13÷80) with a grid spacing of 0.0125 degrees in both longitude and latitude. From this database, stored in netCDF format, it is possible to extract input variables for the modelling tools with their target geographic projections and spatial resolution.
2.6. The Plant-Specific Emission Model (PSEM)The BVOCs emitted by the vegetation located inside the air quality models’ computational domains has been estimated by means of the Plant-Specific Emission Model (PSEM). The biogenic emission model follows the approach described in Pacheco et al. (2014) based on vegetation inventories consid-ering a detailed description of tree species and vegetation types. Once the vegetation inventory has been prepared, PSEM estimates BVOC emissions according to their dependence on light and temperature by distinguishing between synthesis emission, dependent on both light and temperature (L+T), and pool emission, dependent on temperature only (T). In several studies, it has been found that both light and temperature dependence is suitable for isoprene and for monoterpenes emitted by some evergreen and deciduous plants, such as Quercus Ilex (Ciccioli et al., 1997), Fagus Sylvatica (Dindorf et al., 2005), Quercus Suber (Pio et al., 2005), some tropical plants (Kuhn et al., 2004) and crop species (Gentner et al., 2013). In the case of plants that store mono and sesquiterpenes the emission is decoupled from the photosynthesis and the process driving the emission is diffusion through the membranes only dependent on temperature. Isoprene is treated by PSEM as pure synthesis emission, monoterpenes include both synthesis (MTS) and pool (MTP) emission, and sesquiterpenes (SQT) is treated as pure pool emis-sions. Oxygenated volatile organic compounds (OVOC) are treated as pure synthesis emission.The emission rate Ea [μg m-2 h-1] of the BVOC a in each computational grid cell is estimated as:
where Dk is the amount of foliar biomass density per unit ground area [gdw
m-2] of the vegetation species k, eka is the BVOC a emission rate ([mg gdw
-1
𝐸𝐸! =∑ 𝐷𝐷" ∙ 𝑒𝑒"! ∙ 𝛾𝛾#," ∙ 𝛾𝛾% ∙ (1 + 𝛾𝛾&)'"() (1)
34 35
h-1]) due to the species k, γS,k, γc and γL are dimensionless correction factors accounting respectively for the seasonal variation of the emissions of the vegetation species k, the different light and temperature levels experienced by leaves or needles emitting inside a canopy and the contribution from dead biomass accumulated on the soil (litter). Each species emission rate ek
a depend on the species k basal emission factor (see e.g. Table 2.1) and on the meteorological conditions (temperature and solar radiation) occurring during the considered period. The seasonal variability correction factor γS,k takes into account the leaf area index (LAI data can be obtained from the Copernicus Global Land Service, providing bio-geophysical products of global land surface: https://land.copernicus.eu/global/products/lai) and a species dependent phenology correction factor. For further technical details on PSEM model we refer to the VEG-GAP projects documentation (i.e. to the reports published as deliverables) and to the available scientific literature (Silibello et al., 2018; Silibello et al., 2021; Ciccioli et al., 2022).
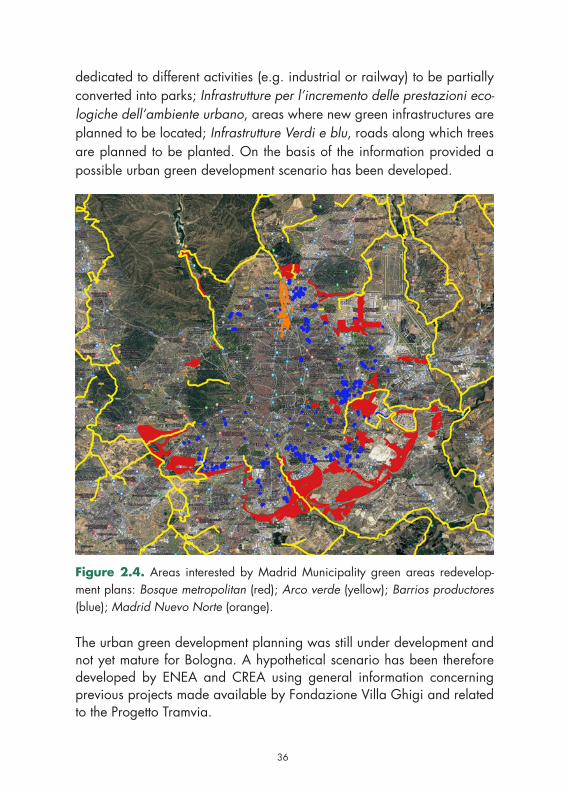
2.7. Urban vegetation development scenariosThe definition of future scenarios to evaluate the impact of urban green increment on air quality and resilience to climate change is based on the municipal urban green development plans where nature-based solutions are considered as measures to improve urban wellness and quality of life. The Municipality of Madrid delivered four public green areas redevelopment plans: Bosque metropolitan, a metropolitan forest included in Plan A and Madrid 360 air quality and climate change strategies; Arco verde, linear plantations along roads, trails and rural paths; Barrios productores, a mu-nicipal network of urban vegetable gardens; Madrid Nuevo Norte, a major urban development approved by the local and regional governments. Data have been provided as vector polygons type supplemented by the identifi-cation of the trees species to be planted. Figure 2.4 shows the areas located inside and around Madrid interested by the green areas development plan.Milan Municipality provided preliminary information about the green areas development plan of the city. The data provided included vector type cartographic data defining the areas interested by four action plans: Aree pubbliche da forestare a piantumare, areas located inside the city where trees are planned to be planted; 20 new parks, areas originally
36
dedicated to different activities (e.g. industrial or railway) to be partially converted into parks; Infrastrutture per l’incremento delle prestazioni eco-logiche dell’ambiente urbano, areas where new green infrastructures are planned to be located; Infrastrutture Verdi e blu, roads along which trees are planned to be planted. On the basis of the information provided a possible urban green development scenario has been developed.
Figure 2.4. Areas interested by Madrid Municipality green areas redevelop-ment plans: Bosque metropolitan (red); Arco verde (yellow); Barrios productores (blue); Madrid Nuevo Norte (orange).
The urban green development planning was still under development and not yet mature for Bologna. A hypothetical scenario has been therefore developed by ENEA and CREA using general information concerning previous projects made available by Fondazione Villa Ghigi and related to the Progetto Tramvia.
36 37
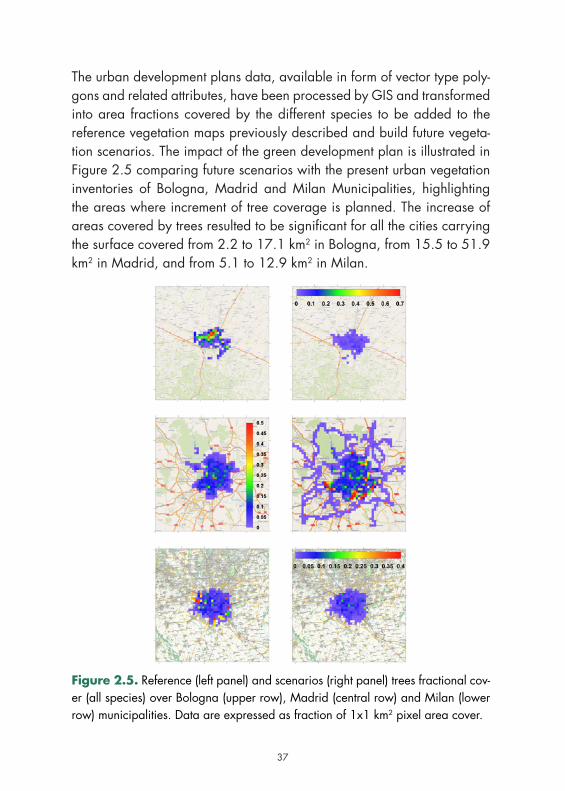
The urban development plans data, available in form of vector type poly-gons and related attributes, have been processed by GIS and transformed into area fractions covered by the different species to be added to the reference vegetation maps previously described and build future vegeta-tion scenarios. The impact of the green development plan is illustrated in Figure 2.5 comparing future scenarios with the present urban vegetation inventories of Bologna, Madrid and Milan Municipalities, highlighting the areas where increment of tree coverage is planned. The increase of areas covered by trees resulted to be significant for all the cities carrying the surface covered from 2.2 to 17.1 km2 in Bologna, from 15.5 to 51.9 km2 in Madrid, and from 5.1 to 12.9 km2 in Milan.
Figure 2.5. Reference (left panel) and scenarios (right panel) trees fractional cov-er (all species) over Bologna (upper row), Madrid (central row) and Milan (lower row) municipalities. Data are expressed as fraction of 1x1 km2 pixel area cover.
38
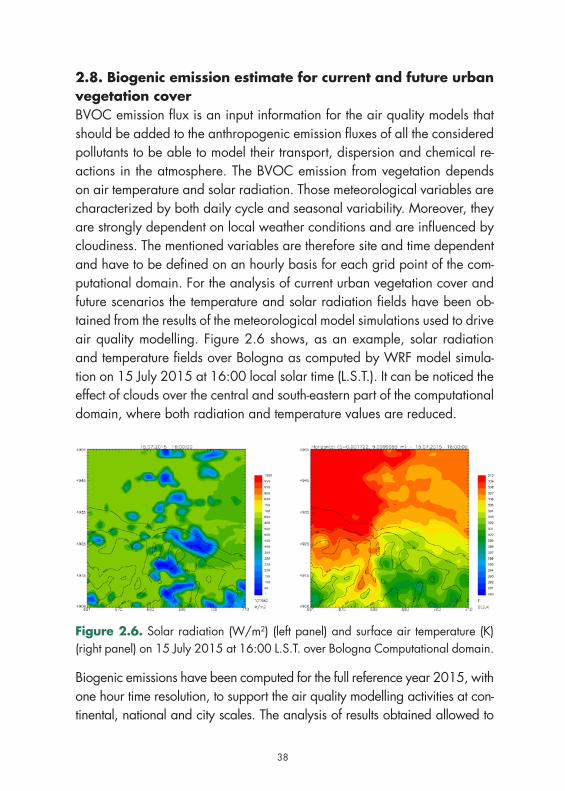
2.8. Biogenic emission estimate for current and future urban vegetation coverBVOC emission flux is an input information for the air quality models that should be added to the anthropogenic emission fluxes of all the considered pollutants to be able to model their transport, dispersion and chemical re-actions in the atmosphere. The BVOC emission from vegetation depends on air temperature and solar radiation. Those meteorological variables are characterized by both daily cycle and seasonal variability. Moreover, they are strongly dependent on local weather conditions and are influenced by cloudiness. The mentioned variables are therefore site and time dependent and have to be defined on an hourly basis for each grid point of the com-putational domain. For the analysis of current urban vegetation cover and future scenarios the temperature and solar radiation fields have been ob-tained from the results of the meteorological model simulations used to drive air quality modelling. Figure 2.6 shows, as an example, solar radiation and temperature fields over Bologna as computed by WRF model simula-tion on 15 July 2015 at 16:00 local solar time (L.S.T.). It can be noticed the effect of clouds over the central and south-eastern part of the computational domain, where both radiation and temperature values are reduced.
Figure 2.6. Solar radiation (W/m2) (left panel) and surface air temperature (K) (right panel) on 15 July 2015 at 16:00 L.S.T. over Bologna Computational domain.
Biogenic emissions have been computed for the full reference year 2015, with one hour time resolution, to support the air quality modelling activities at con-tinental, national and city scales. The analysis of results obtained allowed to
38 39
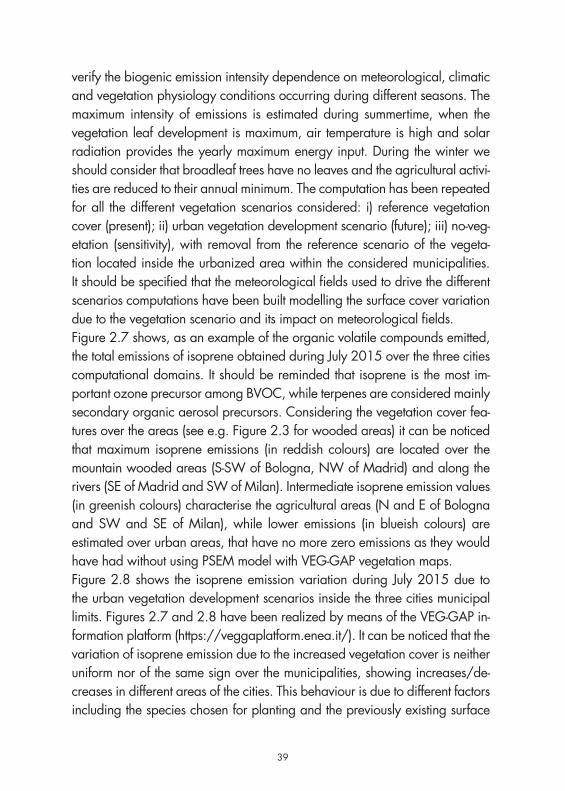
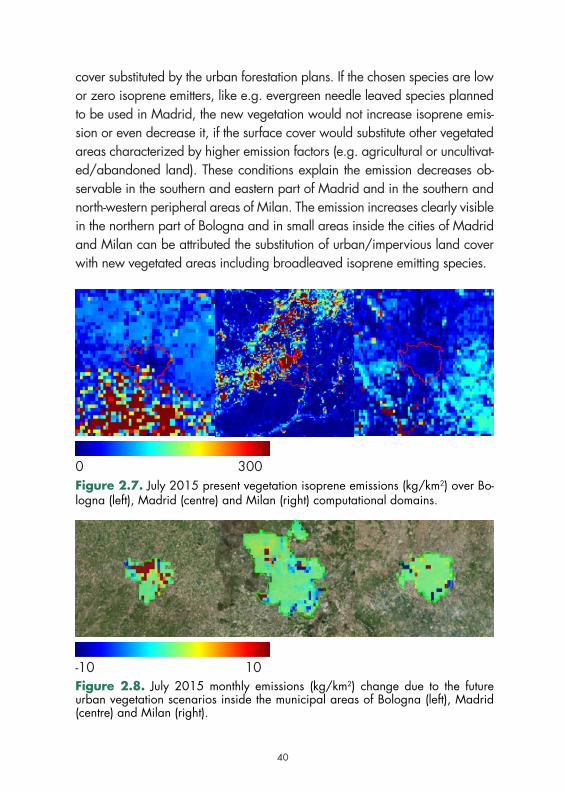
verify the biogenic emission intensity dependence on meteorological, climatic and vegetation physiology conditions occurring during different seasons. The maximum intensity of emissions is estimated during summertime, when the vegetation leaf development is maximum, air temperature is high and solar radiation provides the yearly maximum energy input. During the winter we should consider that broadleaf trees have no leaves and the agricultural activi-ties are reduced to their annual minimum. The computation has been repeated for all the different vegetation scenarios considered: i) reference vegetation cover (present); ii) urban vegetation development scenario (future); iii) no-veg-etation (sensitivity), with removal from the reference scenario of the vegeta-tion located inside the urbanized area within the considered municipalities. It should be specified that the meteorological fields used to drive the different scenarios computations have been built modelling the surface cover variation due to the vegetation scenario and its impact on meteorological fields.Figure 2.7 shows, as an example of the organic volatile compounds emitted, the total emissions of isoprene obtained during July 2015 over the three cities computational domains. It should be reminded that isoprene is the most im-portant ozone precursor among BVOC, while terpenes are considered mainly secondary organic aerosol precursors. Considering the vegetation cover fea-tures over the areas (see e.g. Figure 2.3 for wooded areas) it can be noticed that maximum isoprene emissions (in reddish colours) are located over the mountain wooded areas (S-SW of Bologna, NW of Madrid) and along the rivers (SE of Madrid and SW of Milan). Intermediate isoprene emission values (in greenish colours) characterise the agricultural areas (N and E of Bologna and SW and SE of Milan), while lower emissions (in blueish colours) are estimated over urban areas, that have no more zero emissions as they would have had without using PSEM model with VEG-GAP vegetation maps.Figure 2.8 shows the isoprene emission variation during July 2015 due to the urban vegetation development scenarios inside the three cities municipal limits. Figures 2.7 and 2.8 have been realized by means of the VEG-GAP in-formation platform (https://veggaplatform.enea.it/). It can be noticed that the variation of isoprene emission due to the increased vegetation cover is neither uniform nor of the same sign over the municipalities, showing increases/de-creases in different areas of the cities. This behaviour is due to different factors including the species chosen for planting and the previously existing surface
40
cover substituted by the urban forestation plans. If the chosen species are low or zero isoprene emitters, like e.g. evergreen needle leaved species planned to be used in Madrid, the new vegetation would not increase isoprene emis-sion or even decrease it, if the surface cover would substitute other vegetated areas characterized by higher emission factors (e.g. agricultural or uncultivat-ed/abandoned land). These conditions explain the emission decreases ob-servable in the southern and eastern part of Madrid and in the southern and north-western peripheral areas of Milan. The emission increases clearly visible in the northern part of Bologna and in small areas inside the cities of Madrid and Milan can be attributed the substitution of urban/impervious land cover with new vegetated areas including broadleaved isoprene emitting species.
0 300Figure 2.7. July 2015 present vegetation isoprene emissions (kg/km2) over Bo-logna (left), Madrid (centre) and Milan (right) computational domains.
-10 10Figure 2.8. July 2015 monthly emissions (kg/km2) change due to the future urban vegetation scenarios inside the municipal areas of Bologna (left), Madrid (centre) and Milan (right).
40 41
3. Integration of vegetation inventories with data from satellites
3.1. The concept of Urban and Periurban ForestryUrban forests can be defined as networks or system comprising all woodlands, groups of trees, and individ-ual trees located in urban and periurban areas, they in-clude, therefore, street trees, trees in parks and gardens. Urban forests are the backbone of the green infrastruc-ture bridging rural and urban areas and ameliorating a city’s environmental footprint (Sheets and Manzer,
1991; Lovasi et al., 2008). Several publications and reports have been produced in recent years with the aim of highlighting the economic and environmental importance of urban and periurban forests in the context of international conventions (Rigueiro-Rodríguez et al., 2008; Barbati et al., 2014; Schnell et al., 2015).Especially as regards the ecosystem/vegetation state of the art, data on trees outside forests (TOF) remains scarce and incomplete (Schnell et al. 2015). Quantitative data on urban and peri-urban forests in the Mediter-ranean are generally very poor. While the World Health Organization has set minimum standards of 9 m2 of green space per inhabitant, there is no official definition of “green space” itself, and as the meaning of the term changes significantly depending on local context and institutional framework, the interpretation of the data is problematic.
3.2. The importance of Remote Sensing for evaluating urban greenA great ally for the collection, retrieval and management of qualitative and quantitative data as regards urban greenery, comes from the use of satellites and remote sensing. Significant progress in remote sensing technology and data collection and analysis has been made to facilitate land assessment at different levels (local, national, regional and global).A thorough assessment requires fine spatial resolution imagery to detect
Ilaria Zappitelli,Alessandro Alivernini,Silvano Fares
42
the presence of individual or small groups of trees. With this in mind, new tools allow users to visualize and interpret very high-resolution imag-es (from the Digital Globe archive in Google Earth and Bing Maps), in conjunction with a number of bio-geophysical indices and automatically generated time-series data (e.g., derived from Landsat and MODIS and Sentinel 2 data in the Google Earth Engine) (Bey et al., 2016).A few other tools are dedicated to tree inventory in urban settings. These include the i-Tree suite (so far only adapted for application in the USA; (Morani et al., 2014), Greece’s Urban Tree Management applications (Tasoulas et al. 2013) and the canopy model AIRTREE (Fares et al., 2019).Space research represents one of the most important avant-gardes of technique and engineering and more generally of science (Ammoscato, 2004). The technologies and science of satellite remote sensing are placed in this context. The term remote sensing indicates “a science that allows to obtain qualitative and quantitative information from an object, area or phenomenon through the analysis of data acquired by a remote device that is not in contact with the object, the area or phenomenon investigated” (Papale and Barbati, 2005). Satellite remote sensing thus allows the acquisition of data, in the form of images, over large areas of the earth’s surface in a relatively short time.Remote sensing is composed by two distinct activities:1. Data collection by sensors designed to detect electromagnetic energy from positions on ground-based, aerial, and satellite platforms;2. The methods of interpreting those data.Over time, data acquisition techniques and sensor construction technologies have been improved and now it is possible to access data with different geo-metric, spectral, temporal and radiometric resolutions. To date, multispectral satellite images with geometric resolution of the order of a decimeter are available (Wallace, 2021). In recent decades, remote sensing technology has emerged to support data collection and analysis methods of potential interest and importance in forest management. The forest ecosystem is in-deed complex and multifaceted; understanding how forest ecosystems work requires new types of data, at an appropriate spatial and temporal scales to explain forest dynamics, and therefore remote sensing can fill this gap.Remote sensing information may be integrated with other datasets (i.e.,
42 43
ground observations) and to form the information base upon which sound forest management decisions can be made. Today, forest management problems are multiscale and intricately linked to society’s need to mea-sure, preserve, and manage for multiple forest values. That is why we need remote sensing and maps.It is clear that remote sensing alone poses challenges for the identifi-cation of tree species, but it is useful especially when remotely sensed data are integrated with the data detected on the ground. However, by reducing the number of ground observations, the use of remote sensing may lead to an improvement in estimates at the territorial level with ad-vantageous costs.There are various missions and projects in Europe and around the world that exploit remote sensing technology and have allowed its application in various fields. The European Space Agency (ESA) has launched the Copernicus program, which through satellite data provides a series of products and services to support scientific studies and emergency man-agement. As part of this program, ESA initiated the Sentinel mission, with the launch of a series of Earth observation satellites. They are available, open source, provide radar and multispectral images. The Sentinel-2 mis-sion, in particular the one to which most of these guidelines refer, pro-vides multispectral images (13 bands) with high spatial resolution (10 m) depending on the specific band and temporal resolution from 3 to 5 days (depending on the area). In particular, the Sentinel-2 mission has a wide range of applications, including monitoring of deforestation and desertifi-cation, monitoring of the territory, monitoring of borders and sea routes, emergency management. In the specific case, land cover data were used to create maps at 10 and 500 m.Among the low and medium resolution earth observation systems, MODIS (Moderate-resolution Imaging Spectroradiometer) is a well know product. The MODIS sensor is one of the five sensors belonging to the satellite platforms named “Terra” and “Aqua”. Both of these satellite platforms are part of the Earth Observing System (EOS) program conceived by NASA for the observation of the Earth from Space, which aims to ob-serve long-lasting phenomena affecting the surface of the continents, the biosphere, the atmosphere and the oceans. MODIS’s spatial resolution
44
per channel ranges from 250 to 1000 m. The MODIS information will soon be replaced by that of the Sentinel-3 satellite, which take land and sea temperature measurements and provide color information on both land and sea surfaces. Sentinel-3 provides continuity of an ENVISAT-type ocean measurement capability with consistent quality, very high level of availability (>95%), high accuracy and reliability, and in a sustained op-erational manner, in addition to constant monitoring of the environment and climate. The spatial resolution of Sentinel-3 is 300 m.An example of project at European level derived from interpretation of data from space, is the CORINE program (Coordinated Information on the European Environment) presented by the European Environment Agen-cy (EEA) in 1985. This project has the primary purpose of dynamically verifying the state of the environment in community area, in order to guide common policies, control their effects, propose any corrective measures. Within the CORINE program, the CORINE-Land Cover (CLC) project is specifically intended for the survey and monitoring, at a scale compatible with community needs, of the characteristics of the territory, with particu-lar attention to protection needs. All CLC datasets are based on a legend organized hierarchically in 3 levels, but have unsuitable characteristics (nominal scale 1:100.000, Minimum Mapped Unit equal to 25 ha) for high-scale analysis.
3.3. Knowledge of plant species in the VEG-GAP target citiesIn order to study the capacity of urban plants to provide ecosystem ser-vices and at the same time affect air quality, it is important to have a picture of the most representative species in the target municipalities.The analysis carried out is based on the list of trees and shrubs in the ur-ban perimeter of the municipalities. These inventories, carried out by mu-nicipalities uniquely on public spaces, include: species, height of plants, diameters. We produced a list from the tree survey databases, with the aim of grouping species with the same characteristics as much as possi-ble, plant varieties were merged, to make the data more homogeneous, without losing the information. Taking into consideration the list of species of Bologna, Milano and Madrid, the different frequency of the various species was analyzed using the Pareto criterion (criterion 80/20) (Hoch-
44 45
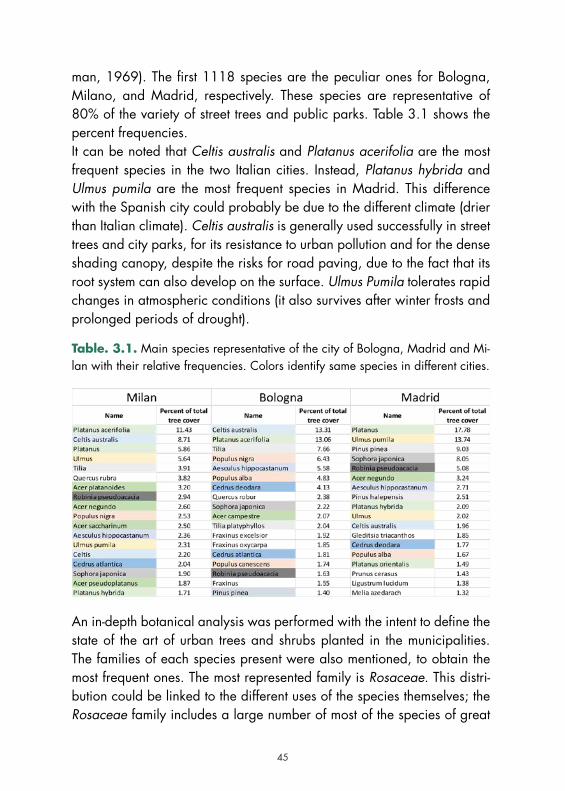
man, 1969). The first 1118 species are the peculiar ones for Bologna, Milano, and Madrid, respectively. These species are representative of 80% of the variety of street trees and public parks. Table 3.1 shows the percent frequencies.It can be noted that Celtis australis and Platanus acerifolia are the most frequent species in the two Italian cities. Instead, Platanus hybrida and Ulmus pumila are the most frequent species in Madrid. This difference with the Spanish city could probably be due to the different climate (drier than Italian climate). Celtis australis is generally used successfully in street trees and city parks, for its resistance to urban pollution and for the dense shading canopy, despite the risks for road paving, due to the fact that its root system can also develop on the surface. Ulmus Pumila tolerates rapid changes in atmospheric conditions (it also survives after winter frosts and prolonged periods of drought).
Table. 3.1. Main species representative of the city of Bologna, Madrid and Mi-lan with their relative frequencies. Colors identify same species in different cities.
An in-depth botanical analysis was performed with the intent to define the state of the art of urban trees and shrubs planted in the municipalities. The families of each species present were also mentioned, to obtain the most frequent ones. The most represented family is Rosaceae. This distri-bution could be linked to the different uses of the species themselves; the Rosaceae family includes a large number of most of the species of great
46
importance for the human economy (Christenhusz, 2016), such as the most common fruit trees, rich in colored flowers and fruits, which in the context of street trees reflect an aesthetic taste which favors them com-pared to other species.Between the various individuals of each species an average of heights was made, so as to obtain a single middle class of belonging. These height classes are inspired to the SIA classification (Italian Arboriculture Society), and are 4: (I), trees that can exceed 30 m in height; (II), trees between 20 and 30 meters; (III), trees between 10 and 20 m height; (IV), small trees that reach a maximum height of 10 m. From the analyzes con-cerning the size classes it turned out that the most frequent class is the one between 0 and 10 m (IV class). Probably this choice is justified by the fact that the trees of this size could be the most suitable for the dimensions of the sidewalks and available spaces, as well as pruning practices.As far as the chorological spectrum is concerned, the exotic and the native are even if the datum is considered qualitative (i.e., number of species), but the native species quantitatively prevail (i.e., number of indi-viduals within each species). The presence of exotic species, in addition to the local growth conditions, and origin of the species, could be linked to historical and cultural reasons as well as to personal preferences for some species (Thomsen et al., 2016).
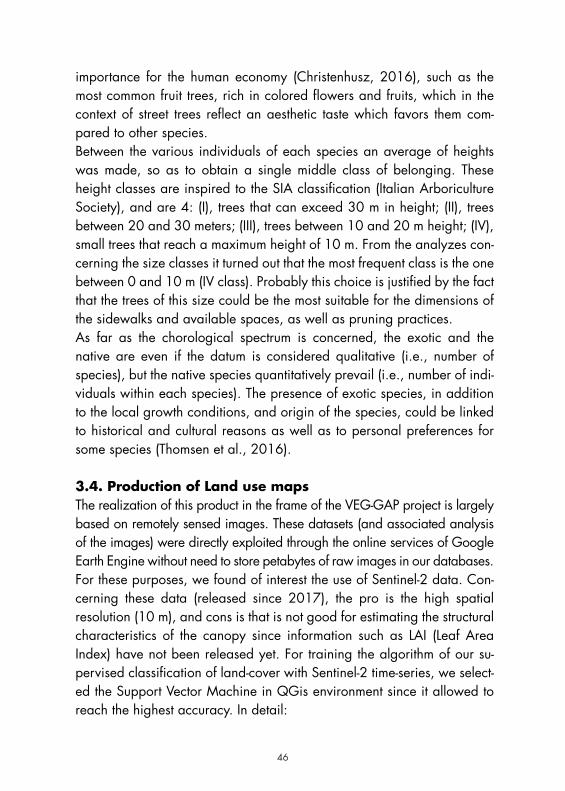
3.4. Production of Land use mapsThe realization of this product in the frame of the VEG-GAP project is largely based on remotely sensed images. These datasets (and associated analysis of the images) were directly exploited through the online services of Google Earth Engine without need to store petabytes of raw images in our databases.For these purposes, we found of interest the use of Sentinel-2 data. Con-cerning these data (released since 2017), the pro is the high spatial resolution (10 m), and cons is that is not good for estimating the structural characteristics of the canopy since information such as LAI (Leaf Area Index) have not been released yet. For training the algorithm of our su-pervised classification of land-cover with Sentinel-2 time-series, we select-ed the Support Vector Machine in QGis environment since it allowed to reach the highest accuracy. In detail:
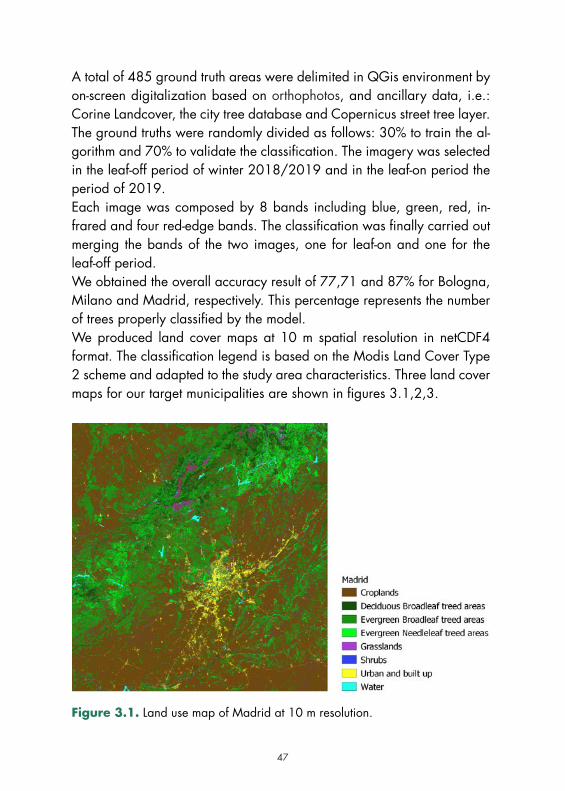
46 47
A total of 485 ground truth areas were delimited in QGis environment by on-screen digitalization based on orthophotos, and ancillary data, i.e.: Corine Landcover, the city tree database and Copernicus street tree layer.The ground truths were randomly divided as follows: 30% to train the al-gorithm and 70% to validate the classification. The imagery was selected in the leaf-off period of winter 2018/2019 and in the leaf-on period the period of 2019.Each image was composed by 8 bands including blue, green, red, in-frared and four red-edge bands. The classification was finally carried out merging the bands of the two images, one for leaf-on and one for the leaf-off period.We obtained the overall accuracy result of 77,71 and 87% for Bologna, Milano and Madrid, respectively. This percentage represents the number of trees properly classified by the model.We produced land cover maps at 10 m spatial resolution in netCDF4 format. The classification legend is based on the Modis Land Cover Type 2 scheme and adapted to the study area characteristics. Three land cover maps for our target municipalities are shown in figures 3.1,2,3.
Figure 3.1. Land use map of Madrid at 10 m resolution.
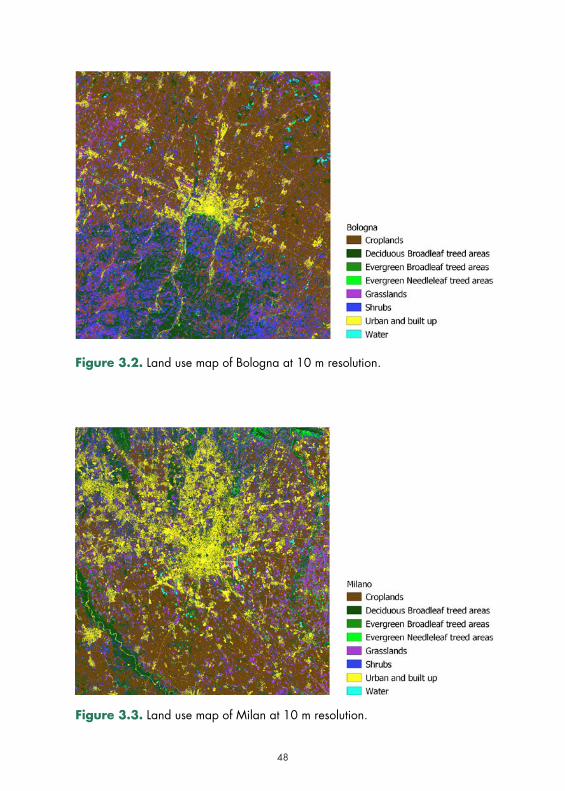
48
Figure 3.2. Land use map of Bologna at 10 m resolution.
Figure 3.3. Land use map of Milan at 10 m resolution.
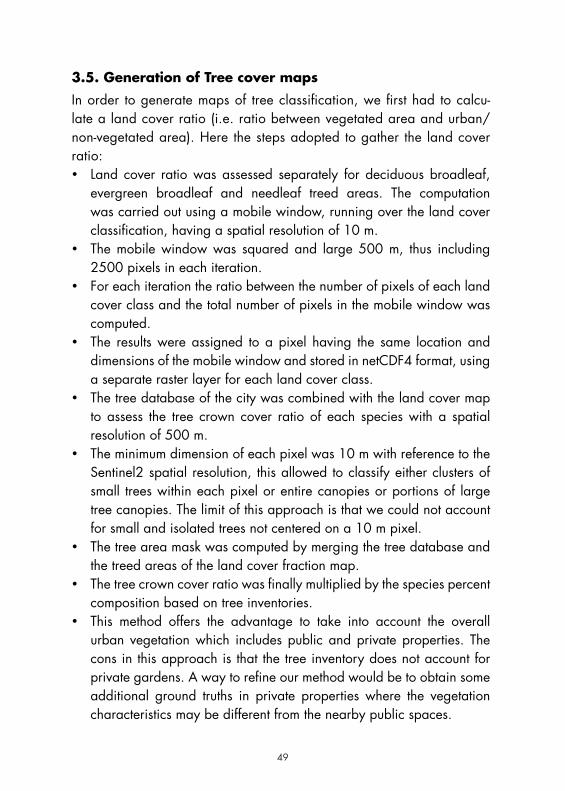
48 49
3.5. Generation of Tree cover maps
In order to generate maps of tree classification, we first had to calcu-late a land cover ratio (i.e. ratio between vegetated area and urban/non-vegetated area). Here the steps adopted to gather the land cover ratio:• Land cover ratio was assessed separately for deciduous broadleaf,
evergreen broadleaf and needleaf treed areas. The computation was carried out using a mobile window, running over the land cover classification, having a spatial resolution of 10 m.
• The mobile window was squared and large 500 m, thus including 2500 pixels in each iteration.
• For each iteration the ratio between the number of pixels of each land cover class and the total number of pixels in the mobile window was computed.
• The results were assigned to a pixel having the same location and dimensions of the mobile window and stored in netCDF4 format, using a separate raster layer for each land cover class.
• The tree database of the city was combined with the land cover map to assess the tree crown cover ratio of each species with a spatial resolution of 500 m.
• The minimum dimension of each pixel was 10 m with reference to the Sentinel2 spatial resolution, this allowed to classify either clusters of small trees within each pixel or entire canopies or portions of large tree canopies. The limit of this approach is that we could not account for small and isolated trees not centered on a 10 m pixel.
• The tree area mask was computed by merging the tree database and the treed areas of the land cover fraction map.
• The tree crown cover ratio was finally multiplied by the species percent composition based on tree inventories.
• This method offers the advantage to take into account the overall urban vegetation which includes public and private properties. The cons in this approach is that the tree inventory does not account for private gardens. A way to refine our method would be to obtain some additional ground truths in private properties where the vegetation characteristics may be different from the nearby public spaces.
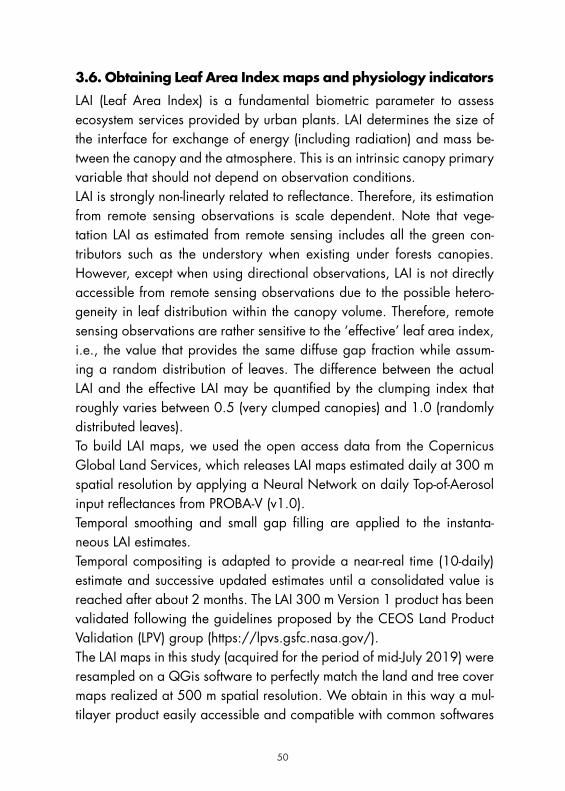
50
3.6. Obtaining Leaf Area Index maps and physiology indicators
LAI (Leaf Area Index) is a fundamental biometric parameter to assess ecosystem services provided by urban plants. LAI determines the size of the interface for exchange of energy (including radiation) and mass be-tween the canopy and the atmosphere. This is an intrinsic canopy primary variable that should not depend on observation conditions.LAI is strongly non-linearly related to reflectance. Therefore, its estimation from remote sensing observations is scale dependent. Note that vege-tation LAI as estimated from remote sensing includes all the green con-tributors such as the understory when existing under forests canopies. However, except when using directional observations, LAI is not directly accessible from remote sensing observations due to the possible hetero-geneity in leaf distribution within the canopy volume. Therefore, remote sensing observations are rather sensitive to the ‘effective’ leaf area index, i.e., the value that provides the same diffuse gap fraction while assum-ing a random distribution of leaves. The difference between the actual LAI and the effective LAI may be quantified by the clumping index that roughly varies between 0.5 (very clumped canopies) and 1.0 (randomly distributed leaves).To build LAI maps, we used the open access data from the Copernicus Global Land Services, which releases LAI maps estimated daily at 300 m spatial resolution by applying a Neural Network on daily Top-of-Aerosol input reflectances from PROBA-V (v1.0).Temporal smoothing and small gap filling are applied to the instanta-neous LAI estimates.Temporal compositing is adapted to provide a near-real time (10-daily) estimate and successive updated estimates until a consolidated value is reached after about 2 months. The LAI 300 m Version 1 product has been validated following the guidelines proposed by the CEOS Land Product Validation (LPV) group (https://lpvs.gsfc.nasa.gov/).The LAI maps in this study (acquired for the period of mid-July 2019) were resampled on a QGis software to perfectly match the land and tree cover maps realized at 500 m spatial resolution. We obtain in this way a mul-tilayer product easily accessible and compatible with common softwares
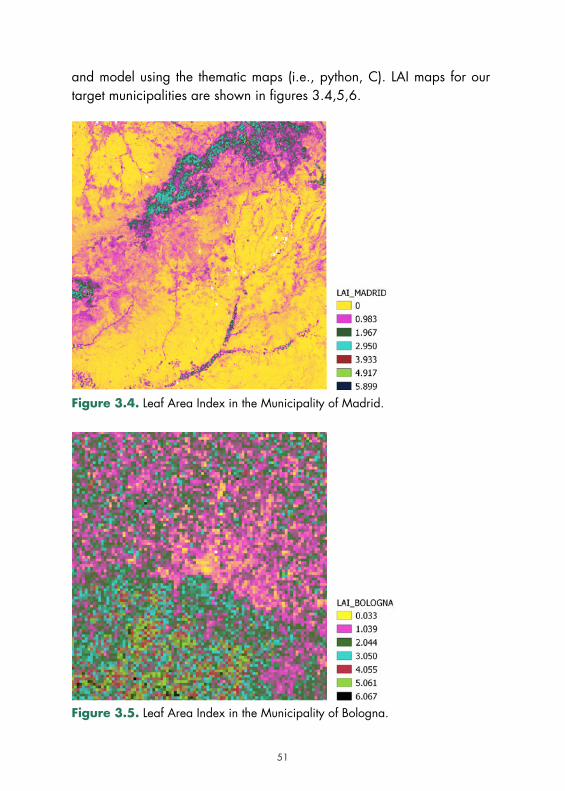
50 51
and model using the thematic maps (i.e., python, C). LAI maps for our target municipalities are shown in figures 3.4,5,6.
Figure 3.4. Leaf Area Index in the Municipality of Madrid.
Figure 3.5. Leaf Area Index in the Municipality of Bologna.
52
Figure 3.6. Leaf Area Index in the Municipality of Milan.
3.7. Phenology InformationThe study of phenology requires using satellite products at high temporal resolution to properly account for the timing of phenological phases (i.e., foliation, leaf expansion, flowering, leaf fall). Even if the spatial resolution is high enough, foliation may not be taken into consideration with Senti-nel 2 data due to weekly resolution and possible loss of data in occasion of the passage of clouds that disturb the capture of the image.In this case we used therefore the Phenological Maps extracted from NASA Visible Infrared Imaging Radiometer Suite (VIIRS) Global Land Sur-face Phenology (GLSP), with a daily temporal resolution.The VIIRS LSP product algorithm is operationally produced and distributed at NASA’s Goddard Space Flight Center. Because MODIS is aging, VIIRS GLSP will replace MCD12Q2 to continue monitoring global phenology variation. The VIIRS GLSP product generates phenological metrics of in-dividual vegetation growing cycles on the vegetated land surface at a spatial resolution of 500 m across the globe. The 500 m product is gen-erated using daily VIIRS Nadir BRDF (bidirectional reflectance distribution function)-Adjusted Reflectance (NBAR) and ancillary data from VIIRS land
52 53
surface temperature (LST), snow cover, and land cover type at each pixel as inputs. The VIIRS NBAR is used to generate time series of two-band enhanced vegetation index (EVI2) that characterizes temporal vegetation phenology development. The product contains seven metrics describing the occurrence timings of vegetation phenological events. As a supple-ment to the phenological timings, it also includes five metrics related to the range, change rate, and summation of vegetation greenness (EVI2) cal-culated from VIIRS surface reflectance data. Moreover, the GLSP product also provides seven metrics to quantify the quality of phenological timing and greenness measurements in each pixel.In this case we started from the data already in our possession of Corine land Cover (CLC) for the three Municipalities. Only the forest polygons are exported and the statistics (median) of each phenological metric have been extracted for each polygon.Afterwards, phenological maps were made by joining between the tree cover maps of each municipality with the phenological statistics built on each municipality through the CLC.The product is a shapefile for each target municipality, which contains all phenology data in the attribute table.The phenological metrics products used and extracted from the standard VIIRS GLSP (spatial resolution of 500 m) contains six phenological transi-tion dates; timing metric (the growing season length, which quantifies the time period between the dates of Greenup onset and dormancy onset) and data sets for the confidence of phenology. Those are all available on the VNP22 User Guide Vol. 1.While this methodology allowed us to obtain species-specific phonology indicators, the cons is that we approximate species-specific information with a coarser forest classification (CLC level 3), therefore single species may have different phenology compared within their forest type classi-fication. Another important aspect which was not taken into account in this study is that the cycle of the vegetation growing season may differ in the urban area (i.e., phonological phases are anticipated) in response to local heat island.Further, vegetation growth can have one or more growing cycles (or parts of growing cycles) during a 12-month period. But the algorithm used for
54
this product allows to record a maximum of two data layers for each phe-nological event in a given calendar year.
3.8. ConclusionsIn some ways, the results and methods of remote sensing examined in this chapter represent one of the many contributions that remote sensing can make to better understand the features of land use and tree cover in urban areas, as the improvement of remote sensing (the sensors, the quality of the data, the methods of analysis, understanding of geospatial environments) is the subject of an intense and continuous global research agenda.There are many case studies that can be taken as an example regarding the use of remote sensing. We might, for example, be interested in the size of trees. There is a study published in Nature (Brandt et al., 2020) which was not carried out in the city, but which is potentially applicable in that context. In this case, satellites such as WorldView 2 and 3 were used, these are the first commercial satellites by DigitalGlobe to carry a high spatial resolution 8-band multispectral sensor with 1,84 m resolution. And also, another very high-resolution satellite by DigitalGlobe, such as Geo-Eye-1, which provides 0,41 m panchromatic and 1,65 m multispectral imagery at nadir. All these satellites were used to detect 1.8 billion (13,4 trees per hectare) trees out of 11,000 images covering most of the Sahel area. The authors assessed tree density (number of trees per hectare) and the crown size of each individual tree. They further showed how tree crown sizes, density and canopy cover are associated with rainfall and land use. Another similar technique has been used to classify clusters of urban trees (Potapov et al., 2021) with foliage covering areas larger than 200 square meters. The authors focused on the height of the trees. There are not many studies in this regard, but there is a new lightweight sys-tem called Global Ecosystem Dynamics Investigation (GEDI) developed by NASA, a spaceborne lidar instrument operating onboard the Interna-tional Space Station since April 2019. It provides footprint-based mea-surements of vegetation structure, including forest canopy height between 52°N and 52°S globally. GEDI produces a footprint between 17 and 25 m and which then is able to detect the height of groups of trees. It is an
54 55
active satellite that not only detects the reflection of the Earth’s surface, but sends a signal to a laser and therefore detects the return pulse. By analyzing this impulse, it is able to differentiate between the tree and the ground, and consequently calculate the height of the tree. However, it is not very accurate for very tall trees, as the height measurement saturates above 30 m (trees that are taller than these are not differentiated). More field studies should be carried out to understand the precision level that this satellite can reach.With the goal to identify and classify tree species, it would also be useful to use time series of images in a given place. Indeed, the change in spec-tral signatures of tree crowns over time can support tree classification. A study which goes in this direction was recently carried out by Fang et al. (2021) in Washington. A data set of 16,000 points, with which it was possible to accurately produce an inventory of urban trees. In this study the authors combined a Random Forest (RF) object-based tree species classification method with two large data sets: 1) A suite of 12 WorldView-3 (WV-3) ultra-high resolution (VHR) images, covering differ-ent phases of the growing season from April to November; and 2) the 16,496 street trees from the Washington D.C. Department of Transporta-tion Field Inventory. (DDOT). The authors ranked the 19 most abundant tree species with an overall accuracy of 61,3% and ranked the ten most abundant genera with an overall accuracy of 73,7%.

56
56 57
4. Impacts of vegetation on meteorology and air quality
The impact of vegetation on meteorological conditions (temperature, precipitation, relative humidity, wind speed) and air quality (concentration of pollutants and their de-position) are evaluated with air quality modelling systems (AQMS) that include a meteorological model and an air quality model in addition to other sub-models and softwa-re to process the model input data. AQMS are therefore capable to consider all vegetation effects on atmosphere:
the shadowing effect of trees; the different albedo with respect to artificial surfaces which may increase or decrease the heat transfer between earth surface and atmosphere; the increase of humidity due to evapotranspira-tion of leaves and decrease of soil sealing; the barrier effect of trees that decrease wind speed and increase turbulence; the removal of gaseous and particulate matter and, in particular, the effect of gases emitted by vege-tation (BVOC-biogenic volatile organic compounds) on air quality as well as their physical and chemical interactions (Figure 4.1). Moreover, the air quality impact of vegetation is evaluated together with an accurate knowle-dge of anthropogenic emissions, of land use and urban morphology.Life VEG-GAP project used two state-of-the-art AQMS: the Atmosphe-ric Modelling System of MINNI project (AMS-MINNI; Mircea et al., 2014, 2016) operated by ENEA and WRF-CMAQ operated by UPM. AMS-MINNI is composed of the meteorological model WRF (Skamarock and Klemp, 2008), and the chemical transport model FARM (Flexible Air Quality Regional Model Silibello et al., 2008). The anthropogenic emis-sions are prepared as input for FARM with the emission processor EMMA (Emission Manager, ARIA/ARIANET, 2008). The AQMS used by UPM (WRF-CMAQ) is also based on the Weather Research and Forecasting (WRF) (Skamarock and Klemp, 2008) and use the Community Multiscale Air Quality (CMAQ) (Byun and Ching, 1999; Byun and Schere, 2006) as a chemical-transport model. Anthropogenic emissions are processed with
Mihaela Mircea,Ettore Petralia
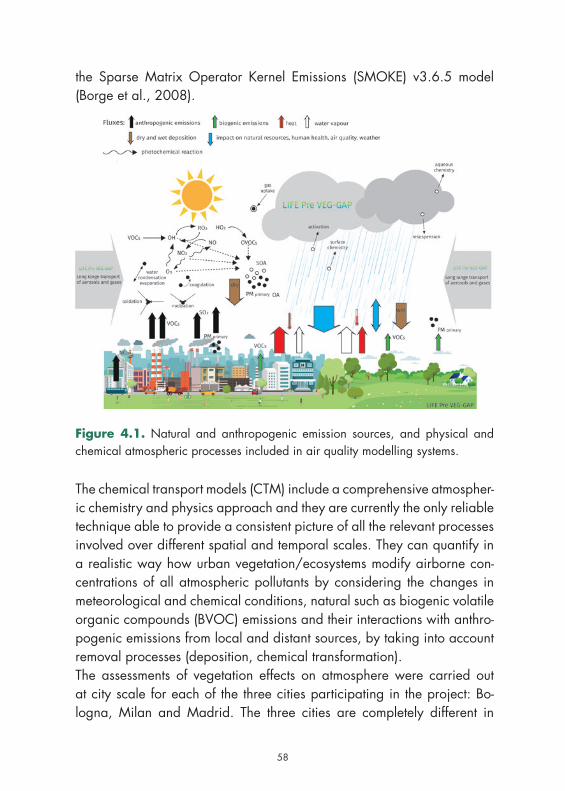
58
the Sparse Matrix Operator Kernel Emissions (SMOKE) v3.6.5 model (Borge et al., 2008).
Figure 4.1. Natural and anthropogenic emission sources, and physical and chemical atmospheric processes included in air quality modelling systems.
The chemical transport models (CTM) include a comprehensive atmospher-ic chemistry and physics approach and they are currently the only reliable technique able to provide a consistent picture of all the relevant processes involved over different spatial and temporal scales. They can quantify in a realistic way how urban vegetation/ecosystems modify airborne con-centrations of all atmospheric pollutants by considering the changes in meteorological and chemical conditions, natural such as biogenic volatile organic compounds (BVOC) emissions and their interactions with anthro-pogenic emissions from local and distant sources, by taking into account removal processes (deposition, chemical transformation).The assessments of vegetation effects on atmosphere were carried out at city scale for each of the three cities participating in the project: Bo-logna, Milan and Madrid. The three cities are completely different in
58 59
terms of size, population, urban morphology and location. Bologna and Milan have similar size, 140.8 km2 and 181.7 km2, respectively but Mi-lan has a much higher population: 1,378,689 inhabitants with respect to Bologna (390,849 inhabitants) being the second most populous city in Italy after Rome. Madrid has an area of 604.3 km2 and 3,141, 991 inhabitants being the most populous city of Spain and the second-largest city in the European Union. The cities are also characterised of different distribution of urban parameters such are height and width of buildings, width and direction of streets, etc.These features were taken into account in the AQMS, in particular in the meteorological model WRF used both for Italian and Spanish simulations. The WRF model was run using a parametrization called BEP (Building Effect Parameterization) (Martilli et al., 2002) that consider the vertical distribution of the sources/sinks of heat, momentum, and turbulent kinetic energy in the whole urban canopy layer. This is one of the main differen-ces in the vertical structure of the surface layer between cities and flat rural areas.AQMS simulated the meteorological conditions and the quality of the air at high resolution (1 km) in the city’s area with a spatial integrated ap-proach. The domains that include the city’s area were chosen such as to include all the representative local features and phenomena that impact on the air in the city. The simulations for the domains including the cities were nested in simulations over larger domains covering European and national/regional areas. Thus, the contributions of large scale air mass circulation and of pollution levels around the cities were considered in a realistic way. The simulations at European scale were carried out by both modelling teams (ENEA and UPM) with the same anthropogenic emission inventory (CAMS-REGAP_v2.2.1) provided by TNO (https://www.tno.nl). The boundary conditions for meteorological and chemical conditions for this domain were obtained from European Centre for Medium-Range Weather Forecasts (ECMWF) and, respectively, from CAMS Copernicus platform. The simulations were validated with monitoring data from Eu-ropean Environment Agency and national/regional/local environmental agencies. The simulations over national/regional and city domains used national/municipal anthropogenic emissions inventories, respectively,
60
since they include more detailed information about emission sources ac-cording to the spatial and temporal distribution of human activities. WR-F-CMAQ used a combination of different official emission inventories: the Spanish National Emission Inventory and the local emission inventory of the Madrid City. AMS-MINNI used the national emission inventory distrib-uted by ISPRA (Italian Institute for Environmental Protection and Research) with provincial level (NUTS3) detail (where NUTS stands for Nomencla-ture of territorial units for statistics, the hierarchical system for dividing up the territory of the European Union) was used for the Italian domain. The local emission inventories provided by Regional Environmental Agencies (ARPA) of Lombardy and Emilia Romagna Regions were used for simula-tion over Milan and Bologna areas. All simulations made by AMS-MIN-NI and WRF-CMAQ used biogenic volatile organic compounds (BVOC) emissions produced with the same model PSEM (Silibello et al., 2017, chapter 2). BVOC emission fluxes were computed using vegetation maps built from the tree inventories provided by the partner municipalities and from ancillary information on the regional forest cover, complemented by European reference CORINE land cover. The meteorological and air quality simulations were performed using the same information for land use and vegetation as PSEM.The effects of vegetation on meteorological and air quality variables were evaluated with the approach used by Air Quality Plans (AQPs). AQPs are instruments introduced by the Ambient Air Quality Directive 2008/50/EC (AQD50) that allow quantitative evaluation of anthropogenic emission reductions on air quality concentrations in order to achieve EU standards. The assessment of the effectiveness of set measures to reduce air pollution is achieved using AQMS. The difference between an AQMS simulation without measures and a simulation with measures shows the effectiveness of a measure. VEG-GAP reveals the effectiveness of vegetation for air quality and temperature by showing the difference between an AQMS simulation with actual vegetation and a simulation without vegetation. Thus, it is providing support to both City Air Quality and Climate Change Plans. The simulation without vegetation was performed by replacing the vegetation with bare soil only in the urbanized area in the simulations performed with both CTMs and meteorological model. The CTM simula-
60 61
tions included all the detailed information on vegetation cover extension and characteristics, the effect of vegetation on meteorology and detailed species-dependent BVOC emissions and provide hourly data for pollutan-ts’ air concentrations and depositions.The main pollutants investigated in Life VEG-GAP project are ozone (O3), nitrogen dioxide (NO2) and aerosol particles (PM10) since they still have high values in some European urban areas (EEA, 2021) being a threat for human health. The behaviour of all these pollutants will be influenced by the meteorological changes (temperature, relative humidity, sunlight, wind speed and direction) induced by vegetation, and, in addition, O3 and PM10 will be directly influenced by BVOC emissions. Ozone is for-med in atmosphere from photochemical reactions between nitrogen oxi-des (NOx=NO2+NO) formed from vehicle emissions (cars, trucks, buses, off-road equipment, etc) and power plants, and volatile organic com-pounds (VOC) which are partly emitted by vegetation. PM10 represents all aerosols (inhalable particles), with diameters lower than 10 microme-ters. Some of these particles, called primary, are emitted directly from an anthropogenic source, such as construction sites, unpaved roads, fields, smokestacks, fires, etc or natural sources vegetation, deserts, sea, etc. A substantial part of these particles, up to 70% in Po Valley, are formed in the atmosphere (secondary particles) as a result of complex reactions of chemicals such as sulphur dioxide and nitrogen oxides, which are pol-lutants emitted from vehicles, power plants and industries, and VOC of anthropogenic and biogenic (BVOC) origin.The effect of current vegetation on atmospheric variables was estimated as the difference between a simulation with vegetation (SVR – simulation vegetation real) and a simulation without urban vegetation (SVN – simula-tions vegetation null). However, SVN did not exclude the peri-urban fore-sts located in the Northern part of Madrid (Cuenca Alta del Manzanares Regional Park) and in the South-Eastern part of Bologna (Colli Bolognesi) respectively, as well as the agricultural area located south and west of Milan (Parco agricolo sud).Figures 4.2 and 4.3 show, as an example, the differences in tempera-ture, concentrations, BVOC emissions and dry deposition for a day, 15 July 2015, induced by the actual vegetation. In all three cities, it can be
62
observed the contribution of vegetation in cooling the air (Figure 4.2, first column). The vegetation has the highest effect on temperature in Milan; in the absence of vegetation, on average, the temperature will be half de-gree Celsius higher over an extended area in the city and outside the city. In Bologna and Madrid, the impact of urban vegetation on temperature is lower; the cooling effect of urban vegetation is below 0.5o C. This may be due to the fact that extended vegetated areas, Colli Bolognesi and Cuenca Alta del Manzanares Regional Park, respectively, are present in both simulations, SVR and SVN, and therefore they “weaken” the effect of urban vegetation. However, the continuous cooling effect of vegetation in the city become important when it is compared with IPCC (https://www.ipcc.ch/sr15/chapter/spm/) global warming prediction that it is about 1.5°C between 2030 and 2052, adding around 0.2C to global ave-rage temperatures every decade. As the differences of temperature, the differences of O3, nitrogen dioxide NO2 and PM10 concentrations show patterns that vary with the city but, with respect to temperature, there are also some areas of the cities with positive values that indicate an increase of concentration due to vegetation. This may be due the fact that the ve-getation decreases the wind speed favouring accumulation of pollutants close to their emission sources. In fact, an increase of NO2 concentrations is evident along the streets in Bologna, along A14 highway, and Madrid. In correspondence of the increase of NO2 concentrations, a decrease of O3 concentrations is observed. In Milan, the dependence of NO2 concen-trations’ differences of streets is less evident, but it has also associated a similar behaviour for O3. Both the increase and the decrease of NO2 and O3 concentrations are on order of few micrograms as daily average. The effect of vegetation on PM10 concentrations is one order of magnitude lower in all three cities. The differences in PM10 concentrations show an increase along the streets as NO2 in Madrid while there is not a definite pattern in Milan. In Bologna, there are also areas where the vegetation decreases the PM10 concentration. O3, NO2 and PM10 are interdependent through nonlinear chemical and physical atmospheric processes, depend-ing on the same anthropogenic and biogenic emissions; therefore, they have to be concomitantly addressed.
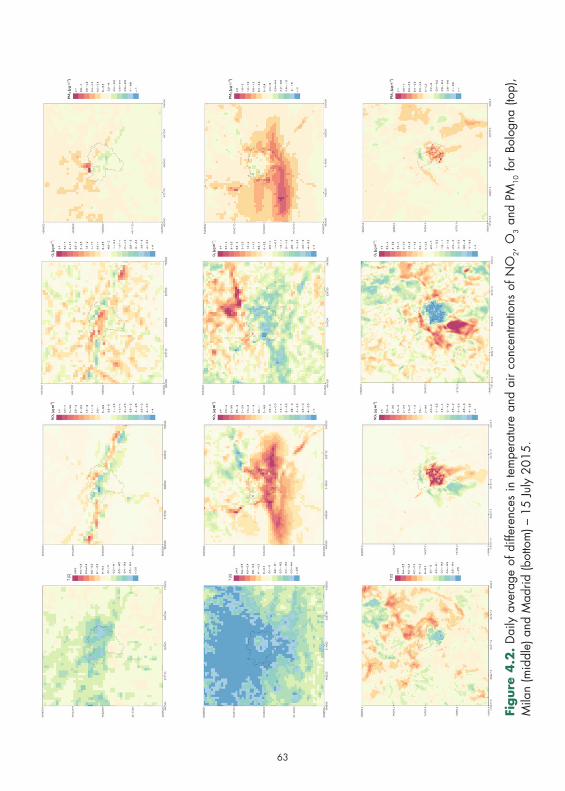
62 63
Figur
e 4
.2.
Dai
ly a
vera
ge o
f diff
eren
ces
in te
mpe
ratu
re a
nd a
ir co
ncen
tratio
ns o
f NO
2, O
3 an
d PM
10 fo
r Bo
logn
a (to
p),
Mila
n (m
iddl
e) a
nd M
adrid
(bot
tom
) – 1
5 Ju
ly 2
015.
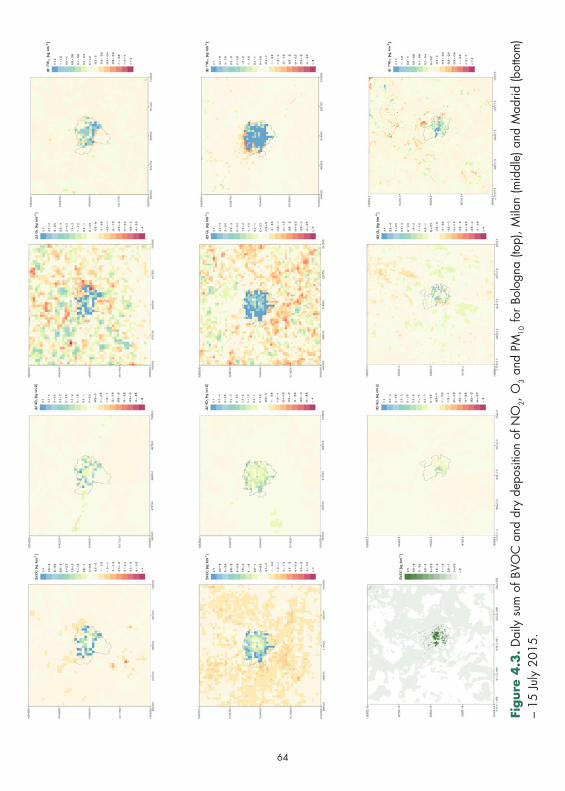
64
Figur
e 4.3
. Dai
ly s
um o
f BVO
C a
nd d
ry d
epos
ition
of N
O2,
O3
and
PM10
for B
olog
na (t
op),
Mila
n (m
iddl
e) a
nd M
adrid
(bot
tom
) –
15 Ju
ly 2
015.
64 65
Figure 4.3 shows the BVOC emissions emitted in a day (first column) and the amount of O3, NO2 and PM10 removed by dry deposition. The dry deposition defines the overall process of removing pollutants, gases and particles, from the atmosphere in the absence of any precipitation (rain, snow, fog). The process is slow but acts continuously leading to removal of substantial amount of pollutants over a year. Both BVOC emissions and dry deposition strongly depend on meteorological conditions and surface characteristics. From Figure 4.3, it can be observed that both emissions and depositions have higher values and cover important areas in Milan for all three pollutants being of on order of few micrograms as daily sum. In Bologna and Madrid similar behaviour is observed for O3 and NO2 deposition while the deposition of PM10 is lower. By comparing the de-positions and the concentrations (Figure 2.3 vs Figure 2.2), it is evident that the amount of pollutant removed is dependent of air concentrations, the deposition of PM10 being the lowest since the concentrations of PM10
are the lowest.Data similar with those shown in Figures 4.2 and 4.3, over the city areas are available through the VEG-GAP information platform (https://veg-gaplatform.enea.it) for both versions, Basic and Advanced (see Chapter 8 for details). Basic shows the impact of vegetation on temperature, con-centrations and dry deposition of O3, NO2 and PM10 on hourly, daily, monthly and yearly basis. The data is shown both as a map and as a histogram with time variation for daily, monthly and yearly periods. The maximum, average and minimum values of the differences for a gi-ven variable, considering only the area of the cities are also available. Advanced version of the platform gives access to these data and other more, and allows a more in-depth investigation of vegetation effects by comparing different variables, different time frames, different points and different locations. Future vegetation scenarios made available by muni-cipalities or created by project partners are also available on Advanced platform.The approach used in VEG-GAP quantify simultaneously the contribution of vegetation ecosystems both as source and sink of air pollution in ur-ban areas, the effect of urban vegetation ecosystems on air temperature (urban heating and cooling patterns) and its impact on air quality. The
66
assessment made for present vegetation scenarios provide bases for te-sting the effect of environmental solutions such as green infrastructures, urban agriculture, urban green belts fostering, etc., on air pollution in an integrated view in space and time. Moreover, the effects of vegetation on temperature and air pollution can be assessed with AQMS and is a base for more “local” evaluations at street/door level.The results show that air temperature and pollution levels are not impacted in the same way by vegetation all over the city area but vary according to different combinations of vegetation and urban morphology, and an-thropogenic emission “cocktail”; therefore, pollution impact assessments on human and vegetation health, biodiversity, etc., should consider this aspect together with its variability in time.VEG-GAP assessment type may support cities to develop joint strategies to combat air pollution and climate change considering the urban ecosy-stems/vegetation characteristics simultaneous with measures to reduce anthropogenic emissions and with urban planning – long term measures in using urban green for adaptation to climate changes.
66 67
5. Impacts of vegetation on health and ecosystem risks
Outdoor air pollution is a major environmental threat affecting human health. The World Health Organization (WHO) estimates that around 4.2 million premature de-aths are caused worldwide every year as a result of a poor outdoor air quality (WHO, 2021). Currently, more than half of the world’s population lives in urban areas and it is expected to reach approximately 70% by 2050
(IPCC, 2015). This rapid growth will result in the development of new ur-ban areas with the consequent increase in energy demand, transport ne-eds, changes in land use, etc. leading to further deterioration of local air quality and urban climate. According to the WHO, the air pollutants that pose the greatest risk to health are gaseous pollutants (nitrogen dioxide NO2, sulphur dioxide SO2 and tropospheric ozone O3), and especially particulate matter (mainly particles smaller than 10 μm, PM10 and smaller than 2 .5 μm, PM2.5). The effects of these compounds on human health are diverse, promoting cardiovascular and respiratory disease, bronchi-tis, asthma, and lung cancer (WHO, 2021, Loomis et al., 2014; Straif et al., 2013). These pollutants are included in the European regulatory framework established in Directive 2008/50/EC of the European Par-liament and of the Council of 21 May 2008 on ambient air quality and cleaner air for Europe. This Directive establishes health-based standards and objectives for a number of pollutants present in the air to protect human health and ecosystems and provides the legal framework for the preparation of plans and programs aimed to air quality improvement.Nature-based solutions (NBS) and urban green infrastructure are becoming increasingly popular in local and regional air quality and climate strate-gies. Therefore, it is necessary to develop assessment tools capable of anti-cipating the effect of such interventions on urban meteorology and air qua-lity at city scale, including health effects and impacts on vegetation itself.
Rafael Borge,David de la Paz,Juan Manuel de Andrés Almeida,Adolfo Narros
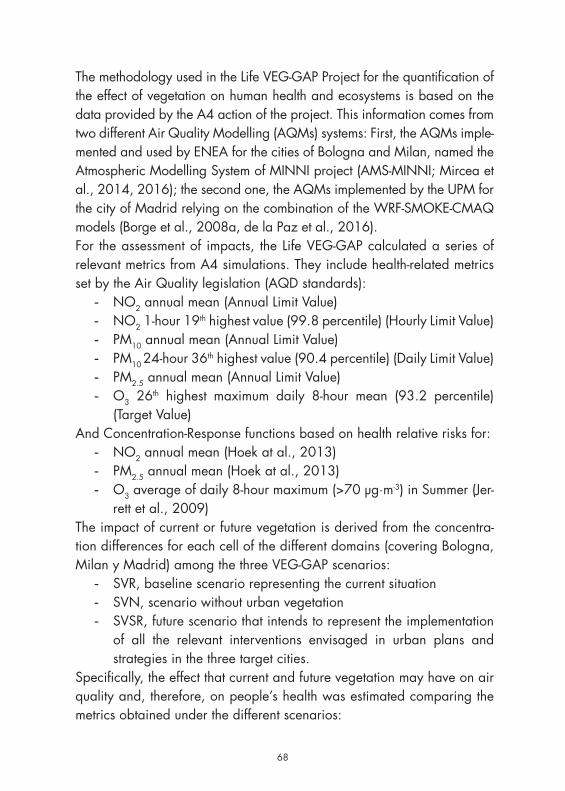
68
The methodology used in the Life VEG-GAP Project for the quantification of the effect of vegetation on human health and ecosystems is based on the data provided by the A4 action of the project. This information comes from two different Air Quality Modelling (AQMs) systems: First, the AQMs imple-mented and used by ENEA for the cities of Bologna and Milan, named the Atmospheric Modelling System of MINNI project (AMS-MINNI; Mircea et al., 2014, 2016); the second one, the AQMs implemented by the UPM for the city of Madrid relying on the combination of the WRF-SMOKE-CMAQ models (Borge et al., 2008a, de la Paz et al., 2016).For the assessment of impacts, the Life VEG-GAP calculated a series of relevant metrics from A4 simulations. They include health-related metrics set by the Air Quality legislation (AQD standards):
- NO2 annual mean (Annual Limit Value)- NO2 1-hour 19th highest value (99.8 percentile) (Hourly Limit Value)- PM10 annual mean (Annual Limit Value)- PM10 24-hour 36th highest value (90.4 percentile) (Daily Limit Value)- PM2.5 annual mean (Annual Limit Value)- O3 26th highest maximum daily 8-hour mean (93.2 percentile)
(Target Value)And Concentration-Response functions based on health relative risks for:
- NO2 annual mean (Hoek at al., 2013)- PM2.5 annual mean (Hoek at al., 2013)- O3 average of daily 8-hour maximum (>70 μg∙m-3) in Summer (Jer-
rett et al., 2009)The impact of current or future vegetation is derived from the concentra-tion differences for each cell of the different domains (covering Bologna, Milan y Madrid) among the three VEG-GAP scenarios:
- SVR, baseline scenario representing the current situation- SVN, scenario without urban vegetation- SVSR, future scenario that intends to represent the implementation
of all the relevant interventions envisaged in urban plans and strategies in the three target cities.
Specifically, the effect that current and future vegetation may have on air quality and, therefore, on people’s health was estimated comparing the metrics obtained under the different scenarios:
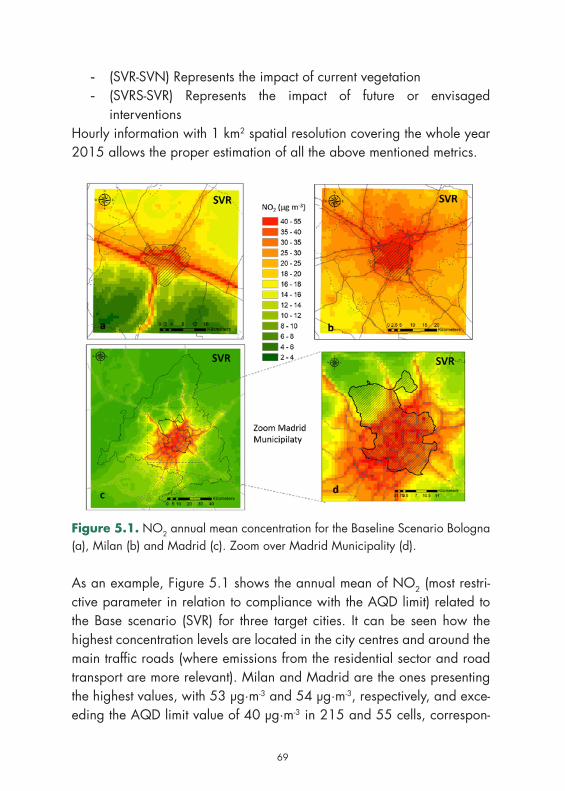
68 69
- (SVR-SVN) Represents the impact of current vegetation- (SVRS-SVR) Represents the impact of future or envisaged
interventionsHourly information with 1 km2 spatial resolution covering the whole year 2015 allows the proper estimation of all the above mentioned metrics.
Figure 5.1. NO2 annual mean concentration for the Baseline Scenario Bologna (a), Milan (b) and Madrid (c). Zoom over Madrid Municipality (d).
As an example, Figure 5.1 shows the annual mean of NO2 (most restri-ctive parameter in relation to compliance with the AQD limit) related to the Base scenario (SVR) for three target cities. It can be seen how the highest concentration levels are located in the city centres and around the main traffic roads (where emissions from the residential sector and road transport are more relevant). Milan and Madrid are the ones presenting the highest values, with 53 μg∙m-3 and 54 μg∙m-3, respectively, and exce-eding the AQD limit value of 40 μg∙m-3 in 215 and 55 cells, correspon-
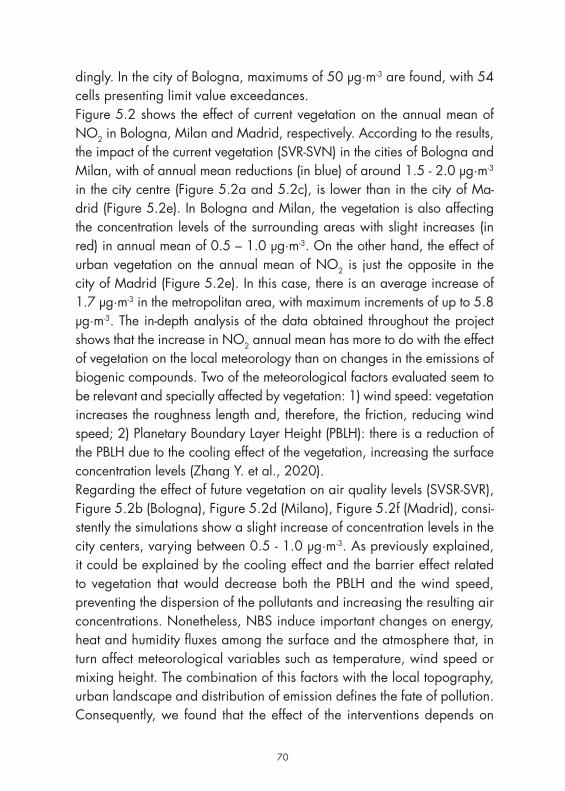
70
dingly. In the city of Bologna, maximums of 50 μg∙m-3 are found, with 54 cells presenting limit value exceedances.Figure 5.2 shows the effect of current vegetation on the annual mean of NO2 in Bologna, Milan and Madrid, respectively. According to the results, the impact of the current vegetation (SVR-SVN) in the cities of Bologna and Milan, with of annual mean reductions (in blue) of around 1.5 - 2.0 μg∙m-3 in the city centre (Figure 5.2a and 5.2c), is lower than in the city of Ma-drid (Figure 5.2e). In Bologna and Milan, the vegetation is also affecting the concentration levels of the surrounding areas with slight increases (in red) in annual mean of 0.5 – 1.0 μg∙m-3. On the other hand, the effect of urban vegetation on the annual mean of NO2 is just the opposite in the city of Madrid (Figure 5.2e). In this case, there is an average increase of 1.7 μg∙m-3 in the metropolitan area, with maximum increments of up to 5.8 μg∙m-3. The in-depth analysis of the data obtained throughout the project shows that the increase in NO2 annual mean has more to do with the effect of vegetation on the local meteorology than on changes in the emissions of biogenic compounds. Two of the meteorological factors evaluated seem to be relevant and specially affected by vegetation: 1) wind speed: vegetation increases the roughness length and, therefore, the friction, reducing wind speed; 2) Planetary Boundary Layer Height (PBLH): there is a reduction of the PBLH due to the cooling effect of the vegetation, increasing the surface concentration levels (Zhang Y. et al., 2020).Regarding the effect of future vegetation on air quality levels (SVSR-SVR), Figure 5.2b (Bologna), Figure 5.2d (Milano), Figure 5.2f (Madrid), consi-stently the simulations show a slight increase of concentration levels in the city centers, varying between 0.5 - 1.0 μg∙m-3. As previously explained, it could be explained by the cooling effect and the barrier effect related to vegetation that would decrease both the PBLH and the wind speed, preventing the dispersion of the pollutants and increasing the resulting air concentrations. Nonetheless, NBS induce important changes on energy, heat and humidity fluxes among the surface and the atmosphere that, in turn affect meteorological variables such as temperature, wind speed or mixing height. The combination of this factors with the local topography, urban landscape and distribution of emission defines the fate of pollution. Consequently, we found that the effect of the interventions depends on
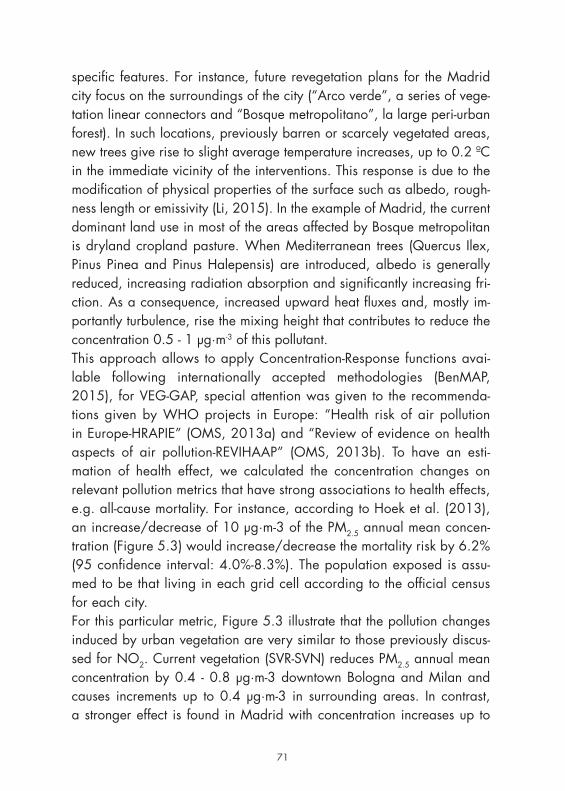
70 71
specific features. For instance, future revegetation plans for the Madrid city focus on the surroundings of the city (“Arco verde”, a series of vege-tation linear connectors and “Bosque metropolitano”, la large peri-urban forest). In such locations, previously barren or scarcely vegetated areas, new trees give rise to slight average temperature increases, up to 0.2 ºC in the immediate vicinity of the interventions. This response is due to the modification of physical properties of the surface such as albedo, rough-ness length or emissivity (Li, 2015). In the example of Madrid, the current dominant land use in most of the areas affected by Bosque metropolitan is dryland cropland pasture. When Mediterranean trees (Quercus Ilex, Pinus Pinea and Pinus Halepensis) are introduced, albedo is generally reduced, increasing radiation absorption and significantly increasing fri-ction. As a consequence, increased upward heat fluxes and, mostly im-portantly turbulence, rise the mixing height that contributes to reduce the concentration 0.5 - 1 μg∙m-3 of this pollutant.This approach allows to apply Concentration-Response functions avai-lable following internationally accepted methodologies (BenMAP, 2015), for VEG-GAP, special attention was given to the recommenda-tions given by WHO projects in Europe: “Health risk of air pollution in Europe-HRAPIE” (OMS, 2013a) and “Review of evidence on health aspects of air pollution-REVIHAAP” (OMS, 2013b). To have an esti-mation of health effect, we calculated the concentration changes on relevant pollution metrics that have strong associations to health effects, e.g. all-cause mortality. For instance, according to Hoek et al. (2013), an increase/decrease of 10 μg∙m-3 of the PM2.5 annual mean concen-tration (Figure 5.3) would increase/decrease the mortality risk by 6.2% (95 confidence interval: 4.0%-8.3%). The population exposed is assu-med to be that living in each grid cell according to the official census for each city.For this particular metric, Figure 5.3 illustrate that the pollution changes induced by urban vegetation are very similar to those previously discus-sed for NO2. Current vegetation (SVR-SVN) reduces PM2.5 annual mean concentration by 0.4 - 0.8 μg∙m-3 downtown Bologna and Milan and causes increments up to 0.4 μg∙m-3 in surrounding areas. In contrast, a stronger effect is found in Madrid with concentration increases up to
72
1.4 μg∙m-3. Looking at the impact of future NBS (SVSR-SVR), shown in Figure 5.3b (Bologna), Figure 5.3d (Milano), Figure 5.3f (Madrid), PM2.5 concentration would rise around 0.4 μg∙m-3 in the city centre of the Ita-lian cities, while concentration increases in Madrid downtown would be below 0.2 μg∙m-3.
Figure 5.2. NO2 annual mean. Impact of current vegetation in the city area Bologna (a), Milan (c), Madrid (e), and impact of vegetation-related interventions Bologna (b), Milan (d), and Madrid (f).
72 73
Oppositely, the average PM2.5 airborne concentration would fall by 0.2 -0.4 μg∙m-3 in the areas were new trees are introduced. According to our preliminary analyses this effect would be dominated by the increase of the mixing height that allows a more effective dispersion of pollutan-ts. Of note, all these simulations assume that anthropogenic emissions, i.e., those from traffic or domestic heating are kept constant among scenarios. This hypothesis is needed to isolate the effect of vegetation specifically but it does not necessarily representative of future pollution levels since emissions are expected to further decline in the future.
Figure 5.3. PM2.5 annual mean. Impact of actual vegetation in the city area Bologna (a), Milan (c), Madrid (e), and impact of vegetation-related interventions Bologna (b), Milan (d), and Madrid (f).
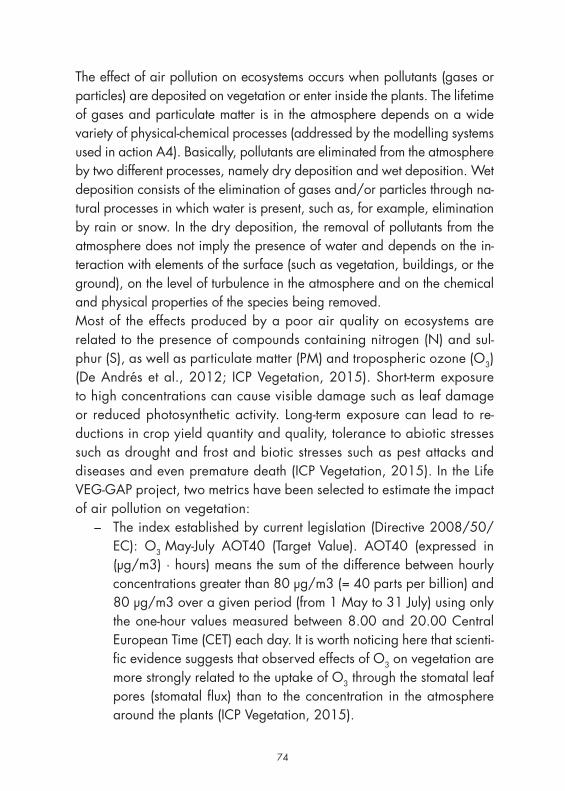
74
The effect of air pollution on ecosystems occurs when pollutants (gases or particles) are deposited on vegetation or enter inside the plants. The lifetime of gases and particulate matter is in the atmosphere depends on a wide variety of physical-chemical processes (addressed by the modelling systems used in action A4). Basically, pollutants are eliminated from the atmosphere by two different processes, namely dry deposition and wet deposition. Wet deposition consists of the elimination of gases and/or particles through na-tural processes in which water is present, such as, for example, elimination by rain or snow. In the dry deposition, the removal of pollutants from the atmosphere does not imply the presence of water and depends on the in-teraction with elements of the surface (such as vegetation, buildings, or the ground), on the level of turbulence in the atmosphere and on the chemical and physical properties of the species being removed.Most of the effects produced by a poor air quality on ecosystems are related to the presence of compounds containing nitrogen (N) and sul-phur (S), as well as particulate matter (PM) and tropospheric ozone (O3) (De Andrés et al., 2012; ICP Vegetation, 2015). Short-term exposure to high concentrations can cause visible damage such as leaf damage or reduced photosynthetic activity. Long-term exposure can lead to re-ductions in crop yield quantity and quality, tolerance to abiotic stresses such as drought and frost and biotic stresses such as pest attacks and diseases and even premature death (ICP Vegetation, 2015). In the Life VEG-GAP project, two metrics have been selected to estimate the impact of air pollution on vegetation:
– The index established by current legislation (Directive 2008/50/EC): O3 May-July AOT40 (Target Value). AOT40 (expressed in (μg/m3) ∙ hours) means the sum of the difference between hourly concentrations greater than 80 μg/m3 (= 40 parts per billion) and 80 μg/m3 over a given period (from 1 May to 31 July) using only the one-hour values measured between 8.00 and 20.00 Central European Time (CET) each day. It is worth noticing here that scienti-fic evidence suggests that observed effects of O3 on vegetation are more strongly related to the uptake of O3 through the stomatal leaf pores (stomatal flux) than to the concentration in the atmosphere around the plants (ICP Vegetation, 2015).
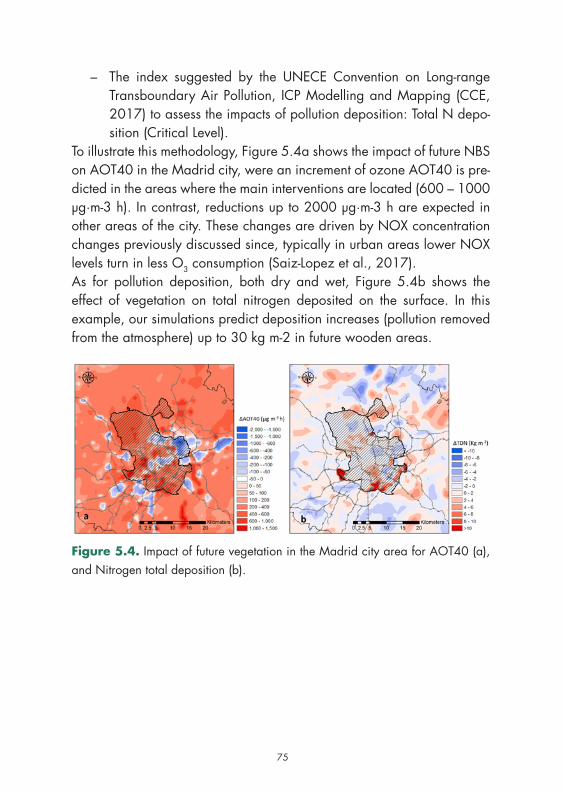
74 75
– The index suggested by the UNECE Convention on Long-range Transboundary Air Pollution, ICP Modelling and Mapping (CCE, 2017) to assess the impacts of pollution deposition: Total N depo-sition (Critical Level).
To illustrate this methodology, Figure 5.4a shows the impact of future NBS on AOT40 in the Madrid city, were an increment of ozone AOT40 is pre-dicted in the areas where the main interventions are located (600 – 1000 μg∙m-3 h). In contrast, reductions up to 2000 μg∙m-3 h are expected in other areas of the city. These changes are driven by NOX concentration changes previously discussed since, typically in urban areas lower NOX levels turn in less O3 consumption (Saiz-Lopez et al., 2017).As for pollution deposition, both dry and wet, Figure 5.4b shows the effect of vegetation on total nitrogen deposited on the surface. In this example, our simulations predict deposition increases (pollution removed from the atmosphere) up to 30 kg m-2 in future wooden areas.
Figure 5.4. Impact of future vegetation in the Madrid city area for AOT40 (a), and Nitrogen total deposition (b).

76
76 77
6. Engaging relevant actors and co-design to gain lasting results
6.1. IntroductionIn a world of increasingly complex problems, collabo-rating is more pressing, and exciting, than ever. Com-plexity requires an eco-system approach: to solve com-plex problems we need multiple stakeholders (internal and external); they do not have just to intertwine their knowledge, but indeed they need to identify common
perspectives and create together. One of the pillars of innovation is in fact participatory planning (or co-design). Co-design is then not just a buzz-word. Co-design is a powerful approach that allows considering different needs and point of views, involving all the stakeholders in the creation, development and management of a product or service.The names used to address collaborative relationship and processes are several: participatory design, co-operative design, co-creation, co-pro-duction, participation, quadruple helix model or co-governance (see Bac-carne et al., 2014, Schuurman and De Marez, 2012; Westerlund and Leminen, 2011). In other words, participatory design and co-creation is broadly understood as an active engagement of stakeholders, who bring different types of knowledge and resources, and which allows to frame problems from diversified point of views: those of the people who will use the product or service, but also of those working behind the scenes, and last but not least, the people who have commissioned it or are undertaken to design it. Through co-design, they will be able not just to convey and align their ideas towards a common goal; indeed, they will activate un-derstanding, creativity and new synergies, by generating collaboratively outcomes (Voorberg et al., 2015).Co-design is not a new practice. The origins are commonly dated back to the ’60s in Scandinavia, when trade unions fought for establishing “cooperative design”. In the US since the ’70s, the term changed into
Valeria Stacchini,Elisa Pighi,Marino Cavallo
78
“participatory design” and the need to involve end users in research gained more and more support, till “human-centered design” and “de-sign-thinking” more in general became consolidated practices. Partici-patory design has been used in many settings and at various scales: software design, urban design, architecture, product design, service de-sign, and even in medicine. Co-design take place mainly in the form of workshops, ensuring an informal and collaborative environment where, with the support of facilitators, participants can explore ideas through brainstorming and other techniques.Co-creations differs from more traditional forms of stakeholders’ engage-ment, as it allows a major impact of societal actors into the processes (Schaepke et al., 2018; Voorberg et al., 2015). Following the public participation spectrum (Arnstein, 1969), stakeholder engagement can range from consultation, involvement, collaboration, to empowerment. These differ with regards to the power and influence stakeholders have: co-creation is ideally located in “collaborate” or “empower” (translated into Italian by R. Lewanski with “capacitare”, which means to put into effect the choices built together).VEG-GAP activated co-creation at different levels, with the objective to better understand problems, as well as opportunities, and provide useful and easy-to-use tools in the end. It was considered important to start this process right from the very beginning, and carry it forward dynamically, so as to build ground for trust, responsibility and thus achieve mutually valued results.In its co-creation process, VEG-GAP involved stakeholders according to the quadruple and quintuple helix model. Quadruple helix approach is about involving government, private sector, research and academia, as well as civil society, in participatory, trans-disciplinary and multi-stake-holder processes. Quadruple helix is a step further than the triple helix movement launched by Henry Etzkowitz (1993) and Leydesdorff (1995). Their thesis was that the potential for innovation and economic devel-opment in a Knowledge Society lies in a more prominent role for the academia and in the hybridisation of elements from research, industry and government. The Quadruple-Helix innovation model embeds also “media-based and culture-based public” and “civil society” (Carayannis and Campbell, 2009; Etzkowitz and Leydesdorff, 2000b). The Quintu-
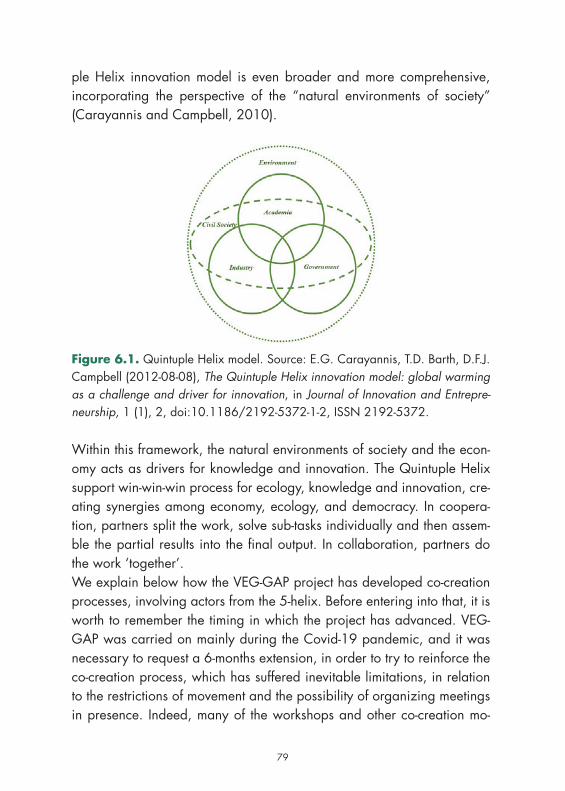
78 79
ple Helix innovation model is even broader and more comprehensive, incorporating the perspective of the “natural environments of society” (Carayannis and Campbell, 2010).
Figure 6.1. Quintuple Helix model. Source: E.G. Carayannis, T.D. Barth, D.F.J. Campbell (2012-08-08), The Quintuple Helix innovation model: global warming as a challenge and driver for innovation, in Journal of Innovation and Entrepre-neurship, 1 (1), 2, doi:10.1186/2192-5372-1-2, ISSN 2192-5372.
Within this framework, the natural environments of society and the econ-omy acts as drivers for knowledge and innovation. The Quintuple Helix support win-win-win process for ecology, knowledge and innovation, cre-ating synergies among economy, ecology, and democracy. In coopera-tion, partners split the work, solve sub-tasks individually and then assem-ble the partial results into the final output. In collaboration, partners do the work ‘together’.We explain below how the VEG-GAP project has developed co-creation processes, involving actors from the 5-helix. Before entering into that, it is worth to remember the timing in which the project has advanced. VEG-GAP was carried on mainly during the Covid-19 pandemic, and it was necessary to request a 6-months extension, in order to try to reinforce the co-creation process, which has suffered inevitable limitations, in relation to the restrictions of movement and the possibility of organizing meetings in presence. Indeed, many of the workshops and other co-creation mo-
80
ments had taken place online. If being online expands the possibilities to reach more participants, on the other hand, it may limit the flow of interactions, and can also be a barrier for reaching some people due to the use of technology. Generally speaking, co-design stimulates group creativity and pushes the participants to dialogue together and collabora-tively define the actions to be taken. The co-design is strictly related also to the spread of design-thinking, an iterative technique which, by placing the person at the centre, allows to analyse different perspectives of the problem, and activate creativity and problem solving; design thinking then has emphasised on team and diversity as the engine of creativity. The co-design sessions are usually carried out in person, with the help of blackboards, post-its, felt-tip pens and with the involvement of one or more facilitators who guides the discussion and sharing among partici-pants and ideas. Unfortunately, Milan, Bologna and Madrid were among the European cities most affected by Covid-19 in 2020, and the lock-down, put a strain on team collaboration, penalizing relationships and social aspects, and all the creative activities (brainstorming, meetings, workshops, focus groups) that usually took place in person.The use of collaborative platforms has only partially compensated the need for interactions. To work together, it is essential that the team is close-knit and communicates. Online tools are very useful as regards the second aspect of communication; however, harmony and empathy are much more immediate and powerful when people can meet, as they can also use non-verbal languages.Despite these difficulties, the work carried out together with stakeholders was helpful for the design of the VEG-GAP platform, as well as the op-portunity to exchange with the advisory board and networking with other projects that have faced or are facing related issues.It is therefore possible to highlight four activities that have had a significant impact on the co-design process: the exchange with the advisory board, networking with other international projects, workshops with stakeholders and the demonstrative days. Moreover, a database of actors and projects was created and constantly updated during the project. The database includes mainly stakeholders from Italy and Spain, as it is the territorial area of reference for the project, but also from other European countries,
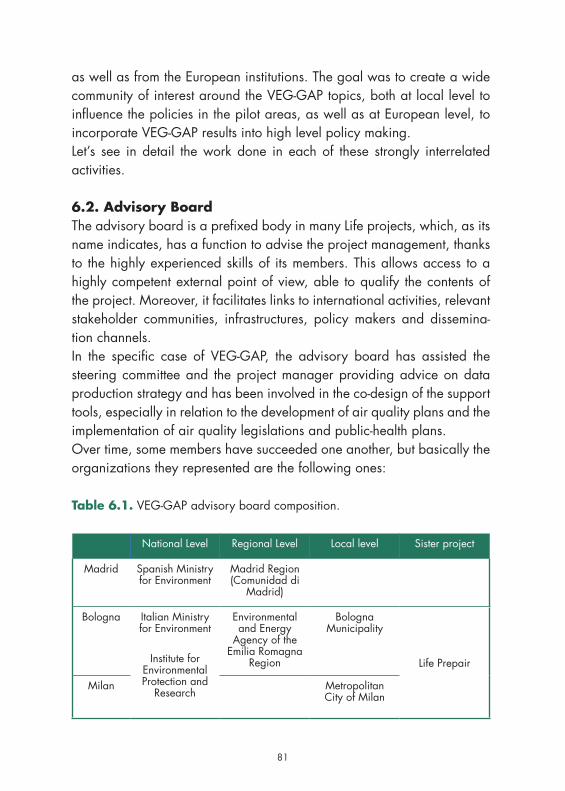
80 81
as well as from the European institutions. The goal was to create a wide community of interest around the VEG-GAP topics, both at local level to influence the policies in the pilot areas, as well as at European level, to incorporate VEG-GAP results into high level policy making.Let’s see in detail the work done in each of these strongly interrelated activities.
6.2. Advisory BoardThe advisory board is a prefixed body in many Life projects, which, as its name indicates, has a function to advise the project management, thanks to the highly experienced skills of its members. This allows access to a highly competent external point of view, able to qualify the contents of the project. Moreover, it facilitates links to international activities, relevant stakeholder communities, infrastructures, policy makers and dissemina-tion channels.In the specific case of VEG-GAP, the advisory board has assisted the steering committee and the project manager providing advice on data production strategy and has been involved in the co-design of the support tools, especially in relation to the development of air quality plans and the implementation of air quality legislations and public-health plans.Over time, some members have succeeded one another, but basically the organizations they represented are the following ones:
Table 6.1. VEG-GAP advisory board composition.
National Level Regional Level Local level Sister project
Madrid Spanish Ministry for Environment
Madrid Region (Comunidad di
Madrid)
Bologna Italian Ministry for Environment
Institute for Environmental Protection and
Research
Environmental and Energy
Agency of the Emilia Romagna
Region
Bologna Municipality
Life Prepair
Milan Metropolitan City of Milan
82
Most of the organization were engaged since the very beginning in the proj-ect proposal development. They represent the most relevant policy owners of the territories involved, both at national, regional and local level. In Italy, im-portant environmental agencies working on air quality have been involved too. It should also be noted the participation of the Life PrepAir project with which a close collaboration has been developed, considering the close in-terrelation of the issues addressed, albeit with different activities and targets.The professionals involved are highly experienced in the project sectors and, in particular, on air quality and vegetation. In addition, they all hold roles of responsibility, and therefore are able to share knowledge and fa-cilitate cross fertilisation with other initiatives. They showed great interest and collaboration, not just providing advice and actively participating into the co-creation meetings, but even showed great interest in integrat-ing the VEG-GAP results into their strategies and programmes.The first meeting took place on October ‘19 in Palazzo Malvezzi, at the headquarters of the Metropolitan City of Bologna. It represented a first occasion to reinforce relationship and collaboration, sharing infor-mation, data and opportunities. Due to the pandemic situation, in 2020 the Advisory Board was unable to meet again in the form of an assembly; however, the iterations one-to-one continued in a more informal way, with regards to specific activities, in particular in order to build the future sce-nario. In April 2021 the advisory board met again: even online, this was a great opportunity to share all the progress made, to generate creativity for the platform improvement and to cross-fertilize actions. The advisory board brought many inputs and suggested different remarks for the plat-form development and for facilitating a replication of results.
6.3. NetworkingTeam culture is important today, but it is no longer enough. We are witness-ing a further evolution, which has to do with digital culture, with the internet and with a magic word, which is network and draw on the work experience of other teams. Networking facilitate the sharing of professional practices of international scope, accelerating the creations of standards, and more gen-erally the creation of a common culture. Networking is fundamental to share and capitalize results, avoiding overlapping and strengthening synergies.

82 83
The VEG-GAP networking activity has been coordinated by the Munici-pality of Milan, involving all the partners. A comprehensive database has been established, identifying local, national and European projects focus-ing on the interactions between air quality and ecosystem or vegetation, funded under various programs and initiatives. The database includes also projects investigating the effect of air quality on health, or on the eco-system, or supporting green infrastructures and nature-based solutions. Project’s teams have been invited to participate in different networking events, as well as workshops, in order to share challenges, results and tools, create synergies and to participate in the co-design process.The networking activity is developed at three level:
- International level: networking activities with other Life and non-Life projects; there are 17 projects that refer to this typology with which discussions and exchanges have been carried out;
- Local project level: it represents an intermediate level of networking, and it consists of regional or local projects related to City’s strategies;
- Local working group level: each city involved in the VEG-GAP project keeps the relationships with any working tables or projects where the VEG-GAP progress and results may contribute.
The list of projects networking with VEG-GAP are listed below:
Table 6.2. VEG-GAP Networking with other Life and/or non-Life projects. Source: Municipality of Milan, VEG-GAP reporting.
LOGO NAME PROGRAM THEMES WEB SITE DURATION
prepAIR -Po Regions Engaged to Policies of Air
LIFE Air quality http://www.lifeprepair.eu/
01/02/17 31/01/24
Urban-Proof -Climate Proofing Urban Mu-nicipalities
LIFE Air qualityClimate changeVegetation
http://urbanproof.eu/it/
01/10/1631/05/20
84
CLEVER Cities
H2020 NBS http://clevercities.eu/
01/06/1830/05/23
iSCAPE -Improving the Smart Control of Air Pollution in Europe
H2020 Air qualitySmart city
https://www.isca-peproject.eu/
01/09/1631/08/19
Con-necting Nature
H2020 NBS https://con-nectingnatu-re.eu/
01/06/1831/05/22
CLAIRO – CLear AIR and Climate Adaptation in Ostrava and other cities
UIA Air quality https://www.uia-i-nitiative.eu/en/uia-cities/ostrava
01/11/1831/10/21
ICARUS – Integrated Climate forcing and Air pollution Reduction in Urban Systems
H2020 Air quality https://ica-rus2020.eu/
01/05/201630/04/2020
ClairCity H2020 Air qual-ity – Citi-zen-led air pollution reduction in cities
http://www.clair-city.eu/
01/05/201630/04/2020
ThinkNa-ture
H2020 NBS https://www.think-nature.eu/
01/12/201630/11/2019
URBAN GreenUP Renaturing Urban Plans
H2020 NBS https://www.urban-greenup.eu/
01/06/201731/05/2022
84 85
GrowGre-en
H2020 NBS http://growgreen-project.eu/
2017-2022
UNaLab -Urban Na-ture Lab
H2020 NBS https://www.una-lab.eu/
01/06/201731/05/2022
Metro Adapt -Climate Change Adaptation
LIFE Climate Change Adaptation
http://www.life-metroadapt.eu/it/
03/09/201830/09/2021
LIFE ASTI – implemen-tation of a forecAsting System for urban heaT Islandeffect for the development of urban adaptation strategies
LIFE urban heat island
https://life-asti.eu/
1/09/2018 1/08/2021
ADRI-ADAPT – A Resilience information platform for Adriatic cities and towns
Interreg To improve the climate change mon-itoring and planning of adaptation measures tackling specific effects, in the cooperation area
https://www.ita-ly-croatia.eu/web/adriadaptt
01/01/2019 –
31/12/2020
Urban-Green – Innovative technologi-cal platform to improve manage-ment of green areas for better climate ad-aptation
LIFE Urban veg-etation and green man-agement
https://www.lifeu-rbangreen.eu/
01/07/2018 –
30/06/2021
86
CLIVUT – Climate Value of Urban Trees
LIFE Mitigation and Ad-aptation to Climate Change
https://www.lifecli-vut.eu/
1/09/2019- 28/02/2023
UR-BANOME – Urban Observa-tory for Multi-partic-ipatory En-hancement of Health and Well-being
Horizon 2020
Urban health
https://www.urban-nome.eu/
2021-2025
CITY-AdaP3
LIFE Adaptation https://www.life-cityadap3.eu/
2020-2024
VARCITIES Horizon 2020
NBS https://www.varci-ties.eu/
2021-2025
Sesame – Supporting Entrepre-neurship and Ag-ricultural Know-How in Metropol-itan Areas
Erasmus+ Urban Agri-culture
https://irfedd.fr/recher-che-action/projet-ses-ame-eras-mus/
9/2019-6/2022
Nature based en-terprises platform
Platform Nature based en-terprises
https://www.naturebase-denterprise.eu/
2021 – ….
Verde Urbano e Biodiver-sità
Fondazione di Comuni-tà Milano
Biodiversity https://www.isti-tuto-oikos.org/proget-ti/comuni-ta-verde-mi-lano
2021 – 2022
Each VEG-GAP pilot cities organized networking meetings, but information have been exchanged also through bilateral communication, or by being
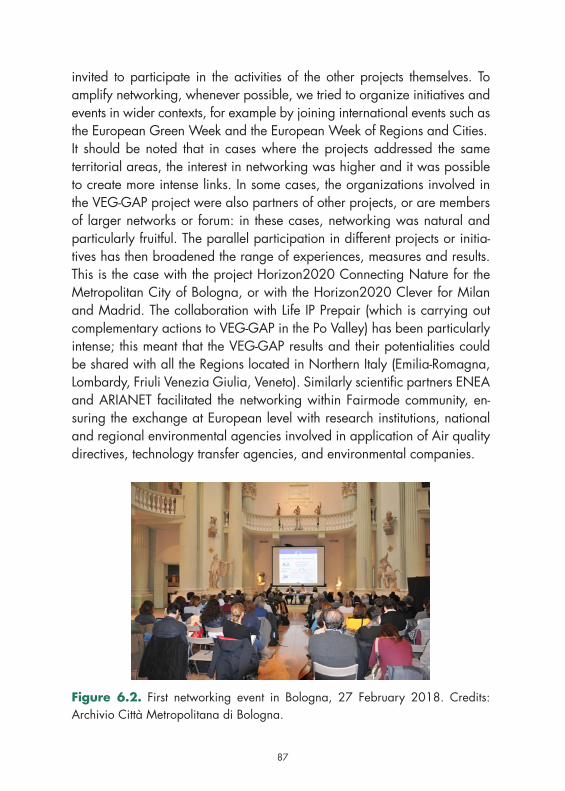
86 87
invited to participate in the activities of the other projects themselves. To amplify networking, whenever possible, we tried to organize initiatives and events in wider contexts, for example by joining international events such as the European Green Week and the European Week of Regions and Cities.It should be noted that in cases where the projects addressed the same territorial areas, the interest in networking was higher and it was possible to create more intense links. In some cases, the organizations involved in the VEG-GAP project were also partners of other projects, or are members of larger networks or forum: in these cases, networking was natural and particularly fruitful. The parallel participation in different projects or initia-tives has then broadened the range of experiences, measures and results. This is the case with the project Horizon2020 Connecting Nature for the Metropolitan City of Bologna, or with the Horizon2020 Clever for Milan and Madrid. The collaboration with Life IP Prepair (which is carrying out complementary actions to VEG-GAP in the Po Valley) has been particularly intense; this meant that the VEG-GAP results and their potentialities could be shared with all the Regions located in Northern Italy (Emilia-Romagna, Lombardy, Friuli Venezia Giulia, Veneto). Similarly scientific partners ENEA and ARIANET facilitated the networking within Fairmode community, en-suring the exchange at European level with research institutions, national and regional environmental agencies involved in application of Air quality directives, technology transfer agencies, and environmental companies.
Figure 6.2. First networking event in Bologna, 27 February 2018. Credits: Archivio Città Metropolitana di Bologna.
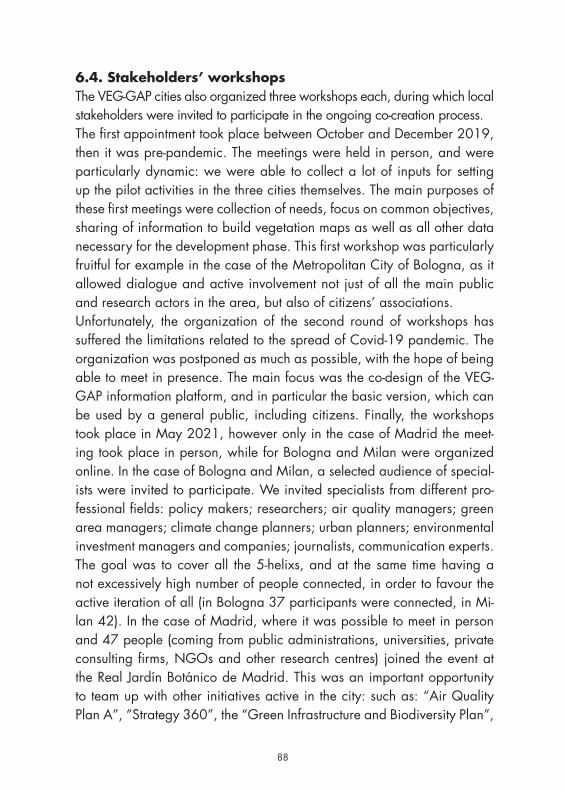
88
6.4. Stakeholders’ workshopsThe VEG-GAP cities also organized three workshops each, during which local stakeholders were invited to participate in the ongoing co-creation process.The first appointment took place between October and December 2019, then it was pre-pandemic. The meetings were held in person, and were particularly dynamic: we were able to collect a lot of inputs for setting up the pilot activities in the three cities themselves. The main purposes of these first meetings were collection of needs, focus on common objectives, sharing of information to build vegetation maps as well as all other data necessary for the development phase. This first workshop was particularly fruitful for example in the case of the Metropolitan City of Bologna, as it allowed dialogue and active involvement not just of all the main public and research actors in the area, but also of citizens’ associations.Unfortunately, the organization of the second round of workshops has suffered the limitations related to the spread of Covid-19 pandemic. The organization was postponed as much as possible, with the hope of being able to meet in presence. The main focus was the co-design of the VEG-GAP information platform, and in particular the basic version, which can be used by a general public, including citizens. Finally, the workshops took place in May 2021, however only in the case of Madrid the meet-ing took place in person, while for Bologna and Milan were organized online. In the case of Bologna and Milan, a selected audience of special-ists were invited to participate. We invited specialists from different pro-fessional fields: policy makers; researchers; air quality managers; green area managers; climate change planners; urban planners; environmental investment managers and companies; journalists, communication experts. The goal was to cover all the 5-helixs, and at the same time having a not excessively high number of people connected, in order to favour the active iteration of all (in Bologna 37 participants were connected, in Mi-lan 42). In the case of Madrid, where it was possible to meet in person and 47 people (coming from public administrations, universities, private consulting firms, NGOs and other research centres) joined the event at the Real Jardín Botánico de Madrid. This was an important opportunity to team up with other initiatives active in the city: such as: “Air Quality Plan A”, “Strategy 360”, the “Green Infrastructure and Biodiversity Plan”,
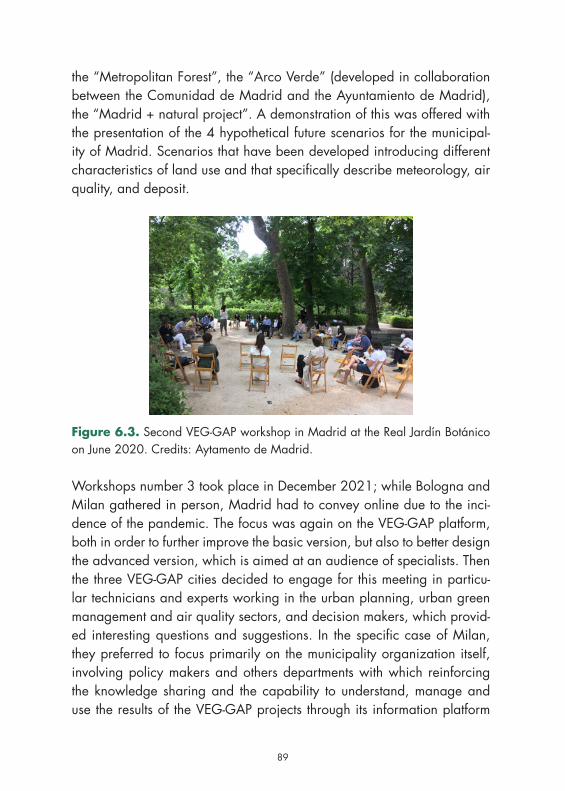
88 89
the “Metropolitan Forest”, the “Arco Verde” (developed in collaboration between the Comunidad de Madrid and the Ayuntamiento de Madrid), the “Madrid + natural project”. A demonstration of this was offered with the presentation of the 4 hypothetical future scenarios for the municipal-ity of Madrid. Scenarios that have been developed introducing different characteristics of land use and that specifically describe meteorology, air quality, and deposit.
Figure 6.3. Second VEG-GAP workshop in Madrid at the Real Jardín Botánico on June 2020. Credits: Aytamento de Madrid.
Workshops number 3 took place in December 2021; while Bologna and Milan gathered in person, Madrid had to convey online due to the inci-dence of the pandemic. The focus was again on the VEG-GAP platform, both in order to further improve the basic version, but also to better design the advanced version, which is aimed at an audience of specialists. Then the three VEG-GAP cities decided to engage for this meeting in particu-lar technicians and experts working in the urban planning, urban green management and air quality sectors, and decision makers, which provid-ed interesting questions and suggestions. In the specific case of Milan, they preferred to focus primarily on the municipality organization itself, involving policy makers and others departments with which reinforcing the knowledge sharing and the capability to understand, manage and use the results of the VEG-GAP projects through its information platform
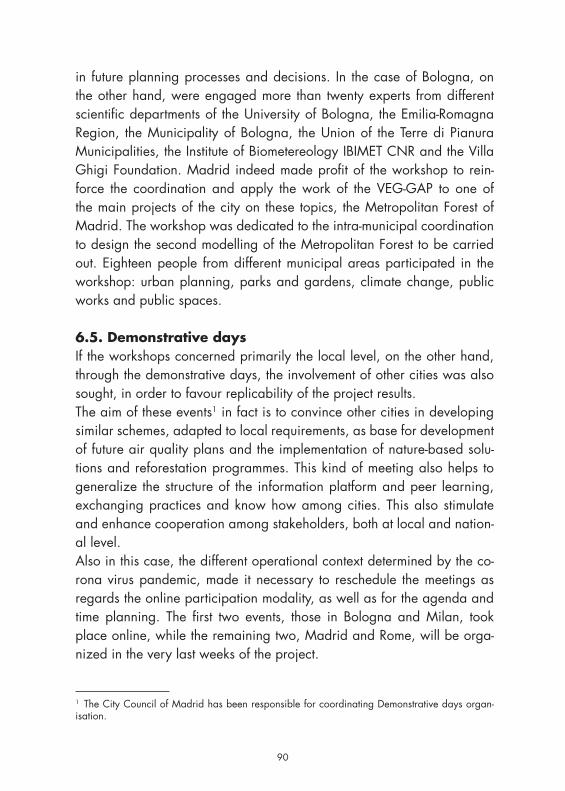
90
in future planning processes and decisions. In the case of Bologna, on the other hand, were engaged more than twenty experts from different scientific departments of the University of Bologna, the Emilia-Romagna Region, the Municipality of Bologna, the Union of the Terre di Pianura Municipalities, the Institute of Biometereology IBIMET CNR and the Villa Ghigi Foundation. Madrid indeed made profit of the workshop to rein-force the coordination and apply the work of the VEG-GAP to one of the main projects of the city on these topics, the Metropolitan Forest of Madrid. The workshop was dedicated to the intra-municipal coordination to design the second modelling of the Metropolitan Forest to be carried out. Eighteen people from different municipal areas participated in the workshop: urban planning, parks and gardens, climate change, public works and public spaces.
6.5. Demonstrative daysIf the workshops concerned primarily the local level, on the other hand, through the demonstrative days, the involvement of other cities was also sought, in order to favour replicability of the project results.The aim of these events1 in fact is to convince other cities in developing similar schemes, adapted to local requirements, as base for development of future air quality plans and the implementation of nature-based solu-tions and reforestation programmes. This kind of meeting also helps to generalize the structure of the information platform and peer learning, exchanging practices and know how among cities. This also stimulate and enhance cooperation among stakeholders, both at local and nation-al level.Also in this case, the different operational context determined by the co-rona virus pandemic, made it necessary to reschedule the meetings as regards the online participation modality, as well as for the agenda and time planning. The first two events, those in Bologna and Milan, took place online, while the remaining two, Madrid and Rome, will be orga-nized in the very last weeks of the project.
1 The City Council of Madrid has been responsible for coordinating Demonstrative days organ-isation.
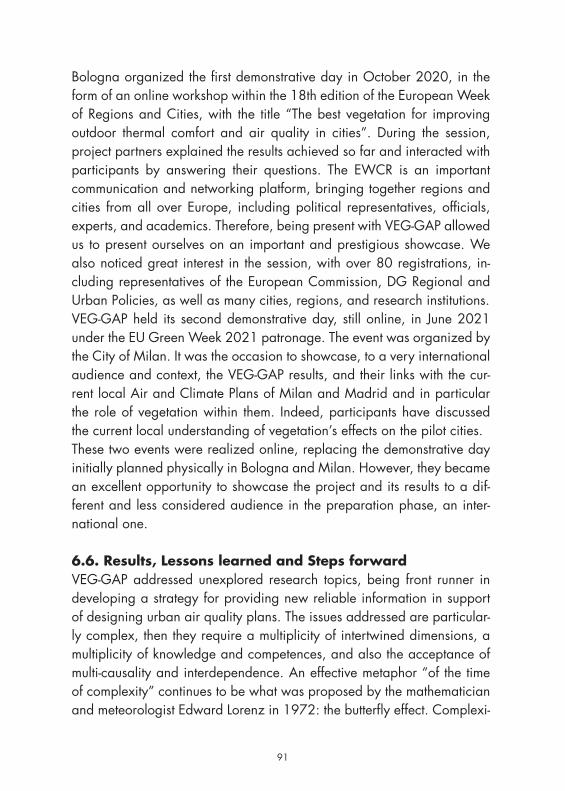
90 91
Bologna organized the first demonstrative day in October 2020, in the form of an online workshop within the 18th edition of the European Week of Regions and Cities, with the title “The best vegetation for improving outdoor thermal comfort and air quality in cities”. During the session, project partners explained the results achieved so far and interacted with participants by answering their questions. The EWCR is an important communication and networking platform, bringing together regions and cities from all over Europe, including political representatives, officials, experts, and academics. Therefore, being present with VEG-GAP allowed us to present ourselves on an important and prestigious showcase. We also noticed great interest in the session, with over 80 registrations, in-cluding representatives of the European Commission, DG Regional and Urban Policies, as well as many cities, regions, and research institutions.VEG-GAP held its second demonstrative day, still online, in June 2021 under the EU Green Week 2021 patronage. The event was organized by the City of Milan. It was the occasion to showcase, to a very international audience and context, the VEG-GAP results, and their links with the cur-rent local Air and Climate Plans of Milan and Madrid and in particular the role of vegetation within them. Indeed, participants have discussed the current local understanding of vegetation’s effects on the pilot cities.These two events were realized online, replacing the demonstrative day initially planned physically in Bologna and Milan. However, they became an excellent opportunity to showcase the project and its results to a dif-ferent and less considered audience in the preparation phase, an inter-national one.
6.6. Results, Lessons learned and Steps forwardVEG-GAP addressed unexplored research topics, being front runner in developing a strategy for providing new reliable information in support of designing urban air quality plans. The issues addressed are particular-ly complex, then they require a multiplicity of intertwined dimensions, a multiplicity of knowledge and competences, and also the acceptance of multi-causality and interdependence. An effective metaphor “of the time of complexity” continues to be what was proposed by the mathematician and meteorologist Edward Lorenz in 1972: the butterfly effect. Complexi-
92
ty requires not fractions, but to establish links, it urges the union of forces, even the most in times of crisis. For this reason, it was important for VEG-GAP to invest time and resources in co-design processes, and expand, as far as possible, the horizon of future scenarios.All the activities mentioned above, and all the people and organizations involved, brought valuable impact to the project results, and contributed to reinforcing synergies and relationship, which will remain beyond the end of the project and will allow everyone to advance towards common objectives, and expand the horizon.

92 93
7. The three pilot cities: Introduction
The three pilot cities, partners of the project, Bologna, Madrid and Milan, are different in terms of size, pop-ulation and urban morphology but, at the same time, they face similar issues related to air quality, pollution, increase in temperatures and the need to promote a sus-tainable development, fostering nature-based solutions, reforestation and air quality policies to offer to their citi-
zens a healthier place to live.In the next paragraphs, for each pilot city, the policies, projects and actions, relevant for the promotion of the environmental sustainability, are presented.The first case we propose is about the Metropolitan city of Bologna and the actions that it took in place, in the last years, to increase urban vegetation and to improve air and life quality in the metropolitan area: the Bologna Charter of environment; the Air Laboratory; the Sustainable Development Agenda; the Guidelines for the metropolitan forestation; the reforestation projects in the metropolitan area funded by the Italian Ministry of the Ecologi-cal Transition; the participation in European projects promoting nature based solutions and a new green entrepreneurship; the commitment to achieve cli-mate neutrality in 2030, to enlarge the urban vegetation and to offer the possibility to the citizens to reach green areas in the city in a short time.Then it follows the example of the Municipality of Madrid and its engage-ment in the promotion of air quality, climate neutrality and new green infrastructures. The tools, the actions and the programmatic documents set up by the city are presented: the Air Quality and Climate Change Plan and the Madrid 360 Environmental Sustainability Strategy; the Climate Neutrality Roadmap that marks the path to follow in the decarbonization of the city; the Madrid + Natural program, an initiative to promote the implementation of nature-based solutions in order to mitigate the effects of climate change; the different programs, projects and air quality studies
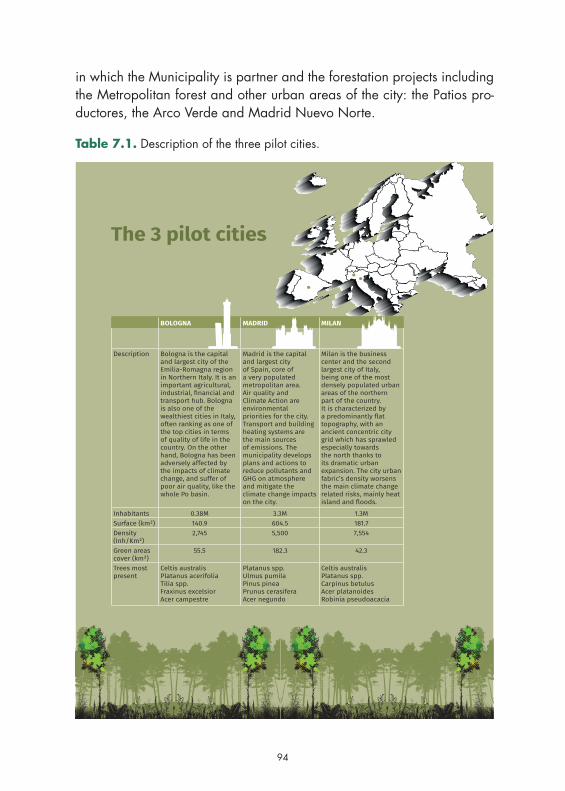
94
in which the Municipality is partner and the forestation projects including the Metropolitan forest and other urban areas of the city: the Patios pro-ductores, the Arco Verde and Madrid Nuevo Norte.
Table 7.1. Description of the three pilot cities.
The 3 pilot cities
BOLOGNA MADRID MILAN
Description Bologna is the capital and largest city of the Emilia-Romagna region in Northern Italy. It is an important agricultural, industrial, financial and transport hub. Bologna is also one of the wealthiest cities in Italy, often ranking as one of the top cities in terms of quality of life in the country. On the other hand, Bologna has been adversely affected by the impacts of climate change, and suffer of poor air quality, like the whole Po basin.
Madrid is the capital and largest city of Spain, core of a very populated metropolitan area. Air quality and Climate Action are environmental priorities for the city. Transport and building heating systems are the main sources of emissions. The municipality develops plans and actions to reduce pollutants and GHG on atmosphere and mitigate the climate change impacts on the city.
Milan is the business center and the second largest city of Italy, being one of the most densely populated urban areas of the northern part of the country. It is characterized by a predominantly flat topography, with an ancient concentric city grid which has sprawled especially towards the north thanks to its dramatic urban expansion. The city urban fabric’s density worsens the main climate change related risks, mainly heat island and floods.
Inhabitants 0.38M 3.3M 1.3MSurface (km²) 140.9 604.5 181.7Density (Inh/Km²)
2,745 5,500 7,554
Green areas cover (km²)
55.5 182.3 42.3
Trees most present
Celtis australisPlatanus acerifoliaTilia spp. Fraxinus excelsiorAcer campestre
Platanus spp. Ulmus pumilaPinus pineaPrunus cerasiferaAcer negundo
Celtis australisPlatanus spp. Carpinus betulusAcer platanoidesRobinia pseudoacacia
94 95
Last but not least, you will read about the Municipality of Milan and its policies aimed to support resilience and adaptation by introduc-ing nature-based solutions. To respond to the issues, especially related to the climate change, many actions, projects, plans and tools are put in place: the Government Plan of the Territory (PGT) of 2016; the provision of twenty new large municipal parks that will contribute to creating a heritage of green infrastructure, part of the more expansive Metropolitan Park; a planning tool, the Air and Climate Plan and the Adaptation Guidelines; several projects of local and European scope, aimed at verify and increase the environmental and systemic benefits of policies and plans for adaptation and resilience; the Forestami Pro-gram; the Depaving Program for hydraulic safety; the Geoportal, a strategic tool for internal use within the administration, which can help the various offices in prioritize areas and interventions overlapping the different territorial opportunities/criticalities; initiatives of collabora-tion and sponsorship for the adoption of green areas by associations and groups of citizens.
7.1. Reforestation and nature-based solutions in Bologna metropoleMarino Cavallo, Elisa Pighi, Valeria Stacchini
7.1.1. Introduction: context analysis of the metropolitan city of Bologna and local policy making for environmental protection and sustainable developmentThe air quality issue is particularly consistent with reference to the territories surrounding the Po basin, which is including the city of Bo-logna. In these areas, the concentration levels of some pollutants de-tected by the monitoring network exceed, in different ways, the limits indicated by the current legislation. As a matter of example, the max-imum limits of PM10 (fine particles) were exceeded for 40 days on a row in 2017. This is a very complex problem of primary importance, firstly because of the health issues that air pollution can cause on the exposed population.
96
With the aim to ensure more liveable and healthier cities for their citizens, the Metropolitan city of Bologna – VEG-GAP project’s partner – in strict collaboration with the Municipality of Bologna and the other 55 munici-palities included within the metropolitan territory are actively engaged in promoting attentive policies on the urban environment.Given the Italian law no. 56 of 2014, Metropolitan cities are defined as local bodies with a broad scope, in charge of strategic, environmental and territorial planning, economic growth and social development, mobil-ity and infrastructure, as well as of ensuring the provision of specific ser-vices to the different municipalities belonging to their administrative area, in alignment with both national and regional policies; Metropolitan cities have the role of identifying and coordinating the development strategies of their entire territory.Specifically, the Metropolitan city of Bologna has the task of governing and ensuring the harmonious, planned and organized growth of its own territory, interacting with regional and national institutions and identifying the key issues for sustainability, urban and environmental regeneration, as founding themes to be addressed locally.Since its first years of life, the Metropolitan city of Bologna has therefore been at the forefront in the implementation of the principles of sustainable development, which have led, in recent years, to the elaboration of a series of strategic policy documents and projects, aimed at stimulating the development of these policies, as well as testing practical solutions through pilot actions at local level.Some years ago, the city of Bologna was selected to be the venue of the G7 Environment Ministers’ Meeting which took place in June 2017. The event ended with twelve Mayors of the fourteen Italian Metropolitan cities signing the Bologna’s Charter for the Environment.The Charter is rooted in the international principles of the 2030 Agenda for Sustainable Development of the United Nations and aims at transpos-ing them into virtuous local policies and practices supporting and promot-ing sustainability at local level.Specifically, the Charter identifies eight key environmental issues related to the goal no. 11. “Sustainable cities and communities”; it set out the commitments which can be traced back to the guidelines of the European
96 97
Union strategy, referring to the need of identifying measurable objectives and targets by defining the possible perspectives at national level.In 2017, the Metropolitan city of Bologna, in collaboration with the Mu-nicipality of Bologna and the University of Bologna, promoted also the creation of an Air Laboratory, managed by the Foundation for Urban In-novation1 – an ‘open and widespread lab’ focusing on urban innovation – which aims at fostering the attention and promoting local actions with reference to the air quality issue.Environmental, economic and social sustainability are at the forefront of the founding principles of the Metropolitan Strategic Plan 2.0 (PSM) draft-ed in the 2018: the act giving born to these guidelines was approved by the Metropolitan Council, in charge of coordinating the strategic action of the Metropolitan city, of the Unions of Municipalities and of the other Municipalities belonging to the metropolitan area, by identifying SMART strategic objectives in the medium and long term.The Metropolitan Strategic Plan 2.0 is the most important document of the Metropolitan city aiming at: promoting transversal projects by field and by territory, federative and supportive actions between local communities, responding to a vision of active collaboration that connects institutions with civil society and other stakeholders of the economic area. In addition to this, it determines the intervention strategy according to the nature of the different geographic areas with attention to their vulnerabilities, their specific characteristics as well as they role as key players.In this context, the first Metropolitan Agenda for Sustainable Development was created in 2019. It responds and provide a step forward to the Char-ter of Bologna for the Environment, by identifying key strategies and policy guidelines on each goal identified with reference to the main environmental issues concerning the metropolitan district, namely: air pollution, land use and green management, waste management and circular economy, water supply, energy consumption and renewable sources, sustainable mobility.
1 The Fondazione per l’Innovazione Urbana (FIU) is a non-profit private legal entity founded by the City of Bologna and the University of Bologna. It represents the new legal framework of the former Urban Center Bologna. Despite being co-founded by both of these entities, the Foundation is supported by major local stakeholders in the City. Our work is supported by a budget divided into financial support from the City, University, and major partners; and international financing, mainly from national and European calls.
98
Following the Italian Ministry of the Environment’s Public Notice of July 2019, which was meant to financing the development of Metropolitan Agendas for Sustainable Development at Country level, the Metropolitan city of Bologna submitted the draft of a new policy document, named “the Agenda 2.0”. The Agenda 2.0 of the Metropolitan city of Bologna de-clines all the SDGs at local level, by considering the different dimensions of sustainability and applying a participatory multi-stakeholder approach at local level, as recalled inter alia by the UN system. The main goal of the Agenda 2.0 is to encourage local authorities to develop local poli-cies and sustainable practice with reference to the management of local resources (and thus take practical action at local level to implement the 2030 Agenda for sustainable development).The Agenda 2.0, published in June 2021, is a dynamic and evolving tool for local administrators and policy makers, containing the sustainable development objectives of the Metropolitan city and providing directions to local authorities for maximising their actual achievement.In the framework of the Agenda 2.0, and with specific reference to point/goal 11 “Sustainable cities and communities” several project initiatives were undertaken at metropolitan level in recent years: the VEG-GAP proj-ect (co-funded by the EU through the Life funding programme) introduced and presented in this publication; the Connecting Nature project (co-fund-ed by the EU through the Horizon2020 funding programme) and the Guidelines for Metropolitan Forestation, which will be presented in the following paragraphs of this chapter.
• Paragraph 7.1.2 introduces the Bologna Charter for the Environment, by explaining the context in which it was developed and by presenting its objectives.
• Paragraph 7.1.3 presents the Air Laboratory (Laboratorio Aria) born from the collaboration between the Municipality of Bologna, the University of Bologna, Arpae Emilia-Romagna, Ausl Bologna and the Metropolitan City of Bologna.
• Paragraph 7.1.4 describes the Sustainable Development Agenda and the Sustainable Development Agenda 2.0 of the Metropolitan city of Bologna.
• Paragraph 7.1.5 focuses on the guidelines for metropolitan forestation.• Paragraph 7.1.6 presents the forestry projects financed in recent years.
98 99
• Paragraph 7.1.7 focuses on some project initiatives of which the Metropolitan city is partner, and that promote a greener economy thanks to nature-based enterprises and nature-based solutions in urban areas.
• Paragraph 7.1.8 describes the current goals and those identified for the coming years (2021-2026) in relation to the urban green and the environment.
7.1.2. The Charter of Bologna for the Environment: the Italian metropoli-tan cities together for sustainable developmentDuring the G7 Environment Ministers’ Meeting hosted in Bolo-gna on June the 11th and 12th 2017, twelve metropolitan cities in It-aly signed the Charter for the Environment of the city of Bologna2
: the first protocol of this kind addressing environmental issues in the urban space at national level. In detail, the Bologna Charter for the En-vironment has identified eight macro-objectives to be further developed and addressed in the metropolitan agendas for sustainable development:
- Sustainable land use and natural process solutions- Circular economy- Adaptation to climate change and risk reduction- Energy transition- Quality of air- Quality of water- Ecosystems, urban vegetation and biodiversity protection- Sustainable mobility
The Charter was indeed drafted and promoted by the Metropolitan city of Bologna and signed by twelve additional Metropolitan Cities (out of fourteen) in Italy, on June the 8th 2017 at Rocchetta Mattei (municipality of Grizzana Morandi, Apennine district). Namely, the Charter of Bologna for the environment was signed and adopted by the following metropol-
2 The Charter for the Environment is available on the website of Metropolitan city of Bologna, following these links:• https://www.cittametropolitana.bo.it/portale/Engine/RAServeFile.php/f/comunicati_stam-
pa/carta_di_bologna_per_l_ambiente.pdf (the charter) – accessed on 2 February 2022.• https://www.cittametropolitana.bo.it/portale/Engine/RAServeFile.php/f/comunicati_stam-
pa/Nota_tecnica_Carta_di_Bologna_per_l_ambiente.pdf (technical notes) – accessed on 2 February 2022.
100
itan cities in Italy: Milan, Turin, Florence, Bari, Rome, Catania, Cagliari, Naples, Reggio Calabria, Genoa and Palermo); among others, the Ital-ian Minister of the Environment and the President of the Emilia-Romagna Region attended the event.As a matter of fact indeed, at the moment in which the Charter was signed, all together the fourteen metropolitan cities in Italian concentrated 36.4% of the national population (22.1 million people) and represented the main economic asset, where more than 40% of the national added value is produced (about 600 billion Euro in 2014) thanks also to 1.8 million companies employing 7.9 million people (about 35% of the total number of employees); indeed, metropolitan areas in Italy concentrate 55 Universities, host all the Italian Polytechnics, over 2,000 innovative start-ups (47% of the national total) and 17 certified business incubators (more than the half of the 31 available at national level).In line with the 2030 Agenda for sustainable development, the Charter of Bologna for the Environment is the first structured and concrete step under-taken by the Italian metropolitan cities to counteracting climate change by promoting a strategic plan for environmental sustainability and iden-tifying the main objectives to be achieved on several key dimensions in the coming years. Large cities are, indeed, playing a key role as living workshops able to identify solutions to major global challenges, pilot and test innovative solutions on sustainable development practices, as well as producing a positive effect not only on the environment, but also in the economic, social and institutional sectors.Among the other big Italian Cities, the city of Bologna plays a role model concerning the development of urban policies addressing sustainability: the city is a leader in promoting environmental protection of the territory (e.g. the protected areas represent a third of the entire metropolitan terri-tory of Bologna) and in the active involvement of citizens and the private sector (businesses), with the aim to be a city able to adapt positively to changes and to promote them as a growth engine.The county seat of Emilia-Romagna Region characterize itself for being a model for the urban ecosystem and the low consumption of land, it enjoys a high density of urban vegetation, it has a low level of water consumption and it is one the most active cities in Italy in reducing the environmental impact of transport.
100 101
The PAES – Action Plan for Sustainable Energy – is the tool through which the Municipality of Bologna, in collaboration with other public and pri-vate entities of the city, has committed to reduce CO2 emissions of the 20% by 2020. The plan includes six areas of intervention (buildings and public lighting, mobility and transport, residential buildings, urban for-estation, energy production from renewable sources, energy strategies for the tertiary sector) and involves all the realities of the territory, encourag-ing sustainability also by financing private initiatives to improve energy efficiency in private spaces (reduced rates and fast times). Already in 2013, the trend of the city recorded a decrease of 12.4% in the emissions level (compared to 2005), with particularly significant peaks in the trans-port sector (-37.9%): a figure that affects the increase in the use of public transport and cycling. Bologna was the first Italian city to adopt a Climate Change Adaptation Plan, thanks to the European project Blue Ap.The Charter of Bologna was drawn up with the contribution of specific ex-pertise, including those of the National Association of Municipalities (ANCI), the Italian Alliance for Sustainable Development (ASVIS) and the National study centre for urban policies (Urban@it). The key issues addressed by the VEG-GAP project today are among the main objectives of the Charter, and namely: protection of the territory against land consuming, counteracting climate change, improved air quality, increase of the urban green. Concern-ing to protection of the territory, the twelve Italian metropolitan cities that have signed the Charter of Bologna for the environment, have a) accepted to reduce their net land consumption of the 20% by 2020 (from the current 2 to 1.6 sqm/ab per year of national average) and b) agreed to focus urban policies on urban regeneration, thus allowing urban expansion only in the presence of sustainable public transport and availability of main services provided to citizens, both public and private. The European target is a zero net land consumption by 2050 and the UN Agenda requires an effort to bring it forward by the 2030. The Italian Mayors are also committed to updating the New Covenant of Mayors for Climate and Energy to prevent the risk of disasters generated by climate change. In terms of energy transi-tion and air quality, Italian cities are aiming at even more ambitious results than what is required by European directives: concerning energy, the goal is to reach – by 2025 (and not by 2030) – a reduction of greenhouse gas emissions of the 40% compared to 1990 levels, improving energy efficiency of 30% and reaching a 27% production of energy from renewable sources.
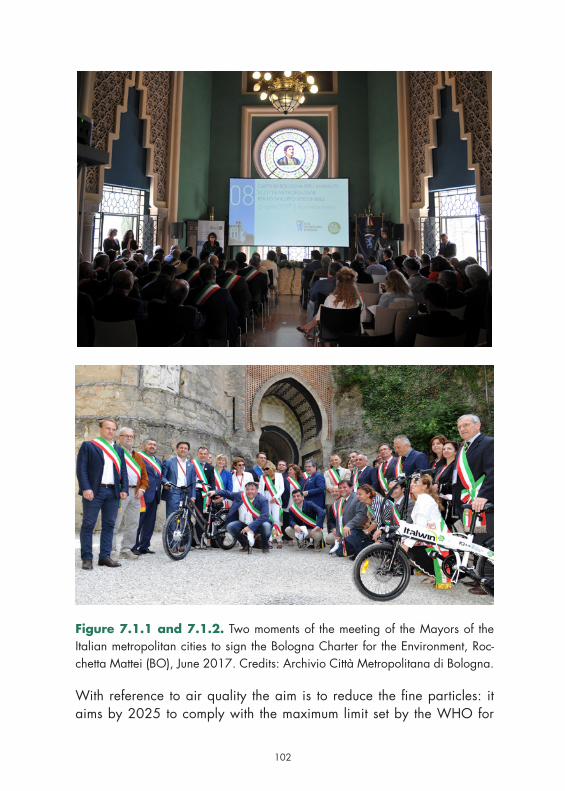
102
Figure 7.1.1 and 7.1.2. Two moments of the meeting of the Mayors of the Italian metropolitan cities to sign the Bologna Charter for the Environment, Roc-chetta Mattei (BO), June 2017. Credits: Archivio Città Metropolitana di Bologna.
With reference to air quality the aim is to reduce the fine particles: it aims by 2025 to comply with the maximum limit set by the WHO for
102 103
thin particles (10 μ/mc, more restrictive than the European: 25 μ/mc in 2015; 20 μ/mc in 2020). To do this, it will be necessary put in place the Regional Plans and the Joint Plan “Government – Regions of the Po Valley” created in 2013 with the aim to assess the effectiveness of the actions taken in the various fields (transport, industry, agriculture, ener-gy). Program agreements between the various local authorities will also be necessary to coordinate policies to fight against atmospheric emis-sions, with local measures (such as traffic jams, traffic limited zones, congestion charges) but also structural measures (e.g. incentives for re-newing heating systems, for sustainable mobility). It is also necessary to strengthen local monitoring systems with data analysis tools for the prediction of pollution peaks and early planning of contrast interven-tions (e.g. traffic blocks).To have more sustainable cities means also to have greener cities. The goal in this regard is to double by 2030 the average area of urban veg-etation per inhabitant, reaching 30 square meters per inhabitant (2/3 more than in 2014). In order to do this, it is necessary to recognize urban vegetation as a whole (public, private, urban, peri-urban), to plan new categories of green areas and infrastructure suitable for tackling climate warming, and to encourage the inclusion of the plant component in build-ing renovations and new buildings.
7.1.3. The Air LaboratoryThe Air Laboratory3 was born in 2017 from the collaboration between the Municipality of Bologna, the University of Bologna, Arpae Emilia-Ro-magna, Ausl Bologna and the Metropolitan City of Bologna. The labora-tory is coordinated by the Foundation for Urban Innovation (Fondazione Innovazione Urbana) as an experimental project of dialogue and col-laboration between different stakeholders to create interest and actions around the theme of air quality.The aim of the Air Laboratory is to raise awareness about the problem of air quality in the city, by creating a constant flow of information, and pro-moting dialogue among the different systems and technologies activated
3 The website of the Air Laboratory is http://www.fondazioneinnovazioneurbana.it/progetto/laboratorioaria accessed on the 15 February 2022.
104
for monitoring and measuring air quality, but also to stimulate behaviours able to reduce its impact and risks towards health.Specifically, the main objectives of the Air Laboratory are to support the construction of a local network of different stakeholders active on the top-ic of air quality – e.g. institutions, associations, committees, formal and informal movements – and to promote active collaboration among them to increase citizens’ awareness and engagement on this issue; in addition to these, the Laboratory identify shared strategies and tools to promote networking activities, disseminating and expanding the air quality moni-toring databases and also define shared strategies, contents and tools to inform and communicate continuously and effectively on the problem of air quality and individual behaviours that can help containing pollution.The air laboratory started its activities in 2018 and continues till today, by offering to citizens daily updates and information on air quality through its website, as well as practical tips to act preventing the increase of pol-lution and to favour a better air quality for all.
7.1.4. The agenda for sustainable development 2.0The Metropolitan city of Bologna, together with the Municipality of Bo-logna and the University of Bologna, and with the contribution of the Ministry for the Environment, the Protection of the Territory and the Sea, has become the leader of the pact signed between Italian metropolitan cities, and this path led, in the years 2018-2019, to the creation of the first sustainable development agenda, structured in eight chapters, as the topics listed in the Charter of Bologna for the environment.The drafting of the Agenda is integrated with the planning and program-ming tools of the Metropolitan city of Bologna, such as the Metropolitan Strategic Plan, PSM 2.0, approved in July 2018, the Urban Plan for Sus-tainable Mobility, approved in November 2019 and the drafting of the Metropolitan Territorial Plan (PTM), approved later in July 2021.The creation of the agenda was characterized by a collaboration be-tween public and private entities and involved local institutions and stake-holders. A participatory approach was also applied for developing and drafting the PSM 2.0: it involved the board of the investee companies and the development board, contexts in which a stable dialogue is im-plemented on the development strategies between the Metropolitan Cities
104 105
and other institutions, the economic actors, the associations, the world of work, the culture, the training, the social and the health sectors.In July 2019, following the Ministry of the Environment’s Public Notice for the Financing of Metropolitan Agendas for Sustainable Development, the Metropolitan city of Bologna took the opportunity to extend the environ-mental dimension of the first agenda, including also the economic and social dimensions. The Metropolitan city of Bologna has thus expanded the concept of sustainable development as advocated by both the UN agenda and the PSM 2.0. The agenda for sustainable development 2.04, published in June 2021, is the natural continuation of the previous agen-da which was developed for the period 2018-2019.Following the agreement signed in February 2020 between the Metropol-itan city of Bologna and the Ministry of the Environment, the Agenda for sustainable development 2.0 was launched. The following organizations have collaborated to the definition of the last version of the Agenda 2.0: the Italian Alliance for Sustainable Development (Asvis); Urban@it – Na-tional Centre for Urban Policy Studies; the Civil engineering, chemistry, environment and materials (DICAM) department and the Business Sciences (DISA) department of the University of Bologna.The agenda 2.0 presents economic and social objectives, as well as indi-cators aiming to extend the purely environmental dimension of the previ-ous version of the agenda, and by making this interacting with planning and programming tools in force or under approval.The new agenda is a document of guidance and integration of planning and programming tools which allows the formulation, on experimental basis, of a Unique Programming Document (DUP – Documento Unico di Programmazione) for the Metropolitan city of Bologna, coherent both with the objectives of the agenda 2.0 and with those of the PSM 2.0, and of course tailored to be applied to the level of the unions of municipalities, as well as to individual municipalities within its own territorial domain. The project provides for the activation, on the territory, of pilot projects promoting sustainable development, including the “guidelines for metro-politan forestation” which will be presented in the next paragraph.
4 The agenda 2.0 for sustainable development of the metropolitan city of Bologna is available here: https://www.cittametropolitana.bo.it/agenda_sviluppo_sostenibile/Engine/RAServeFile.php/f/allegati/QUADERNO_3_CM_Bologna.pdf – accessed on 2 February 2022.
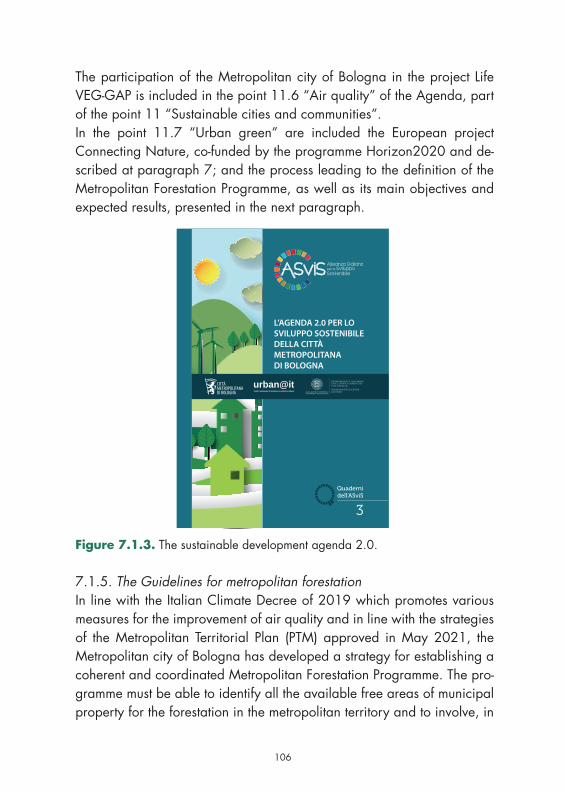
106
The participation of the Metropolitan city of Bologna in the project Life VEG-GAP is included in the point 11.6 “Air quality” of the Agenda, part of the point 11 “Sustainable cities and communities”.In the point 11.7 “Urban green” are included the European project Connecting Nature, co-funded by the programme Horizon2020 and de-scribed at paragraph 7; and the process leading to the definition of the Metropolitan Forestation Programme, as well as its main objectives and expected results, presented in the next paragraph.
Figure 7.1.3. The sustainable development agenda 2.0.
7.1.5. The Guidelines for metropolitan forestationIn line with the Italian Climate Decree of 2019 which promotes various measures for the improvement of air quality and in line with the strategies of the Metropolitan Territorial Plan (PTM) approved in May 2021, the Metropolitan city of Bologna has developed a strategy for establishing a coherent and coordinated Metropolitan Forestation Programme. The pro-gramme must be able to identify all the available free areas of municipal property for the forestation in the metropolitan territory and to involve, in
Quadernidell’ASviS
L’AGENDA 2.0 PER LO SVILUPPO SOSTENIBILE DELLA CITTÀ METROPOLITANADI BOLOGNA
3
106 107
particular, the most critical and sensitive areas which urgently need action to improve their situation.The aim is to create a real “green infrastructure” serving the environment and the community, functional to the needs of well-being and health of ecosystems and citizens.In order to define how to implement this strategy, a territorial assessment was promoted by the Metropolitan city, and specific Guidelines for the Metropolitan Forestation were drafted in collaboration with the Villa Ghi-gi Foundation; this is indeed a local center for environmental and sustain-ability education, which actively collaborates – both in the educational field and for the management of natural and landscape-environmental resources at local level – with the Municipality of Bologna and with other public institutions.Territorial assessment activities were key for drafting Guidelines on met-ropolitan forestation and were indeed carried out in parallel, consisting of two main actions.On the one hand, qualitative and quantitative data were collected to provide a picture of the present state of forestation in the metropolitan area, highlighting the most critical zones of the territory from the point of view of climate-altering emissions and air quality and without neglecting a framework of regulatory and planning instruments for reforestation in the metropolitan and regional territories, as foreseen by national and international standards.On the other hand, an in-depth study about strategies and tools for plan-ning and regulating the green adopted by the individual municipalities belonging to the metropolitan territorial area was undertaken. An ad hoc questionnaire was developed and addressed to municipalities that pres-ent the most critical issues with regard to air quality: in particular, the flat areas of the metropolitan territory and those that, either if located on the hilly zones, are characterized by the presence of supra-municipal productive areas and metropolitan Hubs, and/or Metropolitan Integrated Operational Centres (e.g. Municipality of Sasso Marconi, Municipality of Pianoro and Municipality of Valsamoggia).These municipalities have been asked to indicate the areas of public own-ership available (or in the process of being acquired) and, where they
108
exist, any proposals for action, in order to outline a first updated and complete picture of their situation. The territorial assessment has high-lighted a key factor to be considered in policy making regarding forestry, namely the lack of public available areas for forestation; in fact, although the municipalities have reported over a hundred areas for potential af-forestation, they are indeed very small pieces of land to be used for this purpose. Finally, a further investigation was undertaken about the level of organization and awareness held by local municipalities about the existence of tools for planning new public green areas, as well as their environmental and ecological potential was assessed.The overall picture emerging out of this assessments, clearly shows that the Metropolitan city’s future projects will have to target the most envi-ronmentally sensitive areas located within its own territory, such as the lowland zones, the conurbation which has grown all around the city of Bologna, the main road axes, the supra-communal productive and logis-tic fields and the operational centres (e.g. the freight terminal located in the municipality of Bentivoglio, the Centergross in Castel Maggiore, the Agribusiness Centre – CAAB and the Airport of Bologna), as well as to foreseen project initiatives targeting at the wider and hilly stretches of the Reno, Savena and Santerno rivers’ valleys.The Guidelines for Metropolitan Forestation offer to the local stakehold-ers (e.g. designer, technician, public administrator within the metropoli-tan area of Bologna, or other public and private entity) a practical tool containing the main design and technical-operational requirements to un-dertake interventions towards urban and suburban forestation, ensuring both sustainable ecological – environmental impacts, as well as positive socio-economic outcomes in the medium term.Different types of interventions and technical solutions about forestation are suggested through the “Abacus containing the different typologies of vege-tation and plant species” based on the specific territorial contexts identified (urban, peri-urban and extra-urban), and the characteristics of the main arboreal plant species which are suitable for the territory of Bologna are provided, with specific reference to both urban and flat territorial areas.It is through project initiatives, that the Guidelines are translated into “pi-loted good practices”, starting from those topics which the Metropolitan
108 109
Territorial Plan identifies as strategic for the purposes of spatial planning interventions: Ecological Network; Cycling Network; Mobility centres; Agricultural ecosystem; Supra-municipal productive areas and/or met-ropolitan integrated operational centres. In particular, for each area of intervention identified, project design is foreseen based on context analy-sis, the operational aspects for implementation are thus considered, and the overall management of the intervention is planned and programmed to ensure the achievement of project results; with the aim to maximise a successful intervention since its programming phase, a cost analysis of the equipment required, together with a cost assessment for their mainte-nance is performed.This strategy and related documents were developed aiming at the defini-tion of a metropolitan-scale program to support decisions of local admin-istrations and to systematize and coordinate future achievements.A first step in this direction was taken by participating through bidding on the two recent ministerial calls for tenders which aimed at implementing the Ministerial Decree 9.10.20 referred to art. 4 of the Climate Decree.
Figure 7.1.4. The logo of the Bologna’s Metropolitan Forestation.
7.1.6. The reforestation projects funded by the Italian Ministry of Ecological TransitionIn the year 2020, the Italian Ministry of Ecological Transition (MITE) awarded the Metropolitan city of Bologna with nearly 1 million euros for projects related to the “Urban forestation of the industrial area and sur-rounding area in Ca’ de Fabbri (Municipality of Minerbio)” and “Urban
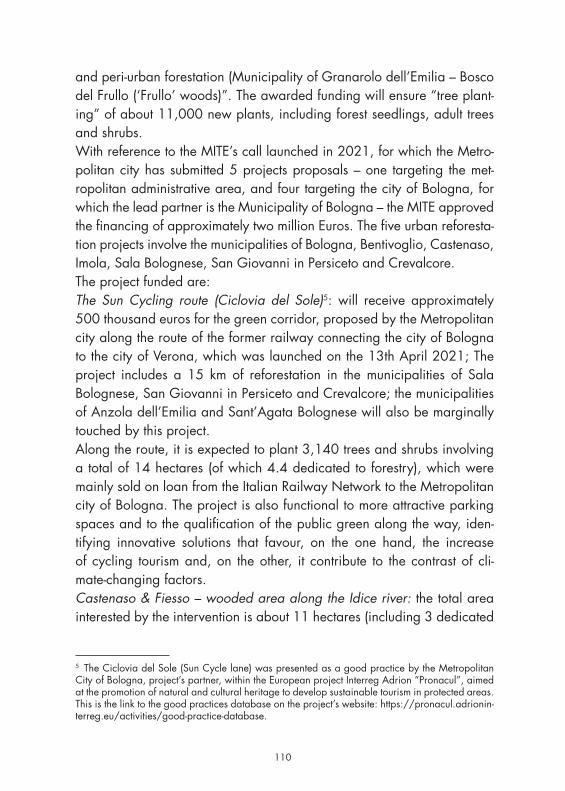
110
and peri-urban forestation (Municipality of Granarolo dell’Emilia – Bosco del Frullo (‘Frullo’ woods)”. The awarded funding will ensure “tree plant-ing” of about 11,000 new plants, including forest seedlings, adult trees and shrubs.With reference to the MITE’s call launched in 2021, for which the Metro-politan city has submitted 5 projects proposals – one targeting the met-ropolitan administrative area, and four targeting the city of Bologna, for which the lead partner is the Municipality of Bologna – the MITE approved the financing of approximately two million Euros. The five urban reforesta-tion projects involve the municipalities of Bologna, Bentivoglio, Castenaso, Imola, Sala Bolognese, San Giovanni in Persiceto and Crevalcore.The project funded are:The Sun Cycling route (Ciclovia del Sole)5: will receive approximately 500 thousand euros for the green corridor, proposed by the Metropolitan city along the route of the former railway connecting the city of Bologna to the city of Verona, which was launched on the 13th April 2021; The project includes a 15 km of reforestation in the municipalities of Sala Bolognese, San Giovanni in Persiceto and Crevalcore; the municipalities of Anzola dell’Emilia and Sant’Agata Bolognese will also be marginally touched by this project.Along the route, it is expected to plant 3,140 trees and shrubs involving a total of 14 hectares (of which 4.4 dedicated to forestry), which were mainly sold on loan from the Italian Railway Network to the Metropolitan city of Bologna. The project is also functional to more attractive parking spaces and to the qualification of the public green along the way, iden-tifying innovative solutions that favour, on the one hand, the increase of cycling tourism and, on the other, it contribute to the contrast of cli-mate-changing factors.Castenaso & Fiesso – wooded area along the Idice river: the total area interested by the intervention is about 11 hectares (including 3 dedicated
5 The Ciclovia del Sole (Sun Cycle lane) was presented as a good practice by the Metropolitan City of Bologna, project’s partner, within the European project Interreg Adrion “Pronacul”, aimed at the promotion of natural and cultural heritage to develop sustainable tourism in protected areas. This is the link to the good practices database on the project’s website: https://pronacul.adrionin-terreg.eu/activities/good-practice-database.
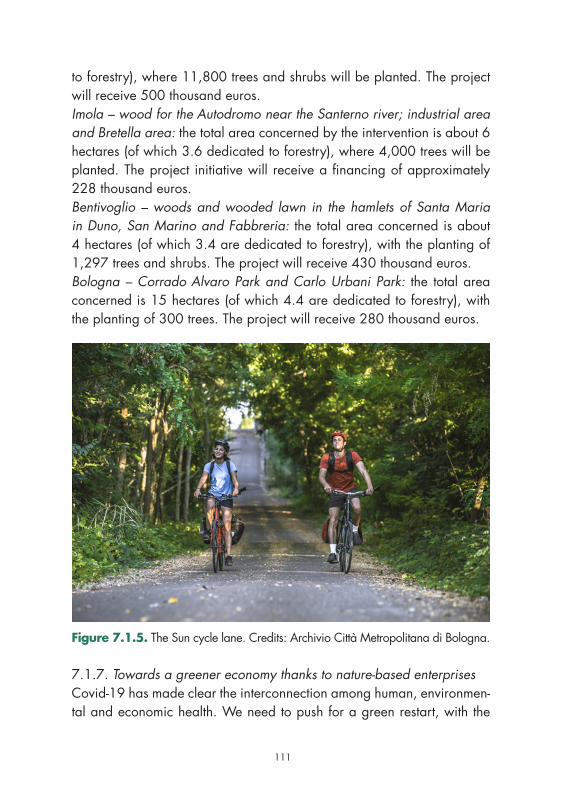
110 111
to forestry), where 11,800 trees and shrubs will be planted. The project will receive 500 thousand euros.Imola – wood for the Autodromo near the Santerno river; industrial area and Bretella area: the total area concerned by the intervention is about 6 hectares (of which 3.6 dedicated to forestry), where 4,000 trees will be planted. The project initiative will receive a financing of approximately 228 thousand euros.Bentivoglio – woods and wooded lawn in the hamlets of Santa Maria in Duno, San Marino and Fabbreria: the total area concerned is about 4 hectares (of which 3.4 are dedicated to forestry), with the planting of 1,297 trees and shrubs. The project will receive 430 thousand euros.Bologna – Corrado Alvaro Park and Carlo Urbani Park: the total area concerned is 15 hectares (of which 4.4 are dedicated to forestry), with the planting of 300 trees. The project will receive 280 thousand euros.
Figure 7.1.5. The Sun cycle lane. Credits: Archivio Città Metropolitana di Bologna.
7.1.7. Towards a greener economy thanks to nature-based enterprisesCovid-19 has made clear the interconnection among human, environmen-tal and economic health. We need to push for a green restart, with the
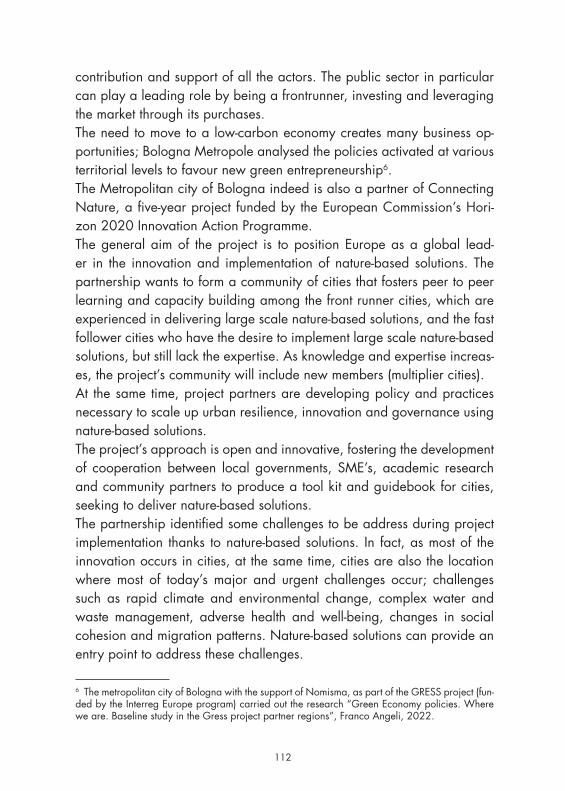
112
contribution and support of all the actors. The public sector in particular can play a leading role by being a frontrunner, investing and leveraging the market through its purchases.The need to move to a low-carbon economy creates many business op-portunities; Bologna Metropole analysed the policies activated at various territorial levels to favour new green entrepreneurship6.The Metropolitan city of Bologna indeed is also a partner of Connecting Nature, a five-year project funded by the European Commission’s Hori-zon 2020 Innovation Action Programme.The general aim of the project is to position Europe as a global lead-er in the innovation and implementation of nature-based solutions. The partnership wants to form a community of cities that fosters peer to peer learning and capacity building among the front runner cities, which are experienced in delivering large scale nature-based solutions, and the fast follower cities who have the desire to implement large scale nature-based solutions, but still lack the expertise. As knowledge and expertise increas-es, the project’s community will include new members (multiplier cities).At the same time, project partners are developing policy and practices necessary to scale up urban resilience, innovation and governance using nature-based solutions.The project’s approach is open and innovative, fostering the development of cooperation between local governments, SME’s, academic research and community partners to produce a tool kit and guidebook for cities, seeking to deliver nature-based solutions.The partnership identified some challenges to be address during project implementation thanks to nature-based solutions. In fact, as most of the innovation occurs in cities, at the same time, cities are also the location where most of today’s major and urgent challenges occur; challenges such as rapid climate and environmental change, complex water and waste management, adverse health and well-being, changes in social cohesion and migration patterns. Nature-based solutions can provide an entry point to address these challenges.
6 The metropolitan city of Bologna with the support of Nomisma, as part of the GRESS project (fun-ded by the Interreg Europe program) carried out the research “Green Economy policies. Where we are. Baseline study in the Gress project partner regions”, Franco Angeli, 2022.
112 113
While the benefits of nature-based solutions are clear and can directly ad-dress the challenges outlined, the development and implementation of na-ture-based solutions has been still slow, uneven and – in many cases – com-plex, requiring efforts across many disciplines. Issues like “silo thinking”, managing social cohesion and tackling the deficit of knowledge that exists around nature-based solutions need to be confronted when developing plans to introduce nature-based solutions at city level. Connecting Nature has taken these challenges on board, by devising and testing approaches using multi-disciplinary methods, where solutions are designed and created collaboratively, leading towards the creation of resilient, greener, healthier cities, and ensuring a more sustainable living for their citizens.In response to the barriers and enabling factors identified, in October 2020 the project launched the “Connecting Nature Enterprise platform” to facilitate the matching of supply and demand in the field of nature-based solutions. The ambition is that this platform becomes not only a geo-local-ized and global database for companies implementing nbs, but also a tool to foster new collaborations and open innovation with nature-based organization (Kooijman Esmee et al., 2021).The platform is organized in thematic communities, moderated and ani-mated by leaders in the sector, and the Metropolitan City of Bologna is animating two of them. These communities will bring together business-es and organizations to discuss on specific interests, from planning and design, to the involvement of communities, from the use of technologies to research and development services, as well as in depth specific types of Nbs, from those related to buildings, public spaces, food and agri-culture, water and forests. On the platform you can access opportunities and resources, useful for inspiring new ideas and sharing knowledge. Furthermore, any organization can bring contributions, ask for support and collect innovative ideas, participating in challenges, with the aim of encouraging open innovation processes, facilitating new collaborations, promoting the adoption of new ideas, innovative processes, and the de-velopment of new products and services.
7.1.8. Bologna: a candidate to be one of the 100 zero impact citiesBologna aims to achieve climate neutrality by 2030. The new Mayor Mat-
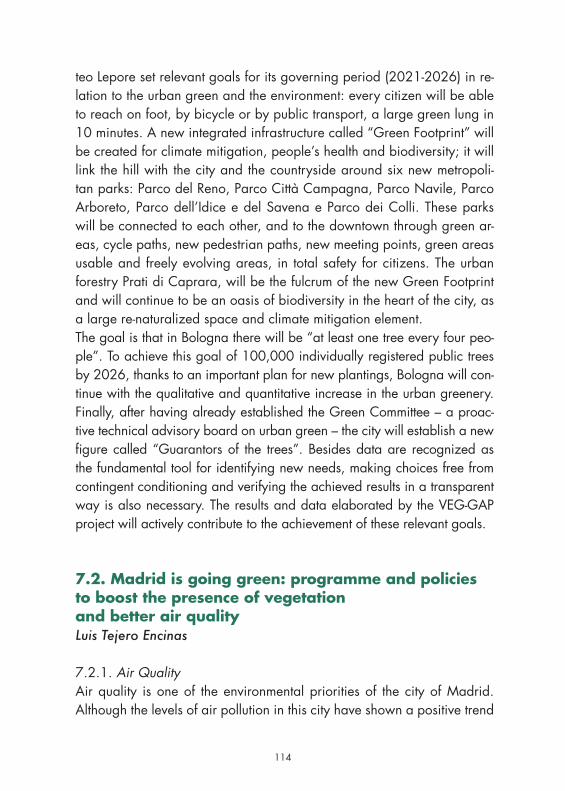
114
teo Lepore set relevant goals for its governing period (2021-2026) in re-lation to the urban green and the environment: every citizen will be able to reach on foot, by bicycle or by public transport, a large green lung in 10 minutes. A new integrated infrastructure called “Green Footprint” will be created for climate mitigation, people’s health and biodiversity; it will link the hill with the city and the countryside around six new metropoli-tan parks: Parco del Reno, Parco Città Campagna, Parco Navile, Parco Arboreto, Parco dell’Idice e del Savena e Parco dei Colli. These parks will be connected to each other, and to the downtown through green ar-eas, cycle paths, new pedestrian paths, new meeting points, green areas usable and freely evolving areas, in total safety for citizens. The urban forestry Prati di Caprara, will be the fulcrum of the new Green Footprint and will continue to be an oasis of biodiversity in the heart of the city, as a large re-naturalized space and climate mitigation element.The goal is that in Bologna there will be “at least one tree every four peo-ple”. To achieve this goal of 100,000 individually registered public trees by 2026, thanks to an important plan for new plantings, Bologna will con-tinue with the qualitative and quantitative increase in the urban greenery. Finally, after having already established the Green Committee – a proac-tive technical advisory board on urban green – the city will establish a new figure called “Guarantors of the trees”. Besides data are recognized as the fundamental tool for identifying new needs, making choices free from contingent conditioning and verifying the achieved results in a transparent way is also necessary. The results and data elaborated by the VEG-GAP project will actively contribute to the achievement of these relevant goals.
7.2. Madrid is going green: programme and policies to boost the presence of vegetation and better air qualityLuis Tejero Encinas
7.2.1. Air QualityAir quality is one of the environmental priorities of the city of Madrid. Although the levels of air pollution in this city have shown a positive trend
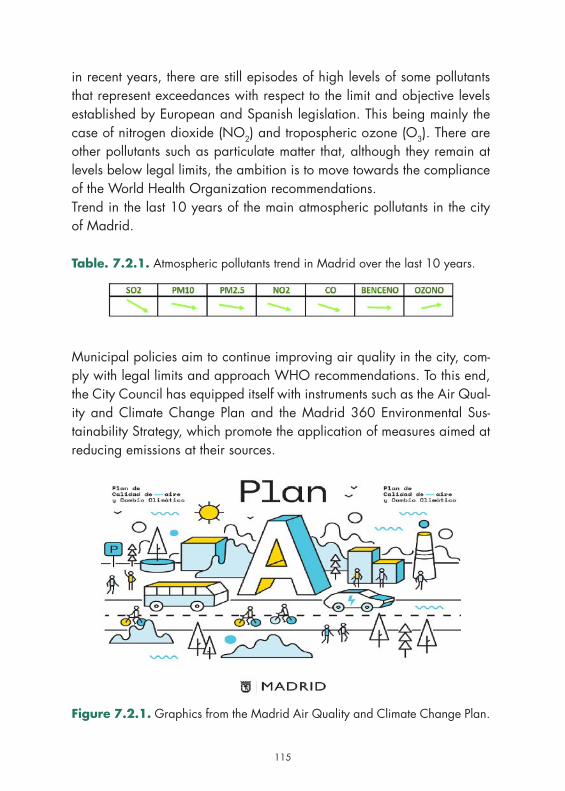
114 115
in recent years, there are still episodes of high levels of some pollutants that represent exceedances with respect to the limit and objective levels established by European and Spanish legislation. This being mainly the case of nitrogen dioxide (NO2) and tropospheric ozone (O3). There are other pollutants such as particulate matter that, although they remain at levels below legal limits, the ambition is to move towards the compliance of the World Health Organization recommendations.Trend in the last 10 years of the main atmospheric pollutants in the city of Madrid.
Table. 7.2.1. Atmospheric pollutants trend in Madrid over the last 10 years.
Municipal policies aim to continue improving air quality in the city, com-ply with legal limits and approach WHO recommendations. To this end, the City Council has equipped itself with instruments such as the Air Qual-ity and Climate Change Plan and the Madrid 360 Environmental Sus-tainability Strategy, which promote the application of measures aimed at reducing emissions at their sources.
Figure 7.2.1. Graphics from the Madrid Air Quality and Climate Change Plan.
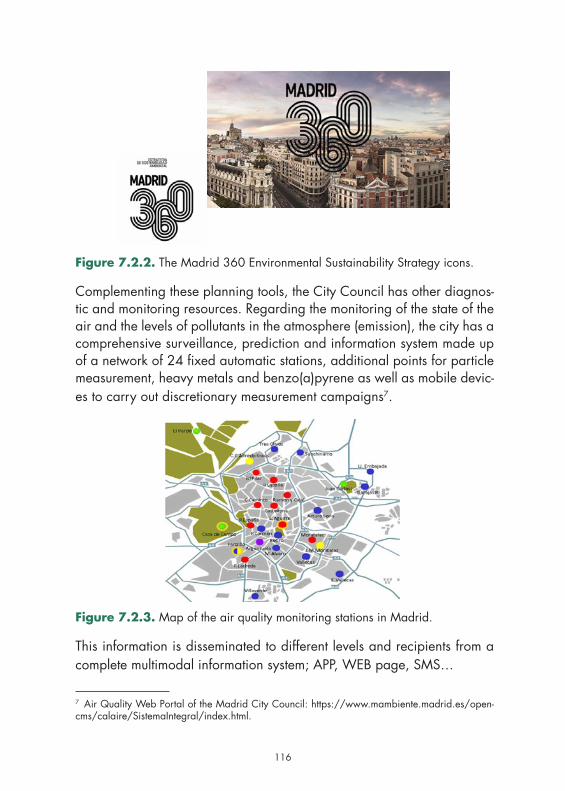
116
Figure 7.2.2. The Madrid 360 Environmental Sustainability Strategy icons.
Complementing these planning tools, the City Council has other diagnos-tic and monitoring resources. Regarding the monitoring of the state of the air and the levels of pollutants in the atmosphere (emission), the city has a comprehensive surveillance, prediction and information system made up of a network of 24 fixed automatic stations, additional points for particle measurement, heavy metals and benzo(a)pyrene as well as mobile devic-es to carry out discretionary measurement campaigns7.
Figure 7.2.3. Map of the air quality monitoring stations in Madrid.
This information is disseminated to different levels and recipients from a complete multimodal information system; APP, WEB page, SMS…
7 Air Quality Web Portal of the Madrid City Council: https://www.mambiente.madrid.es/open-cms/calaire/SistemaIntegral/index.html.
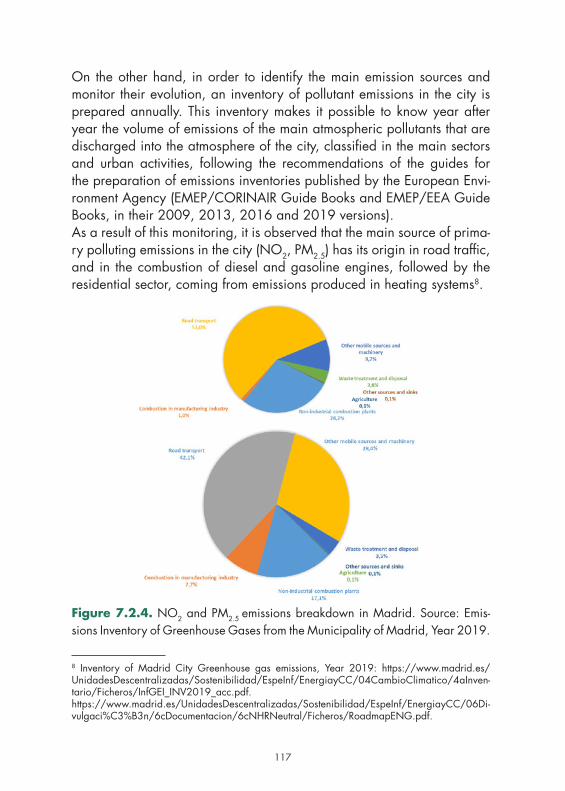
116 117
On the other hand, in order to identify the main emission sources and monitor their evolution, an inventory of pollutant emissions in the city is prepared annually. This inventory makes it possible to know year after year the volume of emissions of the main atmospheric pollutants that are discharged into the atmosphere of the city, classified in the main sectors and urban activities, following the recommendations of the guides for the preparation of emissions inventories published by the European Envi-ronment Agency (EMEP/CORINAIR Guide Books and EMEP/EEA Guide Books, in their 2009, 2013, 2016 and 2019 versions).As a result of this monitoring, it is observed that the main source of prima-ry polluting emissions in the city (NO2, PM2.5) has its origin in road traffic, and in the combustion of diesel and gasoline engines, followed by the residential sector, coming from emissions produced in heating systems8.
Figure 7.2.4. NO2 and PM2.5 emissions breakdown in Madrid. Source: Emis-sions Inventory of Greenhouse Gases from the Municipality of Madrid, Year 2019.
8 Inventory of Madrid City Greenhouse gas emissions, Year 2019: https://www.madrid.es/UnidadesDescentralizadas/Sostenibilidad/EspeInf/EnergiayCC/04CambioClimatico/4aInven-tario/Ficheros/InfGEI_INV2019_acc.pdf.https://www.madrid.es/UnidadesDescentralizadas/Sostenibilidad/EspeInf/EnergiayCC/06Di-vulgaci%C3%B3n/6cDocumentacion/6cNHRNeutral/Ficheros/RoadmapENG.pdf.
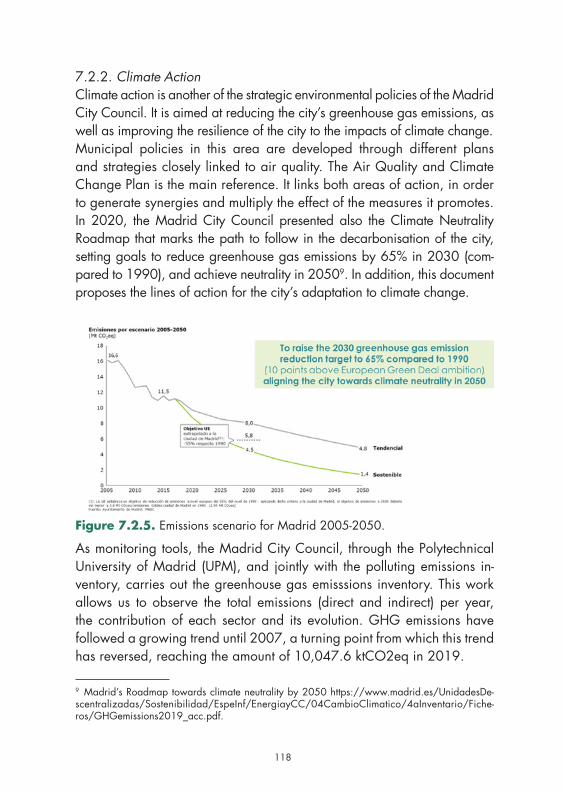
118
7.2.2. Climate ActionClimate action is another of the strategic environmental policies of the Madrid City Council. It is aimed at reducing the city’s greenhouse gas emissions, as well as improving the resilience of the city to the impacts of climate change.Municipal policies in this area are developed through different plans and strategies closely linked to air quality. The Air Quality and Climate Change Plan is the main reference. It links both areas of action, in order to generate synergies and multiply the effect of the measures it promotes.In 2020, the Madrid City Council presented also the Climate Neutrality Roadmap that marks the path to follow in the decarbonisation of the city, setting goals to reduce greenhouse gas emissions by 65% in 2030 (com-pared to 1990), and achieve neutrality in 20509. In addition, this document proposes the lines of action for the city’s adaptation to climate change.
Figure 7.2.5. Emissions scenario for Madrid 2005-2050.
As monitoring tools, the Madrid City Council, through the Polytechnical University of Madrid (UPM), and jointly with the polluting emissions in-ventory, carries out the greenhouse gas emisssions inventory. This work allows us to observe the total emissions (direct and indirect) per year, the contribution of each sector and its evolution. GHG emissions have followed a growing trend until 2007, a turning point from which this trend has reversed, reaching the amount of 10,047.6 ktCO2eq in 2019.
9 Madrid’s Roadmap towards climate neutrality by 2050 https://www.madrid.es/UnidadesDe-scentralizadas/Sostenibilidad/EspeInf/EnergiayCC/04CambioClimatico/4aInventario/Fiche-ros/GHGemissions2019_acc.pdf.
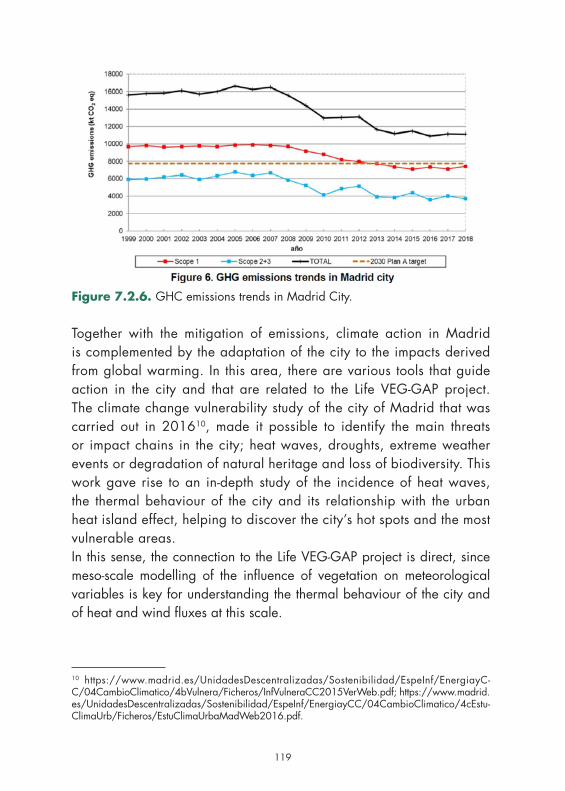
118 119
Figure 7.2.6. GHC emissions trends in Madrid City.
Together with the mitigation of emissions, climate action in Madrid is complemented by the adaptation of the city to the impacts derived from global warming. In this area, there are various tools that guide action in the city and that are related to the Life VEG-GAP project. The climate change vulnerability study of the city of Madrid that was carried out in 201610, made it possible to identify the main threats or impact chains in the city; heat waves, droughts, extreme weather events or degradation of natural heritage and loss of biodiversity. This work gave rise to an in-depth study of the incidence of heat waves, the thermal behaviour of the city and its relationship with the urban heat island effect, helping to discover the city’s hot spots and the most vulnerable areas.In this sense, the connection to the Life VEG-GAP project is direct, since meso-scale modelling of the influence of vegetation on meteorological variables is key for understanding the thermal behaviour of the city and of heat and wind fluxes at this scale.
10 https://www.madrid.es/UnidadesDescentralizadas/Sostenibilidad/EspeInf/EnergiayC-C/04CambioClimatico/4bVulnera/Ficheros/InfVulneraCC2015VerWeb.pdf; https://www.madrid.es/UnidadesDescentralizadas/Sostenibilidad/EspeInf/EnergiayCC/04CambioClimatico/4cEstu-ClimaUrb/Ficheros/EstuClimaUrbaMadWeb2016.pdf.
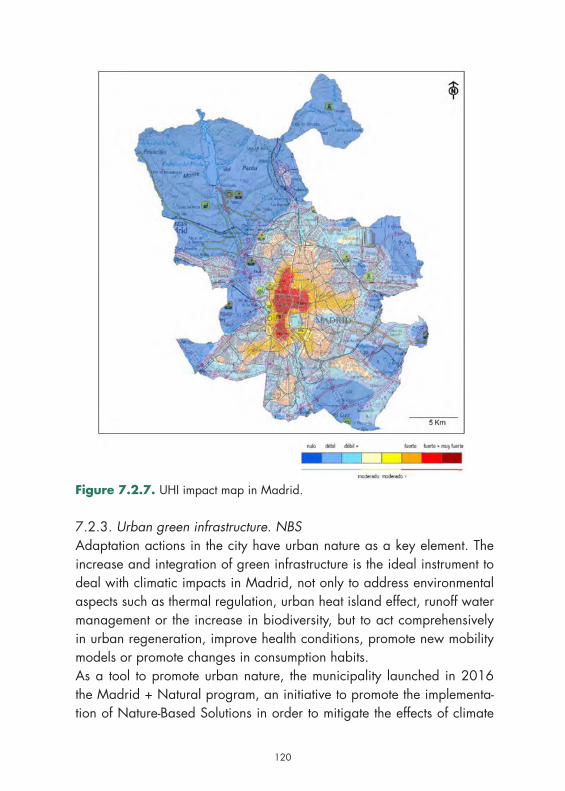
120
Figure 7.2.7. UHI impact map in Madrid.
7.2.3. Urban green infrastructure. NBSAdaptation actions in the city have urban nature as a key element. The increase and integration of green infrastructure is the ideal instrument to deal with climatic impacts in Madrid, not only to address environmental aspects such as thermal regulation, urban heat island effect, runoff water management or the increase in biodiversity, but to act comprehensively in urban regeneration, improve health conditions, promote new mobility models or promote changes in consumption habits.As a tool to promote urban nature, the municipality launched in 2016 the Madrid + Natural program, an initiative to promote the implementa-tion of Nature-Based Solutions in order to mitigate the effects of climate

120 121
change, and unfold its multiple benefits. This program proposes different ways to promote green infrastructure in the city from a broad and inclu-sive approach, enhancing the ecosystem services of urban nature, and integrating it with the different urban systems, health, mobility, consump-tion, energy, urban design... It is a new subject, in which there is a wide need for learning and where the Life VEG-GAP project can contribute to increase that knowledge.
Figure 7.2.8. Madrid + Natural program graphic.
This objective of city re-naturing is shared and promoted from other mu-nicipal spheres, those directly related to the management of green areas and biodiversity and those responsible for urban planning and design.The green infrastructure and biodiversity plan of the city of Madrid11 fo-cuses on the development of the ecosystem services of the green infra-structure, specifically mentioning its effects on air quality and adaptation to climate change.In this context, one of the main projects of the urban planning department for the coming years in the city of Madrid is the Metropolitan Forest. It is
11 https://www.madrid.es/portales/munimadrid/es/Inicio/Medio-ambiente/Parques-y-ja-rdines/Plan-de-Infraestructura-Verde-y-Biodiversidad/?vgnextoid=5fdec0f221714610Vgn-VCM2000001f4a900aRCRD&vgnextchannel=2ba279ed268fe410VgnVCM1000000b205-a0aRCRD.
122
an action to create a green belt around the city, which has the aspiration of causing a broad urban transformation, in terms of connectivity and biodiversity, health, mobility, improvement of air quality and thermal reg-ulation or territorial rebalancing, among other factors.
Figure 7.2.9. The green infrastructure and biodiversity plan of the city of Ma-drid visual identity.
Figure 7.2.10. and 7.2.11. Madrid Metropolitan Forest map and visual graphic.
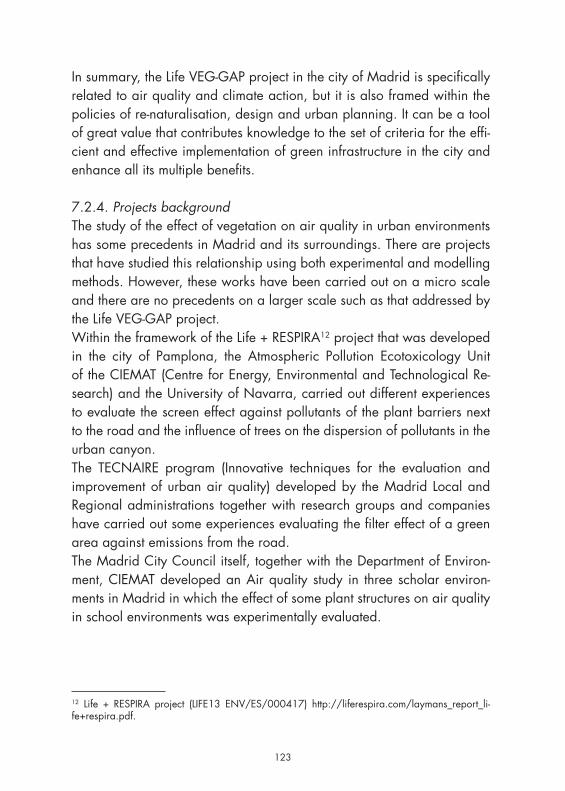
122 123
In summary, the Life VEG-GAP project in the city of Madrid is specifically related to air quality and climate action, but it is also framed within the policies of re-naturalisation, design and urban planning. It can be a tool of great value that contributes knowledge to the set of criteria for the effi-cient and effective implementation of green infrastructure in the city and enhance all its multiple benefits.
7.2.4. Projects backgroundThe study of the effect of vegetation on air quality in urban environments has some precedents in Madrid and its surroundings. There are projects that have studied this relationship using both experimental and modelling methods. However, these works have been carried out on a micro scale and there are no precedents on a larger scale such as that addressed by the Life VEG-GAP project.Within the framework of the Life + RESPIRA12 project that was developed in the city of Pamplona, the Atmospheric Pollution Ecotoxicology Unit of the CIEMAT (Centre for Energy, Environmental and Technological Re-search) and the University of Navarra, carried out different experiences to evaluate the screen effect against pollutants of the plant barriers next to the road and the influence of trees on the dispersion of pollutants in the urban canyon.The TECNAIRE program (Innovative techniques for the evaluation and improvement of urban air quality) developed by the Madrid Local and Regional administrations together with research groups and companies have carried out some experiences evaluating the filter effect of a green area against emissions from the road.The Madrid City Council itself, together with the Department of Environ-ment, CIEMAT developed an Air quality study in three scholar environ-ments in Madrid in which the effect of some plant structures on air quality in school environments was experimentally evaluated.
12 Life + RESPIRA project (LIFE13 ENV/ES/000417) http://liferespira.com/laymans_report_li-fe+respira.pdf.
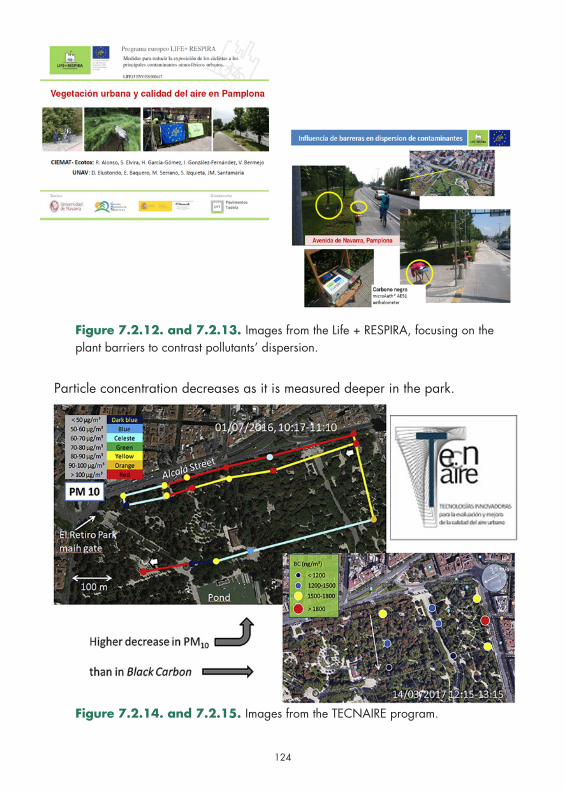
124
Figure 7.2.12. and 7.2.13. Images from the Life + RESPIRA, focusing on the plant barriers to contrast pollutants’ dispersion.
Figure 7.2.14. and 7.2.15. Images from the TECNAIRE program.
Particle concentration decreases as it is measured deeper in the park.
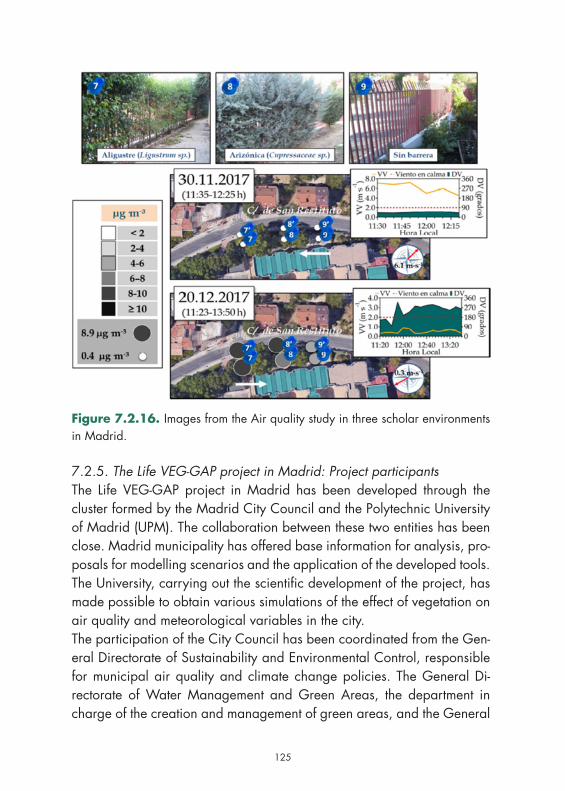
124 125
Figure 7.2.16. Images from the Air quality study in three scholar environments in Madrid.
7.2.5. The Life VEG-GAP project in Madrid: Project participantsThe Life VEG-GAP project in Madrid has been developed through the cluster formed by the Madrid City Council and the Polytechnic University of Madrid (UPM). The collaboration between these two entities has been close. Madrid municipality has offered base information for analysis, pro-posals for modelling scenarios and the application of the developed tools. The University, carrying out the scientific development of the project, has made possible to obtain various simulations of the effect of vegetation on air quality and meteorological variables in the city.The participation of the City Council has been coordinated from the Gen-eral Directorate of Sustainability and Environmental Control, responsible for municipal air quality and climate change policies. The General Di-rectorate of Water Management and Green Areas, the department in charge of the creation and management of green areas, and the General
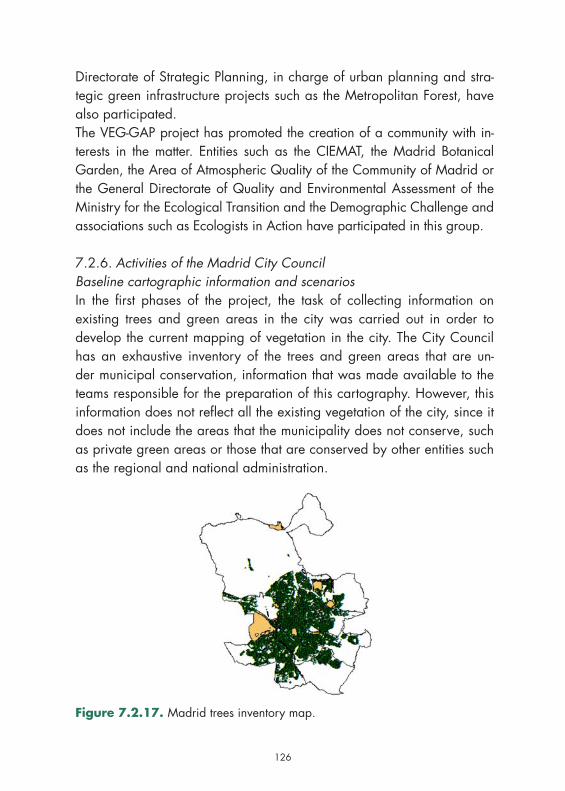
126
Directorate of Strategic Planning, in charge of urban planning and stra-tegic green infrastructure projects such as the Metropolitan Forest, have also participated.The VEG-GAP project has promoted the creation of a community with in-terests in the matter. Entities such as the CIEMAT, the Madrid Botanical Garden, the Area of Atmospheric Quality of the Community of Madrid or the General Directorate of Quality and Environmental Assessment of the Ministry for the Ecological Transition and the Demographic Challenge and associations such as Ecologists in Action have participated in this group.
7.2.6. Activities of the Madrid City CouncilBaseline cartographic information and scenariosIn the first phases of the project, the task of collecting information on existing trees and green areas in the city was carried out in order to develop the current mapping of vegetation in the city. The City Council has an exhaustive inventory of the trees and green areas that are un-der municipal conservation, information that was made available to the teams responsible for the preparation of this cartography. However, this information does not reflect all the existing vegetation of the city, since it does not include the areas that the municipality does not conserve, such as private green areas or those that are conserved by other entities such as the regional and national administration.
Figure 7.2.17. Madrid trees inventory map.
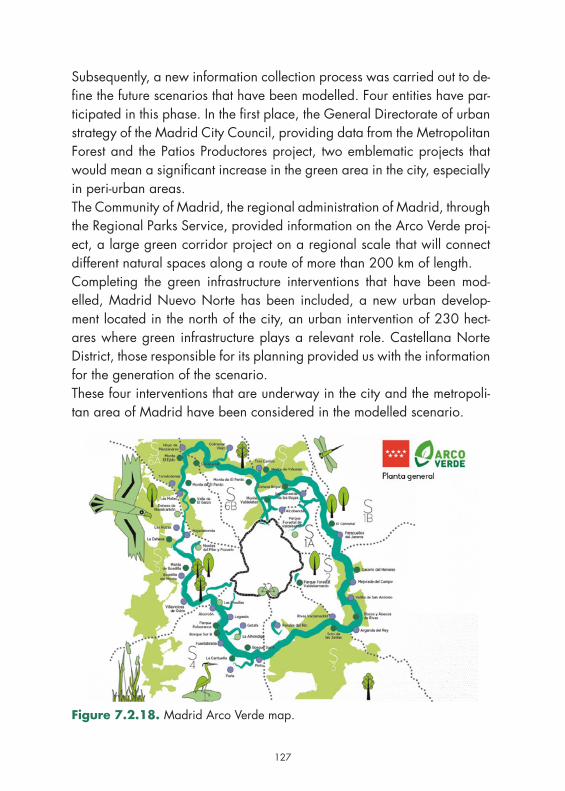
126 127
Subsequently, a new information collection process was carried out to de-fine the future scenarios that have been modelled. Four entities have par-ticipated in this phase. In the first place, the General Directorate of urban strategy of the Madrid City Council, providing data from the Metropolitan Forest and the Patios Productores project, two emblematic projects that would mean a significant increase in the green area in the city, especially in peri-urban areas.The Community of Madrid, the regional administration of Madrid, through the Regional Parks Service, provided information on the Arco Verde proj-ect, a large green corridor project on a regional scale that will connect different natural spaces along a route of more than 200 km of length.Completing the green infrastructure interventions that have been mod-elled, Madrid Nuevo Norte has been included, a new urban develop-ment located in the north of the city, an urban intervention of 230 hect-ares where green infrastructure plays a relevant role. Castellana Norte District, those responsible for its planning provided us with the information for the generation of the scenario.These four interventions that are underway in the city and the metropoli-tan area of Madrid have been considered in the modelled scenario.
Figure 7.2.18. Madrid Arco Verde map.
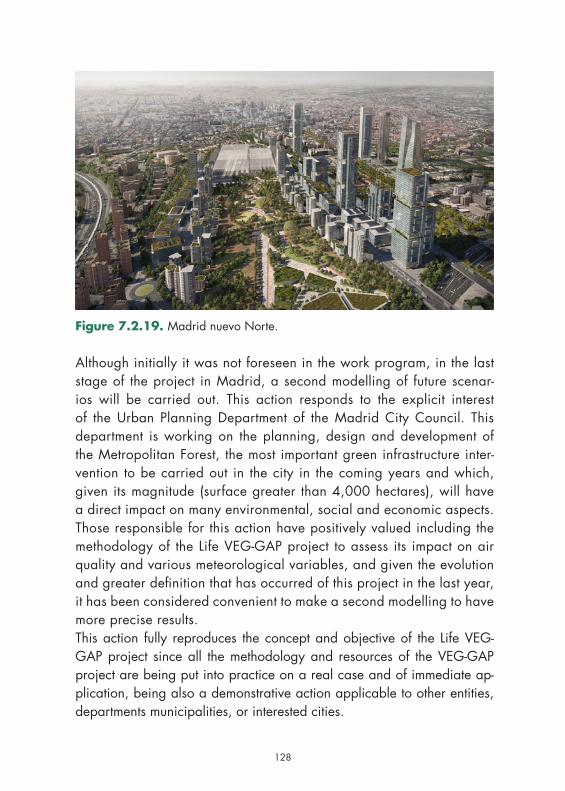
128
Figure 7.2.19. Madrid nuevo Norte.
Although initially it was not foreseen in the work program, in the last stage of the project in Madrid, a second modelling of future scenar-ios will be carried out. This action responds to the explicit interest of the Urban Planning Department of the Madrid City Council. This department is working on the planning, design and development of the Metropolitan Forest, the most important green infrastructure inter-vention to be carried out in the city in the coming years and which, given its magnitude (surface greater than 4,000 hectares), will have a direct impact on many environmental, social and economic aspects. Those responsible for this action have positively valued including the methodology of the Life VEG-GAP project to assess its impact on air quality and various meteorological variables, and given the evolution and greater definition that has occurred of this project in the last year, it has been considered convenient to make a second modelling to have more precise results.This action fully reproduces the concept and objective of the Life VEG-GAP project since all the methodology and resources of the VEG-GAP project are being put into practice on a real case and of immediate ap-plication, being also a demonstrative action applicable to other entities, departments municipalities, or interested cities.
128 129
As a result of this process, the City Council itself is evaluating the pos-sibility of applying these tools to periodically monitor and evaluate the influence of green infrastructure on air quality and urban meteorology.
7.3. Green plans and projects of Milan MunicipalityMarta Alessandra Mauri, Piero Pelizzaro, Elisa Torricelli, Marina Trentin
7.3.1. Milan and the climate change emergencyMilan is experiencing a period of renewal and transition that has demon-strated the city’s great need to adapt. Today, more than ever, public ad-ministrations are facing the so-called “wicked problems”, complex and articulated challenges, whose resolution implies the need for a 360° sys-temic vision and among which the effects of climate change stand out.Climate change is one of the most significant challenges that humanity must face since the risks for the planet and future generations are enor-mous and oblige us to intervene with urgency: the action of Public Admin-istrations must go, therefore, both in the direction of mitigation and reduc-tion of CO2 concentrations in the atmosphere, acting on energy systems, optimization of consumption and improvement of urban and peri-urban green, and in the direction of adaptation policies, with the stated aim of ensuring services and quality of life according to the principle of equity.Impacts can be economic, social, and environmental, with increasingly evident effects on socio-economic disparities: if in different areas, they could be tempered by the availability of space and natural resources, in the city, they are not easily solved.These are complex problems, which cannot have a single solution be-cause they have at the same time environmental, social, economic and health facets: to respond to the urgency posed by climate change in cities, concrete and rapid actions are required, which have immediate impacts and multiple benefits, without depriving citizens of opportunities, espe-cially those who are in situations of discomfort or disadvantage.Therefore, standard processes and approaches are no longer suitable to face these challenges: Milan is learning to act practically and tangibly
130
through innovative tools and actions to develop a new scenario of growth and sustainable development.
7.3.2. Environmental transition as an emergency responseThe city of Milan has urban and morphological characteristics that further accentuate the effects of climate change. It’s getting hotter and hotter. Temperatures are increasing at an increasing rate: according to data from the FOMD Foundation (Meteorological Observatory Milano Duo-mo)13, the average annual temperature of the Lombard capital has risen from 13.7 ° C between 1961, and 1990 to 14.9° C between 1991 and 2020, while in the last decade the warming has been even more evident reaching 15.° C between 2011 and 2020.According to the data of Milan Local Climate Profile14, realized thanks to the collaboration between ARPA Lombardia and ARPA Emilia-Romagna, the analysis of climate variability between 1961 and 2017 shows a sig-nificant increase in minimum, average and maximum seasonal tempera-tures (between 0.2 - 0.5° C every ten years), as well as an increase in the annual average of about 2°C overall. This trend results in less severe winters and an increase in the average duration of heat waves, which doubled in 1991-2017 compared to 1961-1990, and tropical nights, which score a plus 15 with reference to the same period. That leads to a decrease in winter consumption for heating, but a substantial increase in electricity consumption for cooling, which in situations of exceptional heat can overload the power grid, generating blackout situations (as with the events of June 28, 2019 or June 14-15 this year).The presence of large built masses that accumulate considerable amounts of heat means that the city’s morphology reinforces the tendency to heat the areas of denser urbanization. Here, even with a generalized absence of wind, convective-type phenomena such as the canyon effect are trig-gered, creating real “hot-spots” called “heat islands”.Besides increasing the effects of heatwaves, the same characteristic of
13 https://aef1807d-3389-4c8d-b1b0-ce485e9274d3.filesusr.com/ugd/f20bef_948833928c984f-1588bc78c0e404545f.pdf.14 https://partecipazione.comune.milano.it/uploads/decidim/attachment/file/327/sub_Alle-gato_2_Profilo_Climatico_Locale_DEF_01.10.2020.pdf.
130 131
land use reduces the ability to absorb precipitation water, which are di-rectly conveyed in large quantities and short time in sewer systems and receptor bodies.The local climatic profile shows us a trend towards tropicalisation: the pro-gressive concentration of precipitation phenomena in episodes of great intensity, alternating with increasingly prolonged periods of drought. Combined with imperviousness and land consumption (Milan’s urbaniza-tion index is at 72%), these conditions often determine the saturation of infrastructures for water disposal during intense rainfalls. That increases the hydraulic risk causes overflow and flooding phenomena. For exam-ple, in 2014, six consecutive floods between July and September mainly affected the area near the Seveso River, driving economic, social and infrastructural damage.The climate risk for Milan translates, therefore, both in need to manage the effects of extreme heat and in need to resiliently manage stormwater runoff: in a city whose population density is close to 7,700 inhabitants/km2, adapting and responding to the effects of climate change is not only an environmental issue but rather a matter of exposure reduction, equity and vulnerability management.In this framework fits the Environmental Transition Department, whose goal, since its inception in September 2019, is to convey the transformation to-wards a greener, resilient, adaptive, ecological and sustainable Milan.The Department aims to deal with environmental and climate issue and, above all, with their repercussions on a social, territorial, and economic level. Milan wants to take up the challenge of acting practically and tan-gibly through traditional tools and innovative actions. Therefore, the Man-agement must be the bearer and disseminator of a clear vision, which focuses on three primary elements: environment, climate, and people.Therefore, it is essential to actively involve citizens, making them aware and involved in the design and administration of their city, informing, inspiring, and activating the whole community.The activities are carried out thanks to the synergy of three key departments: – Energy Air and Climate Area, for the development of plans and strat-
egies for air protection and quality, climate change mitigation and decarbonization;
132
– Water Resources Area: for the monitoring of environmental matrices (soil and water), the prevention of the phenomenon of flooding and ris-ing of the water table, and the improvement of water and soil quality;
– Resilient Cities Project Department: for the construction of the resilience strategy, with the role of coordinating the implementation activities of the Strategy itself, through the creation of synergies and networks with cities of the global network “Resilient Cities”.
A resilient city is undoubtedly a greener city – both in open space and in the built heritage – as green is an element that can promote livability, usability, comfort, and attractiveness. The difficulty of pursuing this objec-tive by Milan stems from a past in which the cement and industrialization have occupied a predominant role in urban and peri-urban spaces.To respond to these issues, many projects pursue the strategic vision of a Milan 2030 ‘greener, livable and resilient’ contained within the Govern-ment Plan of the Territory (PGT) of 2016, demonstrating that the approach to ecological transition was rooted for years in the work and intentions of the Administration. Among these, the provision of 20 new large mu-nicipal parks, of which 7 recaptured in formerly disused railway yards, through which, filling actual urban “voids”, the city aims to strengthen its environmental and landscape function.Together with the existing Natural Capital, the newly planned green plot, and the identification of further widespread opportunities for renaturaliza-tion, the new parks will contribute to creating a heritage of green infrastruc-ture, part of the more expansive Metropolitan Park: a continuous natural system that, from the dense areas of the city, finds its outlet in the vast spaces of the peri-urban agricultural parks of local and regional character.The climate emergency, perceived as increasingly urgent, and the avail-ability of coordination by the Environmental Transition Department, have prompted the construction and approval of a planning tool, the Air and Climate Plan, which allows the city to achieve the objectives set by the European Union on environmental protection and to respond at the same time to climate emergencies through Adaptation Guidelines.The projects and tools useful for cooling are described in a dedicated “Scope” of the Air and Climate Plan: Scope 4 “Cooler Milan”, brings together the multi-benefit approach necessary to deal with the complex
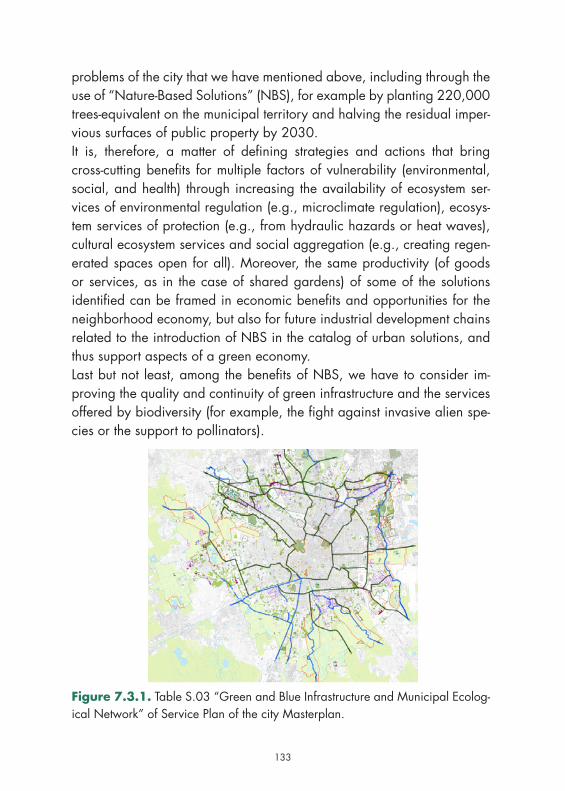
132 133
problems of the city that we have mentioned above, including through the use of “Nature-Based Solutions” (NBS), for example by planting 220,000 trees-equivalent on the municipal territory and halving the residual imper-vious surfaces of public property by 2030.It is, therefore, a matter of defining strategies and actions that bring cross-cutting benefits for multiple factors of vulnerability (environmental, social, and health) through increasing the availability of ecosystem ser-vices of environmental regulation (e.g., microclimate regulation), ecosys-tem services of protection (e.g., from hydraulic hazards or heat waves), cultural ecosystem services and social aggregation (e.g., creating regen-erated spaces open for all). Moreover, the same productivity (of goods or services, as in the case of shared gardens) of some of the solutions identified can be framed in economic benefits and opportunities for the neighborhood economy, but also for future industrial development chains related to the introduction of NBS in the catalog of urban solutions, and thus support aspects of a green economy.Last but not least, among the benefits of NBS, we have to consider im-proving the quality and continuity of green infrastructure and the services offered by biodiversity (for example, the fight against invasive alien spe-cies or the support to pollinators).
Figure 7.3.1. Table S.03 “Green and Blue Infrastructure and Municipal Ecolog-ical Network” of Service Plan of the city Masterplan.
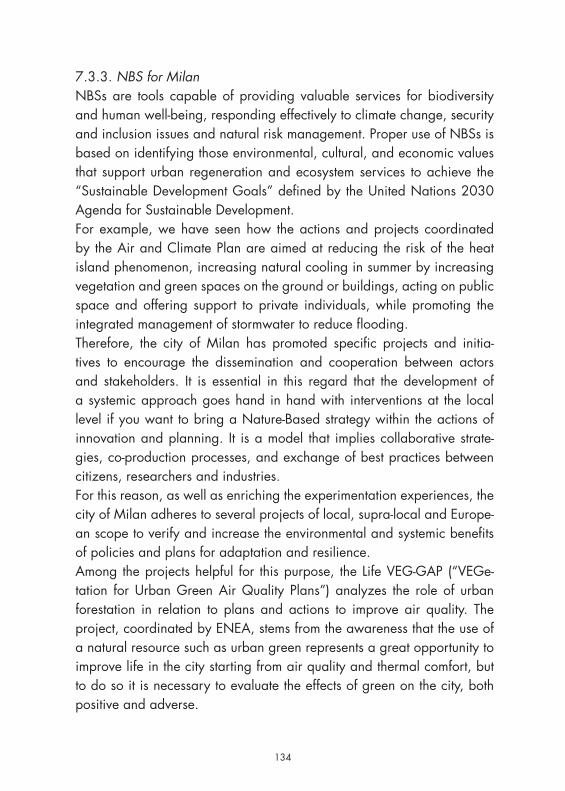
134
7.3.3. NBS for MilanNBSs are tools capable of providing valuable services for biodiversity and human well-being, responding effectively to climate change, security and inclusion issues and natural risk management. Proper use of NBSs is based on identifying those environmental, cultural, and economic values that support urban regeneration and ecosystem services to achieve the “Sustainable Development Goals” defined by the United Nations 2030 Agenda for Sustainable Development.For example, we have seen how the actions and projects coordinated by the Air and Climate Plan are aimed at reducing the risk of the heat island phenomenon, increasing natural cooling in summer by increasing vegetation and green spaces on the ground or buildings, acting on public space and offering support to private individuals, while promoting the integrated management of stormwater to reduce flooding.Therefore, the city of Milan has promoted specific projects and initia-tives to encourage the dissemination and cooperation between actors and stakeholders. It is essential in this regard that the development of a systemic approach goes hand in hand with interventions at the local level if you want to bring a Nature-Based strategy within the actions of innovation and planning. It is a model that implies collaborative strate-gies, co-production processes, and exchange of best practices between citizens, researchers and industries.For this reason, as well as enriching the experimentation experiences, the city of Milan adheres to several projects of local, supra-local and Europe-an scope to verify and increase the environmental and systemic benefits of policies and plans for adaptation and resilience.Among the projects helpful for this purpose, the Life VEG-GAP (“VEGe-tation for Urban Green Air Quality Plans”) analyzes the role of urban forestation in relation to plans and actions to improve air quality. The project, coordinated by ENEA, stems from the awareness that the use of a natural resource such as urban green represents a great opportunity to improve life in the city starting from air quality and thermal comfort, but to do so it is necessary to evaluate the effects of green on the city, both positive and adverse.
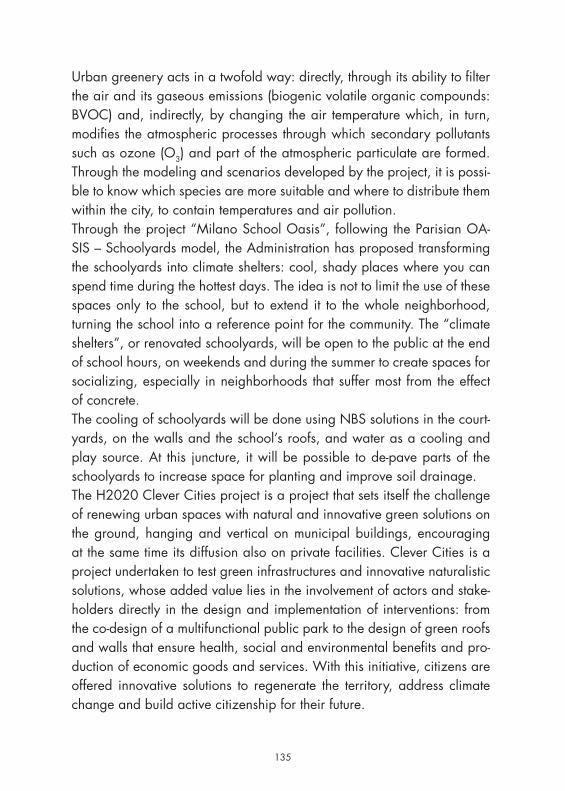
134 135
Urban greenery acts in a twofold way: directly, through its ability to filter the air and its gaseous emissions (biogenic volatile organic compounds: BVOC) and, indirectly, by changing the air temperature which, in turn, modifies the atmospheric processes through which secondary pollutants such as ozone (O3) and part of the atmospheric particulate are formed. Through the modeling and scenarios developed by the project, it is possi-ble to know which species are more suitable and where to distribute them within the city, to contain temperatures and air pollution.Through the project “Milano School Oasis”, following the Parisian OA-SIS – Schoolyards model, the Administration has proposed transforming the schoolyards into climate shelters: cool, shady places where you can spend time during the hottest days. The idea is not to limit the use of these spaces only to the school, but to extend it to the whole neighborhood, turning the school into a reference point for the community. The “climate shelters”, or renovated schoolyards, will be open to the public at the end of school hours, on weekends and during the summer to create spaces for socializing, especially in neighborhoods that suffer most from the effect of concrete.The cooling of schoolyards will be done using NBS solutions in the court-yards, on the walls and the school’s roofs, and water as a cooling and play source. At this juncture, it will be possible to de-pave parts of the schoolyards to increase space for planting and improve soil drainage.The H2020 Clever Cities project is a project that sets itself the challenge of renewing urban spaces with natural and innovative green solutions on the ground, hanging and vertical on municipal buildings, encouraging at the same time its diffusion also on private facilities. Clever Cities is a project undertaken to test green infrastructures and innovative naturalistic solutions, whose added value lies in the involvement of actors and stake-holders directly in the design and implementation of interventions: from the co-design of a multifunctional public park to the design of green roofs and walls that ensure health, social and environmental benefits and pro-duction of economic goods and services. With this initiative, citizens are offered innovative solutions to regenerate the territory, address climate change and build active citizenship for their future.
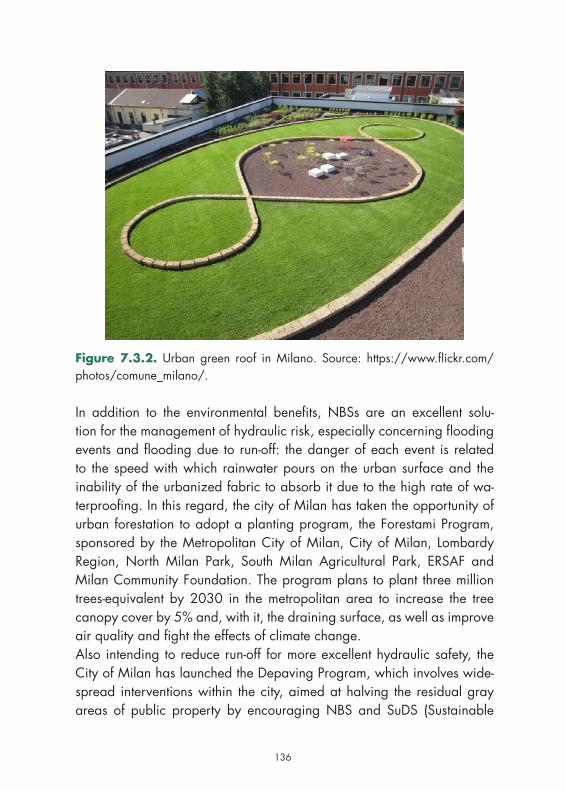
136
Figure 7.3.2. Urban green roof in Milano. Source: https://www.flickr.com/photos/comune_milano/.
In addition to the environmental benefits, NBSs are an excellent solu-tion for the management of hydraulic risk, especially concerning flooding events and flooding due to run-off: the danger of each event is related to the speed with which rainwater pours on the urban surface and the inability of the urbanized fabric to absorb it due to the high rate of wa-terproofing. In this regard, the city of Milan has taken the opportunity of urban forestation to adopt a planting program, the Forestami Program, sponsored by the Metropolitan City of Milan, City of Milan, Lombardy Region, North Milan Park, South Milan Agricultural Park, ERSAF and Milan Community Foundation. The program plans to plant three million trees-equivalent by 2030 in the metropolitan area to increase the tree canopy cover by 5% and, with it, the draining surface, as well as improve air quality and fight the effects of climate change.Also intending to reduce run-off for more excellent hydraulic safety, the City of Milan has launched the Depaving Program, which involves wide-spread interventions within the city, aimed at halving the residual gray areas of public property by encouraging NBS and SuDS (Sustainable
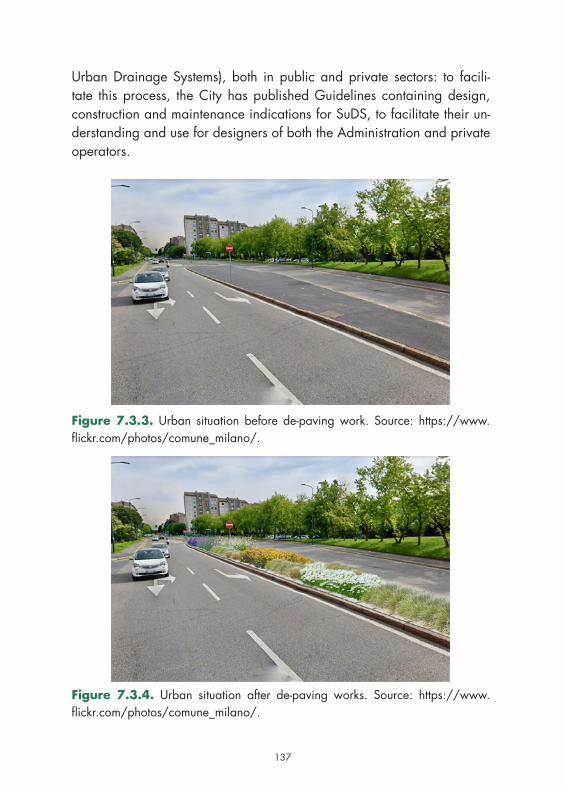
136 137
Urban Drainage Systems), both in public and private sectors: to facili-tate this process, the City has published Guidelines containing design, construction and maintenance indications for SuDS, to facilitate their un-derstanding and use for designers of both the Administration and private operators.
Figure 7.3.3. Urban situation before de-paving work. Source: https://www.flickr.com/photos/comune_milano/.
Figure 7.3.4. Urban situation after de-paving works. Source: https://www.flickr.com/photos/comune_milano/.
138
Article 10 of the Implementation Rules of the PGT Rules Plan, which aims to reduce emissions and introduces a Climate Impact Reduction Index (RIC) for new construction or rehabilitation of existing buildings, defines new building standards. To meet these standards, all building works will have to act, on the one hand, in terms of reduction and minimization of carbon emissions; on the other, in terms of improvement of drainage and urban microclimate, mitigation of heat islands and raising housing standards by increasing the presence of green and permeable surfaces. In this key, the NBSs become an opportunity to counteract the effect of cli-mate and offer the opportunity to redevelop the city, creating new public spaces and socialization at the service of citizens.In conclusion, NBSs render to the Public Administration the service of a more livable city, more inclusive and on a human scale, they redistribute space according to those who live in it, making it healthy and attractive.On the wave of these reflections, the project “Open Squares” uses the approach of tactical urbanism and directly involves the inhabitants in the processes of urban regeneration on a neighborhood scale, experimenting with spatial interventions and short-term policies, low-cost and scalable, to bring back the public space at the center of the lives of the inhabitants. The aim is to bring back the squares to be iconic places for the neighbor-hood, no longer just parking lots or places of passage, but areas in which to live, where Administration and Citizenship actively collaborate in the concrete implementation and proposal of palimpsests.After the temporary “tactical” experimentation and their evaluations, the places are redesigned in a definitive form through structural interventions that provide for the inclusion of new greenery, new paving and new func-tions, becoming a concrete opportunity to insert NBS in contexts that are often very densified.Tackling climate, social and economic change on an urban scale does not disregard the recognition of technology and digital transition as two extraordinary enablers of the transition, which can only be achieved if ac-companied by tools, skills and processes that pass through technological and procedural innovation.The creation and identification of interactive, dynamic and open techno-logical tools, able to perform analysis, forecasting and monitoring, derives
138 139
from the need to accelerate decision-making processes and facilitate the implementation of plans and strategic interventions, with the ultimate goal of improving urban quality and, therefore, the quality of life of citizens.Among these, the Geoportal, with its most recent developments, is de-signed as a strategic tool for internal use within the Administration for the analysis at both territorial and punctual scale, which can help the various offices prioritize areas and interventions overlapping the different territo-rial opportunities/criticalities. In addition, the tool allows to support and facilitate some of the long-term strategic actions of renaturalization that the Municipality is carrying out in these years, from the Urban Forestation program to the implementation of the Neighborhoods Plan, to the Depav-ing program, to facilitate the planning and strategic phase.Through this and other tools, the role of technology is also central to the process of monitoring the achievement of the ambitious goals that the city has set for itself as a whole. In the Municipality’s vision, the approach will be transversal, shared and open both within the administrative structure and externally, with an eye to the citizens.In a city that is being redesigned and will continue to do so in the coming years, it becomes essential to combine traditional financing tools with innovative, inclusive and participatory mechanisms.With this aim, for years, Milan has been promoting initiatives of collabo-ration and sponsorship for the adoption of green areas by associations, small and significant activities of the citizens themselves. For example, the initiative “care and adopt public green”, using partnerships with stake-holders, has been for over 10 years a tool to improve the quality and maintenance of the green heritage of the city through which you can take care of furniture and equipment, spaces in front of stores, condominiums and public places, squares and urban flower beds. Sponsorship and part-nership opportunities range from the simple direct intervention of citizens, without specific investments, to the real financing of ad hoc projects.With the same spirit, the Forestami Fund was born, established in 2019 thanks to the collaboration with the Milan Community Foundation, which responds to the need to have an implementation tool to collect contribu-tions from sponsors, companies, citizens or associations, to contribute to the implementation of the program.
140
7.3.4. ConclusionsThe principle for which the Public Administration experiments with inno-vative solutions is essential that the actual effects of policies must be de-monstrable, both for greater transparency towards citizens and to allow citizens the opportunity for greater involvement, to be part of the change that takes place on the territory of their city and neighborhood.Also for this reason, the emotional impulse that accompanies the presence of NBS makes them tools with a great capacity for involvement, engage-ment, dissemination and opportunity, as we have seen, of co-design and co-responsibility for the use of shared spaces.These practices are now well established and used, in various declina-tions, offering flexible and adaptive responses, but at the same time can be traced to the administrative and regulatory needs of a Public Adminis-tration. That contributes to integrated planning by facilitating urban and social regeneration, the construction of green infrastructure and ecologi-cal networks, supporting the development of biodiversity, offering oppor-tunities for citizens to improve the quality of their living even in situations of more significant socio-economic hardship.They, therefore, offer a prominent tool for investing in the territory, not necessarily financial, that increases the social value of neighborhoods and enriches community ties.
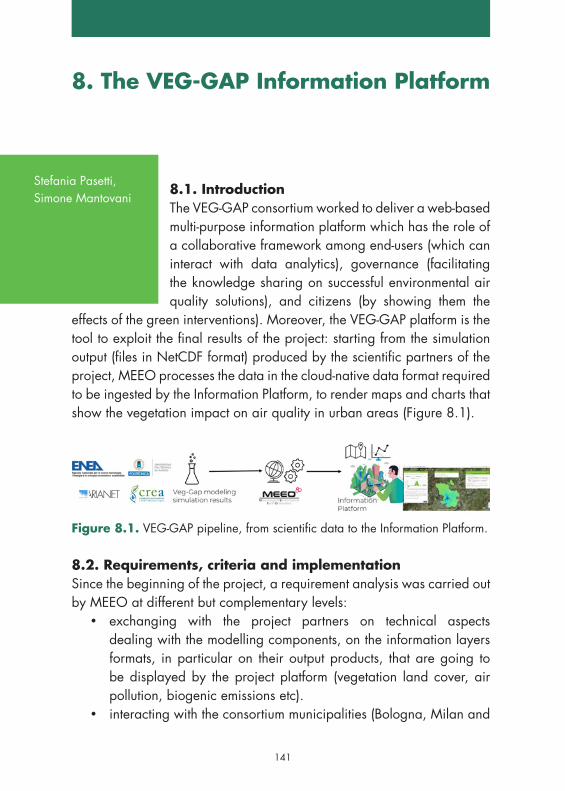
140 141
8. The VEG-GAP Information Platform
8.1. IntroductionThe VEG-GAP consortium worked to deliver a web-based multi-purpose information platform which has the role of a collaborative framework among end-users (which can interact with data analytics), governance (facilitating the knowledge sharing on successful environmental air quality solutions), and citizens (by showing them the
effects of the green interventions). Moreover, the VEG-GAP platform is the tool to exploit the final results of the project: starting from the simulation output (files in NetCDF format) produced by the scientific partners of the project, MEEO processes the data in the cloud-native data format required to be ingested by the Information Platform, to render maps and charts that show the vegetation impact on air quality in urban areas (Figure 8.1).
Figure 8.1. VEG-GAP pipeline, from scientific data to the Information Platform.
8.2. Requirements, criteria and implementationSince the beginning of the project, a requirement analysis was carried out by MEEO at different but complementary levels:
• exchanging with the project partners on technical aspects dealing with the modelling components, on the information layers formats, in particular on their output products, that are going to be displayed by the project platform (vegetation land cover, air pollution, biogenic emissions etc).
• interacting with the consortium municipalities (Bologna, Milan and
Stefania Pasetti,Simone Mantovani
142
Madrid) in order to collect the main requirements related to the three pilots’ basic functionalities;
• valuing the expertise gained by MEEO in the last years, on the development of web-based platform and cloud computing frameworks, in particular on the implementation of scalable platform and user-friendly tools for the data analysis on geospatial dataset.
The main users’ requirements that were identified are the following ones, common to all the three project pilots (Bologna, Milan and Madrid):Integration of the urban ecosystems and vegetation ecosystems characteristics (amount of vegetation, species, type, distribution on the urban areas);Assessment of:
• Contribution of urban vegetation ecosystems both as source and sink of air pollution in urban areas;
• Urban vegetation ecosystems effects on air temperature by identifying urban heating and cooling patterns;
• Urban vegetation ecosystems or plant biodiversity impact on air quality for the most relevant pollutants, mainly for ozone (O3), particulate matter (PM10) and nitrogen dioxide (NO2);
Support the evaluation of the possible risks and benefits for human health and ecosystem themselves in relation to vegetation changes.The platform requirements emerged in terms of main functionalities, usability and availability, are simplified and summarized in the following list:Main functionalities
• Data managing• Time series analysis• Data access• Central repository (on ENEA server)• Distributed repositories (local pilots) • Software system:• Reliability• Availability• Security• Maintainability• Usability
142 143
• User friendly• Web interface• Geo-referred information• Addressing high level users • to be used also by technicians• Replicability• to test the custom approach in different specific local contexts
(Bologna, Milan, Madrid) • adoption of technology ready to replicate the platform on different
geographic areas;• Flexibility:• Possibility to export data and maps
The main expected project outcome consists in a web-based multi-purpose information platform which can be used both by non-technical users (e.g. citizens), to show them the effects of green interventions, both by operators with technical expertise, to facilitate knowledge sharing on successful environmental air quality solutions, so, for the above reason, the Information Platform of the VEG-GAP project was conceived in two versions:1) The Basic version, addressing citizens and non-technical users; by proposing them simple guided pathway to understand the vegetation impact on the air quality;2) The Advanced version, for researcher, technical people, or governance planners, which provides access to all the data and information layers produced by the scientific partners. It requires experience in using webGIS system and in general, in visualizing geo referred data and the relative temporal analysis.In particular, the Basic version of the information platform, mainly conceived for citizens or in general for non-expert users, aims at showing the project results on very complex issues, related to the effect of vegetation on the temperature and air quality. This attempt is required to be done in a very intuitive manner, by guiding and supporting the user in a guided pathway, so, during the first implementation phase, by exploiting the interactions among scientific partners and the municipalities involved in the project, the idea of a basic platform was completely rethought in a new paradigm based on questions and answers able to simply show the
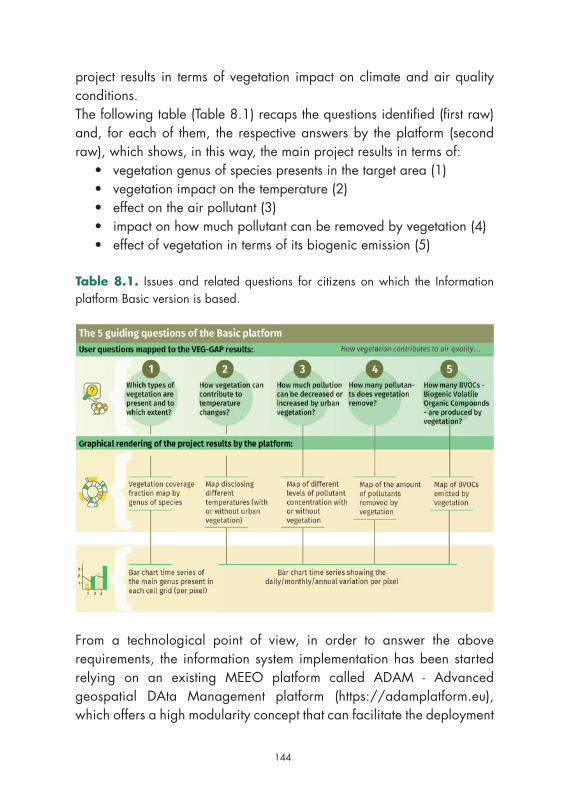
144
project results in terms of vegetation impact on climate and air quality conditions.The following table (Table 8.1) recaps the questions identified (first raw) and, for each of them, the respective answers by the platform (second raw), which shows, in this way, the main project results in terms of:
• vegetation genus of species presents in the target area (1)• vegetation impact on the temperature (2)• effect on the air pollutant (3)• impact on how much pollutant can be removed by vegetation (4)• effect of vegetation in terms of its biogenic emission (5)
Table 8.1. Issues and related questions for citizens on which the Information platform Basic version is based.
User questions mapped to the VEG-GAP results: 1. How much and which type of vegetation is present? 2. How vegetation contributes to temperature? 3. How vegetation contributes to air quality… how much pollutant is decreased or increased by vegetation?
4. How vegetation contributes to air quality…how much pollutants is removed by vegetation? 5. How vegetation contributes to air quality… how much BVOC - Biogenic Volatile Organic Compounds is emitted by vegetation?
Graphical rendering of the project results by the platform: Map with the vegetation coverage fraction with genus of species Bar chart time series of the main genus present in each cell grid (per pixel)
Map of the difference of Temperature (with or without vegetation) Bar chart time series of the daily/monthly/annual variation per pixel
Map of the difference of pollutant (with or without vegetation) concentration Bar chart time series of the daily/monthly/annual variation per pixel
Map of the pollutant amount removed by vegetation Bar chart time series of the daily/monthly/annual variation per pixel
Map of BVOC emitted by vegetation Bar chart time series of the daily/monthly/annual BVOC concentration per pixel
From a technological point of view, in order to answer the above requirements, the information system implementation has been started relying on an existing MEEO platform called ADAM - Advanced geospatial DAta Management platform (https://adamplatform.eu), which offers a high modularity concept that can facilitate the deployment
144 145
of web applications and it is based on Open Geospatial Consortium (OGC) standard interfaces for discovery, access, processing and visualization services1.ADAM was chosen as reference platform because it implements the Digital Earth concept allowing the access to large variety of multi-year global environmental data (e.g. temperature, precipitation, vegetation status, etc.) enabling visualization, combination, processing and download. ADAM makes global environmental geospatial data Findable, Accessible, Interoperable and Reusable (FAIR)2, exposing heterogeneous geospatial data as datacubes3 allowing effective subsetting functionalities: indeed, it provides the user with only the portion of data in space and time which is really needed, providing high performance functionalities and limiting local storage needs.The platform was designed, by considering the following main components (Figure 8.2):Dashboard, or graphical user interface, to access and visualized the information layers;Broker, a sort of orchestrator software component which coordinates the queries coming from the users and the rendering of the resulting data coming from the Data interface tools like the Web Map Service (WMS) or the Application Programming Interfaces (APIs). The data interface module is an intermediate layer which allows the transmission of data among the geo database, the processing or modelling components and the broker.
1 Wagemann J., Clements O., Marco R. Figuera, Rossi A.P., Mantovani S., Geospatial web services pave new ways for server-based on-demand access and processing of Big Earth Data, in International Journal of Digital Earth, doi: 10.1080/17538947.2017.1351583 (https://www.tandfonline.com/doi/full/10.1080/17538947.2017.1351583).2 Garcia-Silva J., Gomez-Perez M., Palma R., Krystek M., Mantovani S., Foglini F., Grande V., De Leo F., Salvi S., Trasati E., Romaniello V., Albani M., Silvagni C., Leone R., Marelli F., Albani S., Lazzarini M., Napier H.., Glaves H.M., Aldridge T., Meertens C., Boler F., Loescher H.W., Laney C., Genazzio M.A., Crawl D., Altintas I. (2018), Enabling FAIR Research in Earth Science through Research Objects, in Journal, eprint = {1809.10617},url = {http://arxiv.org/abs/1809.10617}, Sep. 2018 (https://doi.org/10.1016/j.future.2019.03.046).3 Baumann P., Rossi A.P., Bell B., Clements O., Evans B., Hoenig H., Hogan P., Kakaletris G., Koltsida P., Mantovani S., Marco Figuera R., Merticariu V., Misev D., Bang Pham H., Siemen S., Wagemann J. (2018), Fostering Cross-Disciplinary Earth Science Through Datacube Analytics. In book: Earth Observation Open Science and Innovation, January 2018, doi: 10.1007/978-3-319-65633-5_5 (https://www.researchgate.net/publication/322660086_Fostering_Cross-Disciplinary_Earth_Science_Through_Datacube_Analytics).
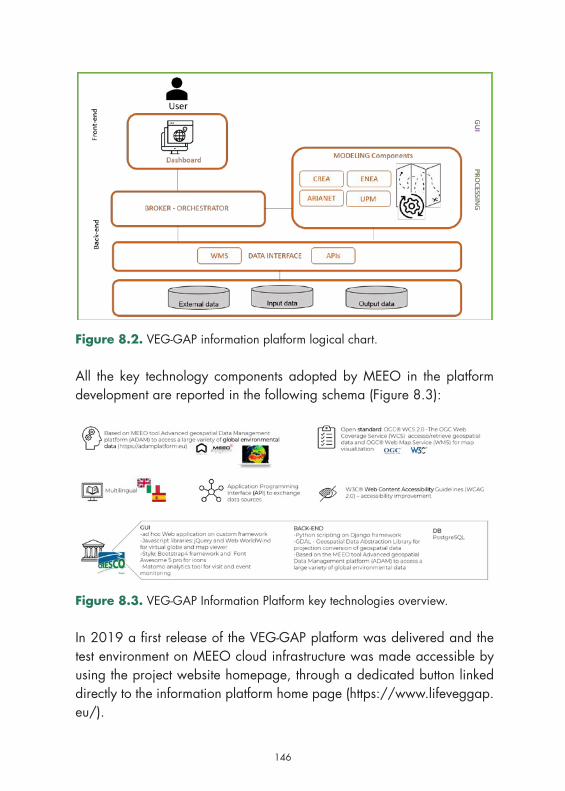
146
Figure 8.2. VEG-GAP information platform logical chart.
All the key technology components adopted by MEEO in the platform development are reported in the following schema (Figure 8.3):
Figure 8.3. VEG-GAP Information Platform key technologies overview.
In 2019 a first release of the VEG-GAP platform was delivered and the test environment on MEEO cloud infrastructure was made accessible by using the project website homepage, through a dedicated button linked directly to the information platform home page (https://www.lifeveggap.eu/).
Figure 8.2. VEG-GAP information platform logical chart. All the key technology components adopted by MEEO in the platform development are reported in the
following schema (Figure 3):
Figure 8.3. Veg-Gap Information Platform key technologies overview. In 2019 a first release of the Veg-Gap platform was delivered and the test environment on MEEO cloud
infrastructure was made accessible by using the project website homepage, through a dedicated button linked directly to the information platform home page (https://www.lifeveggap.eu/).
After further development and the deployment on ENEAGRID/CRESCO (Computational RESsearch Centre on COmplex systems https://www.eneagrid.enea.it/CRESCOportal/) the integrated infrastructure for high performance computing managed by ENEA, at the beginning of 2021, the production instance was published on the direct Information Platform address https://veggaplatform.enea.it/ or through the dedicated button “Veg-Gap Information Platform access” of the project home page (https://www.lifeveggap.eu/).
A simplified overview of the Information Platform implementation plan is represented by the Figure 8.4.
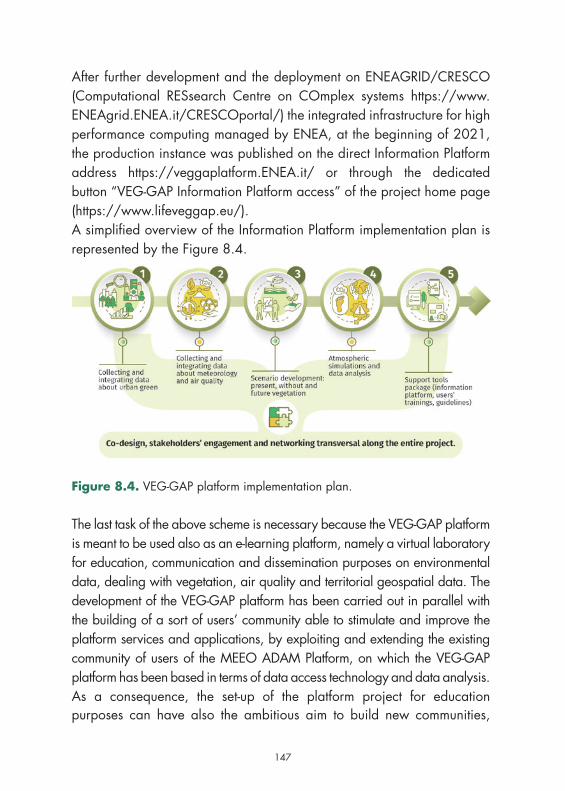
146 147
After further development and the deployment on ENEAGRID/CRESCO (Computational RESsearch Centre on COmplex systems https://www.ENEAgrid.ENEA.it/CRESCOportal/) the integrated infrastructure for high performance computing managed by ENEA, at the beginning of 2021, the production instance was published on the direct Information Platform address https://veggaplatform.ENEA.it/ or through the dedicated button “VEG-GAP Information Platform access” of the project home page (https://www.lifeveggap.eu/).A simplified overview of the Information Platform implementation plan is represented by the Figure 8.4.
Figure 8.4. VEG-GAP platform implementation plan.
The last task of the above scheme is necessary because the VEG-GAP platform is meant to be used also as an e-learning platform, namely a virtual laboratory for education, communication and dissemination purposes on environmental data, dealing with vegetation, air quality and territorial geospatial data. The development of the VEG-GAP platform has been carried out in parallel with the building of a sort of users’ community able to stimulate and improve the platform services and applications, by exploiting and extending the existing community of users of the MEEO ADAM Platform, on which the VEG-GAP platform has been based in terms of data access technology and data analysis. As a consequence, the set-up of the platform project for education purposes can have also the ambitious aim to build new communities,
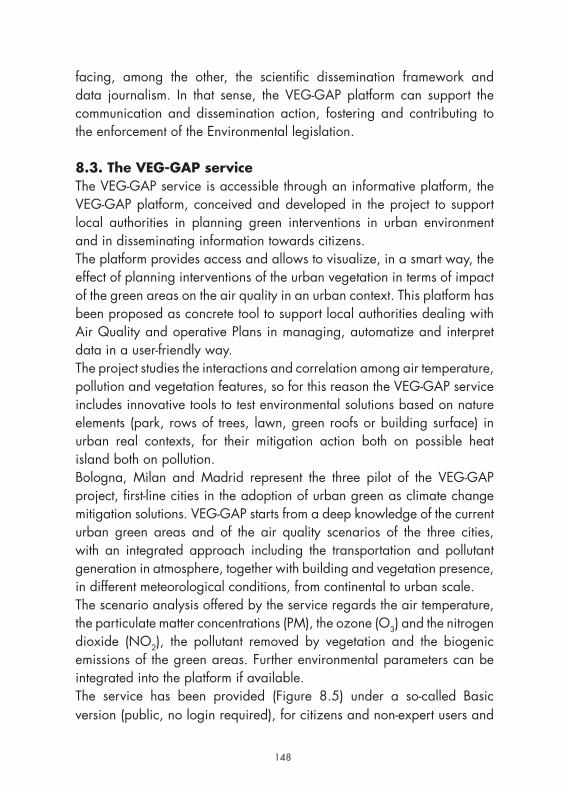
148
facing, among the other, the scientific dissemination framework and data journalism. In that sense, the VEG-GAP platform can support the communication and dissemination action, fostering and contributing to the enforcement of the Environmental legislation.
8.3. The VEG-GAP serviceThe VEG-GAP service is accessible through an informative platform, the VEG-GAP platform, conceived and developed in the project to support local authorities in planning green interventions in urban environment and in disseminating information towards citizens.The platform provides access and allows to visualize, in a smart way, the effect of planning interventions of the urban vegetation in terms of impact of the green areas on the air quality in an urban context. This platform has been proposed as concrete tool to support local authorities dealing with Air Quality and operative Plans in managing, automatize and interpret data in a user-friendly way.The project studies the interactions and correlation among air temperature, pollution and vegetation features, so for this reason the VEG-GAP service includes innovative tools to test environmental solutions based on nature elements (park, rows of trees, lawn, green roofs or building surface) in urban real contexts, for their mitigation action both on possible heat island both on pollution.Bologna, Milan and Madrid represent the three pilot of the VEG-GAP project, first-line cities in the adoption of urban green as climate change mitigation solutions. VEG-GAP starts from a deep knowledge of the current urban green areas and of the air quality scenarios of the three cities, with an integrated approach including the transportation and pollutant generation in atmosphere, together with building and vegetation presence, in different meteorological conditions, from continental to urban scale.The scenario analysis offered by the service regards the air temperature, the particulate matter concentrations (PM), the ozone (O3) and the nitrogen dioxide (NO2), the pollutant removed by vegetation and the biogenic emissions of the green areas. Further environmental parameters can be integrated into the platform if available.The service has been provided (Figure 8.5) under a so-called Basic version (public, no login required), for citizens and non-expert users and
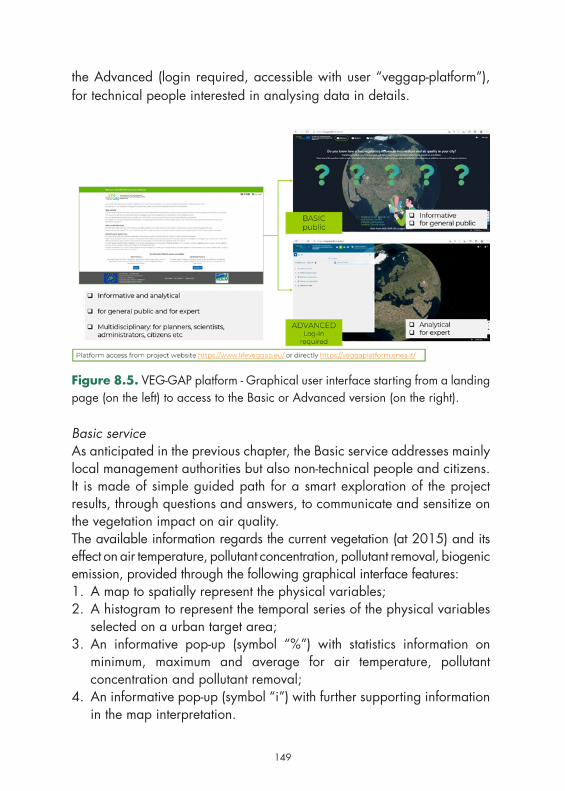
148 149
the Advanced (login required, accessible with user “veggap-platform”), for technical people interested in analysing data in details.
Figure 8.5. VEG-GAP platform - Graphical user interface starting from a landing page (on the left) to access to the Basic or Advanced version (on the right).
Basic serviceAs anticipated in the previous chapter, the Basic service addresses mainly local management authorities but also non-technical people and citizens. It is made of simple guided path for a smart exploration of the project results, through questions and answers, to communicate and sensitize on the vegetation impact on air quality.The available information regards the current vegetation (at 2015) and its effect on air temperature, pollutant concentration, pollutant removal, biogenic emission, provided through the following graphical interface features:1. A map to spatially represent the physical variables;2. A histogram to represent the temporal series of the physical variables
selected on a urban target area;3. An informative pop-up (symbol “%”) with statistics information on
minimum, maximum and average for air temperature, pollutant concentration and pollutant removal;
4. An informative pop-up (symbol “i”) with further supporting information in the map interpretation.
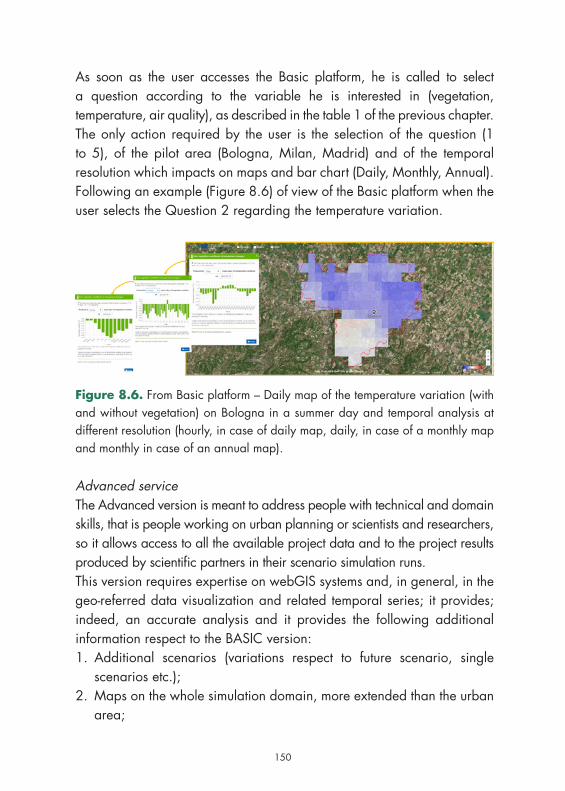
150
As soon as the user accesses the Basic platform, he is called to select a question according to the variable he is interested in (vegetation, temperature, air quality), as described in the table 1 of the previous chapter.The only action required by the user is the selection of the question (1 to 5), of the pilot area (Bologna, Milan, Madrid) and of the temporal resolution which impacts on maps and bar chart (Daily, Monthly, Annual).Following an example (Figure 8.6) of view of the Basic platform when the user selects the Question 2 regarding the temperature variation.
Figure 8.6. From Basic platform – Daily map of the temperature variation (with and without vegetation) on Bologna in a summer day and temporal analysis at different resolution (hourly, in case of daily map, daily, in case of a monthly map and monthly in case of an annual map).
Advanced serviceThe Advanced version is meant to address people with technical and domain skills, that is people working on urban planning or scientists and researchers, so it allows access to all the available project data and to the project results produced by scientific partners in their scenario simulation runs.This version requires expertise on webGIS systems and, in general, in the geo-referred data visualization and related temporal series; it provides; indeed, an accurate analysis and it provides the following additional information respect to the BASIC version:1. Additional scenarios (variations respect to future scenario, single
scenarios etc.);2. Maps on the whole simulation domain, more extended than the urban
area;
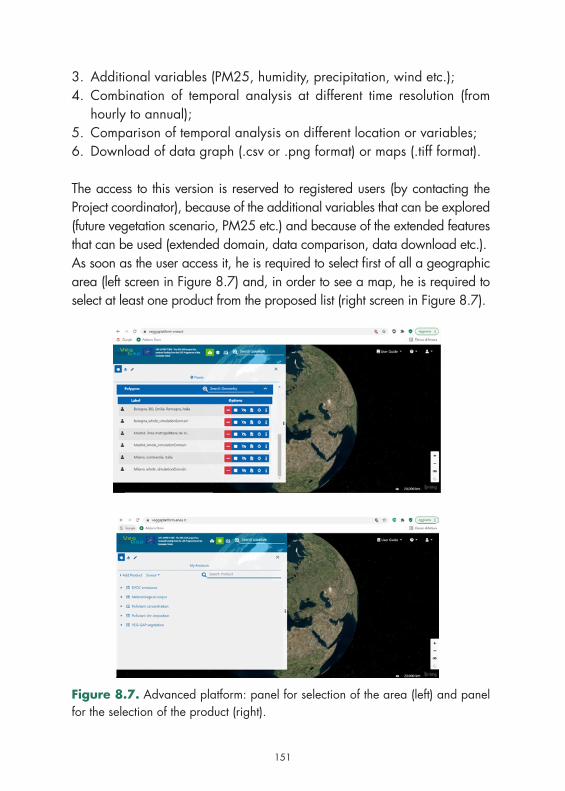
150 151
3. Additional variables (PM25, humidity, precipitation, wind etc.);4. Combination of temporal analysis at different time resolution (from
hourly to annual);5. Comparison of temporal analysis on different location or variables;6. Download of data graph (.csv or .png format) or maps (.tiff format).
The access to this version is reserved to registered users (by contacting the Project coordinator), because of the additional variables that can be explored (future vegetation scenario, PM25 etc.) and because of the extended features that can be used (extended domain, data comparison, data download etc.).As soon as the user access it, he is required to select first of all a geographic area (left screen in Figure 8.7) and, in order to see a map, he is required to select at least one product from the proposed list (right screen in Figure 8.7).
Figure 8.7. Advanced platform: panel for selection of the area (left) and panel for the selection of the product (right).
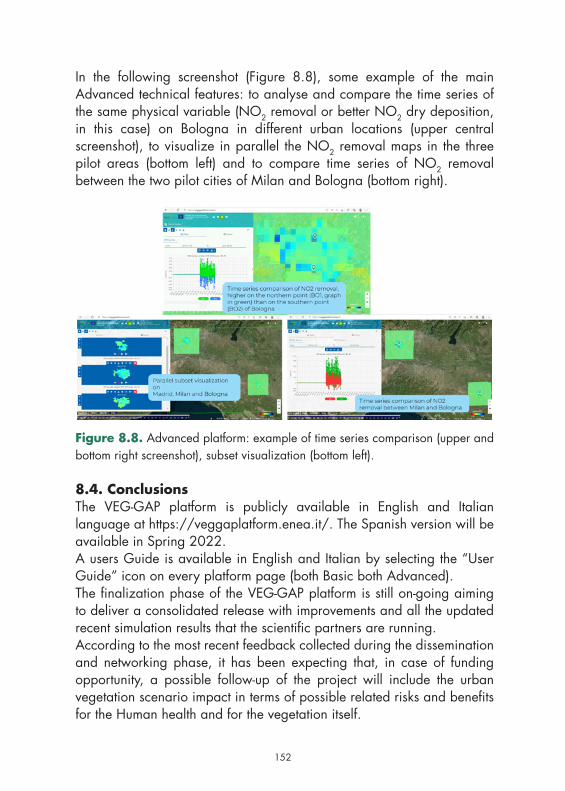
152
In the following screenshot (Figure 8.8), some example of the main Advanced technical features: to analyse and compare the time series of the same physical variable (NO2 removal or better NO2 dry deposition, in this case) on Bologna in different urban locations (upper central screenshot), to visualize in parallel the NO2 removal maps in the three pilot areas (bottom left) and to compare time series of NO2 removal between the two pilot cities of Milan and Bologna (bottom right).
Figure 8.8. Advanced platform: example of time series comparison (upper and bottom right screenshot), subset visualization (bottom left).
8.4. ConclusionsThe VEG-GAP platform is publicly available in English and Italian language at https://veggaplatform.enea.it/. The Spanish version will be available in Spring 2022.A users Guide is available in English and Italian by selecting the “User Guide” icon on every platform page (both Basic both Advanced).The finalization phase of the VEG-GAP platform is still on-going aiming to deliver a consolidated release with improvements and all the updated recent simulation results that the scientific partners are running. According to the most recent feedback collected during the dissemination and networking phase, it has been expecting that, in case of funding opportunity, a possible follow-up of the project will include the urban vegetation scenario impact in terms of possible related risks and benefits for the Human health and for the vegetation itself.
152 153
1Alberti V. et al. (2019), The Future of Cities, Vandecasteele I., Baran-
zelli C., Siragusa A., Aurambout J. (eds.), Publications Office of the European Union, Luxembourg, isbn: 978-92-76-03847-4 (on-line),978-92-76-03848-1 (print), doi:10.2760/375209 (online), 10.2760/364135 (print), JRC116711.
Directive 2008/50/EC of the European Parliament and of the Council of 21 May 2008 on ambient air quality and cleaner air for Europe (OJL152,11.6.2008,1-44).
European Environment Agency, Briefing no. 19/2021 Health impacts of air pollution in Europe, 2021, isbn: 978-92-9480-404-4, issn: 2467-3196, doi: 10.2800/08097 https://www.eea.europa.eu/ds_re-solveuid/MYEHUI01SF.
European Commission, Special Eurobarometer survey 517 ‘Future of Eu-rope’, https://europa.eu/eurobarometer/surveys/detail/2554.
European Environment Agency, Report no. 15/2021 Air quality in Europe 2021, isbn: 978-92-9480-403-7, issn: 1977-8449, doi: 10.2800/549289 TBF37Q6AUI.
European Commission, communication from the Commission to the Eu-ropean Parliament, The Council, the European Economic and Social Committee and the Committee of the Regions Pathway to a Healthy Planet for All EU Action Plan: ‘Towards Zero Pollution for Air, Water and Soil’ COM/2021/400.
European Environmental Agency, Report n. 2 2017, Financing urban ad-aptation to climate change, isbn: 978-92-9213-845-5, https://www.eea.europa.eu/publications/air-quality-in-europe-2021.
European Environmental Agency, 2017, Air Quality in Europe 2017 re-port, EEA Report No 13/2017, doi: 10.2800/850018.
Fares S. et al. (2021), Exploring new strategies for ozone-risk assess-ment: A dynamic-threshold case study, in Environmental Pollution, 287, 117620.
REFERENCES
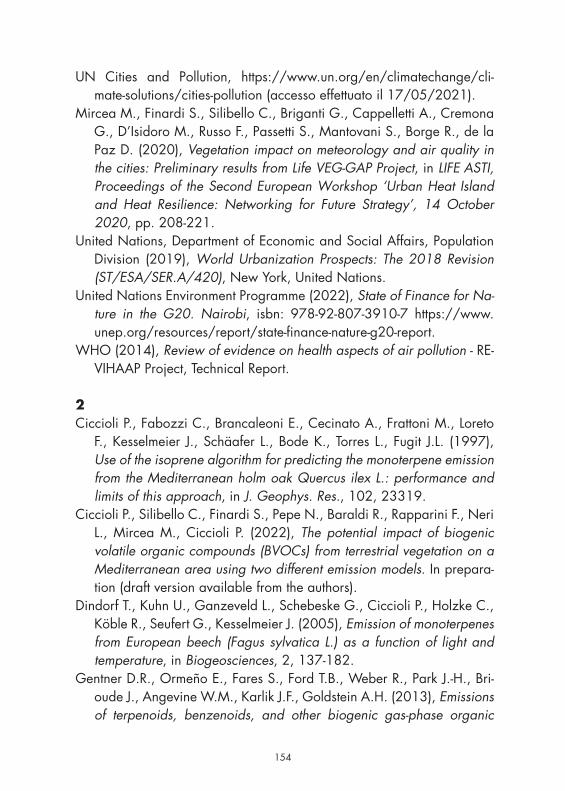
154
UN Cities and Pollution, https://www.un.org/en/climatechange/cli-mate-solutions/cities-pollution (accesso effettuato il 17/05/2021).
Mircea M., Finardi S., Silibello C., Briganti G., Cappelletti A., Cremona G., D’Isidoro M., Russo F., Passetti S., Mantovani S., Borge R., de la Paz D. (2020), Vegetation impact on meteorology and air quality in the cities: Preliminary results from Life VEG-GAP Project, in LIFE ASTI, Proceedings of the Second European Workshop ‘Urban Heat Island and Heat Resilience: Networking for Future Strategy’, 14 October 2020, pp. 208-221.
United Nations, Department of Economic and Social Affairs, Population Division (2019), World Urbanization Prospects: The 2018 Revision (ST/ESA/SER.A/420), New York, United Nations.
United Nations Environment Programme (2022), State of Finance for Na-ture in the G20. Nairobi, isbn: 978-92-807-3910-7 https://www.unep.org/resources/report/state-finance-nature-g20-report.
WHO (2014), Review of evidence on health aspects of air pollution - RE-VIHAAP Project, Technical Report.
2Ciccioli P., Fabozzi C., Brancaleoni E., Cecinato A., Frattoni M., Loreto
F., Kesselmeier J., Schäafer L., Bode K., Torres L., Fugit J.L. (1997), Use of the isoprene algorithm for predicting the monoterpene emission from the Mediterranean holm oak Quercus ilex L.: performance and limits of this approach, in J. Geophys. Res., 102, 23319.
Ciccioli P., Silibello C., Finardi S., Pepe N., Baraldi R., Rapparini F., Neri L., Mircea M., Ciccioli P. (2022), The potential impact of biogenic volatile organic compounds (BVOCs) from terrestrial vegetation on a Mediterranean area using two different emission models. In prepara-tion (draft version available from the authors).
Dindorf T., Kuhn U., Ganzeveld L., Schebeske G., Ciccioli P., Holzke C., Köble R., Seufert G., Kesselmeier J. (2005), Emission of monoterpenes from European beech (Fagus sylvatica L.) as a function of light and temperature, in Biogeosciences, 2, 137-182.
Gentner D.R., Ormeño E., Fares S., Ford T.B., Weber R., Park J.-H., Bri-oude J., Angevine W.M., Karlik J.F., Goldstein A.H. (2013), Emissions of terpenoids, benzenoids, and other biogenic gas-phase organic
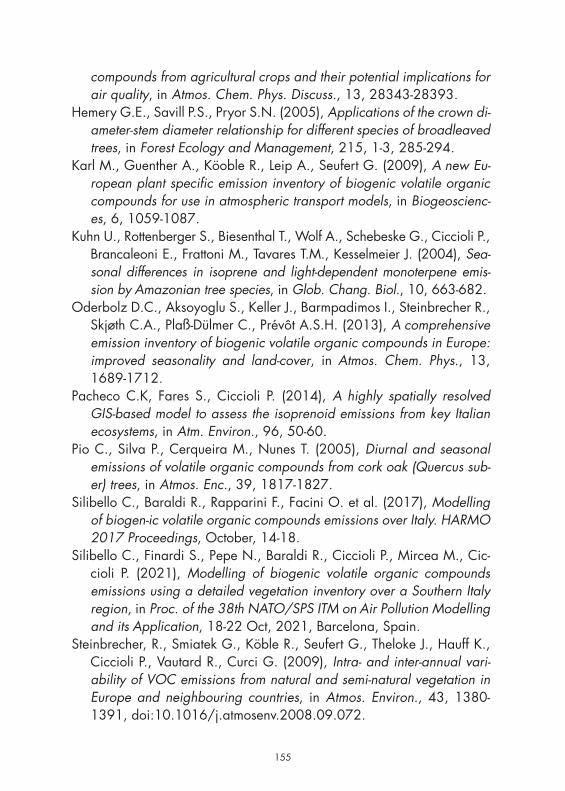
154 155
compounds from agricultural crops and their potential implications for air quality, in Atmos. Chem. Phys. Discuss., 13, 28343-28393.
Hemery G.E., Savill P.S., Pryor S.N. (2005), Applications of the crown di-ameter-stem diameter relationship for different species of broadleaved trees, in Forest Ecology and Management, 215, 1-3, 285-294.
Karl M., Guenther A., Köoble R., Leip A., Seufert G. (2009), A new Eu-ropean plant specific emission inventory of biogenic volatile organic compounds for use in atmospheric transport models, in Biogeoscienc-es, 6, 1059-1087.
Kuhn U., Rottenberger S., Biesenthal T., Wolf A., Schebeske G., Ciccioli P., Brancaleoni E., Frattoni M., Tavares T.M., Kesselmeier J. (2004), Sea-sonal differences in isoprene and light-dependent monoterpene emis-sion by Amazonian tree species, in Glob. Chang. Biol., 10, 663-682.
Oderbolz D.C., Aksoyoglu S., Keller J., Barmpadimos I., Steinbrecher R., Skjøth C.A., Plaß-Dülmer C., Prévôt A.S.H. (2013), A comprehensive emission inventory of biogenic volatile organic compounds in Europe: improved seasonality and land-cover, in Atmos. Chem. Phys., 13, 1689-1712.
Pacheco C.K, Fares S., Ciccioli P. (2014), A highly spatially resolved GIS-based model to assess the isoprenoid emissions from key Italian ecosystems, in Atm. Environ., 96, 50-60.
Pio C., Silva P., Cerqueira M., Nunes T. (2005), Diurnal and seasonal emissions of volatile organic compounds from cork oak (Quercus sub-er) trees, in Atmos. Enc., 39, 1817-1827.
Silibello C., Baraldi R., Rapparini F., Facini O. et al. (2017), Modelling of biogen-ic volatile organic compounds emissions over Italy. HARMO 2017 Proceedings, October, 14-18.
Silibello C., Finardi S., Pepe N., Baraldi R., Ciccioli P., Mircea M., Cic-cioli P. (2021), Modelling of biogenic volatile organic compounds emissions using a detailed vegetation inventory over a Southern Italy region, in Proc. of the 38th NATO/SPS ITM on Air Pollution Modelling and its Application, 18-22 Oct, 2021, Barcelona, Spain.
Steinbrecher, R., Smiatek G., Köble R., Seufert G., Theloke J., Hauff K., Ciccioli P., Vautard R., Curci G. (2009), Intra- and inter-annual vari-ability of VOC emissions from natural and semi-natural vegetation in Europe and neighbouring countries, in Atmos. Environ., 43, 1380-1391, doi:10.1016/j.atmosenv.2008.09.072.
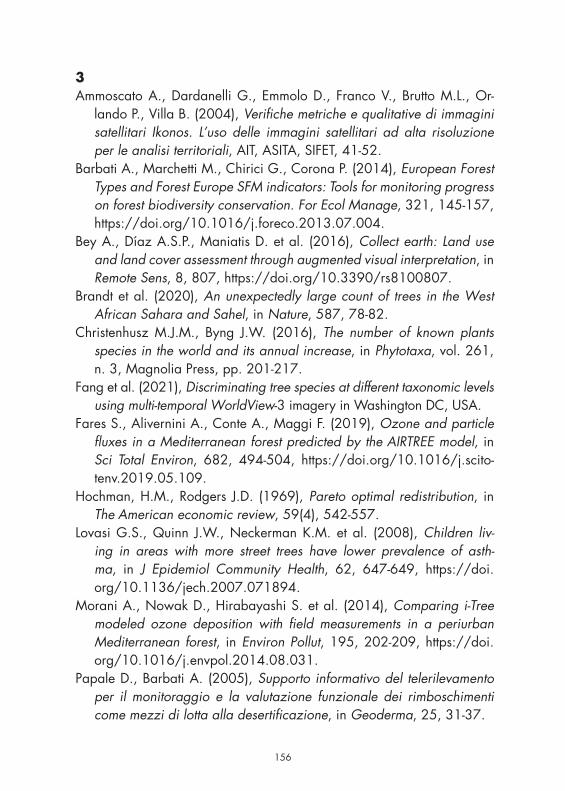
156
3Ammoscato A., Dardanelli G., Emmolo D., Franco V., Brutto M.L., Or-
lando P., Villa B. (2004), Verifiche metriche e qualitative di immagini satellitari Ikonos. L’uso delle immagini satellitari ad alta risoluzione per le analisi territoriali, AIT, ASITA, SIFET, 41-52.
Barbati A., Marchetti M., Chirici G., Corona P. (2014), European Forest Types and Forest Europe SFM indicators: Tools for monitoring progress on forest biodiversity conservation. For Ecol Manage, 321, 145-157, https://doi.org/10.1016/j.foreco.2013.07.004.
Bey A., Díaz A.S.P., Maniatis D. et al. (2016), Collect earth: Land use and land cover assessment through augmented visual interpretation, in Remote Sens, 8, 807, https://doi.org/10.3390/rs8100807.
Brandt et al. (2020), An unexpectedly large count of trees in the West African Sahara and Sahel, in Nature, 587, 78-82.
Christenhusz M.J.M., Byng J.W. (2016), The number of known plants species in the world and its annual increase, in Phytotaxa, vol. 261, n. 3, Magnolia Press, pp. 201-217.
Fang et al. (2021), Discriminating tree species at different taxonomic levels using multi-temporal WorldView-3 imagery in Washington DC, USA.
Fares S., Alivernini A., Conte A., Maggi F. (2019), Ozone and particle fluxes in a Mediterranean forest predicted by the AIRTREE model, in Sci Total Environ, 682, 494-504, https://doi.org/10.1016/j.scito-tenv.2019.05.109.
Hochman, H.M., Rodgers J.D. (1969), Pareto optimal redistribution, in The American economic review, 59(4), 542-557.
Lovasi G.S., Quinn J.W., Neckerman K.M. et al. (2008), Children liv-ing in areas with more street trees have lower prevalence of asth-ma, in J Epidemiol Community Health, 62, 647-649, https://doi.org/10.1136/jech.2007.071894.
Morani A., Nowak D., Hirabayashi S. et al. (2014), Comparing i-Tree modeled ozone deposition with field measurements in a periurban Mediterranean forest, in Environ Pollut, 195, 202-209, https://doi.org/10.1016/j.envpol.2014.08.031.
Papale D., Barbati A. (2005), Supporto informativo del telerilevamento per il monitoraggio e la valutazione funzionale dei rimboschimenti come mezzi di lotta alla desertificazione, in Geoderma, 25, 31-37.
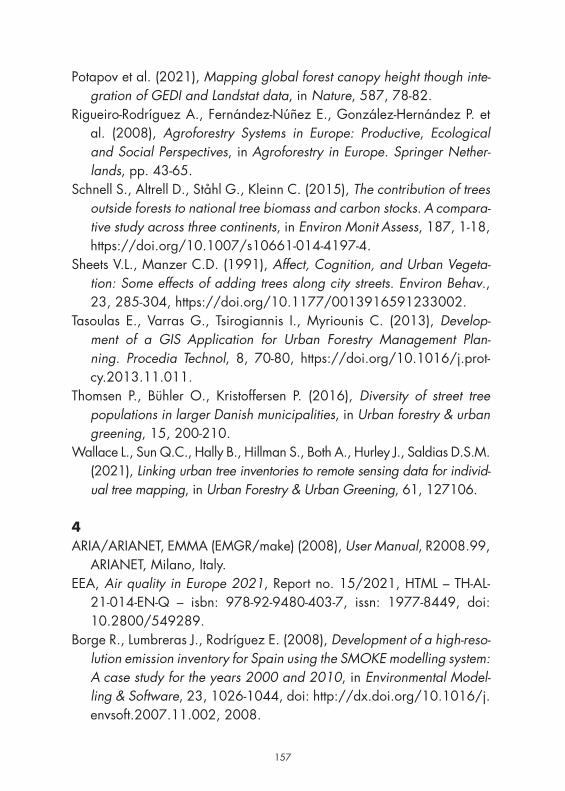
156 157
Potapov et al. (2021), Mapping global forest canopy height though inte-gration of GEDI and Landstat data, in Nature, 587, 78-82.
Rigueiro-Rodríguez A., Fernández-Núñez E., González-Hernández P. et al. (2008), Agroforestry Systems in Europe: Productive, Ecological and Social Perspectives, in Agroforestry in Europe. Springer Nether-lands, pp. 43-65.
Schnell S., Altrell D., Ståhl G., Kleinn C. (2015), The contribution of trees outside forests to national tree biomass and carbon stocks. A compara-tive study across three continents, in Environ Monit Assess, 187, 1-18, https://doi.org/10.1007/s10661-014-4197-4.
Sheets V.L., Manzer C.D. (1991), Affect, Cognition, and Urban Vegeta-tion: Some effects of adding trees along city streets. Environ Behav., 23, 285-304, https://doi.org/10.1177/0013916591233002.
Tasoulas E., Varras G., Tsirogiannis I., Myriounis C. (2013), Develop-ment of a GIS Application for Urban Forestry Management Plan-ning. Procedia Technol, 8, 70-80, https://doi.org/10.1016/j.prot-cy.2013.11.011.
Thomsen P., Bühler O., Kristoffersen P. (2016), Diversity of street tree populations in larger Danish municipalities, in Urban forestry & urban greening, 15, 200-210.
Wallace L., Sun Q.C., Hally B., Hillman S., Both A., Hurley J., Saldias D.S.M. (2021), Linking urban tree inventories to remote sensing data for individ-ual tree mapping, in Urban Forestry & Urban Greening, 61, 127106.
4ARIA/ARIANET, EMMA (EMGR/make) (2008), User Manual, R2008.99,
ARIANET, Milano, Italy.EEA, Air quality in Europe 2021, Report no. 15/2021, HTML – TH-AL-
21-014-EN-Q – isbn: 978-92-9480-403-7, issn: 1977-8449, doi: 10.2800/549289.
Borge R., Lumbreras J., Rodríguez E. (2008), Development of a high-reso-lution emission inventory for Spain using the SMOKE modelling system: A case study for the years 2000 and 2010, in Environmental Model-ling & Software, 23, 1026-1044, doi: http://dx.doi.org/10.1016/j.envsoft.2007.11.002, 2008.
158
Byun D., Schere K.L. (2006), Review of the Governing Equations, Com-putational Algorithms, and Other Components of the Models-3 Com-munity Multiscale Air Quality (CMAQ) Modeling System, in Applied Mechanics Reviews, 59, 51-77, doi: 10.1115/1.2128636.
Byun D.W., Ching J.K.S. (1999), Science Algorithms of the EPA MOD-ELS-3 Community Multiscale Air Quality (CMAQ) Modelling Sys-tem. U.S. Environmental Protection Agency, Washington, DC, EP-A/600/R-99/030 (NTIS PB2000-100561).
Martilli A. (2002), Numerical Study of Urban Impact on Boundary Lay-er Structure: Sensitivity to Wind Speed, Urban Morphology, and Ru-ral Soil Moisture, in Journal of Applied Meteorology (1988-2005), vol. 41, no. 12, American Meteorological Society, pp. 1247-1266, http://www.jstor.org/stable/26185378.
Mircea M., Ciancarella L., Briganti G., Calori G., Cappelletti A., Cionni I., Costa M., Cremona G., D’Isidoro M., Finardi S., Pace G., Piersanti A., Righini G., Silibello C., Vitali, L., Zanini G. (2014), Assessment of the AMS-MINNI system capabilities to predict air quality over Italy for the calendar year 2005, in Atmos. Environ., 84, 178-188.
Mircea M., Grigoras G., D’Isidoro M., Righini G., Adani M., Briganti G., Ciancarella L., Cappelletti A., Calori G., Cionni I., Cremona G., Finardi S., Larsen B.R., Pace G., Perrino C., Piersanti A., Silibello C., Vitali L., Zanini G. (2015), Impact of grid resolution on aerosol pre-dictions: a case study over Italy, in Aerosol and Air Quality Research, 16, 12531267, 2016.
Silibello C., Calori G., Brusasca G., Giudici A., Angelino E., Fossati G. et al. (2008), Modelling of PM10 concentrations over Milano urban area using two aerosol modules, in Environ. Model. Softw., 23, 333-343.
Silibello C., Baraldi R., Rapparini F., Facini O., Neri L., Brilli F., Fares S., Finardi S., Magliulo E., Ciccioli P. (2017), Modelling of biogenic vol-atile organic compounds emissions over Italy. HARMO 2017 – 18th International Conference on Harmonisation within Atmospheric Dis-persion Modelling for Regulatory Purposes, Proceedings, 2017-Octo-ber, pp. 14-18.
Skamarock W.C., Klemp J.B. (2008), A time-split nonhydrostatic atmo-spheric model for weather research and forecasting applications, in
158 159
Journal of Computational Physics, 227, 3465-3485, doi: http://dx.doi.org/10.1016/j.jcp.2007.01.037.
5Borge R., Lumbreras J., Rodríguez M.E. (2008a), Development of a
high-resolution emission inventory for Spain using the SMOKE mod-elling system: a case study for the years 2000 and 2010, in Environ-mental Modelling and Software, 23, 1026-1044.
De Andrés J.M., Borge R., De La Paz D., Lumbreras J., Rodríguez E. (2012), Implementation of a module for risk of ozone impacts assess-ment to vegetation in the Integrated Assessment Modelling system for the Iberian Peninsula. Evaluation for wheat and Holm oak, in Environ-mental Pollution, 165, 25-37.
De la Paz, D, Borge, R, Martilli, A. (2016), Assessment of a high resolu-tion annual WRF-BEP/CMAQ simulation, in Atmospheric Environment, 144, 282-296.
Hoek G., Krishnan R.M., Beelen R., Peters A., Ostro B., Brunekreef B., Kaufman J.D. (2013), Long-term air pollution exposure and cardio-re-spiratory mortality: a review, in Environ. Health, 12, 43. https://doi.org/10.1186/1476-069X-12-43.
Hettelingh J.P., Posch M., Slootweg J. (2017), European critical loads: da-tabase, biodiversity and ecosystems at risk: CCE Final Report 2017.
Henschel S., Chan G., World Health Organization (2013), Health risks of air pollution in Europe-HRAPIE project: new emerging risks to health from air pollution-results from the survey of experts.
ICP Vegetation (2015), Air Pollution and Vegetation. Annaul Report 2015/2016. ICP Vegetation Programme Coordination Centre, Centre for Ecology and Hydrology, September 2016.
IPCC (2021), Climate Change 2021: The Physical Science Basis. Con-tribution of Working Group I to the Sixth Assessment Report of the Intergovernmental Panel on Climate Change [V. Masson-Delmotte, P. Zhai, A. Pirani, S.L. Connors, C. Péan, S. Berger, N. Caud, Y. Chen, L. Goldfarb, M.I. Gomis, M. Huang, K. Leitzell, E. Lonnoy, J.B.R. Mat-thews, T.K. Maycock, T. Waterfield, O. Yelekçi, R. Yu and B. Zhou (eds.)], Cambridge University Press. In Press.
160
Izquierdo R., Dos Santos S.G., Borge R., de la Paz D., Sarigiannis D., Gotti A., Boldo, E. (2020), Health impact assessment by the imple-mentation of Madrid City air-quality plan in 2020, in Environmental research, 183, 109021.
Li Y., Zhao M., Motesharrei S. et al. (2015), Local cooling and warming effects of forests based on satellite observations, in Nat Commun, 6, 6603, https://doi.org/10.1038/ncomms7603.
Loomis D., Huang W., Chen G. (2014), The International Agency for Re-search on Cancer (IARC) evaluation of the carcinogenicity of outdoor air pollution: focus on China, in Chinese journal of cancer, 33, 189.
Mircea M., Ciancarella L., Briganti G., Calori G., Cappelletti A., Cionni I., Costa M., Cremona G., D’Isidoro M., Finardi S., Pace G., Piersanti A., Righini G., Silibello C., Vitali L., Zanini G. (2014), Assessment of the AMS-MINNI system capabilities to predict air quality over Italy for the calendar year 2005, in Atmos. Environ., 84, 178-188.
Mircea M., Grigoras G. D’Isidoro M., Righini G., Adani M., Briganti G., Ciancarella L., Cappelletti A., Calori G., Cionni I., Cremona G., Finardi S., Larsen B.R., Pace G., Perrino C., Piersanti A., Silibello C., Vitali L., Zanini G. (2015), Impact of grid resolution on aerosol predic-tions: a case study over Italy, Aerosol and Air Quality Research, 16, 1253-1267, 2016.
Saiz-Lopez A., Borge R., Notario A., Adame J.A., De la Paz D., Querol X., Artíñano B., Gomez-Moreno F.J., Cuevas C.A. (2017), Unexpect-ed increase in the oxidation capacity of the urban atmosphere of Ma-drid, Spain. Scientific Reports, 7, 45956.
Straif K., Cohen A., Samet J., Cancer IAfRo. IARC Scientific Publication No. 161: Air Pollution and Cancer. World Health Organization, Ge-neva, 2013.
US EPA (2015), Environmental Benefits Mapping and Analysis Program (BenMAP) User’s Manual, [Available online at: http://www2.epa.gov/benmap/manual-and-appendicesbenmap-ce].
WHO global air quality guidelines (2021), Particulate matter (PM2.5
and PM10), ozone, nitrogen dioxide, sulfur dioxide and carbon mon-oxide, Geneva, World Health Organization. Licence, CC BY-NC-SA 3.0 IGO.
160 161
World Health Organization (2021), Review of evidence on health as-pects of air pollution: REVIHAAP project: technical report (No. WHO/EURO: 2013-2663-42419-58845), World Health Organization, Re-gional Office for Europe.
Zhang Y., Bash J.O., Roselle S.J., Shatas A., Repinsky A., Mathur R., Gilliland A. (2020), Unexpected air quality impacts from implementa-tion of green infrastructure in urban environments: A Kansas City case study, in Science of the Total Environment, 744, 140960. https://doi.org/10.1016/j.scitotenv.2020.140960.
6Arnstein S.R. (1969), A Ladder Of Citizen Participation, Journal of the
American Institute of Planners, 35, 4, 216-224, doi: 10.1080/01944366908977-225 https://doi.org/10.1080/01944366908977225.
Baccarne, B. et al. (2014), Urban Socio-Technical Innovations with and by Citizens, in Interdisciplinary Studies Journal, Vol. 3, No. 4, pp. 143-156, http://hdl.handle.net/1854/LU-4365378.
Carayannis E.G., Campbell D.F.J. (2009), “Mode 3’and’Quadruple He-lix”: toward a 21st century fractal innovation ecosystem, in Interna-tional journal of technology management, 46, 3-4, 201-234. https://www.inderscienceonline.com/doi/abs/10.1504/IJTM.2009.023374.
Carayannis E.G., Barth T.D., Campbell David F.J. (2012-08-08), The Quintuple Helix innovation model: global warming as a challenge and driver for innovation, in Journal of Innovation and Entrepreneurship, 1 (1), 2, doi: 10.1186/2192-5372-1-2, issn: 2192-5372, https://rdcu.be/cGhrN.
Cerruti M., Il tempo della complessità. Trascrizione della lectio magis-tralis del prof. Mauro Ceruti per One Planet School, https://one-planetschool.wwf.it/sites/default/files/file_lezioni/Trascrizione%20video%20Ceruti%20per%20OPS%20WWF.pdf.
Etzkowitz H., Leydesdorff L. (1995), The Triple Helix. University-Indus-try-Government Relations: A Laboratory for Knowledge Based Econom-ic Development (January 1, 1995), in EASST Review, Vol. 14, No. 1, pp. 14-19, Available at SSRN: https://ssrn.com/abstract=2480085.
Etzkowitz H., Leydesdorff L. (2000), The dynamics of innovation: from
162
National Systems and “Mode 2” to a Triple Helix of university-indus-try-government relations, in Research Policy, Vol. 29, Issue 2, Pag-es 109-123, issn: 0048-7333, https://doi.org/10.1016/S0048-7333(99)00055-4.
European Committee of the Regions, Volpe M., Friedl J., Cavallini S. et al. (2016), Using the quadruple helix approach to accelerate the transfer of research and innovation results to regional growth, in Committee of the Regions, https://data.europa.eu/doi/10.2863/0082.
Lewanski R. (2014), Introduzione all’edizione italiana: ‘Democratizzare la democrazia’, in Nanz P., Fritsche M., La partecipazione dei cittadi-ni: un manuale. Metodi partecipativi: protagonisti, opportunità e limiti, Bologna, Assemblea legislativa della Regione Emilia-Romagna, pp. 9-19 [introduzione] https://partecipazione.regione.emilia-romagna.it/tutte-le-pubblicazioni/pubblicazioni/la-partecipazione-dei-cittadi-ni-un-manuale.
Ranga M., Etzkowitz H. (2013), Triple Helix Systems: An Analytical Framework for Innovation Policy and Practice in the Knowledge So-ciety, in Industry and Higher Education, 27, 237-262, 10.5367/ihe.2013.0165.
Schäpke N., Bergmann M., Stelzer F., Lang D.J. (2018), Labs in the Real World: Advancing Transdisciplinary Research and Sustainabili-ty Transformation: Mapping the Field and Emerging Lines of Inquiry, https://d-nb.info/1154851540/34.
Florian S., Heidingsfelder M.L., Schraudner M. (2019), Co-shaping the Future in Quadruple Helix Innovation Systems: Uncovering Public Preferences toward Participatory Research and Innovation, She Ji, in The Journal of Design, Economics, and Innovation, Vol. 5, Issue 2, pp. 128-146, issn: 2405-8726, https://doi.org/10.1016/j.she-ji.2019.04.002.
Schuurman D., Baccarne B., De Marez, L., Mechant, Smart P. (2012), Ideas for Smart Cities: Investigating Crowdsourcing for Generat-ing and Selecting Ideas for ICT Innovation in a City Context, in J. Theor. Appl. Electron. Commer. Res., 2012, 7, 49-62, https://doi.org/10.4067/S0718-18762012000300006.
Voorberg W.H., Bekkers V.J.J.M., Tummers Lars G. (2015), A systemat-
162 163
ic review of co-creation and co-production: Embarking on the social innovation journey, in Public management review, 17.9, pp. 1333-1357. https://doi.org/10.1080/14719037.2014.930505.
Westerlund M., Leminen S. (2011), Managing the challenges of becom-ing an open innovation company: experiences from Living Labs, in Technology Innovation Management Review, 1.1, https://timreview.ca/sites/default/files/article_PDF/WesterlundLeminen_TIMReview_October2011_3.pdf.
77.1. Bologna MetropoleCavallo M., Ferraro S. (2020), Nature-based solutions for smarter cities.
Bringing cities to life, bringing life into cities, in Revue Internationale des Gouvernements Ouverts, Vol. 9, 93-103, https://ojs3.imodev.org/?journal=RIGO&page=article&op=view&path%5B%5D=330.
Città Metropolitana di Bologna (2017), Carta di Bologna per l’ambi-ente. Le città metropolitane per lo sviluppo sostenibile, https://www.cittametropolitana.bo.it/portale/Engine/RAServeFile.php/f/comuni-cati_stampa/carta_di_bologna_per_l_ambiente.pdf.
Città Metropolitana di Bologna (2017), Carta di Bologna per l’ambi-ente. Le città metropolitane per lo sviluppo sostenibile, Nota tecnica https://www.cittametropolitana.bo.it/portale/Engine/RAServeFile.php/f/comunicati_stampa/Nota_tecnica_Carta_di_Bologna_per_l_ambiente.pdf.
Città Metropolitana di Bologna (2018), Piano strategico metropolitano di Bologna 2.0, https://psm.bologna.it/Engine/RAServeFile.php/f/documenti/Relazione_PSM_2.0.pdf.
Città Metropolitana di Bologna, ASviS, Urban@it, Alma Mater Studio-rum-Università di Bologna Dipartimenti DICAM e DISA (2021), Agen-da 2.0 per lo sviluppo sostenibile della città metropolitana di Bologna, https://www.cittametropolitana.bo.it/agenda_sviluppo_sostenibile/Engine/RAServeFile.php/f/allegati/QUADERNO_3_CM_Bologna.pdf.
Città Metropolitana di Bologna, Fondazione Villa Ghigi (2021a), Linee guida tecnico scientifiche per la forestazione nell’area metropolitana di Bologna: relazione generale e inquadramento territoriale e norma-
164
tive, https://www.cittametropolitana.bo.it/agenda_sviluppo_sosteni-bile/Engine/RAServeFile.php/f/allegati/LINEE%20GUIDA%20FOR-ESTAZIONE%20RELAZIONE.pdf.
Città Metropolitana di Bologna, Fondazione Villa Ghigi (2021b), Linee guida tecnico scientifiche per la forestazione nell’area metropolitana di Bologna: abaco delle tipologie di verde, abaco delle specie veg-etali, https://www.cittametropolitana.bo.it/agenda_sviluppo_sosteni-bile/Engine/RAServeFile.php/f/allegati/Abaco%20delle%20tipolo-gie%20di%20verde%20e%20delle%20specie%20vegetali.pdf.
Città Metropolitana di Bologna, Fondazione Villa Ghigi (2021c), Linee guida tecnico scientifiche per la forestazione nell’area metropolitana di Bologna: schede progettuali d’ambito, ambiti produttivi e poli fun-zionali metropolitani, https://www.cittametropolitana.bo.it/agen-da_sviluppo_sostenibile/Engine/RAServeFile.php/f/allegati/Sche-da%20Ambiti%20produttivi.pdf.
Città Metropolitana di Bologna, La grande Bologna. Per non lasciare indietro nessuno. Linee di mandato 2021-2026, https://www.bolo-gnametropolitana.it/Home_Page/Notizie_dai_Comuni/001/Bolo-gna_presentate_le_linee_di_mandato_21-26_saranno_metropolitane.
Connecting nature website https://connectingnature.eu/.Kooijman Esmee D., McQuaid S., Rhodes M-L., Collier M.J., Pilla F.
(2021.), Innovating with Nature: From Nature-Based Solutions to Na-ture-Based Enterprises, Sustainability 2021, 13, 1263.
Laboratorio aria website http://www.fondazioneinnovazioneurbana.it/progetto/laboratorioaria.
Stacchini, V. (2020), Ri-connettere le città con la natura ai tempi del Covid, in Ecomondo. The Green Technology Expo, Maggioli, Santar-cangelo di Romagna, 430-436.
7.2. MadridMadrid City Council, Air Quality and Climate Change Plan, https://
www.madrid.es/UnidadesDescentralizadas/Sostenibilidad/Calida-dAire/Ficheros/PlanACalidadAire2019.pdf.
Madrid City Council, Madrid 360 Environmental Sustainability Strategy, https://www.madrid.es/UnidadesDescentralizadas/UDCMedios/noticias/2019/09%20septiembre/30Lunes/Notasprensa/Present-
164 165
aci%C3%B3n%20Madrid%20360/ficheros/Avance-Estrategia-Sostenib-ilidad-Ambiental-Madrid-360.pdft.
Madrid City Council, Inventory of Madrid City Greenhouse gas emis-sions, Year 2019 https://www.madrid.es/UnidadesDescentraliza-das/Sostenibilidad/EspeInf/EnergiayCC/04CambioClimatico/4aIn-ventario/Ficheros/InfGEI_INV2019_acc.pdf.
https://www.madrid.es/UnidadesDescentralizadas/Sostenibilidad/EspeInf/EnergiayCC/06Divulgaci%C3%B3n/6cDocumenta-cion/6cNHRNeutral/Ficheros/RoadmapENG.pdf.
Madrid City Council, Road Map to climate neutrality by 2050, https://www.madrid.es/UnidadesDescentralizadas/Sostenibilidad/EspeInf/EnergiayCC/04CambioClimatico/4aInventario/Ficheros/GHGemis-sions2019_acc.pdf.
Madrid City Council (2016), Climate change vulnerability study of the City of Madrid, https://www.madrid.es/UnidadesDescentralizadas/Sostenibilidad/EspeInf/EnergiayCC/04CambioClimatico/4bVul-nera/Ficheros/InfVulneraCC2015VerWeb.pdf.
Madrid City Council (2016), Detailed study on urban climate in Madrid, https://www.madrid.es/UnidadesDescentralizadas/Sostenibilidad/EspeInf/EnergiayCC/04CambioClimatico/4cEstuClimaUrb/Fiche-ros/EstuClimaUrbaMadWeb2016.pdf.
Madrid City Council, The green infrastructure and biodiversity plan of the city of Madrid, https://www.madrid.es/portales/munimadrid/es/Inicio/Medio-ambiente/Parques-y-jardines/Plan-de-Infraestructu-ra-Verde-y-Biodiversidad/?vgnextoid=5fdec0f221714610VgnVCM-2000001f4a900aRCRD&vgnextchannel=2ba279ed268fe410VgnVCM1000000b205a0aRCRD.
Life + RESPIRA (LIFE13 ENV/ES/000417) http://liferespira.com/lay-mans_report_life+respira.pdf.
7.3. MilanARPAE Emilia-Romagna, Agenzia prevenzione ambiente, energia Emil-
ia-Romagna, https://www.arpae.it/it.ENEA, Agenzia nazionale per le nuove tecnologie, l’energia e lo svilup-
po economico sostenibile, https://www.ENEA.it/it.
166
Fondazione Osservatorio Meteorologico Milano Duomo, https://www.fondazioneomd.it/.
Forestami: https://forestami.org/.H2020 Clever Cities: https://milanoclever.net/.Iucn, Unione Mondiale per la Conservazione della Natura, aiuta il mon-
do a trovare soluzioni pragmatiche per le sfide ambientali e di svilup-po più urgenti, http://www.iucn.it/.
LIFE VEG-GAP, VEGetation for Urban Green Air Quality Plans, https://lifeveggap.eu/.
Natured Based Solutions Città Metropolitana di Milano, https://www.cittametropolitana.mi.it/ambiente/SVILUPPO-SOSTENIBILE/NA-TURE-BASED-SOLUTION/index.html.
OASIS, School yards: https://www.uia-initiative.eu/en/uia-cities/par-is-call3.
Obiettivo 13, Promuovere azioni, a tutti i livelli, per combattere il cambia-mento climatico, Nazioni Unite Centro Regionale di Informazione del-le Nazioni Unite, https://unric.org/it/obiettivo-13-promuovere-azi-oni-a-tutti-i-livelli-per-combattere-il-cambiamento-climatico/.
Piano di Governo del Territorio, VAS Rapporto Ambientale.Profilo Climatico Locale per la città di Milano – Allegato n. 2, Piano Aria
e Clima del Comune di Milano, 2018.Strategia Nazionale di adattamento ai cambiamenti climatici-Ministero
dell’Ambiente e della tutela del Territorio e del Mare https://pdc.mi-nambiente.it/sites/default/files/allegati/strategia_nazionale_adatta-menti_climatici.pdf.
Tetro Tommaso, Cambiamenti climatici, a Milano le temperature crescono sempre più velocemente, 8 febbraio 2021, Rinnovabili.it: https://www.rinnovabili.it/ambiente/cambiamenti-climatici/cambiamenti-cli-matici-a-milano-le-temperature-crescono-sempre-piu-velocemente/.
8ADAM, Advanced geospatial DAta Management platform, https://
adamplatform.eu.Baumann P., Rossi A.P., Bell B., Clements O., Evans B., Hoenig H., Ho-
gan P., Kakaletris G., Koltsida P., Mantovani S., Marco Figuera R.,
166 167
Merticariu V., Misev D., Bang Pham H., Siemen S., Wagemann J. (2018), Fostering Cross-Disciplinary Earth Science Through Datacube Analytics. In book: Earth Observation Open Science and Innovation, January 2018, doi: 10.1007/978-3-319-65633-5_5 (https://www.researchgate.net/publication/322660086_Fostering_Cross-Disci-plinary_Earth_Science_Through_Datacube_Analytics).
ENEAGRID/CRESCO (Computational RESsearch Centre on COmplex systems https://www.ENEAgrid.ENEA.it/CRESCOportal/).
Garcia-Silva J., Gomez-Perez M., Palma R., Krystek M., Mantovani S., Foglini F., Grande V., De Leo F., Salvi S., Trasati E., Romaniello V., Albani M., Silvagni C., Leone R., Marelli F., Albani S., Lazzarini M., Napier H.., Glaves H.M., Aldridge T., Meertens C., Boler F., Loescher H.W., Laney C., Genazzio M.A., Crawl D., Altintas I. (2018), Enabling FAIR Research in Earth Science through Research Objects, in Journal, eprint = {1809.10617},url = {http://arxiv.org/abs/1809.10617}, Sep. 2018 (https://doi.org/10.1016/j.future.2019.03.046).
Life VEG-GAP Information platform (https://veggaplatform.enea.it/).Life VEG-GAP website (https://www.lifeveggap.eu/).Wagemann J., Clements O., Figuera M.R., Rossi A.P., Mantovani S.,
Geospatial web services pave new ways for server-based on-de-mand access and processing of Big Earth Data, in International Journal of Digital Earth, doi: 10.1080/17538947.2017.1351583 (https://www.tandfonline.com/doi/full/10.1080/17538947.2017.1351583).

168
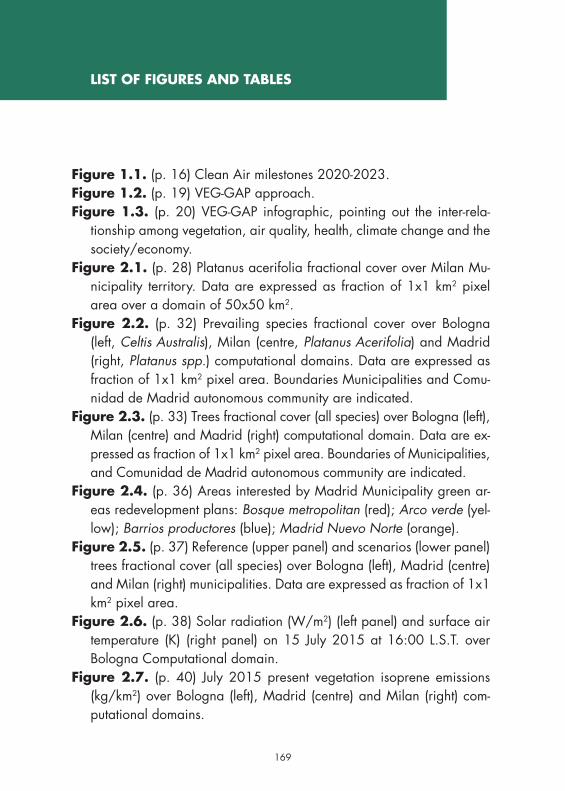
168 169
Figure 1.1. (p. 16) Clean Air milestones 2020-2023.Figure 1.2. (p. 19) VEG-GAP approach.Figure 1.3. (p. 20) VEG-GAP infographic, pointing out the inter-rela-
tionship among vegetation, air quality, health, climate change and the society/economy.
Figure 2.1. (p. 28) Platanus acerifolia fractional cover over Milan Mu-nicipality territory. Data are expressed as fraction of 1x1 km2 pixel area over a domain of 50x50 km2.
Figure 2.2. (p. 32) Prevailing species fractional cover over Bologna (left, Celtis Australis), Milan (centre, Platanus Acerifolia) and Madrid (right, Platanus spp.) computational domains. Data are expressed as fraction of 1x1 km2 pixel area. Boundaries Municipalities and Comu-nidad de Madrid autonomous community are indicated.
Figure 2.3. (p. 33) Trees fractional cover (all species) over Bologna (left), Milan (centre) and Madrid (right) computational domain. Data are ex-pressed as fraction of 1x1 km2 pixel area. Boundaries of Municipalities, and Comunidad de Madrid autonomous community are indicated.
Figure 2.4. (p. 36) Areas interested by Madrid Municipality green ar-eas redevelopment plans: Bosque metropolitan (red); Arco verde (yel-low); Barrios productores (blue); Madrid Nuevo Norte (orange).
Figure 2.5. (p. 37) Reference (upper panel) and scenarios (lower panel) trees fractional cover (all species) over Bologna (left), Madrid (centre) and Milan (right) municipalities. Data are expressed as fraction of 1x1 km2 pixel area.
Figure 2.6. (p. 38) Solar radiation (W/m2) (left panel) and surface air temperature (K) (right panel) on 15 July 2015 at 16:00 L.S.T. over Bologna Computational domain.
Figure 2.7. (p. 40) July 2015 present vegetation isoprene emissions (kg/km2) over Bologna (left), Madrid (centre) and Milan (right) com-putational domains.
LIST OF FIGURES AND TABLES
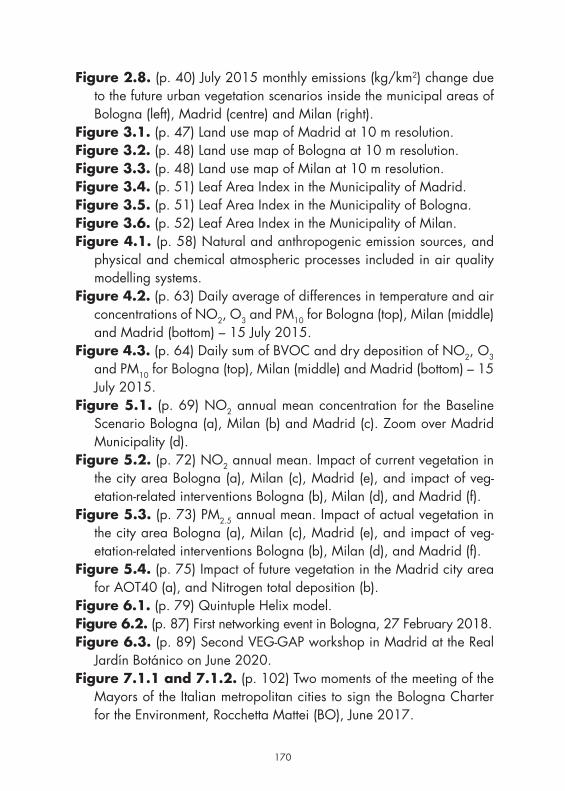
170
Figure 2.8. (p. 40) July 2015 monthly emissions (kg/km2) change due to the future urban vegetation scenarios inside the municipal areas of Bologna (left), Madrid (centre) and Milan (right).
Figure 3.1. (p. 47) Land use map of Madrid at 10 m resolution.Figure 3.2. (p. 48) Land use map of Bologna at 10 m resolution.Figure 3.3. (p. 48) Land use map of Milan at 10 m resolution.Figure 3.4. (p. 51) Leaf Area Index in the Municipality of Madrid.Figure 3.5. (p. 51) Leaf Area Index in the Municipality of Bologna.Figure 3.6. (p. 52) Leaf Area Index in the Municipality of Milan.Figure 4.1. (p. 58) Natural and anthropogenic emission sources, and
physical and chemical atmospheric processes included in air quality modelling systems.
Figure 4.2. (p. 63) Daily average of differences in temperature and air concentrations of NO2, O3 and PM10 for Bologna (top), Milan (middle) and Madrid (bottom) – 15 July 2015.
Figure 4.3. (p. 64) Daily sum of BVOC and dry deposition of NO2, O3 and PM10 for Bologna (top), Milan (middle) and Madrid (bottom) – 15 July 2015.
Figure 5.1. (p. 69) NO2 annual mean concentration for the Baseline Scenario Bologna (a), Milan (b) and Madrid (c). Zoom over Madrid Municipality (d).
Figure 5.2. (p. 72) NO2 annual mean. Impact of current vegetation in the city area Bologna (a), Milan (c), Madrid (e), and impact of veg-etation-related interventions Bologna (b), Milan (d), and Madrid (f).
Figure 5.3. (p. 73) PM2.5 annual mean. Impact of actual vegetation in the city area Bologna (a), Milan (c), Madrid (e), and impact of veg-etation-related interventions Bologna (b), Milan (d), and Madrid (f).
Figure 5.4. (p. 75) Impact of future vegetation in the Madrid city area for AOT40 (a), and Nitrogen total deposition (b).
Figure 6.1. (p. 79) Quintuple Helix model.Figure 6.2. (p. 87) First networking event in Bologna, 27 February 2018.Figure 6.3. (p. 89) Second VEG-GAP workshop in Madrid at the Real
Jardín Botánico on June 2020.Figure 7.1.1 and 7.1.2. (p. 102) Two moments of the meeting of the
Mayors of the Italian metropolitan cities to sign the Bologna Charter for the Environment, Rocchetta Mattei (BO), June 2017.
170 171
Figure 7.1.3. (p. 106) The sustainable development agenda 2.0.Figure 7.1.4. (p. 109) The logo of the Bologna’s Metropolitan Foresta-
tion.Figure 7.1.5. (p. 111) The Sun cycle lane.Figure 7.2.1. (p. 115) Graphics from the Madrid Air Quality and Cli-
mate Change Plan.Figure 7.2.2. (p. 116) The Madrid 360 Environmental Sustainability
Strategy icons.Figure 7.2.3. (p. 116) Map of the air quality monitoring stations in
Madrid.Figure 7.2.4. (p. 117) NO2 and PM2.5 emissions breakdown in Madrid.Figure 7.2.5. (p. 118) Emissions scenario for Madrid 2005-2050.Figure 7.2.6. (p. 119) GHC emissions trends in Madrid City.Figure 7.2.7. (p. 120) UHI impact map in Madrid.Figure 7.2.8. (p. 121) Madrid + Natural program graphic.Figure 7.2.9. (p. 122) The green infrastructure and biodiversity plan of
the city of Madrid visual identity.Figure 7.2.10. and 7.2.11. (p. 122) Madrid Metropolitan Forest
map and visual graphic.Figure 7.2.12. and 7.2.13. (p. 124) Images from the Life + RESPIRA,
focusing on the plant barriers to contrast pollutants’ dispersion.Figure 7.2.14. and 7.2.15. (p. 124) Images from the TECNAIRE
program.Figure 7.2.16. (p. 125) Images from the Air quality study in three schol-
ar environments in Madrid.Figure 7.2.17. (p. 126) Madrid trees inventory map.Figure 7.2.18. (p. 127) Madrid Arco Verde map.Figure 7.2.19. (p. 128) Madrid Nuevo Norte.Figure 7.3.1. (p. 133) Table S.03 “Green and Blue Infrastructure and
Municipal Ecological Network” of Service Plan of the city Masterplan.Figure 7.3.2. (p. 136) Urban green roof in Milano.Figure 7.3.3. (p. 137) Urban situation before de-paving work.Figure 7.3.4. (p. 137) Urban situation after de-paving works.Figure 8.1. (p. 141) VEG-GAP pipeline, from scientific data to the In-
formation Platform.
172
Figure 8.2. (p. 146) VEG-GAP information platform logical chart.Figure 8.3. (p. 146) VEG-GAP Information Platform key technologies
overview.Figure 8.4. (p. 147) VEG-GAP platform implementation plan.Figure 8.5. (p. 149) VEG-GAP platform – Graphical user interface start-
ing from a landing page (on the left) to access to the BASIC or AD-VANCED version (on the right).
Figure 8.6. (p. 150) From BASIC platform – Daily map of the temperature variation (with and without vegetation) on Bologna in a summer day and temporal analysis at different resolution (hourly, in case of daily map, daily, in case of a monthly map and monthly in case of an annual map).
Figure 8.7. (p. 151) ADVANCED platform: panel for selection of the area (left) and panel for the selection of the product (right).
Figure 8.8. (p. 152) ADVANCED platform: example of time series com-parison (upper and bottom right screenshot), subset visualization (bot-tom left).
Table 2.1. (p. 26) Basal emission factors (μg gdw-1 h-1) for selected tree species and different organic compounds: ISOP = isoprene, MTS = synthesis monoterpenes (depending on both temperature and light), MTP = pool monoterpenes (depending on temperature only), SQT = sesquiterpenes, OVOC = oxygenated volatile organic compounds.
Table 2.2. (p. 28) Data available for each tree included in municipal urban vegetation inventories.
Table 2.3. (p. 29) Ranking of the 18 most relevant species in term of percent of the total area covered by trees in the VEG-GAP project cities. Colors identify same species in different cities.
Table 2.4. (p. 31) Land cover datasets used to build the reference veg-etation maps.
Table 3.1. (p. 45) Main species representative of the city of Bologna, Madrid and Milan with their relative frequencies. Colors identify same species in different cities.
Table 6.1. (p. 81) VEG-GAP advisory board composition.Table 6.2. (p. 83) VEG-GAP Networking with other Life and/or non-Life
projects.
172 173
Table 7.1. (p. 94) Description of three pilot cities.Table 7.2.1. (p. 115) Atmospheric pollutants trend in Madrid over the
last 10 years.Table 8.1. (p. 144) Issues and related questions for citizens on which
the Information platform Basic version is based.

174
174 175
Alessandro Alivernini is researcher at CREA, he is an expert in gemo-matics applied to forestry resources. He is also involved in national projects dealing with precision forestry techniques applied to the forestry sector.
Juan Manuel de Andrés Almeida has a PhD in Environmental Engi-neering and is Lecturer at the Department of Chemical and Environmental Engineering of the Universidad Politécnica de Madrid (UPM). He current-ly combines his research activity on air quality and climate change with the participation in studies on energy production, waste valorization and waste management through the application of the Life Cycle Analysis methodology.
Rafael Borge holds a PhD in Environmental Engineering. Associate pro-fessor at the Department of Chemical and Environmental Engineering of the Universidad Politécnica de Madrid (UPM) and visiting scientist at the Harvard School of Public Health. His research focuses on urban air quali-ty and population exposure to air pollution in a context of climate change.
Marino Cavallo is the head of the “Research, Innovation and European projects management” Service at Metropolitan city of Bologna, and con-tract professor at the University of Bologna. Currently is local coordinator for more than 10 European project and project coordinator for the Inter-reg Adrion CREATURES project.
David de la Paz has a PhD in Environmental Engineering and is a hired researcher in the Life Veg Gap project. He is an expert on air qual-ity modelling, development of emission scenarios and simulation of air pollution impacts.
Silvano Fares is Research Director at the National Research Council of Italy and associated to CREA. He is a plant ecologist, with skill in measur-ing and modelling interactions between plant and the atmosphere.
AUTHORS
176
Sandro Finardi (ARIANET), physicist, meteorology and air quality mod-eller, atmospheric boundary layer meteorology expert, surface-atmosphere interaction, long range transport of desert dust and wildfires smoke. His con-tribution to VEG-GAP was focused on vegetation mapping from continental to urban scale and on the BVOC emission impact on urban air quality.
Simone Mantovani, Owner and Managing partner of MEEO S.r.l. Project manager in the Information Platform implementation action of the Life VEG-GAP project.
Marta Mauri is graduated in law in 2015 and worked as Project Man-ager for the Resilient City Project Department of the City of Milan for the Life VEG-GAP project. Since 2021 she has been working as a legal-ad-ministrative consultant for AMAT – Mobility, Environment and Territory Agency, in the team dealing with energy and thermal systems.
Mihaela Mircea holds a PhD in Physics and has expertise in atmo-spheric chemical and physical processes involved in air pollution and climate change. Her activities are devoted to improve the modelling ap-proaches used in reconstruction of atmospheric properties for the purpose of supporting the environmental policies at national and European levels. She is project coordinator for the Life VEG-GAP project.
Adolfo Narros holds a PhD in Chemistry. Associate professor at the De-partment of Chemical and Environmental Engineering of the Universidad Politécnica de Madrid (UPM). He is an expert on atmospheric chemistry and air quality monitoring.
Stefania Pasetti, Project manager and project support officer at MEEO S.r.l. Technical project manager in the Information Platform implementa-tion action of the Life VEG-GAP project.
Piero Pelizzaro has 10 years of experience in climate change policies and urban resilience planning with local public and private entities. Cur-rently he is the Milan Chief Resilience Officer and the City Lead for the H2020 Lighthouse project Sharing Cities at the Municipality of Milan.
Nicola Pepe (ARIANET), Phd, engineer, air quality modeler specialized in source apportionment analysis and emission treatment. His contribution
176 177
to VEG-GAP was focused on translation of Milan and Madrid municipal-ities urban vegetation scenarios into different BVOC emissions using GIS (geographical information system).
Ettore Petralia, biologist, holds a PhD in in Entomological Sciences and the Defense of Agro-ecosystems and has expertise in air quality and air pollution study, working on characterization of air pollutants and source apportionment. He has also experience in the field of ecology, environ-mental assessment and territorial planning.
Elisa Pighi is European projects officer at the Metropolitan city of Bolo-gna, she has been working for several year in the management of Europe-an projects aimed at social inclusion, adult training and, recently, focused on sustainable development.
Camillo Silibello (ARIANET), physicist, regional air quality modeller, atmospheric chemistry expert, data fusion/assimilation, estimation of bio-genic, natural and forest fire emissions, co-author of the Flexible Air qual-ity Regional Model (FARM). His contribution to VEG-GAP was focused on the development and application of the BVOC Plant Specific Emission Model (PSEM).
Valeria Stacchini, architect, senior project manager at the Metropoli-tan city of Bologna, has a 15 years experiences in sustainable develop-ment and European projects, having contributed to over 30 ventures. Cur-rently she is ambassador in the Connecting Nature Enterprise Platform.
Luis Tejero Encinas is Senior Officer at Department of Climate Change. Madrid City Council. Agricultural Engineer and Master in City Science. Currently coordinator of city adaptation to climate change programs and the life VEG-GAP project in Madrid municipality.
Elisa Torricelli is graduated in Environmental Architecture, she works as an urban planner contributing to the design of city Master Plans for the Lombardy Region’ Municipalities and other local climate strategies. She worked as Project Officer for the Resilient City Project Department of the City of Milan for the Life VEG-GAP project.
Marina Trentin is graduated in Environmental Sciences; she has a 15 years experiences on the topics of water and natural resources manage-
178
ment in a changing climate, with a focus in the last 10 years on sustain-ability and urban regeneration through the use of Nature-Based Solutions, leveraging ecosystem services to improve the quality of life and environ-ment in cities, in response and adaptation to climate change.
Ilaria Zappitelli is PhD student at the University of Tuscia, Viterbo, her interest is on urban plants and their capacity to provide Ecosystem Services. She is involved in field measurements and modelling pollutants sequestration by urban trees.

178

Printed in Italy
May 2022