Embed Size (px)
Citation preview

NOS - KLIMA- OG MILJØDEPARTEMENTET - REDD -
KLIMAVERIFIKASJON
Verification of Interim REDD+ Performance indicators under
the Guyana-Norway REDD+ partnership (Year 4) Ministry of Environment– Government of Norway
Report No.: Z0512818, Rev. 1
Document No.: Not applicable
Date: 12 April 2015

DNV GL – Report No. Z0512818, Rev. 1 – www.dnvgl.com Page i
Project name: NOS - Klima- og miljødepartementet - REDD -
Klimaverifikasjon
DNV GL AS
Assessement Services Norway
Veritasveien 1
1322 Høvik, Norway
Tel: +47 67 57 99 00
NO 945 748 931
Report title: Verification of Interim REDD+ Performance
indicators under the Guyana-Norway REDD+
partnership (Year 4)
Customer: Ministry of Environment– Government of Norway,
P.B. 8013 Dep, 0030 Oslo
Contact person: Maarten van der Eynden
Date of issue: 12 April 2015
Project No.: PRJC-512818-2014-AST-NOR
Organisation unit: Business Assurance
Report No.: Z0512818, Rev. 1
Document No.: Not applicable
Task and objective:
DNV GL AS (DNV GL) has been commissioned by the Ministry of Environment– Government of Norway
to perform a verification of the Interim Performance Indicators reported for the period 1 January 2013 to
31 December 2013 – Year 4 as described in the Guyana REDD+ Monitoring Reporting and Verification
System (MRVS) - Interim Measures Report, Version 3 dated 27 February 2015 produced by the Guyana
Forestry Commission – Government of Guyana.
This report provides the verification methodology, results and statement.
Prepared by: Verified by: Approved by:
"Edwin Aalders"
"Team Leader"
"Andres Espejo"
"Technical Reviewer"
"Trine Kopperud"
Assessment Services Manager Nordic
"Pablo Reed"
Auditor
"Vincent Schut"
"GIS Specialist"
☒ Unrestricted distribution (internal and external) Keywords:
REDD, Norwegian-Guyana Partnership, Forestry,
UNFCCC
☐ Unrestricted distribution within DNV GL
☐ Limited distribution within DNV GL after 3 years
☐ No distribution (confidential)
☐ Secret
Reference to part of this report which may lead to misinterpretation is not permissible.
Rev. No. Date Reason for Issue Prepared by Verified by Approved by
0 2015-03-13 First issue Edwin Aalders Guyana Forestry
Commission
1 06 April 2015 Second issue Edwin Aalders Andres Espejo
2 12 April 2015 Final issue Edwin Aalders Andres Espejo Trine Kopperud

DNV GL – Report No. Z0512818, Rev. 1 – www.dnvgl.com Page ii
Table of contents
1 DNV GL VERIFICATION STATEMENT .................................................................................. 1
2 INTRODUCTION .............................................................................................................. 4
1 BASIS OF VERIFICATION ................................................................................................. 4
1.1 Level of assurance 4
1.2 Objectives 5
1.3 Criteria 5
1.4 Scope 5
1.5 Materiality 6
2 METHODOLOGY .............................................................................................................. 7
2.1 Review of documentation 7
2.2 Site visit 7
2.3 Reporting of findings 8
3 MAIN PART OF THE REPORT ............................................................................................. 9
2.4 Interim indicator 1.1 - Gross Deforestation 9
2.5 Verification of Interim indicator 2.1 - Loss of intact forest landscapes 13
2.6 Verification of Interim indicator 2.2 - Forest Management 14
2.7 Verification of Interim indicator 2.3 - Carbon loss as indirect effect of new infrastructure 20
2.8 Verification of Interim indicator 2.4 – Emissions resulting from subsistence forestry, land use and shifting cultivation lands (i.e. slash and burn agriculture) 21
2.9 Verification of Interim indicator 2.5 - Emissions resulting from illegal logging activities 22
2.10 Verification of Interim indicator 2.6 - Emissions resulting from anthropogenically caused forest fires 23
2.11 Verification of Interim indicator 3.1 – Encouragement of increasing carbon sink capacity of non-forest and forest land 24
3 COMMENTS BY STAKEHOLDERS TO REPORT .................................................................... 24
3.1 Received comments and response by the Guyana Forestry Commission 27
4 REFERENCES ................................................................................................................ 63

DNV GL – Report No. Z0512818, Rev. 1 – www.dnvgl.com Page 1
1 DNV GL VERIFICATION STATEMENT
Verification Objective
DNV GL AS (DNV GL) has been commissioned by the Norwegian Ministry of Environment* to
perform a verification of the Interim Performance Indicators under the Guyana-Norway partnership
on REDD+ as reported in the Interim Measures Report†
Verification Scope
The relevant list of indicators for this verification is found from the most recent version of the Joint
Concept Note (31 March 2011). The scope of this verification covers the following deforestation and
degradation indicators.
Report
Measure
Measure
Ref
Indicator
Deforestation
Indicators
1 Indicator 1: Gross Deforestation rate
Degradation
Indicators
2 Indicator 2.1: Loss of intact forest landscapes
3 Indicator 2.2: Forest Management (i.e. selective
logging activities in natural or semi
natural forests
2b Indicator 2.3: Carbon loss as indirect effect of new
infrastructure.
4 Indicator 2.5: Emissions resulting from illegal logging
activities.
5 Indicator 2.6: Emissions resulting from
anthropogenic forest fires.
For this monitoring period there are a few indicators that are not required to be reported by the
JCN in the current monitoring period and therefore have not been considered within the scope of
this statement. These are:
Degradation
Indicators
6 Indicator 2.4: Emissions resulting from subsistence
forestry, land use and shifting
cultivation lands (i.e. slash and burn
agriculture)
Indicator on
increased
carbon removals
7 Indicator 3.1: Encouragement of increasing carbon
sink capacity of non-forest and forest
land
In addition, DNV GL has assessed if the changes in the methodology applied for the determination
of each Interim Performance Indicator in the previous verification period, particularly those
obtained via geographical analysis, follows good practices as defined by a number reference
documents (see below).
* Contract and scope signed between The Norwegian Ministry of Environment and DNV on 10 January 2011
† Guyana REDD+ Monitoring Reporting and Verification System (MRVS) - Interim Measures Report, Guyana Forestry Commission, 16
March 2011

DNV GL – Report No. Z0512818, Rev. 1 – www.dnvgl.com Page 2
The geographical boundary of the verification is Guyana and the time period covered is 1 January
2013 to 31 December 2013 – Year 4.
Materiality
No level of materiality has been fixed by the Norwegian Ministry of Environment for this verification
so any individual or aggregate errors, omissions and misrepresentations which result in
discrepancies have been considered as material and requested to be corrected if feasible. This does
not include individual or aggregate level of error associated with technical equipment (e.g. sensors)
or remote sensing methods (e.g. visual interpretation). However, for Indicator 1 – gross
deforestation rate and Indicator 2.1 - Loss of intact forest landscapes, have been addressed by an
independent accuracy assessment.
Verification criteria
The following reference requirements have been considered during the verification by DNV GL:
Join Concept Note on REDD+ cooperation between Guyana and Norway, Section 3: REDD-plus performance Indicators (dated 9 November 2009 and its amendment of March 2010 and March 2011).
GOFC-GOLD REDD Source Book (2014).
IPCC Guidelines for National Greenhouse Gas Inventories (2006) – Volume 4 Agriculture, Forestry and Other Land Use.
Good Practice Guidance and Uncertainty Management in National Greenhouse Gas Inventories (2000) – Chapter 4: Agriculture; Chapter 6: Quantifying; Chapter 8:Quality Assurance and
Quality Control.
Verification activities
The verification has been guided by the provisions of ISO 14064-3 (1 ed., 2006) that cover the
validation and verification of greenhouse gas assertions.
The verification took place from 01 October 2013 until 24 February 2014 and included desk reviews
of relevant documentation and datasets as listed in the verification report and an on-site
assessment in Guyana from 21 November 2013 to 26 November 2013.
As part of the verification, the results of the independent accuracy assessment included in the
Interim Measures Report dated 27 February 2015 were verified.
Conclusions
It is DNV GL’s opinion that the results provided in the Interim Measures Report by Guyana Forestry
Commission dated 27 February 2015 :
have been obtained applying methodologies in accordance with internationally accepted good
practices as defined by the verification criteria;
are free from omissions and misrepresentations that could lead to material misstatements.
Furthermore, recommendations for improvements in future monitoring periods are summarised as
Minor Corrective Action Requests (MINORs) or Observations. These MINORs and Observations are
listed in Appendix A of the Verification Report.

DNV GL – Report No. Z0512818, Rev. 1 – www.dnvgl.com Page 3
DNV has verified that the values for the interim indicators in this monitoring period (1 January
2013 to 31 December 2013 – Year 4) are:
Measure
Ref Indicator Year 4 results
1 Indicator 1: Gross Deforestation rate in Year 3 0.068%
2 Indicator 2.1: Loss of intact forest landscapes 7 604 425 ha
(155 ha loss)
2b Indicator 2.3: Carbon loss as indirect effect of new infrastructure.
4 352 ha
3 Indicator 2.2: Forest Management 3 106 693 tCO2
4 Indicator 2.5: Emissions resulting from illegal logging activities. 11 533 tCO2
5 Indicator 2.6: Emissions resulting from anthropogenic forest
fires.
395 ha/year
6 Indicator 2.4: Emissions resulting from subsistence forestry,
land us and shifting cultivation lands (i.e. slash and burn agriculture)
765 ha/yr*
Statement Issuing date
12 April 2015
Edwin Aalders Trine Kopperud
Team Leader Assessment Services Manager Nordics
DNV GL AS
-----END OF STATEMENT----
* Indicator 2.4 was reported for the first time by the Guyana Forestry Commission but is not part yet of the performance assessment.
DNV GL assess ed the accuracy and methodology as part of the overall system improvement process.

DNV GL – Report No. Z0512818, Rev. 1 – www.dnvgl.com Page 4
2 INTRODUCTION
DNV GL AS (DNV GL) has been contracted by the Ministry of Environment– Government of Norway
to perform a non-accredited verification of Interim REDD+ Performance indicators under the
Guyana-Norway REDD+ partnership. According to the Joint Concept Note (JCN) signed between
both parties, these indicators will serve to evaluate Guyana’s performance regarding REDD+ until a
MRV system is in place which will serve to accurately monitor the emissions from deforestation
/53/.
DNV GL has been tasked to verify the results in deforestation and forest degradation as measured
using the interim indicators established in the Joint Concept Note, specifically as outlined below and
as detailed in the JCN Table 2, pages 18-24 /53/:
Gross Deforestation in the period from 1 January 2013 to 31 December 2013 – Year 4;
Loss of intact forest landscapes;
Forest Management;
Carbon loss as indirect effect of new infrastructure;
Emissions resulting from illegal logging activities;
Emissions resulting from anthropogenically caused forest fires;
1 BASIS OF VERIFICATION
In order to verify the Interim Performance Indicators, DNV GL has followed the principles and
requirements for verifying GHG inventories and validating or verifying GHG projects defined by ISO
14064-3 /20/. This standard has served as guidance for the definition of the verification plan but it
is important to note that this is not an accredited verification applying ISO 14064-3.
1.1 Level of assurance
According to ISO 14064-3, the level of assurance is used to determine the depth of detail that a
verifier designs into their validation or verification plan to determine if there are any material errors,
omissions or misrepresentations /20/. There are two levels of assurance, reasonable or limited. The
level of assurance affects the relative degree of confidence the verifier requires in order to make a
conclusion /20/ and the wording in the validation or verification statements.
For a reasonable level of assurance, the validator or verifier provides a reasonable, but not
absolute, level of assurance that the responsible party's assertion is materially correct /20/.
Verification of Interim Performance Indicators – 2 STEP PROCESS
1. Validation of Methodology:
The methodology employed for
the determination of each
Interim Performance Indicator
will be validated against relevant
Criteria.
2. Verification of results:
A verification that the
approved methodology has
been applied correctly and give
consistent results to those reported.
ISO 14064-Part 3: Specification with guidance for the validation and
verification of greenhouse gas assertions

DNV GL – Report No. Z0512818, Rev. 1 – www.dnvgl.com Page 5
A limited level assurance is distinguishable from a reasonable level assurance in that there is less
emphasis on detailed testing of data and information supplied to support the assertion /20/.
The verification team has designed the verification plan in order to attain a reasonable level of
assurance in the verification of the Interim Performance Indicators.
1.2 Objectives
The objective of the verification is to provide stakeholders with a professional and independent
verification of the results reported in the Guyana REDD+ Monitoring Reporting and Verification
System (MRVS) - Interim Measures Report (Version 3 of 27 February 2015 ) on deforestation and
forest degradation as measured using the Interim Measures Indicators.
This includes:
- Methodology validation; conformance of the analysis methodology and the monitoring system in place against applicable validation/verification criteria;
- Verification that the validated methodology has been followed to obtain the reported results;
- Verification of the results of the Interim Performance Indicators reported in the IMR;
- Verification that the comments from stakeholders have been taken into account in the IMR;
1.3 Criteria
According to the ISO14064-3 the validation/verification criteria would be the “policy, procedure or
requirement used as a reference against which evidence is compared” /20/. Therefore, the
validation of the analysis methodology and the verification of the reported results would be done
against these criteria:
- Validation criteria
Main Criteria - Joint Concept Note (i.e. Section 3: REDD-plus performance Indicators) /53/;
GOFC-GOLD REDD Source Book, 2014 /54/;
2006 IPCC Guidelines /55/;
Approved REDD methodologies under the VCS programme /64/;
Peered reviewed publications /61/
1.4 Scope
According to ISO 14064-3, in determining the validation or verification scope, the validator or
verifier should consider the extent and boundaries of the validation or verification process /20/.
Taking into consideration the TOR of the assignment /59/ and the provisions of the JCN /53/ the
scope of the verification consists in the verification of the following deforestation and degradation
Interim Measures Indicators as described in the JCN /53/:
Report Measure Measure
Ref
Indicator
Deforestation
Indicators
1 Indicator 1: Gross Deforestation rate
Degradation
Indicators
2 Indicator 2.1: Loss of intact forest landscapes
3 Indicator 2.2: Forest Management (i.e. selective
logging activities in natural or semi
natural forests

DNV GL – Report No. Z0512818, Rev. 1 – www.dnvgl.com Page 6
2b Indicator 2.3: Carbon loss as indirect effect of new
infrastructure.
4 Indicator 2.5: Emissions resulting from illegal
logging activities.
5 Indicator 2.6: Emissions resulting from
anthropogenic forest fires.
6* Indicator 2.4: Emissions resulting from subsistence
forestry, land us and shifting
cultivation lands (i.e. slash and burn
agriculture)
Furthermore the specific verification scope for these indicators is:
- Geographical boundaries: Guyana
- Organizational boundaries: Guyana Forestry Commission (GFC)
- Physical infrastructure, activities, technologies and processes of the organization: GFC Geographic Information System and Wood Chain of Custody System.
- Time period(s) to be covered: Monitoring period: Year 4 (1 January 2013 to 31 December 2013)
- Frequency of subsequent verification processes: Yearly verification
- Intended user for the verification statement: Government of Norway and Government of Guyana
1.5 Materiality
According to ISO 14064-3 materiality is the “concept that individual or the aggregation of errors,
omissions and misrepresentations could affect the assertion and could influence the intended users
decisions” /59/. The concept of materiality is used when designing the validation or verification and
sampling plans to determine the type of substantive processes used to minimize risk that the
verifier will not detect a material discrepancy /59/.
In order to be consistent with the stated level of assurance, a verification plan and an intensive
sampling plan have been designed to minimize risks that a material discrepancy would not be
detected.
No level of materiality has been fixed so any individual or aggregate errors, omissions and
misrepresentations that can be quantified which result in discrepancies have been considered as
material and requested to be corrected.
* Indicator 2.4 was reported for the first time by the Guyana Forestry Commission but is not part yet of the performance assessment.
DNV GL assess the accuracy and methodology as part of the overall system improvement process.

DNV GL – Report No. Z0512818, Rev. 1 – www.dnvgl.com Page 7
2 METHODOLOGY
The verification of the results has assessed all factors and issues that constitute the basis for the
interim measures indicator’s results. These include:
i) Guyana REDD+ Monitoring Reporting and Verification System (MRVS) - Interim Measures Report /1/;
ii) Geo-database with all the raw and processed datasets /2/;
iii) Database of wood harvesting declarations of wood extraction activities in lands classified as State Forest /5/;
iv) Database of wood harvesting declarations of wood extraction activities in lands classified as
Amerindian or Private Property /6/;
v) Database of Procedural Breaches for the four forestry divisions of Bce, Dem, Ess and Nwd /4/;
vi) Database of Illegal logging activities for the four forestry divisions of Bce, Dem, Ess and Nwd /3/;
Verification team
Role Last Name First Name Country
Type of involvement
Desk r
evie
w
Site v
isit
Report
ing
Superv
isio
n
of
work
Technic
al re
vie
w
Secto
ral
com
pete
nce
Team leader Aalders Edwin Norway
Independent Expert
Schut Vincent The Netherlands
Validator Reed Pablo United States of America
Internal Peer Reviewer
Espejo Andrés B. Spain
Duration of verification
Preparations: From 01 December 2014 to 09 February 2015
On-site verification: From 10 February 2015 to 16 February 2015
Reporting, calculation checks and QA/QC: From 17 February 2015 to : 12 April 2015
2.1 Review of documentation
In order to define the verification and sampling plan the verification team performed a review of all
the documentation provided. This included the revision of the IMR /1/, and also a desk review of
the GFC’s database with all the raw datasets and the processed datasets /2/.The verification team
also reviewed the Standard Operating Procedures (SOP) followed by the GFC for the forest
monitoring and the issuance of various permits /21//22//23//24//25//26//27//28//29//30/. This
served to detect the process operations with the highest levels of risk of material discrepancy, and
to consequently design the verification and sampling plan on the basis of this information.
2.2 Site visit
An on-site assessment was performed from 10 February 2015 to 17 February 2015; partly in GFC’s
main headquarters located in Georgetown, and partly in GFC’s forest stations of Linden, Vaitarna
Forest Concession and the base camp of Vaitarna, and the shifting cultivation areas east of Lethem.

DNV GL – Report No. Z0512818, Rev. 1 – www.dnvgl.com Page 8
After the definition of the final verification and sampling plan, the actual verification on-site
assessment was performed. During these days two different verification teams were created to
focus on specific indicators:
Team 1 – remote sensing and GIS: This team carried out the verification of the Indicators 1, 2.1,
2.3, 2.4, 2.5 and 2.6. This verification took place in GFC’s GIS office and by on-site
verification in the area around Lethem.
Team 2 – forest management and illegal logging: This team carried out the verification of
Indicators 2.2, 2.5 and 2.6. A verification of GFC’s databases was carried out on the first
and last day of the audit, and which was supported by a field visit to GFC’s forest stations
and was carried out in the forest concession in and around Vaitarna Holdings PVT. INC., to
allow cross-checking of information and interview of respective staff and/or stakeholders.
On 16 February 2015 a closing meeting with a preliminary reporting of the findings of the
verification took place in the GFC’s headquarters.
2.3 Reporting of findings
A major corrective action request (MAJOR) is issued, where:
i. the evidence provided to prove conformity is insufficient; ii. mistakes have been made in applying assumptions, data or calculations which could have a
material influence on the results; iii. non-compliance with relevant criteria;
A minor corrective action request (MINOR) is issued where:
i. the evidence provided to prove conformity is insufficient but does not lead to breakdown in the systems delivery;
ii. mistakes have been made in applying assumptions, data or calculations which could have an influence on the future results;
iii. if a certain aspect has to be verified in the next verification event (e.g. foreseen modifications, etc.)
An observation shall be raised by the team as a team’s recommendation in relation to future
improvements of the analysis process or the monitoring of the interim measures indicators.
During the audit the team can also raise a clarification request (CL) when it has found that
information is insufficient or not clear enough to validate or verify against applicable criteria.
The results are discussed in Chapter 4 and findings are listed in Annex A.

DNV GL – Report No. Z0512818, Rev. 1 – www.dnvgl.com Page 9
3 MAIN PART OF THE REPORT
2.4 Interim indicator 1.1 - Gross Deforestation
2.4.1 Methodology validation
a Methodology description
For Year 4, the GFC again tasked and acquired full wall to wall coverage of Guyana with 5m
RapidEye data. For almost every RapidEye scene footprint, three or more acquisitions were
available, enabling the GFC to use an image from a different date in case of clouds.
For Year 3, the GFC acquired full image swaths from RapidEye and performed the geo-registration
of these, which is a tedious job. An agreement with RapidEye was made to give them the resulting
geo-registration information (control points), and have RapidEye perform the geo-registration
using the points from the RP. For Year 4 this meant a lot less pre-processing work for the GFC
because RapidEye is now delivered in correctly geo-registered image tiles.
In addition to the RapidEye images, full Landsat 8 (30m) coverage was acquired to assist for areas
with persistent cloud cover in the RapidEye imagery. The resulting persistent cloud cover after
integrating the different datasets is equivalent to 0.2% of the total area in Year 4.
Ancillary FIRMS (MODIS) fire hotspot data were acquired and used to aid in the classification of
areas deforested due to fires.
DNV GL has observed that the Year 4 processing and mapping is essentially the same as in Year 3
and can be summarized by the following steps: 1) pre-processing of RapidEye data; 2) generating
EVI based change polygons; 3) manually digitizing forest change and degradation. The pre-
processing and EVI polygon creation have been largely automated as batch processes in Year 4.
The RapidEye processing consists of the following steps:
Conversion from DN to top-of-atmosphere reflectance
Radiometric normalization by Dark Object Substraction (DOS)
EVI calculation
EVI thresholding on forest/nonforest boundary value
Filtering the resulting forest/nonforest image (“clump and sieve filter”)
Conversion of the non-forest areas to polygons
In addition, a persistent cloud mask image is calculated, showing the areas which are cloudy on all
available RapidEye images.
The resulting intermediate images from each processing step and the EVI threshold value used are
saved for later reference.
This finishes the pre-processing phase, which has largely been automated. From here on, the
mapping process starts, which is entirely manual. the GFC has divided Guyana into 24 km x 24 km
tiles and each GIS operator gets allocated a set of tiles. Each tile is again divided into 1 km x 1 km
blocks, which are visited one by one by the operator. In every block, the new EVI polygons are
checked with the available RapidEye imagery to decide if it indicates a deforestation event. If the
polygon coincides indeed with a deforestation event and exceeds the 1 ha MMU, the extent of the
polygon is edited (if necessary). In order to establish the changes over time, reference images

DNV GL – Report No. Z0512818, Rev. 1 – www.dnvgl.com Page 10
from the other periods (e.g. P1, P2, P3, Year 1*, etc.) are used, whereby the current landcover, the
driver of the change, a reference to the image on which the change was based and the last image
in the database where the area was still forest are entered and saved into the GIS database. As
part of the quality control measures set up by GFC, a toolbar has been developed to ease this
process and ensure that all data is complete and that no invalid combinations can be entered. After
all polygons in the block have been inspected, the block is inspected for changes that the EVI
threshold might have missed. Areas that are identified as being missed areas of deforestation and
that exceed the MMU threshold are consequently mapped and included in the GIS database.
Finally, before the operator visits the next 1 km x 1 km block, a degradation analysis is done for
the newly found areas with the block that represent a change. Older mining or infrastructure
deforestation polygons are revisited to check for possible new degradation around these features.
For this the same toolbar is being used.
All Land Cover mapping is done following specific mapping Standard Operating Procedures (SOPs)
/19/, which ensures full consistency in the interpretation and data treatment. Considering this,
training procedures in place, and the establishment of automatic operations in the processing
change, it is confirmed that enough Quality Control (QC) procedures are in place to provide reliable
mapping results.
When the GIS operator is finished with a 24 km x 24 km tile, it is saved in a standardized way into
the system and passed onto Quality Assurance (QA). During the Quality Assurance stage the data
in the database is checked for inconsistencies, and the mapped polygons are all checked visually
for correctness. Errors are corrected, and discussed with the relevant GIS operator. 100% of the
tiles are subject of the QA procedure.
DNV GL has verified this process with the mapping of the SOP /1/ and confirms that the team
operates in line with the guide. The system is set up to automate those steps that can be
automated, thereby minimizing risk of errors, and the mapping process itself is structured by using
a series of toolbars which guides the operator through the process and performs basic checks to
ensure that all data has been entered.
b Validation criteria and Indicators
Criteria noted in the JCN /53/ requires: 1) assessment of the rate of conversion of forest area as
compared to an agreed reference level; 2) forests are defined by Guyana in accordance with the
Marrakech accords; 3) conversion of natural forests to tree plantations shall count as deforestation
with full carbon loss; 4) forest area converted to new infrastructure, including logging roads, shall
count as deforestation with full carbon loss; 5) forest cover on 1 October 2010 will be used as a
baseline for monitoring gross deforestation; 6) reporting is to be based on medium resolution
satellite imagery and in-situ observations where necessary; and, 7) monitoring shall detect and
report on expansion of human infrastructure (e.g. new roads, settlements, pipelines,
mining/agriculture activities etc.). The provisions made in the JCN /53/ were considered in the
definition of the analysis methodology.
The verification team examined each area of the GIS and remote sensing methods used against
recommended and suggested actionable criteria in the guidance documents (JCN /53/, GOFC-GOLD
REDD Sourcebook /54/, and 2006 IPPC Guidelines (GL) /55/ to validate the methodology for
measurement of gross deforestation followed by the RP. Specific areas included: geometric
correction, radiometric normalization, cloud-masking, forest/non-forest assessment, and mapping
* P1=1990-1999, P2=2000-2005, P3=2005-2009 and Year 1=2009-2010. These periods are defined in Year 1 Verification Report/63/

DNV GL – Report No. Z0512818, Rev. 1 – www.dnvgl.com Page 11
quality control and assessment. In addition an independent accuracy assessment has been
performed by the Durham University.
c Validation of methodology against criteria
Generation of deforestation datasets
The GFC follows a hybrid method of automated and manual mapping. Automated tasks are used for
procedures that are largely independent of local image circumstances, and manual processing is
used where automated processing would probably introduce errors due to inconsistencies in image
characteristics, which automation often has difficulties to deal with. The main reason for using
manual digitizing is the excess in cloud cover of the datasets which made it practically impossible
to use automated methods as recommended in the GOFC-GOLD REDD sourcebook /54/. However,
the applied methods are in line with the GOFC-GOLD REDD Sourcebook as they rely on multi-date
imagery and focusing on the forest change by updating forest cover maps of previous epochs (pre-
classification). Furthermore, the GFC applied QA/QC measures through the establishment of SOPs,
establishment of automatic operations, and revisiting of 100% of the 24 km x 24 km grid cells used
for aiding the visual interpretation which has been verified as having reduced the human error /1/.
Independent accuracy assessment
Additionally, and independent accuracy assessment is conducted as a verification procedure as
defined by the 2006 IPCC GL. The verification team checked the methodology followed for this
assessment /18/. According to this document /18/, builds further on the Year 3 sampling design, in
order to generate a reference change dataset. Using a reference change dataset instead of a new
random sampling reduces the uncertainties in forest change estimates, and allows getting
confidence intervals for the change estimates.
The Year 4 sampling design uses the same two-stage sampling with stratification on the primary
units (being the GeoVantage flight strips of 5x15km). The primary units are stratified using a high-
risk (for forest change) and a low-risk stratum. The stratification and selection of the primary units
within each stratum were the same as in Year 3, thus generating a reference change dataset. In
total, 143 primary sampling units with more than 300 secondary sampling units each were used.
The calculations for the AA for Year 4 have all been implemented in R and the R survey package. R
is an open source statistics package comparable to SAS (and a defacto academic standard). This in
principle allows for a check by repeating the calculations, when GFC would decide to make the AA
data and R scripts public, as the R software is freely available.
The methodology followed meet best practice guidelines in terms of sample design and accounting
for national conditions and capabilities /54/.
Conclusion
The verification team concludes that the analysis methodology used by the GFC meets the
applicable criteria, defined by the JCN /53/, GOFC-GOLD REDD Sourcebook /54/, and 2006 IPPC
Guidelines (GL) /55/. The verification team also concludes that the change of the AA to a reference
change dataset is an improvement over the approach of Year 3 and earlier, as it allows for better
estimates of the forest change certainties and their confidence limits. The verification team also
concludes that the comments by DNV GL and Norway of last year have been addressed properly,
the AA uses the correct formulas and the description of the sampling design in the AA report has
been improved and made consistent.
2.4.2 Verification of Indicator
Image processing

DNV GL – Report No. Z0512818, Rev. 1 – www.dnvgl.com Page 12
The verification team confirmed that the radiometric normalization technique used is the Dark
Object Subtraction (DOS)/1/ and that it was adequately implemented. Cloud-shadow masking
methods used ‘thresholding’ in the blue band and additional manual inspection. These methods are
adequate and in line with the GOFC-GOLD REDD Sourcebook /54/. Least cloud cover RapidEye
input images were selected and geometric correction of images was considered adequate. An
examination of a selection of the input satellite scenes demonstrated that the GFC had produced
products meeting the 1 pixel accuracy, as suggested by guidance materials, for all periods.
Analysis methods
Deforestation in Year 4 was obtained through visual interpretation of RapidEye images, guided by
automated delineation of non-forest features. Taking into account the fact that the same procedure
was used for Year 3 and that an independent accuracy report /18/ has been produced confirming
the accuracy of the mapping of RP, verification focused on conformance between the SOP (in this
case: the mapping guide) and the actual mapping process. The verification team had the operators
demonstrate the entire process for several different areas, and found that the operators followed
the SOP ,evidencing that these SOPs are adequately implemented. The verification team
interviewed the operators and found their level of understanding of the processing and mapping
tasks to be very good. It should be noted that operators are all local persons and GFC staff.
An Excel sheet was developed for Year 4 to aid in the conversion from the GIS mapping output to
the final figures according to IPCC standards. The verification team has inspected this sheet and
cross-checked the calculations, which were found to be correct. Conversion of the GIS mapping
output into the figures and tables on the indicators however is still done manually which may lead
to errors in categorization or misinterpretations. CAR 2 was raised on this issue.
Accuracy assessment
The verification team checked the results of the independent accuracy assessment performed by
the University of Durham /18/ and provided by the RP. According to this assessment the gross
deforestation rate for Y4 is 0.07% with a standard error of 0.0101 at 95% confidence interval. This
agrees with the reported change rate by GFC, which is 0.068%. The verification team has verified
the results of the accuracy assessment by having the validation process demonstrated and checked
for 1 validation tile. Also, the R scripts to do the final statistical calculations have been investigated
and re-run, and the verification team has found the results of the re-run to be the same as those in
the report.
Conclusion
Taking into consideration all the findings obtained with the verification and sampling plan applied
as stated above, and the final results provided for the independent accuracy assessment, the
verification team considers that the validated methodology has been followed correctly and that
reported results are free from omissions and misrepresentations that could lead to material
misstatements.
The verification confirms the gross deforestation rate in Year 4 is 0.068%.

DNV GL – Report No. Z0512818, Rev. 1 – www.dnvgl.com Page 13
2.5 Verification of Interim indicator 2.1 - Loss of intact forest landscapes
2.5.1 Methodology validation
a Methodology description
The methodology followed by the GFC to prepare the Year 1 intact forest landscape (IFL) layer uses
the existing global IFL GIS layer as a starting point and then buffers various P1, P2, P3, Year 1,
Year 2, Year 3 and Year 4 land use layers and excludes them /61/. Layers buffered and excluded
are water bodies (including navigable rivers and shorelines), settlements and municipalities,
agricultural concessions, and deforested areas. The deforested areas had been pre-selected to
contain forestry roads, infrastructure roads, mining, and/or mining roads /61/. Forestry
concessions were also extracted and are considered as logging at an industrial scale, though at low
intensity. Once the deforested areas have been removed, the polygons allowed to remain in the
resulting GIS layer will be larger than 50 000 hectares and capable of enclosing a circular object of
10 km radius. An assessment is made to ensure that at least a 2 km wide corridors or appendages
are observed to and from areas meeting the applicability conditions. All of the buffering, exclusion,
areal calculation, and area-based selection are performed using ArcGIS v.10 modeling code /61/.
Final identification of polygons meeting suitable width criteria is performed manually. Furthermore,
in order to refine the IFL map, cleanup of island polygons which would fail either the 10 km size or
2 km width test was performed.
The GFC has included this operation in their procedures, though still as a manual post-processing
operation. Given the fact that this operation involves only 9 large and non-complex polygons, the
manual character of the operation is not deemed a source of potential material misstatements.
b Validation criteria and Indicators
Criteria used to validate this landscape methodology included the existence of appropriate input
data layers, and defined prerequisite processes for estimation (buffering and exclusion from the
input layers) were sourced from Potapov et al. (2008) /62/, as referred by JCN /53/. The JCN
specifically states that “the total area of intact forest landscapes within the country should remain
constant. Any loss of intact forest landscapes shall be accounted as deforestation with full carbon
loss”. Potapov et al. also suggests that monitoring and estimation should use similar methods as
for forest area change estimation. A footnote defines IFL “as a territory within today’s global extent
of forest cover which contains forest and non-forest ecosystems minimally influenced by human
economic activity, with an area of at least 500 km2 (50 000 ha) and a minimal width of 10 km
(measured as the diameter of a circle that is entirely inscribed within the boundaries of the
territory).” Potapov et al. /62/ had an additional size criteria stating that corridors or appendages
to areas that meet the aforementioned spatial conditions must be at least 2 km wide.
Potapov et al. /62/ did their seminal work with a historical series of Landsat images, and wrote that
construction of the IFL layer should start with the study area and then systematically identify and
eliminate locations of human development. The specific areas of human influence that should be
eliminated are: 1) settlements; 2) infrastructure used for transportation between settlements or for
industrial development of natural resources, including roads (except unpaved trails), railways,
navigable waterways (including seashore), pipelines, and power transmission lines; 3) areas used
for agriculture and timber production; and 4) areas affected by industrial activities during the last
30-70 years, such as logging, mining, oil and gas exploration and extraction, peat extraction, etc.
/62/. Buffers of 1 km were applied to settlements and transportation infrastructure. Burned areas
from forest fires causing stand-replacing wildfires in the vicinity of infrastructure or developed
areas should be eliminated.
DNV GL – Report No. Z0512818, Rev. 1 – www.dnvgl.com Page 14
c Validation of methodology against criteria
The verification team concludes that the analysis methodology used by the GFC meets the
definition and concept of Intact Forest Landscape /63/ and is in line with the recommendations of
Potapov et al. /62/.
2.5.2 Verification of Indicator
The methodology of verification used by the verification team examined the existing GIS layers;
spatial modeling code used by the RP, and output layers and had the operator demonstrate the
procedure step by step.
The verification team concludes that the calculation of IFL is correct and, that the corrected
benchmarks IFL figure for year 4 is 7 604 425 million ha. In Year 4 there was a loss in IFL area of
155 ha, with 59 ha of that being accounted for by newly titled Amerindian land.
2.6 Verification of Interim indicator 2.2 - Forest Management
2.6.1 Methodology validation
a Methodology description
The GFC has a unique approach to sustainable forest management and has put in place a robust
forest monitoring system, which has enforcement of forest legality amongst one of its main
objectives /9/. The forest legality procedures and mechanisms are a direct result of years of
experience and are governed by a series of guiding documents and legislation, mainly the country’s
Forestry Act, the National Forest Policy and Plan, and the Guyana Forestry Commissions’ Work Plan.
At the time of this verification, the monitoring division of the GFC consists of a staff of 205, spread
out over the head office personnel in Georgetown, 4 divisional stations, 39 field stations, and 10
mobile stations.
As it pertains to the interim indicator in question here, the most relevant aspect of the RP’s forest
monitoring system is its four main components to enforce forest legality:
- Forest Concession Monitoring: This part of the monitoring system consists of the monitoring of the concessions from a legal point of view (i.e., permitting, payment of royalties,…) and the strictness of the forest management activities performed by the concessionaires;
- Monitoring of forest produce in transit: This is the Chain of Custody (CoC) system that has been implemented in Guyana since the year 2000 /9/. This CoC system, of which the Log Tracking System is a main part, has as the main objective to verify the origin of raw material and to control the level of harvesting within State Forests/9/;
- Sawmills and Lumberyards monitoring: This component consists of the verification of the legality of sawmills and Lumberyards and their operation /23/
- Exports: This component of the monitoring system seeks to control all exportations and to
check the legality of the produce to be exported /24/.
As in Year 1, 2, and 3, all data used to calculate the Interim Indicator 3 for Year 4 is sourced from
the monitoring of the forest production transit or CoC component of the RP’s monitoring system,
and the verification has therefore concentrated on this.
The existing CoC system provides detectable evidence on the legitimacy, location and magnitude of
forest operations in Guyana, and is currently applied to all forestry operations, including state
forests, Amerindian reservations, as well as private properties. The system is based on the
traceability of forest produce through the use of log tracking tags, which are assigned to all
concessionaires and private forest holders who are involved in commercial logging operations in a
given year. Log tagging is done at the stump, where half of the tag is affixed to the stump at the
time of felling, and the other part of the tag bearing the same sequence of numbers as recorded on

DNV GL – Report No. Z0512818, Rev. 1 – www.dnvgl.com Page 15
the stump tag is affixed to the produce being removed and transported. This procedure is carried
out for all types of forest produce, including logs, lumber piles, poles, and posts. The unique
identification code on each unit of produce will indicate who the concessionary operator is, and can
therefore help indicate the geographic origin of the forest produce. In addition, the tagging
systems is linked to a quota system, where information is gathered in order to control the volume
of produce being harvested from a given area, and which is calculated based on the assigned
sustainable yield of the forest area in question and which also considers variables such as felling
cycles, felling distances, and minimum girth requirements. /19/.
The link between the tagging system and the produce information (e.g. origin, destination, volume,
type of produce) is done through volume declarations, which are included within the removal
permit records emitted by the RPs.
The monitoring process of the extracted volumes varies depending on whether the operation:
- Takes place in a State Forest lands and is not a procedural breach;
- Takes place in the private properties / Amerindian lands and is not a procedural breach;
- It is a procedural breach (i.e. State Forest lands or private properties / Amerindian lands);
- It is illegal logging.
The forest monitoring is implemented with written standard procedures which are now in place for
each of these instances, as DNV-GL was able to confirm.
State Forest lands
The monitoring process for extracted volume from State Forest Lands remains the same as
reported in Year 1, 2, & 3 verification /65//66/. The operator has to request for the issuance of a
removal permit in any of the existing forest stations /19/ (Figure 3) before the logging operations
commence. The removal permit will be filled-out with the operator’s details. Each forest station
records the issuance of the removal permit in specific books and through approval letters emitted
from the central office in Georgetown /31/ /38/ /51/. Once the operator is ready to transport forest
produce beyond their regularized boundaries, they are required to complete the removal permit,
stating the date of removal, destination, vehicle type, vehicle identification, name of driver/captain,
specification of forest produce and associated tags (tags must be listed according to species and
product type), volume and total tags used and any other relevant information /19/. As part of the
QA/QC measures in place, the produce transported and the correctness of the removal permit are
checked by one or various GFC strategically located check-points. This check is recorded in books
stating the removal permit license, the type of produce, volumes and date of when the removal
permit and the produce were checked. The issued removal permits are valid only for 30 days, and
once the produce has reached the destination, concessionaires would have to declare the volume to
the nearest forest station within 24 hours /19/. Every month, these removal permits are sent to
the GFC’s headquarters to be recorded in a specific database. Specific QA/QC measures are in
place to assure that the recording errors are reduced to a minimum (i.e., by using formulae that
check the consistency of data, regular consistency checks, restricted access to the database, etc.).

DNV GL – Report No. Z0512818, Rev. 1 – www.dnvgl.com Page 16
Figure 3. Monitoring process flow chart – State Forest Lands
Private Properties / Amerindian lands:
As in previous verification years 1, 2 & 3, the owner is not required to request a removal permit
before the logging commences when this occurs in private or Amerindian lands. However, the
supposed owners of the logging produce are required to have a removal permit filled-out in any
instance that the produce is to be transported outside the boundaries of the property (Figure 4).
From that point forward, the monitoring system is similar to that of the State Forest lands.
Rem. Perm with declared
volume
Issuance removal
permit
Logging operation –
tagging
Removal
Permit
Book
record
Removal Permit
filled-out Readytrans
Transportation
of produce
Control of removal
permit info.
Book
record
Forest station
Check point
Removal Permit stating
control
Arrival to
destination
Rem. per. inc.declared
volume
Monthly forwarding
to HQ
Input in
Data Base
Book
record
Data
Base
Forest station
GFC HQ

DNV GL – Report No. Z0512818, Rev. 1 – www.dnvgl.com Page 17
Figure 4 Monitoring process flow chart - Private Properties / Amerindian lands
Procedural breach or an illegal logging breach
As in previous verification years, in case the operator does not have a removal permit or a removal
permit has inconsistencies, the amount removed is then recorded respectively into the Illegal
Logging Database or in the Procedural Breaches Database /30/. Also, only in the case it is
demonstrated after investigation that a certain operation is not considered legal logging or a
procedural breach, the respective record is cancelled from this database and is added to the State
Forest or private property/Amerindian databases. As is the case with the state forest database,
volumes are reported to the data base according to species as well as to the type of product
identified and deemed as “illegal” or a “procedural breach”, which may be any of the following:
charcoal; firewood, logs, lumber, piles, poles, posts, and spars.
The reported results of the interim performance indicator for Year 4, as in previous years, are
therefore the total volume extracted in tCO2 (expressed as CBM) obtained from all the removal
permits (or estimations by the authorities in case no removal permit is present) recorded in the
four data bases: Forest state lands; Amerindian and private properties; Illegal logging database;
and Procedural breaches database. In the case of Logs and Sawn-wood, values reported by the
GFC officer reporting the illegal activity are divided by 0.7852 and 0.5 respectively, as the declared
volume is not the real volume felled but the commercial volume extracted /39/.
In 2011 & 2012, the GFC made progress towards developing a methodology and factors that relate
total carbon emissions from biomass damage due to logging activities (collateral damage) to the
volume of timber extracted. This has been achieved through a technical report by Winrock
International (S. Brown et al.) for the GFC: Collateral Damage and Wood Products from Logging
Practices in Guyana, December 2011 /7/ and Guyana FCMS Conversion Factor Handbook – Revised
October 2013 /13/. The methodology applies the logging damage factor (0.95 tC/m3), wood
density of commercially harvested timber (0.38 tC/m3/gap), logging infrastructure factor (skid
trails, etc.) (32.84 t C/km) and the conversion factor for tC to tCO2 in the conversion of total
Re. Per. With
declared
volume
Issuance removal
permit
Logging operation –
tagging
Removal
Permit
Book
record
Removal Permit
filled-out
Ready trans
Transportation
of produce
Control of removal
permit info.
Book
record
Forest station
Check point
Re. Per. stating
control
Arrival to
destination
Re. Per. With declared
volume
Monthly forwarding
to HQ
Input in
Data Base
Book
record
Data
Base
Forest station
GFC HQ

DNV GL – Report No. Z0512818, Rev. 1 – www.dnvgl.com Page 18
volume in CBMs to tCO2, and also includes storage in long term wood products /11/. Total carbon
stock in long-term wood products was estimated from the extracted biomass carbon using Winjum
et al 1998 formula and the approach in the approved VCS Module VMD0005- REDD Methodology
Module: “Estimation of carbon stocks in the long-term wood products pool” which DNV GL cross-
checked and confirmed. This computation was based on all extracted wood biomass (including
exports) captured by GFC’s with the data available of wood harvested for during 1 January 2013
and 31 December 2013 (i.e. Year 4).
b Validation criteria and Indicators
According to the Joint Concept Note (JCN) on REDD+ cooperation between Guyana and Norway
/53/ one of the degradation indicators deals with forest management (i.e. selective logging)
activities in natural or semi-natural forests:
- “All areas under forest management should be rigorously monitored and activities documented (i.e. concession activities, harvest estimates, timber imports/exports).”
- “ Increases in total extracted volume (as compared to mean volume 2003 – 2008) will be
accounted as increased forest carbon emissions unless otherwise can be documented using the gain-loss or stock difference methods as described by the IPCC for forests remaining as forests. In addition to the harvested volume, an appropriate expansion factor of 25% (applied to the hole population of trees under forest management, i.e. harvested + remnant trees) shall be used to take account of carbon loss caused by collateral damage, etc, unless it is document that this has already been reflected in the recorded extracted volume.”
According to the JCN, the way monitoring and estimation of the indicator shall be done is through
“Data on extracted volumes is collected by the Forestry Commission. Independent forest
monitoring will act as an additional data source on forest management to complement this
information. Accounting of this indicator should be done in terms of carbon units referred as close
as possible to extraction of biomass from the above ground carbon pool. ” /53/.
In line with the findings during the first, second, and third verifications /65/ it is understood that
this would imply that the extracted volume makes reference to the total biomass removed from the
above-ground carbon pool, which is closer to giving a reference on the forest degradation than the
commercial volume harvested. Therefore, the methodology shall take this provision into account.
c Validation of methodology against criteria
In order to validate the methodology followed and the monitoring system in place, the verification
team carried out a process-based assessment similar to Year 1, 2 & 3. This involves spot check
verification of respective documentation and data operations of the monitoring process:
Legal Concession Agreements
Boundary Demarcations
Forest Management Plans – Inventories, Initial Business Plans
Annual Operational Plans – Stock Maps, planned Infrastructure, etc.
Quota System Adherence
Log tracking and tagging
Removal Permitting
Production Register
Licensing – Sawmill, Timber Dealer, Export

DNV GL – Report No. Z0512818, Rev. 1 – www.dnvgl.com Page 19
Code of Practice adherence
Data Procedures
o Primary Collection
o Intermediate/secondary data collection
o Recording and storage of data bases (main and field offices)
o Reporting (from field office to main office, other stakeholder reports)
o QA/QC procedures for data collection, intermediate data recording, data recording
in the main data base, procedures for data reporting.
For each of these operations, the verification team checked the training of personnel
/31//32//38//48//49//50//51//52/ via interviews, which checked the GFC staff’s knowledge of the
procedures in place. Furthermore, the verification team also performed spot checks of removal
permits and other relevant information in order to verify the consistency of the same in each
database, with the information in the removal permit (or illegal logging forms) and with the records
available at the transit & forest stations (Linden (Transit station), /52/and the Forest station at
Basecamp of Vaitarna Holdings PVT. INC. were audited) /31//32//38//48//49//50//51//52/.
The GFC demonstrated the knowledge of the procedures in place, and no evidence was identified
that could lead to believe that the monitoring system is not robust. The staff was well trained and
during the audit showed great level of involvement and dedication to not only implementing the
procedures, but also seeking changes to them when this would lead to an overall improvement of
the system.
The preliminary data that has stemmed from the work that the GFC and Winrock has done show
high level of consistency and predictability on the level of damage and impacts per cubic meter
harvested, as does the RP’s adherence to the methodology to determine carbon stored in long-
term wood products.
In addition to the effective implementation of these procedures, GFC also was able to demonstrate
its overall commitment to environmental protection and stakeholder consultation, as well as
outreach programs with various stakeholders and/or communities. GFC staff has been trying to
implement measures so as to socialize their process and illustrate the importance and benefit of
their work to constituents so as to be seen an enabling and friendly institution, rather than a strict
enforcement and penalizing institution. During the visit to the Vaitarna Holdings concession the
audit team was able to verify how in collaboration with the logging company GFC has set aside
protective zoning areas around wildlife habitat and areas of other ecological importance (e,g,
riparian zones, creek beds, high percentage slope areas, ravines, etc.) and how a friendly and
cooperative environment, rather than an enforcer and policing one, has been established. Likewise,
upon a spot check visit to a local sawmill the owners mentioned how adhering to the procedures
and laws of the GFC has not been a problem and that this has been facilitated through a cordial
and cooperative relationship with GFC staff.
In view of the above, the verification concludes that the analysis methodology used by the GFC
meets provisions of the JCN /53/.
2.6.2 Verification of Indicator
In order to verify the reported assertions of Indicator 3, the verification team performed the
following checks:

DNV GL – Report No. Z0512818, Rev. 1 – www.dnvgl.com Page 20
- Consolidation, calculation and reporting: Confirmation that the total reported in the database is consistent with the figure reported in the IMR;
- Recording: Database records were randomly chosen and data was compared with the hard copy documents;
- Collection: Hard copy records and books located in Linden (Transit station), Bamboo (Forest/Transit station) and the Forest station at Basecamp of Vaitarna Holdings PVT. INC.
forest stations were cross-checked against database records.
- Calculation: DNV GL checked the database spread-sheets in the Forest Resources Management Division’s REDD Secretariat and can confirm that the calculations embedded in the tool for estimating emissions and removals due to timber extraction reflected those described in the IMR and the VCS Module VMD0005.
The verification team did not detect any discrepancy that the reported assertions on Interim
indicator 3 - Forest Management is equal to 3 106 693 tCO2.
2.7 Verification of Interim indicator 2.3 - Carbon loss as indirect effect of new infrastructure
2.7.1 Methodology validation
a Methodology description
The Year 4 methodology to calculate the loss of carbon as an indirect effect of new infrastructure is
the same as in Year 3, and was achieved through visual inspection and manual digitizing of
degraded areas visible in the RapidEye imagery, within a buffer of 100 m (but possibly extending
outside of this buffer) around new or existing mining areas and around roads related to mining,
forestry, and infrastructure, but excluding existing deforested lands that intersected the
degradation buffer (such as those from roads and infrastructures built during P1, P2, P3 or Year
1 ,2 or 3) /1/.
Accuracy assessment of degradation mapping is also conducted by the University of Durham
following similar methods as those defined for the assessment of deforestation.
b Validation criteria and Indicators
The main validation criteria is the JCN /53/ guidance document, as there are no other criteria listed
in other guidance materials specific to detecting degradation from establishment of transportation
infrastructure. Interpretation and mapping of new mining and roads related to mining, forestry,
and infrastructure use the same methodology and criteria for verification found in the estimation of
gross deforestation (see Section 4.1).
The JCN /53/ notes that the establishment of new infrastructure in forest areas often contributes to
forest carbon loss outside the areas directly affected by the constructions. “It calls for detection of
degradation in a 100m buffer surrounding new infrastructure (incl. mining sites, roads, pipelines,
reservoirs etc.) As well as it applies a benchmark of a degradation area of 4 368 ha. Any
degradation above this benchmark for the years after year 2 will lead to a reduced compensation
unless other emission factors can be documented through the MRVS, these areas shall be
accounted with a 50% annual carbon loss through forest degradation.” Validation of methodology
against criteria
Apart of this criterion, the recommendations made by the GOFC-GOLD REDD Sourcebook /54/ for
mapping of degradation would also be applicable.
c Validation of methodology against criteria

DNV GL – Report No. Z0512818, Rev. 1 – www.dnvgl.com Page 21
The GFC has fully adopted the degradation mapping method agreed upon in the JCN. Degradation
is manually mapped using high-resolution imagry, starting within a buffer of 100 m from the
outside edge of existing infrastructure. The verification team has checked the degradation and
reporting in their GIS systems, and has found the degradation mapping to be consistent with the
mapping SOP.
The verification team concludes that the analysis methodology used by the GFC meets provisions of
the JCN /53/ and that the degradation mapping using RapidEye images is accurate.
2.7.2 Verification of Indicator
The verification team had the GIS operators re-map the degradation for several areas and
compared the results with the initial degradation polygons. Based on its findings the verification
team concludes that the mapping of degradation is done correctly and conform the mapping SOP.
The verification team has interviewed the GIS operators about their understanding of the
degradation mapping method and concludes that the GIS operators are following their procedures
/15/ and understand the reasoning behind it.
Additionally, the verification team checked the final results of the independent accuracy
assessment performed by the University of Durham /18/ and provided by the RP. According to this
assessment the overall accuracy of the Year 3 degradation mapping would be equal to 99.98%
(97.69% in Year 3), which would confirm the acceptable accuracy of the mapping according to the
REDD sourcebook /54/ and to other applicable criteria /63//64/. The verification team has verified
the results of the accuracy assessment by having the process being demonstrated and checked for
one (1) validation tile, and by inspecting and running the R scripts used to calculate the final
accuracy values.
As a result, the verification team concludes that the Year 4 method conforms to the JCN
requirements, and concludes that the value for indicator 2.3 for Year 4 is equal to 4 352 ha.
2.8 Verification of Interim indicator 2.4 – Emissions
resulting from subsistence forestry, land use and shifting cultivation lands (i.e. slash and burn agriculture)
2.8.1 Methodology validation
In line with the JCN /53/ this indicator is presently not monitored till the full MRV is in place. GFC
has however started to develop a methodology for measuring and reporting of this indicator. Areas
of shifting cultivation which previously were mapped but not considered in the overall assessment
are now being labeled in a manner that will allow tracking and specific changes overtime within the
GIS system from Year 4 onwards. Shifting cultivation areas are either labeled as pioneer, when
they appear to occur as a newly cut area with an area which was seen as high forest in the
previous year, or as rotational, when found within a historical degraded and impacted area. All
areas larger than 0.25 ha are being mapped and tracked.
The main validation criteria would be the GOFC-GOLD REDD Sourcebook /54/ as the JCN /53/
guidance document does not provide any guidance. The JCN only states that this indicator is not
relevant for the interim period before a proper MRVS is in place.

DNV GL – Report No. Z0512818, Rev. 1 – www.dnvgl.com Page 22
The GFC has fully adopted the degradation mapping method agreed upon in the JCN. Degradation
is manually mapped using high-resolution imagery. The verification team has checked the
degradation and reporting in their GIS systems, and has found the degradation mapping to be
consistent with the mapping SOP.
The verification team concludes that the analysis methodology used by the GFC meets provisions of
the GOFC-GOLD REDD Sourcebook /54/.
2.8.2 Verification of Indicator
The verification team has visited several active shifting cultivation areas on-site in the area East of
Lethem. The mapping of new shifting cultivation fields was found to be mostly accurate. However,
GFC’s classification of newly mapped shifting cultivation areas into pioneer or rotational was found
inconsistent with the situation in the field, where most if not all areas were found to be rotational,
i.e. within a historical shifting cultivation area of degraded forest. The verification team has raised
CAR 4 on this, and has advised the GFC to do more research and fieldwork on this issue in order to
develop a sound mapping strategy for shifting cultivation areas, and a valid relation between
shifting cultivation activities and emissions.
Since this Indicator is not yet formally part of the indicators to be verified the team did not
conclude on accuracy and correctness of the shifting cultivation figures.
2.9 Verification of Interim indicator 2.5 - Emissions resulting from illegal logging activities
2.9.1 Methodology validation
a Methodology description
The monitoring of illegal logging is within the main objectives of the forest monitoring system
described in section 4.4.1.a, as the monitoring system serves to enforce legality. Cases of illegal
logging are found in the course of routine/impromptu operations performed by the GFC staff, or
through information of these occurrences by stakeholders. In the case where investigation
demonstrates that a certain operation is not considered illegal logging or a procedural breach, the
respective record is cancelled from the illegal logging database and is added to the State Forest or
private property/Amerindian databases.
b Validation criteria and Indicators
According to the Joint Concept Note (JCN) /53/ one of the degradation indicators has to cover
illegal logging activities:
- “Illegal logging results in unsustainable use of forest resources while undermining national and
international climate change mitigation policies”
- “Areas and processes of illegal logging should be monitored and documented as far as practicable”
The JCN specifies the way the indicator has to be monitored and estimated: “The monitoring of
illegal logging is within the main objectives of the GFC’s forest monitoring system, and is informed
by an illegal logging database. In addition to reporting on illegal logging via the database,
Independent Forest Monitoring will support performance monitoring of forest legality through the
IFM framework. Should IFM detect potentially significant challenges with the established forest
monitoring system, this indicator will be reassessed. In the absence of hard data on volumes of
illegally harvested wood, a default factor of 15% (as compared to the legally harvested volume)
will be used. This factor can be adjusted up- and downwards depending on documentation on

DNV GL – Report No. Z0512818, Rev. 1 – www.dnvgl.com Page 23
illegally harvested volumes, inter alia from Independent Forest Monitoring”. Furthermore, it states
that another means of monitoring should include “Medium resolution satellite to be used for
detecting human infrastructure and targeted sampling of high-resolution satellite for selected sites,
and Accounting of this indicator should be done in terms of carbon units referred as close as
possible to extraction of biomass from the above ground carbon pool.”.
c Validation of methodology against criteria
The rate of illegal logging for the assessment Year 4, January 2013 to 31 December 2013, is
informed by a custom designed database that is updated monthly, and subject to routine internal
audits, much like the processes established for the legal forest management practices mentioned in
earlier sections of this report. DNV GL has verified that reporting on illegal logging activities is done
via the GFC’s 32 forest stations located countrywide, as well as by field, monitoring and audit
teams, through the execution of both routine and random monitoring exercises and investigation
procedures. The infractions are recorded, verified and audited at several levels, both in the field
and at the main data base. All infractions are summarized in the illegal logging database and result
in a total volume being reported as illegal logging for any defined time period.
The verification team concluded that the analysis methodology used by the GFC meets the
requirements of JCN /53/, and if applied correctly it will lead to assertions with minimum material
discrepancies.
2.9.2 Verification of Indicator
In order to verify the reported assertions of Indicator 4 in Year 4, the verification team performed
the following checks:
- Consolidation, calculation and reporting: Confirmation that the total reported in the database is consistent with the figure reported in the IMR;
- Recording: Database records were randomly chosen and data was compared with the hard
copy documents;
- Collection: Hard copy records in the Linden (Transit station) and the Forest station at Basecamp of Vaitarna Holdings PVT. INC. were checked with the database records;
The estimated emissions from illegal logging rate for Year 4 is equal to 11 533 tCO2. The DNV GL
team also verified that the calculations for arriving at this amount also took into consideration long
term wood product storage, as well as collateral damage emission factors as was also done with
the forest management indicator.
2.10 Verification of Interim indicator 2.6 - Emissions
resulting from anthropogenically caused forest fires
2.10.1 Methodology validation
High-resolution RapidEye data is being used to find and determine the extent of the burnt areas.
MODIS Fire Hotspot data (FIRMS) are being used by the GFC to assist in finding the location of
anthropogenic fires and for the decision whether the deforestation driver was fire or not. The
detection of burnt areas has been integrated into the mapping procedures for deforestation and
degradation, where fire is one of the possible drivers for a deforestation or degradation event. The
combined use of high-resolution multispectral images with FIRMS fire hotspot data is in accordance
with the GOFC GOLD Sourcebook /54/.
2.10.2 Verification of Indicator
The audit team has verified the correct operation of the GIS mapping team regarding mapping the
extent of deforestation and degradation and their drivers, including fire, and found their mapping
to be concise and consistent with their mapping SOP.

DNV GL – Report No. Z0512818, Rev. 1 – www.dnvgl.com Page 24
According to the reported assertions, the total burned area (degradation, not deforestation) in the
analysis period was 395 ha/year. While we now seen a steady increase in year 2,3 and 4 (28
ha/year, 208 ha/year and 395 ha /year) the annual totals are still considerably lower than the
initially estimated total of 1 706 ha/year /1//65/. Although Guyana has, during this monitoring
period, seen a higher total number of ha affected by burning most if not all observed fires occurred
in non-forested & savanna areas. Also, the increase might be linked to the heavier focus on the
savannah areas, where the shifting cultivation occurs, which is traditionally linked with vegetation
burning. Note that this indicator and indicator 2.4 might overlap with each other, as usually fire is
used as a field preparation measure for areas under shifting cultivation.
The verification team confirmed that the figure of 395 ha/year is consistent with the verification
result.
2.11 Verification of Interim indicator 3.1 – Encouragement of increasing carbon sink capacity of non-forest and forest land
In line with the JCN /53/ this indicator is presently not monitored till the full MRV is in place.
Therefore, this indicator has not been within the scope of DNV GL’s verification.
3 COMMENTS BY STAKEHOLDERS TO REPORT
The Interim Measures Report was published for public comments from 1 December 2014 to 1
January 2015 in Guyana Forestry Commission’s web page as well as distributed to a list of 94
individual stakeholders of 60 different stakeholder organisations. A Public Notice was placed in the
local media over the 4-week period. Comments received during this period are given in the below
text box. Response from the GFC to these comments and the verification team’s assessment are
included.
Table 1: list of Stakeholders consulted by the Guyana Forestry Commission
Name Agency Role Name Agency Role
1 His Excellency
President Donald
Ramotar
Government of
Guyana, Office of the
President
48 Herold Martin GOFC-GOLD
2 Former President
Dr.BharratJagdeo
Government of Guyana 49 Sandra Brown Winrock International
3 Dr Roger Luncheon Office of the President 50 Felipe Casarim Winrock International
4 Minister Dr Ashni
Singh
Ministry of Finance 51 Katherine Goslee Winrock International
5 Minister Robert
Persaud
Ministry of Natural
Resources and
Environment
52 William Salas Applied Geosolutions
6 Minister Dr. Leslie
Ramsammy
Ministry of Agriculture 53 Bobby Braswell Applied Geosolutions
7 Minister Pauline
Sukhai
Ministry of Amerindian
Affairs
54 Dr James Baker Clinton Climate Initiative

DNV GL – Report No. Z0512818, Rev. 1 – www.dnvgl.com Page 25
Name Agency Role Name Agency Role
8 ShyamNokta Office of the President 55 Maria Sanz Sanchez UN REDD
9 Andrew Bishop Office of the President 56 Dr Jim Penman IPCC Expert
10 Shereeda Yusuf Office of the President 57 Juan Chang IDB
11 James Singh Guyana Forestry
Commission
58 Maarten van der
Eynden
Government of Norway
12 Pradeepa Bholanath Guyana Forestry
Commission
59 Edwin Aalders DNV GL
13 IndarjitRamdass Environmental
Protection Agency
60 Charles Hutchinson WWF Guyana
14 George Jarvis Ministry of Agriculture 61 Josefina Brana
Varela
WWF International
15 Peter Persaud The Amerindian Action
Movement of Guyana
(TAAMOG)
62 WWF Norway
16 Romel Simon The National
Amerindian
Development
Foundation (NADF)
63 Christiane
Ehringhaus
KfW
17 Alfred King Ministry of Culture 64 Josef Haider KfW
18 HilbertusCort Forest Producers
Association (FPA)
65 Sean Frisby UK Department of
Climate Change
19 Ronald Webster Private Sector
Commission (PSC)
66 Sean Richmond UK Department of
Climate Change
20 Carvil Duncan Federation of
Independent Trade
Unions of Guyana
(FITUG)
67 Pat Hardcastle LTS International
21 Hymawattie Lagan Women’s Affairs
Bureau
68 Philippa Lincoln LTS International
20 Raquel Thomas-
Caesar
Independent memeber 69 Ida Hellmark NORAD
23 Janice Bollers Guyana Geology and
Mines Commission
(GGMC)
70 Mads Halfdan Lie NORAD
24 Yvonne Pearson Ministry of Amerindian
Affairs
71 Silje Haugland NORAD
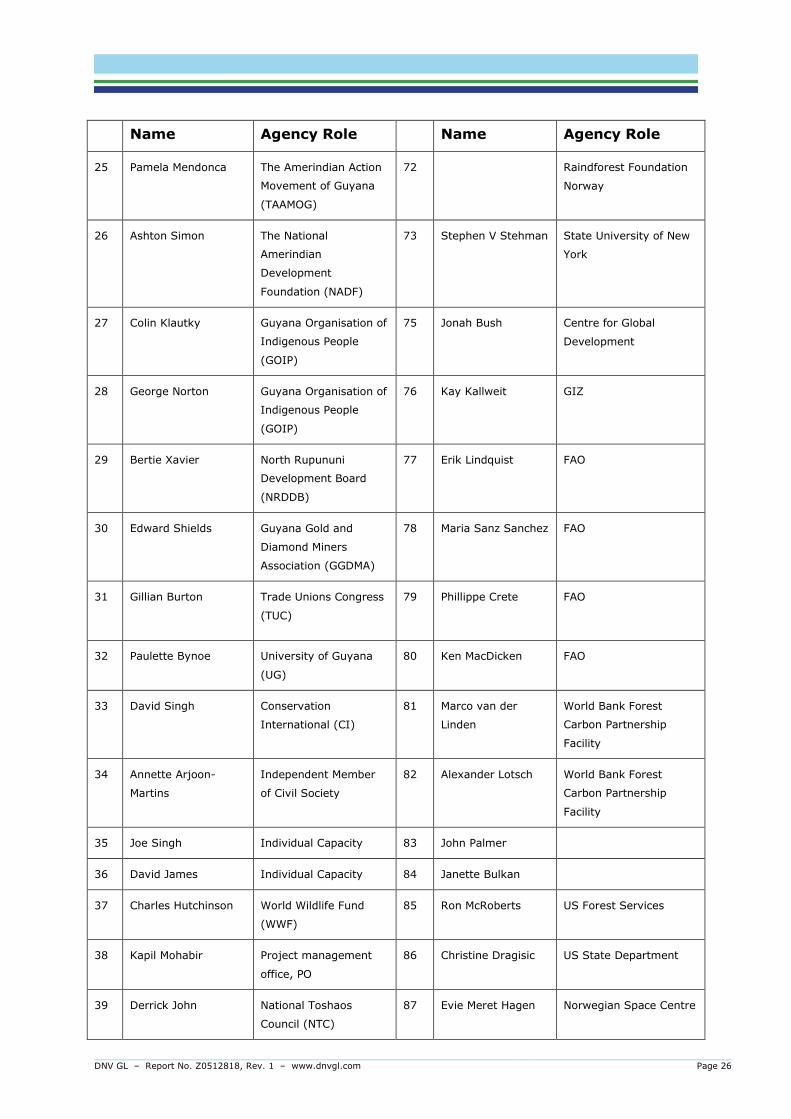
DNV GL – Report No. Z0512818, Rev. 1 – www.dnvgl.com Page 26
Name Agency Role Name Agency Role
25 Pamela Mendonca The Amerindian Action
Movement of Guyana
(TAAMOG)
72 Raindforest Foundation
Norway
26 Ashton Simon The National
Amerindian
Development
Foundation (NADF)
73 Stephen V Stehman State University of New
York
27 Colin Klautky Guyana Organisation of
Indigenous People
(GOIP)
75 Jonah Bush Centre for Global
Development
28 George Norton Guyana Organisation of
Indigenous People
(GOIP)
76 Kay Kallweit GIZ
29 Bertie Xavier North Rupununi
Development Board
(NRDDB)
77 Erik Lindquist FAO
30 Edward Shields Guyana Gold and
Diamond Miners
Association (GGDMA)
78 Maria Sanz Sanchez
FAO
31 Gillian Burton Trade Unions Congress
(TUC)
79 Phillippe Crete
FAO
32 Paulette Bynoe University of Guyana
(UG)
80 Ken MacDicken FAO
33 David Singh Conservation
International (CI)
81 Marco van der
Linden
World Bank Forest
Carbon Partnership
Facility
34 Annette Arjoon-
Martins
Independent Member
of Civil Society
82 Alexander Lotsch World Bank Forest
Carbon Partnership
Facility
35 Joe Singh Individual Capacity 83 John Palmer
36 David James Individual Capacity 84 Janette Bulkan
37 Charles Hutchinson World Wildlife Fund
(WWF)
85 Ron McRoberts US Forest Services
38 Kapil Mohabir Project management
office, PO
86 Christine Dragisic US State Department
39 Derrick John National Toshaos
Council (NTC)
87 Evie Meret Hagen Norwegian Space Centre

DNV GL – Report No. Z0512818, Rev. 1 – www.dnvgl.com Page 27
Name Agency Role Name Agency Role
40 Nikolaus Oudkerk Project management
office, PO
88 Marin Herold Wageningen University
41 Dane Gobin Iwokrama 89 Erik Næsset Norwegian University of
Life Sciences
42 Colin Sparman Guyana Gold &
Diamond Miners
Association
90 Arild Angelsen Norwegian University of
Life Sciences
43 Donald Singh Guyana Geology and
Mines Commission
(GGMC)
91 Donna Lee
44 Geeta Singh Environmental
Protection Agency
92 Nigel Sizer WRI
45 Naseem Nasir Guyana Lands &
Surveys Commission
93 Mika Bucki European Commission
46 Mohindra Chand Forest Producers Association (FPA) 94 Simon Egglestone GFOI
47 Gregory Hodge University of Guyana
(UG)
3.1 Received comments and response by the Guyana Forestry Commission
Comment by: The Amerindian Action Movement of Guyana
NGO Party Other Stakeholders
Subject: Comments on GFC/Indufor report
Comment 1:
The Amerindian Action Movement of Guyana (TAAMOG) has perused the 2013 fourth performance
report on Interim Measures for REDD + under Guyana’s current monitoring, reporting and
verification system (MRVS).
Please be informed that TAAMOG is pleased with the 2013 Forest performance under the
memorandum of understanding (MOU) between the Governments of Guyana and the Kingdom of
Norway in the fight against Climate Change.
TAAMOG therefore endorses fully the fourth performance report and is highly impressed with
Guyana’s 0.068% deforestation rate and I can assure you that Guyana’s Indigenous People are
also pleased with the fourth performance report as they continue to benefit from Guyana’s Low
Carbon Development Strategy (LCDS).
TAAMOG wishes to extend congratulations to you and the staff members of the Guyana Forestry
Commission (GFC) for the extremely hard work demonstrated and continue to demonstrate in
ensuring that Guyana’s Forests are sustainably managed.

DNV GL – Report No. Z0512818, Rev. 1 – www.dnvgl.com Page 28
Response GFC:
The GFC wishes to thank TAAMOG for its review and subsequent provision of comments to the
MRVS Interim Measures Report for Year 4.
DNV GL:
The verification team assessed the comment and the response to be satisfactory.
Comment by: Norwegian Ministry of the Environment
NGO Party Other Stakeholders
Subject: Comments on GFC/Indufor report
Comment 2:
We would like to take this opportunity to congratulate you on the finalization of another Interim
Measures Report. The three previous reports have received a lot of positive attention in the
international REDD+ community, and it is good to see that Guyana is continuing the work to
develop a transparent forest monitoring system of high technical quality.
We note that the deforestation rate seems to have been reduced since 2012. This is good news,
even though the deforestation rate is still higher than the deforestation rates reported historically.
We would encourage Guyana to analyze the reasons for the shifting deforestation rates in the later
years, and to use the information generated through the forest monitoring system to develop
targeted policies that can further contribute to maintaining low deforestation rates in Guyana. This
way, the forest monitoring system can be further developed as a policy tool, in addition to meeting
reporting needs.
Congratulations with the successful update of the MRVS roadmap. The first roadmap has been
highlighted as instrumental in the development of Guyana’s forest monitoring system, and we hope
that the updated roadmap can contribute to further advances.
It is encouraging to see that a method for estimating shifting cultivation is included in this year’s
report. It is also encouraging to see that work is being done to also report using IPCC formats in
the future.
Response GFC:
The GFC wishes to thank the Norwegian Ministry of Climate and Environment for its review and
subsequent provision of comments to the MRVS Interim Measures Report for Year 4.
Information on the MRVS is shared with relevant GoG agencies to inform strategic planning and
policy making.
The GFC is also pleased to have completed the MRVS Roadmap Phase 1.
Shifting agriculture is one of the new areas in the Year 4 Assessment and the GFC is pleased to
integrate this aspect in the reporting.
DNV GL:
The verification team assessed the comment and the response to be satisfactory.
Comment by: Norwegian Ministry of the Environment

DNV GL – Report No. Z0512818, Rev. 1 – www.dnvgl.com Page 29
NGO Party Other Stakeholders
Subject: Comments on GFC/Indufor report
Comment 3:
Page 20: We note the separation between pioneer and rotational shifting cultivation, and the
limitations by Landsat data to enable a historical analysis due to the resolution of the imagery.
Would it be possible to conduct a historical analysis based on the RapidEye imagery available for
the later years? If this is the case, has this been done?
Response GFC:
There are two aspects to consider; the first is detection and the second is monitoring. While it is
possible to delineate the general extent of shifting cultivation from historical Landsat series
because of the small and scattered pattern of the activity (each clearance is often < 1 ha) and the
lack of frequent temporal coverage it is difficult to determine the rotation period.
For Guyana, the approach taken has been to delineate historical extent from Landsat. Since 2012
full coverage from RapidEye has enabled the annual detection and new shifting cultivation events.
These are monitored and classified according to mapping rules (established in 2013). Over time the
rotation length will be established.
To further advance this work it would be prudent to determine shifting cultivation is treated. This
work would seek to determine; confirm the minimum mapping unit, establish a benchmark level,
and importantly qualify the Carbon contribution of shifting cultivation to Guyana’s emission profile.
DNV GL:
The verification team assessed the comment and the response to be satisfactory.
Comment by: Norwegian Ministry of the Environment
NGO Party Other Stakeholders
Subject: Comments on GFC/Indufor report
Comment 4:
Page 20: Based on the delineation of rotational shifting cultivation areas. Would you expect that
these practices lead to more or less shifting cultivation than the more easily quantified pioneer
shifting cultivation?
Response GFC:
Pioneer is likely to cover less area than rotational shifting cultivation due to the effort to clear new
areas. However the dynamics of shifting cultivation are primarily dependent on the local population
size.
See above comment.
DNV GL:
The verification team assessed the comment and the response to be satisfactory.
Comment by: Norwegian Ministry of the Environment
NGO Party Other Stakeholders

DNV GL – Report No. Z0512818, Rev. 1 – www.dnvgl.com Page 30
Subject: Comments on GFC/Indufor report
Comment 5:
Page 36 – Table 6.2: This is a very informative table. It might be even clearer if shifting cultivation
is separated from the total degradation area change number, as shifting cultivation estimation
differs from the methods used to calculate infrastructure related degradation (and because
infrastructure related degradation has a specified benchmark, whereas shifting cultivation does not
at this point in time).
Response GFC:
In this table Pioneer SC has been incorporated into the existing infrastructure degradation
benchmark. It is currently 765ha out of the 4 352 ha of degradation.
Change made in Table 6.2.
DNV GL:
The verification team assessed the comment and the response to be satisfactory.
Comment by: Norwegian Ministry of the Environment
NGO Party Other Stakeholders
Subject: Comments on GFC/Indufor report
Comment 6:
Page 38 – Table 6.4: We note that Forestry seems to have contributed to a lot more forest change
in the period 2001-2009 than in the period 2009-2013. If we have understood correctly, a
corresponding fall in production of forest based products is not observed in Guyana. If this is the
case, could you please elaborate on the reason why this fall in forestry as a deforestation driver is
not clearly reflected in production numbers? We note that production has been reported as
somewhat below the benchmark level for this indicator in the last few years, but it seems the
difference is not in the same magnitude as the numbers in Table 6.4.
Response GFC:
The majority of forest change from the driver of Forestry resulting in deforestation is on account of
forest infrastructure, specifically forest roads. Forest harvest volumes and associated incidental
and collateral damage are recorded under forest degradation as this practice does not results in
deforestation. In both drivers of Forestry and Mining, forest roads and mining roads are included.
As such, Table 6.2 on Page 36, shows this breakdown.
During the period 2000 to 2009, a significant amount of forestry infrastructure was established,
infrastructure which has not expanded in any notable expanse post 2009. For example, the Puruni
Road, the Barama Buckhall Road, Mabura Branch Road to Siparuni, some areas of the Barama
Network in the North West, and the Unamco Road, among others, which service the main forest
harvest areas have seen little change in terms of expansion that would have resulted in forest
clearing post 2009. Over the period 2010 to 2013, the majority of forest harvest took place using
this existing infrastructure with minimal expansion and maintenance in some instances. Whilst
there have been a few new infrastructure established in forest areas post 2009, such as in some
areas in Buckhall, in Siparuni (as part of Demerara Timbers Ltd. operations, a few expansions in
the UNAMCO Road, and in the Variety Woods and Greenheart Ltd concession, these have been

DNV GL – Report No. Z0512818, Rev. 1 – www.dnvgl.com Page 31
small in comparison to that of the major infrastructure work conducted in the 1990 to 2000 period,
and that was continued over the 2001 to 2009 period.
There is therefore not a direct relationship between forestry production levels and forest
infrastructure (which is the primary element of deforestation from forestry) as significant forest
harvest levels can be, and has been attained using existing infrastructure. This is a point that is
encouraged as part of Sustainable Forest Management practices in Guyana as a way of limiting
impact on forest through effective planning and strategic management of forest concessions. Some
may argue that there is even a more inverse relationship between forest infrastructure (the main
aspect of forestry deforestation) and forest production levels, as it is after roads are established
then forest harvest takes place.
It should be noted that forestry degradation resulting from forest harvest has increased in 2013
over the 2012 period.
DNV GL:
The verification team assessed the comment and the response to be satisfactory.
Comment by: Norwegian Ministry of the Environment
NGO Party Other Stakeholders
Subject: Comments on GFC/Indufor report
Comment 7:
Page 49 – Table 8.1: See comment above relating to shifting agriculture and infrastructure related
degradation.
Response GFC:
Shifting Agriculture is reported separately in this table from degradation. Please refer to other
comment and responses on monitoring shifting agriculture above.
DNV GL:
The verification team assessed the comment and the response to be satisfactory.
Comment by: The Norwegian Ministry of the Environment
NGO Party Other Stakeholders
Subject: Comments on GFC/Indufor report
Comment 8:
Page 51: It is proposed that the IFL indicator is removed due to the national forest monitoring
system being implemented. We want to highlight that the phasing out of this indicator is subject to
other progress as described in the JCN of 2012, and that any revision to this indicator should take
this into account. The implementation of the monitoring system is only one of several work tracks
relating to this indicator.
Response GFC:

DNV GL – Report No. Z0512818, Rev. 1 – www.dnvgl.com Page 32
This is noted and added value of monitoring large tracks of forest area for change in forest cover,
concurrently as deforestation and forest degradation are being monitored at a detailed scale at one
hectare, should be considered.
DNV GL:
The verification team assessed the comment and the response to be satisfactory.
Comment by: Norwegian Ministry of the Environment
NGO Party Other Stakeholders
Subject: Comments on GFC/Indufor report
Comment 9:
Accuracy assessment report
Thank you for providing a full accuracy assessment report as an annex to the IMR. As accuracy
assessment is an important part of forest monitoring, this enables a more complete verification of
the IMR.
Response GFC:
Noted
DNV GL:
The verification team assessed the comment and the response to be satisfactory.
Comment by: Norwegian Ministry of the Environment
NGO Party Other Stakeholders
Subject: Comments on GFC/Indufor report
Comment 10:
Parts of the accuracy assessment report are challenging to follow. This is particularly relevant when
the estimators used in the analysis are described. One example is that it is hard to see how/if the
estimators described on page 29 are appropriate for this kind of analysis. The fact that
explanations are not provided for all symbols used in the estimators makes the logic particularly
challenging to follow. Summarized, it is difficult for external readers to understand all mathematical
considerations taken into account when producing the estimates in the report. We would therefore
recommend spending some time to make the report more reader friendly in future accuracy
assessment reports. We would also welcome further elaboration on the mathematical and
statistical estimators used in this year’s IMR.
It seems that the estimations are done only based on the reference data (samples), and not on the
full RapidEye wall-to-wall map that is available from GFC/Indufor. This is surprising, as one would
generally get less uncertain results by using the available wall-to-wall map for this purpose. In
previous years, it had been commented that the estimations using the wall-to-wall map might have
been carried out in a sub-optimal manner. It seems that rather than working to improve this
method, a more simplified method using only the reference samples have been used. We would
welcome elaboration on the reasons for taking this approach. As mentioned, estimations using the
full wall-to-wall map would most likely produce more certain results.
DNV GL – Report No. Z0512818, Rev. 1 – www.dnvgl.com Page 33
Response GFC:
A meeting between Durham and Norway/GFC is requested to provide additional clarification on the
methods applied and processes undertaken.
Two Sections have been added to the Report: one on Acronyms Used, and another explaining the
Mathematical and Statistical Estimators used and making reference to P V Potapov, J Dempewolf, Y
Talero, M C Hansen, S V Stehman, C Vargas, E J Rojas, D Castillo, E Mendoza, A Calderón, R
Giudice, N Malaga and B R Zutta. Environ. Res. Lett. 9 (2014) (13pp) doi:10.1088/1748-
9326/9/12/124012. This Article is also available at the GFC should there be a desire to access
same. We hope that this paper will provide the relevant background on the type of estimators
used and additional examples to show their appropriateness for this application.
We recognise with the view that the description of the statistical analysis is challenging.
Unfortunately, the reality is that these are largely meaningful only to those with professional
statistical training. The purpose of the description is to state formally the analysis that we have
carried out, and why, in order that another professional statistician can verify that the analysis is
appropriate. It is arguable that instead of publishing the formulae used, we would be better served
in the report by limiting to giving the rationale for the kind of analysis we carried out, together with
references to implementational details in the statistical literature.
Let us now come to further elaboration on the statistical method chosen. We are extremely
fortunate to have available a large change-sample, namely 55119 hectares observed in Year 3 and
Year 4. Without going into deep statistical detail, a paired sample of this kind is far more efficient
and powerful (these are statistical terms) in estimating change than would be two independent
samples. This is largely because sources of uncertainty associated with independent samples
disappear when one has a paired sample. Our main response variable is a classification of changes
between Year 3 and Year 4. This is a multinomial response variable. The possible classes for this
response variable are:
1. Forest in Year 3 and Year 4
2. Forest in Year 3, but Degraded in Year 4
3. Forest in Year 3, but NonForest in Year 4
4. NonForest in Year 3 and NonForest in Year 4
5. etc.
There are nine such classes for this response variable, reflecting three possible states in Year 3 and
another three possible states for year 4. Statistically, this is similar to a binomial proportion change
problem, for example estimating a change in voting habits. Estimating the proportions of Guyana
belonging to these nine classes is a key objective. For the objective of estimating rate of change of
deforestation, attention focuses on the first three classes and the probabilities of change
conditional on the state being Forest in Year 3.
To analyze the sample data, we must first describe the method of data collection and then choose
the appropriate method. We are treating the sample as though it is a stratified cluster sample.
There is initial stratification of Guyana into low and high risk clusters, each containing 7500
hectares. Clusters are sampled at random from these strata. Next, hectares are sampled from each
cluster. For a number of reasons, the number of hectares sampled from each cluster varies. The
statistical consequence is that the formulae for estimating variances now become very complicated,
and indeed meaningless except to professional statisticians. We have treated the sample from each
cluster as a random sample. In actual fact, up to 360 hectares were sampled systematically over

DNV GL – Report No. Z0512818, Rev. 1 – www.dnvgl.com Page 34
each cluster, using a predefined regular grid. The proportion of hectare sampled is high, on
average. First, there is a risk that linear features such as roads might be expected to be over-
represented in the sample. This would then lead to a slight overestimation of deforestation rate. It
is not possible post-hoc to correct for this behaviour. Secondly, no account is taken of the potential
for there to be spatial correlation between hectares which are physically close. The consequence
would likely be a slight under-reporting of standard errors. However, the sampled hectares are
sufficiently distant from each other that is appears reasonable to treat spatial correlation as zero.
As such, although we recognize that samples are not fully random within each cluster, we judge
that it is statistically safe to treat them as though they are.
Under these conditions, the method of analysis is straightforward using statistical software. In the
report we explained how we used a package called "survey" within the (free) statistical language
"R". This provides an equivalent alternative to the SURVEYMEANS procedure available in the (not
free) statistical language SAS. It may help to note that a recent paper [1] describes a problem
which is the same as ours in the essentials, and provides a detailed appendix showing essentially
the same formulae as we have shown. The analysis in this paper used the SAS SURVEYMEANS
procedure.
[1] National satellite-based humid tropical forest change assessment in Peru in support of REDD+
implementation
P V Potapov, J Dempewolf, Y Talero, M C Hansen, S V Stehman, C Vargas, E J Rojas, D Castillo, E
Mendoza, A Calderón,
R Giudice, N Malaga and B R Zutta. Environ. Res. Lett. 9 (2014) (13pp) doi:10.1088/1748-
9326/9/12/124012.
As extra analysis to explore deforestation rates more finely, we also defined a secondary response
variable as the proportion of forest cover remaining in Year 4, conditional on the state being Forest
in Year 3. For the vast majority of hectares, the proportion is one. To analyze this problem we use
essentially the same SAS SURVEYMEANS (or R survey equivalent) procedure as before, with the
difference that the response is numerical rather than multinomial. This extra analysis gives a more
accurate assessment of deforestation rate as the response variable contains more information
about the actual level of deforestation in a specific hectare.
The change-sample required a careful assessment of the land cover status of each sample hectare
and this was undertaken for both Year 3 and Year 4 using the best available reference data. In
most cases these data came from GeoVantage aerial imagery that is of superior spatial detail than
the wall-to-wall RapidEye imagery collected by GFC and processed by Indufor. We explain in the
report that it was also necessary, as part of the process of interpretation to refer to the RapidEye
imagery as the GeoVantage aerial imagery was collected in August 2014, part way through Year 5.
There were also areas of Guyana where, for safety reasons, it was not possible to collect
GeoVantage imagery and in these low-risk sample units, RapidEye imagery was reinterpreted by
the accuracy assessment team. Therefore in summary, the accuracy assessment used reference
data of the highest quality available and that the wall-to-wall RapidEye data was an integral part of
change assessment.
DNV GL:
The verification team assessed the comment and the response to be satisfactory.
Comment by: Conservation International Guyana

DNV GL – Report No. Z0512818, Rev. 1 – www.dnvgl.com Page 35
NGO Party Other Stakeholders
Subject: Comments on GFC/Indufor report
Comment 11:
General Comments
As the first national-scale REDD+ arrangement, Guyana’s REDD+ Framework and its attendant
payment scheme, are being considered by the international community as an important yardstick
to measure the outcome(s) of fast-start climate change mitigation efforts as it relates to REDD+.
The reporting on drivers is important progress in terms of improving the accuracy of the emissions
estimates but also for helping identify appropriate measures to work towards national REDD+
objectives. The inclusion of shifting cultivation is also an important addition. Such progress and
strengths presented will provide the foundations for stronger MRVS.
Response GFC:
Noted
DNV GL:
The verification team assessed during interview with stakeholder /46//47/ the comment and
considers the response to be satisfactory.
Comment by: Conservation International Guyana
NGO Party Other Stakeholders
Subject: Comments on GFC/Indufor report
Comment 12:
Consideration should be given to the implementation of measures to mainstream the use of the
outputs of the MRVS by land managers and other stakeholders to address the drivers of
deforestation and as a layer of monitoring of their operations. The presentation of data on detected
change in protected areas and titled Amerindian lands, and making the spatial data on forest
change more widely available would be good steps in this direction in the immediate-term. Given
the restricted areas in which deforestation and forest degradation occur, such information could
help validate good management practices, and communicate management effectiveness.
Response GFC:
Currently MRVS Results and input data are shared with GGMC, EPA, GLSC, MNRE and PAC. These
are among the main land use and land management agencies.
The GIMU provides additional analytical support for decision making relating to REDD+ areas.
DNV GL:
The verification team assessed during interview with stakeholder /46//47/ the comment and
considers the response to be satisfactory.
Comment by: Conservation International Guyana
NGO Party Other Stakeholders

DNV GL – Report No. Z0512818, Rev. 1 – www.dnvgl.com Page 36
Subject: Comments on GFC/Indufor report
Comment 13:
Though specific edits are not provided, typographic errors were noted.
Response GFC:
Thank you for this feedback. We have further reviewed the Report for additional edits that were
required.
DNV GL:
The verification team assessed during interview with stakeholder /46//47/ the comment and
considers the response to be satisfactory.
Comment by: Conservation International Guyana
NGO Party Other Stakeholders
Subject: Comments on GFC/Indufor report
Comment 14:
Specific Comments
The importance of the central repository of data and images cannot be overemphasized. This
initiative could serve as a trigger for improved coordination of spatially explicit information for
identifying high risk and low risk areas as well as providing information needed to create overlay
maps of the areas of known land-use types, projected new development projects, timber harvest
permits, mining concessions, amongst other background information that will be helpful for
projecting high risk areas but also verifying mapping results.
Response GFC:
With the development and implementation of the MRVS, the GFC has been the agency responsible
for gathering, processing, analysing and storing data used in the measurement and monitoring of
forest area change. In fulfilling this purpose, the GFC has become the central repository for all data
for purposes of the MRVS. The GGMC, GLSC, EPA and the Ministry of Natural Resources & the
Environment all have access to and utilise the imagery acquired. Data sharing protocols have been
established among the agencies to govern this and other shared land use datasets.
Through the coordination of the Ministry of Natural Resources & the Environment, coordination
amongst the agencies is further strengthened.
DNV GL:
The verification team assessed during interview with stakeholder /46//47/ the comment and
considers the response to be satisfactory.
The verification team assessed during interview with stakeholder /46//47/ the comment and
considers the response to be satisfactory.
Comment by: Conservation International Guyana
NGO Party Other Stakeholders

DNV GL – Report No. Z0512818, Rev. 1 – www.dnvgl.com Page 37
Subject: Comments on GFC/Indufor report
Comment 15:
The formation of the National GIS committee which will work towards consistency of geographic
information across all government institutions represents very positive progress towards inter-
institutional collaboration and also towards a more efficient, effective and sustainable forest
monitoring effort. We look forward to this work leading to the establishment of a national Spatial
Data Infrastructure.
Response GFC:
The formation of the national GIS committee continues to be a priority initiative of the MNRE. Along
with this the GIMU has undertaken the operation role of collating and analyse geographic
information for inter and intra sectoral purposes and with an aim of supporting the national spatial
data infrastructure.
DNV GL:
The verification team assessed during interview with stakeholder /46//47/ the comment and
considers the response to be satisfactory.
Comment by: Conservation International Guyana
NGO Party Other Stakeholders
Subject: Comments on GFC/Indufor report
Comment 16:
We acknowledge the potential to link community MRV to the national MRVS to strengthen Guyana’s
national REDD+ programme and believe that this may be promising for both data collection for
establishing emissions factors and verification of changes detected through the GFC’s maps.
Community MRV will become important for considering jurisdictional approaches to REDD+, where
community-based monitoring may be integrated with cost-effectiveness and with important value
in securing permanence.
Response GFC:
The approach taken by Guyana is the build the national MRVS and to use this as a platform to build
capacity and capability at the community level. This has been progressing well over the past 3
years with collaborations in the north Rupununi (Annai) as well as the South of Guyana
(Kanashen).
The GFC views community MRV as an important component of the MRVS. To this end, the GFC
aims to continue its work in building and strengthening the capacities of communities in the
implementation of CMRV activities.
DNV GL:
The verification team assessed during interview with stakeholder /46//47/ the comment and
considers the response to be satisfactory.
Comment by: Conservation International Guyana
NGO Party Other Stakeholders

DNV GL – Report No. Z0512818, Rev. 1 – www.dnvgl.com Page 38
Subject: Comments on GFC/Indufor report
Comment 17:
We acknowledge the potential to link community MRV to the national MRVS to strengthen Guyana’s
national REDD+ programme and believe that this may be promising for both data collection for
establishing emissions factors and verification of changes detected through the GFC’s maps.
Community MRV will become important for considering jurisdictional approaches to REDD+, where
community-based monitoring may be integrated with cost-effectiveness and with important value
in securing permanence.
Response GFC:
The approach taken by Guyana is the build the national MRVS and to use this as a platform to build
capacity and capability at the community level. This has been progressing well over the past 3
years with collaborations in the north Rupununi (Annai) as well as the South of Guyana
(Kanashen).
The GFC views community MRV as an important component of the MRVS. To this end, the GFC
aims to continue its work in building and strengthening the capacities of communities in the
implementation of CMRV activities.
DNV GL:
The verification team assessed during interview with stakeholder /46//47/ the comment and
considers the response to be satisfactory.
Comment by: Conservation International Guyana
NGO Party Other Stakeholders
Subject: Comments on GFC/Indufor report
Comment 18:
Page 4. The significance of the improvement in precision in the mapping of forest degradation
when using high resolution imagery rather than medium-resolution should be stated.
Response GFC:
At the commencement of the MRVs in 2010 the possibility of mapping degradation was considered.
However, due to the scale of degradation (less the 1 ha MMU) in Guyana coupled with the low
resolution and lack of Landsat coverage, degradation was estimated by applying a default 500 m
buffer to areas of deforestation – as specified in the Guyana/Norway JCN.
In 2011 extensive field work was conducted (See 2011 MRVs report) to understand the
degradation dynamics surrounding deforestation events. Subsequent to this work an annual
coverage of RapidEye has been used to track and delineate degradation events. These points were
detailed in MRVS Report issued in 2011.
The standard operating procedures (SOPs) for mapping outline how these events are mapped using
high resolution imagery.
DNV GL:
DNV GL – Report No. Z0512818, Rev. 1 – www.dnvgl.com Page 39
The verification team assessed during interview with stakeholder /46//47/ the comment and
considers the response to be satisfactory.
Comment by: Conservation International Guyana
NGO Party Other Stakeholders
Subject: Comments on GFC/Indufor report
Comment 19:
Page 7. The description of “Titled Amerindian Land” seems to include a paragraph describing the
general lands eligible under the Guyana-Norway Agreement. We assume that this is a
typographical error.
Response GFC:
Paragraphs separated in IMR.
DNV GL:
The verification team assessed during interview with stakeholder /46//47/ the comment and
considers the response to be satisfactory.
Comment by: Conservation International Guyana
NGO Party Other Stakeholders
Subject: Comments on GFC/Indufor report
Comment 20:
Page 13. A description of measures in place to ensure that no deforestation is unduly credited to
the Amaila Hydropower Project. The project should be employing measures to avoid, minimize and
restore its impacts, including deforestation.
Response GFC:
The MRVS monitors and reports on all deforestation activities and for the third year, has reporting
separately on impact of Amaila Fall Hydro project. This type of reporting is envisaged to continue
under the national MRVS.
This mapping of impact of the Amaila Falls project is based on background information within the
GFC’s GIS that outlines the general footprint of the Falls and associated infrastructure, as such, the
mapping of deforestation attributed to this activities is validated. The SoPs for mapping is also
quite clear in distinguishing infrastructure impacts from other types of land use impacts such as
mining. Further, the MRVS has also established trends that relate to mining and forestry
infrastructure as these general lead to or are surrounding mining and forest areas.
Management of impacts related to this project is outside of the remit of this national MRVS and is a
dedicated function of another Agency.
DNV GL:
The verification team assessed during interview with stakeholder /46//47/ the comment and
considers the response to be satisfactory.

DNV GL – Report No. Z0512818, Rev. 1 – www.dnvgl.com Page 40
Comment by: Conservation International Guyana
NGO Party Other Stakeholders
Subject: Comments on GFC/Indufor report
Comment 21:
Page 14. The paragraph describing the Protected Areas Commission contains the following
sentence; “The PAC under the Protected Areas Act provides for … including a mechanism for
sustainable long term financing…” This seems to inaccurately suggest that the PAC is responsible
for the National Protected Areas Trust Fund.
Response GFC:
Text removed from IMR.
DNV GL:
The verification team assessed during interview with stakeholder /46//47/ the comment and
considers the response to be satisfactory.
Comment by: Conservation International Guyana
NGO Party Other Stakeholders
Subject: Comments on GFC/Indufor report
Comment 22:
2.8 Coverage of difference satellites.
2.8.1 It is unclear if there was any area that was covered by neither RapidEye nor Landsat due to
clouds. If this was not a problem, it will be helpful to explicitly state this as an area or percent
value.
Response GFC:
This is documented in the report. Section 5.3 shows the 2013 persistent cloud map. It is estimated
that less than 0.2% (of the forest area of Guyana) has no coverage from either Landsat or RE.
DNV GL:
The verification team assessed during interview with stakeholder /46//47/ the comment and
considers the response to be satisfactory.
Comment by: Conservation International Guyana
NGO Party Other Stakeholders
Subject: Comments on GFC/Indufor report
Comment 23:
2.8.2 Page 18 “GeoVantage … capable of identifying degradation with some certainty” – we suggest
specifying how much certainty.
Response GFC:

DNV GL – Report No. Z0512818, Rev. 1 – www.dnvgl.com Page 41
The accuracy assessment quoted a standard error for the estimation of forest degradation for
Guyana and for each stratum. The report notes that forest degradation and its related driver can
be easily identified from the GeoVantage imagery. Therefore, the level of uncertainty is quantified
in the SE statistic provided in the Report. It is intended to point out that it would be difficult to
assess the quality of the GFC mapping of forest degradation from RapidEye data without access to
higher spatial resolution imagery such as GeoVantage or equivalent. The important point that we
make is: deforestation is easily identified from RapidEye, whereas forest degradation is much more
difficult to identify because the scale of the disturbance can be very localised.
DNV GL:
The verification team assessed during interview with stakeholder /46//47/ the comment and
considers the response to be satisfactory.
Comment by: Conservation International Guyana
NGO Party Other Stakeholders
Subject: Comments on GFC/Indufor report
Comment 24:
2.9 Shifting cultivation.
2.9.1 The interim indicator is “Emissions resulting from communities to meet their local needs may
increase as a result of inter alia a shorter fallow cycle or area expansion” yet is represented as
ha/yr without estimates of emissions factors. This is an inconsistency that should be clarified.
Response GFC:
This Interim Indicator is not applicable for the current reporting period. This is clearly outlined in
the current Joint Concept Note. The GFC is actually going beyond the required level of reporting as
outlined in the JCN in providing a value for impact of shifting agriculture.
Having said this, the GFC has been undertaking a phased approach to developing the MRVS to
report on this Indicator. Like in the early period of reporting on the degradation indications on
infrastructure and forest management, when reporting was done in hectares and cubic meters
respectively, reporting on shifting agriculture is starting off in a hectare value, and will move, as
the systems are developed, to emissions reporting. In 2015, this is intended to be advanced in the
execution of field work to establish an emission factor for shifting agriculture. This is a rather
complex issue however, which is included in the development of this aspects of the MRVS, as it is
apparent that the treatment of pioneer and rotational shifting agriculture needs to be considered
separately.
DNV GL:
The verification team assessed during interview with stakeholder /46//47/ the comment and
considers the response to be satisfactory.
Comment by: Conservation International Guyana
NGO Party Other Stakeholders
Subject: Comments on GFC/Indufor report

DNV GL – Report No. Z0512818, Rev. 1 – www.dnvgl.com Page 42
Comment 25:
2.9.2 Page iv states that shifting cultivation is classified as degradation yet 100% of the carbon
stock is considered to be lost. In the Durham accuracy assessment, it states that the pioneer
shifting cultivation is deforestation whereas the rotational historical shifting cultivation is classified
as degradation. Please clarify which is correct.
Response GFC:
This was incorrectly stated in the Accuracy Assessment report, and has been corrected. All shifting
agriculture is considered forest degradation at this point as it is below the MMU for deforestation.
DNV GL:
The verification team assessed during interview with stakeholder /46//47/ the comment and
considers the response to be satisfactory.
Comment by: Conservation International Guyana
NGO Party Other Stakeholders
Subject: Comments on GFC/Indufor report
Comment 26:
2.9.3 Table 3-1 classifies shifting agriculture as forest yet the Appendix 5 classifies it as cropland.
Again, it will be useful to clarify this.
Response GFC:
This has been noted. It is a nomenclature issue more than anything, as the different LUC’s are
separated in both IM & IPCC reporting. In future Shifting Agriculture will be classified as the
relevant degraded forest type.
DNV GL:
The verification team assessed during interview with stakeholder /46//47/ the comment and
considers the response to be satisfactory.
Comment by: Conservation International Guyana
NGO Party Other Stakeholders
Subject: Comments on GFC/Indufor report
Comment 27:
2.10 Deforestation vs degradation – definition
2.10.1 Page 27 Deforestation “long-term or permanent change of land from forest use to other
non-forest uses” – has a cut-off point in terms of the number of years required to classify as “long-
term” in Guyana been determined?
Response GFC:
Guyana has a more specific definition & is mentioned in 3rd sentence that is based on a sustainable
management system that works on 25-60 year cycles.

DNV GL – Report No. Z0512818, Rev. 1 – www.dnvgl.com Page 43
For MRVS purposes also, a definition of Forest has been developed which in essence defines
deforestation. In 2015, a definition of forest degradation will be developed.
DNV GL:
The verification team assessed during interview with stakeholder /46//47/ the comment and
considers the response to be satisfactory.
Comment by: Conservation International Guyana
NGO Party Other Stakeholders
Subject: Comments on GFC/Indufor report
Comment 28:
2.10.2 Table 6-1: lists a change rate of 0.41% for 2009. This should be an annual rate or 0.02%
(based on 19.75 years as listed in the report).
Response GFC:
The rate reported at the benchmark is not an annual rate but a cumulative rate at as September
2009, thereby forming the benchmark. This is the intention of the benchmark and from this point
forward annual assessment are competed reporting on annual change levels. This rates takes into
account 19.75 years of deforestation. As such, the percent of 0.41 for the benchmark is correct.
DNV GL:
The verification team assessed during interview with stakeholder /46//47/ the comment and
considers the response to be satisfactory.
Comment by: Conservation International Guyana
NGO Party Other Stakeholders
Subject: Comments on GFC/Indufor report
Comment 29:
2.10.3 Primary vs Degraded Forests. FAO (2010) reports that only 45% of Guyanese forests are
primary; the use of a single emissions factor for deforestation may therefore be conservative but
there may also be under-calculation of the sequestration from re-growth. What is the cut-off
between non-degraded forest and degraded forest?
Response GFC:
The current plan does not involve the use of a single emission factor for forest degradation. The
current plan is to establish emission factors for each driver and stratum. The threshold of cut-off
between forest and non-forest is based on the forest definition. Work planned for 2015 will also
involve finalising a definition for forest degradation which will define the percent and year of impact
(continuous and persistent) that will define forest degradation. Remote sensing work in mapping
forest degradation for 2013 uses for example for forest degradation arising from shifting
agriculture, a level of 0.25 ha and greater. This will be further explored.
DNV GL:

DNV GL – Report No. Z0512818, Rev. 1 – www.dnvgl.com Page 44
The verification team assessed during interview with stakeholder /46//47/ the comment and
considers the response to be satisfactory.
Comment by: Conservation International Guyana
NGO Party Other Stakeholders
Subject: Comments on GFC/Indufor report
Comment 30:
2.10.4 Page 9, footnote 9 states that the carbon stocks are similar across forest types. We suggest
providing more information here: Are all the sampling plots in primary forest? What about these
degraded/regenerating forests? Logged forests? How “similar” is similar?
Response GFC:
In the commencement of activities in developing Guyana’s Forest Carbon Monitoring System,
preliminary sampling was conducted by randomly locating plots across various forest types outlined
in the Guyana vegetation map, and across a latitude and longitude gradient. The areas sampled for
the preliminary plots were located in large concession areas with good access—these areas were
identified on maps and sampling point randomly located using a module for this task in the GIS
software. Different sampling methods were tested aiming at the optimum design, balancing data
collection with precision, robustness, efficiency and scientific integrity. Single plots and cluster plots
were tested during preliminary data collection.
Initially, it was thought that different forest types would have significantly different carbon stocks.
The only differences were found in those forests identified as swamp forests. Because of this, and
because there was no significant difference between the other forest types, which account for far
more area across Guyana, it was determined that stratification by forest type is not necessary.
Overall, it was concluded that based on the past experience and preliminary data obtained to date
in Guyana, stratifying by forest type did not add any further information, and that all forest types
within the high threat for deforestation zone can be considered on stratum from a carbon stock
perspective. The carbon pools that will be included in the FCMS to determine the carbon stocks will
be standing live trees (above and below ground), standing dead wood, lying dead wood, and soil.
Change in soil carbon emissions will also be addressed for drivers that are likely to result in
emissions of soil carbon (e.g. conversion to permanent agriculture, mining, infrastructure).
DNV GL:
The verification team assessed during interview with stakeholder /46//47/ the comment and
considers the response to be satisfactory.
Comment by: Conservation International Guyana
NGO Party Other Stakeholders
Subject: Comments on GFC/Indufor report
Comment 31:
2.10.5 Page 21. The section on Monitoring forest Degradation suggests that, “infrastructure-related
degradation is restricted to the immediate area around the deforestation site.” However, longer
term studies (Seiler, 2001; Sih, Jonsson and Luikart, 2000; Laurance, Goosem and Laurance,

DNV GL – Report No. Z0512818, Rev. 1 – www.dnvgl.com Page 45
2009) suggest that degradation from infrastructure, especially roads, is sensitive to time and the
vegetation type.
Response GFC:
In Guyana this is monitored and uses empirical data not assumptions.
The extent of any visible degradation is monitored in a spatially explicit manner. So if there are any
variations, they will be recorded.
DNV GL:
The verification team assessed during interview with stakeholder /46//47/ the comment and
considers the response to be satisfactory.
Comment by: Conservation International Guyana
NGO Party Other Stakeholders
Subject: Comments on GFC/Indufor report
Comment 32:
2.11 Estimate of Degradation Area for Year 4. According to the AA, “it proved difficult to separate
unambiguously Year 4 degradation from degradation mapped from other periods… area of Year 4
degradation is overestimated”. According to the AA, change samples may be needed to increase
the accuracy of the yearly attribution of degradation episodes.
Response GFC:
Increasing the number of samples in the AA is not cost effective and not necessary. In fact in the
AA report it suggests reducing the number of samples, might still provide an acceptable level of
confidence.
DNV GL:
The verification team assessed during interview with stakeholder /46//47/ the comment and
considers the response to be satisfactory.
Comment by: Conservation International Guyana
NGO Party Other Stakeholders
Subject: Comments on GFC/Indufor report
Comment 33:
2.12 Natural Events. Page 32 – “Natural events are considered non-anthropogenic change so do
not contribute to deforestation or degradation figures”. This may be problematic as there is no way
to determine whether degradation detected around mining sites or along roads is due to wind-
throw (natural) or cutting (anthropogenic). Or was it the intention to say that it is lumped in with
the drivers when occurring in close proximity and is not distinguished? Please clarify.
Response GFC:

DNV GL – Report No. Z0512818, Rev. 1 – www.dnvgl.com Page 46
All degradation surrounding infrastructure is considered a result of that infrastructure as a
conservative measure. Generally speaking very few natural events occur in the populated areas of
Guyana, mostly these occur in the more mountainous terrain to the SE & far W of the country.
DNV GL:
The verification team assessed during interview with stakeholder /46//47/ the comment and
considers the response to be satisfactory.
Comment by: Conservation International Guyana
NGO Party Other Stakeholders
Subject: Comments on GFC/Indufor report
Comment 34:
2.13 State lands vs other forest areas
2.13.1 Page 7 .Under State Lands the report states, “For purposes of this assessment, State Lands
are…the State Forest Estate.” We assume this was meant to refer to the “State Forest Area” as
described in the preceding section.
Response GFC:
Noted. Change has been made to this Section.
DNV GL:
The verification team assessed during interview with stakeholder /46//47/ the comment and
considers the response to be satisfactory.
Comment by: Conservation International Guyana
NGO Party Other Stakeholders
Subject: Comments on GFC/Indufor report
Comment 35:
2.13.2 Page 7. The description of what constitutes State Lands indicates that “pockets of privately
held lands” are included. It would be useful to include a description of the extent of these isolated
pockets and the rational for their inclusion as State Land.
Response GFC:
Paragraph added to describe this category and justify its inclusion.
Privately held forests lands is a very minimal percent of total forest cover and in most cases not
separately delineated. The original category that this was part of was State Lands and for this
reason it is categories in this way until such time that specifically delineated GPS boundaries are
available for inclusion in the MRVS and separation as a separate category.
DNV GL:
The verification team assessed during interview with stakeholder /46//47/ the comment and
considers the response to be satisfactory.

DNV GL – Report No. Z0512818, Rev. 1 – www.dnvgl.com Page 47
Comment by: Conservation International Guyana
NGO Party Other Stakeholders
Subject: Comments on GFC/Indufor report
Comment 36:
2.13.3 Only land under the LCDS is eligible for REDD+ and this included only State Forest Area and
State Lands. As such, there is potential for leakage into private forests (The 2010 FAO Forest
Resources Assessment cites 2,983,000 ha in private forests (FAO 2010). The report implies that
they are included in the mapping and estimates but it is important to clarify how changes in
deforestation and degradation rates in private forests will be monitored to assess leakage.
Response GFC:
All land areas and change in land areas, and forest are monitored under the MRVS. The MRVS
addresses leakage by conducting a full wall to wall monitoring of forest and land cover of Guyana.
In this way, if there is deforestation occurring in State Forest or Amerindian Lands, these are
clearly identified and linked to the relevant category. .
DNV GL:
The verification team assessed during interview with stakeholder /46//47/ the comment and
considers the response to be satisfactory.
Comment by: Conservation International Guyana
NGO Party Other Stakeholders
Subject: Comments on GFC/Indufor report
Comment 37:
2.13.4 Page 33 “estimates of deforestation and degradation for all land eligible under Guyana’s
LCDS” and Table 6-1 lists Forest area as 18,475,000ha for 2013 – does this mean that there are
25,000 ha of forest that are not eligible? Please include data to clarify. No, there is no area
excluded. Table 2.1 has been rounded for summary purposes in Version 1.
Response GFC:
No, there is no area excluded. Table 2.1 has been rounded for summary purposes in Version 1.
DNV GL:
The verification team assessed during interview with stakeholder /46//47/ the comment and
considers the response to be satisfactory.
Comment by: Conservation International Guyana
NGO Party Other Stakeholders
Subject: Comments on GFC/Indufor report
Comment 38:
DNV GL – Report No. Z0512818, Rev. 1 – www.dnvgl.com Page 48
2.14 Level of degradation
2.14.1 Aside from the logging degradation (see below), other degradation drivers are reported as
hectares. This will be a challenge for emissions factors given that the level of degradation, and thus
emissions will vary depending on the degree of degradation. Please clarify how this will be
addressed? The current plan does not involve the use of a single emission factor for forest
degradation.
Response GFC:
The current plan is to establish emission factors for each driver and stratum. This is being further
advanced in 2015.
DNV GL:
The verification team assessed during interview with stakeholder /46//47/ the comment and
considers the response to be satisfactory.
Comment by: Conservation International Guyana
NGO Party Other Stakeholders
Subject: Comments on GFC/Indufor report
Comment 39:
2.14.2 Page.54. “determine the extent of degradation” – we suggest emphasizing that mapping of
the area impacted is not enough to quantify “the extent” given that degradation can include
anything from selective harvesting to degradation down to just above 30% canopy cover and thus
have substantial variation in terms of emissions. Please indicate how this will be addressed.
Response GFC:
The main goal of this report—it reports on interim measures –mostly focussed on area change and
emission reporting in some cases. For purposes of developing a complete picture of change in area
and emissions due to degradation, we have identified several causes and have completed or are in
process of collecting data to quantify emissions by the various causes of degradation. Causes of
degradation we have identified are timber harvesting (legal and illegal), degrading activities in 100
m wide buffers around mining and infrastructure, rotational shifting cultivation, and fire. Work on
logging emissions is completed and work on developing EF for other causes of degradation is in
process.
DNV GL:
The verification team assessed during interview with stakeholder /46//47/ the comment and
considers the response to be satisfactory.
Comment by: Conservation International Guyana
NGO Party Other Stakeholders
Subject: Comments on GFC/Indufor report
Comment 40:

DNV GL – Report No. Z0512818, Rev. 1 – www.dnvgl.com Page 49
2.15 Fires
2.15.1 The indicator for fire is the area which has been affected even though the “Interim
measure” is “emissions resulting from anthropogenic forest fires”. As such, while reporting on an
annual area of forest fires is a good start, it is important to note that this does not necessarily
indicate emissions levels. Low-intensity fire over a large area may emit less carbon than high-
intensity fires in smaller areas. In addition, forests which burn more than once (which may or may
not be detected by the mapping for previous burns) are likely to burn more intensely and display
higher emissions (Balch et al 2011, Cochrane et al 1999). Please indicate how this will be
addressed.
Response GFC:
We are aware that area of fire does not tell the emission story and have used the IPCC method
(Equation 2.27 from the IPCC 2006 GL) to estimate emissions from fire and developed EFs for each
stratum (range from 775-1043 t CO2/ha burned, including CO2, CH4, and N2O). Historically
(2001-2012) emissions from fire are estimated to be about 278,000 t CO2 or 0.2% of total
emissions—practically insignificant. This is a part of the current development work in execution.
DNV GL:
The verification team assessed during interview with stakeholder /46//47/ the comment and
considers the response to be satisfactory.
Comment by: Conservation International Guyana
NGO Party Other Stakeholders
Subject: Comments on GFC/Indufor report
Comment 41:
2.15.2 Page 44. says that the map shows “distribution of fires resulting in deforestation” yet earlier
in the document it implies that there will be data on degradation from fires – the total area is listed
but the spatial distribution of this information is not reported. Please clarify how the degradation
level (e.g. loss of aboveground biomass) will be assessed.
Response GFC:
Activity data for degradation by fire is not available as of yet (see Table 6-2). But given that the
extent is likely very small and hard to detect with confidence and that emissions from deforestation
by fire is insignificant, resources are better spent on monitoring of significant degradation sources.
Degradation by fire is likely caused by fires escaping from shifting cultivation areas in a particularly
dry season—as part of current work on the carbon dynamics of shifting cultivation, evidence for
escaping fires will be collected to assess if this source of emissions is significant.
DNV GL:
The verification team assessed during interview with stakeholder /46//47/ the comment and
considers the response to be satisfactory.
Comment by: Conservation International Guyana
NGO Party Other Stakeholders

DNV GL – Report No. Z0512818, Rev. 1 – www.dnvgl.com Page 50
Subject: Comments on GFC/Indufor report
Comment 42:
2.15.3 Have low-intensity under-storey fires been accounted for in the assessment of degraded vs
non-degraded forest? Low intensity ground-fires can be difficult to detect (Barlow et al 2012) and
smaller fires may go undetected with MODIS methodologies (Oliveras et al 2014, GOFC-GOLD
2014). Has there been ground-truthing to check for un-detected fires? E.g. Use of community MRV
results to check against mapping and FIRMS data.
Response GFC:
See above.
DNV GL:
The verification team assessed during interview with stakeholder /46//47/ the comment and
considers the response to be satisfactory.
Comment by: Conservation International Guyana
NGO Party Other Stakeholders
Subject: Comments on GFC/Indufor report
Comment 43:
2.16 Reference Measures.
The adoption of a reference measure of 0.275% (the average of Guyana historical deforestation
rates + global average deforestation rates 2005-2010) reflects the intention to pay Guyana for
maintaining such low deforestation rates and not only for reducing deforestation below historic
levels. In the Joint Concept Note, it is agreed that results based payments will not be awarded if
the deforestation rate increases above 0.1% and will be reduced if increasing beyond 0.056% (the
rate for the Benchmark Year1). The justification for the selection of this value as the benchmark is
unclear and does not reflect the deforestation rates prior to the signing of the MoU in 2009
(Deforestation for 2005-2009 = 0.02%, 2000-2005 = 0.04%). Please clarify.
Response GFC:
The MRVS reporting is based on the GoG GoN agreed JCN. Whilst this may be a matter of
relevance, this should be taken up in another track.
DNV GL:
The verification team assessed during interview with stakeholder /46//47/ the comment and
considers the response to be satisfactory.
Comment by: Conservation International Guyana
NGO Party Other Stakeholders
Subject: Comments on GFC/Indufor report
Comment 44:

DNV GL – Report No. Z0512818, Rev. 1 – www.dnvgl.com Page 51
Further development of the MVRS – Gaps
3.1 Degradation from Logging. It is suggested that the GFC reassess estimates of degradation from
logging. Given the complexities of forest governance in remote areas, dependence on official
statistics for both legal timber volumes and maintenance (or not) of a 15% illegal logging rate is
insufficient. Independent monitoring of logging rates should be encouraged in order to review the
current rates and estimates of illegality within the system. The reporting in Year 4 is in accord with
what was agreed for the interim measures but these data are insufficient for the long term
GFC’s method of estimating degradation for logging is based on a published peer reviewed
scientific publication that was informed by field work from Guyana: Pearson, TRH, S Brown, and
FM Casarim. 2014. Carbon emissions from tropical forest degradation caused by logging. Environ,
Res. Lett 9 034017 (11 pp) doi:10.1088/1748-9326/9/3/034017)
Response GFC:
There is no basis for requesting a reassessment as the method derived was developed following
intensive field work and robust methods applied that are in keeping with IPCC guidance.
Monitoring of illegal logging is based on the GFC’s expansive system of monitoring, and is open to
scrutiny in independent verification. We do not agree with, nor see the justification for the
conclusion of remoteness of areas leading to complexities of forest governance. There is no
evidence to support this claim. The indicators currently reported against are interim indicators and
are intended to be replaced by a full scale forest carbon emissions and removals reporting in the
long term.
DNV GL:
The verification team assessed during interview with stakeholder /46//47/ the comment and
considers the response to be satisfactory.
Comment by: Conservation International Guyana
NGO Party Other Stakeholders
Subject: Comments on GFC/Indufor report
Comment 45:
3.2 Use of timber volumes and Gain-Loss calculations. The justification for retaining the use of
official timber volumes to calculate loss from timber activities lies in their explanation (p22) that
RapidEye cannot detect individual canopy gaps unless harvesting is clustered and recent. This flaw
implies then that the degradation assessment may be underestimating disturbance. This does not
seem fully justified as there are alternative methods available to identify degradation from logging.
For example, consider fusion of multi-temporal Landsat and ALOS-PALSAR (Reiche et al 2015).
The EF developed for timber harvesting are based on cubic meters of timber removed (e.g
t CO2/m3 of volume extracted = sum of emissions associated with extracted log, collateral
damage, and construction of skid trails to remove logs). See also recent paper Pearson, TRH, S
Brown, and FM Casarim. 2014. Carbon emissions from tropical forest degradation caused by
logging. Environ, Res. Lett 9 034017 (11 pp) doi:10.1088/1748-9326/9/3/034017) for further
details.
Response GFC:
DNV GL – Report No. Z0512818, Rev. 1 – www.dnvgl.com Page 52
The annual reported volume of timber harvested in cubic meters is very robust and the method
developed and used in Guyana is peer reviewed and given problems of identifying individual gaps
(even using submeter RS imagery) identifying gaps is difficult and even then what to do with the
gap—need field work and factors to relate area of gap to volume removed etc…for which we do
have factors for Guyana but the variability around gap area is very high. Also gap area does not
equate well with timber and biomass damaged as sometimes we found very small gaps even
though tree felled was large—it depends on other characteristics of forest structure.
DNV GL:
The verification team assessed during interview with stakeholder /46//47/ the comment and
considers the response to be satisfactory.
Comment by: Conservation International Guyana
NGO Party Other Stakeholders
Subject: Comments on GFC/Indufor report
Comment 46:
3.3 Page37. “Forestry related change has remained relatively stable between Year 1 and 4” – this
maybe an artifact of the use of official timber volume statistics and not a reflection of actual
logging rates. Please clarify.
Response GFC:
The timber production data are also verified and reflect well, all of logging activities. This statistic
is generated by a formal, structured, well managed system of reporting, that is transparent and
open for scrutiny.
DNV GL:
The verification team assessed during interview with stakeholder /46//47/ the comment and
considers the response to be satisfactory.
Comment by: Conservation International Guyana
NGO Party Other Stakeholders
Subject: Comments on GFC/Indufor report
Comment 47:
. 3.4 Illegal logging.
Degradation from illegal logging is estimated as an additional 15% of that from legal logging (p. v).
There is no citation for the basis for this percentage. Clarke 2006 (World Bank report) that cites
15% based on “perceptions of local experts” (Clarke 2006). Is there any further data to back these
up? It appears low compared to other Latin American countries. The report states that this rate of
15% may change based on the “Independent Forest Monitoring” but seems to also imply that this
monitoring is done by the GFC based on reports from its outposts. Verification by an independent
auditor outside of the GFC would be advisable.

DNV GL – Report No. Z0512818, Rev. 1 – www.dnvgl.com Page 53
Response GFC:
GFC was the first to raise objection with the use of the 15% estimate of illegal logging on the basis
that we believe it to be too high. This number was based by a GoN contracted Study completed by
CIFOR where consultant Mr. Jorge Trevin concluded that this is the rate of illegal logging.
The purpose of the MRVS Report is to provide results based on agreed benchmarks. This is being
done.
DNV GL:
The verification team assessed during interview with stakeholder /46//47/ the comment and
considers the response to be satisfactory.
Comment by: Conservation International Guyana
NGO Party Other Stakeholders
Subject: Comments on GFC/Indufor report
Comment 48:
3.5 Leakage. Leakage is not addressed in the methods and not explicitly a requirement of the
interim measures but we suggest that this should be addressed. There are a number of areas
where lack of clarity of definitions outline in the interim report (see above) should be addressed
explicitly to clarify potential for leakage.
Response GFC:
All land areas and change in land areas, and forest are monitored under the MRVS. The MRVS
addresses leakage by conducting a full wall to wall monitoring of forest and land cover of Guyana.
In this way, if there is deforestation occurring in State Forest or Amerindian Lands, these are
clearly identified and linked to the relevant category.
DNV GL:
The verification team assessed during interview with stakeholder /46//47/ the comment and
considers the response to be satisfactory.
Comment by: Conservation International Guyana
NGO Party Other Stakeholders
Subject: Comments on GFC/Indufor report
Comment 49:
3.6 Amerindian Lands. Page 53. “It is proposed that deforestation located in Amerindian areas is
not counted in calculating reduction in financial remuneration”. This proposal is problematic given
that:
a. Amerindian communities are facing invasions and encroachment from outsiders due to mining
and road building (GCP 2014). This is likely to increase given the proximity of some roads (e.g.
Lethem road) to Amerindian lands.

DNV GL – Report No. Z0512818, Rev. 1 – www.dnvgl.com Page 54
b. Disregarding mining or other activities in Amerindian lands could create perverse incentives to
focus such activities in these lands.
c. If they are not within the LCDS, they are subject to leakage and negative social & environmental
outcomes which need to be monitored.
All forest change are monitored and report under the MRVS for purposes of completeness and
comprehensiveness.
Response GFC:
The MRVS Report does not conclude on financial remuneration. This is a separate process led by a
separate GoG agency.
DNV GL:
The verification team assessed during interview with stakeholder /46//47/ the comment and
considers the response to be satisfactory.
Comment by: Conservation International Guyana
NGO Party Other Stakeholders
Subject: Comments on GFC/Indufor report
Comment 50:
3.7 Amaila Falls Project. It is clear from the JCN that the deforestation from the Amaila Falls
Project will be excluded from the calculations. However, it is not explicit in the MRVS if/how
monitoring of the longer-term impacts of the project will be included in mapping and REDD+
planning.
Response GFC:
The JCN does not conclude that deforestation from Amaila Falls will be excluded from the
computations. The only stipulation on exclusion of Amaila Falls is with respect to the institution of
the sliding scale.
The MRVS monitors all impacts across drivers as identified in the MRVS. As long as the MRVS
continues to be implemented all change will be mapped across all drivers, including from the
Project.
DNV GL:
The verification team assessed during interview with stakeholder /46//47/ the comment and
considers the response to be satisfactory.
Comment by: Conservation International Guyana
NGO Party Other Stakeholders
Subject: Comments on GFC/Indufor report
Comment 51:

DNV GL – Report No. Z0512818, Rev. 1 – www.dnvgl.com Page 55
3.8 Below-ground carbon pools. It is not clear how the below-ground biomass and soil carbon pools
are being treated. They are not included in the Interim Measures required yet they are one of the
IPCC carbon pools which should be included in reporting (GOFC-GOLD 2014). This may be
particularly relevant for the flooded forests. Have there been efforts to identify peat soils in these
areas? Deforestation of peat forests can have significant consequences for emissions (Murdiyarso
et al 2010). Given that there are extensive areas of peat soils in other Amazonian countries (e.g.
Peru, see Draper et al 2014) and Guyana contains areas of swamp forest (as per Appendix 5), it is
important to confirm the absence/presence and extent of these soils.
In addition, given that mining is the main driver of deforestation, emissions factors must account
for the emissions from extensive soil disturbance caused by mining activities. The effects on soil
carbon from mining is extensive (Shrestha and Lal 2006, Frouz et al 2009) much higher than
conversion to agricultural production such that a differentiated system of accounting should be
considered.
Response GFC:
Other Report by GFC also needs to be considered in the area that this comment addresses – such
as on the forest carbon monitoring system-those reports provide details on how we included all
IPCC pools—above and below ground biomass, dead wood, litter and soil and include these when
we estimate EFs
If a sampling plot is located on a highly organic soils then we will know this. Our field work has not
identified forests on highly organic soils so this is not included at present.
Emission factors for mining do factor in soil disturbance using the IPCC 2006 approach. Yes, soils
under mining are disturbed but given the form of mining in Guyana a lot of the top soil is washed
away and deposited elsewhere in streams/rivers. So for now we use a relatively conservative
estimate of the impacts. We have found NO evidence of peat soils in any of our field work (based
on random selection of sample sites).
DNV GL:
The verification team assessed during interview with stakeholder /46//47/ the comment and
considers the response to be satisfactory.
Comment by: Conservation International Guyana
NGO Party Other Stakeholders
Subject: Comments on GFC/Indufor report
Comment 52:
3.9 Costs. There is no assessment of the cost efficiency of the mapping and emissions factor work
that is being carried out. How does RapidEye compare to LiDAR mapping of carbon as done in Peru
(Asner et al 2014)? What are the costs involved? Information on the costs of the current system
would help increase transparency and promote evaluation of the current system. Comparison with
other potential mapping methodologies could be carried out at as a separate exercise.
Response GFC:

DNV GL – Report No. Z0512818, Rev. 1 – www.dnvgl.com Page 56
Costs of implementing the current system are outlined in the consultancy contracts. Satellite
imagery offers the most cost-effective option for detecting and monitoring country-scale forest
change (data cost alone is USD 1 cent vs approx. 5-10/ha in favour of RapidEye over LiDAR).
A sampling approach however, does make sense and this has been adopted for the accuracy
assessment. This is based on the capture high resolution airborne imagery (~0.25 m). The
approach could be expanded to evaluate LiDAR which with field calibration could be used to
determine Carbon stocks, detect degradation and map change. An evaluation of technology
especially makes sense in Guyana thanks to the availability of robust base datasets. The results of
which would provide a useful reference for other tropical countries.
DNV GL:
The verification team assessed during interview with stakeholder /46//47/ the comment and
considers the response to be satisfactory.
Comment by: Conservation International Guyana
NGO Party Other Stakeholders
Subject: Comments on GFC/Indufor report
Comment 53:
3.10 Supplementary information and steps to improve MRVS and REDD+.
3.10.1 It can be expected that measures to improve recovery of mined out sites will be
implemented in the near to medium term, therefore it is essential that the MRVS take on board
advances to assess reforestation and the associated sequestration.
Response GFC:
A priority area outlined in the MRVS Roadmap Phase 2 is that of: Refining the measurement and
reporting of forest degradation and reforestation/regrowth. To this end, in addressing this priority
area in the implementation of Phase 2 of the Roadmap, the GFC will seek to consolidate analysis of
current and new drivers of forest degradation; Test and agree on a definition reflecting the key
processes leading to forest degradation and that will guide following steps by using existing data
and its relationship to definition of forest; and implement for further research and systematic
measuring and monitoring with focus on main sources of emissions from forest degradation,
reforestation and regrowth on the national level.
DNV GL:
The verification team assessed during interview with stakeholder /46//47/ the comment and
considers the response to be satisfactory.
Comment by: Conservation International Guyana
NGO Party Other Stakeholders
Subject: Comments on GFC/Indufor report
Comment 54:

DNV GL – Report No. Z0512818, Rev. 1 – www.dnvgl.com Page 57
3.10.2 Some information on the relative role of illegal vs legal mining would be useful. It appears
that the georeferenced data is available for the mining areas so it would be good to overlay this
with mining detected. This information would help focus REDD+ planning.
Response GFC:
The main objective of the Interim Measures Report is to provide results on the interim measures as
well as a detailed outline on the methods that would have been applied to generate these results.
The results of the MRVS along with the datasets generated are shared with key agencies in the
natural resources sector including the GGMC & GIMU. These agencies utilise the data for purposes
relating to management of the specific area of work (e.g. mining) and strategic interventions and
analysis are done at this level.
As such the national MRVS is seen to be a critical component in informing this process however,
the aspect regarding the legality of activities is addressed at the agency level, in this case the
GGMC.
DNV GL:
The verification team assessed during interview with stakeholder /46//47/ the comment and
considers the response to be satisfactory.
Comment by: Conservation International Guyana
NGO Party Other Stakeholders
Subject: Comments on GFC/Indufor report
Comment 55:
3.10.3 Given the influence of migration to/from rural areas on deforestation and degradation
patterns, it would be helpful to include information on population dynamics in high-risk and low-
risk areas.
Response GFC:
The national MRVS has been designed to monitor and report on forest area change across identified
drivers of deforestation and forest degradation and to generate emission factors for forest carbon
removals and emissions reporting.
Influencing these drivers may be several factors such as population dynamics. In the development
of the MRVS in the medium term, we do see that an assessment of the processes that impact on
these drivers may be informative.
DNV GL:
The verification team assessed during interview with stakeholder /46//47/ the comment and
considers the response to be satisfactory.
Comment by: Conservation International Guyana
NGO Party Other Stakeholders

DNV GL – Report No. Z0512818, Rev. 1 – www.dnvgl.com Page 58
Subject: Comments on GFC/Indufor report
Comment 56:
3.10.4 The Interim Report mentions intent to align the MRVS with community MRV initiatives.
Given the high rates of accuracy found in community forest monitoring (Danielsen et al 2013,
Palmer Fry 2011) and the existence of studies (Butt et al 2015) and projects (GCP 2014, WWF
2014) specific to Guyana, community MRV could feed information into a national MRVS both in
terms of the collection of data for creation of emissions factors but also to detect forest
degradation events (especially low-intensity fires which may not be detected by remote sensing
images) and verify changes detected by the GFC mapping. This also works towards promoting local
participation in the process which can help address safeguard (d) of the Cancun Safeguards.
Response GFC:
It is with this view in mind that the GFC continues to support the development of community MRV
projects. It is intended that the data collected at the level of the communities will feed into the
national MRVS. Work at the level of the communities in this regard will also serve to validate data
collected at the national scale. Data coming from community MRV will be linked to the national
forest monitoring system, thereby allowing sub-national monitoring to inform and strengthen
national monitoring. This data exchange is an essential component and various options are
currently being explored as to how this can be done efficiently in Guyana. Developing standard
operating procedures with user friendly documentation for communities is part of this.
DNV GL:
The verification team assessed during interview with stakeholder /46//47/ the comment and
considers the response to be satisfactory.
Comment by: Conservation International Guyana
NGO Party Other Stakeholders
Subject: Comments on GFC/Indufor report
Comment 57:
3.10.5 Considering that Guyana will also need to produce a summary report on Safeguard
Information Systems, consideration of the links between the MRVS and a future SIS will be
beneficial to both monitoring systems. The potential synergies are particularly relevant for the case
of the carbon-related safeguards (leakage (g) and permanence (f)) and participation of (d) and
respect for (c) indigenous and local communities.
Response GFC:
With the implementation of the MRVS Roadmap Phase 2, the continued work will be aligned with
the outcomes of Cop 19 (Warsaw, 2013). At the COP19 in Warsaw, November 2013, discussions on
REDD+ advanced and final agreements were made resulting in a complete REDD+ package (known
as “The Warsaw Framework on REDD+”). The decisions included, among other things, modalities
for national forest monitoring systems, modalities for measurement, reporting and verification,
guidance on addressing drivers, safeguards reporting, and procedures for submitting forest

DNV GL – Report No. Z0512818, Rev. 1 – www.dnvgl.com Page 59
reference (emission) levels. Earlier decisions included Methodological guidance for REDD+ (4/CP15)
and Modalities relating to forest reference emission levels and forest reference levels (12/II CP.17).
The development and implementation of Guyana’s MRVS seek meet with these evolving
international requirements.
MRVS Phase 2 Roadmap highlights safeguards as an area of work.
DNV GL:
The verification team assessed during interview with stakeholder /46//47/ the comment and
considers the response to be satisfactory.
Comment by: Conservation International Guyana
NGO Party Other Stakeholders
Subject: Comments on GFC/Indufor report
Comment 58:
Summary of Key Recommendations
4.10 Within the text of the report and future reporting, we suggest the inclusion of explicit
definitions of key terms and methodologies used as well as information on the level of certainty.
Response GFC:
We have elaborated on definitions in the Accuracy Assessment Report where some of the more
complex terminologies have been presented. The main aim of the AA is to provide accuracy levels
and this has been done. Within the FCMS this has also been done.
DNV GL:
The verification team assessed during interview with stakeholder /46//47/ the comment and
considers the response to be satisfactory.
Comment by: Conservation International Guyana
NGO Party Other Stakeholders
Subject: Comments on GFC/Indufor report
Comment 59:
4.11 We suggest a reassessment of the methodology used to assess degradation from logging
activities, both in terms of the official statistics and the estimate of illegal activity.
Response GFC:
We continually assess the approach we use and as it is now in a high impact factor peer reviewed
journal we strongly believe we do not need to reassess the method.
There is no basis for requesting a reassessment as the method derived was developed following
intensive field work and robust methods applied. Further, monitoring of illegal logging is based on
the GFC’s expansive system of monitoring, and is open to scrutiny in independent verification. We

DNV GL – Report No. Z0512818, Rev. 1 – www.dnvgl.com Page 60
do not agree with, nor see the justification for the conclusion of remoteness of areas leading to
complexities of forest governance. There is no evidence to support this claim. The indicators
currently reported against are interim indicators and are intended to be replaced by a full scale
forest carbon emissions and removals reporting in the long term..
DNV GL:
The verification team assessed during interview with stakeholder /46//47/ the comment and
considers the response to be satisfactory.
Comment by: Conservation International Guyana
NGO Party Other Stakeholders
Subject: Comments on GFC/Indufor report
Comment 60:
4.12 We suggest including Amerindian lands in the calculations given the risks of leakage, illegal
mining and logging, or encroachment from non-Amerindian actors. Such an approach will also be
consistent with the national approach that Guyana has taken for the MRVS.
Response GFC:
Amerindian lands are include in the MRVS. See Section 6.11 of the Report.
DNV GL:
The verification team assessed during interview with stakeholder /46//47/ the comment and
considers the response to be satisfactory.
Comment by: Conservation International Guyana
NGO Party Other Stakeholders
Subject: Comments on GFC/Indufor report
Comment 61:
4.13 Identification of a strategy to assess (and deal with) leakage should be considered. For
degradation, we suggest extending beyond estimating the area degraded and accounting for the
intensity of fires and other disturbances.
Response GFC:
All land areas and change in land areas, and forest are monitored under the MRVS. The MRVS
addresses leakage by conducting a full wall to wall monitoring of forest and land cover of Guyana.
Degradation monitoring under the MRVS includes areas affected by fire and other disturbances.
In 2015 the plan for continuing work on degradation includes establishing emission factors for key
drivers which will essentially use the area estimate generated through the remote sensing work
along with the emission factors developed to more effectively account for impacts on forest carbon.
DNV GL:

DNV GL – Report No. Z0512818, Rev. 1 – www.dnvgl.com Page 61
The verification team assessed during interview with stakeholder /46//47/ the comment and
considers the response to be satisfactory.
Comment by: Conservation International Guyana
NGO Party Other Stakeholders
Subject: Comments on GFC/Indufor report
Comment 62:
4.14 We suggest incorporation of estimates of changes in soil carbon stocks.
4.15 We suggest including studies of Guyana peat soils.
Response GFC:
See response to comment 3.8 above already include soil emissions and have found no evidence of
peat soils in our field sampling, though we do know swamp forest exist in Guyana and have
sampled in some of these but no evidence of highly organic soils to date (based on soil sampling
and analysis), but we will investigate this further. The key question is do they exist in areas that
are subject to deforestation. .
DNV GL:
The verification team assessed during interview with stakeholder /46//47/ the comment and
considers the response to be satisfactory.
Comment by: Conservation International Guyana
NGO Party Other Stakeholders
Subject: Comments on GFC/Indufor report
Comment 63:
4.16 Data and verification from community MRV in the national strategy should be included. This
can contribute to calculation of emissions factors but also to verification of degradation and
deforestation detected during the mapping, especially for shifting agriculture.
Response GFC:
It is with this view in mind that the GFC continues to support the development of community MRV
projects. It is intended that the data collected at the level of the communities will feed into the
national MRVS. Work at the level of the communities in this regard will also serve to validate data
collected at the national scale. Data coming from community MRV will be linked to the national
forest monitoring system, thereby allowing sub-national monitoring to inform and strengthen
national monitoring. This data exchange is an essential component and various options are
currently being explored as to how this can be done efficiently in Guyana. Developing standard
operating procedures with user friendly documentation for communities is part of this.
DNV GL:
The verification team assessed during interview with stakeholder /46//47/ the comment and
considers the response to be satisfactory.

DNV GL – Report No. Z0512818, Rev. 1 – www.dnvgl.com Page 62
Comment by: Conservation International Guyana
NGO Party Other Stakeholders
Subject: Comments on GFC/Indufor report
Comment 64:
4.17 Identification and building on links between the MRVS and the Safeguard Information Systems
should be considered.
Response GFC:
With the implementation of the MRVS Roadmap Phase 2, the continued work will be aligned with
the outcomes of Cop 19 (Warsaw, 2013). The development and implementation of Guyana’s MRVS
seek meet with these evolving international requirements. Safeguards feature prominently in the
MRVS Roadmap Phase 2. A key activity includes the exploration of the use the REDD+ monitoring
and MRV data to assist the development of a Safeguard Information System, also in the context of
evolving guidance from the UNFCCC negotiations on this matter.
DNV GL:
The verification team assessed during interview with stakeholder /46//47/ the comment and
considers the response to be satisfactory.
Comment by: Conservation International Guyana
NGO Party Other Stakeholders
Subject: Comments on GFC/Indufor report
Comment 65:
4.18 We suggest continuing to build upon the progress in capacity building and methods
development.
Response GFC:
Capacity building and methods development continues to be an ongoing and continuous process,
building on what has already been achieved.
The importance placed on capacity building by the GFC is reflected in the MRVS Roadmap Phase,
for which the overall proposed objective is to consolidate and expand capacities for national REDD+
monitoring and MRV. This will support Guyana in meeting the evolving international reporting
requirements from the UNFCCC as well as continuing to fulfil additional reporting requirements e.g.
to meet reporting commitments under the bilateral cooperation agreement with the Government of
Norway. It will also support Guyana in further developing forest monitoring as a tool for REDD+
implementation, building on the already established foundation.
DNV GL:
The verification team assessed during interview with stakeholder /46//47/ the comment and
considers the response to be satisfactory.

DNV GL – Report No. Z0512818, Rev. 1 – www.dnvgl.com Page 63
4 REFERENCES
Documents provided by the Project Participants. These have been used as direct sources of
evidence for the periodic verification conclusions, and are usually further checked through
interviews with key personnel.
/1/ Guyana Forestry Commission Guyana REDD+ Monitoring Reporting & Verification System
(MRVS) Year 4 Interim Measures Report, Version 1 dated 28 November 2014, Version 2
dated 27 January 2015 and Version 3 dated 27 February 2015
/2/ Guyana Forestry Commission: Geodatabase with all raw and processed datasets, November
2013
/3/ Guyana Forestry Commission: Data Base of Illegal logging activities for the four forestry
divisions of Bce, Dem, Ess and Nwd – 1 January 2013 to 31December 2013 – Year 4
/4/ Guyana Forestry Commission: Data Base of Procedural Breaches for the four forestry
divisions of Bce, Dem, Ess and Nwd – 1 January 2013 to 31December 2013 – Year 4
/5/ Guyana Forestry Commission: Data Base of wood harvesting declarations of wood extraction
activities in lands classified as State Forest– 1 January 2013 to 31December 2013 – Year 4
/6/ Guyana Forestry Commission: Data Base of wood harvesting declarations of wood extraction
activities in lands classified as Amerindian or Private Property– 1 January 2013 to
31December 2013 – Year 4
/7/ Winrock International: Collateral Damage and Wood Products from Logging Practices in
Guyana- December 2011
/8/ Salas, W. Hagen, S, et al. Winrock International and Applied GeoSolution: A Pilot Study to
Assess Forest Degradation Surrounding New Infrastructure. Guyana Forestry Commission.
February, 2012.
/9/ Guyana Forestry Commission: Sampling Design and Implementation Plan for Guyana’s
REDD+ Forest Carbon Monitoring System (FCMS) – June 2014
/10/ Guyana Forestry Commission: Spatial Analyses for Forest Carbon Stratification and Sampling
Design for Guyana’s FCMS: Phase II – June 2013
/11/ Assesment of Illegal Logging Indicator_Year 4; Illegal Logging Production Table_Year 4
2013; and Wood Products Storage in Guayana_2-13_Illegal Logging. Xlsx.
/12/ Assesment of Forest Management Indicator (Carbon Stock Calcualtions) Year 4_GFC_MA-
GFC_2014-v1.xls; Forest Sector Tables BOG BOS 2013; Production Base Sheet for
Computation 2013; and TSA & WCL Production Sheet January – December 2013.
/13/ Guyana Forestry Commission: Forest Carbon Monitoring System: Emission Factors and their
Uncertainties, Version 2. June 2014.
/14/ Guyana Forestry Commission: Establishing a Reference Level for REDD+ in Guyana – June
2012
/15/ The Guyana Forestry Commission and Indufor: Standard Operating Procedures for Forest
Change Assessment: A Guide for Remote Sensing Processing & GIS Mapping
/16/ Sist, Plinio: 2000: Reduced-impact logging in the tropics: objectives, principles and impacts.
International Forestry Review 2(I), 2000. Pages 3-10.
/17/ Guyana Forestry Commission: Standard Operating Procedures for the Forest Carbon
Monitoring System of Guyana – Revised October 2014
/18/ Durham University: Appenidix 2 to IMR –Accuracy Assessment Report, November 2013
Background documents related to the design and/or methodologies employed in the design or
other reference documents.

DNV GL – Report No. Z0512818, Rev. 1 – www.dnvgl.com Page 64
/19/ Guyana Forestry Commission: Standard Operating Procedures for the Forest Carbon
Monitoring System of Guyana. Revised October 2014.
/20/ ISO 14064-3: Greenhouse gases — Part 3: Specification with guidance for the validation and
verification of greenhouse gas assertions, First edition, 1 March 2006
/21/ Guyana Forestry Commission: Detention and Seizure Procedure
/22/ Guyana Forestry Commission: Forest Monitoring Operating Procedure
/23/ Guyana Forestry Commission: Procedure for Export of Forest Produce
/24/ Guyana Forestry Commission: Procedure for Issuance of Sawmill Licence
/25/ Guyana Forestry Commission: Procedure for issuing SFEP,
http://www.forestry.gov.gy/publications.html
/26/ Guyana Forestry Commission: Procedure for issuing SFP,
http://www.forestry.gov.gy/publications.html
/27/ Guyana Forestry Commission: Procedure for issuing TSA or WCL ,
http://www.forestry.gov.gy/publications.html
/28/ Guyana Forestry Commission: Procedure for Timber Dealers Licence
/29/ Guyana Forestry Commission: Forest inspector supervisory check list – Daily supervision of a
forest station, midmonth and month end supervision, routine checks by forest rangers at
forest stations, basic field verification, January 2007
/30/ Guyana Forestry Commission: forest station internal audit control record
Persons interviewed during the initial verification, or persons who contributed with other
information that are not included in the documents listed above.
/31/ Tasreef Khan, Deputy Commissioner of Forests – GFC
/32/ Pradeepa Bholanath, Head, PDD-GFC
/33/ Monitoring Inspectors & Supervisor Port Kaituma Forest station – GFC
/34/ Nasheta Dewnath, Programme Officer – REDD Section
/35/ Pete Watt, Consultant – Indufor
/36/ Jeff Pickering , Consultant – Indufor
/37/ Rosa Rivas Palma, Consultant – Indurfor
/38/ Ambeca Jaggessar, Resource Information Officer – GFC
/39/ Chetram Ramgobind – Program Officer, Illegal Logging and Procedural Breach Database -
GFC, Forest Resources Management Division – GFC
/40/ Kerry Anne Cort – GIS/Remote Sensing Officer, Forest Resources Information Unit – GFC
/41/ Chandroutie Sookdeo – GIS/Remote Sensing Officer, Forest Resources Information Unit –
GFC
/42/ Carey Bhojedat – Project Officer, REDD Secretariat – GFC
/43/ Nasheta Dewnath, Programme Officer, REDD Secretariat
/44/ Hansrajie Sookdeo and Karishma Misir, Project Officers – Data Management, REDD
Secretariat
/45/ Danny Donoghue, Durham University
/46/ David Singh, Executive Director, Guyana Programme at Conservation International
/47/ Dianne Balraj, Environmental Policy Coordinator at Conservation International
/48/ Fabian Jones, Guyana Forestry Commission Economist and Statistician

DNV GL – Report No. Z0512818, Rev. 1 – www.dnvgl.com Page 65
/49/ Keith Austin – Assistant commissioner of forests – legality monitoring and extension unit.
/50/ GFC Station staff Bamboo Landing: Troy Semple
/51/ GFC Station staff at Vaitarna Holdings Concession: Orlando Johnson; Fedal Garraway
/52/ GFC Station staff Linden: Ebo Elles; Kareem Jordan; Leroy Kalilsan
Criteria of validation and verification
/53/ Government of Norway and Government of Guyana: Joint Concept Note on REDD+
cooperation between Guyana and Norway, 9 November 2009, March 2011 & December 2012
/54/ GOFC-GOLD, 2012, A sourcebook of methods and procedures for monitoring and reporting
anthropogenic greenhouse gas emissions and removals associated with deforestation, gains
and losses of carbon stocks in forests remaining forests, and forestation. GOFC-GOLD Report
version COP18-1, (GOFC-GOLD Land Cover Project Office, Wageningen University, The
Netherlands).
/55/ IPCC (2006): 2006 IPCC Guidelines for National Greenhouse Gas Inventories, Prepared by
the National Greenhouse Gas Inventories Programme. Eggleston H.S., Buendia L., Miwa K.,
Ngara T. and Tanabe K. (eds).Published: IGES, Japan
/56/ IPCC (1997). Revised 1996 IPCC Guidelines for National Greenhouse Inventories. Houghton
J.T., MeiraFilho L.G., Lim B., Tréanton K., Mamaty I., Bonduki Y., Griggs D.J. Callander B.A.
(Eds). Intergovernmental Panel on Climate Change (IPCC), IPCC/OECD/IEA, Paris, France.
/57/ IPCC (2000). Good Practice Guidance and Uncertainty Management in National Greenhouse
Gas Inventories. Penman J., Kruger D., Galbally I., Hiraishi T., Nyenzi B., Emmanuel S.,
Buendia L., Hoppaus R., Martinsen T., Meijer J., Miwa K., Tanabe K. (Eds).
Intergovernmental Panel on Climate Change (IPCC), IPCC/OECD/IEA/IGES, Hayama, Japan.
/58/ IPCC (2003). Good Practice Guidance for Land Use, Land-Use Change and Forestry. Penman
J., Gytarsky M., Hiraishi T., Krug, T., Kruger D., Pipatti R., Buendia L., Miwa K., Ngara T.,
Tanabe K., Wagner F. (Eds).Intergovernmental Panel on Climate Change (IPCC), IPCC/IGES,
Hayama, Japan.
/59/ Consultancy Assignment Agreement between Det Norske Veritas and Norwegian Ministry of
Environment including Appendices to the agreement, 10 January 2011& Extension
Agreement, 07 February 2012, 16 May 2013
/60/ Guyana Forestry Commission: Code of Practice for Timber Harvesting 2nd Edition, Final
Version, November 2002
/61/ Poyry: ArcToolbox model for the establishment of an IFL
/62/ Potapov, P., A. Yaroshenko, S. Turubanova, M. Dubinin, L. Laestadius, C. Thies, D. Aksenov,
A. Egorov, Y. Yesipova, I. Glushkov, M. Karpachevskiy, A. Kostikova, A. Manisha, E.
Tsybikova, and I. Zhuravleva. 2008. Mapping the world’s intact forest landscapes by remote
sensing. Ecology and Society 13(2): 51.
[online] URL: http://www.ecologyandsociety.org/vol13/iss2/art51/
/63/ Intact Forest Landscapes: Concept and definition of IntactForest Landscape,
http://www.intactforests.org/concept.html
/64/ Voluntary Carbon Standard Association: REDD Methodology Modules (REDD-MF), Approved
VCS Methodology VM0007 Version 1.2
/65/ Det Norske Veritas: Verification of Interim REDD+ Performance Indicators under the
Guyana-Norway REDD+ Partnership, Monitoring Period: 01 October 2009 to 30 September
2010 – Year 1, 18 February 2011
/66/ Det Norske Veritas: Verification of Interim REDD+ Performance Indicators under the
DNV GL – Report No. Z0512818, Rev. 1 – www.dnvgl.com Page 66
Guyana-Norway REDD+ Partnership, Monitoring Period: 01 October 2010 to 31 December
2011 – Year 2, 16 September 2012
/67/ Det Norske Veritas: Verification of Interim REDD+ Performance Indicators under the
Guyana-Norway REDD+ Partnership, Monitoring Period: 01 January 2012 to 31 December
2012 – Year 3, 24 February 2014
- o0o -

APPENDIX A
CORRECTIVE ACTION REQUESTS, CLARIFICATION REQUESTS
AND OBSERVATIONS

DNV GL – Report No. Z0512818, Rev. 1 – www.dnvgl.com Page A - 1
MINOR Corrective action requests and Observations of the previous year’s audit
CAR ID Major/
Minor
Corrective action request Response by Project Participants DNV GL’s assessment of response by
Project Participants
CAR 3 MINOR Requirement: Interim Measures 1.1 (1
1) Gross Deforestation, Interim
Measures 2.1 (21) Loss of intact forest
and Interim Measures 2.3 (2b1)
Non-Compliance: Clarity on transition plan relating to internal capacity building and maintenance
Objective evidence: Current management and oversight of the GIS unit is due to transition to a local actors, and it is not clear how GFC is able to ensure continued internal capacity building and maintenance which ensures the high level of delivery of GIS services
Within the year 3 (2012) assessment period, the most significant involvement of local resources was seen over the past 3 years. In this period, a separate and dedicated unit was established to perform MRV assessments and saw the contracting of 4 new staff for this purpose. This has brought the local staffing complement of the GFC, dedicated to this effort to 6 persons.
For the 2012 assessment, whilst oversight was provided by a full time specialist of Indufor who was stationed in Guyana for 1 year, this effort was directed at building local capacities for not only GIS and RS mapping and analyses, but also project management and oversight. Evidence of this leadership role by GFC staff is evidenced by the degree of involvement in both mapping and management aspects of the Year 3 assessment process. It should be recognised that ongoing technical assistance is a feature of all international MRV systems – especially during the initial development phase. The GFC is mindful of this and will continue to use technical assistance as required to ensure future reporting adheres to GPG and meets the stipulated requirements.
The plan in moving forward towards the Year 4 assessment is to maintain efficient planning for all activities related to forest cover monitoring and mapping, as well as capitalising on the experiences built within the new unit to fully and effectively manage and execute the analysis to be
DNV GL observed during the audit that the activities of the external expert had been reduced further and concentrated on general oversight and Q&A of the senior local GIS staff, whilst local staff executed all task required in relation to GIS interpretations and day to day data management.
CAR closed out

DNV GL – Report No. Z0512818, Rev. 1 – www.dnvgl.com Page A - 2
CAR ID Major/
Minor
Corrective action request Response by Project Participants DNV GL’s assessment of response by
Project Participants
done.
CAR 4 MINOR Requirement: Interim Measure 2.2 (3
1)
Non-Compliance: Expanding Staff Capacity in forest carbon monitoring beyond current levels.
Objective evidence: Although the GIS staff has seen expansion within the staffing the Forest Carbon Monitoring relays heavily on a few individuals and current work load may be heavy for existing local personnel under the programme.
The Forest Carbon Monitoring Unit within the GFC, has built significant capacity over the past 3 years in managing and implementing the activities involved in the execution of the monitoring programme.
This is evidenced by dedicated staff who work on the management aspect of this activity, full time, as well as a cadre of field staff from the GFC Forest Resources Management division, who have been trained to perform activities such as data collection, recording and processing. All field activities are managed and executed by local staff, with support from external specialists in the area of design and future system development areas.
There is scope to increase the number of local staff in the management aspect of the forest carbon monitoring system from its current level. However, this expansion will be managed with keen consideration to the fact that field work may be more extensive in the current design phase but perhaps less intensive in the full operational stage when relevant system elements would have already been established.
DNV GL assessed the CAR and actions undertaken by GCF and considered that with the further integration and actions undertaken by GCF a better resources management had been adopted by the GCF which will be further enhanced during upcoming monitoring period.
CAR to be closed during next audit
CAR 5 MINOR Requirement: Overall Guyana MRV programme
Non-Compliance: Current system does not establish tolerance levels as part of a QA/QC design framework, necessary for an MRV system
Objective evidence:
Current manuals cover the activities to be undertaken
Manuals of Procedures as seen in Sample Design, Standard Operating Procedures, and Mapping Protocols define system processes for both forest carbon and forest cover monitoring.
QA and QC processes are embedded within these systems are designed to reflect best practice as recommended by IPCC,
DNV GL during the audit assess the CAR and the updated procedures as well as new processes where possible GCF is now introducing clear alternatives and defaults within its processes.
CAR to be closed during the next audit

DNV GL – Report No. Z0512818, Rev. 1 – www.dnvgl.com Page A - 3
CAR ID Major/
Minor
Corrective action request Response by Project Participants DNV GL’s assessment of response by
Project Participants
however it does not cover predefined fall back options for errors in the system
Current QA&QC focus on fixing the problems found but not what the relevancies of the error and whether this has an effect on other data sets.
GOFC GOLD as well as methods outlined in peer reviewed, published scientific studies.
Current systems are designed to achieve as high accuracy and precisions levels that are possible. For example, main elements of the forest carbon monitoring system aim for statistical results that reflect 95% confidence level +/_ 15% of the mean.
Although of minimal occurrence, in instances of errors in data collection and processing, currently, full system checks are performed across datasets.
General tolerance levels for main components the forest area and forest carbon monitoring systems may be beneficial to the overall operation of the MRVS as well as integration within the relevant SOPs an aspect on the treatment and classification of known types of errors.
Additionally, the GFC will further explore the possibility of using a common error term for field measurement to include, for example, Monte Carlo type error analysis. GFC is also working with Winrock International in developing an estimate of error due to the use of allometric model. However, the GFC notes that the sources of error from field measurement and the use of allometric equations is generally small compared to the sample error, which as mentioned earlier has been set by GFC at 95% CI of <15% of the mean for total carbon stocks. Sources of error will be examined and included to the extent

DNV GL – Report No. Z0512818, Rev. 1 – www.dnvgl.com Page A - 4
CAR ID Major/
Minor
Corrective action request Response by Project Participants DNV GL’s assessment of response by
Project Participants
possible once Monte Carlo type analysis has been developed and GFC staff trained. This will likely undertake a phased approach in implementation.
In Year 4, GFC will include further internal consistency checks and assign the acceptable levels of accuracy to the deforestation and degradation mapping products. The actions required should these tolerances exceed the stated objectives will be included in the SoP for Mapping.
Observations
OBS ID Corrective action request Response by Project Participants
DNV GL’s assessment of response by
Project Participants
Obs1 Requirement: Interim indicator 1, 2 and 3
Potential Non-Compliance: Accuracy assessment’s sampling plan and estimate of standard error of the model-assisted estimator.
Objective evidence:
The DU has assumed the 1ha-plot as unit of observation and that it is stratified SRS. This is evidenced from the calculations such as the ones provided 11-8 for the High Risk Stratum, where the confusion matrix and all the calculations of the model-assisted estimator and its variance have been made considering the 1-ha plot as sampling unit (i.e. 24125 units in the matrix). Hence, it has been assumed that it is a SRS within that stratum, which differs from the sampling design.
GFC Response:
The accuracy assessment report clearly states that “A two-stage sampling with stratification of the primary units was adopted to provide precise estimates of forest area.” The first stage sample units are 15 by 1 Km rectangular areas derived from SRS (simple random sampling) of each of the two strata. The second stage systematically samples 1 ha mapping areas within each unit. The rationale is to calculate within-stratum means and variances and then weighted estimates of forest area, where the weights are proportional to the stratum sizes. The stratum size is derived from the analysis of deforestation risk carried out using relevant GIS data layers. As with SRS variance estimators, stratified estimators can be biased when used with systematic sampling. However, stratification of the model assisted difference estimator is, in this case, used to increase the precision of the forest area estimates; a variable closely related to the variable on which the stratification is based. The calculations were done separately by stratum and weights applied when combined.
DNV GL assessed the response and
implementation to the observation
and deemed the changes to be
acceptable.However see Obs 2

DNV GL – Report No. Z0512818, Rev. 1 – www.dnvgl.com Page A - 5
OBS ID Corrective action request Response by Project Participants
DNV GL’s assessment of response by
Project Participants
This may have some implications as:
a) The formulae for the model-assisted estimator and its variances sourced from Roberts & Walters (2012) assumes a SRS.
GFC Response:
The formulae used is for the model assisted difference estimator is taken from McRoberts, Tomppo and Naesset (2010) Scandinavian Journal of Forest Research, 25, 368-381 and McRoberts (2010) Remote Sensing of Environment, 114, 1017-1025. and Sarndal and Swensson (1987) International Statistical Review, 55, 279-294 and McRoberts (pers comm to Indufor).
The DNV GL notes suggest that the interim measures report might have used different terminology. The model assisted difference estimator uses the difference between a model (what Sarndall and Swensson refer to as a naïve estimator) and a probability-based sample. The DU accuracy assessment used a probability-based sample for the first stage and systematically sampled within this; potential bias was examined and an additional analysis of the sample sizes between the strata is presented below. There is no evidence of any systematic bias although the discussion in the report could have been clearer.
DNV GL assessed the response and
implementation to the observation
and deemed the changes to be
acceptable.However see Obs 2
b) Stehman (1997) proves that estimating the overall accuracy of a cluster sampling (with equal-size clusters; in the Guyana case are unequal-size clusters) with formulae from a SRS may bias the results of the standard errors.
As said above, bias is always a problem in any systematic sampling procedure. The DNV GL feedback highlights possible bias associated with the GeoVantage flights not always mapping 15 km2 precisely. Durham University have looked at the distributions of the primary sampling units and these are shown in the density plots below. Analysis of variance shows that there is no significant difference in means between the two strata and standard deviations are very similar. [Bartlett’s test of equal variances between Strata Chi2 = 0.8709; Prob>chi2 = 0.351]. Therefore, although it is not ideal to have variability in the size of the primary sample units, this was an unavoidable consequence of using an aircraft flying a low altitude over a rainforest; in some cases the imaging failed and only part of these data were collected, in other cases additional data were collected.
DNV GL assessed the response and
implementation to the observation
and deemed the changes to be
acceptable.However see Obs 2

DNV GL – Report No. Z0512818, Rev. 1 – www.dnvgl.com Page A - 6
OBS ID Corrective action request Response by Project Participants
DNV GL’s assessment of response by
Project Participants
There was no systematic pattern to this. In previous years, cloud cover resulted in some unevenness in sampling.
In view of this, the reported results in the Accuracy Assessment on areas and confidence intervals may be biased.
GFC are encouraged to improve this potential issue.
GFC Response:
The land cover (LULC) change categories Guyana are Forest, Degraded Forest and various non-forest classes. The data that for land cover transitions are captured in the MRV and are replicated in the independent Accuracy Assessment; that is the drivers of change are recorded where possible. Some of the LULC change categories are very small in area (forest to Cropland is a good example) and robust statistical assessment of such change in Year 4 needs to be balanced against the priority of assessing deforestation and forest degradation due to mining and logging. GFC are aware that the use of stratified sampling and validation of satellite-based mapping with aerial GeoVantage data has reduced uncertainty in the aerial estimate of forest change for Year 3. If a similar approach is taken in Year 4, the estimate of deforestation rate will also be improved. It is appropriate that the Accuracy Assessment team be asked to model this uncertainty and where possible to comment on uncertainly by land cover type / change driver.
DNV GL assessed the response and
implementation to the observation
and deemed the changes to be
acceptable.However see Obs 2

DNV GL – Report No. Z0512818, Rev. 1 – www.dnvgl.com Page A - 7
OBS ID Corrective action request Response by Project Participants
DNV GL’s assessment of response by
Project Participants
The GFC mapping is based on expert manual interpretation of 5 m resolution satellite imagery. It is not a machine-based classification because cloud cover and image data quality over the entire country make it near impossible to create a national data set that would allow automatic classification; hence the trained expert interpretation team and QC procedures.
GFC should note that this is in fact required by the 2006 IPCC GL for Tier1/2 + Approach 2/3 where the reporting is made over change categories and uncertainty has to be reported for the change categories (i.e. ForestLand to CropLand), not the LULC categories (i.e. ForestLand). So a future MRV compliant with 2006 IPCC GL will require determining the uncertainty in the estimation of change.
GFC Response:
As a next step in Accuracy Assessment efforts when the full MRVS is in place, land cover change confusion matrix will be developed and uncertainties will be attached to each land use/cover category, thereby giving uncertainty in the estimate of change. At this point, the MRVS is in its final interim stage.
DNV GL assessed the response and
implementation to the observation
and deemed the changes to be
acceptable.However see Obs 2
Obs2 Requirement: Interim indicator 1, 2 and 3
Potential Non-Compliance:
Inconsistency within the reporting.
Objective evidence:
Confusion matrix of the
forest cover map (year 4)
and degradation not
considering two-stage
sampling design: Although
DNV GL acknowledge that
stratification has been taken
into account in the current
monitoring period, the
confusion matrix provided in
Table 5.1-5.3 seems to
determine the different
accuracy indicators using
secondary sampling units
OBS to be assessed during during next verification

DNV GL – Report No. Z0512818, Rev. 1 – www.dnvgl.com Page A - 8
OBS ID Corrective action request Response by Project Participants
DNV GL’s assessment of response by
Project Participants
without considering their
grouping in primaries (e.g.
the total is 54254 which is
the number of secondary
SUs). In order to obtain
unbiased estimates of the
different accuracy indicators
the sampling design should
be considered. Although, the
estimate of accuracies
should not be very different
from the presented ones,
GFC to considering the
grouping in primaries for
producing the confusion
matrices and the different
accuracy indicators.
Reporting of uncertainties on
accuracy indicators:
Following Olofsson et al.
(2014), it is good practice to
report confidence intervals at
95% of the different
accuracy indicators (i.e.
overall, users and
producers). GFC to consider
reporting uncertainties of the
accuracy indicators in the
next monitoring period.
Forest Cover change Matrix:
In order to have an estimate
of the accuracy of the
change map produced for
year 4, a confusion matrix of
the forest cover change and
accuracy indicators should
be provided. Section 4.9

DNV GL – Report No. Z0512818, Rev. 1 – www.dnvgl.com Page A - 9
OBS ID Corrective action request Response by Project Participants
DNV GL’s assessment of response by
Project Participants
seems to indicate that these
results would be provided
(i.e. Table 4.9.1) but the
filled-out table is not found
in the report. In previous
monitoring periods is was
not possible to derive this
confusion matrix as there
was no reference data on
change classes, but now it
would be possible to report
this confusion matrix of the
change map for forest cover
change as it has been done
for degradation. Hence, GCF
is encouraged to consider
reporting this in the next
monitoring period along with
uncertainties in accuracy
indicators. GCF to consider
the use of the following
guidance provided in
Olofsson et al. (2014)
regarding reporting, yet with
some adaptations in order to
consider the specific
sampling design.
Deforestation by roads: The
AA report indicates that the
average estimate of
deforestation using sampling
could have been slightly
over-estimated in relation to
the estimate provided by
wall-to-wall mapping. The
issue was mainly related to
the sampling units that

DNV GL – Report No. Z0512818, Rev. 1 – www.dnvgl.com Page A - 10
OBS ID Corrective action request Response by Project Participants
DNV GL’s assessment of response by
Project Participants
intersected with roads, that
were accounted as loss
units, while logically they
could be accounted as
degraded or forest units. The
University of Durham has
indicated the urgent
clarification of the mapping
rules of these cases. The
verification team agrees with
this and would like to
recommend to clarify the
mapping rules of these areas
for the next monitoring
period, and/or to analyse the
potential of using
proportions of loss in the
sampling units instead of a
binomial variable, as used in
Potapov et al. (2014).

DNV GL – Report No. Z0512818, Rev. 1 – www.dnvgl.com Page A - 11
Corrective action requests this year’s audit
CAR ID
Major/
Minor/
Obs Corrective action request Response by Project Participants
DNV GL’s assessment of
response by Project
Participants
CAR 1 MAJOR Requirement: Overall MRV Report
Non-Compliance: Report incomplete or data not matching.
Objective evidence:
From year 3 onwards, a higher number
of forest land acreage is used (the bold
number in table 6.2 p 35), resulting
from a more detailed forets/nonforest
mapping of Guyana (as shortly
mentioned on page 2, par. 1.3, section
starting with “The 2012 (Year3)
assessment...”). It is however not clear
how this new figure might (or might
not) influence the consequent figures
on deforestation and degradation. Nor
is there an footnote with the table to
reference to the explanation on page 2
Table 6-1 p 33 shows increase in Year
3 Forest Area from Year 2 as a result
of the RapidEye reanalyses of forest
non forest clasification
Page 57 Table 8-2 shows difference
(tCO2) of 280 323 where text above
shows 280 085
Page 58 Table 8-3 show tCO2
emission form timber harvest where it
should be illegal logging as per table
title.
Section 1.3, paragraph 3 has been expanded to explain how this analysis was undertaken. As of 2012 the start non-forest area is not comparable with the previous non-forest areas as the analyses were undertaken at using higher resolution RapidEye imagery. This is part of GFC’s improvement process. The implication of improvement is that it alters the deforestation rate calculation from 0.0693% to 0.0688%. This is because it changes the denominator or forest area figure used in the calculation. A footnote has been added to the table. This is referred to in the above bullet point. The Year 3 remapping improves the delineation of the forest boundary which is why the two figures are different and the numbers reflect this in the table. The intention of reporting the two areas is show this difference in a transparent manner. A footnote has been added to table 6-1.
Table 8-2 has been corrected to show a difference of 280 085 instead of 280 323 (tCO2).
Table 8-3 has been corrected to read as emissions from illegal logging rather than forest harvest.
DNV GL assessed the changes to the report and is satisfied with the modifications made by the GFC.
CAR is closed

DNV GL – Report No. Z0512818, Rev. 1 – www.dnvgl.com Page A - 12
CAR ID
Major/
Minor/
Obs Corrective action request Response by Project Participants
DNV GL’s assessment of
response by Project
Participants
CAR 2 MINOR Requirement: Interim Measures 1.1
Non-Compliance: Current system does not systematically provide direct alignment between MRVS Reporting tables and the newly designed IPCC Reporting Results tables
Objective evidence:
Currently system is set up to be fully compliant with the IPCC reporting. However, for some categories there is ambiguity as to the categorisation of drivers in MRV report for Norway and certain groupings of data are required from the IPCC data sheets, which are in part due to the categorisation not having been documented in the MRV Report. This could lead to miscategorising deforestation driver by forestry for Y4 (330 ha, table 6.2 p 35) whereby in the IPCC tables, forest infrastructure and mining infrastructure are categorised as one, but in the MRV Reporting tables, these are separated by Driver
Results tables for both MRVS and IPCC reporting aspects are accurate.
Our understanding is that this corrective action came about because the initial report formatting in historical periods was not aligned with IPCC formats, as was not planned for or intended at that early stage. For example, forestry roads and mining roads have historically been included in forestry and mining separately in the typical MRVS Reporting tables, whereas under IPCC format being piloted in year 4, they are both grouped in one category.
In Year 5 Reporting, the format in which the table is produced and the way in which the area change figures are reported will be altered to align more easily with IPCC classes, and to ensure there is no chance of any ambiguity. There continues to be an interest at the national level in Guyana, to separate infrastructure
DNV GL agrees with proposed planning of GFC however the CAR will not be closed till the next verification once the evidence of the implementation can be verified.
CAR to be closed out during next verification

DNV GL – Report No. Z0512818, Rev. 1 – www.dnvgl.com Page A - 13
CAR ID
Major/
Minor/
Obs Corrective action request Response by Project Participants
DNV GL’s assessment of
response by Project
Participants
CAR 3 MINOR Requirement: Interim Measures 1.1
Non-Compliance: Procedure not up to date
with current practices.
Objective evidence:
Current procedure has both old and
newer procedures without clear
indication on which activities are now
be done by RapidEye i.e. section 4.2,
7.1, Appendix 2 of the SOP Forest
Change Assessment_v12).
QA/QC: deviates from procedures e.g.
the GIS mapping process is a largely
interactive and iterative process when
uncertainties are met, where the
mapping analyst requests feedback
from other staff. Systematic neutral
checks to avoid bias, are currently not
mainstreamed as part of mapping
process.
Current area allocation of analyses to
avoid interpretation biases is not
documented within SOP.
The text of the SOP has been updated in the required sections to make it relevant to which processes have been undertaken historically and how things will be done in the future.
The QA/QC procedures have been modified in the SOP. The system is set up in such a way that these checks are continuously undertaken. The accuracy assessment provides an independent measure and also endorses the mapping approach.
A new process of randomly allocating tiles to each operator instead of working on tiles as ‘blocks’ will be trialled from year 5. It is clear from the accuracy assessment results that the current process employs is both robust and accurate.
DNV GL assessed the changes to the report and is satisfied with the modifications made by the GFC.
CAR is closed

DNV GL – Report No. Z0512818, Rev. 1 – www.dnvgl.com Page A - 14
CAR ID
Major/
Minor/
Obs Corrective action request Response by Project Participants
DNV GL’s assessment of
response by Project
Participants
CAR 4 MINOR Requirement: Interim Measures 2.2 and 2.4
Non-Compliance: Biomass assessment plots of degraded forest within shifting cultivation areas are not adequately reflected within overall biomass calculation.
Objective evidence:
Fieldwork evidence shows that most, if
not all, SA mapped as pioneer actually
is rotational.
Fieldwork evidence shows that the
currently map identification of primary
forest in shifting cultivation areas has
led to the allocation of areas as
primary forest where ground truthing of
the same areas identified the area as
rotational agriculture/degraded
secondary forest.
The brief inspection conducted during the audit indicated that rotational shifting cultivation was classified as pioneer. It is worth noting that this the first year shifting cultivation has been reported. It is anticipated that as an approach 3 MRVS and with further repeat image coverages the attribution of both historical and new shifting cultivation areas will be improved.
While the areas in question still fall within Guyana’s definition of forest, it is recognised that this is secondary forest. It is expected that the historical extent of shifting cultivation areas will improve in line with annual coverages of high resolution imagery. The current work on Emission Factors by GFC will account for the differing carbon contents.
It is planned for field assessments to be conducted to inform an emission factor for Shifting Agriculture. This will inform the impact that this activity has on biomass. This will remove the dependence of categorising shifting agriculture type using remove sensing methods only, which evidently has specific challenges.
It is envisaged that an Emission Factor will be developed in 2015 for Shifting Agriculture. It is likely that the emission factor will be a function of the forest-fallow cycle and local practices. The results that the Remote Sensing analyses can reliably deliver on SA will be reassessed and this will be used with the EF to derive carbon impact in these areas.
DNV GL agrees with proposed planning of GFC however the CAR will not be closed till the next verification once the evidence of the implementation can be verified.
CAR to be closed out during next verification

DNV GL – Report No. Z0512818, Rev. 1 – www.dnvgl.com Page A - 15
CAR ID
Major/
Minor/
Obs Corrective action request Response by Project Participants
DNV GL’s assessment of
response by Project
Participants
CAR 5 MINOR Requirement: 1.1, 2.1, 2.2, and 2.3
Non-Compliance: Required sampling strategy do not require reassessment of stratification over time.
Objective evidence:
Stratification of the Accuracy Assessment is out of date missing HR area around Matthew Ridge
Stratification for the Biomass stratification is out of date BPMLA 12-2A already under gone forest change
The Change Sample approach used in the Y4 Accuracy Assessment used the same design as Y3 and the analytical approach has resulted in a significant reduction in the Sampling Error of forest loss and forest degradation area estimates. Nevertheless, deforestation is, as the audit team point out, encroaching into areas in the Low Risk stratum implying that the stratification is not optimum. The AA team acquired 10% additional randomly selected clusters in Y4 that were not used in the accuracy assessment but are available for Y5 assessment. In response to the CAR 5 - we note that financial and time resources are limited for acquisition of reference data; that the pattern of mining has changed with time; that 95% of degradation is associated with mining and mining-related infrastructure; that degradation can be identified with a good level of accuracy from aerial imagery and very high resolution satellite imagery.
For year 5 the accuracy assessment will seek to revise the sampling stratification to maximize the precision of the estimate given the logistical constraints on the number of first-stage clusters that are randomly selected. Our analysis of the existing stratification using the Neyman allocation equation, illustrates that it is possible to optimize the distribution of samples to achieve the same precision using fewer within-cluster samples.
DNV GL agrees with proposed planning of GFC however the CAR will not be closed till the next verification once the evidence of the implementation can be verified.
CAR to be closed out during next verification

DNV GL – Report No. Z0512818, Rev. 1 – www.dnvgl.com Page A - 16
CAR ID
Major/
Minor/
Obs Corrective action request Response by Project Participants
DNV GL’s assessment of
response by Project
Participants
In sum, we will seek efficiencies by (1) improving the stratification using knowledge of deforestation and degradation risk gained from observed patterns, and (2) use a mathematical approach to optimize the number and distribution of first-stage samples allocated to each risk stratum.
As part of the Sample Design for the Forest Carbon Monitoring System, and Stratification and the Long Term Monitoring Framework, the revision of the stratification for forest carbon is planned to take place every 5 years. This means that the system having been developed in 2010/2011. This mean that in 2016, the stratification is planned for revision.
This will mean taking into consideration new infrastructure, areas of deforestation and forest degradation, and allocations. The point made in the CAR is taken and the process of revision of stratification is necessary as land uses are constantly ongoing and as a natural part of this process, brings about varying impacts on forest areas. The SOP for the Forest Carbon Monitoring System will be updated to take account of this likely occurrence and to outline a procedure for addressing this. Whilst there appears to be no expectation for stratification to be revised every month, or even every year, that within the frame of a specific stratification application, that provisions needs to be clearly outlined to address any eventuality – like a randomly selected area, already having undergone forest change.

DNV GL – Report No. Z0512818, Rev. 1 – www.dnvgl.com Page A - 17
CAR ID
Major/
Minor/
Obs Corrective action request Response by Project Participants
DNV GL’s assessment of
response by Project
Participants
A section is proposed to be added to the SOP for Forest Carbon Monitoring, to address this.
CAR 6 MINOR Requirement: Interim Measures 2.2 and 2.5
Potential Non-Compliance: No explanation of and more transparency required on the intermediate amounts and calculations made to arrive at the final interim indicator figures for these measures.
Objective evidence:
While the methodologies for collateral
damage from logging and carbon
storage in long-term wood products
are clearly spelt out in the MRVS
report, it is not clear how and in what
amount the contribution from each of
these factors contributed to the greater
results for the final interim indicators
for forest management and illegal
logging.
While a robust description is included
in the verification report of how the
respective databases compile the
volume information needed to arrive at
the final interim indicator figures, there
is limited information to showcase
what emission factors and or other
conversion computations were made
to arrive at the final figures.
The CAR is noted and although required for consideration in the next MRVS assessment, this change has been made to this MRV Report.
Explanatory notes have been added to each indicator – forest management and illegal logging, to more clearly show the impact of each factor used and the process of applying each step of the computations.
DNV GL assessed the changes to the report and is satisfied with the modifications made by the GCF.
CAR is closed

DNV GL – Report No. Z0512818, Rev. 1 – www.dnvgl.com Page A - 18
OBS ID
Major/
Minor/
Obs Corrective action request Response by Project Participants
DNV GL’s assessment of
response by Project
Participants
Obs 1 OBS Requirement: Interim Indicator 1.1
Potential Non-Compliance: Misclassification of reference samples during Accuracy Assessment
Objective evidence: Change toolbar to become comprehensible and useable for new people.
The GIS toolbar used for accuracy assessment has become complex as the assessment now incorporates a change sample analysis that compares only two independent reference data sets and compares the latest reference data with the GFC map product. For each of these assessments the accuracy assessment analyst may be required to indicate the driver of change and a possible mapping error should this be observed. For year 5 accuracy assessment, the GIS toolbar will be modified and simplified with the objective that it can be learned quickly by a new operator and that none of the drop down menu items are ambiguous.
DNV GL agrees with proposed planning of GFC however the OBS will not be closed till the next verification once the evidence of the implementation can be verified.
OBS to be closed out during next verification
- o0o -

APPENDIX B
CURRICULA VITAE OF THE VERIFICATION TEAM MEMBERS

Edwin Aalders
Mr Aalders has 20 years of experience as an assessor in Environmental Auditing and Policy and
Management. Mr Aalders started his career in SGS in 1992 were he quickly became involved in the
development of new environmental certification & control services. In 2004 he became the Director of
the International Emission Trading Association (IETA) which he held till 2009. In addition to his role as
Director in IETA he was the first CEO for the Verified Carbon Standard Association (VCSa) between
November 2007 and October 2008. After leaving IETA Mr Aalders became a Partner with IDEAcarbon
before joining DNV GL as at their Climate Change and Sustainable Development Department in 2011.
Throughout his career Mr Aalders lived and worked in the various developing and developed countries,
particularly Latin America, Africa and Australasia, involved in developing new environmental markets
services. At SGS his work covered the development of environmental programmes such as SGS’
Services in for Climate Change, Marine Stewardship Council (MSC), Organic, GLOBALGAP and Forest
Stewardship Council (FSC). Whilst within IETA he had the operational responsibility of IETAs overall
activities and in particularly those related to the UNFCCC process (CDM & JI) as well as the voluntary
market which ultimately led to the setting up of the VCSa.
Mr Aalders is and has been an elected member of roster of experts for the Methodology & Accreditation
Panel Expert of the CDM & JI, member of the JI Accreditation Panel, and is currently member of the
VCSa AFOLU Steering Committee and the Pacific Carbon Trust Advisory Panel.
Vincent Schut
Vincent Schut has over 10 years’ experience in earth observation image analysis and received his MSc in
Tropical Agriculture at Wageningen University in 2001. At SarVision, he coordinates the development of
advanced optical image processing chains and supporting algorithms and software for semi-automated
forest and land cover change monitoring in tropical forest areas. He is also responsible for the setup and
maintenance of the processing computer systems and local area network. Vincent is an experienced
programmer (python, idl, C, C++, java) working with ENVI/IDL, Quantum GIS, openJump. Over the
years he has executed several field work campaigns in South East Asia and has good knowledge of the
relation between imagery and land cover characteristics. He has successfully executed image processing
assignments in support of national REDD MRV system development in Suriname, Colombia and
Indonesia as well as private sector VCS projects.
Pablo Reed
Pablo Reed holds more than 12 years of experience in the fields of Forestry, Climate Change, and
International Development. He holds a joint degree in Forest Engineering and Latin-American studies
from the University of Washington, as well as a Masters in Environmental Management from the Yale
School of Forestry and Environmental Studies. His interest and passion for conservation and
development initiatives have led him to work in various countries and projects through the years, such
as serving as country director for a USAID-led indigenous community mapping program in Guatemala;
as an environmental consultant for the Academy of Educational Development in Panama; and as director
for the Natural Resource Conservation Program with the Peace Corps in Ecuador. Since joining DNV GL in
2011, his work has mainly concentrated on the validation of Agriculture, Forestry, and Other Land Use
(AFOLU)-sector carbon offset projects across the globe, and on Low Emissions Development Strategies
(LEDs) and the design of Nationally Appropriate Mitigation Actions (NAMAs) for emerging economies in

Latin America. His main areas of interest and expertise concentrate on issues of community-based
conservation, non-traditional land tenure arrangements, and the feasibility of incorporating indigenous
community lands under Reducing Emissions from Deforestation and Degradation (REDD) and other
payment-for-environmental-services type of initiatives. He is currently based out of Berkeley, California.
Andres B. Espejo
Andres Espejo is the founder and president of AFOLU Global Services. He has 10 years of experience in
forest management and operations plus climate change. Andrés Espejo is a Natural Resource and
Forestry Engineer, with strong technical expertise in quantification and modelling of biomass and carbon
in the Agriculture, Forestry, and Other Land Use (AFOLU) sector, and also with extensive experience in
monitoring, reporting and verification (MRV) of AFOLU carbon offset projects, programmes and initiatives
under the main standards. In the climate change field, he has worked in a CDM DOE (Det Norske Veritas)
and has been involved in more than 30 validations/verifications/assessments of Agriculture, Forestry and
Other Land Use (AFOLU) initiatives, including the assessment of various REDD methodologies and
projects and the assessment of two REDD national and sub-national MRV/RELs, including emission
sources related to biomass burning in all cases. Mr. Espejo has a profound knowledge of AFOLU
methodologies and requirements, REDD relevant COP decisions, 2006 IPCC GL, GOFC-GOLD REDD
Sourcebook, etc. Additionally he has expertise in forest inventory, cruising, forest management and
operations, forest certification, and financial analysis of various types of projects.

About DNV GL Driven by our purpose of safeguarding life, property and the environment, DNV GL enables organizations to advance the safety and sustainability of their business. We provide classification and technical assurance along with software and independent expert advisory services to the maritime, oil and gas, and energy industries. We also provide certification services to customers across a wide range of industries. Operating in more than 100 countries, our 16,000 professionals are dedicated to helping our
customers make the world safer, smarter and greener.


